Embed Size (px)
Citation preview
Agricultural Economics Research ReviewVol. 28 (No.2) July-December 2015 pp 247-261DOI: 10.5958/0974-0279.2016.00004.5
Determinants of Small Milk Producers’ Participation inOrganized Dairy Value Chains: Evidence from India
Vijay Paul Sharma*Centre for Management in Agriculture, Indian Institute of Management, Ahmedabad - 380 015, Gujarat
Abstract
Indian dairy industry which was highly regulated till late-1990s, has been completely liberalized andexposed to world competition. The past decade has seen rapid changes in the Indian dairy sector andthere have been growing concerns on the likely impacts of these changes on smallholder producers. Thepresent paper has analysed determinants of market channel choices of small milk producers based onfarm household survey and has investigated what impacts these market channel choices may have onfarmers’ income and technology adoption. The study has found that though there have been emergingmilk marketing channels, the traditional sector still dominates. The analysis has indicated that small dairyfarmers are not excluded from the cooperatives but are excluded from the modern private sector.
Key words: India, dairy development, operation flood, smallholder producer, market participation,multinomial logit
JEL Classification: Q13, O17, D71
IntroductionFrom chronic shortages of milk, India has emerged
as the largest milk producer in the world crossing 132.4million tonnes in 2012-13 and per capita availabilityof milk increasing from about 110 grams per day inearly-1970s to 299 grams in 2012-13 (GoI, 2014). Thissuccess story of milk production has been writtenprimarily by the millions of smallholder producers, whodot the landscape of milk production in the country.Although the yields have remained quite low comparedto the world average, the dairy sector has not onlysurvived but also flourished. Several factors appear tohave helped it flourish. The “Operation Flood”, one ofthe world’s largest dairy development programs, whichhelped to create strong network and linkages amongmillions of smallholder milk producers, processors andurban consumers, was an important instrument inachieving this success. It is well known that all thishappened under autarky and highly regulated domesticmarkets. The commercial imports and exports of almost
all dairy products had been banned for most of the timeand processing activity had been controlled throughlicensing which favoured cooperatives/public sectorover private sector. However, since early-1990s, Indiaembarked upon liberal policy framework, which gotreinforced with the signing of Uruguay RoundAgreement on Agriculture (URAA) in 1994 and it ledto fundamental changes in the Indian agri-food sector,including dairy. The state interventions and controlsin agribusiness were substantially reduced and foreigndirect investment (FDI) was both encouraged andfacilitated. This resulted in new investments in someagri-food sectors, particularly in agro-processing.Rapid changes are taking place in the structure andgovernance of agri-food markets in developingcountries including India. These changes includeconsolidation, institutional, organizational andtechnological transformations and multinationalization.These have brought rapid changes all the way“upstream” in the agrifood systems.
Some agribusiness and food processing companieshave introduced modern procurement systems like*Email: [email protected]
248 Agricultural Economics Research Review Vol. 28 (No.2) July-December 2015
contract relationship with farmers to provide basicinputs and services in return for guaranteed and qualitysupplies and distribution strategies that have impactedvarious segments of food chains. These modern supplychains provide both new opportunities (price andmarket stability) and new challenges (quality and foodsafety standards).
The socio-economic factors (income, population,tastes and preferences) on the demand side and varioussupply side factors such as trade liberalization,privatization and modernization of agro-processing andretailing sector are the major drivers of changes inagrifood systems. However, there have been growingconcerns on the likely impacts of the rapid changes inagri-food market chains on smallholder producers inmany developing countries. Modern retail chains,particularly supermarkets, have been emerging indeveloping countries since early-1990s (Reardon andTimmer, 2005). Rapid marketing chain changes havealso occurred in food processing, wholesaling andprocurement (Reardon and Timmer, 2007). The earlierstudies show that increase in supermarkets could haveserious distributional impacts on the backend of themarket chain. For example, there are case studies inLatin America, Central and Eastern Europe, Mexico,Brazil and Kenya that suggest that mainly large andwealthy farmers benefit from the rise of demand forhigh-value agriculture and emergence of supermarkets(Reardon and Timmer, 2007; Berdegué et al., 2005).Because of the high transaction costs involved indealing with millions of small farmers and difficultiesin ensuring quality and food safety, it is often assumedthat modern supply chains will concentrate on largeand better-off farmers. As a consequence, the increasein demand for high-value agricultural commodities andthe concomitant rise in supermarkets, have createdconcerns among the international community about thepossible adverse consequences on small resource-poorfarmers (Reardon and Timmer, 2007).
There are a few studies from India on the impactsof modern agri-food chains on production andmarketing at farm level. Some recent studies haveprovided anecdotal evidence of smallholder producers’participation in modern market channels (Joshi et al.,2007; Sharma and Singh, 2007). However, these studiesare restrictive in terms of geographical coverage,commodities and market channels. Some householdsurvey based studies from other developing countries
provide mixed evidence. Some studies have shown thatmodernization has benefited largely large farmers andexcluded smallholder milk producers. On the otherhand, some studies have indicated that modernizationcan have positive impact on smallholder milkproducers.
Since Indian dairy industry, particularly thecooperative sector, has a long and successful historyof linking smallholder milk producers with marketsunder regulated policy environment until 1990s, it isimportant to understand farm-level impacts of changingdairy market structures in India. The strategic issue,which this paper addresses, is: what has been theresponse of smallholder milk producers and processorsto changing modern dairy supply chains in India? Morespecifically, our research questions are:
• What are the determinants of smallholder milkproducers’ participation in modern supply chains?
• What is the impact of this participation on growthof smallholder milk producers in terms of farmers’income, production, and technology choices?
Changing Structure of Indian Dairy SectorMilk production is an important rural activity in
India providing supplementary income, employmentand nutrition to millions of rural households. With avalue of output of about ` 167,720 crore (US$ 28billion) during triennium ending (TE) 2012-13, itranked first, surpassing rice and wheat combined(` 149,046 crore, US$ 24.8 billion), in India’sagricultural sector (CSO, 2014). The output of milkand milk products has increased faster than of the cropsduring the past four decades. The higher incomeelasticity of demand for milk and milk products coupledwith growing urban population, led to a rapid growthin demand, which has been met by higher rate of growthin milk production.
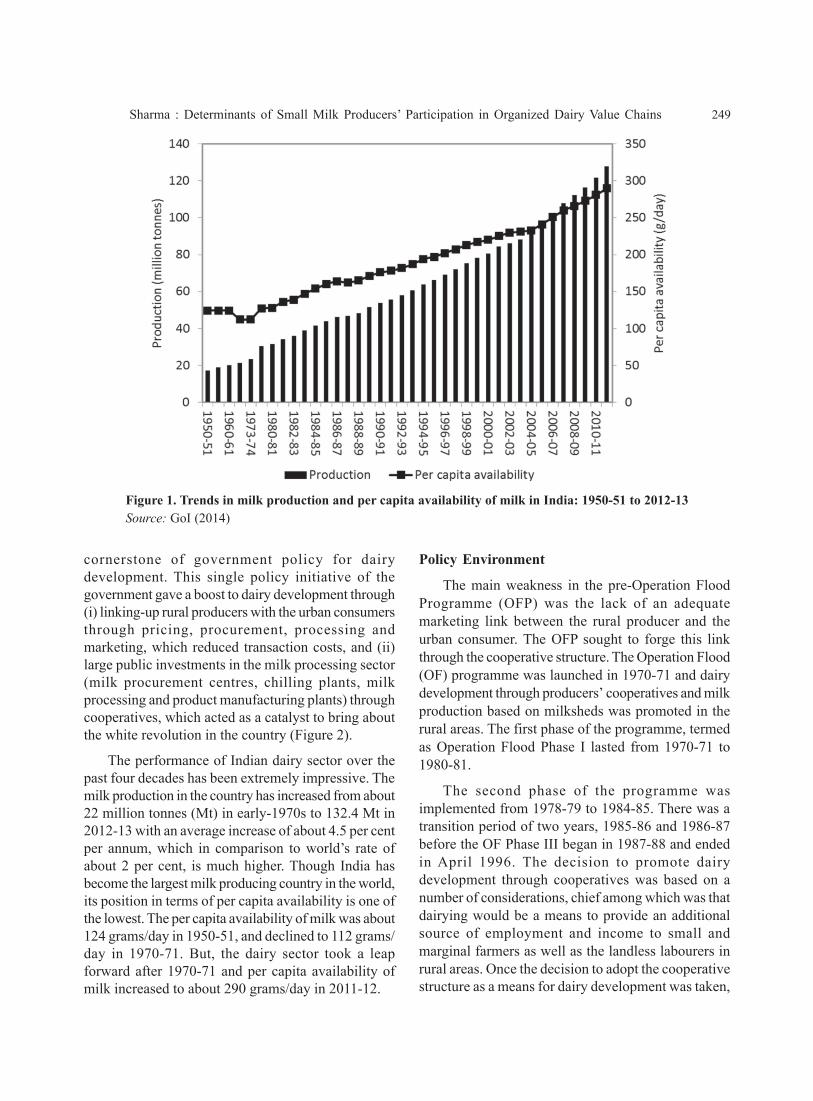
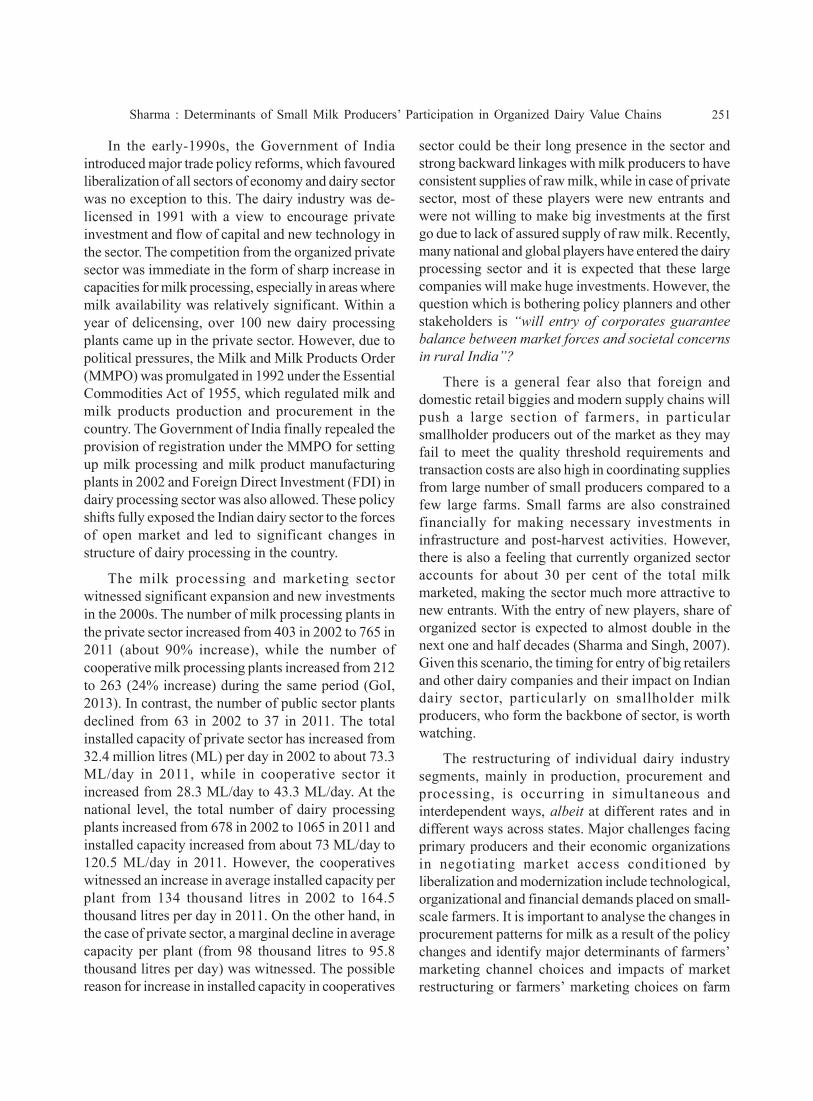
Milk production was more or less stagnant duringthe 1950s and 1960s and annual production growthwas negative in many years (Figure 1). The per capitaavailability of milk declined which concerned thepolicy makers. During the second-half of the 1960s,the Government of India made major policy changesin the dairy sector. Milk production in rural milkshedsthrough milk producer cooperatives and movement ofprocessed milk to urban demand centres became the
Sharma : Determinants of Small Milk Producers’ Participation in Organized Dairy Value Chains 249
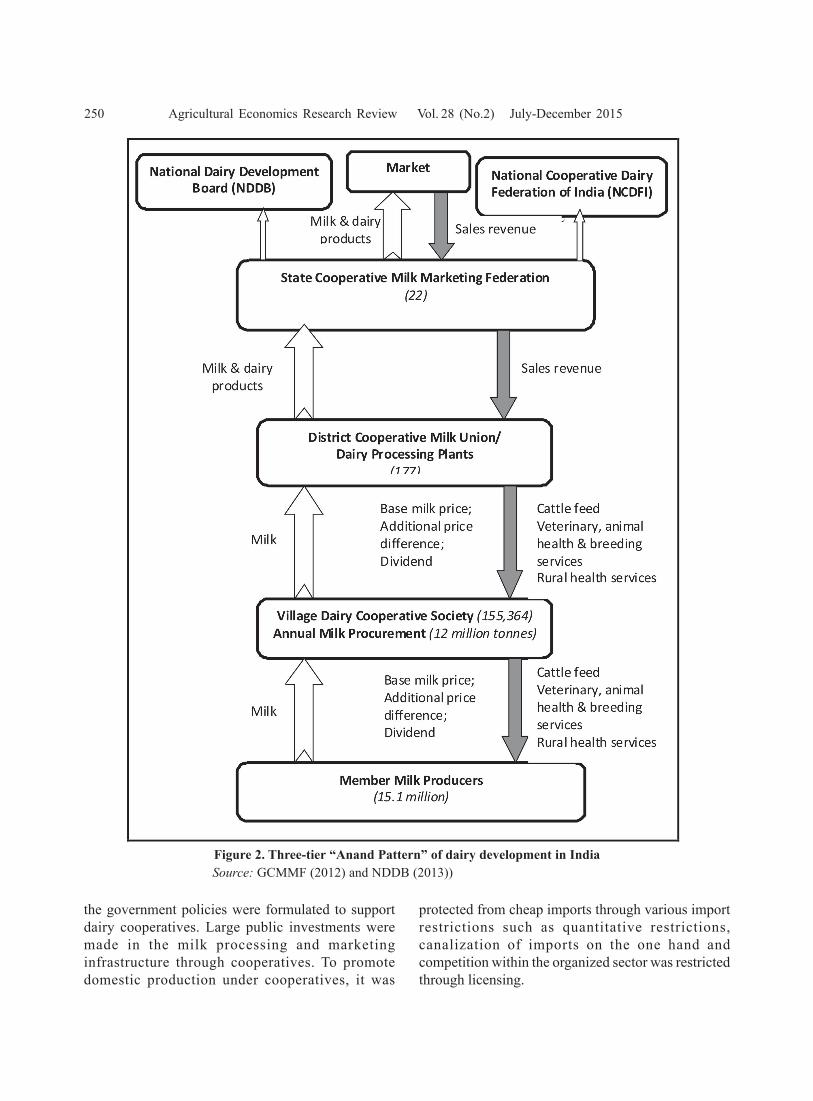
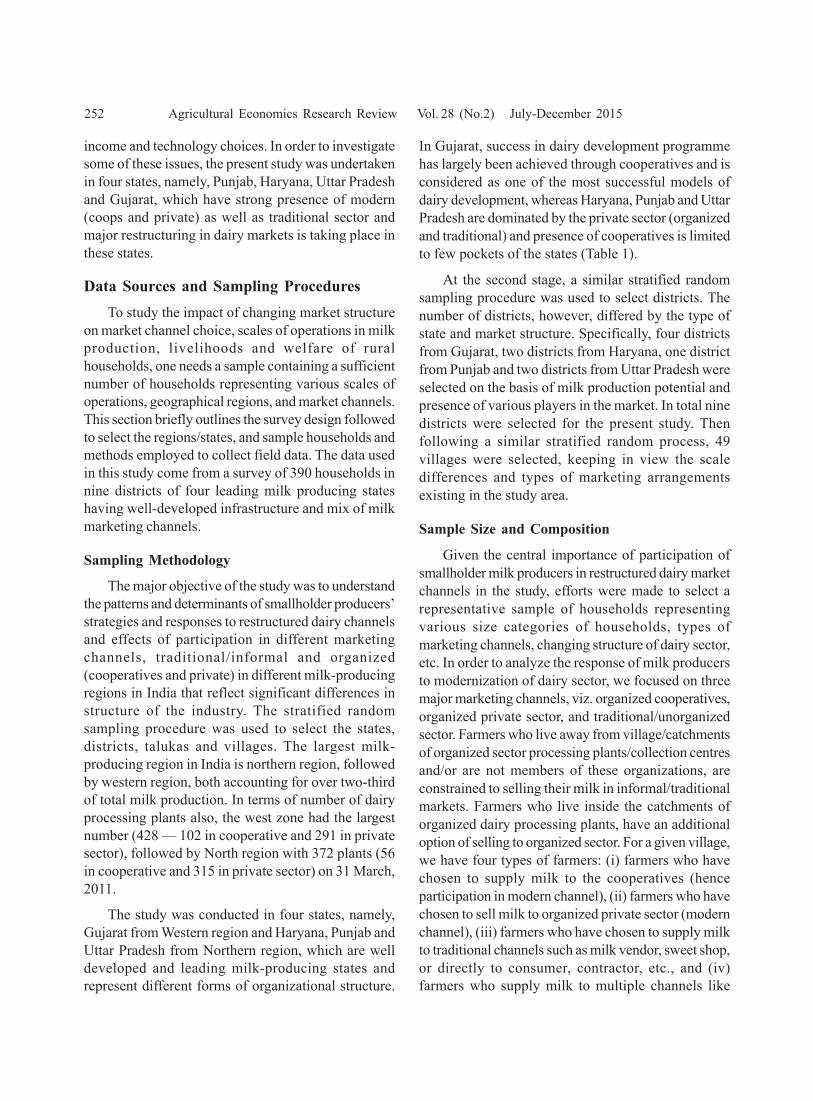
cornerstone of government policy for dairydevelopment. This single policy initiative of thegovernment gave a boost to dairy development through(i) linking-up rural producers with the urban consumersthrough pricing, procurement, processing andmarketing, which reduced transaction costs, and (ii)large public investments in the milk processing sector(milk procurement centres, chilling plants, milkprocessing and product manufacturing plants) throughcooperatives, which acted as a catalyst to bring aboutthe white revolution in the country (Figure 2).
The performance of Indian dairy sector over thepast four decades has been extremely impressive. Themilk production in the country has increased from about22 million tonnes (Mt) in early-1970s to 132.4 Mt in2012-13 with an average increase of about 4.5 per centper annum, which in comparison to world’s rate ofabout 2 per cent, is much higher. Though India hasbecome the largest milk producing country in the world,its position in terms of per capita availability is one ofthe lowest. The per capita availability of milk was about124 grams/day in 1950-51, and declined to 112 grams/day in 1970-71. But, the dairy sector took a leapforward after 1970-71 and per capita availability ofmilk increased to about 290 grams/day in 2011-12.
Policy Environment
The main weakness in the pre-Operation FloodProgramme (OFP) was the lack of an adequatemarketing link between the rural producer and theurban consumer. The OFP sought to forge this linkthrough the cooperative structure. The Operation Flood(OF) programme was launched in 1970-71 and dairydevelopment through producers’ cooperatives and milkproduction based on milksheds was promoted in therural areas. The first phase of the programme, termedas Operation Flood Phase I lasted from 1970-71 to1980-81.
The second phase of the programme wasimplemented from 1978-79 to 1984-85. There was atransition period of two years, 1985-86 and 1986-87before the OF Phase III began in 1987-88 and endedin April 1996. The decision to promote dairydevelopment through cooperatives was based on anumber of considerations, chief among which was thatdairying would be a means to provide an additionalsource of employment and income to small andmarginal farmers as well as the landless labourers inrural areas. Once the decision to adopt the cooperativestructure as a means for dairy development was taken,
Figure 1. Trends in milk production and per capita availability of milk in India: 1950-51 to 2012-13Source: GoI (2014)
250 Agricultural Economics Research Review Vol. 28 (No.2) July-December 2015
Figure 2. Three-tier “Anand Pattern” of dairy development in IndiaSource: GCMMF (2012) and NDDB (2013))
the government policies were formulated to supportdairy cooperatives. Large public investments weremade in the milk processing and marketinginfrastructure through cooperatives. To promotedomestic production under cooperatives, it was
protected from cheap imports through various importrestrictions such as quantitative restrictions,canalization of imports on the one hand andcompetition within the organized sector was restrictedthrough licensing.
Sharma : Determinants of Small Milk Producers’ Participation in Organized Dairy Value Chains 251
In the early-1990s, the Government of Indiaintroduced major trade policy reforms, which favouredliberalization of all sectors of economy and dairy sectorwas no exception to this. The dairy industry was de-licensed in 1991 with a view to encourage privateinvestment and flow of capital and new technology inthe sector. The competition from the organized privatesector was immediate in the form of sharp increase incapacities for milk processing, especially in areas wheremilk availability was relatively significant. Within ayear of delicensing, over 100 new dairy processingplants came up in the private sector. However, due topolitical pressures, the Milk and Milk Products Order(MMPO) was promulgated in 1992 under the EssentialCommodities Act of 1955, which regulated milk andmilk products production and procurement in thecountry. The Government of India finally repealed theprovision of registration under the MMPO for settingup milk processing and milk product manufacturingplants in 2002 and Foreign Direct Investment (FDI) indairy processing sector was also allowed. These policyshifts fully exposed the Indian dairy sector to the forcesof open market and led to significant changes instructure of dairy processing in the country.
The milk processing and marketing sectorwitnessed significant expansion and new investmentsin the 2000s. The number of milk processing plants inthe private sector increased from 403 in 2002 to 765 in2011 (about 90% increase), while the number ofcooperative milk processing plants increased from 212to 263 (24% increase) during the same period (GoI,2013). In contrast, the number of public sector plantsdeclined from 63 in 2002 to 37 in 2011. The totalinstalled capacity of private sector has increased from32.4 million litres (ML) per day in 2002 to about 73.3ML/day in 2011, while in cooperative sector itincreased from 28.3 ML/day to 43.3 ML/day. At thenational level, the total number of dairy processingplants increased from 678 in 2002 to 1065 in 2011 andinstalled capacity increased from about 73 ML/day to120.5 ML/day in 2011. However, the cooperativeswitnessed an increase in average installed capacity perplant from 134 thousand litres in 2002 to 164.5thousand litres per day in 2011. On the other hand, inthe case of private sector, a marginal decline in averagecapacity per plant (from 98 thousand litres to 95.8thousand litres per day) was witnessed. The possiblereason for increase in installed capacity in cooperatives
sector could be their long presence in the sector andstrong backward linkages with milk producers to haveconsistent supplies of raw milk, while in case of privatesector, most of these players were new entrants andwere not willing to make big investments at the firstgo due to lack of assured supply of raw milk. Recently,many national and global players have entered the dairyprocessing sector and it is expected that these largecompanies will make huge investments. However, thequestion which is bothering policy planners and otherstakeholders is “will entry of corporates guaranteebalance between market forces and societal concernsin rural India”?
There is a general fear also that foreign anddomestic retail biggies and modern supply chains willpush a large section of farmers, in particularsmallholder producers out of the market as they mayfail to meet the quality threshold requirements andtransaction costs are also high in coordinating suppliesfrom large number of small producers compared to afew large farms. Small farms are also constrainedfinancially for making necessary investments ininfrastructure and post-harvest activities. However,there is also a feeling that currently organized sectoraccounts for about 30 per cent of the total milkmarketed, making the sector much more attractive tonew entrants. With the entry of new players, share oforganized sector is expected to almost double in thenext one and half decades (Sharma and Singh, 2007).Given this scenario, the timing for entry of big retailersand other dairy companies and their impact on Indiandairy sector, particularly on smallholder milkproducers, who form the backbone of sector, is worthwatching.
The restructuring of individual dairy industrysegments, mainly in production, procurement andprocessing, is occurring in simultaneous andinterdependent ways, albeit at different rates and indifferent ways across states. Major challenges facingprimary producers and their economic organizationsin negotiating market access conditioned byliberalization and modernization include technological,organizational and financial demands placed on small-scale farmers. It is important to analyse the changes inprocurement patterns for milk as a result of the policychanges and identify major determinants of farmers’marketing channel choices and impacts of marketrestructuring or farmers’ marketing choices on farm
252 Agricultural Economics Research Review Vol. 28 (No.2) July-December 2015
income and technology choices. In order to investigatesome of these issues, the present study was undertakenin four states, namely, Punjab, Haryana, Uttar Pradeshand Gujarat, which have strong presence of modern(coops and private) as well as traditional sector andmajor restructuring in dairy markets is taking place inthese states.
Data Sources and Sampling ProceduresTo study the impact of changing market structure
on market channel choice, scales of operations in milkproduction, livelihoods and welfare of ruralhouseholds, one needs a sample containing a sufficientnumber of households representing various scales ofoperations, geographical regions, and market channels.This section briefly outlines the survey design followedto select the regions/states, and sample households andmethods employed to collect field data. The data usedin this study come from a survey of 390 households innine districts of four leading milk producing stateshaving well-developed infrastructure and mix of milkmarketing channels.
Sampling Methodology
The major objective of the study was to understandthe patterns and determinants of smallholder producers’strategies and responses to restructured dairy channelsand effects of participation in different marketingchannels, traditional/informal and organized(cooperatives and private) in different milk-producingregions in India that reflect significant differences instructure of the industry. The stratified randomsampling procedure was used to select the states,districts, talukas and villages. The largest milk-producing region in India is northern region, followedby western region, both accounting for over two-thirdof total milk production. In terms of number of dairyprocessing plants also, the west zone had the largestnumber (428 — 102 in cooperative and 291 in privatesector), followed by North region with 372 plants (56in cooperative and 315 in private sector) on 31 March,2011.
The study was conducted in four states, namely,Gujarat from Western region and Haryana, Punjab andUttar Pradesh from Northern region, which are welldeveloped and leading milk-producing states andrepresent different forms of organizational structure.
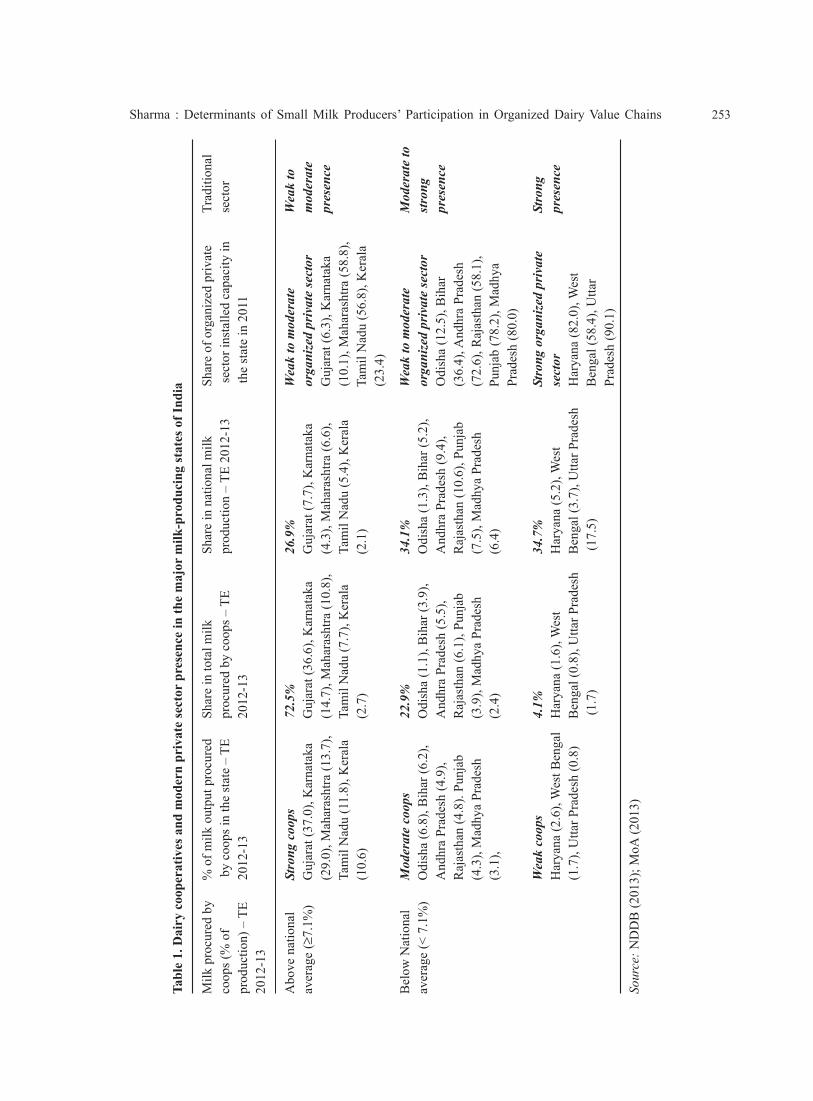
In Gujarat, success in dairy development programmehas largely been achieved through cooperatives and isconsidered as one of the most successful models ofdairy development, whereas Haryana, Punjab and UttarPradesh are dominated by the private sector (organizedand traditional) and presence of cooperatives is limitedto few pockets of the states (Table 1).
At the second stage, a similar stratified randomsampling procedure was used to select districts. Thenumber of districts, however, differed by the type ofstate and market structure. Specifically, four districtsfrom Gujarat, two districts from Haryana, one districtfrom Punjab and two districts from Uttar Pradesh wereselected on the basis of milk production potential andpresence of various players in the market. In total ninedistricts were selected for the present study. Thenfollowing a similar stratified random process, 49villages were selected, keeping in view the scaledifferences and types of marketing arrangementsexisting in the study area.
Sample Size and Composition
Given the central importance of participation ofsmallholder milk producers in restructured dairy marketchannels in the study, efforts were made to select arepresentative sample of households representingvarious size categories of households, types ofmarketing channels, changing structure of dairy sector,etc. In order to analyze the response of milk producersto modernization of dairy sector, we focused on threemajor marketing channels, viz. organized cooperatives,organized private sector, and traditional/unorganizedsector. Farmers who live away from village/catchmentsof organized sector processing plants/collection centresand/or are not members of these organizations, areconstrained to selling their milk in informal/traditionalmarkets. Farmers who live inside the catchments oforganized dairy processing plants, have an additionaloption of selling to organized sector. For a given village,we have four types of farmers: (i) farmers who havechosen to supply milk to the cooperatives (henceparticipation in modern channel), (ii) farmers who havechosen to sell milk to organized private sector (modernchannel), (iii) farmers who have chosen to supply milkto traditional channels such as milk vendor, sweet shop,or directly to consumer, contractor, etc., and (iv)farmers who supply milk to multiple channels like
Sharma : Determinants of Small Milk Producers’ Participation in Organized Dairy Value Chains 253
Tabl
e 1.
Dai
ry c
oope
rativ
es a
nd m
oder
n pr
ivat
e se
ctor
pre
senc
e in
the
maj
or m
ilk-p
rodu
cing
stat
es o
f Ind
ia
Milk
pro
cure
d by
% o
f milk
out
put p
rocu
red
Shar
e in
tota
l milk
Shar
e in
nat
iona
l milk
Shar
e of
org
aniz
ed p
rivat
eTr
aditi
onal
coop
s (%
of
by
coop
s in
the
stat
e –
TEpr
ocur
ed b
y co
ops –
TE
prod
uctio
n –
TE 2
012-
13 se
ctor
inst
alle
d ca
paci
ty in
sect
orpr
oduc
tion)
– T
E20
12-1
320
12-1
3 th
e st
ate
in 2
011
2012
-13
Abo
ve n
atio
nal
Stro
ng c
oops
72.5
%26
.9%
Wea
k to
mod
erat
eW
eak
toav
erag
e (≥
7.1%
)G
ujar
at (3
7.0)
, Kar
nata
kaG
ujar
at (3
6.6)
, Kar
nata
kaG
ujar
at (7
.7),
Kar
nata
kaor
gani
zed
priv
ate
sect
orm
oder
ate
(29.
0), M
ahar
asht
ra (1
3.7)
,(1
4.7)
, Mah
aras
htra
(10.
8),
(4.3
), M
ahar
asht
ra (6
.6),
Guj
arat
(6.3
), K
arna
taka
pres
ence
Tam
il N
adu
(11.
8), K
eral
aTa
mil
Nad
u (7
.7),
Ker
ala
Tam
il N
adu
(5.4
), K
eral
a(1
0.1)
, Mah
aras
htra
(58.
8),
(10.
6)(2
.7)
(2.1
)Ta
mil
Nad
u (5
6.8)
, Ker
ala
(23.
4)
Bel
ow N
atio
nal
Mod
erat
e co
ops
22.9
%34
.1%
Wea
k to
mod
erat
eM
oder
ate
toav
erag
e (<
7.1
%)
Odi
sha
(6.8
), B
ihar
(6.2
),O
dish
a (1
.1),
Bih
ar (3
.9),
Odi
sha
(1.3
), B
ihar
(5.2
),or
gani
zed
priv
ate
sect
orst
rong
And
hra
Prad
esh
(4.9
),A
ndhr
a Pr
ades
h (5
.5),
And
hra
Prad
esh
(9.4
),O
dish
a (1
2.5)
, Bih
arpr
esen
ceR
ajas
than
(4.8
). Pu
njab
Raj
asth
an (6
.1),
Punj
abR
ajas
than
(10.
6), P
unja
b(3
6.4)
, And
hra
Prad
esh
(4.3
), M
adhy
a Pr
ades
h(3
.9),
Mad
hya
Prad
esh
(7.5
), M
adhy
a Pr
ades
h(7
2.6)
, Raj
asth
an (5
8.1)
,(3
.1),
(2.4
)(6
.4)
Punj
ab (7
8.2)
, Mad
hya
Prad
esh
(80.
0)
Wea
k co
ops
4.1%
34.7
%St
rong
org
aniz
ed p
riva
teSt
rong
Har
yana
(2.6
), W
est B
enga
lH
arya
na (1
.6),
Wes
tH
arya
na (5
.2),
Wes
tse
ctor
pres
ence
(1.7
), U
ttar P
rade
sh (0
.8)
Ben
gal (
0.8)
, Utta
r Pra
desh
Ben
gal (
3.7)
, Utta
r Pra
desh
Har
yana
(82.
0), W
est
(1.7
) (1
7.5)
Ben
gal (
58.4
), U
ttar
Prad
esh
(90.
1)
Sour
ce: N
DD
B (2
013)
; MoA
(201
3)
254 Agricultural Economics Research Review Vol. 28 (No.2) July-December 2015
coops and private, coops and traditional, private andtraditional, etc.
Finally, based on the above mentioned criteria anddiscussion with various stakeholders including thegovernment officials, coops, private sector players,village leaders, a stratified random sample of 390households consisting of 146 farmers from Gujarat,85 from Haryana, 90 from Punjab and 69 from UttarPradesh representing three marketing channels,cooperatives, organized private sector and traditionalwas drawn. After cleaning, 374 observations remainedfor analysis.
Econometric Model and EstimationGiven that we have formulated the channel
selection as a three-alternative choice (coops, privateand traditional), we have applied multi-nomial logitmodel estimating marketing channel choice problemswith mixed continuous and discrete dependentvariables. The econometric approach used is two-stepprocedure with channel choice first and then modelthe correlate behaviours with endogenous stratificationof the sample into the channel strata, controlling forthe conditional probability of inclusion in a givenchannel. According to the rational choice theory, weassume individuals rank mutually exclusive alternativemarketing channels in order of utility and will choosethe channel with maximum expected utility given theirsocio-economic and demographic characteristics, andrelevant resource constraints.
The producer’s market channel choice can beconceptualized using a random utility model (RUM).The RUM is particularly appropriate for modelingdiscrete choice decisions such as between marketchannels. It is indirect utility function where anindividual with specific characteristics associates anaverage utility level with each alternative marketchannel in a choice set. In our sample, most of themembers of cooperative dairy sector did not sell rawmilk to other channels; members of private dairycompany did not sell to cooperatives or traditionalchannel and producers from traditional channel did notsell to cooperatives or private dairy plant. However, avery few producers in our sample, who sold raw milkto multiple channels were dropped from the analysis.The selected producers were mapped into threemutually exclusive channels, the cooperatives, privatedairy plants and the traditional channel.
The Model
Consider a sample of individuals indexed by i = 1,………., N, and let j = 0, 1, . . . . , J be the feasiblechoices of an individual, i.e. yi equals j if individual ichooses alternative j. Each alternative is associated withsome random utility:
Uij = Vij + εij (i = 1, . . . ., N and j = 0, 1, . . . ., J)…(1)
where, Vij is the observable part of the utility that istypically assumed to be a linear function of observablecharacteristics xi plus additional variables that solelyreflect the individual’s preferences over market channelchoices, such that
Uij = xi βj + εij …(2)
where xi is the vector of individual characteristics, βj
is the choice specific parameter vector, and εij is theunobserved random component. The individualchooses the alternative with the highest utility, Uij.
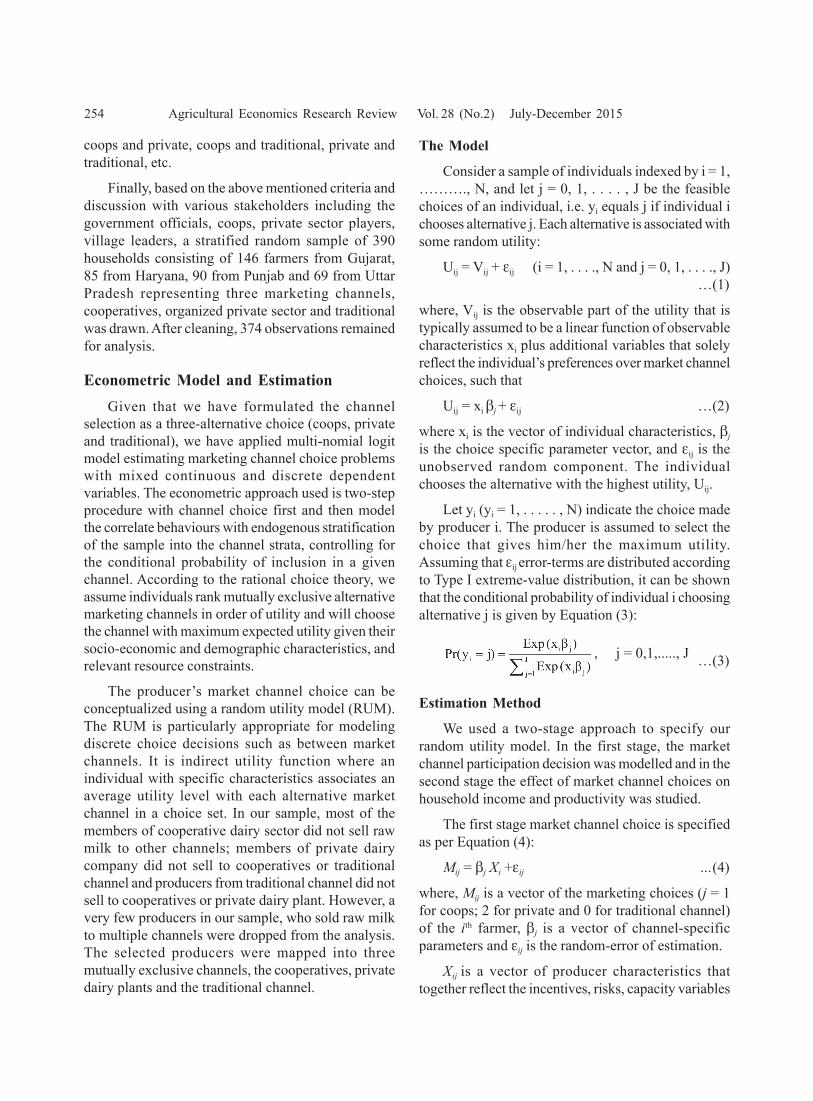
Let yi (yi = 1, . . . . . , N) indicate the choice madeby producer i. The producer is assumed to select thechoice that gives him/her the maximum utility.Assuming that εij error-terms are distributed accordingto Type I extreme-value distribution, it can be shownthat the conditional probability of individual i choosingalternative j is given by Equation (3):
, j = 0,1,....., J …(3)
Estimation Method
We used a two-stage approach to specify ourrandom utility model. In the first stage, the marketchannel participation decision was modelled and in thesecond stage the effect of market channel choices onhousehold income and productivity was studied.
The first stage market channel choice is specifiedas per Equation (4):
Mij = βj Xi +εij …(4)
where, Mij is a vector of the marketing choices (j = 1for coops; 2 for private and 0 for traditional channel)of the ith farmer, βj is a vector of channel-specificparameters and εij is the random-error of estimation.
Xij is a vector of producer characteristics thattogether reflect the incentives, risks, capacity variables
Sharma : Determinants of Small Milk Producers’ Participation in Organized Dairy Value Chains 255
(COLLECTION CENTRE), and distance from milkcollection centre as instrumental variables in thefarmers’ marketing channel choices. We assume thatthese variables do not have any direct impact onfarmers’ milk production, but may have indirect impacton marketing channel choices.
MARKET is the distance to a market measured inkilometres (as a measure of transaction costs facingthe producer). Longer distance to the market is expectedto have positive effect on modern market channelparticipation.
NEW COLLECTION CENTRES is the numberof new processing facilities/milk collection centres setup in the village in post-liberalization period). Settingup of new facilities is expected to have a positive effecton choice of modern channel.
DISTANCE FROM MARKET is proxy for accessto alternative markets and we expect to have a negativeassociation with modern market channel participation.
We used multinomial logit regression using theweights to estimate the determinants of market channelchoice equation because this model fits multiplediscrete choice variables. The multinomial logit modelresults were then used to construct the selection-correction term (Inverse Mills Ratio) following thestandard procedure suggested by Dubin and McFadden(1984) in order to estimate impact regression equationsusing a simple OLS regression in the second stage.
Effects of Market Channel Choices on FarmIncome
Farmer’s market channel choices werehypothesized to have impact on various technologicaland economic parameters, such as income andproductivity. The income and productivity functionswere estimated, again endogenously, stratifying for thethree market channels. Since the separation ofproducers by market channel introduces a bias derivedfrom an endogenous stratification on market channel,this bias needs to be corrected. The regression equationswere estimated for the group accessing modernchannels and those accessing traditional channels. Theestimator used in this production function was InverseMills Ratio (IMR) as a regressor calculated from multi-nomial logit function for the market choice presentedbefore.
and other shifters influencing the producer’s indirectutility, hence his/her market channel decision, andincludes the following variables (Table 2 for variabledescription):
AGE is the number of years of the head ofhousehold. We hypothesize that age of household headwill be negatively related to modern market channelchoice and income which means that the olderhousehold-head is less likely to participate in modernchannel and has less income. Younger farmers tend tobe more enterprising, fast decision-makers and havecapacity to adopt new managerial systems andtechnologies.
EDUCATION refers to years of schooling of thehousehold-head. We expect education to favour entryinto the modern market channels as it would facilitateadoption of new technologies and managementpractices. Education and age are also indicators ofmanagement capabilities.
MEMBERSHIP is proxy for social capital and wehypothesize that there is a positive relationship betweenmembership to an association/cooperative/organizationand participation in modern markets. Collective actionallows small farmers to pool/aggregate their inputs/outputs to achieve economies of scale that enables themto access inputs and services and negotiate for betterprices for their outputs.
HERDSIZE represents the overall herd size ofdairy animals. It can be considered proxy for financialcapability and production capacity of a farmer. Weexpect a positive effect of this variable, as it is linkedto marketable volume considered desirable (by thebuyer) as it reduces transaction costs.
RISK is measured as a coefficient of variation (CV)of milk prices received by farmers. Price risk is likelyto be negatively related with market choices, whichmeans the higher the risks, the more likely a farmer isto participate in modern market channel.
ROAD is the distance to a paved road measured inkilometres and is expected (as a measure of transactioncosts facing the producer as well as infrastructure) tonegatively affect choice of the modern channel.
We have tried household’s distance from nearestmarket (MARKET), establishment of new milkcollection/chilling centres in post-delicensing
256 Agricultural Economics Research Review Vol. 28 (No.2) July-December 2015
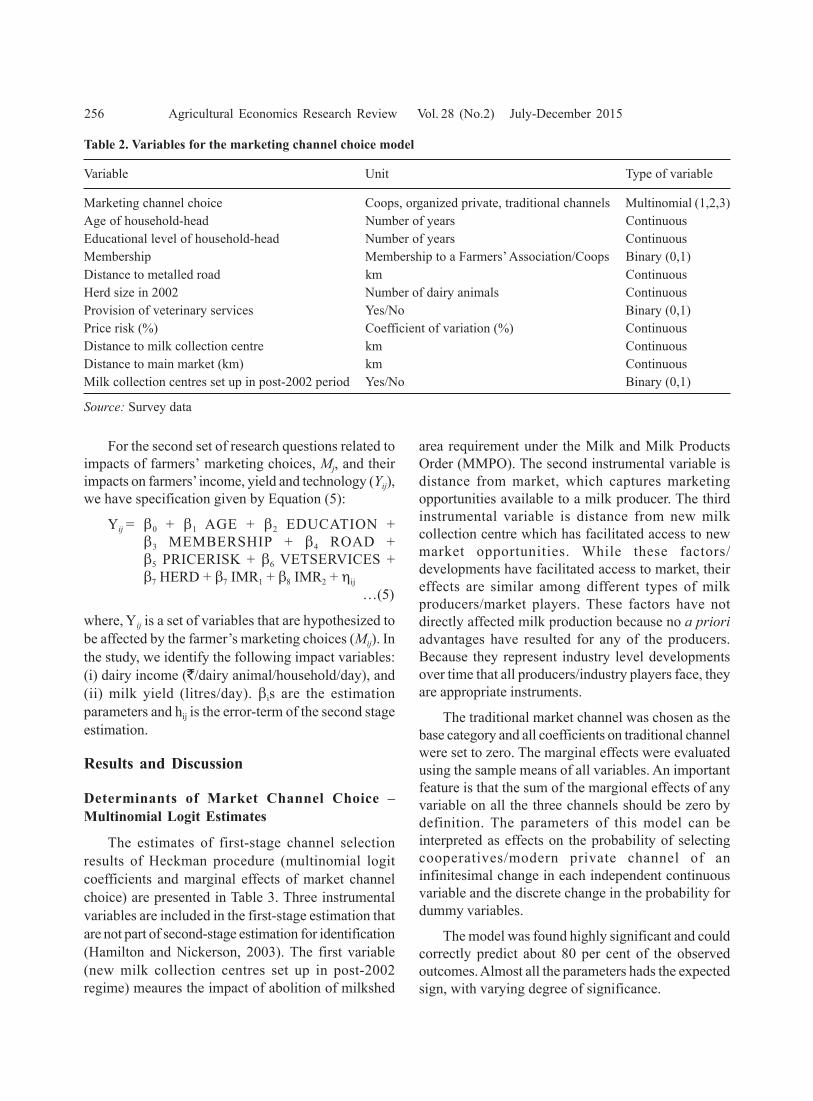
For the second set of research questions related toimpacts of farmers’ marketing choices, Mj, and theirimpacts on farmers’ income, yield and technology (Yij),we have specification given by Equation (5):
Yij = β0 + β1 AGE + β2 EDUCATION +β3 MEMBERSHIP + β4 ROAD +β5 PRICERISK + β6 VETSERVICES +β7 HERD + β7 IMR1 + β8 IMR2 + ηij
…(5)
where, Yij is a set of variables that are hypothesized tobe affected by the farmer’s marketing choices (Mij). Inthe study, we identify the following impact variables:(i) dairy income (`/dairy animal/household/day), and(ii) milk yield (litres/day). βis are the estimationparameters and hij is the error-term of the second stageestimation.
Results and Discussion
Determinants of Market Channel Choice –Multinomial Logit Estimates
The estimates of first-stage channel selectionresults of Heckman procedure (multinomial logitcoefficients and marginal effects of market channelchoice) are presented in Table 3. Three instrumentalvariables are included in the first-stage estimation thatare not part of second-stage estimation for identification(Hamilton and Nickerson, 2003). The first variable(new milk collection centres set up in post-2002regime) meaures the impact of abolition of milkshed
area requirement under the Milk and Milk ProductsOrder (MMPO). The second instrumental variable isdistance from market, which captures marketingopportunities available to a milk producer. The thirdinstrumental variable is distance from new milkcollection centre which has facilitated access to newmarket opportunities. While these factors/developments have facilitated access to market, theireffects are similar among different types of milkproducers/market players. These factors have notdirectly affected milk production because no a prioriadvantages have resulted for any of the producers.Because they represent industry level developmentsover time that all producers/industry players face, theyare appropriate instruments.
The traditional market channel was chosen as thebase category and all coefficients on traditional channelwere set to zero. The marginal effects were evaluatedusing the sample means of all variables. An importantfeature is that the sum of the margional effects of anyvariable on all the three channels should be zero bydefinition. The parameters of this model can beinterpreted as effects on the probability of selectingcooperatives/modern private channel of aninfinitesimal change in each independent continuousvariable and the discrete change in the probability fordummy variables.
The model was found highly significant and couldcorrectly predict about 80 per cent of the observedoutcomes. Almost all the parameters hads the expectedsign, with varying degree of significance.
Table 2. Variables for the marketing channel choice model
Variable Unit Type of variable
Marketing channel choice Coops, organized private, traditional channels Multinomial (1,2,3)Age of household-head Number of years ContinuousEducational level of household-head Number of years ContinuousMembership Membership to a Farmers’ Association/Coops Binary (0,1)Distance to metalled road km ContinuousHerd size in 2002 Number of dairy animals ContinuousProvision of veterinary services Yes/No Binary (0,1)Price risk (%) Coefficient of variation (%) ContinuousDistance to milk collection centre km ContinuousDistance to main market (km) km ContinuousMilk collection centres set up in post-2002 period Yes/No Binary (0,1)
Source: Survey data
Sharma : Determinants of Small Milk Producers’ Participation in Organized Dairy Value Chains 257
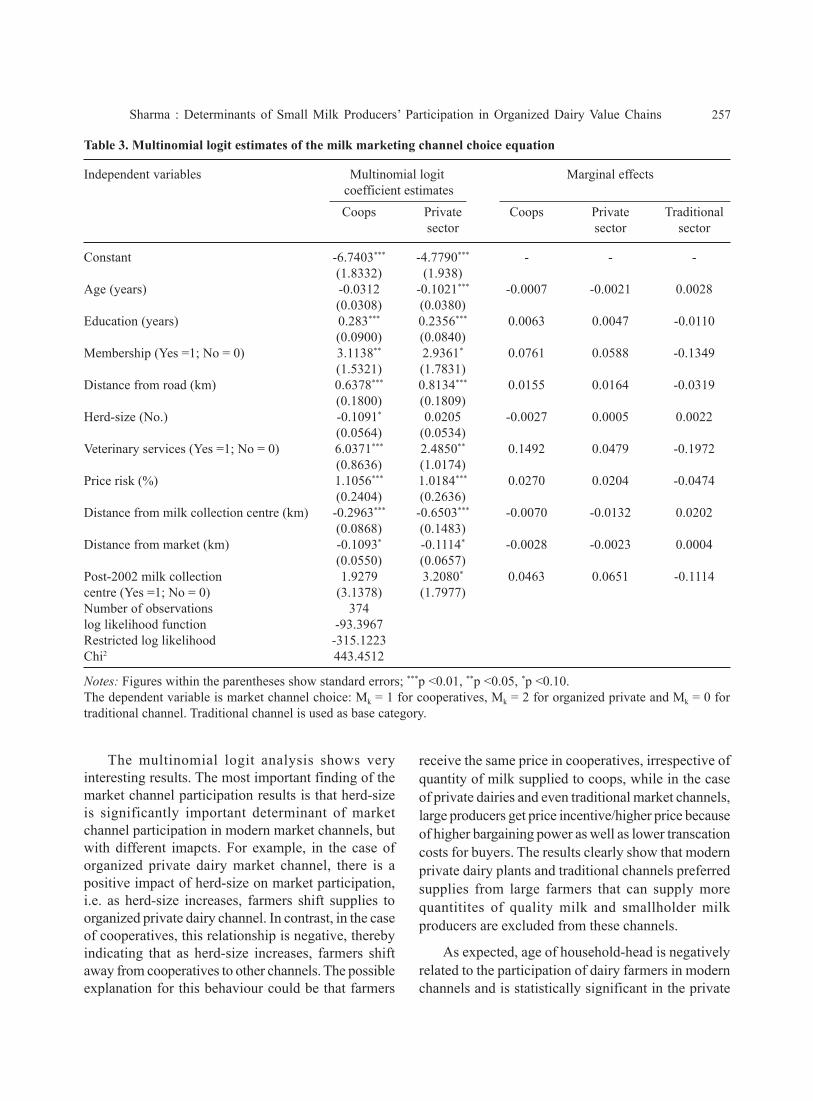
Table 3. Multinomial logit estimates of the milk marketing channel choice equation
Independent variables Multinomial logit Marginal effects coefficient estimates
Coops Private Coops Private Traditionalsector sector sector
Constant -6.7403*** -4.7790*** - - -(1.8332) (1.938)
Age (years) -0.0312 -0.1021*** -0.0007 -0.0021 0.0028(0.0308) (0.0380)
Education (years) 0.283*** 0.2356*** 0.0063 0.0047 -0.0110(0.0900) (0.0840)
Membership (Yes =1; No = 0) 3.1138** 2.9361* 0.0761 0.0588 -0.1349(1.5321) (1.7831)
Distance from road (km) 0.6378*** 0.8134*** 0.0155 0.0164 -0.0319(0.1800) (0.1809)
Herd-size (No.) -0.1091* 0.0205 -0.0027 0.0005 0.0022(0.0564) (0.0534)
Veterinary services (Yes =1; No = 0) 6.0371*** 2.4850** 0.1492 0.0479 -0.1972(0.8636) (1.0174)
Price risk (%) 1.1056*** 1.0184*** 0.0270 0.0204 -0.0474(0.2404) (0.2636)
Distance from milk collection centre (km) -0.2963*** -0.6503*** -0.0070 -0.0132 0.0202(0.0868) (0.1483)
Distance from market (km) -0.1093* -0.1114* -0.0028 -0.0023 0.0004(0.0550) (0.0657)
Post-2002 milk collection 1.9279 3.2080* 0.0463 0.0651 -0.1114centre (Yes =1; No = 0) (3.1378) (1.7977)Number of observations 374log likelihood function -93.3967Restricted log likelihood -315.1223Chi2 443.4512
Notes: Figures within the parentheses show standard errors; ***p <0.01, **p <0.05, *p <0.10.The dependent variable is market channel choice: Mk = 1 for cooperatives, Mk = 2 for organized private and Mk = 0 fortraditional channel. Traditional channel is used as base category.
The multinomial logit analysis shows veryinteresting results. The most important finding of themarket channel participation results is that herd-sizeis significantly important determinant of marketchannel participation in modern market channels, butwith different imapcts. For example, in the case oforganized private dairy market channel, there is apositive impact of herd-size on market participation,i.e. as herd-size increases, farmers shift supplies toorganized private dairy channel. In contrast, in the caseof cooperatives, this relationship is negative, therebyindicating that as herd-size increases, farmers shiftaway from cooperatives to other channels. The possibleexplanation for this behaviour could be that farmers
receive the same price in cooperatives, irrespective ofquantity of milk supplied to coops, while in the caseof private dairies and even traditional market channels,large producers get price incentive/higher price becauseof higher bargaining power as well as lower transcationcosts for buyers. The results clearly show that modernprivate dairy plants and traditional channels preferredsupplies from large farmers that can supply morequantitites of quality milk and smallholder milkproducers are excluded from these channels.
As expected, age of household-head is negativelyrelated to the participation of dairy farmers in modernchannels and is statistically significant in the private
258 Agricultural Economics Research Review Vol. 28 (No.2) July-December 2015
dairy channels. A one year increase in age is predictedto raise the probability of being in traditional channel,but reduces the chances of being in other two channels.In the case of education the results show a statisticallysignificant postive impact in case of both coops andprivate dairy chain.
The membership of a farmers’ group/association/cooperatives significantly determines smallholder dairyproducers’ participation in modern markets. Themembership is positively related to market choice, thatmeans if a farmer is a member of farmers’ group/association/cooperatives, he/she is likely to participatein modern markets. The relationship is much strongerin the case of coops, which shows strength of dairycooperatives in India. It is also known that collectiveaction enables small farmers to attain better bargainingpower, and economies of scale and reduces transcationcosts. The results show that the majority of farmers incooperative market channel, produce their milkindividually (as economies of scale in milk productionare almost absent), but market collectively (aseconomies of scale in marketing and processing of milkare very significant).
Interestingly, selling to modern marketing channelsis positively correlated with the distance from pavedroad, which indicates that those milk producers locatedin areas with less road connectivity, may still be partof modern marketing channels. From our quailitativediscussions with traditional marketing channeloperators, we learnt that many organized dairy plants(coops as well as private) have set up milk collectioncentres mainly in rural areas, while traditional channeloperators procure milk from areas near to urban centresto reduce transportation costs and exploit marketopportunities in big cities.
Price risk is another important impediment tomarket entry, as well as to adoption of improvedtechnologies and investment in productive assets,thereby compounding the market participation effects.Lower prices, greater price risk, or both will typicallydiscourage smallholders’ market participation. Pricerisk has a significant effect on modern market channelparticipation. Reported figures indicate that price risksappear to positively affect entering the modern channel,i.e. as price risk increases, farmers tend to shift to
modern channels due to transparent and stable pricingpolicy being adopted by both coops and organizedprivate dairies. The traditional channel players paymarginally higher price to milk producers during leanseason, but inter-seasonal price fluctuations are highand sometimes they disappear from the market duringperiod of high-production (flush season). As expected,provision of veterinary services is predicted to raiseprobability of being in cooperatives and/or organizedprivate marketing channel.
Milk collection centres set up in post-delicensingperiod (post-2002)) turned out to be a significantdeterminant of market channel participation. Thecoefficient was positive and statistically significant incase of organized private dairy farmers, but non-significant in the case of coops. The possibleexplanation for this pattern could be that many privatecompanies have set up milk processing plants in post-liberalization era, when milk-shed area1 requirementwas abolished, which attracted dairy farmers fromtraditional channel as well as from coops to the privatesector plants.
Distance to milk collection centre is neagtivelyrelated with modern market channel participation,which indicates that as distance of milk collectioncentre increases, farmers tend to sell their output totraditional marketing channel as most of the traditionalchannel players collect milk from farmer’s doorsteps.
The probability of selecting modern channels riseswith increase in distance from market; however itsinfluence is insignificant in the case of coops, butstatistically significant in the private sector channel.This significant positive impact may be explained bythe fact that there has been increasing trend of privatedairies procuring milk directly from farmers throughmilk collection centres or through agents.
Impacts of Market Channel Choice on FarmIncome and Milk Yield
The second stage model estimated the gross dairyincome and yield by generating Inverse Mills Ratio(IMR) of this multinomial logit model and including itas an explanatory variable in the estimation of impactregressions. Following the standard Heckman model,the Mills ratio was included an explanatory variable to
1 The milkshed was an area geographically demarcated by the registration authority for the collection of milk by the holder of aregistration certificate, which restricted collection of raw milk from the designated milkshed (exclusive rights) and did notallow milk collection from outside it.
Sharma : Determinants of Small Milk Producers’ Participation in Organized Dairy Value Chains 259
control for self-selection bias in the second stage OLSmodel. Three sets of second stage OLS modelsestimated were for coops, private channel andtraditional channel.
One of the main shortcomings of the multinomiallogit model is that it is based on the so-calledindependence of irrelevant alternatives (IIA)assumption that the error components in the choicemodel are independently and identically distributed(Hausman and McFadden, 1984; Small and Hsiao,1985). Although the IIA assumption is very restrictive,the multinomial logit model remains widely used inempirical studies estimating polychotomous discretevariables due to its computational ease, i.e., theprobability of choosing each potential outcome can beeasily expressed and the resulting log-likelihoodfunction can be maximized in a straightforward fashion(Hilmer, 2001).
For our study, we believe that it is critical to havethree marketing channel choice set (as opposed to a
set of binary choices) in order to throw clear light onthe issues of India’s dairy market that have not beenexamined in earlier studies. For that reason, we decidedto use multinomial logit model. However, weconducted Small-Hsiao test (Small and Hsiao, 1985)and found that the IIA assumption holds. We were notsurprised with the results because in our sample amember of the cooperative dairy marketing channeldid not sell to other channels; a member of the privatedairy company did not sell to cooperatives or traditionalchannel and a producer for traditional channel did notsell to cooperatives or private dairy plant.
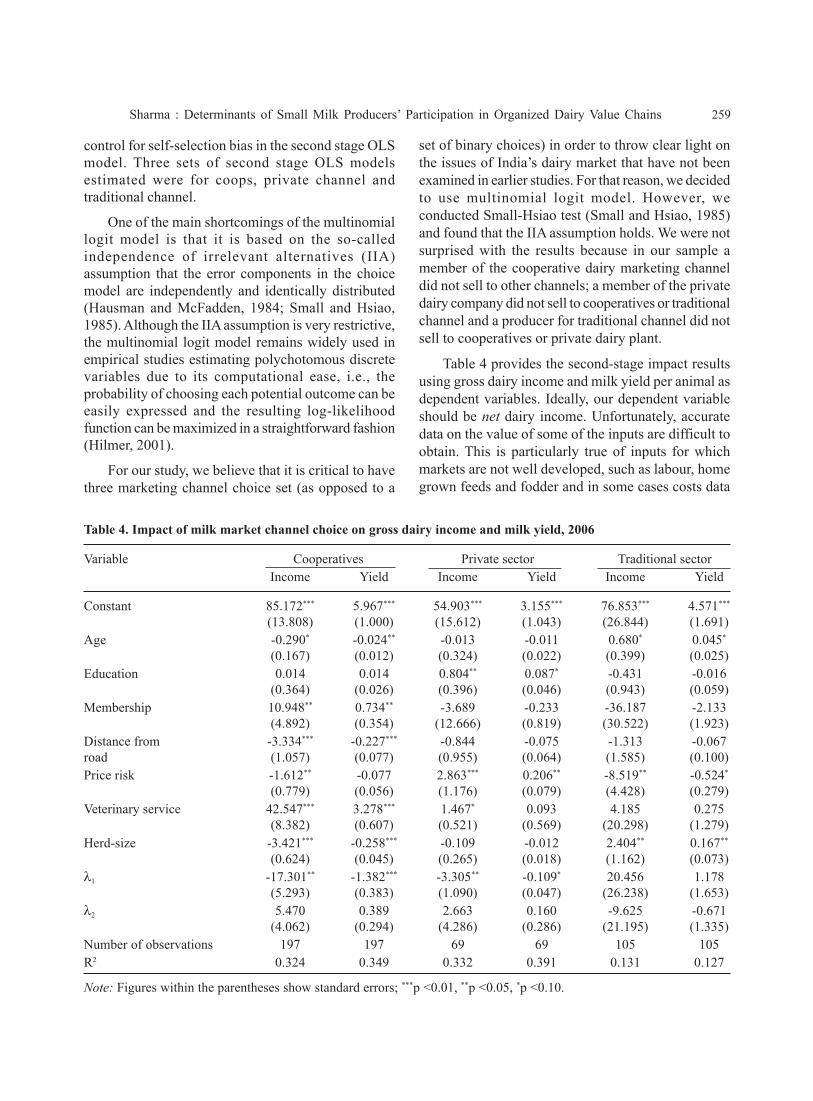
Table 4 provides the second-stage impact resultsusing gross dairy income and milk yield per animal asdependent variables. Ideally, our dependent variableshould be net dairy income. Unfortunately, accuratedata on the value of some of the inputs are difficult toobtain. This is particularly true of inputs for whichmarkets are not well developed, such as labour, homegrown feeds and fodder and in some cases costs data
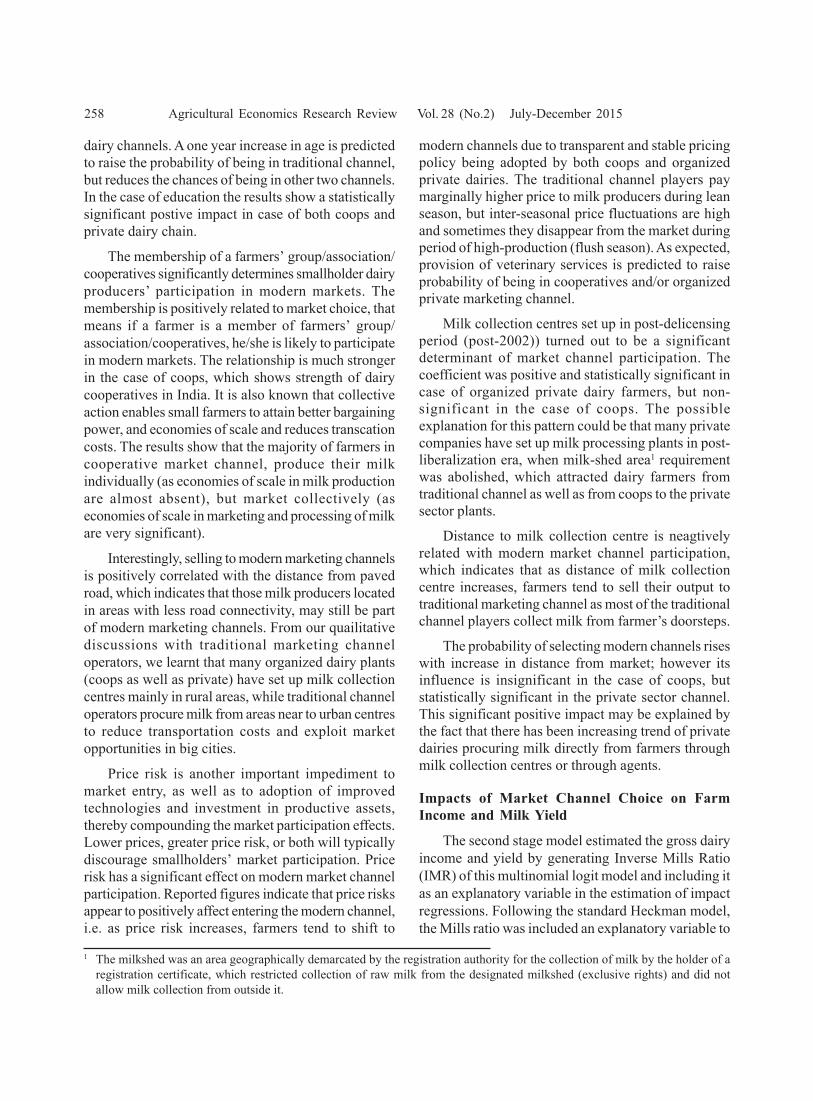
Table 4. Impact of milk market channel choice on gross dairy income and milk yield, 2006
Variable Cooperatives Private sector Traditional sectorIncome Yield Income Yield Income Yield
Constant 85.172*** 5.967*** 54.903*** 3.155*** 76.853*** 4.571***
(13.808) (1.000) (15.612) (1.043) (26.844) (1.691)Age -0.290* -0.024** -0.013 -0.011 0.680* 0.045*
(0.167) (0.012) (0.324) (0.022) (0.399) (0.025)Education 0.014 0.014 0.804** 0.087* -0.431 -0.016
(0.364) (0.026) (0.396) (0.046) (0.943) (0.059)Membership 10.948** 0.734** -3.689 -0.233 -36.187 -2.133
(4.892) (0.354) (12.666) (0.819) (30.522) (1.923)Distance from -3.334*** -0.227*** -0.844 -0.075 -1.313 -0.067road (1.057) (0.077) (0.955) (0.064) (1.585) (0.100)Price risk -1.612** -0.077 2.863*** 0.206** -8.519** -0.524*
(0.779) (0.056) (1.176) (0.079) (4.428) (0.279)Veterinary service 42.547*** 3.278*** 1.467* 0.093 4.185 0.275
(8.382) (0.607) (0.521) (0.569) (20.298) (1.279)Herd-size -3.421*** -0.258*** -0.109 -0.012 2.404** 0.167**
(0.624) (0.045) (0.265) (0.018) (1.162) (0.073)λ1 -17.301** -1.382*** -3.305** -0.109* 20.456 1.178
(5.293) (0.383) (1.090) (0.047) (26.238) (1.653)λ2 5.470 0.389 2.663 0.160 -9.625 -0.671
(4.062) (0.294) (4.286) (0.286) (21.195) (1.335)Number of observations 197 197 69 69 105 105R2 0.324 0.349 0.332 0.391 0.131 0.127
Note: Figures within the parentheses show standard errors; ***p <0.01, **p <0.05, *p <0.10.
260 Agricultural Economics Research Review Vol. 28 (No.2) July-December 2015
are missing. As a consequence, we used gross dairyincome per animal per household as dependent variablein the second stage of Heckman model.
The coefficient of the estimated Inverse Mills Ratiois significant in cooperatives and private channelmodels. The significant of the coefficient of thisvariable reveals importance of allowing selectivity intodifferent marketing channels.
The coefficient estimates in Table 4 were used todetermine whether and how household characteristics,incentives, farm size and other factors affect farmincome. The results indicate that age had a negativeand statistically significant impact on income and milkyield per animal for cooperatives and although age alsohad a negative impact on income and yield for modernprivate channel, that impact was not statisticallysignificant. In the case of traditional channel, impactof age was positive and statistically significant. Theeducation of farmer and the size of farm were alsoimportant factors influencing income and yield.Farmers, who had more years of formal education, hadhigher income and productivity on modern channels(cooperatives and private), which supports ourhypothesis. As modern channels demand minimumquality standards from the producers, traditionalchannels are not so strict about quality issues. Educatedproducers are more capable of meeting the standards.Membership had a significant positive impact onincome and yield in the case of cooperatives, but wasnot statistically significant in the case of modern privateand traditional channels.
As expected, distance from road had a negativeeffect on income for all channels. Herd-size had anegative effect on milk yield per cow and income forcooperatives and private channels, indicating inverserelationship between farm-size and productivity. Thepossible explanation for this inverse relationship couldbe that managerial efficiency of small farms has beenable to offset scale efficiencies, if any. Provision ofveterinary services had a positive effect on yield andincome for all marketing channels, but was statisticallysignificant for cooperatives only as coops have verystrong backward linkages with producers and providebreeding, animal health care and extension services toits producer members. Price risk had a negative effecton farm income and yield in both modern andtraditional channels.
Conclusions and Policy ImplicationsIn response to structural transformations taking
place in the Indian dairy sector mainly in the processingsegment, the present paper has identified thedeterminants of market channel choices of milkproducers based on farm household survey. It has alsoinvestigated what impacts these market channel choicesmay have on farmers’ income and technology adoption.The major findings related to a set of research questionsin this study are summarized below:
There have been emerging modern marketingchannels, but the traditional sector is still dominant inmilk. Farmers sell nearly 70 per cent of their milk totraditional channels. The share of modern organizedsector is growing but at a slow pace. The rapidrestructurings of downstream dairy processing and tosome extent, wholesale and retail markets have notpenetrated into farm procurement. Overall, farmersselling their milk directly to modern channel accountfor nearly 30 per cent of marketed surplus. Thedominant share of traditional channel is an indicationof a very competitive and cost-effective traditionalmarket in linking producers and consumers and maybe high transaction costs of modern channels withmillions of small producers. However, the issue ofhygiene and quality of milk being sold throughtraditional channel requires an attention.
The analysis has indicated that small dairy farmersare not excluded from the cooperatives but excludedfrom the modern private sector channel. There is anevidence of herd-size affecting the farmer’s choices ofselling their milk to modern channels. In the case ofcoops, large farmers are opting out and shifting to eithermodern private sector or traditional sector as theyreceive price incentive for large milk volumes. Largefarmers have better opportunity to participate in modernprivate sector channels. Age and education are alsoimportant determinants of marketing channel choicein the case of modern private sector. Young and moreeducated farmers have better chances of inclusion inthe modern private sector channel. Marketinfrastructure such as road, provision of veterinaryservices, distance from milk collection centre, markets,price risks, etc. are found to have significant effects onfarmers’ marketing choices.
The results of Heckman model have shown thateducation, membership of producers’ association/
Sharma : Determinants of Small Milk Producers’ Participation in Organized Dairy Value Chains 261
cooperatives, provision of veterinary services, andherd-size have a significant impact on cooperativemarketing channel farmers’ income while in the caseof modern private sector, education and price risk havesignificant impact on income. For the traditional marketchannel farmers, dairy income is significantlydetermined by price risk, and herd-size. The modernmarket channel farmers have higher dairy income thantraditional channel farmers, which is explained byhigher yields obtained by modern channel farmers, butthey receive lower prices than traditional marketchannel farmers.
The traditional milk markets being still dominantin India, policies that engage with and improve thesemarketing channels mainly in terms of milk qualityand safety, are likely to be most appropriate for small-scale milk producers, milk market agents andconsumers. The results have revealed that organizedprivate dairy sector prefers to work with large milkproducers due to issues of high transaction costs andmilk quality. Hence, reducing transaction costs(through institutions), improving milk quality andsafety through training and extension programmes fordairy farmers and improving milk marketinginfrastructure are critical for capacity building ofsmallholder milk producers to compete in the marketplace and with large-scale producers.
AcknowledgementsThe author wishes to thank International Institute
for Environment and Development (IIED), London,for financial support under Regoverning MarketsProgramme, a multi-partner collaborative research andpolicy outreach programme. He would like to thankthe editor and anonymous reviewer for the constructivecomments, which helped to improve the manuscript.
ReferencesBerdegué, J.A., Balsevich, F., Flores, L. and Reardon, T.
(2005) Central American supermarkets PrivateStandards of quality and safety in procurement of freshfruits and vegetables. Food Policy, 30 (3): 254-269.
CSO (Central Statistical Organisation) (2014) NationalAccounts Statistics 2014. Ministry of Statistics andProgramme Implementation, Government of India,New Delhi.
Dubin, Jeffrey A. and McFadden, Daniel L. (1984) Aneconometric analysis of residential electric appliance
holdings and consumption. Econometrica, 52 (2): 345-62.
GCCMF (Gujarat Cooperative Milk Marketing FederationLtd.) (2012) The Amul Model. Anand, Accessed from:http://www.amul.com/m/about-us
GoI (Government of India) (2014) Basic Animal Husbandryand Fisheries Statistics 2014. Department of AnimalHusbandry, Dairying and Fisheries, Ministry ofAgriculture, New Delhi. 34p.
Hamilton, B.H. and Nickerson, J.A. (2003) Correcting forendogeneity in strategic management research. StrategicOrganization, 1 (1): 51–78.
Hausman, J. and McFadden, D. (1984) Specification testsfor the multinomial logit model. Econometrica, 52 (5):1219-1240.
Hilmer, M. (2001) A comparison of alternative specificationsof the college attendance equation with an extension totwo-stage selectivity correction models. Economics ofEducation Review, 20 (3): 263-278.
Joshi, P.K., Gulati, Ashok and Cummings, Ralph (Jr) (2007)Agricultural Diversification and Smallholders in SouthAsia. Academic Foundation, New Delhi.
MoA (Ministry of Agriculture) (2013) Basic AnimalHusbandry and Fisheries Statistics 2013. Departmentof Animal Husbandry, Dairying and Fisheries, Ministryof Agriculture, Government of India, New Delhi.
NDDB (National Dairy Development Board) (2013) AnnualReport 2012-13. Anand.
Reardon, T. and Timmer, C.P. (2005) The supermarketrevolution with Asian characteristics. Paper presentedat the International Conference on Agricultural andRural Development in Asia. Philippines.
Reardon, T. and Timmer, C.P. (2007) Transformation ofmarkets for agricultural output in developing countriessince 1950: How has thinking changed? In: Handbookof Agricultural Economics, Agricultural Development:Farmers, Farm Production and Farm Markets, Eds:R.E. Evenson, and P. Pingali. Elsevier Press, Amsterdampp. 2808-2855.
Sharma, Vijay Paul and Singh, Raj Vir (2007) RegoverningMarkets: India Meso-level Study. Regoverning MarketsProjects Report, Indian Institute of Management,Ahmedabad.
Small, K.A. and Hsiao, C. (1985) Multinomial logitspecification tests. International Economic Review,26(3): 619-627.
Received: March, 2015; Accepted: October, 2015


