Embed Size (px)
Citation preview
FISHING AND FISHERIES RESEARCH CENTRE TECHNICAL REPORT No 4
DETERMINATION OF MANAGEMENT UNITS FOR GREY MACKEREL
FISHERIES IN NORTHERN AUSTRALIA
DJ WelchRC Buckworth
JR OvendenSJ NewmanD BroderickRJG LesterAC Ballagh
J StapleyRA Charters
NA GribbleFRDC Project No. 2005/010


Grey mackerel management units in northern Australia
i
Determination of Management Units for Grey Mackerel Fisheries in
Northern Australia DJ Welch1,2, RC Buckworth3, JR Ovenden4, SJ Newman5, D Broderick4, RJG Lester6, AC Ballagh1, J Stapley7, RA Charters6 and NA Gribble7 1 Fishing & Fisheries Research Centre, School of Earth and Environmental Sciences, James Cook University, Townsville, Qld, 4811, Australia 2 Queensland Primary Industries and Fisheries, Department of Employment, Economic Development and Innovation, PO Box 1085, Oonoonba, Qld, 4811, Australia 3 Fisheries, Northern Territory Department of Regional Development, Primary Industries, Fisheries & Resources, GPO Box 3000, Darwin, NT, 0801, Australia 4 Molecular Fisheries Laboratory, Queensland Primary Industries and Fisheries, Department of Employment, Economic Development and Innovation, University of Queensland, Brisbane, QLD 4072, Australia 5 Western Australian Fisheries & Marine Research Laboratories, Department of Fisheries, Government of Western Australia, PO Box 20, North Beach, WA 6920, Australia 6 School of Chemistry and Molecular Biology, University of Queensland, Brisbane, QLD 4072, Australia 7 Queensland Primary Industries and Fisheries, Department of Employment, Economic Development and Innovation, Northern Fisheries Centre, PO Box 5396, Cairns, QLD 4870, Australia
Project No. 2005/010

Grey mackerel management units in northern Australia
ii
Determination of management units for grey mackerel fisheries in northern Australia (FRDC 2005/010) D.J. Welch, R.C. Buckworth, J.R. Ovenden, S.J. Newman, D. Broderick, R.J.G. Lester, A.C. Ballagh, J.M. Stapley, R.A. Charters and N.A. Gribble Published by the Fishing & Fisheries Research Centre, James Cook University, Townsville 4810 Australia. Copyright: © 2009 Fisheries Research and Development Corporation, James Cook University, Queensland Department of Employment, Economic Development and Innovation, Fisheries Western Australia, Northern Territory Department of Regional Development, Primary Industries, Fisheries & Resources and the University of Queensland. This work is copyright. Except as permitted under the Copyright Act 1968 (Cth), no part of this publication may be reproduced by any process, electronic or otherwise, without the specific written permission of the copyright owners. Information may not be stored electronically in any form whatsoever without such permission. The Fisheries Research and Development Corporation plans, invests in and manages fisheries research and development throughout Australia. It is a statutory authority within the portfolio of the federal Minister for Agriculture, Fisheries and Forestry, jointly funded by the Australian Government and the fishing industry. Disclaimer The authors do not warrant that the information in this document is free from errors or omissions. The authors do not accept any form of liability, be it contractual, tortious, or otherwise, for the contents of this document or for any consequences arising from its use or any reliance placed upon it. The information, opinions and advice contained in this document may not relate, or be relevant, to a readers particular circumstances. Opinions expressed by the authors are the individual opinions expressed by those persons and are not necessarily those of the publisher, research provider or the FRDC. This publication should be cited as: D.J. Welch, R.C. Buckworth, J.R. Ovenden, S.J. Newman, D. Broderick, R.J.G. Lester, A.C. Ballagh, J.M. Stapley, R.A. Charters and N.A. Gribble (2009). Determination of management units for grey mackerel fisheries in northern Australia. Final Report, Fisheries Research and Development Corporation Project 2005/010, Fishing & Fisheries Research Centre Technical report No. 4, Fishing & Fisheries Research Centre, James Cook University, Townsville, Australia, 158p. ISBN 9780980558630. Corresponding author: David Welch Queensland Primary Industries and Fisheries, Department of Employment, Economic Development and Innovation Based at: Fishing & Fisheries Research Centre, School of Earth & Environmental Sciences, James Cook University, Townsville, QLD 4811 Phone: +61 7 4781 5114 Email: [email protected]

Grey mackerel management units in northern Australia
iii
Table of Contents
Table of Contents..................................................................................................... iii Non Technical Summary ......................................................................................... vi Acknowledgments .................................................................................................... x
1. INTRODUCTION..................................................................................1 1.1. Overview............................................................................................................. 1 1.2. Background ........................................................................................................ 2 1.3. Need .................................................................................................................... 6 1.4. Objectives........................................................................................................... 6 1.5. Methods .............................................................................................................. 7 1.6 References......................................................................................................... 10
2. NORTHERN AUSTRALIA GREY MACKEREL FISHERIES.............13 2.1. Fishery description.......................................................................................... 13
2.1.1 Queensland East Coast.............................................................................................14 2.1.2 Queensland and Northern Territory Joint management arrangements..............17 2.1.3 Queensland Gulf of Carpentaria ..............................................................................18 2.1.4 Northern Territory ......................................................................................................20 2.1.5 Western Australia ......................................................................................................23
2.2 Fishery characteristics summary .................................................................... 25 2.3 References......................................................................................................... 25
3. NORTHERN AUSTRALIA GREY MACKEREL BIOLOGY ...............27 3.1 Introduction ....................................................................................................... 27 3.2 Biological data collection and analysis methods .......................................... 28
3.2.1. Data analysis .............................................................................................................29 Morphometrics ..................................................................................................... 29 Size, Age and Mortality ....................................................................................... 29 Reproduction........................................................................................................ 31
3.3 Biological analyses results .............................................................................. 31 3.3.1. Morphometrics ..........................................................................................................31
Fork Length-Total Length relationship ............................................................. 31 Fork Length-Upper Jaw Length relationship.................................................... 33 Fork Length-Weight relationship ....................................................................... 36
3.3.2 Size, age and mortality..............................................................................................36 Otolith annulus formation................................................................................... 36 Size and age structures ...................................................................................... 39 Mortality ................................................................................................................ 39
3.3.3 Reproduction..............................................................................................................40 Seasonality ........................................................................................................... 40 Maturity ................................................................................................................. 47

Grey mackerel management units in northern Australia
iv
3.4 Discussion......................................................................................................... 49 3.5 References......................................................................................................... 54
4. STOCK STRUCTURE OF GREY MACKEREL (SCOMBEROMORUS SEMIFASCIATUS) INFERRED FROM BACK-CALCULATED GROWTH ESTIMATES ................................................57 4.1 Introduction ....................................................................................................... 57 4.2 Materials and Methods ..................................................................................... 59
4.2.1 Sample collection ......................................................................................................59 4.2.2 Age estimation ...........................................................................................................60 4.2.3 Age adjustment ..........................................................................................................61 4.2.4 Back-calculation ........................................................................................................61 4.2.5 Data analysis ..............................................................................................................63
4.3 Results............................................................................................................... 65 4.3.1 Otolith radius to fork length relationship................................................................65 4.3.2 Accuracy and precision ............................................................................................66 4.3.3 Growth.........................................................................................................................68 4.3.4 Regional Growth ........................................................................................................68 4.3.5 Comparison to previous growth estimates ............................................................74
4.4 Discussion......................................................................................................... 76 4.5 References......................................................................................................... 79
5. GENETIC POPULATION STRUCTURE OF GREY MACKEREL (SCOMBEROMORUS SEMIFASCIATUS) IN NORTHERN AUSTRALIA...........................................................................................83 5.1 Introduction ....................................................................................................... 83 5.2 Methods ............................................................................................................. 84
5.2.1 Sampling .....................................................................................................................84 5.2.2 Laboratory ..................................................................................................................84
Total genomic DNA extraction ........................................................................... 84 Microsatellite genotyping and analysis ............................................................ 85 Mitochondrial DNA sequencing and analysis .................................................. 86
5.3 Results............................................................................................................... 87 5.3.1 Species Identification................................................................................................87 5.3.2 Microsatellites ............................................................................................................89 4.3.3 Mitochondrial DNA sequencing ...............................................................................92
5.4 Discussion....................................................................................................... 100 5.4.1 Species identification..............................................................................................100 5.4.2 Stock identification..................................................................................................100 5.4.3 Historical processes................................................................................................101 5.4.4 Implications for fisheries management.................................................................102
5.5 References....................................................................................................... 102
6. STOCK STRUCTURE OF GREY MACKEREL, SCOMBEROMORUS SEMIFASCIATUS, ACROSS NORTHERN AUSTRALIA BASED ON OTOLITH ISOTOPE CHEMISTRY.............107 6.1 Introduction ..................................................................................................... 107 6.2 Materials and Methods ................................................................................... 108
6.2.1 Sampling design ......................................................................................................108

Grey mackerel management units in northern Australia
v
6.2.2 Otolith preparation...................................................................................................109 6.2.3 Statistical analysis...................................................................................................109
6.3 Results............................................................................................................. 110 6.4 Discussion....................................................................................................... 114 6.5 References....................................................................................................... 115
7. THE STOCK STRUCTURE OF GREY MACKEREL SCOMBEROMORUS SEMIFASCIATUS IN AUSTRALIA AS INFERRED FROM ITS PARASITE FAUNA ........................................117 7.1 Introduction ..................................................................................................... 117 7.2 Materials and Methods ................................................................................... 118 7.3 Results. ............................................................................................................ 119
7.3.1 Univariate analysis ..................................................................................................120 7.3.2 Multivariate analysis................................................................................................122
7.4 Discussion....................................................................................................... 127 7.5 References....................................................................................................... 129
8. INTEGRATION OF RESULTS: DEFINITION OF GREY MACKEREL SPATIAL MANAGEMENT UNITS..................................131 8.1 Introduction ..................................................................................................... 131 8.2 Methods ........................................................................................................... 132 8.3 Results............................................................................................................. 133 8.4 Discussion....................................................................................................... 136 8.5 References....................................................................................................... 140
9. CONCLUSIONS...............................................................................143 9.1 Benefits and adoption .................................................................................... 143 9.2 Further development ...................................................................................... 143 9.3 Planned outcomes .......................................................................................... 144 9.4 Conclusions .................................................................................................... 146
10. APPENDICES ................................................................................147 Appendix 1: Intellectual Property ........................................................................ 147 Appendix 2: Staff .................................................................................................. 147 Appendix 3: Copies of data sheets and accompanying guides to standardise data collection.................................................................................. 149 Appendix 4: Fisheries manager’s responses to project results. ...................... 155 Appendix 5: Extension ......................................................................................... 157

Grey mackerel management units in northern Australia
vi
Non Technical Summary
Principal Investigator: David J. Welch Address: Fishing & Fisheries Research Centre School of Earth & Environmental Sciences James Cook University Townsville, QUEENSLAND, 4811 AUSTRALIA Telephone: +61 7 4781 5114 Fax: +61 7 4781 4099 Objectives: 1. To determine the spatial and temporal stock structure of grey mackerel over its
northern Australian range. 2. To use stock structure information in defining the geographic framework and
appropriate management units required by Queensland and Northern Territory fisheries agencies for sustainable management planning of grey mackerel resources.
Outcomes achieved to date: i) The project has indicated that the appropriate spatial scale at which grey mackerel fisheries be managed is by state/territory, and by regions within these jurisdictions. The project identified at least five separate stocks of grey mackerel throughout northern Australia for management purposes: a Western Australian stock, a north-western Northern Territory (Timor) stock, northern and southern Queensland east coast stocks, and a Gulf of Carpentaria stock. This information directly assists in compliance with the Commonwealth Environment Protection and Biodiversity Conservation Act 1999 for net fisheries by the responsible agencies as it provides the basis for reliable and robust assessment of the status of grey mackerel stocks, identifies where grey mackerel stocks encompass shared jurisdictions, and helps deliver sustainable harvest and profitable utilisation of grey mackerel resources in northern Australian waters. ii) The project has provided the spatial and biological framework needed for more accurate stock assessment of grey mackerel fisheries. Although not core to the project objectives, through co-contribution from QDPI&F and JCU, the project provides regional growth parameter estimates which will be critical input parameters for future grey mackerel stock assessments of the respective stocks identified during the study. Estimates of mortality, spawning seasonality, and maturity are also documented. The biological information we provide here makes greater use of the samples collected and
FRDC 2005-010 Determination of management units for grey mackerel fisheries in Northern Australia

Grey mackerel management units in northern Australia
vii
value-adds considerably to the project thereby further enhancing project outputs and management outcomes. iii) This project addresses some of the major strategic research recommendations of the FRDC report of Ward and Rogers (2003). This review of northern mackerel research recommended stock structure determination and fisheries biology of grey mackerel as high priority research needs. iv) The project results have influenced the development of monitoring strategies for grey mackerel fisheries on the Queensland east coast, and in the stock assessments for the Gulf of Carpentaria. The QDPI&F Long Term Monitoring Program has developed their monitoring program for grey mackerel based on the spatial dynamics identified during this project. v) The project provided further evidence for the utility of holistic approaches in stock structure studies. Using the template provided for mackerel species by FRDC Project No. 1998/159, the use of multiple concurrent techniques has resulted in greater certainty and resolution in the identification of grey mackerel stocks. Further, to enhance interpretation in holistic stock structure studies this project has developed a simple tool for standardizing data integration, interpretation and presentation. vi) The project helped develop relationships between community groups, research and management to address emerging fisheries issues. The project helped to inform emerging local community concerns of grey mackerel localised depletions in the Port Douglas region of the Queensland east coast through regular and direct communication of results to those communities, the inclusion of extra project sampling with continued industry participation, and analyses to better inform these concerns. vii) The project further enhanced the link between research and management to maximize the uptake of research results by management. Due to the inter-jurisdictional nature of the project, and the possibility of the need for joint management between jurisdictions depending on results, fisheries managers from each jurisdiction were key partners throughout the project, including milestone reporting requirements (see Appendix 4). Managers were provided with regular progress reports throughout the project. viii) The project provided significant human capital development opportunities. The project provided material for two BSc (Hons) projects (James Cook University, Nic Marton; University of Queensland, Robbie Charters). These student projects made significant contributions to the FRDC funded study and form the basis for Chapters 4 and 7 respectively.

Grey mackerel management units in northern Australia
viii
Summary: The requirement for Queensland, Northern Territory and Western Australian jurisdictions to ensure sustainable harvest of fish resources and their optimal use relies on robust information on the resource status. For grey mackerel (Scomberomorus semifasciatus) fisheries, each of these jurisdictions has their own management regime in their corresponding waters. The lack of information on stock structure of grey mackerel, however, means that the appropriate spatial scale of management is not known. As well, fishers require assurance of future sustainability to encourage investment and long-term involvement in a fishery that supplies lucrative overseas markets. These management and fisher-unfriendly circumstances must be viewed in the context of recent 3-fold increases in catches of grey mackerel along the Queensland east coast, combined with significant and increasing catches in other parts of the species' northern Australian range. Establishing the stock structure of grey mackerel would also immensely improve the relevance of resource assessments for fishery management of grey mackerel across northern Australia. This highlighted the urgent need for stock structure information for this species. The impetus for this project came from the strategic recommendations of the FRDC review by Ward and Rogers (2003), "Northern mackerel (Scombridae: Scomberomorus): current and future research needs" (Project No. 2002/096), which promoted the urgency for information on the stock structure of grey mackerel. In following these recommendations this project adopted a multi-technique and phased sampling approach as carried out by Buckworth et al (2007), who examined the stock structure of Spanish mackerel, Scomberomorus commerson, across northern Australia. The project objectives were to determine the stock structure of grey mackerel across their northern Australian range, and use this information to define management units and their appropriate spatial scales. We used multiple techniques concurrently to determine the stock structure of grey mackerel. These techniques were: genetic analyses (mitochondrial DNA and microsatellite DNA), otolith (ear bones) isotope ratios, parasite abundances, and growth parameters. The advantage of using this type of multi-technique approach was that each of the different methods is informative about the fish’s life history at different spatial and temporal scales. Genetics can inform about the evolutionary patterns as well as rates of mixing of fish from adjacent areas, while parasites and otolith microchemistry are directly influenced by the environment and so will inform about the patterns of movement during the fishes lifetime. Growth patterns are influenced by both genetic and environmental factors. Due to these differences the use of these techniques concurrently increases the likelihood of detecting different stocks where they exist. We adopted a phased sampling approach whereby sampling was carried out at broad spatial scales in the first year: east coast, eastern Gulf of Carpentaria (GoC), western GoC, and the NW Northern Territory (NW NT). By comparing the fish samples from each of these locations, and using each of the techniques, we tested the null hypothesis that grey mackerel were comprised of a single homogeneous population across northern Australia. Having rejected the null hypothesis we re-sampled the 1st year locations to test for temporal stability in stock structure, and to assess stock structure at finer spatial scales. This included increased spatial coverage on the east coast, the GoC, and WA. From genetic approaches we determined that there at least four genetic stocks of grey mackerel across northern Australia: WA, NW NT (Timor/Arafura), the GoC and the east

Grey mackerel management units in northern Australia
ix
coast. All markers revealed concordant patterns showing WA and NW NT to be clearly divergent stocks. The mtDNA D-loop fragment appeared to have more power to resolve stock boundaries because it was able to show that the GoC and east coast QLD stocks were genetically differentiated. Patterns of stock structure on a finer scale, or where stock boundaries are located, were less clear. From otolith stable isotope analyses four major groups of S. semifasciatus were identified: WA, NT/GoC, northern east coast and central east coast. Differences in the isotopic composition of whole otoliths indicate that these groups must have spent their life history in different locations. The magnitude of the difference between the groups suggests a prolonged separation period at least equal to the fish’s life span. The parasite abundance analyses, although did not include samples from WA, suggest the existence of at least four stocks of grey mackerel in northern Australia: NW NT, the GoC, northern east coast and central east coast. Grey mackerel parasite fauna on the east coast suggests a separation somewhere between Townsville and Mackay. The NW NT region also appears to comprise a separate stock while within the GoC there exists a high degree of variability in parasite faunas among the regions sampled. This may be due to 1. natural variation within the GoC and there is one grey mackerel stock, or 2. the existence of multiple localised adult sub-stocks (metapopulations) within the GoC. Growth parameter comparisons were only possible from four major locations and identified the NW NT, the GoC, and the east coast as having different population growth characteristics. Through the use of multiple techniques, and by integrating the results from each, we were able to determine that there exist at least five stocks of grey mackerel across northern Australia, with some likelihood of additional stock structuring within the GoC. The major management units determined from this study therefore were Western Australia, NW Northern Territory (Timor/Arafura), the Gulf of Carpentaria, northern east Queensland coast and central east Queensland coast. The management implications of these results indicate the possible need for management of grey mackerel fisheries in Australia to be carried out on regional scales finer than are currently in place. In some regions the spatial scales of management might continue as is currently (e.g. WA), while in other regions, such as the GoC and the east coast, managers should at least monitor fisheries on a more local scale dictated by fishing effort and assess accordingly. Stock assessments should also consider the stock divisions identified, particularly on the east coast and for the GoC, and use life history parameters particular to each stock. We also emphasise that where we have not identified different stocks does not preclude the possibility of the occurrence of further stock division. Further, this study did not, nor did it set out to, assess the status of each of the stocks identified. This we identify as a high priority action for research and development of grey mackerel fisheries, as well as a management strategy evaluation that incorporates the conclusions of this work. Until such time that these priorities are addressed, management of grey mackerel fisheries should be cognisant of these uncertainties, particularly for the GoC and the Queensland east coast. Keywords: Grey mackerel, Scomberomorus semifasciatus, stock structure, spatial dynamics, otolith isotope ratios, population genetics, parasites, fisheries, management.

Grey mackerel management units in northern Australia
x
Acknowledgments The authors gratefully acknowledge funding from the Fisheries Research and Development Corporation (FRDC), the Queensland Department of Primary Industries & Fisheries, and James Cook University (JCU) for this project. Gavin Begg (JCU) and Rod Garret (QDPI&F) were instrumental in leading the development and initial implementation of this project. Iso-Analytical Limited (Sandbach, UK) carried out the stable isotope ratio analyses. Logistical support was provided by the Department of Fisheries, Government of Western Australia. The authors are grateful to the mackerel fishers of Western Australia, the Northern Territory and Queensland for assistance in obtaining fish samples. Fisheries data were kindly provided by Nadia Engstrom, Anna Garland, and Katherine Zahmel of the Queensland Department of Primary Industries & Fisheries, Tricia Beatty and Thor Saunders of the Northern Territory Department of Regional Development, Primary Industries, Fisheries & Resources, and Paul Lewis of the Western Australian Department of Fisheries. Invaluable assistance and advice has also been received from Mark Doohan, Grant Johnson, Chris Tarca, Charles Bryce, Mark Lightowler, Shane Hansford, David McKee, and Tricia Beatty. Raewyn Street is also acknowledged for assisting with the genetic sample analyses, Amos Mapleston assisted with initial sample collection and data storage procedures, and Ann Penny was very helpful in publishing the final report. This work was undertaken as part of FRDC Project No. 2005/010. Photo credits: Front cover – commercial grey mackerel net fisher being assisted by F&F researcher Aaron Ballagh. Photo by D. Welch. Underwater photo of a grey mackerel. Photo by D. Welch

Grey mackerel management units in northern Australia
xi

Grey mackerel management units in northern Australia
1
1. INTRODUCTION
DJ Welch
1.1. Overview
The spatial dynamics of grey mackerel (Scomberomorus semifasciatus) populations
within northern Australian and their relationships with one another were very poorly
understood prior to this study being undertaken. Previous grey mackerel stock structure
research across northern Australian focused primarily on the Queensland east coast
(Cameron and Begg 2002). They used an integrated approach with genetic data to
discriminate the east coast stock from fish found to the west in the Arafura Sea region of
the Northern Territory, while otolith microchemistry data were inconclusive.
In this study we also used an integrated approach consisting of a complementary set of
different techniques simultaneously applied to the same specimens sampled across the
range of the species in Australia with the objective of discriminating stocks of grey
mackerel over their entire Australian range. The techniques used were genetics
(distribution of mitochondrial DNA and microsatellite DNA genotypes), otolith
microchemistry (stable isotope ratios), and parasites (species and loadings), and
comparisons were made between the same samples of fish collected from multiple
locations determined by areas of highest commercial fishing effort. As a value-adding
exercise to the project we also utilised the samples collected as an opportunity for a
student project to generate estimates of growth for grey mackerel from each of the major
regions as an additional technique for stock discrimination.
The project therefore set out to identify the appropriate spatial units of management for
grey mackerel based on stock structure across northern Australia. Given that three
separate management jurisdictions span the range of grey mackerel we also set out to
identify where joint management arrangements between relevant agencies may be
appropriate. In this report the results of each component of the study are laid out in
individual chapters beginning with the current chapter which draws on the information
used for the original proposal and presents the general project approach and

Grey mackerel management units in northern Australia
2
methodology. Chapter 2 presents biological information derived from the project samples
to provide useful comparative information to that of Cameron and Begg (2002) and to
maximise information content beyond the original project design. Chapter 3 presents the
variation in growth rates between regions and discusses how these can be used to
determine stock structure and forms the basis of a BSc (Honours project). Analyses of
genetic information derived from mitochondrial DNA (mtDNA) and microsatellite DNA
(msDNA) loci, provide complementary information on the current and past relationships
between grey mackerel populations on an evolutionary time-scale and this is presented
in Chapter 4. Otolith isotope ratio analyses (Chapter 5) and parasite analyses (Chapter
6) were used as different techniques that provided independent tests of finer scale stock
structure and at temporal scales relevant to fisheries management. Chapter 7 provides a
summary of the integration of all the different methods used to identify the appropriate
management units for grey mackerel.
1.2. Background
Knowledge of the spatial dynamics of targeted marine fish species is essential for
providing a framework for effective natural resource management. Of the northern
Australian mackerel species, all which underpin important fisheries, this information is
least understood for grey mackerel (Scomberomorus semifasciatus). Fundamental
information on stock structure is therefore required so that the management
interventions of grey mackerel fisheries in Queensland, the Northern Territory and
Western Australia, are better informed and provide greater certainty in ensuring
sustainable management. That is, where there exist discrete or semi-discrete units of
grey mackerel, on which fishing effort is imposed, then ensuring the continued future
harvest requires that management interventions reflect the level of harvest from that unit
in the context of their biological attributes. It is this unit of individuals that we refer to as a
stock. It is also important to define what a “stock” is, and although the literature abounds
with such definitions (see Kutkuhn 1981; Waldman 2005), it is the questions being
addressed that should dictate what that definition is (Buckworth et al. 2007). We set out
here to define the management units for grey mackerel fisheries. This dictated that our
definition of a stock, which is derived from the definition proposed by Hilborn and Walters
(1992), was: a semi-discrete group of fish that are essentially self-reproducing with
similar biological attributes. These groups of fish may or may not be genetically

Grey mackerel management units in northern Australia
3
distinguishable, but have other measurable differences that are essentially a gauge of
their behavioural distinctiveness; they might be expected to respond differently to
management. This project used a suite of complementary stock identification techniques
designed to provide the necessary information on the spatial structure and effective
management units of northern Australian grey mackerel populations that is required for
management of this highly valued resource.
Grey mackerel are endemic to northern Australian waters and are an important targeted
species taken across northern Australia predominantly by commercial offshore gill
netters. They are also a highly prized light game fish in the rapidly-growing recreational
and fishing tourism sectors, especially in the Gulf of Carpentaria. During the late 1990s,
most of the Australian catch of grey mackerel was taken in the Gulf of Carpentaria by
Queensland and Northern Territory commercial gillnet fishers. During this period the
national commercial harvest of grey mackerel was approximately 800 tonnes and worth
$6 million per year; thereby, adding significant value to the $12 million annual catch of
northern sharks. In fact, during this period grey mackerel was the dominant single
species in catches from the Northern Territory pelagic gillnet fishery and the Queensland
Gulf N9 offshore set mesh net fishery. Coupled with these increased commercial catches
was the establishment of valuable domestic and overseas markets for premium product.
More recently annual commercial harvest of grey mackerel nationally have increased to
approximately 1050 t (2006) largely due to increases in harvest levels on the
Queensland east coast and in the Northern Territory.
Despite its importance to the commercial fishery, surprisingly little is known about the
biology and stock structure of grey mackerel in northern Australian waters, where the
understanding of this species is largely restricted to the FRDC-funded study of Cameron
and Begg (2002). This study provided some information on grey mackerel, primarily in
Queensland east coast waters. Further research was required to extend this knowledge
westwards to provide information for profitable and sustainable management and to
respond to the requirements of the Commonwealth Environment Protection &
Biodiversity Conservation (EPBC) Act 1999. Information on grey mackerel is important to
the EPBC Act export accreditation process for all the fisheries of which it is a component
species. Studies into stock structure are an important step in the process for improving
the basis for northern Australia fisheries management, and are a prerequisite for the

Grey mackerel management units in northern Australia
4
integrated multi-jurisdictional management arrangements being promoted by the
Northern Australian Fisheries Management Forum (NAFMF).
The spatial extent of grey mackerel populations and the degree of interchange between
them in Australian waters is unknown, although there is some evidence for large scale
stock differences. Allozyme electrophoresis indicated that central Queensland east coast
grey mackerel are genetically distinct from more westerly populations in the Arafura Sea
and Gulf of Carpentaria (Cameron and Begg 2002). However, the relationships among
grey mackerel populations in the Queensland Gulf of Carpentaria and Northern Territory
waters are unknown. In both jurisdictions, grey mackerel fisheries are subject to
management regimes designed to contain fishing effort. Nevertheless, commercial, and
probably recreational, fishing effort has seen rapid growth in recent years.
The impetus for this project was provided by the FRDC-funded strategic review of
northern Australian mackerel undertaken by Ward and Rogers (2003). In this review, it
was recommended that research into the stock structure of grey mackerel across its
Australian range be considered essential and of the highest priority for effective and
cooperative fisheries management, especially where stocks may be shared between
jurisdictions. It was also recommended that the techniques applied in FRDC Project
1998/159 for Spanish mackerel stock identification are adopted for research into the
stock structure of grey mackerel; different from those used by Cameron and Begg
(2002).
This project, therefore, firstly tested the hypothesis of broad scale spatial stock structure
for grey mackerel in Queensland and Northern Territory waters. Secondly, the project
tested finer scale spatial stock structure in areas of high fishing effort. As was
recommended, we used the techniques applied in the FRDC Project 1998/159 on
Spanish mackerel (genetic analyses, otolith microchemistry and parasite incidence) to
provide a robust approach for investigating the northern Australia grey mackerel stock
structure. This multi-technique approach follows the dictum of the FRDC-funded
workshop in July 1997, "Taking Stock: Defining and Managing Shared Resources"
(Hancock 1998), which concluded that an analysis of stock structure is most effective if
several techniques are used because of the different population and temporal scales
addressed by each. Genetic analyses typically identify stocks on large spatial and

Grey mackerel management units in northern Australia
5
temporal scales, where gene flow is minimal. In contrast, otolith microchemistry and
parasite incidence reflect residence and movements of fish in different ways, and may be
used to resolve a genetically homogeneous population into discrete units of adult fish
that may be more appropriate for management (Buckworth 1998).
While responding to the strategic direction for priority mackerel research provided by the
review of Ward and Rogers (2003), this project also addressed a long-standing and high
priority requirement for resource status information driven by the Queensland Gulf of
Carpentaria Fisheries Management Advisory Committee, the Queensland Fisheries Joint
Authority and the Northern Territory Fisheries Joint Authority. During the development of
the project strong support was received from the NAFMF (August 2003 and September
2004) with the recognition of the project's importance across northern Australian
jurisdictions. The project was developed with the participation of fishery management
authorities in Queensland (Department of Primary Industries and Fisheries), the
Northern Territory (Department of Regional Development, Primary Industry, Fisheries
and Resources) and Western Australia (Department of Fisheries), as well as industry
groups in the Gulf of Carpentaria and along the Queensland east coast.
During the project implementation there were two developments that resulted in changes
to the project’s experimental design, particularly the sample collection and analysis
schedules. The first change arose in 2006 when management of grey mackerel fisheries
in WA introduced a grey mackerel Total Allowable Commercial Catch (TACC), effectively
creating a new fishery. This greatly increased the potential for expansion of grey
mackerel harvest in WA and made the inclusion of WA samples in the stock structure
analyses a greater priority. The FRDC agreed and provided extra funding of $21,250 in
late 2006 for the collection and inclusion of WA samples in the suite of analyses being
carried out. The second development came about due to increasing local community
concerns about the sustainability of grey mackerel on the Queensland east coast,
primarily in the Port Douglas region. This necessitated several community and industry
meetings that were attended by the PI and extra sample collections and analyses were
carried out for the Port Douglas region (Snapper Island) across the respective analytical
techniques. Funding for inclusion of these samples was provided by the QDPI&F in
2007.

Grey mackerel management units in northern Australia
6
1.3. Need
Queensland, the Northern Territory and Western Australia legislations require
sustainable harvest of fish resources and their optimal use. Reliable and robust
information on the status of fished resources are central to achieving these outcomes.
Each jurisdiction has its own management regime for the mackerel fisheries in their
corresponding waters. The lack of information on stock structure, however, means that
the appropriate scale of management is not known. As well, fishers require assurance of
future sustainability to encourage investment and long-term involvement in a fishery that
supplies lucrative overseas markets. These management and fisher-unfriendly
circumstances must be viewed in the context of recent 3-fold increases in catches of
grey mackerel along the Queensland east coast, combined with significant and
increasing catches in other parts of the species' northern Australian range. Such a
scenario highlighted the urgent need for information on the stock structure of this
species.
At its August 2003 meeting, the NAFMF signalled its intention to move from single
jurisdiction-based fishery management towards a more integrated approach that
reflected the management needs of species across their northern Australian range. In
2004, NAFMF progressed this undertaking for grey mackerel, with the development of
an operational plan for sustainable harvest across northern Australia. In order to obtain
the maximum benefit from this initiative, the underlying stock structure of grey mackerel
had to be established. Furthermore, this project was consistent with the strategic
directions of the Northern Territory Strategic Plan for Fisheries Research and
Development, particularly those directives related to the sustainable harvesting of fish
and other aquatic resources, and the optimum utilisation of fish and aquatic resources.
1.4. Objectives
1. To determine the spatial and temporal stock structure of grey mackerel over its
northern Australian range.
2. To use stock structure information in defining the geographic framework and
appropriate management units required by Queensland and Northern Territory fisheries
agencies for sustainable management planning of grey mackerel resources.

Grey mackerel management units in northern Australia
7
1.5. Methods
This section provides an overview of the sampling approach and methods used during
this project. Detailed methods for the respective analysis techniques are provided in the
individual chapters of this report.
The approach taken was based on the management questions behind the project
development, which largely dictated the sampling design (ie. when and where fish
samples were taken for inclusion in the analysis regime). Since the vast majority of grey
mackerel catches comes from the commercial sector, one of the main driving factors
behind the development of this project was the management concerns of increased
commercial targeting of grey mackerel (along with shark) in the Gulf of Carpentaria, and
as such was deemed to be an area of focus for the identification of grey mackerel
stocks. Also considered important was identification of whether the major commercial
grey mackerel fishery areas across all state and commonwealth managed jurisdictions in
northern Australia should be considered separate management units or, alternately, that
these jurisdictions needed to adopt joint management in some areas. Sampling was
therefore based on the major commercial fishery areas and as such utilised commercial
fishery operations. As likely stock scenarios were also uncertain we also adopted a
phased or exploratory approach to sampling (Abaunza 2008 – 104-113); an approach
proven to be successful for S. commerson, a similar species to grey mackerel also with a
tropical northern Australian range (Buckworth et al 2007). The major phases of the
project, of which the first two were sampling phases, were:
PHASE 1 (Year 1): Broad spatial scale genetic and environmental influenced differences
in grey mackerel populations were established over their northern Australian range using
the Spanish mackerel stock identification methodology (Buckworth et al 2007) as
recommended by Ward and Rogers (2003). Support for the notion of separate stocks
would justify going to Phase 2, otherwise the project would cease after Phase 1.
PHASE 2 (Year 2-3): Finer spatial and short-term (inter-annual) temporal scale
resolution of grey mackerel stocks were investigated at an increased number of
locations.

Grey mackerel management units in northern Australia
8
PHASE 3 (Year 3): Project results were finalised across analysis methods and the
management units for grey mackerel in northern Australia were defined in collaboration
with the project team and fisheries managers from each of the major jurisdictions.
The project used three basic techniques to examine grey mackerel stock structure: 1)
mitochondrial DNA and microsatellite genetic analyses; 2) whole otolith solution based
microchemistry; and 3) parasite incidence. Growth parameters were also used as an
additional method for determining stock structure. In the first year of the project (Phase
1), these techniques were applied to establish if broad spatial scale structural variation
existed across the major fishing grounds, through the collection of samples from four
primary locations in Queensland (East Coast and the Gulf of Carpentaria) and the
Northern Territory (Gulf of Carpentaria and the North-West Coast). The east coast
samples were initially required to provide an updated reference point for potential Gulf
and Northern Territory stocks, and to compare results from the previous FRDC Project
1992/144 which was undertaken in the early 1990s (Cameron and Begg 2002). The
samples were collected from commercial fishers and used to provide material for
genetic, otolith and parasite analyses.
As the first year results supported the notion of separate stocks of grey mackerel, in the
second year we undertook an extended sampling program to describe finer spatial scale
population structure and temporal (inter-annual) variability in the short-term. This
included sample collections from Western Australia as well as an additional sample
collection from the Port Douglas region on the northeast Queensland coast. The Port
Douglas region was explicitly added to the project experimental design due to emerging
concerns from the local community that grey mackerel in the local area represented a
separate stock from other parts of the Queensland east coast, and that the current
harvest level of this stock was unsustainable. This resulted in four major regions for
sample collection and included a total of 12 locations. The regions were: the Queensland
east coast (4 locations overall), the Gulf of Carpentaria (6 locations), north western
Northern Territory (1 location), and Western Australia (1 location) (Figure 1.1). Table 1.1
lists all of the locations sampled during the project and the acronyms used to describe
the locations throughout this report.

Grey mackerel management units in northern Australia
9
Table 1.1. Summary of the locations sampled and their broad scale regions, the acronyms used to describe these sample locations, and the date/s they were sampled. State Region Location Location
code # fish
sampled Month/year
sampled WA West Coast Port Hedland WA 40 08/2006 NT North West Coast NW coast NW NT 50 05/2005 50 08/2005 26 10/2006 81 04/2007 NT Western Gulf of
Carpentaria Mid WG mid 50 09/2005
15 10/2006 NT Western Gulf of
Carpentaria South west WG SW 35 11/2006
QLD Eastern Gulf of Carpentaria South west EG SW 53 03/2007 QLD Eastern Gulf of Carpentaria South east EG SE 50 03/2007 QLD Eastern Gulf of Carpentaria Mid EG mid 197 09/2005 49 09/2006 53 03/2007 QLD Eastern Gulf of Carpentaria North EG N 146 05/2007 QLD East Coast Port Douglas EC PD 58 08/2007 QLD East Coast North EC N 17 11/2006 QLD East Coast Mid EC mid 401 10/2005 183 10/2006 QLD East Coast South EC S 38 12/2005 40 09/2006
At the completion of each Phase, the project results were assessed by the project team
and progress reported to the FRDC, Northern Australian Fisheries Managers Forum
(NAFMF), relevant Management Advisory Committees and other stakeholder groups.
These progress reports included management responses to the information generated
along the project timeline, directly linking research findings with management outcomes.
Assessment of project progress was facilitated by annual team meetings held centrally in
Darwin. At the final project workshop held in May 2008 the project team was able to
integrate all components of the data analyses to identify grey mackerel management
units. This final workshop was attended by fisheries managers from each jurisdiction,
further facilitating direct transfer of research results to management outcomes.

Grey mackerel management units in northern Australia
10
Figure 1.1. Map of northern Australia showing the locations sampled during the study.
1.6 References
Abaunza, P, Murta, AG, Campbell, N, Cimmaruta, R, Comesaña, AS, Dahle, G, Gallo, E, García Santamaría, MT, Gordo, LS, Iversen, SA, MacKenzie, K, Magoulas, A, Mattiucci, S, Molloy, J, Nascetti, G, Pinto, AL, Quinta, R, Ramos, P, Ruggi, A, Sanjuan, A, Santos, AT, Stransky, C, and Zimmermann, C, (2008). Considerations on sampling strategies for an holistic approach to stock identification: The example of the HOMSIR project. Fisheries Research, 89: 104-113. Buckworth, R.C. (1998) Age structure of the commercial catch of Northern Territory narrow-barred Spanish mackerel. Project T94/015. Final Report to the Fisheries Research and Development Corporation. Northern Territory Department of Primary Industry and Fisheries, Darwin. Fishery Report 42, 28pp. Buckworth, RC, Newman, SJ, Ovenden, JR, Lester, RJG and McPherson, GR, (2007) The stock structure of northern and western Australian Spanish mackerel, Final report, Fisheries Research and Development Corporation Project 1998/159. Department of

Grey mackerel management units in northern Australia
11
Primary Industry, Fisheries & Mines, Northern Territory Government, Australia. Fishery Report 88, i-vi, 225pp. Cameron, D. and Begg, G. (2002) Fisheries biology and interaction in the northern Australian small mackerel fishery. Final report to the Fisheries Research and Development Corporation Projects 92/144 & 92/144.02, 236p. Hancock, DA (ed.) (1998) Taking stock: defining and managing shared resources. Australian Society for Fish Biology and the Fish and Aquatic Resource Management Association of Australasia Joint Workshop Proceedings, Darwin 15-16 June 1997. Australian Society for Fish Biology, Sydney, 234p. Hilborn, R. and Walters, C. J. (Eds) (1992). Quantitative Fisheries Stock Assessment: Choice, Dynamics and Uncertainty. London, Great Britian, Chapman and Hall. Kutkuhn, JH (1981) Stock definition as a necessary basis for cooperative management of Great Lakes fish resources. Canadian Journal of Fisheries & Aquatic Sciences, 38: 1476-1478. Waldman, JR (2005) Definition of stocks: an evolving concept, In: Cadrin, SX, Friedland, KD, and Waldman, JR. (2005). Stock Identification methods: Applications in fishery science, Elsevier Academic Press, USA, 719pp. Ward, T.M. and Rogers, P.J. (2003) Northern mackerel (Scombridae: Scomberomorus): current and future research needs. Project 2002/096 Fisheries Research and Development Corporation. South Australian Research and Development Institute, South Australia. 101pp.

Grey mackerel management units in northern Australia
12
Grey mackerel management units in northern Australia
13
2. NORTHERN AUSTRALIA GREY MACKEREL FISHERIES
JM Stapley and DJ Welch
2.1. Fishery description
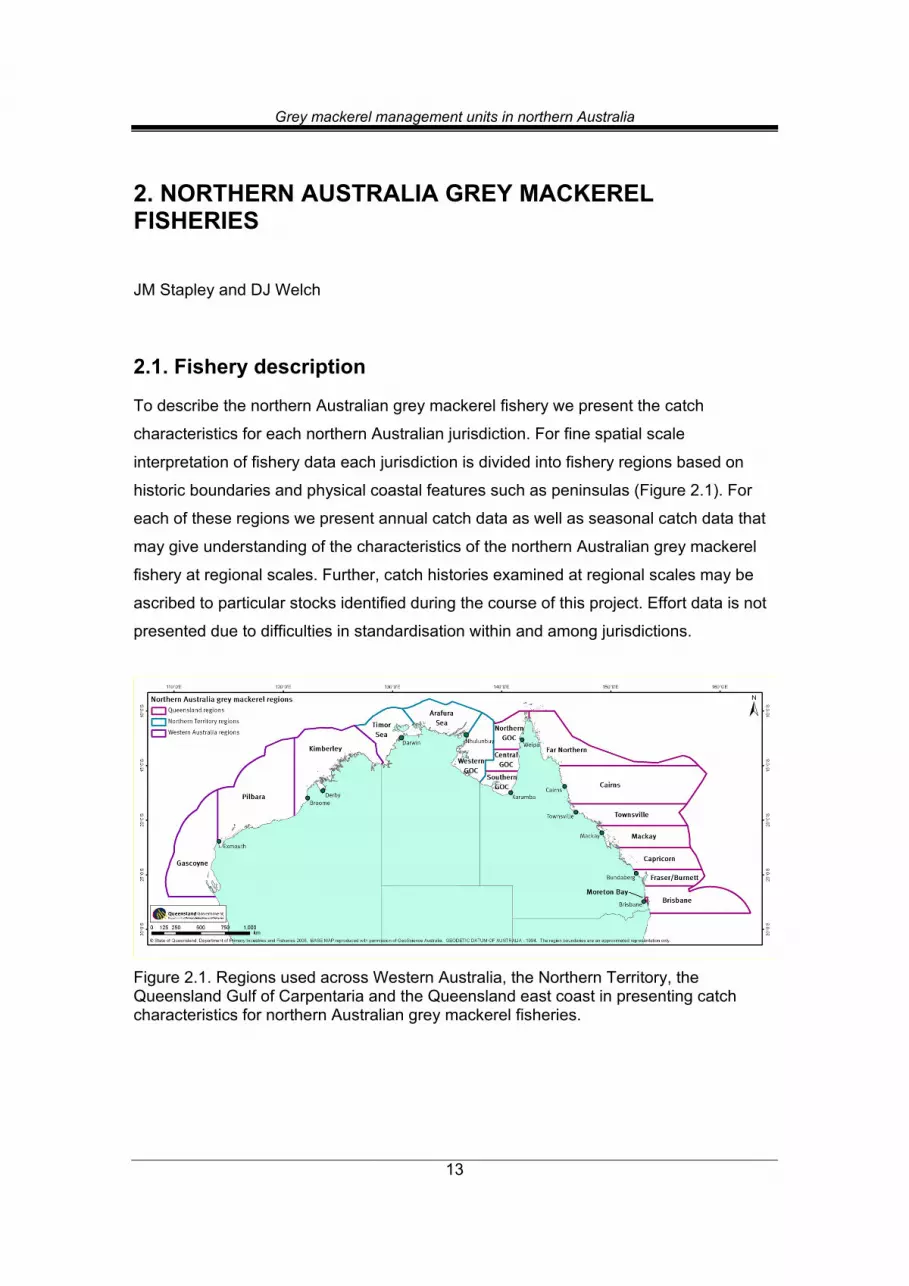
To describe the northern Australian grey mackerel fishery we present the catch
characteristics for each northern Australian jurisdiction. For fine spatial scale
interpretation of fishery data each jurisdiction is divided into fishery regions based on
historic boundaries and physical coastal features such as peninsulas (Figure 2.1). For
each of these regions we present annual catch data as well as seasonal catch data that
may give understanding of the characteristics of the northern Australian grey mackerel
fishery at regional scales. Further, catch histories examined at regional scales may be
ascribed to particular stocks identified during the course of this project. Effort data is not
presented due to difficulties in standardisation within and among jurisdictions.
Figure 2.1. Regions used across Western Australia, the Northern Territory, the Queensland Gulf of Carpentaria and the Queensland east coast in presenting catch characteristics for northern Australian grey mackerel fisheries.

Grey mackerel management units in northern Australia
14
2.1.1 Queensland East Coast Grey mackerel extends the length of the eastern coast of Queensland (Qld) and
commercial mackerel landings are mainly from the East Coast Inshore Fin Fish Fishery
(ECIFFF). The ECIFFF is a multi-species highly complex fishery, currently divided into
six sub-fisheries. The small mackerel and shark sub-fisheries target grey mackerel
intensively; in particular the offshore mesh net (>300t harvest in 2006 and 2007). The
mesh net fisheries predominantly use 160-165mm mesh size for targeting grey
mackerel. A small amount of grey mackerel is also landed from the pelagic troll line
fisheries on the east coast of Qld, which contributed approximately 2 percent of the total
east coast annual grey mackerel catch over the last seven years.
Management arrangements for the east coast inshore finfish fishery have undergone
recent reviews, and changes will be implemented in early 2009. The results of the
community consultation phase of the Regulatory Impact Statement (RIS), in particular,
will determine specific management policy. Prior to this, no change to management had
occurred to the grey mackerel take directly, except Great Barrier Reef Marine Park
Authority (GBRMPA) closures (the Representative Area Program or RAP) that may have
displaced some fishing effort. Various area and temporal closures also exist on the east
coast, but none directly impact grey mackerel fisheries. Effort days where grey mackerel
are targeted have quadrupled from 2000 to 2007 on the Queensland east coast.
The Queensland east coast was divided into 7 regions for fine scale investigation (Figure
2.1). Catch landings from the Commercial logbooks (CFISH) indicate that catches of
grey mackerel have risen back to 1990 levels and are well in excess of 200t. The
Townsville region has been the major contributor to grey mackerel landings along the
entire east coast (Figure 2.2). However, no attempt was made to analyse the catch
component of the logbook data reported as ‘unspecified mackerel’, and the potential
grey mackerel component of this component is not included in Figure 2.2. Cameron and
Begg (2002) estimated the grey mackerel component of the 1995 ‘unspecified mackerel’
was 40%, which would contribute another 5t for that season. The logged ‘unspecified
mackerel’ contribution was the largest between the early 90s to early 2000s, for both
Line and Net sectors. Since 2004, the annual logged ‘unspecified mackerel’ component
has significantly declined, especially in the Net fishery sector. A contributing factor to this
would be the strong and stand-alone market established for grey mackerel since the late

Grey mackerel management units in northern Australia
15
1990s, which was mainly driven by the large catches in the Gulf of Carpentaria and
specific marketing of this species by those commercial fishers. Also, the QDPI&F had
floated the idea of further regulation in grey mackerel fishing, and operators were keen
to establish a history of catch in the fishery.
0
50
100
150
200
250
300
350
19881989
19901991
19921993
19941995
19961997
19981999
20002001
20022003
20042005
20062007
Year
Cat
ch (t
)
BrisbaneFraser/BurnettCapricornMackayTownsvilleCairnsFar NorthernUnspecified
Figure 2.2. Annual commercial net and line catches of grey mackerel from 1988 – 2007 for each region of the Queensland east coast.1
In the early years of logbook reporting a large proportion of the east coast catch was
taken in the Fraser/Burnett region. Townsville however has been consistently the major
fishery region for grey mackerel throughout the time series, although catch has
increased in recent years for the Cairns, Mackay and Capricorn regions (Figure 2.2). For
the east coast of Queensland, across the years 2005 and 2006, the average catch of
grey mackerel per day was 767 kg for net and 183 kg for the line fisheries. Log book
data indicate that in most regions grey mackerel were captured all year round; however
there is very strong seasonality in the fishery with September and October the major
months driven primarily by catches in the Townsville region (Figure 2.3). From regional
monthly average catches for net and line (Figures 2.3 & 2.4 respectively) over the time
series, peak catches in the Cairns region appear during the June-September period,
whereas catches in the Fraser/Burnett region are relatively consistent throughout the
1 NB. ‘Unspecified’ in Figures refers to logbook grey mackerel catch records where no location data were provided.

Grey mackerel management units in northern Australia
16
year. Most other regions show peak catches in the months of September and October
similar to Townsville.
0
5
10
15
20
25
30
35
40
45
1 2 3 4 5 6 7 8 9 10 11 12
Month
Cat
ch (t
)
Brisbane
Fraser/Burnett
Capricorn
Mackay
Tow nsville
Cairns
Far Northern
Unspecif ied
Figure 2.3. Seasonality in commercial net catches of grey mackerel from each region of the Queensland east coast. The y-axis gives mean monthly catches in tonnes pooled across years.
0
0.5
1
1.5
2
2.5
3
1 2 3 4 5 6 7 8 9 10 11 12
Month
Cat
ch (t
)
Brisbane
Fraser/Burnett
Capricorn
Mackay
Tow nsville
Cairns
Far Northern
Unspecif ied
Figure 2.4. Seasonality in commercial line catches of grey mackerel from each region of the Queensland east coast. The y-axis gives mean monthly catches in tonnes pooled across years.

Grey mackerel management units in northern Australia
17
Catches and CPUE can be affected by fisher business decisions and accessibility to the
resource, particularly due to weather constraints, and therefore may not represent the
true dynamics of the grey mackerel population. CFISH data only indicate the potential of
local and migratory and/or aggregation aspects for the grey mackerel population
dynamics along the east coast of Queensland.
Based on logbook returns for the years 1995 – 2007 the charter or fish tour operator
catch of grey mackerel was less than 0.01 t per year retained, although modelled
estimates of grey mackerel charter catches within those recorded as ‘unspecified
mackerel’ would bring this estimate to approximately 0.10 t per year (Begg et al. 2005).
The recreational retained catch is greater than charter take, with estimates of 12 t for
1995 on the east coast (Cameron and Begg, 2002) and a Qld wide estimate of 19 t for
1999 (Williams 2002). Assuming similar catch characteristics and ratio of commercial to
recreational catch has continued on the east coast, and applying the numbers provided
in the McInnes (2008) report; grey mackerel retained could be roughly estimated at 26t
for 1997, 14t for 1999, 4t for 2002 and 29t for 2005 by recreational fishers along the east
coast.
2.1.2 Queensland and Northern Territory Joint management arrangements For management purposes, grey mackerel in the Gulf of Carpentaria (GoC) are
considered to be a shared resource with jurisdiction split between the Australian
Commonwealth Government and two states; Northern Territory and Queensland. The
mackerel stocks of the Gulf of Carpentaria have been fished commercially since the
early 1960’s. The Northern Territory (NT) identified and endorsed a separate
“Shark/Mackerel” fishery in the early 1980’s, but Queensland only officially initiated a
limited entry offshore N9 “Shark” fishing endorsement in 1999. Both these net fisheries
target grey mackerel intensively, using 160-165mm mesh size. The fishery(ies) interact
between the two States, with some operators’ licensed/endorsed in both jurisdictions,
and with the fishing effort of the combined fishery being driven by the local market forces
in either State. A small amount of grey mackerel is also landed from the line fisheries in
the GoC.
Prior to the 1986 Offshore Constitutional Settlement (OCS) Agreement, which formed
the Gulf Northern Territory Fisheries Joint Authority (NTFJA) and Queensland Fisheries

Grey mackerel management units in northern Australia
18
Joint Authority (QFJA), the shark and mackerel fisheries were controlled by the
Commonwealth and reported to the Australian Fisheries Management Authority (AFMA).
Due to an oversight at the time, grey mackerel was not listed as a state managed
species in the OCS therefore management defaulted to the Commonwealth; that is, pre-
OCS arrangements applied. Not only did the states not control the exploitation of the
grey mackerel stock, they had no knowledge of, nor responsibility for establishing, the
status of a fished stock that was caught across both State jurisdictions. In 2003 a
resolution was made that grey mackerel would be jointly managed between the States
and the Commonwealth, via the NTFJA and QFJA through permits to take the species in
state waters.
2.1.3 Queensland Gulf of Carpentaria For the purposes of this report the Qld GoC was divided into three regions for fine scale
investigation; northern, central and southern regions (Figure 2.1). Catch landings from
the Qld GoC commercial logbooks indicated a significant rise in grey mackerel landings
from the mid 1990s onwards, with recent catches in excess of 600t (2007). Effort days
towards grey mackerel from 2000 to 2007 have risen by approximately 30 percent, and a
contributing factor to this increase was the diversification of inshore barramundi fishers
utilising the offshore resources at limited times during the season. A four month netting
closure, in line with barramundi spawning, exists in the Qld-managed GoC fisheries,
usually from October to January, and extends out to 25 nautical miles from the shore.
Historically most of the grey mackerel catch from the Qld GoC has come from the central
region however in the past two years catch has increased dramatically in the north with a
concomitant decrease in catch from the central region (Figure 2.5). Historically the
annual ‘unspecified mackerel’ logged take was minor in both line and net Qld GoC
fisheries (<4t).

Grey mackerel management units in northern Australia
19
0
100
200
300
400
500
600
700
19881989
19901991
19921993
19941995
19961997
19981999
20002001
20022003
20042005
20062007
Year
Cat
ch (t
) Eastern Gulf - SouthEastern Gulf - CentralEastern Gulf - North
Figure 2.5. Annual commercial net and line catches of grey mackerel from 1988 – 2007 for each region of the Queensland Gulf of Carpentaria.
Across the years 2005 and 2006 the average catch of grey mackerel landed per day was
1.323t for net and 0.130t for the line fisheries. Average monthly catches for net and line
(Figure 2.6 & 2.7 respectively) over the years 1988 - 2007 indicates that grey mackerel
were captured all year round with a very strong overall seasonal peak evident for the
months of August and September. This peak is driven primarily by catches in the
northern region and to a lesser extent catches in the southern region. Most of the catch
taken in the central region is during the May – August period. However, note that a
seasonal closure exists for State net fisheries, whereas no such closures have been
placed on State line and Joint Authority net fisheries that operate in Qld waters. The
average catch per unit effort peaks were skewed by one month later for each region,
compared to the catch landings. Thus data from CFISH indicates possible local
migratory and/or aggregation aspects for the grey mackerel population dynamics along
the eastern side of the GoC. Based on logbooks from 1995 – 2007 the charter or fish
tour operator catch of grey mackerel was less than 0.15t per year retained. The
recreational and indigenous take are unknown.

Grey mackerel management units in northern Australia
20
0
10
20
30
40
50
60
70
80
90
100
1 2 3 4 5 6 7 8 9 10 11 12
Month
Cat
ch (t
) Eastern Gulf - South
Eastern Gulf - Central
Eastern Gulf - North
Figure 2.6. Seasonality in commercial net catches of grey mackerel from each region of the Queensland Gulf of Carpentaria. The y-axis gives mean monthly catches in tonnes pooled across years.
0
0.5
1
1.5
2
2.5
3
1 2 3 4 5 6 7 8 9 10 11 12
Month
Cat
ch (t
) Eastern Gulf - South
Eastern Gulf - Central
Eastern Gulf - North
Figure 2.7. Seasonality in commercial line catches of grey mackerel from each region of the Queensland Gulf of Carpentaria. The y-axis gives mean monthly catches in tonnes pooled across years.
2.1.4 Northern Territory The Northern Territory was divided up into three regions for similar fine scale
investigation: Timor, Arafura and western GoC (Figure 2.1). Catch landings from NT

Grey mackerel management units in northern Australia
21
commercial logbooks indicated a significant rise in grey mackerel landings from the late
1990s onwards, with recent catches fluctuating from a peak in 2003 of 760t and then
progressively dropped to 240t for 2007 (Figure 2.8). This drop in catch is a reflection of
management changes in NT towards reducing fishing effort in the offshore net and line
fishery. The dataset incorporated the effects of an effort reduction program which
included a three for one licence reduction scheme, setting of an annual cap in effort
days, reducing the total net length and changes in mesh size. Historically the NT Timor
and Arafura regions were the major catch regions. However these regions seem to be
the most affected by the recent effort-reduction management changes.
0
100
200
300
400
500
600
700
800
900
19841985
19861987
19881989
19901991
19921993
19941995
19961997
19981999
20002001
20022003
20042005
20062007
Year
Catc
h (t) Timor
ArafuraWestern Gulf
Figure 2.8. Annual commercial net and line catches of grey mackerel from 1984 – 2007
for each region of the Northern Territory.
From the 2005 and 2006 period the average catch of grey mackerel landed per day was
0.452t for the offshore net and line fishery predominantly from net fishing. Logbook
monthly catches for the fishery averaged across the years 1984 – 2007 indicates that
grey mackerel were captured all year round with varying seasonal peak catches within
regions (Figure 2.9). Overall there is an extended grey mackerel season across the
months of April – November. In the Timor region catches peak during August to
November; April to August in the Arafura region; and October to November in the

Grey mackerel management units in northern Australia
22
western GoC region. However, the majority of the western GoC catches have been from
recent years and the monthly catch dynamics are more than likely skewed from Qld
fishers entering NT waters during Qld GoC fishing closures. As no temporal closures
exist in NT, the fishery operates on capped effort and “fishing days” which can be utilised
anytime during the season.
As stated previously, catches and CPUE, notwithstanding hyperstability, can be altered
by fisher business decisions and accessibility to the resource. For the NT, the grey
mackerel catch variations are driven by market and operational forces, rather than grey
mackerel catchability (Fishery Status Report 2006).
0
5
10
15
20
25
30
35
1 2 3 4 5 6 7 8 9 10 11 12
Month
Catc
h (t) Timor
ArafuraWestern Gulf
Figure 2.9. Seasonality in combined commercial net and line catches of grey mackerel from each region of the Northern Territory. The y-axis gives mean monthly catches in tonnes pooled across years.
The charter or fish tour operator catch of grey mackerel was not available but is
assumed to be low. The estimated retained recreational catch of grey mackerel caught
every year in NT has been estimated to be approximately 8,400 fish (Crofts and de
Lestang, 2004; Coleman, 2004). With an assumed average grey mackerel recreational
harvest weight of 3kg (usually 1-5kg) this puts annual recreational harvest of
approximately 25t from NT waters.

Grey mackerel management units in northern Australia
23
2.1.5 Western Australia Similar to the other states, Western Australia (WA) was divided up into three operational
regions; Pilbara, Kimberley and Gascoyne (Figure 2.1). Catch landings from WA
commercial line and net logbooks began recording grey mackerel in 2000, and are low
(Figure 2.10) when compared with landings for the corresponding fisheries in Qld and
NT waters. Grey Mackerel catches in WA have been declining from the 25t peak in the
early 2000s due to new interim management arrangements implemented during 2004.
This included the reduction in vessels numbers in each region with mackerel
endorsements, the introduction of a 6 month closed season, a compulsory logbook
program to record all commercial mackerel catches and a grey mackerel quota of 60t for
each of the 3 regions.
0
5
10
15
20
25
30
2000 2001 2002 2003 2004 2005 2006 2007
Year
Cat
ch (t
) PilbaraKimberleyGascoyne
Figure 2.10. Annual commercial net and line catches of grey mackerel from 2000 – 2007 for each region of Western Australia.
Prior to the new management arrangements, the Kimberley region contributed the
largest proportion of the grey mackerel catch (38%). The significant decrease in catch
thereafter may be a result of the remaining boats targeting only Spanish mackerel during
the reduced season to get their quota as grey mackerel attract a lower price. In the
Pilbara a small number of commercial boats have continued to target grey mackerel,
especially when they appear in large numbers at certain times of the year. For the
Gascoyne, the collapse of the whole fish export market from Carnarvon in 2003 meant

Grey mackerel management units in northern Australia
24
that greys were no longer targeted and effort has been reduced; but catches have since
returned to previous levels.
For the years 2005 and 2006 the average catch of grey mackerel per day was 0.112t
combined for the offshore net and line fisheries; predominantly from line trolling. The
overall seasonal catch data for grey mackerel (Figure 2.11) shows a distinct seasonal
pattern for all regions but it must be noted that seasonal closures have been in place
since 2004; from Oct-Feb (Gascoyne) and Oct-May (Pilbara), which may have had some
influence on the pattern. Overall the peak season is from June - September, however the
Kimberley region has a more protracted season from approximately May - November.
0
1
2
3
4
5
6
7
1 2 3 4 5 6 7 8 9 10 11 12
Month
Cat
ch (t
) PilbaraKimberleyGascoyne
Figure 2.11. Seasonality in combined commercial net and line catches of grey mackerel from each region of Western Australia. The y-axis gives mean monthly catches in tonnes pooled across years.
The charter or fish tour operator catch of grey mackerel has been reported as negligible
for all years and in WA it is reported separately from other mackerel species. The
recreationally captured grey mackerel were not reported in the West Coast recreational
survey from Augusta to Kalbarri in 2005-06 or in the Gascoyne 1998/99 survey.
However, in the 1999-2000 Pilbara survey, the recreational catch included approximately
5 t of grey mackerel.

Grey mackerel management units in northern Australia
25
2.2 Fishery characteristics summary
The catch levels of grey mackerel fisheries differ among the different jurisdictions of
northern Australia with the Northern Territory and the Gulf of Carpentaria supporting the
largest catches where the predominant capture method is netting, although catches on
the Qld east coast have increased in recent years. Catches in Western Australia in
comparison were low where trolling using hook and line is the predominant method.
Management changes during the respective catch time series appear to have influenced
catches of grey mackerel. In Western Australia, since management changes were
implemented in 2004, reported catches have declined despite not achieving the
allowable quota. The increasing importance of grey mackerel products as markets have
opened up is evidenced by dramatic increases in catches at various times since the mid
1990s in the Northern Territory, the Gulf of Carpentaria, and more recently on the Qld
east coast. As discussed in Chapter 1, it is these increases that were a major impetus for
this project. Seasonality also varies among the jurisdictions and among the regions
within each jurisdiction. The Qld east coast, the Gulf of Carpentaria and Western
Australia appear to have fairly distinct major seasons for catching grey mackerel across
winter and spring; however the most northern regions in the Northern Territory do not. In
many regions (for example much of the Queensland east coast) it is known that this is
largely driven by seasonal availability of the fish due to movement and aggregating
behaviour. This does not appear to be a factor in the Northern Territory. However as has
been discussed earlier in this chapter, there are other contributing factors that influence
seasonality among the different regions including market value, weather and access to
the fishing grounds, and fishers shifting between different fisheries to target other
species at various times. The vast majority of grey mackerel harvest in all jurisdictions of
northern Australia is by the commercial sector.
2.3 References
Begg, G.A., O’Neill, M.F., Cadrin, S.X. and Bergenius, M.A.J. (2005) Stock assessment of the Australian east coast spotted mackerel fishery. CRC Reef Research Centre Technical report No. 58, CRC Reef Research Centre, Townsville, Australia. Cameron, D. and Begg, G. (2002) Fisheries biology and interaction in the northern Australian small mackerel fishery. Final report to the Fisheries Research and Development Corporation, Projects 92/144 & 92/144.02, 236p.

Grey mackerel management units in northern Australia
26
Coleman, A.P.M. (2004) The national recreational fishing survey: The Northern Territory. Department of Business, Industry and Resource Development. Northern Territory Government. Crofts, N.J. and de Lestang, P. (2004) Fishnote #35, 2004. Department of Business, Industry and Resource Development. Northern Territory Government. Fishery Status Reports (2006) Department of Primary Industries, Fisheries and Mines. Fisheries Report # 87. ISSN 1832-7818. McInnes, K. (2008) Experimental results from the fourth Queensland recreational fishing diary program (2005). Department of Primary Industries and Fisheries, Queensland. Williams, L.E. (2002) Queensland’s fisheries resources current condition and recent trends 1988-2000. QDPI Information Series QI02012.

Grey mackerel management units in northern Australia
27
3. NORTHERN AUSTRALIA GREY MACKEREL BIOLOGY
DJ Welch and AC Ballagh
3.1 Introduction
Grey mackerel, Scomberomorus semifasciatus (Macleay, 1884), is one of several
species of mackerel (Family Scombridae) that are popular with commercial, recreational
and indigenous fishers throughout northern Australia. The species is endemic to the
northern Australian region and ranges from Moreton Bay in south east Queensland,
north along the Queensland coast to the southern parts of Papua New Guinea, and then
west across the top of northern Australia to Shark Bay on the mid Western Australian
coast line (Collette and Nauen 1983). Its known preferred habitat is inshore in the often
turbid waters of tropical and sub-tropical areas where they feed on pelagic baitfish of
sardines and herrings, and so become seasonally available to fishing operations. At
certain times of the year they can also be found around rocky headlands and inshore
reefs (D. Welch, pers. obs.). Larval and juvenile life history stages of grey mackerel are
found inshore, often in estuarine environments, where they feed almost exclusively on
other larvae with prey sometimes reaching up to 89% of the mackerel’s own body length
(Jenkins et al. 1984).
Current knowledge of the biology of grey mackerel is based primarily on a study in which
samples were collected from areas across northern Australia including the NT and the
Gulf of Carpentaria, but with a major emphasis on the Queensland east coast (Cameron
and Begg 2002). This provided a limited spatial comparison of biological characteristics
to primarily the east coast and Gulf of Carpentaria.
The productivity of fish populations and their likely responses to exploitation are
determined by their life-history characteristics such as growth, reproduction and
mortality. The determination of biological information for grey mackerel at different
spatial scales is therefore essential for their sustainable exploitation, particularly where
different stocks can be identified. Although not part of the objectives for the present
study, during the course of sample collections we opportunistically collected further data

Grey mackerel management units in northern Australia
28
that provided useful biological information at different spatial scales. While these data
proved to be sparse when examined among regions, they nevertheless provided an
additional information source for assessing the population structure of grey mackerel,
and at least preliminary biological information for grey mackerel management units
identified during this study. This Chapter and Chapter 3 present these biological data. A
description of the characteristics of the grey mackerel fisheries across northern Australia
are also presented in the current chapter.
3.2 Biological data collection and analysis methods
Samples were collected as per the approach described in the overall methods presented
in Chapter 1. Whole fish and fish frames (whole skeleton remaining after filleting) were
retained by commercial gillnet fishers and stored frozen as soon as possible after
capture. Fish samples were freighted to the respective agency’s laboratory (WA Dept. of
Fisheries, NT DRDPIFR, QDPI&F Northern Fisheries Centre, and the Fishing &
Fisheries Research Centre at JCU). Samples were then thawed out and where possible,
data recorded for individual fish. This data included a unique tag number, catch location
and date, fork length (FL), total length (TL), head length, upper jaw length, sex,
development stage of the gonad, and gonad weight (see Appendix 3). Head length and
upper jaw length were measured to assess the reliability of these metrics as a proxy for
fish length. Establishing a consistent relationship between these two measurements in
the species would enable subsequent collections of grey mackerel samples for age and
growth analyses to only require only collection of fish heads and viscera (for sex
determination) rather than the whole body frame. Sex was macroscopically determined
and the maturity stage was determined using a simplified macroscopic staging system
developed for Spanish mackerel, Scomberomorus commerson (Mackie and Lewis 2001;
see Appendix 3). Sagittal otoliths were also removed by a horizontal incision across the
top of the head to expose the brain cavity, and otoliths were removed, washed in fresh
water, dried and stored for ageing.
Age and growth analyses were carried out as part of a BSc (Hons) student project (N.
Marton) and growth parameters were compared among regions as an additional
technique for determining stock structure. The results of this work are presented
separately in Chapter 3.

Grey mackerel management units in northern Australia
29
3.2.1. Data analysis
Morphometrics Relationships for fork length–total length, fork length–weight and fork length–upper jaw
length were estimated using regression analysis. Weight data were log transformed to
standardise the residuals. Regressions fitted for females and males separately and
pooled across regions were compared using Student’s t-test (Zar, 1984). Regional
comparisons were also performed where sufficient sample numbers (n ≥ 40) made it
possible and separately by gender where appropriate using Analysis of Covariance
(ANCOVA). This generally meant regional comparisons were only possible at broad
spatial scales at best.
Size, Age and Mortality The timing and validation of the assumption of annual formation of otolith opaque
increments (annuli) was done by analysis of otolith margin categories and marginal
increment measurements. The margin categories were determined while reading ages
from otoliths based on the criteria presented in Table 3.1 (see Figure 3.1), and monthly
margin categories were plotted. Mean monthly margin categories for the first four age
classes were analysed using one-way ANOVA per age class to determine if there were
any patterns in the formation of annuli. Tukey’s Honestly Significant Difference (HSD)
tests were used for post hoc pairwise comparisons (Zar 1984).
Age frequencies of the samples collected were plotted for each region and the
instantaneous rate of total mortality (Z = fishing + natural mortality) was estimated for
each region using age-based catch curves (Ricker 1975). These samples were pooled
across gender for each region since sample numbers were not large enough for all
regions, and instantaneous total mortality rate estimates for male and female grey
mackerel have been shown to be similar (Cameron and Begg 2002). Catch curves were
plotted as the loge (frequency) for each age class for the descending right portion of the
age frequency plots from the age of full recruitment to the sampling gear assuming
constant recruitment and constant survival (Ricker 1975). The modal age class was
assumed to represent the age at full recruitment. Catch curves were plotted to include all

Grey mackerel management units in northern Australia
30
age classes that were represented by at least one sample, and were compared between
regions using ANCOVA.
Table 3.1. A description of the otolith margin categories used in assessing the timing of annulus formation (see Tobin and Mapleston 2004).
Margin category Description
0 Complete and continuous opaque band formed around edge of otolith, with no translucent material beyond the last opaque band
I Translucent band laid onto the outer edge comprising 1/4 - 1/3 the width of the previous translucent band
II Translucent band laid onto outer edge comprising roughly ½ the width of the previous translucent band
III Opaque band on edge, however is not continuous or complete
Figure 3.1. A mackerel otolith illustrating the margin categories used (see Table 3.1) in
assessing the timing of otolith annulus formation. In this example the opaque band
(annuli) is on the otolith margin (margin category = 0). Image by Amos Mapleston.
Grey mackerel management units in northern Australia
31
Reproduction Seasonality in spawning was determined for each gender by plotting maturity stages by
month, and by plotting mean monthly gonadosomatic indices (GSI) for females. GSI was
calculated as:
100)/( ×= TWWGSI
where W = total gonad weight (grams) and TW = total fish weight (grams). This was
done by gender and by region where possible to assess the potential for different
spawning times in northern Australia. As staging was done in the laboratory
macroscopically and by different individuals, we also plotted the mean GSI for each
stage to validate the macro-staging methods.
Length and age at which 50% and 95% of fish reach maturity (L50, L95, A50 and A95
respectively) were estimated for males and females separately. These estimates were
determined using logistic regression analysis which plotted the relationship between fish
length and age categories and the proportion of mature fish in each category (Maturity
stage > 1).
Sex ratios were not analysed because sampling was opportunistic and usually by
commercial fishers. This meant there was no way of knowing the representativeness of
the catch from the samples collected; an issue applicable to all metrics.
3.3 Biological analyses results
3.3.1. Morphometrics
Fork Length-Total Length relationship A significant linear relationship between fork length (FL) and total length (TL) was found
for both male and female grey mackerel (Males: F = 8161, df = 1,305, P < 0.001;
Females: F = 2952, df = 1,244, P < 0.001). Different regression slopes (t = 3.13, df =
549, P = 0.002) were estimated for each gender and the linear relationship for males and
females were subsequently dealt with separately (Figure 3.2).

Grey mackerel management units in northern Australia
32
FemaleTL = 1.147FL + 6.2893
r2 = 0.92, n = 246
MaleTL = 1.0721FL + 53.94
r2 = 0.96, n = 307
500
600
700
800
900
1000
1100
1200
500 600 700 800 900 1000Fork length (mm)
Tota
l len
gth
(mm
)
Figure 3.2. Total length (TL) – Fork length (FL) relationships for male (blue line and data points) and female (red line and data points) grey mackerel (regions combined).
Regional comparisons of the FL-TL regressions were only possible for 4 regions for
females (EC, EG, WG, NW NT) and 3 regions for males (EC, EG, NW NT). For both
sexes regression slopes were similar among regions (Males: F = 0.348, df = 2,300, P =
706; Females: F = 2.106, df = 3,239, P = 0.100) while regression intercepts were
estimated to be different among regions (Males: F = 49.136, df = 2,301, P < 0.001;
Females: F = 138.572, df= 3,242, P < 0.001). Multiple comparisons among elevations
revealed that the EC and EG regions were similar for both males and females but were
different for all other regional comparisons regardless of gender. Pooling across the EC
and the EG still resulted in significantly different regressions among regions for females
(Figure 3.3) while for males the pooled EC/EG regression was found to be similar to the
NW NT. A common FL-TL regression relationship was therefore able to be used for male
grey mackerel (Figure 3.2).

Grey mackerel management units in northern Australia
33
EC/EGTL = 1.0993FL+ 28.495
r2 = 0.98, n = 156
NW NTTL = 1.1942FL - 11.007
r2 = 0.95, n = 45
WGTL = 1.0848FL + 82.223
r2 = 0.88, n = 46
500
600
700
800
900
1000
1100
1200
500 600 700 800 900 1000
Fork length (mm)
Tota
l len
gth
(mm
)
Figure 3.3. Total length (TL) – Fork length (FL) relationships among regions for female grey mackerel. The different regions are represented by the colours indicated (WG – red; NW NT – light blue; EC/EG – dark blue).
Fork Length-Upper Jaw Length relationship A significant linear relationship between fork length and upper jaw length (UJL) was
found for both male and female grey mackerel indicating reliability in predicting either FL
or UJL from the other (Males: F = 2222, df = 1,366, P < 0.001; Females: F = 2054, df =
1,314, P < 0.001). Although similar regression slopes were found for each gender (t =
0.128, df = 680, P = 0.899), intercepts were different (t = 5.365, df = 681, P < 0.001) and
so the linear relationships for males and females were subsequently dealt with
separately (Figure 3.4).

Grey mackerel management units in northern Australia
34
FemaleUJL = 0.0895FL + 8.9175
r2 = 0.87, n = 316
MaleUJL = 0.0891FL + 10.317
r2 = 0.86, n = 368
40
50
60
70
80
90
100
110
400 500 600 700 800 900 1000 1100Fork length (mm)
Upp
er ja
w le
ngth
(mm
)
Figure 3.4. Fork length (FL) – Upper jaw length (UJL) relationships for male (blue line and data points) and female (red line and data points) grey mackerel (regions combined).
Regional comparisons of the FL-UJL regressions were only possible for 3 regions for
both females and males (EC, WG, NW NT) due to the lack of some measurements taken
from some regions. For females regression slopes were similar among regions (F =
0.041, df = 2,265, P = 0.960) while regression intercepts were estimated to be different
among regions (F = 42.11, df= 2,266, P < 0.001). Multiple comparisons among
intercepts revealed that the EC and NW NT regions were similar but both were different
to the WG (Figure 3.5). For males regression slopes were different among regions (F =
3.475, df= 2,307, P = 0.032). Multiple comparisons among slopes showed that the WG
was similar to both the EC and NW NT, while the EC and NW NT slopes were different
(Figure 3.6).

Grey mackerel management units in northern Australia
35
WGUJL = 0.0894FL + 6.6646
r2 = 0.78, n = 80
NW NTUJL = 0.0896FL + 8.8821
r2 = 0.83, n = 80
ECUJL = 0.0884FL + 10.671
r2 = 0.96, n = 111
40
50
60
70
80
90
100
110
400 500 600 700 800 900 1000 1100
Fork length (mm)
Upp
er ja
w le
ngth
(mm
)
Figure 3.5. Fork length (FL) – Upper jaw length (UJL) relationships among regions for female grey mackerel. The different regions are represented by the colours indicated (WG – red; NW NT – light blue; EC – dark blue).
NW NTUJL = 0.0952FL + 6.2725
r2 = 0.91, n = 77
WGUJL = 0.0867FL + 11.513
r2 = 0.73, n = 57
ECUJL = 0.0833FL + 14.51
r2 = 0.83, n = 179
40
50
60
70
80
90
100
400 500 600 700 800 900 1000
Fork length (mm)
Upp
er ja
w le
ngth
(mm
)
Figure 3.6. Fork length (FL) – Upper jaw length (UJL) relationships among regions for male grey mackerel. The different regions are represented by the colours indicated (WG – red; NW NT – light blue; EC – dark blue).

Grey mackerel management units in northern Australia
36
Fork Length-Weight relationship A significant linear relationship between loge(Fork length) and loge(Weight) was found for
both male and female grey mackerel (Males: F = 1338, df = 1,88, P < 0.001; Females: F
= 1012, df = 1,67, P < 0.001). Similar regression slopes (t = 0.609, df = 155, P = 0.544)
and elevations (t = 0.266, df = 156, P = 0.790) were found among genders and so male
and female data were combined to describe the linear relationship (Figure 3.7). There
were insufficient numbers of samples for comparing the FL-Weight relationship among
regions.
Loge(Weight) = 2.9968 Loge(FL) - 5.0223r2 = 0.95, n = 159
3
3.1
3.2
3.3
3.4
3.5
3.6
3.7
3.8
3.9
4
2.7 2.75 2.8 2.85 2.9 2.95 3Loge Fork length (mm)
Log e
Wei
ght (
g)
Figure 3.7. Loge transformed Weight (g) – loge transformed Fork length (mm) relationship for grey mackerel (sex and regions combined).
3.3.2 Size, age and mortality
Otolith annulus formation Analyses of monthly otolith margin categories required pooling of data among regions
and years due to a lack of consistent temporal coverage across regions making regional
comparisons invalid. Analysis indicates the formation of opaque annual increments

Grey mackerel management units in northern Australia
37
begins as early as August with completed opaque bands (annuli) generally appearing
from November and December, although complete band formation is evident from as
early as September (Figure 3.8). Monthly variation in mean marginal increments was
only observed in the 2 (F = 5.906, df = 6,139, P < 0.001) and 4 year old fish (F = 3.131,
df = 7,82, P = 0.006) (Figure 2.19). Tukey’s HSD tests were used for post hoc pair-wise
comparisons and in the 2 year olds found that the marginal increments for April and May
were significantly larger than those for September and October (Figure 3.9), while for the
4 year olds the mean marginal increment for April was significantly larger than October
(Figure 3.9). The margin category and marginal increment analyses are consistent with
the annual formation of otolith bands (opaque regions) for 2 and 4 year old fish, with the
formation of annuli occurring between September and November. Knowledge of this
timing is important in helping to validate that the annuli are indeed formed annually, and
in conjunction with information on the date of capture, can be very important in
accurately interpreting age estimates.
MonthJa
nuary
Februa
ryMarc
hApri
lMay
June Ju
ly
Augus
t
Septem
ber
Octobe
r
Novem
ber
Decem
ber
Perc
enta
ge
0
20
40
60
80
100
0IIIIII
106 130 75 4 177 134 22 46 18
Figure 3.8. Monthly margin categories for grey mackerel otoliths (pooled among regions, years and gender). A description of the margin categories are given in Table 3.1. Sample numbers are given at the top of each months bar.

Grey mackerel management units in northern Australia
38
2 year olds
MonthJanu
ary
Februa
ryMarc
hApri
lMay
June Ju
ly
Augus
t
Septem
ber
Octobe
r
Novem
ber
Mea
n m
argi
nal i
ncre
men
t (m
m) +
/- se
0.00
0.05
0.10
0.15
0.20
0.25
0.30
0.35
0.40
4 year olds
MonthJa
nuary
Februa
ryMarc
hApri
lMay
June Ju
ly
Augus
t
Septem
ber
Octobe
r
Novem
ber
Mea
n m
argi
nal i
ncre
men
t (m
m) +
/- se
0.05
0.15
0.25
0.35
0.00
0.10
0.20
0.30
0.40
10
5522
17
2315
6
3
179
18 2015 6
Figure 3.9. Monthly mean marginal increments (mm) for otoliths of 2 year old (top) and 4 year old (bottom) grey mackerel (pooled among regions, years and gender). Error bars represent standard error (se). Sample numbers are given for each mean.

Grey mackerel management units in northern Australia
39
Size and age structures The size ranges of fish collected from each of the major areas were similar with the East
Coast having the greatest range of sizes from 440mm FL – 1060mm FL. Average sizes
were similar across regions with the exception of the West Coast which had larger fish
on average than all other regions (Table 3.2). The youngest fish caught in each region
was either 1 or 2 years old, and the oldest fish varied from 8 years to 12 years among
regions with the East Coast having the greatest age range. The average regional age of
fish sampled was highest in the Western Gulf and the West Coast, and lowest for the
NW NT fish (Table 3.3).
Table 3.2. Size data summary of grey mackerel samples collected from each major region: Mean, minimum, and maximum sizes. All length measurements are in mm.
Region Mean FL Min FL Max FL n Qld East Coast 742.04 440 1060 737 Qld Eastern GoC 740.69 540 928 548 NT Western GoC 758.12 550 895 147 NT NW Coast 742.58 500 920 207 WA Coast 790.39 550 900 64
Table 3.3. Age data summary of grey mackerel samples collected from each major region: Mean, minimum, and maximum ages. All ages are in years.
Region Mean Age Min Age Max Age n Qld East Coast 3.22 1 12 221 Qld Eastern GoC 3.20 1 10 473 NT Western GoC 3.68 2 9 94 NT NW Coast 2.80 1 8 173 WA Coast 3.61 2 10 40
Mortality We assumed that the age when fish were fully recruited to the fishing gear was 2 years
based on that year class being the most common mode among the five regions.
Instantaneous mortality rates among the regions ranged from 0.410 to 0.642 and were
found to be similar (F = 0.492, df = 4,25, P = 0.742). The instantaneous total mortality
rate (Z) for the regions pooled was 0.562 which corresponds to an annual survivorship of
approximately 57% for grey mackerel (Figure 3.10).

Grey mackerel management units in northern Australia
40
Age (years)
0 2 4 6 8 10 12 14
ln(fr
eque
ncy)
0
1
2
3
4
5
6
7
y = -0.5618x + 7.0532r2 = 0.9672
n = 863
Figure 3.10. Catch curve for all data pooled across regions and gender. The instantaneous total mortality rate is estimated by the slope of the fitted curve (age range from 2 to 10 years).
3.3.3 Reproduction
Seasonality An increase in gonad weight, represented by increasing GSI, would be expected with
increasing reproductive macro-stages as the gonad develops (except for Stage 6 =
spent). We were only able to test this for two regions (EC and EG) due to the limited
gonad weight data from other regions. This test served to validate the macro-staging
system used and to assess the interpretations of stages made by the respective
agencies (F&FRC – EC; QDPI&F (NFC) – EG). For both regions there was an increase
in GSI with increasing stage up to stage 5 validating the system used. Although the
patterns of GSI increase with stage was similar among the two regions, GSI values for
the EG were consistently higher than the EC (Figure 3.11).
Regional comparisons in spawning seasonality were limited by sample sizes of individual
fish staged in each month and region, and also by the monthly numbers of fish for which
gonad weight was measured for GSI determination. The EC, EG and the NW NT regions
were used for examination of seasonality in spawning using monthly reproductive stages
for both females (Figure 3.12) and males (Figure 3.13). Sampling across months varied

Grey mackerel management units in northern Australia
41
among these regions and was limited by targeting behaviour of the commercial fishers
within each region and fish availability. Although these plots generally suggested a
primary spawning season running between August and December, there was an
indication also that some earlier spawning may be taking place in more northern regions
on the EG coast and in NW NT. This was supported by the reproductive stages of both
females and males with the possibility that NW NT fish have an extended spawning
season beginning as early as May.
Regional comparison of monthly GSI estimates was only possible for the EC and the EG
and both showed that significant gonad development occurs in September and spawning
continues through until December (Figure 3.14). Despite different temporal coverage
between these two regions, given the consistent timing of gonad development indicated
we combined the data to more comprehensively represent the spawning season of grey
mackerel at least for the EC and the EG (Figure 3.15). The identification of some
spawning and spent females (Stages 5 & 6 respectively; see Appendix 3) during August
in the EG was not supported by GSI estimates and may be due to subjectivity in the
macro-staging system without histological examination. Unfortunately the estimation of
GSI for the NW NT was not possible to corroborate the possibility of an extended
spawning season.
0
1
2
3
4
5
6
7
1 2 3 4 5 6
Reproductive stage
Mea
n G
onad
osom
atic
inde
x
East CoastEastern Gulf
Figure 3.11. Reproductive macro-stages of female grey mackerel plotted against gonadosomatic index (GSI) for the Qld east coast and the eastern Gulf of Carpentaria. Standard error bars are shown.

Grey mackerel management units in northern Australia
42
East Coast
MonthJanu
ary
Februa
ryMarc
hApri
lMay
June Ju
ly
Augus
t
Septem
ber
Octobe
r
Novem
ber
Decem
ber
Perc
enta
ge
0
20
40
60
80
100
Stage 1Stage 2Stage 3Stage 4Stage 5Stage 6
38 21 29 21 13
Eastern Gulf
MonthJanu
ary
Februa
ryMarc
hApri
lMay
June Ju
ly
Augus
t
Septem
ber
Octobe
r
Novem
ber
Decem
ber
Perc
enta
ge
0
20
40
60
80
100
Stage 1Stage 2Stage 3Stage 4Stage 5Stage 6
61 42 29 53 30

Grey mackerel management units in northern Australia
43
North western NT
MonthJanu
ary
Februa
ryMarc
hApri
lMay
June Ju
ly
Augus
t
Septem
ber
Octobe
r
Novem
ber
Decem
ber
Per
cent
age
0
20
40
60
80
100
Stage 1Stage 2Stage 3Stage 4Stage 5Stage 6
4328 14 3520 32
Figure 3.12. Monthly reproductive stages of female grey mackerel for the east coast, eastern Gulf of Carpentaria and the northwestern NT regions indicating seasonality in spawning. Numbers above monthly bars indicate sample sizes.

Grey mackerel management units in northern Australia
44
East Coast
MonthJa
nuary
Februa
ryMarc
hApri
lMay
June Ju
ly
Augus
t
Septem
ber
Octobe
r
Novem
ber
Decem
ber
Per
cent
age
0
20
40
60
80
100
Stage 1Stage 2Stage 3Stage 4Stage 5
20 84 53 14 7
Eastern Gulf
MonthJa
nuary
Februa
ryMarc
hApri
lMay
June Ju
ly
Augus
t
Septem
ber
Octobe
r
Novem
ber
Decem
ber
Per
cent
age
0
20
40
60
80
100
Stage 1Stage 2Stage 3Stage 4Stage 5
95 54 21 75 19

Grey mackerel management units in northern Australia
45
Northwestern NT
MonthJa
nuary
Februa
ryMarc
hApri
lMay
June Ju
ly
Augus
t
Septem
ber
Octobe
r
Novem
ber
Decem
ber
Perc
enta
ge
0
20
40
60
80
100
Stage 1Stage 2Stage 3Stage 4Stage 5
53 36 7 30 6 3
Figure 3.13. Monthly reproductive stages of male grey mackerel for the east coast, eastern Gulf of Carpentaria and the northwestern NT regions indicating seasonality in spawning. Numbers above monthly bars indicate sample sizes.

Grey mackerel management units in northern Australia
46
East Coast
MonthJa
nuary
Februa
ryMarc
hApri
lMay
June Ju
ly
Augus
t
Septem
ber
Octobe
r
Novem
ber
Decem
ber
Gon
ados
omat
ic in
dex
0
1
2
3
4
5
6
12
21
9
17
10
Eastern Gulf
MonthJa
nuary
Februa
ryMarc
hApri
lMay
June Ju
ly
Augus
t
Septem
ber
Octobe
r
Novem
ber
Decem
ber
Gon
ados
omat
ic in
dex
0
1
2
3
4
5
6
7
60
42 2845
29
Figure 3.14. Monthly mean gonadosomatic indices (GSI) for female grey mackerel from the east coast and eastern Gulf of Carpentaria regions indicating seasonality in spawning. Numbers beside data points indicate sample sizes.

Grey mackerel management units in northern Australia
47
MonthJa
nuary
Februa
ryMarc
hApri
lMay
June Ju
ly
Augus
t
Septem
ber
Octobe
r
Novem
ber
Decem
ber
Gon
ados
omat
ic in
dex
0
1
2
3
4
5
6
60
45 282
75
50
9
17
10
Figure 3.15. Monthly mean gonadosomatic index (GSI) for female grey mackerel from all regions pooled indicating seasonality in spawning. Numbers beside data points indicate sample sizes.
Maturity Of the entire pooled samples from all regions, the smallest mature male and female were
474mm FL and 509mm FL respectively. The smallest ripe male and female was 540mm
FL and 700mm FL respectively. Insufficient numbers of grey mackerel samples were
obtained for each gender from each of the locations to carry out robust regional
comparisons of both size and age at maturity estimates. This was likely due to the
selectivity of nets used by commercial fishers from whom samples were sourced, as
numbers were particularly lacking from the critical size and age classes across which
first sexual maturity occurs. To more accurately estimate size and age at maturity we
sourced 12 juvenile grey mackerel samples from trawl surveys conducted on the EC.
These samples ranged from in size from 109 – 228 cm FL and were positively identified
using DNA screening techniques. Logistic regressions were therefore fitted to maturity

Grey mackerel management units in northern Australia
48
data pooled across regions for each gender. The estimate of size at which 50% of the
females were mature was 602 mm FL (697 mm TL; Figure 3.16a) while for males this
estimate was 571 mm FL (666 mm TL; Figure 3.16b). The sizes at which 95% of the
females and males were estimated to be mature was 694 mm FL (802 mm TL) and 697
mm FL (801 mm TL) respectively. The estimated age at maturity was A50 = 0.8 years for
both females and males and A95 was 1.3 years for females and 1.4 years for males
(Figure 3.17a and b respectively).
a. Females
0102030405060708090
100
0 200 400 600 800 1000 1200Size (FL; mm)
Per
cent
age
b. Males
0102030405060708090
100
0 200 400 600 800 1000 1200Size (FL; mm)
Per
cent
age
Figure 3.16. Logistic regression curves fitted to the proportion of mature fish (Reproductive stage > 1) per 50 mm size classes for a. females (above; n = 612) and b. males (below; n = 708). Data are pooled among regions.

Grey mackerel management units in northern Australia
49
a. Females
0102030405060708090
100
0 1 2 3 4 5 6 7 8 9 10Age (years)
Per
cent
age
b. Males
0102030405060708090
100
0 1 2 3 4 5 6 7 8 9 10Age (years)
Per
cent
age
Figure 3.17. Logistic regression curves fitted to the proportion of mature fish (Reproductive stage > 1) per yearly age classes for a. females (above; n = 475) and b. males (below; n = 520). Data are pooled among regions.
3.4 Discussion
We were able to opportunistically estimate information about grey mackerel biology
including morphometrics, otolith annuli formation, growth (see Chapter 4), mortality and
reproduction. We did this even though the collection of this data was not part of the
project objectives. Also, the objectives of this study did not include the use of biological

Grey mackerel management units in northern Australia
50
parameters in determining stock structure. Ideally, we would have also been able to
carry out regional comparisons of all the different biological parameters and relationships
to complement further the main techniques used during the project in determining stock
structure, however the ability to do these comparisons was limited to only some of the
metrics examined in this chapter. Despite this these metrics are valid methods for
identifying different stocks and may be used in the future.
We were able to compare FL:TL and UJL:TL relationships among regions and, although
we found consistency in the regional patterns of FL:TL for both males and females, as
indicators of stock structure, the morphometric comparisons overall were variable and
inconclusive. We also acknowledge that these regional morphometric comparisons were
possibly confounded by measurement error associated with several different measurers
used from the respective agencies in each region, as well as differences in sample sizes
and the distribution in the sizes of fish measured. Fish were collected from different
regions by local agencies involved in the project (WA Fisheries, NT DRDPIFR, QDPI&F
and JCU) and frames were examined and dissected by the respective agencies.
Although standardisation between measurers was discussed among project members
and documents were prepared to assist training in measurements (see Appendix 3), it
was not able to be tested and may have therefore influenced regional comparisons. This
emphasises the importance of effective standardisation of morphometric measurements
for robust comparisons in stock structure studies.
Morphometric relationships are important for being able to convert different direct
measures commonly used in fish sampling to more useable data sets. Often with the
collection of samples for fisheries research and monitoring it is only possible to obtain
fish heads due to market product form preferences (eg. trunks) and limiting storage
space on fishing vessels. This makes ageing possible but knowledge of the
corresponding fish’s length is vital information that is lacking. We found a significant
relationship between the upper jaw length and the fork length of grey mackerel, enabling
estimates of length to be easily and reliably derived from head samples. This makes
sample collection in future a much simpler and more cost-effective process without
compromising information.

Grey mackerel management units in northern Australia
51
We also detected differences between genders in some morphometric relationships
(FL:TL, FL:UJL). Cameron and Begg (2002) did not appear to test for gender differences
in the FL:TL relationship and had a relatively small sample size, however showed a
significant difference in growth among gender. They did find no gender difference in the
relationship of FL-Total weight, which is consistent with our findings in this study.
Significant monthly patterns in the formation of otolith bands from both margin category
and marginal increment analyses supported annual formation. Both techniques also
suggest that the formation of annuli occurs between the months of September and
November. Monthly patterns were only found for 2- and 4-year old fish however. The
inability to detect monthly patterns in annulus formation for 1 and 3 year old fish are
possibly due to a combination of factors including low monthly sample numbers and few
months sampled for some year classes. Independent validation of annual opaque
increment formation was not possible during this study and has proven problematic for
grey mackerel. Being a pelagic species they are difficult to maintain in captivity and they
do not appear to respond well to capture, handling and tagging as they are more
effectively caught by commercial gill nets compared to hook and line. As such past
tagging efforts have been ineffective (Cameron and Begg 2002). Cameron and Begg
(2002) concluded the timing of annuli formation was between November and February, 1
– 3 months later than that observed in the present study. Inter-annual variation in annuli
formation has been observed in other fish species in the Australian tropics including L.
miniatus (Williams et al 2005). The timing of opaque increment formation has been
correlated with a number of factors including seasonal water temperature changes (eg.
Schramm 1989; Pearson et al 1996; Smith and Deguara 2003), timing of spawning
(Hostetter and Munroe 1993), location (Pearson et al 1996; Williams et al 2005), and
also error in the measurement of marginal increments due to regional differences in
otolith growth (Smith and Deguara 2003). In the present study the timing of annulus
formation is consistent with the end of the cooler winter/spring water temperatures, and
is also consistent with the timing of peak spawning. The differences in the timing of
opaque increment formation between the studies may be due to differences in
temperature during the years that samples were collected in since each study found
spawning season to be relatively similar. All of the above factors, however, could
contribute to the differences in timing of annuli formation observed between the two

Grey mackerel management units in northern Australia
52
studies as in each study samples were pooled across regions and years. Also, no
samples were collected in the present study during the months of January and February.
Estimates of instantaneous mortality rates ranged among regions from 0.410 to 0.642
and were not different (pooled estimate = 0.562). These estimates are slightly higher to
those found by Cameron & Begg (2002), which ranged from 0.297 to 0.499, and may
reflect large increases in grey mackerel fishery catches in the intervening period
between studies, particularly on the east coast. The current estimate however is still
appreciably lower than that estimated for school mackerel (S. queenslandicus) and
spotted mackerel (S. munroi) by Cameron and Begg (2002).
Comparisons of seasonality of spawning among different regions were limited due to the
lack of samples across all months and regions. Evidence of spawning using the gonad
staging system indicated that spawning occurred on the EC during the months from
September to December, in the EG spawning females were only detected during August
and males during August and September, while in NW NT spawning occurred
throughout the period of August to November with evidence of spawning as early as
May. Again this was consistent among males and females. Although the assessment of
the validity of the staging system was positive (Figure 3.11), the macro-staging system is
still subject to measurement error both within and among agencies, and the GSI values
are regarded as being more reliable for assessing reproductive development.
Unfortunately, sufficient numbers of gonad weight measurements for comparison were
only taken for the EC and EG regions and so validation of the possible extended
spawning in the NW NT wasn’t possible. For this reason the result that suggests the
possibility of spawning as early as May in the NW NT needs further validation. GSI
values for the EC had good agreement with the staging system, while for the EG a sharp
rise in GSI from low levels in August to very high levels in September indicated the onset
of spawning during this period, at least for the period we sampled. This did not therefore
agree with August spawning though it is possible that it was occurring though not
widespread. All of the spawning or spent fish identified during August (n = 6) were
caught from the same location and year, and in two separate catches only days apart.
Cameron and Begg (2002) concluded that grey mackerel have peak spawning on the
EC between October and January. Despite this, our results are relatively consistent for
the EC results of Cameron and Begg (2002) with a protracted spawning period covering

Grey mackerel management units in northern Australia
53
September to December, though we did not obtain samples during January. Although
we had limited temporal coverage across months for the EG, we were able to determine
that spawning began in this region during at least September, and Cameron and Begg
(2002) determined that the peak spawning was again from October to January. Inter-
annual variability in the timing of spawning has been documented in many different fish
species and is thought to be correlated with sea surface temperatures (eg. Scott and
Pankhurst 1992, Sheaves 2006, Bani and Moltschaniwskyj 2008).
Similar to Cameron and Begg (2002), we were not able to carry out regional
comparisons of maturity for grey mackerel. Our estimates of 50% size at maturity of
602mm FL (697mm TL) and 571mm FL (666mm TL) for females and males respectively
were larger than those estimated by Cameron and Begg (2002). It was unfortunate that
there were insufficient samples for comparisons of this parameter among regions as it is
considered critical biological information for setting legal size limits. Currently legal size
limits for grey mackerel in Queensland are 500 mm TL, significantly below the size at
which it is estimated that 50% of either sex are mature. This suggests that an increase in
the current minimum legal size limit is warranted. Cameron and Begg (2002)
acknowledged this but urged that size limits not be increased unless education showed
improved identification of the different mackerel species by the recreational line fishery.
They also pointed out the low survival rate of net caught grey mackerel post release.
However, it is likely that the recreational catch of grey mackerel is low relative to other
mackerel species. Also, recent announcements of implementation of the East Coast
Inshore Finfish Fishery Management Plan in early 2009 include an increase in the
minimum size limit of grey mackerel to 600 mm TL along with changes to offshore net
mesh sizes to minimise capture of undersize fish.
Sampling of grey mackerel for the Cameron and Begg (2002) study and sampling for this
study were carried out 12-15 years apart. During this period targeting of grey mackerel in
most regions has increased substantially, thus providing us in this chapter to assess for
decadal changes in biological characteristics as a potential consequence of fishing. The
major characters we were able to compare were timing of annuli formation, spawning
seasonality, size at sexual maturity and mortality. The timing of annuli formation was
found to be earlier in this study compared to Cameron and Begg (2002), however this
more likely to be environmentally induced rather than a fishery effect. Despite

Grey mackerel management units in northern Australia
54
differences in the temporal coverage in sample collection between studies, spawning
seasonality was broadly similar for each study period with an extended spawning season
indicated. In this study size at maturity was found to be slightly larger than the earlier
study. It might be expected that a fishery effect would result in the opposite observation
and so it is likely that this difference in size at maturity is influenced by other factors. One
might infer that the lack of apparent effects of fishing on biological characters simply
means that fishing effort not sufficiently high enough to do so. This may be so however
we would caution against this line of thought as the fishery has seen substantial
increases in catches in recent years. Estimates of total mortality derived in this study are
higher than those estimated by Cameron and Begg (2002), and support this increase in
catch observed in commercial logbook entries.
Although not one of the key objectives for the current project, documenting biological
attributes for fishery target species are vital for providing greater certainty in how these
resources are managed. Through comparison with previous grey mackerel research by
Cameron and Begg (2002) this chapter provides greater insight into the potential natural
variability in grey mackerel life history, and although not conclusive, provides some
evidence of stock structuring in grey mackerel across northern Australia. The biological
information we provide here makes greater use of the samples collected and value-adds
considerably to the project thereby further enhancing project outputs and management
outcomes. Further, the estimates for various biological parameters so obtained will be of
very great use as inputs to stock assessment investigations of grey mackerel at regional
and jurisdictional fishery scales.
3.5 References
Bani, A and Moltschaniwskyj, NA (2008) Spatio-temporal variability in reproductive ecology of sand flathead, Platycephalus bassensis, in three Tasmanian inshore habitats: potential implications for management. Journal of Applied Ichthyology, 24: 555-561. Cameron, D. and Begg, G. (2002) Fisheries biology and interaction in the northern Australian small mackerel fishery. Final report to the Fisheries Research and Development Corporation, Projects 92/144 & 92/144.02, 236p. Collette B.B. and C.E. Nauen (1983) FAO species catalogue. Vol. 2 Scombrids of the world: an annotated and illustrated catalogue of tunas, mackerels, bonitos and related species known to date. FAO Fish. Synop., (125) Vol. 2.: 137pp.

Grey mackerel management units in northern Australia
55
Jenkins, GP, Milward, NE, and Hartwick, RF (1984) Food of larvae of Spanish mackerels, genus Scomberomorus (Teleosti: Scombridae), in shelf waters of the Great Barrier Reef. Australian Journal of Marine and Freshwater Research, 35: 477-482. Hostetter, EB and Munroe, TA (1993) Age, growth, and reproduction of tautog Tautoga onitis (Labridae: Perciformes) from coastal waters of Virginia. Fishery Bulletin, 91: 45-64. Mackie, M. and Lewis, P (2001) Assessment of gonad staging systems and other methods used in the study of the reproductive biology of narrow-barred Spanish mackerel, Scomberomorus commerson, in Western Australia. Fisheries Research Report No. 136, Department of Fisheries, Western Australia. Pearson, DE (1996) Timing of hyaline-zone formation as related to sex, location and year of capture in otoliths of the widow rockfish, Sebastes entomelas. Fishery Bulletin, 94: 190-197. Ricker, WE. (1975) Computation and interpretation of biological statistics of fish populations. Bulletin of the Fisheries Research Board of Canada, 191, 382p. Schramm, HL Jr. (1989) Formation of annuli in otoliths of bluegills. Transactions of the American Fisheries Society, 118, 546-555. doi:10.1577/1548-8659(1989)118<0546:FOAIOO>2.3.co;2 Scott, SG and Pankhurst, NW (1992) Interannual variation in the reproductive cycle of the New Zealand snapper Pagrus auratus (Bloch & Schneider) (Sparidae). Journal of Fish Biology, 41, 685-969. Sheaves, M (2006) Is the timing of spawning in sparid fishes a response to sea surface temperatures? Coral Reefs, 25: 655-669. Smith, KA and Deguara, K (2003) Formation and annual periodicity of opaque zones in sagittal otoliths of Mugil cephalus (Pisces: Mugilidae). Marine and Freshwater Research, 54, 57-67. Tobin, A. and Mapleston, A. (2004) Exploitation dynamics and biological characteristics of the Queensland east coast Spanish mackerel (Scomberomorus commerson) fishery, CRC Reef Research Centre Technical Report No. 51, CRC Reef Research Centre, Townsville, Australia, 61p. Williams, AJ, Davies, CR and Mapstone, BD (2005) Variation in the periodicity and timing of increment formation in red throat emperor (Lethrinus miniatus) otoliths. Marine and Freshwater Research, 56, 529-538. Zar, JH (1984) Biostatistical Analysis. 2nd edition, Prentice-Hall International, Englewood Cliffs, NJ, 718p.

Grey mackerel management units in northern Australia
56
Grey mackerel management units in northern Australia
57
4. STOCK STRUCTURE OF GREY MACKEREL (SCOMBEROMORUS SEMIFASCIATUS) INFERRED FROM BACK-CALCULATED GROWTH ESTIMATES AC Ballagh, N Marton, DJ Welch and I Lawler
4.1 Introduction
Identification of the stock structure for harvested fish species is critical for fisheries
management. Stock structure provides the basis for the determination of appropriate
spatial management units and for developing optimal harvest and monitoring strategies
(Ricker, 1981). There are several different methods that have been used to discriminate
different fish stocks (Ihssen et al 1981) including genetic techniques, parasites,
morphology and mark-recapture. Each of these methods is useful in stock determination,
depending on the spatial and temporal scale of interest. Life history parameters have
also been utilised in stock studies as they reflect both the genotypic and environmental
influences on the stock; differences in these parameters are therefore likely to reflect
geographically and/or reproductively isolated populations (eg. Begg & Sellin 1998).
Hilborn and Walters (1992) in fact, define stocks as self-reproducing groups of fish, each
with similar life history characteristics.
Measures of the growth of fish also determine important biological attributes of each
stock, such as their productivity and responses to fishing (eg. Bianchi et al. 2000).
Parameters of growth therefore also inform the selection of appropriate management
strategies. As well as being affected by genetic differences (Sheehan et al. 2005),
growth is strongly environment-dependent, with the influence of temperature and food
availability of the greatest influence (Shoji & Tanaka 2003). It is likely that fish residing in
isolated regions will be exposed to different environmental conditions during their life and
variation in their growth will reflect these differences.
There are several methods available to determine growth in fishes. These include:
observed size at age (Berg & Pedersen 2001), mark-recapture (Faragher 1992), length
frequency analysis (Morales-Nin 1992), and back-calculation (De Vries et al. 1990,

Grey mackerel management units in northern Australia
58
Ballagh et al. 2006). There are problems associated with all of these methods of
determining fish growth rate. For example, it is considered difficult to collect the random
representative samples needed for observed size at age and length frequency analysis
(Morales-Nin 1992), while mark-recapture requires very large initial sample sizes. In a
previous study on movement of school and spotted mackerel off the Queensland east
coast, 4427 and 2106 fish were tagged respectively, while only 93 and 38 were
recaptured respectively (Begg et al. 1997). Back-calculation similarly has problems
associated with it however these are generally once-off problems relating to initial set-up
costs and validation of the periodicity of band formation. Other methods include rounding
an age up or down depending on the amount of material on the otolith beyond the most
recently formed band (eg. Tobin & Mapleston 2004), and assigning a birthday so age
can be used in months instead of whole years (eg. Pilling et al. 2003). These methods
are collectively termed ‘adjusted methods’ and like the methods mentioned above, they
also have problems associated with them.
Of all the methods currently available, observed size at age is the most commonly used
for age and growth studies, largely due to its relative cheapness and the potentially
accurate results provided. However due care must be taken to ensure the samples used
are independent and representative of the wild population (Morales-Nin 1992). While
observed size at age is the most commonly used method, back-calculation is considered
to be a more accurate method as gear selectivity, a significant potential bias, can be
removed from the sample (Campana et al. 1990). Slower growing fish aren’t susceptible
to many gear types until later in life, and thus are often under-represented in data sets
using observed size at age. Once the fish are caught, if their previous size(s) can be
calculated they can be added back into the sample population, reducing the bias present
in observed size at age methods.
In this study stock structure of grey mackerel across northern Australian regions was
inferred by comparing back-calculated estimates of growth parameters. Growth
parameters were also estimated using observed size-at-age data and compared with the
back-calculations to assess bias from gear selectivity associated with using
commercially caught fish for determining growth rates.
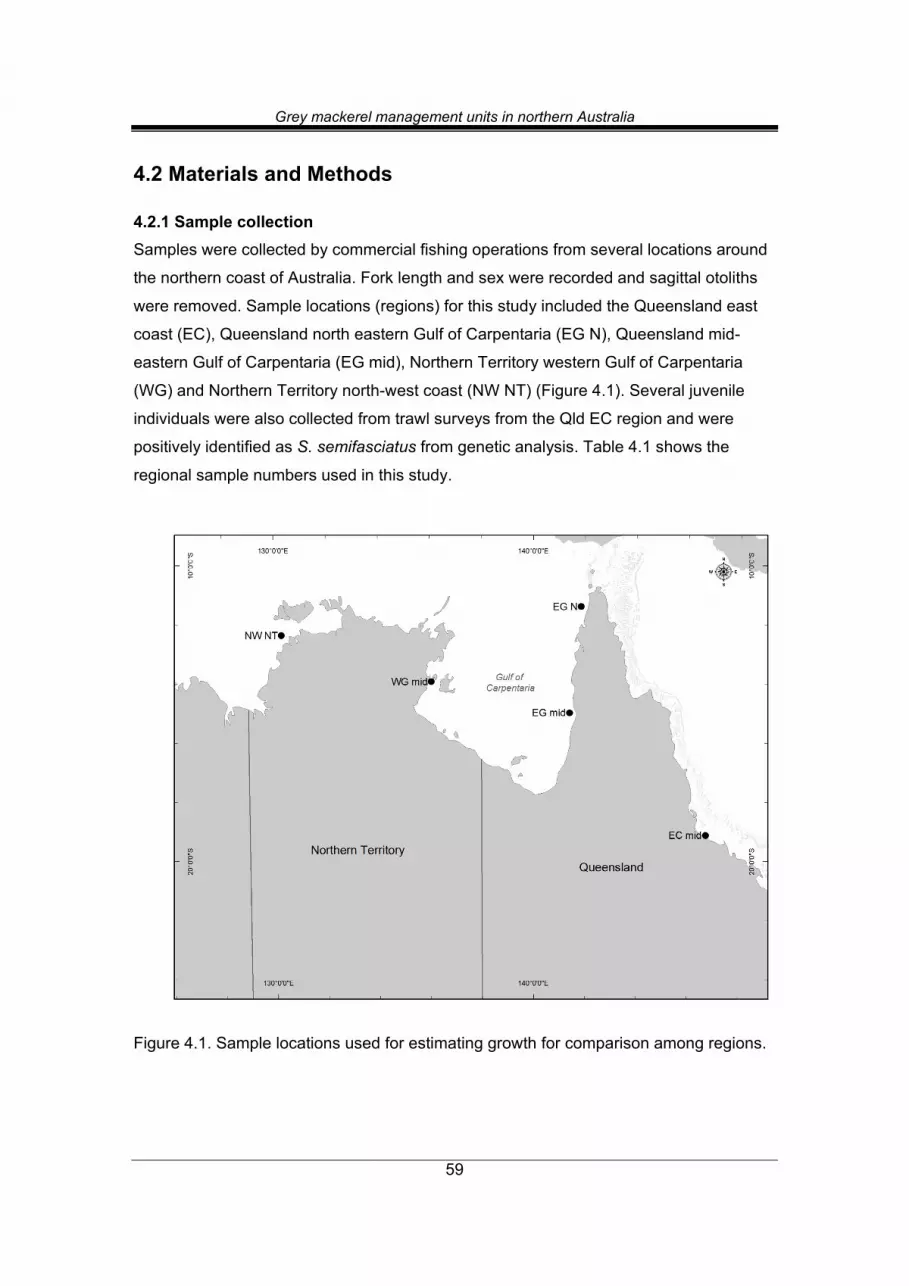
Grey mackerel management units in northern Australia
59
4.2 Materials and Methods
4.2.1 Sample collection Samples were collected by commercial fishing operations from several locations around
the northern coast of Australia. Fork length and sex were recorded and sagittal otoliths
were removed. Sample locations (regions) for this study included the Queensland east
coast (EC), Queensland north eastern Gulf of Carpentaria (EG N), Queensland mid-
eastern Gulf of Carpentaria (EG mid), Northern Territory western Gulf of Carpentaria
(WG) and Northern Territory north-west coast (NW NT) (Figure 4.1). Several juvenile
individuals were also collected from trawl surveys from the Qld EC region and were
positively identified as S. semifasciatus from genetic analysis. Table 4.1 shows the
regional sample numbers used in this study.
Figure 4.1. Sample locations used for estimating growth for comparison among regions.

Grey mackerel management units in northern Australia
60
Table 4.1. Number of samples used for back-calculation of growth, mean fork length (FL) and age of Grey mackerel from each of the sample locations (se = standard error).
Sample numbers Range Sample location Females Males Juveniles
Mean FL (mm) ±se
Mean age (yrs)
±se FL (mm) Age
(yrs) NW NT 72 73 739 ± 7 2.8 ± 0.1 520 - 920 0+ - 8 WG 63 31 768 ± 6 3.7 ± 0.2 620 - 895 2 - 9 EC 45 74 4 719 ± 12 3.3 ± 0.2 109 - 974 0+ - 8 EG mid 63 76 747 ± 6 3.7 ± 0.1 578 - 928 1 - 9 EG N 69 72 766 ± 4 3.3 ± 0.1 630 - 880 1 - 10
4.2.2 Age estimation Whole sagittal otoliths were immersed in mineral oil and viewed against a black
background through a stereo-dissection microscope (10× - 40× magnification). Otoliths
were aged whole rather than taking transverse sections as age estimates from whole
otoliths has been found to be a more accurate method of aging for grey mackerel
(Cameron & Begg 2002). Otoliths were aged through the ‘read’ area (Figure 4.2) from
the posterior end on the proximal surface. Complete increments, annuli (one translucent
and one opaque zone), were counted from the nucleus to the outer edge of the otolith.
All otoliths were read at least twice and included annuli counts and estimates of the
marginal increment category using the category system of Tobin & Mapleston (2004)
(see Chapter 3). Annuli counts from the first two reads were compared. If the counts
agreed, the count was accepted as the agreed age. If the ages from the first two reads
did not match, the otolith was read a third time and the annuli counts compared across
all three readings. If any two of the three counts matched, that count was accepted as
the agreed age of the fish.
Reader accuracy for age estimates was determined by comparing ages assigned in this
study with the ages of a subsample of fish determined by other experienced readers at
the Fishing and Fisheries Research Centre (FFRC), James Cook University. This was
done by assuming that the FFRC’s assigned ages were accurate, and comparisons were
then made using percent agreement and age bias plots. The precision (repeatability) of
the aging method was also determined using percent agreement by comparing multiple
age estimates.

Grey mackerel management units in northern Australia
61
4.2.3 Age adjustment Age estimates were then adjusted based on the criteria outlined in Begg et al. (2006),
where the age of each otolith was adjusted for the margin category. Samples with an
agreed age were assigned a final margin category if any two of the margin reads for a
single otolith agreed. For agreed margin categories of 0 or 1, no adjustment was
deemed necessary and the agreed age was accepted as the final age. If the agreed
margin category was 2, the agreed age was adjusted by adding 0.5. For samples with an
agreed margin category of 3, the age was adjusted by adding 1 to the agreed age. For
samples without agreed margin categories, the higher of the category estimates was
accepted and the age adjusted accordingly.
For fish with no agreed age, it was still possible to assign an adjusted age in some cases
based on the margin increment category and the age. If multiple age estimates were no
more than one year apart and the margin category of the higher age was a 0 or 1 while
the margin category for the lower age estimate was a 3, the adjusted age was accepted
as the higher of the two age estimates. If there was still no agreement between ages and
margin categories, the fish was removed from the sample and the otolith deemed to be
unreadable.
4.2.4 Back-calculation Digital still images of all otoliths were taken using an image analysis system (Diagnostic
Instruments digital camera connected to an Olympus SZX9 stereo-dissection
microscope and the Image Pro 6.2 digital analysis software). Images were checked
against the age estimates to ensure that all the annuli were clearly distinguishable.
Otoliths were measured through the ‘read’ area (Figure 4.2). Measurements were taken
from the nucleus to the furthest point from the nucleus on the posterior end of the
proximal side of the otolith (Figure 4.2). This provided a reference axis that was
consistent across all otoliths. In cases where annuli along the reference axis were
ambiguous, a second axis was measured from the nucleus to the edge of the otolith
within the read area where the annuli were clearer (Figure 4.2). This second line was
called the measurement axis. The length of the reference axis and measurement axis
(where present) were then measured, as was the distance from the nucleus to the outer
edge of the opaque band for each annuli. It was not always possible to accurately
distinguish the outer edge of some annuli or differentiate between annuli, and so

Grey mackerel management units in northern Australia
62
measurements from the first annuli to the latest consecutively distinguishable annuli
where taken.
Standardising the annuli distances taken on the measurement axis to the reference axis
was done using a conversion ratio:
MA
AR A
MRA ×=
Where RA and MA are the lengths of the reference and measurement axes respectively,
AR is the distance from the nucleus to the annulus measured along the reference axis
and MA is the distance from the nucleus to the annulus measured along the
measurement axis.
Figure 4.2. The read area on the posterior end of the proximal surface of a six-year-old Grey mackerel sagittal otolith, with the reference axis (dashed line) and the measurement axis with check marks at the outer edge of each annuli.
Ordinary least-squares regression analysis was used to determine the form of the
relationship between otolith radius (reference axis) and fork length. This relationship was
then determined using geometric mean regression (GMR) (Ricker 1992). Differences in
the relationship between otolith radius and fork length for region and gender were tested
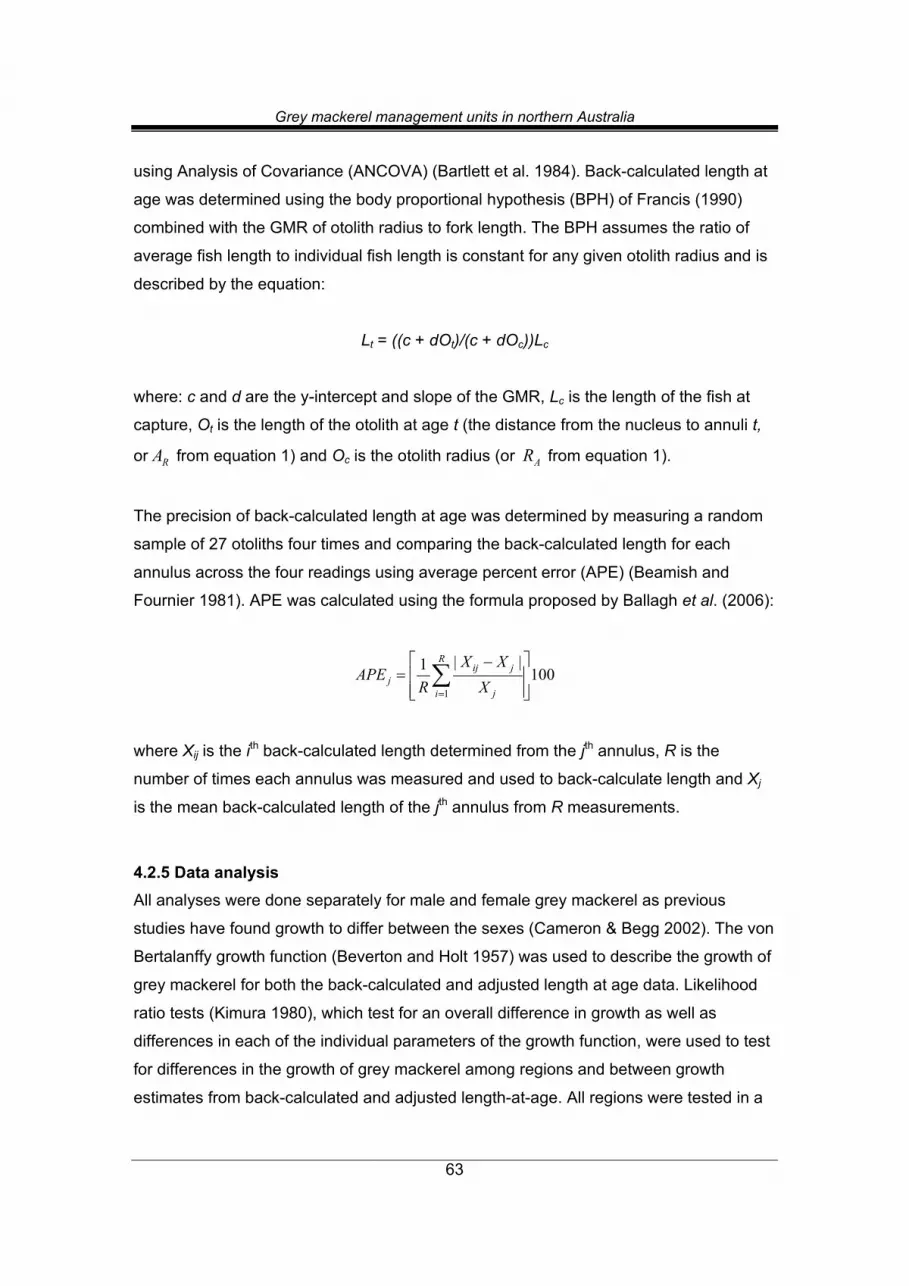
Grey mackerel management units in northern Australia
63
using Analysis of Covariance (ANCOVA) (Bartlett et al. 1984). Back-calculated length at
age was determined using the body proportional hypothesis (BPH) of Francis (1990)
combined with the GMR of otolith radius to fork length. The BPH assumes the ratio of
average fish length to individual fish length is constant for any given otolith radius and is
described by the equation:
Lt = ((c + dOt)/(c + dOc))Lc
where: c and d are the y-intercept and slope of the GMR, Lc is the length of the fish at
capture, Ot is the length of the otolith at age t (the distance from the nucleus to annuli t,
or RA from equation 1) and Oc is the otolith radius (or AR from equation 1).
The precision of back-calculated length at age was determined by measuring a random
sample of 27 otoliths four times and comparing the back-calculated length for each
annulus across the four readings using average percent error (APE) (Beamish and
Fournier 1981). APE was calculated using the formula proposed by Ballagh et al. (2006):
1
| |1 100=
⎡ ⎤−= ⎢ ⎥⎢ ⎥⎣ ⎦∑R
ij jj
ji
X XAPE
R X
where Xij is the ith back-calculated length determined from the jth annulus, R is the
number of times each annulus was measured and used to back-calculate length and Xj
is the mean back-calculated length of the jth annulus from R measurements.
4.2.5 Data analysis All analyses were done separately for male and female grey mackerel as previous
studies have found growth to differ between the sexes (Cameron & Begg 2002). The von
Bertalanffy growth function (Beverton and Holt 1957) was used to describe the growth of
grey mackerel for both the back-calculated and adjusted length at age data. Likelihood
ratio tests (Kimura 1980), which test for an overall difference in growth as well as
differences in each of the individual parameters of the growth function, were used to test
for differences in the growth of grey mackerel among regions and between growth
estimates from back-calculated and adjusted length-at-age. All regions were tested in a

Grey mackerel management units in northern Australia
64
five-way likelihood ratio test to determine if any differences existed among the regions.
Multiple comparisons using likelihood ratio tests were then performed on individual pairs
of regions. A Bonferroni adjustment was used for the likelihood ratio test multiple
comparisons by adjusting the significance level:
nAdjαα =
where: α is the significance level, αAdj is the adjusted significance level and n is the
number of multiple comparisons.
Analysis of variance (ANOVA) and Bonferroni adjusted multiple comparisons were also
used to test for regional differences in back-calculated length-at-age. A full factorial
ANOVA using back-calculated length as the dependent variable and age and region as
fixed factors was initially done to test for differences among regions. One-way ANOVA
and multiple comparisons were then used to test for differences among regions for ages
1 – 6. ANOVA was also used to test for differences between back-calculated and
adjusted length-at-age data. The Student’s t-test was then used to compare back-
calculated and adjusted lengths for ages 1 – 6.
Mean back-calculated length-at-age from all annuli were compared to mean back-
calculated length-at-age from the last annulus only to infer if there were any selectivity
effects on the growth estimates, or the presence of Lee’s Phenomenon. Lee’s
Phenomenon, whereby lengths at early ages back-calculated from younger fish are
greater than lengths at the same age estimated from older fish, has been showed to bias
estimates of growth from back-calculation of length-at-age using all annuli (Vaughan and
Burton 1994). Differences in the mean back-calculated lengths-at-age from all annuli and
the last annulus can also be used to infer any gear selectivity effects on sampling
(Ballagh et al. 2006). The likelihood ratio test was used to test for differences in the
growth estimates between back-calculated length-at-age from all annuli and back-
calculated length-at-age from the last annulus only. ANOVA and the Student’s t-test
were also used to compare mean back-calculated length-at-age from all annuli to mean
back-calculated length-at-age from the last annulus only for ages 1 – 6.

Grey mackerel management units in northern Australia
65
A novel approach to integrating and synthesising the results of the different tests for
differences in regional growth was developed and is proposed here. Each significant
multiple comparison test result was assigned a value of one and added to the results of
other significant tests for each regional combination for males and females separately.
For the likelihood ratio tests, each significant multiple comparison result (overall test and
individual parameters) was assigned a value of one. For the ANOVA, each significantly
different multiple comparison result for each age class was assigned a value of one. The
scores for males and females were then combined to produce a matrix of difference
indices for each region combination.
Estimates of growth from back-calculated data for grey mackerel on the Queensland
east coast from this study were compared to back-calculated growth estimates from a
previous study on the Queensland east coast (Cameron and Begg 2002). The von
Bertalanffy growth curves from this study and Cameron and Begg (2002) were plotted
together, as was mean back-calculated length-at-age.
4.3 Results
4.3.1 Otolith radius to fork length relationship Ordinary least squares regression was used to determine that the relationship between
otolith radius and fork length was linear (R2 = 0.76). The relationship was determined to
be consistent between regions and sex based on ANCOVA (F10, 614 = 1.176, P = 0.304).
Geometric mean regression was then used to determine the parameters of the
relationship for the back-calculation model (Figure 4.3).

Grey mackerel management units in northern Australia
66
0
1
2
3
4
5
6
7
8
9
0 200 400 600 800 1000 1200Fork Length (mm)
Oto
lith
Rad
ius
(mm
)
Figure 4.3. Plot of otolith radius on fork length, and the linear relationship (y = 0.0078x + 0.0028) estimated by geometric mean regression (n = 640).
4.3.2 Accuracy and precision Assessment of the accuracy of the aging technique showed that there was 84% exact
agreement between the two readers, and 99% of ages assigned were within one year of
each other with no significant bias with age (Figure 4.4). Precision was also assessed,
with 83% exact agreement between reads, and 97% of ages assigned between reads
within one year of each other and no significant bias between reads. The precision of the
back-calculation technique was assessed by comparing back-calculated length-at-age
from four separate measurements of the same subset of otoliths using APE. Back-
calculation was found to be less precise from the first annulus, however after the first
annulus; there was a dramatic decrease in error for back-calculated length-at-age
(Figure 4.5).

Grey mackerel management units in northern Australia
67
0
1
2
3
4
5
6
7
8
9
10
0 1 2 3 4 5 6 7 8 9 10FFRC Agreed Age
Age
(thi
s st
udy)
Figure 4.4. Age bias plot of age estimates from this study plotted against the Fishing and Fisheries Research Centre’s (FFRC) agreed age to assess ageing accuracy. Solid line indicates 1:1 age estimates, error bars represent standard error.
0
0.5
1
1.5
2
2.5
3
0 1 2 3 4 5 6 7 8
Annuli number
AP
E
Figure 4.5. Average percent error (APE) of back-calculated length-at-age (± s.e.).

Grey mackerel management units in northern Australia
68
4.3.3 Growth Growth in female and male grey mackerel was found to be different with female growth
characterised by faster growth (K) and a larger average maximum asymptotic length (L∞)
(Figure 4.6). Significant differences in the growth of grey mackerel were found between
back-calculated and adjusted length-at-age data using the likelihood ratio test for both
females (χ2 = 172.92, P < 0.000) and males (χ2 = 169.15, P < 0.000) (Figure 4.6).
ANOVA and t-tests of mean length-at-age also showed differences between back-
calculated and adjusted length-at-age data for males and females with differences in
mean lengths of one-year-olds for both males and females and two-year-old females (P
< 0.05).
Back-calculated estimates of growth and length-at-age from all annuli and the last annuli
did not differ significantly using likelihood ratio tests (Females: χ2 = 0.55, P = 0.91,
Males: χ2 = 0.37, P = 0.95), ANOVA or t-tests (P > 0.05).
4.3.4 Regional Growth Differences were found in the regional growth of grey mackerel (Figure 4.7, Table 4.2).
The five-way likelihood ratio test for differences in regional growth showed that
significant differences exist between the regional growth estimates for grey mackerel
(Table 4.3). Multiple comparisons of regional growth using likelihood ratio tests revealed
that significant overall differences in growth existed between 60% of the regional
combinations for both males and females (Table 4.4). Within the regional combinations
exhibiting significant differences in overall growth, only four female and two male
regional combinations had significant differences in individual growth parameter
estimates (Table 4.5).

Grey mackerel management units in northern Australia
69
0
100
200
300
400
500
600
700
800
900
0 1 2 3 4 5 6 7 8 9 10
Age (years)
Fork
leng
th (m
m)
BC
Adj
Adj-VBGF
BC-VBGF
Females
0
100
200
300
400
500
600
700
800
900
0 1 2 3 4 5 6 7 8 9 10
Age (years)
Fork
leng
th (m
m)
BC
Adj
Adj-VBGF
BC-VBGF
Males
Figure 4.6. =Back-calculated (BC) and adjusted (Adj) length-at-age and the fitted von Bertalanffy growth curves (VBGF) for female (Above; Back-calculated: L∞ = 827, K = 1.03, t0 = 0.18, n = 917, Adjusted: L∞ = 938, K = 0.23, t0 = -4.64, n = 310) and male (Below; Back-calculated: L∞ = 781, K = 1.05, t0 = 0.15, n = 968, Adjusted: L∞ = 845, K = 0.34, t0 = −2.87, n = 325) grey mackerel.

Grey mackerel management units in northern Australia
70
0
100
200
300
400
500
600
700
800
900
0 1 2 3 4 5 6 7 8 9 10Age (years)
Fork
Len
gth
(mm
)
W C NTW G midEC midEG midEG N
Females
0
100
200
300
400
500
600
700
800
900
0 1 2 3 4 5 6 7 8 9 10
Age (years)
Fork
Len
gth
(mm
)
W C NTW G midEC midEG midEG N
Males
Figure 4.7. Regional von Bertalanffy growth curves for female (top) and male (bottom) grey mackerel.

Grey mackerel management units in northern Australia
71
Table 4.2. Regional von Bertalanffy growth function parameters for grey mackerel.
Sex Region K L∞ t0 n Female NW NT 1.43 767 0.41 147 WG 1.16 775 0.27 97 EC 0.89 804 0.05 229 EG mid 0.95 774 0.04 264 EG N 0.99 786 -0.01 231 Male NW NT 1.44 808 0.36 172 WG 1.08 815 0.22 224 EC 0.82 878 0.15 132 EG mid 0.84 840 0.03 195 EG N 1.14 815 0.21 194
Table 4.3. Five-way likelihood ratio test of regional back-calculated growth of grey mackerel.
Sex Test parameter Sum of Squares χ2 df n P Female Overall 3765199 49.56 12 911 0.000* K 3624372 14.83 4 911 0.005* L∞ 3622077 14.25 4 911 0.007* t0 3597236 7.98 4 911 0.092 Male Overall 3140441 64.51 12 960 0.000* K 2973647 12.12 4 960 0.017* L∞ 2965441 9.47 4 960 0.050 t0 2991851 17.98 4 960 0.001*
Table 4.4. Multiple comparisons of regional back-calculated growth from likelihood ratio tests (* indicates significant difference, Bonferonni Adjusted α = 0.005)
Sex Region NW NT WG EG mid EG N Female EC 0.0001* 0.0008* 0.0235 0.0001* NW NT 0.0034* 0.0007* 0.0001* WG 0.2544 0.0898 EG mid 0.0266 Male EC 0.0155 0.1943 0.0024* 0.0000* NW NT 0.7639 0.0011* 0.0000* WG 0.0845 0.0001* EG mid 0.0000*
There were also significant differences in regional back-calculated length-at-age. Full
factorial ANOVA showed the effect of region to be significant for females (F(4) = 2.555, P
= 0.038), while One-way ANOVA demonstrated significant differences in regional back-
calculated length-at-age for males (ages: 1, 2, 3 and 5) and females (ages: 2, 3 and 6)
(Table 4.6). Multiple comparisons revealed which regional combinations differed for each
age (Table 4.7).

Grey mackerel management units in northern Australia
72
Table 4.5. Likelihood ratio tests for regional differences in von Bertalanffy growth function parameters (* indicates significant difference, Bonferonni adjusted α = 0.005)
Sex Region 1 Region 2 L∞ K t0 Female EC NW NT 0.0050* 0.0076 0.1574 EC WG 0.0010* 0.0753 0.5864 EC EG N 0.0054 0.0755 0.7935 NW NT WG 0.7258 0.0892 0.2241 NW NT EG mid 0.0976 0.0032* 0.0144 NW NT EG N 0.0050* 0.0076 0.1574 Male EC EG mid 0.0077 0.4738 0.9990 EC EG N 0.0238 0.1318 0.9294 NW NT EG mid 0.7953 0.0163 0.0015* NW NT EG N 0.6149 0.1140 0.0041* EG mid EG N 0.7271 0.3922 0.9280
Table 4.6. One-way likelihood ratio test of regional growth of grey mackerel Sex Age Sum of Squares df Mean Square F P Female 1 73743.6 4 18435.9 2.21 0.0682 2 53823.7 4 13455.9 6.07 0.0001* 3 14259.7 4 3564.9 2.77 0.0289* 4 4983.9 4 1246.0 0.81 0.5200 5 13818.7 4 3454.7 2.38 0.0654 6 16094.5 4 4023.6 3.20 0.0324*Male 1 123910.3 4 30977.6 4.17 0.0026* 2 26809.8 4 6702.5 5.73 0.0002* 3 13251.2 4 3312.8 3.91 0.0045* 4 6664.6 4 1666.1 1.97 0.1043 5 10785.2 4 2696.3 3.55 0.0117* 6 6320.6 4 1580.1 2.02 0.1301

Grey mackerel management units in northern Australia
73
Table 4.7. Bonferonni adjusted multiple comparisons of regional back-calculated length-at-age (* indicates significant difference).
Sex Age Region NW NT WG EG mid EG N Female 2 EC 0.0244* 1.0000 1.0000 1.0000 2 NW NT 0.0060* 0.0000* 0.1629 2 WG 1.0000 1.0000 2 EG mid 0.1172 3 EC 1.0000 0.6570 0.3298 1.0000 3 NW NT 0.1571 0.0720 1.0000 3 WG 1.0000 1.0000 3 EG mid 1.0000 6 EC 0.0259* 0.3128 1.0000 1.0000 6 NW NT 1.0000 0.2386 1.0000 6 WG 1.0000 1.0000 6 EG mid 1.0000 Male 1 EC 1.0000 1.0000 1.0000 0.1116 1 NW NT 1.0000 0.8049 0.0017* 1 WG 1.0000 0.0676 1 EG mid 0.2938 2 EC 0.0888 1.0000 1.0000 0.4813 2 NW NT 1.0000 0.0004* 1.0000 2 WG 0.7648 1.0000 2 EG mid 0.0025* 3 EC 1.0000 1.0000 0.0437* 1.0000 3 NW NT 1.0000 0.0458* 1.0000 3 WG 0.2644 1.0000 3 EG mid 0.0140* 5 EC 1.0000 0.3174 0.0107* 0.0923 5 NW NT 1.0000 1.0000 1.0000 5 WG 1.0000 1.0000 5 EG mid 1.0000
The integration technique combining the results of the different regional comparisons
revealed the NW NT region to be the most different from all other regions, while the WG
region was the least different (Figure 4.8). The biggest difference in growth occurred
between the NW NT and EG mid regions, while no differences were detected between
the WG and EG mid regions (Figure 4.8).

Grey mackerel management units in northern Australia
74
2474
21
32
3
NW NT
EG mid
EC
WG
WGECEG midEG N
Figure 4.8. Relative differences among pairwise regional comparisons of growth as indicated by the difference indices. Larger indices (circles) represent greater differences.
4.3.5 Comparison to previous growth estimates Differences in the estimates of growth for grey mackerel on the Queensland east coast
were found between this study and Cameron and Begg (2002) (Figure 4.9). Their study
produced estimates of maximum asymptotic length that were higher for both females
and males, while their estimates of growth rate (K) were lower. Differences in mean
back-calculated length-at-age between this study and those of Cameron and Begg
(2002) estimates followed a similar pattern for both male and females whereby the mean
length of one-year-olds were found to be higher in this study, while mean lengths from
older ages (ages 4 – 7) were lower (Figure 4.10).

Grey mackerel management units in northern Australia
75
0
100
200
300
400
500
600
700
800
900
1000
0 1 2 3 4 5 6 7 8 9 10
Age (years)
Fork
leng
th (m
m)
Female
0
100
200
300
400
500
600
700
800
900
1000
0 1 2 3 4 5 6 7 8 9 10
Age (years)
Fork
leng
th (m
m)
Male
Figure 4.9. von Bertalanffy growth curves from back-calculated length-at-age for female (top) and male (bottom) grey mackerel on the Queensland east coast from this study (solid line) and Cameron and Begg (2002) (dashed line).

Grey mackerel management units in northern Australia
76
33
45
2313
85
3
464
326
258186
5520
4
0
100
200
300
400
500
600
700
800
900
1000
0 1 2 3 4 5 6 7
Age (years)
Fork
leng
th (m
m)
Female
4976173
310
74
56
527
1627
40
429
642
0
100
200
300
400
500
600
700
800
900
1000
0 1 2 3 4 5 6 7
Age (years)
Fork
leng
th (m
m)
Male
Figure 4.10. Mean back-calculated length-at-age for female (top) and male (bottom) grey mackerel on the Queensland east coast from this study (solid line, ± s.e.) and Cameron and Begg (2002) (dashed line). Numbers indicate sample size.
4.4 Discussion
The results of this study indicate the possibility that a number of different stocks of grey
mackerel exist across the northern coast of Australia based on differences in growth
among regions. The growth characteristics of fish from the NW NT location were
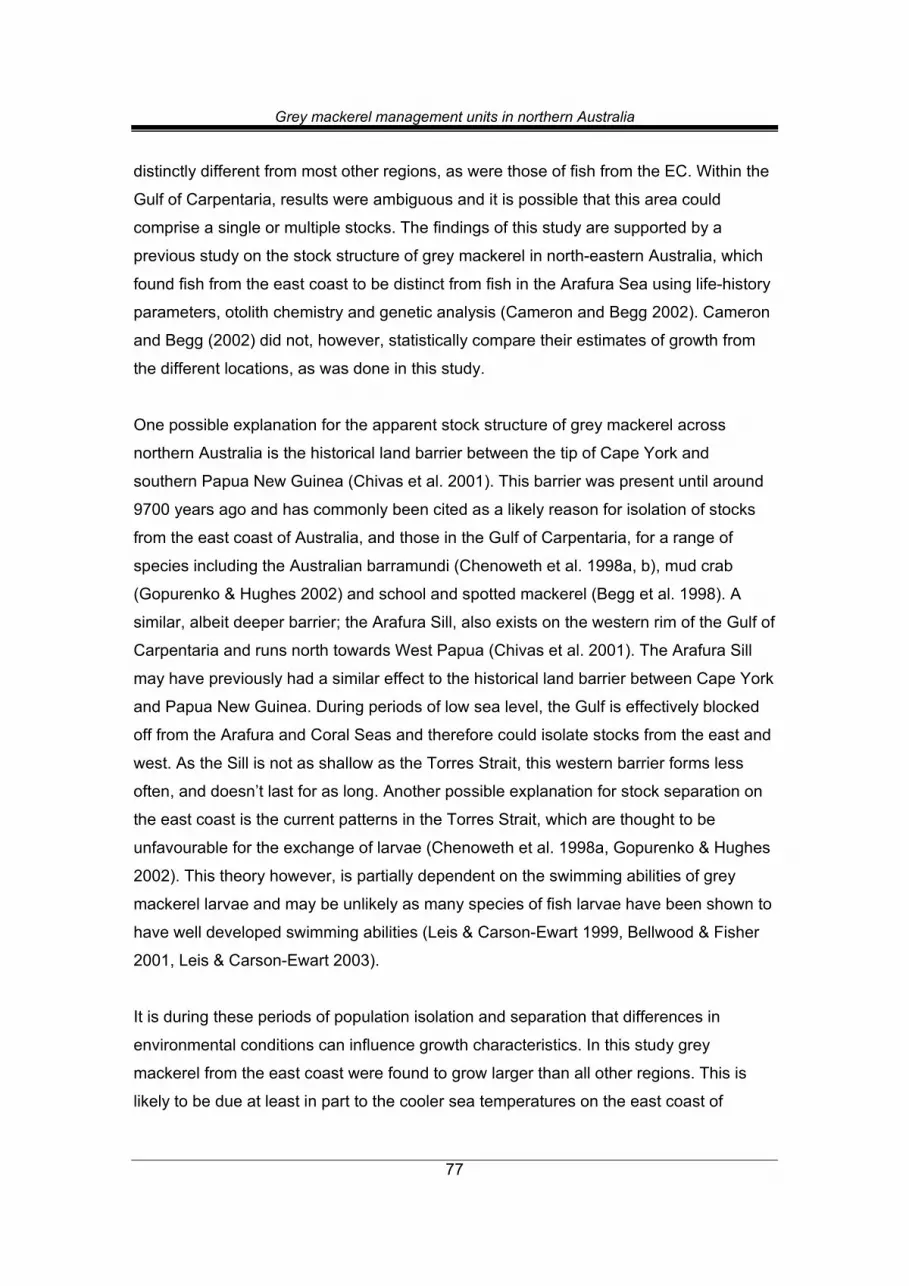
Grey mackerel management units in northern Australia
77
distinctly different from most other regions, as were those of fish from the EC. Within the
Gulf of Carpentaria, results were ambiguous and it is possible that this area could
comprise a single or multiple stocks. The findings of this study are supported by a
previous study on the stock structure of grey mackerel in north-eastern Australia, which
found fish from the east coast to be distinct from fish in the Arafura Sea using life-history
parameters, otolith chemistry and genetic analysis (Cameron and Begg 2002). Cameron
and Begg (2002) did not, however, statistically compare their estimates of growth from
the different locations, as was done in this study.
One possible explanation for the apparent stock structure of grey mackerel across
northern Australia is the historical land barrier between the tip of Cape York and
southern Papua New Guinea (Chivas et al. 2001). This barrier was present until around
9700 years ago and has commonly been cited as a likely reason for isolation of stocks
from the east coast of Australia, and those in the Gulf of Carpentaria, for a range of
species including the Australian barramundi (Chenoweth et al. 1998a, b), mud crab
(Gopurenko & Hughes 2002) and school and spotted mackerel (Begg et al. 1998). A
similar, albeit deeper barrier; the Arafura Sill, also exists on the western rim of the Gulf of
Carpentaria and runs north towards West Papua (Chivas et al. 2001). The Arafura Sill
may have previously had a similar effect to the historical land barrier between Cape York
and Papua New Guinea. During periods of low sea level, the Gulf is effectively blocked
off from the Arafura and Coral Seas and therefore could isolate stocks from the east and
west. As the Sill is not as shallow as the Torres Strait, this western barrier forms less
often, and doesn’t last for as long. Another possible explanation for stock separation on
the east coast is the current patterns in the Torres Strait, which are thought to be
unfavourable for the exchange of larvae (Chenoweth et al. 1998a, Gopurenko & Hughes
2002). This theory however, is partially dependent on the swimming abilities of grey
mackerel larvae and may be unlikely as many species of fish larvae have been shown to
have well developed swimming abilities (Leis & Carson-Ewart 1999, Bellwood & Fisher
2001, Leis & Carson-Ewart 2003).
It is during these periods of population isolation and separation that differences in
environmental conditions can influence growth characteristics. In this study grey
mackerel from the east coast were found to grow larger than all other regions. This is
likely to be due at least in part to the cooler sea temperatures on the east coast of

Grey mackerel management units in northern Australia
78
Queensland compared to the Gulf of Carpentaria and the northwest coast (Anon 2007).
Comparison of growth is a useful method for stock discrimination, however, it should be
noted that where there are no differences in growth between different locations, it does
not necessarily mean fish from these locations comprise one stock. Since growth can be
influenced by genetic and environmental factors, where differences in growth are not
found it may be a result of separate stocks of fish inhabiting similar environments and so
exhibiting similar growth characteristics. There is no single stock identification method
that can be used to emphatically discriminate separate populations and so it has been
proposed that a number of complementary techniques be used (Begg and Waldman
1999).
Although this chapter reports on the results of one technique for stock identification
(growth), we did utilise a number of statistical analysis methods for making inferences
about stock structure based on growth. This was because for each statistical method for
comparing growth, on its own, did not give a complete overview of differences in regional
growth as differences were not entirely consistent between methods. In isolation, growth
comparison methods may provide somewhat unclear results, due in part to the
assumptions and sensitivities of the analyses and the variable nature of growth. The
integration of several methods for comparing growth among regions however, produced
difference indices that encapsulated all the differences in regional growth. This proved to
be a useful technique for summarising the results of the different methods in a manner
which is readily interpretable.
Significant differences were found between estimates of growth from back-calculated
and adjusted length-at-age data, particularly for young fish. It is presumed that back-
calculated length-at-age is more accurate than observed length-at-age when estimating
growth for young fish as it incorporates the early growth history of fish from all ages thus
avoiding potential issues with size-selective mortality (Ballagh et al. 2006). We used age
adjustment in this study as a means of improving the resolution of length-at-age data (De
Vries and Grimes 1997; Mackie et al. 2003; Begg et al. 2006). Despite the use of age
adjustment, differences in adjusted and back-calculated length-at-age for young fish
were still evident, suggesting the presence of size-selective mortality. Contrary to this, no
difference was found between back-calculated length-at-age data from all annuli and the

Grey mackerel management units in northern Australia
79
last annuli only, suggesting neither size-selective mortality nor statistical bias (Lee’s
Phenomenon) was influencing back-calculated growth estimates.
Our estimates for the growth of grey mackerel on the Queensland east coast from back-
calculation were similar to previous back-calculated estimates of Cameron and Begg
(2002). Fishing effort and catch has increased substantially for grey mackerel on the
east coast since the earlier study and this study (see Chapter 2). This increase in fishing
mortality, at this stage at least, appeared to have had no influence on the population
growth of grey mackerel.
Although this study provides evidence and reasoning for a review of management
regimes for grey mackerel across north-eastern Australia, the ambiguous results within
the Gulf of Carpentaria suggests further research is required to resolve whether there
exists multiple stocks or a single stock. The Gulf is even more critical as it encompasses
different jurisdictions for management of grey mackerel. Importantly, this study provides
accurate regional estimates of grey mackerel growth parameters as input parameters for
stock assessments, and stock structure results from this study will be an important guide
as to the spatial scale at which these assessments are applied.
4.5 References
Anon (2007) Oceanic sea surface temperatures. Bureau of Meteorology website (www.bom.gov.au) Accessed: 24.11.07 Ballagh, AC, Begg, GA, Mapleston, A, and Tobin A (2006) Growth trends of Queensland east coast Spanish mackerel (Scomberomorus commerson) from otolith back-calculations. Marine and Freshwater Research, 57:383-393. Bartlett, JR, Randerson, PF, Williams, R, and Ellis DM (1984) The use of analysis of covariance in the back-calculation of growth in fish. Journal of Fish Biology, 24:201-213. Begg GA, Cameron D, and Sawynok W (1997) Movements and stock structure of school mackerel (Scomberomorus queenslandicus) and spotted mackerel (S. munroi) in Australian east-coast waters. Marine and Freshwater Research, 48:295-301. Begg GA, Keenan CP, and Sellin MJ (1998) Genetic variation and stock structure of school mackerel and spotted mackerel in northern Australian waters. Journal of Fish Biology, 53:543-559.

Grey mackerel management units in northern Australia
80
Begg GA and Sellin MJ (1998) Age and growth of school mackerel (Scomberomorus queenslandicus) and spotted mackerel (S. munroi) in Queensland east-coast water with implications for stock structure. Marine and Freshwater Research, 49:109-120. Bellwood DR and Fisher R (2001) Relative swimming speeds in reef fish larvae. Marine Ecology Progress Series, 211:299-303. Berg E and Pedersen T (2001) Variability in recruitment, growth and sexual maturity of coastal cod (Gadus morhua L.) in a fjord system in northern Norway. Fisheries Research, 52:179-189. Beverton, R. J. H. and S. J. Holt (1957). On the dynamics of exploited fish populations. Fish. Invest. Minist. Agric. Fish. Food (G.B.) Ser. II(19): 533. Bianchi, G., Gislason, H., Graham, K., Hill, L., Jin, X., Koranteng, K., Manickchand-Heileman, S., Paya, I., Sainsbury, K., Sanchez, F. & Zwanenburg (2000) Impact of fishing on size composition and diversity of demersal fish communities. Journal of Marine Science, 57:558-571. Cameron D and Begg G (2002) Fisheries biology and interaction in the northern Australian small mackerel fishery. Final report to the Fisheries Research and Development Corporation, FRDC Project #92/144 and 92/144.02, Department of Primary Industries, Brisbane, Australia, 236p. Campana, S.E. (1990) How reliable are growth back-calculations based on otoliths? Canadian Journal of Fisheries and Aquatic Sciences, 47, 2219-2227. Chenoweth SF, Hughes JM, Keenan CP and Lavery S (1998a) Concordance between dispersal and mitochondrial gene flow: isolation by distance in a tropical teleost, Lates calcarifer (Australian barramundi). Heredity, 80:187-197. Chenoweth SF, Hughes JM, Keenan CP and Lavery S (1998b) When oceans meet: a teleost shows secondary integration at an Indian-Pacific interface. Proceedings of the Royal Society of London Series B - Biological Sciences, 265:415-420. Chivas AR, Garcia A, van der Kaars S, Couapel MJJ, Holt S, Reeves JM, Wheeler DJ, Switzer AD, Murray-Wallace CV, NBanerjee D, Price DM, Wang SX, Pearson G, Edgar NT, Beauford L, De Deckker P, Lawson E and Cecil CB (2001) Sea-level and environmental changes since the last interglacial in the Gulf of Carpentaria, Australia: an overview. Quaternary International, 83-85:19-46. De Vries DA, Grimes CB, Lang KL and White B (1990) Age and growth of king and Spanish mackerel larvae and juveniles from the Gulf of Mexico and U.S. South Atlantic Bight. Environmental Biology of Fishes, 29:135-143. Faragher RA (1992) Growth and age validation of Rainbow Trout, Oncorhynchus mykiss (Walbaum) in Lake Eucumbene, NSW. Marine and Freshwater Research, 43:1033-1042. Francis R (1990) Back-Calculation of Fish Length - a Critical-Review. Journal of Fish Biology, 36:883-902.

Grey mackerel management units in northern Australia
81
Gopurenko D and Hughes JM (2002) Regional patterns of genetic structure among Australian populations of the mud crab, Scylla serrata (Crustacea: Decapoda): evidence from mitochondrial DNA. Marine and Freshwater Research, 53:849-857. Hilborn, R. and Walters, C. J. (Eds) (1992). Quantitative Fisheries Stock Assessment: Choice, Dynamics and Uncertainty. London, Great Britian, Chapman and Hall. Ihssen, P. E., Booke, H. E., Casselman, J. M., McGlade, J. M., Payne, N. R. and Utter, F. M. (1981). Stock identification: materials and methods. Canadian Journal of Fisheries and Aquatic Sciences. 38: 1838-1855. Kimura DK (1980) Likelihood methods for the von Bertalanffy Growth Curve. Fishery Bulletin, 77:765-776. Leis JM and Carson-Ewart BM (1999) In situ swimming and settlement behavour of larvae of an Indo-Pacific coral-reef fish, the coral trout (Plectropomus leopardus) (Pisces: Serranidae). Marine Biology, 134:51-64. Leis JM and Carson-Ewart BM (2003) Orientation of pelagic larvae of coral-reef fishes in the ocean. Marine Ecology Progress Series, 252:239-253. Morales-Nin B (1992) Determination of growth in bony fishes from otolith microstructure Technical Papers - T322. FAO Fisheries, p 52. Pilling GM, Grandcourt EM and Kirkwood GP (2003) The utility of otolith weight as a predictor of age in the emperor Lethrinus mahsena and other tropical fish species. Fisheries Research, 60:493-506. Ricker, WE (1981). Changes in the average size and average age of Pacific salmon. Canadian Journal of Fisheries and Aquatic Sciences, 38 (12): 1636-1656. Ricker WE. (1992) Back-Calculation of Fish Lengths Based on Proportionality between Scale and Length Increments. Canadian Journal of Fisheries and Aquatic Sciences, 49:1018-1026. Sheehan TF, Kocik JF, Cadrin SX, Legault CM, Atkinson E and Bengston D (2005) Marine growth and morphometrics for three populations of Atlantic salmon from Eastern Maine, USA. Transactions of the American Fisheries Society, 134:775-788. Shoji, J. and Tanaka, M. (2003). Larval abundance, growth, and recruitment of Japanese Spanish mackerel Scomberomorus niphonius in the Seto Inland Sea, Japan. The Big Fish Bang. Proceedings of the 26th Annual Larval Fish Conference, Os (Norway), Institute of Marine Research, Postboks 1870 Nordnes N-5817 Bergen Norway. Tobin, A. and Mapleston, A. (2004) Exploitation dynamics and biological characteristics of the Queensland east coast Spanish mackerel (Scomberomorus commerson) fishery, CRC Reef Research Centre Technical Report No. 51, CRC Reef Research Centre, Townsville, Australia, 61p.

Grey mackerel management units in northern Australia
82
Vaughan, D. S. and M. L. Burton (1994). Estimation of Von Bertalanffy growth parameters in the presence of size-selective mortality: a simulated example with red grouper. Transactions of the American Fisheries Society, 123: 1-8. Williams. L. E. (2002). Queensland fisheries resources: Current conditions and recent trends 1988-2000. Queensland Department of Primary Industries, Brisbane.

Grey mackerel management units in northern Australia
83
5. GENETIC POPULATION STRUCTURE OF GREY MACKEREL (SCOMBEROMORUS SEMIFASCIATUS) IN NORTHERN AUSTRALIA D Broderick, JR Ovenden, RC Buckworth, SJ Newman, RJG. Lester and DJ Welch
5.1 Introduction
The identification of stocks and the capacity to discriminate among them are integral
elements of fishery management (Waldman 1999). While the definition of a stock is often
contextual, it generally refers to populations that are self sustaining and demographically
independent (Dizon et al., 1992, Moritz 1994, Begg and Waldman 1999). Stocks are
important to fisheries management because fishing mortality needs to be offset against
each stock’s capacity to replenish itself as recruitment from adjacent stocks is often
limited. Molecular techniques are commonly used to investigate stock structuring and
have been deployed in a wide array of marine organisms (e.g. turtles, Dethmers et al.
2006; finfish, Ovenden et al. 2002; sharks, Dudgeon et al. in press; prawns, Ward et al.
2006; mud crabs, Gopurenko and Hughes 2002). Populations typically need to be
isolated for extended periods (100’s of generations) before genetic differences become
apparent. Consequently, populations that are genetically differentiated will also be
demographically independent and managing these populations separately will be key for
successful fisheries management.
Similar issues faced the management of Spanish mackerel across northern Australia but
were resolved by taking a multi-disciplinary approach to elucidate stock structure and
determine the appropriate scale of management (Buckworth et al. 2006). Genetic, otolith
microchemistry (Newman et al. in review) and parasite data (Moore et al. 2003) were
combined to offer unique insights into the organization of fish assemblages over different
temporal and spatial scales. In general, genetic data provides resolution over broad
spatial and temporal scales while parasite and microchemistry data are typically more
sensitive to environmental influences accumulated over a fish’s lifetime. The current
study of grey mackerel followed the same multi-disciplinary approach used to identify

Grey mackerel management units in northern Australia
84
stock structure in the Spanish mackerel fishery but here we report only the genetic
findings.
Existing genetic studies using allozyme data (Cameron and Begg 2002) indicated that
grey mackerel populations along the central Queensland coast were genetically distinct
from more westerly populations in the Gulf of Carpentaria (GOC) and Arafura Sea. This
allozyme study yielded important information about broad scale population structure but
lacked the power to elucidate structure on a finer spatial scale. Our study expands on
this earlier study by using more powerful genetic markers (mtDNA sequence and
microsatellites) applied at major fishing grounds from the eastern coast of central
Queensland (QLD) through to northwestern Northern Territory (NT) and Western
Australia (WA).
5.2 Methods
5.2.1 Sampling Grey mackerel were sampled from commercial catches from several populations across
northern Australia (WA west coast, NT NW coast, GoC and QLD east coast; Figure 5.1).
Biological information was linked to samples taken for genetics, otolith microchemistry
and parasitology on standardized datasheets. Approximately 200mg of muscle tissue
was dissected and preserved in 1ml of NaCl saturated solution with 20% dimethyl-
sulphoxide. Sample vials were later air-freighted to the Molecular Fisheries Laboratory
for DNA extraction and storage at -200C.
5.2.2 Laboratory
Total genomic DNA extraction Total genomic DNA was extracted from small amounts of tissue (0.1g) by overnight
digestion at 56°C in 500ul of extraction buffer containing 10mM NaCl, 10mM TRIS,
25mM EDTA, 0.1 mg/ml Proteinase K and 0.5% SDS (pH 8.0). Digested proteins and
cellular material were precipitated by addition of a ½ volume of 7.5M Ammonium acetate
and centrifugation (13 000 rpm for 20 min at 4°C). The supernatant was transferred to a
new tube and DNA was subsequently precipitated by adding 1 volume of cold EtOH and
centrifugation (13 000 rpm for 20 min at 4°C). Residual salts were removed by rinsing

Grey mackerel management units in northern Australia
85
the DNA pellet with 80% and 100% EtOH washes. The DNA was resuspended in 1x TE
buffer (10mM Tris-HCl, 1mM EDTA, pH 8.0) and concentration estimated by UV
spectrometry using a Biotech Powerwave XS plate reader.
Microsatellite genotyping and analysis Microsatellites developed from Spanish mackerel (Broderick et al. in prep), king
mackerel (Broughton et al. 2002; Gold et al. 2002) and others that are known to amplify
across a range of species (eg. Herwerden et al. 2000) were assessed for their utility in
grey mackerel. Five of the seven loci (Sca30, Sm37, 90RTE, Sca8 & Sm30) used in the
Spanish mackerel Genetag project (FRDC 2002/011), together with four additional loci
(Sca44, Sca37, Bst6 & Sm31), were suitable for grey mackerel genotyping. Microsatellite
PCR amplifications were performed in 96-well plates using Perkin Elmer 9600 & 9700
series thermocyclers. PCR reactions using a Qiagen Multiplex PCR Kit (12μl) contained
6μl of 2xMaster Mix, 1.2 u1 of 5xQ solution, 0.2μM forward and 2μM reverse primer,
2μM fluoro-labeled M13 primer and approximately 20ng of genomic DNA template.
Forward primers had an M13 extension (GAGCGGATAACAATTTCACACAG) at the 5’
end, enabling fluorescent labeling with the M13 primer (Broderick and Ovenden, MS;
Schuelke, 2000). The DNA template and enzyme were denatured at 94oC for 15 min,
followed by 35 cycles consisting of 94oC for 30 sec, 58oC for 45 sec and 72oC for 90 sec.
A final extension at 72oC for 45 min was used to ensure complete addition of adenine to
the PCR product, essential for consistent allele calling during genotyping. Compatible
loci were amplified in multiplexed PCR reactions and all products were combined for gel
separation on an ABI3130xl sequencer located in the Molecular Fisheries Laboratory.
Positive and negative extraction and PCR controls were used throughout and genotypes
were scored and binned using ABI Genemapper 3.7 software.

Grey mackerel management units in northern Australia
86
#
#
#
##
#
#
#
#
#
#
P01
P02P03
P04 P05P06
P07
P08
P09
P10
P11
P12
Code Fine scale locationP01 W A W est CoastP02 NT North W est CoastP03 NT W estern G O C - M idP04 NT W estern G O C - South W estP05 Q LD Eastern G O C - South W estP06 Q LD Eastern G O C - South EastP07 Q LD Eastern G O C - M idP08 Q LD Eastern G O C - NorthP09 Q LD East Coast - North PDP10 Q LD East Coast - North CairnsP11 Q LD East Coast - M idP12 Q LD East Coast - South
0 k m 10 00 km 20 00 km 30 00 km 40 00 km
Figure 5.1. Collection locations for twelve grey mackerel populations across northern Australia.
GenAlEx (Peakall and Smouse 2006) was used to calculate a range of population
genetic statistics including the number of alleles per locus, expected heterozygosity (HE),
observed heterozygosity (HO), genotype probabilities (GP) and to investigate population
structure using standard FST (Weir and Cockerham, 1984) genetic distance measures in
an AMOVA framework. Additional tests for isolation by distance (IBD), Hardy Weinberg
equilibrium, linkage disequilibrium and population differentiation were computed using
Genepop 4.0.7 (Rousset 2007).
Mitochondrial DNA sequencing and analysis MtDNA haplotypes from 4 genes were determined using direct sequencing of PCR
amplicons. For D-loop we amplified the 5′ end of the control region (or D-loop) using
primers Pro889U20 (CCW CTA ACT CCC AAA GCT AG) and TDKD1291L21 (CCT GAA
ATA GGA ACC AAA TGC T; Ovenden et al. 2002), ATPase was amplified using primers
ATP8.2 (AAA GCR TYR GCC TTT CAA GC) and COIII.2 (GTT AGT GGT CAK GGG
CTT GGR TC; Hurwood and Hughes 1998), ND4 was amplified using primers H122293-
LUE (TTG CAC CAA GAG TTT TTG GTT CCT AAG ACC; Inoue et al. 2001) and ND4r
(CAC CTA TGA CTA CCA AAA GCT CAT GTA GAA GC; Arevalo et al. 1994), and CO1
was amplified using primers FishF1 (TCA ACC AAC CAC AAA GAC ATT GGC AC) and

Grey mackerel management units in northern Australia
87
FishR1 (TAG ACT TCT GGG TGG CCA AAG AAT CA; Ward et al. 2005). Polymerase
chain reaction amplifications were carried out in 25μl volumes using the following
reagent concentrations: dNTP’s, 100mM each; primers, 0.5 μM each and 3 mM MgCl2.
Each reaction contained 0.5 Units of Taq DNA polymerase and the reaction buffer
supplied by the manufacturer (®Qiagen P/L). Thermal cycling conditions consisted of an
initial denaturation, 94°C for 1 min 30 secs followed by 35 cycles of 94°C for 5 seconds,
55°C for 30 seconds and 72°C for 30 secs, with a final extension step of 72°C for 5
minutes using Perkin Elmer 9600 & 9700 series thermocyclers. PCR products were
cleaned up prior to sequencing using a Qiagen QIAquick PCR cleanup kit protocol.
Approximately 20ng of DNA was used in standard ABI Dye Terminator sequencing
reactions and capillary gel separated on an ABI3130XL sequencer.
Sequence data was edited and aligned with Staden (Staden 2005). Phylogenetic trees
were constructed from mtDNA sequence data using Tamura and Nei distances (Tamura
and Nei 1993) with a gamma correction of 0.25 in MEGA 3.0 (Kumar et al. 2004).
Arlequin (Excoffier et al. 2005) was used to calculate pairwise FST statistics and conduct
Fisher’s exact tests for population differentiation (Raymond and Rousset, 1995). Tests
for isolation by distance were performed in GenAlEx (Peakall and Smouse 2006) from
distance matrices generated in Arlequin.
5.3 Results
5.3.1 Species Identification In large datasets, species misidentification can lead to erroneous patterns of population
genetic structuring. Moreover, given the potentially ubiquitous nature of hybridization in
mackerel (Srinivasa Rao and Lakshmi, 1993; Banford et al. 1999), and the prevalence of
cross species amplification among related taxa (Broderick et al. in prep), we took a
conservative approach to data analysis. Individuals with low genotype probabilities were
removed, as were individuals that were genotyped with less than nine loci. With less
than nine loci, there was insufficient statistical power for the genotype probability method
to identify species misidentifications and possible hybrids. Animals can be outliers for
either mtDNA or microsatellite genotypes, or both. Animals that are outliers for either
mtDNA or microsatellites, but not both, can occur due to interspecies hybridization

Grey mackerel management units in northern Australia
88
followed by uni-directional backcrossing and as a consequence of the different modes of
inheritance for mtDNA and microsatellites.
To identify individuals with unusual microsatellite genotypes, we plotted genotype
probabilities (GP, Paetkau et al. 1994) in rank order and assessed the distribution for
outliers (Figure 5.2). Three individuals had very low microsatellite GP’s and were outside
the continuous sinusoidal curve (e.g. GP < 10-15) indicating that they are unlikely to have
been drawn from the northern Australian grey mackerel genetic pool. Mitochondrial DNA
sequence confirmed that one of these individuals was a school mackerel (S.
queenslandicus). The other two had grey mackerel mtDNA sequences. All three
individuals were removed from the dataset. More suspect individuals were identified
among the partially genotyped dataset. MtDNA sequence data also indicated the
existence of ‘recombinant’ mitochondrial genomes consistent with interspecies
hybridization. This unusual finding will be reported elsewhere (Ovenden and Broderick in
prep).
0
100
200
300
400
500
600
1.E-37
1.E-35
1.E-33
1.E-31
1.E-29
1.E-27
1.E-25
1.E-23
1.E-21
1.E-19
1.E-17
1.E-15
1.E-13
1.E-11
1.E-09
1.E-07
1.E-05
1.E-03
1.E-01
Genotype probabilty
Rank
Figure 5.2: Plot of ranked genotyped probabilities of 547 grey mackerel based on allele frequencies at seven microsatellite loci. Individuals with very low GP’s and which are outliers from the continuous sinusoidal curve are unlikely to have been drawn from a grey mackerel genetic pool.

Grey mackerel management units in northern Australia
89
5.3.2 Microsatellites Microsatellite summary statistics from 544 grey mackerel genotyped at 9 loci are shown
in Table 5.1. Average heterozygosity across all 9 loci was 0.623 and ranged from 0.356
at the SM31 locus to 0.903 at SCA8. Overall deviations from Hardy-Weinberg
equilibrium were detected at a single locus SCA44 (p < 0.036), somewhat surprising
given the close approximation of HO and HE (0.428 c.f. 0.449), and 8/108 population by
loci tests were significant. Overall linkage disequilibrium was detected between SCA30
and SM3 loci (highly significant) however when we considered all population by loci
pairwise combinations, linkage disequilibrium was detected in only 3% (12/404) of those
combinations. Moreover, linkage disequilibrium between SCA30 and SM3 was only
detected in one population, despite this combination of loci being highly significant
overall. We judged both departures from Hardy-Weinberg equilibrium and levels of
linkage disequilibrium to be slight and the data suitable for subsequent population
genetic analysis.
Table 5.1: Summary statistics across 9 microsatellite loci. Reported are the number of individuals genotyped at each locus (N), the number of alleles observed (Na), effective number of alleles observed (Ne), observed heterozygosity (Ho), expected heterozygosity (He) and the p-value of no significant difference in observed compared to expected genotype proportions (Hardy Weinberg equilibrium (p(HWE))).
SCA30 SM3 SM37 90RTE SCA8 SM31 SCA44 BST6 SCA37N 544 544 544 544 544 544 544 544 544Na 24 9 30 6 33 7 4 9 4Ne 9.994 3.893 6.535 2.016 10.258 1.553 1.815 1.628 2.510Ho 0.906 0.748 0.827 0.487 0.884 0.344 0.428 0.375 0.608He 0.900 0.743 0.847 0.504 0.903 0.356 0.449 0.386 0.602p(HWE) 0.662 0.780 0.791 0.860 0.796 0.504 0.036 0.422 0.520
A strong east – west pattern of population genetic structuring is evident from the low
(range: 0.033 – 0.0624, mean: 0.051) but significant pairwise FST measures that clearly
differentiate PO1 - WA West Coast from all other locations surveyed in this study (Table
5.2a). By contrast, the remaining 11 locations are largely undifferentiated with only 2/55
comparisons significant; both involving NT North West Coast. As the vast majority of
FST’s are near zero, the lack of significant structuring is more likely due to near
homogeneity of gene pools rather than a lack of sampling intensity failing to detect
underlying population genetic structuring. To explore potential subtle population genetic
structuring further we took an iterative approach and pooled adjacent non-significant

Grey mackerel management units in northern Australia
90
populations and recalculated the pairwise FST statistics. This approach is supported by
the linear, coastal distribution of Grey mackerel along northern Australia. In cases of
ambiguous structuring patterns, where locations were differentiated from more distant
but not adjacent locations (e.g. PO2 - NT North West Coast, Table 5.1), they were left
ungrouped until an unambiguous pattern of structuring emerged in later rounds of
pooling. In the first round we combined PO3-4, PO5-7, PO9-10 and P11-P12 and left
PO1, PO2 and PO8 ungrouped. PO1 remained differentiated from all groups but the
pooling strategy did not resolve the ambiguous position of PO2. In the second round we
combined PO3-7 and P09-12 and left PO1, PO2 and PO8 ungrouped. Again, PO1
remained differentiated from all groups but the pooling strategy did not resolve the
ambiguous position of PO2. In the third round we combined PO3-8 and P09-12 and left
PO1 and PO2 ungrouped. In this round an unambiguous pattern of population genetic
structuring emerged (Table 2b). PO1 and PO2 were significantly differentiated from all
other groups but we could not differentiate between east coast QLD (PO9-12) and Gulf
of Carpentaria (PO3-8) groups. The identification of three genetic groups (stocks) should
be viewed with caution given the number of insignificant population comparisons in the
first instance; nonetheless, this strategy is informative to indicate the spatial scale over
which separate stocks may exist.
While the pattern of genetic distinctiveness of PO1 remains strong in the pooled data,
there is a hint of isolation by distance (IBD) as FST and geographic distance appear
correlated. This opens up the possibility that IBD, rather than discrete stock boundaries,
may be a more appropriate way to describe relationships among grey mackerel
populations across northern Australia. However tests for IBD among the 11 NT and QLD
locations show that the slight positive relationship is insignificant (Figure 5.3, p <
0.7804).

Gre
y m
acke
rel m
anag
emen
t uni
ts in
nor
ther
n A
ustra
lia
91
Tabl
e 5.
2: P
airw
ise
F ST
dist
ance
s m
easu
res
from
mic
rosa
telli
te d
ata
are
repo
rted
belo
w th
e di
agon
al a
nd th
eir s
igni
fican
ce a
re
repo
rted
abov
e th
e di
agon
al (s
igni
fican
t com
paris
ons
are
in b
old)
am
ong
a) 1
2 re
gion
s an
d b)
4 g
roup
s of
poo
led
regi
ons.
a)
Pai
rwis
e F S
T 12
regi
ons
Reg
ion
nP
01P
02P
03P0
4P
05P0
6P
07P0
8P
09P
10P
11P1
2P
01 W
A W
est C
oast
150.
0000
0.00
000.
0004
0.00
000.
0000
0.00
000.
0000
0.00
000.
0340
0.00
000.
0000
P02
NT
Nor
th W
est C
oast
144
0.04
060.
4348
0.70
370.
0625
0.16
640.
0011
0.21
650.
2889
0.90
700.
2129
0.03
33P
03 N
T W
este
rn G
OC
- M
id43
0.05
910.
0013
0.68
080.
6179
0.80
990.
1005
0.18
510.
6714
0.85
310.
5846
0.58
02P
04 N
T W
este
rn G
OC
- S
outh
Wes
t9
0.05
89-0
.009
5-0
.004
10.
7214
0.72
370.
5593
0.47
880.
8695
0.76
820.
7668
0.52
50P
05 Q
LD E
aste
rn G
OC
- S
outh
Wes
t23
0.06
430.
0035
-0.0
015
0.00
250.
7893
0.10
520.
5907
0.82
040.
9062
0.55
670.
2802
P06
QLD
Eas
tern
GO
C -
Sou
th E
ast
230.
0478
0.00
19-0
.001
6-0
.002
3-0
.001
60.
6015
0.29
410.
9573
0.54
600.
8273
0.58
70P0
7 Q
LD E
aste
rn G
OC
- M
id12
20.
0468
0.00
100.
0012
-0.0
047
0.00
380.
0005
0.29
790.
6431
0.91
760.
1220
0.71
62P0
8 Q
LD E
aste
rn G
OC
- N
orth
540.
0519
0.00
010.
0027
-0.0
074
-0.0
014
0.00
010.
0002
0.18
470.
2882
0.24
050.
2770
P09
QLD
Eas
t Coa
st -
Nor
th P
D29
0.05
57-0
.002
0-0
.001
1-0
.011
6-0
.003
6-0
.003
5-0
.000
4-0
.003
90.
7049
0.98
970.
9001
P10
QLD
Eas
t Coa
st -
Nor
th c
airn
s7
0.03
32-0
.006
0-0
.002
70.
0001
-0.0
063
-0.0
007
-0.0
055
-0.0
017
-0.0
057
0.99
320.
7839
P11
QLD
Eas
t Coa
st -
Mid
270.
0624
0.00
300.
0003
-0.0
027
0.00
000.
0008
0.00
250.
0027
-0.0
062
-0.0
124
0.75
58P1
2 Q
LD E
ast C
oast
- S
outh
480.
0480
0.00
03-0
.001
3-0
.007
70.
0028
-0.0
020
-0.0
021
-0.0
011
-0.0
035
-0.0
111
-0.0
031
b)
Pai
rwis
e F S
T 4
grou
ps o
f poo
led
regi
ons
Gro
upR
egio
nsn
Gro
up 1
Gro
up 2
Gro
up 3
Gro
up 4
Gro
up 1
P01
150.
0000
0.00
000.
0000
Gro
up 2
P02
144
0.04
06
0.
0003
0.00
03G
roup
3P
03 -
P08
274
0.05
140.
0009
0.07
38G
roup
4P
09 -
P12
111
0.05
360.
0017
0.00
05

Grey mackerel management units in northern Australia
92
y = 30.786x + 2.3306
R2 = 0.0215p < 0.7804
0
0.5
1
1.5
2
2.5
3
3.5
4
-0.014 -0.012 -0.01 -0.008 -0.006 -0.004 -0.002 0 0.002 0.004 0.006
FST/(1-FST)
LogDistance(degrees)
Figure 5.3: The relationship between genetic and geographic distance among NT and QLD grey mackerel populations. A mantel test revealed that the slight positive correlation is insignificant.
4.3.3 Mitochondrial DNA sequencing An initial survey of sequence polymorphism at four mtDNA gene regions from 8
individuals sampled across northern Australia revealed that D-loop was the most
polymorphic (π = 0.0113, 348bp), followed by ATP (π = 0.0030, 800bp), ND4 (π =
0.0014, 733bp) and CO1 (π = 0.0008, 626bp). We chose to expand our survey of the
ATP and D-loop fragments as we judged them to be more informative for stock
discrimination.
Nucleotide polymorphism in 348bp of d-loop sequence revealed 55 transitions and 13
transversions defining 95 haplotypes from 364 individuals surveyed. The three most
common D-loop haplotypes (CR01, CR02 & CR03) were widespread and represented
67% of all individuals surveyed (Table 5.3). Nucleotide polymorphism in 800bp of ATP
sequence revealed 34 transitions and 7 transversions defining 45 haplotypes from 357
individuals surveyed. The two most common ATP haplotypes (AT01 & AT02) were
widespread and represented 78% of all individuals surveyed (Table 5.3). As expected,
both nucleotide and haplotype diversity was higher in the D-loop (π = 0.0095, ĥ= 0.7919)
compared to ATP (π = 0.0016, ĥ= 0.6019) fragment.
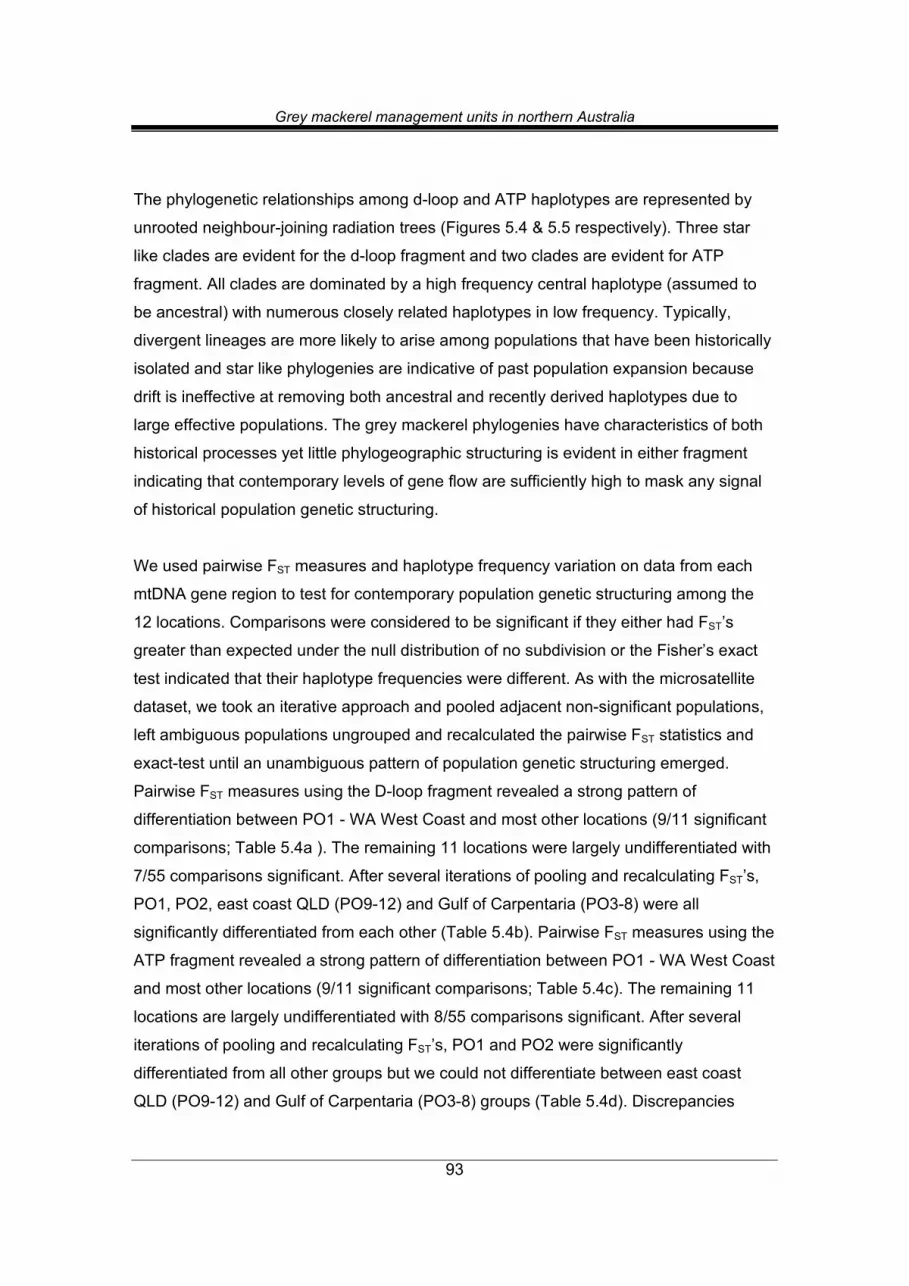
Grey mackerel management units in northern Australia
93
The phylogenetic relationships among d-loop and ATP haplotypes are represented by
unrooted neighbour-joining radiation trees (Figures 5.4 & 5.5 respectively). Three star
like clades are evident for the d-loop fragment and two clades are evident for ATP
fragment. All clades are dominated by a high frequency central haplotype (assumed to
be ancestral) with numerous closely related haplotypes in low frequency. Typically,
divergent lineages are more likely to arise among populations that have been historically
isolated and star like phylogenies are indicative of past population expansion because
drift is ineffective at removing both ancestral and recently derived haplotypes due to
large effective populations. The grey mackerel phylogenies have characteristics of both
historical processes yet little phylogeographic structuring is evident in either fragment
indicating that contemporary levels of gene flow are sufficiently high to mask any signal
of historical population genetic structuring.
We used pairwise FST measures and haplotype frequency variation on data from each
mtDNA gene region to test for contemporary population genetic structuring among the
12 locations. Comparisons were considered to be significant if they either had FST’s
greater than expected under the null distribution of no subdivision or the Fisher’s exact
test indicated that their haplotype frequencies were different. As with the microsatellite
dataset, we took an iterative approach and pooled adjacent non-significant populations,
left ambiguous populations ungrouped and recalculated the pairwise FST statistics and
exact-test until an unambiguous pattern of population genetic structuring emerged.
Pairwise FST measures using the D-loop fragment revealed a strong pattern of
differentiation between PO1 - WA West Coast and most other locations (9/11 significant
comparisons; Table 5.4a ). The remaining 11 locations were largely undifferentiated with
7/55 comparisons significant. After several iterations of pooling and recalculating FST’s,
PO1, PO2, east coast QLD (PO9-12) and Gulf of Carpentaria (PO3-8) were all
significantly differentiated from each other (Table 5.4b). Pairwise FST measures using the
ATP fragment revealed a strong pattern of differentiation between PO1 - WA West Coast
and most other locations (9/11 significant comparisons; Table 5.4c). The remaining 11
locations are largely undifferentiated with 8/55 comparisons significant. After several
iterations of pooling and recalculating FST’s, PO1 and PO2 were significantly
differentiated from all other groups but we could not differentiate between east coast
QLD (PO9-12) and Gulf of Carpentaria (PO3-8) groups (Table 5.4d). Discrepancies

Grey mackerel management units in northern Australia
94
between the two tests of significance can arise because the FST’s incorporate a measure
of genetic distance among haplotypes while Fisher’s exact test is based of haplotype
frequency alone. Discrepancies can also occur when populations are weakly
differentiated and are at the margins of statistical significance. The pooled ATP data is a
good example of this where FST’s are near zero and insignificant but the Fisher’s exact
test indicate that they have different haplotype frequencies.
As expected, the patterns of population genetic structuring revealed by the two mtDNA
fragments are concordant and support the distinctiveness of the PO1 - WA West Coast
location that was clear from the microsatellite dataset. Both fragments clearly indicated
that most of remaining sampled locations were weakly differentiated requiring several
rounds of pooling before any significant population structuring was revealed. This pattern
is also concordant with that revealed by the microsatellite data. The difference between
these markers appears to be one primarily of resolution with the mtDNA D-loop fragment
being the only marker that can distinguish between east coast QLD (PO9-12) and Gulf of
Carpentaria (PO3-8) groups (Table 5.4d).
Like the microsatellite data there was a hint of isolation by distance (IBD) as FST and
geographic distance appear correlated in the pooled datasets of both mtDNA fragments.
Tests for IBD that included PO1 - WA West Coast were significant (D-loop, p < 0.01;
ATP, p < 0.014) but there was no evidence for IBD when P01 was removed from the
analysis (D-loop, p < 0.076; ATP, p < 0.229) indicating that IBD was not a significant
driver of population differentiation among northern and eastern Australian grey mackerel
populations as a group.
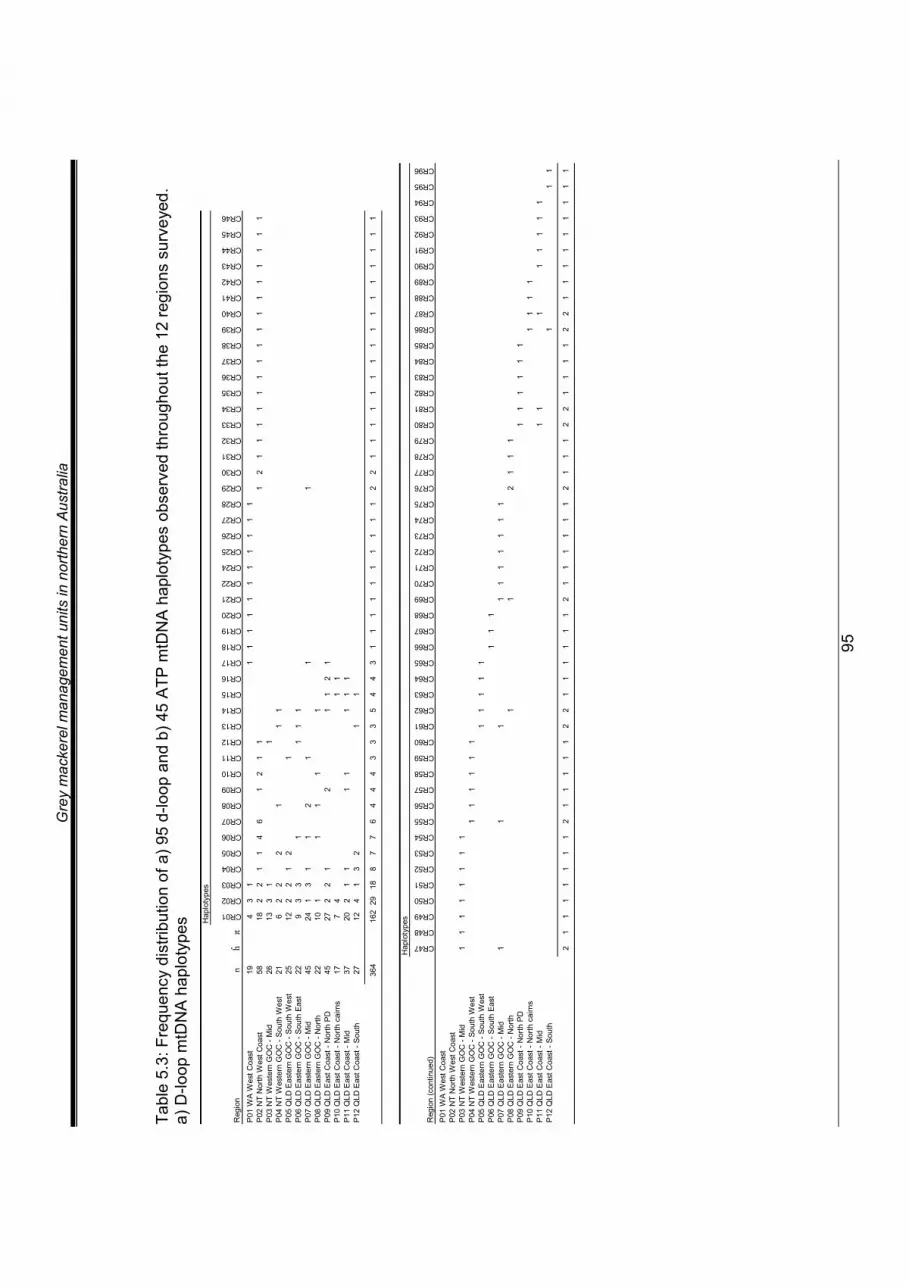
Gre
y m
acke
rel m
anag
emen
t uni
ts in
nor
ther
n A
ustra
lia
95
Tabl
e 5.
3: F
requ
ency
dis
tribu
tion
of a
) 95
d-lo
op a
nd b
) 45
ATP
mtD
NA
hap
loty
pes
obse
rved
thro
ugho
ut th
e 12
regi
ons
surv
eyed
.
a) D
-loop
mtD
NA
hap
loty
pes H
aplo
type
s
Reg
ion
nĥ
π
CR01
CR02
CR03
CR04
CR05
CR06
CR07
CR08
CR09
CR10
CR11
CR12
CR13
CR14
CR15
CR16
CR17
CR18
CR19
CR20
CR21
CR22
CR24
CR25
CR26
CR27
CR28
CR29
CR30
CR31
CR32
CR33
CR34
CR35
CR36
CR37
CR38
CR39
CR40
CR41
CR42
CR43
CR44
CR45
CR46
P01
WA
Wes
t Coa
st19
43
11
11
11
11
11
11
P02
NT
Nor
th W
est C
oast
5818
22
11
46
12
11
12
11
11
11
11
11
11
11
11
P03
NT
Wes
tern
GO
C -
Mid
2613
31
1P
04 N
T W
este
rn G
OC
- S
outh
Wes
t21
62
22
11
1P
05 Q
LD E
aste
rn G
OC
- S
outh
Wes
t25
122
21
21
P06
QLD
Eas
tern
GO
C -
Sou
th E
ast
229
33
11
11
P07
QLD
Eas
tern
GO
C -
Mid
4524
13
11
21
11
P08
QLD
Eas
tern
GO
C -
Nor
th22
101
11
11
P09
QLD
Eas
t Coa
st -
Nor
th P
D45
272
21
21
12
1P
10 Q
LD E
ast C
oast
- N
orth
cai
rns
177
41
1P
11 Q
LD E
ast C
oast
- M
id37
202
11
11
11
1P
12 Q
LD E
ast C
oast
- S
outh
2712
41
32
11
364
162
2918
87
76
44
43
33
54
43
11
11
11
11
11
22
11
11
11
11
11
11
11
11
Hap
loty
pes
Reg
ion
(con
tinue
d)
CR47
CR48
CR49
CR50
CR51
CR52
CR53
CR54
CR55
CR56
CR57
CR58
CR59
CR60
CR61
CR62
CR63
CR64
CR65
CR66
CR67
CR68
CR69
CR70
CR71
CR72
CR73
CR74
CR75
CR76
CR77
CR78
CR79
CR80
CR81
CR82
CR83
CR84
CR85
CR86
CR87
CR88
CR89
CR90
CR91
CR92
CR93
CR94
CR95
CR96
P01
WA
Wes
t Coa
stP
02 N
T N
orth
Wes
t Coa
stP
03 N
T W
este
rn G
OC
- M
id1
11
11
11
1P
04 N
T W
este
rn G
OC
- S
outh
Wes
t1
11
11
1P
05 Q
LD E
aste
rn G
OC
- S
outh
Wes
t1
11
11
P06
QLD
Eas
tern
GO
C -
Sou
th E
ast
11
1P
07 Q
LD E
aste
rn G
OC
- M
id1
11
11
11
11
1P
08 Q
LD E
aste
rn G
OC
- N
orth
11
21
11
P09
QLD
Eas
t Coa
st -
Nor
th P
D1
11
11
1P
10 Q
LD E
ast C
oast
- N
orth
cai
rns
11
11
P11
QLD
Eas
t Coa
st -
Mid
11
11
11
11
P12
QLD
Eas
t Coa
st -
Sou
th1
11
21
11
11
11
21
11
11
22
11
11
11
21
11
11
12
11
12
21
11
12
21
11
11
11
11

Gre
y m
acke
rel m
anag
emen
t uni
ts in
nor
ther
n A
ustra
lia
96
b) A
TP m
tDN
A h
aplo
type
s H
aplo
type
s
Reg
ion
nĥ
π
AT001
AT002
AT003
AT004
AT005
AT006
AT007
AT008
AT009
AT010
AT011
AT012
AT013
AT014
AT015
AT016
AT017
AT018
AT019
AT020
AT021
AT022
AT023
AT024
AT025
AT026
AT027
AT028
AT029
AT030
AT031
AT032
AT033
AT034
AT036
AT037
AT039
AT040
AT041
AT042
AT043
AT044
AT045
AT046
AT047
P01
WA
Wes
t Coa
st19
76
14
1P
02 N
T N
orth
Wes
t Coa
st58
298
62
22
11
11
11
11
1P
03 N
T W
este
rn G
OC
- M
id29
204
41
P04
NT
Wes
tern
GO
C -
Sou
th W
est
2110
91
1P
05 Q
LD E
aste
rn G
OC
- S
outh
Wes
t19
123
21
1P
06 Q
LD E
aste
rn G
OC
- S
outh
Eas
t22
123
31
11
1P
07 Q
LD E
aste
rn G
OC
- M
id45
259
11
11
11
11
11
1P
08 Q
LD E
aste
rn G
OC
- N
orth
2216
31
11
P09
QLD
Eas
t Coa
st -
Nor
th P
D43
364
21
P10
QLD
Eas
t Coa
st -
Nor
th c
airn
s17
94
11
11
P11
QLD
Eas
t Coa
st -
Mid
3624
52
11
11
1P
12 Q
LD E
ast C
oast
- So
uth
2716
42
11
11
1
358
216
6218
61
32
22
11
11
11
11
21
41
21
11
32
21
11
11
11
12
11
11
11
11
Ta
ble
5.4:
Pai
rwis
e F S
T di
stan
ces
mea
sure
s us
ing
D-lo
op a
nd A
TP m
tDN
A fr
agm
ents
are
repo
rted
belo
w th
e di
agon
al a
nd p
val
ues
abov
e th
e di
agon
al w
ith s
igni
fican
ce c
ompa
rison
s in
bol
d. S
igni
fican
t Fis
her’s
exa
ct te
st c
ompa
rison
s ar
e sh
aded
. a)
Pai
rwis
e F S
T D
-loop
12
regi
ons
Reg
ion
nP
01P0
2P
03P
04P
05P0
6P
07P
08P
09P1
0P
11P
12P0
1P
01 W
A W
est C
oast
190.
0127
0.03
130.
3272
0.00
000.
0244
0.00
290.
0000
0.00
000.
1065
0.00
000.
0137
P02
P02
NT
Nor
th W
est C
oast
580.
0704
0.23
930.
4063
0.10
060.
3359
0.06
840.
0234
0.00
200.
0586
0.01
760.
0986
P03
P03
NT
Wes
tern
GO
C -
Mid
260.
0726
0.00
660.
5801
0.64
550.
9688
0.73
830.
2266
0.08
400.
4063
0.21
090.
8818
P04
P04
NT
Wes
tern
GO
C -
Sout
h W
est
210.
0040
-0.0
023
-0.0
126
0.21
480.
6260
0.18
650.
0430
0.00
780.
3311
0.01
560.
3184
P05
P05
QLD
Eas
tern
GO
C -
Sou
th W
est
250.
1299
0.02
69-0
.012
90.
0167
0.72
360.
7529
0.45
410.
2627
0.12
400.
5664
0.79
59P0
6P
06 Q
LD E
aste
rn G
OC
- S
outh
Eas
t22
0.08
540.
0013
-0.0
305
-0.0
165
-0.0
176
0.98
830.
3740
0.23
630.
2881
0.35
650.
9102
P07
P07
QLD
Eas
tern
GO
C -
Mid
450.
1368
0.02
28-0
.014
60.
0150
-0.0
139
-0.0
252
0.48
730.
3135
0.14
360.
4404
0.89
36P0
8P
08 Q
LD E
aste
rn G
OC
- N
orth
220.
1873
0.05
450.
0121
0.06
28-0
.004
2-0
.001
0-0
.005
40.
6260
0.09
180.
8604
0.36
72P0
9P
09 Q
LD E
ast C
oast
- N
orth
PD
450.
2479
0.07
060.
0280
0.09
120.
0078
0.01
070.
0028
-0.0
100
0.01
660.
9697
0.22
07P1
0P
10 Q
LD E
ast C
oast
- N
orth
cai
rns
170.
0420
0.05
44-0
.002
80.
0056
0.03
580.
0126
0.03
240.
0496
0.09
860.
0811
0.30
57P1
1P
11 Q
LD E
ast C
oast
- M
id37
0.20
370.
0603
0.01
140.
0656
-0.0
073
0.00
01-0
.003
8-0
.018
6-0
.017
20.
0561
0.43
07P1
2P
12 Q
LD E
ast C
oast
- S
outh
270.
1040
0.02
23-0
.024
90.
0036
-0.0
201
-0.0
279
-0.0
186
-0.0
008
0.01
100.
0039
-0.0
041

Gre
y m
acke
rel m
anag
emen
t uni
ts in
nor
ther
n A
ustra
lia
97
b) P
airw
ise
F ST
D-lo
op 4
gro
ups
of p
oole
d re
gion
s
Gro
upR
egio
nsn
Gro
up 1
Gro
up 2
Gro
up 3
Gro
up 4
Gro
up 1
P01
190.
0244
0.00
000.
0000
Gro
up 2
P02
580.
0701
0.00
590.
0000
Gro
up 3
P03
-08
161
0.13
120.
0273
0.14
36G
roup
4P
09-1
212
60.
2032
0.06
450.
0043
c)
Pai
rwis
e F S
T A
TP 1
2 re
gion
s
Reg
ion
nP
01P0
2P
03P0
4P
05P0
6P
07P0
8P
09P1
0P
11P
12P0
1 W
A W
est C
oast
190.
0078
0.00
880.
1191
0.02
440.
0078
0.00
200.
0020
0.00
000.
0879
0.00
000.
0039
P02
NT
Nor
th W
est C
oast
580.
1146
0.96
190.
3428
0.97
360.
8447
0.28
520.
1690
0.04
690.
6924
0.08
200.
4424
P03
NT
Wes
tern
GO
C -
Mid
290.
1728
-0.0
201
0.18
750.
9180
0.91
020.
4307
0.33
010.
1621
0.49
020.
2207
0.48
15P0
4 N
T W
este
rn G
OC
- So
uth
Wes
t21
0.06
160.
0006
0.01
920.
2656
0.25
680.
2090
0.09
570.
0098
0.72
270.
0518
0.22
56P0
5 Q
LD E
aste
rn G
OC
- So
uth
Wes
t19
0.15
43-0
.028
7-0
.042
40.
0030
0.99
020.
6611
0.40
530.
1982
0.59
280.
3330
0.65
04P0
6 Q
LD E
aste
rn G
OC
- So
uth
Eas
t22
0.14
13-0
.019
9-0
.032
20.
0082
-0.0
420
0.45
120.
3232
0.10
350.
5586
0.24
120.
4678
P07
QLD
Eas
tern
GO
C -
Mid
450.
1906
0.00
38-0
.006
40.
0199
-0.0
214
-0.0
081
0.62
600.
1504
0.32
420.
4932
0.74
61P0
8 Q
LD E
aste
rn G
OC
- N
orth
220.
2586
0.01
460.
0026
0.07
33-0
.011
3-0
.002
6-0
.016
00.
5127
0.16
110.
9316
0.49
71P0
9 Q
LD E
ast C
oast
- N
orth
PD
430.
3619
0.04
280.
0270
0.15
040.
0189
0.03
010.
0143
-0.0
173
0.03
320.
5508
0.14
36P1
0 Q
LD E
ast C
oast
- N
orth
cai
rns
170.
0738
-0.0
198
-0.0
134
-0.0
362
-0.0
277
-0.0
197
-0.0
004
0.03
370.
0997
0.07
720.
3623
P11
QLD
Eas
t Coa
st -
Mid
360.
2810
0.02
530.
0114
0.08
52-0
.002
20.
0101
-0.0
075
-0.0
255
-0.0
119
0.04
770.
3818
P12
QLD
Eas
t Coa
st -
Sou
th27
0.17
86-0
.005
2-0
.013
60.
0165
-0.0
245
-0.0
113
-0.0
167
-0.0
146
0.01
67-0
.008
4-0
.005
7
d)
Pai
rwis
e F S
T A
TP 4
gro
ups
of p
oole
d re
gion
s
Gro
upR
egio
nsn
Gro
up 1
Gro
up 2
Gro
up 3
Gro
up 4
Gro
up 1
P01
190.
0098
0.00
100.
0000
Gro
up 2
P02
580.
1154
0.35
740.
0654
Gro
up 3
P03
-08
158
0.18
96-0
.001
10.
1816
Gro
up 4
P09
-12
123
0.27
550.
0198
0.00
40

Gre
y m
acke
rel m
anag
emen
t uni
ts in
nor
ther
n A
ustra
lia
98
CR
43C
R79
CR
09C
R75
CR
96C
R51
CR
94C
R74CR53
CR21CR31CR
68CR88
CR93
CR34
CR85
CR13CR17CR41CR29CR76CR78CR63CR12CR37
CR59 CR83 CR16 CR84 CR14
CR47
CR04 CR06
CR66
CR18
CR80
CR92 CR30
CR95
CR10
CR11 CR36
CR71CR62
CR32
CR90
CR05
CR64
CR67
CR91
CR60
CR89
CR7
3
CR82
CR
52
CR
65
CR38 CR49
CR81
CR4
2
CR
55
CR
2 7
CR
23CR
46
CR69
CR87
CR15
CR24
CR70CR20
CR39
CR08
CR77
CR61
CR50
CR54
CR07
CR45
CR40
CR48
CR33
CR19
CR28
CR86
CR5
8CR
72
CR
56
CR
57
CR44
CR26
CR22
CR25CR35
0.00
2
CR
01
CR
02C
R03
Fi
gure
5.4
: An
unro
oted
nei
ghbo
rhoo
d jo
inin
g ra
diat
ion
tree
desc
ribin
g th
e ph
ylog
enet
ic re
latio
nshi
ps a
mon
g 95
mtD
NA
d-lo
op
hapl
otyp
es in
gre
y m
acke
rel.
Pre
sum
ed a
nces
tral h
aplo
type
s (e
.g. C
R01
, CR
02 &
CR
03) a
re a
t the
orig
ins
of e
ach
radi
atio
n w
here
as
deriv
ed h
aplo
type
s ar
e on
the
tips.

Gre
y m
acke
rel m
anag
emen
t uni
ts in
nor
ther
n A
ustra
lia
99
AT007
AT046
AT018 AT013 AT043
AT022AT045
AT030
AT029
AT033
AT014
AT031
AT009
AT017
AT020
AT01
9AT
032
AT01
1
AT02
3
AT0
34
A T03
6
AT04
4
AT021AT039
AT037
AT042
AT010
AT006
AT024
AT016
AT025
AT026
AT02
8 AT00
8
AT00
3
AT01
5
AT0
41
AT0
47
AT01
2AT
027
AT040
AT004
AT005
0.0005
AT00
1
AT00
2
Fi
gure
5.5
: An
unro
oted
nei
ghbo
rhoo
d jo
inin
g ra
diat
ion
tree
desc
ribin
g th
e ph
ylog
enet
ic re
latio
nshi
ps a
mon
g 45
mtD
NA
dA
TP
hapl
otyp
es in
gre
y m
acke
rel.
Pre
sum
ed a
nces
tral h
aplo
type
s (e
.g. A
T01
&A
T02)
are
at t
he o
rigin
s of
eac
h ra
diat
ion
whe
reas
der
ived
ha
plot
ypes
are
on
the
tips.

Grey mackerel management units in northern Australia
100
5.4 Discussion
5.4.1 Species identification Accurate species identification is of critical importance in Scomberomorus as they are
speciose (four in tropical Australia, but many more in Indo-pacific), morphologically similar
and hybridization is known to occur (Banford et al. 1999, Rao and Lakshmi 1993 but see
Collette 1994). We went to great lengths to identify and exclude non grey mackerel
individuals from our dataset by considering only fully genotyped individuals and excluding
those whose genetic profiles did not conform to expectations. This was necessary because
hybrids among Scomberomorus are likely to be morphologically cryptic. Indeed we did find
some misidentified school mackerel and also uncovered evidence of hybridization of grey
mackerel with both school and spotted mackerel. Further work is clearly required to
determine the prevalence and nature of hybridization among Scomberomorus in Australian
waters as it may have implications for fisheries management. Fishing patterns altering
species densities could be linked to the prevalence of hybridization where spawning
aggregations are co-located. Persistent hybrid forms could pose challenges for fisheries
management as they may not be covered by regulation.
5.4.2 Stock identification We have compelling evidence for stock structuring in grey mackerel populations using both
microsatellite and mtDNA markers. All markers revealed concordant patterns showing WA
and NW NT to be clearly divergent stocks. The mtDNA D-loop fragment appeared to have
more power to resolve stock boundaries because it was able to show that the GOC and east
coast QLD stocks were genetically differentiated. We interpret this as clear evidence for
broad scale stock structuring in grey mackerel and is consistent with previous allozyme data
(Cameron and Begg 2002).
Geographic distance can only partly explain the genetic distinctiveness of the WA stock as
the genetic break here also coincides with a species distribution break along the Kimberly’s
coastline. Grey mackerel are an inshore species and have preference for shallow turbid
waters. Not only are grey mackerel uncommon in this region but the genetic evidence
indicates that migration across the Kimberly’s is also rare. Extrapolating from the observation
of limited genetic differentiation over continuous habitat in northern and eastern Australia, we
would expect similar low levels of genetic differentiation of grey mackerel throughout their
WA distribution.

Grey mackerel management units in northern Australia
101
Patterns of stock structure on a finer scale, or where stock boundaries are located, are less
clear. For both mtDNA and microsatellite data significant structure was observed between
some locations and in the process of pooling adjacent insignificant populations some of
these differences were not evident. Stock structuring only became apparent after several
rounds of pooling adjacent, genetically homogenous locations. From an initial 12 locations
we identified four stocks, two stocks comprised of single sampling localities (WA and NW
NT) while the other two comprised of six (GOC) and four (EC QLD) pooled sampling
localities. It is apparent that grey mackerel stock boundaries in the GOC and EC QLD do not
have hard edges, rather they have soft edges. For example, PO8 may have clustered with
the other GOC locations due to our pooling rules but it is genetically very similar to locations
on the EC QLD and would not look out of place there. This is to be expected given grey
mackerels potential for movement and that there is no apparent physical isolating
mechanisms between populations.
5.4.3 Historical processes The northern Australian coastline with its vast shallow waters encompassing the Gulf of
Carpentaria and the Arafura Sea is profoundly affected by sea level change each glacial
cycle. Most of this region was dry land during the Last Glacial Maximum 18,000 years ago
and at its peak when sea levels were 120-150 m below present (Chappell & Shackleton
1986, Voris 2000), the Torres Strait formed a land bridge between the Australian and Papua
New Guinean mainland effectively isolating tropical species from east to west. The patterns
of molecular diversity in many marine species still have signatures reflecting these historical
geological processes of isolation and recolonisation (Spanish mackerel, Buckworth et al.
2006; Barramundi, Chenoweth et al. 1998; Marine turtles, Dethmers et al. 2006; sea snakes,
Lukoshek et al. 2007; mud crabs, Gopurenko and Hughes 2002). The most recent grey
mackerel colonization of northern Australia occurred in the last 6-10,000 years when sea
levels were comparable to contemporary levels. The star shaped phylogenies of grey
mackerel mtDNA are characteristic of past population colonization and expansion most likely
as a response to historical sea level change opening up new habitat. The divergent
haplotypes that occur in high frequency throughout Australia were probably at the origins of
independent expansions and radiations. Subsequent gene flow has been so pervasive that it
is no longer possible, at least with this dataset, to reconstruct historical colonization
pathways. Nor is it possible to tease apart whether this mixing is ongoing in some locations
or whether gene flow is restricted in contemporary populations and our failure to detect this is
due to a slow return to genetic equilibrium. The observation that we were able to elucidate

Grey mackerel management units in northern Australia
102
some stock structure across this species range indicates that contemporary levels of gene
flow are more restricted compared to the past.
5.4.4 Implications for fisheries management While the preference of fisheries managers is for hard stock boundaries to be defined, or
even more preferably, for stock boundaries to be concordant with pre-existing fisheries
jurisdictions, rarely is this achievable for wild fish populations. Fisheries managers are likely
to be comforted, at least from a genetic perspective, that stock boundaries largely conform to
state jurisdictions. The exception being in the Gulf of Carpentaria that straddles both
Queensland and Northern Territory waters where we could find no evidence for population
subdivisions. While this finding indicates that movement of fish through this habitat is
considerable over ecological timescales, it does not preclude a scenario where movement is
limited over generational timescales; a timescale more relevant to the management of fish
stocks. That said, evidence gathered from other stock discrimination techniques (growth
parameters, Chapter 4; otolith microchemistry, Chapter 6; parasites, Chapter 7) is consistent
with considerable movement of grey mackerel in the Gulf of Carpentaria. Joint management
is well within the capabilities of the state based authorities as several precedents exist to
manage GOC fisheries cooperatively.
5.5 References
Arevalo E, Davis SK and Sites JW (1994) Mitochondrial DNA Sequence Divergence and Phylogenetic Relationships among Eight Chromosome Races of the Sceloporus grammicus Complex (Phrynosomatidae) in Central Mexico. Systematic Biology, 43(3), 387-418. Begg, G.A., Keenan, C.P. and Sellin, M.J. (1998). Genetic variation and stock structure of school mackerel and spotted mackerel in northern Australian waters. J. Fish Biol. 53: 543-559. Begg, G.A. and Waldman, J.R. (1999) An holistic approach to fish stock identification. Fisheries Research. 43: 35-44. Broderick D, Ovenden JR and Street R (In press) Isolation and characterisation of microsatellite markers in narrow-barred spanish mackerel (Scomberomorus commerson) and their use in other mackerel and tuna. Molecular Ecology Notes. Broughton RE, Stewart LB and Gold JR (2002) Microsatellite variation suggests substantial gene flow between king mackerel (Scomberomorus cavalla) in the western Atlantic Ocean and Gulf of Mexico. Fisheries Research, 54, 305-316. Buckworth RC, Newman SJ, Ovenden JR, Lester RJG and McPherson GR (2007) The stock structure of Northern and Western Australian Spanish mackerel. Final Report, Fisheries Research & Development Corporation Project, 1998/159. Fisheries Group, Department of

Grey mackerel management units in northern Australia
103
Business Industry and Resource Development, Northern Territory Government, Darwin, Australia, 225p. Cameron, DS and Begg, G (2002) Fisheries biology and interaction in the northern Australian small mackerel fishery, projects 92/144 and 92/144.02 Department of Primary Industries, Queensland QO 02006, 236pp. Chappell J and Shackleton NJ (1986) Oxygen isotopes and sea level. Nature, 324, 137-140. Chenoweth, S., JM Hughes, CP Keenan and S Lavery (1998) When Oceans Meet: A Teleost Shows Secondary Intergradation at an Indian-Pacific Interface. Proceedings Biological Sciences, 265 (1394), 415-420. Clement M, Posada D and Crandall KA (2000) TCS: a computer program to estimate gene genealogies. Molecular Ecology, 9, 1657-1659. Collette, BB. (1994) Scomberomorus lineolatus is a valid species of Spanish mackerel, not an interspecific hybrid: a reply. Journal of Natural History, 28(5), 1205-1208. Collette, BB, and Russo, JL. (1985) Morphology, systematics, and biology of the Spanish mackerels (Scomberomorus, Scombridae), Fishery Bulletin, US, 82, 545-692. Dethmers, KEM, Broderick D, Moritz C, Fitzsimmons NN, Limpus CJ, Lavery S, Whiting S, Guinea M, Prince RIT and Kennett R (2006) The genetic structure of Australasian green turtles (Chelonia mydas): exploring the geographical scale of genetic exchange. Molecular Ecology, 15(13): 3931-3946. Dizon, A.E., Lockyer, C., Perrin, W.F., Demaster, D.P. and Sisson, J. (1992) Rethinking the stock concept: a phylogeographic approach. Conserv. Biol. 6: 24-36. Dudgeon C, Feldheim K, Schick M and Ovenden J (2006) Polymorphic microsatellite loci for the zebra shark Stegostoma fasciatum. Molecular Ecology Notes 6, 1086-1088. Excoffier L, Laval G, and Schneider, S (2005) Arlequin ver. 3.0: An integrated software package for population genetics data analysis. Evolutionary Bioinformatics Online 1:47-50 FRDC (2002) 2001/011 GENETAG: Genetic mark-recapture for real-time harvest rate monitoring - pilot studies in northern Australian Spanish mackerel (Scomberomorus commerson) fisheries. Australian Fisheries Research and Development Corporation. Gold JR, Pak E and De Vries DA (2002) Population structure of king mackerel (Scomberomorus cavalla) around peninsular Florida, as revealed by microsatellite DNA. Fishery Bulletin, 100, 491–509. Gopurenko, D and Hughes, J (2002) Regional patterns of genetic structure among Australian populations of the mud crab, Scylla serrata (Crustacea: Decapoda): evidence from mitochondrial DNA. Marine and freshwater research, 53(5), 849-857. Herwerden LV, Benzie J, Peplow L, and Davies C (2000b) Microsatellite markers for coral trout (Plectropomus laevis) and red throated emperor (Lethrinus miniatus) and their utility in other species of reef fish. Molecular Ecology, 9, 1929-1931. Hurwood DA and Hughes JM (1998) Phylogeography of the freshwater fish, Mogurnda adspera, in streams of northeastern Queensland, Australia: evidence for altered drainage patterns. Molecular Ecology, 7 (11):1507-1517.

Grey mackerel management units in northern Australia
104
Inoue JG, Miya M, Tsukamoto K and Nishida M (2001) A Mitogenomic Perspective on the Basal Teleostean Phylogeny: Resolving Higher-Level Relationships with Longer DNA Sequences. Molecular Phylogenetics and Evolution, 20 (2), 275-285. Kumar S, Tamura K and Nei M (2004) MEGA3: Integrated software for Molecular Evolutionary Genetics Analysis and sequence alignment. Briefings in Bioinformatics 5:2. Lukoshek V, M Waycott and H Marsh. (2007) Phylogeography of the olive sea snake, Aipysurus laevis (Hydrophiinae) indicates Pleistocene range expansion around northern Australia but low contemporary gene flow. Molecular Ecology, 16 (16), 3406-3422. Moore B. R., Buckworth R. C., Moss H. and Lester R. J. G. (2003) Stock discrimination and movements of narrow-barred Spanish mackerel across northern Australia as indicated by parasites. Journal of Fish Biology. 63, 765-779 Moritz C (1994) Defining evolutionarily significant units for conservation. Trends in Ecology & Evolution. 9: 373–375. Ovenden J, Salini JP, Street R and O´Connor S (2004) Pronounced genetic population structure in a potentially vagile fish species (Pristipomoides multidens, Teleostei; Perciformes; Lutjanidae) from the East Indies triangle. Molecular Ecology 13, 1991-1999. Ovenden JR, Lloyd J, Newman SJ, Keenan CP and Slater LS (2002) Spatial genetic subdivision between northern Australian and southeast Asian populations of Pristipomoides multidens: a tropical marine reef fish species. Fisheries Research 59, 57-69. Ovenden JR and Street R (2003) Genetic population structure of mangrove jack, Lutjanus argentimaculatus (Forsskäl, 1775). Marine and Freshwater Research 54, 127-137. Paetkau D and Strobeck C (1994) Microsatellite analysis of genetic variation in black bear populations. Molecular Ecology, 3, 489–495. Peakall R and Smouse PE (2006) GenAlEx 6: genetic analysis in Excel. Population genetic software for teaching and research. Molecular Ecology Notes. Saitou N and Nei M (1987) The neighbor-joining method: A new method for reconstructing phylogenetic trees. Molecular Biology and Evolution. 4, 406-425. Salini JP, Ovenden JR, Street R, Pendrey R and Haryanti, N (2006) Genetic population structure of Lutjanus malabaricus and L. erythropterus between eastern Indonesia and Australia: reconciling allozyme and mtDNA evidence. J. Fish. Biol. 68, 217-234. Schuelke M (2000) An economic method for the fluorescent labeling of PCR fragments. Nature Biotechnology 18, 233-234. Slatkin, M. (1995) A measure of population subdivision based on microsatellite allele frequencies. Genetics 139: 457-462. Staden R, Beal KF and Bonfield JK (1988) The Staden Package. Computer Methods in Molecular Biology, pages 115-130, vol. 132: Bioinformatics Methods and Protocols Eds Stephen Misener and Steve A. Krawetz. The Humana Press Inc., Totowa, NJ 07512.

Grey mackerel management units in northern Australia
105
Tamura K and Nei M (1993) Estimation of the Number of Nucleotide Substitutions in the Control Region of Mitochondrial-DNA in Humans and Chimpanzees. Molecular biology and evolution, 10, 512-526. Voris HK (2000) Maps of Pleistocene sea levels in Southeast Asia: shorelines, river systems and time durations. Journal of Biogeography, 27, 1153-1167. Waldman, J. (1999) The importance of comparative studies in stock analysis. Fisheries Research 43: 237-246. Ward RD, Ovenden JR, Meadows JRS, Grewe PM and Lehnert SA (2006) Population genetic structure of the brown tiger prawn, Penaeus esculentus, in tropical northern Australia. Marine Biology 148, 599-607. Ward RD, Zemlak TS, Innes BH, Last PR and Hebert PDN (2005) DNA barcoding Australia’s fish species. Phil. Trans. R. Soc. B doi:10.1098/rstb.2005.1716. Weir BS and Cockerham CC (1984) Estimating F-statistics for the analysis of population structure. Evolution 38, 1358-1370.

Grey mackerel management units in northern Australia
106

Grey mackerel management units in northern Australia
107
6. STOCK STRUCTURE OF GREY MACKEREL, SCOMBEROMORUS SEMIFASCIATUS, ACROSS NORTHERN AUSTRALIA BASED ON OTOLITH ISOTOPE CHEMISTRY SJ Newman, I Wright, BM Rome, MC Mackie, P Lewis, RC Buckworth, AC Ballagh, RN Garrett, J Stapley, D Broderick, JR Ovenden, RJG Lester and DJ Welch
6.1 Introduction
An important concern for the rational management of fisheries is the ability to discern the
stock structure of the targeted fish species so that each stock or management unit can be
managed in an optimal manner (Begg et al., 1999; Newman et al., 2000). Information on
stock structure is particularly important for fish species that are highly targeted and heavily
exploited and/or are being managed as a single homogeneous stock or management unit.
Knowledge of the stock structure of fish populations aids in the development of rational
management plans that facilitate ecologically sustainable development by defining the
appropriate spatial scale of fisheries management (Newman et al., 2000).
Previous studies have used stable isotopes within the otolith carbonate of fish to delineate
separate stocks or management units and thus the degree of mixing of fish populations
among different areas (Edmonds and Fletcher, 1997; Kennedy et al., 1997; Schwarcz et al.,
1998; Edmonds et al., 1999; Newman et al., 2000; in review). Stable isotopes are neutral,
non-radioactive variants of an element and as a result of their slightly different atomic mass;
their relative incorporation into fish otoliths can be modified by environmental conditions or
biological activity (Campana, 1999). The stable isotopes of oxygen within fish otolith
carbonate are deposited in equilibrium, or very close to equilibrium, with the ambient
seawater. Therefore, if there is no significant variation in the isotopic composition of the
seawater across the area under study, differences in the average sea temperature should be
reflected in the oxygen isotope ratios (Kalish, 1991; Thorrold et al., 1997; Campana, 1999).
In contrast, the stable isotopes of carbon are deposited in otoliths under non-equilibrium
conditions unrelated to ambient seawater (Mulcahy et al., 1979; Kalish, 1991; Campana,
1999). The disequilibria observed in carbon stable isotopes in fish otolith carbonates have
been attributed to metabolic effects, habitat changes and nutrient sources for fish (Kalish,
1991; Thorrold et al., 1997, Schwarcz et al., 1998).

Grey mackerel management units in northern Australia
108
The grey mackerel, Scomberomorus semifasciatus (Macleay), has a restricted distribution
and is confined to the waters of southern Papua New Guinea and around northern Australia
from Shark Bay in Western Australia to northern New South Wales on the east coast
(Collette, 2001). S. semifasciatus is known as an epipelagic, neritic, coastal species that can
attain a maximum size of at least 1.2 m and 10 kg (Collette, 2001). In Australian waters, S.
semifasciatus is an important commercial and recreational species that is targeted from as
far south as the Houtman Abrolhos Islands area on the west coast (23°30’S), across northern
Australia and along the east coast to the waters of northern New South Wales (Kailola et al.,
1993).
This study aimed to determine whether it is appropriate to manage stocks of S. semifasciatus
independently in the various management zones across northern Australia. Populations of
S. semifasciatus are currently managed either as separate fisheries or as part of mixed
mackerel fisheries by state-based management agencies in Western Australia, the Northern
Territory and Queensland (Gulf of Carpentaria and East Coast. The effectiveness of
managing the stocks separately depends on the degree of mixing between management
areas. Stable isotope analysis of sagittal otolith carbonate is a quick and relatively
inexpensive technique to study the degree of mixing between fish populations. Previous
studies have indicated that over a wide latitudinal (and temperature) range, significant
differences between areas should be detectable, if the fish populations in the various areas
remain separate from each other.
6.2 Materials and Methods
6.2.1 Sampling design Samples of S. semifasciatus were sourced from commercial fishers at each location across
northern Australia. Otoliths were collected from fish at ten locations extending from Western
Australia across northern Australian waters, throughout the Gulf of Carpentaria (GoC) to
Queensland on the east coast of Australia, covering a coastline length of approximately 9000
km (~6500 km in straight line distance). Locations sampled were Western Australia west
coast (WA, Port Hedland), Northern Territory north west coast (NT – nwc, Fog Bay, Bathurst
Island), Northern Territory western GoC mid (NT – wGoC – mid, Cape Shields), Queensland
eastern GoC south west (QLD – eGoC – sw, Mornington Island), Queensland eastern GoC
south east (QLD – eGoC – se, Karumba), Queensland eastern GoC mid (QLD – eGoC –
mid, Holroyd, Nassau and Coleman Rivers), Queensland eastern GoC north (QLD – eGoC –
north, Crab Island), Queensland east coast north (QLD – EC – n, Port Douglas), Queensland

Grey mackerel management units in northern Australia
109
east coast mid (QLD – EC – mid, Townsville), Queensland east coast south (QLD – EC – s,
Mackay). Where possible, a target of 40 pairs, of otolith samples (20 male, 20 female), were
collected from each location on two separate occasions, a minimum of six months apart.
6.2.2 Otolith preparation Sagittae were rinsed in water, allowed to dry and stored in vials prior to processing. One
sagitta from each fish was selected at random and cleaned by scrubbing with a nylon brush
under ultrapure water, air-dried (50°C) and crushed to powder in an agate mortar and pestle.
Powdered sagittae were cleaned of organic matter (contaminants) by treatment with
hydrogen peroxide and deproteinated by dissolving and extracting protein using a centrifuge.
Powdered sagittae were then analysed for 18O/16O and 13C/12C ratios by standard mass
spectrometric techniques after the carbonate was decomposed to CO2 with 100% phosphoric
acid. A laboratory reference sample was run every thirty samples. The laboratory reference
sample, consisting of a batch solution of digested otolith reference material, was used to
monitor measurement precision across sample batches, and was subsequently used to
normalise sample batches to a constant reference value. Stable isotope ratios are reported
using the international standard delta (δ) notation relative to the PDB-1 standard for
carbonates (i.e. δ18O and δ13C).
6.2.3 Statistical analysis In order to identify relevant homogeneous groups of the locations an agglomerative,
hierarchical cluster analysis on the mean values of the stable isotope ratios of δ18O and δ13C,
supplemented by MANCOVA and post –hoc analyses, was performed using all sites (a total
of 10 locations). The cluster analysis is based on linkage analysis (closeness) between
different subsets using euclidean distances and is an objective method to determine
minimum variance clustering. In order to remove any confounding effects likely to be
associated with a bias of young fish sampled at a particular location, and to improve
homogeneity and normality and to make treatment effects additive, only mature fish were
included in the analysis. Post-hoc tests from these analyses allowed the identification of
DIGC (disjoint irreducible geographic clusters).
As a tool to quantify the statistical separation between main clusters, discriminant function
analysis was undertaken using the stable isotope ratios of δ18O and δ13C as predictors of
membership to each of the clusters. The observed misclassification rate then provides a
measure of their separation. We first consider only the discrimination between the nearest
neighbour regions (as a simplifying step), producing one discriminating function for each
Grey mackerel management units in northern Australia
110
comparison. In constructing the linear discriminant functions, each cluster was given equal
prior weighting. In order to provide a measure of the misclassification probability between
the clusters we present an analysis of classification errors of each of the discrimination
functions. These statistics then provide an alternative measure of the similarity and
separation between the subregion clusters.
6.3 Results
The dendogram resulting from the cluster analysis of δ18O and δ13C values for the 10
different locations across northern Australia illustrates six natural location groupings (Figure
6.1). Thus, the aggregation of some of these locations into their own natural clusters at the
lowest level provided the following cluster sizes for further analysis; Western Australia
(n=40), Queensland east coast south (n=40), Queensland north (n=91), eastern GoC (n =
101), western and southern GoC (n=324) and the Northern Territory west coast (n=122).
The dendrogram resulting from the cluster analysis of δ18O and δ13C values for the six natural
clusters is illustrated in Figure 2. Examination of the dendrogram (Figure 6.2) of these 6
natural clusters reveals no significant differences among the first 3 clusters and thus they are
combined to form a GoC cluster that represents all GoC sites in addition to those on the
Northern Territory west coast. These 4 significant clusters represent disjoint irreducible
geographic clusters whose closeness can be investigated analytically.
The extent of the separation of these 4 natural clusters above was investigated using
MANCOVA analysis of δ18O and δ13C values as dependent variables and geographic location
as an independent variable for all data points simultaneously. The resulting homogeneous
subsets identified from the post-hoc analysis are aggregated to form 4 contiguous areas.
MANCOVA of the δ18O and δ13C ratios from all S. semifasciatus showed that the location
effect was highly significant (Table 6.1).
In order to identify the pattern of location differences for the bivariate (δ18O and δ13C ratios)
response variable, or rather the degree of statistical separation between sub-clusters of the
dendogram, a bivariate post-hoc test procedure, similar in operation to the univariate
response situation would be extremely useful, but does not appear to be available in the
statistical methodology literature. In this less than ideal world, the approach we take below
represents the best we can get from existing methodology. Since the δ18O ratio provides
much more discriminatory power than the δ13C ratio, evidenced by the much lower p-values
associated with location main effect in the respective analyses of variance, homogeneous

Grey mackerel management units in northern Australia
111
subsets based on Duncans Test were determined for the δ18O ratio within the clusters and
are shown in Tables 6.2 – 6.3. The various mutually exclusive subsets of the various
clusters are of considerable interest, and we designate them as DIGC, and see them as the
base units of the population.
Examination of the homogenous subsets of δ18O in Table 2 showed WA and QLD east coast
south to be very similar, and significantly different from the other locations. Examination of
the homogenous subsets of δ13C in Table 3 showed WA and QLD east coast south to be
significantly different, with QLD east coast south and QLD north very similar. Thus all 4 main
clusters are significantly different and provide conclusive evidence of population subdivision.
These represent the DIGC across northern Australia.
The discriminant function analyses between the identified groups are summarised in Table 4.
For the discrimination between the GoC and the QLD north clusters, 425 of the 547 GoC
values are correctly classified and 75 of the 91 QLD north values are correctly classified. In
the discrimination between the QLD north and QLD EC south clusters, 74 of the 91 QLD
north values are correctly classified and 32 of the 40 QLD EC south values are correctly
classified. These discriminant functions clearly discriminate among clusters.
Tree Diagram for 10 VariablesSingle Linkage
Euclidean distances
0.0 0.1 0.2 0.3 0.4 0.5 0.6 0.7
Linkage Distance
PortHeadland
QleastcoastSou
QleastcoastMid
QlEastcoastFN
QlsoueastGOC
QlnoreastGOC
NTmidwestGOC
QlsweastCOC
QlmideastGOC
NTnwcoast
Figure 6.1: Dendogram summarising cluster analysis of mean δ18O and mean δ13C values for S. semifasciatus sagittal otolith carbonate for all locations across northern Australia.

Grey mackerel management units in northern Australia
112
Tree Diagram for 6 VariablesSingle Linkage
Euclidean distances
0.1 0.2 0.3 0.4 0.5 0.6 0.7
Linkage Distance
mwWA
cQ
nQ
eGOC
wcGOC
NTwC
Figure 6.2: Dendogram summarising cluster analysis of mean δ18O and mean δ13C values for S. semifasciatus sagittal otolith carbonate for the six natural clusters derived from Fig 1.
Table 6.1: MANCOVA results of δ18O and δ13C values from the sagittal otolith carbonate of Scomberomorus semifasciatus from the four significant natural clusters.
Tests of Between-Subjects Effects
43.656a 3 14.552 79.643 .00083.536b 3 27.845 222.441 .000
4133.698 1 4133.698 22623.447 .000373.106 1 373.106 2980.515 .00043.656 3 14.552 79.643 .00083.536 3 27.845 222.441 .000
130.460 714 .18389.380 714 .125
13623.759 7182157.697 718174.117 717172.916 717
Dependent Variablecarbonratoxyratcarbonratoxyratcarbonratoxyratcarbonratoxyratcarbonratoxyratcarbonratoxyrat
SourceCorrected Model
Intercept
loccode02
Error
Total
Corrected Total
Type III Sumof Squares df Mean Square F Sig.
R Squared = .251 (Adjusted R Squared = .248)a.
R Squared = .483 (Adjusted R Squared = .481)b.

Grey mackerel management units in northern Australia
113
Table 6.2: Analyses of homogeneous subsets based on Duncans Test were determined for the δ18O ratio from the four significant natural clusters.
Location N Subset
1 2 3
GoC 547 -1.846
QLD north 91 -1.264
WA 40 -0.876
QLD south 40 -0.855
Sig. 1.000 1.000 .737
Means for groups in homogeneous subsets are displayed, based on Type III Sum of
Squares. The error term is Mean Square (Error) = .125 (a = uses Harmonic Mean Sample
Size = 63.677, b = alpha = 0.05).
Table 6.3: Analyses of homogeneous subsets based on Duncans Test were determined for the δ13C ratio from the four significant natural clusters.
Location N Subset
1 2 3
GoC 547 -4.445
QLD north 91 -4.105
QLD south 40 -4.094
WA 40 -3.470
Sig. 1.000 0.885 1.000
Means for groups in homogeneous subsets are displayed, based on Type III Sum of
Squares. The error term is Mean Square (Error) = .183 (a = uses Harmonic Mean Sample
Size = 63.677, b = alpha = 0.05).

Grey mackerel management units in northern Australia
114
Table 6.4. Discriminant function analysis results from comparison of clusters (the structure matrix consists of pooled within-group correlations between discriminating variables and standardized canonical discriminant functions with the variables ordered by the absolute size of the correlation within functions, all tests are significant p < 0.001).
Discriminant analysis – GoC vs QLD north
Crosstabulation
Cluster Predicted Group for
Analysis
GoC QLD north Total
GoC
QLD north
Total
425
16
441
122
75
197
547
91
638
Discriminant analysis – QLD north vs QLD EC south
Crosstabulation
Cluster Predicted Group for
Analysis
Q north Q EC south Total
QLD north
QLD EC south
Total
74
8
82
17
32
49
91
40
131
6.4 Discussion
In this study, significant and consistent differences in the isotopic composition of otoliths
among populations of S. semifasciatus from a number of locations were established. Four
major groups of S. semifasciatus were identified: Western Australia, North Australia/Gulf of
Carpentaria, northern Queensland east coast and central Queensland east coast.
Differences in the isotopic composition of whole otoliths indicate that these groups must have
spent their life history in different locations. The magnitude of the difference between the
groups suggests a prolonged separation period at least equal to the fish’s life span.
The greatest difference in otolith isotopic signatures was found between S. semifasciatus
between Western Australia and all other groups. This indicates that the Ria coast of the
Kimberley region of Western Australia may be an effective barrier to adult movement.
Grey mackerel management units in northern Australia
115
Smaller but significant differences were found among the other groups. If S. semifasciatus
freely migrated among groups the difference in isotopic signatures between the groups would
not be present, as they would inhabit similar environments. The differences in isotopic
signatures indicate that population separation exists and that these groups remain largely
separate and non-mixing. The Gulf of Carpentaria locations sampled were not discriminated
from each other and neither was the northern Australia site near Darwin suggesting that the
Gulf of Carpentaria and northern Australia is widely mixed.
The results from this study provide support for the view that adult populations of S.
semifasciatus do not represent a single homogeneous stock. Populations of S.
semifasciatus are currently managed separately by state-based management agencies in
Western Australia, the Northern Territory and Queensland (Gulf of Carpentaria and East
Coast) either separately or as part of mixed mackerel fisheries. Little spatial structure is
currently assumed in those states with formal management arrangements in place.
Commercial fisheries management is generally based upon controlling effort within the
fisheries rather than its output; however this is not consistent among the different
jurisdictions. Within each state management is based on the implicit assumption that each
population represents a single homogeneous stock and that demographic parameters do not
vary substantially. The presence of spatial subdivision among adult assemblages of S.
semifasciatus and thus the formation of distinct management units suggest that the spatial
scale of management needs to be reviewed. For example, there is a shared stock within the
Gulf of Carpentaria and the results of this study strongly suggest that the management of this
stock needs to be redesigned taking into consideration the existence of these different
groups or management units.
The present study demonstrated that the stable isotope composition of sagittal otoliths of S.
semifasciatus can be used effectively to delineate assemblages of fish where there is
sufficient water temperature variation to enable differences in δ18O to be detected. The
method provides strong evidence of stock separation at the juvenile and adult stage when
there are differences in stable isotope ratios between fish assemblages. However, this
method does not provide any information regarding mixing or movement during the pelagic
larval stage.
6.5 References
Begg, G.A., Friedland, K.D. and Pearce, J.B. (1999) Stock identification and its role in stock assessment and fisheries management: an overview. Fisheries Research, 43, 1–8.

Grey mackerel management units in northern Australia
116
Campana, S.E. (1999) Chemistry and composition of fish otoliths: pathways, mechanisms and applications. Marine Ecology Progress Series, 188, 263-297. Collette, B.B. (2001). Scombridae. Tunas (also, albacore, bonitos, mackerels, seerfishes, and wahoo). In: Carpenter, K.E. & Niem, V. (Eds.), FAO Species Identification Guide for Fishery Purposes. The Living Marine Resources of the Western Central Pacific, vol. 6. Bony fishes, part 4 (Labridae to Latimeriidae). FAO, Rome, pp. 3721–3756. Edmonds, J.S. and Fletcher, W.J. (1997) Stock discrimination of pilchards Sardinops sagax by stable isotope ratio analysis of otolith carbonate. Marine Ecology Progress Series, 152, 241-247 Edmonds, J.S., Steckis, R.A., Moran, M.J., Caputi, N. & Morita, M. (1999) Stock delineation of pink snapper Pagrus auratus and tailor Pomatomus saltatrix from Western Australia by analysis of stable isotope and strontium/calcium ratios in otolith carbonate. Journal of Fish Biology, 55, 243-259. Kailola, P.J., Williams, M.J., Stewart, P.C., Reichelt, R.E., McNee, A. & Grieve, C. (1993) Australian fisheries resources. Bureau of Resource Sciences, Department of Primary Industries and Energy, and the Fisheries Research and Development Corporation. Canberra, Australia. 422p Kalish, J.M. (1991) 13C and 18O disequilibria in fish otoliths: metabolic and kinetic effects. Marine Ecology Progress Series, 75, 191-203. Kennedy, B.D., Folt, C.L., Blum, J.D., Chamberlain, C.P. (1997) Natural isotope markers in salmon. Nature, 387, 766-767. Mulcahy, S.A., Killingly, J.S., Phleger, C.F. & Berger, W.H. (1979) Isotopic composition of otoliths from a bentho-pelagic fish, Coryphaenoides acrolepis, Macrouridae: Gadiformes. Oceanologica Acta, 2, 423–427. Newman, S.J., Steckis, R.A., Edmonds, J.S. & Lloyd, J. (2000) Stock structure of the goldband snapper, Pristipomoides multidens (Pisces: Lutjanidae) from the waters of northern and western Australia by stable isotope ratio analysis of sagittal otolith carbonate. Marine Ecology Progress Series, 198, 239-247. Newman, S.J., Buckworth, R.C., Mackie, M., Lewis, P.D., Wright, I.W., Williamson, P.C., Bastow, P.D. & Ovenden, J.R. (in review) Spatial subdivision among assemblages of Spanish mackerel, Scomberomorus commerson (Pisces: Scombridae) across northern Australia: implications for fisheries management. Schwarcz, H.P., Gao, Y., Campana, S., Browne, D., Knyf, M. & Brand, U. (1998) Stable carbon isotope variations in otoliths of Atlantic cod (Gadus morhua). Canadian Journal of Fisheries and Aquatic Sciences, 55, 1798-1806. Thorrold, S.R., Campana, S.E., Jones, C.M. & Swart, P.K. (1997) Factors determining δ13C and δ18O fractionation in aragonitic otoliths of marine fish. Geochimica et Cosmochimica Acta, 61, 2909-2919.

Grey mackerel management units in northern Australia
117
7. THE STOCK STRUCTURE OF GREY MACKEREL SCOMBEROMORUS SEMIFASCIATUS IN AUSTRALIA AS INFERRED FROM ITS PARASITE FAUNA RA Charters, RJG Lester, RC Buckworth, SJ Newman, JR Ovenden, D Broderick, O Kravchuk and DJ Welch
7.1 Introduction
Parasites are ubiquitous (Torchin et al., 2002) and it has been suggested that almost every
fish caught commercially has at least one parasite (Lester, 1990). The high occurrence of
parasites in fish species presents an opportunity to use them as biological markers to explore
stock structure (MacKenzie, 2002). One of the advantages of using biological markers over
other more-intrusive methods, such as tagging, is that information about the history of the
animal is available from one sampling event. This means that there is no effect of catching
and releasing an animal that may result in a reduction in growth or change in behaviour that
may bias results.
Parasites have been used as biological markers to discern the stock structure of a number of
fish species (Lester, 1990; Melendy et al., 2005; MacKenzie and Abaunza, 2008; Mackenzie
et al., 2008). In theory, if the number and type of parasites of two groups of fish are similar
they are likely to have had some common history. In contrast, if the parasitic load of one
group of fish is significantly different from that of another group of fish they are likely to have
had a separate history. The length of time the parasite is visible in the fish determines for
how long parasite data can be informative about fish movement.
A stock can be considered to be a group of fish, possibly a breeding population, which
exhibits no significant mixing with neighbouring individuals for a temporal period defined by
the longevity of the parasite fauna in the host. Therefore, to develop a long-term
understanding of the history of the fish, permanent (long-lived) parasites are preferable to
temporary (short-lived) ones (Lester, 1990).
The grey mackerel is an important commercial and recreational fish species across northern
Australia. Despite its importance little is known about its stock structure and movement,
knowledge is now required to ensure the sustainable harvest and management of the

Grey mackerel management units in northern Australia
118
resource. This study aims to elucidate both the spatial and temporal stock structure of grey
mackerel across northern Australia using its parasite fauna.
7.2 Materials and Methods
Data from 593 fish between 1 and 9 years old were analysed from 21 samples collected from
11 locations around the coasts of the Northern Territory and Queensland by commercial
shark and mackerel fishing operators during 2005 – 2007 (Table 7.1). The samples collected
from Western Australia were damaged by heat so were not analysed for parasites. A pilot
study of the parasite fauna of whole fresh grey mackerel (Charters, 2006, unpublished
honours thesis), identified four parasites considered suitable for stock identification analyses,
Pterobothrium pearsoni, Callitetraryhnchus gracilis, Anisakis simplex and Terranova sp.
Fresh samples to accurately identify these parasites were collected from the eastern Gulf of
Carpentaria and the east coast of Queensland. Live trypanorhynchs were placed in fresh
water for approximately 30 minutes to encourage their tentacles to evert. When the tentacles
had everted, specimens were fixed in 3% gluteraldehyde in 0.2 M sodium cacodylate buffer
(Gestal and Azevedo, 2005). Samples were dehydrated using critical point drying
(Sarmiento, 2006), coated in platinum and examined under a scanning electron microscope
(SEM) using standard techniques (Gerrity and Forbes, 2003; Giberson et al. 1997; Giberson
et al. 2003).
Gills and viscera for parasitological examination were frozen after measuring the fish.
Dissections were carried out using the methods of Lester et al. (2001) with the exception that
the whole stomach wall was examined. The four parasites selected were well attached and
easily observed making counts reliable and relatively easy to do, thus improving the
dependability of the analyses and reducing time spent processing samples.
All fish were between 1 and 9 years old (3 fish older than 9 years were excluded from the
analyses). For the analyses the parasite counts were transformed using log (counts + 0.05).
Second order polynomial contrast analysis was conducted to evaluate the effect of age on
parasite numbers in GenStat, v 1.1 using the ANOVA procedure. The parasite abundances
in different samples were compared using univariate (ANOVA) and multivariate (MANOVA,
canonical discriminant analysis) analyses. A log(x+0.05) transformation of the parasite
numbers was applied in both cases. Multivariate analyses used eigen values generated in
Minitab 14.

Grey mackerel management units in northern Australia
119
7.3 Results.
Parasites identified in the preliminary study and selected for analysis were the
trypanorhynchs Pterobothrium pearsoni and Callitetrarhynchus gracilis (Figure 7.1), and
juvenile nematodes identified as Anisakis simplex and Terranova Type II (after Cannon
1977). These parasites were mainly encysted in the liver and stomach wall. The parasites
selected were considered to be long lived based on their suspected life cycle (see
Discussion) and because few were found dead in the host.
The four parasites being long-lived and acquired through the diet were expected to
accumulate in fish as the fish age. A positive linear trend in parasite counts and fish age was
significant in A. simplex though the coefficient of explained variation was very small
(R2=3.5%) and when the site effect was taken into account the age correlation was no longer
significant. Pterobothrium pearsoni showed a negative correlation with age even after the
site effect was taken into account though the coefficient of determination was again very
small (< 5%). For C. gracilis and Terranova sp. there was no correlation with age. As the
correlations were weak or absent, parasite abundances were not adjusted to a fish of a
standard age prior to the multivariate analyses. Most frozen trypanorhynchs had died without
everting their tentacles. However, once the species had been identified from fresh samples,
the morphology of the scolex, bothridia and blastocyst were considered adequate for
diagnostic purposes. C. gracilis had a double-walled cyst noticeably different to the smaller
single walled cysts of P. pearsoni. Terranova spp. differed from A. simplex in their smaller
size and the presence of an intestinal caecum
A B
Figure 7.1. SEM images of the bothridia and metabasal armatures A. Pterobothrium pearsoni. Scale bar = 100µm. B. Callitetrarhynchus gracilis. Scale bar = 1mm.

Grey mackerel management units in northern Australia
120
Summary statistics for each of the samples including sample size, mean length and age of
the fish, and mean abundance for each of the parasites from each location are given in Table
7.1. In four cases samples were in two parts (A+B, E+F, H+I, and Q+R). These were
combined in later analyses unless otherwise stated. The varied range of ages among
samples was unknown until after the samples had been dissected. Given the poor
relationships between fish age and parasite abundance, data from all 9 age classes were
combined in the analyses.
7.3.1 Univariate analysis The Tukey-Kramer pair-wise comparisons (Table 7.2) indicated which pairs of samples had
one or more parasites that were significantly different at a 95% level of confidence. Thus by
chance, significant differences in one parasite may arise every 20 comparisons. If two or
more parasites differ for the same comparison it is an indication that the differences may be
biologically significant. Table 7.2 shows that fish from the east coast, sites A to G, show few
differences among themselves but are generally different from elsewhere. Fish on the
eastern side of the Gulf of Carpentaria generally have similar parasite faunas except for the
northern location of Crabb Island (L) which appears more similar to fish on the east coast.
Locations sampled within the western Gulf are similar and also tend to be similar with the
rest of the locations within the entire Gulf. Within the NT northwest coast locations (O, P and
Q) samples were very similar but were notably different from the east coast and the eastern
Gulf, but not the western Gulf. Temporal (between-year) comparisons among the locations
EC S (E v G), EG mid (H v J), WG mid (S v T) and NW NT (O v Q) all showed no differences.

Grey mackerel management units in northern Australia
121
Table 7.1. Collection details for the 17 sample and 4 subsample locations with means for the fish lengths, ages, and abundance of the four parasite species (untransformed data). Location Sample
date #
fishMean
FL Mean age
P. pears.
C. gracilis
Terra-nova
A. simplex
A EC mid Oct 2005 22 776 3.5 2.1 1.5 79 0.3 B EC mid Sep 2005 49 716 3.1 1.3 1.9 17 0.2 C EC N Nov 2006 13 718 3.1 2.4 1.5 56 0.4 D EC PD Aug 2007 41 788 3.9 0.9 0.9 22 0.9 E EC S Nov 2005 14 619 1.5 0.4 0.8 19 0.1 F EC S Dec 2005 23 693 2.6 0.7 0.2 20 0.9 G EC S Sep 2006 24 796 3.0 0.4 1.3 39 0.1 H EG mid (Coleman R.) Aug 2005 29 723 3.0 3.9 4.9 7 0 I EG mid (Nassau R.) Aug 2005 28 776 4.2 4.9 4.6 13 0 J EG mid Sep 2006 32 766 3.7 4.0 4.3 9 0.1 K EG mid Mar 2007 25 738 3.4 4.2 4.9 11 0 L EG N Apr 2007 27 746 2.8 1.1 0.9 11 0.1 M EG SE Mar 2007 29 722 3.0 5.3 15.8 9 0.1 N EG SW Mar 2007 19 651 1.4 2.2 6.7 10 0 O NW NT May 2005 29 689 2.4 7.4 12.6 15 0 P NW NT Aug 2005 50 789 3.5 7.7 10.1 30 0.2 Q NW NT (Fog Bay) Apr 2007 15 714 2.1 6.2 1.7 15 0 R NW NT (N Bynoe) Apr 2007 25 742 2.8 4.4 3.1 16 0.1 S WG mid Sep 2005 50 750 3.5 8.8 7.8 25 0.6 T WG mid Oct 2006 15 791 3.7 10.9 4.1 23 0.3 U WG SW Nov 2006 34 776 4.0 5.5 1.8 14 0
Table 7.2. Tukey-Kramer significant differences in mean parasite abundance in Scomberomorus semifasciatus between sites. A space indicates no significant difference, the numbers 1-4 indicate that mean parasite abundance was significantly different between the two sites (p < 0.05) for the respective parasites: 1. P. pearsoni, 2.C. gracilis, 3. Terranova Type II larvae, and 4. A. simplex. Sub samples have been combined (A+B, E+F, H+I, and Q+R). A C D E G H J K L M N O P Q S T UA C D E 3 G 3 H 1,2,3 3 1,2,3 1,2,3 1,2,3 J 1,3 3 1,2,3 1,2 1,3 K 1 3 1,2,4 1,2 1,3 L 3 3 1,2 1,2 1,2 M 1,2 2,3 1,2 1,2 1,2,3 2 2 2 1,2 N 2 2,3 2 1,2 1,2 2 O 1,2 1,2,3 1,2 1,2 1,2,3 2 2 2 1,2 1 P 1,2 1,2 1,2 1,2 1,2 1,2,3 1,2,3 1,2,3 1,2 3 1 Q 1 3 1,4 1,2 1 3 1 2 2 2 2 S 1,2 1,2 1,2 1,2 1,2 1,3 1,3 1 1,2 1 2 T 1 1 1 1,2 1 1,3 1 1 1 2 1 2 U 1 1,3 1,4 1 1,3 2 1 2 2 2 2,3 2

Grey mackerel management units in northern Australia
122
7.3.2 Multivariate analysis We were unable to discriminate between any samples or areas using the Random Forests
analytical method. However, the multivariate method clearly distinguished EC fish from the
Gulf of Carpentaria and NT fish (Figure 7.2). Anisakis data had little discriminating ability
and their numbers varied widely. The high mean in one of the EC S samples (F), for
example, was from one fish with 20 A. simplex (CRC0425) while virtually the rest of that
sample was free of the parasite. The variability suggests that one fish may have a very
different history from the other 23 fish in the sample. Figures 7.2 to 7.7 use data from the
other three parasites only.
Figure 7.2. Canonical variate analysis of the abundances of three parasites in the 17 samples and 4 subsamples using transformed data. First two axes are shown. Circles represent approximate 95% rings of confidence.

Grey mackerel management units in northern Australia
123
Figure 7.3. Four pairs of subsamples with their 95% confidence rings. Two pairs in black and two pairs in grey. Note the strong overlaps within the pairs. These pairs are combined in the later figures.
To check the reliability of the multivariate technique, sub samples that were taken from the
same area within a few weeks of one another were analysed separately in the preliminary
analysis. Four pairs are shown in Figure 3 with their approximate 95% confidence limits
(derived from the sample sizes). Samples A and B were from EC mid location, samples E
and F from EC S location, samples H and I (EG mid) from adjacent rivers in the Gulf of
Carpentaria, and samples Q and R were from the NW NT region. The pairs of points fall
relatively close to each other on the graph indicating that the multivariate technique is
surprisingly reliable for these relatively small and somewhat heterogeneous (e.g. in age)
samples of grey mackerel. The pairs have been combined in the other analyses.

Grey mackerel management units in northern Australia
124
Figure 7.4. Samples from EC mid 2005 (A) and EC S 2005 (E) are highlighted in bold for comparison. (Subsamples combined).
The EC region samples fell in a group separate from those from elsewhere (Figure 7.4).
Within this group the parasite fauna from the EC S sample (E) differed greatly from that of
the EC mid sample (A) suggesting little or no mixing. The EC S (G) also is largely distinct
from the EC mid samples. The EC N sample (C), though small, overlaps with EC mid but
appears distinct from the EC PD sample (D). In the comparisons, the most significant
parasite appears to be Terranova sp. (Table 7.2).

Grey mackerel management units in northern Australia
125
Figure 7.5. Eastern Gulf samples, in bold.
From the eastern side of the Gulf of Carpentaria there are five samples (Figure 7.5): EG mid
(H, J & K), the EG N (L) and EG SE (M). Though H, J and K were taken in different years
the parasite faunas are very similar suggesting temporal consistency along the eastern side
of the Gulf. In the south, the EG SE sample (M) only overlaps with one of the EG mid
samples. The EG N sample (L) is very different from all other locations sampled in the EG
and may represent a different subpopulation of fish (Figure 7.5).
Samples from the southern and western Gulf of Carpentaria appear to be more variable and
distinctions and similarities less clear (Figure 7.6). Certainly there is overlap between EG SE
(M) and EG SW (N) but they also show strong similarities to the WG mid locations (S and T).
The only area that seems a little different is WG S (U) which is more similar to the eastern
Gulf samples of J and K than to any others. Thus, in the Gulf of Carpentaria the parasite
samples suggest there could be at least two groups of fish; an eastern group (H, J, K), a
southern and western group (M,N,S,T) and an EC N group (L). This result is somewhat
ambiguous however due to the similarity between the eastern group (EG mid) and the WG
SW (U) location.

Grey mackerel management units in northern Australia
126
On the northwest coast of the Northern Territory, samples O and P show some similarities,
while Q differs (Figure 7.7). All three are not reliably distinguished from the WG mid samples
or the EG SE sample.
Figure 7.6. Samples from southern and western Gulf of Carpentaria (in bold).
Figure 7.7. Samples from the north coast of the Northern Territory in bold.
Grey mackerel management units in northern Australia
127
In four cases, samples were taken from the same areas but in different years. On the EC of
Australia, samples were taken from EC S in 2005 and again in 2006 (Figure 7.4; E and G).
These show little overlap suggesting a different group of fish may have been sampled in the
second year. Similarly on the north coast of the Northern Territory, samples taken in 2005
and 2007 appear to have different parasite faunas (Figure 7.7; O and Q). On the other hand,
samples from the EG taken in 2005 and 2006 (Figure 7.5; H and J) strongly overlap
suggesting the same subgroup of fish were sampled in the second year. Samples from the
WG taken in different years overlap (Figure 7.6; S and T). The fish could still be moving
about but there is insufficient difference between the parasite faunas of these areas to detect
any movement. Thus the parasite data give conflicting results. In two cases the fish in
subsequent years apparently belong to a different group from that sampled in the first year,
and in two cases there is no detectable difference between the years.
7.4 Discussion
The definitive host of the trypanorhynch Pterobothrium pearsoni is unknown but adults in this
genus have been found in carcharinids and other elasmobranchs. The larval parasite
evidently remains alive in the grey mackerel until the fish dies or is ingested by the definitive
host. The trypanorhynch Callitetrarhynchus gracilis has a similar life cycle, having been
found as a larva in over 140 teleost species, and as an adult in 17 species of carcharinids
worldwide (Palm, 2004). The anisakid nematodes Terranova spp. have been found in many
species of marine fish that serve as secondary or paratenic hosts (Doupe et al., 2003).
Those in the grey mackerel probably remain alive until they are ingested by a definitive host,
which is likely to be an elasmobranch or piscivorous bird. The nematode Anisakis simplex
infects cetaceans as definitive hosts (Klimpel et al., 2004). The larvae use grey mackerel as
an intermediate or paratenic host and probably remain alive until they are ingested by the
definitive host.
Combining data from fish of several ages possibly increased variability and decreased
sensitivity though the close similarity of the 4 pairs of subsamples suggested that the method
was reasonably reliable. This was likely to be especially true when two or more samples
from the same region fall together on the canonical graphs.
In a similar study on the closely related S. commerson, Moore et al. (2003) concluded using
canonical analysis found that there were at least 6 parasitologically distinct stocks of S.
commerson across northern Australia, a finding that was supported by otolith isotope

Grey mackerel management units in northern Australia
128
analysis on the same fish species (Newman et al., 2007). In S. semifasciatus the differences
across northern Australia were less marked though differences did exist. This may have
been partly due to the smaller sizes of some of the grey mackerel samples. Had the
samples been added together into larger areas, between-area variability may have
decreased but we would have lost the indication of within-area variability. The S. commerson
analysis also probably benefited from the high abundance of two of its parasite species,
Grillotia branchi and Otobothrium cysticum, which were more prevalent than any of the
parasites in S. semifasciatus.
The parasite faunas of S. semifasciatus were almost indistinguishable over large areas, such
as from NW NT to WG mid. The parasite faunas could be interpreted as evidence that the
fish all belonged to the same stock or alternatively that the probability of infection was similar
over a wide area.
The EG N sample (L) from the near the tip of the York Peninsula had a fauna most similar to
fish from the EC mid region. Again this may indicate that similar parasite faunas occur in the
areas rather than the fish belonging to a common stock. The strong differences between the
EG N sample and the other Gulf samples suggest that Gulf fish are not a homogeneous
group, a conclusion that has already been drawn from comparison of samples from the east
and west sides of the Gulf. However, ambiguities in the fine scale regional comparisons lead
us to conclude the existence of a single Gulf of Carpentaria stock, with the possibility of
localised adult populations.
On the east coast of Queensland the samples come from a heterogeneous population with
samples A and E showing significant differences (Figure 7.4). In a comparative study on S.
commerson, east coast fish from several areas showed great similarity in parasite fauna,
even to the rate at which the parasites were accumulating. That and the seasonal nature of
the southern fishery for S. commerson suggested that part of a relatively homogeneous
population of this species were moving south each summer (Williams and Lester, 2006).
The S. semifasciatus results are quite different; the parasite fauna suggesting these fish are
less mixed and may form sub-populations along the coast.
The parasite data suggest the existence of several stocks of grey mackerel in northern
Australia. Queensland east coast grey mackerel possess a parasite fauna that suggests at
least two east coast stocks are evident: a northern and a southern stock with a separation
apparent somewhere between Townsville and Mackay. The NW NT region also appears to
comprise a separate stock while within the Gulf of Carpentaria there exists a high degree of

Grey mackerel management units in northern Australia
129
variability in parasite faunas among the regions sampled. This may be due to 1. natural
variation within the Gulf and there is one grey mackerel stock, or 2. the existence of multiple
localised adult sub-stocks (metapopulations) within the Gulf of Carpentaria. These results
suggest that localised depletions may warrant concern for the future sustainability of the grey
mackerel resource. It is recommended that for management purposes, fisheries managers
consider these stocks in determining spatial scales for grey mackerel management,
monitoring and stock assessment.
7.5 References
Cameron, D., Begg, G. (2002) Fisheries biology and interaction in the northern Australian small mackerel fishery. Final report to the Fisheries Research and Development Corporation. Projects 92/144 & 92/144.02. The State of Queensland, Department of Primary Industries. Cannon L. R. G. (1977) Some larval Ascaridoids from southeastern Queensland marine fishes. International Journal for Parasitology 7, 233 - 243 Gerrity R. G., Forbes G. W. (2003) Microwave processing in diagnostic electron microscopy. Microscopy Today 11, 38 - 41 Gestal C., Azevedo C. (2005) Ultrastructure of Goussia cruciata (Apicomplexa: Coccidia) infecting the liver of the horse mackerel, Trachurus trachurus (L.), from Ibero-Atlantic waters. Journal of Fish Diseases 28, 125 – 132 Giberson R. T., Demaree R. S. Jr., Nordhausen R. W. (1997) Four-hour processing of clinical/diagnostic specimens for electron microscopy using microwave technique. Journal of Veterinary DdiagnosticInvestigation. 9, 61 -67 Giberson R. T., Austin R. L., Charlesworth J., Adamson G., Herrera G. A. (2003) Microwave and digital imaging technology reduce turnaround times for diagnostic electron microscopy. Journal of Ultrastructural Pathology 27, 187 - 196 Klimpel, S., Palm, H. W., Ruckert, S., Piatkowski, U. (2004). The life cycle of Anisakis simplex in the Norwegian Deep (northern North Sea) Parasitology Research 94, 1-9. Lester R. J. G. (1990) Reappraisal of the use of parasites for fish stock identification. Australian Journal of Marine Freshwater Research 41, 855 – 64. MacKenzie, K., Abaunza, P. (1998) Parasites as biological tags for stock discrimination of marine fish: a guide to procedures and methods. Fisheries Research 38, 45-56. MacKenzie, K., (2002) Parasites as biological tags in population studies of marine organisms: an update. Parasitology. 124, 153 – 163. MacKenzie, K., Campbell, N., Mattiucci, S., Ramos, P., Pinto, A.L., Abaunza, P. (2008). Parasites as biological tags for stock identification of Atlantic horse mackerel Trachurus trachurus L. Fisheries Research 89, 136-145.

Grey mackerel management units in northern Australia
130
Melendy J., McClelland G., Hurlbut T. (2005) Use of parasite tags in delineating stocks of white hake (Urophycis tenuis) from the southern Gulf of St. Lawrence and Cape Breton Shelf. Fisheries Research. 76, 392 – 400. Moore B. R., Buckworth R. C., Moss H. and Lester R. J. G. (2003) Stock discrimination and movements of narrow-barred Spanish mackerel across northern Australia as indicated by parasites. Journal of Fish Biology 63, 765 – 779 Palm, H.W. (2004) The Trypanorhyncha Diesing, 1863. PKSPL-IPB Press, Bogor, x + 710 pp. Sarmiento P. L., Ciarmela M. L., Thevenet P.S., Minvielle M. C., Basualdo J. A. (2006) Comparison of preparation techniques of mixed samples (fungi–helminth eggs) for scanning electron microscopy by critical point drying. Parasitology Research 99, 455 – 458 Torchin, M.E., Lafferty, K.D., Kuris, A.M. (2002) Parasites and marine invasions. Parasitology 124, 137 – 151. Williams, L. E. (2002) Queensland’s fisheries resources. Current condition and recent trends 1988 – 2000. Qld. DPI Information Series QI02012 Williams, R.E., Lester, R.J.G. (2006). Stock structure of Spanish mackerel Scomberomorus commerson along the Australian east coast deduced from parasite data. Journal of Fish Biology 68: 1707-1712.

Grey mackerel management units in northern Australia
131
8. INTEGRATION OF RESULTS: DEFINITION OF GREY MACKEREL SPATIAL MANAGEMENT UNITS DJ Welch, RC Buckworth, JR Ovenden, SJ Newman, D Broderick, RJG Lester, NA Gribble, AC Ballagh, R Street, RA Charters, J Stapley, RN Garrett, and GA Begg
8.1 Introduction
Identification of different fish stocks forms the basis of fisheries management, monitoring and
assessment, as well as the study of populations (Secor 2005). Many techniques exist that
can be used in discriminating fish stocks (Ihssen et al 1981a). These techniques can range
from the very simple and qualitative to more technical and quantitative and include analyses
of fisheries catch data, mark-recapture experiments, molecular approaches (see Cadrin et al
2005), parasite incidence (Mackenzie and Abaunza 2005), scale and otolith characteristics
such as microchemistry, shape, microstructure (Friedland and Cadrin 2005; Campana 2005),
and life history characteristics (Begg 2005). In each of these techniques different spatial and
temporal scales that are method dependent, will influence the attributes being measured.
Genetic analyses typically identify differences on large spatial and temporal scales, where
gene flow is minimal. In contrast, otolith microchemistry and parasite incidence reflect the
residence and movements of fish through different environments during its lifetime but are
influenced by different factors, and may be used to resolve a genetically homogeneous
population into discrete units of adult fish that may be more appropriate for management
(Buckworth et al 2007). Because each method of assessing stock structure addresses
different aspects of the population, the choice of method is a very important one and
depends on the specific research and/or management questions under consideration (Begg
and Waldman 1999).
The most powerful way to reliably identify whether different stocks exist is through a holistic
approach that utilises different techniques concurrently (Begg and Waldman 1999). Despite
some unplanned comparisons of different techniques to identify stocks (Todd 1981; Graves
et al 1992), and some very early integrated technique approaches (Ihssen et al 1981b;
Claytor and MacCrimmon 1988; Safford and Booke 1991), it is only relatively recently that
multi-technique approaches have been advocated as the preferred approach for stock
identification studies. Hancock (1998) concluded that an analysis of stock structure is most
effective if several techniques are used because of the different population scales addressed
by each method. Utilising different techniques that are complementary allows for greater

Grey mackerel management units in northern Australia
132
power in the ability to detect different stocks, providing a more comprehensive overview of
species stock structure. This greatly reduces the inherent uncertainty in the results obtained.
One of the limitations of single-technique studies is that when no differences are detected
between fish from different locales, does not necessarily mean they are not different stocks.
It may merely be a reflection of the discriminating power of the particular method.
Consistency among methods in failing to identify different stocks gives much greater
certainty (yet not proof) that the fish from the regions in question do actually comprise one
stock. By ‘weight of evidence’, a multi-technique approach therefore provides greater power
in identifying separate stocks, and gives greater certainty where single stocks are detected.
In this study we utilised multiple techniques (genetics – microsatellites, mitochondrial DNA;
parasites; otolith isotope ratios - OIR; and growth characteristics) to test the null hypothesis
of a single stock of grey mackerel across northern Australia. Further, we applied these
techniques to the same grey mackerel specimens, facilitating a holistic and integrated
interpretation of the results (Abaunza et al 2008). In this chapter we bring together the results
from the respective techniques and present a simple tool to assist in integrating and
interpreting these results to determine the stock structure and appropriate spatial
management units for grey mackerel in Australia.
8.2 Methods
The details of the methods used for the respective techniques, including sample treatment
and data analyses, are provided in the respective chapters. Results from the respective
techniques produce heterogeneous data types that make combining them into a single
quantitative analysis problematic. Differences in the spatial and temporal scales at which
each of the techniques are informative also make interpretation of combined data
challenging. This is a persistent issue now facing stock identification studies such as this one
that utilise multiple techniques that require integration of results.
In this study, analyses of data from the different techniques necessarily used different
statistical methodologies. Where possible a similar iterative analysis approach was adopted
whereby adjacent non-significant regions were pooled and re-analysed in an attempt to
determine the most parsimonious description of grey mackerel stock structure. To integrate
the results of the respective analyses and assist in their interpretation we developed a matrix
demonstrating where significant differences were found in pairwise comparisons among
different regions. In doing this we presented only regions that best represented the broadest
spatial scale determined by any of the different analyses. This matrix gave us an overview of

Grey mackerel management units in northern Australia
133
the respective results, thereby providing an indication of the strength of the differences
detected (or not) among the different regions. To further assist in interpreting the spatial
structure of stocks through integration we quantified the pairwise results using the mean
number of tests carried out for each technique that were significant and called this the Stock
Difference Index (SDI) given by:
)(SVCountSV
SDI ∑=
where SV is the significance value (sig. = 1; non-sig. = 0). The mean was used since
analyses among all combinations of techniques and regions were not possible due to
sampling issues. This method merely provides a value that indicates the relative differences
among regions, with regions showing the maximum difference having a SDI of 1 and regions
with no differences having a SDI equal to zero. The full interpretation of these values can still
only be accurately carried out by considering the individual results of each technique, taking
into account the time scales by which each of them are defined. It is also best applied when
the same samples are analysed across a suite of methods. Nevertheless it provides a useful
illustrative tool in identifying likely stock boundaries.
8.3 Results
The results from the genetic analyses incorporated both the microsatellite and mitochondrial
data (see Chapter 5). These analyses concluded that there were at least four discrete
genetic stocks across northern Australia for grey mackerel comprising WA, NW NT, the GoC
and the EC (Table 8.1). The results of the OIR analyses (see Chapter 6) also separated WA
from all other regions, but couldn’t separate among the regions sampled across the very top
of northern Australia (NW NT, WG and EG). However, on the east coast OIR analyses found
a clear separation between fish sampled from the south (Mackay, EC S) with those sampled
farther north (EC Nth: EC mid, N, PD). For both the genetics and OIR analyses, WA showed
the strongest signal of separation from all other regions.
Due to inadequate sample sizes and some samples being heat damaged, WA samples were
not available for parasite and growth comparisons. Further, due to a different approach
undertaken in the analysis of the parasite data, separate steps were carried out in order to
make inferences of stock structure to the broadest possible level, which made integration of
results with the other techniques as consistent as possible. The separate steps involved

Grey mackerel management units in northern Australia
134
overlaying both the univariate and multivariate analyses results based on significant pairwise
comparisons, and inferring overall broad spatial scale differences. The spatial scale at which
this was conducted was consistent with that determined by the genetic and OIR techniques
(Table 8.1). As a guide to inferring differences from the parasite results we estimated a
Parasite Difference Index (PDI) according to the following:
5.25.1 MVUVPDI ×+
=
where UV is the univariate value (proportion of the total pairwise comparisons for that broad
region that were significant from univariate analyses), and MV is the equivalent value from
the multivariate analyses. Since the multivariate analyses were considered to be a more
reliable test as it takes into account all parasites concurrently, we weighted the value from
the multivariate results higher by applying a multiplier of 1.5. The denominator is derived by
summing the weighting values (ie. 1.0 + 1.5 = 2.5).
In the parasite analyses (see Chapter 7), the east coast locations showed the strongest and
most consistent differences from all other regions as reflected in the higher PDI values
(Table 8.2). Within the EC there was evidence of stock separation between northern (EC
Nth: EC PD, N, mid) and southern (EC S) locations with the strongest difference evident
between the adjacent EC S (Mackay) and EC mid (Townsville) locations from the multivariate
analysis. The parasite fauna of NW NT fish were not dissimilar to the western Gulf fish, but
showed stronger differences to the eastern Gulf. Within the Gulf of Carpentaria there initially
appeared to be differences between the eastern and western fish (Table 8.2), however, after
further exploration of the data it was apparent that this difference was explained mostly by a
single location (EG N, Crabb Island) (see Figure 7.5), which was more similar to the east
coast fish. Among all other regions within the Gulf of Carpentaria there was a high degree of
variability and although the GoC was concluded to comprise a single stock for management
purposes, it was acknowledged that there was the possibility of the existence of localised
adult sub-stocks.
Results from the analyses of growth characteristics among regions (see Chapter 3) were
strongest between the NW NT and most other regions, with the western Gulf, the nearest
region, being most similar (Table 8.1). Although not as strong, the east coast also tended to
be different from other regions. However, the EG N (Crabb Island) sample of fish was more
similar to the east coast than the other locations within the Gulf (EG mid & WG), which
exhibited similar growth.

Grey mackerel management units in northern Australia
135
Table 8.1. Results matrix of the finest regional scale pairwise comparisons among the four techniques used in the study. Significant results for each pairwise comparison are indicated by the capital letters: G – genetics, P – parasites, M – otolith stable isotopes, V – growth characteristics. Non-significant results are indicated by “n”, and where the analysis was not carried out is given by “-“.
Regions WA NW NT WG EG EC Nth WA NW NT G - M - WG G - M - G n n n EG G - M - G P n V n P n n EC Nth2 G - M - G P M V G P M n G P M V EC S G - M - G P M - G P M - G P M - n P M -
Table 8.2. Parasite Difference Indices (PDI) for the main regional pairwise comparisons estimated from the parasite data analyses.
Regions NW NT WG EG EC Nth EC S NW NT WG 0.18 EG 0.44 0.32 EC Nth 0.91 0.82 0.70 EC S 0.93 0.87 0.88 0.30
From the integration of all methods into the one matrix of Stock Difference Indices general
patterns begin to emerge for stock identification. The WA region is clearly differentiated from
all other regions as belonging to a separate stock of fish, while the east coast can also be
clearly identified as a separate stock to the Gulf of Carpentaria and NT fish (Table 8.3).
Within the Gulf of Carpentaria and the NW Northern Territory region the identification of
stocks was less obvious. A strong difference between the NW NT and the eastern Gulf was
indicated by a large SDI. The lowest differences were within the Gulf itself between the
eastern and western sides, and between the NW NT region and the western Gulf.
Table 8.3. Stock Difference Indices (SDI) for the main regional pairwise comparisons estimated from the integration of the results of data analyses from all techniques. Regions WA NW NT WG EG EC Nth EC S WA NW NT 1.00 WG 1.00 0.25 EG 1.00 0.75 0.25 EC Nth 1.00 1.00 0.75 1.00 EC S 1.00 1.00 1.00 1.00 0.67
2 Growth was estimated for the EC mid location only but is grouped as EC Nth in Table 8.1 due to clear EC S and EC Nth separation indicated by other methods.

Grey mackerel management units in northern Australia
136
8.4 Discussion
In this holistic stock identification study we have been able to clearly demonstrate the
existence of separate stocks of grey mackerel throughout their major fishery regions across
northern Australia, thereby identifying the appropriate spatial management units for grey
mackerel fisheries. The integration of different but complementary stock identification
techniques in the “weight of evidence” approach used here, and employing the SDI approach
as an aid in synthesising that evidence, usefully gives greater confidence in stock
identification. Although we have not identified a critical SDI value, intuitively, any SDI > 0 is
evidence for separate stocks and the actual value indicates the level of corroboration among
the different stock identification methods used (higher values = higher level of corroboration).
Therefore, this study has indicated the existence of at least five stocks of grey mackerel
across northern Australia, with the possibility of additional stock structuring within the Gulf of
Carpentaria (Figure 8.1).
That there was a high level of corroboration among the techniques imparts confidence in the
stock structure identified. The SDI approach presented here does not, however, take into
account the different intrinsic time scales of the techniques employed (Table 8.4; Buckworth
et al 2007) or the mechanisms behind them. These are critical factors in the interpretation of
such data. Buckworth et al (2007) defined the intrinsic time scale as “the approximate time
span to which most information derived from that method applies”. Genetic data tends to be
informative about population differences over a range of temporal scales and generally large
spatial scales (Table 8.4). Given this, it was quite surprising that the genetics results
corroborated very well with the results from other techniques that have much shorter intrinsic
time scales. The greater the degree of isolation of fish between adjacent regions, the greater
the strength in stock division. For example, the genetics data showed that the sample of fish
from WA were very strongly differentiated from samples collected further east, and the OIR
data also demonstrated this clear separation. The genetic data also showed the east coast
was genetically different from regions further west, with very strong corroboration from all
other techniques. However in several areas, despite genetic homogeneity, the techniques
with shorter intrinsic time scales were able to provide greater resolution. The QLD east coast
was determined to represent one genetic stock; however the OIR results indicated a clear
separation showing at least a northern and a southern stock. This was also corroborated by
the parasite results. Homogeneous genetic characters suggest larval dispersal mechanisms
or low levels of adult mixing between adjacent stocks (possibly sex-biased). The latter
mechanism was determined to be occurring for Spanish mackerel in Australia (see
Buckworth et al. 2007).

Grey mackerel management units in northern Australia
137
?
Figure 8.1. Map of northern Australia showing the study sample locations and the approximate boundaries separating grey mackerel stocks. These stock boundaries are approximate due to the inability to sample at finer spatial scales during this study; however sampling locations are indicative of major regions of grey mackerel fisheries. Dotted lines within the Gulf of Carpentaria show where stock division was evident and indicate the possibility of more localised stocks.
In the Gulf of Carpentaria only the parasite data indicated that there may be different grey
mackerel stocks present. The differences detected between fish within the GoC, however,
were ambiguous, suggesting some limited movement of adults between these vast regions.
An interesting result was the clear difference in parasites of fish sampled from the Eastern
Gulf north location (Crabb Island). Fish from this location had a different parasite fauna than
all other regions in the GoC but were similar to fish from the northern east coast locations.
Interestingly the genetics data also suggested a high degree of genetic similarity between
Crabb Island and the east coast, and growth data were more similar between Crabb Island
and the EC compared to the adjacent EG mid region. Crabb Island lies at the very north-
eastern tip of the GoC just to the west of the Torres Strait. This is less simple to explain and
provides some evidence of the possibility of fine scale subdivision of stocks, at least in the
GoC.

Grey mackerel management units in northern Australia
138
Table 8.4. Intrinsic time scales of the different stock identification techniques used in this study. Table has been adapted from Buckworth et al (2007).
Method Intrinsic time scale Origin of information
Genetic spatial analyses 10,000 – 500,000 yrs Rate of evolution of genetic markers
Genetic temporal analyses
5 – 50 yrs Comparison of genetic markers over time
Whole isotope ratios 5 – 10 yrs Average ambient chemical environment over fishes life span
Parasite abundance Seasonal – 10 yrs Parasite and fishes life span, biology
Population parameters 5 – 10+ yrs Fishes life span and longer. Mediated by the environment, genetic influences, generation times and density-dependent mechanisms
Despite the genetic differences between the GoC and the NW NT, results of the OIR,
parasite and growth analyses could not separate these regions. This provides evidence for
little or no reproductive mixing of fish between these regions and may represent evidence for
philopatry to spawning grounds with dispersal during non-breeding periods. This would
require samples used in the genetic analyses to have been collected during the spawning
season. The vast majority of samples, though not all, were collected during the spawning
periods identified in Chapter 3. The possibility of philopatry occurring remains, however, this
hypothesis would need to be further tested. The lack of corroboration among methods is not
surprising as the OIR analyses are strongly influenced by temperature and these broad
regions are spread across similar latitudes with correspondingly similar temperature regimes.
Similarly, parasites and growth characteristics probably reflects a homogeneity of
environmental conditions experienced among these locations.
Detailed interpretation of the spatio-temporal patterns in movement of grey mackerel stocks
from the results of this study is not possible from the methods used here. The results in the
study show discrete stocks of adult fish with evidence of some connectivity between adjacent
stocks that is likely to be due to larval dispersal or limited adult movement. This appears to
be occurring on the east coast and in the GoC. Within the GoC there may also be some
mixing among adult fish deriving from adjacent stocks. Movement of these stocks may vary
seasonally and not necessarily in a uniform manner for all stocks. Strong seasonality in
catches is evident for the EC, WA and the GoC with catches peaking during winter and
spring, whereas in the NT (Timor and Arafura) catches are fairly uniform throughout the year.
Clearly grey mackerel are present and available for capture in these waters throughout the
year. In contrast, on the east coast there is a strong seasonality in catches. This is due

Grey mackerel management units in northern Australia
139
largely to a large increase in availability to capture during the winter/spring months, when
they appear to aggregate in large schools in inshore waters. Whether these schools move to
deeper waters further offshore or whether the schools simply disaggregate and the fish
disperse is unknown. As discussed in Chapter 2 interpretation of movement patterns from
the regional catch data is not straightforward due to other factors influencing targeting of grey
mackerel. Tagging studies would be beneficial in gaining further insight into movement
patterns; however, species such as grey mackerel are not readily tagged effectively using
traditional tagging methods (Cameron and Begg 2002) and information in recapture patterns
would be limited by the distribution of fishing effort.
Multi-technique stock structure studies have relied on qualitative appraisals of the collective
results from the respective techniques (e.g. Abaunza et al. 2008), and final interpretation of
stock structure and the appropriate spatial management scales have not been based on any
consistent framework for integration. Although there are no clear set of objective decision
rules available to guide researchers and provide a clear and consistent basis for analysis and
interpretation, it is the intrinsic scales of information provided by the different techniques that
dictate their interpretation. Nevertheless, the SDI approach we adopted in this study enabled
us to better identify stock divisions and provide confidence in these observations.
It is important to note that no difference detected among samples does not prove the
existence of a single stock but merely fails to falsify the null hypothesis of a single stock. The
use of multiple techniques with different intrinsic time scales and mechanisms behind them,
gives greater resolving power in identifying stocks. That is, one technique may identify
differences between populations where others have failed to do so. The use of multiple
techniques in this study has therefore been its strength and enabled stocks to be identified in
some instances by only one or two of the techniques and not others.
The management implications of these results indicate the need for management of grey
mackerel fisheries in Australia to be carried out on regional scales finer than are currently in
place. In some regions the spatial scales of management might continue as is currently (e.g.
WA), while in other regions, such as the GoC and the EC, management arrangments may
need to be adjusted. On the east coast, managers should at least monitor grey mackerel
fisheries at more local scale and assess accordingly. In the GoC, there is a need for joint
management, and potentially further investigation of stock structuring. Stock assessments
should consider the stock divisions identified and use life history parameters particular to
each stock.

Grey mackerel management units in northern Australia
140
8.5 References
Abaunza, P, Murta, AG, Campbell, N, Cimmaruta, R, Comesaña, AS, Dahle, G, Gallo, E, García Santamaría, MT, Gordo, LS, Iversen, SA, MacKenzie, K, Magoulas, A, Mattiucci, S, Molloy, J, Nascetti, G, Pinto, AL, Quinta, R, Ramos, P, Ruggi, A, Sanjuan, A, Santos, AT, Stransky, C, and Zimmermann, C, (2008). Considerations on sampling strategies for an holistic approach to stock identification: The example of the HOMSIR project. Fisheries Research, 89: 104-113. Begg, GA, (2005) Life history parameters, In: Cadrin, SX, Friedland, KD, and Waldman, JR. (2005). Stock Identification methods: Applications in fishery science, Elsevier Academic Press, USA, 719pp. Buckworth, RC, Newman, SJ, Ovenden, JR, Lester, RJG and McPherson, GR, (2007) The stock structure of northern and western Australian Spanish mackerel, Final report, Fisheries Research and Development Corporation Project 1998/159. Department of Primary Industry, Fisheries & Mines, Northern Territory Government, Australia. Fishery Report 88, i-vi, 225pp. Cadrin, SX, Friedland, KD, and Waldman, JR. (2005). Stock Identification methods: Applications in fishery science, Elsevier Academic Press, USA, 719pp. Cameron, D., Begg, G. (2002) Fisheries biology and interaction in the northern Australian small mackerel fishery. Final report to the Fisheries Research and Development Corporation. Projects 92/144 & 92/144.02. The State of Queensland, Department of Primary Industries. Campana, SE (2005) Otolith elemental composition as a natural marker of fish stocks, In: Cadrin, SX, Friedland, KD, and Waldman, JR. (2005). Stock Identification methods: Applications in fishery science, Elsevier Academic Press, USA, 719pp. Claytor, RR and MacCrimmon, HR (1988) Morphometric and meristic variability among North American Atlantic salmon (Salmo salar). Can. J. Zool. 66: 310-317. Friedland, KD and Cadrin, SX, (2005) Analyses of calcified structures: texture and spacing patterns, In: Cadrin, SX, Friedland, KD, and Waldman, JR. (2005). Stock Identification methods: Applications in fishery science, Elsevier Academic Press, USA, 719pp. Graves, JE, McDowell, JR, and Jones, ML (1992) A genetic analysis of weakfish Cynoscion regalis stock structure along the mid-Atlantic coast. Fish. Bull. 90: 469-475. Hancock, DA (ed.) (1998) Taking stock: defining and managing shared resources. Australian Society for Fish Biology and the Fish and Aquatic Resource Management Association of Australasia Joint Workshop Proceedings, Darwin, June 1997, 234pp. Ihssen, PE, Booke, HE, Casselman, JM, McGlade, JM, Payne, NR, and Utter, FM, (1981a) Stock Identification: Materials and Methods. Can. J. Fish. Aquat. Sci. 38(12): 1838–1855. Ihssen, PE, Evans, DO, Christie, WJ, Reckahn, JA, and DesJardine, RL, (1981b) Life history, morphology, and electrophoretic characteristics of five allopatric stocks of lake whitefish (Coregonus clupeaformis) in the Great Lakes region. Can. J. Fish. Aquat. Sci. 38: 1790-1807. Mackenzie, K and Abaunza, P, (2005) Parasites as biological tags, In: Cadrin, SX, Friedland, KD, and Waldman, JR. (2005). Stock Identification methods: Applications in fishery science, Elsevier Academic Press, USA, 719pp.

Grey mackerel management units in northern Australia
141
Safford, SE and Booke, H (1991) Lack of biochemical genetic and morphometric evidence for discrete stocks of Northwest Atlantic herring Clupea harengus harengus. Fish. Bull. 90: 203-210. Secor, DH (2005) Fish migration and the Unit stock: three formative debates, In: Cadrin, SX, Friedland, KD, and Waldman, JR. (2005). Stock Identification methods: Applications in fishery science, Elsevier Academic Press, USA, 719pp. Todd, TN (1981) Allelic variability in species and stocks of Lake Superior ciscoes (Coregoninae). Can. J. Fish. Aquat. Sci. 38: 1808-1813.

Grey mackerel management units in northern Australia
142

Grey mackerel management units in northern Australia
143
9. CONCLUSIONS
9.1 Benefits and adoption
The results of this project will benefit the commercial and recreational fishing sectors where
they target grey mackerel, through improved management of the resource. Identification of
the appropriate spatial scales and units for management helps inform management in
ensuring sustainability of grey mackerel fisheries in Western Australia, the Northern Territory
and Queensland, particularly for the commercial sector. Results of this project have already
been incorporated into the development of a monitoring program for Queensland east coast
grey mackerel where spatial coverage of catch monitoring has ensured northern and
southern regions are taken into account and considered explicitly. The results have also
indirectly influenced management changes proposed for the Qld east coast grey mackerel
fishery including an increase in the minimum legal size, a reduction in the recreational bag
limit, and changes in commercial net mesh sizes that limit catch of smaller fish.
9.2 Further development
Recommendations for further grey mackerel research and development include:
HIGH IMPORTANCE
Management strategy evaluation should be employed to examine the implications and
alternative management responses to the conclusions of this work.
The status of each grey mackerel stock should be assessed, or steps taken to facilitate
these assessments. This includes the development of an appropriate age-structured
model.
Catch monitoring and assessment should be carried out at spatial scales consistent with
the findings here as a minimum spatial scale, and the potential for localised depletions
investigated. Historic management changes should be taken into account when
interpreting these data sets.
Develop a reliable estimator of grey mackerel stock abundance and/or harvest rates for
the respective stocks.
These R & D recommendations are of highest priority for the Gulf of Carpentaria due to
substantial recent growth in catches, and due to the possibility of more localised adult
populations. The east coast is the second highest priority region due to substantial
growth in catches in recent years.

Grey mackerel management units in northern Australia
144
MEDIUM IMPORTANCE
Further research should establish the stock structure of grey mackerel south of Mackay
on the Queensland east coast, and throughout the Western Australian fishery regions.
Tagging of grey mackerel using strict fish capture and handling protocols to maximise
survival of released fish, should be developed and carried out to better establish
seasonal movement patterns and interchange of adult fish among stocks. Such a
program should be designed to facilitate the estimation of harvest rates from the
respective stocks.
Methods such as laser ablation inductively coupled plasma mass spectrometry of grey
mackerel otoliths should be investigated to examine fine scale life history patterns to
complement tagging.
Larval dispersal/retention mechanisms should be investigated to explore the connectivity
potential among stocks, and establish mechanisms that isolate stocks.
LOW IMPORTANCE
The reliability of the use of upper jaw length as a predictor of fish length should be tested.
Determine the prevalence and nature of hybridization among Scomberomorus in
Australian waters as it may have implications for fisheries management. Fishing patterns
altering species densities could be linked to the prevalence of hybridization where
spawning aggregations are co-located. Persistent hybrid forms would pose challenges for
fisheries management as they are not covered by regulation.
9.3 Planned outcomes
The major planned outcome from the project was to determine the stock structure, and
therefore appropriate management units, for grey mackerel fisheries across Queensland, the
Northern Territory, and additionally, for Western Australia. This was achieved by combining
the results of analyses of several independent stock identification methods to provide robust
conclusions about stocks in relation to existing fisheries effort, and to ensure the resolving
power of the study in achieving this goal was maximised.
The planned outcomes achieved to date include:
The project has indicated that the appropriate spatial scale at which grey mackerel fisheries
be managed is by state/territory, and by regions within these jurisdictions. The project
identified at least five separate stocks of grey mackerel throughout northern Australia for

Grey mackerel management units in northern Australia
145
management purposes: a Western Australian stock, a NW Northern Territory stock, northern
and southern east coast stocks, and a Gulf of Carpentaria stock. This will provide the basis
for reliable and robust assessment of the status of grey mackerel stocks and help deliver
sustainable harvest and profitable utilisation of grey mackerel resources in northern
Australian waters. This will also assist with compliance of the Commonwealth EPBC Act for
northern Australian grey mackerel.
The project has provided the ability for more accurate stock assessment of grey mackerel
fisheries. Regional growth parameter estimates are critical input parameters for stock
assessments of the respective stocks identified during the study. Samples collected have
been utilized to provide these growth estimates, as well as estimates of mortality, spawning
seasonality, and maturity.
This project addresses some of the major strategic research recommendations of the FRDC
report of Ward and Rogers (2003). This review of northern mackerel research recommended
stock structure determination and fisheries biology of grey mackerel as high priority research
needs.
The project results have influenced the development of monitoring strategies for grey
mackerel fisheries on the east coast, and in the stock assessments for the Gulf of
Carpentaria. The QDPI&F Long Term Monitoring Program has developed their monitoring
program for grey mackerel based on the spatial dynamics identified during this project.
The project provided further evidence for the utility of holistic approaches in stock structure
studies. Using the template provided by FRDC Project No. 1998/159, the use of multiple
concurrent techniques has resulted in greater certainty and resolution in the identification of
grey mackerel stocks. Further, to enhance interpretation in stock structure studies this project
has developed a more standardised and quantitative approach for presenting integrated
study results.
The project helped develop relationships between community groups, research and
management across northern Australia. The project helped to inform emerging local
community concerns of grey mackerel localised depletions on the Queensland east coast
through regular and direct communication of results, and also involved the inclusion of extra
project sampling and analyses to better inform these concerns.

Grey mackerel management units in northern Australia
146
The project further enhanced the link between research and management. Due to the inter-
jurisdictional nature of the project and the possibility for the need for co-operative
management approaches depending on results, fisheries managers from each jurisdiction
were key partners throughout the project, including milestone reporting requirements (see
Appendix 4).
The project provided significant human capital development opportunities. The project
provided material for two BSc (Hons) projects (James Cook University, Nic Marton;
University of Queensland, Robbie Charters). These projects made significant contributions
and formed the basis for Chapters 3 and 6 respectively.
9.4 Conclusions
The conclusions from this project are:
Grey mackerel fisheries across northern Australia are comprised of multiple stocks.
For the purposes of management of grey mackerel fisheries at least five management
units were identified: Western Australia, north western Northern Territory (Arafura/Timor
region), the Gulf of Carpentaria, the Queensland northern east coast, and the
Queensland southern east coast.
There are at least four genetic stocks of grey mackerel: Western Australia, north western
Northern Territory (Arafura/Timor region), the Gulf of Carpentaria, and the Queensland
east coast.
The use of different but complementary techniques to identify stocks proved invaluable in
providing greater resolution of stock structure due to the different scales of information
provided.

Grey mackerel management units in northern Australia
147
10. APPENDICES
Appendix 1: Intellectual Property
No patentable or marketable products or processes have arisen from this research. All results will be published in scientific and non-technical literature. The raw data from compulsory fishing logbooks remains the intellectual property of the Queensland Department of Primary Industries and Fisheries. Raw catch data provided by individual fishers to project staff remains the intellectual property of the fishers. Intellectual property accruing from the analysis and interpretation of raw data vests jointly with James Cook University, Queensland Department of Primary Industries & Fisheries, Fisheries Western Australia, Northern Territory Department of Primary Industries, Fisheries & Mines, University of Queensland and the Principle Investigator.
Appendix 2: Staff
Fishing & Fisheries Research Centre, JCU David J. Welch Principal Investigator Gavin Begg Principal Investigator (2005) Aaron Ballagh Research Assistant Amos Mapleston Research Assistant Nic Marton Student & Research Assistant Ann Penny Liaison Officer Iesha Stewart/Katia Bazaka/Bernadette Morgan Administrative Officer Queensland Primary Industries & Fisheries, Department of Employment, Economic Development and Innovation Rod Garrett Co-Investigator Jennifer Ovenden Co-Investigator Damien Broderick Fisheries Geneticist Raewyn Street Fisheries Geneticist Neil Gribble Co-Investigator Jason Stapley Fisheries Biologist Mark Lightowler Fisheries manager Northern Territory Department of Regional Development, Primary Industries, Fisheries & Resources Rik Buckworth Co-Investigator Chris Tarca Fisheries Technician Grant Johnson Fisheries Technician Charles Bryce Fisheries Technician Tricia Beatty Fisheries manager University of Queensland Robert Lester Co-Investigator Robbie Charters Student & Research Assistant Olena Kravchuk Statistician Western Australian Department of Fisheries Stephen Newman Co-Investigator Rachel Green Fisheries manager

Grey mackerel management units in northern Australia
148
Contributing fishers and vessels Mark ”Scrubber” Harris, Mossman, Queensland Colin Patterson, Mossman, Queensland Andrew Tobin, Townsville, Queensland Mark and Debbie A’Hearn, Debbie’s Seafood, Mackay, Queensland Russell and Rhonda Marriage, Mackay, Queensland David Wren (FV Vixen II) Frank Wren (FV Felix) Bill Mounsey (FV Jae Hardy)

Grey mackerel management units in northern Australia
149
Appendix 3: Copies of data sheets and accompanying guides to standardise data collection
Copy of field/lab data collection sheet.
Page
#:
o
fSt
ate:
Grid
ref:
Fork
Len
gth
mm
Upp
er J
aw
Leng
th m
mH
ead
Leng
th
mm
Who
le w
eigh
t (g
)Se
xSt
age
Lobe
1o
r2
G
onad
w
eigh
t (g)
O
tolit
hs
1or2
Gon
ads
Y/N
Gen
etic
s Y/
N
Gut
& G
ill
Y/N
Lat:
Long
:G
ear d
etai
ls (m
esh,
drop
, len
gth)
:
Sour
ce:
Cat
ch D
ate:
Com
men
ts
Site
:S
ampl
e Lo
catio
n:
Tota
l len
gth
mm
Gre
y M
acke
rel C
atch
Dat
a Sh
eet
Obs
erve
r:
Tag
Num
ber
Sam
ple
Reg
ion:

Gre
y m
acke
rel m
anag
emen
t uni
ts in
nor
ther
n A
ustra
lia
15
0
Tabl
e 1.
Dat
a co
llect
ion
field
des
crip
tions
for G
rey
mac
kere
l Fi
eld
Des
crip
tion
Val
ues
Tag
Num
ber
Uni
que
ID ta
g nu
mbe
r giv
en to
eac
h in
divi
dual
fish
Fo
rmat
: CR
C##
## (
eg. C
RC
0123
) (s
ee fi
le T
ag
DPI
####
(eg
. DPI
0123
) N
umbe
rs.x
ls fo
r N
T###
# (
eg. N
T012
3)
cur
rent
num
bers
) Fo
rk L
engt
h Le
ngth
of f
ish
from
tip
of h
ead
to th
e fo
rk in
the
tail
R
ecor
d to
the
near
est m
m
Tota
l Len
gth
Leng
th o
f fis
h fr
om ti
p of
hea
d to
the
end
of th
e ta
il R
ecor
d to
the
near
est m
m
Hea
d Le
ngth
Rec
ord
to th
e ne
ares
t mm
Upp
er Ja
w L
engt
h
Rec
ord
to th
e ne
ares
t mm
To
tal W
eigh
t Th
e to
tal W
eigh
t of t
he w
hole
fish
R
ecor
d to
the
near
est 1
0/10
0 gr
ams i
f pos
sibl
e Se
x Se
x of
the
fish
from
mac
rosc
opic
gon
ad o
bser
vatio
n M
= M
ale,
F =
Fem
ale,
J =
Juve
nile
and
U
= U
nkno
wn
/ not
reco
rded
St
age
Mac
rosc
opic
stag
e of
gon
ad u
sing
Mac
kie
and
Lew
is (2
001)
mac
rosc
opic
st
agin
g sy
stem
Fe
mal
es: 1
= v
irgin
, 2-3
= m
atur
e re
stin
g, 4
= d
evel
oped
, 5 =
spaw
ning
, 6 =
spen
t M
ales
: 1 =
virg
in, 2
= m
atur
e re
stin
g, 3
= d
evel
oped
, 4 =
spaw
ning
(see
Tab
le 2
) Lo
be
Rec
ord
whi
ch g
onad
lobe
has
bee
n w
eigh
ed
1 or
2 lo
bes w
eigh
ed
Gon
ad W
eigh
t Th
e w
eigh
t of o
ne o
r bot
h go
nad
lobe
s (on
ly c
ompl
ete
who
le g
onad
lobe
s)
Rec
ord
to th
e ne
ares
t gra
m
Oto
liths
O
tolit
hs re
mov
ed fr
om fi
sh
0 =
no o
tolit
hs, 1
= o
nly
one
otol
ith, 2
= b
oth
otol
iths,
3 =
otol
iths r
emov
ed b
ut
brok
en
Gon
ads
Gon
ads r
emov
ed, s
tore
d an
d fix
ed fo
r his
tolo
gy /
fecu
ndity
Y
es/N
o G
enet
ics
Gen
etic
sam
ple
take
n fr
om fi
sh
Yes
/No
Gut
/Gill
G
ut a
nd g
ills r
emov
ed fo
r par
asite
rese
arch
Y
es/N
o

Grey mackerel management units in northern Australia
151
Biological Data Collection (See Table 1 for data field descriptions and data details): 1. Tag Numbering
For consistency use the same tag format across all samples (i.e. otoliths, genetics, gonads, guts etc…). The tag format consists of the prefix for the organization (eg. CRC, DPI or NT) followed by four digits. Numbering can follow on from the last number used from last years sampling (see attached file ‘Tag Numbers.xls’ for list of previous tag numbers)
2. Morphological Measurements
If time permits, all morphological measurements should be recorded for each fish, however as a rough guide the following should be recorded: - Fork length (FL) and/or total length (TL) should be recorded for each sample if
possible.
- In the absence of FL or TL, upper jaw length and/or head length should be recorded.
- Total weight of the whole fish if possible
Remember the more measurements the merrier, however, I understand the constraints in the field and this should hopefully provide a guide as to what measurements to record.
3. Reproductive Data
Macroscopic sex and stage should be recorded for each fish if possible. The staging system we are using comes from Mackie and Lewis (2001) (see Table 2) with an additional stage for spent females (stage 6). Gonad weight should also be recorded if possible and the lobe(s) weighed (i.e. both lobes weighed or one lobe weighed).
4. Samples collected
Record what biological samples are collected from each fish (i.e. otoliths, gonads, gut/gills and/or genetic sample). Sample numbers required from each region: - At least 50 gut/gills and genetic samples,
- All otoliths (100+) to look at age and growth by region,
- Gonad collection will be opportunistic as no allowance is built into the budget for collection of gonads. However, if the logistic opportunity exists and the individual agencies budget permits, collection of gonads would be valuable for estimating region specific fecundity. Gonads from spawning (stage 5) females only should be collected across as broad a range of lengths as possible. Gonads should be snap frozen in zip lock bags with the tag number. At least 25 gonads need to be collected per region to make the exercise worth while.

Grey mackerel management units in northern Australia
152
Location Information: It is important to define the sampling location for the samples as accurately and consistently as possible. To do this I have added another level of location detail. The highest level of location information is State, which is implicit from our current regions but may be useful for future sampling locations that may be near state borders. In future, Sampling Region will refer to the broad and fine scale sampling regions (see Figure 1, Table 3). Obviously additional Sampling regions will be sampled in the next phase of the project, and we will have to add names for these new regions. The next level of location information will be Location, which is a slightly finer scale than sample region. The next level of location detail will be Site, which will be a specific reference to a more localized site within a sampling location. The final location fields are Grid, which is the grid cell reference that fishers report to, and Latitude/Longitude in degrees minutes seconds (see Table 3 for current location data from the database).
1 23
4
Figure 1: Sample regions for grey mackerel in North West Coast NT (1), Mid Western Gulf of Carpentaria NT (2), Mid Eastern Gulf of Carpentaria QLD (3) and from the Mid East Coast QLD (4).

Gre
y m
acke
rel m
anag
emen
t uni
ts in
nor
ther
n A
ustra
lia
15
3
Tabl
e 3.
Cur
rent
loca
tion
field
s in
the
Gre
y M
acke
rel D
atab
ase
Sta
te
Sam
ple
regi
on
Loca
tion
Site
G
rid
Latit
ude
Long
itude
Q
LD
Mid
Eas
t Coa
st
Tow
nsvi
lle
Offs
hore
from
Boh
le R
iver
mou
th
Q
LD
Mid
Eas
t Coa
st
Tow
nsvi
lle
Offs
hore
from
Boh
le R
iver
mou
th
Q
LD
Mid
Eas
t Coa
st
Tow
nsvi
lle
Offs
hore
from
Boh
le R
iver
mou
th
Q
LD
Mid
Eas
t Coa
st
Tow
nsvi
lle
Pal
uma
shoa
l
QLD
M
id E
ast C
oast
To
wns
ville
A
lbin
o R
ock
Q
LD
Mid
Eas
t Coa
st
Tow
nsvi
lle
Alb
ino
Roc
k
QLD
M
id E
ast C
oast
To
wns
ville
H
avan
nah
Isla
nd
N
T
Nor
th W
est C
oast
12.7
754
130.
1300
NT
N
orth
Wes
t Coa
st
15
.913
513
0.07
02N
T
Nor
th W
est C
oast
12.8
746
130.
0513
NT
N
orth
Wes
t Coa
st
12
.042
613
0.05
29N
T
Nor
th W
est C
oast
12.3
652
130.
3043
NT
N
orth
Wes
t Coa
st
Wes
t of B
athu
rst I
slan
d
11
.637
912
9.84
58N
T
Nor
th W
est C
oast
W
est o
f Bat
hurs
t Isl
and
11.6
619
129.
7647
NT
M
id W
este
rn G
oC
13
.918
313
6.06
16N
T
Mid
Wes
tern
GoC
13.9
230
136.
0702
NT
M
id W
este
rn G
oC
13
.940
813
6.01
84Q
LD
Mid
Eas
tern
GoC
15
.3 W
NW
Col
eman
Riv
er
A
C12
14
.973
614
1.40
72Q
LD
Mid
Eas
tern
GoC
11
.1 N
W o
f Nas
sau
Riv
er
A
C14
15
.772
114
1.26
16Q
LD
Mid
Eas
tern
GoC
11
.9 N
W N
assa
u R
iver
AC
14
15.7
533
141.
2627
QLD
M
id E
aste
rn G
oC
11.2
NW
Nas
sau
Riv
er
A
C14
15
.771
614
1.26
05Q
LD
Mid
Eas
tern
GoC
9
W N
assa
u R
iver
AC
14
15.9
090
151.
2193
QLD
M
id E
aste
rn G
oC
8.5
sw P
ompu
rae
A
C12
14
.991
314
1.48
36Q
LD
Mid
Eas
tern
GoC
11
.2 s
w P
ompu
rae
A
C12
14
.980
114
1.43
40Q
LD
Mid
Eas
t Coa
st
Mac
kay
Offs
hore
Mac
kay
Q
LD
Mid
Eas
t Coa
st
Tow
nsvi
lle
Offs
hore
from
Boh
le R
iver
mou
th
Q
LD
Mid
Eas
t Coa
st
Tow
nsvi
lle
Offs
hore
from
Boh
le R
iver
mou
th
Q
LD
Mid
Eas
t Coa
st
Tow
nsvi
lle
Chi
lcot
t Roc
ks
Q
LD
Mid
Eas
t Coa
st
Mac
kay
Offs
hore
Mac
kay

Grey mackerel management units in northern Australia
154
Table 2. Simplified macroscopic staging system for S. commerson gonads. F = female, M = male (Mackie and Lewis 2001).
J (Juvenile) Gonad is a small, translucent pink ribbon lying imperceptibly along the dorsal wall of the peritoneal cavity. Sex of the fish cannot be determined. Refer to Plate 1A.
F1 (Virgin) Ovaries are small and usually translucent pink, apricot or ivory in colour (more opaque and red in unbled fish). In smaller females, the ovaries are flattened, flaccid, and relatively inconspicuous, but they become rounded and firmer with a distinct lumen as the fish approaches maturity. The oocytes are microscopic resulting in a smooth, uniform appearance to the ovarian tissue. Yellow-brown bodies are uncommon. Refer to Plates 1B, 2 and 3.
F2-3 (Mature resting) Soon after completion of spawning activity, the resting ovaries appear flaccid with prominent exterior blood vessels. Internally, the lumen is large. Few, if any, oocytes can be seen, whilst yellow-brown bodies are distinct (sometimes very common) and blood clots may also be present. As time since spawning increases, the ovaries become progressively rounder and firmer as the gonad wall contracts and thickens and the ovarian tissue develops. Yellow-brown bodies may be evident for sometime and are the main feature used to distinguish mature resting from virgin ovaries. Colour is typically semi-translucent rose, pink or ivory, although in unbled fish the ovaries are often red. Refer to Plates 4 – 9.
F4 (Developed) Early in this stage, the ovaries appear semi-translucent and speckled because of the many pre-vitellogenic oocytes. As more oocytes develop and turn opaque, the ovaries become large, rotund and opaque with prominent blood vessels. The opaque oocytes are visible through the thin gonad wall and the colour is typically pale yellow or apricot. Towards the end of the reproductive period, the ovaries become more bloodied and flaccid as oocyte reserves are depleted during spawning, and yellow-brown bodies may become more common and the lumen larger. Refer to Plates 10 – 16A.
F5 (Spawning) Ovaries are very large and swollen, although towards the end of the reproductive season they may become somewhat flaccid. Colour is apricot to peach with a prominent network of external blood vessels. The presence of translucent hydrated oocytes gives the ovaries a distinctive speckled or granular appearance through the thin gonad wall. Eggs may also be released from the gonoduct when pressure is applied to the abdomen and may be present within the ovarian lumen. Refer to Plates 16B, 17, 20 – 22, 24.
M1 (Virgin) Testes are small and straplike with a smooth appearance and opaque, ivory or bone colour (red if unbled). No milt is present in the transverse section. It is difficult to distinguish testes early in this stage from juvenile gonads, and testes late in this stage from mature resting (M2) testes.
M2 (Mature resting) Testes are small, opaque and straplike. Little or no milt is extruded from the transverse section when squeezed (unless the sample has been frozen). The section is quite angular in shape, with the central tissue often browner than the bone or ivory coloured peripheral tissue. Sometimes the testes may also be tinged in red.
M3 (Developed) Testes are large, opaque, and ivory or bone in colour. The exterior dorsal blood vessel is large and small blood vessels are usually present. Internally, white sperm (milt) can usually be squeezed from the central sperm sinus. In some cases this may not be possible, although milt should be visible in the outer areas of the transverse section.
M4 (Spawning) Running ripe. Similar to the ripe testis but more swollen and with larger exterior blood vessels. Milt is released with little or no pressure on the abdomen or when the testis is cut.

Grey mackerel management units in northern Australia
155
Appendix 4: Fisheries manager’s responses to project results.
Western Australia Rachel Green Regional Fisheries Management Officer - North Department of Fisheries, Government of Western Australia The FRDC-funded project titled ‘Determination of management units for grey mackerel fisheries in Queensland and the Northern Territory’ has provided definitive information for grey mackerel that will assist fishery managers across northern Australia by definition of population boundaries. Further, it will assist fisheries management agencies in developing appropriate harvest strategies for grey mackerel across northern Australia. In regard to Western Australia, the results from each aspect of this project indicate that the grey mackerel population in Western Australia is distinct from those in each other state and territory both in terms of gene flow and also in terms of adult population separation. This indicates that fisheries management approaches in Western Australia can be undertaken independently of all other jurisdictions. However, as this project has been instrumental in bringing together fisheries managers and researchers from a number of jurisdictions to discuss the management of grey mackerel in northern Australia, it has raised the need for complementary management as well as collaborative research and monitoring arrangements across jurisdictions into the future. Discussions regarding complementary management arrangements for grey mackerel across northern Australia will be facilitated through the Northern Australia Fisheries Management Forum. Queensland Mark Lightowler Queensland Department of Primary Industries & Fisheries Brisbane Grey Mackerel occurs throughout Queensland East Coast waters and in the Gulf of Carpentaria. Grey Mackerel are a hyperstable species which heightens the need for appropriate management. A major consideration when managing a fishery is whether the fish within the area being managed is a single or multiple stock. The FRDC-funded project titled ‘Determination of management units for grey mackerel fisheries in Queensland and the Northern Territory’ was designed to provide that information for northern grey mackerel stocks from Western Australia to Mackay on Queensland’s East Coast. Queensland East Coast The catch of grey mackerel taken in Queensland East Coast has increased over the past few years to levels that are concerning. While new management arrangements are being put in place to minimize the impact of the increased catch (increased size limit, mesh standardization and reduction in netting through a range of mechanisms) a harvest strategy has not been implemented because of information paucity. The FRDC-funded project titled ‘Determination of management units for grey mackerel fisheries in Queensland and the Northern Territory’ has been timely as it will assist in the development of a robust stock assessment following the successful implementation of a long term monitoring program. The project has also provided comfort that, in all likelihood, there are only two major stocks on the Queensland East Coast between Port Douglas and Mackay. Having said that it would have been useful had the project extended its sampling further south than Mackay to ascertain whether the Mackay stock extended to the Queensland/New South Wales border. Given the concerns raised in

Grey mackerel management units in northern Australia
156
the Port Douglas Region about increased netting and the views raised there that it was an isolated stock the project has been valuable to back up the previous view that the Port Douglas stock was likely to be part of a much larger stock. Gulf of Carpentaria New management arrangements were considered for grey mackerel within the Gulf of Carpentaria several years ago. At that time it was considered inappropriate to develop new arrangements until it was known whether the grey mackerel found in the Gulf of Carpentaria were from a single or multiple stock. The results of the project have indicated that one stock occur within the Gulf of Carpentaria. This information will be the key for developing new management arrangements for grey mackerel in the Gulf of Carpentaria. In particular, the QDPI&F will need to work closely with NT Fisheries in how to best manage the single stock identified across the two different jurisdictions. Northern Territory Tricia Beatty Northern Territory Department of Primary Industries, Fisheries & Mines Darwin Results from this project have provided robust information on the grey mackerel stock structure boundaries across northern Australia. This information is invaluable in ensuring appropriate fisheries management is undertaken for these shared stocks. The results have indicated two separate stocks of grey mackerel found within the Northern Territory’s waters. One stock has been identified as being situated over the Gulf of Carpentaria area (crossing the Northern Territory / Queensland border). It is unknown to what extent this Gulf of Carpentaria stock extends westwards into Territory waters. In addition, it is currently unknown whether the North West stocks crosses over the Western Australian border. To address these questions, the project requires additional sampling across the Northern Territory western border and the Arnhem area to identify the location of the boundary for the North Western stock and the western boundary of the Gulf of Carpentaria stock. Future discussions regarding management arrangements for grey mackerel will be addressed through the Northern Australia Fisheries Management Forum. In recognition of the outcomes of this project, any future stock assessments conducted for grey mackerel by the Northern Territory will involve Queensland and Western Australian fishery agencies.

Grey mackerel management units in northern Australia
157
Appendix 5: Extension
Numerous extension activities took place during the course of the project and included: Fishing & Fisheries Research Centre Newsletter articles The Queensland Fisherman article FRDC ‘Fish’ News articles Recreational fishing magazine articles Newspaper articles Radio interviews Fishing & Fisheries Research Centre website
Presentations: Management Advisory Committees Local Marine Advisory Committees Australian Society for Fish Biology conference 2006 (Hobart), 2009 (Fremantle) ASFB/AFS ‘Advances in fish tagging and marking technology’ International Symposium,
February 2008, New Zealand Northern Australian Fisheries Management Forum (NAFMF), Darwin, 2007 Annual workshops with stakeholders (see Figure 2 below) James Cook University seminars & lectures
Figure 2. Project research staff and fisheries managers from each of the three northern Australian jurisdictions discuss the results and management implications at the final project workshop held in Darwin on May 21, 2008. Photo: J. Ovenden.

Grey mackerel management units in northern Australia
158


