Embed Size (px)
Citation preview
Ple
ase
note
that
this
is a
n au
thor
-pro
duce
d P
DF
of a
n ar
ticle
acc
epte
d fo
r pub
licat
ion
follo
win
g pe
er re
view
. The
def
initi
ve p
ublis
her-a
uthe
ntic
ated
ver
sion
is a
vaila
ble
on th
e pu
blis
her W
eb s
ite
1
Journal of Chromatography A Vol. 1160, Issues 1-2, 10 August 2007, P. 106-113 doi:10.1016/j.chroma.2007.04.006 © 2007 Elsevier B.V. All rights reserved
Archimer, archive institutionnelle de l’Ifremer http://www.ifremer.fr/docelec/
Determination of peptaibol trace amounts in marine sediments by liquid chromatography/electrospray ionization-ion trap-mass spectrometry
Laurence POIRIER1*, Jean-Claude AMIARD1, Florence MONDEGUER2, Françoise
QUINIOU3, Nicolas RUIZ1, Yves François POUCHUS1, Monique MONTAGU1 1 Université de Nantes, Nantes Atlantique Universités, SMAB, EA2160, Faculté de pharmacie, 1 rue G. Veil – BP 53508, Nantes, F-44000 France 2IFREMER- DEL/PN, Centre de Nantes, 1 Rue de l’Île d’Yeu Nantes - BP 21105, 44311 Nantes Cedex 3, France 3IFREMER- BE/EX, Centre de Brest – BP 70, 29280 Plouzané, France * Corresponding author: [email protected]
Abstract: Extraction followed by reverse phase liquid chromatography (LC)/electrospray ionization-ion trap-mass spectrometry (ESI-IT-MS) analysis has been successfully developed for the determination of peptaibols, fungal toxic metabolites, in marine sediments. Spiking experiments showed that the mean recovery of target compounds exceeded 85% at a spiking level of 10 ng/g of sediment (wet weight). Detection and quantification limits were 250 and 830 pg/g of sediment, respectively. The method developed constituted the first sensitive assay for quantification of peptaibol trace amounts in a natural environment. A concentration of 5 ng/g in sediment samples collected from Fier d’Ars was found. Keywords: Fungal peptide metabolites; Trichoderma sp.; Marine fungal contamination; Electrospray ionization-ion trap-mass spectrometry (ESI-IT-MS); Matrix matched calibration
- 3 -
1. Introduction 35 36
Fungal production of mycotoxins in the marine environment is proposed as a possible 37 cause for episodes of unexplained toxicity observed in shellfish populations during the last 38 decade. Within this framework, numerous strains of toxigenic saprophytic fungi were isolated 39 from shellfish, sediment and seawater samples collected in shellfish farming areas [1]. Among 40 them, different strains of Trichoderma sp., grown in marine-like culture conditions, produced 41 peptaibols, peptidic metabolites, which are toxic for different larval models (diptera or 42 crustacean larvae) [2]. 43
44
Peptaibols constitute a constantly growing family of linear peptide antibiotics of 45 fungal origin. They are characterized by a molecular mass from 500 to 2200 u, an acetyled N-46 terminus, a C-terminus amino alcohol and a high content of a non proteinogenic amino acid, 47 α-aminoisobutyric acid (Aib or U) [3]. Peptaibols are exclusively produced by filamentous 48 fungi mainly belonging to the genera Trichoderma, Acremonium, Paecilomyces, 49 Emericellopsis and Gliocladium. They have been classified into subfamilies according to their 50 amino acid chain lengths (ranging from 5 to 20 residues) and their chemical characteristics 51 [4]. These fungal metabolites exhibit a variety of biological activities resulting from their 52 membrane-modifying and pore-forming properties. Thus antibacterial, antifungal and 53 occasionally antiviral and antiparasitic activities have been reported [5-8]. 54
55
A previous experimental contamination has shown that peptaibols can be accumulated 56 in filter-feeder molluscs (Mytilus edulis) when present in sea-water as soluble compounds [9]. 57 The presence of such compounds in the marine environment could lead to health risks for 58 shellfish and their consumers. Different peptaibols were recently detected in sediments in a 59 marine area devoted to shellfish farming (Fier d’Ars, Atlantic coast, France) [10]. These 60 sediment samples displayed high toxicity for mussel larvae in the absence of significant 61 contaminations (metals, PCBs, HAPs, pesticides, antibiotics) or eutrophication [11]. 62 Developing analytical methods allowing the precise determination of these fungal metabolites 63 in the marine environment is therefore of great interest in order to establish a causal 64 relationship between peptaibol concentrations and biological effects. Certain methods, that 65 use radioactivity or capillary electrophoresis coupled with UV and ESI-TOF-MS, have 66 already been described for the quantification of peptaibols isolated from fungal cultures 67 [12,13]. However, they are not sensitive enough for determining trace amounts. The aim of 68 this work is to develop a process for extracting peptaibols from marine sediment matrices and 69 a sensitive assay for the determination of trace amounts by using LC/ESI-IT-MS. The method 70 developed focuses on long-sequence peptaibols, including 18 to 20 amino acid residues, 71 because of their high bioactivity [6] and their predominance in peptaibol family [14]. 72
73
74
2. Experimental 75
76
2.1. Chemicals 77
78
- 4 -
Methanol and dichloromethane were purchased from Carlo Erba (Val de Reuil, 79 France) and distilled before use. Ethanol was purchased from APC (Aubervilliers, France). 80 Trifluoroacetic acid (TFA) was obtained from Fluka Chemical (Buchs, Switzerland), 81 hydrochloric acid from Acros organics (Geel, Belgium) and acetic acid from Sigma Aldrich 82 (Saint-Quentin Fallavier, France). For mass spectrometry analysis, HPLC-grade methanol was 83 obtained from Baker (Deventer, Holland). Water was purified to HPLC-grade quality with a 84 Millipore-Q RG ultrapure water system from Millipore (Milford, CT, USA). Alamethicin F50 85 was obtained from Sigma Aldrich (Ref. A4665). 86
87
2.2. Sediment samples 88
89
Sediment samples used for optimizing extraction and purification procedures were 90 collected from La Rochelle (France) in January 2000. They were transported from the site to 91 the laboratory in isothermic containers and frozen at -20°C. 92
Sediment samples used to estimate environmental contamination were collected from 93 different sites on the French Atlantic coast. Surface sediment samples (oxic fraction, 1st cm) 94 were collected from four sites: the Bay of Marennes-Oléron (45° 55’ N 1° 13’ W), Auray 95 River (47° 38’ N 2° 58’ W) and the Bay of Veys (49° 22’ N 1° 08’ W) in June 2004 (in the 96 framework of the French program “MOREST”), and from Fier d’Ars (Ré Island – 46° 13’ N 97 1° 29’ W) in March 2006. All the samples were transported from the site to the laboratory in 98 isothermic containers and frozen at -20°C until analysis. Each sample (approximately 10 g 99 wet weight) was subjected to extraction, purification and LC/ESI-IT-MS analysis. 100
101
2.3. Optimization of the extraction procedure 102
103
The efficiency of the extraction procedure was checked by recovery experiments. The 104 nature of the extraction solvents was the decisive parameter for which optimization was 105 required. Approximately 10 g wet weight (ww) of sediments were spiked with 100 ng of 106 alamethicin F50 and extracted with 3 × 25 mL of different organic solvents. According to the 107 preliminary experiments, five different mixtures of solvents were selected for definitive tests: 108 (a) dichloromethane/methanol (1:1, v/v), (b) methanol/TFA 0.1% (v/v), (c) ethanol/acetic acid 109 1% (v/v), (d) acetone/acetic acid 1% (v/v) and (e) acetone/hydrochloric acid 0.02% (v/v). At 110 each extraction step, the sample was sonicated for 15 min and centrifuged at 700 g for 5 min. 111 Two procedures were used in order to eliminate salts. The supernatants obtained with 112 mixtures (a), (b) and (c) were evaporated to dryness and redissolved in 50 mL of 113 dichloromethane/methanol/water (2:2:1). The aqueous phase containing salts was washed 114 twice with dichloromethane. The organic phases were then combined and evaporated to 115 dryness. The supernatants obtained with solvent mixtures (d) and (e) were simply filtered and 116 evaporated to dryness (crude extracts). 117
118
2.4. Purification of extracts 119
120
Purification of crude extracts was performed by vacuum liquid chromatography (VLC) 121 on a diol-silica gel column (10 x 40 mm) (Supelco, Bellefonte, PA, USA). The column was 122 prepared with 2 g of sorbent and rinsed with 10 mL of dichloromethane prior to sample 123
- 5 -
loading. For this step, two deposit modes were investigated. In mode 1, the extract was 124 redissolved and deposited with 3 mL of three successive solvent mixtures in the purification 125 column: dichloromethane/ethanol (100:0, 90:10 and 50:50, v/v). Mode 2 corresponded to a 126 dry deposit. The crude extract was dissolved in 10 mL of dichloromethane/ethanol mixture 127 (50:50, v/v) and mixed with a quarter of the sorbent phase. This mixture was evaporated to 128 dryness and loaded in the column. Elution was performed with 40 mL of successive 129 dichloromethane/ethanol mixtures (100:0, 98:2, 90:10 and 50:50, v/v). The fractions obtained 130 (A, B, C and D, respectively) were evaporated to dryness and redissolved in methanol (500 131 µL) prior to analysis by using the hyphenated LC/MS technique. 132
133
2.5. LC/MS analysis 134
135
The samples were analyzed on a modular HPLC system consisting of a Spectraphysics 136 Spectra System P2000 pump, an AS 100XR autosampler (Thermo Separation Products, San 137 Jose, CA, USA) equipped with a Kromasil C-18 5-µm reverse-phase 2.0 × 250 mm column 138 (Interchim, Montluçon, France) heated to 40°C and coupled with a Finnigan Matt LCQ™ 139 ESI-IT-mass spectrometer (Thermo Separation Products). The mobile phase consisted of a 140 methanol/H20 (85:15, v/v) mixture delivered at a constant flow rate of 0.2 mL/min (isocratic 141 mode). The sample injection volume was 5 µL. All mass analyses were performed in positive 142 mode. To ensure optimal detection, perfusion of a methanolic solution of alamethicin F50 (50 143 ng/mL) into the flow of LC using a micrometrically automated 250-µL syringe (Hamilton, 144 Reno, NV, USA) at a flow rate of 3 µL/min was performed to optimize the mass spectrometer 145 parameters. The spray voltage was set to 4.50 kV, the capillary temperature to 266°C and the 146 capillary voltage to 42 V. Nitrogen flow rates were 89 and 37 (arbitrary units), respectively, 147 for sheath and auxiliary gas. The parameters of ion optic transmission were adjusted to 55 V 148 for Tube Lens Offset, -3.50 V for Multipole 1 Offset, -6 for Multipole 2 Offset and 400 V for 149 Multipole RF Amplifier (peak to peak). 150
MSn spectra acquisitions were carried out with a collision energy of 32% and an isolation 151 width of 1 u. 152
All spectra acquisitions and reworks were done using LCQ Xcalibur 1.3 software (Thermo 153 Fisher Scientific). 154
155
2.6. Calibration and quantification 156
157
External and matrix matched calibrations were compared. A commercial solution of 158 alamethicin F50 was used as external standard and characterized by LC/MSn analysis. This 159 product contains four individual components which have been identified as alamethicin 160 F50/5, F50/6a, F50/7 and F50/8b with molecular masses of 1962, 1976, 1976 and 1990 u 161 respectively, according to Kirschbaum et al. [15]. 162
The two main components, alamethicin F50/5 (m/z 1004.3, tR 8.8 min) and F50/7 (m/z 163 1011.3, tR 10.6 min), which represented a constant proportion of 90.5 % in the reference 164 solution, were used for the calibration performed by using LC/ESI-IT-MS. This proportion 165 remained constant after the extraction and purification steps. For external standardization, a 166 calibration curve was prepared using 8 concentrations of alamethicin F50 in methanolic 167 solution (1 to 100 µg/L). To consider the matrix effects, matrix matched calibration samples 168
- 6 -
were prepared by adding different concentrations of alamethicin F50 to sediment extracts 169 obtained after purification. 100 µL of alamethicin F50 reference solution at 12.5, 25, 50, 100 170 and 200 µg/L were added to 100 µL of each purified fraction C and D. LC/MS analysis of 171 each concentration level was performed 6 times for both external and matrix matched 172 calibrations. The accuracy and precision of the matrix matched calibration method were 173 calculated for each concentration level. 174
The accuracy of the method developed was determined by the analysis of three 175 sediment samples spiked with 100 ng of alamethicin F50 solution. All the percentages of 176 recovery were determined relative to the standard samples. 177
178
2.7. Statistical treatment 179
180
Mann Whitney U-tests were carried out to compare the percentages of recovery of 181 alamethicin F50 and impurity masses obtained during the optimization of the extraction and 182 purification steps. Pearson’s correlation was used to test the linearity of the quantification 183 data. 184
185
186
187
188
3. Results and discussion 189 190
191
3.1. Selection of extraction conditions of peptaibols from sediments 192
193
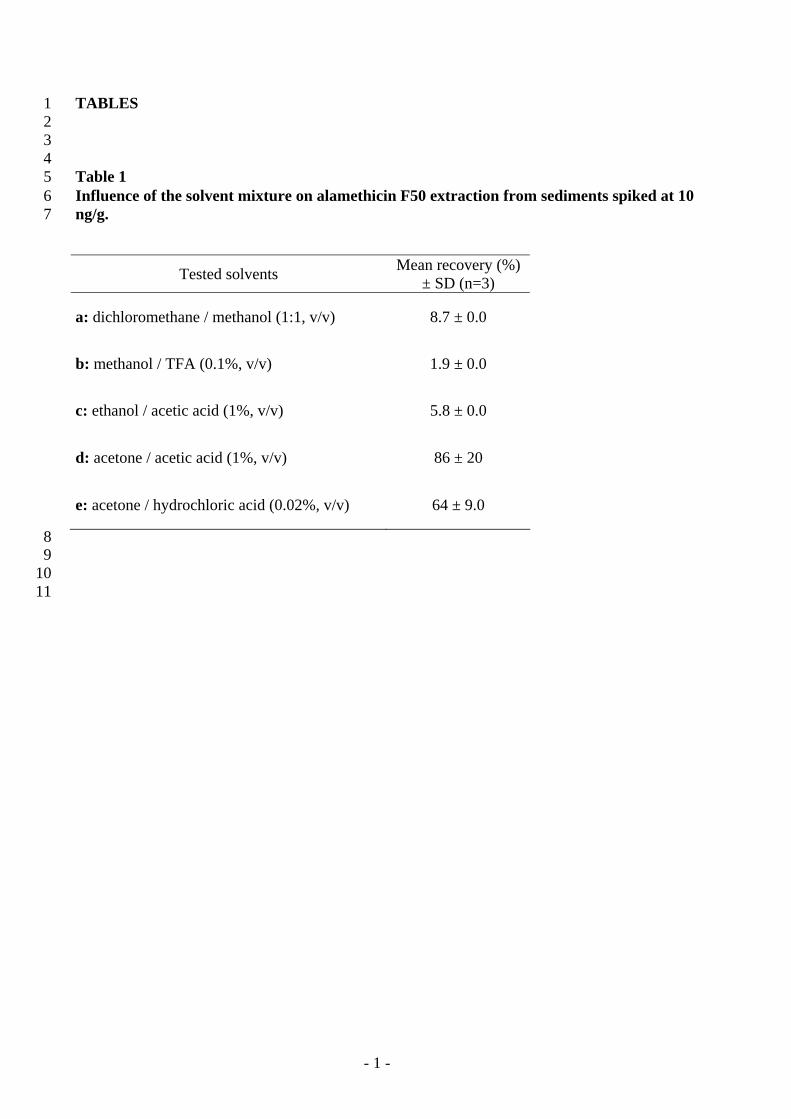
To achieve the efficient extraction of the target compounds, recovery experiments with 194 alamethicin F50 spiked sediments were carried out. Five solvent mixtures were evaluated and 195 the results are shown in Table 1. Extraction using mixtures of dichloromethane/methanol, 196 methanol/TFA and ethanol/acetic acid did not provide satisfactory recovery of alamethicin 197 F50, since the values were below 10%. Methanol was generally used in the extraction 198 procedures of peptaibols from fungal cultures (qualitative analysis) [16,17]. In spite of its 199 high eluotropic strength, this solvent was not strong enough to remove peptaibols from a 200 complex sedimentary matrix. Acetone/hydrochloric acid mixture (e) provided a higher 201 recovery of alamethicin F50 with a mean of 64 ± 9%. Satisfactory extraction efficiency (86 ± 202 20%) was obtained using acetone/acetic acid mixture (d) (significant differences with (a), (b) 203 and (c) at the 95% level). An additional extraction test was performed with acetone 100% and 204 resulting in 47% recovery (results not shown), a value lower than those obtained for acidified 205 acetone mixtures. Acid conditions were essential for the extraction of molecules of interest 206 from sedimentary particles. The acetone/acetic acid 1% (v/v) mixture was therefore chosen as 207 the best solvent for further studies. 208
209
TABLE 1 210
- 7 -
211
212
3.2. Purification of analytes 213
214
The crude extracts thus obtained contained a high level of impurities. Hence it was 215 essential to proceed to further purification steps on extracts to minimize chromatographic 216 interferences and ions suppression. Silica [5,18] and diol-silica gel columns [2,19] were 217 generally used to purify the peptaibols (fungal cultures). In this study, the sediment extracts 218 were purified on diol-silica gel and alamethicin F50 was eluted by fractions C and D 219 (dichloromethane/ethanol 90:10 and 50:50 v/v, respectively). Because of partial dissolution of 220 the extract in dichloromethane, it was necessary to optimize the deposit mode. Thus, two 221 different procedures were tested: mode 1 – solubilization of the extract in three successive 222 solvent mixtures; mode 2 - dry deposit. 223
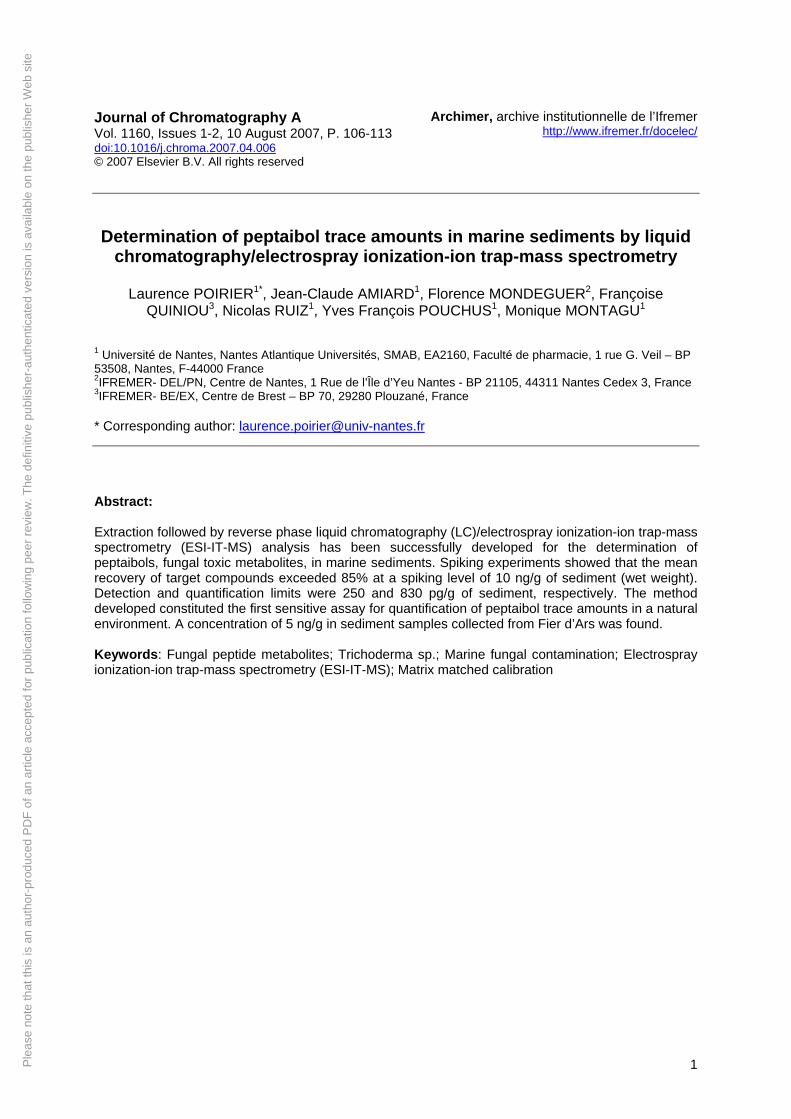
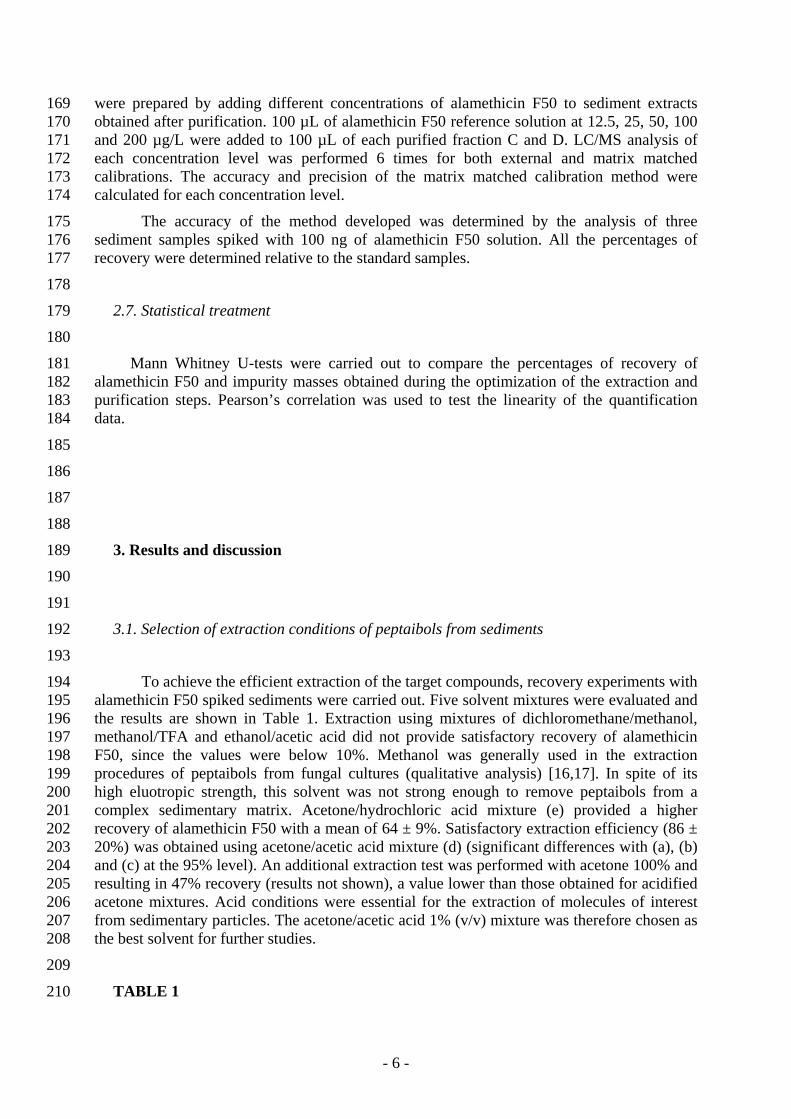
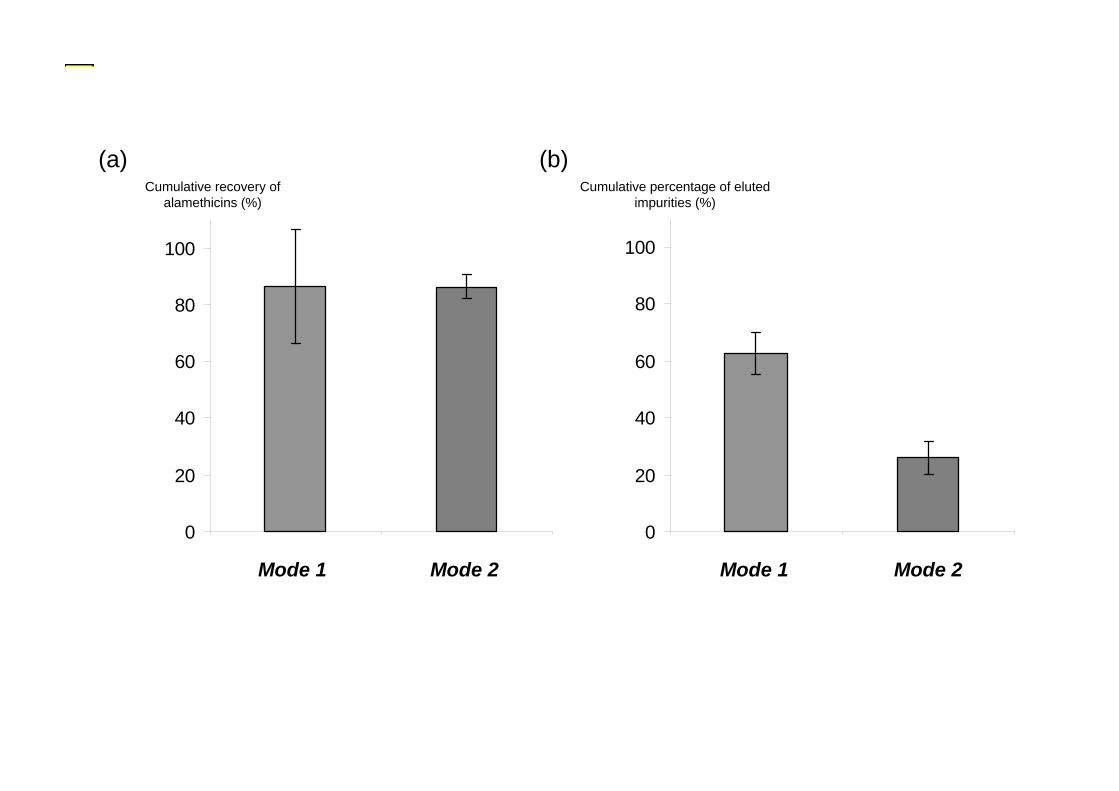
The recovery of alamethicin F50 was not significantly different depending on modes 1 224 and 2 as shown in Fig. 1a (Mann-Whitney, p-value = 0.042). However, there were 225 significantly fewer impurities eluted when using mode 2 than when eluted with mode 1, as 226 shown in Fig. 1b (Mann-Whitney, p-value = 0.05). Moreover, repeatability was better with 227 mode 2 than with mode 1. The dry deposit mode (mode 2) was therefore chosen for the 228 purification of sediment extracts because of less interference from impurities and better 229 repeatability. 230
231
FIGURE 1 232
233 234
3.3 LC/MS identification of peptaibols 235
236
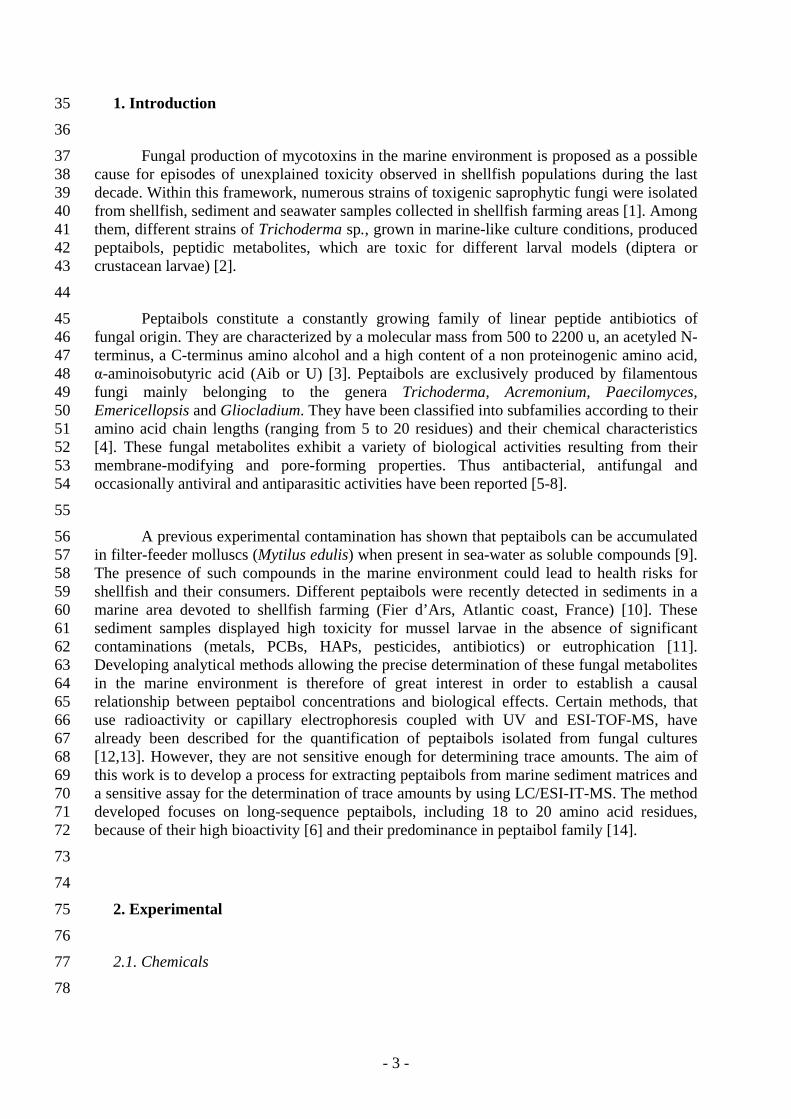
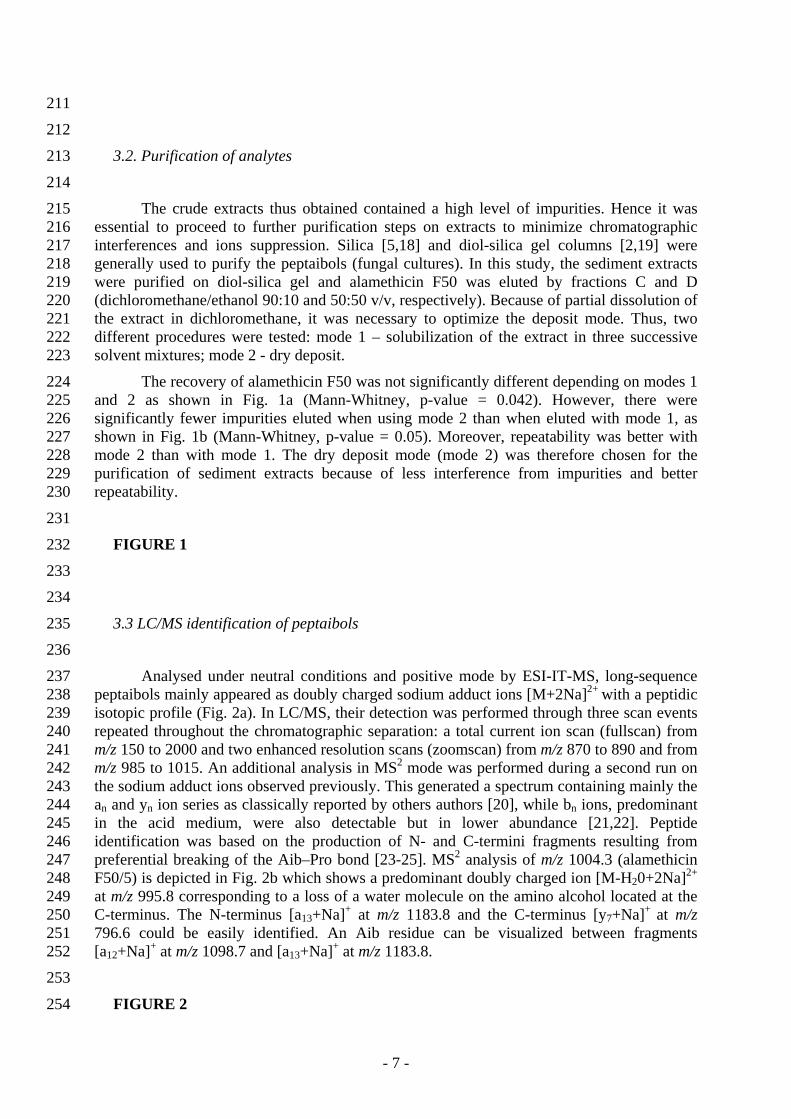
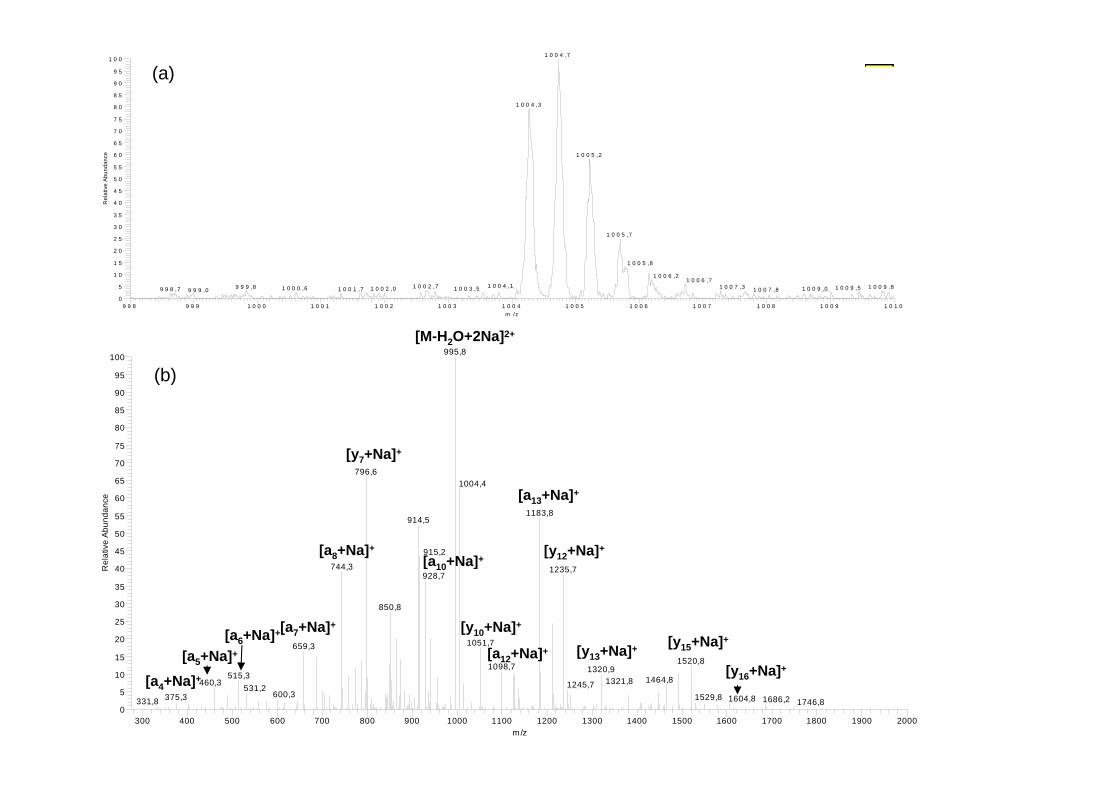
Analysed under neutral conditions and positive mode by ESI-IT-MS, long-sequence 237 peptaibols mainly appeared as doubly charged sodium adduct ions [M+2Na]2+ with a peptidic 238 isotopic profile (Fig. 2a). In LC/MS, their detection was performed through three scan events 239 repeated throughout the chromatographic separation: a total current ion scan (fullscan) from 240 m/z 150 to 2000 and two enhanced resolution scans (zoomscan) from m/z 870 to 890 and from 241 m/z 985 to 1015. An additional analysis in MS2 mode was performed during a second run on 242 the sodium adduct ions observed previously. This generated a spectrum containing mainly the 243 an and yn ion series as classically reported by others authors [20], while bn ions, predominant 244 in the acid medium, were also detectable but in lower abundance [21,22]. Peptide 245 identification was based on the production of N- and C-termini fragments resulting from 246 preferential breaking of the Aib–Pro bond [23-25]. MS2 analysis of m/z 1004.3 (alamethicin 247 F50/5) is depicted in Fig. 2b which shows a predominant doubly charged ion [M-H20+2Na]2+ 248 at m/z 995.8 corresponding to a loss of a water molecule on the amino alcohol located at the 249 C-terminus. The N-terminus [a13+Na]+ at m/z 1183.8 and the C-terminus [y7+Na]+ at m/z 250 796.6 could be easily identified. An Aib residue can be visualized between fragments 251 [a12+Na]+ at m/z 1098.7 and [a13+Na]+ at m/z 1183.8. 252
253
FIGURE 2 254
- 8 -
255
256
3.4. LC/MS quantification of peptaibols 257
258
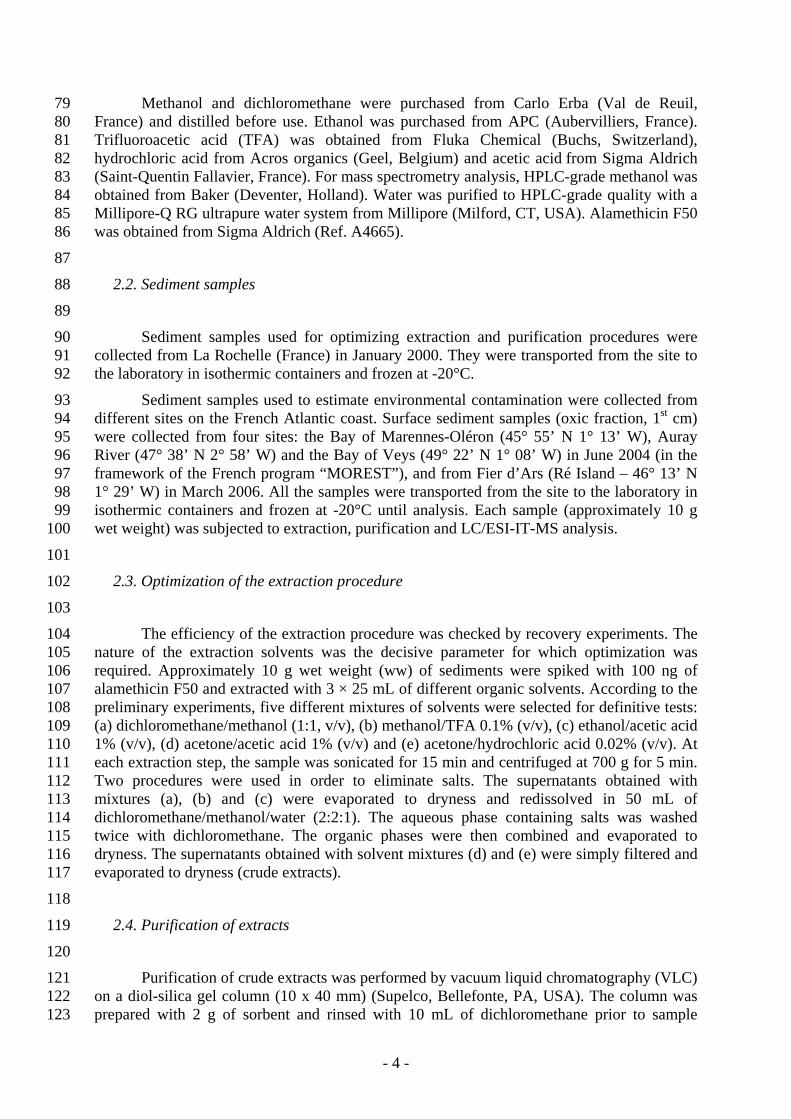
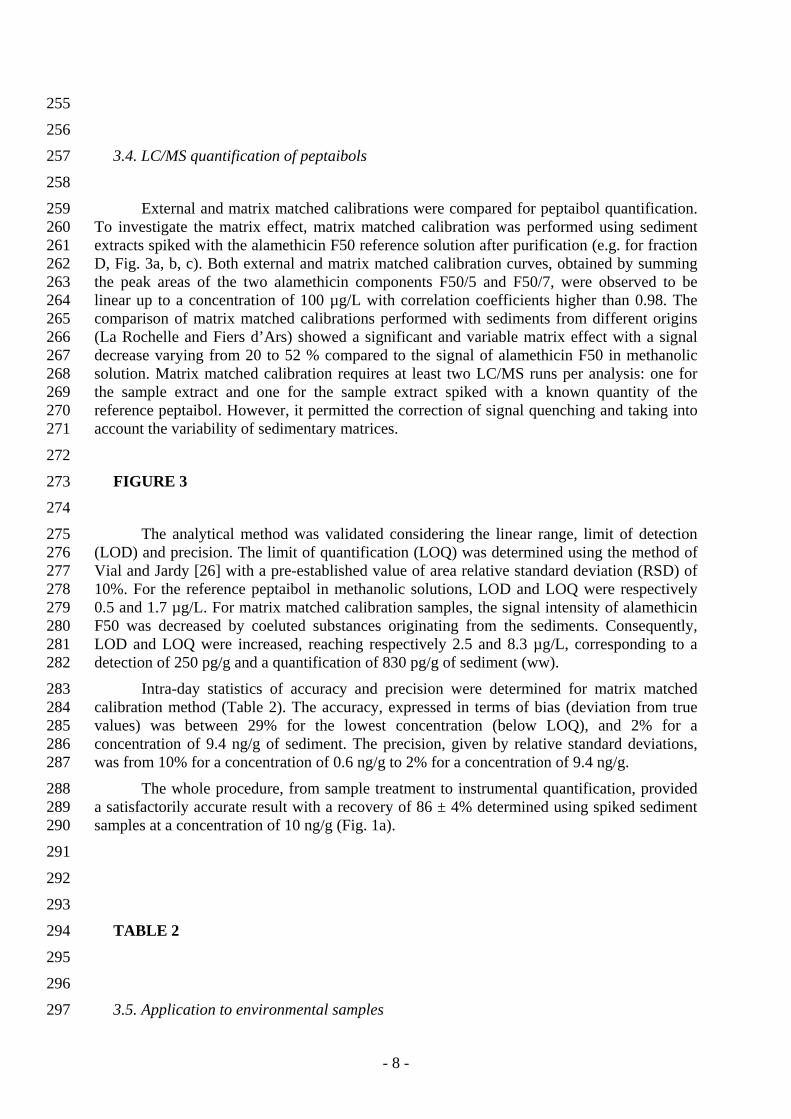
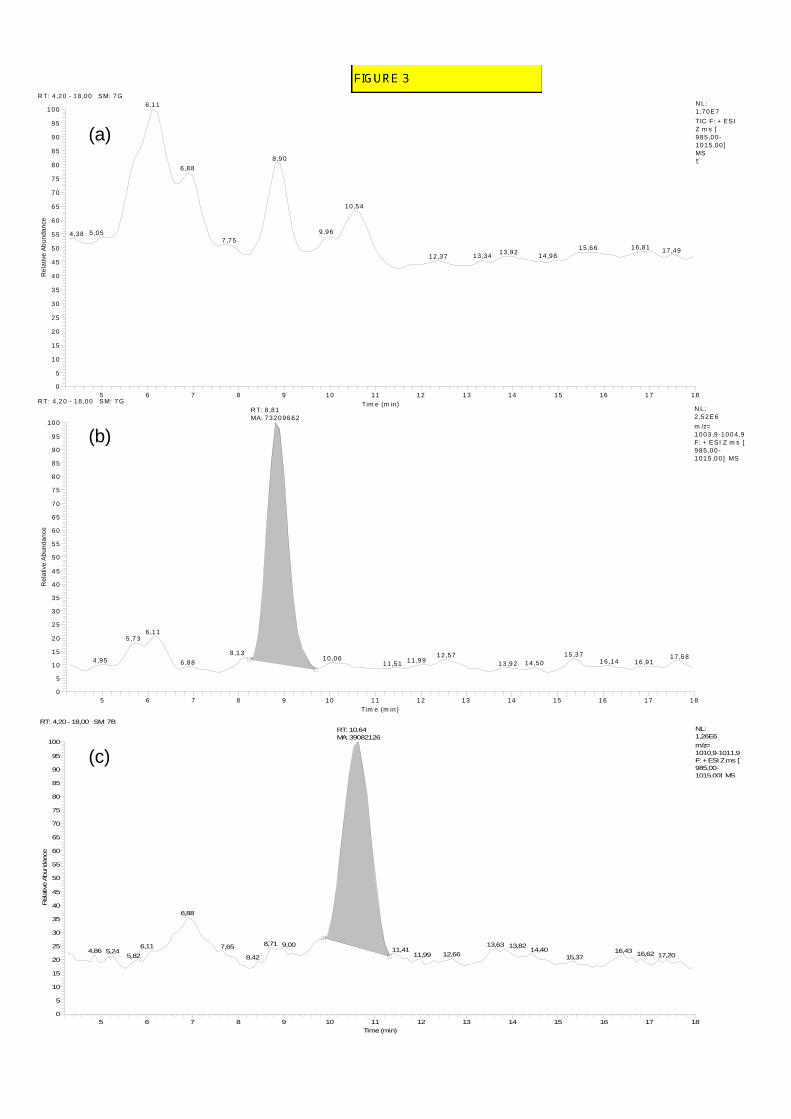
External and matrix matched calibrations were compared for peptaibol quantification. 259 To investigate the matrix effect, matrix matched calibration was performed using sediment 260 extracts spiked with the alamethicin F50 reference solution after purification (e.g. for fraction 261 D, Fig. 3a, b, c). Both external and matrix matched calibration curves, obtained by summing 262 the peak areas of the two alamethicin components F50/5 and F50/7, were observed to be 263 linear up to a concentration of 100 µg/L with correlation coefficients higher than 0.98. The 264 comparison of matrix matched calibrations performed with sediments from different origins 265 (La Rochelle and Fiers d’Ars) showed a significant and variable matrix effect with a signal 266 decrease varying from 20 to 52 % compared to the signal of alamethicin F50 in methanolic 267 solution. Matrix matched calibration requires at least two LC/MS runs per analysis: one for 268 the sample extract and one for the sample extract spiked with a known quantity of the 269 reference peptaibol. However, it permitted the correction of signal quenching and taking into 270 account the variability of sedimentary matrices. 271
272
FIGURE 3 273 274
The analytical method was validated considering the linear range, limit of detection 275 (LOD) and precision. The limit of quantification (LOQ) was determined using the method of 276 Vial and Jardy [26] with a pre-established value of area relative standard deviation (RSD) of 277 10%. For the reference peptaibol in methanolic solutions, LOD and LOQ were respectively 278 0.5 and 1.7 µg/L. For matrix matched calibration samples, the signal intensity of alamethicin 279 F50 was decreased by coeluted substances originating from the sediments. Consequently, 280 LOD and LOQ were increased, reaching respectively 2.5 and 8.3 µg/L, corresponding to a 281 detection of 250 pg/g and a quantification of 830 pg/g of sediment (ww). 282
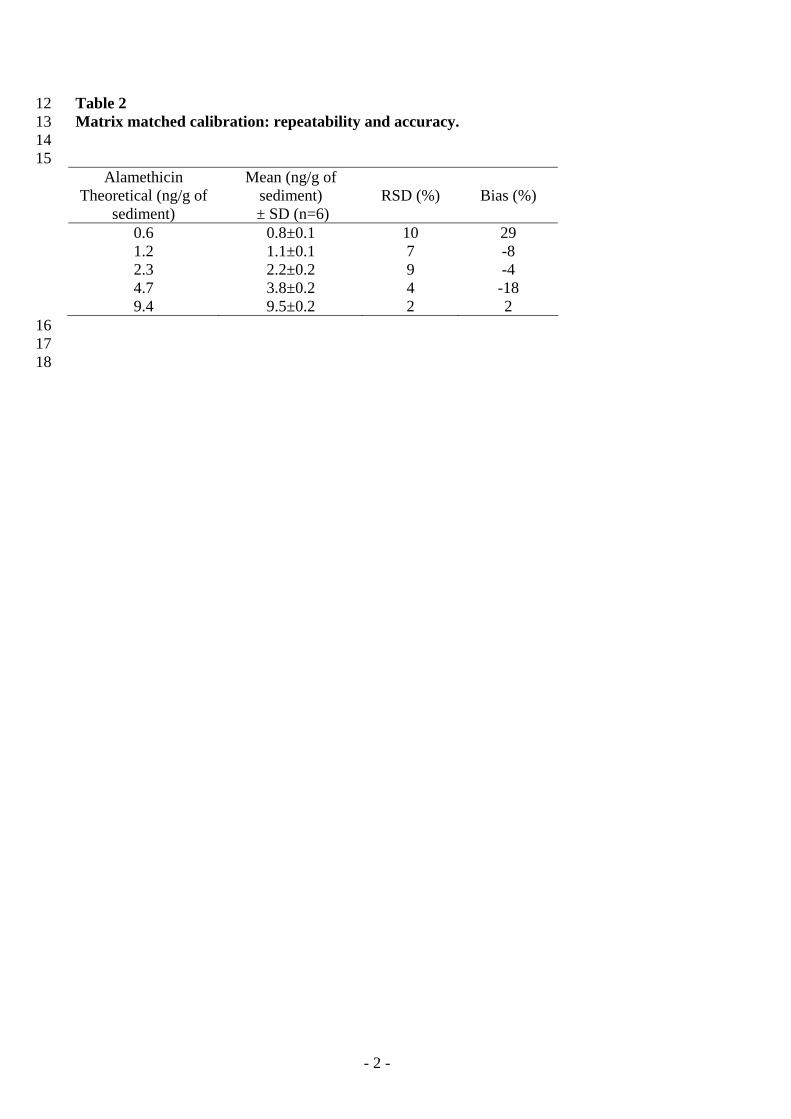
Intra-day statistics of accuracy and precision were determined for matrix matched 283 calibration method (Table 2). The accuracy, expressed in terms of bias (deviation from true 284 values) was between 29% for the lowest concentration (below LOQ), and 2% for a 285 concentration of 9.4 ng/g of sediment. The precision, given by relative standard deviations, 286 was from 10% for a concentration of 0.6 ng/g to 2% for a concentration of 9.4 ng/g. 287
The whole procedure, from sample treatment to instrumental quantification, provided 288 a satisfactorily accurate result with a recovery of 86 ± 4% determined using spiked sediment 289 samples at a concentration of 10 ng/g (Fig. 1a). 290
291
292
293
TABLE 2 294
295
296
3.5. Application to environmental samples 297
- 9 -
298
299
The method developed (acetone/acetic acid extraction; dry deposit; LC/MS analysis 300 using three scan events; matrix matched calibration) was applied to natural sediment samples 301 collected from different sites along the French Atlantic coast. Long-sequence peptaibols were 302 identified and quantified in samples collected from Fier d’Ars but they were not observed in 303 sediment samples collected from the Bay of Marennes-Oléron, Auray River and the Bay of 304 Veys. 305
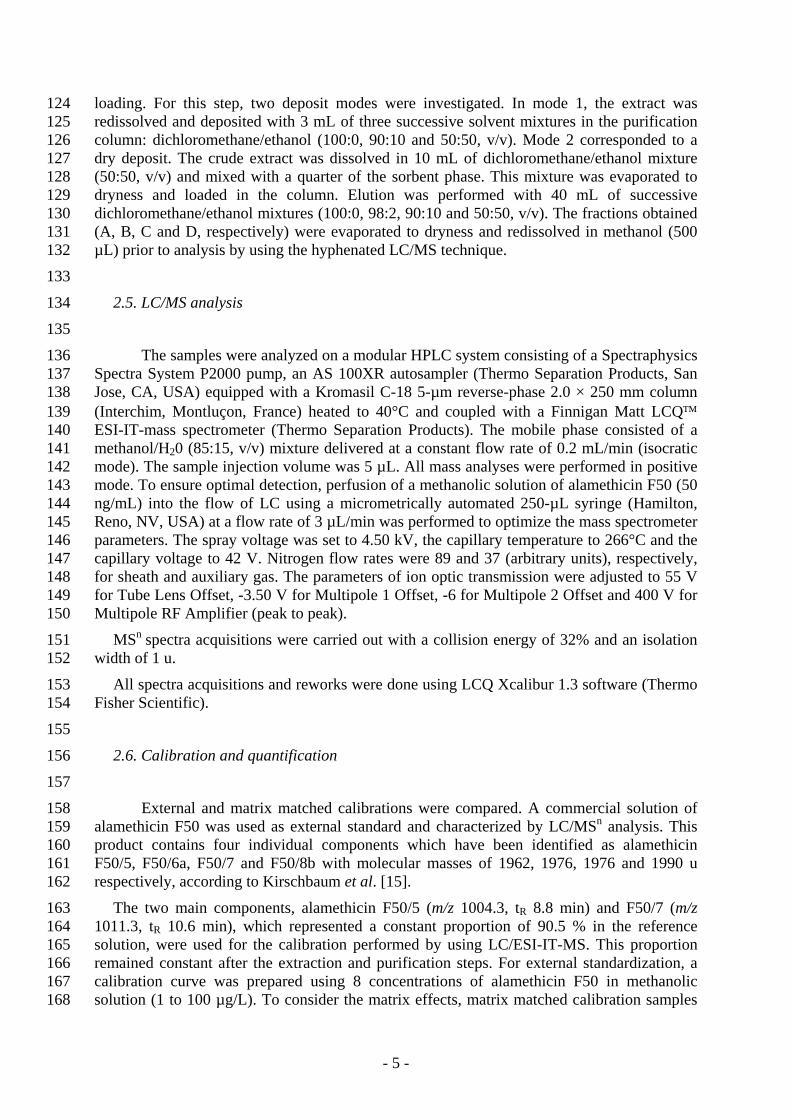
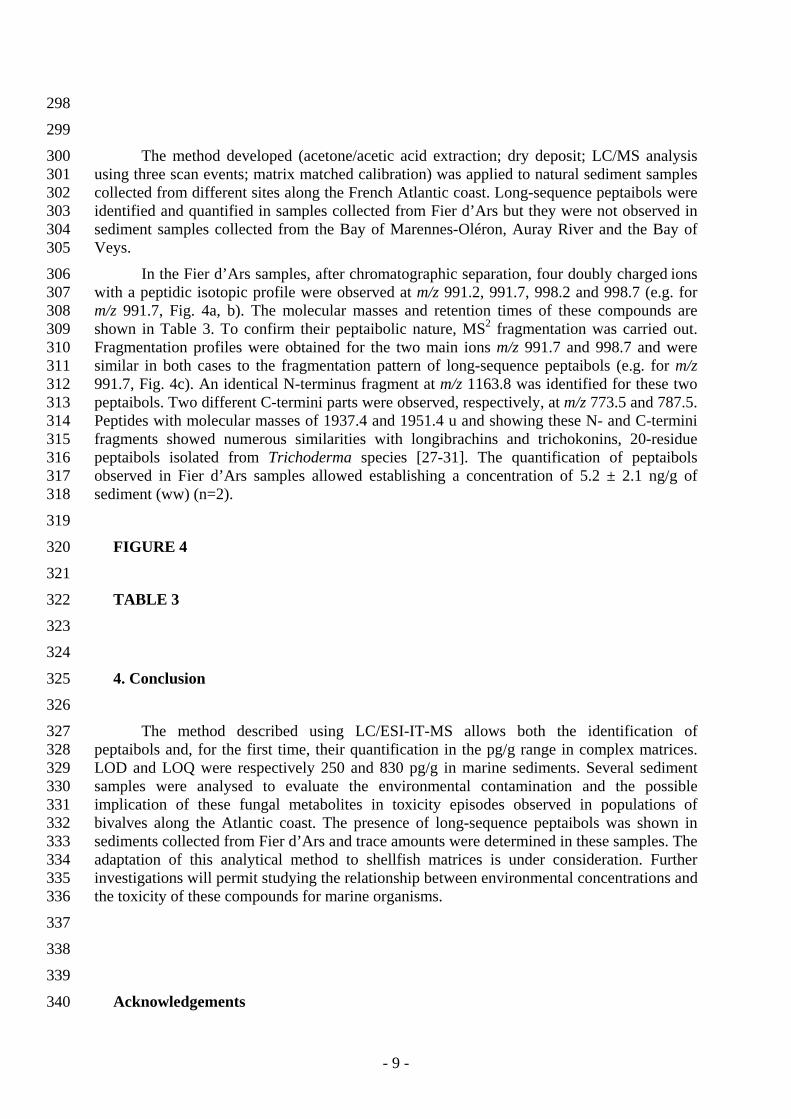
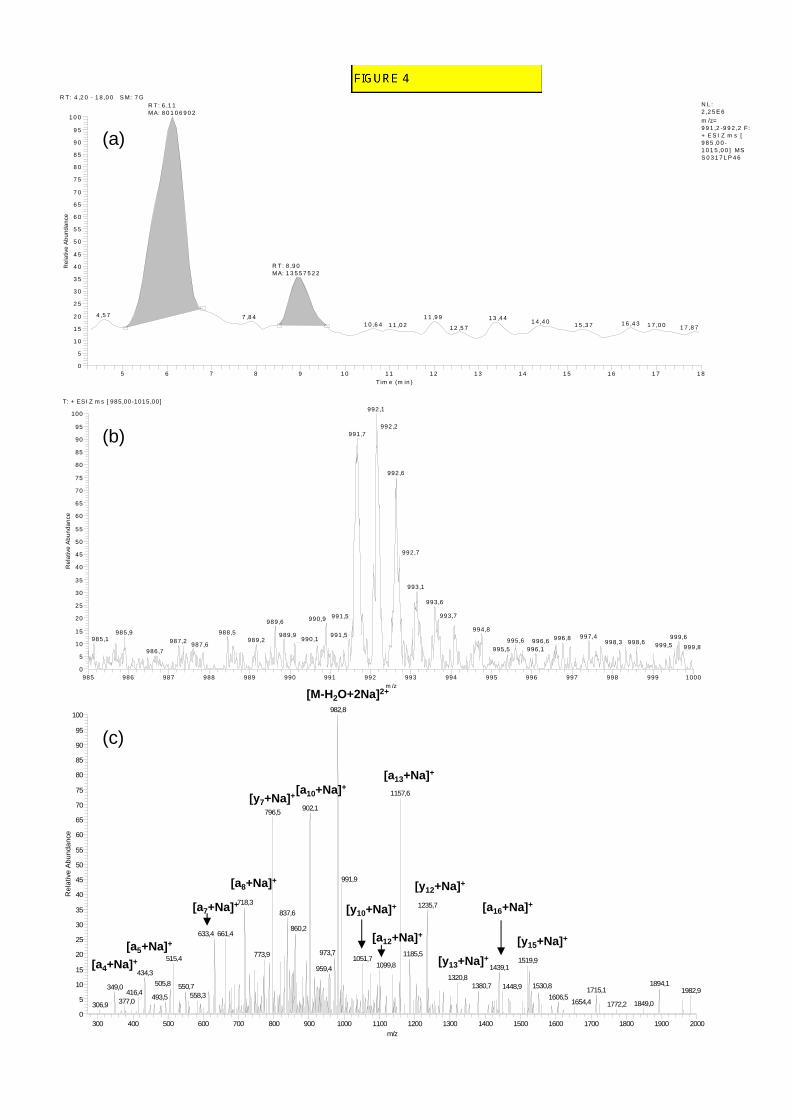
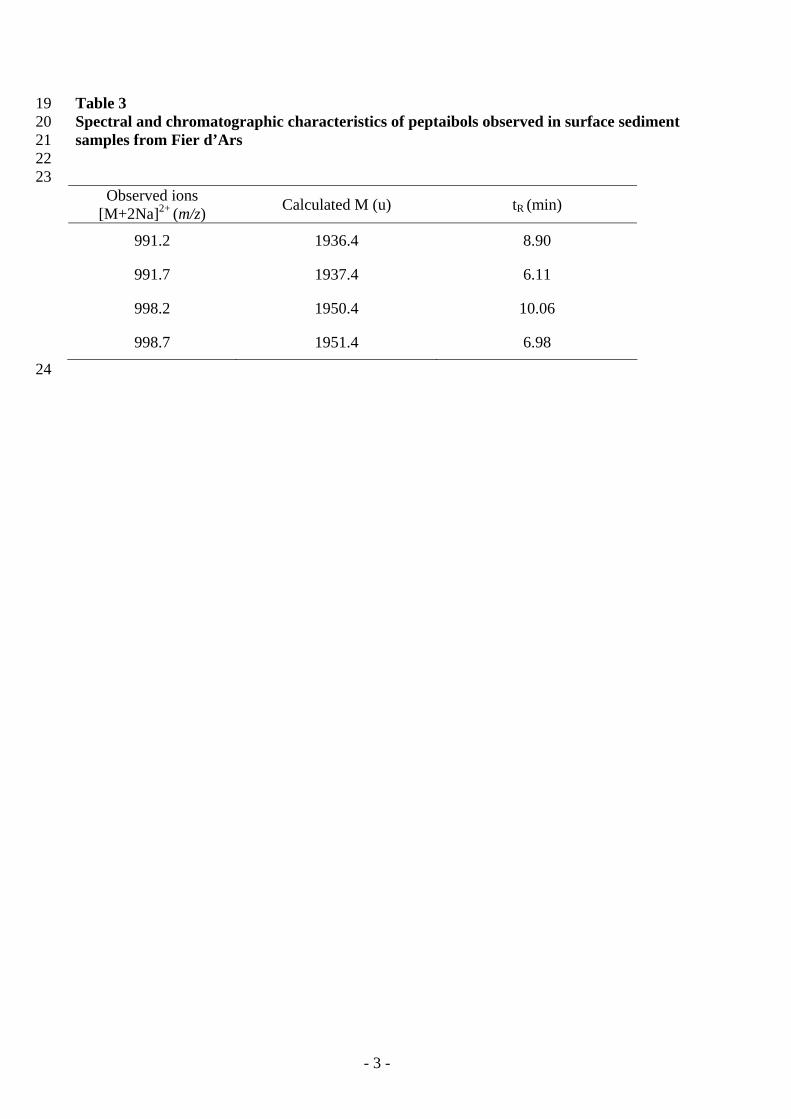
In the Fier d’Ars samples, after chromatographic separation, four doubly charged ions 306 with a peptidic isotopic profile were observed at m/z 991.2, 991.7, 998.2 and 998.7 (e.g. for 307 m/z 991.7, Fig. 4a, b). The molecular masses and retention times of these compounds are 308 shown in Table 3. To confirm their peptaibolic nature, MS2 fragmentation was carried out. 309 Fragmentation profiles were obtained for the two main ions m/z 991.7 and 998.7 and were 310 similar in both cases to the fragmentation pattern of long-sequence peptaibols (e.g. for m/z 311 991.7, Fig. 4c). An identical N-terminus fragment at m/z 1163.8 was identified for these two 312 peptaibols. Two different C-termini parts were observed, respectively, at m/z 773.5 and 787.5. 313 Peptides with molecular masses of 1937.4 and 1951.4 u and showing these N- and C-termini 314 fragments showed numerous similarities with longibrachins and trichokonins, 20-residue 315 peptaibols isolated from Trichoderma species [27-31]. The quantification of peptaibols 316 observed in Fier d’Ars samples allowed establishing a concentration of 5.2 ± 2.1 ng/g of 317 sediment (ww) (n=2). 318
319
FIGURE 4 320
321
TABLE 3 322
323 324
4. Conclusion 325 326
The method described using LC/ESI-IT-MS allows both the identification of 327 peptaibols and, for the first time, their quantification in the pg/g range in complex matrices. 328 LOD and LOQ were respectively 250 and 830 pg/g in marine sediments. Several sediment 329 samples were analysed to evaluate the environmental contamination and the possible 330 implication of these fungal metabolites in toxicity episodes observed in populations of 331 bivalves along the Atlantic coast. The presence of long-sequence peptaibols was shown in 332 sediments collected from Fier d’Ars and trace amounts were determined in these samples. The 333 adaptation of this analytical method to shellfish matrices is under consideration. Further 334 investigations will permit studying the relationship between environmental concentrations and 335 the toxicity of these compounds for marine organisms. 336
337
338
339
Acknowledgements 340
- 10 -
341
Samples from the Bay of Marennes-Oléron, Auray River and the Bay of Veys were 342 collected in the framework of the French program “MOREST” coordinated by IFREMER. 343 We would like to express our thanks to C. Robiou du Pont, N. Berthet and M. Le Goff for 344 their technical participation. 345
346
347
348
349
- 11 -
References 350 351
352
[1] C. Sallenave-Namont, Y.F. Pouchus, T. Robiou du Pont, P. Lassus, J.F. Verbist, 353 Mycopathologia 149 (2000) 21. 354
[2] A. Landreau, Y.F. Pouchus, J.F. Biard, C. Sallenave-Namont, T. Robiou du Pont, J.F. 355 Verbist, J. Microbiol. Meth. 48 (2002) 181. 356
[3] T. Degenkolb, A. Berg, W. Gams, B. Schlegel, U. Gräfe, J. Pept. Sci. 9 (2003) 666. 357
[4] J.K. Chugh, B.A. Wallace, Biochem. Soc. Trans. 29 (2001) 565. 358
[5] S. Oh, B. Yun, S. Lee, J. Kim, I. Yoo, J. Antibiot. 55 (2002) 557. 359
[6] S. Rebuffat, C. Goulard, B. Bodo, M.F. Roquebert, Recent Res. Devel. Org. Bioorg. 360 Chem. 3 (1999) 65. 361
[7] B.S. Yun, I.D. Yoo, Y.H. Kim, Y.S. Kim, S.J. Lee, K.S. Kim, W.H. Yeo, Tetrahedron 362 Lett. 41 (2000) 1429. 363
[8] M. Schiell, J. Hofmann, M. Kurz, F.R. Schmidt, L. Vértesy, M. Vogel, J. Wink, G. 364 Seibert, J. Antibiot. 54 (2001) 220. 365
[9] C. Sallenave-Namont, Y.F. Pouchus, M. Bardouil, P. Lassus, M.F. Roquebert, J.F. 366 Verbist, Toxicon 37 (1999) 77. 367
[10] L. Poirier, M. Montagu, A. Landreau, M. Mohammed-Benkada, O. Grovel, C. 368 Sallenave-Namont, J. Biard, C. Amiard-Triquet, J.C. Amiard, Y.F. Pouchus, Chem. 369 Biodivers. (2007) in press. 370
[11] C. Amiard-Triquet, O. Geffard, A. Geffard, H. Budzinski, J.C. Amiard, D. Fichet, H. 371 Pouliquen, Y. Berthelot, E. His, in H. Tremblay, J. Locat, R. Galvez-Cloutier 372 (Editors), Contaminated Sediments: Characterization, Evaluation, 373 Mitigation/Restoration, Univ. Laval, Québec, 2003, p. 349. 374
[12] M. Schirmbock, M. Lorito, Y.L. Wang, C.K. Hayes, I. Arisan-Atac, F. Scala, G.E. 375 Harman, C.P. Kubicek, Appl. Environ. Microbiol. 60 (1994) 4364. 376
[13] A. Psurek, C. Neusüβ, T. Degenkolb, H. Brückner, E. Balaguer, D. Imhof, G.K.E. 377 Scriba, J. Pept. Sci. 12 (2006) 279. 378
[14] A. Szekeres, B. Leitgeb, L. Kredics, Z. Antal, L. Hatvani, L. Manczinger, C. 379 Vagvölgyi, Acta Microbiol. Immunol. 52 (2005) 137. 380
[15] J. Kirschbaum, C. Krause, R.K. Winzheimer, H. Brückner, J. Pept. Sci. 9 (2003) 799. 381
[16] J. Peltola, A. Ritieni, R. Mikkola, P.A. Grigoriev, G. Pocsfalvi, M.A. Andersson, M.S. 382 Salkinoja-Salonen, Appl. Environ. Microbiol. 70 (2004) 4996. 383
[17] A. Iida, M. Sanekata, T. Fujita, H. Tanaka, A. Enoky, G. Fuse, M. Kanai, P. 384 Rudewicz, E. Tachikawa, Chem. Pharm. Bull. 42 (1994) 1070. 385
[18] S. Rebuffat, C. Goulard, S. Hlimi, B. Bodo, J. Pept. Sci. 6 (2000) 519. 386
[19] M. Mohamed-Benkada, M. Montagu, J.F. Biard, F. Mondeguer, P. Vérité, M. 387 Dalgalarrondo, J. Bissett, Y.F. Pouchus, Rapid Commun. Mass Spectrom. 20 (2006) 388 1176. 389
[20] V. Sabareesh, P. Balaram, Rapid Commun. Mass Spectrom. 20 (2006) 618. 390
- 12 -
[21] P. Roepstorff, J. Fohlman, Biomed. Mass Spectrom. 11 (1984) 601. 391
[22] K. Biemann, Biomed. Environ. Mass Spectrom. 16 (1988) 99. 392
[23] M. Przybylski, I. Dietrich, I. Manz, H. Brückner, Biomed. Mass Spectrom. 11 (1984) 393 569. 394
[24] H. Brückner, W.A. Konig, M. Aydin, G. Jung, Biochim. Biophys. Acta 827 (1985) 51. 395
[25] A. Jaworski, H. Brückner, J. Chromatogr. A 862 (1999) 179. 396
[26] J. Vial, A. Jardy, Anal. Chem. 71 (1999) 2672. 397
[27] L. Whitmore, J.K. Chugh, C.F. Snook, B.A. Wallace, J. Pept. Sci. 9 (2003) 663. 398
[28] Q. Huang, Y. Tezuka, Y. Hatanaka, T. Kikuchi, A. Nishi, K. Tubaki, Chem. Pharm. 399 Bull. 43 (1995) 1663. 400
[29] Q. Huang, Y. Tezuka, Y. Hatanaka, T. Kikuchi, A. Nishi, K. Tubaki, Chem. Pharm. 401 Bull. 44 (1996) 590. 402
[30] G. Leclerc, S. Rebuffat, C. Goulard, B. Bodo, J. Antibiot. 51 (1998) 170. 403
[31] G. Leclerc, C. Goulard, Y. Prigent, B. Bodo, H. Wroblewski, S. Rebuffat, J. Nat. Prod. 404 64 (2001) 164. 405
- 13 -
Figure captions 406
407
408
Fig. 1. Influence of the purification mode of crude extracts 409 Mode 1: extract deposited with three successive fractions: dichloromethane/ethanol 100:0, 90:10 and 50:50 410 (v/v); 411 Mode 2: dry deposit 412 (a) Cumulative recovery of alamethicin F50 413 (b) Cumulative percentage of eluted impurities 414
415
416
Fig. 2. Mass spectra of alamethicin F50/5 417
(a) Zoomscan mode 418 (b) MS2 spectrum of ion at m/z 1004.3 [M+2Na]2+ 419 The main fragments corresponding to an and yn ion series are shown. 420
421
422
Fig. 3. LC/ESI-IT-MS analysis of surface sediment samples collected from Fiers d’Ars - 423 chromatograms of fraction D spiked with alamethicin F50 reference solution (25 µg/L) 424
(a) Total ion current 425 (b) Detection on the range [1003.9-1004.9]: peak of alamethicin F50/5 426 (c) Detection on the range [1010.9-1011.9]: peak of alamethicin F50/7 427
428
429
Fig. 4. LC/ESI-IT-MS analysis of surface sediment samples collected from Fiers d’Ars 430
(a) Chromatogram (detection on the range [991.2-992.2]) 431 (b) Mass spectrum corresponding to peak at tR = 6.11 min 432 (c) MS2 spectrum of ion at m/z 991.7 [M+2Na]2+ 433 The main fragments corresponding to an and yn ion series are shown. 434
435
436
0
20
40
60
80
100
0
20
40
60
80
100
Mode 1 Mode 2 Mode 1 Mode 2
(a) (b)Cumulative recovery of
alamethicins (%)Cumulative percentage of eluted
impurities (%)
échanalyse1004 #48 RT: 1,59 AV: 1 NL: 3,04E5T: + c Full ms2 1004,00@32,00 [ 275,00-2000,00]
300 400 500 600 700 800 900 1000 1100 1200 1300 1400 1500 1600 1700 1800 1900 2000m/z
0
5
10
15
20
25
30
35
40
45
50
55
60
65
70
75
80
85
90
95
100
Rel
ativ
e A
bund
ance
995,8
796,61004,4
1183,8914,5
915,2
744,3 1235,7928,7
850,8
1051,7659,3
1520,81098,7 1320,9
515,3 1464,81321,8460,3 1245,7531,2600,3 1529,8375,3 1604,8 1686,2331,8 1746,8
S 0 3 3 2 L P 0 4 # 3 5 8 - 3 7 0 R T : 8 ,7 9 - 8 ,9 8 A V : 3 N L : 3 ,3 7 E 5T : + E S I Z m s [ 9 8 5 ,0 0 - 1 0 1 5 ,0 0 ]
9 9 8 9 9 9 1 0 0 0 1 0 0 1 1 0 0 2 1 0 0 3 1 0 0 4 1 0 0 5 1 0 0 6 1 0 0 7 1 0 0 8 1 0 0 9 1 0 1 0m /z
0
5
1 0
1 5
2 0
2 5
3 0
3 5
4 0
4 5
5 0
5 5
6 0
6 5
7 0
7 5
8 0
8 5
9 0
9 5
1 0 0
Rel
ativ
e Ab
unda
nce
1 0 0 4 ,7
1 0 0 4 ,3
1 0 0 5 ,2
1 0 0 5 ,7
1 0 0 5 ,8
1 0 0 6 ,21 0 0 6 ,7
1 0 0 4 ,11 0 0 2 ,7 1 0 0 7 ,3 1 0 0 9 ,89 9 9 ,8 1 0 0 9 ,51 0 0 0 ,6 1 0 0 3 ,5 1 0 0 9 ,01 0 0 2 ,09 9 8 ,7 1 0 0 1 ,7 1 0 0 7 ,89 9 9 ,0
(a)
(b)
[y16+Na]+
[M-H2O+2Na]2+
[a10+Na]+[a8+Na]+
[a6+Na]+
[a12+Na]+
[y10+Na]+
[y12+Na]+
[a13+Na]+
[y7+Na]+
[y13+Na]+ [y15+Na]+
[a5+Na]+
[a4+Na]+
[a7+Na]+
RT: 4,20 - 18,00 SM: 7B
5 6 7 8 9 10 11 12 13 14 15 16 17 18Time (min)
0
5
10
15
20
25
30
35
40
45
50
55
60
65
70
75
80
85
90
95
100
Rel
ativ
e Ab
unda
nce
RT: 10,64MA: 39082126
6,88
8,71 9,00 13,63 13,826,11 7,65 11,41 14,40 16,434,86 5,24 16,6212,6611,99 17,205,82 15,378,42
NL:1,26E6m/z= 1010,9-1011,9 F: + ESI Z ms [ 985,00-1015,00] MS S0317LP46
R T: 4 ,20 - 18,00 SM: 7G
5 6 7 8 9 10 11 12 13 14 15 16 17 18Tim e (m in )
0
5
10
15
20
25
30
35
40
45
50
55
60
65
70
75
80
85
90
95
100
Rel
ativ
e Ab
unda
nce
6 ,11
8 ,906 ,88
10 ,54
9,965 ,054,387 ,75
16,8115 ,66 17 ,4913 ,92 14,9813,3412 ,37
N L:1 ,70E7TIC F: + ESI Z m s [ 985 ,00-1015 ,00 ] MS S0317LP46
R T: 4 ,2 0 - 18 ,00 SM: 7 G
5 6 7 8 9 1 0 1 1 1 2 1 3 14 15 16 1 7 1 8Tim e (m in )
0
5
10
15
20
25
30
35
40
45
50
55
60
65
70
75
80
85
90
95
10 0
Rel
ativ
e A
bund
ance
R T: 8 ,81MA: 7 3 20 96 6 2
6 ,115 ,73
8 ,1 3 1 5 ,3 712 ,57 17 ,681 0 ,0 6 1 1 ,9 94 ,95 1 6 ,1 4 16 ,916 ,88 14 ,5011 ,51 1 3 ,9 2
N L:2 ,52 E6m /z= 1 00 3 ,9 -10 0 4 ,9 F: + ESI Z m s [ 9 85 ,00 -1 01 5 ,0 0 ] MS S03 1 7L P4 6
(a)
(b)
(c)
S0346LP02 #241-255 RT: 8,65-9,08 AV: 5 NL: 8,89E3F: + p ESI Full ms2 991,70@33,00 [ 270,00-2000,00]
300 400 500 600 700 800 900 1000 1100 1200 1300 1400 1500 1600 1700 1800 1900 2000m/z
0
5
10
15
20
25
30
35
40
45
50
55
60
65
70
75
80
85
90
95
100
Rel
ativ
e Ab
unda
nce
982,8
1157,6
902,1796,5
991,9
718,3 1235,7837,6
860,2661,4633,4
973,7 1185,5773,9515,4 1051,7 1519,91099,8 1439,1959,4434,3 1320,8505,8 1894,11530,81380,7 1448,9550,7349,0 1715,1 1982,9416,4 558,3493,5 1606,5377,0 1654,4 1849,01772,2306,9
R T: 4 ,2 0 - 1 8 ,0 0 S M: 7 G
5 6 7 8 9 1 0 1 1 1 2 1 3 1 4 1 5 1 6 1 7 1 8Tim e (m in )
0
5
1 0
1 5
2 0
2 5
3 0
3 5
4 0
4 5
5 0
5 5
6 0
6 5
7 0
7 5
8 0
8 5
9 0
9 5
1 0 0
Rel
ativ
e Ab
unda
nce
R T : 6 ,1 1MA: 8 0 1 0 6 9 0 2
R T: 8 ,9 0MA: 1 3 5 5 7 5 2 2
4 ,5 7 1 1 ,9 97 ,8 4 1 3 ,4 4 1 4 ,4 0 1 6 ,4 31 0 ,6 4 1 1 ,0 2 1 7 ,0 01 5 ,3 7 1 7 ,8 71 2 ,5 7
N L :2 ,2 5 E 6m /z= 9 9 1 ,2 -9 9 2 ,2 F : + E S I Z m s [ 9 8 5 ,0 0 -1 0 1 5 ,0 0 ] MS S 0 3 1 7 L P 4 6
S0317LP17 #251-262 RT: 6,17-6,36 AV: 3 NL: 6,30E4T: + ESI Z m s [ 985,00-1015,00]
985 986 987 988 989 990 991 992 993 994 995 996 997 998 999 1000m /z
0
5
10
15
20
25
30
35
40
45
50
55
60
65
70
75
80
85
90
95
100
Rel
ativ
e Ab
unda
nce
992,1
992,2991,7
992,6
992,7
993,1
993,6
993,7991,5990,9989,6994,8985,9 988,5 991,5989,9 997,4 999,6996,8985,1 990,1989,2 995,6 996,6987,2 998,6998,3987,6 999,5 999,8995,5 996,1986,7
(b)
[M-H2O+2Na]2+
[y7+Na]+
[a13+Na]+
[a7+Na]+
[a8+Na]+
[a10+Na]+
[y10+Na]+
[a12+Na]+
[y12+Na]+
[y13+Na]+[a5+Na]+
[a4+Na]+
[a16+Na]+
[y15+Na]+
(c)
(a)
- 1 -
TABLES 1 2 3 4 Table 1 5 Influence of the solvent mixture on alamethicin F50 extraction from sediments spiked at 10 6 ng/g. 7
Tested solvents Mean recovery (%) ± SD (n=3)
a: dichloromethane / methanol (1:1, v/v) 8.7 ± 0.0
b: methanol / TFA (0.1%, v/v) 1.9 ± 0.0
c: ethanol / acetic acid (1%, v/v) 5.8 ± 0.0
d: acetone / acetic acid (1%, v/v) 86 ± 20
e: acetone / hydrochloric acid (0.02%, v/v) 64 ± 9.0
8 9 10 11
- 2 -
Table 2 12 Matrix matched calibration: repeatability and accuracy. 13 14
15 Alamethicin
Theoretical (ng/g of sediment)
Mean (ng/g of sediment)
± SD (n=6) RSD (%) Bias (%)
0.6 0.8±0.1 10 29 1.2 1.1±0.1 7 -8 2.3 2.2±0.2 9 -4 4.7 3.8±0.2 4 -18 9.4 9.5±0.2 2 2
16 17 18
- 3 -
Table 3 19 Spectral and chromatographic characteristics of peptaibols observed in surface sediment 20 samples from Fier d’Ars 21 22
23 Observed ions
[M+2Na]2+ (m/z) Calculated M (u) tR (min)
991.2 1936.4 8.90
991.7 1937.4 6.11
998.2 1950.4 10.06
998.7 1951.4 6.98
24


