Embed Size (px)
Citation preview

Citation: Szabo, R.; Gaspar, A.
Determination of Phenolic
Compounds by Capillary Zone
Electrophoresis–Mass Spectrometry.
Molecules 2022, 27, 4540.
https://doi.org/10.3390/
molecules27144540
Academic Editors: Elias A.G. Zagatto,
Fábio Rodrigo Piovezani Rocha and
Michał Wozniakiewicz
Received: 29 May 2022
Accepted: 14 July 2022
Published: 16 July 2022
Publisher’s Note: MDPI stays neutral
with regard to jurisdictional claims in
published maps and institutional affil-
iations.
Copyright: © 2022 by the authors.
Licensee MDPI, Basel, Switzerland.
This article is an open access article
distributed under the terms and
conditions of the Creative Commons
Attribution (CC BY) license (https://
creativecommons.org/licenses/by/
4.0/).
molecules
Communication
Determination of Phenolic Compounds by Capillary ZoneElectrophoresis–Mass SpectrometryRuben Szabo and Attila Gaspar *
Department of Inorganic and Analytical Chemistry, University of Debrecen, Egyetem ter 1,4032 Debrecen, Hungary; [email protected]* Correspondence: [email protected]; Tel.: +36-30-2792889; Fax: +36-52-518660
Abstract: A CZE-MS method was developed for the determination of several phenolic compounds(phenolic acids, flavonoids). Since the analysis of these components necessitates the application ofbasic conditions for CZE separation and negative ionization mode for MS detection, the simplestchoice was to use 0.5 M NH4OH and IPA:water (1:1 v/v%) as the background electrolyte and sheathliquid, respectively. The LOD values ranged between 0.004–1.9 mg/L showing that there are relativelylarge differences in the ionization (and chemical) features of these compounds. The precision datawere better than 0.75 RSD% for migration times and were between 5–8 RSD% for peak areas. In orderto test the applicability of the developed method, a honey sample was analyzed.
Keywords: phenolic compounds; capillary zone electrophoresis; mass spectrometry; honey
1. Introduction
Phenolic compounds are molecules including several bioactive properties, therebyoffering excellent nutritional and health-protective effects owing to their antioxidant fea-tures. These compounds having an aromatic ring with one or more hydroxyl groups canbe classified to phenols, phenolic acids, flavonoids, tannins or lignans. The organolepticproperties (taste, color) of certain foodstuff (e.g., berries, coffee, wine, honey) are mainlydetermined by these phenolic compounds. More than 8000 (poly)phenolic compoundshave been detected in natural substances. There are several constitutional isomers and alarge part of them (mainly the flavonoids) occur as aglycone, glycosides or methylatedderivatives [1].
The well-known method for the quantitative determination of total phenolic content isthe Folin–Ciocalteu colorimetric method, which, however, cannot provide any informationabout the individual phenolic analytes. In order to distinguish the large number of phenoliccompounds, the combination of a high efficiency separation method with high detectionsensitivity is strongly advised. Such analyses demand the utilization of MS detection, sinceMS allows us to gain information about both the molecular weight and the structure ofa component. Following these requirements, many works can be found in the literatureabout the determination of phenolic compounds by GC-MS [2–4] or LC-MS [5–7]. However,GC analysis generally necessitates the derivatization of phenolic acids due to their lowvolatility and the high temperature applied can damage the analyte components [8]. CE-MSis also considered a powerful hyphenated method, however, its utilization for the analysisof phenolic compounds is relatively rarely demonstrated in the literature [7,9,10].
CE is often applied with a UV detector, which is suitable for the sensitive detection ofchromophoric phenolic compounds. CE is a good alternative and complement to chromato-graphic methods owing to its minimal sample/reagent volume requirement and the easeof sample handling (derivatization is not necessary). In addition, CE showed its superiorityin analyzing complex matrices (e.g., food, agricultural or clinical samples). In the last30 years, several works have been published about the CE analysis of phenolic compounds
Molecules 2022, 27, 4540. https://doi.org/10.3390/molecules27144540 https://www.mdpi.com/journal/molecules
Molecules 2022, 27, 4540 2 of 9
using UV detection, where the CE technique applied was CZE, exclusively [8,11–15]. Thehyphenation of CE with MS detection through electrospray ionization enabled the analysisof thermally labile, non-volatile and polar components like phenolic compounds. Themajority of CE-MS work in this field was aimed at the determination of phenolic com-pounds in food or plant samples [10,16–22]. Arráez-Román et al. [20] analyzed mostlyflavonoids and they expected that positive polarity MS detection is less selective but moresensitive compared to the applied negative polarity detection. They utilized a complexextraction/preconcentration procedure including the mixing of the sample with Amberliteparticles in solution, then sugars and other polar constituents of honey were removed andthe phenolic compounds were eluted. Afterwards, the methanolic extract was concentratedto dryness under reduced pressure in a rotary evaporator at 50 ◦C.
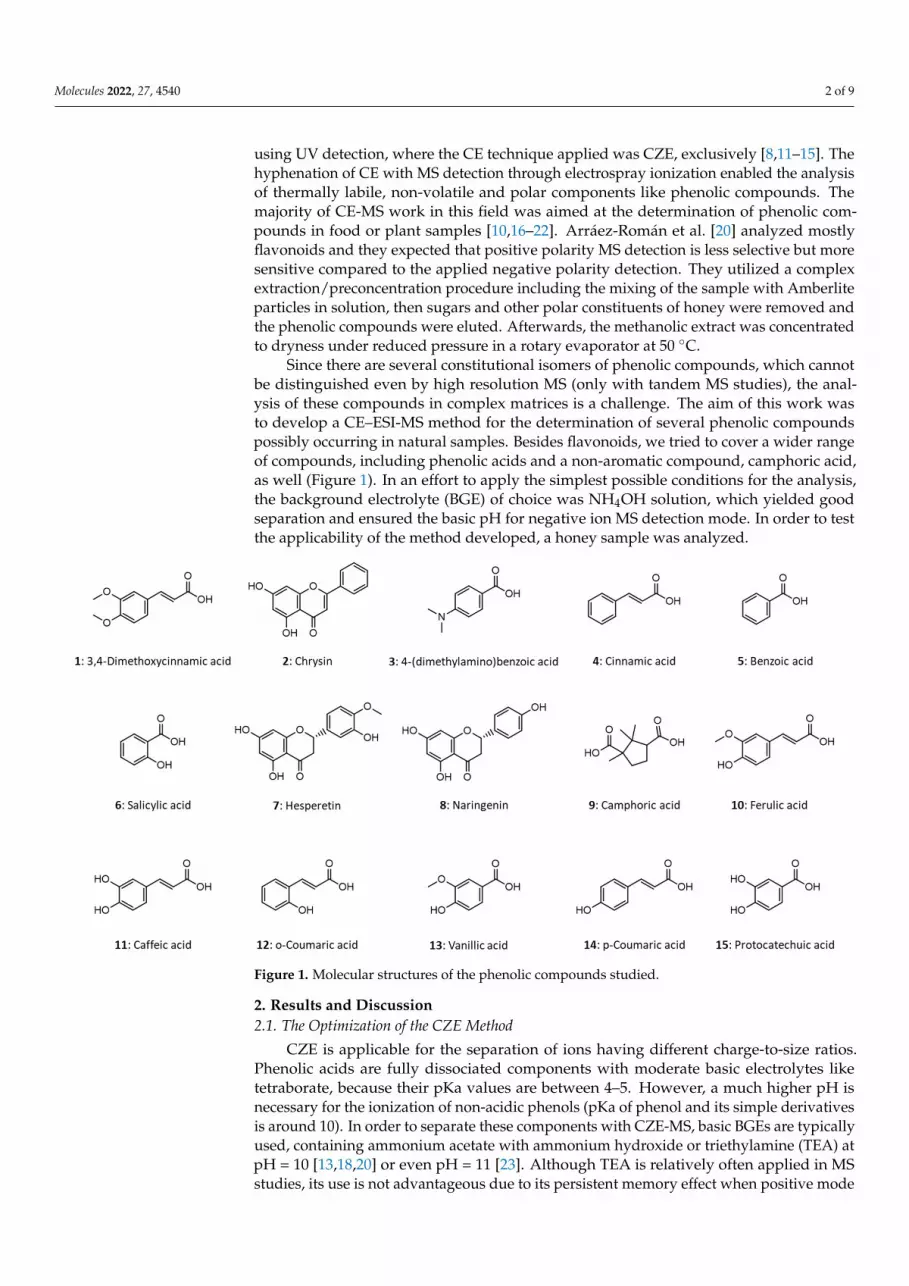
Since there are several constitutional isomers of phenolic compounds, which cannotbe distinguished even by high resolution MS (only with tandem MS studies), the anal-ysis of these compounds in complex matrices is a challenge. The aim of this work wasto develop a CE–ESI-MS method for the determination of several phenolic compoundspossibly occurring in natural samples. Besides flavonoids, we tried to cover a wider rangeof compounds, including phenolic acids and a non-aromatic compound, camphoric acid,as well (Figure 1). In an effort to apply the simplest possible conditions for the analysis,the background electrolyte (BGE) of choice was NH4OH solution, which yielded goodseparation and ensured the basic pH for negative ion MS detection mode. In order to testthe applicability of the method developed, a honey sample was analyzed.
Molecules 2022, 27, x FOR PEER REVIEW 2 of 10
last 30 years, several works have been published about the CE analysis of phenolic com-pounds using UV detection, where the CE technique applied was CZE, exclusively [8,11–15]. The hyphenation of CE with MS detection through electrospray ionization enabled the analysis of thermally labile, non-volatile and polar components like phenolic com-pounds. The majority of CE-MS work in this field was aimed at the determination of phe-nolic compounds in food or plant samples [10,16–22]. Arráez-Román et al. [20] analyzed mostly flavonoids and they expected that positive polarity MS detection is less selective but more sensitive compared to the applied negative polarity detection. They utilized a complex extraction/preconcentration procedure including the mixing of the sample with Amberlite particles in solution, then sugars and other polar constituents of honey were removed and the phenolic compounds were eluted. Afterwards, the methanolic extract was concentrated to dryness under reduced pressure in a rotary evaporator at 50 °C.
Since there are several constitutional isomers of phenolic compounds, which cannot be distinguished even by high resolution MS (only with tandem MS studies), the analysis of these compounds in complex matrices is a challenge. The aim of this work was to de-velop a CE–ESI-MS method for the determination of several phenolic compounds possibly occurring in natural samples. Besides flavonoids, we tried to cover a wider range of com-pounds, including phenolic acids and a non-aromatic compound, camphoric acid, as well (Figure 1). In an effort to apply the simplest possible conditions for the analysis, the back-ground electrolyte (BGE) of choice was NH4OH solution, which yielded good separation and ensured the basic pH for negative ion MS detection mode. In order to test the applica-bility of the method developed, a honey sample was analyzed.
Figure 1. Molecular structures of the phenolic compounds studied.
2. Results and Discussion 2.1. The Optimization of the CZE Method
CZE is applicable for the separation of ions having different charge-to-size ratios. Phenolic acids are fully dissociated components with moderate basic electrolytes like tetraborate, because their pKa values are between 4–5. However, a much higher pH is necessary for the ionization of non-acidic phenols (pKa of phenol and its simple deriva-tives is around 10). In order to separate these components with CZE-MS, basic BGEs are typically used, containing ammonium acetate with ammonium hydroxide or triethyla-mine (TEA) at pH = 10 [13,18,20] or even pH = 11 [23]. Although TEA is relatively often
Figure 1. Molecular structures of the phenolic compounds studied.
2. Results and Discussion2.1. The Optimization of the CZE Method
CZE is applicable for the separation of ions having different charge-to-size ratios.Phenolic acids are fully dissociated components with moderate basic electrolytes liketetraborate, because their pKa values are between 4–5. However, a much higher pH isnecessary for the ionization of non-acidic phenols (pKa of phenol and its simple derivativesis around 10). In order to separate these components with CZE-MS, basic BGEs are typicallyused, containing ammonium acetate with ammonium hydroxide or triethylamine (TEA) atpH = 10 [13,18,20] or even pH = 11 [23]. Although TEA is relatively often applied in MSstudies, its use is not advantageous due to its persistent memory effect when positive mode

Molecules 2022, 27, 4540 3 of 9
MS measurements are carried out [24]. Provided that a highly basic solution (pH > 11) isnecessary for the separation that is also compatible with CZE-MS, the most straightforwardchoice is the use of NH4OH solution. Pure ammonia solution is acceptable as BGE forCZE and also preferred by MS detection (negative ionization mode). The application ofpure ammonia solution yields simple mass spectra, leading to sensitive detection. Theonly concern when using pure ammonia solution as BGE is the lack of buffer capacity andthe volatility of ammonia; however, these drawbacks can be remedied by the frequentreplenishment of the BGE (which can be automatically accomplished in commercial CEinstruments) from/in well-closed containers. It should also be noted that in some works8–15% organic modifier like acetonitrile [15] was used, but the resolution was not improvedfor all compounds and the analysis time was prolonged.
For phenolic compounds the negative ionization mode is preferred due to its betterselectivity, although the sensitivities of the measurements are moderate compared to theusual positive mode MS analyses [20]. The application of sheath liquid is necessary incases when conventional CE-MS setups are utilized; however, its composition and flowrate should be optimized to minimize analyte dilution and to maintain the electrospraystability (i.e., to maximize detection sensitivity). In our work, sheath liquid consisted ofIPA:water (50:50 v/v), with no added electrolyte. Although alkaline sheath liquid is usedfor negative ionization mode in general, the high pH of the BGE ensures the basic conditionfor the ESI even in the solution obtained after the mixing of the CE effluent (BGE) with thesheath liquid.
In basic BGE the majority of the 15 phenolic compounds studied could be well sepa-rated and a considerable difference in separation efficiency was not observed in the pHrange between 9–12. Using 0.5 M NH4OH (pH = 11.4) solution as BGE, co-migrations werefound only in few cases, but even these components could be easily distinguished recordingthe proper extracted ion electropherogram (EIE). In neutral BGE, fewer components (11from the 15) could be detected because of the lower ionization degree of the non-acidiccomponents and the poorer detection sensitivity, however, caffeic acid showed an extremelyhigh signal intensity compared to the other components (Figure 2). Obviously, the mi-gration order was largely changed between pH = 7 and pH = 11.4, since the compoundsstudied show large differences in pK values.
The necessary application of sheath liquid for CE-ESI/MS offers the possibility touse positive MS mode even when the electrophoretic separation is carried out in basicconditions, since the sample solution can be largely acidified if an acid (e.g., 0.1% formicacid) is added to the sheath liquid. In Figure 3, the CZE-MS electropherograms obtainedin negative and positive MS modes were compared. In positive MS mode only a fewcomponents could be detected (5 from the 15), which is understandable regarding theacidic feature of the components studied. In contrast, 4-(dimethylamino)benzoic acidcontains an easily ionizable amino group, due to which considerably higher detectionsensitivity could be observed.
Based on the measurements described above, the optimal parameters for the CZE-MSanalysis of the studied components were 0.5 M NH4OH solution as BGE, pure IPA:wateras sheath liquid and negative mode MS detection. Regardless of the utmost simplicity ofthe BGE and sheath liquid composition we used, their utilization for the CZE-MS analysisof phenolic compounds has not been reported in the literature so far. The only concern inconnection with our BGE of choice is that components might be decomposed at such highpH, which was found in the case of quercetin. Apart from quercetin, all the componentsstudied were stable during the analyses.

Molecules 2022, 27, 4540 4 of 9Molecules 2022, 27, x FOR PEER REVIEW 4 of 10
Figure 2. CZE-MS electropherograms obtained with (a) 0.5 M NH4OH (pH = 11.4) and (b) 50 mM ammonium-acetate (pH = 7) including an inset (c) which represents (b) the electropherogram with a larger intensity scale. The number of the peaks correspond with the number assigned to the com-ponents given in Figure 1. Conditions: capillary: 90 cm × 50 µm, U = +30 kV, sample injection: 50 mbar × 4 s, MS: negative ionization mode, sheath liquid: IPA:water = 1:1, sheath liquid flow: 6 µL/min, nebulizer pressure: 0.8 bar, drying temperature: 200 °C, spectra rate: 2 Hz. Sample: 3.833 mg/L 3,4-dimethoxycinnamic acid (1), 0.209 mg/L chrysin (2), 11.63 mg/L 4-(dimethylamino)benzoic acid (3), 17.44 mg/L cinnamic acid (4), 49.87 mg/L benzoic acid (5), 22.89 mg/L salicylic acid (6), 1.765 mg/L hesperetin (7), 1.637 mg/L naringenin (8), 7.881 mg/L camphoric acid (9), 4.968 mg/L ferulic acid (10), 85.66 mg/L caffeic acid (11), 19.98 mg/L o-coumaric acid (12), 15.69 mg/L vanillic acid (13), 35.706 mg/L p-coumaric acid (14), 8.73 mg/L protocatechuic acid (15).
The necessary application of sheath liquid for CE-ESI/MS offers the possibility to use positive MS mode even when the electrophoretic separation is carried out in basic condi-tions, since the sample solution can be largely acidified if an acid (e.g., 0.1% formic acid) is added to the sheath liquid. In Figure 3, the CZE-MS electropherograms obtained in neg-ative and positive MS modes were compared. In positive MS mode only a few components could be detected (5 from the 15), which is understandable regarding the acidic feature of the components studied. In contrast, 4-(dimethylamino)benzoic acid contains an easily ionizable amino group, due to which considerably higher detection sensitivity could be observed.
Figure 2. CZE-MS electropherograms obtained with (a) 0.5 M NH4OH (pH = 11.4) and (b) 50 mMammonium-acetate (pH = 7) including an inset (c) which represents (b) the electropherogramwith a larger intensity scale. The number of the peaks correspond with the number assignedto the components given in Figure 1. Conditions: capillary: 90 cm × 50 µm, U = +30 kV, sampleinjection: 50 mbar × 4 s, MS: negative ionization mode, sheath liquid: IPA:water = 1:1, sheathliquid flow: 6 µL/min, nebulizer pressure: 0.8 bar, drying temperature: 200 ◦C, spectra rate:2 Hz. Sample: 3.833 mg/L 3,4-dimethoxycinnamic acid (1), 0.209 mg/L chrysin (2), 11.63 mg/L4-(dimethylamino)benzoic acid (3), 17.44 mg/L cinnamic acid (4), 49.87 mg/L benzoic acid (5),22.89 mg/L salicylic acid (6), 1.765 mg/L hesperetin (7), 1.637 mg/L naringenin (8), 7.881 mg/L cam-phoric acid (9), 4.968 mg/L ferulic acid (10), 85.66 mg/L caffeic acid (11), 19.98 mg/L o-coumaric acid (12),15.69 mg/L vanillic acid (13), 35.706 mg/L p-coumaric acid (14), 8.73 mg/L protocatechuic acid (15).
Molecules 2022, 27, x FOR PEER REVIEW 5 of 10
Figure 3. CZE-MS electropherograms obtained using 0.5 M NH4OH as BGE with (a) negative and (b) positive ionization mode. The inset (c) represents the electropherogram with a larger intensity scale in positive ionization mode. Conditions are the same as in Figure 2a, but for (b,c) the sheath liquid was 0.1% formic acid in IPA:water = 1:1 and the positive ionization mode was applied.
Based on the measurements described above, the optimal parameters for the CZE-MS analysis of the studied components were 0.5 M NH4OH solution as BGE, pure IPA:wa-ter as sheath liquid and negative mode MS detection. Regardless of the utmost simplicity of the BGE and sheath liquid composition we used, their utilization for the CZE-MS anal-ysis of phenolic compounds has not been reported in the literature so far. The only concern in connection with our BGE of choice is that components might be decomposed at such high pH, which was found in the case of quercetin. Apart from quercetin, all the compo-nents studied were stable during the analyses.
2.2. Analytical Performance Study The analytical performance of the CZE-MS method developed was evaluated for the
proposed separation and detection conditions of the 15 phenolic compounds studied. The calibration diagrams showed good linearities (better than 0.996 for the majority of com-ponents) in the concentration ranges of 0.1–200 mg/L and 2–500 mg/L for 5 and 9 compo-nents, respectively (Figure S1). The precision of the analyses was studied by the consecu-tive measurement of the mixture of standard solutions (Figure S2). The RSD data were better than 0.75% for migration times and ranged between 5–8% for peak areas. The rela-tively poor peak area precision can be attributed to the inaccurate integration of over-lapped and slightly tailed peaks. The LOD values scattered between 0.004–1.9 mg/L, which indicates that there are relatively large differences in the ionization (and chemical) characteristics of these compounds. It is commonly known that the detection sensitivity of CZE methods can be largely enhanced by increasing the sample injection volume (for instance, the application of 60 s injection time instead of 6 s could lead to a seven-fold improvement of LOD values). The analytical performance data are summarized in Table 1.
Figure 3. CZE-MS electropherograms obtained using 0.5 M NH4OH as BGE with (a) negative and(b) positive ionization mode. The inset (c) represents the electropherogram with a larger intensityscale in positive ionization mode. Conditions are the same as in Figure 2a, but for (b,c) the sheathliquid was 0.1% formic acid in IPA:water = 1:1 and the positive ionization mode was applied.

Molecules 2022, 27, 4540 5 of 9
2.2. Analytical Performance Study
The analytical performance of the CZE-MS method developed was evaluated forthe proposed separation and detection conditions of the 15 phenolic compounds studied.The calibration diagrams showed good linearities (better than 0.996 for the majority ofcomponents) in the concentration ranges of 0.1–200 mg/L and 2–500 mg/L for 5 and9 components, respectively (Figure S1). The precision of the analyses was studied by theconsecutive measurement of the mixture of standard solutions (Figure S2). The RSD datawere better than 0.75% for migration times and ranged between 5–8% for peak areas.The relatively poor peak area precision can be attributed to the inaccurate integration ofoverlapped and slightly tailed peaks. The LOD values scattered between 0.004–1.9 mg/L,which indicates that there are relatively large differences in the ionization (and chemical)characteristics of these compounds. It is commonly known that the detection sensitivityof CZE methods can be largely enhanced by increasing the sample injection volume (forinstance, the application of 60 s injection time instead of 6 s could lead to a seven-foldimprovement of LOD values). The analytical performance data are summarized in Table 1.
Table 1. Analytical Performance Data of CZE-MS Measurements.
# Name Formula [M-H]−Mass
Equation forCalibration Graph R2 Linear Range
(mg/L) LOD (mg/L) Recovery(%) 1Conc. inHoney
(mg/kg) 2
RSD%(Min)
RSD%(Area)
1 3,4-Dimethoxycinnamicacid C11H12O4 207.0663 y = 14.86x − 35.19 0.9942 0.1–200 0.026 88.2 0.59 7.69
2 Chrysin C15H10O4 253.0506 y = 36.23x − 8.07 0.9948 0.1–200 0.004 84.6 0.68 6.9
3 4-(dimethylamino)-benzoicacid C9H11NO2 164.0717 y = 5.16x − 0.24 0.9944 0.5–500 0.067 86.1 0.63 7.42
4 Cinnamic acid C9H8O2 147.0452 y = 3.49x − 9.18 0.9995 0.5–500 0.153 94.2 0.65 6.375 Benzoic acid C7H6O2 121.0295 y = 0.54x + 13.7 0.9982 10–1000 0.628 95.6 0.65 5.276 Salicylic acid C7H6O3 137.0244 y = 3.49x − 37.0 0.9966 2–500 0.323 84.9 0.56 6.617 Hesperetin C16H14O6 301.0718 y = 28.6x − 6.17 0.9996 0.1–200 0.016 84.8 0.49 5.938 Naringenin C15H12O5 271.0612 y = 24.3x + 11.0 0.9992 0.1–200 0.011 95.7 0.599 ± 0.036 0.42 5.629 Camphoric acid C10H16O4 199.0976 y = 7.45x + 19.4 0.9998 0.5–500 0.079 91.2 0.38 6.3510 Ferulic acid C10H10O4 193.0506 y = 11.1x + 14.1 0.9990 0.1–200 0.06 96.4 0.0130 ± 0.001 0.47 5.1811 Caffeic acid C9H8O4 179.035 y = 1.13x − 20.0 0.9860 10–500 1.921 95.9 3.369 ± 0.22 0.75 7.7412 o-Coumaric acid C9H8O3 163.0401 y = 4.58x − 7.42 0.9824 2–500 0.517 87.3 0.17 6.0613 Vanilic acid C8H8O4 167.035 y = 3.41x + 10.4 0.9995 2–500 0.197 86.2 0.13 6.2814 p-Coumaric acid C9H8O3 163.0401 y =15.1x + 4.73 0.9886 0.5–500 0.085 97.0 0.28 7.3115 Protocatechuic acid C7H6O4 153.0193 y = 4.31x − 38.0 0.9995 2–500 0.33 99.4 0.73 6.42
1 sample solution was spiked with 6.67 mg/L standards. 2 SPE was performed by an elution with ACN:water = 7:3 + 0.1% FA.
In order to test the CZE-MS method developed, two extracts of a sunflower honeysample were analyzed in triplicate (Figure 4). Reversed phase SPE cartridge was usedfor sample clean-up, whereby the high glucose/fructose content was removed and thephenolic compounds were collected for subsequent analyses. Two different extractionswere carried out: ACN:water = 7:3 + 0.1% FA and MeOH:ACN = 2:1. The peak patterns ofthe base peak electropherograms obtained for the two extracts showed similarities (severalcomponents in similar migration windows and some peaks with the same migration timeappeared (e.g., peaks at 6.42, 7.95, 8.35 and 8.86 min)) as well as considerable differences(e.g., a high intensity component can be seen at 9.4 min in Figure 4b, while in Figure 4a itshows very low signal intensity).
The theoretical (calculated) and the experimentally obtained masses typically agreedwithin 1.5 ppm accuracy. Most masses (m/z) from among the components studied (12 fromthe 15) were detected in the extracts; however, in several cases (e.g., 3,4-dimethoxycinnamicacid, camphoric acid, salicylic acid, chrysin) there was a mismatch in migration timesbetween the standard and the sample component of equivalent m/z value. Since theamount of detected components was often very low, the peak with the expected m/z couldbe observed only in the extracted ion electropherogram recorded at the proper m/z value.

Molecules 2022, 27, 4540 6 of 9
Molecules 2022, 27, x FOR PEER REVIEW 7 of 10
additionally used for analysis, especially when isomeric compounds had to be identified [25].
Several works can be found in the literature where the identification of a compound was based solely on the molecular mass detected in a natural sample. However, our results show that the use of HR-MS exclusively is not sufficient for high probability identification. In such cases, tandem MS might bring some insights into structural characteristics; however, the acquisition of valuable fragment mass spectra can be difficult for the small intensity peaks (components in real samples are often present only in a very low concentration). For instance, four different cinnamic acid isomers (C9H8O2) in propolis extract detected by HPLC-MS appeared in the chromatogram at very different retention times (5.87, 13.12, 13.81 and 16.15 min) [25]. In our study, only three phenolic components could be clearly identified based on matching with theoretical exact masses, migration times with standards and standard addition (spiking). There were 11 further components where only the isomer(s) could be determined, not the available and measured standard. Therefore, only three phenolic components could be quantitatively determined. For the qualitative and quantitative determination of the separated components in natural samples, a more detailed investigation would be necessary with proper standards or special, indirect analytical methods, tandem MS or NMR studies.
Figure 4. Base peak CZE-MS electropherograms obtained for two different SPE extracts of the same honey sample (sunflower). Conditions are the same as in Figure 2a. The number of the peaks correspond with the number assigned to the components given in Figure 1. SPE (Dionex OnGuard RP cartridge) for (a): preconditioning the cartridge with 9 mL MeOH, 9 mL water and 9 mL 10 mM HCl, loading the sample (8.9 g honey diluted in 22.25 mL 10 mM HCl), washing with 12 mL 10 mM HCl, elution with ACN:water = 7:3 + 0.1% FA and postconditioning with 9 mL ACN and 9 mL MeOH. SPE for (b): preconditioning the cartridge with 5 mL MeOH; 5 mL water and 5 mL 10 mM HCl, loading the sample (6 g honey diluted in 9 mL 10 mM HCl), washing with 5 mL 10 mM HCl and 5 mL water, elution with MeOH:ACN = 2:1 and postconditioning with 5 mL ACN and 5 mL MeOH.
3. Materials and Methods 3.1. Reagents and Solutions
Figure 4. Base peak CZE-MS electropherograms obtained for two different SPE extracts of the samehoney sample (sunflower). Conditions are the same as in Figure 2a. The number of the peakscorrespond with the number assigned to the components given in Figure 1. SPE (Dionex OnGuard RPcartridge) for (a): preconditioning the cartridge with 9 mL MeOH, 9 mL water and 9 mL 10 mM HCl,loading the sample (8.9 g honey diluted in 22.25 mL 10 mM HCl), washing with 12 mL 10 mM HCl,elution with ACN:water = 7:3 + 0.1% FA and postconditioning with 9 mL ACN and 9 mL MeOH. SPEfor (b): preconditioning the cartridge with 5 mL MeOH; 5 mL water and 5 mL 10 mM HCl, loadingthe sample (6 g honey diluted in 9 mL 10 mM HCl), washing with 5 mL 10 mM HCl and 5 mL water,elution with MeOH:ACN = 2:1 and postconditioning with 5 mL ACN and 5 mL MeOH.
Generally, the identification of analytes should be carried out by the comparisonof their migration times and high-resolution mass spectrometry data with those of thestandard solution. However, these data could not be matched for several peaks detected inthe honey samples (e.g., peaks at 9.68, 9.95, 10.43 and 14.63 min). The explanation could bethe presence of miscellaneous isomers. Although high-resolution MS provides the chemicalformula for a given peak at the electropherogram with high probability through accuratemass measurement, a given chemical formula (elemental composition) can specify severalpossible chemical structures, and constitutional isomers. This means that the detected peakwith an m/z value may belong to an isomer of the expected compound. In some works,NMR (besides the HPLC–Q-Exactive-Orbitrap®–MS analysis) was additionally used foranalysis, especially when isomeric compounds had to be identified [25].
Several works can be found in the literature where the identification of a compoundwas based solely on the molecular mass detected in a natural sample. However, our resultsshow that the use of HR-MS exclusively is not sufficient for high probability identification.In such cases, tandem MS might bring some insights into structural characteristics; however,the acquisition of valuable fragment mass spectra can be difficult for the small intensitypeaks (components in real samples are often present only in a very low concentration).For instance, four different cinnamic acid isomers (C9H8O2) in propolis extract detectedby HPLC-MS appeared in the chromatogram at very different retention times (5.87, 13.12,13.81 and 16.15 min) [25]. In our study, only three phenolic components could be clearlyidentified based on matching with theoretical exact masses, migration times with standardsand standard addition (spiking). There were 11 further components where only the iso-

Molecules 2022, 27, 4540 7 of 9
mer(s) could be determined, not the available and measured standard. Therefore, onlythree phenolic components could be quantitatively determined. For the qualitative andquantitative determination of the separated components in natural samples, a more de-tailed investigation would be necessary with proper standards or special, indirect analyticalmethods, tandem MS or NMR studies.
3. Materials and Methods3.1. Reagents and Solutions
Analytical grade reagents were used. The phenolic compounds like 3,4-dimethoxycinnamicacid, chrysin, 4-(dimethylamino)-benzoic acid, cinnamic acid, benzoic acid, salicylic acid,hesperetin, naringenin, camphoric acid, ferulic acid, caffeic acid, o-coumaric acid, vanillicacid, p-coumaric acid and protocatechuic acid were obtained from Sigma (St. Louis, MO,USA). The standards were dissolved in methanol and the stock solutions were stored at4 ◦C for max. 4 weeks. NH4OH and NH4Ac stock solutions (all Sigma products) wereprepared in double-deionized water (Elix-3, Millipore, Darmstadt, Germany). HCl, NaOH,acetic acid (HAc) and formic acid (FA) solutions, isopropyl alcohol (IPA), methanol andacetonitrile were purchased from VWR (Radnor, PA, USA).
3.2. Samples and Its Pretreatment
The sunflower honey sample was obtained from a local producer. The honey wasdiluted with 10 mM HCl and the sugar content along with some other matrix materials wasremoved with the use of SPE (Dionex OnGuard RP cartridge). Two SPE procedures wereapplied according to ref. [26]: (1) Preconditioning the cartridge with 9 mL MeOH, 9 mLwater and 9 mL 10 mM HCl, loading the sample (8.9 g honey diluted in 22.25 mL 10 mMHCl), washing with 12 mL 10 mM HCl, elution with 400 µL ACN:water = 7:3 + 0.1% FAand postconditioning with 9 mL ACN and 9 mL MeOH. (2) Preconditioning the cartridgewith 5 mL MeOH; 5 mL water and 5 mL 10 mM HCl, loading the sample (6 g honey dilutedin 9 mL 10 mM HCl), washing with 5 mL 10 mM HCl and 5 mL water, elution with 250 µLMeOH:ACN = 2:1 and postconditioning with 5 mL ACN and 5 mL MeOH.
3.3. Instrumentation
CZE-MS measurements were performed with a 7100 model CE instrument (Agilent,Waldbronn, Germany) coupled to a maXis II UHR ESI-QTOF MS (Bruker, Bremen, Ger-many) via a CE-ESI Sprayer interface (G1607B, Agilent). Sheath liquid was delivered with a1260 Infinity II isocratic pump (Agilent). The CE instrument and the pump were controlledby OpenLAB CDS Chemstation software (Agilent). The MS was operated by otofControlversion 4.1 (build: 3.5, Bruker) and the obtained electropherograms and mass spectra wereprocessed by Compass DataAnalysis version 4.4 (build: 200.55.2969, Bruker).
3.4. CZE-MS Measurements
For CZE-MS analyses 90 cm × 50 µm id. fused silica capillaries were used. TheBGE was 0.5 M NH4OH, the applied voltage was +30 kV and sample injection was per-formed with 50 mbar for 4 s. The postconditioning step involved washing with acetonitrile(4 bar, 2 min), water (4.5 bar, 2 min) and BGE (4.5 bar, 3 min). Sheath liquid consisted ofIPA:water = 1:1 and was delivered at a flow rate of 6 µL/min to establish electric connectionand stable electrospray formation. In the majority of cases the following parameters wereapplied for MS acquisition: negative polarity mode; nebulizer pressure: 0.4 bar; dry gastemperature: 200 ◦C; dry gas flow rate: 4 L/min; capillary voltage: 4500 V; end plateoffset: 500 V; MS spectra rate: 2 Hz; mass range: 80–1000 m/z. Na–acetate adducts enabledinternal m/z calibration.
4. Conclusions
In our study, a CZE-MS method was developed for the determination of severalphenolic compounds (phenolic acids, flavonoids). As we ascertained that the analysis of

Molecules 2022, 27, 4540 8 of 9
these components requires CZE separation under basic conditions and negative ionizationmode for MS detection, the simplest choice was to apply 0.5 M NH4OH and IPA:water (1:1v/v%) for the BGE and the sheath liquid, respectively. The absence of acetate, formate orany salts (that are commonly used) provided a simple mass spectrum during the analyses.Proper precision of the measurements could be achieved even with these solutions havingno buffer capacity, if frequent (at least after three runs) BGE replenishment and well-closedsolution containers were used.
CE is considered suitable for the analysis of samples having high matrix content,since there are no considerable interferences arising during the separation. On the otherhand, such minute (nanoliter ranged) amounts of sample are actually not expected tocause interferences or memory effects in the MS detection. Extracts of honey as a naturalsample with many different types of compounds were used to test the developed CZE-MSmethod. The suggested SPE method required much lower amounts of samples and allowedeasier extraction than others found in literature. In these measurements the unambiguousdetermination of several compounds was rather challenging, since the migration times andhigh-resolution mass spectrometry data obtained from the standard and the sample didnot match. The high number of isomers, aglycones, glycosides or methylated derivativesof the phenolic compounds possibly occurring in natural samples obligates the use ofproper standards and high-performance analytical approaches (e.g., tandem MS or NMR).Although the accurate molecular masses of several expected compounds were detectedwith high-resolution MS, the reliable qualitative and quantitative determinations wereaccomplished only for three components.
Supplementary Materials: The following supporting information can be downloaded at: https://www.mdpi.com/article/10.3390/molecules27144540/s1. Figure S1: CZE-MS measurements ofdifferent concentration standard solution mixtures. Conditions are the same as in Figure 2a; from topto bottom, concentrations are 5, 3.33, 2.5, 1, 0.5 and 0.33 times higher for all compounds as specified inFigure 2a. Figure S2: 6 repetitions of CZE-MS measurements of standard solution mixture. Conditionsare the same as in Figure 2a.
Author Contributions: Conceptualization, A.G.; methodology, A.G. and R.S.; investigation, R.S.;writing original draft preparation, A.G. and R.S.; writing review and editing, A.G.; supervision,A.G.; funding acquisition, A.G. All authors have read and agreed to the published version ofthe manuscript.
Funding: The authors acknowledge the financial support provided to this project by the NationalResearch, Development and Innovation Office, Hungary (K127931).
Institutional Review Board Statement: Not applicable.
Informed Consent Statement: Not applicable.
Data Availability Statement: The data presented in this study are available on request from thecorresponding author.
Acknowledgments: We are grateful to Zsofi Sajtos (University of Debrecen) for providing honey sam-ples and for assisting with their SPE procedure. The assistance in experimental work is acknowledgedto Sofia Rivadeneira (University of Debrecen).
Conflicts of Interest: The authors declare no conflict of interest.
Sample Availability: Samples of the compounds are available from the authors.
References1. Pandey, K.B.; Rizvi, S.I. Plant Polyphenols as Dietary Antioxidants in Human Health and Disease. Oxid. Med. Cell. Longev. 2009,
2, 270–278. [CrossRef] [PubMed]2. Cinquanta, L.; Esti, M.; Notte, E. La Evolution of Phenolic Compounds in Virgin Olive Oil during Storage. J. Am. Oil Chem. Soc.
1997, 74, 1259–1264. [CrossRef]3. Angerosa, F.; D’Alessandro, N.; Corana, F.; Mellerio, G. Characterization of Phenolic and Secoiridoid Aglycons Present in Virgin
Olive Oil by Gas Chromatography-Chemical Ionization Mass Spectrometry. J. Chromatogr. A 1996, 736, 195–203. [CrossRef]

Molecules 2022, 27, 4540 9 of 9
4. Ríos, J.J.; Gil, M.J.; Gutiérrez-Rosales, F. Solid-Phase Extraction Gas Chromatography-Ion Trap-Mass Spectrometry QualitativeMethod for Evaluation of Phenolic Compounds in Virgin Olive Oil and Structural Confirmation of Oleuropein and LigstrosideAglycons and Their Oxidation Products. J. Chromatogr. A 2005, 1093, 167–176. [CrossRef]
5. De La Torre-Carbot, K.; Jauregui, O.; Gimeno, E.; Castellote, A.I.; Lamuela-Raventós, R.M.; López-Sabater, M.C. Characterizationand Quantification of Phenolic Compounds in Olive Oils by Solid-Phase Extraction, HPLC-DAD, and HPLC-MS/MS. J. Agric.Food Chem. 2005, 53, 4331–4340. [CrossRef]
6. Bianco, A.; Buiarelli, F.; Cartoni, G.; Coccioli, F.; Jasionowska, R.; Margherita, P. Analysis by Liquid Chromatography-TandemMass Spectrometry of Biophenolic Compounds in Virgin Olive Oil, Part II. J. Sep. Sci. 2003, 26, 417–424. [CrossRef]
7. Molnár-Perl, I.; Füzfai, Z. Chromatographic, Capillary Electrophoretic and Capillary Electrochromatographic Techniques in theAnalysis of Flavonoids. J. Chromatogr. A 2005, 1073, 201–227. [CrossRef]
8. Fukuji, T.S.; Tonin, F.G.; Tavares, M.F.M. Optimization of a Method for Determination of Phenolic Acids in Exotic Fruits byCapillary Electrophoresis. J. Pharm. Biomed. Anal. 2010, 51, 430–438. [CrossRef]
9. Carrasco-Pancorbo, A.; Arráez-Román, D.; Segura-Carretero, A.; Fernández-Gutiérrez, A. Capillary Electrophoresis-ElectrosprayIonization-Mass Spectrometry Method to Determine the Phenolic Fraction of Extra-Virgin Olive Oil. Electrophoresis 2006, 27,2182–2196. [CrossRef]
10. Carrasco-Pancorbo, A.; Neusüß, C.; Pelsing, M.; Segura-Carretero, A.; Fernandez Gutiérrez, A. CE- and HPLC-TOF-MS for theCharacterization of Phenolic Compounds in Olive Oil. Electrophoresis 2007, 28, 806–821. [CrossRef]
11. Cartoni, G.; Coccioli, F.; Jasionowska, R. Capillary Electrophoretic Separation of Phenolic Acids. J. Chromatogr. A 1995, 709,209–214. [CrossRef]
12. Cao, Y.H.; Wang, Y.; Yuan, Q. Analysis of Flavonoids and Phenolic Acid in Propolis by Capillary Electrophoresis. Chromatographia2004, 59, 135–140. [CrossRef]
13. Priego-Capote, F.; Ruiz-Jiménez, J.; Luque De Castro, M.D. Fast Separation and Determination of Phenolic Compounds byCapillary Electrophoresis-Diode Array Detection: Application to the Characterisation of Alperujo after Ultrasound-AssistedExtraction. J. Chromatogr. A 2004, 1045, 239–246. [CrossRef] [PubMed]
14. Ehala, S.; Vaher, M.; Kaljurand, M. Characterization of Phenolic Profiles of Northern European Berries by Capillary Electrophoresisand Determination of Their Antioxidant Activity. J. Agric. Food Chem. 2005, 53, 6484–6490. [CrossRef]
15. Lima, D.L.D.; Duarte, A.C.; Esteves, V.I. Optimization of Phenolic Compounds Analysis by Capillary Electrophoresis. Talanta2007, 72, 1404–1409. [CrossRef]
16. Huck, C.W.; Stecher, G.; Ahrer, W.; Stöggl, W.M.; Buchberger, W.; Bonn, G.K. Analysis of Three Flavonoids by CE-UV andCE-ESI-MS. Determination of Naringenin from a Phytomedicine. J. Sep. Sci. 2002, 25, 903–908. [CrossRef]
17. Huck, C.W.; Stecher, G.; Scherz, H.; Bonn, G. Analysis of Drugs, Natural and Bioactive Compounds Containing Phenolic Groupsby Capillary Electrophoresis Coupled to Mass Spectrometry. Electrophoresis 2005, 26, 1319–1333. [CrossRef]
18. Gómez-Caravaca, A.M.; Verardo, V.; Segura-Carretero, A.; Caboni, M.F.; Fernández-Gutiérrez, A. Development of a RapidMethod to Determine Phenolic and Other Polar Compounds in Walnut by Capillary Electrophoresis-Electrospray IonizationTime-of-Flight Mass Spectrometry. J. Chromatogr. A 2008, 1209, 238–245. [CrossRef]
19. Nevado, J.J.B.; Peñalvo, G.C.; Robledo, V.R.; Martínez, G.V. New CE–ESI-MS Analytical Method for the Separation, Identificationand Quantification of Seven Phenolic Acids Including Three Isomer Compounds in Virgin Olive Oil. Talanta 2009, 79, 1238–1246.[CrossRef]
20. Arráez-Román, D.; Gómez-Caravaca, A.M.; Gómez-Romero, M.; Segura-Carretero, A.; Fernández-Gutiérrez, A. Identification ofPhenolic Compounds in Rosemary Honey Using Solid-Phase Extraction by Capillary Electrophoresis–Electrospray Ionization-Mass Spectrometry. J. Pharm. Biomed. Anal. 2006, 41, 1648–1656. [CrossRef]
21. Sawalha, S.M.S.; Arráez-Román, D.; Segura-Carretero, A.; Fernández-Gutiérrez, A. Quantification of Main Phenolic Compoundsin Sweet and Bitter Orange Peel Using CE–MS/MS. Food Chem. 2009, 116, 567–574. [CrossRef]
22. Zhen, X.-T.; Zhu, S.-C.; Shi, M.-Z.; Yu, Y.-L.; Yan, T.-C.; Yue, Z.-X.; Gu, Y.-X.; Zheng, H.; Cao, J. Analysis of Flavonoids in CitrusFruits by Capillary Zone Electrophoresis Coupled with Quadrupole Time-of-Flight Mass Spectrometry Using Chemometrics. J.Food Compos. Anal. 2022, 106, 104275. [CrossRef]
23. Bustamante-Rangel, M.; Delgado-Zamarreño, M.M.; Pérez-Martín, L.; Carabias-Martínez, R. QuEChERS Method for the Ex-traction of Isoflavones from Soy-Based Foods before Determination by Capillary Electrophoresis-Electrospray Ionization-MassSpectrometry. Microchem. J. 2013, 108, 203–209. [CrossRef]
24. Rütters, H.; Möhring, T.; Rullkötter, J.; Griep-Raming, J.; Metzger, J.O. The Persistent Memory Effect of Triethylamine in theAnalysis of Phospholipids by Liquid Chromatography/Mass Spectrometry. Rapid Commun. Mass Spectrom. 2000, 14, 122–123.[CrossRef]
25. Pavlovic, R.; Borgonovo, G.; Leoni, V.; Giupponi, L.; Ceciliani, G.; Sala, S.; Bassoli, A.; Giorgi, A. Effectiveness of DifferentAnalytical Methods for the Characterization of Propolis: A Case of Study in Northern Italy. Molecules 2020, 25, 504. [CrossRef][PubMed]
26. Bertoncelj, J.; Polak, T.; Kropf, U.; Korošec, M.; Golob, T. LC-DAD-ESI/MS Analysis of Flavonoids and Abscisic Acid withChemometric Approach for the Classification of Slovenian Honey. Food Chem. 2011, 127, 296–302. [CrossRef]


