Embed Size (px)
Citation preview

Determining the Effect of Pad Lining Geometry on Brake NoisePerformance
Stephen Moorea 1, Joseph Laia 2, Sebastian Obersta,Antti Papinniemib, Said Hamdib, Daniel Stanefb
a The University of New South Wales at the Australian Defence ForceAcademy, Northcott Drive, A.C.T 2600, Australia.
b Bosch Chassis Systems Asia Pacific264 East Boundary Rd, East Bentleigh, Victoria 3165, Australia.
AbstractBrake squeal remains a significant source of acoustic noise from passenger cars, in contrast toimprovements in acoustic emissions from other sources in automobiles such as exhausts, theengine, and drive-train. The development of a new brake system involves optimising manyinter-related aspects of performance, including brake noise, although significant changes tobrake components become more difficult as the design process progresses. Consequently, brakemanufacturers aim to achieve acceptable baseline noise performance early in the designprocess, and rely on easily-implemented changes to optimise the noise performance later in thedesign process. An example of a design feature that can be changed relatively easily is thegeometry of the brake pad lining. This study discusses systematic noise testing of differentbrake lining designs. Three different brake systems were tested with variations in the size andalignment of the pad lining chamfers. The results of the study were used to establish guidelinesto assist engineers in proposing changes in the pad geometry to mitigate noise issues in calipersof a similar design to those tested.
1 INTRODUCTIONThe development of a brake system involves optimising many aspects of brake system
performance, including the propensity for brake noise, to meet the customer’s specification.Brake noise is perceived as an indication of quality; excessive brake noise suggests a poorlyfunctioning product. In addition, brake noise is an annoyance for vehicle occupants and others inclose proximity to the vehicle. The various types of brake noise include discrete-frequencysqueal, low-frequency groan, and scraping. Many measures of brake performance can bemodelled and confidently predicted; however, brake noise, in particular brake squeal, can bemuch harder to manage. Existing numerical methods for predicting brake squeal, for examplecomplex eigenvalue analysis [1 2] and non-linear time-domain analysis [3] of finite-elementmodels often fail to accurately identify frequencies of brake squeal, and less confidence is thengiven to determining the likelihood of excessive brake noise given the wide range of conditions ahydraulic brake system operates in. Physical testing of brake systems using dynamometers or

vehicles is therefore relied upon to provide an indication of a brake system’s noise performance.The accuracy of physical testing relies on the availability of representative parts as noiseperformance can change due to subtle differences between prototype and production parts [4]. Inorder to better manage these difficulties, design engineers can employ a number of easily-implemented design changes to influence the noise performance of a brake system. An exampleof a design change that can be adopted later in the design process is the geometry of the brakepad lining. Features of the pad lining geometry include the chamfers and slots, as shown byfigure 1. The lining (friction material) is usually moulded to the pad backplate, sometimes withan additional underlayer, which can influence the mechanical and thermal properties of the pad.Slots and chamfers can be either moulded or machined, and the friction surface is typicallymachined to ensure pad-flatness criteria are met.
Figure 1 CAD model of a typical brake pad showing a chamfer at each end of the pad lining and a central slot.
A limitation associated with adopting this approach is that little information is available toguide the choice and dimensions of modifications and a trial-and-error approach can lead to along and costly period of testing before a satisfactory design is validated. The aim of this studywas to carry out a systematic investigation of the effect of pad lining chamfers on the propensityfor brake noise. The results of the testing were then used to assess the sensitivity of noiseperformance to pad geometry changes, and to assist engineers propose design changes to improvenoise performance. Three sliding-pin caliper designs were tested, two of which were two-pistoncalipers and the third was a single-piston caliper. The calipers were representative of designs usedon current production mid-sized sedans and the original pad design for each brake systemincluded slots and chamfers on the lining. Further background and details of the test program,including the test procedure, data collection, and pad designs are outlined in the followingsection. Results analysis and further discussion is given in Section 3 and concluding remarks aremade in Section 4.

2 TEST PROGRAM
2.1 Noise Test ProcedureTesting of the different pad designs was carried out on a Link 3900 brake noise dynamometer
(figure 2). This type of dynamometer is designed specifically for brake noise testing and allowssystematic testing of a brake system under controlled conditions, including controlledtemperature and humidity. A typical brake noise test includes several different sections that areintended to condition the brake system; i.e. burnish the pads and bed-in the brake assembly, andtest the brake’s noise performance at a wide range of different temperatures, applied pressures,and different types of stops.
Figure 2 Link 3900 brake noise dynamometer Figure 3 Dynamometer drive shaft coupled to brake disc(lower left-hand corner) and microphone mountedapproximately 0.5m above brake disc.
Figure 4 Fixture for mounting brake system. Note the use of vehicle knuckle, steering control arms, bushes, shockabsorber and spring, to provide boundary conditions representative of those on a car. The suspension spring is also
preloaded. A cooling air vent can be seen in the left of the figure.

Figure 3 shows the dynamometer drive shaft coupled to a brake disc, and a microphone withwind shield is mounted approximately half a metre above the brake system. Figure 4 shows thefixture that the brake system is mounted to, which includes a suspension knuckle, steering controlarms, shock absorber, and spring, which is preloaded. It is desirable to include at least thesecomponents in a mounting fixture for brake noise testing to ensure the boundary conditions of thebrake system are representative of those found on a vehicle. Even with these efforts, brake noisetest specifications, for example SAE J2521 Disc and Drum Brake Dynamometer Squeal NoiseMatrix specification [5] state that noise at frequencies below approximately 1kHz be discounteddue to differences in the structural dynamics of the mounting fixture compared to the dynamics ofa full vehicle suspension system.
The test procedure used for all tests was based on the SAE J2521 specification. The originalSAE J2521 specification included over 2,000 stops at temperatures ranging from 0° - 550° CIBT (initial braking temperature), and pressures ranging from 0 – 30 bar (0 – 3 MPa) for dragstops. The test duration is dependent on the time for the brake system to reach the IBT for a givenstop and cooling is specific to the particular brake system under test and the flow rate of coolingair that is provided (the cooling air duct for the Link 3900 dynamometer can be seen on the left inFigure 4). A typical SAE J2521 test would run for 30-35 hours. The modified version was cutdown and could typically be run within a 24 hour period. The IBTs and test chamber temperatureand humidity are shown in figure 5 for each stop of the test procedure. Note that the humiditytrace stops in the cold section because relative humidity is not controlled for ambienttemperatures below zero degrees.
Temperature and Humidity
-50
0
50
100
150
200
250
300
350
400
450
0 200 400 600 800 1000 1200 1400 1600
Stop No.
Tem
pera
ture
(o C)
0
10
20
30
40
50
60
70
80
90
100
Hum
idity
(%)
Initial Brake Temperature Chamber TemperatureChamber Humidity
Figure 5 Initial brake temperature (IBT), test chamber temperature and humidity for the brake noise test procedure.
Warmsection
Coldsection

The test procedure begins with burnishing and bedding stops before starting a warm moduleconsisting of drag (approximately constant speed and torque) stops performed at differenttemperatures and pressures. This is followed by forward and backwards drag stops, anddeceleration (decel) stops (constant brake torque acting against dynamometer inertia). The warmmodule is repeated after a fade section, which involves decel stops with IBTs up to 350°C. Theproperties of brake pad linings are affected by high temperatures and the fade section ensures thisis taken into account for noise tests. The cold section of the test procedure involved forward andbackwards drag stops with IBTs ranging from 0° - 50° C.
2.2 Data AnalysisThe propensity for brake noise was assessed by logging noise occurrences during the test
procedure. Microphone measurements were made for each stop and noise occurrences werecategorised according to sound pressure level (SPL) and frequency: noise below 70dB(A) wasdiscounted as was noise with peak SPL occurring outside the frequency range of 1 – 18 kHz. Theremaining noise occurrences were classified using the frequency and SPL of the maximum of thepeak-hold-averaged SPL spectrum. An example of a peak-hold-average SPL spectrum for asqueal occurrence is shown in figure 6. For this case, the noise occurrence is classified as97dB(A) at 11.2kHz. It should be noted that this classification method ignores multiple peaks,which can occur for high SPL squeal as this often includes harmonically-related discretefrequencies above the background noise.
Figure 6 Peak-hold-average SPL spectrum of a brake noise occurrence. In this case the noise was squeal, which isindicated by the narrow-band peak at 11.2 kHz.
Noise occurrences can be further classified according to the section of the test in which theywere recorded, for example, warm or cold sections; the frequency range of the occurrence; andthe direction of rotation of the rotor during the stop. This study required the noise performance ofa number of different brake systems to be compared and a single-number noise index wascalculated to allow easy comparison. The noise-index was calculated by summing the weighted
[11.2kHz, 97dB(A)]

numbers of noise occurrences in particular frequency ranges. The weighting was applied toreflect the SPL of the noise occurrence as listed in table 1. The frequency ranges used were: 1 –18kHz; 2 – 4kHz; 1st tangential in-plane (1IP) rotor modal frequency ± 500Hz; and 2nd tangentialin-plane (2IP) rotor modal frequency ± 500Hz. Frequency ranges around the first and second in-plane rotor modal frequencies were used because it is common for brake squeal to occur close tothese frequencies [6 7].
Table 1 Weighting applied to noise occurrences to reflect SPL.Peak SPL
(dB(A))Weighting
<7070-7980-8990-99
100-109110-119>=120
-13
1032100316
Figure 7 shows noise occurrences plotted on a SPL versus frequency plot for a brake noisetest, and the noise index SPL weighting and different frequency ranges are shown. Differentmarkers are used to indicate whether the noise occurrence was measured in the warm or the coldsection and the direction of the stop.
2.3 Brake Systems and Pad GeometryThree caliper designs were used in the test program:
Caliper A: Two-piston sliding pin caliper, single slot pads.
Caliper B: Two-piston sliding pin caliper, two-slot pads.
Caliper C: Single-piston sliding pin caliper, single-slot pads.
Figures 8 and 9 show examples of two-piston and single-piston sliding pin calipers, respectively.

Figure 7 Noise occurrence SPL versus frequency. Noise index SPL weighting is indicated as are the differentfrequency ranges used for noise indices.
Figure 8 CAD model of a two piston sliding pin caliper.
SPL vs. Frequency
70
80
90
100
110
120
0 2000 4000 6000 8000 10000 12000 14000 16000 18000
Frequency (Hz)
SPL
(dB
A)
SPL FwdWarm
SPL RevWarm
SPL FwdCold
SPL RevCold
2 – 4 kHz 1IP 500Hz 2IP 500Hz 100
32
10
3
1
1 – 18 kHz

Figure 9 CAD model of a single piston sliding pin caliper.
Calipers A and B are representative of front brakes currently used on mid-sized passengervehicles, similarly, caliper C is representative of a rear brake currently used on passengervehicles. The pads used in the production version of each brake system included chamfers andslots in the lining as well as a noise shim bonded to the back-plate of the pad. Noise shims aretypically a metal-rubber laminate bonded to the pad back-plate and are therefore located betweenthe piston or caliper housing and the pad back-plate. These are very effective in improving thenoise performance of a brake system [8] and were not used in this study in order to ensure asignificant amount of noise occurred during each test. The different pad geometries tested foreach caliper design are summarised in figure 10 and table 2.
Chamfer dimensions were constrained to a certain extent by the dimensions of each type ofpad. Also, a significant effect of reducing the lining volume is a reduction in pad life. Thedimensions of the leading/trailing combinations were taken from the best (lowest noise index)parallel or radial chamfer result. For example, the 25mm parallel chamfer produced the lowestnoise index for caliper A and was therefore used in the leading trailing combinations. L and Trefer to leading and trailing edges of the pad, respectively; the leading edge of the pad passes agiven point on the circumference of the rotor before the trailing edge during a forward stop. Thefirst letter in the leading/trailing notation refers to the inner pad, the second letter refers to theouter pad; e.g. L/T refers to a leading chamfer on the inner pad and a trailing chamfer on theouter pad.
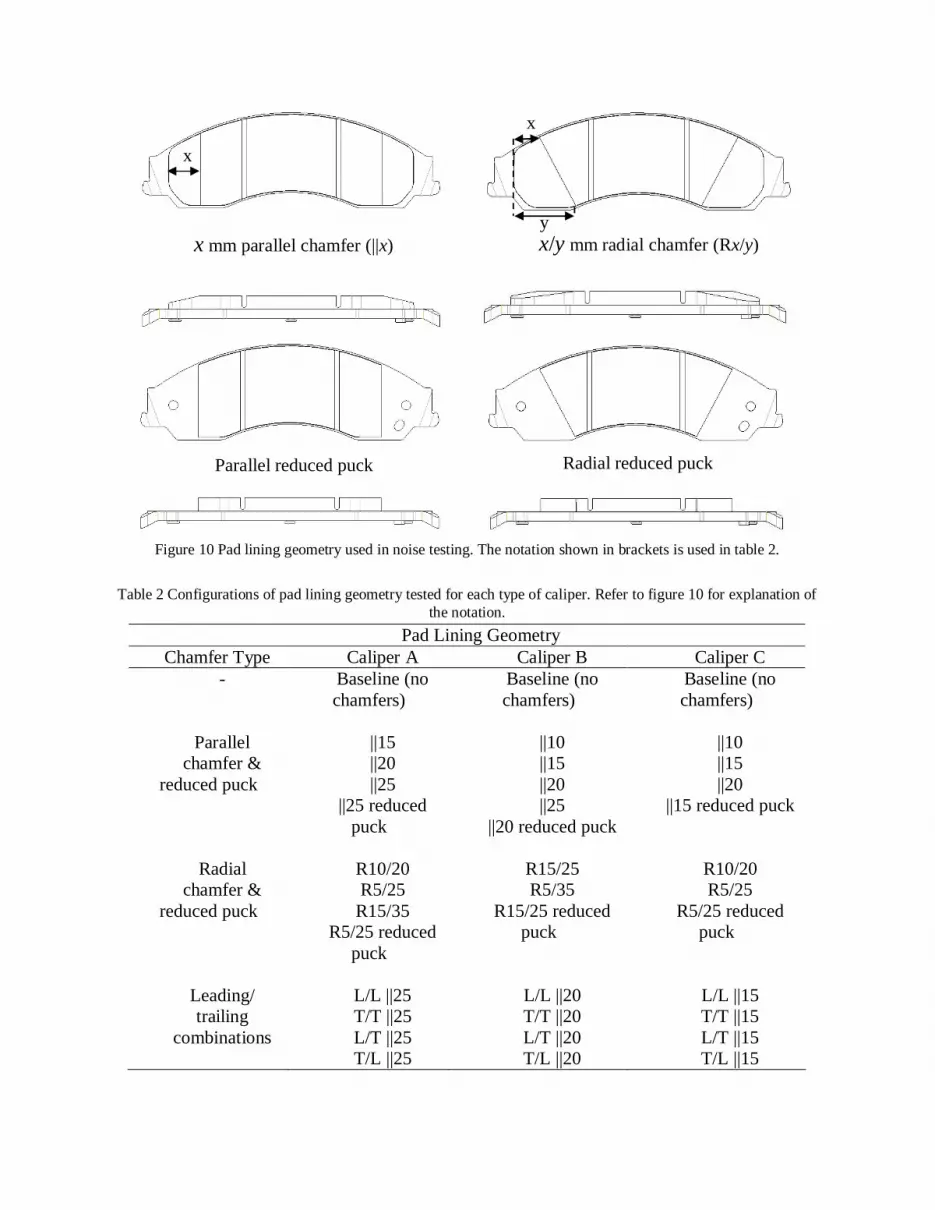
Figure 10 Pad lining geometry used in noise testing. The notation shown in brackets is used in table 2.
Table 2 Configurations of pad lining geometry tested for each type of caliper. Refer to figure 10 for explanation ofthe notation.
Pad Lining GeometryChamfer Type Caliper A Caliper B Caliper C
-
Parallelchamfer &
reduced puck
Radialchamfer &
reduced puck
Leading/trailing
combinations
Baseline (nochamfers)
||15||20||25
||25 reducedpuck
R10/20R5/25
R15/35R5/25 reduced
puck
L/L ||25T/T ||25L/T ||25T/L ||25
Baseline (nochamfers)
||10||15||20||25
||20 reduced puck
R15/25R5/35
R15/25 reducedpuck
L/L ||20T/T ||20L/T ||20T/L ||20
Baseline (nochamfers)
||10||15||20
||15 reduced puck
R10/20R5/25
R5/25 reducedpuck
L/L ||15T/T ||15L/T ||15T/L ||15
x mm parallel chamfer (||x)
Parallel reduced puck
x/y mm radial chamfer (Rx/y)
Radial reduced puck
x
x
y

Noise performance of a brake system is sensitive to a large number of parameters, includingmaterial properties of the components [4]. Steps were taken to minimise the influence of materialproperties on the tests carried out for this study in order to better isolate the effect of the padgeometry. The same caliper assembly was used for all testing of a given caliper design and thecompressibility of pads, which is indicative of the material properties of the pad, was limited to asmall range for all pads used in testing of a given caliper design. In addition, rotors were selectedto minimise the variation of the natural frequencies obtained by impact testing. The naturalfrequencies of the rotors are sensitive to changes in material properties [9], and the variation ofthe 2IP natural frequencies for a set of rotors was typically less than 3%.
3 RESULTS ANALYSIS AND DISCUSSION
3.1 Caliper AFigure 11 plots the noise indices across frequency ranges for the baseline test, parallel
chamfer tests, and parallel reduced puck test on caliper A. Note that the noise indices in eachfrequency range are presented in terms of warm and cold section noise. Noise indices for warmand cold sections, and also for the complete test are shown and these include all noiseoccurrences in the 1 – 18kHz frequency range. It is clear that the highest noise indices for all padconfigurations occurred in the 2IP ± 500Hz frequency range during the cold section. This patternis also reflected in the radial chamfer and leading-trailing combination test results shown infigures 12 and 13, respectively. The dimensions of parallel chamfers in order of increasing noiseindex are 25mm, 15mm, 20mm, and the best and worst parallel chamfer results are comparable tothe best and worst radial chamfer results. The baseline test had the highest noise index, whichwas comparable to the worst parallel chamfer results. This suggests that for this particular brakesystem, testing a range of parallel and radial chamfers would be advantageous when pursuingimproved noise performance. It should be noted that the mechanism improving the noiseperformance is quite sensitive to the chamfer dimensions, which has implications for noise as thepad wears. The radial and parallel reduced puck configurations performed quite differently; theparallel reduced puck results were similar to the parallel chamfer of the same dimension andsignificantly better than the baseline test, while the radial reduced puck results were quitedifferent to the radial chamfer of the same dimension, and comparable to the baseline result.These results are ambiguous when attempting to determine whether the contact area is moreimportant than the presence of chamfer. The leading-trailing combination tests were allsignificantly worse than the parallel chamfer of the same dimension: there appears to be nobenefit in using these configurations; symmetrical chamfers on both the inner and outer padsproduce the best noise performance.

0
2000
4000
6000
8000
10000
12000
14000
16000
Warm Cold Warm Cold Warm Cold Warm Cold
2 - 4kHz 1IP ± 500Hz 2IP ± 500Hz Total Total
Noi
se In
dex
Baseline
||15
||20
||25
||25 red.puck
Figure 11 Parallel chamfer results for Caliper A.
0
2000
4000
6000
8000
10000
12000
14000
16000
Warm Cold Warm Cold Warm Cold Warm Cold
2 - 4kHz 1IP ± 500Hz 2IP ± 500Hz Total Total
Noi
se In
dex
Baseline
R5/25
R10/20
R15/35
R5/25 red.puck
`
Figure 12 Radial chamfer results for Caliper A.

0
5000
10000
15000
20000
25000
Warm Cold Warm Cold Warm Cold Warm Cold
2 - 4kHz 1IP ± 500Hz 2IP ± 500Hz Total Total
Noi
se In
dex
Baseline
L/L ||25
T/T ||25
L/T ||25
T/L ||25
Figure 13 Leading/trailing combination results for Caliper A.
3.2 Caliper BThe results for tests on Caliper B are shown in figures 14, 15 and 16 for the parallel, radial
and leading-trailing configurations, respectively. As with Caliper A, the highest noise indiceswhere in the 2IP ± 500Hz frequency range and were recorded during the cold section of the test.This demonstrates the sensitivity of the noise performance to temperature: the cold section IBTsrange from 0 - 50° C, while the warm section IBTs range from 50 – 300°C, not including the fadesection. A further distinction between the warm and the cold sections of the test is the range ofapplied pressures. The cold section stops are typically low pressure, between 2 and 10 bar (0.2 –1 MPa), while in the warm section applied pressure range from 2 to 30 bar (0.2 – 3 MPa).
Tests on Caliper B generally yielded low noise indices relative to tests on Caliper A. Aninteresting result is that the baseline configuration out-performed all the parallel, radial, andleading-trailing chamfer combinations. This result was unexpected given the results for CaliperA, although it is conceivable that the low overall noise levels hindered discrimination betweenthe different configurations. It is worthwhile noting that the R15/25 chamfer had a similar noiseindex in the 2IP ± 500Hz to the baseline configuration, but introduced a significant number ofnoise occurrences outside the 2 – 4 kHz, 1IP ± 500Hz, and 2IP ± 500Hz frequency ranges. Thiswas indicated by a Total Cold noise index almost double that of the 2IP ± 500Hz result. Again,this demonstrates the sensitivity of the brake’s noise performance to the geometry of the pad andverifies pad lining geometry as an effective design parameter for modifying noise performance.
All the leading-trailing combinations of the ||20 chamfer are worse than the symmetricalchamfer configurations, apart from the L/T ||20 chamfer. This configuration also introduced asignificant amount of noise in the cold section at frequencies outside the 2 – 4 kHz, 1IP ± 500Hz,and 2IP ± 500Hz frequency ranges. The fact that this configuration produced the lowest noiseindex in the 2IP ± 500Hz may justify further study, as noise in this frequency range dominated allother results.

0
1000
2000
3000
4000
5000
6000
7000
8000
Warm Cold Warm Cold Warm Cold Warm Cold
2 - 4kHz 1IP ± 500Hz 2IP ± 500Hz Total Total
Noi
se In
dex
Baseline
||10
||15
||20
||25
||20 red.puck
Figure 14 Parallel chamfer results for Caliper B.
0
500
1000
1500
2000
2500
3000
3500
4000
4500
5000
Warm Cold Warm Cold Warm Cold Warm Cold
2 - 4kHz 1IP ± 500Hz 2IP ± 500Hz Total Total
Noi
se In
dex
Baseline
R15/25
R5/35
R15/25 red.puck
Figure 15 Radial chamfer results for Caliper B.

0
1000
2000
3000
4000
5000
6000
7000
Warm Cold Warm Cold Warm Cold Warm Cold
2 - 4kHz 1IP ± 500Hz 2IP ± 500Hz Total Total
Noi
se In
dex
Baseline
L/L ||20
T/T ||20
L/T ||20
T/L ||20
Figure 16 Leading/trailing combination results for Caliper B.
3.3 Caliper CNoise occurrences in the 1IP ± 500Hz frequency range were the greatest contributor to
overall noise for Caliper C. In contrast to Caliper A and B, a significant amount of warm sectionnoise was observed for all configurations. Figure 17 shows noise results for the baseline, parallelchamfer and parallel reduced puck tests; figure 18 shows results for the radial chamfer andreduced puck tests; and figure 19 shows results for the leading-trailing ||15mm configurations.Overall, the parallel chamfer results for Caliper C can be viewed as promising in the same way asthose for Caliper A: adjusting the chamfer size by no more than 10mm induced a significantchange in the noise performance of the brake system. The ||15 reduced puck design introducedsignificant cold section noise in the 2IP ± 500Hz frequency range not observed for any other paddesign tested on Caliper C and radial chamfers performed worse than parallel chamfers and thebaseline pads. The leading-leading ||15mm result was comparable to the ||15 parallel chamfer;cold noise in the 1IP ± 500Hz range was almost eliminated. Other leading-trailing combinationswere significantly worse.

0
500
1000
1500
2000
2500
3000
3500
4000
Warm Cold Warm Cold Warm Cold Warm Cold
2 - 4kHz 1IP ± 500Hz 2IP ± 500Hz Total Total
Noi
se In
dex
Baseline
||10
||15
||20
||15 red.puck
Figure 17 Parallel chamfer results for Caliper C.
0
1000
2000
3000
4000
5000
6000
7000
8000
9000
10000
Warm Cold Warm Cold Warm Cold Warm Cold
2 - 4kHz 1IP ± 500Hz 2IP ± 500Hz Total Total
Noi
se In
dex
Baseline
R10/20
R5/25
R5/25 red.puck
Figure 18 Radial chamfer results for Caliper C.

0
1000
2000
3000
4000
5000
6000
7000
8000
9000
10000
Warm Cold Warm Cold Warm Cold Warm Cold
2 - 4kHz 1IP ± 500Hz 2IP ± 500Hz Total Total
Noi
se In
dex
Baseline
L/L ||15
T/T ||15
L/T ||15
T/L ||15
Figure 19 Leading/trailing combination results for Caliper C.
3.4 DiscussionThe range of pad geometry tested for all three calipers demonstrated the effectiveness of this
design parameter in inducing changes in a brake system’s noise performance. Symmetricalchamfers are generally preferred on the basis of other performance aspects, for example pad wearand tapering, and the leading-trailing combinations generally performed worse than symmetricalchamfers on each pad. No clear evidence was found to suggest noise was more dependent onchamfers located on a particular edge of the pad. Furthermore, comparison of the reduced puckresults with those from chamfered pads of the same dimension did not support the hypothesis thatreducing the pad-rotor contact area is the dominant factor in changing noise performance. Thepresence of a chamfer could produce a significantly different noise result.
While this study justifies the modification of pad lining geometry for inducing a change innoise performance, a limitation is that no clear trends can be established for a particular brakesystem. Brake noise performance is sensitive to many factors and it is expected that the relativeperformance of a set of chamfers reported in this study would not be reflected in tests carried outon the same designs with the addition of a noise shim.
The data generated in this testing has been used in two other studies conducted by the authors[10 11]. The results of these two papers demonstrate strong non-linear dynamic behaviour andextreme sensitivity of noise performance to parameters in the brake systems, which ultimatelylimit the scope for identifying relationships between high-level physical features in the brakesystem and the noise performance.

4 CONCLUSIONThe effect of pad lining geometry on brake noise has been investigated by systematic noise
testing of different pad lining chamfers for three caliper designs, representative of those used onmid-sized passenger cars. The different pad designs included parallel and radial chamfers,parallel and radial reduced puck pads, and asymmetrical leading-trailing combinations of aparticular chamfer. Noise performance of the three brake systems was affected differently for agiven type of chamfer, and no clear trends could be identified from the data. Results clearlyshowed that small, easily implemented changes to pad lining geometry could significantly affectnoise performance, and verified a range of parallel and radial chamfer sizes that could beproposed during the design process of similar brake systems.
5 REFERENCES[1] W.V. Nack, “Brake squeal analysis by finite elements”, Int J of Vehicle Design, 23(3/4),
263-275 (2000).[2] A. Bajer, et al., “Combining a nonlinear static analysis and complex eigenvalue extraction
in brake squeal simulation”, SAE Paper No. 2003-01-3349 (2003).[3] Y. Chern, F. Chen and J. Swayze, “Non-linear dynamics of brake squeal”, SAE Paper No.
2002-01-3138 (2002).[4] D. Stanef, A. Papinniemi and J. Zhao, “From prototype to production – the practical nature
of brake squeal noise”, SAE Paper No. 2006-01-3217 (2006).[5] SAE J2521, Disc and Drum Brake Dynamometer Squeal Noise Matrix, Society of
Automotive Engineers, Warrendale, PA, January (2006).[6] F. Chen, et al., “Measurement and analysis of rotor in-plane induced disc brake squeal and
beyond”, SAE paper No. 2004-01-2798 (2004).[7] A.T. Papinniemi, J. Zhao, and J.C.S. Lai, “A Study on in-plane vibration modes in disc
brake squeal noise”, Proceedings of INTER-NOISE 2005, Rio de Janeiro, Brazil, 7-10Aug., 2005.
[8] J. Flint and J. Hald, “Traveling waves in squealing disc brakes measured with acousticholography”, SAE Paper No. 2003-01-3319 (2003).
[9] J.B. Malosh, “Disc brake noise reduction through metallurgical control of rotorresonances”, SAE Paper No. 982236 (1998).
[10] S. Oberst, J.C.S. Lai, S. Moore, A. Papinniemi, S. Hamdi, and D. Stanef, “Statisticalanalysis of brake squeal noise”, Internoise ’08, Shanghai, China, 26-29 Oct (2008).
[11] S. Oberst, J.C.S. Lai, S. Moore, A. Papinniemi, S. Hamdi, and D. Stanef, “Chaos in brakesqueal noise”, Internoise ’08, Shanghai, China, 26-29 Oct (2008).


