Embed Size (px)
Citation preview
Core Collections of Plant Genetic Resources Edited by T. Hodgkin, A.H.D. Brown, Th.1.L. van Hintum and E.A.V. Morales O 1995 International Plant Genetic Resources lnslilute (IPGRI) A Wiley-Sayce Publication
3.3
Developing a coffee core collection using the principal components score strategy with quantitative data
S. HAMON, M. NOIROT and F. ANTHONY
- Abstract
The genetic organisation of the coffee gene pool was examined at three levels: biogeography, genetic resources and available data. This investigation indicated that a core csllection for coffee should consist of 88 genetic diversity groups of three typs, accordin% to their genetic history and the available genetic knowledge: a Coffcu arabica category, a category contairiing well-studied species such as C. liberica and C. canephoru, and a category with a large number of neglected species. Different strategies were applied to the three categories. After defining ;he diversity groups, tests were conducted, using data obtained for C. liberica, c:! a new method (principal components score strategy) for developing a core collection using quanticative data. The results showed that about half the inertia was obtained when 10% of the 338 genotypes were selected, and 90% of the total inertia was obtained with asample of 50% of these genotypes,
Setting up a core collection implies the selection of a limited number of accessions which are genetically representative of the cultivated species and its wild relatives (Franke1 and Brown, 1984).
. The main objectives of establishing a core collection are to facilitate the management of germplasm, reduce the cost of conservation, and promote the diffusion and the use of genetic resources. Brown (1989a, b) suggested, on the basis of allele frequencies, two types of strategy: the first, fully random sampling, can be used when the genetic organisation is unknown; the second, stratified sampling with three sampling possibilities (constant, proportional or logarithmic) is appropriate when information is available on the target species
Creriion of a core collectim for a given crop is difficult when the gene pool is large and there are differeEt evolution~ry histcries, ploidy levels and breeding behaviours, and when the extent of knowledge of genetic diversity is not the same for each species, several being well studied but others still undescribed botanically. This is not helped by the level of information available in world collections. It has been estimated that some 65% of accessions in world collections have no passport
117
ORSTOMI Fonds Documentaire I

1
c
i ”,
118 CORE COLLECTIONS OF PLANT GENETIC RESOURCES
data, 80% are not characterised and only 1% have been extensively evaluated (Peeters and Williams, 1984). So, despite the simple formulation of the core collection concept, the strategy to be used is difficult to define precisely.
Coffee has been widely collected (Berthaud and Charrier, 1988; Anthony, 1992). In terms of storage possibilities coffee seeds are considered as intermediate -they currently cannot be conserved for longer than 1 year - and so genetic resources are conserved in field collections. The cultivated species, Coffea arabica, is well known, but other species are still undescribed. The maintenance of coffee genetic resources in the field is expensive, time consuming and subject to the risk of loss. In this chapter we will first define the diversity groups of coffee and then describe the application of the principal components score strategy (PCSS), designed to maximise the selected inertia, to a well- studied category of the diversity groups.
DEFINITION OF THE DIVERSITY GROUPS OF COFFEE
Main biogeographic groups
In Africaand Madagascarcoffee trees grow under the canopy of tropical forest. Species are distributed according to three biogeographic units delimited by the Mozambican canal and the dorsal of Kiwu located in the eastern part of Zaire. About 100 taxonomic units have been described by many botanists (for example, Chevalier, 1947; Bridson and Verdcourt, 1988).
The most economically important species, C. arahica, is native to and geographically isolated in southern Ethiopia, northern Kenya and southem Sudan. In West Africa, coffee species, particularly in the area with a guineo-congolese climate, have.a tree-like shape and long, thin leaves. The period between flowering and ripening ranges from 7 to 15 months and the coffee beans have a relatively high level of caffeine content (0.5-4% dry weight). In East Africa, coffee species have characteristics of xerophyllus adaptation. Plants are bushy with small thick leaves. Beans have a lower content of caffeine (O-2% dry weight). Apart from this subcontinental differentiation, well-diversified groups are also found at lower geographic levels (Berthaud, 1986; Anthony, 1992).
Collected genetic resources
Apart from C. arabica, which is allotetraploid (2n = 44) and self-fertile, all Coffea species are diploid (2n = 22) and self-sterile.. The diploid species all have the same genome. Because C. arabica is very different both at the genetic and the economic level, coffee genetic resources can be divided in two categories: C.arabica and the other species.
For C. arabica, a collecting mission was conducted in 1964 in Ethiopia, the centre of origin and domestication. The mission to collect cultivated forms was organised by the Food and Agriculture Organisation (FAO) and an association of coffee producers (FAO, 1968). A collecting mission, focusing particularly on ‘native types’, was undertaken in 1966 by the Office de la Recherche Scientifique et Technique Outre Mer (ORSTOM). Some 196 samples were collected by FAO and 70 by ORSTOM (IFCC, 1978). With regard to the actual field collections, the base collection is located in Jimma, Ethiopia, and a large number of other collections, partially duplicates, are located in Cameroon, Costa Rica, Côte d’Ivoire and Kenya. Isozyme studies have shown thzt the amphiploid, self-fertile C. arabica is characterised by a low level of genetic diversity, with a polymorphism index of 0.003 compared with 0.05 for the diploid species (Berthou and Trouslot, 1977).

1
USING THE PRINCIPAL COMPONENTS SCORE STRATEGY 119
All diploid species are native to Africa and Madagascar. Collecting missions were conducted in eight countries by ORSTOM and the Institut de Recherche sur le Café et le Cacao (IRCC); for a review, the reader is refesed toBerthaud.and Charrier (1988). In West Africa, collections were made in Côte d'Ivoire and Guinea; in Central Africa they were made in Cameroon, the Central African Republic and the Congo; and in East Africa they were made in Kenya and Tanzania. About 17 500 genotypes were collected, representing 75 species. The only field collections are in Côte d'Ivoire for all African accessions and in Madagascar for all Madagascar species.
Definition of diversity groups
To build up the core collection we used a database (BASECAFE) with passport and characterisation data (Anthony, 1992). Passport data are systematic and include taxonomic identification, origin, site and type of collected material, Characterisation data are also available, as are data on the location of the plant in the field, the year of planting and the nature of root system. The list of descriptors is presented in Table 1. The list includes both morphological and biochemical data. As for other crops, the availability of characterisation data depends upon the economic importance of the species and the priorities of the genetic resources centre.
For the identification of the coffee diversity groups we summarised collecting and characterisation reports, and synthesised the following genetic evaluation data (Charrier, 1978; Hamon et al., 1984;
Table 1 Coffee descriptors used for characterisation, recorded in the BASECAFE database
Characters Descriptors Coding
Morphology Leaf dimensions mm Fruit stalk length mm Fruit dimensions mm Bean dimensions mm
Isozymesa Esterases alpha, beta cathodic (EST) 1 /o lsocitrate dehydrogenase (ICD) 1 /o Malate dehydrogenase (MDH) 1 /o Phospho-gl uco-isomerase (PG I ) 1 /o Phospho-gluco-mutase (PGM) 1 /o
Flowering Intensity (estimation of flower number) 5 classes
Production Mature berry weight by passage kg
Technology Commercial coffee yield % 1 O 0 beans weight at 1 2°/o moisture content g
Biochemistry 'Caffeine content in green bean Caracoli bean rate
O/O dm %
Fertility Filling ovule rate % Berry filling YO
Note: a Presence of an allele (1); lack of an allele (O)

c
120
Table 2 Main diversity groups for the core collection of Coffea
Africa (38 groups)
C. arabica (3 groups)(la) C. arabica ( cultivated, wilda, Mt Marsabit)
Simple groups, botanically described (5 groups) (4") C. fadenii C. racemosaa C. humilip C. salvatrixd C. pseudozanguebariaP
Simple groups, botanically undescribed (8 groups) (7a) C. sp. Fa C. sp. 'BakossP C. sp. 'Congola C. sp. 'Mayombela
C. sp. "gongo 2'" C. sp. "gongo 3Ia C, sp. 'Nkoumbala'a C. sp. 'Song-Mbong'
Complex groups (22 groups) (1 9 a ) C. brevipes C. canephora C. congensis C. eugenioides (kenyan, var. kivuensis) C. kapakata (tanzanian, 'brésilian 3 C. liberica (guineana, congoliana, Kotoa) C. sessiliflora C., stenophylla (Asablia, Iraa) C. sp. 'Moloundou' (Moloundoua, Souankéa)
(Mt Camerouna, Kuniba-Louma, var. heterocalyx") (guineana, congoliana, cameroonesea, Nanaa) (centra fricana, cameroonesea, congoliana)
(Shim baa, Kitu langaloa)
Madagascar (50 groups)
C. andrambovatensis C. arenesiana C. augagneuri C. bertrandi C. boivin iana C. buxifolia . C. dolichophylla C. dubardi C. fa ra fanganensis C. heimii C. humblotiana (Comores Islands) C. homollei C. jumelleì C. kianja vatensis C. lancifolia C. mangoroensis
C. mauritiana (Réunion Island) C. millotii C. mogeneti C. perrieri C. pervilleana C. resinosa C. richardii C. sahafariensis C. sakarahae C, tetragona C. tsirananae C. vatovavyensis . '
C. vaughanii C. vianneyi C. ind. (20 undescribed taxons)
Note: a Diversity groups represented in the current Coffea core collection

USING THE PRINCIPAL COMPONENTS SCORE STRATEGY 121
Berthaud, 1986; Berthaud and Charrier, 1988; Anthony, 1992; Rakotomalala, 1993). This resulted in 88 groups for the core collection (see Table 2). There are 64 simple groups that correspond to 64 taxa. A further 24 groups are complex; these groups correspond to nine species, structured mainly according to ecological regions or to morphotypes.
THE PRINCIPAL COMPONENTS SCORE STRATEGY
Statistical procedure
To avoid ambiguity, we will first define the difference between diversity, variability and inertia and describe the assumptions on which the strategy is based.
Diversity relates to all that is potentially diverse and is a function of the genetic material and the tools used for its estimation. In this context, variability, in terms of the statistical parameter ‘variance’, is a part of the diversity restricted to quantitative data. Inertia is the generalised sum of squares of standardised and independent variables. In a given diversity group we assume that there is no reproductive barrier, apart from self-incompatibility alleles, and that the principle of general additivity for quantitative data could be applied. We consider that a cross between two extreme genotypes is possible and that all intermediate phenotypic forms can be obtained by recombination.
Using quantitative descriptors, the variability of a given set of genotypes depends upon the differences recorded between individuals. Here, the distance used to describe differences between individuals has the following characteristics: it is metric, gives the same weight to the descriptors, avoids the Co-linearity between descriptors, and removes the residual variability. PCSS consists of three steps: the application of principal components analysis (PCA) to the quantitative data; the computerisation of the weighted Euclidean distance between individuals; and the selection of genotypes that maximise subset inertia.
The choice of the weighted Euclidean distance allows the two first conditions to be fulfilled. The distance di, between two individuals (i and k) is:
dik = 45 [(Xu- Xkj) . cy-’]*
where: J = number of descriptors sj = standard deviation of the jth descriptor
-
j= I
The Co-linearity between variables and the residual variability are removed by the’use of PCA. This step applies a PCA to the quantitative data table in order to obtain new uncorrelated variables (the eigenvectors) and new coordinates of each individual. The residual variability is removed only by considering an axis with an eigenvalue greater than 1’(by definition the number is L). .
The second step computes the weighted Euclidean distance between individuals, using new coordinates on the L first axis. Weights are given by the square root of eigenvalues. Thus, the weighted Euclidean distance between two genotypes is: .-
where: lj = the eigenvalue value of the jth eigenvector
, .:
122 CORE COLLECTIONS OF PLANT GENETIC RESOURCES
The third step applies the following selection. Let us consider the total inertia of an N*L table, where N is the number of genotypes and L is the number of uncorrelated and reduced variables. It is equal to the product N x L (Lebart et al., 1977). The inertia of one genotype (Pi) is the sum of squares of their factorial coordinates for the L factors:
L Pi = Ex2
j=l ij
The relative contribution of each genotype (RC,) is therefore:
RC, = P J ( N * L )
The selection procedure involves searching for genotypes which have the higher RC,, Then, step by step, we add the genotype that gives the highest RC score. This procedure can be curtailed at any moment, either at a pre-selected level of inertia or when a certain percentage of genotypes is selected. Theoretically, the percentage of the selected inertia using PCSS, with random sampling, a large number of descriptors and N infinite, increases linearly (see Figure 1, curve c).
Testing the PCSS in the Cuffeu Eiben" guinean group
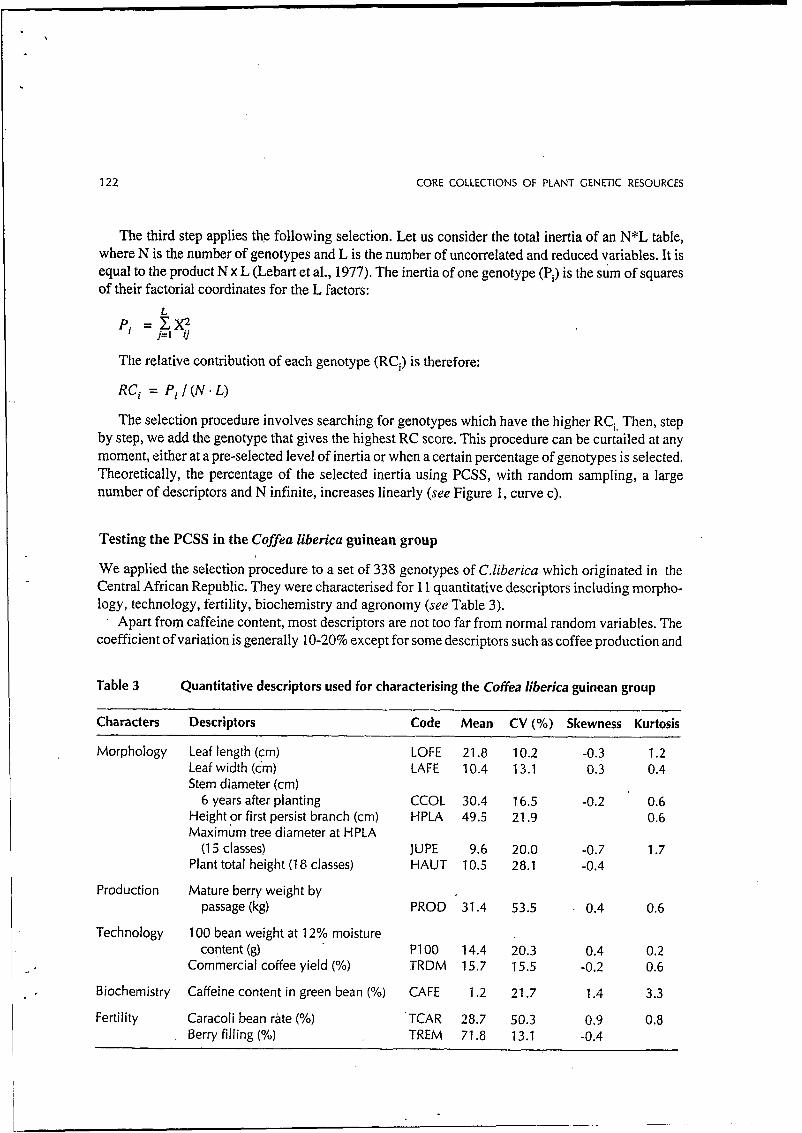
We applied the selection procedure to a set of 338 genotypes of C.liberica which originated in the Central African Republic. They were characterised for 1 1 quantitative descriptors including morpho- logy, technology, fertility, biochemistry and agronomy (see Table 3).
. Apart from caffeine content, most descriptors are not too far from normal random variables. The coefficient of variation is generally IO-20% except for some descriptors such as coffee production and
Table 3 Quantitative descriptors used for characterising the Coffea Iiberica guinean group
Characters Descriptors Code Mean CV (YO) Skewness Kurtosis
Morphology
Production
Tech nology
Biochemistry
Fertility
Leaf length (cm) Leaf width (cm) Stem diameter (cm)
Height or first persist branch (cm) Maximum tree diameter at HPLA
Plant total height (1 8 classes)
Mature berry weight by
1 O0 bean weight at 12% moisture
Commercial coffee yield (Yo)
Caffeine content in green bean (Yo)
Caracoli bean rate (Yo) Berry filling (Yo)
6 years after planting
(1 5 classes}
passage (kg)
content (g)
LOFE 21.8 LAFE 10.4
10.2 -0.3 13.1 0.3
1.2 0.4
CCOL 30.4 HPLA 49.5
JUPE 9.6 HAUT 10.5
PROD 31.4
Pl00 14.4 TRDM 15.7
CAFE 1.2
TCAR 28.7 TREM 71.8
16.5 -0.2 21.9
20.0 -0.7 28.1 -0.4
53.5 . 0.4
20.3 0.4 15.5 -0.2
21.7 1.4
50.3 0.9 13.1 -0.4
0.6 0.6
1.7
0.6
0.2 0.6
3.3
0.8

USING THE PRINCIPAL COMPONENTS SCORE STRATEGY 123
Table 4 Correlations between descriptors and partial contributions of the descriptors to the principal component axes .
Variable LOFE LAFE DCOL CCOL HAUT JUPE HPLA PlOO TRDM TREM TCAR CAFE PROD
LOFE LAFE DCOL CCOL HAUT JUPE HPLA P1 O0 TRDM TREM TCAR CAFE PROD
71 4
135 174 884 210 259 692 711
78 102
83 120 516 549 411 61 15 302 278 252 123
53 125 155 173 276 154 54 555 9 127 211 274 285 226 -19
132 103 159 134 251 91 105 167 549 -50 -40 -58 -45 -155 18 83 1 -351 -785 128 139 4 -10 42 69 25 104 71 75 18 136 98 420 480 426 324 165 203 232 251 -230 -104
Axis/descriptor
1 (29.9%) 90 117 641 696 662 364 114 203 251 230 110 4 394 2 (15.2%) 10 10 153 157 30 99 21 25 320 580 550 20 3 (12.8%) 707 703 23 8 2 13 3 17 20 37 103 19
Total 807 830 817 861 692 465 148 231 588 830 697 127 413
caracoli bean rate, where it reaches 50%. Correlations between the descriptors and the PCA axes indicate that the first three main axes have the following features: axis 1 (30%) plant shape and vigour; axis 2’( 15%) plant fertility; and axis 3 (13%) essentially the leaf polymorphism (see Table 4). The distribution of the genotypes along these axes did not reveal visually defined subgroups. The group test, made by clustering methods followed by a discriminant analysis, confirmed the lack of a robust subgroup and was thus in accord with the hypothesis of a single diversity group.
The effect of selection on the inertia retained is presented in Figure 1. Curve (b) shows that the selection of the first 10% of the most variable genotypes corresponds to 30% of the total inertia. The Ievel of 50% inertia is obtained with 25% of the genotypes. When we repeated the analysis with only the three most informative descriptors (that is, those with the maximum contribution to axis 1 -stem diameter, berry filling and leave width), we observed (curve a) that 10% of the most variable genotypes corresponded to 45% of the total inertia and 50% of the genotypes corresponded to 90% of the total inertia. In both cases, the selected inertia using PCSS was greater than that with the strictly random sampling (curve c), which is theoretically linear when N trends to infinite. . .
DISCUSSION
Global definition of genetic diversity groups
A good core collection needs to define genetic diversity groups precisely and thus it is important to have standardised descriptors. The available data (passport and characterisation) are very different in
. . ..

124 CORE COLLECTIONS OF PLANT GENETIC RESOURCES
Figure 1 Principal components score selection within the Coffea liberica guinean group
1 O0
90
80
e 70
.- 60
'I 50 2 2 40
- 30
20
10
h
=- a m
Y .- -
Y v
W (A
I I I I I l
O 50 1 O0 150 200 250 300 i 2
Number of genotypes
Curve (a) Curve (b) Curve (c)
Sampling with PCSS and only the three most informative variables Sampling with PCSS and al l variables Sampling with a strictly random process
L I
nature, quantity and reliability. The starting point is certainly the biological species. When available, botanical data must be confirmed by inter-crossing tests in order to specify the level and nature of putative reproductive barriers. This almost corresponds to the former definition of the gene pools and compartments (Harlan, 1975; Pemès, 1984). The definition of the diversity group must be more precise. Biogeographic data on the original sampling site could be used to emphasise ecological subgroups. Climatic and pedological data on the sites of origin are of great importance, but unfortunately they are often missing from or inadequately covered in collection reports (Peeters and Williams, 1984).
The genetic structure of plant populations is influenced mainly by biological and ecological factors (Loveless and Hamrick, 1984). Crawford (1985) reports that rapid and recent speciation is correlated with little or no allozyme divergence. Davis and Gilmartin (1985) stress that morphological differen- tiation could be associated with negligible isozymic difference. Despite this, these factors are often useful for design strategies and the choice of samples for in-depth molecular analysis (Brown, 1990); Taking Coflea as an example, let us consider the differences between theory and practice.
Establishing a coffee core collection: One strategy or more?
As mentioned earlier in this chapter, we propose that, for coffee species, 88 diversity groups divided into three categories (based on knowledge of their genetic diversity) need to be represented in the core

USING THE PRINCIPAL COMPONENTS SCORE STRATEGY I
CONCLUSION
Several different strategies, ratlier than a single one, should be used to establish a core collection, depending not p l y upon the organisation of the gene pool but also upon the level of knowledge. A
r rkliable definition of genetic diversity groups is then the first priority. When the groups have been
125
collection. For each of these three categories, different strategies need to be employed in forming the I core collection:
C. arabica category: The economically important species, C. arabica (three diversity groups), has to be studied separately. This species is amphiploid, autogamous and has a recent domestication history. In addition, its level of isozymic polymorphism (IE = 0.005) is particularly low (Berthou and Trouslot, 1977). The genetic basis is narrow and most accessions in collections are genetically closely related. For this species, workers selectcultivatedoriginal mutants and variants. To remove redundancy in the collection, detailed identification methods have to be used, such as fingerprint- ing (Weising.et al., 1992) and random amplified polymorphic DNA (RAPD) (Hadrys et al., 1992). Currently, collections are working or breeders’ collections, described mainly by quanti tative characters, for which PCSS would be appropriate.
A category containing little-studied wild species: For a large number of wild species, few studies have been conducted and some species remain botanically undescribed (84 diversity groups). These species, diploid and self-sterile, are highly heterozygous. Brown’s (1989b) logarithmic strategy is certainly the most suitable strategy for this category. Unfortunately, in practice it is difficult to conserve such large diversity. The genetic resources of Madagascar species (50 diversity groups) are not available outside the country. So, we considered only the African species (35diversitygroups), forwhich wechose, asafirststep, toconductarandomselectionofaconstant number of genotypes (40) for each diversity group (groups marked with an ‘a’ in Table 2).
.
A category containing well-studied species, characterised by quantitative data: For this category, we suggest that the sampling strategy is improved by using PCSS, a procedure which is based on a simple concept and is easy to use with a standard computer. It allows the choice of the most variable genotypes. As for other methods, however, we need to be sure that we are actually in a diversity group. Consequently, the main limitation for the global core collection strategy is the definition and the validity test of a diversity group. Chloroplastic DNA is useful to test phylogenic hypothesis between genera of the Rubiaceae family (Bremer, 199 1). Perhaps the systematic study of chloroplastic DNA within a particular genus (that is, Cuflea) could be useful for defining these diversity groups. Despite this, the PCSS procedure, which maximises the selected inertia, introduces de facru a statistical sampling bias. If we assume that there is no correlation between morphological and molecular markers and that the postulate of general additivity can be applied within a diversity group, the selection of 10% of the most extreme genotypes, using PCSS, theoretically does not produce less neutral diversity than a completely random selection method (Brown’s strategy). Thus, for the C. liberica guinean group, 15% of 338 studied genotypes (not far from the Brown’s 10%) could capture almost 60% of the total inertia using PCSS.

126 CORE COLLECTIONS OF PLANT GENETIC RESOURCES
References
Anthony, F. 1992. Les Ressources Génétiques des Caféiers: Collecte. Gestion d’un Consersatoire et
Berthaud, J. 1986. Les Ressources Gértétiques pour I’Amélioratiolt des Caféiers Afiicairts Diploïdes: Evaluation de la Diversité Génétique. Série TDM 8 1. Paris, France: ORSTOM.
Evaluatìoit de la Richesse Génétique des Populations Sylvestres et de ses Mécanismes 0rgairisateur.s. Conséquences pour L’Application. Série TDM 188. Paris, France: ORSTOM
Agronomy. London, UK: Elsevier.
Adaptation d’une méthode d’électrophorèse en série, premiers résultats. In Actes du 8Pme Colloque de f’ ASIC, Abidjan, Côte d’Ivoire. Pans, France: ASIC.
Bridson, D. and Verdcourt, B. 1988. Coffea. In Polhill, R.M. and Balkema, A.A. (eds) Flora of Tropical East Africa. Rubiaceae. Part 2. Rotterdam, Netherlands: A.A. Balkema.
Bremer, B. 1991. Restriction data from chloroplast DNA for phylogenetic reconstruction: Is there only one way of scoring? Plant Systematics and Evolution 175: 39-54.
Brown, A.H.D. 1989a. The case for core collections. In Brown, A.H.D., Frankel, O.H., Marshall, D.R. and Williams, J.T. (eds) The Use of Plant Genetic Resources. Cambridge, UK: Cambridge University Press.
Brown, A.H.D. 1989b. Core collection: A practical approach to genetic resources management. Genome
Brown, A.H.D. 1990. The role of isozyme studies in molecular systematics. Australian Systematic Botany
Charrier, A. 1978. La Shwture Génétique des Caféiers Spontanés de la Région Malgache (Mascarouofeu). Leurs Relations avec les Caféiers d’Origiite Africaine (Eucoffea). Série Mémoires 87. France: ORSTOM.
Chevalier, A. 1947. Les cafeiers du globe. Systématique des caféiers et faux caféiers. Maladies et insectes nuisibles. In Encycl. Biol. XXVIII, Fas. III. Paris, France: Lechevalier.
Crawford, D.J. 1985. Electrophoretic data and plant speciation. Systematic Botany 10: 405- 16. Davis, J.I. and Gilmartin, A.J. 1985. Morphological variation and speciation. Systematic Botany. 10: 417-25. FAO. 1968. FAO Coffee Mission to Ethiopia 1964-1965. Roma, Italy: FAO. Frankel, 0.H.and Brown, A.H.D. 1984. Plant genetic resources today: A critical appraisal. In Holden, J.H.W. and
Williams, J.T. (eds) Crop Genetic Resources: Conservation and Evaluatioir. London, UK: Allen and Unwin. Hadrys, H., Balick, M. and Schierwater, B. 1992. Applications of random amplified polymorphic DNA
(RAPD) in molecular ecology. Molecular Ecology 1: 55-63. Hamon, S. , Anthony, F. and Le Pierrbs, D. 1984. La variabilité génétique des caféiers de la section
Mozambicoffea A. Chev. Précisions sur 2 espèces affines: C. pseudozangirebariae Bridson et C. sp. Bridson. Bull. Mus. Hist, Nat., Andansonia 4 (série 6): 207-23.
Society of America.
expérimentations réalisées au Cameroun, en Côte d’Ivoire et à Madagascar sur l’espèce Cofea arabica L. collectée en Ethiopie par une mission ORSTOM en 1966. Bulletin IFCC 14.
Logiciels pour l’Analyse des Grands TableaiLy. Paris, France: Dunod.
Anriual Review of Ecology and Systematics 15: 65-95.
Plant Genetic Resources Newsletter 60: 22-32.
Paris, France: ACCT.
France: ORSTOM.
Berthaud, J. and Charrier A. 1988. Genetic resources of Coffea. In Clarke, R.J.and Macrae, R. (eds) Coffee. 4.
Berthou, F. and Trouslot, P. 1977. L’analyse du polymorphisme enzymatique dans le genre Coflea:
30: 818-24.
3: 39-46.
Harlan, J.R. 1975. Crops and Man. Madison, Wisconsin, USA: American Society of Agronomy/Crop Science
IFCC. 1978. Etude de la structure et de la variabilité génétique des caféiers: Résultats des éludes et des
Lebart, L., Morineau, A. and Tabart, N. 1977. Techniques de la Description Statistique: Méthodes et
Loveless, M.D. and Hamrick, J.L. 1984. Ecological determinants cif genetic structure in plant populations.
Peeters, J.P. and Williams, T. 1984. Towards better use of gene banks with reference to information. IBPGR
Perni%, J. 1984. Gestion des Ressources Génétiques des Plantes. 2. Organisation des Complexes d’Espèces.
Rakotomalala, J.J. 1993. Analyse de la Diversité Biochimique des Caféiers Malgaches. Série TDM. Paris,
Weising, K., Kaemmer, D., Weigand, F., Epplen, J.T. and Kahl, G. 1992. Oligonucleotide fingerprinting reveals probe-dependent levels of informativeness in chickpea (Cicer arietinum). Genome 35: 436-42.