Embed Size (px)
Citation preview
South Dakota State University South Dakota State University
Open PRAIRIE: Open Public Research Access Institutional Open PRAIRIE: Open Public Research Access Institutional
Repository and Information Exchange Repository and Information Exchange
Electronic Theses and Dissertations
2022
Development of a Chromatographic Method to Authenticate Development of a Chromatographic Method to Authenticate
Aspirin Brands Aspirin Brands
Megan Guetzloff South Dakota State University, [email protected]
Follow this and additional works at: https://openprairie.sdstate.edu/etd2
Part of the Analytical Chemistry Commons, and the Medicinal-Pharmaceutical Chemistry Commons
Recommended Citation Recommended Citation Guetzloff, Megan, "Development of a Chromatographic Method to Authenticate Aspirin Brands" (2022). Electronic Theses and Dissertations. 338. https://openprairie.sdstate.edu/etd2/338
This Thesis - Open Access is brought to you for free and open access by Open PRAIRIE: Open Public Research Access Institutional Repository and Information Exchange. It has been accepted for inclusion in Electronic Theses and Dissertations by an authorized administrator of Open PRAIRIE: Open Public Research Access Institutional Repository and Information Exchange. For more information, please contact [email protected].
DEVELOPMENT OF A CHROMATOGRAPHIC METHOD TO
AUTHENTICATE ASPIRIN BRANDS
BY
MEGAN GUETZLOFF
A thesis submitted in partial fulfillment of the requirements for the
Master of Science
Major in Chemistry
South Dakota State University
2022
THESIS ACCEPTANCE PAGE
Megan Guetzloff
11
This thesis is approved as a creditable and independent investigation by a candidate for
the master's degree and is acceptable for meeting the thesis requirements for this degree.
Acceptance of this does not imply that the conclusions reached by the candidate are
necessarily the conclusions of the major department.
Brian Logue
Advisor
Douglas Raynie
Department Head
Nicole Lounsbery, PhD
Director, Graduate School
Date
Date
Date

iii
I would like to dedicate this thesis to my mother, Christine Justel Guetzloff
(Richter), and my father, Thomas Fredrick Guetzloff, who were my inspiration to earn a
Master of Science degree (M.S.). You both gave me unconditional love, support,
encouragement, and guidance over the years that I will cherish forever. Not only are you
my heroes, but your passion towards chemistry ignited the spark in me to lead in your
footsteps and become curious to learn about the universe on a macro and micro level.
Thank you for being the best parents that a daughter could ask for. I love you both
forever and always. To my loving husband/best friend, Jonathan David Simms: I would
like to thank you for your love, support, and patience you given me on this journey
towards obtaining my master’s degree. I also, want to thank you for believing in me when
at times I did not believe in myself. You always know how to cheer me up on my good
and bad days. Thank you for being my best friend, partner in crime, and soulmate. I love
you (always) and cannot wait for what life has in store for us. To my family, thank you
for your support and encouragement to get to this point in my life.

iv
ACKNOWLEDGEMENTS
I would like to personally thank and acknowledge my advisor, Dr. Brian A.
Logue, for all the guidance you have given me on my journey to receiving my M.S.
degree. You taught me how to critical think throughout my research project and most of
all, you believed in me when at times I did not. Thank you for not only being my
principal investigator, but someone I can look up to in my years to come. I would also
like to thank the LARGE group for the supporting me. I will cherish the memories that
we have created together. I would like to also thank Dr. Saunders, Cami Fuglsby, and
Janean Hanka for working with me on my research project. Your perspectives allowed
this research project to take flight and I appreciate everything. I would lastly like to thank
the South Dakota State University Chemistry and Biochemistry Department for providing
me this wonderful opportunity to obtain my master’s degree. I have made so many
friends and memories here that I will treasure for my lifetime.
v
ABBREVIATIONS .......................................................................................................... vii
LIST OF FIGURES ......................................................................................................... viii
LIST OF TABLES ............................................................................................................. xi
ABSTRACT ..................................................................................................................... xiii
Chapter 1: INTRODUCTION ......................................................................................... 1
1.1. Significance .............................................................................................................. 1
1.2. Objective .................................................................................................................. 1
1.3. Counterfeit Drugs ..................................................................................................... 2
1.3.1. The Impact of Counterfeit Pharmaceuticals ...................................................... 2
1.3.2. Current Strategies to Combat Counterfeit Pharmaceuticals ............................ 3
1.4. Current Methods for Source Attribution .................................................................. 5
1.4.1 Raman Spectroscopy ........................................................................................... 5
1.4.2 Isotope Ratio Mass Spectrometry ....................................................................... 7
1.4.3 Liquid Chromatography Tandem Mass Spectrometry........................................ 9
1.4.4 Gas Chromatography Mass Spectrometry ....................................................... 12
1.5 Research Goal ......................................................................................................... 14
CHAPTER 2: DEVELOPMENT OF A CHROMATOGRAPHIC METHOD TO
AUTHENTICATE ASPIRIN BRANDS ....................................................................... 16
Abstract ............................................................................................................................ 16
2.1 Introduction ............................................................................................................. 17
2.2 Materials and Methods ............................................................................................ 20
2.2.1 Materials .............................................................................................................. 20
2.2.2 Standard Solutions ............................................................................................ 21
2.2.3. Aspirin Sample Preparation for GC-MS Analysis ........................................... 21
2.2.3.2 Aspirin Sample Preparation for LC-MS/MS Analysis ................................... 22
2.2.3.3 Double-Blind Study Sample Preparation ...................................................... 22
2.2.4 Gas Chromatography-Mass Spectrometry ....................................................... 23
2.2.5 Liquid Chromatography Tandem Mass Spectrometry...................................... 24
vi
2.2.4 Identification of Excipients and Active Ingredients in Aspirin ......................... 25
2.2.5 Chemometrics ................................................................................................... 26
2.3 Results and Discussion ............................................................................................ 27
2.3.1 GC-MS Analysis of Aspirin............................................................................... 27
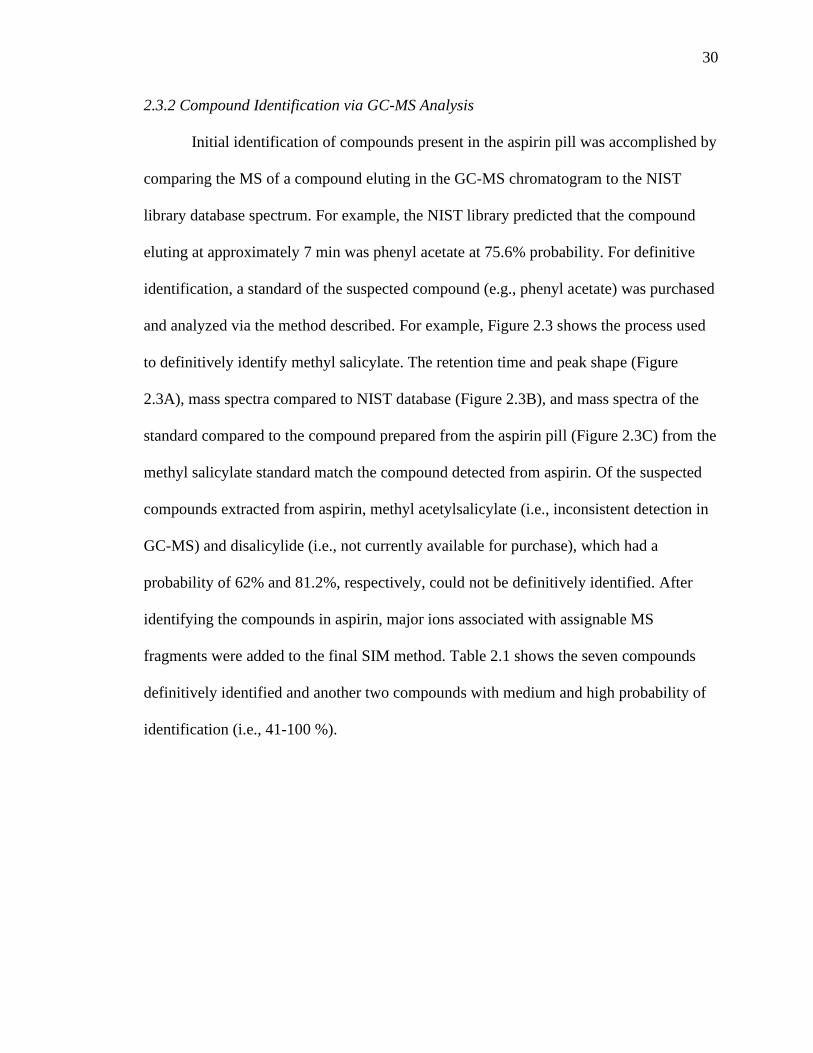
2.3.2 Compound Identification via GC-MS Analysis ................................................ 30
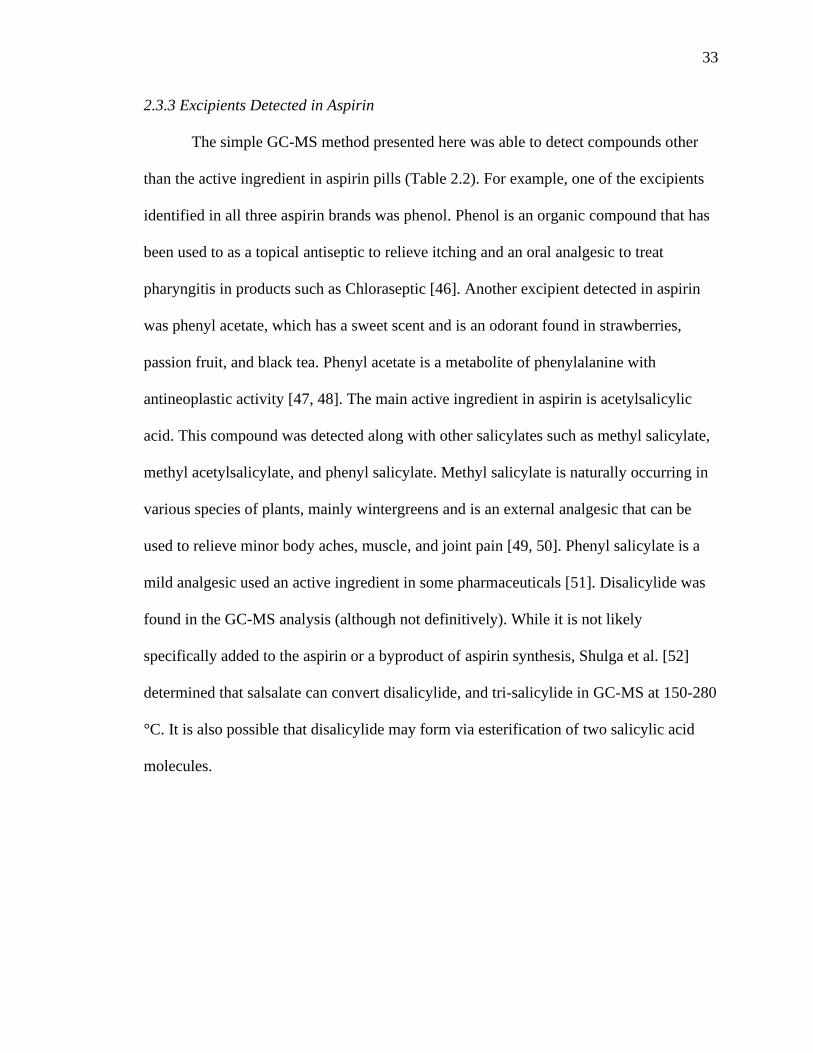
2.3.3 Excipients Detected in Aspirin ......................................................................... 33
2.3.4 Evaluation of GC-MS and LC-MS/MS for Aspirin Authentication .................. 34
2.3.5 Preparation of LC-MS/MS Data for Statistical Analysis ................................. 39
2.3.5.1 Chemometric Analysis of LC-MS/MS Chromatograms ................................. 39
2.3.6 Classification of Unknown Aspirin Brands ...................................................... 44
2.4 Conclusion ............................................................................................................... 49
CHAPTER 3: CONCLUSIONS AND FUTURE WORK........................................... 51
3.1. Conclusions ........................................................................................................ 51
3.2 Future Work ......................................................................................................... 52
4. . REFERENCES............................................................................................................. 53
vii
ABBREVIATIONS
GC-MS Gas chromatography mass spectroscopy
LDA Linear discriminate analysis
QDA Quadratic discriminate analysis
IRMS Isotope ratio mass spectrometry
LC-MS/MS Liquid chromatography tandem mass spectrometry
LC Liquid chromatography
MS Mass spectrometry
PCA Principal component analysis
ICP-MS Inductively coupled plasma-mass spectrometry
MRM Multiple Reaction Monitoring
CI Chemical ionization
EI Electron Ionization
CE Collision energy
DP Declustering potential
CXP Cell exit potential
NIST National Institute of Standards and Technology
DC Direct current
RSD Relative standard deviation
API Active pharmaceutical ingredient
SVM Support vector machines
viii
LIST OF FIGURES
Figure 1.1 Schematic of Raman principle utilizing a H2O molecule. H2O is bombarded with
irradiated light from a laser. The wavelength of the scattered light from the H2O sample
that is equivalent to that of the laser light is not analyzed, however, the difference of the
excited and emitted light of the sample yields the vibrational spectrum ………...…………5
Figure 1.2 A) Basic schematic diagram of LC-MS. Sample is injected into the mobile phase
(e.g., isocratic or gradient) where analytes are separated in the column. Partitioned sample
is ionized, separated in the mass spectrometer by m/z ratio, and detected. B) Basic
schematic diagram of LC-MS/MS. LC-MS/MS sample introduction is the same as LC-MS
but differs once resultant ions are introduced to the MS. A specific precursor ion is selected
where it passes through the first quadrupole (Q1). In the collision cell (Q2), the selected
m/z ions are fragmented into product ions or daughter ions by collision. The third
quadrupole (Q3) selects the products ions and traverse towards the detector ……………11
Figure 1.3 Schematic diagram of GC-MS. The injected sample is heated in the GC inlet
where the mobile phase carriers the volatile analyte through the column. The separated
analyte(s) are introduced into the ion source for the ionization process. The interferent ions
are filtered out of the quadrupole based on DC and RF voltages and the selected ions are
detected in the detector ………….……………….……………….…………….………12
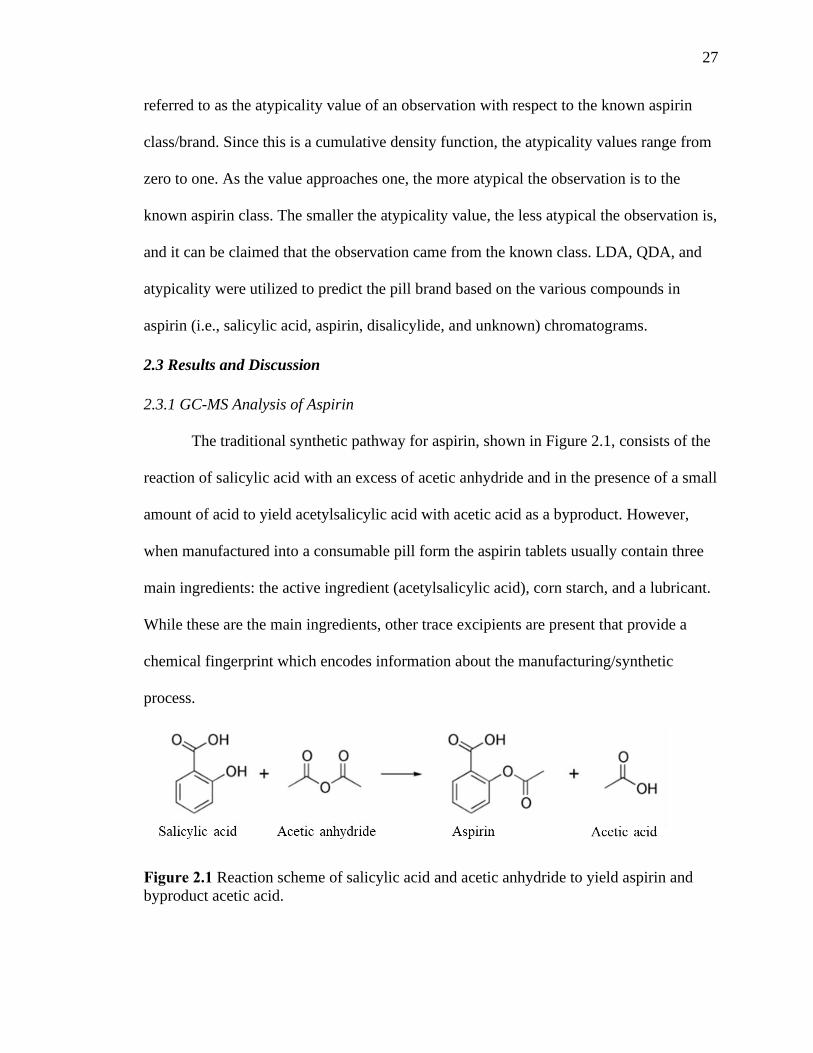
Figure 2.1 Reaction scheme of salicylic acid and acetic anhydride to yield aspirin and
byproduct acetic acid….…………….…………….……………….…………….………27
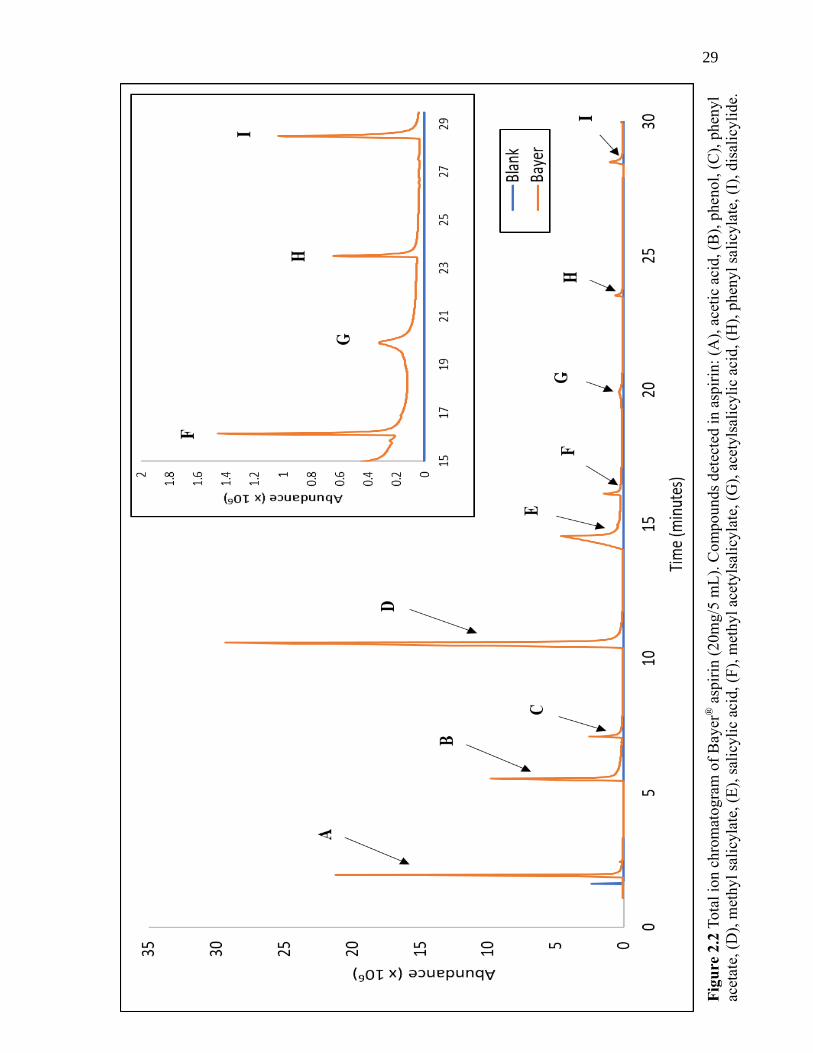
Figure 2.2 Total ion chromatogram of Bayer® aspirin (25mg/15 mL). Compounds detected
in aspirin: (A), acetic acid, (B), phenol, (C), phenyl acetate, (D), methyl salicylate, (E),
salicylic acid, (F), methyl acetylsalicylate, (G), acetylsalicylic acid, (H), phenyl salicylate,
(I), disalicylide. ….…………….…………….………….………….…………….………29
ix
Figure 2.3 Example of definitively identified compound. A) GC-MS chromatogram of
excipient methyl salicylate confirmed with its standard. B) NIST C) Mass spectrum of
methyl salicylate in aspirin pill and methyl salicylate standard.…………………….……31
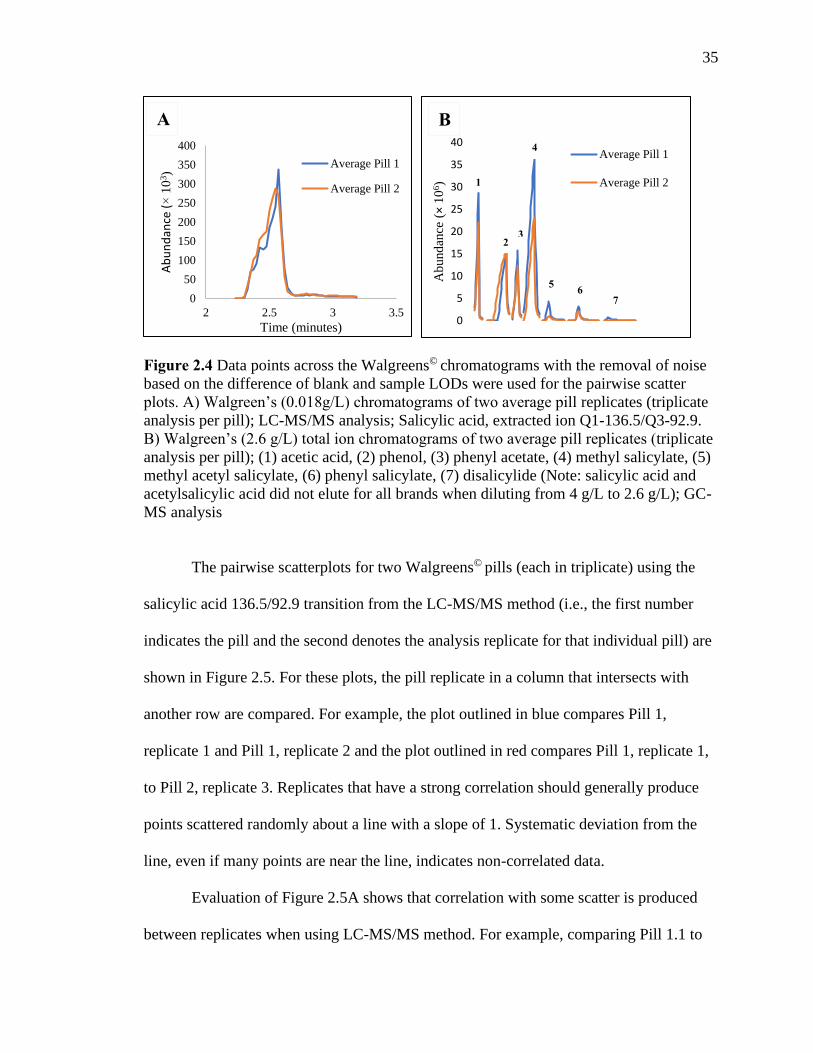
Figure 2.4 Data points across the Walgreens© chromatograms with the removal of noise
based on the difference of blank and sample LODs were used for the pairwise scatter plots.
A) Walgreen’s (0.018g/L) chromatograms of two average pill replicates (triplicate analysis
per pill); LC-MS/MS analysis; Salicylic acid, extracted ion Q1-136.5/Q3-92.9. B)
Walgreen’s (2.6 g/L) total ion chromatograms of two average pill replicates (triplicate
analysis per pill); (1) acetic acid, (2) phenol, (3) phenyl acetate, (4) methyl salicylate, (5)
methyl acetyl salicylate, (6) phenyl salicylate, (7) disalicylide (Note: salicylic acid and
acetylsalicylic acid did not elute for all brands when diluting from 4 g/L to 2.6 g/L); GC-
MS analysis.…….…………………….…….………….…………………….…….……35
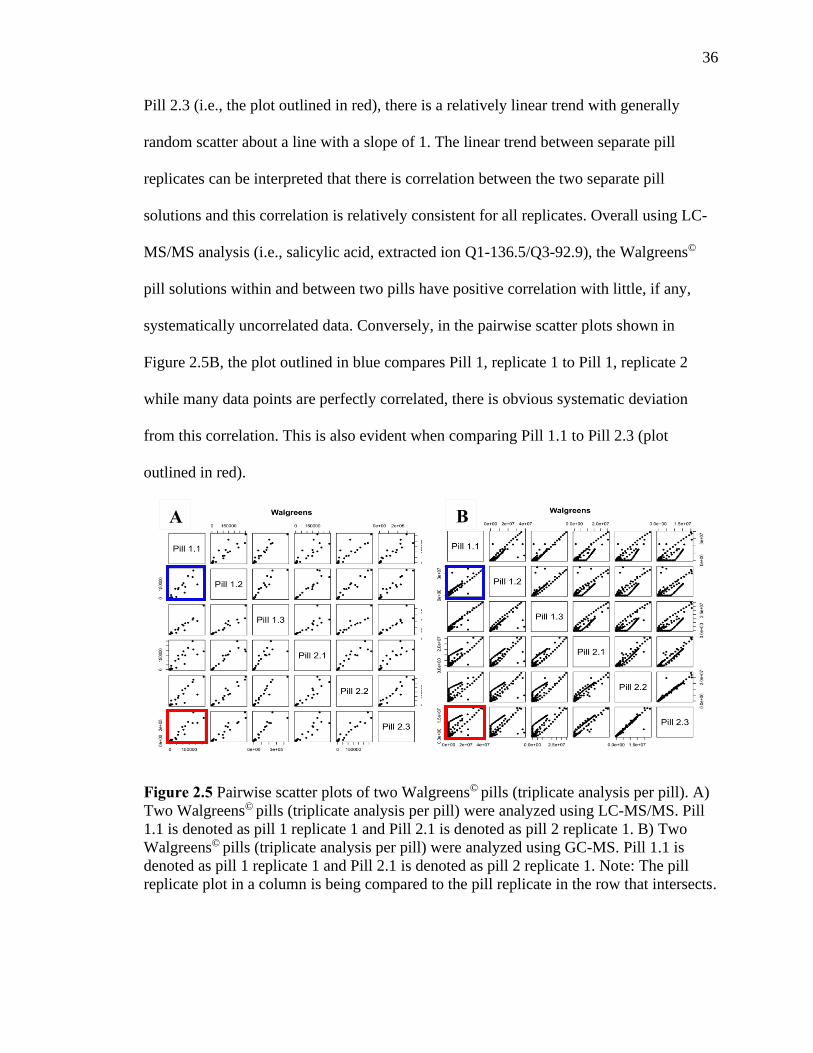
Figure 2.5 Pairwise scatter plots of two Walgreens© pills (triplicate analysis per pill). A)
Two Walgreens© pills (triplicate analysis per pill) were analyzed using LC-MS/MS. Pill
1.1 is denoted as pill 1 replicate 1 and Pill 2.1 is denoted as pill 2 replicate 1. B) Two
Walgreens© pills (triplicate analysis per pill) were analyzed using GC-MS. Pill 1.1 is
denoted as pill 1 replicate 1 and Pill 2.1 is denoted as pill 2 replicate 1. Note: The pill
replicate plot in a column is being compared to the pill replicate in the row that
intersects.………….………….……….………….………………….………….……… 36
Figure 2.6 A) LDA plot of pill brands Bayer®, Premier Value®, and Walgreens© for Day 1
of the three-day study. B) LDA plot of pill brands Bayer®, Premier Value®, and Walgreens©
for Day 2 of the three-day study. C) LDA plot of the pill brands Bayer®, Premier Value®
and Walgreens© for Day 3 of the three-day study…………………………….…….……43
x
Figure 2.7 LDA plot of pill brands Bayer®, Premier Value®, and Walgreens© for the
training/control pills where there was perfect class prediction.…………………………45
Figure 2.8 LDA plot of pill brands Bayer®, Premier Value®, and Walgreens© for the
training/control pills compared the unblinded pills……….……………………………47
xi
LIST OF TABLES
Table 1.1 Executing Strategies to Combat Counterfeit Pharmaceuticals.
Counterfeiters are persistent to distribute illicit goods due to high profit margins,
however, implementing strategic methods can reduce counterfeit products…………4
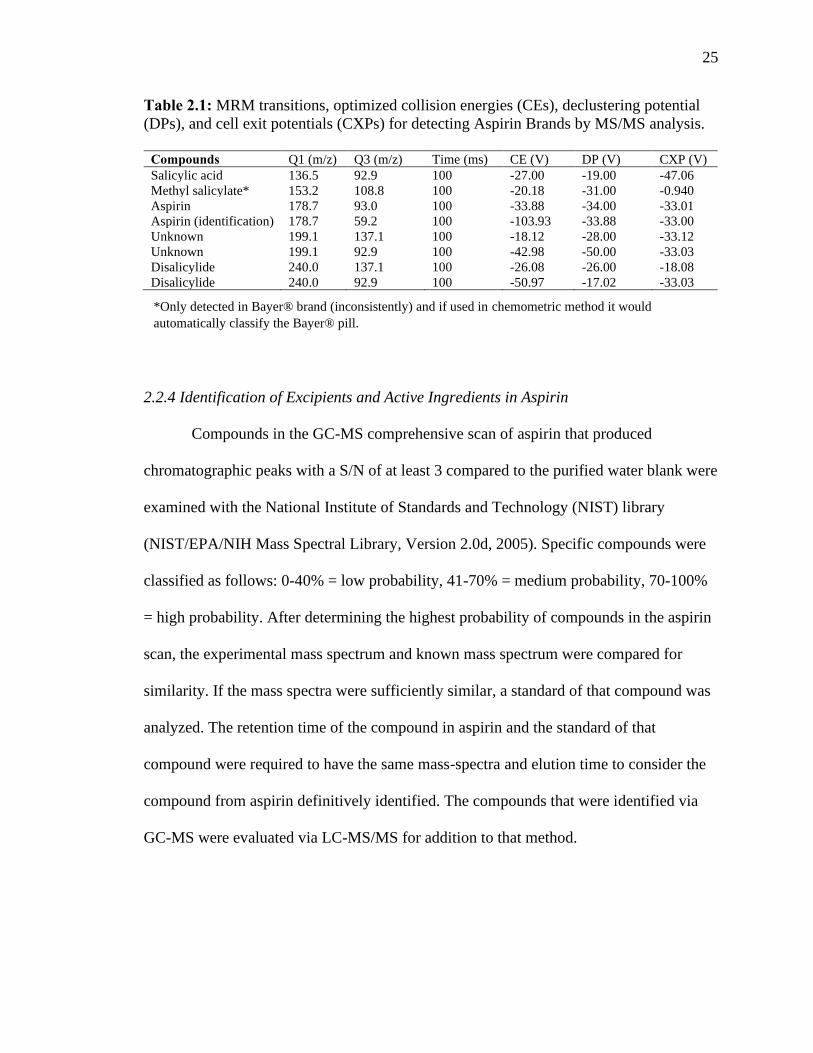
Table 2.1 MRM transitions, optimized collision energies (CEs), declustering potential
(DPs), and cell exit potentials (CXPs) for detecting Aspirin Brands by MS/MS
analysis………………………………………………………………………………….25
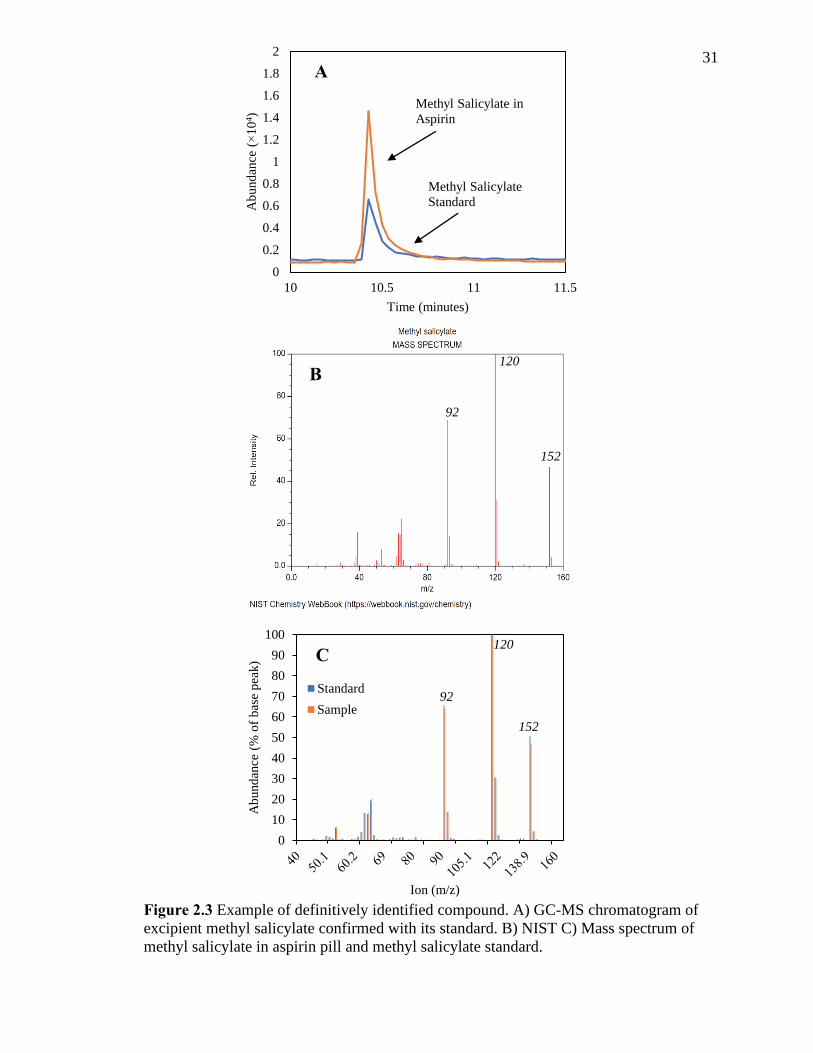
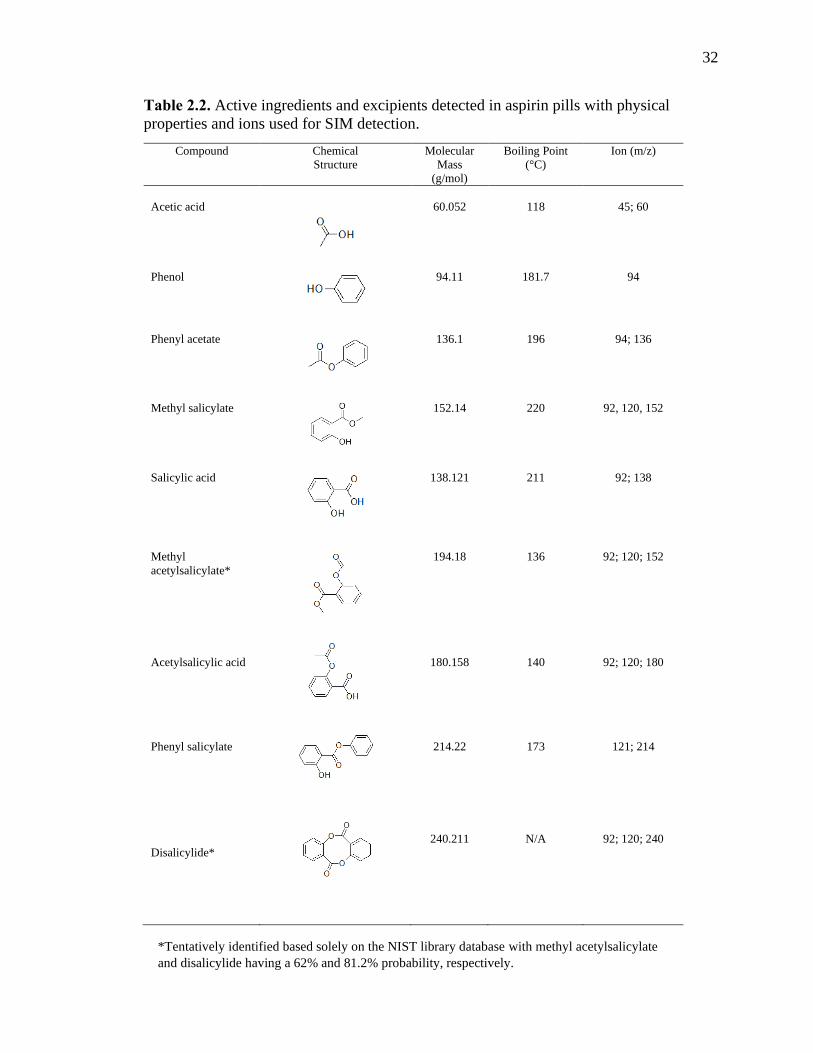
Table 2.2 Active ingredients and excipients detected in aspirin pills with physical
properties and ions used for SIM detection.……….….….….….….….….….…………32
Table 2.3 The relative standard deviation (%RSD) was obtained using peak area for within
two separate Walgreens© pills (triplicate analysis per pill) and between two Walgreens©
pills (triplicate analysis per pill) for the MRM transition compounds and was calculated to
determine the precision of the pill solutions analyzed using the LC-MS/MS.….….….….38
Table 2.4 The relative standard deviation (%RSD) was obtained using peak area from the
total-ion-chromatogram for within two separate Walgreens© pills (triplicate analysis per
pill) and between two Walgreens© pills (triplicate analysis per pill) and was calculated to
determine the precision of the pill solutions analyzed using the GC-MS…….….…….….38
Table 2.5 The total correct percentage of pill brand classification across all brands using
LDA, QDA, and atypicality chemometric methods.……….….…….….….….…………41
Table 2.6 The total correct percentage of within-brand classification using LDA, QDA and
atypicality chemometric methods.….….….…….……….…….….…………………… 41
Table 2.7 Sample atypicality values for analyzing pill brands on Day 1. The atypicality
values that are bolded in black had the lowest atypicality values and the values that are
bolded black and have an asterisk were predicted incorrectly……………………………42
xii
Table 2.8 The total correct percentage of with-in-brand classification using LDA, QDA
and atypicality chemometric methods for the known training/control pills that were
analyzed on the same day as the double-blinded pills.………………………………… 45
Table 2.9 The double-blinded pills were predicted using the three chemometric methods
LDA, QDA, and Atypicality, but LDA and Atypicality predictions were noted. The four
peak transitions that were used in the Day 1-3 study were used in developing the
chemometric methods and classifying the pills brands. After classification predictions, the
pills were unblinded to determine what pills were correctly classified.…….….…………46
Table 2.10 The double-blinded pills were predicted using the three chemometric methods
LDA, QDA, and Atypicality. Two peak transitions 136.5/92.9 and 178.9/93 were used to
see if there were other classification trends versus using the four MRM transition. After
classification predictions, the pills were unblinded to determine what pills were correctly
classified…………………………………………………………………………………49
xiii
ABSTRACT
DEVELOPMENT OF A CHROMATOGRAPHIC METHOD TO AUTHENTICATE
ASPIRIN BRANDS
MEGAN GUETZLOFF
2022
Counterfeit pharmaceuticals pose a threat to society that can include inaccurate
amounts of the active pharmaceutical ingredient (API), no API, or containing off-target
compounds. For example, there are many recent examples of counterfeit pharmaceuticals
containing potentially lethal doses (> 2 mg) of fentanyl (i.e., a synthetic opioid). Current
measures to combat illicit pharmaceuticals (e.g., unique packaging and product
serialization) have merit, however with evolved technologies, counterfeiters can
relatively easily simulate these measures and continue to distribute illicit
pharmaceuticals. The only accurate way to definitively determine that a suspected
counterfeit is, in fact, counterfeit is advanced chemical analysis. However, current
methods of authentication via chemical analysis have disadvantages. Therefore, a general
drug authentication method was developed to authenticate and correctly classify
pharmaceuticals, specifically Bayer®, Walgreens©, and Premier Value® aspirin. Gas-
chromatography mass-spectrometry (GC-MS) and liquid-chromatography tandem mass
spectrometry (LC-MS/MS) were evaluated for analysis of aspirin. LC-MS/MS produced
the most consistent analysis results. Additionally, three statistical techniques, linear
discriminant analysis (LDA), quadratic discriminant analysis (QDA), and atypicality
analysis, were evaluated for their usefulness in source attribution. LDA outperformed the
other statistical treatments, with perfect classification of the training data set using LDA.
xiv
However, when applying the method to a set of double-blinded pills, all statistical
treatments failed to correctly classify over 25% of the pills. Because this method of
source attribution was inconsistent, further optimization of the method is needed before
introducing unknown sources.
1
CHAPTER 1: INTRODUCTION
1.1. Significance
In recent years, counterfeit pharmaceuticals have produced an increasingly
detrimental impact on human health worldwide. Overdose, underdose, or exposure to off-
target chemicals (e.g. fentanyl), is much more likely than with authentic medicines,
leading to up to 1 million deaths per year [1]. Because the tactics of counterfeiters are
sophisticated, including manufacture of pharmaceuticals which are virtually
indistinguishable from the original product, strategies to mitigate counterfeiting are
diverse. Primary strategies to combat counterfeit pharmaceuticals include unique
packaging, product serializing, and verification methods at different points in the supply
chain [2]. For example, the Food and Drug Administration (FDA) produced a counterfeit
detector device that uses ultraviolet and infrared light the scan drugs and packaging to
help determine if the packaging of a drug is authentic [3]. However, even with current
strategies, counterfeiting of pharmaceuticals has continued to increase at an alarming
rate, fueled by advanced counterfeit technologies and heavy consumer demand for cheap
medicine. While current strategies to combat counterfeiting each have merit, the most
accurate is advanced chemical analysis, which allows attribution of a pharmaceutical to
its source. Therefore, there is a critical need for improved analysis methodologies to
authenticate suspected counterfeit drugs more easily and accurately.
1.2. Objective
The objective of this study was to develop the most accurate authentication
protocol to identify the source of suspected counterfeit pharmaceuticals by using an
accurate chemical analysis technique and advanced chemometric methods. In order to
2
accomplish the objective, two chromatographic methods were executed to analyze aspirin
brands (Bayer®, Premier Value®, and Walgreens©): gas chromatography-mass
spectrometry (GC-MS) and liquid chromatography tandem mass spectrometry (LC-
M/MS). When comparing the two techniques used to establish chemical fingerprints of
the various aspirin brands, LC-MS/MS yielded the most consistent results. Therefore, in
the final method, LC-MS/MS was implemented, and linear discriminate analysis (LDA),
quadratic discriminate analysis (QDA), and atypicality based measures were utilized to
differentiate these fingerprints.
1.3. Counterfeit Drugs
1.3.1. The Impact of Counterfeit Pharmaceuticals
The World Health Organization (WHO) and the International Federation of
Pharmaceutical Manufacturers & Associations (IFPMA) define counterfeit drugs
those being falsely labeled, regarding their identity and/or origin, to deliberately
deceive consumers [4]. According to Interpol, approximately 30% of all drugs sold
globally are counterfeit [5]. Methods to counterfeit drugs can be sophisticated, such
as the full-scale manufacturing of fake drugs, or simple, such as minor changes in
packaging (e.g. altering the expiration date) [4]. Counterfeiters tend to focus on
more expensive drugs, such as various chemotherapeutic drugs, antibiotics,
vaccines, AIDS medicines, antivirals, and antianxiety drugs. Due to the high price
of these drugs, people are tempted to search for drugs from a cheaper source,
which creates a market for cheaper counterfeits. Consequently, the consumer may
unknowingly take the counterfeit pharmaceuticals, which could lead to delayed or
immediate health problems, including death [6].
3
The amount and type of counterfeit pharmaceuticals consumed in each
country is independent from other countries, due to various factors. The majority
of illicit drugs purchased in the U.S. originate from the web (e.g., dark web) [3].
The counterfeit drug problem in developing countries is more severe because there
are fewer regulations, ineffective authority control, and loss of trust in the health
care system [7]. In these countries, counterfeiters specifically target life-saving
drugs such as anti-retroviral, antimalarials, and antibiotics [7]. For example, in
1995, 60,000 people were injected with a counterfeit meningitis vaccine in Niger,
Africa [7].
Recently, the opioid epidemic has increased the risk for those consuming
counterfeit pharmaceuticals. According to the DEA, 27% of confiscated
counterfeit pills contain “potentially lethal doses of fentanyl” [8] Fentanyl is a
powerful synthetic opioid used to treat patients with severe pain that is 50 to 100
times more potent than morphine. While fentanyl is a legally prescribed drug, it is
highly addictive, and as little as 2 mg of fentanyl can be lethal to 95% of the
population [8, 9]. Additionally, the U.S. Drug Enforcement Administration (DEA)
issued a warning that the Mexican drugs cartels’ manufacturing mass quantities of
counterfeits containing fentanyl is “killing Americans” [8].
1.3.2. Current Strategies to Combat Counterfeit Pharmaceuticals
Counterfeit pharmaceuticals are highly profitable and only modest
punishments are associated with convictions. Hence, counterfeiters are motivated
to continue developing evolved counterfeiting methods. With counterfeiters
developing advanced technology to produce fake medicines, it is difficult for
4
authorities to enforce anti-counterfeiting laws and almost impossible for
consumers to identify counterfeits [2]. Luckily, there are strategies that can be
implemented to combat counterfeit pharmaceuticals. Common strategies are listed
in Table 1.1.
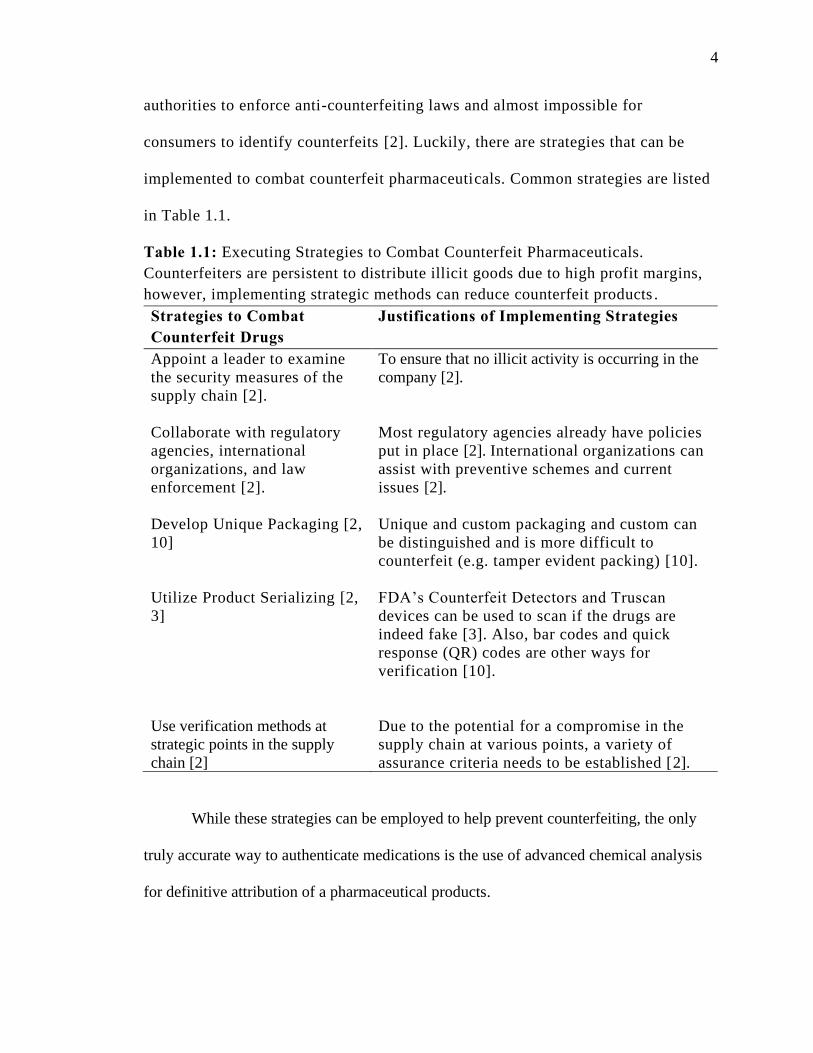
Table 1.1: Executing Strategies to Combat Counterfeit Pharmaceuticals.
Counterfeiters are persistent to distribute illicit goods due to high profit margins,
however, implementing strategic methods can reduce counterfeit products .
Strategies to Combat Counterfeit Drugs
Justifications of Implementing Strategies
Appoint a leader to examine
the security measures of the
supply chain [2].
To ensure that no illicit activity is occurring in the
company [2].
Collaborate with regulatory
agencies, international
organizations, and law
enforcement [2].
Most regulatory agencies already have policies
put in place [2]. International organizations can
assist with preventive schemes and current
issues [2].
Develop Unique Packaging [2,
10]
Unique and custom packaging and custom can
be distinguished and is more difficult to
counterfeit (e.g. tamper evident packing) [10].
Utilize Product Serializing [2,
3]
FDA’s Counterfeit Detectors and Truscan
devices can be used to scan if the drugs are
indeed fake [3]. Also, bar codes and quick
response (QR) codes are other ways for
verification [10].
Use verification methods at
strategic points in the supply
chain [2]
Due to the potential for a compromise in the
supply chain at various points, a variety of
assurance criteria needs to be established [2].
While these strategies can be employed to help prevent counterfeiting, the only
truly accurate way to authenticate medications is the use of advanced chemical analysis
for definitive attribution of a pharmaceutical products.
5
1.4. Current Methods for Source Attribution
1.4.1 Raman Spectroscopy
Raman spectroscopy is a non-destructive, fast, and portable chemical analysis
technique that provides information based on chemical structure, phase and
polymorphism, crystallinity, and molecular interactions. This information is obtained by
irradiating the sample with light from a laser source and measuring light scattered by
molecules in the sample. The wavelength of most scattered light is the same as the laser
source, known as Rayleigh scattering, which does not provide useful information about
the chemical makeup of the sample. However, some of the scattered light has a different
wavelength than the laser source based on the interaction of the irradiated light with
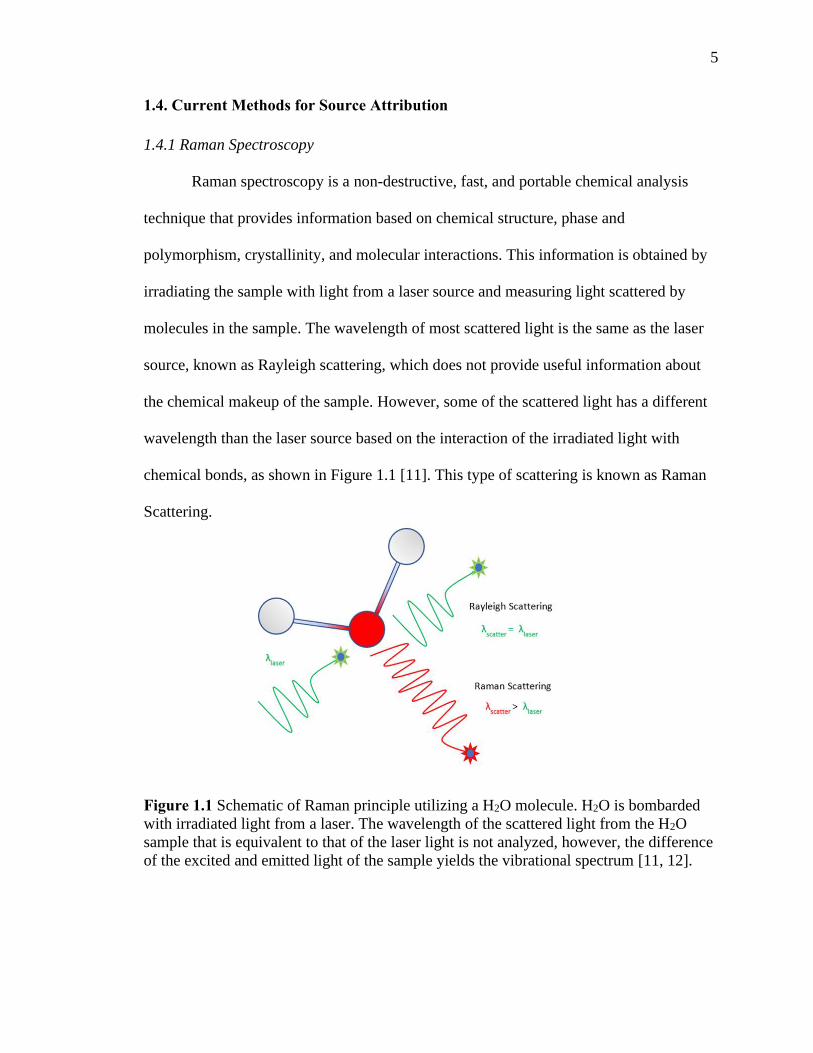
chemical bonds, as shown in Figure 1.1 [11]. This type of scattering is known as Raman
Scattering.
Figure 1.1 Schematic of Raman principle utilizing a H2O molecule. H2O is bombarded
with irradiated light from a laser. The wavelength of the scattered light from the H2O
sample that is equivalent to that of the laser light is not analyzed, however, the difference
of the excited and emitted light of the sample yields the vibrational spectrum [11, 12].
6
When inelastically scattered light is detected, a Raman spectrum (which has a unique
chemical fingerprint) is obtained as combination of the intensity and wavelength of the
scattered light. The wavelength of the scattered light corresponds to vibrational levels of
a chemical bond, such as C-C, C=C, N-O, C-H, etc., or from a group of bonds in a
chemical in the sample [11].
Raman spectroscopy has diverse applications. It has multiple advantages, such as
the ability to provide qualitative and quantitative information, it is fast (i.e. on the order
of seconds), organic and aqueous samples can be analyzed with minimal or no sample
preparation, compounds can be identified without labeling, it is nondestructive, and it can
be used to analyze most compounds in a variety of states of matter (solid, liquid, and gas)
[13].
In respect to drug authentication, there are several useful methods utilizing Raman
spectroscopy. Researchers at Queen’s University (Belfast, UK) and Forensic Science
Agency of Northern Ireland constructed Raman spectroscopic methods to differentiate
between ecstasy (MDMA, 3,4-methylenedioxymethylamphetamine) and ecstasy
analogues [14]. The researchers sampled 400 tablets from a group of over 50,000 tablets
and were able to classify the tablets only based on the excipients (e.g. sorbitol, glucose,
or cellulose) [14]. A further study with 1500 tablets was executed because the physical
description coupled with active drug content did not fully characterize the 400 tablets due
to tablet similarity. The 1500 tablets were analyzed as follows: (1) peak heights of the
excipients band in the Raman spectrum were obtained (2) the ratios of peak heights were
obtained (peak height of prominent MDMA peak/compared to the peak height of
excipient) (3) analysis of variance (ANOVA) was used to determine variances within the
7
tablets [15]. In this study, the researchers were able to characterize the tablets; however,
only two sets, out of the many sets tested, were considered identical [15]. In another
study, Dégardin et al. [16] developed a Raman method for the analysis of medicinal
counterfeits. The first step of the method consisted of identifying 31 types of genuine
capsules and tablets and detecting their counterfeits by Raman spectroscopy [16]. The
genuine spectra of the sample and Active Pharmaceutical Ingredient (API) peak detection
were correlated together to determine legitimate from counterfeit samples [16]. The
second step consisted of chemometric methods for chemical profiling purposes where 27
seizures of counterfeits were classified into 15 chemical classes [16].
Although Raman spectroscopy excels in certain situations, it has a number of
disadvantages, including low sensitivity, difficulty in analyzing complex samples, and it
is limited to surface analysis [17].
1.4.2 Isotope Ratio Mass Spectrometry
Isotope ratio mass spectrometry (IRMS) is precise and accurate technique used to
measure isotopic abundances of a material. While natural isotope abundances are
generally fixed, small changes in isotope ratios occur based on biological, chemical, and
physical processes. The small differences in isotope ratios can be used to determine the
source of a material. In preparation for IRMS analysis, samples are combusted to simple
gases such as H2, CO2, N2, and CO. These gases are analyzed via mass spectrometry to
determine the ratio of stable isotopes, such as 2H/1H, 13C/12C, 15N/14N, and 18O/16O, and
using an internal standard (i.e., a well-characterized standard is needed to establish a
known isotopic profile for determination purposes), the change in isotope abundances for
a particular sample can be quantified [18].
8
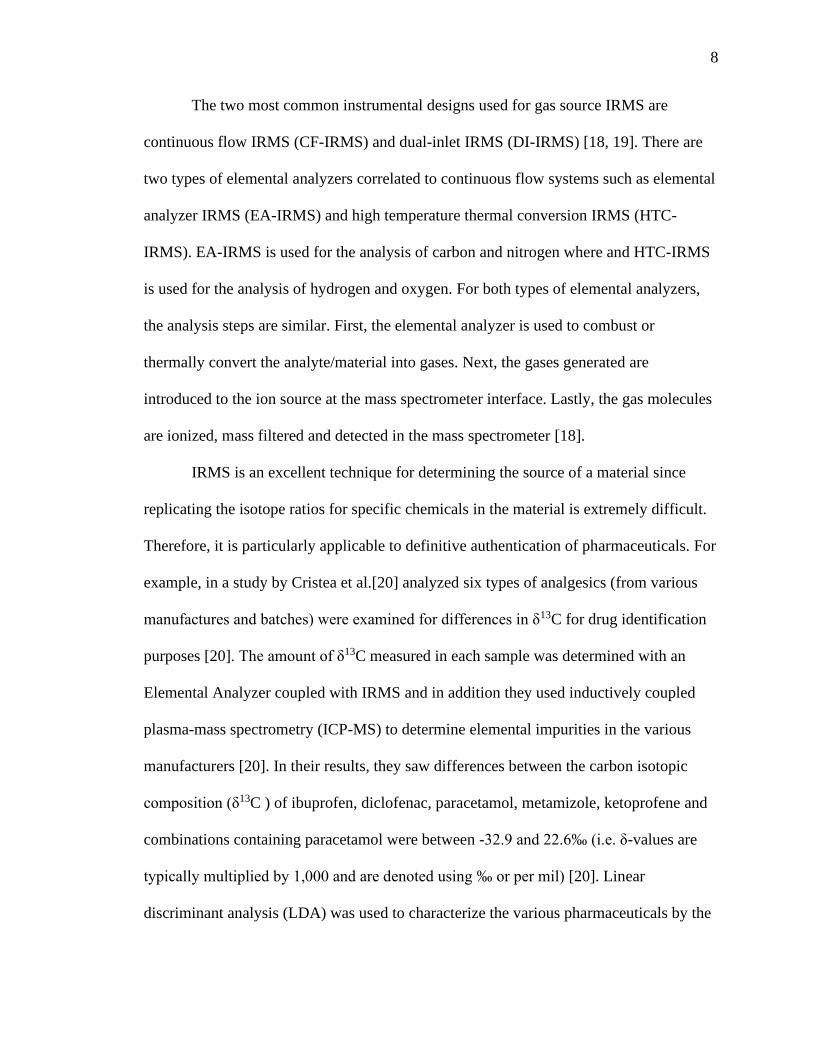
The two most common instrumental designs used for gas source IRMS are
continuous flow IRMS (CF-IRMS) and dual-inlet IRMS (DI-IRMS) [18, 19]. There are
two types of elemental analyzers correlated to continuous flow systems such as elemental
analyzer IRMS (EA-IRMS) and high temperature thermal conversion IRMS (HTC-
IRMS). EA-IRMS is used for the analysis of carbon and nitrogen where and HTC-IRMS
is used for the analysis of hydrogen and oxygen. For both types of elemental analyzers,
the analysis steps are similar. First, the elemental analyzer is used to combust or
thermally convert the analyte/material into gases. Next, the gases generated are
introduced to the ion source at the mass spectrometer interface. Lastly, the gas molecules
are ionized, mass filtered and detected in the mass spectrometer [18].
IRMS is an excellent technique for determining the source of a material since
replicating the isotope ratios for specific chemicals in the material is extremely difficult.
Therefore, it is particularly applicable to definitive authentication of pharmaceuticals. For
example, in a study by Cristea et al.[20] analyzed six types of analgesics (from various
manufactures and batches) were examined for differences in δ13C for drug identification
purposes [20]. The amount of δ13C measured in each sample was determined with an
Elemental Analyzer coupled with IRMS and in addition they used inductively coupled
plasma-mass spectrometry (ICP-MS) to determine elemental impurities in the various
manufacturers [20]. In their results, they saw differences between the carbon isotopic
composition (δ13C ) of ibuprofen, diclofenac, paracetamol, metamizole, ketoprofene and
combinations containing paracetamol were between -32.9 and 22.6‰ (i.e. δ-values are
typically multiplied by 1,000 and are denoted using ‰ or per mil) [20]. Linear
discriminant analysis (LDA) was used to characterize the various pharmaceuticals by the
9
isotopic and elemental data where diclofenac was clearly separated from ibuprofen and
paracetamol, but ibuprofen and paracetamol did not have the optimum separation [20]. In
another study, Jasper et al. [21] tested the isotopic variability of carbon-, oxygen-, and
hydrogen- in four types of analgesics: two types of acetaminophen and two types of
aspirin [21]. Ratios of acetaminophen and aspirin were measured by continuous flow
system (elemental analyzer) coupled with IRMS [21]. The results of the study indicated
that the analgesic samples were isotopically heterogenous from batch to batch even
though drugs are manufactured to a specific procedure [21].
Although IRMS is an excellent method for authentication, the instrument is
sophisticated, costly, non-portable, and the instrument is prone to contamination. In
addition, the determination of IRs for each sample is expensive [18].
1.4.3 Liquid Chromatography Tandem Mass Spectrometry
Liquid chromatography tandem mass spectrometry (LC-MS/MS) is a technique
that can be used to separate molecules, such as proteins and complex peptides, using a
mobile phase and stationary phase. A mixture of analytes are separated based on their
interaction with the mobile and stationary phases (i.e., LC) and detected based on mass
filtering (i.e., MS) [22, 23].
For LC, a mixture of analytes is separated based on their interactions with the
mobile and stationary phase. In LC-MS (Figure 1.2), the sample mixture is first injected
into the mobile phase where it passes through a chromatographic column under high
pressure. Generally, a sample mixture is separated in the column into individual
components based on polarity [23]. After the separated compound(s) exit the column, the
compound(s) pass through an interface where the compounds are ionized using an ion
10
source. Then, the generated ions travel though the mass spectrometer and are separated
based on their mass-to-charge ratio (m/z), producing a spectrum comprised of the relative
abundance of the resultant ions [24]. As shown in Figure 1.2, LC-MS consists of only one
MS and LC-MS/MS uses a tandem MS configuration for detection, providing much more
selectivity than an LC-MS, including the ability to identify structural isomers (e.g., L-
lactic acid and D-lactic acid) [25, 26].
LC-MS/MS methods can be executed to analyze and authenticate
pharmaceuticals. For instance, Pang et al. [27] developed an LC-MS/MS method to
identify and quantitate the ten most commonly used synthetic antidiabetic drugs (e.g.
gliquidone, glipizide, glibenclamide, glimepiride, rosiglitazone, repaglinide, metformin,
phenformin, and tolbutamide) that are present in herbal remedies [27]. In this study, they
concluded that the advertised all-natural herbal supplements actually consisted of some
synthetic hypoglycemic drugs [27]. Another example of an LC-MS/MS method
implemented for the analysis of pharmaceuticals was by Lee et al. [28]. In their study,
they developed a method to extract and detect seven erectile dysfunction (ED) drugs (e.g.
sildenafil, tadalafil, vardenafil, udenafil, mirodenafil, avanafil, and lodenafil carbonate)
and their analogues in various suspected counterfeit drugs from 2009 to 2013 [28]. In 89
suspected counterfeit drugs and herbal medicines, they found that ED drugs were
detected in 84 out of 89 drugs. Additionally, they determined that Viagra (sildenafil) was
the most prevalent ED drugs in counterfeits (73.8%), followed by Cialis (tadalafil)
(25.4%) [28].
11
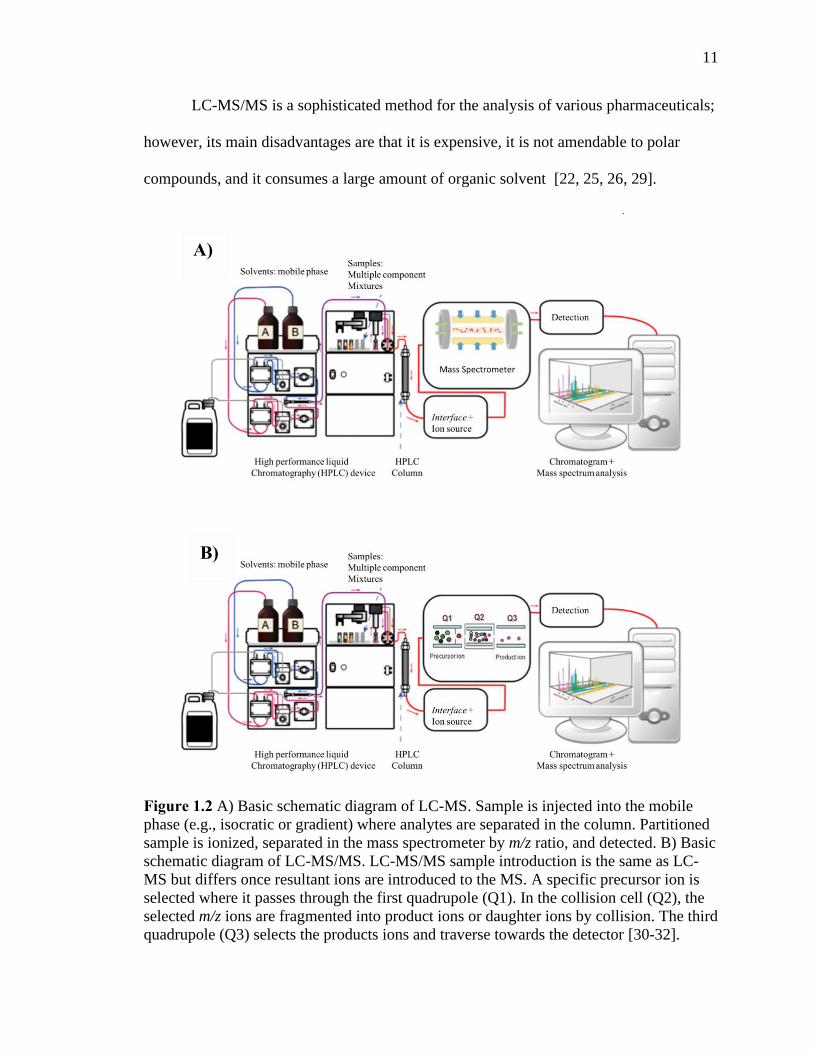
LC-MS/MS is a sophisticated method for the analysis of various pharmaceuticals;
however, its main disadvantages are that it is expensive, it is not amendable to polar
compounds, and it consumes a large amount of organic solvent [22, 25, 26, 29].
Figure 1.2 A) Basic schematic diagram of LC-MS. Sample is injected into the mobile
phase (e.g., isocratic or gradient) where analytes are separated in the column. Partitioned
sample is ionized, separated in the mass spectrometer by m/z ratio, and detected. B) Basic
schematic diagram of LC-MS/MS. LC-MS/MS sample introduction is the same as LC-
MS but differs once resultant ions are introduced to the MS. A specific precursor ion is
selected where it passes through the first quadrupole (Q1). In the collision cell (Q2), the
selected m/z ions are fragmented into product ions or daughter ions by collision. The third
quadrupole (Q3) selects the products ions and traverse towards the detector [30-32].
A)
B)
12
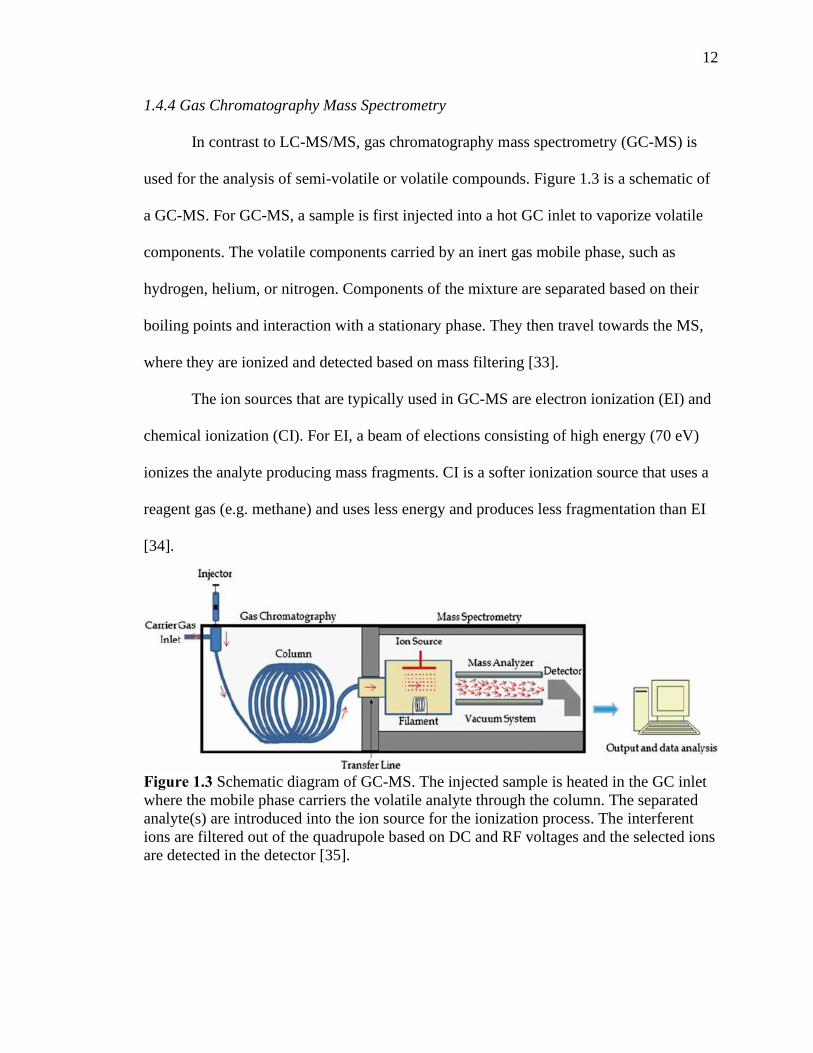
1.4.4 Gas Chromatography Mass Spectrometry
In contrast to LC-MS/MS, gas chromatography mass spectrometry (GC-MS) is
used for the analysis of semi-volatile or volatile compounds. Figure 1.3 is a schematic of
a GC-MS. For GC-MS, a sample is first injected into a hot GC inlet to vaporize volatile
components. The volatile components carried by an inert gas mobile phase, such as
hydrogen, helium, or nitrogen. Components of the mixture are separated based on their
boiling points and interaction with a stationary phase. They then travel towards the MS,
where they are ionized and detected based on mass filtering [33].
The ion sources that are typically used in GC-MS are electron ionization (EI) and
chemical ionization (CI). For EI, a beam of elections consisting of high energy (70 eV)
ionizes the analyte producing mass fragments. CI is a softer ionization source that uses a
reagent gas (e.g. methane) and uses less energy and produces less fragmentation than EI
[34].
Figure 1.3 Schematic diagram of GC-MS. The injected sample is heated in the GC inlet
where the mobile phase carriers the volatile analyte through the column. The separated
analyte(s) are introduced into the ion source for the ionization process. The interferent
ions are filtered out of the quadrupole based on DC and RF voltages and the selected ions
are detected in the detector [35].
13
Following ionization, the ions produced enter the mass analyzer. The most
common mass analyzers used in GC-MS are quadrupole and ion-trap [33]. Quadrupole
mass spectrometers are cheap, robust, and simple to use, but offer low mass resolution
and mass accuracy. Quadrupole mass filters consists of four metal rods that are connected
to a direct current (DC) in permutation with RF voltages, which acts as a filter to allow
specific m/z fragments to traverse to the detector [36, 37]. Ion trap mass spectrometers
are set up similar to that of quadrupole mass filters, however, ions are not filtered like
quadrupole mass spectrometers; instead, ion trap mass spectrometers use either electric or
magnetic fields to “trap” the selected range of ions based on specific mass-to-charge
ratios. There are a variety of designs for ion traps, such as a 3D ion trap (Paul ion traps), a
linear ion trap (2D trap), an electrostatic ion trap (Orbitrap), or a magnetic field-based
trap (ion cyclotron resonance). Ion trap mass spectrometers have several advantages such
as high sensitivity, qualitative identification, and the capability for tandem MS. However,
based on the limited size of the ion trap not all of the charged species can be quantitated
and reduces the dynamic range [38, 39].
GC-MS is mainly used for the identification and quantification of organic
compounds in complex matrices; however, non-volatile analytes can be analyzed via GC-
MS with additional sample preparation techniques. With the help of various sample
preparation techniques, GC-MS can analyze most compounds, including a variety of
pharmaceuticals and potential pharmaceutical counterfeits. For example, Neves and
Caldas [40] developed a GC-MS method that is suitable for the analysis of counterfeit
and substandard anabolic steroids (tablet, aqueous suspension and oil solution forms) for
analysis of individual pharmaceuticals (N= 345, with 328 medicines and 17 dietary
14
supplements) previously identified by the Brazilian Federal Police as potential
counterfeits. They reported that 42% of the medicines, 28% of the tablets, 12%
suspensions, and 65.2% oil solutions were counterfeit [40]. In another study, Foroughi et
al [41] developed a method to detect undeclared active pharmaceutical ingredients in
herbal medicines used as opioid substitution therapy. They analyzed 80 different herbal
medicines by GC-MS. Most of the samples (96%) contained one active pharmaceutical,
with diphenoxylate and tramadol identified in 90% and 67% of the samples, respectively.
Other ingredients that were identified in the method were acetaminophen, codeine,
sertraline, and fluoxetine [41]. While GC-MS is a useful technique for analyzing
pharmaceuticals, it has its disadvantages, such as it is moderate expense, difficulty in
development of a field portable device, and it is difficult to analyze polar and large
molecular weight compounds [42].
1.5 Research Goal
There are limitations to current methods authentication techniques, including
multiple sample preparation techniques for identifying chemical compositions of
pharmaceuticals. Therefore, it is critical to develop the most simple, efficient, and
accurate technique that is sensitive enough to identify chemical compositions and
authenticate various drugs. Aspirin replicates were evaluated using GC-MS and LC-
MS/MS to determine the most consistent method for analyzing various aspirin brands.
After further evaluation, LC-MS/MS resulted in more precise and accurate results
between pill replicates. In this study, LC-MS/MS and chemometrics were used to
distinguish various aspirin brands by using multiple reaction monitoring method (MRM)

15
for the analysis of trace excipients, allowing application for authentication of commonly
counterfeit drugs.
16
CHAPTER 2: DEVELOPMENT OF A CHROMATOGRAPHIC METHOD TO AUTHENTICATE ASPIRIN BRANDS
ABSTRACT
Aspirin is a nonsteroidal anti-inflammatory drug (NSAID) that is used to relieve
pain, reduce fevers, and reduce inflammation. While aspirin is not commonly
counterfeited, in 2013, French customs seized 1.2 million doses of counterfeit aspirin that
originated from China and, in a separate incident, 26 people in 2018 were arrested for
selling more than 1.49 million illicit drugs, including fake aspirin. Since aspirin is readily
available from multiple manufacturers, a general authentication method was developed
for aspirin that may allow authentication for counterfeit drugs. Aspirin pills from Premier
Value®, Walgreens©, and Bayer® were used as known source objects. While gas-
chromatography mass-spectrometry was evaluated, liquid-chromatography tandem mass-
spectrometry (LC-MS/MS) produced more consistent results. Therefore, pills (N=3 per
brand) were analyzed using a simple LC-MS/MS method to produce a chemical
fingerprint. Three statistical techniques, linear discriminant analysis (LDA), quadratic
discriminant analysis (QDA), and atypicality analysis, were applied to differentiate
between aspirin brands. A double-blind study was executed to test the applicability of the
LC-MS/MS method coupled with each statistical technique. Each aspirin pill utilized in
the training set was perfectly classified using LDA, however, the double-blinded pills
were only 25% correctly classified. While this technique shows promise, further
development of the method is necessary to correctly classify unknown pills.
17
2.1 Introduction
It is estimated that counterfeit pharmaceuticals are responsible for up to 1 million
deaths each year globally [1], creating a serious concern for public health officials,
private companies, and consumers. Interpol estimates up to 30% of drugs sold worldwide
are counterfeit [5], affecting the health of millions of people. The main strategies to
combat counterfeit pharmaceuticals include unique packaging, product serialization, and
product/packaging verification methods at strategic points in the supply chain [2]. Even
with these measures, it is difficult to distinguish counterfeit from authentic drugs.
The most inexpensive, and least effective, way to identify counterfeit
pharmaceuticals is by inspecting packaging, or the physical characteristics of the
medicine (shape, color, etc.). This method is ineffective because counterfeiters regularly
manufacture pharmaceuticals that are virtually indistinguishable from the original
product. A more robust method of detecting counterfeits is chemical analysis of
medicines. Chemical analysis techniques for drug authentication range from affordable,
simplistic, and portable methods to extremely sophisticated laboratory-based techniques.
While simple and sophisticated techniques are complementary, the only definitive way to
authenticate pharmaceuticals is through advanced chemical analysis to attribute a
chemical to its source. Due to increased sophistication of counterfeiting practices and the
disadvantages of current techniques for authentication, there is a need for improved
methods for authentication of drugs (i.e., verification of the drug matching the package
description, confirmational analysis of ingredients listed on the label, and the storage
conditions have been met) and potential source attribution (i.e., sufficient scientific
results obtained from the source that can be used for identifying its origin).
18
Source attribution is best accomplished by identifying the chemical composition
of pharmaceuticals. The most common analysis methods for source attribution of
pharmaceuticals are Raman spectroscopy, isotope ratio mass-spectrometry (IRMS),
liquid-chromatography tandem mass-spectroscopy (LC-MS/MS), and gas-
chromatography mass-spectroscopy (GC-MS). While these techniques have proven to be
effective for authentication of pharmaceuticals, they each have disadvantages. For
example, in a study by Dégardin et al. [16] the authors developed a method to determine
if pharmaceuticals were genuine or counterfeit using a combination of Raman
spectroscopy and chemometrics. However, their method was complex and required
multiple steps. For example, the first step consisted of identification of suspect samples
as more likely genuine or counterfeit using Raman spectra treated with multiple statistical
methods, including normalization, support vector machines (SVM) for classification, and
an active pharmaceutical ingredient (API) correlation test. If suspected as counterfeit
following this step, the drug was then classified using PCA and a distance measure to
classify the counterfeits. If the drug was in an existing counterfeit class, then
determination of the composition and a forensic investigation was executed. If the drug
was considered a new counterfeit class, then interpretation of Raman spectra, infrared
spectroscopy, and GC-MS was implemented to determine the chemical composition.
Even with the multi-step method which utilized three analysis techniques and multiple
chemometric techniques, the authors could not classify all 27 seizures of counterfeits into
15 separate PCA chemical classes due to the heterogenous nature of the illicit drugs [16].
In another study by Cristea et al. [20], the authors analyzed 38 pharmaceuticals from six
pain relivers (e.g., ibuprofen and paracetamol) pharmaceutical classification by IRMS to
19
determine δ13C isotopic compositions. Additionally, inductively coupled plasma-mass
spectrometry (ICP-MS) was used for monitoring elemental impurities. Even with these
two sophisticated analytical methods and linear discriminant analysis (LDA) for
classification of pharmaceuticals, a clear separation for ibuprofen and acetaminophen was
not produced [20]. Lee et al. [28] developed a quantitative LC-MS/MS method to
determine the erectile dysfunction drugs and their analogues concentration in the
counterfeit drugs. Out of the 89 counterfeit drugs and herbal medicines the author’s
analyzed, 73% of the secured drugs were adulterated with sildenafil where the
concentration ranged from 21.0-947.5 mg/g. However, their sample preparation for 89
counterfeit drugs and herbal remedies (~0.5 g each) consumed a large amount of organic
solvent for extraction (25 mL of methanol per sample) and the LC-MS/MS method was
time consuming (i.e., a run time of 20 minutes per sample) [28]. Neves et al. [40]
developed a quantitative GC-MS method determine the concentration of anabolic
androgenic steroids in 345 counterfeit pharmaceuticals that were seized by the Brazilian
Federal Police. In general, they found that counterfeits were adulterated or had no active
ingredient. However, the GC-MS method was plagued by a large rise in baseline for
testosterone cypionate (structural base of testosterone in addition of a cyclopentyl
propionate group on C17β, MW 412.6 g/mol), nandrolone phenylpropionate (structural
base of testosterone in addition to a phenylpropionate group on C17β, MW 406.8 g/mol),
testosterone phenylpropionate (internal standard that has a structural base of testosterone
in addition to a phenylpropionate group on C17β, MW 420.6 g/mol), and boldenone
undecylenate (structural base of testosterone in addition to an alkenyl group on the C1
20
position and a undecylenate group on the C17β, MW 452.7 g/mol) which could produce
inaccurate results for determining the illicit drugs [40].
Aspirin is a common pain reliever that can relieve headaches, reduce swelling,
lower fever, and decrease the risk of cardiovascular events. Because of the medicinal
properties that aspirin provides, it is readily available and relatively cheap. Therefore, it is
not counterfeited frequently as other drugs (e.g., fentanyl). Yet, there are still reports of
aspirin being counterfeit. For example, in 2013 the French customs seized 1.2 million
doses of counterfeit aspirin from China. Also in 2018, there was 26 people that were
arrested for marketing 1.49 million fake drugs, including aspirin [43, 44]. Because aspirin
is readily available from many manufactures, it is an excellent candidate to develop
general authentication protocol for more commonly counterfeited drugs.
Due to limitations of current methods for drug authentication, there is a need for
improved techniques to determine the authenticity of pharmaceuticals. Hence, the
objective of this investigation was to evaluate the performance of GC-MS and LC-
MS/MS for analysis of multiple aspirin brands coupled with assessment of multiple
chemometric methods for their usefulness in source attribution of various aspirin brands.
Development of a general methodology would potentially allow extension of the method
to source attribution of more commonly counterfeited drugs.
2.2 Materials and Methods
2.2.1 Materials
The aspirin brands (325 mg) used to establish chemical fingerprints were Bayer®,
Walgreens©, and Premier Value®, purchased from local stores in Brookings, SD, USA for
Bayer®, and Premier Value® and Sioux Falls, SD, USA for Walgreens©. All aspirin
21
brands were stored in their respective containers at room temperature. For the double-
blind study, expired aspirin brand Equate (325 mg) was purchased from a local store in
Brookings, SD, USA and used. Phenyl Acetate (C8H8O2, > 98%), methyl salicylate,
(C8H8O3, 99+%), 2-hydroxybenzoic acid (C7H6O3, > 99.5%), acetylsalicylic acid
(C9H8O4, 98+%), and phenyl salicylate (C13H10O3, > 98%) were purchased from Tokyo
Chemical Industry (TCI) (Portland, OR, USA). Acetic acid, glacial (CH3COOH) and
methanol (CH3OH, HPLC grade) were purchased from Fisher Scientific (Fair Lawn, NJ,
USA). Ethyl acetate (C4H8O2, ≥ 99.5%) was purchased from Sigma-Aldrich (St. Louis,
MO, USA). Phenol (C6H6O, 99%) was purchased from Acros Organics (Fair Lawn, NJ,
USA). Purified water was obtained from a water PRO PS polisher (Labconco, Kansas
City, KS, USA) at a resistivity of 18.2 MΩ-cm
2.2.2 Standard Solutions
Stock solutions of acetic acid (5 mM) and methyl salicylate (5 mM) were
prepared in 50 mL of water and stored at room temperature. 2-hydroxybenzoic acid (5
mM), phenyl salicylate (1 mM), and acetylsalicylic acid (5 mM) were prepared in 500
mL of purified water and stored at room temperature. These stock solutions were diluted
with purified water to the desired concentrations for experiments. A stock solution of
phenol (1 mM) was prepared in methanol and stored at 4 °C. Phenol was diluted with
methanol to the desired concentration for individual experiments.
2.2.3. Aspirin Sample Preparation for GC-MS Analysis
Each aspirin pill (325 mg) was separately crushed in a clean mortar and pestle. A
portion of crushed aspirin pill was weighed (20 mg for comprehensive GC-MS analysis
via “Scan mode” and 13 mg for analysis via selected ion monitoring mode) and added to
22
a 15-mL centrifuge tube along with 5 mL of purified water. This solution was vortexed
for 10 s to mix. Proceeding this step, the solution was added to a stainless steel ultrasonic
bath (model 75D) and sonicated for 35 min at 55 °C. When completed, the extract was
vortexed for 20 s to mix and subsequently filtered with a 0.45 µm nylon filter. An aliquot
of this solution (500 µL, analyzed in triplicate) was transferred into a 4-mL vial and
capped. Prior to analysis, samples were dried under N2, the residue was reconstituted with
100 µL of methanol, and the solution was transferred into a 300-µL insert in a 2-mL
capped vial for a GC-MS analysis.
2.2.3.2 Aspirin Sample Preparation for LC-MS/MS Analysis
Each aspirin pill (325 mg) was separately crushed in a clean mortar and pestle. A
portion of crushed pill was weighed (1.8 mg) and added to a 15-mL centrifuge tube along
with 10 mL of purified water. The 10 solution was vortexed for 10 s to mix. Proceeding
this step, the solution was added to a stainless steel ultrasonic bath (model 75D) and
sonicated for 35 min at 55 °C. The extract solution was then diluted from 1:10, vortexed
at 3000 for 20 s to mix and filtered with a 0.2 µm polytetrafluorethylene (PTFE) syringe
filter. For each study, triplicate samples (1.5 mL each) were transferred into a 2-mL
capped vials for analysis via LC-MS/MS.
2.2.3.3 Double-Blind Study Sample Preparation
Three aspirin pills per brand (Bayer®, Walgreens©, Premier Value®, and expired
Equate) were crushed in a clean mortar and pestle. The crushed pills were added to
separate 20 mL scintillation vials. The vials were labeled with random letters by an
independent individual; the sample key was recorded and kept isolated from anyone
involved in this project. The labeled samples were delivered to another independent
23
individual and the sample labels were changed from letters to numbers. The sample key
was recorded, and the double-blinded samples were given to project personnel for LC-
MS/MS analysis.
2.2.4 Gas Chromatography-Mass Spectrometry
Each prepared sample was analyzed using an Agilent Technologies 6890N gas
chromatograph and a 5975B inert XL electron ionization (EI)/chemical ionization (CI)
mass selective detector (MSD) with a 7683 series injector. Samples were injected (1 µL
injection volume) into an electronic pneumatics control (EPC) split/spitless inlet. The
EPC inlet was set at 250 °C using spitless mode with a purge flow of 20 mL/min at 1
minute before introducing the analytes into the column. The GC oven temperature started
at an initial temperature of 40 °C for 1 minute, it was increased at 5 °C/minute to 240 °C
for 3 minutes, producing a total run time of 44 minutes. The excipients and active
ingredients in aspirin were separated in a DB5-MS capillary column (30 m x 250 µm x
0.25 µm) with hydrogen as a carrier gas and a flow rate of 1.2 mL/min with a pressure of
10.67 psi. The MS source and MS quadrupole were set at 150 °C and 230 °C,
respectively. Electron ionization (EI) was used as the ionization mode at 70 eV with an
initial scan range of 40 – 400 m/z to identify compounds in the aspirin. After
identification of compounds in the comprehensive scan of aspirin, one to three major ions
were selected for each compound and added to a final selected ion monitoring (SIM)
method for higher selectivity and sensitivity for analytes compared to scan mode. The
SIM ions used (m/z) are as follows: acetic acid (45, 60), phenol (94), phenyl acetate (94,
136), salicylic acid, (92,138), methyl salicylate (92, 120, 152), methyl acetylsalicylate
24
(92, 120, 152), acetylsalicylate (92, 120, 180), phenyl salicylate (121, 214) and
disalicylide (92, 120, 240).
2.2.5 Liquid Chromatography Tandem Mass Spectrometry
Analysis of prepared aspirin samples (10 µL injection volume) was carried out
using LC separation with a Shimadzu HPLC (LC-20AD, Shimadzu Corp., Kyoto, Japan).
The chromatographic separation was performed on an Agilent Eclipse XDB-C18 column
(4.6 × 150 mm, 5 µm). Mobile phase A was water (100%) and mobile phase B was
methanol (100%). The chromatographic separation was achieved using gradient elution at
a flow rate of 0.5 mL/min starting at 50% B and increased to 90% B over 4 minutes, held
constant for 2 minutes, and decreased to 50% B over 4 minutes.
A tandem mass spectrometer (AB Sciex Q-Trap 5500 MS) with an electrospray
ionization interface operating in negative polarity was used for detection. To determine
which compounds were detected, a Q1 scan of a 9 mg/L aspirin solution of each brand
(infused at a 10 µL/min flow rate) was performed (40-400 m/z). Nitrogen (20 psi) was
used as both the curtain and nebulization gas. The ion spray voltage and source
temperature were set at -4,500 V and 0 °C, respectively, with the ion source gas (GS1)
pressure at 10 psi. After determining excipients present in the Q1 scan, multiple reaction
monitoring (MRM) transitions were obtained and optimized (Table 2.1). All aspirin
samples were analyzed in MRM mode. Chromatograms were acquired and analyzed with
the Analyst software program.
25
Table 2.1: MRM transitions, optimized collision energies (CEs), declustering potential
(DPs), and cell exit potentials (CXPs) for detecting Aspirin Brands by MS/MS analysis.
Compounds Q1 (m/z) Q3 (m/z) Time (ms) CE (V) DP (V) CXP (V)
Salicylic acid 136.5 92.9 100 -27.00 -19.00 -47.06
Methyl salicylate* 153.2 108.8 100 -20.18 -31.00 -0.940
Aspirin 178.7 93.0 100 -33.88 -34.00 -33.01
Aspirin (identification) 178.7 59.2 100 -103.93 -33.88 -33.00
Unknown 199.1 137.1 100 -18.12 -28.00 -33.12
Unknown 199.1 92.9 100 -42.98 -50.00 -33.03
Disalicylide 240.0 137.1 100 -26.08 -26.00 -18.08
Disalicylide 240.0 92.9 100 -50.97 -17.02 -33.03
2.2.4 Identification of Excipients and Active Ingredients in Aspirin
Compounds in the GC-MS comprehensive scan of aspirin that produced
chromatographic peaks with a S/N of at least 3 compared to the purified water blank were
examined with the National Institute of Standards and Technology (NIST) library
(NIST/EPA/NIH Mass Spectral Library, Version 2.0d, 2005). Specific compounds were
classified as follows: 0-40% = low probability, 41-70% = medium probability, 70-100%
= high probability. After determining the highest probability of compounds in the aspirin
scan, the experimental mass spectrum and known mass spectrum were compared for
similarity. If the mass spectra were sufficiently similar, a standard of that compound was
analyzed. The retention time of the compound in aspirin and the standard of that
compound were required to have the same mass-spectra and elution time to consider the
compound from aspirin definitively identified. The compounds that were identified via
GC-MS were evaluated via LC-MS/MS for addition to that method.
*Only detected in Bayer® brand (inconsistently) and if used in chemometric method it would
automatically classify the Bayer® pill.
26
2.2.5 Chemometrics
Three statistical methods were used when developing the method for the analysis
of various aspirin brands. Linear discriminate analysis (LDA) and quadratic discriminate
analysis (QDA) were used for classification of brands by determining a set of projections
in the aspirin chromatograms that separate them into classes relative to within-class
variation. LDA and QDA are similar, however, LDA uses a linear projection while QDA,
uses a polynomial or non-linear projection. When using LDA and QDA, an observation is
assigned to a known class that has the highest likelihood. If the observation has a low
likelihood within that class, the observation does not belong to that class. In both the
LDA and QDA methods, normality is assumed of each class and each method has their
respective assumptions about variance [45]. When using LDA and QDA, no matter how
low the likelihood of the observation is for any class, the methods require the observation
to be assigned to a known class. For example, if an unknown aspirin pill was observed
using the set of LDA and QDA functions, the unknown aspirin pill would have to be
classified as either a Bayer®, Walgreens©, or Premier Value®, even if it does not belong
to that class (e.g., expired Equate pill). Hence, an atypically discriminate rule was
implemented to determine if in an unknown aspirin pill does not belong to the known
aspirin pill brands and to double check the LDA and QDA class predictions.
Atypicality is the probability of observing a new sample that was randomly drawn
from a class, where the likelihood of that sample being observed in that same class is
greater than the likelihood of the observation in question. Atypicality is a modification of
the Hotelling T2 statistic, which has the relation to the F distribution, F = mT2. The
cumulative density function evaluated at the T2 statistic can then be found; this value is
27
referred to as the atypicality value of an observation with respect to the known aspirin
class/brand. Since this is a cumulative density function, the atypicality values range from
zero to one. As the value approaches one, the more atypical the observation is to the
known aspirin class. The smaller the atypicality value, the less atypical the observation is,
and it can be claimed that the observation came from the known class. LDA, QDA, and
atypicality were utilized to predict the pill brand based on the various compounds in
aspirin (i.e., salicylic acid, aspirin, disalicylide, and unknown) chromatograms.
2.3 Results and Discussion
2.3.1 GC-MS Analysis of Aspirin
The traditional synthetic pathway for aspirin, shown in Figure 2.1, consists of the
reaction of salicylic acid with an excess of acetic anhydride and in the presence of a small
amount of acid to yield acetylsalicylic acid with acetic acid as a byproduct. However,
when manufactured into a consumable pill form the aspirin tablets usually contain three
main ingredients: the active ingredient (acetylsalicylic acid), corn starch, and a lubricant.
While these are the main ingredients, other trace excipients are present that provide a
chemical fingerprint which encodes information about the manufacturing/synthetic
process.
Figure 2.1 Reaction scheme of salicylic acid and acetic anhydride to yield aspirin and
byproduct acetic acid.
28
To determine active ingredients and excipients in various brands of aspirin, the
aspirin samples (Bayer®, Walgreens©, and Premier Value®) were simply prepared simply
dissolving the compounds in aspirin in water under sonication, filtering, drying, and
reconstituting the sample. The resulting solution was analyzed via GC-MS with a mass
range of 40-400 m/z. An example of a GC-MS chromatogram produced via a
comprehensive scan of the prepared Bayer® aspirin is shown in Figure 2.2. Once the
compounds in each brand were established, one to three major ions were selected to add
to the SIM method.
29
Figu
re 2
.2 T
ota
l io
n c
hro
mat
ogra
m o
f B
ayer
® a
spir
in (
20m
g/5
mL
). C
om
pounds
det
ecte
d i
n a
spir
in:
(A),
ace
tic
acid
, (B
), p
hen
ol,
(C
), p
hen
yl
acet
ate,
(D
), m
ethyl
sali
cyla
te, (E
), s
alic
yli
c ac
id,
(F),
met
hyl
acet
yls
alic
yla
te, (G
), a
cety
lsal
icyli
c ac
id, (H
), p
hen
yl
sali
cyla
te,
(I),
dis
alic
yli
de.
30
2.3.2 Compound Identification via GC-MS Analysis
Initial identification of compounds present in the aspirin pill was accomplished by
comparing the MS of a compound eluting in the GC-MS chromatogram to the NIST
library database spectrum. For example, the NIST library predicted that the compound
eluting at approximately 7 min was phenyl acetate at 75.6% probability. For definitive
identification, a standard of the suspected compound (e.g., phenyl acetate) was purchased
and analyzed via the method described. For example, Figure 2.3 shows the process used
to definitively identify methyl salicylate. The retention time and peak shape (Figure
2.3A), mass spectra compared to NIST database (Figure 2.3B), and mass spectra of the
standard compared to the compound prepared from the aspirin pill (Figure 2.3C) from the
methyl salicylate standard match the compound detected from aspirin. Of the suspected
compounds extracted from aspirin, methyl acetylsalicylate (i.e., inconsistent detection in
GC-MS) and disalicylide (i.e., not currently available for purchase), which had a
probability of 62% and 81.2%, respectively, could not be definitively identified. After
identifying the compounds in aspirin, major ions associated with assignable MS
fragments were added to the final SIM method. Table 2.1 shows the seven compounds
definitively identified and another two compounds with medium and high probability of
identification (i.e., 41-100 %).
31
Figure 2.3 Example of definitively identified compound. A) GC-MS chromatogram of
excipient methyl salicylate confirmed with its standard. B) NIST C) Mass spectrum of
methyl salicylate in aspirin pill and methyl salicylate standard.
0
0.2
0.4
0.6
0.8
1
1.2
1.4
1.6
1.8
2
10 10.5 11 11.5
Ab
und
ance
(×
10
4)
Time (minutes)
Methyl Salicylate in
Aspirin
Methyl Salicylate
Standard
0
10
20
30
40
50
60
70
80
90
100
Ab
und
ance
(%
of
bas
e p
eak)
Ion (m/z)
Standard
Sample
A
B
C
92
120
152
120
92
152
32
Table 2.2. Active ingredients and excipients detected in aspirin pills with physical
properties and ions used for SIM detection.
Compound Chemical
Structure
Molecular
Mass
(g/mol)
Boiling Point
(°C)
Ion (m/z)
Acetic acid 60.052 118 45; 60
Phenol 94.11 181.7 94
Phenyl acetate 136.1 196 94; 136
Methyl salicylate 152.14 220 92, 120, 152
Salicylic acid 138.121 211 92; 138
Methyl
acetylsalicylate*
194.18 136 92; 120; 152
Acetylsalicylic acid 180.158 140 92; 120; 180
Phenyl salicylate 214.22 173 121; 214
Disalicylide*
240.211 N/A 92; 120; 240
*Tentatively identified based solely on the NIST library database with methyl acetylsalicylate
and disalicylide having a 62% and 81.2% probability, respectively.
33
2.3.3 Excipients Detected in Aspirin
The simple GC-MS method presented here was able to detect compounds other
than the active ingredient in aspirin pills (Table 2.2). For example, one of the excipients
identified in all three aspirin brands was phenol. Phenol is an organic compound that has
been used to as a topical antiseptic to relieve itching and an oral analgesic to treat
pharyngitis in products such as Chloraseptic [46]. Another excipient detected in aspirin
was phenyl acetate, which has a sweet scent and is an odorant found in strawberries,
passion fruit, and black tea. Phenyl acetate is a metabolite of phenylalanine with
antineoplastic activity [47, 48]. The main active ingredient in aspirin is acetylsalicylic
acid. This compound was detected along with other salicylates such as methyl salicylate,
methyl acetylsalicylate, and phenyl salicylate. Methyl salicylate is naturally occurring in
various species of plants, mainly wintergreens and is an external analgesic that can be
used to relieve minor body aches, muscle, and joint pain [49, 50]. Phenyl salicylate is a
mild analgesic used an active ingredient in some pharmaceuticals [51]. Disalicylide was
found in the GC-MS analysis (although not definitively). While it is not likely
specifically added to the aspirin or a byproduct of aspirin synthesis, Shulga et al. [52]
determined that salsalate can convert disalicylide, and tri-salicylide in GC-MS at 150-280
°C. It is also possible that disalicylide may form via esterification of two salicylic acid
molecules.
34
2.3.4 Evaluation of GC-MS and LC-MS/MS for Aspirin Authentication
To determine which analysis technique, GC-MS or LC-MS/MS, provided the
most consistency (i.e., consistency of analysis is extremely important to allow statistical
differentiation between pills with similar composition), pill replicates were evaluated
using “pairwise scatter plots”. Pairwise scatter plots visually show the distribution of
single variables and the relationships between two variables within a dataset. Once the
dataset is plotted, trends can be identified before implementing analysis techniques.
Pairwise scatter plots are similar to line graphs in that the numerical variables in the
dataset will be shared across the y-axes and x-axes. If the data points exhibit a trend that
increases from the x axes to the y axes at a 45-degree angle then there is a positive
correlation (i.e., a slope of 1 indicates a perfect positive correlation and a slope of -1
indicates a perfect negative correlation) [53]. To evaluate if analyzing samples in the GC-
MS or LC-MS/MS provided the highest correlation within pill and between pill solutions,
aspirin brands (N=7, with triplicate analysis) were analyzed and pairwise scatter plots
were constructed. Because slight peak shifting was evident for each compound, the
analyte peaks were shifted to the same retention time before comparing analytical
techniques using pairwise scatter plots. Also, the noise was eliminated by comparing the
limit of detection (LOD; 3*standard deviation + average) of the blank to the noise within
the sample within a certain retention time. If the LOD of noise in the selected sample was
lower than the LOD of the blank at the selected retention time range, then these
“baseline” signals were removed. Examples of the chromatograms treated in this manner
in preparation for pairwise scatter plots of the GC-MS and LC-MS/MS chromatographic
peaks produced for two samples of Walgreens© aspirin are shown in Figure 2.4.
35
Figure 2.4 Data points across the Walgreens© chromatograms with the removal of noise
based on the difference of blank and sample LODs were used for the pairwise scatter
plots. A) Walgreen’s (0.018g/L) chromatograms of two average pill replicates (triplicate
analysis per pill); LC-MS/MS analysis; Salicylic acid, extracted ion Q1-136.5/Q3-92.9.
B) Walgreen’s (2.6 g/L) total ion chromatograms of two average pill replicates (triplicate
analysis per pill); (1) acetic acid, (2) phenol, (3) phenyl acetate, (4) methyl salicylate, (5)
methyl acetyl salicylate, (6) phenyl salicylate, (7) disalicylide (Note: salicylic acid and
acetylsalicylic acid did not elute for all brands when diluting from 4 g/L to 2.6 g/L); GC-
MS analysis
The pairwise scatterplots for two Walgreens© pills (each in triplicate) using the
salicylic acid 136.5/92.9 transition from the LC-MS/MS method (i.e., the first number
indicates the pill and the second denotes the analysis replicate for that individual pill) are
shown in Figure 2.5. For these plots, the pill replicate in a column that intersects with
another row are compared. For example, the plot outlined in blue compares Pill 1,
replicate 1 and Pill 1, replicate 2 and the plot outlined in red compares Pill 1, replicate 1,
to Pill 2, replicate 3. Replicates that have a strong correlation should generally produce
points scattered randomly about a line with a slope of 1. Systematic deviation from the
line, even if many points are near the line, indicates non-correlated data.
Evaluation of Figure 2.5A shows that correlation with some scatter is produced
between replicates when using LC-MS/MS method. For example, comparing Pill 1.1 to
0
50
100
150
200
250
300
350
400
2 2.5 3 3.5
Ab
un
dan
ce (
×1
03)
Time (minutes)
Average Pill 1
Average Pill 2
A
0
5
10
15
20
25
30
35
40
Ab
und
ance
(×
10
6)
Average Pill 1
Average Pill 2
B
1
5
23
67
4
36
Pill 2.3 (i.e., the plot outlined in red), there is a relatively linear trend with generally
random scatter about a line with a slope of 1. The linear trend between separate pill
replicates can be interpreted that there is correlation between the two separate pill
solutions and this correlation is relatively consistent for all replicates. Overall using LC-
MS/MS analysis (i.e., salicylic acid, extracted ion Q1-136.5/Q3-92.9), the Walgreens©
pill solutions within and between two pills have positive correlation with little, if any,
systematically uncorrelated data. Conversely, in the pairwise scatter plots shown in
Figure 2.5B, the plot outlined in blue compares Pill 1, replicate 1 to Pill 1, replicate 2
while many data points are perfectly correlated, there is obvious systematic deviation
from this correlation. This is also evident when comparing Pill 1.1 to Pill 2.3 (plot
outlined in red).
Figure 2.5 Pairwise scatter plots of two Walgreens© pills (triplicate analysis per pill). A)
Two Walgreens© pills (triplicate analysis per pill) were analyzed using LC-MS/MS. Pill
1.1 is denoted as pill 1 replicate 1 and Pill 2.1 is denoted as pill 2 replicate 1. B) Two
Walgreens© pills (triplicate analysis per pill) were analyzed using GC-MS. Pill 1.1 is
denoted as pill 1 replicate 1 and Pill 2.1 is denoted as pill 2 replicate 1. Note: The pill
replicate plot in a column is being compared to the pill replicate in the row that intersects.
A B
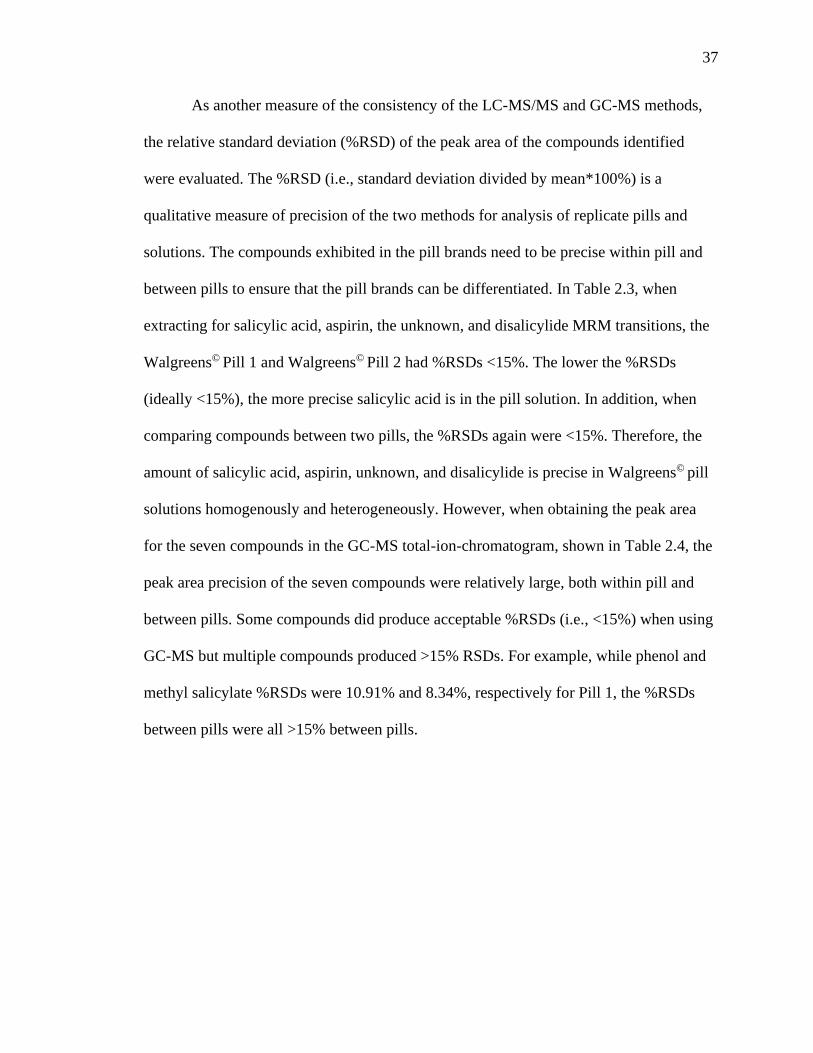
37
As another measure of the consistency of the LC-MS/MS and GC-MS methods,
the relative standard deviation (%RSD) of the peak area of the compounds identified
were evaluated. The %RSD (i.e., standard deviation divided by mean*100%) is a
qualitative measure of precision of the two methods for analysis of replicate pills and
solutions. The compounds exhibited in the pill brands need to be precise within pill and
between pills to ensure that the pill brands can be differentiated. In Table 2.3, when
extracting for salicylic acid, aspirin, the unknown, and disalicylide MRM transitions, the
Walgreens© Pill 1 and Walgreens© Pill 2 had %RSDs <15%. The lower the %RSDs
(ideally <15%), the more precise salicylic acid is in the pill solution. In addition, when
comparing compounds between two pills, the %RSDs again were <15%. Therefore, the
amount of salicylic acid, aspirin, unknown, and disalicylide is precise in Walgreens© pill
solutions homogenously and heterogeneously. However, when obtaining the peak area
for the seven compounds in the GC-MS total-ion-chromatogram, shown in Table 2.4, the
peak area precision of the seven compounds were relatively large, both within pill and
between pills. Some compounds did produce acceptable %RSDs (i.e., <15%) when using
GC-MS but multiple compounds produced >15% RSDs. For example, while phenol and
methyl salicylate %RSDs were 10.91% and 8.34%, respectively for Pill 1, the %RSDs
between pills were all >15% between pills.
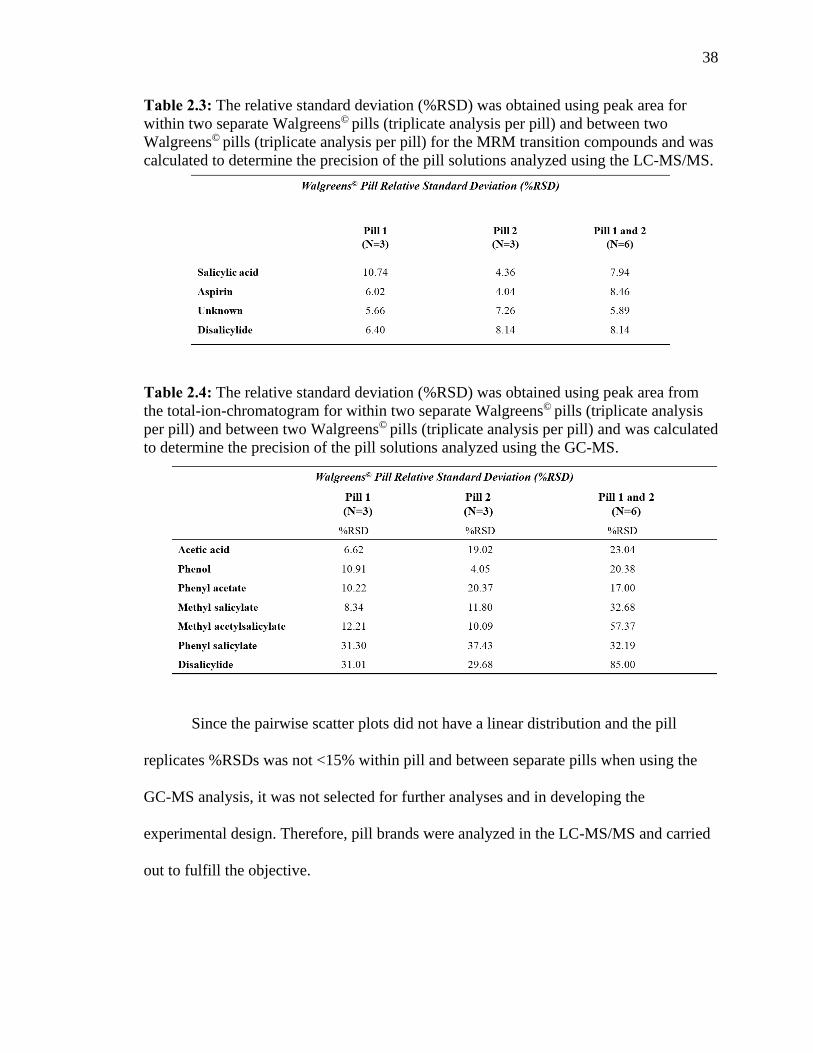
38
Table 2.3: The relative standard deviation (%RSD) was obtained using peak area for
within two separate Walgreens© pills (triplicate analysis per pill) and between two
Walgreens© pills (triplicate analysis per pill) for the MRM transition compounds and was
calculated to determine the precision of the pill solutions analyzed using the LC-MS/MS.
Table 2.4: The relative standard deviation (%RSD) was obtained using peak area from
the total-ion-chromatogram for within two separate Walgreens© pills (triplicate analysis
per pill) and between two Walgreens© pills (triplicate analysis per pill) and was calculated
to determine the precision of the pill solutions analyzed using the GC-MS.
Since the pairwise scatter plots did not have a linear distribution and the pill
replicates %RSDs was not <15% within pill and between separate pills when using the
GC-MS analysis, it was not selected for further analyses and in developing the
experimental design. Therefore, pill brands were analyzed in the LC-MS/MS and carried
out to fulfill the objective.
39
2.3.5 Preparation of LC-MS/MS Data for Statistical Analysis
Known sources of Bayer®, Premier Value®, and Walgreens© aspirin needed to be
established before introducing unknown source objects. To do this, pills per brand were
analyzed on three separate days to account for day-to-day variation and to get enough
data accumulation before introducing an unknown source. Extracted ions of aspirin
(178.7/93), salicylic acid (136.5/92.9), disalicylide (240/137.1), and an unknown
(199.1/137) were used for establishing the chemical fingerprint of the known source
brands and the chromatograms were used to for chemometric studies. Before using the
chromatograms for further statistical analyses, the noise was eliminated by comparing the
limit of detection (LOD; 3*standard deviation + average) of the blank to the noise within
the sample within a certain retention time. Once establishing the retention times ranges,
those retention times were set for all future analyses. If peaks shifted out of the set time
range, the peak with the respective transition was manually shifted to be in that set
retention time range to prevent misclassification of brands. After shifting peaks to the
same retention time with each respective transition, LDA, QDA, and atypicality were
applied to the pills (i.e., seven pills for each brand with triplicate analysis for each
prepared solution from individual pills).
2.3.5.1 Chemometric Analysis of LC-MS/MS Chromatograms
The normalized chromatograms for Bayer®, Walgreens©, and Premier Value®
aspirin brands were used for LDA, QDA, and atypicality analysis. When observing the
total correct percentage classification across three days and between brands, shown in
Figure 2.5, LDA produced the highest correct classification percentage with 79.4%.
Atypicality analysis produced the second highest correct classification with 74.6%. While
40
this provides useful information regarding the number of pills that were predicted
correctly across days, it does not focus on the total correct classification within-pill.
Therefore, the correct classification percentage for within-brand analysis was calculated
and is presented in Table 2.6. Premier Value® had the highest percentage of being
classified correctly for LDA, QDA, and atypically chemometric methods with percentage
values of 90.5%, 90.5%, and 85.7%, respectively. Walgreens© had the second highest
percentage of being classified correctly with LDA, QDA, and atypicality percentage
values of 76.2%, 66.7%, and 76.2%, respectively.
LDA had the highest total correct percentage for predicting across and within
classes. A visual representation of the LDA analysis across three different days is shown
in Figure 2.6. There is separation between classes within a day, however, there is not a
distinct classification trend across days. When plotting the first linear discriminant (LD1)
and the second linear discriminant (LD2) for Day 1 analysis (Figure 2.6A), there is clear
separation between the various brands. For Day 2 and Day 3, shown in Figure 2.6B and
2.6C, respectively, the separation between classes is not as distinct. The maximum
separation for the known pill brands was mainly accomplished using LD1 for Day 2,
while pill brands analyzed on Day 3 produced separation in both LD1 and LD2. Across
all three days, Premier Value® is clearly separated from Bayer® and Walgreens©.
Although there was not a similar classification trend across the three days, there is a
relatively nice class separation in the LDA plots within a day, especially for Premier
Value®. When looking at the Bayer® brand misclassification trends, it was most
commonly misclassified as Walgreens©. Therefore, an investigation was executed to
determine if Bayer® and Walgreens© were produced at the same manufacture. A
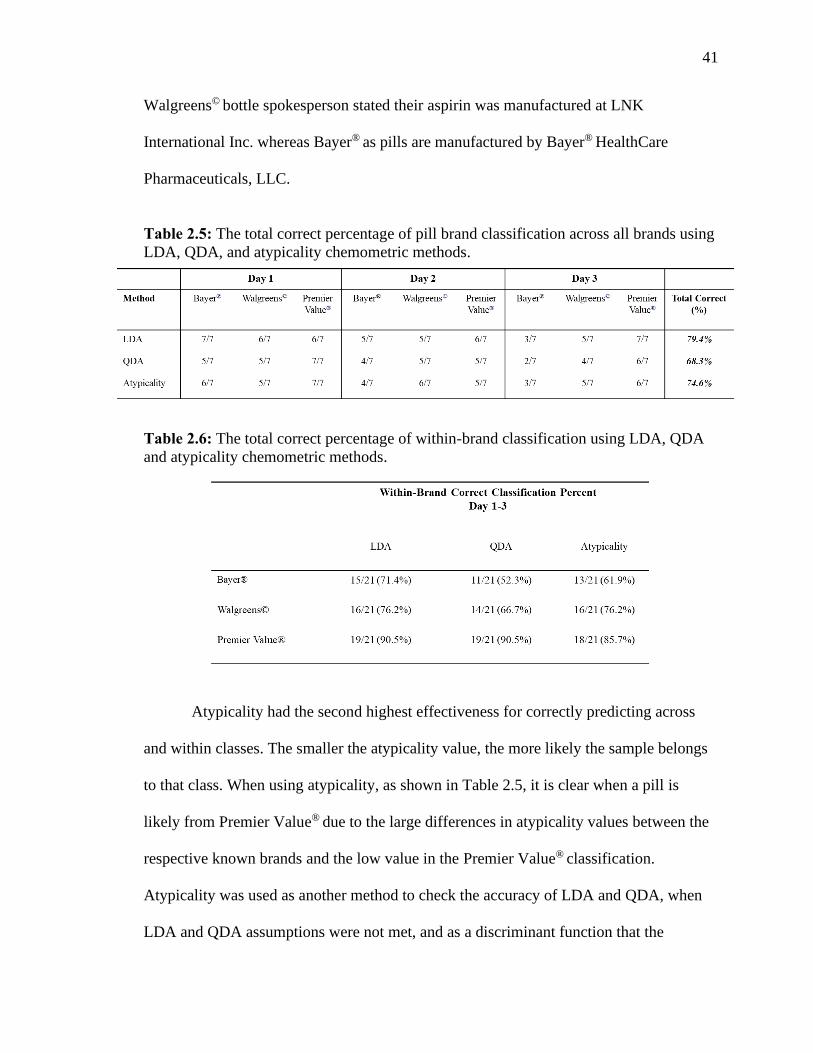
41
Walgreens© bottle spokesperson stated their aspirin was manufactured at LNK
International Inc. whereas Bayer® as pills are manufactured by Bayer® HealthCare
Pharmaceuticals, LLC.
Table 2.5: The total correct percentage of pill brand classification across all brands using
LDA, QDA, and atypicality chemometric methods.
Table 2.6: The total correct percentage of within-brand classification using LDA, QDA
and atypicality chemometric methods.
Atypicality had the second highest effectiveness for correctly predicting across
and within classes. The smaller the atypicality value, the more likely the sample belongs
to that class. When using atypicality, as shown in Table 2.5, it is clear when a pill is
likely from Premier Value® due to the large differences in atypicality values between the
respective known brands and the low value in the Premier Value® classification.
Atypicality was used as another method to check the accuracy of LDA and QDA, when
LDA and QDA assumptions were not met, and as a discriminant function that the
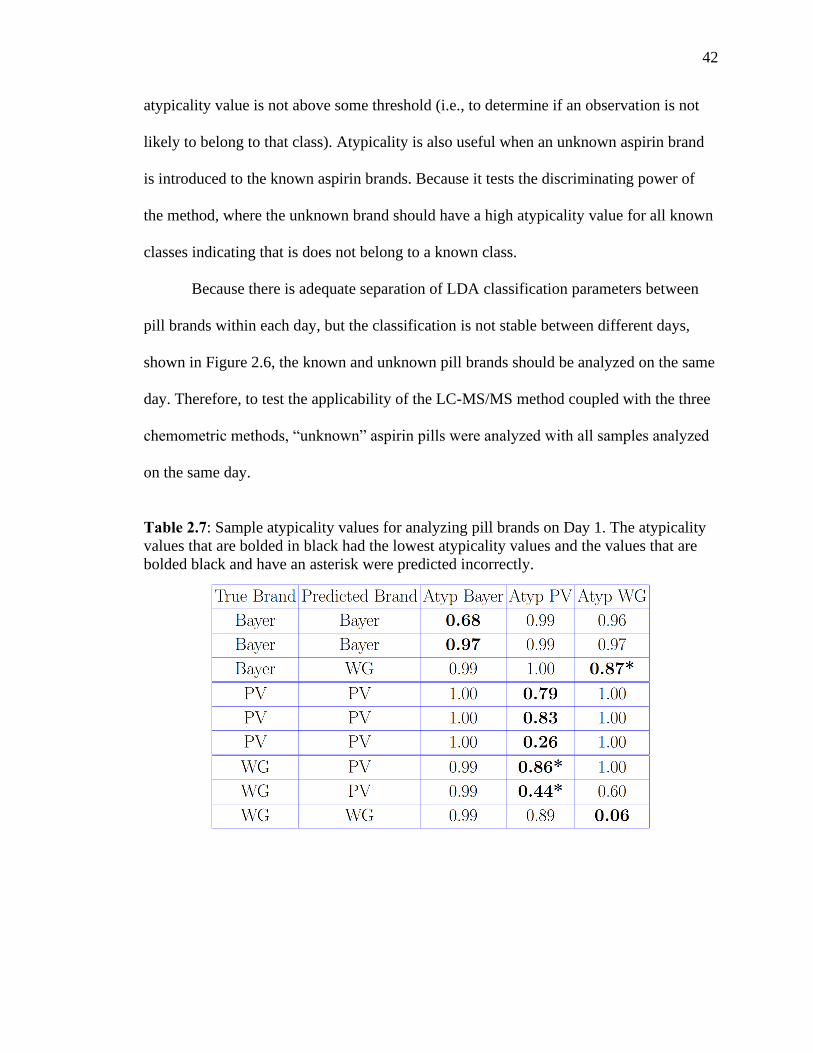
42
atypicality value is not above some threshold (i.e., to determine if an observation is not
likely to belong to that class). Atypicality is also useful when an unknown aspirin brand
is introduced to the known aspirin brands. Because it tests the discriminating power of
the method, where the unknown brand should have a high atypicality value for all known
classes indicating that is does not belong to a known class.
Because there is adequate separation of LDA classification parameters between
pill brands within each day, but the classification is not stable between different days,
shown in Figure 2.6, the known and unknown pill brands should be analyzed on the same
day. Therefore, to test the applicability of the LC-MS/MS method coupled with the three
chemometric methods, “unknown” aspirin pills were analyzed with all samples analyzed
on the same day.
Table 2.7: Sample atypicality values for analyzing pill brands on Day 1. The atypicality
values that are bolded in black had the lowest atypicality values and the values that are
bolded black and have an asterisk were predicted incorrectly.
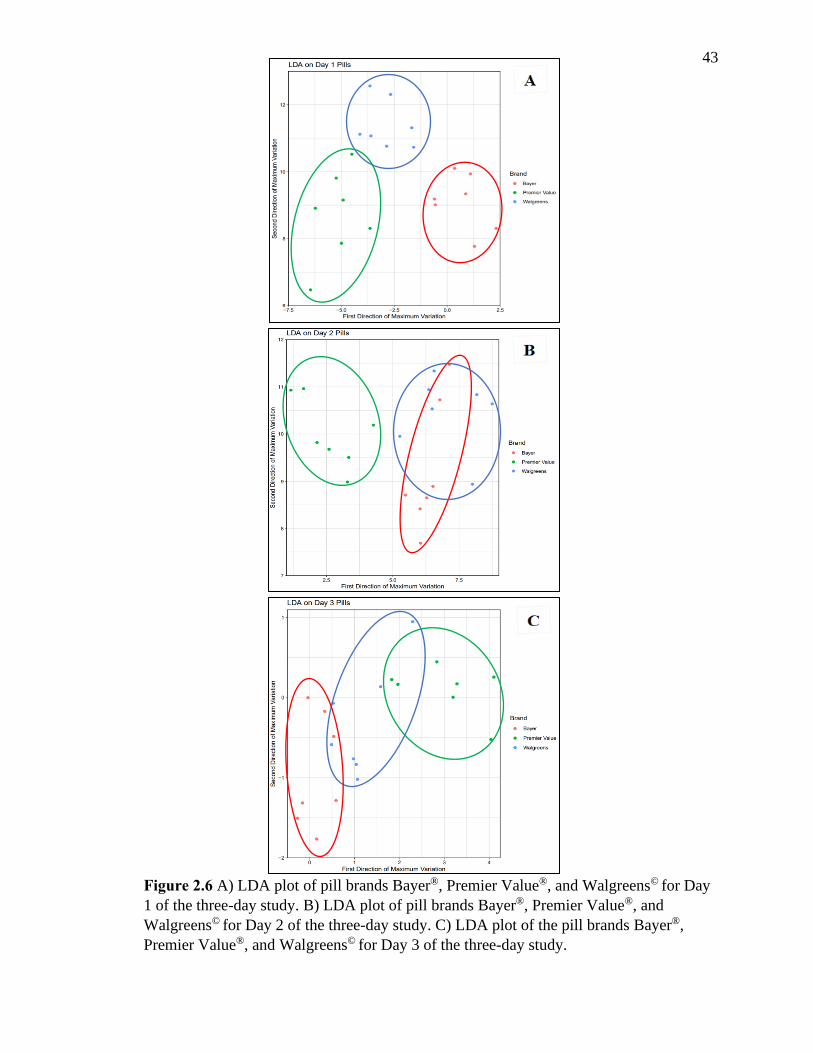
43
Figure 2.6 A) LDA plot of pill brands Bayer®, Premier Value®, and Walgreens© for Day
1 of the three-day study. B) LDA plot of pill brands Bayer®, Premier Value®, and
Walgreens© for Day 2 of the three-day study. C) LDA plot of the pill brands Bayer®,
Premier Value®, and Walgreens© for Day 3 of the three-day study.
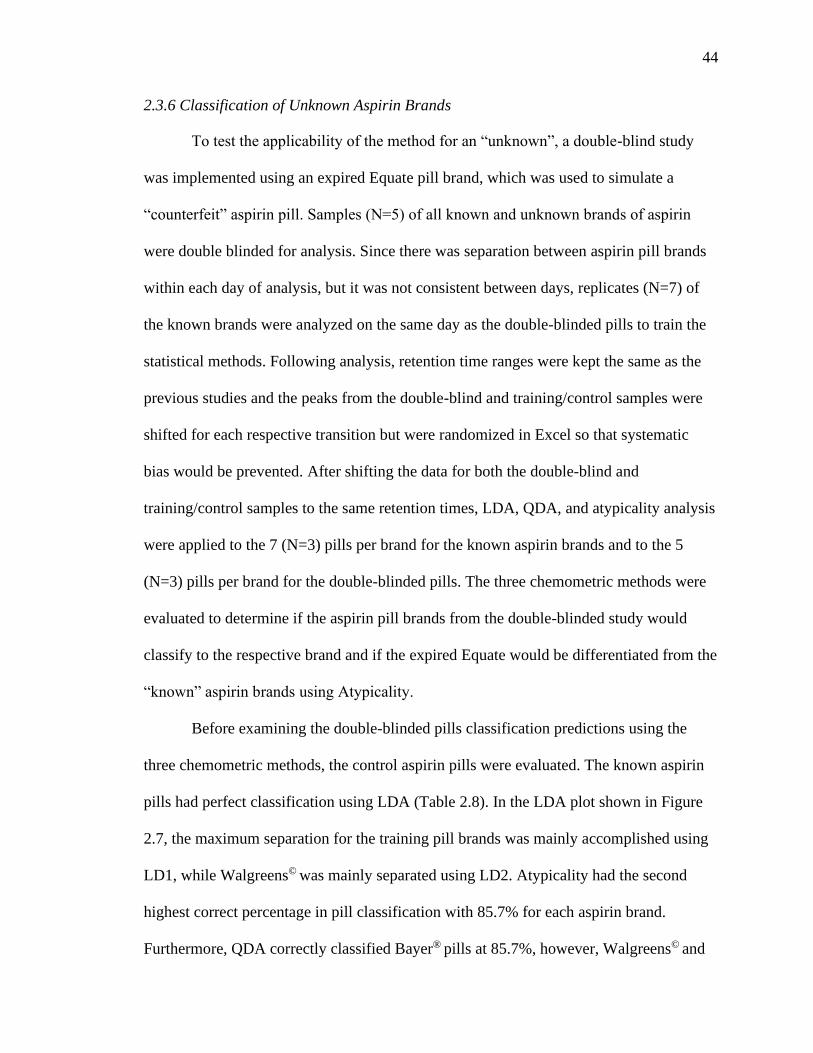
44
2.3.6 Classification of Unknown Aspirin Brands
To test the applicability of the method for an “unknown”, a double-blind study
was implemented using an expired Equate pill brand, which was used to simulate a
“counterfeit” aspirin pill. Samples (N=5) of all known and unknown brands of aspirin
were double blinded for analysis. Since there was separation between aspirin pill brands
within each day of analysis, but it was not consistent between days, replicates (N=7) of
the known brands were analyzed on the same day as the double-blinded pills to train the
statistical methods. Following analysis, retention time ranges were kept the same as the
previous studies and the peaks from the double-blind and training/control samples were
shifted for each respective transition but were randomized in Excel so that systematic
bias would be prevented. After shifting the data for both the double-blind and
training/control samples to the same retention times, LDA, QDA, and atypicality analysis
were applied to the 7 (N=3) pills per brand for the known aspirin brands and to the 5
(N=3) pills per brand for the double-blinded pills. The three chemometric methods were
evaluated to determine if the aspirin pill brands from the double-blinded study would
classify to the respective brand and if the expired Equate would be differentiated from the
“known” aspirin brands using Atypicality.
Before examining the double-blinded pills classification predictions using the
three chemometric methods, the control aspirin pills were evaluated. The known aspirin
pills had perfect classification using LDA (Table 2.8). In the LDA plot shown in Figure
2.7, the maximum separation for the training pill brands was mainly accomplished using
LD1, while Walgreens© was mainly separated using LD2. Atypicality had the second
highest correct percentage in pill classification with 85.7% for each aspirin brand.
Furthermore, QDA correctly classified Bayer® pills at 85.7%, however, Walgreens© and
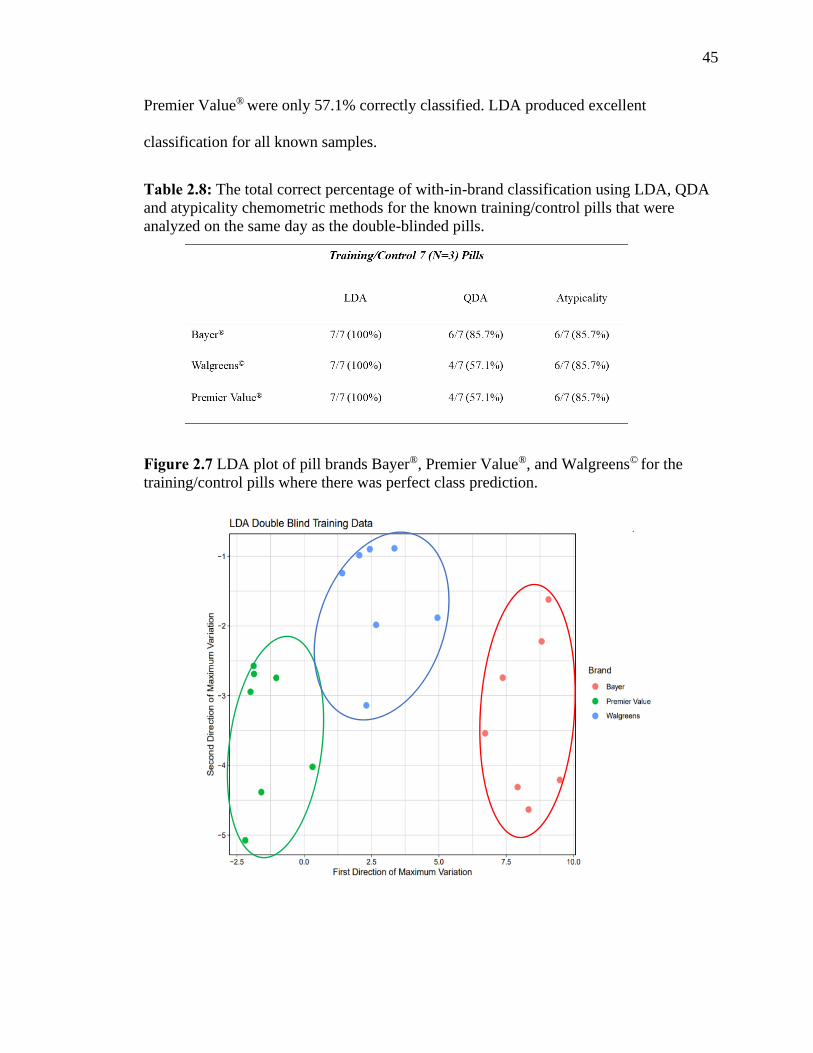
45
Premier Value® were only 57.1% correctly classified. LDA produced excellent
classification for all known samples.
Table 2.8: The total correct percentage of with-in-brand classification using LDA, QDA
and atypicality chemometric methods for the known training/control pills that were
analyzed on the same day as the double-blinded pills.
Figure 2.7 LDA plot of pill brands Bayer®, Premier Value®, and Walgreens© for the
training/control pills where there was perfect class prediction.
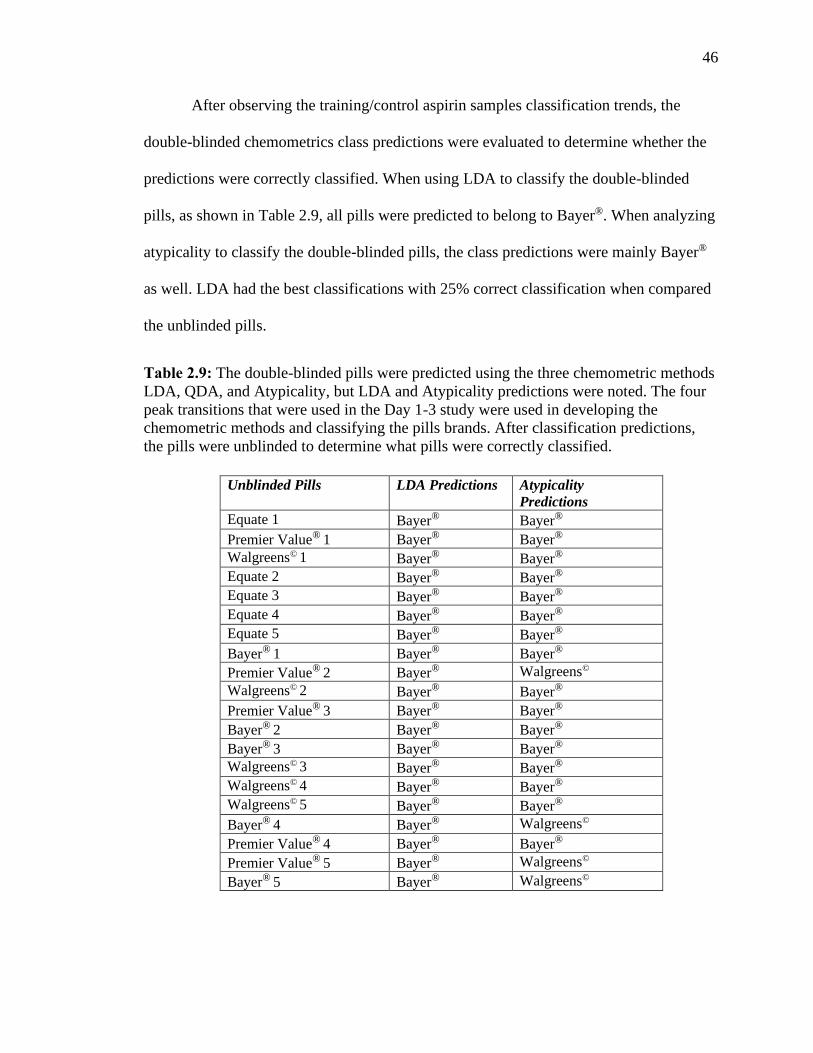
46
After observing the training/control aspirin samples classification trends, the
double-blinded chemometrics class predictions were evaluated to determine whether the
predictions were correctly classified. When using LDA to classify the double-blinded
pills, as shown in Table 2.9, all pills were predicted to belong to Bayer®. When analyzing
atypicality to classify the double-blinded pills, the class predictions were mainly Bayer®
as well. LDA had the best classifications with 25% correct classification when compared
the unblinded pills.
Table 2.9: The double-blinded pills were predicted using the three chemometric methods
LDA, QDA, and Atypicality, but LDA and Atypicality predictions were noted. The four
peak transitions that were used in the Day 1-3 study were used in developing the
chemometric methods and classifying the pills brands. After classification predictions,
the pills were unblinded to determine what pills were correctly classified.
Unblinded Pills LDA Predictions Atypicality
Predictions
Equate 1 Bayer® Bayer®
Premier Value® 1 Bayer® Bayer®
Walgreens© 1 Bayer® Bayer®
Equate 2 Bayer® Bayer®
Equate 3 Bayer® Bayer®
Equate 4 Bayer® Bayer®
Equate 5 Bayer® Bayer®
Bayer® 1 Bayer® Bayer®
Premier Value® 2 Bayer® Walgreens©
Walgreens© 2 Bayer® Bayer®
Premier Value® 3 Bayer® Bayer®
Bayer® 2 Bayer® Bayer®
Bayer® 3 Bayer® Bayer®
Walgreens© 3 Bayer® Bayer®
Walgreens© 4 Bayer® Bayer®
Walgreens© 5 Bayer® Bayer®
Bayer® 4 Bayer® Walgreens©
Premier Value® 4 Bayer® Bayer®
Premier Value® 5 Bayer® Walgreens©
Bayer® 5 Bayer® Walgreens©
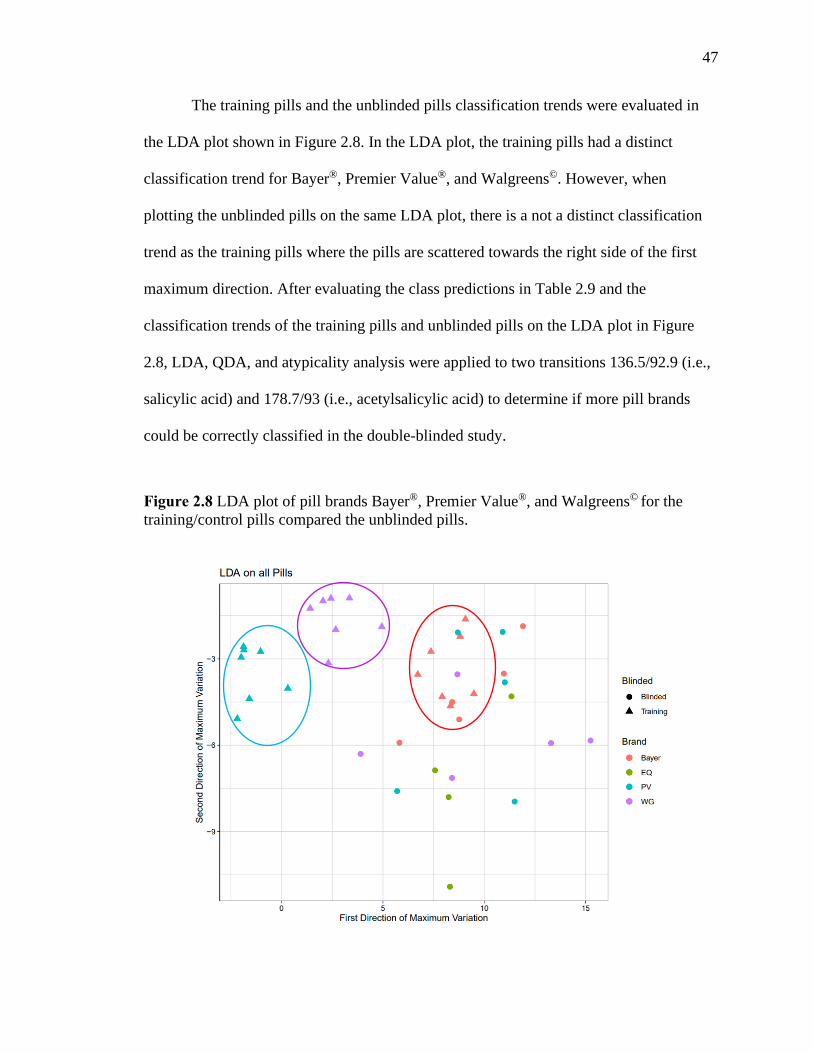
47
The training pills and the unblinded pills classification trends were evaluated in
the LDA plot shown in Figure 2.8. In the LDA plot, the training pills had a distinct
classification trend for Bayer®, Premier Value®, and Walgreens©. However, when
plotting the unblinded pills on the same LDA plot, there is a not a distinct classification
trend as the training pills where the pills are scattered towards the right side of the first
maximum direction. After evaluating the class predictions in Table 2.9 and the
classification trends of the training pills and unblinded pills on the LDA plot in Figure
2.8, LDA, QDA, and atypicality analysis were applied to two transitions 136.5/92.9 (i.e.,
salicylic acid) and 178.7/93 (i.e., acetylsalicylic acid) to determine if more pill brands
could be correctly classified in the double-blinded study.
Figure 2.8 LDA plot of pill brands Bayer®, Premier Value®, and Walgreens© for the
training/control pills compared the unblinded pills.
48
When using two peak transitions instead of four transitions for the three
chemometric methods, as shown in Table 2.10, produced different classifications for the
double blinded pills. Atypicality had the highest correct classification with 15% out of the
twenty double-blinded pills where pills Walgreens© 1, Bayer® 2, and Bayer® 5 were
correctly classified. Training/control data was classified perfectly using LDA, however,
the pill classification was not ideal for the double-blind study and atypicality analysis was
unable to be used to isolate the expired Equate pill.
To evaluate the reason for the misclassification of the double-blinded pills, the
average area under the peak for each replicate per pill brand was obtained, followed by a
final average of the averaged replicates; then, the final average of the pill replicates was
used to compare the four transitions based on the time the known manufactures were ran
on the instrument. The final average peak area per pill for the four MRM transitions in
the known pill brands decreased over time. Instrument sensitivity could play a role in the
pill classification. This could suggest that the samples need to be analyzed on the LC-
MS/MS in a random order versus orientating the samples based on batch sequences.
Also, an internal standard could be implemented to correct for loss of sample and
instrument sensitivity.
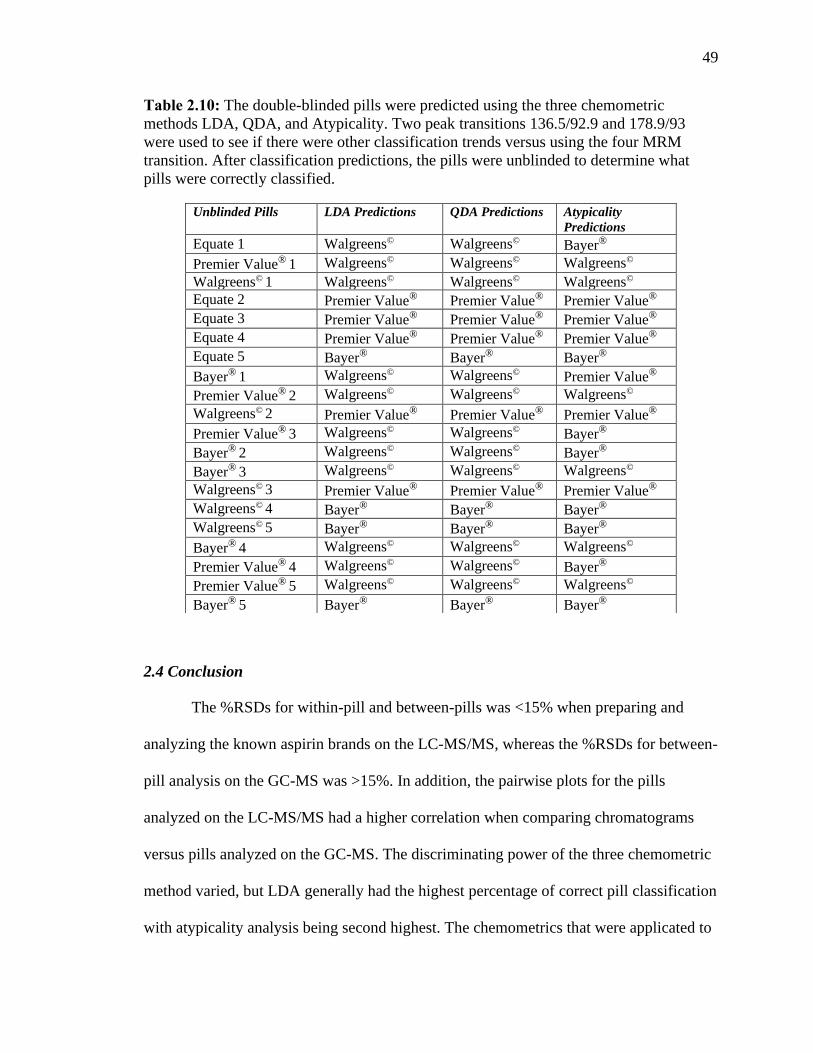
49
Table 2.10: The double-blinded pills were predicted using the three chemometric
methods LDA, QDA, and Atypicality. Two peak transitions 136.5/92.9 and 178.9/93
were used to see if there were other classification trends versus using the four MRM
transition. After classification predictions, the pills were unblinded to determine what
pills were correctly classified.
2.4 Conclusion
The %RSDs for within-pill and between-pills was <15% when preparing and
analyzing the known aspirin brands on the LC-MS/MS, whereas the %RSDs for between-
pill analysis on the GC-MS was >15%. In addition, the pairwise plots for the pills
analyzed on the LC-MS/MS had a higher correlation when comparing chromatograms
versus pills analyzed on the GC-MS. The discriminating power of the three chemometric
method varied, but LDA generally had the highest percentage of correct pill classification
with atypicality analysis being second highest. The chemometrics that were applicated to
Unblinded Pills LDA Predictions QDA Predictions Atypicality
Predictions
Equate 1 Walgreens© Walgreens© Bayer®
Premier Value® 1 Walgreens© Walgreens© Walgreens©
Walgreens© 1 Walgreens© Walgreens© Walgreens©
Equate 2 Premier Value® Premier Value® Premier Value®
Equate 3 Premier Value® Premier Value® Premier Value®
Equate 4 Premier Value® Premier Value® Premier Value®
Equate 5 Bayer® Bayer® Bayer®
Bayer® 1 Walgreens© Walgreens© Premier Value®
Premier Value® 2 Walgreens© Walgreens© Walgreens©
Walgreens© 2 Premier Value® Premier Value® Premier Value®
Premier Value® 3 Walgreens© Walgreens© Bayer®
Bayer® 2 Walgreens© Walgreens© Bayer®
Bayer® 3 Walgreens© Walgreens© Walgreens©
Walgreens© 3 Premier Value® Premier Value® Premier Value®
Walgreens© 4 Bayer® Bayer® Bayer®
Walgreens© 5 Bayer® Bayer® Bayer®
Bayer® 4 Walgreens© Walgreens© Walgreens©
Premier Value® 4 Walgreens© Walgreens© Bayer®
Premier Value® 5 Walgreens© Walgreens© Walgreens©
Bayer® 5 Bayer® Bayer® Bayer®
50
the known brands Walgreens©, Bayer®, and Premier Value® had discriminating power
within a day, however, it was not constant between days. In the double-blinded study, the
known pill training set was 100% correctly classified by LDA, and atypicality had 85.7%
correct classification. However, when using the three chemometric techniques for the
double-blinded data, atypicality analysis was unable to be used to isolate the expired
Equate pills due to inconsistent peaks are between the training data and double-blinded
pills. Due to variation of the training and double-blinded pills, it suggests that an internal
standard(s) should be implemented to account for loss of sample, matrix effects, or
instrument sensitivity.
51
3. CHAPTER 3: CONCLUSIONS AND FUTURE WORK
3.1. Conclusions
In this study, known source pill brands Walgreens©, Premier Value®, and Bayer®
were compared to an “unknown” source pill brand using three chemometric methods:
LDA, QDA, and atypicality. Before determining what analytical technique was best to
provide a consistent chemical fingerprint for each pill brand manufacturer, the
compounds were identified with the GC-MS detected 9 compounds versus 4 compounds
on the LC-MS/MS. Active pharmaceuticals and excipients were initially identified from
GC-MS data via the NIST library and seven of these compounds were definitively
identified using commercially available standards. LC-MS/MS and GC-MS were then
investigated to determine which would be best-suited for classifying Walgreens©, Premier
Value®, and Bayer® aspirin pill brands. The %RSDs for two Walgreens© pills for salicylic
acid (extracted ion 136.5/92.9) had <15% for within and between pill samples whereas %
RSDs was >15% when comparing two pill samples. To accumulate enough data for the
various pill brands, 7 pills per brand (each analyzed in triplicate) were evaluated over
three separate days using LC-MS/MS coupled with three chemometric methods: LDA,
QDA, and atypicality. Overall, the discriminating power of the chemometrics was good
within-day, but not between days. Because there was within day chemometric separation,
a double-blind study was executed to test the applicability of the method. LDA had
perfect discriminating power for pill classification of known manufactures, however, it
was unable to correctly classify the blinded pill brands. Also, atypicality analysis was
unable to differentiate the “unknown” (i.e., expired Equate) it
52
from the known source pills. Due to peak area variation in the known and blinded data,
an internal standard is likely necessary for this technique.
3.2 Future Work
Known aspirin pill brands Walgreens©, Bayer®, and Premier Value® chemical
fingerprint is not consistent. The peak area of the known pills and double-blinded pills
varied based on the time it was analyzed. This suggests that an internal standard is
essential for reducing these variations. The internal standards acetylsalicylic acid-d4 and
salicylic acid-d4 seem promising for optimization of the method. After optimization, the
method should be further assessed.
53
4. REFERENCES
1. Toscano, P., The Dangerous World of Counterfeit Prescription Drugs. CNBC,
2011.
2. Esposito, M. 5 Strategies To Combat Counterfeit Drugs And Other Pharma
Supply Chain Threats. November 24, 2019]; Available from:
https://www.pharmaceuticalonline.com/doc/strategies-to-combat-counterfeit-
drugs-and-other-pharma-supply-chain-threats-0001.
3. Baggaley, K., Counterfeit drugs are putting the whole world at risk Popular
Science 2017.
4. AG, B. What Are Counterfeit Drugs? [cited 2020 January 21 ]; Available from:
https://www.bayer.com/en/background-information-on-counterfeit-drugs.aspx.
5. Southwick, N., Counterfeit Drugs Kill 1 Mn People Annually: Interpol. Insight
Crime, 2013.
6. Williams, L. and E. Mcknight, The Real Impact of Counterfeit Medications. U.S.
Pharmacist, 2014. 39(6): p. 44-46.
7. Baratta, F., A. Germano, and P. Brusa, Diffusion of counterfeit drugs in
developing countries and stability of galenics stored for months under different
conditions of temperature and relative humidity. Croatian medical journal, 2012.
53(2): p. 173-184.
8. Lynn, S., Counterfeit prescription pills made of fentanyl are killing Americans:
DEA. 2019.
9. Abuse, N.I.o.D. Fentanyl. [cited 2020; Available from:
https://www.drugabuse.gov/publications/drugfacts/fentanyl.
54
10. Burgett, S., Combat counterfeiting with packaging design and color consisitency.
Packaging Digest 2016.
11. What is Raman Spectroscopy Available from:
https://www.horiba.com/en_en/raman-imaging-and-spectroscopy/.
12. Application Note-The Raman Spectrum of Water. August 14, 2019; Available
from: https://www.stellarnet.us/application-note-raman-spectrum-water/.
13. What is Raman Spectroscopy & Where is it used. MarqMetrix November 24,
2019]; Available from: https://www.marqmetrix.com/what-is-raman/.
14. Deisingh, A.K., Pharmaceutical counterfeiting. Analyst, 2005. 130(3): p. 271-
279.
15. Bell, S.E., et al., Tracking the distribution of “ecstasy” tablets by Raman
composition profiling: A large scale feasibility study. Analyst, 2003. 128(11): p.
1331-1335.
16. Dégardin, K., et al., Detection and chemical profiling of medicine counterfeits by
Raman spectroscopy and chemometrics. Analytica chimica acta, 2011. 705(1-2):
p. 334-341.
17. Bumbrah, G.S. and R.M. Sharma, Raman spectroscopy–Basic principle,
instrumentation and selected applications for the characterization of drugs of
abuse. Egyptian Journal of Forensic Sciences, 2016. 6(3): p. 209-215.
18. Carter, D.J. and V.B. (Eds), Good Practice Guide for Isotope Ratio Mass
Spectrometry, FIRMS 2011.
19. Isotope Ratio Mass Spectrometry. Available from:
https://www.sciencedirect.com/topics/chemistry/isotope-ratio-mass-spectrometry.
55
20. Cristea, G., et al., Stable Isotope Fingerprinting for Pharmaceutical
Authentication. Analytical Letters, 2017. 50(17): p. 2691-2698.
21. Jasper, J.P., et al., Stable isotopic characterization of analgesic drugs.
Pharmaceutical Technology, 2004. 28(8): p. 60-67.
22. Liquid Chromatography Mass Spectrometry (LC-MS) Information. Available
from: https://www.thermofisher.com/us/en/home/industrial/mass-
spectrometry/mass-spectrometry-learning-center/liquid-chromatography-mass-
spectrometry-lc-ms-information.html.
23. Libretexts. Liquid Chromatography 2019; Available from:
https://chem.libretexts.org/Bookshelves/Analytical_Chemistry/Supplemental_Mo
dules_(Analytical_Chemistry)/Instrumental_Analysis/Chromatography/Liquid_C
hromatography.
24. Mass Spectrometry : Introduction, Principle of Mass Spectrometry, Components
of Mass Spectrometer, Applications. Available from:
http://www.premierbiosoft.com/tech_notes/mass-spectrometry.html.
25. Smith, C., Disadvantages & Advantages of an HPLC Sciencing. Leaf Group Ltd,
2018.
26. Johannessen, S.I., Therapeutic drug monitoring of antiepileptic drugs, in
Handbook of Analytical Separations. 2004, Elsevier. p. 221-253.
27. Pang, W., et al., LC-MS–MS in MRM mode for detection and structural
identification of synthetic hypoglycemic drugs added illegally to ‘natural’anti-
diabetic herbal products. Chromatographia, 2009. 70(9-10): p. 1353.
56
28. Lee, J.H., et al., Analysis of erectile dysfunction drugs and their analogues in
counterfeit drugs and herbal medicines by LC-ESI-MS/MS. 분석과학, 2016.
29(4): p. 155-161.
29. LC-MS and LC-MS/MS. Pacific BioLabs.
30. File:Liquid Chromatography Mass Spectrometer.png. Available from:
https://commons.wikimedia.org/wiki/File:Liquid_Chromatography_Mass_Spectro
meter.png.
31. Shi, T., et al., Advancing the sensitivity of selected reaction monitoring‐based
targeted quantitative proteomics. Proteomics, 2012. 12(8): p. 1074-1092.
32. Liquid Chromatography - Tandem Mass Spectrometry (LC-MS-MS). [cited 2021
10/30]; Available from: https://www.eag.com/techniques/mass-spec/lc-ms-ms/.
33. Gas Chromatography Chemistry LibreTexts 2019; Available from:
https://chem.libretexts.org/Bookshelves/Analytical_Chemistry/Supplemental_Mo
dules_(Analytical_Chemistry)/Instrumental_Analysis/Chromatography/Gas_Chro
matography.
34. Maslamani, N.O., Ice Concentration Linked with Extractive Stirrer (ICECLES), in
Chemistry and Biochemistry 2016, South Dakota State University
35. Emwas, A.-H., et al., Gas Chromatography–Mass Spectrometry of Biofluids and
Extracts. Methods in molecular biology (Clifton, N.J.), 2015. 1277: p. 91-112.
36. Caballero, B., L.C. Trugo, and P.M. Finglas, Encyclopedia of food sciences and
nutrition. 2003: Academic.
37. Dunn, W.B., Mass spectrometry in systems biology: An introduction, in Methods
in enzymology. 2011, Elsevier. p. 15-35.
57
38. Nair, H. and W. Clarke, Mass spectrometry for the clinical laboratory. 2016:
Academic Press.
39. Clarke, W. and M. Marzinke, Contemporary practice in clinical chemistry. 2020:
Academic Press.
40. da Justa Neves, D.B. and E.D. Caldas, GC–MS quantitative analysis of black
market pharmaceutical products containing anabolic androgenic steroids seized
by the Brazilian Federal Police. Forensic science international, 2017. 275: p. 272-
281.
41. Foroughi, M.H., et al., Identification of undeclared active pharmaceutical
ingredients in counterfeit herbal medicines used as opioid substitution therapy.
Australian journal of forensic sciences, 2017. 49(6): p. 720-729.
42. Gas Chromatography Mass Spectroscopy Building Construction Directory 2017
[cited 2019; Available from:
http://www.buildingconstructiondirectory.com.ng/gas-chromatography-mass-
spectrometry-advantages-and-disadvantages/.
43. French customs seize 1.2 million doses of fake aspirin. 26/05/2013 Available
from: https://www.france24.com/en/20130526-french-customs-seize-biggest-
haul-fake-medecine-ever-france-eu.
44. Hui, Z. 26 people arrested for selling fake aspirin. 2018; Available from:
https://www.globaltimes.cn/page/201904/1146567.shtml.
45. Brereton, R., Chemometrics for Pattern Recognition. 2009, West Sussex, United
Kingdom: Wiley.
46. Phenol. [cited 2021; Available from: https://go.drugbank.com/drugs/DB03255.
58
47. National Center for Biotechnology Information. PubChem Compound Summary
for CID 31229, Phenyl acetate. [cited 2021 September 4]; Available from:
https://pubchem.ncbi.nlm.nih.gov/compound/Phenyl-acetate.
48. Sciences., N.C.f.A.T. Phenyl Acetate: Inxight Drugs. [cited 2021 September 4];
Available from: https://drugs.ncats.io/substance/355G9R500Y.
49. National Center for Biotechnology Information. PubChem Compound Summary
for CID 4133, Methyl salicylate. [cited 2021 September 4]; Available from:
https://pubchem.ncbi.nlm.nih.gov/compound/Methyl-salicylate.
50. knowyourOTC.org. Methyl Salicylate. Available from:
https://www.knowyourotcs.org/ingredient/methyl-salicylate/.
51. National Center for Biotechnology Information. PubChem Compound Summary
for CID 8361, Phenyl salicylate. [cited 2021 Sepember 4]; Available from:
https://pubchem.ncbi.nlm.nih.gov/compound/Phenyl-salicylate
52. Shulga, O. and J. Dunn, A simultaneous TG–DTA study of the thermal
decomposition of 2-hydroxybenzoic acid, 2-carboxyphenyl ester (salsalate).
Thermochimica acta, 2004. 410(1-2): p. 15-21.
53. Pahmeyer, C. Plotting pairwise relationships in a dataset. 2021; Available from:
https://observablehq.com/@chrispahm/plotting-pairwise-relationships-in-a-
dataset.


