Embed Size (px)
Citation preview

JOURNAL OF APPLIED POLYMER SCIENCE VOL. 20, 1389-1404 (1976)
Development of an Autographic Falling-Weight Impact System
HENRY GONZALEZ, JR., and W. J. STOWELL, Research Laboratories, Tennessee Eastman Company, Division of Eastman Kodak Company,
Kingsport, Tennessee 37662
Synopsis
The objective of this project was to develop a system that would allow the determination of the energy absorbed during fracture in a falling-weight impact test. Equipment was developed which would allow the force exerted by the impact tup on the specimen to be determined during the test. Using this information and the equations developed, i t was possible to convert force- versus-time traces on an oscilloscope to energy absorbed. Tests were conducted to compare the autographic method with the normal falling-weight method. The system was shown to give re- sults which are similar to results from normal falling-weight impact tests, but requires much fewer specimens. Tests can be made and results can be obtained on small sample sizes, since re- sults are obtained for each specimen tested. Also, a more representative value of falling-weight impact strength can be determined in cases where there are mixed failure modes. The autogra- phic system may be used in those instances where there are limitations of material, and with fur- ther use it may eventually replace the normal falling-weight impact determination.
INTRODUCTION
The strength, ductility, and toughness of materials are modified when im- pact loads are used instead of static loads. Various testing machines and methods have been developed for testing materials under impact Falling-weight impact tests are generally regarded as one of the more mean- ingful toughness characterization tests. They have proven useful in evaluat- ing materials used in large plane or smoothly and gently curved sheet^.^ The falling-weight test closely simulates the occasional blows that these articles receive in use. There are several disadvantages to the falling-weight method. The falling-weight impact determinations require relatively large amounts of material to be tested. The failure criterion is usually visual; therefore, some discrepancies may occur due to operator bias. These two disadvantages could be eliminated if the energy absorbed during fracture could be measured much in the same manner as the energy absorbed during fracture is measured in pendulum-type impact tests. The objective of this work was to develop a sys- tem that would allow the determination of the energy absorbed during frac- ture in a falling-weight test.
1389
0 1976 by John Wiley & Sons, Inc.

1390 GONZALEZ AND STOWELL
THEORETICAL BACKGROUND
Conventional Falling-Weight Methods*9
The conventional method for determining the falling-weight impact strength of a material is to determine a mean “critical energy level.” A t this critical energy level, a given specimen will fail when the impacting tup is dropped and will pass if the impacting tup is dropped from an incrementally lower energy level. The population of specimens is thus characterized by a continuous variable-the critical energy level-which cannot be measured in conventional test methods. Since this critical energy level is never known, a common procedure has been to drop the impact tup from various energy lev- els onto the specimens near the estimated mean critical energy level and de- termine whether or not they break. As the energy level is altered, the speci- mens concerned may or may not break. I t may be assumed that those that did not break would have done so if the critical energy level, or a greater one, had been used in the test. Unfortunately, it is not possible to simply increase the energy level and redrop the impact tup since repeated drops change the characteristic of the specimen itself, thus invalidating the results obtained. While energy level is an easily measured variable, individual critical energy levels can only be measured in terms of whether, a t a given energy level, the specimen will or will not break. This “fail-no-fail” type of testing is the only available tool for the measurement of the continuous variable, critical energy level. In general, two types of statistical procedures have been used to estab- lish the mean critical energy level for a given set of specimens. They both in- volve determination of a 50% failure level, that is, an energy level a t which 50% of the specimens tested would be expected to fail.
Fig. 1. Typical failure modes.
FALLING-WEIGHT IMPACT SYSTEM 1391
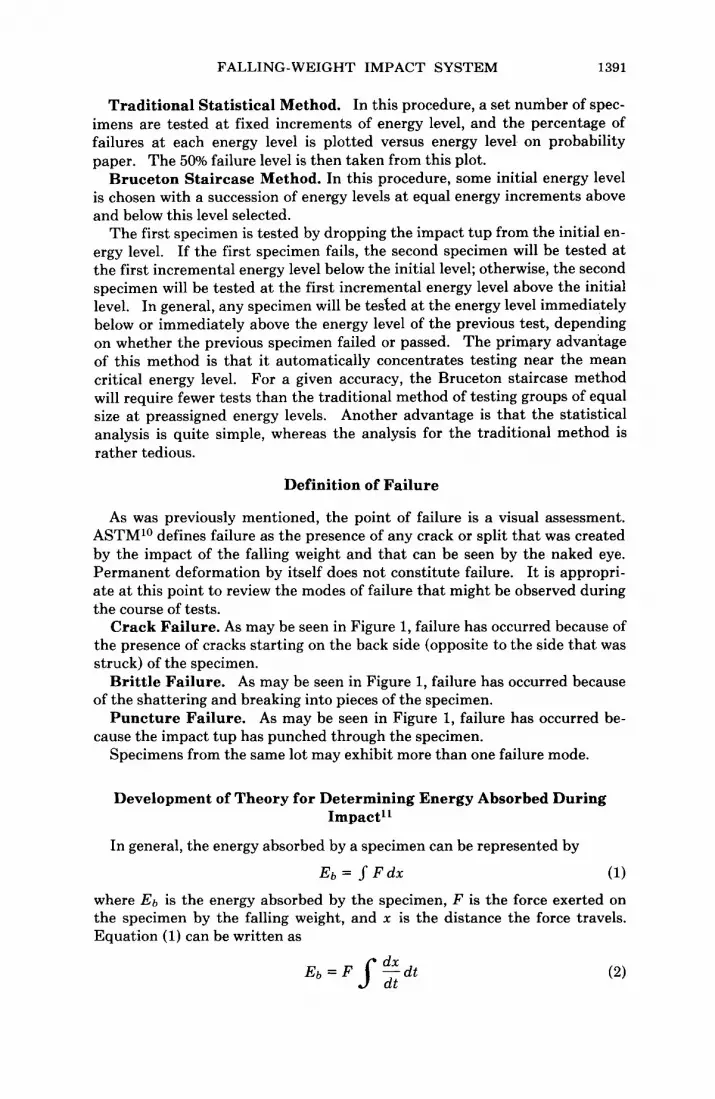
Traditional Statistical Method. In this procedure, a set number of spec- imens are tested at fixed increments of energy level, and the percentage of failures at each energy level is plotted versus energy level on probability paper. The 50% failure level is then taken from this plot.
Bruceton Staircase Method. In this procedure, some initial energy level is chosen with a succession of energy levels at equal energy increments above and below this level selected.
The first specimen is tested by dropping the impact tup from the initial en- ergy level. If the first specimen fails, the second specimen will be tested at the first incremental energy level below the initial level; otherwise, the second specimen will be tested at the first incremental energy level above the initial level. In general, any specimen will be tested at the energy level immediately below or immediately above the energy level of the previous test, depending on whether the previous specimen failed or passed. The primary advantage of this method is that it automatically concentrates testing near the mean critical energy level. For a given accuracy, the Bruceton staircase method will require fewer tests than the traditional method of testing groups of equal size at preassigned energy levels. Another advantage is that the statistical analysis is quite simple, whereas the analysis for the traditional method is rather tedious.
Definition of Failure
As was previously mentioned, the point of failure is a visual assessment. ASTMlO defines failure as the presence of any crack or split that was created by the impact of the falling weight and that can be seen by the naked eye. Permanent deformation by itself does not constitute failure. It is appropri- ate at this point to review the modes of failure that might be observed during the course of tests.
Crack Failure. As may be seen in Figure 1, failure has occurred because of the presence of cracks starting on the back side (opposite to the side that was struck) of the specimen.
Brittle Failure. As may be seen in Figure 1, failure has occurred because of the shattering and breaking into pieces of the specimen.
Puncture Failure. As may be seen in Figure 1, failure has occurred be- cause the impact tup has punched through the specimen.
Specimens from the same lot may exhibit more than one failure mode.
Development of Theory for Determining Energy Absorbed During Impact"
In general, the energy absorbed by a specimen can be represented by
Eb = F d x (1)
where Eb is the energy absorbed by the specimen, F is the force exerted on the specimen by the falling weight, and x is the distance the force travels. Equation (1) can be written as

1392 GONZALEZ AND STOWELL
where u is the speed of the tup at the point of impact.
of deformation, eq. (3) may be written as Now, if it is assumed that the tup speed remains constant during the course
(4 ) Eb = uo 1 F d t
or
Eb = UoA (5)
where uo is the speed of the tup at the point of impact and A is the impulse exerted on the specimen.
The approximation that the tup velocity remains constant is, of course, not valid since the velocity after impact is considerably different from the veloci- ty before impact. A correction to account for this difference in velocity may be calculated as follows: If a particle of mass m (mass of weight) moving with velocity uo is acted on by an impulse A , the velocity will be changed to vf such that (using only one-dimensional components)
A = m(u0 - u f ) . (6)
+ v f ) (i.e., the average velocity), we Multiplying both sides of eq. (6) by have
Now, 'hmvo2 is the available energy immediately before impact, and ?hmuf2 is the available energy immediately after impact. Therefore, the difference of these two is the total energy absorbed. Therefore, we have
Combining eqs. (6) and (8), we have
The maximum energy available from the tup is
Emax = %muo2. (10)
Therefore, eq. (9) becomes
( 1 1 )
where Eb is the energy absorbed by the specimen during impact, A is the im- pulse exerted on the specimen during impact, uo is the velocity at the point of impact and is equal to v'2gh, g is the acceleration due to gravity, h is the height from which the tup is dropped, Emax is the maximum energy available and is equal to Wh, and W is the weight of the impacting tup.
From eq. ( 1 1 ) it may be seen that to obtain the energy absorbed by a speci- men during impact, it is necessary to measure the weight of the impacting
u0A 4Etnax
Eb = Avo ( 1 - -)

FALLING-WEIGHT IMPACT SYSTEM 1393
tup, the height from which it is dropped, and the impulse it exerts on the test specimen. The first two items are easily measured. The third item requires that the impacting tup be instrumented in such a way that the force being ex- erted on the specimen during the short time duration of the impact process can be measured. The development of this system will be described in the experimental section.
Relation Between Energy Absorbed and Mean Critical Energy Level
As was previously described, the mean critical energy level is the average energy level at which specimens from the same lot will fail. The mean criti- cal energy should, therefore, be equivalent to the average energy absorbed by specimens at failure from the same lot. This relation will be investigated later.
EXPERIMENTAL
Falling Weight Impact Tester
The falling-weight impact tester used in this evaluation was a Testing Ma- chines, Inc., Model No. 43-21 tester (Fig. 2). This tester was built to our specifications and generally conforms to ASTM Method D3029, Procedure B.Io It has a maximum weight of 10 lb, a minimum weight of 2 lb, and a maximum drop height of 6 ft. This gives a maximum available energy of 60 ft-lb. Specimen size is normally 4% X 4% in. and can be varied in thickness up to % in. The inside diameter over which the specimen rests is 3 in., and the impact tup has a $&in. hemispherical impacting surface. All specimens were clamped with a rectangular guide as shown in Figure 3.
Autographic Measuring System
The autographic measuring system consisted of (1) a modified tup contain- ing a strain gauge transducer (Testing Machines, Inc., Dynamic Load Cell), (2) a signal conditioner for the strain gauge (Testing Machines, Inc., Series 400 Signal Conditioner), (3) a photoelectric trigger, and (4) a Tretronic Type- 549 Storage Oscilloscope (Figs. 2 and 4). A force-time record of an impact test was produced by the tup passing through the light beam of the photo- electric cell and, thus, triggering a sweep on the oscilloscope. The force of impact was then translated to deflection of the oscilloscope beam and stored. Because the photoelectric cell was in a fixed position on the falling-weight tester, it was necessary as the drop height changed to delay the sweep of the trace different amounts of time. This ensured that triggering occurred at the proper point to allow a full view of the impact process on the oscilloscope.
Calibration of Transducer
The signal conditioner contained an internal resistor corresponding to some preset load to allow calibration. The internal resistor was inserted in the electrical circuit to unbalance the strain gauge bridge, and the amount of

1394 GONZALEZ AND STOWELL
Fig. 2. Falling-weight impact tester with autographic equipment.
deflection of the oscilloscope trace was noted. The transducer was then load- ed in compression on an Instron Universal Testing Machine until the same deflection that was caused by the internal resistor was reached. The load corresponding to this deflection was noted, and it was the preset load that the internal resistor corresponded to. Using the gain adjustment on the signal conditioner, it was thus possible to adjust the sensitivity of the strain gauge output to some convenient scale.
Materials
The following materials were used in this evaluation (Tennessee Eastman Company): ) Tenite 6PR0 polyterephthalate; (2) Tenite 6P40 polyterephth- alate; (3) Tenite 6G91 polyterephthalate; (4) Tenite 7DR0 polyterephthalate; (5) Tenite CAB 460A cellulose acetate butyrate; (6) Tenite Polypropylene 4231. These materials cover a range of impact levels and a range of failure modes.
All materials were molded into 4%- x 4yz- X %-in. plaques on a New Brit- ain 175 TP Reciprocating-Screw Injection Molding Machine.

FALLING-WEIGHT IMPACT SYSTEM
Fig. 3. Specimen clamp.
1395
Fig. 4. Tup and photoelectric cell.

1396 GONZALEZ A N D STOWELL
TABLE I Fallingweight Impact Strength Determined by Normal (Bruceton Staircase) Method
Failure mode, % Average 95% Confidence
Material ft-lb interval, ft-lb Puncture Brittle Crack
Tenite 6PR0 Polyterephthalate 46.2 43.9-48.5 80 20 0
Tenite 6P50 Polyterephthalate 42.1 37.4-46.8 63 37 0
Tenite 7DR0 Polyterephthalate 43.2 42.0-44.4 100 0 0
Tenite CAB 460A 26.5 24.4-28.5 0 100 0 Tenite Polypropylene
4231 1.3 1.1-1.6 0 0 100 Tenite 6G91
Polyterephthalate 0.8 0.5-1.1 0 0 100
Methods
Falling-Weight Impact Test. Normal falling-weight impact tests (Bru- ceton Staircase Methodlo) were run on all samples using the autographic tup. The results of these tests are shown in Table I.
Autographic Impact Tests From Normal Falling-Weight Tests. Si- multaneously with the normal falling-weight tests, autographic traces of force versus time were made for each of the specimens tested. An analysis was made of the energy absorbed for those specimens that failed, using the equa- tions previously developed. The results of these analyses are shown in Table 11.
Autographic Impact Tests from Energy Levels Which Are Known to Cause Failure. An additional set of experiments was conducted where the energy level from which the tup was dropped was known to produce failure 100% of the time. The results of these experiments are shown in Table 111.
The areas under the force-time curves of the autographic traces were determined by using triangles and rec-
Integration of Force-Time Trace.
TABLE I1 Autographic Falling-Weight Impact Strength, Specimens of Normal Test Method
Number and average for each failure mode, ft-lb
Average 95% Confidence Material ft-lb interval, ft-lb Puncture Brittle Crack
Tenite 6PR0
Tenite 6P50
Tenite 7DR0
Polyterephthalate 41.7 34.2-49.2 8-46.5 2-22.6
Polyterephthalate 32.9 21.4-44.4 7-45.0 4-11.8
Polyterephthalate 43.6 42.8-44.4 9-43.6 Tenite CAB 460 A 24.5 21.6-27.4 10-24.5 Tenite Polypropylene
Tenite 6G91 4231 0.9 0.8-1.0 10-0.9
Polyterephthalate 0.7 0.6-0.8 10-0.7
FALLING-WEIGHT IMPACT SYSTEM 1397
TABLE I11 Autographic Falling-Weight Impact Strength, Energy Levels
Known to Cause 100% Failure
Number and average for each failure mode, ft-lb
Average 95% Confidence Material ft-lb interval, ft-lb Puncture Brittle Crack
Tenite 6PR0 Pol yterephthalate (50 ft-lb) 41.3 34.4-48.2 10-46.0 2-18.0
Tenite 6P50 Polyterephthalate (50 ft-lb) 33.8 22.8-44.8 8-41.1 2-4.5
Tenite 7DR0 Polyterephthalate (50 ft-lb) 43.8 42.5-45.1 10-43.
(30 ft-lb) 23.8 23.0-24.6 10-23.8 Tenite CAB 460A
Tenite Polypropylene 4231 (2 ft-lb) 1 .o 0.9-1.1 10-1.0
(2 ft-lb) 1.0 0.9-1.1 10-1.0
Tenite 6G91 Polyterephthalate
tangles to divide the area. The information from these determinations was then coded into a computer program and the absorbed energy calculated.
DISCUSSION OF RESULTS
Traces of Different Failure Modes
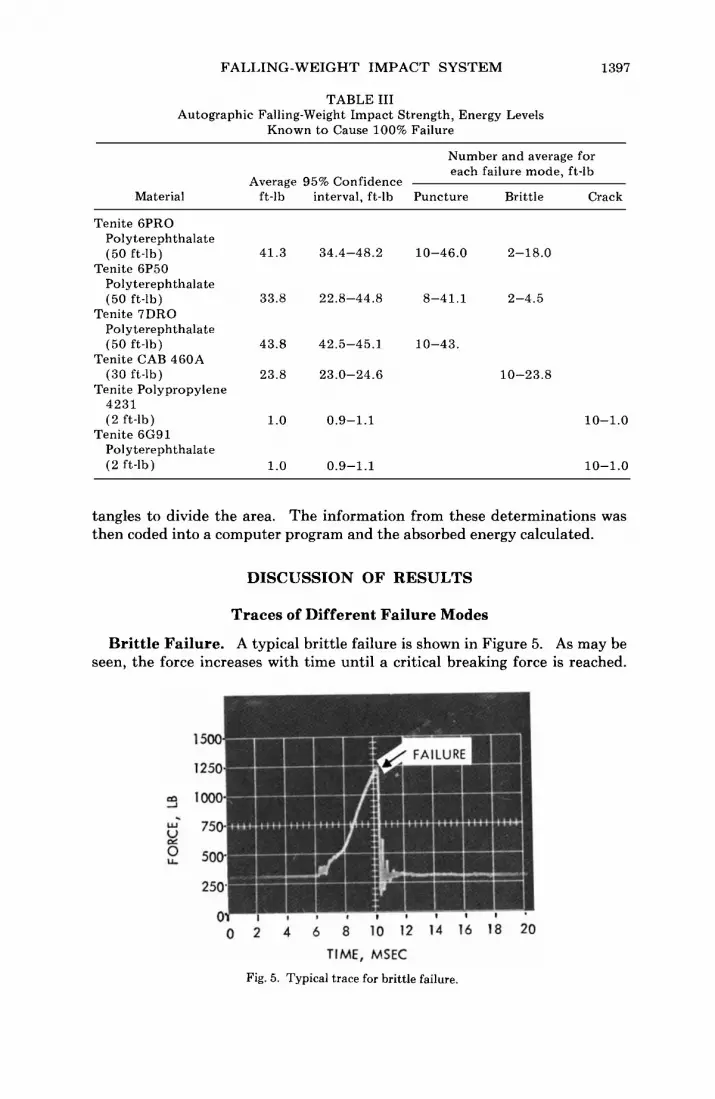
Brittle Failure. A typical brittle failure is shown in Figure 5. As may be seen, the force increases with time until a critical breaking force is reached.
Fig. 5. Typical trace for brittle failure.

1398 GONZALEZ AND STOWELL
Fig. 6. Typical traces for crack failure: (a) 1.5 ft-lb energy available; (b) 2.0 ft-lb energy avail- able.
Fig. 7. Typical trace for puncture failure.

FALLING-WEIGHT IMPACT SYSTEM 1399
Fig. 8. Typical trace for near puncture failure.
A t this point, the specimen completely shatters and the load is immediately reduced to zero.
Crack Failure. A typical crack failure is shown in Figures 6a and 6b. The maximum energy level for Figure 6a was 1.5 ft-lb, while the maximum energy level for Figure 6b was 2-ft-lb (i.e., a 2-lb tup weight at 0.75 f t and 1 ft, res’pectively). As may be seen in Figure 6a, the force increases with time until a peak is reached; then, the force begins to decrease until a point of dis- continuity is reached. This point of discontinuity is the point at which a crack forms. Therefore, area under the force-time curve is taken only up to this point. In Figure 6b the slow decrease in force after the peak is not present, rather the force decreases suddenly to zero from the peak. In both Figures 6a and 6b, a further buildup in force is observed after the crack has formed. This is due to the tup continuing to make contact with the specimen even though a crack has formed.
Puncture Failure. A typical puncture failure is shown in Figure 7. As may be seen, the force increases with time until a peak is reached. After the
Fig. 9. Typical trace for bounce failure.

1400 GONZALEZ AND STOWELL
TUP MOVEMENT
SPECIMEN- TUP + L! ”%! “ : I TIME a TUP MOVEMENT D T ‘ O R P M E
FORCE
;,c%b TUP MOVEMENT
AREA I TIME
FORCE
TUP MOVEMENT
Fig. 10. Deformation process in a bounce failure.
peak, a decrease in force is seen until a point of discontinuity is reached. At this point, the tup punctures through the specimen. Therefore, area under the force-time curve is taken only up to this point of discontinuity. The de- crease in force after the peak force and before the puncture is attributed to the drawing of the specimen. After the tup has punctured the specimen, it slides through the hole, creating the area of constant force in Figure 7. For comparison, a specimen that was not punctured is shown in Figure 8. As may be seen, the drawing process continued until the tup was stopped. As may be seen in Figure 8, no discontinuity occurred.
Bounce. In some tests, the tup does not actually stick into the specimen, rather it bounces. A typical trace for a bounce is shown in Figure 9. As the tup penetrates into and deforms the specimen, the force should reach a maxi- mum and begin to decrease as the drawing process begins (Fig. 10). When the drawing process has proceeded as far as possible and the deflection of the specimen has reached a maximum, the tup will actually change direction and begin to move up until it loses contact with the specimen. All through this process, a force will be exerted on the tup. However, for a certain portion of the time, the tup will be moving down and for another portion it will be mov- ing up. Therefore, a change in the sign of the velocity will have occurred, and the specimen may have absorbed all the energy available. However, this en- ergy was not absorbed in a plastic manner; rather, i t was absorbed in an elas-

FALLING-WEIGHT IMPACT SYSTEM 1401
tic manner, and part of the energy absorbed by the specimen was given up in moving the tup upward. The difference between the maximum energy avail- able and the energy required to move the tup upward is the amount of energy the specimen absorbed in a plastic manner.
The trace of Figure 9 actually represents two different types of energy; namely, (1) energy being absorbed by the specimen in both a plastic and elas- tic manner, and (2) energy being given up by the specimen in moving the tup toward. It should be pointed out that bounce may also be associated with specimens in which the tup actually sticks into the specimen. For any given energy level, there is a maximum area corresponding to a maximum energy that can be absorbed. The computer program to analyze the data was writ- ten so that areas larger than the maximum area would give error messages. These error messages indicate that a misinterpretation has been made of the area under the force-time curve, in that part of the energy in the upward movement of the tup is being counted as part of the energy absorbed.
Mixed Failure Modes
In analyzing the results of the experiments, it became apparent that a spe- cial problem occurs when mixed failure modes occur for the same sample, in particular, when some specimens of a given sample fail in a puncture mode while others fail in a brittle mode. When brittle failures occur in otherwise puncture failure regions, it may be assumed that much less energy was re- quired to break the brittle specimen than a normal puncture failure. The normal falling-weight procedure does not differentiate between differknt types of failure modes; rather, each failure, whether it be brittle or puncture, is treated as a nondistinguishable failure. This is a weakness of the normal falling-weight procedure. The only manner of giving indications of mixed mode failures is to report the percentage of each type of failure mode along with the average falling-weight impact strength. When brittle failures occur in the autographic procedure, in otherwise puncture regions, it is possible to determine exactly how much energy was required to break the brittle speci- men. However, when comparisons are made between the normal falling- weight results and results from autographic tests where mixed mode failures have occurred, the autographic tests will be lower because they include lower values of brittle failures that are essentially ignored in the normal falling- weight procedure.
Correlations Between Normal Falling-Weight Impact Test and Autographic Falling-Weight Impact Test
As long as there are no mixed mode failures, a good correlation exists be- tween the normal falling-weight impact and the autographic falling-weight impact results, as shown in Tables I and 11. In the two cases where there were mixed mode failures (Tenite 6PR0 and 6P50 polyterephthalate), the autographic impact strength was considerably less than the normal falling- weight impact strength. As previously explained, this was because of the in- clusion of low values for the brittle specimens in the autographic method; while those low values were essentially not included in the normal method.

1402 GONZALEZ AND STOWELL
60 - THEORETICAL +
50 -
40 -
30 -
0 10 20 30 40 50 60 NORMAL FALLING WEIGHT IMPACT
STRENGTH, FT-LB
60 THEORETICAL +
30
0 10 20 30 40 50 60 NORMAL FALLING WEIGHT IMPACT
STRENGTH, FT-LB
Fig. 11. Comparison of normal falling-weight impact strength with autographic falling-weight impact strength, specimens of normal method.
If only the absorbed energy for puncture failures is considered from Table 11, a very good correlation is found with the normal falling-weight results (Fig. 11).
A good correlation was also found between absorbed energy measured from the specimens of the normal falling-weight tests and absorbed energy mea- sured from fixed energy levels known to cause 100% failures (Tables I1 and 111, respectively). This correlation was good, even though there were again some mixed mode failures for Tenite 6PR0 and 6P50 polyterephthalate. Again, a good correlation was found between the results of autographic tests from fixed energy levels and normal falling-weight tests (considering punc- ture failures only for Tenite 6PR0 and 6P50 polyterephthalate), even though these results are based on different specimens (Fig. 12).
It would appear that results from autographic tests give much more insight
zi -- 0 0 10 20 30 40 50 60
NORMAL FALLING WEIGHT IMPACT STRENGTH, FT-LB
Fig. 12. Comparison of normal falling-weight impact strength with autographic falling-weight impact strength, energy levels known to cause 100% failures.

FALLING-WEIGHT IMPACT SYSTEM 1403
into the reproducibility of falling-weight impact tests than do normal falling- weight impact tests, since the averages reported for all specimens that in- clude mixed mode failures more nearly represent the performance of the ma- terial.
Effect of Varying Weight and Height on Autographic Falling-Weight Impact Strength
An additional series of tests were conducted to determine if changing the height and weight would have any effect on the energy absorbed as deter- mined with the autographic equipment. Two materials were evaluated at different weight andlor height combinations. The results of these tests are shown in Table IV. (It should be noted that the Tenite CAB 460A cellulose acetate butyrate sample had a slightly different processing history than the sample previously used in Tables I to 111.)
TABLE IV Autographic Falling-Weigh't at Different Weight/Height Combinations
Number and average for - each failure mode, ft-lb
Weight, Height, Average 95% Confidence Material lb ft ft-lb interval, ft-lb Brittle Crack
Tenite CAB 460A 10 3 21.1 19.2-23.0 10-21.1
5 5 22.1 20.3-23.9 10-22.1 Tenite
Polypropylene 2 1 1 .o 0.9-1.0 10-1.0 4231 2 2 1 .o 0.9-1.0 6-1.0 4-1.0
2 3 1.1 1 .o-1.2 10-1.1
As may be seen the amount of energy absorbed for each sample remained constant even though the weight andlor height was changed. In fact the Tenite Polypropylene 4231 sample changed from crack-type failures to brittle failures with the energy absorbed remaining essentially constant.
CONCLUSIONS
A system has been developed whereby the energy absorbed during fracture in a falling-weight impact test can be measured for each specimen tested. The system has been shown to give results that are comparable with those of normal falling-weight impact tests, but requiring fewer specimens. Tests can be made; and results can be obtained on small sample sizes, since results are obtained for each specimen tested. Also, a more representative value of fall- ing-weight impact strength can be determined in cases where there are mixed mode failures. The autographic system may be used in those instances where there are limitations of material, and with further use it may eventual- ly replace the present normal method of falling-weight impact determination.
The authors are grateful to Mr. Russell Owens for setting up the photoelectric triggering unit and to Dr. G. M. Armstrong for helpful discussions.

1404 GONZALEZ AND STOWELL
References
1. R. F. Westover, Plast. Technol., 4,223 (1958). 2. R. F. Westover, Plast. Technol., 4,348 (1958). 3. R. A. Hansley et al., Plastics (London), 31,1551 (December, 1966). 4. C. H. Adams et al., SPEJ. , 12 (3), 13 (1956). 5. J. L. O’Toole et al., Modern Plastics Encyclopedia, McGraw-Hill, New York, 1966, pp.
6. R. H. Shoulberg et al., SPE J., 23 (12), 32 (1967). 7. D. R. Reid et al., Brit. Plast., 156 (April 1959). 8. 0. R. Weaver, Mater. Res. Stand., 285 (June 1966). 9. W. J. Dixon et al., J. Amer. Stat. Assoc., 43,109 (1948).
39-52.
10. ASTM Annual Book of Standards, Part 27, Method D3029,1973. 11. C. B. Arends, J. Appl. Polym. Sci., 9,3531 (1965).
Received July 24,1975 Revised August 8,1975