Embed Size (px)
Citation preview
Development of an UPLC-mass spectrometry method for 1
measurement of myofibrillar protein synthesis: application to 2
analysis of murine muscles during cancer cachexia 3
Maria Lima1, Shuichi Sato2, Reilly T. Enos2, John W. Baynes3 and James A. Carson2* 4
1 Research and Innovation Centre, Fondaizone Edmund Mach – IASMA, San Michele all’ Adige 5
Trento, Italy 6 2 Department of Exercise Science, University of South Carolina, Columbia, South Carolina, 7
United States of America 8 3 Department of Pharmacology, Physiology and Neuroscience, University of South Carolina 9
School of Medicine, Columbia, SC, United States of America 10
* Correspondence to: 11
J. A. Carson, Dept. of Exercise Science, Public Health Research Center, Univ. of South Carolina, 12
921 Assembly St., Rm 405, Columbia, SC 29208 (email: [email protected]) 13
14
Running Head: Myofibrillar protein synthesis in skeletal muscle 15
16
Keywords: cachexia, myofibrillar protein synthesis, soleus, plantaris, ultra performance liquid 17
chromatography-mass spectrometry 18
19
20
21
22
Articles in PresS. J Appl Physiol (January 17, 2013). doi:10.1152/japplphysiol.01141.2012
Copyright © 2013 by the American Physiological Society.
ABSTRACT 23
Cachexia, characterized by skeletal muscle mass loss, is a major contributory factor to patient 24
morbidity and mortality during cancer. However, there are no reports on the rate of myofibrillar 25
protein synthesis (MPS) in skeletal muscles that vary in primary metabolic phenotype during 26
cachexia, in large part because of the small-size muscles and regional differences in larger 27
muscles in the mouse. Here we describe a sensitive method for measurement of MPS and its 28
application to analysis of MPS in specific muscles of mice with (ApcMin/+) and without 29
(C57BL/6) cancer cachexia. Mice were injected with a loading dose of deuterated phenylalanine 30
(D5F) and myofibrillar proteins extracted from skeletal muscles at 30 min. The relative 31
concentrations of D5F and naturally occurring phenylalanine (F) in the myofibrillar proteins and 32
the amino acid pool were quantified by ultra-performance liquid chromatograph (UPLC)-mass 33
spectrometry (MS). The rate of MPS was determined from D5F: F ratio in the protein fraction, 34
compared to the amino acid pool. The rate of MPS, measured in 2-5 mg muscle protein, was 35
reduced by up to 65% with cachexia in the soleus, plantaris, diaphragm, and oxidative and 36
glycolytic regions of the gastrocnemius. The rate of MPS was significantly higher in the 37
oxidative vs. glycolytic gastrocnemius muscle. A sufficiently sensitive UPLC-MS method 38
requiring very small amount of muscle has been developed to measure the rate of MPS in various 39
mouse muscles. This method should be useful for studies in other animal models for quantifying 40
effects of cancer and anti-cancer therapies on protein synthesis in cachexia, and particularly for 41
analysis of sequential muscle biopsies in a wide range of animal and human studies. 42
43
INTRODUCTION 44
Skeletal muscle is a highly plastic tissue, which can undergo hypertrophy or atrophy in response 45
to a variety of stimuli, including: disuse, variations in nutritional and hormonal status, aging, 46
exercise, chronic diseases and associated metabolic syndromes (15, 21, 27). Cachexia, is a 47
chronic wasting condition associated with inflammatory diseases such as cancer and is 48
characterized by severe loss of both muscle and adipose tissue mass (11, 20). Losses in muscle 49
mass lead to muscle weakness and impaired muscle function, which can negatively impact 50
quality of life, response to therapy, and can increase mortality (22, 24, 26). Cachexia affects up 51
to 80% of patients with advanced cancers and more than 20% of patients die as a result of 52
cachexia-related complications (1, 2, 29). The rapid progressive muscle loss rooted in cachexia is 53
the result of an imbalance between decreased protein synthesis (MPS) and increased protein 54
degradation (28). Because of its importance as a marker of cachexia, measurement of MPS is a 55
valuable tool for evaluating the effectiveness of strategies to combat cachexia. 56
Although there are several different animal models that are used to study cachexia, the 57
genetically-engineered ApcMin/+ mouse model (Min: multiple intestinal neoplasia) is commonly 58
utilized; the slow-progressive cachexia and associated side effects exhibited by this model 59
closely mimic human cachexia (4, 6). The ApcMin/+ mouse is heterozygous for a point mutation in 60
the adenomatous polyposis coli (Apc) gene, which leads to development of familial adenomatous 61
polyposis (FAP), a form of colon cancer. The mouse develops intestinal polyps at approximately 62
4 weeks of age, and loses body weight gradually between 14 and 20 weeks of age. At 20 weeks 63
of age, the mouse is usually severely cachectic, having lost more than 15% of body mass 64
compared to its peak body mass (4, 6, 25). Muscle phenotype related to the capacity for 65
oxidative metabolism can affect myofiber susceptibility to wasting (17), and primarily glycolytic 66
myofibers in the ApcMin/+ mouse demonstrated more atrophy during the development of cachexia 67
(5). The standard procedure for measuring protein synthesis in vivo involves measurement of 68
incorporation of isotopically labeled tracers into myofibrillar protein, using liquid scintillation 69
counting, isotope ratio mass spectrometry (IRMS), and gas chromatography/mass spectrometry 70
(GC-MS) (16, 23, 31). Although these methods have been useful, they require relatively large 71
amounts of tissue (typically 20 - 50 mg wet weight), which in some cases is not readily available, 72
except by pooling samples, and in any case, limits the availability of tissue needed for other 73
analyses (e.g. western blots, RT-PCR, etc) (14, 23). To date, many researchers have been 74
utilizing various mouse models of cachexia to understand the mechanisms responsible for muscle 75
wasting, and the role of muscle phenotype in the process (7, 9, 12, 18). 76
Tandem Mass spectrometry (MS/MS), coupled with ultra-performance liquid 77
chromatography (UPLC), provides high resolution, specificity and sensitivity for measurement 78
of amino acids in tissues (8). In this paper we describe a method for analysis of MPS in 79
individual mouse muscles using UPLC-MS/MS. 80
81
METHODS 82
Materials 83
Nonafluoropentanoic acid (NFPA, 97%) and sodium hydroxide (NaOH) were purchased 84
from Sigma (St. Louis, MO). Trifluoroacetic acid (TFA) was purchased from ThermoFisher 85
Scientific (Waltham, MA). L-[ring-2H5]phenylalanine (D5F) was from Cambridge Isotope 86
Laboratories (Andover, MA), and HPLC-grade water and methanol from VWR, Inc. (Radnor, 87
PA). 88
Animals & Tissue Collection 89
Male ApcMin/+ mice on a C57BL/6 background were originally purchased from Jackson 90
Laboratories (Bar Harbor, ME) and crossed with C57BL/6 female mice at the University of 91
South Carolina’s animal resource facility. Offspring were genotyped as heterozygotes by RT-92
PCR for the Apc gene as described by Mehl et al.(18, 19) All mice were housed in standard 93
cages. The room was maintained at 24 °C on a 12:12 light:dark cycle with the light period 94
starting at 0700. All mice were provided with standard rodent chow (Harlan Teklad Rodent Diet, 95
#8604, Madison, WI) and water ad libitum. Male C57BL/6 and ApcMin/+ mice (n = 6-7) were 96
sacrificed at 20 weeks of age. 97
Thirty minutes prior to sacrifice, all mice received an intraperitoneal injection of 150 mM 98
D5F in a 75 mM NaCl solution at a dose of 0.02 mL/g body weight. Subsequently, mice were 99
given a subcutaneous injection of a ketamine-xylazine-acepromazine cocktail (1.4 mL/kg body 100
weight). Muscles (plantaris, soleus, gastrocnemius, and diaphragm) were excised under 101
anesthesia, rinsed in PBS, weighed, snap frozen in liquid nitrogen, and stored at -80 °C until 102
further analysis. Red and white fibers were isolated from the gastrocnemius as previously 103
described (32). All animal experimentation was conducted in accordance with procedures 104
approved by the University of South Carolina’s Institutional Animal Care and Use Committee. 105
106
Protein Extraction and Isolation 107
108
Frozen muscle tissues were processed using the method of Welle et al (31) for 109
measurement of myofibrillar protein synthesis by gas chromatography mass spectrometry. Tissue 110
samples (~5 mg) were weighed in a 1.5 mL Eppendorf plastic centrifuge tube, to which 200 µL 111
of ice cold homogenizing buffer (HB: 50 mM KPO4, pH 7.0, 0.25 M sucrose, 1% Triton X-100) 112
was added, and kept on ice. Each sample was sonicated twice for 20 seconds on ice. The 113
sonicate was centrifuged at 10,000 g for 10 min at 4 °C, and the supernatant containing the free 114
amino acid pool was transferred to a fresh tube and dried under vacuum (Speed Vac, Thermo 115
Electron Corp., Milford, MA), then reconstituted in 1% aqueous TFA (1 mL) and stored at -116
20 °C. The pellet fraction was resuspended by sonication in 350 μL of HB, and centrifuged at 117
10,000 g for 10 min at 4 °C. The supernatant was discarded, and this washing procedure was 118
repeated once with HB (350 uL) and twice with ice-cold deionized water (500 uL). 119
NaOH (0.3 M, 200 uL) was added to the final pellet followed by centrifugation at 10,000 120
g for 10 min at 4 °C. The supernatant, containing myofibrillar proteins, was diluted with 6 M 121
HCl (1 mL) and the protein hydrolyzed at 110 °C for 24 h in 2 mL screw-closure polypropylene 122
O-ring sealed vials (Sarstedt, Nümbrecht, Germany). HCl was removed under vacuum (Speed 123
Vac, Thermo Electron Cooperation, Milford, MA), and the dried protein hydrolysate was 124
reconstituted in 1% aqueous TFA (1 mL) and stored at -20 °C. The free amino acid pool and 125
myofibrillar protein hydrolysate were applied to a 3 mL Supelco C18 cartridge (Waters, Milford, 126
MA), equilibrated in 1% aqueous TFA. The aromatic amino acid fraction was eluted with 1% 127
TFA in methanol:water (20:80, v/v, 3 mL). The eluate was dried under vacuum and reconstituted 128
in aqueous 5 mM NFPA (45 μL) prior to analysis by UPLC-MS/MS. 129
130
LC-MS Conditions and Instrumentation 131
132
Samples were fractioned on a Waters (Manchester, UK) Acquity UPLC-MS/MS system using a 133
BEH C18 column (2.1 x 50 mm, particle size 1.7 µm), which was maintained at room 134
temperature. Samples were eluted at a flow rate of 0.2 mL/min, eluting for 2.0 min with 100% 135
solvent A (aqueous 5 mM NFPA), followed linear gradient to 50% solvent B (acetonitrile) over 136
10 min, then washed with 80% solvent B for 15 min. The injection volume was 5 µL (equivalent 137
to ~ 3 nmol of F). 138
Mass spectrometry experiments and optimization of the method were performed utilizing 139
a Micromass Quattro Premier XE Tandem Mass Spectrometer (Waters). Multiple reaction 140
monitoring (MRM) was conducted operating the MS in positive ion electrospray mode. Table 1 141
details the MRM conditions of analysis. Other MS operating conditions used were: scan 142
duration, 1s; capillary voltage, 3 kV; cone voltage, 25 eV; source temperature, 100 °C; 143
desolvation temperature, 350 °C. Sample peaks corresponding to phenylalanine, naturally 144
occurring 13C-phenylalanine and D5F were integrated. Data were analyzed using MassLynx 145
software (version 4.1), supplied by Waters. Analytes were quantified by comparing the peak 146
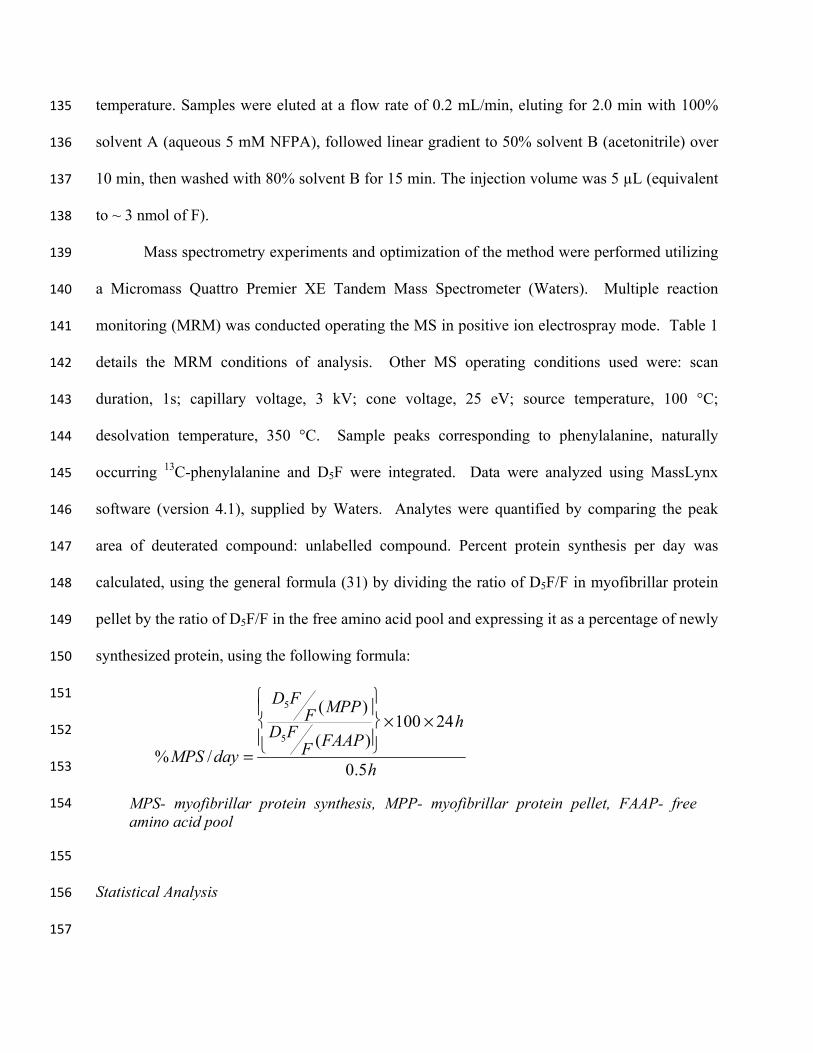
area of deuterated compound: unlabelled compound. Percent protein synthesis per day was 147
calculated, using the general formula (31) by dividing the ratio of D5F/F in myofibrillar protein 148
pellet by the ratio of D5F/F in the free amino acid pool and expressing it as a percentage of newly 149
synthesized protein, using the following formula: 150
151
152
153
154
155
Statistical Analysis 156
157
%MPS /day =
D5FF (MPP)
D5FF (FAAP)
×100 × 24h
0.5h
MPS- myofibrillar protein synthesis, MPP- myofibrillar protein pellet, FAAP- free amino acid pool
All statistical analyses were performed using GraphPad Prism (La Jolla, CA). All 158
comparisons were analyzed using a Student’s two-tailed t-test, with significance set at p ≤ 0.05. 159
160
RESULTS AND DISCUSSION 161
UPLC-MS conditions were optimized to resolve phenylalanine in a short 162
chromatographic run. Addition of 5 mM NFPA, an ion-pairing agent, to the mobile phases 163
improved signal intensity and resolution. MRM conditions were manually optimized for each 164
compound in positive ESI ionization mode to obtain maximal response. The mass spectrum of 165
phenylalanine is shown in Fig. 1A. The precursor ion (m/z 166) was selected for fragmentation 166
and the fragment corresponding to the immonium ion (m/z 120), which was the most abundant 167
fragment in the spectrum, was recorded by the second mass analyzer. Chromatograms obtained 168
for F, 13C-F and D5F are shown in Fig. 1B and 1C for myofibrillar protein pellet and the amino 169
acid pool, respectively. The natural abundance peak of 13C-F, which is 1.1 % the intensity of the 170
12C-F peak, was used for internal standardization since the 12C-F signal saturated the detector for 171
some samples. 172
All peaks were normalized to the strongest signal in the pellet and amino acid pool 173
fractions, respectively. As expected, the myofibrillar pellet contained an abundant amount of F, 174
followed by naturally occurring 13C-F, which accounts for ~ 10% of F, and D5F. Although the 175
peak intensity for the D5F in pellet was only ∼ 0.14% of F in the myofibrillar protein, this was 176
well within the linear range of the instrument and yielded a strong signal during MRM analysis 177
(Fig. 1B, insert). 178
Using the optimized MRM conditions and the formula above, myofibrillar protein 179
synthesis was quantified in various skeletal muscles (Fig. 2). The mice chosen for the study, at 180
20 weeks of age, were chosen from a group of severely cachectic Apc Min/+mice (Table 2). 181
Cachectic Apc Min/+mice experience an average of ~20% weight loss between their 12th and 19th 182
week of age (32). Not all of the weight changes the result of loss of skeletal muscle - there are 183
comparable losses of adipose tissue mass. Even with adjustment for the lifespan of mice, 184
compared to humans, the rate of weight loss in untreated severely cachectic mice is extreme. In 185
humans, pre-cachexia is generally defined as ≤5% weight loss during a 6-month period, while 186
weight loss ≥6% during this period is described as cachexia (3). 187
The rate of MPS varied from ~1.25 %/d to ~2.5 %/d in white and red gastrocnemius, 188
respectively, to ~4.3 %/day in the diaphragm muscle of control animals at 20 weeks (5 months) 189
of age (Fig. 2), in reasonable agreement with the 3% estimate of MPS in the gastrocnemius of 190
C57BL/6 mice at 6 months of age, analyzed by the GC-MS/MS procedure (31). MPS was 191
significantly reduced in all muscles in cachectic animals, but varied significantly with the 192
specific muscle, from ~60% in the red gastrocnemius and diaphragm muscles, to ~75% in the 193
plantaris muscle (Fig. 2). In a previous study, using a GC-MS/MS procedure, we observed an 194
~50% decrease in the rate of gastrocnemius muscle protein synthesis in a group of animals with 195
≥20% weight loss (33), which is reasonably consistent with the results of the UPLC-MS/MS 196
method applied to a more severely cachectic group of mice. There is also an ~150% increase in 197
the rate of muscle protein degradation in these animals (33), which further contributes to the 198
decrease in muscle mass. Percentage reductions in MPS were observed across all muscle types, 199
including the soleus and plantaris muscles, which could not be measured (without pooling 200
samples) by the GC-MS/MS method. We also show for the first time that the absolute rate of 201
MPS is significantly higher in the red portion of the gastrocnemius and the soleus muscle 202
compared to the white portion of the gastrocnemius and the plantaris muscle in the mouse. This 203
is consistent with the observation that MPS in glycolytic muscle fibers is more susceptible to 204
wasting compared to oxidative fibers in humans and rats (10, 13, 30). However, to the best of our 205
knowledge, no other studies have examined the rate of MPS in different muscle phenotypes of 206
cachectic mice due to limitations regarding tissue mass needed for the analysis. 207
To further validate the method, MPS was measured in younger ApcMin/+mice group 208
compared to the C57BL/6 controls animals (aged 10 wk) (Fig. 3). These results illustrated that 209
there was no significant difference in MPS across genotypes, which supports the observation that 210
Apc Min/+mice are not cachetic at this age (33), hence MPS is not decreased. Compared to the 211
GC-MS/MS method (33), which requires ~ 50 mg of tissue per analysis, the current method 212
requires only 5 mg of tissue, which permits triplicate injections and applies more straightforward 213
calculations. The intra-assay variance within a group of animals was < 2. Limit of detection is ~ 214
50 fmol for F standard injected on the column. Compared to GCMS, which requires 215
derivatization and longer analysis time, this method is far more advantageous due to its 216
simplicity of sample preparation and short analysis time. The small sample requirement for the 217
UPLC-MS/MS assay also allows for analysis of MPS in subcellular fractions of mouse muscles, 218
and should also be applicable to the analysis of sequential biopsy samples from animal and 219
human studies. 220
In summary, a specific, sensitive, and relatively simple method has been developed to 221
measure MPS in mouse tissues and has been applied to analysis of MPS in control and cachectic 222
mice. This method has been applied to analysis of small muscles (soleus and plantaris) muscles 223
and to analysis of MPS in different regions of the gastrocnemius muscle (red vs. white) 224
of ApcMin/+ mice. These results show that the rate of MPS is greater in red, oxidative muscles, 225
and that the rate of MPS is comparably decreased in all of these muscles including the 226
involuntary skeletal muscle diaphragm in ApcMin/+ mice during cachexia. Future studies on the 227
rates of protein turnover in these tissues will provide a better understanding of the relative roles 228
of changes in muscle protein synthesis vs. turnover in the loss of muscle mass during cachexia. 229
230
ACKNOWLEDGEMENTS 231
The authors thank Dr. William Cotham for technical assistance with mass spectrometry 232
analyses, and Drs. James A. White and Norma Frizzell for helpful discussions. 233
234
GRANTS 235
This work was supported by the grant R01CA121249. 236
237
DISCLOSURES 238
The authors have declared that they have no competing interests. 239
240
AUTHOR CONTRIBUTIONS 241
Conceived and designed the experiments: ML SS RTE JWB JAC. Performed the 242
experiments: ML SS RTE JAC. Analyzed the data: ML SS RTE JWB JAC. Contributed 243
reagents/materials/analysis tools: ML JWB JAC. Wrote the paper: ML SS RTE JWB JAC. 244
245
246
REFERENCES 247
1. Acharyya S, Butchbach ME, Sahenk Z, Wang H, Saji M, Carathers M, Ringel MD, Skipworth RJ, 248 Fearon KC, Hollingsworth MA, Muscarella P, Burghes AH, Rafael-Fortney JA, and Guttridge DC. 249 Dystrophin glycoprotein complex dysfunction: a regulatory link between muscular dystrophy and cancer 250 cachexia. Cancer Cell 8: 421-432, 2005. 251 2. Argiles JM, Busquets S, Garcia-Martinez C, and Lopez-Soriano FJ. Mediators involved in the 252 cancer anorexia-cachexia syndrome: past, present, and future. Nutrition 21: 977-985, 2005. 253 3. Argiles JM, Lopez-Soriano FJ, Toledo M, Betancourt A, Serpe R, and Busquets S. The cachexia 254 score (CASCO): a new tool for staging cachectic cancer patients. J Cachexia Sarcopenia Muscle 2: 87-93, 255 2011. 256 4. Baltgalvis KA, Berger FG, Pena MM, Davis JM, Muga SJ, and Carson JA. Interleukin-6 and 257 cachexia in ApcMin/+ mice. American journal of physiology Regulatory, integrative and comparative 258 physiology 294: R393-401, 2008. 259 5. Baltgalvis KA, Berger FG, Pena MM, Davis JM, White JP, and Carson JA. Muscle wasting and 260 interleukin-6-induced atrogin-I expression in the cachectic Apc ( Min/+ ) mouse. Pflugers Archiv : 261 European journal of physiology 457: 989-1001, 2009. 262 6. Baltgalvis KA, Berger FG, Pena MM, Mark Davis J, White JP, and Carson JA. Activity level, 263 apoptosis, and development of cachexia in Apc(Min/+) mice. J Appl Physiol 109: 1155-1161, 2010. 264 7. Bennani-Baiti N, and Walsh D. Animal models of the cancer anorexia-cachexia syndrome. 265 Support Care Cancer 19: 1451-1463, 2011. 266 8. Churchwell MI, Twaddle NC, Meeker LR, and Doerge DR. Improving LC-MS sensitivity through 267 increases in chromatographic performance: comparisons of UPLC-ES/MS/MS to HPLC-ES/MS/MS. J 268 Chromatogr B Analyt Technol Biomed Life Sci 825: 134-143, 2005. 269 9. DeBoer MD. Update on melanocortin interventions for cachexia: progress toward clinical 270 application. Nutrition 26: 146-151, 2011. 271 10. Dickinson JM, Lee JD, Sullivan BE, Harber MP, Trappe SW, and Trappe TA. A new method to 272 study in vivo protein synthesis in slow- and fast-twitch muscle fibers and initial measurements in 273 humans. J Appl Physiol 108: 1410-1416, 1982. 274 11. Dodson S, Baracos VE, Jatoi A, Evans WJ, Cella D, Dalton JT, and Steiner MS. Muscle wasting in 275 cancer cachexia: clinical implications, diagnosis, and emerging treatment strategies. Annu Rev Med 62: 276 265-279, 2011. 277 12. Emery PW. Cachexia in experimental models. Nutrition 15: 600-603, 1999. 278 13. Garlick PJ, Maltin CA, Baillie AG, Delday MI, and Grubb DA. Fiber-type composition of nine rat 279 muscles. II. Relationship to protein turnover. Am J Physiol 257: E828-832, 1989. 280 14. Garlick PJ, Wernerman J, McNurlan MA, Essen P, Lobley GE, Milne E, Calder GA, and Vinnars E. 281 Measurement of the rate of protein synthesis in muscle of postabsorptive young men by injection of a 282 'flooding dose' of [1-13C]leucine. Clin Sci (Lond) 77: 329-336, 1989. 283 15. Hawley JA, Burke LM, Phillips SM, and Spriet LL. Nutritional modulation of training-induced 284 skeletal muscle adaptations. J Appl Physiol 110: 834-845, 2011. 285 16. Kubera M, Skowron-Cendrzak A, and Garlicki M. Prolongation of H--Y incompatible skin grafts 286 in mice by neonatal spleen cells. Folia Biol (Krakow) 37: 165-169, 1989. 287 17. Li P, Waters RE, Redfern SI, Zhang M, Mao L, Annex BH, and Yan Z. Oxidative phenotype 288 protects myofibers from pathological insults induced by chronic heart failure in mice. The American 289 journal of pathology 170: 599-608, 2007. 290 18. Mehl KA, Davis JM, Berger FG, and Carson JA. Myofiber degeneration/regeneration is induced 291 in the cachectic ApcMin/+ mouse. J Appl Physiol 99: 2379-2387, 2005. 292
19. Mehl KA, Davis JM, Clements JM, Berger FG, Pena MM, and Carson JA. Decreased intestinal 293 polyp multiplicity is related to exercise mode and gender in ApcMin/+ mice. J Appl Physiol 98: 2219-2225, 294 2005. 295 20. Morley JE, Thomas DR, and Wilson MM. Cachexia: pathophysiology and clinical relevance. Am J 296 Clin Nutr 83: 735-743, 2006. 297 21. Murton AJ, Constantin D, and Greenhaff PL. The involvement of the ubiquitin proteasome 298 system in human skeletal muscle remodelling and atrophy. Biochim Biophys Acta 1782: 730-743, 2008. 299 22. O'Gorman P, McMillan DC, and McArdle CS. Impact of weight loss, appetite, and the 300 inflammatory response on quality of life in gastrointestinal cancer patients. Nutr Cancer 32: 76-80, 1998. 301 23. Patterson BW, Zhang XJ, Chen Y, Klein S, and Wolfe RR. Measurement of very low stable 302 isotope enrichments by gas chromatography/mass spectrometry: application to measurement of muscle 303 protein synthesis. Metabolism 46: 943-948, 1997. 304 24. Persson C, and Glimelius B. The relevance of weight loss for survival and quality of life in 305 patients with advanced gastrointestinal cancer treated with palliative chemotherapy. Anticancer Res 22: 306 3661-3668, 2002. 307 25. Puppa MJ, White JP, Sato S, Cairns M, Baynes JW, and Carson JA. Gut barrier dysfunction in the 308 Apc(Min/+) mouse model of colon cancer cachexia. Biochimica et biophysica acta 1812: 1601-1606, 309 2011. 310 26. Scott HR, McMillan DC, Brown DJ, Forrest LM, McArdle CS, and Milroy R. A prospective study 311 of the impact of weight loss and the systemic inflammatory response on quality of life in patients with 312 inoperable non-small cell lung cancer. Lung Cancer 40: 295-299, 2003. 313 27. Taaffe DR, and Marcus R. Musculoskeletal health and the older adult. J Rehabil Res Dev 37: 245-314 254, 2000. 315 28. Tisdale MJ. Mechanisms of cancer cachexia. Physiological reviews 89: 381-410, 2009. 316 29. Tisdale MJ. Pathogenesis of cancer cachexia. J Support Oncol 1: 159-168, 2003. 317 30. Watt PW, Kelly FJ, Goldspink DF, and Goldspink G. Exercise-induced morphological and 318 biochemical changes in skeletal muscles of the rat. J Appl Physiol 53: 1144-1151, 1982. 319 31. Welle S, Bhatt K, and Pinkert CA. Myofibrillar protein synthesis in myostatin-deficient mice. Am 320 J Physiol Endocrinol Metab 290: E409-415, 2006. 321 32. White JP, Baltgalvis KA, Puppa MJ, Sato S, Baynes JW, and Carson JA. Muscle oxidative capacity 322 during IL-6-dependent cancer cachexia. American journal of physiology Regulatory, integrative and 323 comparative physiology 300: R201-211, 2011. 324 33. White JP, Baynes JW, Welle SL, Kostek MC, Matesic LE, Sato S, and Carson JA. The regulation of 325 skeletal muscle protein turnover during the progression of cancer cachexia in the Apc(Min/+) mouse. 326 PLoS One 6: e24650, 2011. 327 328 329 330
331
332
333

334
335
336
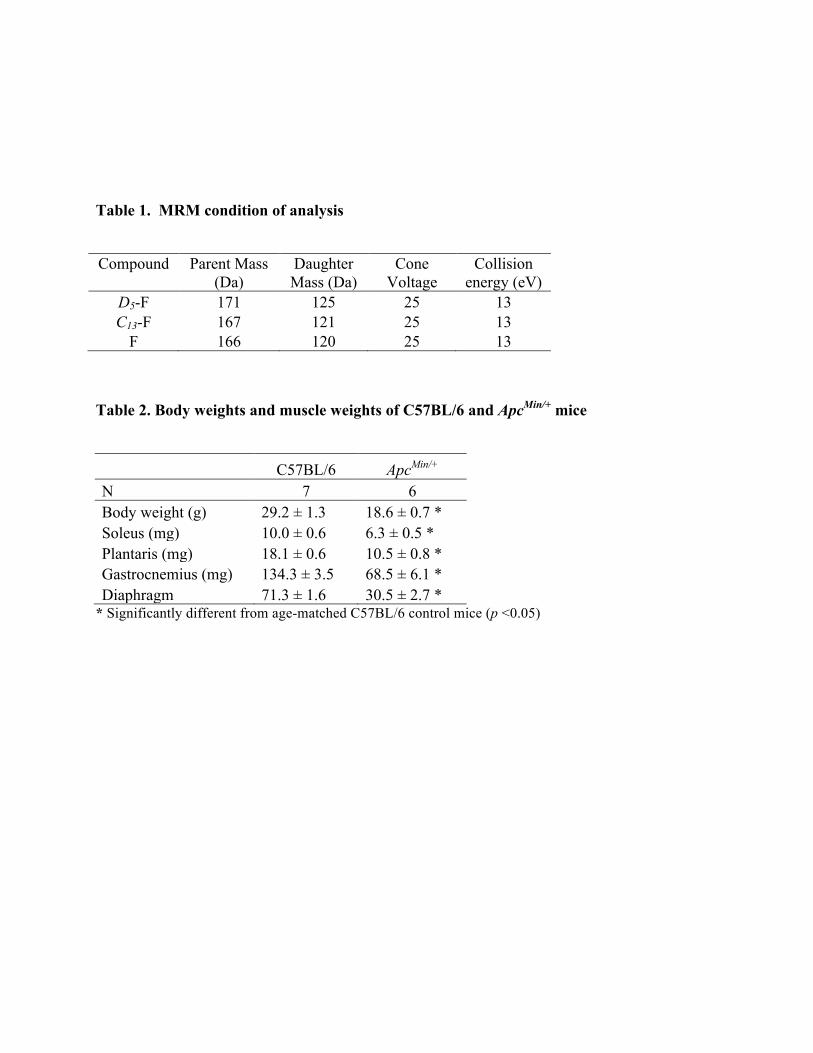
Table 1. MRM condition of analysis
Compound Parent Mass (Da)
Daughter Mass (Da)
Cone Voltage
Collision energy (eV)
D5-F 171 125 25 13 C13-F 167 121 25 13
F 166 120 25 13
Table 2. Body weights and muscle weights of C57BL/6 and ApcMin/+ mice
C57BL/6 ApcMin/+ N 7 6 Body weight (g) 29.2 ± 1.3 18.6 ± 0.7 * Soleus (mg) 10.0 ± 0.6 6.3 ± 0.5 * Plantaris (mg) 18.1 ± 0.6 10.5 ± 0.8 * Gastrocnemius (mg) 134.3 ± 3.5 68.5 ± 6.1 * Diaphragm 71.3 ± 1.6 30.5 ± 2.7 *
* Significantly different from age-matched C57BL/6 control mice (p <0.05)
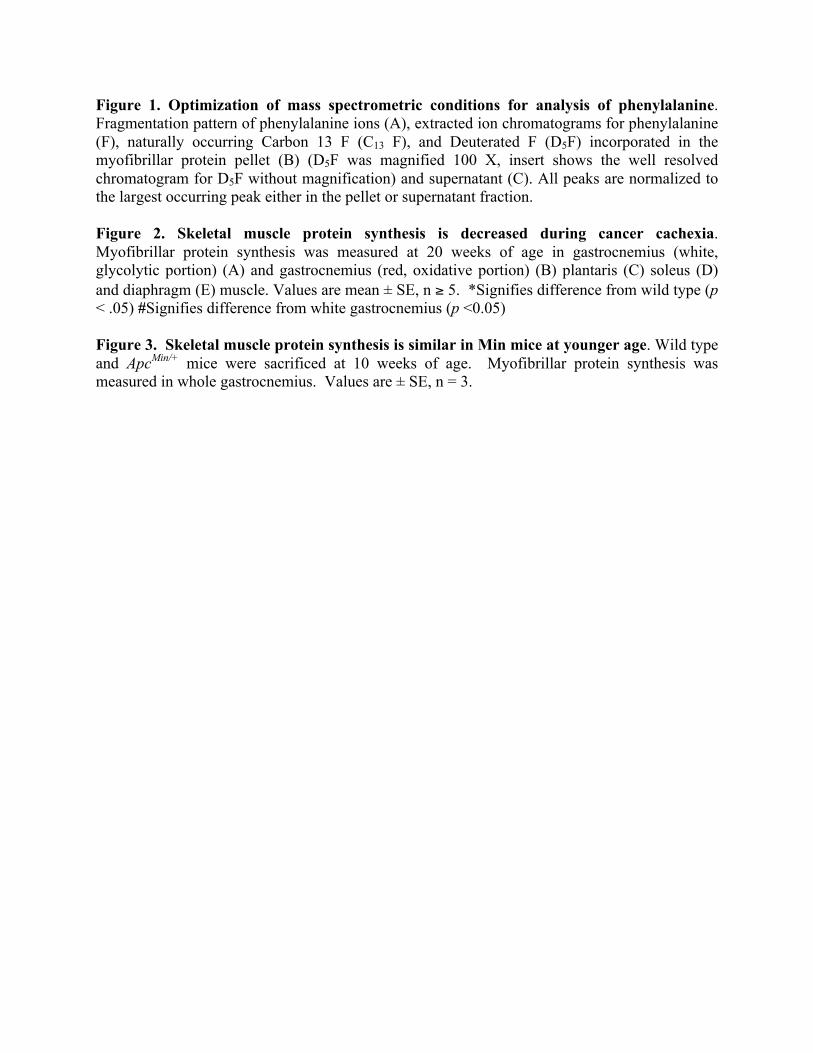
Figure 1. Optimization of mass spectrometric conditions for analysis of phenylalanine. Fragmentation pattern of phenylalanine ions (A), extracted ion chromatograms for phenylalanine (F), naturally occurring Carbon 13 F (C13 F), and Deuterated F (D5F) incorporated in the myofibrillar protein pellet (B) (D5F was magnified 100 X, insert shows the well resolved chromatogram for D5F without magnification) and supernatant (C). All peaks are normalized to the largest occurring peak either in the pellet or supernatant fraction. Figure 2. Skeletal muscle protein synthesis is decreased during cancer cachexia. Myofibrillar protein synthesis was measured at 20 weeks of age in gastrocnemius (white, glycolytic portion) (A) and gastrocnemius (red, oxidative portion) (B) plantaris (C) soleus (D) and diaphragm (E) muscle. Values are mean ± SE, n ≥ 5. *Signifies difference from wild type (p < .05) #Signifies difference from white gastrocnemius (p <0.05) Figure 3. Skeletal muscle protein synthesis is similar in Min mice at younger age. Wild type and ApcMin/+ mice were sacrificed at 10 weeks of age. Myofibrillar protein synthesis was measured in whole gastrocnemius. Values are ± SE, n = 3.
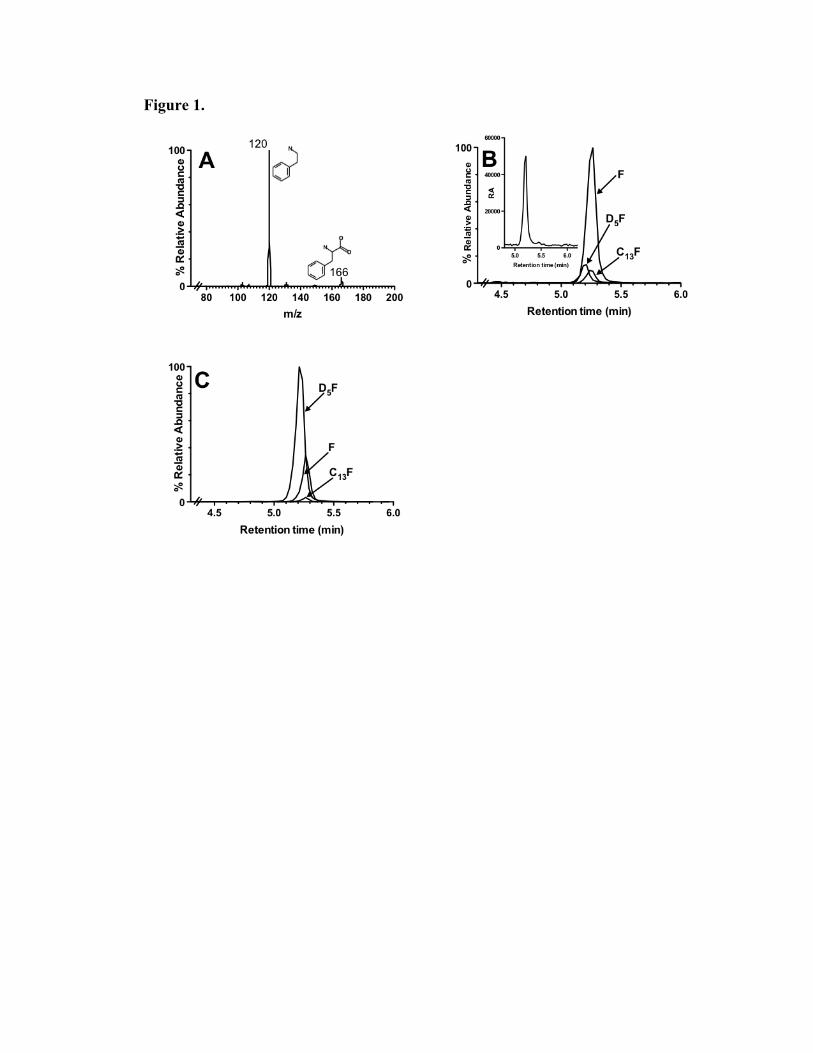
Figure 1.
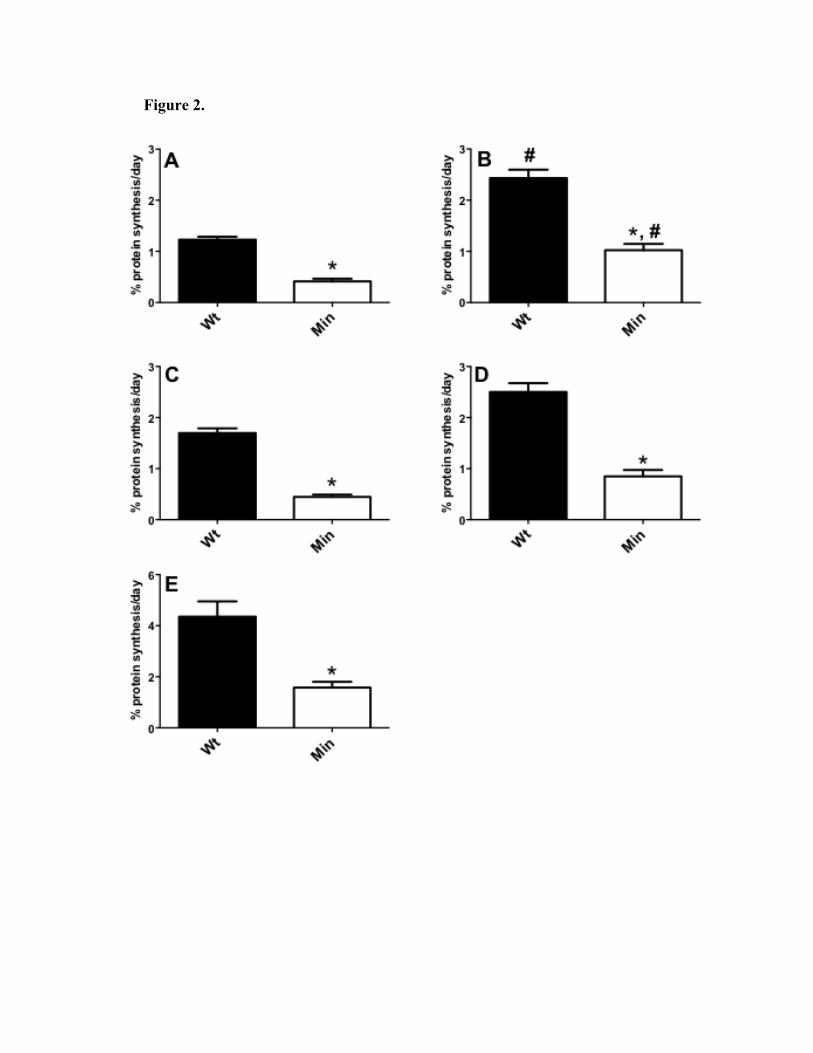
Figure 2.
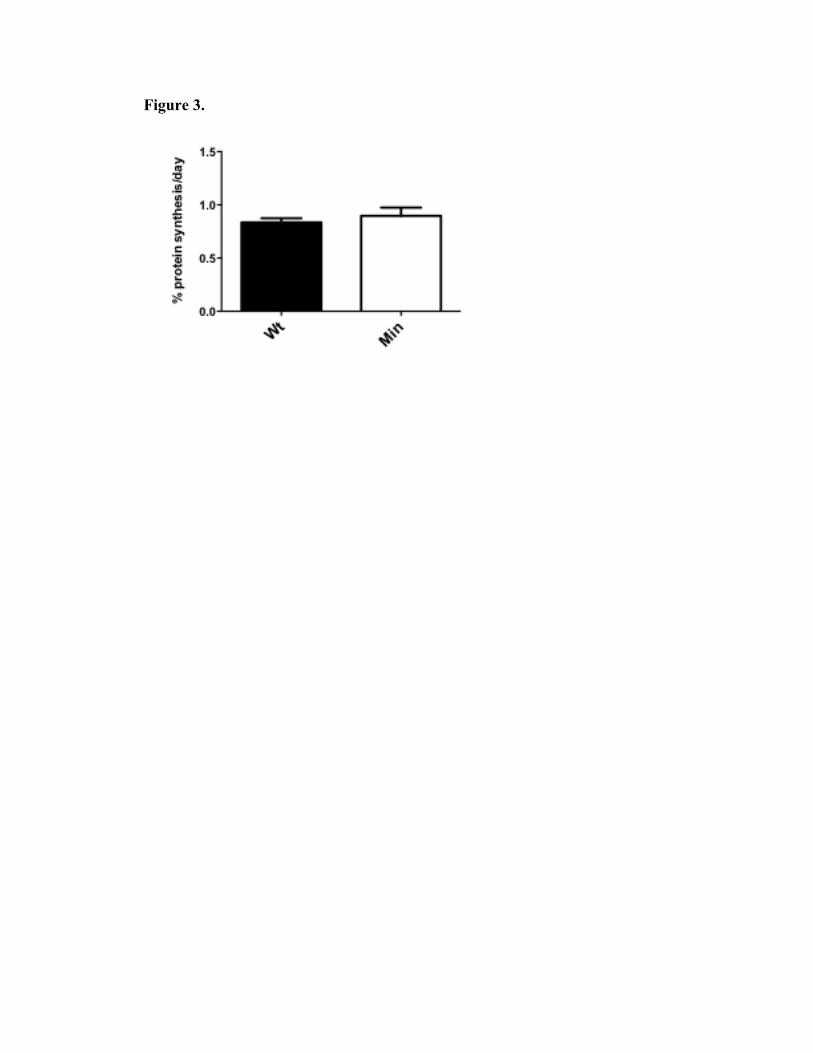
Figure 3.


