Embed Size (px)
Citation preview
BIOCHEMISTRY: EDDS ET AL.
the maximal lunar influence would be expected to center over 6 A.M. and, at thirdquarter, to center over the noon hour. These expectations are essentially fulfilled.This qualitative similarity relative to bodies intrinsically as different in most re-spects as our sun and moon might suggest that gravitational forces in some mannerenter into the chain of forces coupling them with biological activities, possiblythrough certain geophysical fluctuations associated with the well-known solar andlunar tides of the atmosphere.In summary, it has been shown that during the 14-month period when this study
was being made, there were statistically significant synodic monthly cycles of Ok.consumption, with a skewed form. This was demonstrated for four more or less in-dependent parameters of metabolic change which were found to exhibit among them-selves only low correlations in day-to-day changes. In each instance, in the averageskewed monthly cycle for this period, the minimum occurred at the time of newmoon, and maximum at the time of third quarter.
* These studies were aided by a contract between the Office of Naval Research, Department ofthe Navy, and Northwestern University, NONR-122803.
f The authors wish to express their appreciation to the several students who contributed manyhours in assisting to obtain the data used here. Thanks are especially due to Messrs. E. F. Lutsch,E. J. Macey, W. D. Korte, F. H. Barnwell, and H. Gibson, Jr.
I F. A. Brown, Jr., and H. M. Webb, Physiol. Zool., 21, 371-381, 1948.2 F. A. Brown, Jr., H. M. Webb, M. F. Bennett, and M. I. Sandeen, Physiol. Zool., 27, 345-
349, 1954.3 N. G. Ball, and I. J. Dyke, J. Exptl. Bot., 5, 421-433, 1954.4E. Bunning, and E. W. Bauer, Z. Bot., 40, 67-76, 1952.6 F. A. Brown, Jr., R. 0. Freeland, and C. L. Ralph, Plant Physiol., 30, 280-292, 1955.6 F. A. Brown, Jr., H. M. Webb, M. F. Bennett, and M. I. Sandeen, Biol. Bull., 109, 238-254,
1955.7F. A. Brown, Jr., Rev. Sci. Instr., 25, 415-417, 1954.8 F. A. Brown, Jr., Biol. Bull., 112, 288-304, 1957.9 F. A. Brown, Jr., Anat. Rec., 128, 528-529, 1957.
10 C. L. Ralph, Physiol. Zo6l., 30, 41-55, 1957; and Biol. Bull., 113, 188-197, 1957.' J. F. G. Wheeler, J. Linnean Soc. London, 40, 325-345, 1937.12 F. A. Brown, Jr., J. Shriner, and H. M. Webb, Biol. Bull., 113, 103-111, 1957.13 F. A. Brown, Jr., H. M. Webb, and E. J. Macey, Biol. Bull., 113, 112-119, 1957.
DEVELOPMENT OF COLLAGEN IN THE FROG EMBRYO*
BY MAC V. EDDS, JR.t
DEPARTMENT OF BIOLOGY, MASSACHUSETTS INSTITUTE OF TECHNOLOGY, CAMBRIDGE, MASSACHUSETTS
Communicated by Francis 0. Schmitt, February 25, 1958
INTRODUCTION
Ideally, any macromolecular substance which is selected as a model for a studyof embryonic chemodifferentiation should satisfy the following criteria: The sub-stance should be identifiable by at least one highly specific and sensitive analyticalmethod, preferably chemical. It should be well characterized biologically, chemi-cally, and physically, so that information about its biosynthesis, if not alreadyavailable, may reasonably be anticipated. It should not occur in the egg but
296 PROC. N. A. S.
BIOCHEMISTRY: EDDS ET AL.
should have a developmental history such that its emergence is one consequence ofdifferentiation. Finally, it should participate detectably in distinctive structuresor functions in later embryonic or adult stages.Although a few macromolecules fulfil one or more of these requirements (e.g.,
nucleic acid, myosin, cholinesterase, fertilizing, none of them is ideal, as severalembryological investigations attest. There is one substance, collagen, which doessatisfy the criteria listed above but which, despite long and extensive study by avariety of methods, has not received the attention it deserves from modern embryol-ogists. Collagen is one of the best-known biologically important macromolecules;recent physical and chemical studies have provided abundant information aboutits shape, size, and structure. 1-3 The value of collagen for analyses of morphogene-sis at the macromolecular and macromolecular aggregate levels is well estab-lished.4-6 The biosynthesis of collagen has been studied during the healing ofadult skin wounds (for references, see Gould and Woessner7) and in tissue cul-tures.8-10The developmental appearance of collagen should be readily traceable because,
first, it gives a distinctive X-ray diffraction pattern; second, it is apparently uniqueamong animal proteins in containing large amounts of hydroxyproline; and, third,it normally forms cross-banded fibrils with an axial period averaging about 640 Aand a detailed intraperiod fine structure. Despite these features, there is littleinformation about the earliest origins of collagen in the embryo. Neuman1' foundabout 1 tug of hydroxyproline in the 5-day chick embryo and by day 8, when Neu-man's data show approximately 100 ,ug hydroxyproline/embryo, Jackson"2 was ableto detect collagen fibrils in electron micrographs of the metatarsal tendon. In re-porting a chromatographic analysis of amino acids in eggs and embryos of the frog,Holtfreter et al."3 implied in the description of their Figure 1 that hydroxyproline isalready present in the egg but gave no further attention to this possibility.The results described below represent the initial phase of an investigation under-
taken to determine whether collagen is, in fact, suitable for a developmental studyof the kind suggested here. Answers were sought to two questions: When duringfrog development does hydroxyproliine appear? and What is the subsequent his-tory of its accumulation?
METHODS
Embryos and larvae of the frog, Rana pipiens, were raised from eggs obtainedfollowing implantation of pituitary glands into mature females. A series ofstages was studied, ranging from the unfertilized egg (Stage 1; Shumway'4) tolarvae which had been feeding for up to 3 weeks at room temperature (Stage II;Taylor and Kollrosl").
Five to 20 embryos or larvae were analyzed at each stage. Autoclave extractswere prepared and hydrolyzed following the procedure of Gould and Woessner.7The autoclave residues were uniformly free of hydroxyproline and will not be con-sidered further. Aliquots of the hydrolyzates, representing from one-eighth to one-half the embryos in the original sample, were tested for hydroxyproline by thecalorimetric method of Neuman and Logan'6 as modified by Martin and Axelrod."7The test proved suitable for detecting down to about 0.5 ug hydroxyproline/ml. ofaliquot analyzed if optical density was measured with a spectrophotometer (Beck-
VOL. 44, 19j58 297
BIOCHEMISTRY: EDDS ET AL.
man, Model DU) rather than a colorimeter, as recommended in the original proce-dure. Immediately following the determination of absorbance at 560 mMl, partial(520-580 m.) absorption spectra of the test solutions were measured. The formervalues permitted quantitative estimation of the hydroxyproline content. Becausethe pink color fades about 1-2 per cent per minute, the absorption spectra were notquantitatively useful. They were invaluable, however, for qualitative information,especially in the case of solutions containing less than 1 s4g hydroxyproline/ml.10Aqueous solutions of hydroxyproline (H. M. Chemical Co., Santa Monica, Calif.),previously tested for purity by paper chromatography, were used as standards. Asolution of hydrolyzed Eastman Kodak gelatin was included in each test as acontrol.
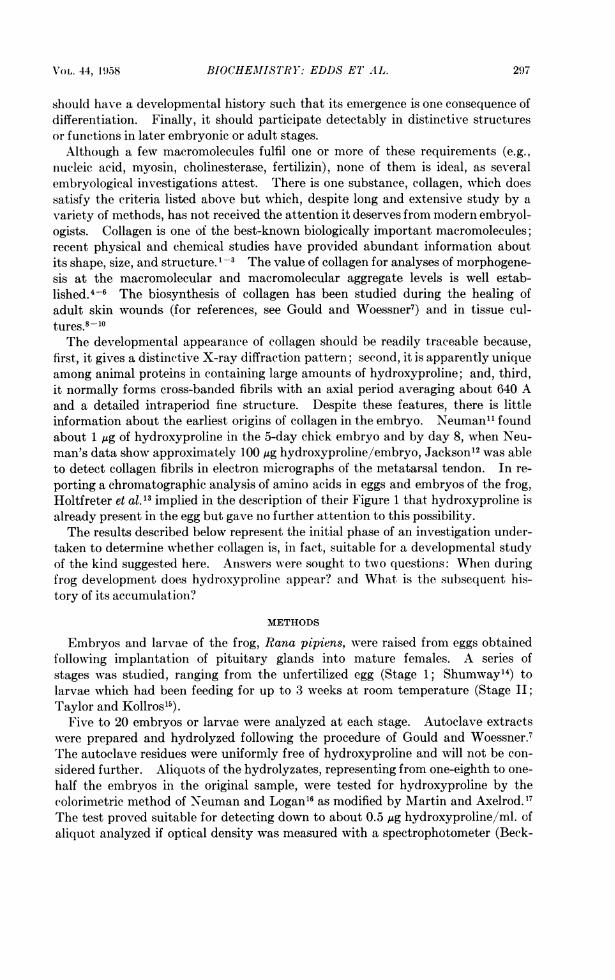
TABLE 1ANALYSES OF SERIES III EMBRYOS
DryWt.X 100Autoclave
Dry Weight Dry Wt. X 100 Extract; Hydroxyprolineper Embryo Wet Wt. Per Cent of per Embryo
Stage (mg.) (Per Cent) Dry Weight (Ag.)*(1) (2) (3) (4) (5)
............. 1.20 12.6t 33.3 0.169)............ 1.19 22.6 31.1 0.161x'............ 1.18 18.0 32.2 0.1616............. 1.10 25.3t 33.7 0.141E.............. 1.13 22.7 30.9 0.1421............ 1.07 17.6 30.9 0.2622............ 1.09 15 8 30.3 0.3223............ 1.11 10.9 31.5 0.4824............ 1.13 10.7 32.7 0.7425............ 1.04 7.1 37.5 1.3625+2.1.09 5.1 56.8 2.4225 +.1.22 4.3 54.1 3.8425 +.1.12 3.8 54.5 3.3225+11 ............ .99 3.7 49.5 5.12
Some jelly included in wet weight thus reducing the apparent % dry weight of the egg.$ Chorions removed from this and subsequent stages thus eliminating pervitelline fluid from wetweights and increasing the apparent % dry weight.
* Stages up to 21 probably not greater than zero; see text.
Two-dimensional chromatograms of selected stages were run onWhatman No. 1paper. Aliquots of the hydrolyzates representing two or three embryos were placedon the paper. N-butyl alcohol: acetic acid: water (4:1:5) and phenol: o-cresol (1:1,water-saturated) mixtures were used as solvents. The length of each run was ap-proximately 30 cm. Spots were developed with ninhydrin (reagent according toBriiggemann and Drepper'8) or with isatin and Ehrlich's reagent (as recommendedby Jepson and Smith'9).
Continuous preparative paper electrophoresis ("Elphor Va"20) was used to sep-arate acid, basic, and neutral fractions of one hydrolyzate. The buffer system waspyridine-acetic acid at pH 3.9. A potential difference of 290 volts was appliedacross the paper with a current of 15 mA, and an aqueous solution of the samplewas delivered to the paper at 0.07 ml/hr. The separation was carried out at 12°C. for 20 hours. Five fractions were collected and analyzed with the Neuman-Logan'6 test.
OBSERVATIONS
Four series of embryos were analyzed. Mutually consistent results were ob-
298 PRoc. N. A. S.
BIOCHEMISTRY: EDDS ET AL.
tained in the four series, but, since Series I and II were mainly exploratory, onlythe last two will be considered here.
Colorimetric Analyses.-The embryos of Series III developed from the eggs of asingle female. After reaching Stage 25 (Shumway"4) 13 days after fertilization,they were maintained on boiled lettuce and were at Stage II (Taylor and Kollros'5)11 days later. Since the stages analyzed after Stage 25 were more closely spacedthan those of the Taylor and Kollros series, they are designated Stage 25+1, 25+2,etc., the superscripts indicating days at room temperature after the onset of feeding(cf. Table 1).Twenty embryos or larvae at each of fourteen stages were studied (Table 1).
The data show the expected constancy of fat-free dry weights (col. 2) and steady
i60
140
(nz
CLia
-i4
0~
120
100
080
060
040
020
5jig
24"
23"., ,-/-\.
A- * \~~~~2
.......
530 550 570 530 550 570
WAVELENGTH,mp
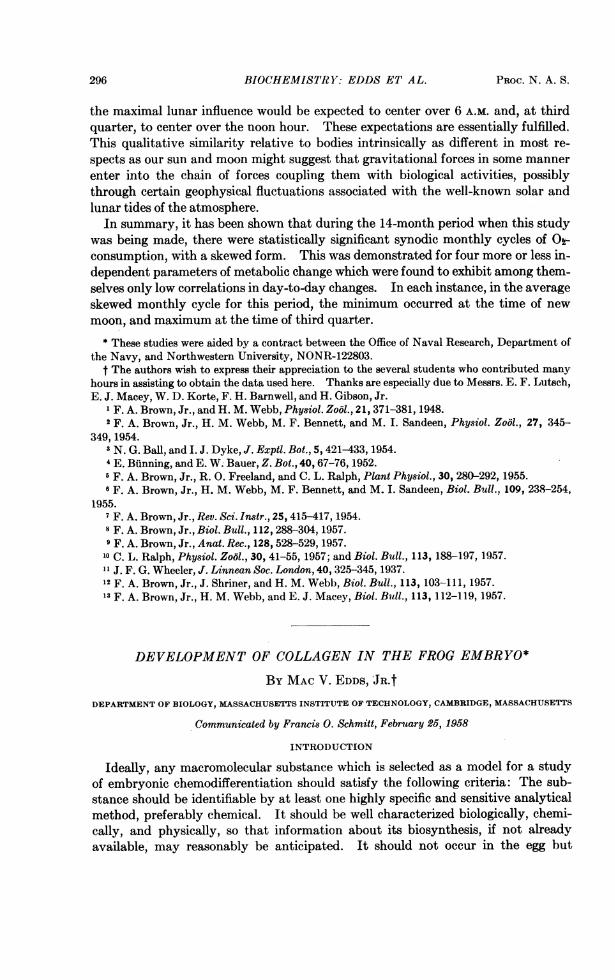
FIG. 1.-Partial absorption spectra (left) of aqueous hydroxyproline solutions and (right) ofhydrolyzates of Rana pipiens embryos (Shumway Stages 18-24; 5 embryos/ml).
increase of wet weights (col. 3; cf. Needham2", pp. 824, 883 ff.). Through Stage25, there is a similar constancy in the weight of autoclave-extractable fractions;roughly one-third of the dry weight is extracted. Thereafter, there is an abrupt in-crease in this fraction, and within 2 days (Stage 25 +2) over half the dry weight be-comes extractable (col. 4). Although some of this increase in autoclave-extract-able material may be attributed to recently synthesized collagen, the bulk of it isnot collagen, as results presented below will show. Presumably, the increase is duelargely to other water-soluble proteins emerging in the embryo at this time.Hydrolyzed samples of all the stages listed in Table 1 were analyzed colori-
metrically for hydroxyproline. The most relevant results are summarized in
VOL. 44, 1958 299
.--,. , "mg
BIOCHEMISTRY: EDDS ET AL.
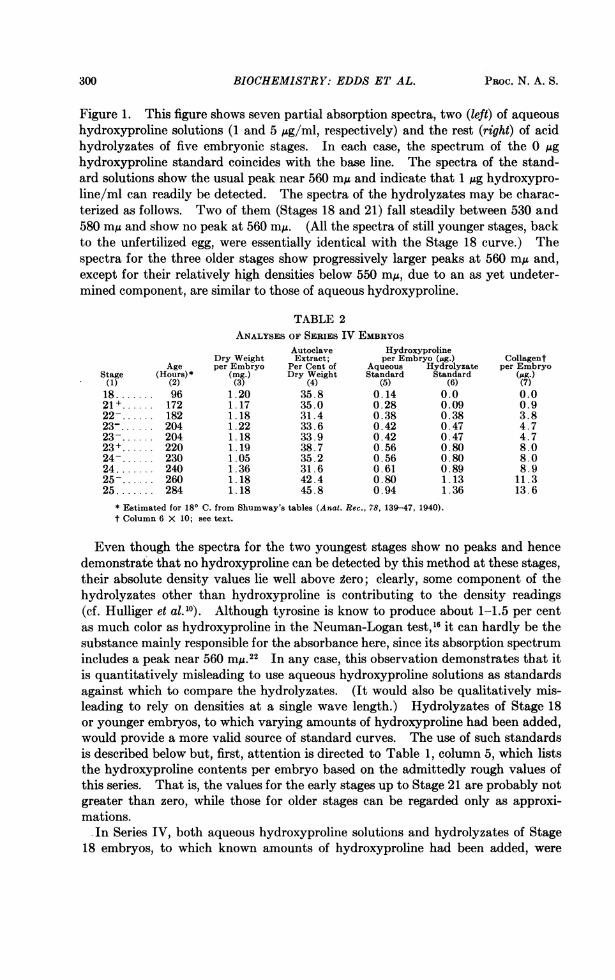
Figure 1. This figure shows seven partial absorption spectra, two (left) of aqueoushydroxyproline solutions (1 and 5 Mug/ml, respectively) and the rest (right) of acidhydrolyzates of five embryonic stages. In each case, the spectrum of the 0 ,ughydroxyproline standard coincides with the base line. The spectra of the stand-ard solutions show the usual peak near 560 m~u and indicate that 1 j.g hydroxypro-line/ml can readily be detected. The spectra of the hydrolyzates may be charac-terized as follows. Two of them (Stages 18 and 21) fall steadily between 530 and580 mIu and show no peak at 560 mjA. (All the spectra of still younger stages, backto the unfertilized egg, were essentially identical with the Stage 18 curve.) Thespectra for the three older stages show progressively larger peaks at 560 mg and,except for their relatively high densities below 550 m/A, due to an as yet undeter-mined component, are similar to those of aqueous hydroxyproline.
TABLE 2ANALYSES OF SERIES IV EMBRYOS
Autoclave HydroxyprolineDry Weight Extract; per Embryo (pg.) Collagent
Age per Embryo Per Cent of Aqueous Hydrolyzate per EmbryoStage (Hours)* (mg.) Dry Weight Standard Standard (pg.)(1) (2) (3) (4) (5) (6) (7)18....... 96 1.20 35.8 0.14 0.0 0.021+.... 172 1.17 35.0 0.28 0.09 0.922....... 182 1.18 31.4 0.38 0.38 3.823 ... 204 1.22 33.6 0.42 0.47 4.723....... 204 1.18 33.9 0.42 0.47 4.723 ....... 220 1.19 38.7 0.56 0.80 8.024....... 230 1.05 35.2 0.56 0.80 8.024....... 240 1.36 31.6 0.61 0.89 8.925....... 260 1.18 42.4 0.80 1.13 11.325....... 284 1.18 45.8 0.94 1.36 13.6
* Estimated for 180 C. from Shumway's tables (Anat. Rec., 78, 139-47, 1940).t Column 6 X 10; see text.
Even though the spectra for the two youngest stages show no peaks and hencedemonstrate that no hydroxyproline can be detected by this method at these stages,their absolute density values lie well above zero; clearly, some component of thehydrolyzates other than hydroxyproline is contributing to the density readings(cf. Hulliger et al.10). Although tyrosine is know to produce about 1-1.5 per centas much color as hydroxyproline in the Neuman-Logan test,16 it can hardly be thesubstance mainly responsible for the absorbance here, since its absorption spectrumincludes a peak near 560 mMA.22 In any case, this observation demonstrates that itis quantitatively misleading to use aqueous hydroxyproline solutions as standardsagainst which to compare the hydrolyzates. (It would also be qualitatively mis-leading to rely on densities at a single wave length.) Hydrolyzates of Stage 18or younger embryos, to which varying amounts of hydroxyproline had been added,would provide a more valid source of standard curves. The use of such standardsis described below but, first, attention is directed to Table 1, column 5, which liststhe hydroxyproline contents per embryo based on the admittedly rough values ofthis series. That is, the values for the early stages up to Stage 21 are probably notgreater than zero, while those for older stages can be regarded only as approxi-mations.
In Series IV, both aqueous hydroxyproline solutions and hydrolyzates of Stage18 embryos, to which known amounts of hydroxyproline had been added, were
300 PRoc. N. A. S.
BIOCHEMISTRY: EDDS ET AL.
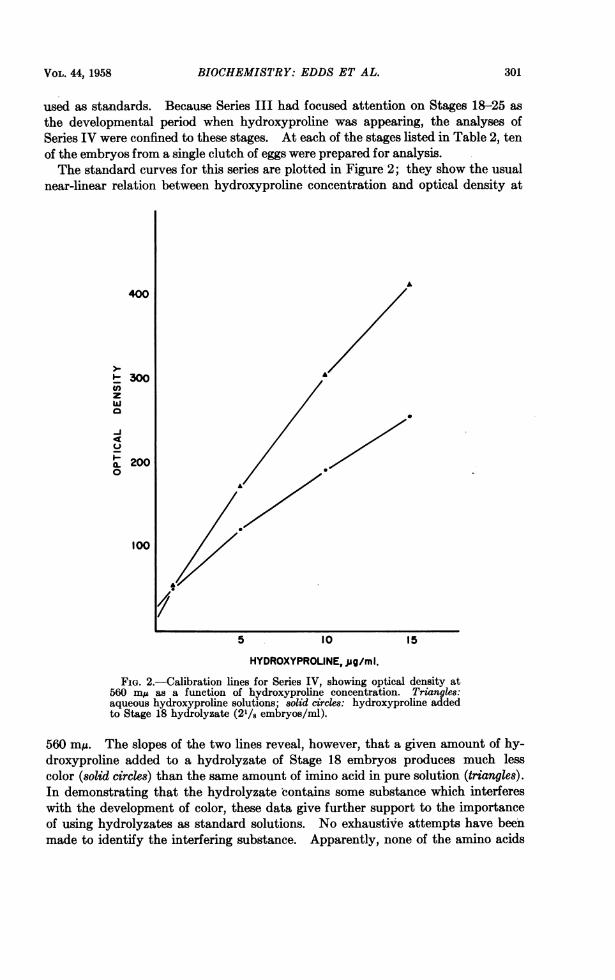
used as standards. Because Series III had focused attention on Stages 18-25 asthe developmental period when hydroxyproline was appearing, the analyses ofSeries IV were confined to these stages. At each of the stages listed in Table 2, tenof the embryos from a single clutch of eggs were prepared for analysis.The standard curves for this series are plotted in Figure 2; they show the usual
near-linear relation between hydroxyproline concentration and optical density at
400
p300z
WSCL 2001
0
I/./100
L5 10 15
HYDROXYPROLINE, ,jg/ml.FIG. 2.-Calibration lines for Series IV, showing optical density at
560 mju as a function of hydroxyproline concentration. Triangles:aqueous hydroxyproline solutions; solid circles: hydroxyproline addedto Stage 18 hydrolyzate (21/8 embryos/ml).
560 m1A. The slopes of the two lines reveal, however, that a given amount of hy-droxyproline added to a hydrolyzate of Stage 18 embryos produces much lesscolor (solid circles) than the same amount of imino acid in pure solution (triangles).In demonstrating that the hydrolyzate contains some substance which interfereswith the development of color, these data give further support to the importanceof using hydrolyzates as standard solutions. No exhaustive attempts have beenmade to identify the interfering substance. Apparently, none of the amino acids
301VOL. 44, 1958
BIOCHEMISTRY: EDDS ET AL.
in gelatin is responsible; gelatin hydrolyzates included routinely in all tests gavevalues for hydroxyproline close to those generally accepted. Similarly, aminoacids which are either absent from or in very low concentration in collagen butwhich would be expected in hydrolyzates of other proteins-cystine, histidine,phenylalanine, and tyrosine-did not interfere with the hydroxyproline test whenthey were added either singly or together to gelatin hydrolyzates in amounts up to25 ,g/ml (however, cf. Martin and Axelrod"7).
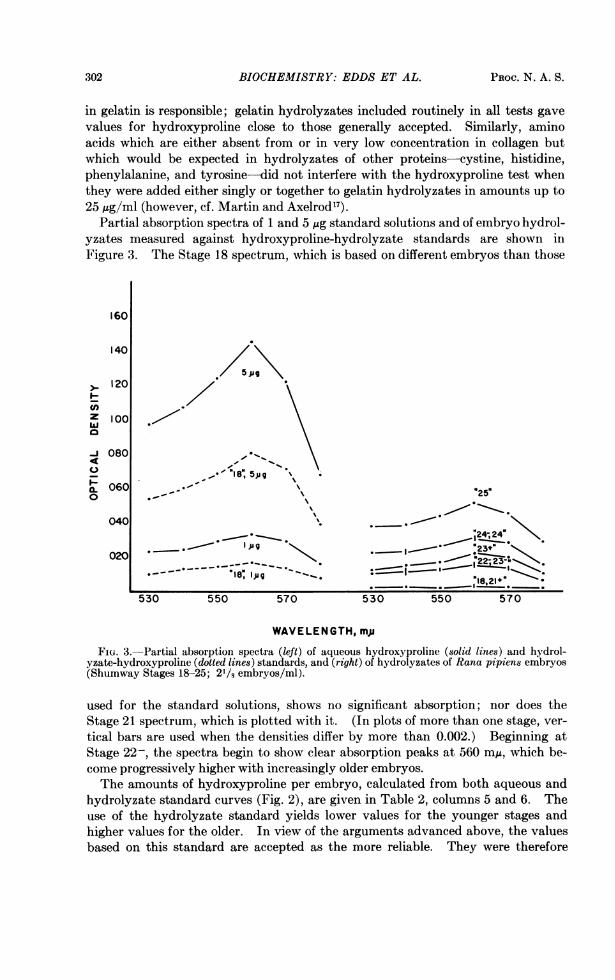
Partial absorption spectra of 1 and 5 ,ug standard solutions and of embryo hydrol-yzates measured against hydroxyproline-hydrolyzate standards are shown inFigure 3. The Stage 18 spectrum, which is based on different embryos than those
160
40
120
conz 100
< 080 --
o .,_ ' "18, spgg
I 060 . "25"
04024;24"
020L-- X* I * eIs, Ipg
is"1*
530 550 570 530 550 570
WAVELENGTH, mju
FIG. 3.-Partial absorption spectra (left) of aqueous hydroxyproline (solid lines) and hydrol-yzate-hydroxyproline (dotted lines) standards, and (right) of hydrolyzates of Rana pipiens embryos(Shumway Stages 18-25; 21/j embryos/ml).
used for the standard solutions, shows no significant absorption; nor does theStage 21 spectrum, which is plotted with it. (In plots of more than one stage, ver-tical bars are used when the densities differ by more than 0.002.) Beginning atStage 22-, the spectra begin to show clear absorption peaks at 560 m/u, which be-come progressively higher with increasingly older embryos.The amounts of hydroxyproline per embryo, calculated from both aqueous and
hydrolyzate standard curves (Fig. 2), are given in Table 2, columns 5 and 6. Theuse of the hydrolyzate standard yields lower values for the younger stages andhigher values for the older. In view of the arguments advanced above, the valuesbased on this standard are accepted as the more reliable. They were therefore
302 PROC. N. A. S.
BIOCHEMISTRY: EDDS ET AL.
used to calculate the amount of collagen per embryo (col. 7). (Collagen contentequals hydroxyproline content X 10; amphibian collagen has a hydroxyprolinecontent somewhat lower than that of mammals, some 10 per cent as compared to12-13 per cent).23'24Chromatographic and Electrophoretic Analyses.-Two other procedures, namely,
paper chromatography and continuous paper electrophoresis, were employed in aneffort to provide additional evidence that the substance giving a pink color in theNewman-Logan test was, in fact, hydroxyproline. The paper chromatograms ofembryo hydrolyzates all showed an array of well-separated chromagens typical ofa complex mixture of amino acids and demonstrated that hydrolysis had been com-plete. All the expected amino acids except hydroxyproline, but including proline,were detected. This was true of all stages analyzed up to and including Stage25+7 (Stage I of Taylor and Kollros'5). In the latter case the chromatographedsample contained the amino acids from an extract of two embryos of Series III andshould have included some 6-7 Ag of hydroxyproline, judging from the Neuman-Lo-gan test applied to the same material (Table 1). Employing isatin and dimethyl-aminobenzaldehyde as color reagents, 2 4ug of pure hydroxyproline spotted directlyon the paper could be detected easily. Yet no hydroxyproline chromagen couldbe demonstrated with these reagents on the chromatogram of the Stage 25+7 hy-drolyzate. The use of ninhydrin, alone or followed by treatment with dilutealkali and acid as recommended by Pasieka and Morgan,25 also failed to develop avisible hydroxyproline spot. With the latter method, moreover, 5 Ag of hydroxy-proline added to the hydrolyzate before chromatographing could not be detected.
Although the chromatographic results cast some doubt on the nature of the sub-stance revealed in this study by the Neuman-Logan test, the evidence obtainedfrom continuous paper electrophoresis increases the probability that it is hydroxy-proline. A hydrolyzate of twenty Stage 25+4 embryos was separated into fourstrongly ninhydrin-positive fractions presumably containing, respectively, asparticacid, glutamic acid, neutral amino acids, and basic amino acids. A fifth fraction,quantitatively small and showing as a faint yellow line on the cathode side of thepaper upon treatment with ninhydrin, was also collected.When these five fractions were subjected to the Neuman-Logan test, only the
neutral amino acid fraction developed the pink color characteristic of hydroxypro-line. It absorbed strongly, with a sharp peak at 560 m1u, where its optical densitywas 0.349. The absorption spectra of the four remaining fractions showed nopeaks between 530 and 580 mMu. Between these wave lengths, the basic amino acidfraction had a uniformly higher optical density (0.054 at 560 mMA) than the otherthree fractions (0.009-0.017 at 560 mMu). Apparently, the basic amino acid frac-tion contains the substance responsible in embryo hydrolyzates for non-specificabsorption. No analysis was made of the capacity of this fraction to interfere withthe recovery of added hydroxyproline, but it should be considered in any futureeffort to identify the substances responsible for these effects. Basic amino acids,however, are apparently not involved. Substantial amounts of lysine and arginineare present in, and histidine may be added to, gelatin hydrolyzates without ap-preciably influencing the values for hydroxyproline obtained in the Neuman-Logan test (see also Neuman and Logan24 and Grunbaum and Glick22).
VOL. 44, 1958 303
BIOCHEMISTRY: EDDS ET AL.
DISCUSSION
The first appearance and subsequent history of hydroxyproline during embryonicand early larval development of the frog can be established with considerable pre-cision, as the foregoing results demonstrate. The data indicate that this imino acidemerges in Rana pipiens between Stages 21 and 22 and increases linearly thereafterthrough Stage II.As for the amounts of collagen which are represented by the hydroxyproline
values reported, there is an element of uncertainty. Recent studies23'26 indicatethat the skin collagen of one amphibian species (Xenopus laevis) is, as might be ex-pected, more like that of fish than of mammals. If Leach's23 value of 10 per centhydroxyproline for Xenopus collagen holds for R. pipiens embryos, then some 13-14 ,ug of collagen per embryo undergo at least the final stages of synthesis during the5 days of development between Stages 21 and 25; collagen then represents some1.2 per cent of the fat-free dry weight of the embryo (calculated from data in Table2), a value similar to that obtained by Neuman'" for the 8-day chick embryo(which, however, contains well over fifty times as much collagen as a Stage 25 frogembryo).The data offer no hints as to the specific nature of the collagen being measured.
Thus it is not possible to make any commitment about precursor or definitive col-lagen molecules. On the basis of their solubility properties, at least three formsof collagen are believed to exist: acid-soluble, neutral-salt-soluble, and insolubleunless converted to gelatin. The present tendency is to regard neutral-salt-solublecollagen as a precursor form which can be transformed into the other two types (forreferences see Schmitt et al. ;5 Jackson27). However, each of the three forms con-tains hydroxyproline, and any or all could occur in the frog embryos described here.
In view of the answers obtained in the present study as to when collagen firstappears during embryonic life, questions about where this substance is first detect-able become pressing. Preliminary findings indicate that much, though not all, ofthe hydroxyproline occurs in the basement membrane of the epidermis, a resultwhich might have been predicted from its fine structure.6 The developmentalhistory of the basement membrane is now being investigated both chemically andelectron-microscopically.
SUMMARY
Using the hydroxyproline content as a means of detecting collagen, the earlyhistory of this fibrous protein has been traced in the frog embryo. Hydroxyprolinefirst appears between Stages 21 and 22, the latter containing about 0.4 pg/embryo,and increases linearly at least through Stage II, when some 5 ,g/embryo are pres-ent. These hydroxyproline values correspond to 4 and 50 ,ug of collagen, whichthus comprises some 0.3 and 5 per cent, respectively, of the fat-free dry weights.The results suggest that collagen is particularly suitable for a study of embryonicchemodifferentiation.
* This investigation was conducted during a sabbatical leave from Brown University andduring tenure of a U.S. Public Health Service Fellowship (CF-6675) of the National CancerInstitute. The work was done in the laboratory of Dr. F. 0. Schmitt, where it was supported bya research grant, E-1469 (C1), from the National Institute of Allergy and Infectious Diseases,National Institutes of Health, U.S. Public Health Service. Dr. Schmitt's hospitality, guidance,
304 PROC. N. A. S.
BIOCHEMISTRY: MAGER AND LIPMANN
and stimulation are gratefully acknowledged. Of the many people who helped with the solutionof technical problems, special thanks are due Dr. G.. Deffner, who carried out the chromatographicand electrophoretic separations, and Dr. B. S. Gould for advice on the colorimetric procedures.
t Present address: Biology Department, Brown University, Providence 12, Rhode Island.
1 R. S. Bear, Symposia Soc. Exptl. Biol., 9, 97-114, 1955.2 H. Boedtker and P. Doty, J. Am. Chem. Soc., 78, 4267-4280, 1956.3 K. H. Gustavson, The Chemistry and Reactivity of Collagen (New York: Academic Press,
Inc., 1956).4 J. Gross, J. Biophys. Biochem. Cytol., 2 (suppl.), 261-274, 1956.5 F. 0. Schmitt, J. Gross, and J. H. Highberger, Symposia Soc. Exptl. Biol., 9, 148-162, 1955.6 P. Weiss, these PROCEEDINGS, 42, 819-830, 1956.7 B. S. Gould and J. F. Woessner, J. Biol. Chem., 226, 289-300, 1957.8 J. F. Woessner and B. S. Gould, J. Biophys. Biochem. Cytol., 3, 685-695, 1957.9 R. H. Smith and S. F. Jackson, J. Biophys. Biochem. Cytol., 3, 913-922, 1957.
10 L. Hulliger, D. W. James, and M. Allgower, Experientia, 13, 454-456, 1957.11 R. E. Neuman, Proc. Soc. Exptl. Biol. Med., 75, 37-39, 1950.12 S. F. Jackson, Proc. Roy. Soc. London, B, 144, 556-572, 1956.13 J. Holtfreter, T. R. Koszalka, and L. L. Miller, Exptl. Cell Research, 1, 453-459, 1950.14 W. Shumway, Anat. Rec., 78, 139-147, 1940.16 A. C. Taylor and J. J. Kollros, Anat. Rec., 94, 7-24, 1946.16 R. E. Neuman and M. A. Logan, J. Biol. Chem., 184, 299-306, 1950.17 C. J. Martin and A. E. Axelrod, Proc. Soc. Exptl. Biol. Med., 83, 461-462, 1953.18 T. Bruggemann and K. Drepper, Naturwissenschaften, 39, 301-302, 1952.19 J. B. Jepson and I. Smith, Nature, 172, 1100-1101, 1953.20 W. Grassmann and K. Hannig, Z. physiol. Chem., 292, 32-50, 1953.21 J. Needham, Chemical Embryology (Cambridge: Cambridge University Press, 1931).22 B. W. Grunbaum and D. Glick, Arch. Biochem. and Biophys., 65, 260-267, 1956.23 A. A. Leach, Biochem. J., 67, 83-87, 1957.24 R. E. Neuman and M. A. Logan, J. Biol. Chem., 186, 549-556, 1950.25 A. E. Pasieka and J. F. Morgan, Proc. Soc. Exptl. Biol. Med., 92, 96-99, 1956.26 J. E. Eastoe, Biochem. J., 65, 363-368, 1957.27 D. S. Jackson, Biochem. J., 65, 277-284, 1957.
AMINO ACID INCORPORATION AND THE REVERSIONOF ITS INITIAL PHASE WITH CELL-FREE TETRAHYMENA
PREPARA TIONS*
BY J. MAGERt AND FRITZ LIPMANN
ROCKEFELLER INSTITUTE FOR MEDICAL RESEARCH, NEW YORK CITY
Communicated February 21, 1958
Cell-free preparations of various biological systems present a rather uniform pat-tern of amino acid incorporation. However, often the different systems seem tobe more or less appropriate for studying a particular step in the sequence of reac-tions from initial activation' to final incorporation into protein. In the presentstudy, Tetrahymena pyriformis was chosen as a test organism. This protozoonyields subcellular fractions analogous to those obtained with mammalian tissuehomogenates. The Tetrahymena system was found to be particularly suitable forthe demonstration of a reversibility of transfer of activated amino acid to the solubleribonucleic acid fraction.
VrOL. 44, 1958 305


