Embed Size (px)
Citation preview
Development of equations for predicting Puerto Rican subtropical
dry forest biomass and volume
Thomas J. Brandeis a,*, Matthew Delaney b, Bernard R. Parresol c, Larry Royer c
a U.S. Department of Agriculture, Forest Service, Southern Research Station, 4700 Old Kingston Pike, Knoxville, TN 37919, United Statesb Delaney Forestry Services, LLC, 1216 Calapooia Street, Albany, OR 97321, United States
c U.S. Department of Agriculture, Forest Service, Southern Research Station, 200 WT Weaver Blvd., Asheville, NC 28804, United States
Received 5 April 2006; received in revised form 7 June 2006; accepted 8 June 2006
www.elsevier.com/locate/foreco
Forest Ecology and Management 233 (2006) 133–142
Abstract
Carbon accounting, forest health monitoring and sustainable management of the subtropical dry forests of Puerto Rico and other Caribbean
Islands require an accurate assessment of forest aboveground biomass (AGB) and stem volume. One means of improving assessment accuracy is
the development of predictive equations derived from locally collected data. Forest inventory and analysis (FIA) measured tree diameter and
height, and then destructively sampled 30 trees from 6 species at an upland deciduous dry forest site near Ponce, Puerto Rico. This data was used to
develop best parsimonious equations fit with ordinary least squares procedures and additive models fit with nonlinear seemingly unrelated
regressions that estimate subtropical dry forest leaf, woody, and total AGB for Bucida buceras and mixed dry forest species. We also fit equations
for estimating inside and outside bark total and merchantable stem volume using both diameter at breast height (d.b.h.) and total height, and
diameter at breast height alone for B. buceras and Bursera simaruba. Model fits for total and woody biomass were generally good, while leaf
biomass showed more variation, possibly due to seasonal leaf loss at the time of sampling. While the distribution of total AGB into components
appeared to remain relatively constant across diameter classes, AGB variability increased and B. simaruba and B. buceras allocated more carbon
into branch biomass than the other species. When comparing our observed and predicted values to other published dry forest AGB equations, the
equation developed in Mexico and recommended for areas with rainfall >900 mm/year gave estimates substantially lower than our observed
values, while equations developed using dry forest data from forest in Australia, India and Mexico were lower than our observed values for trees
with d.b.h.<25 cm and slightly higher for trees with d.b.h.>30 cm. Although our ability to accurately estimate merchantable stem volume and live
tree AGB for subtropical dry forests in Puerto Rico and other Caribbean islands has been improved, much work remains to be done to sample a
wider range of species and tree sizes.
Published by Elsevier B.V.
Keywords: FIA; Subtropical dry forest; Biomass; Stem volume; Puerto Rico; Caribbean; Additive models
1. Introduction
In Puerto Rico, subtropical dry forest life zone (sensu Ewel
and Whitmore, 1973) is found in areas with rainfall between
600 and 1100 mm/year at elevations less than 300 m. This
forested life zone covers 15% of Puerto Rico, mainly along the
south coast and over most of the outlying islands of Vieques,
Culebra and Mona (Ewel and Whitmore, 1973). Caribbean
island subtropical dry forest covers a broad transitional zone
* Corresponding author. Tel.: +1 865 862 2030; fax: +1 865 862 0262.
E-mail addresses: [email protected] (T.J. Brandeis),
[email protected] (M. Delaney), [email protected] (B.R. Parresol),
[email protected] (L. Royer).
0378-1127/$ – see front matter. Published by Elsevier B.V.
doi:10.1016/j.foreco.2006.06.012
between subtropical moist forest at one rainfall extreme and
tropical dry forest at the other (Ewel and Whitmore, 1973). As a
result, this life zone encompasses a variety of vegetation and
forest types with species of varying degrees of deciduousness
and growth form. This study focuses on a forest type within the
larger subtropical dry forest life zone that typically has greater
biomass accumulation in larger, better developed trees, the
upland deciduous forest type (Murphy et al., 1995).
Native tree species typically found in the upland deciduous
dry forest in Puerto Rico and much of the Caribbean include
Bursera simaruba (L.) Sarg.; Bucida buceras L., Gymnanthes
lucida Sw., Exostema caribaeum (Jacq.) J.A. Schultes;
Guaiacum officinale L., Guaiacum sanctum L., Pisonia albida
(Heimerl) Britt. ex Standl.; Pictetia aculeata (Vahl) Urban;
Acacia macracantha Humb. and Bonpl., Capparis spp. and
T.J. Brandeis et al. / Forest Ecology and Management 233 (2006) 133–142134
Coccoloba spp. among many others (Ewel and Whitmore,
1973; Little and Wadsworth, 1989; Murphy et al., 1995).
Besides natural variability, disturbance has dominated
subtropical dry forest development since European coloniza-
tion of the islands, and on mainland Puerto Rico, only 4% of the
original dry forest remains (Murphy et al., 1995). Human uses
of dry forest areas in Puerto Rico have included sugar cane
production, livestock grazing, irrigated agricultural crops and
fruit trees, urbanization, industrialization and live fire military
exercises in parts of Vieques and Culebra. Naturalized species
often dominate highly disturbed Caribbean subtropical dry
forests and include Prosopis juliflora (Sw.) DC., Parkinsonia
aculeata L., Tamarindus indica L., Acacia farnesiana (L.)
Willd., Melicoccus bijugatus Jacq. and Leucaena leucocephala
(Lam.) DeWit. (depending on authority, L. leucocephala is
considered either native or naturalized) (Ewel and Whitmore,
1973; Little and Wadsworth, 1989).
Murphy and Lugo (1986), working in subtropical dry forest
of the Guanica Commonwealth Forest, found that the basal area
of all trees with d.b.h. (stem diameter at 1.37 m) �2.5 cm
averaged 19.8 m2/ha on 12,173 stems/ha, and there was
44.75 Mg/ha of AGB in all living vegetation. The largest tree
sampled had a d.b.h. <25 cm and 97% of the stems had d.b.h.
<10 cm (Murphy and Lugo, 1986). Over 40% of the trees had
heights between 3 and 4 m, with the overstory canopy height
averaging 9 m (Murphy and Lugo, 1986, 1990).
Carbon accounting, forest health monitoring, and sustain-
able management of these forests require an accurate
assessment of the tree biomass and wood volume. Early
inventories of Puerto Rico excluded dry forests even though
they comprise a substantial portion of the island’s forests
because they were not considered to have the productive
capacity to support commercial wood production (Birdsey and
Weaver, 1982; Franco et al., 1997). Current inventories include
all forest types regardless of their productive capacities, so
resource reports will include estimates of live tree AGB and
wood volume and for forest types where these resources were
not previously considered.
However, no locally developed allometric equations for
estimating AGB in Puerto Rico’s dry forests have been
available, so estimates were made using equations developed
from international data sets, principally Brown (1997) whose
equation uses d.b.h. to estimate AGB, from Martınez-Yrızar
et al. (1992) which uses basal area as the explanatory variable.
Brown (1997) equations were developed from 2 datasets from
India of 29 trees with d.b.h. ranging from 3.7 to 39.2 cm, and
the author states that these equations should be used for dry
forest in zones with rainfall >900 mm/year. Brown (1997)
recommends the use of equations from Martınez-Yrızar et al.
(1992) for dry forests in zones with rainfall <900 mm/year.
Martınez-Yrızar et al. (1992) harvested 191 trees with d.b.h.
ranging from 3.0 to 44.9 cm in a single 1000 m2 plot in dry
tropical deciduous forest in Mexico. However, their equation
does not take into account leaf biomass (Martınez-Yrızar
et al., 1992). Forests classified as subtropical dry in Puerto
Rico occur in areas with rainfall that ranges from 600 to
1400 mm/year (Ewel and Whitmore, 1973), so AGB estimates
would have to be made with at least two of the three
equations.
Using forest inventory data collected from 2001 to 2003 and
the equations of Brown et al. (1989), Brown (1997) and
Martınez-Yrızar et al. (1992), Brandeis and Suarez-Rozo
(2005) found Puerto Rican dry forest AGB that ranged from
33.9 to 76.5 Mg/ha, an average of 11.6 m2/ha of basal area on
4174 trees with d.b.h. >2.5 cm. The importance of trees with
d.b.h. <10.0 cm in dry forest surveyed in the island-wide FIA
inventory should be noted. Saplings (trees with
2.5 � d.b.h. � 12.4) contributed 50.9% of the AGB, 63.3%
of the basal area and 94.5% of the stem density (Brandeis and
Suarez-Rozo, 2005). Brandeis and Suarez-Rozo (2005)
concluded that for dry forest, equations from Martınez-Yrızar
et al. (1992) estimated AGB densities which were similar to
those found in the dry Guanica Commonwealth Forest, which
has an average annual rainfall of 860 mm (Murphy and Lugo,
1986). They also concluded that the equation in Brown (1997)
could be considered for estimating AGB in Caribbean
subtropical dry forests with higher annual rainfalls. Brandeis
and Suarez-Rozo (2005) concluded that accurate per hectare
AGB estimates in Puerto Rico need to include saplings with
d.b.h.<10 cm because they make up a significant portion of the
total subtropical dry forest AGB, and that estimating AGB in
larger trees will be erratic and imprecise until more, larger trees
have been sampled and that data included in deriving new
allometric equations.
The lack of predictive equations hinders accurately
estimating of subtropical dry forest wood volume as well.
Total stem volume outside bark is used by the United Nations’
Food and Agriculture Organization’s Forest Resource Assess-
ment when reporting on forest cover and condition worldwide,
while merchantable stem volume inside bark is used by the U.S.
Department of Agriculture (USDA) Forest Service’s FIA
program for their reporting. Volume equations have been
developed for Puerto Rican subtropical moist forest, sub-
tropical wet forests and plantation-grown species (Wadsworth,
1949; Francis, 1988, 1989; Bauer and Gillespie, 1990; Brandeis
et al., 2005), and volume equations were developed for
plantation-grown B. buceras L. trees (Francis, 1988). In the
Puerto Rican forest inventories conducted in 1980 (Birdsey and
Weaver, 1982; Franco et al., 1997) and 1990 (Birdsey and
Weaver, 1982; Franco et al., 1997) field crews took multiple
diameter and height measurements along the bole of each tree
so that merchantable stem volume inside bark could be
calculated by applying a geometric formula to different bole
sections. Subsequently, volume equations were derived from
Puerto Rican forest inventory data by first directly calculating
stem volume using a geometric formula, then regressing stem
volume on diameter at d.b.h. and total tree height (HT)
(Brandeis et al., 2005). However, as previously mentioned past
forest inventories did not include dry forests, so volume
equations could not be derived from past inventory data sets for
that forest type. Despite having detailed and current forest
inventory data we have been unable to accurately estimate live
tree AGB and merchantable stem volume for subtropical dry
forest life zone of Puerto Rico.
T.J. Brandeis et al. / Forest Ecology and Management 233 (2006) 133–142 135
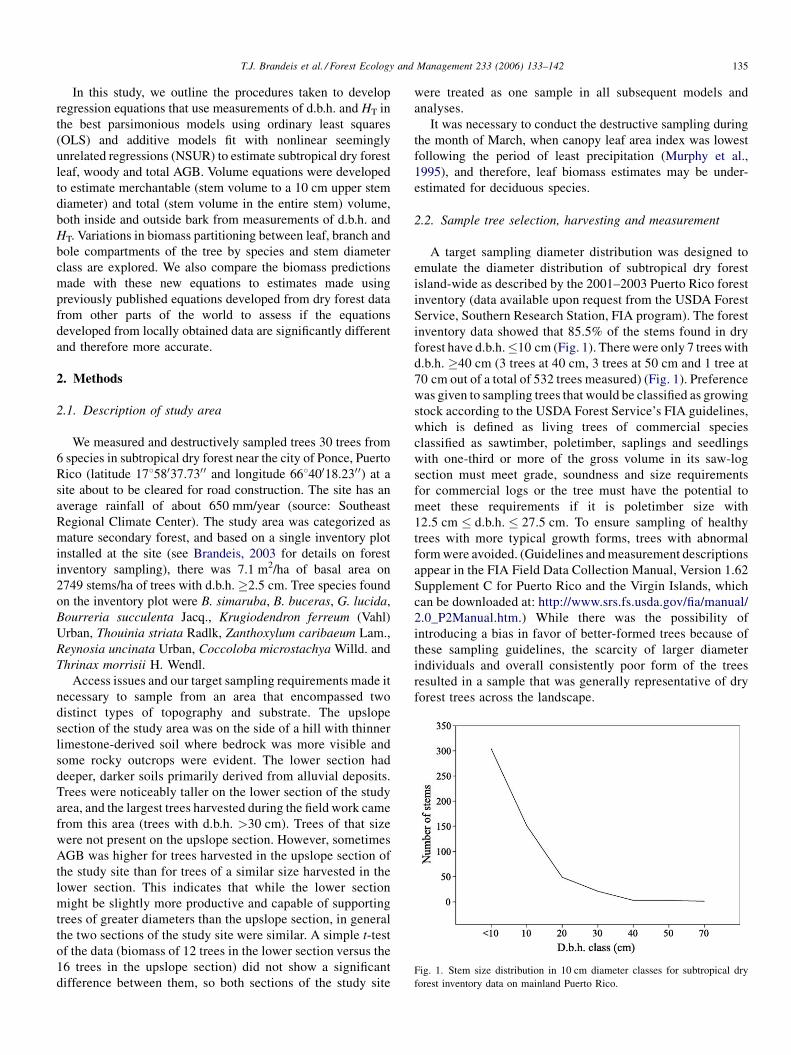
Fig. 1. Stem size distribution in 10 cm diameter classes for subtropical dry
forest inventory data on mainland Puerto Rico.
In this study, we outline the procedures taken to develop
regression equations that use measurements of d.b.h. and HT in
the best parsimonious models using ordinary least squares
(OLS) and additive models fit with nonlinear seemingly
unrelated regressions (NSUR) to estimate subtropical dry forest
leaf, woody and total AGB. Volume equations were developed
to estimate merchantable (stem volume to a 10 cm upper stem
diameter) and total (stem volume in the entire stem) volume,
both inside and outside bark from measurements of d.b.h. and
HT. Variations in biomass partitioning between leaf, branch and
bole compartments of the tree by species and stem diameter
class are explored. We also compare the biomass predictions
made with these new equations to estimates made using
previously published equations developed from dry forest data
from other parts of the world to assess if the equations
developed from locally obtained data are significantly different
and therefore more accurate.
2. Methods
2.1. Description of study area
We measured and destructively sampled trees 30 trees from
6 species in subtropical dry forest near the city of Ponce, Puerto
Rico (latitude 17858037.7300 and longitude 66840018.2300) at a
site about to be cleared for road construction. The site has an
average rainfall of about 650 mm/year (source: Southeast
Regional Climate Center). The study area was categorized as
mature secondary forest, and based on a single inventory plot
installed at the site (see Brandeis, 2003 for details on forest
inventory sampling), there was 7.1 m2/ha of basal area on
2749 stems/ha of trees with d.b.h. �2.5 cm. Tree species found
on the inventory plot were B. simaruba, B. buceras, G. lucida,
Bourreria succulenta Jacq., Krugiodendron ferreum (Vahl)
Urban, Thouinia striata Radlk, Zanthoxylum caribaeum Lam.,
Reynosia uncinata Urban, Coccoloba microstachya Willd. and
Thrinax morrisii H. Wendl.
Access issues and our target sampling requirements made it
necessary to sample from an area that encompassed two
distinct types of topography and substrate. The upslope
section of the study area was on the side of a hill with thinner
limestone-derived soil where bedrock was more visible and
some rocky outcrops were evident. The lower section had
deeper, darker soils primarily derived from alluvial deposits.
Trees were noticeably taller on the lower section of the study
area, and the largest trees harvested during the field work came
from this area (trees with d.b.h. >30 cm). Trees of that size
were not present on the upslope section. However, sometimes
AGB was higher for trees harvested in the upslope section of
the study site than for trees of a similar size harvested in the
lower section. This indicates that while the lower section
might be slightly more productive and capable of supporting
trees of greater diameters than the upslope section, in general
the two sections of the study site were similar. A simple t-test
of the data (biomass of 12 trees in the lower section versus the
16 trees in the upslope section) did not show a significant
difference between them, so both sections of the study site
were treated as one sample in all subsequent models and
analyses.
It was necessary to conduct the destructive sampling during
the month of March, when canopy leaf area index was lowest
following the period of least precipitation (Murphy et al.,
1995), and therefore, leaf biomass estimates may be under-
estimated for deciduous species.
2.2. Sample tree selection, harvesting and measurement
A target sampling diameter distribution was designed to
emulate the diameter distribution of subtropical dry forest
island-wide as described by the 2001–2003 Puerto Rico forest
inventory (data available upon request from the USDA Forest
Service, Southern Research Station, FIA program). The forest
inventory data showed that 85.5% of the stems found in dry
forest have d.b.h.�10 cm (Fig. 1). There were only 7 trees with
d.b.h. �40 cm (3 trees at 40 cm, 3 trees at 50 cm and 1 tree at
70 cm out of a total of 532 trees measured) (Fig. 1). Preference
was given to sampling trees that would be classified as growing
stock according to the USDA Forest Service’s FIA guidelines,
which is defined as living trees of commercial species
classified as sawtimber, poletimber, saplings and seedlings
with one-third or more of the gross volume in its saw-log
section must meet grade, soundness and size requirements
for commercial logs or the tree must have the potential to
meet these requirements if it is poletimber size with
12.5 cm � d.b.h. � 27.5 cm. To ensure sampling of healthy
trees with more typical growth forms, trees with abnormal
form were avoided. (Guidelines and measurement descriptions
appear in the FIA Field Data Collection Manual, Version 1.62
Supplement C for Puerto Rico and the Virgin Islands, which
can be downloaded at: http://www.srs.fs.usda.gov/fia/manual/
2.0_P2Manual.htm.) While there was the possibility of
introducing a bias in favor of better-formed trees because of
these sampling guidelines, the scarcity of larger diameter
individuals and overall consistently poor form of the trees
resulted in a sample that was generally representative of dry
forest trees across the landscape.
T.J. Brandeis et al. / Forest Ecology and Management 233 (2006) 133–142136
After each tree was felled, the field crew took detailed
measurements following the methodology described in Cost
(1978) used for developing volume equations in the Southern
United States. The measurements included diameter at the base
or stump, diameter at d.b.h., diameters every 60–150 cm along
the length of the stem depending on bole form, branch diameter
and lengths, and total tree height. Bark thickness was sampled
each time bole diameter was measured so that inside and
outside bark merchantable volume could be estimated. The
merchantable bole was defined as the main stem from a 30 cm
tall stump to a 10 cm upper stem diameter.
After the felled measurements were taken, the tree was
separated into components and each component weighed
separately. The first component was the tree’s crown, which
consisted of leaves, small branches and sometimes seeds and
fruits. Time constraints did not allow us to pluck all of the
leaves from the crown and weigh them separately. Therefore,
we collected all of the small branches (<2.5 cm in diameter)
and leaves and weighed them together. In a few cases, no
leaves were present on trees that were harvested (5 out of 30
trees, with 3 of those trees not having leaves or twigs; see
Table 1). Large branches were defined as any branch with
diameter�2.5 cm. If a branch was�2.5 cm in diameter it was
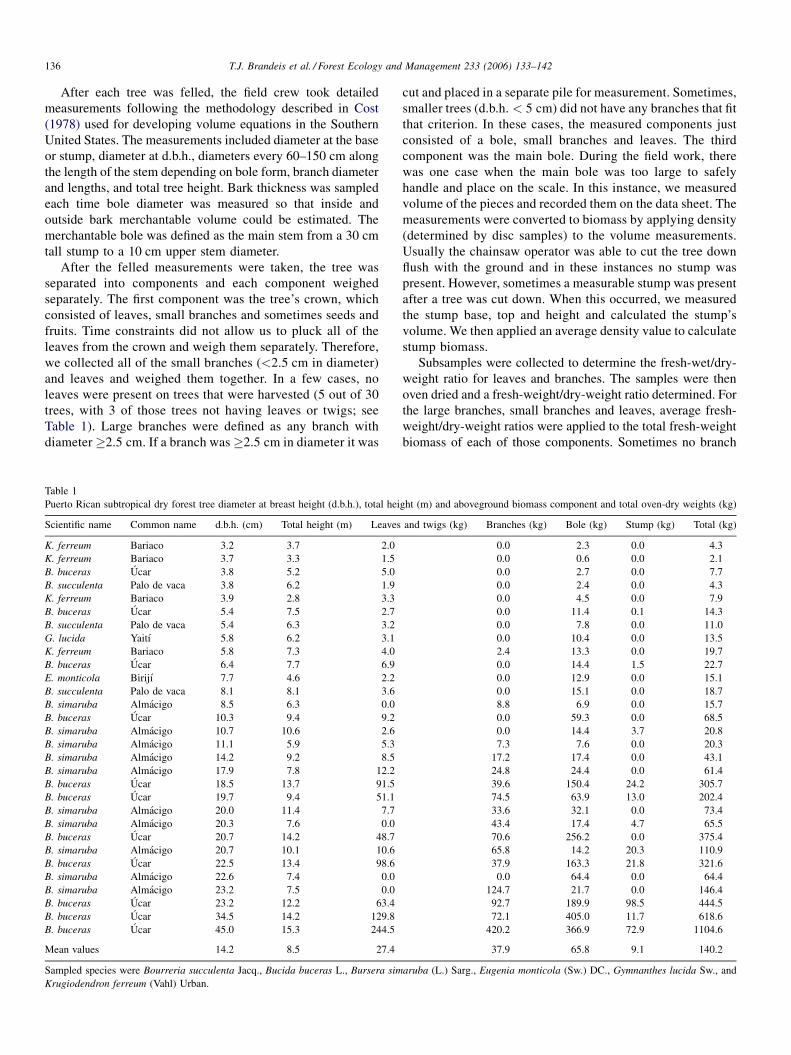
Table 1
Puerto Rican subtropical dry forest tree diameter at breast height (d.b.h.), total hei
Scientific name Common name d.b.h. (cm) Total height (m) Leaves
K. ferreum Bariaco 3.2 3.7 2.0
K. ferreum Bariaco 3.7 3.3 1.5
B. buceras Ucar 3.8 5.2 5.0
B. succulenta Palo de vaca 3.8 6.2 1.9
K. ferreum Bariaco 3.9 2.8 3.3
B. buceras Ucar 5.4 7.5 2.7
B. succulenta Palo de vaca 5.4 6.3 3.2
G. lucida Yaitı 5.8 6.2 3.1
K. ferreum Bariaco 5.8 7.3 4.0
B. buceras Ucar 6.4 7.7 6.9
E. monticola Birijı 7.7 4.6 2.2
B. succulenta Palo de vaca 8.1 8.1 3.6
B. simaruba Almacigo 8.5 6.3 0.0
B. buceras Ucar 10.3 9.4 9.2
B. simaruba Almacigo 10.7 10.6 2.6
B. simaruba Almacigo 11.1 5.9 5.3
B. simaruba Almacigo 14.2 9.2 8.5
B. simaruba Almacigo 17.9 7.8 12.2
B. buceras Ucar 18.5 13.7 91.5
B. buceras Ucar 19.7 9.4 51.1
B. simaruba Almacigo 20.0 11.4 7.7
B. simaruba Almacigo 20.3 7.6 0.0
B. buceras Ucar 20.7 14.2 48.7
B. simaruba Almacigo 20.7 10.1 10.6
B. buceras Ucar 22.5 13.4 98.6
B. simaruba Almacigo 22.6 7.4 0.0
B. simaruba Almacigo 23.2 7.5 0.0
B. buceras Ucar 23.2 12.2 63.4
B. buceras Ucar 34.5 14.2 129.8
B. buceras Ucar 45.0 15.3 244.5
Mean values 14.2 8.5 27.4
Sampled species were Bourreria succulenta Jacq., Bucida buceras L., Bursera sim
Krugiodendron ferreum (Vahl) Urban.
cut and placed in a separate pile for measurement. Sometimes,
smaller trees (d.b.h. < 5 cm) did not have any branches that fit
that criterion. In these cases, the measured components just
consisted of a bole, small branches and leaves. The third
component was the main bole. During the field work, there
was one case when the main bole was too large to safely
handle and place on the scale. In this instance, we measured
volume of the pieces and recorded them on the data sheet. The
measurements were converted to biomass by applying density
(determined by disc samples) to the volume measurements.
Usually the chainsaw operator was able to cut the tree down
flush with the ground and in these instances no stump was
present. However, sometimes a measurable stump was present
after a tree was cut down. When this occurred, we measured
the stump base, top and height and calculated the stump’s
volume. We then applied an average density value to calculate
stump biomass.
Subsamples were collected to determine the fresh-wet/dry-
weight ratio for leaves and branches. The samples were then
oven dried and a fresh-weight/dry-weight ratio determined. For
the large branches, small branches and leaves, average fresh-
weight/dry-weight ratios were applied to the total fresh-weight
biomass of each of those components. Sometimes no branch
ght (m) and aboveground biomass component and total oven-dry weights (kg)
and twigs (kg) Branches (kg) Bole (kg) Stump (kg) Total (kg)
0.0 2.3 0.0 4.3
0.0 0.6 0.0 2.1
0.0 2.7 0.0 7.7
0.0 2.4 0.0 4.3
0.0 4.5 0.0 7.9
0.0 11.4 0.1 14.3
0.0 7.8 0.0 11.0
0.0 10.4 0.0 13.5
2.4 13.3 0.0 19.7
0.0 14.4 1.5 22.7
0.0 12.9 0.0 15.1
0.0 15.1 0.0 18.7
8.8 6.9 0.0 15.7
0.0 59.3 0.0 68.5
0.0 14.4 3.7 20.8
7.3 7.6 0.0 20.3
17.2 17.4 0.0 43.1
24.8 24.4 0.0 61.4
39.6 150.4 24.2 305.7
74.5 63.9 13.0 202.4
33.6 32.1 0.0 73.4
43.4 17.4 4.7 65.5
70.6 256.2 0.0 375.4
65.8 14.2 20.3 110.9
37.9 163.3 21.8 321.6
0.0 64.4 0.0 64.4
124.7 21.7 0.0 146.4
92.7 189.9 98.5 444.5
72.1 405.0 11.7 618.6
420.2 366.9 72.9 1104.6
37.9 65.8 9.1 140.2
aruba (L.) Sarg., Eugenia monticola (Sw.) DC., Gymnanthes lucida Sw., and
T.J. Brandeis et al. / Forest Ecology and Management 233 (2006) 133–142 137
samples were collected for a particular tree because the tree
consisted of just a slender bole with just a few small branches
and leaves. In these cases, only bole and leaf samples were
collected. Wood discs subsamples were cut from the main bole;
one disc collected from the top, one disc from the middle and a
third collected at the base of the bole. After all three discs were
collected, detailed measurements of disc volume were taken,
which consisted of two measurements of diameter and two
measurements of thickness. After the measurements were
taken, each of the discs were placed in cloth bags and labeled.
Oven-dry weight was determined by a commercial laboratory.
To determine oven-dry weight of the bole, the density results
from each of the three discs were applied to the fresh-weight
values. After all of the oven-dry weights were determined, the
total biomass of the tree was calculated by summing all
components.
2.3. Biomass model fitting and estimate comparisons
We used two approaches to modeling biomass data. In the
first approach, we sought the best parsimonious model using
ordinary least squares procedures models for the leaf, woody
and total tree biomass. No consideration is given that the
models be additive in nature. That is, the sum of the predicted
leaf and the woody biomass do not exactly equal the total
predicted biomass for a tree. In the second approach, we sought
an additive model where the predicted leaf and predicted woody
biomass sum to give exactly the total biomass predicted from
the total biomass equation. A desirable feature of tree
component regression equations is that the predictions for
the components sum to the prediction from the total tree
regression. Parresol (1999, 2001) has discussed the problem of
forcing additivity on a set of tree biomass functions. The
property of additivity assures regression functions that are
consistent with each other. That is, if one tree component is part
of another component, it is logical to expect the estimate of the
part not to exceed the estimate of the whole. Also, if a
component is defined as the sum of two subcomponents, its
regression estimate should equal the sum of the regression
estimates of the two subcomponents. Because of the additivity
restriction, the inherent model for wtotal cannot be linearized.
Thus, nonlinear seemingly unrelated regressions must be used
as opposed to linear seemingly unrelated regressions by
imposing across-equation constraints and fitting the resultant
system of equations (Parresol, 2001). This system was fitted
with PROC MODEL in SAS software (SAS Institute Inc.,
1993).
Observed AGB values, values predicted by our best
parsimonious mixed species dry forest model and values
predicted by the equations in Brown (1997) and Martınez-
Yrızar et al. (1992) were graphed together to facilitate
comparison. Since the start of our work, Chave et al. (2005)
builds upon and supersedes the work in Brown (1997), so this
models estimates were also included for comparison. The dry
forest equation in Chave et al. (2005) draws upon data from 404
trees with diameters ranging from 5 to 63.4 cm sampled in
Australia, India and Mexico.
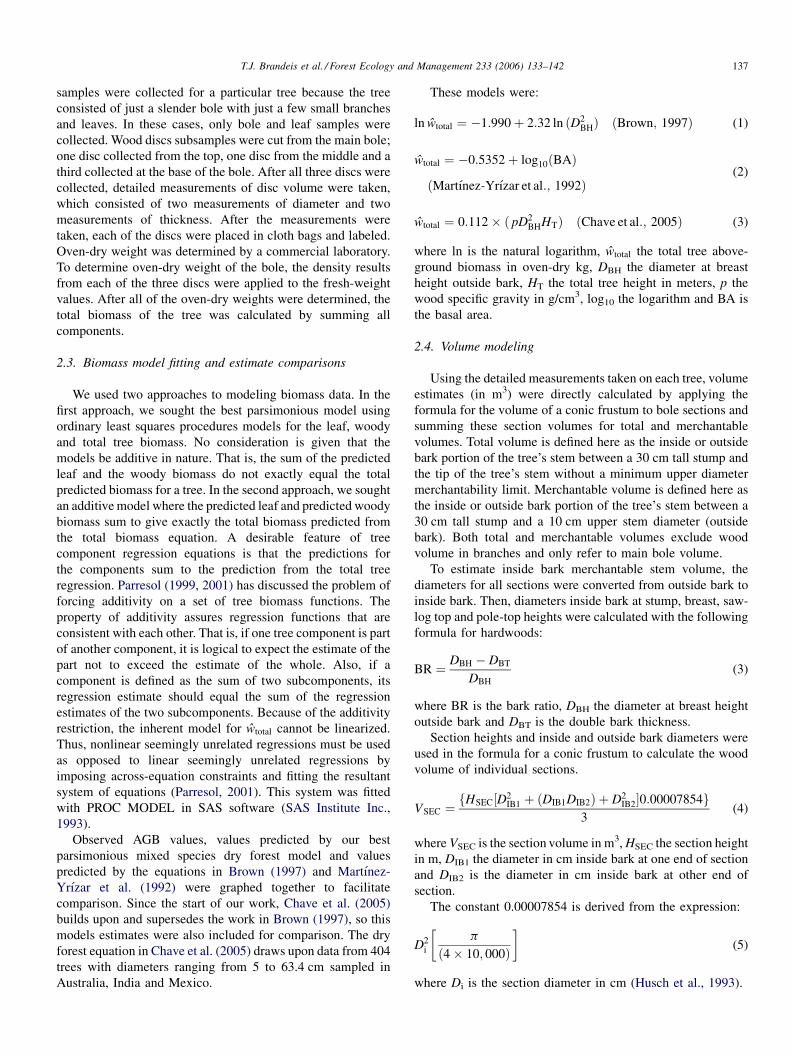
These models were:
ln wtotal ¼ �1:990þ 2:32 ln ðD2BHÞ ðBrown; 1997Þ (1)
wtotal ¼ �0:5352þ log10ðBAÞ
ðMartınez-Yrızar et al:; 1992Þ(2)
wtotal ¼ 0:112� ð pD2BHHTÞ ðChave et al:; 2005Þ (3)
where ln is the natural logarithm, wtotal the total tree above-
ground biomass in oven-dry kg, DBH the diameter at breast
height outside bark, HT the total tree height in meters, p the
wood specific gravity in g/cm3, log10 the logarithm and BA is
the basal area.
2.4. Volume modeling
Using the detailed measurements taken on each tree, volume
estimates (in m3) were directly calculated by applying the
formula for the volume of a conic frustum to bole sections and
summing these section volumes for total and merchantable
volumes. Total volume is defined here as the inside or outside
bark portion of the tree’s stem between a 30 cm tall stump and
the tip of the tree’s stem without a minimum upper diameter
merchantability limit. Merchantable volume is defined here as
the inside or outside bark portion of the tree’s stem between a
30 cm tall stump and a 10 cm upper stem diameter (outside
bark). Both total and merchantable volumes exclude wood
volume in branches and only refer to main bole volume.
To estimate inside bark merchantable stem volume, the
diameters for all sections were converted from outside bark to
inside bark. Then, diameters inside bark at stump, breast, saw-
log top and pole-top heights were calculated with the following
formula for hardwoods:
BR ¼ DBH � DBT
DBH
(3)
where BR is the bark ratio, DBH the diameter at breast height
outside bark and DBT is the double bark thickness.
Section heights and inside and outside bark diameters were
used in the formula for a conic frustum to calculate the wood
volume of individual sections.
VSEC ¼fHSEC½D2
IB1 þ ðDIB1DIB2Þ þ D2IB2�0:00007854g
3(4)
where VSEC is the section volume in m3, HSEC the section height
in m, DIB1 the diameter in cm inside bark at one end of section
and DIB2 is the diameter in cm inside bark at other end of
section.
The constant 0.00007854 is derived from the expression:
D2i
�p
ð4� 10; 000Þ
�(5)
where Di is the section diameter in cm (Husch et al., 1993).
T.J. Brandeis et al. / Forest Ecology and Management 233 (2006) 133–142138
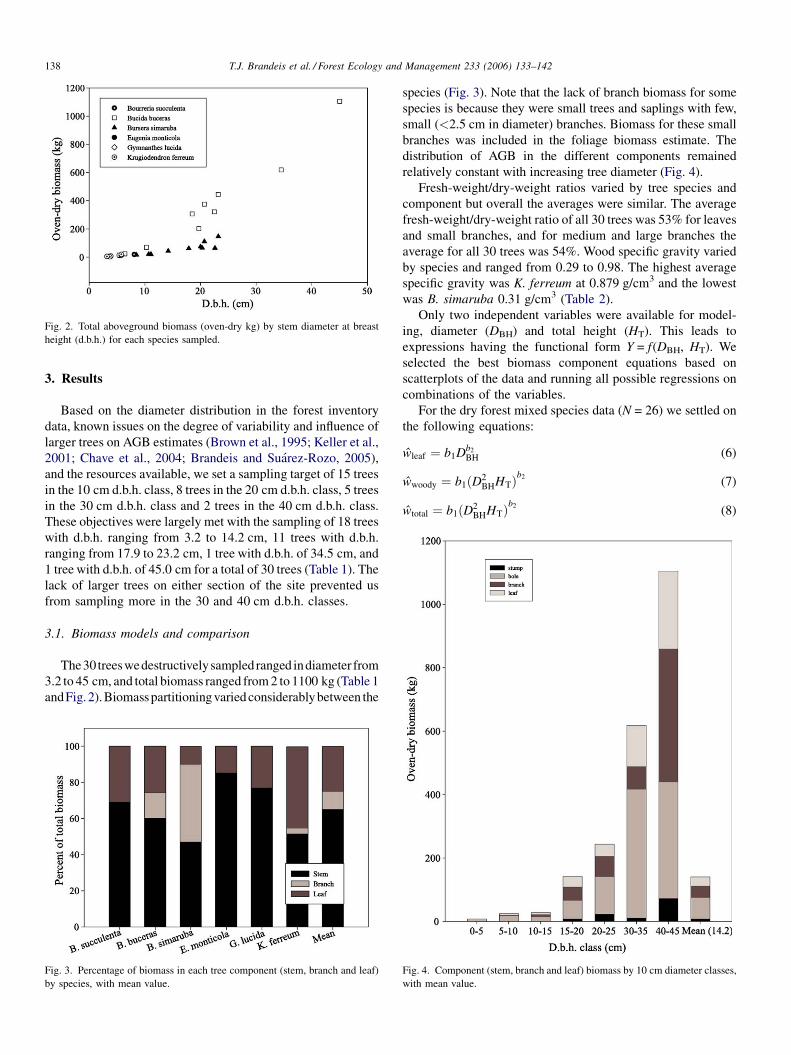
Fig. 2. Total aboveground biomass (oven-dry kg) by stem diameter at breast
height (d.b.h.) for each species sampled.
3. Results
Based on the diameter distribution in the forest inventory
data, known issues on the degree of variability and influence of
larger trees on AGB estimates (Brown et al., 1995; Keller et al.,
2001; Chave et al., 2004; Brandeis and Suarez-Rozo, 2005),
and the resources available, we set a sampling target of 15 trees
in the 10 cm d.b.h. class, 8 trees in the 20 cm d.b.h. class, 5 trees
in the 30 cm d.b.h. class and 2 trees in the 40 cm d.b.h. class.
These objectives were largely met with the sampling of 18 trees
with d.b.h. ranging from 3.2 to 14.2 cm, 11 trees with d.b.h.
ranging from 17.9 to 23.2 cm, 1 tree with d.b.h. of 34.5 cm, and
1 tree with d.b.h. of 45.0 cm for a total of 30 trees (Table 1). The
lack of larger trees on either section of the site prevented us
from sampling more in the 30 and 40 cm d.b.h. classes.
3.1. Biomass models and comparison
The30treeswedestructivelysampled ranged indiameter from
3.2 to 45 cm, and total biomass ranged from 2 to 1100 kg (Table 1
andFig. 2).Biomasspartitioning varied considerably between the
Fig. 3. Percentage of biomass in each tree component (stem, branch and leaf)
by species, with mean value.
species (Fig. 3). Note that the lack of branch biomass for some
species is because they were small trees and saplings with few,
small (<2.5 cm in diameter) branches. Biomass for these small
branches was included in the foliage biomass estimate. The
distribution of AGB in the different components remained
relatively constant with increasing tree diameter (Fig. 4).
Fresh-weight/dry-weight ratios varied by tree species and
component but overall the averages were similar. The average
fresh-weight/dry-weight ratio of all 30 trees was 53% for leaves
and small branches, and for medium and large branches the
average for all 30 trees was 54%. Wood specific gravity varied
by species and ranged from 0.29 to 0.98. The highest average
specific gravity was K. ferreum at 0.879 g/cm3 and the lowest
was B. simaruba 0.31 g/cm3 (Table 2).
Only two independent variables were available for model-
ing, diameter (DBH) and total height (HT). This leads to
expressions having the functional form Y = f(DBH, HT). We
selected the best biomass component equations based on
scatterplots of the data and running all possible regressions on
combinations of the variables.
For the dry forest mixed species data (N = 26) we settled on
the following equations:
wleaf ¼ b1Db2
BH (6)
wwoody ¼ b1ðD2BHHTÞ
b2(7)
wtotal ¼ b1ðD2BHHTÞ
b2(8)
Fig. 4. Component (stem, branch and leaf) biomass by 10 cm diameter classes,
with mean value.
T.J. Brandeis et al. / Forest Ecology and Management 233 (2006) 133–142 139
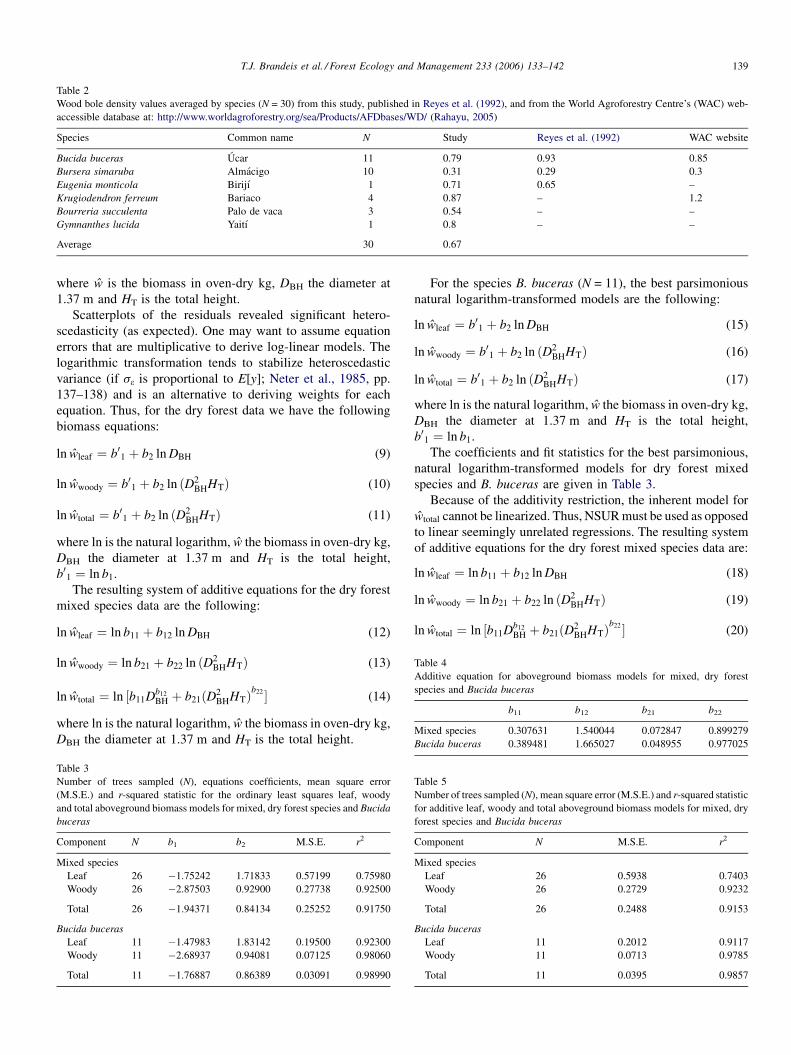
Table 2
Wood bole density values averaged by species (N = 30) from this study, published in Reyes et al. (1992), and from the World Agroforestry Centre’s (WAC) web-
accessible database at: http://www.worldagroforestry.org/sea/Products/AFDbases/WD/ (Rahayu, 2005)
Species Common name N Study Reyes et al. (1992) WAC website
Bucida buceras Ucar 11 0.79 0.93 0.85
Bursera simaruba Almacigo 10 0.31 0.29 0.3
Eugenia monticola Birijı 1 0.71 0.65 –
Krugiodendron ferreum Bariaco 4 0.87 – 1.2
Bourreria succulenta Palo de vaca 3 0.54 – –
Gymnanthes lucida Yaitı 1 0.8 – –
Average 30 0.67
Table 4
Additive equation for aboveground biomass models for mixed, dry forest
species and Bucida buceras
b11 b12 b21 b22
Mixed species 0.307631 1.540044 0.072847 0.899279
Bucida buceras 0.389481 1.665027 0.048955 0.977025
where w is the biomass in oven-dry kg, DBH the diameter at
1.37 m and HT is the total height.
Scatterplots of the residuals revealed significant hetero-
scedasticity (as expected). One may want to assume equation
errors that are multiplicative to derive log-linear models. The
logarithmic transformation tends to stabilize heteroscedastic
variance (if se is proportional to E[y]; Neter et al., 1985, pp.
137–138) and is an alternative to deriving weights for each
equation. Thus, for the dry forest data we have the following
biomass equations:
ln wleaf ¼ b01 þ b2 ln DBH (9)
ln wwoody ¼ b01 þ b2 ln ðD2BHHTÞ (10)
ln wtotal ¼ b01 þ b2 ln ðD2BHHTÞ (11)
where ln is the natural logarithm, w the biomass in oven-dry kg,
DBH the diameter at 1.37 m and HT is the total height,
b01 ¼ ln b1.
The resulting system of additive equations for the dry forest
mixed species data are the following:
ln wleaf ¼ ln b11 þ b12 ln DBH (12)
ln wwoody ¼ ln b21 þ b22 ln ðD2BHHTÞ (13)
ln wtotal ¼ ln ½b11Db12
BH þ b21ðD2BHHTÞ
b22 � (14)
where ln is the natural logarithm, w the biomass in oven-dry kg,
DBH the diameter at 1.37 m and HT is the total height.
Table 3
Number of trees sampled (N), equations coefficients, mean square error
(M.S.E.) and r-squared statistic for the ordinary least squares leaf, woody
and total aboveground biomass models for mixed, dry forest species and Bucida
buceras
Component N b1 b2 M.S.E. r2
Mixed species
Leaf 26 �1.75242 1.71833 0.57199 0.75980
Woody 26 �2.87503 0.92900 0.27738 0.92500
Total 26 �1.94371 0.84134 0.25252 0.91750
Bucida buceras
Leaf 11 �1.47983 1.83142 0.19500 0.92300
Woody 11 �2.68937 0.94081 0.07125 0.98060
Total 11 �1.76887 0.86389 0.03091 0.98990
For the species B. buceras (N = 11), the best parsimonious
natural logarithm-transformed models are the following:
ln wleaf ¼ b01 þ b2 ln DBH (15)
ln wwoody ¼ b01 þ b2 ln ðD2BHHTÞ (16)
ln wtotal ¼ b01 þ b2 ln ðD2BHHTÞ (17)
where ln is the natural logarithm, w the biomass in oven-dry kg,
DBH the diameter at 1.37 m and HT is the total height,
b01 ¼ ln b1.
The coefficients and fit statistics for the best parsimonious,
natural logarithm-transformed models for dry forest mixed
species and B. buceras are given in Table 3.
Because of the additivity restriction, the inherent model for
wtotal cannot be linearized. Thus, NSUR must be used as opposed
to linear seemingly unrelated regressions. The resulting system
of additive equations for the dry forest mixed species data are:
ln wleaf ¼ ln b11 þ b12 ln DBH (18)
ln wwoody ¼ ln b21 þ b22 ln ðD2BHHTÞ (19)
ln wtotal ¼ ln ½b11Db12
BH þ b21ðD2BHHTÞ
b22 � (20)
Table 5
Number of trees sampled (N), mean square error (M.S.E.) and r-squared statistic
for additive leaf, woody and total aboveground biomass models for mixed, dry
forest species and Bucida buceras
Component N M.S.E. r2
Mixed species
Leaf 26 0.5938 0.7403
Woody 26 0.2729 0.9232
Total 26 0.2488 0.9153
Bucida buceras
Leaf 11 0.2012 0.9117
Woody 11 0.0713 0.9785
Total 11 0.0395 0.9857
T.J. Brandeis et al. / Forest Ecology and Management 233 (2006) 133–142140
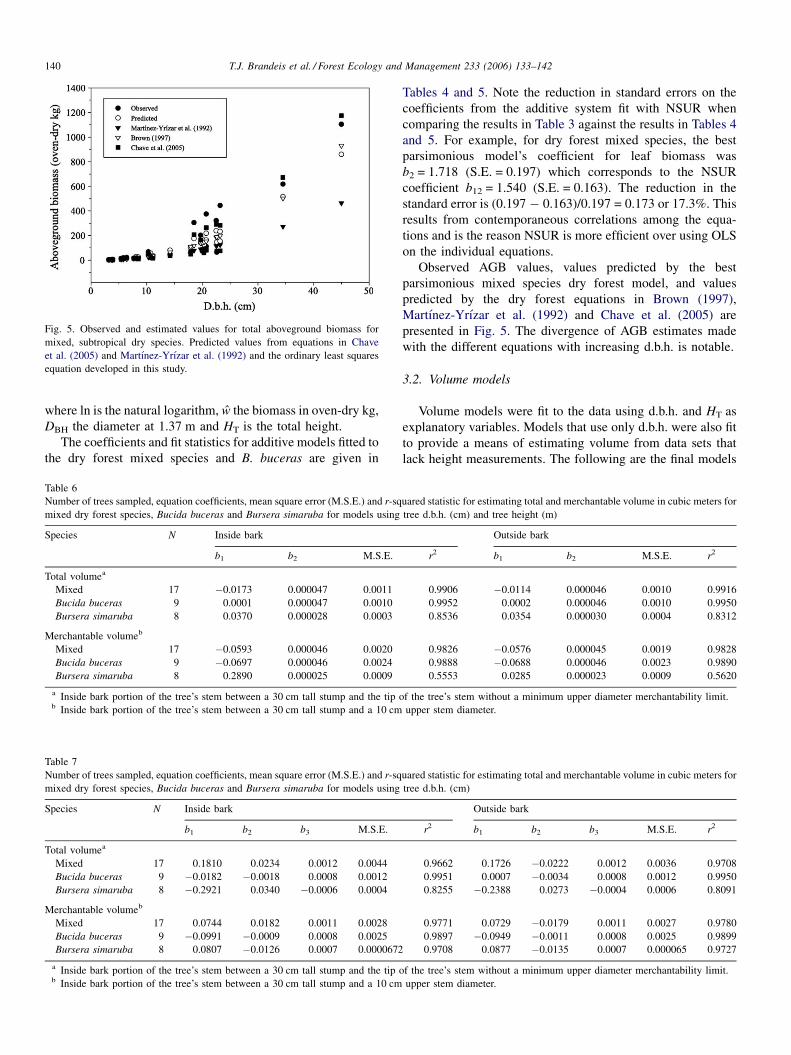
Fig. 5. Observed and estimated values for total aboveground biomass for
mixed, subtropical dry species. Predicted values from equations in Chave
et al. (2005) and Martınez-Yrızar et al. (1992) and the ordinary least squares
equation developed in this study.
where ln is the natural logarithm, w the biomass in oven-dry kg,
DBH the diameter at 1.37 m and HT is the total height.
The coefficients and fit statistics for additive models fitted to
the dry forest mixed species and B. buceras are given in
Table 7
Number of trees sampled, equation coefficients, mean square error (M.S.E.) and r-sq
mixed dry forest species, Bucida buceras and Bursera simaruba for models using
Species N Inside bark
b1 b2 b3 M.S.E.
Total volumea
Mixed 17 0.1810 0.0234 0.0012 0.0044
Bucida buceras 9 �0.0182 �0.0018 0.0008 0.0012
Bursera simaruba 8 �0.2921 0.0340 �0.0006 0.0004
Merchantable volumeb
Mixed 17 0.0744 0.0182 0.0011 0.0028
Bucida buceras 9 �0.0991 �0.0009 0.0008 0.0025
Bursera simaruba 8 0.0807 �0.0126 0.0007 0.0000672
a Inside bark portion of the tree’s stem between a 30 cm tall stump and the tip ob Inside bark portion of the tree’s stem between a 30 cm tall stump and a 10 cm
Table 6
Number of trees sampled, equation coefficients, mean square error (M.S.E.) and r-sq
mixed dry forest species, Bucida buceras and Bursera simaruba for models using
Species N Inside bark
b1 b2 M.S.E.
Total volumea
Mixed 17 �0.0173 0.000047 0.0011
Bucida buceras 9 0.0001 0.000047 0.0010
Bursera simaruba 8 0.0370 0.000028 0.0003
Merchantable volumeb
Mixed 17 �0.0593 0.000046 0.0020
Bucida buceras 9 �0.0697 0.000046 0.0024
Bursera simaruba 8 0.2890 0.000025 0.0009
a Inside bark portion of the tree’s stem between a 30 cm tall stump and the tip ob Inside bark portion of the tree’s stem between a 30 cm tall stump and a 10 cm
Tables 4 and 5. Note the reduction in standard errors on the
coefficients from the additive system fit with NSUR when
comparing the results in Table 3 against the results in Tables 4
and 5. For example, for dry forest mixed species, the best
parsimonious model’s coefficient for leaf biomass was
b2 = 1.718 (S.E. = 0.197) which corresponds to the NSUR
coefficient b12 = 1.540 (S.E. = 0.163). The reduction in the
standard error is (0.197 � 0.163)/0.197 = 0.173 or 17.3%. This
results from contemporaneous correlations among the equa-
tions and is the reason NSUR is more efficient over using OLS
on the individual equations.
Observed AGB values, values predicted by the best
parsimonious mixed species dry forest model, and values
predicted by the dry forest equations in Brown (1997),
Martınez-Yrızar et al. (1992) and Chave et al. (2005) are
presented in Fig. 5. The divergence of AGB estimates made
with the different equations with increasing d.b.h. is notable.
3.2. Volume models
Volume models were fit to the data using d.b.h. and HT as
explanatory variables. Models that use only d.b.h. were also fit
to provide a means of estimating volume from data sets that
lack height measurements. The following are the final models
uared statistic for estimating total and merchantable volume in cubic meters for
tree d.b.h. (cm)
Outside bark
r2 b1 b2 b3 M.S.E. r2
0.9662 0.1726 �0.0222 0.0012 0.0036 0.9708
0.9951 0.0007 �0.0034 0.0008 0.0012 0.9950
0.8255 �0.2388 0.0273 �0.0004 0.0006 0.8091
0.9771 0.0729 �0.0179 0.0011 0.0027 0.9780
0.9897 �0.0949 �0.0011 0.0008 0.0025 0.9899
0.9708 0.0877 �0.0135 0.0007 0.000065 0.9727
f the tree’s stem without a minimum upper diameter merchantability limit.
upper stem diameter.
uared statistic for estimating total and merchantable volume in cubic meters for
tree d.b.h. (cm) and tree height (m)
Outside bark
r2 b1 b2 M.S.E. r2
0.9906 �0.0114 0.000046 0.0010 0.9916
0.9952 0.0002 0.000046 0.0010 0.9950
0.8536 0.0354 0.000030 0.0004 0.8312
0.9826 �0.0576 0.000045 0.0019 0.9828
0.9888 �0.0688 0.000046 0.0023 0.9890
0.5553 0.0285 0.000023 0.0009 0.5620
f the tree’s stem without a minimum upper diameter merchantability limit.
upper stem diameter.
T.J. Brandeis et al. / Forest Ecology and Management 233 (2006) 133–142 141
chosen:
vstem ¼ b1 þ b2ðD2BHHTÞ (21)
vstem ¼ b1 þ b2ðDBHÞ þ b3ðDBHÞ2 (22)
where vstem is the stem volume in cubic meters, DBH the
diameter at 1.37 m and HT is the total height.
The number of trees sampled, equation coefficients, mean
square error (M.S.E.) and r-squared statistic for estimating
inside and outside bark total and merchantable volume in cubic
meters for mixed dry forest species, B. buceras, and B.
simaruba for models using d.b.h. and HT are given in Table 6.
Statistics and coefficients for inside and outside bark total and
merchantable volume estimation models that use only d.b.h. as
an explanatory variable are in Table 7.
4. Discussion
Although this study has improved our ability to accurately
estimate live tree AGB and stem volume for upland forests in
the subtropical dry forest life zone of Puerto Rico and other
Caribbean islands that share these species and forest types,
work remains to be done. Due to the time-consuming nature of
biomass sampling, future sampling that would build on this
initial data set should be carefully targeted to provide the largest
possible contribution to model improvement.
Our study’s sampling emulated the diameter distribution of
the forest inventory but probably did not adequately sample
larger trees where AGB has been show to become highly
variable (Brandeis and Suarez-Rozo, 2005). In the future, we
need to lower our threshold for what we would normally
consider larger trees down to 25 cm d.b.h., or even 20 cm d.b.h.,
and sample more of those trees from a wider variety of species
to improve the fit of our models and capture variations in
growth form and biomass allocation that appear to become
more marked as trees increase in size.
The study site had 650 mm of precipitation annually, so the
recommended equation for AGB estimation would be that of
Martınez-Yrızar et al. (1992) developed in Mexico at a site that
has an average rainfall of 707 mm/year. However, even after
adding 25% (the average percentage of total AGB that was in
leaves and small branches with diameter<2.5 cm in this study),
to account for the leaf biomass not sampled by Martınez-Yrızar
et al. (1992), this equation estimates AGB to be substantially
lower than the observed values, estimates from using the Brown
(1997) equation and Chave et al. (2005) equations or estimates
from the equations developed in this study. Our additive
equations, those of Brown (1997) and those of Chave et al.
(2005) underestimated AGB for trees in the 20 cm d.b.h. class
(Fig. 5). Our additive equations and those of Brown (1997) still
underestimated the biomass in the larger diameter
(d.b.h. > 30 cm) trees, while the estimates made using the
equations from Chave et al. (2005) were only slightly greater
than the observed values for larger trees.
Our models’ AGB predictions for larger trees are heavily
influenced by B. buceras, the only species found in the study
area with a d.b.h.�30 cm (Fig. 2). This may result in our mixed
species models over-estimating AGB at larger diameters for
species other than B. buceras. For example, there is indication
that B. simaruba, a tree commonly found throughout Caribbean
subtropical dry forest, does not accumulate AGB with
increasing d.b.h. as quickly as B. buceras (Fig. 2). Additionally,
biomass partitioning into leaf, branch and stem components
varies considerably among the species sampled, with B.
simaruba and B. buceras investing more into branch biomass
than the other species (Fig. 3). Although most of the larger trees
sampled were either B. buceras or B. simaruba, this trend in
AGB distribution does not appear to be an artifact of sampling
because the distribution of total AGB into components
appeared to remain relatively constant across diameter classes.
Although the lack of data for large trees is a common
difficulty in biomass modeling, and large trees have been shown
to strongly influence stand-level AGB estimates in humid
tropical forests (Brown et al., 1995; Keller et al., 2001; Chave
et al., 2004), there are also good reasons for not concentrating
all our future efforts on sampling large trees alone. Keller et al.
(2001) posited that, while the AGB of large trees made up a
substantial portion of an area’s AGB at the plot and stand level,
it was less influential on AGB estimates made across a
landscape because large trees are relatively rare at that level.
We can expand on the argument made by adding that overall
tree size and the frequency of relatively large trees is even less
in subtropical dry forest, and therefore large trees may be less
influential on stand-level subtropical dry forest AGB estimates
than we originally anticipated. Also, we must not focus entirely
on less-disturbed upland dry forests where larger trees are more
frequently found and neglect to sample the species more typical
of heavily disturbed areas that are currently prevalent in the
Caribbean subtropical dry forest life zone.
Further sampling is needed to provide data for a wider range
of species with potentially differing growth forms and patterns
of biomass allocation. Biomass equations for more of the
common subtropical dry forest species need to be developed if
we are to further improve our ability to estimate AGB and
carbon for these forests. This work should be seen as part of an
ongoing process, and the equations presented here will be
refined as additional sampling adds to the data available.
Acknowledgements
We would like to thank James Bentley, Vincent Few, Tony
Johnson, Humfredo Marcano, Luis Ortız of the USDA Forest
Service Southern Research Station, Forest Inventory and
Analysis program; Ross Hammons of the Tombigbee National
Forest; Eileen Helmer and Ivan Vicens of the USDA Forest
Service International Institute of Tropical Forestry; Esther
Rojas of the Puerto Rican Conservation Foundation.
References
Bauer, G.P., Gillespie, A.J., 1990. Volume tables for young plantation-grown
hybrid mahogany (Swietania macrophylla x S. mahagoni) in the Luquillo
experimental forest of Puerto Rico. Research Paper SO-257. USDA Forest
Service, Southern Forest Experiment Station, New Orleans, LA.
T.J. Brandeis et al. / Forest Ecology and Management 233 (2006) 133–142142
Birdsey, R.A., Weaver, P.L., 1982. The forest resources of Puerto Rico.
Resource Bulletin SO-85. USDA Forest Service Southern Forest Experi-
ment Station, New Orleans, LA.
Brandeis, T.J., 2003. Puerto Rico’s forest inventory: adapting the forest
inventory and analysis program to a Caribbean island. J. Forest. 101, 8–13.
Brandeis, T.J., Kuegler, O., Knowe, S.A., 2005. Merchantable volume equations
for the subtropical moist and wet forests of Puerto Rico. Research Paper
SRS-39. USDA Forest Service, Southern Research Station, Asheville, NC.
Brandeis, T.J., Suarez-Rozo, M.D.R., 2005. Effects of model choice and forest
structure on inventory-based estimations of Puerto Rican forest biomass.
Caribbean J. Sci. 41, 250–268.
Brown, I.F., Martinelli, L.A., Thomas, W.W., Moreira, M.Z., Ferreira, C.A.C.,
Victoria, R.A., 1995. Uncertainty in the biomass of Amazonian forests: an
example from Rondonia, Brazil. Forest Ecol. Manage. 75, 175–189.
Brown, S., 1997. Estimating biomass and biomass change in tropical forests. A
primer. FAO Forestry Paper 134. Food and Agriculture Organization of the
United Nations, Rome.
Brown, S., Gillespie, A.J., Lugo, A.E., 1989. Biomass estimation methods for
tropical forests with application to forest inventory data. Forest Sci. 35, 881–
902.
Chave, J., Andalo, C., Brown, S.L., Cairns, M.A., Chambers, J.Q., Eamus, D.,
Folster, H., Fromard, F., Higuchi, N., Kira, T., Lescure, J.P., Nelson, B.W.,
Ogawa, H., Puig, H., Riera, B., Yamakura, T., 2005. Tree allometry and
improved estimation of carbon stocks and balance in tropical forests.
Oecologia 145, 87–99.
Chave, J., Condit, R., Aguilar, S., Hernandez, A., Lao, S., Perez, R., 2004. Error
propagation and scaling for tropical forest biomass estimates. Philos. Trans.
R. Soc.: Biol. Sci. 359, 409–420.
Cost, N.D., 1978. Multiresource inventories—a technique for measuring
volumes in standing trees. Research Paper SE-196. USDA Forest Service,
Southeastern Forest Experiment Station, Asheville, NC.
Ewel, J.J., Whitmore, J.L., 1973. The ecological life zones of Puerto Rico and
the US Virgin Islands. Research Paper ITF-18. USDA Forest Service
Institute of Tropical Forestry, Rıo Piedras, Puerto Rico.
Francis, J.K., 1988. Merchantable volume table for Ucar in Puerto Rico.
Research Note SO-350. USDA Forest Service Southern Forest Experimen-
tal Station, New Orleans, LA.
Francis, J.K., 1989. Merchantable volume and weights of Mahoe in Puerto
Rican plantations. Research Note SO-355. USDA Forest Service Southern
Forest Experimental Station, New Orleans, LA.
Franco, P.A., Weaver, P.L., Eggen-McIntosh, S., 1997. Forest resources of
Puerto Rico, 1990. In: Southern Resource Bulletin SRS-22, USDA Forest
Service Southern Research Station, Asheville, NC.
Husch, B., Miller, C.I., Beers, T.W., 1993. Forest Mensuration, third ed. Krieger
Publishing Company, Malabar, FL.
Keller, M., Palace, M., Hurtt, G., 2001. Biomass estimation in the Tapajos
National Forest, Brazil: examination of sampling and allometric equations.
Forest Ecol. Manage. 154, 371–382.
Little, E.L., Wadsworth, F.H., 1989. Common Trees of Puerto Rico
and the Virgin Islands, second ed. USDA Forest Service, Washington,
DC.
Martınez-Yrızar, A., Sarukhan, J., Perez-Jimenez, A., Rincon, E., Maass, M.,
Solıs-Magallanes, A., Cervantes, L., 1992. Above-ground phytomass of a
tropical deciduous forest on the coast of Jalisco, Mexico. J. Trop. Ecol. 8,
87–96.
Murphy, P.G., Lugo, A.E., 1986. Structure and biomass of a subtropical dry
forest in Puerto Rico. Biotropica 18, 89–96.
Murphy, P.G., Lugo, A.E., 1990. Dry forests of the tropics and subtropics:
Guanica forest in context. Acta Cientıfica 4, 15–24.
Murphy, P.G., Lugo, A.E., Murphy, A.J., Nepstad, D.C., 1995. The dry forests
of Puerto Rico’s south coast. In: Lugo, A.E., Lowe, C. (Eds.), Tropical
Forests: Management and Ecology. Springer-Verlag, New York, NY, pp.
178–209.
Neter, J., Wasserman, W., Kutner, M.H., 1985. Applied Linear Statistical
Models, second ed. Irwin, Homewood, IL.
Parresol, B.R., 1999. Assessing tree and stand biomass: a review with examples
and critical comparisons. Forest Sci. 45, 573–593.
Parresol, B.R., 2001. Additivity of nonlinear biomass equations. Can. J. Forest
Res. 31, 865–878.
Rahayu, S., 2005. Wood Density Database. A web-accessible database at World
Agroforestry Centre’s website: http://www.worldagroforestry.org/sea/Pro-
ducts/AFDbases/WD/Index.htm, accessed on June 6, 2005.
Reyes, G., Brown, S., Chapman, J., Lugo, A.E., 1992. Wood densities of tropical
tree species. General Technical Report SO-88. USDA Forest Service
Southern Forest Experiment Station, New Orleans, LA.
SAS Institute Inc., 1993. SAS/ETS User’s Guide, Version 6, second ed. SAS
Institute Inc., Cary, NC.
Wadsworth, F.H., 1949. The development of the forest lands resources of the
Luquillo Mountains, Puerto Rico. Ph.D. Dissertation. University of Michi-
gan, Ann Arbor, MI.


