Embed Size (px)
Citation preview

FACULTY OF INFORMATION ANDCOMMUNICATION TECHNOLOGIES
BITOLA
PROCEEDINGS OF THE 6 INTERNATIONAL CONFERENCE ON APPLIED INTERNET AND INFORMATION TECHNOLOGIES
th
BITOLA, 3-4 JUNE 2016
co-organized by
www.aiitconference.org
Faculty of Information and Communication Technologies - Bitola“St. Kliment Ohridski” University - Bitola, Macedonia
Technical Faculty “Mihajlo Pupin” - ZrenjaninUniversity of Novi Sad, Serbia

6TH INTERNATIONAL CONFERENCE ON
APPLIED INTERNET AND INFORMATION
TECHNOLOGIES
3-4 JUNE 2016, BITOLA, R. MACEDONIA
Organizing Partners
Faculty of Information and Communication Technologies - Bitola
"St. Kliment Ohridski" University - Bitola
MACEDONIA
http://www.fikt.edu.mk/
Technical Faculty "Mihajlo Pupin" Zrenjanin
University of Novi Sad
Zrenjanin, SERBIA
http://www.tfzr.uns.ac.rs/
Conference Chairman
Prof. Pece Mitrevski, PhD Faculty of Information and Communication Technologies – Bitola
“St. Kliment Ohridski” University - Bitola
Republic of Macedonia

Organizing Committee
Ilija Jolevski, Faculty of Information and Communication Technologies - Bitola, Macedonia
Biljana Radulovic, Technical Faculty "Mihajlo Pupin" Zrenjanin, Serbia
Blagoj Ristevski, Faculty of Information and Communication Technologies - Bitola,
Macedonia
Natasa Blazeska-Tabakovska, Faculty of Information and Communication Technologies -
Bitola, Macedonia
Dalibor Dobrilovic, Technical Faculty "Mihajlo Pupin" Zrenjanin, Serbia
Elena Vlahu-Gjorgievska, Faculty of Information and Communication Technologies - Bitola,
Macedonia
Zoran Kotevski, Faculty of Information and Communication Technologies - Bitola,
Macedonia
Zeljko Stojanov, Technical Faculty "Mihajlo Pupin" Zrenjanin, Serbia
Tome Dimovski, Faculty of Information and Communication Technologies - Bitola,
Macedonia
Mimoza Bogdanoska-Jovanovska, Faculty of Information and Communication Technologies
- Bitola, Macedonia
Zdravko Ivankovic, Technical Faculty "Mihajlo Pupin" Zrenjanin, Serbia
Dejan Lacmanovic, Technical Faculty "Mihajlo Pupin" Zrenjanin, Serbia
Program Committee:
Mirjana Pejić Bach, University of Zagreb, Croatia
Evgeny Cherkashin, Institute of System Dynamic and Control Theory SB RAS, Russia
Madhusudan Bhatt, R.D. National College, University of Mumbai, India
Amar Kansara, Parth Systems LTD, Navsari, Gujarat, India
Narendra Chotaliya, H. & H.B. Kotak Institute of Science, Rajkot, Gujarat, India
Christina Ofelia Stanciu, Tibiscus University, Faculty of Economics, Timisoara, Romania
Željko Jungić, ETF, University of Banja Luka, Bosnia and Hercegovina
Saso Tomazic, Univerisity of Ljubljana, Slovenia
Marijana Brtka, Centro de Matemática, Computação e Cognição, Universidade Federal do
ABC, São Paulo Brazil
Zoran Ćosić, Statheros, Split, Croatia
Istvan Matijevics, Institute of Informatics, University of Szeged, Hungary
Slobodan Lubura, ETF, University of East Sarajevo, Bosnia and Hercegovina
Zlatanovski Mita, Ss. Cyril and Methodius University in Skopje, Republic of Macedonia
Josimovski Saša, Ss. Cyril and Methodius University in Skopje, Republic of Macedonia
Edit Boral, ASA College, New York, NY, USA
Dana Petcu, West University of Timisoara, Romania
Marius Marcu, "Politehnica" University of Timisoara, Romania
Zora Konjović, Faculty of technical sciences, Novi Sad, Serbia
Rajnai Zoltán, Obuda University, Budapest, Hungaria
Gogolák László, Subotica Tech - College of Applied Sciences, Subotica, Serbia
Siniša Nešković, FON, University of Belgrade, Serbia
Nataša Gospić, Faculty of transport and traffic engineering, Belgrade, Serbia
Željen Trpovski, Faculty of technical Sciences, Novi Sad, Serbia
Branimir Đorđević, Megatrend University, Belgrade, Serbia
Slobodan Jovanović, Faculty of Information Technology, Metropolitan University, Belgrade,
Serbia

Zlatko Čović, Subotica Tech / Department of Informatics, Subotica, Serbia
Sanja Maravić-Čisar, Subotica Tech / Department of Informatics, Subotica, Serbia
Petar Čisar, Academy of Criminalistic and Police Studies, Belgrad, Serbia
Diana Gligorijević, Telegroup, Serbia
Borislav Odadžić, Technical faculty “Mihajlo Pupin”, Zrenjanin, Serbia
Miodrag Ivković, Technical faculty “Mihajlo Pupin”, Zrenjanin, Serbia
Biljana Radulović, Technical faculty “Mihajlo Pupin”, Zrenjanin, Serbia
Ivana Berković, Technical faculty “Mihajlo Pupin”, Zrenjanin, Serbia
Vladimir Brtka, Technical faculty “Mihajlo Pupin”, Zrenjanin, Serbia
Branko Markoski, Technical faculty “Mihajlo Pupin”, Zrenjanin, Serbia
Dalibor Dobrilović, Technical faculty “Mihajlo Pupin”, Zrenjanin, Serbia
Željko Stojanov, Technical faculty “Mihajlo Pupin”, Zrenjanin, Serbia
Dejan Lacmanović, Technical faculty “Mihajlo Pupin”, Zrenjanin, Serbia
Zdravko Ivanković, Technical faculty “Mihajlo Pupin”, Zrenjanin, Serbia
Ljubica Kazi, Technical faculty “Mihajlo Pupin”, Zrenjanin, Serbia
Višnja Ognjenović, Technical faculty “Mihajlo Pupin”, Zrenjanin, Serbia
Eleonora Brtka, Technical faculty “Mihajlo Pupin”, Zrenjanin, Serbia
Predrag Pecev, Technical faculty “Mihajlo Pupin”, Zrenjanin, Serbia
Zoltan Kazi, Technical faculty “Mihajlo Pupin”, Zrenjanin, Serbia
Ilija Hristoski, Faculty of Economics - Prilep, Macedonia
Pece Mitrevski, Faculty of Information and Communication Technologies - Bitola,
Macedonia
Violeta Manevska, Faculty of Information and Communication Technologies - Bitola,
Macedonia
Aleksandar Markoski, Faculty of Information and Communication Technologies - Bitola,
Macedonia
Igor Nedelkovski, Faculty of Information and Communication Technologies - Bitola,
Macedonia
Ilija Jolevski, Faculty of Information and Communication Technologies - Bitola, Macedonia
Blagoj Ristevski, Faculty of Information and Communication Technologies - Bitola,
Macedonia
Natasa Blazeska-Tabakovska, Faculty of Information and Communication Technologies -
Bitola, Macedonia
Elena Vlahu-Gjorgievska, Faculty of Information and Communication Technologies - Bitola,
Macedonia
Zoran Kotevski, Faculty of Information and Communication Technologies - Bitola,
Macedonia
Tome Dimovski, Faculty of Information and Communication Technologies - Bitola,
Macedonia
Mimoza Bogdanoska-Jovanovska, Faculty of Information and Communication Technologies
- Bitola, Macedonia
Andrijana Bocevska, Faculty of Information and Communication Technologies - Bitola,
Macedonia
Snezana Savoska, Faculty of Information and Communication Technologies - Bitola,
Macedonia
Nikola Rendevski, Faculty of Information and Communication Technologies - Bitola,
Macedonia
Bozidar Milenkovski, Faculty of Information and Communication Technologies - Bitola,
Macedonia

6TH INTERNATIONAL CONFERENCE ON
APPLIED INTERNET AND INFORMATION
TECHNOLOGIES
3-4 JUNE 2016, BITOLA, R. MACEDONIA
PROCEEDINGS
Editor: Prof. Pece Mitrevski, PhD
Faculty of Information and Communication Technologies – Bitola
Publisher: Prof. Sasho Korunovski, PhD, Rector
“St. Kliment Ohridski” University - Bitola
Republic of Macedonia
ISBN-10 9989-870-75-6
ISBN-13 978-9989-870-75-0

Welcome address and opening remarks
“Honorable Minister of Information Society and Administration of the Republic of Macedonia, honorable Vice-rector, distinguished members of the academic and research community, distinguished members of the business community, ladies and gentlemen:
It gives me great pleasure to extend to you all a very warm welcome on behalf of the Faculty of Information and Communication Technologies (FICT) at the 6th International Conference on “Applied Internet and Information Technologies” here in Bitola.
It is an appropriate time to renew contacts and discuss problems of mutual interest with colleagues from surrounding countries of the region and countries from (literally) Mexico in the west to Vietnam in the east. It is the year when the University in Bitola celebrates 1.100 years of the repose of our patron, St. Kliment Ohridski, and “1110 years” (binary) of computer science and information technologies in Bitola. Indeed, the Faculty of Information and Communication Technologies was founded by virtue of law in December, 2013, and by founding such a higher education unit, the University “St. Kliment Ohridski” – Bitola promotes a faculty completely focused on educating information professionals.
It is gratifying to note that the agenda of this year’s conference covers a wide range of very interesting topics relating to Information Systems, Communications and Computer Networks, Data and System Security, Embedded Systems and Robotics, Software Engineering and Applications, Electronic Commerce, Internet Marketing, Business Intelligence, and ICT Practice and Experience, with 50 papers by 113 authors from 12 different countries.
Right after the opening remarks, Prof. Vladimir Dimitrov from the Faculty of Mathematics and Informatics at the University of Sofia, Bulgaria, as well as Prof. Željko Stojanov from the Technical Faculty "Mihajlo Pupin" in Zrenjanin, Serbia, will give their keynote speeches toward formalization of software security issues and inductive approaches in software process assessment. Prof. Dimitrov is one of the key initiators of the Bulgarian segment of the European Grid and a member of the editorial board of IEEE IT Professional and Transactions on Cloud Computing. Similarly, Prof. Stojanov has participated in a handful of research and industrial projects and is a member of IEEE and the Association for Computing Machinery (ACM).
Nevertheless, no matter how much we can do by ourselves on the national or regional level, whether it be research or application, it is never enough. In a spirit of true cooperation, we in this region of the world, must join in an action-oriented effort to attack

and solve the problems encompassing the economic, social, institutional and physical elements of development, in a wider sense!
Are Macedonia and Western Balkans moving towards their maturity as outsourcing destinations? That’s why we’ve dedicated a whole day to outsourcing opportunities that exist in Macedonia and Western Balkans – what can we do to boost up outsourcing, how can we become outsourcing experts, overcome cultural differences, and use all that in our everyday work? Independent consultants, Mr. Richard Avery, Ms. Carola Copland and Ms. Nina Ugrinoska will share their mind-coaching techniques, their experience in nearly all areas of the strategic outsourcing lifecycle, and their real life stories and solutions provided.
Last but not least, we should have in mind that all these economic, social, institutional and physical elements of development are under the auspices of the Ministry of Information Society and Administration. Therefore, at the very beginning, after the welcoming note of our Vice-rector, Prof. Svetlana Nikoloska, I invite the Minister of Information Society and Administration of the Republic of Macedonia, Mrs. Marta Arsovska Tomovska, who was a featured speaker at the 22nd “Smart Government and Smart Cities” conference held in Dubai in May, 2016.
In concluding, as a Conference Chairman, I wish you every success in your deliberations and a very pleasant stay in the beautiful city of Bitola.”
Conference Chairman,
Prof. Dr. Pece Mitrevski
Dean of the Faculty of Information and Communication Technologies – Bitola

CONTENTS
1. MongoDB as solution for data warehousing in online
HRM systems Biljana Radulović, Dragica Radosav, Milan Malić
1
2. Exploring software maintenance process
characteristics by using inductive thematic analysis Zeljko Stojanov, Jelena Stojanov
9
3. Local Cloud Solution’s and Distance Learning
System’s Reliability Predrag Alargić, Tanja Kaurin
18
4. Example of IoT platform usage for wireless video
surveillance with support of NoSQL and cloud
systems Milan Malić, Dalibor Dobrilović, Ivana Petrov
27
5. Agile Management of IT Projects by Modified
Scrum Processes Zoran Ćirić, Stojan Ivanišević, Otilija Sedlak, Ivana Ćirić,
Bogdan Laban
35
6. Design of Prototype Expert System as a University
Knowledge Management Tool for Academic
Teaching Activity Evaluation Mihajlo Hasanu, Hristina Ambaroska, Natasha Blazeska-
Tabakovska, Mimoza Bogdanovska-Jovanovska
43
7. Designing Multi-Agent System Model for University
Teaching Activities by Using UML Mihajlo Hasanu, Hristina Ambaroska, Elena Vlahu-
Gjorgievska, Ilija Jolevski
51
8. Incorporation of Defined Quality Attributes into
Solutions Based on Service-Oriented Architecture Lazar Atanasov, Vladimir Trajkovik, Elena Vlahu-
Gjorgievska
58
9. Modern technologies for data storage, organization
and managing in CRM systems Adriana Grigorescu, Alina Elena Cerchia, Florin Victor
Jeflea
66

10. Implementation of embedded assistive device for
disabled people Predrag Pecev, Dejan Lacmanović, Zdravko Ivanković,
Branko Markoski
76
11. Effects of Using Databases of Educational Materials
in the Education System in Macedonia Mimoza Anastoska-Jankulovska and Pece Mitrevski
82
12. The Advantages of Using Raspberry Pi 3 Compared
to Raspberry Pi 2 SoC Computers for Sensor System
Support Jovan Ivković, Biljana Radulović
88
13. An IoT Concept of the Small Virtual Power Plant
Based on Arduino Platform and MQTT Protocol Dmytro Zubov
95
14. An Examination of the Relationship between
Security Awareness and Digital Competence Zoltan Nyikes, Ksenia V. Baimakova
104
15. Examples of Raspberry Pi usage in Internet of
Things Nikola Petrov, Dalibor Dobrilovic, Mila Kavalić, Sanja
Stanisavljev
112
16. Context-aware Technologies and Systems Seblewonge Esseynew, Berhanyikun Amanuel, Mekuria
Sinke, Abel Damte, Saso Koceski
120
17. Application of 3ds Max for 3D Modelling and
Rendering Igor Stojanov, Blagoj Ristevski, Zoran Kotevski, Snezana
Savoska
133
18. Simulation Based Comparative Performance
Analysis of OSPF and EIGRP Routing Protocols Emilija Stankoska, Nikola Rendevski, Pece Mitrevski
145
19. Reducing Competitive Cache Misses in Modern
Processor Architectures Milcho Prisagjanec, Pece Mitrevski
156
20. Applying SMT algorithms to code analysis Milorad Filipovic, Goran Sladic, Branko Milosavljevic,
163

Gordana Milosavljevic
21. Controlling Robotic Arms Using Raspberry Pi
Through the Internet Anita Sabo, Henrik Lábadi, Tibor Szakáll, Andrea Kukla
171
22. Autonomous Devices to Map Rooms and Other
Indoor Spaces and Storing Maps in the Cloud Henrik Lábadi, Anita Sabo, Bojan Kuljić, Goran Arslanović
181
23. Visualization of flood data using HTML5
technologies Edis Latifoski, Zoran Kotevski, Ilija Hristoski
191
24. Wireless sensor networks simulators – computer
simulation tools Igor Georgioski, Hristina Trenchevska
199
25. Virtual Private Network Implementation with GRE
Tunnels and EIGRP Protocol Tihomir Stojchevski, Tome Dimovski and Nikola Rendevski
206
26. Geometric modeling and principle of the golden
section Snežana Vrekić, Milosav Đorđević
213
27. Expert System for Structural Analysis of
Electrocardiograms Kristina Krasovitskaya, Evgeny Cherkashin, Sergey
Gorunchik
220
28. Approach for Synonyms Detection in Conceptual
Data Model Zoltan Kazi, Ljubica Kazi, Biljana Radulovic
228
29. Data Visualization in Business Intelligent &Analysis
– Analysis of First Positioned Tools According to
Gartner’s Magic Quadrant in Ability to Execute Snezana Savoska, Andrijana Bocevska
236
30. Improving Readability of Medical Data by Using
Decision Rules Vladimir Brtka, Ivana Berkovic, Visnja Ognjenovic,
Eleonora Brtka, Dobrivoje Martinov, Tatjana Stojkovic–
Jovanovic
244

31. Gesture Control of a Mobile Robot using Kinect
Sensor Katerina Cekova, Natasa Koceska, Saso Koceski
251
32. E-health monitoring system Aleksandar Kotevski, Natasa Koceska, Saso Koceski
259
33. Fully Automatic MRI Brain Tumor Segmentation Mihajlo Hasanu, Hristina Ambaroska, Blagoj Ristevski
266
34. Separation of Players in Teams during Basketball
Matches Zdravko Ivanković, Predrag Pecev, Branko Markoski,
Dragica Radosav, Dejan Lacmanović
273
35. CUDA DSP Filter for ECG Signals Ervin Domazet, Marjan Gusev, Sasko Ristov
280
36. Intelligence approach in improving business
processes Ljubinka Sandjakoska, Daniela Koteska Lozanoska
289
37. A mobile application for ECG detection and feature
extraction Aleksandar Stojmenski, Marjan Gusev, Ivan Chorbev
299
38. Modeling and Implementation of Bus Rapid Transit
corridor based on Traffic Prioritization and
Automatic Location Ioannis Patias, Vasil Georgiev
307
39. Model for integrating Six Sigma in Manufacturing
Execution System in industrial production
environment Goran Tasevski, Marjan Tomovski
314
40. Development of the Infocommunication System for
the Intelligent Rail Transport System of Dangerous
Goods in Hungary Daniel Tokody, György Schuster, Peter Holicza
321
41. Ubiquitous Computing in the context of developing
countries Seblewongel Esseynew, Berhanyikun Amanuel, Mekuria
Sinke, Abel Damtew, Saso Koceski
333

42. Change control in project of web application
development in e-commerce environment Milan Malić, Vesna Makitan, Ivana Petrov
344
43. Factors influencing the successful adoption of an
innovative e-commerce product: single case study Olga Popovska, Vladimir Trajkovik
351
44. On the Pulse of ICT Revolution, Productivity, and
Growth: Macedonia versus European Union Olivera Kostoska, Ilija Hristoski
358
45. Analyisis of digital marketing and branding for the
purpose of understanding the consumers in digital
age Slađana Borić, Sanja Stanisavljev, Mila Kavalić, Marko
Vlahović, Erika Tobolka
375
46. Evaluating e-Customers’ Satisfaction in B2C e-
Commerce: the Case of Macedonian Students Ilija Hristoski, Pece Mitrevski, Tome Dimovski, and Zoran
Kotevski
382
47. Online Loans – New Business model on the
Macedonian Financial Market Marina Blazhekovikj Toshevski
390
48. Economic Factors Affecting Business Decision
Making Istat Visnja, Jelena Jovičić, Saša Arsovski, Mira Živković-
Drezgić, Darko Badjok
396
49. Informatization as a Measure for Improvement of
the Education Policy – Case Study: Electronic
Content Portal Ana Sekulovska, Jahi Jahija
404
50. Information Technologies in Human Resources
Management: An Overview Amar Kansara, Mohamed Hafez, Ljubica Kazi
410

International Conference on Applied Internet and Information
Technologies, 2016
DOI:10.20544/AIIT2016.01
MongoDB as solution for data warehousing
in online HRM systems
Biljana Radulović1, Dragica Radosav1, and Milan Malić1
1 University of Novi Sad / Technical Faculty “Mihajlo Pupin”, Djure Djakovica bb,
23000 Zrenjanin, Serbia
[email protected]; [email protected]; [email protected]
Abstract. With development of technology and techniques for data collection,
modern business organizations are able to store large amounts of new information
about customers and employees within it. In order to respond to the needs
identified in the field of data warehousing and data analysis within human
enterprise resource planning (ERP), business organizations increasingly opt for
new ways to store the data. One of them is use of non-relational databases
(NoSQL). This paper presents an information system (IS), developed for the
needs of human resource management (HRM). For data warehousing IS use
benefits of NoSQL MongoDB and was developed to be accessible via the Internet
At this point, the authors aim to point out the potential solution in data
warehousing and ERP system development. This solution can be used as the
initial point for the systems further evolving, which tend to support futures that
Industry 4.0 offers.
Keywords: NoSQL, HRM, IS development, data analysis.
1. Introduction
The emergence of Web 2.0 and its influence on the development of modern web
applications, have brought about a major shift in the way of running the business
organizations [1]. Nowadays, the Internet as we know it and the data exchanged on it,
significantly differ from their original purpose. The amount of data and their volume
exchanged over the Internet are nowadays measured in zettabytes per year, with the
increase of 2 zettabytes yearly, until 2019 [2].
According to the research conducted in 2009, only a small number of worldwide
business organizations used the Big Data while running their projects, and the total
amount of material resources invested in the projects did not exceed 100 million dollars
[3]. Today, a lot of companies invest heavily in development of Big Data. This fact has
been pointed out by David White, the CEO of Import.io:
“Traditionally, Enterprise has heavily invested in Big Data teams and infrastructure,
but what we are seeing now is democratization of Big Data – the tools/services to
collect and analyse data at scale are now within the price range of mainstream business.
It’s the start of something very exciting”.
A very important conclusion can be derived from the enclosed information,
supporting the fact that the business organizations are ready to change and accept the
1

Biljana Radulović et al.
new, so far unknown ways of storing, analysing and processing data in order to reach
the new findings related to their business. The development of new systems and
application of new technologies in the domain of data warehousing can lead to
significant benefits, from more efficient data management, faster and more precise
analysis, to delivering the potentially critically important data in real time.
It is the ERP systems that have been researched and improved over years, using
numerous new technologies, like innovations in the field of communication
technologies, service-oriented architecture [4], etc. However, regardless of all the
innovation mentioned and improvements applied, they still can be made better.
Therefore, one could say that ERP systems can be improved today through the
implementation of new data warehousing technologies, like non-relational databases
(NoSQL).
NoSQL databases represent a database group which is not based on the relational
model. The data model, used for warehousing by NoSQL database, is not fixed, but a
frequent possibility of NoSQL database, which is not used by the relational database
model. In the majority of cases, in fact, NoSQL databases do use SQL, so NoSQL does
not mean that SQL is absolutely not used. Therefore, we can see from the literature that
NoSQL also means „Not only SQL“[6].
By using all the mentioned technologies, ERP systems can be significantly
improved, so as to be made accessible in real time to various groups of people within
the organization, like management, economists, analysts, marketing professionals and
such. In this way, the time needed for making decisions, as well as the number of
communication and decision-making errors have been greatly reduced. Real-time data
processing and displaying the ones that the management was unaware of, enhances the
managing of an organization and its resources.
The rest of the paper is organized as follows: Section II. Review of the papers in the
field, Section III. Detailed review of the suggested system functionality, Section IV.
Development, technologies and description of the system architecture, Section V.
Conclusions and future research.
2. Related work
ERP systems have a significant role in making business decisions. They improve
business and organization efficiency. It can be said that there are numerous papers and
applicable approaches in the field of ERP system developing. However, it should be
pointed out that there are a really small number of the ones including NoSQL databases
as the data warehousing mechanism in their development [5].
Recent research, conducted by some media companies and regarding the expansion
of NoSQL, point out the annual growth of 21%, in the period from 2013 to 2018 [7].
Hence, it can be said that exactly this type of growth promotes the technology as one of
the fastest growing.
The increasing application of NoSQL is reflected in the numerous benefits it brings
[8-12]. NoSQL databases can be easily scaled, enabling a flexible data model [10][11].
Thanks to their horizontal scalability, NoSQL databases do not have limits, on the
contrary to the vertical, which adds up new server clusters [12]. In this way, greater
capacity is obtained and there is no performance loss. Thanks to their flexible scheme,
2

MongoDB as solution for data warehousing in online HRM systems
on the contrary to the relational databases, NoSQL databases do not require scheme
defining nor flexible dynamic schemes [13]. The asynchronous replication is used when
creating and storing the data copies, enabling faster creation of the documents stored in
NoSQL database, and thus faster work.
Anyway, flaws of NoSQL should be pointed out as well. As the author of the paper
[14] says, NoSQL enables BASE, on the opposite to SQL, enabling ACID. A more
recent research indicates possible solutions to this problem, suggesting that they should
be made on the middle tier in order to support the ACID features in NoSQL database
[15].
Thanks to their increasing popularity, a large number of NoSQL database types have
been developed in the recent years. They can be divided into several groups according
to the way of storing. Each of these groups has a large number of various producers
developing and maintaining their databases. They mainly differ mutually in a certain
segment within their group, and each of them has its advantages and disadvantages
[8][13].
The papers published in the several recent years show that the NoSQL databases
have been developed specifically for the needs of Big Data [8][11][16]. According to
the research in the field, it can be said with certainty that NoSQL will remain the field
leader [7].
In the paper [17], the author points out the need to invest into innovative
technologies, web services as well as the technology pervasion, since they will be of
vital significance if the producers of ERP systems want to survive in the future. For
this reason, it is necessary to accept new trends, which, as already mentioned, include
the implementation of NoSQL.
One of the important aspects of modern ERP systems is definitely the data transfer
between users and remote company divisions, in real time. The paper [18] points out the
possible solutions regarding improvement of applications to enable real-time
information delivery. It can be easily concluded that this is really significant since real-
time data exchange lead to more efficient decision making when problems occur in a
business organization’s work, and application of new technologies definitely leads to
more precise and clear answers.
3. Functionality
From the user’s viewpoint, the solution for managing human resources consists of a
web application, which can be accessed over the Internet.
This application is in fact an ERP system, designed so as to meet all the requirements
of human resource management, in order to remotely collect all the relevant information
on the employees’ work. It creates the records of the employees’ visits and activities
throughout the workday, their performance and effective work time. In this way, the
business organization can collect and analyse their employees’ work, and then establish
a more efficient way of their management. Based on the processed data, the
organization management can make more effective decisions regarding allocation of
human resources on active projects, and all with the aim to reduce costs and increase
work efficiency.
3

Biljana Radulović et al.
Given that the application was developed for the web environment, using the
program languages PHP and JavaScript, and its Graphical User Interface (GUI) in
HTML5 format, it can be accessed from all the contemporary portable devices which
support the most popular browsers.
The major benefit of this ERP system for human resource management, is the fact
that it uses NoSQL MongoDB database for warehousing all the collected information.
In this way, a possibility to create applications bringing the new data warehousing
solution for business organizations is pointed out. As it has been presented in the paper,
NoSQL brings multiple benefits that can tackle the majority of new problems, regarding
storing the growing data.
Fig. 1. Main control panel. This figure shows the control panel is segmented into fore
mentioned modules, and each of them has the option of data entry, data display and data
removal from NoSQL database.
The application consists of three parts – control panel, user interface and front-end
application. In this way, data managing is separated and safety is increased. The
modules of the application’s control panel are as follows:
Simple configuration
Creating the user groups and their allocation to employees
Creating a detailed employees’ activity log throughout the day
Client management
Employee management
Creating, managing and monitoring of the project
Company structure creating
Workplace management
Managing salary scales
Travel management
Salary management
Loan management
Creating reports
4

MongoDB as solution for data warehousing in online HRM systems
Fig. 2. Consists of two parts, where (a) shows the data entry form, on the basis of which
the report will be created, and (b) shows the created report. As it can be seen in Figure
2a, it is possible to filter the reports by multiple parameters, including the date range.
Figure 2b presents the use of complex aggregate queries on NoSQL databases, to obtain
the result set.
As of the user interface, its first role is the automated collection of employees’
activities during a session. The modules of the interface are as follows:
Collecting the data on employees’ project activities
Displaying the information on employees’ project activities
Displaying the information on the previous period activities
Displaying the information on travel and finances
Payroll accounting for the current month, on the basis of the realized activities
Fig. 3. Salary reports for employee. As it can be seen in Figure 3, apart from collecting
information about the employees and their activities, the application for human resource
management offers their overview as well, when creating the salary reports. In this way,
the employees can have the insight in all their activities, and thus the ways to improve
their work.
5

Biljana Radulović et al.
4. Development
The following techniques have been used for the developing of ERP system for
human resource management, presented in Section III: NoSQL MongoDB [18], PHP
program language, JavaScript, HTML5 and Linux Ubuntu Server 14.04 x64 for
initiation of Apache2 web server.
MongoDB server was used for storing the data. It uses the object-structured objects,
stored into collections as a data model [18]. As of queries, they are posed through
manipulating the objects in the collections. A lot of people opt for using the MongoDB,
as can be seen in the conducted research [19]. Easy use, flexible scheme and great
scalability are just some of the benefits offered by this NoSQL database. Nowadays, a
large number of leading organizations, like CERN, Craigslist, Foursquare etc. use
MongoDB in their environment.
The document structure in MongoDB collection corresponds to JavaScript Object
Notation (JSON) object. However, when storing the documents into the collection,
MongoDB server performs the serialization of the object into the binary encoded
system [18]. According to the research, BSON is a more efficient way to store data than
XML and JSON format, due to the fact that it consumes fewer server resources, as well
as the shorter time for processing. [20].
MongoDB-PHP Driver was used to connect MongoDB server and application. It
enables API through which the connection with MongoDB server is established. At this
point, it should be underlined that, in order for the driver to function properly, PHP 5.1
or up should be used. The driver is open-source and can be downloaded freely.
Regarding the document relation management, MongoDB as a non-relational model
has no foreign key and JOIN operations. The connecting is done in the embedded
documents or by creating a reference from one document to another [18].
Moreover, one of the great benefits of MongoDB lays in the fact that it can be used
alongside with the RDBMS systems. It can be easily concluded from this fact, that it is
a good solution for implementation with the already existing systems.
Additionally, MongoDB has the built-in system for managing big files, named
GridFS. By using it, MongoDB stores the binary files into the database, but the fact that
BSON object cannot be greater than 16MB should be pointed out.
5. Conclusions and future work
This paper presented the ways in which NoSQL DB can be successfully used to store
data in running of ERP system. There are numerous benefits of using the NoSQL DB,
from scalability, flexible scheme, work speed, smaller maintenance costs etc., which
make these databases a new and competitive solution for developing modern web 2.0
applications.
Although a really small number of companies have been using Big Data in their
projects only a couple of years ago, the things are rapidly changing nowadays and
Fortune 500 companies are increasingly using them in some of their projects. In the
same manner, the world-renown laboratories use NoSQL when conducting their
experiments, to store the obtained results.
6

MongoDB as solution for data warehousing in online HRM systems
On the other hand, this technology also has some flaws. NoSQL does not provide
ACID properties in their transactions, as it is the case with relational database
management system. NoSQL provides BASE transaction properties, as presented in this
paper. However, as mentioned, the research shows that these flaws can be overcome.
The increasing popularity of NoSQL DB in active projects of today has made this
data warehousing technology simpler for use. Therefore, it is now much easier for
software developers to master and implement in their new projects. The operations for
data processing are simplified and their use is very simple in the majority of modern
program languages. Moreover, it can be concluded that the data can be analysed and
displayed to the users in real time using contemporary techniques and technologies in
programming, which is a great advantage when the management needs to make critical
decisions.
Likewise, this paper has presented warehousing of big files using GridFS. Today,
when web 2.0 applications almost do not contain text data, managing big files is
crucially important. GridFS represents MongoDB’s solution for storing binary files into
a database. As it could be seen in this paper, the solution offers a number of benefits
when working with big files, from storing files in a distributed architecture, safety,
possibility of storing metadata, etc.
As it can be concluded from the facts mentioned in this paper, NoSQL databases are
definitely a good option in data storing in business organizations nowadays. The
multiple benefits they offer are the reason why companies increasingly implement these
databases in their work environment. Furthermore, the emergence of new technologies
like Internet of Things (IoT), which use sensor networks to collect numerous data from
their environment, make SQL an ideal solution for data storing.
Storing and analysing of these data offers a new way of collecting and reviewing
new information to business organizations, which can lead to new vision in their
operation.
6. References
1. B. W. Wirtz, O. Schilke and S. Ullrich, „Strategic Development of Business Models:
Implications of the Web 2.0 for Creating Value on the Internet“ ScienceDirect Long Range
Planning, vol. 43, Issues 2–3, pp. 272–290, April–June 2010.
2. Cisco Co., „Cisco Visual Networking Index: Forecast and Methodology, 2009–2014“, Cisco
Public Information, June 2010.
3. J. McKendrick, „Big Data Market Set to Explode This Year, but What Is ‘Big Data’?“,
SmartPlanet.com, February 2012.
4. M.P. Papazoglou, „Service-oriented computing: concepts, characteristics and directions“,
Web Information Systems Engineering, 2003. WISE 2003., pp. 3 – 12, December 2013.
5. Elragal, „ERP and Big Data: The Inept Couple“, ScienceDirect on Procedia Technology
CENTERIS 2014, vol. 16, pp. 242–249, Novmer 2014.
6. J. Pokorný, „New database architectures: Steps towards big data processing“, IADIS
European Conference Data Mining 2013, 2013.
7. DataStax, „Why NoSQL?“, October 2012.
8. B. M. Moniruzzaman and S. A. Hossain, „NoSQL Database: New Era of Databases for Big
data Analytics – Classification, Characteristics and Comparison“, International Journal of
Database Theory and Application, vol. 6, No. 4., 2013
7

Biljana Radulović et al.
9. R. Cattell., „Scalable SQL and NoSQL data stores“. ACM SIGMOD, vol. 39, Issue 4, pp 12-
27., December 2010.
10. Bhatewara and K. Waghmare, „Improving Network Scalability Using NoSql Database“,
International Journal of Advanced Computer Research, vol. 2, No. 4, Issue 6, pp. 488-490,
December 2012.
11. Oussous, F. Benjelloun, A. A. Lahcen and S. Belfkih, „Comparison and Classification of
NoSQL Databases for Big Data“, International Journal of Database Theory and
Application, vol. 6, No. 4.2013, 2013.
12. J. Pokorny, „NoSQL databases: a step to database scalability in web environment“,
Proceedings of the 13th International Conference on Information Integration and Web-based
Applications and Services, pp. 278-283, December 2011.
13. BĂZĂR, „The Transition from RDBMS to NoSQL. A Comparative Analysis of Three
Popular Non-Relational Solutions: Cassandra, MongoDB and Couchbase“, Database
Systems Journal, vol. V, no. 2/2014, March 2014.
14. N. Leavitt, „Will NoSQL Databases Live Up to Their Promise?“, IEEE Computer, vol. 43 ,
Iss. 2, pp 12-14, Feb. 2010.
15. E. Lotfya, A. I. Salehb, H. A. El-Ghareebc and H. A. Alid, „A middle layer solution to
support ACID properties for NoSQL databases“, Journal of King Saud University -
Computer and Information Sciences, vol 28., Iss. 1., pp. 133–145, January 2016.
16. J. McKendrick, „Big Data Market Set to Explode This Year, but What Is ‘Big Data’?“,
http://www.mckinsey.com, Februar 2012.
17. P. Hofmann, „ERP is Dead, Long Live ERP“, IEEE Internet Computing, vol. 12, Iss: 4, pp
84-88, July-Aug. 2008.
18. K. Chodorow, MongoDB: The Definitive Guide, O’Reilly Media, USA, pp 389-390, 2013.
19. Z. Parker, S. Poe and V. S. Vrbsky, „Comparing NoSQL MongoDB to an SQL DB“,
Proceedings of the 51st ACM Southeast Conference, Article No. 5, April 2013.
20. Nayak, A. Poriya and D. Poojary, „Type of NOSQL Databases and its Comparison with
Relational Databases“. International Journal of Applied Information Systems (IJAIS), vol. 5,
No.4, pp 16-19, March 2013.
8

International Conference on Applied Internet and Information
Technologies, 2016
DOI:10.20544/AIIT2016.02
Exploring software maintenance process
characteristics by using inductive thematic analysis
Zeljko Stojanov1 and Jelena Stojanov2
1 University of Novi Sad, Technical faculty ”Mihajlo Pupin”
Djure djakovica BB, 23000 Zrenjanin, Serbia
[email protected] 2 University of Novi Sad, Technical faculty ”Mihajlo Pupin”
Djure djakovica BB, 23000 Zrenjanin, Serbia
Abstract. Software maintenance is the most costly part of software life cycle,
deserving more attention of research community. Systematic consideration of
software maintenance problems and challenges becomes even more important in
small software companies that face several difficulties due to their constraints
related to staff, resources and funding. This paper outlines a method for
identifying and systematizing knowledge about practice in small organizations.
The method is implemented in a micro software company for identifying
characteristics of software maintenance processes. Thematic analysis enables
identification and systematization of knowledge in a framework that is grounded
in the empirical data collected in the company. This knowledge about the
maintenance processes is available to the company staff for usage in everyday
activities. The method can be easily tailored to other small organizations.
Keywords: process, characteristics, software maintenance, qualitative methods,
inductive thematic analysis.
1. Introduction and background
There are many processes involved in software life cycle. Processes in software
engineering practice encompass both technical and managerial activities within the
software life cycle. Implementation of software life cycle processes requires appropriate
infrastructure with available resources such as staff, tools and funding, as well as
assigned responsibilities in the processes. Software processes are creative, feedback
driven, adaptable and should be observed within the real context [12]. Since software
organizations are based on knowledgeable workers, it is common practice to implement
process assessment and improvementactivities together with organizationallearning
activities [18], resulting with increased awareness of importance of knowledge assets
for overall business performances of organizations [13].
Software maintenance is a set of activities aimed at providing cost-effective support
to software [6]. Although it has been recognized as the most costly part of software life
9

Zeljko Stojanov and Jelena Stojanov
cycle it does not attract enough attention comparing to development [19,26].
Maintenance activities enable: controlling software’s day-to-day functions, controlling
software modifications, perfecting existing functions, dealing with security threats, and
preventing problems and performance degradation. Since software maintenance is an
ongoing process aimed at keeping software useful, the imperative in software
maintenance is to reach managed process that will reduce errors through the software
life cycle [3]. However, April et al. [2] reported that many software organizations do
not have defined processes for their software maintenance activities.
Qualitative research methods have been recently adopted in software engineering
for exploring and illuminating everyday practice [11]. Qualitative methods enable
deeper understanding of practice and processes from the perspective of involved people,
with particular emphasis on social issues in the practice. Qualitative methods have been
used in software maintenance for exploring: how developers manage relevant
information while solving maintenance tasks [15], documentation usage [17],
development agile methodology [20], or effects of inter-smell relations on
maintainability [33].
It is well-known that software industry consists of mostly small organizations that
rarely adopt best practice proposals, but rather develop their own methods for managing
maintenance activities [4,20]. In addition, due to the complexity of software
maintenance tasks, many of development techniques, tools, models and processes
cannot be directly applied in maintenance [21]. Anquetil et al. [1] stated that the
fundamental problem in software maintenance is the lack of various types of
knowledge, which is usually only in heads of software engineers. In this course of
research, several ontologies, typologies and frameworks were proposed for
systematizing knowledge on software maintenance processes [14,10,23,1,32]. All these
models and frameworks have been developed in order to direct empirical research in
software maintenance, or are suitable for larger organizations that have resources for
implementing them in the practice. Therefore, systematization of knowledgethat will
facilitate knowledgereuse, especially in small software organizations, can help
maintainers to more efficiently cope with difficulties in everyday maintenance activities.
These observations suggest that further research in the area of software maintenance
processes is necessary.
This paper presents a method suitable for identifying characteristics of software
maintenance processes in small software organizations, as well as a cases study in a
micro software company, resulting with developed thematic framework with
systematized characteristics of software maintenance processes. The paper is structured
as follows. The next section presents a case study with the description of the research
context, methods and findings. The third section contains the discussion of the
trustworthiness of the study and the benefits for the company.The last section contains
concludingremarks and further research directions.
10

Exploring software maintenance process characteristics
2. Case study
2.1. Context
A case study was implemented in a local software company focused on local clients
in Serbia. According to European commission [8], the company can be classified as a
micro enterprise since it has seven employees. The company develops and maintains
over 30 business software applications for over 100 clients. Based on the trend analysis
of clients’ requests, over 84 percent of the tasks are focused on maintenance activities
[28], which strongly emphasizes the importance of software maintenance for the overall
business performance of the company. Based on that, the company management
recognized the importance of assessing and improving software maintenance processes.
In this course of thinking, the company implemented software maintenance process
improvement project, as well as identification and systematization of knowledge related
to software maintenance activities [31].
By having in mind the well known constraints of small software companies [22,16],
the method for identifying and systematizing knowledge was developed as a bottom-up.
This means that the identification of knowledge starts with the investigation of the real
state of the practice in the company, without attempting to fit the research process and
findings to any prescribed strategy, directive, standard or guideline. This method relies
on the company staff, who have the best insight into everyday practice. Their
knowledge and experience are of the crucial significance for the identification and
systematization of the most relevant knowledge. In addition, the method requires full
commitment of the company’s management. This approach ensures availability of all
necessary resources in the company during the research process.
2.2. Methods
Characteristics of software maintenance processes are identified by using a Lightweight Inductive Method for Knowledge Identification and Systematization (LIM4KIS) [30].
The method enables knowledge identification and systematization without disturbing
everyday practice in an organization.Inductivethematic analysis proposedby Braun and
Clarke [7] serves as a method for the data analysis and development of the thematic
knowledge framework. Fig. 1 presents iterative process of creating knowledge
framework about software maintenance practice in the company.
The most comprehensive understanding of the practice assumes combining a variety
of different data sources, and using both qualitative and quantitative methods [9]. The
main sources of knowledge for identifying characteristics of software maintenance
process are interviews with the employees, observations of the everyday practice, the
documents available in the company, and data extracted from the internal repository of
maintenance requests (MRs). Based on the variety of data sources, different methods for
data analysis were used, such as trend analysis [28], regression analysis [29] and fuzzy
screening [27] for quantitative data, and thematic analysis for qualitative data. All these
11

Zeljko Stojanov and Jelena Stojanov
data were prepared for feedback sessions, which were organized as working meetings in
the company. The feedback sessions are essential for the successful implementation of
the method. The sessions were chaired by the leading researcher, while other
participants were invited based on the current state of the research (e.g. an interviewee
whose transcribed interview was prepared for the discussion). The transcripts from the
feedback sessions were analyzed by using inductive thematic analysis [7].
Methodological memos were used for elaboratingall decisions, while theoretical memos
were used for developing theoretical constructs (themes, sub-themes and relationships
in the framework) during the whole research process [5].
Fig.1. Iterative process of creating a thematic knowledge framework for software
maintenance practice in the company
2.3. Findings
Maintenance activities are organized in order to solve clients’ requests related to
sustaining software products usable. These requests are called maintenance requests
(MRs). Two themes in this thematic area relate to the process and the features of MRs:
Requestfeatures and Processing maintenance requests. Fig. 2 shows thematic area with
identified themes and sub-themes of MR processing in the company. This thematic area
is a segment of thematic knowledge framework describing the maintenance practice in
the company [31]. According to the typology of qualitative findings proposed by
Sandelowski and Barroso [24], the findings can be classified as conceptual/thematic
description, since they were shaped as a set of developed themes and sub-themes
integrated into a thematic framework.
12

Exploring software maintenance process characteristics
Fig.2. Software maintenance request processing
Processing maintenance requests. Few types of software maintenance processes can be
distinguished in the company. All maintenance processes, regardless of the type, are
recorded in the repository with the same attributes. Typical maintenance processes
relate to the modification of software products, including enhancements of software
with new functionality or solving reported problems, and providing support to the
clients through organized training and technical support. The following sub-themes
related to processing of MRs were identified:
– Stages in process. Each process is adjusted to the current MR and a client that
submitted it, starting from receiving a request, analyzing a request, and
implementing necessary tasks. The stages in the process are: receiving a request,
checking urgency, checking client’s status, assigning a programmer to the request,
implementing necessary work, and finishing documentation.
– Decisions. Decisions are regularly made by programmers in all stages and in
transitions between stages, while in some cases decisions are expected also by the
clients.
– Classification of requests. Requests are classified based on the urgency, and after
that based on the internal classification of the clients’ organizations.
– Managing unsolved requests. Unsolved requests are requests postponed due to the
high occupancy of the programmers or inappropriate request specification provided
by a client. These requests are either scheduled for solving in the near future or
rejected.
– Communication between stakeholders. Communication between the programmers
and the clients is essential for efficient processing of MRs and occurs during all
stages in the process. It includes variety of techniques such as email, phone calls,
meetings, etc.
– Software tools. Several software tools are used for supporting technical and
organizational aspects of MR processing. The most important software tool for
processing MRs is internal web based application for managing requests and
associated tasks.
Request features. Efficient processing of MRs is based on a conceptual model that
includes all relevant attributes related to clients, programmers, tasks and invoices. The
13

Zeljko Stojanov and Jelena Stojanov
conceptual model is based on several years of experience in solving the clients requests.
The following sub-themes related to the features of MRs were identified:
– Request attributes are divided in two sets. The first set of attributes defines a MR,
which includes its description, the reason for the request, the priority (high, medium
and low), and a client that submitted the request. The second set of attributes relates
to processing of a MR, with the attributes related to the critical times in processing
a MR, the evidence of the performed work, and the information about the assigned
programmer.
– Types of requests are distinguished for classifying requests. The classification
includes modification requests that includes requests for enhancements and
problem reports, and requests for technical support including requests for
administration of software systems, requests for training and requests for technical
assistance to the clients.
3. Discussions
3.1. Benefits for the company
Active engagement of the company management and the staff in the whole research
process resulted with several benefits for them. The first benefit relates to identification
and systematization of knowledge on software maintenance processes, which has
become available to the staff. The next benefit relates to the increased self importance
and motivation of the staff involved in the research. And finally, deep and overall
knowledge about processes enables identification of potential improvements.
3.2. Trustworthiness
The validity and rigor of qualitative research is based on ensuring that
trustworthiness criteria, such as credibility, neutrality and transferability [25]. In this
study, the credibility, or internal validity, was increased through careful application of
inductive thematic analysis method supported by rich description of the research
process and findings, triangulation of data sources, and active participation of the
company staff in data analysis. The research findings are grounded in the data collected
in the company and validated by the employees, which ensures neutrality of the
researchers, whose work served only for creating the most faithful representation of
knowledge about the practice.
The main threat to the trustworthiness of this study is transferability of the research
findings. However, the aim of this study is not to provide the findings relevant for all
similar software organizations, but rather to provide guidelines how to organize a study
resulting with the identified characteristics of a selected segment of practice. In
14
Exploring software maintenance process characteristics
addition, the thick description of used research methods provides guidelines for
organizing the similar researches in other small organizations.
4. Conclusions
This paper presents a study aimed at identifying characteristics of software
maintenance processes in a micro software company. The study is based on inductive
method for identifying and systematizing knowledge about the selected segment of
practice, assuming active involvement of the company staff. The findings are presented
as a thematic knowledge framework, which is available to all staff in the company. The
main contribution of this paper is an inductive lightweight method for knowledge
identification and systematization, suitable for small organizations. In addition, the
presented segment of the framework can be used as a starting point for deeper
investigation of specific aspects of software maintenance.
Several possible directions for further work can be distinguished. The first direction
includes implementation of the presented method for identifying characteristics of other
segments of the practice, such as requirements engineering or testing, and integration of
independentlydevelopedframeworks into a general one. Implementationof the method in
other small organizationswill providethe evidence about its usefulness. The most
promising direction relates to developing mechanisms that will ensure evolution of
developed frameworks aimed at ensuring compliance with the changes in the practice.
Acknowledgement
Ministry of Education, Science and Technological Development, Republic of Serbia,
partly supports this research under the project ”The development of software tools for
business process analysis and improvement”, project number TR32044, 2011-2016.
References
1. Anquetil, N., de Oliveira, K.M., de Sousa, K.D., Dias, M.G.B.: Software maintenance seen
asa knowledge management issue. Information and Software Technology 49(5), 515–529
(2007)
2. April, A., Huffman Hayes, J., Abran, A., Dumke, R.: Software maintenance maturity
model(SMmm): the software maintenance process model. Journal of Software Maintenance
and Evolution: Research and Practice 17(3), 197–223 (2005)
3. Banker, R.D., Datar, S.M., Kemerer, C.F., Zweig, D.: Software errors and software
maintenancemanagement. Inf. Technol. and Management 3(1-2), 25–41 (2002)
4. Basri, S., O’Connor, R.V.: Understanding the perception of very small software companies
towards the adoption of process standards. In: Riel, A., O’Connor, R., Tichkiewitch, S.,
Messnarz, R. (eds.) Systems, Software and Services Process Improvement, Communications
15

Zeljko Stojanov and Jelena Stojanov
in Computer and Information Science, vol. 99, pp. 153–164. Springer Berlin Heidelberg
(2010)
5. Birks, M., Chapman, Y., Francis, K.: Memoing in qualitative research: Probing data and
processes. Journal of Research in Nursing 13(1), 68–75 (2008)
6. Bourque, P., Fairley, R.E.D. (eds.): Guide to the Software Engineering Body of
Knowledge(SWEBOK). IEEE Press, Piscataway, NJ, USA, 3rd edn. (2014)
7. Braun, V., Clarke, V.: Using thematic analysis in psychology. Qualitative Research in
Psychology 3(2), 77–101 (2006)
8. Commission, E.: The new SME definition: user guide and model declaration. Enterprise
andindustry publications, Office for Official Publications of the European Communities
(2005)
9. Creswell, J.W.: Research design: Qualitative, quantitative, and mixed methods
approaches.SAGE Publications, Thousand Oaks, CA, USA, 3rd edn. (2009)
10. Dias, M.G.B., Anquetil, N., de Oliveira, K.M.: Organizing the knowledge used in
softwaremaintenance. Journal of Universal Computer Science 9(7), 641–658 (2003)
11. Dittrich, Y., John, M., Singer, J., Tessem, B.: For the special issue on qualitative
softwareengineering research. Information and Software Technology 49(6), 531–539 (2007)
12. Gray, E.M., Smith, W.L.: On the limitations of software process assessment and the
recognitionof a required re-orientation for global process improvement. Software Quality
Control 7(1), 21–34 (1998)
13. Ho, C.F., Hsieh, P.H., Hung, W.H.: Enablers and processes for effective knowledge
management. Industrial Management & Data Systems 114(5), 734–754 (2014)
14. Kitchenham, B.A., Travassos, G.H., von Mayrhauser, A., Niessink, F., Schneidewind, N.F.,
Singer, J., Takada, S., Vehvilainen, R., Yang, H.: Towards an ontology of software
maintenance. Journal of Software Maintenance: Research and Practice 11(6), 365–389
(1999)
15. Ko, A.J., Myers, B.A., Coblenz, M.J., Aung, H.H.: An exploratory study of how
developersseek, relate, and collect relevant information during software maintenance tasks.
IEEE Transactions on Software Engineering 32(12), 971–987 (2006)
16. Liao, Y., Barnes, J.: Knowledge acquisition and product innovation flexibility in SMEs.
Business Process Management Journal 21(6), 1257–1278 (2015)
17. Lutters, W.G., Seaman, C.B.: Revealing actual documentation usage in software
maintenancethrough war stories. Information and Software Technology 49(6), 576–587
(2007)
18. Messnarz, R., Ekert, D.: Assessment-based learning systemslearning from best projects.
Software Process: Improvement and Practice 12(6), 569–577 (2007)
19. Pfleeger, S.L.: Software Engineering: Theory and Practice. Prentice Hall, Upper Saddle
River,NJ, USA, 3rd edn. (2006)
20. Pino, F.J., Ruiz, F., Garca´, F., Piattini, M.: A software maintenance methodology for small
organizations: Agile MANTEMA. Journal of Software: Evolution and Process 24(8), 851–
876 (2012)
21. Polo, M., Piattini, M., Ruiz, F.: Using a qualitative research method for building a
softwaremaintenance methodology. Software: Practice & Experience 32(13), 1239–1260
(2002)
22. Raninen, A., Ahonen, J.J., Sihvonen, H.M., Savolainen, P., Beecham, S.: Lappi: A light-
weight technique to practical process modeling and improvement target identification.
Journal of Software: Evolution and Process 25(9), 915–933 (2013)
16

Exploring software maintenance process characteristics
23. Ruiz, F., Vizcaino, A., Piattini, M., Garcia, F.: An ontology for the management of
softwaremaintenance projects. International Journal of Software Engineering and Knowledge
Engineering 14(3), 323–349 (2004)
24. Sandelowski, M., Barroso, J.: Classifying the findings in qualitative studies. Qualitative
HealthResearch 13(7), 905–923 (2003)
25. Schwandt, T.A., Lincoln, Y.S., Guba, E.G.: Judging interpretations: But is it rigorous?
trustworthiness and authenticity in naturalistic evaluation. New Directions for Evaluation
2007(114), 11–25 (2007)
26. Sommerville, I.: Software Engineering. Addison Wesley, Boston, MA, USA, 9th edn. (2011)
27. Stojanov, Z., Brtka, V., Dobrilovic, D.: Evaluating software maintenance processes in
smallsoftware company based on fuzzy screening. In: Proceedings of IEEE 9th International
Symposium onApplied Computational Intelligence and Informatics (SACI 2014). pp. 67–72.
Timisoara, Romania (May 2014)
28. Stojanov, Z., Dobrilovic, D., Stojanov, J.: Analyzing trends for maintenance request process
assessment: Empirical investigation in a very small software company. Theory and
Applications of Mathematics & Computer Science 3(2), 59–74 (2013)
29. Stojanov, Z., Dobrilovic, D., Stojanov, J., Jevtic, V.: Estimating software maintenance effort
by analyzing historical data in a very small software company. Scientific Bulletin of The
”Politehnica” University of Timisoara, Transactions on Automatic Control and Computer
Science 58 (72)(2), 131–138 (2013)
30. Stojanov, Z., Dobrilovic, D., Zarkov, A.: Lightweight inductive method for knowledge
identification and systematization - LIM4KIS. Technical report 004-2015, Technical faculty
”Mihajlo Pupin”Zrenjanin, University of Novi Sad, Zrenjanin, Serbia (2015), [In serbian]
31. Stojanov, Z., Stojanov, J., Dobrilovic, D.: Knowledge discovery and systematization
throughthematic analysis in software process assessment project. In: Proceedings of the IEEE
13th International Symposium on Intelligent Systems and Informatics (SISY 2015). pp. 25–
30. Subotica, Serbia (2015)
32. Ulziit, B., Warraich, Z.A., Gencel, C., Petersen, K.: A conceptual framework of
challengesand solutions for managing global software maintenance. Journal of Software:
Evolution and
Process 27(10), 763–792 (2015)
33. Yamashita, A., Moonen, L.: Exploring the impact of inter-smell relations on software
maintainability: An empirical study. In: Proceedings of the 2013 International Conference on
Software Engineering. pp. 682–691. ICSE ’13 (2013)
17

International Conference on Applied Internet and Information
Technologies, 2016
DOI:10.20544/AIIT2016.03
Local Cloud Solution’s and Distance Learning System’s
Reliability
Predrag Alargić1, Tanja Kaurin2
1 Univerzitet Union, Fakultet za pravne i poslovne studije dr Lazar Vrkatić, Novi Sad,
Republika Srbija
[email protected], [email protected]
Abstract. One of the distance learning system’s functions is to train attendants for
easier learning and new knowledge acquisition in education. Such a system
introduction in education requires preparations regarding maintenance, system
termination prevention and possible accompanying costs. Present paper shall
elaborate the advantages of such a system within a local cloud solution compared
to the traditional approach in more detail.
Keywords: computer science, information systems, Cloud computing, Moodle,
teaching, maintenance .
1. Introduction
The proces of globalization brought about back door challenges to all institutions.
Traditional learning methods are proving inadequate in new environment. Global
economic crisis has largely contributed to reduction of IT related financial funds. The
above resulted with educational institutions being forced to undertake number of
changes. Herein further the study will explain how the way distance learning system
located on the local cloud solution compares to a traditional solution, and the way it’s
both technical and constructive solutions simplify system’s technical maintenance.
2. Materials and methods
Firstly, we need to explain the definition of cloud computing solution. The one that
stands out is Gartner's definition, claiming that: "Cloud computing is a style of
computing in which scalable and elastic IT-enabled capabilities are delivered as a
service to external customers using Internet technologies".
The second, generally accepted definition of cloud computing solution is the one
provided by the US National Institute of Standards and Technology (NIST), stating that
“Cloud computing is a model for enabling convenient, on-demand network access to a
18

Predrag Alargić et al.
shared pool of configurable computing resources (e.g., networks, servers, storage,
applications, and services) that can be rapidly provisioned and released with minimal
management effort or service provider interaction”. 1
In contrast to the traditional computing, involving the software being actually
purchased, cloud computing solution implies moving user’s data to the Internet. Cloud
computing solutions are being expected double-digit growth in the coming years, and
according to Gartner's predictions as many as 30% of enterprises by the 2015 would
change their IT resources usage purpose. Private users are presently utilizing the cloud
computing predominantly for file storage or Webmail services. In general, all
applications that are currently being utilized on PCs should continue as services via
cloud computing solutions.
In Serbia, at present, a wide range of services are being offered. The cooperation
based on VMware solutions is one of the most important. Telekom Srbija (thanks to
their regional market presence in Montenegro and Bosnia and Herzegovina as well) has
about nine million subscribers, and being mobile telephony services operator as well as
broadband Internet provider, represents an ideal partner. There is a business
requirement for both public and private cloud solutions offering flexible use of virtual
infrastructure, virtual servers renting, i.e. either server and user applications or entire
platform. Such services’ elements include company Cloud computing connectivity with
the system infrastructure location, access to the virtual desktop and/or server devices,
virtual elements creation and setup according to customer requirements, as well as
corresponding applications installation and configuration. Services are always
accompanied by the data security support systems as well as system’s crash recovery
mechanisms. 2
Data storage was one of the issues not previously associated with the solution. If the
service being utilized, provided by cloud computing solution vendor not located in the
country of our institution where it’s actually being used, and we opt to cancel the
services, what would then happen to our data and how sure can we be that they will not
end up being misused?
The present paper will try to provide explanation of an ideal solution for the above
problems, detailing the implementation of the local cloud computing solution
containing distance learning software.
In order to gain insight into feasibility of distance learning system introducing we
have conducted research utilizing the scientific investigation and survey techniques.
Survey in written was conducted on a sample totaling one hundred students aged
between 19 and 25. All of the surveyed had already accessed distance learning system.
Survey questions designated as essential for the distance learning introduction are:
whether the use of information technology is necessary in the distance learning process
and whether they regard Internet classroom as a useful tool for students.
Obtained survey results are more than sufficient for us to realize the need for such
system (Figure 1).
1 NIST Tech Beat : “Final Version of NIST Cloud Computing Definition”, October 25, 2011,
Published 2 Alargić P, Tanja K. “ INFOTEH-JAHORINA” Vol. 13, March 2014.
19

Local Cloud Solution’s and Distance Learning System’s Reliability
Figure1. Distance learning system requirement
Number of surveyed individuals with positive stand regarding such a platform
requirement amounted to 87%, while 100% of respondents believe this system is one of
the most useful tools during the course of the study (Table 1).
The following factor affecting the feasibility of such a system introduction is renting
storage space cost and leasing Cloud computing solution to store the required software.
As an innovative and cost-effective solution, taking into account the herein above
pointed issues, indeed proved to be the one in the form of a combined free software
tools, regular PC and widely available Internet connection. Free Ubuntu Server
platform is the one we decided to implement as our basis platform3 . In addition to free
platform we utilized their free cloud computing solution called Ubuntu OpenStack,
which we used to perform our server virtualization4.
3. Implementation
The system of at least seven PCs, each of which have two hard drives, as well as
additional requirement that the two PCs each have two network interface cards (NIC),
are required in order to implement internal cloud computing server. Ubuntu Server
platform needs to be installed on PCs that have two network cards.
It is then necessary for all of the PCs to be connected to the internal private network
in order to utilize other PCs’ resources. OpenStack Ubuntu platform implementation is
the step that follows, used to configure or change our cloud computing solution
performance (Figure 2).
Table 1. Students’ requirement regarding e-learn classroom
The use of information technology is necessary
in the e-leaning process 87%
3 www.ubuntu.com/server 4 www.ubuntru.com/Cloud/openstack
20

Predrag Alargić et al.
I regard Internet classroom as a useful tool for
students 100%
Figure 2. Ubuntu OpenStack
With this our internal cloud computing solution is properly configured and ready for
use. It is now necessary to install and configure one of the distance learning solutions
on such configured and set platform. We also opted for a free of charge solution, based
on Open Source platform. OpenSource platform is a term used to describe “free of
charge” software provided to users, having no restrictions how to be utilized, modified
or shared. In general, source code is made fully available to user so that he/she is able to
fully customize it as per specific requirements5. Moodle platform represents good
solution being applied worldwide, and also translated into numerous languages,
including Serbian6. Simple installation of Apache server7 and a MySQL database8
utilizing only the command line on our platform, as well as Moodle distance learning
platform installation – rendered the system ready for setup and operation (Figure 3).
Figure 3. Moodle platform - configured system is ready for operation
5 http://tehnografija.net/operativni-sistemi/linux-operativni-sistemi/sta-je-zapravo-open-source/ 6 www.modle.org 7 http://http.apache.org/ 8 http://www.mysql.com/
21

Local Cloud Solution’s and Distance Learning System’s Reliability
The final step represents opening of our private Cloud computing PC network to the
Internet. This is accomplished by enabling free passage on our router (allowing access
to Internet) for the PC where Moodle distance learning platform has been installed.
Those router settings are found in the section entitled "Port Range Forwarding", and it
is necessary to enter the PC’s with installed distance learning platform IP address and
port 80, and save such data in settings (Figure 4).
In order to explain why we opted for cloud computing platform model in a local
network (with number of PCs, as in our case, are connected in one system) and not
utilizing until now prevailing approach (available via the services provider lease), we
must have knowledge regarding cons/pros of such systems. In Table 2. we have
compared two systems, local cloud computing solution and services purchase.
The advantage of our cloud computing solution is based on its ability to:
• Control of the management system,
• Lock,
• Failure isolation,
• Risk adjustment,
• Data protection,
Failure isolation is an important feature to be singled out. Multiple leases and shared
resources are the Cloud Computing defining characteristics during the services
purchase. It Includes failure mechanisms for sharing storage, memory, routing, and
even good reputation among different occupants such is the so-called VM/hyper
jumping. One is to keep on mind the low current frequency of attacks on resources
isolation mechanisms, with experience requiring caution even at this stage.
Another characteristic that must not be omitted is insecure or incomplete data
deletion. At service purchasing point, when the request is made to delete cloud
resources, it may happen, as with many operating systems, that the data is not actually
deleted. Adequate or timely data deletion can also be disabled (or undesirable from a
user's perspective) or for the reason of unavailability of additional data copies or
because destruction disk contains other clients’ data. In case of multiple requests and
hardware resources re-use, this represents a greater user risk than a separate software.9
4. Maintenance suitability
System’s maintenance suitability is the single most important as well as decisive
characteristic of cloud computing solution in the local network in conjunction with
distance learning platform.
9 Ljiljana Paunović, “Cloud computing kao vrsta web hosting servisa”. http://www.itresenja.com/
22

Predrag Alargić et al.
Figure 4. Router settings
Table 2. Local cloud computing solution and services purchase comparative
review
SERVICE CLOUD
local
CLOUD
service
purchase
Usage and response
time reduction X X
Infrastructure
errors minimization X X
Basic costs
reduction X X
Innovation pace
increase X X
Loss of control over
management system X
Locking X
Failure isolation X
Harmonization risks X
Management
interface compromise X
Data protection X
Insecure or
incomplete data
deletion
X
Malicious intrusions X X
Delay X
In an effort to define, we can single out that maintenance suitability represents
probability of projected maintenance procedure being carried out at the provided time,
23

Local Cloud Solution’s and Distance Learning System’s Reliability
environmental conditions and at minimal cost.10 Thereby, the maintenance suitability is
related to:
• Technical system structure simplicity principle and benefits of combining
them,
• System’s build quality,
• Conditions for performing maintenance activities, and
• System’s integral support level.
The herein laid out system is not flawlessly designed, and as well as with any other
similar system, there are parts and particles prone to failure. Such positions can be
called “weak points”. There are many different ways to detect weak points:
• During system’s operation commencement, with initial failures, and
• During the working process.
The most important thing is to find, analyze how to troubleshoot and remove them.
Weak points may reveal themselves by the emergence of failure, so they should not be
sought out, even though weak points are often not recognized because the failure is
remedied and a weak point remains and is able to surprise again.
Based on failure information on our local network cloud computing system, we are
able to calculate the performance indicator on the basis of which we can get information
on whether system possesses weak points or not. Performance indicator (K) is
calculated utilizing the following formula:
(1)
With :
a Count on this kind of previous failures,
b Mean time between two failures,
c Records keeping time or system’s integral parts that failures are being
considered, and
d Number same type of assemblies or system’s integral parts that failures are
being considered.
The system being observed shall first include cloud computing solution purchase and
calculate the performance indicator (K1), observing only the number of the same
assembly which was in failure.
(2)
With :
a1=24
b1=14 (days)
c1=365 (days)
d1=1
10 Prof. dr Živoslav Adamović, doc. Dr Cariša Bešić : „Održavanje tehničkih sistema“, Želnid,
Beograd, 2008.
24

Predrag Alargić et al.
Resulting performance indicator is K1=0.92054.
Another system being observed is local network cloud computing solution (herein
above described) and we shall calculate its performance indicator (K2).
(3)
With :
a1=3
b1=36 (days)
c1=365 (days)
d1=1
Resulting performance indicator is K2=0.29589.
As can be seen, measurement results show the obtained failure coefficient for Cloud
computing solution in conjunction with the Moodle distance learning system is multiple
times lower when compared to the same system with the service provider.
Finding technical systems’ weak points, except for the failure monitoring process,
there is a proceeding by which to monitor stoppage and stoppage caused costs. Utilizing
this method of finding weak points by monitoring the cost or stoppage is done
periodically, and results then compared with the expected state.
5. Conclusion
The presented study describes and identifies the benefits of local based cloud
solutions in conjunction with distance learning system. The new era demands reliable
information and communication systems operation, either for business or private
purposes. Low reliability and availability lead to safety endangerment, customer
dissatisfaction and great losses both because it is not delivering services, and at the
same time running with higher maintenance costs. Reliability can be no longer
calculated on the basis of hardware reliability only, but must take into account the
software reliability as well. However, a human represents huge factor in system
reliability, especially in determining the reliability of task execution system with human
being part thereof, or is triggered in the event of failure of some of the system’s
functions. During the last twenty years, due to a lack of classical statistical approach in
determining the reliability and suitability of the ever growing requirement for
calculating the failure coefficient, based on the measurement and determination of the
weakest links in the observed system. Rapid development of new and modern
technologies indicates that the challenges being put before the reliability experts are still
immense, especially when it comes to systems with increasingly present hardware and
software.
6. References
[1] Kočović, P. : “Osnovi primene kompjuterske tehnike”, Fakultet za obrazovanje
rukovodećih kadrova u privredi, Beograd 2010, Unpublished
25

Local Cloud Solution’s and Distance Learning System’s Reliability
[2] NIST Tech Beat : “Final Version of NIST Cloud Computing Definition”,
October 25, 2011, Published
[3] Alargić P, Tanja K. “ INFOTEH-JAHORINA” Vol. 13, March 2014.
[4] www.ubuntu.com/server
[5] www.ubuntru.com/Cloud/openstack
[6] http://tehnografija.net/operativni-sistemi/linux-operativni-sistemi/sta-je-zapravo-
open-source/
[7] www.modle.org
[8] http://httpd.apache.org/
[9] http://www.mysql.com/
[10] Ljiljana Paunović, “Cloud computing kao vrsta web hosting servisa”.
http://www.itresenja.com/
[11] Prof. dr Živoslav Adamović, doc. Dr Cariša Bešić : „Održavanje tehničkih
sistema“, Želnid, Beograd, 2008.
26

International Conference on Applied Internet and Information
Technologies, 2016
DOI:10.20544/AIIT2016.04
Example of IoT platform usage for wireless video
surveillance with support of NoSQL and cloud systems
Milan Malić1, Dalibor Dobrilović1, and Ivana Petrov1
1 University of Novi Sad / Technical Faculty “Mihajlo Pupin”, Djure Djakovica bb,
23000 Zrenjanin, Serbia
[email protected]; [email protected]; [email protected]
Abstract. Today there is an increasing need for implementation of area security
systems, especially in sense of monitoring areas of interest. Many of the solutions
related to wireless security cameras that are available on the market are mainly
limited with their predefined functionalities. Furthermore, these sets of
functionalities largely affect price levels. Thanks to an increasing development
and availability of open-source hardware and DIY (Do It Youself) electronics
applicable in the field of Internet of Things (IoT), as well as new methods in data
storage, such as NoSQL, new opportunities for creation of custom systems for
video monitoring and storing video data are opened. Through this work it is
presented the solution for wireless security cameras, based on the IoT enabled
open-source hardware and MongoDB database as the storage system. Also, in
order to achieve replication of created content, possibilities of storing this content
on the cloud storage system are explored. Established solution can be used on a
daily basis, both in the private and business environments. Also, in this paper are
presented technologies used for system development. The solution can be used as
a starting point for further development of the systems for areal monitoring and
content of interest creation using the emerging technologies.
Keywords: Internet of Things, open-source hardware, wireless video
surveillance, NoSQL, video streaming
1. Introduction
Nowadays, wireless security cameras can be easily purchased in local and online shops.
These devices can be mounted inside the building and used in outdoor areas. Deployed
devices of this type have wireless network connectivity and ability to be activated in the
case of detecting movement in their proximity. Unfortunately, these devices are often
limited in their functionality by the default settings provided by manufacturer and with
limited sets of configuration functions. Their prices range from several tens up to
several hundreds of Euros depending of supported features.
Today, the Internet and Internet data greatly differ in comparison with the original
concepts by their functions and purpose. By 2016, the expected portion of video traffic
27

Milan Malić et al.
on Internet will be 86% of total traffic. Every second, 1.2 million minutes of video
content are passing through the network. According to this, it becomes clear that video
traffic is becoming dominant traffic, and its usage in wireless platforms and portable
devices will rise continuously.
The development of systems based on emerging technologies, such as the Internet of
Things (IoT), became increasingly popular and much easier with open-source hardware.
Today, platforms used to build security camera systems are low-cost and simple to use.
According to the research conducted by Gartner, 6.4 billion IoT devices will be
operational by 2016 and more than 20.5 billion by 2020 [1]. According to the same
research, over 50% of large business organizations will have implemented some form
of IoT through their systems [2]. Therefore, it can be concluded that IoT enabled
devices carved their way in the development of modern business organizations.
In this paper is presented the solution based on the Arduino Yún microcontroller board,
in combination with USB web camera and passive infrared (PIR) motion detection
sensor. These components are used to create the wireless security camera system. Also,
with the usage of Python, PHP, data storage and cloud system and NoSQL MongoDB
database, the additional functionalities are added. The usage of NoSQL databases (DB)
in this solution gives the advantage because NoSQL databases are not based on the
relational model. Data model that is used during storage is not fixed and this ability
significantly facilitates the application development.
The system is created for live video surveillance and for storing captured images to the
remote server. Storing of captured images is available on the internal memory of the
device, on the cloud system and on the private server. The security camera is also able
to transmit live video steams via Internet portals such as Youtube.com or Twitch.tv.
Captured content can be easily reviewed, shared and used for monitoring the areas over
the Internet in real time. System is designed to allow users to be able to access data over
the Internet, regardless of the platform they used. The advantages and disadvantages of
this approach in development are presented in this paper. One of the key advantages of
using open-source hardware and software in building such systems is the possibility of
utilization of new technologies and services with the significant savings in the budget.
The rest of the paper is organized as follows: Section II - Related work, Section III -
Detailed overview of the proposed solution and its functionality, Section IV -
Development, technology and system architecture description, Section V - Conclusions
and further research.
2. Related work
Today, IoT devices have an increasing role in generating data for making critical
business decisions. Just by using these devices and connected sensors, it is possible to
create complex systems for data acquisition, with relatively low budget. It can be
pointed out that in these times there are a large number of papers that highlight the
importance of IoT and its usage, both in the private and in the business environments.
However, very small percentage of these works show the interoperability between
NoSQL with IoT and the significance of providing platforms that combine these two
technologies.
28

Example of IoT platform usage for wireless video surveillance with support of NoSQL and cloud
systems
According to the Gartner analytics [1], it is clear that the importance of IoT
technologies is great and constantly increasing. Data acquired from sensors should be
stored and analyzed in efficient way. Therefore, NoSQL and Big Data are the right
solutions for this problem. With utilization of these solutions based on the
implementation of Big Data and analysis of data flows generated by sensor networks,
modern business organizations can find new information that had not been obvious
earlier. Those information can be used for improving the business.
There are four types of NoSQL DBs, which differ in the way of data storage [3-7].
Those four types [12,13] of NoSQL DBs are:
Key-value store: Data is stored on the basis of key-value pairs. Value is retrieved based
on the keys. Redis, Dynomite, and Voldemort are examples of these DB type.
Column-oriented store: DBs organize data similar to the data in the RDBMS tables,
with the difference of storing items by columns instead of the rows. They are good for
data warehouse applications. The examples of column-oriented DBs are Hbase,
Cassandra, Hypertable.
Document store: Data are stored and organized as a collection of documents.
Documents are flexible; each document can have a number of fields. The examples are
Apache CouchDB and MongoDB.
Graph store: These DBs use graph theory for storage and data retrieval. The focus is
on the inner connectivity between different pieces of data. Data segments are displayed
based on nodes and relationships between them and are defined by the edge of the
connection nodes. Neo4j is an example of this DB type.
Each of these NoSQL DB groups have their advantages and disadvantages, and it was
analyzed in greater details in [6] and [8]. Research by Winkler S. [9] points to the issue
of transfer of video signal and packet loss via wireless and wired networks. Through the
study author examined 11 different DBs and the related packet loss and compares the
created video content.
Finally, this paper aims to establish solutions for the implementation of open-source
IoT oriented hardware and NoSLQ DB in order to create wireless security camera
systems. Therefore, in this paper is presented approach in creation of wireless security
cameras with the goal of reducing loss of the video content created by the system. Also,
it is necessary to point out that the proposed solution, which uses the MongoDB
NoSQL DB, enables storage of materials generated in real time, which greatly shortens
the access time to the content. This feature has importance for the systems designed to
detect patterns in real time.
Related to wireless video surveillance systems, there are various and interesting
examples of application of these systems in different areas such as precision agriculture
[14], using 6LoWPAN [15] and WiMAX [17] technology, or in using efficient
prioritization techniques [16].
3. Solution description
Proposed solution consists of two main subsystems: hardware and software. Software
subsystem consists of a system for storing generated video content and web applications
for accessing this content. Web application enables access to the video content via
29

Milan Malić et al.
Internet from any location and using any device (computer, tablet, smart phone). There
is also option for the local transmission of video signal, which can be accessed directly
by the system user. User can also set the camera operation modes. The captured video
content is transferred with wireless IEEE 802.11 technology.
System performs video surveillance with additional feature of making security copies of
the captured content to multiple locations. So, authorized person within the organization
can analyze collected information. System enables wireless remote access to the video
surveillance systems located in isolated locations.
Front-end application is developed using PHP, JavaScript, and for the graphical user
interface (GUI) is used HTML5. Content is also accessible via Youtube or Dropbox
services, e.g. can be accessed using modern portable devices such as smart phones,
tablets, notebooks and laptops.
The main advantage of the proposed solution is in the utilization of MongoDB database
system for document storage and captured images. This is relatively novel approach in
storing data that is significantly more efficient than the traditional one.
Hardware subsystem is presented in Figure 1, and it consists of the following elements:
USB webcam, PIR sensor for motion detection, Arduino Yún, microSD card and power
bank. The system wiring is presented in the Figure 1 and described in figure caption.
Fig. 1. The detailed wiring of the Arduino Yún based wireless security camera node is presented
here. In the center of the figure is Arduino Yún microcontroller board, connected with USB web
camera (on the left) via USB port and with PIR sensor (on the right) with three wires: 5V, Ground
and digital input (pin 8 on Arduino Yún). This image is created using Fritzing 0.9.2b
(http://www.fritzing.org).
Developed application has multi language support (Serbian and English). Applications
for hardware and created content management consist of the following elements:
Arduino Yún operating subsystem OpenWRT-Yun,
camera control application,
application for the automatic creation or capturing of a detected motion
pictures,
web application for accessing captured images supported by MongoDB with
support for: reviewing captured images, removing images and Meta-image
data definition,
application for sending images to Dropbox,
application for transferring video content to the local and remote server,
application for storing captured images on local device (microSD),
30

Example of IoT platform usage for wireless video surveillance with support of NoSQL and cloud
systems
Application for accessing the captured images, which is supported by MongoDB,
consists of the following modules: Session management, Managing user accounts,
Complex aggregation queries (executed on the time range basis), Image galleries and
MapReduce functions for tracking image access.
4. Development
The following hardware and software components are used to develop wireless security
cameras presented in Section 3: Arduino Yún, Logitech C170 webcam, PIR sensor HC-
SR501, TP-Link wireless router 740N, Power Bank, NoSQL MongoDB, Python, PHP,
JavaScript, HTML and Linux Ubuntu server 04.14 x64 with Apache2 web server.
Complete system is presented on Fig. 2. All parts of the system are tested. Live video
streaming and video capturing are not possible in the same time. The main focus in this
research was to enable the feature of storing captured images in MongoDB and
Dropbox cloud. Since the image capturing is priority, YouTube and stream server
presented in figure were not active in this appliance.
Fig. 2. The schema of the complete system: (1) The wireless web camera station based on
Arduino Yún, (2) LAN network connected with wireless web camera station via WiFi and Access
Point, (3) video streaming server, (4) Mongo DB server, (5) YouTube, (6) Drop Box, (7) public
web server, (8) users with variety of devices with Internet access.
Arduino Yún (Fig. 3) is according to the number of authors, perfect platform for
designing sensor networks, and especially for IoT projects. Operating system that is
embedded in this platform is OpenWRT-Yún, and it is based on the Linux OS. This OS
enables easy system resource management and system development as well. It is
powerful solution considering the support for latest technologies and programming
languages.
31

Milan Malić et al.
Fig. 3. Arduino Yún microcontroller board based on the ATmega32u4 and the Atheros AR9331.
Atheros processor supports a Linux distribution based on OpenWrt named OpenWrt-Yun. The
board has built-in Ethernet and WiFi support, a USB-A port, micro-SD card slot, 20 digital
input/output pins (of which 7 can be used as PWM outputs and 12 as analog inputs), a 16 MHz
crystal oscillator, a micro USB connection, an ICSP header and a 3 reset buttons. The LED
indicators are presented in the figure.
Arduino Yún is a microcontroller board based on the Atheros AR9331 ATmega32u4
processors, power supplied with 5V source. Also, it is important to note that the OS
supports the work with the latest versions of the Python programming language. The
price of the platform is around $90 including Yún ($75), camera ($15) and sensor ($1).
The calculated price strongly supports platform usage in similar IoT projects.
Arduino Yún orientation towards usage of Linux based OS affects the selection of USB
web camera. To enable proper camera functions it is necessary that camera supports
USB video class (UVC) protocol. This protocol describes the USB devices that have
the ability to transfer video signal, which are supported by Linux OS. For the purpose
of this project Logitech webcam C170 was selected. This webcam not only supports
UVC protocol but it is also very affordable and can be purchased for about $15. Also, it
is important to note that the camera supports 5 megapixel images and video with
resolution of 640 x 480 pixels.
For motion detection, PIR sensor HC-SR501 was used. One of the main advantages of
this sensor is its affordable price of around $1. Also, one of its main features is the
maximum range of motion detection, which according to official specification is around
7m.
Python, and PHP are used for programming languages used to develop wireless security
cameras. Both languages are open-source and are considered very popular
programming languages.
As it was mentioned before, MongoDB NoSQL is document-base store DB. The
structure of documents in MongoDB collection corresponds to JavaScript Object
Notation (JSON) object. However, when storing documents in a collection MongoDB
server performs object serialization in a binary encoded system [10]. According to
studies [11], BSON is more efficient in storage compared to XML and JSON, because it
takes less server resources, as well as shorter time for data search.
Also, it is important to emphasize that the advantage of MongoDB is related to
management of documents. MongoDB server has an embedded document management
32

Example of IoT platform usage for wireless video surveillance with support of NoSQL and cloud
systems
system, called GridFS. With the help of this system, MongoDB stores documents in
DB.
GridFS stores files in two different collections, such as: files and chunks. The basic idea
of this system is reflected in the fact that every file that will be stored with the help
GridFS will be divided into two listed collections, where the files will have exactly one
document consisting of a title, name, size, time of sending as well as any other metadata
set by the user. Content files will be stored in one or more documents in the collection
chunks (for PHP implementations each part stored up to 256KB of data). Because
MongoDB uses BSON for document storage, documents cannot be larger than 16 MB.
5. Conclusion
In order to respond to the rising security needs, especially in the segment of monitoring
the areas of interests comes the need for developing new solutions for wireless video
surveillance. This solution for wireless security camera is based on the open-source IoT
oriented hardware, cloud and MongoDB DB as data storage systems.
Thanks to the growing popularity of IoT, today we are able to develop systems easily
and efficiently in various fields at significantly lower costs of development. Open-
source hardware movement significantly speeds this process. The new approaches in
data storage are important because exiting RDBMS systems are not able to respond to
new types of requirements. The data exchange over Internet today significantly differs
in comparison to previous period. For all these reasons, the solution for the problem and
accomplishment of the needs may be solved with NoSQL DB, which is increasingly
being implemented in modern web applications.
The advantages NoSQL DB are numerous, and therefore it clears the question why
these systems are increasingly applied today. In the sense of programming, web
application development is greatly simplified precisely because NoSQL DBs support
flexible schemes. Also, MongoDB, used for the implementation of the proposed
solution, is supported by many programming languages.
For development of back-end application and for storing captured images after motion
detection, Python programming language is used. For displaying and reviewing of
images and the front-end of the system PHP is used. End users can access captured
images via cloud and Internet portals like Dropbox and YouTube.
The successfully implemented system showed number of advantages. However, like
any other new technology, in this approach new problems appeared, especially in the
field of security and data protection. So, future research should be focused on reducing
corruption of captured and stored video content in order to improve its quality and
protection of data warehousing storages.
Finally, NoSQL certainly represent one of the possible and efficient solutions for data
storage created by IoT hardware. Many of the NoSQL DBs benefits force business
organizations to increasingly implement them in their working environments. The other
contribution of this work is proven efficiency in using open-source hardware in
development of IoT systems cooperating with NoSQL DBs.
33

Milan Malić et al.
6. References
1. van der Meulen, R.: Gartner Says 6.4 Billion Connected "Things" Will Be in Use in 2016,
Up 30 Percent From 2015, Press Release, Stamford, Conn., November 10, 2015 (Retrieved
March 2016), http://www.gartner.com/ newsroom/id/3165317
2. Woods, V.: Gartner Says By 2020, More Than Half of Major New Business Processes and
Systems Will Incorporate Some Element of the Internet of Things, Press Release, Stamford,
Conn., January 14, 2016, http://www.gartner.com/newsroom/id/3185623
3. Pokorný, J.: New database architectures: Steps towards big data processing, Charles
University, Faculty of Mathematics and Physics, 2013.
4. DataStax NoSQL: Why NoSQL White Paper, 2013.
5. Băzăr, B.: The Transition from RDBMS to NoSQL. A Comparative Analysis of Three
Popular Non-Relational Solutions: Cassandra, MongoDB and Couchbase“. Database
Systems Journal vol. V, no. 2/2014
6. Moniruzzaman, A. B. M., Hossain, S. A.: NoSQL Database: New Era of Databases for Big
data Analytics – Classification, Characteristics and Comparison, International Journal of
Database Theory and Application. Vol. 6, No. 4, 2013.
7. Tiwari, S.: Professional NoSQL. John Wiley & Sons. 2011.
8. Yishan, L.: Manoharan, S.: A performance comparison of SQL and NoSQL databases, IEEE
Pacific Rim Conference on, 2013.
9. Winkler, S.: Analysis of Public Image and Video Databases for Quality Assessment,
Selected Topics in Signal Processing, IEEE Journal of, vol. 6, no. 6, pp. 616 – 625, 2012.
10. Chodorow, K.: MongoDB: The Definitive Guide, O’Reilly Media, USA, 2013.
11. Nayak, A., Poriya, A., Poojary, D.: Type of NOSQL Databases and its Comparison with
Relational Databases. International Journal of Applied Information Systems (IJAIS), vol. 5,
No.4, pp 16-19, March 2013.
12. Vaish, G.: Getting Started with NoSQL, Packt Publishing Ltd., Birmingham, UK, 2013.
13. Tiwari, S.: Professional NoSQL, John Wiley & Sons, Inc., Indianapolis, USA, 2011.
14. Garcia-Sanchez, A., Garcia-Sanchez, F.., Garcia-Haro, J.: Wireless sensor network
deployment for integrating video-surveillance and data-monitoring in precision agriculture
over distributed crops, Computers and Electronics in Agriculture, Vol. 75, Issue 2, February
2011, pp 288-303 , http://dx.doi.org/10.1016/j.compag.2010.12.005.
15. Salvadori, C., Petracca, M., Madeo, S.. Bocchino, S., Pagano, P.: Video streaming
applications in wireless camera networks: A change detection based approach targeted to
6LoWPAN, Journal of Systems Architecture, Vol. 59, Issue 10, Part A, November 2013, pp
859-869, http://dx.doi.org/10.1016/j.sysarc.2013.05.009.
16. Mehmood, I., Sajjad, M., Ejaz, W., Baik, S. W.: Saliency-directed prioritization of visual
data in wireless surveillance networks, Information Fusion, Vol. 24, July 2015, pp 16-30,
http://dx.doi.org/10.1016/j.inffus.2014.07.002.
17. Lubobya, S. C., Dlodlo, M. E., De Jager, G., Zulu, A.: Throughput Characteristics of
WiMAX Video Surveillance Systems, Procedia Computer Science, Vol. 45, 2015, pp 571-
580, http://dx.doi.org/10.1016/j.procs.2015.03.110.
34

International Conference on Applied Internet and Information
Technologies, 2016
DOI:10.20544/AIIT2016.05
Agile Management of IT Projects by Modified Scrum
Processes
Zoran Ćirić1, Stojan Ivanišević2, Otilija Sedlak1, Ivana Ćirić2 and Bogdan Laban3
1University of Novi Sad, Faculty of Economics Subotica,
24000 Subotica, Segedinski put 9-11, Serbia,
zoran.ciric, [email protected] 2PhD student, Faculty of Economics Subotica, Subotica, Serbia
[email protected] 3EPS Distribucija, Beograd, Serbia
Abstract Scrum is the result of evolution in product development originating
from the Japanese management system and process improvement (kaizen) and the
Toyota production system from middle of the 20th century. However, Scrum is
not the end result but a constant evolution. The purpose of this paper is an attempt
to add new knowledge to this evolution. There are numerous alternatives to
Scrum process and rules, commonly called hybrids. It is important to be aware
that one approach or process cannot be a solution for every software development
project. The key is to find a balance between the processes and the people,
policies and the principles, as well as focus on long-term or short-term goals, etc.
This problem is one of the biggest challenges widely discussed in present-day
scientific and industrial communities.
Keywords: project management, agile, Scrum, ROI.
1. Introduction
The area of information and communication technologies is extremely large. IT projects cover
wide array of projects in the field of hardware (purchase of computers and / or computer
components, installing computer networks, etc.) and software (design and / or implementation of
software applications, information systems, databases, web portals, etc.), as well as projects that
include a combination of hardware and software. However, because of their frequency, their
sensitivity to a variety of changes, their specificity and their creativity, this paper will focus on IT
software projects.
The emergence of software development has a very short history - only about half a century
long. Despite its short history, the number of approaches, activities, techniques and methods
which are used in software development has increased drastically. From the holistic point of
view, any practice of software product development is so variable, diverse and complex that any
future project management is under pressure and at risk of not being successful. Being successful
for a project means to carry out the planned framework, with the specific resources and within the
given timeframe. A large number of failed projects points to the lack of real development
methodologies. Software crisis of the seventies is a particularly well known result of a complete
35

Zoran Ćirić, Otilija Sedlak, Stojan Ivanišević and Ivana Ćirić
lack of methodology. However if we look at the meaning of the word crisis (Greek Crisis - make
a judgment, evaluation, make a difficult decision) we can say that the choice of the right approach
to software development has always been and will remain for a long time in the crisis.
Term ‘methodology’ is mentioned less often and is replaced by the term ‘approach’ in
contemporary literature. Concept of an activity in a specific process is being replaced by an
activity in a particular framework. The reason for this change should be seen in the fact that the
complex challenges are best answered by complex approaches. In other words, one rather simple
model can not present response to a complex and turbulent reality. Precisely because of the
constant change the emphasis is on the flexibility and the adaptability of the approach, which is
often associated with agility and agile methodologies (approach).
In some communities Scrum has a dominant share in the total use of agile methodologies.
Scrum is also recognized as the most faithful manifestation of the agile approach. Within the
range of discussions and different opinions on this particular topic it is difficult to distinguish
between the fans and the fanatics. On the other hand, there are many critics who are disregarded
due to mass popularity and application of the Scrum process. The theme of this paper is an
attempt to analyze the agility and work experience in order to set a Scrum alternative to such
strictly defined framework.
Changes include:
Situational approach based on the principles of project management rather than a
process based on predefined rules,
Quasi-indefinite duration "time-boxes" instead of explicitly defined time duration,
Elimination of Scrum master as a separate role in the Scrum team,
Possible shift from incremental to the continual development,
Not giving higher priority to development activities based solely on short-term benefits.
2. Project Management
Traditional project management is based on managing people [10]. It includes a variety of
techniques for planning, forecasting and control of activities in order to achieve the desired
results according to pre-defined rules strictly within a certain time frame and with certain budget
[1]. According to PMI, the traditional approach is taken as the basis for the division of the stages
of management [8]:
1. Initiating - definition and approval of the project;
2. Planning - the action plan to achieve the goal;
3. Executing - coordinate human and other resources in order to implement the defined
project plan;
4. Monitoring and Controlling - monitoring and controlling the progress of the project to
detect deviations from the plan and take the necessary corrective action;
5. Closing - acceptance of products, services, or results and completion of the project.
The first task which is placed in front of the project manager and the project team is to define
the tasks. The definition of the tasks is needed to be done even before the formal start of the
project in some circumstances.
When using traditional approach the plan is the foundation of everything because it represents
not only the description of the tasks and the time needed for their implementation, but also the
tool for decision making. During the planning phase tasks are determined and assigned to the
most competent team members. Planning reduces uncertainty because it provides the ability to
correct erroneous steps in achieving the desired goal and it increases the understanding of the
36

Agile Management of IT Projects by Modified Scrum Processes
objectives and tasks in the project. Planning therefore increases the effect of taking into account
the possible distribution of work in relation to the timetable and the availability of resources.
The next step, executing, is basically permission to perform assigned tasks. During the
execution it is essential to monitor and control whether everything is going according to plan.
Time and resource loss should be minimized by the quick correction of the identified
irregularities in order to complete the project on time and within the planned budget. In addition
to time and cost successfully completed task is a perquisite to successful project completion.
In the final phase the project has to be formally completed and closed. This indicates that all
the project`s scheduled tasks have been successfully completed. The finished project is submitted
to the client and used resources are now free to be assigned to a new project. During the closure
of the project, evaluation is carried out. In certain situations evaluation can serve as a valuable
source of knowledge, especially if something unexpected has happened that is then successfully
overcome. This designates completion of the project as an important phase which is often
overlooked, mostly because of the pressure to begin work on the next project immediately.
Although the traditional approach to project management is very robust it can be applied to
the simplest as well as the most complex projects, because the same steps are always applied
during the project.
Striving for continuous innovation and the struggle to reduce costs is present in all branches
of industry. This has prompted a group of authors to develop a new approach to software
development. Although considered new this approach is based on several already-known
principles: continuous innovation, adapting products, reducing delivery times, adjustment of
people and processes, reliable results [4]. All of these principles are included in the concept of
agility which represents attitude rather than process. Agility is the ability to create and respond to
change in order to obtain profit in a turbulent business environment [4]. In addition, agility is the
ability to balance between flexibility and stability.
To address these issues in the year 2001st. the Manifesto for Agile Software Development [6]
was created containing four most prized values of agile development:
the members of the development team and the relationships between them must be in
higher regard then the processes and tools,
software development is more important than the extensive documentation,
cooperation and constant communication with customers is placed ahead of the long,
slow negotiations and writing contracts,
prompt and effective response to changes in many ways are more useful than rigid and
inflexible respect for the set plan.
Agile project management is based on the traditional approach and it has five phases, but
these phases are modified to make them more suitable for use in practice [4]:
Envision - determine the vision of the project and the project organization (instead of
the initial phase in order to emphasize the importance of vision);
Speculate - develop a model which is determined by the characteristics, functionality,
timelines, iteration plan for achieving the vision (instead of planning, to emphasize the
uncertainty because a plan is associated with determination);
Explore - tested to deliver parts for short periods and constantly look for ways to reduce
the risk and uncertainty of the project (rather than management, because research
iteratively or non-linear);
Adapt - inspect the delivered results, the current situation and the behavior of the
project team and all that is necessary to adjust adequately;
Close - complete the project and highlight the key things that the team learned during
the work on the project.
37

Zoran Ćirić, Otilija Sedlak, Stojan Ivanišević and Ivana Ćirić
3. Agile Principles and Scrum Rules
Agile management stresses iterative approach to the project and is therefore applicable to a
variety of projects. If a very large project team is involved, one can expect additional
coordination. According to the author of this paper it is better to apply agile project management
methodology to the projects with small or medium sized teams in order to achieve the best results
and the highest level of productivity while preserving stability.
Scrum (a term taken from rugby, marks the moment when the opposing teams are grouped
together fighting for the possession of the ball; related to agile software project management) as a
development approach includes several important features of the environment and technical
characteristics that have a significant ability to change during the course of the project. Emphasis
is placed on the organization and motivation of the project team. Life cycle stages are pre game,
game development and operations (Figure 1).
Fig. 1. Scrum life cycle stages and corresponding activities
It is expected for Scrum dogma to put an equal sign between the two terms from the title.
However, I believe that the first thought when reading the titles are about the similarities and the
differences in approaches between the agile approach and Scrum. This will be addressed later in
the article, but the key to this kind of guidance is actually the relationship between the concept of
principles and the concept of rules. We can safely say that the principle is more of an abstraction
and is more general in relation to the rule. The principle is more often observed through one or
more rules than vice versa. The rules are derived from principles. The most important
characteristic of all principles comes from the inner mental state, state of mind and motivation of
the individual to do the right thing, within externally imposed rules. It is important to note that
because of the subjectivity of the principles there may be conflicts between different
interpretations of the principles. This conflict does not necessarily mean that the result will be
something bad. While translating the principles to the rules and vice versa contradictions may
occur, such as those with agile principles and Scrum rules means
Scrum follows strict rules, such as the duration of the event (meeting) which are: Sprint
Planning (8 hours for a one-month sprint), daily Scrum (15 minutes), the audit sprint (4 hours for
38

Agile Management of IT Projects by Modified Scrum Processes
a one-month Sprint) Sprint Retrospective ( 3 hours for a one-month sprint). Take for instance the
daily Scrum meeting, which is the "15-minute restricted event for developers to synchronize
activities and a plan for the next 24 hours" [9]. This can be seen as rule concretization of the
twelfth principle, the last in the list of principles on which the agile manifesto is based: "At
regular intervals, the team reflects on how to become more effective and then adapt their behavior
accordingly" [2]. But on the basis of which principles or scientific research has it been
determined that the meeting should last 15 minutes each day? Why not 10, 14, 16 or 20 minutes?
Can it be expected that a team of three members and a team of nine members would need the
same time to get snchronized, not to mention different situations and circumstances. Why every
day? If a team is having a free and open communication, and if every team member is aware what
every other member is doing daily meetings are not necessary. In these situations time is wasted
contrary to the principle of lean management - one of the root principles in agile approach. There
has been some research, but also anyone can do an experiment to determine how much time it
takes to regain full concentration on some intellectual work after being interrupted. That period
is about 20 minutes. This yields potential total loss of 140 minutes each day for a team of 4
members: 4 members * (15 min + 20 min for return of focus on work). Is it not more rational use
of time to initiate this type of meetings only if a member of the Scrum team believes that it is
necessary and to have them for a necessary duration rather than a limited time period. This is also
true for other events. The role of the team leader would be to monitor the "breathing" of the team
and make sure that every event takes place in a rational timeframe. In "The Scrum Guide" it
would make a significant difference if the word “around” was placed before duration time for the
meetings. This transition to the vague time span relies on the belief that every team member is a
professional who strives for most effective realization of the mutual goal. Only one of the
principles of agile manifesto refers to this: "Build projects around motivated individuals. Provide
them with the environment and the support that they need and trust them that they will do the job
"’[2].
With this precondition met, I give priority to the flexible and adaptive situational approach
over the processes and to the principles over the rules. If you look at the quality of food at fast
food restaurants you can expect the same average quality of the finished product each time. This
equals a standard output as the result of processes and rules which clearly defines food (input)
and processing of these foods. This organization of labor is imposed on the grounds that the
workers who prepare the food are uneducated and incompetent. On the other hand if you take real
master chefs for example, you can see that they do not use rules (recipes), but their intuition and
the principle to, based on the available ingredients selected on the basis of an assessment of
freshness and quality, prepare uniquely exquisite dish.
A question which definitely arises is what is the expected quality of the software product we
aim to build and how capable is the team we have to build it. Unfortunately, reality shows that
not everyone is a master of the craft and can not be expected to apply all of the principles in order
to perform the most effective and most efficient action. For each individual project the team
needs to carefully decide what will be the trade-off between the degrees of implementation of the
principles and enforcement of the rules. Rules and processes are meant to solve standard
problems, while principles and chaotic process create flexibility.
Table 1. The table below represents the different characteristics of the two approaches which
are the subject of this part of the paper in the project management
Rules Principles
Problem and solution: Standard Non Standard
Productivity: Average and constant High and volatile
Creativity: Low High
Adaptability to changes: Rigid Rapid
39

Zoran Ćirić, Otilija Sedlak, Stojan Ivanišević and Ivana Ćirić
Minimal team competence: Low High
4. Scrum Team Role in Development of Software Products
Scrum teams consist of the owner of the product (product owner), the developers (development
team) and the Scrum master. As can be seen, one of the Scrum ideas is to eliminate the
conventional role of the manager in the project. Most importantly the direct influences of all
stakeholders on the development team are eliminated. Stakeholders can give their input
exclusively through the owner of the product. This prevents unnecessary conflicts and confusion.
But then why should anyone create conflict and confusion in the context of the Scrum team? This
comes from the relationship between the product owner and the Scrum master. On the one hand,
the interest of the product owner is exclusively the result of the product development without any
empathy for the team, while the Scrum master focuses on the development process, time and the
team. It turns out that the result of the project depends on the negotiation skills of the two sides,
where we run a completely unnecessary risk of dominance of one or the other party. It is also
difficult to see that the Scrum master actually cares for the team and its productivity, because
Scrum master acts like a cop enforcing Scrum process like a law and regulates any deviation. The
problem with the "law" is that the law is not always in favor of a better functioning within the
team and team results, as discussed in the previous topic.
Responsibility of a classical manager is not only to set or deliver requirements to the team but
also to be aware of how the team „breathes” and to have expectations in accordance to realistic
team abilities. This responsibility greatly resembles the role of coaches in the sport teams. This is
precisely the role that each team requires. Even a team assembled from the best players in the
world requires a coach who sets demands and cares for execution at the same time. Separating
these two roles is wrong. In addition there is no direct control in Scrum. Scrum master does not
have the role of the leader and the coach that he is credited with but the one of a shepherd who
directs the team like sheep. On this basis, Scrum master as separatist separate role in the team
should be abolished. This opens the possibility that the owner of the product or someone
competent and respected within the development team can be elected leader of the team, unless
he comes from the client’s side. The only task left to the team management is to set the context
and identify and bind the team to achieve the goal of the project [7].
Regarding the development process, agile approach as well as time and Scrum are iterative
and incremental development processes. That means that the difference between the two is visible
as a result of the development of usable and ready for implementation products, as opposed to the
traditional methodology. But one can go a step further. We need to recall that agile approach has
its roots in the paradigm of lean management and the essence of this approach in the area of
production is reflected in the philosophy of production at the right time (eng. Just in Time - JIT).
One of the methods for the implementation of this strategy is kanban. It is known that this
concept is already being applied in the IT sphere under the same name, but only in cases where
the purpose is the provision of services, such as technical assistance, or possibly in a late stage of
the product life cycle. The idea is to start using the concept of JIT in combination with iterative
development which enables the fastest possible time use but use it only when there are
conditions for it. The main condition is that particular requirements, user stories or functionality,
can be implemented separately from other requirements. User stories and functionalities can be
implemented without the need to wait for the end of an iteration, or a sprint [3]. On the other hand
if there are more such requirements with the highest priority for development, it makes no sense
to put them in a time-limited iteration and one increment. Going into the estimation, analysis,
development and the implementation of "one by one" system the way they are arranged in order
of priority in product Backlog is a far better approach.
40

Agile Management of IT Projects by Modified Scrum Processes
5. Return of the Investment in Software Product Development
The great advantage of the processes and the rules is that they allow the prediction of the input
(resources), the output, the time, the risk and the like, for each instance of iteration. Stakeholders
and managers are reluctant to use Scrum precisely for this reason. Iterative and incremental
development is a big shift in relation to the waterfall model. Specific problems of software
development can occur if the development is viewed solely in the short term. More specifically
investors should be aware that investing in a project to develop software is a long term
investment [5].
The main metric used to determine the whole purpose of the project is the return on
investment - ROI. Responsibility for maximizing ROI falls upon product owner through the
requirement schedule, user stories or features in Product Backlog. According to Scrum,
scheduling is performed based on the value that each item contributes. Value comes down to the
formula of benefit / development costs for each item. By viewing things this way, development is
focused on short-term ROI. For example if the goal and the greatest value of building a house is
the protection from rainfall, it would mean that you should start building it from the roof down. In
addition, ROI depends largely on the context. Priority should not be accompanied by the current
ROI. Priority of constructing the roof is much higher in the early fall than in the late spring
because of the much higher incidence of rainfall. Therefore it is necessary to analyze and
compare the items in Product Backlog in a manner which will take into account the current
situation (context) and the expected ROI at the end of the future sprint on the one hand and the
future ROI of all future sprints on the other hand. Future sprints ROI will depend on current
decisions about which item in Product Backlog will be developed.
Calculating ROI based on future sprints:
ROI=ROI(n)+(ROI(n+1)*α+ROI(n+2)*β+⋯+ROI(n+i)*ω) (1)
Where:
n – Represents number of the sprint for which we are calculating ROI,
i – Last sprint in a row which brings added value related to the n sprint,
Greek alphabet letters – coefficient of shared ROI from future sprints as a result of investing
into n sprint.
This formula is the way to calculate the total potential investment return based on the
investment in Sprint n. Unlike the current short-term perception that the investment in a sprint
delivers ROI equal to ROI at the end of the sprint, the long term ROI can be calculated as the sum
of ROI at the end of the current sprint and the amount of shares in ROI of future sprints which are
the result of investment in the current sprint. Coefficient share is represented by the symbols of
the Greek alphabet and is defined on the basis of analysis and projection of future products and
future market trends and business needs.
It is important to keep in mind that there is always a suspicion about the total, short-term and
long-term, return of investment. This suspicion is crucial for decision what needs to be developed
in the next iteration. If we look at investing as a business activity, we see that it depends on the
size of the investment, the size of return, time and risk. It is necessary to keep abreast of all these
factors when deciding on future investments. The time dimension of investment in terms of
immobilization of the means until their return and the risks are the most common reasons to favor
investments in short-term results. On the other hand if the rate of return on investment over the
long term is much higher than the short-term, this justifies the opportunity cost and the risk.
Because of this higher return rate the focus should be on long-term investment. The conclusion is
that the layout of user stories in Product Backlog should be determined by taking into account all
relevant variables.
41

Zoran Ćirić, Otilija Sedlak, Stojan Ivanišević and Ivana Ćirić
6. Conclusion
Many aspects of software product development process can be found through reviewing the
Scrum and its characteristics. Due to the existence of different perspectives, deciding what is best
or at least good enough is not easy. This applies to software development and management as
well as to each member of the development team all the way to the highest managers. By
covering the different roles and responsibilities of the Scrum, this article suggests improvements
in some aspects of work. The aspects that were highlighted are related to managers via the
planning, organization and project management, through to the team members role and
particularly to product owners who need to prioritize development and to Scrum master whose
responsibilities should be divided into pre-existing roles in the team.
References
1. Bach, J., & Pressman, R. Enough about process: What we need are heroes. IEEE
Software, 12(2), 96–98. http://doi.org/10.1109/52.368273 (1995).
2. Beck, K., Beedle, M., Van Bennekum, A., Cockburn, A., Cunningham, W., Fowler,
M., Thomas, D. Agile Manifesto. Retrieved from http://agilemanifesto.org/ (2001).
3. Gray, L. Gray rebuts Bach: no cowboy programmers! Computer, 31(4), 102–
103,105. http://doi.org/10.1109/2.666846 (1998).
4. Highsmith J.: Agile Project Management, Boston, MA: Addison-Wesley, 2004.
5. Lukasiewicz, K., Miler, J. Improving agility and discipline of software
development with the Scrum and CMMI, IET Software, Volume 6, Issue 5, pages
416-422, DOI: 10.1049 (2012). (accessed 10.03.2016.)
6. Manifesto for Agile Software Development , http://www.agilemanifesto.org
(accessed 03.03. 2016.)
7. Permana, Putu Adi Guna, Scrum Method Implementation in a Software
Development Project Management, International Journal of Advanced Computer
Science and Applications, Volume 6, Issue 9, pages 198-204 (2015).
8. PMI: A Guide to the Project Management Body of Knowledge, Third Edition
(PMBOK Guide), Newtown Square, PE: Project Management Institute, 2004.
9. Schwaber, K., & Sutherland, J. The Scrum Guide - The Definitive Guide to Scrum:
The Rules of the Game. Scrum. Org, October, 2(October), 17.
http://doi.org/10.1053 (2011). (accessed 10.03. 2016.)
10. Wysocki K. R., McGary R.: Effective Project Management, Third Edition,
Indianapolis, In: John Wiley & Sons, Inc, 2003
42

International Conference on Applied Internet and
Information Technologies, 2016
DOI:10.20544/AIIT2016.06
Design of Prototype Expert System as a University
Knowledge Management Tool for Academic Teaching
Activity Evaluation
Mihajlo Hasanu1, Hristina Ambaroska1, Natasha Blazeska-Tabakovska1 and Mimoza
Bogdanovska-Jovanovska1
1 Faculty of information and communication technologies, Partizanska bb,
7000 Bitola, Macedonia
[email protected], [email protected], [email protected]
Abstract. Knowledge management is a relatively young field of research in the era
of the information society. Nowadays, organizations are increasingly aware of the
vital importance and value of the knowledge they possess and they are in a constant
race to manage their knowledge and to make it available for future use in order to
maintain the value of the knowledge. The most suitable organizations that
implement the knowledge management core concepts are universities. In this paper
the main focus is to represent a model framework for the structure of the university
knowledge management system and to give an overview for the design of prototype
expert system for evaluating university teaching activities tо enhance the university
performance and decision making process.
Keywords: Knowledge management, University knowledge management system,
Expert system, University teaching activity.
1. Introduction
For centuries, scientists, philosophers and intelligent laymen have been concerned with
creating, acquiring and sharing knowledge and improving the re-utilization of knowledge.
However, approximately two decades ago, i.e. in the 1990s, a field of research was born
with basic goal to deal the concern with knowledge known as - knowledge management
(KM). Knowledge management represents one big complex area which by its nature is a
subject of continuous development. The essential goal of KM includes creating and
networking of individual knowledge, its transformation into collective and using different
forms of knowledge in the process of creating value [1].
Nowadays so much attention is dedicated to this area that for a big number of
organizations, where experts’ knowledge is the key factor to their success and
development, knowledge management represents a very important strategic area [2].
Since the interest of organizations for knowledge is growing rapidly, they become aware
of the value that has the knowledge and if the knowledge is not shared and used within
the organizations loses its value. Through integration of IT and the concept of knowledge
43

Mihajlo Hasanu et al.
management it should be observed as an opportunity for creating information systems
known as knowledge management systems (KMS), which efficiently and effectively
manage knowledge and support the four process model by Alavi and Leidner that
contains: knowledge creation, storage/access, transfer and application [3].
Universities are the most suitable type of organizations that easily and naturally
implement the knowledge management concepts in the core of their functioning. By
taking into consideration the idea of mixing universities with knowledge management the
main objective in this paper is based on representing framework for a model structure of
a university knowledge management system that covers three activities, under the St.
Kliment Ohridski University in Bitola, including: research activities, teaching activities
and university management activities. However, the spotlight of this paper is oriented on
the design of a prototype expert system as a tool for evaluating the teaching activities.
The paper is organized as follows. Section 2 gives an overview of the importance of
university knowledge management systems and also representing a framework for a
model structure of a university knowledge management system. In section 3 examples of
implementation of knowledge management by universities are briefly described. Section
4 presents the UKLOExS_TAs expert system that was developed as a university KM tool
for evaluating teaching activity as well as details about the architecture of the system,
ontology and the knowledge base. Section 5 briefly describe the future work. The last
section concludes the paper.
2. University Knowledge Management System
From the learning point of view, it seems like universities are the most suitable type of
organizations for implementing ways of approaching and importance of knowledge
management. Knowledge sharing is one of the most important feature of every university,
while one of the main missions is the transmission of knowledge from teachers to students
and the transmission of knowledge from the researchers to the academic communities.
Because of that the implementation of university knowledge management system
(UKMS) can be done by natural way, so that knowledge transmission within university
community is a natural process.
Main reasons for implementing knowledge management into the core functioning of
universities are: (1) universities mostly own modern IT infrastructure; (2) in general
knowledge sharing with others is natural for teachers and professors; (3) gaining
knowledge from accessible sources as fast as possible is a common will of all students;
(4) existence of trustworthy atmosphere at universities, no one is afraid or doubting of
publishing or expanding their knowledge.
Knowledge management at university level is considered of multiple strategies,
methods, practices and identification tools, creating, sharing and application of
knowledge for efficient and effective goals accomplishment. An efficient UKMS requires
usage of intelligent software tools based on artificial intelligence techniques.
44

Design of Prototype Expert System as a University Knowledge Management Tool for Academic
Teacing Activity Evaluation
2.1. Framework for a Model Structure of a University KMS
A University KMS incorporates three modules for the main activities performed by a
university: teaching, research and university management. Fig. 1 shows the structure of a
generic university KMS.
Fig. 1. The structure of a generic university knowledge management system, adapted from
Mihaela Oprea, “A University Knowledge Management Tool for Academic Research Activity
Evaluation”, 2011
The structure is composed of three modules: Teaching Activity KM Module – TKM,
Research Activity KM Module – RKM and University Management KM Module – UKM,
as well as some supporting modules: IT infrastructure (e.g. Internet) and university portal
that offers user interface for potential users: students (bachelors, masters, PhD candidates,
post PhD candidates), academic staff, potential students and other people interested in the
university activities.
The TKM module manages with the whole knowledge regarding the teaching activity
done under different programs of study, bachelors, masters, PhD, post PhD for different
domains of studies. The RKM module manages with all the activities related with
research done at the university by different departments. The UKM module manages with
all the activities related with administration actions done by the university, such as
strategic planning budget creating, administrative services (human recourses,
investments, accounting), public relations etc.
45

Mihajlo Hasanu et al.
3. Related work
In the last decade, a major number of universities have started a development of their own
knowledge management system, in direction of enhancing their performance and the
decision making process, minimizing expenses, improved academic services, etc. Among
many universities in this paper are presented the following examples.
Hradec Králové University, Czech Republic. The Faculty for management and IT
recognized the key benefits in the area of knowledge management and put effort into their
incorporation in the working practices of the faculty, and at the university level as well,
in direction of improving the decision making process via KM. Using the SyllabusPlus
by Scientia Ltd. they started their first steps towards creating an advance knowledge-
based course planner and scheduler to enhance the decision making process where three
actors have the main roles, i.e. university management, teaching and research staff and
the students as well, that will be able to make fast but high quality decisions [4].
University Petroleum-Gas of Ploiesti, Romania. The IT department made efforts in the
direction of developing a university KM tool for academic research activity evaluation.
The result was development of prototype expert system (ACDI-UPG, developed in VP-
Expert) used as an analysis support tool in the research module based on knowledge and
decision support tool in the process of making new strategies for improving the research
activity [5].
Tatung Institute of Commerce and Technology, Taiwan. In direction for improving the
performance and quality of the high level education, a technical and organizational
infrastructure was formed by an outsourcing Gweb e-KM software solution by the Lotus
Domino system. Its main goal was creating a culture of sharing knowledge using
organization-wide vocabulary. Also a knowledge management model that consists KM
strategies was included as well as KM Road Maps, KM process and implementation,
knowledge database, knowledge transmission, KM infrastructure and measurements and
evaluation [6].
University of Education, Indonesia. The development of KMS is focused on collecting
data in a form of digital files accessible online. The role of such a system is to improve
the teachers’ skills, abilities and experiences via e-learning and research. Therefore, the
KMS was developed by considering the following matters: content management,
experience management and process management. For developing the system, the
Microsoft Sharepoint software was used. The KMS has seven layers as follows: (1)
interface, (2) access and authentication, (3) collaborative intelligence and filtering, (4)
application, (5) middleware, (6) transport and (7) repository [7].
4. UKLOExS_TAs expert system
Expert systems by their nature represent automatic judgement and reasoning systems that
aim to mirror and imitate the behavior of human experts. The development of the
prototype expert system is implemented in Exsys Corvid, software tool designed for
generating expert system.
The goal of the designed UKLOExS_TAs expert system is to evaluate the activities
related with the university (teaching activity as the main subject in this case; research
activity and management activity) in direction of improving the university’s
46

Design of Prototype Expert System as a University Knowledge Management Tool for Academic
Teacing Activity Evaluation
performances as well as improving the decision making process. As mentioned earlier the
UKLOExS_TAs expert system aims to help to evaluate the teaching activities including
teachers and students, helping the teachers to improve their performance and make the
student successful long life learners. It is important to note that the expert system is
developed to a stage where it only covers evaluation of teaching activities regarding the
professors, while the part related to learning activity under teaching activities regarding
the students it is considered as a future challenge.
The evaluation of the teaching activities will be conducted through evaluation of:
grading the students, grading the teaching methods used by teachers during the lectures,
as well as evaluation of the course description, aiming to grade the way of course content
defining and implementation of adequate materials through which the knowledge is
passed onto the students. The evaluation of these key factors will be done by defining
indicators for each, as well as creating IF-THAN rules, which when run through the
inference engine will result with making some decisions regarding the level of the
teaching activities being well graded.
4.1. Architecture of UKLOExS_TAs Expert System
Fig. 2 shows the modules of the UKLOExS_TAs system architecture.
Fig. 2. Architecture of UKLOExS_TAs system
The main modules of the expert system are the knowledge database and the inference
engine. The knowledge database contain the knowledge that the system uses in a form of
IF-THAN rules which makes the database of logic rules and permanent facts that are used
during the evaluation of teaching activities. The inference engine is doing the evaluation
reasoning by using the knowledge from the database and the temporary facts that define
47
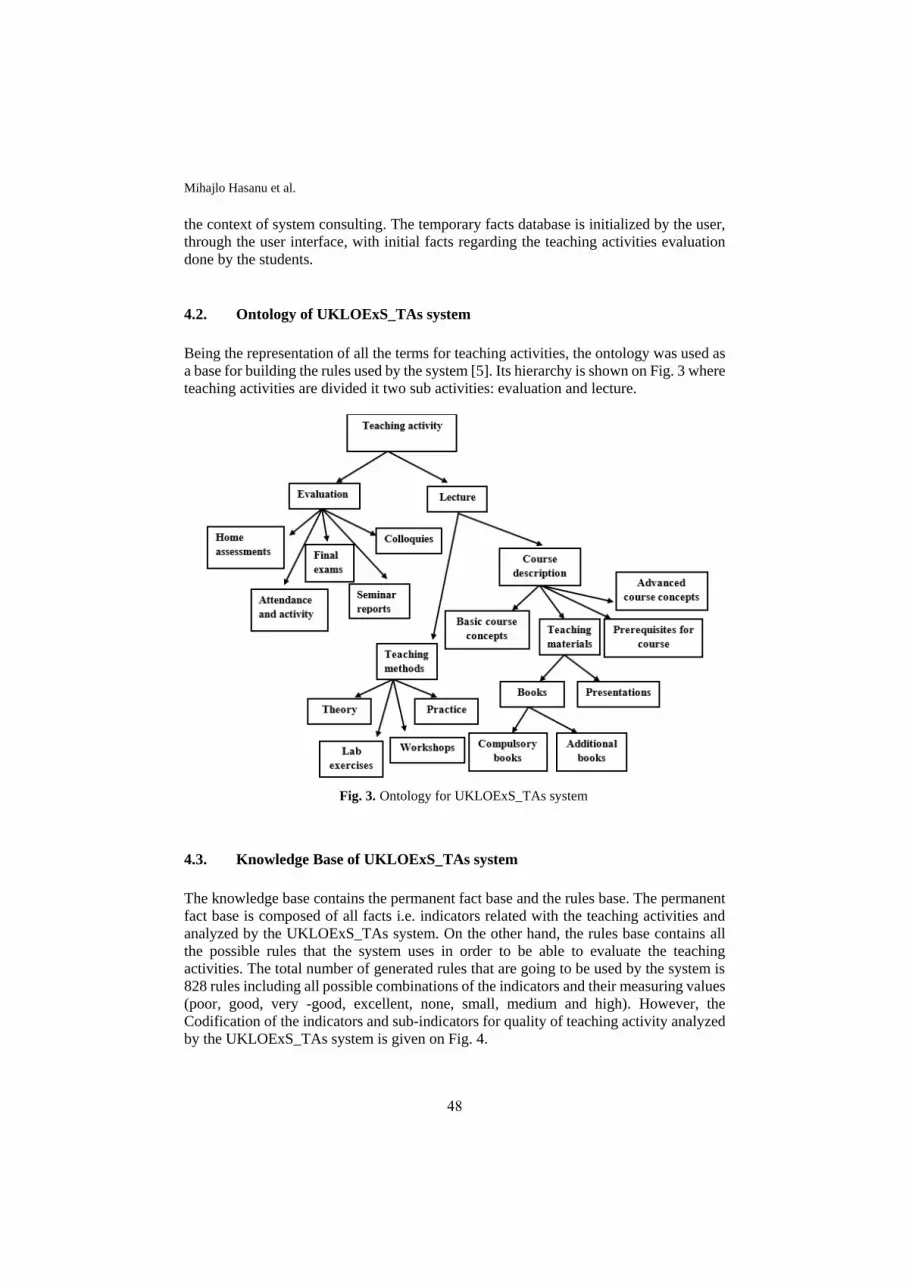
Mihajlo Hasanu et al.
the context of system consulting. The temporary facts database is initialized by the user,
through the user interface, with initial facts regarding the teaching activities evaluation
done by the students.
4.2. Ontology of UKLOExS_TAs system
Being the representation of all the terms for teaching activities, the ontology was used as
a base for building the rules used by the system [5]. Its hierarchy is shown on Fig. 3 where
teaching activities are divided it two sub activities: evaluation and lecture.
Fig. 3. Ontology for UKLOExS_TAs system
4.3. Knowledge Base of UKLOExS_TAs system
The knowledge base contains the permanent fact base and the rules base. The permanent
fact base is composed of all facts i.e. indicators related with the teaching activities and
analyzed by the UKLOExS_TAs system. On the other hand, the rules base contains all
the possible rules that the system uses in order to be able to evaluate the teaching
activities. The total number of generated rules that are going to be used by the system is
828 rules including all possible combinations of the indicators and their measuring values
(poor, good, very -good, excellent, none, small, medium and high). However, the
Codification of the indicators and sub-indicators for quality of teaching activity analyzed
by the UKLOExS_TAs system is given on Fig. 4.
48

Design of Prototype Expert System as a University Knowledge Management Tool for Academic
Teacing Activity Evaluation
Fig 4. Codification of the indicators and sub-indicators for quality of teaching
activity analyzed by the UKLOExS_TAs system
The system has a goal to help rising the quality of students’ gained knowledge. In that
direction it values: the methodology of knowledge acceptance by the student (that is not
a subject of consideration in this paper) and teacher’s activities in that direction. However,
in this paper are considered the quality of the teachers’ activities for evaluating: (1)
students’ achievements: home assignments (their difficulty level, connectivity with
teaching content, etc.); exams; attendance and activity; seminar reports and (2) quality of
knowledge transmission: lectures; teaching materials; presentations.
5. Future work
So far the effort was put on developing an expert system for evaluating the teaching
activities regarding the teachers, what is planned as future work is developing a full expert
system as a university knowledge management tool that will cover all of the university’s
activities. Such a system will be of a great importance since its benefits will improve the
performances of the university as a whole, and not just the teachers themselves.
49

Mihajlo Hasanu et al.
6. Conclusion
In the last years, the development of university knowledge management systems becomes
an important area to explore. Today, modern universities as business organizations with
a big number of business activities on the education market, are aware that every method
for increasing their competence is of a great importance to them. As education centers
keeping up with the turbulent changes of the IT era, they become more aware of the value
of the knowledge they own and that combined with the IT they can develop tools that will
manage the knowledge and will minimize the chances of losing its value, in total. In this
paper it has been developed an expert system for academic teaching activity evaluation
that can be used as a tool for enhancing and maximizing the university performances and
improvements in the decision making process as well. This tool on the one hand will help
the teaching staff to become more experienced, effective and efficient in their field of
knowledge, and on the other hand will help students to become long life learners to meet
its designed goals.
References
1. Blazeska-Tabakovska N. Manevska V.: The Impact of Knowledge Management
Information System on Businesses in Technology, Innovation, and Enterprise
Transformation, Chapter 5. IGI Global. (2014)
2. Blazeska-Tabakovska N., Manevska V.: Model of knowledge management system for
increasing the customer satisfaction. Zenith international journal of multidisciplinary
research, Vol. 4, No.1, 117-128. (2014)
3. Alavi, M., & Leidner, E. D. R.: Knowledge management and knowledge management
systems: conceptual foundations and research issues. Management Information Systems
Quarterly, Vol. 25, No.1, 107–136. DOI: 10.2307/3250961. (2001)
4. Jaroslava Mikulecká, Peter Mikulecký.: University Knowledge Management – Issues and
Prospects. Journal – Principles of Data Mining and Knowledge Discovery 4th European
Conference Proceedings, Volume 13, Issue 16. (2000)
5. Mihaela OPREA.: A University Knowledge Management Tool for Academic Research
Activity Evaluation. University Petroleum-Gas of Ploiesti, Romania. (2011)
6. Yaying Mary Chou Yeh.: The Implementation of knowledge base Management System
in Taiwan’s Higher Education. Journal of College Teaching and Learning, Volume – 2,
Number – 9, Yung Ta Institute of Technology and Commerce, Taiwan. (2005)
7. Munir Rohendi, Dedi Rohendi.: Development Model for Knowledge Management
System to Improve University’s Performance. International Journal of Computer Science
Issues, Volume – 9, Issue – 1. (2012)
50

International Conference on Applied Internet and
Information Technologies, 2016
DOI:10.20544/AIIT2016.07
Designing Multi-Agent System Model for University
Teaching Activities by Using UML
Mihajlo Hasanu1, Hristina Ambaroska1, Elena Vlahu-Gjorgievska1 and Ilija Jolevski1
1 Faculty of information and communication technologies, Partizanska bb,
7000 Bitola, Macedonia
[email protected], [email protected], [email protected],
Abstract. The area which covers the meaning of intelligent agents and their
contribution is a subject of constant changes. Researchers are in a constant race to
create intelligent agents that will contribute the most benefits in their life and will
represent an extenuating circumstance regarding different complexity level
problems, aiming to satisfy people’s needs. Some of them show agent models that
are going to be the starting point of future projects, and some give the whole picture
of fully functioning agents. This paper gives a review of a systematic approach for
designing multi agent system model for university teaching activities using UML
approach.
Keywords: Intelligent agent, Multi-agent systems, UML diagrams.
1. Introduction
Nowadays, the available technology allows humanity to generate artificial intelligent
agents that are capable to work according to people’s need. Although there is not a
universal consensus on the definition of an agent, the most acceptable definition is
proposed by Wooldridge and Jennings [1]. They define the agent as a system that is
situated in some environment and is capable to act in the environment in order to meet its
design objectives. Also, many researchers are trying to make a distinction between the
terms agent and intelligent agent. According to Wooldridge [1] [7] intelligent agent is
required to be reactive (responds in a timely manner to the changes in its environment),
proactive (persistently pursues goals) and social (interacts with other agents). Intelligent
agent should perform its activities automatically by following its own agenda with a
certain level of intelligence. As such, intelligent agent is advanced tool used by people
for solving problems and achieving goals. The key problem that the agent faces is the
decision for the actions that need to be taken in order to satisfy the goals in the best
possible way. This decision can be under influence of different environment properties
[2].
Any system which uses the agent abstraction and is designed and implemented within
the agent technology can be seen as an agent-based system [7]. Depending of the
complexity level of the given problem and the number of agents that can be included in
the system, there are two types of systems: single-agent system and multi-agent system.
Since the activities performed by the single-agent systems are intended for solving simple
51

Mihajlo Hasanu et al.
problems, sometimes it is necessary to perform activities for solving more complex
problems that occur in the real world.
The paradigm of multi agent systems is introduced due to the need of agents to solve
problems with higher level of complexity that requires a joined effort by multiple agents
within the working environment. The characteristics of multi-agent systems [8] are: (1)
each agent has incomplete information or capabilities for problem solving, (2) there is no
overall global control, (3) the data which the agents manipulate with is decentralized, and
(4) the computational process is asynchronous. And their main advantages are: efficiency,
robustness, scalability, simplified programming and decreased expenses. But, the key
factor for the success of multi agent systems is cooperation. It is achieved through data
exchange, providing a partly planned solution and enforcing restrictions between agents.
Cooperation can be done by rollback of the actions, synchronization, intermediation and
sharing information.
The goal of this paper is to present a systematic approach for creating a framework
model for a multi agent system for university teaching activities by using UML diagrams.
The main users of this multi agent system model are students and teaching staff. The
designed model integrates three agents that allow entering important data and generating
reports for students’ evaluation.
This paper is organized as follows. In the next section the meaning of multi-agent
systems is covered and overview of the multi-agent system model for university teaching
activities is presented. The last section briefly describes the future work and concludes
the paper.
2. Multi-Agent System Model for University Teaching Activities
Developing a multi agent system model for university teaching activities includes three
agents performing different activities and work according to the user’s needs. The agents
that are integrated into the system are information agents because they provide useful
information for the user. In the proposed multi agent system, the agents perform their
activities independently without language for communication in-between agents, but they
share same data.
The model has three agents: (1) Reports generating agent (Report Agent), that provides
help to the teaching staff in the process of evaluating students; (2) Lecture Information
Agent, providing the students with better information regarding the courses they choose,
different schedules for lectures, exams, and other important events; (3) Input Agent,
allows inputs for the activities in the database. Agents integrated in the system can be
accessed through the user interface that allows different agent functionalities based on the
user type (staff, student or guest).
The main users of this multi agent system are students and teaching staff. The users
will gain access to the functionality of the three agents via login with validate user account
through the user interface. By logging with validate account; the teaching staff will gain
access to the functionality of the Report and Input Agents. They will be able to request
generating reports for: seminar papers; attendance and activity; home assessments; passed
exams and final grades for certain course for evaluating students’ performances, as well
as inputting essential data to the database as a source for the report and lecture information
agents. On the other hand, the students will gain access to the functionality of the Report
52

Designing Multi-Agent System Model for University Teaching Activities by Using UML
Agent with permitted right only to request report for their own final grades for a certain
course or grades for all courses, and Lecture information Agent for providing useful
information about courses they choose.
2.1. UML Diagrams for the Multi-Agent System Model
The approach used to represent the agents, that are part of the proposed multi-agent
system model, is the unified modeling language–UML. Although this approach is
intended for modeling object oriented systems, many researchers dealing with the field
of multi-agent systems have accepted UML approach as a way to represent the agents [3-
6]. As a tool for creating the UML diagrams Microsoft Visio software solution is used.
Class Diagram. The class diagram in this paper is used for two purposes: (1) a
representation of the agents separately as a classes; and (2) class diagram representation
of the system as a whole so a general idea of the system can be presented. On Fig.1 are
presented the agents as separate classes, with an indication of their attributes and the
functions they performed.
In addition a short overview of the Report Agent’s functions is given.
Report_seminars– gives reports regarding seminar papers submitted by students and the
points they get; Report_attendance_activity– gives reports regarding certain filtering over
the attendance and activity data collected during the lectures and lab exercises for a
chosen course; Report_passed_exam – gives reports regarding the course status (passed
or failed) and the grade for it; Report_home_assesments – gives reports regarding the
home assessments turned in and the points gained for them; Report_final_grades_Student
– gives reports regarding student’s final grade using student’s ID number as an input
argument of the function; and Report_final_grade– gives reports regarding all final
grades for a certain course, using information about the desired course as an input
argument.
Functions of the Lecture Information Agent are: Info_course_description – shows
descriptive information for the searched course; Info_notification– shows notification to
the user in case of exceptions from the originally provided information; Info_timetable –
shows information about courses scheduling.
53

Mihajlo Hasanu et al.
Fig. 1. Presentation of separate classes of agents: A) Report Agent class; B) Lecture Information
Agent class and C) Input Agent class
Functions of the third agent, Input Agent are: Input_attendence_activity– input points
for keeping records about students’ attendance and activity during lectures and lab
exercises; Input_seminars– input the digital version of seminar papers turned in by
students, accompanied by the points they gain for the paper; Input_home_assessments–
input points gained for home assessments turned in by the students; Input_exams – input
information for passed exams; Input_info_course – input information for course
description; Input_notifications – input notifications for certain changes and exceptions
from the original information; Input_timetable – input the lectures and lab exercises
timetable; Input_student – input data in the database for each student individually for a
certain course; and Input_final_grade – input data regarding the final grade defined by
previously set criteria.
Fig.2 presents general class diagram that integrates all three agents, by establishing
associations between the user interface and the agents and connections with the database.
54

Designing Multi-Agent System Model for University Teaching Activities by Using UML
Fig. 2. General class diagram for the multi-agent system by establishing associations between the
user interface with the agents and connections with the database
The general class diagram establishes one to one associations between the user
interface and the agents. Additionally, the Input Agent is in one way interaction with the
database (this agent inputs data into the database). While the Report Agent and Lecture
information Agent are also in one way interaction with the database but these agents are
getting the information from the database.
Sequence Diagram. The sequence diagram describes a single scenario, one flow of
activities for a possible case. Fig.3 represents a general sequence diagram for the flow of
activities for the multi-agent system model for university teaching activities.
The entire procedure covered with the general sequence diagram is as follows. First,
from the user is required to make a login action through the user interface with validate
account in order to use the agents (1: Request Login). Than the user interface makes an
authentication account action to check the entered username and password (2:
Authentication account), if they are wrong the user receives error message (3: error login),
on the opposite it will continue to use the functionality of the agents. After that, depending
on the users’ needs, the user will request for inputting data or request for report or request
for gaining information for lecture activities regarding the courses (4: Request data input/
55

Mihajlo Hasanu et al.
Request report/ Request info). As mentioned earlier, depending on the users’ needs, one
of the three agents will start to perform their immanent functions. Then, the chosen agent
will perform its main function in order to make a record in the database or to initialize an
action for gathering information for generating report or information for lecture activities
by establishing a connection with the database (5: Input data/ Request generating report/
Get info). After that, the appropriate agent will either make an update data in the database
or will generate report and select information from the database. (6: Update data/
Generating Report/ Selecting information). The corresponding agent will acquire the
necessary information of successfully done operations by feedback i.e. feedback approval
for successfully updated data or massages that send the information included in the report
or sending information regarding the lecture activities (7: Feedback approval/ Send
report/ Send info). At the end, the corresponding agent will present the results of the
required needs of the user through the user interface in a form adequate for the user (8:
Display message feedback/ Display report/ Display information; 9: Report results/
Results info).
Fig.3. General sequence diagram for describing the flow of activities as whole for the multi-agent
system
56

Designing Multi-Agent System Model for University Teaching Activities by Using UML
3. Conclusion
This paper presents a model for multi-agent system for university teaching activities. In
the paper are covered intelligent agents, their technology and the meaning of agent based
systems. The used approach for model representation is UML (United Modeling
Language), implemented by the Microsoft Visio tool. Even though this language is meant
for object oriented system, it is widely accepted by researchers from the multi agent
systems area, as one of the ways to represent agents.
The presented model framework is meant for multi agent system that integrates three
agents generating different reports that allow student evaluation by the teaching staff of
the university; getting information regarding students’ activities and input crucial data to
enable agents’ life cycle.
Besides the designed multi agent system model, in the future, development and
implementation of a functional multi agent system is planned. The system will aim to
improve the university’s performances and simplify solving some student’s related
problems the universities have. Increasing the agent’s number will be taken in
consideration in order the system to be able to solve as complex problems as possible and
getting optimal results to achieve its goals.
References
1. Lin Padgham, Michael Winikoff.: Developing Intelligent Agent Systems – A practical
guide. RMIT University, Melbourne Australia, John Wiley & Sons, Ltd. (2004)
2. Stuart J. Russel, Peter Norvig.: Artificial Intelligence – A Modern Approach. Patience
Hall, Englewood Cliffs, New Jersey, 3-rd edition. (2009)
3. Viviane Torres da Silva, Carlos J.P. de Lucena.: Extending UML to Model Multi-Agent
Systems. Computer Science Department –Pontifical Catholic University, Rio de Janeiro,
PUC-Rio Inf.MCC 08/04. (2004)
4. Feras Ahmad Hanandeh, Izzat Alsmadi.: Mobile agents modeling using UML.
Department of Computer Science, Int. J. Business information Systems, Vol. 19, No. 4.
(2015)
5. Jinyu Song, Zhiyu Zhou.: Agent UML Sequence Diagram and Meta-Model. American
Journal of Engineering and Technology Research, Vol. 15, No. 1. (2015)
6. Momtaz Al-Kholy, Ahmed Khalifa.: A Systematic Approach for Agent Design Based on
UML. International Arab Journal of e-technology, Vol. 2, No.2. (2011)
7. Nicholas R. Jennings, Michael J. Wooldridge.: Agent Technology: Foundations,
Applications, and Markets. Springer – Verlag Berlin Heidelberg New York. (2002)
8. Katia P. Sycara.: Multi Agent Systems. Article in AI magazine, volume 19, No.2
Intelligent Agents. (1998)
https://www.cs.cmu.edu/~softagents/papers/multiagentsystems.PDF
57

International Conference on Applied Internet and Information
Technologies, 2016
DOI:10.20544/AIIT2016.08
Incorporation of Defined Quality Attributes into
Solutions Based on Service-Oriented Architecture
Lazar Atanasov1, Vladimir Trajkovik1, and Elena Vlahu-Gjorgievska2
1 Faculty of Computer Science and Engineering, Rugjer Boshkovikj 16, P.O. Box 393,
1000 Skopje, Macedonia
[email protected], [email protected] 2 Faculty of Information and Communication Technologies, Partizanska bb,
7000 Bitola, Macedonia
Abstract. The shift of the Service-Oriented Architecture (SOA) to the
Information Technology, its use and implementation enables the feature of having
more robust system offered to the Service Industry. This paper will present
enhancement efforts to software platform solution with including quality
attributes and will describe the design of the Quality Service-Oriented
Architecture. A well known branch of the service industry market in the US is the
Pest Control Services which should be part of every single physical object in the
USA. There are many Service-Oriented Platforms that handle the Pest Control
Industry and our target in this article will be to describe a Quality Oriented and
Service-Oriented Design for the Pest Control Industry, which will meet the
criteria and the needs of the industry as well to meet all laws requirements to each
US state related to the pest control policies and rules. Most important is that the
presented software platform provides competitive edge.
Keywords: Service-Oriented Architecture, Quality Oriented Design, Service-
Oriented Design.
1. Introduction
The implementation of Service-Oriented Architecture and its integration in the Pest
Control Industry means more flexible service and better maintenance for the Service
Industry clients. Using such a system design results with a better Information handling
and coverage of all service oriented businesses (including the Pest Control Industry)
with a single Service–Oriented Software [1-3].
The design of service–oriented system requires two sub-phases: Identification of
service candidates and specification of the service candidates. There are several
introduced analysis for modeling the Service-Oriented Architecture represented by Erl
[1], Engels at al [2], The Rational Unified Service Oriented Modeling [4-7], The
58

Lazar Atanasov et al.
Service Oriented Architecture Framework (SOAF) [8]. These analyses are focused on
abstract design techniques which are describing the design of the architecture, meaning
that they are not using any modal language to fully describe the architecture, and also
they don’t describe the quality attributes. Unlike that the analysis of Erl [3], Engels at
al. [4],Reussner at al [9], Josuttis [10], Maier et al [11], Prepletchikov at al. [12,13]
Hirzala at al. [14], Choi at al. [15] и SoaML (Service-Oriented Architecture Modeling
Language) [16] are focused on the design description defined by using the modeling
language, and also using the quality attributes to improve the quality of the Service–
Oriented Architecture.
In this article all design decisions will appear at the development process related to
the quality attributes which are part of the design. All attributes will be included step by
step, and every state of the design will be considered and described including the
advantages and the weaknesses of the design. In several steps, this article will build a
design which will impact the process on positive manner, meaning that it will offer
Service-Oriented Platform with improved quality value. The quality-oriented design
model will provide benefit to the Service Industry (the companies), the Service Industry
Clients, and the US States (more accurate statistics and reports for the state of the
Industry Objects).
The main purpose of this article is to describe the general process of the Services in
the Pest Control Industry, starting with the process of generating the core items of the
platform (the service items), then scheduling and assigning them, and at the end
performing them. Minor processes will also be included and will be part of the general
process. The main target is to create a system which will efficiently execute the process
and will improve benefits on the both sides – the companies and the clients. In order to
present the design, we are using a Modeling Language based on the UML [17, 18].
2. Incorporating of the Quality Attributes into a Quality Oriented
Design
In this section a service oriented design for the Pest Control Industry will be presented.
Pest Control Industry is an industry which impacts to each house/building object. The
US pest control market will be referenced as an instance and all the scenarios and
designs will be based on it. Every single object (referring to buildings, houses, yards
etc.), which is part of the everyday living, should be inspected by the Pest Control
companies that perform the pest control services.
In the US market we can split the pest control companies in 3 categories: Small Pest
Control Companies (use basic design), Medium Pest Control Companies and Big Pest
Control Companies. In this article we are considering Big Pest Control Companies.
A Big Pest Control Company is an organization with thousands of staff (one hundred
thousand employees or more) that handles millions of clients. These companies need a
Quality Service–Oriented Design which will improve the quality of the company’s daily
processes. An enterprise software platform based on Quality Service–Oriented Design
can be the solution.
An Enterprise Software Solution is an Information System which provides service to
the industries like payment processing, business intelligence, collaborating, reporting,
59

Incorporation of defined quality attributes into solutions based on service – oriented architecture
customer relations management, service management, human resources management
and much more. The Enterprise Pest Control Software is fully integrated to every single
part of the Company’s activities - starting from the internal company organization (rules
and policies), defining the service products, the company staff, working with the clients
and performing the services to the clients.
We can define several crucial segments which should be part of the Pest Control
Software: Setup (company policies, service staff etc.), Clients, Inventory, Invoicing,
Reporting System, Emailing System, Service Processing Engine, HandHeld modules
(Mobile based modules), Scheduling, Routing, Payments and CRM Module. The
quality processes, which will be integrated into the service oriented design, are:
Generating Services (defining all services that need to be performed);
Scheduling Services (creating a work pool, by choosing services and routes in
defined time range);
Routing (optimizing the routes to maximize the production);
Statistics (collecting the accurate information and provide the data to the US State).
Since the Pest Control Services are part of the every day’s living in the US there are
several requirements that need to be satisfied. Regarding the services, there are many
required services that need to be performed to each object. This is an obligation to each
owner/client and there is a company that performs the services. The second requirement
is related to the US law. Depends on the country, there are rules regarding the process
of providing statistics to the state. Every state has its own law which requires every Pest
Control Company to provide statistics about the state of the objects belonging to US
State territory (meaning that there should be information about the state of every object
-house/building, about the condition of its exterior and interior). This means that there
must be provided an information about the current state of the territory, analyzed by
many perspectives (each perspective has its own type of service that needs to be
performed).
In order to deliver these information and perform all the actions we should propose a
design that improves quality and accuracy.
2.1. Design of the processes
In this section the design of the Pest Control processes will be specified. In order to
improve quality, the main processes that need to be integrated into the design are:
generating the services, scheduling the services, routing and providing statistics.
Every quality process should be specified in a separate step. In the first step, the first
quality process will be integrated into the design; the second step will include the
second quality process into the design; and so on. Every quality process will have its
own phase until all quality features are included into the design. Once all steps of the
quality features are done, a completed interface design of the Quality Pest Control
Platform can be specified.
The design process is specified with several features included into the process:
Service Platform
The Service Generating Engine (the first feature included into the system which
improve quality),
60

Lazar Atanasov et al.
The Reporting/Statistics (the fourth feature included into the system which
improve quality);
Scheduler (the second feature included into the system which improve quality);
Routing (the third feature included into the system which improve quality);
The Object (an Object where the service is performed to).
In Fig.1(a) a basic service process is specified. The service items are generated and
performed to the object. At this process we included the generating service feature and
it is a first step of the quality pest control design.
At step 2 the scheduling feature is included. So, once the services are generated the
next phase is the scheduling of the services. This process is getting all available dates,
and then assigns a proper date to the service. The service has technician and a route
where it needs to be performed. The Scheduler is creating a work pool by choosing
services and routes in defined time range. This design gives opportunity for maximizing
the effect of the service performing. This flow is specified with the UML diagram
shown on Fig.1(b).
The next step is the integration of the Routing feature (Fig.1(c)). This is one of the
most vital features used at the Pest Control Service Design which improves the
productivity of the company and also saves resources (maximizing the productivity for
the available resources). The Services are generated and once the scheduler is executed
the Routing Process is coming next on the flow. In order to perform this feature there
are many maps service and APIs that can be used (Google Maps / Google Maps API,
Bing Maps / Maps SDK, Maps API, Navteq (Nokia Maps), MapQuest, etc.).
The Routing feature enables the optimization of the route for the technicians. The
routing improves the productivity by integrating the sub-features:
Grab all scheduled service for the given date and build the route which will
maximize the productivity,
Give the ability to the user to change the route if there is possibility for even a better
route (this is common used feature in practice).
61

Incorporation of defined quality attributes into solutions based on service – oriented architecture
Fig. 1. (a) Service Design including the Generating Services process, (b) Service Design
including the Scheduling process, (c) Service Design including the Routing process, (d) Service
Design including the Reporting process.
(a)
(b)
(c) (d)
62

Lazar Atanasov et al.
On Fig.1(d) the last feature is integrated into the flow. This is also important part of
the service design. It is not business related, it is not customer related but it is related to
the State laws. When performing the services to the object, once all the services are
executed the technician assigns ranking to the object and defines the state of the object.
This information is updated into the system and the reporting system is providing the
latest information for the area state to the US State (monthly or yearly).
Generally, we can split all the processes (quality features) in three benefit segments:
Company Benefits: The Service Oriented Platform Design as a General Benefit,
Generating the services, Scheduling, Routing, Reporting/Statistics;
Object/Client Benefits: Scheduling (improves accuracy), Routing (improves
productivity);
State Benefits: Reporting/Statistics (receives on time delivered and accurate
statistics).
On Fig.2 the service interface is specified. The design shows the Service architecture
for the Pest Control Industry using the UML. In the diagram only the main artifacts are
presented. For further development additional details to the diagram can be added, so it
will fulfill the minor attributes and objects of the design.
Fig. 2. The Service Interface
63

Incorporation of defined quality attributes into solutions based on service – oriented architecture
3. Conclusion
The main objective of this paper is to specify a service design based on quality which
can be used by the Pest Control Industry at the US market. All major requirements of
such service have been defined and all major processes have been specified in a step by
step manner in order to achieve such target. At the end a service interface design has
been specified with all major components.
The Pest Control Industry has a big role in the US service industry. Having a
Service-Oriented design as an enterprise solution is a huge benefit for the entire
process, starting from the company’s basic activities, continuing to the main process
(generating and assigning and performing services) and ending with an accurate statistic
which is provided to the State. In addition, the service design approach helps the Pest
Control Companies to get maximum productivity from their resources thus increasing
its productivity.
References
1. Erl, T.: Service-Oriented Architecture – Concepts, Technology, and Design. Pearson
Education. (2006)
2. Engels, G., Hess, A., Humm, B., Juwig, O., Lohmann, M., Richter, J.P., Voß, M.,
Willkomm, J.: Quasar Enteprise. Dpunkt. verlag, ISBN 978-3-89864-506-5. (2008)
3. Krafzig, D., Banke, K., Slama, D.: Enterprise SOA: service-oriented architecture best
practices. Prentice Hall Professional. (2005)
4. RUP for service-oriented modeling and architecture. IBM Developer Works,
http://www.ibm.com/developerworks/rational/
5. Wahli, U., Ackerman, L., Di Bari, A., Hodgkinson, G., Kesterton, A., Olson, L., Portier, B:
Building SOA Solutions using the Rational SDP. IBM Redbook. (2007)
6. Arsanjani, A.: Service-oriented modeling and architecture. IBM developer works, pp.1-15.
(2004)
7. Kroll, P., Kruchten, P.: The rational unified process made easy: a practitioner's guide to the
RUP. Addison-Wesley Professional. (2003)
8. Erradi, A., Anand, S., Kulkarni, N.: SOAF: An architectural framework for service definition
and realization. In proceeding of the IEEE International Conference on Services Computing,
pp. 151-158. (2006)
9. Reussner, R., Hasselbring, W.: Handbuch der Software- Architektur. Dpunkt.verlag, ISBN
978-3898643726. (2006)
10. Josuttis, N.: SOA in der Praxis–System-Design für verteilte Geschäftsprozesse. Dpunkt.
Verlag, Auflage, München. (2008)
11. Maier, B., Normann, H., Trops, B., Utschig-Utschig, C., Winterberg, T.: Die soa-service-
kategorienmatrix. SOA-Spezial, Software & Support Verlag. (2009)
12. Perepletchikov, M., Ryan, C., Frampton, K., Schmidt, H.: Formalising service-oriented
design. Journal of software, Vol. 3, No. 2, pp.1-14. (2008)
13. Perepletchikov, M., Ryan, C., Frampton, K., Tari, Z.: Coupling metrics for predicting
maintainability in service-oriented designs. In proceedings of the 18th Australian Software
Engineering Conference ASWEC 2007, pp. 329-340, IEEE. (2007)
14. Hirzalla, M., Cleland-Huang, J., Arsanjani, A.: A metrics suite for evaluating flexibility and
complexity in service oriented architectures. In proceeding of the 2008 Workshops on
Service-Oriented Computing, pp. 41-52, Springer Berlin Heidelberg. (2008)
64

Lazar Atanasov et al.
15. Choi, S.W., Kim, S.D.: A quality model for evaluating reusability of services in soa. In
proceedings of the 10th IEEE Conference on E-Commerce Technology and the Fifth IEEE
Conference on Enterprise Computing, E-Commerce and E-Services, pp. 293-298. (2008)
16. OMG: Service oriented architecture modeling language (SoaML) – specification for the uml
profile and metamodel for services (UPMS), Version 1.0 Beta 1. (2009)
17. Amsden, J.: Modeling with soaml, the service-oriented architecture modeling language–part
1–service identification. IBM Developer Works, http://www.ibm.
com/developerworks/rational/library/09/modelingwithsoaml-1/index. (2010)
18. Johnston, S.: UML 2.0 profile for software services. IBM developerWorks, http://www. ibm.
com/developerworks/rational/library/05/419_soa. (2005)
65

International Conference on Applied Internet and Information
Technologies, 2016
DOI:10.20544/AIIT2016.09
Modern technologies for data storage, organization and
managing in CRM systems
Adriana Grigorescu1, Alina Elena Cerchia 2 and Florin Victor Jeflea3
1 National University of Political Studies and Public Administration
6 Povernei Street, sector 1, Bucharest,
[email protected] 2 Valahia University from Târgoviște, Doctoral School,
Bd. Carol I, Nr. 2, 130024, Târgovişte, Dâmboviţa,
[email protected] 3 Ovidius University from Constanța, Economics School,
B-dul Mamaia Nr. 124, Constanța,
Abstract. In our study we intend to emphasize the main targeted objectives for
the implementation of CRM type platforms. According to these objectives, in
order to provide the functionality of CRM platforms, we will make a reference to
the prime methods of collecting and organizing information: databases, data
warehouses, data centers from Cloud Computing field. As a representative
procedure of handling information we will exemplify the OLAP technique which
is implemented by means of SQL Server Analysis Service software instrument.
Finally, we will try to look over some of the Cloud Computing based CRM
platforms and how the OLAP techniques can be applied to them.
Keywords: Business Intelligence, Cloud Computing, CRM, Data Centers, OLAP.
1. Introduction
The new information and communication technologies play an important part in
focusing organizational strategies on the satisfaction of clients` needs and demands. The
integrated approach of technologies, equipment and organizational knowledge in the
systems for customer relationship management leads to a sustainable development of
relationships between a company and its clients. So we could say that the incorporation
of strategy for the customer relationship management, based on the new technologies, is
imposed as a necessity in the current context, where attracting and keeping customers
require orientation to market and to its needs.
Taking right decisions in real time regarding transactions is essential in the process
of understanding what happens in any economic enterprise. Cloud Computing based
CRM platforms must have analytical and interactive abilities in order to allow the
makers of decisions to have a deeper perspective on the conducted activities, necessary
for fast and documented identification of market changing conditions and for generating
a response reaction according with those transformations. Analyzing Cloud Computing
66

Grigorescu A., Cerchia A. E., Jeflea V. F.
based CRM systems helps the companies to obtain an increased profitability through
streamlining the functional systems and the decisional capacities in order to improve
activities and to increase the profit. In this context, Cloud Computing based CRM
platforms which are endowed with Business Intelligence instruments are seen as being
the key to any marketing analysis.
2. Targeted objectives by implementation of CRM platforms
The main objective of investment in CRM is represented by the automation of
salesforce, the design of separate applications for CRM based on its own data. Current
tendencies in customer relationship management consist in the idea of supporting the
CRM platforms through data warehouses. Lately, data warehouses are found in data
centers which are basically elements of Cloud Computing paradigm.
Following the implementation of data warehouses resulted higher amounts of data
which are delivered in time and with a superior quality according to the objectives of
business- improving services and keeping customers.
The targeted effects remain unchanged under the influence of CRM implementation,
being subscribed to the general objectives on organizational level: getting new clients,
building up strong loyalty relations, sales and post- sale services.
Both `business-to-business` and `business-to-customer` companies are interested in
improving the loyalty relation with clients as a main purpose. Contrary, while the B2B
companies intend to attract new clients, the B2C companies try to increase the customer
satisfaction level.
In order to keep up with the accomplishment of these important priorities, the CRM
Cloud Computing solutions are predominantly used by organizations of all size. Over
50% of big and medium organizations in North America and Europe have already
implemented this technology and they are investing more and more in order to upgrade
their CRM systems.
3. Databases, data warehouses and data centers for CRM
platforms
One of the most important activity for marketing department or for the customer
relationship management from any economic entity is the one of analysis of customers
collected data. Some authors believe that economically, such an analysis can be
accomplished through many steps:
Marketing analysis;
Market analysis through its segmentation;
Using and combining marketing techniques;
Observing the market and competitions’ activities.
For the accuracy of marketing analysis, the interrogated collection of data must be
as wide as possible and the analysis techniques must be fast, with an increased
efficiency. In general, specialized CRM platforms are used as we pictured in a previous
section. These contain guides, procedures, processes and strategies which give to the
economic entities the ability to group interactions with customers and also the ability to
67

Modern technologies for data storage, organization and managing in CRM systems
store all information about them. Slowly, economic realities led to shaping a brand new
Business Intelligence concept which contains economic and informational notions and
principles and suitable modern technologies.
Many authors define in an intrinsic way Business Intelligence. They consider that BI
includes characteristics which are linked to the ability of collecting, processing and
recording data which will provide information in time for customers and according with
their requests. Some published studies picture the existence of the following
components for Business Intelligence:
Data sources - Are, in general, operational databases, data with a specific historical
background, and data from different sources. They can also be relational databases or
other data sources matching the applications. Some of them contain information that
is structured as worksheets, charts or simple multimedia files;
Data warehouses - Data warehouses are defined as data collections that are
orientated towards integrated, timeless, historical and persistent subjects which are
meant to support the process of managerial substantiation. Data warehouses have
operational and external data in order to sustain the substantiation of decisions;
Fig. 1. Data warehouse architecture. Source: Khan A., Ehsanb E., Mirzac E., Sarward
S., Integration between Customer Relationship Management (CRM) and Data
Warehousing, 2011
Mc Donell estimates that exist the following advantages of data warehouses: provide
a single convincing data source for the business, offer clear relevant information in
68

Grigorescu A., Cerchia A. E., Jeflea V. F.
time for making decisions regarding the business, the architecture of the data
warehouse is scalable and extensible for the entire organization. In a personal
acceptation, a data warehouse is a data collection which comprise a large period of
time, well arranged on subjects and domains of interest, with an architecture that is
adaptable to requests and capable to provide clear and exact information, given in
real time for the assistance and the substantiation of the managerial decision;
Data centers - A data center is a collection of subjects from a certain area which is
meant to serve a specialized department such as financial, marketing or customer
relationship management one. There is an independent data center suitable for the
department which is many times used for giving information about customer. The
right naming is Independent Data Mart- IDM. Inside the department it also exists a
DDM- Dependent Data Mart- a subgenre of the data center where data is organized
according to a set of requires.
Interrogations and reporting instruments- OLAP technique (On Line Analytical
Processing) supplies a multidimensional synthesized image of data and it is used in
reporting, analysis, modeling and planning with the purpose of improving the business.
OLAP technique and its technologies can be used in working with data warehouses,
data centers which serve intelligent informational systems. Some authors say that
OLAP technique uses multidimensional data warehouses predominantly made of
historical or external data which is originated in different organizations. OLAP
technique permits a multidimensional modeling of data through the OLAP cube, a
multidimensional structure, a hypercube that allows the complex aspects of phenomes
being modeled.
Through a personal perception, OLAP technique represents a multidimensional
analysis instrument of the big efficient data collections in real time, with increased
accuracy which allows, thanks to the dimensional structural cube, complex modeling of
any economic phenomenon. The newest software instruments make this technique one
of the most used for the substantiation of economic analysis, that being easily
extrapolated in the Cloud Computing area. One of this software is provided by
Microsoft, SSAS- SQL SERVER ANALYSIS SERVICE.
New studies picture multidimensional analysis which can be obtained with the aid
of the transferred information in SQL SERVER database. Those way managers can
identify precisely the position of products when they develop strategies for value
management or for calculation of clients’ profit. Data transfer from an operational
database integrated in CRM system of SQL SERVER gives the possibility of a
diagrams’ view.
Multidimensional analysis is achieved by using the instruments made available by
Microsoft Excel- pivot tables. According to the known purpose, an analysis’ cube is
made that ensuring sales approach on two segmentation criteria: educational level and
age. With the aid of Excel program, the cubes’ dimension is divided in rows and
columns considering the pivot, the amount of invoiced values.
4. OLAP technique extension in Cloud Computing area
In previous sections we proved that OLAP technique is a major component of
Business Intelligence systems, which is used especially in data warehouses and data
centers area. We aim to find out how extensive OLAP technique is and if it is according
69

Modern technologies for data storage, organization and managing in CRM systems
to the new Cloud Computing technologies. Recent studies identify the next components
of OLAP technique into Business Intelligence systems: a graphic component- an user
interface which contains an extensive library with graphic reporting instruments, a
component used for data analysis which includes predictive scripts, reports,
interrogations and data examples, a component for OLAP cubes storage which consists
in multidimensional data, extracted from data warehouses, a component for the process
of data that is extracted from the data warehouses in order to integrate it in OLAP
cubes, a data warehouses matching component, a component with a role in obtaining
storage and process of external data, an IT infrastructure matching component.
Fig. 2. Graphic for BI and OLAP. Source: Al-Agrabi H., Liu L., Hill R., Antonopoulos N Future
of business intelligence in the Cloud, 2015
The previous picture indicates the existence of two OLAP cubes: a
multidimensional OLAP data cube and a master OLAP data cube. The master cube has
the aim of controlling the relationships between bi-dimensional data and
multidimensional data cube. The data is included in online processing and transformed
into tables. In return, these are included in databases which can be accessed by the final
users.
Within the process of adopting the specific Business Intelligence systems to Cloud
Computing we have to keep in mind the following aspects: adapting the Business
Intelligence applications’ standards to the Cloud Computing architecture standards, the
introduction of a simultaneous data system that has a role in uniform delivery of
interrogations and of some response times forms to all data servers, an architecture
which is designed for the matrix distribution of interrogations.
There are architectural patterns of the mentioned directions. They cover the
following elements: hardware resources for processing, storage and networks, software
resources which consist in operational systems, data interrogations, data centers which
consist in relational or multidimensional databases, data warehouses instruments,
specific Business Intelligence instruments, application sets for data reading and
analysis.
70

Grigorescu A., Cerchia A. E., Jeflea V. F.
5. OLAP multi-cube CLOUD space
According to the previous experiences we will emphasis the modality in which the
OLAP technology can be applied in the Cloud Computing space, more exactly we will
show how a multi-cube can be built in an experimental data base center. The cube
dimensions will be formed taking over data from the 3 created cubes connected to the
central data cloud computing servers.
Fig. 3. OLAP multi-cube in a Database Center
To generate the cube model we will assume that we have to take decisions at a
fundamental level of a company that acts in customer relationship management domain.
Therefore, we will have to prioritize projects or stop projects depending on incomes
that they will generate. For this, we will need the data stored on different servers of the
regional departments of the company to be stored in corresponding data bases. We will
need a data base that contains information about potential projects or projects that are
already developing. This will be named: PROJECTS DB and contains the following
head tables: clients, project list and project locations. It will be followed by
SUPPLIERS DB and it is composed by the following tables: requests, offers received
and orders placed. Another relevant data base in our model is MATERIALS DB that
contains information about the necessary materials regarding the proper developing of
the project. The tables included in this data base are: Acquisitions Demands, materials
list, materials, producers.
The model we proposed is applicable, but indicative. The databases` structure can
be modified regarding the company` activity, organigram, IT existing platform, etc.
With the proposed model we try to simulate the real decisional activity. The existing
data bases from the regional servers will be undertaken with Microsoft SQL Server
software and elaborated with Microsoft Visual Studio.
In what concerns the data base structure, these are related as follows: in the
PROJECTS DB, the relations are established in the tabs: Client ID and Location ID; in
the SUPPLIERS DB, the tabs of connection between tables are: ID Request and ID
Offer; in the data base MATERIALS DB the tabs of connection are: ID Acquisition, ID
material and ID producer. The data base structure is illustrated in Fig. 4 and Fig. 5
71

Modern technologies for data storage, organization and managing in CRM systems
Fig. 4. MATERIALS data base structure - imported in the Center of DATA
Source: Microsoft SQL SERVER 2014
Fig. 5. Projects DB and Suppliers DB structures imported in the Center of DATA
Source: Microsoft SQL SERVER 2014
The existing data from the databases will be aggregated and used for developing the
following cubes: PROJECTS, SUPPLIERS and MATERIALS. The information that we
are willing to obtain from the 3 cubes are: the necessary amount of materials for the
good evolution of the projects, total value of the acquisitions of materials and the total
value of the projects.
The measurements of the cubes are: quantity, price per unit and total price. The
three cubes will finally generate a multi-cube that will help us to calculate the total
profit of the company.
To create the cubes, we used Microsoft Visual Studio and Cube Wizard. We
selected the database assigned to the cube, then we introduced the created dimensions
using the tables and we introduced the measures as we previously showed. The cubes
structure is illustrated in fig. 6. For generating the multi-cube we will use the wizard
through the option Mining Structures, stating that the database sources can be found
within the existing cubes.
72

Grigorescu A., Cerchia A. E., Jeflea V. F.
Fig. 6 Cubes structures created in Microsoft Visual Studio
6. The classification of CRM platforms that are using Cloud
Computing technology; Forthcoming research directions
There are many types of Cloud Computing based CRM platforms which have to be
taken into consideration: platforms that are designed for big and medium companies
and specialized platforms.
CRM platforms designed for big companies- These platforms are made for
enterprises with an income which is bigger than one billion dollars a year or with 1000
or more employees. These offer an entire range of functionalities which can serve to
some numerous population users and have multidimensional and multilingual support.
Some examples are: SAP CRM, Oracle Siebel CRM, Oracle CRM On Demand, Oracle
E-Business Suite CRM, Oracle PeopleSoft Enterprise CRM, Microsoft Dynamics
CRM, Pegasystems Customer Process Manager, RightNow CX, Salesforce.com,
Chordiant Software CX Suite, Sword Ciboodle.
CRM platforms designs for medium companies- These platforms are made for
enterprises that have an income which is less than one billion dollars and/or less than
73

Modern technologies for data storage, organization and managing in CRM systems
1000 employees. These offer limited and simpler functionalities and capacities of CRM
systems comparing to the platforms that are designed for companies’ market. Some
examples of such companies are: SAP Business All-in-One CRM, CDC Software
Pivotal, Oracle CRM On Demand, Microsoft Dynamics CRM, FrontRange Solutions,
GoldMine Enterprise Edition, Maximizer CRM, NetSuite, RightNow CX, SageCRM,
Sage SalesLogix, Sugar Enterprise.
Specialized CRM platforms- These software solutions offer ample functionalities
and capacities for both big and medium companies. Specialized CRM platforms are
available for the automation of marketing, customers’ services, customers’ analysis and
customer data management for specific industries such as sciences and
telecommunications. There are five types of specialized CRM platforms: analysis
platforms, customer data management, customer services platforms, marketing
automation platforms, industry specific platforms. Some examples of such CRM
platforms are presented on types as the following:
Analysis platforms: SPSS Predictive Analytics;
Customer data management: SAP NetWeaver MDM, Oracle Customer Hub, SAS
DataFlux CDI Solution, IBM Initiate Master Data Service:, IBM InfoSphere MDM
Server, D&B Purisma’s Purisma Data Hub, Siperian MDM Hub, Sun Master Data
Management Suite;
Customer services platforms: Consona CRM, eGain Service, Genesys
Telecommunications Labs’ CIM Platform, InQuira Customer Experience Platform,
KANA Suite, LivePerson’s Enterprise Platform, nGen Customer Interaction Mgmt.
Suite, Numara FootPrints for eService, Parature Customer Service;
Marketing automation platforms: Alterian Marketing Suite, Aprimo Enterprise, Infor
CRM Epiphany, SAS Customer Intelligence Platform, Teradata Customer
Management, Unica’s Affinium Marketing Management
Industry specific platforms: Amdocs CES Customer Management
(telecommunications), Veeva VBioPharma (sciences), StayinFront CRM (sciences),
Cegedim Dendrite (sciences).
Regarding banking area, the main suppliers of Cloud Computing platforms which
are adapted to financial and banking services particularities are: Salesforce.com,
Microsoft, Oracle, IBM şi Pegasystems.
In the forthcoming article we aim to identify how the named platforms use Business
Intelligence instruments. We aim to define a taxonomy for implementation of Business
Intelligence systems in Cloud Computing, including configuration aspects, to create a
methodology which allows organizations to develop their own applications for data
storage and managing, a methodology for data storage in Cloud, for developing
applications in Cloud Computing.
7. Conclusions
In our study we tried to penetrate a fascinating customer analysis data area, the area
of Business Intelligence according to the latest technological tendencies and to the
CRM platforms for Cloud Computing. In order to achieve our goals, we defined the
74

Grigorescu A., Cerchia A. E., Jeflea V. F.
basic concepts, we tried redefining some of them through our perception and we
pictured the way the OLAP technology is applied to data analysis. We made a
classification of Cloud Computing based CRM platforms and we aim to have as future
research directions the exact nomination of Business Intelligence components which are
integrated in these systems and the possibilities of developing and improving them.
We appreciate that one of this paper strength is represented by the development of
the concepts: Business Intelligence, CRM and Cloud Computing, strongly related one
to another. We tried to develop these concepts by analyzing the data about clients. To
achieve a correct analysis, in real time about the client, we have to use modern
technologies in order to aggregate information. Therefore, we considered that it is very
important to emphasis how data can be aggregate in Cloud Computing or in data centers
of Cloud Computing, using the OLAP technology. The main difficulty we have faced in
our research, and definitely a weak point of the paper, was the lack of real data. We
propose ourselves in the future that all the models that we developed in this paper, both
theoretically and conceptual, to implement them effectively, using real data.
Nevertheless, in the future research we will test, in order to obtain compared results,
the functionality of the Cloud Computing platforms, classified previously.
Bibliography 1. Assuncao D., Calheiors N., Bianchi S., Netto A.S.: Big Data computing and clouds:
Trends and future directions: J. Parallel Distrib. Comput. 79–80 (2015) 3–15
2. Al-Agrabi H., Liu L., Hill R., Antonopoulos N.: Cloud BI: Future of business
intelligence in the Cloud: Journal of Computer and System Sciences 81 (2015) 85–96
3. Bahrami M., Arabzad , Ghorbani M.: Innovation In Market Management By Utilizing
Business Intelligence: Introducing Proposed Framework: International Conference on
Leadership, Technology and Innovation Management: Procedia - Social and Behavioral
Sciences 41 ( 2012 ) 160 – 167
4. Khan A., Ehsanb E., Mirzac E., Sarward S.: Integration between Customer
Relationship Management (CRM) and Data Warehousing: INSODE 2011: Procedia
Technology 1(2012) 239 – 249
5. Maria, F. (2005). "Improving the utilization of external strategic information", Tampere
University of Technology, Master of Science Thesis.
6. McDonnell F.: Data Warehouse and ETL( System Dynamics).
7. Micu A., Micu A. E., Capatina A.: Innovative Analysis of a CRM Database using
Online Analytical Processing (OLAP) Technique in Value Chain Management
Approach: Proceedings of the 10th WSEAS Int. Conference on MATHEMATICS and
COMPUTERS in BUSINESS and ECONOMICS, 2009
8. Mwilu S., Wattiau I., Prat N.: Design science research contribution to business
intelligence in the cloud — A systematic literature review: Future Generation Computer
SystemsAvailable online 21 November 2015
9. Orzan G: Tehnologii informatice inteligente de accesare multidimensională a bazelor şi
depozitelor de date de marketing: Revista de Marketing Online, Vol. 1, Nr. 2(2007)
10. Tileagă C., Nițu O., Nițu C.V.:Customers Relatioships Management in Orgnization. In
International Economic Conference of Sibiu 2013 Post Crisis Economy: Challenges and
Opportunities, IECS 2013, Procedia Economics and Finance 6 ( 2013 ) 399 – 404
75

International Conference on Applied Internet and Information
Technologies, 2016
DOI:10.20544/AIIT2016.10
Implementation of embedded assistive device for
disabled people
Predrag Pecev1, Dejan Lacmanović1, Zdravko Ivanković1 and Branko Markoski1
1 University of Novi Sad, Technical faculty “Mihajlo Pupin”, Đure Đakovića bb,
23000 Zrenjanin, Serbia
pecev, [email protected], [email protected], [email protected]
Abstract. In this paper we present an embedded assistive device for disabled
people that is intended to be used as both keyboard and mouse replacement.
Assistive device consists of two main parts: an Arduino compatible board,
preferably an Arduino UNO R3 as used in this paper, or an Arduino Leonardo,
and a simple analog thumb-stick joystick. Presented device is connected to a
computer trough a USB port trough which it sends its input data. Special software
collects the received input data and triggers various events in order to execute
various actions. Primary goal of presented assistive device is to simulate mouse
movements and a single mouse click and in that manner replace majority of moue
functions thus enabling users to perform various mouse based tasks such as
navigating through menus, drag and drop actions etc., as well as to enable an
input and control over a virtual onscreen keyboard thus enabling users to type.
Keywords: embedded, assistive, device, arduino, disabled people
1. Introduction
With growth of technology, and in recent years Open source electronic devices,
programmable micro controller boards such as Arduino, NodeMCU, BeagleBone etc.
and microcomputers such as Raspberry Pi, Intel Edison and Intel Galileo, a whole new
world has opened up towards both experts and enthusiasts to work on various projects
that could be classified as Embedded systems. Ease of access and low cost of
aforementioned components also contributed towards an increase of general interest
towards custom embedded devices.
It is in human nature to help one another. A lot of actions and activities that we take
for granted great number of people can only dream of. For example a simple task of
communicating one with another, weightier that be trough a verbal or visual
communication a lot of people with disabilities find rather difficult. Disabilities can be
various ranging from light to severe and focusing on both physical and mental ones. In
this project we made and attempt towards building and assistive device that would
enable disabled people with various kinds of disabilities to use a computer in order to
communicate and work. Basic idea is to control a computer via a simple thumb-stick
joystick that can be found on various game console controllers such as Sony
PlayStation 4 or Microsoft XBOX.
76

Predrag Pecev et al.
This would enable people with limited or slim hand movement and coordination to
interact with a computer, express emotions, communicate with other people etc. There
are various devices that are designed to act as assistive devices, however their price
range is somewhat expensive. Our goal is to create and embedded low cost assistive
device and push developed software on services such as GitHub in order to be used by
an Open Source community in order to help disabled people that do not have resource
to obtain other more expensive assistive devices. The hardware itself, both micro
controller board and analog hat joystick, cost approximately around 20 dollars or it
could be even cheaper if some sort of Arduino clone or counterfeits that are available
on the market are obtained, while the source code of a software and the software itself
is intended to be released free of charge as an Open Source software that can be
extended towards specific needs of a disabled person that will be using the device. This
way a great level of freedom is given towards the extensibility and development of a
presented device.
As mentioned before, there are various other assistive devices for disabled people
and various researchers are already working on various assistive devices that would
help disabled people. With this in mind we can say a field of study has already been
formed that focuses on making assistive devices for disabled people. With this attempt
we are trying to make our small contribution in the aforementioned field by introducing
Open Source low cost components and concepts of Open Source software in order to
produce cheap non profitable assistive devices.
There are examples of other Arduino board based assistive and monitoring devices
such as a microcontroller that is placed on a wheelchair and tracks users movement and
notifies his or hers caretaker if something goes wrong. E.g. An epileptic seizure. This is
presented in work of Jesús Cabal-Aragón et. Al. [1]. Work of Geonea et. Al [2]
describes an Arduino based wheelchair prototype while Leite et. Al. [3] present a
device for electromechanical braille reading digital text that is also Arduino based with
usage of servo motors. In work of Abd Wahab et. Al [4] a Smart Cane that helps
visually impaired by alerting them of certain obstructions trough voice alerts and
vibrations is presented while Gangopadhyay et. Al [5] present a similar Arduino based
system as Leite et. Al. [3].
2. Device implementation
Hardware implementation of presented device is rather simple. As mentioned before, it
consists of two key parts: an Arduino compatible board in this case Arduino UNO R3
and a simple analog thumb-stick joystick that can be found in most Arduino starter kits.
Arduino Uno is a microcontroller board based on the ATmega328P. It has 14 digital
input/output pins (of which 6 can be used as PWM outputs), 6 analog inputs, a 16 MHz
quartz crystal, a USB connection, a power jack, an ICSP header and a reset button [6].
Wiring is quite simple, as shown in Fig 1. and relies on supplying power to the analog
thumb-stick joystick trough 5V pin, ground trough GND pin, and reading analog values
from X Axis and Y Axis on Analog 0 and Analog 1 pins. Switch is connected via
digital pin 2 and essentially presents a left mouse click button.
77

Implementation of embedded assistive device for disabled people
Fig.1. Arduino UNO R3 and analog thumb-stick joystick
A simple piece of code is written to read both analog and digital inputs and write
them to serial port formatted as shown in Fig. 2. Frequency of sampling and sending
input data is 100ms meaning that in 1 second we get 10 analog readings from analog
thumb-stick joystick. A sample of input data that is being sent is also shown in Fig. 2,
while composed device itself is shown in Fig. 1.
Fig.2. Format and sample of input data
Software implementation of a presented device relies on interpreting data that
described device sends via USB port on a baud rate of 9600 bits per second. A simple
78

Predrag Pecev et al.
windows forms .NET application is made using Visual Studio 2015 Edition that listens
to a USB port that device is connected to, and based on sent values invokes WINAPI
functions that are located within user32.dll file. Aforementioned application is shown in
Fig 3. To control a mouse pointer values from X and Y axis of a thumb-stick joystick
are converted to appropriate offsets for mouse input and sent via SendInput function [7]
as input instructions. The same goes for left mouse click simulation. Based on all of the
previously stated facts it can be concluded that, for now, devised device is supported by
a software that runs only on Windows operating systems and requires a .NET
Framework.
Fig. 3. Joystick control application
It is important to emphasize that device and software itself is treated as an additional
input device so it can be used as an input in any full screen application such as various
games while keyboard and mouse remain completely functional. Developed application
itself could be configured to emulate various keys in order to potentially simulate
movement trough virtual environments such as museums and various well know
architectural sites.
To enable keyboard interaction a user must hold switch on thumb-stick joystick for 3
second and then a dialog pops out asking a user to choose an input type.
Aforementioned dialog is shown in Fig. 4. Since Mouse Input is default and preferred
method of input, alternative input method is Keyboard Input.
79

Implementation of embedded assistive device for disabled people
Fig. 4. Input methods
Fig. 5. Onscreen keyboard and typing in Microsoft Word
If Keyboard Input is selected a custom virtual onscreen keyboard is displayed as
shown in Fig. 5. Navigation trough available keys is done via an analog thumb-stick
joystick while activation of a key, or a key press, is done via button (switch) press.
Currently selected key is indicated with a light blue color as shown in Fig. 5. Before a
user starts typing it is required for a user to select an application to which software will
send simulated keystrokes. Keystrokes are also send trough WINAPI SendInput
function. After every keystroke using Microsoft Speech Synthesis each typed letter and
80

Predrag Pecev et al.
key is spoken out in order to indicate what key has been typed in with an option to read
entire typed text.
3. Conclusion
In order to provide usage data, presented device will be tested on a number of disabled
people. Presented concept is not new since various efforts have been made towards
constructing assistive devices of various kind, and, based on the currently perceived
literature, we have found similar solutions that use Infra-Red (IR) sensors and other
input methods to simulate mouse input. However, we have not found a solution that
combines aforementioned components with software support to obtain described
functionality, and therefore consider it to be, so far somewhat unique. Further
development will include extensibility towards non Windows operating systems such as
various Linux/Unix distributions, Mac OS etc. and implementation of described
functionality on a driver level or as an operating system service. As mentioned before,
we hope that this will become an Open Source project in order to assist as many
disabled people as possible. However whether presented solution will become an Open
Source project will be determined by aforementioned tests, and if we get positive
feedback development of presented device would take a step from a test / pilot project
towards a potential Arduino based assistive device platform.
References
1. Jesús Cabal-Aragón, Juan Pomárico-Franquiz, Yuriy S. Shmaliy, Oscar Vera-Almanza
“Embedded Microcontroller using GPS as a Security Resource for Disabled People” IEEE
International Instrumentation and Measurement Technology (I2MTC) Proceedings, 2014,
978-1-4673-6386-0/14/$31.00 ©2014 IEEE
2. GEONEA Ionut Daniel, DUMITRU Nicolae, MARGINE Alexandru, “ MOTION
EVALUATION OF A WHEELCHAIR PROTOTYPE FOR DISABLED PEOPLE”, ACTA
UNIVERSITATIS CIBINIENSIS – TECHNICAL SERIES Vol. LXVII 2015, DOI:
10.1515/aucts-2015-0062, pages 46 – 50
3. Cicília Raquel Maia Leite, Davi Alves Magalhães, Pedro Fernandes Ribeiro Neto, Suellem
Stephanne Fernandes Queiroz, Yáskara Ygara Menescal Pinto Fernandes, “A Device For
Electromechanical Braille Reading Digital Texts”, ICSEA 2013 : The Eighth International
Conference on Software Engineering Advances ISBN: 978-1-61208-304-9, pages 612 – 615
4. Mohd Helmy Abd Wahab, Amirul A. Talib, Herdawatie A. Kadir, Ayob Johari, A.Noraziah,
Roslina M. Sidek, Ariffin A. Mutalib, “Smart Cane: Assistive Cane for Visually-impaired
People”, IJCSI International Journal of Computer Science Issues, Vol. 8, Issue 4, No 2, July
2011, pages 21 – 275. 5.
5. Shreedeep Gangopadhyay,Molay Kumar Mondal and Arpita Pramanick, “SIMPLE HAND-
HELD CALCULATING UNIT TO AID THE VISUALLY IMPAIRED WITH VOICE
OUTPUT”, International Journal of Embedded systems and Applications(IJESA) Vol.5,
No.3, September 2015 pages 1 – 13
6. https://www.arduino.cc/en/Main/ArduinoBoardUno
7. https://msdn.microsoft.com/en-us/library/windows/desktop/ms646310%28v=vs.85%29.asp
81

International Conference on Applied Internet and
Information Technologies, 2016
DOI:10.20544/AIIT2016.11
Effects of Using Databases of Educational Materials in
the Education System in Macedonia
Mimoza Anastoska-Jankulovska and Pece Mitrevski
1 Faculty of information and communication technologies, Partizanska bb,
7000 Bitola, Macedonia
[email protected], [email protected]
Abstract. Technologies have become important part of our lives. Their inclusion
in education is inevitable. The steps for introducing ICTs in education vary from
country to country. Macedonia has invested with a lot of hardware and software in
education. Teachers have received numerous training, some for use of ICTs. This
research was aiming to determine the situation of usage of educational materials
and to define recommendation for future improvements. Teachers from urban
schools were interviewed with the questionnaire. Data from multiple choice
questions have given quantitative results, and several open-ended questions have
given qualitative information. The findings are several: only part of the interviewed
teachers had experience with databases of educational materials; all teachers still
need capacity building activities focusing exactly on the use and benefits from
databases of educational materials; technical support and upgrading of software and
materials should be performed on a regular basis. Training materials for
professional development of teachers on preparation and usage of databases of
educational materials in Macedonian language should be developed and
implemented. Subsequently, teachers will be able to design, develop, use and
update educational materials in Macedonian language. Thus, application of ICT in
education will have bigger positive impact.
Keywords: databases of educational materials, teachers, education, research,
findings.
1. Introduction
During the previous decade in schools in Macedonia, a lot of hardware has been installed,
and teachers have undergone a lot of professional development activities. Computers in
schools are connected on the Internet; numerous software applications have been
translated and adopted for Macedonian education; each teacher has received a laptop to
facilitate own preparation for work and implementation of teaching activities. Having in
mind that for more than a decade different projects were focusing on preparation of
teaching/learning materials for Macedonian schools, it is important to see if and how the
digital materials have changed the educational process, and if and how the approach of
teachers has been adjusted accordingly.
82

Mimoza Anastoska-Jankulovska and Pece Mitrevski
2. Research Description
This research was aiming to explore how structured databases of educational materials
are used by Macedonian teachers. This research has been implemented in urban schools
across the country, not selecting any educational level in particular. In total 182 teachers
were interviewed, and their answers were analysed.
The questionnaire consisted of very few general questions about gender, type of school,
or working experience in education. Then followed the questions about the use of ICT in
education, for work and private purposes. There were several open-ended questions
aiming to collect more information about what kind of materials and software is used by
teachers, and also to receive more qualitative data about the teachers’ approach towards
ICT.
The distribution of the respondents across gender, age, or schools’ levels is matching the
distribution of teachers against these criteria in all schools in Macedonia; hence, it is
confirming the findings from this research. The extracts selected for this paper from the
detailed research are illustrating the most distinctive research findings.
3. Findings
Considering the availability of hardware in schools and handheld devices of teachers, the
questionnaire for this research was uploaded online with the aim to ease access to it, and
give teachers the possibility to fill it at arbitrary place and time. At the commencement
point of the research, even before “diving” into the data processing and the data analysis,
one finding emerged: The teachers are not willing to fill online questionnaires. Although,
the link to it and information about the research were distributed in many schools across
the country, only 1/3 of all respondents (60 teachers) have used this online possibility.
However, when the teachers received paper copies of the questionnaire, their response
rate was much higher. The reasons can be numerous: preference of human interaction
while delivering paper copies; no willingness to work with digital documents; problems
with the equipment in schools; or something else. This research had no ambition to define
the reason behind this striking finding. The question why teachers are not willing to fill
online forms can be a topic for a future research.
The gender distribution of respondents is: 32% male and 68% female. The age
distribution of respondents is as follows: 27% less or equal to 35 years old, 34% between
ages of 36 and 45, 33% between ages of 46 and 55, and 6% more than 55 years. The
gathered data from these questions were used to determine if there is a difference in
understanding and approaches between genders or age groups, or if it is dependent on
experience with ICTs or the duration of experience in schools.
The predominant number of respondents have said that they are using ICTs for private
purposes for more than 10 years (>65%), and the others between 3 and 10 years. Most of
the respondents (64%) have stated that they are using ICTs in schools between 3 and 10
years.
83

Effects of Using Databases of Educational Materials in the Education System in Macedonia
Several questions were focusing on the databases of educational material (DEM). During
the implementation of different projects and training activities in the past period, a lot of
educational materials were developed and shared between different groups of teachers. It
was expected that the interviewed teachers will have experience with DEM and can
explain own understanding and approach. Big percent of the respondents (≈60%) have
selected that they think DEM is helping them improve the effectiveness of their own
work. Approximately 30% have replied that they cannot say how DEM will affect their
work, which means that they do not have enough experience in implementing DEM in
education. Having in mind the previously mentioned fact that there have been a lot of
materials developed, this finding is revealing that these materials are not widely used in
schools. The first recommendation will be to make all previously prepared educational
materials available for teachers to use in everyday work. Even some guidelines can be
drafted for new teachers to be able to use all existing materials. The interesting result is
that 15% of the teachers think that DEM will not help in improvement of students
learning. Although this percent is not high, it is still significant since it is supporting the
finding of international researches saying that only with introducing ICT and DEM in
classes, instant success and change cannot be expected.
Cross-tabulating, as a tool for defining the frequency of answers with the combination of
two or more questions, was one of the analytical approaches used. By combining the
answers from two questions, more insight about the teachers’ views and approaches
towards DEM in education is received. The following table is presenting the frequency
of answers on how the usage of DEM is affecting the teachers’ work divided by school
levels and types.
Table 1. Cross-tabulation of school levels/types and affect of usage of DEM on teachers’
work
%
DEM
decreases the
effectiveness
of teachers’
work
DEM
doesn’t
affect
teachers’
work
DEM
improves
effectiveness
of teachers’
work
I cannot
say TOTAL
Primary school 2.9 8.7 59.4 29.0 100
Gymnasia 3.4 8.5 55.9 32.2 100
VET high school 0.0 9.3 64.8 25.9 100
On each school level/type, the biggest percent of teachers think that DEM will improve
the effectiveness of teachers work. However, it is important to note that in VET schools
this percent is the biggest, and the lowest percent is in gymnasia. These data are showing
that in VET schools DEMs are used the most, and benefits from them are already
comprehended; in gymnasia, the teachers have less experience with the use of DEMs in
classrooms, and they cannot answer this question.
84

Mimoza Anastoska-Jankulovska and Pece Mitrevski
It is important to realise that there is no difference based on gender in acceptance of DEM
and ICT in educational processes. In all questions, the general distribution is almost equal
between genders without any difference – in general, women are equally willing to use
DEM in their work as men are.
Table 2. Cross-tabulation of duration of teachers’ experience in education and affect of
DEM on students’ learning
%
DEM
reduces
success of
learning
DEM do
not affect
on success
of learning
DEM
enforces
success of
learning
I cannot
say TOTAL
<= 3 years 0.0 40.0 40.0 20.0 100
between 3 and 10 years 4.3 7.1 58.6 30.0 100
> 10 years 0.9 15.0 64.5 19.6 100
A significant number of respondent teachers (30%) with experience between 3 and 10
years in education do not have experience in use of DEM in education, which is evident
from their answers that they cannot define how DEM will affect in gaining knowledge
among students. The future work on capacity development of teachers should target use
of DEM in education in order to provide experience to teachers so that they can implement
them more freely and benefit from their potential. The experience of teachers that were
using DEM in education longer is very positive and is stating that students can better learn
the material by using DEMs.
Table 3. Cross-tabulation of teachers’ age and willingness to implement DEMs in
education process
%
I do not
want to use
DEM
Only with some
classes/subjects
I want to use
DEM with all
classes/subjects
TOTAL
<= 35 years 4.0 56.0 40.0 100
between 36 and 45
years 11.3 43.5 45.2 100
between 46 and 55
years 13.3 40.0 46.7 100
>= 56 years 30.0 20.0 50.0 100
Younger teachers are accepted as “digital natives”, by default. Therefore, it was expected
that younger teachers will be more eager in accepting ICTs and DEMs in their own work.
85

Effects of Using Databases of Educational Materials in the Education System in Macedonia
However, findings are that older teachers and teachers with longer teaching experience
are more willing to use DEM with all the classes and during all of the subjects. Future
capacity building activities should especially target younger teachers too, without
positive discrimination of them and prejudice that they are “digital natives”, and that they
have experience in how to use any technology under any circumstance.
The qualitative analysis of the open-ended questions has revealed several important
findings. Experiences in implementing DEMs in educational process are divided – there
are positive and negative ones. The given answers are supporting the previous quantitative
finding that only introducing DEMs and without other changes, no positive result and
improvement can be expected. Another finding is that the teachers still need a lot of
training and capacity building in effective implementation of DEMs; permanent technical
support should be available combined with timely upgrading of hardware and software.
Larger volume of digital materials on Macedonian language will help and facilitate the
introduction of DEMs at all levels.
Very positive was the finding that teachers understand the importance of the professional
development and are doing their best to use all available resources, especially with the
help of technology, to improve own development. This teachers’ attitude towards
professional development is important because it is also found that teachers need quite a
lot of training on understanding, using, preparing and updating DEMs. This is especially
important because a lot of the respondents have identified as weakness non-existing (or
very few) educational materials in Macedonian language; in the near future, a lot of
educational materials on Macedonia language should be developed. With this, DEM on
Macedonian language should be created. This area should be in a focus of the future
developments in education.
4. Conclusions and recommendations
Database of educational material (DEM) is an organised collection of educational
materials: sometimes it has free access, sometimes it can be updated by the user.
Regardless of that, its main aim is to provide materials that can facilitate the educational
process by using the existing technologies. Structured DEMs are the next developmental
stage; they consist of more information about the implemented changes, their author,
usage of material, achieved results, time and date of accomplishments, etc. Using
structured DEMs in education will provide more information about the progress of
students, but will also provide teachers with an opportunity to design own subset of
materials that is suitable for them and their students.
The experience of Macedonian teachers with DEMs is various. One of the most important
recommendations from this research is that adequate capacity building should be
implemented in order to reach similar level of knowledge and understanding for most
teachers. All teachers should be trained to be able to design, implement and upgrade
DEMs. Preparation of educational materials in Macedonian language is the prerequisite
in order to improve the quality of education and to achieve the same level of technology
usage in all schools and by all teachers and students.
86

Mimoza Anastoska-Jankulovska and Pece Mitrevski
Introducing of DEMs in schools itself cannot accomplish big improvement because
adequate attitude and practices should be in place, too. This research has identified that
teachers should be equipped with adequate teaching approach in order to be able to use
DEMs efficiently and to achieve the desired results. Another recommendation is to
implement frequent periodic professional development training for all Macedonian
teachers in order to exchange experiences and improve their own teaching approaches
while using technologies and databases of educational materials.
References
1. Anastoska-Jankulovska, M., (2009), Information systems in education, Bitola, Macedonia.
2. Bingimlas, K.A., (2009), Barriers to the Successful Integration of ICT in Teaching and
Learning Environments: A Review of the Literature, Eurasia Journal of Mathematics,
Science and Technology Education.
3. National Council for Curriculum and Assessment, (2007), ICT Framework – A structured
approach to ICT in Curriculum and Assessment, Ireland.
4. Scrimshaw, P., ed. (2004), Enabling teachers to make successful use of ICT, Coventry:
British Educational Communications and Technology Agency, UK.
5. Tondeur, P., (2012), Preparing pre-service teachers to integrate technology in education: A
synthesis of qualitative evidence, Computers and education, 59.
6. West, D., (2013), Mobile Learning: Transforming Education, Engaging Students, and
Improving Outcomes, Center for Technology Innovation in Brookings, Washington, USA.
87

International Conference on Applied Internet and Information
Technologies, 2016
DOI:10.20544/AIIT2016.12
The Advantages of Using Raspberry Pi 3 Compared to
Raspberry Pi 2 SoC Computers for Sensor System Support
Jovan Ivković 1, Biljana Radulović2
Tehnical Faculty „Mihajlo Pupin“, Đure Đakovića bb,
23000 Zrenjanin, Republic of Serbia [email protected], [email protected]
Abstract. This paper shows the comparison between two generations of
Raspberry Pi SoC computers, which can be marked as the first stage of nano
revolution of ubiquitous computing and the Internet of Things.
Keywords: Information systems, Raspberry Pi SoC system, sensor systems,
computer infrastructure, IoT.
1. Introduction
The evolution of the Internet, network technologies and Web application solutions have
brought upon the marginalization of computer hardware and system programming.
Virtualization of hardware and software platforms and introducing of large number of
abstraction tiers have eased the development of application solutions for supporting
work with Internet technologies. The application software development has become
independent from the platform, and by its form more concise and closer to the natural
language, when compared to standard high-level programming languages.
The idea of a general-use computer, minute by its size and affordable by the price, has
been developed in 2006 by a group of Cambridge University professors. The reason lay
in the concern about the IT students' foreknowledge. On the contrary to the students
from the '80s and the '90s, whose foreknowledge about computer hardware and system
programming was solid, the 21st century students know the world of IT only through
Web applications, PC and game consoles. The initial idea was to develop something to
stimulate interest for computer hardware and raise the level of software skills.
The first concept of Raspberry Pi system was based on Atmel Atmega644
microcontroller, but this solution was soon abandoned since the use of microcontrollers
was excessively hardware-oriented, which made the PC architecture simulation harder.
The alternative was found in SoC microprocessors aimed for Smart telephones and
multimedia DVB TV BOX appliances. The use of Broadcom media processor (ARM
1176JZF – S) led to the creation of the first Raspberry Pi SoC computer, with the
following dimensions: 8,6 x 5,4 x 1,7cm. Until this moment, Raspberry Pi reached its
third generation, and according to the latest estimations, over six million copies have
been sold. The key advantage of this SoC platform, when compared to usual PC
88

Jovan Ivković.
computers, is the existence of GPIO (general-purpose input/output) ports, by which it is
possible for software applications to directly communicate and control hardware
components and microcontrollers via serial USART, I2C and I2S protocols, as well as
through the parallel connection via free GPIO ports.
2. Presenting Raspberry Pi 2 and Raspberry Pi 3 systems
Before directly comparing the hardware features of these two systems, we should point
out that the two systems are mutually compatible by software. Although different
versions and generations of ARM CPU architecture are found in Raspberry Pi 2 and Pi
3, Raspberry Pi foundation delivers the identical version of NOOBS and Raspbian
Jessie image of Linux Debian operating system (current version 1.9.0 and 4.1, since 18th
March 2016), with all the related software libraries. In this way, full compatibility of
Raspberry Pi 3 with the new 64bit ARM Cortex-A53 processor ARM v8 and Raspberry
Pi 2 with ARM v7 generation ARM Cortex-A7 32bit processor has been achieved.
Apart from ARM CPU and increase of clock frequency, Broadcom BCM2837 SoC
CPU in Raspberry Pi 3 contains almost all the same components as its second-
generation predecessor, Broadcom BCM2836 SoC CPU.
Table 1 shows the comparative review of the second and third generation of Raspberry
Pi system, where improvements regarding network adapters and CPU performance are
seen.
System Raspberry Pi 2 Raspberry Pi 3
Release date 6th February 2015 29th February 2016
SoC IC Broadcom BCM2836 Broadcom BCM2837
CPU 900MHz quad-core ARM
Cortex-A7, ARM v7 generation
1.2GHz 64-bit quad-core ARM
Cortex-A53, ARM v8 generation
GPU Broadcom VideoCore IV on 250 MHz (BCM2837 GPU: 3D on 300 MHz,
video part of on 400 MHz)
Memory
(SDRAM)
1GB LDDR2 400MHz (shared
with GPU)
1GB LDDR3 900MHz (shared with
GPU)
USB 2.0 ports 4 (via the on-board 5-port USB hub)
Video input 15-pin MIPI camera interface (CSI) connector, used with the Raspberry Pi
camera or Raspberry Pi NoIR camera
Video outputs HDMI (rev 1.3 & 1.4), composite video (3.5 mm jack)
Audio inputs As of revision 2 boards via I²S
Audio outputs Analog via 3.5mm phone jack; digital via HDMI and, as of revision 2
boards, I²S
Storage MicroSDHC slot
On-board
network
100Mbit/s 802.3 Ethernet (WiFi
using USB adapter)
100Mbit/s 802.3 Ethernet;
802.11n 150Mbit/s WiFi;
Bluetooth 4.1
Low-level
peripherals 17× GPIO plus the same specific functions, and HAT ID bus
Power ratings 600 mA 800mA
Power source 5 V via MicroUSB or GPIO header
89

The Advantages of Using Raspberry Pi 3 Compared to Raspberry Pi 2 SoC Computers for Sensor
System Support
Size, Weight 85.60 mm × 56.5 mm, 45g
Table 1. Comparative review of the second and third generation of Raspberry Pi system
characteristics
Figure 1. Raspberry Pi 3 and Pi 2 with the installed coolers and modified voltage level
regulator
Figure 2. Broadcom BCM43438 chip with the Bluetooth 4.1/Low Energy (LE) support
and 802.11n 2.4GHz WiFi, size ~5 x 3 mm
Apart from the new SoC CPU, another novelty from Raspberry Pi 3 is the board-
integrated Broadcom BCM43438 chip, enabling support for Bluetooth 4.1 HS/Low
Energy (LE), 802.11n dual band 2.4 and 5.6GHz WiFi and FM radio reception1. This
frees 2 USB ports in comparison to the previous model, and enables lower investment
1 Broadcom co. “Single-Chip Dual-Band Combo Device Supporting 802.11n, Bluetooth 4.0+HS
& FM Receiver”, https://www.broadcom.com/products/Wireless-LAN/802.11-Wireless-LAN-
Solutions/BCM4334; last visited on 22-03-2016
90

Jovan Ivković.
in preparing the system for wireless sensor system support, which would use the
aforementioned communication standards.
A standardized 40-pin GPIO connector was introduced with Raspberry Pi B+ series2,
enabling I2C, I2S, SPI, UART, EEPROM communication protocols on the remaining
26+2 ports, next to the power outlets (+3,3V i 5V), leaving 17 unallocated GPIOs for
the user to program them.
Figure 3 shows the scheme and architecture of GPIO prots, introduced with Raspberry
Pi B+ system, which is still a valid format standard, used with Raspberry Pi 2 and Pi 3
SoC systems.
Figure 3. An extract from the electronic scheme of Raspberry Pi B+ system, with the
emphasis on GPIO connectors and their connection to the CPU (left), an individual
GPIO port3scheme, within Broadcom BCM2835 CPU.
As it can be seen in Figure 3, all ports are directly connected to SoC CPU, which
enables an extremely fast access. What should be noted are the limits related to work
conditions, i.e. the allowed electricity unit value. The input voltage of any GPIO port
cannot exceed 3.3V (absolute maximum 3.6V), nor be lower than GND level which
powers the CPU (regardless of the fact that each port has the rudimentary overvoltage
protection). On the other hand, the electric current per one GPIO port can vary from
2mA to the maximum of 16mA, and the total current in all GPIO ports must not exceed
50mA. The direct link with CPU and its system bus enables really small latencies and
extremely fast bus operation. The documentation accompanying Broadcom BCM2835
SoC3 notes that the standardized protocols UART, SPI and I2C are limited only to the
speed of system bus, therefore the SPI_clock=125MHz is possible for the system bus
clock speed of the CPU of 250 MHz. On the contrary to the aforementioned standard
protocols, free GPIO ports are not predefined by the clock speed and are approachable
2 https://www.raspberrypi.org/documentation/hardware/raspberrypi/schematics/Raspberry-Pi-B-
Plus-V1.2-Schematics.pdf 3 https://www.raspberrypi.org/documentation/hardware/raspberrypi/bcm2835/BCM2835-ARM-
Peripherals.pdf
91

The Advantages of Using Raspberry Pi 3 Compared to Raspberry Pi 2 SoC Computers for Sensor
System Support
from the program code, directly reading, setting up, monitoring or triggering events by
their states or changes.
Given that after the mentioned BCM2835, new BCM2836 and BCM2837 SoC CPU
have not been released with the publically available documents regarding speed and
parameters of input/output ports, it can be assumed that all of the above is valid for
them as well. The subject of our study will be exactly the aspect of access speed, i.e. the
free GPIO ping from program code of various program languages and driver libraries.
Our interest lies in the fact that Raspberry Pi has been increasingly used (directly or
indirectly) for controlling and monitoring of work of microcontrollers, analog-digital
converters and other electronic sets, related to the use in sensor systems.
In operation theory, the maximum speed at which the processor can handle these ports
is:
FGPIO(max) =Periferial_Clock_Source/(Clock Divisors+1) (1)
Where Clock Divisors, i.e. DIVI is an integer, aligned with the applied MASH (Multi-
stAge noise SHaping) degree of filtering order. As of BCM2835, the producer
recommends not to set the values which would exceed the frequency of 25MHz,
although the maximum clock speed frequency of GPIO ports is around 125 MHz at
1.2V. This frequency can drop significantly, depending on GPIO port capacitance and
usage.
The flexibility offered by Raspberry Pi and other similar SoC computers can be
followed by the advanced 32bit microcontroller systems in certain way, but only in the
narrow field of process control and analog electrical values. On the other hand, SoC
systems have several times better performances in the terms of classical computing,
multimedia etc.
3. Measuring and System Performances
If we begin with the model by which it is expected that Raspberry Pi 2 or Pi 3 systems
are able to do successive and parallel reading of 8bit fast industrial sensor AD converter
AD7821/22 with 1.6-2MSPS or to set the 8bit states on 5.6MSPS DA-converter like
AD7528JN, a question arises – at which software environment and under which
conditions Raspberry Pi 2 or Pi 3 can enable it?
By using a simple sequence which directly sets the GPIO port state 11 to 1 in program
code, and then erases it, i.e. sets it to the zero value using the SainSmart DDS140
osciloscope and the UNI-T UT61E frequency meter, we have been monitoring the
generated sequence clock speed, and the measurement results have been summarized in
Table 2.
The key part of the code sequence executed in C is: // To set GPIO pin 11 to output
// we must use INP_GPIO before we can use OUT_GPIO
INP_GPIO(11);
92

Jovan Ivković.
OUT_GPIO(11);
while(1)
GPIO_SET = 1<<11;
GPIO_CLR = 1<<11;
A similar code is executed in Pyton: import RPi.GPIO as GPIO
import time
GPIO.setmode(GPIO.BCM)
GPIO.setup(11, GPIO.OUT)
while True:
GPIO.output(11, True)
GPIO.output(11, False)
Language Used Library Rasberry
Pi 1 B+ Pi 2 Pi 3
Shell /proc/mem access 2.8 kHz 6.2 kHz 12.92
kHz
Shell /
wiringPi
WiringPi gpio
utility 40 Hz 92 Hz 183 Hz
Python RPi.GPIO 70 kHz 190.23
kHz
322.5
kHz
Python wiringpi2 bindings 28 kHz 105 kHz 168.9
kHz
C Native library 22 MHz 42.16
MHz
55.8-57
Mhz
C BCM2835 5.4 MHz 6.97 MHz 9.3-11
MHz
C
WiringPi normal
GPIO
wiringPiSetup()
4.1 MHz 9.76 MHz 13.83
MHz
Table 2. A comparative review of speed.-frequency, code generated clock speed of
GPIO port in various programming languages on the Raspberry Pi, Pi2 and Pi3
platform.
4. Conclusion
Given that, according to the results of measurements presented in Table 2, Raspberry Pi
3 has generated the clock speed greater by 67,5% (between 35.2 and 108.4%) in
average, compared to Raspberry Pi 2 and has managed to enable over 9MHz more by
maximum CPU usage of 25% (1x core tread) in all tests written in C, we can say that
Raspberry Pi 3 is a far better and faster platform, compared to its predecessor. Despite
93

The Advantages of Using Raspberry Pi 3 Compared to Raspberry Pi 2 SoC Computers for Sensor
System Support
the acceleration brought by Raspberry Pi 3 program library and the speed of access to
GPIO port from script and interpreter languages, it still cannot meet the more serious
and demanding application requirements. In both cases, the speed of port state change
higher than 150 kHz has been achieved in Python, which can enable successful value
reading for the majority of commercial 50-100KSPS analog-digital converters. All the
mentioned facts enable for Raspberry Pi 3 to provide better performance in its domain
than the popular Atmel ATMega328 microcontroller with Arduino development
platform.
According to our measuring in Whitestone test, Raspberry Pi 3 achieves 727,85MIPS,
in comparison to 497MIPS with Raspberry Pi 2. Moreover, according to the arithmetic
tests with floating point - Linpack and Livermore Loops Benchmark, Raspberry Pi 3
achieves 194MFLOPS (max 422) compared with 150MFLOPS (max 247), which in
total present the values which are one step away from the PC world, but far beyond the
reach of microcontroller platform possibilities.
References
1. Dogan, I.: Raspberry Pi,Niš, R. Serbia, Infoelektronika, 2016.
2. Cox, T.: Raspberry Pi Cookbook for Python Programmers,UK, Packt Publishing, 2014.
3. Dogan, I.: Internet of things,Niš, R. Serbia, Agencija Eho, 2016.
4. Ivkovic, J., Odadzic, B.: Analysis of Visible Light Communication System for
Implementation in Sensor Networks. XV International Conference INFOTEH-JAHORINA
2016. (IEEE BiH, RS, MNE section) Sarajevo, BiH. 2016.
5. Broadcom co. “Single-Chip Dual-Band Combo Device Supporting 802.11n, Bluetooth
4.0+HS & FM Receiver”, https://www.broadcom.com/products/Wireless-LAN/802.11-
Wireless-LAN-Solutions/BCM4334; last visited on 22-03-2016
6. https://www.raspberrypi.org/documentation/hardware/raspberrypi/schematics/Raspberry-Pi-
B-Plus-V1.2-Schematics.pdf, Raspberry Pi foundation; last visited on 22-03-2016
7. https://www.raspberrypi.org/documentation/hardware/raspberrypi/bcm2835/BCM2835-ARM-
Peripherals.pdf, Raspberry Pi foundation; last visited on 22-03-2016
94

International Conference on Applied Internet and Information
Technologies, 2016
DOI:10.20544/AIIT2016.13
An IoT Concept of the Small Virtual Power Plant Based
on Arduino Platform and MQTT Protocol
Dmytro Zubov
School of Engineering and Sciences, University Tecnológico de Monterrey
Av. Eugenio Garza Sada 300, Lomas del Tecnologico, 78211 San Luis Potosi, S.L.P., Mexico
Abstract. In this paper, a new IoT concept of the small virtual power plant is
proposed. The main principle is the smart control of the high-voltage power lines
by the low-cost and low-voltage Arduino platform with Mosquitto open-source
message broker that implements the secure TCP connection based on MQTT IoT
protocol using specific topics, passwords, and SSL cryptography. The C#
Windows form app and Arduino sketch were developed with MQTT publisher
and subscriber, respectively. The hardware simulation of the proposed concept is
realized using the solar panel (12.5 V, 180 mA), two relays SRD-05VDC-SL-C,
buck (DC/DC YEC SD200) and buck/boost (DC/DC Tusotek TS-IPS-VO2)
converters, and two small power banks (first one is to supply the consumption
part simulated by Arduino Uno with LED, second one is to supply the smart
power distribution block). The hardware was tested successfully in three regimes:
the charge of battery by the solar panel, the power supply of the Arduino Uno
board with LED using the power bank or solar panel. The proposed infrastructure
can be directly applied to the power off-grid solutions of the smart houses if grid-
tie inverter is added as well as generation and storage parts are more powerful.
Keywords: virtual power plant, IoT, Arduino, MQTT, C#.
1. Introduction
Nowadays, the virtual power plant (VPP) is the leading concept to manage different
types of the renewable (solar, wind, biogas, geothermal mainly), classical (e.g. coal,
gas, and hydroelectric), and nuclear energy resources [1, 2]. This synergetic approach is
based on the smart power grids with distributed generation facilities and possibility to
control the consumption using different levels of the power quality and reliability.
Currently, many companies (e.g. Bosch, Schneider Electric, Siemens, and RWE)
propose industrial-scale solutions for VPP. However, the small-scale VPPs (e.g. smart
house with off-grid electric power system) with unified soft- and hardware are not well
represented in literature and Internet. For instance, the simulation of the small VPP in
MATLAB 7.6 is presented theoretically in [3]. In [4], the microrenewable sources of
energy and electric vehicles are discussed as the parts of a microgrid concept. In [2], the
95

Dmytro Zubov
structure, application, and optimization of VPP are reviewed in general. In addition, the
budget solutions for VPPs are discussed conceptually, as well as not the whole system
but some parts of it are proposed mainly nowadays. For instance, Arduino Mega board
is used for the control and monitoring of the wind turbine in [5]. In [6], the high-
precision solar algorithms are implemented by Arduino platform. Other example is the
solar and wind battery charging regulator processed by Arduino board
(http://www.herbandbarbara.com/index_files/Page4001.htm).
Over the past fifteen years, the VPP together with Smart Energy application domain
have been developing within the Internet of Things (IoT) methodology because the IoT
soft- and hardware, as well as algorithms are applied directly to VPP [7]. The well-
known IoT platforms are Arduino/Genuino and Raspberry Pi [8]. However, the price of
Raspberry Pi is several times greater than Arduino analogues usually. The Arduino Uno
run-time is 50 days approximately (http://forum.arduino.cc/index.php?topic=191416.0).
Arduino is used in industry (e.g. the industrial microcontroller Industruino is a fully
featured Arduino Leonardo compatible board; https://industruino.com). Hence, Arduino
platform is used widely in IoT. In addition, new WiFi Arduino-compatible development
boards like NodeMcu Lua ESP8266 ESP-12E (https://smartarduino.gitbooks.io/user-
manual-for-esp-12e-devkit/content/index.html) are discussed for the wireless
connection to the sensors using web-server. In this case, Arduino IDE is used for the
software development. Different sensors and actuators [9] provide the interaction
among the physical objects. Then, the hardware implements the appropriate
algorithm(s) to control the VPP (e.g. the multi-agent system [10]). It should be
mentioned that is not the scope of this paper to define the optimal algorithm. The author
proposes the infrastructure as a service with the focus on hard- and software realization
of the control methodology. In the following, the Arduino sketches include the control
algorithms.
Different IoT devices are connected by special type of IoT protocols because of real-
time communication requirement, low performance of IoT hardware, as well as Internet
connection is slow sometimes. Nowadays, two IoT protocols, MQTT and CoAP, are in
use mainly
(https://eclipse.org/community/eclipse_newsletter/2014/february/article2.php;
https://www.linkedin.com/pulse/iot-communication-protocols-james-stansberry). First
one is based on the Internet TCP (Transmission Control Protocol), second one – on the
UDP (User Datagram Protocol). The viable alternative of the IoT protocol depends on
the project. If a message is going to be published from one node to many nodes, the
MQTT protocol is recommended to use. In the systems with the traffic limitations,
CoAP is recommended because it uses UDP, which eliminates the overhead of TCP/IP.
It makes a big difference in traffic if system has 1000s of nodes. In the following, the
MQTT protocol is applied to transmit/receive the data because of the author’s
background, feasibility to provide the secure connection among clients/broker, and the
correspondence with the multi-agent methodology [10], where MQTT clients represent
the agents.
Based on the above-stated brief analysis of the previous studies, this paper main goal
is to discuss a new IoT concept of the small VPPs. The main principles are as follows:
1. The power grids’ control based on the low-cost reliable Arduino open-source soft-
and hardware.
96
An IoT Concept of the Small Virtual Power Plant Based on Arduino Platform and MQTT Protocol
2. The high-voltage power lines’ control based on the low-voltage devices like the
relay module SRD-05VDC-SL-C for Arduino (output voltage is up to 250 V AC).
3. Communication between the different parts of the small VPP based on MQTT IoT
protocol using specific topics.
In the following, the secure TCP connection using the MQTT protocol’s passwords
and Secure Sockets Layer (SSL) cryptography are not in use because of the small scale
of prototype and the isolated network.
This paper is organized as follows: In Section 1, a new IoT concept is proposed for
the small VPPs based on the analysis of the previous studies. In Section 2, an
infrastructure of the small VPP is presented using the consumption (Arduino Uno with
light-emitting diode, LED), generation (solar panel), and storage (power bank)
components. In Section 3, the small VPP software for the supervisory control and data
acquisition (SCADA) is discussed based on the MQTT protocol for the communication
among the physical objects. Conclusions are summarized in Section 4.
2. The Infrastructure of the Small Virtual Power Plant
Classical infrastructure of the VPP consists of three main parts, generation,
consumption, and storage, which are connected by bidirectional (depends on the role –
generation or consumption) power lines. The proposed integration of renewable energy
sources and consumers is similar to presented in [11] idea, where the
connecting/disconnecting of these sources are made via the appropriate contactors,
automatically (or manually) controlled according to the energy consumption/generation.
The structure of the small VPP is presented in Fig. 1. The main distinction is the control
of the consumption part. In the system, the roles (generation or consumption) of the
components may be changed vice versa. Smart power distribution block (SPDB) is
responsible for the realization of commutation between the generation and consumption
parts. This communication is described by the states of the connectors (i.e. relays) KS1
– KSN and KL1 – KLM, where N is the number of the KS connectors between energy
sources and SPDB, M is the number of the KL connectors between energy sources and
SPDB. SPDB can be realized based on Arduino Uno and Ethernet Shield or NodeMcu
Lua ESP8266 ESP-12E WiFi development board. Energy source and load controllers
are the buck/boost converters or/and the grid-tie inverters. SCADA app controls the
system in general, as well as it stores and represents the info for the end-users. For
instance, Python and C# programming languages can be in use for the development of
the web and desktop apps with MQTT protocol support, respectively.
An example of the small VPP’s hardware is presented in Fig. 2. The generation part
is based on the solar panel (12.5 V, 180 mA). The consumption part is based on the
Arduino Uno with LED and Ethernet Shield. Buck (DC/DC YEC SD200 6-24V to 5V
3A USB step-down stabilized voltage supply module) and buck/boost (Tusotek TS-IPS-
VO2 6-35V to 1-35V DC/DC buck/boost power converter module) converters are the
controllers: first one converts 12.5 V voltage of the solar panel to 5 V to charge the
battery of the load part; second one converts 12.5 V voltage of the solar panel to 10 V
to supply the consumption part. Relays are connectors: first one controls the buck/boost
converter; second one controls the buck converter. If relay 1 is on and solar panel has
enough power, the battery is charged (if solar panel does not provide enough power,
97

Dmytro Zubov
battery supplies the consumption part); in this case, the power bank does not supply the
consumption part because of the specificity of the power bank’s voltage management. If
relay 2 is on, the solar panel supplies the consumption part. If relay 2 is on and relay 1
is off, the Arduino Uno with LED is supplied by the solar panel only because of the
specificity of the board’s voltage management. Because of the small current (180 mA)
of the solar panel, the battery can be charged together with the power supply of the
consumption part in this small VPP project if the battery is almost charged only (i.e. the
charge current is almost zero). SPDB changes the states of the relays according to the
SCADA commands sent by MQTT protocol. Here, the Arduino fault tolerance can be
improved based on the parallel power and signal lines.
. . .
. . .
MQTT protocol
Energy Source 1
(e.g. solar panel)
Energy Source 2
(e.g. wind turbine)
Energy Source N
Load 1
(e.g. heating system)
Load 2
(e.g. battery)
Load M
Energy Source
Controller 1
Energy Source
Controller 2
Energy Source
Controller N
Load
Controller 1
Load
Controller 2
Load
Controller M
KS1
Smart
Power
Distribution
Block
(acquisition,
monitoring,
and energy
management)
KS2
KSN
KL1
KL2
KLM
SCADA app (e.g. web, mobile or desktop app)
Fig. 1. The functional blocks scheme of the small VPP
98

An IoT Concept of the Small Virtual Power Plant Based on Arduino Platform and MQTT Protocol
Solar panel
LED with Arduino Uno and Ethernet Shield (consumer)
Buck/boost converter
Buck converter
Battery for the load part
1st relay to control the buck converter
2nd relay to control the buck/boost converter
Battery for SPDB
SPDB
Fig. 2. An example of the small VPP hardware part
3. Small VPP Software for the Supervisory Control and Data
Acquisition Using MQTT protocol
The SCADA software has two parts, low-level back-end (i.e. SPDB or microcontroller;
Arduino sketch here) and high-level front-end (C# Windows form app here). They are
connected based on the open-source message MQTT broker Mosquitto
(http://mosquitto.org/). Hereafter, the programming code is discussed in detail with
purpose to simplify the development of the similar VPP.
99

Dmytro Zubov
MQTT Client Library for .Net and WinRT (https://github.com/ppatierno/m2mqtt) is
used to start MQTT publisher and subscriber in the C# Windows form app. For this
purpose, the namespaces are declared as follows:
using uPLibrary.Networking.M2Mqtt;
using uPLibrary.Networking.M2Mqtt.Messages;
The MQTT subscriber is started using the following code:
var client = new
MqttClient(System.Net.IPAddress.Parse("10.24.206.126"));
client.MqttMsgPublishReceived +=
client_MqttMsgPublishReceived;
string clientId = Guid.NewGuid().ToString();
client.Connect(clientId);
client.Subscribe(new string[] "/VPP/Relays" , new
byte[] MqttMsgBase.QOS_LEVEL_EXACTLY_ONCE );
Here, 10.24.206.126 is the IP address of the computer with MQTT broker,
"/VPP/Relays" is the topic of the message. In addition, the following methods are in
use:
public void client_MqttMsgPublishReceived(object sender,
MqttMsgPublishEventArgs e)
SetText(Encoding.UTF8.GetString(e.Message));
public void button2_Click(object sender, EventArgs e)
textBox1.Text += '1';
delegate void SetTextCallback(string text);
private void SetText(string text)
if (this.textBox1.InvokeRequired)
SetTextCallback d = new SetTextCallback(SetText);
this.Invoke(d, new object[] text );
else
this.textBox1.Text += text + "\r\n";
The MQTT publisher is started using following code as follows:
byte[] a1 = new byte[1];
var clientS = new
MqttClient(System.Net.IPAddress.Parse("10.24.206.126"));
string clientId = Guid.NewGuid().ToString();
clientS.Connect(clientId);
a1[0] = Convert.ToByte(textBox2.Text);
clientS.Publish("/VPP/Relays", a1);
Here, the command (i.e. number) is published from the array a1 with topic
"/VPP/Relays". Then, this number is read by the MQTT subscriber in Arduino sketch.
The screen shot of the C# Windows form app is shown in Fig. 3. The text field in the
left part of the figure includes four numbers 4, 5, 2, and 3, which are commands
for
100

An IoT Concept of the Small Virtual Power Plant Based on Arduino Platform and MQTT Protocol
Fig. 3. Screen shot of the C# Windows form app
SPDB: 4 – switch on relay 1 (52 is coding), 5 – switch off relay 1 (53 is coding), 2 –
switch on relay 2 (50 is coding), 3 – switch off relay 2 (51 is coding).
MQTT Arduino client (http://pubsubclient.knolleary.net) is used to start MQTT
subscriber in the Arduino sketch. The following library is declared as follows:
#include <PubSubClient.h>
In addition, Ethernet client is started as follows:
int Relay1 = 9;
int Relay2 = 8;
int regime;
// MAC address of Arduino Uno board:
byte mac[] = 0x00, 0xAA, 0xBB, 0xCC, 0xDE, 0x03 ;
// IP address of Arduino Uno in LAN:
byte ip[] = 10, 24, 206, 56 ;
// IP address of the computer with MQTT broker:
byte server[] = 10, 24, 206, 126 ;
EthernetClient ethClient;
PubSubClient client(server,1883,callback,ethClient);
void callback(char* topic,byte* payload,unsigned int
length)
for (int i=0;i<length;i++) Serial.print("Regime ");
Serial.print((char)payload[i]);
regime = (int)((char)payload[0]);
if ( regime == 50) digitalWrite(Relay2,HIGH);
Serial.print(": Relay 2 is HIGH");
if ( regime == 51) digitalWrite(Relay2,LOW);
Serial.print(": Relay 2 is LOW");
if ( regime == 52) digitalWrite(Relay1,HIGH);
Serial.print(": Relay 1 is HIGH");
if ( regime == 53) digitalWrite(Relay1,LOW);
Serial.print(": Relay 1 is LOW");
Serial.println();
101

Dmytro Zubov
void setup()
pinMode(Relay1, OUTPUT); pinMode(Relay2, OUTPUT);
Serial.begin(9600); Serial.println("Starting...");
Ethernet.begin(mac,ip);
if(client.connect("Arduino1 (relays) Client"))
Serial.println("Client connected");
client.subscribe("/VPP/Relays");
Else Serial.println("Clientnotconnected");
void loop() client.loop();
Here, the first relay is connected to digital pin 9, the second one – to pin 8.
The hardware was tested successfully in three regimes as follows:
1. The charge of battery using the solar panel (relay 1 is on, relay 2 is off).
2. The power supply of the Arduino Uno board with LED using the power bank
(relay 1 and 2 are off).
3. The power supply of the Arduino Uno board with LED using the solar panel
(relay 1 is off, relay 2 is on).
The fourth regime (the charge of the battery together with the power supply of the
Arduino Uno board with LED) was not realized because of the solar panel’s low power
(the charge current is half ampere approximately if battery is fully discharged).
4. Conclusions
In this paper, a new IoT concept is proposed for the small VPPs. The main principles
are as follows:
1. To use the low-cost reliable Arduino open-source soft- and hardware for the smart
control of the power grid.
2. To use the low-voltage devices like the relay module SRD-05VDC-SL-C for
Arduino (output voltage is up to 250 V AC) for the control of the high-voltage power
lines.
3. Communication between the different parts of the small VPP based on MQTT IoT
protocol using specific topics and possibility of the secure TCP connection (passwords
and SSL cryptography).
The remote control of the small VPP components is based on the relays and
commands sent by the Mosquitto open-source message broker that implements the
MQTT IoT protocol. For this purpose, C# Windows form app and Arduino sketch were
developed with MQTT publisher and subscriber, respectively.
The hardware part consists of solar panel (12.5 V, 180 mA), two relays SRD-
05VDC-SL-C, buck (DC/DC YEC SD200) and buck/boost (DC/DC Tusotek TS-IPS-
VO2) converters, two small power banks (first one is to supply the consumption part
simulated by Arduino Uno with LED, second one is to supply the SPDB). The
hardware was tested successfully in three regimes: the charge of battery using the solar
panel (relay 1 is on, relay 2 is off); the power supply of the Arduino Uno board with
102

An IoT Concept of the Small Virtual Power Plant Based on Arduino Platform and MQTT Protocol
LED using the power bank (relay 1 and 2 are off) and the solar panel (relay 1 is off,
relay 2 is on).
The most likely prospect for the further development of this work is the usage of
more powerful components (e.g. 24 V solar panel(s), power bank with greater
capacity), as well as design of smart house with embedded VPP based on proposed
concept.
5. References
1. Jennie C. Stephens, Elizabeth J. Wilson, Tarla Rai Peterson: Smart Grid (R) Evolution:
Electric Power Struggles. Cambridge University Press, UK. (2015)
2. Łukasz Nikonowicz, Jarosław Milewski: Virtual Power Plants – General Review: Structure,
Application and Optimization. Journal of Power Technologies, 92 (3), 135-149. (2012)
3. Das, C.K., Das, N.K., Islam, M.M., Sazzad Hossain, S.M.: Virtual Power Plant as A Remedy
to The Power Crisis of Bangladesh: A Case Study-CUET. The annual technical journal of
MIST-Galaxy (Dhaka), Bangladesh, Vol. 3 No. 3, Sl. No. 10. (2011)
4. Christos Ioakimidis, Konstantinos Genikomsakis: Design of a Virtual Power Plant in the
Presence of Microrenewables and Electric Vehicles in a Microgrid Concept for Real-time
Simulation as part of a Remote Lab. In Proceedings of the International Conference on
Renewable Energies and Power Quality ICREPQ’13. Bilbao, Spain, 1-5. (2013)
5. Wind Turbine Control and Monitoring. Eds. Ningsu Luo, Yolanda Vidal, Leonardo Acho.
Springer, Cham Heidelberg New York Dordrecht London (2014)
6. Gerro Prinsloo, Robert Thomas Dobson: Solar Tracking: High Precision Solar Position
Algorithms, Programs, Software and Source-Code for Computing the Solar Vector, Solar
Coordinates & Sun Angles in Microprocessor, PLC, Arduino, PIC and PC-based Sun
Tracking Devices or Dynamic Sun Following Hardware. Stellenbosch University,
Stellenbosch, South Africa. (2015). [Online].
https://www.researchgate.net/publication/263085113_Solar_Tracking_High_precision_solar
_position_algorithms_programs_software_and_source-
code_for_computing_the_solar_vector_solar_coordinates_sun_angles_in_Microprocessor_P
LC_Arduino_PIC_and_PC-based_sun (current May 2016)
7. Dirk Slama, Frank Puhlmann, Jim Morrish, Rishi M. Bhatnagar: Enterprise IoT: Strategies
and Best Practices for Connected Products and Services. O'Reilly Media, Sebastopol, USA.
(2015)
8. Norris, D.: The Internet of Things: Do-It-Yourself at Home Projects for Arduino, Raspberry
Pi, and BeagleBone Black. McGraw-Hill Education, New York, USA. (2015)
9. Charalampos Doukas: Building Internet of Things with the Arduino. Amazon.com,
CreateSpace Independent Publishing Platform, Seattle, Washington, USA. (2012)
10. Dimeas, A.L., Hatziargyriou, N.D.: Agent Based Control of Virtual Power Plants. In
Proceedings of the 14th International Conference on Intelligent System Applications to
Power Systems. Kaohsiung, Taiwan, 536-541. (2007)
11. Laurenţiu Alboteanu, Gheorghe Manolea, Sergiu Ivanov: Management of Renewable Energy
Sources Integrated in a Micro Smart Grid. Annals of the University of Craiova, Electrical
Engineering series, No. 39, 131-137. (2015)
103
International Conference on Applied Internet and Information
Technologies, 2016
DOI:10.20544/AIIT2016.14
An Examination of the Relationship between Security
Awareness and Digital Competence
Zoltan Nyikes1, Ksenia V. Baimakova2 1Óbuda University/Doctoral School on Safety and Security Sciences, Bécsi str. 9
1118 Budapest, Hungary
[email protected] 2Saint-Petersburg State University of Aerospace Instrumentation
Bolshaya Morskaya ul. 67,
St Petersburg, 190000 Russia
Abstract: This aim of this article to present the relationship between the security
awareness and digital competency. The digital world as the achievement of the
modern age is developed over the last two centuries because of the needs of a
knowledge –based society. Since the electricity and the ability of the information
carrying has discovered it started to apply more widely. The Internet and the
World Wide Web are the networking side of this modern age achievements. A
man of our times need to develop their digital competences, because more and
more widely applied to a digital utilities with which the growing segment of
society reach growth of digital goods day to day. The safety awareness as a form
of behaviour not only important in the digital world but in the physical reality as
well. Using physical security devices are evident for everyone. From another
perspective how to use the digital world security tools are not so clear for
everyone. It is possible to improve this type of behaviour with increasing the
digital competence.
Keywords: digital competence, digital literacy, security awareness, digital
prosperity.
1. Digital wealth
It is a fundamental expectation of the members of an information- or knowledge-based
society that such a society should ensure them wealth. In this case, wealth means digital
wealth, such as electronic commerce, banking, education or administration. However, it
is the fundamental expectation of the society that its individual members access, use
and prosper from digital wealth in order to improve their lives. Of course, all this
should be achieved in a way that is safe for everyone. The individual is just as
responsible for gaining access to the wealth ensured to them as the leadership of the
society. Therefore, it cannot be said that the only responsibility of the State is to
104

Zoltan Nyikes
increase the digital capacity of the public. All efforts of the government are in vain, if
the individuals fail to do anything to achieve these goals, and to meet the aspirations of
both the individual and the Government.
1.1. Digital prosperity
It is the individuals’ best interest to learn how to use those utilities which serve their
welfare. Due to industrialisation in the 20th century, people gained access to tramway
networks, piped drinking water, sewerage, gas and landline telephone networks. These
utilities have greatly improved social comfort. And then, at the end of the 20th century,
the Internet appeared, as the largest public information network. Over the last half
century the explosion of information technology development has resulted in the spread
of information systems. A growing number of people have encountered computer
systems in their everyday lives. Some of them first met with information technology
applications at work or during their studies in the 1980s, which later had a further effect
on their lives. Some people only heard about the existence of such applications, but
their lives were not affected directly by them. And then, in the 1990s, computers
appeared in more and more workplaces, which meant that an increased number of
people had direct contact with computer systems. The scope of education has also
widened in this field. The previously mentioned emergence of the World Wide Web
helped the spread of the Internet. Then the first smart phones became available at the
beginning and in the middle of the 2000s, capable of internet access. Of course, this
required the tremendous development of mobile phone service providers and cable TV
operators. IT solutions became available in all areas of life, changing them completely.
It has developed to such extent, that if IT systems fail to work for some reasons (power
supply problem, hardware/software problem, transmission path problem, or deliberate
injury), it could stop the normal course of life. The fact that IT is present everywhere
means that our lives have become easier. We are able to make arrangements, do the
shopping or banking, keep in touch with family and friends in a faster, cheaper and
easier way by using the Internet.
2. Generation gap
As technology evolved, the different generations had to change and adapt as well.
Today, the members of generations Y and Z are now called "digital natives". The
presence of information technology is completely natural for them, as electricity and
piped water for the members of generation X. Information technology, however, should
not only make the lives of generations Y and Z easier, but also the lives of all
generations, similarly to all the other utilities which make life more comfortable and of
which all generations can take advantage. It is false to assume that now all children
understand computers and cell phones. It is true at a certain level, but in most cases,
they have no idea about security, and this can cause serious problems. Information
technology or digital literacy is not an innate ability, but a skill that one must learn or
acquire, since no one is born with the ability of using a spreadsheet or a word
105

An Examination of the Relationship between Security Awareness and Digital Competence
processing program. Yet, the misconception about digital natives still persists.
According to a survey carried out by the British Computer Society, only 52 percent of
the employers think that their employees have the appropriate digital skills. [1]
Research made in Germany and Austria shows that while many people consider
themselves digitally literate, the tests revealed that many of them were unable to
perform even the most basic operations.[1] It should be made clear that being able to
use a Smartphone or to chat with friends on a social networking site is by no means the
same as being digitally literate. It is a further problem that the concept of "digital
literacy" is not defined; practically it can mean anything. A survey conducted by the
Italian University, 42 percent of university students are not aware of the dangers of free
Wi-Fi, 40 percent of them do not protect their phones by a pin-code, and 50 percent of
them download anything to their computers without checking the source. The
International Computer and Information Literacy Study (ICILS) conducted a survey
among 60,000 young people, which showed that 17 percent of those participating in the
survey failed to meet even the most basic requirements, and only 2 percent had a high
level of knowledge necessary for conscious facility sharing.[1]
2.1. Competence
It is the complex system of knowledge, skills, abilities, qualities and attitudes which
enable
the holder to perform,
in different situations,
complex
and real-life tasks effectively
and efficiently.[2]
2.2. Digital competence
Digital competence means the use of electronic media in a confident and critical way
for work, leisure and communication purposes. This competence is related to logical
and critical thinking, high-level information management skills and advanced
communication skills. The application of information and communication technology
skills, at the most basic level, involve the research, assessment, storage, creation and
transfer of the information of multimedia technology, as well as the ability of
communicating via the Internet or networking.[3]
2.3. Digital literacy
Digital literacy means the combination of such awareness, attitudes and skills which
allows the proper and safe use of digital instruments and institutions to identify,
manage, integrate and evaluate digital resources, to produce new knowledge and media
manifestations, as well as to communicate with others and reflect on this process. [4]
106

Zoltan Nyikes
2.3.1 The importance of digital literacy
40.2 percent of the people above the age of 15, ~ 3 million people are not
digitally competent in Hungary.
The other ~ 7 million people are not digitally competent either, because they
do not use such digital contents which comply with the framework of digital
literacy.
They are afraid of exploring the digital world; therefore they do not develop
their digital skills. [5]
3. Security awareness and digital competence
In order to achieve that everyone would be able to use the available ICT technologies
safely and efficiently, all layers of the society should have the adequate digital
competence. Why is it important to have digital competence? Because it can be
observed that the penetration of information technology, the Internet, mobile phones
and smart phones is high and still increasing. In his article entitled “The significance of
IT security awareness in Hungary in the field of data protection”, Sándor Magyar
writes: "By now the digital way of life has become a routine. We live in an age where
the number of mobile phone subscriptions exceeds the number of the country's
population, and a significant and increasing proportion of those phones are smart
phones. As the large majority of these phones store personal information and they can
reveal an extremely great deal about the users’ preferences, the issue of data protection
must have a priority. "[6] In addition to the relevance of the above statement, the
security of devices must also be dealt with, as it is quite low compared to the usage and
wide range of application. Especially considering the fact that the use of game
applications, social networking sites and various "chat" programs is quite high on these
devices. In contrast, e-learning, or the use of navigation systems is very low. The real
problem is that the average user pays little attention to the security or secure use of the
most widespread applications. Thus the vulnerability rate is very high. "In the area of
security it is not enough to be sceptical. One must never trust in technology and
administrative regulations alone. The presence of numerous solutions can be
misleading, it cannot mean total security. The use of a firewall or a strong encryption,
and the lack of wireless network in the system are not sufficient to ensure security." [6]
3.1. The top 10
The above statement is supported by the results of the examination of the ten most
popular free mobile applications among the applications developed for the three most
popular mobile operating systems.
The iOS operating system was among the most popular free apps with 2 game
applets, 2 chat applications, 2 community sites, 1 movie sharing, 1 music sharing and 1
community video sharing application and only 1 educational application. It is
107

An Examination of the Relationship between Security Awareness and Digital Competence
interesting that the first e-commerce application was only at the 25th place. Not a single
security application occurred among the first hundred applications. [7]
In case of the Android operating system, the situation is a bit better for the first ten
applications, as besides 2 game applications, 3 community site and 2 chat applications,
1 anti-virus application, 1 maintenance application and 1 public transport application
could also be found. [8]
Examining the users of the Windows operating system, among the free applications 1
free community site, 1 news application, 1 weather application, 1 video player and 1
book reader application, 1 online movie and 1 online radio application, 1 internet phone
application, 1 birthday reminder application and 1 language learning application
occurred. In the course of the survey, the software of the in-build application store was
used.
As it can be seen from the survey or the graph showing its results, community media
connection and communication applications which are necessary for keeping contact
can be found among the free applications used on all the three operating systems. Game
applications, however, divide users. [9] Various utilities represent the two extremes and
the transition between them, just as the use of online media applications. Finally, it can
be seen that the occurrence of educational programs as well as maintenance and
antivirus solutions is very low. The above statistics clearly shows that users prefer to
use their smart phones for entertainment purposes rather than learning.
Fig. 1. TOP 10 free applications for distribution (prepared by the authors)
108

Zoltan Nyikes
The situation of security awareness in the use of security applications is rather
distressing. "In many cases, users are not aware of the fact that in most cases free
applications can be used free of charge because they collect certain data about the user
(position, visited websites, contacts, etc.). They can make a profit by selling this
information to third parties, while the user is unaware of this or accept the terms of use
automatically without reading them."[10]
"Downloads from unknown or unreliable sites can cause vulnerability or a threat.
Programs should be downloaded only from those sites which can be trusted. If the
private or corporate email client is synchronised with the mobile phone, one must
beware of unsolicited mail and be aware of security issues when clicking on hyperlinks,
as this can allow the installation of a malicious application."[10]
3.2. Development of safety awareness
In addition to digital competence, a great emphasis should be placed on digital security
awareness, too. "We might succeed if we are able to make people feel the urge for a
change. If they understand that security measures are meant to protect them and the
Organization, and they are not just administrative regulations, in case of which non-
compliance would lead to punishment."[6] Those employees who in any way use
information technology at their workplace, either as users or operators, should regularly
attend training courses on security. The regularity of such training (provided it does not
only exist on paper) is the company's "internal matter". However, nowadays no
company can afford to risk its reputation by allowing any information security incident
to occur due to the lack of security awareness. Therefore, regular training and its
effectiveness is a strategic issue. If the users have the appropriate level of security
awareness at their workplace, their security awareness at home or in the private sphere
will also be higher. So, if someone as an adult shows a good example to their children,
there is a good chance that their children will instinctively follow such an example. This
also means that the effort made to increase the safety awareness of employees will not
only increase the efficiency of the work of those employees, but also has a great
influence of the security intelligence of the next generation.
4. Suggestion
The relationship between security awareness and digital competence can be clearly
seen. As stated above, security awareness could be increased by strengthening digital
competence, and vice versa. If people were more conscious in the field of security, their
digital competence would also be higher. The question is, which way could these goals
be achieved more efficiently. People are rather reluctant to make sacrifice if the
perceived benefits are low, as in the case of security. [11] Bad things will only happen
to other people, they think, why then should they worry. But as it is known, the time,
energy and money spent on security is not just for the sake of appearance. As it was
difficult to make the use of the safety belt in transportation generally accepted (even
though it is regulated by the law), widespread security awareness will also be difficult
109

An Examination of the Relationship between Security Awareness and Digital Competence
to achieve. The eradication of Illiteracy began in Hungary during the reign of Maria
Theresa. After more than 200 years it still has not been completed. There have been a
little more than 20 years to make digital literacy widespread, but the above figures
suggest that it has not been achieved yet. In many schools, information technology is
taught at a minimal level, as unfortunately teachers also lack the adequate digital
competence that would be necessary to understand the digital world. What can be
expected from students, when teachers are afraid of using the digital boards installed
within the framework of a hundred million dollar investment, for fear of “spoiling them
". The solution could probably be the launch of a national program that would address
these deficiencies from different directions. Such measures taken from both directions
would probably be effective and the final result could be achieved much sooner than
one might think.
5. Conclusions
The article focused on the correlation between the security awareness and digital
competency. The security awareness as a form of behaviour and the digital competence
as an ability was presented. The study was showed some questions related to the
security awareness and digital competency, how these two factors are impacts on each
other. It is necessary to continue the analysing of those items. The result of the research
shows a very strong effect between the skills and behaviours. The better security-
conscious behaviour cause higher digital competence for each person. The further
questions are which methodology helps to improve those factors in an individual or
social level.
References
1. DigitalHungary: Fogalmunk sincs róla mi az a digitális írástudás, 2015. február 09., [Online] Available: www.digitalhungary.hu/e-volution/Fogalmunk-sincs-rola-mi-az-a-digitalis-
irastudas/1748/#sthash.eVmwNQTS.dpuf, (Download: 08. 12. 2015)
2. Klenovitsné, Zóka Tünde: Digitális nemzedék, Digitális kompetencia, [Online] Available:
www.janus.ttk.pte.hu/tamop/tananyagok/digitalis_nemzedek/digitlis_kompetencia.html
(Download: 07. 12. 2015)
3. Az egész életen át tartó tanuláshoz szükséges kulcskompetenciák, 2009. jún. 17., [Online]
Available: www.ofi.hu/tudastar/nemzetkozi-kitekintes/egesz-eleten-at-tarto (Download: 07.
12. 2015)
4. Koltay, Tibor: Médiaműveltség, média-írástudás, digitális írástudás, [Online] Available:
www.mediakutato.hu/cikk/2009_04_tel/08_mediamuveltseg_digitalis_irastudas (Download:
05. 12. 2015)
5. Zoltan Nyikes – Zoltan Rajnai: Big Data, As Part of the Critical Infrastructure, SISY 2015,
IEEE 13th International Symposium on Intelligent Systems and Informatics, Serbia,
Zrenjanin, 2015., pp. 217-222., ISBN:978-1-4673-9388-1
6. Magyar, Sándor: Az informatikai biztonságtudatosság jelentősége az adatvédelem területén,
SZAKMAI SZEMLE 2015: (2) pp. 121-128. [Online] Available:
http://www.kfh.hu/hu/letoltes/szsz/2015_2_szam.pdf (Download: 15. 01. 2016) HU ISSN
1785-1181
110

Zoltan Nyikes
7. iTunes Charts, [Online].Available: www.apple.com/itunes/charts/free-apps/ (Download: 23.
01. 2016)
8. Google Play: The most popular Apps categories, [Online] Available:
www.play.google.com/store/apps/collection/topselling_free (Download: 23. 01. 2016.)
9. Fregan, Beatrix: Pourquoi la guerre informatique, In: Fekete Károly: Kommunikáció 2002 -
Nemzetközi szakmai tudományos konferencia kiadványa, ZMNE, 2002., pp. 51-54.,
ISBN:963-86229-2-X
10. Magyar, Sándor – Molnár, Péter: Vállalati mobiltelefonok védelmének lehetősége MDM
megoldással, SZAKMAI SZEMLE 2015: (4) pp. 89-102. [Online] Available:
http://www.kfh.hu/hu/letoltes/szsz/2015_4_szam.pdf (Download: 15. 01. 2016), HU ISSN
1785-1181
11. Rajnai, Zoltán – Bleier, Attila: Structural problems in the fixed communication systems of the
Hungarian Army, In: Fekete Károly: Kommunikáció 2009., Budapest: Zrínyi Miklós
Nemzetvédelmi Egyetem, Budapest, 2009., pp. 227-234., ISBN:978 963 7060 70 0
111

International Conference on Applied Internet and Information
Technologies, 2016
DOI:10.20544/AIIT2016.15
Examples of Raspberry Pi usage in Internet of Things
Nikola Petrov1, Dalibor Dobrilovic1, Mila Kavalić1 and Sanja Stanisavljev1
1 University of Novi Sad / Technical Faculty “Mihajlo Pupin”, Djure Djakovica bb,
23000 Zrenjanin, Serbia
[email protected]; [email protected]; [email protected];
Abstract. Very fast expansion of Internet of Things gives a challenge for the
educators in finding tools for efficient teaching Internet of Things (IoT) and
related technologies. The growth of the development boards market, which is
evident in past few years, gives a number of opportunities and choices. This paper
gives the short overview of part of the available platforms together with their
main characteristics. Paper explores the applicability of Raspberry Pi
development board or single board computer for teaching IoT technologies and
environments. Goal of this research is to find and propose low-cost, efficient and
flexible platform which can help in introducing the IoT paradigm in teaching
process, as well as to be good enough to be used in classroom for lab exercises or
for student projects. The detailed configuration of Raspberry Pi and the whole
environment is given in this paper.
Keywords: Internet of Things, Raspberry Pi, communication engineering
education, embedded Linux, sensors.
1. Introduction
The rapid growth, expansion and development of Internet of Things (IoT) and related
technologies make strong influence on shaping the needs of higher education in modern
times. The projected growth in the number of deployed IoT and networked devices by
year 2020 influences the high expected number of software developers that will be
needed in upcoming years. So far, those projections are shown to be real and university
lecturers need to tackle this challenge by innovation of university courses and
introduction of IoT related technologies. The different opinions about IoT architecture
are given in [1], [2] and [3]. The elements of IoT platform planned to be implemented
in university teaching process should be in accordance with defined architectures. One
approach of introducing the open-source hardware based on Arduino/Genuino platform
is given in [4]. This paper explores the possibility of using Raspberry Pi for creating
efficient, low-cost platform that can be used for teaching IoT related technologies in
laboratory exercises within university courses, such as Communication Systems,
Computer Networks, and Advanced Communications primary in Information
Technology curricula.
This paper is structured as follows. After the introduction section, popular embedded
Linux development boards are presented and compared. The platform based on
112

Petrov et al.
Raspberry Pi for teaching IoT is described in next section. The discussion about the
experiences with the platform and conclusion and further work is given at the end of
paper.
2. Embedded Linux boards comparison
In recent years a number of Linux Based development boards appeared on the market.
Their appearance significantly empowered research and application development in IoT
environments. These boards differ in their specification, power usage and performance.
The comparison of most popular Linux-based development is given in Table 1 with
their main characteristics.
Table 1. Embedded Linux Board Comparison. Table gives the list of popular Linux boards with
their main characteristics.
Board
Specification
Beaglebone
Black Rev C
Raspberry Pi 2
Model B Intel Galileo 2
Intel Edison
for Arduino Arduino Yun
SoC
(System on a Chip)
Texas
Instruments
AM3358
Broadcom
BCM2836
Intel Quark
X1000
Intel “Tangier”
Atom Atheros AR9331
CPU ARM
Cortex-A8
ARM
Cortex-A7
Intel Quark
X1000
single core
Intel Atom
dual Core
MIPS32 24K
and
ATmega32U4
Speed 1GHz 900 MHz 400 MHz 500 MHz
400mhz
(AR9331) and
16mhz
(ATmega)
Memory 512 MB 1 GB
512KB
on-chip SRAM &
256MB DRAM
1 GB RAM
64MB
(AR9331) and
2.5KB
(ATmega)
GPU PowerVR
SGX530
Broadcom
Dual Core
VideoCore IV®
Multimedia
Co-Processor
No No No
Internal storage 4 GB No 8 MB 4 GB eMMC
16MB
(AR9331) and
32KB
(ATmega)
External storage Micro-SD
Card Micro-SD Card Micro-SD Card SD card
Micro-SD
(AR9331)
Networking 10/100Mbit
Ethernet
10/100Mbit
Ethernet
10/100Mbit
Ethernet
WiFi Dual-band
802.11 and
Bluetooth 2.1/4.0
10/100Mbit
Ethernet and
802.11b/g/n
WiFi
GPIO 65 pins 27 pins
on 0.1" headers 20 pins
70 pins
on 0.4mm
mezzanine header
Dimensions 86.4mm (L) x 85.60mm (L) x 123.8 mm (L) × 127.0 mm (L) x 68.6 mm (L) x
113

Examples of Raspberry Pi usage in Internet of Things
53.3mm (W) 56mm (W) 72.0 mm (W) 72.0 (W) x
12.0 (H) mm
53.3 mm (W)
Weight 40g 45g 50g - 41g
Approximate price $55 $35 $75 $99 $75
Digital I/O Pins 65 17 14 20 20
Digital I/O Power 3.3V 3.3V
3.3V or 5V
(switched with
jumper)
3.3V to 4V
5V
Analog Input 7 with 12-bit
ADC, 0-1.8V
7 with 12-bit
ADC, 0-1.8V
6 with 12-bit
ADC, 0-5V 6
12 with
10-bit ADC,
0-5V
PWM Output 8 8 6 4 7
UART 4 4 2 1 2 (1 wired
to AR9331)
SPI 2 2 1 1 1
I2C 2 2 1 1 1
USB Host
1 standard
A connector
1 standard
A connector
1 micro AB
Connector
1 micro
connector
1 standard
A connector
(AR9331)
USB Client
1 standard
B connector
1 mini B
Connector
1 micro
B connector
1 micro
Connector
1 micro
B connector
(ATmega)
Video Output Micro HDMI
HDMI,
Composite
RCA, DSI
None None None
Video Input None CSI (camera) None None None
Audio Output Micro HDMI HDMI, 3.5mm
jack None None None
Power Output
3.3V up to
800mA,
5V up to
800mA
3.3V up to
50mA,
5V up to
300-500mA
3.3V up to
800mA,
5V up to 800mA
3.3 V up to
100 mA,
1.8 V up to
100 mA
3.3V up to
50mA, 5V
Each of these boards has its own advantages and disadvantages. The goal of this paper
is not to compare all boards for usage in same environment and for the same purpose,
but to explore the usability of the presented platform. The platform presented in this
paper is used simply because of its availability at our institutions. The experience with
other platforms shaped the process of platform utilization. During the research and
testing platform, the advantages of its usage are defined. Platform is very suitable to be
used as a compact device for teaching students Linux OS basics, Python programming,
basic sensor operations. Having this compact multi sensor expansion board as Sense
HAT students are able to work with multiple sensors, without need to do complex
wiring or even soldering components. This is particularly important for teaching
Information Technology and Software Engineering students.
3. Platform for teaching IoT
In [1] the IoT architecture is divided in 5 layers. Those layers are: sensing, access,
network, middleware and application layer. Sensing layer deals with capturing and
sharing information. Information are transferred from sensing layer to the network layer
114

Petrov et al.
via access layer. Network layer integrates the information resources and establishes an
infrastructure platform for applications. The middleware layer manages and controls
network information and application layer enables application for analyzing and
monitoring data.
All five layers of proposed architecture are given on Fig. 2. The detailed explanation
of Raspberry Pi 2 B subsystem and other layers is given in following section. The
Raspberry Pi 2 subsystem is in the focus of this work.
3.1. Raspberry Pi subsystem
The Raspberry Pi subsystem is build upon Raspberry Pi 2 B as a core component. The
Raspberry Pi 2 Model B is the second generation Raspberry Pi [5]. It replaced the
original Raspberry Pi 1 Model B+ in February 2015. Pi 2 B has 900MHz quad-core
ARM Cortex-A7 CPU, 1GB RAM, 4 USB ports, 40 GPIO pins, Full HDMI port,
Ethernet port, Combined 3.5mm audio jack and composite video, Camera interface
(CSI), Display interface (DSI), Micro SD card slot, VideoCore IV 3D graphics core.
With ARMv7 processor, it can run variety of ARM GNU/Linux distributions and
Microsoft Windows 10. The operating systems are available on
https://www.raspberrypi. org/downloads/. The RPi 2 B used in this research has 8 GB
SD card with Raspbian OS installed. The full compatibility with Raspberry Pi 1 is
preserved.
115

Examples of Raspberry Pi usage in Internet of Things
Fig. 1. Raspberry Pi 2 B based platform for teaching IoT. Wireless USB adapter (lower left side
of the figure) is used for Internet connection. Raspberry Pi 2 B and Sense HAT (right side of the
figure) are stacked. The platform is powered via USB cable connected to PC. On the top of Sense
HAT there is 8×8 RGB LED matrix display. Six sensors are integrated in the Sense HAT.
Although, there is integrated Ethernet port in the board, the wireless USB adapter
TP-Link TL-WN722N is used for connection to wireless access point and LAN and
Internet. This was made to ensure the mobility of the station. The Sense HAT is an add-
on board for Raspberry Pi, made especially for the Astro Pi mission (sent to
International Space Station in December 2015). Sense HAT has an 8×8 RGB LED
matrix, a five-button joystick and six sensors: Gyroscope, Accelerometer,
Magnetometer, Temperature, Barometric pressure and Humidity sensor. There is
Python library that enables programming and access to board components [6]. The
Raspberry Pi Sense HAT is compatible with the Raspberry Pi 2, Model B+, and Model
A+, but NOT the earlier 26-pin models of Raspberry Pi 1 Model B & A’s. The Sense
HAT is clearly presented on Fig 1 mounted on top of Raspberry Pi 2 B (right side of the
figure).
3.2. The IoT environment
Since, the LAN network and its nodes simple have role to connect the Raspberry 2 Pi
with Internet, next core component of the system is middleware layer based on the
ThingSpeak (6) platform. This is free and open data platform and API for the Internet
of Things [7],[12],[13] that enables collection, storage, analysis and visualization of
data from sensors or actuators. Platform gives support for: Arduino/Genuino ®,
Raspberry Pi™, BeagleBone Black, and other hardware and variety of programming
languages. The platform is under the Mathworks and has support for data analysis and
data processing with MATLAB® code [4], [7].
In working with ThingSpeak it is important to say that access to the platform is made
with HTTP protocol. The example of code for Arduino, C language, Java, Python,
.NET/C# and many other languages and platforms are given at [7]. The main element of
platform is channel which can track up to 8 sensor data. One field of the channel is
dedicated to one sensor. The channels can be made private or public. Channels are used
to upload data from the connected devices, showing graphs related to data and access
data through a REST request and downloading it in XML, JSON or CSV format.
After the channel is created, write API key is generated automatically. Write API key
is used for sending data to the channel and read API key is used for reading the channel
data. ThingSpeak API is an open source interface which listens for incoming data,
timestamps it, and outputs it for both human users and machines [7]. To enable sending
sensor readings to ThingSpeak, the developer need to create HTTP request. The request
can be created in Python script in form of URI. This URI, besides initial URI for
ThingSpeak channel update, also contain write API key, and sensor readings. The data
can be sent every 10 seconds, using a loop. This loop, with each new execution, sends a
HTTP request.
116

Petrov et al.
Once the data is uploaded, it creates interactive charts to visualize the data [13].
Besides the data field, there are location and status field. In this particular example, the
Python 3.4 script is made for sending the data from RPi B 2 to ThingSpeak.
Fig. 2. Raspberry Pi 2 B based platform in IoT environment. Platform is based on [4]
with needed modifications. Components of the platform are: (1) Sense HAT with six
different sensors and 8x8 RGB LED matrix (upper left side); (2) Raspberry 2 B with
IEEE 802.11 USB adapter (lower left side); (3) Wireless access point for connection to
LAN and Internet (lower middle side); (4) institution’s LAN; (5) LAN servers,
gateways and firewalls (upper middle side); (6) ThingSpeak [7] IoT system for data
visualization, storage and analytics (lower right side); (7) Users and applications based
on web browsers for monitoring data (upper right side).
4. Discussion
The experience with the platform is very good. Platform is easy to assemble and to
configure. Also, the programming part is very easy. The students are able to get in
touch with so many different technologies in very short period. They can learn Linux
operating system basics, Python network and HTTP programming basics, sensor
management having the deep insight of architecture ad structure of the IoT. The
extended data analyses with data stored on IoT cloud based service are also tasks which
can be assigned to students within lab exercises and for student projects.
Platform is used experimentally in order to get experience and to explore the
possibilities of integration in university courses. The platform is put in operation several
times in duration of 1 or 2 hours. The longest period of platform operation was 10
hours. During the experimental work authors haven’t experienced any significant
problems and operation of the platform can be qualified with highest possible grades.
Still, the problem with the usage in the classroom still stands. Faculty has the 4
Raspberry Pi B+ and Raspberry Pi 2 B for laboratory exercises. The problem is only
one Sense HAT. So, the implementation of the proposed platform in classroom should
for now concentrated on creation of one lab exercise set that will be rotated between
117

Examples of Raspberry Pi usage in Internet of Things
student working groups during the semester, or assigned to the students for their project
works.
Having in mind, that this platform is clearly proved itself to be efficient and useful in
teaching process, the work on possible extension of laboratory Raspberry Pi/Sense
HAT sets will be seriously considered.
5. Conclusion and further work
Considering the positive experience with the presented platform and very clear need for
implementation for efficient IoT platforms in university classes, the work presented
here should be continued and expanded as well. The main goal of the further work will
be pointed in efforts to establish a larger number of sets and their integration in one or
several exercises in Computer Networks course. The possibility of usage of these
platforms in the Advanced Communications (master degree) and Communication
Systems (bachelor degree) courses will be also explored.
One of the interesting possible further research directions will be pointed towards the
experimentation with the other expansion board for Raspberry Pi such as Arduino
Adapter for Raspberry Pi or similar.
Acknowledgement
This research using Raspberry Pi and Sense HAT is made possible with the courtesy of
Mr. Miljan Vuletić (Lausanne, Switzerland)
References
1. Chen, X., Jin, Z.: Research on Key Technology and Applications for Internet of Things,
Physics Procedia, Volume 33, pp. 561-566. (2012)
2. An, J., Gui, X., He, X.: Study on the Architecture and Key Technologies for Internet of
Things, International Conference on Electrical and Computer Engineering, Advances in
Biomedical Engineering, Vol.11, (2012)
3. Piyare, R., Lee, S. R.: Towards Internet of Things (IoTs): Integration of wireless sensor
network to Cloud services for data collection and Sharing, International Journal of Computer
Networks & Communications (IJCNC) Vol.5, No.5. (2013)
4. Dobrilovic, D., Stojanov, Z.: Design of open-source platform for introducing Internet of
Things in university curricula, 11th IEEE International Symposium on Applied
Computational Intelligence and Informatics, Timisoara, Romania (2016) – in press.
5. Raspberry Pi 2 Model B – official Raspberry Pi site, available on
https://www.raspberrypi.org/products/raspberry-pi-2-model-b/, retrieved April (2016)
6. Sense HAT – official Raspberry Pi site, available on https://www.raspberrypi.org/
products/sense-hat/, retrieved April (2016)
7. ThingSpeak – official site, available on https://thingspeak.com/, retrieved April (2016)
118

Petrov et al.
8. Zhao, C. W., Jegatheesan, J., Loon, S. C.: Quest International University Perak: Exploring
IOT Application Using Raspberry Pi, International Journal of Computer Networks and
Applications Volume 2, Issue 1, January - February (2015)
9. DiCola, T.: Embedded Linux Board Comparison, https://learn.adafruit.com/embedded-linux-
board-comparison, Adafruit learning system (2014)
10. Shah, D., Haradi, V.: IoT Based Biometrics Implementation on Raspberry Pi, Procedia
Computer Science, Volume 79, Pages 328-336, ISSN 1877-0509, (2016) http://dx.doi.org/
10.1016/j.procs.2016.03.043.
11. Mano, L.Y., Faiçal, B.S., Nakamura, L.H.V., Gomes, P.H., Libralon, G.L., Meneguete, R.I.,
Filho, G.P.R., Giancristofaro, G.T., Pessin, G., Krishnamachari, B., Ueyama, J.: Exploiting
IoT technologies for enhancing Health Smart Homes through patient identification and
emotion recognition, Computer Communications, Available online 15 March (2016), ISSN
0140-3664, http://dx.doi.org/10.1016/j.comcom.2016.03.010.
12. Mashal, I., Alsaryrah, O., Chung, T., Yang, C., Kuo, W., Agrawal, D. P.: Choices for
interaction with things on Internet and underlying issues, Ad Hoc Networks, Volume 28,
May 2015, Pages 68-90, ISSN 1570-8705, http://dx.doi.org/10.1016/j.adhoc.2014.12.006.
13. García, C. G., G-Bustelo, B. C. P., Espada, J. P., Cueva-Fernandez, G..: Midgar: Generation
of heterogeneous objects interconnecting applications. A Domain Specific Language
proposal for Internet of Things scenarios, Computer Networks, Volume 64, 8 May 2014,
Pages 143-158, ISSN 1389-1286, http://dx.doi.org/10.1016/j.comnet.2014.02.010.
119

International Conference on Applied Internet and Information
Technologies, 2016
DOI:10.20544/AIIT2016.16
Context-aware Technologies and Systems
Seblewongel Esseynew1, Berhanyikun Amanuel1, Mekuria Sinke1, Abel Damtew1
and Saso Koceski2
1Addis Ababa University, Addis Ababa, Ethiopia
[email protected], berhanyihun, meksin98, [email protected] 2 University Goce Delcev- Stip, Faculty of Computer Science, 2000 Stip, Macedonia
Abstract. The move from traditional desktop computing environment to
ubiquitous and mobile computing have brought to the front Context-aware
applications which are capable of providing appropriate information and services
to the user depending upon the computational/user context. This paper attempts to
discuss the concept of Context-awareness from functionality perspective. The
components and characteristics of Context-aware systems are identified and
described in terms of the requirements expected from other applications. The
different architectural approaches used in the envisioning of context-aware
systems are presented to highlight the functionalities and quality concerns which
dictate their choice. Moreover, Context-aware frameworks and middleware which
facilitate the efficient development of Context-aware applications are highlighted
as instantiations of various architectural styles. Finally, the paper highlights the
importance of context-awareness for pervasive computing by discussing sample
applications in diverse fields of education, health and tourism.
Keywords: context-awareness; context framework; sensors; context model;
Context-aware applications; context-aware systems.
1. Introduction
Context can be defined as any information that characterizes a person, place or object
that could impact the application use of a person [1]. Its derivative, the term context-
aware, was first used by Schilit and Theimer, [2] and it refers to the ability of an
application to use context information to satisfy a dynamic adaptability requirement.
One of the first context-aware systems was the Active Badge Location System by [3]. It
was typical of the first efforts because most of the first context-aware systems were
primarily location aware. Since these first attempts and because of advances in
technology (including mobile technology) the capability of context-aware systems to
utilize other types of context has increased. Moreover, during the past two decades
context-awareness as a functionality has also been a crucial part of nascent IT
paradigms of pervasive computing and advanced HCI.
This paper attempts to discuss the concept of Context-awareness in a comprehensive
manner. It starts by looking at historical trends and foundational definitions of context.
The components and characteristics of Context-aware systems are identified and
120

Esseynew et al.
described in terms of the requirements expected from other applications. The different
architectural approaches used in the envisioning of context-aware systems are presented
to highlight the functionalities and quality concerns which dictate their choice.
Moreover, Context-aware frameworks and middleware which facilitate the efficient
development of Context-aware applications are highlighted as instantiations of various
architectural styles. Given, the dominance of layered approach to context-aware
systems, an important functionality, Context-modeling is treated in a separate section to
gain more insight into the different choices, considerations, and perceived advantages
of more common modeling techniques from the literature. Finally, the paper highlights
the importance of context-awareness for pervasive computing by discussing sample
applications in diverse fields of education, health and tourism.
2. Context Awareness
Several researchers define context in various circumstances and occasions. One
possible definition of context was suggested by Schmidt [4] and it states that: "A
context describes a situation and the environment a device or user is in. A context is
identified by a unique name. For each context, a set of features is relevant. For each
relevant feature a range of values is determined by the context”. In addition, Dey [1]
also defines context as: “Any information that can be used to characterize the current
situation of an entity”. Another variety of context definition is by specifying instances
of contexts. For example, Schilit and Theimer [2] tried to identify four categories of
contexts: “Computing context: network connectivity, communication costs,
communication bandwidth, nearby resources such as printers, displays, and
workstations. User context: the user's profile, location, people nearby, the current social
situation. Physical context: lighting, noise levels, traffic conditions, and temperature.
Time context: time of a day, week, month, and year.”
Concerning Context-aware system, Schilit, Adams and Want [5] initially defined it
as: “A system is context-aware if it uses context to provide relevant information or
services to the user, where relevancy depends on the user's task”.
If a given application is aware of its context, then it can propose the user with a
group of services that the user can instantly access. Moreover, the application might
also change its procedures so that it matches the contemporary context of the user. Most
common context types to scrutinize situational awareness are: User's location, User's
working activity by sharing video, User's audio and User's overall activity. Moreover,
different researchers consider issues such as: Where you are, who you are with and
what resources are nearby as an important attributes of context aware.
Therefore, Context-aware systems represent applications which can read certain
contextual elements and reason about such elements. Accordingly, adjust their behavior
so that the user needs might be satisfied in relation to the current operational context.
Despite, the advantages of context-aware systems; such systems are not yet widely
spread. One of the possible causes might be an immense gap between the system
behavior and user's expectation and this has been pointed out by Sitou and Spanfelner
[6].
121
Context-aware Technologies and Systems
3. Evolution of Context-aware Computing
During the initial stage of mobile computing, in the late 80s and 90s, the main target
was providing mobility services everywhere, regardless of environmental changes.
After the appearance of ubiquitous computing, in the early 90s, there was a move in
thinking and mobile computing is extended and the context of use as a resource has
been become hot topic for researchers [7].
Schilit and Theimer [2] commence the concept of context-aware computing in 1994
on their paper entitled “Disseminating Active Map Information to Mobile Hosts” which
was presented at “the Workshop on Mobile Computing Systems and Applications
(WMCSA)” [7, 8]. Nevertheless, according to [9], the development of Olivetti Active
Badge in 1992 could be considered as the first attempt and research exploration of
context-aware computing. In Schilit and Theimer’s work [2], context is robustly
associated with location of machines and devices in which mobile devices can provide
variety services in different locations. Starting from that time onwards, there have been
many efforts in the areas of context-aware computing. Currently context-aware
computing is widely used not only through mobile phones but also through different
devices, machines, infrastructures and in diverse areas [9] such as in the area of
robotics, wearable computing, adaptive and intelligent user interfaces, augmented
reality, adaptive computing, intelligent environments, and context-sensitive interfaces .
Also the usage of context is expand and it is very useful in many fields encompassing e-
commerce personalization, information retrieval, ubiquitous and mobile computing,
data mining, marketing, and management [10].
4. Context-awareness and Ubicomp
Context awareness is fundamental feature of ubiquitous computing devices which helps
them to give adaptive services for users and applications based on the inclusive context
[11]. Context-aware ubiquitous computing systems are crucial applications which are
able to respond and interact to their physical environment dynamically by the help of
sensor technologies. They perceive, respond and interact according to the user’s
environment, needs and desires to take smart decisions about when, where and what
service to provide to the users. Nevertheless, such ability of systems is determined by
the developer of them. Designers of context-aware ubiquitous computing systems have
to include the ability to dynamically add, change and select the appropriate needed
functionality or services [12].There have been many instances of these; context-aware
messenger [13], context-aware communication service provider [14], office assistant
[15] , context-aware applications which are used in the areas of Internet of Things (IoT)
[8], and many ambient intelligent context-aware systems and applications [16, 17] can
be considered as potential applications of context-aware systems.
122

Esseynew et al.
5. Evolution of Context-aware Computing
Context-aware systems can be characterized by the satisfaction of requirements for 5
R’s [18]: “the ‘Right’ Information, at the ‘Right’ Time, in the ‘Right’ Place, in the
‘Right’ Way to the ‘Right’ Person”. The word ‘right’ is put into quotes because in most
cases there is no simple ‘right’ or ‘wrong’.
- The ‘right’ information involves task modeling; and maps and makes inference
about habitual user behavior and activity pattern even if the sensory data is
incomplete;
- The ‘right’ time concerns with choosing the right moment to deliver
information which can distract the user. It may involve prioritizing between
interruptions and user discretion [19];
- The ‘right’ place makes use of location based context information [20];
- The ‘right’ way requires choosing appropriately between multiple ways of
service providing. E.g. choosing font sizes for people with eye sight
problem [21];
- The ‘right’ person refers to developing accurate profile of users so to as to
differentiate services according to user model [22].
It is also noteworthy that there might be overlapping within the requirements, for
example a geographical context might be associated with a corresponding time zone or
season. Consequently, to satisfy the above requirements, context-aware system gathers
raw data through the sensors [23]. Sensor drivers are hardwired into the system. The
system also interacts with other systems through API. After data is gathered,
preprocessing phase will be conducted. In this phase tasks such as reasoning,
interpreting, extraction and aggregation are done. The next phase is storage which
consist public interface to the client and synchronization of data. Finally, the
applications component is used to facilitate actual reactions on various events and
context instances are implemented in order to provide desired services.
6. Context-aware Systems Architecture
Architecture refers to how the components of a system are organized and how the
components are related to each other [24]. A comprehensive architecture for context-
aware systems can facilitate the envisioning, designing and implementation of context-
aware systems. There are a number of factors which affect the architecture of Context-
aware systems. The nature of sensors and their intended location, scale of the intended
system, the type of target applications, mobility concerns and the limits of computing
and communicating resources are some of the factors [25]. Moreover, the methods of
context acquisition and representation have also a considerable effect on the design and
architectural layout of the components.
A number of architectural approaches [26, 27, 28] prefer to apply a layered view of
Context-aware systems. Knappmeyer et al. [25] observe that: “Context-aware systems
are usually designed as middleware adopting a layered design – each functional layer
hiding the details of the underlying layers.”
123

Context-aware Technologies and Systems
They also outlined the advantages of these approaches where varied sources of
sensory data and different requirements of applications is served well by a layered
approach which encapsulates the complexities and organize the functionalities of each
layer. This architectural view is also analogous with the life cycle of context data.
Context data usually goes through the stages of acquisition, formatting, aggregation,
organization and communication [25]. A sensory data access oriented view of
architecture is provided by Balduaf et al. [23]. They identify between context-aware
designs: which allow a direct access to sensory data, which use a middle-ware to
acquire a managed sensory data, and finally approaches, as a further decoupling of the
middle-ware tactic, which employ a context server to provide sensory data. In a more
holistic view of architecture as a design, Hong et al. [29] recognize: (1) Network
Infrastructure Layer, (2) Middleware Layer, (3) Application Layer and (4) User
Infrastructure Layer.
Fig. 1. Abstract layer architecture of context-aware systems. Hong et al., 2009
Context-aware systems and frameworks have also been characterized by design and
deployment based architectures. Object-oriented approaches to context-awareness
employ object to encapsulate Context-awareness functions and share information by
communication between objects. These approaches also make use of inheritance and
polymorphism to facilitate the required extensibility of context-aware systems. Event-
driven approaches like SOA have also been chosen for their propensity to mirror the
stimuli-response world of context-aware applications [30]. Components designated as
context consumers can register to be notified, when events which happen in the
environment are captured by context producers. SOA based architecture is well
positioned to be the dominant approach for context-aware systems because of the
increasing pervasiveness of cloud computing infrastructure. Other types of
architectural styles like, blackboard based architecture are used in a manner which a
central repository of context can be updated by different sensors. It can also provide an
access point for components which use context information. In some cases, the
distributed nature of context-aware systems is one of the reasons where, a distributed
clients with a centralized server, type of architecture is used by some frameworks to
circumvent the communicational /computational limitations of distributed sensors.
Other more specialized types of architectures can be observed in some of the Context-
124

Esseynew et al.
aware frameworks; for example Gaia [26] uses an extended MVC pattern, and The
Context Toolkit [31] employs a widget based style. In conclusion, even though there are
numerous architectural approaches, the most common theme in the architectures and
frameworks is the separation between context acquisition and storage, and the
application which provides service to the user by accessing the context information.
7. Context-aware Systems Frameworks and Design
Frameworks offer support for the building of Context-aware systems by providing
reusable design resources which facilitate the rapid development of Context-aware
application [32]. Moreover, a context-awareness framework supports context-aware
applications by giving guidance and provisions for: context representation and storage,
access of context, context source identification, etc. [33]. Lie in [32], pointed out that
Context-aware frameworks should support the requirements of: being lightweight,
extensibility, robustness, Meta-Information and context sharing. There have been a
number of Context-aware frameworks provided by researchers since the early days of
Context-aware computing. Early efforts like Context Toolkit framework by Dey et al.
[31] used widgets to access sensors, and attribute value tuples supported by XML
schema for context modeling. Gaia [26], another framework for smart spaces applies
concepts from operating system like I/O access and operations to facilitate
communication between objects which correspond to active spaces. Another framework
for intelligent space which is based on distributed agents is exemplified by CoBra [34].
A central broker maintains common context representation for agents which can be
devices, services or web services. A context-aware framework tailored for mobile
devices is provided by the Hydrogen project [27]. It provides a layered framework with
the capacity to differentiate between local (information a device knows) and remote
context (information from another device); and enables sharing of information through
peer-peer communication. CORTEX [35] is also a mobile based approach albeit using
object oriented principles for its architecture. It is primarily based on Sentient Object
Model; which encapsulates; Sensory capture, Context hierarchy and Inference engine.
More recently, there have also been frameworks which advocate Service Oriented based
implementations for context-aware systems like CoWSAMI [36] that give provision for
dynamic service discovery through communication protocols such as SOAP and
WDSL.
8. Context Modeling Approaches
Context-aware applications need to interpolate information that are gathered from
different sources with varying quality in order to adapt to changes. This feature of
context-aware applications inevitably makes development process complex [37]. To
simplify and introduce greater structure into the task of developing context-aware
applications a number of context models have been introduced.
125

Context-aware Technologies and Systems
8.1. Key-Value models
Key value models are one of the earliest and simplest approaches which use simple data
structure for context modeling [23, 37]. In this approach context information is modeled
as key-value pairs and the values are provided to application environment variables.
This mechanism allows matching algorithm for easier lookup [23, 25]. Such an
approach can be observed in [5, 38]. Even though Key-Value models are easier to
manage they are not suitable for efficient context retrieval and complex contexts [25].
8.2. Markup scheme models
Markup scheme models represent contexts by markup schemas such as XML [37].
These models incorporate a hierarchical approach comprising of markup tags with
attributes and content [23]. Profiles based on serialization of a derivative of Standard
Generic Markup Language (SGML) are considered as a typical representative for
markup scheme models [39]. User Agent Profile (UAProf) (Open Mobile Alliance) [40]
and Capabilities/Preferences Profile (CC/PP) [41], which are based on Resource
Description Framework Schema (RDF-S) syntax, are the most popular examples of
markup scheme modeling.
Markup scheme models are good for handling heterogeneity and incompleteness.
However, these models lack expressive structure and have weak formalism. In addition,
they are Insufficient for capturing context information, relationships, dependencies,
timeliness, and quality of context information [37].
8.3. Graphical Models
In this approach contextual information is expressed using graph data structures and
richer data types. Unified Modeling Language (UML) [42], a well-known general
purpose modeling instrument, is used to model context [43, 44]. This is shown for
instance by Gámez et al. in [45], where the context information for wireless sensor
networks is modeled using the UML. Another example of graphical modeling
approaches is a context extension of Object-Role Model (ORM) [46] introduced by
Henricksen et al. [47].
Graphical Models are more expressive than key-value and markup scheme models as
they allow relationships to be captured into the context model. Furthermore, as
graphical modeling is well-known it is easy to learn and use. However, lack of
formalism for on-line automated access and support for distributed context model poses
a challenge [44].
8.4. Object oriented models
Object oriented context models employ object oriented approach (encapsulation,
inheritance, reusability) into context [23, 25]. In this approach, details of context
126

Esseynew et al.
processing and representation are hidden to other components. Consequently,
contextual information can only be accessed through well-defined interfaces [23, 39].
Modeling context using object oriented models offers the powerful capabilities of
object orientation. However, the complexity of the models requires high computation
power which might not be supported by low-end hand-held device [43]. Such an
approach can be observed in [48, 49].
8.5. Logic based models
In logic based models context information is represented as facts, expressions and rules
[39]. A logic based system made it flexible to add, update and delete contextual
information in terms of facts and a reasoning process is applied to drive new facts based
on existing rules in the system [23]. A variety of applications have adopted this model
for instance in Ranganathan et al. [50] used first-order predicate logic to model context
for their context-aware chat program. Logic based context models have a strong
formality and expressive structure. However, handling heterogeneity and
incompleteness are still lacking [44].
8.6. Ontology based models
In ontology based models context is organized into ontologies using semantic
technologies like RDF and Web Ontology Language (OWL) [25, 43]. Ontologies are
descriptions of concepts and their relationships [23]. There are several ontology based
approaches available for context modeling among them CONON [51], ULCO [52] and
COBRA-ONT [53] use OWL as the base language. Other approaches can be seen in
[37, 39].
Due to their formal expressiveness, the ability to handle heterogeneity and the ability
of applying ontology reasoning techniques ontology based models are regarded as the
most promising methods to model context [23, 44]. However, it can computationally
intensive and time consuming when searching and processing context in large volume
of data, in particular in low resource embedded environments. Moreover, their
capability is limited in handling uncertainty and unavailable data [25, 44].
9. Using MS Word
Context-Aware applications in tandem with UbiComp systems are being advanced to
solve many real world problems. In the health sector, specifically in ambient assisted
living (AAL), there have been various efforts to improve the lives of people with
disabilities and chronic medical conditions. Forkan et al. [16] developed a generic
scalable framework, known as “CoCaMAAL”. CoCaMAAL supports body sensor
networks integrated with AAL environments, by using cloud computing and service
oriented architectures with context management system. These components help the
model to provide “assisted living service” and “unified context generation”, to
127

Context-aware Technologies and Systems
aggregate raw sensor data and to select services appropriately. CoCaMAAL provides
medical support and monitoring services effectively and efficiently for vulnerable
groups of the community. It helps users, patients and healthcare professionals, to
gather, access, process, envisage, record, distribute and look for large quantity of data
from various AAL systems and service providers without any difficulty. It also
functions as decision support systems.
Location based context-aware applications for mobile users are one of the dominant
applications for context-awareness [44]. Examples of such projects include smart health
(s-Health) application [54] and iConAwa project [55].
Patsakis et al. [54], applied the concept of s-Health coined by Solanas et al. [56] to
develop a mobile application that leverages smart cities’ infrastructure for personalized
medical services. The mobile application aims at minimizing health related risks for
patients with respiratory related conditions by determining the best route while they are
travelling. The application takes user’s current location and destination, possible routes
for the user’s destination determined by Google Directions API, user input for type of
measurement he/she is interested in and data collected from sensors between the user’s
current location and destination as inputs and calculates the best route.
Another location based context-aware application (but tailored to tourism) iConAwa,
is given by Yılmaz and Erdur [55]. iConAwa is an intelligent context-aware multi-agent
system which provides users with context-aware information that are acquired through
ontologies using rule-based reasoning. iConAwa combines the user’s current location
information and user’s personal information stored in context ontology to determine a
list of points of interest and nearby users which are suitable for the user’s context.
Points of interest which can be an activity place, museum, historical/cultural place,
restaurant, Movie Theater, shopping store, etc. are displayed for the user on a map after
they sorted according to the match degrees of the user’s interest. The system also allows
users to send messages to nearby users with same interests.
There have also been a number of recent context-aware applications in education. One
recent work on this issue is described by Gómez et al. [57]. Context-aware adaptive
mobile learning based systems usually integrate wireless, mobile, and sensor
technologies to adapt their operations to the current context of a learner without explicit
intervention by the learner. Hence, such system can sense, track, detect and monitor the
real-world situation of the learner using sensing technologies and then with
communication capabilities present the learner with learning guidance, supplementary
materials, feedback and advice through a mobile devices. Context-Aware mobile role
playing game (CAM-RPG) is designed to encourage pupils to use mobile educational
systems [58]. It uses role playing and story generation based on location awareness to
engage students in their quest to complete tasks. The system is based on multi-agent
architecture. According to the developers the reason for the choice is because of agents’
ability to complete different self-sufficient tasks on different devices. Context
information is stored in Personal Experience and Knowledge structure database; a
database access agent makes interaction with this module possible by servicing requests
from other agents like Map holder and Story teller. The other significant agent, player
agent, is the only one responsible for the interaction between the user and other agents.
A student chooses a role and the game generates learning activities applicable to the
role; the student then can proceed by registering objects necessary for the session using
128

Esseynew et al.
a camera. The game tracks the progress of the student and progressively presents
learning materials.
10. Conclusion
In this paper we have attempted to discuss Context-aware systems by examining
different notions and definitions of Context and Context-awareness in the literature.
Different characteristics of Context-aware systems are identified; and particularly the
5Rs requirements for context-aware systems: the ‘Right’ Information, at the ‘Right’
Time, in the ‘Right’ Place, in the ‘Right’ Way to the ‘Right’ Person, was found to be a
helpful framework in illuminating the features of context-aware systems. In light of
these requirements, we identified the components and functions which enable typical
context-aware system to satisfy them. Physical, logical and virtual sensors are used to
monitor relevant changes in the computational or/and physical environment of the user.
The information from diverse set of sensors is filtered or transformed and stored
formats which facilitate efficient retrieval. This is done by a context-modeling
component of the system. Key-Value models, ontology based models, Graphical based
models, logic-based models, Multi-disciplinary models are some of the Context
modeling approaches employed. The stored context can be aggregated to form a higher
level context which can be shared across applications.
The number and choice of components which could make up context-aware systems
drives architectural considerations. Depending on the requirements of the systems, the
platform on which they are to be deployed and quality requirements, numerous
architectures for Context-aware systems are proposed and implemented. Many
approaches chose a layered view of architecture because of its suitability to encapsulate
diverse devices and functionalities. Agent based, object oriented and service oriented
architectures are some of the more common approaches identified by this study. We
think the new paradigm shift to cloud computing can provide a sustainable
infrastructure to SOA based context-aware systems because of equivalences in both
(Context-awareness and SOA) event driven paradigms. Moreover, several Context-
aware frameworks and middleware which are based on these architectures are realized
to facilitate the implementation of context-aware applications.
Context-awareness constitutes an important part of ubiquitous computing and
modern HCI designs. Many applications from these fields have applied the
functionalities of context-awareness. Particularly, Ubicomp systems for education,
manufacture, health, agriculture, tourism etc., sampled in this paper use context
modeling and reasoning techniques, often with provided frameworks. Hence, context-
aware applications can be readily applied in Ethiopia’s Tourism industry which is
characterized by scarcity of information which can direct Tourists to appropriate
destinations and service providers.
129

Context-aware Technologies and Systems
References
1. Dey, A. K.: Understanding and using context. Personal and Ubiquitous Computing, Vol. 5,
No. 1, 4-7. (2001)
2. Schilit B., Theimer M.: Disseminating Active Map Information to Mobile Hosts, Vol. 8, No.
5, IEEE Networ , 22-32. (1994)
3. Want, R., Hopper, A., Falcao, V., Gibbons, J.: The active badge location system. ACM
Transactions on Information Systems, Vol. 10, No. 1, 91-102. (1992)
4. Schmidt A., Adoo K. A., Takaluoma A., Tuomela U., Laerhoven K. V. , Velde WVD.:
Advanced interaction in context. In Proceedings of 1st international symposium on handheld
and ubiquitous computing. Springer, London, 89-101. (1999)
5. Schilit, B., Adams, N., Want, R. (1994, December). Context-aware computing applications.
In Proceedings of the 1994 First Workshop on Mobile Computing Systems and Applications
WMCSA 1994. IEEE, 85-90. (1994)
6. Sitou, W., Spanfelner, B.: Towards requirements engineering for context adaptive systems.
In Proceedings of 31st Annual International Computer Software and Applications
Conference, COMPSAC 2007. Vol. 2, IEEE, 593-600. (2007)
7. Musumba G., Nyongesa H.: Context awareness in mobile computing: A review.
International Journal of Machine Learn Applications, Vol. 2, No. 1, 1-10. (2013)
8. Perera, C., Zaslavsky, A., Christen, P., Georgakopoulos, D.: Context aware computing for
the internet of things: A survey. Communications Surveys & Tutorials, IEEE, Vol. 16, No. 1,
414-454. (2014)
9. Krumm, J. (ed.): Ubiquitous Computing Fundamentals. Washington: USA, Microsoft
Corporation, Taylor and Francis Group, LLC, (2010)
10. Adomavicius G., Tuzhilin A.: Context-Aware Recommender Systems. (2010), [Online].
Available: ids.csom.umn.edu/faculty/gedas/nsfcareer/CARS-chapter.pdf (Current April
2016)
11. Miraoui M., Tadj C., Amar C.: Architectural Survey of Context-Aware Systems in Pervasive
Computing Environment. Ubiquitous Computing and Communication, Vol. 3 No. 3, 68-76.
(2008)
12. Mcheick H.: Modeling Context Aware Features for Pervasive Computing. In proceedings of
the 5th International Conference on Emerging Ubiquitous Systems and Pervasive Networks.
EUSPN, 135-142. (2014)
13. Hong J., Yang S., Cho S.: ConaMSN: A Context-Aware Messenger Using Dynamic
Bayesian Networks with Wearable Sensors. Expert System Application, Vol. 37, No. 6,
4680-4686. (2010)
14. Chihani B, Bertin E, Jeanne F, Crespi N.: Context-aware systems: a case study. In
Proceedings of International Conference on Digital Information and Communication
Technology and its Applications. Dijon France, Heidelberg: Springer, 718-732. (2011)
15. Baltrunas L, Kaminskas M, Ludwig B., Peer S., Ricci F.: Incarmusic: Context-aware music
recommendations in a car. E-Commerce Web Technol, 89–100. (2011)
16. Forkan A., Khalil I., Tari Z.: CoCaMAAL: A Cloud Oriented Context – Aware Middleware
in Ambient Assisted Living. ELSEVIER, Future Generation Computer Systems, (2013)
17. Ongenae F., Duysburght P., Verstraete M., Sulman N., Bleumerst L., Jacab A.: User-driven
design of a context-aware application: an ambient-intelligent nurse call system. In
Proceedings of the 6th International Conference on Pervasive Computing Technologies for
Healthcare (PervasiveHealth) and Workshops. Belgium, 205-210. (2012)
18. Maryam Hosseini-Pozveh , “A multidimensional approach for context-aware
recommendation in mobile commerce”, International Journal of Computer Science and
Information Security, Vol. 3, No. 1, (2009)
130

Esseynew et al.
19. Horvitz, E., Jacobs, A., & Hovel, D.: Attention-sensitive alerting. In Proceedings of the
Fifteenth conference on Uncertainty in artificial intelligence, Morgan Kaufmann Publishers
Inc., 305-313. (1999)
20. Dey, A. K., Abowd, G. D., Salber, D.: A Conceptual Framework and a Toolkit for
Supporting the Rapid Prototyping of Context-Aware Applications. Human Computer
Interaction, Vol. 16, No.2-4, 97-166. (2001)
21. Carmien, S., Dawe, M., Fischer, G., Gorman, A., Kintsch A., Sullivan, J. F.: Socio-Technical
Environments Supporting People with Cognitive Disabilities Using Public Transportation.
Transactions on Human-Computer Interaction (ToCHI), Vol. 12, No. 2, 233-262. (2005)
22. Fischer, G.: User Modeling in Human-Computer Interaction. User Modeling and User-
Adapted Interaction (UMUAI), Vol. 11, No.1, 65-86. (2001)
23. Baldauf, M., Dustdar, S., Rosenberg, F.: A survey on context-aware systems. International
Journal of Ad Hoc and Ubiquitous Computing, Vol. 2, No. 4, 263-277. (2007)
24. Bass, L., Clements, P., Kazman, R.: Software Architecture in Practice, second edition.
Boston: Addison-Wesley. (2003)
25. Knappmeyer, M., Kiani, S. L., Reetz, E. S., Baker, N., Tonjes, R.: Survey of context
provisioning middleware. IEEE Communication Surveys and Tutorials, Vol. 15, No. 3,
1492-1519. (2013)
26. Roman, M., Hess, C., Cerqueira, R., Ranganathan, A., Campbell, R., Nahrstedt, K.: A
middleware infrastructure for active spaces. Pervasive Computing, IEEE, Vol. 1, No. 4, 74-
83. (2002)
27. Hofer, T., Schwinger, W., Pichler, M., Leonhartsberger, G., Altmann, J.: Context-awareness
on mobile devices – the hydrogen approach. In Proceedings of the 36th Annual Hawaii
International Conference on System Sciences, 292-302. (2002)
28. Zimmermann, A.: Context Management and Personalisation. Ph.D. dissertation, University
of Aachen. (2007)
29. Hong, J., Suh, E., Kim, S.: Context-aware systems: A literature review and classification.
Expert Systems with Applications, Vol. 36, No. 4, 8509–8522. (2009)
30. Dockhorn Costa, P.: Architectural support for context-aware applications: from context
models to services platforms. University of Twente, (2007)
31. Dey, A. K., Salber, D., Futakawa, M., Abowd, G. D.: An architecture to support context-
aware applications. Georgia Institute of Technology, Technical Report GIT-GVU-99-23.
(1999)
32. Lei, H.: Context awareness: a practitioner’s perspective. In Proceedings of the International
Workshop on Ubiquitous Data Management UDM 2005, 43-52. (2005)
33. Satyanarayanan, M.: Pervasive computing: vision and challenges. IEEE Personal
Communications, Vol. 8, No.4, 10-17. (2001)
34. Chen, H.: An intelligent broker architecture for pervasive context-aware systems. Ph.D.
dissertation, University of Maryland, Baltimore County. (2004)
35. Biegel, G., Cahill, V.: A framework for developing mobile, context-aware applications. In
Proceedings of the Second IEEE International Conference on Pervasive Computing and
Communications (PerCom’04), IEEE Computer Society, Washington, DC, USA, 361-365.
(2004)
36. Athanasopoulos, D., Zarras, A. V., Issarny, V., Pitoura, E., Vassiliadis, P. CoWSAMI:
Interface-aware context gathering in ambient intelligence environments. Pervasive and
Mobile Computing, Vol. 4, No. 3, 360-389. (2008)
37. Bettini, C., Brdicz, O., Henricksen, k., Indulska, J., & Nicklas, D.: A survey of context
modelling and reasoning techniques. Pervasive and Mobile Computing, Vol. 6, No. 2, 161-
180. (2010)
38. Voelker, G. M., Bershad, B. N.: Mobisaic: An information system for a mobile wireless
computing environment. In Mobile Computing. Springer US, 375-395. (1994)
131

Context-aware Technologies and Systems
39. Strang, T., Linnhoff-Popien, C.: A Context Modeling Survey. In Proceedings of the First
International Workshop on Advanced Context Modelling, Reasoning and Management,
UbiComp. Nottingham, England. (2004)
40. Open Mobile Alliance. WAP Forum. Retrieved April 28, 2016, from
http://technical.openmobilealliance.org/Technical/technical-information/material-from-
affiliates/wap-forum
41. W3C.: CC/PP Information Page. (W3C) (2007). [Online]. Available:
https://www.w3.org/Mobile/CCPP/ (current April 2016)
42. Object Management Group.: Unified modeling language (UML). (2016) [Online]. Available:
http://www.uml.org/ (current April 2016)
43. Zhang, D., Huang, H., Lai, C.-F., Liang, X., Zou, Q., Guo, M.: Survey on context-awareness
in ubiquitous media. Multimedia tools and applications, Vol. 67, No. 1, 179-211. (2013)
44. Poslad, S.: Ubiquitous Computing: Smart Devices, Environments and Interactions. John
Wiley & Sons, Ltd., Chippenham, UK. (2009)
45. Gámez, N., Cubo, J., Fuentes, L., Pimentel, E.: Configuring a context-aware middleware for
wireless sensor networks. Sensors, Vol. 12, No. 7, 8544-8570. (2012)
46. The ORM Foundation. The ORM Found. (2016). [Online]. Available:
http://www.ormfoundation.org/ (current April 2016)
47. Henricksen, K., Indulska, J., Rakotonirainy, A.: Generating Context Management
Infrastructure from HighLevel Context Models. In Proceedings of the 4th International
Conference on Mobile Data Management (MDM2003). Melbourne, Australia, 1-6. (2003)
48. Schmidt, A., Adoo, K.A., Takaluoma, A., Tuomela, U., Laerhoven, K.V., Velde, W.V.D.:
Advanced interaction in context. In Proceedings of the 1st international symposium on
handheld and ubiquitous computing. Springer, London, 89–101. (1999)
49. Cheverst, K., Mitchell, K., Davies, N.: Design of an object model for a context sensitive
tourist guide. Comput Graph, Vol. 23, No. 6, 883-891. (1999)
50. Ranganathan, A., Campbell, R., Ravi, A., Mahajan, A.: Conchat: a contextaware chat
program, Pervasive Computing, IEEE, Vol. 1, No. 3: 51-57. (2002)
51. Wang, X. H., Zhang, D. Q., Gu, T., Pung, H. K.: Ontology based context modeling and
reasoning using OWL. In Proceeding the Second IEEE Annual Conference on Pervasive
Computing and Communication. IEEE, 18-22). (2004)
52. Wang X.: Semantic space: an infrastructure for smart spaces. IEEE Pervasive Computing,
Vol. 3, No. 3, 32-39. (2004)
53. Chen, H., Finin, T., Joshi, A.: An ontology for context-aware pervasive computing
environments. The Knowledge Engineering Review, Vol. 18, No. 3, 197-207. (2003)
54. Patsakis, C., Venanzi, R., Bellavista, P., Solanas, A., Bouroche, M.: Personalized Medical
Services using Smart Cities’ Infrastructures. In Proceeding of IEEE International
Symposium on Medical Measurements and Applications (MeMeA), Lisboa: IEEE. 1-5.
(2014)
55. Yılmaz, Ö., & Erdur, R. C.: iConAwa–An intelligent context-aware system. Expert Systems
with Applications, Vol. 39, No. 3, 2907-2918. (2012)
56. Solanas, A., Patsakis, C., Conti, M., Vlachos, I., Ramos, V., Falcone, F., Martínez-Ballesté,
A.: Smart health: a context-aware health paradigm within smart cities. Communications
Magazine, IEEE, Vol. 52, No. 8, 74-81. (2014)
57. Gómez, S., Zervas, P., Sampson, D. G., Fabregat, R.: Context-aware adaptive and
personalized mobile learning delivery supported by UoLmP. Journal of King Saud
University-Computer and Information Sciences, Vol. 26, No. 1, 47-61. (2014)
58. Lu, C., Chang, M., Kinshuk, Huang, E., Chen, C.-W.: Architecture and collaborations among
agents in mobile educational game. In Proceedings of the 7th IEEE International Workshop
on PervasivE Learning, Life, and Leisure. 171-175. (2011)
132

International Conference on Applied Internet and Information
Technologies, 2016
DOI:10.20544/AIIT2016.17
Application of 3ds Max for 3D Modelling and Rendering
Igor Stojanov1, Blagoj Ristevski2, Zoran Kotevski3 and
Snezana Savoska4
Faculty of Information and Communication Technologies,
“St. Kliment Ohridski” University – Bitola
Partizanska bb, 7000 Bitola, Macedonia [email protected], 2, 3, 4blagoj.ristevski, zoran.kotevski,
Abstract. In this article, the application of 3ds Max for 3D modelling and
rendering of a car model is described. The process of creating a 3D car model is
explained as well as setting up the references, working with editable poly, details
in car interior, using turbosmooth and symmetry modifier. The manner which
materials are applied to the model are described as well as lighting the scene and
setting up the render. The rendering methods and techniques are described, too.
Final render results from several rendering plugins, such as V-ray, Mental Ray,
Iray, Scanline, Maxwell, Corona, Octane and LuxRender are presented and
compared.
Keywords: Computer Graphics, 3ds Max, 3D Modelling, Rendering Techniques.
1. Introduction
We live in time when visualization and visual effects are widely used. There is no
movie that does not use special visual effects and there is no television which not
broadcast commercials made with special visual effects. 3ds Max started the revolution
in 3D computer graphics and is the longest on the market, compared to the other 3D
graphics software packages. This long existence makes 3ds Max to be still at the top of
the most popular software for 3D graphics. 3ds Max is a professional 3D computer
graphics program for making 3D animations, models, games and images. It is
developed and produced by Autodesk Media and Entertainment. It contains many
features specifically designed to help artists, architects, engineers and designers in
various disciplines in the realization of their projects.
In this paper, 3ds Max is used for modelling, texturing and rendering 3D model of a
car Mercedes S class coupe 2014. Also rendering methods are explained and renders
from V-Ray, Mental Ray, Iray, Scanline, Maxwell, Corona, Octane and Luxrender are
shown and compared.
The rest of the paper is structured as follows. In the second section creating a 3D car
model, basic techniques for creating an exterior and interior of the car model are
described. In the following section the rendering is explained as well as the manner how
the materials are applied and the scene lighting. In the Section 4 real time and non-real
time rendering are explained. In the following section renders from different render
plugins are shown and compared. The last section gives the concluding remarks.
133

Igor Stojanov et al.
2. Creating a 3D car model
Preparation of the 3D car model in 3ds Max is a complex process in which it is
necessary to have basic knowledge of polygonal modelling. Polygonal modelling is an
approach for modelling objects by representing or approximating the surfaces by using
polygons. This type of modelling is the basis of development of the car model. To
create polygons as a starting form, 3ds Max offers dozens of classes form such as cube,
sphere, plane, cylinder, pyramids, etc. By converting these forms into polygons, then
moving, adding or dividing the vertices and polygons and using some modifiers,
arbitrary objects can be created [1].
2.1 Setting up the reference image
For making a complex 3D models such as a car, it is necessary to have a technical
drawings of at least two views. Also very important is these drawings to be accurately
and professionally drawn and to be with the same scale from all views. They are the
basis for making the accurate 3D model. Creating a simple material with a reference
image from Mercedes S class coupe in a diffuse map is the first step for creating a 3D
car model. This material is aligned on a plane and moved to align with the view.
This process should be repeated for all views. Furthermore, a cube should be created
with dimensions equal to the width of the car and all planes with technical drawing are
increased or decreased to match the size of cube. This process makes the car to be in the
real scale.
2.2. Modelling a car
First step for modelling a car is to make a rough plan where the mesh is going to be
[4]. Next stage is creating a box or plane from one particular view and convert it to
editable poly. A polygon is created by holding Shift key from the keyboard and moving
one edge. Another polygons following all reference images are created by using and
repeating this technique. It is very important do not forget to check the mesh from all
views all the time, because if polygons match from one view it does not mean that they
match from another views. The mesh created is not a smooth surface. Turbo smooth is a
modifier that creates polygons automatically, and makes the surface to be smoother.
This is very important modifier and without it, it is impossible to create a correct
smooth surface.
Also symmetry modifier is very important because it reduces the modelling time.
Only half of the shell of the car should be created by using this symmetry modifier,
because the other half is created symmetrically. Particular thickness on the object is
made by applying the shell modifier. It is used to make a thickness on the shell of the
car. For the remaining parts of the car such as headlights, tail lights, Mercedes logo and
rims, similar techniques and modifiers are used. It is very important to have several
134

Application of 3ds Max for 3D Modelling and Rendering
reference images from each element to make more accurate model. The mesh of the car
model is shown on Fig. 1.
Fig. 1. Mesh of the car model.
2.3. Modelling the car interior
The interior of the car is composed of many objects and details modelled as separate
elements. There are many buttons with different details and signs on them and all of
them should be modelled. This modelling stage highlights the details of the car interior.
Most of the objects in the car interior are modelled with the same techniques as objects
from the car exterior.
Fig. 2. Interior of the car.
135

Igor Stojanov et al.
One primitives converted in editable poly and with moving and cutting polygons to
match the desired object. After that, mostly turbosmooth, symmetry and shell modifiers
are used. The interior of the car contains small details such as stitches that makes the
render more realistic. Firstly, a small cylinder is modelled and then an animation on
spline or path constraints is made. Fig. 2 shows the car interior without applied
materials.
3. Rendering
The final process of converting the 3D scene in a two-dimensional picture is called
rendering. It is a process that converts the 3D model, complete scene in 2D image
simulating the light rays. The data contained in the file of the scene transmitted to the
rendering program are processed to obtain a digital image or raster graphics image.
Rendering is one of the main sub-topics of 3D computer graphics. In graphic
preparation, it is the last step, which gives the final appearance of the models and
animation.
The theoretical concept of rendering is presented by Eq. 1, which serves for more
formal expression of non-perceptual aspect of rendering [6].
𝐿𝑜 𝑥, 𝑤 = 𝐿𝑒 𝑥, 𝑤 + Ω 𝑓𝑟(𝑥, 𝑤 , 𝑤 ) 𝐿𝑖 𝑥, 𝑤 𝑤 ∙ 𝑛 𝑑𝑤 (1)
where the output light Lo is a set of emitted light Le and reflected light. Reflected
light is a set of incoming light Li from all directions multiplied by the reflectance of the
surface and incoming angles, x is the space location, w is the light direction and fr is the
bidirectional reflectance distribution function. The complete algorithms can be viewed
as a solution to specific formulations of this equation. Fig. 3 shows the vectors defined
in the Eq. 1.
Fig. 3. The rendering process.
The car model is rendered by V-Ray render plugin which is one of the most used
render plugins in the 3D visualization. Setting up the render is very important part to
finalize the image. The first and most important step is to enable the global illumination.
Without global illumination the picture will only has light and shadow without surface
illuminated by light reflected from other areas. As a primary engine in global
illumination, irradiance map is used while for secondary engine light cache is used.
136

Application of 3ds Max for 3D Modelling and Rendering
Medium preset for irradiance map is used and 1200 subdivision for the light cash. Also
exterior preset is chosen on V-Ray saving a priceless time for setting up the render.
Obtaining a desired render takes a lot of testing, so minimized resolution and image
quality to quickly see the changes made in the settings are recommended.
3.1 Materials
The materials describe how an object reflects or transmits the light. They are data
that are applied on the surface of an object and they are shown in a particular way when
the scene is rendered. Creation of materials can take a long time and for faster results,
plugin called V-Ray Material Presets Pro is used for applying materials on the car
elements. This plugin contains many types of materials and with a little editing of these
materials, the desired results are obtained. Depending on the desired results, it can be
often encountered with material that needs to reduce reflection, reflection glossiness,
bumpiness and opacity. All these settings and many others can be changed in material
editor window.
Most of the materials contained in the car do not contain texture and they are only
applied on the objects. While those materials containing a texture, when applied applied
on very small or big objects do not look realistic. To solve this problem, the UVW Map
modifier is used. It is a mathematical technique for coordinating textures. It includes the
possibility of adjusting the size of texture in three dimensions to give additional
flexibility to get the desired results. The option Multi/Sub-Object is used on the objects
that need more than one material. For materials such as a screen on the display of the
car, VRayLightMtl is used to illuminate light whereas for particular textures that can
not be found online Unwrap UVW modifier is used [2] [3].
3.2. Lighting the scene and setting up the camera
Lights are objects that simulate real light sources, such as lamps, table lamps, sun
etc. Different types of lighting objects lights in different ways to simulate different
types of real sources of light. The lights allow adjustment of the distribution, intensity,
color temperature and other characteristics of the lights in the real world referenca. One
of the easiest and fastest way to light scenes is using High Dynamic Range Imaging
(HDRI). This technique make the scene to look like as a picture on the same place in
the real life. Because HDRI is pictured in 360 degree, it is easy to adjust the desired
angle by rotating the HDRI in the material editor.
V-Ray sun is used to get more strong shadows in the scene. For the car interior a lot
of V-Ray Plane lights is used with blue color located in each angle illuminating light in
the real life interior. For lightening the scene, the camera properties are also very
important. The cameras are objects set in the place where the image is going to be. It is
used v-ray physical camera with certain f-number, focal length, white balance, shutter
speed and ISO. These properties are important to get a correct lightened rendering.
137

Igor Stojanov et al.
Fig.4 shows the final render from the car interior while the final render from exterior of
the car with motion blur effect are shown on Fig. 5.
Fig. 4. Final render from interior of the car.
Fig. 5. Final render from exterior of the car with motion blur effect.
4. Rendering methods
Real time rendering is a rendering of interactive media, such as games and
simulations by calculations and displaying in the real time, with rates of about 20-120
frames per second. The purpose of rendering process in the real time is to show as much
as possible information the human eye can process in a part of a second. Primary
purpose is to achieve the highest possible degree of photo realisms with acceptable
minimum speed for rendering, usually 24 frames per second. This speed is the
minimum that the human eye can see to successfully create the illusion of movement.
138

Application of 3ds Max for 3D Modelling and Rendering
This is the basic method used for rendering of games and interactive worlds. The rapid
growth of computer power provides a higher degree of realism even for rendering in the
real time, including techniques such as HDR rendering.
No-real time rendering allows expansion of the limited processing power in order
to get higher picture quality. Animations for non-interactive media, movies and video,
are rendered more slowly. This is the basic method used in digital media and art. More
techniques has been developed for simulating other environmental effects such as light
interactions with various forms of matter. Examples of such techniques are: particle
systems (which can simulate rain, smoke, or fire), volumetric sampling (that can
simulate fog, dust and other spatial atmospheric effects), caustics systems (simulates the
light that focuses on uneven light surfaces break, such as light that can be seen from the
bottom of the pool) and subsurface scattering systems that simulate light reflecting
inside the solid objects such as human skin).
4.1 Rendering techniques
Ray casting uses ray surface intersection tests to solve various problems in computer
graphics and computational geometry. The scene seen from a certain perspective,
calculates the observed image based solely on geometry and basic optical laws of
reflection, and possibly by using Monte Carlo techniques to reduce artifacts [5]. Ray
casting is mostly a base of many computer graphics rendering algorithms.
Ray tracing is a technique for generating an image by tracing the path of light
through pixels in an image plane, simulating the effects of its encounters with virtual
objects. This technique is capable to produce a very high degree of visual realism,
usually higher than that of typical scanline rendering methods, with greater
computational costs. This makes ray tracing to be best suited for applications where the
image can be rendered slowly through the time, such as in still images, movies and TV
visual effects. It is more poorly suited for real-time applications, like video games,
where the speed is critical and very important.
Radiosity is a rendering method based on detail analysis of light reflections of
diffuse surfaces. The images obtained from radiosity rendering are characterized by soft
gradual shadows. Radiosity is typically used to render images of the buildings’ interior
and can achieve extremely photo-realistic results for scenes that are comprised of
diffuse reflecting surfaces. The computation of lighting via radiosity is unlike many
traditional computer graphics lighting computation because it is view independent. The
intensity of surfaces in the model is computed before any view computation to be made.
This difference can be considered as the difference between demand-driven and data-
driven lighting computation.
5. Render plugins
Final renders are made by using the V-ray, Mental Ray, Iray, Scanline, Maxwell,
Corona, Octane and LuxRender render plugins. Fig. 6 depicts the final render from V-
Ray, while the final render from Mental Ray is presented on Fig. 7. The Fig. 8 shows
139

Igor Stojanov et al.
the final render from Iray, whereas the final renders from Scanline is shown on Fig. 9.
The final render from Maxwell, Corona, Octane and LuxRender are shown on Fig. 10,
Fig. 11, Fig. 12 and Fig. 13, respectively.
Fig. 6. Final render obtained by V-Ray.
Fig. 7. Final render obtained by Mental Ray.
140

Application of 3ds Max for 3D Modelling and Rendering
Fig. 8. Final render obtained by Iray.
Fig. 9. Final render obtained by Scanline.
141

Igor Stojanov et al.
Fig. 10. Final render obtained by Maxwell.
Fig. 11. Final render obtained by Corona.
142

Application of 3ds Max for 3D Modelling and Rendering
Fig. 12. Final render obtained by Octane.
Fig. 13. Final render obtained by LuxRender.
6. Conclusion
3ds Max is a powerful computer program that is particularly designed to help 3D
artists, architects, engineers and designers in various disciplines in the implementation
of their projects. Modelling a car with 3ds Max is a complex task and for this reason,
the most important step is to set up reference images from at least two views. Modelling
process cannot be imagined without knowledge of working with polygons or editable
143

Igor Stojanov et al.
poly and understanding how turbosmooth modifier works. Adding the more details to
the car interior makes the final image to be more realistic.
Obtaining desired render takes a lot of testing, and for this purpose it is
recommended resolution and image quality to be minimized in order to notice the
changes made in the settings. Good starting point for the materials is V-Ray Material
Presets Pro. This plugin contains many types of materials, and desired results can be
obtain with a simple editing of these materials. One of the easiest and fastest way to
light scenes is using High Dynamic Range Imaging shortened HDRI. This technique
makes the scene to seem as to be pictured in the same place in real life. The settings in
camera are important to get a correct lightened render.
There are two types of rendering methods: real time rendering and non-real time
rendering. The first one is a rendering of interactive media, such as games and
simulations and the second one is used for animations for non-interactive media,
movies and video.
In this paper, in application of 3ds Max, the following render plugins: V-ray, Mental
Ray, Iray, Scanline, Maxwell, Corona, Octane and LuxRender are used for modelling
and rendering the car model. It can be noticed that the final result of rendering was the
best when V-ray and Corona render plugins were used, while weaker results were
achieved when Scanline, Iray and LuxRender render plugins were applied.
References
[1] Kelly L. Murdock, Autodesk 3ds Max 2014 Bible, 2014.
[2] Hu, Jia Ying., The Application of Computer Software—3D Studio Max,
Lightscape and V-Ray in the Environmental Artistic Expression, Advanced
Materials Research 631 (2013): 1379-1384.
[3] Lin, T. H., Lan, C. C., Wang, C. H., & Chen, C. H., Study on realistic texture
mapping for 3D models, International Conference on Information Science,
Electronics and Electrical Engineering (ISEEE), Vol. 3, pp. 1567-1571, 2014.
[4] Chandler, M., Podwojewski, P., Amin, J., & Herrera, F, 3ds Max Projects: A
Detailed Guide to Modeling, Texturing, Rigging, Animation and Lighting, 2014.
[5] Woop, Sven; Schmittler, Jörg; Slusallek, Philipp (2005), "RPU: A Programmable
Ray Processing Unit for Realtime Ray Tracing", Siggraph 2005.
[6] Kajiya, James T: The rendering equation, 1986.
144

International Conference on Applied Internet and Information
Technologies, 2016
DOI:10.20544/AIIT2016.18
Simulation Based Comparative Performance Analysis of
OSPF and EIGRP Routing Protocols
Emilija Stankoska, Nikola Rendevski and Pece Mitrevski
Faculty of information and communication technologies, Partizanska bb,
7304 Bitola, Macedonia
[email protected], nikola.rendevski, [email protected]
Abstract. In the computer networks, the data traffic transmission is based on the
routing protocol which select the best routes between two nodes. Variety of
routing protocols are applied to specific network environments. Routing protocol
is taking a crucial role in the modern communication networks and its
functionality is to determine how the routers communicate with each other and
forward the packets through the optimal path from source to destination node. In
this paper, two typical types of routing protocol are chosen as the simulation
samples: EIGRP and OSPF. Each of them has different architecture, route delays
and convergence characteristics. The aim is to present a simulation based
comparative analysis between EIGRP and OSPF for real time applications
considering realistic backbone communication links and existing subnets. The
evaluation of the proposed routing protocols is performed based on the widely
accepted quantitative metrics such as: convergence time, end-to-end delay, jitter,
packet loss and throughput of the simulated network models. Tractable
conclusions and discussions are presented for each protocols and multi-protocol
network implementations.
Keywords: BGP, EIGRP, OSPF, routing protocols, performance evaluation.
1. Introduction
Nowadays, the communication networks are growing rapidly day by day. In the
complex infrastructure computer networks, routing protocols are used to transmit
packets across the Internet. There are different types of routing protocols in the IP
networks. However, three classes are common in the IP networks: Interior gateway
routing over link state routing protocols, such as IS-IS and OSPF; Interior gateway
routing over distance-vector protocols, such as RIP, IGRP and EIGRP and Exterior
gateway routing, such as BGP routing protocol [1][2][4]. Among all routing protocols, we have chosen EIGRP and OSPF routing protocols for
realizing performance evaluation in a simulation based network model for real time
applications such video streaming and voice conferencing. The evaluation is based on
different parameters such: convergence time, jitter, delay variation, end-to-end delay
and throughput. Optimized Network Engineering Tool (OPNET) [6] is employed as a
simulator to analyze and measure the performance of these routing protocols. We
145

Emilija Stankoska et al.
organized this work as follows. First of all, network model with EIGRP is simulated
with OPNET while observing the results of such EIGRP-only implementation for real
time applications. Second, in the same network scenario, we implemented OSPF instead
of EIGRP to simulate the network model while observing the impact of OSPF-only real
time applications, and finally, we designed a network model by implementing subnets
and nodes using EIGRP and OSPF and measure the performance for real-time traffic.
2. Routing Protocols
A routing protocol is the “language” a router speaks with other routers in order to share
information about the reachability and status of the network. It includes a procedure to
select the best path based and for storing this information in a so-called routing table. In
a network, routing can be defined as transmitting information from a source to a
destination by one hop or multiple hops. Generally, the routing protocols should
provide at least two functionalities [4][6]: selecting routes for different pairs of
source/destination nodes and successful transmission of the data to a given destination.
Different routing protocols have specific performance metrics of interest. When there is
more than one route between two nodes, a router shall determine the routing protocol to
calculate the best path considering the current metrics parameters. In IP routing
protocols, the following metrics are used mostly: hop count, bandwidth, delay, load and
reliability.
2.1. Enhanced Interior Gateway Routing Protocol (EIGRP)
EIGRP is a CISCO proprietary protocol, which is an improved version of the Interior
Gateway Routing Protocol (IGRP). EIGRP is considered as advanced distance-vector
routing protocol with automatic routing decisions and configuration. There are four
basic components to operate EIGRP, which are: Neighbor discovery/recovery, Reliable
Transport Protocol (RTP), Diffusing Update Algoritm (DUAL) and Protocol Dependent
Modules (PDMs) [3]. The neighbor discovery/recovery method allows the routers to
gain knowledge about other routers which are directly linked to their networks. Reliable
Transport Protocol insures fast transport when there are unacknowledged packets
pending. The Diffusing Update Algorithm (DUAL) is the default convergence
algorithm which is used in EIGRP to prevent routing loops from recalculating routes.
DUAL tracks all routes and detect the optimal path in terms of efficiency and cost
which will be added in the routing table. There also exist backup routes that can be used
in case the optimal route is dropped. DUAL uses some provisions and theories which
has a significant role in loop-avoidance mechanism as follows: Feasible Distance (FD),
Reported Distance (RD), Successor, Feasible Successor (FS) and Feasible Condition
(FC). Protocol Dependent Modules are used to encapsulate the IP packets for network
layer. It determines if an additional route is necessary from sources such as routing
table. In addition to the routing table, EIGRP uses three types of tables to store the
information: neighbor table, topology table and routing table. EIGRP associates six
different vector metrics with each route and considers only four of the vector metrics in
146

Simulation Based Comparative Performance Analysis of OSPF and EIGRP Routing Protocols
computing the composite metric: bandwidth, load, delay, reliability, MTU (Maximum
Transmission Unit) and hop count. There are some advantages provides by EIGRP as
follows [3][9]:
Simple configuration;
Back up path to reach the destination;
Multiple network layer protocols;
Low convergence time and reduction of the bandwidth utilization;
Support of routing update authentication.
2.2. Open Shortest Path First (OSPF)
Open Shortest Path First (OSPF) is a routing protocol for Internet Protocol (IP)
networks. It based on link-state routing algorithm which calculates the shortest path and
falls into the group of interior routing protocols. OSPF is the most widely used routing
protocol in large enterprise networks [7]. It gathers link state information from available
routers and constructs a topology map of the network. OSPF packets consist of nine
fields: version, type, lenghth, router ID, area ID, checksum, autype, authentication and
data. There are five different types of OSPF packets in which each packet has a specific
purpose in OSPF process that are: Hello, Database Description (DBD), Link State
Request (LSR), Link State Update (LSU) и Link State Acknowledgement (LSAck).
OSPF should be designed in a hierarchical manner, which basically means that can
separate large interconnected networks into smaller interconnected networks called
areas. OSPF will have at least one area in the network. If more than one area exists in
the network, one of the areas must be a backbone area which has to be connected to all
other areas. OSPF areas are: backbone area, stub area, totally stub area, not-so-stubby
area (NSSA), totally not-so-stubby area. OSPF routers play a various roles in the
network where they are placed and the areas in which they are positioned. Different
types of OSPF routers are defined as follows: internal router, backbone router, area
border router, autonomous system boundary router and designated router. Route
summarizaton is used to merge up the list of multiple routes into one route. The main
purpose of summarization is to reduce the bandwidth and processing time. There are
two types of route summarization which can be performed in OSPF [9][10]: Inter-Area
Route Summarization and External Route Summarization. OSPF is a link state routing
protocol which uses a Shortest Path First Algorithm to calculate the lowest cost path to
all known destinations. Dijkstra algorithm is used for calculating the shortest path.
Dijkstra is a type of search algorithm graph that can solve a problem in the form of the
shortest path in a graph with non-negative values (weights) on the branches of a graph
(the distance from one point to another is a branch), such that the algorithm produced
the shortest path tree (shortest path tree).
OSPF is characterized by several key advantages [13]:
OSPF always determine the loop free routes;
Fast reaction (updates) to changes;
Minimizing the routes and reducing the size of routing table
147

Emilija Stankoska et al.
Low bandwidth utilization
Multiple routes support
Cost effectiveness
Support Variable Length Subnet Mask (VLSM);
Suitability for large networks
Disadvantages of OSPF are:
Complex Configuration;
Link state scaling issues;
Memory requirements
3. Simulation
In this paper, network simulator Optimized Network Engineering Tool (OPNET)
modeler (v.14.5) is used as a simulation environment. OPNET is among leading
simulators for network research and development and allows users to plan and study
communication networks, devices, protocols and applications with flexibility. OPNET
model is divided into three domains: network domain, node domain and process domain
[5][13]. The protocols used in this paperwork are EIGRP and OSPF routing protocol.
The proposed routing protocols are compared and evaluated based on quantitative
metrics such as convergence duration, packet delay variation, jitter, end to end delay
and throughput. These protocols are intended to use to get better performance of one
over the other for real time traffic such as video streaming and voice conferencing in
the entire network [14]. In this paperwork, three scenarios are created that consists of
six interconnected subnets where routers within each subnet are configured by using
EIGRP and OSPF routing protocols. The network topology composed of the following
network devices and configuration utilities:
Cisco 7304 Routers;
Application Server;
Layer 2 Switch;
PPP_DS3 Duplex Links
PPP_DS1 Duplex Links;
Ethernet 10 BaseT Duplex Links;
Ethernet Workstations;
Six Subnets;
Application Configuration;
Profile Configuration;
Failure Recovery Configuration;
QoS Attribute Configuration.
148

Simulation Based Comparative Performance Analysis of OSPF and EIGRP Routing Protocols
Fig. 1. Network Topology
The subnet in Skopje consist of one Cisco 7304 Router and one Ethernet Server. The
subnet of Bitola consists of two Cisco 7304 Routers, one Ethernet Switch and four
Ethernet workstations. The subnet in Kumanovo consists of one Cisco 7304 Router, one
Ethernet Switch and four Ethernet workstations. The subnet of Prilep consists of one
Cisco 7304 Router, one Ethernet Switch and four Ethernet workstations. The subnet in
Tetovo consists of two Cisco 7304 Routers and six Ethernet workstations. The subnet
of Strumica consists of three Cisco 7304 Routers and four Ethernet workstations. An
Application Config and a Profile Config are added from the object palette into the
workspace. The Application Config in OPNET allows generating different application
traffic patterns. As we are considering real time applications, the Application Definition
Object is set to support Video Streaming (Low Resolution Video) and Voice
Conferencing with Pulse Code Modulation - PCM. A Profile Definition Object defines
the profiles within the defined application traffic. In the Profile Config, two profiles are
created. One of the Profiles (Video) has the application support of Video Streaming
(Light) and another one (Voice) has Voice Conferencing (PCM Quality) support.
Failure link has been configured in the scenarios. Failure events introduce disturbances
in the routing topology, leading to additional intervals of convergence activity. The link
connected between Kumanovo and Prilep is set to be failure for 300 seconds and to
recover after 500 seconds. One Video server is connected to Router-Skopje which is set
to the Video Streaming Service of the Video Broadcasting Server.
3.1. Scenarios
In the first scenario, EIGRP routing protocol is enabled first for all routers on the
network. After configuring routing protocols, individual DES statistics was chosen to
select performance metrics and to measure the behavior of this routing protocol. Then
simulation run time was set to 20 minutes
149

Emilija Stankoska et al.
Fig. 2. Internal Infrastructure of Network Topology (Subnets Architecture)
In the second scenario, OSPF routing protocol is enabled first for all routers on the
network. After configuring routing protocols, individual DES statistics was chosen to
select performance metrics and to measure the behavior of this routing protocol. Then
simulation run time was set to 20 minutes. In the third scenario, a key issue is to analyze
the performance of the network where both EIGRP and OSPF are running concurrently.
In this scenario the subnets of Skopje, Kumanovo and Strumica are configured with
EIGRP and the subnets of Bitola, Prilep and Tetovo are configured with OSPF (Fig.3.).
4. Results
4.1. Convergence time
The time of convergence in a network determines the time it takes for all routers have
an identical routing table. From the Figure 4 can be observed that the time of
convergence of EIGRP network is faster than the convergence of OSPF and
EIGRP_OSPF networks. The convergence time of EIGRP_OSPF network is slower
than EIGRP and OSPF networks. Figure 4 shows that the convergence time of EIGRP
network decreases rapidly growing the EIGRP_OSPF network. Conversely, the time of
convergence of OSPF network is faster than EIGRP_OSPF network.
150

Simulation Based Comparative Performance Analysis of OSPF and EIGRP Routing Protocols
Fig. 3. Network topology of EIGRP_OSPF scenario
Fig. 4. Convergence time (left subplot) and Packet Delay Variation (right subplot)
4.2. Packet Delay Variation for Video Streaming
Packet delay variation is measured by the difference in the delay of the packets. This
metric has significant influence on video applications. It is observed from the Fig. 5.
that EIGRP_OSPF network has less packet delay variation than EIGRP and OSPF
networks. It is also shown that despite of high congestion, EIGRP_OSPF network is
experiencing significantly better performance than other two networks in terms of
packet delay variation.
151

Emilija Stankoska et al.
4.3. End-to-end Delay for Video Streaming
End-to-end delay refers to the time taken for a packet to be transmitted across a network
from source to destination. End-to-end delay has a critical importance when a packet
arrives too late at the receiver as a consequence, the packet can be effectively lost. Lost
packets due to delay have a negative effects on the received quality for both video and
voice traffic. Figure 6 illustrates the behavior of end-to-end delay across the networks.
As shown in figure 6, end-to-end delay of EIGRP_OSPF network is comparatively
smaller than EIGRP and OSPF networks. End-to-end delay of EIGRP network is
slightly higher than end-to-end delay of OSPF network.
Fig. 5. End-to-end Delay for Video Streaming (left) and Sent Traffic (right)
4.4. Sent and received traffic for Video Streaming
We have considered the multimedia streaming traffic class for low resolution video
traffic. All users in the network are watching video from a video server. Figure 7
demonstrates that a sent traffic in EIGRP and OSPF networks is almost the same, apart
from EIGRP_OSPF network where the sent traffic is less.
As shown on Fig. 6., some packets are being dropped due to the very high congestion in
the network. EIGRP network has the smallest packet loss and OSPF network has the
largest packet loss. Jitter is the variation of delay of each packet. It is a very
experienced problem in the packet switched network due to the fact that information is
segmented into packets that travel to the receiver via different paths.
4.5. Jitter for voice conferencing
Jitter is measured by the variance of time latency in a network. It is caused by poor
quality of connections or traffic congestion. It also occurs due to the dynamic change of
network traffic loads. However, for real time applications, such as voice, jitter has an
152
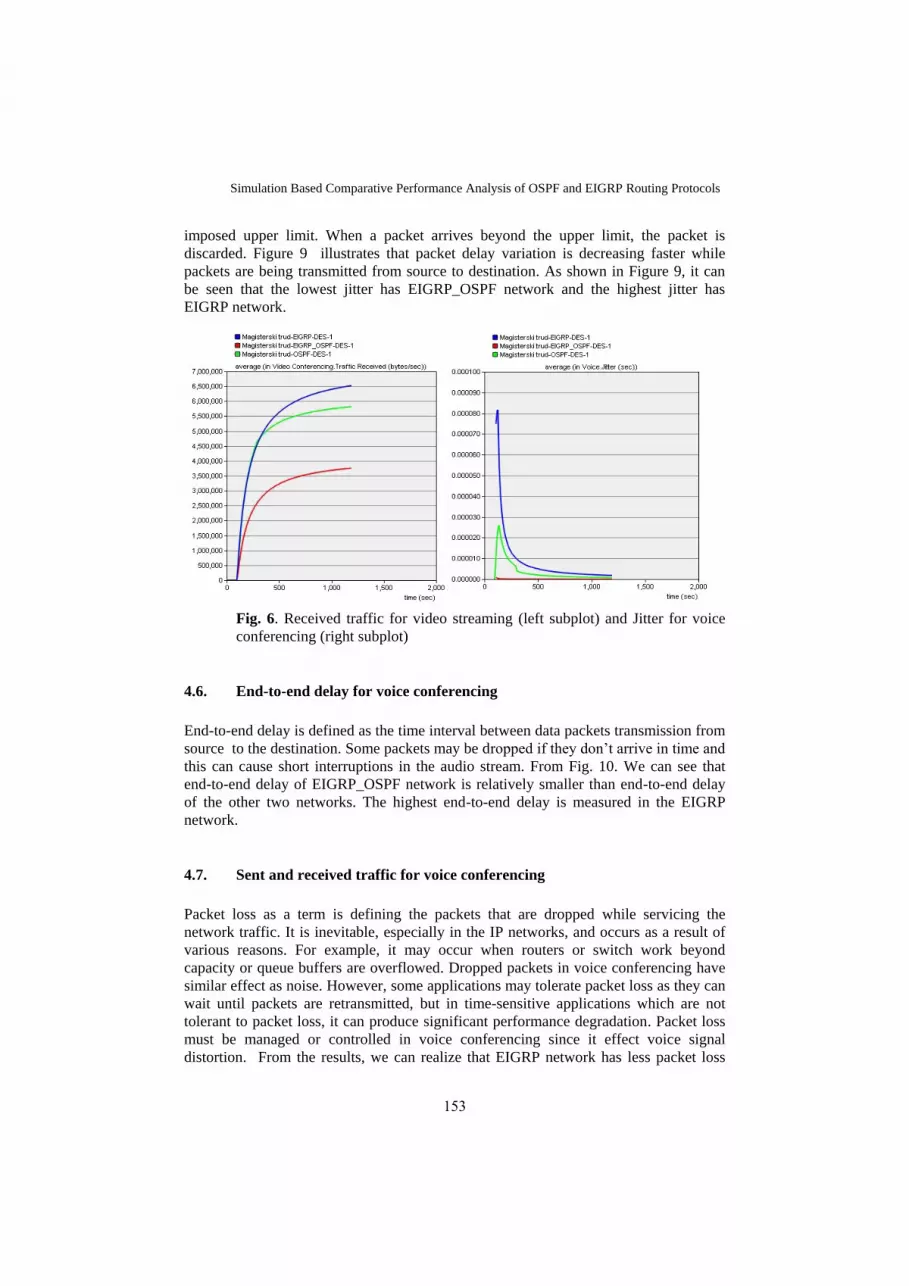
Simulation Based Comparative Performance Analysis of OSPF and EIGRP Routing Protocols
imposed upper limit. When a packet arrives beyond the upper limit, the packet is
discarded. Figure 9 illustrates that packet delay variation is decreasing faster while
packets are being transmitted from source to destination. As shown in Figure 9, it can
be seen that the lowest jitter has EIGRP_OSPF network and the highest jitter has
EIGRP network.
Fig. 6. Received traffic for video streaming (left subplot) and Jitter for voice
conferencing (right subplot)
4.6. End-to-end delay for voice conferencing
End-to-end delay is defined as the time interval between data packets transmission from
source to the destination. Some packets may be dropped if they don’t arrive in time and
this can cause short interruptions in the audio stream. From Fig. 10. We can see that
end-to-end delay of EIGRP_OSPF network is relatively smaller than end-to-end delay
of the other two networks. The highest end-to-end delay is measured in the EIGRP
network.
4.7. Sent and received traffic for voice conferencing
Packet loss as a term is defining the packets that are dropped while servicing the
network traffic. It is inevitable, especially in the IP networks, and occurs as a result of
various reasons. For example, it may occur when routers or switch work beyond
capacity or queue buffers are overflowed. Dropped packets in voice conferencing have
similar effect as noise. However, some applications may tolerate packet loss as they can
wait until packets are retransmitted, but in time-sensitive applications which are not
tolerant to packet loss, it can produce significant performance degradation. Packet loss
must be managed or controlled in voice conferencing since it effect voice signal
distortion. From the results, we can realize that EIGRP network has less packet loss
153

Emilija Stankoska et al.
than OSPF and EIGRP_OSPF networks. Also, It can be observed that in the network
OSPF and EIGRP are performed simultaneously, EIGRP_OSPF has a very large packet
loss.
Fig. 7. End to end delay for voice conferencing and Sent traffic for voice
conferencing
Fig. 8. Received traffic for voice conferencing (left) and Throughput (right)
5. Conclusion
Interior routing protocols such as EIGRP and OSPF are widely being used in the
computer networking. In this study, we presented a comparative analysis of selected
routing protocols such as EIGRP, OSPF and the combination of EIGRP and OSPF. The
comparative analysis has been done in the same network with different protocols for
real time applications. Performance has been measured on the basis of paperwork, the
154

Simulation Based Comparative Performance Analysis of OSPF and EIGRP Routing Protocols
implementation of EIGRP shows that network convergence time is much faster than
EIGRP_OSPF and OSPF networks because EIGRP network learns some parameters
that aimed to figure out the effects of routing protocols.
The throughput is a key parameter to determine the rate at which total data packets are
successfully delivered through the channel in the network. EIGRP network has higher
throughput and less packet loss than OSPF and EIGRP_OSPF networks. EIGRP_OSPF
network has lowest throughput and largest packet loss.
References
1. Black, Uyless D. IP Routing Protocols. Upper Saddle River, NJ: Prentice Hall,
2000. Print.
2. Malhotra, Ravi. IP Routing. Sebastopol, CA: O'Reilly, 2002. Print.
3. Medhi, Deepankar and Karthikeyan Ramasamy. Network Routing. Amsterdam:
Elsevier/Morgan Kaufmann Publishers, 2007. Print.
4. Carthern, Chris et al. Cisco Networks. Print.
5. http://www.riverbed.com
6. Faraz Shamim, Zaheer Aziz, Johnson Liu, Abe Martey, Troubleshooting IP
Routing Protocols Cisco Press, Pages: 912, May 07, 2002.
7. Rick Graziani and Allan Jonson, Routing protocols and concepts: CCNA
exploration companion guide, Pearson Education. London, 2008.
8. Christian Huitema, Routing in the internet, 2. Ed. Prentice Hall PTR, cop. 2000.
9. Scott M. Ballew, Managing IP Networks with Cisco Routers, O‟REILLY Press.
Chapter 5. ISBN: 1-56592-320-0. Published in 1997.
10. Cisco, IP Routing, Introduction to EIGRP, Document ID: 13669.
11. Talal Mohamed Jaffar, Simulation-Based Routing Protocols Analysis, (Thesis),
Ph.D., Dept. Elect. Eng., Georgia Institute of Technology, 2007.
12. Esuendale Lemma; Syed Hussain; Wendwossen Anjelo; Performance Comparison
of EIGRP/ IS-IS and OSPF/ IS-IS, Blekinge Tekniska Hogskolan. Sweden, 2010.
13. http://www.sfu.ca/~mtn9/427_Report.pdf
14. http://www.rhyshaden.com/ospf.htm
15. http://users.salleurl.edu/~zaballos/opnet_interna/pdf/OPNET%20Simulator.pdf
155

International Conference on Applied Internet and
Information Technologies, 2016
DOI:10.20544/AIIT2016.19
Reducing Competitive Cache Misses in Modern
Processor Architectures
Milcho Prisagjanec1 and Pece Mitrevski1
1 Faculty of information and communication technologies, Partizanska bb,
7000 Bitola, Macedonia
milco.prisaganec, [email protected]
Abstract. The trends in the development of the multicore processors very often
have the first level of cache memory implemented in. The increasing number of
threads inside the cores and access competitively to the shared cache memory
becomes the reason for the increased number of the competitive cache misses and
decline the performances. Develop of the modern processor architectures leads to
an increased number of cache misses. This paper has been made an attempt to
implement the technique of decreasing the number of the competitive cache misses
in the first level of the cache memory. This technique enables a competitive access
to the complete cache memory when there is a hit inside of it. But if there are cache
misses, then the memory data through the techniques of replacement is put in a
virtual part given to the threads so that the competitive cache misses can be avoided.
The results gained by using a simulator of the processor show decrease of the
number of the cache misses and increase the performances for 15%. The conclusion
out of this research can be that the cache misses are a real challenge for the future
designers of processors and they need to be paid more attention to.
Keywords: processor, memory hierarchy, cache memory, cache misses, multicore
processors, multithread processor, competitive cache misses, modern processor
architectures
1. Introduction
The basic target develops the processor is increasing of the performances. The bottlenecks
in the processor which decrease its performances are being eliminated by implementation
of the different types of techniques in the architecture itself. If we view this historically
we can notice that the increasing of the frequency, implement the out of order execution
of the instruction, enlargement of the instruction window, and the parallelism of the
instructional levels all these contributed to increasing the performances of the processors
in some periods of time.
But, according to some authors, the gap between the processor speed and its memory
which has still existed since appear the computers, despite the many offered techniques,
while some of them already implemented in the commercial processors, is the reason for
the decrease of the performances [2]. The instruction that accesses memory until the
complete with memory data blocks the processor resources at the same time and decrees
the performances. The basic technique which is being implemented all the time is the
memory hierarchy. When the processor needs a memory data it access to the first level of
the cache memory. If the memory data are in it, we can say that there is a hit, and the
156

Milcho Prisagjanec and Pece Mitrevski
processor loads them inside. But if not, we say that there is a cache miss and the memory
system starts a procedure of elimination which can take several hundred tact cycles [3].
The researches made by many authors showed that the cache misses reduce the
performances of the processors even up to 20%. Even more significant information is that
the gap between the speed and the memory of the processors is getting deeper and bigger
through the time, which contributes to the cache misses number. That is why there have
been numerous efforts made to design techniques to reduce the cache misses. For
example, the prefetching technique [5], which has been implemented into the commercial
processors, supplies taking over the memory data and fetching them into the cache
memory before the processor gets to them. Some other authors [6], [7], in their works
have given ideas of a virtual enlargement of the instruction window, so that it would be
possible to unlock the processor’s resources in the window and withdrawing in advance
the memory data which are to be used by the processor in the near future.
In the modern processor architectures the trends of implementation of bigger number
of cores and threads in the processor itself and the shared memory between them, are the
reason for increase the number of the cache misses and the decrees performances. Among
them appear competitive cash failures by a common access memory system. There are
even some techniques that are used for reduction of the cache misses, for example the
prefetching techniques, contribute now to the appearance of such competitive cache
misses and decrees performances.
Taking that into consideration, we, as authors of this work, propose a technique for
reduction of the competitive cache misses. The idea is, every thread to have its own virtual
cache memory in the first level in the process of replacement of the blocks, while during
the process of loading, all the cache memory to be used. The proposed technique to the
simulator of a processor showed great increasing of the performances of the processor up
to 15%. As positive sides of the technique that we propose are the easy way of
implementation, and the fact it doesn't change revolutionized the present architecture of
the processor. But as a negative point can be noticed that the cache memory is poorly
used in the first level in the process of not very intensive workload of the processor.
The researches of our work certified again that the cache misses significantly reduce
the number of the performances of the processor. The reduction of its number is a
challenge to the future explorers and processor designers.
2. Competitive Cache Misses and Performance Impact
The inability to break through the technological reductions in the processor design,
changes the direction of their development. That means that the idea is to design an
architecture which would perform multiple numbers of instructions at the same clock
frequency. The new concept is based on the previously known system in the
supercomputers where more computers parallel execute their workload. This architecture
is modified by using more processor cores to be placed on one silicon crystal. Each of the
cores is a processor for itself, but the new architecture significantly reduces dissipation
of the energy. The trends of increasing the number of cores and the threads in them are
more present in the modern architectures of processors. The new technology increases
the pipeline of the instruction through the processor, but that means necessity of a larger
instructional window. By doing so, there is increasing of the number of the instructions
157

Reducing Competitive Cache Misses in Modern Processor Architectures
which have greater need of the memory data from the memory system, whose latency is
too big and causes stagnation in the work of the processor.
2.1. Performances of Multi Core Processors
In an ideal case, the double core processor should accomplish a programmer code in a
double speed, compared to the single core processor. But the practical cases so far showed
that it doesn't really happen, and that the double core processor is only 1.5 times faster
than the single core processor. In certain cases, the single core processors even showed
better performances. One of the reasons is the cache misses.
In [8] there has been done an analysis of the cache misses depending on the number of
the cores. By using a simulator there has been designed a multicore processor. This
processor has got only L1 cache memory with capacity of 512Kbytes, the instruction
cache memory of 256Kbytes and the data cache memory of 256Kbytes. The bus supports
MESI protocol for maintenance of the coherency of the memory. The capacity of the main
memory is 1 GB. By using a simulator is executing a benchmark of the designed
processor. All the time the testing process is being made by changing the number of cores
in the processor. The results shown can be read from the figure 1.
Fig. 1. How the number of processor cores affects cache misses
From the figure we can see that the number of the cache misses for the simulated
architecture of the processor is 10% of the number of the memory access. But it can also
be concluded from the figure that by increasing the number of cores from 16 to more, the
number of cache misses also increases which has a negative effect to the performances of
the processor.
The idea in the modern multi core architecture is to improve the pipeline of the
instructions by increasing the number of cores and the threads in each of them. That would
provide parallel execution of a greater number of instructions that means enlargement of
the instruction window. It would hide the latency of the memory which brings to
increasing the number of the performances. But the increasing of the number of the cores
and threads leads to increasing of the number of the cache misses, causing decrease the
processor performances. One of the reasons for that is the competitive cache misses.
158

Milcho Prisagjanec and Pece Mitrevski
2.2. Competitive Cache Misses
In modern processor architectures, more cores and threads share the same memory. The
workload that the processor has to accomplish is divided into processes. The processes
are independent entities, which can be paralleled accomplished in the threads. In the
modern processor architecture, more threads use shared cache memory. Every process
needs certain memory data, and if it cannot provide them from the first level of the
memory, it loads them from the memory system by using a certain method for change of
the blocks. This method of change does not check if the block, which is being changed,
would be used in the near future by some other process. It would bring to removal of
some memory blocks, which would be needed by some other active processes in the future
cycles. It would cause a decrease processor performance.
This scenario would get even worse if we use the prefetching technique to load the
memory data from the first level of the cache memory. If every process would use this
technique to load the memory data from the first level of cache memory, which it would
need in the near future, due to the restricted capacity of the cache memory and its shared
use, would cause competitive memory access and mutual removal of the blocks of data
for the processes. It would cause the appearance of the cache misses. The possibility of
appearance of the competitive cache memory access grows with processor workload,
then, with the increasing of the number of the cores and the threads which share the same
memory, and finally because of the restricted capacity of the cache memory of the
processor.
3. Reducing Competitive Cache Misses – Techniques and Benefits
To avoid the competitive access of the threads, we suggest this technique of a one-way
shared cache memory. The cache memory in the first level is shared to as many parts as
the number of the threads. All threads competitively access the memory. If a thread
contains an instruction, which accesses the memory, check that there is the required
memory data. Therefore, if this data can be found in the first level of the cache memory,
then it is being loaded. It is the same as in the modern processor architecture. If the data
can not be found in the first level of the cache memory, then it is necessary to be loaded
by the upper level of the memory system. The loading of the memory block is completed
by using one of the modern techniques for replacing, but by doing this the block can be
loaded only in the part of the cache memory which belongs to the thread. That means that
during the loading of the memory data this thread uses all the shared cache memory from
the first level. But if a certain data doesn't exist in the first level of the memory, then it
loads it from the memory system, but in the her virtual part of the cache memory.
The prefetching technique, which is frequently used in the modern architecture of the
processors, is also a reason for the appearance of the competitive cache misses. This
technique is implemented in the architecture of the processor in order to decrease the
latency of the memory and the number of the cache misses. This means that for the
instructions which have the access to the memory this technique makes early loading of
the memory data and places them in the first level of the cache memory. At the moment
of execution of the instruction the memory data are already in the cache memory and the
processor just takes them from there with minimal delay.
159

Reducing Competitive Cache Misses in Modern Processor Architectures
But in the modern processor architectures, there is competitive access of the threads to
the first level of the cache memory with the prefetching technique. That is the reason for
the competitive access to the same memory address while loading the memory data from
the upper levels of the cache memory. That is the reason why it is necessary in the offered
technique the prefetching technique to load the memory blocks to the second level of the
cache memory.
3.1. Performance Benefits
In order to get measurable values of the performances of the processor architecture, which
could be compared, we designed a processor simulator with programming language
python. By using this simulator, we tested the performances of an ideal processor which
doesn't have cache misses, a multithread processor and a processor where we
implemented the offered technique for non-competitive access to the cache memory in
the first level. The results gained from the testing are shown in figure 2 where you can
see the time of execution of the benchmark by using different simulated architectures of
the processor. The offered technique is implemented in the multi thread processor
architecture which is with one core with 4 threads. The simulator makes parallel execution
of the instructions in all of the threads. When the simulator comes to an instruction with
access to the memory, it checks whether it can be found in the L1 cache memory. If there
is a a hit, it loads the memory data and completing instruction in the processor. But if
there is a miss in L1 cache memory, the simulator searches this memory data in the upper
levels of the memory. The simulator uses the technique of block replacement and loads
the memory data only in the virtual part of L1 cache memory which belongs to the
matching thread.
Fig. 2. Graphical overview of the performances of three types of processors
According to the results shown the offered technique makes the time of execution of the
programme faster for 15%. The reason is the decreased number of the competitive cache
misses to the first level of the cache memory.
The good side of the offered technique is that it doesn't revolutionary change the
architecture of the processors. It can be implemented very easily. The change comes only
in the technique of replacing the blocks in the first level of the cache memory. In the
160

Milcho Prisagjanec and Pece Mitrevski
cache memory are implemented a tag which is used for marking which block belongs to
which thread.
While replacing the memory block we use this tag for virtual division of the cache
memory of the number of the threads which access to the memory.
The prefetching technique is not something new, this technique is used in modern
processors. The change means that this technique early load memory data in the second
level of the cache memory, to avoid the competitive access to the first level of the cache
memory. This technique doesn't increase the processor complexity, and so, it doesn't
cause the additional dissipation of the energy.
The disadvantages of this technique are the low exploitation of the first level of the
cache memory during the poor workload on the processor. In cases where we have a small
number of processes that reduced the number of active threads, reduced the capacity of
the cache memory in the first level.
4. Conclusions
The results of this paper showed again the huge effect of the cache misses on the
performances of the processor. In order to hide the latency of the memory, which is more
expressed in the modern processors, there is memory hierarchy implemented in the
processor architecture. But it also causes cache misses and decreasing processor
performances.
This paper and the results of the simulation showed that the decreased processor
performances due to the cache misses could not be ignored. The offered technique
succeeds in decreasing the number of the cache misses for 15%, and it increases the
processor performances.
The results of the researches show that the number of the cache misses in the modern
architectures is still very big. On the other side, the direction in which they develop, by
increasing the number of cores and threads and using shared cache memory, brings about
the appearance of bigger number of cache misses even more, and decreasing processor
performances. That is why the decreasing of the number of the cache misses is a great
challenge to the future explorers and designers.
References 1. Tullsen, Dean M. and Jeffery A. Brown: Handling long-latency loads in a simultaneous
multithreading processor in Proceeding of 34th annual ACM/IEEE international
symposium on Microarchitecture, IEEE Computer Society, pp120-122, (2001)
2. Carvalho, C.: The gap between processor and memory speeds In Proc. of IEEE
International Conference on Control and Automation (2002).
3. Hennessy, J. L., & Patterson, D. A.: Computer architecture: a quantitative approach.
Elsevier (2012).
4. Smith, A. J. Cache memories. ACM Computing Surveys (CSUR), 14(3), 473-530,
(1982)
5. Kim, D., Liao, S. S. W., Wang, P. H., Cuvillo, J. D., Tian, X., Zou, X., ... & Shen, J.
P. :Physical experimentation with prefetching helper threads on Intel's hyper-threaded
processors. In Proceedings of the international symposium on Code generation and
161

Reducing Competitive Cache Misses in Modern Processor Architectures
optimization: feedback-directed and runtime optimization (p. 27). IEEE Computer
Society (2004, March).
6. Mutlu, O., Stark, J., Wilkerson, C., & Patt, Y. N.: Runahead execution: An alternative
to very large instruction windows for out-of-order processors. In High-Performance
Computer Architecture In Proceedings The Ninth International Symposium on (pp.
129-140). IEEE, (2003, February).
7. Zhou, H., & Conte, T. M.: Enhancing memory-level parallelism via recovery-free
value prediction. Computers, IEEE Transactions on, 54(7), 897-912, (2005).
8. Prisaganec, M., Mitrevski, P.: Cache misses challenge to modern processor
architectures, Proc. of the XLVIII International Scientific Conference on Information,
Communication and Energy Systems and Technologies (ICEST 2013), Vol. 1, pp. 273-
276, Ohrid, Macedonia (2013).
162

International Conference on Applied Internet and Information
Technologies, 2016
DOI:10.20544/AIIT2016.20
Applying SMT algorithms to code analysis
Milorad Filipovic, Goran Sladic, Branko Milosavljevic, and Gordana Milosavljevic
Faculty of Technical Sciences
University of Novi Sad, Serbia
mfili, sladicg, mbranko, [email protected]
Abstract. This paper presents an overview of tools and techniques that can be
used to detect potential vulnerabilities and design flaws in computer programs by
applying mathematical knowledge in solving Boolean satisfiability (SAT)
problems. SMT (Satisfiability Modulo Theories) algorithms check satisfiability of
given logical formulas with regards to some background theory, so we can say
that SMT represents an abstraction of general SAT theory. If a computer program
can be presented as a logical expression, we can use SMT process to discover
input values that can lead it to an inconsistent state. Obtaining logical structures
from programming code can be done by symbolic execution techniques, which
transform program execution flow to Boolean expressions suitable for analysis
using SMT solving software. This paper proposes usage of Binary Analysis
Platform (BAP) for symbolic execution and Z3 SMT Solver as SMT solving
software.
Keywords: Software security, Code analysis SMT, Algorithms
1. Introduction
Mathematical SAT problems[8] are aimed at finding concrete boolean values for
formula variables that satisfy given logical expression. Solving SAT problem means
finding concrete values for variables of specified logical expression for which given
formula evaluates to true (if such values can be found, we say that formula is
satisfiable). If we consider each state that computer program can be in at a given
moment to be a result of input data set which is transformed by programming constructs
such as flow control commands, it is easily noticeable that such states can be
represented as mathematical expressions with input data as variables. By finding data
sets that lead to certain program states, we can backtrack which concrete data can lead a
software program to states of interest. This approach can be used to track vulnerabilities
and to generate exploits in order to conduct security testing of software platforms. The
NP-completeness of SAT problems makes them relatively hard to implement in
computer algorithms, but with recent development of computer software and hardware,
we are witnessing emergence of a large number of software solvers for SAT problems
[11]. The Satisfiability Modulo Theories (SMT) problems extend SAT by supporting
higher level theories such as Integer or Bitvector arithmetics (in contrast with SAT,
which is able to reason only logical values and operations) which makes it especially
suitable for modeling software constructs and methodologies.
163

Milorad Filipovic et al.
In order to obtain Boolean expressions from programming code suitable for
reasoning using SMT solvers, we use symbolic execution[4][5] which (in opposite to
concrete execution) uses symbolic values for variables and results. Using symbolic
values makes it possible to track all data paths within programming code instead just
one concrete, which in turn results in expressing analyzed program in the format
suitable for SMT solvers. As can be noticed from the previous discussion, a number of
possible data flow paths to be analyzed grows with observed program complexity, so in
order to process complex software systems, we use an approach called Concolic execution which combines methodologies from both symbolic and concrete execution.
As an example of usage of described methods, we propose Binary Analysis Platform (BAP)[2] for obtaining SMT input data which is passed to Z3 SMT Solver[6].
2. SAT and SMT
As mentioned in the introduction, boolean satisfiability theories (SAT) study
problems of finding variable values that satisfy given logical expression. Such
expression is usually specified as a conjunction of logical terms called atoms. The
formula is satisfied if it evaluates to > for given values. If such values can be found, a
formula is satisfiable and the problem is solved. This process if often called solving the formula. For instance, consider following logical expression:
(x + y ≤ 0)∧(x = 0)∧(¬a ∨(x = 1))∧(y ≥ 0) (1)
where x and y are variables ranging over Z and a is logical variable. In order to solve
this formula, our task is to find values for x,y and a that will evaluate an expression to >.
For this concrete example, formula is satisfied for following values: x = 0,y = −10 and a = >, so the formula is satisfiable. Set of values that satisfy formula is called it’s model.
Since SAT solving is theory-agnostic approach, operators that appear in expressions
don’t work in the way we expect them to unless that is specified in theory definition. In
first-order logic[9], a Theory is defined by the set of axioms that specify it’s syntax and
semantics. The syntax of a theory specifies set of symbols used to construct formulas. It
consists of signature Σ which defines function symbols (operators) and set of variables
marked as V. Semantics of a theory is used to define rules of using symbols in
expressions. For instance, each symbol is associated with a set of values µ. Logical type
Bool is associated with >,⊥. As an extension of SAT, SMT works on already defined
theories, so the syntax and semantics for our problem are predefined. For example,
when working with on arithmetic problems, the notion for well-known operators such
as + is exactly the one we learned in elementary school, there is no need for
constructing any rules that define how it works. Most recent SMT solvers use SMT-
LIB[3] notation for Theories definition. Beside already built-in theories, we can use
SMT-LIB to define our own theories and extend the platform to suit our needs. This
support for higher level theories such as Integers or Array arithmetics makes SMT
suitable to model software and hardware problems. If a certain system in a given state
could be represented as a logical term described above, and if inputs (such as data input
for software program or signals for some kind of controlling component) are considered
to be variables in the formula, then it represents an SMT instance. Solving that instance
164

Applying SMT algorithms to code analysis
means finding the input set which led the system to a given state. Using this approach
we can backtrack which occurrences can lead observed system into inconsistent states.
3. SMT-LIB
The Satisfiability Modulo Theories Library (SMT-LIB) standard is initiative started
in 2003 by the authors of [3] and maintained by worldwide community of SMT
researchers that aims to define standard input format for SMT solvers and use
community knowledge and expertise to form a common library of SMT benchmarks
and definitions of widely used theories. SMT benchmarks are script-like input files that
contain formula that is passed to SMT solver. Besides specifying benchmarks, SMT-
LIB notation is used to specify background theories. A set of already defined basic
SMT theories (such as theory of real numbers, theory of arrays and theory of lists) can
be found at [1], but it is also possible do define new background theories by specifying
all the rules from scratch, combining multiple basic theories or making a new theory as
a reduction of existent theory.
SMT benchmark files contain formula definition and SMT solving commands
written in SMT-LIB standard. Each term contained in the formula is specified using
assert command and written in prefix notation. SMT-LIB benchmark that defines
boolean expression:
(x − y ≤ 0)∧(y − z ≤ 1)∧((z − x ≤−1)∨(z − x ≤−2)) (2)
is shown in Listing 1.1
(set-logic QF_LIA) (declare-const x Int) (declare-const y Int) (declare-const z Int) (assert (<= (- x y) 0)) (assert (<= (- y Z) 1)) (assert (or (<= (- z x) -1)
(<= (- z x) -2))) (check-sat) (exit)
Listing 1.1. SMT-LIB benchmark example
4. Z3 SMT Solver
Z3 An Efficient SMT Solver is high-performance automatic SMT solver developed by
Microsoft Research group in C++ programming language. The solver is specialized for
solving software analysis and verification problems and it is available under open-
source license. It can be used as standalone SMT solver with standard benchmark files
as inputs, or it can be implemented into existing software tools and invoked trough API.
Z3 supports three formats for input files: SMT-LIB, Simplify[7] and DIMACS, and has
API specification for C, Python and .NET programming languages. Z3 relies on modern
165

Milorad Filipovic et al.
DPLL SAT solver combined with task-specific components such as simplifier, compiler
and multiple theory solvers[6].
Z3 defines logical data type Bool and supports standard logical operators (AND, OR,
EXOR, negation and implication) as well as the if-then-else construct (written as ite in Z3). Usage of logical variables and operations to prove implication transitivity is
shown in Listing 1.2.
(declare-const p Bool)
(declare-const q Bool)
(declare-const r Bool)
(define-fun conjecture () Bool
(=> (and (=> p q) (=> q r))
(=> p r )))
(assert (not conjecture))
(check-sat)
Listing 1.2. Implication transitivity proof in Z3
In this example, command define-fun is used to define a boolean function called
conjecture which defines transitivity of implication operation. In order to show that
implication is transitive relation, we need to show that it’s negation is not satisfiable.
Z3 also supports linear and non-linear integer arithmetics in a pretty straightforward
way, but with a few remarks. In linear arithmetics, Z3 does not automatically promote
data types like most programming languages do, instead explicit conversion needs to be
done using toreal command. Also, non-linear arithmetics (multiplying, division,
exponentiation) is not completely supported in Z3, so the check-sat can return unknown as a result, meaning that formula is not decidable in Z3.
Since most of the modern processor arithmetic is done on bit-vectors, it is interesting
for us to show an example of bit-vector arithmetics in Z3. Z3 supports a wide range of
bit-vector operations which have bv prefix (bvsub is bit-vector subtraction).
5. Symbolic execution
Symbolic execution represents a powerful link for combining SMT solving and
software security engineering. The computer program is constructed to run using
concrete data values as inputs and results of its operations, which we call concrete execution. Unlike concrete execution, symbolic execution substitutes concrete
expressions with symbolic variables in order to obtain data flow paths which lead to
certain outputs. When logical expressions in control flow commands (such as if statement) are reduced to symbolic variables, the result of a logical operation is either
that symbolic variable or it’s negation, which represents two possible paths that
program execution can take. By executing conjunction of these values down the
selected paths we are able to backtrack the concrete data inputs which led to the
execution of observed part of the code. An example of a symbolic representation of
programming code is shown in Figure 1.
On the left side of Figure 1, we can see a simple piece of program code with logical
expressions which lead program execution to one of the four possible outputs. Program
166

Applying SMT algorithms to code analysis
execution paths are shown in the right part of the figure. Each logical term branches a
program into two possible paths (> or ⊥) and conjunction of these values leads to one of
four outputs, marked as o1...o4. This way of representing the program flow is the core of
symbolic execution and in order to, for example, trace the input which leads to output
o3 we trace the path from the figure and write conditions in conjunction. This eventually
gives us a logical formula (x > 12) ∧¬(x > 0). Passing such an expression to SMT
solving algorithm can give us concrete values that satisfy the formula.
Fig.1. Examle of symbolic execution
When performing security assessment of software, in many cases (like when
analyzing malicious programs) we don’t have the insight into observed system’s source
code. Instead, analysis needs to be preformed on the binary level which complicates the
whole process additionally. One thing that needs to be coped with is the absence of
abstract constructs available in the higher level programming language. Also, binary
code is more complex than the source code and large number of binary instructions
have implicit sideeffects which are not directly obvious from the code. For these
reasons, modern symbolic execution and binary code analysis algorithms transform
concrete binary code to certain intermediate language which makes the analyzing
process easier and platform independent.
6. Binary Analysis platform
As a concrete example of a symbolic execution tool, this section presents Binary Analysis Platform (BAP)[2] developed at the Carnegie Mellon University, Pittsburgh,
USA. BAP is designed to enable binary code analysis with an emphasis on software
security assessment. BAP reduces complex instruction sets used by modern processing
units to a language called BAPIntermediateLanguage(BIL). BIL represents link between
platformdependent BAP front-end, and BAP back-end, which uses only the
intermediate language and consists of various analysis tools such as graph generator,
code generator and optimizer and symbolic execution tools. Front and back end are
interacting using BAP commands such as toil or getfunctions which transform
executable code to BIL. Obtained BIL code can be symbolically executed using the
iltrans command in order to get SMT solver benchmarks.
Current limitations of BAP platform include:
– Support for x86 processor platforms only
167

Milorad Filipovic et al.
– Lack of support for floating point operations
– The correctness of intermediate language cannot be formally proved since
formal definitions of architectures do not exist.
7. Practical example
In this concrete example, we analyze software code that verifies serial number validity
in order to obtain valid number using the Z3 SMT solver. After transforming executable
code using disassembler tool, analyzing it, we came to a conclusion that the code reads
4 bytes from the user input and passes them to an algorithm which calculates the
checksum. For valid checksum values, the algorithm returns true. Pseudo-code of the
discussed an example is shown in Listing 1.3.
s = get_input(4)
num = to_number(s)
num1 = num << 21
num2 = num >> 21
num = num1 OR num2
num = num XOR 0xdeadbeef
num = num + 0xdeadbeef
if num == 0x2f5b7b03: return TRUE else: return FALSE
Listing 1.3. Serial number verification pseudo-code
As can be noticed from the Listing 1.3, in order to satisfy the algorithm, checksum
needs to be equal to 0x2f5b7b03. Operation of checksum calculation is, obviously, not
reversible, so just by knowing the result, there is no way of writing the equation for it.
But modeling the problem as a logical formula based on the noticed constraints, we can
use the SMT approach to get the solutions. Listing 1.4 shows the SMT-LIB benchmark
that represents checksum calculation process.
(set-logic BV) (declare-const input(_BitVec 32)) (assert (= (bvadd
(bvxor (bvor
(bvshl input (_ bv21 32)) (bvashr input (_ bv21 32)))
#xdeadbeef) #xdeadbeef)
#x2f5b7b03)) (check-sat) (get-model) Listing 1.4. SMT-LIB model of the example argorithm
168

Applying SMT algorithms to code analysis
Using the Z3 solver, we obtain the model shown on the Listing 1.5, which shows us
on solution for the algorithm (0x5f600470).
sat (model (define-fun input() (_ BitVec 32) 0x5f600470) )
Listing 1.5. Z3 solution
In order to obtain valid serial numbers, we can only accept the values that can be
entered by the user via keyboard, which is not the case with our result. Running Z3
solver until we get a valid result is time-consuming brute-force way, so a better
approach is to write additional constraints to the formula which will limit input to
readable values. For the sake of simplicity, this modification is hereby excluded.
8. Conclusion
Usage of mathematical knowledge, especially practices from the field of logic are
being more and more popular in research of techniques for software security analysis.
Recent research activity along with a great technological progress of the software and
hardware industries has emerged a number of platforms and tools which can be coupled
to overcome the problems faced in initial stages their usage. Many studies and practical
problems propose SMT solving algorithms for software and hardware flaw detections
and analysis in general. In order to be processed by SMT solver, the observed system
needs to be presented as a logical expression which can be obtained with symbolic
execution techniques.
In this paper, we proposed usage of Z3 SMT solver and Binary Analysis Platform as
a powerful and flexible combination for software security assessment. Each system is
discussed in the corresponding section with concrete examples which follow the
discussion in order to help the readers get a better insight in presented techniques. In
addition, two real-world examples were provided to illustrate the usage of BAP and Z3
solver in conjunction. We hope that the paper presents a good overview and a solid
starting point for researchers interested in combining mathematical methods in software
engineering.
References
1. Smt-lib theories (version 2), www.smtlib.org (2014), http://www.smtlib.org/,
[Online; accessed 21-May-2014]
2. Brumley, D., Jager, I., Avgerinos, T., Schwartz, E.J.: Bap: A binary analysis
platform. In: Proceedings of the 23rd International Conference on Computer
Aided Verification. pp. 463–469. CAV’11, Springer-Verlag, Berlin,
Heidelberg (2011),
http://dl.acm.org/citation.cfm?id=2032305.2032342
169

Milorad Filipovic et al.
3. C. Barrett, A. Stump, C.T.: The SMT-Lib standard: Version 2.0 (2010),
technical report
4. Cadar, C., Sen, K.: Symbolic execution for software testing: Three decades
later. Commun. ACM 56(2), 82–90 (Feb 2013),
http://doi.acm.org/10.1145/2408776.2408795
5. Chipounov, V., Kuznetsov, V., Candea, G.: S2e: A platform for in-vivo
multipath analysis of software systems. SIGPLAN Not. 47(4), 265–278 (Mar
2011),
http://doi.acm.org/10.1145/2248487.1950396
6. De Moura, L., Bjørner, N.: Z3: An efficient smt solver. In: Proceedings of the
Theory and Practice of Software, 14th International Conference on Tools and
Algorithms for the Construction and Analysis of Systems. pp. 337–340.
TACAS’08/ETAPS’08, Springer-Verlag, Berlin, Heidelberg (2008),
http://dl.acm.org/citation.cfm?id=1792734.1792766
7. Detlefs, D., Nelson, G., Saxe, J.B.: Simplify: A theorem prover for program
checking. J. ACM 52(3), 365–473 (May 2005),
http://doi.acm.org/10.1145/1066100.1066102
8. Dixon, H.E., Ginsberg, M.L., Parkes, A.J.: Generalizing boolean satisfiability
i: Background and survey of existing work. J. Artif. Intell. Res. (JAIR) 21,
193–243 (2004)
9. Enderton, H.B.: A mathematical introduction to logic. Academic Press (2001)
10. Godefroid, P., Levin, M.Y., Molnar, D.: Sage: Whitebox fuzzing for security
testing. Queue 10(1), 20:20–20:27 (Jan 2012),
http://doi.acm.org/10.1145/2090147.2094081
11. Vanegue, J., Heelan, S.: Smt solvers in software security. In: Bursztein, E.,
Dullien, T. (eds.) WOOT. pp. 85–96. USENIX Association (2012),
http://dblp.unitrier.de/db/conf/woot/woot2012.html
170

International Conference on Applied Internet and Information
Technologies, 2016
DOI:10.20544/AIIT2016.21
Controlling Robotic Arms Using Raspberry Pi Through
the Internet
Anita Sabo 1, Henrik Lábadi 2, Tibor Szakáll 3 and Andrea Kukla 4
1,2,3,4 Subotica Technical-College of Applied Sciences, MarkaOreskovića 16, Subotica, Serbia
[email protected], [email protected], [email protected],
Abstract. Robotic arms are widely used in the industry, research and even in
some consumer products. They are used to automate movements or to substitute
humans for various reasons. These can be hazardous environment, for example
radiation, extreme heat, lack of oxygen; or other factors, like long travel time as
in case with the robotic arm of a Mars rover. In both cases, it is crucial to allow
controlling the arm from the distance. The solution described in this research uses
a cloud service to connect the client software and the device itself. The client
application then can be deployed to computers, tablets, even mobile phones with
internet access.
Keywords: Raspberry Pi, Robotic Arm, MeArm.
1. Expectations
The expectations of the research were to build the robotic arm itself, connect its
servo motors to the controller, which is in this case was a Raspberry Pi, write the
control software and the network connection module, build the web service and create
the client applications. In addition to this, several scenarios had to be planned where the
solution could be used.
The solution had to be universal so it could be used in various different areas. At the
time of design these were architecture and car building industry, namely cranes used to
build buildings and the robotic arms used to build cars. Parallel control was also critical.
This means that by using a single control unit and the motors connected to the same
buses, all of them must be able to make the same movements at the same time [1].
171

Sabo et al.
2. Robot overview
The structure of the solution is very simple as shown in Figure 1. The same principle
was used as in software development, namely every task and function has been split
into several smaller subtasks until they were easy to implement or build. Reusability
was another key point during the development. This meant that universal functions had
to be written to be able to work with any kind and number of joints, universal web
service had to be designed to be able to handle communications from these potentially
distinct form factors and data structures [2].
Fig. 1. Control flow of the solution
When the user sets the direction of any of the joints the client software translates
these data to a previously selected transmission format. In this case, JSON (JavaScript
Object Notation) was selected as the format. It is more lightweight than XML
(Extensible Markup Language) and several popular already implemented libraries are
available for handling such data on the client side, on the server side and on the arm
itself. As JSON can be passed to the web service only via POST methods, a simpler
GET alternative has been developed which was suitable for our requirements. POST
requests supply additional data from the client (browser) to the server in the message
body. In contrast, GET requests include all required data in the URL (Uniform
Resource Locator). Forms in HTML (HyperText Markup Language) can use either
method by specifying method="POST" or method="GET" (default) in the <form>
element. The method specified determines how form data is submitted to the server.
When the web service receives the data, it prepares it to be served to the client. In
both cases of data, they have to be disassembled to plain variables and then rebuilt into
the JSON file. This file contains all the required joint states, a timestamp and a unique
identifier of the packet. The last two were required because no push mechanism was
used, so the control module polls the server at a predefined interval. This means that it
is very likely that the same package is served multiple times to the robot, so it has to
decide whether the action has to be completed [3][4][5].
172

Controlling Robotic Arms Using Raspberry Pi Through the Internet
The software on the Raspberry Pi polls the server in predefined intervals. These were
not hardcoded but instead were set as variables in the code. This means that they could
be easily changed if that was required. The interval was set to ten seconds by default.
Because of the nature of the solution, this means that after every ten seconds some data
was downloaded. If it was a valid package, it was necessary to verify whether it was
newer than the last processed data. If that was the case, the difference between the
current position and the desired position of each motor was computed. The next step
was to move the servos if the results required it.
3. Realized device
The Robot represents the combination of four main parts:
The device
The control unit
The cloud service
The client software
The device is basically the robotic arm itself. It consists of the cut out Plexiglas parts
assembled and the servos attached to it. The base of the arm was a third party solution
called MeArm, which can be downloaded and cut out or printed, or the parts could be
ordered leaving only the assembly to the user as represented in Figure 2 and Figure 5.
In this experiment, the download option was chosen. After downloading, the file could
be used on a CNC or it could be printed using a 3D printer. For the current robot, the
parts were cut out using a laser head on the CNC. The parts were then screwed together
using simple screws.
Fig. 2. The MeArm robotic arm
To complete the build, servos were attached. Four motors control the robot, three
were used to move the arm around and one for opening and closing the gripper. The
three servos were placed in such a way that the robot’s workspace corresponds to an
173

Sabo et al.
RRT arm’s workspace even though only rotational joints were used, so the arm was
actually a RRR structure [6][7].
Fig. 3. The robotic arms joint functions
The Figure 3 depicts the robotic arm as the representation of the human arm. As
presented robotic arm has 4 DOF (degrees of freedom) and simulates behavior of the
shoulder and the elbow. Last segment is the gripper which represents the fingers
gripping action without wrist joint.
4. The control unit
Even though the MeArm came with its own downloadable software, it has been
decided that a new one had to be developed. The main reason for this was that the kit’s
software was written for Linux. For our project, Windows 10 IoT Core was chosen as
the operating system because of the simplicity of the development. It could be easily
programmed using C# or Visual Studio [8][9].
Fig. 4. Connecting the control unit to the arm
174

Controlling Robotic Arms Using Raspberry Pi Through the Internet
The wiring was kept as it was recommended by the MeArm team as shown in the
Figure 4 where a separate power supply was connected to the breadboard to power the
servos. Control of the motors was performed through general purpose pins which were
used for PWM (Pulse-width modulation) signal generation. This caused some trouble
until the 1511 version of the operating system was released, namely it was impossible to
generate useful PWM signals that would meet the time requirements.
Fig. 5. The assembled robotic arm with the wiring visible
The software part of control unit is a very simple modular solution. It has only one
task, to connect the robotic arm to the cloud. Windows 10 IoT Core requires the apps to
be written as Universal Windows applications. This, in theory, means that the very
same application could be deployed in Windows 10 based devices: PCs and Windows
phones. This option was not used, but the control software has its own graphical
interface and if the user connects the Raspberry Pi to a display using HDMI (High-
Definition Multimedia Interface) and together with a mouse, the motors could be
controlled directly, without the cloud [10]…[20].
Microsoft provides very straightforward documentation for the Azure IoT Hub
connection for Raspberry Pi’s running Windows. This option has been considered but a
custom client-server solution was developed instead. The client basically sends requests
the web service and polls it for the results.
5. The cloud
When designing the cloud part, the most comfortable and easy solution was to use
the already built and configured Azure IoT Hub. Code samples and step by step
tutorials are available for that purpose. The pricing is user friendly as well.
Despite this, the decision was to implement a very simple Web API based web
service as shown in the Figure 6. Because of the fact that in this case only one single
robot was used, the authentication and parallel control parts were left out of the service.
The following example shows the JSON data stream:
"guid": "A8118DAA-C9AA-438B-8F22-BCBD6D36BE5F",
175

Sabo et al.
"timestamp": "21.03.2016. 12:13:31",
"xangle": "-90",
"yangle": "73",
"zangle": "0",
"endeffector": "90"
The operation starts with the client sending a HTTP GET request to the service with
the angles of the servos. GET was used for the sake of simplicity. After the services
process the data, a JSON file is created and written to a predefined location on the
server, currently /results.json. The JSON file contains the timestamp of the operation
and a GUID (globally unique identifier), so the control unit would know whether it
processed the results already. The header is followed by the desired absolute angles of
the servos. This had to be done, because the server never knows and never should know
whether the device is powered on or has been reset to the starting position. The device
therefore has to add or subtract the angles to get the correct number of degrees it has to
move the servos.
6. The client application
The last piece of the puzzle was the client running on a PC or a mobile phone. Like
the Raspberry’s software, it has been written as a Universal Windows app [21][22][23].
This allowed the same codebase to be used on the phones and the computers, without
any modification.
The purpose of the client software was to provide an interface through which the user
could interact with the robot. This was realized with use of sliders where one could
choose the desired angle they wanted to move each servo. The other part of the
software is the network stack. Because most of the hard work was done by the service,
the client application only needed to send the absolute angles to the server. In this case,
it meant that the application had to navigate to a specific website.
In its current form the system supports Windows 10 only on a PC and on mobile
phones. Technologies, like Xamarin allow easy portability of the C# codebase to the
other mobile platforms, like Android or iOS.
176

Controlling Robotic Arms Using Raspberry Pi Through the Internet
Fig. 6. The client application
7. Shortcomings and future research areas
While building the system some design flaws were discovered. Other elements that
were chosen from the start had to be left out. For example, the authentication part of the
web service is completely missing, because only one robot was used, the website’s
address was not public and the risk factor was minimal. In the case that other robots
were made for the construction sites or the factories, this part would be crucial.
Another missing piece was the lack of feedback mechanism. The user does not know
whether the robotic arm is turned on or is online. They cannot be sure that the robot’s
move was completed. Even the server could be offline. This is crucial for industrial
usage[24][25][26].
It is planned to implement and offer the service part through the Azure IoT Hub
instead of the custom built web service. It would allow bigger flexibility and more
options to the end users [27][28][29]. Different form factors are planned as well. Even
though the current version was designed keeping civil engineering in mind too, a proper
crane form factor is required [30]. Our work has already started in this area.
177

Sabo et al.
8. Conclusion
While the expectations were met, the shortcomings described in the above chapter
mean that the solution has to be updated and perfected further before any industrial
usage is possible. Also, while this was not regarded as a project scope, direct Bluetooth
connection could be useful in some cases which became clear during the development
process. For example, for security reasons, a factory can disable all internet activity for
the robots, or constructions at remote places could be out of service areas of the mobile
providers. Despite of all these problems, the future use of the project is clearly visible.
As a primary concept Raspberry Pi is a fully functional computer that is
characterized by small size (the size of a credit card), low price and a wide range of
applications. Raspberry Pi computers were eventually managed to conquer space for a
much wider application than the one that was initially planned. Although the hardware
is much weaker than standard PCs, due to the well designed components and excellent
integration Raspberry provide excellent performance. This article demonstrated that this
platform can be easily used as embedded solutions in case of a small robotic system.
This is the result of great support coming from the open source community and the
emergence of the concept of Internet of things. With more and more devices that
communicate with each other independently and produce large amounts of user data, it
is possible to create new forms of social networks in which not only people
communicate with each other, but devices can communicate between each other
autonomously.
9. References
1. Familiar, B. (2015). Microservices, IoT, and Azure. apress
2. Gillett, R., Kerr, A., Sallaberger, C., Maharaj, D., Martin, E., Richards, R., & Ulitsky, A. (2-5
May 2004). A hybrid range imaging system solution for in-flight space shuttle inspection.
Electrical and Computer Engineering, 2004. Canadian Conference on (Volume:4 ) (pp. 2147 -
2150 Vol.4 ) IEEE.
3. Jayavardhana Gubbia, R. B. (2013). Internet of Things (IoT): A vision, architectural
elements, and future directions. Future Generation Computer Systems, Pages 1645–1660.
4. Upton, E., & Halfacree, G. (2014). Raspberry Pi user guide. John Wiley & Sons.
5. Aikenhead, B. A., Daniell, R. G., & Davis, F. M. (1983). Canadarm and the space shuttle.
Journal of Vacuum Science & Technology A, 1(2), 126-132.
6. POPA, M. (2014, 1). Considerations Regarding the Cross-Platform Mobile Application
Development Proces. Economy Informatics, pp. 40-52.
7. Bräunl, T. (2008). Embedded robotics: mobile robot design and applications with embedded
systems. Springer Science & Business Media.
178

Controlling Robotic Arms Using Raspberry Pi Through the Internet
8. Gustafson-Söderman, U. (1987). The effect of an adjustable sitting angle on the perceived
discomfort from the back and neck-shoulder regions in building crane operators. Applied
ergonomics, 18(4), 297-304.
9. Miorandi D, Sicari S, De Pellegrini F, Chlamtac I. Internet of things: vision, applications and
research challenges. Ad Hoc Netw 2012;10:1497–516.
10. Dennis AK. Raspberry Pi home automation with Arduino. USA: Packt Publishing; 2013.
11. Bell CA. Beginning sensor networks with Arduino and Raspberry Pi. Apress Media; 2013.
12. Gomes MC, Paulino H, Baptista A, Araujo F. Dynamic interaction models for web enabled
wireless sensor networks, parallel and distributed processing with applications (ISPA); 2012.
13. Vujovic´ V, Maksimovic´ M, Kosmajac D, Miloševic´ V, Perišic´ B. Web integration of
REST enabled wireless sensor networks for fire detection,
14. International Conference on Applied Internet and Information Technologies, Zrenjanin,
Serbia; 2013. p. 30–5.
15. LumsdenJ,SanchezC.Modularautonomousroboticsplatformforeducational use. In: IEEE
TENCON conference 2010: pp 1577–1582.
16. WagnerB,HohmannP,GereckeU,BrennekeC.: Technical Framework for robot platforms
ineducation.In Proceedings of international conferenceon engineering education and
research2004, pp.699–703.
17. HarlanRM,LevineDB,McClariganS.TheKheperarobotandthekRobotclass: a platform for
introducing robotics in the undergraduate curriculum.In: Proceedings of the thirty-second
SIGCSE technical symposium on computer science education2001, pp 105–109.
18. Levin I, Kolberg E, ReichY. Robot control teaching with a state machine-based design
method.IntJEngEduc2004;pp 202–212.
19. Kikuchi T, Kenjo T, Terauchi M, Kaji N. Handrobot: hands-on learning for engineering
undergraduates. Proceedings of IEEE international workshop on robot and human interactive
communication (ROMAN) 2004, pp 223–228.
20. Weinberg JB, Yu X. Robotics in education: Low-cost platforms for teaching integrated
systems. IEEE Robot AutomMag 2003; pp 4–6.
21. Ferreira NMF. Tenreiro MJA. RobLib: an educational program for analysis of robots,
Proceedings of the fourth Portuguese conference on automatic control, 2000, pp 406–11.
22. Candelas FA, Puente ST, Torres F, Ortiz G, GilP, Pomares J. A virtual laboratory for
teaching robotics. IntJEng Educ2003; pp 363–70.
23. Arshad H, Jamal J, Sahran S. Teaching robot kinematic in a virtual environment.
Proceedings of the world congress on engineering and computer science 2010, vol.1.
24. A.M. Zanchettin, P. Rocco, L. Bascetta, I. Symeonidis, S. Peldschus, Kinematic analysis and
synthesis of the human arm motion during a manipulation task, IEEE International
Conference on Robotics and Automation, 2011, pp. 2692–2697.
25. P.T. Katsiaris, P.K. Artemiadis, K.J. Kyriakopoulos, Modeling anthropomorphism in
dynamic human arm movements, IEEE/RSJ International Conference on Intelligent Robots
and Systems, 2010, pp. 3507–3512.
179

Sabo et al.
26. K. Seungsu, K. Chang Hwan, P. Jong Hyeon, Human-like arm motion generation for
humanoid robots using motion capture database, IEEE/RSJ International Conference on
Intelligent Robots and Systems, 2006, pp. 3486–3491.
27. P. Ga-Ram, K. Kanggeon, K. Changhwan, J. Mun-Ho, Y. Bum-Jae, R. Syungkwon, Human-
like catching motion of humanoid using Evolutionary Algorithm (EA)-based imitation
learning, 18th IEEE International Symposium on Robot and Human Interactive,
Communication, 2009, pp. 809–815.
28. B. Almasri, F.B. Ouezdou, Human-like motion based on a geometrical inverse kinematics and
energetic optimization, IEEE/RSJ International Conference on Intelligent Robots and
Systems, 2008. 640–646.
29. F. Zacharias, C. Schlette, F. Schmidt, C. Borst, J. Rossmann, G. Hirzinger, Making planned
paths look more human-like in humanoid robot manipulation planning, IEEE International
Conference on Robotics and Automation, 2011, pp. 1192–1198.
30. K. Hyunchul, L. Zhi, D.Milutinovic, J. Rosen, Resolving the redundancy of a seven DOF
wearable robotic system based on kinematic and dynamic constraint, IEEE International
Conference on Robotics and Automation, 2012, pp. 305–310.
180

International Conference on Applied Internet and Information
Technologies, 2016
DOI:10.20544/AIIT2016.22
Autonomous Devices to Map Rooms and Other Indoor
Spaces and Storing Maps in the Cloud
Henrik Lábadi 1, Anita Sabo 1, Bojan Kuljić 2 and Goran Arslanović 3
1,2,3 Subotica Technical-College of Applied Sciences, MarkaOreskovića 16, Subotica, Serbia
[email protected], [email protected], [email protected],
Abstract. The publication presents a three wheeled robot that has been designed
to map rooms, halls and other indoor areas. The device uses an ultrasonic sensor
for measuring distance, which is later used for both navigation and obstacle
detection. Data were used later to compose a matrix – the schematic map of the
room. This map could be uploaded to the cloud for later use by other 3rd party
devices so they do not have to redo the mapping process again.
Keywords: Autonomous Robots, Indoor Mapping, Ultrasound, Distance
Measurement, Cloud.
1. Expectations
When the robot was designed, the expectations were clear: a self-navigating robot
should be built that could map indoor areas all by itself. This mapping process does not
have to be very deep in terms of navigation, the limit was set to one clockwise turn
from the main path as demonstrated in the Figure 1.
181

Henrik Lábadi et al.
Fig.1. The robot's main path and the single allowed turn
Fig. 2. Example represantiotion of the result matrix. Each number is a distance from the nearest
obstacle, starting from ahead going in clockwise direction
The device is capable of finding a way back to the main path should it navigate
away. Besides of exploring the room, the robot was able to do 360 degree turns in order
to measure distance from obstacles in each direction.
The results were processed as an n-by-m matrix, where values of each cell were the
result of the measurements as shown in the Figure 2.
2. Basic properties
The robot used in the experiments was a specifically build three-wheeled vehicle.
The back wheels were driven; the single front wheel had no specific function. The robot
was able to move forward and backward and turn in 360 degrees without steering.
Instead, when there was a need for turning, the wheels started spinning at different
speeds [1][2][3]. Because the faster wheel travels further, it rotates the vehicle in the
opposite direction. The downside of this method was that because there is no on-board
gyroscope on the device, the angle could not be determined precisely and the robot had
to be calibrated for different surfaces[4][5][6].
182

Autonomous Devices to Map Rooms and Other Indoor Spaces and Storing Maps in the Cloud
Fig. 3. The device
The device was designed to be small, so it could get under furniture and between
furniture as shown in the Figure 3. However, due to the ultrasound sensor’s field of
view these scenarios were ruled out [7][8]. The vehicle consists of the following
components:
One Arduino board
One Arduino shield
Two servos
One ultrasound sensor
Housing
Two wheels
Cables
The Arduino board constitutes the main control unit. It runs the software and is
wired to the shield board, the power button and the sensor. The shield board is
connected to the servos, which have the wheels attached under the vehicle itself. The
sensor was mounted higher above the main plain of the device.
3. Methods for measuring distance, and navigation
Distance was measured using the sensor on the front of the device. The robot starts
from a random starting position. At first, it does not know anything about the world
around itself. The first step is to do a full circle and measure the distances from the
obstacles as in the Figure 4 and the Figure 5. The computed starting point would be
determined by the software. It tries to get to the nearest corner and use that point as a
new starting point [9][10][11]. This method has been chosen to simplify the mapping
process by not having to worry about fragments. By this way on the other hand the
vehicle could travel farther at first. When the secondary starting point has been
183

Henrik Lábadi et al.
determined, the robot tries to navigate there. In a special case, when all the distances are
equal, the forward right corner is chosen as secondary starting point. Clearly, in this
special case the original placement of the robot plays an important role.
Fig. 4. Sample initial measurement
Fig. 5. Starting position of the robot in the room if the measured data is from Figure 4
Because there is no gyroscope on the robot, the operation is completely dead
reckoning based. For the most cases, it is sufficient, as the robot travels mostly in a
straight line. Straight runs can be measured using the onboard distance sensor. When
the distance from the nearest obstacle changes, that measured value becomes the travel
distance for that period. The cases where dead reckoning falls short were the turns.
Without a compass or a gyroscope, the only way to execute them was by blindly
powering one side of the wheels while holding the other one or spinning it backwards
[12][13][14]. The problem with this method was the need for long calibration and that
even with extensive calibration, the angle could not be trusted completely. When setting
up the robot, different surfaces provided different grip for the wheels. It also means that
if the system is set up with the parameters for carpet, it will not work properly on
wooden floor or concrete.
The navigation is rather simple as shown in the Figure 6. When the secondary start
point is found, the robot moves one unit from the border of the world. This is parallel to
the side border of the world, towards the other side of the room. The units are flexible
and can be set up during the calibration process in the code. By default, this value is
100 millimetres. After the first forward move, the robot checks its surroundings again
by doing a 360 degree turn in four stops, 90 degrees each. These readings are saved and
the process starts again. It runs in an infinite loop until the end of the room is found. In
that position, the robot does a 90 degree turn, moves one unit forward, takes another 90
184

Autonomous Devices to Map Rooms and Other Indoor Spaces and Storing Maps in the Cloud
degree turn and the straight running part starts over. The robot’s movements can be
described as a cycle:
Fig. 6. The robot's movement cycle
Likewise, the straight run forward consists of two elements, “Move one unit
forward” and “Turn four times 90 degrees, measure distance”. In practice, this method
means that these components could be defined as separate functions in the code.
4. Measuring distance and composing matrices
The distance from the closest obstacle is measured after every step. The result is a 2x2
matrix containing the values in millimetres in the following order (Table I):
TABLE I.
STRUCTURE OF THE MEASUREMENT MATRIX
Top Right
Bottom Left
Since the device knows its direction (up-down or down-up) from the number of the
columns it scanned already [15]...[30]. If the current column number is odd, the
direction is up-down. If it’s even, it is down-up. In case of up-down direction, the
“forward” measurement becomes “bottom”, the “back” “top”, the “left” and the “right”
readings are swapped. In case of down-up direction, the “forward” data mean “top”, the
“back” “down”, “left” and “right” are kept as they are. At the end of the columns, the
distance readings are not stored, they only signal to the software whether the end of the
process was reached. The data are saved in the following form:
start
[0, 0, 1000, 1000]
[30, 0, 970, 1000]
…
185

Henrik Lábadi et al.
[1000, 0, 0, 1000]
eoc
[1000, 30, 0, 970]
[970, 30, 30, 970]
…
eoc
…
eof
After the room has been processed, the results were uploaded to the computer,
where an application converted those data to a matrix, which represented the schematic
map of the room.
The Figure 8 depicts the experiment which was performed in the room 3x3 m2.
Objects in the room were the table, the square box and the round box. It was concluded
that the errors occurred in instances where the objects were close to the walls, but that
had no effect because those distances were smaller than the width of the robot.
5. The cloud service
Probably the most important part of the project was the potential unified cloud based
storage of the mapped rooms. A proof of concept version of this service has been
implemented with some basic functionality [31].
Matrices can be uploaded from computers, tablets and mobile phones, in the future
automatic upload from the devices themselves will be possible. This would enable
seamless working and uploading, maybe even without human interaction. It could lead
to scenarios, when the robot would map a whole factory and when the battery gets
depleted it would find a charging station, continue the work and when each room is
finished, the work would be uploaded to the internet.
Currently one can upload new maps and browse existing ones, search by several
criteria and download the required maps. Users can also view the matrices in real time
using the online interface.
186

Autonomous Devices to Map Rooms and Other Indoor Spaces and Storing Maps in the Cloud
Fig. 7. The interface of the map store
As it can be seen on the figure, the interface is really simple and it was designed for
functionality. The interface has three columns:
The name of the map
The uploader
The tags for easy finding
Fig. 8. The representation of the actual room and coresponding map matrix
None of these fields has to be unique, maps with the same name are allowed. On the
other hand, in case of some industrial designs, it might be required for the map to be
private. This is not implemented in the current version, but requires only a simple
“where” clause to be added to the current SQL (Structured Query Language) query.
When one clicks on the map name a selection of options is shown. The user can
either download the map in a .robomap file, they can open it in the online viewer or
they can copy the link. In future versions, push-to-device support will be added, which
would enable automatic upload to compatible devices.
Because the above mentioned cloud based storage engine makes portability and the
delivery of the map files really easy, a decision has been made to write a specification
for devices that are supported by this cloud delivery system. Most importantly, Azure
IoT Hub was to be used. Any device that supports Azure IoT Hub is mostly compatible
with the delivery method. Another solution was to poll the server each thirty seconds.
Because Microsoft supports a wide variety of devices, in most cases no 3rd party
implementation is required when implementing the communication module of the
solution.
Processing the .robomap files can be difficult, too. The robot developed for the
experiment uses an Arduino board, where the sensors’ readings were used to form the
matrices. That means, if the inverse is performed, then the robot could be driven
through the matrix by itself. While Arduino is popular, the main target for the map
consuming feature was Raspberry Pi. It can be programmed using C# in .net, many
libraries are available for the platform. Raspberry Pi also runs Windows 10 IoT Core.
187

Henrik Lábadi et al.
6. Shortcomings and future improvements
After the experiments were done, some serious shortcomings were found in the
solution, which were not foreseen during the design process. The most important one
was the lack of compass or other sensor to measure the exact angle of turning. This
would make the lengthy calibration process obsolete and improve the efficiency of the
measurements, because the columns would be perfectly straight. This addition could
also help eliminate the even-odd column number based direction detection. This is the
most important problem, and as such, it has the highest priority to fix.
Another improvement area would be the addition of steerable front wheel or wheels.
It would increase the turning radius, which could affect the minimum width of the
columns, but would reduce the wheel drag of the unpowered (front) wheel(s) and fix
the issue with the sometimes uncontrollable turning front wheel. This addition requires
deeper modifications to the way the robot is controlled.
Regarding the sensors, other ones will be added to overcome the limitations of the
ultrasound sensor, namely the blind spots occurring at angles around 45 degrees. It
could also solve the too wide angle of the sensor and because of this, the vehicle could
enter tighter spaces between furniture.
7. Conclusion
During the development and the process of experimenting with the robot, it has been
found that even though the device is capable of mapping rooms, halls and other indoor
areas, it currently has numerous limitations. The current stage is considered as phase 1
of the overall development, with features to be added to improve the precision and the
efficiency.
The main goals however were met. A robot has been developed, which can create a
map of the room, process it, and format it as a matrix. That matrix can be uploaded to
the cloud to be consumed by other similar smart devices.
8. References
1. Ernesztina Zuban, Henrik Labadi, Istvan Balogh, Kornel Kovacs, Zlatko Covic: Digital
Radar Aided Cane, 10th Jubilee International Symposium on Intelligent Systems and
Informatics (SISY), 2012.
188

Autonomous Devices to Map Rooms and Other Indoor Spaces and Storing Maps in the Cloud
2. Ernesztina Zuban, Henrik Labadi, Kornel Kovacs: Detecting and processing objects using
radio waves and opto-electrical methods, 3rd International Conference on Cognitive
Infocommunications (CogInfoCom), 2012.
3. Borenstein, J. (Johann); Feng, L. (Liqiang): UMBmark: a method for measuring,
comparing, and correcting dead-reckoning errors in mobile robots, 1994.
4. Familiar, B.: Microservices, IoT, and Azure.Apress, 2015.
5. Bräunl, T.: Embedded robotics: mobile robot design and applications with embedded
systems, Springer Science & Business Media, 2008.
6. Kleeman, L.: Optimal estimation of position and heading for mobile robots using ultrasonic
beacons and dead-reckoning, In Robotics and Automation, 1992 IEEE International
Conference, pp. 2582-2587.
7. Juang, H. S., & Lum, K. Y.: Design and control of a two-wheel self-balancing robot using
the arduino microcontroller board, In Control and Automation (ICCA), 2013 10th IEEE
International Conference, pp. 634-639, 2013.
8. Borenstein, J., & Koren, Y.: Obstacle avoidance with ultrasonic sensors. Robotics and
Automation, IEEE Journal of, 4(2), pp. 213-218, 1988.
9. L.Jiang, W.Yun-Peng, C.Bai-gen, W.Jian, S.Wei, Multi-sensor based vehicle autonomous
navigation for vehicle infrastructure integration: concept and simulation analysis,
Proceedings of the 2011 International Conference on Transportation, Mechanical and
Electrical Engineering (TMEE), 2011, pp. 698–702,
10. E.Thurman, J.Riordan, D.Toal, Real-time adaptive control of multiple collocated acoustic
sensors for an unmanned underwater vehicle, oceanic engineering, IEEE Journal of Oceanic
Engineering 38(3) (2013) pp. 419–432
11. T.Luettel, M.Himmelsbach, H.-J.Wuensche, Autonomous ground vehicles — concepts and
a path to the future, Proceedings of the IEEE100 (Special Centennial Issue) (2012)
pp.1831–1839
12. M.Atia, S.Liu,H.Nematallah, T.Karamat, A.Noureldin, Integrated indoor navigation system
for ground vehicles with automatic 3d alignment and position initialization, vehicular
technology, Proceedings of the IEEE (Volume 100, Special Centennial Issue) 64(4) (2015)
pp. 1279–1292.
13. F.BoninFont, A.Ortiz,G.Oliver, Visual navigation for mobile robots: a survey, J. Intell.
RoboticSyst. 53(3)(2008) pp 263–296.
14. G.Desouza, A.Kak, Vision for mobile robot navigation: a survey, pattern analysis and
machine intelligence, IEEE Transactions on Pattern Analysis and Machine Intelligence
24(2)(2002) pp. 237–267.
15. D.Gonzalez-Arjona, A.Sanchez, F.López-Colino, A.deCastro, J.Garrido, Simplified
occupancy grid indoor mapping optimized for low-cost robots, ISPRSInt. J.Geo-
Inf.2(4)(2013) pp. 959–977.
16. A.Ward, A.Jones, A.Hopper, A new location technique for the active office, personal
communications, IEEE Personal Communications 4(5)(1997) pp. 42–47
17. A.Sanchez, A.deCastro, S.Elvira, G.G.deRivera, J.Garrido, Autonomous indoor ultrasonic
positioning system based on a low-cost conditioning circuit, Measurement 45(3)(2012) pp.
276–283.
189

Henrik Lábadi et al.
18. S.Elvira, A.deCastro, J.Garrido, ALO:an ultrasound system for localization and orientation
based on angles, Microelectron.J.10 (2013) pp 959–967.
19. V. Gungor, G. Hancke, Industrial wireless sensor networks: challenges, design principles,
and technical approaches, Industrial Electronics, IEEE Transactions on 56 (10) (2009) pp.
4258–4265.
20. J. Sladek, P.M. Blaszczyk, M. Kupiec, R. Sitnik, The hybrid contact-optical coordinate
measuring system, Measurement 44 (3) (2011) pp 503–510.
21. D. Xu, L. Han, M. Tan, Y.F. Li, Ceiling-based visual positioning for an indoor mobile robot
with monocular vision, Industrial Electronics, IEEE Transactions on 56 (5) (2009) pp.
1617–1628.
22. S. Saab, S. Nakad, A standalone RFID indoor positioning system using passive tags,
Industrial Electronics, IEEE Transactions on 58 (5) (2011) pp. 1961–1970.
23. M. Rahman, L. Kleeman, Paired measurement localization: a robust approach for wireless
localization, Mobile Computing, IEEE, Transactions on 8 (8) (2009) pp. 1087–1102.
A. Mirahmadi, A. Mansourzadeh, A novel method for construction of a point coordinate
measuring instrument using ultrasonic waves, Measurement 44 (3) (2011) pp. 539–548.
A. Ward, A. Jones, A. Hopper, A new location technique for the active office, Personal
Communications IEEE 4 (5) (1997) pp. 42–47.
24. N.B. Priyantha, A. Chakraborty, H. Balakrishnan, The cricket location support system, in:
Proceedings of the 6th Annual International Conference on Mobile Computing and
Networking, ser. MobiCom ’00, ACM, New York, NY, USA, 2000, pp. 32–43.
25. N.B. Priyantha, A.K. Miu, H. Balakrishnan, S. Teller, The cricket compass for context-
aware mobile applications, in: Proceedings of the 7th Annual International Conference on
Mobile Computing and Networking, ser. MobiCom ’01, ACM, New York, NY, USA, 2001,
pp. 1–14.
26. Randell, H.L. Muller, Low cost indoor positioning system, in: Proceedings of the 3rd
International Conference on Ubiquitous Computing, ser. UbiComp ’01, Springer-Verlag,
London, UK, 2001, pp. 42–48.
27. M.R. McCarthy, H.L. Muller, RF free ultrasonic positioning, in: Wearable Computers,
IEEE International Symposium, vol. 0, IEEE Computer Society, Los Alamitos, CA, USA,
2003, pp. 79-83.
28. M. McCarthy, P. Duff, H. Muller, C. Randell, Accessible ultrasonic positioning, Pervasive
Computing, IEEE 5 (4) (2006) pp. 86–93.
29. E. Dijk, C. van Berkel, R. Aarts, E. van Loenen, 3-D indoor positioning method using a
single compact base station, in: Pervasive Computing and Communications, 2004. PerCom
2004, Proceedings of the Second IEEE Annual Conference on, March 2004, pp. 101–110.
30. E. Foxlin, M. Harrington, G. Pfeifer, Constellation: a wide-range wireless motion-tracking
system for augmented reality and virtual set applications, in: Proceedings of the 25th
Annual Conference on Computer Graphics and Interactive Techniques, ser. SIGGRAPH
’98, ACM, New York, NY, USA, 1998, pp. 371–378.
31. J. Rodriguez-Andina, M. Moure, M. Valdes, Features, design tools, and application
domains of FPGAs, Industrial Electronics, IEEE Transactions on 54 (4) (2007) pp. 1810–
1823.
190

International Conference on Applied Internet and Information
Technologies, 2016
DOI:10.20544/AIIT2016.23
Visualization of flood data using HTML5 technologies
Edis Latifoski1, Zoran Kotevski2 and Ilija Hristoski3
1,2 Faculty of information and communication technologies, Partizanska bb,
7000 Bitola, Macedonia [email protected], [email protected]
3 Faculty of economics, Marksova 133, Prilep, Macedonia
Abstract. Human civilization always used to settle near water sources, such as
rivers, lakes and seas. But, beside the vast benefits that these regions offer, they
sometimes present a huge threat of flooding the inhabited areas, when even the
human life could be endangered. Thus, a systems that would offer an early
information about the flood state of an endangered region is crucial for all the
inhabitants, so they can base their quick actions on real and accurate data and not
only on certain speculations. This paper presents a low cost solution that offers
precise information about a flooded (or high risk) region using current web
technologies. The system presents mapped data visualizations that show the
position, the water level and the time of the last condition of multiple marked map
points representing the flood sensors placement.
Keywords: Flood visualization, HTML5, WebGL, Cesium map engine, Flood
security planning.
1. Introduction
Inhabited areas situated near water surfaces (rivers, lakes and seas) sometime are
endangered by floods that can occur due to various environmental factors. In such areas,
where beside the significant negative economic impact the human life can be threatened
as well, it is crucial that a system that offers early and accurate flood information exists.
Security planning for limitation of flood consequences includes many aspects of
engineering and analyses, as defined in [1], such as: surveillance of previous and current
water levels of the endangered region, statistical and hydrological model analyses,
mapping of the flooded regions including the water levels and historic water level data,
engineering, design and construction of flood proof buildings, flood state monitoring,
weather forecasting and in-time notification of the population. Concerning the
possibilities for forecasting and early warning for such disasters on European land, the
Joint Research Centre of the European Commission was assigned with the task to develop
EFAS (European Flood Awareness System) [2]. As stated in [3,4], the main goal of EFAS
is to increase preparedness for floods in trans-national European river basins by providing
national hydro-meteorological services with medium-range deterministic and
probabilistic flood forecasting information, from 3 to 10 days in advance. We must admit
that this effort is of immense importance, but nevertheless, there are times when floods
191

Edis Latifoski et al.
simply cannot be prevented. When these unwanted situations happen the next logical step
is to provide the population with immediate and accurate information about the flood state
in the region, for which one of the best means is to map the flood water levels. Many
systems for flood mapping already exist. For example, Jerad D. in [5] use LiDAR (Light
Detection And Ranging) technology to create flood-inundation maps for selected stream
gage sites in the North Carolina Tar River basin, where the system exhibits vertical
accuracy of 20 cm. Majority of other systems for flood mappings use SAR (Synthetic
Aperture Radar) technologies, such as in [6-8]. All these systems present excellent results,
but the main drawback of these systems is that they are quite expensive, which was our
main motivation to explore a feasible and less expensive solution.
This research deals with the visualizations and mappings of a flooded region and water
levels using current HTML5 technologies. Since this research only deals with
visualizations and represents only one segment of a larger system, the collection of data
using certain flood sensors is assumed. We also assume that these sensors are distributed
on multiple locations over the observed region, and in defined time intervals they send
flood data in a specific format including location (longitude, latitude), water level and the
exact time of the flood state. These data are written in a database wherefrom the
visualization module collect’s them and updates the map with current flood information.
In this manner, the system serves real-time data for the current condition of the flooded
region that can be accessed via web interface and used by the population to plan their
necessary activities.
The rest of the paper is organized as follows. Section two describes the technologies that
are used to realize the task of flood data visualizations. Section three presents the
developed system and its functions, while concluding remarks are presented in section
four.
2. Web framework for flood state visualizations
As a basic tool to deliver the practical model for flood state visualizations we used
CESIUM [9]. CESIUM is built on several HTML5 technologies, among which the most
important is WebGL (JavaScript API for rendering interactive 3D computer graphics and
2D graphics within any compatible web browser without the use of plug-ins). We should
also bear in mind that these new web standards and technologies are still evolving and
some web browsers, even though quickly adaptive, may exhibit certain issues or require
the latest updates in order to work properly. CESIUM is a package that is carefully built
by an experienced team, statistically analyzed, well documented and publicly tested of
over 90% of the code. Cesium was founded by Analytical Graphics, Inc. (AGI) in 2011
as a cross-platform virtual globe for dynamic-data visualization in the space and defense
industries. Since then, Cesium has grown into a 3D globe, serving industries from
geospatial oil and gas, to agriculture, real estate, entertainment, and sports. AGI leads
Cesium's open-source development with support from a growing contributor community.
CESIUM is created with the following main goals and capabilities: visualizations of
geospatial dynamic data, high resolution terrain visualizations and variety of supported
map layer imagery and sources, sush as WMS (Web Map Service), TMS (Tile Map
Service), WTMS (Web Map Tile Service), Bing Maps, Mapbox, Google Earth Enterprise,
OpenStreetMap, ArcGIS MapServer, standard image files, and custom tiling schemes.
192

Visualization of flood data using HTML5 technologies
Each layer can be alpha-blended with the layers below it, and its brightness, contrast,
gamma, hue, and saturation can be dynamically changed. It supports industry standard
vector formats, such as KML, GeoJSON, and TopoJSON. CESIUM uses data-driven
time-dynamic scenes using CZML (Cesium Language) and supports drawing and styling
of a wide range of geometries (polylines, billboards, labels, points, polygons, rectangles,
circles, ellipses, boxes, spheres, ellipsoids, cylinders, corridors, polyline volumes, and
walls). Atmospheric drawing is realized using techniques for fog, sun, sun lighting, moon,
stars, and water. It includes camera navigation with mouse and touch handlers for
rotation, zoom, pan with inertia, flights, free look, and terrain collision detection. It also
supports batching, culling, and JavaScript and GPU optimizations for performance, as
well as precision handling for large view distances (avoiding z-fighting) and large world
coordinates (avoiding jitter). CESIUM features a 3D globe, 2D map, and Columbus view
(2.5D) with the same API.
The task of visualization in this research is realized using the KML data format.
Fig. 1. Sample image from a CESIUM interface
2.1. KML (Keyhole Markup Language)
KML is a XML notation for representation of geographic data and visualizations that are
integrated into Internet-based, two-dimensional maps and three-dimensional earth views
[10]. KML is created by Keyhole Inc, a company that was officially acquired by Google
in 2004. Google Earth is the first application in which KML files can be accessed and
edited. Later in 2008 KML data format was officially accepted as an international
standard by the OGC (Open Geospatial Consortium).
The KML data format defines variety of properties (places, images, polygons, 3D
models, textual descriptions etc.) for map display in many geographic software packages
that understand and implement KML. Each point in KML always contains longitude and
latitude and other data that can provide specific visual appearance. KML files can be used
in compressed KMZ format as well. The KML file can also use 3D geography coordinates
(longitude, latitude and altitude), with negative values for west, south and below mean
sea level if the altitude data is available. The longitude and latitude components (decimal
193

Edis Latifoski et al.
degrees) are formatted as defined by the World Geodetic System of 1984 (WGS84). The
vertical component (altitude) is measured in meters from the WGS84 EGM96 Geoid
vertical datum. If altitude is omitted from a coordinate string, e.g. (21.21647, 41.89763)
then the default value of 0 (approximately sea level) is assumed for the altitude
component, i.e. (21.03647, 41.89763, 0).
A formal definition of the coordinate reference system (encoded as GML) used by
KML is contained in the OGC KML 2.2 Specification. This definition references well-
known EPSG (European Petroleum Survey Group) CRS components.
3. A model for visualization of flood data
The model that we have developed in this research places real-time data from the MySQL
server in a KML data format, which is then visualized on the map using CESIUM. The
data inside KML are structurally ordered and contain map point name, geographic
coordinates, time of the last change and visual display of the flooded point which is three
dimensionally elevated over the mapped region. During the research and development of
this system other possibilities for displaying the flood points were also investigated. Some
of those possibilities include displaying the data using geometry polygons. Using
polygons was better to present the flooded region, but the main drawback was that these
polygons weren’t suitable for displaying the elevation of the water surface. Other
investigated visualization idea was to use lines that would connect the many flood sensor
point on the map and to display the full flooded region, but we encountered some
problems visualizing this data and for now we concentrated purely on this more simplistic
model with the presentation of a certain points by images.
Displaying data by the use of discrete points have shown to be among the simplest
and fully functional solutions that encompass all the required data for these flood state
visualizations. A single point is represented with its geographic coordinates, including
elevation, and can have time attributes. These map points represent the flood sensors that
are distributed over the flood endangered region, usually near rivers, lakes or seaside.
The user interface of the developed application is the standard view of the CESIUM
frame, which offers several options for viewing the flood data. The options include Globe
view, two dimensional top view and 3D perspective view. It is also possible to choose
from different mapping imagery. In the system developed in this research we use Globe
view and Bing mappings. At the bottom of the interface we placed a time strip from which
the user can choose the time at she/he wants to see the flood condition over a predefined
time period.
Several short commands are used for the CESIUM frame to load the required
functions that are used for graphic mapping. The startup code is displayed in figure 2
which starts with the declaration of variables for function callings required for map
display. After the definition of the basic view there is a requirement for definition of a
KML data reader. This is presented in figure 3. In the code of figure 3 the KML file is
loaded from its location, and the clock multiplier is set to 30 which means that the changes
in the water level will be presented quicker than real-time. Further we can hypothesize
that the data from the sensors is read once in five minutes by default, but the time frame
for which we want to observe the flood visualizations can be interactively defined, as well
as the position of the time frame, such as earlier in time.
194
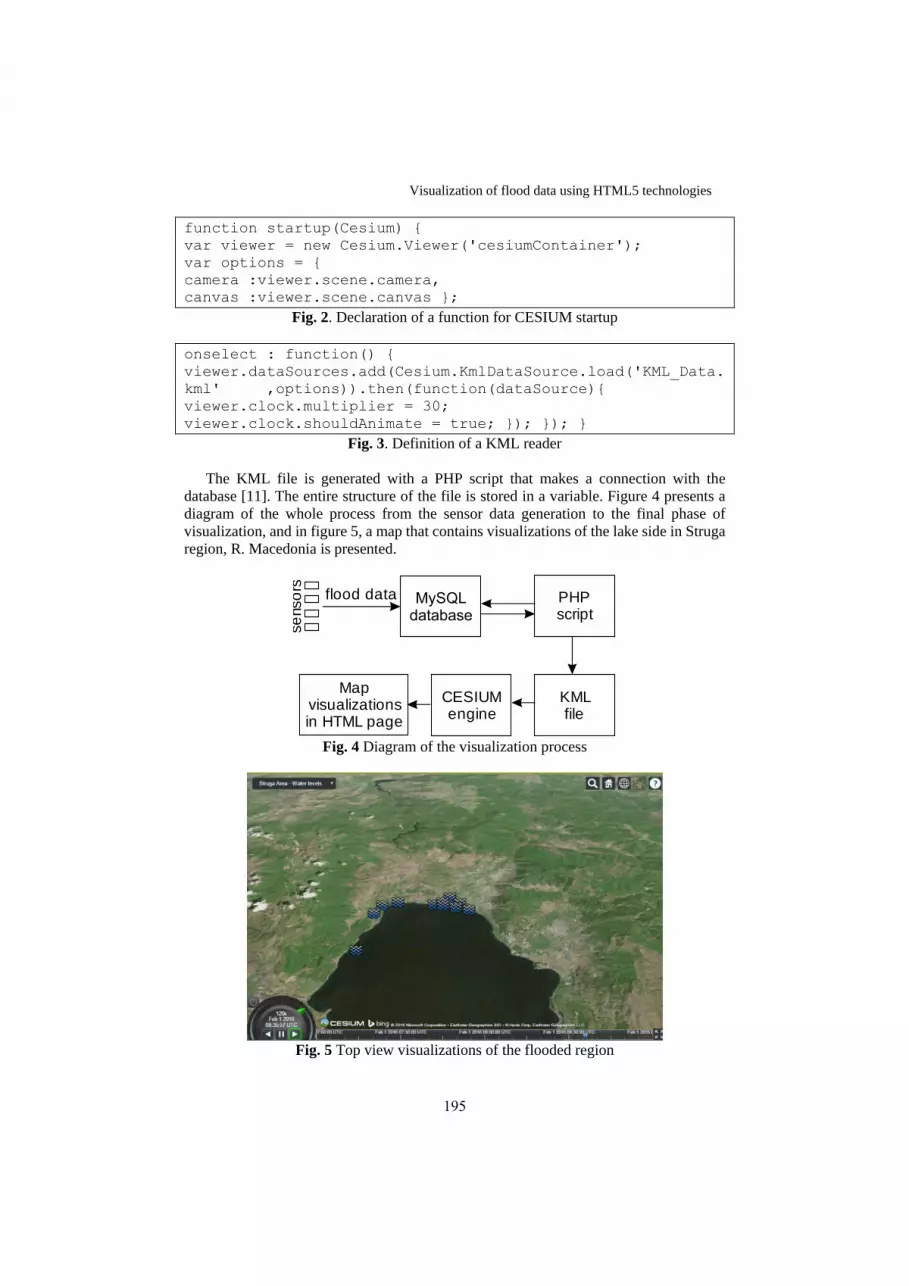
Visualization of flood data using HTML5 technologies
function startup(Cesium)
var viewer = new Cesium.Viewer('cesiumContainer');
var options =
camera :viewer.scene.camera,
canvas :viewer.scene.canvas ;
Fig. 2. Declaration of a function for CESIUM startup
onselect : function()
viewer.dataSources.add(Cesium.KmlDataSource.load('KML_Data.
kml' ,options)).then(function(dataSource)
viewer.clock.multiplier = 30;
viewer.clock.shouldAnimate = true; ); );
Fig. 3. Definition of a KML reader
The KML file is generated with a PHP script that makes a connection with the
database [11]. The entire structure of the file is stored in a variable. Figure 4 presents a
diagram of the whole process from the sensor data generation to the final phase of
visualization, and in figure 5, a map that contains visualizations of the lake side in Struga
region, R. Macedonia is presented.
Fig. 4 Diagram of the visualization process
Fig. 5 Top view visualizations of the flooded region
PHPscript
KMLfile
CESIUMengine
Mapvisualizationsin HTML page
se
nso
rs
flood data
195
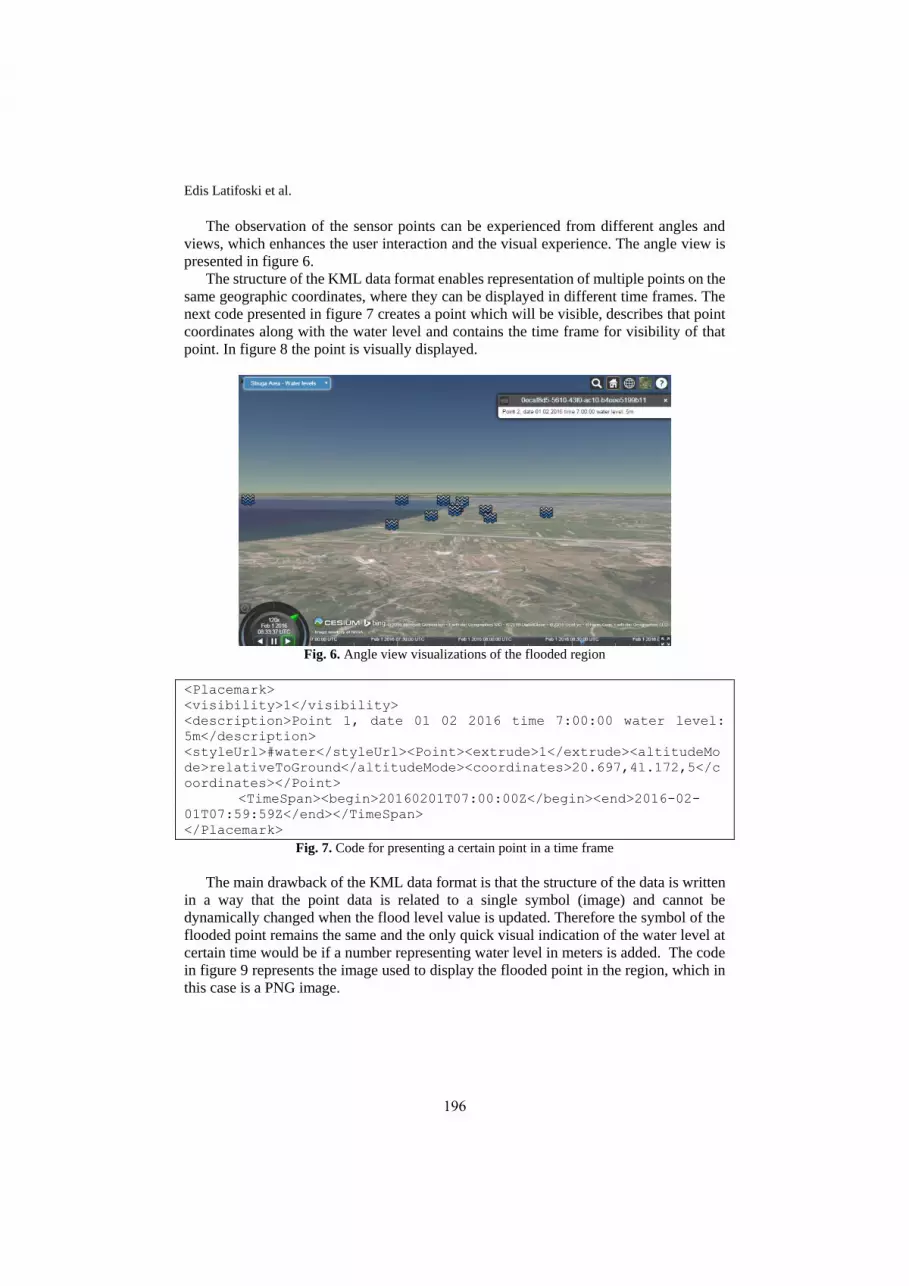
Edis Latifoski et al.
The observation of the sensor points can be experienced from different angles and
views, which enhances the user interaction and the visual experience. The angle view is
presented in figure 6.
The structure of the KML data format enables representation of multiple points on the
same geographic coordinates, where they can be displayed in different time frames. The
next code presented in figure 7 creates a point which will be visible, describes that point
coordinates along with the water level and contains the time frame for visibility of that
point. In figure 8 the point is visually displayed.
Fig. 6. Angle view visualizations of the flooded region
<Placemark>
<visibility>1</visibility>
<description>Point 1, date 01 02 2016 time 7:00:00 water level:
5m</description>
<styleUrl>#water</styleUrl><Point><extrude>1</extrude><altitudeMo
de>relativeToGround</altitudeMode><coordinates>20.697,41.172,5</c
oordinates></Point>
<TimeSpan><begin>20160201T07:00:00Z</begin><end>2016-02-
01T07:59:59Z</end></TimeSpan>
</Placemark>
Fig. 7. Code for presenting a certain point in a time frame
The main drawback of the KML data format is that the structure of the data is written
in a way that the point data is related to a single symbol (image) and cannot be
dynamically changed when the flood level value is updated. Therefore the symbol of the
flooded point remains the same and the only quick visual indication of the water level at
certain time would be if a number representing water level in meters is added. The code
in figure 9 represents the image used to display the flooded point in the region, which in
this case is a PNG image.
196

Visualization of flood data using HTML5 technologies
Fig. 8. Visualization of the point defined in the code in figure 7
<Style id="water">
<LabelStyle>
<scale>1.5</scale>
</LabelStyle>
<IconStyle>
<Icon>
<href>http://maps.google.com/mapfiles/kml/shapes/water.png</href>
</Icon>
</IconStyle>
<LineStyle><width>10</width></LineStyle>
</Style>
Fig. 9. Code for definition of the water image
In the next figure 10, water level image along with the number representing the water
depth is presented.
Fig. 10. Visualizations of water levels along with the water depth
197

Edis Latifoski et al.
4. Conclusion and future work
In this research we presented a model for visualizations of water levels in a certain flooded
region. The flood data is assumed to be gathered by flood sensors distributed over the
endangered region and in five minute intervals they send flood information to a web
server where PHP script writes that data in a MySQL database. The latest data from the
database is then extracted by another PHP script which created KML data file and writes
it on the web server. The CESIUM module that we have created reads the KML file that
contains the complete flood data and updates the map creating current visual information.
For the purposes of constant observations of the flood advancement the system offers
selection of time frames, as well as historical statistical analyses due to the fact that all
the historical information is recorded in the database. Further research will be
concentrated on placement of real sensors that would feed the database with real flood
data, as well as on a development of a module that would offer early e-mail and/or SMS
notifications to the registered users. The final phase of the project would include
distribution of the system to include multiple regions that are potentially threatened by
flood disasters.
5. References
1. Eychaner, J.H., “Lessons from a 500-year record of flood elevations”, Association of State
Floodplain Managers, Technical Report 7, 2015
2. https://www.efas.eu/
3. J. Thielen , J. Bartholmes , M.-H. Ramos and A. de Roo, “The European Flood Alert System
– Part 1: Concept and development”, Journal of Hydrology and Earth System Sciences, Vol.
13, pp125-140, 2009
4. J. C. Bartholmes, J. Thielen , M. H. Ramos and S. Gentilini, “The european flood alert system
EFAS – Part 2: Statistical skill assessment of probabilistic and deterministic operational
forecasts”, ”, Journal of Hydrology and Earth System Sciences, Vol. 13, pp141-153, 2009
5. Jerad D. Bales, Chad R. Wagner, Kirsten C. Tighe, and Silvia Terziotti, “LiDAR-Derived
Flood-Inundation Maps for Real-Time Flood-Mapping Applications, Tar River Basin, North
Carolina”, Scientific Investigations Report 2007-5032, Geological survey (U.S.) 2007
6. R. Oberstadler, H. Honsch and D. Huth, “Assessment of the mapping capabilities of ERS-1
SAR data for flood mapping: a case study in Germany”, Journal of Hydrological Processes,
Vol. 11/10, pp. 1415–1425, August 1997
7. P. Matgen, R. Hostache, G. Schumann, L. Pfister, L. Hoffmann, H.H.G. Savenije, “Towards
an automated SAR-based flood monitoring system: Lessons learned from two case studies”,
Journal of Physics and Chemistry of the Earth, Parts A/B/C, Vol. 36/7–8, pp. 241–252,
ELSEVIER, 2011
8. J.‐B. Henry, P. Chastanet, K. Fellah and Y.‐L. Desnos, “Envisat multi‐polarized ASAR data
for flood mapping”, International Journal of Remote Sensing, Vol. 27/10, pp. 1921-1929,
Taylor & Francis, 2006
9. https://cesiumjs.org/features.html
10. https://developers.google.com/kml/documentation/kml_tut
11. https://developers.google.com/kml/articles/phpmysqlkml#step-3-using-php-to-output-kml
198

International Conference on Applied Internet and Information
Technologies, 2016
DOI:10.20544/AIIT2016.24
Wireless sensor networks simulators – computer
simulation tools
Igor Georgioski and Hristina Trenchevska
Faculty of information and communication technologies, Partizanska bb,
7000 Bitola, Macedonia
[email protected], [email protected]
Abstract. With the development of embedded systems and network technologies
there was a need to find a device that will be used for measurements and at the
same time it will be economical. Wireless sensors, using self-configuring sensors
are perfect for this purpose. With the sensors it was ensured traceability of the
physical conditions of the environment (temperature, humidity, vibration,
pressure, sound, movement, etc.) with very low power consumption and high
precision. The sensors also have the ability to transmit and return data to a base
station. But before implementing, you have to use the simulator to test these
sensors, especially in the initial phase of these designs. The cost to simulate
thousands of nodes networks is very low, and the simulation can be completed in
a short time. Therefore, simulation of WSN is of great importance for the
development of WSN. Protocols, schemes or even new ideas can be assessed in
very large sizes. WSN simulators allow users to isolate different factors with
setting up configurable parameters. In this paperwork we have used two
simulators: Network Simulator 2 and Omnet++.
Keywords: network simulators, wireless sensors, information system, embedded
systems, sensors
1. Introduction
Wireless sensor networks are networks that consists a large number of sensor nodes
wirelessly connected to each other and to the base station. [1] The beginnings of wireless
sensor networks are even from Cold War, and were firstly invented from the United
States. This technology was upgraded in the mid-1980s when the Institute of
Technology in Massachusetts developed DSN which consisted of acoustic sensors
designed to monitor low flying aircraft. There are many factors that affect the design of
wireless networks. When a designer is designing protocols for WSN he must consider
these factors. Also, he can use simulation. That is an important approach in the
development and evaluation of systems in terms of time and cost. The simulation shows
199

Igor Georgioski and Hristina Trenchevska
the expected behaviour of the system based on the simulation model under different
conditions. In this paper we have used NS2 (Network Simulator v. 2) and Omnet ++
v4.6 simulators. We have simulated one event in each of this simulators. The second
simulator Omnet++ is also integrated with the famous program for maps, Google Earth.
At the end of this paper, we have submitted the results of this simulations.
2. Wireless Sensor Networks
The wireless sensor network consists a large number of sensor nodes wirelessly
connected to each other and the base station, which connects the sensor nodes with
another network. [9] Sensor networks find great use and entirely new field of research,
which is currently growing rapidly. However, for all this to be put into use, requires
huge resources, and it is not allowed the slightest mistake. Therefore, before being
placed into use and implement, we need to test or simulate. That is why companies for
manufacturing and implementation of wireless sensor networks develop software
solutions called simulators.
2.1. Beginnings and development of wireless sensor networks
The beginnings of sensor networks were initiated even during the Cold War by the
United States. [9] A network of acoustic sensors were placed in strategic locations at the
bottom of the ocean to detect and track submarines of the Soviet Union. This system of
acoustic sensors was called Monitoring System sound (Sound Surveillance System-
SOSUS). During the same period, the United States also deployed networks of radars
against air defence. These sensor networks use hierarchical processing, where data is
processed in different layers until the data reach the user. In the mid-1980s, the Institute
of Technology in Massachusetts developed DSN which consisted of acoustic sensors
designed to monitor low flying aircraft.
2.2. Factors affecting the design of wireless sensor networks
In the wireless sensor networks can be incorporated other types of sensors, including:
temperature sensors, vibration, infrared and acoustics. WSN applications differ greatly
from one another, there are some common factors that affect all WSNs. These include:
reliability, scalability, production costs, network topology, operating environment,
media transmission and consumption. [9] When a designer is designing protocols for
WSN must take into account these factors.
2.3. Standards for wireless connectivity
In March 1999, IEEE established 802.15 working group as part of the IEEE Computer
Society's 802 Local and Metropolitan Area Network Standards Committee. 802.15
200

Wireless sensor networks simulators – computer simulation tools
working group was established for the specific purpose for developing standards for
short wireless networks, known as a personal wireless network (Wireless Personal Area
Network- WPANs). Within the 802.15 working group there are four target groups.
Target group number one (802.15.1) defines the standard for WPAN based on the
physical (PHY) and MAC layer of Bluetooth version 1.1. Target group two (802.15.2)
develops a model for coexistence of WLAN (802.11) and WPAN (802.15). The group's
goal three (802.15.3) to develop standards for massive data in WPAN (20Mbps and
higher). The target group four (802.15.4) is responsible for developing standards of
physical (PHY) and MAC layer for Low data rate. [10]
2.4. Simulation model
Simulation is an important approach in the development and evaluation of systems in
terms of time and cost. The simulation shows the expected behaviour of the system
based on the simulation model under different conditions. The purpose of any
simulation model is to determine the exact model and predict its behaviour in practice.
For simulation in this paper, we have used NS2 (Network Simulator v. 2) and Omnet
++ v. 4.6. NS2 is a simulator that uses discrete event simulation, an open software,
general simulator, that can simulate over 100 nodes. NS-2 cannot simulate problems of
bandwidth or power consumption in WSN. Its newest version is NS-3. It is popular in
academia for its extensibility (due to its open source model) and plentiful online
documentation. NS is popularly used in the simulation of routing and multicast
protocols, among others, and is heavily used in ad-hoc networking research. NS
supports an array of popular network protocols, offering simulation results for wired
and wireless networks alike. It can be also used as limited-functionality network
emulator. NS is licensed for use under version 2 of the GNU General Public License [3].
The Omnet++ discrete event simulation environment has been publicly available since
1997. It has been created with the simulation of communication networks,
multiprocessors and other distributed systems in mind as application area, but instead of
building a specialized simulator, Omnet++ was designed to be as general as possible.
Since then, the idea has proven to work, and Omnet++ has been used in numerous
domains from queuing network simulations to wireless and ad-hoc network simulations,
from business process simulation to peer-to-peer network, optical switch and storage
area network simulations.
Omnet ++ is a simulator that uses simulation with discrete event, it has commercialized
a license for open source and online documents, general simulator, supports MAC
simulators and some localized protocols of WSN simulators, it can simulate the
consumption of power and control channel and has limited protocols. [8] NS2 runs on
Windows XP environment so we had to use a virtual machine (Oracle VM Virtual Box)
on which you install the operating system, while Omnet ++ works on the latest version
of Windows, Windows 10.
201

Igor Georgioski and Hristina Trenchevska
3. Examples
3.1. Network Simulator v. 2 (NS2)
NS2 is a simulator that is written in C++ and Python. [3] To star the simulator, first open
Command Prompt (Start> Run> cmd) and with commands cd desktop/ns. Next
command that you need to ask is ns nameoftheproject.tcl (with the command ns we are
starting the program and .tcl is the simulation extension) [4]. CMD provides information
how many nodes are included in the simulation and what nodes will or won’t be
affected by the simulation. After executing the last command, we can see the
simulation.
Fig. 1. Starting position of the nodes
Fig. 2. Operation of the nodes during the simulation and movement of nodes 1 and 2
to their final destination
202

Wireless sensor networks simulators – computer simulation tools
Table 1. Characteristics of the NS-2 simulation
Number
of nodes
Range of
each node
FTP
transmitters
Field size Duration of
the simulation
Final result
7 250 meters 2 1000m x
1000m
400 seconds 32 seconds
In this simulation we have included the conduct of the Ad Hoc network with 7 nodes [5]. In this scenario, node 0 has to reach destination node 5, while the node number 1 has
a destination at node number 6. Nodes 2, 3 and 4 are intermediate nodes. The range of
each node is 250 meters. Two of the nodes (node 2 and 3) are FTP transmitters. The
simulation is performed in case with this parameters: size 1000m x 1000m, duration of
the simulation is 400 seconds, FTP 1 begins at 10 seconds and ends at 300 seconds,
while FTP 2 begins at 20 seconds and ends at 400 seconds. The time needed for all
nodes to reach its final destination is 32 seconds. To create a new simulation in the
simulator, we need to open the .jar library Scenario> New wireless scenario. [7] A new
window appears in which we have several options (Hand, Node, Agent, Application,
Parameters and TCL). When we add all nodes and set all the options we need and want
for simulation, we are free to choose the menu TCL. It will show the code that will be
generated, and gives us the option to save it. [6]
3.2. Omnet++ v. 4.6
The simulator will start with double click on the mingwenv.cmd file, and after that a
command prompt will be opened. After typing all necessary commands, Omnet ++ will
start.
Fig. 3. Starting position of the cars and packet traveling
203

Igor Georgioski and Hristina Trenchevska
Table 2. Characteristics of the Omnet++ simulation
Number
of nodes
Range of
each node
FTP transmitters Field size Number
of events
Final result
10 500 meters 2 2000m x
2000m
21 0.1 seconds
The purpose of this simulation is a simulation of a wireless mobile ad hoc network.
The model contains 10 mobile nodes (which in this case are represented by cars) that
run on their own random area of 2000m x 2000m. Nodes have similar settings, each
node can range over an area of 500m. When two nodes meet, they can communicate
with each another, forming an ad-hoc network (T\the term ad hoc networking typically
refers to a system of network elements that combine to form a network requiring little
or no planning [2]). The time needed one data to be sent to all nodes in the simulation is
0.1 seconds, and for the data to be transferred from the first node to the end, 21 events
will happen. The advantage of this simulation is the ability for visualization in the
application Google Earth. The simulation can be seen visually and live in Google Earth,
as it can be seen on the next picture Fig. 4.
Fig. 4. Omnet ++ simulation Google Earth live preview
204

Wireless sensor networks simulators – computer simulation tools
4. Conclusion
Wireless sensor networks consist of small knots with capacity for tenderness,
calculations and wireless communication. One of the main aspects of sensor networks is
that it tends to be application-specific. The advantage of these networks is that they
configure themselves, which means that the sensor network can be distributed randomly
on the battlefield, in areas where it occurred disasters or inaccessible areas, without the
need for a person to have access to them and configure them. Flexibility, high
sensitivity, low cost and the quality rapid deployment of sensor networks create many
new and existing application areas for remote observations. Ad-hoc technology allows
people to be in the conference room where the transmission using infrared or radio
frequency wireless signals to link their computers with other computers in the local
network with shared data and resources. Each user has a unique network address that is
currently registered as part of the network. The technology also includes remote users
and hybrid wireless / wired connections. Mobile devices can be connected in any
network, anywhere because it eliminated the need for central administration and have
great commercial potential. In the future, this broad range of application areas will
make sensor networks an integral part of our lives. Omnet++ should be used when we
need to visually present the results to the audience, because it offers various graphic
interfaces, such as the one used in this simulation, Google Earth. Network Simulator 2
should be used when we want to have more options and to test more simulation
scenarios.
5. References
1. https://arxiv.org/ftp/arxiv/papers/1307/1307.4129.pdfhttps://en.wikipedia.org/
wiki/Ad_hoc
2. http://ijarcet.org/wp-content/uploads/IJARCET-VOL-2-ISSUE-4-1629-
1635.pdf
3. http://ns2tutor.weebly.com/simulation-of-adhoc-networks.html
4. http://www.ijarcsse.com/docs/papers/Volume_5/3_March2015/V5I3-0309.pdf
5. http://conferences.sigcomm.org/sigcomm/2011/papers/sigcomm/p418.pdf
6. http://iitkgp.vlab.co.in/?sub=38&brch=121&sim=581&cnt=1
7. http://dl.acm.org/citation.cfm?id=1416290&dl=ACM&coll=DL&CFID=61498
5599&CFTOKEN=29320983
8. http://www.dei.unipd.it/~casarip/Collection_publications/c029_2009_WUWN
ET_woss.pdfhttp://www.opal-
rt.com/sites/default/files/technical_papers/Comprehensive%20Real-
Time%20Simulation.pdf
205

International Conference on Applied Internet and Information
Technologies, 2016
DOI:10.20544/AIIT2016.25
Virtual Private Network Implementation with GRE
Tunnels and EIGRP Protocol
Tihomir Stojchevski, Tome Dimovski and Nikola Rendevski
Faculty of information and communication technologies, Partizanska bb,
7000 Bitola, Macedonia
[email protected], tome.dimovski, [email protected]
Abstract. Nowadays, the modern companies and institutions have a inevitable
need for secure connections with remote locations trough broadband WAN
networks. The reason for such requisite is mainly the need for shared services
utilization like application servers, database servers, messaging servers, etc.,
physically located at remote datacenters. In this paper, we present realistic VPN
implementation and configuration for a company with two central locations (head
office and warehouse) and branch offices in several cities. For secure
communication between central locations and branch offices, Generic Routing
Encapsulation (GRE) tunnels are implemented. EIGRP protocol is used for
routing the data between networks. From the implementation analyses conducted
in this paper, we can figure out that this approach allows low-complexity
realization and low-cost maintenance solution.
Keywords: computer network, virtual private network, routing.
1. Introduction
Establishing network communication between more commercial entities located in
different geographical locations, becomes a inevitable operation in contemporary
enterprises. The early VPNs (virtual private networks)[1] used for connecting remote
sites were realized by special types of connections like peer-to-peer (P2P),
multiprotocol label switching (MPLS), that fall into the category of very expensive
lines [2]. Today, the most prevalent method of connection is through the Internet.
In this paper we present VPN implementation and configuration for a key customer
company with two main locations in Skopje (HQ Office and Warehouse) and remote
branch offices located in several cities throughout the country. The customer need is to
deal with frequently network topology changes, i.e., opening temporary branch offices
with short time of usage (few days only), but without daily routing configuration
changes which is usually practice in implementations where static-routing complex
networks are designed.
Starting from specific company needs for quality of service (QoS), we decide to
build network based on two most popular methods today, Generic Routing
206

Tihomir Stojchevski et al.
Encapsulation (GRE) tunneling [3] for establishing VPN connections between HQ
offices and branches, and Cisco Enhanced Interior Gateway Routing Protocol (EIGRP)
[4-5] to automate the routing decisions and configuration for all networks that will exist
within the company.
The paper is organized as follows. Section 2 gives a survey of tunneling and EIGRP
routing protocol. In Section 3 we present VPN implementation and configuration for
the key costumer company, and finally, in Section 4 discussion and conclusions are
drawn.
2. Tunneling and EIGRP routing protocol
2.1. Tunneling
In the computer networks, a tunneling protocol allows a network user to access or
provide a network service that the underlying network does not support or provides
directly. One important use of a tunneling protocol is to allow a foreign protocol to run
over a network that does not support that particular protocol, in example, running IPv6
over IPv4. Another important use is providing services that are impractical or unsafe to
be offered using only the underlying network services. In example, providing a
corporate network address to a remote user whose physical network address is not part
of the corporate network. Tunneling involves repackaging the traffic data into a
different form to hide the nature of the traffic that is passing through the tunnels.
Fig. 1. IP Tunneling encapsulation – IP packet before and after tunnel encapsulation
Tunneling protocol encapsulates each packet, including the address of the source
and destination IP network, and the new package is part of the transmition network. For
the border areas between the original and the transmission network, as well as transport
and destination network, intermediate routers are used for establishing endpoints of the
IP tunnel through the transmission network. Thus, endpoints of the tunnel provide route
for normal IP communication between source and destination network.
IP tunnel “overrides” simpler firewall rules as the addressing of source datagrams
are hidden. Encapsulation is developed like tool for tunneling, with purpose of caring
any type of protocol from OSI layer 3 level over IP networks. IP Tunnels carry different
protocols over IP protocol, provide communication between networks with a limited
number of hops, connect physical connectionless networks and allow VPN connections
over WAN networks
207

Virtual Private Network Implementation with GRE Tunnels and EIGRP Protocol
2.2. Enhanced Interior Gateway Routing (EIGRP) Protocol
EIGRP is a network protocol that allows routers to exchange information with each
other more efficiently than current network protocols. EIGRP derived from IGRP
(Interior Gateway Routing Protocol), but this is not a compatibility issue during their
mutual exchange of routing information because the metrics used within one protocol
can be translated to the corresponding metrics of the second protocol.
Router using EIGRP protocol, has a copy of the routing tables of its neighbors (routers).
If it is not able to find a suitable route in these tables, addresses a request for
information for that route to its neighbors, which still turns to their neighbors, until the
required route is not found.
When the contents of one routing table is changed (adding or removing some
network segments), that router sends information to its own neighbors only for the
occurred change. Some of the earlier routing protocols had “bad” practice for
exchanging the entire routing tables. Therefore, the actual state of each router was
detected by sending “hello” packets across the network. The router from which the
“hello” packet is not received in a certain time, will be considered as unreachable and
its routing table is deleted at its neighbors. EIGRP protocol use Diffusing-Update
Algorithm (DUAL) for detecting most effective routes (with smaller cost path) to some
location. The information about the final status of routing tables, used by DUAL
algorithm is to learn the lowest-cost path (loop-free).
EIGRP protocol does not use TCP or UDP protocols which means that port number
for identifying type of traffic is not in use. Instead of this, it is designed to work on the
top on the level 3 from IP protocol. Because it does not use TCP for communication, it
implements Cisco Reliable Transport (RTP) to secure that EIGRP updates will be
delivered to all of the neighbors. EIGRP is often considered as a hybrid protocol
because it also sends link state updates when the link states change.
Some of the key EIGRP operational characteristics include:
Full support for Classless Inter-Domain Routing (CIDR) and variable
length subnet masking. Routes are not summarized at the classful network
boundary unless auto summary is enabled.
Support for load balancing on parallel links between sites.
The ability to use different authentication passwords at different times.
MD5 authentications between two routers.
Sends topology changes, rather than sending the entire routing table when
a route is changed.
Periodically checks if a route is available and propagates routing changes
to neighboring routers if any changes have occurred.
Backwards compatibility with the IGRP routing protocols.
3. VPN implementation for the key customer with GRE Tunnels
and EIGRP Protocol
On Fig. 2, network topology for a key customer company is depicted, with two main
locations in Skopje (HQ Office and Warehouse) and remote branch offices located in
208

Tihomir Stojchevski et al.
several cities throughout the country.
Fig. 2. Network topology for the key customer company
At the central location (HQ-Skopje-RT1) we have installed Cisco 2911 router, Cisco
2960 switch, WEB/SQL server and e-mail server - all connected in one Local Area
Network (LAN) segment. The Cisco 2911 router has the role of HUB router that keeps
connection with so-called spoke routers form the remote offices. At the second central
location (Warehouse) we have installed Cisco 2911 router, Cisco 2960 switch and FTP
server - connected in the same LAN segment.
The WAN interfaces on the Cisco 2911 routers (HQ-Skopje-RT1 and HQ-Skopje-
RT2) are the destination points for all GRE tunnels, configured with IP addresses from
the transport network (172.30.30.1 and 172.40.40.1).
On each spoke router (Cisco 2911) in branch offices, we configured two WAN
interfaces, used to separate the communication in the same transport network, with the
HUB routers at the central location. For each spoke router we implemented tunnel
interfaces for GRE connections to each HUB router in the central location. We
configured IP addresses from tunneling pools as 172.16.16.0 and 172.17.1.0.
After configuration of the VPN network, the next phase is exchanging the routing
information between routers about local network pools using EIGRP pre-defined area
20. From that moment, all of the network elements which uses private LAN networks
(192.168.0.0 and 10.10.10.0) are reachable trough transport network. Main parts of the
network configuration is shown in the next section.
3.1. Network configuration
Table 1. Central office addressing scheme
Host/Device IP address
Cisco 2911 192.168.1.1
WEB server 192.168.1.2
Mail server 192.168.1.3
209

Virtual Private Network Implementation with GRE Tunnels and EIGRP Protocol
Table 2. Warehouse addressing scheme
Host/Device IP address
Cisco 2911 10.10.10.1
FTP server 10.10.10.2
Table 3. List of the addressing scheme on remote locations (branches)
Location IP Network
Tetovo 192.168.2.0/28
Kumanovo 192.168.3.0/28
Shtip 192.168.4.0/28
Veles 192.168.5.0/28
Ohrid 192.168.6.0/28
Bitola 192.168.7.0/28
Debar 192.168.8.0/28
Table 4. Major coniguration blocks on HUB 1 router
Cisco 2911 RT-1 (Headquarter) HUB 1
interface Tunnel0
ip address 172.30.30.1 255.255.255.240
tunnel source GigabitEthernet0/0
MultiGRE tunnel 0 source IP
address
interface GigabitEthernet0/0
description LAN
ip address 192.168.1.1 255.255.255.248
Local LAN interface
interface GigabitEthernet0/1
description WAN
ip address 172.16.1.1 255.255.255.240
WAN interface (tunnel 0
destination IP for spoke Routers)
router eigrp 20
network 172.30.30.0 0.0.0.15
network 172.16.1.0 0.0.0.15
network 192.168.1.0 0.0.0.7
EIGRP sends updates for this
networks from HUB-1 router
Table 5. Major coniguration blocks on HUB 2 router
Cisco 2911 RT-2 (Warehouse) HUB 2
210

Tihomir Stojchevski et al.
interface Tunnel0
ip address 172.40.40.1 255.255.255.240
tunnel source GigabitEthernet0/0
MultiGRE tunnel 0 source IP
address
interface GigabitEthernet0/0
ip address 10.10.10.1 255.255.255.248
Local LAN interface
interface GigabitEthernet0/1
description WAN
ip address 172.17.1.1 255.255.255.240
WAN interface (tunnel 0
destination IP for spoke Routers)
router eigrp 20
network 172.40.40.0 0.0.0.15
network 172.17.1.0 0.0.0.15
network 10.10.10.0 0.0.0.7
EIGRP sends updates for this
networks from HUB-1 router
Table 6. Major coniguration blocks on SPOKE routers
RT-Bitola (Branch office) Spoke router
interface Tunnel0
ip address 172.30.30.5 255.255.255.240
tunnel source GigabitEthernet0/1
tunnel destination 172.16.1.1
GRE tunnel source and
destination IP addresses for
connection with HUB-1
interface Tunnel1
ip address 172.40.40.5 255.255.255.240
tunnel source GigabitEthernet0/2
tunnel destination 172.17.1.1
GRE tunnel source and
destination IP addresses for
connection with HUB-2
interface GigabitEthernet0/0
ip address 192.168.5.1 255.255.255.248
LAN interface IP
interface GigabitEthernet0/1
ip address 172.16.1.5 255.255.255.240
WAN interface IP
router eigrp 20
network 172.30.30.0 0.0.0.15
network 172.40.40.0 0.0.0.15
network 172.17.1.0 0.0.0.15
network 192.168.5.0 0.0.0.7
EIGRP sends updates for this
networks from RT-Bitola spoke
router
4. Conclusion
In this paper we presented VPN network implementation and configuration for
company with two central locations in Skopje (head office and warehouse) and branch
offices in several cities. GRE tunneling was used as a secure solution for secure
211

Virtual Private Network Implementation with GRE Tunnels and EIGRP Protocol
communication between central locations and branch offices. We used EIGRP dynamic
routing protocol for routing the data between networks. Using such approach, low-cost
and low-complex solution is presented completely meeting the company needs and
fulfilling the QoS requirements, while providing solution for the dynamic topology
without routing configuration changes.
5. References
1. Andrew, M.: Cisco Secure Private Networks. Cisco Press. (2001)
2. Stuart, D. F.: A CCIE v5 guide to Tunnels, DMVPN, VPNs and NAT (Cisco CCIE Routing
and Switching v5.0) (Volume 3), 13-32. (2015)
3. Point-to-Point GRE over IPSec Design Guide. Cisco System, San Jose, USA. (2006)
4. Jeff, D., Jennifer, C.: Routing TCP/IP, Volume 1 (2nd Edition), 297 – 315. (2005)
5. Diane, T., Bob, V., Rick, G.: Implementing Cisco IP Routing (ROUTE) Foundation
Learning Guide: (CCNP ROUTE 300-101), 576-582. (2015)
212

International Conference on Applied Internet and Information
Technologies, 2016
DOI:10.20544/AIIT2016.26
Geometric modeling and principle of the golden section
Snežana Vrekić1, Milosav Đorđević1
1 High Technical School of Professional Studies, Kragujevac, Kosovska 8,
34000 Kragujevac, Serbia
Abstract. Modeling the process is a virtual representation of the object (model).
Mathematical and geometrical principles for designing a model based on the so-
called golden ratio. The paper aims to present the specifics of expressing the
proportions of the golden section. As the golden section studied and used by
many artists and architects in the creation of their work at the end of these
examples are described its use. In addition, it will be listed and examples of the
golden ratio occurrence in the art.
Keywords: geometric modeling, golden section, applications, proportions
1. Introduction
Contemporary in design processes in mechanical engineering based on the application
of computer technologies and their integration. The main feature of the material world
is the geometry from the geometry arise many properties such as mechanical,
functional, aesthetic, etc. Therefore, the use of computers in engineering and
development of computer processing geometric data closely related, either in terms of
visualization, any design and separation of functional and physical properties.
Historically, the development of CAD/CAE system has led to the formation of a
"model" as a product related to the computer and to the term "computer modeling ".
Under the term "model products" means the conceptual mode, which is able to present
all the information about a product to be used in the design and production. Model
Product represents the internal computer presentation of the product and contains all the
necessary information about it. In essence, the product model is a transformation in
which all geometric - technological and general characteristics presented in the form of
a logical data structure or rules. Nowadays, it is usually based on CAD geometry
shaped composition generating tool path with appropriate processing methods, which
immediately embarked on making products. Graphics programs mimic the three-
dimensional representation of the objects by: wired (edge) model (wireframe), surface
model, and volume (solid) model. Three-dimensional models are created so as to simple
3D shapes (primitive) apply operations union, intersection and difference. You can use
the finished basic primitives, to create a two-dimensional profile of primitive operations
using translation and rotation in space. Universal CAD software uses a set of geometric
primitives: box, cone, cylinder, sphere, wedge, pyramid, torus (Figure 1). By applying
213

Snežana Vrekić, Milosav Đorđević
Boolean design feature (union, difference or intersection) form more complex shapes.
Basic Bool operations are: union - collection ( U ), intersection ( ∩ ) and the difference
subtraction ( \ ). Computer support product design based on geometric modeling
methods whose primary objective is the creation of geometric models that will later take
all other virtual physical and functional properties.
Fig. 1. Geometric primitive
Fig.2. Decompodition of complex shapes on the primitive
The model has been simplified and idealized picture of reality. In the broadest sense,
modeling is profitable (in terms of cost) the use of something (model) instead of
something else (real system) in order to arrive at a certain knowledge. The result of
modeling the model. In other words, the model is a description of the real system with
all the characteristics that are relevant from our point of view. Modeling the process is a
virtual representation of the object (model) for the purpose of its development,
transformation, manipulation, storage, and further application. Modeling form, as one
214

Geometric modeling and principle of the golden section
of the stages in the design can be done using a number of different principles or criteria.
As with the design, modeling shapes is carried out on the basis of:
• aesthetic properties;
• functions that should be done;
• properties of different materials;
• ways of production;
• ergonomic and ecological characteristics;
• amount to quality, reliability, and of course
• the prices of products.
Different shapes and forms in the design process (models) it should be possible to
transform one another in that they contain far more information and data on the finished
product than is necessary for the actual development of technical documentation.
Modelling of parts using the basic geometric shape of the model represents today the
most widely spread CAD technology. Forms provide a model creating a very complex
product models in a very easy and intuitive way. Regardless of the complexity of the
geometry of a particular category of machine elements and structures to which it
belongs (standard machine elements , special machine elements, cast and forged shapes,
parts of sheet metal, etc.), the modeling process has more or less universal stream,
which consists essentially of the following steps: establishment of a sketch, creating the
model form and composing of model forms in part.
2. Forming model-some universal principles
In mathematical and geometric principles for designing a model based on so-called
of gold compared include: Golden Section, a rectangle and a triangle, Kepler triangle
and a golden pyramid, Pentagram, Fibonacci sequence, Gold and Fibonacci spirals,
Golden angle, Dynamic Balance and Generalization 1. Engineering is an engineering
discipline that involves the application of the laws of physics for analysis, design,
construction and maintenance of mechanical systems. There are also close links with
the art of engineering, which in some areas direct (architecture, landscape architecture,
industrial design), but in some indirect. Engineering and artistic creativity are
sometimes inextricably linked. In the nineteenth century activities that now call
engineering, were called mechanical arts. I conclude that the facility should be strict,
geometric art or with line subtly threaded. Basically constructivism was the use of
simple geometric shapes: square, circle, triangle and free lines, which were painted and
were "designed" picture. The sense of constructivism consists in the fact that it gives the
impression the necessity of harmonizing one element to another.
3. The Golden ratio
Golden Section proportions which is often mentioned when discussing relations
distances in simple geometric figures. More in the time of ancient Greece and Egypt,
was known for the golden ratio, which is primarily involved in the construction of
monumental buildings as well as in painting works. Historically, there are those who
215

Snežana Vrekić, Milosav Đorđević
claim that the ancient Egyptians used the golden ratio when building the pyramids, and
that example the ratio of the length of the sides of the Great Pyramid and its height
(approximately) equal to the golden ratio. Golden Section occurs as a growing
proportion of forms in nature and for centuries has attracted the attention of
mathematicians and artists. The proportion of the golden section is required by law that
beauty is in the proportionality between the individual parts and the parts to the whole.
The beauty of architectural structures depends on several factors. The most important
are proportionality and harmony. Harmonious proportions are best reflected in the
proportions of the golden section 2. After Euclid it reads:
b:a = a:(a+b) (1)
or "Less by the Chamber as well as to the larger continent ".
Fig. 3. The golden mean proportion : a / b = (a + b ) /A=1.61803.
If a = 1.0 then b = 0.618 , ie . a + b = 1.618 , and this size is known as the golden
mean (golden number), or the golden ratio. It represents the Greek letter and it is an
irrational number: = 1.6180339887499 ...
The Golden section is a specific relationship between two variables that satisfy the
following rule: the ratio of the sum of their larger size is equal to larger sizes compared
to the lesser. Golden ratio is everywhere in nature. It defines the relationship between
the parts. Showing the Greek letter phi, is expressed as ( 1 + root ( 5 ) ) / 2 = .
Number is a number that defines the golden ratio. For practical matters , the easiest
way is to use a number: 1,618. Architecture Antiquity and the Middle Ages was used
in the design proportions in accordance with the golden ratio. Gold number are used by
painters, musicians, physicists ... and all because this number is woven into the very
nature and all living things, because everything seems to be developing in certain steps.
is the proportions of the face, the rhythm of the heartbeat, the structure of DNA, etc.
3.1. Symmetry of the Golden section
Golden section in mathematics and art is a specific relationship between the two
sizes. Symmetry of the golden section, unlike the free symmetry, introduces the idea of
movement. I split in half along one get two equal segments, the ratio of 1: 1, you divide
along the principle of the golden ratio, we get two unequal segments that enable the
establishment of a Fibonacci sequence ( 1, 1, 2, 3, 5, 8, 13, 21, ... ), as well as
continuous proportions, where the third segment still represents the sum of the first two.
This continuity allows for endless movement in both directions, which reminds us of
the results of fractal geometry, and the like, and can be explained by way of organic
216

Geometric modeling and principle of the golden section
growt. It is possible to increase the myriad segments, which are to one another in a
continuous relationship, and that the basic principle and not to disturb the integrity of
being. It is this dynamic aspect of who we are interested in, the golden ratio as a
principle of dynamic symmetry.
3.2. Golden rectangle
A rectangle whose sides are in the ratio 1 : is called the golden rectangle. These
are 13/8 , 21/13 , 34/21 , 55/34 , etc . The proportions of the Golden restangle are a
natural starting point for preliminary sizing of structures and elements. In AutoCAD
golden section is drawn using the Rectangle and Arc commands. Rectangle command
is used to draw a square (or rectangular), and works with two clicks that define the
opposite corners of the square. The first click defines the start of a second click is
necessary to enter the coordinates where they can be positive or negative depending on
whether they are in the positive direction of x, y axes. These squares are measuring 1,
1, 2, 5, 8, 13. Arc command is used to draw the arc, and used its option: Center, Start,
End, which defines the center, the beginning and end of the arc. Previous studies in
connection with the golden ratio pointed to the various aspects of knowledge and the
application of its srazmerskih values, of which the most important are long division of
the golden section, and then the more complex aspects of cognition of his geometrical
structuration.
Fig. 4. The Golden Rectangle
4. Application of the golden section in technology
The latest application of the golden ratio can be seen in a new design of Twitter
(Figure 5). When creating a layout fikse width - is assumed to be the width of 1280 px.
In the event that there are two boxes (large box designed content and smaller box
designed for navigation) that it is necessary to determine the width, then use the
following proportions: the relationship between these two parts just need to be less
opposed to increasing as higher compared to the mainland.
US factory for the production of computers Apple uses a gold intersection for the
design of its mobile phones, logo and Applications listed (Figure 6). Their popular logo
in the shape of apples and iPhone5 in the proportion of the golden section. It is less
217

Snežana Vrekić, Milosav Đorđević
known that the use of the golden section as the ideal proportions present in Web design.
Golden section can be observed in the design and many other web pages. Featured
website (Twitter.com, FastCompany.com, Mashable.com, ColorMetrix.com) have
implemented the rules of the golden section and performed rule of thirds 3, 4.
Fig. 5. The effective length of the barrier
Fig. 6. Golden section in the design of the iPad, iPhone5 and Apple logo factory
5. Conslusion
From Pythagoras and Euclid, through the Renaissance to the present day
mathematical constant golden section of people they found in everything - from art and
architecture to nature. The scientists of the 20th and 21st century, modeled after the
theorists and scholars of the previous period, to continue studies of the golden ratio and
Fibonacci numbers, and found that this principle of proportion, or numeric sequence,
regulates the extremely large number of different relationships in the world around us.
Thus, the occurrence of the above mentioned phenomena, except in flora and fauna,
human anatomy, structure of geometric shapes, artistic and architectural works, starting
from the 20th century was observed in music, and in recent decades has been
considered in the context of narrow scientific fields such as psychology of human
relations, chaos theory, DNA analysis, quantum mechanics, etc. Proper understanding
of the golden section are invaluable for all modes of design - from architecture,
architecture, painting, sculpture until web design.
218

Geometric modeling and principle of the golden section
6. References
1. Marinković, A.: Modeliranje oblika: Prezentacija. Mašinski fakultet, Univerzitet u Beogradu,
Srbija. (2008)
2. http://en.wikipedia.org/wiki/Golden_ratio
3. Zlatić, S.: Zlatni rez. Tehnički glasnik, Vol. 7, No. 1, 84-90, (mart 2013)
4. http://tehnoklik.net.hr/dizajn-twittera-u-zlatnom-rezu
219

International Conference on Applied Internet and
Information Technologies, 2016
DOI:10.20544/AIIT2016.27
Expert System for Structural Analysis of
Electrocardiograms
Kristina Krasovitskaya1, Evgeny Cherkashin2, and Sergey Gorunchik3
1Irkutsk National Research Technical University,
Lermontov str. 83, Irkutsk, 664074, Russian Federation [email protected] 2Matrosov Institute for System Dynamics and Control Theory of
Siberian Branch of Russian Academy of Sciences, Lermontov str. 134, Irkutsk, 664033,
Russian Federation [email protected] 3Specialized Tuberculosis Hospital in Rostov region,
Orskaya str. 24, Rostov-on-Don, 344000, Russian Federation [email protected]
Abstract. The paper deals with process of a cardiological expert system
development. A definition of a electrocardiogram is presented. Problems of ECG
characteristics determination such as ECG data digitizing is considered. A problem
of QRS complex recognition and P and T waves parameters measurement is
discussed. A general outline of analysis technique for ECG using wavelet
transformation are proposed.
Keywords: electrocardiogram, ECG, expert system, ECG recognition,
electrocardiosignal, time series recognition, image processing, continuous wavelet
transformation.
1. Introduction
Medical images are popular objects of automatic analysis. An image of an
electrocardiogram (ECG) contains time series of a cardiosignals, which are processed
synchronously. Manual static analysis is always a multistage process. The signal
processing software delivered with a cardiological diagnosis is intended for experienced
functional diagnostician and rigidly bound to the appliance model, resulting to
impossibility to make a comparative analysis of ECGs of the same patient data obtained
in different medical centers and time moments. This, in turn, implies additional
examination to be carried on the patient to obtain the time series in a required file and
data format, increasing the cost of the patient residence in the diagnostic center. Also,
Russia has regions where the specialized professional cardiological treatment is not
possible, this can lead to fatal complications due to time delays.
In order to improve the quality and accessibility of medical cardiology provision for
the population, Ministry of Health of Russian Federation started to elaborate of a law
project aimed at a legal basis construction of IT infrastructure for public health
protection. The infrastructure will be based on remote interaction of medical
220

Kristina Krasovitskaya, Evgeny Cherkashin, and Sergey Gorunchik
professionals and patients. At present the interaction (such as remote consultations) is
out of professional moderation and provided via forums, specialized internet sites and
Skype. The cardiological data is supplied as attached photographic as scanned images.
The final conclusions made in the environment are of question.
The automatic processing and analysis of the ECG will reduce human factor impact
on the final conclusion since automatic processing results are not affected by the degree
of fatigue, observation time, and body physical condition of the physician. Moreover the
results produced by human expert are usually intuitive, expressed in quality statements,
and the reasoning process can be hardly represented as explicit elementary stages (as an
algorithm). For example, expert estimates the width of PQ interval to be shorter as
compared to one described in the literature, in addition, the subjective estimation varies
among specialists [1]. Computer processing and analysis is significantly formalized and
operates by qualitative values.
The computational ECG processing has already more than fifteen years. But it seems
that there are no industry standards of data representation and processing pipelines of the
EGC images as well as complete set of methods, data formats, IT tools and techniques
for implementation of each stage of the pipeline. The ECG image processing problem is
classified as artificial intelligence recognition task with the lack and data distortion.
Among the existing ECG processing software made in Russian Federation we
emphasize system “Valenta” as a popular software tool for ECG data analysis obtained
from its instrument. The program does not allow processing data from other sources such
as scanned tape images and time series obtained from other appliances. Monitor control
systems, e.g., arrhythmia monitor system “Argus”, require special equipment. Professor
MD V. M. Uspensky suggested new diagnostic method that allows expert to diagnose a
wide range of deceases of internal organs by describing a ECG. The method does not
allow one to diagnose an essential set of hearth deceases causing arrhythmia that has 8%
of all the cases in last three years. The analytic systems do not support importing raster
graphics of scanned images of ECG printed on a paper — still the most popular media.
Digitizing such sources and extraction of time series allow us to organize automated
diagnostic environments on the base of electronic medical records.
In this investigation we develop an IT technique and software, which will process
and analyze ECG raster images obtained in cardiologist’s offices, medical organizations
and from medical histories. The aim of the investigation is to develop software allowing
cardiologists to watch the dynamics as an ECG evolution in time. To achieve so we need
to digitize ECG time series, filter parasite distortions (low and high frequency), straighten
the signal base, and measure signal relative entity sizes in % to the reference ones.
Another problem is automatic interpretation of an ECG as a result of signal form analysis.
The automatic analysis as a pedantic and formal procedure will rise the probability to
mention, e.g., atrial fibrillation, and lower human factor in decision making.
2. Structire of ECG
Electrocardiogram (ECG) is a graphical representation (a time series records) of impulse
conduction on the nodes and bundles of the cardiac conduction system of heart. ECG is
recorded as a number of electrical entities (pikes made of rising and drooping, and
221

Expert System for Structural Analysis of Electrocardiograms
horizontal segments) [2]. Pike entities are denoted by letters P, Q, R, S and T, whereas
horizontal segments are denoted by PR segment and ST segment.
Each ECG analysis is started from verification of the registration process. The
registration of hearth electric field potential, named as lead, is measured between two
placements of the chest surface. The standard ECG consists of twelve leads (vectors):
three 2-pole (3 standard leads), three 1-pole reinforced limb leads, six 1-pole chest leads.
Fig.1. Standard twelve-lead ECG
3. Image processing
a. Recognition of lead time series
The first stage of the ECG image processing is a recognition of the time series if the leads.
The source image scan consists of tracing paper background with square grid and lines of
time series. Time series include a reference pulse at the beginning (Fig. 1). The processing
of the image can be done with various techniques. We started directly from the application
of edge tracing algorithms and obtained the results like ones depicted in Fig. 2.
Fig.2. Sobel filter processing (inverted)
222

Kristina Krasovitskaya, Evgeny Cherkashin, and Sergey Gorunchik
As the image consists of the combination of the background and signal time
series, we decided to filter out the background [3,4]. The following schema
implements the filtering.
1. A color channel of the background hue is extracted from the source image.
2. A red image copy is blurred with Gaussian filter in the red channel.
3. The digital image of the lead time series is obtained using the following formula:
s(n) = f(n) + σe(n), where f(n) is the signal, σ is the noise level, e(n) is the Gaussian
white noise, and s(n) is the original signal. The threshold transformation is applied
to the image as well.
4. The signal recording is restored in a cyclic processing of the columns of the obtained
pixel array of the image.
The algorithm did not produce results on all the test given. Ten out of 156 ECGs did not
completely analyzed due to threshold transformation function faults. The function
parameters were adjusted by means of a machine learning technique. Hue and brightness
characteristics of each column of the image were used as attributes of input train set.
Fig.3. Algorithm stages of time series recognition
b. Time series post processing
The original ECG image in a general case contains signal distortions such as baseline
drift and proximity effect to energy supply network. A similar low frequency distortion
could also be introduces by time series recognition algorithms. The baseline drift arises
due to patient’s strong movement, electrode polarization, appliance measurement error,
and poor electrode contact to patient’s skin. We used discrete Butterworth filter in the
removal procedure of the low frequency distortions
223

Expert System for Structural Analysis of Electrocardiograms
where H is frequency response of the analog filter, kc is a cutoff frequency (rad/s), k is the
analog frequency in radiant. The energy supply network has usually 50 or 60 Hertz
frequency, and its distortion is suppressed with band-stop and comb filters.
In the case when many copies of ECG is accessible, one can take advantage of
synchronous and ensemble averaging techniques. The noise is a stationary stochastic
process, and the ECG signal itself is (quasi-) periodical or cyclically-stationary. Sliding
mean filer in time space is applicable to a statistically stationary low frequency signals.
This technique provides filtering capabilities in real time mode.
If the real time mode is not required we use filtering in the frequency space. If a power
spectral density and autocorrelation function parameters are known, one can make use of
optimal Wiener filter. If the noise is not correlated to the signal or the distortion has
nonstationary (or even stochastic) properties and there are no additional data, but we have
a record from a secondary source, then adaptive filtering is used.
4. ECG entities recognition
c. QRS complex detection
The QRS complex detection is usually based on locating R pike with the following
removal of the whole QRS complex from the ECG time series. The R location can be
obtained by means of various methods, e.g., based on the derivative [5], sliding mean
filer, weighted and squared operators of the first derivative [6], detection algorithm of
PanTompkins [7]. For PQRST complex detection, there are discrete wavelet
transformation based algorithms [8,9], and duration transformation [10].
In this project we used discrete wavelet transformation method as it can determine
pikes in the signals with base line drift distortion. The previously recognized time series
are loaded from a file, and 4th degree wavelet decomposition is computed over the loaded
data (Fig. 4), the source signal is decomposed with Daubechies wavelet.
Fig.4. Low frequencies decomposition
224

Kristina Krasovitskaya, Evgeny Cherkashin, and Sergey Gorunchik
At the next stage the obtained time series analyzed visually by operator (user). Operator chooses the variant that is similar to the original time series. The chosen variant contains no distortion. Then the R pikes are determined as maximal values among time moments, where signal amplitude is greater than 60% of the maximal digital value on the interval.
Fig.5. R pike determination
The determined maximal values positions are also filtered according to pike average
distance criterion. The measured pike amplitude is corrected with respect to the basis of
the original signal, then the locations of the rest of the pikes are determined (Fig.6 and 7).
Fig.6. R pike determination (base line drift)
5. Usage the digitized time series of leads
A comparative dynamics analysis of EGC of abnormal hearth rhythms in form of various
arrhythmia and conduction disorder has been carried on during patient observations of
primary manifestations of undesirable side effects on the months-long anti-tuberculosis
chemotherapy. The abnormalities are as follows (with the number of observations): the
rhythm of the right atrium (18 cases), atrioventricular block I st. (7 cases), full blockade
of the left His’ leg bundle (2 cases), Brugad syndrome (7 cases), sick sinus syndrome (1
case), pacemaker migration on the atria (2 cases), pacemaker migration on the atria (10
cases), lengthening the interval Q–T (1 case), shortening of P–Q interval — syndrome
premature ventricular heart lerk-Levi-Cristesco (CLC) (12 cases), atal syndrome of
225
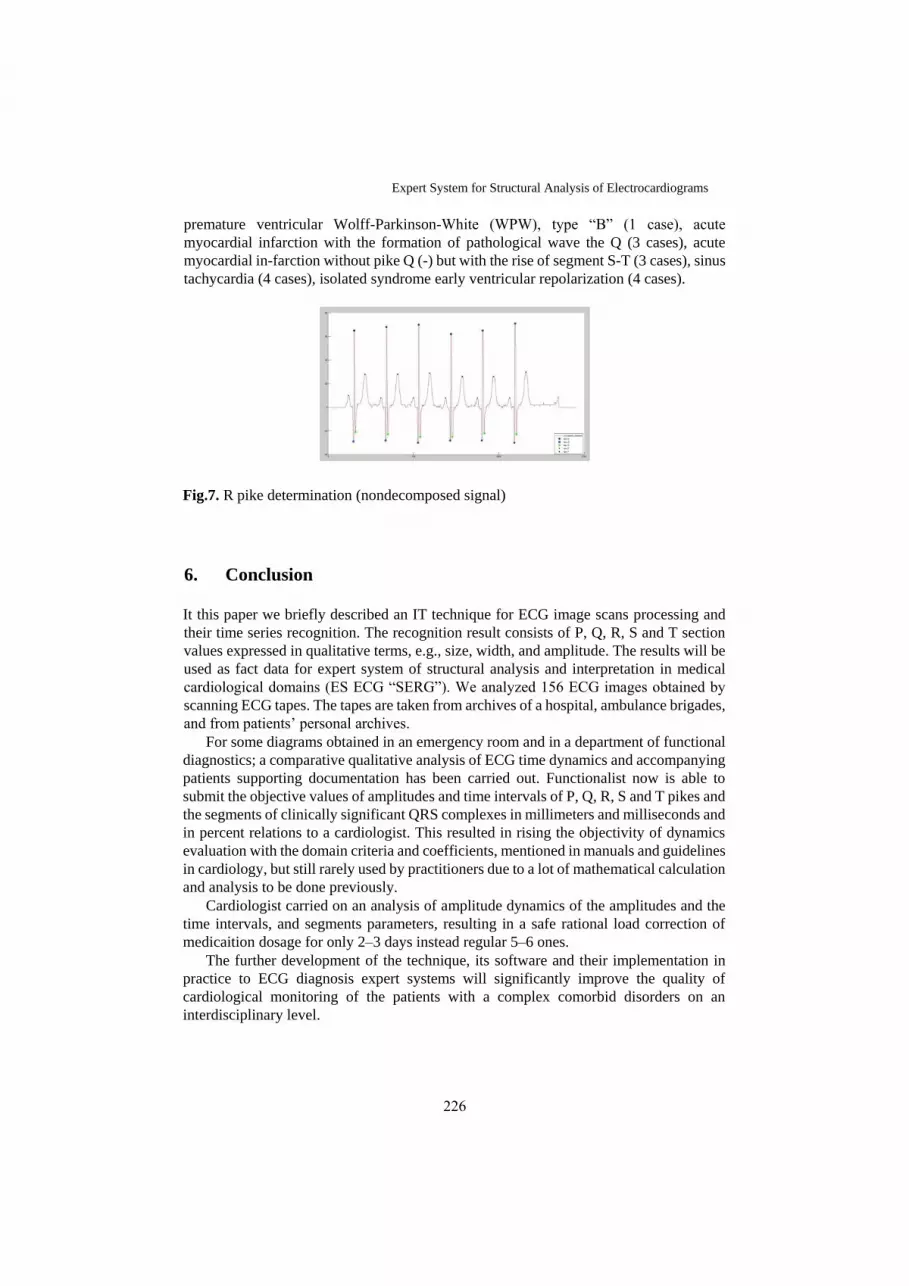
Expert System for Structural Analysis of Electrocardiograms
premature ventricular Wolff-Parkinson-White (WPW), type “B” (1 case), acute
myocardial infarction with the formation of pathological wave the Q (3 cases), acute
myocardial in-farction without pike Q (-) but with the rise of segment S-T (3 cases), sinus
tachycardia (4 cases), isolated syndrome early ventricular repolarization (4 cases).
Fig.7. R pike determination (nondecomposed signal)
6. Conclusion
It this paper we briefly described an IT technique for ECG image scans processing and
their time series recognition. The recognition result consists of P, Q, R, S and T section
values expressed in qualitative terms, e.g., size, width, and amplitude. The results will be
used as fact data for expert system of structural analysis and interpretation in medical
cardiological domains (ES ECG “SERG”). We analyzed 156 ECG images obtained by
scanning ECG tapes. The tapes are taken from archives of a hospital, ambulance brigades,
and from patients’ personal archives.
For some diagrams obtained in an emergency room and in a department of functional
diagnostics; a comparative qualitative analysis of ECG time dynamics and accompanying
patients supporting documentation has been carried out. Functionalist now is able to
submit the objective values of amplitudes and time intervals of P, Q, R, S and T pikes and
the segments of clinically significant QRS complexes in millimeters and milliseconds and
in percent relations to a cardiologist. This resulted in rising the objectivity of dynamics
evaluation with the domain criteria and coefficients, mentioned in manuals and guidelines
in cardiology, but still rarely used by practitioners due to a lot of mathematical calculation
and analysis to be done previously.
Cardiologist carried on an analysis of amplitude dynamics of the amplitudes and the
time intervals, and segments parameters, resulting in a safe rational load correction of
medicaition dosage for only 2–3 days instead regular 5–6 ones.
The further development of the technique, its software and their implementation in
practice to ECG diagnosis expert systems will significantly improve the quality of
cardiological monitoring of the patients with a complex comorbid disorders on an
interdisciplinary level.
226

Kristina Krasovitskaya, Evgeny Cherkashin, and Sergey Gorunchik
Acknowledgment
The research is partially supported by Russian Foundation of Basic Research, grant No.
1607-00554 “Development of Method for Object Recognition on Raster Images on the
Base of Logical Models with Spatial Constraints”, by the Council for Grants of the
President of Russian Foundation for state support of the leading scientific schools, project
NSh8081.2016.9. The software development is hosted on the resources of Shared
Equipment Center of Integrated information and computing network of Irkutsk Research
and Educational Complex (http://net.icc.ru).
References
1. Rangaraj, M.R.: Biomedical Signal Analysis. A Case-Study Approach. IEEE Press and
Wiley, New York, NY. (2002). ISBN 0-471-20811-6
2. Electrocardiography – Wikipedia, the free encyclopedia, [Online]. Available:https://en.
wikipedia.org/wiki/Electrocardiogram (current March 2016)
3. Gonsalez, R.C., Woods, R.E.: Digital Image Processing. MA: Addison-Wesley. (1992)
4. Gonzalez, R.C., Woods, R.E., Eddins, S.L.: Digital Image Processing Using MATLAB, 2nd
ed. Gatesmark Publishing. (2009)
5. Ahlstrom, M.L., Tomhins, W.J.: Digital filters for real-time ECG signal processing using
microprocessors. IEEE Trans. Biomed. Eng. vol. 32. pp. 708–713 (1985)
6. Murthy, I.S.N., Rangaraj, M.R.: New concepts for PVC detection. IEEE Trans. Biomed.
Eng. vol. 26, 7 pp. 409–416 (1979)
7. Pan, J., Tomhins, W.J.: A real-time QRS detection algorithm. IEEE Trans. Biomed. Eng.
vol. 32. pp. 230-236 (1985)
8. Khaled, D., Ibrahim, N.A., Abdel-Rahman, Al-Q.: QRS Complex Detection Based on
Symmetry Wavelet Function. In: 5th International MultiConference on Systems, Signals and
Devices (2008)
9. Dubrovin, V.I., Tverdohleb, J.V., Kharchenko, V.V.: R-peaks detection using wavelet
Technology. Radioelectronka, informatika, upravlinnya.
2(29) (2013), [Online]. Available:http://cyberleninka.ru/article/n/ r-peaks-detection-using-
wavelet-technology (current March 2016)
10. Gritzali, F., Frangakis, G., Papakonstantinou G.: Detection of the P and T waves in an ECG
//Comput. Biomed. Res. vol. 9. pp. 125–132 (1976)
227

International Conference on Applied Internet and Information
Technologies, 2016
DOI:10.20544/AIIT2016.28
Approach for Synonyms Detection in Conceptual Data
Model
Zoltan Kazi, Ljubica Kazi, and Biljana Radulovic
University of Novi Sad, Technical faculty “Mihajlo Pupin” Zrenjanin,
Djure Djakovica bb, 23000 Zrenjanin, Serbia
Abstract. Detection of synonyms in data modeling is considered as a significant
problem, especially within the semantic evaluation of a conceptual data model.
This paper presents an approach for synonyms detection in a system for
conceptual data model semantic evaluation. It is based on automated reasoning in
ontology mapping with conceptual data model with tool that formalizes ontology
and conceptual data model and merges them with a set of reasoning rules.
Reasoning was done with Prolog system. These rules are created for ontology–to-
conceptual data model mapping, as well for synonyms extraction. Examples of
testing reasoning rules are also shown in the paper.
Keywords: synonyms detection, conceptual data model, ontology, reasoning.
1. Introduction
Research in information system design evaluation has recently received considerable
attention in information technology community [1]. In the field of models in
information system development [2] introduces a general metrics framework related to
syntax, semantic and pragmatic aspect of a model quality evaluation. A comparative
analysis and categorization of many systems analysis and design methods has been
presented in [3].
Data quality research [4] is related to development of methodologies, frameworks
and tools for measurement and improvement of data models and data in databases.
Results in this field propose frameworks that define set of quality characteristics,
metrics that could measure the level of quality characteristics achievement in particular
case and the set of activities to perform in aim to perform measurement and metrics data
processing.
This paper presents the developed system for synonyms detection within the
evaluation of conceptual data models, based on ontology mapping. In
the synonyms detection, methods of the composite matching, combined with structural
analysis were used.
228

Zoltan Kazi et al.
2. Related Work
Problems of schema matching [5] could appear in applications such as schema
integration, data warehouse, semantic query processing etc. The matching solutions
based on comparison of names, constraints and structure could be applied to various
schema types, relational model, object oriented models and conceptual data model
(CDM). Shvaiko and Euzenat [6] presented techniques of schemas matching based on
terminological (linguistics-based), semantic (ontology-based) and structure (elements
relations-based), including a confidence measure for the level of correspondence
between the matching entities.
Similarly, ontology mapping, as “the process of linking corresponding terms from
different ontologies”, could be used in query answering or for navigation on the
Semantic Web [7]. Authors, in paper [8], defined a matching at lexical, semantic
(related to synonyms) and structural level. Kalfoglou and Schorlemmer conducted
survey [9] on methods and frameworks for comparison and merging of ontologies with
different, similar or equal vocabulary, as well as possibly different ontology languages
and corresponding ontology tools.
3. The Proposed Approach for Synonyms Detection in CDM
The approach for synonyms detection in CDM proposes automated reasoning in
mapping ontology elements with appropriate elements of conceptual data model. The
basic idea is comparing elements of conceptual data model with elements of previously
created ontology, which represent knowledge, i.e. semantics of the business domain. If
corresponding elements of conceptual data model could be matched or mapped with
elements from ontology, then conceptual data model could be considered as
“semantically correct” regarding the related ontology to the appropriate extent
(percentage, i.e. semantic mark).
Underlying assumptions for the proposed approach are:
Created ontology describes the business domain of interest,
Created ontology could be transformed to a form suitable for automated reasoning,
Created CDM could be transformed to a form suitable for automated reasoning,
Ontology elements and conceptual data model elements could be compared.
Possible situations in the comparison of conceptual data model elements to ontology
elements are:
CDM element is “equal” to an ontology element (“matching” of ontology element to
conceptual data model element) – both elements have the same form, i.e. they are
equal words,
CDM element is “similar“ to any ontology element - CDM element is considered a
“synonym” to an ontology element (“mapping” of ontology element to conceptual
data model element) – both elements have similar structural characteristics
(neighboring) with other elements in a way that could be considered similar, or
“synonyms” and could be processed as mapping elements. Conceptual data model
element is not considered as “synonym” to an ontology element,
CDM element could not be related to any ontology element.
229

Approach for Synonyms Detection in Conceptual Data Model
Automated reasoning is based on set of rules that are used for decision making and
extracting elements within the comparison of ontology elements with conceptual data
model elements. Automated reasoning enables extracting of matching elements,
mapping elements (“synonyms”), as well as uncovered elements (not matching and not
mapping elements). Uncovered elements could be:
Elements from ontology that are not matching and not mapping with conceptual data
model elements;
Elements from conceptual data model that are not matching and not mapping with
ontology elements.
The proposed approach is developed into a system presented at the component diagram
at Fig. 1. The proposed system integrates using tools for ontology creation and
conceptual data model creation with automated reasoning engine. The proposed system
also consists of an integration tool that enables transformation of ontology and CDM
into a form suitable for automated reasoning, integration of the transformed input with
reasoning rules and starting the automated reasoning engine.
Fig. 1. Conceptual data model evaluation schema
230

Zoltan Kazi et al.
3.1. Ontology Presentation
“Ontologies have been proposed as an important and natural means of representing
real world knowledge for the development of database designs” [10]. In broader
definition, ontologies are categorized as types of conceptual models [11], but more
commonly used term in practice relates conceptual data models as separate concepts
[12]. Practical implementation of ontologies is based on widely accepted standards such
as World Wide Web Consortium standard formats such as OWL – Ontology Web
Language and RDF - Resource Document Framework. Structure of ontology in OWL
format consists of a collection of OWL elements [13], which could be transformed
into a RDF expression. This expression is a collection of triplets: RDF (S, P, O), where:
S is a subject, P is a predicate, and O is an object.
Main purpose of ontology is to capture and share knowledge in a specific domain of
interest. A main characteristic of ontology is hierarchy of concepts and objects (i.e.
instances of concepts established by using different semantic links). Ontology is used to
describe words that represent various concepts, or can be used as taxonomy that shows
how particular areas of knowledge are related. Basic ontology concepts are: classes,
subclasses, properties, sub-properties, domains and ranges. Objects relations are well
defined with object properties characteristics and data properties with data ranges
belong to objects that are connected in specific domain. Structure of ontology consists
of a collection of OWL/RDF elements, transformed into RDF expression that is
accepted by World Wide Web Consortium. In the RDF form, ontology represents a
collection of triplets, consisting of subject, predicate and object RDF(S, P, O), where S
is subject, P is predicate and O is object.
3.2. Data Model Formalization
A data model enables representation of a real world through a set of data entities and
their connections [14] that are represented in various forms: diagram (schema) with data
dictionary as well as formal languages representation, such as predicate logic calculus
[15]. In papers [16], [17] that are based on [18], formal presentation of a conceptual
data model is extended to S = (E, A, R, C, P), where:
E is a finite set of entities,
A is a finite set of attributes,
R is a finite set of relationships,
C is a finite set of restrictions concerning attributes domains, relationships
constraints, integrity rules for entities, attributes and relationships,
P is a finite set of association rules for entities, attributes, relationships and
restrictions.
231

Approach for Synonyms Detection in Conceptual Data Model
3.3. Reasoning Rules
Rule 1 – extracts object properties from the ontology that are covered by
relationships in the data model, but one of the entities are covered by the appropriate
OWL class, while the second has a different name except object properties that are
already discovered:
ontorelsinent(XC1,YOP,XC2,XE1,YR,XE2):-
rdf(XC1,type,class), rdf(XO1,classassertion,XC1),
rdf(XO1,type,namedindividual), rdf(XC2,type,class),
rdf(XO2,classassertion,XC2),rdf(XO2,type,namedindividual),
rdf(YOP,type,objectproperty), rdf(XO1,YOP,XO2),
ent(XE1),ent(XE2), rel(YR), p(XE1,YR), p(YR,XE2),
(XE1=XC1;XE2=XC2),YR=YOP,
not ontorel(XC1,YOP,XC2,XE1,YR,XE2),
not ontorelsinrel(XC1,YOP,XC2,XE1,YR,XE2). (1)
Rule 2- extracts object properties from ontology, that are not covered by
relationships in the data model, but one of the entities is covered by the appropriate
OWL class, while the second has a different name except object properties that are
already discovered:
ontorelsinentrel(XC1,YOP,XC2,XE1,YR,XE2):-
rdf(XC1,type,class),rdf(XO1,classassertion,XC1),
rdf(XO1,type,namedindividual),rdf(XC2,type,class),
rdf(XO2,classassertion,XC2),rdf(XO2,type,namedindividual),
rdf(YOP,type,objectproperty),rdf(XO1,YOP,XO2),
ent(XE1),ent(XE2),rel(YR),p(XE1,YR),p(YR,XE2), (XE1=XC1;XE2=XC2),not
ontorel(XC1,YOP,XC2,XE1,YR,XE2),
not ontorelsinrel(XC1,YOP,XC2,XE1,YR,XE2),
not ontorelsinent(XC1,YOP,XC2,XE1,YR,XE2),
not ontorelsinent2(XC1,YOP,XC2,XE1,YR,XE2). (2)
Rule 3 – extracts data properties from ontology that are not covered by attributes
with equal names in the data model, but attribute data type is equal to the ontology data
property range:
ontodataatribtypesin(X,Y,X1,Y1):-rdf(X,type,dataproperty),
rdf(X,range,Y),atr(X1),res(Y1),p(X1,Y1),Y=Y1,not X=X1. (3)
In previously presented rules, the special symbols represent:
Variables: X, X1, X2, XC1, XC2, XE, XE1, XE2, XC1, XC2, XE1, XE2, XO1,
XO2, Y, Y1, YP, YR, YOP, and YER;
Constant values: type, class, object property, data property, range, named individual,
and class assertion;
Predicates: rdf, ent, atr, rel, res, p, ontoclassent, ontoclassnoent, ontodataatrib,
ontodatanoatrib, ontodataatribtype, ontocard, and ontorel.
232

Zoltan Kazi et al.
4. The Synonyms Detection Example
Fig. 2 presents simple example of an ontology schema with basic domain ontology
elements: classes, objects as class instances and relations for objects. Each object has
data property with a range that defines specific datatype. These data properties are not
visible on schema but exist in the ontology dictionary. The domain is related to the
international scientific conference organization. The part of domain related to an
author’s (or participant’s) submission of a paper to a conference is presented as an
ontology graph. Certain details such as data properties and data types are not presented
in the ontology graph.
Ontology schema on Fig. 2 shows similarities and differences. Intentional
differences, for the purpose of synonyms detection, are made in the case of:
Entity type: “author” (in the ontology) vs. “participant” (in the CDM diagram).
Relationships: “attend” (in the ontology) vs. “participate” (in the CDM diagram).
Attributes: “phone” (in the ontology) vs. “phone_num” (in the CDM diagram),
“email_address” (in the ontology) vs. “email” (in the CDM diagram).
Fig. 2. Domain ontology graph
To enable synonyms detection with the previously presented reasoning rules (1)-(3)
automated reasoning is performed within Prolog system. Application of rules for
synonyms detection is demonstrated with previously presented examples of intentional
differences of the ontology compared to the CDM model.
4.1. Testing Rules
Previously presented examples demonstrate using reasoning rules for synonyms
detection upon formalized ontology and data model. Prolog detects and extracts
synonyms among all elements of ontology and conceptual data model. In previous
examples, it has been demonstrated that appropriate synonyms extraction rules
successfully detect synonyms in entities, relationships and attributes.
Example 1 - Prolog query (upon Rule 1, (1)) and answer that extracts synonyms -
ontology class “author” with data model entity type “participant”.
233

Approach for Synonyms Detection in Conceptual Data Model
?- ontorelsinent (XC1,YOP,XC2,XE1,YR,XE2).
XC1 = author,
YOP = write,
XC2 = paper,
XE1 = participant,
YR = write,
XE2 = paper.
Example 2 - Prolog query (upon 2, (2)) and answer that extracts synonyms -
ontology object property “attend” with data model relationship “participate”.
?- ontorelsinentrel(XC1,YOP,XC2,XE1,YR,XE2).
XC1 = author,
YOP = attend,
XC2 = conference,
XE1 = write,
YR = participate,
XE2 = conference.
Example 3 - Prolog query (upon Rule 3, (3)) and answer that extracts synonyms -
ontology data property “phone” with data model attribute “phone_num”. It also
extracts synonyms - ontology data property “email_address” with data model attribute
“email”.
?- ontodataatribtypesin(X,Y,X1,Y1).
X = phone,
Y = string,
X1 = phone_num,
Y1 = string,
X = email_address,
Y = string,
X1 = email,
Y1 = string.
5. Conclusion
This approach enables processing of matching elements from both conceptual data
model and ontology, similar elements as synonyms and uncovered elements. It is
particularly useful in synonyms detection, which is helpful in overall semantic
evaluation of conceptual data model. Advantage of this system is also in externally
stored reasoning rules that could be enhanced, changed or added, according to the needs
of particular type of data model, enabling evaluation of different data model types and
modeling technology, i.e. file formats.
The proposed approach is particularly applicable in situations where single ontology
is created as a basis for evaluation of a group of conceptual models with the same
semantics. The particular focus in this research was on synonyms detection. Automated
reasoning rules for synonyms extraction were presented, as well as an example of their
usage with a simple part of domain related to international conference organization.
234

Zoltan Kazi et al.
6. References
1. Wang, S., & Wang, H. Towards Innovative Design Research in Information Systems,
Journal of Computer Information Systems, Vol. 51, No. 1, pp. 11-18, (2010).
2. Van Belle, J.P. A Framework for the Evaluation of Business Models and its Empirical
Validation, The Electronic Journal Information Systems Evaluation 9(1): 31-44, (2006).
3. Siau, K., & Rossi, M. Evaluation techniques for systems analysis and design modelling
methods – a review and comparative analysis, Info Systems J 21, pp. 249–268, (2011).
4. Batini, C., & Scannapieco, M. “Data Quality”, Springer, (2006).
5. Rahm, E., & Bernstein, P. A Survey of Approaches to Automatic Schema Matching. The
VLDB Journal, vol. 10, pp. 334–350, (2001).
6. Shvaiko, P., & Euzenat, J. A Survey of Schema-Based Matching Approaches, Journal on
Data Semantics, vol. IV, (2005).
7. Fernandez, M., Gomez-Perez, A., & Juristo, N. Methontology. From Ontological Art
Towards Ontological Engineering. AAAI Technical Report SS-97-06, (1997).
8. Trojahn, C., Moraes, M., Quaresma, P., & Vieira, R.A. Cooperative Approach For
Composite Ontology Mapping. Journal of Data Semantics, Lecture Notes in Computer
Science 4900, Springer, (2008).
9. Kalfoglou, Y., & Schorlemmer, M. Ontology Mapping: The State of the Art, The Knowledge
Engineering Review Journal, vol. 1, pp. 1-31, (2003).
10. Sugumaran, V., & Storey, V.C. Ontologies for Conceptual Modeling: Their Creation, Use,
and Management. Data & Knowledge Engineering, vol. 3, pp. 251–271, (2002).
11. Spaccapietra, S., March, S.T., & Kambayashi, Y. Conceptual Modeling. In: Proceedings of
21st International Conference on Conceptual Modeling, Tampere, Finland, (2002).
12. Weber, R. Conceptual Modeling and Ontology Possibilities and Pitfalls. In: Proceedings of
the 21st International Conference on Conceptual Modeling, Spaccapietra S, March ST,
Kambayashi Y, editors. Lecture Notes in Computer Science, vol. 2503, 1–2, Springer-
VerlagBerlin, Germany, (2002).
13. Benslimane, S., Malki, M., & Bouchiha, Dj. Deriving Conceptual Schema From Domain
Ontology: A Web Application Reverse Engineering Approach,. The International Arab
Journal of Information Technology, vol. 2, pp. 167-176, (2010).
14. Chen, P. The Entity-Relationship Data Model – Toward a Unified View of Data, ACM
Transactions on Database Systems, vol. 1, no 1, pp. 9-36. (1976).
15. Elmasri, R., & Navathe, S.B. Fundamentals of Database Systems, Addison Wesley, (2007).
16. Kazi, Lj., Kaz,i Z., Radulovic, B., & Letic, D. Using Automated Reasoning System for Data
Model Evaluation, In Proc. International Symposium on Intelligent Systems and Informatics
SISY 2010, Subotica, Serbia, ISBN 978-1-4244-7394-6; (8): 522-527, (2010).
17. Kazi, Z., Radulovic, B., Kazi, Lj., & Bhat, M. Ontology-based System for Conceptual Data
Model Evaluation, The International Arab Journal of Information Technology, vol. 13, no. 5,
(2016).
18. Emer, M.C., Vergilio, S.R., & Jino, M. Testing Relational Database Schemas with
Alternative Instance Analysis, 20th International conference on software engineering and
knowledge engineering SEKE, San Francisco, (2008).
235

International Conference on Applied Internet and
Information Technologies, 2016
DOI:10.20544/AIIT2016.29
Data Visualization in Business Intelligent &Analysis –
Analysis of First Positioned Tools According to Gartner’s
Magic Quadrant in Ability to Execute
Snezana Savoska1, Andrijana Bocevska1 1 Faculty of information and communication technologies, Partizanska bb,
7000 Bitola, Macedonia
snezana.savoska, andrijana [email protected]
Abstract - Data Visualization tools in Business Intelligent (BI) and Analysis are
very effective because they allow gaining of deeper understanding of huge
amounts of data stored in databases. For this reasons many market research
companies take into consideration usage of Data Visualization tools as part of
their BI solutions and analyze their competitive advantage at the market as well as
the benefits and disadvantages. In this paper, the Data Visualization tools that are
on the top of Gartner and Forrester researches, Tableau and Qlik, are taken into
consideration. They are positioned higher on the “Ability to execute” axis and
according to researchers’ report, are faster growing sales tools and deserve
analyses in details. They are used as Visual Data Analysis (VDA) tools from
theoretical and practical side and are analyzed for previous defined Key
Performance Indicators in order to gain deeper insights and make a comparison of
their ability to execute.
Keywords: Data Visualization tools, Business Intelligence and Analytics,
Tableau, Qlik
1. Introduction
The latest researches of Gartner, Forrester and Ovum [1, 2, 3] show that the Visualization
tools’ market in Business Intelligence and Analytics (BI&A) grows more and becomes
competitive in the area of user friendliness as well as compatibility with the tools that are
used for data gathering, storing and manipulating and creating information and
knowledge from data [1]. The biggest global companies admit that they had a lot of
problems with understanding of their and customers and merchandizers’ demands for
analysis [4, 8]. Many efforts were conducted to establish a new form of reporting
connected with decreasing time and effort until they started to use Visual Data Analysis
tools and gained solutions based on these tools, through principles of self-service [5].
These kind of guidelines show companies how to gain experience that benefits with
turning data into another kind of intelligence, called Actionable intelligence, needed for
survival of companies in the market and gaining competitive advantage [6].
236

Snezana Savoska and Andrijana Bocevska
Although some analysis of usage of Advanced Data Visualization (ADV) from
different researches give different ranges according to different criteria [8], the
researches show suitability it some Key Performance Indicators (KPI) that are taken into
considerations. They mainly argue with the results of researches where the same criteria
for evaluation are taken into consideration. The market analysis of Data Visualization
Tools (DVT) for BI&A, according to Gartner [1], shows that, if KPI Ability to execute is
taken into consideration, the market leaders are Tableau software and Qlik. Microsoft
group of tools for BI is closely to them and have the better position if Completeness of
Vision is taken in consideration [1,2,3] but the higher progress from 2015 to 2016 exceed
the two mentioned DVA tools for BI&A [1, 3].
At most of prestigious World’s journals analysis [1, 2 ,3, 6, 11], researchers stated
that the percentage of usage of these DVT for BI&A for corporate reporting is around
100% for all company’s data analysis, especially when financial, marketing and e-
commerce key reports are taken into consideration. For these reasons, our opinion is that
these tools deserve analysis according to KPI and comparative analysis of their quality
according to some practical working experience with them.
In this paper some KPI and Critical success factors (CSF) analysis are made for
Tableau and Qlik DVA tools for BI&A. Driven by the need of investigate their
performances with the goal of objective assessment of their visualization parameters, we
made a comparative analysis, taking into consideration more aspects related to their
prerequisites, capabilities, responsiveness, user friendliness, data integration and other
attributes.
After the introduction, the second section of the paper is dedicated to studying related
works in this area and giving an overview of papers and researches that consider VDA,
Data Visualization (DV) for BI&A, ADV. In this session the newest researches in this
area are highlighted. The next, third session explains the plans of research and used
methodology framework. The forth part summarizes obtained results in comparative
table, highlighting advantages and limits of the tools. The final part of the paper draws
conclusions and proposes the directions for future research.
2. Related works
Many researches are dedicated of usage of DV in BI&A, firstly because of power they
give to decision makers with visual display allowed [10, 12]. The flow of enormous
volume of data that can be analyzed for trends identification and predictions, bring
additional values for companies. BI&A tools give the opportunity for easy transformation
of raw data into valuable information with VDA tools commonly called Visual Business
Intelligence Data Visualization [13]. In this way, it is easier to make more sense in data,
to present them in the visual form, some hypothesis are tested and some trends are
highlighted as well as some insights in data are made [7, 8].
All the benefits brought by Visual Business Intelligence (VBI) contribute to the
market demands of staff that possesses VDA knowledge to be enormous increased in the
world. This fact produced deficit of staff with VDA skills on the labor market [14]. Also,
there is increased market staff demand for managers capable to decide according to VDA
for BI&A [15].
237

Data Visualization in Business Intelligent &Analysis – Analysis of First
Positioned Tools According to Gartner’s Magic Quadrant in Ability to Execute
DV is an emerging field that is developed on the base of statistic, mathematics,
probability and data representation to gain sense in a huge data sets, stored in data bases
[13]. Many authors highlighted that the companies depend more on usage of Decision
support systems (DSS) and BI&A tools [16]. Turban [17] and Chaudhuri [8] state that
with these concepts, many business processes are improved in many companies.
Chen,[14] links BI&A with Big data analytics that becomes increasingly important for
the academic community as well as business community in the last decade, that cause an
explosion of demands of staffs with advanced analytical knowledge [5,6,14,15,18].
Already, in many Universities are introduced courses with objectives to help in education
for VDA, based on principals of usage of concepts “learning-by-doing” and “trial-and-
error experimentation” [14].
Aigner&all explore how the interactive visual methods are used in practice in Austria
[7]. From the quantitative research conducted through semi-structured interviews with
the users of DV for BI&A and usage of cognitive and pre-cognitive methods and
theories, concludes that the usage of Visual analysis most depends on corporate culture,
the job attractiveness and creativity. Their hypothesis that the most used are static
analysis with limited possibility for interaction with BI, increased users’ demands for
interactivity and the state that interactivity helps to gain more information and knowledge
in DV for BI&A are confirmed. The data complexity, possibilities to compare couples
scenarios and alternatives and deeply understanding outcomes needed in the processes of
decision making, are motivation factors for usage of ADV [7].
Ovum researches see the information as company’s wealth [3] and analyze DV in
BI&A from different aspects, as Visual point-and-click querying & dashboard
development tools, intelligent natural languages similar to Google interface and new self-
services tools. They analyze tools according to market position, technology and service
assessment, execution and market fit. The gained analysis can be seen on Fig. 1c and 1d
[3].
IBM use Visualization of big data to obtain “big picture” of corporate data [6].
Because the human visual system can process 9 Mb information per second, which
correspond to 1 million of text letters a second, they think that visual tools have to be
integrated in BI&A tools. Only 26% of companies can analyze unstructured data (as
sound and video) and only 35% can analyze streaming data. It is important to gain a “Big
Picture” of corporate data that can be done with tools for Dashboard creating and
creating reports with reporting tools (KPI & Historical data) [6]. Although sometimes
tools for data reduction are used before the process of visualization in order to catch
essential data attributes (such as segmentation, clustering, linear regression and
logarithms), they went further by creating new types of analysis and solutions. Rapidly
Adaptive Visualization Engine (RAVE) is created for unstructured data analysis and
include libraries that contains novel visualization techniques which are still unknown and
under development [6].
The big data analysis is achieved with creation of frame that include ADV tools with
previous defining semantic Business definition, data modeling and Data Source
Mapping, with Apache Hadoop, eXtrime Data Warehouse and Big Data Analytics with
focus of self-service BI tools [5]. Many others studies are made for DV for BI&A in
which different tools are used. One of the famous groups of tools for BI is Microsoft
tools that enable advanced visual analysis [9, 2]. SAS Visual BI tools also enable
238

Snezana Savoska and Andrijana Bocevska
interactive graphs and 3D projections, filtering possibilities for unstructured data analysis
[20]. Oracle [21], Tibco [22] and the others, also have impressive tools. Their ability and
capabilities for analysis can be seen in worlds’ analytical companies business reports,
where, despite business achievements and their profits, some technical and users’
performances according to different KPI are analyzed [1, 2, 3].
3. Introduction Starting points, research planning and used
methodology
We are starting with analysis of Gartner Magic Quadrant data, where Tableau and Qlik
are in the higher position of DV tools for BI&A according to Ability to Execute (Figure
1a and b). Although they lag behind tools of SAP, SAS and Microsoft BI if
Completeness of Vison is taken into consideration (Figure 1b and 1c), the gained profits
and higher position in axis of Visual Discovery and self-service automation (Figure 1d)
are these reliable facts that give them competency to be analyzed in details.
As KPI we analyzed: ease of use, connectivity to other data sources, data integration
capabilities, needed hardware specification, used BI technologies, OLAP support, Drill-
down abilities, insights generation, PowerPivot support, ease to learning, data access
models, graphic user interface and available visualization techniques. Also abilities as
mapping, trend analysis, prediction, statistic tools, dashboards, publishing and sharing
and mobility are also taken into consideration. Practical researches methods are used on
same data sets and same hardware. Also, literature reviews as well as comparison of
insights in available tutorials are made.
4. Comparative analysis of KPI of Qlik and Tableau
Analysis was made by the authors in the period of January to march 2016 with previous
reading of the mentioned and cited literature and other internet resources [23, 24]. We
gained the following insights for planned KPI as software performances (Table 1).
Fig.1.a. Magic Quadrant for BI & A according to Gartner; Fig.1.b. Forrester Wave BI [1,2]
239

Data Visualization in Business Intelligent &Analysis – Analysis of First
Positioned Tools According to Gartner’s Magic Quadrant in Ability to Execute
Fig.1.c. Ovum Decision Matrix Fig.1.d. Market Leaders according to Ovum
Table 1. Results gained from the research of KPI of Qlik and Tableau
KPI/
Properties Qlik Tableau
Ease of use
Requires basic scripting; thus, it’s
beneficial for user to have moderate
technical experience.
Intuitive to build dashboards and
explore data regardless of technical
ability or background.
Connection to
multiple data
source
Capability to integrate data from a
long list of data sources.
Capability to integrate data from a
long list of data sources (Tableau list
is shorter than that of Qlik)
Data
Integration
Built-in ETL tools. ETL is usually
done and completed by developers
and requires more extensive IT skills
as it is more script-driven.
Has native connectors to many
common databases and the data
integration is done via user interface
(wizards) without scripting skills.
Hardware
specification
Supports only multiple core
processors and requires much more
RAM memory.
Not support Apple platform
Supports single and multiple core
processors.
Used BI
technology
In-memory associative technology by
means of which can maintain
associations among datasets in
computer’s memory, realized by so-
called symbol compression.
Traditional query-based technology
that operates from disk, called
VizQL™.
Tableau's Data Engine-an analytics
database that does not require to load
data in memory.
OLAP Cube
support
Doesn’t hold data in cubes or similar
OLAP structures, it holds data within
a special in-memory structure, faster
to access.
Has the best ability to interact with
OLAP cubes.
Drill-down
capability
May be the best visualization product
for interactive drill-down capabilities.
Qlik performs calculations on the fly,
which means drill-down groups are
not limited to a simple hierarchy.
Traditional OLAP tools must pre-
calculate aggregations, so their drill-
down capabilities are limited to
moving up and down a defined
hierarchy.
240

Snezana Savoska and Andrijana Bocevska
Insight
Generation
Associative technology makes it
more powerful and it helps to read
association between variables easily.
This feature helps businesses to
understand hidden relation between
data points.
Story telling feature helps users to
create presentation, using available
data points.
PowerPivot
support
Currently does not support this
functionality.
It is only ADV tool which can use
SSAS Cubes and connect to
PowerPivot and is much better choice
for serious analytical application.
Easy to learn
It has actively engaged community
and resources (help manual, books,
posted videos) to help users to learn
this software in the best possible
manner.
It has actively engaged community
and resources (help manual, books,
posted videos) to help users to learn
this software in the best possible
manner.
Data access
model
The data can be loaded by selecting
the Reload button (before that it is
necessary script) or using the wizard
called Table File.
To import data it is necessary from
the menu Data to choose Connect to
Data, than select data source type and
data file name. Using Go to
Worksheets, data will be imported as
dimensions and measures.
Graphic user
interface
(GUI)
Qlik has an associative interface. It is
quite easy to find relationships
between variables and data fields
among tables and charts by means of
instantaneous selection filter. Menus
have too many tabs that lack a logical
structure.
Very intuitive GUI; it groups
variables by dimensions and
measures. As a result of simple
operating interface it has strong
capabilities in performing
multidimensional analysis.
Visualization
techniques
Standard charts (bar chart, line chart,
pie chart, area chart, and scatter plot).
Provides 3D charts, gauges, faded bar
charts which have no real business
value.
Standard charts (bar chart, line chart,
pie chart, area chart, and scatter plot).
Features such as “word clouds” or
“bubble maps” are great tools to
enhance comprehension. Supports
multidimensional analysis.
Mapping
Is not standardly integrated and
requires purchasing an additional
extension such as GeoQlik.
Ii is one of the strongest features. It
is fully integrated in the software and
does not require additional license
costs.
Trend lines,
Forecasting
and Statistics
Include trend analysis and
forecasting. It is required to connect
with R project using the R Connector. Statistical calculations are performed
in R, and completed results are
returned to Qlik.
Include trend analysis and
forecasting.
Includes methods for statistical
analysis, built-in the software.
Dashboards
The default settings of the
visualizations are not optimal, and it
requires quite some time to improve
the appearance of dashboard objects.
Only selection filters are available.
Dashboards look better than Qlik
dashboards with respect to resolution,
fonts, colors, text size, margins and
other formatting features. Available
many types of filters (e.g. sliders,
select menu and checkbox)
Publishing
and Sharing
Several ways to publish and share
dashboard.
Several ways to publish and share
your dashboard. One of the most
important features where Tableau
241

Data Visualization in Business Intelligent &Analysis – Analysis of First
Positioned Tools According to Gartner’s Magic Quadrant in Ability to Execute
differentiates from Qlik is "Tableau
Public" that allows everyone to share
their visualization with the world.
Mobility
Not dependent on device and
available on all devices, they can be
accessed over internet.
Not dependent on device and
available on all devices, they can be
accessed over internet.
Conclusion
Data Visualization tools are more integrated in BI&A tools and becoming their part
because of the fact that more diverse data has to be analyzed to gat “the Big Picture” of
the enterprise data. The necessity to analyze variate data, structured as well as
unstructured, lead to approaching of Data Visualization tools to interactivity and also,
intelligent tools for Advanced Visual Data Analysis to the concept of big data. Therefore
these tools are more focused on achieving higher Ability to execute as KPI. Leaders in
BI&A Data Visualization tools, according to worlds’ analytic researchers as Gartner,
Forrester and Ovum, Tableau and Qlik are analyzed in this paper according to previous
defined KPI, for many attributes that contribute to highlighting some practical aspects of
usage of the mentioned software tools in the direction of Ability to execute. The research
was made in the last two months by the authors with the mentioned methods and the
latest version of Tableau and Qlik tools. The results are placed in the Table from which
comparative analysis of the tools can be performed.
The paper has no intention to judge about the software quality, rather to explain and
highlight their capabilities and suitability through comparative analysis and benefits for
the mentioned KPI. The created visualizations with these tools are analyzed too, but they
exceed the scope of this paper.
As the future researches, some analysis of tools have to be proposed, but created
according to variate criteria according to visualizations gained on the same data sets, with
the same visualization techniques but with possibilities of gaining visualization of
unstructured data sets.
References
[1] Sallam R.L. & all, Magic Quadrant for Business Intelligence and Analytics Platforms,Gartnet Inc., (February 2015)
[2] Evelson B. & all, The Forrester Wave™: Agile Business Intelligence Platforms, Q3 2015,
For application and delivery professionals, (March 2015)[3] Mukherjee S., Ovum Decision Matrix: Selecting a Business Intelligence Solution, 2014–15,
Ovum, (July 2014), Product code: IT0014-002923
[4] Ranjan J., Business Intelligence: Concepts, Components, Technologies and Benefits, Journalof Theoretical and Applied Information Technology, Vol.9 No.1, pp.060-070, (2009)
[5] Schaefer D. & all, Delivering Self-Service BI, Data Visualization, and Big Data Analytics,IT@Intel White Paper, Intel, (June 2013)
[6] Keahey T.A., Using visualization to understand big data, IBM Corporation, (Sep 2013)
242

Snezana Savoska and Andrijana Bocevska
[7] [Pubdat..] Aigner W., Current Work Practice and Users’ Perspectives on Visualization andInteractivity in Business Intelligence, 2013 17th International Conference on InformationVisualisation, IEEE, DOI: 10.1109/IV.2013.38
[8] Chaudhuri, S., Dayal, U., & Narasayya, V. (2011). An overview of business intelligencetechnology. Communications of the ACM, 54(8), 88-98.
[9] Food & Beverage Industry Brief, How Microsoft & Excel are Redefining BusinessIntelligence/Business Analysis in the Food and Beverage Industry,http://kudzucreative.com/wp-content/uploads/2014/11/112514_KC_CONTENT_FB_BUSINESSINTELLIGENCE_V1.pdf, Accessed 17.4.2016
[10] Dupin-Bryant P.A. and all, Business Intelligence, Analytics And Data Visualization: A Heat
Map Project Tutorial, International Journal of Management & Information Systems – Third
Quarter 2014 Volume 18, Number 3[11] White D.&all, Visualization: Set Your Analytics Users Free, Aberden Groups, (2013)
[12] Kandel S. et al., “Enterprise Data Analysis and Visualization: An Interview Study,” IEEETrans. Visualization and Computer Graphics, vol. 18, no. 12, 2012, pp. 2917–2926.
[13] Baltzan, P. (2014). Business driven information systems (4th ed.). New York, NY: McGraw-
Hill.
[14] Chen, H., Chiang, R. H. L., & Storey, V. C. (2012). Business intelligence and analytics:
From big data to big impact. MIS Quarterly, 36(4), 1165-1188.
[15] Manyika, J. & all, Big data: The next frontier for innovation, competition, and productivity.
McKinsey Global Institute: McKinsey and Company. Retrieved from
http://www.mckinsey.com/Insights/MGI/Research/Technology_and_
Innovation/Big_data_The_next_frontier_for_innovation (2011), Accesed 17.3.2016[16] Alazmi A. & Alazmi, R., Data mining and visualization of large databases. International
Journal of Computer Science and Security, (2012), 6(5), 295-314.
[17] Turban, E., Sharda, R., & Denlen, D. (2011). Decision support and business intelligence
systems (9th ed.). Upper Saddle River, NJ: Pearson Prentice Hall.[18] Fisher D. et al., “Interactions with Big Data Analytics,” Interactions, vol. 19, no. 3, 2012, pp.
50–59.12, pp. 45–5
[19] Few S., “BizViz: The Power of Visual Business Intelligence,” http://www.b-eye-
network.com/view/2470, Mar. 2007, accessed at: January 25, 2009.
[20] Stodder D., Data Visualization and Discovery, TDWI Research (2013)[21] Oracle Data Sheet, Oracle Powerful Visual Analytics for the Entire Organization Oracle
Business Intelligence 12c, Oracle corporation (2015)
[22] http://www.b-eye-network.com/offers/spotfire/TIBCO_Spotfire_Guided_Analytics.pdf
[23] http://www.tableau.com/about/press-releases/2015/tableau-awarded-hichertribcs-
certificationinternational-Business, Accesses 21.4.2016[24] http://home.agh.edu.pl/~edyta/QVTutorial.pdf, 17.4.2016
243

International Conference on Applied Internet and Information
Technologies, 2016
DOI:10.20544/AIIT2016.30
Improving Readability of Medical Data by Using
Decision Rules
Vladimir Brtka1, Ivana Berkovic1, Visnja Ognjenovic1, Eleonora Brtka1
Dobrivoje Martinov2, Tatjana Stojkovic–Jovanovic2
1 Technical faculty “Mihajlo Pupin”, Djure Djakovica bb,
23000 Zrenjanin, Serbia
vbrtka, berkovic, visnjao, [email protected] 2 General hospital “Djordje Joanovic”, dr. Vase Savica 5,
23000 Zrenjanin, Serbia
[email protected], [email protected]
Abstract. As medical journal abstracts have become more and more difficult to
read, there is a burning issue for physicists to get relevant medical information in
order to solve a problem in a fast and efficient way. The paper deals with the
synthesis of sentences of spoken language from tabular historical data that relate
to a specific medical sub–domain. In this case Systematic Syntax Classification of
Objects or SSCO algorithm was used in order to generate decision rules which
were consequently transformed to natural language and delivered to the user by a
machine text reader. The system is “hands–free”, reliable, and enables
communication by natural language. The experiments were conducted on data
sample consisting of patient’s conditions after hip surgery procedure and
originating from General hospital “Djordje Joanovic”, Zrenjanin, Serbia.
Keywords: decision rules, classification, voice communication, rehabilitation.
1. Introduction
Handling data is a difficult task, regardless of the domain from which the data is
originating. The task of handling data readability is emphasized as database grows, and
becomes even more tough as data structure complicates. More complicated data that
comprises of multiple elements which differs in a structure, type and size is a complex
task. The task of handling data readability is even more important in the case when
there are time and space constraints or data itself is of sensitive nature. This, sensitive
nature of data can be related to data secrecy, security and importance, so that data has a
great impact to some important study, investigation or conclusion.
This paper deals with the data from medical domain. As medical domain is very
important and especially sensitive for humans because somebody’s life chances rest on
correct and timely diagnosis, the task of correct handling with this kind of data gains in
importance. In everyday medical practice there are situations of emergency, time
244

Brtka et al.
constraints, possible shortage of medical stuff and/or materials which contributes to the
importance of a good organization while handling the data. Timely possession of
relevant information is of the key importance in the domain of medicine. There are
multiple ways to gain some information in the domain of medicine: one possible way is
to browse a bunch of paper abstracts in order to find a solution for a problem or to
minimize the damage that can be done by the lack of appropriate data or information on
subject or situation that has to be resolved. In [1] a study on whether the readability of
medical research journal abstracts changed from 1960 to 2010 in ten-year batches had
been investigated. Abstracts from medical journals were downloaded from
PubMed.org, and their readability was estimated by the Coleman-Liau Index (CLI)
readability score [2]. The results here indicate an increase in difficulty grade levels
during this time period. So, medical journal abstracts have become more and more
difficult to read. This is certainly a problem in domain of medicine; this problem is even
intensified by a fact that a solution of a current problem was indeed tackled before by
some investigation which results were already published in some journal or conference
paper, so that the results are known, and available to professional public. There are also
different ways to tackle the problem of medical data readability: if the data is available
in the form of some data-table or database then there is no need to search for a problem
solution in journals abstract database. It is possible to analyze the database and to infer
some conclusions that will hopefully lead to problem solution. This kind of approach
requires the existence of some previous knowledge in the form of data-table – the larger
the database is, the better. This database comprises of historical data that were collected
during some period and usually corresponds to a certain medical situation. For example:
database that contains the data about hart rate at rest, blood pressure levels, some hart
function anomalies, etc. is usually used in cardiology or cardiovascular sub-domains. If
analyzed, this kind of data can yield some important conclusions which will hopefully
lead to a problem solution. The question of interest is: How to represent the data after
analysis? Fortunately, there are some solutions offered in a literature. As in [3]: “In
general, human-readable rule refers to data shown in a format easily read by most
humans – normally in the form of IF...THEN rules. This kind of knowledge
representation is the most convenient way for physicians to express their knowledge in
medical diagnosis.”. So, the research presented in this paper concentrates on analysis of
table-organized data and representing the results of the analysis in the readable
IF…THEN form. The next step is a transformation of multiple IF…THEN statements to
a single sentence that is read by a machine text reader.
The paper is organized as follows: Section 2 deals with basic idea and techniques for
data analysis which yields IF…THEN rules. Section 3 represents the data sample used
for experimental research and results, while Section 4 gives conclusions.
2. Background
The main goal of this investigation is to analyze data-table or database in the domain of
medicine, then to generate conclusions of the analysis in the readable IF…THEN form
and to deliver these conclusions to the user, typically a physician. The conclusions are
delivered to the user by some machine text reader so that user is not forced to use paper,
computer monitor, smartphone or any kind of similar device. Instead, the user can use
245

Improving Readability of Medical Data by Using Decision Rules
some “hands–free” device such as headphones or speakers in order to get the results of
the analysis “on the way”. Whole process is show on Fig. 1.
1
2
3
4
Fig. 1. The database (1) is transformed to a decision rules in the IF…THEN form and
consequently to the readable text which contains linguistic terms and sentences (2), then
the text is read to the physicist (4) by a machine text reader (3)
There are many IF…THEN rule generators or decision rules generators. Some most
common systems are C4.5, C5 (See 5), Weka, etc. which are based on the application of
decision trees. However, in this research is used the approach that is based on
Systematic Syntax Classification of Objects (SSCO) [4, 5]. This approach is developed
at Technical faculty “Mihajlo Pupin” in Zrenjanin, Serbia. The SSCO is comparable to
systems that applies the Rough Sets Theory (RST) [6, 7, 8, 9] in order to generate
decision rules. The systems which are capable to generate decision rules were used in
the domain of medicine [10, 11, 12] and they showed to be suitable for the analysis of
medical data.
2.1. Systematic Syntax Classification of Objects
Every object of the universe is described by certain amount of information expressed by
means of some attributes used for object description. Let U be a finite set of objects
(patients in this case), Q=q1,… ,qm is a finite set of attributes, Vq is the domain of
attribute q and set V is the union of all domain attribute sets Vq. There is a function f
called information function, that defines the value for object’s attribute: f=UQV. To
every non–empty subset of attributes P is associated an indiscernibility relation on U,
denoted by IP:
),,(),(:),( PqqyfqxfUUyxIP . (1)
The (1) is mathematical basis of RST, as well as SSCO based algorithms. This
relation is an equivalence relation (reflexive, symmetric and transitive). If some
attribute q has discrete values then number of classes generated by (1) performed on
this attribute is card(Vq), where card stands for set cardinality. The j-th class of i-th
246

Brtka et al.
attribute Ci,j consists of those elements of universe for which some relation R is
satisfied:
)),,((,: ,, truevqxfRUxxC jiiji . (2)
In (2) vi,j is j-th value of i-th attribute and f is an information function. If R is relation
of equivalence, then indiscernibility (1) is preserved. It is possible to carry the task of
state–space search in the manner of depth first search (DFS) algorithm. The root of the
state–space graph is set PU, while nodes are sets Ci,j. The arcs (operators) of state–
space graph are defined by (2). Under the assumption that decision attribute (the
attribute in the THEN part of the rule) is the last one, every path of state–space graph
which ends with non–empty leaf will produce one decision rule. The attributes which
are superfluous (not needed) are omitted from rules. The “roughness” in sense of RST
is achieved in the case when consequent (THEN) part of the rule is formed by two or
more leafs. Maximal number of nodes in state space is calculated by:
DC
n
n
iqiV
1 1
. (3)
In (3) C is a set of attributes that make antecedent part of the rule, while D is a set of
attributes that make consequent part of the rule. There is usually only one binary
attribute in set D. As (3) produces very large numbers, even for a fairly small data set,
the memory consumption is rather high, but this depends on the algorithm that is used
for state–space search. The algorithm used here is based on LIFO structure so that
memory consumption is optimal.
3. The Experiment
The experiment was conducted on the data set consisting of 180 objects (patients). The
data was sampled at General hospital “Djordje Joanovic” in Zrenjanin, Serbia.
Attributes and their respective descriptions are given in Table 1. The data relates to
patients who were hospitalized because of hip surgery.
Table 1. Attributes and their descriptions
No. Attribute Description
1. Age Age in years.
2. LoH Length of hospitalization in days.
3. SP Surgical procedure.
4. DS Delay to surgery in hours.
5. PRBCs Blood transfusion - The number of units of packed red
blood cells which patient received during rehabilitation
treatment.
6. CD Cardiovascular disease.
7. DM Diabetes Mellitus.
8. CVI Medical data about cerebrovascular insult.
9. PD Psychiatric diagnosis. Mental and behavioral disorders.
247

Improving Readability of Medical Data by Using Decision Rules
10. D Dementia was ascertained based on relevant medical record.
11. LReh Length of rehabilitation in days.
12. MC Medical data about the mental confusion.
13. Coop Patient cooperation.
14. SW Salvati Wilson’s score on discharge.
The aim of this experiment was to assess the relations among patient characteristics
(attributes 1 – 13), and Salvati-Wilson’s (SW) score on discharge (attribute 14). In
other words, the aim was to assess how attributes relates to high or low SW score. The
SW score is a measure of results of early functional recovery after hip surgery. After
applying SSCO based algorithm 175 rules were generated. Some of them are given
below:
1. IF (Age is [84,*)) and (LoH is 36) THEN (SW is low)
2. IF (Age is [84,*)) and (LoH is 31) THEN (SW is low)
3. IF (Age is [84,*)) and (LoH is 30) THEN (SW is low)
4. IF (Age is [84,*)) and (LoH is 24) and (DS is more48)
and (PRBCs is 6)
THEN (SW is high)
5. IF (Age is [84,*)) and (LoH is 24) and (DS is more48)
and (PRBCs is 3)
THEN (SW is low)
The results are in the form of IF…THEN rules which are fairly readable by humans.
The rest of generated decision rules are similar except that they include different
attributes in order to estimate the value of SW score. However, the goal is to achieve
even more readable form, e.g. first three rules can be condensed so that they form one
rule or one sentence expressed by means of linguistic terms:
If a patient is older than 84 years and length of hospitalization is more than 30 days,
then SW score is still low.
This means that physician must undertake some different treatment. Rules 4 and 5
can be also condensed so that they form single sentence:
For a very old patient who stayed in hospital for 24 days and delay to surgery was
more than 48 hours it is needed that a number of units of packed red blood cells is
bigger or equal to six in order to have high SW score.
Now, there is a possibility to deliver the conclusions of analysis expressed in form of
readable sentences to user (usually physician), by means of automated text reader.
There are many text readers that are available online or even incorporated to MS Office
package. In this research, the “Natural Reader” system which is available at
http://www.naturalreaders.com/index.html was used for initial experiments.
248

Brtka et al.
4. Conclusions
As the readability of medical research journal abstracts changed drastically from 1960
to this day in a way that medical journal abstracts have become more difficult to read,
there is the urgent need for information source that is reliable, responsive and, above all
easy to understand.
This research deals with synthesis of the readable sentences from medical data
presented in a form of data table or database. This data is usually historical data that
consists of records from some particular medical sub–domain. In this case data sample
includes data about patient’s conditions after hip surgery procedure and was collected at
General hospital “Djordje Joanovic” in Zrenjanin, Serbia. So called SSCO based
algorithm was applied to available data and decision rules in the IF…THEN form were
generated, few of them are shown in previous section. Decision rules were
consequently condensed (joined) to form even more readable sentences which include
linguistic terms. These sentences are delivered to the user by the machine text reader.
The importance of solutions presented in this paper are:
The user (usually physician) is able to acquire data in a form of spoken words.
The system enables “hands–free” communication so that the user is able to
continue the tasks without interruptions.
System is fast and reliable.
Communication by using natural language is enabled.
In a future, the solution will be improved in order to generate even more complex
sentences.
Acknowledgment
Ministry of Science and Technological Development, Republic of Serbia financially supported this
research, under the project number TR32044: ”The development of software tools for business process
analysis and improvement”.
5. References
1. Severance, S., Bretonnel, Cohen, K.: Measuring the readability of medical research journal
abstracts, Proceedings of the 2015 Workshop on Biomedical Natural Language Processing
(BioNLP 2015), pages 127–133, Beijing, China, Association for Computational Linguistics,
(2015)
2. Coleman, M., Liau, T. L.: A computer readability formula designed for machine scoring.
Journal of Applied Psychology, 60 (2), 283, (1975)
3. Daud, N., R., Corne, D., W., in Mastorakis et al. (ed.): Proceeding of European Computing
Conference, Lecture Notes in Electrical Engineering 27, DOI: 10.1007/978-0-387-84814-
3_79, Springer Science + Business Media LLC, (2009)
4. Brtka V.: Automated Synthesis of Rule Base in Inference Systems, Technical faculty
"Mihajlo Pupin", Zrenjanin, Serbia, (2008)
5. Ognjenovic, V., Brtka, V., Berkovic, I., Brtka E.: “Comparison of the classification rules
generated by See 5.0 and SSCO Systems”, Proceedings of the 23rd Central European
Conference on Information and Intelligent Systems - CECIIS, Varaždin, Croatia, September
19-21, ISSN 1847-2001, pp. 71-76, (2012)
249

Improving Readability of Medical Data by Using Decision Rules
6. Pawlak, Z., Grzymala-Busse, J., Slowinski, R., and Ziarko, W.: Rough sets, Association for
Computing Machinery. Communications of the ACM 38, (1995)
7. Pawlak, Z., Skowron, A.: Rudiments of rough sets, An International Journal of Information
Sciences 177, pp. 3–27, (2007)
8. Pawlak, Z.: Rough set approach to knowledge-based decision support, European Journal of
OR 99, pp. 48-57, (1997)
9. Greco, S., Benedetto, M., Slowinski, R.: New Developments in the Rough Set Approach to
Multi – Attribute Decision Analysis, Bulletin of International Rough Set Society, Volume 2,
Number 2/3, pp. 57–87, (1998)
10. Brtka, V., Stokic, E., Srdic, B.: Automated extraction of decision rules for leptin dynamics -
A rough sets approach, Journal of Biomedical Informatics, Vol. 41, No. 4, pp. 667-674,
(2008)
11. Stokic, E., Brtka, V., Srdic, B.: The synthesis of the rough set model for the better
applicability of sagittal abdominal diameter in identifying high risk patients, Computers in
Biology and Medicine, Vol. 40, No. 9, pp. 786-790, (2010)
12. Øhrn, A.: Discernibility and Rough Sets in Medicine: Tools and Applications, Department of
Computer and Information Science, Norwegian University of Science and Technology, N-
7491 Trondheim, Norway, ISBN 82-7984-014-1, ISSN 0802-6394, (1999)
250

International Conference on Applied Internet and Information
Technologies, 2016
DOI:10.20544/AIIT2016.31
Gesture Control of a Mobile Robot using Kinect Sensor
Katerina Cekova1, Natasa Koceska1, Saso Koceski1
1 Faculty of Computer Science, Krste Misirkov 10-A,
2000 Stip, Macedonia
natasa.koceska, [email protected]
Abstract. This paper describes a methodology for gesture control of a custom
developed mobile robot, using body gestures and Microsoft Kinect sensor. The
Microsoft Kinect sensor’s ability is to track joint positions has been used in order
to develop software application gestures recognition and their mapping into
control commands. The proposed methodology has been experimentally
evaluated. The results of the experimental evaluation, presented in the paper,
showed that the proposed methodology is accurate and reliable and it could be
used for mobile robot control in practical applications.
Keywords: Kinect sensor, gesture recognition, mobile robot, control, human-
robot interaction.
1. Introduction
With the development of technology, robots are gradually entering our life. The
applications are ranging from rehabilitation [1, 2], assisted living [3], education [4],
housework assistance [5], to warfare applications [6]. Various applications require
specific control strategies and controllers. Development of a myriad of low-cost sensing
devices, even nowadays, makes remote control of robotics devices a topic of interest
among researchers. In particular, gesture control of robotic devices with different
complexity and degrees-of-freedom is still considered as a challenging task [7].
In this context, recently developed depth sensors, like Kinect sensor [8], have
provided new opportunities for human-robot interaction. Kinect can recognize different
gestures performed by a human operator, thus simplifying the interaction process. In
this way, robots can be controlled easily and naturally. The key enabling technology is
human body language understanding. The computer must first understand what a user is
doing before it can respond [9, 10, 11].
The concept of gesture control to manipulate robots has been used in many research
studies. Thanh et al. [12] developed a system in which human user can interact with the
robot using body language. They used a semaphore communication method for
controlling the iRobot to move up, down, to turn left or right. Waldherr et al. [13]
describe a gesture interface for controlling a mobile robot equipped with a manipulator.
They have developed an interface which uses a camera to track a person and recognize
gestures involving arm motion. Luo et al. [14] use the Kinect sensor as motion capture
device to directly control the arms by using the Cartesian impedance control to follow
251

Cekova et al.
the human motion. Jacob and Wachs [15] have used hand’s orientation and hand
gestures to interact with a robot which uses the recognized pointing direction to define
its goal on a map. Kim and Hong [16] have proposed a system intended to support
natural interaction with autonomous robots in public places, such as museums and
exhibition centers.
In this paper we have used Kinect sensor for a real-time mobile robot control. The
developed application allows us to control the robot with a predefined set of a body
gestures. The operator, standing in front of the Kinect, performs a particular gesture
which is recognized by the system. The system then sends commands to the
microcontroller Arduino Uno, which operates with the robot.
2. System architecture
The proposed system is composed of several components: operator, Microsoft Kinect
sensor, mobile robot, computer, and mobile robot. The architecture of the system is
shown in Figure 1.
Fig. 1. System architecture
To control the mobile robot user has to make some pre-defined gestures using its
body. The Kinect sensor than captures the movement in real time and sends the skeleton
joints’ data to the computer via USB for processing. Application on the computer
processes the information from the Kinect sensor converts them into control commands
and sends them to the robot i.e. to the Arduino microcontroller via Bluetooth.
Depending on the received command data the mobile robot is moving.
252

Gesture Control of a Mobile Robot using Kinect Sensor
2.1. Microsoft Kinect sensor
Kinect sensor was introduced on the market in 2010 as a line of motion sensing input
devices by Microsoft and was intended to be used with Xbox 360 console. It is a
peripheral input device composed of several sensors. Namely, it contains a depth
sensor, a RGB camera, and four-microphone array. The core component of Kinect is the
range camera (originally developed by PrimeSense) which is using an infrared projector
and camera and a special microchip to track objects in 3D. So, the sensor provides full-
body 3D motion capture, facial recognition, and voice recognition capabilities. The
internal structure (sensor components) and the architecture of Kinect for Windows are
presented in Figure 2.
Fig. 2. Kinect Sensor internal structure
Capabilities of image and depth capturing, audio recording as well as its low cost
make Kinect very popular input device for various applications. It allows users natural
interaction with the computer and control of applications or games solely using their
bodies. This is enabled by identification of the position and orientation of 25 individual
joints (including thumbs) and their motion tracking. The angular field of view of the
Kinect sensor in the horizontal direction is 57° and in the vertical direction is 43°. It is
also equipped with an additional motorized pivot which can tilt the sensor up for an
additional 27° either up or down. The sensor can maintain tracking through an extended
range of about 0.7–6 m. It can track up to 6 human body skeletons in the working area.
2.2. Mobile robot description
Developed mobile robot contains the following components: Bluetooth Module HC-06,
Arduino Uno, H-Bridge L293D, DC motors, Jumper Wire and Breadboard. The control
algorithm runs on the Arduino Uno. The communication with the computer is
established via the HC-06 Bluetooth Module. The L293D is designed to provide
bidirectional drive currents of up to 600-MA at voltages from 4.5V to 36V. The
connection scheme of the robot is depicted in Figure 3 and the developed robot is
presented in Figure 4.
253

Cekova et al.
Fig. 3. Connection schema of the mobile robot
Fig. 4. Developed robot and its model
The develop robot has two powered wheels driven by separate DC motors and one
castor wheel used for stability. Robot position in the global reference frame is defined
by the position of the mid-point axis (M) and the heading angle i.e. with following
vector (x, y, θ). Considering the robot geometry (Figure 4) one may conclude that
during the motion its left and right wheels are moving around the ICC with the same
angular velocity as defined by Eq.1.
L
VV
LR
V
LR
V
R
V LRLRMM
)2/()2/(
(1)
The instantaneous curvature radius of the trajectory is defined by the Eq.2.
2
L
VV
VVR
LR
LR
(2)
The kinematic model of the developed robot can be represented with Eq.3.
254

Gesture Control of a Mobile Robot using Kinect Sensor
M
MVVy
Vx
y
x
10
0sin
0cos
.
.
. (3)
Having in mind that VM=(VR+VL)/2 the above equation could be rewritten as:
L
R
V
V
LL
y
x
/1/1
sin2/1sin2/1
cos2/1cos2/1
.
.
.
(4)
3. System evaluation
To evaluate the proposed system a dedicated application written in Visual Studio using
C# programming language was developed. The interface of the application is shown in
Figure 5. Joints that are recognized and tracked are marked with blue circles.
Fig. 5. Screenshots of the developed application
The set of gestures aimed at robot control and their meaning are presented in Table
1.
To stop the robot user needs to move down right and left elbow. If one elbow is up
and other is down the robot is moving right or left depending on which elbow is up. To
move the car forward or backward the user must place the right and left elbow in front
or behind the hip center. The software application than detects the user’s gesture in real-
time. The application converts detected movements into control commands. Bluetooth
255

Cekova et al.
communication is used to sends the commands to the microcontroller on the robot. With
detected body movement user controls the motors. Also, the microcontroller returns
direction of movement back in the application.
Table 1. Overview of gesture sets.
Command Action description
Stop elbow right and elbow left down
Right elbow right up elbow left down
Left elbow right down elbow left up
Forward elbow right and left placed before hip center
Backward elbow right and left placed behind hip center
The system has been evaluated in the laboratory environment. The aim of the
evaluation was to determine the percentage of successfully recognized and executed
commands. The robot was controlled by five different users that were initially
instructed on how the system works, and each user was given 20 test trials. Afterwards
they were asked to perform each command three times in a random order. The results
(in %) of successfully recognized and executed commands are presented in the Table 2
bellow.
Table 2. Results of the experimental evaluation.
User
No.
Stop Right Left Forward Backward
%
Rec
%
Exe
c
%
Rec
%
Exe
c
%
Rec
%
Exec
%
Rec
%
Exec
%
Rec
%
Exec
U1 85 94 100 100 100 100 95 100 90 100
U2 90 89 100 100 100 100 85 100 95 100
U3 90 100 100 100 100 100 100 100 100 100
U4 95 100 100 100 100 100 100 100 100 100
U5 95 100 100 100 100 100 100 100 100 100
Moreover, during the tests we have measured execution times for each command
(the time from the moment the gesture is performed by the operator till its execution),
and we have determined that they vary between 50 and 150ms, which makes this
interface applicable even for real-time control.
4. Conclusion
In this paper we present a system that enables human robot interaction using low-cost
Microsoft Kinect sensor. The ability of depth perception enables full-human body
skeleton tracking and gesture recognition. Recognized gestures afterwards are used to
turn the mobile robot left, right or move it forward, backward and to stop it. The
evaluation of the proposed system suggests that the proposed human-robot interface is
reliable (with high percentage of recognized gestures) and accurate (high percentage of
256

Gesture Control of a Mobile Robot using Kinect Sensor
executed actions) and thus it could be used in practice for various applications of
mobile robot control. The proposed system could be applied in control of various
robotic devices (such as robotic wheelchairs) that are aimed at disabled persons having
functional upper limbs. Moreover, the proposed system could be applied for control of
industrial or medical processes where the user could not directly interact with the
equipment or apparatus. From user perspective, the system could support more than one
user because the Kinect sensor and the developed control application have the
possibility to track multiple skeletons in the same time.
References
1. Koceska, Natasa, Saso Koceski, Francesco Durante, Pierluigi Beomonte, and Terenziano
Raparelli. "Control architecture of a 10 DOF lower limbs exoskeleton for gait rehabilitation."
International Journal of Advanced Robotic Systems 10 (2012): 1.
2. Koceska, Natasa, and Saso Koceski. "Review: Robot Devices for Gait Rehabilitation."
International Journal of Computer Applications 62, no. 13 (2013).
3. Koceski, Saso, and Natasa Koceska. "Evaluation of an Assistive Telepresence Robot for
Elderly Healthcare." Journal of Medical Systems 40, no. 5 (2016): 1-7.
4. Serafimov, Kire, Dimitrija Angelkov, Natasa Koceska, and Saso Koceski. "Using mobile-
phone accelerometer for gestural control of soccer robots." In Embedded Computing
(MECO), 2012 Mediterranean Conference on, pp. 140-143. IEEE, 2012.
5. Koceski, Saso, Natasa Koceska, and Ivica Kocev. "Design and evaluation of cell phone
pointing interface for robot control." International Journal of Advanced Robotic Systems 9
(2012).
6. Arkin, Ronald C. "Ethical robots in warfare." Technology and Society Magazine, IEEE 28, no.
1 (2009): 30-33.
7. Koceski, Saso, and Natasa Koceska. "Vision-based gesture recognition for human-computer
interaction and mobile robot's freight ramp control." In Information Technology Interfaces
(ITI), 2010 32nd International Conference on, pp. 289-294. IEEE, 2010.
8. Zhang, Z.: Microsoft kinect sensor and its effect. MultiMedia, IEEE, 19(2), pp.4-10.(2012)
9. Xia, L., Chen, C.C. and Aggarwal, J.K.: Human detection using depth information by kinect.
In Computer Vision and Pattern Recognition Workshops (CVPRW), 2011 IEEE Computer
Society Conference on (pp. 15-22). IEEE. (2011)
10. Gabriele Pozzato, Stefano Michieletto, Emanuele Menegatti, Fabio Dominio, Giulio Marin,
Ludovico Minto, Simone Milani, Pietro Zanuttigh, HUMAN-ROBOT INTERACTION
WITH DEPTH-BASED GESTURE RECOGNITION
11. Shotton, J., Fitzgibbon, A., Cook, M., Sharp, T., Finocchio, M., Moore, R., Blake, A.
(2011). Real-time human pose recognition in parts from single depth images. In Proceedings
of IEEE conference on computer vision and pattern recognition (CVPR 2011) (pp. 1297–
1304).
12. Nguyen-Duc-Thanh, N., Stonier, D., Lee, S. and Kim, D.H.: A new approach for human-
robot interaction using human body language. In Convergence and Hybrid Information
Technology (pp. 762-769). Springer Berlin Heidelberg.(2011)
13. Waldherr, S., Romero, R. and Thrun, S.: A gesture based interface for human-robot
interaction. Autonomous Robots, 9(2), pp.151-173.(2000)
14. Luo, R.C., Shih, B.H. and Lin, T.W.: October. Real time human motion imitation of
anthropomorphic dual arm robot based on Cartesian impedance control. In Robotic and
Sensors Environments (ROSE), 2013 IEEE International Symposium on (pp. 25-30).
IEEE.(2013)4.
257

Cekova et al.
15. M. G. Jacob and J. P. Wachs. Context-based hand gesture reognition for the operating room.
Pattern Recognition Letters, 36:196–203, 2014.
16. J.Oh, T. Kim, and H. Hong. Using binary decision tree and multiclass svm for human gesture
recognition. In International Conference on Information Science and Applications (ICISA),
pages 1–4, 2013.
258

International Conference on Applied Internet and Information
Technologies, 2016
DOI:10.20544/AIIT2016.32
E-health monitoring system
Aleksandar Kotevski1, Natasa Koceska2 and Saso Koceski2
1 Faculty of Law, Rudnicka bb, 6500 Kicevo, Macedonia
[email protected] 2 Faculty of Computer Science, Stip
2000 Stip, Macedonia
natasa.koceska,[email protected]
Abstract. Monitoring of patients’ vital parameters very often is limited to hospitals
or other health care centres, which makes the process time consuming and
expensive. Rapid advancement in information and communication technologies
offers great opportunities for development of remote monitoring systems, which on
one hand, will reduce costs and travel time, and on the other will increase health
service efficiency and user satisfaction. The goal of this paper is to propose an e-
health system that allows doctors to closely monitor patients’ vital parameters, no
matter where they are located. Integration of web, mobile and smart TV technology,
will provide greater accessibility of patients’ data, and will improve patient – doctor
communications.
Keywords: e-health, mobile, Smart TV, web services.
1. Introduction
Advanced information and communication technologies, offering anywhere and anytime
connectivity, play a key role in the development of a modern healthcare systems [1].
Various online systems for monitoring and collecting patient data exists nowadays. This
kind of solutions are very useful especially when a treatment includes monitoring of some
vital parameters for long period of time.
There are a number of researchers focusing their activities in this research area. Ostmark
et al. [2] proposed sensor system that acts as a Bluetooth device providing a TCP/IP
interface for configuration and maintenance and allows user interaction through standard
WWW-browser technology. Their concept is based on mobile wireless EIS (Embedded
Internet System) sensor platform. Hung and Zhang [3] described the implementation and
experiences with a WAP-based telemedicine system for monitoring. Authorized users can
access to patients' general data, and can monitor blood pressure and electrocardiogram on
WAP devices in store-and-forward mode. Sorwar and Hasan [4] proposed an integrated
tele-monitoring framework for supporting patient monitoring process. They used Smart
TV technology for interaction between patient and health care providers. Arcelus et al.
[5] used a sensor technology integrated in a home-based system that monitors patients'
259

Aleksandar Kotevski et al.
health. They also proposed a framework for data processing. Chan et al. [6] focused their
work on multi-sensor home monitoring system developed to help elderly people, by
observing mobility changes indicative of abnormal events. The proposed system is only
one part of their final goal - to build an abnormal event diagnosis system to help elderly
people living alone. Similar system that provides an end-to-end solution is described by
Agarwal and Lau [7]. Authors described a remote health monitoring service that collects
blood pressure readings from a patient through a mobile phone and make them available
to the doctors through a web interface. Yong et al. [8] developed a health monitoring
system based on smart phones. 3G or Wi-Fi network is used for transferring data to a
remote healthcare server, that can monitor multiple users in real-time. Sapal et al. [9] and
Silva et al. [10] review some new technologies for making remote monitoring and health
care process more flexible and convenient. Additionally, authors present a comprehensive
review of the state of the art on m-Health applications.
In this paper we propose a remote monitoring system, for a healthcare delivery outside of
hospitals, in order to reduce costs and travel times, from one site, and to improve quality
of patient care, from the other. The system can be used for monitoring vital parameters
data, such as: blood pressure, heart rate, body temperature, respiratory flow, glucose,
weight etc. Because of the nature of these health parameters, their values must be
monitored and controlled on a regular (daily, weekly or monthly) basis.
The proposed system integrates web, mobile and smart TV technologies, which ensure
greater visibility and interaction between doctors and patients. The system can capture,
organize and display patient data using a customizable user-friendly interface.
Proposed system can be used for healthcare of elderly living along in their homes, patients
in rural areas, as well as chronically ill patients that have high level of medical need.
2. E-health monitoring system
The e-health system, described in this paper, will be used for monitoring of patients’ vital
physiological data. It is composed of three modules: web, mobile and Smart TV module,
which cover the essential features for a remote monitoring healthcare system. The system
can collect required vital data and make them visible to doctors. Doctors can act upon
them (suggest or modify the therapy for example). Additional functionalities like
generating and displaying a group overview chart having one data point for each patient,
are also implemented.
To ensure compatibility with other systems, we are using Open m-Health platform for
data collection and visualization. All modules use common database (MS SQL). The
mobile and Smart TV application use web services for interaction with database.
Web application is accessible from every device that has Internet connection. As far as
for mobile and Smart TV application, it can be downloaded and installed on appropriate
user devices.
260
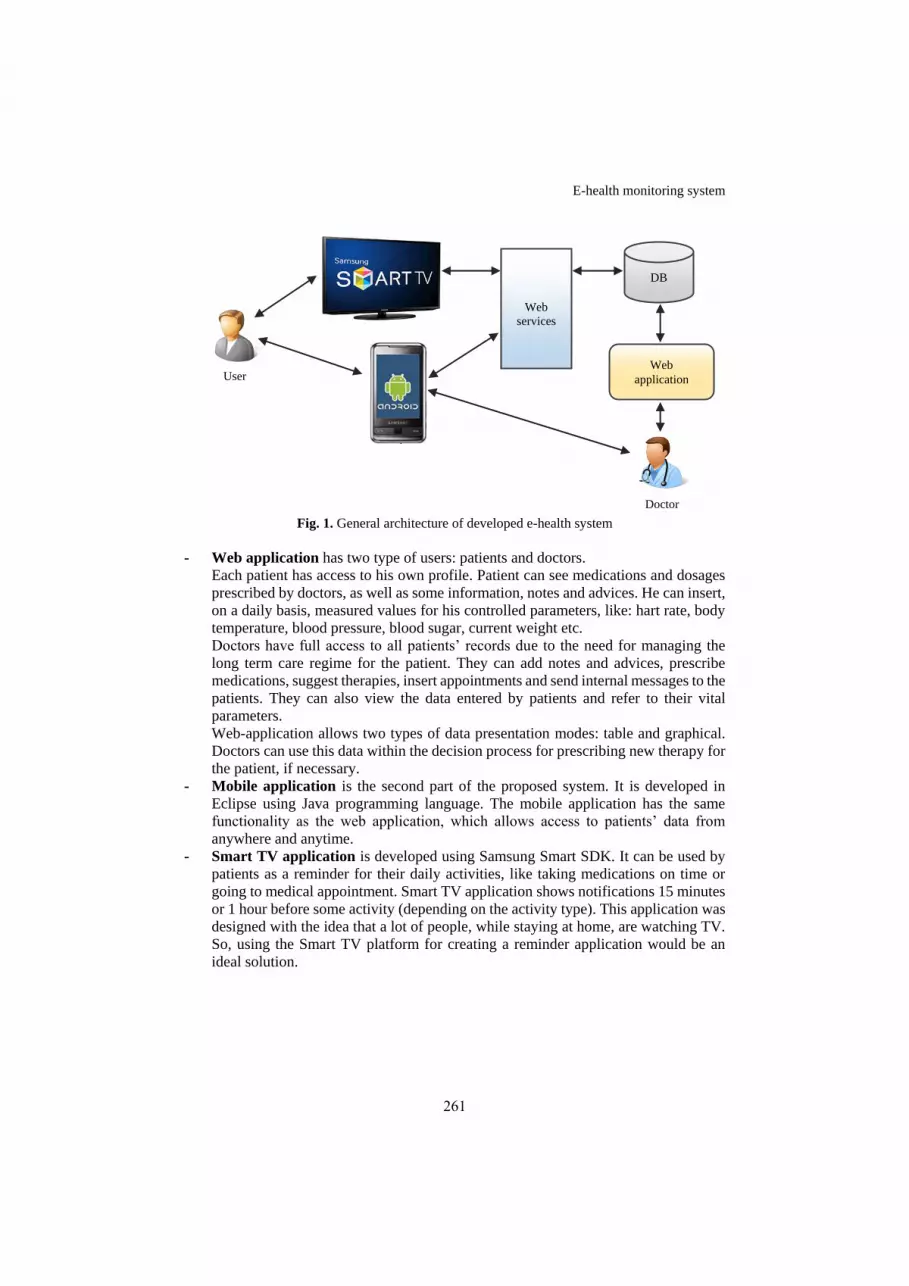
E-health monitoring system
Fig. 1. General architecture of developed e-health system
- Web application has two type of users: patients and doctors.
Each patient has access to his own profile. Patient can see medications and dosages
prescribed by doctors, as well as some information, notes and advices. He can insert,
on a daily basis, measured values for his controlled parameters, like: hart rate, body
temperature, blood pressure, blood sugar, current weight etc.
Doctors have full access to all patients’ records due to the need for managing the
long term care regime for the patient. They can add notes and advices, prescribe
medications, suggest therapies, insert appointments and send internal messages to the
patients. They can also view the data entered by patients and refer to their vital
parameters.
Web-application allows two types of data presentation modes: table and graphical.
Doctors can use this data within the decision process for prescribing new therapy for
the patient, if necessary.
- Mobile application is the second part of the proposed system. It is developed in
Eclipse using Java programming language. The mobile application has the same
functionality as the web application, which allows access to patients’ data from
anywhere and anytime.
- Smart TV application is developed using Samsung Smart SDK. It can be used by
patients as a reminder for their daily activities, like taking medications on time or
going to medical appointment. Smart TV application shows notifications 15 minutes
or 1 hour before some activity (depending on the activity type). This application was
designed with the idea that a lot of people, while staying at home, are watching TV.
So, using the Smart TV platform for creating a reminder application would be an
ideal solution.
Web
application
Web
services
DB
User
Doctor
261

Aleksandar Kotevski et al.
3. User interface design
Taking into account that most of the patients are elderly people, a great deal was putted
on user interface design. After extensive analyses on other similar medical applications,
and design recommendations proposed in different research studies, a GUI for web,
mobile and smart TV applications was designed. Large font size, easy readable typeface,
colour contrast, and sufficient blank spaces among the text and graphical items on the
screen, were applied for the graphical output optimization.
Elderly people can be easily confused if they need to perform a number of operations to
get some information. Having this fact in mind, the system was designed to reach the
desired information in a fewer steps as possible. Considering the fact that very often the
elderly are not able or willing to enter a lot of information by typing, the interface is
designed so only important information need to be entered (e.g. measured values,
medication, dosage etc.)
4. Usage scenario
Access to the system have all users who already have a profile in the system. Creation of
user profiles and managing some general information is responsibility of the
administrator. After the profiles are created users can log on to the application using their
credentials (provided by administrator).
Patient can use web or mobile application for inserting measured values for their
controlled parameters. He can select one of the controlled parameters, after which an
appropriate form for inserting values is presented. Patient can also choose if he wants to
write some notes to the doctor.
Fig.3. a).Mobile application dashboard for patient b) Inserting values for a specific parameter
262

E-health monitoring system
Patient receives notifications about medications, or some appointment, using Smart TV
applications. It is very important for the patient to take the prescribed medication on time,
so the notification window will stay active until the patient turned it off.
Fig. 4. Smart TV notification
Doctors can check patients' medical record, can suggest therapy or prescribe medications
using web-based application or a mobile application. After successful login action,
doctors can select a desired activity from the application dashboard.
Fig. 5. Applications dashboard for doctors (a. mobile application b. web application)
After selecting the patient, from a patient list, doctors can also see patient medical records.
The data added by the patients can be presented as a table or a graphic.
263

Aleksandar Kotevski et al.
Fig. 6 Overview of patients' medical record
Furthermore, the doctor can add new values for some pre-defined medical parameters.
Fig. 7. Adding new values for pre-define health parameters
Adding a note or suggestion for the patient is done by clicking the "New" hyperlink in
Contact section. For sending this note/suggestion to the patient, doctor should click the
Save button, after which the text is stored in the database and is available for further
review by the patient.
5. Conclusion
In this paper a low cost e-health monitoring system was proposed. The system offers
remote capabilities that enhance the level of medical support the patient receives while
enabling them to be monitored in the comfort of their home. This is especially important
for patients with chronic diseases and patients that require regular monitoring of vital
parameters.
Using web or mobile application, patients’ data can be collected easily and efficiently, at
the same time providing access to them from any location. Visualisation of this data as
264

E-health monitoring system
well as tracking the progress and facilitating communication between patients and
doctors, are considered as a great advantage of this solution.
Taking the medicine on time is considered to be a high priority for patients. Failure to
take the medicine on time cannot only delay recovery, but can worsen the symptoms of
an existing illness or cause serious side effects. In this context the use smart TV
application for showing reminders and notifications, is very important.
Our next step will be conducting the evaluation study with the end users in order to get
the feedbacks from them, which will be used for further system improvement.
6. References
1. Bruno M.C. Silva, Joel J.P.C. Rodrigues, Isabel de la Torre Díez, Miguel López-Coronado,
Kashif Saleem, Mobile-health: A review of current state in 2015, Journal of Biomedical
Informatics, Vol. 56, pp. 265-272, August 2015.
2. Ostmark, Ake, et al. "Mobile medical applications made feasible through use of EIS
platforms." IEEE Instrumentation and Measurement Technology conference proceedings. Vol.
1. IEEE; 1999, 2003.
3. Hung, Kevin, and Yuan-Ting Zhang. "Implementation of a WAP-based telemedicine system
for patient monitoring." Information Technology in Biomedicine, IEEE Transactions on 7.2
(2003): 101-107.
4. Sorwar, Golam, and Raqibul Hasan. "Smart-TV based integrated e-health monitoring system
with agent technology." Advanced Information Networking and Applications Workshops
(WAINA), 2012 26th International Conference on. IEEE, 2012.
5. Arcelus, Amaya, et al. "Integration of smart home technologies in a health monitoring system
for the elderly." Advanced Information Networking and Applications Workshops, 2007,
AINAW'07. 21st International Conference on. Vol. 2. IEEE, 2007.
6. Chan, Marie, Eric Campo, and Daniel Estève. "Assessment of activity of elderly people using
a home monitoring system." International Journal of Rehabilitation Research 28.1 (2005): 69-
76.
7. Agarwal, Sparsh, and Chiew Tong Lau. "Remote health monitoring using mobile phones and
Web services." Telemedicine and e-Health 16.5 (2010): 603-607.
8. Yong.L, Won J., Gilwon Y.: Telemedicine and e-Health. 18(8): 585-590, October 2012.
9. Sapal T., Wang X.H., Robert I., Song Y.H.: Telemedicine Journal and e-Health. 9(3): 247-257,
July 2004.
10. Silva, Bruno MC, et al. "Mobile-health: A review of current state in 2015." Journal of
biomedical informatics 56 (2015): 265-272.
265

International Conference on Applied Internet and
Information Technologies, 2016
DOI:10.20544/AIIT2016.33
Fully Automatic MRI Brain Tumor Segmentation
Mihajlo Hasanu1, Hristina Ambaroska2 and Blagoj Ristevski3
St. Kliment Ohridski University – Bitola, Republic of Macedonia
Faculty of Information and Communication Technologies [email protected], [email protected], [email protected]
Abstract. Today in the area of medical research, the care of brain tumor patient
attracts a lot of attention. Brain tumor segmentation consists of separating the
different brain tumor tissues from normal tissues. In the past, many researchers in
the field of medical imaging and soft computing have made significant survey in
the field of brain tumor segmentation. Both semiautomatic and fully automatic
methods have been proposed. Clinical acceptance of segmentation techniques has
depended on the simplicity of the segmentation and the degree of user supervision.
Additionally, with the development of particular software tools for automatic
segmentation and brain tumor detection, which reduce the doctors’ time spent on
manual segmentation, more effective and efficient results are provided. In this paper
BraTumIA software tool has been used for automated segmentation on MRI brain
tumor images in order to perform fully segmentation by separating different brain
tumor tissues from the normal ones.
Keywords: Image Segmentation, Biomedical Engineering, MRI Brain Tumor,
Medical Imaging.
1. Introduction
As the most important medium for information transmission, images allow information
extracted from them to be used for further analysis. Hence, a method known as image
segmentation helps in understanding those images and information extraction as well as
the objects contained in those images. Image segmentation refers to the process of
partition of a digital image into a set of regions covering the image, i.e. dividing the image
in multiple segments (a set of pixels, known as superpixels) [5]. Image segmentation has
two important goals. The first one is image decomposition to parts that will be used for
further analysis, while the second goal is making a change in the image representation.
Image segmentation has multiple areas of application. It can be used in medical images
for tumor location as well as for segmentation on organs like kidneys, heart, liver eyes;
object detection; face recognition (fingerprint, iris); traffic control systems; video
surveillance; computer vision; content-based image retrieval and in many other areas.
This paper is pointed towards the image segmentation applied in medicine for brain
tumor segmentation using MRI images.
The rest of this paper is structured as follows. Conceptual determination of brain tumor
image segmentation is discussed in Section 2, followed by the description of different
types of segmentation in the Section 3 of this article. The following section describes
segmentation methods, through the Section 5 an example of an automatic brain tumor
266

Mihajlo Hasanu et al.
images segmentation is shown, using the software tool BraTumIA. The last section
provides concluding remarks.
2. MRI Brain Tumor Segmentation
Today, brain tumor image segmentation is a highly popular research area due to the
advances of new technologies. Brain tumor segmentation is an important process that
provides information extraction from a complex brain MRI images. This segmentation is
consisted of separating different tumor tissues as solid or active tumor, edema and
necrosis from the normal brain tissues such as gray matter, white matter, and
cerebrospinal fluid CSF [7].
The final goal of the brain tumor scanning and segmentation is information extraction
of specific and clinically important patients, as well as their diagnostic properties. This
information incorporated in data of multidimensional images can detect and localize the
illness, eventually leading to a diagnosis, adequate treatment and stopping the illness.
3. Types of MRI Brain Tumor Segmentation
Image segmentation techniques can be grouped by two criteria: the level of human
interaction and achieving an objective measurement for defining the homogeneity level
of each tissue [1].
According to the level of human interaction, there are following three types of MRI
brain tumor segmentation:
- Manual segmentation includes manual drawing of the brain borders and structures of
interest or marking regions of anatomic structures with different labels. By this type of
segmentation, experts (radiologists, anatomy specialists and trained technicians) use not
only the presented information from the image, but also they need to use their additional
knowledge from the particular medical area, e.g. anatomy.
- Semiautomatic segmentation usually needs intervention by a human operator who
has a task to initialize the method, to check the accuracy of the obtained results, as well
as manually correcting the segmentation results, when needed. The semiautomatic
segmentation gives better, more accurate results than the manual segmentation, but shows
variations in the results when the segmentation is done by different clinical experts in the
same area.
- Fully automatic segmentation uses computers to determine the brain segmentation
without human interaction. Fully automated methods, in general, include human
intelligence and previous knowledge in the algorithms in a way that they use soft
computing and model based techniques. Currently, the fully automated segmentation
methods are desired in the processing of large series of images and are mainly restricted
to the research environment [7].
According to achievement of an objective measurement for defining the homogeneity
level of each tissue, there are supervised and unsupervised MRI brain tumor
segmentation.
The task of the unsupervised segmentation is automatically finding the data structure.
When data from the image is not labeled, then the image segmentation can be done using
267

Fully Automatic MRI Brain Tumor Segmentation
clustering algorithms, in a way that subsets of data cannot be found or labeled in order to
find predicative dependences i.e. training data. The unsupervised segmentation can be
conducted using anatomically objective measurement and image based objective
measurement to assess segmentation quality.
Supervised segmentation requires data delivery for training data which usually is found
via drawing the regions of interest on the same image. The supervised segmentation
includes a training stage for predicative dependences that uses labeled data aiming to train
a model that maps features to labels and a testing stage used for assigning labels to
unlabeled data based on measured features.
4. Segmentation Methods
The image segmentation techniques are classified as follows [7].
- Threshold-based segmentation techniques represent simple and effective methods for
the region segmentation on the image, where the objects in the image are classified
through comparison of their intensities with one or more intensities of the thresholds.
These thresholds can be global (i.e. the procedure for determining light from dark regions
– intensity property) or local (the local threshold is determined in a local region round the
pixel).
- Edge-based segmentation techniques are used to detect edges in segmentation of
images based on grey levels (gradients) effect. Edge detection is a process of finding
discontinuities in an image. The edge detection methods transform the original image into
image based on edges using changes on the grey levels effect of the image. Such edge
detection methods are Roberts, Prewitt, Sobel, Canny, Gaussian and Laplacian of
Gaussian. The interested reader is referred to [1].
- Region-based segmentation techniques examine the image pixels and connect
neighboring pixels with homogenous properties based on prior defined criteria of pixel
resemblance from unrelated regions. One such technique is the region merging method,
used for extracting a related region with similar image pixels, starts with a single pixel or
a group of pixels so-called “seeds” that belong to the region of interest. Another technique
is the watershed technique, which represents an approach for performing a special
segmentation of regions, using morphological operations on grey levels techniques [7].
- Segmentation techniques using pixel classification are restricted on using only
unsupervised and supervised classifiers to cluster pixels in the feature space. Clustering
is a process of unsupervised learning about grouping of similar items into a single cluster,
while objects with different characteristics are grouped in different clusters based on some
conditions of resemblance. An example of such technique is k-means clustering that
groups n pixels closest to the cluster’s centroid [4]. Fuzzy clustering can be used in cases
when there are no defined borders between different objects in the image. Fuzzy
clustering divides the input pixels into a single cluster or a group of clusters based on
some resemblance criteria such as distance, connection, intensity, etc.
268

Mihajlo Hasanu et al.
5. BraTumIA
BraTumIA is a software tool used for automatic analysis of brain tumor images,
developed by Institute for Surgical Technology & Biomechanics [8]. This tool can
perform tumor segmentation including its sub-compartments of MRI images of people
that have glioma. It needs four different MRI image sequences T1, T1 contrast, T2 and
Fluid Attenuated Inversion Recovery (FLAIR) to be able to perform an effective and
efficient automatic brain tumor image segmentation [8].
The images are processed using a pipeline approach, where skull-stripping is
performed first in order to generate a brain mask. Subsequently, all images are co-
registered to ensure voxel-to-voxel correspondence between the different MRI sequences.
Based on these registered images, a segmentation of the patient images into healthy and
tumor tissues is done based on combined classification and regularization. This produces
a label map and quantitative information about tissue volumes. Healthy subcortical
structures are segmented using a deformable registration of an atlas to the patient image.
Finally, the label maps can be transformed back into the original space of each image
sequence so that they can be shown as an overlay on the original images.
Aiming to approach the software functionality, these four image sequences need to be
loaded by specifying their locations in the testing folder that contains the data sets saved
on a set location. In the process of setting the locations, a specific location needs to be set
for each of the four sequence modalities and additional one for the location of the folder
containing the output results. The data sets used for testing images are downloaded from
the Neuroimaging Informatics Tools and Resources Clearinghouse (NITRC) where the
software itself, can be found as well [9]. Fig. 1 shows the images for the four sequences
in the main software window, shown clockwise, starting with T1 in the top left corner,
T1c in the top right corner, T2 in the bottom right corner, and FLAIR in the bottom left
corner.
Fig. 1. Sequences representation in the four visualization sub-windows in BraTumIA.
269

Fully Automatic MRI Brain Tumor Segmentation
5.1. Data Processing and the Results’ Visualization
For data processing, the user can refer to any segmentation module separately or a full
segmentation for all modules: skull-striping, multimodal registration and classification.
The skull-striping module allows creating a brain mask that can be adjusted in the desired
position i.e. creation of registered versions of images. The multimodal registration
module allows getting a correspondence between the segmented regions, while the
classification module allows tissue and structure classification, for the healthy and
diseased brain regions as well as their volume of the total brain volume. Fig. 2 represents
the original vs registered MRI image.
Fig. 2. (A) Original version of the image vs. (B) registered version of the image.
After performing the data processing in the background by using suitable algorithms
implemented in this software for automated segmentation, in the main window for
visualization, label maps in different colors are shown as an overlay on the original or
registered version of the image. In this particular case the modality T1 is chosen. This
kind of label maps actually represents the performed image segmentations in regions
related to the tumor tissue. The segmentation results are shown on Fig. 3.
Fig. 3. Segmentation performed for T1 modality.
270

Mihajlo Hasanu et al.
The BraTumIA software allows additional activities, such image multi-scrolling,
zooming in on images, as well as adjusting the contrast intensity of the images. By
adjusting the contrast intensity for the chosen modality T1 with a small mouse movement
to the left or to the right, an extraction will be done only to the part containing the tumor
tissue, as shown on Fig. 4.
Fig. 4. Extracted part of segmentation for T1 modality.
If it is needed to see the volume of the healthy and cancer tissue regarding to the total
brain mass, then such information can be accessed and presented to the user by pressing
the Segmentation Table button which triggers opening a new window. In this window the
volume for each tissue (gray matter, white matter, and cerebrospinal fluid, necrotic tissue,
enhancing and non-enhancing tumor tissues and edema) is given measured in cm3.
Additionally, by clicking each of the tissues’ names a full brain tumor segmentation is
presented, i.e. separation of the healthy from the tumor infected tissue. Fig. 5 shows the
volume of each tissue from the brain volume (A) and fully automatic segmentation
performed of healthy and diseased brain tissues (B).
Fig. 5. (A) Segmentation table window that shows the volumes for each segmented tissue
compartment and (B) fully segmentation performed for each tissue.
271

Fully Automatic MRI Brain Tumor Segmentation
6. Conclusion
Today, in the area of biomedical research, the care of patients suffered from brain
tumor gets a lot of attention. There are a plethora of software packages developed for
automatic segmentation and brain tumor detection that reduces the doctors’ time spent on
manual segmentation. StripTs, iSix, FISICO, Di2Mesh, Point Wise Multimodal Demons
Registration, Brain tissue segmentation are examples of software tools for MRI
segmentation and analysis. The automatic brain tumor segmentation offers numerous
benefits for the medicine. There are many methods used for brain tumor segmentation
providing the doctors with detailed, precise and complete aspects of the brain tumor and
help them to diagnose and choose the best treatment for healing the tumors.
In this research, BraTumIA was chosen as a tool for automatic brain tumor
segmentation which gives as a result successfully performed tumor tissue segmentation
compared to the normal brain tissue. Furthermore, this tool provides detailed and
complete information about the volume of the tumor and normal tissue regarding to the
total brain volume. For this purpose, in this paper a testing data set has been used which
contains MRI images for all four modalities T1, T1c, T2 and FLAIR.
Although this tool provides a lot of advantages for medical usage and implementation,
there is a still challenging task to develop some modules of this software package to allow
maximum functionality for the MRI tumor segmentation.
References
[1] Jobin Christ MC.: Segmentation and classification of brain tumors using hierarchical
topology preserving map. Anna University, Faculty of Information and Communication
Engineering (2013).
[2] Sushovan Mandal.: Brain tumor detection using mathematical morphology and density
approximation approach. Dissertation, Jadavpur University, Faculty of Engineering and
Technology (2010).
[3] A.M. Khan, Ravi. S.: Image Segmentation Methods: A Comparative Study. International
Journal of Soft Computing and Engineering, ISSN: 2231-3207, Volume-3, Issue-4.
(2013)
[4] Ruchi D. Deshmukh, Chaya Jadhav.: Study of Different Brain Tumor MRI Image
Segmentation Techniques. International journal of Computer Science Engineering and
Technology, Volume-4, Issue-4 (2014).
[5] Linda G. Shapiro, George C. Stockman.: Computer Vision – Chapter 10: Image
Segmentation. University of Washington (2000).
[6] Sudipta Roy, Sanjay Nag.: A Review on Automated Brain Tumor Detection and
Segmentation from MRI of Brain. International journal of Advanced Research in
Computer Science and Software Engineering, Volume-3, Issue-6 (2013).
[7] Nelly Gordillo, Eduard Montseny.: State of the art survey on MRI brain tumor
segmentation. Review article on Magnetic Resonance Imaging (2013).
[8] S. Bauer, T. Fejes, R. Meier, M. Reyes, J. Slotboom, N. Porz, A. Pica, and R. Wiest.:
BraTumIA – A software tool for automatic Brain Tumor Image Analysis (2013).
[9] https://www.nitrc.org
272

International Conference on Applied Internet and Information
Technologies, 2016
DOI:10.20544/AIIT2016.34
Separation of Players in Teams during Basketball
Matches
Zdravko Ivanković1, Predrag Pecev1, Branko Markoski1, Dragica Radosav1, Dejan
Lacmanović1
1 University of Novi Sad, Technical Faculty “Mihajlo Pupin”, 23000 Zrenjanin, Serbia
zdravko.ivankovic, predrag.pecev, branko.markoski, dragica.radosav,
Abstract. This paper represents a framework for automatic player separation in
teams during basketball matches. Separation is made in images broadcasted via
television stations. In them, we have view from only single camera in particular
point of time. This makes detection of players and their separation much more
difficult. The player detection is based on mixture of non-oriented pictorial
structures. After detection we extract image parts that represent player’s jersey.
Over that area we calculate histogram on S value from HSV color system.
According to top five picks, we cluster players in teams. This approach give us
accuracy of 92.38%. Its main advantages are robustness and applicability on the
large number of footages from different basketball games without need for
additional training and algorithm changes.
Keywords: computer vision, player detection, player separation, clustering.
1. Introduction
Analysis of digital media content represents a technology with constant growth and
progress in recent years. Application of this technology can be found in medicine,
public security, industry, traffic, sport and many other fields.
The aim of this research is to analyze images from basketball games that are publicly
broadcasted via television networks. It includes a wide range of activities from how to
identify players, determine their position on the court, recognize ball, hoops, when the
player takes the shoot, and weather the shoot was successful or not.
The process of analysis starts with a basketball game footage. From it, we extract
video frames. In most common scenario, each second of the footage contains 30 frames.
During the analysis, we concluded that it is not necessary to perform analysis on each
273

Ivankovic et al.
frame. In this research, we used every third frame, or ten frames per second. This has
significant impact on performances without loss of accuracy because no event is
happening so fast that it will not be recorded with a reduced set of frames. This set of
frames is the starting point for algorithms that will allow player detection and separation
in teams.
During the basketball game footages that are distributed view television networks,
we often could see shots that do not represent the game itself. Those are mainly scenes
of audience, players that are currently on the bench, replay and slow motions of
previous actions etc. Since they do not represent the game itself, they need to be
removed from the analysis process. Recognition of those frames is done by comparing
quantified color histograms. By application of this algorithm, we remove all frames that
do not represent court. Frames representing the game are further analyzed in order to
determine the court, hoops, ball and the players.
In order to separate players in teams, we first need to recognize them. The player
detection is quite a difficult problem. The reason is in basketball game itself, which is a
very dynamic sport with players constantly altering in a wide variety of positions and
poses. The camera moves from one side of the court to the other and zooms certain
moments, so the player’s size is not always constant. Secondly, due to players changing
an angle in relation to the camera, some body parts may seem foreshorten compared to
the others. Also, it happens quite often that a player is to some extent obscured by other
players.
2. Related Work
Human motion analysis using computer vision is very widespread. Its attractiveness is
based on a wide field of application and great complexity. Complexity represents a
challenge in the research, seen from a pure academic point of view [1]. From the point
of application, methods based on the computer vision are often only non-invasive
solution, which makes them particularly attractive. The process of capturing
movements, called human motion capture covers many aspects. It is mainly related to
the recording of the obvious movements that man does (movements of the head, arms,
torso and legs). Previous definition do not cover body movements of smaller scale such
are facial expressions and gestures.
Discriminative methods are dominant in object recognition and sport events analysis.
One of the first solution that has been successfully applied in the detection and
monitoring of players on sports matches was a BPF (Boosted Particle Filter). Okuma et
al. were using BPF in order to track players on hockey matches [2].
The player detection in this paper is done via part-based methods [3]. These methods
decompose the appearance of the objects into local part templates, together with
geometric constraints on locations of the parts. In this paper we used a mixture of non-
oriented pictorial structures [4] which is a very robust algorithm. Beside players, this
algorithm detects a player arms, legs, head and torso.
274

Separation of Players in Teams during Basketball Matches
Mixture of non-oriented pictorial structures augments the classic spring models with
co-occurrence constraints that favor certain combinations of parts. Such constraints can
capture the local rigidity. What it means is that two parts on the same limb should have
the same orientation. The key issue is learning such a complex presentation from the
training data. As in [4, 5], the solution is in a supervised learning mode. Model training
is performed using the player’s images that are labeled in fourteen points (ankles,
knees, hips, wrists, elbows, shoulders, chin and scalp). The area around each point
represents an instance of specific object category. Detail description of player detection
is described in our paper Automatic Player Position Detection in Basketball Games [6].
3. Separation of Players in Teams
When we detect all players on the field, we want to separate them into teams.
Applied algorithm is shown by diagram in Fig. 1.
Fig. 1. Algorithm for player separation in teams.
From Fig. 1 we could see that first step is selection of clustering areas. This is
selection of those parts that are covered with jersey. In case of basketball players, those
are parts 3, 8, 9, 10, 11, 12, 15, 20, 21, 22, 23 and 24. Those parts are marked with red
color in Fig 2. All these parts form one area that will be used in further processing.
Example of created area is shown in Fig 3.
Selection of clustering areas
Turn that area into HSV
Court and skin removal
Histogram calculation and pick detection
Clustering
275

Ivankovic et al.
Fig. 2. Selected areas for clustering
Fig. 3. Creation of clustering area
After clustering area creation, we transform it to HSV color system for two reasons.
First reason is the fact that H (Hue) component of this system represents a color. By
specifying the scope which contains parquet and player skin, these pixels can be
removed from further processing. An example of removal of the skin and parquet
flooring, within the clustering area, is shown in Fig. 4. Another reason is that every
team in the league has two sets of jerseys. One set is "bright" and the other is "dark".
Both sets are designed in accordance with the colors of the team, and in accordance
with the previous limit. On any match, the teams are in different types of jerseys (one is
in the light set, and the other in the dark). If we observe saturation component S of HSV
model, it may be noted that light set has low saturation, while dark set of jerseys has a
high saturation. This is exactly the qualities that we used for histogram calculation and
team clustering.
276
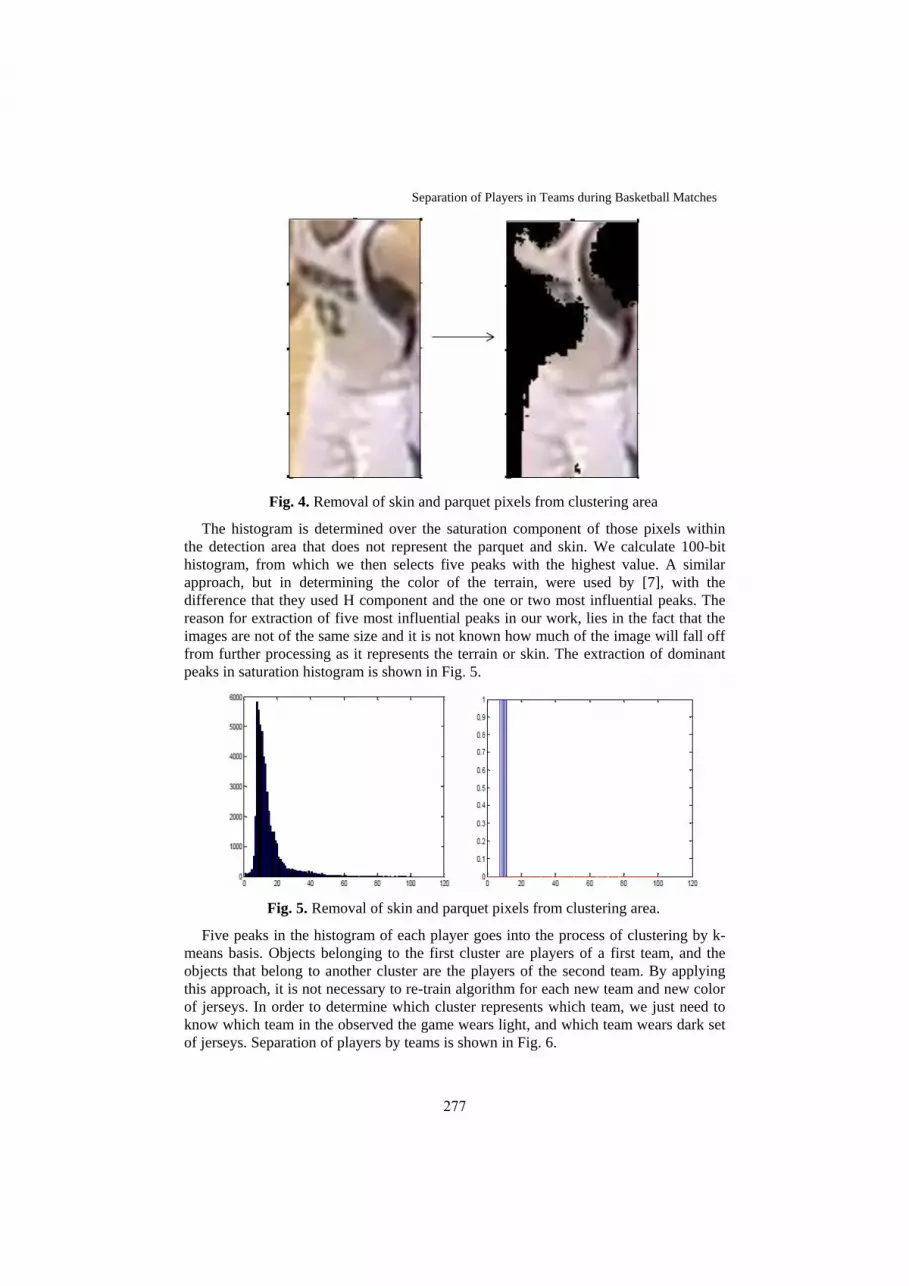
Separation of Players in Teams during Basketball Matches
Fig. 4. Removal of skin and parquet pixels from clustering area
The histogram is determined over the saturation component of those pixels within
the detection area that does not represent the parquet and skin. We calculate 100-bit
histogram, from which we then selects five peaks with the highest value. A similar
approach, but in determining the color of the terrain, were used by [7], with the
difference that they used H component and the one or two most influential peaks. The
reason for extraction of five most influential peaks in our work, lies in the fact that the
images are not of the same size and it is not known how much of the image will fall off
from further processing as it represents the terrain or skin. The extraction of dominant
peaks in saturation histogram is shown in Fig. 5.
Fig. 5. Removal of skin and parquet pixels from clustering area.
Five peaks in the histogram of each player goes into the process of clustering by k-
means basis. Objects belonging to the first cluster are players of a first team, and the
objects that belong to another cluster are the players of the second team. By applying
this approach, it is not necessary to re-train algorithm for each new team and new color
of jerseys. In order to determine which cluster represents which team, we just need to
know which team in the observed the game wears light, and which team wears dark set
of jerseys. Separation of players by teams is shown in Fig. 6.
277
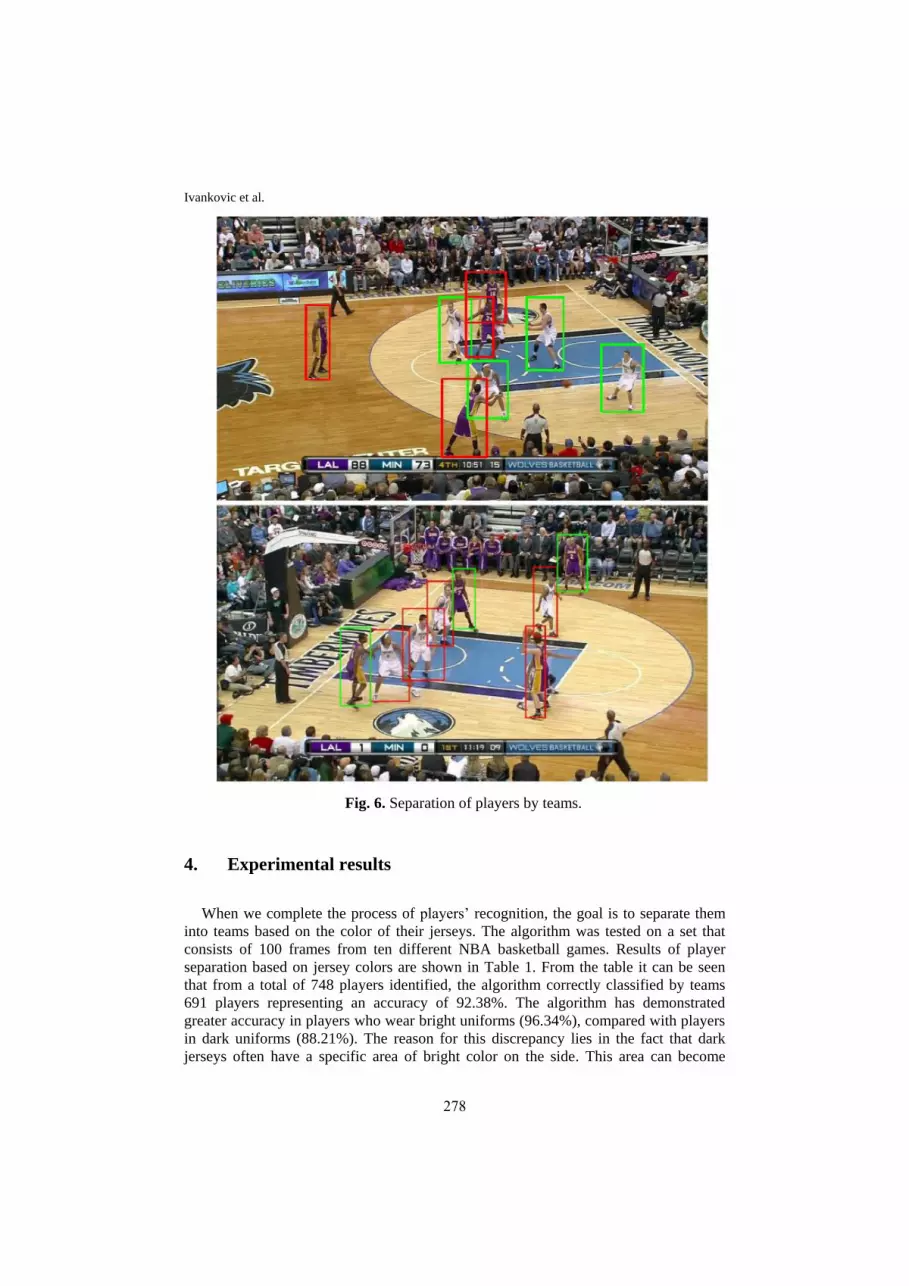
Ivankovic et al.
Fig. 6. Separation of players by teams.
4. Experimental results
When we complete the process of players’ recognition, the goal is to separate them
into teams based on the color of their jerseys. The algorithm was tested on a set that
consists of 100 frames from ten different NBA basketball games. Results of player
separation based on jersey colors are shown in Table 1. From the table it can be seen
that from a total of 748 players identified, the algorithm correctly classified by teams
691 players representing an accuracy of 92.38%. The algorithm has demonstrated
greater accuracy in players who wear bright uniforms (96.34%), compared with players
in dark uniforms (88.21%). The reason for this discrepancy lies in the fact that dark
jerseys often have a specific area of bright color on the side. This area can become
278

Separation of Players in Teams during Basketball Matches
dominant, especially when the player is not directly facing the camera. From the table it
can be seen that the number of incorrectly classified players in dark jerseys is almost
three times higher in comparison with players in light jerseys.
Table 1. Player separation by teams.
Correct classifications Incorrect classifications %
Light jerseys 369 14 96.34
Dark jerseys 322 43 88.21
Total 691 57 92.38
5. Conclusion
The presented algorithms represent a step forward for the process of automatic
separation of players in teams. Separation is done on basketball game footages
broadcasted via TV stations. This type of footage, at any point of time, can provide a
view from only one camera, which makes a detection process much harder. Its main
contribution is robustness and applicability on the large number of footages from
different basketball games without need for additional training and algorithm changes.
Space for further investigation is very broad. It includes the determination of the
player’s jersey number in order to accomplish its identification.
6. References
1. Moeslund, T., Hilton, A., Kruger, V. : A Survey of Advances in Vision-based Human
Motion Capture and Analysis. Computer Vision and Image Understanding, Vol. 104, 90-126.
(2006)
2. Okuma, K., Taleghani, A., Freitas, N., Little, J.J., Love, D.G. : A Boosted Particle Filter :
Multitarget Detection and Tracking. European Conference on Computer Vision. (2004)
3. Felzenszwalb, P., Huttenlocher, D. : Pictorial structures for object recognition. Int Journal of
Computer Vision. Vol. 61, No. 1, 55–79 (2005)
4. Yang, Y., Ramanan, D. : Articulated pose estimation using flexible mixture of parts.
Computer Vision and Pattern Recognition, 1385–1392, (2011)
5. Bourdev, L., Malik, J. : Poselets: Body part detectors trained using 3d human pose
annotations. International conference on computer vision (ICCV), 1365–1372, (2009)
6. Ivankovic, Z., Rackovic, M., Ivkovic, M. : Automatic Player Position Detection in
Basketball Games. Multimedia Tools And Applications. Vol. 72, No. 3, 2741:2767, (2014)
7. Wu, L., Gong, Y., Yuan, X., Zhang, X., Cao, L. : Semantic Aware Sport Image Resizing
Jointly Using Seam Carving and Warping. Multimedia Tools and Applications.
doi:10.1007/s11042-012-1002-7
279

International Conference on Applied Internet and Information
Technologies, 2016
DOI:10.20544/AIIT2016.35
CUDA DSP Filter for ECG Signals
Ervin Domazet, Marjan Gusev, and Sasko Ristov
Ss. Cyril and Methodius University, Faculty of Computer Science and Engineering
1000 Skopje, Macedonia
ervin [email protected],marjan.gushev, [email protected]
Abstract. Real time processing is very important and critical for analysis of ECG
signals. Prior to each processing, the signal needs to be filtered to enable feature
extraction and further analysis. In case of building a data processing center that
analyzes thousands of connected ECG sensors, one expects that the signal
processing needs to be done very fast. In this paper, we focus on parallelizing the
sequential DSP filter for processing of heart signals on GPU cores. We set a
hypothesis that a GPU version is much faster than the CPU version. In this paper
we have provided several experiments to test the validity of this hypothesis and to
compare the performance of the parallelized GPU code with the sequential code.
Assuming that the hypothesis is valid, we would also like to find what is the
optimal size of the threads per block to obtain the maximum speedup. Our
analysis shows that parallelized GPU code achieves linear speedups and is much
more efficient than the classical single processor sequential processing.
Keywords: DSP, ECG, Heart Signal, Parallelization, CUDA, GPGPU.
1. Introduction
Due to low electrical levels, ECG signals are accompanied by noise, stemming from
different sources, such as electrical switching power, radio waves and internal human
breathing physical movement. Data preprocessing is essential for doing precise
analysis and interpretation.
Digital Signal Processing (DSP) enables analysis of the ECG signal, with the
intention to extract and interpret hidden data. Filters are among the most important
tools of the DSP area, and are used to eliminate noise from the ECG signal. In some
special circumstances, the real time processing of the ECG signal can even save lives.
Sequential algorithms are insufficient of processing ECG signals in real time,
especially when thousands of signals from remote wearable ECG sensors are reaching
to the cloud data server.
In our previous research [4] we focussed on parallelizing DSP filters on Maxeler
dataflow cores. We obtained relatively good results, with linear speedups proportional
to the kernel length.
In this research, we focus on parallelizing the sequential DSP filter for processing of
heart signals on graphics processing unit (GPU) cores. Implementation of FIR low
pass, high bass and bandpass filters are used in our experiments for variable noise
components of the ECG signal. We consider using CUDA library, which is a parallel
280

Ervin Domazet et al.
computing platform and programming model invented by NVIDIA. CUDA-enabled
GPUs makes it possible for developers to use GPUs for general processing.
The hypothesis set in this paper is to confirm if the GPU DSP filter processing of
the ECG signals is faster than the CPU processing. To test the hypothesis we will
measure the speedup of the obtained GPU solution over the serial solution. Further
one, our research question is to determine the optimal size of threads per block to
obtain the maximum speedup.
The paper is organized as follows. The background about ECG signals and CUDA
advantages is presented in Section 2. Section 3 presents DSP filters and convolution
operators. An explanation of the parallelization method and the obtained CUDA code
of the DSP filter is presented in Section 4. Obtained results of measured processing
time and performance analysis of the parallelized code versus the original sequential
code are presented in Section 5. Finally, the paper is concluded with a discussion and
future work in Section 7.
2. Background
ECG holds significant information related to the cardiovascular condition of the
human. This makes the analysis and interpretation significant for a healthier life.
Figure 1 shows the general method for processing and analyzing ECG signals [6].
Fig.1. Methodology for ECG signal processing.
DSP involves a variety of tools aimed for signal analysis [3],[8], and DSP filters are
considered as very important tools, useful for noise elimination. After noise
elimination, features can be extracted for analyzing the complex heart condition. ECG
features can vary from detecting hidden information and subtle deviation of the heart
rhythm to alternating changes of the wave amplitude [2].
CUDA, or Compute Unified Device Architecture, is NVIDIA’s technology which
ensures a significant increase in software performance by using the GPU power [5,7].
The difference between a CPU and GPU is to compare how they process tasks. CPU
consists of a few cores optimized for sequential serial processing, while the GPU has a
massively parallel architecture consisting of thousands of smaller, more efficient cores
designed for handling multiple tasks simultaneously [1].
281

CUDA DSP Filter for ECG Signals
Fig.2. A segment of an ECG signal with several QRS complexes, filtered with a low
pass filter of 30Hz, high pass filter of 0.5Hz and a band pass filter between 0.5Hz and
30Hz.
3. Digital Signal Processing
Digital Signal Processing (DSP) is considered as a set of tools for processing signals.
They vary from filtering, measuring to producing or compressing analog signals. The
power of this field in computer science dramatically increased during last decades [8].
Most complex systems use revolutionary DSP methods.
The focus of this research is on data preprocessing phase of ECG signal analysis.
This phase has the intention to eliminate the noise of the signal. In this respect, DSP
filters are used as tools of the first phase.
The most widely used method for a DSP filter is the convolution, defined to
generate a new output stream as a mathematical operation of the input stream and
impulse response The impulse response of a filter is usually denoted as a filter kernel using the weight coefficients h(i). In case of an Infinite Impulse Response (IIR) Filter,
i ∈ −∞,+∞. while, in the Finite Impulse Response (FIR) filters, i ∈0,...,M −1, where
M is the filter length.
Denote by x(i) the elements of the input stream and by y(i) the elements of the
output stream for i = 0,.... The convolution is a mathematical operation calculated by
(1).
(1)
Three classic filters are used in this research to eliminate the noise: low-pass,
highpass and band-pass filters. Figure 3 reveals simple frequency responses for low-
pass, band-pass and high-pass filters respectively.
282

Ervin Domazet et al.
Low-pass filters weaken all the frequencies above the cutoff frequency, known as a
stopband, while passing all frequencies below the passband [8]. All samples of the
output stream are in fact a weighted average of the input with the adjacent points of the
low pass filter.
Fig.3. Frequency responses of the low-pass, band-pass and high-pass filters.
The high-pass filter is functioning completely opposite of the low-pass filter. The
main effect of the filter is to weaken the frequencies below the cutoff frequency whereas passing all frequencies above the cutoff frequency.
A band-pass filter is a combination of the high-pass and low-pass filters. It passes a
predefined range of frequencies and rejects the frequencies of the remaining region.
Figure 2 presents the effect of applying a low pass filter with a 30 Hz cut-off
frequency on the ECG signal. It can be noted that 50Hz noise is eliminated. The effect
of applying a high pass filtering with a cut-off frequency of 0.5 Hz is the elimination
of the baseline drift, caused by breathing and other physical movements. The band
pass filter by its nature is a combination of low pass and high pass filters. It eliminates
both the baseline drift, caused by breathing and other physical movements and also the
50Hz noise caused by the electricity.
4. Parallelization for GPU Computing
The algorithm presented in Figure 4(a) is a sequential version of a convolution of a one
dimensional input with a corresponding kernel. The complexity of the algorithm
depends on the input and the kernel stream length, i.e O(nm). When run on a CPU, the
flow is sequential, meaning that the inner loop length depends on the kernel size.
GPU computing is a rather different computing paradigm when compared to the
traditional CPUs. GPUs have a massively parallel architecture consisting of thousands
of smaller, more efficient cores designed for handling multiple tasks simultaneously.
Using this key feature, we have achieved a row based parallelization of convolution
computation for the ECG input signal.
The sequential loop iterating the input signal is massively parallelized by
synchronously utilizing thousands of GPU cores. Proposed solution is visualized in
Figure 4(b).
General purpose GPU programing on NVIDIA CUDA enables modifiable
execution plans, which are specified by blocks and grids. Block is considered as a
group of threads. Its important to note that threads inside the blocks can be
synchronized. Threads across same block can communicate via a shared memory
283

CUDA DSP Filter for ECG Signals
dedicated to the block. Besides, a grid is a group of blocks. CUDA does not provide
means for synchronization between blocks. Moreover, a blocks inside a grid can
communicate via the global memory.
This row version of the algorithm uses threads which size is proportional to the
filter kernel. Whenever the threads are executed on a streaming multiprocessor of a
GPU, a
(a) Sequential Solution (b) Parallel GPU Solution
Fig.4. Flow of sequential and GPU computing filtering algorithm.
number of threads per block (TPB) is defined. We plan to test several values of TPB
and determine its optimal size.
Note that this solution does not include any optimization of the CUDA code, and we
are aware of a lot of concurrent memory reads. Still, the distribution of the workload
on the GPU cores, makes the advantage of using 1536 cores, even the system clock is
much lower.
5. Experimental results
This section describes the conducted experiments and presents the obtained results.
5.1 Testing environment
The sequential and parallelized code are tested on an Amazon G2 2xlarge instance. It
consists of a 8-core Intel(R) Xeon(R) CPU E5-2670 2.60GHz 64-bit system with a
15GB of memory. Additionally, the parallelized code is tested on a NVIDIA GRID
(Kepler GK104) device, having 1,536 CUDA cores with 800Mhz system clock and
4GB RAM.
284

Ervin Domazet et al.
In this research we have experimented with the Hamming window and the
Blackman window with length of 100 and 200 elements to obtain relatively good
results.
5.2 Functional Verification
Several experiments are conducted to verify if the functional characteristics of the
sequential and parallel algorithms are identical The input was a short stream of 1000
samples of an ECG signal with all characteristic P, Q, R, S and T waves, as presented
in Figure 2.
We have verified both the sequential and parallelized CUDA and sequential
solutions obtain identical results.
5.3 Test data
The measured parameters in the experiments are the time required to process the
sequential algorithm Ts, and the time required to process the parallel algorithm with p cores, denoted by Tp.
The speed-up is calculated by (2) as a ratio of the measured times for execution of
the sequential and parallel algorithms.
(2)
5.4 Results
Note that for each input signal, the speedup values are calculated by using Ts and Tp
values for the same input configuration. Hence, the main reason for using these values
is to compare the performance of the sequential code on CPU and the parallelized code
on CUDA enabled GPU.
A total of 3 experiments were conducted, where input length varies from 10.000 to
500.000 in steps of 10.000 samples. The tested kernel length was 100, 500, 2000, 5000
and 7500.
Table 1 presents the running times of the sequential and parallel algorithms tested in
our experiments only for selected values.
One can observe that the speedup increases as the input length is increased as it was
expected. Moreover, the speedup is increasing slightly as the kernel length increases,
due to a more efficient utilization of GPU cores without extra costs for allocating and
dealocating a core.
285

CUDA DSP Filter for ECG Signals
Table 1. Speed-up analysis as the input size and kernel increase.
No ECG Signal
Length Kernel
Length CPU Running
Time (ms) GPU Running
Time(ms) Speedup
1
10000
100
5.3 0.6 9.1
50000 26 1 27.8
100000 54 2 30.5
500000 266 6 42.8
2
10000
500
27 1 40.5
50000 132 2 60.7
100000 264 4 66.9
500000 1323 16 80.9
3
10000
2500
113 1 79.5
50000 670 8 85.8
100000 1275 14 92.9
500000 5684 57 99.7
6. Discussion
This section evaluates and discusses the obtained results, and also provides an analysis
of the TPB number to determine an optimal configuration of the algorithm.
Speedup of CUDA GPU vs CPU Solution The conducted experiments are tested for
various input and kernel length. Figure 5 presents the speedup of the CUDA algorithm
compared to the sequential version, where the input length varies from 10.000 to
500.000 samples and filter kernel lengths of 100, 1.000 and 2.500, with TPB value of
1024.
Fig.5. Speedup of parallelized CUDA solution compared to sequential version.
286

Ervin Domazet et al.
The algorithm has a steady linear speedup as the ECG signal length increases.
Additionally, increasing the kernel length has a noticable effect on the speedup. This is
due to the effect of allocating and deallocating a thread, which becomes negligible as
kernel length increase. We observe that for some configurations a speedup of up to
100 is achieved, with a scalable nature. Therefore the hypothesis is confirmed.
Optimal number of Threads Per Block In the context of our research question we
have provided several additional experiments. Selecting right parameters for number
of threads in a block has positive effect on the speedup. In order to find the optimal
value of the TPB number, we have conducted tests for various TPB from 8 up to 1024.
Figure 6 presents the speedup values for different TPB values.
Our analysis shows that, TPB should be kept as high as possible by taking into
account the upper limit of threads per block being provided by the specification of the
GPU.
7. Conclusion
This work contributes CUDA GPU parallelization for noise filtering of ECG heart
signals. The provided parallel solution takes advantage of thousands of CUDA cores.
Their size is increasing linearly to the input length used.
Fig.6. Effect of threads per block on speedup.
Results obtained by executing the sequential algorithm and the parallel CUDA
algorithm show they are identical for low-pass, high-pass and band-pass filters.
The analysis on GPU shows higher numbers for threads per block produce higher
speedups. Increasing the kernel length has a noticable effect on the speedup. The row
version of the CUDA algorithm achieves a speedup proportional to the input and filter
length.
This research is the first step of the ECG signal processing with the intention to
extract hidden information.
287

CUDA DSP Filter for ECG Signals
As future work, we plan to carry out more tests on multiple GPUs tied together and
compare the results to the OpenMP and similar solutions. We also plan to find a more
appropriate CUDA algorithm and optimize the GPU execution if possible by an
element algorithm version, where the threads are defined on element level, and not on
a row level, expecting that the parallelized code will scale linearly with increasing
filter size, and achieve even higher speedups by eliminating the synchronization
barriers and aligning the memory access without bank conflicts.
References
1. The cuda zone, https://developer.nvidia.com/cuda-zone, last visited on 25.04.2016
2. Acharya, R., Krishnan, S.M., Spaan, J.A., Suri, J.S.: Advances in cardiac signal
processing.Springer (2007)
3. Antoniou, A.: Digital signal processing. McGraw-Hill Toronto, Canada: (2006)
4. Domazet, E., Gushev, M., Ristov, S.: Dataflow dsp filter for ecg signals. In: 13th
InternationalConference on Informatics and Information Technologies. Bitola, Macedonia
(2016)
5. Duato, J., Pena, A.J., Silla, F., Mayo, R., Quintana-Orti, E.S.: Performance of cuda
virtualizedremote gpus in high performance clusters. In: Parallel Processing (ICPP), 2011
International Conference on. pp. 365–374. IEEE (2011)
6. Lugovaya, T.S.: Biometric human identification based on ecg (2005)
7. Phillips, E.H., Fatica, M.: Implementing the himeno benchmark with cuda on gpu clusters.
In: Parallel & Distributed Processing (IPDPS), IEEE International Symposium on. IEEE
(2010)
8. Smith, S.W.: Digital signal processing: a practical guide for engineers and scientists (2003)
288

International Conference on Applied Internet and
Information Technologies, 2016
DOI:10.20544/AIIT2016.36
Intelligence approach in improving business processes
Ljubinka Sandjakoska 1, 3, Daniela Koteska Lozanoska 2
1 Faculty of Computer Science and Engineering, University for Information Science and
Technology “St. Paul the Apostle” Ohrid Partizanska bb,
6000 Ohrid, Macedonia 2 Faculty of Information Systems, Visualization, Multimedia and Animation, University for
Information Science and Technology “St. Paul the Apostle” Ohrid, Partizanska bb,
6000 Ohrid, Macedonia 3 Faculty of Computer Science and Engineering, University Ss. Cyril and Methodius,
Republic of Macedonia, Rugjer Boshkovikj 16, 1000 Skopje, Macedonia
ljubinka.gjergjeska, [email protected]
Abstract. Nowadays, business intelligence (BI) has the top-most priority for the
contemporary enterprises. The aim of this paper is to emphasize the advantages of
this computer based approach in improving business processes. Data analytics and
modeling of sales prediction system for enterprise is realized with artificial neural
networks (ANNs). For the purpose of this research are created over 100 artificial
neural networks. Three types of artificial neural networks are designed and
evaluated: Function fitting neural networks, Focused Time-delay neural networks
and NARX (Non-linear autoregressive) neural networks. Also were performed
simulations with different architectures that differ to the number of delays and the
number of neurons in the hidden layer. The network prediction performance was
evaluated with Average Percentage Error (APE) and Root Mean Square Error
(RMSE). The obtained results show big accuracy in prediction of the product sale.
The precise prediction has influence to optimization of most of the business
processes such as: supply of raw materials, organization of production process, staff
scheduling, plan the electricity demand, cost reduction etc.
Keywords: business intelligence, artificial neural networks, forecasting, business
process
1. Introduction
Nowadays, business intelligence (BI) has the top-most priority for the
contemporary enterprises. The market dynamics force the use of
information and communications technologies (ICT) in the daily
operations of enterprises. Here it should be noted that the use of ICT is
not only related to the daily operation or short-term business strategies but
also with long-term strategies, on which the success of a company rely on.
289

Ljubinka Sandjakoska, Daniela Koteska Lozanoska
The term BI is broad and covers many aspects of the functioning of an
enterprise.
In general, BI is related to data warehouse, data mining, data analytics,
etc. The authors of [1] give overview of typical architecture for support BI
within an enterprise. This architecture is organized in five layers. The first
layer is consisted of the data sources (external and operational datasets).
The second includes data movements and streaming engines. The
following two layers are for the servers: data warehouse servers and mid-
tier servers. The last layer for the front-end applications such as: ad-hoc
query, dashboard, spreadsheets etc. In this paper we focus on artificial
neural networks (ANNs) as data mining tool. Data mining tools usually are
included in the fourth layer – mid-tier server. These engines allow analysis
that is the basis of predictive modeling. Building predictive models is key
for developing support system for decision making. The process of
decision making is crucial for profitable working of the company. Many
factors have influence on the business processes or units. Predictive
models use this factors or its distributions for providing solutions. Since
that, its accuracy is usually high and the need of using them is obvious. In
the past a lot of statistical techniques, which are well-defined, fairly
predictable and computable in reasonable time, is been utilized for
prediction. Now arise the question - why do we need new computing
techniques? Or more precise - why we need business intelligence? The
author of [2] give explicate answer of this questions. Business intelligence
is used to understand the capabilities available in the firm; the state of the
art, trends, and future directions in the markets, the technologies, and the
regulatory environment in which the firm competes; and the actions of
competitors and the implications of these actions.
Also here have to mention that predictive modeling based on ANN is
data driven approach. Companies have tendency to provide, manipulate
and store big amount of data. Since that, data as a basic resource, are not
always fully utilized. The authors of [3] conclude that a critical component
for the success of the modern enterprise is its ability to take the advantages
of all available data. Business intelligence approach based on ANN can
deal with all available data, extracting knowledge for the business process.
ANN are widely used for solving many business issues, such that:
prediction of stock price index, prediction of thrift failures, investment
management and risk control, developing stock trading decision support
system [4], market segmentation [5-8], forecasting stock returns [9],
forecasting market response [10] etc. Since the wide range of application
290

Intelligence approach in improving business processes
financial service organizations have become the second largest sponsor of
research on the application of this tool [11].
2. Methods and Materials
ANNs are one of sophisticated tools of the intelligence approaches. Key
question is what makes them so sophisticated. Or, why to use ANN? The
basic feature of ANNs is its ability to learn, and therefore does not need
reprogramming. Also, adaptability and self-organization contribute in
effectiveness and efficiency of solving complex problems. Processing time
and error tolerance are other advantages that influence to its sophistication.
ANNs can deal with the problem of missing data because of the ability of
generalization. All of this advantages provide solid framework for its
utilization in business processes.
We would like to stress that the dynamics present in the economic
systems make their modeling challenging process. In this research ANNs
have proved as appropriate tool for business process implementation.
2.1. What are ANN?
Artificial Neural Networks (ANNs) are mathematical concepts that are
computer realized. These models are based on principle of structural
organization and function of biological neural systems. Its architecture is
consisted of set of related units, known as neurons. (Fig.1)
Fig.1. Artificial neuron
According to the DARPA Neural Network Study [12]: a neural network
is a system composed of many simple processing elements operating in
parallel, whose function is determined by network structure, connection
strengths, and the processing performed at computing elements or nodes.
According to Haykin [13]: a neural network is a massively parallel
distributed processor that has a natural propensity for storing experiential
knowledge and making it available for use. It resembles the brain processor
291

Ljubinka Sandjakoska, Daniela Koteska Lozanoska
in two aspects: i) knowledge is acquired by the network through a learning
process; ii) interneuron connection strengths known as synaptic weights
are used to store the knowledge. ANNs are intelligent tools since they are
characterized by: representation of experiential knowledge, application of
the knowledge for problem solving (making conclusion) and gathering
new knowledge (learning). Learning is crucial for ANN. This process
includes several events. First event is - environment stimulates neural
network. After that the neural network is changing as a result of
stimulation and due to the different change network responds to new
events. The design of ANN should be viewed from several aspects. Here
will be discussed only two of them. The first aspect is network structures:
a recurrent or nonrecurrent structure. A recurrent structure of the network
is realized by feedback. This type of network calculates its outputs based
on the inputs and feeds them back to modify the inputs. [14] Second aspect
is learning method. The mathematical and software realization depends on
a learning method which could be supervised, unsupervised and
reinforcement. The authors of [15] claim that most business applications
of ANNs today use supervised learning method.
2.2. ANNs architecture development
Designing aspects
The aspects that have most influence in the design of artificial neural
networks for prediction can be organized into three groups: data
preprocessing, training and topology. Data preprocessing, as a basis or
starting point, plays an important role in achieving good network
performance. Key parameters that have to be adjust in the data
preprocessing are: frequency of data (daily, weekly, monthly, quarterly),
data type, method of data sampling, method of scaling of the mean and/or
standard deviation. Also data preprocessing includes: noise reduction,
dealing with the problem of missing values, inconsistent data, redundancy
etc. The second group of parameters that refer to learning or to network
training are: rate of learning layer, momentum / dynamics, training
tolerance, size of the epoch, maximum number of simulations, random
values for weights, data dividing on training, testing and validation sets.
The last aspect that is called topology refers to: number of input neurons,
number of hidden layers, number of neurons in hidden layers, transfer
function, error function.
292

Intelligence approach in improving business processes
The main goal is - to design a precise neural network with appropriate
architecture that corresponds to the actual processing of segment for orders
in the production system. The aim of designing network is to be capable to
provide information for requirements in future periods and therefore to be
made with a very high accuracy. The goal of using intelligence approach
is to be minimized the prediction error. The most important question that
has to be answered by ANN is: what will be the order of product X for next
month? The order will be forecasted from the business factors that
influence on it and historical data of already realized orders in previous
months and years. (Fig.2)
Figure 2: General view of the predictive model
Software modeling
The ANNs created for the purpose of this research are MATLAB realized
and can be classified into two categories: static and dynamic. Static neural
networks have no feedback elements and do not contain delays. Output
is calculated directly from the input, through connections that process
forward the signal (feed-forward connections). In dynamic networks the
output depends not only on the current input but also by the previous inputs
and previous outputs variables that describe the state of the network. The
entrance of the network consists of two different input canals: conditions
(parameters) and past inputs in the network. Dynamic networks can be
divided into two categories. The first category includes those which have
connections that only process forward signal (feed-forward connections).
The second category includes those which have feedback connections, or
connections carrying the output signal back to the input, to assist in
generating future output. To create a network that solves relevant and
complex problems, we need to make distinguish between static feed-
293
Ljubinka Sandjakoska, Daniela Koteska Lozanoska
forward neural network, the dynamic feed-forward network and recurrent
- dynamic networks. Signal processing in static feed-forward and dynamic
feed-forward network has the same principle, the difference is that
dynamic networks have memory and can be trained to teach sequential, or
time variable data templates. It makes them more powerful as opposed to
static, but greatly affects the field of application. Most used dynamic
networks are: Focused Time - Delay Neural Network, Distributed Time -
Delay Neural Network, NARX Network - Non-liner Auto Regressive
neural network with Exogenous Input, Layer - Recurrent Network.
The nature of the task predicting the orders and system behavior
determine the type of the network. Predicting future order is characterized
by dynamics because events (the order) and variables (factors that
determine the order) are time dependent and are described by time series.
From the theoretical studies of ANN, and the study of the order as an event
and / or subsystem can be concluded that - compatible neural networks that
will provide forecasts for the following orders are: Focused Time - Delay
Neural Network and NARX Neural Network.
The scenarios for simulations also differ from the data organizations. In
this research work two different data arrangements were provided. The
first group of simulations are done with matrix data organizations, and the
second one with vector data organizations.
2.3. Business factors included in predictive modeling
The aim of forecasting model from the proposed intelligent approach is to
provide information for decision making in the development of a short-
term strategy for optimization of the production process. The precise
prediction of the orders has influence to optimization of most of the
business processes such as: supply of raw materials, organization of
production process, staff scheduling, plan the electricity demand, cost
reduction etc. The ANNs discussed in this paper are for one product. For
complete support of decision process should be created predictive models
for all products.
As factors that have influence on the order are: profit per unit product,
production costs, quality, promotion, market trend, pricing and logistical
availability for customers, as well as: market size, number of population,
the preferences of the buyers, attractiveness of the product etc. These are
considered as general factors that are relevant to the order of any of the
294

Intelligence approach in improving business processes
products. Here is given short explanation of the relation of this factors with
the prediction of the order.
Profit per unit of product that is realized from the sale of confectionary
product - if varies, variations will occur in order for its cardboard
packaging.
Production costs - if they are acceptable, then is acceptable the
realization of a particular order or its scope.
Quality of the product determines the demand and order, because the
demand for better market products goes in proportion to their quality.
Promotion affect the order from the aspect of unfamiliarity. The
demand for unfamiliar product is lower, but for promoted product it is
bigger.
Market trend shows the tendency of purchasing the product, which
express the need of the product that actually determine the size of the order.
Price is one of the most influential factors of the demand of any product,
and if accepted by customers, increased consumption will affect the order
of the packaging.
Logistic availability conditions widely represented, more accessible
products to be more demanded and therefore the need for packaging will
be greater.
Market size or size of the place where the product is offered, largely
determines the demand for the product and the need for packaging, which
will used for transporting the product to the national and international area.
The population with its size influence of potentially increasing
consumption of the product, and therefore on the size of the order for
packaging.
The preferences of the buyers, refers to the affections of buyers to a
certain product instead of its substitutes, because the greater preferences
of buyers influence on the increasing of the demand for the product, which
causes a higher order of packaging.
The attractiveness of the product, among other things is conditioned by
its packaging, and therefore its order depends on it.
3. Results and Discussion
For the purpose of this research are designed 142 artificial neural
networks. The types of the networks are: Function fitting neural networks,
Focused Time-delay neural networks and NARX (Non-linear
295

Ljubinka Sandjakoska, Daniela Koteska Lozanoska
autoregressive) neural networks. The number of delays and the number of
neurons in hidden layer are variables that depend on organization of input
data (vector or matrix) and also depend on the size of the dataset. The
criteria for performance measurement is the root mean square error
(RMSE). As a comparison variable, which indicates the accuracy of the
network, is considered Average of Percentage Error (APE).
Table 1. Summarized results for all scenarios and variants of ANNs
Type /
designing principle
Function fitting
ANN
Focused
time-delay ANN
NARX ANN
Variant 1 Variant 1 Var. 1 Var. 2 Var. 3
Optimal architecture 1-50-1 1-45-1
delay=49
12-45-12
delay=3
1-45-1
delay=36
1-20-1
delay=48
Number of simulations 1 44 15 12 70
APE 7.1080% 3.2403% 0.0078% 16.0530% 1.4410%
RMSE 1.25e-19 4.38e-20 3.71e-06 3.35e-01 9.03e-21
In Tab. 1 are given summarized results for all scenarios and variants of
ANNs. The results show that the function fitting ANN variant has 7.1%
error. Although the error is not great, in practice acceptable are the
predictive models that have error less than or equal to 5%. So this is ANN
is excluded from the optimal solution set. The focus-time delay ANN
variant give good results and has error in acceptable ranking. This could
be one of the solution. For this research the best results are obtained with
NARX ANN. Since that the predictive model for this purpose has to be
based on this variant.
Here will be discussed only the ANNs that follow NARX principle
because with that type are obtained the best and the worst results for the
prediction.
The variant with architecture 12 - 45 – 12 (inputs – hidden neurons –
outputs), where we use 12 neurons for every month order. The training
algorithm is Bayesian regulation back-propagation. The number of delays
is 3 and the number of iterations is 26 for all epochs in all simulations. The
data are organized in matrices. With this variant the best value for
prediction is obtained. The average percentage error is 0.0078. The second
variant from this type has different data organization. In this case the data
are vector organized. The number of delays is 36 and this is the same as in
the previous variant where we have 3 delays, because here we have vector
data organization and the delays are 12 x 3 (from one row). Is expected to
get similar results, because it is used the same code, which is means the
same training algorithm, performance function, number of epochs, data
296

Intelligence approach in improving business processes
division and other characteristics of network. It is important to be
emphasized that – in modeling of NARX neural network for prediction the
data organization is very important and have big influence. The number of
hidden neurons should not be bigger than 45 for this variant because with
trials and errors we show that with increasing of the number of neurons
increase and the probability for over-fitting. In order to avoid an
occurrence of this phenomenon in ANNs we make limitation for the
number of delays. For example, with 60 neurons in the hidden layer in the
network we have over-fitting and the network is not able to make good
forecasting. The third variant is specific because in the coding we have
two different configurations: open loop and close loop. The combination
of those configurations creates the possibility of predicting of the network
one step ahead. Unlike previous approaches, where the last field is filled
with Not a Number (NaN), this variant works with the data without having
to “reserve” place for the next order. This ability separates the ANNs of
other tools for predicting. Also here we have vector data organization and
the optimal network architecture is 1-20-1 with 56 delays. The training
algorithm is Levenberg – Marquardt. The performance function is MSE
(Mean Squared Error).
Also have to be noted that, for good profitable strategy should be
developed predictive models not only for the sale but for more processes
and/or functions of the enterprise, such as predictive model for electricity
demand, electricity price, taxes, prices of raw materials and so on. This
include complete data mining and analyzing that could improve decision
making process in the business.
4. Conclusion
Improving business processes is the most challenging task that have to be
solved in order to increase the profit of the enterprise. Business
intelligence, as a key concept for success, may be considered from many
aspects. One of the aspects data mining and analytics, realized by artificial
neural networks, allows reducing the unpredictability of system behavior.
Since the obtained results show big accuracy in prediction of the product
sale, the proposed intelligent approach give good framework for
optimization of the processes in the production systems. We can conclude
that ANNs have proven to be excellent tools in developing solid predictive
models.
297

Ljubinka Sandjakoska, Daniela Koteska Lozanoska
5. References
1. Chaudhuri, S., Dayal, U., Narasayya, V.: An Overview of Business Intelligence
Technology. Communication of the ACM, Vol. 54, No. 8 (2011).
2. Negash, S.: Business Intelligence. Communications of the Association for Information
Systems, Vol.13, 177-195 (2004) .
3. Cody, V.F., Kreulen, J.T., Krishna, V., Spangler, W.S: The Integration of Business
Intelligence and Knowledge Management. IBM System Journal, Vol. 41, No. 4, 697-713.
(2002)
4. Kuo, R.J., Chenb, C.H., Hwang, Y.C.: An Intelligent Stock Trading Decision Support
System Through Integration of Genetic Algorithm Based Fuzzy Neural Network and
Artificial Neural Network. Fuzzy Sets and Systems 118, 21–45. (2001)
5. Chattopadhyay, M., Dan P. K., Majumdar, S., Chakraborty, P. S.: Application Of
Artificial Neural Network In Market Segmentation: A Review On Recent Trends.
https://arxiv.org/ftp/arxiv/papers/1202/1202.2445.pdf
6. Byan, X., Li Y.J: Customer Segmentation based on Neural Network with Clustering
Technique. Proceedings of the 5th WSEAS International Conference on Artificial
Intelligence, Knowledge Engineering and Data Bases, Madrid, Spain. 265-268 (2006)
7. Petroulakis, N., Miaoudakis, A.: An Application of Neural Networks in Market
Segmentation. PanHellenic Conference in New Technologies and Marketing. 185-190
(2007)
8. Bloom, J. Z.: Market Segmentation: A Neural Network Application. Annals of Tourism
Research, Vol. 32, No. 1, 93–111. (2005) doi:10.1016/j.annals.2004.05.001
9. Thawornwong, S., Enke, D.: Forecasting Stock Returns with Artificial Neural Networks.
Neural Networks in Business Forecasting, edited by G. Peter Zhang, 47-79. (2004) doi:
10.4018/978-1-59140-176-6.ch003
10. Parsons, L.J., Dixit, A.: Using Artificial Neural Networks to Forecast Market Response.
Neural Networks in Business Forecasting, edited by G. Peter Zhang, 23-46. (2004) doi:
10.4018/978-1-59140-176-6.ch002
11. White, H.: Learning in neural networks: A statistical perspective. Neural
Computation,Vol. 4, 425-464. (1989).
12. DARPA Neural Network Study, AFCEA International Press, 60, (1988)
13. Haykin, S.: Neural Networks: A Comprehensive Foundation, NY: Macmillan, 2. (1994)
14. Hopfield, J.J. “Neural Networks and Physical Systems with Emergent Collective
Computational Abilities”, Proceedings of the Nationul Academy of Science, Vol. 79,
2554-2558. (1982)
15. Li, E. Y.: Artificial neural networks and their business applications. Information &
Management 27, 303-313. (1994)
298

International Conference on Applied Internet and
Information Technologies, 2016
DOI:10.20544/AIIT2016.37
A mobile application for ECG detection and feature
extraction
Aleksandar Stojmenski1, Marjan Gusev1, and Ivan Chorbev1
1 Faculty of Computer Science and Engineering, Rugjer Boskovikj 16
1000 Skopje, Macedonia
aleksandar.stojmenski, marjan.gushev, [email protected]
Abstract. This paper presents a system for early detection and alerting of the onset
of a heart attack. The system consists of a wireless, easy wearable and mobile ECG
biosensor, a cloud based data center, smartphone and web application. A significant
part in the system is the 24h health monitoring and care provided by expert cardiac
physicians. The system predicts potential heart attack and sends risk alerts to the
medical experts for assessment. If a potential heart attack risk exists, ambulance is
being called with the coordinates of the cardiac patient wearing the sensor. The
timely reaction can prevent serious tissue damage or even death to the users of the
system.
Keywords: electrocardiogram, sensors, cloud, Internet of things, medical
application, heart monitoring
1. Introduction
It is scientifically proved that certain types of heart attacks can be detected up to two
hours before the heart attack takes place [1]. Traditional ECG tests are done in a special
medical institution with the proper equipment and with professional medical personnel
who will read the results and look for patterns and problems with the activity of the
patient’s heart. Recently, with the advent of new advanced portable and wireless
technologies, the medical institution need not be the only place where ECG tests are
conducted [2]. With the advancements these technologies, we are able to detect the risk
of heart attack occurrence, and with a timely medical attention potentially reduce the
number of heart attacks and their impact to the patients at a global level.
This paper presents a proof-of-concept system for analysis of heart operation and heart
attack detection using ECG (Electrocardiogram) sensor.
The wireless ECG sensors that are used in the presented system architecture are easy
to wear on the human body, they do not cause any discomfort and can be worn at all
times, wherever the patient goes.
The organization of the paper is as follows. The background is presented in Section 2.
Section 3 describes the system architecture. Related work is discussed in Section 4 and
finally, the conclusions are given in Section 5.
299

Stojmenski et al.
2. Background work
Traditionally heart operation analysis is performed in the hospital or clinic where the
patient is lying and sophisticated immobile medical equipment is being used for a
Electrocardiography scan. This limits the ability for obtaining ECG data since the patient
must be physically present in a medical institution.
Several improvements for this problem are provided. Some of them are data recorders
such as Holter[1] or Cardionet[2]. These improvements use a lot of loose cables that are
attached to the body in order to connect the device to multiple ECG electrodes.
In the research communities, IoT (Internet of Things) has been defined from various
different perspectives and hence numerous definitions for IoT exist. The system that is
presented in this paper is based on the IoT paradigm and presents a significant
improvement of those problems since it uses only two electrodes for ECG scanning and
utilizes cloud technology for real-time online analysis and diagnosis.
The main reason for the vagueness of the IoT term is the fact that it is composed of
two distinct terms – Internet and things. Those two terms are distinct as the first one refers
to the network oriented vision of the IoT and the second one tends to focus on different
objects in our surrounding that should operate together in a common framework [3].
Recent publications shows that IoT is moving towards cloud of things [4], which is why
we decided to build a cloud based system.
3. System architecture
This system consists of two parts: a mobile application and a web application in the cloud.
The mobile application aims to:
communicate with the ECG sensor worn on a patient’s body,
monitor the patient’s ECG scans,
alert on abnormal heart function.
The cloud web application is used to:
manage the information for all patients,
analyze the received signals,
alert on abnormal heart function,
monitor the ECGs.
The mobile application communicates with the ECG sensor via Bluetooth (eventually
Ultrasound or other communication technology). It will also communicate to the
accelerator, GPS sensor or other data stored on the mobile phone. Further on, it
communicates via WiFi or 3G/4G mobile operator network to the cloud server. As an
alternative the mobile phone can communicate to the local computer (laptop or desktop
computer) connected by an appropriate cable.
Since this is a data-centric product it will need somewhere to store the data. Both the
mobile application and cloud web application will communicate with the database,
however in slightly different ways. All of the database communication will go over the
Internet.
Data is stored in the mobile phone in a limited capacity dependent on the available
phone’s memory. Data files are also stored in the cloud server and can be a subject for
various analyses.
300

A mobile application for ECG detection and feature extraction
The patient can monitor and access the data on the phone received directly from the
sensor. Another user role that can monitor the ECG of a patient and receive alerts for
abnormal heart functions the caregiver. The caregiver can access the cloud and retrieve
data files representing the patient’s ECGs. The doctor can use a web application to
retrieve patient’s ECGs.
Whenever detected, the alerts are sent to the patient and the caregiver. When the doctor
receives an alert, he/she is able to make a proper diagnosis and specify an EHR
(Electronic Health Record), which can be overviewed by the patient or the caregiver.
The workflow starts with the cardiac patient that attaches the ECG sensor to the chest.
The sensor sends information to a smartphone using low energy Bluetooth 4.0 technology
and specific data transfer protocols. Afterwards authorized users can log in into the web
application for status reports and history of the patients. Authorized users consist of
medical personnel (this personnel can give diagnosis based on an ECG and monitor alerts
for their validity) and caregivers (this users could only view the ECG history and
diagnosis given from the medical personnel for a particular patient). This process is
shown on Figure 1.
Fig. 1. Workflow of the ECGalert system
3.1. Sensors
The ECG biosensor used in our proof of concept is Savvy. It is fixed on two standard
ECG electrodes that are waterproof and can be easy attached/detached to the body of the
users. The sensor is small and lightweight with dimensions of 7x2cm and weight of only
3 grams. On Figure 2, the Savvy ECG biosensor is shown along with a two-euro coin for
size compartment.
301

Stojmenski et al.
Fig. 2. Savvy Ecg BioSensor
3.2. Web application
The cloud based web application helps users to detect the onset of a heart attack, using
sophisticated, intelligent algorithms that analyze ECG data. The ECG data sent to the
cloud servers is analyzed and stored on the server, where registered doctors have
permission to check it. If potential risk of a heart attack is detected, the patient, doctor
and caregivers are alerted. Data is received, analyzed and processed prior to storing. The
main database keeps information about all users and realizes authentication, authorization
and alerting.
The main function of the web application is to enable heart condition monitoring by
analyzing ECG data. This function is authorized to doctors, patients and their caregivers.
They can monitor and access the cloud and retrieve data files representing the patient’s
ECGs. If the doctor receives an alert for abnormal heart operation, he/she is able to make
a proper diagnosis and specify an EHR (Electronic Health Record), which can be
overviewed by the patient or the caregiver on the web application.
A sample patient ECG scan on the web application interface is shown in Figure 3,
when a doctor is the authenticated user, according to [5]. The diagnosis of the current
scan is provided on the current display of the web application, under the actual ECG
visualization. The doctor can also view all the patients in this application, view the history
of ECG scans and diagnosis for a specific patient using the electronic health record.
302

A mobile application for ECG detection and feature extraction
Fig. 3. Web application interface
3.3. Mobile application
The mobile application receives streaming data from the sensor, which is captured and
saved as files 30 sec. Those files are stored locally on the device for history view and sent
to the server for analysis. The Bluetooth connection to the sensor provides 126 samples
per second, and each sample is 10 bits. A sample file of 5130 bytes is packed for a 30 sec
ECG recording. If abnormal function detected, an alert file is saved for the detected
problem. A listing of alert files is always updated on the mobile phone. Each alert file
should be accompanied by an EHR (Electronic Health Record). A doctor forms an EHR
after examination of the alert ECG file. Additionally, the doctor sets diagnosis and
eventually modifies the therapy or recommends a more thorough examination.
In case of a persistent Internet connection, each ECG file is sent to the cloud. However,
the patient user can set an Internet saver mode. In Internet saver mode, the system sends
only files on a given period, for example, 1 file per 1, 5, 10 or 60 minutes. Alert files are
always sent! If there is no Internet connection, then files are sent when Internet connection
is possible. Alert files are sent first, then one file per hour is sent from the normal heart
function files. Files can be kept in the mobile hone’s memory up to 2 months, depending
on available memory capacity. In case of keeping the files for last 60 days, the required
phone memory is 1.6GB.
Figure 4 presents two screens of the mobile application. The first screen shows the
current ECG measurement along with the information for the connected sensor and the
connected cloud network for ECG analysis. The second screen shows the screen for
examination of a particular ECG in the phone history. The ECG scan contains the average
bpm and hrv, the diagnosis and anamnesis for that scan, the prescribed therapy if it exists
and some additional notes that can be added from the medical personnel or the user.
303

Stojmenski et al.
Fig. 4. Mobile ECG application
The history part of the mobile application enables to view recorded ECG files with
alert info and corresponding note. Filters for daily, monthly and yearly view are provided
and the alert files are first on the list. The mobile application sends a compressed ECG
file to the file server (streaming unit) in order to keep the data transfer as low as possible.
Each ECG file represents samples within a 30 second interval.
4. Related work
A medical cloud is a cloud that offers health care oriented services to the customers and
mainly is working with EHRs. Tasic et al. [6] present a design of a cloud. For the purpose
of this project, we have adapted this idea for the use of ECG signals.
Prior to storing, data is processed via band pass filters to eliminate the noise from
electricity (50Hz) or the noise initiated by a physical movement or breathing. An example
of an efficient implementation of an algorithm using a wavelet transformation is presented
by Milchevski and Gusev [7]. A way to speedup the flitering processing is also
demonstrated by a Maxeler dataflow engine [8].
Recently, few researchers work towards a wearable wireless, mobile, and remote ECG
biosensor that is going to monitor heart rate and display. All of them differ to our work
in few crucial aspects.
304

A mobile application for ECG detection and feature extraction
For instance, the sensor Shimmer3 ECG [9] provides a continuous recording of vital
signs, but does not analyze the data and has no mechanisms for early warning.
Similarly, NeuroSky [10] provides a recording of vital signs but is more intended for
conducting stress tests in hospitals.
QardioCore [11] is a multi-sensor platform that besides ECG, measures body
temperature, the level of activity, and other vital signs, and thus presents a more complete
picture of the patient’s health. Nonetheless, the data is only presented, and not processed
at all.
Philips health applications [12] also introduced a sensor in the form of a replaceable
patch where the battery lasts for up to 14 days and sends data to clinical software, where
medical professionals set a diagnosis and therapy. While this is a good starting point, no
warning in case of emergencies is offered.
One such comprehensive study [13] examined 120 different ECG biosensors from
several aspects. The authors conclude that this area is a hot research topic, and that
innovative, applicative solutions may seize a unique market chance.
Worldwide, there is no published work that organizes a 24h remote medical care based
on remote sensing and early alerting. Usually, they function by telephone or by physical
presence. The end-user benefit is the reduced mortality rate due to early alerting of
potential heart attack, and prolonged patient life. The benefit of the medical experts that
will actively participate is in the possibility to react faster and be more successful in the
treatment of the patients. Also, potentially large data knowledge databases are going to
be generated from the everyday system operating and the diagnosis that can help doctors
in their process of diagnosis using similar scenarios.
5. Conclusion
This paper presents a proof-of-the-concept of a system for early alerting of a heart attack.
The prototype built is being tested and the EU is testing the sensor for a certification.
The main diference to other similar systems is in the intended use. While the others
think about replacing the existing Holter procedures and system with a lot of wires
attached to a human body, our system is moving a step forward, with several benefits:
It is intended for a constant 24h monitoring of a patient.
The sensor is easy to wear, as a sticker with two electrodes attached to a human
body.
An alert is generated whenever an abnormal heart function is detected, so a
medical expert can provide a medical healthcare and prevent serious
consequences.
Although a prototype is built, still this is a kind of a work in progress, since it allows
a lot of research opportunities to estimate the current heath condition, or to evaluate the
influence of other factors on heart function.
305

Stojmenski et al.
References
1. Laguna, P., Thakor, N.V., Caminal, P., Jane, R., Yoon, H.R., Bayés de Luna, A., Marti, V. and
Guindo, J., 1990. New algorithm for QT interval analysis in 24-hour Holter ECG: performance
and applications. Medical and Biological Engineering and Computing, Vol. 28, No.1, 67-73
(1990).
2. Karlstädt, A., Fliegner, D., Kararigas, G., Ruderisch, H.S., Regitz-Zagrosek, V. and
Holzhütter, H.G.: CardioNet: a human metabolic network suited for the study of
cardiomyocyte metabolism. BMC systems biology, Vol. 6, No.1, p.114. (2012)
3. Parwekar, P.: From Internet of Things towards cloud of things. In Computer and
Communication Technology (ICCCT), 2011 2nd IEEE International Conference on, 329-333.
(2011)
4. L. Atzori, A. Lera, and G. Morabito.: The Internet of Things: A Survey. Computer Networks
Vol. 54, No.15, 2787-2805. (2010).
5. Ristovski, A., Guseva, A., Gusev, M. and Ristov, S.: Visualization in the ECG QRS Detection
Algorithms, In Information & Communication Technology Electronics & Microelectronics
(MIPRO), 39th IEEE International Convention on, in press, (2016).
6. Tasic, J., Gusev, M. and Ristov, S.: A Medical Cloud, In Information & Communication
Technology Electronics & Microelectronics (MIPRO), 39th IEEE International Convention
on, in press, (2016).
7. Milchevski, A. and Gusev, M.: Improved pipelined Wavelet implementation for filtering ECG
signals, Pattern recognition letters, in press, (2016).
8. Domazet, E., Gusev, M. and Ristov, S.: Dataflow DSP filter for ECG signals, 13th Conference
on Informatics and Information Technologies, (CiiT), in press, (2016).
9. Burns, A., Greene, B.R., McGrath, M.J., O'Shea, T.J., Kuris, B., Ayer, S.M., Stroiescu, F. and
Cionca, V.: SHIMMER™–A wireless sensor platform for noninvasive biomedical
research. Sensors Journal, IEEE, Vol. 10, No.9,1527-1534. (2010)
10. NeuroSky, Inc. (2016). [Online]. Available: http://neurosky.com/ (as seen on May 2016)
11. QardioCore, (2016). [Online]. Available: https://www.getqardio.com/qardiocore-wearable-
ecg-ekg-monitor-iphone/ (as seen on May 2016)
12. Ackermans, P.A., Solosko, T.A., Spencer, E.C., Gehman, S.E., Nammi, K., Engel, J. and
Russell, J.K.: A user-friendly integrated monitor-adhesive patch for long-term ambulatory
electrocardiogram monitoring. Journal of electrocardiology, Vol. 45, No. 2,148-153. (2012)
13. Baig, M.M., Gholamhosseini, H. and Connolly, M.J.: A comprehensive survey of wearable
and wireless ECG monitoring systems for older adults. Medical & biological engineering &
computing, Vol. 51, No.5, pp.485-495. (2013)
306

International Conference on Applied Internet and Information
Technologies, 2016
DOI:10.20544/AIIT2016.38
Modeling and Implementation of Bus Rapid Transit
corridor based on Traffic Prioritization and Automatic
Location
Ioannis Patias, and Vasil Georgiev
Faculty of Mathematics and Informatics
University of Sofia St.Kliment Ohridski“
5 James Bourchier blvd., 1164, Sofia, Bulgaria
Abstract. In many cities facts defining conditions for very high concentration of
functions and population make transport difficult. The proposed solution is an
Automated Vehicle Location (AVL) and prioritization system for mass urban
transport buses, and priority vehicles, through a Bus Rapid Transit (BRT) corridor.
The solution consists of a detection sub-system, with a bus component, using
transmitter, and a receiver placed on the traffic lights, the traffic lights, and a control
center. We aim in minimizing the waiting time on traffic lights, and thus the waste
of time on traveling. Such system is a useful instrument for any mass urban
transport system.
Keywords: Intelligent Transport System (ITS), Automated Vehicle Location
(AVL), Traffic Prioritization, Bus Rapid Transit (BRT).
1. Introduction
The term Intelligent Transport Systems (ITS) refers to a wide range of applications. The
most basic ones include simple traffic signal control and management systems, automatic
number plate recognition with speed cameras, security CCTV systems. The more
advanced applications can integrate real-time traffic and vehicle data and can regulate the
traffic in real-time with using such historical data.
Although ITS may refer to all modes of transport, EU Directive 2010/40/EU [1] (7 July
2010) defines ITS as systems in which information and communication technologies are
applied in the field of road transport, including infrastructure, vehicles and users, and in
traffic management and mobility management, as well as for interfaces with other modes
of transport. ITSs are important in increasing safety and also manage Europe's growing
emission and congestion problems. They make transport safer, more efficient and more
sustainable.
307

Ioannis Patias and Vasil Georgiev
On the other side in other countries, like the United States, the increased interest in the
area of ITSs is rather motivated by an increasing focus on homeland security. Many of
the proposed ITS systems also involve surveillance of the roadways, which is a priority
of homeland security [2, 3].
When talking about ITS, there is e a wide range of technologies applied [4]. Those
technologies include: data processing, management and archiving, detection,
communication, information dissemination, location referencing and positioning, traffic
control and vehicle control, electronic payment, and surveillance and enforcement
technologies.
Bus Prioritization System (BPS) or Transit Signal Priority (TSP) is an ITS aiming to
reduce the time waist on traffic lights for Mass Urban Public Transport vehicles. Although
are most often related with buses, they also are applied in trams, rails, etc., and any kind
of priority vehicles. In terms of technologies BPS involve traffic control, and detection
technologies.
There are two categories of BPS. The so-called active BPS is a system based on detecting
Mass Urban Public Transport vehicles as they approach the traffic light and adjusting the
traffic light’s timing dynamically, and thus create “green wave”, meaning uninterrupted
traffic along the bus line route. It is important to mention here that implemented this way
the system can also be used for the emergency vehicles, so from now on when we are
talking about buses we always mean also emergency vehicles. The most advanced active
BPS are based on AVL, and real-time Estimated Time of Arrival (ETA) calculation.
Passive BPS called those systems, which are built with specialized hardware and try to
optimize the traffic lights timing by using historical data, and this effect applies to all
vehicles along a route.
2. Literature Review
The term Ubiquitous Computing [5] is used to express the idea of a post-desktop model
of human-computer interaction, where we have integration of information processing into
everyday objects and activities. In many cases the end-user uses more than one distributed
systems and devices even simultaneously, without even being aware of their existence.
The implementation of this concept is not that easy. But the overall dividend is great. Our
life would be quite easier if all objects in the world surrounding us get equipped with
identifying devices.
The most widely used identifying devices are the ones using Radio-Frequency
Identification (RFID). RFID tags, or electronic labels are used with objects to be
monitored or tracked. The technology can be applied to any object, animal, or people. We
can identify and track the objects by using radio waves or sensing signals. There are tags,
which can be tracked with range of tens or hundreds of meters. The syntax of RFID tags
contains two major parts at least. The first is storing and processing information integrated
308

Modeling and Implementation of Bus Rapid Transit corridor based on Traffic Prioritization and
Automatic Location
circuit, which is also modulating and demodulating a radio-frequency (RF) signal. The
second part consists of an antenna, used for receiving and transmitting the radio signals.
There are active, semi-active, and passive RFID tags. Tags can store up data and consist
of microchip, and antenna, and also battery for the cases of active and semi-passive tags.
All the components can be enclosed in plastic, or silicon. In general RFID tags help us in
our everyday activities, since they are not expensive, and at the same time they can apply
in almost any object.
The use of RFID enriches the options of systems used for giving priority to vehicles. The
concrete needs determine the most appropriate measures to be used. A feasibility study
should be implemented prior to the concrete measures to be used can be defined.
There are various ways of giving priority to buses, which could be broadly categorized as
[6]:
• physical measures,
• traffic signal priorities, and
• integrated measures.
Physical measures can include with and contra-flow lanes, bus only lanes or even streets.
Traffic signal priorities method’s typical example is the BPS. Integrated measures are
those, which combine traffic signal measures with physical measures. The latest is
applicable in cases where none of the first two systems alone is effective.
Focusing on the traffic signal priorities method, there are different systems
implementations. Those differentiations usually called traffic signal control systems and
strategies, and are categorized in:
• Isolated systems
In isolated systems the controlled by signal traffic light is located and operates
independently, this is why the term isolated traffic light is used. Traffic light’s signals can
also be linked to a Control Centre, but only for fault monitoring purposes, not for
management. Isolated system can further be divided into fixed time or vehicle actuated
(VA).
• Co-ordinated systems
Co-ordinated systems, are so called because they co-ordinate the operations at a traffic
light, with the operations at one or more neighboring traffic lights. All traffic lights have
to be connected to a centralized system implementing a Control Center system. Co-
ordinated under Control Center systems can be further divided into traffic responsive or
fixed time.
VA systems rely on detectors placed on traffic lights. When a bus approaches to the traffic
light, and once it is detected the traffic light performs the appropriate timing. A bus
approaching a traffic light with red light sends to the controller a demand for a green light.
The demand is then served by the controller, which can apply different timing cycles.
After serving any signals and with no more incoming ones, the controller will continue
the preprogrammed mode/s.
309

Ioannis Patias and Vasil Georgiev
The VA system can give priority both to buses, and any other special purpose and/or
emergency vehicle. Also the VA systems can serve different priority levels requests. This
means that special purpose vehicles can transmit a higher priority level “priority request”,
and thus be served with privilege.
3. System architecture
The proposed AVL and prioritization system for urban transport buses, through the BRT
corridor system architecture consists of the two major sub-systems, the vehicle, and the
traffic lights sub-system. The deployment diagrams of the two sub-systems are given in
the following figures:
Figure 1: Vehicle sub-system deployment diagram
Figure 2: Traffic lights sub-system deployment diagram
310

Modeling and Implementation of Bus Rapid Transit corridor based on Traffic Prioritization and
Automatic Location
4. System functionality
At each junction the phase selector is set and configured according to respective approach
points for that intersection. Meaning when the bus approaches the intersection (and
assuming that a request for priority is activated by the onboard AVL system), the
intersection tracks the progress of the vehicle. When the bus reaches the predefined
distance to the intersection or the respective ETA time limit, the request is activated.
The respective priority signals are transmitted further, and the AVL system will activate
the application to ensuring priority. The request for priority is processed only if it is made
within the "virtual sensor" – a so-called area, the boundaries of which are determined by
the sensors positioning, defining the location of the intersection and the approaches to
them. Such geo-fencing may be of any shape or combination of shapes (e.g., square,
rectangle, a series of rectangles, etc.).
Using such software setup and phase selector configuration, the system makes the
approach zones corresponding to an intersection. Thus, suitable zones act based on
sensors, and they are used by the system to trigger a request for priority. And finally the
system allows the use of conditions, when requesting priority based on distance and / or
time.
When the bus is moving towards an intersection and the request for priority by AVL, its
location and ETA are calculated once per second. This additional functionality of using
the ETA as a variable for the operation, allows the system to take into consideration any
variations in the speed of the bus and to provide an effective extension of the green phase
or early termination of the red phase.
When the bus reaches a certain point approaching the intersection, static trigger point is
an optimal solution only if the buses are approaching the intersection with predefined
unchanging speed. Busses, that are faster than the average buses will need to point the
trigger further back from the intersection to ensure that the green phase is available and
the priority request has been overlooked. But, busses slower than the average bus will
have to trigger a request at a point closer to the intersection to avoid the use of more than
the optimum amount of the green phase and its extension. Thus, the system allows the
use of either pure distance from the intersection or a combination of distance/ETA of the
priority activation. Reaching that either a certain place or at some point a priority request
will be triggered. As a point of activation it can be set to a certain distance or a certain
period of time - whichever comes first. Meaning it is possible to make a combination of
the two activation criteria.
Converting the requests for priority in to data to the controller:
The phase selector, which is located at the intersections, is associated with the controller
supporting digital inputs with discrete signal wires. When a request for priority
intersection is approved, a request is transferred by any of the outputs of the phase selector
to the controller, by activating one of the electrical input controllers, each of which
corresponds to the direction of priority. This system allows the user to activate different
311

Ioannis Patias and Vasil Georgiev
traffic phases like straight, left, or right, depending on the current need. The signal to the
controller can be a constant low voltage to activate the highest priority, or pulsatile low
voltage to activate the low priority depending on the desired system performance. The
controller will recognize this signal as a priority for the phase and adjust the timing of
signals as programmed.
Assuring priority:
Each controller must be configured to provide priority, as follows:
Option 1. Prolongation of priority: Upon receiving the request for priority (through an
external input) and the priority phase/stage is a green signal in the direction of the bus,
then the green signal is extended to the set maximum time for priority (in addition to the
normal green time).
Option 2. Change Priority: Upon receiving the request for priority and priority
phase/stage is red, then the current phase is terminated prematurely but not suddenly with
the minimum values as assured safety limits and the following phases, which are also
reduced to the minimum required in order to proceed to the next cycle to reach the next
green phase/stage where the green signal will be extended in the direction of the bus.
Upon receiving of a request for priority during the yellow signal and when the next phase
is green, it will be the first option that will be used to proceed. And upon receiving of a
request for priority during the yellow signal and the next phase is red, then it will be the
second option that will be used to proceed.
5. Conclusions
The Automated Vehicle Location (AVL) and prioritization system for mass urban
transport buses, and priority vehicles, through the Bus Rapid Transit (BRT) corridor can
help both passengers and the mass urban transport authorities. Implemented in accordance
with the applied standards, it can minimize the waiting time on traffic lights, and thus the
waste of time on traveling, increasing this way the capacity of urban transport systems.
By increasing the passengers’ satisfaction, the number of passengers increases on public
transport together with the market share of public transport.
References
[1] DIRECTIVE 2010/40/EU OF THE EUROPEAN PARLIAMENT AND OF THE COUNCIL
http://eur-lex.europa.eu/LexUriServ/LexUriServ.do?uri=OJ:L:2010:207:0001:0013:EN:PDF
[2] Torin Monahan, “WAR ROOMS” OF THE STREET: SURVEILLANCE PRACTICES IN
TRANSPORTATION CONTROL CENTERS, http://publicsurveillance.com/papers/
war_rooms.pdf, The Communication Review, 10: 367–389, 2007
[3] United States Department of Transportation, Intelligent Transportation System Strategic Plan
2015-2019. (http://www.its.dot.gov/landing/ strategicplan2015.htm)
312

Modeling and Implementation of Bus Rapid Transit corridor based on Traffic Prioritization and
Automatic Location
[4] ROAD NETWORK OPERATIONS & INTELLIGENT TRANSPORT SYSTEMS http://rno-
its.piarc.org/en
[5] Kai Hwang, Geoffrey C. Fox, and Jack J. Dongarra, “Distributed and Cloud Computing From
Parallel Processing to the Internet of Things”, 2012 Elsevier.
[6] UK Department for Transport, Keeping Buses Moving. A Guide to Traffic Management to
Assist Buses in Urban Areas. (https://www.gov.uk/government/uploads/system/uploads/
attachment_data/file/329973/ltn-1-97__Keeping-buses-moving.pdf).
313

International Conference on Applied Internet and
Information Technologies, 2016
DOI:10.20544/AIIT2016.39
Model for integrating Six Sigma in
Manufacturing Execution System in industrial production
environment
Goran Tasevski1, Marjan Tomovski2
1 Technical Faculty Bitola, Ivo Lola Ribar bb., 7000 Bitola, Macedonia
[email protected] / [email protected] 2 Faculty of Electrical Engineering and Information Technology, Rugjer
Boshkovik bb,
1000 Skopje, Macedonia
Abstract. Manufacturing and assembly organizations today and strategically in the
following years will put main focus and investment on the implementation of
optimization tasks and traceability systems, to be able to trace the path for
development, strength and maintenance of quality. Six Sigma is a methodology
consisting of defined phases in which main parts are statistical tools and methods.
It is a management and metrical methodology, with main target to visualize and
eliminate variations in the process and keeping the process in required control
limits. Information systems such as MES – Manufacturing Execution Systems
provides the opportunities for identify and monitor this variations available in the
processes. Merging this two systems gives opportunities for increased effectiveness
and efficiency during the processing and achieving increasing customer
expectations.
Keywords: information technology, manufacturing, quality, MES, Six Sigma,
1. Introduction
In the modern business world, competitiveness of products and services offered in the market are
essential for the survival, growth and development of companies. Because of this, companies that
compete in the market are searching for the effective and efficient way to produce as much as
possible better quality product or service at a lower production cost. Also, the globalization of the
economy and the factors that goes together with this modern phenomenon, as increased efficiency
in production, shortening the time needed for one production cycle, ensuring and guaranteeing high
quality, steadily increase the pressure on the manufacturing business (Heiko Meyer, Franz Fusch,
Klaus Thiel, 2009).
Because future improvements in rival products will be based primarily on strategies that will offer
added value to customers such as high flexibility, shorter time to production, short delivery time,
high reliability of delivery, a wide range of varieties, shorter life cycle of manufacturing products
etc. If the recognition of these improvements can be seen that the improvements are not part of
improving production but part of the process improvement. (Kletti str.1-2).
314

Goran Tasevski, Marjan Tomovski
2. Six Sigma – Evolution of quality
Six Sigma methodological approach is an evolution of quality. The first reaction when we mention
Six Sigma methodology is that it is complex and modern methodology. But the facts as previously
mentioned, has shown that this methodology is part of the evolution of the system for total quality
management. In his work (De Mast 2006) explains that this methodology is currently in the
development stage where methods and tools are evaluating to improve the quality and efficiency of
processes. This methodology is a set of principles, stages and statistical tools. The development of
Six Sigma methodology begins in late eighties of the last century by the company Motorola. In that
period the company struggled for survival, especially the main cause of the crises was no possibility
to achieve the quality required by customers due the complex products the company produced.
After the development and creation of the concept and its application to Motorola, this methodology
is becoming very popular, so in the mid-nineties and has been adopted and used by "General
Electric" company. Finally the two companies consider Six Sigma as a part of their strategic policy.
Starting from then, Six Sigma has become one of the most popular global methodologies applicable
in various spheres of industrial production, and in other activities of business and work.
Since the middle nineties until today Six Sigma goes through a number of changes and develop at
a higher level (Folaron, Morgan, 2003). If at the beginning it was a concept for solving quality
problems based on statistical principles, the next level was a transformation technique for process
improvement (i.e. reducing variations in the system through their monitoring and resolution using
a number of statistical techniques). According to Harry (1999), Six Sigma is defined as a disciplined
method that is based on accurate data collection, their statistical analysis in order to identify the
source of the problem and take corrective actions to eliminate it.
In its final phase, in a modern industrial production today, this methodology is recognized as a
strategy for continuous improvement. Today this methodology is adopted in various sectors and
spheres besides the automotive industry such as finance, transactions, software, healthcare, military
industry, and aircraft industry and so on. In the last ten years number of organizations that have
shown interest in using Six Sigma as their management philosophy are increasing. However it is
important to note that one of the modern companies seek to implement this philosophy proper step
by step like Motorola and General Electric provides a solid strategic foundation for a longer period.
On the other hand there are those companies that wish to benefit from Six Sigma as a tool for
quickly achieving profit, which often lead to undesirable results, inadequate implementation and
improper use of statistical tools. This results in a number of projects that are not end-to-end and
certainly unable to profit in the long term.
3. Production structures - MESA case study
Manufacturing or production facilities, are a set of processes and systems (normal people), which
are designed to transform the (revised) certain materials in products that have increased value. The
three main building blocks, materials, processes and systems creates the basis of modern production
(Groover, p.7).
To achieve better production is not necessary to increase the demand for products that are produced
but also to standardize and improve the processes that are used in production. In parallel with
improvements in processing technology and reducing costs for materials and work, target is to
improve efficiency initially achieved by improving the structures of production and control
procedures. With achieving of these goals - improved movement and track the order through
production is gained. For these reasons there have been new approaches that meet the needs for
shorter execution of production processes and greater flexibility, particularly in terms of increasing
product variants (Kletti p.4).
315

Model for integrating Six Sigma in
Manufacturing Execution System in industrial production environment
Association for manufacturing solutions company MESA is the first organization to adopt this
concept and is an organization with the most experience when it comes to this kind of systems.
MESA access to this concept is very pragmatic and describes twelve functional groups that are
required to support effective management of production. These functional groups are:
1. Detailed Planning (Operations / detailed layouts),
2. Resource Management (allocation of resources and their status),
3. Registration and display the current status of resources,
4. Management of the documentation (document control),
5. Management materials (sending generating units),
6. Performance Analysis,
7. Order Management (management of labor),
8. Manage the maintenance in order to maintain and service,
9. Process management,
10. Management of quality,
11. Obtain and data collection,
12. Monitoring of the products and their origin
Figure 1. Functional structure model MESA (from Kletti, Manufacturing Execution System –
MES, page 19)
316

Goran Tasevski, Marjan Tomovski
4. Six Sigma and operations costs
According to Murphy (1998), most of the companies are working on three sigma level
and in most of them are making an effort to quantify the financial effect of the variability
of the sigma factor. According Klefso to reach a level equivalent to the operation Six
Sigma, it is the cost of poor quality to less than 1% of total sales, and the level of five
sigma cost of poor quality is 15% of total sales, and level three sigma cost of poor quality
is equal to 25-40% of total sales. (Six Sigma by Graeme Knowles). Costs in the company come for defective products are called "costs of poor quality." For
the first time these costs mentioned James Harrington in his book "Poor Quality Costs"
(1987). These costs include the costs that fill the gap between current and desired quality
of the product or process. These include repair costs, labor participating in the repair of defective materials,
resorting and made drawback of the product. These costs do not include the cost for
detection and prevention. The overall share of the cost of poor quality because it consists of:
- Labor costs which works on repairing defects,
- Costs of material that was used,
- The cost of additional services,
- The cost of lost opportunities:
1. Losses on sales (revenues),
2. Potential loss of market share,
3. Low level of service to customers,
Insufficiently clear picture of the costs for poor quality in an industrial system may
lead to the prevention of improvements for an extended period. Six Sigma
methodology directly estimated cost of poor quality based on the principle of
working project by project, providing a solid base for improvement and
achievement of goals set up as an organization target. Even the smallest
improvement in terms of prevention of defects provides significant benefit in terms
of reduction of costs they cause if they arise.
5. Model for integrating Six Sigma in MES systems in industrial
manufacturing (accent on Automotive Electronics Industry)
In the picture below you can recognize the processes that one MES system can offer:
317

Model for integrating Six Sigma in
Manufacturing Execution System in industrial production environment
Figure 2. MES processes that can be achieved
MES system, through built-in application programming interfaces (Application Program
Interface - API) that are integrated into process machines through MEC customers fully
covers all the processes that are essential for DMAIC phases of 6 Sigma methodology. In
the MES system, through the work plans system will be able to define the processes that
would be subject to improvement. Through standardized API functions that are
implemented separately on the machines along the processes that need to be improved,
they will gather the necessary records from the measurements of the machines and to
forward it to the MES system. This will be a centralized location for the collection and
processing of data. Further through 6 Sigma tools will be implemented in the MES system
can analyze data collected from individual machines that previously sent measurements.
Based on the analysis of the measurements MES system with 6 Sigma tools are
implemented in the MES system, we will be able to present the summarized data
processes to show bottlenecks in processes and propose directions in which the process
could be improved . The control of the entire cycle will also be monitored by the MES
system in order to avoid unwanted side effects such as:
1. Some of the products cannot be processed or tested to the appropriate workstation
defined by standard during the process,
2. Double or multiple processing of a product on the same station,
3. Bad performance measured values on the testing or a processing station,
4. Inadequate Setups of machinery and working posts,
5. Gaps in repair products, increased scrap and defect rate etc.
318

Goran Tasevski, Marjan Tomovski
Primarily in terms of monitoring capability of the processes in order to meet the
requirements and criteria for quality, defining capability factor Cpk is essential. This
section refers specifically to the testing of products in terms of functionality. All
measurable values obtained for each component of the product is transferred to the MES
system. The same, using the conversion results as variable values makes calculation Cpk
coefficient and defines the ability of the process – Capability. If this is applied for a longer
period of time, gives a clear picture of stability and level variations that occur within that
process.
Benefits:
- Reduction of the production cycle time,
- Reduce errors in processing orders,
- Reduction of time for working posts settings
- Reduce work in progress (WIP),
- Reducing the time for managing schedules,
- Reducing the time from initialization to completing of the products,
- Reduction of orders waiting time to be produced,
- Reducing transactions for stock,
- Reduce paperwork between shifts,
- Reducing the possibility of loss of technical documentation,
- Reduce the need for data entry,
- Reducing wastage of materials,
- Reduce procedural errors,
- Increase of production capacity (utilization of machines),
- Reducing the inventory of raw materials and finished products,
- Empowering employees,
- Reduce operating and other expenses,
- Improving quality (defects reduction),
- Centralized and real-time tracking , and to control of production,
- Beneficiaries of the planning process,
- Fast preparation of customer orders,
- Provides the flexibility to respond to customer demand,
5. Conclusion
Six Sigma is effective way to get a clear picture of the manufacturing process, with all
their variations, waste and constraints that appear. With this approach all weak side of the
process could be visualized, measured and directly faced to be optimized, in effective and
efficient way. Using statistical approach and measuring the process is the most precise
and accurate way to get a real status of the process. Their combination with appropriate
tools enables choosing right counteractions and making correct decision during the
everyday work. Six Sigma is methodology and set of tools that can enable a
319

Model for integrating Six Sigma in
Manufacturing Execution System in industrial production environment
manufacturing organization to improve performance systematically. For this type of
organizations to continue making breakthroughs and meet the expectation of their
stakeholders, they must master the skills to plan, control, and improve quality. MES
system by itself gives extended range of benefits that allows for production, as well as for
the organization, customers and suppliers evidence that the industry and the company will
be able to continuously improve and to compete. This enables to position themselves in
the competitive place in the business of interest and also to ensure the future of the
industry and the company. Through all the benefits offered by the use of MES systems
can reliably conclude that MES systems play a key role in improving production
processes and production, and it is heavily influenced by the improvement of the
company. Merging of MES system and Six Sigma methodology is an approach for integrating the
power of Six Sigma Tools and information technology to create the fastest rate of
improvement, maximize value, and increase customer satisfaction in manufacturing and
production plants.
References
1. George L. Michael, Combining Six Sigma Quality with Lean Production Speed, McGrawHill,
2002, 18-19, 5-6, 8.
2. Heiko Meyer, Franz Fusch, Klaus Thiel. Manufacturing Execution systems – Optimal Design,
Planning, and Deployment. McGrawHill. 2009.
3. Kletti, J: Manufacturing Execution Systems – MES. Springer. 2007.
4. Mikell P. Groover. Fundamentals of Modern Manufacturing – Materials, Processes, and
Systems. Third Edition. John Wiley & Sons, Inc. 2007.
5. Sokovic M, Pavletic D, Krulcic E, Six Sigma Process Improvements in automotive parts
production, Journal of Achievements in Materials and Manufacturing Engineering, Volume
19, Issue 1, Poland, November 2006
320

International Conference on Applied Internet and Information
Technologies, 2016
DOI:10.20544/AIIT2016.40
Development of the Infocommunication System for the
Intelligent Rail Transport System of Dangerous Goods in
Hungary
Daniel Tokody1, György Schuster2, Peter Holicza1
1 Doctoral School on Safety and Security Sciences, Óbuda University
1034 Budapest, Hungary
[email protected] 2 Instrument Technique and Automation Department Faculty of Electrical Engineering,
Óbuda University
1034 Budapest, Hungary
Abstract. Through the examples of recent accidents in Hungary and abroad, we
will reveal the possible reasons for the release of dangerous goods into the
environment, and, considering these accidents, we will draw conclusions for the
safety of rail transport of dangerous goods. While examining the situation of the
rail transport of dangerous goods in Hungary, we will present the fundamental
concepts and regulations of the transport of dangerous goods in Europe. Today
the system of the transport of dangerous goods greatly relies on manual recording
and identification methods. Our aim is to provide the ICT bases for tracking the
transport of such goods and monitoring their storage conditions, by making
suggestions for the development of a monitoring and tracking system to increase
the safety of the rail transport system, provide protection for the critical rail
infrastructure and ensure the safety of the transport of dangerous goods.
Keywords: ICT, transport of dangerous goods, railway safety, RID, accidents
1. Introduction - Incidents and examples of recent accidents in
Hungary and abroad
1.1. Problem statement
“In the EU-28 in 2013, 48 accidents occurred involving the transport of dangerous
goods. In 67 % of them there was a release of dangerous material. Austria reported the
highest number of accidents (23, 16 of which included the release of dangerous
material), followed by Lithuania (10, none of which included the release of dangerous
321

Daniel Tokody et al.
material).” [1] Throughout Europe, these accidents cause significant material damage
and an increased risk for society, therefore all efforts must be made to prevent such
accidents or to minimise the damage if such accident happens.
In Europe, according to Tokody et al. on the basis of Safety Database Report [2]
“77.2 % of railway accidents (2013, UIC) are caused by a third party (external reason),
and secondly, in 7.3 % of the cases, the human factor is responsible for these accidents
(2013, UIC) (internal reasons from the point of railway). According to the safety report
of the UIC, external reasons mean that the accident was caused by a third party, or by
the weather or the natural environment. These factors cause more than 80 % of the
accidents. In case of accidents caused by a third party, 47.1 % is the result of
unauthorised trespassing, while in 24.8 % of the cases the train hits a vehicle (this is
higher rate, 17.2 %) or a pedestrian (7.6%) in level crossings. Among the internal
reasons, the infrastructure, the rolling stock, the human factor (only the railway
personnel) and the users of the railway (passengers) are mentioned. Internal reasons are
responsible for approximately 20% of accidents. The highest rate is caused by the
human factor (7.3 %), then by the rolling stock (4 %), the users of the railway (3.9 %)
and finally the infrastructure (3.4 %).
From the above data it can be stated that 88.4 % of railway accidents are directly
caused by human activities (unauthorized trespassing, ignoring signposts, etc.). In 7.4
% of the cases, accidents are due to some technical (indirectly human) reasons, when
inadequate human activities cause the problem (problems in planning, implementation
or maintenance, etc.). The lowest rate (3.5 %) of accidents is caused by chance or vis
major events (weather and environmental conditions).
In our opinion, by reducing the human factor, the statistics of accidents can be
improved for the whole transport process. Our study does not discuss third-party
accidents, as this issue is addressed by transport safety experts. Our investigations focus
on the human resource operating the railway system and the technical part of the
railway system (infrastructure, rolling stock and safety equipment).” [3]
This problem also exists outside Europe. According to Erkut et al. about 36% of rail
incidents in the USA (in 2013) were caused by human error, 33% were due to the
failure of the storage or packaging material used for dangerous goods, and 30%
happened because of the accidents of vehicles, (the remaining number of incidents were
caused by other reasons) [4]
Our hypothesis is the following. The safety of the transport of dangerous goods
depends on human activity, the condition of the technical systems and the safety of
railway transport, as well as the quality and quantity of the transported material and the
appropriate way of its storage [5].
“Member States shall ensure that railway safety is generally maintained and, where
reasonably practicable, continuously improved, taking into consideration the
development of Community legislation and technical and scientific progress and giving
priority to the prevention of serious accidents.” [6]
1.2. Example of an accident abroad
In the following section, we will present several examples, and by examining these
incidents we will determine the way of making the rail transport of dangerous goods
322

Development of the Infocommunication System for the Intelligent Rail Transport System of Dangerous
Goods in Hungary
safer through the use of ICT. During our research we will try to find the possibilities of
increasing the safety of dangerous goods by using information systems, communication
and computer networks, embedded systems and robotics. So far, the accidents in the
transport of dangerous goods in Hungary have not been listed among the major events
in international records. Accident situations in Hungary may be assessed in comparison
with the following incident which happened abroad.
Recently, a very serious rail accident has taken place in a foreign country during the
transport of dangerous goods. On 27 December 2015, one of the freight trains of the
Queensland Rail Company consisting of 26 tank cars with a cargo of sulphuric acid was
derailed at Julia Creek (Australia). The estimated amount of the transported sulphuric
acid was between 200 000 and 820 000 litres. Two days after the accident, local
authorities talked to ABC News about the release of 310 000 litres of dangerous
substances into the environment.[7] [8]
In case of such an accident, besides the release of the transported goods, the diesel used
by the rail locomotive can also escape into the environment. In many cases, the
damaged train set creates a hazard of fire and explosion, and the release of dangerous
substances could cause serious harm to the environment. If the accident happens in an
inhabited area, it can have unpredictable consequences for the population.
Fig. 1. 27.12.2015 Julia Creek, Australia [7] [8]
1.3. Examples of accidents in Hungary
On 02.04.2015, during the setting up of a train set at the marshalling yard of
Miskolc, and during the switching the points of railroad switch a tank car filled with
liquefied isobutene (UN 1969) was derailed and turned over to its side on the rail brake
while hump shunting. The derailed car collided with two empty cars while shunting,
and the rolling cars also derailed. The tank car was not damaged to such extent that
could have caused the release of dangerous substances into the environment. [9]
On.03.12.2013, at the marshalling yard of Eperjeske and Fényeslitke-Déli, dangerous
substance leaked into the environment from the tank cars filled with liquefied
hydrocarbon gas mixture (UN 1965). [9]
323

Daniel Tokody et al.
Fig. 2. The overturned tank car filled with liquefied isobutene at the marshalling yard of Miskolc
[9]
On 03.12.2013 and 04.12.2013, at the station of Kelebia, dangerous substance
escaped from the internationally used tank cars filled with hydrocarbon gas mixture
(UN 1965) as a result of untight sealing. The vehicle was returned from the station of
the Serbian town Szabadka for repair. [9]
On 16.10.2013, at the station of Almásfüzitő-felső, dangerous substance leaked from
a Slovakian tank car filled with hydrocarbon gas mixture (UN 1965), and the main
railway line no. 1 was closed from traffic for one hour. As the leakage (dripping of the
liquefied substance) could not be stopped at the station, the tank car was forwarded for
offloading and service at a restricted speed with interrupted power supply. [9]
On 12.05.2012, between Máriabesnyő and Bag, six tank cars of a freight train
derailed and overturned. The railway track, the overhead contact line system and the
vehicles suffered serious material damage (approx. 200 million HUF). The accident was
caused by the fault of the track and the inattention of the driver failing to observe the
speed restrictions and exceeding the speed limit. Other irregularities also played a part
in the accident. Besides the six tank cars, a tank car filled with sulphuric acid was also
added to the train, but luckily, it did not derail. [9]
Fig. 3. The tank cars at Mariabesnyő [9] [10]
Besides high-capacity heavy train sets, high running speed and the technical
condition of the vehicles and the tracks can also affect the safety of freight transport. In
324

Development of the Infocommunication System for the Intelligent Rail Transport System of Dangerous
Goods in Hungary
many cases, however, it is the cumulative effect of many factors, the fault of a number
of responsible persons, as well as long-existing technical problems, which can lead to
an accident causing significant damage. Such a case has been presented through a
foreign example, where a large amount of dangerous substance escaped into the
environment. Considering the circumstances in Hungary, sadly, it can be said that only
luck has prevented the happening of accidents with more tragic consequences.
Other examples of accidents in Hungary which are not related to freight transport,
but which resulted in the release of dangerous substances into the environment:
On 20.11.2014, between the stations of Révfülöp and Badacsonytomaj, a Bz
multiple-unit train hit a wild boar, and 700 litres of gas oil (UN 1202) escaped from the
fuel tank of the multiple-unit cars into the environment. [9]
On 30.08.2014, between the stations of Millér and Szajol, in the middle of
construction work, a misplaced railway construction material (long rail) caused
significant material damage and environmental pollution. It ripped the fuel tank of the
locomotive without the driver noticing it. He only noticed it after travelling three
kilometres, by which time 1600 litres of gas oil (UN 1202) had escaped. [9]
Fig. 4. The gas oil tank of the locomotive which was ripped on open line, and the long rail
causing the accident [9]
On 09.12.2012, between the stations of Baja and Bácsalmás, a passenger train hit a
snowdrift, and its fuel tank was damaged, which caused the leakage of 500 litres of gas
oil into the environment. [9]
In many cases, these non-freight accidents are due to the circumstances caused by
negligent or inappropriate working practice. Technical failures only rarely lead to the
release of dangerous substances, as, for example, a passenger train does not carry a
significant amount of dangerous material, apart from the gas oil in the fuel tank of
diesel locomotives, and the material collected in the closed-system toilet of modern
passenger trains or multiple-unit trains, which could pollute the environment.
325

Daniel Tokody et al.
1.4. Impact on the Environment, Public Safety, Transport Infrastructure and
Business Costs
The accidents and incidents happening during the transportation of dangerous goods
have a wide range of negative effects. For example, they can significantly affect the
population (death, injuries), cause long-term damage to the environment, may require
the evacuation of the population, or harm the infrastructure, the buildings or vehicles.
Explosive materials pose further risks, as terrorists can use them to attack civilians or
critical infrastructure. [11] [12] [13]
An average tank car has the capacity of 60 m3 (60 000 litre). In 1995 in Hungary
(Kaba – Straw factory) a disaster-like event of environmental pollution took place at the
industrial site. 200-400 m3 of gas oil leaked onto the ground, which leached into the
soil and groundwater. After 10 years, during the remediation process, nearly 14 000 m3
of polluted groundwater has been extracted and cleaned. Also 135 litres of hydrocarbon
products have been extracted. [14]
1 litre of gas oil can pollute 1 million litres of water. [15] Therefore, in case of the
release of 60 000 litres of gas oil, 60 billion litres of water could become unfit to drink.
This, besides causing significant harm to the environment, would have serious effect on
public and personal safety, and the remediation process would impose an immense
financial burden on society, as it could last for decades. As the above examples show,
in the event of such accidents, the transportation infrastructure can also be seriously
damaged. The damages caused in railway infrastructure can mount to hundreds of
millions forints, as, in case of a single rail car, the damages often reach the amount of
tens of millions forints.
2. Administrative background - Transportation of Dangerous
Goods Regulations and Laws
Goods, materials or objects are considered dangerous if their extraction, production,
storage and/or transport can have a harmful effect on the environment (e.g. pollution,
fire or explosion) and on people’s health (e.g. poisoning or radioactivity).The
transportation of such goods are strictly regulated in road, rail, water and air traffic.
According to these regulations, all dangerous substances have their own UN numbers.
The list of dangerous substances are rather limited compared to the number of known
chemicals, however, the substances on this list have been given their UN numbers. At
the transport of dangerous goods, an orange plate, the sign of danger, indicates the UN
number and the Kemler number, which identify the transported material. The Kemler
number shows the main and secondary hazards of the substance identified by the UN
number.
“The transport of dangerous goods by rail is regulated by the Regulations
Concerning the International Carriage of Dangerous Goods by Rail (RID) specified in
Annex C of the Convention Concerning International Carriage by Rail (COTIF). The
version of its text harmonized with ADR, the RID 2011 was issued with Act LXXX of
2011.”[16]
326

Development of the Infocommunication System for the Intelligent Rail Transport System of Dangerous
Goods in Hungary
The act of 2011 has been amended several times, as in 2013 and last year as well.
Therefore, the second annex of the Act LXXXIII of 2015, which has been in effect
since 02.07.2015, is Annex C of the Convention Concerning International Carriage by
Rail (COTIF) which consists of 1337 pages including the Regulations Concerning the
International Carriage of Dangerous Goods by Rail (RID). The above regulations do
not apply to all countries, only to the RID Contracting States, or more specifically, to
the members successfully concluding the ratification process.
Besides the above-mentioned international regulations, the European Union issued
Directive 2008/68/EC on the transportation of dangerous goods on land. This was
necessary to provide uniform regulations for dangerous goods at the level of the
member states. International agreements do not always ensure that all member states
observe its regulations, and the differences between member states must also be
regulated. [17]
In order to apply the regulations in effect, an interpretative decree was issued by the
Ministry of National Development: Decree No. 62/2013 (X.17.) entitled “The Domestic
Application of the Regulations Concerning the International Carriage of Dangerous
Goods by Rail (RID), which is still effective.
The above-mentioned laws and regulations mostly referred to the agreements
between the countries of Western Europe. Therefore, international freight transport
between the states of the former Soviet Union or China, Vietnam, etc. (eastern
“socialist” countries) and Hungary (23 member states) is regulated by the SMGS
Convention. It is entitled “Act XXXVII of 2011 on the publication of the consolidated
text of the Convention concerning International Freight Traffic by Rail (SMGS) and its
Annexes with modifications and complements”. This law was amended as “Act LXVII
of 2014 on the announcement of the modification of the Convention Concerning
International Freight Traffic by Rail (SMGS) and it Annexes of 2014”.
2.1. Hazard Identification
The classification of dangerous substances, according to the Convention Concerning
International Freight Traffic by Rail (COTIF) Annex C, is based on the Regulations
Concerning the International Carriage of Dangerous Goods by Rail (RID) in effect
since 1st January 2015, which divides the substances into classes from 1 to 9. Class 1
includes explosive materials and objects. Class 2 covers gases, while Class 3 flammable
liquid substances. Class 4.1 includes flammable solid substances, self-reactive
substances and desensitised solid explosives. Class 4.2 is for substances liable for
spontaneous combustion, while Class 4.3 covers those materials which, in contact with
water, can emit flammable gases. Class 5.1 includes oxidising substances, while Class
5.2 is for organic peroxides. Similarly, in case of Class 6, Class 6.1 includes toxic,
while Class 6.2 infectious substances. Class 7 is for radioactive, Class 8 for corrosive
and Class 9 for miscellaneous dangerous materials and objects. [18]
The above-mentioned UN and Kemler numbers indicate the type and hazardousness
of dangerous goods. Example for the UN number: UN 1202 – gas oil or diesel fuel or
heating oil light (flash-point not more than 60 °C). Kemler numbers (2-4 numbers)
indicate main hazard and secondary hazards as the following:
2. gas released due to pressure or chemical reaction
327

Daniel Tokody et al.
3. flammability of liquids, gases and vapours
4. flammability of solid materials
5. oxidising (fire-intensifying) effect
6. toxic effect
8. corrosive effect
9. risk of spontaneous violent reaction [18]
If the number of secondary hazard is zero, the secondary hazard is negligible.
However, if the letter x appears before the series of numbers (max. 3 numbers) the
substance can have dangerous reaction with water.
Apparently, the identification of the transported dangerous goods is not an easy task
for humans, especially in extraordinary situations. The recognition and identification of
dangerous goods must be achieved by using machines. The modern ID system allows
the storage and, if necessary, the display of much more information than manual
solutions.
3. Security and Monitoring System prototype system architecture
In Europe, the vehicles carrying dangerous goods are identified by the visual inspection
of the RID plate on site. The inappropriate transportation of goods causes significant
hazards (see Fig. 5). Vehicles transporting dangerous goods cannot be identified in a
standard, automatic way. In case of an accident, every minute counts in the
identification process, as human lives may depend on it. Any delay in the recognition of
hazards can cause more extensive and more serious damage.
Fig. 5. Inappropriate transport of dangerous goods [19]
Therefore, a uniform monitoring, tracking and identification system is needed
throughout Europe for the transportation of dangerous goods (see Fig. 6). In the
situation of an accident such a system could provide information for the disaster
management staff. It could also help to identify the causes of the accident. It could send
alert (via e.g. GSM-R) to the competent persons if a loss of pressure occurs in the tank,
or the temperature of the transported substance exceeds the pre-set level of temperature.
Each of the railway vehicles has own ID tag (RFID tag). [20]
328

Development of the Infocommunication System for the Intelligent Rail Transport System of Dangerous
Goods in Hungary
A further advantage of such a system is that it does not only make the transport of
dangerous goods safer but it also improves the safety of the entire system of traffic.
Through the collection and analysis of data, it is possible to predict certain events. This
way all traffic participants can be informed about any current and expected events.
This system is based on communication and intelligence programmed into various
system elements. This intelligence means that the different system elements are able to
communicate with each other, and based on their states, perceived information and
calculations they are able to influence and inform the participants of the system.
Fig. 6. Monitoring system of the transport of dangerous goods and communication systems for
safer railway transport
4. Summary
Dangerous substances, due to their material properties, can carry potential risks in
themselves even during their warehouse storage. What can happen then, if such
substances are taken into rail transport, a system which is known for having its risks?
The average speed of international railway transport in Europe is 18 km/h [21], while,
according to certain references, the average speed of freight trains in Hungary could
reach 20-40 km/h, but in reality, the average speed is only the fraction of the European
level. Elsewhere in the world, for example in India, freight trains move at an average
329

Daniel Tokody et al.
speed of 14-25km/h. [22] The reason for such a low average speed is of course the
amount of time spent waiting during the route. The real momentary speed of a freight
train can be higher. In case of the accident of a high-speed vehicle, the physical harm,
and, therefore, the material damage is more extensive, and the transported dangerous
goods could be scattered or spilt in a larger area. Consequently, this could affect a
greater number of people. Slow international traffic could also cause problems, as the
train sets transporting dangerous goods spend more time in the territory of our country,
carrying further risks. Potential risks, therefore, could arise from the transport of
dangerous substances, their storage in railway territories, or their trafficking by the
areas used by railway staff or passengers. The factors causing accidents include the
technical conditions of the railway lines and vehicles, the negligence of the participants
of the transportation process, or their inappropriate working practice. However, certain
unexpected events could also happen, such as the accidents caused by the failure of
noticing different signs (e.g. at road and rail crossings, passing the stop sign) or the
error of the participants of railway traffic (e.g. engine driver, switchman or train
dispatcher).
Considering the examples of the above-mentioned railway accidents, it can be stated
that the release of dangerous substances into the environment is often caused by human
inattentiveness, and it is followed by a long and expensive remediation process. The
safety of the transport of dangerous goods by rail primarily depends on the observance
of transport regulations, but it is not possible without ensuring the adequate level of
safety in railway traffic. Therefore, the issue of safety needs to be addressed in a
complex way in this case, too. It can only be achieved by collecting and analysing a
wide range of information about the system with the help of the presented monitoring
system.
References
1. Eurostat, Transport accident statistics - Railway accident statistics,
http://ec.europa.eu/eurostat/statistics-explained/index.php/Transport_accident_statistics,
ISSN 2443-8219, (2015)
2. International Union of Railways Safety Platform, Safety Database Report 2014 - Significant
Accidents 2013, old.uic.org/download.php/publication/545c_pub.pdf, ISBN 978-2-7461-
2325-0, (2014)
3. Dániel Tokody, György Schuster, I2 - Intelligent Infrastructure, REVIEWED
PROCEEDINGS Fifth International Scientific Videoconference of Scientists and PhD.
students or candidates: Trends and Innovations in E- business, Education and Security.
Bratislava, Szlovákia, 2015.11.18 Bratislava: University of Economics in Bratislava, 2015.
pp. 121-128., ISBN 978-80-225-4191-6, (2015)
4. Erhan Erkut, Stevanus A. Tjandra, Vedat Verter, Chapter 9 Hazardous Materials
Transportation, In: Cynthia Barnhart and Gilbert Laporte, Editor(s), Handbooks in
Operations Research and Management Science, Elsevier, Vol. 14, pp. 539-621, ISSN 0927-
0507, ISBN 9780444513465, (2007)
5. Richard Montgomery and William F. Martin, Chapter 17 - Transportation Safety, In
Protecting Personnel at Hazardous Waste Sites (Third Edition), Butterworth-Heinemann,
Woburn, pp. 498-533, ISBN 9780750670494, http://dx.doi.org/10.1016/B978-075067049-
4/50019-9, (2000)
330

Development of the Infocommunication System for the Intelligent Rail Transport System of Dangerous
Goods in Hungary
6. DIRECTIVE 2004/49/EC OF THE EUROPEAN PARLIAMENT AND OF THE COUNCIL
of 29 April 2004 on safety on the Community’s railways and amending Council Directive
95/1, 8/EC on the licensing of railway undertakings and Directive 2001/14/EC on the
allocation of railway infrastructure capacity and the levying of charges for the use of railway
infrastructure and safety certification (Railway Safety Directive) [Online]. Available:
http://eur-lex.europa.eu/LexUriServ/LexUriServ.do?uri=OJ:L:2004:220:0016:0039:EN:PDF
(06.01.2016.)
7. ABC NEWS: A freight train carrying approximately 200,000 litres of sulphuric acid has
derailed east of Julia Creek in north-west Queensland, 2015.december 27., [Online].
Available: http://www.abc.net.au/news/2015-12-27/a-freight-train-carrying-approximately-
200,000-litres-of-sulphu/7055862, (06.01.2016.)
8. ABC NEWS: Freight train derailment: Up to 31,500 litres of sulphuric acid may have leaked
near Julia Creek, [Online]. Available: http://www.abc.net.au/news/2015-12-29/31000-litres-
sulphuric-acid-leak-derailed-train-julia-creek/7058000, (06.01.2016.)
9. Hungarian State Railways (Hungarian: Magyar Államvasutak or MÁV), The Director-
General of Railway Safety: safety and accidents information, manuscripts, In Hungarian.
(2012-2015)
10. Lánglovagok.hu: A freight train carrying hazardous material slid out between Gödöllő-
Máriabesnyő, In Hungarian. [Online]. Available:
http://www.langlovagok.hu/kepek/6988_veszelyes-anyagot-szallito-tehervonat-siklott-ki-es-
borult-fel-godollo-mariabesnyo-hataraban, (10.01.2016)
11. Garbolino, E., Tkiouat, M., Yankevich, N., Lachtar, D. (Eds.), Transport of Dangerous
Goods, Methods and Tools for Reducing the Risks of Accidents and Terrorist Attack,
Springer, p. 258, NATO Science for Peace and Security Series C: Environmental Security,
ISBN 978-94-007-2683-3. DOI 10.1007/978-94-007-2684-0, (2012)
12. Batta, R., & Kwon, C. (Eds.), (2013). Handbook of OR/MS models in hazardous materials
transportation. Berlin: Springer, ISBN 9781461467946, DOI 10.1007/978-1-4614-6794-6
13. Vamanu, Bogdan I., Gheorghe, Adrian V., Katina, Polinpapilinho F., Critical Infrastructures:
Risk and Vulnerability Assessment in Transportation of Dangerous Goods Transportation by
Road and Rail, ISBN 978-3-319-30931-6, Sringer, (2016)
14. Ministry of Environment and Water. The 2004 year, the Ministry launched a priority list in
previous years investments using remediation projects. In Hungarian. [Online]. Available:
www.kvvm.hu/cimg/documents/10mell__thuz_d_.doc, (10.01.2016)
15. Balázs Zákányi, The protection of surface waters. Slide show, Miskolc, 2011, [Online].
Available: http://www.hidrotanszek.hu/Eloadasanyagok/Zakanyi_Balazs-
Kornyezetvedelem_alapjai/IV_ea..pdf, (10.01.2016)
16. Lajos Berek, János Solymosi: Safety of Transport of Hazardous Materials, p.51. BOLYAI
SZEMLE, XXIV. évfolyam, 2015/2. ISSN 1416-1443, (2015)
17. Directive 2008/68/EC on the inland transport of dangerous goods, [Online]. Available:
http://eur-lex.europa.eu/legal-content/HU/TXT/HTML/?uri=URISERV:tr0006&from=HU,
(12.28.2015.)
18. Convention concerning International Carriage by Rail (COTIF), Appendix C – Regulations
concerning the International Carriage of Dangerous, Goods by Rail (RID) 2015, [Online].
Available: http://doc.hjegy.mhk.hu/20150000000083_2.PDF, (10.01.2016)
19. Newer seized railway cars, [Online]. Available:
http://www.miabonyunk.hu/cikkek/2012/06/09/Ujabb_lefoglalt_vasuti_kocsik, (15.01.2016.)
20. M. Yu, T. Deng and J. Fu, "Application of RFID and GPS Technology in Transportation
Vehicles Monitoring System for Dangerous Goods," Remote Sensing, Environment and
Transportation Engineering (RSETE), 2012 2nd International Conference on, Nanjing, 2012,
pp. 1-4., doi: 10.1109/RSETE.2012.6260409
331

Daniel Tokody et al.
21. Lily Jacobs: European rail network for competitive freight, Strasbourg 2009. Április 22.,
[Online]. Available: http://www.europarl.europa.eu/sides/getDoc.do?pubRef=-
//EP//TEXT+CRE+20090422+ITEM-021+DOC+XML+V0//EN, (15.01.2016.)
22. Government of India: Average speed of goods train, [Online]. Available:
https://data.gov.in/catalog/average-speed-goods-train, (15.01.2016.)
332

International Conference on Applied Internet and Information
Technologies, 2016
DOI:10.20544/AIIT2016.41
Ubiquitous Computing in the context of developing
countries
Seblewongel Esseynew1, Berhanyikun Amanuel1, Mekuria Sinke1, Abel Damtew1
and Saso Koceski2
1Addis Ababa University, Addis Ababa, Ethiopia
[email protected], berhanyihun, meksin98, [email protected] 2 University Goce Delcev- Stip, Faculty of Computer Science, 2000 Stip, Macedonia
Abstract. Ubiquitous computing is an ultra-interdisciplinary field. Because of its
capacity to affect every sphere of human life, it is endowed with a wide range of
characteristics and features. This paper attempts to describe the more salient and
diverse features of Pervasive Computing in an organized manner that appreciates
the multi-disciplinary nature of the field. Five categories: Setup, design,
architecture, deployment and operations; interface; security; engineering and
socio-economic; are used to systematically outline the current characteristics of
Ubiquitous computing. Sample applications from the field of Ubicomp are also
discussed to illustrate some of the characteristics of pervasive computing.
Moreover, we have also tried to highlight the challenges and opportunities for
implementing Pervasive Computing in the context of developing countries. .
Keywords: Ubiquitous Computing, Features, Pervasive Computing, Developing
Countries, U-Agriculture, Pervasive Health
1. Introduction
Historically, there have been three waves of computing: mainframe, desktop and
ubiquitous computing [1, 2, 3]. In the mainframe computing era (60’s – 70’s), a single
large computer was shared and used by many people simultaneously. Whereas, in the
Desktop Computing era (80’s – 90’s), a personal computer was mainly possessed and
utilized by one person at a time. Currently, we are living in ubiquitous computing era,
which is characterized by a single user’s simultaneous engagement with multiple
invisible computing devices. These devices, which can be found in the individual’s
surrounding, are systematically integrated into everyday objects. Hence, facilitating the
ubiquitous accessibility of information and computing functions.
Ubiquitous computing, as originally envisioned by Weiser in [4], can be defined as a
computing technology in which the power of computer is embedded in everyday objects
which have the ability to serve and address human needs and wants. Ubiquitous
computing can address all spheres of human being life [5] and makes human life easy
and intelligent by using it [3]. Mobile phones are fundamentally altering our
relationship with physical space, while multitude of sensors are digitizing the physical
environment.
333

Esseynew et al.
Context aware systems are being employed in education, health care, agriculture,
supply chain management, marketing, etc.
Ubiquitous computing is an inter-disciplinary in every sense of the word. Because of
its capacity to affect every sphere of human life, it is endowed with a wide range of
characteristics and features. A systematic discussion of these multifaceted features can
help designers, system engineers, users, managers, policy makers etc., in enhancing
their understanding of the potentials and limits of Ubicomp technologies. This paper
attempts to describe the more salient features of Pervasive Computing in an organized
manner that appreciates the multi-disciplinary nature of the field. Sample applications
from the field of Ubicomp are also discussed to help illustrate some of the
characteristics of Pervasive Computing. Moreover, we have also tried to highlight the
challenges and opportunities of implementing Pervasive Computing in the context of
developing countries.
2. Features of Pervasive Computing
Pervasive computing, both as a socio-technical vision and its increasingly recurrent
implementations, is more and more revealing its unique features that differentiate it
from the ‘conventional’ computing paradigms. The features are never static; they
change as a result of progresses in the technological and economic spheres. In addition,
features are emerging as reactions to the interactions of the society to implementations
of Ubiquitous computing. It is also noteworthy that, as the prevalence of pervasive
computing increases so that “it should disappear as a niche topic in computing” [6]; the
features may end up to be features of generic computing in the future.
Pervasive computing is generally characterized by interconnected, context-aware,
scaled and autonomous computing resources which seamlessly integrate into the
environment. More specifically, the study has identified the following categories to
delineate and organize some identified features of Pervasive Computing.
2.1. Setup, Design, Architecture, Deployment and Operations
Most pervasive systems are set up as diverse set of autonomic components (sensors
and computing nodes) with energy autarky, making up networks with ad-hoc and
dynamic topologies. They are particularly designed to handle mobility and
interoperability which arises as a result of this setup. In an environment which is
dynamic and volatile where networks, devices and software components fail [1]; they
are also expected to be ‘available anytime and anywhere for long time’. This entails
being fault tolerant, optimizing performance according to energy levels and the capacity
to recover from unanticipated errors. Most notably, as per the prescription of Weiser’s;
pervasive systems strive to be invisible. The ability to be hidden both physically and
cognitively is one the most important features of Pervasive systems. Physically,
Pervasive systems should blend with the existing environment often deploying hidden
sensors and displays with scaled sizes fit for purpose. Cognitively, pervasive
components and routines should be designed with the aim of not distracting the user in
334

Ubiquitous Computing in the context of developing countries
her/his daily tasks. The user should seamlessly carry on daily tasks which are enabled
by Ubicomp, without noticing the existence of the implemented technology.
The physical invisibility characteristic makes it necessary for many Ubicomp
components to be simple, and that can be easily be maintained and dispensed.
Consequently, task-specific hardware is the more logical option for implementation of
Ubicomp systems. The nascent phenomenon of IoT (Internet of things) is also expected
to facilitate pervasive computing analogous with this choice [7]. Yet, perhaps given this
preference for specialization of hardware it comes as a surprise that mobile phones have
been the most significant devices which have contributed to the success of Pervasive
Computing in recent times [7]. This and recent advances in 3D printing are shading new
light on the paradox between task-specificity and adaptability. A near future realization
may be a system which changes the nature and size of sensors according to context
information.
2.2. Interface
Pervasive computing as a paradigm values the preciousness of user’s attention [8].
Hence, many UbiComp systems are designed to work with minimum human
interaction. The aim for ‘calm technologies’, has led to the design of innovative
interfaces which are multimodal and context-aware. Ubicomp systems can abstract
interaction elements so that a particular task can be performed using a choice of UI
elements (buttons, voice, gesture recognitions etc…) according to specific context for
single or multiple users [1]. Furthermore, pervasive computing strives for natural
interfaces which include interaction mechanisms that mimic users’ habitual interaction
patterns with everyday objects. This has been achieved by using interfaces which utilize
hepatic and tactile feedback.
2.3. Security
Pervasive computing amplifies the complexity of security and privacy issues that
arise from the use of Information technologies. The ever expanding smart spaces,
wearable technologies and associated social networks facilitate the perpetual
accumulation of data about an individual [9].This would enable not only direct
surveillance but the ability to infer about the habits of a person from patterns in
contextual data. Pervasive computing extends the notion of privacy to include bodily
and territorial privacy in addition to the communicational privacy introduced by IT [1].
The multiple sensors (including those which monitor health) have the capacity to reveal
the physical state and ‘existential’ status of a subject.
In aspects which are more oriented to security, the heterogeneous and autonomous
nature of Ubicomp introduces new challenges as more and more critical business
functions are being supported by Pervasive Computing. The need for unfamiliar
systems to interoperate with each other brings to the front the aspect of ‘openness’ to be
expected from these distributed systems; often in varying degree and according to
specific context. In addition, pervasive computing is more characterized by security
versus functionality issues. An autonomous pervasive component with diminishing
335

Esseynew et al.
power can choose whether to encrypt data or follow a less secure protocol which
preserves battery life. Similarly, a compromise is also necessary between pervasiveness
and security. A component which prompts users for authentication or which ostensibly
notifies users about security issues is more secure but degrades the ‘invisibility’ of a
pervasive system.
2.4. Engineering
Abowd in [10] identified three main features of ubiquitous computing namely;
transparent interfaces, the ability to modify behavior based on context and the capacity
to capture live experiences for later recall. He proposed a new approach for the software
engineering of UbiComp systems with the goal of incorporating these features.
Loureiro et al. [11] also suggested the incorporation of new software engineering
techniques comprising; Service oriented computing, component-based development,
plug-in-based architectures, event-based systems, and dynamic software evolution, to
cater for the unique demands of UbiComp.
The notion that pervasive computing is more task oriented than device oriented [12]
is illustrated by the setup where the concern shifts from, deploying a complete software
component on a single device which dictates the physical positioning of the user, to
partitioning of tasks on large number of devices in the ‘natural space’ of the user. A
new paradigm of software engineering which abstracts the notion of process for
deployment of ‘tasks’ on multiple hardware with capability for sharing and foraging is
deemed necessary. Moreover, managing and testing strategies which can accommodate
the issue of uncertainty should be part of this paradigm.
2.5. Socio-Economic
The impacts of Pervasive computing are also becoming visible in the social and
economic realm. One of the effects is the blurring of the distinction between physical
and virtual spaces. Ubicomp is merges the physical and digital space by appropriating
digital characteristics to tangible objects [13]. This has given rise to economic models
which depend on knowing the accurate and precise Spatial-Temporal relationship
between humans and other objects. Services and terms which apply to them can be
dependent on physical location and other contexts. They can also be proactively
provided without an explicit demand from a human actor. Pervasive computing is also
inspiring and enabling per-utility economic models. Analogous to cloud computing,
Per-utility service models are making it possible for people to lease resource for the
duration of task completion (also in a particular context). These types of models can
only be realized by extensive pervasive computing infrastructures which often require
coordination between diverse Ubicomp modules. This rises up the challenging issue of
who pays for, manages and maintains the infrastructure.
A recent socio-economic phenomenon, Pervasive Social Computing, has also
spawned from Pervasive Computing. Pervasive technologies are motivating
communities in voluntary groupware sensing endeavors. People in a social context use
336

Ubiquitous Computing in the context of developing countries
pervasive technologies to augment their collective knowledge, experience and efforts in
reaching collective goals [14]. Deciphering human intention, gleaning of meaning from
social media data, etc., are the ultimate challenges for Pervasive Computing if they are
to evolve to Pervasive Social computing as proposed by Mokhtar and Capra 2009 [15].
3. Pervasive Computing in Developing Countries
Before envisioning or implementing pervasive computing solutions in developing
countries, we need to plan for the challenges we could ran into. These challenges
include equipment failures, poor infrastructure, shortage of skilled professionals, power
outages, cultural barriers, financial constraints, environmental aspects, and poor internet
connection among other things [16, 17, 18]. For example, the problem of connectivity
can make prefetching, caching, and archiving data more of an issue than in developed
countries. According to Brewer et al. [16], although there are variations from one
developing country to another, some of the challenges are easier to solve. Chaudhri et
al. [19] and Prieto-Egido et al. [20] elected to use low tier mobile phone and low-cost
digital microscope camera respectively to mitigate financial constraints. Using devices
with integrated batteries are also good options for overcoming power outage related
problems where there is no power backup [16, 19].
Most developing countries are affected by resource constraints which have
contributed to the stagnation of technological progress. The automation of human
activities (one of the features of Ubicomp) is negligible. In certain cases automation is
dissuaded by the presence of cheap labor. Hence, a pervasive systems endeavor should
consider and prioritize which tasks to automate. The fundamental assumption that,
pervasive systems act like a middleware for the environment and information
processing systems can be challenged if the environment is not ripe for integration due
to lack of any electro-mechanical infrastructure. Where can we embed a sensor when
there is no machine or structure? However, the absence of an existing infrastructure can
be a blessing in disguise because it enables the bottom up implementation of Ubicomp
components. There are few structures to dismantle or lace awkwardly with ubiquitous
technology. However, pervasive computing must take the initiative in imposing itself in
development projects by highlighting the advantages of imbedding components in the
design of new infrastructure projects. In the absence of relatively high tech
infrastructure pervasive systems can also be embedded in low tech tools and cultural
artifacts. This process should entail making the embedded artifacts economically and
culturally feasible.
Finally, the prevalence of cheap labor in developing countries also provides
challenges and opportunities for the adoption of Pervasive Computing. Group sensing
and reporting projects which employ people who are given proper technical trainings
can be implemented in small budget. Nevertheless, pushing some aspects of
Information processing to the user can be challenging in the context of less tech-savvy
and in some cases illiterate users. Hence, user interfaces which are either based on local
languages or which transcend literacy requirements should be utilized.
337

Esseynew et al.
4. Sample Review of Representative Applications
The following section reviews a sample of Ubicomp applications in the agricultural
and health sector.
4.1. U-Agriculture applications
A recent Beecham Research report entitled “Towards smart farming: Agriculture
Embracing the IoT Vision” predicts that food production must increase by 70 percent in
the year 2050 in order to meet our estimated world population of 9.6 billion people
[21]. It also describes growing concern about farming in the future: climate change and
limited arable land. So, there is a need to consider smart farming. Smart farming is a
concept which is rapidly adapted by several agricultural activities. Offering high-
precision crop control, useful data collection, and automated farming techniques, there
are clearly many advantages a networked farm has to offer.
Various studies have tried to develop a mobile sensor application to assist farmers in
monitoring environmental factors and crop status. One such research is “An Intelligent
Agent based Farming Mega Portal assisted by pervasive devices” by Emada Khan,
College of Computer & Information Science, Imam University, Nigeria [22]. The paper
designed a U-Farm mobile application framework which can help the farmers in
monitoring their resources, farm environment and crops which indirectly help the
farmers improve their harvest with the help of the sensing devices and generate reports
and statistics. As a result the research described that effective use of pervasive devices
has an impact in improving and increasing food production and minimize food waste.
The paper presented the conceptual model and the system components that comprise
the mobile application. The study aims to make mobile device gateway an integrated
gateway which supports heterogeneous devices. In the proposed U-Agriculture system,
the received sensing information was analyzed using Smartphone devices which
generated keywords. The keywords are then sent to the knowledge expert system for
analysis. This provides the benefits such as real-time monitoring, alerts and statistical
analysis of crop conditions and environmental factors.
Another example of U-agriculture was implemented in Egypt; A country well known
for its agriculture [23]. However, the country faces a lot of challenges in the agricultural
processes and productions of crops; including poor rangeland, diseases and pests which
may destroy harvests, etc. To resolve such complex agricultural problems in the country
Precision Farming (PF) is practiced. PF is the capability to perform farming activities
efficiently and effectively by using sensing and communication technologies. To this
end, potato was selected, since it is the most important vegetable crop in Egypt, to
investigate a possible PF solution using Wireless Sensor Network (WSN) technology.
The WSN can be used to test the suitability of the agricultural land, check nutrient
availability, improve the storage of potato seed, prevent and/or detect early harmful
diseases and so on. WSN was implemented in Lofar Agro project. The WSN data and
statistics are sent to a field gateway then to the Lofar gateway via WiFi connection, then
through a wired connection they sent to the Internet to Lofar server and a couple of
other servers under XML format. Sensors placed at different locations in a crop field
where the intended characteristics of the soil or atmosphere need to be captured. The
338

Ubiquitous Computing in the context of developing countries
actuation is done based on the readings supplied by the sensors, upon exceeding a
threshold; the system will generate automated alert messages on the console, upon
which appropriate action can be taken.
Another research in Tanzania was concerned with farmer’s use electronic market
using pervasive devices. The article has revealed that the main challenges faced by
farmers are lack of market information, lack of platform to share agriculture knowledge
and absence of reliable market to sell crops [24]. Therefore, the objective was to show
the use of SMS technology to enhance communication in agricultural value chains in
Tanzania. The project worked closely with farmers, traders, silo managers and Ministry
of Commerce officials to develop an electronic marketing system (EMS) based on text
messaging.
In a similar project implemented in Ethiopia, the interaction of users in rural area
with remote data centers is increasing due to the proliferation of pervasive devices
(PDAs, Cell phones, tablets, browsers). For example, Ethiopian Commodity Exchange
(ECX) and Ministry of Agriculture (MoA) in collaboration have started the use of text
messaging services to promote market communication and exchange between farmers
and traders [25].
The rearing of animals is important for the economies of most African countries.
Nevertheless, it is very challenging due to many problems such as; inefficiencies in
information delivery, lack of an effective way to collect farm produce data, track
medical expenditure on their livestock and others. A project in Kenya [26] attempted to
address some of these problems using mobile technology through model development.
The model known as M-Kulima was developed to implement mobile application in
dairy farming. The proposed model can provide M – Agriculture services for different
stakeholders in the dairy industry. The model offers an interaction platform between the
farmer and other key stakeholders of the dairy industry. Farmers, milk buyers and
veterinary doctors can use their mobile phones and communicate with the application
server through the Internet using either data or SMS.
M-Kulima consists of different hardware and software such as router, firewall,
mobile payment gateway, M-Kulima Application, M-Kulima Database server, M-
Kulima SMS server and also variety security mechanisms for the data, database and
SMS. These components help to give diversity services for different stakeholders.
4.2. Pervasive Health
Pervasive health care can be defined as: “healthcare to anyone, anytime, and
anywhere by removing locational, time and other restraints while increasing both the
coverage and the quality of healthcare” [27]
Recent developments in ICT and emerging trends in health sector like the rise in
non-communicable and chronic diseases have facilitated the application of ubiquitous
computing in health services [28].These developments have also resulted in a paradigm
shift which encouraged the move from doctor centric to patient centric health care
system [29].The envisioning and implementation of pervasive health systems is a
daunting task because, health care activities are complex in nature and they are
characterized by multidimensional and multidirectional information exchanges from
339

Esseynew et al.
wide range of entities spanning from practitioners and health facilities to policy makers
[30].
Pervasive health applications within hospital settings are usually concerned with
increasing the effectiveness and efficiency of health care for in-patients by improving
professional practices through novel technologies [31, 32]. Examples of pervasive
health approaches which follow a patient centric health care system can be found in [33,
34]. The project by Ghose et al. [33] named UbiHeld (Ubiquitous Healthcare for
Elderly) uses mobile technology as its main data source for amassing physiological
data, and complements monitoring (for cases where the users may not carry mobile
phones; e.g. in cases of sleeping, toilet visits and TV viewing) using a depth sensor,
Kinect, to detect movement in a way which preserves the privacy of the patients.
Moreover, UbiHeld proposes the use of data from social networks in combination with
data from sensors to accurately depict the health status of an elderly. A similar but
scaled up monitoring of elderly people in their resident setting is provided by Hayes et
al. [35], the study used gait analysis to evaluate the health status of multiple individuals
in one setting. A patient centric approach for a specific group is adopted by Cafazzo et
al., 2012 [36]. A mobile app called bant, targeting the adolescent type 1 diabetes
population was employed. The app uses a LifeScan glucometer with a Bluetooth
adapter to measure blood glucose level. The result of the pilot study revealed the use of
game-based designs, unique visualizations, and incentives increased daily average
frequency of blood glucose measurements by 50%.
The application of Pervasive health as a tool for effective management of health
related resources is exemplified by Chaudhri et al. [19].They developed a low-cost
mobile phone based sensing system called FoneAstra for monitoring national vaccine
cold chains in Albania. FoneAstra includes an embedded microcontroller based on an
ARM7 processor attached to a low tier mobile phone through its data port. Temperature
sensors connected to the ARM7 processor’s I/O interfaces continuously measure the
temperature inside cold rooms or refrigerators. FoneAstra reads sensor values at a
specified rate set by SMS messages sent to the phone, compresses the data, and packs
the result into an SMS message for the phone to send. The researchers claimed that the
system successfully detected alarm conditions, power interruptions and also gave
insights into the operational efficiency of equipment being used in the cold chain.
A more holistic view of pervasive health is proposed by Wickramasinghe [28].
Whereby, pervasive health is envisioned as a coordination of collective activities. The
researchers posited that a comprehensive approach towards pervasive health which
strives for universal access to a more efficient and effective service, should amass
sensory information from Physician/Nurse, pharmacies, blood banks, clinics,
administration etc., i.e. from all sources of health information related with the health
sector. Moreover, financial, political, military, geological, law enforcement,
infrastructure level, etc. information which is not directly associated with health
activities but which can impact the health sector should also be augmented with health
care operation data.
Some of challenges and opportunities for pervasive health are expected to be
different in the case of developing countries. Even though, the impact of cultural and
socioeconomic factors on technology acceptance and use has often been understudied
[37]; certain peculiar characteristics can be identified. The implementation of pervasive
340

Ubiquitous Computing in the context of developing countries
health in developing countries can be influenced by some of the distinguishing trends
where:
1. Communicable diseases (and not chronic) are the main cause of health
challenges.
2. Practices like family care for the elderly in a home setting are more common
than in developed countries’ context.
3. Acute shortage of medical resources which can make certain risky pervasive
health practices acceptable given the dismal alternative of not getting any
service.
4. Maternal health care is very important.
5. Health education can have a significant impact. (For example sensor based
monitoring of environment and people’s habit after health awareness programs
could facilitate preventative health care.)
5. Conclusion and Recommendation
In this paper we have presented five categories; Setup, design, architecture,
deployment and operations; interface; security; engineering and socio-economic , in
which, identified characteristics of ubiquitous systems can be described. The categories
do not provide pronounced demarcations in the classification of these features. They
are neither mutually exclusive nor exhaustive. Considering the universal aspects of
pervasive computing aiming at such categories would most probably end up being
futile. Despite these limitations the classification scheme can be used to organize the
multiple concerns of different stakeholders. We also hope to encourage other works
with the aim of providing a comprehensive framework which organizes features and
components of Pervasive Computing that can guide in the; envisioning, designing ,
implementing and managing of such systems.
The chosen sample pervasive applications discussed in the paper, more or less
manifest most of the outlined features of ubiquitous systems. Projects from the
agriculture and health sectors are increasingly being enabled using Ubicomp
technologies. Furthermore, some of the Ubicomp projects are being deployed in
developing countries. The unique aspects of developing countries present both
challenges and opportunities. Equipment failures, poor infrastructure, shortage of
skilled professionals, power outages, cultural barriers, financial constraints,
environmental aspects, and poor internet connection are some of the identified
challenges .The potential to incorporate pervasive technologies on the onset of
infrastructure development was also identified as an opportunity. However, studies
which comprehensively address the overall characteristics of pervasive computing in
developing countries’ context are lacking. A discipline that distinguishes itself as being
context-aware should also be more aware of the socio-technical settings in which its
applications are going to be implemented, especially in the context of developing
countries.
341

Esseynew et al.
References
1. Krumm, J. (ed.): Ubiquitous Computing Fundamentals, Microsoft Corporation, Taylor and
Francis Group, LLC. Washington: USA. (2010)
2. Mousa, A. A. H.: Ubiquitous/Pervasive Computing. International Journal of Innovative
Research and Development, Vol. 2, No. 10. (2013)
3. Mathew, S.: Ubiquitous Computing- A Technological Impact for an Intelligent System.
International Journal of Computer Science and Electronics Engineering (IJCSEE), Vol. 1,
No. 5, 595-598. (2013)
4. Weiser, M.: The computer for the 21st century. Scientific American, Vol. 265, No. 3, 94-
104. (1991)
5. Friedewald, M., Raabe, O.: Ubiquitous computing: An overview of technology impacts.
Telematics and Informatics, Vol. 28, No. 2, 55-65. (2011)
6. Abowd, G. D.: What next, ubicomp?: celebrating an intellectual disappearing act. In
Proceedings of the 2012 ACM Conference on Ubiquitous Computing, ACM, 31-40. (2012)
7. Caceres, R., Friday, A.: Ubicomp systems at 20: Progress, opportunities, and challenges.
IEEE Pervasive Computing, Vol. 1, 14-21. (2012)
8. Russell, D. M., Weiser, M.: The future of integrated design of ubiquitous computing in
combined real & virtual worlds. In CHI 98 Conference Summary on Human Factors in
Computing Systems, ACM, 275-276. (1998)
9. Satyanarayanan, M.: Pervasive computing: Vision and challenges. Personal
Communications, IEEE, Vol. 8, No. 4, 10-17. (2001)
10. Abowd, G.: Software engineering issues for ubiquitous computing. ACM Press. (1999)
11. Loureiro, E., Oliveira, L., Bublitz, F., Perkusich, A., Almeida, H.: A Software Engineering
Perspective on Ubiquitous Computing Systems. Ubiquitous Computing: Design,
Implementation, and Usability. (2008)
12. Banavar, G., Beck, J., Gluzberg, E., Munson, J., Sussman, J., Zukowski, D.: Challenges: an
application model for pervasive computing. In Proceedings of the 6th annual international
conference on Mobile computing and networking, ACM, 266-274. (2000)
13. Katz, R.H., Long, D., Satyanarayanan, M., Tripathi, S.: Workspaces in the Information Age.
In Report of the NSF Workshop on Workspaces in the Information Age. Leesburg, VA.
(1996)
14. Zhou, J., Sun, J., Athukorala, K., Wijekoon, D., Ylianttila, M.: Pervasive social computing:
augmenting five facets of human intelligence. Journal of Ambient Intelligence and
Humanized Computing, Vol. 3, No. 2, 153-166. (2012)
15. Ben Mokhtar, S., Capra, L.: From pervasive to social computing: algorithms and
deployments. In Proceedings of the 2009 international conference on Pervasive services,
ACM, 169-178. (2009)
16. Brewer, E., Demmer, M., Ho, M., Honicky, R. J., Pal, J., Plauché, M.: The Challenges of
Technology Research for Developing Regions. IEEE Pervasive Computing, Vol. 2, 15-23.
(2006)
17. Cook, D. J., Das, S. K.: Pervasive Computing at Scale: Transforming the State of the Art.
Pervasive and Mobile Computing, Vol. 8, No. 1, 22-35. (2012)
18. Lambrechts, J., Sinha, S.: Microsensing Networks for Sustainable Cities. (2016)
19. Chaudhri, R., Borriello, G., Anderson, R.: Monitoring Vaccine Cold Chains in Developing
countries. IEEE Pervasive Computing, Vol. 11, No. 3, 26-33. (2012)
20. Prieto-Egido, I., García-Giganto, V., González-Escalada, A., Martínez-Fernández, A.:
Design and validation of a low-cost telemicroscopy system. International Conferences ICT
2014, WBC 2014, EC 2014, ISPCM 2014 and EH 2014. (2014)
21. Beecham Research.: Towards smart farming: Agriculture Embracing the IoT Vision.
Beecham Research Ltd. (2014)
342

Ubiquitous Computing in the context of developing countries
22. Khan, E. M. D. A. D.: An Intelligent Agent based Farming Mega Portal: A Necessity for
Farmers. In 12th WSEAS International Conference on APPLIED COMPUTER and
APPLIED COMPUTATIONAL SCIENCE (ACACOS'13), 2-4. (2013)
23. El-kader, S. M. A., El-Basioni, B. M. M.: Precision farming solution in Egypt using the
wireless sensor network technology. Egyptian Informatics Journal, Vol. 14, No. 3, 221-233.
(2013)
24. Tenge, E., Wambaya, K.: Electronic Marketplaces as an Agricultural Value Chain
Development Stimulus in Low Income Countries. Journal of Emerging Trends in Computing
and Information Sciences, Vol. 5, No. 3, 178-185. (2014)
25. Ministry of Agriculture and Natural Resources, www.moa.gov.et/home, (2016). [Online].
Available: http:// www.moa.gov.et/home f (current April 2016)
26. Gichamba, A., Lukandu, I. A.: A model for designing M-agriculture applications for dairy
farming. The African Journal of Information Systems, Vol. 4, No. 4. (2012)
27. Varshney, U.: Pervasive healthcare computing. New York: Springer. (2009)
28. Wickramasinghe, N., Troshani, I., Rao, S., Hague, W., Goldberg, S.: A transaction cost
assessment of a pervasive technology solution for gestational diabetes. IJHISI (in press)
(2011)
29. Swan, M.: Emerging patient-driven health care models: an examination of health social
networks, consumer personalized medicine and quantified self-tracking. International journal
of environmental research and public health, Vol. 6, No. 2, 492–525. (2009)
30. Akhtar, R. (ed.): Health care patterns and planning in developing countries, 1–336.New
York: Greenwood. (1991)
31. Pabllo, C., Soto, R., Campos, J.: Mobile medication administration system: Application and
architecture. Paper presented at the Proceedings of the 2008 Euro American Conference on
Telematics and Information Systems, Aracaju, Brazil, 10–12. (2008)
32. Randell, R., Wilson, S., Woodward, P., Galliers, J.: Beyond handover: supporting awareness
for continuous coverage. Cognition, Technology and Work, Vol. 12, No. 4, 271–83. (2010)
33. Koceski, S., Koceska, N.: Evaluation of an Assistive Telepresence Robot for Elderly
Healthcare. Journal of Medical Systems, Vol. 40, No. 5, 1-7. (2016)
34. Ghose, A., Sinha, P., Bhaumik, C., Sinha, A., Agrawal, A., Dutta Choudhury, A.: Ubiheld:
ubiquitous healthcare monitoring system for elderly and chronic patients. In Proceedings of
the 2013 ACM conference on Pervasive and ubiquitous computing adjunct publication,
ACM, 1255-1264. (2013)
35. Hayes, T. L., Pavel, M., Larimer, N., Tsay, I. A., Nutt, J., Adami, A. G.: Distributed
healthcare: Simultaneous assessment of multiple individuals. IEEE Pervasive Computing,
Vol. 1, 36-43. (2007)
36. Cafazzo, J. A., Casselman, M., Hamming, N.: Design of an mHealth App for the Self-
management of Adolescent Type 1 Diabetes: A Pilot Study. Medical Internet Research, Vol.
14, No 3. (2012)
37. Straub, D., Loch, K.,&Hill, C.: Transfer of information technology to the Arab world: A test
of Cultural influence modeling. In M. Dadashuadeh (ed.), Information Technology
Management in Developing Countries, Hershey: IRM Press, 92–151. (2002)
343

International Conference on Applied Internet and Information
Technologies, 2016
DOI:10.20544/AIIT2016.42
Change control in project of web application development
in e-commerce environment
Milan Malić1, Vesna Makitan1 and Ivana Petrov1
1 University of Novi Sad / Technical Faculty “Mihajlo Pupin”, Djure Djakovica bb,
23000 Zrenjanin, Serbia
[email protected]; [email protected]; [email protected]
Abstract. In order to survive in the market and to become concurrent in modern
business, companies need to accept and implement new technologies in their
business processes. Internet presence enabled companies’ new way of running
business and presenting product/services to the clients. Using e-business,
companies may collect large amount of information about their clients and
partners, and after its analysis, they may create new products/services and answer
effectively to the global market needs. Too many information and efficient
analysis demand new data storage methods. BigData and NoSQL databases
prevailed as a suitable solution. Faster data delivery, real time work and lower
costs, are some of the reasons why companies begin to implement those
technologies. On the other hand, uncertainty about the processes of database
system change may slow down the changes. This work illustrates above-
mentioned changes through change control in project of web application
development in e-commerce environment. Advantages and disadvantages of the
new way of data storage are presented too. Therefore this work may be used as an
example in the companies that run business by e-way or are beginners in this area.
Keywords: change control, e-commerce, development, RDBMS, NoSQL.
1. Introduction
Intensive changes in the world of information technologies (IT), development of
information and communication technologies (ICT), as well as growing need for new
information are some of the reasons that push modern companies to make changes. As
Bill Gates ones said: “Change is not an option. We cannot vote and say we want it
stops. In fact, we are changing faster than ever.”
It is obvious that modern business organizations, now, more than ever, need to
accept new prevailing business rules, not only to conquer new markets, but also to
survive in them. Expansion of IT and Internet forced companies to provide their
business in e-way to the clients and partners. New technologies forced companies to
adopt new ways of storing and analyzing collected data, by using information systems
(IS). The CHAOS report [1] from 1995 stressed that only 16.2% of IT projects in the
USA were completed successfully. According to this, software development projects
are the most problematic and they need better project management.
344

Malić et al.
It is clear that nowadays Internet became inseparable part of modern business, and
companies seek for new ways of delivering products to their clients. E-market enabled
new ways of product/service delivering, as well as gathering information about clients
and partners for organizations that run business like this.
Due to the amount and capacity of data, classical relational database management
system (RDBMS) cannot be the reasonable solution for imposed requirements. BigData
and NoSQL are logical solutions in this case. According to [2] BigData represents new
generation of technologies and architectures, they have design that enable economical
usage of data from the big data sets, with great agility in saving, finding and/or
analyzing of data.
The majority of modern business is in marketing, and Internet marketing takes more
and more significant part in companies' advertisement. Tools for Internet search
epmhpasise download speed. In order to satisfy standards, having search engine
optimization (SEO) on company’s Internet portal becomes mandatory. Teams of experts
are gathered to accomplish even one millisecond faster download and to become
competitive.
This work represents implementation of the new way of data storing – NoSQL, in e-
commerce environment of business companies, as potential solution of nowadays
requirements. Above all the advantages of this way of data storing and change and risk
management as consequences of its implementation are represented as well.
Also, there are: Related work; Detailed review of change control in NoSQL database
implementation in e-commerce application development; Advantages, disadvantages
and risks of NoSQL implementation; Conclusion and further work.
2. Related work
E-business means usage of e-resources and platforms in running companies’
business [3]. E-commerce is more specific than e-business and means that beside
companies’ data about its history, business politics and products, Internet portal offers
possibility of on-line buying [3]. In that way e-business includes not only e-commerce,
but also trading with intangible – information. It supports all the steps of classical
commerce. Moreover, it includes e-services, post sales service or on-line advice.
According to Ecommerce foundation [4] over 1,200 million people bought
something over Internet, at least once. It means that turnover was 1,442 billion dollars,
i.e. average purchase was over 1,100 dollars. Also, the same reference implies that the
greatest share in e-commerce has Asia (34.6%), Europe (31%) and North America
(28.4%). It is obvious that, nowadays the great part of the market migrated in e-market,
and this development is yet to come.
According to [5] only in Europe there are 2.4 million jobs related to business-to-
customer (B2C) commerce. Also, there are over 715,000 active Internet portals that run
some way of e-commerce with B2C connections. It is important to stress that there were
over 4 billion shipment after buying product/services by e-commerce.
Abovemantioned statistics implies on importance of projects in e-business area. The
amount of exchanged data between interested parties is large and significant. By storing
this data, and afterwards, by its analysis, organizations may discover new data and use
it in business decissions and for creating new strategies.
345

Change control in project of web application development in e-commerce environment
As it was said, organizations were forced to seek for the new data storing
technologies. Centralized systems, such as Data Warehouse, are implemented in
modern organizations more offen. This architecture enables integration of different
databases into a unique system, with centralized data management that speed up access
and data analyzing [6].
In order to find appropriate reaction to risks and problems during implementation of
the new technologies for data storing, such projects need good management and change
control [7]. Considering previous statistics about project management, its significance
for implementation of the new technologies into existing systems is obvious.
Changes and their implementation usully have consequences [8], and change control
enables projects to stay on track and in accordance with the previous developed and
defined requirements. Moreover, change control means rejecting unnecessary changes
or those who have minimal advantage per high price for the project.
In case of the project of web application development of company’s e-business that
requires changes in implemented technology for data storing, it is clear why this project
need to be well controlled and managed. Changes are necessary almost for the entire
segment related to communication with database that supports only application.
Although it can be said with correct certainty which amount of changes is necessary for
the application in total, those considering Model-View-Controller will be 100%. This is
important because according to many sources changes in project should not influence
on project more than 10 or 15% during risks and uncertainty that may occur and
produce unsuccessful project.
On the other hand, according to [39, 10, 11, 12, 13] advantages of NoSQL
comparing to RDBMS are many. One of them is real time work, which is vital for
Internet searching tools, such as Google, BING and Yahoo [14]. This is one of the basic
parameters that those searching tools use during ranking Internet portals on pages with
resulting sets after defined searches. In this way organization may become respectable,
its site may be visited more often, had better rank comparing to competition and provide
new clients for the company.
3. Project realization and change control
Every change that may influence on project needs to be approved by Change Control
Board (CCB). This board is usually consisted of experts, stakeholders and project
sponsors who decide whether the control will be accepted and implemented or not. In
literature, this board is named as “change resistance board” because the majority of
changes were rejected. In information technology (IT) projects changes are usual and
have great impact on risk level and uncertainty. Once uncertainty is accepted,
implementation of changes may be examined from different perspectives [14]: enabling
change is more important than change control; to become better in rework is virtue;
change control is the best if focuses final product components; backup information must
be implemented on every development level; enabling change demands processes on
many levels.
346

Malić et al.
Fig 1. Steps in accepting change request.
Considering that implementation of the new way of data storing, such as NoSQL,
demands changes on several levels, starting with applicative ones, to the storing
systems, those changes had to be observed as processes at many levels. In order to
accept change request it has to pass several phases illustrated in the figure 1. The first
step in change request acceptance is its submission to the CCB for revision. The request
may be rejected, reworked or accepted. In case of acceptance CCB requests detailed
analysis and exploring its advantages. After this, change request may be rejected,
reworked or accepted. Accepted change request means approval of changes and its
implementation in project plan. The document about change request that CCB gets has
basic information about the change, as it may be seen in the figure 2a. The CCB reply
should be the final decision (figure 2b) no matter on its consequences.
Submitter – Basic info
No.: Change description:
Submitter: Reasons of change: CCB reply on the change request document
Submission date: Decision: Yes No Amendment
Reply to: Business
justification:
Decision
date:
Signature:
Priority:
Expected results:
(a) (b)
Fig 2. (a) Change request document; (b) Change request approval/disapproval document.
347

Change control in project of web application development in e-commerce environment
According to the CCB reply document, change request is further processed or
rejected. In case of change request acceptance, the next step is analyzing and exploring
change influence and impact on project. In this phase experts should be included in
order to gather reliable information. Beside change advantages, experts should stress
risks. This will enable the right contingency plan in case of undesirable situations.
Figure 3 represents the document with information about the risk.
No: number Risk: Descriptive risk name
Priority: integer Description: Detailed risk description
Probability: low/medium/high
Influence: low/medium/high
Origin: the cause of the risk Class: technology/resource/3rd party Assigned: employee
Possible replies: Primary reply:
Strategy: which strategy will enable risk elimination
Actions: what has to be done to fulfill the strategy
Contingency plan: creating plans in case of primary strategy failure
Status: Date:
Approved by: Date: Reason:
Fig 3. A document including information about the risk.
After the change request revision and after analysis of related research about the
change follows revision of gathered research. If change request appears justified and its
implementation is reasonable, CCB approves the change and its implementation in
project plan. Otherwise, if the change does not improve project and may influences
project failure, it will be rejected and project will continue with previously defined plan.
Fig 4. Project plan after implementation of changes.
Changes that concern NoSQL implementation in e-commerce environment are many,
but also advantages that they bring with them. This will be discussed later in this paper.
After the change approval it should be implemented into the project, and determined,
what actions need to be done, in order to implement the change completely. It should be
348

Malić et al.
stressed that moving from classical RDBMS to NoSQL brings changes on many levels,
and every one of them should be controlled and monitored. In order to accomplish the
previous it is necessary to create journals that will be the main reference when error
occurs. Also, it is important to stress that only those changes that influence on final
project result or change project course need CCB approval.
In order to support project management and change control there are project
management software (Microsoft Project 2016 was used in this work). Figure 4
represents project plan after the changes caused by implementation of the new storing
system. Because of the changes and uncertainty that they bring it is important to
implement techniques represented in this work to minimize the risk and enable efficient
management.
4. Project results
Implementation of NoSQL in e-commerce systems brings many advantages, but also
uncertainty. Thanks to IT project management and change control it is possible to
control risks that occur during change implementation. Although this process is risky,
the advantages it brings are countless, starting with query implementation through
program code to many direct or indirect savings that company gets.
Comparing project plan from previous section implies on time savings, as well as
resources during web application development. Implementation of this storing system in
modern applications becomes usual because it is faster and easier and brings advantages
concerning maintenance and future application development. Flexible scheme that
supports NoSQL enables developers to make changes in database at any time. Also,
NoSQL database does not requires new highly sophisticated hardware, and in that way
enables savings concerning equipment for system storing. Modern servers that support
large RDBMS cost over tens of thousands of dollars, while NoSQL systems may have
lower class servers by lower price. Some of the advantages of NoSQL databases are:
scalability, availableness, low hardware requirements, flexible scheme, big data, object
oriented programming, performances, failure control, less administration, asynchronous
replication with auto-failover, cloud implementation... The change of complete system
is not always the best solution and CCB may decide to change only one segment of the
system that will bring expected results. In this case, application code should have
separate modules for accessing and data processing to both, RDBMS and NoSQL.
Some of the cases that enable usage NoSQL and RDBMS together are: storing
aggregation queries results, archiving data, creating journals, storing entities of
metadata.
5. Conclusion and further work
In this work change control in project of web application development in e-
commerce environment, concerning implementation of the new storing system was
presented. Change control is very demanding and involves total commitment of project
manager. Many risks that may occur are some of the reasons why CCB disapproves
349

Change control in project of web application development in e-commerce environment
changes. On the other hand organization that accepts the challenge may become
competitive. Also, this work showed the way of overcoming mistakes during changes
and efficient risk management. Advantages of NoSQL databases are many and some of
them are savings in: hardware features, application code development time, replication
data support, flexible scheme, performances, availability, etc. NoSQL application in e-
commerce environment is needed for modern organization development. This is
because sensor networks in modern industry and management, and environment like
building management system (BMS) demand NoSQL storing system. That is why
future project management should follow the steps of modern business organizations
and industry.
References
1. Agrawal, R., Srikant, R.: Fast Algorithms for Mining Association Rules. In Proceedings of
the 20th International Conference on Very Large Databases. Morgan Kaufmann, Santiago,
Chile, 487-499. (1994)
2. Garcia-Molina, H., Ullman, D. J., Widom, J.: Database Systems: The Complete Book.
Prentice Hall, New Jersey, USA. (2002)
3. Wang, X., Bettini, C., Brodsky, A., Jajoida, S.: Logical Design for Temporal Databases with
Multiple Granularities. ACM Transactions on Database Systems, Vol. 22, No. 2, 115-170.
(1997)
4. Bruce, K. B., Cardelli, L., Pierce, B. C.: Comparing Object Encodings. In: Abadi, M., Ito, T.
(eds.): Theoretical Aspects of Computer Software. Lecture Notes in Computer Science, Vol.
1281. Springer-Verlag, Berlin Heidelberg New York, 415–438. (1997)
5. van Leeuwen, J. (ed.): Computer Science Today. Recent Trends and Developments. Lecture
Notes in Computer Science, Vol. 1000. Springer-Verlag, Berlin Heidelberg New York
(1995)
6. Ribière, M., Charlton, P.: Ontology Overview. Motorola Labs, Paris (2002). [Online].
Available: http://www.fipa.org/docs/input/f-in-00045/f-in-00045.pdf (current October 2003)
350

International Conference on Applied Internet and Information
Technologies, 2016
DOI:10.20544/AIIT2016.43
Factors influencing the successful adoption of an
innovative e-commerce product: single case study
Olga Popovska1, and Vladimir Trajkovik2
1 Faculty of Computer Science and Engineering
"Rugjer Boshkovikj no.16
P.O. Box 393
[email protected] 2 Faculty of Computer Science and Engineering
"Rugjer Boshkovikj no.16
P.O. Box 393
Abstract. This paper studies the acceptance of an innovative e-commerce product
by customers, and how the market characteristics influence its adoption and
diffusion. By introducing the concept of e-readiness, which summarizes a broad
set of characteristics of a given country, we were able to analyze the factors that
drive the adoption of an innovative solution in a market. Our findings suggest that
both environmental and firm level factors play an important role in the adoption
of an innovative e-commerce solution.
Keywords: entrepreneurship, e-commerce software, e-readiness, success factors,
developing countries, Republic of Macedonia
1. Introduction
The use of the Internet as means of conducting business continues to grow and has
become one of the core components of many firms’ business strategies [1]. These
technological and social changes are transforming the global economy into a state
where e-commerce is embedded in many companies’ business strategies [2]. For the
purposes of this paper we adopted the definition of Gibbs, Kraemer, and Dedrick, who
define e-commerce as “the use of Internet to buy, sell or support products and services”
(p.4) [3]. Although the introduction of e-commerce has enormous business potential, e-
commerce is still largely undeveloped in many countries around the world [2], [4]. The
level of adoption of e-commerce is unequal between different countries and it requires
an understanding of the local characteristics of each market [1]. Gibbs, Kraemer, and
Dedrick argue that although globalization has, generally, a positive effect on the
adoption of e-commerce, its influence is mediated by the national characteristics of
each market [3].
351

Olga Popovska et al.
When it comes to innovative products related to the Internet, researchers tend to
proclaim the level of e-readiness of a country as the main measure of how prepared a
country is to accept electronic activities such as e-commerce [5]. Pare argues that
creating an e-ready environment is not enough for a successful acceptance of e-
commerce in a country, as besides the environmental factors, one must also look at
firm-level factors [6]. Hence, this paper seeks to arrive at an understanding of both
environmental and firm-level factors that were detrimental to the successful sales of an
e-commerce product.
Measuring e-readiness is not a simple task and, as Maugis et al. argues, although there
is a vast body of studies addressing e-readiness, there is not a coherent view of the
realities in hand [7]. According to Al-Solbi and Mayhew, the literature still seems
fragmented and there is not a single framework that has earned ample acceptance [8].
Bui, Sankaran, and Sebastian develop a framework to evaluate e-readiness of a nation
based on eight factors, which, in turn, are measured by 52 different indicators [2]. Their
framework has been validated and it identifies the following major factors:
knowledgeable citizens, access to skilled workforce, macro economy, digital
infrastructure, industry competitiveness, culture, ability and willingness to invest, and
cost of living and pricing. However, their proposed framework focuses only on
national-level indicators and does not take into account the organizational variables,
which affect business’ decision to adopt e-commerce. On the other hand, Molla argues
that contrary to the belief that environmental factors are the key enablers of successful
e-commerce adoption, key variables are the ones related to organizational e-readiness
[9]. This statement is backed by the research conducted by Molla and Licker since their
findings suggest that organizational factors have a greater influence on e-commerce
adoption than environmental ones [10].
In response to this issue, we reviewed the existing e-readiness literature and found that
the model developed by Molla and Licker as the most suitable for our case study [10].
Therefore, as Ali and Alrayer acknowledge, this model is followed by many researchers
due to its inclusion of both external and internal factors [11]. Another reason why this
model is adopted in this paper is the fact that as Dada notes, its theoretical grounding is
based purely on businesses with a sole intention of undertaking e-commerce [5].
Finally, it is also very important that this model is developed specifically to address
factors that affect the adoption of e-commerce in developing countries.
2. Methodology
This paper will apply the PERM model developed by Molla and Licker on a single case
study [10]. It is suggested that a case study approach is suitable when there is a need to
focuses on ‘how’ and ‘why’ types of questions, when the behavior of those involved
cannot be manipulated and finally, when the contextual conditions need to be covered,
because they are relevant to the phenomenon under the study [12].
The case study involves a software company, InoTek (fictitious name). The analysis
was conducted from June 2014 to December 2015. It has combined a variety of sources.
352

Factors influencing the successful adoption of an innovative e-commerce product: single case study
The researcher was involved in numerous meetings, sales opportunities and had
frequent consultations with the two founders regarding their customers and prospects.
Additionally, the documentation provided by InoTek was thoroughly analyzed,
including their business plans for 2012 and 2013. A phenomenological approach to the
data was utilized. Husserl defined phenomenology as “the science of essence of
consciousness” and focused on defining the concept of intentionality and the meaning
of lived experience, from the first-person point of view [13].
The population consists small and medium enterprises operating in the Macedonian
market and the sample consists of five companies, which were given free e-commerce
packaged software. The interviews were conducted over a telephone.
3. Case Study: InoTec
The company started in 2012. Both founders noticed that the Macedonian e-commerce
market is not yet developed to its full potential and believed that they could exploit this
opportunity by exporting an e-commerce software product whose sale was a success in
Turkey. Once the software (the e-commerce product) was localized, the two founders
employed a sales team, consisting of two people and a supporting technical staff,
consisting of four people. Their target market was comprised of the small and mid-sized
companies in the Republic of Macedonia. Companies which were operating without a
website, or having a website publishing basic company information without any
interactivity or a retail companies that could sell their products online.
The InoTek’s product was a packaged software solution, which aimed to cater for the
needs of many. It incorporated a high level of functionality and was far more
configurable than a custom developed one. Furthermore, it accommodated options for
adjusting largely the contents and appearance on a regular basis, incorporating
thousands of ready-to-use design templates and many supplementary features, which
allowed the user to easily set-up and manage the website or e-commerce store. Finally,
all the required adjustments could be implemented in significantly less time and without
any additional costs compared to custom developed software where beside the higher
costs, one have to dedicate a large amount of time for development purposes.
The product was designed to be sold on a market shelf in a commercial paper box that
included a detailed three-step guide and a compact disk containing video tutorial. Since
the goal of the founders was to position the product in all the biggest IT store chains in
the Republic of Macedonia. This innovative way of sale allowed them to increase the
number of sales channels. InoTek entered the market by signing consignation
agreements with three major IT store chains. By using this model, the InoTek’s team
placed the product boxes in more than 20 IT stores and gained a network of more than
25 well-trained sales representatives. The IT stores salespersons who examined
InoTek’s product were all impressed with the software’s capabilities as InoTek’s
solution provided great features at a good price.
353

Olga Popovska et al.
InoTek’s marketing efforts began at the same time as the launch of the product. A
small-scale online marketing campaign was launched to increase the awareness of
potential customers about the new product. Furthermore, a number of potential
consumers arranged appointments with InoTek’s sales team, however, none of them
had the intention to purchase the product and all were interested in a custom software
solution.
InoTek’s team also did regular follow-ups with the sales representatives in the IT
stores. Their feedback was noted and showed that the interest in the product was
present. However, results from the twelve months sales in the IT stores was far from
positive since no sales were made. In order to excite the product, InoTek gave five free
of charge products randomly to potential customers. All customers were informed that
the product was free of charge and the only fee they would need to pay was for the
domain name and the hosting fee. After two weeks of continuous calls for reminding
the customers to activate the product, none of them did. Moreover, the researcher
carried out lengthy telephone interviews with all five customers in order to evaluate the
reasons behind their unwillingness to adopt the e-commerce solution.
Since no actual sale of the product was achieved, InoTek realized that the product was a
complete failure and recalled all products from the IT stores. At the time of publication,
InoTek is not in business anymore.
4. Case Study Analysis
The case study analysis is conducted using the PERM framework proposed by Molla
and Licker [10]. The “Perceived E-Readiness Model” (PERM) postulates that the
adoption of a given technology is determined by a combination of both perceived
organizational e-readiness (POER) and perceived environmental e-readiness (PEER).
POER is defined as the degree managers believe that their organization has the
awareness, resources, commitment, and governance to adopt e-commerce while PEER
as the degree to which managers believe that market forces, government, and other
supporting industries are ready to aid in their organizations’ e-commerce
implementation [10].
This research will apply the proposed model to the information contained in the case
study of InoTek and thus, using the proposed variables in the model, we will conduct a
qualitative analysis of the organizational and environmental factors that influence the
adoption of the company’s e-commerce software. The definitions of the PERM
variables used in this case study analysis are identical to the definition by Molla and
Licker [10].
354

Factors influencing the successful adoption of an innovative e-commerce product: single case study
4.1. Perceived Organizational E-readiness (POER)
In order to measure the POER factors, we will use the information obtained by
telephone interviews made with the five companies’ representatives that were given the
software free of charge and which did not adopted it. Hence, these measures represent
the level of perceived e-readiness of these five companies.
Awareness -The awareness of e-commerce among the interviewed companies was not
very high. Most of the interviewed managers were convinced that e-commerce is a
western trend, which is not yet applicable to our environment. However, many of the
managers answered that they are aware of the potential benefits that the adoption of e-
commerce can bring and thus, it is something that they are considering.
Commitment - The commitment for e-commerce among the interviewed companies
was non-existent since none of them had a clear vision of e-commerce, or a strategy for
its implementation.
Governance - The interviewed companies also scored very low on this variable since
their organization was not aligned for e-commerce adoption. Hence, not only they did
not have clearly defined roles for the adoption of e-commerce, but also they did not
have any employees to guide the initiative in the first place.
Human resources - The interviewed companies had a strong score on this variable, as
almost all of their employees were computer literate and had unrestricted access to
computers.
Technological Resources - In general, the interviewed companies scored low on this
measure as the majority of them had limited experience in working with network-based
applications and did not possess technical resources to implement e-commerce.
Furthermore, the majority of them had systems that were not flexible.
Business Resources - The interviewed companies also scored very low on this measure
as the majority of them reported that they do not have the adequate capabilities to use
the e-commerce software. Furthermore, they also reported that their organization is not
very open to innovative solutions since they are not capable of dealing with rapid
changes.
4.2. Perceived environmental e-readiness (PEER)
In order to measure the PEER factors, we will use the Global Information Technology
Report 2013. The report is regarded as the most authoritative and comprehensive
assessment of how ICT affects the competitiveness and well-being of nations [14], [15].
Government’s e-readiness - Government e-readiness in Macedonia tends to be very
high. The Global Information Technology Report 2013 shows that on the question
“How would you assess your country’s laws relating to the use of ICT (e.g., electronic
355

Olga Popovska et al.
commerce, digital signatures, consumer protection)? [1= highly undeveloped, 7 = well
developed], Republic of Macedonia is ranked 62nd with a score of 4.1 points out of 7.
Regarding the Importance of ICTs to government vision of the future, Republic of
Macedonia is ranked 61st with a score of 4.1. In 2012/2013 regarding this question
Republic of Macedonia is ranked 29th with a score of 4.6 and in 2015 Republic of
Macedonia continues to progress by 10 more places and it is ranked 19th out of 143
countries with a score of 4.9 points [14].
Market forces’ e-readiness - Market forces e-readiness in Macedonia tends to be high.
On the question: “In your country, to what extent do businesses use ICTs for
transactions with other businesses?” Macedonia is ranked 56th with score of 5.0. On
the other hand, 68.3% of the households in Macedonia have personal computers, and
61.9% have Internet access [14].
Supporting industries’ e-readiness - Supporting industries e-readiness in Macedonia
tends to be high. The level of competition index for Internet services, international long
distance services, and mobile telephone services in Macedonia on a scale from one to
two, is rated one. Furthermore, the telecommunication infrastructure can be considered
reliable and efficient to support e-commerce and e-business in Macedonia. International
Internet bandwidth (KB/s) per Internet user in 2013 or more recent, is 36.4, when in
Hong Kong in same year ranked 2nd has 1,939.5 (KB/s) per Internet user. The number
of secure Internet servers per million inhabitants scores 28.6 according to the Global
Information Technology Report 2013 [14].
5. Conclusion
Most of the studies regarding the adoption of e-commerce in developing countries are
focused on a macro level and environmental constraints; however, clearly those factors
are not the only constraints. The organizational factors tend to be more important and
pose a significant barrier [10]. By implication, a multilevel model is essential to
explicate the diffusion of e-commerce in developing countries. The results indicate that
firms in developing countries should pay attention to both organizational and
environmental considerations when making e-commerce adoption decisions.
Our findings confirm these earlier arguments against considering just the environmental
factors since the analysis showed that besides the somewhat favorable environment for
e-commerce adoption in the Republic of Macedonia, the companies who obtained the e-
commerce software failed to do so. Even though they were aware of the potential
benefits of its adoption and use, they considered the product being “ahead of their
time”, a product that they are not prepared for yet. Hence, our findings suggest that
creating an environment supportive of adoption of new technologies is not enough, as
organizational factors also play a very important role. One company’s resources,
commitment, and awareness could be either the key to success or detrimental for the
implementation of different technologies.
356

Factors influencing the successful adoption of an innovative e-commerce product: single case study
A limitation of this research was the small sample size of only 5 companies. Therefore,
the possibilities for a further research are present.
6. References
1. Gibbs, Jennifer L., and Kenneth L. Kraemer. "A cross‐country investigation of the
determinants of scope of e‐commerce use: an institutional approach." Electronic Markets.
(2004)
2. Bui, Tung X., Siva Sankaran, and Ina M. Sebastian. "A framework for measuring national e-
readiness." International Journal of Electronic Business. (2003)
3. Kraemer, Kenneth, Jennifer Gibbs, and Jason Dedrick. "Environment and policy factors
shaping e-commerce diffusion: A cross-country comparison." ICIS 2002 Proceedings. (2002)
4. Liang, Ting-Peng, and Jin-Shiang Huang. "An empirical study on consumer acceptance of
products in electronic markets: a transaction cost model." Decision support systems. (1998)
5. Dada, Danish. "E-readiness for developing countries: Moving the focus from the
environment to the users." The Electronic Journal of Information Systems in Developing
Countries. (2006)
6. Paré, Daniel J. "Does this site deliver? B2B e-commerce services for developing countries."
The Information Society. (2003)
7. Maugis, Vincent, et al. "Global e-readiness - For what? Readiness for e-banking."
Information Technology for Development. (2005)
8. Al-Solbi, Ali, and Pam J. Mayhew. "Measuring e-readiness assessment in Saudi
organisations preliminary results from a survey study." From E-government to M-
government, Mobile Government Consortium International LLC. (2005)
9. Molla, Alemayehu. “The impact of e-readiness on ecommerce success in developing
countries: firm-level evidence.” University of Manchester. Institute for development policy
and management. (2004)
10. Molla, Alemayehu, and Paul S. Licker. "eCommerce adoption in developing countries: a
model and instrument." Information & management. (2005)
11. Ali, Hayat, and Amal Alrayes. "An Empirical Investigation of the Effect of E-Readiness
Factors on Adoption of E-Procurement in Kingdom of Bahrain." International Journal of
Business and Management. (2014)
12. Schell, Charles. "The value of the case study as a research strategy." Manchester, UK:
University of Manchester, Manchester Business School. (1992)
13. Wojnar, Danuta M., and Kristen M. Swanson. "Phenomenology an exploration." Journal of
holistic nursing. (2007)
14. Dutta, Soumitra, Thierry Geiger, and Bruno Lanvin. "The global information technology
report 2015." World Economic Forum. (2015)
15. Bilbao-Osorio, Beñat, Soumitra Dutta, and Bruno Lanvin. "The global information
technology report 2013." (2013)
357

International Conference on Applied Internet and Information
Technologies, 2016
DOI:10.20544/AIIT2016.44
On the Pulse of ICT Revolution, Productivity, and
Growth: Macedonia versus European Union
Olivera Kostoska1 and Ilija Hristoski1
1 Faculty of Economics, Marksova 133,
7500 Prilep, Republic of Macedonia
olivera.kostoska, [email protected]
Abstract. Information and Communication Technologies (ICTs) have become
more accessible, more powerful and more widespread. Yet, the use of ICTs is not
an end in itself. The impact that such technologies have on the economy and
society is what ultimately matters. Understanding the economics of ICTs requires
a deep and thorough knowledge of how the new technology generates the
economic impacts. The ICT revolution holds the transformative potentials,
offering many promises and benefits, even while posing severe risks and
challenges. Therefore, it is of great importance and still a challenge to measure
the capacity of countries to leverage ICTs for increased competitiveness and well-
being. Aimed at reaching such a complex task, this paper employs the extensive
data compendium of the Networked Readiness Index (NRI) 2015 and a set of
supplemental data analysis tools (descriptive statistics, five-number summary
statistics and a Box & Whisker plot, Euclidean and statistical distances,
hierarchical cluster analysis and a corresponding dendrogram) to estimate both
the performance of Macedonia in the NRI and the country’s relative position vis-
à-vis the EU member states. Looking at the trends since 2012 reveals that
Macedonia is one of the ten most improved countries in their overall NRI
performance. Nevertheless, the findings suggest that the country is lagging behind
the European average in most indicators. The EU member states with the shortest
statistical distance from Macedonia are Croatia, Cyprus, Romania, Hungary and
Slovenia. Quite the reverse, the Nordics (Finland, Sweden and Denmark) and
Western Europe (Luxemburg, Netherlands and UK) are the most ‘distant’
countries from Macedonia. These latter findings confirm the results obtained by
the five-number summary statistics and the hierarchical cluster analysis.
Keywords: ICTs, NRI 2015, productivity, growth, Macedonia, European Union.
1. Introduction
Technology has incredible power to promote economic growth, improve people’s life
and make opportunities for individuals, companies and nations worldwide. Nowadays,
everyone is faced with living an age of unparalleled digital disruption, with huge
amounts of technology-driven change, enormous innovation and substantial
development in the ways people use technology. The digital economy, which refers to
economy empowered by digital technologies, is developing rapidly around the globe. In
358

Olivera Kostoska et al.
point of fact, such technologies accounted for more than 21% of gross domestic product
(GDP) growth in the most advanced economies of the world in the past five years,
while the European Union (EU) digital economy is growing at 12% each year and is
now bigger than the Belgian national economy [1]. New digital trends, such as smart
grids, mobile web services, cloud computing and social media, are drastically changing
the business landscape, redesigning the boundaries of firms, the nature of work and the
responsibilities of business leaders. These trends permit more than mere technological
innovation. They stimulate innovation in the business models, business networking and
transfer of knowledge and access to international markets.
The rising importance of the digital economy is demonstrated in a number of
ambitious EU-level policy proposals and targets which have been set in the Digital
Agenda for Europe. Launched in 2010, it contains more than 100 actions to ensure that
digital technologies are used to stimulate Europe’s economy and help the businesses
and citizens to get the most out of these technologies. The Digital Agenda is actually
one of the seven pillars of the Europe 2020 Strategy, which sets objectives for the
growth of the EU by 2020. This Agenda intends to define the key enabling role that the
use of ICTs will have to play if Europe wants to succeed in its aspirations for 2020.
“The ICT sector is directly responsible for 5% of European GDP, with a market value
of € 660 billion annually, but it contributes far more to overall productivity growth
(20% directly from the ICT sector and 30% from ICT investments). This is because of
the high levels of dynamism and innovation inherent in the sector, and the enabling role
the sector plays in changing how other sectors do business. At the same time, the social
impact of ICT has become significant – for example, the fact that there are more than
250 million daily internet users in Europe and virtually all Europeans own mobile
phones has changed life style” [2].
In fact, ICT has developed into the “general purpose technology” (GPT) to our time,
given the essential spillovers to the other economics sectors, their ability to transform
the economic activities and business practices, and their role as efficient infrastructure
for commercial transactions. Countries with businesses that aggressively incorporate
these new technologies in their production processes tend to have enhanced
productivity improvements than others. It is noteworthy that all stakeholders
(individuals, companies, governments) in the economy are obliged to use these tools in
order to create a real information society that ensures maximum productivity gains from
ICT adoption [3]. However, the evidence reveals that, so far, the ICT revolution has
benefited mostly the rich countries. Unexpectedly, the ICTs have opened up new digital
divide which is, more generally, seen as “the gap between nations which can and cannot
afford the technology, between the businesses and consumers enjoying the advantages
of the Information age and those still awaiting its benefits, as the divide which separates
the haves from the have-nots in the sphere of information, or as the exclusion of those
who are poor, illiterate, rural or non-English speaking” [4]. Even in the most advanced
economies, only certain segments of the population take advantage from ICTs. Progress
made in enhancing national competitiveness may generate or deepen domestic
inequalities if the unconnected become second-class citizens. In the absence of
corrective tools, ICTs may possibly add to a non-inclusive type of growth, thus making
the problem worse instead of mitigating it. To attain the ICT revolution and bridge
digital divides, the countries are required to develop their ICT ecosystems. This entails
long-term, expensive investment in infrastructure and education. “But low-hanging
359

On the Pulse of ICT Revolution, Productivity, and Growth: Macedonia vs European Union
fruits do exist. Governments can create an enabling environment by promoting
competition through sound regulation and liberalization” [5]. In general, if employed
properly, ICTs can generate economic opportunities and promote social and political
inclusion, ultimately contributing to shared prosperity.
Given the transformative power of ICTs and the essential role they have in
improving competitiveness, permitting development and bringing progress to all levels
of society, measuring the extent to which ICTs are used and understanding the
determinants of ICT adoption have become a major concern of researchers around the
globe. In 2001, the World Economic Forum embarked on the Global Information
Technology Report series and the Networked Readiness Index (NRI). This was
essentially a major effort to make conceptual sense of the complex ICT reality,
recognizing the common factors that permit countries to implement technology
effectively. The past 15 years have provided abundant evidence of these advances.
Countries such as Israel, Republic of Korea and Estonia have built their national
competitiveness on ICT products and services. In view of that, this paper implements
the Networked Readiness Index 2015 to measure the capacity of Macedonia in
leveraging ICTs to boost competitiveness and well-being. The country has filed its
candidature to become an EU member state. Thus, Macedonia may become a full
member at some point and must then abide by the EU’s overall goals. This provides a
sense of the challenges it currently faces, and makes the case to estimate the relative
position of Macedonia and its ‘distance’ from the EU member states in the context of
NRI variables. The rest of the paper is organized as follows. Section 2 reviews some
evidence on the impact of ICT on economic growth and productivity. Section 3
introduces description of data and the methodology applied. Section 4 discusses the
main empirical findings. Section 5 concludes and recommends.
2. From the Solow Paradox to the ICT-driven Productivity
Resurgence: an Overview of Literature
ICTs have radically changed societies in the last quarter of the century prompting
unexpected qualitative and quantitative changes. In the course of mid 80s and early 90s,
a strong effort was made to measure the impact of ICTs on growth. The discussion was
inspired by the so-called Solow paradox or productivity paradox, when, in 1987, Nobel
Prize–winning economist Robert Solow noted, “you can see the computer age
everywhere but in the productivity statistics” [6]. While until the early and mid-1990’s
the effects of ICT revolution on growth were not yet fully visible or measurable, by the
end of the nineties, the academic literature agreed on the significance of ICT for the
U.S. growth revival observed from 1995 to 2000. The deferral in recognizing the
importance of ICT in accounting for labor productivity growth can give prominence to
different factors, such as: a lack of precise quantitative measures for the output and
value created by ICT; obstacles to measure productivity in the service sector, which is a
heavy user of ICT; and finally, the total effect of ICT diffusion and use on GDP growth
is expected to be proportional to the ICT capital stock existing in the economy [7].
What the growth accounting literature suggests is that rapid technological progress in
the ICT-producing sector, especially semiconductors, after 1994 led to a rapid drop in
360

Olivera Kostoska et al.
quality-adjusted prices for ICT goods. These trends have been mirrored by the total
factor productivity (TFP) growth in the ICT-producing sectors and ICT capital
deepening in other sectors. This led to productivity growth. Given that the outstanding
performance of the U.S. was not shared by the EU, interest emerged in finding the
reasons for this divergence and trying to understand if the U.S.-EU productivity gap
was in a way attributable to ICTs.
Oliner and Sichel (2000) find that the use of information technology (including
computer hardware, software and communication equipment) made a relatively small
contribution to output and productivity growth through the early 1990s. This
contribution seems to have surged in the second half of the decade. The authors
estimate that “the use of information technology and the production of computers
accounted for about two thirds of the 1 percentage point step-up in productivity growth
between the first and second halves of the decade”. Thus, they conclude that
information technology has been crucial for the increased productivity performance of
the U.S. economy [8]. To assess the robustness of the earlier evidence on the role of
information technology, the authors extend the growth-accounting results. Yet again,
the data confirm a substantial pickup in labor productivity growth and show that, both
the use of information technology and efficiency gains related to production of
information technology were the critical factors behind the observed resurgence [9].
In a similar effort, Schreyer (2000) examines the ICT contribution to economic
growth along with labor and multi-factor productivity. The paper provides an
international perspective displaying results for the G7 countries. The findings suggest
that ICT capital goods have been important contributors to economic growth for all
seven countries, even though the role of ICT has been particularly emphasized in the
U.S. [10]. Furthermore, Colecchia and Schreyer (2002) compare the impact of ICT
capital accumulation on output growth in Australia, Canada, Finland, France, Germany,
Italy, Japan, United Kingdom and United States. The authors draw attention to the fact
that “despite differences between countries, the United States has not been alone in
benefiting from the positive effects of ICT capital investment on economic growth nor
was the United States the sole country to experience an acceleration of these effects.
ICT diffusion and ICT usage play a key role and depend on the right framework
conditions, not necessarily on the existence of a large ICT-producing sector” [11].
The substantial role that information technology played in the U.S. productivity
revival has been additionally confirmed by Jorgenson et al. (2002) [12] and Daveri
(2003). The latter stated that the limited growth-improving effects from information
technologies in countries other than the U.S. have happened in the IT-producing
sectors, while the IT-using industries have contributed bulk of the productivity gains in
the U.S [13].
Oulton (2001) employs a growth accounting approach to the UK and tries to measure
the contribution of ICT to the growth of both aggregate output and aggregate input.
Additionally, US price indices (adjusted for exchange rate changes) are used as
deflators for ICT. The findings suggest that, from 1989 to 1998, the growth of ICT
output contributed about a fifth of overall GDP growth. Since 1989, 55% of capital
deepening has been contributed by ICT capital, and 90% since 1994. In essence, the
UK performance in the second half of nineties resembles that of the U.S. in some
respects. Both countries experienced acceleration in the rate of output growth
accompanied by an upsurge in the contribution of ICT capital deepening. But, “despite
361

On the Pulse of ICT Revolution, Productivity, and Growth: Macedonia vs European Union
the ICT adjustments, the UK growth rate of labour productivity weakens after 1994.
Part of this is due to a fall in the contribution of non-ICT capital but part to a slowdown
in total factor productivity (TFP) growth. By contrast, the US labour productivity
acceleration has been accompanied by a rise in TFP growth (in both the ICT and non-
ICT sectors of the economy). Overall, TFP growth has increased in the United States by
about one half a percentage point, whereas it has fallen in the United Kingdom by about
three quarters of a percentage point” [14].
A recent study summarizing the work in this area is that of van Ark et al. (2008). The
analysis divides Europe’s growth performance relative to the U.S. into three periods:
1950-1973 (labor productivity growth in the EU came with catching-up in terms of per
capita income levels with the U.S. The key factors behind this period of catch-up were
technology imitation and the new institutions); 1973-1995 (the “golden age” of post-
World War II growth came to an end rather abruptly in the early 1970s, followed by a
period of substantially slower growth lasting almost two decades on both continents);
and 1995-2006 (the pattern of productivity growth between Europe and U.S. changed
radically. The U.S. average annual labor productivity growth accelerated, while that of
the EU declined. By 2004, GDP per hour worked in the EU was about 10 percentage
points below the U.S. level). The authors indicate that the European productivity slump
is attributable to the slower emergence of the knowledge economy in Europe compared
to the U.S. They consider different reasons, which are not mutually exclusive, such as:
lower growth contributions from investment in information and communication
technology in Europe, the relatively small share of technology-producing industries in
Europe and the slower multifactor productivity growth that can be observed as a proxy
for advances in technology and innovation. The paper underlines that market service
sectors are crucial in accounting for the productivity growth divergence between the
two regions. Hence, the authors argue that improved productivity growth in European
market services is needed so as to evade a further widening of the productivity gap [15].
3. Methodology and Data
Since 2001, the Global Information Technology Report series published by the World
Economic Forum in partnership with Cornell University and INSEAD has measured the
drivers of ICT revolution by means of Networked Readiness Index (NRI). In essence,
the Index measures the propensity and readiness for countries to exploit the
opportunities offered by ICTs. The networked readiness framework relies on several
principles, such as [5]: a) a high-quality regulatory and business environment is
essential to fully leverage ICTs and produce impact; b) ICT readiness (ICT
affordability, skills and infrastructure) is a prerequisite to generate impact; c) fully-
leveraging ICTs involves a society-wide efforts; d) the impact that ICTs have on society
and economy is something that ultimately matters; e) the set of drivers (environment,
readiness and usage) interact and reinforce each other to construct a virtuous cycle; f)
the networked readiness framework should deliver a clear policy guidance. Such
framework underpins the Networked Readiness Index and has been intended to provide
direction for policymakers on the factors they need to consider for taking maximum
advantage of ICTs in their growth strategies. Recently, the debate has moved from the
point of ensuring access to the issue of how to make the best use of ICTs so that
362

Olivera Kostoska et al.
business innovation, governance, social cohesion and citizens’ political participation
may improve. Given this shift in emphasis, the Impact subindex was added to the NRI
framework in 2012 [16]. Technically, the NRI 2015 is a composite indicator made up of
4 main subindexes, 10 pillars and 53 individual indicators distributed across the
different pillars (Fig. 1). The computation of the Index is based on successive
aggregation of scores from the most disaggregated level (i.e. the indicator level) to the
highest level (i.e. overall NRI score).
Fig. 1. The complex structure of the Networked Readiness Index 2015
(Source: World Economic Forum, 2015; authors’ original representation)
This paper uses the relevant data1 provided by the Global Information Technology
Report 2015 as a secondary data source to carry out two types of analyses by means of
the NRI ranks and values. The first one refers to a descriptive analysis of the NRI
scores for Macedonia in order to assess the country’s overall position and performance
on a global scale, while the second estimates the NRI performance of Macedonia vis-à-
1 The dataset on the NRI indicator values and ranks is publicly available, and can be freely
accessed at http://www3.weforum.org/docs/WEF_NRI_2012-2015_Historical_Dataset.xlsx.
363

On the Pulse of ICT Revolution, Productivity, and Growth: Macedonia vs European Union
vis the EU-28 member states. Based on descriptive statistical methods, the latter opts to
evaluate the percentage change (as a measure of deviation) between NRI 2015 indicator
values for Macedonia with reference to the EU-28 mean values. With the aim of
visualizing the best and worst performers and the interquartile range (from the 75th
downto the 25th percentile) by NRI pillars, we further implement a five-number
summary statistics accompanied by a corresponding Box & Whisker plot. Moreover,
the article uses both the Euclidean and statistical distances, as well as the hierarchical
cluster analysis approach to measure the country’s ‘distance’ from each EU member
state within the multi-dimensional dataspace.
Given that the measurement scales of the indicator values differ in the original
dataset, we conduct, prior to introducing the concept of distance, a Min-Max scaling
(i.e. normalization) data pre-processing technique to a number2 of NRI indicator values
in order to convert the input data into a unified range of values on a 1-7 scale (the
lowest and the highest score possible). As an alternative approach to Z-score
normalization/standardization, the Min-Max normalization scales the data a[i] within an
array to new values a[i], that belong to a fixed, pre-defined bounded range [x, y], as in
(1). For those NRI indicators3 set to obtain worse outcomes at higher values and vice
versa, the Min-Max formulation translates into (2), so that we could still preserve the
lowest (x = 1) and the highest value (y = 7). This approach generally produces smaller
standard deviations in the array, which can suppress the effects of outliers. As such, the
scaling is intended for use in the concept of distance, particularly when the x and y
range of data is known a priori.
' min
max mini
ii
y xa i a i a i x
a i a i
(1)
' min
max mini
ii
x ya i a i a i y
a i a i
(2)
2 These include: Tertiary education gross enrollment rate, % (2.07); Electricity production,
kWh/capita (3.01); Mobile network coverage, % pop. (3.02); Int’l Internet bandwidth, kb/s per
user (3.03); Secure Internet servers/million pop. (3.04); Internet & telephony competition, 0–2
(best) (4.03); Secondary education gross enrollment rate, % (5.03); Adult literacy rate, %
(5.04); Mobile phone subscriptions/100 pop. (6.01); Individuals using Internet, % (6.02);
Households w/ personal computer, % (6.03); Households w/ Internet access, % (6.04); Fixed
broadband Internet subs/100 pop. (6.05); Mobile broadband subs/100 pop. (6.06); PCT patents,
applications/million pop. (7.03); Government Online Service Index, 0–1 (best) (8.02); ICT
PCT patents, applications/million pop. (9.02); Knowledge-intensive jobs, % workforce (9.04);
and E-Participation Index, 0–1 (best) (10.04).
3 These include: Software piracy rate, % software installed (1.07); No. procedures to enforce a
contract (1.08); No. days to enforce a contract (1.09); Total tax rate, % profits (2.03); No. days
to start a business (2.04); No. procedures to start a business (2.05); Prepaid mobile cellular
tariffs, PPP $/min. (4.01); Fixed broadband Internet tariffs, PPP $/month (4.02).
364

Olivera Kostoska et al.
The Euclidean distance, Dij, is a well-known measure of distance between two
observations, i and j, in a p-dimensional dataspace. Assuming that i represents the
Republic of Macedonia, j (j = 1, …, 28) – the EU member states, pk (k = 1, 2, …, 53) –
NRI 2015 indicators, xik (k = 1, 2, …, 53) – the indicator values for Macedonia, and xjk
(j = 1, …, 28; k = 1, 2, …, 53) – the indicator values for each EU country, the Euclidean
distance is given by (3).
2
1
p
ij ik jk
k
D x x
(3)
The statistical distance, SDij, is obtained from Euclidean distance, once the latter is
adjusted to take into account the variance of the variables, 2
ks , as in (4).
2
1
pik jk
ij
k k
x xSD
s
(4)
In (4), sk stands for a standard deviation of the variable pk (k = 1, 2, …, 53).
Hierarchical cluster analysis (HCA) is one of the most commonly used exploratory
techniques for identifying data structures. As with other clustering algorithms, HCA
separates the groups (clusters) of similar cases/observations, based upon their scores on
a set of Interval/Ratio-level measures. By virtue of clustering variables together in a
manner somewhat similar to the factor analysis, HCA produces a series of models with
cluster solutions generally ranging from 1 (all cases are classified into a single cluster)
to N (all cases belong to an individual cluster). In fact, hierarchical cluster analysis is an
agglomerative method where all cases start in their own distinct cluster. The two
‘closest’ (most similar) clusters are then combined - a step that repeats until all cases are
placed into a minimally specified number of clusters (ultimately, into a single cluster).
At the end, the optimal number of clusters is specified out of all cluster solutions.
Given that the number of clusters is not predefined, we consider this kind of
multivariate statistical analysis the most appropriate to conduct here. Our goal is to
provide clusters of countries that reliably distinguish from each other in terms of their
intrinsic characteristics vis-à-vis all 53 NRI indicator values, which represent Interval-
level measures on a 1-7 scale.
The HCA analysis conducted here includes five different cluster solutions (N = 2 to
N = 6 clusters). This is because we keep in mind that there is always a trade-off
between the number of clusters and their sizes, i.e. the more the clusters are, each of
them contains more homogeneous, yet smaller group of countries.
When it comes to clustering methods, we have opted for the Ward’s method. The
latter assumes the concept of distance as that of all clusters relative to the grand average
of the sample. Thanks to the use of F value (like ANOVA) that maximizes the
significance of differences between clusters, the Ward's method has the highest
statistical power among other clustering methods. The downside is that this method is
365

On the Pulse of ICT Revolution, Productivity, and Growth: Macedonia vs European Union
prone to outliers and generally tends to produce relatively small clusters of
approximately equal size, which is not always a desirable feature.
Finally, we have opted for the Squared Euclidian Distance measure, which is the
most commonly used measure for scale data, primarily for its ability to increase the
importance of large distances, while gravely weakening the position of the small ones.
4. Empirical Findings
The NRI 2015 covers 143 economies, which jointly account for 98.4% of world GDP.
Not surprisingly, advanced economies perform better in leveraging ICTs than
developing ones. In essence, the position of countries in the NRI mirrors their
performance on the development ladder, i.e. a higher level of income is usually related
to a higher NRI score. Singapore tops the 2015 rankings, while seven of the top ten
economies are European. “In Europe, Northern and Western Europe are home to some
of the best connected and most innovation-driven economies in the world. In particular,
the Nordics - Finland (2nd), Sweden (3rd), Norway (5th), Denmark (15th), and Iceland
(19th) – continue to perform well in the NRI. Indeed, these five countries have featured
in the top 20 of every edition since 2012” [5]. Similarly, the Western European
economies enjoy a strong group performance, viz. the Netherlands, Switzerland, UK
and Luxemburg all appear in the top ten. Owing to the strong performance of Estonia
and the steady growth of Latvia, which is catching up to Lithuania, the Baltic States are
gradually but surely bridging the gap with the Nordics. These countries are running
away from what was once a rather homogenous group of Eastern European Countries
that have joined the EU since 2004, i.e. the others are either stable or losing the ground
[5]. In essence, the Global Information Technology Report 2015 provides data to
represent a profile for each of the 143 economies covered in the Report.
4.1. Profile of Macedonia in the various NRI dimensions
Looking at the trends since 2012 reveals that Republic of Macedonia is one of the ten
most improved countries4 in their overall NRI performance [5]. With 0.51 points up, the
country has improved its NRI score between 2012 and 2015 along with the obvious
progress seen in the rankings (Fig. 2).
The impressive percentage increase (43.14%) in the value of the 4th NRI pillar
(Affordability) between 2012 and 2015 has largely contributed to such positive trends
(Fig. 3). This exceptional improvement is essentially attributable to the strong
performance of two indicators, i.e. 4.03: Internet & telephony competition [values are in
range 0 to 2 (best)] and 4.01: Prepaid mobile cellular tariffs, PPP $/min. Taking the
value of 1 and 117th position (out of 142 economies) in 2012, the former indicator has
received the best value and climbed to the first place (out of 143) in 2015. The latter
4 In order of score differences, these include: Armenia, Georgia, United Arab Emirates,
Kazakhstan, Russian Federation, El Salvador, Macedonia, Mauritius, Kyrgyz Republic and
Latvia.
366

Olivera Kostoska et al.
exhibits a less impressive but still solid performance both in the value and rank (0.58
and 125, respectively in 2012; 0.15 and 40, respectively in 2015).
66 67
57
47
3.913.89
4.19
4.42
3.6
3.7
3.8
3.9
4
4.1
4.2
4.3
4.4
4.5
0
10
20
30
40
50
60
70
80
2012(out of 142)
2013(out of 144)
2014(out of 148)
2015(out of 143)
NR
I val
ue
NR
I ran
k
Year
Republic of Macedonia: NRI rank and value(2012 - 2015)
NRI rank
NRI value (1-7)
Fig. 2. Republic of Macedonia: NRI rank and value, 2012-2015 (Source: The NRI Historical
Dataset, 2012-2015 World Economic Forum; authors’ original representation)
The percentage increase (17.87%) in the value of the 6th NRI pillar (Individual
usage) is also worth paying attention to (Fig. 3). Hereby, the most interesting features
reveal the indicator related to the use of virtual social networks [measured on a 1-to-7
(best) scale]. Beginning with the 47th place in 2012 (value = 5.7), the country has
gradually moved up to 12th position in 2015 (value = 6.4).
11.29%
9.78%
1.61%
43.14%
4.07%
17.87%
11.39%
5.44%
15.22%
12.90%
0% 5% 10% 15% 20% 25% 30% 35% 40% 45% 50%
1st pillar: Political and regulatory environment
2nd pillar: Business and innovation environment
3rd pillar: Infrastructure
4th pillar: Affordability
5th pillar: Skills
6th pillar: Individual usage
7th pillar: Business usage
8th pillar: Government usage
9th pillar: Economic impacts
10th pillar: Social impacts
Republic of Macedonia: Percentage change in value of NRIpillars (2015 vs 2012)
Fig. 3. Republic of Macedonia: Percentage change in value of NRI pillars (2015 vs 2012)
(Source: The NRI Historical Dataset, 2012-2015 World Economic Forum; authors’ calculations)
367

On the Pulse of ICT Revolution, Productivity, and Growth: Macedonia vs European Union
4.2. Macedonia versus EU: performance in the NRI 2015
This part first discusses and compares the values of each NRI indicator for Macedonia
with reference to the EU mean values, i.e. the percentage change as a measure of
deviation between the respective variables (Fig. 4).
-100%
-80%
-60%
-40%
-20%
0%
20%
40%
60%
80%
100%
1 2 3 4 5 6 7 8 9 10 11 12 13 14 15 16 17 18 19 20 21 22 23 24 25 26 27 28 29 30 31 32 33 34 35 36 37 38 39 40 41 42 43 44 45 46 47 48 49 50 51 52 53
NRI 2015 indicator
Republic of Macedonia vs EU-28: NRI indicator percentage change relative to EU-28 mean values (2015)
Fig. 4. NRI indicators: deviation between Macedonia and the EU-28 mean values (2015)
(Source: The NRI Historical Dataset, 2012-2015 World Economic Forum; authors’ calculations)
The findings suggest that Macedonia is lagging behind the corresponding EU mean
values in most indicators (39 out of 53). Thus far, the largest gap (99.55%) is observed
in the NRI indicator 9.02 (ICT PCT patents, applications/million pop.) that belongs to
the 9th pillar (Economic impacts). This pillar aims to measure the effect of ICTs on the
economy through technological and non-technological innovations in a country and the
overall shift of an economy toward more knowledge-intensive activities [5]. The NRI
indicator 7.03 (PCT patents, applications/million pop.) is the second where Macedonia
is performing worse (99.27%) than the European average. It is noteworthy that this
indicator belongs to the 7th pillar (Business usage), which captures the extent to which
businesses in a country use the Internet for business-to-business and business-to-
consumer operations, as well as their efforts to integrate ICTs in their operations. It also
measures the capacity of firms to come up with new technologies by taking into account
the number of patent applications under the Patent Cooperation Treaty (PCT) [5]. In
essence, there is a body of theoretical work that has sought to explain the motives why
broadband infrastructures could have an impact on productivity (levels and growth).
That is to say, the high-speed Internet, via broadband infrastructures, produces cheaper
and faster exchange of information between economic agents (both within and across
organizations) [7]. This makes a sense to place special emphasis on another critical
example of a major deviation (90.85%) from the EU mean value, viz. the NRI
indicator 3.03 (Int’l Internet bandwidth, kb/s per user) that belongs to the 3rd pillar
(Infrastructure). This last pillar actually captures the state of a country’s ICT
infrastructure, as well as infrastructure that matters for ICT development: mobile
368

Olivera Kostoska et al.
network coverage international Internet bandwidth, secure Internet servers, and
electricity production [5]. All the same, the results also show that Macedonia
outperforms the EU average in a very few instances of indicators. The greatest
difference is actually observed in two NRI variables with relative change of +82.72%
(2.04: No. days to start a business) and +82.32% (2.05: No. procedures to start a
business).
In order to divide among the best- and worst-performing countries and to identify the
interquartile range, we look at the distribution of NRI values for Macedonia and each
EU country by individual NRI pillars (Fig. 5). The five-number summary stipulates that
both Macedonia and the rest of European Union are outperformed at all pillars by the
Western European countries (Austria, Netherlands and Luxembourg), Nordics
(Sweden, Finland and Denmark) and Estonia. On the other hand, the country is better
placed than the worst-performing economies (Bulgaria, Italy, Slovak Republic,
Romania and Greece) and consistently below the median in all cases except the 4th
pillar (Affordability) where it lies above the third quartile. In point of fact, this pillar
assesses the affordability of ICTs in a country through measures of mobile telephony
usage costs and broadband Internet subscription costs, as well as the state of
liberalization in 17 categories of ICT services, because more intense competition tends
to reduce retail prices in the long run [5].
Fig. 5. Box and Whisker plot resembling the five-number summary of the EU-28 member states
+ Republic of Macedonia, to point out the best and worst performers, by NRI pillars (2015)
(Source: The NRI Historical Dataset, 2012-2015 World Economic Forum; authors’ calculations)
369

On the Pulse of ICT Revolution, Productivity, and Growth: Macedonia vs European Union
Next to the previous descriptive measures, the paper further examines the ‘distance’
between Macedonia and each EU country within the normalized NRI space. For that
reason, we use two distance measures, viz. the Euclidean distance and the statistical
distance (Fig. 6). The findings point to a slight difference between the two types of
distance. The EU countries with the shortest statistical distance from Macedonia are
Croatia, Cyprus, Romania, Hungary and Slovenia. Quite the opposite, the Nordics
(Finland, Sweden and Denmark) and the Western Europe (Luxemburg, Netherlands and
UK) are the most ‘distant’ countries from Macedonia. These findings confirm yet again
the results already obtained by the five-number summary statistics.
17.68
16.85
16.52
15.95
14.87
14.81
14.24
14.00
13.57
12.65
12.54
11.85
11.45
11.20
10.39
9.88
9.77
9.67
9.34
8.55
8.47
7.67
7.51
7.07
6.89
6.72
6.61
6.00
0.00
0 5 10 15 20
Finland
Sweden
Netherlands
Luxembourg
United Kingdom
Denmark
Germany
France
Austria
Belgium
Ireland
Malta
Czech Republic
Greece
Slovak Republic
Estonia
Italy
Spain
Latvia
Bulgaria
Poland
Lithuania
Slovenia
Hungary
Portugal
Croatia
Romania
Cyprus
Macedonia
Macedonia vs EU-28: Euclidean distance
15.36
14.29
14.27
14.11
13.12
12.79
11.95
11.69
11.34
11.22
10.88
10.75
10.69
10.36
10.09
9.88
9.10
9.04
9.04
8.60
8.52
8.50
8.35
7.91
7.81
7.66
7.10
7.09
0.00
0 5 10 15 20
Finland
Luxembourg
Netherlands
Sweden
United Kingdom
Denmark
Germany
France
Greece
Belgium
Austria
Italy
Estonia
Ireland
Spain
Malta
Czech Republic
Latvia
Poland
Lithuania
Slovak Republic
Bulgaria
Portugal
Slovenia
Hungary
Romania
Cyprus
Croatia
Macedonia
Macedonia vs EU-28: Statistical distance
(a) Euclidean distance (b) Statistical distance
Fig. 6. Euclidean and statistical ‘distance’ between Macedonia and each EU-28 country (2015)
(Source: The NRI Historical Dataset, 2012-2015 World Economic Forum; authors’ calculations)
The previous findings have finally been completed by the hierarchical clustering
analysis approach. Fig. 7 clearly shows that countries fall into different groups, which
include diverse number of clusters (2-6). It is noteworthy that the group consisting of N
= 4 clusters reflects entirely the grouping of the EU-28 member states relative to
Macedonia with respect to the Euclidean distances, i.e. cluster #4 corresponds to TOP 2
EU-28 countries, followed by those of cluster #1. The same as Macedonia, EU-28
370

Olivera Kostoska et al.
countries, positioned in the bottom half of the Fig. 6 (a), belong to the cluster #2. Table
1 reveals the grouping with four clusters and the member countries thereof. Finally, the
dendrogram presented in Fig. 8 depicts the overall picture of the hierarchical clustering
analysis.
Fig. 7. Cluster membership of the EU-28 countries + Macedonia according to the Ward’s
clustering method and squared Euclidean distance measure (2015)
(Source: The NRI Historical Dataset, 2012-2015 World Economic Forum; authors’ calculations)
Table 1. The membership of EU-28 countries + Macedonia in the solution that relies
on four clusters (Source: The NRI Historical Dataset, 2012-2015 World Economic
Forum; authors’ calculations)
Cluster Country
#1 Austria, Belgium, Denmark, France, Germany, Ireland, Luxembourg,
Netherlands, United Kingdom
#2 Bulgaria, Croatia, Cyprus, Estonia, Greece, Hungary, Italy, Latvia,
Lithuania, Macedonia, Malta, Poland, Portugal, Romania, Slovenia, Spain
#3 Czech Republic, Slovak Republic
#4 Finland, Sweden
371

On the Pulse of ICT Revolution, Productivity, and Growth: Macedonia vs European Union
Fig. 8. Dendrogram depicting the cluster membership of the EU-28 countries + Macedonia
according to the Ward’s clustering method and squared Euclidean distance measure (2015)
(Source: The NRI Historical Dataset, 2012-2015 World Economic Forum; authors’ calculations)
5. Conclusions and Recommendations
As a general purpose technology, ICTs have an influence that extends well beyond the
productivity gains. Those technologies act as a vector of economic and social
transformation by enhancing connectivity, improving access to basic services,
generating employment and business opportunities and shifting the ways people
interact, communicate and engage among themselves and with their governments. With
the Networked Readiness Index 2015 and a set of supplemental data analysis tools, this
paper tries to assess both the ability of Macedonia to leverage ICTs for increased
competitiveness and the country’s relative position vis-à-vis the EU member states. In
an effort to accomplish such a complex task, our empirical analysis aims to provide
372

Olivera Kostoska et al.
guidance to decision makers for those areas where policy interventions may possibly
boost the impact of ICTs on productivity and growth. Apart from the market failures,
worth paying is the evidence that ICTs investment respond more rapidly to demand
shocks than other forms of capital. This implies that programs triggering ICTs
investment may be beneficial for counter-cyclical policies, and this may prove to be
especially important in terms of economic crisis. Though this paper does not explicitly
cover the most appropriate types of policy interventions, a number of indications can be
drawn from the empirical research conducted here.
Namely, the results of the Networked Readiness Index reveal that Macedonia is one
of the ten most improved countries in their overall NRI performance. The awe-inspiring
percentage increase (43.14%) in the value of the 4th NRI pillar (Affordability) between
2012 and 2015 has largely contributed to such positive trends. The percentage increase
(17.87%) in the value of the 6th NRI pillar (Individual usage) is also worth revealing.
All the same, the findings suggest that Macedonia is lagging behind the European
average in most NRI indicators (39 out of 53). Thus far, the largest gap is observed in
the effects of ICTs on the economy through technological and non-technological
innovations in a country (economic impacts), as measured by the number of patent
applications in ICT-related technologies. Similarly, Macedonian companies are falling
significantly behind their EU peers in the capacity to innovate (reflected by the PCT
patent applications per million populations). Another example of a major deviation
from the European average is the NRI indicator (Int’l Internet bandwidth, kb/s per user)
that belongs to the Infrastructure pillar. Improvements hereby are of critical importance
as they can give rise to development of new products and processes and to new business
models (so that broadband infrastructure can be interpreted as an investment promoting
the GPT features of ICT). Furthermore, the five-number summary specifies that both
Macedonia and the rest of European Union are outperformed at all NRI pillars by the
Western Europe (Austria, Netherlands and Luxembourg), Nordics (Sweden, Finland
and Denmark) and Estonia. Hitherto, Macedonia performs better than Bulgaria, Italy,
Slovak Republic, Romania and Greece and is consistently below the median in all cases
except the 4th pillar (Affordability) where it lies above the third quartile. These findings
are confirmed once again in our research efforts to examine the ‘distance’ between
Macedonia and each EU country within the normalized NRI space. The findings point
to a minor difference between the two distances, viz. the Euclidean and the statistical
distance. That is to say, Nordics and the Western European countries (Luxemburg,
Netherlands and UK) are the most ‘distant’ from Macedonia, while Croatia, Cyprus,
Romania, Hungary and Slovenia are those EU member states, which exhibit the shortest
statistical distance from the country. The previous results have been reaffirmed by the
hierarchical cluster analysis. In view of the Euclidean distance, the grouping of
countries in four clusters has proven to match the exact ordering of the EU-28
countries.
References
1. European Commission, Directorate-General for Communication: The EU explained: Digital
agenda for Europe. Luxemburg: Publications Office of the European Union (2014). [Online].
Available: http://europa.eu/pol/index_en.htm; http://europa.eu/!bY34KD
373

On the Pulse of ICT Revolution, Productivity, and Growth: Macedonia vs European Union
2. European Commission: Communication from the Commission to the European Parliament,
the Council, the European Economic and Social Committee and the Committee of the
Regions. A Digital Agenda for Europe, Brussels (2010)
3. World Economic Forum: The Europe 2020 Competitiveness Report: Building a More
Competitive Europe, Geneva (2014). [Online]. Available: www.weforum.org/Europe2020
4. Gourova, E., Herrmann, C., Leijten, J., Clemens, B.: The Digital Divide - a research
perspective. Report to the G8 Digital Opportunities Task Force, IPTS. (2001)
5. World Economic Forum: The Global Information Technology Report, Geneva (2015).
[Online]. Available: www.weforum.org/gitr
6. Solow, R.: We’d Better Watch Out. New York Times Book Review (1987)
7. Biagi, F.: ICT and Productivity: A Review of the Literature. JCR Technical Reports.
Institute for Prospective Technological Studies. Digital Economy Working Paper 2013/09.
Luxemburg: Publications Office of the European Union (2013)
8. Oliner, S. D., Sichel, D.: The Resurgence of Growth in the Late 1990s: Is Information
Technology the Story?. Journal of Economic Perspectives, Vol. 14, No. 4, 3-22. (2000)
9. Oliner, S. D., Sichel, D.: Information technology and productivity: where are we now and
where are we going?. Journal of Policy Modeling 25, 477-503. (2003)
10. Schreyer, P.: The Contribution of Information and Communication Technology to Output
Growth: A Study of the G7 Countries. Organisation for Economic Co-operation and
Development, Paris, France. (2000)
11. Colecchia, A., Schreyer, P.: ICT Investment and Economic Growth in the 1990s: Is the
United States a Unique Case?: A Comparative Study of Nine OECD Countries. Review of
Economic Dynamics, Vol. 5, Issue 2, 408-442. (2002)
12. Jorgenson, D. W., Ho, M. S., Stiroh, K. J.: Projecting Productivity Growth: Lessons from the
U.S. Growth Resurgence. Economic Review, Vol. 87, No. 3, 1-13. (2002)
13. Daveri, F.: Information Technology and Productivity Growth Across Countries and Sectors.
IGIER WP 227. (2003)
14. Oulton, N.: ICT and productivity growth in the United Kingdom. Bank of England (2001).
[Online]. Available: http://www.bankofengland.co.uk/archive/Documents/historicpubs/
workingpapers/2001/wp140.pdf
15. Van Ark, B., O’Mahony, M., Timmer, M. P.: The Productivity Gap between Europe and the
United States: Trends and Causes. Journal of Economic Perspectives, Vol. 22, No. 1, 25–44.
(2008)
16. Dutta, S., Bilbao-Osorio, B., Geiger, T.: The Networked Readiness Index 2012:
Benchmarking ICT Progress and Impacts for the Next Decade. The Global Information
Technology Report, World Economic Forum, Geneva. (2012)
374

International Conference on Applied Internet and Information
Technologies, 2016
DOI:10.20544/AIIT2016.45
Analyisis of digital marketing and branding for the
purpose of understanding the consumers in digital age
Slađana Borić1, Sanja Stanisavljev1, Mila Kavalić1, Marko Vlahović1, Erika
Tobolka1
1 University of Novi Sad, Technical faculty “Mihajlo Pupin”, Đure Đakovića bb,
23000 Zrenjanin, Serbia [email protected] [email protected] [email protected]
Abstract. The changes have brought us a new age – “the digital age” and this age
has brought us some new challenges that seek to solve the problems of
organization in a new way. The digital age, as far as branding is concerned, has
brought many advantages to the organization and it can be an extremely valuable
marketing tool, but only if the organization manages to gain a positive
relationship between the brand and consumers and if it has a proportional
advantage in comparison to its opponents; because, on the other hand, besides all
advantages it brings us, the digital age can set up many traps. This paper is about
the current situation in the global market and pays our attention to some segments
of business which are important in digital age for subsistence and the success of
an organization. It presents the current awareness of consumers and their way of
thinking and acting. The purpose of this paper is to point out conceptual
frameworks of branding in Internet form, to show how those frameworks can help
marketing planners by organizing and integrating the existing knowledge in
development of successful strategies of branding on the Internet. A real example
of one of the leading global brands that succeeded to win the challenges of the
digital age will be presented in this paper.
Keywords: digital age, digital marketing, Internet, branding, consumers.
1. INTRODUCTION
Modern business is characterized by frequent changes, that changes are rapid and often
unpredictable. With the development of technology, digitization, the advent of Internet
and changes that came with it, and will come, the market is becoming digital. The
information is more accessible to manufacturers and consumers, and they should be
used in the best possible way. Communicating on market is the key hypothesis for
successful business of one organization. Organizations usually have different ways of
communication, creating and conveying a special and perfectly clear message which is
assigned to the consumer. By the appearance of modern technology and digital age, a
change in attitude and awareness of consumers has happened which will be shown more
detailed in this paper, some consumers are identified with traditional media, and
younger modern generations apply digital media as a method of informing and
shopping. Each type of media proffers some advantages as well as the constraints in the
meaning of creativity. Today it is not enough to publish the message in different media,
it is necessary to direct the marketing in media on what is important for the people, with
special accent on additional product value.
375

Slađana Borić et al.
2. THE METHODOLOGY AND DISCUSSION
The methodology is based on an analysis of several literary and research sources and
the purpose of this paper is to highlight the importance of digital marketing and
advertising as key to attract consumers. This paper present an theoretical research,
where the application of analysis, synthesis and comparison of relevant literature
sources and research, given inclusive thinking on the subject.
Questions that were analyzed in this paper are the following: RQ1: Reviewing of the
new - digital age, and the advantages which it is provided? RQ2: Comparison of
traditional and digital marketing / advantages and disadvantages? RQ3: Relationship
between the digital age and the consumers?
The answers to these questions created the image of the current situation, through
this paper.
2.1. THE NEW – DIGITAL AGE
Modern marketing denotes a business activity which connects production with
consumption in such a way to satisfy the needs of a society which appear on the market
as the demand in a profitable way [1]. One of many definitions of marketing says that
marketing represents the art of finding and keeping the consumers. Branding
contributes to both goals, especially to keeping the consumer which is more important
and valuable. The relationship between the cost of keeping and the price of the product
is much more favorable than the relationship between the cost of acquiring a new
customer and the same price of the product. The increment of customer retention, rating
by 5%, can increase profitability by 35% to 95% depending on activity [2]. In not so
distant past, the commercial functioned in a simple way. Brand messages that are
brilliantly creative, found their way to consumers through various forms of media,
through television, newspapers, and sometimes in the form of electronic mail.
Consumers familiar with the brand through these media could choose and purchase a
product or service. Instinct and brand recognition led to the purchase. Consumers had
very little information in order to be able to make rational decisions. Consumers would
compare the products on the shelves and chose a brand that is adequate for them.
Simply put, marketing is the tool that has served and serves for the transmission of
messages from the organization to the consumer.
But, it is different today; consumers have an unlimited amount of information at their
disposal. There is a lot of competition which is strongly deployed in all market
segments, a lot of competitive products and services, sending messages to the
consumer; it has all become a difficult challenge. Fortunately, the digital age has
created new forms of two-way channels that transmit the message to consumers
throughout the market chaos. This can be represented in a following way (Fig. 1.):
376

Analyisis of digital marketing and branding for the purpose of understanding the consumers in digital
age
Fig. 1. The New Digital Marketing: Marketing messages must be fragmented and creatively fed
into various digital channels to reach consumers at the correct moment file [3]
The distribution area of information is unlimited, consumers now know much.
Google connects potential buyers with the presented online opinion, articles, and
reviews. Digital media channels provide the opportunity to develop deep relationships
with consumers more than has ever before been possible. However, the digital age is a
marketing double-edged sword.
The world has become digitized. More than half of the adult world population spends
most of its waking hours, "connected", using the Internet, mobile phone or other digital
media. We conclude that the social web does not belong to anyone, and yet, it belongs
to everyone. The digital era requires the change of all without excuses, all leading
organizations have initiated changes within the organization - one part refers to the
aspect of products and solutions it offers, and the other on the issue of its own
organization and the way it provides services to final users. The digitization is not only
the use of the Internet and mobile applications, it changes the way of work and
production, needed jobs, successful business models, products that the market wants
[4]. Often there is no perception that the job market is changing every few years. It is
noted that the requirements of customers and competitiveness significantly change
every few years in industries such as steel production, telecommunications, healthcare
and entertainment [5]. Globalization and technology are the leading drivers through
which a new level of fragility in the global economy is created. The future is no longer
what it once was, the changes are happening so fast that the ability to accept and adapt
to change has become a competitive advantage; the organization will change or they
will perish.
On this basis, it can be concluded that there are three types of companies:
companies that make things possible,
which view events from the side,
those that wonder what happened.
Marketing challenges faced by today's organizations are:
consumers are becoming more sophisticated and price sensitive,
have no time and seek greater benefits,
recognize that the equality of products from supplier to supplier is increasing,
are less sensitive to manufacturing brand and are increasingly accepting dealers’
brand and generic products,
expect a lot from provided service,
are less loyal to supplier.
377

Slađana Borić et al.
All this indicates that organizations are faced with severe challenges trying to
improve their performance on the market. Wise, market oriented organizations improve:
their own knowledge about customers, technologies to connect customers and
understanding their business [6]. Such organizations are urging their customers to
participate in creating products, are available 7 days a week, 24 hours a day by phone or
via email. They use technologies such as video conferences, sales automation, websites
and Internet and extranet. Such organizations have adopted and apply the digital age. A
premium will be achieved by organizations that have invented new ways of creating,
communicating and delivering value to their target market. On this basis, it is concluded
that organizations fall into two types: those that change and those that disappear.
Table 1. Differences between traditional and digital marketing [7]
Traditional marketing Digital marketing
A closed system Open system
Not transparent Transparent
Mass communication Communication is one to one
Oriented to the product Focused on consumer
The message is created by a
professional
In creating messages participating
consumers
Formal communication Informal communication
Paid Free
In Table 1, we can observe a comparison of traditional and digital marketing:
Traditional marketing is considered to be traditional, because it contains original
and basic methods of marketing and advertising on four basic ways: through the press,
through electronic devices (TV, radio), through direct mail and by phone. Before the
digital era began, those were the basic ways in which we were given the necessary
information about products and services. Digital marketing is marketing that, with the
help of electronic devices such as computers, smart phones, tablets, and sometimes even
a game consoles, connects stakeholders. So, any type of device that can be connected to
the Internet can participate in digital marketing. One of the leading methods and ways
to interpret the digital marketing are social networks, which cannot be imagined without
digital marketing today. The benefits to marketing via social networks are numerous
and largely gained at a very low cost. Through social networks, the company can [8]:
increase product and brand awareness, increase web traffic, increase customer loyalty
and increase success of new product launches.
The essence of digital is the continuous dialogue with the target group, unlike
traditional media where this is not the case. Today the results of digital campaigns are
easily measurable in real time and this has probably had the greatest impact on the
creative process. If the organization is not sure that a creative solution is better, it will
make a one-day test, measure the results and continue with a better option. If a
particular media channel does not work as planned, it will transfer the budget to the one
that proved to be better than expected. The creative process does not stop when the
campaign is launched; only then activities culminate.
378

Analyisis of digital marketing and branding for the purpose of understanding the consumers in digital
age
2.2. THE RELATIONSHIP BETWEEN THE DIGITAL AGE AND THE
CONSUMERS
Organizations have to accept that they do not know their consumers, not anymore. All
researches and data collecting over the past few years can not provide an adequate
picture of modern consumers now. The truth is: the consumer develops much faster
than the organization itself. Today's world is the one in which technology and
information flows will allow the consumers to always be several steps ahead of the
organization. It can be concluded that organizations today do not know enough about
their customers.
Today's consumers’ awareness in the digital age can be presented (Fig. 2.):
Fig. 2. The New Consumer’s Decision Journey: With brand loyalty diminishing, purchase
decisions are increasingly driven by a single critical moment that is generally influenced by
digital channels [3]
We can conclude that the contemporary consumer - digital consumer, conveys the
decision to purchase the brand through one of the three ways:
1. No-loyalty – without the loyalty of consumers who were dissatisfied with a
previous purchase, as if they buy a particular product for the first time, thoroughly
investigate using all available information in order to make a good decision. In this
case also comes to culmination of digital and traditional marketing channels
together into a single valuable proposal that influences the consumer's decision at
the time of purchase.
2. Blind-Loyalty – due to lack of access to information (or the will to use the
technology) or an absolute loyalty to the brand, consumers will continue to buy the
product of the same brand over and over again without considering the alternatives.
They enter the loop of "blind-loyalty" and remain there until they feel the
disappointed by the brand. Through genuine quality products, excellent service and
a feeling of complete experience, all brands should seek to focus their customers
this way.
3. Quasi-loyalty – in the digital world, there is an increasing percentage of consumers
who are satisfied with the last purchase of the brand, but it is possible that under
the influence of various factors they taste the product of another brand. Just a
decade ago, most of these consumers would probably move into the "blind-loyalty"
group and bought the product of a certain brand without question. Today, these
consumers often have critical moment right before buying. By using the wealth of
information that are available to them at this time, consumers will either opt to have
the mood to purchase products from the same brand, or could be affected by one or
379

Slađana Borić et al.
more factors to buy a product of another brand. For "quasi-loyalist" those can be
negative information about the current brand, or positive information about another
brand, which will determine the outcome.
The critical moment, often called the zero moment of truth, the outcome of this
critical moment is defined as: the digital marketing. At the critical moment, consumers
can visit the site via a computer or a mobile phone, can access a social network such as
Facebook and see the experience with the brand, can be informed about a particular
brand, run a search that reveals the most important news about the brand, and opt for
shopping. Digital marketing can and should be applied, in the traditional sense to help
shape and strengthen and perpetuate the image of the brand. From marketing point of
view, loyal consumers make the major capital of an organization.
3. THE EXAMPLES OF DIGITAL MARKETING APPLY IN
COMPANY NIKE
Nike brand has transformed its marketing strategy by accepting digital key strategies
such as the use of analytics, social engagement and "storytelling".
The problem with which the Nike Company faced with is: as one of the biggest
sports brands in the world, Nike brand has not fought for display or distraction for some
time, simply put, for sometime the company has lived from its earlier popularity.
However, the brand has noticed that their traditional strategy of advertising has
contributed less and less as the time passed. The largest market for the Nike brand
products represents the group of young people aged 15 to 25 years, who spend 20% or
more on the Nike brand than any other group [9]. But these generations and buyers,
through changing time and consumer awareness, were looking for the brand that
offered constant changes and innovations, not just the same old thing over and over
again. Nike brand understood that the new approach is needed to win this digital
generation of consumers. The solution was found in the understanding that marketing in
the digital age is the conversation, not a monologue. Nike brand has reduced the cost of
advertising on television and the press by 40% between 2010 and 2012, but has
increased the total marketing budget to $2.4 billion in 2012 [9], which is directed as
follows; Nike brand has chosen to use a combination of technological innovations,
analytics and social media to win a new group of digitally educated consumers.
Engineers and scientists associated with prestigious organizations such as MIT and
Apple are engaged in building an exciting new technology and market research. One of
their biggest achievements was the creation of Nike + products in 2010 - a device that
allows users to monitor their workout, upload results to the web, monitor progress and
share their achievements and experiences socially. It is essential that this new
community is constantly creating incredible amounts of data, which Nike brand uses to
track consumer behavior in online communities and created space for the Nike
supporters and creates meaningful relationships between the brand and its consumers.
Nike has moved its Social Media Marketing team in the homes of the consumers.
Results: Nike's new approach - creating various social digital strategy, which has
achieved continuous communication with the customers and provided data to users,
necessary for further successful business of the company, had great results. It all starts
with understanding the business challenges the brand is faced with. Effective marketing
strategy should be focused on the market; all important decisions must be based on
solid research and data.
380

Analyisis of digital marketing and branding for the purpose of understanding the consumers in digital
age
4. CONCLUSION
Every time has its own rules, so that business activities in business and in life are
effective, it is necessary to adapt and accept the rules. In this case we should accept the
rules of the digital age. In order to become powerful, the brand, to be well-placed on the
market, to guarantee the quality and gain the loyalty of consumers, it is needed a lot of
time, a large number of different experts who will, through the process of creating and
launching the brand in the market, go through a number of different analytical tests.
Today, what helps to isolate a specific brand over its competitors is the emotional value
of the product or “higher value''. Modern consumers are not satisfied with the basic,
default product quality, which is why the creators of the brand and marketing sector
tend to create an adequate emotional component for a specific brand, and thereby
differentiate the product in the minds of consumers. It is extremely important at all
times to bear in mind the wishes of consumers and know their attitudes. Without digital
marketing we have nothing to look for in the digital age, neither as an organization nor
as a consumer.
References:
1. Rocco, F.: Marketing: osnova i načela, Birotehnika, Centar za dopisno obrazovanje, Zagreb.
(1991)
2. Reichheld, F.F.: The Loyalty Effect: The Hidden Force Behind Growth, Profits, and Lasting
Value. Bain & Company, Boston. (1996)
3. Greenberg, E., Kates, A.: Strategic Digital Marketing: Top Digital Experts Share the
Formula for Tangible Returns on Your Marketing Investment. McGraw-Hill Education, New
York City. (2014)
4. Bačelić, M.: Digitalno doba zahtejva promenu svih bez iznimke. (2015). [Online] Available:
http://liderpress.hr/tvrtke-i-trzista/poslovna-scena/digitalno-doba-zahtijeva-promjenu-svih-
bez-iznimke (current November 2015)
5. Slywotzky, J.A.: Value Migration: How to Think Several Moves Ahead of Competition.
Harvard Business School Press, Boston. (1996)
6. Kotler, Ph.: Kotler on marketing: How to create, win and dominate markets, Simon and
Schuster, New York City. (2012)
7. Tomše, D., Snoj, B.: Marketing Communication on Social Networks – Solution in the Times
of Crisis. Časopis za marketing teoriju i praksu – Marketing, Vol. 45, No. 2, 131-138. (2014)
8. Sourabh, B,: Social Media Marketing - A powerful and adaptable approach for achieving
and sustaining positive consumer behavior. International Journal of Software and Web
Sciences (IJSWS), Vol. 1, No. 10, 77-81. (September-November 2014)
9. Vipat, R.: Digital marketing at Nike. (2013). [Online] Available:
http://www.slideshare.net/ojasvipat/final-digital-marketing-at-nike (current November
2015)
381

International Conference on Applied Internet and Information
Technologies, 2016
DOI:10.20544/AIIT2016.46
Evaluating e-Customers’ Satisfaction in B2C e-Commerce:
the Case of Macedonian Students
Ilija Hristoski1, Pece Mitrevski2, Tome Dimovski2, and Zoran Kotevski2
1 Faculty of Economics, Marksova, 133
7500 Prilep, Republic of Macedonia
[email protected] 2 Faculty of Information and Communication Technologies, Partizanska, bb
7000 Bitola, Republic of Macedonia
pece.mitrevski, tome.dimovski, [email protected]
Abstract. The rapid development and adoption of information and
communication technologies (ICTs), especially the vast proliferation of Internet
and Web 2.0 paradigm in the recent years, have profoundly transformed the
traditional ways of doing businesses worldwide. Going virtual has offered the
companies many new possibilities, but it has also revealed many potential
obstacles that have imposed new business strategies. Beyond any doubt, creating
satisfied e-Customers, who will generate more e-Customers, is the best business
strategy of all for online companies. Satisfied e-Customers are the key premise to
attracting new e-Customers and then retaining them on a long term, the two most
important aspects of doing business online. In that context, the paper highlights
some results of an online survey, conducted among college students in the
Republic of Macedonia, regarding their perceived levels of satisfaction vis-à-vis
their B2C e-Commerce purchasing experiences. The statistical analysis of the
survey results is based on the appliance of elements of descriptive and inferential
statistics, as well as linear correlation and factor analysis. As such, the aim of the
paper is to provide a profound knowledge and understanding of how Macedonian
college students evaluate their online shopping experiences.
Keywords: B2C e-Commerce, e-Customer satisfaction, online survey, college
students, Republic of Macedonia.
1. Introduction
The introduction and worldwide propagation of the e-Commerce paradigm have led to
an expansion of the global market and consecutively, have brought numerous benefits
for both sellers and buyers during the last two decades. E-Commerce has emphasized
the generation and exploitation of new business opportunities over the Internet, and has
offered unprecedented possibilities of purchasing wide-ranging gamut of products and
services to an immense number of e-Customers worldwide.
Beyond any doubt, the two most important concepts that Internet companies have to
recognize and continually work on are the Quality-of-Service (QoS) and, consequently,
382

Ilija Hristoski et al.
the e-Customer satisfaction, which are both considered key factors that guarantee their
sustainable competitive advantage and growth on a long term. According to Peter
Drucker1, “quality in a service or product is not what you put into it; it is what the
customer gets out of it”, whilst Michael LeBoeuf2 claims, “a satisfied customer is the
best business strategy of all”. In marketing, the term ‘customer satisfaction’ is defined
as a measure of how products and services supplied by a company meet or surpass
customer expectation. In highly competitive marketplaces like e-Commerce, where
businesses compete for each customer, customer satisfaction is seen as a key
differentiator, which has increasingly become a key element of business strategies [1].
E-Customer satisfaction positively affects an Internet organization’s profitability.
Satisfied e-Customers form the foundation of any successful business since
e-Customers’ satisfaction leads to repurchasing, loyalty, and positive word of mouth.
According to Hansemark & Albinson (2004), “satisfaction is an overall customer
attitude towards a service provider, or an emotional reaction to the difference between
what customers anticipate and what they receive, regarding the fulfillment of some
needs, goals or desire” [2]. E-Customers’ satisfaction is a premise to repurchasing and
e-Customers’ loyalty, which refers to “a deeply held commitment to re-buy a preferred
product or service in the future despite situational influences and marketing efforts
having the potential to cause switching behavior” [3]. In addition, word-of-mouth
advertising, being “an unpaid form of promotion in which satisfied customers tell other
people how much they like a business, product or service”, is highly important for
every business, especially e-Commerce, as “each happy e-Customer can steer dozens of
new ones” [4]. This is completely in line with the popular slogan, “The purpose of a
business is to create a customer who creates more customers.”
The rest of the paper is organized as follows. Section 2 reviews some evidence on
the research in the field, both globally and in the country. Section 3 introduces
description of data and the methodology applied. Section 4 discusses some of the main
empirical findings. Section 5 concludes.
2. Related Research
As e-Commerce prevails in everyday shopping activities throughout the world, a
substantial research endeavors have been taken in order to scientifically assess and
measure the perceived levels of e-Customers’ satisfaction. For instance, Boyd (2002)
has proposed the utilization of the GQIM (goals, questions, indicators, and measures)
approach to the measurement of customer satisfaction with e-Commerce websites,
which has proved effective in helping managers to identify critical business information
[5]. Lin (2003) argues that e-Customer satisfaction is of a critical importance when
measuring perceived customer-delivered value that is offered by e‐Commerce [6].
Kumar & Petersen (2006) have studied how e‐Commerce has affected online
1 Peter Ferdinand Drucker (1909 - 2005) was an Austrian-born American management consultant,
educator, and author, whose writings contributed to the philosophical and practical foundations
of the modern business corporation. 2 Michael LeBoeuf (1942) is an American business author and former professor of management
at the University of New Orleans, USA.
383
Evaluating e-Customers’ Satisfaction in B2C e-Commerce: the Case of Macedonian Students
companies' abilities to serve the e-Customers' needs and to raise their level of
satisfaction [7]. Liu et al. (2008) identify factors that may influence Chinese customers'
online shopping satisfaction from the perspective of total online shopping experience.
They have found that eight constructs – information quality, website design,
merchandise attributes, transaction capability, security/privacy, payment, delivery, and
customer service – are strongly predictive of online shopping customer satisfaction,
while the effect of response time is not significant [8].
Lately, an emerging number of research papers do not deal strictly with e-
Customers’ satisfaction, but rather take into account its relationship with other relevant
aspects, like service quality, loyalty and trust. To name a few, Kassim & Abdullah
(2010) have shown that the perceived service quality have a significant impact on
customer satisfaction, which, in turn, was found to have a significant effect on trust.
Both customer satisfaction and trust have significant effects on loyalty through word of
mouth [9]. In addition, Sheng & Liu (2010) have developed a new conceptual model of
customer satisfaction and loyalty in online purchases, based on four dimensions of
e‐service quality: efficiency, requirement fulfillment, system accessibility, and privacy
[10]. Their results indicate that efficiency and fulfillment have positive effects on
customer satisfaction, and fulfillment and privacy have positive effects on customer
loyalty.
To date, there have been limited research studies that address Macedonian e
Commerce issues, especially those related to e-Customer satisfaction. It is worthy to
mention that Ciunova-Shuleska et al. (2011) have examined how gender and online
shopping experience affect young adults’ attitudes towards online shopping with
college students [11]. Recently, Veseli & Rakipi (2015) have investigated the
relationship between the attributes of the Internet and e-Customers’ satisfaction in the
Republic of Macedonia [12].
3. Methodology and Data
The main objective of this research is to evaluate various aspects of e-Customers’
contentment concerning online shopping activities accomplished by college students in
the Republic of Macedonia. College students are both exceptionally interesting and
suitable population for such research, since: (1) their age range corresponds to the
population that is highly interested in doing online shopping activities; (2) the high
level of their computer and Internet literacy and skills allows them an extensive usage
of Internet technologies; (3) the proliferation and usage rates of smartphones to access
Internet and convey online shopping activities are very high with their population. The
target group involves the students attending all three cycles of study at the “St. Kliment
Ohridski” University in Bitola, Republic of Macedonia, who have had any online
shopping experience previously. Since the sample comprises of college students, i.e. it
is highly specific, it cannot be generalized on the whole population in the country.
Because the objective of the research is a multi-dimensional by its nature, hereby it
will be elaborated through two particular aspects. These include: (1) an evaluation of
the overall personal user experience while shopping online, along with an assessment of
e-Customers’ behavior in the case when the perceived user experience was negative;
384
Ilija Hristoski et al.
and (2) a valuation of e-Customers’ satisfaction regarding various aspects of the
purchasing process.
To accomplish the objectives of the study, a Web-based survey was conducted
among the students during a two-month period (February – March 2016). The sample
data were collected by means of a self-administered online questionnaire, prepared in
Google Forms, and disseminated to all the students on their personal e-Mail accounts,
as well as via faculties’ websites and Facebook groups.
The online questionnaire consisted of two major sections.
The first one was designed to gather the basic, yet most relevant data about the
respondents, including his/her gender, age, faculty attended, ECTS cycle of study, year
of study, employment status, and average personal monthly incomes3.
The questions in the second section were aimed at addressing the two above-
mentioned aspects of respondent’s satisfaction.
4. Analysis Results
The data analysis was accomplished using the IBM SPSS Statistics v20 statistical
software. For each question from the second section, two types of analyses have been
conducted: the first one includes descriptive statistics, whilst the second one involves
both inferential and exploratory data analysis revealing the relationships among some of
the variables included.
After the initial reliability and validity screening, a total of N = 93 responses were
found to be complete and usable for further statistical analyses. Having minded the fact
that the total number of students on the University on all three ECTS cycles of study is
about 8,500, only 1.09% of them have answered the online questionnaire. This finding
is completely in line with the previously elaborated observation that, in general,
e-Commerce B2C activities in the country are still at a very low level, even among the
young population.
Before we continue with specific data analyses by groups of questions, we first
reveal some basic facts about the respondents’ structure.
Regarding the respondents’ gender, out of 93 respondents, N = 48 (51.6%) were
males and N = 45 (48.4%) were females.
The age distribution clearly shows that 50% of the respondents are aged between 21
and 27, with a mean of 24.59, and a standard deviation of 6.024. Half of the
respondents are aged between 18 and 22, and 25% between 22 and 27.
Regarding the ECTS cycle of study the respondents affiliate to, a great majority of
them (N = 59, 63.4%) are undergraduate students, followed by postgraduate students
(N = 19, 20.4%) and doctoral students (N = 12, 12.9%). Specialist studies are attended
by N = 3 (3.2%) of the respondents.
A great number of respondents that yields 2/3 of the sample (N = 62, 66.7%) are
unemployed, whilst in total 1/3 (N = 31, 33.3%) are employed, as follows: N = 16
3 After the preliminary screening of the answers obtained for this particular variable, it was
concluded that respondents’ data were highly controversial and untrustworthy. As such, this
variable was excluded from the latter analyses.
385

Evaluating e-Customers’ Satisfaction in B2C e-Commerce: the Case of Macedonian Students
(17.2%) respondents work in private companies, and N = 15 (16.1%) respondents work
in public institutions.
4.1. Overall personal user experience while shopping online
The evaluation of this issue is conducted using two, mutually related questions. The
first one is “How can you estimate your overall personal user experience when
shopping online?” The respondents’ answers are registered on a five-point Likert scale4.
The relatively high average of 3.87, especially the fact that the modal value is 4,
show that the majority of the respondents (N = 64, 68.8%) had, generally, a ‘mostly
positive’ or ‘exceptionally positive’ personal experience while shopping online, vis-à-
vis a negligible small number of them (N = 3, 3.2%) who had a negative personal
experience. The relatively low standard deviation of 0.863 shows that there is a
relatively small dispersion of the answers around the average score.
According to the group statistics generated by the SPSS Independent-Samples
T-Test, females’ mean score is 3.69, with a standard deviation of 0.763, while males’
mean score is 4.04, with a standard deviation of 0.922. That is, females’ averaged
overall online shopping experience is less positive than males’ one. Since the
significance of the T-Test for Equality of Means is Sig. (2-tailed) = p = 0.048 < 5%, it
can be concluded that there is a significant statistical difference between the
respondents’ answers obtained for the overall online shopping experience vis-à-vis their
gender.
The SPSS Crosstabs Chi-Square Test confirms that there is no significant statistical
difference in the respondents’ answers vis-à-vis their affiliated ECTS cycle of study
(χ2 = 14.622, df = 12, Asymp. Sig. (2-sided) = p = 0.263 > 5%), whilst the SPSS
correlation analysis shows that there is a very weak negative, yet statistically
insignificant linear correlation between the respondents’ answers vis-à-vis their age
(Pearson Correlation = 0.060, Sig. (2-tailed) = p = 0.565 > 5%).
Finally, The SPSS Crosstabs Chi-Square Test shows that there is no statistically
significant relationship between respondents’ answers vis-à-vis their employment status
(χ2 = 11.779, df = 8, Asymp. Sig. (2-sided) = p = 0.161 > 5%).
The second part of this section is dedicated to investigate the e-Customers’ behavior
in the case of a negative online shopping experience, be it assumed or real. The
question we have posed to students was “What would you do if your personal user
experience while shopping online was negative?”.
Almost half of the respondents (N = 46; 49.46%) do not know what would they do if
their online shopping experience was negative, a finding that points out the general
indecisiveness of the young population. However, a significant number of the
respondents (N = 30; 32.26%) are eager not to visit again the e-Commerce website
which caused them a negative online shopping experience.
The SPSS Independent-Samples T-Test shows that there is no significant statistical
difference in the respondents’ answers as opposed to their gender (t = 0.506, df = 91,
Sig. (2-tailed) = p = 0.614 > 5%).
4 The range of values includes 1 = ‘Exceptionally negative’, 2 = ‘Mostly negative’,
3 = ‘Neutral / I don’t know’, 4 = ‘Mostly positive’, and 5 = ‘Exceptionally positive’.
386

Ilija Hristoski et al.
In addition, the SPSS Crosstabs Chi-Square Test confirms that there is no
significant statistical difference in the respondents’ answers against their affiliated
ECTS cycle of study (χ2 = 19.329, df = 18, Asymp. Sig. (2-sided) = p = 0.372 > 5%).
The SPSS correlation analysis shows that there is a very weak negative, and
statistically insignificant linear correlation between the respondents’ answers vis-à-vis
their age (Pearson Correlation = 0.133, Sig. (2-tailed) = p = 0.203 > 5%).
Finally, according to the SPSS Crosstabs Chi-Square Test, there is no statistically
significant relationship between the respondents’ answers vis-à-vis their employment
status (χ2 = 11.945, df = 12, Asymp. Sig. (2-sided) = p = 0.450 > 5%).
4.2. E-Customers’ satisfaction regarding various aspects of the online
purchasing process
In this section, we assess respondents’ satisfaction regarding the key aspects of the
online purchasing process, including product prices, transport costs, shipping speed,
transportation time, product packaging, and product quality. All of these variables are
measured on a five-point Likert scale5.
Table 1 resembles the list of the assessed variables, along with their corresponding
mean values and standard deviations.
Table 1. Evaluation of the respondents’ satisfaction regarding the key aspects
of the online purchasing process, including mean value and standard deviation
(Source: Authors’ calculations)
Variable Mean value St. deviation
Product prices μ = 4.34 σ = 0.699
Transport costs μ = 4.17 σ = 0.868
Shipping speed μ = 3.55 σ = 0.950
Transportation time μ = 3.43 σ = 0.949
Product packaging μ = 3.99 σ = 0.891
Product quality μ = 3.91 σ = 0.816
According to Table 1, respondents are satisfied at most with product prices
(μ = 4.34), transport costs (μ = 4.17), and product packaging (μ = 3.99), whilst they are
not satisfied with the transportation time (μ = 3.43). In all cases, the relatively small
standard deviation (< 1.000) points out the unity of the respondents’ answers vis-à-vis
the assessed variables.
According to the group statistics generated by the SPSS Independent-Samples
T-Test, the highest absolute differences in the mean values between males and females
are present with the variables ‘Product packaging’ (Δ = 0.33) and ‘Product quality’
(Δ = 0.30). Still, the SPSS Independent-Samples T-Test reveals that these two
differences in the mean scores are not statistically significant. For the variable ‘Product
packaging’, t-test = 1.771 (assuming equal variances), df = 91, Sig. (2-tailed) = p =
5 The range of values includes 1 = ‘Extremely unsatisfied’, 2 = ‘Mostly unsatisfied’, 3 = ‘Neutral
/ I don’t know’, 4 = ‘Mostly satisfied’, and 5 = ‘Extremely satisfied’.
387

Evaluating e-Customers’ Satisfaction in B2C e-Commerce: the Case of Macedonian Students
0.080 > 5%, and for the variable ‘Product quality’, t-test = 1.835 (assuming equal
variances), df = 91, Sig. (2-tailed) = p = 0.070 > 5%.
The SPSS Crosstabs Chi-square Test confirms that the observed variables
statistically significantly distinguish neither vis-à-vis the respondents’ affiliated ECTS
cycles of study, a propos the respondents’ age, nor concerning the respondents’
employment status.
However, the SPSS Factor analysis6 performed on the set of these variables points
out the existence of two factors (linear components) with Eigen values above 1.00
(Kaiser’s criterion). The first one that can be referred to as ‘Secondary aspects’,
includes the following variables: ‘Shipping speed’, ‘Transportation time’, ‘Product
packaging’, and ‘Product quality’, whilst the second component, which can be
identified as ‘Primary aspects’, encompasses ‘Product prices’, ‘Transport costs’, and
‘Product quality’ (Fig. 1). After rotation, the first factor yields for 38.742% of the
variance, contrasted to 30.652% of the second one.
Fig. 1. SPSS Rotated Component Matrix, showing the two identified linear components
(factors), and variables’ affiliation to each of them (Source: Authors’ calculations)
5. Conclusion
Despite the obvious limitations of the research results due to the relatively small
number of respondents and the specifics of the sample, the paper significantly deepens
both the knowledge and understanding of how much are Macedonian college students
satisfied vis-à-vis their online shopping experience. This is especially true since it
supplements the very limited research done on this particular subject in the country.
Among other significant findings, the survey results suggest that a great majority of
the respondents had, generally, a positive personal experience while shopping online. In
addition, female respondents’ overall online shopping experience is significantly less
positive than the males’ one. Almost half of the respondents do not know what would
6 The factor analysis has been conducted using the ‘Principal components’ extraction method,
whilst the rotation was performed according to the ‘Varimax’ method. The factor scores were
obtained using the Anderson-Rubin method.
388

Ilija Hristoski et al.
they do if their online shopping experience was negative, a finding that points out the
general indecisiveness of the young population. However, a significant number of the
respondents are eager not to visit again the e-Commerce website, which caused them a
negative online shopping experience. Respondents’ satisfaction is highest with product
prices, transport costs, and product packaging, whilst they are not satisfied with the
transportation time. On the other hand, the group of primary aspects regarding the
online shopping process includes product prices, transport costs, and product quality.
As such, the results provide substantial and profound managerial and theoretic
insights that can serve not only as a solid basis for performing further research
activities, but also they provide valuable conclusions that can be used by online
companies competing in the Macedonian Internet market.
References
1. Gitman, L. J., McDaniel, C.: The Future of Business: The Essentials, Fourth Edition. South-
Western Cengage Learning, Mason, OH, USA. (2008)
2. Hansemark, O. C., Albinsson, M.: Customer satisfaction and retention: the experiences of
individual employees. In Managing Service Quality: An International Journal, Vol. 14, Issue
1, 40-57. (2004)
3. Oliver, R. L.: Satisfaction: A Behavioral Perspective on the Consumer, Second Edition.
Routledge/Taylor and Francis, New York, NY, USA. (2010)
4. Entrepreneur: Word-of-Mouth Advertising. Small Business Encyclopedia (2016).
Entrepreneur Media, Inc. [Online]. Avilable: http://www.entrepreneur.com/encyclopedia/
word-of-mouth-advertising (current March 2016)
5. Boyd, A.: The goals, questions, indicators, measures (GQIM) approach to the measurement
of customer satisfaction with e‐commerce Web sites. In Aslib Proceedings, Vol. 54, Issue 3,
177-187. (2002)
6. Lin, C. C.: A critical appraisal of customer satisfaction and e-commerce. In Managerial
Auditing Journal, Vol. 18, Issue 3, 202-212. (2003)
7. Kumar, S., Petersen, P.: Impact of e-commerce in lowering operational costs and raising
customer satisfaction. In Journal of Manufacturing Technology Management, Vol. 17, Issue
3, 283-302. (2006)
8. Liu, X., He, M., Gao, F., Xie, P.: An empirical study of online shopping customer
satisfaction in China: a holistic perspective. In International Journal of Retail & Distribution
Management, Vol. 36, Issue 11, 919-940. (2008)
9. Kassim, N., Abdullah, N. A.: The effect of perceived service quality dimensions on customer
satisfaction, trust, and loyalty in e‐commerce settings: a cross cultural analysis. In Asia
Pacific Journal of Marketing and Logistics, Vol. 22, Issue 3, 351-371. (2010)
10. Sheng, T., Liu, C.: An empirical study on the effect of e‐service quality on online customer
satisfaction and loyalty. In Nankai Business Review International, Vol. 1, Issue 3, 273-283.
(2010)
11. Ciunova-Shuleska, A., Grishin, M., Palamidovska, N.: Assessing young adults’ attitudes
toward online shopping in the Republic of Macedonia. In Ekonomski pregled, Vol. 62, Issue
12, 752-772. (2011)
12. Veseli, T., Rakipi, R.: The relationship between the attributes of the Internet and consumers’
satisfaction: a study of e-Commerce in Macedonia. In Proceedings of the 4th REDETE
Conference (Researching Economic Development and Entrepreneurship in Transitional
Economics). Graz, Austria (in press). (2015)
389

International Conference on Applied Internet and Information
Technologies, 2016
DOI:10.20544/AIIT2016.47
Online Loans – New Business model on the Macedonian
Financial Market
Marina Blazhekovikj Toshevski1
1 Faculty of information and communication technologies, Partizanska bb,
7000 Bitola, Macedonia
Abstract. As a result of new technological developments, every day we witness
of new business models and new online products that make daily life. One of
these business models and new online financial products that this model offers
and which recently appeared on the Macedonian financial market is iCredit or
Easycredit model as it is called in some countries. It is an iCredit new model of
financial services that enables to get quick loans to certain amounts, for which the
application is online. The purpose of this paper is to provide more detailed
information on this new business model and new products that it offers and will
be made analysis of its strengths and opportunities, but also be made and the
comparative analysis of the product in the countries where is used. It will be
presented an overview of the issues that most users would set up if decide to
choose some of the types of online loans.
Keywords: internet technology, loans, online loans
1. Introduction
Today, in modern and dynamic operating environment, the great advantage is the use of
electronic commerce. The latest technological advancements facilitate everyday life as a
result of the increasing number of electronic products that are more and more
accessible. The number of these products that are available is quite large, and one of
these products is in the focus of this paper. It is a easy credit or online loan, that means
that it is a loan for which can to apply online, from home, from work, from a mobile
phone or personal computer and that means there is no need for wasting time and going
to the bank or other financial institution and no waiting at counters if you need a certain
amount offered by online lending.
The online lending is just one of the most recent developments, a combination of
internet and private peer to peer lending. The online lending could occur between any
two individuals that do not know each other. [1]
This business model and products that offered in the field of microfinance, particular in
the field of online microfinance, was created and aligned with the needs of the
Macedonian market, which offers a small loan quickly and easily in real time when
need the funds, which loan is granted extremely quickly - from a few minutes to several
hours. The companies that dealing with the issuance of these loans are called non-bank
390

Marina Blazhekovikj Toshevski
financial institutions and in Macedonian financial market has only one company that
offers online loans.
The procedure for applying for this type of loan is quite simple and consists of 3 steps
as follows:
1. Apply online or by the phone
2. Get the answer for 2 hours
3. Obtained approval amount In less than 24 hours
Fig.1 Steps for applying for the online loan
Currently, in Republic of Macedonia there are two types of online loans,that vary in
amount and repayment period. They are listed in the following table:
Table 1. Types of online loans in Republic of Macedonia
Amount 6.000 – 12.000 MKD 13.000–70.000 MKD
Repayment period 14-30 days 2 – 12 days
Source: https://www.mcash.mk/
2. Advantages and features of online loans
One of the main advantages of taking this type of loan is easy procedure for
assignment. With the help of a quick loan, the higher expenditure could be divided into
several installments and thus cover without undue burdens to your budget. This is
especially important when the budget does not allow to spend a large sum of money at
once, or if the cost is incurred unplanned. Another significant advantage of this loan is
easy procedure for assignment. While in the bank should fill out a bunch of papers and
wait for days, in this business model, the whole process is much simpler, saving time
and effort - the only document that needed in attached is a copy of ID The advantages
and opportunities, can be summarized as follows:
Apply online without going out of home;
Apply with an ID
Reply by phone, 24 hours after application;
Choose weekly or monthly installments;
Funds from the approved loan is directly transferred to personal bank account.
Table 2. Features of the online loans
Approval 24 hours
Required documents Identity Card
Application fee No
391

Online Loans – New Business model on the Macedonian Financial Market
Method of application Online
Source: https://www.mcash.mk/
Follows a list of frequently asked questions when it comes to online credit, and for that
is necessary to know the answers:
• Why to choose online loan?
• How to know if the loan is approved?
• Whether can get a report on the loan?
• What to do if are not able to repay the loan on time?
• Is it possible to pay off the loan early?
• Are protected personal data?
• How can get a certificate of pay loans?
The advantages of this product are answering the question of why to choose exactly
online loan. In the application, with the data is necessary to leave and e-mail address so
that the answer of question of how to know if the loan is approved, can find out in e-
mail address where are send all the necessary documents related to the loan online.
Because in the application have and phone number of users, via SMS, sending code that
should fill in the necessary box, click the button and signed the loan agreement is
concluded. Report on the loan also gets at the email address. For repay the loan early,
should call the call center to inform and to obtain information about the exact amount
that be returned. In the situation when not repay the loan on time, need to contact the
call center, in order to choose the most adequate option out of this situation. Depending
on which type of loan is chosen, the deadline for return is 14 or 30 days or 2 to 12
months. The data is fully protected appropriate law on protection of personal data.
Confirmation that the loan is paid off, gets at the email address specified in the
application form.
3. Countries where are used online loan business model
Online loan business model and its performance is part of the "Easy Asset
Management" international non-bank financial group. Group aspires to determine the
fastest growing and fastest delivery of financial services in Central and Eastern Europe,
thanks to planning and innovation in business ideas companies. Some of them are over
10 years of history in the operations of financial services, with over 6,000 employees
and associates in more than 270 offices in Bulgaria, Ukraine, Romania, Poland, Czech
Republic and Republic of Macedonia and over 1,200,000 assigned credits[10].
392

Marina Blazhekovikj Toshevski
Fig. 2 Countries where used online business model
http://www.icredit.ua/Internationalfilials
Analyzing this model in countries where it is used, leading to the conclusion that the
criteria and conditions for obtaining this loan are similar in all countries with the sole
difference that in different countries there are and other forms of this type of online loan
that still not available in the Macedonian financial market, but it is understandable for
countries where exist, taking the fact the many years of experience with online loans in
those countries.
Besides the above mentioned online loans with corresponding amounts in our country,
in other countries such forms of online loan are follows:
Table 3. Type of online loan business model in different countries
Country Type of online loan
business model
Bulgaria Easycredit
Ukraine iCredit
Romania iCredit
Poland iCredit
Czech Republic iCredit
Republic of Macedonia Mcash
Source: websites of online business model of all countries that use this model
The loan "iCredit Pensioner" has been developed to meet the needs and financial
capabilities of pensioners. This type operates in Czech Republic, Poland, Romania and
Bulgaria. In Romania functions iCredit Plus, financial product for those who need more
money for large projects, even when they have other loans. The main advantage of this
product is very good conditions to get. For immediate need of fresh funds for business
in Bulgaria, offers product Fintrade that offers access to funds with easier procedure
and flexible credit solutions for businesses.
393

Online Loans – New Business model on the Macedonian Financial Market
Table 4. Type of online loan in different countries
Country Type of online loans
Bulgaria Easycredit
Easymonth
Easymax
Vipeasy
Credit Pensioner
Fintrade
Ukraine iCredit
iMonth
Romania iCredit Rapid
iCredit Pensioner
iCredit Plus
Poland iCredit
"iCredit Pensioner"
Czech Republic iCredit
iCtredit ″Senior″
Republic of Macedonia MFlax
MFix
Source: websites of online business model of all countries that use this model
4. Risks associated with online lending
The online lending emerges with the development of the internet and is currently still
in the early stage of its development. There are some types of risks in online lending [2]
The risks of Credit Check
The risks of Intermediate Account
The Liquidity Risk
The Legal risk
The credit check is at the core of the essential technologies of an online lending
platform and the key of credit check lies in the control of loan size. The risks of Credit
Check will be reflected in borrowers overdue or default. Intermediate Account is a
custody account opened by a third-party institution to deposit transaction funds for both
sides of lending to order to reduce transaction risks. Liquidity risks refers to risk that a
loan transaction cannot be completed during the specified period of time due to
insufficient transaction volume in the market. The legal risk of the compliance of
electronic contract. As online lending is based on the Internet, it is difficult for the
lenders and borrowers to sign a paper contract face to face. At present, almost at all the
platforms, lenders and borrowers regulate their relationship in the form of electronic
contract.
394

Marina Blazhekovikj Toshevski
5. Conclusion
From the above it can be concluded that the advantages offered by online loans
provide to enhance application for them, but also taking the example of countries that
have experience with using this business model, it is good to develop other forms in our
country.
While it is in the beginning of its development, this business model is developing in
our country at a satisfactory pace, taking the simple procedure for access to the
necessary resources for temporary financing. In these loans, there are risks associated
with lending, just as there are risks to traditional loans, and for that is necessary to take
many measures to protect all parties involved in the online lending, taking the fact that
it is a credit with specific characteristics.
References
1. Jiazhuo G. Wang, Juan Yang, Financing without Bank Loans, Springer, 2016, pp. 57
2. Jiazhuo G Wang, Hongwei Xu, Jun Ma, Financing the Underfinanced, Springer, 2015,
pp. 119
3. http://www.icredit.ua/Internationalfilials
4. http://www.icredit.co.cz/
5. http://www.icredit.pl/
6. http://www.icredit.ua/
7. http://www.icredit.co.ro/
8. http://www.easycredit.bg/
9. http://www.fintrade.bg/
10. http://managementfinancialgroup.com/
11. https://www.mcash.mk/
395

International Conference on Applied Internet and
Information Technologies, 2016
DOI:10.20544/AIIT2016.48
Economic Factors Affecting Business Decision Making
Istat Visnja1, Jelena Jovičić2, Saša Arsovski3, Mira Živković-Drezgić4, Darko
Badjok5
1University of Belgrade, Faculty of Organizati onal Science, Jove Ilica 154, Serbia,
11000 Beograd, Serbia
visnja,[email protected] 2 Faculty of Faculty of Law, University of Kragujevac,
34000 Kragujevac, Serbia
[email protected] 3 Guarantee Fund of Autonomus province of Vojvodina, Hajduk Veljkova 11,
21000 Novi Sad, Sebia
[email protected] 3 City Tax Administration, Bulevar Mihajla Pupina 3, Novi Sad
21000 Novi Sad, Serbia
[email protected] 5 University of Novi Sad,Techical Faculty M. Pupin Zrenjanin, D. Djakovica bb,
23000 Zrenjanin, Serbia
Abstract. Innovation is driving force for future growth. Economies of many
countries are mostly based on old, traditional linear models of "closed" innovation,
that include none or minimal external stakeholder engagement in creating market
value. However, in order to achieve the well-being of the whole society, all relevant
external stakeholders should be involved in creating open innovation environments
and platforms that foster collaboration and co-creation of new business solutions.
In today's knowledge society ICT enables availability of different and various
pieces of information in global terms. One of the most brilliant scientists Einstein
long time ago said that "Imagination is more important than knowledge". The core
of every successful business or project is imagination. In order to use information
to create new real market value and innovative business approaches, good ideas,
imagination and intuition is necessary. Wisdom of innovative open-minded
stakeholders creates wisdom society. How can entrepreneurs contribute to the
modern economy? What should be changed so that better environment for creative
thinking and doing can me make?
Keywords: Social media, Decision making, Information Systems.
1. ICT as enabler for Open Innovation Environment
Social Media Technologies enable Connectivity
396

Istat Visnja1 et al.
Since its inception, the Internet has become a platform for interaction and collaboration
- allowing people and organisations to communicate, exchange ideas and trade goods and
services globally, in new, more efficient and exciting ways. It is now an essential part of
the fabric of commerce and society, and a primary engine of sustainable economic growth
and social benefit [1].
Social Media Technologies (SMT) are the new and personalized face of the Internet
[2]. Nowadays social media represent one of the most powerful tools that affect the core
of doing business. The Internet's contributions to European economy are substantial,
profound and pervasive The Internet economy in the EU grows seven times faster than
overall EU GDP [3]. Connecting different stakeholders (consumers, producers, managers,
etc.) enable faster information flow, better expressing one's opinions at convenient way
using very popular ICT enabled platforms. Faster than ever before, it is possible to
connect at no-time impressively big number of engaged stakeholders. ICT have crucial
role in changing the basics of business and creation of jobs and growth. ICT has
transformative nature that is an important tool in transforming people’s lives to more
prosperous, easier and happier side. ICT if used in appropriate manner, can be marked as
the most important driver for change in modern economies. Social media enable
connectivity cross-border in no-time. Connectivity that enables exchange of ideas,
thoughts and collaboration is more important than single competence. Connected
competences make the difference. Connectivity creates mass collaboration and great
values.
Connectivity creates competitive advantage of enterprises. Moreover, ICT-enabled
connectivity creates competitiveness of economies world-wide. The bigger investments
in ICT research & development should create the more powerful knowledge and skills of
ICT experts. The better outcome as aggregation of value at the market becomes, the more
predictable future comes. ICT represent key tool for addressing societal challenges. The
companies that know will become creators of the society development.
Fig 1. Social Media Technologies Platforms enable stakeholder connectivity – key to business
success
Current main social media technologies (SMTs) platforms that provide efficient
communication, knowledge sharing and value creation:
397

Economic Factors Affecting Business Decision Making
1. Blogs and user-generated content
2. Social networks
3. Wikis and open source
4. Forums, ratings and reviews
5. RSS and widgets
6. Twitter (and alike)
7. Co-creation via crowd-sourcing and workshops
8. Sharing knowledge and assistance in the innovation process
It is interesting to note that knowledge in Western cultures represent object that one
possesses; in Eastern cultures knowledge is rather process and relationship between
multiple actors. Open innovation is also process that engages multiple stakeholders; it is
interesting to spot similarity of Open Innovation 2.0 paradigm with knowledge adoption
process in Eastern cultures. Both are continuously open and endless processes. There is
space for researchers to analyze the role and impact of knowledge adoption as endless
flow, as well as the role of Open Innovation in that process. The role of SMTs should be
oriented more to support knowledge sharing by using Open Innovation 2.0 paradigm.
These would enable collaboration, interaction and assistance among the people each one
with the specific purpose that results in more efficient and effective upgrading the value
of the products/services. The companies that are able to set up the organizational culture
where SMTs are widely and appropriately used will have competitive advantage as the
leader at the market. The key questions whose answers should put provide guidelines to
more effective use of SMT are [16]:
How to use SMTs for creating business value?
How to engage users to SMT to provide value?
How to engage consumers to be prosumers?
SMTs should be used for business purposes as the source of large number of consumers
where the opinion on new products or services or developing ideas should be tested. The
accent should be put in future on creating new business models based on SMTs as future
most popular technologies.
2. Some ways SMTs can accelerate large-scale change
Facebook, Twitter, YouTube, Linkedin, instant messaging, video-conferencing, web
meetings: These and many other collaboration and social media platforms are now an
everyday part of people’s lives around the world. They are also finding their way into
enterprise communications and management strategies. But how these social media
applications and technologies can help to address even greater challenge—helping
companies and government agencies successfully implement major business change
programs?
According to numerous studies [26], from 50 percent to 80 percent of change programs
do not live up to expectations. Although the reasons for failure vary, many can be traced
to the difficulty with managing multiple talent and organizational elements effectively
across a global enterprise—creating a shared vision, gaining buy-in across locations and
398
Istat Visnja1 et al.
levels, dealing with expectations and handling the day-to-day upheavals inherent in
change. There are social media and collaboration tools that find the solution to business
problems. Based on numerous experiences with corporations and government agencies
that have successfully pioneered social media solutions, there are some ways in which
collaboration tools and social media technologies, properly planned and implemented,
can support more rapid and predictable management of large-scale change [27].
3. Building a collaborative culture
Executives know that achieving success at major business transformation requires
more than simply telling everyone about the new ways things are going to be done.
Acceptance of change—processes, services, working relationships, policies and more—
can be accelerated across the organization through the real-time sharing of experiences.
Social networking and collaboration applications are extremely effective ways of
bringing employees together to perform new processes and to share experiences—both
the successes and the temporary setbacks. People with common interests or related roles
can form communities to learn from and support one another. Social media can also help
in cases where creating a more collaborative culture is one of the major objectives of the
change initiative.
USTRANSCOM, company from USA, has launched several social media initiatives
including an executive blog and a Q&A blog hosted on the Command’s intranet, as well
as a public presence on Facebook and Twitter. The executive blog (which has been
recognized by the U.S. Department of Defense as a best practice) enables executives to
hear from staff directly, without having messages filtered through intermediate
management levels. These social media programs—which quickly generated more than
5 million impressions—have flattened the organizational hierarchy and driven positive
culture shifts, as measured by an annual staff survey.
The collaboration and networking platforms are empowering employees, customers
and partners to be active participants in the global conversation [3]. New business models
should be created based on collaboration and networking platforms where all engaged
stakeholders can participate in the creation of final products or services. Crowdsourcing
of knowledge based on SMTs can be the future of creating successful companies with
large share at the market due to the co-development of ideas co-creation of
products/services.Collaborative culture incorporated into business is one of the basic
characteristics that determine the successful positioning of the company at the market.
4. Establishing more effective communication
Critical issue for ecosystems that should be addresses is trust building. All actors
involved in communication should be secured via suitable social media platforms. This
would require different rules for social platforms in future. There is the need for
researchers to elaborate more on the issue of providing safe ecosystems to address the
needs of all participants in communication process. Trust is the precondition to build
effective working environment that can contribute to successful business projects.
399

Economic Factors Affecting Business Decision Making
Informal communication is also one of the hubs for creating successful business.
Networks of professionals sharing information online should be ensured to have stabile
platforms that work successfully. Informal communication among experts should be
supported by various online tools. Cross-disciplinary communication is also very
important; personal or profiled contacts from different fields sharing their knowledge and
experience via SMTs could be the starting point for many new ideas that improve state-
of-the-art of science. At later phase projects in real-term settings could develop. Such
environments should be created by the SMTs. Social media tools provide an effective
communications medium—for the core change program teams and across the
organization as a whole—as a large-scale change initiative proceeds. In addition, by
monitoring and participating in online discussions, managers can more readily see where
any misunderstandings that exist across the enterprise and take steps to address them. For
example, one global resources company recently established a presence on Yammer, a
secure and enterprise-strength social network that enables co-workers to communicate
and share information with one another. Seventy percent of the company’s team members
signed up for Yammer after its initial launch and 25 groups were created to discuss work-
related issues. Today, about 2,000 messages are posted each month [27].
Participation by leadership in social media-based collaboration platforms is essential
[11]. Collaboration tools can actually undermine change effectiveness if they merely
cause confusion and discontent to multiply across social networking sites. Management
must establish a mechanism for delivering the “voice of truth”—an authoritative, trusted
and believable source of information [9]. This reinforces the idea that social media can
be used by employees not only to voice ideas and concerns but also to get accurate and
credible answers regarding the company’s change effort.
Effective two-way communication is very important for companies to get the feedback
from the employees and consumers so that it can help improving business processes or
end-products and services.
5. Improving employee involvement and engagement
One of the critical success factors for managing large-scale change programs is
engaging employees in the change—helping them to feel ownership in the initiative and
tapping into their energy to resolve issues and advance the business. Social media and
collaboration solutions allow information to flow in multiple directions rather than just
from the top down. For example, using wikis and microblogs - applications for sharing
short bursts of information in Twitter-like fashion—organizations can “crowdsource”
ideas and involve employees more directly in the change program. Organizations can
build greater internal loyalty by actively soliciting continuous feedback on issues related
to the change. One US bank initiated a major change program to improve the customer
experience as a means of gaining market share. The bank leveraged a crowdsourcing tool
to tap into its workforce for ideas about how to improve customer service. In the first use
of the tool, more than 250 employees submitted 50 separate ideas resulting in seven high-
quality innovations for the company—many of which resulted in programs that have
generated value for the bank.
400

Istat Visnja1 et al.
6. Cloud Computing
The Digital Agenda for Europe (DAE) is the European Union's roadmap for bringing
the benefits of a digital society and economy to Europe's citizens [4]. DAE highlights the
importance of developing EU-wide strategy on Cloud Computing. Neelie Kroes, Vice-
President of the European Commission responsible for the Digital Agenda in says that
Europe should be 'cloud-active' rather than only 'cloud-friendly'. She founds Cloud
critical for further growth in Europe. To take full advantage of the cloud's potential, while
protecting the citizens' interests, Europe needs a cloud-friendly legal framework, and a
cloud-active community of providers and users [7]. In 2012 it was expected that European
Commission propose European Cloud Computing Strategy. In addition, new initiative on
cloud computing has been announced – the European Cloud Partnership. Within the right
framework, cloud computing can help create jobs and boost economic growth [7].
The three broad areas for the cloud strategy are [4]:
1. The legal framework which addresses the questions about data protection and privacy
in international dimensions, as well as the other laws and rules.
2. Technical and commercial fundamentals with the aim to extend EU's research support
and focus on critical issues such as security and availability of cloud services.
3. The market where pilot projects will be supported aiming at cloud deployment.
Fig 2. Cloud Computing – emerging trend that fosters e-services and enables societal growth
Cloud computing is a general term for anything that involves delivering hosted services
over the Internet [4]. The name cloud computing was inspired by the cloud symbol that's
often used to represent the Internet in flowcharts and diagrams. These services are broadly
divided into three categories: Infrastructure-as-a-Service (IaaS), Platform-as-a-Service
(PaaS) and Software-as-a-Service (SaaS). The name cloud computing was inspired by the
cloud symbol that has often been used to represent the Internet in flowcharts and
diagrams. A cloud service has three distinct characteristics that differentiate it from
traditional hosting. It is sold on demand, typically by the minute or the hour; it is elastic
-- a user can have as much or as little of a service as they want at any given time; and the
401

Economic Factors Affecting Business Decision Making
service is fully managed by the provider (the consumer needs nothing but a personal
computer and Internet access) [5].
A cloud service has three distinct characteristics that differentiate it from traditional
hosting. It is sold on demand, typically by the minute or the hour; it is elastic -- a user can
have as much or as little of a service as they want at any given time; and the service is
fully managed by the provider (the consumer needs nothing but a personal computer and
Internet access). Significant innovations in virtualization and distributed computing, as
well as improved access to high-speed Internet and a weak economy, have accelerated
interest in cloud computing. A cloud can be private or public. A public cloud sells services
to anyone on the Internet. (Currently, Amazon Web Services is the largest public cloud
provider.) A private cloud is a proprietary network or a data center that supplies hosted
services to a limited number of people. When a service provider uses public cloud
resources to create their private cloud, the result is called a virtual private cloud. Private
or public, the goal of cloud computing is to provide easy, scalable access to computing
resources and IT services [8].
Main advantages of Cloud Computing are better availability of e-services with
significant cost savings [4]. Therefore, companies and national economies that will use
in the future advance business concept cloud computing rather than the traditional will
have bigger ROI and will contribute to more efficient societal development. In addition,
new concepts and ICT enabled technologies create various kinds of different jobs towards
prosperous societal development. Open innovation concept together with social media
and cloud computing will create new business environment where all stakeholders are
engaged in value aggregation and will have crucial impact on filling the targets of Europe
2020 strategy. Removing the barriers by creating the legal framework for cloud
computing strategy and setting the wide community of active users is one of the ways to
boost growth and jobs. Unlocking the full potential of social media technologies, cloud
computing and other Internet-based emerging solutions will foster the process of
establishing open innovation environment where new business solutions are being made.
7. Conclusion
Open innovation creates wisdom society. Emerging ICT technologies such as social
media, cloud computing, Future Internet private public partnerships enable better
connectivity and innovative forms of entrepreneurship. Investing in new technologies and
connecting people can bring competitiveness to the economies. Open innovation
environments where all stakeholders are engaged from the beginning in the process of
creating value at the market should encouraged by getting the appropriate legislature and
legal framework for actions. Use of crowd-sourcing concept, crowd-funding and crowd-
sharing of experts around the Globe in order to put together the experience and knowledge
is essential for creating new valuable types of entrepreneurship for new wisdom society.
Innovative business approach involves users as co-creators of change from the beginning
of process by of transferring business idea to the final product or service at the market.
The creation of jobs and growth could be fostered by Open innovation environments as
the hub where creative thinking brings new ideas to the market is changing the way of
modern economy.
402

Istat Visnja1 et al.
References
1. Internet 2018: an Essential Platform for the Global Economy and Society, Business Vision
Paper, OECD Ministerial Meeting on the Future of the Internet Economy, Seoul, Korea, June
(2008)
2. Forum on tax administration: taxpayer services sub-group, Information note, Social media
technologies and tax administration, Organization for economic co-operation and
development, (October 2011)
3. S. Hoorens, D. Elixmann, J. Cave, Man Sze Li, G. Cattaneo, “Towards a competitive European
Internet industry, a socio-economic analysis of the European Internet industry and the Future
Internet Public-Private partnership”, Final study report, (May 2012)
4. http://ec.europa.eu/information_society/activities/cloudcomputing/index_en.htm
5. http://searchcloudcomputing.techtarget.com/definition/cloud-computing
6. www.ifm.eng.cam.ac.uk/ctm/teg/openinnovation.html
7. N. Kroes 'The silver lining”, The Parliament', politics, policy and people magazine, Issue 350,
11, pages 17-18, (June 2012)
8. http://www.fi-ppp.eu/eit-ict-labs-and-fi-ppp-signing-memorandum-of-collaboration-on-21-
june-2012/
9. http://www.businessdictionary.com/definition/dynamics.html
10. Blog: Design thinking and design-driven innovation a la Verganti, Antii, Hautamaki, Sunday,
August 15 2010 9:47 pm
11. http://www.15inno.com/2009/11/09/userdriven/
12. www.csreurope.org/enterprise2020
13. http://www.bu.edu/itec/action/building-global/
14. Anthony D. Williams, “The Rise of the Micro-Multinational: How Freelancers and
Technology-Savvy Start-Ups Are Driving Growth”, Jobs and Innovation, the Lisbon Council
Policy Brief, Ann Mettler, (October 2011.)
15. http://www.enterprisingnonprofits.ca/about_social_enterprise/definitions/
16. http://www.socialenterprisemagazine.org/
17. Green growth and developing countries - a summary for policymakers, Organisation for
Economic Co-operation and Development, Development co-operation Directorate,
Development Assistance Committee, DAC Meeting, (June 2012)
18. Call for proposals, Economic Impact of Social Enterprises, Grant Programme 2012, Enterprise
& Industry Directorate General, European Commission, , page 3, (June 2012)
19. http://ec.europa.eu/information_society/activities/collectiveawareness/index_en.htm
20. http://www.businessdictionary.com/definition/freelance.html
21. C.Ta'eed, C. Ta'eed, “The Freelance Statistics Report“ Rockable press, (2007).
22. http://www.freelancer.com/
23. E. Arolas, E.; González Ladrón-de-Guevara, “Towards an integrated crowd-sourcing
definition”, Journal of Information Science (in press), (2012).
24. Open Innovation Yearbook 2012, Directorate-General Information Society and Media, page-
4, (2012)
25. http://francisgouillart.com/wordpress/?p=720
26. M. Ghafoor, T. Martin, “Six ways social media technologies can accelerate large-scale
change”, Accenture, Outlook point of view, no 1, (January 2012)
27. http://www.dashe.com/blog/social-learning/how-social-networks-can-harness-the-power-of-
weak-ties
28. http://searchcloudcomputing.techtarget.com/definition/cloud-computing
403
International Conference on Applied Internet and Information
Technologies, 2016
DOI:10.20544/AIIT2016.49
Informatization as a Measure for Improvement of the
Education Policy – Case Study: Electronic Content Portal
Ana Sekulovska1 and Jahi Jahija2
1 Faculty of information and communication technologies, Partizanska bb,
7000 Bitola, Macedonia
[email protected] 2 Ministry of Information Society and Administration, Sv. Kiril i Metodij 54, 1000 Skopje,
Macedonia
Abstract. The intensive development of information technology in the new
millennium has redesigned the functioning views, rules and principles of
educational organizations. They have been set to the challenge of how and in
which way information technologies influence the improvement of the
effectiveness of the educational surrounding. As a result of this process, the
overall improvement of the education system, analyzed as a whole, as well as its
compliance with modern trends and needs, inevitably leads to the necessity of
improving the process by applying information technologies. The extent by which
a geographical area, an economy or a society is becoming information-base,
increase in size of its information labor force, is referred to as informatization,
whereas the principles and government policy-making in educational sphere, as
well as the collection of laws and rules that govern the operation of education
systems is an education policy. In this paper, the need of creation of educational
policy by using information technology is examined, with particular reference to
one of the measures for improvement of the education policy, such as an online
resource (www.skoool.mk), as a case study, on the bases of which appropriate
conclusions and recommendations are drawn.
Keywords: Information technology, education policy, informatization, Software
as a Service (SaaS), electronic content portal, Republic of Macedonia.
1. Introduction
Informatization refers to the extent by which a geographical area, an economy or a
society is becoming information-base, increase in size of its information labor force,
whereas education policy are the principles and government policy-making in
educational sphere, as well as the collection of laws and rules that govern the operation
of education systems [1], [2]. The creation of public policy is an interdisciplinary
activity that incorporates the transformation of political decisions in real solutions that
are implemented inside the society. One of the key stages in the development of every
new policy or adjusting the existing one is the process of adaptation and transformation
of the legal framework, the legislation on which the policy is implemented. Bringing
404

Ana Sekulovska et al.
new legislation, or analyzing an existing one, should have one single starting point:
effective address to the problems of a certain area for both the directly involved, but
also and for society as a whole. To achieve this goal, it is necessary to perform a
comprehensive and detailed analysis, including internal and external circumstances of
the problem being treated, to find regulatory or non-regulatory solutions, to make
analysis of the involved parties and most importantly, to determine the most favorable
decision in terms of the economic justification for the decision.
In the remainder of this paper, the need of creation of educational policy by using
information technology will be examined, with particular reference to one of the
measures of improving education policy, such as an online resource – www.skoool.mk,
as a case study, on the bases of which appropriate conclusions and recommendations
will be drawn.
2. Related work on the creation of education policy by using ICT
One of the priorities of modern living is putting information technology for improving
the process of monitoring students’ achievements as well as their general adaptation to
novelties caused by information-technological reflections. The usage of ICT in
education should be stressed as a need for it to be seen as functional modern tool rather
than as an imposed technological trend.
The new changes in the sphere of information highlighted and emphasized the need
to create a policy that strives for efficient education and realistically measurable results
and more transparent work of those involved in education, that leaded to the step of
policy-making and defining of electronic society. The information society is the result
of changes in the use of new information and communication technologies, in order to
overcome the shortcomings or problems.
This policy underlines the importance of information technology to enhance the level
of effective and quality teaching in the educational process, through full access to
educational digital content on the global Internet network. This policy aims to increase
the efficiency of the educational process, to maximize the usage of computers and
Internet, as well as to improve the IT skills of the parties involved in the educational
process.
According to [3], the overall objective of the Attracting, Developing and Retaining
Effective Teachers Activity is to provide policy makers with information and analysis to
assist them in formulating and implementing teacher policies leading to quality teaching
and learning at the school level.
By offering a valuable cross-country perspective, the report based on an OECD study
of school leadership policies and practices around the world [4] identifies four policy
levers and a range of policy options to help governments improve school leadership
now and build sustainable leadership for the future.
Similarly, the OECD “Schooling for Tomorrow” scenarios [5] combine different
elements – trends, plausible inter-relationships between clusters of variables, and
guiding policy ideas. They are thus neither purely empirical (predictions) nor purely
normative (visions). However, to arrive at a more accurate picture of views about
educational futures, many more would need to be surveyed and drawn from a wider
cross-section of relevant stakeholders.
405

Informatization as a Measure for Improvement of the Education Policy
3. Case study: Electronic Content Portal
Software as a service (SaaS) is a software licensing and delivery model in which
software is licensed on a subscription basis and is centrally hosted, and is typically
accessed by users using a thin client via a web browser. SaaS has become a common
delivery model for many business applications, including office and messaging
software, DBMS software, management software, development software, collaboration,
customer relationship management (CRM), management information systems (MIS),
enterprise resource planning (ERP), human resource management (HRM), content
management (CM), service desk management, etc. [6], [7].
In a SaaS manner, the Ministry of Information Society and Administration (MISA) of
the Republic of Macedonia started implementing a new IT configuration, the use of
educational software and application of ICT in teaching. The usage of digital content
enables more successful implementation of educational programs and curricula and
makes it clearer. In this manner the aim is completed, i.e. the use of ICT in teaching and
its convergence to the modern and international educational systems. One of the pilot
projects of the Government of the Republic of Macedonia and the Ministry of
Information Society and Administration was the www.skoool.mk portal [8] to see how
much the web application will be visited and how much it is being used.
Skoool.mk is an online resource prepared by MISA and the “Bureau for
Development of Education” and a part of the network skoool.com. The web-site
provides tools and content in the fields of mathematics, physics, chemistry and biology.
The site contains interactive audio and video materials that can be applied in teaching.
Activities offered include these subjects in primary and secondary education in relation
to the content curriculum in Macedonia under that instruction in these subjects. The
website offers concise notes for users in the field of mathematics and natural sciences.
All the e-content during the month of July 2015 were set and published on the portal
and can be accessed online and used in teaching [9]. In addition statistics are presented
regarding the usage of the education content portal (Figs. 1-3). The presented data
provide diagnostic picture of the conditions that represent our educational system when
considering the introduction and use of modern educational technology and the need of
introduction and innovation of the education system with new educational ICT.
Regarding the temporal dimension, Fig. 1 and Fig. 2 show that both the data volume
and the number of visits of the electronic content portal is significantly higher during the
first and the second half of the academic year, which clearly emphasizes the need of the
application of information technologies and underlines the importance level of it as an
applicable tool.
On the other hand, Fig. 3 highlights the bigger need of electronic content in the field
of natural sciences – digital aid was useful, it made the work easier, it was clear and
simple for pupils, tasks were presented practically, therefore they were meaningful in
practical sense. Theoretical information was illustrated by visual examples, and tasks
were differentiated, therefore all the pupils involved themselves into activities.
From the above submitted, it can be noted that e-learning systems must adapt to the
changing lifestyles – this tool highlights and emphasizes the importance of the
application of information technologies, acquisition of new skills for universal and
continuous approach in order to improve skills needed for participation in a society
where knowledge is of great importance.
406

Ana Sekulovska et al.
Fig. 1. Statistics of visits at skoool.mk by months (data volume)
Fig. 2. Statistics of visits at skoool.mk by months (frequency)
407

Informatization as a Measure for Improvement of the Education Policy
Fig. 3. Statistics of visits at skoool.mk by subjects
4. Conclusions and recommendations
The world is being moved by the paradigm: from a learning society into a society of
knowledge. It means a society in which education plays a key role. For this purpose and
the application of Information technologies are a major engine towards reforming
education, as metaphorically prejudiced the famous philosopher Edgar Morin “a head
that thinks, not one that remembers”.
One can conclude that the use of information technology positively affects the level
of awareness, the faster access to all necessary information on curricula, as well as in
saving time on searching the required information. The usage, the upgrading of usage
implementation of such tools, visibly eases the work in the education system. The
application of digital contents enables more successful implementation of educational
programs and curricula, as well as provides an opportunity for it to be clearer, more
interesting and clearer for perceiving, thus students to be more interested in the adoption
of new contents and to form knowledge more efficiently.
This tendency of using and application of information technologies will contribute to
increased efficiency and effectiveness in education. In this manner, the purpose of the
application of ICT in teaching and bringing it to closer to the modern European and
world educational systems, is accomplished, as well.
How can we know what our position is in the process of global informatization?
What development strategies should be taken? To solve the above problem, we propose
a nationally unified education informatization index system that conforms to the reality
of our country and communicates with the international community.
408

Ana Sekulovska et al.
References
1. Fischer, F., Miller, G. J. and Sidney, M. S., “Handbook of public policy analysis: theory,
politics, and methods“, Implementing Public Policy, Taylor & Francis Group, LLC (2007)
2. Fridman, A. L. and Miles, S., “Stakeholders Theory and Practice“, Oxford university press
(2006)
3. Mulford, B., “School Leaders: Changing Roles And Impact On Teacher And School
Effectiveness”, A paper commissioned by the Education and Training Policy Division,
OECD, for the Activity Attracting, Developing and Retaining Effective Teachers (2003)
4. Pont, B., Nusche, D. and Moorman, H., “Improving School Leadership”, Volume 1: Policy
and Practice, OECD, DIRECTORATE FOR EDUCATION, Education and Training Policy
Division, www.oecd.org/dataoecd/6/52/40545479.pdf (2011)
5. OECD: What schools for the future? Paris: OECD (2001)
6. Wikipedia, “Software as a Service”, Retrieved February 17, 2012, from Web site
http://en.wikipedia.org/wiki/Software_as_a_service#cite_note-0
7. Bunch, C., Navraj, C. and Chandra, K., “AppScale: Open-Source Platform-As-A-Service”,
UCSB Technical Report #2011-01, Computer Science Department, University of California,
Santa Barbara (2011)
8. http://www.skoool.mk, Ministry of Information Society and Administration of the Republic
of Macedonia; last visited on May 22, 2016
9. http://www.stat.gov.mk/, State Statistical Office of the Republic of Macedonia; last visited
on May 22, 2016
409

International Conference on Applied Internet and Information
Technologies, 2016
DOI:10.20544/AIIT2016.50
Information Technologies in Human Resources
Management: An Overview
Amar Kansara1, Mohamed Hafez2, and Ljubica Kazi3
1 Parth Systems, Zaveri Road 3-1293, Navsari 396445, Gujarat, India
2 Al Khazindara General Hospital 3 Shiban St. from Shubra St. El Sahel, Cairo, Egypt
3 University of Novi Sad, Technical Faculty “Mihajlo Pupin”, Djure Djakovica bb, 23000
Zrenjanin, Serbia
Abstract. Human resources management is one of the most important areas that
influence business performance. Information technologies applied within an
organization brings integration of business processes and enables their
functionality. Synergy of human resources management and application of
information technologies is core architectural component of an organization that
brings value to organizational processes outcomes. Therefore, it is of a great
interest to determine their mutual influence. There are two mayor research
perspectives of human resources management synergy with information
technologies, that are presented in this paper: implementing information
technologies in human resources management and influence of human resources
management to information technology related projects and companies.
Keywords: human resources management, information technologies, application.
1. Introduction
Human resources management (HRM) is one of crucial areas in a company
management and it directly impacts quality of business process results and performance
[1]. “People add value to a firm to the extent that they will perform future services.
Some of this value is added directly by transforming the firm’s product, but much of it
is less tangible, consisting of solving problems, coordinating the work of departments
and exercising judgment in novel situations” [2]. Therefore, it is of a strategic
importance to carefully deal with human resources i.e. human capital [2]. “HRM, once
responsible for record-keeping and maintenance, has evolved into a strategic partner,
sharing comparable boardroom status with disciplines such as accounting, marketing,
and finance” [3].
Applying information technologies within organizational Business Information
System (BIS) enables the integration of business processes and support in making
decision, via data collection, flow, processing and visualization.
410

Amar Kansara et al.
Furthermore, the implementation of BIS could support the monitoring of strategic
decisions implementation and transformation of organizations [4]. Human Resources
are considered (parallel with Equipment and Material Availability) as one of the most
important aspects in establishing the best functionality within the Advance Planning
System (APS) of an organization (particularly in productive companies such as
factories).
It is of a great importance to determine the existing practices in implementing
information technologies with HRM, as well the influence of HRM to IT related
projects and companies. This synergy of HRM and IT is presented in this paper.
2. Human Resources Management – Concepts and Research
Basic concept of human resources management is the concept of “human capital”, that
is related to “skills, experience and knowledge that have economic value to
establishment” [2]. “Human capital is the result of a firm’s making a deliberate
investment either through hiring certain individuals “on the market” or developing them
in-house.” [2] According to [2], it is of a great importance to emphasize that human
capital is not owned by a company, but it is embodied in employees, who are free to
move from one firm to another. For employees that stay with a firm, their contribution
depends on their willingness to perform their abilities. So, investments in control of
employees’ performance, their retaining, empowerment with additional education and
motivation is also considered as human capital investments.
Research in the field of Human Resources Management is widely represented in
review papers, as well as in papers related to particular areas [3]. Research topics are
related to evolution of HRM function, cross-functional approaches, particular industrial
psychology topics, as well as related to particular functional tasks such as selection,
training, compensation, motivation and performance monitoring. “Strategic,
international and political perspectives of HRM represent three of the most significant
areas of practical and theoretical concern on which theory and research in HRM has
focused in the past decade and a half.” [3]
Strategic perspective of HRM links human resources with the strategic needs of the
business. In [5], the 5-P model of strategic human resources management is described
with many activities within the five P’s (HR Philosophy, Policies, Programs, Practices
and Processes). Empirical research in [6] shows technical and strategic human resource
management effectiveness as determinants of firm performance. In [7], Total Quality
Paradigm applied in HRM is presented (Table 1). Aspects of measuring human
resources, with approach based on Balanced Scorecard, are presented in [8]. Elements
of control theory with administrative information for the purpose of strategic human
resource management are presented in [10].
411
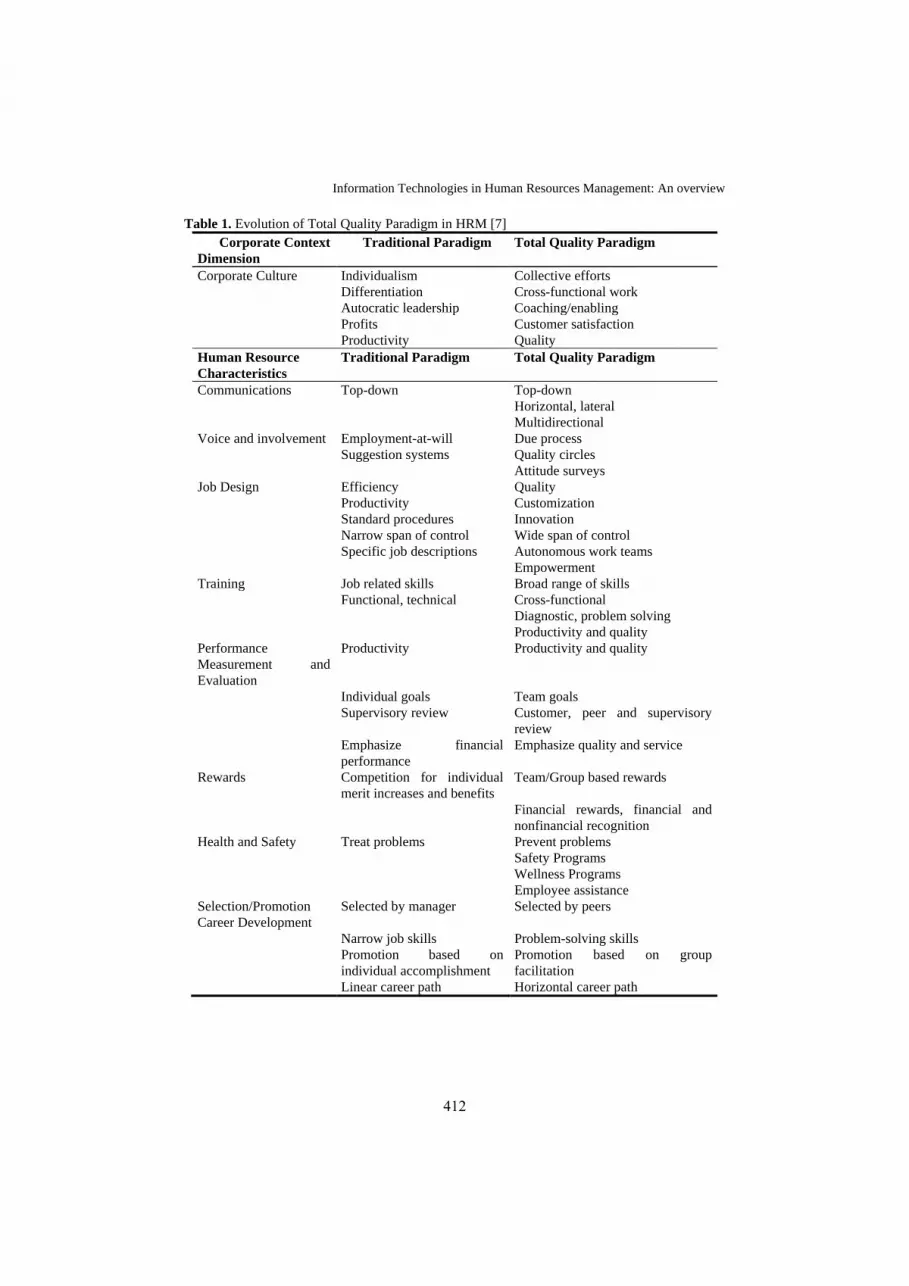
Information Technologies in Human Resources Management: An overview
Table 1. Evolution of Total Quality Paradigm in HRM [7]
Corporate Context
Dimension
Traditional Paradigm Total Quality Paradigm
Corporate Culture Individualism Collective efforts
Differentiation Cross-functional work
Autocratic leadership Coaching/enabling
Profits Customer satisfaction
Productivity Quality
Human Resource
Characteristics
Traditional Paradigm Total Quality Paradigm
Communications Top-down Top-down
Horizontal, lateral
Multidirectional
Voice and involvement Employment-at-will Due process
Suggestion systems Quality circles
Attitude surveys
Job Design Efficiency Quality
Productivity Customization
Standard procedures Innovation
Narrow span of control Wide span of control
Specific job descriptions Autonomous work teams
Empowerment
Training Job related skills Broad range of skills
Functional, technical Cross-functional
Diagnostic, problem solving
Productivity and quality
Performance
Measurement and
Evaluation
Productivity Productivity and quality
Individual goals Team goals
Supervisory review Customer, peer and supervisory
review
Emphasize financial
performance
Emphasize quality and service
Rewards Competition for individual
merit increases and benefits
Team/Group based rewards
Financial rewards, financial and
nonfinancial recognition
Health and Safety Treat problems Prevent problems
Safety Programs
Wellness Programs
Employee assistance
Selection/Promotion
Career Development
Selected by manager Selected by peers
Narrow job skills Problem-solving skills
Promotion based on
individual accomplishment
Promotion based on group
facilitation
Linear career path Horizontal career path
412

Amar Kansara et al.
3. Related work
Review efforts in systematization of research and practical solutions resulted in several
published review papers, such as [11]. Innovative solutions in HRM that are proposed
in [11] are related to decision support system, i.e. expert system application MATCH,
that enables selection of team members, answering to one of questions: “Which
combinations of people and skills will produce the most productive teams in our major
business divisions?”
Research on usage of information technologies in [11] is conducted with
questionnaire that was organized to reveal answers regarding efficiency of HR IT tools,
reaching strategic goals with using HR IT tools and covering of HR area by IT tools. It
has been shown (Fig.1) that IT is mostly used in career management segment of HR
processes, while other most used segment is recruiting.
Fig. 1. Impact of HR IT tools regarding HRM areas [11]
Recently, the concept of e-HRM systems has been widely used [12]. Application
areas include payroll [13], “recruitment and selection, development and training,
employee assessment, motivation, talent management, personnel service” [12] (Fig.2).
Generally, IT solutions for HRM support could be categorized as:
External/International (giving support mostly to recruitment)
“In-house” solutions, giving support to the whole “life-cycle” of an
employee, from personal records, payroll, training, work quality
monitoring, to retirement.
One of the most important activities in HRM is recruiting, where on-line i.e. “e-
recruiting” systems have important role [13]. One of the main functions of e-Recruiting
systems is gathering and centralization of information about potential employees and
employers, with matching mechanisms and mutual exchange of information in aim to
help companies find the best job candidates and help candidates present themselves and
find appropriate job. In [13] there are several types of e-Recruiting systems presented
(Table 2). Of course, today one of the most used general-purpose job boards within
professional social network is LinkedIn [14], while other similar web applications try to
413

Information Technologies in Human Resources Management: An overview
enhance functionality and gain respect and trust from job seekers, such as Opportunity
[15] and others.
Fig. 2. Application e-HRM solutions in USA enterprises [12]
Table 2. Types of e-Recruiting systems and examples [13]
E-recruiting source Advantages Disadvantages Sample participants
General-Purpose Job
Board
Brand recognition,
E-recruiting
experience, High
traffic, Industry best
tools, Large
candidate base,
Large recruiter base
Relatively high job
posting cost,
Potentially low-
quality applications,
Limited content
control, Stickiness of
the job board,
Limited candidate
relationship
Monster.com,
HorJobs.com,
CareerBuilder.com
Niche Job Board Gathering of passive
job seekers, focused
search, community
of professionals
Low brand
recognition,
possibility of identity
theft
Dice.com,
Erexchange.com,
Taonline.com,
JournalismJobs.com,
MarketingjJbs.com,T
exasJobs.com
E-Recruiting
Application Service
Provider
Low application
development cost for
recruiters, Quick
application
development
Integration issues
with existing
systems, Possibility
of closeout due to
competition,
possibility of lock-in,
low graffic
Recruitsoft,
Brassring,
RecruitUSA,
PeopleClick,
TalentFusion,
Lawson
Hybrid Recruiting Expertise in Strong image as a New York Times,
414

Amar Kansara et al.
Service Providers advertising industry,
portfolio of
recruiting media,
price bundling with
conventional media
conventional media,
low traffic, low
technology
Wall street Journal,
Chronicle of Higher
education
E-Recruiting
Consortium
Low service cost,
direct and immediate
link to corporate
career site
Potential conflicts
among members, low
exposure, low
technology
DirectEmployers.co
m, NACElink
Corporate Career Web
Site
Candidate
relationship
management, High
interest in jobs by
job applicants,
Integration with
existing systems
Needs for IT
specialists, High
upfront development
cost
94% of Fortune 100
Companies, 81% of
Fortune 500
companies
Important aspect of HRM and IT synergy is answering the question: “How
application of information technologies affects human resources and human resources
management?” Actual impact of using information technologies by human resources
professionals is examined in [16]. It has been shown that more extensive use of IT
enables HR professionals to make greater use of external professional links, to have
increased information responsiveness by HR professionals and HR professionals have
greater information autonomy.
Another important aspect of application of HRM in IT business sector is answering
the question: “How HRM influences IT business or IT projects performance?”.
Analysis of the role of human resources management in information technologies has
been presented in [17], where special concern is given to questionnaire based analysis
of factors influencing success of IT projects. Results are given in Table 3.
Table 3. Some HRM factors affecting IT project performance [17]
INDIVIDUAL FACTORS JOB FACTORS ORGANIZATIONAL
FACTORS
Accountability and deep sense
of responsibility
Necessary education and
research opportunities
Fair and adequate salary and
compensation
IT knowledge and ability Timely improvement of
organizational structure and
redefining of jobs (appropriate
with IT changes)
Suitable environment
Passion and interest for the
job
Adequate job knowledge and
describing of the duty
Awareness of the IT director
of the type of specialist
activities of the staff
Good work ethics and attitude Highlighted role in giving
services
Attention to professional and
general education programs
Having a spirit of teamwork Having work respect and
dignity with otjers
More attention to job security
and official employment
Appropriateness of the
individual spirit with many
changes in IT
No conflict of roles, duties
and responsibilities
To create conditions for
continuing education
Having the spirit of Opportunities o do group Opportunities to rest and
415

Information Technologies in Human Resources Management: An overview
knowledge and skills transfer
to others
work and participation in
tasks
avoid work stress
Passion and interest to the
workplace
Having a role in decision-
making
More attention to the
experience and knowledge of
the staff in professonal fields
Work background and
experience
Lack of monotonous and
repettiveness
Participation of IT staff in
exibitions and organizing
work camps
Some important factors, from the experts perspective [17] related to IT project
success impact are: Attention to personality characteristics in hiring project team
members; Abilities of technical staff; Salary and sufficient wages; Anachronism of IT
managers in being aware of high speed of changes in information and communication
technologies; Managerial and technical knowledge of IT managers; Appropriate work
environment; Using IT tools for management of IT related projects.
4. Preliminary empirical research
Since the recruitment is one of the most important areas in HRM, it has been
emphasized in this empirical research. The main problem of e-Recruiting systems to job
candidates and employers is lack of pre-interview personal contact in aim to be
acquainted with organizational culture of the company and personal characteristics of
candidates. Therefore, companies contact universities to meet students and present
themselves as potential companies of their employment and even “talent seeking” or
“job offering” agencies are helping companies and candidates in their efforts. For the
same purpose, job fairs are organized, such as IT related job fair and conference IT
Konekt [18].
Main research questions in this empirical research are related to synergy of HRM
and IT related to job candidates recruitment from both perspectives: 1) Importance of
HRM to IT company success; 2) Use of IT in HRM.
Sample for this empirical research consists of 22 companies that were presented at
IT Job fair and conference IT Konekt on 20-21 May 2016 in Belgrade. Each of these 22
companies was interviewed with questionnaire related to previously defined research
questions.
Key findings of this preliminary empirical research, according to previously set
research questions are:
1) Importance of HRM to IT company success - Each company has human
resource officer and each company has HR related questions at interview. 80% of
companies equally value personality aspect and technical knowledge and skills aspect
of candidates during interview process, 10 % of companies emphasize personality and
10% of companies emphasize technical knowledge and skills. 10% of companies have
“one-day” interview and simple process of HRM and Technical interview part, while
90% companies have “multiple-day” interviews with duration of 1/4 of personality and
communication tests, while 3/4 of interview time are technical oriented tests, interviews
and case studies.
416

Amar Kansara et al.
2) Use of IT in HRM – Each company has web site and career part of official
company website as well as appropriate LinkedIn company profile. As a first step in
interview process, only 5% of companies use “phone” interview with using video
conferencing tool such as Skype, while 10 % of companies use technology-oriented on-
line tests with questions and work assignments. Most companies require personal
attendance of job candidates during full process of interview.
5. Conclusion
Aim of this paper is to explore synergy of HRM and IT in success of a company.
Particular concerns are given to the role of HRM in Total Quality Management and the
role of using IT in HRM. Summary review results are presented regarding the use of IT
in HRM generally, but particularly the process of recruiting is emphasized as one of
crucial business processes in HRM.
Synergy of HRM and IT in a company is presented from two perspectives –
influence of IT to HRM success and influence of HRM to IT related projects and
companies success. Preliminary empirical research in particular field of recruiting is
conducted with 22 IT companies regarding both perspectives. It has been shown that,
within the specified sample of companies, all companies use the same type of IT related
HRM tools for recruiting. Most companies equally value personality and technical
skills, while, during interview, most companies dedicate approximately ¼ of total
interview time to personality and communication skills tests.
References
1. Huselid, M.: The impact of human resource management practices on turnover,
productivity, and corporate financial performance. Academy of Management Journal,
Vol. 38, 635–672. (1995)
2. Snell S.A., Dean J,W.: Integrated Manufacturing and Human Resource Management: A
Human Capital Perspective. The Academy of Management Journal, Vol. 35, No. 3,
467-504. (1992).
3. Ferris G.R., Hochwarter W.A., Buckley M.R., Harrel-Cook G, Frink D.D.: Human
Resources Management: Some New Directions. Journal of Management, Vol. 25, No.
3, 385-415. (1999)
4. Henderson J.C., Venkatraman N.: Strategic alignment: Leveraging information
technology for transforming organizations. IBM Systems Journal, Vol. 32, No. 1, 472-
484. (1993)
5. Schuler R.S.: Strategic Human Resources Management: Linking the People with the
Strategic Needs of the Business. Journal Organizational Dynamics, Vol. 21, No. 1, p18.
(1992)
6. Huselid A. M., Jackson S.E., Schuler R.S.: Technical and Strategic Human Resource
Management Effectiveness as Determinants of Firm Performance. Academy of
Management Journal, Vol. 40, No. 1, 171-188 (1997)
7. Blackburn R., Rosen B.: Total Quality and Human Resources Management: Lessons
Learned from Baldrige Award-winning companies. Journal Academy of Management
Executive, Vol. 7, No. 3 (1993)
417

Information Technologies in Human Resources Management: An overview
8. Ulrich D.: Measuring human resources: An Overview of Practice and a Prescription for
Results. Journal Human Resource Management, Special Issue: Measuring Human
Resource Effectiveness and Impact, Vol. 36, No. 3, 303-320 (1997)
9. Snell S.A.: Control Theory in Strategic Human Resource Management: The Mediating
Effect of Administrative Information. The Academy of Management Journal, Vol. 35,
No. 2, 292-327 (1992)
10. Broderick, R., Boudreau, J. W.: Human resource management, information technology,
and the competitive edge. Ithaca, NY: Cornell University, School of Industrial and
Labor Relations, Center for Advanced Human Resource Studies. (1991)
11. Mamoudou, S., Joshi G.P.: Impact of Information Technology in Human Resources
Management. Global Journal of Business Management and Information Technology,
Vol.4, No. 1, 33-41 (2014)
12. Karasek A.: Information Technologies in Human Resources Management – Selected
Examples. International Journal of Social, Behavioral, Educational, Economic,
Business and Industrial Engineering, Vol. 9, No. 6 (2015)
13. Lee I.: An Architecture for Next-Generation Holistic e-Recruiting System.
Communications of the ACM, Vol. 50, No. 7, 81-85 (2007)
14. General Purpose e-Recruiting system LinkedIn, www.linkedin.com
15. General Purpose e-Recruiting system Opportunity, https://myopportunity.com/
16. Gardner S.D., Lepak D.P., Bartol K.M.: Virtual HR: The Impact of Information
Technology on the Human Resource Professional. Journal of Vocational Behavior, Vol.
63, 159-179 (2003)
17. Tohidi H.: Human Resources Management Main Role in Information Technology
Project Management. Journal Procedia Computer Science 3, 925-929 (2011)
18. Job fair and professional conference IT Konekt. Available: www.it-konekt.com (visited
May 2016)
418