Embed Size (px)
Citation preview

Diastolic Electromechanical Coupling: Association of theElectrocardiographic T-peak to T-end Interval withEchocardiographic Markers of Diastolic Dysfunction
Andrew Sauer, MD, Jane E. Wilcox, MD, Adin-Cristian Andrei, PhD, Rod Passman, MD,MSCE, Jeffrey J. Goldberger, MD, and Sanjiv J. Shah, MDDivision of Cardiology, Dept of Medicine, Northwestern University Feinberg School of Medicine,Chicago, IL
AbstractBackground—Electromechanical coupling, a well-described phenomenon in systolicdysfunction, has not been well studied in diastole. We hypothesized that the ECG T-peak to T-end(TpTe) interval, representing transmural dispersion of repolarization, is associated withechocardiographic markers of diastolic dysfunction (DD).
Methods and Results—We performed a prospective, cross-sectional study of the associationbetween TpTe and markers of DD in 84 consecutive, unselected patients referred for exerciseechocardiography. We systematically measured TpTe on the resting electrocardiogram (ECG),and we performed comprehensive assessment of DD at rest and at peak stress. ECGs andechocardiograms were analyzed independently, blinded to each other and to all clinical data. Byunivariable analysis, increased TpTe was associated with older age, increased E/e’ ratio and DD(P<0.05 for all associations after correcting for multiple comparisons). Increased TpTe wasinversely associated with reduced tissue Doppler e’ velocity, a marker of DD (R=−0.66,P<0.0001). This association persisted after adjusting for age, QTc, exercise-induced wall motionabnormalities, and left ventricular mass index (β=−0.41 [95% CI −0.70 to −0.12] cm/s per 10-msincrease in TpTe; P=0.006). Baseline TpTe was also independently associated with resting DD(adjusted OR=3.9 [95% CI 1.4 to 10.7]; P=0.009), and peak exercise E/e’ ratio (P<0.0001).
Conclusions—Increased TpTe is associated with both resting and exercise-induced DD.Electromechanical coupling may represent a pathophysiologic link between electrical transmuraldispersion of repolarization and abnormal myocardial relaxation, and may be a novel therapeutictarget.
Keywordsdiastole; ECG; echocardiography; repolarization; tissue Doppler imaging
Address for correspondence: Sanjiv J. Shah, MD, FAHA, FACC, Assistant Professor of Medicine, Division of Cardiology,Department of Medicine, Northwestern University Feinberg School of Medicine, 676 N. St. Clair St., Suite 600, Chicago, IL 60611,Tel: 312-926-2926, Fax: 312-253-4470, [email protected].
Publisher's Disclaimer: This is a PDF file of an unedited manuscript that has been accepted for publication. As a service to ourcustomers we are providing this early version of the manuscript. The manuscript will undergo copyediting, typesetting, and review ofthe resulting proof before it is published in its final citable form. Please note that during the production process errors may bediscovered which could affect the content, and all legal disclaimers that apply to the journal pertain.
Conflict of Interest Disclosures: None.
NIH Public AccessAuthor ManuscriptCirc Arrhythm Electrophysiol. Author manuscript; available in PMC 2013 June 01.
Published in final edited form as:Circ Arrhythm Electrophysiol. 2012 June 1; 5(3): 537–543. doi:10.1161/CIRCEP.111.969717.
NIH
-PA Author Manuscript
NIH
-PA Author Manuscript
NIH
-PA Author Manuscript

IntroductionDiastolic dysfunction (DD) identified by comprehensive echocardiography is common, witha prevalence of up to 30% in the community, and both the presence and progression of DDhave been associated with adverse outcomes, including progression to overt heart failure(HF).1–3 Although much is known about the pathogenesis of DD and its relation to HFsyndromes, the underlying myocardial electrophysiologic properties associated with DDhave been less well studied. Characterization of the electrophysiologic substrate underlyingDD may allow for the development of novel therapies for DD and may also provide insightinto the high prevalence of sudden cardiac death observed in patients with HF withpreserved ejection fraction (HFpEF; also known as diastolic HF).4
While inherited long QT syndrome (LQTS) has historically been considered a purelyelectrical disease, echocardiographic studies over the past two decades have demonstrated acrude but replicable relationship between a prolonged QT interval and abnormal mechanicalfunction.5–9 Observational data paired with animal studies propose the theory that electricaltransmural dispersion of repolarization manifest on the surface electrocardiogram (ECG) canbe associated with mechanical dispersion of left ventricular relaxation observed usingcomprehensive echocardiography.10–15 We recently reported an association between ECGQTc interval and DD among patients undergoing echocardiography for suspected HF, noneof whom had known LQTS.16 We also validated this finding in an unselected cohort ofpatients referred for echocardiography.16 These findings extended prior results showing thatelectrical repolarization correlates with mechanical relaxation in a broad sample ofpatients.17
Although these prior studies demonstrate an association between QTc and DD, the QTcinterval encompasses both depolarization (systole) and repolarization (diastole). Animalmodels have demonstrated that the ECG T-peak to T-end (TpTe) interval is morerepresentative of transmural dispersion of repolarization than QTc.18 We therefore sought toevaluate the relationship between TpTe and DD. We hypothesized that TpTe would beindependently associated with DD even after adjusting for QTc, and would be more closelyrelated to tissue Doppler e’ velocity than QTc.
MethodsStudy design
We performed a prospective, cross-sectional study of the association between TpTe intervaland DD in 84 patients at the Bluhm Cardiovascular Institute of Northwestern MemorialHospital (Chicago, Illinois). We initially recruited 107 consecutive unselected patients whopresented for full Doppler exercise echocardiography from June 30, 2008 to August 21,2008. We excluded 17 patients due to poor echocardiographic image quality or poor qualitytissue Doppler tracings, 1 due to ventricular paced rhythm, and 5 due to atrial arrhythmia,resulting in 84 patients for the final analysis. The study protocol was approved by theinstitutional review board at Northwestern University Feinberg School of Medicine, and allstudy participants provided written informed consent.
Clinical characteristicsWe collected and analyzed the following clinical characteristics of the study participants:demographics, comorbidities, medications, body-mass index, and laboratory data (whichincluded serum potassium and renal function). Estimated glomerular filtration rate (eGFR)was calculated using the Modified Diet in Renal Disease equation.
Sauer et al. Page 2
Circ Arrhythm Electrophysiol. Author manuscript; available in PMC 2013 June 01.
NIH
-PA Author Manuscript
NIH
-PA Author Manuscript
NIH
-PA Author Manuscript

Hypertension was defined by systolic blood pressure >140 mmHg or diastolic bloodpressure >90 mmHg, physician documented history of hypertension, or use ofantihypertensive medications. Diabetes mellitus was defined by the presence of physician-documented history of diabetes or use of oral hypoglycemic agents or insulin for thetreatment of hyperglycemia. Coronary artery disease (CAD) was defined by the presence ofphysician documented history of CAD, known coronary stenosis > 50%, prior history ofmyocardial infarction, percutaneous intervention, coronary artery bypass grafting, orabnormal stress test consistent with myocardial ischemia. Obesity was defined by a bodymass index > 30 kg/m2.
ElectrocardiographyAll subjects underwent baseline 12-lead ECG recording (Marquette MAC 5000 RestingECG System; GE Healthcare; Boston, MA) at the time of baseline echocardiogram. ECGswere analyzed by a single trained reader blinded to the echocardiographic findings. EachECG was analyzed according to a systematic protocol which included measurement of thePR interval, QRS duration, QT interval, and QTc interval as described in a prior study ofours.16 We excluded patients with atrial arrhythmias, premature atrial or ventricular beats,irregular R-R intervals, or paced rhythms due to their influence on transmural dispersion ofrepolarization as well as difficulty measuring QTc and TpTe in these cases.19 We analyzedthe T-wave and measured TpTe interval based on methods described in previous studies.12
We employed a manual analysis of standard 12-lead ECG tracings at 25-mm/s speed and 10-mm/mV amplitude. Since previous studies have postulated that precordial leads best reflecttransmural dispersion of repolarization, while limb leads best reflect apical-basal or globalspatial dispersion, TpTe was measured from the peak of the T-wave to the end of the T-wave using the best available T-wave in lead V5, a method which has been describedpreviously.20–22 In cases in which V5 was not suitable for analysis leads, V4 and V6 (in thatorder) were measured.21 Since both animal and human models have previouslydemonstrated that transmural dispersion of repolarization typically manifest as late T-waveabnormalities in downslope or morphology, the offset of the descending limb of the T-wavewas defined as the intersection of the tangent to the terminal downslope of the T-wave andthe isoelectric line (Figure 1).21, 23, 24 For purposes of maintaining precision, leads wereexcluded from analysis if there was a prominent U-wave or if the T-wave amplitude was lessthan 1.5 mV. For the assessment of interobserver variability of TpTe measurements, asecond trained investigator independently measured the TpTe interval in 15 randomlyselected patients, blinded to all other clinical, ECG, and echocardiographic data.
EchocardiographyAll subjects underwent a complete M-mode, two-dimensional, Doppler and tissue Dopplerechocardiographic examination using a Sonos 7500 or iE33 system (Philips MedicalSystems, Andover, MA) with additional dedicated imaging of mitral inflow using pulsewave Doppler echocardiography and pulse wave tissue Doppler echocardiography of theseptal mitral annulus according to the published guidelines.25, 26 Echocardiograms werereviewed by a single trained reader blinded to the ECG and clinical data. Diastolic functionwas diagnosed and graded as normal, mild dysfunction (grade 1), or moderate or greaterdysfunction (grade 2 or 3) based on mitral inflow velocities (i.e., ratio of early [E] to late [A]mitral inflow velocity [E/A ratio]), tissue Doppler e’ velocities, and E/e’ ratio.3
Exercise testing and exercise echocardiographyExercise stress testing (including diastolic stress echocardiography) was performed using aprotocol consistent with prior published studies.27, 28 All patients underwent treadmillexercise according to the Bruce protocol with physician supervision to encourage maximallytolerated exercise. Immediately following peak exercise, regional wall motion was assessed
Sauer et al. Page 3
Circ Arrhythm Electrophysiol. Author manuscript; available in PMC 2013 June 01.
NIH
-PA Author Manuscript
NIH
-PA Author Manuscript
NIH
-PA Author Manuscript

using standardized two-dimensional views. Shortly after two-dimensional image acquisition,mitral inflow and septal tissue Doppler velocities were obtained within 5 minutes ofcessation of exercise at the earliest time to sufficiently allow separation of the E and Avelocities permitting appropriate measurement (typically when heart rate decreased to < 90bpm).
Statistical analysisFor the evaluation of interobserver variability of TpTe measurements, the agreementbetween the measurements obtained by 2 independent investigators was determined as themean bias and 95% limits of agreement (1.96 SD). Interobserver reliability also wasevaluated using the intraclass correlation coefficient29 and Bland-Altman analysis.
For descriptive purposes, we dichotomized study participants into 2 groups by median TpTeinterval (TpTe < 75 ms vs. TpTe ≥ 75 ms). Clinical characteristics, laboratory data, restingECG parameters, resting echocardiographic parameters, and stress test data (exerciseduration and capacity, peak stress wall motion, and peak stress diastolic parameters) werecompared between groups. Continuous data, displayed as mean ± standard deviation, werecompared using t-tests (all continuous data were normally distributed). Chi-squared tests (orFisher’s exact test when appropriate) were used to compare categorical variables betweengroups. To account for multiple comparisons (N=54 statistical tests in Tables 1–4), we used3 approaches: Bonferroni, Šidák, and false discovery rate (FDR). Results using the 3methods were similar, except for a significant difference in peak heart rate detected usingthe FDR method but not after correcting for multiple comparisons using the other 2 methods(see Table 3).
Next, we performed univariable and multivariable linear regression analyses to determinewhether TpTe (independent variable) was associated with tissue Doppler e’ velocity(dependent variable). We similarly performed univariable and multivariable logisticregression to determine whether TpTe (independent variable) was associated with thepresence of DD (dependent variable). Due to the relatively small sample size of our study,we used parsimonious models to avoid over-adjustment. Candidate covariates were selectedfor inclusion into our multivariable models if they were previously known to be associatedwith DD and therefore thought to be potential confounders. We excluded collinearity withTpTe for all covariates prior to inclusion into our multivariable models. All analyses wereperformed using Stata v.10.1 (StataCorp, College Station, TX).
ResultsIn the sample of 84 consecutive outpatients referred for stress echocardiography, the meanage was 52±14 years, 47% were female, and comorbidities such as hypertension, CAD,obesity, and dyslipidemia were common. The majority of subjects had normal cardiacchamber dimensions and wall thickness. Left ventricular ejection fraction was normal (>55%) in all subjects. Of the 84 patients, 63% had normal diastolic function, 13% had mild(grade 1) DD, and 24% had moderate or greater (grade 2 or 3) DD.
The mean TpTe was 75±17 ms, and the mean QTc was 423±27 ms. There was goodagreement in measurements of TpTe between 2 blinded investigators. Correlation betweenmeasurements made by the 2 independent investigators was high (R=0.94, P<0.0001), anddifferences in TpTe values measured by the 2 independent investigators were notstatistically significant (P=0.83 by paired t-test). Mean bias and 95% limits of agreement forthe TpTe measurement were −0.33 ms and −12.01 to 11.35 ms, respectively (seeSupplemental Figure S1 for Bland-Altman plot). The intraclass correlation coefficient was0.94 (95% confidence interval 0.89–0.99).
Sauer et al. Page 4
Circ Arrhythm Electrophysiol. Author manuscript; available in PMC 2013 June 01.
NIH
-PA Author Manuscript
NIH
-PA Author Manuscript
NIH
-PA Author Manuscript

Table 1 displays the baseline clinical characteristics by TpTe group (below vs. abovemedian TpTe). Those with higher TpTe values were older, but otherwise were similar tothose with lower TpTe values with a similar prevalence of comorbidities between the twogroups. Table 2 summarizes the resting ECG and echocardiographic characteristics bymedian TpTe. Subjects with an increased TpTe had a more leftward QRS axis, longer PRinterval, longer QT interval, and longer QTc interval but none of these differences remainedsignificant after accounting for multiple comparisons; QRS duration was similar among thetwo groups. There were several echocardiographic differences among TpTe groups: in thosein the TpTe ≥ 75 ms group, septal wall thickness and posterior wall thickness were higherand early mitral inflow (E) velocity and E/A ratio were lower. By tissue Doppler imaging,subjects in the TpTe ≥ 75 ms group had a much lower septal e’ velocity when compared tothose with lower TpTe (7.7±2.2 cm/s vs. 10.9±2.3 cm/s, P<0.0001). Left ventricular fillingpressure (estimated non-invasively by the E/e’ ratio) was also higher among patients in theTpTe ≥ 75 ms group (10.7±3.2 vs. 8.3±2.2, P=0.0001). Although there were severalechocardiographic differences among the TpTe groups, the only differences which remainedstatistically significant after multiple comparison testing were e’ velocity, E/e’ ratio, andDD.
Figure 1 displays representative examples of tissue Doppler images and corresponding leadV5 ECG tracings in a patient with short TpTe (and normal e’ velocity) and a patient withlong TpTe (and reduced e’ velocity). Figure 2 demonstrates the inverse relationship betweenTpTe interval and e’ velocity as well as the inverse relationship between QTc interval and e’velocity. The correlation between TpTe and e’ velocity (R=−0.66, P<0.0001) was muchstronger than the correlation between QTc and e’ velocity (R=−0.28, P=0.011).
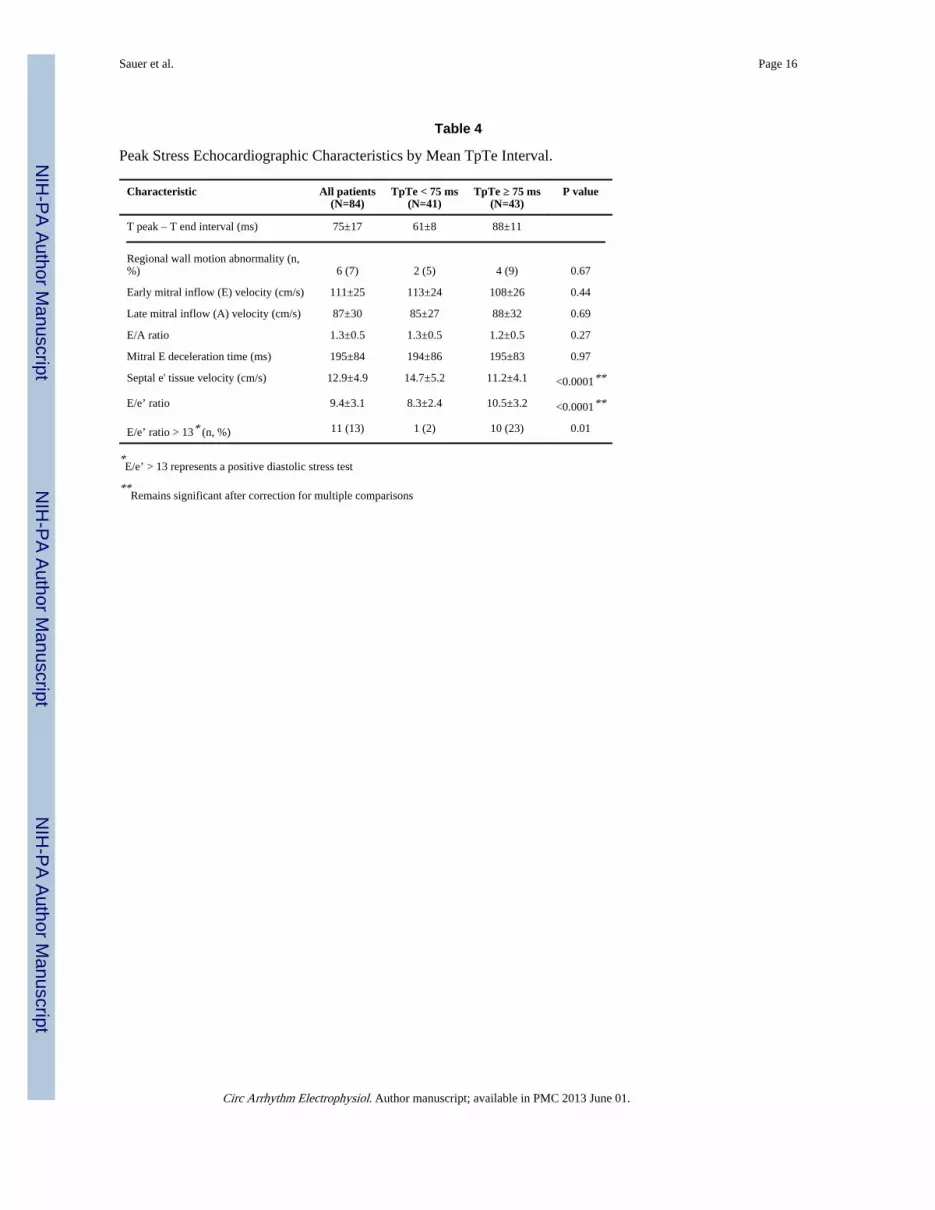
Tables 3 and 4 display the exercise test characteristics by median TpTe. Resting heart ratewas similar among groups; however, patients with increased TpTe demonstrated lower heartrate at peak exercise and reduced exercise capacity. There were no significant differences inregional wall motion abnormalities, mitral inflow velocities, or mitral E deceleration time atpeak stress. However, higher TpTe was associated with a decreased peak-exercise tissueDoppler septal e’ velocity and an increased peak-exercise E/e’ ratio. In addition, the numberof subjects with an abnormal diastolic stress test (i.e., peak exercise E/e’ > 13) was muchhigher in the TpTe ≥ 75 ms group compared to the TpTe < 75 ms group (23% vs. 2%,P=0.007). Only peak heart rate, peak exercise e’ velocity, and and peak exercise E/e’ ratioremained significantly different among the TpTe groups after accounting for multiplecomparisons.
Table 5 summarizes univariable and multivariable regression analyses for the associationbetween TpTe and septal e’ velocity, and for the association between TpTe and DD. Theseresults demonstrate the independent inverse association between TpTe and e’ velocity evenafter adjusting for potential confounders, including age, QTc, left ventricular mass index,and exercise-induced wall motion abnormalities. In unadjusted analyses, each 10-msincrease in TpTe was associated with a 1.02 cm/s decrease in e’ velocity (P<0.001). In thefinal multivariable model, each 10-ms increase in TpTe was associated with a 0.41 cm/sdecrease in e’ velocity (P=0.006), and QTc was no longer associated with e’ velocity(P=0.08). TpTe was also independently associated with worse DD (Figure 3 and Table 5).
DiscussionIn a sample of 84 consecutive outpatients referred for exercise echocardiography, we founda significant inverse linear association between the TpTe interval and tissue Doppler septale’ velocity. This association persisted after adjustment for several important potentialconfounders, including age, QTc interval, and left ventricular wall thickness. Moreover,
Sauer et al. Page 5
Circ Arrhythm Electrophysiol. Author manuscript; available in PMC 2013 June 01.
NIH
-PA Author Manuscript
NIH
-PA Author Manuscript
NIH
-PA Author Manuscript

TpTe remained associated with DD independent of exercise-induced regional wall motionabnormalities, suggesting TpTe relates directly to DD rather than representing a surrogate ofischemia. After adjusting for TpTe and other clinical and echocardiographic covariates, QTcwas not independently associated with septal e’ velocity. These findings suggest that TpTeprolongation explains the QTc prolongation previously associated with DD16 and may betterrepresent the electrical manifestations associated with abnormal relaxation and DD.
Ours is the first study to our knowledge to demonstrate the inverse relationship betweenECG TpTe and tissue Doppler septal e’ in unselected patients without LQTS. However,electromechanical coupling in the setting of prolonged QTc is not new. It was firstdemonstrated as an unsuspected late systolic left ventricular thickening seen on M-mode inpatients with genetic LQTS without structural abnormalities.5 These findings werereplicated using a 12-segment M-mode measurement of thickening time in cases of LQTSversus controls, suggesting not only electrical but also mechanical dispersion of the leftventricle in patients with LQTS.7 The advent of tissue Doppler imaging has allowed forfurther demonstration of abnormalities in left ventricular systolic and diastolic function inLQTS patients when compared to controls.8 A larger case-control study using tissue Dopplerimaging demonstrated that patients with inherited LQTS have a longer contraction durationwhen compared to controls and increased duration of contraction was more predictive ofcardiac events than QTc.9 Mechanical implications of electrical heterogeneity have alsobeen studied and validated in animal models.13
Multiple recent studies have demonstrated the role of T-wave analysis, and TpTe inparticular, as a potential ECG biomarker of dispersion of repolarization.18, 20, 30–33 Inaddition, some experiments have begun to investigate the ability of pharmacologicallyreversing dispersion of repolarization measured by TpTe as a potential therapeuticmechanism for reducing proarrhythmic substrate.34 Nevertheless, transmural dispersion ofrepolarization has only recently been demonstrated as a potential mechanism contributing tomechanical dysfunction in patients with overt HF.35
Our results should not be interpreted to suggest that TpTe measured on surface ECG can beused to screen for DD or exercise-induced DD on echocardiography. Rather, these findingsadd to the growing literature of evidence suggesting a possible contribution ofelectromechanical coupling of dispersion of repolarization as a mechanism of DD. Thenovel inverse association of TpTe with septal e’ among unselected patients should promptfurther investigations into both the electrical and mechanical markers of dispersion and animproved understanding of the mechanism behind electromechanical coupling.
The following limitations should be considered when interpreting the results of our study.We performed measurement of TpTe manually (and not by automated, computerizedanalysis), which may have introduced slight errors into the TpTe measurement; however,inaccuracy in TpTe would only decrease the association between TpTe and DD, and ourevaluation of interobserver variability showed that there was good agreement in TpTemeasurements among independent observers. Nevertheless, TpTe may be a crude measureof dispersion compared to more sophisticated software analysis of T-wave itself; particularmarkers such as T-wave slope, roundness, area and morphology may better reflecttransmural dispersion of repolarization after further validation.36 Moreover, we cannotaccount for the effect or the significance of excluding prominent U-waves from our analysissince the cellular basis for the origin of the U-wave remains inadequately defined.37–39
Finally, the tissue Doppler measurement of e’ velocity, though a marker of DD, may notdirectly reflect the transmural dispersion of mechanical myocardial relaxation.
Sauer et al. Page 6
Circ Arrhythm Electrophysiol. Author manuscript; available in PMC 2013 June 01.
NIH
-PA Author Manuscript
NIH
-PA Author Manuscript
NIH
-PA Author Manuscript

In conclusion, there is an inverse, linear correlation between TpTe and tissue Doppler e’velocity, an indicator of left ventricular myocardial relaxation and diastolic function.Furthermore, increased TpTe is associated with both resting DD and exercise-induced DD.Electromechanical coupling may represent a link between transmural dispersion ofrepolarization and abnormal mechanical myocardial relaxation. Further studies arewarranted to investigate the mechanism underlying diastolic electromechanical coupling ofdispersion of repolarization since such a mechanism may be a novel target for therapy inpatients with HF syndromes.
Supplementary MaterialRefer to Web version on PubMed Central for supplementary material.
AcknowledgmentsFunding Sources: This work was supported by grants from the American Heart Association (ScientistDevelopment Grant #0835488N) and the National Institutes of Health (R01 HL107557) (both to S.J.S.).
References1. Abhayaratna WP, Marwick TH, Smith WT, Becker NG. Characteristics of left ventricular diastolic
dysfunction in the community: An echocardiographic survey. Heart. 2006; 92:1259–1264.[PubMed: 16488928]
2. Kane GC, Karon BL, Mahoney DW, Redfield MM, Roger VL, Burnett JC Jr, Jacobsen SJ,Rodeheffer RJ. Progression of left ventricular diastolic dysfunction and risk of heart failure. JAMA.2011; 306:856–863. [PubMed: 21862747]
3. Redfield MM, Jacobsen SJ, Burnett JC Jr, Mahoney DW, Bailey KR, Rodeheffer RJ. Burden ofsystolic and diastolic ventricular dysfunction in the community: Appreciating the scope of the heartfailure epidemic. JAMA. 2003; 289:194–202. [PubMed: 12517230]
4. Zile MR, Gaasch WH, Anand IS, Haass M, Little WC, Miller AB, Lopez-Sendon J, Teerlink JR,White M, McMurray JJ, Komajda M, McKelvie R, Ptaszynska A, Hetzel SJ, Massie BM, CarsonPE. Mode of death in patients with heart failure and a preserved ejection fraction: Results from theIrbesartan in Heart Failure with Preserved Ejection Fraction Study (I-PRESERVE) trial.Circulation. 2010; 121:1393–1405. [PubMed: 20231531]
5. Nador F, Beria G, De Ferrari G, Stramba-Badiale M, Locati E, Lotto A, Schwartz P. Unsuspectedechocardiographic abnormality in the long QT syndrome. Diagnostic, prognostic, and pathogeneticimplications. Circulation. 1991; 84:1530–1542. [PubMed: 1914095]
6. De Ferrari G, Nador F, Beria G, Sala S, Lotto A, Schwartz P. Effect of calcium channel block on thewall motion abnormality of the idiopathic long QT syndrome. Circulation. 1994; 89:2126–2132.[PubMed: 8181137]
7. Nakayama K, Yamanari H, Otsuka F, Fukushima K, Saito H, Fujimoto Y, Emori T, Matsubara H,Uchida S, Ohe T. Dispersion of regional wall motion abnormality in patients with long QTsyndrome. Heart. 1998; 80:245–250. [PubMed: 9875083]
8. Savoye C, Klug D, Denjoy I, Ennezat PV, Le Tourneau T, Guicheney P, Kacet S. Tissue Dopplerechocardiography in patients with long QT syndrome. Eur J Echocardiogr. 2003; 4:209–213.[PubMed: 12928025]
9. Haugaa KH, Edvardsen T, Leren TP, Gran JM, Smiseth OA, Amlie JP. Left ventricular mechanicaldispersion by tissue Doppler imaging: A novel approach for identifying high-risk individuals withlong QT syndrome. Eur Heart J. 2009; 30:330–337. [PubMed: 18940888]
10. Belardinelli L, Dhalla A, Shryock J. Abnormal left ventricular relaxation in patients with long QTsyndrome. Eur Heart J. 2009; 30:2813–2814. [PubMed: 19843555]
11. Rosenbaum DS. Is long QT syndrome a disease of abnormal mechanical contraction? Circulation.2010; 122:1353–1354. [PubMed: 20855657]
Sauer et al. Page 7
Circ Arrhythm Electrophysiol. Author manuscript; available in PMC 2013 June 01.
NIH
-PA Author Manuscript
NIH
-PA Author Manuscript
NIH
-PA Author Manuscript

12. Antzelevitch C. Role of spatial dispersion of repolarization in inherited and acquired suddencardiac death syndromes. Am J Physiol Heart Circ Physiol. 2007; 293:H2024–H2038. [PubMed:17586620]
13. Cordeiro JM, Greene L, Heilmann C, Antzelevitch D, Antzelevitch C. Transmural heterogeneity ofcalcium activity and mechanical function in the canine left ventricle. Am J Physiol Heart CircPhysiol. 2004; 286:H1471–H1479. [PubMed: 14670817]
14. Provost J, Lee W-N, Fujikura K, Konofagou EE. Imaging the electromechanical activity of theheart in vivo. Proc Natl Acad Sci U S A. 2011; 108:8565–8570. [PubMed: 21571641]
15. Laurita KR, Katra R, Wible B, Wan X, Koo MH. Transmural heterogeneity of calcium handling incanine. Circ Res. 2003; 92:668–675. [PubMed: 12600876]
16. Wilcox JE, Rosenberg J, Vallakati A, Gheorghiade M, Shah SJ. Usefulness of electrocardiographicQT interval to predict left ventricular diastolic dysfunction. Am J Cardiol. 2011; 108:1760–1766.[PubMed: 21907948]
17. Alessandrini RS, McPherson DD, Kadish AH, Kane BJ, Goldberger JJ. Cardiac memory: Amechanical and electrical phenomenon. Am J Physiol Heart Circ Physiol. 1997; 272:H1952–H1959.
18. Antzelevitch C. T peak-T end interval as an index of transmural dispersion of repolarization. Eur JClin Invest. 2001; 31:555–557. [PubMed: 11454006]
19. Hinterseer M, Thomsen MB, Beckmann BM, Pfeufer A, Schimpf R, Wichmann HE, Steinbeck G,Vos MA, Kaab S. Beat-to-beat variability of QT intervals is increased in patients with drug-induced long-QT syndrome: A case control pilot study. Eur Heart J. 2008; 29:185–190. [PubMed:18156612]
20. Antzelevitch C, Sicouri S, Di Diego JM, Burashnikov A, Viskin S, Shimizu W, Yan G-X, KoweyP, Zhang L. Does T peak–T end provide an index of transmural dispersion of repolarization? HeartRhythm. 2007; 4:1114–1116. [PubMed: 17675094]
21. Panikkath R, Reinier K, Uy-Evanado A, Teodorescu C, Hattenhauer J, Mariani R, Gunson K, Jui J,Chugh SS. Prolonged T peak-to-T end interval on the resting ECG is associated with increasedrisk of sudden cardiac death. Circ Arrhythm Electrophysiol. 2011; 4:441–447. [PubMed:21593198]
22. Yamaguchi M, Shimizu M, Ino H, Terai H, Uchiyama K, Oe K, Mabuchi T, Konno T, Kaneda T,Mabuchi H. T wave peak-to-end interval and QT dispersion in acquired long QT syndrome: A newindex for arrhythmogenicity. Clin Sci (Lond). 2003; 105:671–676. [PubMed: 12857349]
23. Okin PM, Devereux RB, Fabsitz RR, Lee ET, Galloway JM, Howard BV. Principal componentanalysis of the T wave and prediction of cardiovascular mortality in American Indians.Circulation. 2002; 105:714–719. [PubMed: 11839627]
24. Yan GX, Antzelevitch C. Cellular basis for the normal T wave and the electrocardiographicmanifestations of the long-QT syndrome. Circulation. 1998; 98:1928–1936. [PubMed: 9799215]
25. Lang RM, Bierig M, Devereux RB, Flachskampf FA, Foster E, Pellikka PA, Picard MH, RomanMJ, Seward J, Shanewise JS, Solomon SD, Spencer KT, St John Sutton M, Stewart WJ.Recommendations for chamber quantification: A report from the American Society ofEchocardiography’s Guidelines and Standards Committee and the Chamber QuantificationWriting Group, developed in conjunction with the European Association of Echocardiography, abranch of the European Society of Cardiology. J Am Soc Echocardiogr. 2005; 18:1440–1463.[PubMed: 16376782]
26. Nagueh SF, Appleton CP, Gillebert TC, Marino PN, Oh JK, Smiseth OA, Waggoner AD,Flachskampf FA, Pellikka PA, Evangelista A. Recommendations for the evaluation of leftventricular diastolic function by echocardiography. J Am Soc Echocardiogr. 2009; 22:107–133.[PubMed: 19187853]
27. Burgess MI, Jenkins C, Sharman JE, Marwick TH. Diastolic stress echocardiography:Hemodynamic validation and clinical significance of estimation of ventricular filling pressure withexercise. J Am Coll Cardiol. 2006; 47:1891–1900. [PubMed: 16682317]
28. Grewal J, McCully RB, Kane GC, Lam C, Pellikka PA. Left ventricular function and exercisecapacity. JAMA. 2009; 301:286–294. [PubMed: 19155455]
Sauer et al. Page 8
Circ Arrhythm Electrophysiol. Author manuscript; available in PMC 2013 June 01.
NIH
-PA Author Manuscript
NIH
-PA Author Manuscript
NIH
-PA Author Manuscript

29. McGraw K, Wong S. Forming inferences about some intraclass correlation coefficients. PsycholMethods. 1996; 1:30–46.
30. Andersen MP, Xue JQ, Graff C, Hardahl TB, Toft E, Kanters JK, Christiansen M, Jensen HK,Struijk JJ. A robust method for quantification of IKr-related T-wave morphology abnormalities.Comput Cardiol. 2007; 34:341–344.
31. Antzelevitch C. Arrhythmogenic mechanisms of QT prolonging drugs: Is QT prolongation reallythe problem? J Electrocardiol. 2004; 37:15–24. [PubMed: 15534788]
32. Couderc JP, McNitt S, Hyrien O, Vaglio M, Xia X, Polonsky S, Moss AJ, Zareba W. Improvingthe detection of subtle I(Kr)-inhibition: Assessing electrocardiographic abnormalities ofrepolarization induced by moxifloxacin. Drug Saf. 2008; 31:249–260. [PubMed: 18302449]
33. Couderc JP, Vaglio M, Xia X, McNitt S, Wicker P, Sarapa N, Moss AJ, Zareba W. Impaired T-amplitude adaptation to heart rate characterizes I(Kr) inhibition in the congenital and acquiredforms of the long QT syndrome. J Cardiovasc Electrophysiol. 2007; 18:1299–1305. [PubMed:17916157]
34. Jia S, Lian J, Guo D, Xue X, Patel C, Yang L, Yuan Z, Ma A, Yan G-X. Modulation of the latesodium current by ATX-II and ranolazine affects the reverse use-dependence and proarrhythmicliability of IKr blockade. Br J Pharmacol. 2011; 164:308–316. [PubMed: 21182492]
35. Lou Q, Fedorov VV, Glukhov AV, Moazami N, Fast VG, Efimov IR. Transmural heterogeneityand remodeling of ventricular excitation-contraction coupling in human heart failure. Circulation.2011; 123:1881–1890. [PubMed: 21502574]
36. Couderc J-P, Xia X, Peterson DR, McNitt S, Zhao H, Polonsky S, Moss AJ, Zareba W. Twavemorphology abnormalities in benign, potent, and arrhythmogenic IKr inhibition. Heart Rhythm.2011; 8:1036–1043. [PubMed: 21315844]
37. Antzelevitch C. Cellular basis for the repolarization waves of the ECG. Ann N Y Acad Sci. 2006;1080:268–281. [PubMed: 17132789]
38. Hopenfeld B, Ashikaga H. Origin of the electrocardiographic U wave: Effects of M cells anddynamic gap junction coupling. Ann Biomed Eng. 2010; 38:1060–1070. [PubMed: 20127511]
39. Ritsema van Eck HJ, Kors JA, van Herpen G. The U wave in the electrocardiogram: A solution fora 100-year-old riddle. Cardiovasc Res. 2005; 67:256–262. [PubMed: 15913583]
Sauer et al. Page 9
Circ Arrhythm Electrophysiol. Author manuscript; available in PMC 2013 June 01.
NIH
-PA Author Manuscript
NIH
-PA Author Manuscript
NIH
-PA Author Manuscript

Figure 1.Examples of the relation between tissue Doppler e’ velocity and electrocardiographic T-peakto T-end interval. Panel A: Normal e’ velocity (12.1 cm/s) and short TpTe interval (65 ms).Panel B: Abnormally reduced e’ velocity (7.8 cm/s) and long TpTe interval (115 ms).Asterisks denote e’ wave on tissue Doppler tracings. Arrows denote TpTe interval onelectrocardiography tracings.
Sauer et al. Page 10
Circ Arrhythm Electrophysiol. Author manuscript; available in PMC 2013 June 01.
NIH
-PA Author Manuscript
NIH
-PA Author Manuscript
NIH
-PA Author Manuscript
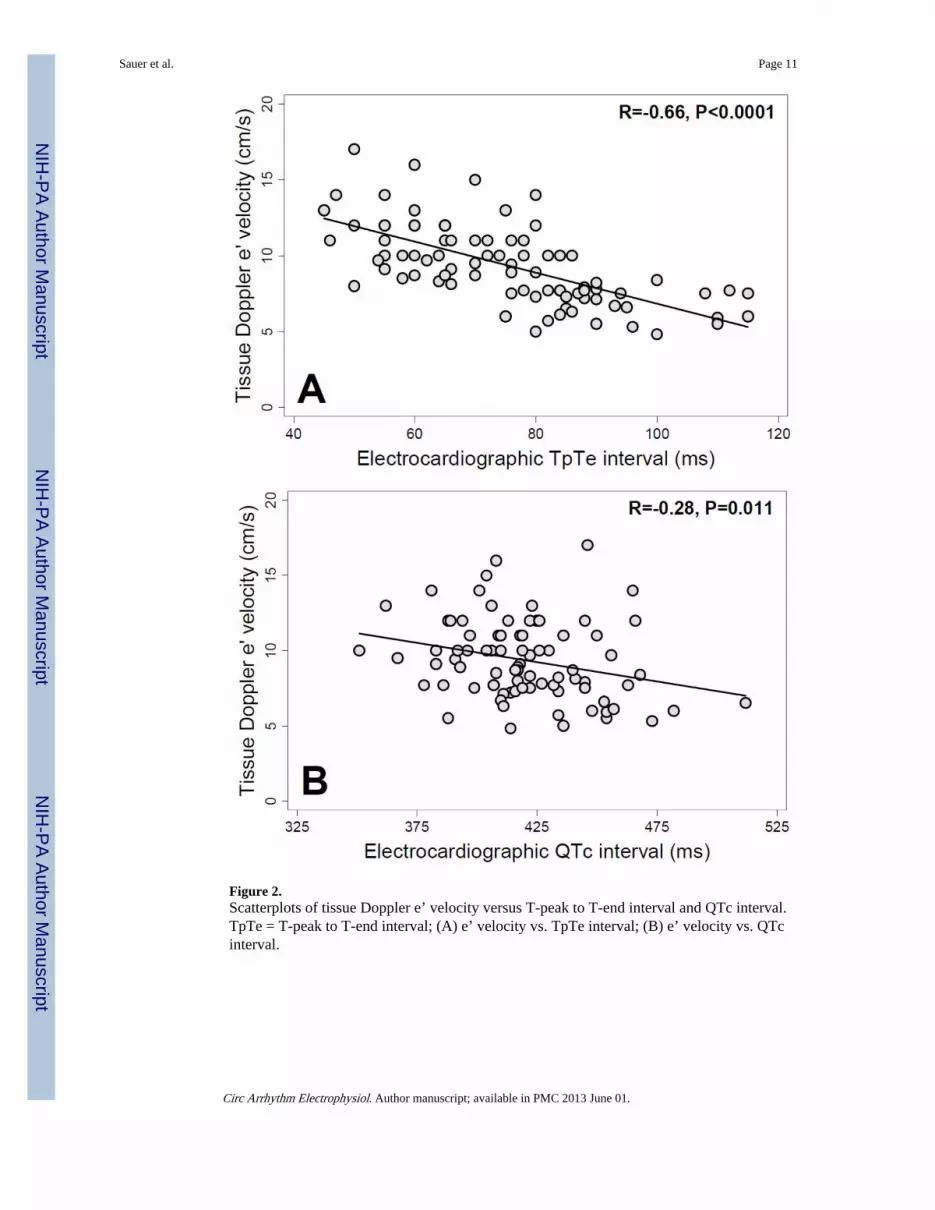
Figure 2.Scatterplots of tissue Doppler e’ velocity versus T-peak to T-end interval and QTc interval.TpTe = T-peak to T-end interval; (A) e’ velocity vs. TpTe interval; (B) e’ velocity vs. QTcinterval.
Sauer et al. Page 11
Circ Arrhythm Electrophysiol. Author manuscript; available in PMC 2013 June 01.
NIH
-PA Author Manuscript
NIH
-PA Author Manuscript
NIH
-PA Author Manuscript

Figure 3.Box-and-whisker plot of T-peak to T-end interval versus left ventricular diastolicdysfunction grade. P-value across all 3 groups calculated using one-way analysis ofvariance. Individual diastolic dysfunction groups were compared to normal diastolicfunction using t tests. Asterisk denotes P<0.0001 for comparison versus normal diastolicfunction group.
Sauer et al. Page 12
Circ Arrhythm Electrophysiol. Author manuscript; available in PMC 2013 June 01.
NIH
-PA Author Manuscript
NIH
-PA Author Manuscript
NIH
-PA Author Manuscript

NIH
-PA Author Manuscript
NIH
-PA Author Manuscript
NIH
-PA Author Manuscript
Sauer et al. Page 13
Table 1
Clinical Characteristics by Median TpTe Interval
Characteristic All patients(N=84)
TpTe < 75 ms(N=41)
TpTe ≥ 75 ms(N=43)
P value
T peak – T end interval (ms) 75±17 61±8 88±11
Age (years) 52±14 45±12 58±13 <0.0001*
Female (n, %) 40 (47) 24 (58) 16 (37) 0.05
Body-mass index (kg/m2) 26±5 25±4 27±5 0.02
Comorbidities (n, %)
Hypertension 28 (34) 12 (30) 16 (37) 0.48
Coronary artery disease 20 (24) 7 (17) 13 (30) 0.17
Diabetes mellitus 5 (6) 2 (5) 3 (7) 0.70
Chronic kidney disease 5 (6) 3 (7) 2 (5) 0.58
Dyslipidemia 37 (44) 15 (37) 22 (51) 0.21
Obesity 17 (20) 5 (12) 12 (28) 0.10
Medications (n, %)
Beta-blocker 31 (37) 14 (35) 17 (40) 0.61
ACE-I / ARB 24 (29) 8 (20) 16 (38) 0.08
Aspirin 32 (38) 11 (27) 21 (49) 0.046
Statin 31 (38) 13 (32) 18 (43) 0.33
Diuretic 10 (12) 5 (12) 5 (12) 0.93
Laboratory data
Serum potassium (mEq/L) 4.1±0.5 4.2±0.4 4.1±0.5 0.72
Estimated GFR (ml/min/1.73m2) 77±22 78±24 75±21 0.58
ACE-I / ARB = angiotensin converting enzyme inhibitor or angiotensin receptor blockerGFR = glomerular filtration rate
*Remains significant after correction for multiple comparisons
Circ Arrhythm Electrophysiol. Author manuscript; available in PMC 2013 June 01.

NIH
-PA Author Manuscript
NIH
-PA Author Manuscript
NIH
-PA Author Manuscript
Sauer et al. Page 14
Table 2
Resting Electrocardiographic and Echocardiographic Parameters by Median TpTe Interval
Parameter All patients(N=84)
TpTe < 75 ms(N=41)
TpTe ≥ 75 ms(N=43)
P value
T peak – T end interval (ms) 75±17 61±8 88±11
Electrocardiography:
PR interval (ms) 160±28 153±23 167±31 0.03
QRS interval (ms) 90±14 87±9 93±17 0.06
QT interval (ms) 401±41 390±30 413±46 0.01
QTc interval (ms) 423±27 416±22 430±29 0.02
QRS axis (degrees) 36±38 46±29 27±42 0.02
Echocardiography:
LV end-diastolic dimension (cm) 4.4±0.6 4.3±0.6 4.4±0.5 0.69
LV end-systolic dimension (cm) 2.9±0.5 2.9±0.5 2.9±0.5 0.91
LV posterior wall thickness (cm) 1.0±0.2 0.9±0.1 1.0±0.2 0.02
LV septal wall thickness (cm) 1.0±0.2 0.9±0.1 1.0±0.2 0.02
LV mass index (g/m2) 78±20 75±20 80±20 0.22
LV ejection fraction (%) 60±4 59±3 60±5 0.24
Left atrial dimension (cm) 3.3±0.4 3.2±0.5 3.4±0.4 0.12
Early mitral inflow (E) velocity (cm/s) 83±19 88±20 80±17 0.04
Late mitral inflow (A) velocity (cm/s) 69±17 67±17 70±16 0.44
E/A ratio 1.3±0.5 1.4±0.6 1.2±0.3 0.03
Mitral E deceleration time (ms) 204±70 198±70 210±71 0.42
Septal e' tissue velocity (cm/s) 9.3±2.8 10.9±2.3 7.7±2.2 <0.0001*
E/e' ratio 9.5±3.0 8.3±2.2 10.7±3.2 0.0001*
Diastolic function (n, %) <0.0001*
Normal diastolic function 53 (63) 40 (98) 13 (30)
Grade 1 diastolic dysfunction 11(13) 1(2) 10 (23)
Grade 2 or 3 diastolic dysfunction 20 (24) 0 (0) 20 (47)
*Remains significant after correction for multiple comparisons
Circ Arrhythm Electrophysiol. Author manuscript; available in PMC 2013 June 01.

NIH
-PA Author Manuscript
NIH
-PA Author Manuscript
NIH
-PA Author Manuscript
Sauer et al. Page 15
Table 3
Exercise Treadmill Testing Results by Median TpTe Interval
Characteristic All patients(N=84)
TpTe < 75ms
(N=41)
TpTe ≥ 75 ms(N=43)
P value
T peak – T end interval (ms) 75±17 61±8 88±11
Resting HR (bpm) 80±13 83±10 76±15 0.02
Peak HR (bpm) 156±23 164±21 149±23 0.002*
Percent predicted peak HR (%) 92±10 94±11 91±10 0.12
Resting systolic BP (mmHg) 120±16 117±18 122±14 0.14
Resting diastolic BP (mmHg) 77±11 75±11 77±11 0.37
Resting pulse pressure (mmHg) 43±14 41±16 45±12 0.31
Peak systolic BP (mmHg) 157±20 158±22 157±18 0.73
Peak diastolic BP (mmHg) 70±13 68±12 72±13 0.22
Peak pulse pressure (mmHg) 88±20 90±21 85±19 0.26
Exercise time (minutes) 10.1±3.1 10.7±3.1 9.5±3.0 0.07
Exercise capacity (METs) 11.8±3.5 12.6±3.4 11.1±3.5 0.049
HR = heart rate, BP = blood pressure, METs = metabolic equivalents
*Remains significant after correction for multiple comparisons using the false discovery rate (FDR) method (FDR-corrected P=0.015) but not by
Bonferroni and Šidák methods (P=0.11 and P=0.10, respectively).
Circ Arrhythm Electrophysiol. Author manuscript; available in PMC 2013 June 01.
NIH
-PA Author Manuscript
NIH
-PA Author Manuscript
NIH
-PA Author Manuscript
Sauer et al. Page 16
Table 4
Peak Stress Echocardiographic Characteristics by Mean TpTe Interval.
Characteristic All patients(N=84)
TpTe < 75 ms(N=41)
TpTe ≥ 75 ms(N=43)
P value
T peak – T end interval (ms) 75±17 61±8 88±11
Regional wall motion abnormality (n,%) 6 (7) 2 (5) 4 (9) 0.67
Early mitral inflow (E) velocity (cm/s) 111±25 113±24 108±26 0.44
Late mitral inflow (A) velocity (cm/s) 87±30 85±27 88±32 0.69
E/A ratio 1.3±0.5 1.3±0.5 1.2±0.5 0.27
Mitral E deceleration time (ms) 195±84 194±86 195±83 0.97
Septal e' tissue velocity (cm/s) 12.9±4.9 14.7±5.2 11.2±4.1 <0.0001**
E/e’ ratio 9.4±3.1 8.3±2.4 10.5±3.2 <0.0001**
E/e’ ratio > 13* (n, %) 11 (13) 1 (2) 10 (23) 0.01
*E/e’ > 13 represents a positive diastolic stress test
**Remains significant after correction for multiple comparisons
Circ Arrhythm Electrophysiol. Author manuscript; available in PMC 2013 June 01.

NIH
-PA Author Manuscript
NIH
-PA Author Manuscript
NIH
-PA Author Manuscript
Sauer et al. Page 17
Tabl
e 5
Uni
vari
able
and
Mul
tivar
iabl
e R
egre
ssio
n A
naly
ses
for
the
Ass
ocia
tion
of T
pTe
Inte
rval
with
Res
ting
Tis
sue
Dop
pler
e’
Vel
ocity
and
Dia
stol
icD
ysfu
nctio
n
Tis
sue
Dop
pler
e’
velo
city
Dia
stol
ic d
ysfu
ncti
on
Mod
elβ-
Coe
ffic
ient
*95
% C
IP
val
ueO
dds
Rat
io*
95%
CI
P v
alue
Una
djus
ted
−1.
02−
1.28
, −0.
77<
0.0
018.
33.
1, 2
2.3
< 0
.001
Mod
el I
−0.
60−
0.86
, −0.
34<
0.0
015.
61.
9, 1
6.4
0.00
2
Mod
el I
I−
0.50
−0.
77, −
0.22
0.00
14.
71.
6, 1
3.8
0.00
5
Mod
el I
II−
0.41
−0.
70, −
0.12
0.00
63.
91.
4, 1
0.7
0.00
9
* Per
stan
dard
dev
iatio
n 10
-ms
incr
ease
in T
pTe
Mod
el I
: adj
uste
d fo
r ag
eM
odel
II:
adj
uste
d fo
r ag
e an
d Q
Tc
inte
rval
Mod
el I
II: a
djus
ted
for
age,
QT
c in
terv
al, l
eft v
entr
icul
ar m
ass
inde
x, a
nd th
e pr
esen
ce o
f w
all m
otio
n ab
norm
ality
on
stre
ss e
choc
ardi
ogra
phy
Circ Arrhythm Electrophysiol. Author manuscript; available in PMC 2013 June 01.


![Dysfunction of Diastolic [Ca2+] in Cardiomyocytes Isolated From Chagasic Patients](https://img.pdfslide.net/doc/110x75/63547b7ab17b833cd801f904/dysfunction-of-diastolic-ca2-in-cardiomyocytes-isolated-from-chagasic-patients.jpg)


