Embed Size (px)
Citation preview

Fullerenes, Nanotubes, and Carbon Nanostructures, 22: 332–345, 2014Copyright © Taylor & Francis Group, LLCISSN: 1536-383X print / 1536-4046 onlineDOI: 10.1080/1536383X.2012.684189
Dielectric and Microwave Properties of Fullerenes
Containing Natural Rubber-based Nanocomposites
OMAR A. AL-HARTOMY1,2 , AHMED A. AL-GHAMDI1,FALLEH AL-SALAMY1,3 , NIKOLAY DISHOVSKY4 ,DESISLAVA SLAVCHEVA4, VLADIMIR ILIEV5
AND FARID EL-TANTAWY6
1Department of Physics, King Abdulaziz University, Jeddah, Saudi Arabia2Department of Physics, University of Tabuk, Tabuk, Saudi Arabia3Department of Mathematics, University of Tabuk, Tabuk, Saudi Arabia4Department of Polymer Engineering, University of Chemical Technology andMetallurgy, Sofia, Bulgaria5College of Telecommunications and Posts, Sofia, Bulgaria6Department of Physics, Suez Canal University, Ismailia, Egypt
In this study, the influence of fullerenes in concentrations from 0.5 to 1.5 phr onthe dielectric (dielectric permittivity, dielectric loss angle tangent) and microwave(reflection coefficient, attenuation coefficient, shielding effectiveness) properties ofnanocomposites on the basis of natural rubber has been investigated in the 1-12 GHzfrequency range. Some additional investigations on the morphology and microstructureof the studied composites have been carried out by scanning electron microscopy andtransmission electron microscopy. To confirm to the high purity of the fullerene usedRaman spectra and X-ray diffraction analysis were carried out.
Keywords Fullerene, rubber nanocomposites, dielectric and microwave properties
Introduction
The 1996 Nobel Prize for Chemistry was won by Harold W. Kroto, Robert F. Curl andRichard E. Smalley for their discovery in 1985 of a new allotrope of carbon, in which theatoms are arranged in closed shells. The new form was found to have the structure of trun-cated icosahedrons and was named Buckminsterfullerene, after the architect BuckminsterFuller who designed geodesic domes in the 1960s. Unlike the other two allotrope formsof carbon—graphite and diamond, which are volumetric materials that have the propertiesof three-dimensional crystals—the fullerenes are hollow molecules composed of carbon insp2- hybrid state of the valent electrons.
Fullerenes have a number of unique properties, including superconductivity (1,2), lowthermal conductivity (3) and greater hardness than the diamond in crystal state (4), whichmakes them attractive for different applications.
Address correspondence to Nikolay Dishovsky, University of Chemical Technology andMetallurgy, Department of Polymer Engineering, 8 Kl. Ohridski Boulevard, 1756, Bulgaria. E-mail:[email protected]
332
Dow
nlo
aded
by [
Dr
Om
ar A
lhar
tom
y]
at 0
6:0
6 0
7 M
arch
2014

Properties of Fullerenes Containing Rubber-Based Nanocomposites 333
The most significant representative of the fullerenes is C60. It consists of molecularballs made of 60 or more carbon atom clusters linked together (1,2). Each of the carbonatoms has two single bonds and one double bond that attach to other carbon atoms. Thiscauses C60 to act more like a “superalkene” than a “superaromatic” (3). The structure,properties and possible applications of the fullerenes have been described in detail in (5).Their possible applications as ingredients in rubber compounds and composites on thebasis of these compounds have been described with expected positive influence on somecharacteristics—enhanced durability and structural rigidity (6–8), modification in the vis-coelastic properties (8), lower heat buildup (9), superior processability (10), better fueleconomy (5) and improved wear and tear resistance (11). Data of the influence of thefullerenes on the microwave properties of the elastomeric composites are scarce. In (12) theinfluence of fullerenes in concentrations between 0.065 and 0.75 phr (parts per hundred rub-ber) on the properties of composites on the basis of natural rubber, as well as the influenceon some microwave properties, has been investigated. The coefficients of reflection R andattenuation S of the electromagnetic radiation passing through the specimens under studyare estimated. The scatterometric method and a panoramic indicator are used to measurethe standing-wave factor by the voltage (SWFv). The specimens are placed into a wave-guide path of the indicator and tested under a normal incidence of the electromagnetic wave(EMW) within 8–12 GHz frequency range. To estimate the reflection coefficient, the spec-imens were brought into contact with a metal substrate reflecting the radiation and placedinto the wave-guide path of the indicator where the SWFv is measured at different frequen-cies. It is found that the specimen with 0.065 phr of fullerene does not influence EMWabsorption in any way. On increasing the fullerene concentration, the absorption kineticchanges to a mirror reflection. The increased fullerene content does not affect attenuationwithin the studied concentration range (0.2–0.75 phr). Evidently, its threshold concentra-tion in rubber at which the microwave absorption behavior changes abruptly is somewherebetween 0.065 and 0.2 phr. However, the fullerenes are included in the composition ofthe rubber compounds together with carbon black, and the total quantity of the fullerenesand the carbon black rests always 5 phr whereas the amount of the pure fullerenes varies.A similar investigation has been carried out on the dielectric and microwave properties ofcomposites on the basis of natural rubber SMR 10, containing up to 7.5% phr fullerene car-bon black where the concentration of pure fullerenes is 7.5%; that is, the maximum amountof the pure fullerenes in composites will be from 0.075 up to 0.56 phr (13).
In this work, the dielectric (relative dielectric permittivity and dielectric loss angletangent) and microwave (reflection coefficient, attenuation coefficient, shielding effective-ness) properties of composites containing various concentration of fullerene black wereinvestigated in the 1–12 GHz frequency range. It has been established that within the 1-12 GHz range the increasing frequency and fullerene filler amount lead to an increase inthe values of relative dielectric permittivity, dielectric loss angle tangent, reflection coeffi-cient and attenuation of electromagnetic waves, while the values for shielding effectivenessget lower. That is because under the experimental conditions, the change in the reflectioncoefficient is greater than that in the attenuation of electromagnetic waves.
We supposed that an additional change in the microwave properties may be expectedand achieved by the introduction of fullerenes in higher concentrations, which the authors(12,13) have not studied and no additional reference or data has been found in the litera-ture. We have also decided to add the fullerenes to the rubber compound independently (ontheir own) without carbon black or any other fillers in order to show their influence in pureform and to compare it to the properties of a composite that does not contain fullerenes.Apart from this we have also investigated the microwave properties in coaxial line unlike
Dow
nlo
aded
by [
Dr
Om
ar A
lhar
tom
y]
at 0
6:0
6 0
7 M
arch
2014

334 O. A. Al-Hartomy et al.
the authors of some other investigations (12) who studied the microwave properties inwaveguide line with metal plate behind the sample.
The purpose of this work is to study the influence of fullerenes added on their ownunder the form of powder in amounts from 0.5 to 1.5 phr on the dielectric (dielectricpermittivity, dielectric loss angle tangent) as well as the microwave properties (absorptionand reflection of the electromagnetic waves, the effectiveness of the electromagnetic shield-ing ) of composites on the basis of natural rubber in a significantly greater frequency rangefrom 1 to 12 GHz. Some additional investigations on the morphology and microstructureof the studied composites have been carried out by scanning electron microscopy (SEM)and (transmission electron microscopy) TEM.
Experimental
Fullerene Characterization
In the current investigation pure fullerene powder produced by the company Alfa Aesar(Johnson Matthey Company, Karlsruhe, Germany) has been used, which contains 99.5%fullerene C60. Its density is 1.65g/cm3. From the TEM micrograph (Figure 1), it is evident
Figure 1. TEM Micrograph of fullerene aggregates.
Dow
nlo
aded
by [
Dr
Om
ar A
lhar
tom
y]
at 0
6:0
6 0
7 M
arch
2014

Properties of Fullerenes Containing Rubber-Based Nanocomposites 335
Figure 2. Raman spectra of the fullerene powder.
Figure 3. X-ray diffraction patterns of the powder (color figure available online).
that the fullerene particles are aggregates with size up to a few hundred nanometers, forexample, width about 300 nm and length about 700 nm, made up of primary particleswhose size is about 40–50 nm.
To confirm the high purity of the fullerene used, Raman spectra and X-ray diffrac-tion analysis were carried out (Figures 2 and 3). The Raman spectra were obtained usinga single Raman spectrometer LabRAM HR Visible (Jobin Yvon), equipped with a micro-scope, edge filters and Peltier-cooled CCD detector. The 633 nm He-Ne and 458, 488, and525 nm Ar+ laser lines were used for excitation. An 100X objective was used to both focus
Dow
nlo
aded
by [
Dr
Om
ar A
lhar
tom
y]
at 0
6:0
6 0
7 M
arch
2014
336 O. A. Al-Hartomy et al.
the incident laser beam onto a spot of about 1 µm in diameter and to collect the scatteredlight in a backscattering geometry. The laser power on the spot was kept at very low val-ues (about 50 µW) to prevent possible local overheating. In the Raman spectra obtainedwith the 633 nm He-Ne excitation, only a strong background, probably due to a lumines-cence, was observed. Using an excitation in the blue–green region, however, the obtainedRaman spectra contain relatively low background and numerous sharp lines (see Figure 2).According to the literature (14), all the observed lines can be assigned to the Raman-activemodes of the fullerene C60.
The structure of C60 fullerene powder can be examined by small-angle and large-anglediffraction (15) X-ray techniques to find the size of its scatterers. Powder X-ray diffractionpatterns were collected within the range from 5.3 to 80◦ 2θ with a constant step 0.02◦ 2θon Bruker D8 Advance diffractometer with Cu Kα radiation and LynxEye detector. Phaseidentification was performed with the Diffracplus EVA using ICDD-PDF2 Database. Themain phase isC60 (01-082-0505) with cubic crystal structure: a= 14.19470Å, space group(SG) Fm-3m, but some impurities are also detected: C70 (00-048-1206) with hexagonalcrystal structure with unit cell parameters a = 10.59340Å, c = 17.26200Å, SG P63/mmc
and C70 (01-073-5048) with orthorhombic crystal structure with unit cell parameters a =
17.30300Å, b = 9.99000Å, c = 17.92400Å, SG Ccmm (Figure 3).
Sample Preparation and Vulcanization
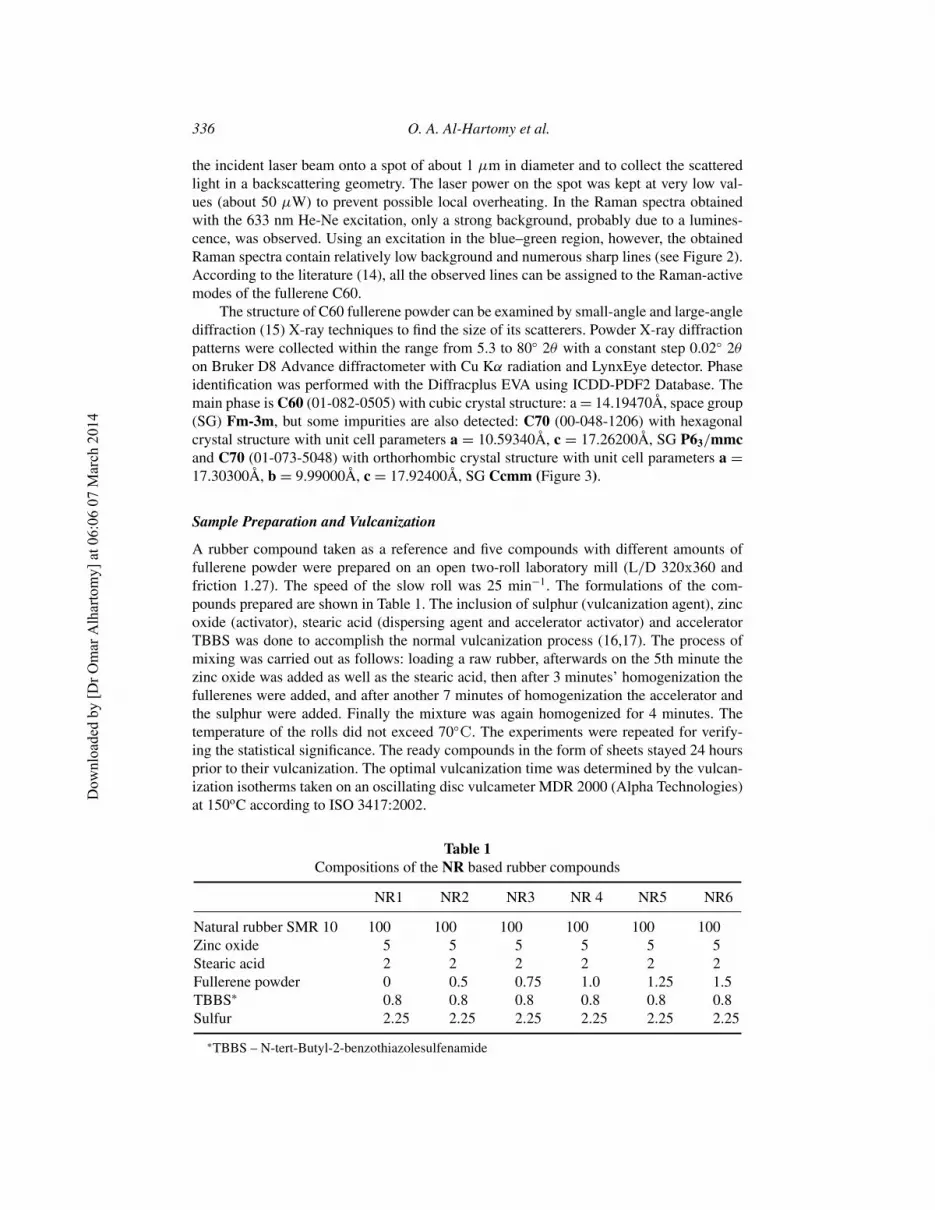
A rubber compound taken as a reference and five compounds with different amounts offullerene powder were prepared on an open two-roll laboratory mill (L/D 320h360 andfriction 1.27). The speed of the slow roll was 25 min−1. The formulations of the com-pounds prepared are shown in Table 1. The inclusion of sulphur (vulcanization agent), zincoxide (activator), stearic acid (dispersing agent and accelerator activator) and acceleratorTBBS was done to accomplish the normal vulcanization process (16,17). The process ofmixing was carried out as follows: loading a raw rubber, afterwards on the 5th minute thezinc oxide was added as well as the stearic acid, then after 3 minutes’ homogenization thefullerenes were added, and after another 7 minutes of homogenization the accelerator andthe sulphur were added. Finally the mixture was again homogenized for 4 minutes. Thetemperature of the rolls did not exceed 70◦S. The experiments were repeated for verify-ing the statistical significance. The ready compounds in the form of sheets stayed 24 hoursprior to their vulcanization. The optimal vulcanization time was determined by the vulcan-ization isotherms taken on an oscillating disc vulcameter MDR 2000 (Alpha Technologies)at 150oC according to ISO 3417:2002.
Table 1
Compositions of the NR based rubber compounds
NR1 NR2 NR3 NR 4 NR5 NR6
Natural rubber SMR 10 100 100 100 100 100 100Zinc oxide 5 5 5 5 5 5Stearic acid 2 2 2 2 2 2Fullerene powder 0 0.5 0.75 1.0 1.25 1.5TBBS∗ 0.8 0.8 0.8 0.8 0.8 0.8Sulfur 2.25 2.25 2.25 2.25 2.25 2.25
∗TBBS – N-tert-Butyl-2-benzothiazolesulfenamide
Dow
nlo
aded
by [
Dr
Om
ar A
lhar
tom
y]
at 0
6:0
6 0
7 M
arch
2014

Properties of Fullerenes Containing Rubber-Based Nanocomposites 337
The vulcanization was carried out in a hydraulic electric press, with the size of the plate400x400mm at pressure 10 MPa. From the composites obtained with size 200x200x2 mmwere cut samples necessary for our further measurements were cut.
Measurement Methods
Reflectance and Attenuation
Measurements of reflection and attenuation is carried out using the measurement of output(adopted) power Pa in the output of a measuring line without losses, which may includesamples of materials. Because of the wide frequency, the measurement is done using a coax-ial line. Samples of materials are shaped like discs with an external diameter D= 20.6 mm,equal to the outer diameter of the coaxial line, and thickness of1 ≈ 2mm. The internaldiameter depends on the relative dielectric permittivity of the material to no accidentalinclusion a sample in the line.
Part of the incident electromagnetic wave (EMW) with power Pin. on the sampleis reflected from it. The rest of the wave with power Pp penetrates the material with athickness1. Thus the attenuation L,dB relative to the thickness of the sample 1,cm deter-mined attenuation coefficient α, dB/cm, which depends on the coefficient of reflection |G|.Its module is determined by a reflect meter.
α =1
110 log
Pa
Pp
=L
1, dB/cm (1)
Where
Pp = Pin.(1− |Ŵ|2) (2)
For the testing of both parameters is used the scheme, consisting of a set of generatorsfor the whole range (1), coaxial section with a sample of material measured (2), Powermeter HP432A (3), Scalar reflectance meter HP416A (4) and Reflect meter (R) (Figure 4).
Shielding Effectiveness
This parameter is defined as the sum of the reflection losses R, dB and attenuation L, dB inthe material.
Figure 4. Scheme of the equipment for measuring the coefficients of attenuation and reflection.
Dow
nlo
aded
by [
Dr
Om
ar A
lhar
tom
y]
at 0
6:0
6 0
7 M
arch
2014

338 O. A. Al-Hartomy et al.
S.E. = R, dB+ L, dB (3)
where R, dB is the attenuation due to the reflection of power at the interfaces, and
R = −20 log |Ŵ| , dB (4)
Complex Relative Dielectric Permittivity ε̇ = εr − j tan δ
The determination of complex permittivity is carried out using the resonance method, basedon the cavity perturbation technique (18). Real and imaginary parts of ε̇ of the sample inthe resonator change its parameters: resonant frequency and loading quality factor.
The resonance frequency of empty cavity resonator fr and then the shift in resonancefrequency with the sample material fε were measured. Because the thickness of the sampleis not equal to the height of the resonator, in its inclusion is obtained a dielectric with anequivalent permittivity εe, which is determined by equation (5)
εe = 1+Sr
2Sε
.fr − fε
fr(5)
where Sr and Sεare cavity and the sample cross sections.Then the dielectric constant εr of the sample is calculated by
εr ≈ a [εe(k + 1)− k], (1 << d) (6)
where k = d/1 and d is the distance from the disc to the top of the resonator and d is aconstructive constant.
The sample is in the form of disc with a diameter of 11 to 30 mm, depends of using cav-ity resonator and thickness about 2 mm. It is placed at the maximum electric field locationof the cavity.
The loss factor tanδ is calculated from quality factor of the cavity with Qε and withoutsample Qr
tan δ =1
4εr
Sr
Sε
(
1
Qε
−1
Qr
)
(7)
The measurement setup uses several generators for the whole range (1), frequencymeters: H 532A; FS – 54 (2), cavity resonator (3), sample (4) and oscilloscope EO 213(5)(Figure 5).
Figure 5. Scheme of the equipment for measuring the relative dielectric permittivity.
Dow
nlo
aded
by [
Dr
Om
ar A
lhar
tom
y]
at 0
6:0
6 0
7 M
arch
2014

Properties of Fullerenes Containing Rubber-Based Nanocomposites 339
SEM and TEM Micrographs
The composite morphology was investigated by SEM micrographs taken on a JEOL JSM–5510 scanning electron microscope. The surfaces of pre-frozen in liquid nitrogen andbroken down samples of the composites were observed at voltage 10 kV.
The particle size, size distribution of the filler and microstructure of the compositeswere determined using a TEM JEOL 2100 at accelerating voltage 200 kV. The specimenswere prepared by grinding the samples in an agate mortar and dispersing them in ethanol byultrasonic treatment for 6 min. A droplet of the suspension was dripped on standard carbonfilms on Cu grids.
Results and Discussion
Dispersion of the Fullerene Powder in the Rubber Matrix
One of the primary purposes of the mixing process for rubber compounds is the distributionand disagglomeration, often called dispersion, of reinforcing fillers. It is well known thatthe dispersion of the filler has a great effect on the properties of the obtained vulcanizates(19), including the microwave properties. Achieving good dispersion of the filler absorb-ing the electromagnetic waves and higher homogeneity of the composite are two of therequirements for having good interaction of the electromagnetic waves with it. Absorptionin whole composite volume is another basic requirement for the production of qualitymicrowave absorbers (20). On the other hand, with the increase of the degree of disper-sion of the filler its relative surface increases as well as its surface energy. On the hand,with smaller particles there is agglomeration which hampers the obtaining of a homoge-neous system when compounding. It has been found out that the compounding starts withthe formation of the so-called “soft” agglomerates, which are further broken down intopieces and dispersed (21). With a shorter cycle of mixing these originally formed agglom-erates worsen the properties including the microwave properties because of the bigger sizeof the particles. It was found (22) that the agglomeration is probably the most importantaspect of dispersion, because of the detrimental effects on the structure-sensitive proper-ties. We used SEM and TEM to investigate the fullerene aggregates and their dispersion(see Figure 4).
The difference between unfilled with fullerenes and the filled composites is obvi-ous. The particles of the fullerenes stand out and they differ sharply from the particlesof some other ingredients in the composite, for example, those of the zinc oxide.It is obvious, however, that their size lies in the borders of 0.1–0.2µm. AlthoughSEM is useful to observe different morphologies of fracture and failure surface aswell as aggregates of fillers, it should be noted that it is not suitable to observe thethe structure of the particles of the filler. Figure 5 shows TEM micrographs of com-posite containing 1.5 phr of fullerenes together with selected area electron diffractionmicrographs.
The micrographs in Figure 6c show that the fullerene particles are comparativelyevenly dispersed in the elastomeric matrix and it is characterized with adequate homo-geneity that guarantees good interaction with the electromagnetic waves. However, theaggregates shown in Figure 1 have undergone an additional disaggregation in the process ofcompounding, as a result of which the sizes of the fullerene particles have decreased until40–50 nm, considerably lower than 100 nm.
Dow
nlo
aded
by [
Dr
Om
ar A
lhar
tom
y]
at 0
6:0
6 0
7 M
arch
2014

340 O. A. Al-Hartomy et al.
Figure 6. (a) SEMmicrograph of unfilled composite: (b) SEMmicrographs of composite, containing1.5 phr of fullerenes, and (c) TEM micrograph of composite, containing 1.5 phr of fullerenes.
Dielectric Properties
Complex Relative Dielectric Permittivity. Real Part
The real part of dielectric permittivity is the ratio of the capacity of an electric capacitorfilled with the substance investigated to that of the same capacitor in vacuum, at a definiteexternal field of frequency (23). The dependence of the real part of the complex relativedielectric permittivity on frequency εr(f) is shown in Figure 7. As can be seen in this figure,in the investigated concentration interval the values of the dielectric permittivity are tooclose to each other with a tendency to a slight increase with the growth of the concentrationof the filler. A similar tendency has been described by the authors of (12) who investi-gate the change of the dielectric permittivity of composites on the basis of natural rubber,containing fullerenes in the concentration interval from 0.065 to 0.75 phr finding out anincrease in its values, respectively, from 4.8 to 5.2 with the growth of their concentration;however, that investigation refers to a frequency of 50 Hz. The values indicated by us areclose to those described in (24), where is shown that the values of the dielectric permittivityof the natural rubber at frequency 1000Hz are within the borders of 2.40–2.70. As Figure 7shows, our investigations also confirm that with the increase of the frequency, the dielectricpermittivity also increases. The dependence of the dielectric permittivity on the frequencymay be observed in three ranges: in the 1-3 GHz range the dielectric permittivity increasesslightly; in the frequency interval of about 3 to 9 GHz relative stability of the values of εr isobserved; and in the 9-12 GHz range there is comparatively faster increase of the dielectricpermittivity with the increase of frequency. In this last range the influence of the different
Figure 7. Dependence of the dielectric permittivity on frequency at different degree of filling of thecomposite with fullerenes.
Dow
nlo
aded
by [
Dr
Om
ar A
lhar
tom
y]
at 0
6:0
6 0
7 M
arch
2014

Properties of Fullerenes Containing Rubber-Based Nanocomposites 341
concentrations of the fullerenes is the strongest. Since the dielectric permittivity is related tothe polarization of the composite (25), it is probable that the latter takes place in the matrixof natural rubber with greater difficulty at frequencies above 9 GHz which leads to someincrease of the values of the dielectric permittivity, in other words the increase of εr provesthe lower polarization of the composite at higher frequencies. The specimens containing0.75 and 1.25 phr, which are not given on the figure in order it to be plain enough, con-firm this tendency completely. Compared to composites containing up to 7.5 phr fullerenecarbon black, respectively, up to 0.56 phr pure fullerenes (13) it is evident that those com-posites have slightly higher values of the relative dielectric permittivity and almost a linearmovement of its change depending on the frequency which is unquestionably due to the sig-nificant amount of ordinary carbon black in the composite which alone contributes to theformation of the dielectric permittivity. The results also show that according to the valuesof the relative dielectric permittivity those composites containing 1.5 phr pure fullerene arealmost equivalent to the others containing 7.5 phr fullerene carbon black which are muchcheaper and accessible. Since the values of εr are basically related to the polarization of thecomposite, it can be supposed that with these two composites the values of polarization aresimilar.
Complex Relative Dielectric Permittivity. Imaginary Part (Dielectric Loss)
The imaginary part of the relative complex dielectric permittivity of the material, alsoknown as dielectric loss angle tangent-tanδε, changes more sharply depending on the fre-quency in the (1–12) GHz range (Figure 8) than the real part discussed above. From the verybeginning of that range, the values of tanδ are clearly distinguished depending on the dif-ferent degree of filling. As might be expected with the increase of frequency, the dielectriclosses increase. The filler does not change the progress of this dependence since it can beobserved with unfilled composites. However, adding even 0.5 phr fullerenes increases sig-nificantly the dielectric losses, and with the increase of the amount of the fullerenes thelosses continue to grow. It is also evident that with the unfilled composite this change ispractically linear whereas with composites filled even with 0.5 phr, there is already devia-tion from the lenearity which is definitely due to the presence of fullerenes. The values oftanδε are higher than the data available for unfilled composites on the basis of natural rubberand than the values of composites containing 0.065-0.75 phr fullerenes which are withinthe borders of 0.001-0.005 (12,24), but they refer to considerably lower frequencies from1 to 10 MHz. When compared with composites containing fullerene carbon black (13), wefind that the composites with pure fullerenes have much greater values of the dielectric
Figure 8. The dependence of the dielectric loss angle tangent (tanδε .103) on the frequency atdifferent degree of filling of the composite with fullerenes.
Dow
nlo
aded
by [
Dr
Om
ar A
lhar
tom
y]
at 0
6:0
6 0
7 M
arch
2014

342 O. A. Al-Hartomy et al.
losses than the composites containing even 7.5 phr carbon black; that is, with regard to thischaracteristic, fullerenes are much more efficient than carbon black.
Microwave Properties
Coefficient of Reflection
The coefficient of reflection is a complex number.. For the purpose of this research it isenough just to determine its modulus |G| because by its help that part of the falling onthe sample electromagnetic wave which then reflects back may be shown. This makes itpossible to determine the absorption properties of the tested material. The dependence of|G| on the frequency is shown in Figure 9. It is evident that in the whole frequency range|G| does not have high values—it does not exceed 0.50 for the highest frequency and forthe greatest filling. At this point we should make reference to the dielectric losses thatwere discussed above (Figure 8), which increase smoothly but in comparatively narrowborders.This fact explains to a greater extent the insignificant change in the coefficientof reflection. On the whole, with the increase of frequency and the degree of filling, thecoefficient of reflection increases slightly, especially in the 6-12 GHz range, whereas inthe 1-6 GHz range the coefficient of reflection almost does not change with frequency.This corresponds to a similar effect with the real component of the complex dielectricpermittivity (Figure 7). When compared with composites containing fullerene carbon black(13), it is evident that the tendencies are analogous, but the values of |G| are much higheras they reach up to 0.72; that is, for the obtaining of lower reflection it is preferable to usepure fullerenes in smaller amount than fullerene carbon black in greater amount.
Attenuation Coefficient
The change of the attenuation coefficient (α) with frequency can be studied in three inter-vals: (1- 6) GHz; (6 - 9) GHz and (9 - 12) GHz (Figure 10). In the first α≤2, in the second2 ≤ α≤ 14 and in the third α > 14 as it reaches up to 18 dB/cm when n = 1.5. By com-paring this dependence with the coefficient of reflection and the dielectric permittivity,some similarity is found out which may be due to one and the same factor (the structureof fullerene and its specific characteristics). When compared with composites containingfullerene carbon black (13), it is obvious that at similar dependences they have considerablyhigher/about two times the values of attenuation in the interval 8–12 GHz than composites
Figure 9. Dependence of the coefficient of reflection on the frequency at different degree of fillingof the composite with fullerenes.
Dow
nlo
aded
by [
Dr
Om
ar A
lhar
tom
y]
at 0
6:0
6 0
7 M
arch
2014

Properties of Fullerenes Containing Rubber-Based Nanocomposites 343
Figure 10. Dependence of the attenuation coefficient on the frequency at different degree of fillingthe composite with fullerenes.
Figure 11. Dependence of the electromagnetic shielding effectiveness on the frequency at differentdegrees of filling of the composite with fullerenes.
containing pure fullerenes, which undoubtedly is due to the presence of carbon black in thecomposites, which in its own way contributes to the absorption of electromagnetic waves.As a result of greater specific surface of carbon black, their electromagnetic absorption ismore efficient. This fact has a direct impact on the attenuation as well as on the shieldingeffectiveness of the composites.
Shielding Effectiveness
Figure 11 presents the dependence of the effectiveness of the electromagnetic waveshielding on frequency. In the beggining of the frequency range, the values of shieldingeffectiveness (S.E.) are greater but decrease with frequency until they reach the range ofsome stabilization of the values, namely from 2 GHz to 7 GHz, with value between 13 and17 dB, on average 15dB. With the further increase of frequency in the 7–8 GHz range,the effectiveness decreases to a certain extent; in the 8-12 GHz range, the change is slightagain. The initial values are due mainly to the return loss because of interference. In theend of the frequency range since the coefficient of reflection increases (Figure 9) and theattenuation of the sample is not enough high to have compensate this increase, the S.E.decreases. If this parameter is used to make a comparison with the composites containingfullerene carbon black (13), some priority of the latter is evident—the frequency range ofapproximate stability of S.E. is wider and the average effectiveness value there is above15dB, which is also due to the presence of carbon black together with the fullerenes.
Dow
nlo
aded
by [
Dr
Om
ar A
lhar
tom
y]
at 0
6:0
6 0
7 M
arch
2014

344 O. A. Al-Hartomy et al.
Conclusions
The influence of fullerenes in concentrations from 0.5 to 1.5 phr on the dielectric andmicrowave properties of nanocomposites on the basis of natural rubber, characterized mor-phologically and structurally, has been investigated in the 1–12 GHz frequency range. It hasbeen found that the size of the fullerene particles in the composite is below 100 nm. It hasbeen found out that the imaginary part of the complex relative dielectric permittivity ismore sensitive to the frequency change and the amount of the filler than the real part. Withregard to the coefficient of reflection, it has been found out that in the 1–6 GHz frequencyrange it almost does not depend on the frequency and the amount of the filler, whereas in the6–12 GHz range it increases with their increase almost lenearly. With regard to the attenu-ation coefficient, it has been found out that in the 1-6 GHz frequency range, the fullereneshave almost no influence; in the 6–9 GHz as well as in the 9–12 GHz range the attenuationincreases with the increase of the amount of the filler and the frequency; the increase isfaster in the former than in the latter. In the studied frequency and concentration interval,the effectiveness of the electromagnetic shielding changes within the borders of 10–20 dB.The attenuation increase is not enough in order to compensate the increase of the reflection,as a result of which the shielding effectiveness on the whole gradually decreases.
The influence of fullerenes on the dielectric and microwave properties on the compos-ites is mainly in the 6–12 GHz range.
Acknowledgments
This research is a result of an international collaboration program between University ofTabuk, Tabuk, Kingdom of Saudi Arabia and the University of Chemical Technology andMetallurgy, Sofia, Bulgaria. The authors gratefully acknowledge the financial support fromthe University of Tabuk.
References
1. Murayama, H., Tomonoh, S., Alford, J. M., and Karpuk, M. E. (2005) Fullerene production intons and more: From science to industry. Fullerenes, Nanotubes and Carbon Nanostructures,12(1–2): 1.
2. Kroto, H. W., Heath, J. R., O’Brien, S. C., Curl, R. F., and Smalley, R. E. (1985) C60:Buckminsterfullerene. Nature, 318(6042): 162.
3. Birkett, P. R., Hitchcock, P. B., Kroto, H. W., Taylor, R., andWalton, D. R. M. (1992) Preparationand characterization of C60Br6 and C60Br8. Nature, 357(6378): 479.
4. Thomas, S. and Stephen, R. (2010) Rubber Nanocomposites Preparation, Properties and
Applications, Wiley: Singapore.5. Yadav, B. C. and Kumar, R. (2008) Structure, properties and applications of fullerenes.
International Journal of Nanotechnology and Applications, 2(1): 15.6. Lukish, L. T., Duncan, Th. E., and Lansinger, C. M. (1996) Use of fullerene carbon in curablerubber compounds. U.S. Patent 5,750,615.
7. Bartholomew, D. D. (1991) Polymer based articles having increased structural rigidity. U.S.Patent 5,296,536.
8. Aoki, S. (2006) Rubber composition and tire produced from the same. Japan PatentWO2005003227.
9. Thomann, H. Brant, P., Dismukes, J. P., Lohse, D. J., Hwang, J. -F., Kresge, E. N. (1991)Fullerene-polymer compositions. U.S. Patent 5,281,653.
10. Ashiura, M., Kawazura, T., and Yatsuyanagi, F. (2009) Rubber composition containing modifiedconjugated diene-based polymer bonded to fullerene. U.S. Patent Application 20090182069.
Dow
nlo
aded
by [
Dr
Om
ar A
lhar
tom
y]
at 0
6:0
6 0
7 M
arch
2014

Properties of Fullerenes Containing Rubber-Based Nanocomposites 345
11. Chow, L. (1994) CVD method of producing and doping of fullerene. U.S. Patent, 5,510,098.12. Jurkovska, B., Kamrovski, P., Pesetskii, S. S., Koval, V. N., Pinchuk, L. S., and Olkhov, Y. A.
(2006) Properties of fullerene-containing natural rubber. Journal of Applied Polymer Science,100(1): 390.
13. Al-Hartomy, O. A., Al-Ghamdi, A., Dishovsky, N., Slavcheva, D., Iliev, V., and El-Tantawy,F. (2011) Dielectric and microwave properties of natural rubber-based composites containingfullerene black. International Review of Chemical Engineering, 3(3): 386.
14. Kuzmany, H., Pfeiffer, R., Hulman, M., and Kramberger, Ch. (2004) Raman spectroscopy offullerenes and fullerene-nanotube composites. Philosophical Transactions of the Royal Society
A: Mathematical, Physical & Engineering Sciences, 362: 2375.15. Ginzburg, B. M., Tuichiev, Sh., Tabarov, S. Kh., Shepelevskii, A. A., and Shibaev, L. A. (2005)
X-ray diffraction analysis of C60 fullerene powder and fullerene soot. Technical Physics, 50(11):1458.
16. Dick, J. S. (Ed.). (2001) Rubber Technology. Compounding and Testing for Performance, CarlHanser Verlag: Munich.
17. Mark, J. E., Erman, B., and Eirich, F. R. (Eds.) (2005) The Science and Technology of Rubber,3rd ed., Elsevier Academic Press: Amsterdam.
18. Meng, B., Booske, J., and Cooper, R. (1995) Extended cavity perturbation technique to determinethe complex permittivity of the dielectric materials. IEEE Transactions on Microwave Theory
and Techniques, 43: 2633.19. Putman, M. (2008) Review of dispersion methods and the relationships of dispersion to physical
properties. Tire Technology International, Annual Review: 52.20. Dishovsky, N. (2009) Rubber based composites with active behavior to microwaves. Journal of
the University of Chemical Technology and Metallurgy, 44(2): 115.21. Payne, A. R. (1965) Effect of dispersion on the dynamic properties of filler-loaded rubbers.
Journal of Applied Polymer Science, 9(6): 2273.22. Smith, A. P., Aybar, T. L., Magee, R. W., and Herd, C. R. (2004) Carbon black dispersion
measurement in rubber vulcanizates via interferometric microscopy, Rubber Chemistry and
Technology, 77(4): 691.23. Banerjee, P. and Biswas, S. (2011) Dielectric properties of EVA rubber composites at microwave
frequencies. Journal of Microwave Power and Electromagnetic Energy, 45(1): 24.24. Kornev, A., Bukanov, A., and Sheverdiaev, O. (2005) Technology of Elastomeric Materials,
Istek: Moscow (in Russian).25. Niedermeier, W. (2009) Influence of Soft Carbon Blacks on Electrical Resistance,
Electrochemical Degradation and Microwave Absorption, Degussa, Technical Report TR 832.
Dow
nlo
aded
by [
Dr
Om
ar A
lhar
tom
y]
at 0
6:0
6 0
7 M
arch
2014


