Embed Size (px)
Citation preview

Dietary Hydrogenated Fat Increases High-DensityLipoprotein apoA-I Catabolism and Decreases Low-Density
Lipoprotein apoB-100 Catabolism inHypercholesterolemic Women
Nirupa R. Matthan, Francine K. Welty, P. Hugh R. Barrett, Carrie Harausz, Gregory G. Dolnikowski,John S. Parks, Robert H. Eckel, Ernst J. Schaefer, Alice H. Lichtenstein
Objective—To determine mechanisms contributing to decreased high-density lipoprotein cholesterol (HDL-C) andincreased low-density lipoprotein cholesterol (LDL-C) concentrations associated with hydrogenated fat intake, kineticstudies of apoA-I, apoB-100, and apoB-48 were conducted using stable isotopes.
Methods and Results—Eight postmenopausal hypercholesterolemic women were provided in random order with 3 dietsfor 5-week periods. Two-thirds of the fat was soybean oil (unsaturated fat), stick margarine (hydrogenated fat), or butter(saturated fat). Total and LDL-C levels were highest after the saturated diet (P�0.05; saturated versus unsaturated)whereas HDL-C levels were lowest after the hydrogenated diet (P�0.05; hydrogenated versus saturated). PlasmaapoA-I levels and pool size (PS) were lower, whereas apoA-I fractional catabolic rate (FCR) was higher after thehydrogenated relative to the saturated diet (P�0.05). LDL apoB-100 levels and PS were significantly higher, whereasLDL apoB-100 FCR was lower with the saturated and hydrogenated relative to the unsaturated diet. There was nosignificant difference among diets in apoA-I or B-100 production rates or apoB-48 kinetic parameters. HDL-Cconcentrations were negatively associated with apoA-I FCR (r��0.56, P�0.03) and LDL-C concentrations werenegatively correlated with LDL apoB-100 FCR (r��0.48, P�0.05).
Conclusions—The mechanism for the adverse lipoprotein profile observed with hydrogenated fat intake is determined inpart by increased apoA-I and decreased LDL apoB-100 catabolism. (Arterioscler Thromb Vasc Biol. 2004;24:1092-1097.)
Key Words: trans fatty acids � hydrogenated fat � apolipoprotein kinetics � stable isotopes � soybean oil� margarine � butter
Considerable interest has been focused on the mechanismby which dietary fatty acids influence plasma lipid and
lipoprotein profiles and subsequently cardiovascular disease(CVD) risk.1–3 One specific class of dietary fatty acids thathas received increased attention since the early 1990s is transfatty acids. These fatty acids are produced as a result ofbiohydrogenation in the ruminant fat of animals or bycommercial hydrogenation of vegetable oils.4 The majority oftrans fatty acids in the US diet is contributed by productsmade with hydrogenated fat such as commercially bakedgoods, fried foods, and margarines.5,6 Relative to unsaturatedfatty acids, trans fatty acid/hydrogenated fat consumption
results in higher low-density lipoprotein cholesterol (LDL-C)concentrations and relative to saturated fat lower high-densitylipoprotein cholesterol (HDL-C) concentrations.7–13 Severalinvestigators have also reported modest but significant ele-vations in plasma triglyceride and Lp(a) concentrations.14–16
There are limited data on the mechanism(s) by which transfatty acid/hydrogenated fat intake alters plasma lipoproteinpatterns. Areas investigated thus far include endogenouscholesterol synthesis and esterification17–19 and the activitiesof cholesterol ester transfer protein (CETP)20–23 and lecithincholesterol acyltransferase (LCAT).24–26 An alternate ap-proach to defining a mechanism by which trans fatty acids/
Received March 4, 2004; accepted April 1, 2004.From Cardiovascular Nutrition (N.R.M., C.H., A.H.L.), Mass Spectrometry (G.G.D.), and Lipid Metabolism Laboratories (E.J.S.), Jean Mayer USDA Human
Nutrition Research Center on Aging at Tufts University, Boston, Mass; Division of Cardiology (F.K.W.), Beth Israel Deaconess Medical Center, Boston Mass;School of Medicine and Pharmacology (P.H.R.B.), University of Western Australia and Western Australia Institute for Medical Research, Perth, Australia;Department of Pathology (J.S.P.), Section on Comparative Medicine, Wake Forest University School of Medicine, Winston-Salem, NC; and Department ofMedicine, Division of Endocrinology, Metabolism, and Diabetes (R.H.E.), University of Colorado Health Sciences Center, Denver, Co.
Disclaimer: This material is based on work supported by the U.S. Department of Agriculture, under agreement no. 58-1950-4-401. Any opinions,findings, conclusions, or recommendations expressed in this publication are those of authors and do not necessarily reflect the view of the U.S. Departmentof Agriculture.
Correspondence to Dr Nirupa Matthan, Cardiovascular Nutrition Laboratory, Jean Mayer USDA Human Nutrition Research Center on Aging at TuftsUniversity, 711 Washington Street, Boston MA 02111. E-mail [email protected]
© 2004 American Heart Association, Inc.
Arterioscler Thromb Vasc Biol. is available at http://www.atvbaha.org DOI: 10.1161/01.ATV.0000128410.23161.be
1092 by guest on March 21, 2016http://atvb.ahajournals.org/Downloaded from by guest on March 21, 2016http://atvb.ahajournals.org/Downloaded from by guest on March 21, 2016http://atvb.ahajournals.org/Downloaded from by guest on March 21, 2016http://atvb.ahajournals.org/Downloaded from by guest on March 21, 2016http://atvb.ahajournals.org/Downloaded from

hydrogenated fat alters lipoprotein concentrations relative toother fats is to directly assess the kinetic behavior of majorapoproteins associated with HDL and LDL particles. Thisarea remains largely unexplored in humans.
The aim of the present study was to determine the effectsof a diet consistent with current dietary recommendations1,27
enriched in soybean oil (unsaturated fat), soybean oil-basedtraditional stick margarine (hydrogenated fat), or butter (sat-urated fat) on lipoprotein metabolism, with the intent ofelucidating mechanisms contributing to the adverse lipopro-tein profile reported with hydrogenated fat intake.
MethodsSubjectsEight postmenopausal women (older than 50 years) with LDL-Cconcentrations �3.36 mmol/L at the time of screening were recruitedfor this study. Subjects were free from chronic illness and were notusing medications known to affect lipid metabolism (lipid-loweringdrugs, fish-oil capsules, beta-blockers, diuretics, or hormones).Subjects who smoked or reported consuming �2 alcoholic drinks perday were excluded from the study. The protocol was approved by theHuman Investigation Review Committee of the New EnglandMedical Center and Tufts University. All subjects gave writteninformed consents.
Experimental Design and DietsSubjects were provided with each of 3 diets for 5-week periodsaccording to a randomized, blinded, crossover design as previouslydescribed for an earlier study.7 The experimental fats comprised 20%of energy in each diet. All food and drink were provided to thesubjects. Initial energy intakes were calculated using the Harris-Benedict equation and adjustments were made when necessary tomaintain body weight. Analysis of the macronutrient and cholesterolcontents of the diets were performed by Covance Laboratories(Madison, Wis) and fatty acid profiles by Best Foods Research andEngineering Center (Union, NJ) (Table 1).
Measurement of Lipoprotein KineticsAt the end of each experimental diet, a primed-constant infusion ofdeuterated leucine was performed in the fed state to determine thekinetics of HDL apoA-I, triglyceride-rich lipoprotein (TRL)–apoB-100, intermediate-density lipoprotein (IDL)–apoB-100, and LDL–apoB-100, and TRL apoB-48. After fasting for 12 hours, subjectswere fed hourly for 20 hours starting at 6:00 AM. Each identical meal
consisted of one-twentieth their daily caloric intake specific for eachdietary phase as previously described.28 Five hours after their firstmeal, subjects received an intravenous bolus dose (10 �mol/kg)followed by a constant infusion (10 �mol/kg per hour) of [5,5,5-2H3]-L-leucine over a 15-hour period. Blood samples (20 mL) werecollected via a second intravenous line at 0, 0.5., 0.75, 1, 2, 3, 4, 6,8, 10, 12, and 15 hours.
The protocol for plasma lipid and lipoprotein characterization,quantification, and isolation of the apolipoproteins, isotopic enrich-ment determinations, and kinetic analysis were performed as previ-ously described.29–37 For HDL compositional analysis, total and freecholesterol, triglyceride, and phospholipid concentrations were de-termined using commercially available enzymatic assays (RocheDiagnostics, Indianapolis, Ind and Wako Diagnostics, Richmond,Va). Total protein was determined using the Biuret method. Thecholesteryl ester and phospholipid fatty acid composition of the HDLfraction was determined using gas chromatography.38 At the end ofeach dietary infusion protocol, plasma samples were collected 10minutes before and after the administration of heparin (100 Uheparin sodium/kg body weight) for the measurement of lipoproteinlipase (LPL) and hepatic lipolytic activity (HTGL).39,40
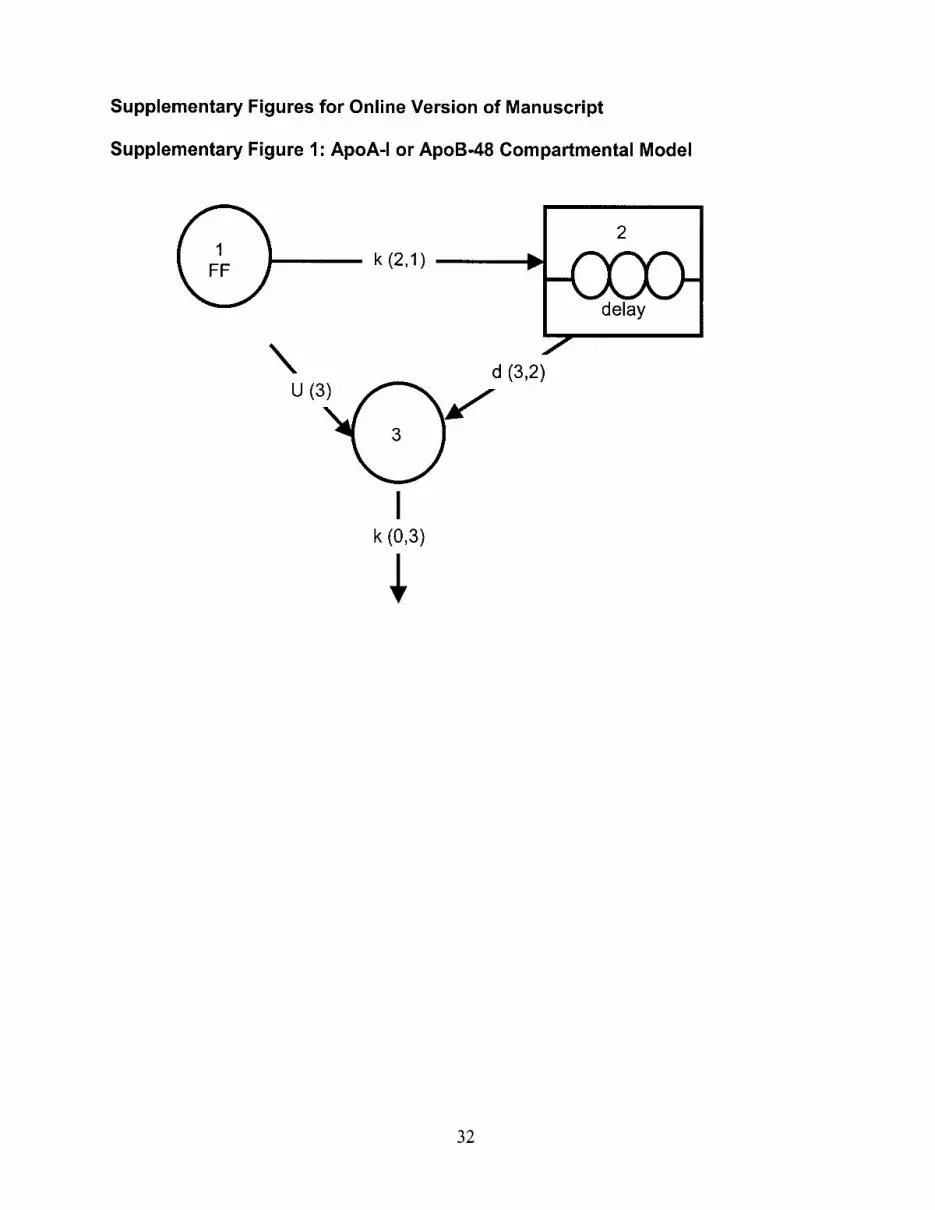
Kinetic AnalysisThe kinetics of HDL apoA-I and TRL apoB-48 (Figure I, availableonline at http://atvb.ahajournals.org) and apoB-100 (Figure II, avail-able online at http://atvb.ahajournals.org) in TRL, IDL, and LDLfractions were determined by fitting the multicompartmental modelto the tracer/tracee (T/T) ratio data using the SAAM II program(SAAM Institute, Seattle, Wash) as previously described.35–37 Afterfitting the observed data to the respective models, fractional cata-bolic rates (FCR) (in pools/d) and production rates (PR) (in mg/kgper day) of apoA-I, apoB-100, and apoB-48 were calculated asdescribed.35–37
Statistical AnalysesOne-way analyses of variance with diet as the study factor andsubject as the repeated measure was used on each outcome variableusing a SAS general linear model program (SAS version 6; SASInstitute Inc, Cary, NC). Differences in group means were identifiedusing Tukey honestly significant differences at a significance level ofP�0.05. Within subject partial correlation coefficients adjusted fordiet were calculated between variables of interest. If data were notnormally distributed, appropriate transformations were performedbefore statistical testing. Untransformed data are presented in textand tables as means�standard deviation (SD). The lipid and lipopro-tein values are averages of 3 measurements taken at the end of eachdietary phase.
ResultsLipids and LipoproteinsTotal and LDL-C concentrations were 11% and 15% higherafter subjects consumed the saturated fat relative to theunsaturated fat diet (P�0.05, Table 2), with levels beingintermediate between the saturated and unsaturated diets aftersubjects consumed the hydrogenated fat diet (7% and 12%,respectively). In contrast, HDL-C concentrations were 7%lower after subjects consumed the hydrogenated relative tosaturated fat diet (P�0.05). Triglyceride concentrations werehighest after subjects ate the hydrogenated and lowest afterthe unsaturated fat diets, although these differences did notreach statistical significance. These data suggest that thesubjects participating in this kinetic study responded to thedietary fat similarly to that as would be predicted on the basisof other human metabolic studies.7,10,12,14
TABLE 1. Composition of the Experimental Diets asDetermined by Chemical Analysis
Dietary Constituent
Experimental Diets
UnsaturatedFat*
HydrogenatedFat*
SaturatedFat*
Carbohydrate 55.8 53.5 54.0
Protein 15.7 16.7 16.9
Fat 28.5 29.7 29.1
SFA 7.3 8.5 16.7
MUFA† 8.1 8.5 8.1
PUFA† 12.5 6.3 2.4
Trans 0.6 6.7 1.3
Cholesterol (mg/1000 kcal) 66 67 121
* Percentage of total daily energy intake. Percentages may not total 100because of rounding.
†Only cis isomers are included.
Matthan et al Hydrogenated Fat Intake and Lipoprotein Metabolism 1093
by guest on March 21, 2016http://atvb.ahajournals.org/Downloaded from

ApoA-I KineticsApoA-I concentrations and PS followed a pattern similar tothat of HDL-C, lowest after the hydrogenated and highestafter the saturated fat diet (Table 3). These differences were
accounted for by an 11% higher apoA-I FCR after subjectsconsumed the hydrogenated relative to the saturated fat diet(P�0.05). The FCR after subjects ate the unsaturated dietwas intermediate, with the differential between the hydroge-
TABLE 2. Lipid and Lipoprotein Concentrations at the End of EachExperimental Phase
Variable
Experimental Diets
UnsaturatedFat
HydrogenatedFat
SaturatedFat
Total cholesterol (mmol/L) 4.85�0.73* 5.16�0.57*† 5.39�0.76†
LDL-C 2.99�0.57* 3.27�0.39*† 3.43�0.72†
HDL-C 1.32�0.39*† 1.30�0.35* 1.39�0.33†
HDL2 0.27�0.16 0.28�0.18 0.29�0.18
HDL3 1.05�0.23 1.02�0.24 1.10�0.19
VLDL-C 0.55�0.24 0.59�0.29 0.57�0.29
Triglycerides (mmol/L) 1.21�0.52 1.29�0.64 1.25�0.63
Values are mean�SD.*†For each variable, values with different superscripts are significantly different at P�0.05.To convert values for cholesterol to milligrams per deciliter, multiply by 38.67.To convert values for triglycerides to milligrams per deciliter, multiply by 88.54.
TABLE 3. Kinetic Parameters of ApoA-I, HDL Fatty Acid Profile, and HDLComposition at the End of Each Experimental Phase
Variable
Experimental Diets
UnsaturatedFat
HydrogenatedFat
SaturatedFat
ApoA-I Kinetics
ApoA-I (mg/dL) 117�13*† 114�14* 118�12†
Pool Size (mg) 3326�287*† 3211�358* 3353�198†
FCR (pools/d) 0.19�0.04*† 0.20�0.04† 0.18�0.03*
PR (mg/kg per day) 9.79�0.89 10.14�1.94 9.53�1.12
HDL Fatty Acid Profile (molar percent)
Cholesteryl Ester
SFA 7.7�2.1 6.4�1.5 8.1�3.1
MUFA‡ 18.1�2.2* 18.9�2.3* 25.9�3.5†
PUFA 73.8�3.0† 74.1�2.9† 65.3�7.0*
Trans (18:1) 0.1�0.2*† 0.4�0.2† 0.1�0.1*
Phospholipid
SFA 39.5�3.3 37.5�2.6 40.2�2.5
MUFA‡ 7.7�0.9* 8.5�1.5* 9.9�2.1†
PUFA 50.0�3.3 49.2�2.7 46.8�3.7
Trans (18:1) 0.8�0.5* 3.0�0.9† 1.2�0.8*
HDL Composition (% wt/wt)
Protein 43.6�2.8 44.9�3.0 42.4�7.3
Free cholesterol 3.1�1.0 2.6�0.5 3.3�1.2
Cholesteryl ester 20.3�2.1 19.3�2.2 20.6�4.0
Triglyceride 6.3�2.0 6.6�2.1 5.9�1.3
Phospholipid 26.7�1.4 26.0�2.1 28.4�4.0
‡Only cis isomers are included.Values are mean�SD.FCR indicates fractional catabolic rate; PR, production rate.*†For each variable, values with different superscripts are significantly different at P�0.05.
1094 Arterioscler Thromb Vasc Biol. June 2004
by guest on March 21, 2016http://atvb.ahajournals.org/Downloaded from

nated and unsaturated diet reaching 8%. The PR of apoA-Iwas similar among the 3 diets.
To determine whether the decrease in HDL-C levelsobserved after shifting subjects from the saturated to thehydrogenated-based diet was associated with changes inapoA-I metabolism, partial correlations were performed.Plasma HDL-C concentrations were negatively correlatedwith apoA-I FCR (r��0.56, P�0.03; FigureA) and posi-tively correlated with plasma apoA-I concentrations (r�0.48,P�0.05) and apoA-I PS (r�0.48, P�0.03) (data not shown).Plasma apoA-I concentrations were also negatively correlatedwith apoA-I FCR (r��0.59; P�0.04). The apoA-I PR wasnot significantly related to differences in plasma HDL-Cconcentrations. These data suggest that the lower HDL-Cconcentrations observed after subjects consumed the hydro-genated relative to the saturated fat diet is attributable to ahigher rate of HDL catabolism, resulting in a shorter resi-dence time.
To further understand the factors that might contribute tothe diet-induced differences in HDL apoA-I FCR, fatty acidprofile and composition of the HDL particles was assessed(Table 3). In the cholesteryl ester fraction, the relativeproportion of polyunsaturated and trans fatty (18:1) acids wassignificantly higher at the expense of monounsaturated fattyacids as a result of subjects consuming the hydrogenatedrelative to the saturated fat diet. In the phospholipid fraction,
the relative proportion of trans fatty acids was significantlyhigher at the expense of monounsaturated fatty acids. Thesedifferences in the fatty acid profile of the HDL subfraction areconsistent with an earlier study that had a larger cohort.41
There were no significant differences in HDL composition asa result of altering dietary fat.
ApoB-100 KineticsPlasma TRL and IDL apoB-100 values, PS, FCR, and PRwere not significantly different among diet phases (Table 4).Plasma LDL apoB-100 concentrations and PS were 12% and14% higher after subjects consumed the saturated relative tothe unsaturated fat diet (P�0.05), with concentrations beingintermediate after subjects consumed the hydrogenated fatdiet. LDL apoB-100 FCR were 20% and 13% lower aftersubjects consumed the saturated and hydrogenated relative tothe unsaturated fat diet (P�0.05). There was no significanteffect of dietary fat type on LDL apo-B100 PR. LDLapoB-100 FCR was negatively correlated with plasmaLDL-C (r��0.48; P�0.05) (Figure B) and LDL apoB-100concentrations (r��0.35; P�0.05). Plasma LDL-C concen-trations were not significantly related to differences inLDL-C apoB-100 PR. These data suggest the mechanism forthe LDL-C elevating effect of hydrogenated fat is similar tothat of saturated fat, primarily determined by decreasedcatabolism, leading to an increased residence time.
ApoB-48 KineticsApoB-48 concentrations and PS values tended to be 78%(P�0.19) and 70% (P�0.21) higher after subjects consumed
Correlation between (A) plasma HDL-C concentrations (mmol/L)and HDL apoA-I FCR (pools/d) and (B) plasma LDL-C concen-trations (mmol/L) and LDL apoB-100 FCR (pools/d). Data arepresented for 8 subjects after consumption of the unsaturated(black triangles) fat-enriched, hydrogenated (squares) fat-enriched, and saturated (asterisks) fat-enriched diets. The r val-ues refer to partial correlations.
TABLE 4. Kinetic Parameters of ApoB-100 and ApoB-48 at theEnd of Each Experimental Phase
Variable
Experimental Diets
UnsaturatedFat
HydrogenatedFat
SaturatedFat
TRL apoB-100 (mg/dL) 6.1�3.7 6.3�4.5 6.6�3.3
Pool Size (mg) 175�102 180�127 191�95
FCR (pools/d) 9.1�6.5 7.7�4.1 6.8�3.3
PR (mg/kg per day) 17.7�2.1 16.9�6.4 16.5�3.6
IDL apoB-100 (mg/dL) 2.4�1.4 2.9�1.6 2.8�1.2
Pool Size (mg) 69�39 83�45 80�36
FCR (pools/d) 8.2�2.9 7.9�2.9 7.8�3.0
PR (mg/kg per day) 7.9�3.4 8.7�2.1 8.8�2.5
LDL apoB-100 (mg/dL) 80.5�8.9* 81.4�11.7*† 87.7�8.8†
Pool Size (mg) 2267�233* 2319�413*† 2507�305†
FCR (pools/d) 0.39�0.07† 0.33�0.08* 0.30�0.05*
PR (mg/kg per day) 14.3�2.9 11.6�2.8 12.8�1.6
ApoB-48 (mg/dL) 0.20�0.08 0.32�0.23 0.25�0.18
Pool Size (mg) 5.12�2.36 8.44�6.86 6.62�5.13
FCR (pools/d) 6.96�2.88 4.98�1.23 5.35�2.01
PR (mg/kg per day) 0.52�0.26 0.63�0.43 0.51�0.38
Values are mean�SD.*†For each variable, values with different superscripts are significantly
different at P�0.05.
Matthan et al Hydrogenated Fat Intake and Lipoprotein Metabolism 1095
by guest on March 21, 2016http://atvb.ahajournals.org/Downloaded from

the hydrogenated diet relative to the unsaturated fat diet,which was accompanied by a 19% lower FCR (P�0.15) and44% higher PR (P�0.19) (Table 4). Because of the highdegree of variability in response among subjects, thesedifferences did not attain statistical significance.
Lipoprotein Lipase ActivityThere was no significant effect of dietary fat type on lipaseactivities. Total lipoprotein lipase activity was 3105�998,3562�948, and 4471�1116 nEq of free fatty acids(FFA)/mL per hour, and HTGL activity 12 168�1665,11 654�1279, and 11 901�1398 nEq FFA/mL per hour,after subjects consumed the unsaturated, hydrogenated, andsaturated fat diets, respectively.
DiscussionDietary trans fatty acid/hydrogenated fat intake has beenshown to increase plasma LDL-C concentrations relative tounhydrogenated oil and decrease HDL-C concentrations rel-ative to saturated fat.7,9–14 The results of this study areconsistent with previous observations. The unique finding ofthis study is that the metabolic basis for these effects ispredominantly caused by changes in FCR rather than PR forHDL apoA-I and LDL apoB-100.
Data identifying the metabolic basis for differences inHDL-C concentrations induced by trans fatty acid/hydroge-nated fat intake are limited. In the only report currentlyavailable, Khosla et al26 assessed the effect of diets high inelaidic acid (18:1 t) or palmitic acid (C 16:0) in normocho-lesterolemic cibus monkeys. They reported that elaidic acidlowered HDL-C concentrations relative to palmitic acid andthat this difference was attributable to an increase in apoA-IFCR. These findings in nonhuman primates are consistentwith the results of the current study.
Differences observed in LDL-C concentrations after shift-ing the fatty acid pattern of the diet from unsaturated to transfatty or saturated fatty acids were caused by changes in FCRrather than PR. No significant difference in TRL and IDLapoB-100 PS or kinetic behavior was observed attributable tothe different experimental fats. These data suggest thatdifferences in LDL-C concentrations were unlikely caused bychanges in the conversion rate of TRL to IDL or IDL to LDL,but solely to the clearance of LDL. Similar to these observa-tions, Khosla et al26 reported no significant effect of elaidicrelative to palmitic acid on apoB-100 metabolism in normo-cholesterolemic cebus monkeys.
In addition to elevated LDL-C concentrations, trans fattyacid intake has been associated with small but at timessignificant increases in triglyceride concentrations.14 –16
Whether the higher triglycerides concentrations are attribut-able to an increase in the chylomicron remnants or the VLDLfraction is unclear. Our previous work measuring remnant-like particle cholesterol or triglyceride concentrations aftersubjects consumed diets enriched in polyunsaturated or hy-drogenated fat was not helpful in addressing this issue.41 Inthe present study, triglyceride concentrations and apoB-48concentrations, PS and PR, tended to be higher, whereasapoB-48 FCR was lower, after subjects consumed the hydro-genated fat diet relative to the other diets. However, these
differences did not reach statistical significance. It is impor-tant to note that triglyceride carrying lipoprotein particlestend to show a higher degree of lability than other lipoproteinparticles. Likewise, differences in the activities of HTGL orLPL (involved in postprandial lipid metabolism by facilitat-ing the clearance of chylomicrons derived from dietary fat)do not appear to explain potential differences in plasmatriglyceride concentrations resulting from hydrogenated fatfeeding.
In conclusion, the results of the present study demonstratethat an increase in apoA-I clearance rather than a decrease inproduction rates was the putative factor in modulatingHDL-C concentrations after consumption of diets enriched inhydrogenated relative to saturated fat. The mechanism for theLDL-C elevating effect of hydrogenated fat appears to besimilar to that of saturated fat, primarily determined bydecreased catabolism. These findings support current recom-mendations to reduce saturated and hydrogenated fatconsumption.
AcknowledgmentsThis work was supported by grant (HL 54727) from the NationalInstitute of Health (A.H.L. and N.R.M.). P.H.R.B. and F.K.W. werepartially supported by NIH grants P41 EB-001975 and HL 56895,respectively. We are indebted to the staff of the Metabolic ResearchUnit, including Helen Rasmussen, for their expert care of the studysubjects, to Susan Jalbert for the apolipoprotein isotopic enrichmentdeterminations, to Dalan Jensen for the lipase activity measurements,and to the study subjects, without whom this investigation would notbe possible.
References1. Expert Panel on Detection Evaluation and Treatment of High Blood
Cholesterol in Adults (Adult Treatment Panel III). Executive summary ofthe third report of the National Cholesterol Education Program (NCEP).JAMA. 2001;285:2486–2497.
2. Mensink RP, Zock PL, Kester AD, Katan MB. Effects of dietary fattyacids and carbohydrates on the ratio of serum total to HDL cholesteroland on serum lipids and apolipoproteins: a meta-analysis of 60 controlledtrials. Am J Clin Nutr. 2003;77:1146–1155.
3. Sacks FM, Katan M. Randomized clinical trials on the effects of dietaryfat and carbohydrate on plasma lipoproteins and cardiovascular disease.Am J Med. 2002;113:13S–24S.
4. Emken EA. Nutrition and biochemistry of trans and positional fatty acidisomers in hydrogenated oils. Annu Rev Nutr. 1984;4:339–376.
5. Lichtenstein AH. Trans fatty acids and cardiovascular disease risk. CurrOpin Lipidol. 2000;11:37–42.
6. Wilson TA, McIntyre M, Nicolosi RJ. Trans fatty acids and cardiovas-cular risk. J Nutr Health and Aging. 2001;5:184–187.
7. Lichtenstein AH, Ausman LM, Jalbert SM, Schaefer EJ. Effects ofdifferent forms of dietary hydrogenated fats on serum lipoprotein cho-lesterol levels. N Engl J Med. 1999;340:1933–1940.
8. Mensink RP, Katan MB. Effect of dietary trans fatty acids on high-density and low-density lipoprotein cholesterol levels in healthy subjects.N Engl J Med. 1990;323:439–445.
9. Katan MB, Mensink R, Van Tol A, Zock PL. Dietary trans fatty acids andtheir impact on plasma lipoproteins. Can J Cardiol. 1995;11:36G–38G.
10. Katan MB, Zock PL, Mensink RP. Trans fatty acids and their effects onlipoproteins in humans. Annu Rev Nutr. 1995;15:473–493.
11. Ascherio A, Katan MB, Zock PL, Stampfer MJ, Willett WC. Trans fattyacids and coronary heart disease. N Engl J Med. 1999;340:1994–1998.
12. Judd JT, Baer DJ, Clevidence BA, Kris-Etherton P, Muesing RA, IwaneM. Dietary cis and trans monounsaturated and saturated FA and plasmalipids and lipoproteins in men. Lipids. 2002;37:123–131.
13. Nestel P, Noakes M, Belling B, McArthur R, Clifton P, Janus E, AbbeyM. Plasma lipoprotein lipid and Lp[a] changes with substitution of elaidicacid for oleic acid in the diet. J Lipid Res. 1992;33:1029–1036.
1096 Arterioscler Thromb Vasc Biol. June 2004
by guest on March 21, 2016http://atvb.ahajournals.org/Downloaded from

14. Khosla P, Hayes KC. Dietary trans-monounsaturated fatty acids nega-tively impact plasma lipids in humans: critical review of the evidence.J Am Coll Nutr. 1996;15:325–339.
15. Judd JT, Clevidence BA, Muesing RA, Wittes J, Sunkin ME, PodczasyJJ. Dietary trans fatty acids: effects on plasma lipids and lipoproteins ofhealthy men and women.[comment]. Am J Clin Nutr. 1994;59:861–868.
16. Zock PL, Mensink RP. Dietary trans-fatty acids and serum lipoproteins inhumans. Curr Opin Lipidol. 1996;7:34–37.
17. Matthan NR, Ausman LM, Lichtenstein AH, Jones PJ. Hydrogenated fatconsumption affects cholesterol synthesis in moderately hypercholester-olemic women. J Lipid Res. 2000;41:834–839.
18. Matthan NR, Cianflone K, Lichtenstein AH, Ausman LM, Jauhiainen M,Jones PJ. Hydrogenated fat consumption affects acylation-stimulatingprotein levels and cholesterol esterification rates in moderately hypercho-lesterolemic women. J Lipid Res. 2001;42:1841–1848.
19. Cuchel M, Schwab US, Jones PJ, Vogel S, Lammi-Keefe C, Li Z,Ordovas J, McNamara JR, Schaefer EJ, Lichtenstein AH. Impact ofhydrogenated fat consumption on endogenous cholesterol synthesis andsusceptibility of low-density lipoprotein to oxidation in moderatelyhypercholesterolemic individuals. Metab Clin Exp. 1996;45:241–247.
20. Abbey M, Nestel PJ. Plasma cholesteryl ester transfer protein activity isincreased when trans-elaidic acid is substituted for cis-oleic acid in thediet. Atherosclerosis. 1994;106:99–107.
21. Gatto LM, Sullivan DR, Samman S. Postprandial effects of dietary transfatty acids on apolipoprotein(a) and cholesteryl ester transfer. Am J ClinNutr. 2003;77:1119–1124.
22. van Tol A, Zock PL, van Gent T, Scheek LM, Katan MB. Dietary transfatty acids increase serum cholesteryl ester transfer protein activity inman. Atherosclerosis. 1995;115:129–134.
23. Lichtenstein AH, Jauhiainen M, McGladdery S, Ausman LM, Jalbert SM,Vilella-Bach M, Ehnholm C, Frohlich J, Schaefer EJ. Impact of hydro-genated fat on high density lipoprotein subfractions and metabolism. JLipid Res. 2001;42:597–604.
24. Subbaiah PV, Subramanian VS, Liu M. Trans unsaturated fatty acidsinhibit lecithin: cholesterol acyltransferase and alter its positional speci-ficity. J Lipid Res. 1998;39:1438–1447.
25. Moore CE, Alfin-Slater RB, Aftergood L. Effect of trans fatty acids onserum lecithin: cholesterol acyltransferase in rats. J Nutr. 1980;110:2284–2290.
26. Khosla P, Hajri T, Pronczuk A, Hayes KC. Replacing dietary palmiticacid with elaidic acid (t-C18:1 delta9) depresses HDL and increasesCETP activity in cibus monkeys. J Nutr. 1997;127:531S–536S.
27. Am Heart Association. Heart and stroke statistical update. Dallas, TX:American Heart Association; 2001.
28. Lichtenstein AH, Cohn JS, Hachey DL, Millar JS, Ordovas JM, SchaeferEJ. Comparison of deuterated leucine, valine, and lysine in the mea-surement of human apolipoprotein A-I and B-100 kinetics. J Lipid Res.1990;31:1693–1701.
29. Warnick GR, Benderson J, Albers JJ. Dextran sulfate-Mg2� precipitationprocedure for quantitation of high-density-lipoprotein cholesterol. ClinChem. 1982;28:1379–1388.
30. Havel R, Eder H, Bragdon J. The distribution and chemical compositionof ultracentrifugally separated lipoproteins in human serum. J Clin Invest.1955;34:1345–1353.
31. McNamara JR, Schaefer EJ. Automated enzymatic standardized lipidanalyses for plasma and lipoprotein fractions. Clin Chim Acta. 1987;166:1–8.
32. Contois J, McNamara JR, Lammi-Keefe C, Wilson PW, Massov T,Schaefer EJ. Reference intervals for plasma apolipoprotein A-1determined with a standardized commercial immunoturbidimetric assay:results from the Framingham Offspring Study. Clin Chem. 1996;42:507–514.
33. Ordovas JM, Peterson JP, Santaniello P, Cohn JS, Wilson PW, SchaeferEJ. Enzyme-linked immunosorbent assay for human plasma apoli-poprotein B. J Lipid Res. 1987;28:1216–1224.
34. Cohn JS, Wagner DA, Cohn SD, Millar JS, Schaefer EJ. Measurement ofvery low density and low density lipoprotein apolipoprotein (Apo) B-100and high density lipoprotein Apo A-I production in human subjects usingdeuterated leucine. Effect of fasting and feeding. J Clin Invest. 1990;85:804–811.
35. Velez-Carrasco W, Lichtenstein AH, Welty FK, Li Z, Lamon-Fava S,Dolnikowski GG, Schaefer EJ. Dietary restriction of saturated fat andcholesterol decreases HDL ApoA-I secretion. Arterioscler Thromb VascBiol. 1999;19:918–924.
36. Welty FK, Lichtenstein AH, Barrett PH, Dolnikowski GG, Ordovas JM,Schaefer EJ. Decreased production and increased catabolism of apoli-poprotein B-100 in apolipoprotein B-67/B-100 heterozygotes. Arte-rioscler Thromb Vasc Biol. 1997;17:881–888.
37. Welty FK, Lichtenstein AH, Barrett PH, Dolnikowski GG, Schaefer EJ.Human apolipoprotein (Apo) B-48 and ApoB-100 kinetics with stableisotopes. Arterioscler Thromb Vasc Biol. 1999;19:2966–2974.
38. Gillotte KL, Lund-Katz S, de la Llera-Moya M, Parks JS, Rudel LL,Rothblat GH, Phillips MC. Dietary modification of high densitylipoprotein phospholipid and influence on cellular cholesterol efflux. JLipid Res. 1998;39:2065–2075.
39. Eckel RH, Goldberg IJ, Steiner L, Yost TJ, Paterniti JR, Jr. Plasmalipolytic activity. Relationship to postheparin lipolytic activity andevidence for metabolic regulation. Diabetes. 1988;37:610–615.
40. Boberg J, Augustin J, Baginsky ML, Tejada P, Brown WV. Quantitativedetermination of hepatic and lipoprotein lipase activities from humanpostheparin plasma. J Lipid Res. 1977;18:544–547.
41. Lichtenstein AH, Erkkila AT, Lamarche B, Schwab US, Jalbert SM,Ausman LM. Influence of hydrogenated fat and butter on CVD riskfactors: remnant-like particles, glucose and insulin, blood pressure andC-reactive protein. Atherosclerosis. 2003;171:97–107.
Matthan et al Hydrogenated Fat Intake and Lipoprotein Metabolism 1097
by guest on March 21, 2016http://atvb.ahajournals.org/Downloaded from

Dolnikowski, John S. Parks, Robert H. Eckel, Ernst J. Schaefer and Alice H. LichtensteinNirupa R. Matthan, Francine K. Welty, P. Hugh R. Barrett, Carrie Harausz, Gregory G.
WomenDecreases Low-Density Lipoprotein apoB-100 Catabolism in Hypercholesterolemic
Dietary Hydrogenated Fat Increases High-Density Lipoprotein apoA-I Catabolism and
Print ISSN: 1079-5642. Online ISSN: 1524-4636 Copyright © 2004 American Heart Association, Inc. All rights reserved.
Greenville Avenue, Dallas, TX 75231is published by the American Heart Association, 7272Arteriosclerosis, Thrombosis, and Vascular Biology
doi: 10.1161/01.ATV.0000128410.23161.be2004;24:1092-1097; originally published online April 15, 2004;Arterioscler Thromb Vasc Biol.
http://atvb.ahajournals.org/content/24/6/1092World Wide Web at:
The online version of this article, along with updated information and services, is located on the
http://atvb.ahajournals.org/content/suppl/2004/06/11/24.6.1092.DC1.htmlData Supplement (unedited) at:
http://atvb.ahajournals.org//subscriptions/
at: is onlineArteriosclerosis, Thrombosis, and Vascular Biology Information about subscribing to Subscriptions:
http://www.lww.com/reprints
Information about reprints can be found online at: Reprints:
document. Question and AnswerPermissions and Rightspage under Services. Further information about this process is available in the
which permission is being requested is located, click Request Permissions in the middle column of the WebCopyright Clearance Center, not the Editorial Office. Once the online version of the published article for
can be obtained via RightsLink, a service of theArteriosclerosis, Thrombosis, and Vascular Biologyin Requests for permissions to reproduce figures, tables, or portions of articles originally publishedPermissions:
by guest on March 21, 2016http://atvb.ahajournals.org/Downloaded from