Embed Size (px)
Citation preview
HAL Id: tel-01816177https://tel.archives-ouvertes.fr/tel-01816177
Submitted on 15 Jun 2018
HAL is a multi-disciplinary open accessarchive for the deposit and dissemination of sci-entific research documents, whether they are pub-lished or not. The documents may come fromteaching and research institutions in France orabroad, or from public or private research centers.
L’archive ouverte pluridisciplinaire HAL, estdestinée au dépôt et à la diffusion de documentsscientifiques de niveau recherche, publiés ou non,émanant des établissements d’enseignement et derecherche français ou étrangers, des laboratoirespublics ou privés.
Dietary Iodine Intake, Fingernail Selenium, and Risk ofDifferentiated Thyroid Cancer : Analyses of
Case-Control Studies from Epi-Thyr ConsortiumYan Ren
To cite this version:Yan Ren. Dietary Iodine Intake, Fingernail Selenium, and Risk of Differentiated Thyroid Cancer :Analyses of Case-Control Studies from Epi-Thyr Consortium. Food and Nutrition. Université Paris-Saclay, 2017. English. �NNT : 2017SACLS120�. �tel-01816177�
NNT : 2017SACLS120
THESE DE DOCTORAT DE
L’UNIVERSITE PARIS-SACLAY
PREPAREE A
UNIVERSITE DE PARIS SUD
ECOLE DOCTORALE N° 570
EDSP Santé Publique
Spécialité de doctorat : Santé Publique - Épidémiologie
Par
Madame Yan Ren
L’apport alimentaire en iode, sélénium dans les ongles, et risque du cancer
différencié de la thyroïde: Analyses d’études cas-témoins du consortium Epi-Thyr
Thèse présentée et soutenue à Villejuif, le 14 juin 2017
Composition du Jury :
Monsieur Bruno Falissard Professeur des université Ŕ praticien hospitalier, Président
Inserm, Université Paris Sud, Université Paris Saclay
Monsieur Marc Colonna Directeur de recherche Rapporteur
CHU de Grenoble, Universitaire Grenoble Alpes
Monsieur Marc Klein Professeur des université Ŕ praticien hospitalier, Rapporteur
Chu Nancy, Universitaire de Nancy
Madame Marie-Christine Boutron-Ruault Directrice de recherche, Examinatrice
Inserm, Université Paris Sud, Université Paris Saclay
Madame Mathilde Touvier Chargé de recherche, Examinatrice
Inserm, Inra, Cnam, Universités Paris V, VII et XIII
Monsieur Florent de Vathaire Directeur de recherche Directeur de thèse
Inserm, Université Paris Sud, Université Paris Saclay
Remerciements
Je remercie Florent de Vathaire pour m’avoir donné l’opportunité de réaliser cette thèse sur
un sujet passionnant. Je le remercie de m’avoir ouverte un portail merveilleux d’un monde
scientifique, pour m’avoir fait bénéficier de ses connaissances et de son expérience.
Je tiens à remercier Marc Colonna et Marc Klein d’avoir accepté d’être les rapporteurs de ce
travail. Je remercie également Marie-Christine Boutron-Ruault, Mathilde Touvier et Bruno
Falissard d’avoir accepté d’être membre de mon jury de thèse, ainsi que Jean Bouyer qui m’a suivie
durant tout au long de cette thèse.
Mes remerciements vont ensuite à Rodrigue Allodji qui m’a soutenu tout au long de ma
thèse, même commencé par mon stage de Master 1. Ses conseils scientifiques m’ont été d’une aide
très précieuse. Malgré son emploi du temps chargé, il a toujours été disponible pour moi.
Merci à Constance Xhaard, pour son aide scientifique, ce fut un plaisir de partager le même
bureau! Un grand merci à Nadia Haddy pour ses conseils et sa gentillesse, je la remercie pour son
enthousiasme et son écoute qui m’ont permis de tenir le coup dans les moments difficiles. Merci à
Carole Rubino, Ibrahima Diallo, Agnès Dumas, pour ses conseils scientifiques très précieux.
Je remercie Vincent Souchard pour m’aider nettoyer les bases de données avec soin et
patience, et les discussions très intéressantes partagées avec lui. Je remercie Angéla Jackson pour
son super support informatique et son enthousiasme qui m’a soutenue moralement.
Je remercie Françoise Terrier pour son aide administrative et sa gentillesse et ses soins qui
m’ont portée.
Mes remerciements s’adressent aux Giao Vu-Bezin et Damien Llanas, pour ses souris et bon
sens d’humeur, notamment le moment badminton partagé avec vous.
Merci à Isao Kobayashi pour son écoute, sa gentillesse, sa compréhension et ses soutiens
silencieux. Merci à Fara Diop, Adel Kaddi, Cristina Veres, Imene Mansouri, pour ses
compréhensions, aides et soutiens.
Je remercie tous les autres membres de l’équipe Cancer et Radiations de l’Unité 1018
Inserm, pour d’avoir partagé d’une expérience de vie merveilleuse professionnelle et personnelle
avec moi.
Je remercie vivement à Catherine Hill, Serge Koscielny et Nils Ternès du Service de
Biostatistique et d'Epidémiologie de l’IGR pour ses conseils précieux et ses aides tout au long de
ma thèse.
Mes remerciements s’adressent également à toutes les personnes ayant contribué à la
réalisation des études du consortium Epi-Thyr, dont les collègues de France, de Polynésie française,
de Nouvelle Calénodie et de Cuba: Thérèse Truong, Pascal Guénel, Françoise Doyon, Enora Cléro,
Stéphane Maillard, Fabienne Lesueur, Catherine Tcheandjieu, Françoise Borson-Chazot, Geneviève
Sassolas, Laurent Bailly, Eugènia Mariné Barjoan, Martin Schlumberger, Emilie Cordina-Duverger,
Marie Sanchez, Elisabeth Adjadj, Axelle Leufroy, Thierry Guérin, Laurent Noël, Anne Boland,
Jean-François Deleuze, Frédérique Rachedi, Jean-Louis Boissin, Joseph Sebbag, Larrys Shan, John
Paoaafaite, Rosa M Ortiz, Juan J Lence-Anta, Celia M Pereda, Mae Chappe, Milagros Velasco,
Idalmis Infante, Marlene Bustillo, Silvia Turcios, Regla Rodriguez.
J’aimerais adresser un remerciement particulier à mes collègues Australiens à l’occasion du
programme d’échange pour les doctorants et post-doctorants entre l’Inserm et l’Université de
Sydney: Bruce Robinson, Rory Clifton-Bligh, Martyn Bullock, Trisha Dwight, Diana Benn,
Anthony Glover, Lauren Joo, Danielle Somers, Elizabeth Carter, et Joonsup Lee pour ses aides,
soutiens précieuses, ses gentillesses et ses conseils. Merci tout particulièrement à Rory pour son
encadrement, sa disponibilité et sa bienveillance qui a rendu mon séjour à Sydney riche et agréable.
Merci aussi à Martyn pour m’avoir fait bénéficier de son savoir et de sa connaissance génétique. Ce
fut un plaisir de travailler ensemble!
Un grand merci à mes moniteurs et amis plongeurs: Christian Aragon, Marie-Rose Aragon,
Guillaume Aragon, Sébastien Aragon, Marco Delecluse, Pascal Liot, Pascal Passaquit… pour ses
enthousiasmes, encouragements et amitiés qui m’ont soutenue moralement, avec qui j’ai gagné une
famille sous-marine!
Je remercie fortement pour les recommandations fortes de la part de Josiane Schilling, de
Jean-Marc Chantelot, et de Pascal Astagneau pour la demande de bourse, qui m’ont permis de
réaliser cette thèse.
Je remercie la Fondation de France qui a financé ce travail de thèse. Je remercie la Ligue
Nationale Contre le Cancer (LNCC), l’Association pour la Recherche contre le Cancer (ARC),
l’Agence Nationale pour la Recherche (ANR), le comité de radioprotection d’Electricité De France
(EDF), l’Agence Française de Sécurité Sanitaire de l’Environnement et du Travail (AFSSET) et la
Direction Générale de la Santé (DGS) qui ont permis de réaliser les études en Polynésie française et
en Nouvelle-Calédonie.
Et enfin, je tiens à remercier profondément mes parents sans qui rien de tout ça n’aurait été
possible. Ils ont toujours été là pour moi et m’ont soutenue tout au long de mes études.
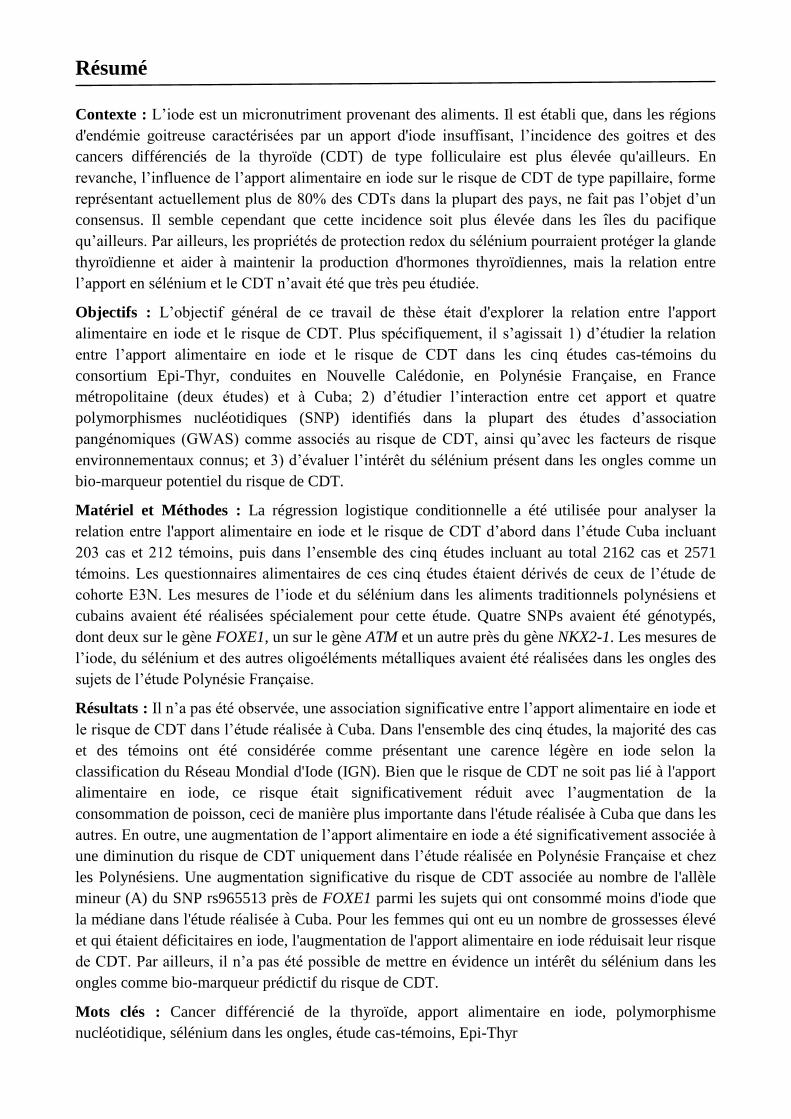
Résumé
Contexte : L’iode est un micronutriment provenant des aliments. Il est établi que, dans les régions
d'endémie goitreuse caractérisées par un apport d'iode insuffisant, l’incidence des goitres et des
cancers différenciés de la thyroïde (CDT) de type folliculaire est plus élevée qu'ailleurs. En
revanche, l’influence de l’apport alimentaire en iode sur le risque de CDT de type papillaire, forme
représentant actuellement plus de 80% des CDTs dans la plupart des pays, ne fait pas l’objet d’un
consensus. Il semble cependant que cette incidence soit plus élevée dans les îles du pacifique
qu’ailleurs. Par ailleurs, les propriétés de protection redox du sélénium pourraient protéger la glande
thyroïdienne et aider à maintenir la production d'hormones thyroïdiennes, mais la relation entre
l’apport en sélénium et le CDT n’avait été que très peu étudiée.
Objectifs : L’objectif général de ce travail de thèse était d'explorer la relation entre l'apport
alimentaire en iode et le risque de CDT. Plus spécifiquement, il s’agissait 1) d’étudier la relation
entre l’apport alimentaire en iode et le risque de CDT dans les cinq études cas-témoins du
consortium Epi-Thyr, conduites en Nouvelle Calédonie, en Polynésie Française, en France
métropolitaine (deux études) et à Cuba; 2) d’étudier l’interaction entre cet apport et quatre
polymorphismes nucléotidiques (SNP) identifiés dans la plupart des études d’association
pangénomiques (GWAS) comme associés au risque de CDT, ainsi qu’avec les facteurs de risque
environnementaux connus; et 3) d’évaluer l’intérêt du sélénium présent dans les ongles comme un
bio-marqueur potentiel du risque de CDT.
Matériel et Méthodes : La régression logistique conditionnelle a été utilisée pour analyser la
relation entre l'apport alimentaire en iode et le risque de CDT d’abord dans l’étude Cuba incluant
203 cas et 212 témoins, puis dans l’ensemble des cinq études incluant au total 2162 cas et 2571
témoins. Les questionnaires alimentaires de ces cinq études étaient dérivés de ceux de l’étude de
cohorte E3N. Les mesures de l’iode et du sélénium dans les aliments traditionnels polynésiens et
cubains avaient été réalisées spécialement pour cette étude. Quatre SNPs avaient été génotypés,
dont deux sur le gène FOXE1, un sur le gène ATM et un autre près du gène NKX2-1. Les mesures de
l’iode, du sélénium et des autres oligoéléments métalliques avaient été réalisées dans les ongles des
sujets de l’étude Polynésie Française.
Résultats : Il n’a pas été observée, une association significative entre l’apport alimentaire en iode et
le risque de CDT dans l’étude réalisée à Cuba. Dans l'ensemble des cinq études, la majorité des cas
et des témoins ont été considérée comme présentant une carence légère en iode selon la
classification du Réseau Mondial d'Iode (IGN). Bien que le risque de CDT ne soit pas lié à l'apport
alimentaire en iode, ce risque était significativement réduit avec l’augmentation de la
consommation de poisson, ceci de manière plus importante dans l'étude réalisée à Cuba que dans les
autres. En outre, une augmentation de l’apport alimentaire en iode a été significativement associée à
une diminution du risque de CDT uniquement dans l’étude réalisée en Polynésie Française et chez
les Polynésiens. Une augmentation significative du risque de CDT associée au nombre de l'allèle
mineur (A) du SNP rs965513 près de FOXE1 parmi les sujets qui ont consommé moins d'iode que
la médiane dans l'étude réalisée à Cuba. Pour les femmes qui ont eu un nombre de grossesses élevé
et qui étaient déficitaires en iode, l'augmentation de l'apport alimentaire en iode réduisait leur risque
de CDT. Par ailleurs, il n’a pas été possible de mettre en évidence un intérêt du sélénium dans les
ongles comme bio-marqueur prédictif du risque de CDT.
Mots clés : Cancer différencié de la thyroïde, apport alimentaire en iode, polymorphisme
nucléotidique, sélénium dans les ongles, étude cas-témoins, Epi-Thyr
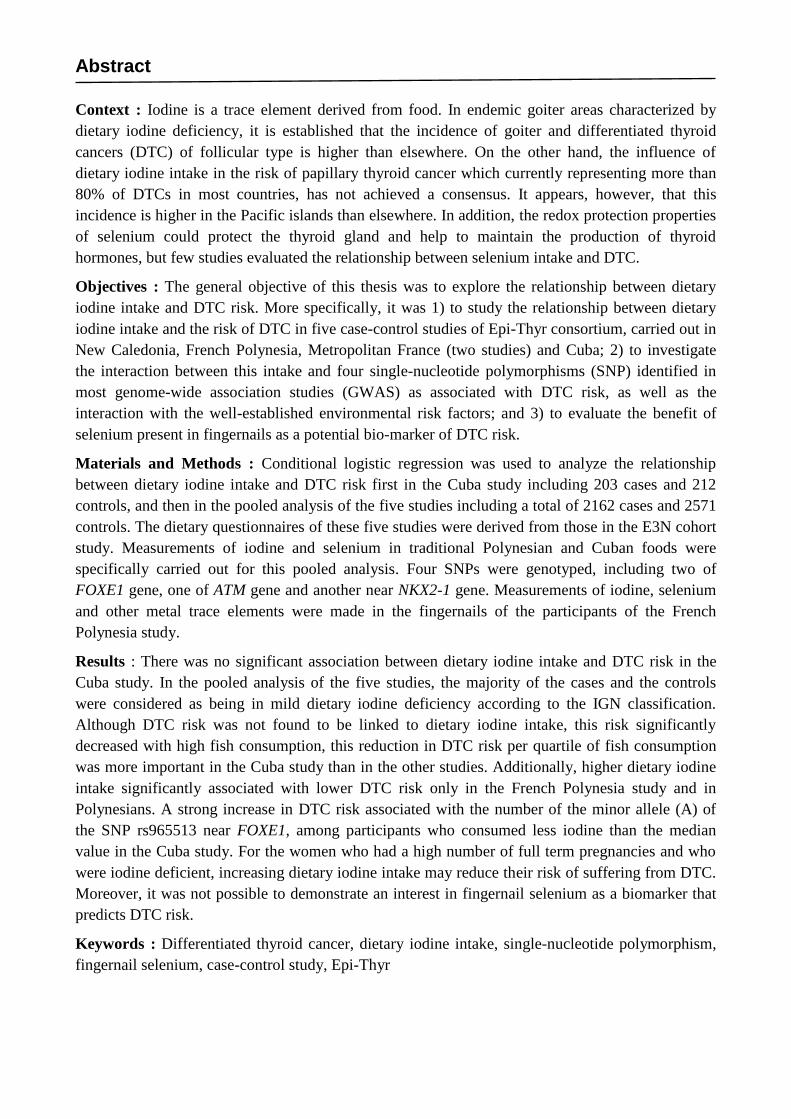
Abstract
Context : Iodine is a trace element derived from food. In endemic goiter areas characterized by
dietary iodine deficiency, it is established that the incidence of goiter and differentiated thyroid
cancers (DTC) of follicular type is higher than elsewhere. On the other hand, the influence of
dietary iodine intake in the risk of papillary thyroid cancer which currently representing more than
80% of DTCs in most countries, has not achieved a consensus. It appears, however, that this
incidence is higher in the Pacific islands than elsewhere. In addition, the redox protection properties
of selenium could protect the thyroid gland and help to maintain the production of thyroid
hormones, but few studies evaluated the relationship between selenium intake and DTC.
Objectives : The general objective of this thesis was to explore the relationship between dietary
iodine intake and DTC risk. More specifically, it was 1) to study the relationship between dietary
iodine intake and the risk of DTC in five case-control studies of Epi-Thyr consortium, carried out in
New Caledonia, French Polynesia, Metropolitan France (two studies) and Cuba; 2) to investigate
the interaction between this intake and four single-nucleotide polymorphisms (SNP) identified in
most genome-wide association studies (GWAS) as associated with DTC risk, as well as the
interaction with the well-established environmental risk factors; and 3) to evaluate the benefit of
selenium present in fingernails as a potential bio-marker of DTC risk.
Materials and Methods : Conditional logistic regression was used to analyze the relationship
between dietary iodine intake and DTC risk first in the Cuba study including 203 cases and 212
controls, and then in the pooled analysis of the five studies including a total of 2162 cases and 2571
controls. The dietary questionnaires of these five studies were derived from those in the E3N cohort
study. Measurements of iodine and selenium in traditional Polynesian and Cuban foods were
specifically carried out for this pooled analysis. Four SNPs were genotyped, including two of
FOXE1 gene, one of ATM gene and another near NKX2-1 gene. Measurements of iodine, selenium
and other metal trace elements were made in the fingernails of the participants of the French
Polynesia study.
Results : There was no significant association between dietary iodine intake and DTC risk in the
Cuba study. In the pooled analysis of the five studies, the majority of the cases and the controls
were considered as being in mild dietary iodine deficiency according to the IGN classification.
Although DTC risk was not found to be linked to dietary iodine intake, this risk significantly
decreased with high fish consumption, this reduction in DTC risk per quartile of fish consumption
was more important in the Cuba study than in the other studies. Additionally, higher dietary iodine
intake significantly associated with lower DTC risk only in the French Polynesia study and in
Polynesians. A strong increase in DTC risk associated with the number of the minor allele (A) of
the SNP rs965513 near FOXE1, among participants who consumed less iodine than the median
value in the Cuba study. For the women who had a high number of full term pregnancies and who
were iodine deficient, increasing dietary iodine intake may reduce their risk of suffering from DTC.
Moreover, it was not possible to demonstrate an interest in fingernail selenium as a biomarker that
predicts DTC risk.
Keywords : Differentiated thyroid cancer, dietary iodine intake, single-nucleotide polymorphism,
fingernail selenium, case-control study, Epi-Thyr
Scientific production
Publications
Ren Y, Kitahara CM, Berrington de Gonzalez A, Clero E, Brindel P, Maillard S, Cote S,
Dewailly E, Rachedi F, Boissin JL, Sebbag J, Shan L, Bost-Bezeaud F, Petitdidier P, Xhaard
C, Rubino C, De Vathaire F. Lack of association between fingernail selenium and thyroid
cancer risk: a case-control study in French Polynesia. Asian Pac J Cancer Prev.
2014;15:5187-94.
Ren Y, Lence-Anta JJ, Pereda CM, Chappe M, Velasco M, Infante I, Bustillo M, Turcios S,
Leufroy A, Guérin T, Noël L, Lesueur F, Maillard S, Cléro É, Xhaard C, Allodji RS, Rubino
C, Rodriguez R, Ortiz RM, de Vathaire F. FOXE1 Polymorphism Interacts with Dietary
Iodine Intake in Differentiated Thyroid Cancer Risk in the Cuban Population. Thyroid. 2016
Dec;26(12):1752-1760.
Ren Y, Truong T, Xhaard C, Souchard V, Maillard S, Lence-Anta JJ, Pereda CM, Ortiz RM,
Turcios S, Leufroy A, Guérin T, Noël L, Rachedi F, Boissin JL, Sebbag J, Shan L, Borson-
Chazot F, Sassolas G, Bailly L, Barjoan EM, Schlumberger M, Tcheandjieu C, Cordina-
Duverger E, Sanchez M, Adjadj E, Boland A, Deleuze JF, Allodji RS, Rubino C, Guénel P
and de Vathaire F. Dietary Iodine Intake and Thyroid Cancer Risk - a Pooled analysis of 5
Case-Control Studies from Epi-Thyr Consortium. (manuscript done)
Conferences
Oral Presentation
Presentation in the annual conference of NACRe-Partenariat (The National Network of Food
and Cancer Research) on «Fingernail selenium and thyroid cancer risk: a case-control study in
French Polynesia», Paris, France, April 2014.
Presentation in the annual conference of NACRe-Partenariat on «Foxe1 polymorphism
interacts with dietary iodine intake in DTC risk in the Cuban population», Paris, France,
March 2015.
Presentation in the Gustave Roussy’s research days of the pooled analysis of my PhD study
entitled «Dietary iodine intake and thyroid cancer risk: a pooled analysis of 5 case-control
studies from Epi-Thyr Consortium», Tours, France, March 2016.
Poster Presentation
Presentation in the 86th
Annual Meeting of the American Thyroid Association, a poster
entitled «Dietary iodine uptake and thyroid cancer risk: a pooled analysis of 5 case-control
studies from Epi-Thyr consortium », Denver, the USA, September 2016.
Exchange Program

Representative of Inserm’s PhD students to take the doctoral and post-doctoral students
exchanges program between Inserm and University of Sydney, Cancer Genetics Diagnostic
Laboratory of Kolling Institute of Medical Research, Royal North Shore Hospital, 1) a
clinical research project to study association between somatic mutations in the TERT gene
promoter and outcomes of papillary thyroid cancer, the results successfully published through
this exchange program (Bullock M and Ren Y et al., TERT promoter mutations are a major
indicator of recurrence and death due to papillary thyroid carcinomas. Clin Endocrinol (Oxf).
2016 Aug;85(2):283-90. Epub 2016 Feb 8.); 2) Measuring iodine content in human thyroid
tumor tissue samples using Raman spectroscopy, in the University of Sydney. Sydney,
Australia, from June to September 2015.
List of abbreviations
ANSES: French Agency for Food, Environmental and Occupational Health & Safety
ASR: Age-Standardized Rate
ATC: Anaplastic Thyroid Cancer
ATM: Ataxia-Telangiectasia Mutated
BMI: Body Mass Index
BSA: Body Surface Area
CFCT 2014: Traditional Cuban Food Composition Table Made By the Collaboration with
ANSES in 2014
CI: Confidence Interval
Ciqual: Centre d'Information sur la Qualité des Aliments
CT: Computed Tomography
CTN: Calcitonin
DTC: Differentiated Thyroid Cancer
FAO: Food and Agriculture Organization of the United Nations
FNAC: Fine-Needle Aspiration Cytology
FOXE1: forkhead box E1, also called TTF2 for Thyroid Transcription Factor 2
FPFCT 2013: Traditional French Polynesian Food Composition Table Made By the
Collaboration with ANSES in 2013
FTC: Follicular Thyroid Cancer
GLOBOCAN: Estimated Cancer Incidence, Mortality and Prevalence Worldwide from
International Agency for Research on Cancer of World Health Organization
GWAS: Genome-Wide Association Study
HR: Hazard Ratio
IARC: International Agency for Research on Cancer
ICP-MS: Inductively Coupled Plasma Mass Spectrometry
IGN: Iodine Global Network
INFOODS: International Network of Food Data Systems
MAF: Minor Allele Frequency
MHP: MantelŔHaenszel P
MTC: Medullary Thyroid Cancer
NKX2-1: NK2 homeobox 1, also called TTF1 for Thyroid Transcription Factor 1
OR: Odds Ratio
PDTC: Poorly Differentiated Thyroid Cancer
PTC: Papillary Thyroid Cancer
SNP: Single Nucleotide Polymorphism
TMAH: Tetramethylammonium hydroxide
UIC: Urinary Iodine Concentration
TABLE OF CONTENTS
PART I: GENERAL INTRODUCTION ........................................................................... 1 1
THYROID CANCER ...................................................................................................................................... 2 1.1
1.1.1 HISTOLOGIC TYPES .......................................................................................................................... 2
1.1.1.1 Papillary thyroid cancer (PTC) ............................................................................................................... 2
1.1.1.2 Follicular thyroid cancer (FTC) ............................................................................................................... 2
1.1.1.3 Poorly differentiated thyroid cancer (PDTC) ......................................................................................... 3
1.1.1.4 Medullary thyroid cancer (MTC) ........................................................................................................... 3
1.1.1.5 Anaplastic thyroid cancer (ATC, undifferentiated thyroid cancer) ........................................................ 3
1.1.2 INCIDENCE AND MORTALITY ........................................................................................................... 3
1.1.3 THYROID MICROCARCINOMAS ........................................................................................................ 8
1.1.4 ETHNIC DIFFERENCES ...................................................................................................................... 9
1.2 RISK FACTORS FOR DIFFERENTIATED THYROID CANCER ........................................................................... 9
1.2.1 FAMILY HISTORY .............................................................................................................................. 9
1.2.2 EXPOSURE TO IONIZING RADIATION DURING CHILDHOOD .......................................................... 10
1.2.3 PRE-EXISTING BENIGN THYROID DISEASES ................................................................................... 10
1.2.4 HORMONAL AND REPRODUCTIVE FACTORS ................................................................................. 12
1.2.5 DIETARY IODINE INTAKE ................................................................................................................ 13
1.2.6 OTHER DIETARY FACTORS ............................................................................................................. 14
1.2.6.1 Fish ...................................................................................................................................................... 15
1.2.6.2 Salt Water Fish .................................................................................................................................... 15
1.2.6.3 Fresh Water Fish .................................................................................................................................. 16
1.2.6.4 Shellfish ............................................................................................................................................... 16
1.2.6.5 Vegetables ........................................................................................................................................... 16
1.2.6.6 Cruciferous Vegetables ........................................................................................................................ 16
1.2.6.7 Meat .................................................................................................................................................... 16
1.2.7 BODY SIZE ...................................................................................................................................... 17
1.3 FOOD COMPOSITION TABLES AND IODINE CONTENT IN FOOD .............................................................. 17
1.3.1 THE MAIN FOOD COMPOSITION TABLES....................................................................................... 17
1.3.1.1 Food and Agriculture Organization of the United Nations (FAO) Databases (123) ............................. 17
1.3.1.2 French Food Composition Table Centre d'Information sur la Qualité des Aliments Ciqual (version
2013) (124) ………………………………………………………………………………………………………………………………………………………..18
1.3.1.3 Traditional French Polynesian and Cuban Food Composition Tables Made By the Collaboration with
ANSES in 2013 (FPFCT 2013) and in 2014 (CFCT 2014) Respectively ........................................................................ 18
1.3.2 THE VARIABILITY OF DIETARY IODINE DATA ................................................................................. 19
1.3.3 RESULTS OF THE DIETARY IODINE MEASUREMENT IN THE TRADITIONAL FRENCH POLYNESIAN
AND CUBAN FOOD SAMPLES ....................................................................................................................... 22
1.4 OBJECTIVES OF THE THESIS ..................................................................................................................... 25

2 PART II: EPI-THYR CONSORTIUM .............................................................................26
2.1 OBJECTIVE AND HISTORY ........................................................................................................................ 27
2.2 MATCHING PROCESS ............................................................................................................................... 27
2.2.1 INDIVIDUAL MATCHING ................................................................................................................ 28
2.2.2 FREQUENCY MATCHING ................................................................................................................ 28
2.2.3 WHY MATCHING? .......................................................................................................................... 28
2.3 CARACTERISTICS OF THE 5 CASE-CONTROL STUDIES .............................................................................. 29
2.3.1 THE NEW CALEDONIA STUDY ........................................................................................................ 29
2.3.1.1 Background.......................................................................................................................................... 30
2.3.1.2 Case Selection ..................................................................................................................................... 31
2.3.1.3 Control Selection ................................................................................................................................. 32
2.3.1.4 Data Collection .................................................................................................................................... 32
2.3.1.5 Dietary Questionnaire ......................................................................................................................... 32
2.3.2 THE FRENCH POLYNESIA STUDY .................................................................................................... 34
2.3.2.1 Background.......................................................................................................................................... 35
2.3.2.2 Case Selection ..................................................................................................................................... 36
2.3.2.3 Control Selection ................................................................................................................................. 37
2.3.2.4 Data Collection .................................................................................................................................... 37
2.3.2.5 Dietary Questionnaire ......................................................................................................................... 37
2.3.3 THE YOUNG-THYR STUDY .............................................................................................................. 39
2.3.3.1 Background.......................................................................................................................................... 40
2.3.3.2 Case Selection ..................................................................................................................................... 41
2.3.3.3 Control Selection ................................................................................................................................. 41
2.3.3.4 Data Collection .................................................................................................................................... 42
2.3.3.5 Dietary Questionnaire ......................................................................................................................... 43
2.3.4 THE CATHY STUDY ......................................................................................................................... 44
2.3.4.1 Case Selection ..................................................................................................................................... 44
2.3.4.2 Control Selection ................................................................................................................................. 45
2.3.4.3 Data Collection .................................................................................................................................... 45
2.3.4.4 Dietary Questionnaire ......................................................................................................................... 46
2.3.5 THE CUBA STUDY ........................................................................................................................... 47
2.3.5.1 Background.......................................................................................................................................... 48
2.3.5.2 Case Selection ..................................................................................................................................... 49
2.3.5.3 Control Selection ................................................................................................................................. 50
2.3.5.4 Data Collection .................................................................................................................................... 50
2.3.5.5 Dietary Questionnaire ......................................................................................................................... 51
2.3.6 THE HOMOGENEITY AND THE HETEROGENEITY AMONG THE 5 STUDIES ..................................... 52
2.4 GENETIC ANALYSES ................................................................................................................................. 59
2.4.1 GENOTYPING ................................................................................................................................. 60
2.4.1.1 The French Polynesia Study ................................................................................................................. 60
2.4.1.2 The Cuba Study .................................................................................................................................... 61
2.4.1.3 The French Young-Thyr Study.............................................................................................................. 62
2.4.1.4 The New Caledonia and French Cathy Studies .................................................................................... 62
3 PART III: DIETARY IODINE INTAKE AND DIFFERENTIATED THYROID CANCER RISK: THE CASE-CONTROL STUDY IN CUBA .................................................................63
3.1 METHOD ................................................................................................................................................. 64
3.1.1 ANALYZED PARAMETERS ............................................................................................................... 64
3.1.2 STATISTICAL ANALYSIS ................................................................................................................... 65
3.2 RESULTS .................................................................................................................................................. 65
3.2.1 FOOD CONSUMPTIONS OF THE STUDY PARTICIPANTS ................................................................. 65
3.2.2 DIETARY ENERGY INTAKE OF THE STUDY PARTICIPANTS .............................................................. 69
3.2.3 DIETARY IODINE INTAKE OF THE STUDY PARTICIPANTS ................................................................ 70
3.2.4 DIETARY SELENIUM INTAKE OF THE STUDY PARTICIPANTS .......................................................... 72
3.2.5 FISH, SHELLFISH CONSUMPTION AND DTC RISK............................................................................ 74
3.2.6 DIETARY IODINE INTAKE AND DTC RISK ........................................................................................ 75
3.2.7 FOXE1 POLYMORPHISM INTERACTS WITH DIETARY IODINE INTAKE IN DTC RISK ........................ 80
3.3 DISCUSSION ............................................................................................................................................ 82
3.3.1 SUMMARY OF THE RESULTS .......................................................................................................... 82
3.3.2 STRENGTHS AND LIMITATIONS OF THE STUDY ............................................................................. 82
3.3.3 COMPARISON RESULTS FROM THE LITERATURE ........................................................................... 84
3.4 CONCLUSION .......................................................................................................................................... 85
4 PART IV: DIETARY IODINE INTAKE AND DIFFERENTIATED THYROID CANCER RISK: A POOLED ANALYSIS OF THE 5 CASE-CONTROL STUDIES FROM EPI-THYR CONSORTIUM .....................................................................................................................86
4.1 STUDY PARTICIPANTS ............................................................................................................................. 87
4.2 METHOD ................................................................................................................................................. 88
4.2.1 ANALYZED PARAMETERS ............................................................................................................... 88
4.2.2 STATISTICAL ANALYSIS ................................................................................................................... 93
4.2.2.1 Analysis Strategy from the Matching Process ..................................................................................... 93
4.2.2.2 Mixed Models ...................................................................................................................................... 96
4.2.2.3 Conditional Logistic Regression ........................................................................................................... 96
4.3 POPULATION DESCRIPTION .................................................................................................................... 98
4.3.1 CHARACTERISTICS OF THE STUDIED POPULATION ........................................................................ 98
4.3.2 FOOD CONSUMPTIONS OF THE STUDY PARTICIPANTS ............................................................... 102
4.3.3 DIETARY ENERGY INTAKE OF THE STUDY PARTICIPANTS ............................................................ 103
4.3.4 DIETARY IODINE INTAKE OF THE STUDY PARTICIPANTS .............................................................. 105
4.3.5 DIETARY SELENIUM INTAKE OF THE STUDY PARTICIPANTS ........................................................ 106
4.3.6 DIETARY PATTERNS OF EACH STUDY IN THE POOLED ANALYSIS ................................................. 108
4.4 RESULTS ................................................................................................................................................ 111
4.4.1 DIETARY IODINE INTAKE .............................................................................................................. 111
4.4.1.1 Pooled Analysis of Epi-Thyr Consortium ............................................................................................ 111
4.4.1.2 Heterogeneity between Studies ........................................................................................................ 112
4.4.1.3 Heterogeneity between Ethnicity ...................................................................................................... 113
4.4.1.4 Interaction with the 4 Investigated SNPs .......................................................................................... 117
4.4.1.5 Interaction with the Number of Pregnancies .................................................................................... 122
4.4.2 FISH CONSUMPTION ................................................................................................................... 123
4.5 DISCUSSION .......................................................................................................................................... 124
4.5.1 SUMMARY OF THE RESULTS ........................................................................................................ 124
4.5.2 STRENGTHS AND LIMITATIONS OF THE STUDY ........................................................................... 125
4.5.3 COMPARISON RESULTS FROM THE LITERATURE ......................................................................... 127
4.6 CONCLUSION ........................................................................................................................................ 131
5 PART V: FINGERNAIL SELENIUM AND THYROID CANCER RISK: A CASE-CONTROL STUDY IN FRENCH POLYNESIA ................................................................... 132
5.1 MATERIALS AND METHODS .................................................................................................................. 133
5.1.1 STUDY PARTICIPANTS .................................................................................................................. 133
5.1.2 DATA COLLECTION ....................................................................................................................... 134
5.1.3 FINGERNAIL SELENIUM AND IODINE MEASUREMENTS .............................................................. 134
5.1.4 STATISTICAL ANALYSIS ................................................................................................................. 134
5.2 RESULTS ................................................................................................................................................ 135
5.3 DISCUSSION .......................................................................................................................................... 140
5.3.1 SUMMARY OF THE RESULTS ........................................................................................................ 140
5.3.2 STRENGTHS AND LIMITATIONS OF THE STUDY ........................................................................... 141
5.3.3 COMPARISON RESULTS FROM THE LITERATURE ......................................................................... 141
5.4 CONCLUSION ........................................................................................................................................ 144
CONCLUSION AND PERSPECTIVES .............................................................................. 145
PERSONAL CONTRIBUTION ........................................................................................... 148
REFERENCES ................................................................................................................... 152
APPENDIXES .................................................................................................................... 177
RESUME SUBSTANTIEL EN FRANÇAIS .................................................................. 177 1
1.1 CONTEXTE ................................................................................................................................................ 177
1.2 OBJECTIFS ................................................................................................................................................ 179
1.3 MATÉRIEL ET MÉTHODES ............................................................................................................................ 180
1.4 PROGRAMME DE TRAVAIL ............................................................................................................................ 181
1.5 RÉSULTATS ............................................................................................................................................... 182
1.5.1 Apport alimentaire en iode et risque de cancer thyroïdien à Cuba ........................................................ 182
1.5.2 Apport alimentaire en iode et risque de cancer thyroïdien dans les 5 études du consortium Epi-Thyr . 184
1.5.3 Sélénium présent dans les ongles ........................................................................................................... 187
1.6 DISCUSSION ET CONCLUSION........................................................................................................................ 188
1.7 PERSPECTIVES ........................................................................................................................................... 190
SUPPLEMENTAL TABLE 1 - DETAILS USED COMMON FOOD GROUPS AND ITEMS 2FOR THE POOLED ANALYSIS ......................................................................................... 190
SUPPLEMENTAL TABLE 2 - ADJUSTED ODDS RATIO OF DTC ASSOCIATED WITH 3DIETARY IODINE INTAKE ACCORDING TO IGN CLASSIFICATION IN THE POOLED ANALYSIS .......................................................................................................................... 197
SUPPLEMENTAL TABLE 3 - DIETARY IODINE INTAKE AND THYROID CANCER 4RISK: SUMMARY OF THE RESULTS FROM THE PUBLISHED CASE-CONTROL STUDIES 198
SUPPLEMENTAL TABLE 4 - THE ASSOCIATION BETWEEN FISH, FRUITS, 5VEGETABLES, MEAT, DAIRY FOOD, AND THYROID CANCER RISK: SUMMARY OF THE RESULTS FROM THE PUBLISHED OBSERVATIONAL STUDIES ................................... 200
SUPPLEMENTAL TABLE 5 - THE ASSOCIATION BETWEEN ALCOHOL 6CONSUMPTION AND THYROID CANCER RISK: SUMMARY OF THE RESULTS FROM THE PUBLISHED OBSERVATIONAL STUDIES ................................................................ 212
PUBLICATIONS WITHIN THE THESIS ...................................................................... 216 7
TABLE LIST
Table 1-1 - Top 10 Countries with the highest ASR of thyroid cancer incidence for both sexes
.................................................................................................................................................... 7
Table 1-2 - The Variation of Iodine Content in Different French Polynesian Food Samples . 20
Table 1-3 - Dietary Iodine and Selenium Intake from Typical Cuban Food in the Cases and in
the Controls based on the composition of 20 traditional Cuban food items measured by the
French ANSES (CFCT 2014) .................................................................................................. 23
Table 2-1 - Characteristics of the Studied 5 Case-Control Studies from Epi-Thyr Consortium
.................................................................................................................................................. 53
Table 2-2 - Description of the five studied polymorphisms in the French Polynesia Study
(Maillard et al. 2015) ................................................................................................................ 60
Table 2-3 - Description of the five studied polymorphisms in the Cuba Study (Pereda et al.
2015) ......................................................................................................................................... 61
Table 3-1 - Food consumptions of the study participants (By decreasing order of the 20 sub-
groups) ...................................................................................................................................... 65
Table 3-2 - Dietary energy intake of the study participants ..................................................... 69
Table 3-3 - Dietary iodine intake of the study participants ...................................................... 71
Table 3-4 - Dietary selenium intake of the study participants ................................................. 73
Table 3-5 - Odds Ratios of DTC Associated with Fish and Shellfish Consumption ............... 75
Table 3-6 - Odds Ratios of DTC Associated with Dietary Iodine Intake According to IGN
Classification in the Studied Cuban Population ....................................................................... 76
Table 3-7 - DTC Risk Associated with Dietary Iodine Intake by Various Confounding Factors
in the Studied Cuban Population .............................................................................................. 77
Table 3-8 - Odds Ratios of DTC Risk Associated with Dietary Iodine Intake and the
Polymorphism of SNP rs965513 near FOXE1 ........................................................................ 81
Table 4-1 - Results of the generalized linear model ................................................................. 90
Table 4-2 - Description of the strata ......................................................................................... 93
Table 4-3 - Characteristics of the Studied 5 Case-Control Studies from Epi-Thyr Consortium
................................................................................................................................................ 100
Table 4-4 - Food consumptions of the pooled analysis of the 5 studies’ participants (By
decreasing order of the 20 sub-groups) .................................................................................. 102
Table 4-5 - Dietary energy intake of the pooled analysis of the 5 studies’ participants (By
decreasing order of the 20 sub-groups) .................................................................................. 104
Table 4-6 - Dietary iodine intake of the pooled analysis of the 5 studies’ participants (By
decreasing order of the 20 sub-groups) .................................................................................. 105
Table 4-7 - Dietary selenium intake of the pooled analysis of the 5 studies’ participants (By
decreasing order of the 20 sub-groups) .................................................................................. 107
Table 4-8 - Dietary iodine intake and DTC risk, dietary iodine intake classified according to
the quartiles of the value distribution of the controls in each study of the pooled
analysis(µg/day) ..................................................................................................................... 112
Table 4-9 - Heterogeneity between each study and the other 4 studies, and global
heterogeneity .......................................................................................................................... 113
Table 4-10 - Heterogeneity between each ethnical group and European group, and global
heterogeneity .......................................................................................................................... 114
Table 4-11 - DTC risk associated with dietary iodine intake adjusted by various confounding
factors ..................................................................................................................................... 115
Table 4-12 - Odds-Ratio Associated with dietary iodine intake adjusted by Various
Confounding Factors .............................................................................................................. 116
Table 4-13 - Odds-Ratio Associated with dietary iodine intake (all food items, but bread)
adjusted by Various Confounding Factors. ............................................................................ 116
Table 4-14 - Alleles Frequency of the Four Polymorphisms Which Associated with the Risk
of Developing DTC of the Genotyped Participants in each Study ........................................ 118
Table 4-15 - Association between the Risk of Developing DTC and Investigated 4 SNPs in
the Pooled analysis ................................................................................................................. 119
Table 4-16 - Association between the Risk of Developing DTC and the 4 Investigated SNPs,
as well as Their Interactions with Total Dietary Iodine Intake in the Pooled Analysis ......... 121
Table 4-17 - DTC Risk Associated with Fish Consumption, Adjusted by Various
Confounding Factors in the Pooled Analysis ......................................................................... 124
Table 5-1 - Predictor of selenium concentration in fingernails in thyroid cancer patients and
controls ................................................................................................................................... 136
Table 5-2 - Fingernail selenium and thyroid cancer by various confounding factors in French
Polynesia, 1981-2003 ............................................................................................................. 137
Table 5-3 - Fingernail selenium and thyroid cancer by the time between diagnosis and
interview in French Polynesia, 1981-2003 ............................................................................. 140
FIGURE LIST
Figure 1-1 - World wide Variation in Thyroid Cancer Incidence Age-Standardised Rates
(ASR) Worldwide ...................................................................................................................... 5
Figure 1-2 - Worldwide Age-Standardized Rate (ASR) of Incidence and Mortality of Thyroid
Cancer (GLOBOCAN 2012) ...................................................................................................... 6
Figure 1-3 - Incidence and mortality of thyroid cancer chronological trend in France (105
person-years) (Colonna et al. 2013) ........................................................................................... 8
Figure 1-4 - Forest plot for the association between thyroid cancer risk and fish consumption
stratified by location. 1 = iodine deficiency areas; 2 = iodine-rich areas. a Study in Sweden.
b
Study in Norway. ...................................................................................................................... 15
Figure 1-5 - Variation of iodine content in different food samples measured by different food
composition tables .................................................................................................................... 20
Figure 1-6 - Iodine content in fish samples from the seven different French Polynesian areas
measured by FPFCT 2013 ........................................................................................................ 21
Figure 1-7 - Measurements of Iodine Content in Typical Cuban Food by the French ANSES
(CFCT 2014) (µg/g) ................................................................................................................. 24
Figure 1-8 - Measurements of Selenium Content in Typical Cuban Food by the French
ANSES (CFCT 2014) (µg/g) ................................................................................................... 24
Figure 2-1 - Map of New Caledonia ........................................................................................ 30
Figure 2-2 - Photo booklet to help fill out the dietary questionnaire. Example of standard
portions of raw vegetables and standard beverages volumes ................................................... 34
Figure 2-3 - Map of French Polynesia ..................................................................................... 35
Figure 2-4 - Map of constituent lands of the French Republic ................................................ 40
Figure 2-5 - Map of Cuba ......................................................................................................... 49
Figure 3-1 - Food consumptions of the study participants (By decreasing order of the 20 sub-
groups: g/day/person) ............................................................................................................... 68
Figure 3-2 - Mean of dietary energy intake of the Cuba study participants ............................. 70
Figure 3-3 - Mean of dietary iodine intake of the Cuba study participants ............................. 72
Figure 3-4 - Mean of dietary selenium intake of the Cuba study participants ......................... 74
Figure 4-1 - Participant flow chart of inclusion criteria, the Pooled Analysis, 1979-2011 ..... 88
Figure 4-2 - Predicted values for bread consumption in the Cathy study ................................ 91
Figure 4-3 - Residuals in bread consumption prediction of the Cathy study ........................... 91
Figure 4-4 - Dietary iodine intake distributions of the cases and the controls of the pooled
analysis ..................................................................................................................................... 92
Figure 4-5 - Mean of food consumptions of the pooled analysis of the 5 studies’ participants
................................................................................................................................................ 103
Figure 4-6 - Mean of dietary energy intake of the pooled analysis of the 5 studies’ participants
(by decreasing order of the 20 sub-groups: kcal/day/person) ................................................ 104
Figure 4-7 - Mean of dietary iodine intake of the pooled analysis of the 5 studies’ participants
(by decreasing order of the 20 sub-groups: µg/day/person) ................................................... 106
Figure 4-8 - Mean of dietary selenium intake of the pooled analysis of the 5 studies’
participants ............................................................................................................................. 107
Figure 4-9 - (1) Mean of the top 3 consumed foods of each study (g/day/person); (2) Mean of
dietary energy intake of each study (by order of the first 3 foods which brought the most
dietary energy intake: kcal/day/person); (3) Mean of dietary iodine intake of each study (by
order of the first 3 foods which brought the most dietary iodine intake: µg/day/person); (4)
Mean of dietary selenium intake of each study (by order of the first 3 foods which brought the
most dietary selenium intake: µg/day/person), by case, control and all study participants in the
pooled analysis ....................................................................................................................... 111
Figure 4-10 - Significant Interaction between Dietary Iodine Intake and The SNP rs965513
near FOXE1 for The French Polynesia and the Cuba Studies ............................................... 122
Figure 4-11 - Significant Interaction between Dietary Iodine Intake and Number of
pregnancies in DTC risk (P-interaction=0.05) ....................................................................... 123
Figure 5-1 - Fingernail selenium concentration in studied population of French Polynesia . 136

1
PART I: GENERAL INTRODUCTION 1
2
THYROID CANCER 1.1
The thyroid gland is a butterfly-shaped endocrine gland that is normally located in the lower
front of the neck. The thyroid’s job is to make thyroid hormones, which are secreted into the
blood and then carried to every tissue in the body. Thyroid hormone helps the body use
energy, stay warm and keep the brain, heart, muscles, and other organs working as they
should (1). An abnormal growth of thyroid cells that forms a lump within the thyroid gland
called thyroid nodule (2). Although the vast majority of thyroid nodules are benign
(noncancerous), a small proportion (5%-10%) of thyroid nodules do contain thyroid cancer
(3), which is the most frequent endocrine cancer and represents 1-2% of all solid human
malignancies (4).
1.1.1 HISTOLOGIC TYPES
1.1.1.1 Papillary thyroid cancer (PTC)
PTC is referred to as follicular cell-derived differentiated thyroid cancer (DTC). PTC is the
most common type, making up about 70% to 80% of all thyroid cancers in iodine sufficient
areas. PTC can occur at any age and its incidence is maximal between 30 to 50 years of age
(mean age: 45 years). The female to male ratio is 2:1. It tends to grow slowly and often
spreads to lymph nodes in the neck. However, unlike many other cancers, papillary cancer has
a generally excellent prognosis with 30 year disease specific survivals in excess of 95% (5, 6).
1.1.1.2 Follicular thyroid cancer (FTC)
FTC is also referred to as follicular cell-derived differentiated thyroid cancer (DTC), with
capsular and/or vascular invasion or invasion of adjacent structures in the absence of nuclear
features of papillary thyroid cancer (7). In epidemiological surveys, FTC tends to be more
common in areas with iodine deficiency. Owing to a combination of changing diagnostic
criteria and an increase in the incidence of PTC associated with dietary iodine
supplementation, the diagnosis of FTC is less frequent. While usually a sporadic disease, FTC
is more likely than PTC to spread to distant organs, particularly the lungs and bones (8).
3
1.1.1.3 Poorly differentiated thyroid cancer (PDTC)
PDTC is a concept proposed to include carcinomas of follicular thyroid epithelium that retain
sufficient differentiation to produce scattered small follicular structures and some
thyroglobulin, but generally lack the usual morphologic characteristics of papillary and
follicular carcinoma (9, 10), it comprises a small subset of heterogeneous thyroid tumors,
occupying an intermediate area between well differentiated follicular or papillary carcinoma
and anaplastic carcinomas, from both a histopathogenetic and a clinical point of view,
accounting for less than 5% of all thyroid cancer cases, includes the following 3 features: (11)
a solid, trabecular or insular growth pattern, (11) lack of classic PTC nuclear features, and (12)
tumor necrosis, 3 or more mitoses per 10 high power fields, or convoluted nuclei which is
evidence for loss of differentiation in PTC (13). Using this definition, clinical outcomes of
PDTCs are significantly worse than seen in PTC and FTC with 10 year survival rates of
approximately 50% (13, 14).
1.1.1.4 Medullary thyroid cancer (MTC)
MTC arises from parafollicular or C-cells of the thyroid that produce calcitonin (CTN), and
accounts for 3%-5% of all thyroid cancers. Approximately 25% of all MTC runs in families
and is associated with other endocrine tumors. In family members of an affected person, a test
for a genetic mutation in the RET proto-oncogene can lead to an early diagnosis of medullary
thyroid cancer and, as a result, to curative surgery (8).
1.1.1.5 Anaplastic thyroid cancer (ATC, undifferentiated thyroid cancer)
ATC is a rare undifferentiated tumor derived from follicular cells. It is found in less than 2%
of patients with thyroid cancer (8). ATC is the most advanced and aggressive thyroid cancer
and the least likely to respond to treatment.
My PhD subject only deals with differentiated thyroid cancers (PTC and FTC).
1.1.2 INCIDENCE AND MORTALITY
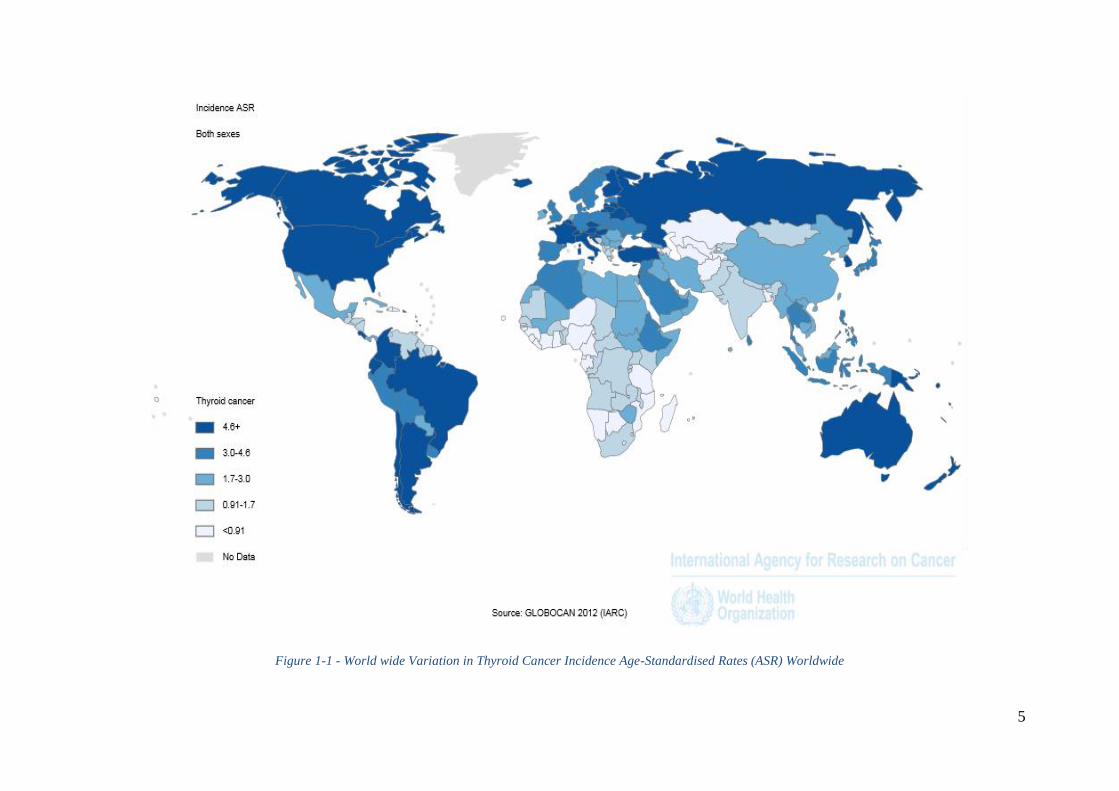
The incidence of thyroid cancer is quite various worldwide. GLOBOCAN 2012 (15), from
International Agency for Research on Cancer (IARC) of World Health Organization shows,
thyroid cancer accounted for 2.1% of all cancers worldwide in 2012. Number of new thyroid
4
cancers in 2012 was estimated at about 298,102: 229,923 for women and only 68,179 for men.
In most parts of the world, the incidence of thyroid cancer was 2 to 6 cases per 105 person-
years in women and 1 to 2 cases per 105 person-years in men. High-risk areas (areas whose
incidence of men and women is more than 10 per 105 person-years), are mainly from the
North America (Canada and the United States), Pacific Islands: Polynesia (French Polynesia
and Samoa), Australia / New Zealand and Melanesia (Fiji, New Caledonia, Papua New
Guinea, Solomon Islands and Vanuatu) (Figure 1-1, Figure 1-2).
Worldwide variations in thyroid cancer incidence may reflect not only true variations in
incidence, but also variations of economic level, convenience of access to medical diagnosis,
and health insurance system among countries. In general, people from high-income countries
pay more attention to their health care, have easier access to the successive new imaging
techniques of thyroid disease diagnosis, such as ultrasound guided fine needle aspiration. This
may introduce overdiagnosis. Figure 1-1 and Figure 1-2 show that the “high-risk areas” are
mainly from the more developed countries rather than the less developed countries.
Vaccarella et al. provided a measure of thyroid-cancer overdiagnosis over the past two
decades in 12 selected high-income countries. These authors estimated that between 2003 and
2007, overdiagnosis in women accounted for 90% of thyroid-cancer cases in South Korea; 70
to 80% in the United States, Italy, France, and Australia; and 50% in Japan, the Nordic
countries, England and Scotland. In men, overdiagnosis was approximately 70% in France,
Italy, and South Korea; 45% in the United States and Australia; and less than 25% in all other
countries they examined (16).
5
Figure 1-1 - World wide Variation in Thyroid Cancer Incidence Age-Standardised Rates (ASR) Worldwide
6
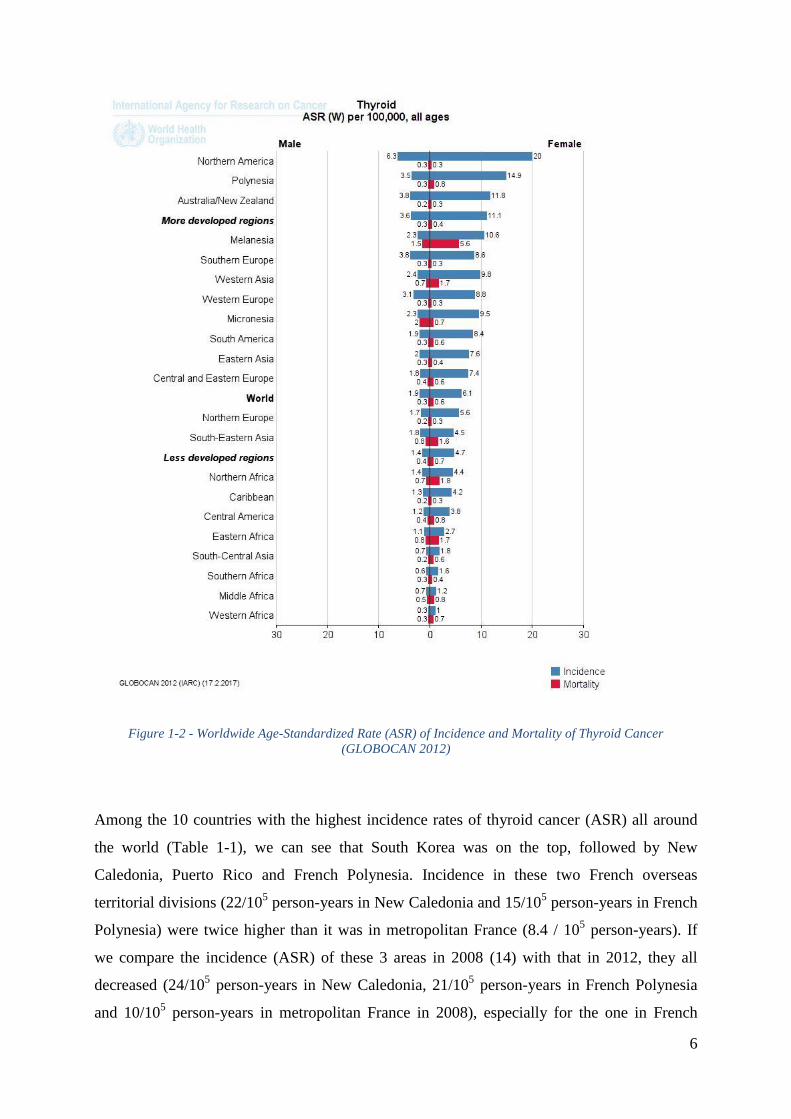
Figure 1-2 - Worldwide Age-Standardized Rate (ASR) of Incidence and Mortality of Thyroid Cancer
(GLOBOCAN 2012)
Among the 10 countries with the highest incidence rates of thyroid cancer (ASR) all around
the world (Table 1-1), we can see that South Korea was on the top, followed by New
Caledonia, Puerto Rico and French Polynesia. Incidence in these two French overseas
territorial divisions (22/105 person-years in New Caledonia and 15/10
5 person-years in French
Polynesia) were twice higher than it was in metropolitan France (8.4 / 105 person-years). If
we compare the incidence (ASR) of these 3 areas in 2008 (14) with that in 2012, they all
decreased (24/105 person-years in New Caledonia, 21/10
5 person-years in French Polynesia
and 10/105 person-years in metropolitan France in 2008), especially for the one in French
7
Polynesia. This may be due to the current recommendation to avoid fine-needle aspiration
cytology (FNAC) for tumors that are less than 10 mm in diameter when there is no evidence
of extension beyond the thyroid capsule and of lymph node metastases (18).
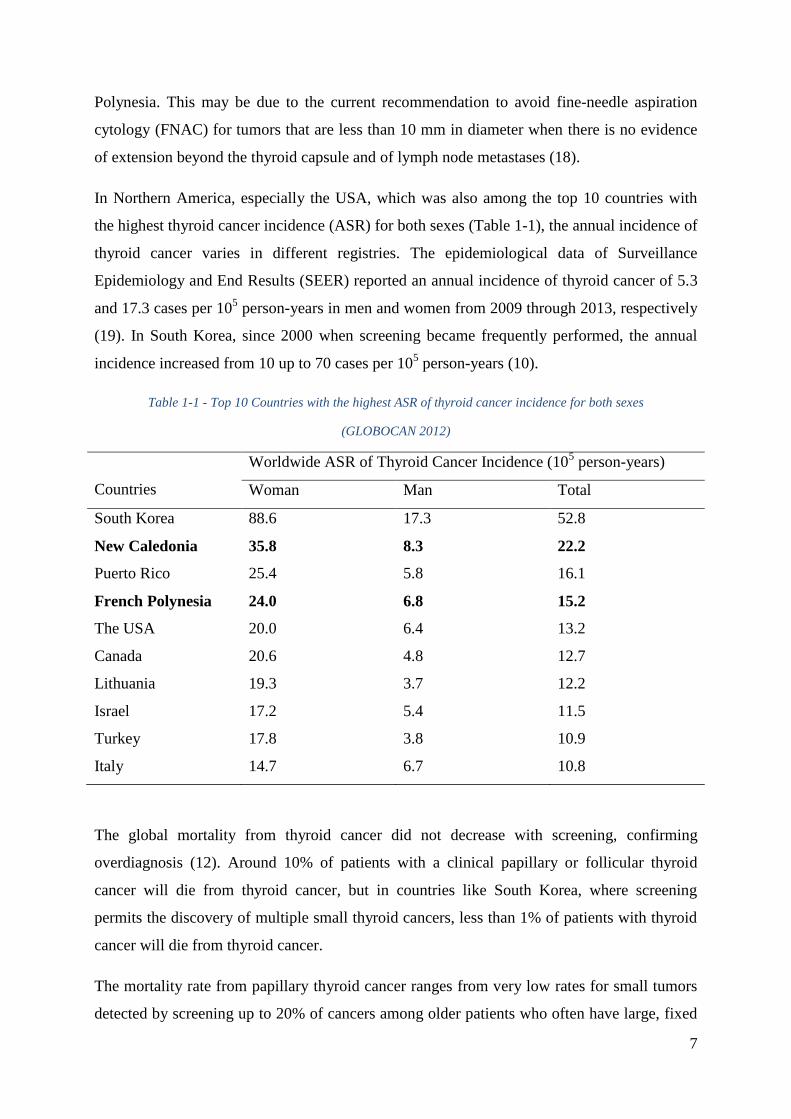
In Northern America, especially the USA, which was also among the top 10 countries with
the highest thyroid cancer incidence (ASR) for both sexes (Table 1-1), the annual incidence of
thyroid cancer varies in different registries. The epidemiological data of Surveillance
Epidemiology and End Results (SEER) reported an annual incidence of thyroid cancer of 5.3
and 17.3 cases per 105 person-years in men and women from 2009 through 2013, respectively
(19). In South Korea, since 2000 when screening became frequently performed, the annual
incidence increased from 10 up to 70 cases per 105 person-years (10).
Table 1-1 - Top 10 Countries with the highest ASR of thyroid cancer incidence for both sexes
(GLOBOCAN 2012)
Countries
Worldwide ASR of Thyroid Cancer Incidence (105 person-years)
Woman Man Total
South Korea 88.6 17.3 52.8
New Caledonia 35.8 8.3 22.2
Puerto Rico 25.4 5.8 16.1
French Polynesia 24.0 6.8 15.2
The USA 20.0 6.4 13.2
Canada 20.6 4.8 12.7
Lithuania 19.3 3.7 12.2
Israel 17.2 5.4 11.5
Turkey 17.8 3.8 10.9
Italy 14.7 6.7 10.8
The global mortality from thyroid cancer did not decrease with screening, confirming
overdiagnosis (12). Around 10% of patients with a clinical papillary or follicular thyroid
cancer will die from thyroid cancer, but in countries like South Korea, where screening
permits the discovery of multiple small thyroid cancers, less than 1% of patients with thyroid
cancer will die from thyroid cancer.
The mortality rate from papillary thyroid cancer ranges from very low rates for small tumors
detected by screening up to 20% of cancers among older patients who often have large, fixed
8
or invasive cervical lesions or distant metastases at the time of diagnosis, and the initial risk
of dying from thyroid cancer is estimated by the tumor, node, metastases (TNM) staging
system (19,20).
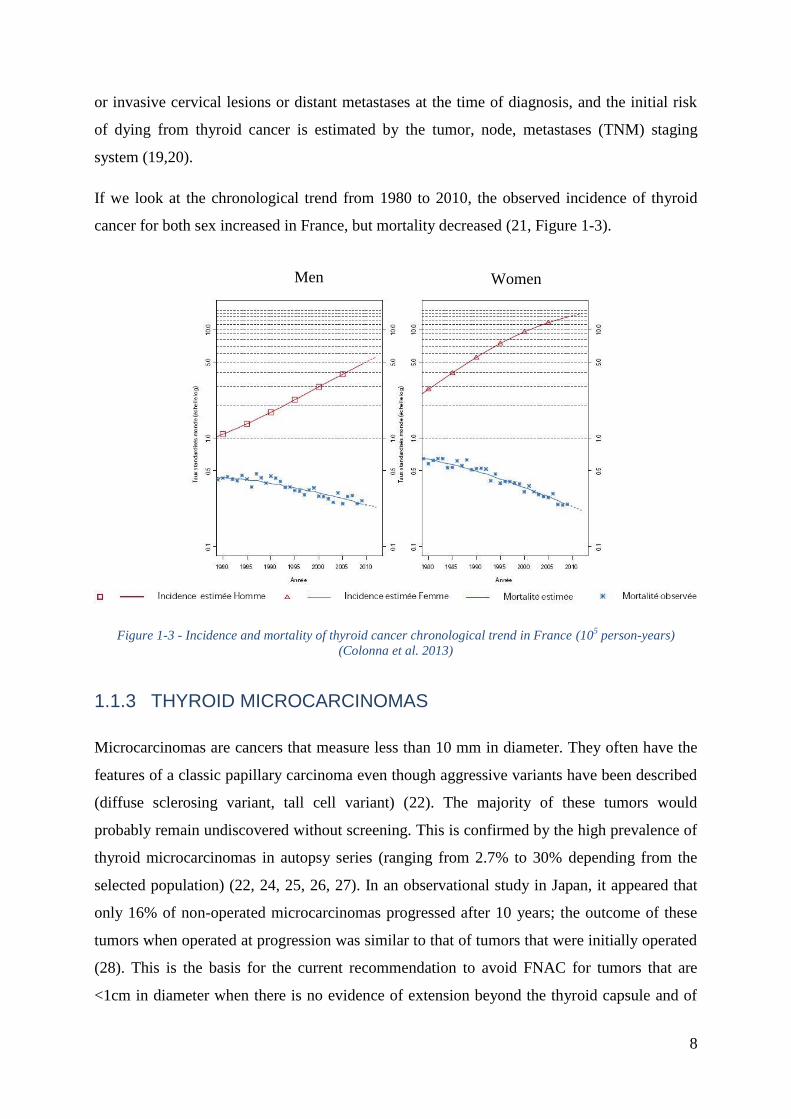
If we look at the chronological trend from 1980 to 2010, the observed incidence of thyroid
cancer for both sex increased in France, but mortality decreased (21, Figure 1-3).
Figure 1-3 - Incidence and mortality of thyroid cancer chronological trend in France (105 person-years)
(Colonna et al. 2013)
1.1.3 THYROID MICROCARCINOMAS
Microcarcinomas are cancers that measure less than 10 mm in diameter. They often have the
features of a classic papillary carcinoma even though aggressive variants have been described
(diffuse sclerosing variant, tall cell variant) (22). The majority of these tumors would
probably remain undiscovered without screening. This is confirmed by the high prevalence of
thyroid microcarcinomas in autopsy series (ranging from 2.7% to 30% depending from the
selected population) (22, 24, 25, 26, 27). In an observational study in Japan, it appeared that
only 16% of non-operated microcarcinomas progressed after 10 years; the outcome of these
tumors when operated at progression was similar to that of tumors that were initially operated
(28). This is the basis for the current recommendation to avoid FNAC for tumors that are
<1cm in diameter when there is no evidence of extension beyond the thyroid capsule and of
Men Women
9
lymph node metastases. Also the name of papillary “microcarcinoma” may be changed to
papillary “microtumor” (the Porto consensus) (29).
1.1.4 ETHNIC DIFFERENCES
The differences of incidence of thyroid cancer according to ethnic origins allow the study of
the pathogenic role of genetic and environmental factors including dietary habits and their
combination. In general, thyroid cancer is more frequent in males and females of Caucasian
than that of African and Puerto Rican Hispanics (15,20).
1.2 RISK FACTORS FOR DIFFERENTIATED THYROID
CANCER
Several risk factors for thyroid carcinoma have emerged from epidemiological studies (30,31),
but the only clearly demonstrated etiologic factor is a history of radiation exposure during
childhood. In most patients, and as for most other cancers, no risk factor is identified.
1.2.1 FAMILY HISTORY
Epidemiological studies have suggested that about 3 to 10% of PTC occur as familial cancers
(32,33). DTC may have a greater familial component than other nonhereditary cancers, with
relative risk estimates of 3-4 (or higher) for first-degree relatives of persons with DTC
(34,35,36,37). PTC is the highest heritable cancer among all cancers and has been shown to
be the only cancer for which the contribution of inherited genetic factors more than that of
environmental factors (38). If three or more first degree relatives are diagnosed with DTC,
there is a greater than 94% chance that this represents a hereditary familial syndrome (39).
Thyroid cancers are present in several familial syndromes. Patients with familial adenomatous
polyposis coli (FAP) and its subtype the Gardner’s syndrome caused by inherited mutations
of APC (adenomatous polyposis coli) at chromosome 5q21, have a 5- to 10-fold increased
risk of PTC compared to the general population, and its prevalence is about 2% of affected
individuals (40,41). These PTCs are mainly found in females less than 35 years of age.
Genome-wide association studies (GWAS) of SNPs with large cohorts of patients with DTC
and controls have been performed. Associations between DTC and SNPs have been found at
10
9q22.33 located near FOXE1 (Forkhead factor E1, also called TTF2 for Thyroid
Transcription Factor 2) gene and 14q13.3 located near the NKX2-1 (NK2 homeobox 1, also
called TTF1 for Thyroid Transcription Factor 1) gene (42,43). Also, studies focusing on
radiation induced PTC confirmed the association with the 9q22.33 SNPs (rs925489,
rs7850258, rs965513 and rs10759944) (44). These associations were confirmed in several
studies (45,46,47,48,49) and also associations with other loci were found including 2q35,
3q25, 7q21, 8p12, 9q34. The conclusion drawn from these studies is that predisposition to
DTC is complex and is most likely due to low and moderate risk mutations (50,51).
1.2.2 EXPOSURE TO IONIZING RADIATION DURING CHILDHOOD
Exposure to external irradiation to the neck during childhood and adolescence increases the
risk for PTC (30, 31, 52,53,54,55). The latency period between exposure and diagnosis is at
least 5 years. In children exposed to a dose of 1 Gy (100 rad) to the thyroid, excess risk for
thyroid cancer is 7.7-fold (55). The risk decreases with older age at exposure and is low or
even not significant when radiation exposure occurs in adults. Similarly, diagnostic or
therapeutic administration of I131
to adults does not seem to be associated with an increased
risk for thyroid cancer (31, 55). However, the increased incidence of PTC in children in the
Marshall Islands after atomic bomb testing and more recently in Belarus and Ukraine after the
Chernobyl nuclear reactor accident indicates a direct carcinogenic effect of radioactive
isotopes, both I131
and/or short-lived isotopes, on the thyroid gland during childhood
(56,57,58,59,60).
1.2.3 PRE-EXISTING BENIGN THYROID DISEASES
Thyroid cancer is often preceded by other thyroid abnormalities, such as benign thyroid
nodules or goiter (61). Franceschi et al. (62) did a pooled analysis of case-control studies of
benign nodules and goiter and thyroid cancer, including 2519 cases (2008 were PTC) and
4176 controls from 11 studies of goiter and 8 studies of benign nodules/adenomas. The
studies of goiter included populations from five regions with sufficient to excessive iodine
intakes (four studies from the U.S. in the early 1980s, and one from Japan) and six
populations with sufficient to mildly deficient intakes (one from coastal China before the
introduction of iodized salt and five from Europe). For women, ORs for a goiter history for all
thyroid cancer were 5.9 (95 % CI: 4.2-8.1), and for PTC and FTC were 5.5 (95 % CI: 3.9-7.8)
11
and 6.9 (95 % CI: 3.8-12.4), respectively. For men, the OR for all thyroid cancer was 38.3
(95 % CI: 5.0-291.2). In that review, with the exception of a Japanese study where the OR for
thyroid cancer was very high for women (26.5), the individual ORs from the other ten studies
did not vary widely. For women, OR for a benign nodules/adenomas history for all thyroid
cancer were 29.9 (95 % CI: 14.5-62.0), and for PTC and FTC were 28.9 (95 % CI: 13.6-61.2)
and 62.3 (95 % CI: 18.9-205.8), respectively. The excess risk for goiter and benign
nodules/adenomas was greatest within 4 years prior to thyroid cancer diagnosis, but a
significantly elevated OR was still present more than 10 years before diagnosis. Case-control
and cohort studies published since this analysis (62) have supported a link between goiter
and/or thyroid nodules and an increased risk of developing thyroid cancer (63,64,65).
However, biases cannot be excluded, one thyroid disease paving the way for the discovery of
another. Also nodules considered benign at FNAC and therefore not operated do not progress
into a malignant tumor.
Higher risk for DTC has been noted in patients with Graves’ disease and cold thyroid nodules,
and increased aggressiveness of such Graves’ disease-associated thyroid cancer has been
proposed (66,67,68,69).
The global rate of malignancy is similar in case of single or multiple nodules, suggesting that
the risk of malignancy for each individual nodule is lower in case of multiple nodules than
that of a solitary nodule (70). A meta-analysis of 14 cross-sectional or retrospective cohort
studies (71) found the risk of thyroid cancer was significantly lower in multi-nodular goiter
than in single nodules (OR = 0.8; 95 % CI: 0.67-0.96). However, there was moderate
inconsistency across studies (I2 = 35 %): studies in iodine sufficient areas (U.S., Saudi Arabia,
Nigeria, Croatia) found risk was lower in multi-nodular goiter than in single nodules (OR =
0.77; 95 % CI: 0.65-0.92), while studies in mildly iodine deficient areas (Italy, Turkey),
where multi-nodular goiter would be expected to be more common, found no significant
association (OR = 0.88; 95 % CI: 0.68-1.14).
Occasionally, thyroid cancer has been found in patients with congenital goiter, suggesting that
prolonged and sustained stimulation by TSH may promote the clinical appearance of DTC.
This association has been proposed by various authors (72,73), while some others did not
(74,75).
12
1.2.4 HORMONAL AND REPRODUCTIVE FACTORS
The incidence of thyroid cancer is approximately the same for males and females before
puberty and after the menopause; the female to male ratio is highest during puberty and
declines thereafter. Various studies demonstrated that thyroid volume increases during
puberty and pregnancy and fluctuates during the menstrual cycle (76,77,78). In in vitro
studies, it has been demonstrated that estrogen receptors are present on thyroid cancer cell
lines and can stimulate proliferation (79).
These findings suggest that hormonal or reproductive factors may play a role in the risk of
thyroid cancer in females. Various epidemiological studies tried to explain the link between
thyroid cancer and reproductive age of the woman, but the results were contrasting. A
younger age at menarche was significantly associated with a higher risk of DTC in a case-
control study performed among young women (35 years or younger) in eastern France, for
girls’ age of 11 years or younger vs. those 12-14 years old, OR = 1.3, 95% CI: 1.0-1.8) (80).
However, this result was directly opposite of the findings of a pooled analysis (for girls age of
15 years or older vs. those younger than 13 years, OR = 1.2, 95% CI: 1.0-1.4) (81), and those
from a cohort study conducted in California in which the analysis was restricted to women
less than 45 years of age (for girls 14 years of age or older vs. those younger than 13 years,
relative risk = 1.88, 95% CI: 1.13-3.13) (82). No such association with age at menarche was
observed in several other studies, including one conducted in Serbia on subjects less than 20
years of age (83) and 3 in which the analysis was restricted to subjects less than 45 years of
age in New Caledonia (84), French Polynesia (85), and California (86). These differences
between age at menarche and DTC risk may be due to the age and ethnicity of subjects
(84,86).
The only risk factor for which association has been established is a high parity rate. The case-
control study performed among younger people in eastern France, showed that having high
number of pregnancies was significantly associated with high DTC risk (80). A meta-analysis
with 21 studies including 406,329 thyroid cancer cases suggested a strong association of
parity (≥ 3 pregnancies) with the risk of thyroid cancer (87). Early population-based case-
control study of thyroid cancer also demonstrated that among females, the radiogenic risk
appeared to be potentiated by the number of subsequent live-births (88). Three case-control
studies performed in the USA (89), in China (90) and in New Caledonia (84) respectively
revealed evidence of high risk in women who had been pregnant and who had a high number
13
of pregnancies. A possible explanation for the higher risk of DTC in women who have had a
high number of pregnancies, could be the proliferation of thyroid cells, as maternal thyroid
activity increases during pregnancy (91). Estrogens, which are elevated during pregnancy, are
associated with elevated serum thyroxin and triiodothyronine levels, which might induce high
cell turnover (92). The highest levels of serum TSH, even within the normal range, are
associated with a subsequent diagnosis of thyroid cancer in individuals with thyroid
abnormalities (93). Repeated pregnancies may increase the risk of DTC by revealing DNA
damage due to carcinogens, such as ionizing radiation, that may have remained silent without
pregnancies (94).
1.2.5 DIETARY IODINE INTAKE
It is established that in endemic goiter regions with iodine deficiency, incidences of goiter and
follicular thyroid cancer are higher than elsewhere (95). However, the impact of iodine
deficiency in the risk of papillary cancer, in most countries, has not achieved a consensus.
Some biologically experimental models revealed that under normal conditions, thyroid
follicular cells only slowly proliferate, but in iodine deficient animals, serum thyroid-
stimulating hormone (TSH) increases and the proliferation rate of thyroid cells increases by 5
to 30-fold, leading to marked thyroid hyperplasia and hypertrophy. Rapidly proliferating
thyroid cells are likely more vulnerable to mutagens such as radiation, chemical carcinogens
and oxidative stress, and may accumulate a higher number of genetic alterations (96). Several
authors have suggested that thyroid carcinomas caused by iodine deficiency are due to
chronic TSH overstimulation (97,98,99,100), because serum TSH is increased in moderate to
severe iodine deficiency in an effort to maintain euthyroidism (101) leading to the increasing
of follicular thyroid cancer (FTC) and anaplastic thyroid cancer (ATC) in populations with
severe endemic goiter. Excess iodide, by inhibiting thyroid hormone production (the Wolff-
Chaikoff effect), can transiently increase TSH. However, in animal studies, chronic iodine
excess does not increase serum TSH (96), and, in cell studies, moderate doses of iodide
inhibit thyroid cell proliferation (102). Moreover, some population-based studies have
reported, compared to the populations with mildly deficient iodine intake, populations with
adequate or excess iodine intakes had slightly higher mean serum TSH, but this may be due to
increased toxic adenomas in mild iodine deficiency (101). Thus, the mechanism by which
iodine excess promotes thyroid tumorigenesis is uncertain.
14
The population-based case-control studies which had been carried out in high iodine intake
areas (Hawaii and California), which means 2-3 fold higher than recommended intakes, didn’t
achieved the consensus about the association between dietary iodine intake and thyroid cancer
risk. The case-control study based on 191 cases and 442 controls in Hawaiian adults revealed
no association (103), however, another case-control study of 608 women with thyroid cancer
and 558 controls in northern California showed that a significant reduction in the papillary
thyroid cancer risk was seen in the highest iodine intake quintile (> 537 μg/day) compared
with the lowest (< 273 μg/day) (OR = 0.49, 95 % CI: 0.29-0.84). Iodine intake from food
alone was not associated with risk, but iodine intake from supplements was (63). While, the
other case-control studies done in Pacific Islands populations with mildly deficient intakes
didn’t have the same conclusion neither. The case-control study based on 293 cases and 354
controls in New Caledonia demonstrated no association (104), the study launched in French
Polynesia with 229 cases and 371 controls evidenced the significant reduction of DTC risk
with the increasing dietary iodine intake (105). The meta-analysis of publications of animal
and human studies about iodine intake and thyroid cancer risk done by Zimmermann et al.
(106) examined the four case-control studies described above, by adjusting OR for the highest
iodine intake quartile compared to the lowest quartile, and revealed the odds for thyroid
cancer risk are 23 % less in the highest quartile of iodine intake versus the lowest, although
this effect was only borderline significant (OR = 0.77; 95 % CI: 0.58-1.02; p = 0.068).
1.2.6 OTHER DIETARY FACTORS
Several epidemiological studies were interested in the relationship between foods rich in
iodine, such as fish, shellfish or meat (107,108,109,110), and some other dietary factors such
as cruciferous vegetables, and thyroid cancer risk. However, studies showing the association
between dietary factors and thyroid cancer risk have been inconsistent. A meta-analysis of 19
observational studies on dietary factors and thyroid cancer risk summarized the ORs for each
dietary factor classified by sex, histologic type, located in an iodine deficiency or iodine rich
region. Based on the highest level of total consumption versus the lowest level, results
showed by the alimental group were as following (111):
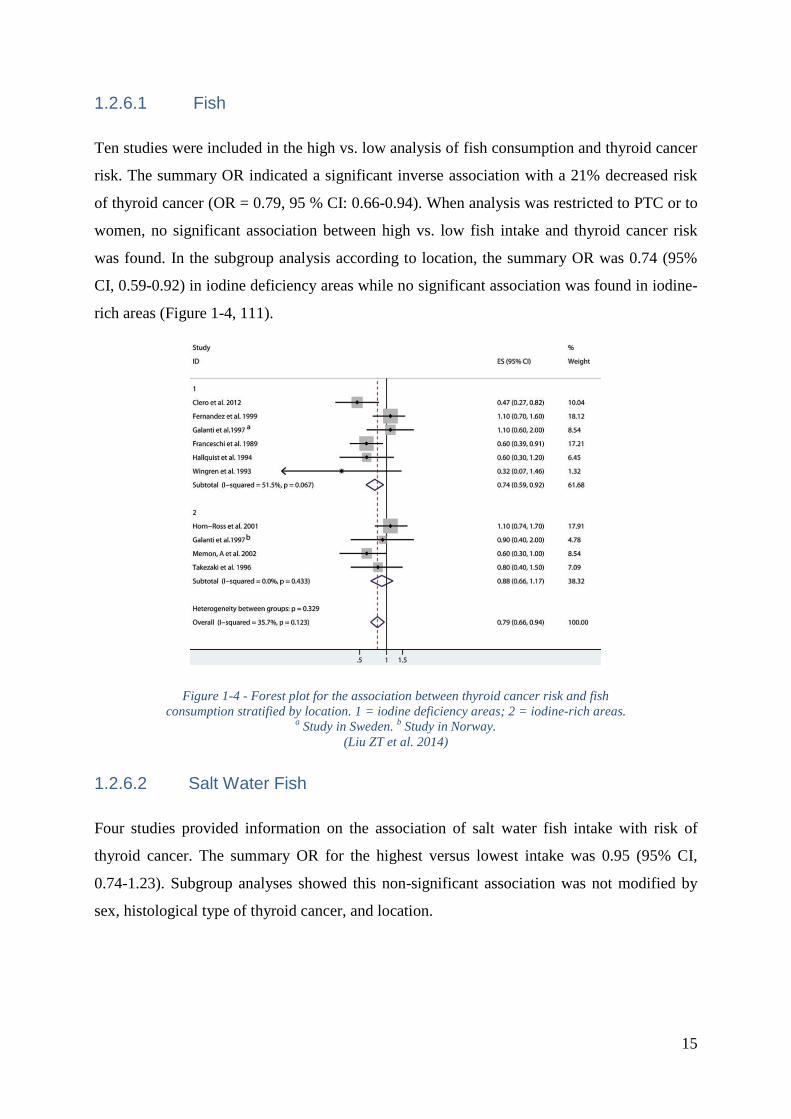
15
1.2.6.1 Fish
Ten studies were included in the high vs. low analysis of fish consumption and thyroid cancer
risk. The summary OR indicated a significant inverse association with a 21% decreased risk
of thyroid cancer (OR = 0.79, 95 % CI: 0.66-0.94). When analysis was restricted to PTC or to
women, no significant association between high vs. low fish intake and thyroid cancer risk
was found. In the subgroup analysis according to location, the summary OR was 0.74 (95%
CI, 0.59-0.92) in iodine deficiency areas while no significant association was found in iodine-
rich areas (Figure 1-4, 111).
Figure 1-4 - Forest plot for the association between thyroid cancer risk and fish
consumption stratified by location. 1 = iodine deficiency areas; 2 = iodine-rich areas. a Study in Sweden.
b Study in Norway.
(Liu ZT et al. 2014)
1.2.6.2 Salt Water Fish
Four studies provided information on the association of salt water fish intake with risk of
thyroid cancer. The summary OR for the highest versus lowest intake was 0.95 (95% CI,
0.74-1.23). Subgroup analyses showed this non-significant association was not modified by
sex, histological type of thyroid cancer, and location.
16
1.2.6.3 Fresh Water Fish
In 5 studies with information about fresh water fish intake, the summary estimate effect did
not show association of it with thyroid cancer (OR = 0.86, 95% CI, 0.63-1.16). When
adjusting this association by sex, histological type of thyroid cancer, and location (iodine
deficiency areas or iodine-rich areas). The estimates OR was varied a little by them, showing
that fresh water fish consumption had no effect on thyroid cancer risk.
1.2.6.4 Shellfish
A meta-analysis of 9 studies yielded a summary OR of 0.88 (95% CI, 0.72-1.08). When
analysis was restricted to PTC or to women, this non-significant association reminded
consistent. In the subgroup analysis according to location, a favorable effect was found in
iodine deficiency areas (OR = 0.46, 95% CI, 0.27-0.75), whereas the estimate OR in iodine-
rich areas was not statistically significant.
1.2.6.5 Vegetables
A total of 5 studies examined the association between vegetables intake and thyroid cancer
risk. The pooled OR was 0.76 (95% CI, 0.58-1.00). In subgroup analysis, there was no
significant association between vegetables consumption and thyroid cancer whatever adjusted
for sex, histologic type or location.
1.2.6.6 Cruciferous Vegetables
Eight studies provided information on the association between cruciferous vegetable
consumption and risk of thyroid cancer. The random effects summary OR was 0.93 (95% CI,
0.66-1.29). Subgroup analyses showed that sex, histological type, and location did not
markedly influence the observed null association.
1.2.6.7 Meat
A meta-analysis of 5 studies for thyroid cancer risk with meat consumption yielded a
summary OR of 0.96 (95% CI, 0.70-1.34). Subgroup analyses showed that histological type
and location did not markedly influence this observed non-significant association.
17
1.2.7 BODY SIZE
Various epidemiological studies documented an increased risk in thyroid cancer in persons
with tall height and large body size (measured as either body surface area or body mass index
(BMI; weight in kilograms divided by height in meters squared)) (114,115,116,117,118,119).
The mechanisms responsible for this association are still unknown, even if several
explanations have been proposed (chronic inflammation (120), higher TSH levels in obese
patients (121), cooperation between TSH and insulin-like growth factor 1 in activation of
MAP kinase and PI3K pathways (122)).
1.3 FOOD COMPOSITION TABLES AND IODINE CONTENT
IN FOOD
1.3.1 THE MAIN FOOD COMPOSITION TABLES
1.3.1.1 Food and Agriculture Organization of the United Nations (FAO)
Databases (123)
The FAO/ International Network of Food Data Systems (INFOODS) Global Food
Composition Databases provide nutrient values for pulses (a subgroup of legumes that
includes dry edible seeds with low fat content), for fish and shellfish, for food supplements.
The majority of data are analytical data complemented by data from other published sources
covering data for foods in raw, cooked and processed forms on proximates, minerals, vitamins,
phytate, amino acids and fatty acids fractions. The data compilation process followed
standards and guidelines outlined by FAO/INFOODS, and the species were selected based on
the importance of the food and the available data. Emphasize is put on nutrient variations
among different species, varieties and origin. The data are presented in Excel format
alongside with a comprehensive documentation in PDF format.
The FAO/INFOODS also provides the Density Database - a tool for researchers and
professionals to convert volume into weight and vice-versa; the Biodiversity Database; the
Analytical Food Composition Database - a global compendium of scrutinized analytical data
(without any additional estimations, imputation or calculation of missing values) for
commonly consumed foods; and The West African Food Composition Table contains 472
foods and 28 components and presents a compilation of existing compositional data from 9
18
countries (Benin, Burkina Faso, Gambia, Ghana, Guinea, Mali, Niger, Nigeria and Senegal)
which were supplemented with data from other countries.
However, these food composition databases haven’t included the data on iodine, selenium or
other trace elements in foods.
1.3.1.2 French Food Composition Table Centre d'Information sur la
Qualité des Aliments Ciqual (version 2013) (124)
Since 2012, Ciqual is part of the Observatory of Food Nutritional Quality (Ciqual-Oqali), unit
of ANSES (French Agency for Food, Environmental and Occupational Health & Safety).
The first mission of Ciqual is to collect, evaluate and make available French food composition
data.
The three main tasks consist in:
- Input and management of a reference database on food composition
- Contribution to risk assessment in nutrition, within the French agency for food,
environmental and occupational health safety
- Communication and dissemination of food composition data to administrations,
researchers, nutritionists, food companies and consumers
At present, the French food composition databank of ANSES is permanently enriched through
CIQUAL's yearly analytical programs, research programs in collaboration with external
partners, scientific literature, data from producers or suppliers, recipe calculation, or as a last
resort borrowed data from foreign food composition tables.
1.3.1.3 Traditional French Polynesian and Cuban Food Composition
Tables Made By the Collaboration with ANSES in 2013 (FPFCT 2013)
and in 2014 (CFCT 2014) Respectively
In order to better estimate dietary iodine, selenium and other trace elements of Asia-Pacific
Islands’ populations and Cuban population (Explanation in details see 4) and understand the
role of these dietary factors in the DTC risk, Cancer and Radiations team of Centre for
research in epidemiology and population health (CESP)/Unit 1018 of the French National
Institute of Health and Medical Research (Inserm) collaborated with the Laboratory for Food
Safety of ANSES. The colleagues from French Polynesia and Cuba and me, we organized the
19
collection of a large number of traditional French Polynesian and Cuban food samples;
including fruit, vegetables, seafood, and beverages in French Polynesia between 2011 and
2013 in seven areas: Tahiti and Maupiti (Society Islands), Hao and Rangiroa (Tuamotu
Archipelago), Mangareva (Gambier Islands or Mangareva Islands), Tubuai (Austral Islands)
and Hiva Oa (Marquesas Islands). Foods were selected so as to cover the typical diet of the
French Polynesian population. Each of the composite samples from the seven areas of
sampling was composed of up to five sub-samples from five different locations. We also
selected some fruit, vegetables, beverages, grains, dairy and canned products, tuberous plant
food samples in Havana and its suburb areas in 2013. These samples allowed ANSES to
develop a new measurement method to quantify iodine (I), selenium (Se), vanadium (V),
copper (Cu), zinc (Zn), arsenic (As), cadmium (Cd), tellurium (Te), mercury (Hg), lead (Pb),
uranium (U) in these food samples. For iodine, it is the first table adapted to these populations.
The composition of 124 traditional French Polynesian and 39 traditional Cuban food items
were measured by this collaboration.
It is noteworthy that the ANSES used an innovative technology for determining total iodine
(100). This technology is based on a European standard (125) that involves alkaline extraction
using tetra tetramethylammonium hydroxide (TMAH), optimized with an additional
enzymatic treatment for samples containing starch, and followed by inductively coupled
plasma mass spectrometry (ICP-MS) analysis. A complete single-laboratory validation was
performed according to the accuracy profile approach (126, 127) based on tolerance intervals
to select the best calibration function and to determine the validated concentration ranges.
This method was used to determine the iodine, selenium and other trace elements content in
the main foods consumed by French Polynesians and Cubans (Supplementary Figs. S1 and
S2).
1.3.2 THE VARIABILITY OF DIETARY IODINE DATA
Dietary iodine has high volatility and strong variability, for the same food item, dietary iodine
data depend on soil, agricultural techniques, meal preparation, and food composition tables
measured by different laboratories, for example, iodine content in cabbage was estimated to
be 0.0106 µg/g in France (CIQUAL 2013 table) (124), 0.0160 µg/g in French Polynesia
(FPFCT 2013), but 0.00427 µg/g in Cuba (CFCT 2014) (Figure 1-5), between 0.0026 and
0.0037 µg/g in Cameroon (128). Figure 1-5 shows us the variations of iodine content in
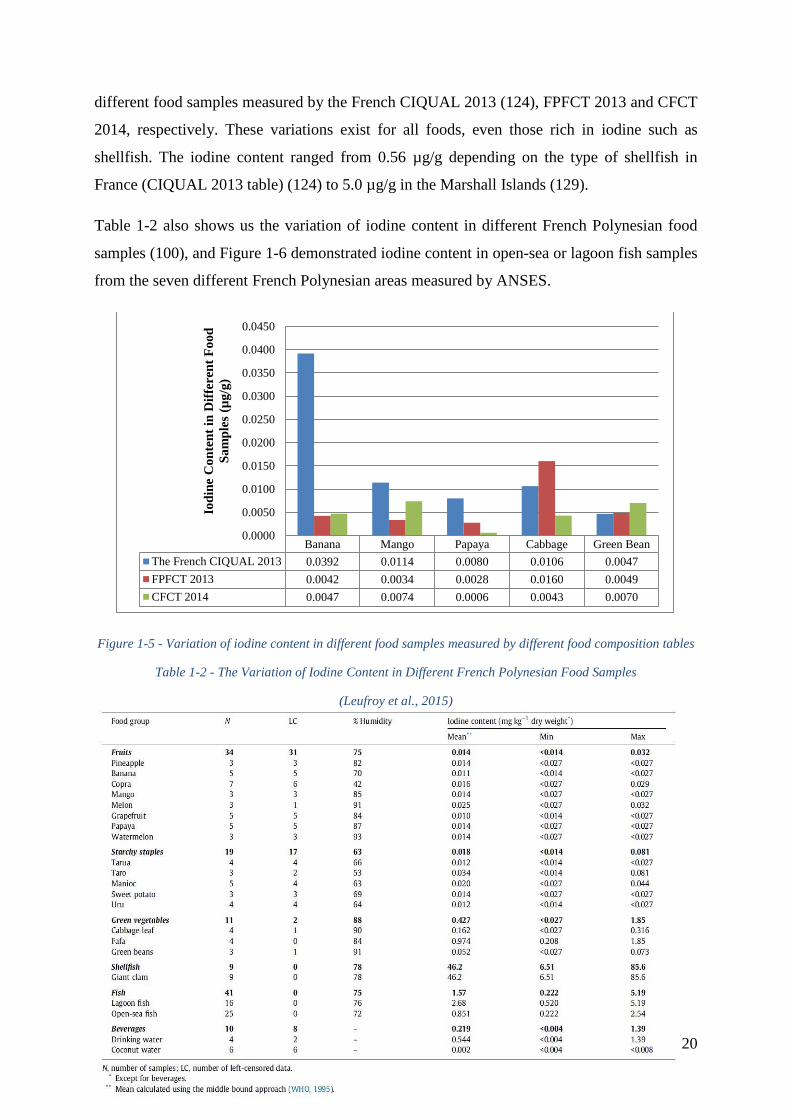
20
different food samples measured by the French CIQUAL 2013 (124), FPFCT 2013 and CFCT
2014, respectively. These variations exist for all foods, even those rich in iodine such as
shellfish. The iodine content ranged from 0.56 µg/g depending on the type of shellfish in
France (CIQUAL 2013 table) (124) to 5.0 µg/g in the Marshall Islands (129).
Table 1-2 also shows us the variation of iodine content in different French Polynesian food
samples (100), and Figure 1-6 demonstrated iodine content in open-sea or lagoon fish samples
from the seven different French Polynesian areas measured by ANSES.
Figure 1-5 - Variation of iodine content in different food samples measured by different food composition tables
Table 1-2 - The Variation of Iodine Content in Different French Polynesian Food Samples
(Leufroy et al., 2015)
Banana Mango Papaya Cabbage Green Bean
The French CIQUAL 2013 0.0392 0.0114 0.0080 0.0106 0.0047
FPFCT 2013 0.0042 0.0034 0.0028 0.0160 0.0049
CFCT 2014 0.0047 0.0074 0.0006 0.0043 0.0070
0.0000
0.0050
0.0100
0.0150
0.0200
0.0250
0.0300
0.0350
0.0400
0.0450
Iod
ine
Co
nte
nt
in D
iffe
ren
t F
oo
d
Sa
mp
les
(µg
/g)
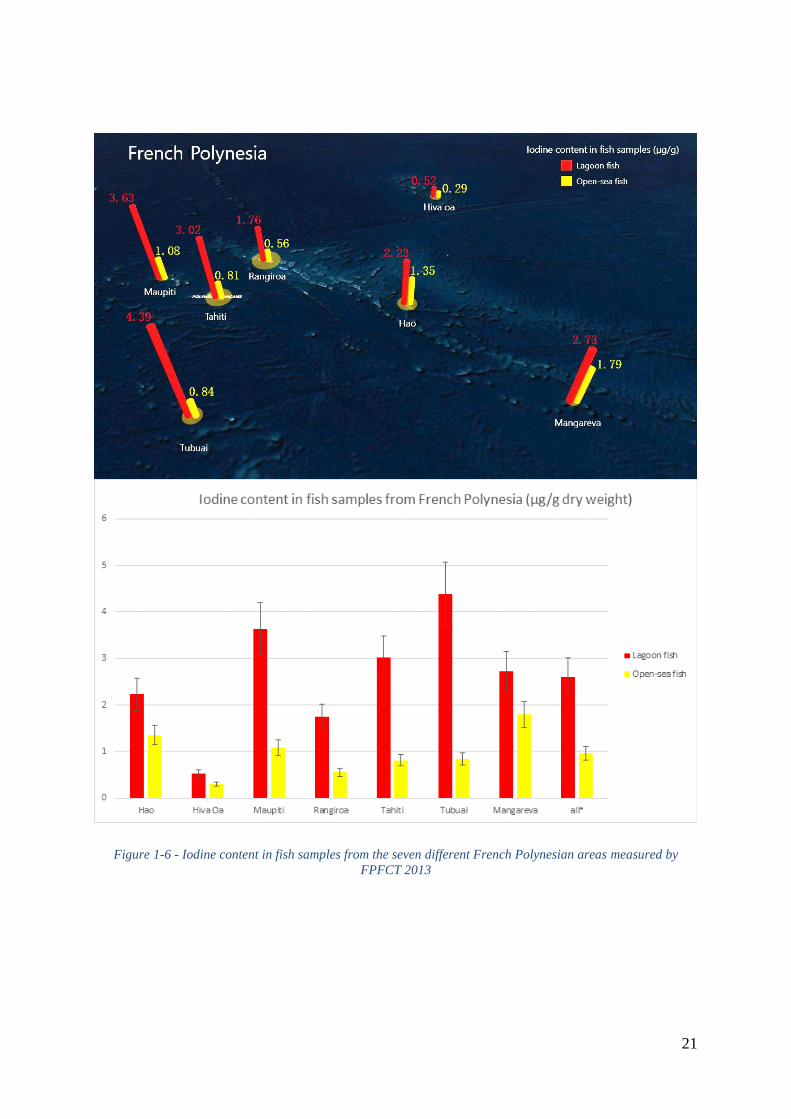
21
Figure 1-6 - Iodine content in fish samples from the seven different French Polynesian areas measured by
FPFCT 2013
22
1.3.3 RESULTS OF THE DIETARY IODINE MEASUREMENT IN THE
TRADITIONAL FRENCH POLYNESIAN AND CUBAN FOOD
SAMPLES
Table 1-3 shows us the results of dietary iodine and selenium intake from typical Cuban food
in the cases and in the controls of the Cuba study (see 2.3.5), based on the composition of 20
traditional Cuban food items in the dietary questionnaire of this study, and measured by the
French ANSES (CFCT 2014, see 1.3.1.3). Within these food items, the results confirmed that
iodine is rich in meats, cheese and egg (Figure 1-7).
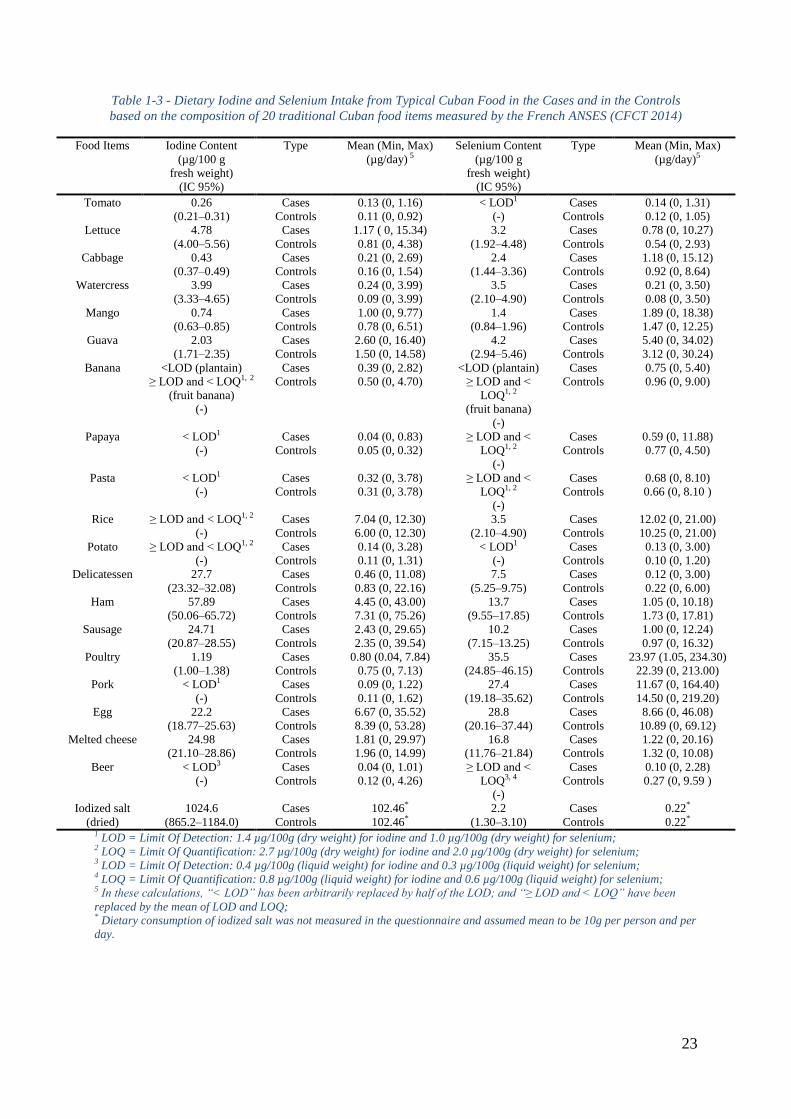
23
Table 1-3 - Dietary Iodine and Selenium Intake from Typical Cuban Food in the Cases and in the Controls
based on the composition of 20 traditional Cuban food items measured by the French ANSES (CFCT 2014)
Food Items Iodine Content
(µg/100 g
fresh weight)
(IC 95%)
Type Mean (Min, Max)
(µg/day) 5
Selenium Content
(µg/100 g
fresh weight)
(IC 95%)
Type Mean (Min, Max)
(µg/day)5
Tomato 0.26
(0.21Ŕ0.31)
Cases 0.13 (0, 1.16) < LOD1
(-)
Cases 0.14 (0, 1.31)
Controls 0.11 (0, 0.92) Controls 0.12 (0, 1.05)
Lettuce 4.78
(4.00Ŕ5.56)
Cases 1.17 ( 0, 15.34) 3.2
(1.92Ŕ4.48)
Cases 0.78 (0, 10.27)
Controls 0.81 (0, 4.38) Controls 0.54 (0, 2.93)
Cabbage 0.43
(0.37Ŕ0.49)
Cases 0.21 (0, 2.69) 2.4
(1.44Ŕ3.36)
Cases 1.18 (0, 15.12)
Controls 0.16 (0, 1.54) Controls 0.92 (0, 8.64)
Watercress 3.99
(3.33Ŕ4.65)
Cases 0.24 (0, 3.99) 3.5
(2.10Ŕ4.90)
Cases 0.21 (0, 3.50)
Controls 0.09 (0, 3.99) Controls 0.08 (0, 3.50)
Mango 0.74
(0.63Ŕ0.85)
Cases 1.00 (0, 9.77) 1.4
(0.84Ŕ1.96)
Cases 1.89 (0, 18.38)
Controls 0.78 (0, 6.51) Controls 1.47 (0, 12.25)
Guava 2.03
(1.71Ŕ2.35)
Cases 2.60 (0, 16.40) 4.2
(2.94Ŕ5.46)
Cases 5.40 (0, 34.02)
Controls 1.50 (0, 14.58) Controls 3.12 (0, 30.24)
Banana <LOD (plantain)
≥ LOD and < LOQ1, 2
(fruit banana)
(-)
Cases 0.39 (0, 2.82) <LOD (plantain)
≥ LOD and <
LOQ1, 2
(fruit banana)
(-)
Cases 0.75 (0, 5.40)
Controls 0.50 (0, 4.70) Controls 0.96 (0, 9.00)
Papaya < LOD1
(-)
Cases 0.04 (0, 0.83) ≥ LOD and <
LOQ1, 2
(-)
Cases 0.59 (0, 11.88)
Controls 0.05 (0, 0.32) Controls 0.77 (0, 4.50)
Pasta < LOD1
(-)
Cases 0.32 (0, 3.78) ≥ LOD and <
LOQ1, 2
(-)
Cases 0.68 (0, 8.10)
Controls 0.31 (0, 3.78) Controls 0.66 (0, 8.10 )
Rice ≥ LOD and < LOQ1, 2
(-)
Cases 7.04 (0, 12.30) 3.5
(2.10Ŕ4.90)
Cases 12.02 (0, 21.00)
Controls 6.00 (0, 12.30) Controls 10.25 (0, 21.00)
Potato ≥ LOD and < LOQ1, 2
(-)
Cases 0.14 (0, 3.28) < LOD1
(-)
Cases 0.13 (0, 3.00)
Controls 0.11 (0, 1.31) Controls 0.10 (0, 1.20)
Delicatessen 27.7
(23.32Ŕ32.08)
Cases 0.46 (0, 11.08) 7.5
(5.25Ŕ9.75)
Cases 0.12 (0, 3.00)
Controls 0.83 (0, 22.16) Controls 0.22 (0, 6.00)
Ham 57.89
(50.06Ŕ65.72)
Cases 4.45 (0, 43.00) 13.7
(9.55Ŕ17.85)
Cases 1.05 (0, 10.18)
Controls 7.31 (0, 75.26) Controls 1.73 (0, 17.81)
Sausage 24.71
(20.87Ŕ28.55)
Cases 2.43 (0, 29.65) 10.2
(7.15Ŕ13.25)
Cases 1.00 (0, 12.24)
Controls 2.35 (0, 39.54) Controls 0.97 (0, 16.32)
Poultry 1.19
(1.00Ŕ1.38)
Cases 0.80 (0.04, 7.84) 35.5
(24.85Ŕ46.15)
Cases 23.97 (1.05, 234.30)
Controls 0.75 (0, 7.13) Controls 22.39 (0, 213.00)
Pork < LOD1
(-)
Cases 0.09 (0, 1.22) 27.4
(19.18Ŕ35.62)
Cases 11.67 (0, 164.40)
Controls 0.11 (0, 1.62) Controls 14.50 (0, 219.20)
Egg 22.2
(18.77Ŕ25.63)
Cases 6.67 (0, 35.52) 28.8
(20.16Ŕ37.44)
Cases 8.66 (0, 46.08)
Controls 8.39 (0, 53.28) Controls 10.89 (0, 69.12)
Melted cheese 24.98
(21.10Ŕ28.86)
Cases 1.81 (0, 29.97) 16.8
(11.76Ŕ21.84)
Cases 1.22 (0, 20.16)
Controls 1.96 (0, 14.99) Controls 1.32 (0, 10.08)
Beer < LOD3
(-)
Cases 0.04 (0, 1.01) ≥ LOD and <
LOQ3, 4
(-)
Cases 0.10 (0, 2.28)
Controls 0.12 (0, 4.26) Controls 0.27 (0, 9.59 )
Iodized salt
(dried)
1024.6
(865.2Ŕ1184.0)
Cases 102.46* 2.2
(1.30Ŕ3.10)
Cases 0.22*
Controls 102.46* Controls 0.22* 1 LOD = Limit Of Detection: 1.4 µg/100g (dry weight) for iodine and 1.0 µg/100g (dry weight) for selenium; 2 LOQ = Limit Of Quantification: 2.7 µg/100g (dry weight) for iodine and 2.0 µg/100g (dry weight) for selenium; 3 LOD = Limit Of Detection: 0.4 µg/100g (liquid weight) for iodine and 0.3 µg/100g (liquid weight) for selenium; 4 LOQ = Limit Of Quantification: 0.8 µg/100g (liquid weight) for iodine and 0.6 µg/100g (liquid weight) for selenium; 5 In these calculations, “< LOD” has been arbitrarily replaced by half of the LOD; and “≥ LOD and < LOQ” have been
replaced by the mean of LOD and LOQ; * Dietary consumption of iodized salt was not measured in the questionnaire and assumed mean to be 10g per person and per
day.
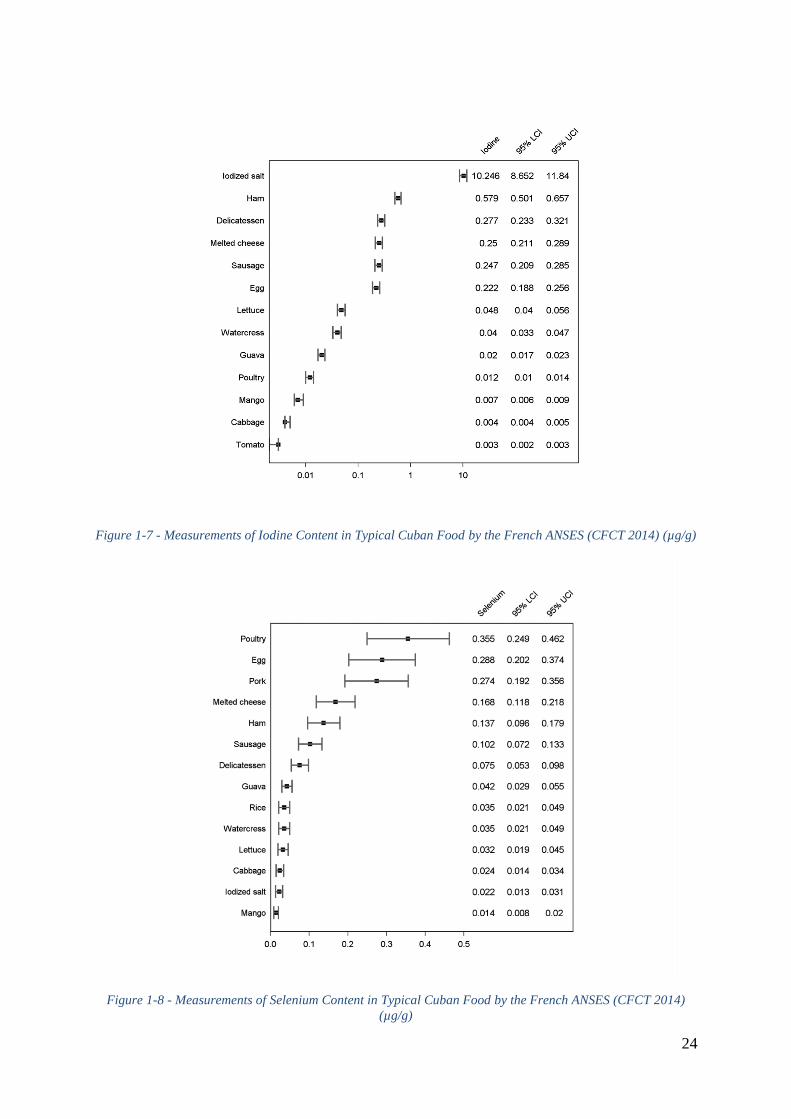
24
Figure 1-7 - Measurements of Iodine Content in Typical Cuban Food by the French ANSES (CFCT 2014) (µg/g)
Figure 1-8 - Measurements of Selenium Content in Typical Cuban Food by the French ANSES (CFCT 2014)
(µg/g)
25
1.4 OBJECTIVES OF THE THESIS
The overall objectives of this thesis is to explore the relation between dietary iodine intake
and differentiated thyroid cancer risk in a multiethnic set of case-control studies, to identify
environmental and genetic risk factors which interact with this relation, and to investigate the
possibility to use selenium present in nails as a potential biomarkers in thyroid cancer case-
control studies.
The specific objectives are:
- To explore the role of specific food groups or items, especially in regard to iodine
intake, in the risk of developing DTC, in case-control study performed in Cuba. It was
hypothesized, fish consumption may reduce DTC risk.
- To establish or reestablish dietary iodine, selenium, energy intake for the participants
in Epi-Thyr consortium of 5 cases-control studies performed in New Caledonia,
French Polynesia, metropolitan France (2 studies), and Cuba, according to different
food composition tables.
- To investigate the relationship between dietary iodine status and the risk of DTC in the
pooled analysis of Epi-Thyr consortium of the 5 cases-control-studies.
- To assess the possibility of interaction between iodine status and number of
pregnancies in DTC risk, in the 5 Epi-Thyr case-control studies. It was hypothesized,
iodine deficiency may interact with high number of pregnancies that leads to a high
DTC risk.
- To study, in the 5 Epi-Thyr case-control studies, the possible interaction between
dietary iodine intake and 4 common variants of the SNPs previously identified in most
of GWAS as associated with DTC risk. Two of these variants are on FOXE1, which is
a thyroid hormones transcription factor.
- To investigate in a study performed in French Polynesia the possibility to use
selenium present in nails as a potential biomarker in thyroid cancer case-control
studies.
26
2 PART II: EPI-THYR CONSORTIUM
27
2.1 OBJECTIVE AND HISTORY
In order to identify the genetic and environmental risk factors of thyroid cancer and their
interactions, Cancer and Radiations group and Cancer and Environment group, Center for
research in Epidemiology and Population Health (CESP) - Unit 1018, the French National
Institute of Health and Medical Research (Inserm) established a set of 5 large case-control
studies which have been carried out in French Polynesia, New Caledonia, metropolitan France
(2 studies) and Cuba, conducted homogeneously in contrasting populations, both genetically
and in terms of the environment and life style, using similar questionnaire and DNA
collection, to date, about 2212 cases and 2581 controls were interviewed face-to-face by
trained professionals (nursing and medical staff), using the standardized dietary questionnaire
and the photo booklet from Epic cohort. Buccal cell taken by cytobrush or saliva taken by
DNA Genotek Oragene collection brush/kit (Ottawa, Canada) given to each study participant
for their DNA collection. Since 2013, Cancer and Radiations group and Cancer and
Environment group have established a consortium and synchronized the data of these 5 Case-
Control studies together called Epi-Thyr consortium (Detailed characters of these 5 studies
see Table 2-1). To the best of our knowledge, this consortium is the largest case-control
consortium about thyroid cancer going across different population and ethnicity samples all
over the world, and this consortium still expands.
2.2 MATCHING PROCESS
Confounding implies that the confounding factor (which is one of the exposures) is not evenly
distributed between cases and controls. Therefore in order to prevent confounding the
simplest solution would be to design a study in which cases and controls would have an equal
distribution of the confounding factor. This process is called matching. Matching is most
often applied into case-control studies.
We usually identify two types of matching process, individual matching and frequency
matching. Both individual and frequency matching have the same consequence: matching will
have to be taken into account during the analysis (130).
28
2.2.1 INDIVIDUAL MATCHING
In this first method, matching is performed subject by subject. This is called individual
matching. For example, if age is a confounding factor, for each case age 30 years, one control
of the same age will be selected, and so far and so on for all cases included in the study. The
results are pairs of individuals belonging to the same study population and sharing one
common characteristic (in this example, a specific age).
In individual matching, we may also consider to select more than one control per case. Then
two or more controls have then the same characteristic of the case. We have then constituted
triplets (one case and 2 controls), quadruplets (one case and 3 controls), etc (130).
2.2.2 FREQUENCY MATCHING
In a second type of matching process, matching is no longer done individually but for groups
of subjects. In such instance a group of controls is matched to a group of cases with respect to
a particular characteristic (the confounding factor). For example if in a case-control study
with 50 cases there are 20 men and 30 women, we would select a control group having the
same gender distribution. We would first select 20 men from the male study population and
then 30 women from the female study population (130).
2.2.3 WHY MATCHING?
Matching controls to cases is nothing more than stratifying in advance of analysis. Instead of
constituting strata at the time of the study analysis we prepare them before the study is done,
at the time of controls selection. When we select one control per case, each stratum will
include one case and one control, when we select two controls per case, each stratum will
include one case and two controls, and so on. We will therefore have as many strata as pairs
in the study. The objective of matching is to prepare the analysis. Matching optimizes the
number of cases and controls per stratum. It avoids having no case or no control in a stratum,
as could happen when doing a stratified analysis afterwards (The biggest inefficiency in a
stratified analysis done afterward would occur when in a stratum there is either no case or no
control). This is why matching is frequently mentioned as a way to improve the efficiency of
an analysis by better distributing cases and controls between strata (130).
29
2.3 CARACTERISTICS OF THE 5 CASE-CONTROL
STUDIES
2.3.1 THE NEW CALEDONIA STUDY
New Caledonia had a very high thyroid cancer incidence during the last decade, but the risk
factors in this particular area were still little known, to investigate the remarkably high
incidence of thyroid cancer and to clarify the role of certain risk factors for thyroid cancer in
general, a countrywide population-based case-control study was conducted in general
population of New Caledonia in 1998.
Previously, this study reported that, thyroid cancer was associated with goiter, age at
menarche, irregular menstruation, hysterectomy and miscarriage as an outcome of the first
pregnancy. There was a dose-response trend with number of full-term pregnancies (84). The
sharp increase of thyroid cancer incidence in 1985-1999 in New Caledonia was partly related
to enhanced detection of small size carcinomas (131). Thyroid cancer was negatively
associated with tobacco smoking and alcohol drinking. Strong positive associations with
weight and body mass index were observed in Melanesian women aged 50 years or more
(132). Later, in order to show the dominant role of body surface area (BSA) in DTC risk, this
study had been pooled with another case-control study carried out in French Polynesia, a high
proportion of cases (73%) were overweight or obese before diagnosis of thyroid cancer was
found in this pooled Analysis. An increased risk of thyroid cancer was observed with greater
height, weight, BMI, BF%, and BSA. The association of thyroid cancer risk with height,
weight, BMI, and BF% did not remain when adjustment was made for BSA (114). Brackish
water fish consumption was inversely related to DTC risk in Melanesian women; but high
consumption of cruciferous vegetables was associated with thyroid cancer risk among women
with low iodine intake (104). Thyroid cancer was associated with a history of thyroid cancer
in first-degree relatives and with a family history of multinodular goiter; however, thyroid
cancer was not associated with a family history of thyroid diseases in Melanesians from the
Loyalty Islands, the area with the highest incidence rates for thyroid cancer, possibly
indicating a high frequency of genetic susceptibility variants and lack of genetic variation in
this population subgroup (133). In the recent publication about fine-mapping of two DTC
susceptibility loci at 9q22.33 and 14q13.3 in Europeans from metropolitan France and
Melanesians from New Caledonia, the people auto-declaring as having European ancestry
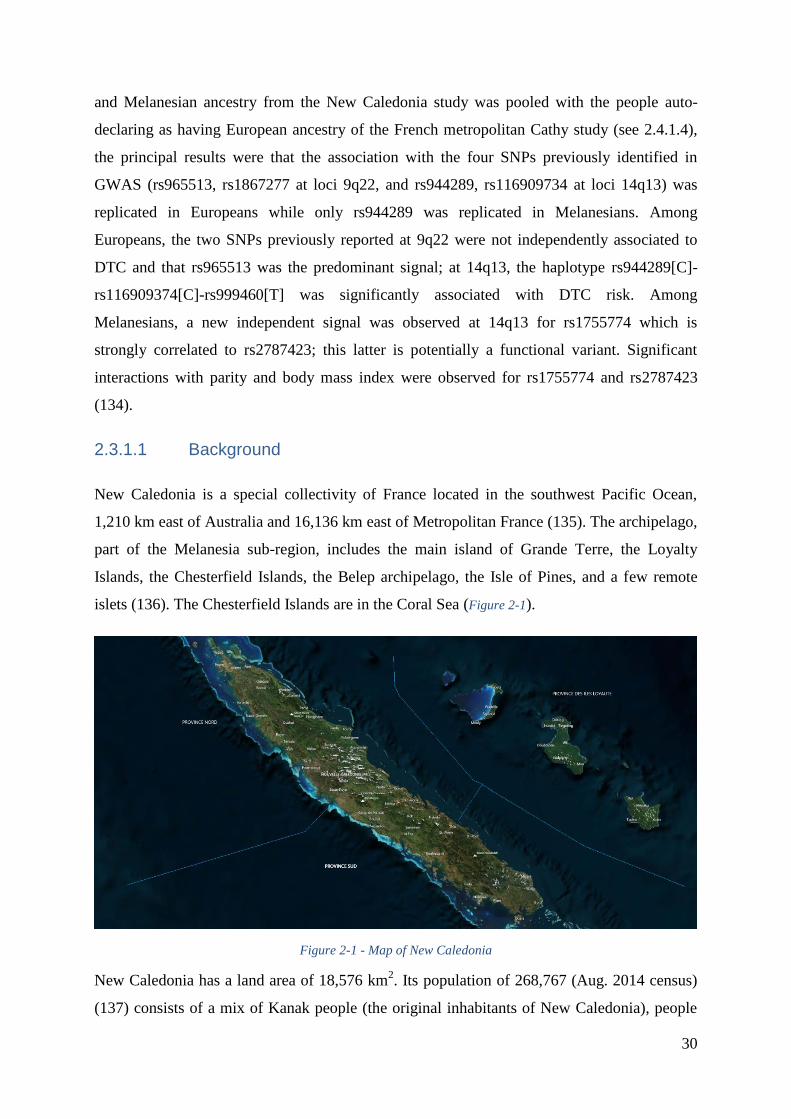
30
and Melanesian ancestry from the New Caledonia study was pooled with the people auto-
declaring as having European ancestry of the French metropolitan Cathy study (see 2.4.1.4),
the principal results were that the association with the four SNPs previously identified in
GWAS (rs965513, rs1867277 at loci 9q22, and rs944289, rs116909734 at loci 14q13) was
replicated in Europeans while only rs944289 was replicated in Melanesians. Among
Europeans, the two SNPs previously reported at 9q22 were not independently associated to
DTC and that rs965513 was the predominant signal; at 14q13, the haplotype rs944289[C]-
rs116909374[C]-rs999460[T] was significantly associated with DTC risk. Among
Melanesians, a new independent signal was observed at 14q13 for rs1755774 which is
strongly correlated to rs2787423; this latter is potentially a functional variant. Significant
interactions with parity and body mass index were observed for rs1755774 and rs2787423
(134).
2.3.1.1 Background
New Caledonia is a special collectivity of France located in the southwest Pacific Ocean,
1,210 km east of Australia and 16,136 km east of Metropolitan France (135). The archipelago,
part of the Melanesia sub-region, includes the main island of Grande Terre, the Loyalty
Islands, the Chesterfield Islands, the Belep archipelago, the Isle of Pines, and a few remote
islets (136). The Chesterfield Islands are in the Coral Sea (Figure 2-1).
Figure 2-1 - Map of New Caledonia
New Caledonia has a land area of 18,576 km2. Its population of 268,767 (Aug. 2014 census)
(137) consists of a mix of Kanak people (the original inhabitants of New Caledonia), people
31
of European descent (Caldoches and Metropolitan French), Polynesian people (mostly
Wallisians), and Southeast Asian people, as well as a few people of Pied-Noir and Maghreban
descent. The capital of the territory is Nouméa (135).
2.3.1.2 Case Selection
All patients with papillary or follicular thyroid cancer diagnosed between January 1, 1993,
and December 31, 1999, and having resided in New Caledonia for at least 5 years at the time
of cancer diagnosis were eligible for the study (84).
The cases were identified from the pathology records kept by the two histopathology
laboratories, one public and one private, operating in New Caledonia. All pathology reports
including a diagnosis of thyroid cancer were retrieved by manual or electronic searches. The
cancer diagnoses were made by the local pathologists. Most of the histologic slides were also
reviewed by the Pathology Department of the Royal Prince Alfred Hospital in Sydney,
Australia. The case list was cross-checked with the New Caledonia cancer registry, which
collects information on cancer diagnoses from medical facilities throughout the country.
However, no additional case of thyroid cancer was detected. All of the pathology reports were
retrieved in order to code the histology, number, and size of the cancerous nodules. Mixed
papillary-follicular cases were included in the papillary group (138). If insufficient
information had been included in the initial report (e.g., unspecified tumor size), the
histologic slide was reviewed to obtain the missing information. The thyroid cancer cases
were classified according to histology and size of the largest cancerous nodule (84).
All cases diagnosed during the 5-year period before the start of data collection in 1998 and all
cases newly diagnosed up to the end of the study period in 1999 were recruited for the study.
Good prognosis of differentiated thyroid tumors, residential stability, and enabled subject
enrollment were achieved several years after the initial diagnosis (84).
Among the 369 eligible differentiated thyroid cancer cases, 37 (10%) were not interviewed
because they refused to participate (n=10), had died (n=21), could not be contacted (n=5), or
was too sick to reply the questionnaire (n=1). The study participants thus consisted of 332
cases.
32
2.3.1.3 Control Selection
Controls were randomly selected from updated electoral rolls that included the name, address,
and date of birth of all New Caledonia residents aged 18 years or older. The controls were
frequency matched to the cases by sex and 5-year age group in order to control the
distribution of these two variables in controls was the same as it in cases. The distribution by
sex and 5-year age group of the cases diagnosed during the period 1990-1995 was used as a
first approximation from the cancer registry data. This distribution was used to constitute a
pool of randomly selected controls from the electoral rolls after stratification on sex and age
group. From the pool of controls thus constituted, three lists of controls were created at the
beginning, in the middle and at the end of the data collection period, by random selection.
Controls were allocated a year of reference equal to the year of diagnosis of the case group for
which they were selected. Only those events or exposures that occurred before the reference
date were considered in the analyses. Controls were excluded if they had not lived in New
Caledonia for at least 5 years before the reference date or if they had had thyroid cancer
before that date. For practical reasons, prior to study initiation, the decision was made to
restrict the total number of controls to 500 (84).
Among the 473 eligible controls, 61 (13%) were not interviewed because they refused to
participate (n=21), had died (n=13), could not be contacted (n=24), were too sick to reply the
questionnaire (n=2), or did not respond with for another reason (n=1). The remaining 412
controls were included in the study.
2.3.1.4 Data Collection
Trained interviewers conducted a face-to-face interview with the cases and controls at their
home, using a structured questionnaire, after having obtained informed consent. The
interviewers elicited information on socio-demographic characteristics, diet, alcohol drinking,
tobacco smoking, anthropometric factors, gynecologic and reproductive history, medical
conditions and medical x-ray exposure, occupational and residential history, personal history
of thyroid disease and familial history of thyroid cancer (84).
2.3.1.5 Dietary Questionnaire
The dietary questionnaire included two parts on the consumption (frequency and quantity) of
11 sub-groups and 5 questions on dietary habit before or at the time of the interview. Overall,
33
the questionnaire provided estimation for daily consumption of 122 food items, 17 of which
were fish or shellfish including fresh open-sea fish, fresh water fish, brackish water fish,
shellfish, oysters, mussels, octopus, lobster, shrimp, coconut crab, mangrove crab, smoked,
dried or salted fish, canned sardines, canned tuna, and canned pilchards.
In the dietary questionnaire, for each food item, the study participants were asked to indicate
the frequency of consumption (never or almost never, number of times per day, per week or
per month) and the quantity of consumption (in portion or in a standard unit). The
consumption of foods indicated by a portion (mainly marked A, B or C) was estimated with
the help of the photo booklet from the E3N cohort validated by the EPIC (European
Prospective Investigation into Cancer) study (139, 140, Figure 2-2 shows one page of this
photo booklet), which indicating the weight corresponding to each portion according to the
different food sub-groups, in order to facilitate the estimation of portion sizes. Information on
the seasonality and weight of local fruits and vegetables was reviewed with a nutritionist from
New Caledonia. Then, the daily consumption (in g/day) per person was calculated for each
food item on multiplying the frequency by the quantity of the portion. Season factor was
taken into account for certain seasonal foods as well, in converting the food daily
consumption for the whole year into the food consumption only when it is in season (the food
daily consumption for the whole year × the proportion of the numbers of available
consumption days in 365 days).
We used the FPFCT 2013 (presented above, see 1.3.1.3) to convert the traditional New
Caledonian foods into daily dietary iodine intake because these local foods are closed to those
of French Polynesian. For the other general food in the study, the French CIQUAL 2013 food
composition table (124) was a necessary complement. For each food item in the diet
questionnaire, iodine intake was estimated by multiplying the daily consumption of each food
by the iodine content in this food based on these composition tables (if iodine content were
measured from several similar foods in these food composition tables, the mean of the iodine
content in these similar foods was taken), sub-group iodine content by summing the iodine
content in each food item in this sub-group. Later, we recreated 21 sub food groups and
selected 66 common food items of the 5 case-control studies from Epi-Thyr consortium for
the standardization of the next pooled analysis (details see in the supplemental Table1).
We used the FAO Databases (presented above, see 1.3.1.1) to convert the daily food
consumption into daily dietary energy intake (kcal/day). For each study participant, we
34
calculated the total energy intake corresponding to the energy sum of all foods consumed per
day.
Figure 2-2 - Photo booklet to help fill out the dietary questionnaire. Example of standard portions of raw
vegetables and standard beverages volumes
2.3.2 THE FRENCH POLYNESIA STUDY
As I demonstrated above, thyroid cancer incidence was high in French Polynesia, in particular
among natives of this set of archipelago (141). However, up to date, there isn’t enough data or
qualified information to reveal whether this area is iodine deficiency. To investigate the
reasons for this level of incidence and the potential role of atmospheric fallout from nuclear
tests performed by France between 1966 and 1974, Cancer and Radiations group conducted
between 2002 and 2005 a population-based case-control study among natives of French
Polynesia in Tahiti Islands, Windward Islands, Leeward Islands, Marquesas Islands, Australes
Islands, Tuamotu-Gambier Archipelago, including most of the thyroid cancer patients
diagnosed between 1985 and 2003, who were aged 55 years or less and still alive. The study
was approved by the French Polynesian Ethics Committee. Written informed consent was
obtained from all participants so that we could contact their physician.
Previously, this study reported that a low level of education (85), tallness and a high body
mass index (142), a family history of thyroid cancer (34), and, in women, a large number of
pregnancies (85) were associated with an increased risk of thyroid cancer in this population. It
also estimated the radiation doses received by the study subjects during the atmospheric
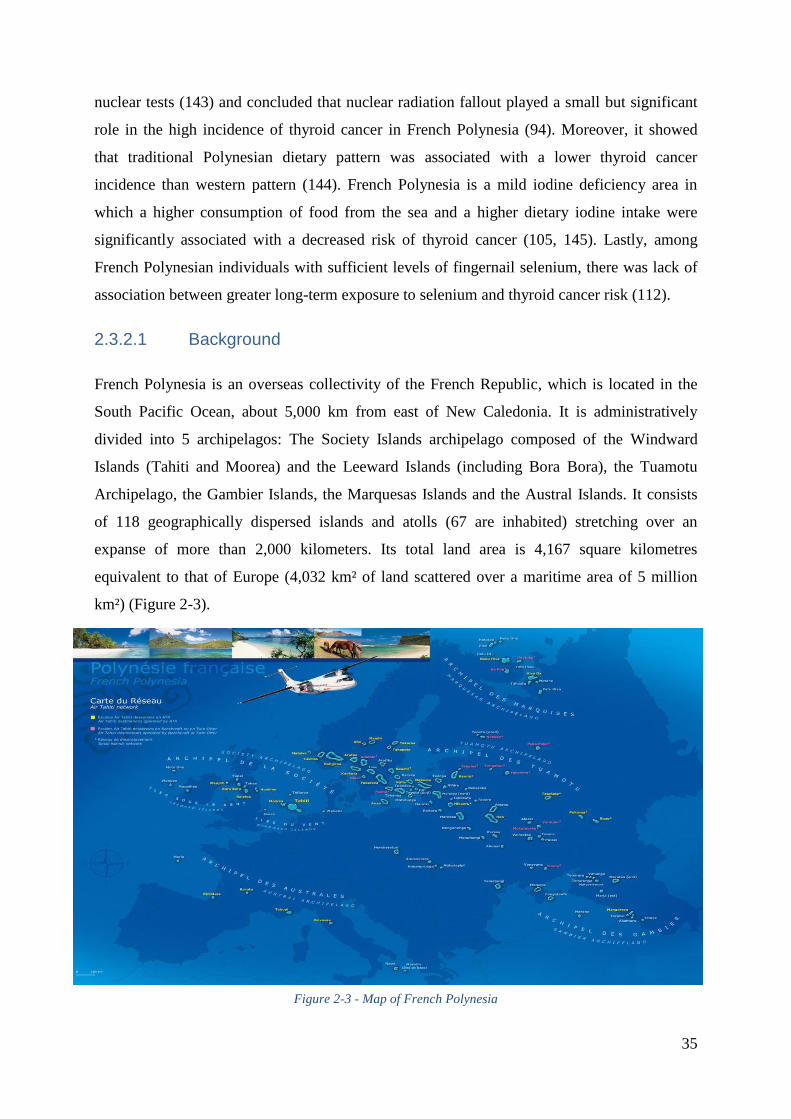
35
nuclear tests (143) and concluded that nuclear radiation fallout played a small but significant
role in the high incidence of thyroid cancer in French Polynesia (94). Moreover, it showed
that traditional Polynesian dietary pattern was associated with a lower thyroid cancer
incidence than western pattern (144). French Polynesia is a mild iodine deficiency area in
which a higher consumption of food from the sea and a higher dietary iodine intake were
significantly associated with a decreased risk of thyroid cancer (105, 145). Lastly, among
French Polynesian individuals with sufficient levels of fingernail selenium, there was lack of
association between greater long-term exposure to selenium and thyroid cancer risk (112).
2.3.2.1 Background
French Polynesia is an overseas collectivity of the French Republic, which is located in the
South Pacific Ocean, about 5,000 km from east of New Caledonia. It is administratively
divided into 5 archipelagos: The Society Islands archipelago composed of the Windward
Islands (Tahiti and Moorea) and the Leeward Islands (including Bora Bora), the Tuamotu
Archipelago, the Gambier Islands, the Marquesas Islands and the Austral Islands. It consists
of 118 geographically dispersed islands and atolls (67 are inhabited) stretching over an
expanse of more than 2,000 kilometers. Its total land area is 4,167 square kilometres
equivalent to that of Europe (4,032 km² of land scattered over a maritime area of 5 million
km²) (Figure 2-3).
Figure 2-3 - Map of French Polynesia
36
The Polynesian islands are volcanic origin: the activity of hot spots situated under the oceanic
plate gave birth to submarine volcanoes which grew up progressively and emerged to form
tall islands that next evolved into Motus (islets) then into atolls (coral rings surrounding a
lagoon).
Total population at the August 2012 census was 268,270 inhabitants (146). At the 2012
census, 68.5% of the population of French Polynesia lived on the island of Tahiti (146), which
is located within the Society Islands, is the largest and most populous island and the seat of
the capital of the collectivity, the urban area of Papeete, the capital city, has 133,627
inhabitants (2012 census). In 2016, the population was estimated at more than 285,000, with a
steady population growth rate of 1.1% (147, 148). In 2015, the ethnic makeup of the
population was estimated to be 78% native Polynesian, 12% Chinese, 6% French Polynesian
(referred to in the source as "local French") and 4% French (referred to in the source as
"metropolitan French").
2.3.2.2 Case Selection
All patients diagnosed with a differentiated thyroid cancer before the age of 56, born and
living in French Polynesia, were eligible for the study. This cutoff age was chosen in order to
include mainly subjects who were younger than 15 at the time of the atmospheric nuclear tests
(between 1966 and 1974). Four patients aged from 56 to 62 years at the time of the diagnosis,
one case diagnosed in 1979, and two cases diagnosed in 2004 were included erroneously and
were kept in the analysis because their characteristics were close to the inclusion criteria and
results were unchanged when these cases and their controls were excluded. The cases were
identified from the cancer registry of French Polynesia and medical insurance files and by the
four endocrinologists in Tahiti. Histological information was obtained from the two
histopathology laboratories (one public and one private) in Tahiti and from the medical files
of endocrinologists. The histological slides of 68 patients who had received I131
treatment at
the Institute of Gustave Roussy were reviewed in the institute’s pathology department, and the
diagnoses were in agreement with those established in French Polynesia for 64 patients (94%).
Of the 255 eligible differentiated thyroid cancer cases, 26 (10%) individuals were not
interviewed because they had died (n=14), could not be located (n=6), refused to participate
(n=5), or the person was too ill to be interviewed (n=1). Finally, the study population
consisted of 229 cases (105).
37
2.3.2.3 Control Selection
For each eligible case, two potential controls closest in terms of the date of birth and matched
on sex were randomly selected from the registry of births, which records all inhabitants born
in French Polynesia. An SAS random number generator (SAS Institute, Inc., Cary, NC) was
used for random selection. At the end of the interviews, a few cases had no interviewed
controls. Each of those cases was matched with a control initially selected for another case of
the same sex and with the same date of birth. Matching on the date of birth was then extended
if necessary. Finally, of the 229 interviewed cases, 87 were matched with one control (38%)
and 142 with two controls (62%). Of the 458 randomly selected controls, 85 (19%) were not
interviewed because the subjects had died (n=9), could not be located (n=29), refused to
participate (n=29), were too ill to be interviewed (n=2), or had left French Polynesia (n=16).
Among interviewed controls, we had no information on dietary consumption for two controls:
overall, 371 controls were considered in the present analysis (105).
2.3.2.4 Data Collection
The addresses of cases and controls were obtained from the territorial medical insurance plan,
which covers all inhabitants, whatever their professional status. Interviews were conducted
face-to-face by trained Polynesian interviewers and medical staff using a structured
questionnaire. Cases diagnosed between 1979 and 2004 and matched controls answered the
questionnaire between 2002 and 2004. Data collection included their ethnicity, education,
smoking habits, lifetime weight changes, personal and family history of thyroid disease and
cancer, places of residence, gynecologic and reproductive factors, medical X-ray exposure,
and diet. For each subject, the total thyroid dose was calculated by summing the thyroid doses
reconstructed for each nuclear test, taking into account age, source of drinking water, and data
collected in the diet questionnaire (143).
2.3.2.5 Dietary Questionnaire
The dietary questionnaire was composed of two parts with a booklet of photographs from the
E3N cohort validated by the EPIC study, in order to facilitate the estimation of portion sizes.
The two parts included questions on the consumption (frequency and quantity) of seven food
groups and one question on dietary habit: the first part concerned consumption at the time of
the interview and the second part concerned consumption during childhood. Overall, the
questionnaire provided estimation for daily consumption of 66 food items, 5 of which were
38
food from the sea including pelagic fish, lagoon fish, fafaru, and shellfish (giant clams, other
shellfish) (105).
In the dietary questionnaire, for each food item, the study participants were asked to indicate
the frequency of consumption (never or almost never, number of times per day, per week or
per month) and the quantity of consumption (in portion or in a standard unit). The
consumption of foods indicated by a portion (mainly marked A, B or C) was estimated with
the help of the photo booklet from the E3N cohort validated by the EPIC study (139), which
indicating the weight corresponding to each portion according to the different food sub-
groups, in order to facilitate the estimation of portion sizes. Food consumption in a standard
unit (for example, number of yoghurt), was estimated from the data of a dietary survey (149),
conducted by the French Polynesian Health Directorate in 1995, indicating the average weight
of local foods such as fe'i (cooking banana, typical in French Polynesia) and uru (fruit of the
breadfruit tree). Then, the daily consumption (in g/day) per person was calculated for each
food item on multiplying the frequency by the quantity of the portion. Season factor was
taken into account for certain seasonal foods as well, in converting the food daily
consumption for the whole year into the food consumption only when it is in season (the food
daily consumption for the whole year × the proportion of the numbers of available
consumption days in 365 days).
We used the FPFCT 2013 (presented above, see 1.3.1.3) to convert the traditional French
Polynesian foods into dietary iodine. For the other general food in the study, the French
CIQUAL 2013 food composition table (124) was a necessary complement. The overall iodine
intake took into account all the foods of questionnaire, except iodized salt, because we had no
precise information on the amount of iodized salt consumption. Later, we recreated 21 sub
food groups and selected 66 common food items of the 5 case-control studies from Epi-Thyr
consortium for the standardization of the next pooled analysis (details see in the supplemental
Table1).
We used the FAO Databases (presented above, see 1.3.1.1) to convert the daily food
consumption into daily dietary energy intake (kcal/day). For each study participant, we
calculated the total energy intake corresponding to the energy sum of all foods consumed per
day.
39
2.3.3 THE YOUNG-THYR STUDY
After the Chernobyl nuclear power plant accident in April 1986, an increased incidence of
DTC was observed in children living in contaminated areas of Belarus, Ukraine, and the
Russian Federation (150, 151). Although the radioactive fallout was much less severe and the
thyroid radiation dose was much lower in France than in the previously mentioned
contaminated areas, a case-control study was performed to investigate the role of the fallout
and of other potential risk factors in the incidence of DTC in young people who lived through
that period in eastern France.
The study was approved by the French Data Protection Authority Commission Nationale de
l’Informatique et des Libertés (agreement 05-1120; April 5, 2005). Written consent forms
were obtained from all participants.
Each eligible subject who agreed to participate in the study received an information notice
about the study’s aims and a consent form to be signed and returned. Once consent forms
were received, a database of eligible subjects was compiled so that controls could be selected
randomly according to the selection criteria, with at least one control per case.
Previously, this study reported that a higher number of pregnancies, used a lactation
suppressant, or had early menarche were associated with a higher DTC risk; conversely,
breastfeeding, oral contraceptive use, and late age at first pregnancy were associated with a
lower DTC risk. No association was observed between thyroid cancer and having irregular
menstrual cycle, undergoing treatment for menstrual cycle regularity shortly after menarche,
having a cessation of menstruation, use of another contraceptive, history of miscarriage or
abortion for the first pregnancy, or having had gestational diabetes. The results support the
fact that exposure to estrogens increases thyroid cancer risk (80). The risk of PTC was higher
for participants with a high body surface area (BSA), great height, or excess weight and for
women with a high body fat percentage. Conversely, no significant association was found
between body mass index and the PTC risk. These results provide further evidence of the role
of BSA and excess weight in the risk of thyroid cancer (152). In the pooled analysis of two
case-control studies including the present Young-Thyr study focusing on the relationship
between recreational physical activity and DTC risk, results showed DTC risk was slightly
reduced among subjects who reported recreational physical activity. The weekly frequency
(i.e. h/week) seems to be more relevant than the duration (years) (153). Furthermore, a recent
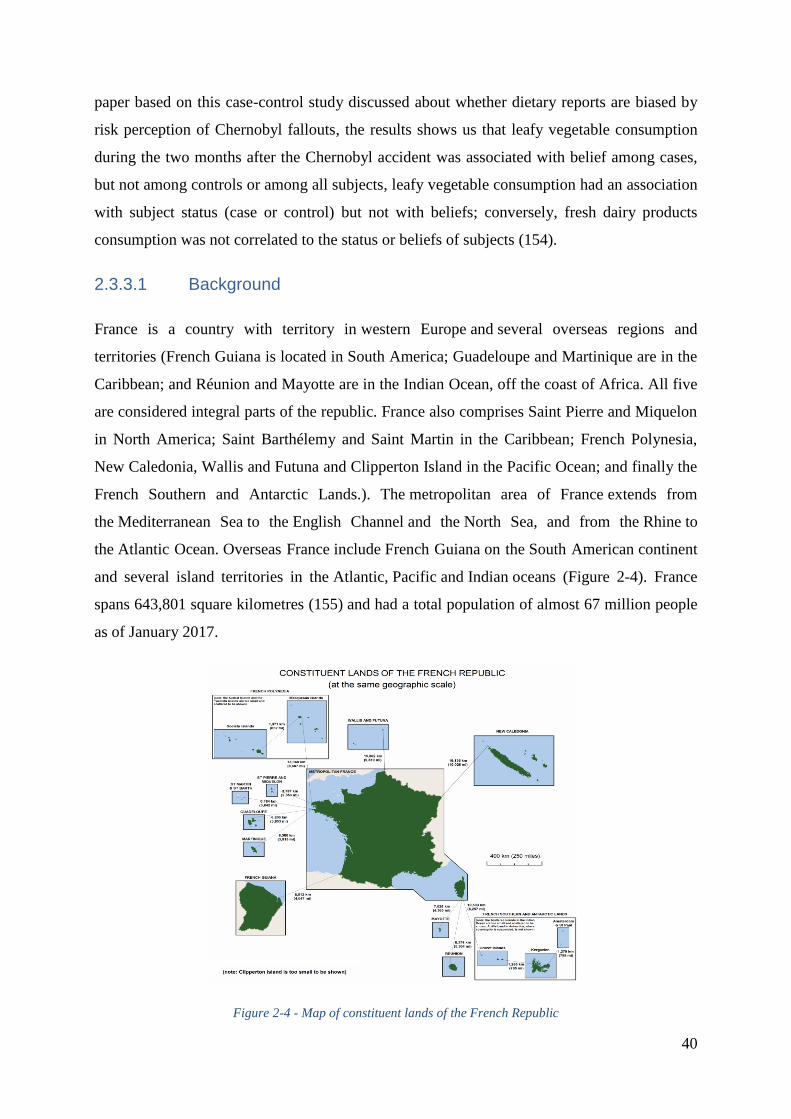
40
paper based on this case-control study discussed about whether dietary reports are biased by
risk perception of Chernobyl fallouts, the results shows us that leafy vegetable consumption
during the two months after the Chernobyl accident was associated with belief among cases,
but not among controls or among all subjects, leafy vegetable consumption had an association
with subject status (case or control) but not with beliefs; conversely, fresh dairy products
consumption was not correlated to the status or beliefs of subjects (154).
2.3.3.1 Background
France is a country with territory in western Europe and several overseas regions and
territories (French Guiana is located in South America; Guadeloupe and Martinique are in the
Caribbean; and Réunion and Mayotte are in the Indian Ocean, off the coast of Africa. All five
are considered integral parts of the republic. France also comprises Saint Pierre and Miquelon
in North America; Saint Barthélemy and Saint Martin in the Caribbean; French Polynesia,
New Caledonia, Wallis and Futuna and Clipperton Island in the Pacific Ocean; and finally the
French Southern and Antarctic Lands.). The metropolitan area of France extends from
the Mediterranean Sea to the English Channel and the North Sea, and from the Rhine to
the Atlantic Ocean. Overseas France include French Guiana on the South American continent
and several island territories in the Atlantic, Pacific and Indian oceans (Figure 2-4). France
spans 643,801 square kilometres (155) and had a total population of almost 67 million people
as of January 2017.
Figure 2-4 - Map of constituent lands of the French Republic
41
2.3.3.2 Case Selection
All patients who were diagnosed with DTC between January 1, 2002, and December 31, 2006,
were born after January 1, 1971, were less than 35 years of age, and had their main residence
in one of the regions of eastern France (Alsace, Champagne-Ardennes, Corse, Franche-Comté,
Lorraine, Rhône-Alpes, or Provence-Alpes-Côte d’Azur) were eligible for this study. Incident
cases were identified by thoroughly investigating 3 main sources according to the region: 1)
the General Cancer Incidence Registry in Champagne-Ardennes, Alsace, and Rhône-Alpes; 2)
the National Childhood Cancer Registry (which contains information on children <15 years of
age) in all regions; and 3) private and public hospitals in Lorraine, Franche-Comté, Corse, and
Provence-Alpes-Côte d’Azur. In these last 4 regions, which are not covered by the General
Cancer Incidence Registry, the identification of cancer cases was performed in collaboration
with local public health structures. In this way, collaboration was set up with pathologist
networks, specifically with one in the Provence-Alpes-Côte d’Azur region, for which the
exhaustiveness and the quality of database has been assessed in previous works (156, 157).
All cases of DTC were histologically confirmed. Information on histopathological diagnosis,
the size of the largest cancerous nodule, tumor extension beyond the thyroid capsule, and
multifocality were obtained from either the registries or histopathology laboratories. All DTC
cases were eligible, regardless of tumor size. Mixed papillary follicular cancers were
considered as papillary lesions.
Of the 1,049 eligible persons with DTC, 223 (21%) were not interviewed, because they
refused to participate (n=120), could not be contacted (n=95), were excluded for another
raison (n=6), or had died (n=2). Of the 826 cases who were interviewed, 70 were matched
with 2 controls; the others were matched to 1 control. One case who did not live in the region
in which he was interviewed and 20 cases who were not matched to a control at the end of
this process were excluded. In all, the study consisted of 805 cases, 633 of whom were female.
2.3.3.3 Control Selection
Controls were selected from the general population and individually matched to a single case
who was the same sex and had the same date of birth (plus or minus 1 year) and region of
residence in the year that the case was diagnosed with cancer. Potentially eligible controls
were randomly selected in each region from the landline telephone subscriber directory. This
was achieved using an SAS random number generator (SAS Institute, Inc., Cary, North
42
Carolina) and a file from France Telecom containing all landline phone numbers
(approximately 100 million) in France. Because a large proportion of the population in the
targeted age group (10-40 years old at time of interview) only has mobile phones and because
a number of people are not included in the directory, controls included not just those selected
from the directory but also relatives of those people. Each established contact was asked
whether they knew people who fit the selection criteria (year of birth, sex, and region of
residence) and whether they could communicate the phone contact details of these potentially
eligible controls. This step was done parallel to but independently of the case selection and
interview process. This was possible because we used national incidence data to anticipate the
age distribution of the cases and therefore the age distribution of the controls required in each
region. Only people without DTC were eligible to serve as controls. At the time of the first
phone contact, controls were asked about their lack of thyroid cancer, but they did not
undergo a medical examination (80).
Of the 1,045 contacted controls, 164 (16%) were refused to be interviewed. Of the 881
controls who were interviewed, 5 were not matched to a case at the end of this process and
were excluded. In all, the study consisted of 876 controls, 679 of whom were female. The
median difference in the date of birth between each case and his or her control was 103
(standard deviation, 282) days.
2.3.3.4 Data Collection
Between July 2005 and October 2010, cases and controls were interviewed face to face by a
trained interviewer using a structured questionnaire that was sent to the subjects at least one
week before the interview so that they could gather documents (e.g., medical examination and
radiography results) and ask their parents questions relating to their youth. Interviews were
conducted mostly at each subject’s place of residence. The same interviewer systematically
interviewed all subjects in the same strata (same sex, same age at the reference year: the year
that the case was diagnosed with cancer and same residence region).
The questionnaire included items on ethnicity, lifetime height-weight changes, specific
questions during the period (26/04/1986-30/06/1986) when the Chernobyl accident took place,
smoking habit, physical activities, personal history of thyroid disease, family history of
thyroid disease and cancer, places of residence, education and occupation, gynecologic and
43
reproductive factors, medical x-ray exposure, diet, both at the time of the interview and
during childhood, and perception of the risk due to the Chernobyl accident.
2.3.3.5 Dietary Questionnaire
The dietary questionnaire was composed of two parts. The first part included questions on the
consumption (frequency and quantity) of 12 food sub-groups and 6 questions on dietary habit
concerned the food consumption one year before the time of the interview, the questionnaire
provided estimation for daily consumption of 73 food items, 8 of which were fish or shellfish
including open-sea fish, river or lake fish, canned sardines, canned tuna, frozen fish, oysters
or mussels, lobster or crab, and shrimp; and the second part included questions on the
consumption (frequency and quantity) of 5 food sub-groups and 2 questions on dietary habit
concerned the food consumption during childhood of the study participant when the
Chernobyl accident took place (26/04/1986-30/06/1986).
In the dietary questionnaire, for each food item, the study participants were asked to indicate
the frequency of consumption (never or almost never, number of times per day, per week or
per month) and the quantity of consumption (in portion or in a standard unit). The
consumption of foods indicated by a portion (mainly marked A, B or C) was estimated with
the help of the photo booklet from the E3N cohort validated by the EPIC study (139), which
indicating the weight corresponding to each portion according to the different food sub-
groups, in order to facilitate the estimation of portion sizes. For food consumption in a
standard unit (for example, number of yoghurt), the estimation of the unit was from the
average weight of the local food in several food markets or super markets. Then, the daily
consumption (in g/day) per person was calculated for each food item on multiplying the
frequency by the quantity of the portion. Season factor was taken into account for certain
seasonal foods as well, in converting the food daily consumption for the whole year into the
food consumption only when it is in season (the food daily consumption for the whole year ×
the proportion of the numbers of available consumption days in 365 days).
We used the French CIQUAL 2013 food composition table (124) to convert the daily foods
consumption into daily dietary iodine intake. For each food item in the diet questionnaire,
iodine intake was estimated by multiplying the daily consumption of each food by the iodine
content in this food based on the French CIQUAL 2013 food composition table (if iodine
content were measured from several similar foods in the composition table, the mean of the
44
iodine content in these similar foods was taken), sub-group iodine content by summing the
iodine content in each food item in this sub-group. Later, we recreated 21 sub food groups and
selected 66 common food items of the 5 case-control studies from Epi-Thyr consortium for
the standardization of the next pooled analysis (details see in the supplemental Table1).
We also used the French CIQUAL 2013 food composition table (124) to convert the daily
food consumption into daily dietary energy intake (kcal/day) for this French study. For each
study participant, we calculated the total energy intake corresponding to the energy sum of all
foods consumed per day.
2.3.4 THE CATHY STUDY
The Cathy study is a population-based caseŔcontrol study conducted in metropolitan France,
including three French administrative areas (départements): Marne, Ardennes and Calvados,
covered by a cancer registry. All participants signed written consent. The study has focused
special interest on the role of some environmental factors such as pesticides, dioxin, xeno-
estrogens, in DTC risk.
Up to date, Tcheandjieu et al. (134) selected Europeans ethnicity of this study and pooled
them with the people auto-declaring as having European ancestry from the New Caledonia
study in order to detect novel candidate functional SNPs in Europeans from metropolitan
France and Melanesians from New Caledonia by Fine-mapping of two differentiated thyroid
carcinoma susceptibility loci at 9q22.33 and 14q13.3, the principal results were that the
association with the four SNPs previously identified in GWAS (rs965513, rs1867277 at loci
9q22, and rs944289, rs116909734 at loci 14q13) was replicated in Europeans. Among
Europeans, the two SNPs previously reported at 9q22 were not independently associated to
DTC and that rs965513 was the predominant signal; at 14q13, the haplotype rs944289[C]-
rs116909374[C]-rs999460[T] was significantly associated with DTC risk and that the
association with rs116909374 differed by smoking status.
2.3.4.1 Case Selection
Eligible cases were all patients diagnosed with DTC between 01/01/2002 and 31/12/2007
residing in one of the three areas mentioned above, aged 25 years and over at the time of
diagnosis.
45
The cases were identified by the general cancers register of Calvados and the specialized
thyroid cancers register of Marne-Ardennes. Topography and morphology were coded
according to the third version of the International Classification of Diseases for Oncology
(ICD-O-3). Thyroid cancers were classified according to the characteristics (size, histology)
of the largest cancer nodule.
Since the study had begun in 2005, the cases diagnosed between 2002 to 2004 were identified
retrospectively. The cases diagnosed from 2005 to 2007 were identified prospectively.
Among 853 eligible cases, 232 (27%) could not be interviewed: 148 refused to participate, 29
died at the time of the interview, 52 could not be contacted, and 3 were too sick to respond.
Finally, the study involved 621 cases.
2.3.4.2 Control Selection
Controls were randomly selected by the survey institute CSA (Conseil-Sondage-Analyse) and
who were at least 25 years old, residing in the same area (Calvados, Marne or Ardennes) at
the time of cases’ diagnoses. The random draw was made from telephone directories, based
on telephone numbers incremented by one unit in order to be able to contact the people on the
red list as well. A first telephone contact was used to determine whether one of the members
of the household met the inclusion criteria of the study. If applicable, the person was proposed
to participate in the study by receiving an interviewer at home.
Controls were frequency-matched to cases by sex and 5-year age groups. The randomly
selected controls were stratified on the socio-professional category so that the distribution of
socio-professional categories among the controls was representative of that of their residence
departments.
Therewith, a reference year between 2002 and 2007 was also allocated to the controls. Only
exposures that occurred before the reference year were included in the analyses.
Among 943 eligible controls, 236 (25%) could not be interviewed: 232 refused to participate
and 4 could not be contacted. Finally, the study involved 707 controls.
2.3.4.3 Data Collection
Data from the Cathy study were collected using standardized questionnaires by face-to-face
interviews at home, conducted by interviewers specially trained for the study. The collected
46
data included the information about socio-demographic, medical history (personal and family
medical history), characteristics of hormonal and reproductive life, anthropometric
characteristics, lifestyle (physical activity, tobacco and alcohol consumptions), recreation,
occupation, and residential history.
2.3.4.4 Dietary Questionnaire
The dietary questionnaire included two questions on the consumption (frequency and quantity)
of 15 sub-groups and 5 questions on dietary habit before or at the time of the interview.
Overall, the questionnaire provided estimation for daily consumption of 161 food items, 15 of
which were fish or shellfish including open-sea fish, river or lake fish, breaded fish, natural or
oiled canned tuna, natural or oiled canned sardines or anchovies, natural or oiled canned
mackerel, mussels, oysters, other shells (whelks, periwinkles, clams…), shrimp, crab, and
lobster.
In the dietary questionnaire, for each food item, the study participants were asked to indicate
the frequency of consumption (never or almost never, number of times per day, per week or
per month) and the quantity of consumption (in portion or in a standard unit). The
consumption of foods indicated by a portion (mainly marked A, B or C) was estimated with
the help of the photo booklet from the E3N cohort validated by the EPIC study (139), which
indicating the weight corresponding to each portion according to the different food sub-
groups, in order to facilitate the estimation of portion sizes. For food consumption in a
standard unit (for example, number of yoghurt), the estimation of the unit was from the
average weight of the local food in several food markets or super markets. Then, the daily
consumption (in g/day) per person was calculated for each food item on multiplying the
frequency by the quantity of the portion. Season factor was taken into account for certain
seasonal foods as well, in converting the food daily consumption for the whole year into the
food consumption only when it is in season (the food daily consumption for the whole year ×
the proportion of the numbers of available consumption days in 365 days).
We used the French CIQUAL 2013 food composition table (124) to convert the daily foods
consumption into daily dietary iodine intake. For each food item in the diet questionnaire,
iodine intake was estimated by multiplying the daily consumption of each food by the iodine
content in this food based on the French CIQUAL 2013 food composition table (if iodine
content were measured from several similar foods in the composition table, the mean of the
47
iodine content in these similar foods was taken), sub-group iodine content by summing the
iodine content in each food item in this sub-group. Later, we recreated 21 sub food groups and
selected 66 common food items of the 5 case-control studies from Epi-Thyr consortium for
the standardization of the next pooled analysis (details see in the supplemental Table1).
We also used the French CIQUAL 2013 food composition table (124) to convert the daily
food consumption into daily dietary energy intake (kcal/day) for this French study. For each
study participant, we calculated the total energy intake corresponding to the energy sum of all
foods consumed per day.
2.3.5 THE CUBA STUDY
Cuba is an island of 100,000 km2 where 35% of the population belongs to the African ethnic
group (158). Although thyroid cancer is the sixth most common female cancer in Cuba, its
incidence is quite low. Indeed, while in North America the world age-standardized rate (ASR)
of DTC incidence was 10.0/100,000 in white females during the period 1998Ŕ2002 (159), the
ASR of DTC incidence in Cuba was around 4.1/100,000 for females and was even six-fold
less frequent in males in 2009 (160). For other Latin American countries such as Colombia,
the ASR of DTC incidence was 9.4/100,000 in females during the period 1998Ŕ2002 (159).
Why is DTC incidence low in Cuba? Is this situation related to dietary iodine intake or other
dietary factors?
Traditional Cuban food includes staple food such as potato, taro, yam, vegetable banana, rice,
and spaghetti; meat such as chicken, pork, beef, and ham; eggs; vegetables such as watercress,
lettuce, tomato, red bean, and cabbage; fruits such as guava, mango, papaya, and banana; and
fish or seafood such as sardine, tuna (canned or fresh), lobster, crab, shrimp, and shellfish.
However, it was not clear whether dietary factors contribute to thyroid cancer risk in the
Cuban population. Moreover, no clear explanation for the low incidence of DTC in the Cuban
population has been established.
In order to establish the role of environmental and lifestyle factors and to relate some
common SNPs previously associated with the risk of developing DTC in Cuba, between 2009
and 2011, we established a case-control study in Havana and its surrounding area. This study
was revised and approved by the Clinical Research Ethics Committee of the National Institute
48
of Oncology and Radiobiology (INOR), Havana, Cuba. Informed written consent was
obtained from all of the participants in the study.
Previously, this study reported that non-African ethnicity, non-smokers, parity, and high body
mass index, being rhesus factor-positive, having a personal history of benign thyroid disorder,
agricultural occupation, and consumption of artesian well water significantly associated with
an increased risk of developing DTC (161). It also found that the thyroid volume was higher
in current or former smokers and in persons with AB or B blood type (162). Significant
association with DTC risk was found for rs1867277 in the promoter region and the poly-
alanine tract expansion polymorphism rs71369530 of the FOXE1 gene; Women who had 2 or
more pregnancies had a 3.5-fold increase in risk of DTC if they carried the A allele of the
SNP rs18015616 in the ATM gene, while 0.8 in those who had fewer than 2 (48). This study
was involved in a pooled analysis of two case-control studies focusing on the relationship
between recreational physical activity and DTC risk, results showed DTC risk was slightly
reduced among subjects who reported recreational physical activity. The weekly frequency
(i.e. h/week) seems to be more relevant than the duration (years) (153). Furthermore, it
observed DTC risk was significantly reduced with increasing fish consumption, but no
association with total dietary iodine intake. Nevertheless, DTC risk was significantly
associated with the number of copies in the minor allele (A) for SNP rs965513 near FOXE1
among people who consumed less iodine than the median value (113).
2.3.5.1 Background
Cuba is a country comprising the island of Cuba as well as Isla de la Juventud and several
minor archipelagos. It is located in the northern Caribbean where the Caribbean Sea, the Gulf
of Mexico, and the Atlantic Ocean meet. Cuba is the largest island in the Caribbean, with an
area of 109,884 square kilometres, and the second-most populous after Hispaniola, with over
11 million inhabitants (163, Figure 2-5).
Prior to Spanish colonization in the late 15th century, Cuba was inhabited by Amerindian
tribes. It remained a colony of Spain until the Spanish-American War of 1898, which led to
nominal independence as a de facto United States protectorate in 1902. Then it was under the
dictatorship of Fulgencio Batista in 1952. Further unrest and instability led to Batista's ousting
in January 1959 by the July 26 Movement, which afterwards established a government under
the leadership of Fidel Castro. A point of contention during the Cold War between the Soviet
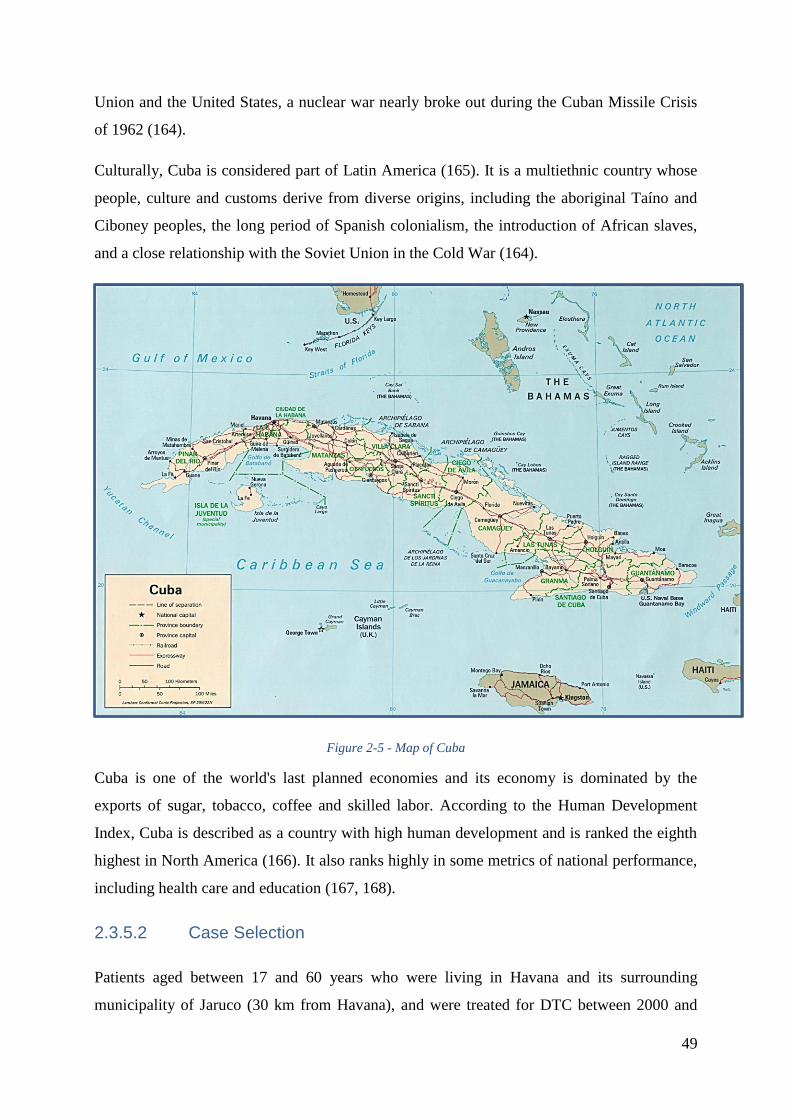
49
Union and the United States, a nuclear war nearly broke out during the Cuban Missile Crisis
of 1962 (164).
Culturally, Cuba is considered part of Latin America (165). It is a multiethnic country whose
people, culture and customs derive from diverse origins, including the aboriginal Taíno and
Ciboney peoples, the long period of Spanish colonialism, the introduction of African slaves,
and a close relationship with the Soviet Union in the Cold War (164).
Figure 2-5 - Map of Cuba
Cuba is one of the world's last planned economies and its economy is dominated by the
exports of sugar, tobacco, coffee and skilled labor. According to the Human Development
Index, Cuba is described as a country with high human development and is ranked the eighth
highest in North America (166). It also ranks highly in some metrics of national performance,
including health care and education (167, 168).
2.3.5.2 Case Selection
Patients aged between 17 and 60 years who were living in Havana and its surrounding
municipality of Jaruco (30 km from Havana), and were treated for DTC between 2000 and
50
2011 at Cuban National Institute of Oncology and Radiobiology (INOR) and at the Institute
of Endocrinology, were eligible for the study. Potential cases were selected from the National
Cancer Registry databases (C73 ICD-10) and were cross-referenced with the INOR Pathology
Register. On average, around 25Ŕ30 patients who fit these criteria were identified for each
year of the study period. In order to achieve the estimated sample size, the selection was
extended to include incident cases (161).
Of the 240 eligible DTC cases, 37 (15%) individuals were not interviewed because they could
not be located (n=32) or refused to participate (n=5). The final study population consisted of
203 cases. 37% of the cases were interviewed just after their cancers diagnoses (either 0 or 1
year of the time lag between diagnosis and interview), while 19% of the cases had a lag
time >5 year.
2.3.5.3 Control Selection
Controls (229) were randomly selected from the general population living in Havana city and
its surrounding areas municipality of Jaruco using consultation files from primary care units
(family doctors). They were frequency-matched with cases by sex and age at cancer diagnoses
of the cases (±5 years). Of the 229 potential controls, 17 refused and 212 agreed to be
interviewed.
2.3.5.4 Data Collection
Both cases and controls were interviewed face-to-face by trained professionals (nursing and
medical staff) using a structured questionnaire between January 2009 and December 2011. A
standardized questionnaire was used to collect data on demographic characteristics (age, sex,
place of residence, and occupation), blood group, rhesus factor status, anthropometric
parameters, reproductive and hormonal history, lifestyle (smoking habits, dietary habits),
exposure to radiation or chemicals, personal medical history and family medical history in
first-degree relatives. Size, blood group and rhesus factor collected by interviewers were
compared to those in the national identity card and in medical records for cases.
Interviewers were trained to collect information related to one year before diagnosis for cases
and one year before interview for controls. The majority of interviews were conducted in the
presence of a parent or relative. Some were conducted at the workplace in the presence of a
general practitioner.
51
2.3.5.5 Dietary Questionnaire
The dietary questionnaire was composed of two parts which included questions on the
consumption (frequency and quantity): the first part concerned general food consumption of
10 sub-groups and 5 questions on dietary habit, and the second part concerned the traditional
Cuban food consumption including 2 sub-groups, one year before the time of the interview.
Overall, the questionnaire provided estimation for daily consumption of 87 food items, 8 of
which were fish or shellfish including open-sea fish, river or lake fish, canned sardines,
canned tuna, frozen fish, oysters or mussels, lobster or crab, and shrimp.
In the dietary questionnaire, for each food item, the study participants were asked to indicate
the frequency of consumption (never or almost never, number of times per day, per week or
per month) and the quantity of consumption (in portion or in a standard unit). The
consumption of foods indicated by a portion (mainly marked A, B or C) was estimated with
the help of the photo booklet from the E3N cohort validated by the EPIC study (139), which
indicating the weight corresponding to each portion according to the different food sub-
groups, in order to facilitate the estimation of portion sizes. For food consumption in a
standard unit (for example, number of yoghurt), the estimation of the unit was from the
average weight of the local food in several food markets or super markets. Then, the daily
consumption (in g/day) per person was calculated for each food item on multiplying the
frequency by the quantity of the portion. Season factor was taken into account for certain
seasonal foods as well, in converting the food daily consumption for the whole year into the
food consumption only when it is in season (the food daily consumption for the whole year ×
the proportion of the numbers of available consumption days in 365 days).
We used the CFCT 2014 (presented above, see1.3.1.3) to convert the 20 traditional Cuban
foods into dietary iodine. For the other general food in the study, the French CIQUAL 2013
food composition table (124) was a necessary complement. For each food item in the diet
questionnaire, iodine intake was estimated by multiplying the daily consumption of each food
by the iodine content in this food based on the two food composition tables mentioned above
(if iodine content were measured from several similar foods in the composition tables, the
mean of the iodine content in these similar foods was taken), sub-group iodine content by
summing the iodine content in each food item in this sub-group.
An item for quantifying iodized salt intake in the questionnaire was only included in this
study. In fact, since 2005, Cuba has established compulsory iodization of salt for human
52
consumption for the whole Cuban population, because a global strategy at the national level is
the best solution for a cost-effective prevention and control of iodine deficiency (169). A
fixed value of 10 g of iodized salt per person per day was included. This value was estimated
to be the average consumption of iodized salt per inhabitant per day by the Center for
Nutrition and Food Hygiene, the National Institute of Hygiene, Epidemiology, and
Microbiology (Inhem) of Cuba. Later, we recreated 21 sub food groups and selected 66
common food items of the 5 case-control studies from Epi-Thyr consortium for the
standardization of the next pooled analysis (details see in the supplemental Table1).
We used the FAO Databases (presented above, see 1.3.1.1) to convert the daily food
consumption into daily dietary energy intake (kcal/day). For each study participant, we
calculated the total energy intake corresponding to the energy sum of all foods consumed per
day.
2.3.6 THE HOMOGENEITY AND THE HETEROGENEITY AMONG
THE 5 STUDIES
The 5 studies conducted homogeneously in contrasting populations, both genetically and in
terms of the environment and life style, using similar questionnaire and DNA collection,
study participants were interviewed face-to-face by trained professionals, using the
standardized dietary questionnaire and the photo booklet from Epic cohort.
The five different studies of Epi-Thyr consortium are heterogeneous in terms of their size, of
the period of diagnosis, of age at diagnosis and of proportion of papillary thyroid cancer. The
proportion of papillary thyroid cancer in the French Polynesia study was lower than in the
other studies, probably because this study included cases diagnosed much earlier (1979-2004)
than the other ones. It has also to be noted that the difference in age at diagnosis between
studies not only reflect difference in age structure of studied populations and in thyroid cancer
incidence, but also restriction in age at diagnosis imposed in the design of studies: no more
than 15 years at time of the first atmospheric test, in French Polynesia, i.e. born in 1950 or
after, and no more than 15 years at time of Chernobyl accident in the Young-Thyr study, i.e.
born in 1971 or after (Table 2-1).
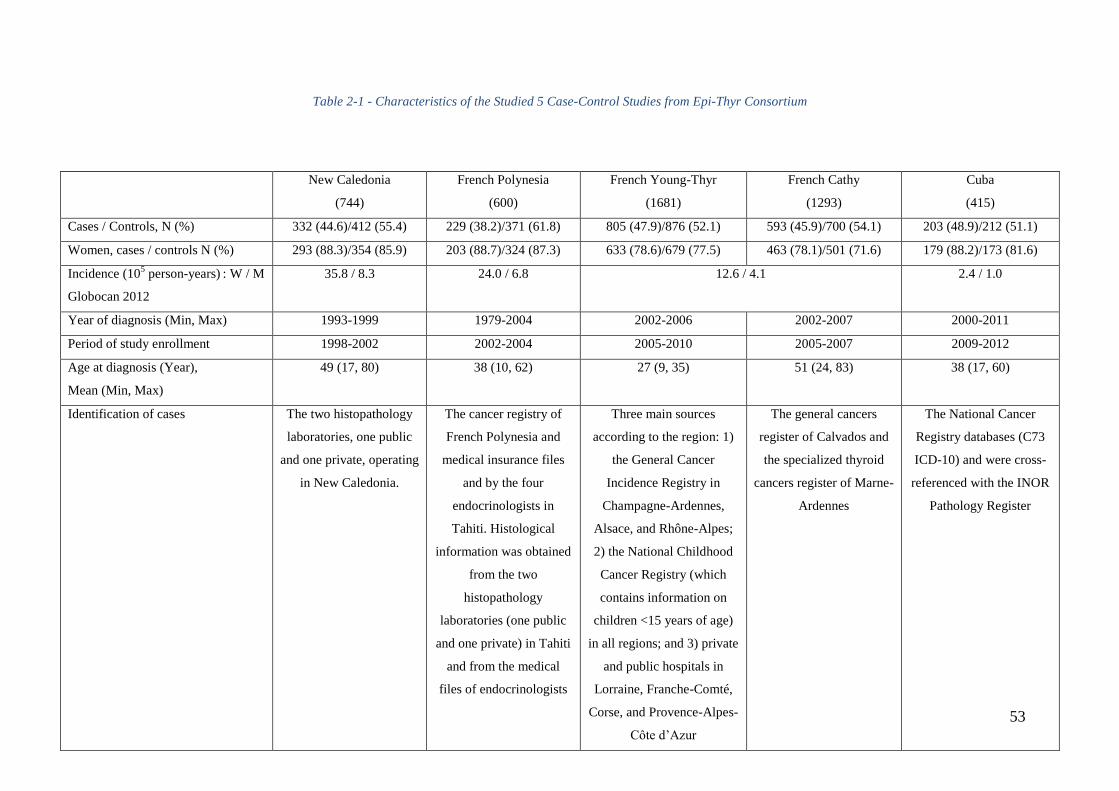
53
Table 2-1 - Characteristics of the Studied 5 Case-Control Studies from Epi-Thyr Consortium
New Caledonia
(744)
French Polynesia
(600)
French Young-Thyr
(1681)
French Cathy
(1293)
Cuba
(415)
Cases / Controls, N (%) 332 (44.6)/412 (55.4) 229 (38.2)/371 (61.8) 805 (47.9)/876 (52.1) 593 (45.9)/700 (54.1) 203 (48.9)/212 (51.1)
Women, cases / controls N (%) 293 (88.3)/354 (85.9) 203 (88.7)/324 (87.3) 633 (78.6)/679 (77.5) 463 (78.1)/501 (71.6) 179 (88.2)/173 (81.6)
Incidence (105 person-years)
: W / M
Globocan 2012
35.8 / 8.3 24.0 / 6.8 12.6 / 4.1 2.4 / 1.0
Year of diagnosis (Min, Max) 1993-1999 1979-2004 2002-2006 2002-2007 2000-2011
Period of study enrollment 1998-2002 2002-2004 2005-2010 2005-2007 2009-2012
Age at diagnosis (Year),
Mean (Min, Max)
49 (17, 80) 38 (10, 62) 27 (9, 35) 51 (24, 83) 38 (17, 60)
Identification of cases The two histopathology
laboratories, one public
and one private, operating
in New Caledonia.
The cancer registry of
French Polynesia and
medical insurance files
and by the four
endocrinologists in
Tahiti. Histological
information was obtained
from the two
histopathology
laboratories (one public
and one private) in Tahiti
and from the medical
files of endocrinologists
Three main sources
according to the region: 1)
the General Cancer
Incidence Registry in
Champagne-Ardennes,
Alsace, and Rhône-Alpes;
2) the National Childhood
Cancer Registry (which
contains information on
children <15 years of age)
in all regions; and 3) private
and public hospitals in
Lorraine, Franche-Comté,
Corse, and Provence-Alpes-
Côte d’Azur
The general cancers
register of Calvados and
the specialized thyroid
cancers register of Marne-
Ardennes
The National Cancer
Registry databases (C73
ICD-10) and were cross-
referenced with the INOR
Pathology Register
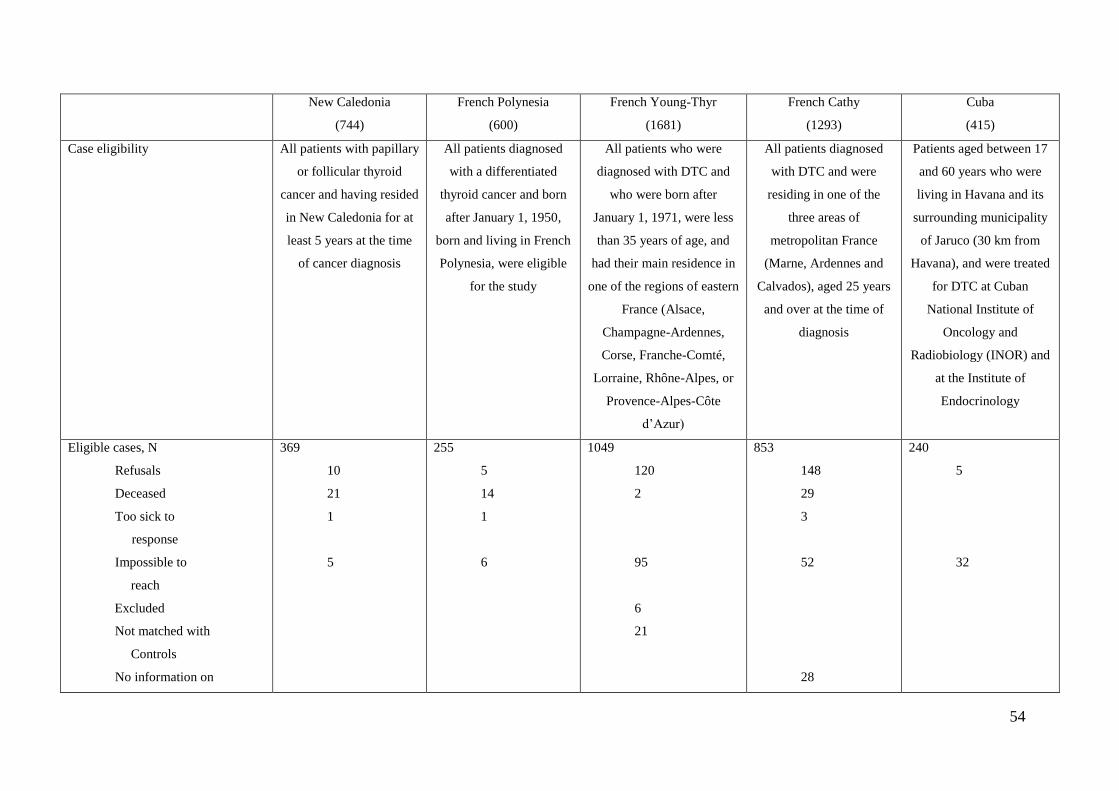
54
New Caledonia
(744)
French Polynesia
(600)
French Young-Thyr
(1681)
French Cathy
(1293)
Cuba
(415)
Case eligibility All patients with papillary
or follicular thyroid
cancer and having resided
in New Caledonia for at
least 5 years at the time
of cancer diagnosis
All patients diagnosed
with a differentiated
thyroid cancer and born
after January 1, 1950,
born and living in French
Polynesia, were eligible
for the study
All patients who were
diagnosed with DTC and
who were born after
January 1, 1971, were less
than 35 years of age, and
had their main residence in
one of the regions of eastern
France (Alsace,
Champagne-Ardennes,
Corse, Franche-Comté,
Lorraine, Rhône-Alpes, or
Provence-Alpes-Côte
d’Azur)
All patients diagnosed
with DTC and were
residing in one of the
three areas of
metropolitan France
(Marne, Ardennes and
Calvados), aged 25 years
and over at the time of
diagnosis
Patients aged between 17
and 60 years who were
living in Havana and its
surrounding municipality
of Jaruco (30 km from
Havana), and were treated
for DTC at Cuban
National Institute of
Oncology and
Radiobiology (INOR) and
at the Institute of
Endocrinology
Eligible cases, N
Refusals
Deceased
Too sick to
response
Impossible to
reach
Excluded
Not matched with
Controls
No information on
369
10
21
1
5
255
5
14
1
6
1049
120
2
95
6
21
853
148
29
3
52
28
240
5
32
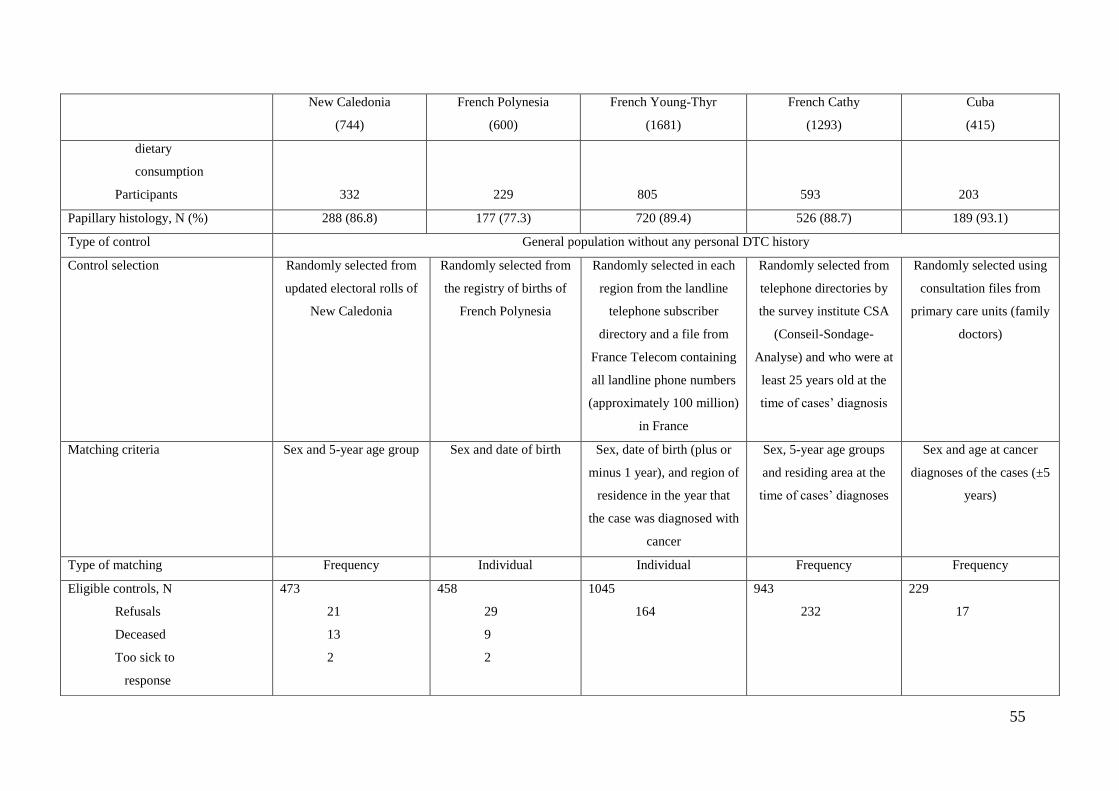
55
New Caledonia
(744)
French Polynesia
(600)
French Young-Thyr
(1681)
French Cathy
(1293)
Cuba
(415)
dietary
consumption
Participants
332
229
805
593
203
Papillary histology, N (%) 288 (86.8) 177 (77.3) 720 (89.4) 526 (88.7) 189 (93.1)
Type of control General population without any personal DTC history
Control selection Randomly selected from
updated electoral rolls of
New Caledonia
Randomly selected from
the registry of births of
French Polynesia
Randomly selected in each
region from the landline
telephone subscriber
directory and a file from
France Telecom containing
all landline phone numbers
(approximately 100 million)
in France
Randomly selected from
telephone directories by
the survey institute CSA
(Conseil-Sondage-
Analyse) and who were at
least 25 years old at the
time of cases’ diagnosis
Randomly selected using
consultation files from
primary care units (family
doctors)
Matching criteria Sex and 5-year age group Sex and date of birth Sex, date of birth (plus or
minus 1 year), and region of
residence in the year that
the case was diagnosed with
cancer
Sex, 5-year age groups
and residing area at the
time of cases’ diagnoses
Sex and age at cancer
diagnoses of the cases (±5
years)
Type of matching Frequency Individual Individual Frequency Frequency
Eligible controls, N
Refusals
Deceased
Too sick to
response
473
21
13
2
458
29
9
2
1045
164
943
232
229
17
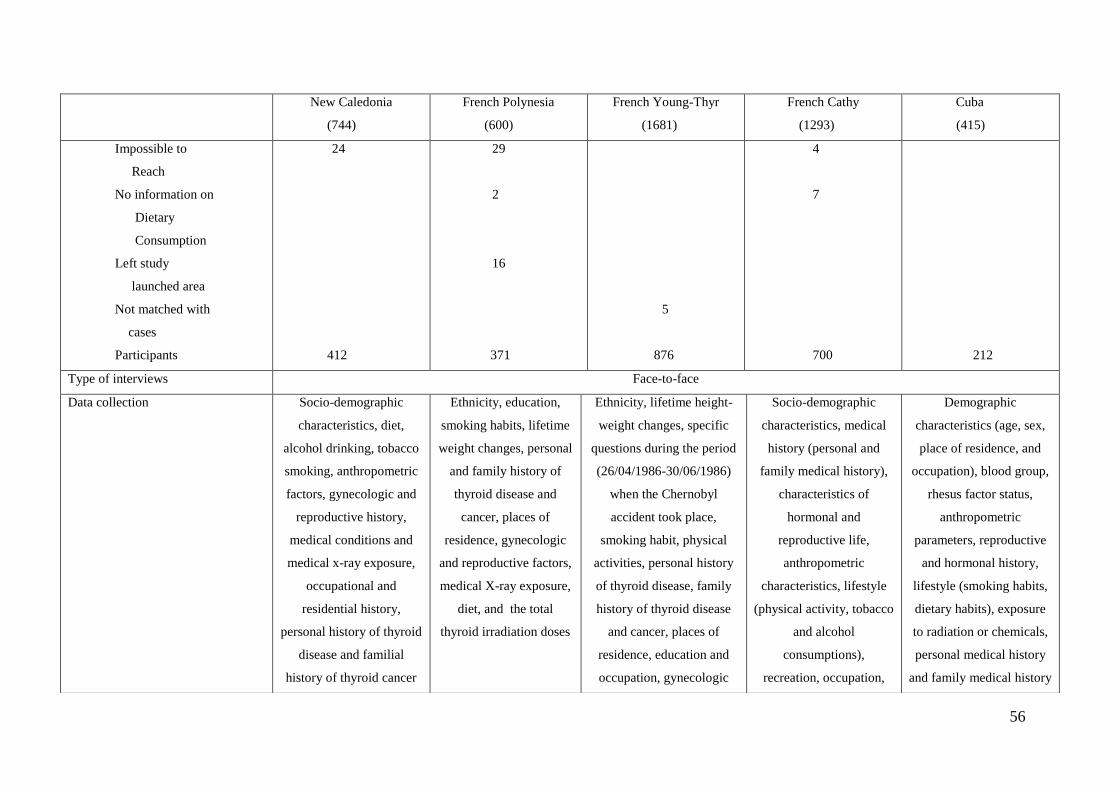
56
New Caledonia
(744)
French Polynesia
(600)
French Young-Thyr
(1681)
French Cathy
(1293)
Cuba
(415)
Impossible to
Reach
No information on
Dietary
Consumption
Left study
launched area
Not matched with
cases
Participants
24
412
29
2
16
371
5
876
4
7
700
212
Type of interviews Face-to-face
Data collection Socio-demographic
characteristics, diet,
alcohol drinking, tobacco
smoking, anthropometric
factors, gynecologic and
reproductive history,
medical conditions and
medical x-ray exposure,
occupational and
residential history,
personal history of thyroid
disease and familial
history of thyroid cancer
Ethnicity, education,
smoking habits, lifetime
weight changes, personal
and family history of
thyroid disease and
cancer, places of
residence, gynecologic
and reproductive factors,
medical X-ray exposure,
diet, and the total
thyroid irradiation doses
Ethnicity, lifetime height-
weight changes, specific
questions during the period
(26/04/1986-30/06/1986)
when the Chernobyl
accident took place,
smoking habit, physical
activities, personal history
of thyroid disease, family
history of thyroid disease
and cancer, places of
residence, education and
occupation, gynecologic
Socio-demographic
characteristics, medical
history (personal and
family medical history),
characteristics of
hormonal and
reproductive life,
anthropometric
characteristics, lifestyle
(physical activity, tobacco
and alcohol
consumptions),
recreation, occupation,
Demographic
characteristics (age, sex,
place of residence, and
occupation), blood group,
rhesus factor status,
anthropometric
parameters, reproductive
and hormonal history,
lifestyle (smoking habits,
dietary habits), exposure
to radiation or chemicals,
personal medical history
and family medical history
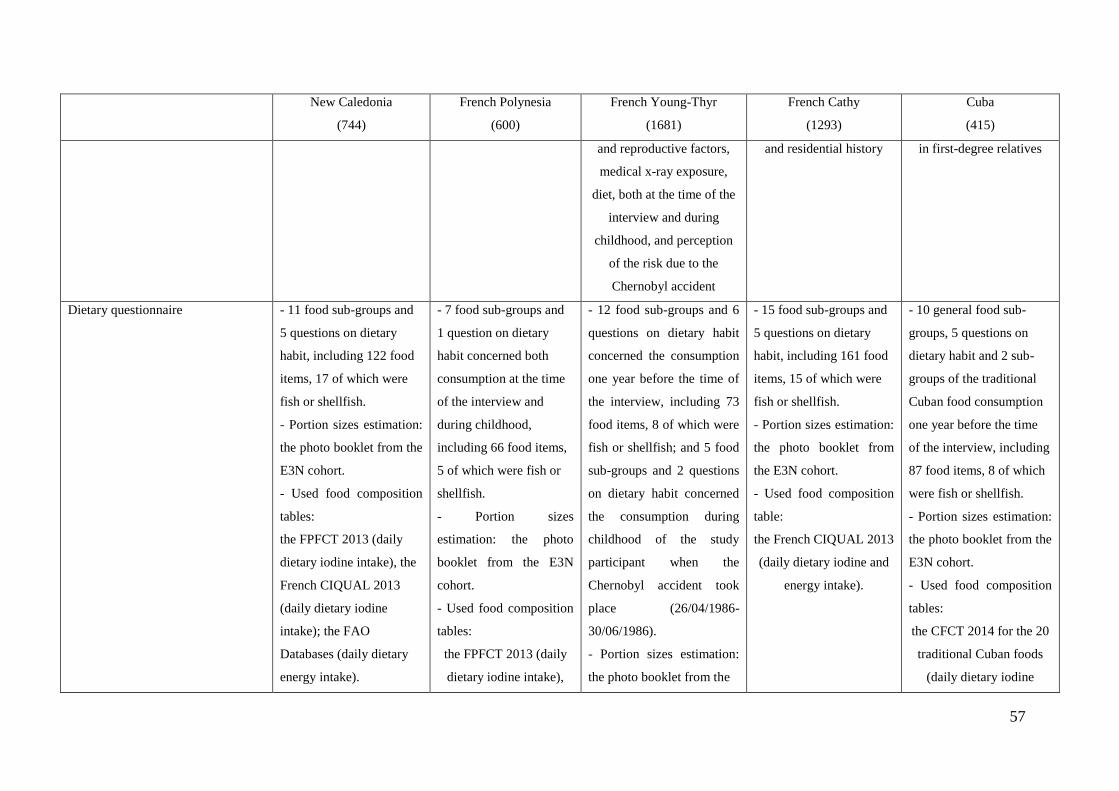
57
New Caledonia
(744)
French Polynesia
(600)
French Young-Thyr
(1681)
French Cathy
(1293)
Cuba
(415)
and reproductive factors,
medical x-ray exposure,
diet, both at the time of the
interview and during
childhood, and perception
of the risk due to the
Chernobyl accident
and residential history in first-degree relatives
Dietary questionnaire - 11 food sub-groups and
5 questions on dietary
habit, including 122 food
items, 17 of which were
fish or shellfish.
- Portion sizes estimation:
the photo booklet from the
E3N cohort.
- Used food composition
tables:
the FPFCT 2013 (daily
dietary iodine intake), the
French CIQUAL 2013
(daily dietary iodine
intake); the FAO
Databases (daily dietary
energy intake).
- 7 food sub-groups and
1 question on dietary
habit concerned both
consumption at the time
of the interview and
during childhood,
including 66 food items,
5 of which were fish or
shellfish.
- Portion sizes
estimation: the photo
booklet from the E3N
cohort.
- Used food composition
tables:
the FPFCT 2013 (daily
dietary iodine intake),
- 12 food sub-groups and 6
questions on dietary habit
concerned the consumption
one year before the time of
the interview, including 73
food items, 8 of which were
fish or shellfish; and 5 food
sub-groups and 2 questions
on dietary habit concerned
the consumption during
childhood of the study
participant when the
Chernobyl accident took
place (26/04/1986-
30/06/1986).
- Portion sizes estimation:
the photo booklet from the
- 15 food sub-groups and
5 questions on dietary
habit, including 161 food
items, 15 of which were
fish or shellfish.
- Portion sizes estimation:
the photo booklet from
the E3N cohort.
- Used food composition
table:
the French CIQUAL 2013
(daily dietary iodine and
energy intake).
- 10 general food sub-
groups, 5 questions on
dietary habit and 2 sub-
groups of the traditional
Cuban food consumption
one year before the time
of the interview, including
87 food items, 8 of which
were fish or shellfish.
- Portion sizes estimation:
the photo booklet from the
E3N cohort.
- Used food composition
tables:
the CFCT 2014 for the 20
traditional Cuban foods
(daily dietary iodine
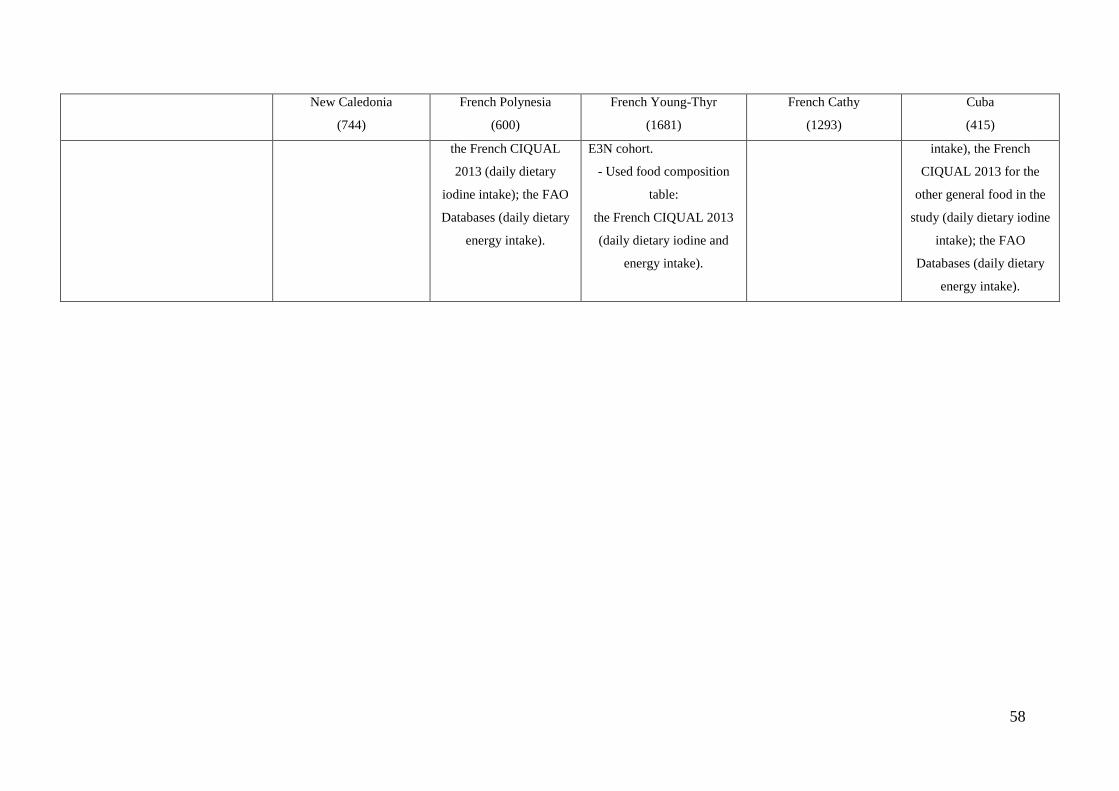
58
New Caledonia
(744)
French Polynesia
(600)
French Young-Thyr
(1681)
French Cathy
(1293)
Cuba
(415)
the French CIQUAL
2013 (daily dietary
iodine intake); the FAO
Databases (daily dietary
energy intake).
E3N cohort.
- Used food composition
table:
the French CIQUAL 2013
(daily dietary iodine and
energy intake).
intake), the French
CIQUAL 2013 for the
other general food in the
study (daily dietary iodine
intake); the FAO
Databases (daily dietary
energy intake).
59
2.4 GENETIC ANALYSES
Both NKX2-1 (NK2 homeobox 1, also called TTF1 for Thyroid Transcription Factor 1) and
FOXE1 (Forkhead factor E1, also called TTF2 for Thyroid Transcription Factor 2) encode
thyroid-specific transcription factors. They play a crucial role in the development of the
thyroid gland and their expression is modified in thyroid tumors (170, 171, 172, 173). In 2009,
a GWAS reported the contribution of two SNPs nearby NKX2-1 and FOXE1 to the risk of
developing DTC in Icelandic and European populations (42). The first SNP, rs944289, is
located 337-kb upstream of the NKX2-1 gene and was described to increase the risk of DTC
(42, 43). The second SNP, rs965513, is located in an intergenic region, 57-kb upstream of the
FOXE1 gene. It has been related to many endocrine and metabolic disorders (174), to changes
in the concentration of thyroid hormones (42), and to an increased risk of DTC (42, 43, 45).
Rs965513 has been reported as a strong genetic factor for both sporadic and radioinduced
PTC (44). Located within the 5' untranslated region (UTR) of FOXE1, the SNP rs1867277 has
been reported as a risk factor for DTC and has been suggested as the causal SNP (45, 46). It
has been also proposed that the minor allele A could modulate a transcriptional regulation
pathway of the FOXE1 gene, by recruiting USF1/USF2 transcription factors (47). The ATM
(Ataxia-Telangiectasia Mutated) gene is involved in the repair of DNA double-strand breaks.
Mutations in this gene have been related to ataxia telangiectasia and other disorders,
especially characterized by radiation sensitivity and cancer predisposition (175). Variations in
this gene were reported to play a role in hormone cancers (176, 177). An association between
the missense substitution D1853N (rs1801516) and a reduced risk of PTC was also reported
for both sporadic and radiation-induced thyroid cancer (178). Recently, we also showed that
this coding SNP in ATM contributes to the risk of PTC in Belarusian children exposed to
ionizing radiation from the Chernobyl nuclear power plant accident (179).
We thus sought to investigate the contribution of genetic variations at the NKX2-1, FOXE1
and ATM loci to the risk of DTC in the 5 studies of Epi-Thyr Consortium, especially for the
minor allele of the 4 common SNPs of Epi-Thyr Consortium: rs965513, rs1867277,
rs1801516 and rs944289.
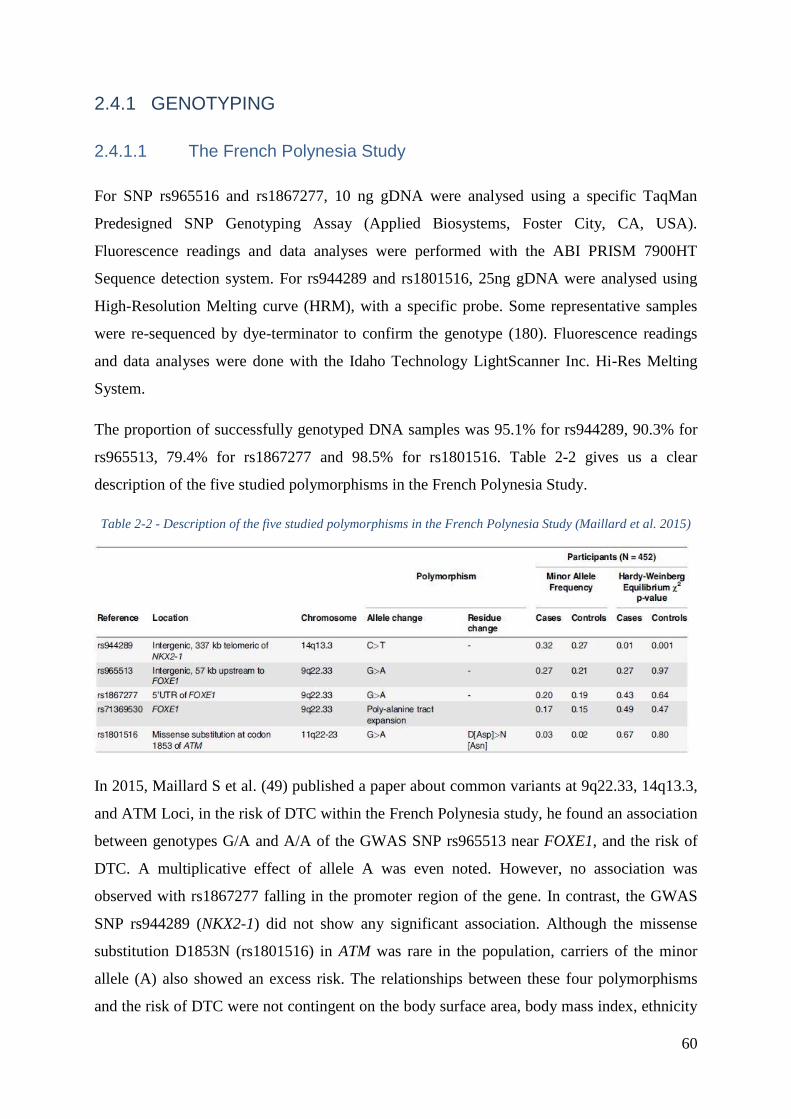
60
2.4.1 GENOTYPING
2.4.1.1 The French Polynesia Study
For SNP rs965516 and rs1867277, 10 ng gDNA were analysed using a specific TaqMan
Predesigned SNP Genotyping Assay (Applied Biosystems, Foster City, CA, USA).
Fluorescence readings and data analyses were performed with the ABI PRISM 7900HT
Sequence detection system. For rs944289 and rs1801516, 25ng gDNA were analysed using
High-Resolution Melting curve (HRM), with a specific probe. Some representative samples
were re-sequenced by dye-terminator to confirm the genotype (180). Fluorescence readings
and data analyses were done with the Idaho Technology LightScanner Inc. Hi-Res Melting
System.
The proportion of successfully genotyped DNA samples was 95.1% for rs944289, 90.3% for
rs965513, 79.4% for rs1867277 and 98.5% for rs1801516. Table 2-2 gives us a clear
description of the five studied polymorphisms in the French Polynesia Study.
Table 2-2 - Description of the five studied polymorphisms in the French Polynesia Study (Maillard et al. 2015)
In 2015, Maillard S et al. (49) published a paper about common variants at 9q22.33, 14q13.3,
and ATM Loci, in the risk of DTC within the French Polynesia study, he found an association
between genotypes G/A and A/A of the GWAS SNP rs965513 near FOXE1, and the risk of
DTC. A multiplicative effect of allele A was even noted. However, no association was
observed with rs1867277 falling in the promoter region of the gene. In contrast, the GWAS
SNP rs944289 (NKX2-1) did not show any significant association. Although the missense
substitution D1853N (rs1801516) in ATM was rare in the population, carriers of the minor
allele (A) also showed an excess risk. The relationships between these four polymorphisms
and the risk of DTC were not contingent on the body surface area, body mass index, ethnicity
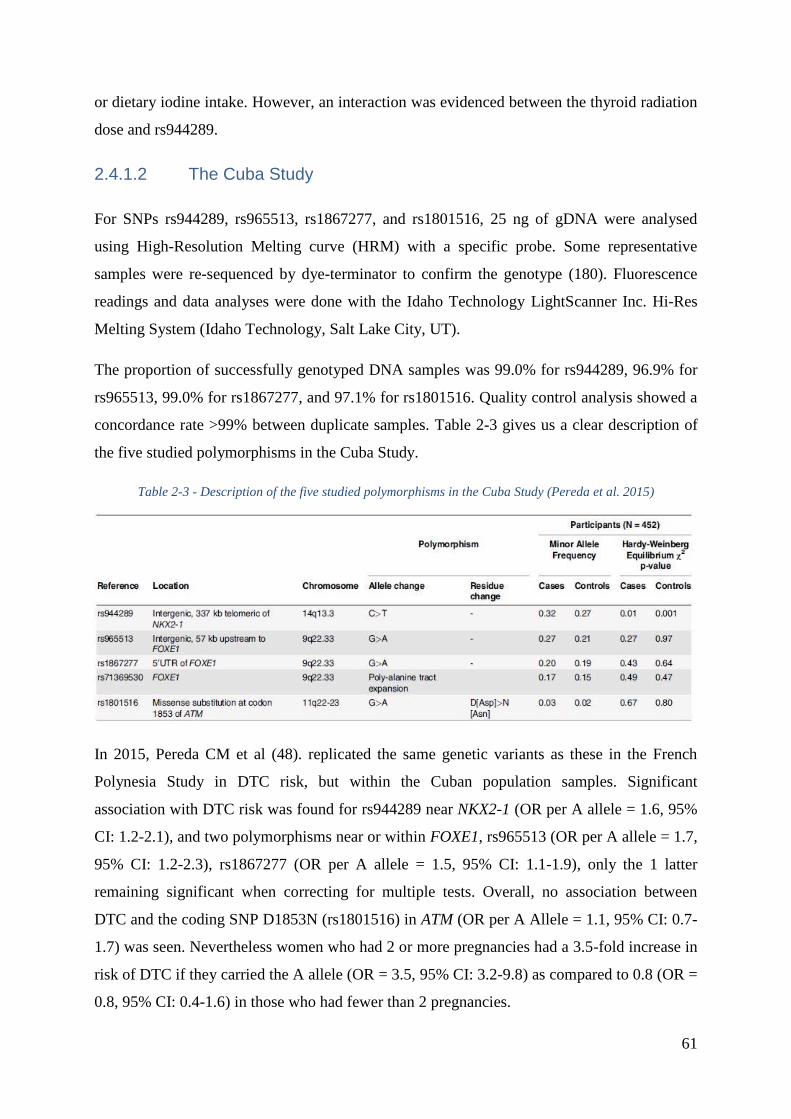
61
or dietary iodine intake. However, an interaction was evidenced between the thyroid radiation
dose and rs944289.
2.4.1.2 The Cuba Study
For SNPs rs944289, rs965513, rs1867277, and rs1801516, 25 ng of gDNA were analysed
using High-Resolution Melting curve (HRM) with a specific probe. Some representative
samples were re-sequenced by dye-terminator to confirm the genotype (180). Fluorescence
readings and data analyses were done with the Idaho Technology LightScanner Inc. Hi-Res
Melting System (Idaho Technology, Salt Lake City, UT).
The proportion of successfully genotyped DNA samples was 99.0% for rs944289, 96.9% for
rs965513, 99.0% for rs1867277, and 97.1% for rs1801516. Quality control analysis showed a
concordance rate >99% between duplicate samples. Table 2-3 gives us a clear description of
the five studied polymorphisms in the Cuba Study.
Table 2-3 - Description of the five studied polymorphisms in the Cuba Study (Pereda et al. 2015)
In 2015, Pereda CM et al (48). replicated the same genetic variants as these in the French
Polynesia Study in DTC risk, but within the Cuban population samples. Significant
association with DTC risk was found for rs944289 near NKX2-1 (OR per A allele = 1.6, 95%
CI: 1.2-2.1), and two polymorphisms near or within FOXE1, rs965513 (OR per A allele = 1.7,
95% CI: 1.2-2.3), rs1867277 (OR per A allele = 1.5, 95% CI: 1.1-1.9), only the 1 latter
remaining significant when correcting for multiple tests. Overall, no association between
DTC and the coding SNP D1853N (rs1801516) in ATM (OR per A Allele = 1.1, 95% CI: 0.7-
1.7) was seen. Nevertheless women who had 2 or more pregnancies had a 3.5-fold increase in
risk of DTC if they carried the A allele (OR = 3.5, 95% CI: 3.2-9.8) as compared to 0.8 (OR =
0.8, 95% CI: 0.4-1.6) in those who had fewer than 2 pregnancies.
62
2.4.1.3 The French Young-Thyr Study
For the 1417 Young-Thyr samples, TaqMan genotyping was performed at the National Centre
of Genotyping (CEA, Evry, France), on a 7900HT Sequence detection system (Applied
Biosystem).
All probes were purchased from ThermoFisher-Applied Biosystems. Probes for rs1801516
(C_11736668_10) and rs965513 (C_1444137_10) were purchased as TaqMan SMP
genotyping assays (Ref : 4351376), and probes rs1867277 and rs944289 as custom Taqman
genotyping assays (Ref : 4332072). Genotyping was performed on 5 ng of gDNA, using
standard protocols. All samples were treated in a 384-well plate format, and each plate
included several positive and negative control samples in order to validate the process.
Fluorescence reading and data analyses were performed with the ABI7900HT sequence
detection systems version 2.4.1 (Applied Biosystem), in duplicate by two different people.
The proportion of successfully genotyped DNA samples was 99.29% for rs1801516, 99.22%
for rs965513, 98.58% for rs1867277, and 98.44% for rs944289. Quality control analysis
showed a concordance rate >99% between duplicate samples.
2.4.1.4 The New Caledonia and French Cathy Studies
The four common SNPs of Epi-Thyr Consortium mentioned above were genotyped in
International Agency of Cancer Research (IRAC, Lyon, France) of the World Health
Organization (WHO) using the Fluidigm Dynamic array chip (société Intégragen).
Oligonucleotide probes and primer were validated in 90 CEPH DNA sample. All the
genotyped SNPs had a call rate>95% and did not deviated from hardy Weinberg equilibrium
(p>0.001). We exclude subjects with low DNA concentration (64 cases/65 controls in the
French Cathy study) and with genotype completions less than 90% (19 cases/11 controls in
both the New Caledonia and French Cathy studies).
The proportion of successfully genotyped DNA samples was 97.74% and 99.14% for
rs1801516, 97.74% and 98.66% for rs965513, 96.71% and 98.19% for rs1867277, and 97.53%
and 98.76% for rs944289, in the New Caledonia study and French Cathy study, respectively.
63
3 PART III: DIETARY IODINE INTAKE AND
DIFFERENTIATED THYROID CANCER RISK: THE
CASE-CONTROL STUDY IN CUBA
64
Basing on the scientific background, interesting and the materials that I previously presented
in 2.3.5, 2.4.1.2 of the Cuba study, in this part, I will explore the role of specific food groups
or items, especially in regard to iodine intake, in the risk of developing DTC, and to assess the
possibility of interaction between environmental factors and some common SNPs previously
associated with DTC in the Cuban population that we haven’t known before.
It was hypothesized, first, that fish consumption may reduce the risk of DTC; second, that
dietary iodine deficiency and excess dietary iodine could be associated with an increasing risk
of DTC; and third, that dietary iodine deficiency may interact with FOXE1 due to its role in
thyroid hormone pathways.
3.1 METHOD
3.1.1 ANALYZED PARAMETERS
For quantitative factors, such as fish, shellfish, and total seafood consumption, the study
participants were categorized into tertiles according to the consumption value distribution in
controls.
Overall, the study participants were classified into three categories according to the Iodine
Global Network (IGN) (181): mild iodine deficiency (75Ŕ149 µg/day), optimal iodine intake
(150Ŕ299 µg/day), and more than adequate or excess iodine intake (≥300 µg/day).
Furthermore, the study participants were regrouped into quartiles according to the dietary
iodine intake in controls.
The possible interaction between dietary iodine intake and the following polymorphisms was
investigated: rs944289 (near NKX2-1), rs965513 (near FOXE1), rs1867277 (5’ UTR of
FOXE1), and rs71369530 (polyalanine length polymorphism in FOXE1), which were
significantly associated with the risk of developing DTC in the same Cuban case-control
study (48). For this purpose, the values of dietary iodine intake were classified into two
categories: either less or more than the median (186 µg/day) value observed in controls.
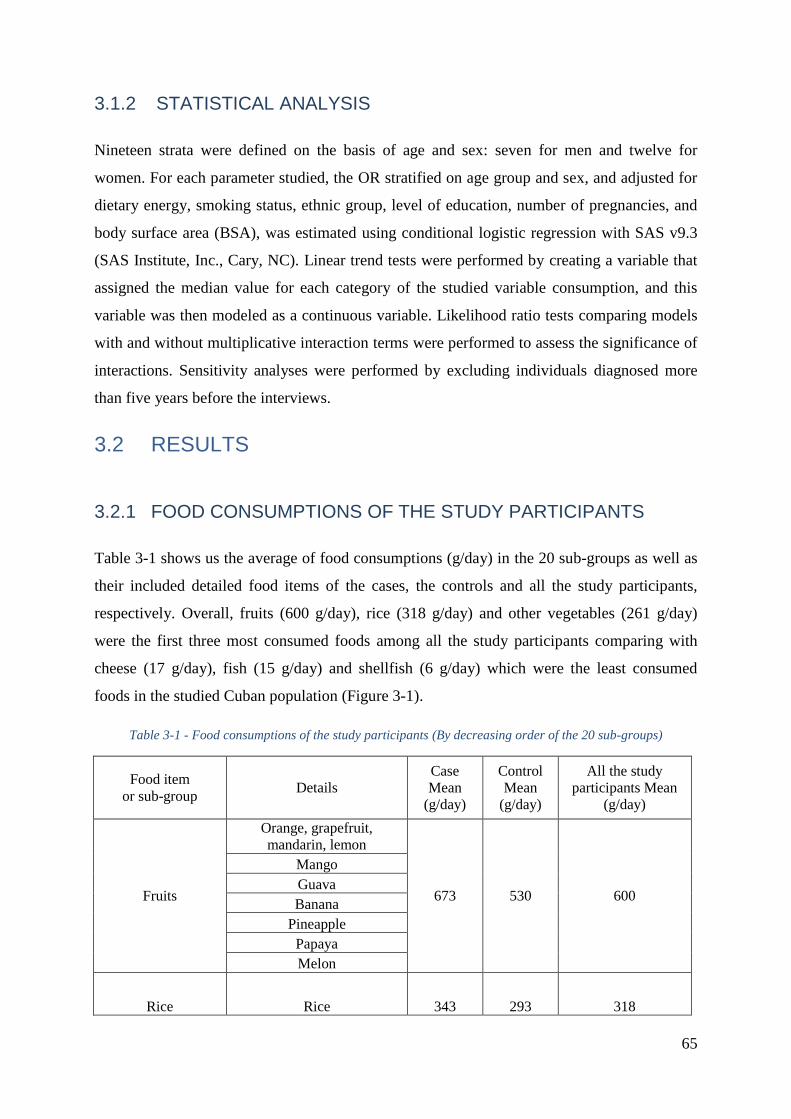
65
3.1.2 STATISTICAL ANALYSIS
Nineteen strata were defined on the basis of age and sex: seven for men and twelve for
women. For each parameter studied, the OR stratified on age group and sex, and adjusted for
dietary energy, smoking status, ethnic group, level of education, number of pregnancies, and
body surface area (BSA), was estimated using conditional logistic regression with SAS v9.3
(SAS Institute, Inc., Cary, NC). Linear trend tests were performed by creating a variable that
assigned the median value for each category of the studied variable consumption, and this
variable was then modeled as a continuous variable. Likelihood ratio tests comparing models
with and without multiplicative interaction terms were performed to assess the significance of
interactions. Sensitivity analyses were performed by excluding individuals diagnosed more
than five years before the interviews.
3.2 RESULTS
3.2.1 FOOD CONSUMPTIONS OF THE STUDY PARTICIPANTS
Table 3-1 shows us the average of food consumptions (g/day) in the 20 sub-groups as well as
their included detailed food items of the cases, the controls and all the study participants,
respectively. Overall, fruits (600 g/day), rice (318 g/day) and other vegetables (261 g/day)
were the first three most consumed foods among all the study participants comparing with
cheese (17 g/day), fish (15 g/day) and shellfish (6 g/day) which were the least consumed
foods in the studied Cuban population (Figure 3-1).
Table 3-1 - Food consumptions of the study participants (By decreasing order of the 20 sub-groups)
Food item
or sub-group Details
Case
Mean
(g/day)
Control
Mean
(g/day)
All the study
participants Mean
(g/day)
Fruits
Orange, grapefruit,
mandarin, lemon
673 530 600
Mango
Guava
Banana
Pineapple
Papaya
Melon
Rice Rice 343 293 318
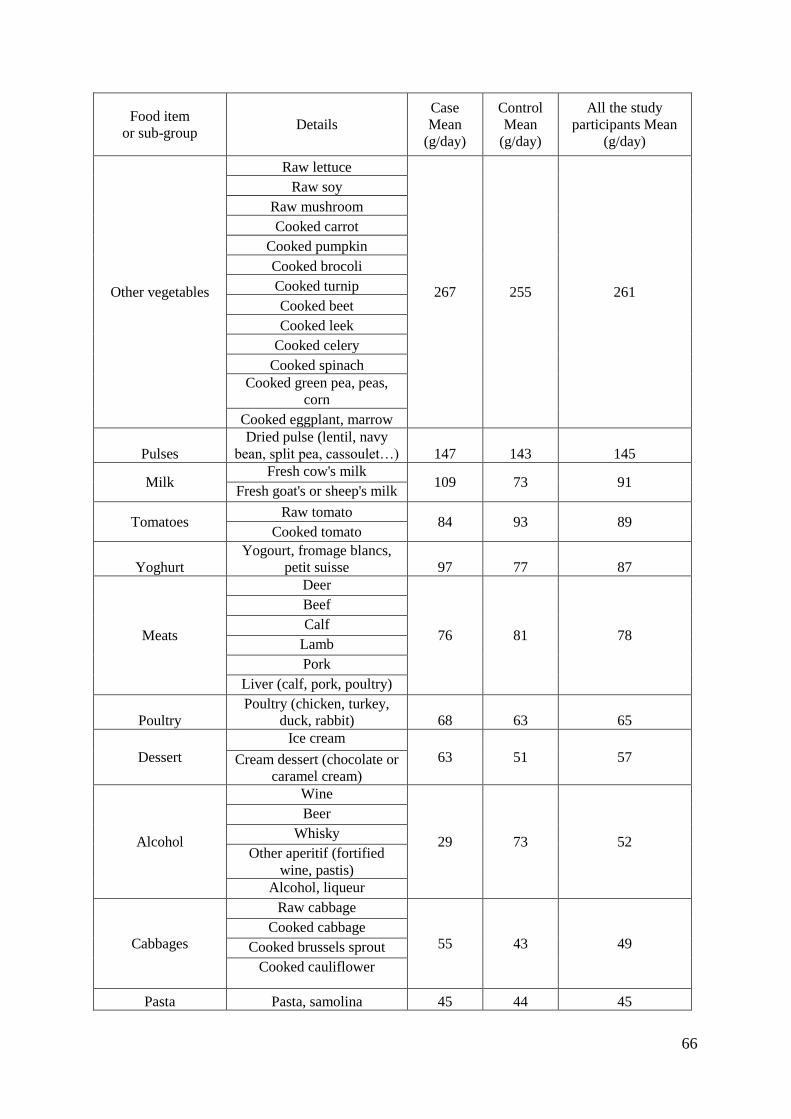
66
Food item
or sub-group Details
Case
Mean
(g/day)
Control
Mean
(g/day)
All the study
participants Mean
(g/day)
Other vegetables
Raw lettuce
267 255 261
Raw soy
Raw mushroom
Cooked carrot
Cooked pumpkin
Cooked brocoli
Cooked turnip
Cooked beet
Cooked leek
Cooked celery
Cooked spinach
Cooked green pea, peas,
corn
Cooked eggplant, marrow
Pulses
Dried pulse (lentil, navy
bean, split pea, cassoulet…) 147 143 145
Milk Fresh cow's milk
109 73 91 Fresh goat's or sheep's milk
Tomatoes Raw tomato
84 93 89 Cooked tomato
Yoghurt
Yogourt, fromage blancs,
petit suisse 97 77 87
Meats
Deer
76 81 78
Beef
Calf
Lamb
Pork
Liver (calf, pork, poultry)
Poultry
Poultry (chicken, turkey,
duck, rabbit) 68 63 65
Dessert
Ice cream
63 51 57 Cream dessert (chocolate or
caramel cream)
Alcohol
Wine
29 73 52
Beer
Whisky
Other aperitif (fortified
wine, pastis)
Alcohol, liqueur
Cabbages
Raw cabbage
55 43 49 Cooked cabbage
Cooked brussels sprout
Cooked cauliflower
Pasta Pasta, samolina 45 44 45
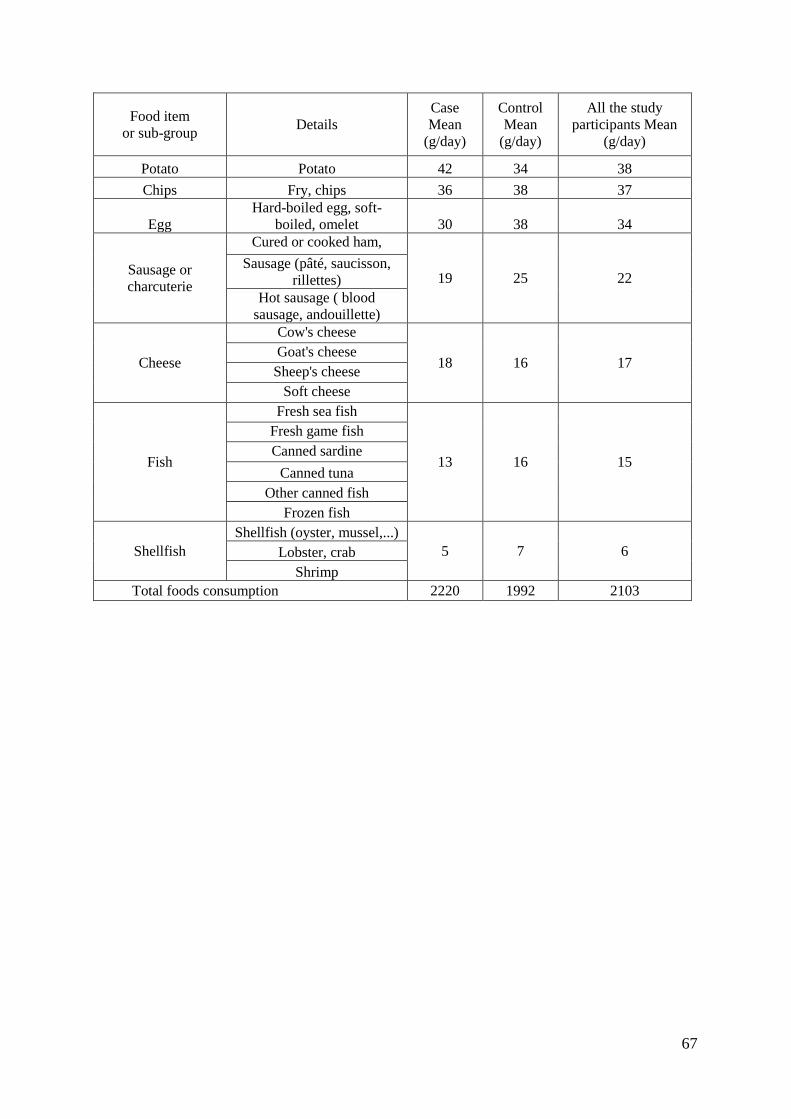
67
Food item
or sub-group Details
Case
Mean
(g/day)
Control
Mean
(g/day)
All the study
participants Mean
(g/day)
Potato Potato 42 34 38
Chips Fry, chips 36 38 37
Egg
Hard-boiled egg, soft-
boiled, omelet 30 38 34
Sausage or
charcuterie
Cured or cooked ham,
19 25 22 Sausage (pâté, saucisson,
rillettes)
Hot sausage ( blood
sausage, andouillette)
Cheese
Cow's cheese
18 16 17 Goat's cheese
Sheep's cheese
Soft cheese
Fish
Fresh sea fish
13 16 15
Fresh game fish
Canned sardine
Canned tuna
Other canned fish
Frozen fish
Shellfish
Shellfish (oyster, mussel,...)
5 7 6 Lobster, crab
Shrimp
Total foods consumption 2220 1992 2103
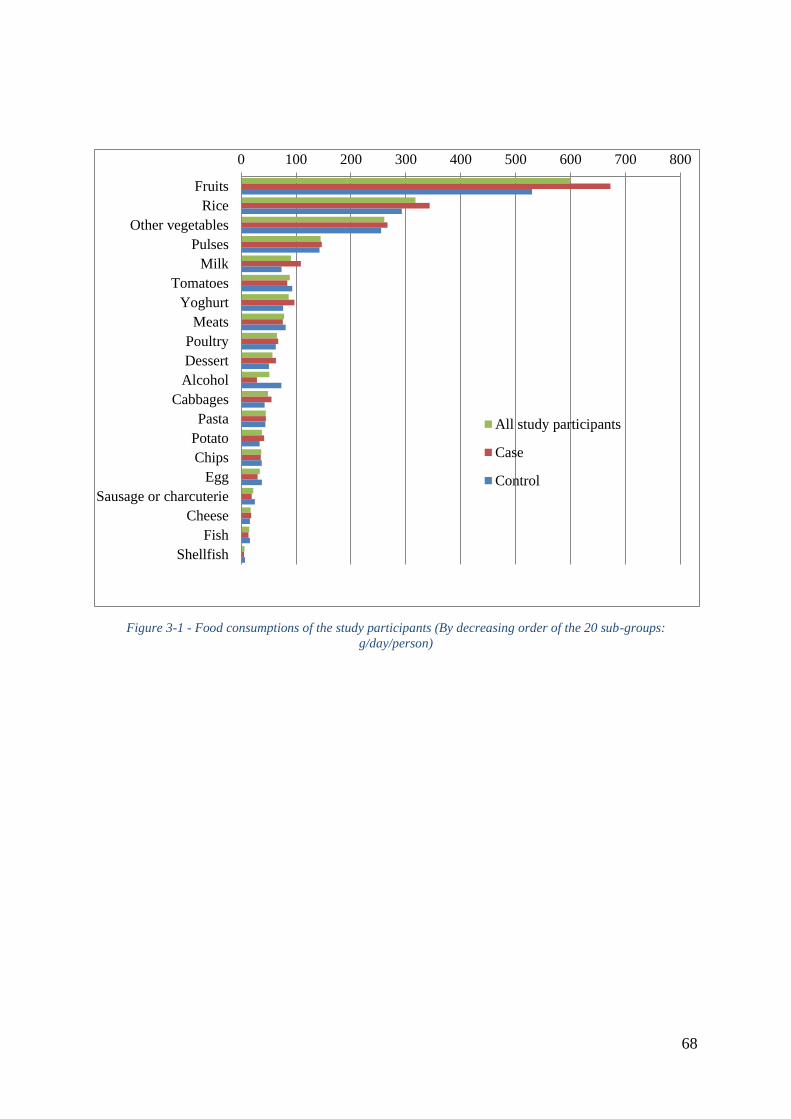
68
Figure 3-1 - Food consumptions of the study participants (By decreasing order of the 20 sub-groups: g/day/person)
0 100 200 300 400 500 600 700 800
Fruits
Rice
Other vegetables
Pulses
Milk
Tomatoes
Yoghurt
Meats
Poultry
Dessert
Alcohol
Cabbages
Pasta
Potato
Chips
Egg
Sausage or charcuterie
Cheese
Fish
Shellfish
All study participants
Case
Control
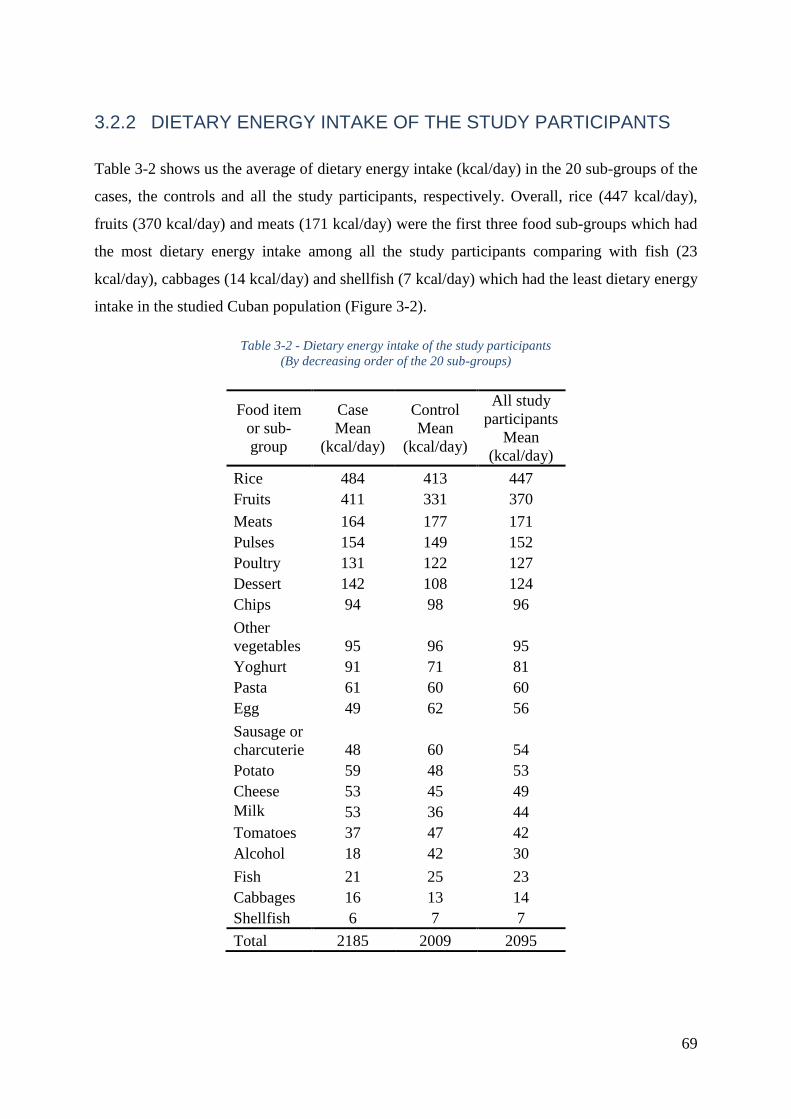
69
3.2.2 DIETARY ENERGY INTAKE OF THE STUDY PARTICIPANTS
Table 3-2 shows us the average of dietary energy intake (kcal/day) in the 20 sub-groups of the
cases, the controls and all the study participants, respectively. Overall, rice (447 kcal/day),
fruits (370 kcal/day) and meats (171 kcal/day) were the first three food sub-groups which had
the most dietary energy intake among all the study participants comparing with fish (23
kcal/day), cabbages (14 kcal/day) and shellfish (7 kcal/day) which had the least dietary energy
intake in the studied Cuban population (Figure 3-2).
Table 3-2 - Dietary energy intake of the study participants
(By decreasing order of the 20 sub-groups)
Food item
or sub-
group
Case
Mean
(kcal/day)
Control
Mean
(kcal/day)
All study
participants
Mean
(kcal/day)
Rice 484 413 447
Fruits 411 331 370
Meats 164 177 171
Pulses 154 149 152
Poultry 131 122 127
Dessert 142 108 124
Chips 94 98 96
Other
vegetables 95 96 95
Yoghurt 91 71 81
Pasta 61 60 60
Egg 49 62 56
Sausage or
charcuterie 48 60 54
Potato 59 48 53
Cheese 53 45 49
Milk 53 36 44
Tomatoes 37 47 42
Alcohol 18 42 30
Fish 21 25 23
Cabbages 16 13 14
Shellfish 6 7 7
Total 2185 2009 2095
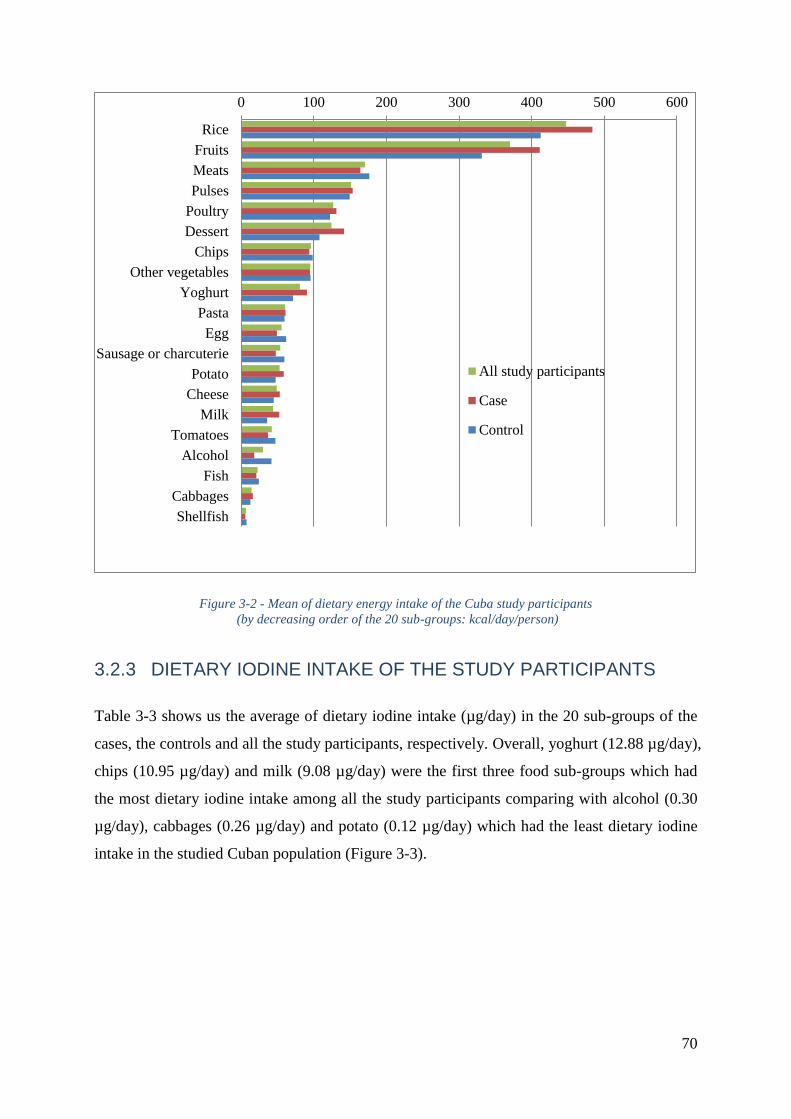
70
Figure 3-2 - Mean of dietary energy intake of the Cuba study participants
(by decreasing order of the 20 sub-groups: kcal/day/person)
3.2.3 DIETARY IODINE INTAKE OF THE STUDY PARTICIPANTS
Table 3-3 shows us the average of dietary iodine intake (µg/day) in the 20 sub-groups of the
cases, the controls and all the study participants, respectively. Overall, yoghurt (12.88 µg/day),
chips (10.95 µg/day) and milk (9.08 µg/day) were the first three food sub-groups which had
the most dietary iodine intake among all the study participants comparing with alcohol (0.30
µg/day), cabbages (0.26 µg/day) and potato (0.12 µg/day) which had the least dietary iodine
intake in the studied Cuban population (Figure 3-3).
0 100 200 300 400 500 600
Rice
Fruits
Meats
Pulses
Poultry
Dessert
Chips
Other vegetables
Yoghurt
Pasta
Egg
Sausage or charcuterie
Potato
Cheese
Milk
Tomatoes
Alcohol
Fish
Cabbages
Shellfish
All study participants
Case
Control
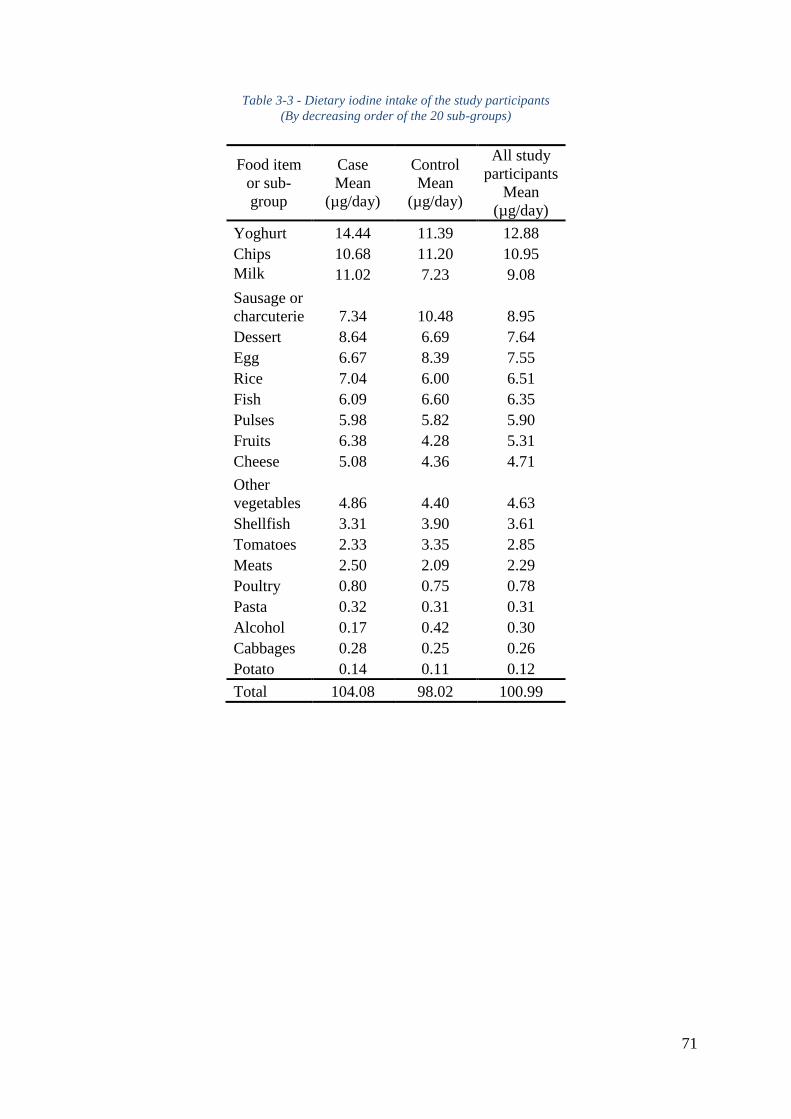
71
Table 3-3 - Dietary iodine intake of the study participants
(By decreasing order of the 20 sub-groups)
Food item
or sub-
group
Case
Mean
(µg/day)
Control
Mean
(µg/day)
All study
participants
Mean
(µg/day)
Yoghurt 14.44 11.39 12.88
Chips 10.68 11.20 10.95
Milk 11.02 7.23 9.08
Sausage or
charcuterie 7.34 10.48 8.95
Dessert 8.64 6.69 7.64
Egg 6.67 8.39 7.55
Rice 7.04 6.00 6.51
Fish 6.09 6.60 6.35
Pulses 5.98 5.82 5.90
Fruits 6.38 4.28 5.31
Cheese 5.08 4.36 4.71
Other
vegetables 4.86 4.40 4.63
Shellfish 3.31 3.90 3.61
Tomatoes 2.33 3.35 2.85
Meats 2.50 2.09 2.29
Poultry 0.80 0.75 0.78
Pasta 0.32 0.31 0.31
Alcohol 0.17 0.42 0.30
Cabbages 0.28 0.25 0.26
Potato 0.14 0.11 0.12
Total 104.08 98.02 100.99
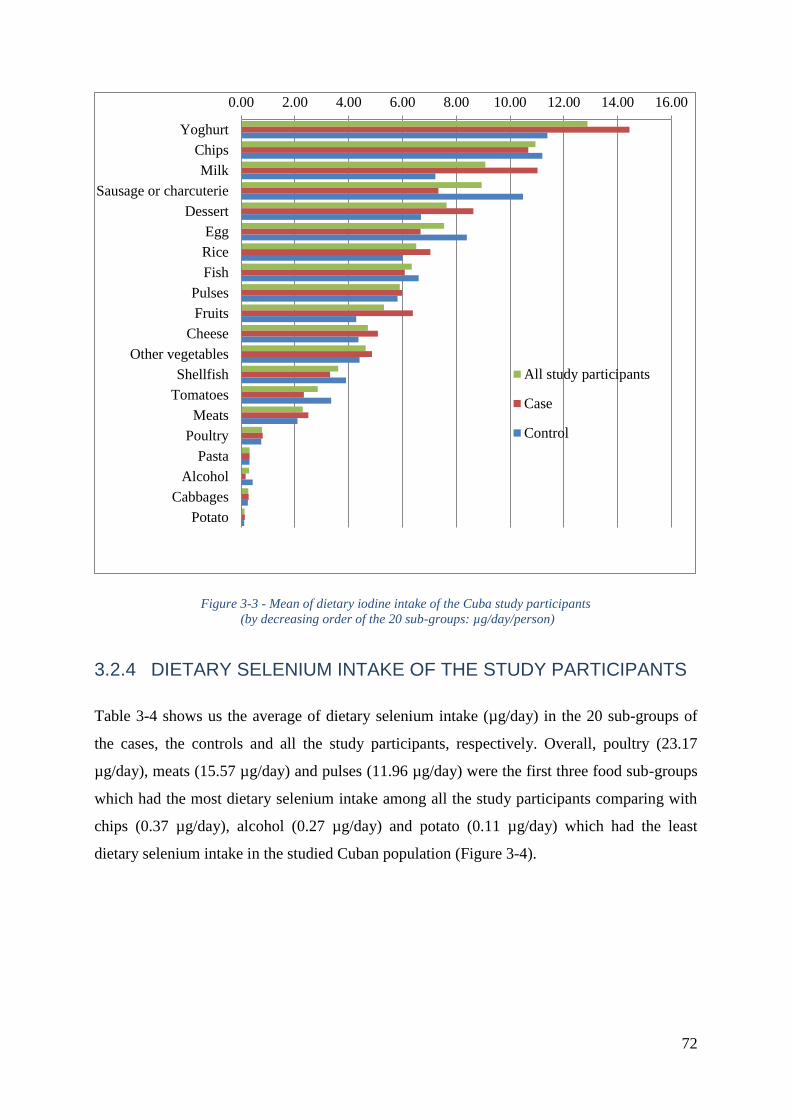
72
Figure 3-3 - Mean of dietary iodine intake of the Cuba study participants
(by decreasing order of the 20 sub-groups: µg/day/person)
3.2.4 DIETARY SELENIUM INTAKE OF THE STUDY PARTICIPANTS
Table 3-4 shows us the average of dietary selenium intake (µg/day) in the 20 sub-groups of
the cases, the controls and all the study participants, respectively. Overall, poultry (23.17
µg/day), meats (15.57 µg/day) and pulses (11.96 µg/day) were the first three food sub-groups
which had the most dietary selenium intake among all the study participants comparing with
chips (0.37 µg/day), alcohol (0.27 µg/day) and potato (0.11 µg/day) which had the least
dietary selenium intake in the studied Cuban population (Figure 3-4).
0.00 2.00 4.00 6.00 8.00 10.00 12.00 14.00 16.00
Yoghurt
Chips
Milk
Sausage or charcuterie
Dessert
Egg
Rice
Fish
Pulses
Fruits
Cheese
Other vegetables
Shellfish
Tomatoes
Meats
Poultry
Pasta
Alcohol
Cabbages
Potato
All study participants
Case
Control
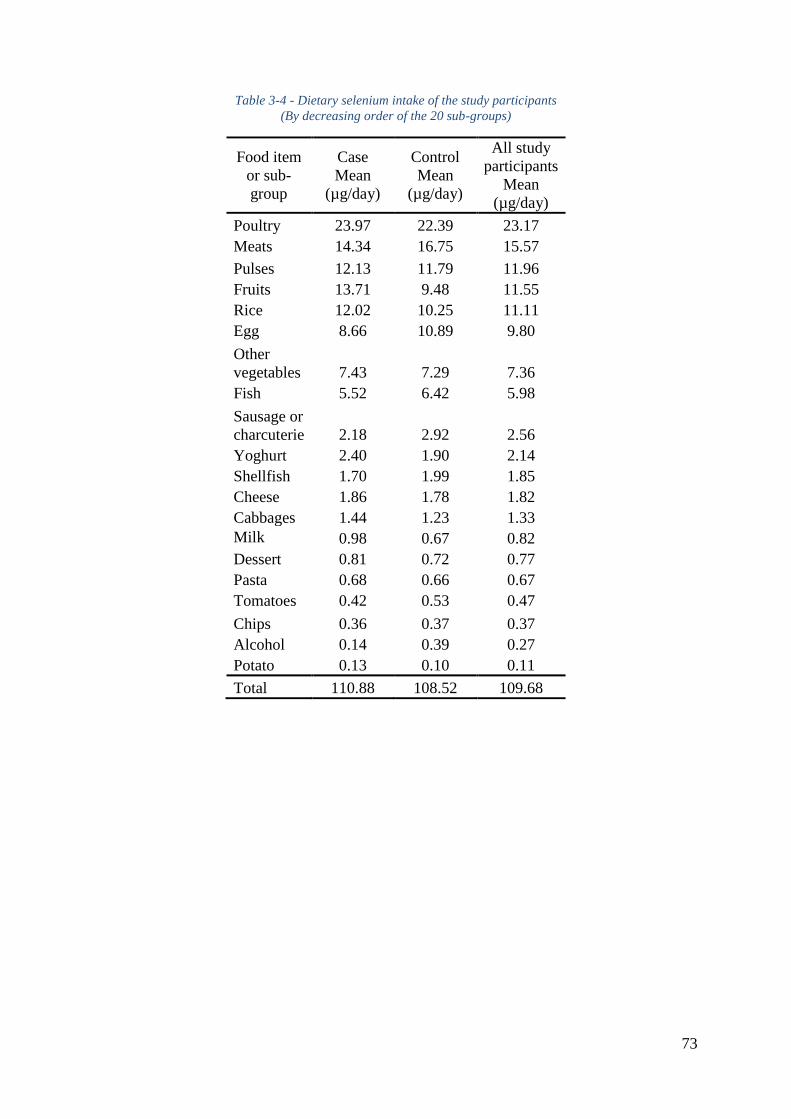
73
Table 3-4 - Dietary selenium intake of the study participants
(By decreasing order of the 20 sub-groups)
Food item
or sub-
group
Case
Mean
(µg/day)
Control
Mean
(µg/day)
All study
participants
Mean
(µg/day)
Poultry 23.97 22.39 23.17
Meats 14.34 16.75 15.57
Pulses 12.13 11.79 11.96
Fruits 13.71 9.48 11.55
Rice 12.02 10.25 11.11
Egg 8.66 10.89 9.80
Other
vegetables 7.43 7.29 7.36
Fish 5.52 6.42 5.98
Sausage or
charcuterie 2.18 2.92 2.56
Yoghurt 2.40 1.90 2.14
Shellfish 1.70 1.99 1.85
Cheese 1.86 1.78 1.82
Cabbages 1.44 1.23 1.33
Milk 0.98 0.67 0.82
Dessert 0.81 0.72 0.77
Pasta 0.68 0.66 0.67
Tomatoes 0.42 0.53 0.47
Chips 0.36 0.37 0.37
Alcohol 0.14 0.39 0.27
Potato 0.13 0.10 0.11
Total 110.88 108.52 109.68
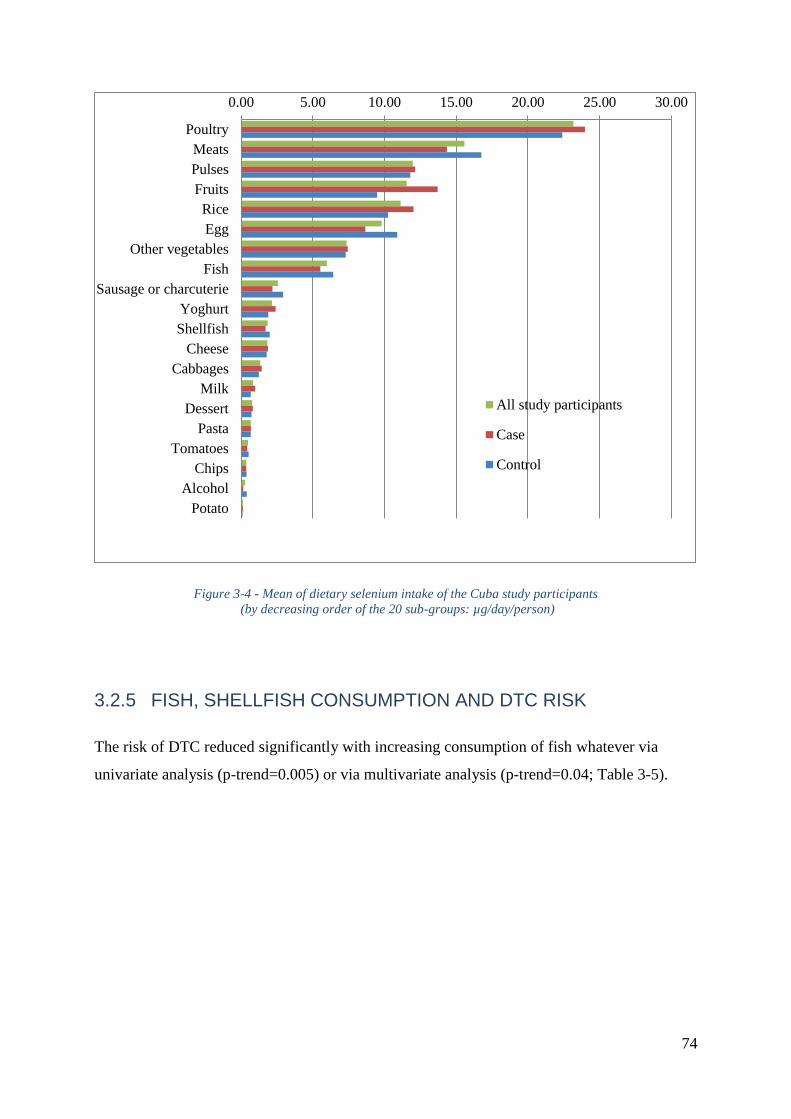
74
Figure 3-4 - Mean of dietary selenium intake of the Cuba study participants
(by decreasing order of the 20 sub-groups: µg/day/person)
3.2.5 FISH, SHELLFISH CONSUMPTION AND DTC RISK
The risk of DTC reduced significantly with increasing consumption of fish whatever via
univariate analysis (p-trend=0.005) or via multivariate analysis (p-trend=0.04; Table 3-5).
0.00 5.00 10.00 15.00 20.00 25.00 30.00
Poultry
Meats
Pulses
Fruits
Rice
Egg
Other vegetables
Fish
Sausage or charcuterie
Yoghurt
Shellfish
Cheese
Cabbages
Milk
Dessert
Pasta
Tomatoes
Chips
Alcohol
Potato
All study participants
Case
Control
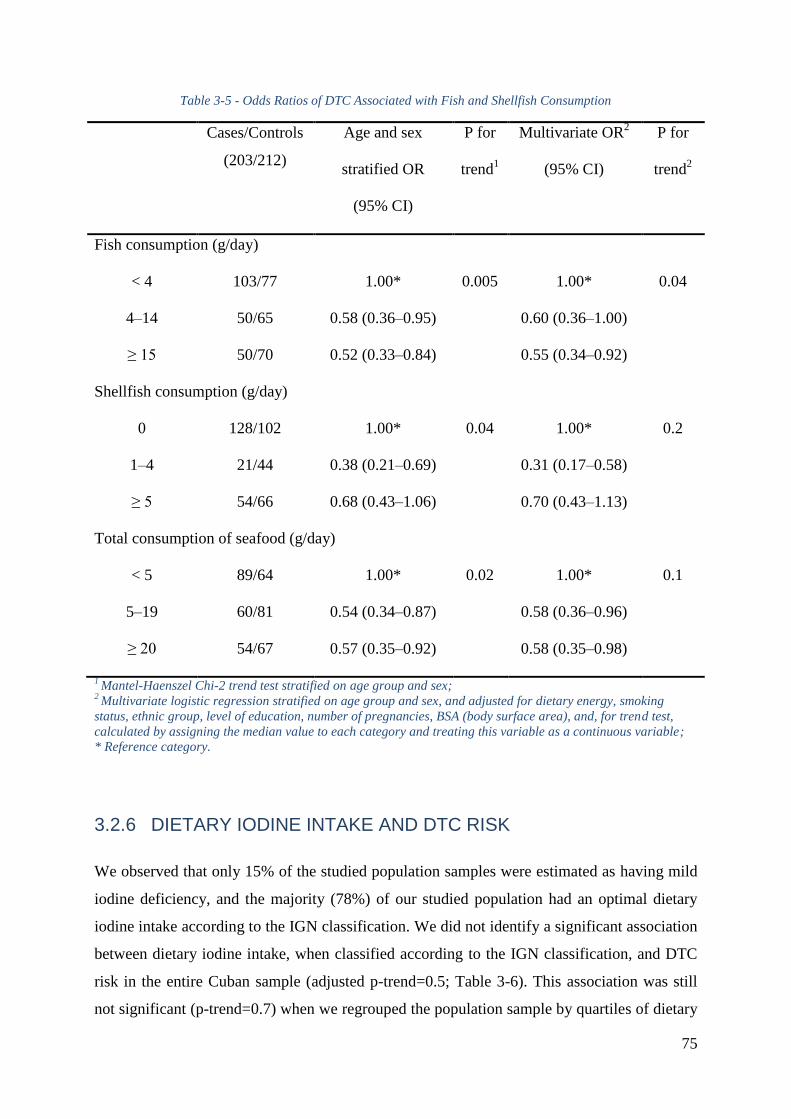
75
Table 3-5 - Odds Ratios of DTC Associated with Fish and Shellfish Consumption
Cases/Controls
(203/212)
Age and sex
stratified OR
(95% CI)
P for
trend1
Multivariate OR2
(95% CI)
P for
trend2
Fish consumption (g/day)
< 4 103/77 1.00* 0.005 1.00* 0.04
4Ŕ14 50/65 0.58 (0.36Ŕ0.95) 0.60 (0.36Ŕ1.00)
≥ 15 50/70 0.52 (0.33Ŕ0.84) 0.55 (0.34Ŕ0.92)
Shellfish consumption (g/day)
0 128/102 1.00* 0.04 1.00* 0.2
1Ŕ4 21/44 0.38 (0.21Ŕ0.69) 0.31 (0.17Ŕ0.58)
≥ 5 54/66 0.68 (0.43Ŕ1.06) 0.70 (0.43Ŕ1.13)
Total consumption of seafood (g/day)
< 5 89/64 1.00* 0.02 1.00* 0.1
5Ŕ19 60/81 0.54 (0.34Ŕ0.87) 0.58 (0.36Ŕ0.96)
≥ 20 54/67 0.57 (0.35Ŕ0.92) 0.58 (0.35Ŕ0.98)
1 Mantel-Haenszel Chi-2 trend test stratified on age group and sex;
2 Multivariate logistic regression stratified on age group and sex, and adjusted for dietary energy, smoking
status, ethnic group, level of education, number of pregnancies, BSA (body surface area), and, for trend test,
calculated by assigning the median value to each category and treating this variable as a continuous variable;
* Reference category.
3.2.6 DIETARY IODINE INTAKE AND DTC RISK
We observed that only 15% of the studied population samples were estimated as having mild
iodine deficiency, and the majority (78%) of our studied population had an optimal dietary
iodine intake according to the IGN classification. We did not identify a significant association
between dietary iodine intake, when classified according to the IGN classification, and DTC
risk in the entire Cuban sample (adjusted p-trend=0.5; Table 3-6). This association was still
not significant (p-trend=0.7) when we regrouped the population sample by quartiles of dietary
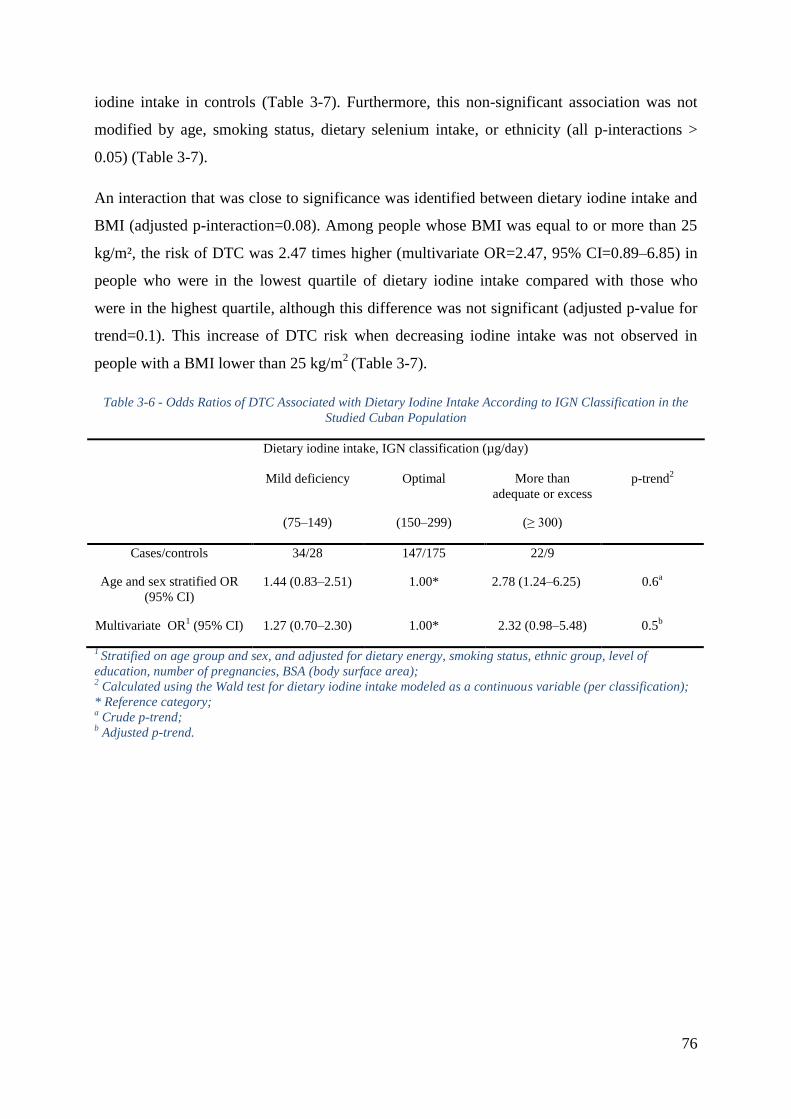
76
iodine intake in controls (Table 3-7). Furthermore, this non-significant association was not
modified by age, smoking status, dietary selenium intake, or ethnicity (all p-interactions >
0.05) (Table 3-7).
An interaction that was close to significance was identified between dietary iodine intake and
BMI (adjusted p-interaction=0.08). Among people whose BMI was equal to or more than 25
kg/m², the risk of DTC was 2.47 times higher (multivariate OR=2.47, 95% CI=0.89Ŕ6.85) in
people who were in the lowest quartile of dietary iodine intake compared with those who
were in the highest quartile, although this difference was not significant (adjusted p-value for
trend=0.1). This increase of DTC risk when decreasing iodine intake was not observed in
people with a BMI lower than 25 kg/m2
(Table 3-7).
Table 3-6 - Odds Ratios of DTC Associated with Dietary Iodine Intake According to IGN Classification in the
Studied Cuban Population
Dietary iodine intake, IGN classification (µg/day)
Mild deficiency Optimal More than
adequate or excess
p-trend2
(75Ŕ149) (150Ŕ299) (≥ 300)
Cases/controls 34/28 147/175 22/9
Age and sex stratified OR
(95% CI)
1.44 (0.83Ŕ2.51) 1.00* 2.78 (1.24Ŕ6.25) 0.6a
Multivariate OR1 (95% CI) 1.27 (0.70Ŕ2.30) 1.00* 2.32 (0.98Ŕ5.48) 0.5
b
1 Stratified on age group and sex, and adjusted for dietary energy, smoking status, ethnic group, level of
education, number of pregnancies, BSA (body surface area); 2 Calculated using the Wald test for dietary iodine intake modeled as a continuous variable (per classification);
* Reference category; a Crude p-trend;
b Adjusted p-trend.
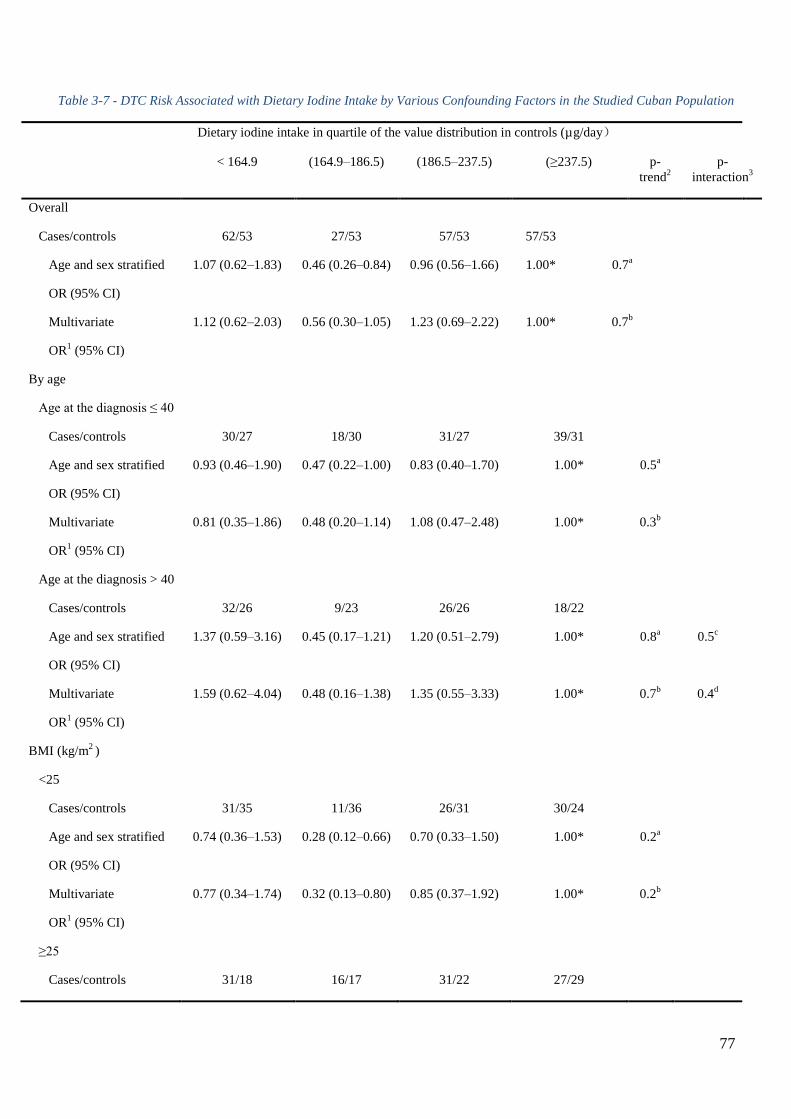
77
Table 3-7 - DTC Risk Associated with Dietary Iodine Intake by Various Confounding Factors in the Studied Cuban Population
Dietary iodine intake in quartile of the value distribution in controls (µg/day)
< 164.9 (164.9Ŕ186.5) (186.5Ŕ237.5) (≥237.5) p-
trend2
p-
interaction3
Overall
Cases/controls 62/53 27/53 57/53 57/53
Age and sex stratified
OR (95% CI)
1.07 (0.62Ŕ1.83) 0.46 (0.26Ŕ0.84) 0.96 (0.56Ŕ1.66) 1.00* 0.7a
Multivariate
OR1 (95% CI)
1.12 (0.62Ŕ2.03) 0.56 (0.30Ŕ1.05) 1.23 (0.69Ŕ2.22) 1.00* 0.7b
By age
Age at the diagnosis ≤ 40
Cases/controls 30/27 18/30 31/27 39/31
Age and sex stratified
OR (95% CI)
0.93 (0.46Ŕ1.90) 0.47 (0.22Ŕ1.00) 0.83 (0.40Ŕ1.70) 1.00* 0.5a
Multivariate
OR1 (95% CI)
0.81 (0.35Ŕ1.86) 0.48 (0.20Ŕ1.14) 1.08 (0.47Ŕ2.48) 1.00* 0.3b
Age at the diagnosis > 40
Cases/controls 32/26 9/23 26/26 18/22
Age and sex stratified
OR (95% CI)
1.37 (0.59Ŕ3.16) 0.45 (0.17Ŕ1.21) 1.20 (0.51Ŕ2.79) 1.00* 0.8a 0.5
c
Multivariate
OR1 (95% CI)
1.59 (0.62Ŕ4.04) 0.48 (0.16Ŕ1.38) 1.35 (0.55Ŕ3.33) 1.00* 0.7b 0.4
d
BMI (kg/m2 )
<25
Cases/controls 31/35 11/36 26/31 30/24
Age and sex stratified
OR (95% CI)
0.74 (0.36Ŕ1.53) 0.28 (0.12Ŕ0.66) 0.70 (0.33Ŕ1.50) 1.00* 0.2a
Multivariate
OR1 (95% CI)
0.77 (0.34Ŕ1.74) 0.32 (0.13Ŕ0.80) 0.85 (0.37Ŕ1.92) 1.00* 0.2b
≥25
Cases/controls 31/18 16/17 31/22 27/29
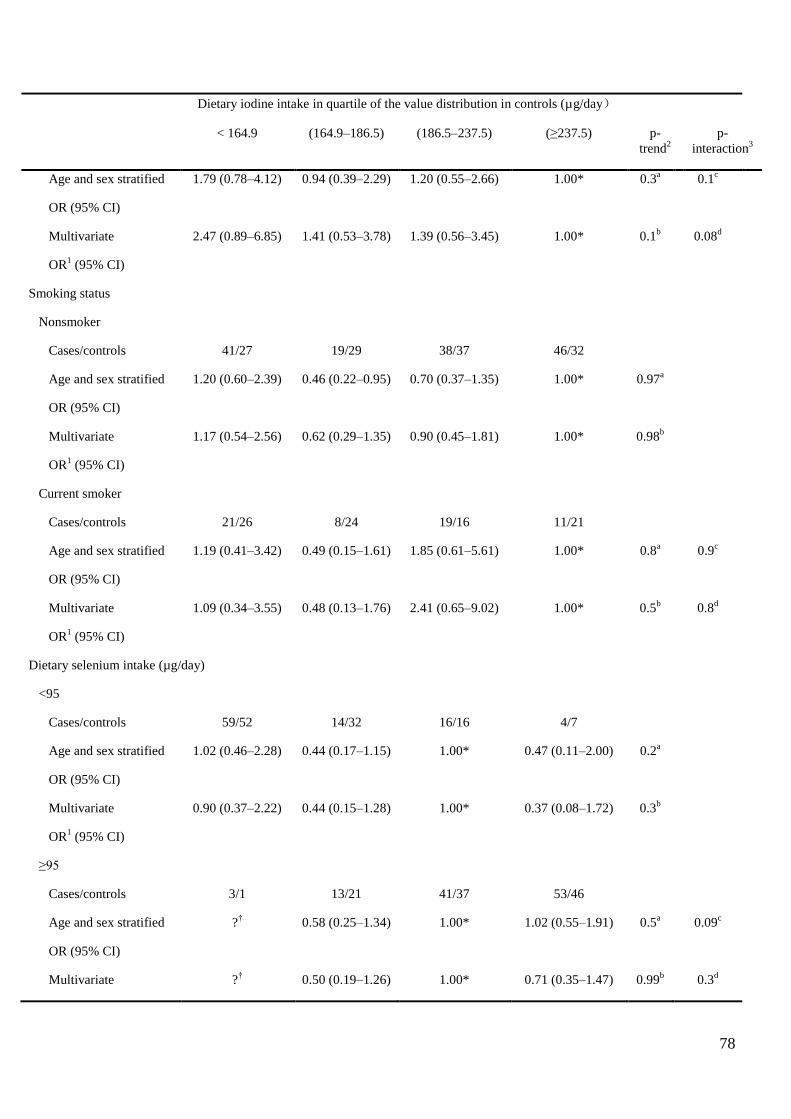
78
Dietary iodine intake in quartile of the value distribution in controls (µg/day)
< 164.9 (164.9Ŕ186.5) (186.5Ŕ237.5) (≥237.5) p-
trend2
p-
interaction3
Age and sex stratified
OR (95% CI)
1.79 (0.78Ŕ4.12) 0.94 (0.39Ŕ2.29) 1.20 (0.55Ŕ2.66) 1.00* 0.3a 0.1
c
Multivariate
OR1 (95% CI)
2.47 (0.89Ŕ6.85) 1.41 (0.53Ŕ3.78) 1.39 (0.56Ŕ3.45) 1.00* 0.1b 0.08
d
Smoking status
Nonsmoker
Cases/controls 41/27 19/29 38/37 46/32
Age and sex stratified
OR (95% CI)
1.20 (0.60Ŕ2.39) 0.46 (0.22Ŕ0.95) 0.70 (0.37Ŕ1.35) 1.00* 0.97a
Multivariate
OR1 (95% CI)
1.17 (0.54Ŕ2.56) 0.62 (0.29Ŕ1.35) 0.90 (0.45Ŕ1.81) 1.00* 0.98b
Current smoker
Cases/controls 21/26 8/24 19/16 11/21
Age and sex stratified
OR (95% CI)
1.19 (0.41Ŕ3.42) 0.49 (0.15Ŕ1.61) 1.85 (0.61Ŕ5.61) 1.00* 0.8a 0.9
c
Multivariate
OR1 (95% CI)
1.09 (0.34Ŕ3.55) 0.48 (0.13Ŕ1.76) 2.41 (0.65Ŕ9.02) 1.00* 0.5b 0.8
d
Dietary selenium intake (µg/day)
<95
Cases/controls 59/52 14/32 16/16 4/7
Age and sex stratified
OR (95% CI)
1.02 (0.46Ŕ2.28) 0.44 (0.17Ŕ1.15) 1.00* 0.47 (0.11Ŕ2.00) 0.2a
Multivariate
OR1 (95% CI)
0.90 (0.37Ŕ2.22) 0.44 (0.15Ŕ1.28) 1.00* 0.37 (0.08Ŕ1.72) 0.3b
≥95
Cases/controls 3/1 13/21 41/37 53/46
Age and sex stratified
OR (95% CI)
?† 0.58 (0.25Ŕ1.34) 1.00* 1.02 (0.55Ŕ1.91) 0.5
a 0.09
c
Multivariate ?† 0.50 (0.19Ŕ1.26) 1.00* 0.71 (0.35Ŕ1.47) 0.99
b 0.3
d
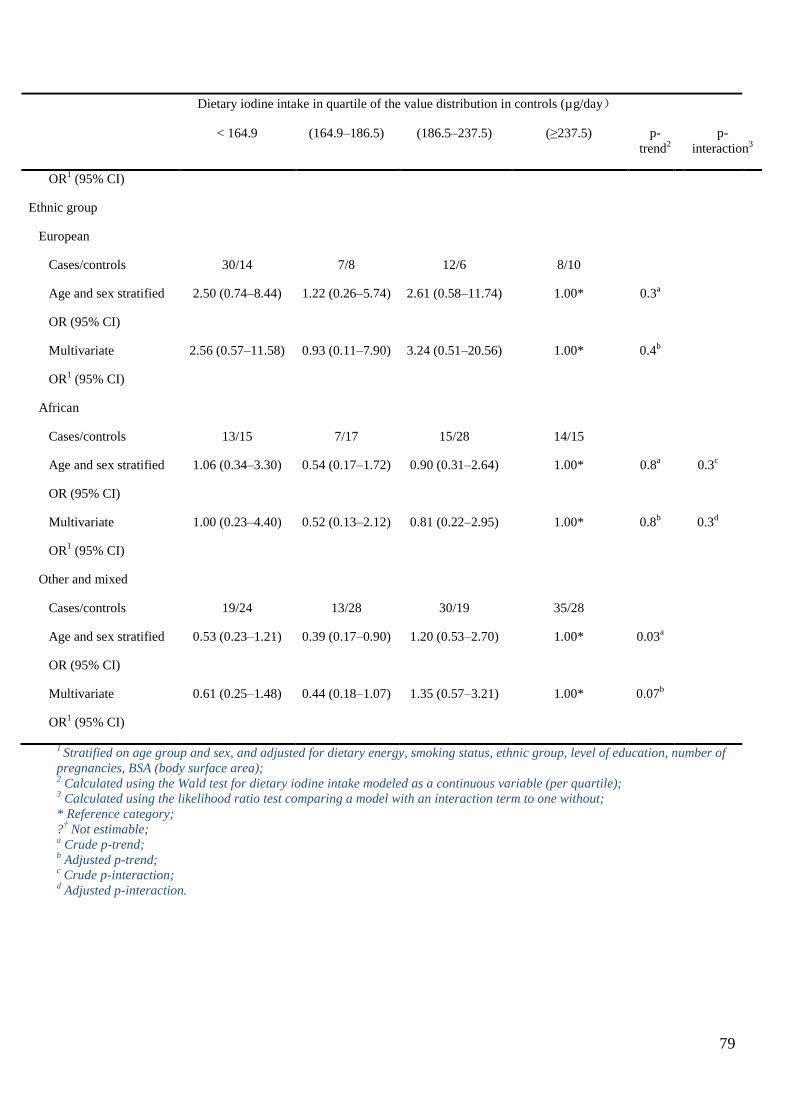
79
Dietary iodine intake in quartile of the value distribution in controls (µg/day)
< 164.9 (164.9Ŕ186.5) (186.5Ŕ237.5) (≥237.5) p-
trend2
p-
interaction3
OR1 (95% CI)
Ethnic group
European
Cases/controls 30/14 7/8 12/6 8/10
Age and sex stratified
OR (95% CI)
2.50 (0.74Ŕ8.44) 1.22 (0.26Ŕ5.74) 2.61 (0.58Ŕ11.74) 1.00* 0.3a
Multivariate
OR1 (95% CI)
2.56 (0.57Ŕ11.58) 0.93 (0.11Ŕ7.90) 3.24 (0.51Ŕ20.56) 1.00* 0.4b
African
Cases/controls 13/15 7/17 15/28 14/15
Age and sex stratified
OR (95% CI)
1.06 (0.34Ŕ3.30) 0.54 (0.17Ŕ1.72) 0.90 (0.31Ŕ2.64) 1.00* 0.8a 0.3
c
Multivariate
OR1 (95% CI)
1.00 (0.23Ŕ4.40) 0.52 (0.13Ŕ2.12) 0.81 (0.22Ŕ2.95) 1.00* 0.8b 0.3
d
Other and mixed
Cases/controls 19/24 13/28 30/19 35/28
Age and sex stratified
OR (95% CI)
0.53 (0.23Ŕ1.21) 0.39 (0.17Ŕ0.90) 1.20 (0.53Ŕ2.70) 1.00* 0.03a
Multivariate
OR1 (95% CI)
0.61 (0.25Ŕ1.48) 0.44 (0.18Ŕ1.07) 1.35 (0.57Ŕ3.21) 1.00* 0.07b
1 Stratified on age group and sex, and adjusted for dietary energy, smoking status, ethnic group, level of education, number of
pregnancies, BSA (body surface area); 2 Calculated using the Wald test for dietary iodine intake modeled as a continuous variable (per quartile);
3 Calculated using the likelihood ratio test comparing a model with an interaction term to one without;
* Reference category;
?† Not estimable;
a Crude p-trend;
b Adjusted p-trend;
c Crude p-interaction;
d Adjusted p-interaction.
80
3.2.7 FOXE1 POLYMORPHISM INTERACTS WITH DIETARY IODINE
INTAKE IN DTC RISK
We did not find any interaction between dietary iodine intake and the following
polymorphisms, rs944289, rs1867277 and rs71369530 in the risk of developing DTC.
Conversely, a strong interaction (multivariate p-interaction=0.005) was identified between
dietary iodine intake and rs965513, near the FOXE1 gene on chromosome 9q22.33 (Table
3-8). A strong increased DTC risk was observed with the number of copies in the minor allele
(A) of rs965513 among people who consumed less iodine than the median (< 186 µg/day).
The risk of DTC was 3.4 times higher (adjusted p-trend=0.0005, 95% CI=1.7Ŕ6.5) for
subjects carrying one copy of the A allele, and 6.7 times higher (adjusted p-trend=0.0005, 95%
CI=1.6Ŕ27.3) for subjects carrying two copies of the A allele when compared to the reference
group of subjects with no copies in the minor allele (A). This dose effect with regard to the
DTC risk with the increasing number of copies in the A allele was not observed in subjects
consuming more iodine than the median (> 186 µg/day); independent of the number of copies
in the minor allele (A), the risk of DTC was around three times higher than that of the
reference group whose subjects were not carrying any A allele and had a dietary iodine intake
below the median (Table 3-8).
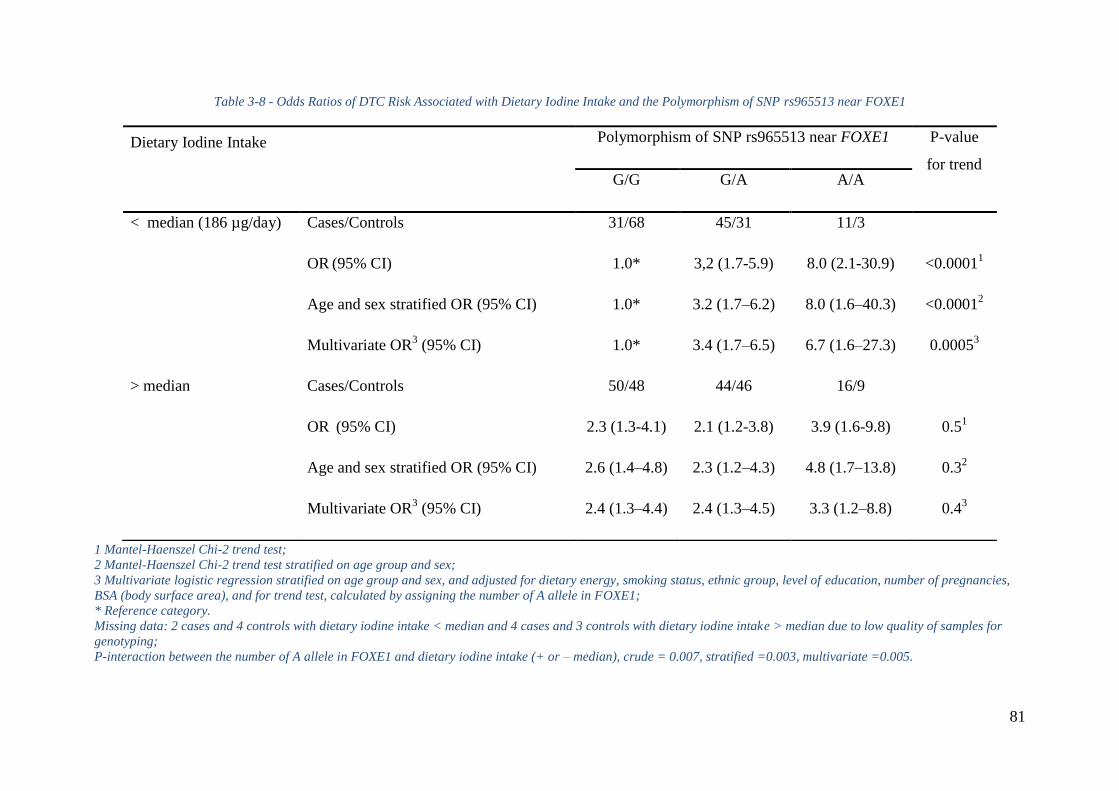
81
Table 3-8 - Odds Ratios of DTC Risk Associated with Dietary Iodine Intake and the Polymorphism of SNP rs965513 near FOXE1
1 Mantel-Haenszel Chi-2 trend test;
2 Mantel-Haenszel Chi-2 trend test stratified on age group and sex;
3 Multivariate logistic regression stratified on age group and sex, and adjusted for dietary energy, smoking status, ethnic group, level of education, number of pregnancies,
BSA (body surface area), and for trend test, calculated by assigning the number of A allele in FOXE1;
* Reference category.
Missing data: 2 cases and 4 controls with dietary iodine intake < median and 4 cases and 3 controls with dietary iodine intake > median due to low quality of samples for
genotyping;
P-interaction between the number of A allele in FOXE1 and dietary iodine intake (+ or – median), crude = 0.007, stratified =0.003, multivariate =0.005.
Dietary Iodine Intake
Polymorphism of SNP rs965513 near FOXE1 P-value
for trend G/G G/A A/A
< median (186 µg/day) Cases/Controls 31/68 45/31 11/3
OR (95% CI) 1.0* 3,2 (1.7-5.9) 8.0 (2.1-30.9) <0.0001
1
Age and sex stratified OR (95% CI) 1.0* 3.2 (1.7Ŕ6.2) 8.0 (1.6Ŕ40.3) <0.00012
Multivariate OR3 (95% CI) 1.0* 3.4 (1.7Ŕ6.5) 6.7 (1.6Ŕ27.3) 0.0005
3
> median Cases/Controls 50/48 44/46 16/9
OR (95% CI) 2.3 (1.3-4.1) 2.1 (1.2-3.8) 3.9 (1.6-9.8) 0.5
1
Age and sex stratified OR (95% CI) 2.6 (1.4Ŕ4.8) 2.3 (1.2Ŕ4.3) 4.8 (1.7Ŕ13.8) 0.32
Multivariate OR3 (95% CI) 2.4 (1.3Ŕ4.4) 2.4 (1.3Ŕ4.5) 3.3 (1.2Ŕ8.8) 0.4
3
82
3.3 DISCUSSION
3.3.1 SUMMARY OF THE RESULTS
We have observed that the risk of DTC significantly decreased with increasing consumption
of fish in the Cuban population. In addition, we found a strong increase in DTC risk with the
number of copies in the minor allele (A) of rs965513 near FOXE1 on chromosome 9q22.33
among people who consumed less than the median value of iodine in controls. Furthermore,
the risk of DTC tended to be higher among people whose BMI was equal to or more than 25
kg/m² and who were in the lowest quartile of dietary iodine intake.
3.3.2 STRENGTHS AND LIMITATIONS OF THE STUDY
The present study is the first case-control study to focus on the risk factors of DTC in the
Cuban population. We used the food photo booklet from the E3N cohort (140) in this study in
order to estimate the portions of food and drink daily consumption by the study cohort, which
complemented the quantificational questionnaire and gave us normative, accurate and
qualitative information on which to build the database. Another noteworthy point is that we
have constructed a special food composition table to measure the quantity of iodine in typical
Cuban food for this study. However, only 28% of the food items in the questionnaire of this
study were measured using this special and innovative table, knowing that until now, no such
measurement of iodine has been made by other organizations for typical Cuban or Latino food.
This case-control study has for the first time identified a strong increase in DTC risk
associated with the number of copies in the minor allele (A) of SNP rs965513, near FOXE1 at
9q22.33, among people who consumed less iodine than the median, but no variation among
people who consumed more (multivariate P-interaction=0.005). To the best of my knowledge,
gene-environment interactions in DTC have only been investigated in relation to radiation
exposure in a candidate gene approach, but no convincing association has been reported so far.
In particular, no gene-environment interaction study has investigated an association with
FOXE1 (at 9q22.33) and dietary iodine intake.
As with any case-control study, this study has some limitations. Self-reported food
consumption is associated with imprecise measures and recall bias. Another limitation is that
83
for a large part of the Cuban diet, we estimated iodine content from the CIQUAL 2013 food
composition table, which had been established for French food, and may not be applicable to
Cuban food. The French CIQUAL 2013 food composition table was used in this study in
order to evaluate the iodine content in fish and shellfish. This could introduce some
uncertainties. Nevertheless, the iodine content in fish is highly variable even in one country
(182). It depends strongly on the species and the places of capture, and most of the sea fish
consumed in Cuba are from areas far away from Cuban coasts. Given the low number of fish
captured by Cuban boats and low fish consumption in Cuba, the difficulty in measuring the
iodine content in fish, and the cost-effectiveness of this study, we did not measure the iodine
content in either Cuban fish or shellfish.
Moreover, because cases usually take more care of their health and are more motivated to
participate in research studies than controls, the cases may have reported more precise
information than the controls did, and this could have introduced a differential bias in the final
results and overestimated the risk of DTC. Nevertheless, this potential bias cannot explain the
significant relation between the number of copies in the minor allele (A) of rs965513 and the
risk of DTC among people who consumed less iodine than the median. Indeed, it is very
unlikely that our finding regarding an interaction between SNP rs965513 and iodine intake
was due to chance because it remained present when correcting the p-value for the number of
SNPs tested, which was four SNPs in the analyses (183). Additionally, this result was almost
exactly identical when adjusting or not for other DTC risk factors and stratifying or not for
age groups and sex. Lastly, recall bias was probably reduced by the fact that food import and
export limitations exist in Cuba, which keeps the typical Cuban food more stable and less
diversified than Western food.
According to the IGN classification, an optimal iodine intake corresponds to 150Ŕ299 µg/day
(181). The quartiles of the dietary iodine intake in the controls in this study were: < 164.9,
164.9Ŕ186.5, 186.5Ŕ237.5 and ≥ 237.5 µg/day. The last three quartiles cover the optimal
iodine intake, as well as more than adequate or excess iodine intake. However, a case-control
study using a food frequency questionnaire is not an adequate way to estimate iodine status
(because a case-control study without iodine measurement in urine is not designed to estimate
the iodine status of a population, but to perform comparisons between the cases and the
controls).
84
3.3.3 COMPARISON RESULTS FROM THE LITERATURE
This study shows that in the Cuban population, the risk of DTC significantly decreased with
the increasing consumption of fish at the time of the interview (Table 3-5). This important
finding is in line with another case-control study, which was carried out in French Polynesia
(105). A meta-analysis of 19 observational studies on dietary factors and thyroid cancer risk
summarized the ORs for each risk factor. Based on the highest level of total consumption
versus the lowest level, the aggregate OR (95% CI) of thyroid cancer was 0.79 (0.66, 0.94)
for fish consumption. Subgroup analysis showed that fish (OR=0.74, 95% CI=0.59Ŕ0.92) and
shellfish (OR=0.46, 95% CI=0.27Ŕ0.75) consumption has a protective effect in iodine-
deficient areas (111). Another related review showed that iodine-rich food such as fish and
shellfish may provide a protective role in populations with insufficient daily iodine intake
(184). In contrast, a Japanese cohort where subjects were followed up for a mean of 14.5
years showed that a high intake of seaweed was positively associated with thyroid cancer risk,
although this result was not statistically significant. In addition, a high intake of seaweed was
positively associated with papillary thyroid cancer risk in postmenopausal women (especially
for papillary carcinoma, the hazard ratio (HR) for almost daily consumption compared with 2
days/week or less was 3.81, 95% CI: 1.67Ŕ8.68; p-trend<0.01) (185).
First-degree relatives of DTC patients have an increased risk for developing thyroid cancer,
and a positive family history is reported in approximately 5% of cases (38, 186, 187, 188).
These observations strongly suggest the contribution of genetic factors to the susceptibility to
the disease. Six potential regions for harboring a high-risk DTC gene have been identified
through family-based linkage studies in the early 2000s: MNG1 (14q32) (189), TCO (19p13.2)
(190,191), fPTC/PRN (1q21) (192), NMTC1 (2q21) (193), FTEN (8p23.1-p22) (194), and the
telomere-telomerase complex (195). More recently, population-based studies, particularly
GWASs, have identified and replicated susceptibility loci at 9q22, 14q13, 2q35 and 8p12
(196). In a previous study, in the same sample of the Cuban population, we validated the
association between DTC risk and variants of genes localized at 9q22.33 (FOXE1) and
14q13.3 (NKX2-1) (48). The FOXE1 locus is the most widely replicated susceptibility locus
associated with DTC risk in a number of population-based studies of various ethnic origins,
especially associated with sporadic and radiation-related papillary thyroid cancer and also
with familial nonmedullary thyroid carcinoma (197, 198).
85
The majority of the studied population had an optimal dietary iodine intake. If this result was
confirmed by other studies, it would emphasize the effectiveness of the compulsory public
health policy by using iodized salt in urban, rural and mountainous areas of Cuba. A cross-
sectional study to assess the effectiveness of this program through determination of UIC and
goiter prevalence has been previously completed in Cuban schoolchildren aged 6 to 11 years
in 2011Ŕ2012. The results of this study by Terry-Berro et al. showed that the median UIC was
176.3 µg/L (199). Only 7.6% of the children showed iodine deficiency (2.2% had severe
deficiency <50 µg/L) and 15.3% had an UIC above 300 µg/L. The prevalence of optimal
iodine nutrition was 43.5% (52.5% in mountain areas). The overall goiter prevalence was
17.6%, which reflects mild endemic goiter. However, in mountain areas, the prevalence of
goiter was 32.6% (severe endemic goiter). The authors concluded that iodine deficiency is no
longer a public health problem in urban and rural areas of Cuba, which is attributable to
successful salt iodization. Nevertheless, high goiter rates are still observed in mountain areas.
In a comprehensive synthesis of animal and human studies (106), Zimmermann et al.
concluded that iodine deficiency increases DTC risk. However, the present study does not
have enough participants in the moderate iodine deficiency group to verify this conclusion
with sufficient statistical power.
3.4 CONCLUSION
In conclusion, the majority of the studied population had an optimal dietary iodine intake.
Although DTC risk was not found to be linked to dietary iodine intake in this study, DTC risk
significantly decreased with high fish consumption. Additionally, DTC risk significantly
increased with an increasing number of copies in the minor allele (A) of rs965513 near
FOXE1 among people who consumed less iodine than the median. Because these findings are
based on post-diagnostic measures, studies with pre-diagnostic dietary iodine are needed for
confirmation.
86
4 PART IV: DIETARY IODINE INTAKE AND
DIFFERENTIATED THYROID CANCER RISK: A
POOLED ANALYSIS OF THE 5 CASE-CONTROL
STUDIES FROM EPI-THYR CONSORTIUM
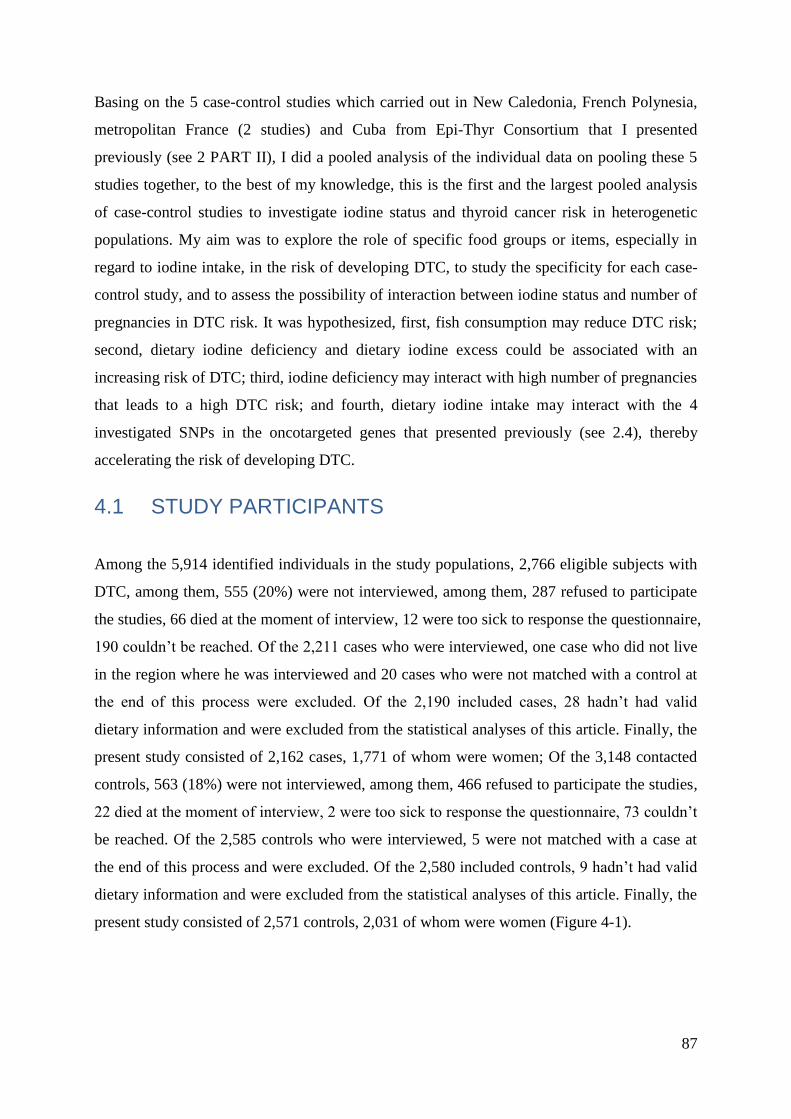
87
Basing on the 5 case-control studies which carried out in New Caledonia, French Polynesia,
metropolitan France (2 studies) and Cuba from Epi-Thyr Consortium that I presented
previously (see 2 PART II), I did a pooled analysis of the individual data on pooling these 5
studies together, to the best of my knowledge, this is the first and the largest pooled analysis
of case-control studies to investigate iodine status and thyroid cancer risk in heterogenetic
populations. My aim was to explore the role of specific food groups or items, especially in
regard to iodine intake, in the risk of developing DTC, to study the specificity for each case-
control study, and to assess the possibility of interaction between iodine status and number of
pregnancies in DTC risk. It was hypothesized, first, fish consumption may reduce DTC risk;
second, dietary iodine deficiency and dietary iodine excess could be associated with an
increasing risk of DTC; third, iodine deficiency may interact with high number of pregnancies
that leads to a high DTC risk; and fourth, dietary iodine intake may interact with the 4
investigated SNPs in the oncotargeted genes that presented previously (see 2.4), thereby
accelerating the risk of developing DTC.
4.1 STUDY PARTICIPANTS
Among the 5,914 identified individuals in the study populations, 2,766 eligible subjects with
DTC, among them, 555 (20%) were not interviewed, among them, 287 refused to participate
the studies, 66 died at the moment of interview, 12 were too sick to response the questionnaire,
190 couldn’t be reached. Of the 2,211 cases who were interviewed, one case who did not live
in the region where he was interviewed and 20 cases who were not matched with a control at
the end of this process were excluded. Of the 2,190 included cases, 28 hadn’t had valid
dietary information and were excluded from the statistical analyses of this article. Finally, the
present study consisted of 2,162 cases, 1,771 of whom were women; Of the 3,148 contacted
controls, 563 (18%) were not interviewed, among them, 466 refused to participate the studies,
22 died at the moment of interview, 2 were too sick to response the questionnaire, 73 couldn’t
be reached. Of the 2,585 controls who were interviewed, 5 were not matched with a case at
the end of this process and were excluded. Of the 2,580 included controls, 9 hadn’t had valid
dietary information and were excluded from the statistical analyses of this article. Finally, the
present study consisted of 2,571 controls, 2,031 of whom were women (Figure 4-1).
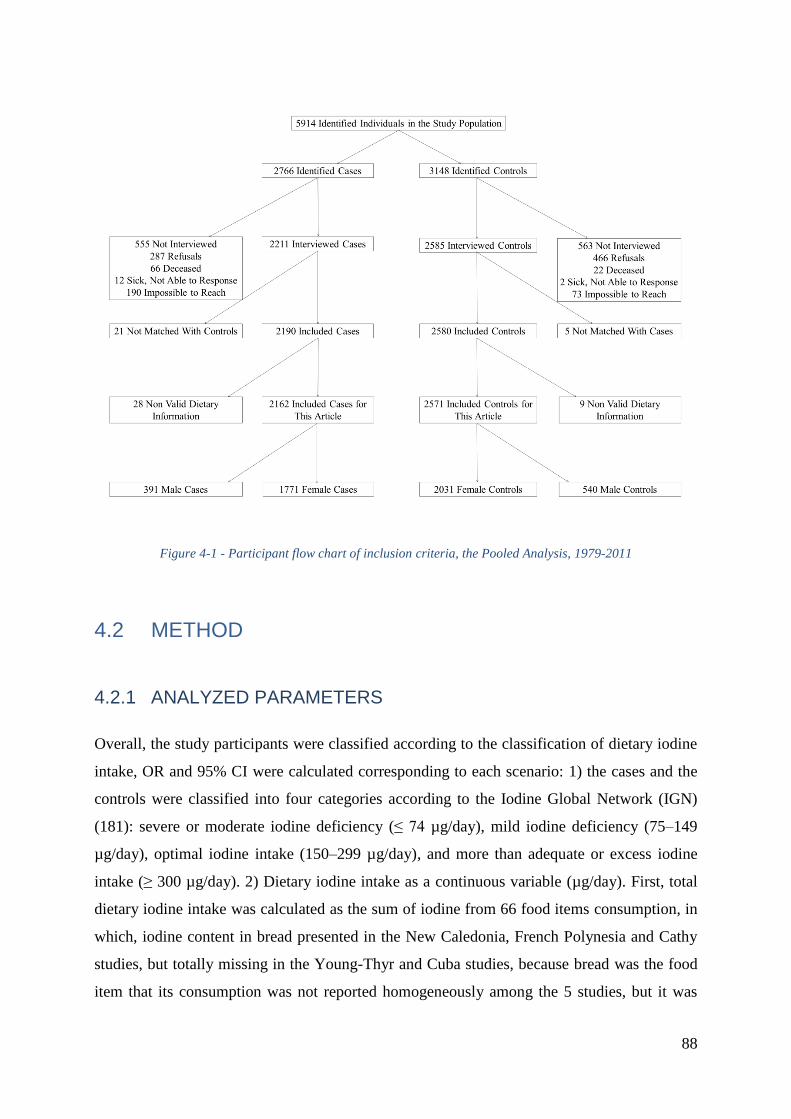
88
Figure 4-1 - Participant flow chart of inclusion criteria, the Pooled Analysis, 1979-2011
4.2 METHOD
4.2.1 ANALYZED PARAMETERS
Overall, the study participants were classified according to the classification of dietary iodine
intake, OR and 95% CI were calculated corresponding to each scenario: 1) the cases and the
controls were classified into four categories according to the Iodine Global Network (IGN)
(181): severe or moderate iodine deficiency (≤ 74 µg/day), mild iodine deficiency (75Ŕ149
µg/day), optimal iodine intake (150Ŕ299 µg/day), and more than adequate or excess iodine
intake (≥ 300 µg/day). 2) Dietary iodine intake as a continuous variable (µg/day). First, total
dietary iodine intake was calculated as the sum of iodine from 66 food items consumption, in
which, iodine content in bread presented in the New Caledonia, French Polynesia and Cathy
studies, but totally missing in the Young-Thyr and Cuba studies, because bread was the food
item that its consumption was not reported homogeneously among the 5 studies, but it was
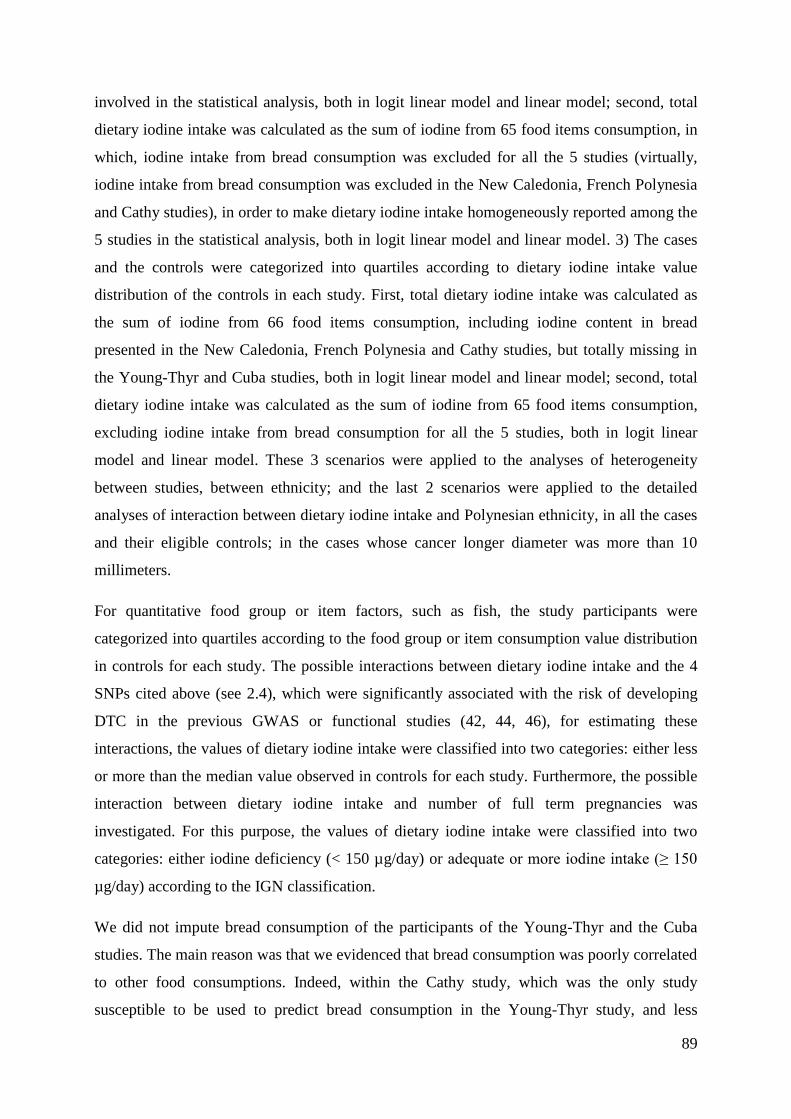
89
involved in the statistical analysis, both in logit linear model and linear model; second, total
dietary iodine intake was calculated as the sum of iodine from 65 food items consumption, in
which, iodine intake from bread consumption was excluded for all the 5 studies (virtually,
iodine intake from bread consumption was excluded in the New Caledonia, French Polynesia
and Cathy studies), in order to make dietary iodine intake homogeneously reported among the
5 studies in the statistical analysis, both in logit linear model and linear model. 3) The cases
and the controls were categorized into quartiles according to dietary iodine intake value
distribution of the controls in each study. First, total dietary iodine intake was calculated as
the sum of iodine from 66 food items consumption, including iodine content in bread
presented in the New Caledonia, French Polynesia and Cathy studies, but totally missing in
the Young-Thyr and Cuba studies, both in logit linear model and linear model; second, total
dietary iodine intake was calculated as the sum of iodine from 65 food items consumption,
excluding iodine intake from bread consumption for all the 5 studies, both in logit linear
model and linear model. These 3 scenarios were applied to the analyses of heterogeneity
between studies, between ethnicity; and the last 2 scenarios were applied to the detailed
analyses of interaction between dietary iodine intake and Polynesian ethnicity, in all the cases
and their eligible controls; in the cases whose cancer longer diameter was more than 10
millimeters.
For quantitative food group or item factors, such as fish, the study participants were
categorized into quartiles according to the food group or item consumption value distribution
in controls for each study. The possible interactions between dietary iodine intake and the 4
SNPs cited above (see 2.4), which were significantly associated with the risk of developing
DTC in the previous GWAS or functional studies (42, 44, 46), for estimating these
interactions, the values of dietary iodine intake were classified into two categories: either less
or more than the median value observed in controls for each study. Furthermore, the possible
interaction between dietary iodine intake and number of full term pregnancies was
investigated. For this purpose, the values of dietary iodine intake were classified into two
categories: either iodine deficiency (< 150 µg/day) or adequate or more iodine intake (≥ 150
µg/day) according to the IGN classification.
We did not impute bread consumption of the participants of the Young-Thyr and the Cuba
studies. The main reason was that we evidenced that bread consumption was poorly correlated
to other food consumptions. Indeed, within the Cathy study, which was the only study
susceptible to be used to predict bread consumption in the Young-Thyr study, and less
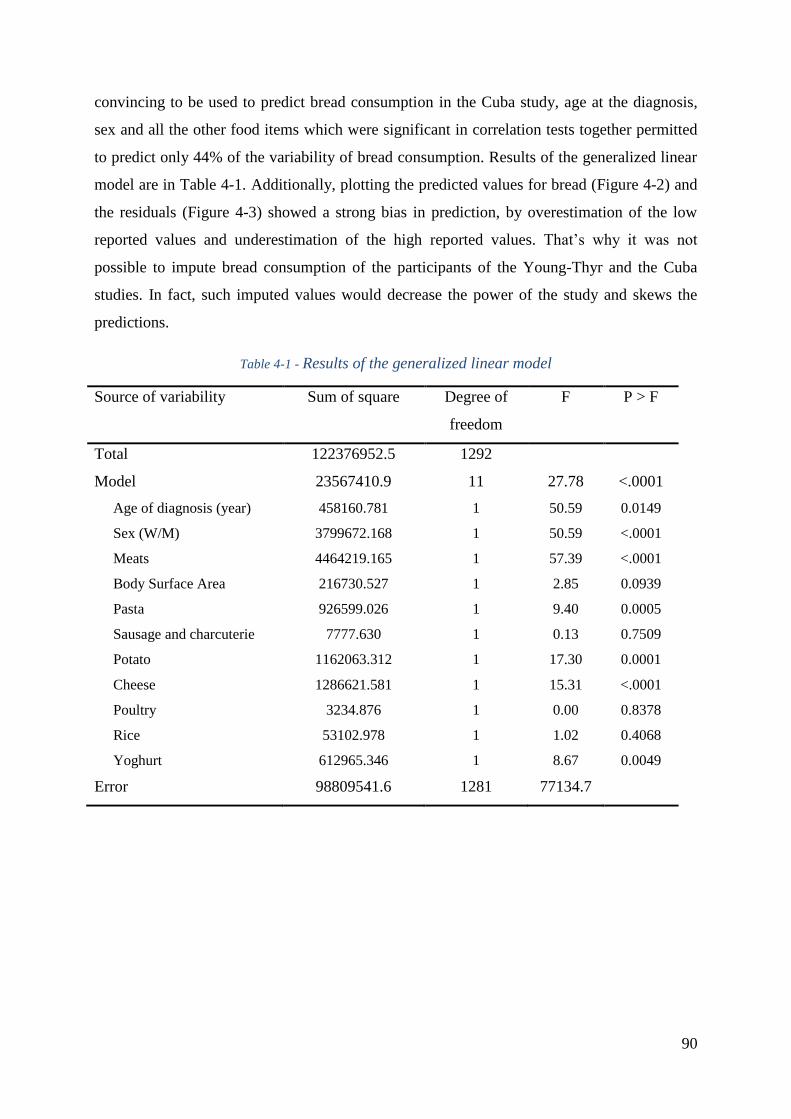
90
convincing to be used to predict bread consumption in the Cuba study, age at the diagnosis,
sex and all the other food items which were significant in correlation tests together permitted
to predict only 44% of the variability of bread consumption. Results of the generalized linear
model are in Table 4-1. Additionally, plotting the predicted values for bread (Figure 4-2) and
the residuals (Figure 4-3) showed a strong bias in prediction, by overestimation of the low
reported values and underestimation of the high reported values. That’s why it was not
possible to impute bread consumption of the participants of the Young-Thyr and the Cuba
studies. In fact, such imputed values would decrease the power of the study and skews the
predictions.
Table 4-1 - Results of the generalized linear model
Source of variability Sum of square Degree of
freedom
F P > F
Total 122376952.5 1292
Model 23567410.9 11 27.78 <.0001
Age of diagnosis (year) 458160.781 1 50.59 0.0149
Sex (W/M) 3799672.168 1 50.59 <.0001
Meats 4464219.165 1 57.39 <.0001
Body Surface Area 216730.527 1 2.85 0.0939
Pasta 926599.026 1 9.40 0.0005
Sausage and charcuterie 7777.630 1 0.13 0.7509
Potato 1162063.312 1 17.30 0.0001
Cheese 1286621.581 1 15.31 <.0001
Poultry 3234.876 1 0.00 0.8378
Rice 53102.978 1 1.02 0.4068
Yoghurt 612965.346 1 8.67 0.0049
Error 98809541.6 1281 77134.7
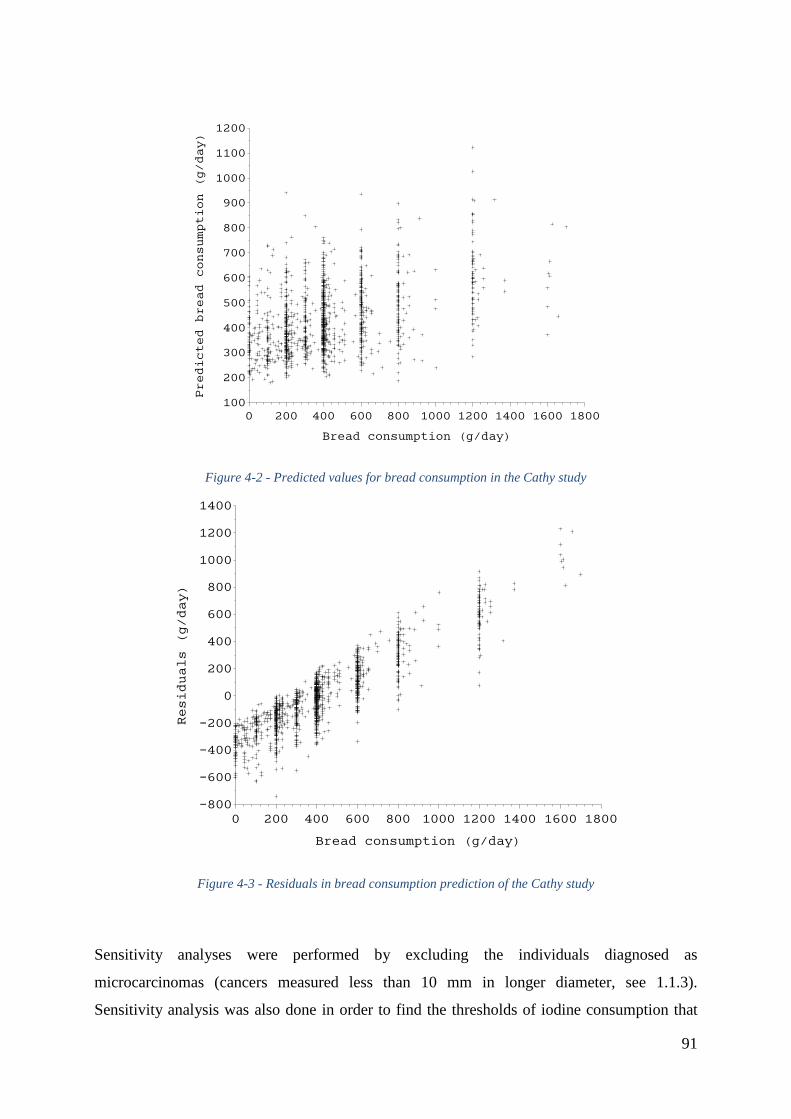
91
Figure 4-2 - Predicted values for bread consumption in the Cathy study
Figure 4-3 - Residuals in bread consumption prediction of the Cathy study
Sensitivity analyses were performed by excluding the individuals diagnosed as
microcarcinomas (cancers measured less than 10 mm in longer diameter, see 1.1.3).
Sensitivity analysis was also done in order to find the thresholds of iodine consumption that
Predicted bread consumption (g/day)
100
200
300
400
500
600
700
800
900
1000
1100
1200
Bread consumption (g/day)
0 200 400 600 800 1000 1200 1400 1600 1800
Residuals (g/day)
-800
-600
-400
-200
0
200
400
600
800
1000
1200
1400
Bread consumption (g/day)
0 200 400 600 800 1000 1200 1400 1600 1800
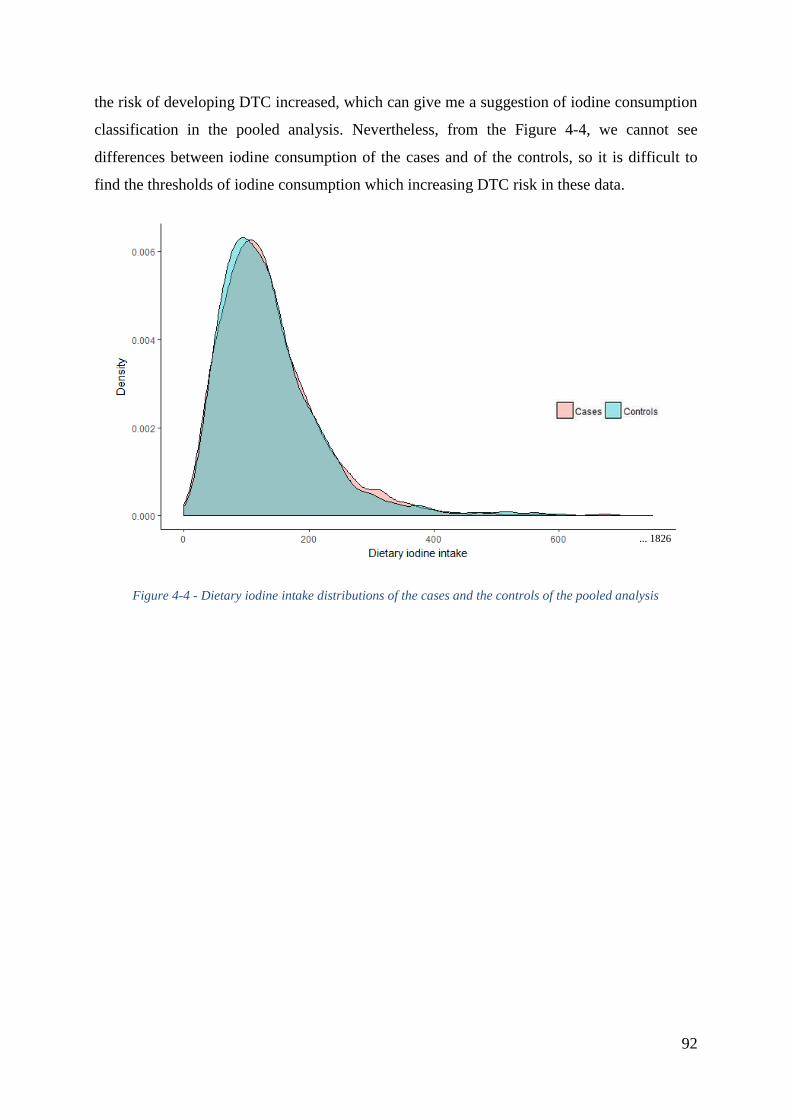
92
the risk of developing DTC increased, which can give me a suggestion of iodine consumption
classification in the pooled analysis. Nevertheless, from the Figure 4-4, we cannot see
differences between iodine consumption of the cases and of the controls, so it is difficult to
find the thresholds of iodine consumption which increasing DTC risk in these data.
Figure 4-4 - Dietary iodine intake distributions of the cases and the controls of the pooled analysis
... 1826
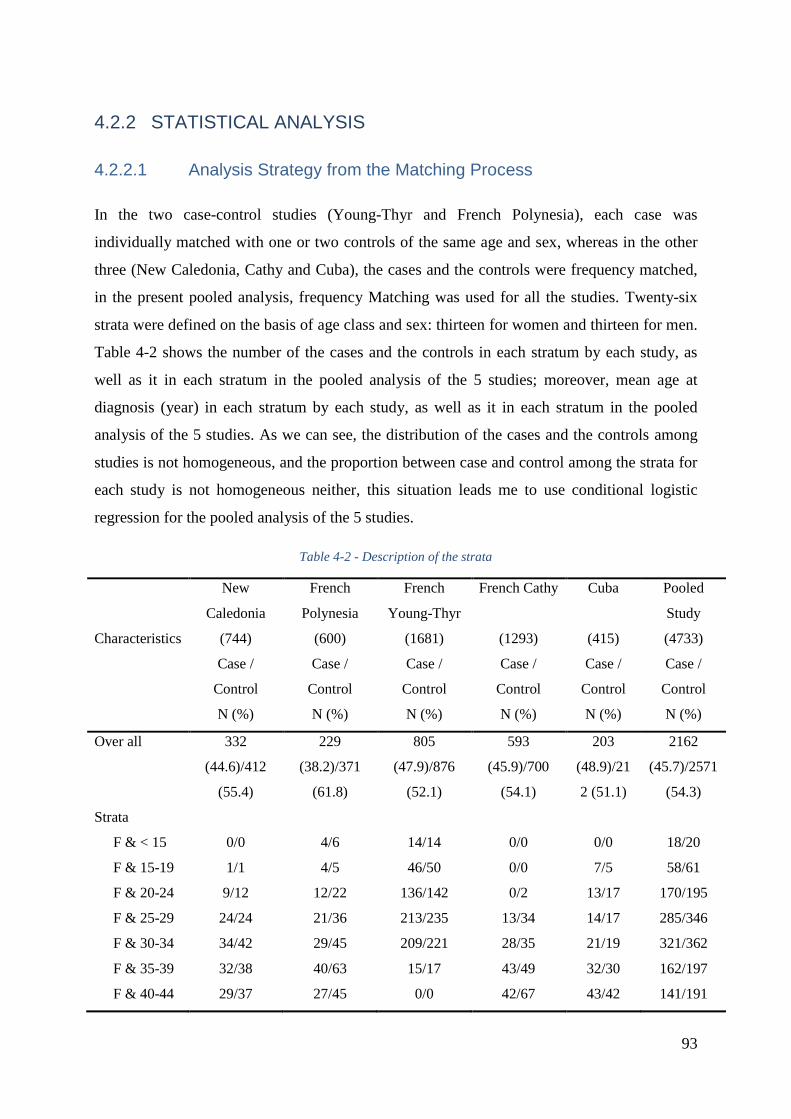
93
4.2.2 STATISTICAL ANALYSIS
4.2.2.1 Analysis Strategy from the Matching Process
In the two case-control studies (Young-Thyr and French Polynesia), each case was
individually matched with one or two controls of the same age and sex, whereas in the other
three (New Caledonia, Cathy and Cuba), the cases and the controls were frequency matched,
in the present pooled analysis, frequency Matching was used for all the studies. Twenty-six
strata were defined on the basis of age class and sex: thirteen for women and thirteen for men.
Table 4-2 shows the number of the cases and the controls in each stratum by each study, as
well as it in each stratum in the pooled analysis of the 5 studies; moreover, mean age at
diagnosis (year) in each stratum by each study, as well as it in each stratum in the pooled
analysis of the 5 studies. As we can see, the distribution of the cases and the controls among
studies is not homogeneous, and the proportion between case and control among the strata for
each study is not homogeneous neither, this situation leads me to use conditional logistic
regression for the pooled analysis of the 5 studies.
Table 4-2 - Description of the strata
Characteristics
New
Caledonia
(744)
French
Polynesia
(600)
French
Young-Thyr
(1681)
French Cathy
(1293)
Cuba
(415)
Pooled
Study
(4733)
Case /
Control
N (%)
Case /
Control
N (%)
Case /
Control
N (%)
Case /
Control
N (%)
Case /
Control
N (%)
Case /
Control
N (%)
Over all 332
(44.6)/412
(55.4)
229
(38.2)/371
(61.8)
805
(47.9)/876
(52.1)
593
(45.9)/700
(54.1)
203
(48.9)/21
2 (51.1)
2162
(45.7)/2571
(54.3)
Strata
F & < 15 0/0 4/6 14/14 0/0 0/0 18/20
F & 15-19 1/1 4/5 46/50 0/0 7/5 58/61
F & 20-24 9/12 12/22 136/142 0/2 13/17 170/195
F & 25-29 24/24 21/36 213/235 13/34 14/17 285/346
F & 30-34 34/42 29/45 209/221 28/35 21/19 321/362
F & 35-39 32/38 40/63 15/17 43/49 32/30 162/197
F & 40-44 29/37 27/45 0/0 42/67 43/42 141/191
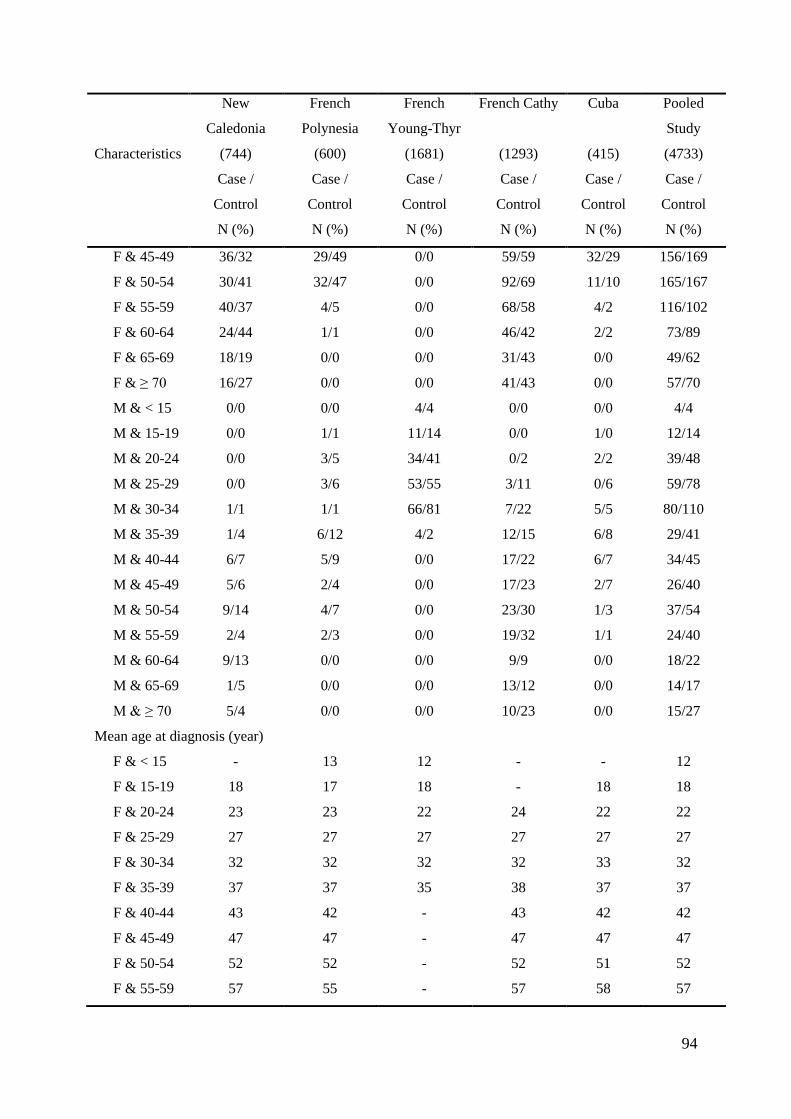
94
Characteristics
New
Caledonia
(744)
French
Polynesia
(600)
French
Young-Thyr
(1681)
French Cathy
(1293)
Cuba
(415)
Pooled
Study
(4733)
Case /
Control
N (%)
Case /
Control
N (%)
Case /
Control
N (%)
Case /
Control
N (%)
Case /
Control
N (%)
Case /
Control
N (%)
F & 45-49 36/32 29/49 0/0 59/59 32/29 156/169
F & 50-54 30/41 32/47 0/0 92/69 11/10 165/167
F & 55-59 40/37 4/5 0/0 68/58 4/2 116/102
F & 60-64 24/44 1/1 0/0 46/42 2/2 73/89
F & 65-69 18/19 0/0 0/0 31/43 0/0 49/62
F & ≥ 70 16/27 0/0 0/0 41/43 0/0 57/70
M & < 15 0/0 0/0 4/4 0/0 0/0 4/4
M & 15-19 0/0 1/1 11/14 0/0 1/0 12/14
M & 20-24 0/0 3/5 34/41 0/2 2/2 39/48
M & 25-29 0/0 3/6 53/55 3/11 0/6 59/78
M & 30-34 1/1 1/1 66/81 7/22 5/5 80/110
M & 35-39 1/4 6/12 4/2 12/15 6/8 29/41
M & 40-44 6/7 5/9 0/0 17/22 6/7 34/45
M & 45-49 5/6 2/4 0/0 17/23 2/7 26/40
M & 50-54 9/14 4/7 0/0 23/30 1/3 37/54
M & 55-59 2/4 2/3 0/0 19/32 1/1 24/40
M & 60-64 9/13 0/0 0/0 9/9 0/0 18/22
M & 65-69 1/5 0/0 0/0 13/12 0/0 14/17
M & ≥ 70 5/4 0/0 0/0 10/23 0/0 15/27
Mean age at diagnosis (year)
F & < 15 - 13 12 - - 12
F & 15-19 18 17 18 - 18 18
F & 20-24 23 23 22 24 22 22
F & 25-29 27 27 27 27 27 27
F & 30-34 32 32 32 32 33 32
F & 35-39 37 37 35 38 37 37
F & 40-44 43 42 - 43 42 42
F & 45-49 47 47 - 47 47 47
F & 50-54 52 52 - 52 51 52
F & 55-59 57 55 - 57 58 57
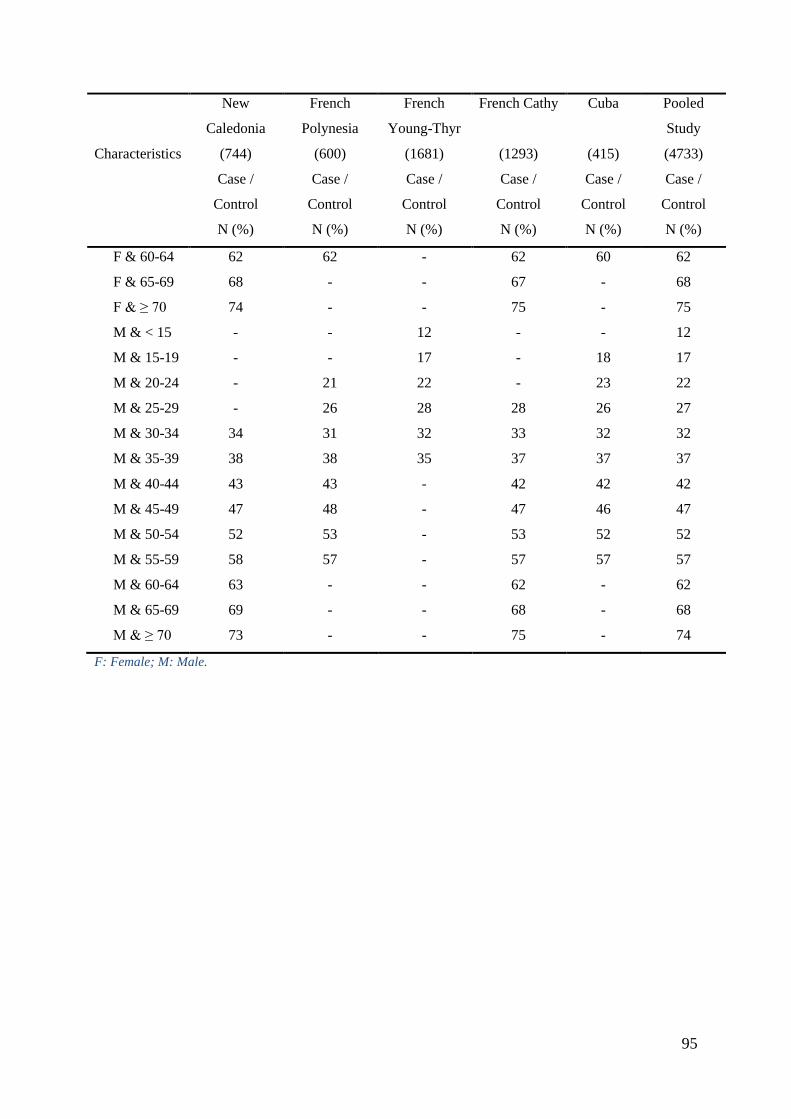
95
Characteristics
New
Caledonia
(744)
French
Polynesia
(600)
French
Young-Thyr
(1681)
French Cathy
(1293)
Cuba
(415)
Pooled
Study
(4733)
Case /
Control
N (%)
Case /
Control
N (%)
Case /
Control
N (%)
Case /
Control
N (%)
Case /
Control
N (%)
Case /
Control
N (%)
F & 60-64 62 62 - 62 60 62
F & 65-69 68 - - 67 - 68
F & ≥ 70 74 - - 75 - 75
M & < 15 - - 12 - - 12
M & 15-19 - - 17 - 18 17
M & 20-24 - 21 22 - 23 22
M & 25-29 - 26 28 28 26 27
M & 30-34 34 31 32 33 32 32
M & 35-39 38 38 35 37 37 37
M & 40-44 43 43 - 42 42 42
M & 45-49 47 48 - 47 46 47
M & 50-54 52 53 - 53 52 52
M & 55-59 58 57 - 57 57 57
M & 60-64 63 - - 62 - 62
M & 65-69 69 - - 68 - 68
M & ≥ 70 73 - - 75 - 74
F: Female; M: Male.
96
4.2.2.2 Mixed Models
Although I did consider using linear generalized mixed model (using PROC GLIMMIX
procedure of SAS® v9.4), in order to take into account possible random effect for study and
for dietary iodine intake, I did not use the obtained results with this method and the results
presented in this thesis were obtained with conditional logistic regression without random
effect.
Indeed, the number of studies in this present pooled analysis is small, only five, and linear
generalized mixed model to estimate random effect for dietary iodine intake between studies
is not well adapted to such a small number, in particular when using logit link (200).
In our case, the GLIMMIX procedure of SAS® was unable to estimate both a random study
effect (intercept in dose-response for iodine) and a random effect for iodine (slope of the
dose-response for iodine), this inability whatever the number of qpoints for the quadrature we
specified in the GLIMMIX procedure in order to fit the integration which approximates the
likelihood (201).
4.2.2.3 Conditional Logistic Regression
The data were analyzed by conditional logistic regression (202) with the software SAS® v9.4
(Statistical Analysis System, SAS Institute, Inc., Cary, North Carolina), applying the PROC
LOGISTIC procedure.
Logistic regression (203) is a model used to estimate the probability of a binary response Y
based on one or more independent variables Xi which can be quantitative or qualitative. It
allows one to say that the presence of a risk factor Xi increases the probability of a given
disease Y (here, differentiated thyroid cancer) by a specific percentage: pXXXDP ,...,, 21
.
In the case of a single variable X, the logistic regression model is written:
XeXfXDP
1
1, here f is the logistic function.
For example, the association between the disease D and an exposure X (exposed X1 /
unexposed X0) is measured with the following logistic model:
- for the exposed subjects:
ePXDP
1
111 and
e
eP
11 1

97
1
1
11
1X
P
PLnPLogit
- for the unexposed subjects:
ePXDP
1
100 et
e
eP
11 0
0
0
0
01
XP
PLnPLogit
We thus obtain the odds ratio (OR) defined by:
0101 XXPLogitPLogitORLn or
01
00
11
1
1 XXe
PP
PPOR
.
is estimated by maximum likelihood estimation (MLE) method, which estimating the
parameters of a statistical model given observations, by finding the parameter values that
maximize the likelihood of making the observations given the parameters.
In case-control studies with matched data, the conditional logistic regression model is used. A
matched population sample can be considered as a stratified sample at the extreme, each
stratum consisting of the subjects of the same pair. Then, the conditional logistic regression
model is written: XkeXDP
1
1, here k is the number of strata and k varies from
one stratum to another.
To estimate the parameters, the likelihood kV in each stratum was calculated. After
simplification, the conditional likelihood for the stratum k is written: kk
k
xx
x
kee
eV
10
0
, kV
no longer depends on k . Then, the product of kV is made to obtain the total likelihood.
The value that maximizes this total likelihood makes it possible to calculate exp which
is an unbiased estimate of the OR.
For potential risk factors, ORs (95% CI) for the risk of DTC were computed by conditional
logistic regression models, stratified by age class, sex and study, and they were later adjusting
for smoking status, ethnicity, education level, number of full term pregnancies, body surface
area (BSA), radiotherapy for previous cancer, first-degree relative thyroid cancer history, and
energy intake. 3428 individuals have completed data for all these variables. In addition, to
98
look for a dose- response relationship, intake of selected nutrients and food items was divided
into quartiles of consumption, and adjusted odds ratios were obtained for each consumption
level. To test for linear trend in the logit of risk, a trend variable for consumption was entered
into the logistic model, this variable was assigned the median value of each quartile, then
modeled as a continuous variable. Likelihood ratio tests comparing models with and without
multiplicative interaction terms were performed to assess the significance of interactions, by
entering into the model the main effects and an interactive term.
Assuming a prevalence of exposure close to 30%, the size of this study (about 2,200 cases and
2,500 controls) was large enough to allow us to reach a power of 80% for identifying the role
of a risk factor associated with an odds ratio (OR) of 1.8 when accepting a type I error of 5%.
4.3 POPULATION DESCRIPTION
4.3.1 CHARACTERISTICS OF THE STUDIED POPULATION
Average age of the study participants in this pooled analysis was 39, the youngest was 9 and
oldest was 83. Table 4-3 shows us the distribution of the cases and the controls in each age
class. Study participants were older in the Cathy study and younger in the Young-Thyr study,
comparing with the other studies. The majority of the population in this pooled analysis was
females (80%), nonsmoker (53%) and Europeans (64%, ethnicity was declared by the study
participants regarding to the ethnicity of his or her parents). The French Polynesia and the
Cuba studies had the more mixed races participants compared to the other studies; In the
French Polynesia study, Polynesian - European mixed race had the highest rate among all the
mixed races and in the Cuba study, Afro-Cubans accounted for 30% of the total study
participants in accord with the 2012 Cuban Census, Afro-Cubans accounted for 35% of the
population (204). Their ancestors originated predominantly from the Congo in Central Africa.
The average of body surface area was a little bit higher in the French Polynesia study
comparing with the other studies. The 2 metropolitan France studies had more participants
whose education level was Baccalaureate or higher, and in the pooled analysis, more controls
than cases whose education level was higher than BEPC, CAP, BEP. More than 40% of the
female cases in the New Caledonia and the French Polynesia studies declared having 4 or
more full term pregnancies. In this pooled analysis, the majority of the DTC was papillary
thyroid cancer (88%), only 3% of the cases declared that they had had radiotherapy treatment

99
to a previous cancer (excluding thyroid cancer), and only 5.5% of the cases declared that they
had had a first-degree relative thyroid cancer history (Table 4-3).
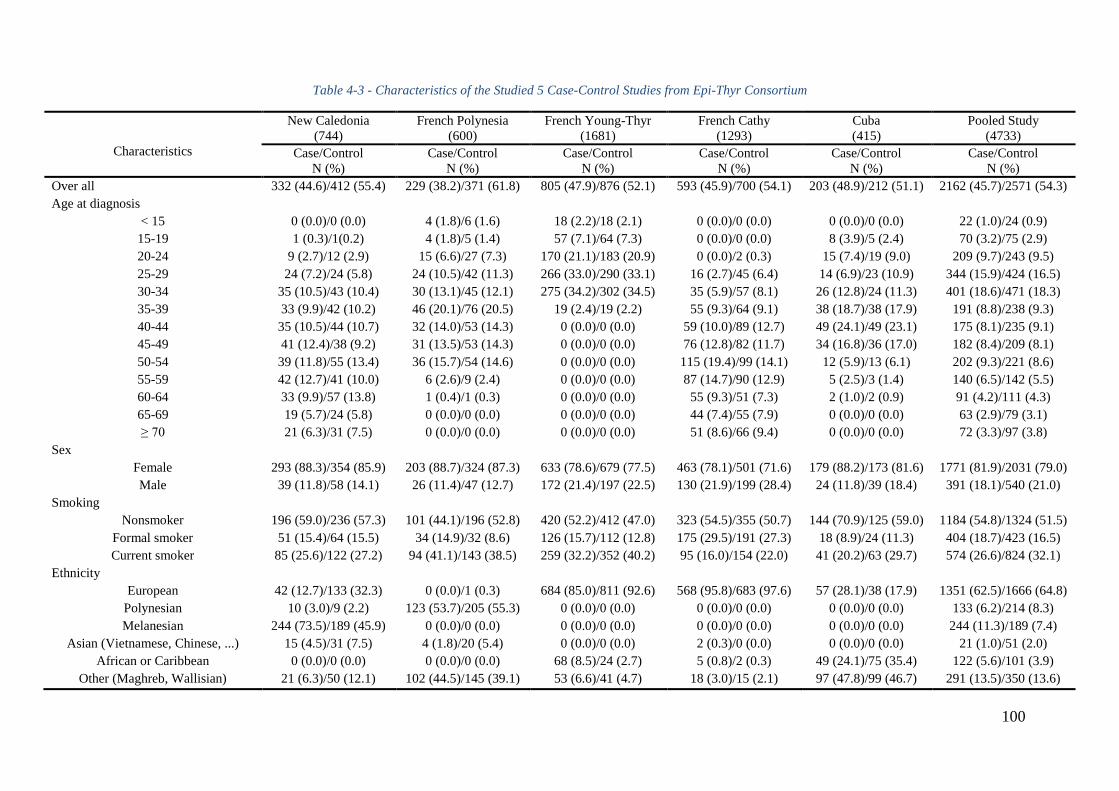
100
Table 4-3 - Characteristics of the Studied 5 Case-Control Studies from Epi-Thyr Consortium
Characteristics
New Caledonia
(744)
French Polynesia
(600)
French Young-Thyr
(1681)
French Cathy
(1293)
Cuba
(415)
Pooled Study
(4733)
Case/Control
N (%)
Case/Control
N (%)
Case/Control
N (%)
Case/Control
N (%)
Case/Control
N (%)
Case/Control
N (%)
Over all 332 (44.6)/412 (55.4) 229 (38.2)/371 (61.8) 805 (47.9)/876 (52.1) 593 (45.9)/700 (54.1) 203 (48.9)/212 (51.1) 2162 (45.7)/2571 (54.3)
Age at diagnosis
< 15 0 (0.0)/0 (0.0) 4 (1.8)/6 (1.6) 18 (2.2)/18 (2.1) 0 (0.0)/0 (0.0) 0 (0.0)/0 (0.0) 22 (1.0)/24 (0.9)
15-19 1 (0.3)/1(0.2) 4 (1.8)/5 (1.4) 57 (7.1)/64 (7.3) 0 (0.0)/0 (0.0) 8 (3.9)/5 (2.4) 70 (3.2)/75 (2.9)
20-24 9 (2.7)/12 (2.9) 15 (6.6)/27 (7.3) 170 (21.1)/183 (20.9) 0 (0.0)/2 (0.3) 15 (7.4)/19 (9.0) 209 (9.7)/243 (9.5)
25-29 24 (7.2)/24 (5.8) 24 (10.5)/42 (11.3) 266 (33.0)/290 (33.1) 16 (2.7)/45 (6.4) 14 (6.9)/23 (10.9) 344 (15.9)/424 (16.5)
30-34 35 (10.5)/43 (10.4) 30 (13.1)/45 (12.1) 275 (34.2)/302 (34.5) 35 (5.9)/57 (8.1) 26 (12.8)/24 (11.3) 401 (18.6)/471 (18.3)
35-39 33 (9.9)/42 (10.2) 46 (20.1)/76 (20.5) 19 (2.4)/19 (2.2) 55 (9.3)/64 (9.1) 38 (18.7)/38 (17.9) 191 (8.8)/238 (9.3)
40-44 35 (10.5)/44 (10.7) 32 (14.0)/53 (14.3) 0 (0.0)/0 (0.0) 59 (10.0)/89 (12.7) 49 (24.1)/49 (23.1) 175 (8.1)/235 (9.1)
45-49 41 (12.4)/38 (9.2) 31 (13.5)/53 (14.3) 0 (0.0)/0 (0.0) 76 (12.8)/82 (11.7) 34 (16.8)/36 (17.0) 182 (8.4)/209 (8.1)
50-54 39 (11.8)/55 (13.4) 36 (15.7)/54 (14.6) 0 (0.0)/0 (0.0) 115 (19.4)/99 (14.1) 12 (5.9)/13 (6.1) 202 (9.3)/221 (8.6)
55-59 42 (12.7)/41 (10.0) 6 (2.6)/9 (2.4) 0 (0.0)/0 (0.0) 87 (14.7)/90 (12.9) 5 (2.5)/3 (1.4) 140 (6.5)/142 (5.5)
60-64 33 (9.9)/57 (13.8) 1 (0.4)/1 (0.3) 0 (0.0)/0 (0.0) 55 (9.3)/51 (7.3) 2 (1.0)/2 (0.9) 91 (4.2)/111 (4.3)
65-69 19 (5.7)/24 (5.8) 0 (0.0)/0 (0.0) 0 (0.0)/0 (0.0) 44 (7.4)/55 (7.9) 0 (0.0)/0 (0.0) 63 (2.9)/79 (3.1)
≥ 70 21 (6.3)/31 (7.5) 0 (0.0)/0 (0.0) 0 (0.0)/0 (0.0) 51 (8.6)/66 (9.4) 0 (0.0)/0 (0.0) 72 (3.3)/97 (3.8)
Sex
Female 293 (88.3)/354 (85.9) 203 (88.7)/324 (87.3) 633 (78.6)/679 (77.5) 463 (78.1)/501 (71.6) 179 (88.2)/173 (81.6) 1771 (81.9)/2031 (79.0)
Male 39 (11.8)/58 (14.1) 26 (11.4)/47 (12.7) 172 (21.4)/197 (22.5) 130 (21.9)/199 (28.4) 24 (11.8)/39 (18.4) 391 (18.1)/540 (21.0)
Smoking
Nonsmoker 196 (59.0)/236 (57.3) 101 (44.1)/196 (52.8) 420 (52.2)/412 (47.0) 323 (54.5)/355 (50.7) 144 (70.9)/125 (59.0) 1184 (54.8)/1324 (51.5)
Formal smoker 51 (15.4)/64 (15.5) 34 (14.9)/32 (8.6) 126 (15.7)/112 (12.8) 175 (29.5)/191 (27.3) 18 (8.9)/24 (11.3) 404 (18.7)/423 (16.5)
Current smoker 85 (25.6)/122 (27.2) 94 (41.1)/143 (38.5) 259 (32.2)/352 (40.2) 95 (16.0)/154 (22.0) 41 (20.2)/63 (29.7) 574 (26.6)/824 (32.1)
Ethnicity
European 42 (12.7)/133 (32.3) 0 (0.0)/1 (0.3) 684 (85.0)/811 (92.6) 568 (95.8)/683 (97.6) 57 (28.1)/38 (17.9) 1351 (62.5)/1666 (64.8)
Polynesian 10 (3.0)/9 (2.2) 123 (53.7)/205 (55.3) 0 (0.0)/0 (0.0) 0 (0.0)/0 (0.0) 0 (0.0)/0 (0.0) 133 (6.2)/214 (8.3)
Melanesian 244 (73.5)/189 (45.9) 0 (0.0)/0 (0.0) 0 (0.0)/0 (0.0) 0 (0.0)/0 (0.0) 0 (0.0)/0 (0.0) 244 (11.3)/189 (7.4)
Asian (Vietnamese, Chinese, ...) 15 (4.5)/31 (7.5) 4 (1.8)/20 (5.4) 0 (0.0)/0 (0.0) 2 (0.3)/0 (0.0) 0 (0.0)/0 (0.0) 21 (1.0)/51 (2.0)
African or Caribbean 0 (0.0)/0 (0.0) 0 (0.0)/0 (0.0) 68 (8.5)/24 (2.7) 5 (0.8)/2 (0.3) 49 (24.1)/75 (35.4) 122 (5.6)/101 (3.9)
Other (Maghreb, Wallisian) 21 (6.3)/50 (12.1) 102 (44.5)/145 (39.1) 53 (6.6)/41 (4.7) 18 (3.0)/15 (2.1) 97 (47.8)/99 (46.7) 291 (13.5)/350 (13.6)
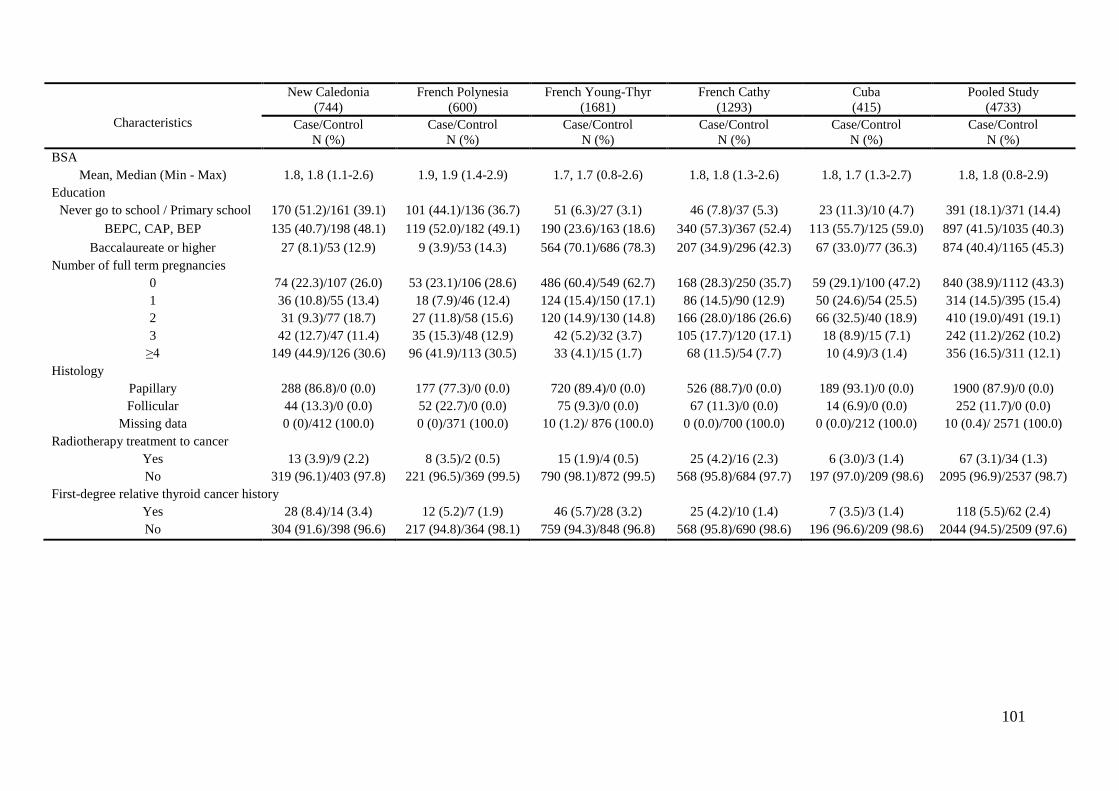
101
Characteristics
New Caledonia
(744)
French Polynesia
(600)
French Young-Thyr
(1681)
French Cathy
(1293)
Cuba
(415)
Pooled Study
(4733)
Case/Control
N (%)
Case/Control
N (%)
Case/Control
N (%)
Case/Control
N (%)
Case/Control
N (%)
Case/Control
N (%)
BSA
Mean, Median (Min - Max) 1.8, 1.8 (1.1-2.6) 1.9, 1.9 (1.4-2.9) 1.7, 1.7 (0.8-2.6) 1.8, 1.8 (1.3-2.6) 1.8, 1.7 (1.3-2.7) 1.8, 1.8 (0.8-2.9)
Education
Never go to school / Primary school 170 (51.2)/161 (39.1) 101 (44.1)/136 (36.7) 51 (6.3)/27 (3.1) 46 (7.8)/37 (5.3) 23 (11.3)/10 (4.7) 391 (18.1)/371 (14.4)
BEPC, CAP, BEP 135 (40.7)/198 (48.1) 119 (52.0)/182 (49.1) 190 (23.6)/163 (18.6) 340 (57.3)/367 (52.4) 113 (55.7)/125 (59.0) 897 (41.5)/1035 (40.3)
Baccalaureate or higher 27 (8.1)/53 (12.9) 9 (3.9)/53 (14.3) 564 (70.1)/686 (78.3) 207 (34.9)/296 (42.3) 67 (33.0)/77 (36.3) 874 (40.4)/1165 (45.3)
Number of full term pregnancies
0 74 (22.3)/107 (26.0) 53 (23.1)/106 (28.6) 486 (60.4)/549 (62.7) 168 (28.3)/250 (35.7) 59 (29.1)/100 (47.2) 840 (38.9)/1112 (43.3)
1 36 (10.8)/55 (13.4) 18 (7.9)/46 (12.4) 124 (15.4)/150 (17.1) 86 (14.5)/90 (12.9) 50 (24.6)/54 (25.5) 314 (14.5)/395 (15.4)
2 31 (9.3)/77 (18.7) 27 (11.8)/58 (15.6) 120 (14.9)/130 (14.8) 166 (28.0)/186 (26.6) 66 (32.5)/40 (18.9) 410 (19.0)/491 (19.1)
3 42 (12.7)/47 (11.4) 35 (15.3)/48 (12.9) 42 (5.2)/32 (3.7) 105 (17.7)/120 (17.1) 18 (8.9)/15 (7.1) 242 (11.2)/262 (10.2)
≥4 149 (44.9)/126 (30.6) 96 (41.9)/113 (30.5) 33 (4.1)/15 (1.7) 68 (11.5)/54 (7.7) 10 (4.9)/3 (1.4) 356 (16.5)/311 (12.1)
Histology
Papillary 288 (86.8)/0 (0.0) 177 (77.3)/0 (0.0) 720 (89.4)/0 (0.0) 526 (88.7)/0 (0.0) 189 (93.1)/0 (0.0) 1900 (87.9)/0 (0.0)
Follicular 44 (13.3)/0 (0.0) 52 (22.7)/0 (0.0) 75 (9.3)/0 (0.0) 67 (11.3)/0 (0.0) 14 (6.9)/0 (0.0) 252 (11.7)/0 (0.0)
Missing data 0 (0)/412 (100.0) 0 (0)/371 (100.0) 10 (1.2)/ 876 (100.0) 0 (0.0)/700 (100.0) 0 (0.0)/212 (100.0) 10 (0.4)/ 2571 (100.0)
Radiotherapy treatment to cancer
Yes 13 (3.9)/9 (2.2) 8 (3.5)/2 (0.5) 15 (1.9)/4 (0.5) 25 (4.2)/16 (2.3) 6 (3.0)/3 (1.4) 67 (3.1)/34 (1.3)
No 319 (96.1)/403 (97.8) 221 (96.5)/369 (99.5) 790 (98.1)/872 (99.5) 568 (95.8)/684 (97.7) 197 (97.0)/209 (98.6) 2095 (96.9)/2537 (98.7)
First-degree relative thyroid cancer history
Yes 28 (8.4)/14 (3.4) 12 (5.2)/7 (1.9) 46 (5.7)/28 (3.2) 25 (4.2)/10 (1.4) 7 (3.5)/3 (1.4) 118 (5.5)/62 (2.4)
No 304 (91.6)/398 (96.6) 217 (94.8)/364 (98.1) 759 (94.3)/848 (96.8) 568 (95.8)/690 (98.6) 196 (96.6)/209 (98.6) 2044 (94.5)/2509 (97.6)
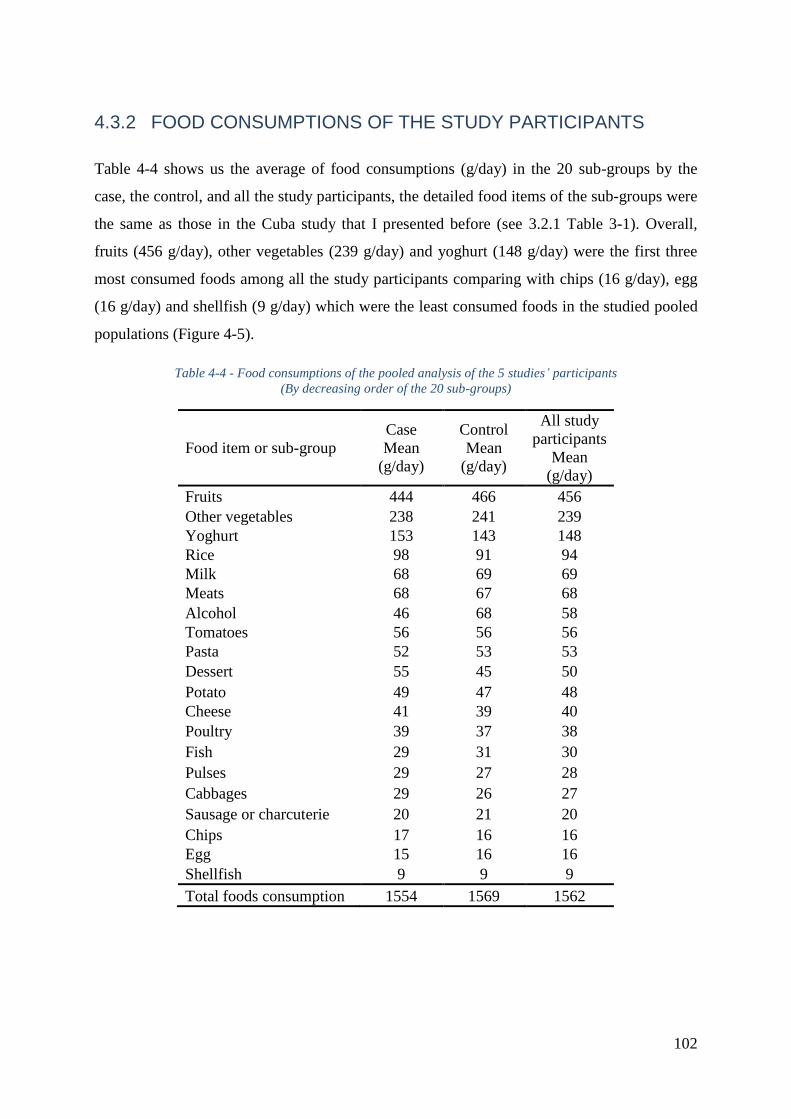
102
4.3.2 FOOD CONSUMPTIONS OF THE STUDY PARTICIPANTS
Table 4-4 shows us the average of food consumptions (g/day) in the 20 sub-groups by the
case, the control, and all the study participants, the detailed food items of the sub-groups were
the same as those in the Cuba study that I presented before (see 3.2.1 Table 3-1). Overall,
fruits (456 g/day), other vegetables (239 g/day) and yoghurt (148 g/day) were the first three
most consumed foods among all the study participants comparing with chips (16 g/day), egg
(16 g/day) and shellfish (9 g/day) which were the least consumed foods in the studied pooled
populations (Figure 4-5).
Table 4-4 - Food consumptions of the pooled analysis of the 5 studies’ participants
(By decreasing order of the 20 sub-groups)
Food item or sub-group
Case
Mean
(g/day)
Control
Mean
(g/day)
All study
participants
Mean
(g/day)
Fruits 444 466 456
Other vegetables 238 241 239
Yoghurt 153 143 148
Rice 98 91 94
Milk 68 69 69
Meats 68 67 68
Alcohol 46 68 58
Tomatoes 56 56 56
Pasta 52 53 53
Dessert 55 45 50
Potato 49 47 48
Cheese 41 39 40
Poultry 39 37 38
Fish 29 31 30
Pulses 29 27 28
Cabbages 29 26 27
Sausage or charcuterie 20 21 20
Chips 17 16 16
Egg 15 16 16
Shellfish 9 9 9
Total foods consumption 1554 1569 1562
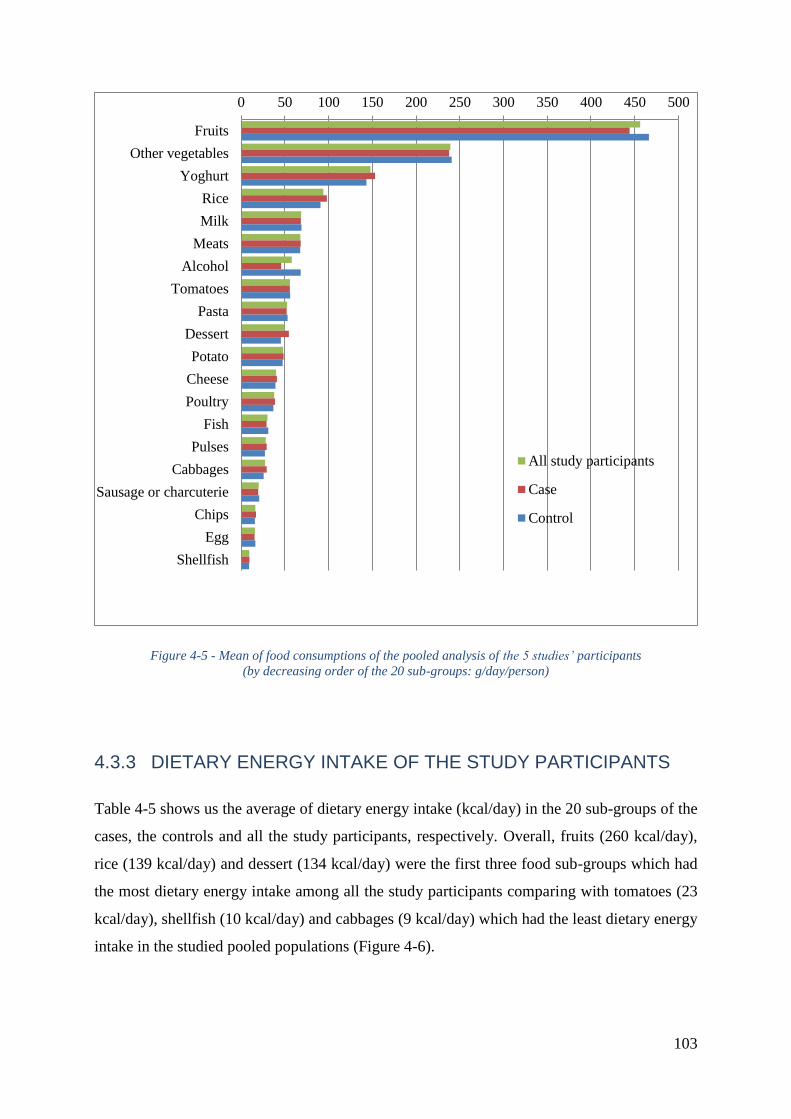
103
Figure 4-5 - Mean of food consumptions of the pooled analysis of the 5 studies’ participants
(by decreasing order of the 20 sub-groups: g/day/person)
4.3.3 DIETARY ENERGY INTAKE OF THE STUDY PARTICIPANTS
Table 4-5 shows us the average of dietary energy intake (kcal/day) in the 20 sub-groups of the
cases, the controls and all the study participants, respectively. Overall, fruits (260 kcal/day),
rice (139 kcal/day) and dessert (134 kcal/day) were the first three food sub-groups which had
the most dietary energy intake among all the study participants comparing with tomatoes (23
kcal/day), shellfish (10 kcal/day) and cabbages (9 kcal/day) which had the least dietary energy
intake in the studied pooled populations (Figure 4-6).
0 50 100 150 200 250 300 350 400 450 500
Fruits
Other vegetables
Yoghurt
Rice
Milk
Meats
Alcohol
Tomatoes
Pasta
Dessert
Potato
Cheese
Poultry
Fish
Pulses
Cabbages
Sausage or charcuterie
Chips
Egg
Shellfish
All study participants
Case
Control
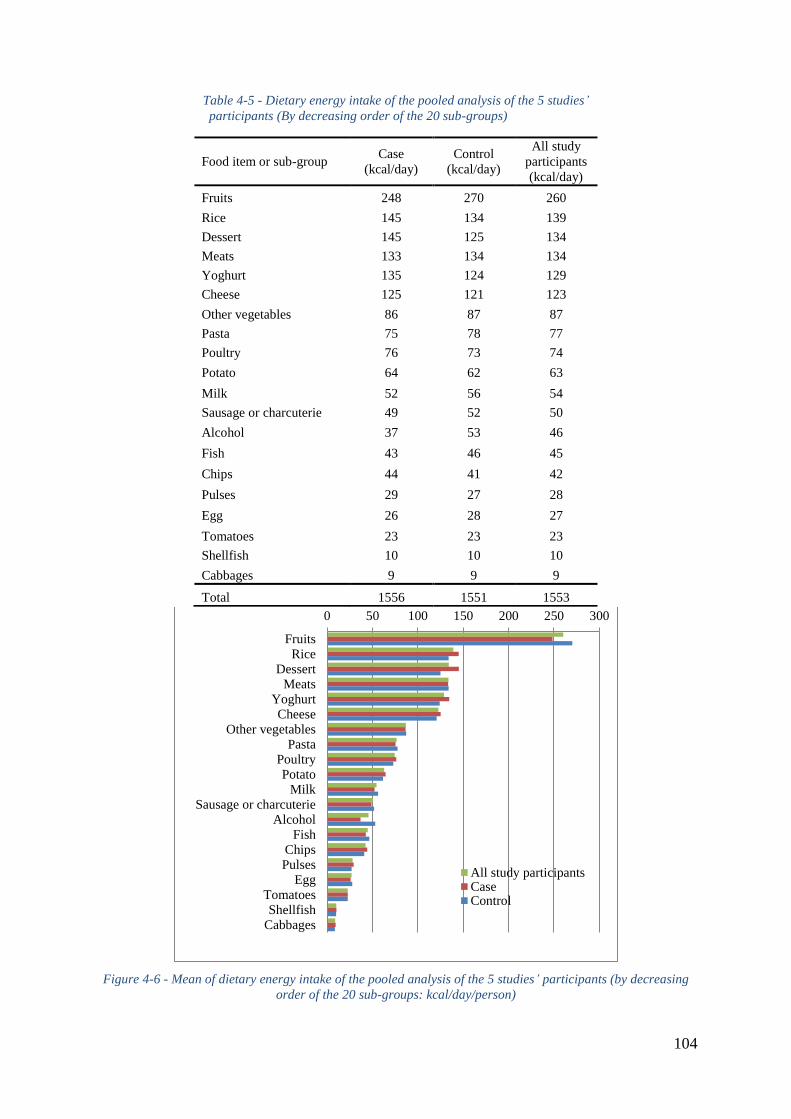
104
Table 4-5 - Dietary energy intake of the pooled analysis of the 5 studies’
participants (By decreasing order of the 20 sub-groups)
Food item or sub-group Case
(kcal/day)
Control
(kcal/day)
All study
participants
(kcal/day)
Fruits 248 270 260
Rice 145 134 139
Dessert 145 125 134
Meats 133 134 134
Yoghurt 135 124 129
Cheese 125 121 123
Other vegetables 86 87 87
Pasta 75 78 77
Poultry 76 73 74
Potato 64 62 63
Milk 52 56 54
Sausage or charcuterie 49 52 50
Alcohol 37 53 46
Fish 43 46 45
Chips 44 41 42
Pulses 29 27 28
Egg 26 28 27
Tomatoes 23 23 23
Shellfish 10 10 10
Cabbages 9 9 9
Total 1556 1551 1553
Figure 4-6 - Mean of dietary energy intake of the pooled analysis of the 5 studies’ participants (by decreasing
order of the 20 sub-groups: kcal/day/person)
0 50 100 150 200 250 300
Fruits
RiceDessert
Meats
YoghurtCheese
Other vegetablesPasta
Poultry
PotatoMilk
Sausage or charcuterie
AlcoholFish
ChipsPulses
Egg
TomatoesShellfish
Cabbages
All study participantsCaseControl
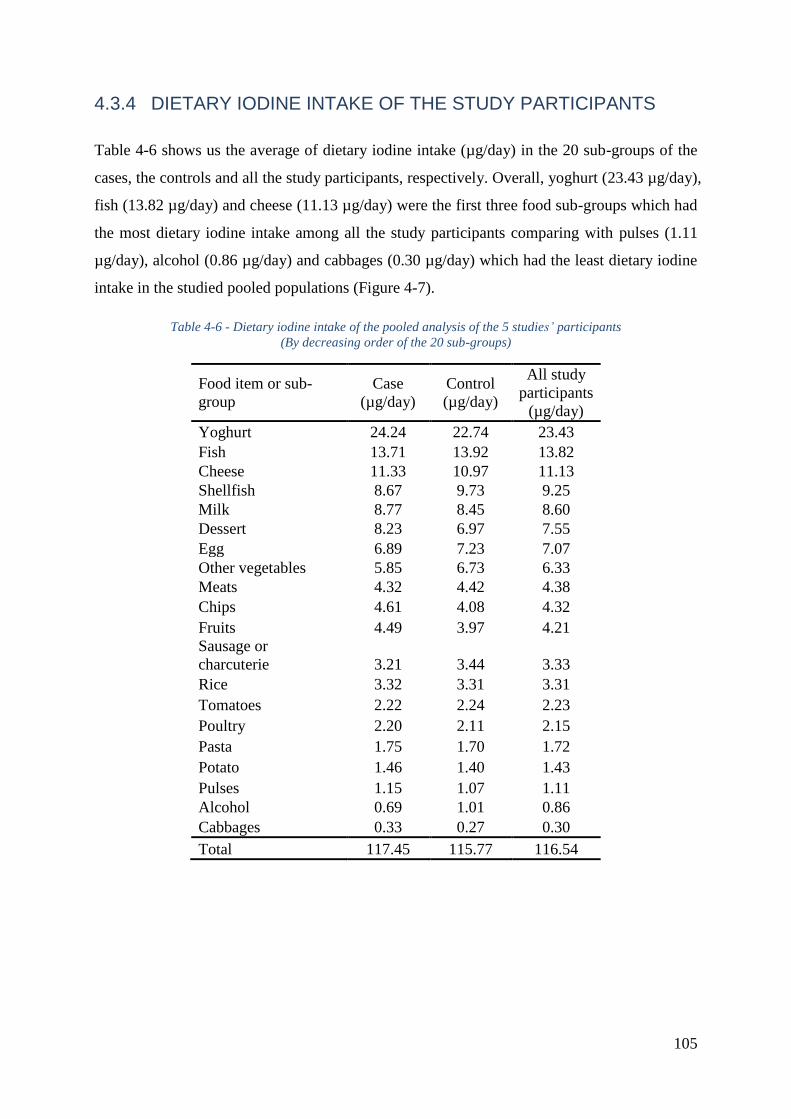
105
4.3.4 DIETARY IODINE INTAKE OF THE STUDY PARTICIPANTS
Table 4-6 shows us the average of dietary iodine intake (µg/day) in the 20 sub-groups of the
cases, the controls and all the study participants, respectively. Overall, yoghurt (23.43 µg/day),
fish (13.82 µg/day) and cheese (11.13 µg/day) were the first three food sub-groups which had
the most dietary iodine intake among all the study participants comparing with pulses (1.11
µg/day), alcohol (0.86 µg/day) and cabbages (0.30 µg/day) which had the least dietary iodine
intake in the studied pooled populations (Figure 4-7).
Table 4-6 - Dietary iodine intake of the pooled analysis of the 5 studies’ participants
(By decreasing order of the 20 sub-groups)
Food item or sub-
group
Case
(µg/day)
Control
(µg/day)
All study
participants
(µg/day)
Yoghurt 24.24 22.74 23.43
Fish 13.71 13.92 13.82
Cheese 11.33 10.97 11.13
Shellfish 8.67 9.73 9.25
Milk 8.77 8.45 8.60
Dessert 8.23 6.97 7.55
Egg 6.89 7.23 7.07
Other vegetables 5.85 6.73 6.33
Meats 4.32 4.42 4.38
Chips 4.61 4.08 4.32
Fruits 4.49 3.97 4.21
Sausage or
charcuterie 3.21 3.44 3.33
Rice 3.32 3.31 3.31
Tomatoes 2.22 2.24 2.23
Poultry 2.20 2.11 2.15
Pasta 1.75 1.70 1.72
Potato 1.46 1.40 1.43
Pulses 1.15 1.07 1.11
Alcohol 0.69 1.01 0.86
Cabbages 0.33 0.27 0.30
Total 117.45 115.77 116.54
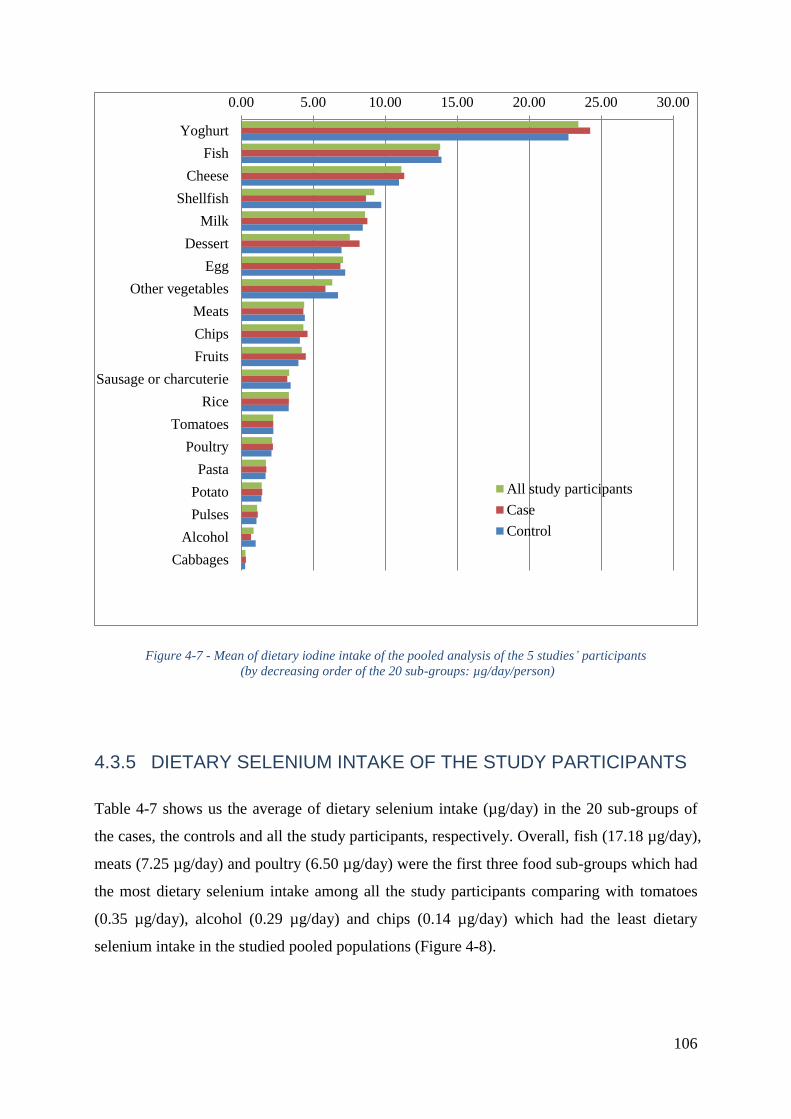
106
Figure 4-7 - Mean of dietary iodine intake of the pooled analysis of the 5 studies’ participants
(by decreasing order of the 20 sub-groups: µg/day/person)
4.3.5 DIETARY SELENIUM INTAKE OF THE STUDY PARTICIPANTS
Table 4-7 shows us the average of dietary selenium intake (µg/day) in the 20 sub-groups of
the cases, the controls and all the study participants, respectively. Overall, fish (17.18 µg/day),
meats (7.25 µg/day) and poultry (6.50 µg/day) were the first three food sub-groups which had
the most dietary selenium intake among all the study participants comparing with tomatoes
(0.35 µg/day), alcohol (0.29 µg/day) and chips (0.14 µg/day) which had the least dietary
selenium intake in the studied pooled populations (Figure 4-8).
0.00 5.00 10.00 15.00 20.00 25.00 30.00
Yoghurt
Fish
Cheese
Shellfish
Milk
Dessert
Egg
Other vegetables
Meats
Chips
Fruits
Sausage or charcuterie
Rice
Tomatoes
Poultry
Pasta
Potato
Pulses
Alcohol
Cabbages
All study participants
Case
Control
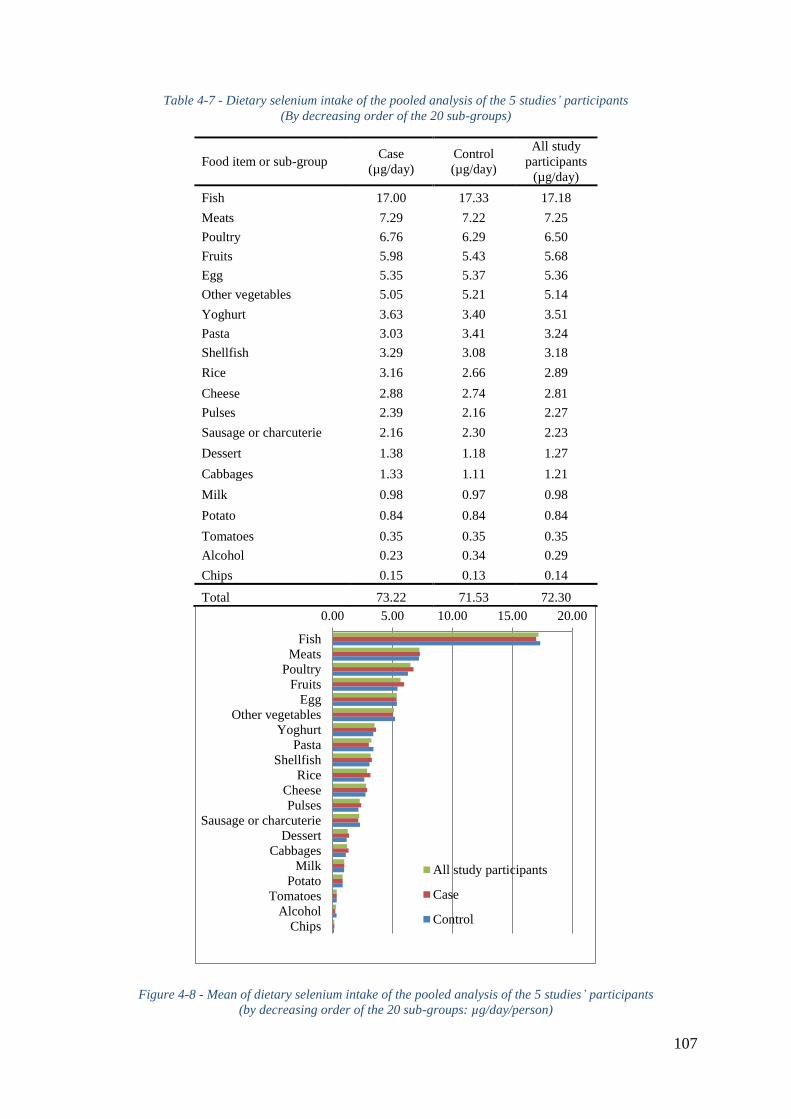
107
Table 4-7 - Dietary selenium intake of the pooled analysis of the 5 studies’ participants
(By decreasing order of the 20 sub-groups)
Food item or sub-group Case
(µg/day)
Control
(µg/day)
All study
participants
(µg/day)
Fish 17.00 17.33 17.18
Meats 7.29 7.22 7.25
Poultry 6.76 6.29 6.50
Fruits 5.98 5.43 5.68
Egg 5.35 5.37 5.36
Other vegetables 5.05 5.21 5.14
Yoghurt 3.63 3.40 3.51
Pasta 3.03 3.41 3.24
Shellfish 3.29 3.08 3.18
Rice 3.16 2.66 2.89
Cheese 2.88 2.74 2.81
Pulses 2.39 2.16 2.27
Sausage or charcuterie 2.16 2.30 2.23
Dessert 1.38 1.18 1.27
Cabbages 1.33 1.11 1.21
Milk 0.98 0.97 0.98
Potato 0.84 0.84 0.84
Tomatoes 0.35 0.35 0.35
Alcohol 0.23 0.34 0.29
Chips 0.15 0.13 0.14
Total 73.22 71.53 72.30
Figure 4-8 - Mean of dietary selenium intake of the pooled analysis of the 5 studies’ participants
(by decreasing order of the 20 sub-groups: µg/day/person)
0.00 5.00 10.00 15.00 20.00
Fish
Meats
Poultry
Fruits
Egg
Other vegetables
Yoghurt
Pasta
Shellfish
Rice
Cheese
Pulses
Sausage or charcuterie
Dessert
Cabbages
Milk
Potato
Tomatoes
Alcohol
Chips
All study participants
Case
Control
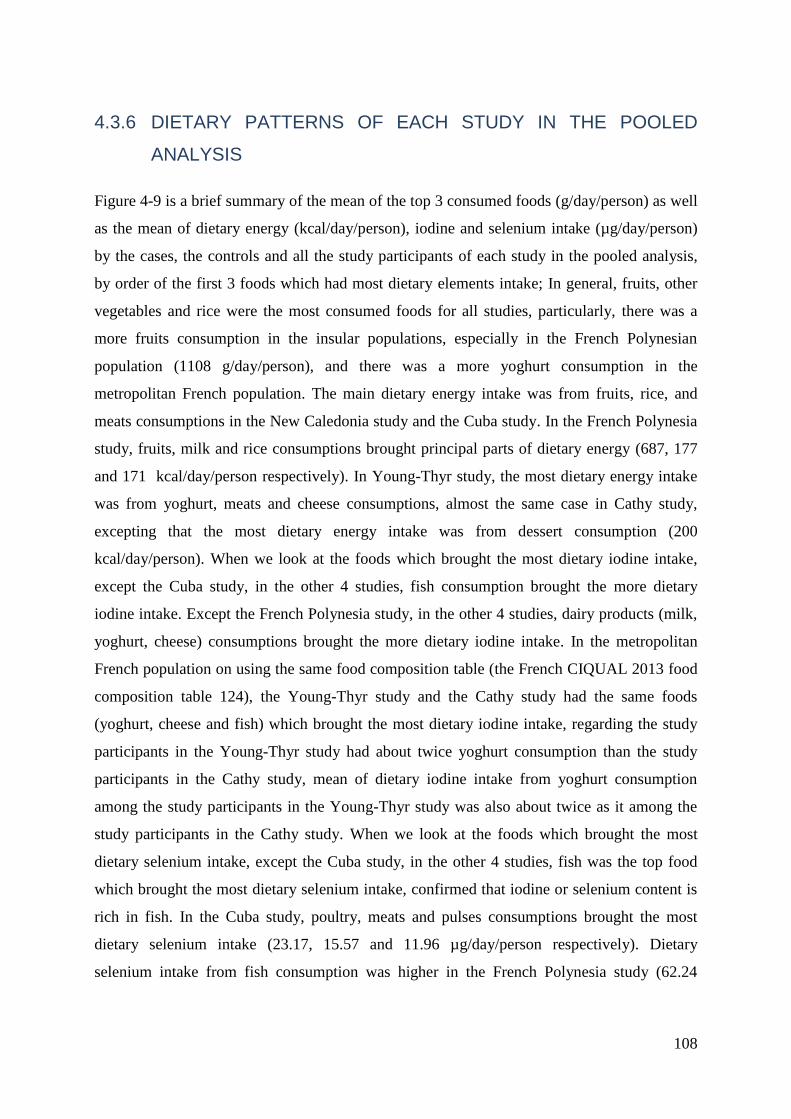
108
4.3.6 DIETARY PATTERNS OF EACH STUDY IN THE POOLED
ANALYSIS
Figure 4-9 is a brief summary of the mean of the top 3 consumed foods (g/day/person) as well
as the mean of dietary energy (kcal/day/person), iodine and selenium intake (µg/day/person)
by the cases, the controls and all the study participants of each study in the pooled analysis,
by order of the first 3 foods which had most dietary elements intake; In general, fruits, other
vegetables and rice were the most consumed foods for all studies, particularly, there was a
more fruits consumption in the insular populations, especially in the French Polynesian
population (1108 g/day/person), and there was a more yoghurt consumption in the
metropolitan French population. The main dietary energy intake was from fruits, rice, and
meats consumptions in the New Caledonia study and the Cuba study. In the French Polynesia
study, fruits, milk and rice consumptions brought principal parts of dietary energy (687, 177
and 171 kcal/day/person respectively). In Young-Thyr study, the most dietary energy intake
was from yoghurt, meats and cheese consumptions, almost the same case in Cathy study,
excepting that the most dietary energy intake was from dessert consumption (200
kcal/day/person). When we look at the foods which brought the most dietary iodine intake,
except the Cuba study, in the other 4 studies, fish consumption brought the more dietary
iodine intake. Except the French Polynesia study, in the other 4 studies, dairy products (milk,
yoghurt, cheese) consumptions brought the more dietary iodine intake. In the metropolitan
French population on using the same food composition table (the French CIQUAL 2013 food
composition table 124), the Young-Thyr study and the Cathy study had the same foods
(yoghurt, cheese and fish) which brought the most dietary iodine intake, regarding the study
participants in the Young-Thyr study had about twice yoghurt consumption than the study
participants in the Cathy study, mean of dietary iodine intake from yoghurt consumption
among the study participants in the Young-Thyr study was also about twice as it among the
study participants in the Cathy study. When we look at the foods which brought the most
dietary selenium intake, except the Cuba study, in the other 4 studies, fish was the top food
which brought the most dietary selenium intake, confirmed that iodine or selenium content is
rich in fish. In the Cuba study, poultry, meats and pulses consumptions brought the most
dietary selenium intake (23.17, 15.57 and 11.96 µg/day/person respectively). Dietary
selenium intake from fish consumption was higher in the French Polynesia study (62.24

109
µg/day/person) than in the other studies. Dietary selenium intake from poultry consumption
was higher in the Cuba study (23.17 µg/day/person) than in the other studies.
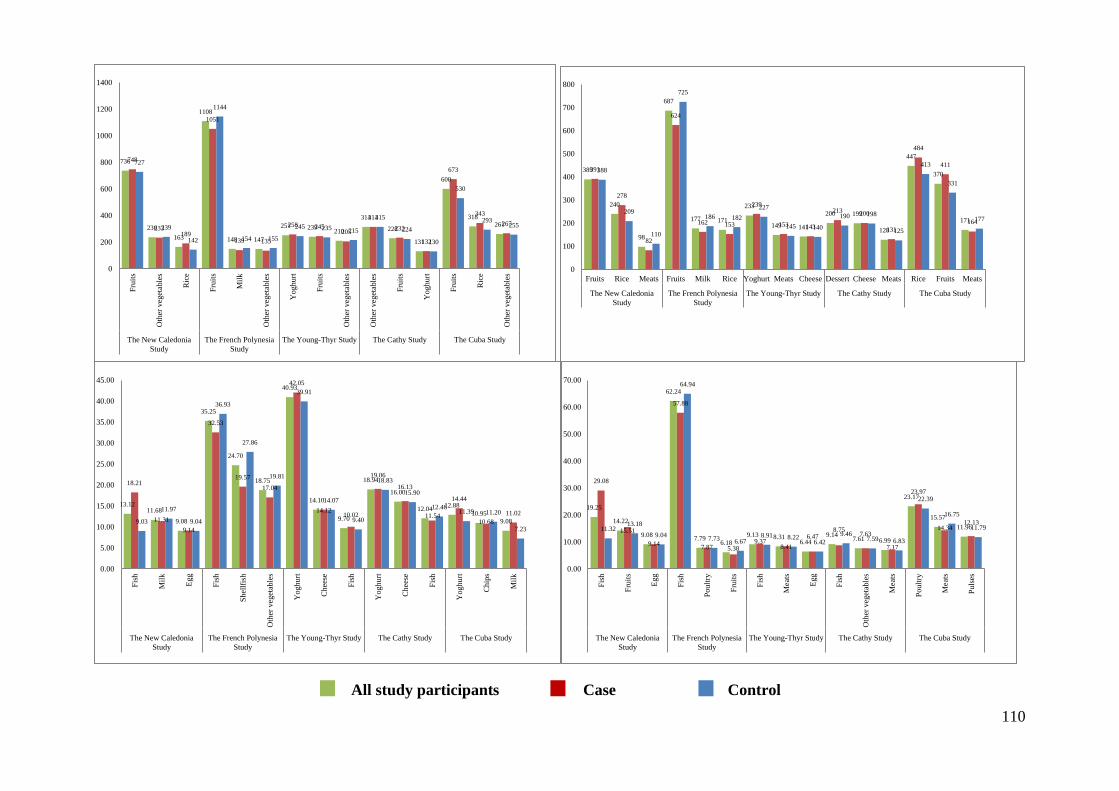
110
736
236
163
1108
148 147
251 239 210
314
228
131
600
318 261
748
233 189
1051
139 135
258 245 205
314
232
132
673
343
267
727
239
142
1144
154 155
245 235 215
315
224
130
530
293 255
0
200
400
600
800
1000
1200
1400
Fru
its
Oth
er v
eget
able
s
Ric
e
Fru
its
Mil
k
Oth
er v
eget
able
s
Yoghurt
Fru
its
Oth
er v
eget
able
s
Oth
er v
eget
able
s
Fru
its
Yoghurt
Fru
its
Ric
e
Oth
er v
eget
able
s
The New Caledonia
Study
The French Polynesia
Study
The Young-Thyr Study The Cathy Study The Cuba Study
389
240
98
687
177 171
233
149 141
200 199
128
447
370
171
391
278
82
624
162 153
239
153 143
213 200
131
484
411
164
388
209
110
725
186 182
227
145 140
190 198
125
413
331
177
0
100
200
300
400
500
600
700
800
Fruits Rice Meats Fruits Milk Rice Yoghurt Meats Cheese Dessert Cheese Meats Rice Fruits Meats
The New Caledonia
Study
The French Polynesia
Study
The Young-Thyr Study The Cathy Study The Cuba Study
13.12 11.68
9.08
35.25
24.70
18.75
40.93
14.10
9.70
18.94
16.00
12.04 12.88
10.95
9.08
18.21
11.31
9.14
32.53
19.57
17.04
42.05
14.12 10.02
19.06
16.13
11.54
14.44
10.68
11.02
9.03
11.97
9.04
36.93
27.86
19.81
39.91
14.07
9.40
18.83
15.90
12.46 11.39 11.20
7.23
0.00
5.00
10.00
15.00
20.00
25.00
30.00
35.00
40.00
45.00
Fis
h
Mil
k
Egg
Fis
h
Shel
lfis
h
Oth
er v
eget
able
s
Yoghurt
Chees
e
Fis
h
Yoghurt
Chees
e
Fis
h
Yoghurt
Chip
s
Mil
k
The New Caledonia
Study
The French Polynesia
Study
The Young-Thyr Study The Cathy Study The Cuba Study
19.25
14.22
9.08
62.24
7.79 6.18
9.13 8.31 6.44
9.14 7.61 6.99
23.17
15.57
11.96
29.08
15.51
9.14
57.88
7.87 5.38 9.37
8.41
6.47 8.75
7.63
7.17
23.97
14.34 12.13
11.32 13.18
9.04
64.94
7.73 6.67 8.91 8.22
6.42
9.46 7.59 6.83
22.39
16.75
11.79
0.00
10.00
20.00
30.00
40.00
50.00
60.00
70.00
Fis
h
Fru
its
Egg
Fis
h
Poult
ry
Fru
its
Fis
h
Meat
s
Egg
Fis
h
Oth
er v
eget
able
s
Meat
s
Poult
ry
Meat
s
Puls
es
The New Caledonia
Study
The French Polynesia
Study
The Young-Thyr Study The Cathy Study The Cuba Study
All study participants Case Control
111
Figure 4-9 - (1) Mean of the top 3 consumed foods of each study (g/day/person); (2) Mean of dietary energy intake of
each study (by order of the first 3 foods which brought the most dietary energy intake: kcal/day/person); (3) Mean of
dietary iodine intake of each study (by order of the first 3 foods which brought the most dietary iodine intake:
µg/day/person); (4) Mean of dietary selenium intake of each study (by order of the first 3 foods which brought the most
dietary selenium intake: µg/day/person), by case, control and all study participants in the pooled analysis
4.4 RESULTS
4.4.1 DIETARY IODINE INTAKE
4.4.1.1 Pooled Analysis of Epi-Thyr Consortium
Overall, the majority of the cases (n=966, 45%) and the controls (n=1,164, 45%) were
considered as being in mild iodine deficiency according to the IGN classification
(APPENDIXES 3Supplement Table 2). When considering the pooled analysis of the 5 case-
control studies from Epi-Thyr consortium, we did not evidence a significant association
between dietary iodine intake and DTC risk, either when considering the quartiles of dietary
iodine intake of the controls in each study (with or without iodine in bread, Table 4-8, Table
4-12, Table 4-13), or when considering estimated dietary iodine intake (with or without iodine
in bread) as a continuous variable in a logit linear or a linear model (Table 4-11), or when
classifying by the IGN classification (Crude p-trend = 0.1, APPENDIXES 3Supplement Table
2).
This no significant association was confirmed when excluding the microcarcinoma cases
(Table 4-11, Table 4-12, Table 4-13).
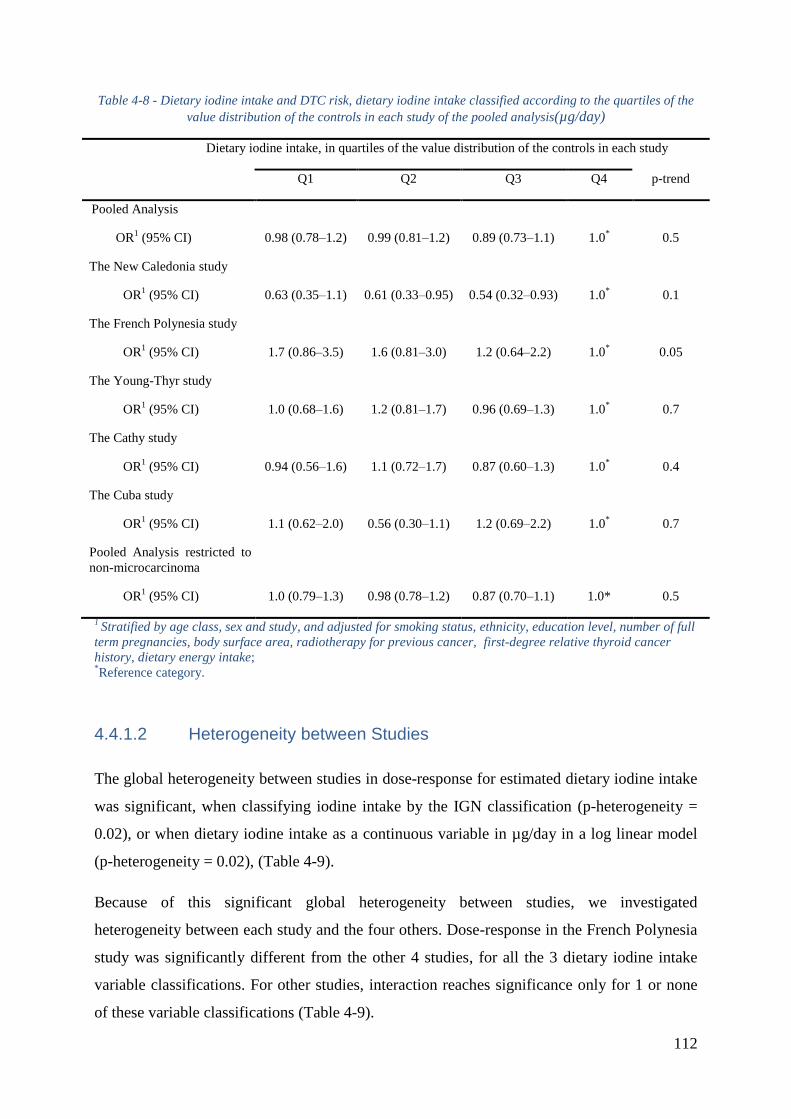
112
Table 4-8 - Dietary iodine intake and DTC risk, dietary iodine intake classified according to the quartiles of the
value distribution of the controls in each study of the pooled analysis(µg/day)
Dietary iodine intake, in quartiles of the value distribution of the controls in each study
Q1 Q2 Q3 Q4 p-trend
Pooled Analysis
OR1 (95% CI) 0.98 (0.78Ŕ1.2) 0.99 (0.81Ŕ1.2) 0.89 (0.73Ŕ1.1) 1.0
* 0.5
The New Caledonia study
OR1 (95% CI) 0.63 (0.35Ŕ1.1) 0.61 (0.33Ŕ0.95) 0.54 (0.32Ŕ0.93) 1.0
* 0.1
The French Polynesia study
OR1 (95% CI) 1.7 (0.86Ŕ3.5) 1.6 (0.81Ŕ3.0) 1.2 (0.64Ŕ2.2) 1.0
* 0.05
The Young-Thyr study
OR1 (95% CI) 1.0 (0.68Ŕ1.6) 1.2 (0.81Ŕ1.7) 0.96 (0.69Ŕ1.3) 1.0
* 0.7
The Cathy study
OR1 (95% CI) 0.94 (0.56Ŕ1.6) 1.1 (0.72Ŕ1.7) 0.87 (0.60Ŕ1.3) 1.0
* 0.4
The Cuba study
OR1 (95% CI) 1.1 (0.62Ŕ2.0) 0.56 (0.30Ŕ1.1) 1.2 (0.69Ŕ2.2) 1.0
* 0.7
Pooled Analysis restricted to to
non-microcarcinoma
OR1 (95% CI) 1.0 (0.79Ŕ1.3) 0.98 (0.78Ŕ1.2) 0.87 (0.70Ŕ1.1) 1.0* 0.5
1 Stratified by age class, sex and study, and adjusted for smoking status, ethnicity, education level, number of full
term pregnancies, body surface area, radiotherapy for previous cancer, first-degree relative thyroid cancer
history, dietary energy intake; *Reference category.
4.4.1.2 Heterogeneity between Studies
The global heterogeneity between studies in dose-response for estimated dietary iodine intake
was significant, when classifying iodine intake by the IGN classification (p-heterogeneity =
0.02), or when dietary iodine intake as a continuous variable in µg/day in a log linear model
(p-heterogeneity = 0.02), (Table 4-9).
Because of this significant global heterogeneity between studies, we investigated
heterogeneity between each study and the four others. Dose-response in the French Polynesia
study was significantly different from the other 4 studies, for all the 3 dietary iodine intake
variable classifications. For other studies, interaction reaches significance only for 1 or none
of these variable classifications (Table 4-9).
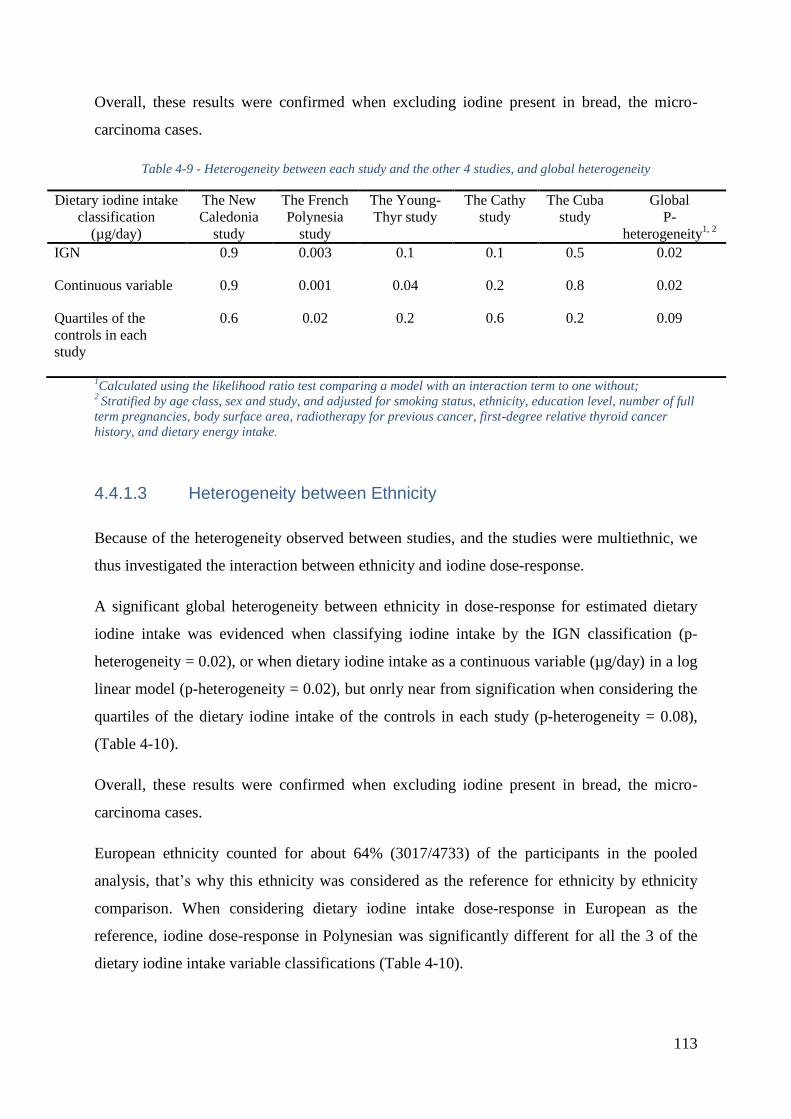
113
Overall, these results were confirmed when excluding iodine present in bread, the micro-
carcinoma cases.
Table 4-9 - Heterogeneity between each study and the other 4 studies, and global heterogeneity
Dietary iodine intake
classification
(µg/day)
The New
Caledonia
study
The French
Polynesia
study
The Young-
Thyr study
The Cathy
study
The Cuba
study
Global
P-
heterogeneity1, 2
IGN 0.9 0.003 0.1 0.1 0.5 0.02
Continuous variable 0.9 0.001 0.04 0.2 0.8 0.02
Quartiles of the
controls in each
study
0.6 0.02 0.2 0.6 0.2 0.09
1Calculated using the likelihood ratio test comparing a model with an interaction term to one without;
2 Stratified by age class, sex and study, and adjusted for smoking status, ethnicity, education level, number of full
term pregnancies, body surface area, radiotherapy for previous cancer, first-degree relative thyroid cancer
history, and dietary energy intake.
4.4.1.3 Heterogeneity between Ethnicity
Because of the heterogeneity observed between studies, and the studies were multiethnic, we
thus investigated the interaction between ethnicity and iodine dose-response.
A significant global heterogeneity between ethnicity in dose-response for estimated dietary
iodine intake was evidenced when classifying iodine intake by the IGN classification (p-
heterogeneity = 0.02), or when dietary iodine intake as a continuous variable (µg/day) in a log
linear model (p-heterogeneity = 0.02), but onrly near from signification when considering the
quartiles of the dietary iodine intake of the controls in each study (p-heterogeneity = 0.08),
(Table 4-10).
Overall, these results were confirmed when excluding iodine present in bread, the micro-
carcinoma cases.
European ethnicity counted for about 64% (3017/4733) of the participants in the pooled
analysis, that’s why this ethnicity was considered as the reference for ethnicity by ethnicity
comparison. When considering dietary iodine intake dose-response in European as the
reference, iodine dose-response in Polynesian was significantly different for all the 3 of the
dietary iodine intake variable classifications (Table 4-10).
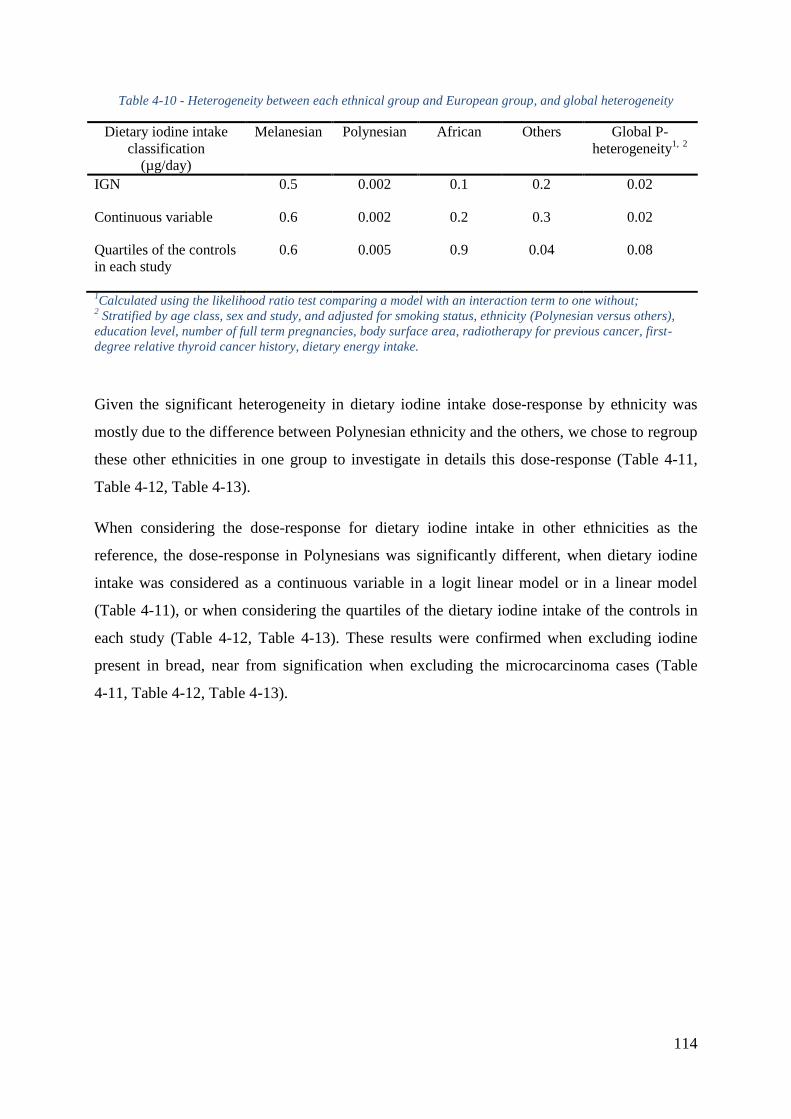
114
Table 4-10 - Heterogeneity between each ethnical group and European group, and global heterogeneity
Dietary iodine intake
classification
(µg/day)
Melanesian Polynesian African Others Global P-
heterogeneity1, 2
IGN 0.5 0.002 0.1 0.2 0.02
Continuous variable 0.6 0.002 0.2 0.3 0.02
Quartiles of the controls
in each study
0.6 0.005 0.9 0.04 0.08
1Calculated using the likelihood ratio test comparing a model with an interaction term to one without;
2 Stratified by age class, sex and study, and adjusted for smoking status, ethnicity (Polynesian versus others),
education level, number of full term pregnancies, body surface area, radiotherapy for previous cancer, first-
degree relative thyroid cancer history, dietary energy intake.
Given the significant heterogeneity in dietary iodine intake dose-response by ethnicity was
mostly due to the difference between Polynesian ethnicity and the others, we chose to regroup
these other ethnicities in one group to investigate in details this dose-response (Table 4-11,
Table 4-12, Table 4-13).
When considering the dose-response for dietary iodine intake in other ethnicities as the
reference, the dose-response in Polynesians was significantly different, when dietary iodine
intake was considered as a continuous variable in a logit linear model or in a linear model
(Table 4-11), or when considering the quartiles of the dietary iodine intake of the controls in
each study (Table 4-12, Table 4-13). These results were confirmed when excluding iodine
present in bread, near from signification when excluding the microcarcinoma cases (Table
4-11, Table 4-12, Table 4-13).
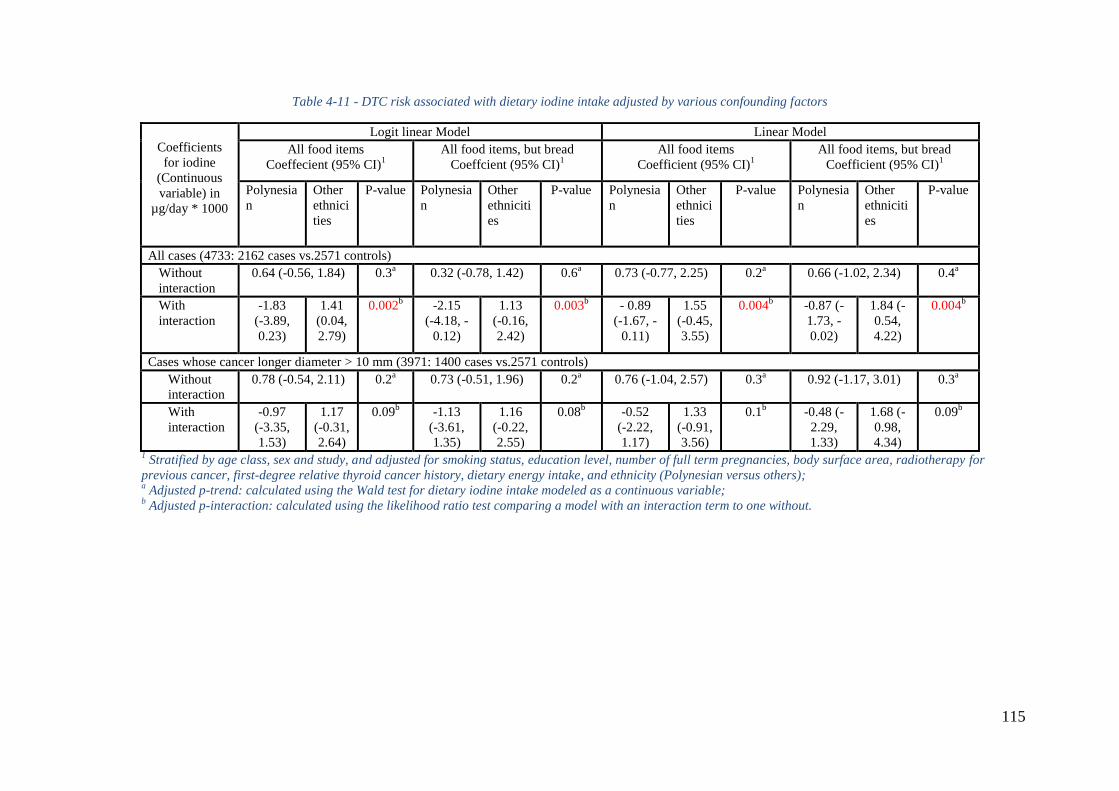
115
Table 4-11 - DTC risk associated with dietary iodine intake adjusted by various confounding factors
Coefficients
for iodine
(Continuous
variable) in
µg/day * 1000
Logit linear Model Linear Model
All food items
Coeffecient (95% CI)1
All food items, but bread
Coeffcient (95% CI)1
All food items
Coefficient (95% CI)1
All food items, but bread
Coefficient (95% CI)1
Polynesia
n
Other
ethnici
ties
P-value Polynesia
n
Other
ethniciti
es
P-value Polynesia
n
Other
ethnici
ties
P-value Polynesia
n
Other
ethniciti
es
P-value
All cases (4733: 2162 cases vs.2571 controls)
Without
interaction
0.64 (-0.56, 1.84) 0.3a 0.32 (-0.78, 1.42) 0.6
a 0.73 (-0.77, 2.25) 0.2
a 0.66 (-1.02, 2.34) 0.4
a
With
interaction
-1.83
(-3.89,
0.23)
1.41
(0.04,
2.79)
0.002b
-2.15
(-4.18, -
0.12)
1.13
(-0.16,
2.42)
0.003b - 0.89
(-1.67, -
0.11)
1.55
(-0.45,
3.55)
0.004b -0.87 (-
1.73, -
0.02)
1.84 (-
0.54,
4.22)
0.004b
Cases whose cancer longer diameter > 10 mm (3971: 1400 cases vs.2571 controls)
Without
interaction
0.78 (-0.54, 2.11) 0.2a 0.73 (-0.51, 1.96) 0.2
a 0.76 (-1.04, 2.57) 0.3
a 0.92 (-1.17, 3.01) 0.3
a
With
interaction
-0.97
(-3.35,
1.53)
1.17
(-0.31,
2.64)
0.09b -1.13
(-3.61,
1.35)
1.16
(-0.22,
2.55)
0.08b -0.52
(-2.22,
1.17)
1.33
(-0.91,
3.56)
0.1b -0.48 (-
2.29,
1.33)
1.68 (-
0.98,
4.34)
0.09b
1 Stratified by age class, sex and study, and adjusted for smoking status, education level, number of full term pregnancies, body surface area, radiotherapy for
previous cancer, first-degree relative thyroid cancer history, dietary energy intake, and ethnicity (Polynesian versus others); a Adjusted p-trend: calculated using the Wald test for dietary iodine intake modeled as a continuous variable;
b Adjusted p-interaction: calculated using the likelihood ratio test comparing a model with an interaction term to one without.
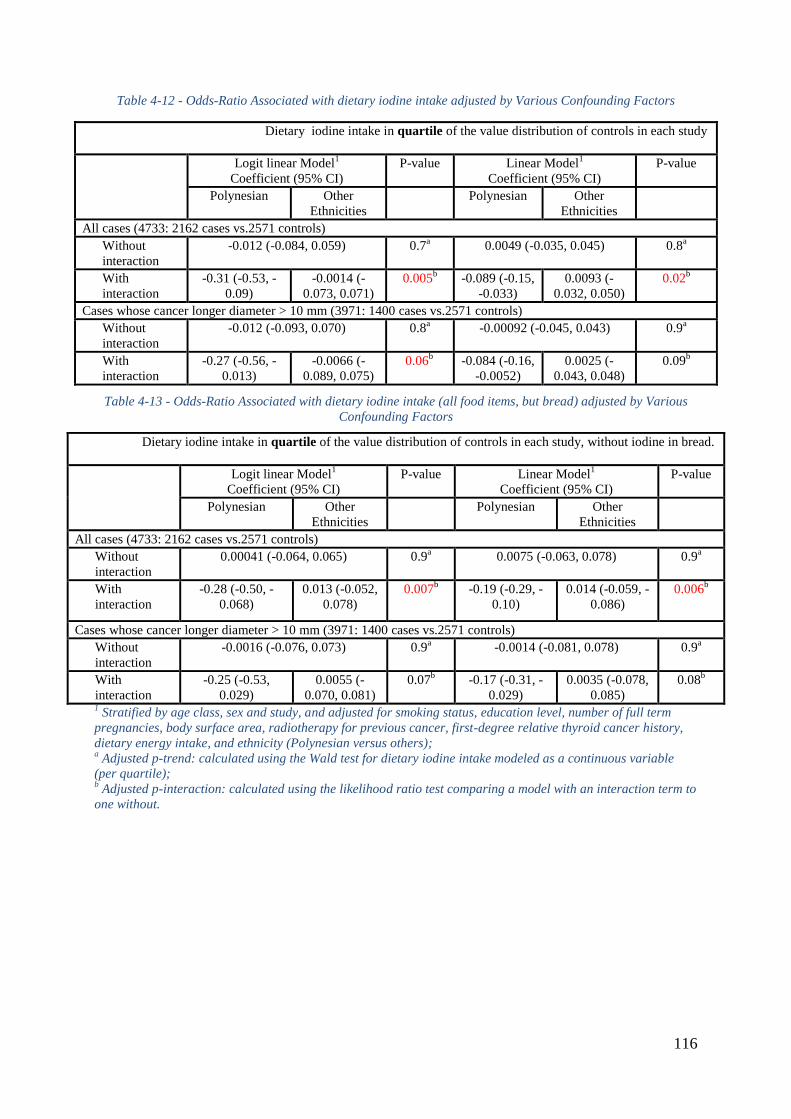
116
Table 4-12 - Odds-Ratio Associated with dietary iodine intake adjusted by Various Confounding Factors
Dietary iodine intake in quartile of the value distribution of controls in each study
Logit linear Model1
Coefficient (95% CI)
P-value Linear Model1
Coefficient (95% CI)
P-value
Polynesian Other
Ethnicities
Polynesian Other
Ethnicities
All cases (4733: 2162 cases vs.2571 controls)
Without
interaction
-0.012 (-0.084, 0.059) 0.7a 0.0049 (-0.035, 0.045) 0.8
a
With
interaction
-0.31 (-0.53, -
0.09)
-0.0014 (-
0.073, 0.071)
0.005b -0.089 (-0.15,
-0.033)
0.0093 (-
0.032, 0.050)
0.02b
Cases whose cancer longer diameter > 10 mm (3971: 1400 cases vs.2571 controls)
Without
interaction
-0.012 (-0.093, 0.070) 0.8a -0.00092 (-0.045, 0.043) 0.9
a
With
interaction
-0.27 (-0.56, -
0.013)
-0.0066 (-
0.089, 0.075)
0.06b -0.084 (-0.16,
-0.0052)
0.0025 (-
0.043, 0.048)
0.09b
Table 4-13 - Odds-Ratio Associated with dietary iodine intake (all food items, but bread) adjusted by Various
Confounding Factors
Dietary iodine intake in quartile of the value distribution of controls in each study, without iodine in bread.
Logit linear Model1
Coefficient (95% CI)
P-value Linear Model1
Coefficient (95% CI)
P-value
Polynesian Other
Ethnicities
Polynesian Other
Ethnicities
All cases (4733: 2162 cases vs.2571 controls)
Without
interaction
0.00041 (-0.064, 0.065) 0.9a 0.0075 (-0.063, 0.078) 0.9
a
With
interaction
-0.28 (-0.50, -
0.068)
0.013 (-0.052,
0.078)
0.007b -0.19 (-0.29, -
0.10)
0.014 (-0.059, -
0.086)
0.006b
Cases whose cancer longer diameter > 10 mm (3971: 1400 cases vs.2571 controls)
Without
interaction
-0.0016 (-0.076, 0.073) 0.9a -0.0014 (-0.081, 0.078) 0.9
a
With
interaction
-0.25 (-0.53,
0.029)
0.0055 (-
0.070, 0.081)
0.07b -0.17 (-0.31, -
0.029)
0.0035 (-0.078,
0.085)
0.08b
1 Stratified by age class, sex and study, and adjusted for smoking status, education level, number of full term
pregnancies, body surface area, radiotherapy for previous cancer, first-degree relative thyroid cancer history,
dietary energy intake, and ethnicity (Polynesian versus others); a Adjusted p-trend: calculated using the Wald test for dietary iodine intake modeled as a continuous variable
(per quartile); b Adjusted p-interaction: calculated using the likelihood ratio test comparing a model with an interaction term to
one without.
117
4.4.1.4 Interaction with the 4 Investigated SNPs
For the 4 investigated polymorphisms which had been identified as associated with the risk of
developing DTC, the 2 French metropolitan studies have the most Minor Allele Frequencies
(MAF) of the SNP rs965513 in both cases and controls comparing with the other studies; For
the SNP rs1867277, at the opposite of the other studies, the GG genotype in the cases (22%)
of the Young-Thyr study was less frequent than the AA genotype (27%); In general, the A/A
allele comparing with the other alleles of the SNP rs1801516 was very less present in both
cases and controls of all these 5 studies, which could be considered as a minor allele of ATM
in general population; However, the T/T allele comparing with the other alleles which was
less frequent in both cases and controls in the southern Asia-Pacific populations samples,
while it was more frequent in the French population samples, whereas it was more frequent in
the cases (35%) but less frequent in the controls (19%) of the Cuban population sample
(Table 4-14).
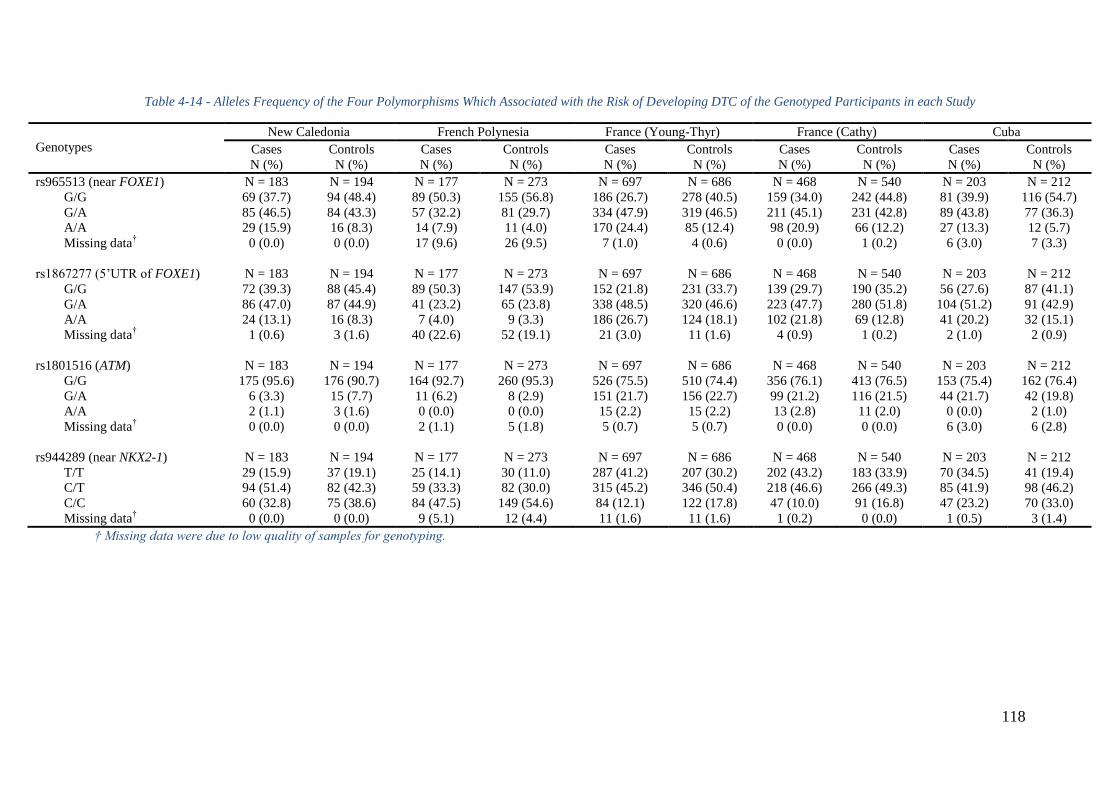
118
Table 4-14 - Alleles Frequency of the Four Polymorphisms Which Associated with the Risk of Developing DTC of the Genotyped Participants in each Study
Genotypes
New Caledonia French Polynesia France (Young-Thyr) France (Cathy) Cuba
Cases
N (%)
Controls
N (%)
Cases
N (%)
Controls
N (%)
Cases
N (%)
Controls
N (%)
Cases
N (%)
Controls
N (%)
Cases
N (%)
Controls
N (%)
rs965513 (near FOXE1) N = 183 N = 194 N = 177 N = 273 N = 697 N = 686 N = 468 N = 540 N = 203 N = 212
G/G 69 (37.7) 94 (48.4) 89 (50.3) 155 (56.8) 186 (26.7) 278 (40.5) 159 (34.0) 242 (44.8) 81 (39.9) 116 (54.7)
G/A 85 (46.5) 84 (43.3) 57 (32.2) 81 (29.7) 334 (47.9) 319 (46.5) 211 (45.1) 231 (42.8) 89 (43.8) 77 (36.3)
A/A 29 (15.9) 16 (8.3) 14 (7.9) 11 (4.0) 170 (24.4) 85 (12.4) 98 (20.9) 66 (12.2) 27 (13.3) 12 (5.7)
Missing data† 0 (0.0) 0 (0.0) 17 (9.6) 26 (9.5) 7 (1.0) 4 (0.6) 0 (0.0) 1 (0.2) 6 (3.0) 7 (3.3)
rs1867277 (5’UTR of FOXE1) N = 183 N = 194 N = 177 N = 273 N = 697 N = 686 N = 468 N = 540 N = 203 N = 212
G/G 72 (39.3) 88 (45.4) 89 (50.3) 147 (53.9) 152 (21.8) 231 (33.7) 139 (29.7) 190 (35.2) 56 (27.6) 87 (41.1)
G/A 86 (47.0) 87 (44.9) 41 (23.2) 65 (23.8) 338 (48.5) 320 (46.6) 223 (47.7) 280 (51.8) 104 (51.2) 91 (42.9)
A/A 24 (13.1) 16 (8.3) 7 (4.0) 9 (3.3) 186 (26.7) 124 (18.1) 102 (21.8) 69 (12.8) 41 (20.2) 32 (15.1)
Missing data† 1 (0.6) 3 (1.6) 40 (22.6) 52 (19.1) 21 (3.0) 11 (1.6) 4 (0.9) 1 (0.2) 2 (1.0) 2 (0.9)
rs1801516 (ATM) N = 183 N = 194 N = 177 N = 273 N = 697 N = 686 N = 468 N = 540 N = 203 N = 212
G/G 175 (95.6) 176 (90.7) 164 (92.7) 260 (95.3) 526 (75.5) 510 (74.4) 356 (76.1) 413 (76.5) 153 (75.4) 162 (76.4)
G/A 6 (3.3) 15 (7.7) 11 (6.2) 8 (2.9) 151 (21.7) 156 (22.7) 99 (21.2) 116 (21.5) 44 (21.7) 42 (19.8)
A/A 2 (1.1) 3 (1.6) 0 (0.0) 0 (0.0) 15 (2.2) 15 (2.2) 13 (2.8) 11 (2.0) 0 (0.0) 2 (1.0)
Missing data† 0 (0.0) 0 (0.0) 2 (1.1) 5 (1.8) 5 (0.7) 5 (0.7) 0 (0.0) 0 (0.0) 6 (3.0) 6 (2.8)
rs944289 (near NKX2-1) N = 183 N = 194 N = 177 N = 273 N = 697 N = 686 N = 468 N = 540 N = 203 N = 212
T/T 29 (15.9) 37 (19.1) 25 (14.1) 30 (11.0) 287 (41.2) 207 (30.2) 202 (43.2) 183 (33.9) 70 (34.5) 41 (19.4)
C/T 94 (51.4) 82 (42.3) 59 (33.3) 82 (30.0) 315 (45.2) 346 (50.4) 218 (46.6) 266 (49.3) 85 (41.9) 98 (46.2)
C/C 60 (32.8) 75 (38.6) 84 (47.5) 149 (54.6) 84 (12.1) 122 (17.8) 47 (10.0) 91 (16.8) 47 (23.2) 70 (33.0)
Missing data† 0 (0.0) 0 (0.0) 9 (5.1) 12 (4.4) 11 (1.6) 11 (1.6) 1 (0.2) 0 (0.0) 1 (0.5) 3 (1.4)
† Missing data were due to low quality of samples for genotyping.
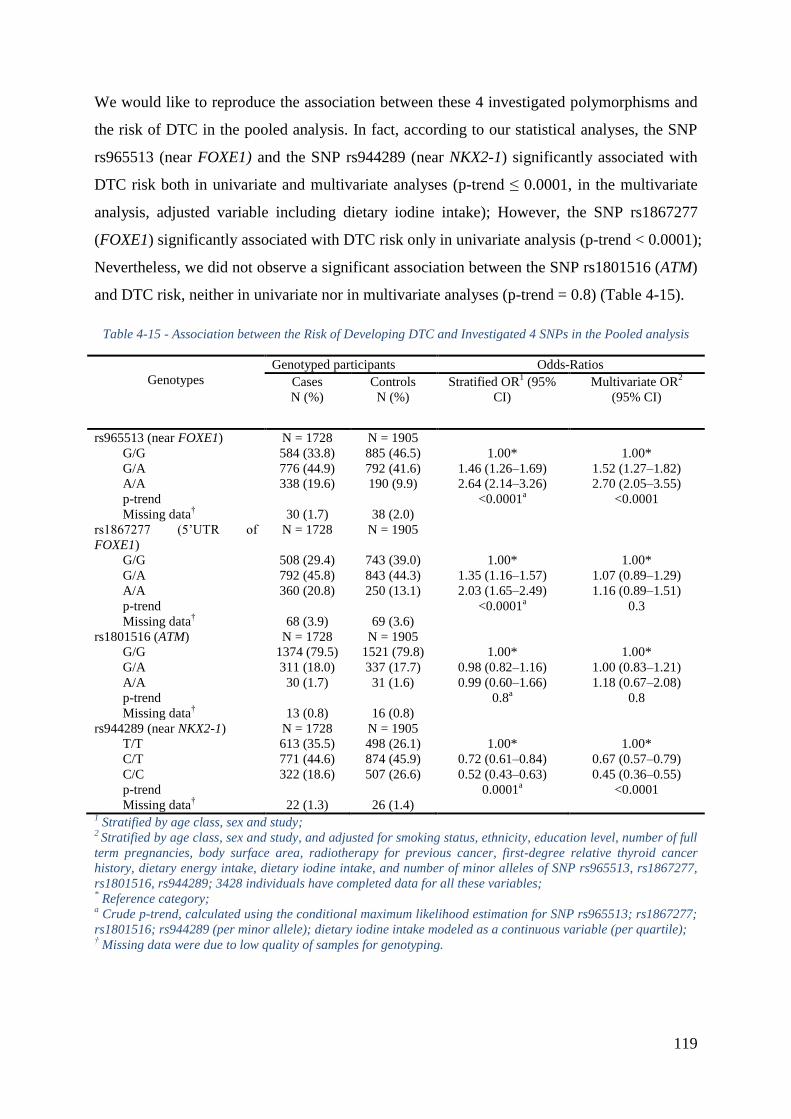
119
We would like to reproduce the association between these 4 investigated polymorphisms and
the risk of DTC in the pooled analysis. In fact, according to our statistical analyses, the SNP
rs965513 (near FOXE1) and the SNP rs944289 (near NKX2-1) significantly associated with
DTC risk both in univariate and multivariate analyses (p-trend ≤ 0.0001, in the multivariate
analysis, adjusted variable including dietary iodine intake); However, the SNP rs1867277
(FOXE1) significantly associated with DTC risk only in univariate analysis (p-trend < 0.0001);
Nevertheless, we did not observe a significant association between the SNP rs1801516 (ATM)
and DTC risk, neither in univariate nor in multivariate analyses (p-trend = 0.8) (Table 4-15).
Table 4-15 - Association between the Risk of Developing DTC and Investigated 4 SNPs in the Pooled analysis
Genotypes
Genotyped participants Odds-Ratios
Cases
N (%)
Controls
N (%)
Stratified OR1 (95%
CI)
Multivariate OR2
(95% CI)
rs965513 (near FOXE1) N = 1728 N = 1905
G/G 584 (33.8) 885 (46.5) 1.00* 1.00*
G/A 776 (44.9) 792 (41.6) 1.46 (1.26Ŕ1.69) 1.52 (1.27Ŕ1.82)
A/A 338 (19.6) 190 (9.9) 2.64 (2.14Ŕ3.26) 2.70 (2.05Ŕ3.55)
p-trend <0.0001a <0.0001
Missing data† 30 (1.7) 38 (2.0)
rs1867277 (5’UTR of
FOXE1)
N = 1728 N = 1905
G/G 508 (29.4) 743 (39.0) 1.00* 1.00*
G/A 792 (45.8) 843 (44.3) 1.35 (1.16Ŕ1.57) 1.07 (0.89Ŕ1.29)
A/A 360 (20.8) 250 (13.1) 2.03 (1.65Ŕ2.49) 1.16 (0.89Ŕ1.51)
p-trend <0.0001a 0.3
Missing data† 68 (3.9) 69 (3.6)
rs1801516 (ATM) N = 1728 N = 1905
G/G 1374 (79.5) 1521 (79.8) 1.00* 1.00*
G/A 311 (18.0) 337 (17.7) 0.98 (0.82Ŕ1.16) 1.00 (0.83Ŕ1.21)
A/A 30 (1.7) 31 (1.6) 0.99 (0.60Ŕ1.66) 1.18 (0.67Ŕ2.08)
p-trend 0.8a 0.8
Missing data† 13 (0.8) 16 (0.8)
rs944289 (near NKX2-1) N = 1728 N = 1905
T/T 613 (35.5) 498 (26.1) 1.00* 1.00*
C/T 771 (44.6) 874 (45.9) 0.72 (0.61Ŕ0.84) 0.67 (0.57Ŕ0.79)
C/C 322 (18.6) 507 (26.6) 0.52 (0.43Ŕ0.63) 0.45 (0.36Ŕ0.55)
p-trend 0.0001a <0.0001
Missing data† 22 (1.3) 26 (1.4)
1 Stratified by age class, sex and study;
2 Stratified by age class, sex and study, and adjusted for smoking status, ethnicity, education level, number of full
term pregnancies, body surface area, radiotherapy for previous cancer, first-degree relative thyroid cancer
history, dietary energy intake, dietary iodine intake, and number of minor alleles of SNP rs965513, rs1867277,
rs1801516, rs944289; 3428 individuals have completed data for all these variables; * Reference category;
a Crude p-trend, calculated using the conditional maximum likelihood estimation for SNP rs965513; rs1867277;
rs1801516; rs944289 (per minor allele); dietary iodine intake modeled as a continuous variable (per quartile); † Missing data were due to low quality of samples for genotyping.
120
In the French Polynesia study, a reduction of DTC risk (p-trend = 0.009) was observed among
people who consumed more iodine than the median value (p-interaction = 0.02) and does not
carry minor allele (A) of the SNP rs965513 near FOXE1, this reduction of risk when
increasing dietary iodine intake was not observed in the rare allele carriers (Figure 4-10). At
the opposite, in the Cuba study, I identified a strong increase of DTC risk associated with the
number of copies in the minor allele (A) of this SNP (p-trend = 0.0003), among people who
consumed less iodine than the median value, this association did not exist among those who
consumed more iodine than the median value (p-interaction=0.01) (Figure 4-10). However,
other from the French Polynesia study, the Cuba study didn’t have independent effect of
iodine intake (Adjusted p-trend = 0.7, Table 4-8). No significant interaction was observed in
other studies or in ethnicity, and other SNPs (Table 4-16).
All the above results remained very similar when reanalyzing this pooled analysis on
excluding iodine in bread. Moreover, all these results remained very similar when restricting
only for papillary thyroid cancer (PTC) patients (88% in this pooled analysis).
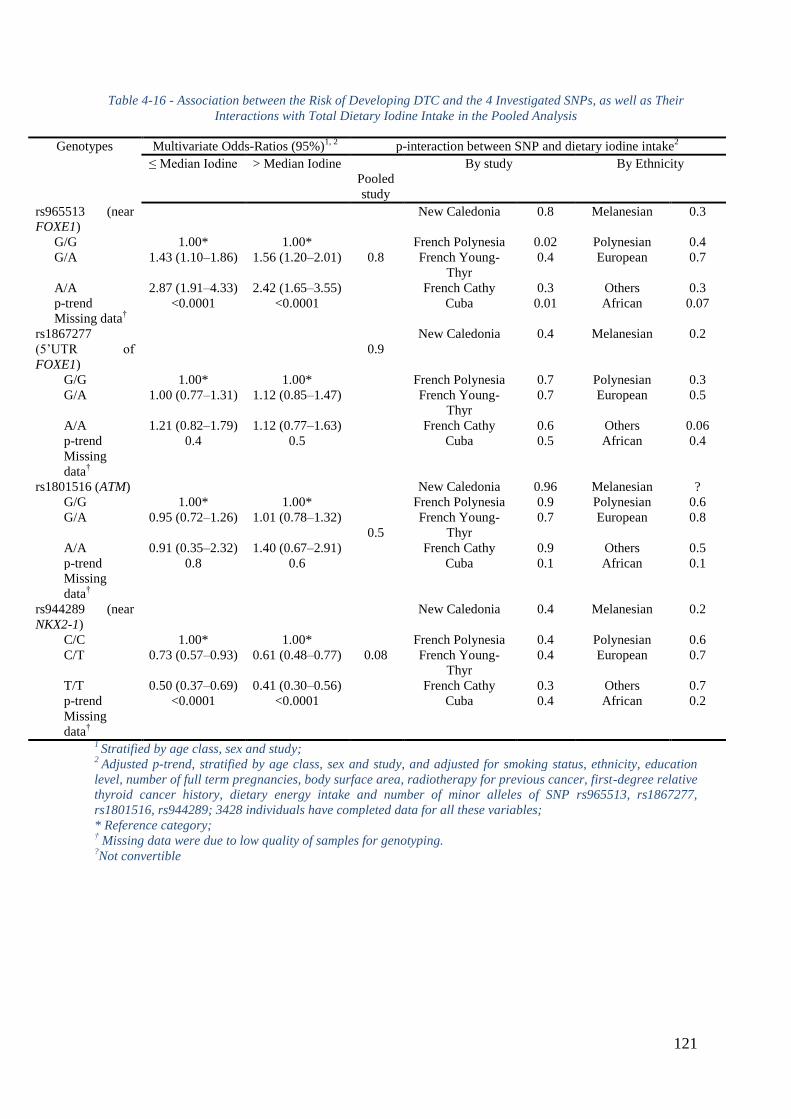
121
Table 4-16 - Association between the Risk of Developing DTC and the 4 Investigated SNPs, as well as Their
Interactions with Total Dietary Iodine Intake in the Pooled Analysis
Genotypes Multivariate Odds-Ratios (95%)1, 2
p-interaction between SNP and dietary iodine intake2
≤ Median Iodine > Median Iodine
Pooled
study
By study By Ethnicity
rs965513 (near
FOXE1)
0.8
New Caledonia 0.8 Melanesian 0.3
G/G 1.00* 1.00* French Polynesia 0.02 Polynesian 0.4
G/A 1.43 (1.10Ŕ1.86) 1.56 (1.20Ŕ2.01) French Young-
Thyr
0.4 European 0.7
A/A 2.87 (1.91Ŕ4.33) 2.42 (1.65Ŕ3.55) French Cathy 0.3 Others 0.3
p-trend <0.0001 <0.0001 Cuba 0.01 African 0.07
Missing data†
rs1867277
(5’UTR of
FOXE1)
0.9
New Caledonia 0.4 Melanesian 0.2
G/G 1.00* 1.00* French Polynesia 0.7 Polynesian 0.3
G/A 1.00 (0.77Ŕ1.31) 1.12 (0.85Ŕ1.47) French Young-
Thyr
0.7 European 0.5
A/A 1.21 (0.82Ŕ1.79) 1.12 (0.77Ŕ1.63) French Cathy 0.6 Others 0.06
p-trend 0.4 0.5 Cuba 0.5 African 0.4
Missing
data†
rs1801516 (ATM)
0.5
New Caledonia 0.96 Melanesian ?
G/G 1.00* 1.00* French Polynesia 0.9 Polynesian 0.6
G/A 0.95 (0.72Ŕ1.26) 1.01 (0.78Ŕ1.32) French Young-
Thyr
0.7 European 0.8
A/A 0.91 (0.35Ŕ2.32) 1.40 (0.67Ŕ2.91) French Cathy 0.9 Others 0.5
p-trend 0.8 0.6 Cuba 0.1 African 0.1
Missing
data†
rs944289 (near
NKX2-1)
0.08
New Caledonia 0.4 Melanesian 0.2
C/C 1.00* 1.00* French Polynesia 0.4 Polynesian 0.6
C/T 0.73 (0.57Ŕ0.93) 0.61 (0.48Ŕ0.77) French Young-
Thyr
0.4 European 0.7
T/T 0.50 (0.37Ŕ0.69) 0.41 (0.30Ŕ0.56) French Cathy 0.3 Others 0.7
p-trend <0.0001 <0.0001 Cuba 0.4 African 0.2
Missing
data†
1 Stratified by age class, sex and study;
2 Adjusted p-trend, stratified by age class, sex and study, and adjusted for smoking status, ethnicity, education
level, number of full term pregnancies, body surface area, radiotherapy for previous cancer, first-degree relative
thyroid cancer history, dietary energy intake and number of minor alleles of SNP rs965513, rs1867277,
rs1801516, rs944289; 3428 individuals have completed data for all these variables;
* Reference category; † Missing data were due to low quality of samples for genotyping.
?Not convertible
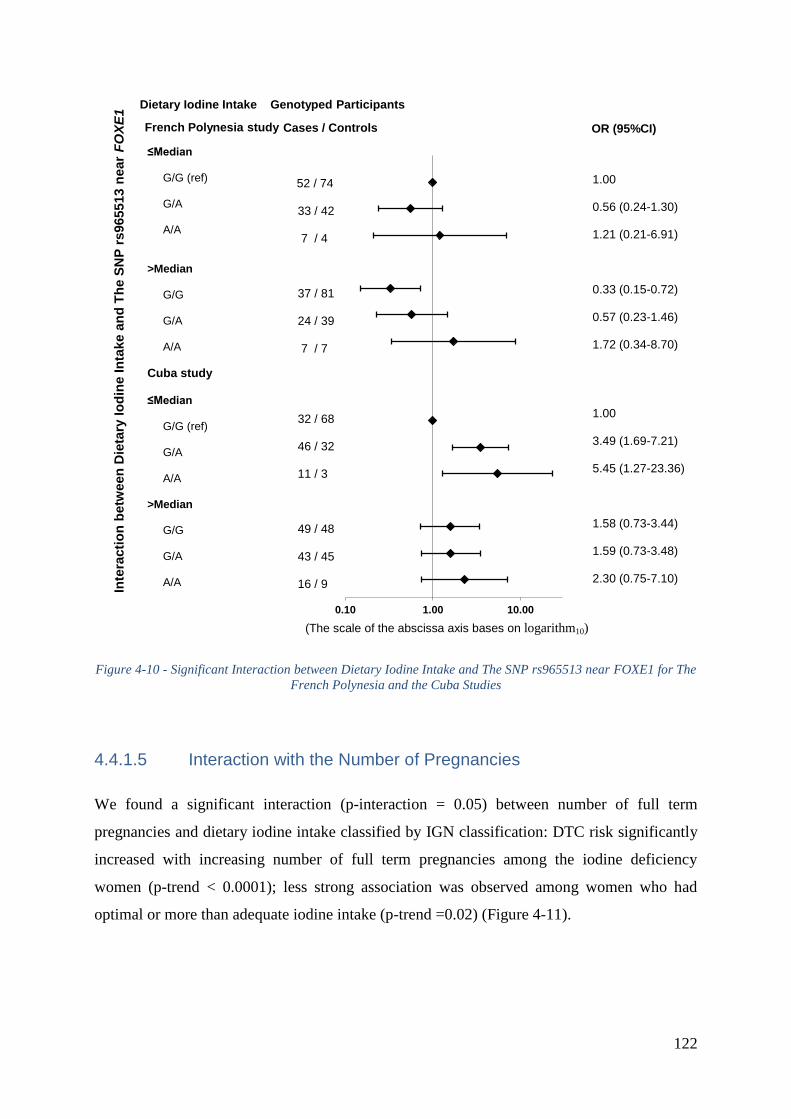
122
Figure 4-10 - Significant Interaction between Dietary Iodine Intake and The SNP rs965513 near FOXE1 for The
French Polynesia and the Cuba Studies
4.4.1.5 Interaction with the Number of Pregnancies
We found a significant interaction (p-interaction = 0.05) between number of full term
pregnancies and dietary iodine intake classified by IGN classification: DTC risk significantly
increased with increasing number of full term pregnancies among the iodine deficiency
women (p-trend < 0.0001); less strong association was observed among women who had
optimal or more than adequate iodine intake (p-trend =0.02) (Figure 4-11).
0.10 1.00 10.00
≤Median G/G (ref) G/A A/A >Median G/G G/A A/A
Cuba study ≤Median G/G (ref) G/A A/A >Median G/G G/A A/A
1.00 0.56 (0.24-1.30) 1.21 (0.21-6.91) 0.33 (0.15-0.72) 0.57 (0.23-1.46) 1.72 (0.34-8.70) 1.00 3.49 (1.69-7.21) 5.45 (1.27-23.36) 1.58 (0.73-3.44) 1.59 (0.73-3.48) 2.30 (0.75-7.10)
French Polynesia study
Genotyped Participants
Cases / Controls
Inte
racti
on
betw
een
Die
tary
Io
din
e I
nta
ke a
nd
Th
e S
NP
rs965513 n
ear
FO
XE
1
52 / 74 33 / 42 7 / 4 37 / 81 24 / 39 7 / 7
32 / 68 46 / 32 11 / 3 49 / 48 43 / 45 16 / 9
OR (95%CI)
Dietary Iodine Intake
(The scale of the abscissa axis bases on logarithm10)
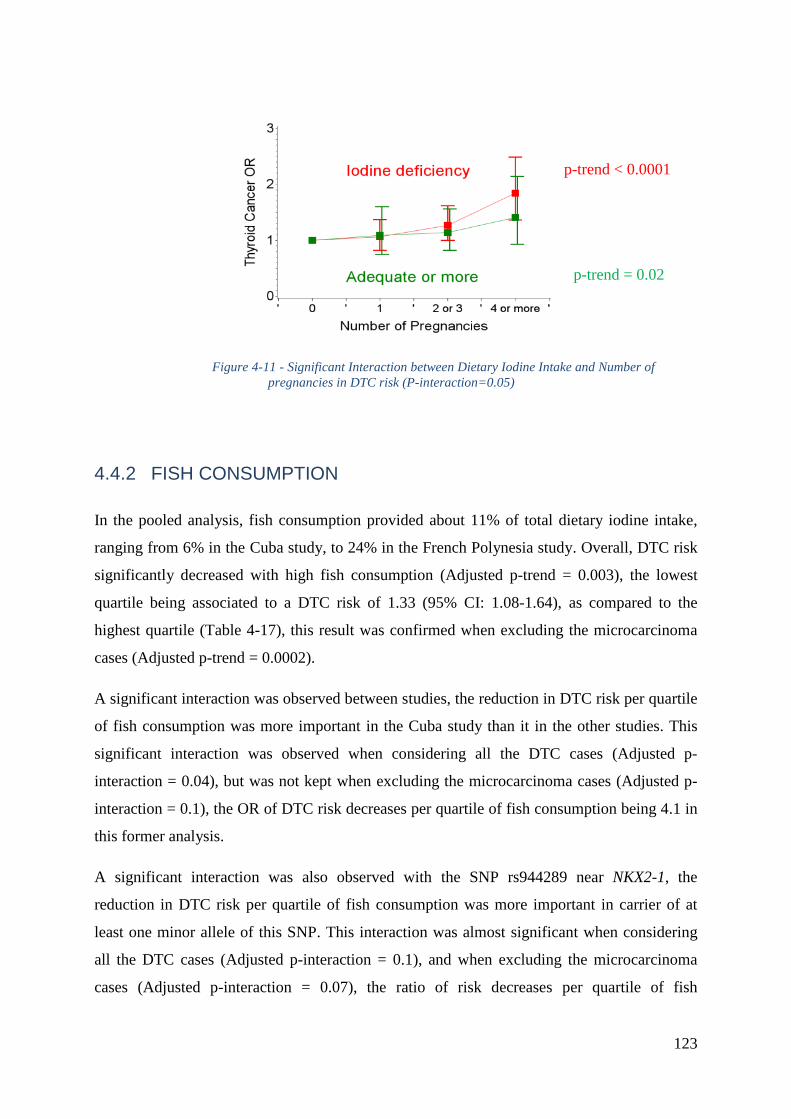
123
Figure 4-11 - Significant Interaction between Dietary Iodine Intake and Number of
pregnancies in DTC risk (P-interaction=0.05)
4.4.2 FISH CONSUMPTION
In the pooled analysis, fish consumption provided about 11% of total dietary iodine intake,
ranging from 6% in the Cuba study, to 24% in the French Polynesia study. Overall, DTC risk
significantly decreased with high fish consumption (Adjusted p-trend = 0.003), the lowest
quartile being associated to a DTC risk of 1.33 (95% CI: 1.08-1.64), as compared to the
highest quartile (Table 4-17), this result was confirmed when excluding the microcarcinoma
cases (Adjusted p-trend = 0.0002).
A significant interaction was observed between studies, the reduction in DTC risk per quartile
of fish consumption was more important in the Cuba study than it in the other studies. This
significant interaction was observed when considering all the DTC cases (Adjusted p-
interaction = 0.04), but was not kept when excluding the microcarcinoma cases (Adjusted p-
interaction = 0.1), the OR of DTC risk decreases per quartile of fish consumption being 4.1 in
this former analysis.
A significant interaction was also observed with the SNP rs944289 near NKX2-1, the
reduction in DTC risk per quartile of fish consumption was more important in carrier of at
least one minor allele of this SNP. This interaction was almost significant when considering
all the DTC cases (Adjusted p-interaction = 0.1), and when excluding the microcarcinoma
cases (Adjusted p-interaction = 0.07), the ratio of risk decreases per quartile of fish
p-trend < 0.0001
p-trend = 0.02
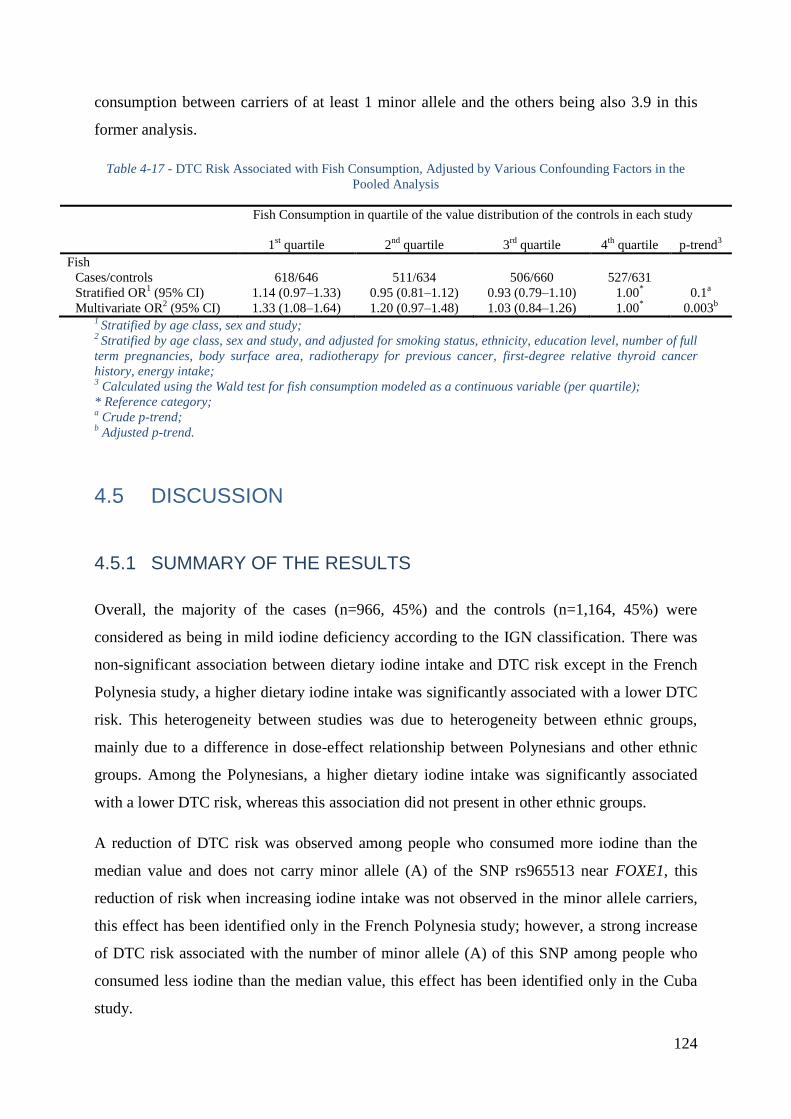
124
consumption between carriers of at least 1 minor allele and the others being also 3.9 in this
former analysis.
Table 4-17 - DTC Risk Associated with Fish Consumption, Adjusted by Various Confounding Factors in the
Pooled Analysis
Fish Consumption in quartile of the value distribution of the controls in each study
1st quartile 2
nd quartile 3
rd quartile 4
th quartile p-trend
3
Fish
Cases/controls 618/646 511/634 506/660 527/631
Stratified OR1 (95% CI) 1.14 (0.97Ŕ1.33) 0.95 (0.81Ŕ1.12) 0.93 (0.79Ŕ1.10) 1.00
* 0.1
a
Multivariate OR2 (95% CI) 1.33 (1.08Ŕ1.64) 1.20 (0.97Ŕ1.48) 1.03 (0.84Ŕ1.26) 1.00
* 0.003
b
1 Stratified by age class, sex and study;
2 Stratified by age class, sex and study, and adjusted for smoking status, ethnicity, education level, number of full
term pregnancies, body surface area, radiotherapy for previous cancer, first-degree relative thyroid cancer
history, energy intake; 3 Calculated using the Wald test for fish consumption modeled as a continuous variable (per quartile);
* Reference category; a Crude p-trend;
b Adjusted p-trend.
4.5 DISCUSSION
4.5.1 SUMMARY OF THE RESULTS
Overall, the majority of the cases (n=966, 45%) and the controls (n=1,164, 45%) were
considered as being in mild iodine deficiency according to the IGN classification. There was
non-significant association between dietary iodine intake and DTC risk except in the French
Polynesia study, a higher dietary iodine intake was significantly associated with a lower DTC
risk. This heterogeneity between studies was due to heterogeneity between ethnic groups,
mainly due to a difference in dose-effect relationship between Polynesians and other ethnic
groups. Among the Polynesians, a higher dietary iodine intake was significantly associated
with a lower DTC risk, whereas this association did not present in other ethnic groups.
A reduction of DTC risk was observed among people who consumed more iodine than the
median value and does not carry minor allele (A) of the SNP rs965513 near FOXE1, this
reduction of risk when increasing iodine intake was not observed in the minor allele carriers,
this effect has been identified only in the French Polynesia study; however, a strong increase
of DTC risk associated with the number of minor allele (A) of this SNP among people who
consumed less iodine than the median value, this effect has been identified only in the Cuba
study.
125
DTC risk also significantly increased with increasing number of full term pregnancies among
the iodine deficient women.
In the pooled analysis, DTC risk significantly decreased with increasing fish consumption, a
significant interaction was observed between studies, the reduction in DTC risk per quartile of
fish consumption was more important in the Cuba study than it in the other studies.
4.5.2 STRENGTHS AND LIMITATIONS OF THE STUDY
To the best of the authors’ knowledge, this present pool study is the first and the largest case-
control study to investigate iodine status and thyroid cancer risk in heterogenetic ethnicities
across different geographic zone of the world. Another point worth mentioning is that we
have elaborated two special food composition tables (FPFCT2013, CFCT 2014, see 1.3.1.3)
to measure the quantity of iodine in typically French Polynesian and Cuban food samples for
this study, which gave us normative, accurate dietary iodine measurements for the French
Polynesian and Cuban populations. Although the two tables have not been applied to all of the
food items in the two studies, knowing that until now, no such measurement of iodine has
been performed by other organizations for typically French Polynesian, Cuban or Latino food.
As with any case-control study, this pooled analysis of the 5 case-control studies has some
limitations. Self-reported food consumptions led to imprecise measures and recall bias. The
dietary questionnaires were heterogenetic between each individual study, each study did not
have the equal and same food items, because these 5 studies were carried out in 5 different
places and the dietary patterns could be different between one and others, in order to solve
this problem, we stratified all the statistical analyses by study. Besides, in the daily life, each
food item is a dependent variable but in the questionnaire, we inquire the study participant in
an independent way, it may over-estimate the daily food consumption, thereby, over-estimate
the daily dietary iodine intake. Nevertheless, if this over-estimation exists, it will be
systematically applied to both cases and controls in this pooled analysis, so the overall
estimation of the DTC risk OR will not be deflective. Additionally, this independent effect
was compensated by the frequency of the food consumption (by day, week or month). We
agree that urine or blood iodine concentration is regarded as the worldwide standardization to
estimate the iodine status of general population. Nevertheless, our case-control studies used
food frequency questionnaire rather than urine or blood iodine concentration to measure the
dietary iodine intake is not seems like a good way, because they were not designed to estimate
126
the iodine status of general population, but to perform comparisons of certain potential
characteristics (in this present study is the dietary iodine intake) between the cases and the
controls. In addition, even if we had performed urine iodine measurement, it would have been
confused by thyroid hormone replacement therapy received by the DTC cases of our studies
due to their previous thyroidectomy. Therefore, iodine measured in urine of the cases would
not have any clinical meaning. Another limitation could come from the difficulties to quantify
iodine in diet, as iodine is very volatile, and the use of food composition tables in which the
different values for different food items have not been assessed using the same iodine
quantification methodology, which led to extremely variable value, in particular for fishes, it
strongly depends on the species, the places of capture and the laboratory validation method of
iodine measurement in this food, for example, in the French CIQUAL 2013 food composition
table (124), for fish group, iodine content in natural albacore tuna was 1 µg/100g, but in raw
tuna was 36.7 µg/100g. With such a large distribution echelon of iodine measurement among
places of capture, laboratories, it did not seem pertinent to propose an average value. This
problem only concerns the CIQUAL food composition table, but not the two tables performed
by ANSES for our studies.
Another point worth discussing is that, we didn’t include iodized salt in the statistical analyses,
although we didn’t have quantified but qualified information (always; sometimes; no) about
iodized salt in our questionnaire, nevertheless, we did have the iodine (10.25 µg/g, 95% CI =
8.65-11.84) and selenium (0.022 µg/g, 95% CI = 0.013-0.031) content measurement in the
iodized salt in CFCT 2014 (see 1.3.1.3) and in the French CIQUAL 2013 food composition
table (124). Indeed, it is difficult to take iodized salt into account because firstly, we didn’t
know exactly when was the systematic iodized salt policy carried out in the countries or
regions included in this pooled analysis. If it was carried out prior to the reference year
(cancer diagnostic year for the cases and the same year for their eligible matched controls) of
the study participants, normally, 100% of the participants had to use iodized salt in their daily
life; if it was carried out during interval of their reference years, it is difficult to know how
many percent of the study participants using iodized salt in their daily life, in particular, some
participants were even not able to make difference between ordinary salt and iodized salt; if it
was carried out after the upper bound of their reference years interval, especially for the elder
participants in the French Polynesia and the New Caledonia studies, normally, 0% of the
participants used iodized salt in their daily life because it hadn’t existed at that time.
Moreover, even if we had known the time when launching the iodized salt policy, we would
127
not have had the accurate information about the frequency and the quantity of using iodized
salt in their daily life because salt is not an independent variable, it dependents on the cooking
patterns and the dietary habits, for example, table salt supplementation is a dietary habit rather
for the French than for the French Polynesian, the New Caledonian and the Cuban. Due to
these variabilities and uncertainties, the “iodized salt” issue is quite difficulty to interpret
because of the possible confusion.
4.5.3 COMPARISON RESULTS FROM THE LITERATURE
In this pooled analysis, dietary iodine intake didn’t significantly associated with DTC risk
whatever classified by the IGN classification or by the distribution value of the quartiles in
the controls of each study, or considering iodine intake as a continuous variable, or
considering the ratio between dietary iodine intake and dietary energy intake. A case-control
study with the similar method of ours reported the same result as ours based on 191 cases and
442 controls in Hawaiian adults (103). Another caseŔcontrol study of 608 women with
thyroid cancer and 558 controls in northern California showed that a significant reduction in
the papillary thyroid cancer risk was seen in the highest iodine intake quintile (> 537 μg/day)
compared with the lowest (< 273 μg/day) (OR = 0.49, 95 % CI: 0.29, 0.84). Iodine intake
from food alone was not associated with risk, but iodine intake from supplements was (63).
The previous paper of the New Caledonia study about iodine intake and thyroid cancer risk
found the same result as the present pooled analysis, but at that time, iodine intake was
computed only using the French food composition table CIQUAL 1995 (205), which did not
have data for some local seafood, so iodine intakes may have been underestimated (104);
However, even the present pooled analysis took this previous study limitation into account
and used the new measurements made by French ANSES (FPFCT 2013 and CFCT 2014, see
1.3.1.3) for the local food, and for the other general food, the French CIQUAL 2013 food
composition table (124) was as a necessary complement, this non-significant association has
not been changed. Nevertheless, the present pooled analysis confirmed with the previous
paper of the French Polynesia study about the significant reduction of DTC risk with the
increasing dietary iodine intake (105). The meta-analysis of publications of animal and human
studies about iodine intake and thyroid cancer risk done by Zimmermann et al. (106)
examined the four case-control studies described above, by adjusting OR for the highest
iodine intake quartile compared to the lowest quartile, and revealed the odds for thyroid
cancer risk were 23 % less in the highest quartile of iodine intake versus the lowest, although
128
this effect was only borderline significant (OR = 0.77; 95 % CI: 0.58-1.02; p = 0.068).
Moderate evidence for between-study heterogeneity (I2 = 42.6 %; p = 0.058) was reported.
Except the SNP rs944289 near NKX2-1, minor alleles of the other three investigated SNPs
were not more frequent in the controls of the French Polynesia, New Caledonia and Cuba
studies than in the controls of the two French studies (Table 4-14). That suggests the risk
allele of the two SNPs in FOXE1 gene could be more frequent in European populations rather
than in Polynesian, Melanesian, Caribbean or other island populations. However, this
situation was just reverse for minor allele of the SNP rs944289 near NKX2-1. These results
were concordant with the previous findings (134).
The result that dietary iodine intake interacts with number of minor allele A of the SNP
rs965513 near FOXE1 in the risk of DTC, was valid only for the French Polynesia and Cuba
studies, and dietary iodine intake only interacts with this SNP, it may be due to the genetic
specificity in these populations. Furthermore, the French Polynesia and the Cuba studies had
the more mixed races people compared to the other studies, we assume that being mixed race
present less number of minor allele (A) of the SNP rs965513, and less risk of DTC, especially
for the half-breeds in French Polynesia who consumed more iodine and for the half-breeds in
Cuba who consumed less. To the best of the authors’ knowledge, except my previous
publication of the Cuba study (113), gene-environment interactions in DTC risk have only
been investigated in relation to radiation exposure in two candidate regions approach, in fact,
a Chernobyl accident post consequence investigation conducted a genome-wide association
study, employing Belarusian patients with PTC aged 0-18 years at the time of accident and
age-matched Belarusian control subjects. They identified 4 SNPs (rs925489, rs7850258,
rs965513 and rs10759944) at chromosome 9q22.33 showing significant associations with
radiation-related PTC (MantelŔHaenszel P: mhp = 1.7×10⁻⁹
to 4.9×10⁻⁹
). The association was
further reinforced by a validation analysis using one of these SNP markers, rs965513 near
FOXE1, with a new set of samples (overall mhp = 4.8×10⁻¹²
, OR = 1.65, 95% CI: 1.43-1.91).
They also tested rs944289 near NKX2-1 at 14p13.3, no association with radiation-related PTC
was obtained (mhp = 0.17) (44). However, until now, except the studies of Epi-Thyr
consortium, no gene-environment interaction study has investigated an association with
FOXE1 and dietary iodine intake.
In this pooled analysis, we found that DTC risk significantly increased with increasing
number of full term pregnancies among the iodine deficient women. Moreover, the infants
129
born of the mothers with iodine deficiency have high cretinism risk, characterized by severe
delays in physical and mental growth, language disorders, deafness and dwarfism. According
to the meta-analysis of Bleichrodt and Born, iodine deficiency is the leading cause of brain
damage in infants, and it can lose 13.5 IQ points on average (206). A more recent meta-
analysis conducted on studies in China produced a very similar result (207). During the
pregnancy, hormone synthesis is increased to maintain both mother and fetus metabolism, and
iodine requirements are increased by 150 µg/day to 220 µg/day during pregnancy, and 270
µg/day during breastfeeding (208). In the previous publication of the Young-Thyr study about
reproductive factors in DTC risk, Xhaard et al. found that having high number of pregnancies
was significantly associated with high DTC risk in women with 35 years old or below who
lived in eastern France (80). A meta-analysis with 21 studies including 406,329 study
participants suggested a strong association of parity (≥ 3 pregnancies) with the risk of thyroid
cancer (87). Early population-based case-control study of thyroid cancer also demonstrated
that among females, the radiogenic risk appeared to be potentiated by the number of
subsequent live-births (88). Three case-control studies performed in the USA (89), in China
(90) and in New Caledonia (84) respectively revealed evidence of high risk in women who
had been pregnant and who had a high number of pregnancies. However, the results above
simply based on the association between number of pregnancies and thyroid cancer risk, in
this present pool analysis, we are the first to investigate the interaction between number of
pregnancies and iodine status in thyroid cancer risk. A possible explanation for the higher risk
of DTC in women who have had a high number of pregnancies and were in iodine deficiency
status could be the acceleration on proliferation of thyroid cells, among iodine deficiency
people, maybe among pregnant women who were iodine deficiency, the effect of thyroid cells
proliferation is accumulate, as maternal thyroid activity increases during pregnancy (91).
Estrogens, which are elevated during pregnancy, are associated with elevated serum thyroxin
and triiodothyronine levels, which might induce high cell turnover (92). The highest levels of
serum TSH, even within the normal range, are associated with a subsequent diagnosis of
thyroid cancer in individuals with thyroid abnormalities (93). Repeated pregnancies may
increase the risk of DTC by revealing DNA damage due to carcinogens, such as ionizing
radiation, that may have remained silent without pregnancies (94).
DTC risk significantly decreased with increasing fish consumption but there was no
association with dietary iodine intake within the pooled analysis, however, in general, iodine
is rich in fish. This result could be explained by the presence of protection factors in fish,
130
maybe selenium, maybe omega-3 polyunsaturated fatty acids or others. Several publications
showed current evidence for an interaction between genetic polymorphisms and dietary LCn-
3 PUFA in the risk of breast, prostate and colorectal cancers, in regards to inflammation and
eicosanoid synthesis: Lower activity genotypes of the GSTM1, GSTT1, GSTP1 genes
associated with higher breast cancer protection with high intake of marine n-3 FA (209); High
intake of n-3 FA associated with low risk of prostate cancer (210); C allele at locus rs5275
correlated with low risk of prostate cancer with high intake of fatty fish (211); Carriers of T
allele of rs7873087 of PGES gene with high fish intake have low colorectal cancer risk;
Contrarily, carriers of Ile variant of EP4 gene showed correlation between high fish intake but
high colorectal cancer risk (212). However, a meta-analysis with systematic review showed
that omega-3 polyunsaturated fatty acids has been found to be beneficial for brain
development, furthermore, higher fish intake significantly related with lower risk of brain
cancer based on nine observational studies, dose-response analysis showed that the RR per
100 g/day increase in fish intake was 0.95 (95% CI: 0.91-0.98) (213). In a recent study by
Haslam et al. (214), the effects of fish consumption on the risk of thyroid cancer in humans
were examined. Prior to this study, there was no report on any association between ingestion
of PCBs (Polychlorinated biphenyls from fish consumption) and thyroid cancer, PCBs are
known as endocrine disruptors and have potential effects on thyroid functions. The authors
recruited participants (135 sports fishermen and their spouses) from the New York State
Angler Cohort Study (215). The controls were matched with the same sex ratio of the thyroid
cancer cases. The scientists asked the participants about their fish consumption patterns at the
beginning of the study in 1991, and then followed the participants for 17 years (from 1991 to
2008), to observe incidences of thyroid cancer and to determine any differences between the
fish consumers and non-fish consumers. Using this information, the authors estimated
exposure to PCBs and the intake of omega-3 fatty acids from fish consumption. In total, 27
thyroid cancer cases were reported with 108 control participants. Results showed that there
was no significant association between total fish consumption or the estimated PCBs intake
from Great Lakes fish and the thyroid cancer incidence. Previously reported findings indicate
that fish consumption was associated with a higher thyroid cancer risk in areas with an iodine-
rich diet, but high fish consumption had a protective effect of thyroid cancer in areas with
endemic goiters (216). In the analyses of Haslam et al. (214), there were no differences in
previous diagnosis of a thyroid goiter between cases and controls, but fish asked about in
these analyses did not come from iodine-rich waters. Taken together, this may partially
explain why there was no association seen between Great Lake fish consumption and thyroid
131
cancer. Nevertheless, those who had higher long-term estimated omega-3 fatty acids
consumption from Great Lakes fish had lower incidence of thyroid cancer than those with
lower omega-3 fatty acids consumption. These results suggest that long-term intake of
omega-3 fatty acids from Great Lakes fish may protect against the development of thyroid
cancer.
Other explanation maybe the inaccuracy in the estimation of dietary iodine intake in this
pooled analysis, it did not only depend on the auto-declaration of our dietary questionnaire,
but also depended on all the food composition tables we used for dietary iodine intake
calculation. Different food species items, different gastronomies and especially, different
criterions of laboratory measuring validation (for example, for the same food item which
reached the limit of detection or the limit of quantification of iodine, one laboratory chose the
average iodine content of the limit of detection value and the limit of quantification value of
several different measurements, another laboratory preferred the least restrictive value which
could mediate the limit of detection value or the limit of quantification value), all these
variations introduce the inaccuracy, that may be more important than the inaccuracy in the
estimation of fish consumption which only depended on the auto-declaration of our dietary
questionnaire.
4.6 CONCLUSION
Overall, in this pooled analysis, the majority of the studied population was considered as
being in mild dietary iodine deficiency according to the IGN classification. Although DTC
risk was not found to be linked to dietary iodine intake, this risk significantly decreased with
high fish consumption, this reduction in DTC risk per quartile of fish consumption was more
important in the Cuba study than it in the other studies. Additionally, higher dietary iodine
intake may reduce DTC risk only in French Polynesia and in Polynesians. A strong increase
in DTC risk associated with the number of the minor allele (A) of the SNP rs965513 near
FOXE1, among people who consumed more iodine than the median value in the French
Polynesia study, but among people who consumed less iodine than the median value in the
Cuba study. For the women who had a high number of full term pregnancies and who were
iodine deficient, increasing dietary iodine intake may reduce their risk of suffering from DTC,
thus reduce the hereditary risk to their infants.
132
5 PART V: FINGERNAIL SELENIUM AND THYROID
CANCER RISK: A CASE-CONTROL STUDY IN
FRENCH POLYNESIA
133
Selenium is an essential trace element present mainly in grains, meat, fish, eggs, and dairy
products, as well as multivitamin supplements (217, 218). Like iodine, the selenium content
of a given food strongly depends upon the geographic location where it is produced, as plant
uptake is largely influenced by the availability and chemical species of selenium in the soil
(217). The redox-protective properties of selenium are important during oxidative thyroid
hormone production, in which thyroid cells produce excess H2O2 and reactive oxygen species.
Due to its ability to protect the thyroid gland and maintain thyroid hormone production, there
is a high concentration of selenium in the thyroid (217), and supply of selenium to the thyroid
is prioritized even during periods of selenium deficiency (219).
Although numerous studies have shown that selenium deficiency may be associated with an
increased risk for several types of cancer (220, 221, 222, 223), the relationship between
selenium and thyroid cancer has been examined in few studies. One in vitro study showed that
selenium causes growth inhibition of thyroid cancer cells accompanied by cell-cycle arrest in
the S and G2/M phases (224). In addition, a small case-control study of 43 thyroid cancer
cases showed a significant increased risk for low compared to high prediagnostic serum
selenium concentrations (225).
In the present study, we examined the association between fingernail selenium concentrations
with thyroid cancer in a case-control study of men and women in French Polynesia, a country
who has high incidence of thyroid cancer in females (226) also highly exposed to selenium
mainly through fish consumption (227). In contrast to other biomarker measures of selenium,
such as blood or urine, nail concentrations represent longer-term exposure, typically the
previous three to six months.
5.1 MATERIALS AND METHODS
5.1.1 STUDY PARTICIPANTS
The process for selection and interviews of thyroid cancer patients and controls has been
extensively described in 2.3.2. In total, the study population included 229 interviewed cases
and 373 interviewed controls, with 85 cases (37%) matched to one control and 144 cases
(63%) matched to two controls. We further excluded 6 cases and 9 controls for missing data
on fingernail selenium, and a batch of 8 cases and 33 controls for which all measures of any
134
elements in the fingernails were returned as null. The final analytic population was 215 cases
and 331 controls.
5.1.2 DATA COLLECTION
Details in data collection through the structured questionnaire also have been described in
2.3.2. The slight difference applied to this present study was at the time of the analysis
process, the FPFCT 2013 (see 1.3.1.3) was in the laboratory validation process and was not
ready for this application, so we used French CIQUAL-REGAL food composition table (205)
for the calculation of iodine and selenium intake. The overall iodine intake took into account
all foods of the questionnaire, except iodized salt because we had no information on the
amount of iodized salt consumption.
All participants provided fingernail clippings on the date of the interview. Clippings were
stored in paper envelopes at room temperature before being transferred to the toxicology
centre of the Institut National de Santé Publique du Quebec (INSPQ).
5.1.3 FINGERNAIL SELENIUM AND IODINE MEASUREMENTS
Nail samples were digested under basic conditions using trimethylammonium hydroxide for
iodine and under acidic conditions with nitric acid for selenium. The digested material was
directly analysed by ICP-MS (inductively coupled plasma mass spectrometry, Perkin Elmer
Sciex, Elan DRCII with autosampler ESI SC-4 and work station Elan version 3.0) (228).
Certified reference materials used were: Human hair powder GBW 07601 and GBW 09101b.
5.1.4 STATISTICAL ANALYSIS
Descriptive statistics and trend tests in univariate analysis were performed using non-
parametric Jonckheere-Terpstra test for association between two quantitative variables; non-
parametric Wilcoxon rank test for association between a qualitative variable with two classes
and a quantitative variable; and non-parametric Kruskal-Wallis rank tests for association
between a qualitative variable with more than two classes and a quantitative variable.
The association between selenium in nails and other parameters has been investigated using
generalized linear models.
135
We used conditional logistic regression to estimate OR and 95%CI for thyroid cancer by
fingernail selenium concentration. Selenium was categorized into quartiles based on the
distribution among the controls. All models were conditioned on year of birth (< 1945, 1945-
1955, 1955-1965, ≥ 1965) and sex to reduce the potential bias due to the matching process
and adjusted for year of birth (continuous, per year) to control for residual confounding by
age. Multivariable models were additionally adjusted for ethnicity (Polynesian, mixed, other),
education (primary school or lower vs. middle school or higher), BMI at the moment of
cancer (< 25, 25-29.9, ≥ 30 kg/m2, missing), current smoking (yes vs. no), and radiotherapy
treatment to head or neck (ever vs. never). These associations were also evaluated by sex,
smoking status, BMI, thyroid cancer histology, tumor size, fingernail iodine and dietary
iodine. Effect modification of selenium levels by sex, smoking status, BMI, thyroid cancer
histology, tumor size, fingernail iodine and dietary iodine was evaluated using the likelihood
ratio test comparing a model with an interaction term to one without. We also investigated for
potential bias due to the delay between thyroid cancer diagnosis and fingernails sampling, by
performing separate analysis for various categories of delay.
All statistical analyses were conducted using SAS software (version 9.3, SAS Institute Inc.,
Cary, NC, USA).
5.2 RESULTS
The cases and controls were generally comparable in terms of ethnicity and level of education.
Thirty percent of the cancers’ longer diameters were less than 10 mm. About 70% of cases
had papillary thyroid cancer, and 30% had a follicular type.
Among controls, higher fingernail selenium levels were observed in older people (p < 0.001),
and people who have higher BMI (p = 0.001) and in non-smokers (p < 0.0001), but in a
multivariate analysis, only age (p = 0.01) and smoking (p < 0.0001) remained significant
(Table 5-1). The highest fingernail selenium levels were in inhabitants of the Marquises
Islands (M = 0.87 μg/g) and of the Tuamotu-Gambier Archipelago (M = 0.86 μg/g) (Figure
5-1). Adjusting by other factors, including estimated selenium and iodine in diet, selenium in
fingernails of the controls from the Tuamotu-Gambier Archipelago remained significantly
higher than in the rest of French Polynesia, but not from the Marquises Islands (Table 5-1).
On the contrary, among cases, only selenium in fingernails of the Marquises Islands
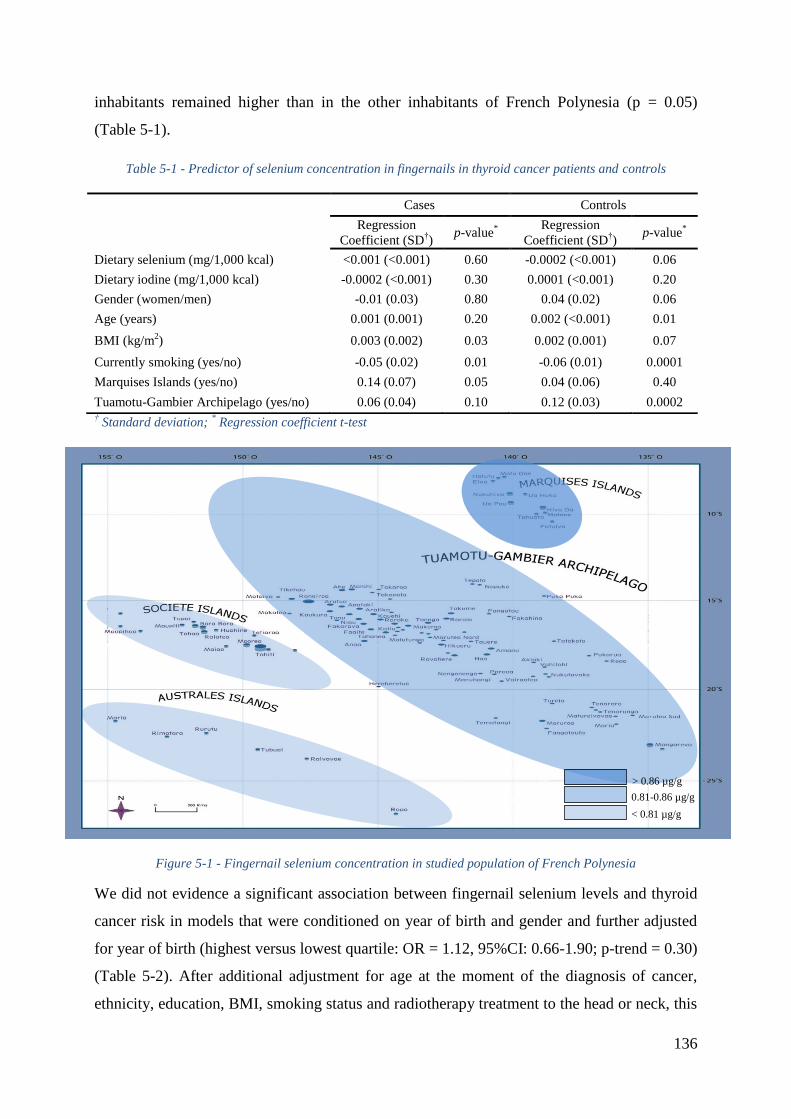
136
inhabitants remained higher than in the other inhabitants of French Polynesia (p = 0.05)
(Table 5-1).
Table 5-1 - Predictor of selenium concentration in fingernails in thyroid cancer patients and controls
† Standard deviation;
* Regression coefficient t-test
Figure 5-1 - Fingernail selenium concentration in studied population of French Polynesia
We did not evidence a significant association between fingernail selenium levels and thyroid
cancer risk in models that were conditioned on year of birth and gender and further adjusted
for year of birth (highest versus lowest quartile: OR = 1.12, 95%CI: 0.66-1.90; p-trend = 0.30)
(Table 5-2). After additional adjustment for age at the moment of the diagnosis of cancer,
ethnicity, education, BMI, smoking status and radiotherapy treatment to the head or neck, this
Cases Controls
Regression
Coefficient (SD†)
p-value*
Regression
Coefficient (SD†)
p-value*
Dietary selenium (mg/1,000 kcal) <0.001 (<0.001) 0.60 -0.0002 (<0.001) 0.06
Dietary iodine (mg/1,000 kcal) -0.0002 (<0.001) 0.30 0.0001 (<0.001) 0.20
Gender (women/men) -0.01 (0.03) 0.80 0.04 (0.02) 0.06
Age (years) 0.001 (0.001) 0.20 0.002 (<0.001) 0.01
BMI (kg/m2) 0.003 (0.002) 0.03 0.002 (0.001) 0.07
Currently smoking (yes/no) -0.05 (0.02) 0.01 -0.06 (0.01) 0.0001
Marquises Islands (yes/no) 0.14 (0.07) 0.05 0.04 (0.06) 0.40
Tuamotu-Gambier Archipelago (yes/no) 0.06 (0.04) 0.10 0.12 (0.03) 0.0002
> 0.86 µg/g
0.81-0.86 µg/g
< 0.81 µg/g
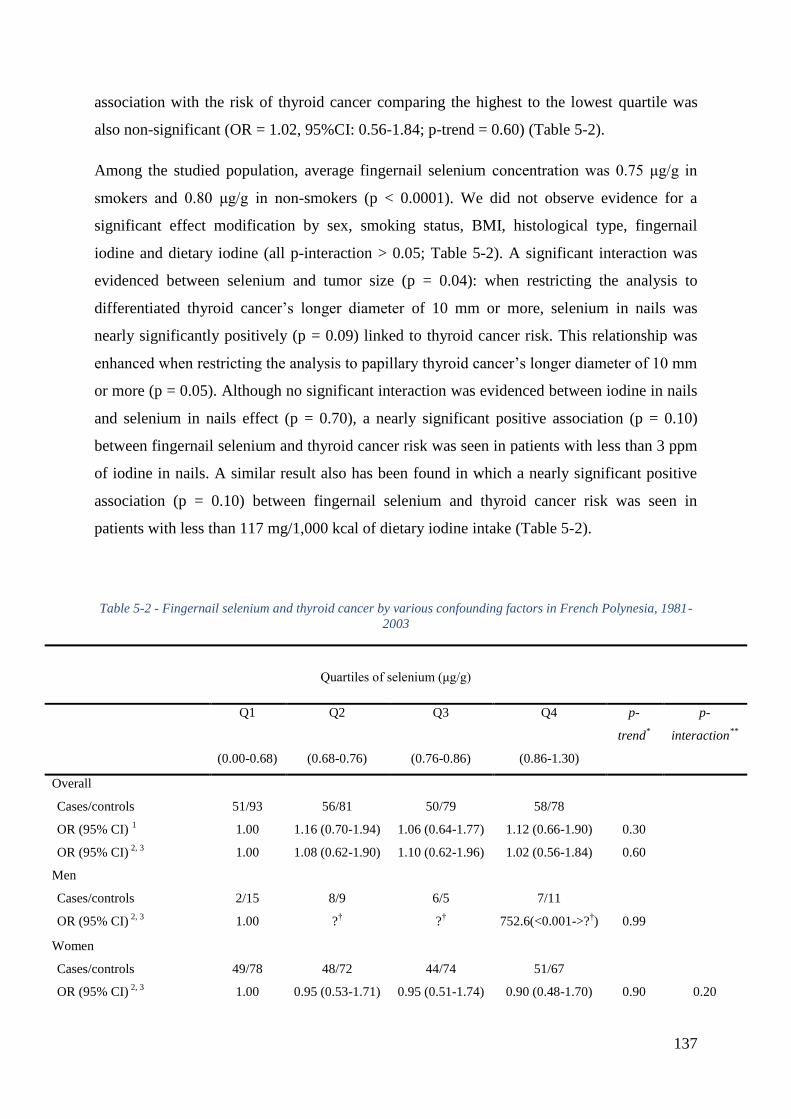
137
association with the risk of thyroid cancer comparing the highest to the lowest quartile was
also non-significant (OR = 1.02, 95%CI: 0.56-1.84; p-trend = 0.60) (Table 5-2).
Among the studied population, average fingernail selenium concentration was 0.75 μg/g in
smokers and 0.80 μg/g in non-smokers (p < 0.0001). We did not observe evidence for a
significant effect modification by sex, smoking status, BMI, histological type, fingernail
iodine and dietary iodine (all p-interaction > 0.05; Table 5-2). A significant interaction was
evidenced between selenium and tumor size (p = 0.04): when restricting the analysis to
differentiated thyroid cancer’s longer diameter of 10 mm or more, selenium in nails was
nearly significantly positively (p = 0.09) linked to thyroid cancer risk. This relationship was
enhanced when restricting the analysis to papillary thyroid cancer’s longer diameter of 10 mm
or more (p = 0.05). Although no significant interaction was evidenced between iodine in nails
and selenium in nails effect (p = 0.70), a nearly significant positive association (p = 0.10)
between fingernail selenium and thyroid cancer risk was seen in patients with less than 3 ppm
of iodine in nails. A similar result also has been found in which a nearly significant positive
association (p = 0.10) between fingernail selenium and thyroid cancer risk was seen in
patients with less than 117 mg/1,000 kcal of dietary iodine intake (Table 5-2).
Table 5-2 - Fingernail selenium and thyroid cancer by various confounding factors in French Polynesia, 1981-
2003
Quartiles of selenium (μg/g)
Q1 Q2 Q3 Q4 p-
trend*
p-
interaction**
(0.00-0.68) (0.68-0.76) (0.76-0.86) (0.86-1.30)
Overall
Cases/controls 51/93 56/81 50/79 58/78
OR (95% CI) 1 1.00 1.16 (0.70-1.94) 1.06 (0.64-1.77) 1.12 (0.66-1.90) 0.30
OR (95% CI) 2, 3
1.00 1.08 (0.62-1.90) 1.10 (0.62-1.96) 1.02 (0.56-1.84) 0.60
Men
Cases/controls 2/15 8/9 6/5 7/11
OR (95% CI) 2, 3
1.00 ?† ?
† 752.6(<0.001->?
†) 0.99
Women
Cases/controls 49/78 48/72 44/74 51/67
OR (95% CI) 2, 3
1.00 0.95 (0.53-1.71) 0.95 (0.51-1.74) 0.90 (0.48-1.70) 0.90 0.20
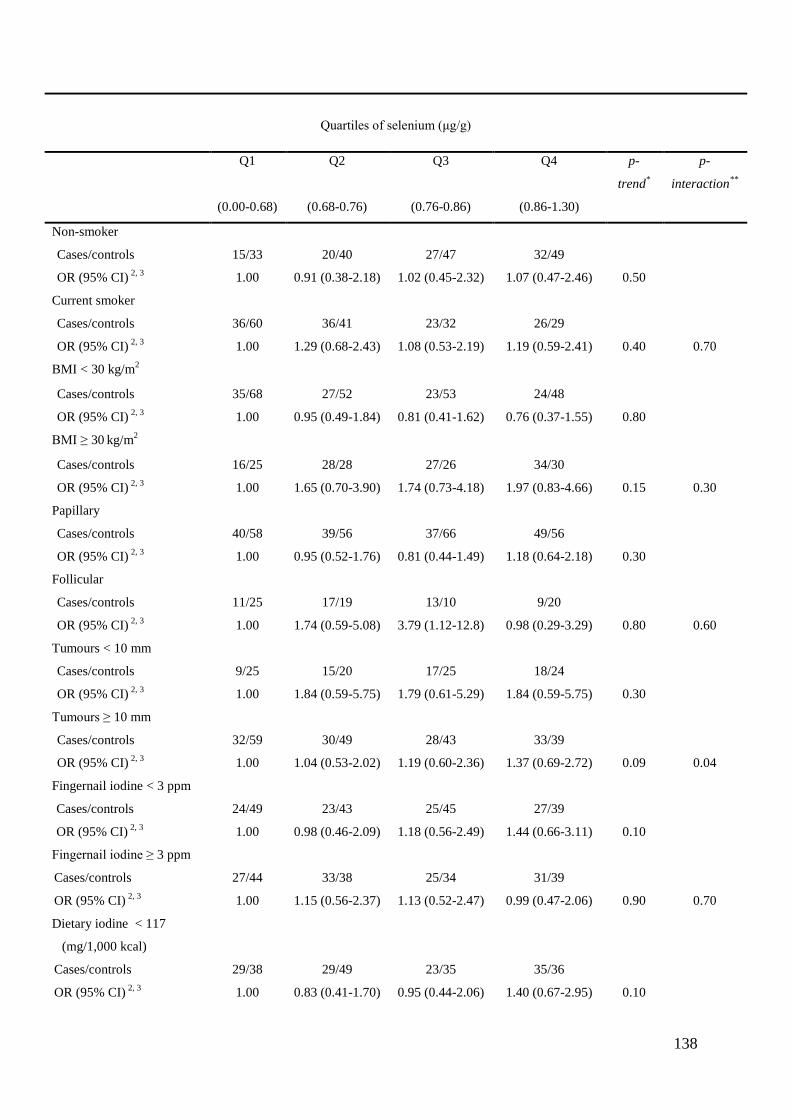
138
Quartiles of selenium (μg/g)
Q1 Q2 Q3 Q4 p-
trend*
p-
interaction**
(0.00-0.68) (0.68-0.76) (0.76-0.86) (0.86-1.30)
Non-smoker
Cases/controls 15/33 20/40 27/47 32/49
OR (95% CI) 2, 3
1.00 0.91 (0.38-2.18) 1.02 (0.45-2.32) 1.07 (0.47-2.46) 0.50
Current smoker
Cases/controls 36/60 36/41 23/32 26/29
OR (95% CI) 2, 3
1.00 1.29 (0.68-2.43) 1.08 (0.53-2.19) 1.19 (0.59-2.41) 0.40 0.70
BMI < 30 kg/m2
Cases/controls 35/68 27/52 23/53 24/48
OR (95% CI) 2, 3
1.00 0.95 (0.49-1.84) 0.81 (0.41-1.62) 0.76 (0.37-1.55) 0.80
BMI ≥ 30 kg/m
2
Cases/controls 16/25 28/28 27/26 34/30
OR (95% CI) 2, 3
1.00 1.65 (0.70-3.90) 1.74 (0.73-4.18) 1.97 (0.83-4.66) 0.15 0.30
Papillary
Cases/controls 40/58 39/56 37/66 49/56
OR (95% CI) 2, 3
1.00 0.95 (0.52-1.76) 0.81 (0.44-1.49) 1.18 (0.64-2.18) 0.30
Follicular
Cases/controls 11/25 17/19 13/10 9/20
OR (95% CI) 2, 3
1.00 1.74 (0.59-5.08) 3.79 (1.12-12.8) 0.98 (0.29-3.29) 0.80 0.60
Tumours < 10 mm
Cases/controls 9/25 15/20 17/25 18/24
OR (95% CI) 2, 3
1.00 1.84 (0.59-5.75) 1.79 (0.61-5.29) 1.84 (0.59-5.75) 0.30
Tumours ≥ 10 mm
Cases/controls 32/59 30/49 28/43 33/39
OR (95% CI) 2, 3
1.00 1.04 (0.53-2.02) 1.19 (0.60-2.36) 1.37 (0.69-2.72) 0.09 0.04
Fingernail iodine < 3 ppm
Cases/controls 24/49 23/43 25/45 27/39
OR (95% CI) 2, 3
1.00 0.98 (0.46-2.09) 1.18 (0.56-2.49) 1.44 (0.66-3.11) 0.10
Fingernail iodine ≥ 3 ppm
Cases/controls 27/44 33/38 25/34 31/39
OR (95% CI) 2, 3
1.00 1.15 (0.56-2.37) 1.13 (0.52-2.47) 0.99 (0.47-2.06) 0.90 0.70
Dietary iodine < 117
(mg/1,000 kcal)
Cases/controls 29/38 29/49 23/35 35/36
OR (95% CI) 2, 3
1.00 0.83 (0.41-1.70) 0.95 (0.44-2.06) 1.40 (0.67-2.95) 0.10
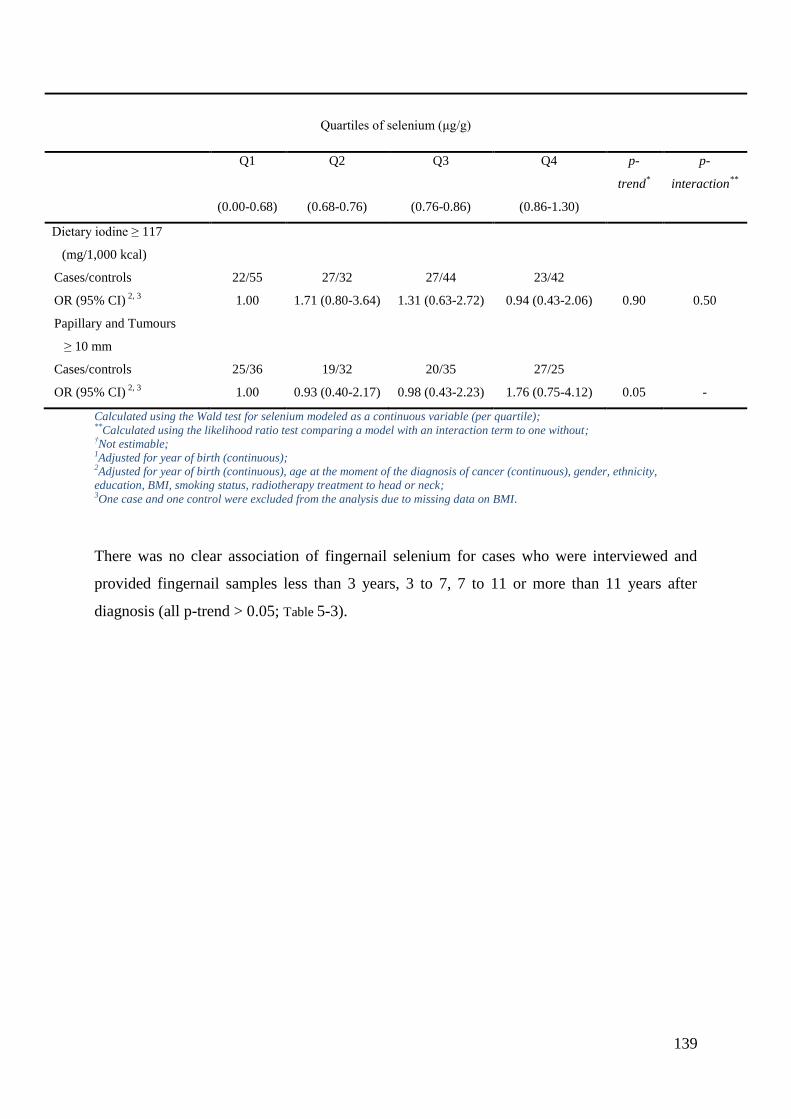
139
Quartiles of selenium (μg/g)
Q1 Q2 Q3 Q4 p-
trend*
p-
interaction**
(0.00-0.68) (0.68-0.76) (0.76-0.86) (0.86-1.30)
Dietary iodine ≥ 117
(mg/1,000 kcal)
Cases/controls 22/55 27/32 27/44 23/42
OR (95% CI) 2, 3
1.00 1.71 (0.80-3.64) 1.31 (0.63-2.72) 0.94 (0.43-2.06) 0.90 0.50
Papillary and Tumours
≥ 10 mm
Cases/controls 25/36 19/32 20/35 27/25
OR (95% CI) 2, 3
1.00 0.93 (0.40-2.17) 0.98 (0.43-2.23) 1.76 (0.75-4.12) 0.05 -
Calculated using the Wald test for selenium modeled as a continuous variable (per quartile); **Calculated using the likelihood ratio test comparing a model with an interaction term to one without; †Not estimable; 1Adjusted for year of birth (continuous); 2Adjusted for year of birth (continuous), age at the moment of the diagnosis of cancer (continuous), gender, ethnicity,
education, BMI, smoking status, radiotherapy treatment to head or neck; 3One case and one control were excluded from the analysis due to missing data on BMI.
There was no clear association of fingernail selenium for cases who were interviewed and
provided fingernail samples less than 3 years, 3 to 7, 7 to 11 or more than 11 years after
diagnosis (all p-trend > 0.05; Table 5-3).
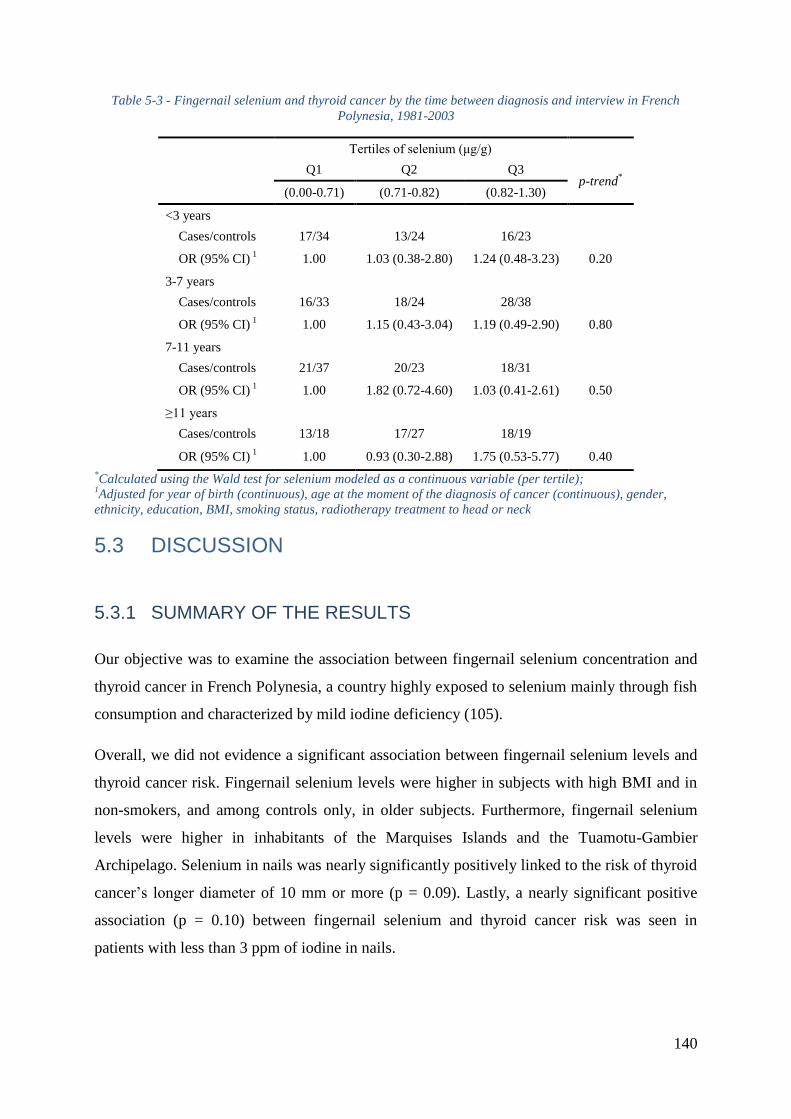
140
Table 5-3 - Fingernail selenium and thyroid cancer by the time between diagnosis and interview in French
Polynesia, 1981-2003
Tertiles of selenium (μg/g)
Q1 Q2 Q3 p-trend
*
(0.00-0.71) (0.71-0.82) (0.82-1.30)
<3 years
Cases/controls 17/34 13/24 16/23
OR (95% CI) 1 1.00 1.03 (0.38-2.80) 1.24 (0.48-3.23) 0.20
3-7 years
Cases/controls 16/33 18/24 28/38
OR (95% CI) 1 1.00 1.15 (0.43-3.04) 1.19 (0.49-2.90) 0.80
7-11 years
Cases/controls 21/37 20/23 18/31
OR (95% CI) 1 1.00 1.82 (0.72-4.60) 1.03 (0.41-2.61) 0.50
≥11 years
Cases/controls 13/18 17/27 18/19
OR (95% CI) 1 1.00 0.93 (0.30-2.88) 1.75 (0.53-5.77) 0.40
*Calculated using the Wald test for selenium modeled as a continuous variable (per tertile);
1Adjusted for year of birth (continuous), age at the moment of the diagnosis of cancer (continuous), gender,
ethnicity, education, BMI, smoking status, radiotherapy treatment to head or neck
5.3 DISCUSSION
5.3.1 SUMMARY OF THE RESULTS
Our objective was to examine the association between fingernail selenium concentration and
thyroid cancer in French Polynesia, a country highly exposed to selenium mainly through fish
consumption and characterized by mild iodine deficiency (105).
Overall, we did not evidence a significant association between fingernail selenium levels and
thyroid cancer risk. Fingernail selenium levels were higher in subjects with high BMI and in
non-smokers, and among controls only, in older subjects. Furthermore, fingernail selenium
levels were higher in inhabitants of the Marquises Islands and the Tuamotu-Gambier
Archipelago. Selenium in nails was nearly significantly positively linked to the risk of thyroid
cancer’s longer diameter of 10 mm or more (p = 0.09). Lastly, a nearly significant positive
association (p = 0.10) between fingernail selenium and thyroid cancer risk was seen in
patients with less than 3 ppm of iodine in nails.
141
5.3.2 STRENGTHS AND LIMITATIONS OF THE STUDY
This analysis has important strengths including, the population-based design with virtually
exhaustive identification of thyroid cancer cases in isolated Pacific Islands and a high
participation rate among cases and population control subjects, which were from the
population register of French Polynesia (142). Another important strength is that French
Polynesia ranks as one of world’s leading consumers of fish (229), a major dietary source of
selenium (227), which increased the power of our analysis. Furthermore, despite recent
changes in lifestyle and nutrition, an important proportion of inhabitants (at least the ones
living outside Tahiti), still have a traditional diet of fish, starchy roots and fruits, and
consumed at the time of interview few imported foods that are high in fat and low in fibre
(230), and thus are more likely to accurately report their dietary intake.
This analysis also has some limitations. In regard to the statistical method, when we
conditioned on age and sex using the original matching criteria (year of birth ± 6 months and
sex), we observed similar results but reduced statistical power since matched groups that were
missing either a case or control were dropped from the analysis.
Because of the transition in diet habits from a traditional Polynesian diet to a more
Westernized one, the results of this case-control study about diet in adulthood could be
confounded by diet in previous periods.
We did not find a correlation between selenium measured in fingernails and dietary selenium
intake, as estimated using dietary questionnaire data and a French food composition. This lack
of correlation was not surprising because the concentration of selenium in foods is largely
variable and its quantification from food composition table data is uncertain. Indeed, its
concentration in vegetables is dependent on the soil content in a particular geographical
location (217), and its concentration in fishes is dependent on the type of cooking and variable
between species (205). Therefore, our estimation of selenium in diet is probably uncertain.
Thus, biomarker measures are essential in investigating the relationship between selenium
exposure and chronic disease risk.
5.3.3 COMPARISON RESULTS FROM THE LITERATURE
Selenium concentration in nails is a highly reproducible value. In a cohort on the investigation
of dietary supplement use and cancer risk in Western Washington state, the concentration of
142
toenail selenium without selenium supplement was about six times higher than the
concentration of plasma selenium without selenium supplement, mean toenail and plasma
concentrations were 1.02 ± 0.21 μg/g and 161 ± 29 μg/L, respectively (231). There are
advantages to measure selenium concentration in fingernails rather than blood: the quantity of
selenium in nails is more stable, cumulative, and integrates exposure occurring from 12 to 18
months before sampling (232). Additionally, collecting, transporting and storing fingernails
are easier than blood.
A previous cross-sectional study, including 195 adults aged 18 years old and over from Tahiti
and the Moorea islands, found that serum selenium levels in French Polynesia in 2008 were
similar to those observed in Inuit adults in 1992; however, these are four times lower than
France (foods imported to Polynesia come from France), even considering the whole
blood/plasma ratio (229).
We found that the highest fingernail selenium concentration of French Polynesia were in the
Marquises Islands and in the Tuamotu-Gambier Archipelago, which is similar to observations
performed on cord blood selenium concentration in French Polynesian new-borns in 2008
(229). These highest values are probably mostly attributable to higher seafood consumption,
but the results shown in Table 5-1, in which the higher fingernail selenium values in controls
living in the Tuamotu-Gambier Archipelago remained when adjusting for estimated dietary
selenium intake, showing that other factors could interact, or that selenium level could be
higher in the Tuamotu-Gambier Archipelago fishes. Because most of the fishes eaten in the
atolls of the Tuamotu-Gambier Archipelago come from the lagoon, rather than the open sea
like other archipelagos of French Polynesia, this result could be due to an under-estimation of
selenium contents for lagoon fishes in food composition tables.
Among the studied population, fingernail selenium concentration averages in French
Polynesian, 0.75 ppm in smokers and 0.80 ppm in non-smokers (p < 0.0001), are very similar
to those measured in other studies, and in particular in a large cohort study of US women,
which have shown that toenail selenium was significantly reduced among cigarette smokers
(M = 0.75, SD = 0.12, among 146 current smokers; and M = 0.82, SD = 0.16, among 311
never smokers; p < 0.001) (233).
We found a positive relationship between BMI and selenium in fingernails, both in cases and
controls (Table 5-1). Our result is in opposition with most European surveys (234,235,236) or
US populations (237), in which obese patients have lower serum selenium concentration, but
143
in agreement with Dewailly’s survey of a French Polynesian sampling in which selenium
concentration in blood was positively linked to BMI (229), the regression coefficient (β)
being 0.02, i.e. ten times higher than in our study, among the controls (β = 0.002). A possible
explication is that in the general population, BMI has a trend to rise with age, if we do not
consider extreme ages. Furthermore, older people have more possibilities to eat traditional
food, which is rich in selenium.
There may be a range of selenium that offers optimal protection against cancer development
in general, as a deficiency in selenium has been associated with an increased risk of cancer,
this association having been evidenced for selenium in hair and nails and prostate cancer in
Malaysia (238), and selenium in serum and, respectively bladder carcinoma in China (223),
and breast cancer in India (239). In the latter case-control study, it has been estimated that
each increase of one μ mol/l of selenium was associated to decrease in 7% of breast cancer
risk (239). Nevertheless, selenium supplementation may reduce cancer risk only in selenium-
deficient individuals.
Few studies have examined the association between selenium and thyroid cancer risk,
however, we haven’t found association between fingernail selenium and thyroid cancer risk in
our results. In a case-control study of 43 cases and 129 matched controls in Norway,
prediagnostic serum selenium levels were inversely associated with thyroid cancer; levels ≤
1.25 and 1.26-1.64 µmol/l were associated with a 7.70- and 6.10-fold increased risk of thyroid
cancer compared to levels ≥ 1.65 µmol/l (225). This case-control study also showed, when
considering the delay from blood sampling to diagnosis of the case, that the protective effect
of high serum selenium concentration was restricted to the seven-year period prior to the
diagnosis of thyroid cancer, because the serum selenium concentration of cases tended to
decrease, relatively to controls, when the delay from blood sampling to the diagnosis was
shorter. Similarly, in an Austrian survey the average selenium blood concentration was 1.14
μmol/l in 554 healthy controls, 0.97 μmol/l in 42 patients with follicular thyroid carcinoma
and 1.02 μmol/l in 73 patients with papillary thyroid carcinoma (240).
Our study did not evidence a significant association between fingernail selenium levels and
thyroid cancer, even when considering only patients for which the delay between cancer
diagnosis and fingernail sample was less than seven or less than three years (Table 5-3). It has
to be noted that over a period of six years, selenium in toenails was one of the most
reproducible trace elements (241). Therefore, our non-significant results are probably not due
144
to the fact that we investigated post-diagnosis selenium levels rather than prediagnosis ones,
except if thyroid cancer, by itself, modifies selenium level in nails. A possible explication for
the lack of association could be the iodine status of French Polynesians, who could be less
frequently iodine deficient than Norwegians because selenium acts synergistically with iodine.
These results could nevertheless also be due to the fact that fingernail samplings among cases
were performed after thyroid cancer diagnosis and therefore during thyroid hormone
substitution treatment, such as levothyrox, which could interact with selenium. Indeed, all
three mono-deiodinase enzymes are selenium-dependent and are involved in thyroid hormone
regulation. In this way, selenium status may affect both thyroid hormone homeostasis and
iodine availability (242, 243, 244). Lastly, we evidenced a nearly significant positive
association (p = 0.15) between fingernail selenium and thyroid cancer risk in patients with
more than 30 kg/m2 BMI (Table 5-2). This result has to be considered with caution because it
is nearly significant, but it could be due to some specificity of obese patients.
Because cigarette smoking has been shown to be inversely associated with both selenium
status (245) and thyroid cancer risk (246), it was important to adequately control for these
exposures in our analysis. Despite having evidenced a lower selenium status in smokers than
in non-smokers, we failed to show an interaction between fingernail selenium levels, smoking
habit and thyroid cancer risk: both in smokers and nonsmokers, selenium status did not
influence thyroid cancer risk. Nevertheless, it should be noted that such interaction tests are
not very powerful in our study, given the number of patients.
5.4 CONCLUSION
In summary, our results do not support, among individuals with sufficient levels of selenium,
that greater long-term exposure to selenium may reduce thyroid cancer risk. Because these
findings are based on post-diagnostic measures, studies with prediagnostic selenium are
needed for corroboration.

145
CONCLUSION AND PERSPECTIVES
146
There was no significant association between dietary iodine intake and DTC risk in the Cuba
study. In the pooled analysis of the five studies, the majority of the cases and the controls was
considered as being in mild dietary iodine deficiency according to the IGN classification.
Although DTC risk was not found to be linked to dietary iodine intake, this risk significantly
decreased with high fish consumption, this reduction in DTC risk per quartile of fish
consumption was more important in the Cuba study than in the other studies. Additionally,
higher dietary iodine intake significantly associated with lower DTC risk only in the French
Polynesia study and in Polynesians. A strong increase in DTC risk associated with the number
of the minor allele (A) of the SNP rs965513 near FOXE1, among participants who consumed
less iodine than the median value in the Cuba study. For the women who had a high number
of full term pregnancies and who were iodine deficient, increasing dietary iodine intake may
reduce their risk of suffering from DTC, thus reduce the hereditary risk to their infants.
Moreover, it was not possible to demonstrate an interest in fingernail selenium as a biomarker
that predicts DTC risk.
Dietary iodine intake declared by auto-questionnaire and fingernail selenium seem like
impossible to predict DTC risk, the next step, maybe we should focalize on urine iodine
concentration or thyroid-stimulating hormone (TSH). My publication on FOXE1 interacts
with dietary iodine intake in DTC risk within the Cuba study, and this significant interaction
has been replicated in the pooled analysis for the French Polynesia and the Cuba studies,
which could lead to the future biological investigation on evolution of the interaction between
germline mutation and dietary iodine, thus from the dietary source, prevent thyroid cancer
risk. This effect could bring big scientific interest in clinical nutrition for the prognosis of
thyroid cancer patients if dietary iodine interacts with some somatic mutations as well, thus
giving thyroid cancer patients high iodine content diet, may be helpful for their recovery.
Composition of high iodine content diet, as well as the quantity of optimal iodine intake, need
further investigations.
Since the early 90s, iodine supplement intake from iodized salt for people in endemic-goiter
areas has been compulsively carried out in order to reduce goiter incidence, however, several
studies demonstrated that excess iodine intake, especially from iodine supplement may
increase the incidence of papillary thyroid cancer, especially in endemic-goiter areas, if future
study confirms this result, we should reconsider iodized salt compulsive policy and
conditionally apply it according to different iodine status areas. As we don’t have enough
cases and controls classified in the excess iodine intake class according to the IGN
147
classification, in future study, we’d better to include more study participants regarding the
Epi-Thyr consortium still extends, and we will be able to include the Chernobyl post effect
case-control study and the case-control study niched in the E3N cohort.
Classification of the colors of food label which indicate high iodine content food will bring
some interesting scientific issues for public health.
The main perspective of my work concerns deepening my results about the specificity of the
Polynesian population, which can be achieved thanks to an extension of the French Polynesia
study on DTC risk associated with high number of pregnancies in women with iodine
deficiency. Validation of this result will require specific studies.
Our group is organizing a GWAS on the 7 case-controls studies of the Epi-Thyr consortium in
collaboration with Cancer and Environment group of Unit 1018 Inserm, and the colleagues
from Curie Institute, IARC, and CNG. We use OncoArray chips (Illumina ®) designed for
common cancers (lung cancer, breast cancer, prostate cancer, colon cancer and ovary cancer),
composing 570,000 SNPs (including 250,000 tag-SNPs), enriched with 10,000 SNPs
specially chosen for thyroid cancer, including thyroid pathway genes (cancer, signaling,
synthesis), fine-Mapping at 9q22, 14q13, 2q35 and 8p12, candidate SNPs (linked with thyroid
cancer, or tumor size or obesity), and tag-SNPs from candidate genes (HTR1B, LOC727677,
MGMT, Mir146a, TSHR, WDR11), in order to replicate and identify common variants that
can be related to DTC pathogenesis and potential interaction with environmental risk factors
in multiethnic population samples.
148
PERSONAL CONTRIBUTION
149
My personal contribution first of all, consisted in the literature review on dietary factors,
especially on dietary iodine intake and the risk of thyroid cancer.
The analyses of these factors actualized on the data of Epi-Thyr consortium of the 5 cases-
control studies performed in New Caledonia, French Polynesia, metropolitan France (2
studies), and Cuba. The first objective of my thesis was to explore the role of dietary iodine
intake, in the risk of developing DTC, in the case-control study performed in Cuba. For this
purpose, I participated in the organization of the traditional Cuban food samples’ collection
and storage, the Cuban colleague - Celia Pereda brought them from Cuba to France, then I
transported them to the laboratory for food safety of ANSES (French Agency for Food,
Environmental and Occupational Health & Safety, Maisons-Alfort) for the CFCT 2014
establishment. In 2014, I spent one month in Cuba in order to do quality & control of the data
in the dietary questionnaire auto-declared by the study participants, working with the help of
Dr. Rosa M. Ortiz and the biostatistician - Dr. Juan J. Lence-Anta, Celia Pereda, Mae Chappe
from Department of Clinical Research, Institute of Oncology and Radiobiology, Havana,
Cuba, I reinterviewed several study participants for the dietary questionnaire face to face or
by telephone to correct their previous aberrant declarations. Afterwards, I filed the dietary
questionnaire and updated the data. Then I reestablished the unit and the seasonal adjustment
of each food item in the Cuba study from the investigations of several local fruits and
vegetables markets in Havana and from the review of documents from the institute of
investigation in tropical fruit under the direction of Ministry of Agriculture of Cuba, with the
help of Dr. C. Blanca Terry-Berro - director of the Center for Nutrition and Food Hygiene, the
National Institute of Hygiene, Epidemiology and Microbiology (Inhem) under the direction of
Ministry of Public Health of Cuba, we fixed an average value of 10 g of iodized salt
consumption per inhabitant per day, in order to better fit the local situation and have better
estimation of local foods consumptions, thereby have better estimation of dietary iodine
intake in the Cuba study. Later, I searched in the CFCT 2014 and the FAO Databases, the
food items corresponding to those of the dietary questionnaire of the Cuba study, and
established dietary iodine, selenium, energy intake for the participants in this study. Finally, I
published a scientific paper to analyze these work (APPENDIXES7).
Besides, I also reestablished dietary iodine, selenium, energy intake for the participants in the
French Polynesia study, according to the FPFCT 2013 and the FAO Databases (see 1.3.1.3
and 1.3.1.1), and added the seasonality of certain fruits and vegetables from the investigations
of several local fruits and vegetables markets in French Polynesia, in order to better fit the
150
local situation and have better estimation of these trace elements intakes in this study. And I
established fingernail selenium dosage for the study participants in order to test whether
fingernail selenium could be a good biomarker for thyroid cancer risk, then I published a
scientific paper to analyze these work (APPENDIXES7).
The New Caledonia study and the Cathy study have been administrated by Cancer and
Environment group, Center for research in Epidemiology and Population Health (CESP) -
Unit 1018 - Inserm, Dr. Thérèse Truong sent me the dataset of the adjustment variables of the
New Caledonia study and the dietary variables of the New Caledonia and the Cathy studies,
Dr. Emilie Cordina-Duverger sent me the dataset of the adjustment variables of the Cathy
study, Dr. Catherine Tcheandjieu sent me the dataset of the 4 investigated SNPs of the New
Caledonia and the Cathy studies, I did quality & control, checked and corrected these datasets,
then, I combined the adjustment variables datasets together with the ones of the French
Polynesia, the Young-Thyr and the Cuba studies administrated by our group, and standardized
all these variables’ coding for the next pooled analysis.
For the dietary variables, with the help of the data manager of our group - Vincent Souchard,
we did the quality & control, checked and corrected the aberrant values and the missing data
of these variables in these datasets by statistical imputation. We searched in the different food
composition tables presented above, the food items corresponding to those of the dietary
questionnaire of the Young-Thyr, Cathy and New Caledonia studies, I established and
reestablished dietary iodine, selenium, energy intake for the participants in these studies, and I
added the seasonality of certain fruits and vegetables for the Young-Thyr study according to
the Cathy study. Later, we recreated 21 sub food groups and selected 66 common food items
of the 5 case-control studies from Epi-Thyr consortium and standardized all these dietary
variables’ coding for the standardization of the next pooled analysis.
I participated in the organization of TaqMan genotyping of the 4 investigated SNPs for the
1417 Young-Thyr study participants’ samples, with the collaboration of the National Centre
of Genotyping (CEA, Evry, France), when I received the genotyping data, I did quality &
control in order to check whether both allele and genotype frequencies in this population
samples following the Hardy-Weinberg Equilibrium Proportions. Then I combined these
SNPs variables’ dataset together with the ones of the other 4 studies, and standardized all
these variables’ coding for the next pooled analysis.
151
I merged the datasets of the adjustment variables, the dietary variables, and 4 investigated
SNPs variables of the 5 case-controls studies from Epi-Thyr consortium into a unique
database and did the pooled analysis, I wrote the manuscript of this pooled analysis.
Moreover, I studied different statistic models and methods, such as mixed model, logit linear
model, linear model, analysis of genetic association studies, multiple imputation etc., in order
to know which model or method is the best to adapt to the pooled analysis.
During my PhD study, I did several scientific communications by oral presentation, poster
presentation or exchange program: I presented the study of « Fingernail selenium and thyroid
cancer risk: a case-control study in French Polynesia », in the annual conference of NACRe-
Partenariat (The French National Network of Food and Cancer Research), in Paris, in 2014; I
presented the study entitled « Foxe1 Polymorphism Interacts with Dietary Iodine Intake in
DTC Risk in the Cuban Population », in the annual conference of NACRe-Partenariat, in
Paris, in 2015; I presented the pooled analysis of my PhD study « Dietary iodine intake and
thyroid cancer risk: a pooled analysis of 5 case-control studies » in the Gustave Roussy’s
research days, in Tours, in 2016; I presented a poster entitled « Dietary iodine uptake and
thyroid cancer risk - a pooled analysis of 5 case-control studies of Epi-Thyr consortium » in
the 86th
Annual Meeting of the American Thyroid Association, in Denver, in 2016; I was
selected as representative of Inserm’s PhD students to take the doctoral and post-doctoral
students exchanges program between Inserm and University of Sydney, in 2015, I spent three
months in Cancer Genetics Diagnostic Laboratory of Kolling Institute of Medical Research,
Royal North Shore Hospital, in Sydney, under the direction of Pr. Roderick Clifton-Bligh for
a clinical research project to study association between somatic mutations in the TERT gene
promoter and outcomes of papillary thyroid cancer, whose results successfully published
through this exchange program which I was the first co-auteur (Bullock, Ren et al., TERT
promoter mutations are a major indicator of recurrence and death due to papillary thyroid
carcinomas. Clin Endocrinol (Oxf). 2016 Aug;85(2):283-90. Epub 2016 Feb 8.). I also learnt
and launched an experiment in measuring iodine content in human thyroid tumor tissue
samples using Raman spectroscopy, in the University of Sydney. In addition, I participated in
several doctoral seminars organized by our Doctoral School of Public Health (EDSP: Ecole
Doctorale de Santé Publique) and the Doctoral College of the University Paris-Saclay, the
scientific seminars or conferences organized by NACRe, which assembling the experts in the
analysis of nutritional factors, by French Endocrine Society, which assembling the
152
endocrinologists in the treatment of thyroid disease, by the Department of Biostatistics of the
University of Liverpool, specialises in statistical analysis of genetic association studies.
In summary, within my PhD study, I wrote 3 scientific articles, 2 of them were published (see
APPENDIXES 7).
REFERENCES
1. American Thyroid Association, the USA 2017: Thyroid Cancer (Papillary and Follicular)\
Thyroid Cancer FAQs\WHAT IS THE THYROID GLAND? Available at:
http://www.thyroid.org/thyroid-cancer/ (Accessed February 15, 2017).
2. American Thyroid Association, the USA 2017: Thyroid Nodules. Available at:
http://www.thyroid.org/thyroid-nodules/ (Accessed February 15, 2017).
3. Choi KU, Kim JY, Park DY, Lee CH, Sol MY, Han KT, Kim YG. Recommendations for
the management of cystic thyroid nodules. ANZ J Surg. 2005 Jul;75(7):537-41.
4. Agate L, Lorusso L, Elisei R. New and old knowledge on differentiated thyroid cancer
epidemiology and risk factors. J Endocrinol Invest. 2012;35(6 Suppl):3-9.
5. Hay ID, Thompson GB, Grant CS, Bergstralh EJ, Dvorak CE, Gorman CA, Maurer MS,
McIver B, Mullan BP, Oberg AL, Powell CC, van Heerden JA, Goellner JR. Papillary
thyroid carcinoma managed at the Mayo Clinic during six decades (1940-1999): temporal
trends in initial therapy and long-term outcome in 2444 consecutively treated patients.
World J Surg. 2002 Aug;26(8):879-85. Epub 2002 May 21.
6. Mazzaferri EL, Kloos RT. Clinical review 128: Current approaches to primary therapy for
papillary and follicular thyroid cancer. J Clin Endocrinol Metab. 2001 Apr;86(4):1447-63.
7. Dionigi G, Kraimps JL, Schmid KW, Hermann M, Sheu-Grabellus SY, De Wailly P,
Beaulieu A, Tanda ML, Sessa F. Minimally invasive follicular thyroid cancer (MIFTC)--a
consensus report of the European Society of Endocrine Surgeons (ESES). Langenbecks
Arch Surg. 2014 Feb;399(2):165-84.
8. American Thyroid Association, the USA 2017: Thyroid Cancer (Papillary and Follicular)\
Thyroid Cancer FAQs\WHAT ARE THE TYPES OF THYROID CANCER? Available at:
http://www.thyroid.org/thyroid-cancer/ (Accessed February 15, 2017).
9. Burman KD, Ringel MD, Wartofsky L, et al. Unusual types of thyroid neoplasms.
Endocrinol Metab Clin North Am. 1996;25:49-68.
153
10. Livolsi VA. Surgical Pathology of the Thyroid. Philadelphia, Pa: Saunders; 1990.
11. Adeniran AJ, Zhu Z, Gandhi M, Steward DL, Fidler JP, Giordano TJ, Biddinger PW,
Nikiforov YE. Correlation between genetic alterations and microscopic features, clinical
manifestations, and prognostic characteristics of thyroid papillary carcinomas. Am J Surg
Pathol. 2006 Feb;30(2):216-22.
12. Ahn HS, Kim HJ, Welch HG. Korea's thyroid-cancer "epidemic"--screening and
overdiagnosis. N Engl J Med. 2014 Nov 6;371(19):1765-1767.
13. Volante M, Landolfi S, Chiusa L, Palestini N, Motta M, Codegone A, Torchio B, Papotti
MG. Poorly differentiated carcinomas of the thyroid with trabecular, insular, and solid
patterns: a clinicopathologic study of 183 patients. Cancer. 2004 Mar 1;100(5):950-7.
14. Carcangiu ML, Zampi G, Rosai J. Poorly differentiated ("insular") thyroid carcinoma. A
reinterpretation of Langhans' "wuchernde Struma". Am J Surg Pathol. 1984 Sep;8(9):655-
68.
15. GLOBOCAN 2012: Estimated Cancer Incidence, Mortality and Prevalence Worldwide in
2012, International Agency for Research on Cancer, World Health Organization 2012.
Available at: http://globocan.iarc.fr/Pages/Map.aspx (Accessed December 20, 2016).
16. Vaccarella S, Franceschi S, Bray F, Wild CP, Plummer M, Dal Maso L. Worldwide
Thyroid-Cancer Epidemic? The Increasing Impact of Overdiagnosis. N Engl J Med.
2016;375:614-7.
17. Ferlay J, Shin HR, Bray F, Forman D, Mathers C, Parkin DM. Estimates of worldwide
burden of cancer in 2008: GLOBOCAN 2008. Int J Cancer 2010;127:2893-917.
18. Schlumberger M, Pacini F, Tuttle RM. THYROID TUMORS. FOURTH EDITION.
tcgraphite. ISBN 978-2-7466-7881-1.
19. Howlader N, Noone AM, Krapcho M, Miller D, Bishop K, Altekruse SF, Kosary CL, Yu
M, Ruhl J, Tatalovich Z, Mariotto A, Lewis DR, Chen HS, Feuer EJ, Cronin KA (eds).
SEER Cancer Statistics Review, 1975-2013, National Cancer Institute. Bethesda, MD,
Available at: http://seer.cancer.gov/csr/1975_2013/, based on November 2015 SEER data
submission, posted to the SEER web site, April 2016 (Accessed February 15, 2017).
20. Bosetti C, Bertuccio P, Levi F, Lucchini F, Negri E, La Vecchia C. Cancer mortality in
the European Union, 1970-2003, with a joinpoint analysis. Ann Oncol. 2008
Apr;19(4):631-40.
21. Colonna M, Guizard A-V, Dabakuyo S, Schvartz C. Thyroïde. Estimation nationale de
l’incidence et de la mortalité par cancer en France entre 1980 et 2012. Partie 1 Ŕ Tumeurs
solides. 2013 July;p.96-99.
154
22. Kuo EJ, Goffredo P, Sosa JA, Roman SA. Aggressive variants of papillary thyroid
microcarcinoma are associated with extrathyroidal spread and lymph-node metastases: a
population-level analysis. Thyroid. 2013 Oct;23(10):1305-11.
23. Sampson RJ, Woolner LB, Bahn RC, Kurland LT. Occult thyroid carcinoma in Olmsted
County, Minnesota: prevalence at autopsy compared with that in Hiroshima and Nagasaki,
Japan. Cancer. 1974 Dec;34(6):2072-6.
24. Fukunaga FH, Yatani R. Geographic pathology of occult thyroid carcinomas. Cancer.
1975 Sep;36(3):1095-9.
25. Silverberg SG, Vidone RA. Carcinoma of the thyroid in surgical and postmortem material.
Analysis of 300 cases at autopsy and literature review. Ann Surg. 1966 Aug;164(2):291-9.
26. Bisi H, Fernandes VS, de Camargo RY, Koch L, Abdo AH, de Brito T. The prevalence of
unsuspected thyroid pathology in 300 sequential autopsies, with special reference to the
incidental carcinoma. Cancer. 1989 Nov 1;64(9):1888-93.
27. Harach HR, Franssila KO, Wasenius VM. Occult papillary carcinoma of the thyroid. A
"normal" finding in Finland. A systematic autopsy study. Cancer. 1985 Aug 1;56(3):531-8.
28. Ito Y, Miyauchi A, Inoue H, Fukushima M, Kihara M, Higashiyama T, Tomoda C,
Takamura Y, Kobayashi K, Miya A. An observational trial for papillary thyroid
microcarcinoma in Japanese patients. World J Surg. 2010 Jan;34(1):28-35.
29. Rosai J, LiVolsi VA, Sobrinho-Simoes M, Williams ED. Renaming papillary
microcarcinoma of the thyroid gland: the Porto proposal. Int J Surg Pathol. 2003
Oct;11(4):249-51.
30. Franceschi S, Boyle P, Maisonneuve P, La Vecchia C, Burt AD, Kerr DJ, MacFarlane GJ.
The epidemiology of thyroid carcinoma. Crit Rev Oncog. 1993;4(1):25-52.
31. Schneider AB, Ron E. Carcinoma of follicular epithelium: pathogenesis in Werner &
Ingbar’s The Thyroid 2000, 8th
ed, Lippincott, Williams, Wilkins (Philadelphia)
32. Loh KC. Familial nonmedullary thyroid carcinoma: a meta-review of case series. Thyroid.
1997 Feb;7(1):107-13.
33. Uchino S, Noguchi S, Kawamoto H, Yamashita H, Watanabe S, Yamashita H, Shuto S.
Familial nonmedullary thyroid carcinoma characterized by multifocality and a high
recurrence rate in a large study population. World J Surg. 2002 Aug;26(8):897-902.
34. Brindel P, Doyon F, Bourgain C, Rachédi F, Boissin JL, Sebbag J, Shan L, Bost-Bezeaud
F, Petitdidier P, Paoaafaite J, Teuri J, de Vathaire F. Family history of thyroid cancer and
the risk of differentiated thyroid cancer in French Polynesia. Thyroid. 2010
Apr;20(4):393-400.
155
35. Frich L, Glattre E, Akslen LA. Familial occurrence of nonmedullary thyroid cancer: a
population-based study of 5673 first-degree relatives of thyroid cancer patients from
Norway. Cancer Epidemiol Biomarkers Prev. 2001 Feb;10(2):113-7.
36. Hemminki K, Eng C, Chen B. Familial risks for nonmedullary thyroid cancer. J Clin
Endocrinol Metab. 2005 Oct;90(10):5747-53.
37. Xu L, Li G, Wei Q, El-Naggar AK, Sturgis EM. Family history of cancer and risk of
sporadic differentiated thyroid carcinoma. Cancer. 2012 Mar 1;118(5):1228-35.
38. Hemminki K, Li X. Familial risk of cancer by site and histopathology. Int J Cancer. 2003
Jan 1;103(1):105-9.
39. Kebebew E. Hereditary non-medullary thyroid cancer. World J Surg. 2008
May;32(5):678-82.
40. Bell B, Mazzaferri EL. Familial adenomatous polyposis (Gardner's syndrome) and thyroid
carcinoma. A case report and review of the literature. Dig Dis Sci. 1993 Jan;38(1):185-90.
41. Cetta F, Montalto G, Gori M, Curia MC, Cama A, Olschwang S. Germline mutations of
the APC gene in patients with familial adenomatous polyposis-associated thyroid
carcinoma: results from a European cooperative study. J Clin Endocrinol Metab. 2000
Jan;85(1):286-92.
42. Gudmundsson J, Sulem P, Gudbjartsson DF, Jonasson JG, Sigurdsson A, Bergthorsson JT,
et al. Common variants on 9q22.33 and 14q13.3 predispose to thyroid cancer in European
populations. Nat Genet. 2009;41: 460Ŕ464.
43. Matsuse M, Takahashi M, Mitsutake N, Nishihara E, Hirokawa M, Kawaguchi T,
Rogounovitch T, Saenko V, Bychkov A, Suzuki K, Matsuo K, Tajima K, Miyauchi A,
Yamada R, Matsuda F, Yamashita S. The FOXE1 and NKX2-1 loci are associated with
susceptibility to papillary thyroid carcinoma in the Japanese population. J Med
Genet.2011;48: 645Ŕ648.
44. Takahashi M, Saenko VA, Rogounovitch TI, Kawaguchi T, Drozd VM, Takigawa-
Imamura H, Akulevich NM, Ratanajaraya C, Mitsutake N, Takamura N, Danilova LI,
Lushchik ML, Demidchik YE, Heath S, Yamada R, Lathrop M, Matsuda F, Yamashita S.
The FOXE1 locus is a major genetic determinant for radiation-related thyroid carcinoma
in Chernobyl. Hum Mol Genet 2010;19(12):2516Ŕ2523.
45. Jones AM, Howarth KM, Martin L, Gorman M, Mihai R, Moss L, et al. Thyroid cancer
susceptibility polymorphisms: confirmation of loci on chromosomes 9q22 and 14q13,
validation of a recessive 8q24 locus and failure to replicate a locus on 5q24. J Med Genet.
2012;49: 158Ŕ163.
156
46. Landa I, Ruiz-Llorente S, Montero-Conde C, Inglada-Pérez L, Schiavi F, Leskelä S, Pita
G, Milne R, Maravall J, Ramos I, Andía V, Rodríguez-Poyo P, Jara-Albarrán A, Meoro A,
del Peso C, Arribas L, Iglesias P, Caballero J, Serrano J, Picó A, Pomares F, Giménez G,
López-Mondéjar P, Castello R, Merante-Boschin I, Pelizzo MR, Mauricio D, Opocher G,
Rodríguez-Antona C, González-Neira A, Matías-Guiu X, Santisteban P, Robledo M. The
variant rs1867277 in FOXE1 gene confers thyroid cancer susceptibility through the
recruitment of USF1/USF2 transcription factors. PLoS Genet. 2009;5: e1000637.
47. Carré A, Castanet M, Sura-Trueba S, Szinnai G, Van Vliet G, Trochet D, Amiel J, Léger J,
Czernichow P, Scotet V, Polak M. Polymorphic length of FOXE1 alanine stretch:
evidence for genetic susceptibility to thyroid dysgenesis. Hum Genet. 2007;122: 467Ŕ476.
48. Pereda CM, Lesueur F, Pertesi M, Robinot N, Lence-Anta JJ, Turcios S, Velasco M,
Chappe M, Infante I, Bustillo M, García A, Cléro É, Xhaard C, Ren Y, Maillard S,
Damiola F, Rubino C, Salazar S, Rodriguez R, Ortiz RM, de Vathaire F. Common
variants at the 9q22.33, 14q13.3 and ATM loci, and risk of differentiated thyroid cancer in
the Cuban population. BMC Genet. 2015 Mar 1;16:22.
49. Maillard S, Damiola F, Cléro É, Pertesi M, Robinot N, Rachédi F, Boissin JL, Sebbag J,
Shan L, Bost-Bezeaud F, Petitdidier P, Doyon F, Xhaard C, Rubino C, Blanché H,
Drozdovitch V, Lesueur F, de Vathaire F. Common variants at 9q22.33, 14q13.3, and
ATM loci, and risk of differentiated thyroid cancer in the French Polynesian population.
PLoS One. 2015 Apr 7;10(4):e0123700.
50. Malchoff CD, Malchoff DM. The genetics of hereditary nonmedullary thyroid carcinoma.
J Clin Endocrinol Metab. 2002 Jun;87(6):2455-9.
51. Nagy R, Ringel MD. Genetic predisposition for nonmedullary thyroid cancer. Horm
Cancer. 2015 Feb;6(1):13-20.
52. DeGroot L, Paloyan E. Thyroid carcinoma and radiation. A Chicago endemic. JAMA.
1973 Jul 30;225(5):487-91.
53. Favus MJ, Schneider AB, Stachura ME, Arnold JE, Ryo UY, Pinsky SM, Colman M,
Arnold MJ, Frohman LA. Thyroid cancer occurring as a late consequence of head-and-
neck irradiation. Evaluation of 1056 patients. N Engl J Med. 1976 May 6;294(19):1019-
25.
54. Refetoff S, Harrison J, Karanfilski BT, Kaplan EL, De Groot LJ, Bekerman C. Continuing
occurrence of thyroid carcinoma after irradiation to the neck in infancy and childhood. N
Engl J Med. 1975 Jan 23;292(4):171-5.
157
55. Ron E, Lubin JH, Shore RE, Mabuchi K, Modan B, Pottern LM, Schneider AB, Tucker
MA, Boice JD Jr. Thyroid cancer after exposure to external radiation: a pooled analysis of
seven studies. Radiat Res. 1995 Mar;141(3):259-77.
56. Baverstock K, Egloff B, Pinchera A, Ruchti C, Williams D. Thyroid cancer after
Chernobyl. Nature. 1992 Sep 3;359(6390):21-2.
57. Dobyns BM, Hyrmer BA. The surgical management of benign and malignant thyroid
neoplasms in Marshall Islanders exposed to hydrogen bomb fallout. World J Surg. 1992
Jan-Feb;16(1):126-39; discussion 139-40.
58. Kazakov VS, Demidchik EP, Astakhova LN. Thyroid cancer after Chernobyl. Nature.
1992 Sep 3;359(6390):21.
59. Pacini F, Vorontsova T, Demidchik EP, Molinaro E, Agate L, Romei C, Shavrova E,
Cherstvoy ED, Ivashkevitch Y, Kuchinskaya E, Schlumberger M, Ronga G, Filesi M,
Pinchera A. Post-Chernobyl thyroid carcinoma in Belarus children and adolescents:
comparison with naturally occurring thyroid carcinoma in Italy and France. J Clin
Endocrinol Metab. 1997 Nov;82(11):3563-9.
60. Tronko N, Bogdanova T, Kommisarenko I. Thyroid cancer in children and adolescents in
Ukraine after the Chernobyl accident (1986-1995) in The Radiological Consequences of
the Chernoby Accident 1996 (Luxemburg)
61. Belfiore A, La Rosa GL, La Porta GA, Giuffrida D, Milazzo G, Lupo L, Regalbuto C,
Vigneri R. Cancer risk in patients with cold thyroid nodules: relevance of iodine intake,
sex, age, and multinodularity. Am J Med. 1992 Oct;93(4):363-9.
62. Franceschi S, Preston-Martin S, Dal Maso L, Negri E, La Vecchia C, Mack WJ, et al. A
pooled analysis of caseŔcontrol studies of thyroid cancer. IV. Benign thyroid diseases.
Cancer Causes Control. 1999;10:583Ŕ95.
63. Horn-Ross PL, Morris JS, Lee M, West DW, Whittemore AS, McDougall IR, et al. Iodine
and thyroid cancer risk among women in a multiethnic population: the Bay Area Thyroid
Cancer Study. Cancer Epidemiol Biomarkers Prev. 2001;10:979Ŕ85.
64. Memon A, Varghese A, Suresh A. Benign thyroid disease and dietary factors in thyroid
cancer: a caseŔcontrol study in Kuwait. Br J Cancer. 2002;86:1745Ŕ50.
65. Iribarren C, Haselkorn T, Tekawa IS, Friedman GD. Cohort study of thyroid cancer in a
San Francisco Bay area population. Int J Cancer. 2001;93:745Ŕ50.
66. Farbota LM, Calandra DB, Lawrence AM, Paloyan E. Thyroid carcinoma in Graves'
disease. Surgery. 1985 Dec;98(6):1148-53.
158
67. Pacini F, Elisei R, Di Coscio GC, Anelli S, Macchia E, Concetti R, Miccoli P, Arganini M,
Pinchera A. Thyroid carcinoma in thyrotoxic patients treated by surgery. J Endocrinol
Invest. 1988 Feb;11(2):107-12.
68. Shapiro SJ, Friedman NB, Perzik SL, Catz B. Incidence of thyroid carcinoma in Graves'
disease. Cancer. 1970 Dec;26(6):1261-70.
69. Pellegriti G, Mannarino C, Russo M, Terranova R, Marturano I, Vigneri R, Belfiore A.
Increased mortality in patients with differentiated thyroid cancer associated with Graves'
disease. J Clin Endocrinol Metab. 2013 Mar;98(3):1014-21.
70. Frates MC, Benson CB, Doubilet PM, Kunreuther E, Contreras M, Cibas ES, Orcutt J,
Moore FD Jr, Larsen PR, Marqusee E, Alexander EK. Prevalence and distribution of
carcinoma in patients with solitary and multiple thyroid nodules on sonography. J Clin
Endocrinol Metab. 2006 Sep;91(9):3411-7.
71. Brito JP, Yarur AJ, Prokop LJ, McIver B, Murad MH, Montori VM. Prevalence of thyroid
cancer in multinodular goiter versus single nodule: a systematic review and meta-analysis.
Thyroid. 2013;23:449Ŕ55.
72. Boelaert K, Horacek J, Holder RL, Watkinson JC, Sheppard MC, Franklyn JA. Serum
thyrotropin concentration as a novel predictor of malignancy in thyroid nodules
investigated by fine-needle aspiration. J Clin Endocrinol Metab. 2006 Nov;91(11):4295-
301.
73. Fiore E, Rago T, Provenzale MA, Scutari M, Ugolini C, Basolo F, Di Coscio G, Berti P,
Grasso L, Elisei R, Pinchera A, Vitti P. Lower levels of TSH are associated with a lower
risk of papillary thyroid cancer in patients with thyroid nodular disease: thyroid autonomy
may play a protective role. Endocr Relat Cancer. 2009 Dec;16(4):1251-60.
74. Castro MR, Espiritu RP, Bahn RS, Henry MR, Gharib H, Caraballo PJ, Morris JC.
Predictors of malignancy in patients with cytologically suspicious thyroid nodules.
Thyroid. 2011 Nov;21(11):1191-8.
75. Kim KW, Park YJ, Kim EH, Park SY, Park do J, Ahn SH, Park do J, Jang HC, Cho BY.
Elevated risk of papillary thyroid cancer in Korean patients with Hashimoto's thyroiditis.
Head Neck. 2011 May;33(5):691-5.
76. Fleury Y, Van Melle G, Woringer V, Gaillard RC, Portmann L. Sex-dependent variations
and timing of thyroid growth during puberty. J Clin Endocrinol Metab. 2001
Feb;86(2):750-4.
77. Berghout A, Wiersinga W. Thyroid size and thyroid function during pregnancy: an
analysis. Eur J Endocrinol. 1998 May;138(5):536-42.
159
78. Hegedüs L, Karstrup S, Rasmussen N. Evidence of cyclic alterations of thyroid size
during the menstrual cycle in healthy women. Am J Obstet Gynecol. 1986 Jul;155(1):142-
5.
79. Chen GG, Vlantis AC, Zeng Q, van Hasselt CA. Regulation of cell growth by estrogen
signaling and potential targets in thyroid cancer. Curr Cancer Drug Targets. 2008
Aug;8(5):367-77.
80. Xhaard C, Rubino C, Cléro É, Maillard S, Ren Y, Borson-Chazot F, Sassolas G, Schvartz
C, Colonna M, Lacour B, Danzon A, Velten M, Buemi A, Bailly L, Mariné Barjoan E,
Schlumberger M, Orgiazzi J, Adjadj E, de Vathaire F. Menstrual and reproductive factors
in the risk of differentiated thyroid carcinoma in young women in France: a population-
based case-control study. Am J Epidemiol. 2014 Nov 15;180(10):1007-17.
81. Negri E, Dal Maso L, Ron E, et al. A pooled analysis of case-control studies of thyroid
cancer. II. Menstrual and reproductive factors. Cancer Causes Control. 1999;10(2):143Ŕ
155.
82. Horn-Ross PL, Canchola AJ, Ma H, et al. Hormonal factors and the risk of papillary
thyroid cancer in the California Teachers Study cohort. Cancer Epidemiol Biomarkers
Prev. 2011;20(8):1751Ŕ1759.
83. Zivaljevic VR, Vlajinac HD, Marinkovic JM, et al. Case-control study of anaplastic
thyroid cancer: goiter patients as controls. Eur J Cancer Prev. 2008;17(2):111Ŕ115.
84. Truong T, Orsi L, Dubourdieu D, et al. Role of goiter and of menstrual and reproductive
factors in thyroid cancer: a population-based case-control study in New Caledonia (South
Pacific), a very high incidence area. Am J Epidemiol. 2005;161(11):1056Ŕ1065.
85. Brindel P, Doyon F, Rachédi F, et al. Menstrual and reproductive factors in the risk of
differentiated thyroid carcinoma in native women in French Polynesia: a population-based
case-control study. Am J Epidemiol. 2008;167(2):219Ŕ229.
86. Sakoda LC, Horn-Ross PL. Reproductive and menstrual history and papillary thyroid
cancer risk: the San Francisco Bay Area thyroid cancer study. Cancer Epidemiol
Biomarkers Prev. 2002;11(1):51Ŕ57.
87. Zhou Y, Zhou Z, Qian M, Gong T, Wang J. Association of thyroid carcinoma with
pregnancy: a meta-analysis. Mol Clin Oncol 2014:341Ŕ346.
88. Ron E, Kleinerman RA, Boice JD Jr, LiVolsi VA, Flannery JT, Fraumeni JF Jr. A
population-based case-control study of thyroid cancer. J Natl Cancer Inst. 1987;79:1-12.
160
89. Preston-Martin S, Bernstein L, Pike MC, Maldonado AA, Henderson BE. Thyroid cancer
among young women related to prior thyroid disease and pregnancy history. Br J Cancer.
1987;55:191-195.
90. Preston-Martin S1, Jin F, Duda MJ, Mack WJ. A case-control study of thyroid cancer in
women under age 55 in Shanghai (People’s Republic of China). Cancer Causes Control.
1993;4:431Ŕ440.
91. Sack J. Thyroid function in pregnancy Ŕ maternal-fetal relationship in health and disease.
Pediatr Endocrinol Rev. 2003;1(Suppl 2):170-176.
92. Adami HO, Hunter D, Trichopoulos D, eds. Textbook of Cancer Epidemiology.
2008;USA: Oxford University Press.
93. Haymart MR, Repplinger DJ, Leverson GE, Elson DF, Sippel RS, Jaume JC, Chen H.
Higher serum thyroid stimulating hormone level in thyroid nodule patients is associated
with greater risks of differentiated thyroid cancer and advanced tumor stage. J Clin
Endocrinol Metab. 2008 Mar;93(3):809-814.
94. de Vathaire F, Drozdovitch V, Brindel P, Rachedi F, Boissin JL, Sebbag J, Shan L, Bost-
Bezeaud F, Petitdidier P, Paoaafaite J, Teuri J, Iltis J, Bouville A, Cardis E, Hill C, Doyon
F. Thyroid cancer following nuclear tests in French Polynesia. Br J Cancer.
2010;103(7):1115Ŕ1121.
95. Galanti MR, Sparén P, Karlsson A, Grimelius L, Ekbom A. Is residence in areas of
endemic goiter a risk factor for thyroid cancer? Int J Cancer. 1995;61:615-21.
96. Boltze C, Brabant G, Dralle H, Gerlach R, Roessner A, Hoang-Vu C. Radiationinduced
thyroid carcinogenesis as a function of time and dietary iodine supply: An in vivo model
of tumorigenesis in the rat. Endocrinology. 2002;143:2584Ŕ92.
97. Riesco G, Taurog A, Larsen R, Krulich L. Acute and chronic responses to iodine
deficiency in rats. Endocrinology. 1977;100:303Ŕ13.
98. Hill RN, Erdreich LS, Paynter OE, Roberts PA, Rosenthal SL, Wilkinson CF. Thyroid
follicular cell carcinogenesis. Fundam Appl Toxicol. 1989;12:629Ŕ97.
99. Ward JM, Ohshima M. The role of iodine in carcinogenesis. Adv Exp Med Biol.
1986;206:529Ŕ42.
100. Kaplan MM. Progress in Thyroid-Cancer. Endocrin Metab Clin. 1990;19:469Ŕ78.
101. Zimmermann MB, Boelaert K. Iodine deficiency and thyroid disorders. Lancet
Diabetes Endocrinol. 2015;3:286Ŕ95.
102. Uyttersprot N, Pelgrims N, Carrasco N, Gervy C, Maenhaut C, Dumont JE, et al.
Moderate doses of iodide in vivo inhibit cell proliferation and the expression of
161
thyroperoxidase and Na+/I- symporter mRNAs in dog thyroid. Mol Cell Endocrinol.
1997;131:195Ŕ203.
103. Kolonel LN, Hankin JH, Wilkens LR, Fukunaga FH, Hinds MW. An epidemiologic
study of thyroid cancer in Hawaii. Cancer Causes Control. 1990;1:223Ŕ34.
104. Truong T, Baron-Dubourdieu D, Rougier Y, Guenel P. Role of dietary iodine and
cruciferous vegetables in thyroid cancer: a countrywide caseŔcontrol study in New
Caledonia. Cancer Causes Control. 2010;21:1183-92.
105. Cléro É, Doyon F, Chungue V, Rachédi F, Boissin JL, Sebbag J, Shan L, Bost-
Bezeaud F, Petitdidier P, Dewailly E, Rubino C, de Vathaire F. Dietary iodine and thyroid
cancer risk in French Polynesia: a case-control study. Thyroid. 2012;22:422-9.
106. Zimmermann MB, Galetti V. Iodine intake as a risk factor for thyroid cancer: a
comprehensive review of animal and human studies. Thyroid Res. 2015;8:8.
107. British Geological Survey 2003 Database of the iodine content of food and diets
populated with data from published literature. British Geological Survey Commissioned
Report, Keyworth, Nottingham, United Kingdom.
108. Haldimann M, Alt A, Blondeau ABK 2005 Iodine content of food groups. J Food
Compost Anal 18:461Ŕ471.
109. Rose M, Miller P, Baxter M, Appleton G, Crews H, Croasdale M 2001 Bromine and
iodine in 1997 UK total diet study samples. J Environ Monit 3:361Ŕ365.
110. Leufroy A, Noël L, Bouisset P, Maillard S, Bernagout S, Xhaard C, de Vathaire F,
Guérin T 2015 Determination of total iodine in French Polynesian foods: method
validation and occurrence data. Food Chem 169:134Ŕ140.
111. Liu ZT, Lin AH. Dietary factors and thyroid cancer risk: a meta-analysis of
observational studies. Nutr Cancer. 2014;66(7):1165-78.
112. Ren Y, Kitahara CM, Berrington de Gonzalez A, Cléro É, Brindel P, Maillard S, Cote
S, Dewailly E, Rachedi F, Boissin JL, Sebbag J, Shan L, Bost-Bezeaud F, Petitdidier P,
Xhaard C, Rubino C, de Vathaire F. Lack of association between fingernail selenium and
thyroid cancer risk: a case-control study in French Polynesia. Asian Pac J Cancer Prev.
2014;15(13):5187-94.
113. Ren Y, Lence-Anta JJ, Pereda CM, Chappe M, Velasco M, Infante I, Bustillo M,
Turcios S, Leufroy A, Guérin T, Noël L, Lesueur F, Maillard S, Cléro É, Xhaard C,
Allodji RS, Rubino C, Rodriguez R, Ortiz RM, de Vathaire F. FOXE1 Polymorphism
Interacts with Dietary Iodine Intake in Differentiated Thyroid Cancer Risk in the Cuban
Population. Thyroid. 2016 Dec;26(12):1752-1760.
162
114. Cléro É, Leux C, Brindel P, Truong T, Anger A, Teinturier C, Diallo I, Doyon F,
Guénel P, de Vathaire F. Pooled analysis of two case-control studies in New Caledonia
and French Polynesia of body mass index and differentiated thyroid cancer: the
importance of body surface area. Thyroid. 2010 Nov;20(11):1285-93.
115. Kitahara CM, Platz EA, Freeman LE, Hsing AW, Linet MS, Park Y, Schairer C,
Schatzkin A, Shikany JM, Berrington de González A. Obesity and thyroid cancer risk
among U.S. men and women: a pooled analysis of five prospective studies. Cancer
Epidemiol Biomarkers Prev. 2011 Mar;20(3):464-72.
116. Rinaldi S, Lise M, Clavel-Chapelon F, Boutron-Ruault MC, Guillas G, Overvad K,
Tjønneland A, Halkjær J, Lukanova A, Kaaks R, Bergmann MM, Boeing H, Trichopoulou
A, Zylis D, Valanou E, Palli D, Agnoli C, Tumino R, Polidoro S, Mattiello A, Bueno-de-
Mesquita HB, Peeters PH, Weiderpass E, Lund E, Skeie G, Rodríguez L, Travier N,
Sánchez MJ, Amiano P, Huerta JM, Ardanaz E, Rasmuson T, Hallmans G, Almquist M,
Manjer J, Tsilidis KK, Allen NE, Khaw KT, Wareham N, Byrnes G, Romieu I, Riboli E,
Franceschi S. Body size and risk of differentiated thyroid carcinomas: findings from the
EPIC study. Int J Cancer. 2012 Sep 15;131(6):E1004-14.
117. Xu L, Port M, Landi S, Gemignani F, Cipollini M, Elisei R, Goudeva L, Müller JA,
Nerlich K, Pellegrini G, Reiners C, Romei C, Schwab R, Abend M, Sturgis EM. Obesity
and the risk of papillary thyroid cancer: a pooled analysis of three case-control studies.
Thyroid. 2014 Jun;24(6):966-74.
118. Peterson E, De P, Nuttall R. BMI, diet and female reproductive factors as risks for
thyroid cancer: a systematic review. PLoS One. 2012;7(1):e29177.
119. Kitahara CM, McCullough ML, Franceschi S, Rinaldi S, Wolk A, Neta G, Olov
Adami H, Anderson K, Andreotti G, Beane Freeman LE, Bernstein L, Buring JE, Clavel-
Chapelon F, De Roo LA, Gao YT, Gaziano JM, Giles GG, Håkansson N, Horn-Ross PL,
Kirsh VA, Linet MS, MacInnis RJ, Orsini N, Park Y, Patel AV, Purdue MP, Riboli E,
Robien K, Rohan T, Sandler DP, Schairer C, Schneider AB, Sesso HD, Shu XO, Singh
PN, van den Brandt PA, Ward E, Weiderpass E, White E, Xiang YB, Zeleniuch-Jacquotte
A, Zheng W, Hartge P, de González AB. Anthropometric Factors and Thyroid Cancer
Risk by Histological Subtype: Pooled Analysis of 22 Prospective Studies. Thyroid. 2016
Feb;26(2):306-18.
120. Renehan AG, Tyson M, Egger M, Heller RF, Zwahlen M. Body-mass index and
incidence of cancer: a systematic review and meta-analysis of prospective observational
studies. Lancet. 2008 Feb 16;371(9612):569-78.
163
121. Nyrnes A, Jorde R, Sundsfjord J. Serum TSH is positively associated with BMI. Int J
Obes (Lond). 2006 Jan;30(1):100-5.
122. Tramontano D, Cushing GW, Moses AC, Ingbar SH. Insulin-like growth factor-I
stimulates the growth of rat thyroid cells in culture and synergizes the stimulation of DNA
synthesis induced by TSH and Graves'-IgG. Endocrinology. 1986 Aug;119(2):940-2.
123. Food and Agriculture Organization of the United Nations (FAO)/International
Network of Food Data Systems (INFOODS) Food Composition Databases. Available at:
http://www.fao.org/infoods/infoods/tables-and-databases/faoinfoods-databases/en/
(accessed January 17, 2017).
124. Agence nationale de sécurité sanitaire de l’alimentation, de l’environnement et du
travail 2013 French food composition table Ciqual version 2013. Available at:
https://pro.anses.fr/tableciqual/index.htm (accessed September 23, 2015).
125. Comite Europeen de Normalisation 2007 Foodstuffs Ŕ Determination of trace elements
ŔDetermination of iodine by ICP-MS (inductively coupled plasma mass spectrometry).
Comite Europeen de Normalisation 15111, Brussels.
126. Association française de normalisation 2010 NF V03Ŕ110 Ŕ Analyse des produits
agricoles et alimentaires ŔProtocole de caractérisation en vue de la validation d’une
méthode d’analyse quantitative par construction du profil d’exactitude. Association
française de normalisation, La Plaine Saint-Denis.
127. Mermet JM, Granier G 2012. Potential of accuracy profile for method validation in
inductively coupled plasma spectrochemistry. Spectrochimica ActaŔPart B 76:214Ŕ220.
128. Taga I, Sameza ML, Kayo AV, Ngogang J. Iodine levels in food and soil in different
regions in Cameroon. Sante. 2004;14:11Ŕ15.
129. Takahashi T, Fujimori K, Simon SL, Bechtner G, Edwards R, Trott KR. Thyroid
nodules, thyroid function and dietary iodine in the Marshall Islands. Int J Epidemiol. 1999
Aug;28(4):742-9.
130. Field Epidemiology Manual. Available at:
https://wiki.ecdc.europa.eu/fem/w/wiki/principles-of-matching#freq (accessed March 29,
2017).
131. Truong T, Rougier Y, Dubourdieu D, Guihenneuc-Jouyaux C, Orsi L, Hémon D,
Guénel P. Time trends and geographic variations for thyroid cancer in New Caledonia, a
very high incidence area (1985-1999). Eur J Cancer Prev. 2007 Feb;16(1):62-70.
132. Guignard R, Truong T, Rougier Y, Baron-Dubourdieu D, Guénel P. Alcohol drinking,
tobacco smoking, and anthropometric characteristics as risk factors for thyroid cancer: a
164
countrywide case-control study in New Caledonia. Am J Epidemiol. 2007 Nov
15;166(10):1140-9.
133. Leux C, Truong T, Petit C, Baron-Dubourdieu D, Guénel P. Family history of
malignant and benign thyroid diseases and risk of thyroid cancer: a population-based case-
control study in New Caledonia. Cancer Causes Control. 2012 May;23(5):745-55.
134. Tcheandjieu C, Lesueur F, Sanchez M, Baron-Dubourdieu D, Guizard AV, Mulot C,
Laurent-Puig P, Schvartz C, Truong T, Guenel P. Fine-mapping of two differentiated
thyroid carcinoma susceptibility loci at 9q22.33 and 14q13.3 detects novel candidate
functional SNPs in Europeans from metropolitan France and Melanesians from New
Caledonia. Int J Cancer. 2016 Aug 1;139(3):617-27.
135. "Présentation" (in French). Nouvelle-caledonie.gouv.fr. Archived from the original on
30 October 2012. Retrieved 2013-01-30. Available at:
https://web.archive.org/web/20121030174803/http://www.nouvelle-
caledonie.gouv.fr/site/La-Nouvelle-Caledonie/Presentation (accessed January 29, 2017).
136. "Présentation Ŕ L'Outre-Mer". Outre-mer.gouv.fr. Retrieved 2013-01-30. Available at:
http://www.outre-mer.gouv.fr/?presentation-nouvelle-caledonie.html (accessed January 29,
2017).
137. "268 767 habitants en 2014.". ISEE. Retrieved 2014-11-16. Available at:
http://www.isee.nc/population/recensement/structure-de-la-population-et-evolutions
(accessed January 29, 2017).
138. Hedinger C, Williams ED, Sobin LH. Histological typing of thyroid tumours. In:
Hedinger C,Williams ED, Sobin LH, eds. International histological classification of
tumours. 2nd ed. Berlin, Germany: Springer-Verlag, 1988.
139. Lucas F, Niravong M, Villeminot S, Kaaks R, Clavel-Chapelon F. Estimation of food
portion size using photographs: validity, strength, weaknesses and recommendations. J
Hum Nutr Diet. 1995;8:65Ŕ74.
140. Van Liere MJ, Lucas F, Clavel F, Slimani N, Villeminot S. Relative validity and
reproducibility of a French dietary history questionnaire. Int J Epidemiol. 1997; 26:S128Ŕ
136.
141. Gleize L, Laudon F, Yen Kai Sun L, et al (2000). Cancer registry in French Polynesia:
results for the 1990-1995 period for native and immigrant populations. Eur J Epidemiol,
16, 661-7.
142. Brindel P, Doyon F, Rachédi F, Boissin JL, Sebbag J, Shan L, Chungue V, Bost-
Bezeaud F, Petitdidier P, Paoaafaite J, Teuri J, de Vathaire F. Anthropometric factors in
165
differentiated thyroid cancer in French Polynesia: a case-control study. Cancer Causes
Control. 2009 Jul;20(5):581-90.
143. Drozdovitch V, Bouville A, Doyon F, Brindel P, Cardis E, de Vathaire F.
Reconstruction of individual radiation doses for a case-control study of thyroid cancer in
French Polynesia. Health Phys. 2008 May;94(5):418-33.
144. Cléro É, Doyon F, Chungue V, Rachédi F, Boissin JL, Sebbag J, Shan L, Rubino C, de
Vathaire F. Dietary patterns, goitrogenic food, and thyroid cancer: a case-control study in
French Polynesia. Nutr Cancer. 2012;64(7):929-36.
145. Xhaard C, Ren Y, Clero E, Maillard S, Brindel P, Rachedi F, Boissin JL, Sebbag J,
Shan L, Bost-Bezeaud F, Petitdidier P, Drozdovitch V, Doyon F, Rubino C, de Vathaire F.
Differentiated thyroid carcinoma risk factors in French Polynesia. Asian Pac J Cancer
Prev. 2014;15:2675-2680.
146. "Population des communes de Polynésie française". INSEE. Retrieved 13 October
2013. Available at: https://www.insee.fr/fr/statistiques/2122859 (accessed January 29,
2017).
147. "Total Population - Both Sexes". World Population Prospects, the 2015 Revision.
United Nations Department of Economic and Social Affairs, Population Division,
Population Estimates and Projections Section. July 2015. Retrieved 1 June 2016.
148. "French Polynesia". United Nations. Retrieved 19 August 2016. Available at:
http://data.un.org/CountryProfile.aspx?crName=FRENCH%20POLYNESIA#Economic
(accessed January 29, 2017).
149. Bricas N, Etienne J, Mou Y. Résultats de l'enquête de consommation alimentaire
réalisée en Polynésie Française en 1995. Tahiti: Direction de la santé, Cirad, 2001.
150. Stsjazhko VA, Tsyb AF, Tronko ND, Souchkevitch G, Baverstock KF. Childhood
thyroid cancer since accident at Chernobyl. BMJ. 1995 Mar 25;310(6982):801.
151. Cardis E, Krewski D, Boniol M, Drozdovitch V, Darby SC, Gilbert ES, Akiba S,
Benichou J, Ferlay J, Gandini S, Hill C, Howe G, Kesminiene A, Moser M, Sanchez M,
Storm H, Voisin L, Boyle P. Estimates of the cancer burden in Europe from radioactive
fallout from the Chernobyl accident. Int J Cancer. 2006 Sep 15;119(6):1224-35.
152. Xhaard C, de Vathaire F, Cléro É, Maillard S, Ren Y, Borson-Chazot F, Sassolas G,
Schvartz C, Colonna M, Lacour B, Danzon A, Velten M, Marrer E, Bailly L, Barjoan EM,
Schlumberger M, Orgiazzi J, Adjadj E, Rubino C. Anthropometric Risk Factors for
Differentiated Thyroid Cancer in Young Men and Women From Eastern France: A Case-
Control Study. Am J Epidemiol. 2015 Aug 1;182(3):202-14.
166
153. Xhaard C, Lence-Anta JJ, Ren Y, Borson-Chazot F, Sassolas G, Schvartz C, Colonna
M, Lacour B, Danzon A, Velten M, Cléro É, Maillard S, Marrer E, Bailly L, Mariné
Barjoan E, Schlumberger M, Orgiazzi J, Adjadj E, Pereda CM, Turcios S, Velasco M,
Chappe M, Infante I, Bustillo M, García A, Salazar S, Rodriguez R, Benadjaoud MA,
Ortiz RM, Rubino C, de Vathaire F. Recreational Physical Activity and Differentiated
Thyroid Cancer Risk: A Pooled Analysis of Two Case-Control Studies. Eur Thyroid J.
2016 Jul;5(2):132-8.
154. Constance Xhaard, Agnes Dumas, Vincent Souchard, Yan Ren, Françoise Borson-
Chazot, Geneviève Sassolas, Claire Schvartz, Marc Colonna, Brigitte Lacour, Anne-
Sophie Wonoroff, Michel Velten, Enora Cléro, Stéphane Maillard, Emilie Marrer, Laurent
Bailly, Eugènia Mariné Barjoan, Martin Schlumberger, Jacques Orgiazzi, Elisabeth
Adjadj, Carole Rubino, André Bouville, Vladimir Drozdovitch, Florent de Vathaire. Are
dietary reports in a case-control study on thyroid cancer biased by risk perception of
Chernobyl fallout? Accepted by EPIDEMIOLOGY AND PUBLIC HEALTH (REVUE
D'EPIDÉMIOLOGIE ET DE SANTÉ PUBLIQUE, January 29, 2017).
155. "The World Factbook Ŕ Field Listing Ŕ Area". CIA.gov. Central Intelligence Agency.
Retrieved 1 November 2015. Available at: https://www.cia.gov/library/publications/the-
world-factbook/fields/2147.html (accessed January 29, 2017).
156. Bailly L, Giusiano B, Barjoan EM, Michiels JF, Ambrosetti D, Lacombe S, Granon C,
Viot A, Dunais B, Daurès JP, Pradier C. Investigating the completeness of a
histopathological cancer registry: estimation by capture-recapture analysis in a French
geographical unit Alpes-Maritimes, 2008. Cancer Epidemiol. 2011 Dec;35(6):e62-e68.
157. Bailly L, Mariné-Barjoan E, Ambrosetti D, Roussel JF, Caissotti C, Ettore F, Diebolt
E, Grill JM, Sattonnet C, Michiels JF, Pradier C. Data quality of cancer registration by
Adicap codes, used by French pathologists from Paca, 2005-2006. Ann Pathol. 2009
Apr;29(2):74-79.
158. Cuban National Bureau of Statistics, Havana, Cuba 2014. Available at:
www.one.cu/aec2013/esp/20080618_tabla_cuadro.htm (accessed September 23, 2015).
159. Kilfoy BA, Zheng T, Holford TR, Han X, Ward MH, Sjodin A, Zhang Y, Bai Y, Zhu
C, Guo GL, Rothman N, Zhang Y 2009 International patterns and trends in thyroid cancer
incidence, 1973Ŕ2002. Cancer Causes Control 20:525Ŕ531.
160. Ministerio de Salud Pública-Dirección Nacional de Registros Médicos y Estadísticas
de Salud 2015 Anuario estadístico de salud 2014. Available at
167
http://files.sld.cu/dne/files/2015/04/anuario-estadistico-de-salud-2014.pdf (accessed
September 23, 2015).
161. Lence-Anta JJ, Xhaard C, Ortiz RM, Kassim H, Pereda CM, Turcios S, Velasco M,
Chappe M, Infante I, Bustillo M, García A, Cléro É, Maillard S, Salazar S, Rodriguez R,
de Vathaire F. Environmental, lifestyle, and anthropometric risk factors for differentiated
thyroid cancer in cuba: a case-control study. Eur Thyroid J. 2014 Sep;3(3):189-96.
162. Turcios S, Lence-Anta JJ, Santana JL, Pereda CM, Velasco M, Chappe M, Infante I,
Bustillo M, García A, Cléro É, Maillard S, Rodriguez R, Xhaard C, Ren Y, Rubino C,
Ortiz RM, de Vathaire F. Thyroid volume and its relation to anthropometric measures in a
healthy cuban population. Eur Thyroid J. 2015 Mar;4(1):55-61.
163. "Cuba profile: Facts". BBC News. Retrieved March 26, 2013. Available at:
http://www.bbc.com/news/world-latin-america-19583446 (accessed January 29, 2017).
164. "Cuba". Available at: https://en.wikipedia.org/wiki/Cuba#cite_note-BBC_profile-14
(accessed January 29, 2017).
165. Rangel, Carlos (1977). The Latin Americans: Their Love-Hate Relationship with the
United States. New York: Harcourt Brace Jovanovich. pp. 3Ŕ5. ISBN 978-0-15-148795-0.
Skidmore, Thomas E.; Peter H. Smith (2005). Modern Latin America (6 ed.). Oxford and
New York: Oxford University Press. pp. 1Ŕ10. ISBN 978-0-19-517013-9.
166. "Human Development Report 2015 Ŕ "Rethinking Work for Human Development""
(PDF). HDRO (Human Development Report Office) United Nations Development
Programme. Available at:
http://hdr.undp.org/sites/default/files/2015_human_development_report.pdf (accessed
January 29, 2017).
167. "GHO Ŕ By category Ŕ Life expectancy Ŕ Data by country". Available at:
http://apps.who.int/gho/data/node.main.688?lang=en (accessed January 29, 2017).
168. Field Listing: Literacy Archived November 24, 2016, at the Wayback Machine.. CIA
World Factbook. Available at: https://www.cia.gov/library/publications/the-world-
factbook/fields/2103.html#136 (accessed January 29, 2017).
169. Acosta LF 2015 Los dilemas de la sal. Available at: www.granma.cu/cuba/2015-03-
20/los-dilemas-de-la-sal?page=1 (accessed May 23, 2016).
170. Parlato R, Rosica A, Rodriguez-Mallon A, Affuso A, Postiglione MP, Arra C,
Mansouri A, Kimura S, Di Lauro R, De Felice M. An integrated regulatory network
controlling survival and migration in thyroid organogenesis. Dev Biol. 2004 Dec
15;276(2):464-75.
168
171. Zannini M1, Avantaggiato V, Biffali E, Arnone MI, Sato K, Pischetola M, Taylor BA,
Phillips SJ, Simeone A, Di Lauro R. TTF-2, a new forkhead protein, shows a temporal
expression in the developing thyroid which is consistent with a role in controlling the
onset of differentiation. EMBO J. 1997 Jun 2;16(11):3185-97.
172. Zhang P, Zuo H, Nakamura Y, Nakamura M, Wakasa T, Kakudo K.
Immunohistochemical analysis of thyroid-specific transcription factors in thyroid tumors.
Pathol Int. 2006 May;56(5):240-5.
173. Perna MG, Civitareale D, De Filippis V, Sacco M, Cisternino C, Tassi V. Absence of
mutations in the gene encoding thyroid transcription factor-1 (TTF-1) in patients with
thyroid dysgenesis. Thyroid. 1997 Jun;7(3):377-81.
174. Denny JC, Crawford DC, Ritchie MD, Bielinski SJ, Basford MA, Bradford Y, Chai
HS, Bastarache L, Zuvich R, Peissig P, Carrell D, Ramirez AH, Pathak J, Wilke RA,
Rasmussen L, Wang X, Pacheco JA, Kho AN, Hayes MG, Weston N, Matsumoto M,
Kopp PA, Newton KM, Jarvik GP, Li R, Manolio TA, Kullo IJ, Chute CG, Chisholm RL,
Larson EB, McCarty CA, Masys DR, Roden DM, de Andrade M. Variants near FOXE1
are associated with hypothyroidism and other thyroid conditions: using electronic medical
records for genome- and phenome-wide studies. Am J Hum Genet. 2011 Oct 7;89(4):529-
42.
175. Canman CE, Lim DS. The role of ATM in DNA damage responses and cancer.
Oncogene. 1998 Dec 24;17(25):3301-8.
176. Schrauder M, Frank S, Strissel PL, Lux MP, Bani MR, Rauh C, Sieber CC, Heusinger
K, Hartmann A, Schulz-Wendtland R, Strick R, Beckmann MW, Fasching PA. Single
nucleotide polymorphism D1853N of the ATM gene may alter the risk for breast cancer. J
Cancer Res Clin Oncol. 2008 Aug;134(8):873-82.
177. Barrett JH, Iles MM, Harland M, Taylor JC, Aitken JF, Andresen PA, et al. Genome-
wide association study identifies three new melanoma susceptibility loci. Nat Genet. 2011
Oct 9;43(11):1108-13.
178. Akulevich NM, Saenko VA, Rogounovitch TI, Drozd VM, Lushnikov EF, Ivanov VK,
Mitsutake N, Kominami R, Yamashita S. Polymorphisms of DNA damage response genes
in radiation-related and sporadic papillary thyroid carcinoma. Endocr Relat Cancer. 2009
Jun;16(2):491-503.
179. Damiola F, Byrnes G, Moissonnier M, Pertesi M, Deltour I, Fillon A, Le Calvez-Kelm
F, Tenet V, McKay-Chopin S, McKay JD, Malakhova I, Masyakin V, Cardis E, Lesueur F,
Kesminiene A. Contribution of ATM and FOXE1 (TTF2) to risk of papillary thyroid
169
carcinoma in Belarusian children exposed to radiation. Int J Cancer. 2014 Apr
1;134(7):1659-68.
180. Nguyen-Dumont T, Calvez-Kelm FL, Forey N, McKay-Chopin S, Garritano S, Gioia-
Patricola L, De Silva D, Weigel R, Sangrajrang S, Lesueur F, Tavtigian SV; Breast
Cancer Family Registries (BCFR); Kathleen Cuningham Foundation Consortium for
Research into Familial Breast Cancer (kConFab). Description and validation of high-
throughput simultaneous genotyping and mutation scanning by high-resolution melting
curve analysis. Hum Mutat. 2009 Jun;30(6):884-90.
181. Li M, Eastman CJ. The changing epidemiology of iodine deficiency. Nat Rev
Endocrinol. 2012 Apr 3;8(7):434-40.
182. Lee SM, Lewis J, Buss DH, Holcombe GD, Lawrance PR. Iodine in British foods and
diets. Br J Nutr. 1994 Sep;72(3):435-46.
183. Dunn OJ. Multiple comparisons among means. JASA. 1961;56:52Ŕ64.
184. Choi WJ, Kim J. Dietary factors and the risk of thyroid cancer: a review. Clin Nutr
Res. 2014 Jul;3(2):75-88.
185. Michikawa T, Inoue M, Shimazu T, Sawada N, Iwasaki M, Sasazuki S, Yamaji T,
Tsugane S; Japan Public Health Center-based Prospective Study Group. Seaweed
consumption and the risk of thyroid cancer in women: the Japan Public Health Center-
based Prospective Study. Eur J Cancer Prev. 2012 May;21(3):254-60.
186. Goldgar DE, Easton DF, Cannon-Albright LA, Skolnick MH. Systematic population-
based assessment of cancer risk in first-degree relatives of cancer probands. J Natl Cancer
Inst. 1994 Nov 2;86(21):1600-1608.
187. Pal T, Vogl FD, Chappuis PO, Tsang R, Brierley J, Renard H, Sanders K, Kantemiroff
T, Bagha S, Goldgar DE, Narod SA, Foulkes WD. Increased risk for nonmedullary
thyroid cancer in the first degree relatives of prevalent cases of nonmedullary thyroid
cancer: a hospital-based study. J Clin Endocrinol Metab. 2001 Nov;86(11):5307-5312.
188. Hemminki K, Vaittinen P. Effect of paternal and maternal cancer on cancer in the
offspring: a population-based study. Cancer Epidemiol Biomarkers Prev. 1997
Dec;6(12):993-997.
189. Bignell GR, Canzian F, Shayeghi M, Stark M, Shugart YY, Biggs P, Mangion J,
Hamoudi R, Rosenblatt J, Buu P, Sun S, Stoffer SS, Goldgar DE, Romeo G, Houlston RS,
Narod SA, Stratton MR, Foulkes WD. Familial nontoxic multinodular thyroid goiter locus
maps to chromosome 14q but does not account for familial nonmedullary thyroid cancer.
Am J Hum Genet. 1997 Nov;61(5):1123-30.
170
190. Canzian F, Amati P, Harach HR, Kraimps JL, Lesueur F, Barbier J, Levillain P,
Romeo G, Bonneau D. A gene predisposing to familial thyroid tumors with cell oxyphilia
maps to chromosome 19p13.2. Am J Hum Genet. 1998 Dec;63(6):1743-1748.
191. Lesueur F, Stark M, Tocco T, Ayadi H, Delisle MJ, Goldgar DE, Schlumberger M,
Romeo G, Canzian F. Genetic heterogeneity in familial nonmedullary thyroid carcinoma:
exclusion of linkage to RET, MNG1, and TCO in 56 families. NMTC Consortium. J Clin
Endocrinol Metab. 1999 Jun;84(6):2157-2162.
192. Malchoff CD, Sarfarazi M, Tendler B, Forouhar F, Whalen G, Joshi V, Arnold A,
Malchoff DM. Papillary thyroid carcinoma associated with papillary renal neoplasia:
genetic linkage analysis of a distinct heritable tumor syndrome. J Clin Endocrinol Metab.
2000 May;85(5):1758-1764.
193. McKay JD, Lesueur F, Jonard L, Pastore A, Williamson J, Hoffman L, Burgess J,
Duffield A, Papotti M, Stark M, Sobol H, Maes B, Murat A, Kääriäinen H, Bertholon-
Grégoire M, Zini M, Rossing MA, Toubert ME, Bonichon F, Cavarec M, Bernard AM,
Boneu A, Leprat F, Haas O, Lasset C, Schlumberger M, Canzian F, Goldgar DE, Romeo
G. Localization of a susceptibility gene for familial nonmedullary thyroid carcinoma to
chromosome 2q21. Am J Hum Genet. 2001 Aug;69(2):440-446. Epub 2001 Jul 2.
194. Cavaco BM, Batista PF, Sobrinho LG, Leite V. Mapping a new familial thyroid
epithelial neoplasia susceptibility locus to chromosome 8p23.1-p22 by high-density
single-nucleotide polymorphism genome-wide linkage analysis. J Clin Endocrinol Metab.
2008 Nov;93(11):4426-4430.
195. Capezzone M, Cantara S, Marchisotta S, Filetti S, De Santi MM, Rossi B, Ronga G,
Durante C, Pacini F. Short telomeres, telomerase reverse transcriptase gene amplification,
and increased telomerase activity in the blood of familial papillary thyroid cancer patients.
J Clin Endocrinol Metab. 2008 Oct;93(10):3950-3957.
196. Figlioli G, Köhler A, Chen B, Elisei R, Romei C, Cipollini M, Cristaudo A, Bambi F,
Paolicchi E, Hoffmann P, Herms S, Kalemba M, Kula D, Pastor S, Marcos R, Velázquez
A, Jarząb B, Landi S, Hemminki K, Försti A, Gemignani F. Novel genome-wide
association study-based candidate loci for differentiated thyroid cancer risk. J Clin
Endocrinol Metab. 2014 Oct;99(10):E2084-2092.
197. Bonora E, Rizzato C, Diquigiovanni C, Oudot-Mellakh T, Campa D, Vargiolu M,
Guedj M; NMTC Consortium, McKay JD, Romeo G, Canzian F, Lesueur F. The FOXE1
locus is a major genetic determinant for familial nonmedullary thyroid carcinoma. Int J
Cancer. 2014 May 1;134(9):2098-2107.
171
198. Zhuang Y, Wu W, Liu H, Shen W. Common genetic variants on FOXE1 contributes to
thyroid cancer susceptibility: evidence based on 16 studies. Tumour Biol. 2014
Jun;35(6):6159-6166.
199. Terry-Berro CB, Quintana-Jardines I, de la Paz-Luna M, García J, Fernández-
Bohórquez R, Silvera-Téllez D, Díaz-Fuentes Y, Ferret-Martínez A, Reyes-Fernández D.
Impact of the actions for the sustainable elimination of iodine deficiency in Cuba. Rev
Peru Med Exp Salud Publica. 2014;31(1):24-29.
200. Bell BA, Morgan GB, Schoeneberger JA, Loudermilk BL, Kromrey JD, Ferron JM.
Dancing the Sample Size Limbo with Mixed Models: How Low Can You Go? SAS
Global Forum 2010. Paper 197-2010.
201. Li B, Lingsma HF, Steyerberg EW, Lesaffre E. Logistic random effects regression
models: a comparison of statistical packages for binary and ordinal outcomes. BMC Med
Res Methodol. 2011 May 23;11:77.
202. Breslow NE, Day NE. Statistical methods in cancer research. Volume 1 - The analysis
of case-control studies. Lyon, 1980.
203. Bouyer J, Hémon D, Cordier S, et al. Épidémiologie - Principes et methods
quantitatives. Paris, 2009.
204. Cuban National Bureau of Statistics, Havana, Cuba 2012. Available at:
www.one.cu/EstadisticaPoblacion/EstadisticaPoblacion.asp (accessed January 17, 2017).
205. Favier JC, Ireland-Ripert J, Toque C, Feinberg M. Repertoire general des aliments.
Table de composition [Food composition tables] CIQUAL-REGAL. Paris: Tec & Doc
Lavoisier and INRA. 1995.
206. Bleichrodt N, Born M.P. A meta-analysis of research on iodine and its relationship to
cognitive development. In: Stanbury J.B., editor. The damaged brain of iodine deficiency:
Cognitive, Behavioral, Neuromotor and Educative Aspects. Cognizant Communication
Corporation; New York, NY, USA: 1994. pp. 195Ŕ200.
207. Qian M, Wang D, Watkins WE, Gebski V, Yan YQ, Li M, Chen ZP. The effects of
iodine on intelligence in children: a meta-analysis of studies conducted in China. Asia
pacific J Clin Nutr. 2005;14:32-42.
208. Mackerras DE, Eastman CJ. Estimating the iodine supplementation level to
recommend for pregnant and breastfeeding women in Australia. Med J Aust.
2012;197:238-42.
172
209. Gago-Dominguez M. Marine n-3 fatty acid intake, glutathione S-transferase
polymorphisms and breast cancer risk in post-menopausal Chinese women in Singapore.
Carcinogenesis. 2004;25, 2143-2147.
210. Fradet V, Cheng I, Casey G, Witte JS. Dietary omega-3 fatty acids, cyclooxygenase-2
genetic variation, and aggressive prostate cancer risk. Clin. Cancer Res. 2009;15, 2559Ŕ
2566.
211. Hedelin M, Chang ET, Wiklund F, Bellocco R, Klint A, Adolfsson J, Shahedi K, Xu J,
Adami HO, Grönberg H, Bälter KA. Association of frequent consumption of fatty fish
with prostate cancer risk is modified by COX-2 polymorphism. Int. J. Cancer 2007;120,
398Ŕ405.
212. Poole EM, Hsu L, Xiao L, Kulmacz RJ, Carlson CS, Rabinovitch PS, Makar KW,
Potter JD, Ulrich CM. Genetic variation in prostaglandin E2 synthesis and signaling,
prostaglandin dehydrogenase, and the risk of colorectal adenoma. Cancer Epidemiol.
Biomark. Prev. 2010;19, 547Ŕ557.
213. Lian W, Wang R, Xing B, Yao Y. Fish intake and the risk of brain tumor: a meta-
analysis with systematic review. Nutr J. 2017;16:1.
214. Haslam A, Robb SW, Bonner MR, Lindblad W, Allegra J, Shen Y, Vena JE.
Polychlorinated biphenyls and omega-3 fatty acid exposure from fish consumption, and
thyroid cancer among New York anglers. J Environ Sci (China). 2016;41:270-7.
215. Vena JE, Buck GM, Kostyniak P, Mendola P, Fitzgerald E, Sever L, Freudenheim J,
Greizerstein H, Zielezny M, McReynolds J, Olson J. The New York angler cohort study:
exposure characterization and reproductive and developmental health. Toxicol Ind Health.
1996;12:327-34.
216. Bosetti C, Kolonel L, Negri E, Ron E, Franceschi S, Dal Maso L, Galanti MR, Mark
SD, Preston-Martin S, McTiernan A, Land C, Jin F, Wingren G, Hallquist A, Glattre E,
Lund E, Levi F, Linos D, La Vecchia C. A pooled analysis of case-control studies of
thyroid cancer. VI. Fish and shellfish consumption. Cancer Causes Control. 2001
May;12(4):375-82.
217. Aaseth J, Frey H, Glattre E, Norheim G, Ringstad J, Thomassen Y. Selenium
concentrations in the human thyroid gland. Biol Trace Elem Res. 1990;24:147-52.
218. Jung HJ, Seo YR. Current issues of selenium in cancer chemoprevention. Biofactors.
2010;36:153-8.
219. Fairweather-Tait SJ, Bao Y, Broadley MR, Collings R, Ford D, Hesketh JE et al.
Selenium in human health and disease. Antioxid Redox Signal. 2011;14:1337-83.
173
220. Willett WC, Polk BF, Morris JS, Stampfer MJ, Pressel S, Rosner B et al. Prediagnostic
serum selenium and risk of cancer. Lancet. 1983;2:130-4.
221. Clark LC, Combs GF, Turnbull BW, Slate EH, Chalker DK, Chow J et al. Effects of
selenium supplementation for cancer prevention in patients with carcinoma of the skin. A
randomized controlled trial. Nutritional prevention of cancer study group. JAMA.
1996;276:1957-63.
222. Duffield-Lillico AJ, Reid ME, Turnbull BW, Combs GF, Slate EH, Fischbach LA et al.
Baseline characteristics and the effect of selenium supplementation on cancer incidence in
a randomized clinical trial: a summary report of the Nutritional Prevention of Cancer Trial.
Cancer Epidemiol Biomarkers Prev. 2002;11:630-9.
223. Guo KF, Zhang Z, Wang JY, et al. Variation of urinary and serum trace elements (Ca,
Zn, Cu, Se) in bladder carcinoma in China. Asian Pac J Cancer Prev. 2012;13, 2057-61.
224. Kato MA, Finley DJ, Lubitz CC, Zhu B, Moo TA, Loeven MR et al. Selenium
decreases thyroid cancer cell growth by increasing expression of GADD153 and
GADD34. Nutr Cancer. 2010;62:66-73.
225. Glattre E, Thomassen Y, Thoresen SO, Haldorsen T, Lund-Larsen PG, Theodorsen L
et al. Prediagnostic serum selenium in a case-control study of thyroid cancer. Int J
Epidemiol. 1989;18:45-9.
226. Moore MA, Baumann F, Foliaki S, et al. Cancer epidemiology in the Pacific Islands -
past, present and future. Asian Pac J Cancer Prev. 2010;11, 99-106.
227. Dewailly E, Château-Degat L, Suhas E. Fish consumption and health in French
Polynesia. Asia Pac J Clin Nutr. 2008;17:86-93.
228. Elwaer N, Hintelmann H. Comparative performance study of different sample
introduction techniques for rapid and precise selenium isotope ratio determination using
multi-collector inductively coupled plasma mass spectrometry (MC-ICP/MS). Anal
Bioanal Chem. 2007;389:1889-99.
229. Dewailly E, Suhas E, Mou Y, Dallaire R, Chateau-Degat L, Chansin R. High fish
consumption in French Polynesia and prenatal exposure to metals and nutrients. Asia Pac
J Clin Nutr. 2008;17:461-70.
230. World Health Organization. Diet, food supply and obesity in the Pacific. Geneva:
Regional Office for the Western Pacific, World Health Organization; 2003.
231. Satia JA, King IB, Morris JS, Stratton K, White E. Toenail and plasma levels as
biomarkers of selenium exposure. Ann Epidemiol. 2006;16:53-8.
232. Fleckman P. Anatomy and physiology of the nail. Dermatol Clin. 1985;3:373-81.
174
233. Hunter DJ, Morris JS, Chute CG, Kushner E, Colditz GA, Willett WC et al. Predictors
of selenium concentration in human toenails. Am J Epidemiol. 1990;132:114-22.
234. Arnaud J, Bertrais S, Roussel AM, Arnault N, Ruffieux D, Favier A et al. Serum
selenium determinants in French adults: the SU.VI.M.AX study. Brit J Nutr. 2006;95:313-
20.
235. Méplan C, Crosley LK, Nicol F, Beckett GJ, Howie AF, Hesketh JE et al. Genetic
polymorphisms in the human selenoprotein P gene determine the response of
selenoprotein markers to selenium supplementation in a gender-specific manner (the
SELGEN study). FASEB J. 2007;21:3063-74.
236. Ortega RM, Rodríguez-Rodríguez E, Aparicio A, Jiménez-Ortega AI, Palmeros C,
López-Sobaler AM et al. Young children with excess of weight show an impaired
selenium status. Int J Vitam Nutr Res. 2012;82:121-9.
237. Bleys J, Navas-Acien A, Laclaustra M, Pastor-Barriuso R, Menke A, Guallar E et al.
Serum selenium and peripheral arterial disease: results from the national health and
nutrition examination survey, 2003-2004. Am J Epidemiol. 2009;169:996-1003.
238. Karimi G, Shahar S, Homayouni N, et al (2012). Association between trace element
and heavy metal levels in hair and nail with prostate cancer. Asian Pac J Cancer Prev, 13,
4249-53.
239. Singh P, Kapil U, Shukla NK, Deo S, Dwivedi SN. Association between breast cancer
and vitamin C, vitamin E and selenium levels: results of a case-control study in India.
Asian Pac J Cancer Prev. 2005;6, 177-80.
240. Moncayo R, Kroiss A, Oberwinkler M, Karakolcu F, Starzinger M, Moncayo H et al.
The role of selenium, vitamin C, and zinc in benign thyroid diseases and of selenium in
malignant thyroid diseases: low selenium levels are found in subacute and silent
thyroiditis and in papillary and follicular carcinoma. BMC Endocr Disord. 2008;8:2.
241. Garland M, Morris JS, Rosner BA, Stampfer MJ, Spate VL, Hunter DJ et al. Toenail
trace element levels as biomarkers: reproducibility over a 6-year period. Cancer
Epidemiol Biomarkers Prev. 1993;2:493-7.
242. Cann SA, van Netten JP, van Netten C. Hypothesis: iodine, selenium and the
development of breast cancer. Cancer Cause Control. 2000;11:121-7.
243. Brauer VF, Schweizer U, Köhrle J, Paschke R. Selenium and goiter prevalence in
borderline iodine sufficiency. Eur J Endocrinol. 2006;155:807-12.
244. Köhrle J, Gärtner R. Selenium and thyroid. Best Pract Res Clin Endocrinol Metab.
2009;23:815-27.
175
245. Lloyd B, Lloyd RS, Clayton BE. Effect of smoking, alcohol and other factors on the
selenium status of a healthy population. J Epidemiol Community Health. 1983;37:213-17.
246. Meinhold CL, Ron E, Schonfeld SJ, Alexander BH, Freedman DM, Linet MS et al.
Nonradiation risk factors for thyroid cancer in the US Radiologic Technologists Study.
Am J Epidemiol. 2010;171:242-52.
247. Galanti MR, Hansson L, Bergström R, Wolk A, Hjartåker A, Lund E, Grimelius L,
Ekbom A. Diet and the risk of papillary and follicular thyroid carcinoma: a population-
based case-control study in Sweden and Norway. Cancer Causes Control 1997;8:205-14.
248. Mack WJ, Preston-Martin S, Bernstein L, Qian D. Lifestyle and other risk factors for
thyroid cancer in Los Angeles County females. Ann Epidemiol. 2002;12:395-401.
249. Daniel CR, Cross AJ, Graubard BI, Hollenbeck AR, Park Y, Sinha R. Prospective
investigation of poultry and fish intake in relation to cancer risk. Cancer Prev Res (Phila).
2011;4:1903-11.
250. Markaki I, Linos D, Linos A. The influence of dietary patterns on the development of
thyroid cancer. Eur J Cancer. 2003;39:1912-9.
251. Bandurska-Stankiewicz E, Aksamit-Białoszewska E, Rutkowska J, Stankiewicz A,
Shafie D. The effect of nutritional habits and addictions on the incidence of thyroid
carcinoma in the Olsztyn province of Poland. Endokrynol Pol. 2011;62:145-50.
252. Jung SK, Kim K, Tae K, Kong G, Kim MK. The effect of raw vegetable and fruit
intake on thyroid cancer risk among women: a case-control study in South Korea. Br J
Nutr. 2013;109:118-28.
253. Park Y, Leitzmann MF, Subar AF, Hollenbeck A, Schatzkin A. Dairy food, calcium,
and risk of cancer in the NIH-AARP Diet and Health Study. Arch Intern Med.
2009;169:391-401.
254. Takezaki T, Hirose K, Inoue M, Hamajima N, Kuroishi T, Nakamura S, Koshikawa T,
Matsuura H, Tajima K. Risk factors of thyroid cancer among women in Tokai, Japan. J
Epidemiol. 1996;6:140-7.
255. Rossing MA, Cushing KL, Voigt LF, Wicklund KG, Daling JR. Risk of papillary
thyroid cancer in women in relation to smoking and alcohol consumption. Epidemiology.
2000;11:49-54.
256. Nagano J, Mabuchi K, Yoshimoto Y, Hayashi Y, Tsuda N, Land C, Kodama K. A
case-control study in Hiroshima and Nagasaki examining nonradiation risk factors for
thyroid cancer. J Epidemiol. 2007;17:76-85.
176
257. Navarro Silvera SA, Miller AB, Rohan TE. Risk factors for thyroid cancer: a
prospective cohort study. Int J Cancer. 2005;116:433-438.
258. Allen NE, Beral V, Casabonne D, Kan SW, Reeves GK, Brown A, Green J; Million
Women Study Collaborators. Moderate alcohol intake and cancer incidence in women. J
Natl Cancer Inst. 2009;101:296-305.
259. Meinhold CL, Park Y, Stolzenberg-Solomon RZ, Hollenbeck AR, Schatzkin A,
Berrington de Gonzalez A. Alcohol intake and risk of thyroid cancer in the NIH-AARP
Diet and Health Study. Br J Cancer. 2009;101:1630-4.
260. Kabat GC, Kim MY, Wactawski-Wende J, Rohan TE. Smoking and alcohol
consumption in relation to risk of thyroid cancer in postmenopausal women. Cancer
Epidemiol. 2012;36:335-40.
177
APPENDIXES
Résumé Substantiel En Français 1
L’apport alimentaire en iode, sélénium dans les ongles, et risque du
cancer différencié de la thyroïde: Analyses d’études cas-témoins du
consortium Epi-Thyr
1.1 Contexte
Le cancer différencié de la thyroïde est un cancer à évolution lente et à bon pronostique, qui
frappe des individus relativement jeunes. On distingue 5 types histologiques de cancer de la
thyroïde: le cancer papillaire, le cancer folliculaire, le cancer peu différencié, le cancer
médullaire, et le cancer anaplastique.
L’interprétation des variations temporelles et spatiales des données d’incidence de ce cancer
rapportées dans les registres est très difficile car le facteur explicatif le plus important de ces
variations est le sur-dépistage. Il semble cependant que cette incidence soit plus élevées dans
les îles du pacifique qu’ailleurs.
Plusieurs facteurs de risque de cancer de la thyroïde ont émergé d'études épidémiologiques,
mais le seul facteur étiologique clairement démontré est exposition aux rayonnements
ionisants durant l'enfance. Par ailleurs, une histoire familiale du cancer de la thyroïde, les
facteurs anthropométriques, et la résidence dans les régions d'endémie goitreuse caractérisées
par un apport d'iode insuffisant, sont des facteurs de risque confirmés dans plusieurs études
épidémiologiques. L’apport alimentaire en iode, les perturbateurs endocriniens, l’activité
physique, un nombre élevé de grossesses, et certains facteurs génétiques, sont des facteurs de
risque potentiels du cancer de la thyroïde.
Le cancer différencié de la thyroïde est le type de cancer (hors les rares cancers « héréditaires
») dont l’héritabilité est la plus élevée, il est le seul pour lequel la contribution des facteurs
héréditaires est considéré comme plus importante que celle des facteurs environnementaux.
Selon certaines études familiales et génétiques, il s’agirait d’une transmission autosomique
dominante à pénétrance réduite. Les analyses pan-génomiques réalisées dans les populations
178
européennes depuis 2009 ont permis d’identifier un certain nombre de variants génétiques
associés au risque de cancer thyroïdien, et, récemment, d’autres variants dans des études
menées chez d’autres ethnies, de nouveaux variants ont été associés au risque de cancer de la
thyroïde. Cependant les SNPs mis en évidence dans ces GWAS, même si la signification
statistique de leur association était forte, étaient associés à des risques relatifs de cancer
différencié de la thyroïde considérés comme modérés à faibles.
L’identification des facteurs environnementaux de risque du cancer différencié de la thyroïde,
est rendu complexe du fait du sur-diagnostic important car il est très difficile de séparer les
facteurs liés à la fréquence des consultations médicales, et donc de diagnostic, des facteurs
liés à l’incidence réelle de ces cancers.
Il est établi que, dans les régions d'endémie goitreuse caractérisées par un apport d'iode
insuffisant, la fréquence des goitres et des cancers différenciés de la thyroïde de type
folliculaire est plus élevée qu'ailleurs. En revanche, l’influence de l’apport alimentaire en iode
sur le risque de cancer papillaire, forme représentant actuellement plus de 80% des cancers
différenciés de la thyroïde, dans la plupart des pays, ne fait pas l’objet d’un consensus.
Plusieurs auteurs ont affirmé qu'un apport excessif d'iode pouvait augmenter le risque de
cancer thyroïdien de type papillaire. Ceci est clairement démontré pour les goitres. Dans tous
les pays dans lesquels une supplémentation en iode a été introduite, une réduction de
l'incidence des cancers différenciés de la thyroïde a été observée pour les formes vésiculaires
et anaplastiques, mais une augmentation a été observée dans certain cas pour les formes
papillaires. Il est cependant nécessaire de faire très attention dans l'interprétation de ces
données, car, dans un grand nombre de pays, la supplémentation en iode a été initiée durant
les années 1990, c’est-à-dire durant la période de généralisation de la biopsie à l'aiguille fine,
moyen diagnostic qui a entrainé une augmentation de l'incidence observée, et probablement
un sur-diagnostic important.
Une meilleure compréhension du rôle de l’apport alimentaire en iode dans le risque de cancer
de la thyroïde, et des facteurs influençant ce rôle est un enjeu important pouvant avoir des
applications en santé publique.
Par ailleurs, le sélénium est un oligo-élément essentiel présent principalement dans les
céréales, la viande, le poisson, les œufs et les produits laitiers. De même que pour l’iode, la
teneur en sélénium d'un aliment donné dépend fortement de l'emplacement géographique où il
179
est produit. Les propriétés de protection redox du sélénium peuvent jouer un rôle important
lors de la production d'hormones thyroïdiennes. En raison de sa capacité à protéger la glande
thyroïde et à maintenir la production d'hormones thyroïdiennes, il existe une forte
concentration de sélénium dans la thyroïde, et l'approvisionnement en sélénium de la thyroïde
est prioritaire même pendant les périodes de carence en sélénium. La carence en sélénium a
été associée à un risque accru de plusieurs types de cancer, mais la relation entre le sélénium
et le cancer de la thyroïde n’avait été que très peu étudiés.
1.2 Objectifs
Les objectifs généraux de ce travail de thèse étaient d'explorer la relation entre l'apport
alimentaire en iode et le risque de cancer différencié de la thyroïde dans un ensemble d'études
cas-témoins, réalisées dans des régions d’incidence très variables, afin d'identifier les facteurs
de risque environnementaux et génétiques qui interagissent avec cette relation et d'étudier la
possibilité d'utiliser le sélénium présent dans les ongles comme biomarqueur potentiel dans
les études de cas-témoins sur le cancer de la thyroïde.
Les objectifs spécifiques étaient les suivants:
1) Estimer la relation entre des groupes d'aliments, ou l'apport alimentaire en iode, et le risque
de CDT, dans une étude de cas-témoins réalisée à Cuba.
2) Établir ou de rétablir l’apport alimentaire en iode, en énergie et en sélénium, pour les
participants de l'ensemble de 5 études cas-témoins du consortium Epi-Thyr réalisées en
Nouvelle Calédonie, en Polynésie Française, en France métropolitaine (2 études) et à Cuba,
selon les différentes tables de composition alimentaire.
3) Étudier la relation entre l’apport alimentaire en iode et le risque de CDT, ainsi d’évaluer la
possibilité d'interaction entre cet apport et 4 polymorphismes identifiés dans la plupart des
études d’association génomes entier (GWAS) comme associés au risque de CDT, dont deux
sur le gène FOXE1, un sur le gène ATM et un sur le gène NKX2-1, et d’explorer l’interaction
avec les facteurs de risque environnementaux, dans une méta-analyse sur des données
individuelles de l'ensemble des 5 études cas-témoins.
4) Évaluer la possibilité d'utiliser le sélénium présent dans les ongles comme bio-marqueur
potentiel du risque de CDT, dans l’étude cas-témoins de Polynésie française.
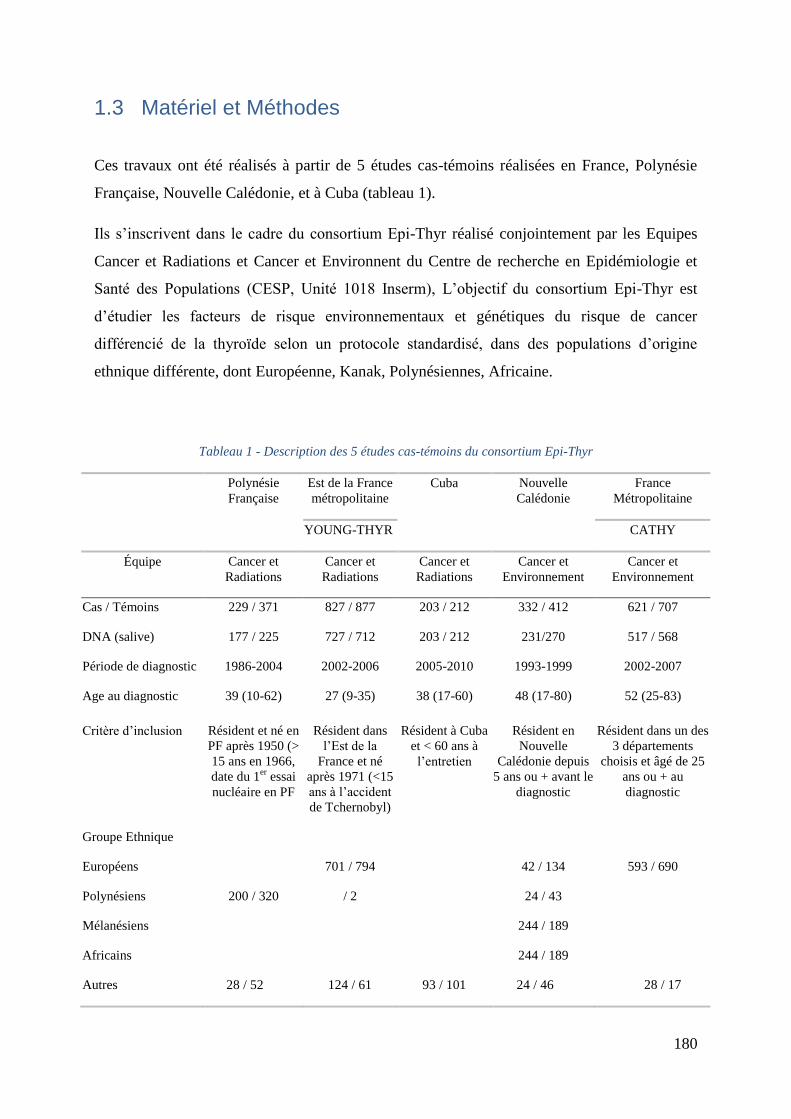
180
1.3 Matériel et Méthodes
Ces travaux ont été réalisés à partir de 5 études cas-témoins réalisées en France, Polynésie
Française, Nouvelle Calédonie, et à Cuba (tableau 1).
Ils s’inscrivent dans le cadre du consortium Epi-Thyr réalisé conjointement par les Equipes
Cancer et Radiations et Cancer et Environnent du Centre de recherche en Epidémiologie et
Santé des Populations (CESP, Unité 1018 Inserm), L’objectif du consortium Epi-Thyr est
d’étudier les facteurs de risque environnementaux et génétiques du risque de cancer
différencié de la thyroïde selon un protocole standardisé, dans des populations d’origine
ethnique différente, dont Européenne, Kanak, Polynésiennes, Africaine.
Tableau 1 - Description des 5 études cas-témoins du consortium Epi-Thyr
Polynésie
Française
Est de la France
métropolitaine
Cuba Nouvelle
Calédonie
France
Métropolitaine
YOUNG-THYR CATHY
Équipe Cancer et
Radiations
Cancer et
Radiations
Cancer et
Radiations
Cancer et
Environnement
Cancer et
Environnement
Cas / Témoins 229 / 371 827 / 877 203 / 212 332 / 412 621 / 707
DNA (salive) 177 / 225 727 / 712 203 / 212 231/270 517 / 568
Période de diagnostic 1986-2004 2002-2006 2005-2010 1993-1999 2002-2007
Age au diagnostic 39 (10-62) 27 (9-35) 38 (17-60) 48 (17-80) 52 (25-83)
Critère d’inclusion Résident et né en
PF après 1950 (>
15 ans en 1966,
date du 1er
essai
nucléaire en PF
Résident dans
l’Est de la
France et né
après 1971 (<15
ans à l’accident
de Tchernobyl)
Résident à Cuba
et < 60 ans à
l’entretien
Résident en
Nouvelle
Calédonie depuis
5 ans ou + avant le
diagnostic
Résident dans un des
3 départements
choisis et âgé de 25
ans ou + au
diagnostic
Groupe Ethnique
Européens 701 / 794 42 / 134 593 / 690
Polynésiens 200 / 320 / 2 24 / 43
Mélanésiens 244 / 189
Africains 244 / 189
Autres 28 / 52 124 / 61 93 / 101 24 / 46 28 / 17

181
Les questionnaires alimentaires de ces 5 études cas-témoins étaient dérivés de celui de l’étude
de cohorte E3N. Ils étaient donc relativement homogènes quant à leur méthodologie
(fréquence et portions basées sur des photographies). Cependant le pain, source importante
d’iode, n’avait pas été pris en compte dans les questionnaires des études réalisées à Cuba et
dans l’Est de la France (Young-Thyr).
Des mesures de l’iode, du sélénium et d’autres éléments dans les aliments traditionnels de
Polynésie Françaises et de Cuba ont été effectuées par l’ANSES (FPFCT 2013 et CFCT 2014),
à partir d’échantillons collectés par l’IRSN en Polynésie Française, et par nos partenaires à
Cuba.
Avant le début de ce travail de thèse, le rôle des facteurs alimentaires et de l’iode avait été
étudié pour les études réalisées en Polynésie Française et en Nouvelle Calédonie, mais à en
utilisant une table de composition alimentaire élaborée à partir d’aliments collectés en France
(Table Ciqual 205), et donc peu adaptée à ces régions du Pacifique. Aucune analyse de ces
facteurs n’avait encore été réalisée pour les études réalisées à Cuba et en France
métropolitaine.
Les génotypages des 4 SNPs investigués sont faites par les collaborations avec CIRC et CNG.
Par ailleurs, des mesures de l’iode, du sélénium et d’autres oligoéléments métalliques avaient
été réalisées par l’université du Québec dans les ongles des sujets de l’étude réalisée en
Polynésie Française.
1.4 Programme de travail
Chronologiquement, dans le cadre de cette thèse de doctorat, mon travail a consisté à:
1) Etudier, à partir des données de l’étude réalisée en Polynésie Française, la différence
entre la teneur en sélénium dans les ongles des mains des cas de cancer de la thyroïde
et les témoins.
2) Reconstituer à partir des données des questionnaires alimentaires, l’apport alimentaire
en iode, en sélénium, à partir de la nouvelle table de composition alimentaire des
mesures dans les aliments traditionnels cubains (CFCT 2014), et en énergie à partir
des bases de données de FAO, la table de composition alimentaire du CIQUAL pour
les autres aliments, pour les sujets de l’étude réalisée à Cuba. Ceci a nécessité
182
préalablement que j’effectue un nettoyage et des corrections importantes dans ces
questionnaires alimentaires.
3) Analyser les données alimentaires de l'étude cas-témoins réalisée à Cuba, et étudier
l’interaction avec les 4 SNPs qui avaient été génotypés.
4) Collecter et standardiser les données des questionnaires alimentaires des 5 études cas-
témoins du consortium Epi-Thyr.
5) Reconstituer à partir des données des questionnaires alimentaires, des mesures de
l’iode et du sélénium dans les aliments traditionnels polynésiens, pour les études
réalisées en Polynésie Française et en Nouvelle Calédonie, et des données de la table
de composition alimentaire du CIQUAL pour les autres aliments de ces mêmes études;
pour tous les aliments pour les études réalisées en France, l’apport alimentaire en iode
et en sélénium des cas et des témoins des 4 autres études du Consortium Epi-Thyr.
6) Etudier comment prendre en considération le fait qu’il n’y avait pas d’item Pain, dans
les questionnaires alimentaire de certaines études.
7) Analyser le rôle de l’apport alimentaire en iode dans les 5 études cas-témoins du
Consortium Epi-Thyr, et l’interaction entre ce rôle et celui des 4 SNPs génotypés dans
les 5 études, ainsi que des facteurs alimentaires.
1.5 Résultats
1.5.1 Apport alimentaire en iode et risque de cancer thyroïdien à Cuba
Le risque de DTC était plus faible chez les sujets qui avaient déclaré une consommation plus
importante de poisson (p=0,005), ce résultat restant significatif après ajustement sur les
facteurs suspectés de risque de DTC (p = 0,04). En revanche, il n’a pas été possible de mettre
en évidence de relation avec la consommation de fruit de mer (Tableau 2).
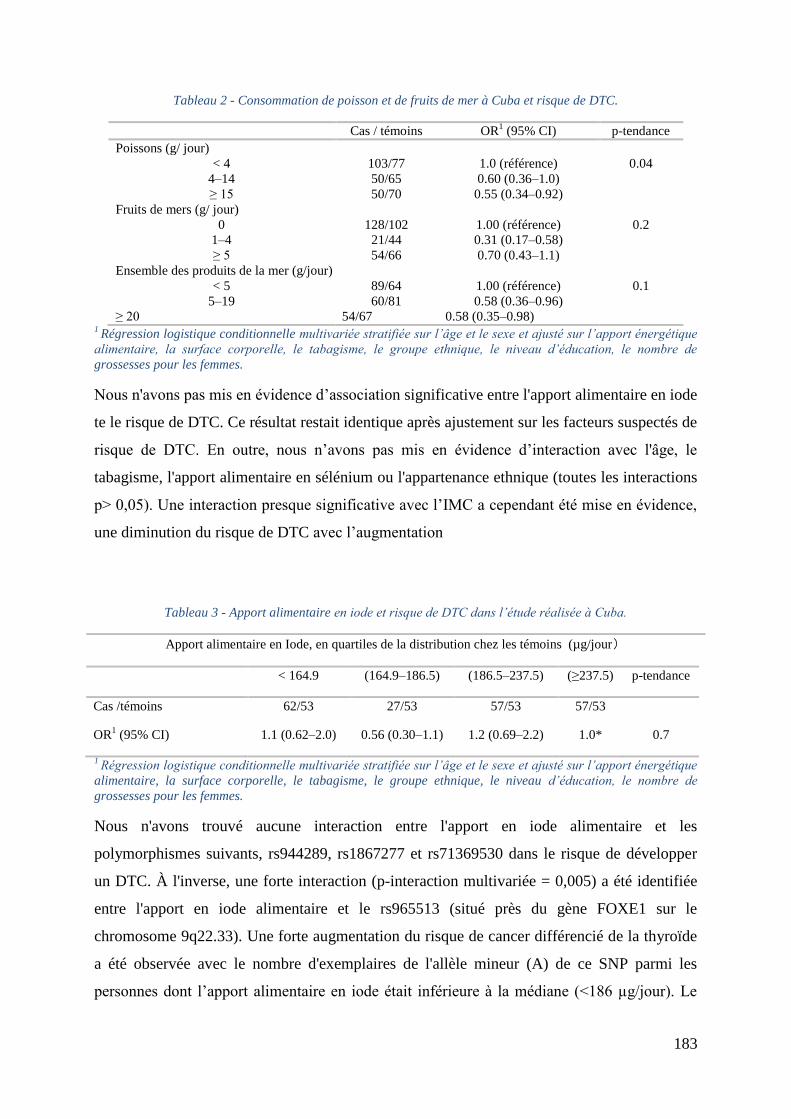
183
Tableau 2 - Consommation de poisson et de fruits de mer à Cuba et risque de DTC.
Cas / témoins OR1 (95% CI) p-tendance
Poissons (g/ jour)
< 4 103/77 1.0 (référence) 0.04
4Ŕ14 50/65 0.60 (0.36Ŕ1.0)
≥ 15 50/70 0.55 (0.34Ŕ0.92)
Fruits de mers (g/ jour)
0 128/102 1.00 (référence) 0.2
1Ŕ4 21/44 0.31 (0.17Ŕ0.58)
≥ 5 54/66 0.70 (0.43Ŕ1.1)
Ensemble des produits de la mer (g/jour)
< 5 89/64 1.00 (référence) 0.1
5Ŕ19 60/81 0.58 (0.36Ŕ0.96)
≥ 20 54/67 0.58 (0.35Ŕ0.98) 1 Régression logistique conditionnelle multivariée stratifiée sur l’âge et le sexe et ajusté sur l’apport énergétique
alimentaire, la surface corporelle, le tabagisme, le groupe ethnique, le niveau d’éducation, le nombre de
grossesses pour les femmes.
Nous n'avons pas mis en évidence d’association significative entre l'apport alimentaire en iode
te le risque de DTC. Ce résultat restait identique après ajustement sur les facteurs suspectés de
risque de DTC. En outre, nous n’avons pas mis en évidence d’interaction avec l'âge, le
tabagisme, l'apport alimentaire en sélénium ou l'appartenance ethnique (toutes les interactions
p> 0,05). Une interaction presque significative avec l’IMC a cependant été mise en évidence,
une diminution du risque de DTC avec l’augmentation
Tableau 3 - Apport alimentaire en iode et risque de DTC dans l’étude réalisée à Cuba.
Apport alimentaire en Iode, en quartiles de la distribution chez les témoins (µg/jour)
< 164.9 (164.9Ŕ186.5) (186.5Ŕ237.5) (≥237.5) p-tendance
Cas /témoins 62/53 27/53 57/53 57/53
OR1 (95% CI) 1.1 (0.62Ŕ2.0) 0.56 (0.30Ŕ1.1) 1.2 (0.69Ŕ2.2) 1.0* 0.7
1 Régression logistique conditionnelle multivariée stratifiée sur l’âge et le sexe et ajusté sur l’apport énergétique
alimentaire, la surface corporelle, le tabagisme, le groupe ethnique, le niveau d’éducation, le nombre de
grossesses pour les femmes.
Nous n'avons trouvé aucune interaction entre l'apport en iode alimentaire et les
polymorphismes suivants, rs944289, rs1867277 et rs71369530 dans le risque de développer
un DTC. À l'inverse, une forte interaction (p-interaction multivariée = 0,005) a été identifiée
entre l'apport en iode alimentaire et le rs965513 (situé près du gène FOXE1 sur le
chromosome 9q22.33). Une forte augmentation du risque de cancer différencié de la thyroïde
a été observée avec le nombre d'exemplaires de l'allèle mineur (A) de ce SNP parmi les
personnes dont l’apport alimentaire en iode était inférieure à la médiane (<186 µg/jour). Le
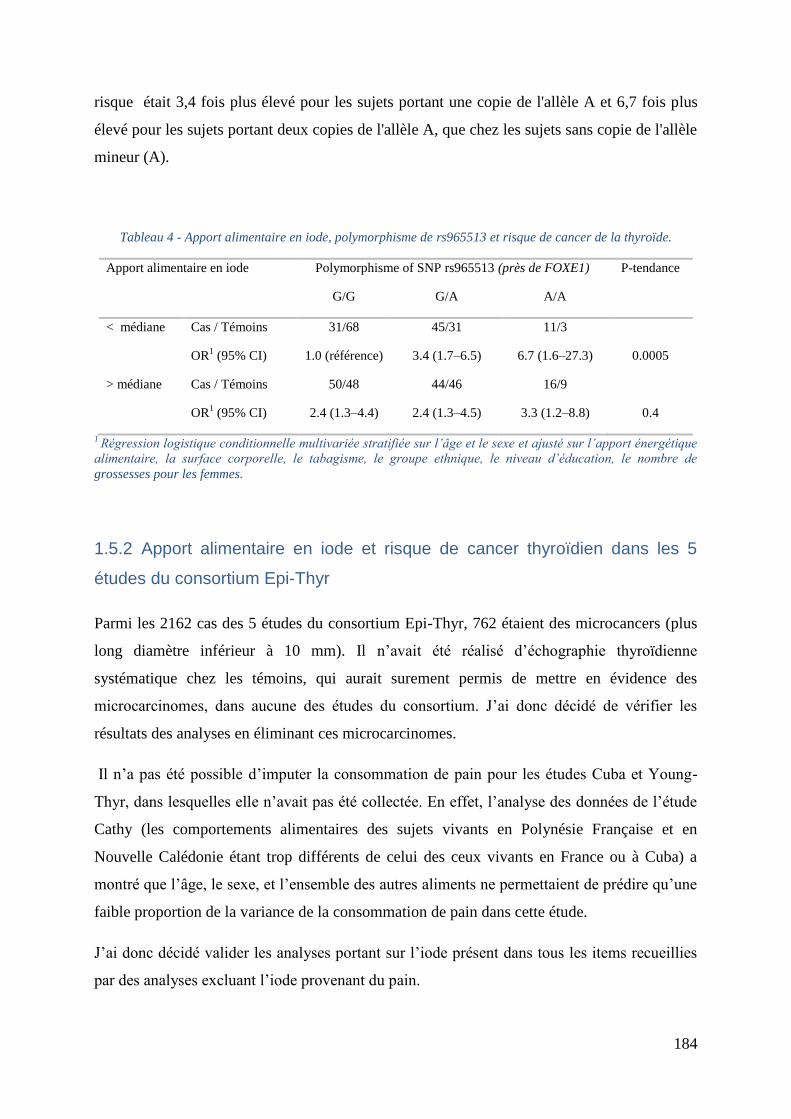
184
risque était 3,4 fois plus élevé pour les sujets portant une copie de l'allèle A et 6,7 fois plus
élevé pour les sujets portant deux copies de l'allèle A, que chez les sujets sans copie de l'allèle
mineur (A).
Tableau 4 - Apport alimentaire en iode, polymorphisme de rs965513 et risque de cancer de la thyroïde.
Apport alimentaire en iode
Polymorphisme of SNP rs965513 (près de FOXE1) P-tendance
G/G G/A A/A
< médiane Cas / Témoins 31/68 45/31 11/3
OR1 (95% CI) 1.0 (référence) 3.4 (1.7Ŕ6.5) 6.7 (1.6Ŕ27.3) 0.0005
> médiane Cas / Témoins 50/48 44/46 16/9
OR1 (95% CI) 2.4 (1.3Ŕ4.4) 2.4 (1.3Ŕ4.5) 3.3 (1.2Ŕ8.8) 0.4
1 Régression logistique conditionnelle multivariée stratifiée sur l’âge et le sexe et ajusté sur l’apport énergétique
alimentaire, la surface corporelle, le tabagisme, le groupe ethnique, le niveau d’éducation, le nombre de
grossesses pour les femmes.
1.5.2 Apport alimentaire en iode et risque de cancer thyroïdien dans les 5
études du consortium Epi-Thyr
Parmi les 2162 cas des 5 études du consortium Epi-Thyr, 762 étaient des microcancers (plus
long diamètre inférieur à 10 mm). Il n’avait été réalisé d’échographie thyroïdienne
systématique chez les témoins, qui aurait surement permis de mettre en évidence des
microcarcinomes, dans aucune des études du consortium. J’ai donc décidé de vérifier les
résultats des analyses en éliminant ces microcarcinomes.
Il n’a pas été possible d’imputer la consommation de pain pour les études Cuba et Young-
Thyr, dans lesquelles elle n’avait pas été collectée. En effet, l’analyse des données de l’étude
Cathy (les comportements alimentaires des sujets vivants en Polynésie Française et en
Nouvelle Calédonie étant trop différents de celui des ceux vivants en France ou à Cuba) a
montré que l’âge, le sexe, et l’ensemble des autres aliments ne permettaient de prédire qu’une
faible proportion de la variance de la consommation de pain dans cette étude.
J’ai donc décidé valider les analyses portant sur l’iode présent dans tous les items recueillies
par des analyses excluant l’iode provenant du pain.
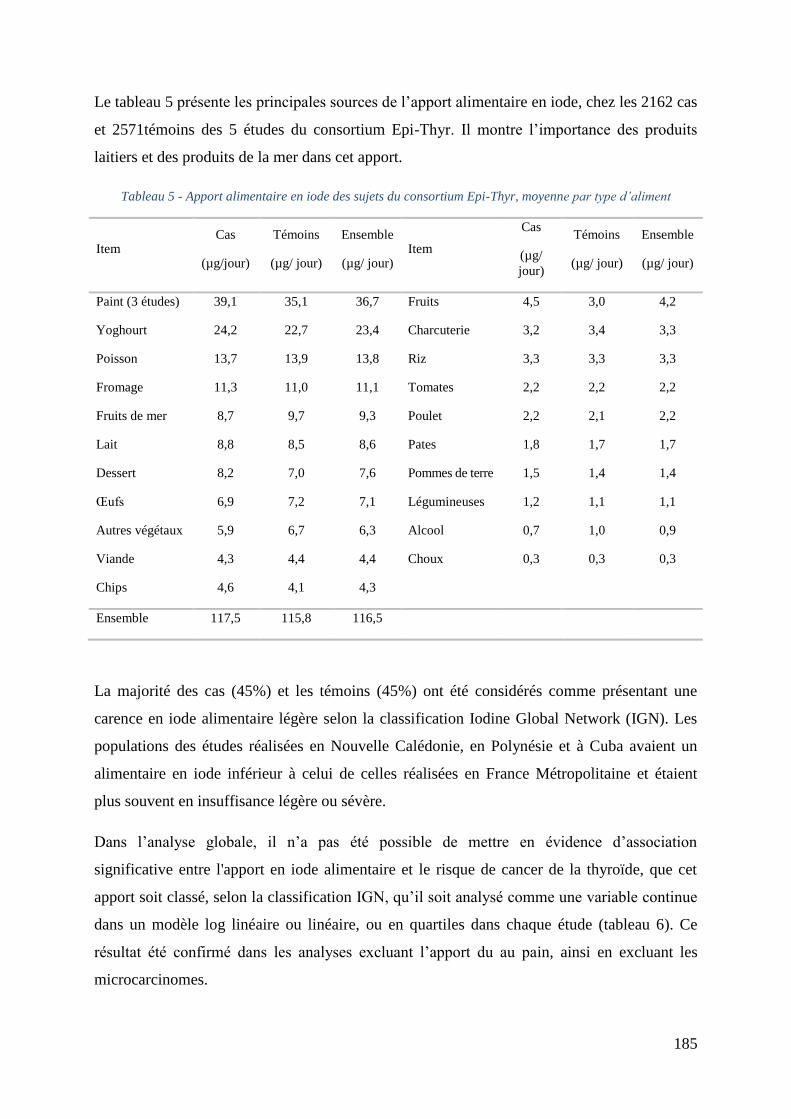
185
Le tableau 5 présente les principales sources de l’apport alimentaire en iode, chez les 2162 cas
et 2571témoins des 5 études du consortium Epi-Thyr. Il montre l’importance des produits
laitiers et des produits de la mer dans cet apport.
Tableau 5 - Apport alimentaire en iode des sujets du consortium Epi-Thyr, moyenne par type d’aliment
Item Cas
(µg/jour)
Témoins
(µg/ jour)
Ensemble
(µg/ jour) Item
Cas
(µg/
jour)
Témoins
(µg/ jour)
Ensemble
(µg/ jour)
Paint (3 études) 39,1 35,1 36,7 Fruits 4,5 3,0 4,2
Yoghourt 24,2 22,7 23,4 Charcuterie 3,2 3,4 3,3
Poisson 13,7 13,9 13,8 Riz 3,3 3,3 3,3
Fromage 11,3 11,0 11,1 Tomates 2,2 2,2 2,2
Fruits de mer 8,7 9,7 9,3 Poulet 2,2 2,1 2,2
Lait 8,8 8,5 8,6 Pates 1,8 1,7 1,7
Dessert 8,2 7,0 7,6 Pommes de terre 1,5 1,4 1,4
Œufs 6,9 7,2 7,1 Légumineuses 1,2 1,1 1,1
Autres végétaux 5,9 6,7 6,3 Alcool 0,7 1,0 0,9
Viande 4,3 4,4 4,4 Choux 0,3 0,3 0,3
Chips 4,6 4,1 4,3
Ensemble 117,5 115,8 116,5
La majorité des cas (45%) et les témoins (45%) ont été considérés comme présentant une
carence en iode alimentaire légère selon la classification Iodine Global Network (IGN). Les
populations des études réalisées en Nouvelle Calédonie, en Polynésie et à Cuba avaient un
alimentaire en iode inférieur à celui de celles réalisées en France Métropolitaine et étaient
plus souvent en insuffisance légère ou sévère.
Dans l’analyse globale, il n’a pas été possible de mettre en évidence d’association
significative entre l'apport en iode alimentaire et le risque de cancer de la thyroïde, que cet
apport soit classé, selon la classification IGN, qu’il soit analysé comme une variable continue
dans un modèle log linéaire ou linéaire, ou en quartiles dans chaque étude (tableau 6). Ce
résultat été confirmé dans les analyses excluant l’apport du au pain, ainsi en excluant les
microcarcinomes.
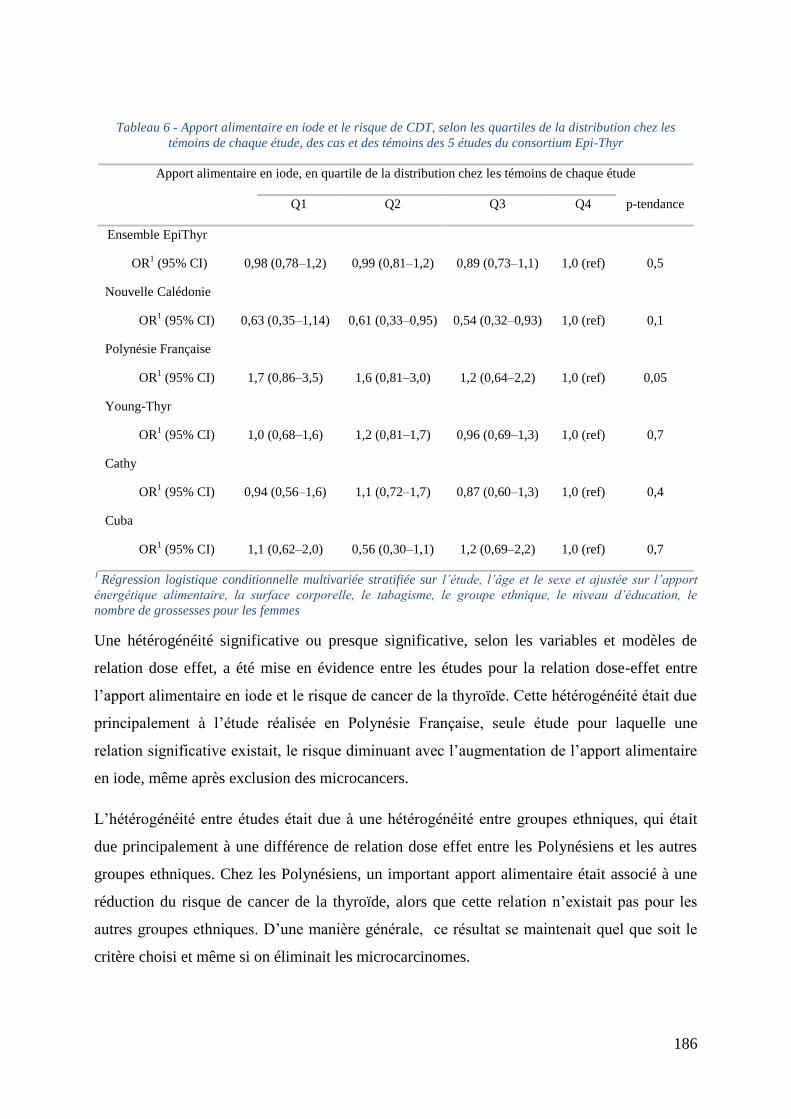
186
Tableau 6 - Apport alimentaire en iode et le risque de CDT, selon les quartiles de la distribution chez les
témoins de chaque étude, des cas et des témoins des 5 études du consortium Epi-Thyr
Apport alimentaire en iode, en quartile de la distribution chez les témoins de chaque étude
Q1 Q2 Q3 Q4 p-tendance
Ensemble EpiThyr
OR1 (95% CI) 0,98 (0,78Ŕ1,2) 0,99 (0,81Ŕ1,2) 0,89 (0,73Ŕ1,1) 1,0 (ref) 0,5
Nouvelle Calédonie
OR1 (95% CI) 0,63 (0,35Ŕ1,14) 0,61 (0,33Ŕ0,95) 0,54 (0,32Ŕ0,93) 1,0 (ref) 0,1
Polynésie Française
OR1 (95% CI) 1,7 (0,86Ŕ3,5) 1,6 (0,81Ŕ3,0) 1,2 (0,64Ŕ2,2) 1,0 (ref) 0,05
Young-Thyr
OR1 (95% CI) 1,0 (0,68Ŕ1,6) 1,2 (0,81Ŕ1,7) 0,96 (0,69Ŕ1,3) 1,0 (ref) 0,7
Cathy
OR1 (95% CI) 0,94 (0,56Ŕ1,6) 1,1 (0,72Ŕ1,7) 0,87 (0,60Ŕ1,3) 1,0 (ref) 0,4
Cuba
OR1 (95% CI) 1,1 (0,62Ŕ2,0) 0,56 (0,30Ŕ1,1) 1,2 (0,69Ŕ2,2) 1,0 (ref) 0,7
1 Régression logistique conditionnelle multivariée stratifiée sur l’étude, l’âge et le sexe et ajustée sur l’apport
énergétique alimentaire, la surface corporelle, le tabagisme, le groupe ethnique, le niveau d’éducation, le
nombre de grossesses pour les femmes
Une hétérogénéité significative ou presque significative, selon les variables et modèles de
relation dose effet, a été mise en évidence entre les études pour la relation dose-effet entre
l’apport alimentaire en iode et le risque de cancer de la thyroïde. Cette hétérogénéité était due
principalement à l’étude réalisée en Polynésie Française, seule étude pour laquelle une
relation significative existait, le risque diminuant avec l’augmentation de l’apport alimentaire
en iode, même après exclusion des microcancers.
L’hétérogénéité entre études était due à une hétérogénéité entre groupes ethniques, qui était
due principalement à une différence de relation dose effet entre les Polynésiens et les autres
groupes ethniques. Chez les Polynésiens, un important apport alimentaire était associé à une
réduction du risque de cancer de la thyroïde, alors que cette relation n’existait pas pour les
autres groupes ethniques. D’une manière générale, ce résultat se maintenait quel que soit le
critère choisi et même si on éliminait les microcarcinomes.
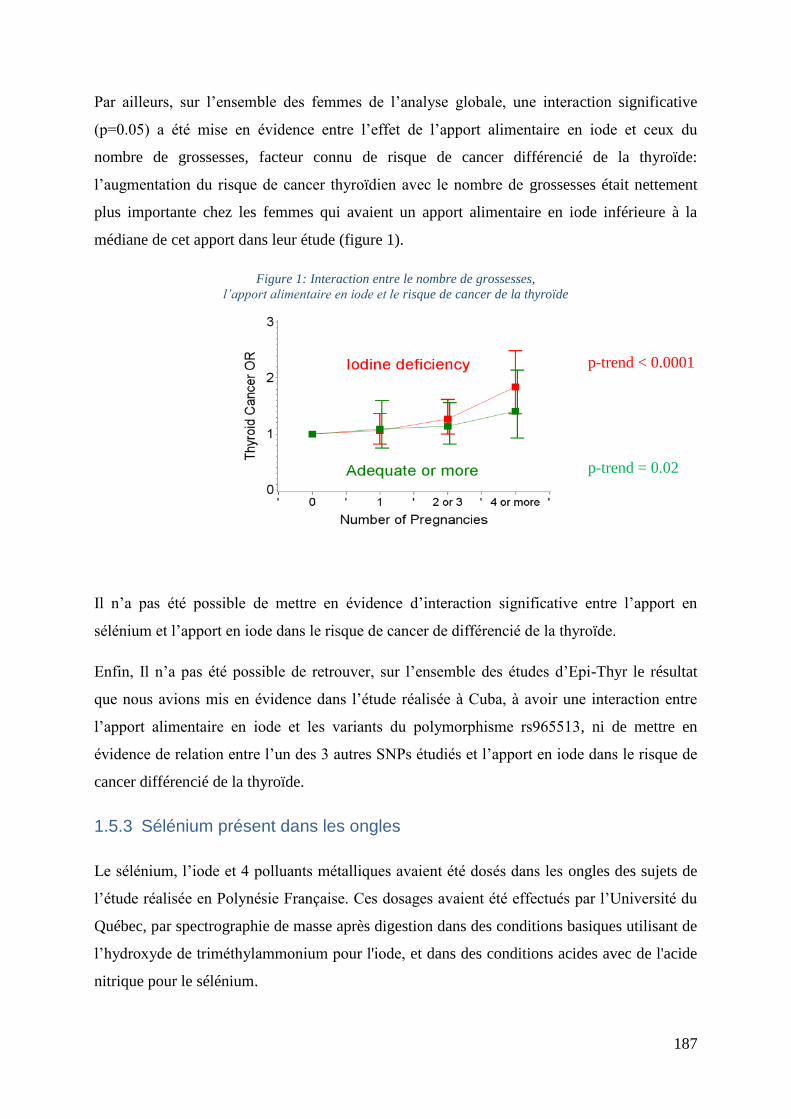
187
Par ailleurs, sur l’ensemble des femmes de l’analyse globale, une interaction significative
(p=0.05) a été mise en évidence entre l’effet de l’apport alimentaire en iode et ceux du
nombre de grossesses, facteur connu de risque de cancer différencié de la thyroïde:
l’augmentation du risque de cancer thyroïdien avec le nombre de grossesses était nettement
plus importante chez les femmes qui avaient un apport alimentaire en iode inférieure à la
médiane de cet apport dans leur étude (figure 1).
Figure 1: Interaction entre le nombre de grossesses,
l’apport alimentaire en iode et le risque de cancer de la thyroïde
Il n’a pas été possible de mettre en évidence d’interaction significative entre l’apport en
sélénium et l’apport en iode dans le risque de cancer de différencié de la thyroïde.
Enfin, Il n’a pas été possible de retrouver, sur l’ensemble des études d’Epi-Thyr le résultat
que nous avions mis en évidence dans l’étude réalisée à Cuba, à avoir une interaction entre
l’apport alimentaire en iode et les variants du polymorphisme rs965513, ni de mettre en
évidence de relation entre l’un des 3 autres SNPs étudiés et l’apport en iode dans le risque de
cancer différencié de la thyroïde.
1.5.3 Sélénium présent dans les ongles
Le sélénium, l’iode et 4 polluants métalliques avaient été dosés dans les ongles des sujets de
l’étude réalisée en Polynésie Française. Ces dosages avaient été effectués par l’Université du
Québec, par spectrographie de masse après digestion dans des conditions basiques utilisant de
l’hydroxyde de triméthylammonium pour l'iode, et dans des conditions acides avec de l'acide
nitrique pour le sélénium.
p-trend < 0.0001
p-trend = 0.02
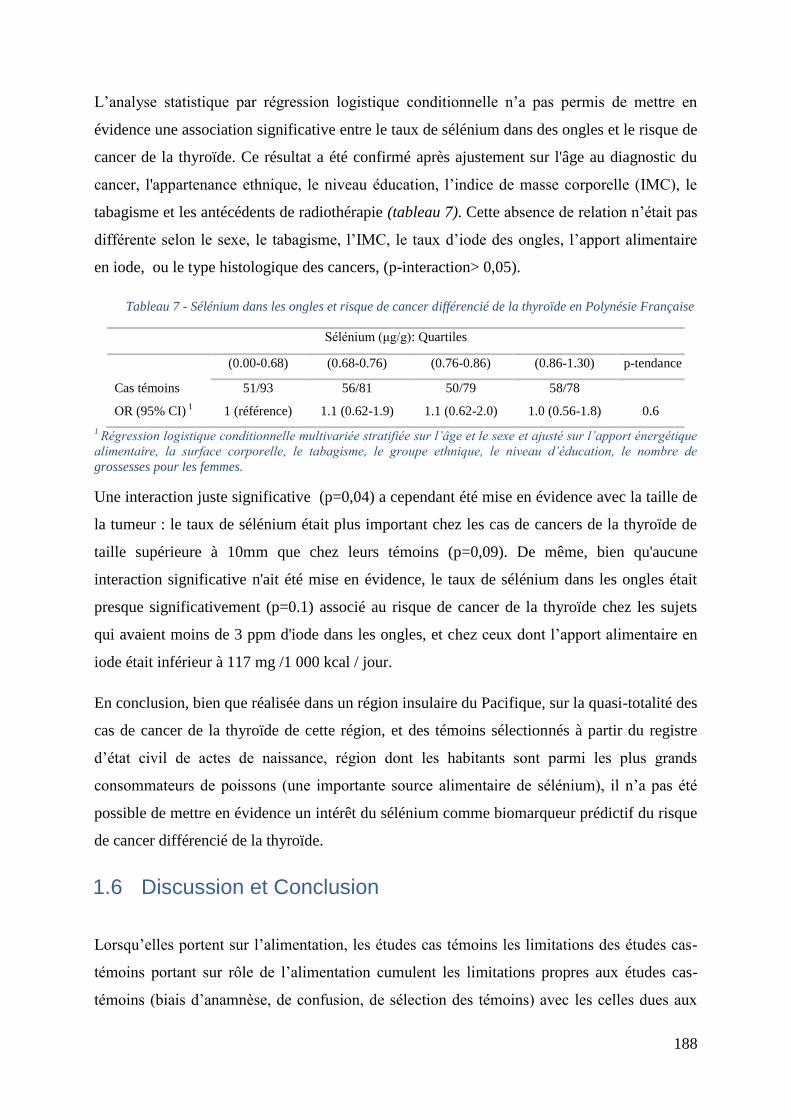
188
L’analyse statistique par régression logistique conditionnelle n’a pas permis de mettre en
évidence une association significative entre le taux de sélénium dans des ongles et le risque de
cancer de la thyroïde. Ce résultat a été confirmé après ajustement sur l'âge au diagnostic du
cancer, l'appartenance ethnique, le niveau éducation, l’indice de masse corporelle (IMC), le
tabagisme et les antécédents de radiothérapie (tableau 7). Cette absence de relation n’était pas
différente selon le sexe, le tabagisme, l’IMC, le taux d’iode des ongles, l’apport alimentaire
en iode, ou le type histologique des cancers, (p-interaction> 0,05).
Tableau 7 - Sélénium dans les ongles et risque de cancer différencié de la thyroïde en Polynésie Française
Sélénium (μg/g): Quartiles
(0.00-0.68) (0.68-0.76) (0.76-0.86) (0.86-1.30) p-tendance
Cas témoins 51/93 56/81 50/79 58/78
OR (95% CI) 1 1 (référence) 1.1 (0.62-1.9) 1.1 (0.62-2.0) 1.0 (0.56-1.8) 0.6
1 Régression logistique conditionnelle multivariée stratifiée sur l’âge et le sexe et ajusté sur l’apport énergétique
alimentaire, la surface corporelle, le tabagisme, le groupe ethnique, le niveau d’éducation, le nombre de
grossesses pour les femmes.
Une interaction juste significative (p=0,04) a cependant été mise en évidence avec la taille de
la tumeur : le taux de sélénium était plus important chez les cas de cancers de la thyroïde de
taille supérieure à 10mm que chez leurs témoins (p=0,09). De même, bien qu'aucune
interaction significative n'ait été mise en évidence, le taux de sélénium dans les ongles était
presque significativement (p=0.1) associé au risque de cancer de la thyroïde chez les sujets
qui avaient moins de 3 ppm d'iode dans les ongles, et chez ceux dont l’apport alimentaire en
iode était inférieur à 117 mg /1 000 kcal / jour.
En conclusion, bien que réalisée dans un région insulaire du Pacifique, sur la quasi-totalité des
cas de cancer de la thyroïde de cette région, et des témoins sélectionnés à partir du registre
d’état civil de actes de naissance, région dont les habitants sont parmi les plus grands
consommateurs de poissons (une importante source alimentaire de sélénium), il n’a pas été
possible de mettre en évidence un intérêt du sélénium comme biomarqueur prédictif du risque
de cancer différencié de la thyroïde.
1.6 Discussion et Conclusion
Lorsqu’elles portent sur l’alimentation, les études cas témoins les limitations des études cas-
témoins portant sur rôle de l’alimentation cumulent les limitations propres aux études cas-
témoins (biais d’anamnèse, de confusion, de sélection des témoins) avec les celles dues aux
189
imprécisions des réponses aux questionnaires alimentaires. Concernant l’étude de la relation
entre l’apport d’iode et en sélénium d’origine alimentaire et le risque de cancer de la thyroïde,
une autre source d’incertitude s’ajoute, celle autours de la valeur de la teneur en iode des
aliments, qui peut être très variable, pour un même aliment.
Cependant, 3 des études cas-témoins du consortium avaient été réalisées dans des régions où
l’alimentation n’est pas très variée, soit à cause de l’importance que continue à y avoir
l’alimentation traditionnelle (Polynésie Française et Nouvelle Calédonie), soit à cause d’un
niveau de vie très bas et d’un isolement du à un embargo (Cuba). De plus des mesures de
l’iode présent dans l’alimentation traditionnelle en Polynésie Française et à Cuba,
spécialement réalisée à cet effet.
Ces particularités étaient une des motivations lors du choix de ce sujet de thèse, outre son
intérêt majeur en santé publique.
D’une manière générale, ce travail n’a pas permis de mettre en évidence de relation entre
l’apport en iode d’origine alimentaire et le risque de cancer de la thyroïde, ni d’interaction
avec l’apport alimentaire en sélénium, ni d’utilisation possible du sélénium dans les ongles
comme biomarqueur prédictif du risque de cancer de la thyroïde. Il n’a pas non plus permis de
mettre évidence d’interaction entre les 4 polymorphismes choisis et l’apport alimentaire en
iode, à l’exception de rs965513 dans la population cubaine.
L’interprétation du résultat concernant la différence observée entre les Polynésiens, chez
lesquels un apport alimentaire en iode était associé à une réduction risque de cancer de la
thyroïde, et les autres groupes ethniques, chez lesquels une telle relation n’a pas observée, est
compliquée. En effet, même si l’apport alimentaire en iode des Polynésiens est légèrement ou
modérément insuffisant, cela est vrai aussi des Mélanésiens vivant en Nouvelle Calédonie,
chez lesquels ce phénomène n’a pas été observé.
Le résultat concernant le risque associé au nombre de grossesse élevée chez les femmes ayant
un apport alimentaire insuffisant en iode pourrait être important en santé publique. Etant
donné l’importante de l’iode dans le développement du fœtus, il est certain que les femmes
qui ont un grand nombre de grossesse ont un état thyroïdien plus surveillé que les autres, et
que ceci explique en partie l’association observée dans la plupart des études entre le nombre
de grossesses et le risque de cancer différencié de la thyroïde. Il ne s’agit probablement pas de
la seule explication car, par exemple, Epi-Thyr, cette relation reste très significative (p<0.001),
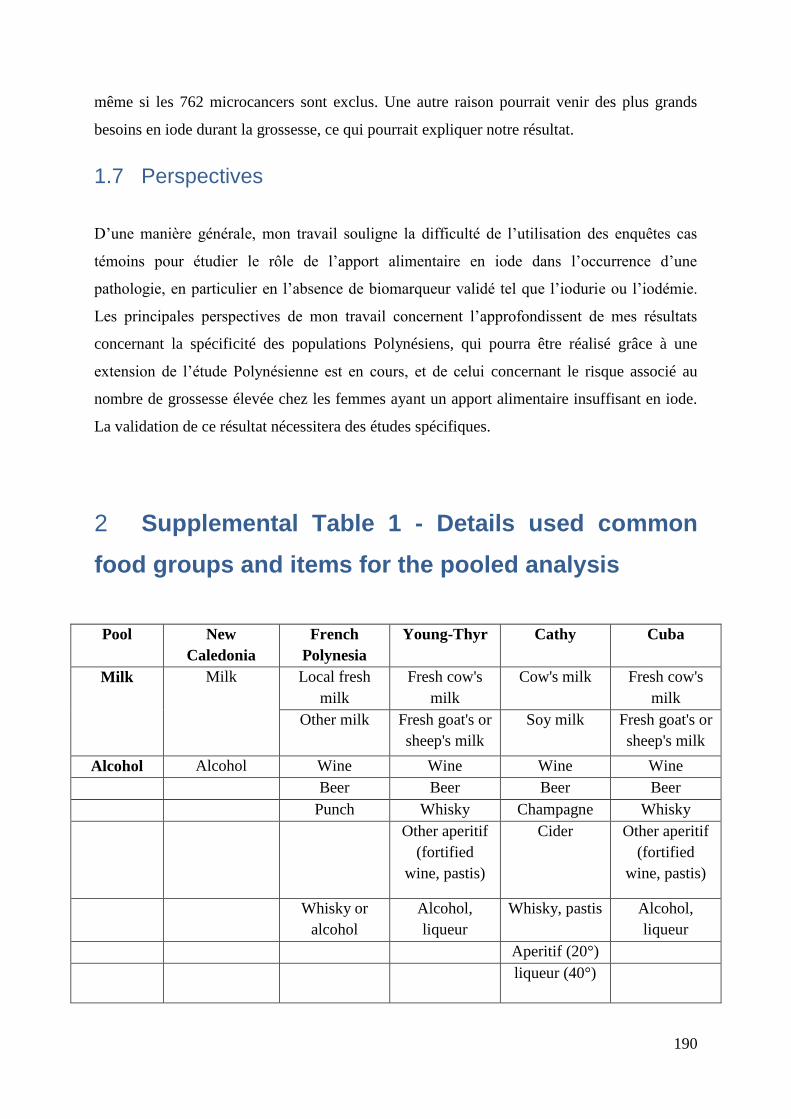
190
même si les 762 microcancers sont exclus. Une autre raison pourrait venir des plus grands
besoins en iode durant la grossesse, ce qui pourrait expliquer notre résultat.
1.7 Perspectives
D’une manière générale, mon travail souligne la difficulté de l’utilisation des enquêtes cas
témoins pour étudier le rôle de l’apport alimentaire en iode dans l’occurrence d’une
pathologie, en particulier en l’absence de biomarqueur validé tel que l’iodurie ou l’iodémie.
Les principales perspectives de mon travail concernent l’approfondissent de mes résultats
concernant la spécificité des populations Polynésiens, qui pourra être réalisé grâce à une
extension de l’étude Polynésienne est en cours, et de celui concernant le risque associé au
nombre de grossesse élevée chez les femmes ayant un apport alimentaire insuffisant en iode.
La validation de ce résultat nécessitera des études spécifiques.
Supplemental Table 1 - Details used common 2
food groups and items for the pooled analysis
Pool New
Caledonia
French
Polynesia
Young-Thyr Cathy Cuba
Milk Milk Local fresh
milk
Fresh cow's
milk
Cow's milk Fresh cow's
milk
Other milk Fresh goat's or
sheep's milk
Soy milk Fresh goat's or
sheep's milk
Alcohol Alcohol Wine Wine Wine Wine
Beer Beer Beer Beer
Punch Whisky Champagne Whisky
Other aperitif
(fortified
wine, pastis)
Cider Other aperitif
(fortified
wine, pastis)
Whisky or
alcohol
Alcohol,
liqueur
Whisky, pastis Alcohol,
liqueur
Aperitif (20°)
liqueur (40°)
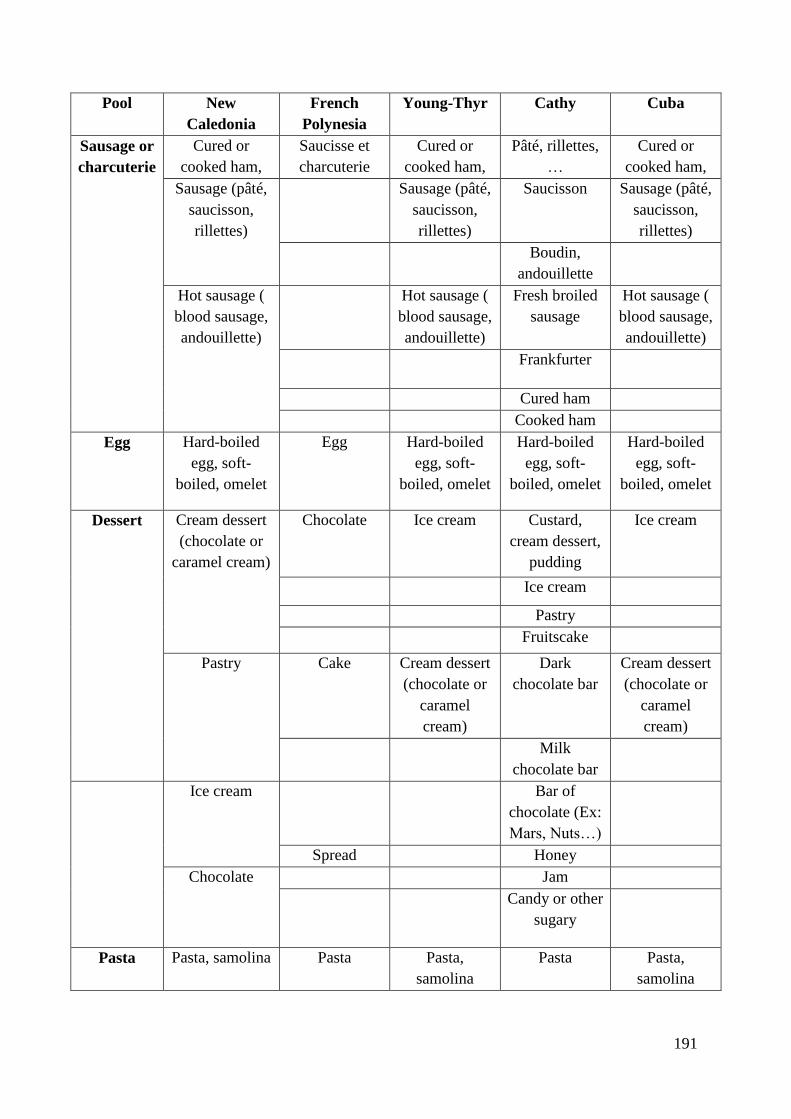
191
Pool New
Caledonia
French
Polynesia
Young-Thyr Cathy Cuba
Sausage or
charcuterie
Cured or
cooked ham,
Saucisse et
charcuterie
Cured or
cooked ham,
Pâté, rillettes,
…
Cured or
cooked ham,
Sausage (pâté,
saucisson,
rillettes)
Sausage (pâté,
saucisson,
rillettes)
Saucisson Sausage (pâté,
saucisson,
rillettes)
Boudin,
andouillette
Hot sausage (
blood sausage,
andouillette)
Hot sausage (
blood sausage,
andouillette)
Fresh broiled
sausage
Hot sausage (
blood sausage,
andouillette)
Frankfurter
Cured ham
Cooked ham
Egg Hard-boiled
egg, soft-
boiled, omelet
Egg Hard-boiled
egg, soft-
boiled, omelet
Hard-boiled
egg, soft-
boiled, omelet
Hard-boiled
egg, soft-
boiled, omelet
Dessert Cream dessert
(chocolate or
caramel cream)
Chocolate Ice cream Custard,
cream dessert,
pudding
Ice cream
Ice cream
Pastry
Fruitscake
Pastry Cake Cream dessert
(chocolate or
caramel
cream)
Dark
chocolate bar
Cream dessert
(chocolate or
caramel
cream)
Milk
chocolate bar
Ice cream Bar of
chocolate (Ex:
Mars, Nuts…)
Spread Honey
Chocolate Jam
Candy or other
sugary
Pasta Pasta, samolina Pasta Pasta,
samolina
Pasta Pasta,
samolina
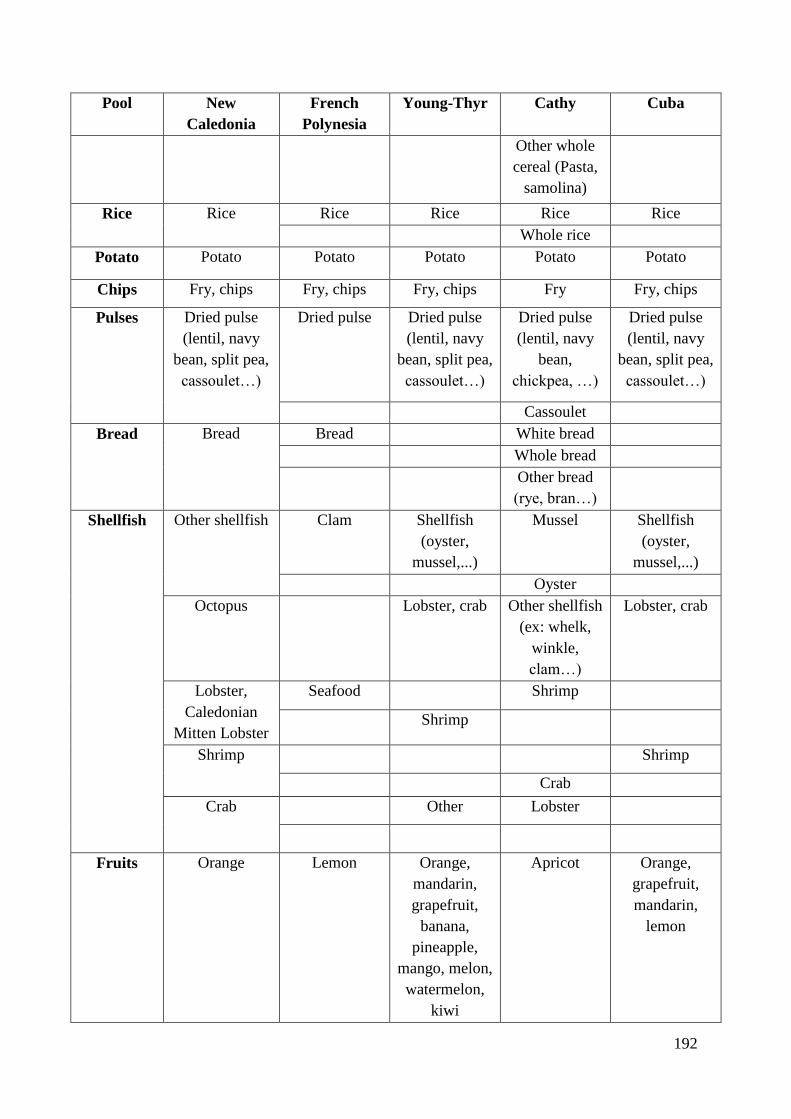
192
Pool New
Caledonia
French
Polynesia
Young-Thyr Cathy Cuba
Other whole
cereal (Pasta,
samolina)
Rice Rice Rice Rice Rice Rice
Whole rice
Potato Potato Potato Potato Potato Potato
Chips Fry, chips Fry, chips Fry, chips Fry Fry, chips
Pulses Dried pulse
(lentil, navy
bean, split pea,
cassoulet…)
Dried pulse Dried pulse
(lentil, navy
bean, split pea,
cassoulet…)
Dried pulse
(lentil, navy
bean,
chickpea, …)
Dried pulse
(lentil, navy
bean, split pea,
cassoulet…)
Cassoulet
Bread Bread Bread White bread
Whole bread
Other bread
(rye, bran…)
Shellfish Other shellfish Clam Shellfish
(oyster,
mussel,...)
Mussel Shellfish
(oyster,
mussel,...)
Oyster
Octopus Lobster, crab Other shellfish
(ex: whelk,
winkle,
clam…)
Lobster, crab
Lobster,
Caledonian
Mitten Lobster
Seafood Shrimp
Shrimp
Shrimp Shrimp
Crab
Crab Other Lobster
Fruits Orange Lemon Orange,
mandarin,
grapefruit,
banana,
pineapple,
mango, melon,
watermelon,
kiwi
Apricot Orange,
grapefruit,
mandarin,
lemon
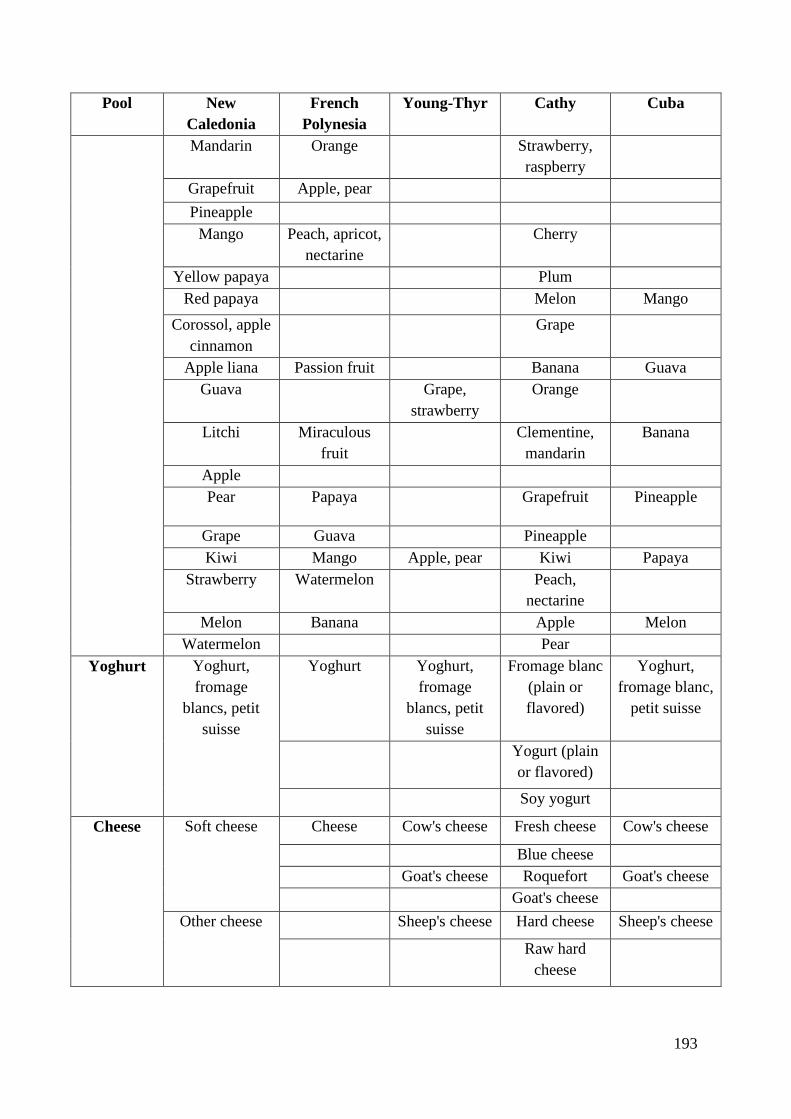
193
Pool New
Caledonia
French
Polynesia
Young-Thyr Cathy Cuba
Mandarin Orange Strawberry,
raspberry
Grapefruit Apple, pear
Pineapple
Mango Peach, apricot,
nectarine
Cherry
Yellow papaya Plum
Red papaya Melon Mango
Corossol, apple
cinnamon
Grape
Apple liana Passion fruit Banana Guava
Guava Grape,
strawberry
Orange
Litchi Miraculous
fruit
Clementine,
mandarin
Banana
Apple
Pear Papaya Grapefruit Pineapple
Grape Guava Pineapple
Kiwi Mango Apple, pear Kiwi Papaya
Strawberry Watermelon Peach,
nectarine
Melon Banana Apple Melon
Watermelon Pear
Yoghurt Yoghurt,
fromage
blancs, petit
suisse
Yoghurt Yoghurt,
fromage
blancs, petit
suisse
Fromage blanc
(plain or
flavored)
Yoghurt,
fromage blanc,
petit suisse
Yogurt (plain
or flavored)
Soy yogurt
Cheese Soft cheese Cheese Cow's cheese Fresh cheese Cow's cheese
Blue cheese
Goat's cheese Roquefort Goat's cheese
Goat's cheese
Other cheese Sheep's cheese Hard cheese Sheep's cheese
Raw hard
cheese
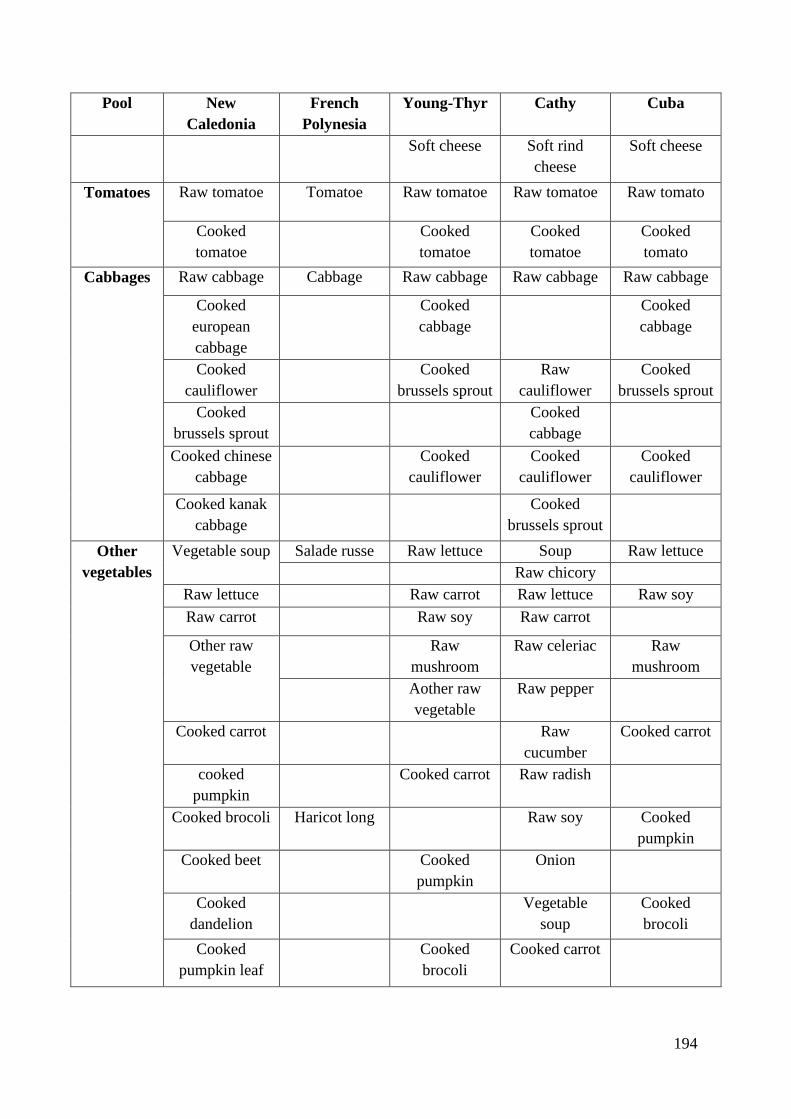
194
Pool New
Caledonia
French
Polynesia
Young-Thyr Cathy Cuba
Soft cheese Soft rind
cheese
Soft cheese
Tomatoes Raw tomatoe Tomatoe Raw tomatoe Raw tomatoe Raw tomato
Cooked
tomatoe
Cooked
tomatoe
Cooked
tomatoe
Cooked
tomato
Cabbages Raw cabbage Cabbage Raw cabbage Raw cabbage Raw cabbage
Cooked
european
cabbage
Cooked
cabbage
Cooked
cabbage
Cooked
cauliflower
Cooked
brussels sprout
Raw
cauliflower
Cooked
brussels sprout
Cooked
brussels sprout
Cooked
cabbage
Cooked chinese
cabbage
Cooked
cauliflower
Cooked
cauliflower
Cooked
cauliflower
Cooked kanak
cabbage
Cooked
brussels sprout
Other
vegetables
Vegetable soup Salade russe Raw lettuce Soup Raw lettuce
Raw chicory
Raw lettuce Raw carrot Raw lettuce Raw soy
Raw carrot Raw soy Raw carrot
Other raw
vegetable
Raw
mushroom
Raw celeriac Raw
mushroom
Aother raw
vegetable
Raw pepper
Cooked carrot Raw
cucumber
Cooked carrot
cooked
pumpkin
Cooked carrot Raw radish
Cooked brocoli Haricot long Raw soy Cooked
pumpkin
Cooked beet Cooked
pumpkin
Onion
Cooked
dandelion
Vegetable
soup
Cooked
brocoli
Cooked
pumpkin leaf
Cooked
brocoli
Cooked carrot
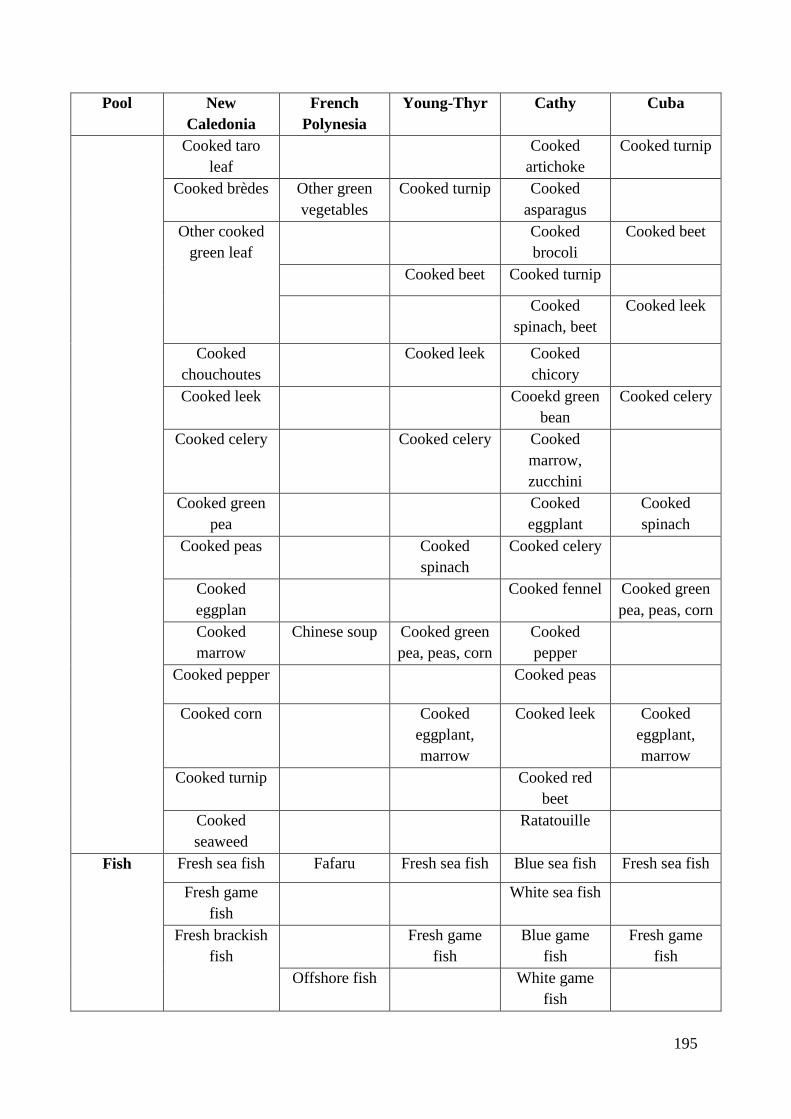
195
Pool New
Caledonia
French
Polynesia
Young-Thyr Cathy Cuba
Cooked taro
leaf
Cooked
artichoke
Cooked turnip
Cooked brèdes Other green
vegetables
Cooked turnip Cooked
asparagus
Other cooked
green leaf
Cooked
brocoli
Cooked beet
Cooked beet Cooked turnip
Cooked
spinach, beet
Cooked leek
Cooked
chouchoutes
Cooked leek Cooked
chicory
Cooked leek Cooekd green
bean
Cooked celery
Cooked celery Cooked celery Cooked
marrow,
zucchini
Cooked green
pea
Cooked
eggplant
Cooked
spinach
Cooked peas Cooked
spinach
Cooked celery
Cooked
eggplan
Cooked fennel Cooked green
pea, peas, corn
Cooked
marrow
Chinese soup Cooked green
pea, peas, corn
Cooked
pepper
Cooked pepper Cooked peas
Cooked corn Cooked
eggplant,
marrow
Cooked leek Cooked
eggplant,
marrow
Cooked turnip Cooked red
beet
Cooked
seaweed
Ratatouille
Fish Fresh sea fish Fafaru Fresh sea fish Blue sea fish Fresh sea fish
Fresh game
fish
White sea fish
Fresh brackish
fish
Fresh game
fish
Blue game
fish
Fresh game
fish
Offshore fish White game
fish
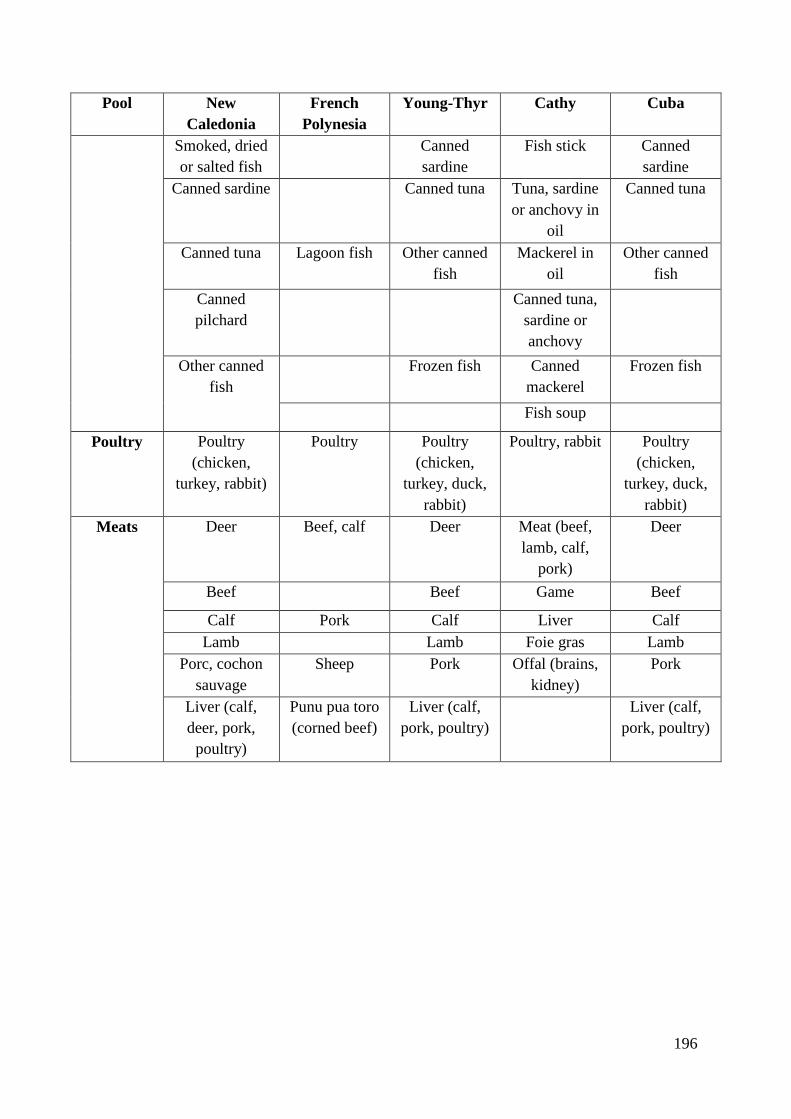
196
Pool New
Caledonia
French
Polynesia
Young-Thyr Cathy Cuba
Smoked, dried
or salted fish
Canned
sardine
Fish stick Canned
sardine
Canned sardine Canned tuna Tuna, sardine
or anchovy in
oil
Canned tuna
Canned tuna Lagoon fish Other canned
fish
Mackerel in
oil
Other canned
fish
Canned
pilchard
Canned tuna,
sardine or
anchovy
Other canned
fish
Frozen fish Canned
mackerel
Frozen fish
Fish soup
Poultry Poultry
(chicken,
turkey, rabbit)
Poultry Poultry
(chicken,
turkey, duck,
rabbit)
Poultry, rabbit Poultry
(chicken,
turkey, duck,
rabbit)
Meats Deer Beef, calf Deer Meat (beef,
lamb, calf,
pork)
Deer
Beef Beef Game Beef
Calf Pork Calf Liver Calf
Lamb Lamb Foie gras Lamb
Porc, cochon
sauvage
Sheep Pork Offal (brains,
kidney)
Pork
Liver (calf,
deer, pork,
poultry)
Punu pua toro
(corned beef)
Liver (calf,
pork, poultry)
Liver (calf,
pork, poultry)
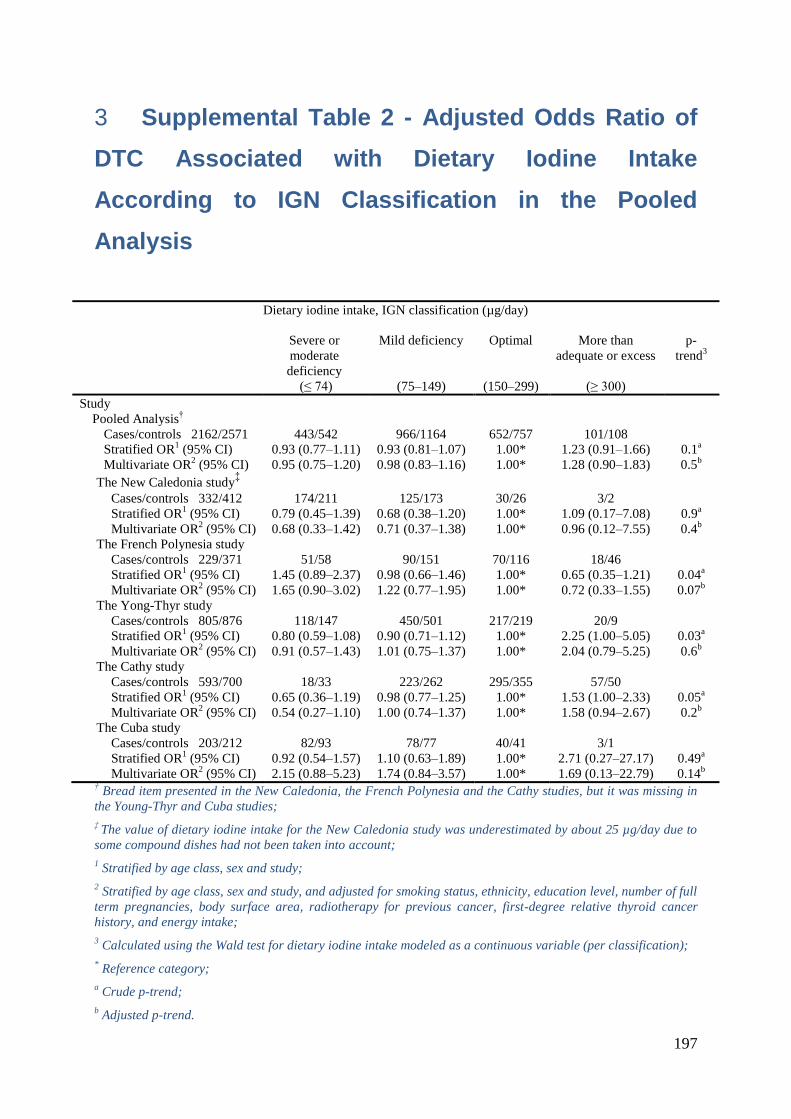
197
Supplemental Table 2 - Adjusted Odds Ratio of 3
DTC Associated with Dietary Iodine Intake
According to IGN Classification in the Pooled
Analysis
Dietary iodine intake, IGN classification (µg/day)
Severe or
moderate
deficiency
Mild deficiency Optimal More than
adequate or excess
p-
trend3
(≤ 74) (75Ŕ149) (150Ŕ299) (≥ 300)
Study
Pooled Analysis†
Cases/controls 2162/2571 443/542 966/1164 652/757 101/108
Stratified OR1 (95% CI) 0.93 (0.77Ŕ1.11) 0.93 (0.81Ŕ1.07) 1.00* 1.23 (0.91Ŕ1.66) 0.1
a
Multivariate OR2 (95% CI) 0.95 (0.75Ŕ1.20) 0.98 (0.83Ŕ1.16) 1.00* 1.28 (0.90Ŕ1.83) 0.5
b
The New Caledonia study‡
Cases/controls 332/412 174/211 125/173 30/26 3/2
Stratified OR1 (95% CI) 0.79 (0.45Ŕ1.39) 0.68 (0.38Ŕ1.20) 1.00* 1.09 (0.17Ŕ7.08) 0.9
a
Multivariate OR2 (95% CI) 0.68 (0.33Ŕ1.42) 0.71 (0.37Ŕ1.38) 1.00* 0.96 (0.12Ŕ7.55) 0.4
b
The French Polynesia study
Cases/controls 229/371 51/58 90/151 70/116 18/46
Stratified OR1 (95% CI) 1.45 (0.89Ŕ2.37) 0.98 (0.66Ŕ1.46) 1.00* 0.65 (0.35Ŕ1.21) 0.04
a
Multivariate OR2 (95% CI) 1.65 (0.90Ŕ3.02) 1.22 (0.77Ŕ1.95) 1.00* 0.72 (0.33Ŕ1.55) 0.07
b
The Yong-Thyr study
Cases/controls 805/876 118/147 450/501 217/219 20/9
Stratified OR1 (95% CI) 0.80 (0.59Ŕ1.08) 0.90 (0.71Ŕ1.12) 1.00* 2.25 (1.00Ŕ5.05) 0.03
a
Multivariate OR2 (95% CI) 0.91 (0.57Ŕ1.43) 1.01 (0.75Ŕ1.37) 1.00* 2.04 (0.79Ŕ5.25) 0.6
b
The Cathy study
Cases/controls 593/700 18/33 223/262 295/355 57/50
Stratified OR1 (95% CI) 0.65 (0.36Ŕ1.19) 0.98 (0.77Ŕ1.25) 1.00* 1.53 (1.00Ŕ2.33) 0.05
a
Multivariate OR2 (95% CI) 0.54 (0.27Ŕ1.10) 1.00 (0.74Ŕ1.37) 1.00* 1.58 (0.94Ŕ2.67) 0.2
b
The Cuba study
Cases/controls 203/212 82/93 78/77 40/41 3/1
Stratified OR1 (95% CI) 0.92 (0.54Ŕ1.57) 1.10 (0.63Ŕ1.89) 1.00* 2.71 (0.27Ŕ27.17) 0.49
a
Multivariate OR2 (95% CI) 2.15 (0.88Ŕ5.23) 1.74 (0.84Ŕ3.57) 1.00* 1.69 (0.13Ŕ22.79) 0.14
b
† Bread item presented in the New Caledonia, the French Polynesia and the Cathy studies, but it was missing in
the Young-Thyr and Cuba studies;
‡ The value of dietary iodine intake for the New Caledonia study was underestimated by about 25 µg/day due to
some compound dishes had not been taken into account;
1 Stratified by age class, sex and study;
2 Stratified by age class, sex and study, and adjusted for smoking status, ethnicity, education level, number of full
term pregnancies, body surface area, radiotherapy for previous cancer, first-degree relative thyroid cancer
history, and energy intake;
3 Calculated using the Wald test for dietary iodine intake modeled as a continuous variable (per classification);
* Reference category;
a Crude p-trend;
b Adjusted p-trend.
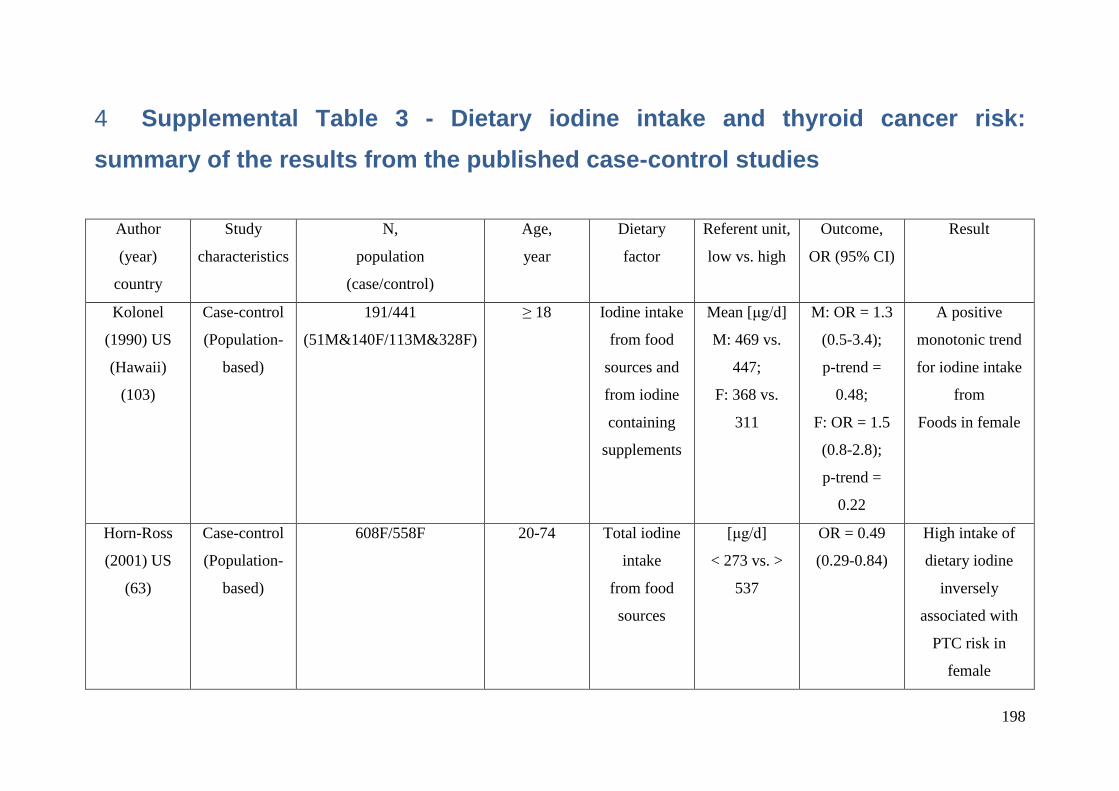
198
Supplemental Table 3 - Dietary iodine intake and thyroid cancer risk: 4
summary of the results from the published case-control studies
Author
(year)
country
Study
characteristics
N,
population
(case/control)
Age,
year
Dietary
factor
Referent unit,
low vs. high
Outcome,
OR (95% CI)
Result
Kolonel
(1990) US
(Hawaii)
(103)
Case-control
(Population-
based)
191/441
(51M&140F/113M&328F)
≥ 18 Iodine intake
from food
sources and
from iodine
containing
supplements
Mean [μg/d]
M: 469 vs.
447;
F: 368 vs.
311
M: OR = 1.3
(0.5-3.4);
p-trend =
0.48;
F: OR = 1.5
(0.8-2.8);
p-trend =
0.22
A positive
monotonic trend
for iodine intake
from
Foods in female
Horn-Ross
(2001) US
(63)
Case-control
(Population-
based)
608F/558F 20-74 Total iodine
intake
from food
sources
[μg/d]
< 273 vs. >
537
OR = 0.49
(0.29-0.84)
High intake of
dietary iodine
inversely
associated with
PTC risk in
female
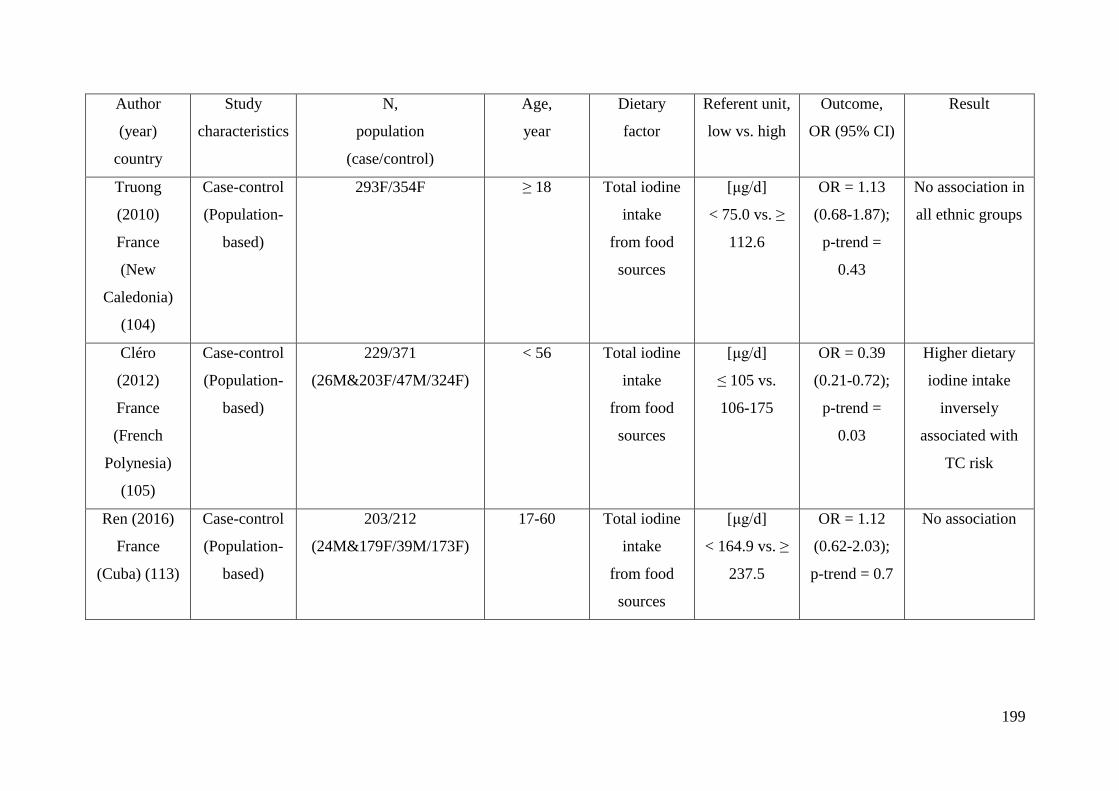
199
Author
(year)
country
Study
characteristics
N,
population
(case/control)
Age,
year
Dietary
factor
Referent unit,
low vs. high
Outcome,
OR (95% CI)
Result
Truong
(2010)
France
(New
Caledonia)
(104)
Case-control
(Population-
based)
293F/354F ≥ 18 Total iodine
intake
from food
sources
[μg/d]
< 75.0 vs. ≥
112.6
OR = 1.13
(0.68-1.87);
p-trend =
0.43
No association in
all ethnic groups
Cléro
(2012)
France
(French
Polynesia)
(105)
Case-control
(Population-
based)
229/371
(26M&203F/47M/324F)
< 56 Total iodine
intake
from food
sources
[μg/d]
≤ 105 vs.
106-175
OR = 0.39
(0.21-0.72);
p-trend =
0.03
Higher dietary
iodine intake
inversely
associated with
TC risk
Ren (2016)
France
(Cuba) (113)
Case-control
(Population-
based)
203/212
(24M&179F/39M/173F)
17-60 Total iodine
intake
from food
sources
[μg/d]
< 164.9 vs. ≥
237.5
OR = 1.12
(0.62-2.03);
p-trend = 0.7
No association
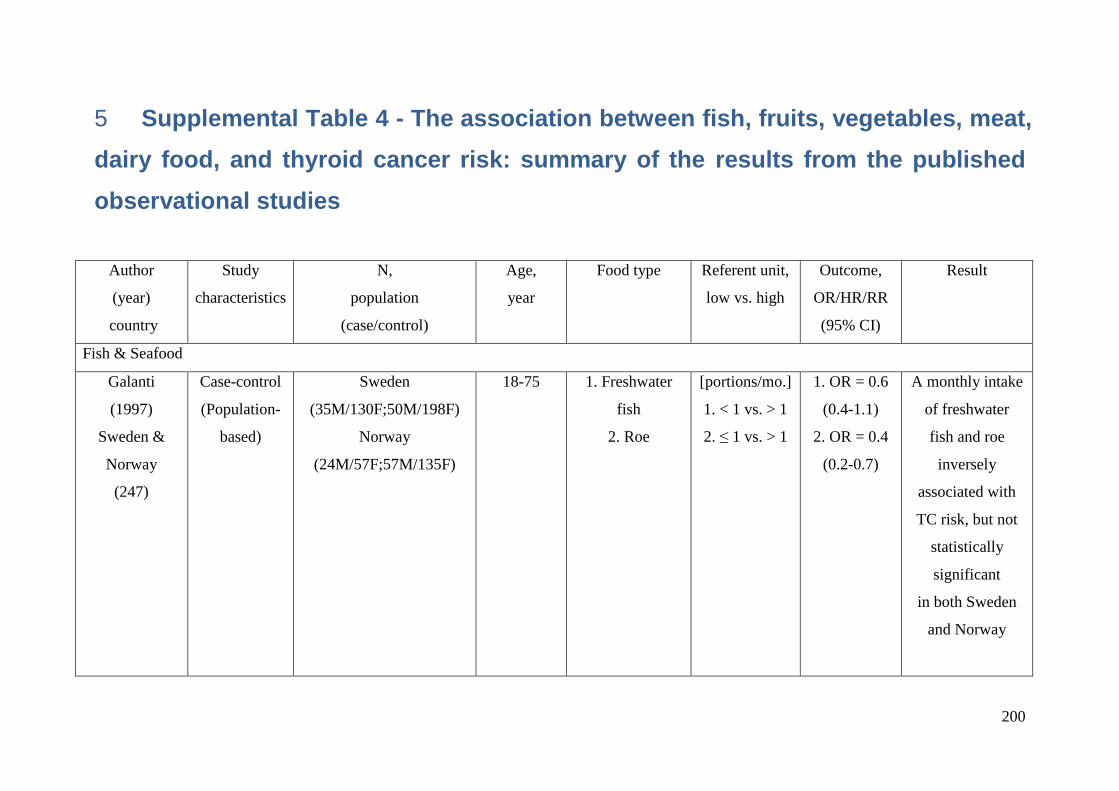
200
Supplemental Table 4 - The association between fish, fruits, vegetables, meat, 5
dairy food, and thyroid cancer risk: summary of the results from the published
observational studies
Author
(year)
country
Study
characteristics
N,
population
(case/control)
Age,
year
Food type Referent unit,
low vs. high
Outcome,
OR/HR/RR
(95% CI)
Result
Fish & Seafood
Galanti
(1997)
Sweden &
Norway
(247)
Case-control
(Population-
based)
Sweden
(35M/130F;50M/198F)
Norway
(24M/57F;57M/135F)
18-75 1. Freshwater
fish
2. Roe
[portions/mo.]
1. < 1 vs. > 1
2. ≤ 1 vs. > 1
1. OR = 0.6
(0.4-1.1)
2. OR = 0.4
(0.2-0.7)
A monthly intake
of freshwater
fish and roe
inversely
associated with
TC risk, but not
statistically
significant
in both Sweden
and Norway
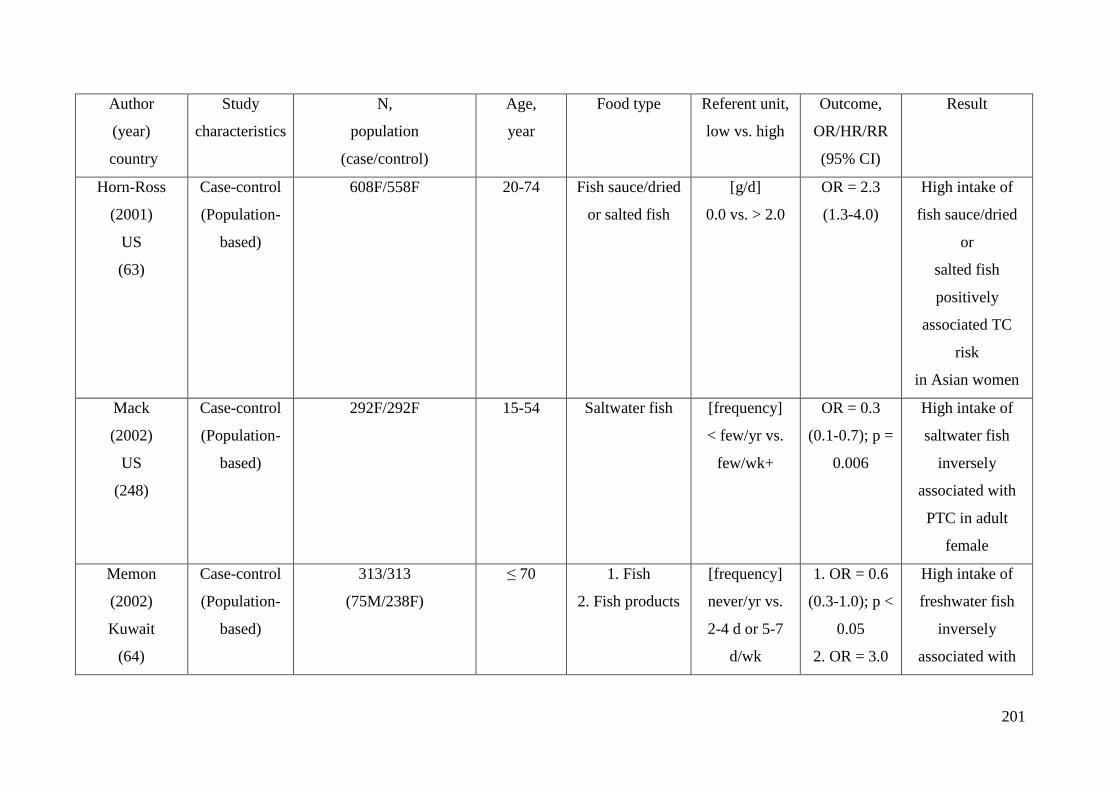
201
Author
(year)
country
Study
characteristics
N,
population
(case/control)
Age,
year
Food type Referent unit,
low vs. high
Outcome,
OR/HR/RR
(95% CI)
Result
Horn-Ross
(2001)
US
(63)
Case-control
(Population-
based)
608F/558F 20-74 Fish sauce/dried
or salted fish
[g/d]
0.0 vs. > 2.0
OR = 2.3
(1.3-4.0)
High intake of
fish sauce/dried
or
salted fish
positively
associated TC
risk
in Asian women
Mack
(2002)
US
(248)
Case-control
(Population-
based)
292F/292F 15-54 Saltwater fish [frequency]
< few/yr vs.
few/wk+
OR = 0.3
(0.1-0.7); p =
0.006
High intake of
saltwater fish
inversely
associated with
PTC in adult
female
Memon
(2002)
Kuwait
(64)
Case-control
(Population-
based)
313/313
(75M/238F)
≤ 70 1. Fish
2. Fish products
[frequency]
never/yr vs.
2-4 d or 5-7
d/wk
1. OR = 0.6
(0.3-1.0); p <
0.05
2. OR = 3.0
High intake of
freshwater fish
inversely
associated with
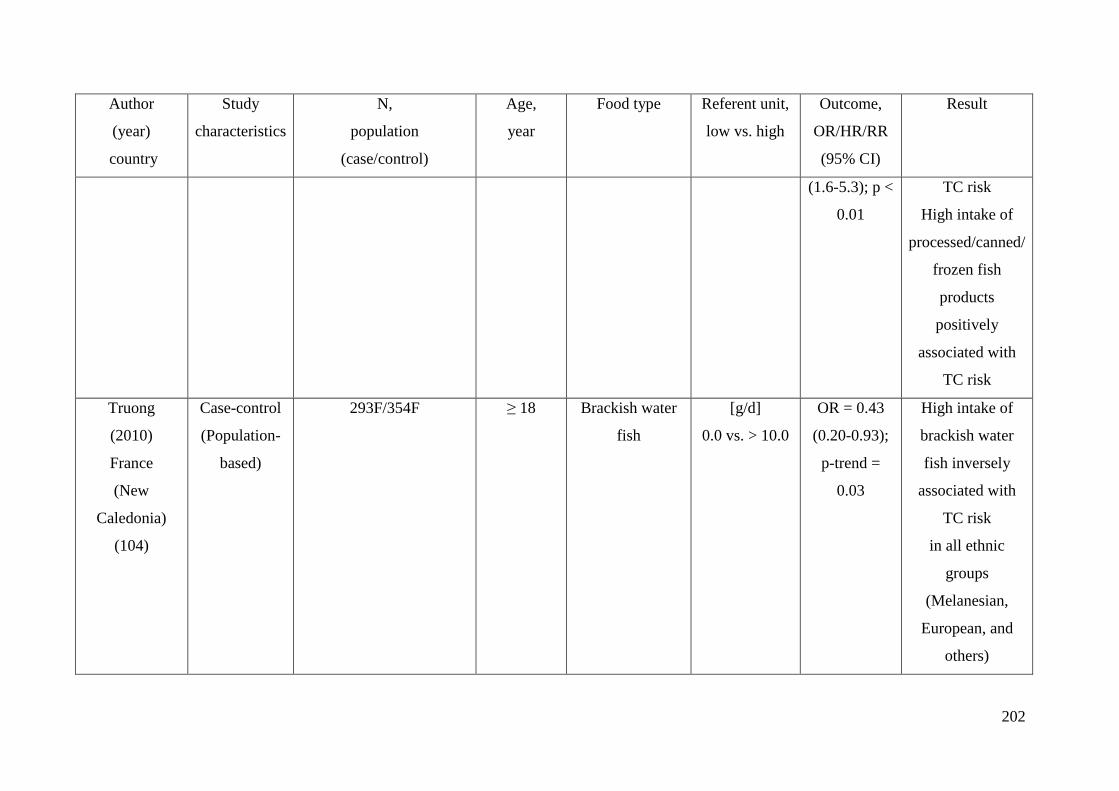
202
Author
(year)
country
Study
characteristics
N,
population
(case/control)
Age,
year
Food type Referent unit,
low vs. high
Outcome,
OR/HR/RR
(95% CI)
Result
(1.6-5.3); p <
0.01
TC risk
High intake of
processed/canned/
frozen fish
products
positively
associated with
TC risk
Truong
(2010)
France
(New
Caledonia)
(104)
Case-control
(Population-
based)
293F/354F ≥ 18 Brackish water
fish
[g/d]
0.0 vs. > 10.0
OR = 0.43
(0.20-0.93);
p-trend =
0.03
High intake of
brackish water
fish inversely
associated with
TC risk
in all ethnic
groups
(Melanesian,
European, and
others)
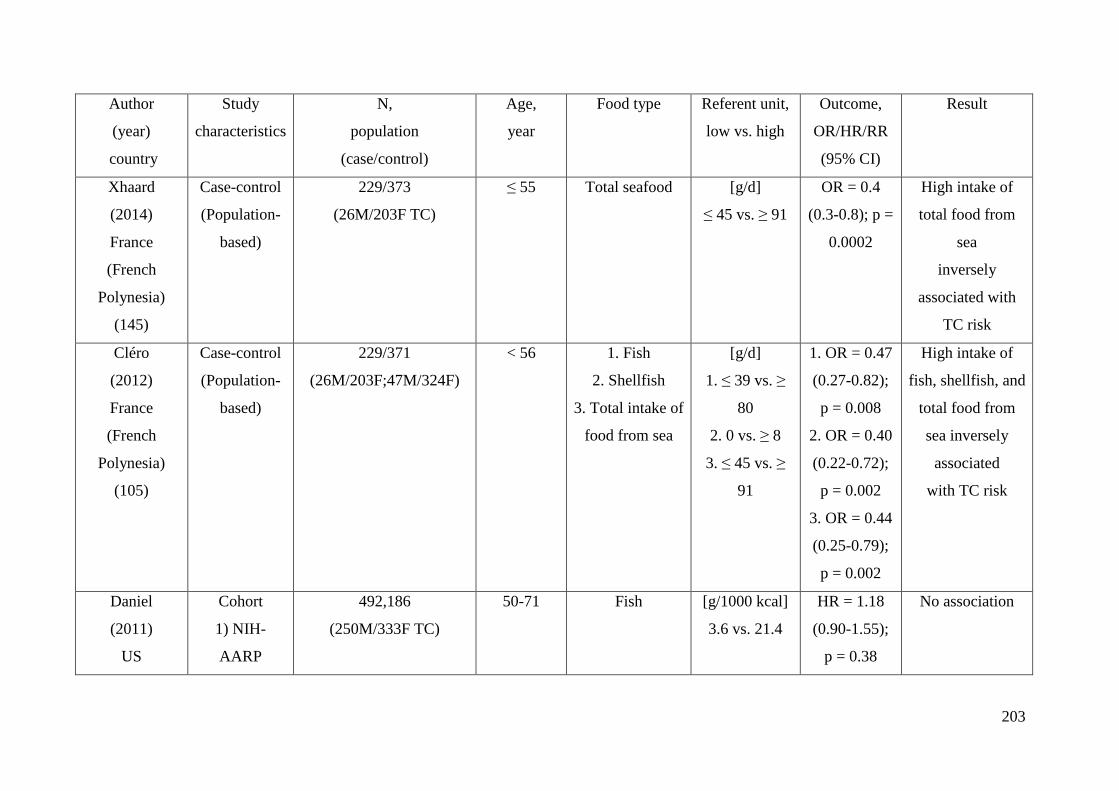
203
Author
(year)
country
Study
characteristics
N,
population
(case/control)
Age,
year
Food type Referent unit,
low vs. high
Outcome,
OR/HR/RR
(95% CI)
Result
Xhaard
(2014)
France
(French
Polynesia)
(145)
Case-control
(Population-
based)
229/373
(26M/203F TC)
≤ 55 Total seafood [g/d]
≤ 45 vs. ≥ 91
OR = 0.4
(0.3-0.8); p =
0.0002
High intake of
total food from
sea
inversely
associated with
TC risk
Cléro
(2012)
France
(French
Polynesia)
(105)
Case-control
(Population-
based)
229/371
(26M/203F;47M/324F)
< 56 1. Fish
2. Shellfish
3. Total intake of
food from sea
[g/d]
1. ≤ 39 vs. ≥
80
2. 0 vs. ≥ 8
3. ≤ 45 vs. ≥
91
1. OR = 0.47
(0.27-0.82);
p = 0.008
2. OR = 0.40
(0.22-0.72);
p = 0.002
3. OR = 0.44
(0.25-0.79);
p = 0.002
High intake of
fish, shellfish, and
total food from
sea inversely
associated
with TC risk
Daniel
(2011)
US
Cohort
1) NIH-
AARP
492,186
(250M/333F TC)
50-71 Fish [g/1000 kcal]
3.6 vs. 21.4
HR = 1.18
(0.90-1.55);
p = 0.38
No association
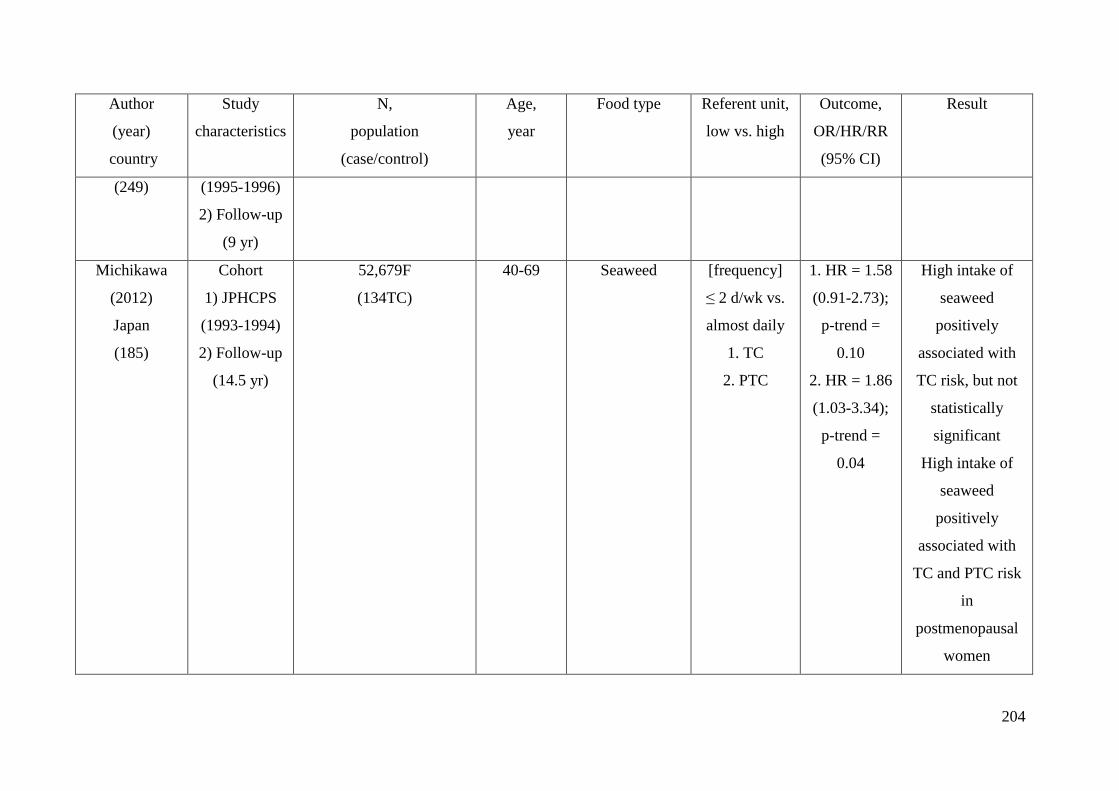
204
Author
(year)
country
Study
characteristics
N,
population
(case/control)
Age,
year
Food type Referent unit,
low vs. high
Outcome,
OR/HR/RR
(95% CI)
Result
(249) (1995-1996)
2) Follow-up
(9 yr)
Michikawa
(2012)
Japan
(185)
Cohort
1) JPHCPS
(1993-1994)
2) Follow-up
(14.5 yr)
52,679F
(134TC)
40-69 Seaweed [frequency]
≤ 2 d/wk vs.
almost daily
1. TC
2. PTC
1. HR = 1.58
(0.91-2.73);
p-trend =
0.10
2. HR = 1.86
(1.03-3.34);
p-trend =
0.04
High intake of
seaweed
positively
associated with
TC risk, but not
statistically
significant
High intake of
seaweed
positively
associated with
TC and PTC risk
in
postmenopausal
women
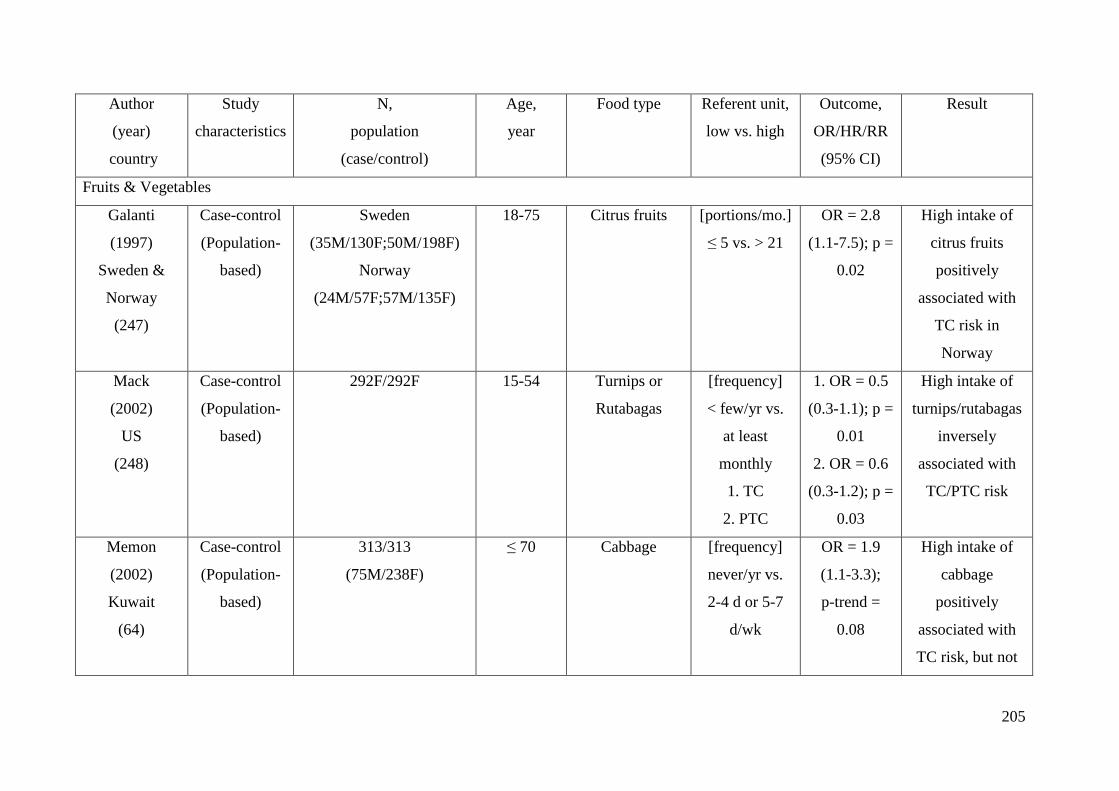
205
Author
(year)
country
Study
characteristics
N,
population
(case/control)
Age,
year
Food type Referent unit,
low vs. high
Outcome,
OR/HR/RR
(95% CI)
Result
Fruits & Vegetables
Galanti
(1997)
Sweden &
Norway
(247)
Case-control
(Population-
based)
Sweden
(35M/130F;50M/198F)
Norway
(24M/57F;57M/135F)
18-75 Citrus fruits [portions/mo.]
≤ 5 vs. > 21
OR = 2.8
(1.1-7.5); p =
0.02
High intake of
citrus fruits
positively
associated with
TC risk in
Norway
Mack
(2002)
US
(248)
Case-control
(Population-
based)
292F/292F 15-54 Turnips or
Rutabagas
[frequency]
< few/yr vs.
at least
monthly
1. TC
2. PTC
1. OR = 0.5
(0.3-1.1); p =
0.01
2. OR = 0.6
(0.3-1.2); p =
0.03
High intake of
turnips/rutabagas
inversely
associated with
TC/PTC risk
Memon
(2002)
Kuwait
(64)
Case-control
(Population-
based)
313/313
(75M/238F)
≤ 70 Cabbage [frequency]
never/yr vs.
2-4 d or 5-7
d/wk
OR = 1.9
(1.1-3.3);
p-trend =
0.08
High intake of
cabbage
positively
associated with
TC risk, but not
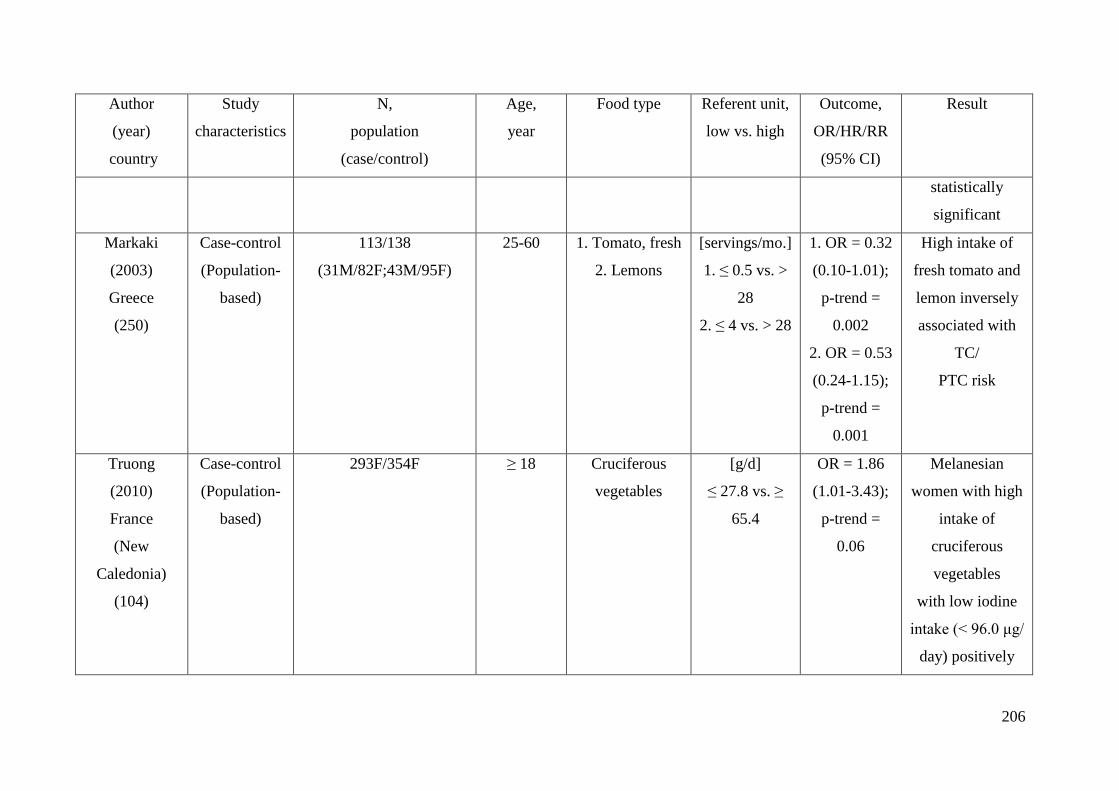
206
Author
(year)
country
Study
characteristics
N,
population
(case/control)
Age,
year
Food type Referent unit,
low vs. high
Outcome,
OR/HR/RR
(95% CI)
Result
statistically
significant
Markaki
(2003)
Greece
(250)
Case-control
(Population-
based)
113/138
(31M/82F;43M/95F)
25-60 1. Tomato, fresh
2. Lemons
[servings/mo.]
1. ≤ 0.5 vs. >
28
2. ≤ 4 vs. > 28
1. OR = 0.32
(0.10-1.01);
p-trend =
0.002
2. OR = 0.53
(0.24-1.15);
p-trend =
0.001
High intake of
fresh tomato and
lemon inversely
associated with
TC/
PTC risk
Truong
(2010)
France
(New
Caledonia)
(104)
Case-control
(Population-
based)
293F/354F ≥ 18 Cruciferous
vegetables
[g/d]
≤ 27.8 vs. ≥
65.4
OR = 1.86
(1.01-3.43);
p-trend =
0.06
Melanesian
women with high
intake of
cruciferous
vegetables
with low iodine
intake (< 96.0 μg/
day) positively
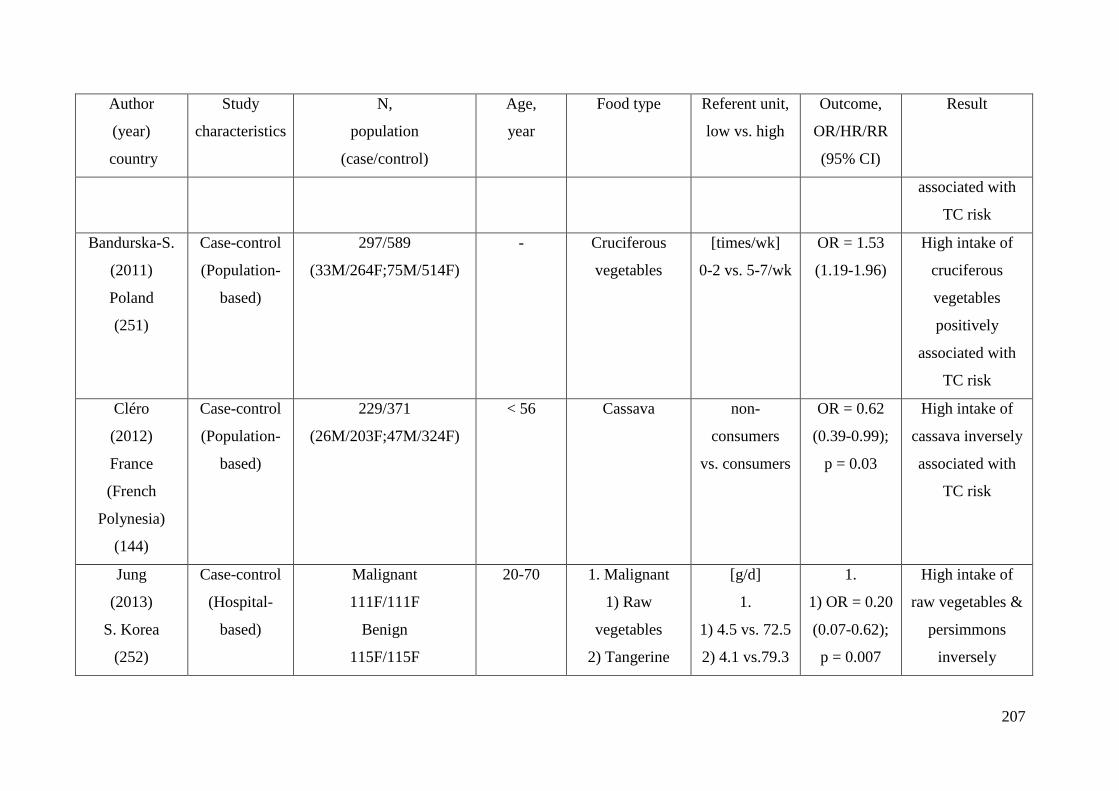
207
Author
(year)
country
Study
characteristics
N,
population
(case/control)
Age,
year
Food type Referent unit,
low vs. high
Outcome,
OR/HR/RR
(95% CI)
Result
associated with
TC risk
Bandurska-S.
(2011)
Poland
(251)
Case-control
(Population-
based)
297/589
(33M/264F;75M/514F)
- Cruciferous
vegetables
[times/wk]
0-2 vs. 5-7/wk
OR = 1.53
(1.19-1.96)
High intake of
cruciferous
vegetables
positively
associated with
TC risk
Cléro
(2012)
France
(French
Polynesia)
(144)
Case-control
(Population-
based)
229/371
(26M/203F;47M/324F)
< 56 Cassava non-
consumers
vs. consumers
OR = 0.62
(0.39-0.99);
p = 0.03
High intake of
cassava inversely
associated with
TC risk
Jung
(2013)
S. Korea
(252)
Case-control
(Hospital-
based)
Malignant
111F/111F
Benign
115F/115F
20-70 1. Malignant
1) Raw
vegetables
2) Tangerine
[g/d]
1.
1) 4.5 vs. 72.5
2) 4.1 vs.79.3
1.
1) OR = 0.20
(0.07-0.62);
p = 0.007
High intake of
raw vegetables &
persimmons
inversely
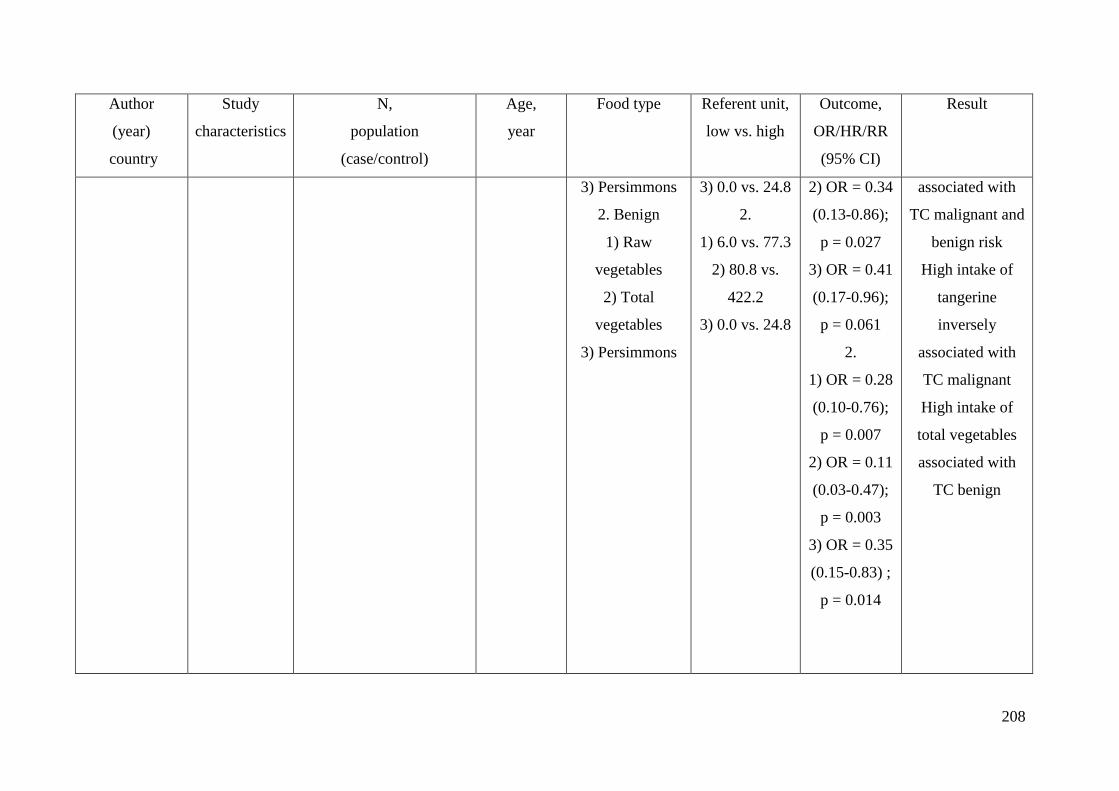
208
Author
(year)
country
Study
characteristics
N,
population
(case/control)
Age,
year
Food type Referent unit,
low vs. high
Outcome,
OR/HR/RR
(95% CI)
Result
3) Persimmons
2. Benign
1) Raw
vegetables
2) Total
vegetables
3) Persimmons
3) 0.0 vs. 24.8
2.
1) 6.0 vs. 77.3
2) 80.8 vs.
422.2
3) 0.0 vs. 24.8
2) OR = 0.34
(0.13-0.86);
p = 0.027
3) OR = 0.41
(0.17-0.96);
p = 0.061
2.
1) OR = 0.28
(0.10-0.76);
p = 0.007
2) OR = 0.11
(0.03-0.47);
p = 0.003
3) OR = 0.35
(0.15-0.83) ;
p = 0.014
associated with
TC malignant and
benign risk
High intake of
tangerine
inversely
associated with
TC malignant
High intake of
total vegetables
associated with
TC benign
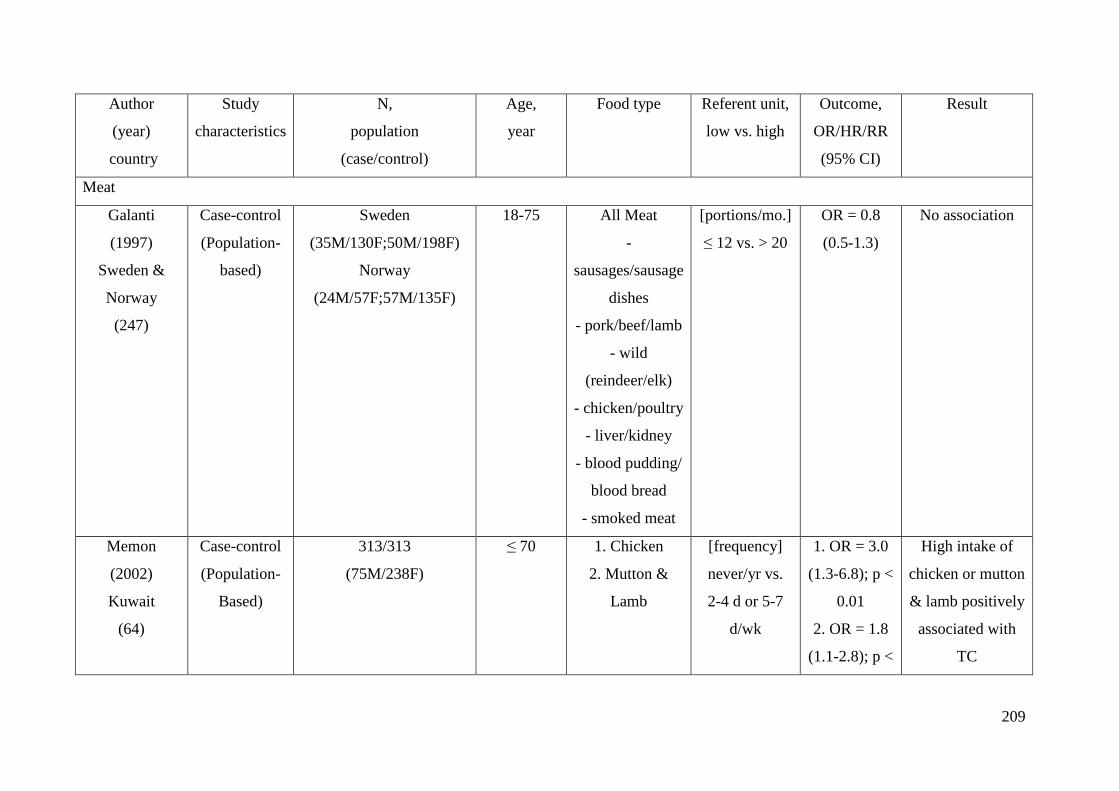
209
Author
(year)
country
Study
characteristics
N,
population
(case/control)
Age,
year
Food type Referent unit,
low vs. high
Outcome,
OR/HR/RR
(95% CI)
Result
Meat
Galanti
(1997)
Sweden &
Norway
(247)
Case-control
(Population-
based)
Sweden
(35M/130F;50M/198F)
Norway
(24M/57F;57M/135F)
18-75 All Meat
-
sausages/sausage
dishes
- pork/beef/lamb
- wild
(reindeer/elk)
- chicken/poultry
- liver/kidney
- blood pudding/
blood bread
- smoked meat
[portions/mo.]
≤ 12 vs. > 20
OR = 0.8
(0.5-1.3)
No association
Memon
(2002)
Kuwait
(64)
Case-control
(Population-
Based)
313/313
(75M/238F)
≤ 70 1. Chicken
2. Mutton &
Lamb
[frequency]
never/yr vs.
2-4 d or 5-7
d/wk
1. OR = 3.0
(1.3-6.8); p <
0.01
2. OR = 1.8
(1.1-2.8); p <
High intake of
chicken or mutton
& lamb positively
associated with
TC
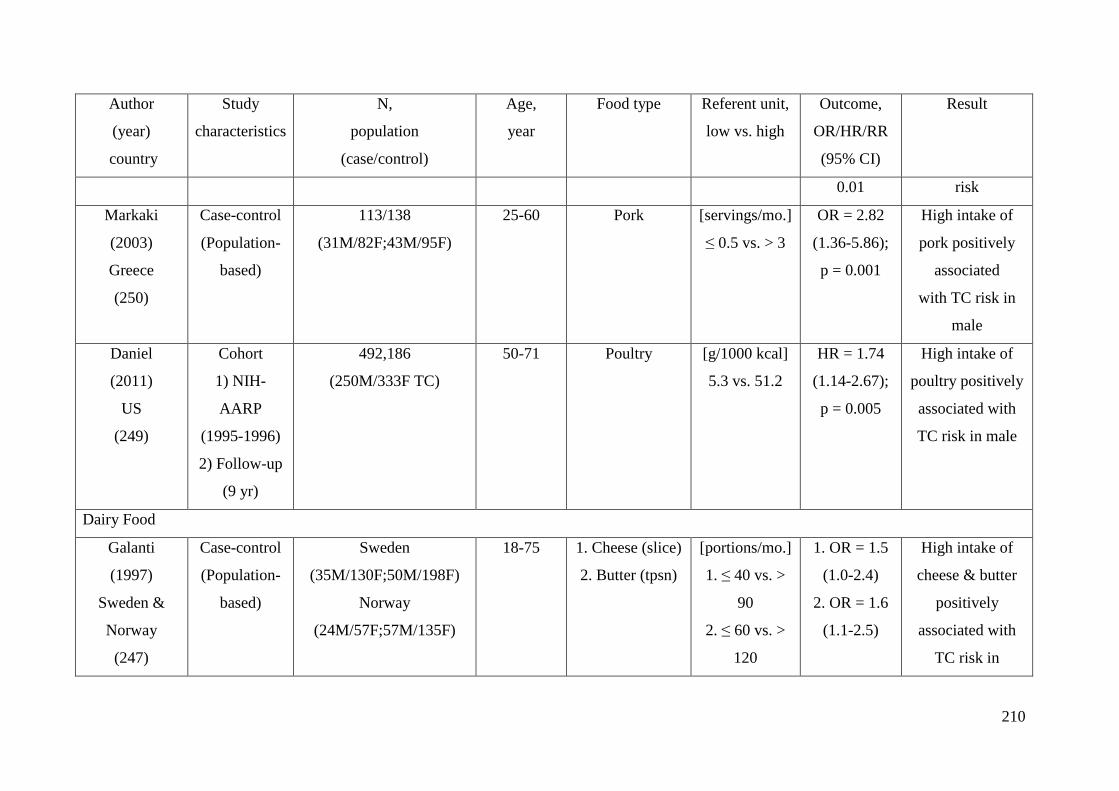
210
Author
(year)
country
Study
characteristics
N,
population
(case/control)
Age,
year
Food type Referent unit,
low vs. high
Outcome,
OR/HR/RR
(95% CI)
Result
0.01 risk
Markaki
(2003)
Greece
(250)
Case-control
(Population-
based)
113/138
(31M/82F;43M/95F)
25-60 Pork [servings/mo.]
≤ 0.5 vs. > 3
OR = 2.82
(1.36-5.86);
p = 0.001
High intake of
pork positively
associated
with TC risk in
male
Daniel
(2011)
US
(249)
Cohort
1) NIH-
AARP
(1995-1996)
2) Follow-up
(9 yr)
492,186
(250M/333F TC)
50-71 Poultry [g/1000 kcal]
5.3 vs. 51.2
HR = 1.74
(1.14-2.67);
p = 0.005
High intake of
poultry positively
associated with
TC risk in male
Dairy Food
Galanti
(1997)
Sweden &
Norway
(247)
Case-control
(Population-
based)
Sweden
(35M/130F;50M/198F)
Norway
(24M/57F;57M/135F)
18-75 1. Cheese (slice)
2. Butter (tpsn)
[portions/mo.]
1. ≤ 40 vs. >
90
2. ≤ 60 vs. >
120
1. OR = 1.5
(1.0-2.4)
2. OR = 1.6
(1.1-2.5)
High intake of
cheese & butter
positively
associated with
TC risk in
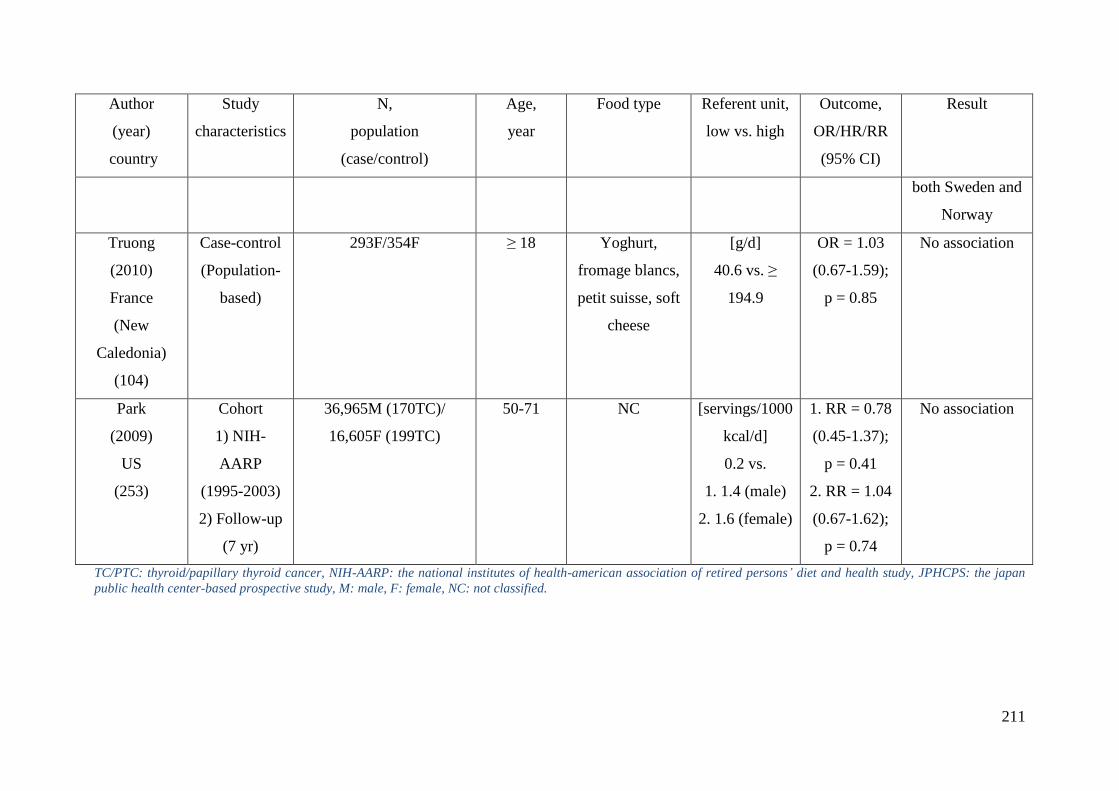
211
Author
(year)
country
Study
characteristics
N,
population
(case/control)
Age,
year
Food type Referent unit,
low vs. high
Outcome,
OR/HR/RR
(95% CI)
Result
both Sweden and
Norway
Truong
(2010)
France
(New
Caledonia)
(104)
Case-control
(Population-
based)
293F/354F ≥ 18 Yoghurt,
fromage blancs,
petit suisse, soft
cheese
[g/d]
40.6 vs. ≥
194.9
OR = 1.03
(0.67-1.59);
p = 0.85
No association
Park
(2009)
US
(253)
Cohort
1) NIH-
AARP
(1995-2003)
2) Follow-up
(7 yr)
36,965M (170TC)/
16,605F (199TC)
50-71 NC [servings/1000
kcal/d]
0.2 vs.
1. 1.4 (male)
2. 1.6 (female)
1. RR = 0.78
(0.45-1.37);
p = 0.41
2. RR = 1.04
(0.67-1.62);
p = 0.74
No association
TC/PTC: thyroid/papillary thyroid cancer, NIH-AARP: the national institutes of health-american association of retired persons’ diet and health study, JPHCPS: the japan
public health center-based prospective study, M: male, F: female, NC: not classified.
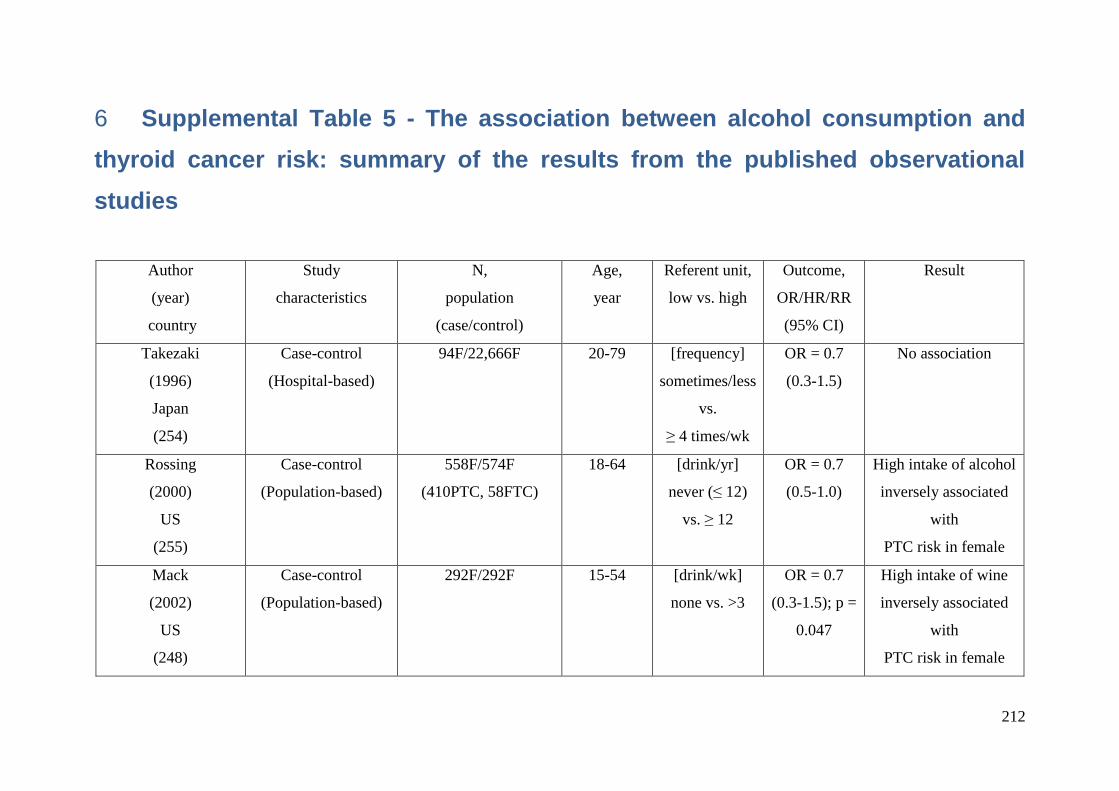
212
Supplemental Table 5 - The association between alcohol consumption and 6
thyroid cancer risk: summary of the results from the published observational
studies
Author
(year)
country
Study
characteristics
N,
population
(case/control)
Age,
year
Referent unit,
low vs. high
Outcome,
OR/HR/RR
(95% CI)
Result
Takezaki
(1996)
Japan
(254)
Case-control
(Hospital-based)
94F/22,666F 20-79 [frequency]
sometimes/less
vs.
≥ 4 times/wk
OR = 0.7
(0.3-1.5)
No association
Rossing
(2000)
US
(255)
Case-control
(Population-based)
558F/574F
(410PTC, 58FTC)
18-64 [drink/yr]
never (≤ 12)
vs. ≥ 12
OR = 0.7
(0.5-1.0)
High intake of alcohol
inversely associated
with
PTC risk in female
Mack
(2002)
US
(248)
Case-control
(Population-based)
292F/292F 15-54 [drink/wk]
none vs. >3
OR = 0.7
(0.3-1.5); p =
0.047
High intake of wine
inversely associated
with
PTC risk in female
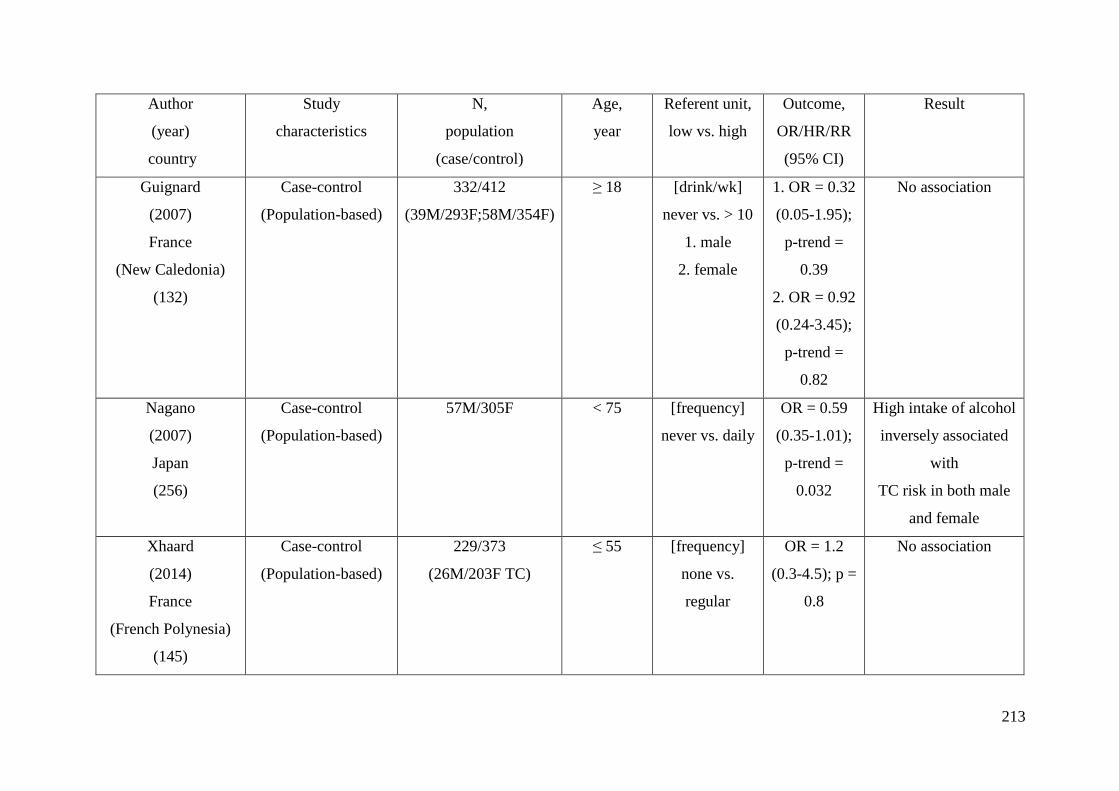
213
Author
(year)
country
Study
characteristics
N,
population
(case/control)
Age,
year
Referent unit,
low vs. high
Outcome,
OR/HR/RR
(95% CI)
Result
Guignard
(2007)
France
(New Caledonia)
(132)
Case-control
(Population-based)
332/412
(39M/293F;58M/354F)
≥ 18 [drink/wk]
never vs. > 10
1. male
2. female
1. OR = 0.32
(0.05-1.95);
p-trend =
0.39
2. OR = 0.92
(0.24-3.45);
p-trend =
0.82
No association
Nagano
(2007)
Japan
(256)
Case-control
(Population-based)
57M/305F < 75 [frequency]
never vs. daily
OR = 0.59
(0.35-1.01);
p-trend =
0.032
High intake of alcohol
inversely associated
with
TC risk in both male
and female
Xhaard
(2014)
France
(French Polynesia)
(145)
Case-control
(Population-based)
229/373
(26M/203F TC)
≤ 55 [frequency]
none vs.
regular
OR = 1.2
(0.3-4.5); p =
0.8
No association
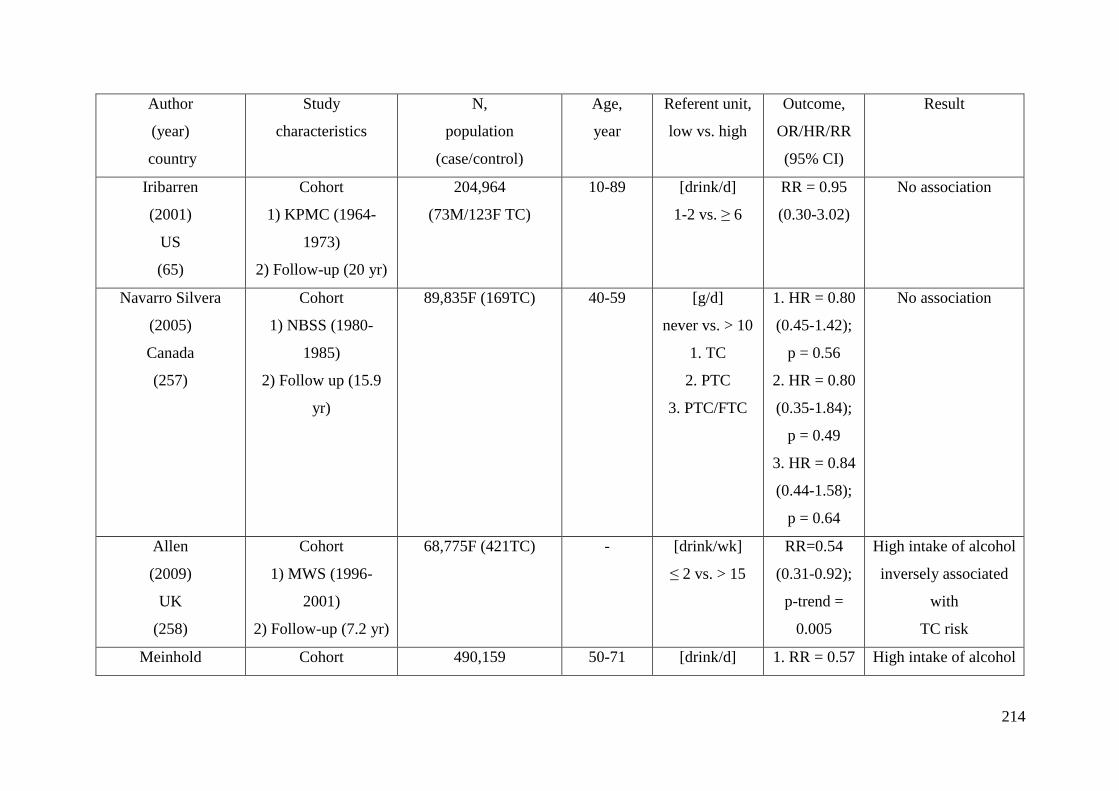
214
Author
(year)
country
Study
characteristics
N,
population
(case/control)
Age,
year
Referent unit,
low vs. high
Outcome,
OR/HR/RR
(95% CI)
Result
Iribarren
(2001)
US
(65)
Cohort
1) KPMC (1964-
1973)
2) Follow-up (20 yr)
204,964
(73M/123F TC)
10-89 [drink/d]
1-2 vs. ≥ 6
RR = 0.95
(0.30-3.02)
No association
Navarro Silvera
(2005)
Canada
(257)
Cohort
1) NBSS (1980-
1985)
2) Follow up (15.9
yr)
89,835F (169TC) 40-59 [g/d]
never vs. > 10
1. TC
2. PTC
3. PTC/FTC
1. HR = 0.80
(0.45-1.42);
p = 0.56
2. HR = 0.80
(0.35-1.84);
p = 0.49
3. HR = 0.84
(0.44-1.58);
p = 0.64
No association
Allen
(2009)
UK
(258)
Cohort
1) MWS (1996-
2001)
2) Follow-up (7.2 yr)
68,775F (421TC) - [drink/wk]
≤ 2 vs. > 15
RR=0.54
(0.31-0.92);
p-trend =
0.005
High intake of alcohol
inversely associated
with
TC risk
Meinhold Cohort 490,159 50-71 [drink/d] 1. RR = 0.57 High intake of alcohol
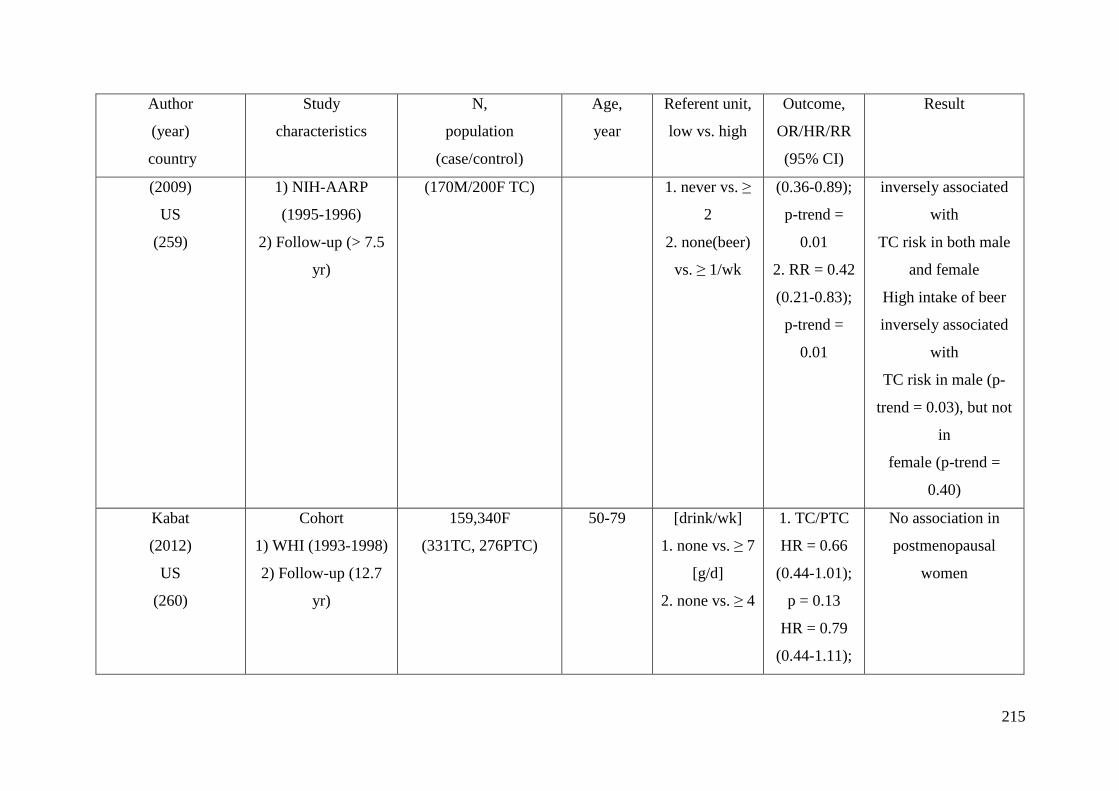
215
Author
(year)
country
Study
characteristics
N,
population
(case/control)
Age,
year
Referent unit,
low vs. high
Outcome,
OR/HR/RR
(95% CI)
Result
(2009)
US
(259)
1) NIH-AARP
(1995-1996)
2) Follow-up (> 7.5
yr)
(170M/200F TC) 1. never vs. ≥
2
2. none(beer)
vs. ≥ 1/wk
(0.36-0.89);
p-trend =
0.01
2. RR = 0.42
(0.21-0.83);
p-trend =
0.01
inversely associated
with
TC risk in both male
and female
High intake of beer
inversely associated
with
TC risk in male (p-
trend = 0.03), but not
in
female (p-trend =
0.40)
Kabat
(2012)
US
(260)
Cohort
1) WHI (1993-1998)
2) Follow-up (12.7
yr)
159,340F
(331TC, 276PTC)
50-79 [drink/wk]
1. none vs. ≥ 7
[g/d]
2. none vs. ≥ 4
1. TC/PTC
HR = 0.66
(0.44-1.01);
p = 0.13
HR = 0.79
(0.44-1.11);
No association in
postmenopausal
women
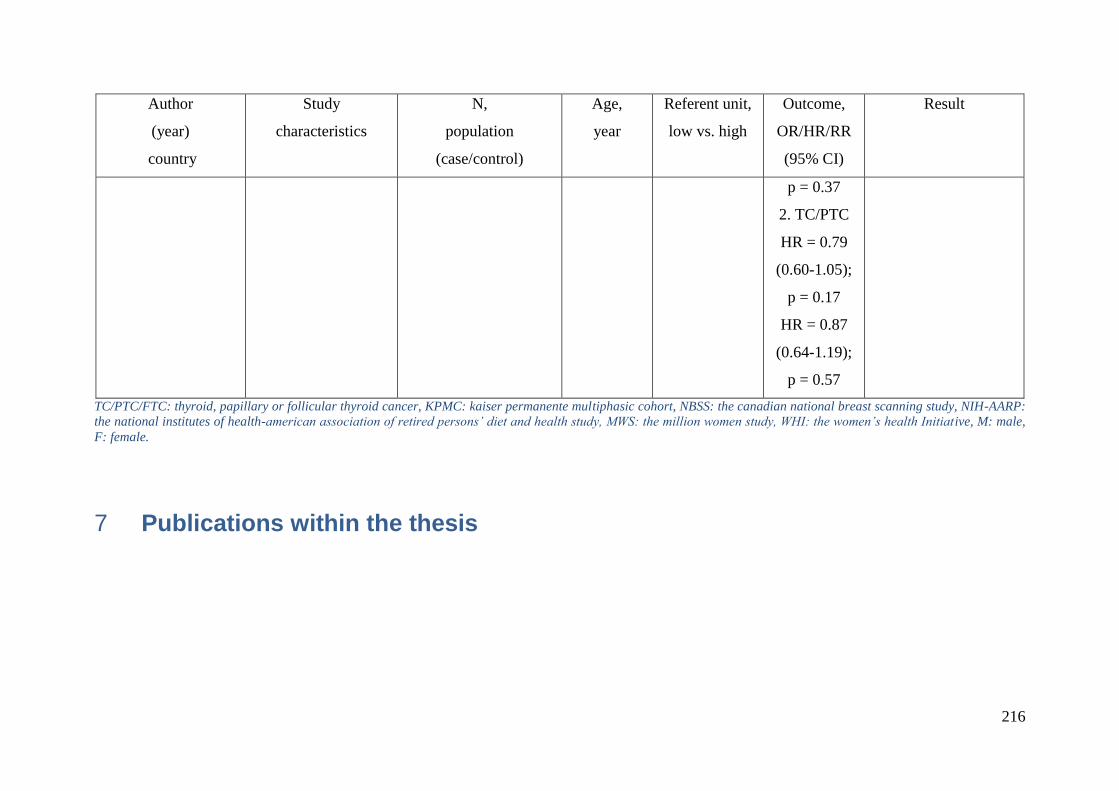
216
Author
(year)
country
Study
characteristics
N,
population
(case/control)
Age,
year
Referent unit,
low vs. high
Outcome,
OR/HR/RR
(95% CI)
Result
p = 0.37
2. TC/PTC
HR = 0.79
(0.60-1.05);
p = 0.17
HR = 0.87
(0.64-1.19);
p = 0.57
TC/PTC/FTC: thyroid, papillary or follicular thyroid cancer, KPMC: kaiser permanente multiphasic cohort, NBSS: the canadian national breast scanning study, NIH-AARP:
the national institutes of health-american association of retired persons’ diet and health study, MWS: the million women study, WHI: the women’s health Initiative, M: male,
F: female.
Publications within the thesis 7
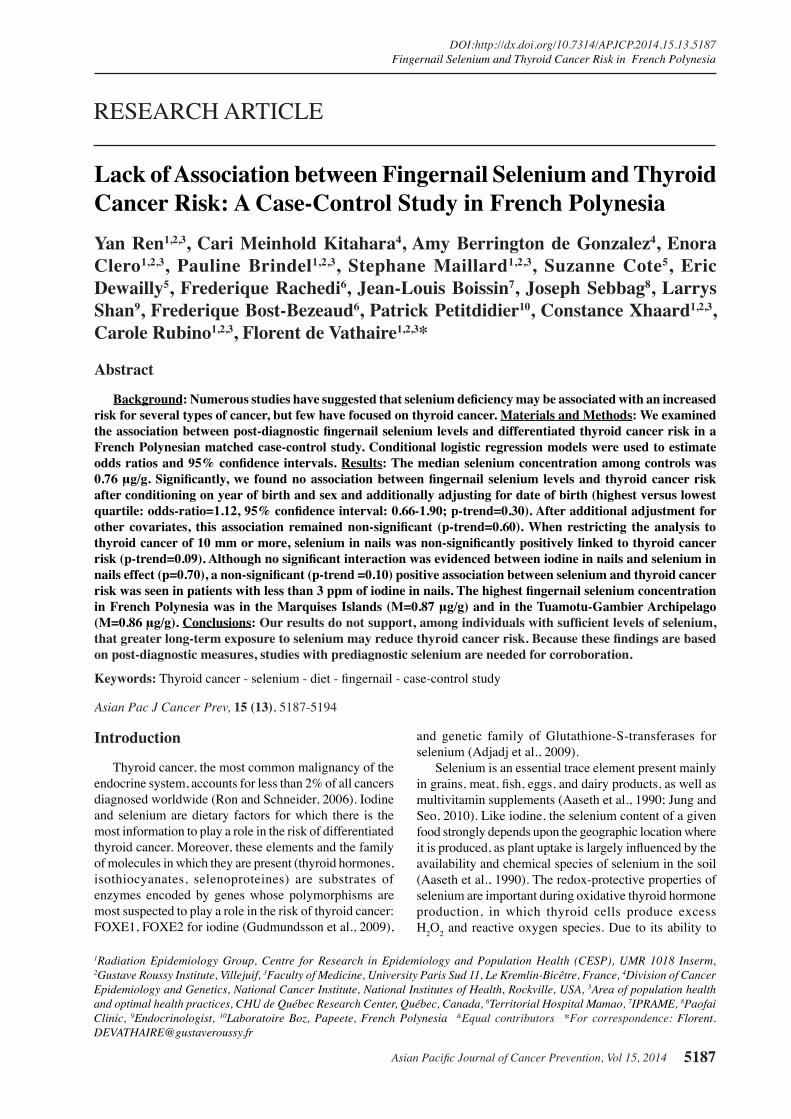
Asian Pacific Journal of Cancer Prevention, Vol 15, 2014 5187
DOI:http://dx.doi.org/10.7314/APJCP.2014.15.13.5187Fingernail Selenium and Thyroid Cancer Risk in French Polynesia
Asian Pac J Cancer Prev, 15 (13), 5187-5194
Introduction
Thyroid cancer, the most common malignancy of the endocrine system, accounts for less than 2% of all cancers diagnosed worldwide (Ron and Schneider, 2006). Iodine and selenium are dietary factors for which there is the most information to play a role in the risk of differentiated thyroid cancer. Moreover, these elements and the family of molecules in which they are present (thyroid hormones, isothiocyanates, selenoproteines) are substrates of enzymes encoded by genes whose polymorphisms are most suspected to play a role in the risk of thyroid cancer: FOXE1, FOXE2 for iodine (Gudmundsson et al., 2009),
1Radiation Epidemiology Group, Centre for Research in Epidemiology and Population Health (CESP), UMR 1018 Inserm, 2Gustave Roussy Institute, Villejuif, 3Faculty of Medicine, University Paris Sud 11, Le Kremlin-Bicêtre, France, 4Division of Cancer Epidemiology and Genetics, National Cancer Institute, National Institutes of Health, Rockville, USA, 5Area of population health and optimal health practices, CHU de Québec Research Center, Québec, Canada, 6Territorial Hospital Mamao, 7IPRAME, 8Paofai Clinic, 9Endocrinologist, 10Laboratoire Boz, Papeete, French Polynesia &Equal contributors *For correspondence: [email protected]
Abstract
Background: Numerous studies have suggested that selenium deficiency may be associated with an increased risk for several types of cancer, but few have focused on thyroid cancer. Materials and Methods: We examined the association between post-diagnostic fingernail selenium levels and differentiated thyroid cancer risk in a French Polynesian matched case-control study. Conditional logistic regression models were used to estimate odds ratios and 95% confidence intervals. Results: The median selenium concentration among controls was 0.76 μg/g. Significantly, we found no association between fingernail selenium levels and thyroid cancer risk after conditioning on year of birth and sex and additionally adjusting for date of birth (highest versus lowest quartile: odds-ratio=1.12, 95% confidence interval: 0.66-1.90; p-trend=0.30). After additional adjustment for other covariates, this association remained non-significant (p-trend=0.60). When restricting the analysis to thyroid cancer of 10 mm or more, selenium in nails was non-significantly positively linked to thyroid cancer risk (p-trend=0.09). Although no significant interaction was evidenced between iodine in nails and selenium in nails effect (p=0.70), a non-significant (p-trend =0.10) positive association between selenium and thyroid cancer risk was seen in patients with less than 3 ppm of iodine in nails. The highest fingernail selenium concentration in French Polynesia was in the Marquises Islands (M=0.87 μg/g) and in the Tuamotu-Gambier Archipelago (M=0.86 μg/g). Conclusions: Our results do not support, among individuals with sufficient levels of selenium, that greater long-term exposure to selenium may reduce thyroid cancer risk. Because these findings are based on post-diagnostic measures, studies with prediagnostic selenium are needed for corroboration. Keywords: Thyroid cancer - selenium - diet - fingernail - case-control study
RESEARCH ARTICLE
Lack of Association between Fingernail Selenium and Thyroid Cancer Risk: A Case-Control Study in French PolynesiaYan Ren1,2,3, Cari Meinhold Kitahara4, Amy Berrington de Gonzalez4, Enora Clero1,2,3, Pauline Brindel1,2,3, Stephane Maillard1,2,3, Suzanne Cote5, Eric Dewailly5, Frederique Rachedi6, Jean-Louis Boissin7, Joseph Sebbag8, Larrys Shan9, Frederique Bost-Bezeaud6, Patrick Petitdidier10, Constance Xhaard1,2,3, Carole Rubino1,2,3, Florent de Vathaire1,2,3*
and genetic family of Glutathione-S-transferases for selenium (Adjadj et al., 2009). Selenium is an essential trace element present mainly in grains, meat, fish, eggs, and dairy products, as well as multivitamin supplements (Aaseth et al., 1990; Jung and Seo, 2010). Like iodine, the selenium content of a given food strongly depends upon the geographic location where it is produced, as plant uptake is largely influenced by the availability and chemical species of selenium in the soil (Aaseth et al., 1990). The redox-protective properties of selenium are important during oxidative thyroid hormone production, in which thyroid cells produce excess H2O2 and reactive oxygen species. Due to its ability to
Yan Ren et al
Asian Pacific Journal of Cancer Prevention, Vol 15, 20145188
protect the thyroid gland and maintain thyroid hormone production, there is a high concentration of selenium in the thyroid (Aaseth et al., 1990), and supply of selenium to the thyroid is prioritized even during periods of selenium deficiency (Fairweather-Tait et al., 2011). Although numerous studies have shown that selenium deficiency may be associated with an increased risk for several types of cancer (Willett et al., 1983; Clark et al., 1996; Duffield-Lillico et al., 2002; Guo et al., 2012), the relationship between selenium and thyroid cancer has been examined in few studies. One in vitro study showed that selenium causes growth inhibition of thyroid cancer cells accompanied by cell-cycle arrest in the S and G2/M phases (Kato et al., 2010). In addition, a small case-control study of 43 thyroid cancer cases showed a significant increased risk for low compared to high prediagnostic serum selenium concentrations (Glattre et al., 1989). In the present study, we examined the association between fingernail selenium concentrations with thyroid cancer in a case-control study of men and women in French Polynesia, a country who has high incidence of thyroid cancer in females (Moore et al., 2010) also highly exposed to selenium mainly through fish consumption (Dewailly et al., 2008). In contrast to other biomarker measures of selenium, such as blood or urine, nail concentrations represent longer-term exposure, typically the previous three to six months. This case-control study has already shown that a high number of pregnancies (Brindel et al., 2008), tallness and obesity (Brindel et al., 2009; Clero et al., 2010), familial history of thyroid cancer (Brindel et al., 2010), low dietary intake of iodine (Clero et al., 2012), poor economic conditions (De Vathaire et al., 2010), and nuclear radiation fallout (De Vathaire et al., 2010), having a spring as the main source of drinking water (Xhaard et al., 2014) are thyroid cancer risk factors in French Polynesia. Materials and Methods
Selection of cases and controls The process for selection and interviews of thyroid cancers and controls has been extensively described elsewhere (De Vathaire et al., 2010). Eligible cases were born and resided in French Polynesia and had been diagnosed with differentiated thyroid cancer before the age of 56 between 1981 and 2003. Four patients between the ages of 56 and 62 at diagnosis, one case diagnosed in 1979, and two cases diagnosed in 2004 were included in the study inadvertently and were retained in the analysis. The cases were identified from the cancer registry in French Polynesia, medical insurance files, and/or four endocrinologists in Tahiti. Information on histology was obtained from the two histopathology laboratories in Tahiti and/or the endocrinologists’ medical files. Of the 255 eligible differentiated thyroid cancer cases, 26 (10%) were not interviewed because they had died (n=14), could not be located (n=6), refused to participate (n=5), or were too ill to participate in the interview (n=1). For each case, two controls were randomly selected from the birth registry in French Polynesia and matched to each case by date of birth (±3 months for the first
interviewed controls, increased by ±20 days afterwards) and sex. Of the 458 randomly selected controls, 85 (19%) were not interviewed for the study because they had died (n=9), could not be located (n=29), refused to participate (n=29), were too ill to participate in the interview (n=2), or they no longer resided in French Polynesia (n=16). After these exclusions, 35 cases had one and 25 cases had no matched controls. Each of the 25 cases with no matched control was then matched to a control from among cases that had two matched controls; the matching criteria for date of birth were relaxed if necessary. In total, the study population included 229 interviewed cases and 373 interviewed controls, with 85 cases (37%) matched to one control and 144 cases (63%) matched to two controls. We further excluded 6 cases and 9 controls for missing data on fingernail selenium, and a batch of 8 cases and 33 controls for which all measures of any elements in the fingernails were returned as null. The final analytic population was 215 cases and 331 controls. The French Polynesian Ethics Committee approved the study, and written informed consent to participate in the study and to contact his or her physician was obtained from each participant. Detailed characteristics of cases and controls are, as well as thyroid cancer risk factor estimates are reported elsewhere (de Vathaire et al. 2010, Xhaard et al., 2014).
Data collection Home addresses for cases and controls were obtained through the territorial medical insurance plan that offers coverage for all inhabitants. In-person interviews were conducted in the participants’ homes (though some cases were interviewed at the hospital on the day of their usual follow-up consultation) by trained interviewers and medical staff using a structured questionnaire which included questions regarding ethnicity, education, smoking, weight at various ages, personal history of thyroid disease and cancer, places of residence, reproductive and hormonal exposures, history of medical X-rays and diet. We used a French food composition table (Favier et al., 1995) for the calculation of iodine and selenium intake because data were lacking in the Pacific Islands food composition tables (Dignan et al., 2004). The overall iodine intake took into account all foods of the questionnaire, except iodized salt because we had no information on the amount of iodized salt consumption. All participants provided fingernail clippings on the date of the interview. Clippings were stored in paper envelopes at room temperature before being transferred to the toxicology centre of the Institut National de Sante Publique du Quebec (INSPQ).
Fingernail selenium and iodine measurements Nail samples were digested under basic conditions using trimethylammonium hydroxide for iodine and under acidic conditions with nitric acid for selenium. The digested material was directly analysed by ICP-MS (inductively coupled plasma mass spectrometry, Perkin Elmer Sciex, Elan DRCII with autosampler ESI SC-4 and work station Elan version 3.0) (Elwaer and Hintelmann,
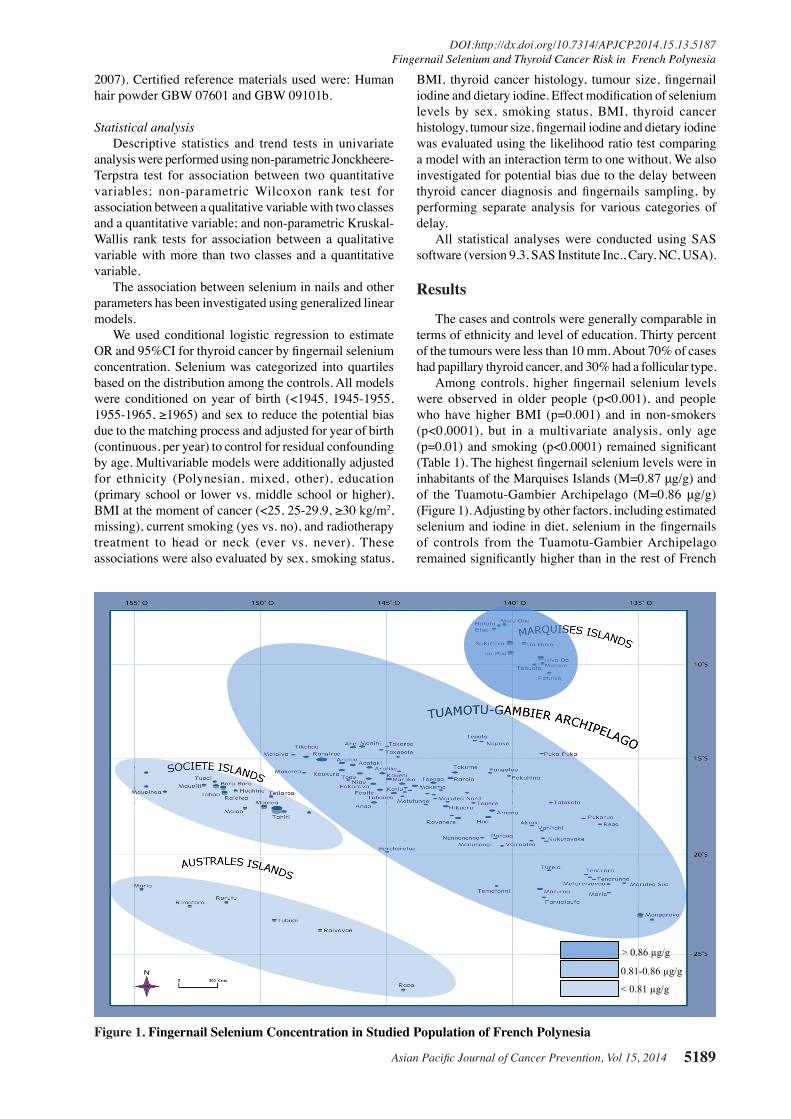
Asian Pacific Journal of Cancer Prevention, Vol 15, 2014 5189
DOI:http://dx.doi.org/10.7314/APJCP.2014.15.13.5187Fingernail Selenium and Thyroid Cancer Risk in French Polynesia
2007). Certified reference materials used were: Human hair powder GBW 07601 and GBW 09101b.
Statistical analysis Descriptive statistics and trend tests in univariate analysis were performed using non-parametric Jonckheere-Terpstra test for association between two quantitative variables; non-parametric Wilcoxon rank test for association between a qualitative variable with two classes and a quantitative variable; and non-parametric Kruskal-Wallis rank tests for association between a qualitative variable with more than two classes and a quantitative variable. The association between selenium in nails and other parameters has been investigated using generalized linear models. We used conditional logistic regression to estimate OR and 95%CI for thyroid cancer by fingernail selenium concentration. Selenium was categorized into quartiles based on the distribution among the controls. All models were conditioned on year of birth (<1945, 1945-1955, 1955-1965, ≥1965) and sex to reduce the potential bias due to the matching process and adjusted for year of birth (continuous, per year) to control for residual confounding by age. Multivariable models were additionally adjusted for ethnicity (Polynesian, mixed, other), education (primary school or lower vs. middle school or higher), BMI at the moment of cancer (<25, 25-29.9, ≥30 kg/m2, missing), current smoking (yes vs. no), and radiotherapy treatment to head or neck (ever vs. never). These associations were also evaluated by sex, smoking status,
BMI, thyroid cancer histology, tumour size, fingernail iodine and dietary iodine. Effect modification of selenium levels by sex, smoking status, BMI, thyroid cancer histology, tumour size, fingernail iodine and dietary iodine was evaluated using the likelihood ratio test comparing a model with an interaction term to one without. We also investigated for potential bias due to the delay between thyroid cancer diagnosis and fingernails sampling, by performing separate analysis for various categories of delay. All statistical analyses were conducted using SAS software (version 9.3, SAS Institute Inc., Cary, NC, USA).
Results
The cases and controls were generally comparable in terms of ethnicity and level of education. Thirty percent of the tumours were less than 10 mm. About 70% of cases had papillary thyroid cancer, and 30% had a follicular type. Among controls, higher fingernail selenium levels were observed in older people (p<0.001), and people who have higher BMI (p=0.001) and in non-smokers (p<0.0001), but in a multivariate analysis, only age (p=0.01) and smoking (p<0.0001) remained significant (Table 1). The highest fingernail selenium levels were in inhabitants of the Marquises Islands (M=0.87 μg/g) and of the Tuamotu-Gambier Archipelago (M=0.86 μg/g) (Figure 1). Adjusting by other factors, including estimated selenium and iodine in diet, selenium in the fingernails of controls from the Tuamotu-Gambier Archipelago remained significantly higher than in the rest of French
Figure 1. Fingernail Selenium Concentration in Studied Population of French Polynesia
> 0.86 µg/g
0.81-0.86 µg/g
< 0.81 µg/g
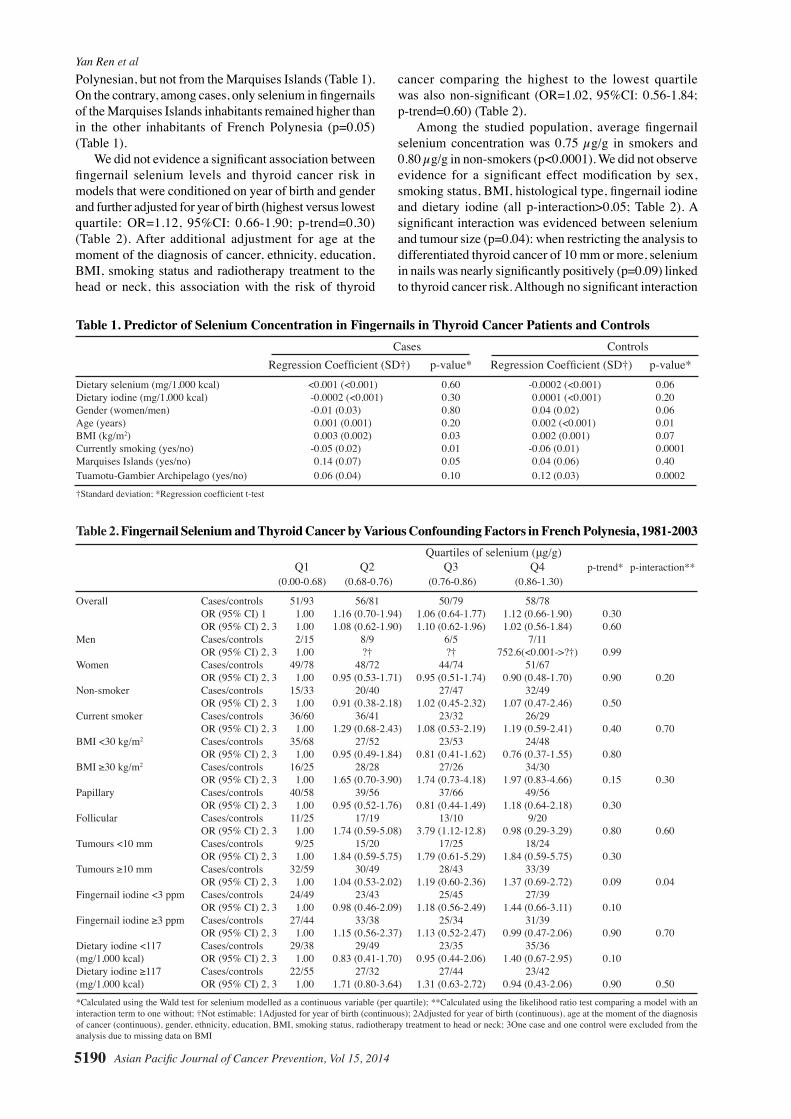
Yan Ren et al
Asian Pacific Journal of Cancer Prevention, Vol 15, 20145190
Table 2. Fingernail Selenium and Thyroid Cancer by Various Confounding Factors in French Polynesia, 1981-2003 Quartiles of selenium (μg/g) Q1 Q2 Q3 Q4 p-trend* p-interaction** (0.00-0.68) (0.68-0.76) (0.76-0.86) (0.86-1.30)
Overall Cases/controls 51/93 56/81 50/79 58/78 OR (95% CI) 1 1.00 1.16 (0.70-1.94) 1.06 (0.64-1.77) 1.12 (0.66-1.90) 0.30 OR (95% CI) 2, 3 1.00 1.08 (0.62-1.90) 1.10 (0.62-1.96) 1.02 (0.56-1.84) 0.60 Men Cases/controls 2/15 8/9 6/5 7/11 OR (95% CI) 2, 3 1.00 ?† ?† 752.6(<0.001->?†) 0.99 Women Cases/controls 49/78 48/72 44/74 51/67 OR (95% CI) 2, 3 1.00 0.95 (0.53-1.71) 0.95 (0.51-1.74) 0.90 (0.48-1.70) 0.90 0.20Non-smoker Cases/controls 15/33 20/40 27/47 32/49 OR (95% CI) 2, 3 1.00 0.91 (0.38-2.18) 1.02 (0.45-2.32) 1.07 (0.47-2.46) 0.50 Current smoker Cases/controls 36/60 36/41 23/32 26/29 OR (95% CI) 2, 3 1.00 1.29 (0.68-2.43) 1.08 (0.53-2.19) 1.19 (0.59-2.41) 0.40 0.70BMI <30 kg/m2 Cases/controls 35/68 27/52 23/53 24/48 OR (95% CI) 2, 3 1.00 0.95 (0.49-1.84) 0.81 (0.41-1.62) 0.76 (0.37-1.55) 0.80 BMI ≥30 kg/m2 Cases/controls 16/25 28/28 27/26 34/30 OR (95% CI) 2, 3 1.00 1.65 (0.70-3.90) 1.74 (0.73-4.18) 1.97 (0.83-4.66) 0.15 0.30Papillary Cases/controls 40/58 39/56 37/66 49/56 OR (95% CI) 2, 3 1.00 0.95 (0.52-1.76) 0.81 (0.44-1.49) 1.18 (0.64-2.18) 0.30 Follicular Cases/controls 11/25 17/19 13/10 9/20 OR (95% CI) 2, 3 1.00 1.74 (0.59-5.08) 3.79 (1.12-12.8) 0.98 (0.29-3.29) 0.80 0.60Tumours <10 mm Cases/controls 9/25 15/20 17/25 18/24 OR (95% CI) 2, 3 1.00 1.84 (0.59-5.75) 1.79 (0.61-5.29) 1.84 (0.59-5.75) 0.30 Tumours ≥10 mm Cases/controls 32/59 30/49 28/43 33/39 OR (95% CI) 2, 3 1.00 1.04 (0.53-2.02) 1.19 (0.60-2.36) 1.37 (0.69-2.72) 0.09 0.04Fingernail iodine <3 ppm Cases/controls 24/49 23/43 25/45 27/39 OR (95% CI) 2, 3 1.00 0.98 (0.46-2.09) 1.18 (0.56-2.49) 1.44 (0.66-3.11) 0.10 Fingernail iodine ≥3 ppm Cases/controls 27/44 33/38 25/34 31/39 OR (95% CI) 2, 3 1.00 1.15 (0.56-2.37) 1.13 (0.52-2.47) 0.99 (0.47-2.06) 0.90 0.70Dietary iodine <117 Cases/controls 29/38 29/49 23/35 35/36 (mg/1,000 kcal) OR (95% CI) 2, 3 1.00 0.83 (0.41-1.70) 0.95 (0.44-2.06) 1.40 (0.67-2.95) 0.10 Dietary iodine ≥117 Cases/controls 22/55 27/32 27/44 23/42 (mg/1,000 kcal) OR (95% CI) 2, 3 1.00 1.71 (0.80-3.64) 1.31 (0.63-2.72) 0.94 (0.43-2.06) 0.90 0.50
*Calculated using the Wald test for selenium modelled as a continuous variable (per quartile); **Calculated using the likelihood ratio test comparing a model with an interaction term to one without; †Not estimable; 1Adjusted for year of birth (continuous); 2Adjusted for year of birth (continuous), age at the moment of the diagnosis of cancer (continuous), gender, ethnicity, education, BMI, smoking status, radiotherapy treatment to head or neck; 3One case and one control were excluded from the analysis due to missing data on BMI
Table 1. Predictor of Selenium Concentration in Fingernails in Thyroid Cancer Patients and Controls Cases Controls Regression Coefficient (SD†) p-value* Regression Coefficient (SD†) p-value*Dietary selenium (mg/1,000 kcal) <0.001 (<0.001) 0.60 -0.0002 (<0.001) 0.06Dietary iodine (mg/1,000 kcal) -0.0002 (<0.001) 0.30 0.0001 (<0.001) 0.20Gender (women/men) -0.01 (0.03) 0.80 0.04 (0.02) 0.06Age (years) 0.001 (0.001) 0.20 0.002 (<0.001) 0.01BMI (kg/m2) 0.003 (0.002) 0.03 0.002 (0.001) 0.07Currently smoking (yes/no) -0.05 (0.02) 0.01 -0.06 (0.01) 0.0001Marquises Islands (yes/no) 0.14 (0.07) 0.05 0.04 (0.06) 0.40Tuamotu-Gambier Archipelago (yes/no) 0.06 (0.04) 0.10 0.12 (0.03) 0.0002
†Standard deviation; *Regression coefficient t-test
Polynesian, but not from the Marquises Islands (Table 1). On the contrary, among cases, only selenium in fingernails of the Marquises Islands inhabitants remained higher than in the other inhabitants of French Polynesia (p=0.05) (Table 1). We did not evidence a significant association between fingernail selenium levels and thyroid cancer risk in models that were conditioned on year of birth and gender and further adjusted for year of birth (highest versus lowest quartile: OR=1.12, 95%CI: 0.66-1.90; p-trend=0.30) (Table 2). After additional adjustment for age at the moment of the diagnosis of cancer, ethnicity, education, BMI, smoking status and radiotherapy treatment to the head or neck, this association with the risk of thyroid
cancer comparing the highest to the lowest quartile was also non-significant (OR=1.02, 95%CI: 0.56-1.84; p-trend=0.60) (Table 2). Among the studied population, average fingernail selenium concentration was 0.75 µg/g in smokers and 0.80 µg/g in non-smokers (p<0.0001). We did not observe evidence for a significant effect modification by sex, smoking status, BMI, histological type, fingernail iodine and dietary iodine (all p-interaction>0.05; Table 2). A significant interaction was evidenced between selenium and tumour size (p=0.04): when restricting the analysis to differentiated thyroid cancer of 10 mm or more, selenium in nails was nearly significantly positively (p=0.09) linked to thyroid cancer risk. Although no significant interaction
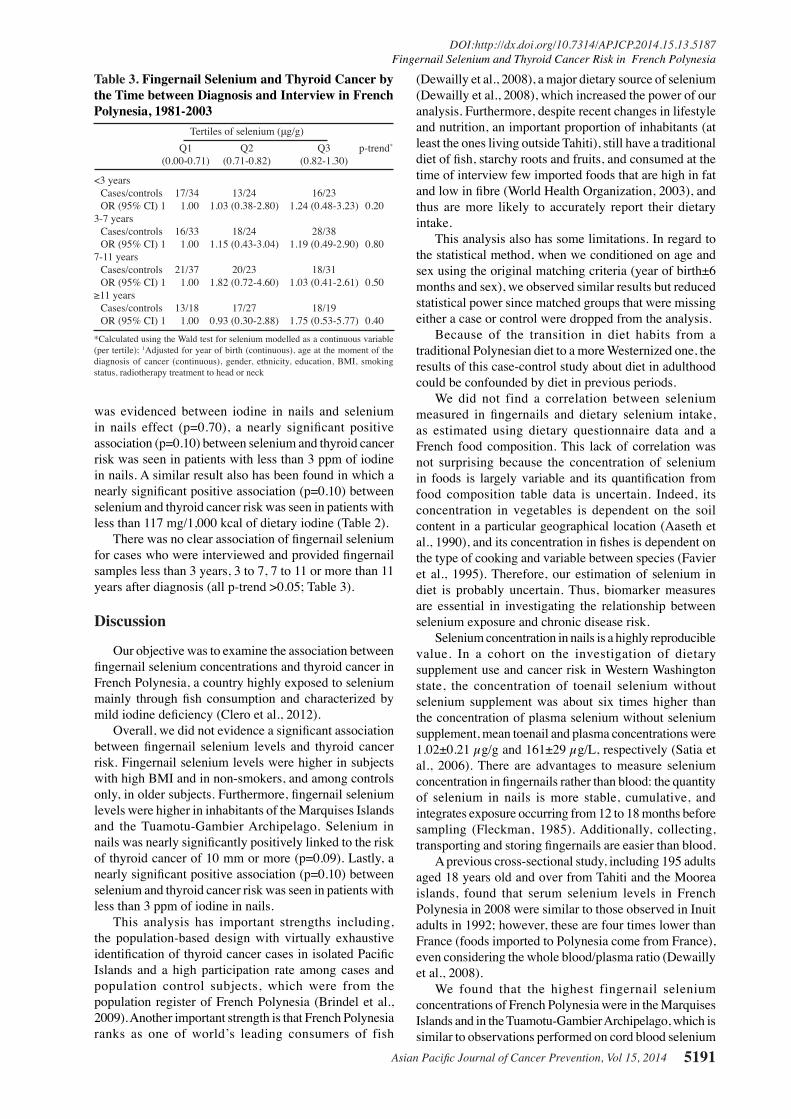
Asian Pacific Journal of Cancer Prevention, Vol 15, 2014 5191
DOI:http://dx.doi.org/10.7314/APJCP.2014.15.13.5187Fingernail Selenium and Thyroid Cancer Risk in French Polynesia
was evidenced between iodine in nails and selenium in nails effect (p=0.70), a nearly significant positive association (p=0.10) between selenium and thyroid cancer risk was seen in patients with less than 3 ppm of iodine in nails. A similar result also has been found in which a nearly significant positive association (p=0.10) between selenium and thyroid cancer risk was seen in patients with less than 117 mg/1,000 kcal of dietary iodine (Table 2). There was no clear association of fingernail selenium for cases who were interviewed and provided fingernail samples less than 3 years, 3 to 7, 7 to 11 or more than 11 years after diagnosis (all p-trend >0.05; Table 3).
Discussion
Our objective was to examine the association between fingernail selenium concentrations and thyroid cancer in French Polynesia, a country highly exposed to selenium mainly through fish consumption and characterized by mild iodine deficiency (Clero et al., 2012).
Overall, we did not evidence a significant association between fingernail selenium levels and thyroid cancer risk. Fingernail selenium levels were higher in subjects with high BMI and in non-smokers, and among controls only, in older subjects. Furthermore, fingernail selenium levels were higher in inhabitants of the Marquises Islands and the Tuamotu-Gambier Archipelago. Selenium in nails was nearly significantly positively linked to the risk of thyroid cancer of 10 mm or more (p=0.09). Lastly, a nearly significant positive association (p=0.10) between selenium and thyroid cancer risk was seen in patients with less than 3 ppm of iodine in nails.
This analysis has important strengths including, the population-based design with virtually exhaustive identification of thyroid cancer cases in isolated Pacific Islands and a high participation rate among cases and population control subjects, which were from the population register of French Polynesia (Brindel et al., 2009). Another important strength is that French Polynesia ranks as one of world’s leading consumers of fish
(Dewailly et al., 2008), a major dietary source of selenium (Dewailly et al., 2008), which increased the power of our analysis. Furthermore, despite recent changes in lifestyle and nutrition, an important proportion of inhabitants (at least the ones living outside Tahiti), still have a traditional diet of fish, starchy roots and fruits, and consumed at the time of interview few imported foods that are high in fat and low in fibre (World Health Organization, 2003), and thus are more likely to accurately report their dietary intake.
This analysis also has some limitations. In regard to the statistical method, when we conditioned on age and sex using the original matching criteria (year of birth±6 months and sex), we observed similar results but reduced statistical power since matched groups that were missing either a case or control were dropped from the analysis.
Because of the transition in diet habits from a traditional Polynesian diet to a more Westernized one, the results of this case-control study about diet in adulthood could be confounded by diet in previous periods.
We did not find a correlation between selenium measured in fingernails and dietary selenium intake, as estimated using dietary questionnaire data and a French food composition. This lack of correlation was not surprising because the concentration of selenium in foods is largely variable and its quantification from food composition table data is uncertain. Indeed, its concentration in vegetables is dependent on the soil content in a particular geographical location (Aaseth et al., 1990), and its concentration in fishes is dependent on the type of cooking and variable between species (Favier et al., 1995). Therefore, our estimation of selenium in diet is probably uncertain. Thus, biomarker measures are essential in investigating the relationship between selenium exposure and chronic disease risk.
Selenium concentration in nails is a highly reproducible value. In a cohort on the investigation of dietary supplement use and cancer risk in Western Washington state, the concentration of toenail selenium without selenium supplement was about six times higher than the concentration of plasma selenium without selenium supplement, mean toenail and plasma concentrations were 1.02±0.21 µg/g and 161±29 µg/L, respectively (Satia et al., 2006). There are advantages to measure selenium concentration in fingernails rather than blood: the quantity of selenium in nails is more stable, cumulative, and integrates exposure occurring from 12 to 18 months before sampling (Fleckman, 1985). Additionally, collecting, transporting and storing fingernails are easier than blood.
A previous cross-sectional study, including 195 adults aged 18 years old and over from Tahiti and the Moorea islands, found that serum selenium levels in French Polynesia in 2008 were similar to those observed in Inuit adults in 1992; however, these are four times lower than France (foods imported to Polynesia come from France), even considering the whole blood/plasma ratio (Dewailly et al., 2008).
We found that the highest fingernail selenium concentrations of French Polynesia were in the Marquises Islands and in the Tuamotu-Gambier Archipelago, which is similar to observations performed on cord blood selenium
Table 3. Fingernail Selenium and Thyroid Cancer by the Time between Diagnosis and Interview in French Polynesia, 1981-2003 Tertiles of selenium (μg/g) Q1 Q2 Q3 p-trend*
(0.00-0.71) (0.71-0.82) (0.82-1.30)
<3 years Cases/controls 17/34 13/24 16/23 OR (95% CI) 1 1.00 1.03 (0.38-2.80) 1.24 (0.48-3.23) 0.203-7 years Cases/controls 16/33 18/24 28/38 OR (95% CI) 1 1.00 1.15 (0.43-3.04) 1.19 (0.49-2.90) 0.807-11 years Cases/controls 21/37 20/23 18/31 OR (95% CI) 1 1.00 1.82 (0.72-4.60) 1.03 (0.41-2.61) 0.50≥11 years Cases/controls 13/18 17/27 18/19 OR (95% CI) 1 1.00 0.93 (0.30-2.88) 1.75 (0.53-5.77) 0.40
*Calculated using the Wald test for selenium modelled as a continuous variable (per tertile); 1Adjusted for year of birth (continuous), age at the moment of the diagnosis of cancer (continuous), gender, ethnicity, education, BMI, smoking status, radiotherapy treatment to head or neck
Yan Ren et al
Asian Pacific Journal of Cancer Prevention, Vol 15, 20145192
0
25.0
50.0
75.0
100.0
New
ly d
iagn
osed
with
out
trea
tmen
t
New
ly d
iagn
osed
with
tre
atm
ent
Pers
iste
nce
or r
ecur
renc
e
Rem
issi
on
Non
e
Chem
othe
rapy
Radi
othe
rapy
Conc
urre
nt c
hem
orad
iatio
n
10.3
0
12.8
30.025.0
20.310.16.3
51.7
75.051.1
30.031.354.2
46.856.3
27.625.033.130.031.3
23.738.0
31.3
0
25.0
50.0
75.0
100.0
New
ly d
iagn
osed
with
out
trea
tmen
t
New
ly d
iagn
osed
with
tre
atm
ent
Pers
iste
nce
or r
ecur
renc
e
Rem
issi
on
Non
e
Chem
othe
rapy
Radi
othe
rapy
Conc
urre
nt c
hem
orad
iatio
n
10.3
0
12.8
30.025.0
20.310.16.3
51.7
75.051.1
30.031.354.2
46.856.3
27.625.033.130.031.3
23.738.0
31.3
concentration in French Polynesian new-borns in 2008 (Dewailly et al., 2008). These highest values are probably mostly attributable to higher seafood consumption, but the results shown in Table 1, in which the higher fingernail selenium values in controls living in the Tuamotu-Gambier Archipelago remains when adjusting for estimated dietary selenium intake, showing that other factors could interact, or that selenium level could be higher in the Tuamotu-Gambier Archipelago fishes. Because most of the fishes eaten in the atolls of the Tuamotu-Gambier Archipelago come from the lagoon, rather than the open sea like other archipelagos of French Polynesia, this result could be due to an under-estimation of selenium contents for lagoon fishes in food composition tables.
Among the studied population, fingernail selenium concentration averages in French Polynesian, 0.75 ppm in smokers and 0.80 ppm in non-smokers (p<0.0001), are very similar to those measured in other studies, and in particular in a large cohort study of US women, which have shown that toenail selenium was significantly reduced among cigarette smokers (M=0.75, SD=0.12, among 146 current smokers; and M=0.82, SD=0.16, among 311 never smokers; p<0.001) (Hunter et al., 1990).
We found a positive relationship between BMI and selenium in fingernails, both in cases and controls (Table 1). Our result is in opposition with most European surveys(Arnaud et al., 2006; Meplan et al., 2007; Ortega et al., 2012) or US populations (Bleys et al., 2009), in which obese patients have lower serum selenium concentration, but in agreement with Dewailly’s survey of a French Polynesian sampling in which selenium concentration in blood was positively linked to BMI (Dewailly et al., 2008), the regression coefficient (β) being 0.02, i.e. ten times higher than in our study, among the controls (β=0.002). A possible explication is that in the general population, BMI has a trend to rise with age, if we do not consider extreme ages. Furthermore, older people have more possibilities to eat traditional food, which is rich in selenium.
There may be a range of selenium that offers optimal protection against cancer development in general, as a deficiency in selenium has been associated with an increased risk of cancer, this association having been evidenced for selenium in hair and nails and prostate cancer in Malaysia (Karimi et al., 2012), and selenium in serum and, respectively bladder carcinoma in China (Guo et al., 2012), and breast cancer in India (Singh et al., 2005). In the latter case-control study, it has been estimated that each increase of one μ mol/l of selenium was associated to decrease in 7% of breast cancer risk (Singh et al., 2005). Nevertheless, selenium supplementation may reduce cancer risk only in selenium-deficient individuals.
Few studies have examined the association between selenium and thyroid cancer risk, however, we haven’t found association between fingernail selenium and thyroid cancer risk in our results. In a case-control study of 43 cases and 129 matched controls in Norway, prediagnostic serum selenium levels were inversely associated with thyroid cancer; levels ≤1.25 and 1.26-1.64 μmol/l were associated with a 7.70- and 6.10-fold increased risk of thyroid cancer compared to levels ≥1.65 μmol/l (Glattre et al., 1989). This case-control study also showed, when
considering the delay from blood sampling to diagnosis of the case, that the protective effect of high serum selenium concentrations was restricted to the seven-year period prior to the diagnosis of thyroid cancer, because the serum selenium concentration of cases tended to decrease, relatively to controls, when the delay from blood sampling to the diagnosis was shorter. Similarly, in an Austrian survey the average selenium blood concentration was 1.14 µmol/l in 554 healthy controls, 0.97 µmol/l in 42 patients with follicular thyroid carcinoma and 1.02 µmol/l in 73 patients with papillary thyroid carcinoma (Moncayo et al., 2008).
Our study did not evidence a significant association between fingernail selenium levels and thyroid cancer, even when considering only patients for which the delay between cancer diagnosis and nails sample was less than seven or less than three years (Table 3). It has to be noted that over a period of six years, selenium in toenails was one of the most reproducible trace elements (Garland et al., 1993). Therefore, our non-significant results are probably not due to the fact that we investigated post-diagnosis selenium levels rather than prediagnosis ones, except if thyroid cancer, by itself, modifies selenium level in nails. A possible explication for the lack of association could be the iodine status of French Polynesians, who could be less frequently iodine deficient than Norwegians because selenium acts synergistically with iodine. These results could nevertheless also be due to the fact that fingernail samplings among cases were performed after thyroid cancer diagnosis and therefore during thyroid hormone substitution treatment, such as levothyrox, which could interact with selenium. Indeed, all three mono-deiodinase enzymes are selenium-dependent and are involved in thyroid hormone regulation. In this way, selenium status may affect both thyroid hormone homeostasis and iodine availability (Cann et al., 2000; Brauer et al., 2006; Köhrle and Gärtner, 2009). Lastly, we evidenced a nearly significant positive association (p=0.15) between fingernail selenium and thyroid cancer risk in patients with more than 30 kg/m2 BMI (Table 2). This result has to be considered with caution because it is nearly significant, but it could be due to some specificity of obese patients.
Because cigarette smoking has been shown to be inversely associated with both selenium status(Lloyd et al., 1983) and thyroid cancer risk (Meinhold et al., 2010), it was important to adequately control for these exposures in our analysis. Despite having evidenced a lower selenium status in smokers than in non-smokers, we failed to show an interaction between fingernail selenium levels, smoking habit and thyroid cancer risk: both in smokers and non-smokers, selenium status did not influence thyroid cancer risk. Nevertheless, it should be noted that such interaction tests are not very powerful in our study, given the number of patients.
In summary, our results do not support, among individuals with sufficient levels of selenium, that greater long-term exposure to selenium may reduce thyroid cancer risk. Because these findings are based on post-diagnostic measures, studies with prediagnostic selenium are needed for corroboration.
Asian Pacific Journal of Cancer Prevention, Vol 15, 2014 5193
DOI:http://dx.doi.org/10.7314/APJCP.2014.15.13.5187Fingernail Selenium and Thyroid Cancer Risk in French Polynesia
Acknowledgements
This study was supported by the Association pour la Recherche contre le Cancer, the Ligue Nationale Contre le Cancer, the Direction Generale de la Sante, the Comite de radioprotection de Electricite de France, Agence Française de Securite Sanitaire et Environnementale et du Travail, CHILD-THYR EEC programme and the Fondation de France.
The first author Yan Ren has a scholarship from the Fondation de France for her Ph.D study.
References
Aaseth J, Frey H, Glattre E, et al (1990). Selenium concentrations in the human thyroid gland. Biol Trace Elem Res, 24, 147-52.
Adjadj E, Schlumberger M, de Vathaire F (2009). Germ-line DNA polymorphisms and susceptibility to differentiated thyroid cancer. Lancet Oncol, 10, 181-90.
Arnaud J, Bertrais S, Roussel AM, et al (2006). Serum selenium determinants in French adults: the SU.VI.M.AX study. Brit J Nutr, 95, 313-20.
Bleys J, Navas-Acien A, Laclaustra M, et al (2009). Serum selenium and peripheral arterial disease: results from the national health and nutrition examination survey, 2003-2004. Am J Epidemiol, 169, 996-1003.
Brauer VF, Schweizer U, Köhrle J, Paschke R (2006). Selenium and goiter prevalence in borderline iodine sufficiency. Eur J Endocrinol, 155, 807-12.
Brindel P, Doyon F, De Vathaire F, et al (2008). Menstrual and reproductive factors in the risk of differentiated thyroid carcinoma in native women in French Polynesia: a population-based case-control study. Am J Epidemiol, 28, 219-29.
Brindel P, Doyon F, De Vathaire F, et al (2009). Anthropometric factors in differentiated thyroid cancer in French Polynesia: a case-control study. Cancer Causes Control, 20, 581-90.
Brindel P, Doyon F, De Vathaire F, et al (2010). Family history of thyroid cancer and the risk of thyroid cancer in French Polynesia. Thyroid, 20, 393-400.
Cann SA, van Netten JP, van Netten C (2000). Hypothesis: iodine, selenium and the development of breast cancer. Cancer Causes Control, 11, 121-7.
Clark LC, Combs GF, Turnbull BW, et al (1996). Effects of selenium supplementation for cancer prevention in patients with carcinoma of the skin. A randomized controlled trial. Nutritional prevention of cancer study group. JAMA, 276, 1957-63.
Clero E, Doyon F, De Vathaire F, et al (2012). Dietary iodine and thyroid cancer risk in French Polynesia: a case-control study. Thyroid, 22, 422-9.
Clero E, Leux C, De Vathaire F, et al (2010). Pooled analysis of two case-control studies in New Caledonia and French Polynesia of body mass index and differentiated thyroid cancer: the importance of body surface area. Thyroid, 20, 1285-93.
De Vathaire F, Drozdovitch V, Brindel P, et al (2010). Thyroid cancer following nuclear tests in French Polynesia. Brit J Cancer, 103, 1115-21.
Dewailly E, Château-Degat L, Suhas E (2008). Fish consumption and health in French Polynesia. Asia Pac J Clin Nutr, 17, 86-93.
Dewailly E, Suhas E, Mou Y, et al (2008). High fish consumption in French Polynesia and prenatal exposure to metals and nutrients. Asia Pac J Clin Nutr, 17, 461-70.
Dignan C, Burlingame B, Kumar S, Aalbersberg W (2004). The
Pacific Islands food composition tables - second edition. Rome: FAO.
Duffield-Lillico AJ, Reid ME, Turnbull BW, et al (2002). Baseline characteristics and the effect of selenium supplementation on cancer incidence in a randomized clinical trial: a summary report of the nutritional prevention of cancer trial. Cancer Epidemiol Biomarkers Prev, 11, 630-9.
Elwaer N, Hintelmann H (2007). Comparative performance study of different sample introduction techniques for rapid and precise selenium isotope ratio determination using multi-collector inductively coupled plasma mass spectrometry (MC-ICP/MS). Anal Bioanal Chem, 389, 1889-99.
Fairweather-Tait SJ, Bao Y, Broadley MR, et al (2011). Selenium in human health and disease. Antioxid Redox Signal, 14, 1337-83.
Favier JC, Ireland-Ripert J, Toque C, Feinberg M (1995). Repertoire general des aliments. Table de composition [Food composition tables] CIQUAL-REGAL. Paris: Tec & Doc Lavoisier and INRA.
Fleckman P (1985). Anatomy and physiology of the nail. Dermatol Clin, 3, 373-81.
Garland M, Morris JS, Rosner BA, et al (1993). Toenail trace element levels as biomarkers: reproducibility over a 6-year period. Cancer Epidemiol Biomarkers Prev, 2, 493-7.
Glattre E, Thomassen Y, Thoresen SO, et al (1989). Prediagnostic serum selenium in a case-control study of thyroid cancer. Int J Epidemiol, 18, 45-9.
Gudmundsson J, Sulem P, Gudbjartsson D, et al (2009). Common variants on 9q22.33 and 14q13.3 predispose to thyroid cancer in European populations. Nat Genet, 41, 460-4.
Guo KF, Zhang Z, Wang JY, et al (2012). Variation of urinary and serum trace elements (Ca, Zn, Cu, Se) in bladder carcinoma in China. Asian Pac J Cancer Prev, 13, 2057-61.
Hunter DJ, Morris JS, Willett WC, et al (1990). Predictors of selenium concentration in human toenails. Am J Epidemiol, 132, 114-22.
Jung HJ, Seo YR (2010). Current issues of selenium in cancer chemoprevention. Biofactors, 36, 153-8.
Karimi G, Shahar S, Homayouni N, et al (2012). Association between trace element and heavy metal levels in hair and nail with prostate cancer. Asian Pac J Cancer Prev, 13, 4249-53.
Kato MA, Finley DJ, Lubitz CC, et al (2010). Selenium decreases thyroid cancer cell growth by increasing expression of GADD153 and GADD34. Nutr Cancer, 62, 66-73.
Köhrle J, Gärtner R (2009). Selenium and thyroid. Best Pract Res Clin Endocrinol Metab, 23, 815-27.
Lloyd B, Lloyd RS, Clayton BE (1983). Effect of smoking, alcohol and other factors on the selenium status of a healthy population. J Epidemiol Community Health, 37, 213-17.
Meinhold CL, Ron E, Schonfeld SJ, et al (2010). Nonradiation risk factors for thyroid cancer in the US radiologic technologists study. Am J Epidemiol, 171, 242-52.
Meplan C, Crosley LK, Nicol F, et al (2007). Genetic polymorphisms in the human selenoprotein P gene determine the response of selenoprotein markers to selenium supplementation in a gender-specific manner (the SELGEN study). FASEB J, 21, 3063-74.
Moncayo R, Kroiss A, Oberwinkler M, et al (2008). The role of selenium, vitamin C, and zinc in benign thyroid diseases and of selenium in malignant thyroid diseases: low selenium levels are found in subacute and silent thyroiditis and in papillary and follicular carcinoma. BMC Endocr Disord, 8, 2.
Moore MA, Baumann F, Foliaki S, et al (2010). Cancer epidemiology in the Pacific Islands - past, present and future. Asian Pac J Cancer Prev, 11, 99-106.
Ortega RM, Rodríguez-Rodríguez E, Aparicio A, et al (2012). Young children with excess of weight show an impaired
Yan Ren et al
Asian Pacific Journal of Cancer Prevention, Vol 15, 20145194
selenium status. Int J Vitam Nutr Res, 82, 121-9. Ron E, Schneider AB (2006). Thyroid cancer. In: Schottenfeld D,
Fraumeni J, editors. Cancer Epidemiology and Prevention. Oxford University Press, New York: pp. 975-94.
Satia JA, King IB, Morris JS, Stratton K, White E (2006). Toenail and plasma levels as biomarkers of selenium exposure. Ann Epidemiol, 16, 53-8.
Singh P, Kapil U, Shukla NK, Deo S, Dwivedi SN (2005). Association between breast cancer and vitamin C, vitamin E and selenium levels: results of a case-control study in India. Asian Pac J Cancer Prev, 6, 177-80.
Willett WC, Polk BF, Morris JS, et al (1983). Prediagnostic serum selenium and risk of cancer. Lancet, 2, 130-4.
World Health Organization (2003). Diet, food supply and obesity in the Pacific. Geneva: regional office for the Western Pacific.
Xhaard C, Ren Y, Clero E, et al (2014). Differentiated thyroid carcinoma risk factors in French Polynesia. Asian Pac J Cancer Prev, 15, 2675-80.
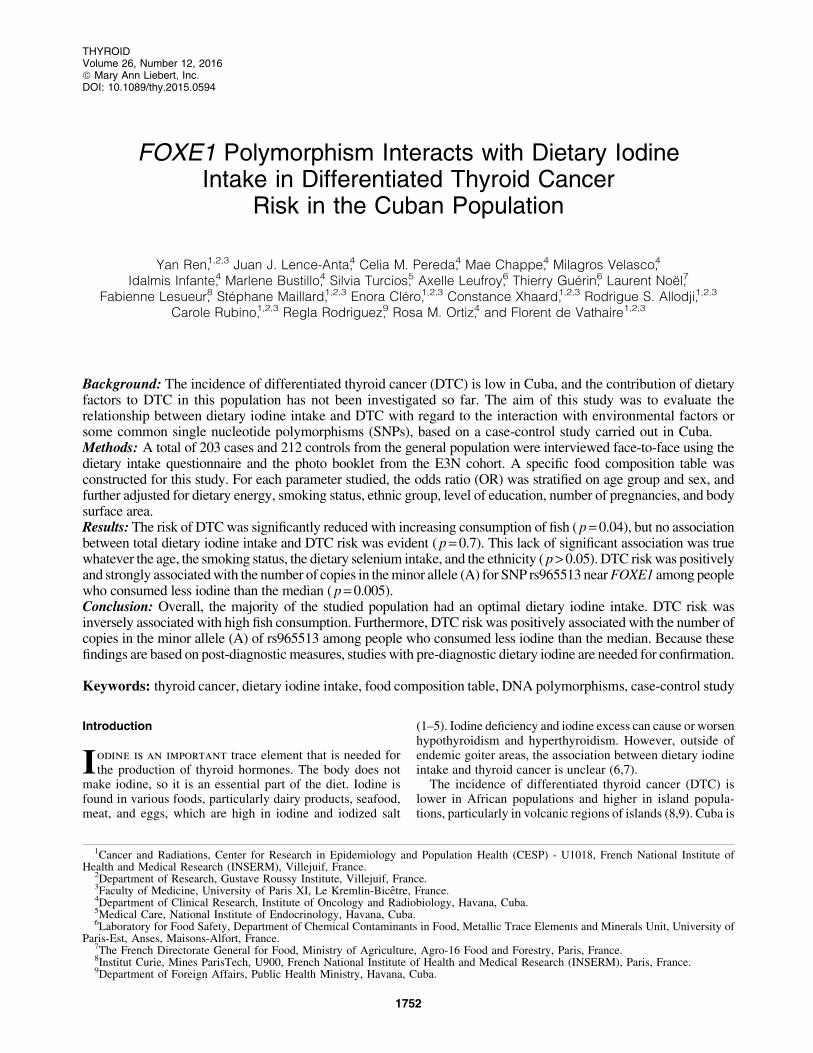
FOXE1 Polymorphism Interacts with Dietary IodineIntake in Differentiated Thyroid Cancer
Risk in the Cuban Population
Yan Ren,1,2,3 Juan J. Lence-Anta,4 Celia M. Pereda,4 Mae Chappe,4 Milagros Velasco,4
Idalmis Infante,4 Marlene Bustillo,4 Silvia Turcios,5 Axelle Leufroy,6 Thierry Guerin,6 Laurent Noel,7
Fabienne Lesueur,8 Stephane Maillard,1,2,3 Enora Clero,1,2,3 Constance Xhaard,1,2,3 Rodrigue S. Allodji,1,2,3
Carole Rubino,1,2,3 Regla Rodriguez,9 Rosa M. Ortiz,4 and Florent de Vathaire1,2,3
Background: The incidence of differentiated thyroid cancer (DTC) is low in Cuba, and the contribution of dietaryfactors to DTC in this population has not been investigated so far. The aim of this study was to evaluate therelationship between dietary iodine intake and DTC with regard to the interaction with environmental factors orsome common single nucleotide polymorphisms (SNPs), based on a case-control study carried out in Cuba.Methods: A total of 203 cases and 212 controls from the general population were interviewed face-to-face using thedietary intake questionnaire and the photo booklet from the E3N cohort. A specific food composition table wasconstructed for this study. For each parameter studied, the odds ratio (OR) was stratified on age group and sex, andfurther adjusted for dietary energy, smoking status, ethnic group, level of education, number of pregnancies, and bodysurface area.Results: The risk of DTC was significantly reduced with increasing consumption of fish ( p = 0.04), but no associationbetween total dietary iodine intake and DTC risk was evident ( p = 0.7). This lack of significant association was truewhatever the age, the smoking status, the dietary selenium intake, and the ethnicity ( p > 0.05). DTC risk was positivelyand strongly associated with the number of copies in the minor allele (A) for SNP rs965513 near FOXE1 among peoplewho consumed less iodine than the median ( p = 0.005).Conclusion: Overall, the majority of the studied population had an optimal dietary iodine intake. DTC risk wasinversely associated with high fish consumption. Furthermore, DTC risk was positively associated with the number ofcopies in the minor allele (A) of rs965513 among people who consumed less iodine than the median. Because thesefindings are based on post-diagnostic measures, studies with pre-diagnostic dietary iodine are needed for confirmation.
Keywords: thyroid cancer, dietary iodine intake, food composition table, DNA polymorphisms, case-control study
Introduction
Iodine is an important trace element that is needed forthe production of thyroid hormones. The body does not
make iodine, so it is an essential part of the diet. Iodine isfound in various foods, particularly dairy products, seafood,meat, and eggs, which are high in iodine and iodized salt
(1–5). Iodine deficiency and iodine excess can cause or worsenhypothyroidism and hyperthyroidism. However, outside ofendemic goiter areas, the association between dietary iodineintake and thyroid cancer is unclear (6,7).
The incidence of differentiated thyroid cancer (DTC) islower in African populations and higher in island popula-tions, particularly in volcanic regions of islands (8,9). Cuba is
1Cancer and Radiations, Center for Research in Epidemiology and Population Health (CESP) - U1018, French National Institute ofHealth and Medical Research (INSERM), Villejuif, France.
2Department of Research, Gustave Roussy Institute, Villejuif, France.3Faculty of Medicine, University of Paris XI, Le Kremlin-Bicetre, France.4Department of Clinical Research, Institute of Oncology and Radiobiology, Havana, Cuba.5Medical Care, National Institute of Endocrinology, Havana, Cuba.6Laboratory for Food Safety, Department of Chemical Contaminants in Food, Metallic Trace Elements and Minerals Unit, University of
Paris-Est, Anses, Maisons-Alfort, France.7The French Directorate General for Food, Ministry of Agriculture, Agro-16 Food and Forestry, Paris, France.8Institut Curie, Mines ParisTech, U900, French National Institute of Health and Medical Research (INSERM), Paris, France.9Department of Foreign Affairs, Public Health Ministry, Havana, Cuba.
THYROIDVolume 26, Number 12, 2016ª Mary Ann Liebert, Inc.DOI: 10.1089/thy.2015.0594
1752
an island of 100,000 km2 where 35% of the population belongto the African ethnic group (10). Before colonization bySpain, Cuba was occupied by Native Americans who hadmigrated from the mainland of North, Central, and SouthAmerica several centuries before (11). Although thyroidcancer is the sixth most common female cancer in Cuba, itsincidence is quite low. Indeed, while in North America theworld age-standardized rate (ASR) of DTC incidence was10.0/100,000 in white females during the period 1998–2002(12), the ASR of DTC incidence in Cuba was around 4.1/100,000 for females and was even sixfold less frequent inmales in 2009 (13). For other Latin American countries suchas Colombia, the ASR of DTC incidence was 9.4/100,000 infemales during the period 1998–2002 (12). Why is DTC in-cidence low in Cuba? Is this situation related to dietary iodineintake or other dietary factors?
Up to now, no clear explanation for the low incidence ofDTC in the Cuban population has been established. Globally,the only highlighted risk factors for developing thyroidcancer are radiation exposure, having a family history ofthyroid cancer, residing in an iodine-deficient area, largebody size, and a high number of pregnancies (14–16). Theeffect of alcohol, green tea, coffee, and other food groups ornutrients on the risk of developing thyroid cancer has alsobeen investigated, but no significant associations have beenidentified (6,17).
It has been established that in endemic goiter areas withinsufficient iodine intake, the incidence of follicular thyroidcancer is higher than elsewhere (18). However, this has notbeen replicated in papillary cancer, which currently repre-sents >80% of DTCs in most countries, and 93% of the casesin this study, although overall goiter prevalence by palpationand inspection was 17.6% in Cuba, which corresponds to amild endemic goiter area. However, the median urinary io-dine concentration (UIC) of Cuban schoolchildren 6–11years of age was 176 lg/L in 2011 and 2012 (19), whichreflects adequate iodine intake (20), attributable to successfulsalt iodization. Nevertheless, until now, there has been noevidence to prove that iodine supplementation or excess di-etary iodine intake in general decrease papillary DTC risk.The debate, however, is complicated because iodine contentin food is very variable and, for the same food, depends onsoil, agricultural techniques, and meal preparation. In addi-tion, iodine is very volatile, and its measurement is still achallenge (4). For example, iodine content in cabbage wasestimated to be 0.000427 mg/100 g in Cuba (ANSES 2014food composition table), but 0.0007 mg/100 g in France(CIQUAL 2013 table) (21), and between 0.00026 and0.00037 mg/100 g in Cameroon, depending on the samples(22). These variations exist for all foods, even those rich iniodine such as shellfish. The iodine content ranged from0.056 mg/100 g depending on the type of shellfish in France(CIQUAL 2013 table) (21) to 0.50 mg/100 g in the MarshallIslands (23). In addition, iodine deficiency may also occurfrom interaction with other factors such as foods that are richin isothiocyanates (24).
Traditional Cuban food includes staple food such as potato,taro, yam, vegetable banana, rice, and spaghetti; meat such aschicken, pork, beef, and ham; eggs; vegetables such as wa-tercress, lettuce, tomato, red bean, and cabbage; fruits such asguava, mango, papaya, and banana; and fish or seafood such assardine, tuna (canned or fresh), lobster, crab, shrimp, and
shellfish. However, it is not clear whether dietary factorscontribute to thyroid cancer risk in the Cuban population.
Both NK2 homeobox 1 (NKX2-1, also called TTF1 forThyroid Transcription Factor 1) and Forkhead factor E1(FOXE1, also called TTF2 for Thyroid Transcription Factor 2)play a crucial role in the development of the thyroid gland, andtheir expression is modified in thyroid tumors (25–28). Thesingle nucleotide polymorphism (SNP) rs944289 of the NKX2-1 gene was reported to increase the risk of DTC (29, 30). TheSNP rs965513, rs1867277, and rs71369530 near or within theFOXE1 gene were identified in previous genome-wide asso-ciation studies (GWASs) as being associated with an increasedrisk of DTC (29–33). This study thus sought to investigate thecontribution of genetic variations at the NKX2-1 and FOXE1loci to the risk of DTC in the Cuban population.
To the best of the authors’ knowledge, this observationalstudy is the first to investigate dietary factors in the Cubanpopulation. The aims were to explore the role of specific foodgroups or items, especially in regard to iodine intake, in therisk of developing DTC, and to assess the possibility of in-teraction between environmental factors and some commonSNPs previously associated with DTC in the Cuban popula-tion. It was hypothesized, first, that fish consumption mayreduce the risk of DTC; second, that dietary iodine deficiencyand excess dietary iodine could be associated with an in-creasing risk of DTC; and third, that dietary iodine deficiencymay interact with FOXE1 due to its role in thyroid hor-mone pathways.
Materials and Methods
This population-based case-control study was carried outin Havana, Cuba. A detailed methodology and the results ofthe analysis of non-dietary risk factors have already beenpublished (34).
Consent
The Clinical Research Ethics Committee of the NationalInstitute of Oncology and Radiobiology (INOR; Havana,Cuba) revised and approved this study. Informed writtenconsent was obtained from all the study participants.
Study participants
All patients aged between 17 and 60 years who were livingin Havana and its surrounding areas and who were treated forDTC between 2003 and 2010 at INOR and at the Institute ofEndocrinology, Havana, were eligible for the study. Potentialcases were selected from the National Cancer Registry da-tabases (C73 ICD-10) and were cross-referenced with theINOR Pathology Register. On average, around 25–30 pa-tients corresponding to these criteria were identified for eachyear of the study period. Among the 240 eligible DTC cases,37 (15%) individuals were not interviewed because they hadan unknown address (n = 32) or refused to participate (n = 5).The final study population consisted of 203 cases.
A total of 229 controls were selected from the generalpopulation living in Havana city and its surroundings usingconsultation files from primary-care units (family doctors)and from workplaces with a general practitioner. Each con-trol was frequency matched with each case by age (–5 years)
FOXE1 SNP, DIETARY IODINE, AND THYROID CANCER RISK 1753
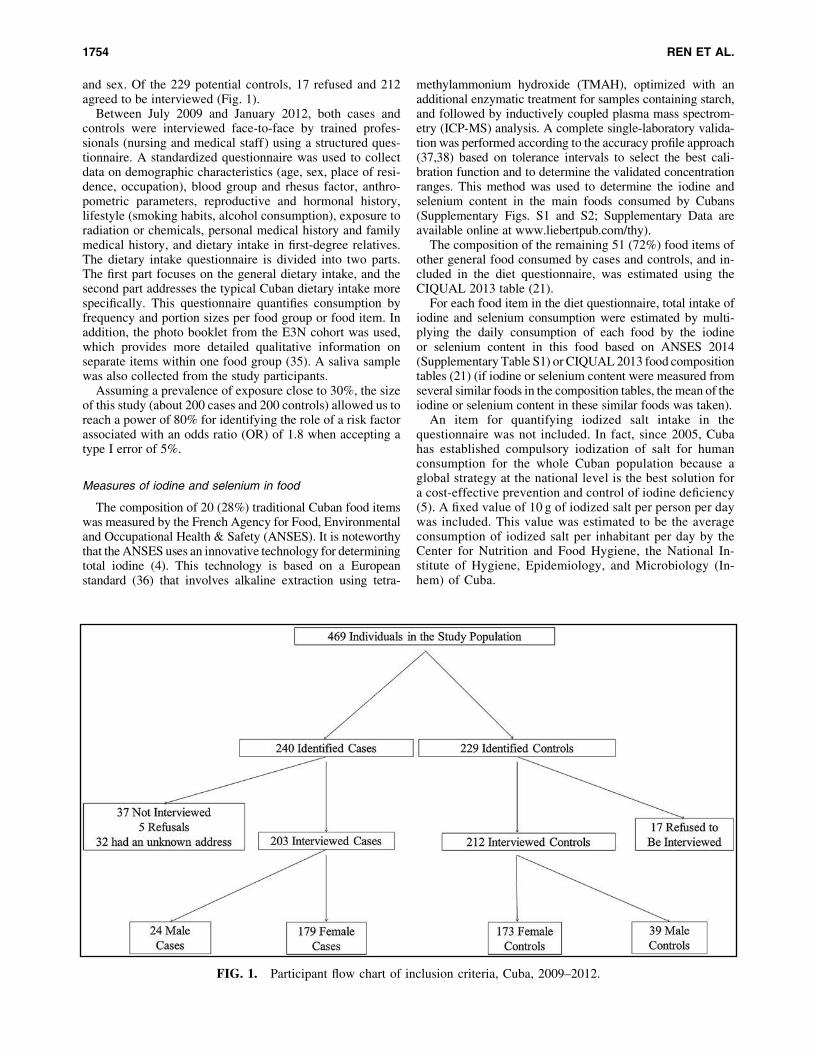
and sex. Of the 229 potential controls, 17 refused and 212agreed to be interviewed (Fig. 1).
Between July 2009 and January 2012, both cases andcontrols were interviewed face-to-face by trained profes-sionals (nursing and medical staff) using a structured ques-tionnaire. A standardized questionnaire was used to collectdata on demographic characteristics (age, sex, place of resi-dence, occupation), blood group and rhesus factor, anthro-pometric parameters, reproductive and hormonal history,lifestyle (smoking habits, alcohol consumption), exposure toradiation or chemicals, personal medical history and familymedical history, and dietary intake in first-degree relatives.The dietary intake questionnaire is divided into two parts.The first part focuses on the general dietary intake, and thesecond part addresses the typical Cuban dietary intake morespecifically. This questionnaire quantifies consumption byfrequency and portion sizes per food group or food item. Inaddition, the photo booklet from the E3N cohort was used,which provides more detailed qualitative information onseparate items within one food group (35). A saliva samplewas also collected from the study participants.
Assuming a prevalence of exposure close to 30%, the sizeof this study (about 200 cases and 200 controls) allowed us toreach a power of 80% for identifying the role of a risk factorassociated with an odds ratio (OR) of 1.8 when accepting atype I error of 5%.
Measures of iodine and selenium in food
The composition of 20 (28%) traditional Cuban food itemswas measured by the French Agency for Food, Environmentaland Occupational Health & Safety (ANSES). It is noteworthythat the ANSES uses an innovative technology for determiningtotal iodine (4). This technology is based on a Europeanstandard (36) that involves alkaline extraction using tetra-
methylammonium hydroxide (TMAH), optimized with anadditional enzymatic treatment for samples containing starch,and followed by inductively coupled plasma mass spectrom-etry (ICP-MS) analysis. A complete single-laboratory valida-tion was performed according to the accuracy profile approach(37,38) based on tolerance intervals to select the best cali-bration function and to determine the validated concentrationranges. This method was used to determine the iodine andselenium content in the main foods consumed by Cubans(Supplementary Figs. S1 and S2; Supplementary Data areavailable online at www.liebertpub.com/thy).
The composition of the remaining 51 (72%) food items ofother general food consumed by cases and controls, and in-cluded in the diet questionnaire, was estimated using theCIQUAL 2013 table (21).
For each food item in the diet questionnaire, total intake ofiodine and selenium consumption were estimated by multi-plying the daily consumption of each food by the iodineor selenium content in this food based on ANSES 2014(Supplementary Table S1) or CIQUAL 2013 food compositiontables (21) (if iodine or selenium content were measured fromseveral similar foods in the composition tables, the mean of theiodine or selenium content in these similar foods was taken).
An item for quantifying iodized salt intake in thequestionnaire was not included. In fact, since 2005, Cubahas established compulsory iodization of salt for humanconsumption for the whole Cuban population because aglobal strategy at the national level is the best solution fora cost-effective prevention and control of iodine deficiency(5). A fixed value of 10 g of iodized salt per person per daywas included. This value was estimated to be the averageconsumption of iodized salt per inhabitant per day by theCenter for Nutrition and Food Hygiene, the National In-stitute of Hygiene, Epidemiology, and Microbiology (In-hem) of Cuba.
FIG. 1. Participant flow chart of inclusion criteria, Cuba, 2009–2012.
1754 REN ET AL.
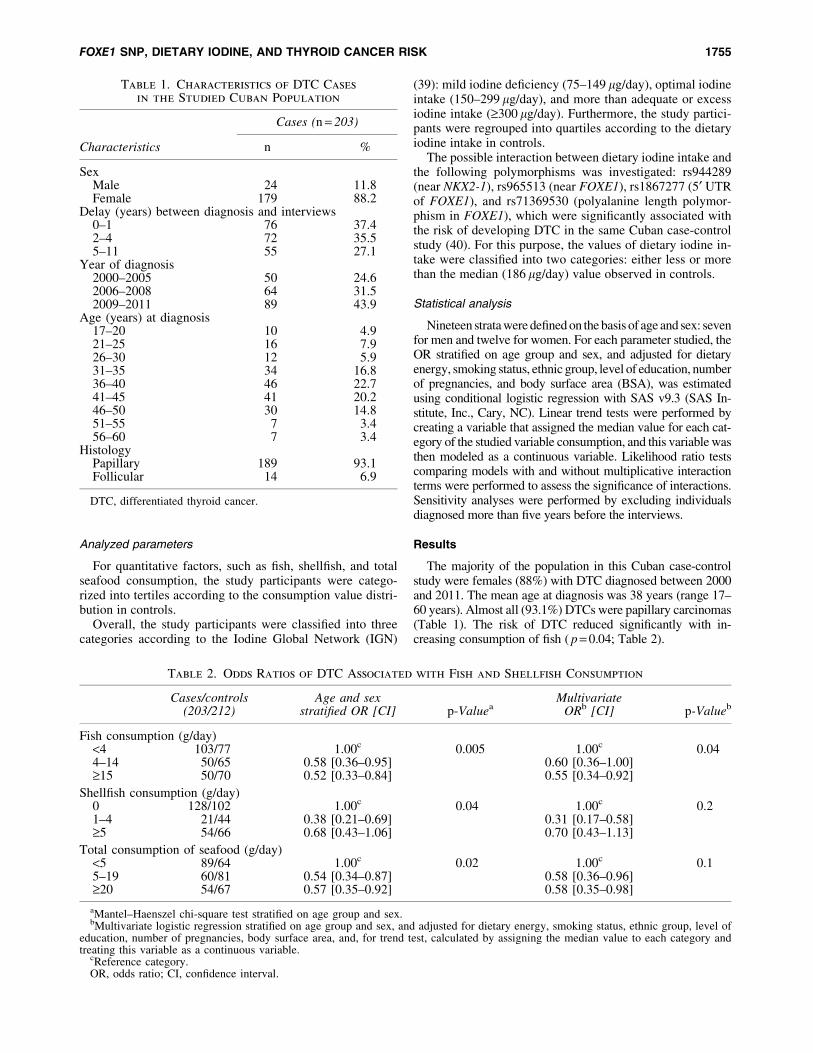
Analyzed parameters
For quantitative factors, such as fish, shellfish, and totalseafood consumption, the study participants were catego-rized into tertiles according to the consumption value distri-bution in controls.
Overall, the study participants were classified into threecategories according to the Iodine Global Network (IGN)
(39): mild iodine deficiency (75–149 lg/day), optimal iodineintake (150–299 lg/day), and more than adequate or excessiodine intake (‡300 lg/day). Furthermore, the study partici-pants were regrouped into quartiles according to the dietaryiodine intake in controls.
The possible interaction between dietary iodine intake andthe following polymorphisms was investigated: rs944289(near NKX2-1), rs965513 (near FOXE1), rs1867277 (5¢ UTRof FOXE1), and rs71369530 (polyalanine length polymor-phism in FOXE1), which were significantly associated withthe risk of developing DTC in the same Cuban case-controlstudy (40). For this purpose, the values of dietary iodine in-take were classified into two categories: either less or morethan the median (186 lg/day) value observed in controls.
Statistical analysis
Nineteen strata were defined on the basis of age and sex: sevenfor men and twelve for women. For each parameter studied, theOR stratified on age group and sex, and adjusted for dietaryenergy, smoking status, ethnic group, level of education, numberof pregnancies, and body surface area (BSA), was estimatedusing conditional logistic regression with SAS v9.3 (SAS In-stitute, Inc., Cary, NC). Linear trend tests were performed bycreating a variable that assigned the median value for each cat-egory of the studied variable consumption, and this variable wasthen modeled as a continuous variable. Likelihood ratio testscomparing models with and without multiplicative interactionterms were performed to assess the significance of interactions.Sensitivity analyses were performed by excluding individualsdiagnosed more than five years before the interviews.
Results
The majority of the population in this Cuban case-controlstudy were females (88%) with DTC diagnosed between 2000and 2011. The mean age at diagnosis was 38 years (range 17–60 years). Almost all (93.1%) DTCs were papillary carcinomas(Table 1). The risk of DTC reduced significantly with in-creasing consumption of fish ( p = 0.04; Table 2).
Table 1. Characteristics of DTC Cases
in the Studied Cuban Population
Characteristics
Cases (n = 203)
n %
SexMale 24 11.8Female 179 88.2
Delay (years) between diagnosis and interviews0–1 76 37.42–4 72 35.55–11 55 27.1
Year of diagnosis2000–2005 50 24.62006–2008 64 31.52009–2011 89 43.9
Age (years) at diagnosis17–20 10 4.921–25 16 7.926–30 12 5.931–35 34 16.836–40 46 22.741–45 41 20.246–50 30 14.851–55 7 3.456–60 7 3.4
HistologyPapillary 189 93.1Follicular 14 6.9
DTC, differentiated thyroid cancer.
Table 2. Odds Ratios of DTC Associated with Fish and Shellfish Consumption
Cases/controls(203/212)
Age and sexstratified OR [CI] p-Valuea
MultivariateORb [CI] p-Valueb
Fish consumption (g/day)<4 103/77 1.00c 0.005 1.00c 0.044–14 50/65 0.58 [0.36–0.95] 0.60 [0.36–1.00]‡15 50/70 0.52 [0.33–0.84] 0.55 [0.34–0.92]
Shellfish consumption (g/day)0 128/102 1.00c 0.04 1.00c 0.21–4 21/44 0.38 [0.21–0.69] 0.31 [0.17–0.58]‡5 54/66 0.68 [0.43–1.06] 0.70 [0.43–1.13]
Total consumption of seafood (g/day)<5 89/64 1.00c 0.02 1.00c 0.15–19 60/81 0.54 [0.34–0.87] 0.58 [0.36–0.96]‡20 54/67 0.57 [0.35–0.92] 0.58 [0.35–0.98]
aMantel–Haenszel chi-square test stratified on age group and sex.bMultivariate logistic regression stratified on age group and sex, and adjusted for dietary energy, smoking status, ethnic group, level of
education, number of pregnancies, body surface area, and, for trend test, calculated by assigning the median value to each category andtreating this variable as a continuous variable.
cReference category.OR, odds ratio; CI, confidence interval.
FOXE1 SNP, DIETARY IODINE, AND THYROID CANCER RISK 1755
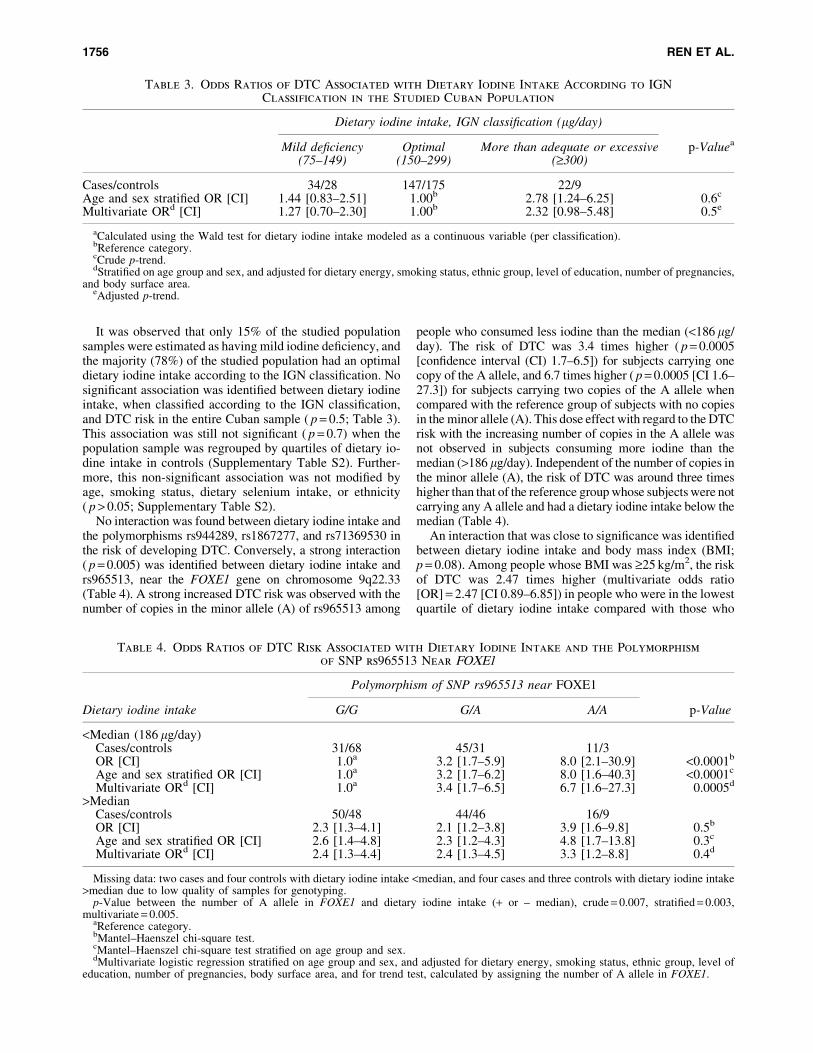
It was observed that only 15% of the studied populationsamples were estimated as having mild iodine deficiency, andthe majority (78%) of the studied population had an optimaldietary iodine intake according to the IGN classification. Nosignificant association was identified between dietary iodineintake, when classified according to the IGN classification,and DTC risk in the entire Cuban sample ( p = 0.5; Table 3).This association was still not significant ( p = 0.7) when thepopulation sample was regrouped by quartiles of dietary io-dine intake in controls (Supplementary Table S2). Further-more, this non-significant association was not modified byage, smoking status, dietary selenium intake, or ethnicity( p > 0.05; Supplementary Table S2).
No interaction was found between dietary iodine intake andthe polymorphisms rs944289, rs1867277, and rs71369530 inthe risk of developing DTC. Conversely, a strong interaction( p = 0.005) was identified between dietary iodine intake andrs965513, near the FOXE1 gene on chromosome 9q22.33(Table 4). A strong increased DTC risk was observed with thenumber of copies in the minor allele (A) of rs965513 among
people who consumed less iodine than the median (<186 lg/day). The risk of DTC was 3.4 times higher ( p = 0.0005[confidence interval (CI) 1.7–6.5]) for subjects carrying onecopy of the A allele, and 6.7 times higher ( p = 0.0005 [CI 1.6–27.3]) for subjects carrying two copies of the A allele whencompared with the reference group of subjects with no copiesin the minor allele (A). This dose effect with regard to the DTCrisk with the increasing number of copies in the A allele wasnot observed in subjects consuming more iodine than themedian (>186 lg/day). Independent of the number of copies inthe minor allele (A), the risk of DTC was around three timeshigher than that of the reference group whose subjects were notcarrying any A allele and had a dietary iodine intake below themedian (Table 4).
An interaction that was close to significance was identifiedbetween dietary iodine intake and body mass index (BMI;p = 0.08). Among people whose BMI was ‡25 kg/m2, the riskof DTC was 2.47 times higher (multivariate odds ratio[OR] = 2.47 [CI 0.89–6.85]) in people who were in the lowestquartile of dietary iodine intake compared with those who
Table 3. Odds Ratios of DTC Associated with Dietary Iodine Intake According to IGN
Classification in the Studied Cuban Population
Dietary iodine intake, IGN classification (lg/day)
p-ValueaMild deficiency Optimal More than adequate or excessive(75–149) (150–299) (‡300)
Cases/controls 34/28 147/175 22/9Age and sex stratified OR [CI] 1.44 [0.83–2.51] 1.00b 2.78 [1.24–6.25] 0.6c
Multivariate ORd [CI] 1.27 [0.70–2.30] 1.00b 2.32 [0.98–5.48] 0.5e
aCalculated using the Wald test for dietary iodine intake modeled as a continuous variable (per classification).bReference category.cCrude p-trend.dStratified on age group and sex, and adjusted for dietary energy, smoking status, ethnic group, level of education, number of pregnancies,
and body surface area.eAdjusted p-trend.
Table 4. Odds Ratios of DTC Risk Associated with Dietary Iodine Intake and the Polymorphism
of SNP rs965513 Near FOXE1
Dietary iodine intake
Polymorphism of SNP rs965513 near FOXE1
p-ValueG/G G/A A/A
<Median (186 lg/day)Cases/controls 31/68 45/31 11/3OR [CI] 1.0a 3.2 [1.7–5.9] 8.0 [2.1–30.9] <0.0001b
Age and sex stratified OR [CI] 1.0a 3.2 [1.7–6.2] 8.0 [1.6–40.3] <0.0001c
Multivariate ORd [CI] 1.0a 3.4 [1.7–6.5] 6.7 [1.6–27.3] 0.0005d
>MedianCases/controls 50/48 44/46 16/9OR [CI] 2.3 [1.3–4.1] 2.1 [1.2–3.8] 3.9 [1.6–9.8] 0.5b
Age and sex stratified OR [CI] 2.6 [1.4–4.8] 2.3 [1.2–4.3] 4.8 [1.7–13.8] 0.3c
Multivariate ORd [CI] 2.4 [1.3–4.4] 2.4 [1.3–4.5] 3.3 [1.2–8.8] 0.4d
Missing data: two cases and four controls with dietary iodine intake <median, and four cases and three controls with dietary iodine intake>median due to low quality of samples for genotyping.
p-Value between the number of A allele in FOXE1 and dietary iodine intake (+ or – median), crude = 0.007, stratified = 0.003,multivariate = 0.005.
aReference category.bMantel–Haenszel chi-square test.cMantel–Haenszel chi-square test stratified on age group and sex.dMultivariate logistic regression stratified on age group and sex, and adjusted for dietary energy, smoking status, ethnic group, level of
education, number of pregnancies, body surface area, and for trend test, calculated by assigning the number of A allele in FOXE1.
1756 REN ET AL.
were in the highest quartile, although this difference was notsignificant ( p = 0.1). This increase of DTC risk when de-creasing iodine intake was not observed in people with a BMI<25 kg/m2 (Supplementary Table S2).
Discussion
It was observed that the risk of DTC significantly de-creased with increasing consumption of fish in the Cubanpopulation. In addition, a strong increase in DTC risk wasfound with the number of copies in the minor allele (A) ofrs965513 near FOXE1 on chromosome 9q22.33 amongpeople who consumed less than the median value of iodine incontrols. Furthermore, the risk of DTC tended to be higheramong people whose BMI ‡25 kg/m2 and who were in thelowest quartile of dietary iodine intake.
The increasing number of eligible DTC cases in this studyfrom the first six years (n = 50) to the last three years (n = 89)was not related to technical developments in thyroid cancerdiagnosis (e.g., fine-needle aspiration). For cases diagnosedcloser to the year of their interview (between July 2009 andJanuary 2012), the reason was that their clinical and personaldossiers were more easily obtained. Furthermore, the chartscontained more precise information, and therefore thesecases were more likely to fulfill the inclusion criteria.
The present study is the first case-control study to focus onthe risk factors of DTC in the Cuban population. The foodphoto booklet from the E3N cohort (35) was used in thisstudy in order to estimate the portions of food and drink dailyconsumption by the participants, which complemented thequantificational questionnaire and gave us normative, accu-rate, and qualitative information on which to build the data-base. Another noteworthy point is that a special foodcomposition table was constructed to measure the quantity ofiodine in typical Cuban food for this study. However, only28% of the food items in the questionnaire of this study weremeasured using this special and innovative table.
As with any case-control study, this study has some limi-tations. Self-reported food consumption is associated withimprecise measures and recall bias. Another limitation is thatfor a large part of the Cuban diet, iodine content was estimatedfrom the CIQUAL 2013 food composition table, which hadbeen established for French food, and may not be applicable toCuban food. Moreover, because cases usually take more careof their health and are more motivated to participate in re-search studies than controls, the cases may have reported moreprecise information than the controls did, and this could haveintroduced a differential bias in the final results and over-estimated the risk of DTC. Nevertheless, this potential biascannot explain the significant relation between the number ofcopies in the minor allele (A) of rs965513 and the risk of DTCamong people who consumed less iodine than the median.Indeed, it is very unlikely that the finding regarding an in-teraction between SNP rs965513 and iodine intake was dueto chance because it remained present when correcting thep-value for the number of SNPs tested, which was four SNPs inthe analyses (41). Additionally, this result was almost exactlyidentical when adjusting or not for other DTC risk factors andstratifying or not for age groups and sex. Lastly, recall bias wasprobably reduced by the fact that food import and exportlimitations exist in Cuba, which keeps the typical Cuban foodmore stable and less diversified than Western food.
The French CIQUAL 2013 food composition table wasused in this study in order to evaluate the iodine content infish and shellfish. This could introduce some uncertainties.Nevertheless, the iodine content in fish is highly variableeven in one country (42). It depends strongly on the speciesand the places of capture, and most of the sea fish consumedin Cuba are from areas far away from Cuban coasts. Given thelow number of fish captured by Cuban boats and low fishconsumption in Cuba, the difficulty in measuring the iodinecontent in fish, and the cost-effectiveness of this study, theiodine content was not measured in either Cuban fish orshellfish. This study shows that in the Cuban population, therisk of DTC significantly decreased with the increasingconsumption of fish at the time of the interview (Table 2).This important finding is in line with another case-controlstudy, which was carried out in French Polynesia (43). Ameta-analysis of 19 observational studies on dietary factorsand thyroid cancer risk summarized the ORs for each riskfactor. Based on the highest level of total consumption versusthe lowest level, the aggregate OR [CI] of thyroid cancer was0.79 [0.66–0.94] for fish consumption. Subgroup analysisshowed that fish (OR = 0.74 [CI 0.59–0.92]) and shellfish(OR = 0.46 [CI 0.27–0.75]) consumption has a protectiveeffect in iodine-deficient areas (44). Another related reviewshowed that iodine-rich food such as fish and shellfish mayprovide a protective role in populations with insufficientdaily iodine intake (6). In contrast, a Japanese cohort wheresubjects were followed up for a mean of 14.5 years showedthat a high intake of seaweed was positively associated withthyroid cancer risk, although this result was not statisticallysignificant. In addition, a high intake of seaweed was posi-tively associated with papillary thyroid cancer risk in post-menopausal women (especially for papillary carcinoma, thehazard ratio [HR] for almost daily consumption comparedwith £2 days/week was 3.81 [CI 1.67–8.68]; p < 0.01) (45).
First-degree relatives of DTC patients have an increasedrisk for developing thyroid cancer, and a positive familyhistory is reported in approximately 5% of cases (46–49).These observations strongly suggest the contribution of ge-netic factors to the susceptibility to the disease. Six potentialregions for harboring a high-risk DTC gene have beenidentified through family-based linkage studies in the early2000s: MNG1 (14q32) (50), TCO (19p13.2) (51,52), fPTC/PRN (1q21) (53), NMTC1 (2q21) (54), FTEN (8p23.1-p22)(55), and the telomere–telomerase complex (56). More re-cently, population-based studies, particularly GWASs, haveidentified and replicated susceptibility loci at 9q22, 14q13,2q35, and 8p12 (57). In a previous study, in the same sampleof the Cuban population, the association was validated be-tween DTC risk and variants of genes localized at 9q22.33(FOXE1) and 14q13.3 (NKX2-1) (40). The FOXE1 locus isthe most widely replicated susceptibility locus associatedwith DTC risk in a number of population-based studies ofvarious ethnic origins, especially associated with sporadicand radiation-related papillary thyroid cancer and also withfamilial nonmedullary thyroid carcinoma (58,59).
This case-control study has for the first time identified astrong increase in DTC risk associated with the number ofcopies in the minor allele (A) of SNP rs965513, near FOXE1at 9q22.33, among people who consumed less iodine than themedian, but no variation in people who consumed more( p = 0.005). To the best of the authors’ knowledge, gene–
FOXE1 SNP, DIETARY IODINE, AND THYROID CANCER RISK 1757
environment interactions in DTC have only been investigatedin relation to radiation exposure in a candidate gene ap-proach, but no convincing association has been reported sofar. In particular, no gene–environment interaction study hasinvestigated an association with FOXE1 (at 9q22.33) anddietary iodine intake.
According to the IGN classification, an optimal iodineintake corresponds to 150–299 lg/day (39). The quartiles ofthe dietary iodine intake in the controls in this study were:<164.9, 164.9–186.5, 186.5–237.5, and ‡237.5 lg/day. Thelast three quartiles cover the optimal iodine intake, as well asmore than adequate or excess iodine intake. However, a case-control study using a food frequency questionnaire is not anadequate way to estimate iodine status (because a case-control study without iodine measurement in urine is notdesigned to estimate the iodine status of a population, but toperform comparisons between the cases and the controls).Nevertheless, the majority of the studied population had anoptimal dietary iodine intake. If this result was confirmed byother studies, it would emphasize the effectiveness of thecompulsory public health policy by using iodized salt in urban,rural, and mountainous areas of Cuba. A cross-sectional studyto assess the effectiveness of this program through determi-nation of UIC and goiter prevalence has been previouslycompleted in Cuban schoolchildren aged 6–11 years in 2011–2012. The results of this study by Terry-Berro et al. showedthat the median UIC was 176.3 lg/L (19). Only 7.6% of thechildren showed iodine deficiency (2.2% had severe deficiency<50 lg/L) and 15.3% had an UIC >300 lg/L. The prevalenceof optimal iodine nutrition was 43.5% (52.5% in mountainareas). The overall goiter prevalence was 17.6%, which re-flects mild endemic goiter. However, in mountain areas, theprevalence of goiter was 32.6% (severe endemic goiter). Theauthors concluded that iodine deficiency is no longer a publichealth problem in urban and rural areas of Cuba, which isattributable to successful salt iodization. Nevertheless, highgoiter rates are still observed in mountain areas.
In a comprehensive synthesis of animal and human studies(7), Zimmermann et al. concluded that iodine deficiency in-creases DTC risk. However, the present study does not haveenough participants in the moderate iodine deficiency groupto verify this conclusion with sufficient statistical power.
In conclusion, the majority of the studied population hadan optimal dietary iodine intake. Although DTC risk was notfound to be linked to dietary iodine intake in this study, DTCrisk significantly decreased with high fish consumption.Additionally, DTC risk significantly increased with an in-creasing number of copies in the minor allele (A) of rs965513near FOXE1 among people who consumed less iodine thanthe median. Because these findings are based on post-diagnostic measures, studies with pre-diagnostic dietary io-dine are needed for confirmation.
Acknowledgments
We sincerely acknowledge the Ligue Nationale Contre leCancer (LNCC), the Region Ile de France, and the InstitutNational du Cancer (INCA) for funding this research project.We extend special gratitude to Fondation de France forfunding the first author, Yan Ren, for her PhD study, and wesincerely thank the Region Ile de France for the grant toConstance Xhaard.
Author Disclosure Statement
The authors state that no competing financial interests exist.
References
1. British Geological Survey 2003 Database of the iodinecontent of food and diets populated with data from pub-lished literature. British Geological Survey CommissionedReport, Keyworth, Nottingham, United Kingdom.
2. Haldimann M, Alt A, Blondeau ABK 2005 Iodine contentof food groups. J Food Compost Anal 18:461–471.
3. Rose M, Miller P, Baxter M, Appleton G, Crews H,Croasdale M 2001 Bromine and iodine in 1997 UK totaldiet study samples. J Environ Monit 3:361–365.
4. Leufroy A, Noel L, Bouisset P, Maillard S, Bernagout S,Xhaard C, de Vathaire F, Guerin T 2015 Determination oftotal iodine in French Polynesian foods: method validationand occurrence data. Food Chem 169:134–140.
5. Acosta LF 2015 Los dilemas de la sal. Available at: www.granma.cu/cuba/2015-03-20/los-dilemas-de-la-sal?page=1(accessed May 23, 2016).
6. Choi WJ, Kim J 2014 Dietary factors and the risk of thyroidcancer: a review. Clin Nutr Res 3:75–88.
7. Zimmermann MB, Galetti V 2015 Iodine intake as a riskfactor for thyroid cancer: a comprehensive review of ani-mal and human studies. Thyroid Res 8:8.
8. Pellegriti G, De Vathaire F, Scollo C, Attard M, GiordanoC, Arena S, Dardanoni G, Frasca F, Malandrino P, Ver-miglio F, Previtera DM, D’Azzo G, Trimarchi F, Vigneri R2009 Papillary thyroid cancer incidence in the volcanic areaof Sicily. J Natl Cancer Inst 101:1575–1583.
9. Kristbjornsdottir A, Rafnsson V 2012 Incidence of canceramong residents of high temperature geothermal areas in Ice-land: a census-based study 1981–2010. Environ Health 11:73.
10. Cuban National Bureau of Statistics, Havana, Cuba 2014.Available at: www.one.cu/aec2013/esp/20080618_tabla_cuadro.htm (accessed September 23, 2015).
11. Dacal R, Rivero de la Calle M 1996 Art and Archaeologyof Pre-Columbian Cuba. University of Pittsburgh Press,Pittsburgh, PA.
12. Kilfoy BA, Zheng T, Holford TR, Han X, Ward MH,Sjodin A, Zhang Y, Bai Y, Zhu C, Guo GL, Rothman N,Zhang Y 2009 International patterns and trends in thyroidcancer incidence, 1973–2002. Cancer Causes Control 20:525–531.
13. Ministerio de Salud Publica-Direccion Nacional de RegistrosMedicos y Estadısticas de Salud 2015 Anuario estadıstico desalud 2014. Available at: http://files.sld.cu/dne/files/2015/04/anuario-estadistico-de-salud-2014.pdf (accessed September23, 2015).
14. Clero E, Leux C, Brindel P, Truong T, Anger A, TeinturierC, Diallo I, Doyon F, Guenel P, de Vathaire F 2010 Pooledanalysis of two case-control studies in New Caledonia andFrench Polynesia of body mass index and differentiatedthyroid cancer: the importance of body surface area. Thy-roid 20:1285–1293.
15. Peterson E, De P, Nuttall R 2012 BMI, diet and femalereproductive factors as risks for thyroid cancer: a system-atic review. PLoS One 7:e29177.
16. Xhaard C, Rubino C, Clero E, Maillard S, Ren Y, Borson-Chazot F, Sassolas G, Schvartz C, Colonna M, Lacour B,Danzon A, Velten M, Buemi A, Bailly L, Marine BarjoanE, Schlumberger M, Orgiazzi J, Adjadj E, de Vathaire F2014 Menstrual and reproductive factors in the risk of
1758 REN ET AL.
differentiated thyroid carcinoma in young women inFrance: a population-based case-control study. Am J Epi-demiol 180:1007–1017.
17. Michikawa T, Inoue M, Shimazu T, Sasazuki S, Iwasaki M,Sawada N, Yamaji T, Tsugane S 2011 Green tea and coffeeconsumption and its association with thyroid cancer risk: apopulation-based cohort study in Japan. Cancer CausesControl 22:985–993.
18. Galanti MR, Sparen P, Karlsson A, Grimelius L, Ekbom A1995 Is residence in areas of endemic goiter a risk factor forthyroid cancer? Int J Cancer 61:615–621.
19. Terry-Berro CB, Quintana-Jardines I, de la Paz-Luna M,Garcıa J, Fernandez-Bohorquez R, Silvera-Tellez D, Dıaz-Fuentes Y, Ferret-Martınez A, Reyes-Fernandez D 2014Impact of the actions for the sustainable elimination ofiodine deficiency in Cuba. Rev Peru Med Exp Salud Pub-lica 31:24–29.
20. WHO, UNICEF, ICCIDD 2007 Assessment of the io-dine deficiency disorders and monitoring their elimina-tion: a guide for programme managers. Third edition.Available at: http://apps.who.int/iris/bitstream/10665/43781/1/9789241595827_eng.pdf (accessed March 14, 2016).
21. Agence Francaise de Securite Sanitaire des Aliments2013 French food composition table Ciqual version2013. Available at: https://pro.anses.fr/tableciqual/index.htm (accessed September 23, 2015).
22. Taga I, Sameza ML, Kayo AV, Ngogang J 2004 Iodinelevels in food and soil in different regions in Cameroon.Sante 14:11–15.
23. Takahashi T, Fujimori K, Simon SL, Bechtner G, EdwardsR, Trott KR 1999 Thyroid nodules, thyroid function anddietary iodine in the Marshall Islands. Int J Epidemiol28:742–749.
24. Truong T, Baron-Dubourdieu D, Rougier Y, Guenel P 2010Role of dietary iodine and cruciferous vegetables in thyroidcancer: a countrywide case-control study in New Caledo-nia. Cancer Causes Control 21:1183–1192.
25. Parlato R, Rosica A, Rodriguez-Mallon A, Affuso A,Postiglione MP, Arra C, Mansouri A, Kimura S, Di LauroR, De Felice M 2004 An integrated regulatory networkcontrolling survival and migration in thyroid organogene-sis. Dev Biol 276:464–475.
26. Zannini M, Avantaggiato V, Biffali E, Arnone MI, Sato K,Pischetola M, Taylor BA, Phillips SJ, Simeone A, Di LauroR 1997 TTF-2, a new forkhead protein, shows a temporalexpression in the developing thyroid which is consistentwith a role in controlling the onset of differentiation.EMBO J 16:3185–3197.
27. Zhang P, Zuo H, Nakamura Y, Nakamura M, Wakasa T,Kakudo K 2006 Immunohistochemical analysis of thyroid-specific transcription factors in thyroid tumours. Pathol Int56:240–245.
28. Perna MG, Civitareale D, De Filippis V, Sacco M, Cis-ternino C, Tassi V 1997 Absence of mutations in the geneencoding thyroid transcription factor-1 (TTF-1) in patientswith thyroid dysgenesis. Thyroid 7:377–381.
29. Gudmundsson J, Sulem P, Gudbjartsson DF, Jonasson JG,Sigurdsson A, Bergthorsson JT, He H, Blondal T, Geller F,Jakobsdottir M, Magnusdottir DN, Matthiasdottir S, StaceySN, Skarphedinsson OB, Helgadottir H, Li W, Nagy R,Aguillo E, Faure E, Prats E, Saez B, Martinez M, EyjolfssonGI, Bjornsdottir US, Holm H, Kristjansson K, Frigge ML,Kristvinsson H, Gulcher JR, Jonsson T, Rafnar T, Hjartars-son H, Mayordomo JI, de la Chapelle A, Hrafnkelsson J,
Thorsteinsdottir U, Kong A, Stefansson K 2009 Commonvariants on 9q22.33 and 14q13.3 predispose to thyroidcancer in European populations. Nat Genet 41:460–464.
30. Matsuse M, Takahashi M, Mitsutake N, Nishihara E, Hir-okawa M, Kawaguchi T, Rogounovitch T, Saenko V, By-chkov A, Suzuki K, Matsuo K, Tajima K, Miyauchi A,Yamada R, Matsuda F, Yamashita S 2011 The FOXE1 andNKX2-1 loci are associated with susceptibility to papillarythyroid carcinoma in the Japanese population. J Med Genet48:645–648.
31. Jones AM, Howarth KM, Martin L, Gorman M, Mihai R,Moss L, Auton A, Lemon C, Mehanna H, Mohan H, ClarkeSE, Wadsley J, Macias E, Coatesworth A, Beasley M,Roques T, Martin C, Ryan P, Gerrard G, Power D, Brem-mer C; TCUKIN Consortium, Tomlinson I, Carvajal-Carmona LG 2012 Thyroid cancer susceptibility polymor-phisms: confirmation of loci on chromosomes 9q22 and14q13, validation of a recessive 8q24 locus and failure toreplicate a locus on 5q24. J Med Genet 49:158–163.
32. Landa I, Ruiz-Llorente S, Montero-Conde C, Inglada-PerezL, Schiavi F, Leskela S, Pita G, Milne R, Maravall J, Ra-mos I, Andıa V, Rodrıguez-Poyo P, Jara-Albarran A,Meoro A, del Peso C, Arribas L, Iglesias P, Caballero J,Serrano J, Pico A, Pomares F, Gimenez G, Lopez-MondejarP, Castello R, Merante-Boschin I, Pelizzo MR, Mauricio D,Opocher G, Rodrıguez-Antona C, Gonzalez-Neira A,Matıas-Guiu X, Santisteban P, Robledo M 2009 The variantrs1867277 in FOXE1 gene confers thyroid cancer suscep-tibility through the recruitment of USF1/USF2 transcriptionfactors. PLoS Genet 5:e1000637.
33. Bullock M, Duncan EL, O’Neill C, Tacon L, Sywak M,Sidhu S, Delbridge L, Learoyd D, Robinson BG, LudgateM, Clifton-Bligh RJ 2012 Association of FOXE1 poly-alanine repeat region with papillary thyroid cancer. J ClinEndocrinol Metab 97: E1814–1819.
34. Lence-Anta JJ, Xhaard C, Ortiz RM, Kassim H, PeredaCM, Turcios S, Velasco M, Chappe M, Infante I, BustilloM, Garcıa A, Clero E, Maillard S, Salazar S, Rodriguez R,de Vathaire F 2014 Environmental, lifestyle, and anthro-pometric risk factors for differentiated thyroid cancer inCuba: a case-control study. Eur Thyroid J 3:189–196.
35. Van Liere MJ, Lucas F, Clavel F, Slimani N, Villeminot S1997 Relative validity and reproducibility of a French di-etary history questionnaire. Int J Epidemiol 26:S128–136.
36. Comite Europeen de Normalisation 2007 Foodstuffs—Determination of trace elements—determination of iodineby ICP-MS (inductively coupled plasma mass spectrome-try). Comite Europeen de Normalisation 15111, Brussels.
37. Association francaise de normalisation 2010 NF V03–110—analyse des produits agricoles et alimentaire—protocole de caracterisation en vue de la validation d’unemethode d’analyse quantitative par construction du profild’exactitude. Association francaise de normalisation, LaPlaine Saint-Denis.
38. Mermet JM, Granier G 2012. Potential of accuracy profilefor method validation in inductively coupled plasma spec-trochemistry. Spectrochimica Acta–Part B 76:214–220.
39. Li M, Eastman CJ 2012 The changing epidemiology ofiodine deficiency. Nat Rev Endocrinol 8:434–440.
40. Pereda CM, Lesueur F, Pertesi M, Robinot N, Lence-AntaJJ, Turcios S, Velasco M, Chappe M, Infante I, Bustillo M,Garcıa A, Clero E, Xhaard C, Ren Y, Maillard S, DamiolaF, Rubino C, Salazar S, Rodriguez R, Ortiz RM, de Va-thaire F 2015 Common variants at the 9q 22.33, 14q13.3
FOXE1 SNP, DIETARY IODINE, AND THYROID CANCER RISK 1759
and ATM loci, and risk of differentiated thyroid cancer inthe Cuban population. BMC Genet 1:16–22.
41. Dunn OJ 1961 Multiple comparisons among means. JASA56:52–64.
42. Lee SM, Lewis J, Buss DH, Holcombe GD, Lawrance PR1994 Iodine in British foods and diets. Br J Nutr 72:435–446.
43. Clero E, Doyon F, Chungue V, Rachedi F, Boissin JL,Sebbag J, Shan L, Bost-Bezeaud F, Petitdidier P, DewaillyE, Rubino C, de Vathaire F 2012 Dietary iodine and thyroidcancer risk in French Polynesia: a case-control study.Thyroid 22:422–429.
44. Liu ZT, Lin AH 2014 Dietary factors and thyroid cancerrisk: a meta-analysis of observational studies. Nutr Cancer66:1165–1178.
45. Michikawa T, Inoue M, Shimazu T, Sawada N, Iwasaki M,Sasazuki S, Yamaji T, Tsugane S 2012 Japan Public HealthCenter-based Prospective Study Group. Seaweed con-sumption and the risk of thyroid cancer in women: theJapan Public Health Center-based Prospective Study. Eur JCancer Prev 21:254–260.
46. Goldgar DE, Easton DF, Cannon-Albright LA, SkolnickMH 1994 Systematic population-based assessment of can-cer risk in first-degree relatives of cancer probands. J NatlCancer Inst 86:1600–1608.
47. Pal T, Vogl FD, Chappuis PO, Tsang R, Brierley J, RenardH, Sanders K, Kantemiroff T, Bagha S, Goldgar DE, NarodSA, Foulkes WD 2001 Increased risk for nonmedullarythyroid cancer in the first degree relatives of prevalent casesof nonmedullary thyroid cancer: a hospital-based study. JClin Endocrinol Metab 86:5307–5312.
48. Hemminki K, Vaittinen P 1997 Effect of paternal and ma-ternal cancer on cancer in the offspring: a population-basedstudy. Cancer Epidemiol Biomarkers Prev 6:993–997.
49. Hemminki K, Li X 2003 Familial risk of cancer by site andhistopathology. Int J Cancer 103:105–109.
50. Bignell GR, Canzian F, Shayeghi M, Stark M, Shugart YY,Biggs P, Mangion J, Hamoudi R, Rosenblatt J, Buu P, SunS, Stoffer SS, Goldgar DE, Romeo G, Houlston RS, NarodSA, Stratton MR, Foulkes WD 1997 Familial nontoxicmultinodular thyroid goiter locus maps to chromosome 14qbut does not account for familial nonmedullary thyroidcancer. Am J Hum Genet 61:1123–1130.
51. Canzian F, Amati P, Harach HR, Kraimps JL, Lesueur F,Barbier J, Levillain P, Romeo G, Bonneau D 1998 A genepredisposing to familial thyroid tumors with cell oxyphiliamaps to chromosome 19p13.2. Am J Hum Genet 63:1743–1748.
52. Lesueur F, Stark M, Tocco T, Ayadi H, Delisle MJ,Goldgar DE, Schlumberger M, Romeo G, Canzian F 1999Genetic heterogeneity in familial nonmedullary thyroidcarcinoma: exclusion of linkage to RET, MNG1, and TCOin 56 families. NMTC Consortium. J Clin EndocrinolMetab 84:2157–2162.
53. Malchoff CD, Sarfarazi M, Tendler B, Forouhar F, WhalenG, Joshi V, Arnold A, Malchoff DM 2000 Papillary thyroidcarcinoma associated with papillary renal neoplasia: ge-netic linkage analysis of a distinct heritable tumor syn-drome. J Clin Endocrinol Metab 85:1758–1764.
54. McKay JD, Lesueur F, Jonard L, Pastore A, Williamson J,Hoffman L, Burgess J, Duffield A, Papotti M, Stark M,Sobol H, Maes B, Murat A, Kaariainen H, Bertholon-Gregoire M, Zini M, Rossing MA, Toubert ME, BonichonF, Cavarec M, Bernard AM, Boneu A, Leprat F, Haas O,Lasset C, Schlumberger M, Canzian F, Goldgar DE, RomeoG 2001 Localization of a susceptibility gene for familialnonmedullary thyroid carcinoma to chromosome 2q21. AmJ Hum Genet 69:440–446.
55. Cavaco BM, Batista PF, Sobrinho LG, Leite V 2008Mapping a new familial thyroid epithelial neoplasia sus-ceptibility locus to chromosome 8p23.1-p22 by high-densitysingle-nucleotide polymorphism genome-wide linkage anal-ysis. J Clin Endocrinol Metab 93:4426–4430.
56. Capezzone M, Cantara S, Marchisotta S, Filetti S, De SantiMM, Rossi B, Ronga G, Durante C, Pacini F 2008 Shorttelomeres, telomerase reverse transcriptase gene amplifi-cation, and increased telomerase activity in the blood offamilial papillary thyroid cancer patients. J Clin EndocrinolMetab 93:3950–3957.
57. Figlioli G, Kohler A, Chen B, Elisei R, Romei C, CipolliniM, Cristaudo A, Bambi F, Paolicchi E, Hoffmann P, HermsS, Kalemba M, Kula D, Pastor S, Marcos R, Velazquez A,Jarzab B, Landi S, Hemminki K, Forsti A, Gemignani F2014 Novel genome-wide association study-based candi-date loci for differentiated thyroid cancer risk. J Clin En-docrinol Metab 99:E2084–2092.
58. Bonora E, Rizzato C, Diquigiovanni C, Oudot-Mellakh T,Campa D, Vargiolu M, Guedj M; NMTC Consortium, McKayJD, Romeo G, Canzian F, Lesueur F 2014 The FOXE1 locus isa major genetic determinant for familial nonmedullary thyroidcarcinoma. Int J Cancer 134:2098–2107.
59. Zhuang Y, Wu W, Liu H, Shen W 2014 Common geneticvariants on FOXE1 contributes to thyroid cancer suscepti-bility: evidence based on 16 studies. Tumour Biol 35:6159–6166.
Address correspondence to:Florent de Vathaire, PhD
Cancer and RadiationsCESP—U1018 Inserm
Institut Gustave Roussy114, rue Edouard-Vaillant
94805 Villejuif CedexFrance
E-mail: [email protected]
1760 REN ET AL.
Title : Dietary iodine intake, fingernail selenium, and risk of differentiated thyroid cancer: Analyses of case-control
studies from Epi-Thyr consortium
Keywords : Differentiated thyroid cancer, dietary iodine intake, single-nucleotide polymorphism, fingernail
selenium, case-control study, Epi-Thyr
Context : Iodine is a trace element derived from food. In endemic goiter areas characterized by dietary iodine
deficiency, it is established that the incidence of goiter and differentiated thyroid cancers (DTC) of follicular type is
higher than elsewhere. On the other hand, the influence of dietary iodine intake in the risk of papillary thyroid
cancer which currently representing more than 80% of DTCs in most countries, has not achieved a consensus. It
appears, however, that this incidence is higher in the Pacific islands than elsewhere. In addition, the redox protection
properties of selenium could protect the thyroid gland and help to maintain the production of thyroid hormones, but
few studies evaluated the relationship between selenium intake and DTC.
Objectives : The general objective of this thesis was to explore the relationship between dietary iodine intake and
DTC risk. More specifically, it was 1) to study the relationship between dietary iodine intake and the risk of DTC in
five case-control studies of Epi-Thyr consortium, carried out in New Caledonia, French Polynesia, Metropolitan
France (two studies) and Cuba; 2) to investigate the interaction between this intake and four single-nucleotide
polymorphisms (SNP) identified in most genome-wide association studies (GWAS) as associated with DTC risk, as
well as the interaction with the well-established environmental risk factors; and 3) to evaluate the benefit of
selenium present in fingernails as a potential bio-marker of DTC risk.
Materials and Methods : Conditional logistic regression was used to analyze the relationship between dietary
iodine intake and DTC risk first in the Cuba study including 203 cases and 212 controls, and then in the pooled
analysis of the five studies including a total of 2162 cases and 2571 controls. The dietary questionnaires of these
five studies were derived from those in the E3N cohort study. Measurements of iodine and selenium in traditional
Polynesian and Cuban foods were specifically carried out for this pooled analysis. Four SNPs were genotyped,
including two of FOXE1 gene, one of ATM gene and another near NKX2-1 gene. Measurements of iodine, selenium
and other metal trace elements were made in the fingernails of the participants of the French Polynesia study.
Results : There was no significant association between dietary iodine intake and DTC risk in the Cuba study. In the
pooled analysis of the five studies, the majority of the cases and the controls were considered as being in mild
dietary iodine deficiency according to the IGN classification. Although DTC risk was not found to be linked to
dietary iodine intake, this risk significantly decreased with high fish consumption, this reduction in DTC risk per
quartile of fish consumption was more important in the Cuba study than in the other studies. Additionally, higher
dietary iodine intake significantly associated with lower DTC risk only in the French Polynesia study and in
Polynesians. A strong increase in DTC risk associated with the number of the minor allele (A) of the SNP rs965513
near FOXE1, among participants who consumed less iodine than the median value in the Cuba study. For the
women who had a high number of full term pregnancies and who were iodine deficient, increasing dietary iodine
intake may reduce their risk of suffering from DTC. Moreover, it was not possible to demonstrate an interest in
fingernail selenium as a biomarker that predicts DTC risk.
Titre : L’apport alimentaire en iode, sélénium dans les ongles, et risque du cancer différencié de la thyroïde:
Analyses d’études cas-témoins du consortium Epi-Thyr
Mots clés : Cancer différencié de la thyroïde, apport alimentaire en iode, polymorphisme nucléotidique, sélénium
dans les ongles, étude cas-témoins, Epi-Thyr
Contexte : L’iode est un micronutriment provenant des aliments. Il est établi que, dans les régions d'endémie
goitreuse caractérisées par un apport d'iode insuffisant, l’incidence des goitres et des cancers différenciés de la
thyroïde (CDT) de type folliculaire est plus élevée qu'ailleurs. En revanche, l’influence de l’apport alimentaire en
iode sur le risque de CDT de type papillaire, forme représentant actuellement plus de 80% des CDTs dans la plupart
des pays, ne fait pas l’objet d’un consensus. Il semble cependant que cette incidence soit plus élevée dans les îles du
pacifique qu’ailleurs. Par ailleurs, les propriétés de protection redox du sélénium pourraient protéger la glande
thyroïdienne et aider à maintenir la production d'hormones thyroïdiennes, mais la relation entre l’apport en sélénium
et le CDT n’avait été que très peu étudiée.
Objectifs : L’objectif général de ce travail de thèse était d'explorer la relation entre l'apport alimentaire en iode et le
risque de CDT. Plus spécifiquement, il s’agissait 1) d’étudier la relation entre l’apport alimentaire en iode et le
risque de CDT dans les cinq études cas-témoins du consortium Epi-Thyr, conduites en Nouvelle Calédonie, en
Polynésie Française, en France métropolitaine (deux études) et à Cuba; 2) d’étudier l’interaction entre cet apport et
quatre polymorphismes nucléotidiques (SNP) identifiés dans la plupart des études d’association pangénomiques
(GWAS) comme associés au risque de CDT, ainsi qu’avec les facteurs de risque environnementaux connus; et 3)
d’évaluer l’intérêt du sélénium présent dans les ongles comme un bio-marqueur potentiel du risque de CDT.
Matériel et Méthodes : La régression logistique conditionnelle a été utilisée pour analyser la relation entre l'apport
alimentaire en iode et le risque de CDT d’abord dans l’étude Cuba incluant 203 cas et 212 témoins, puis dans
l’ensemble des cinq études incluant au total 2162 cas et 2571 témoins. Les questionnaires alimentaires de ces cinq
études étaient dérivés de ceux de l’étude de cohorte E3N. Les mesures de l’iode et du sélénium dans les aliments
traditionnels polynésiens et cubains avaient été réalisées spécialement pour cette étude. Quatre SNPs avaient été
génotypés, dont deux sur le gène FOXE1, un sur le gène ATM et un autre près du gène NKX2-1. Les mesures de
l’iode, du sélénium et des autres oligoéléments métalliques avaient été réalisées dans les ongles des sujets de l’étude
Polynésie Française.
Résultats : Il n’a pas été observée, une association significative entre l’apport alimentaire en iode et le risque de
CDT dans l’étude réalisée à Cuba. Dans l'ensemble des cinq études, la majorité des cas et des témoins ont été
considérée comme présentant une carence légère en iode selon la classification du Réseau Mondial d'Iode (IGN).
Bien que le risque de CDT ne soit pas lié à l'apport alimentaire en iode, ce risque était significativement réduit avec
l’augmentation de la consommation de poisson, ceci de manière plus importante dans l'étude réalisée à Cuba que
dans les autres. En outre, une augmentation de l’apport alimentaire en iode a été significativement associée à une
diminution du risque de CDT uniquement dans l’étude réalisée en Polynésie Française et chez les Polynésiens. Une
augmentation significative du risque de CDT associée au nombre de l'allèle mineur (A) du SNP rs965513 près de
FOXE1 parmi les sujets qui ont consommé moins d'iode que la médiane dans l'étude réalisée à Cuba. Pour les
femmes qui ont eu un nombre de grossesses élevé et qui étaient déficitaires en iode, l'augmentation de l'apport
alimentaire en iode réduisait leur risque de CDT. Par ailleurs, il n’a pas été possible de mettre en évidence un intérêt
du sélénium dans les ongles comme bio-marqueur prédictif du risque de CDT.


