Embed Size (px)
Citation preview

Different Profiles of Acute Stress Disorder 1
Published in Psychological Assessment
(pre-published copy)
Different Profiles of Acute Stress Disorder Differentially Predict Posttraumatic Stress
Disorder in a Large Sample of Female Victims of Sexual Trauma
Mark Shevlin, Philip Hyland, and Ask Elklit
Prof. Mark Shevlin – Professor of Psychology University of Ulster
Dr. Philip Hyland – Lecturer in Psychology, National College of Ireland
Prof. Ask Elklit, Professor of Psychology, Southern Danish University

Different Profiles of Acute Stress Disorder 2
Abstract
This study aimed to test the dimensional structure of acute stress disorder (ASD). Latent
profile analysis was conducted on scores from the Acute Stress Disorder Scale (Bryant,
Moulds, & Guthrie, 2000) using a large sample of female victims of sexual trauma. Four
distinct classes were found. Two of the classes represented high and low levels of ASD,
and the high ASD class was associated with a high probability of subsequent
posttraumatic stress disorder (PTSD). There were two intermediate classes that were
differentiated by the number of arousal symptoms, and the class with high levels of arousal
symptoms had a higher risk of PTSD. The results suggested that ASD is best described by
qualitatively and quantitatively differing subgroups in this sample, whereas previous
research has assumed ASD to be dimensional. This may explain the limited success of
using ASD to predict subsequent PTSD.

Different Profiles of Acute Stress Disorder 3
Introduction
Acute stress disorder (ASD) is a psychiatric condition characterised by acute stress
responses that may last from two days to four weeks subsequent to the experience of a
traumatic life event. In addition to the experience of a traumatic life event, a diagnosis of
ASD requires that a person experiences an intense emotional reaction to this stressor,
along with a specific constellation of symptoms that lead to significant impairment or
distress. In the newly published Diagnostic and Statistical Manual of Mental Disorders (5th
ed.; DSM-5: American Psychiatric Association, 2013) ASD is no longer listed as an anxiety
disorder but rather as a trauma- or stressor-related disorder. The DSM-5 has
deemphasised the focus placed on the dissociation symptoms highlighted in the previous
edition, and now states that a diagnosis of ASD can be made if a person displays any 9 of
14 symptoms in the areas of intrusions, negative mood, dissociation, avoidance, and
arousal.
ASD was introduced to the DSM-IV (APA, 1994) as a condition characterised
by four symptom classes; dissociation, reexperiencing, avoidance, and arousal. The
introduction of ASD to the DSM-IV was done so for two reasons. The primary purpose was
to describe the acute phase of stress responses experienced by many sufferers of
traumatic events prior to the timeframe in which a diagnosis of PTSD could be made. The
secondary purpose was to identify those trauma survivors who were at a high-risk for
developing PTSD (Koopman, Classen, & Spiegel, 1994). With respect to this secondary
objective of the ASD classification, a substantial body of empirical evidence has called into
question the predictive utility of ASD. Accurately assessing the predictive utility of ASD
necessitates the use of a psychometrically valid measure of the disorder. Unlike the
assessment of PTSD in which a range of reliable and valid measures exist (see Bovin &
Weathers, 2012), the assessment of ASD has been problematic given the absence of a

Different Profiles of Acute Stress Disorder 4
gold standard method of assessment (see Edmondson, Mills, & Park, 2010). The Acute
Stress Disorder Interview (ASDI; Bryant, Harvey, Dang, & Sackville, 1998) is a structured
clinical interview based upon the diagnostic criteria outlined in DSM-IV. ASDI scores have
been shown to possess satisfactory internal consistency (Cronbach alpha = .90) as well as
test-retest reliability (r = .88). A subsequent confirmatory factor analytic (CFA) study
indicated that the latent structure of the ASDI is best represented by the four factor model
outlined in the DSM-IV (Brooks, Silove, Bryant, O’Donnell, Creamer, & McFarlane, 2008).
In addition to the ASDI, two self-report measures of ASD are commonly
employed. The Stanford Acute Stress Reaction Questionnaire (SASRQCardeña,
Koopman, Classen, Walde, & Spiegel, 2000) has been used in a number of studies (e.g.,
Classen, Koopman, Hales, & Spiegel, 1998; Koopma, Classen, Spiegel, 1994) and the
scores have demonstrated good internal reliability (Cronbach alpha = .90 and .91,
respectively) as well as good concurrent validity with scores on the Impact of Events Scale
(r = .52-.69; see Cardeña et al., 2000). The most recently developed and widely used self-
report measure of ASD is the Acute Stress Disorder Scale (ASDS: Bryant, Moulds, &
Guthrie, 2000) and scores on the scale have been shown to have high test-retest reliability
(r = .94), sensitivity (95%) and specificity (83%). Results from CFA studies to determine
the latent structure of ASDS scores have inconsistent. Wang et al. (2010) found support
for the DSM-IV’s four-factor conceptualisation, whereas Edmondson et al. (2010)
supported a hierarchical model containing a second-order distress factor (with re-
experiencing, arousal, and avoidance first order factors) that was correlated with a
dissociation single first-order factor. Other studies have supported a three-factor model
(dissociation, avoidance, and re-experiencing/arousal; Armour, Elklit, & Shevlin, 2011) and
the DSM-IV’s four-factor model (Hansen, Lasgaard, & Elklit, 2012).

Different Profiles of Acute Stress Disorder 5
Initially there was evidence that a diagnosis of ASD could be used to
effectively predict the subsequent development of PTSD (Harvey & Bryant, 1998, 1999;
Spiegel, Koopman, Cardefia, & Classen, 1996). However, more recent findings began to
challenge this conclusion. For example, in a longitudinal study of cancer patients, Kangas,
Henry, and Bryant (2005) found that 53% of individuals diagnosed with ASD subsequently
met the criteria for PTSD six months later, however only 36% of those who developed
PTSD satisfied the criteria for ASD during the immediate aftermath of their traumatic
experience. The limited positive predictive power, and poor sensitivity, of ASD in this study
was consistent with other findings (e.g., Brewin, Andrews, & Rose, 2003; Bryant, 2003;
Harvey & Bryant, 2002). Bryant (2011) recently conducted a large-scale meta-analysis to
determine the ability of ASD to predict subsequent PTSD. The review included 22
longitudinal studies consisting of a total of 3,335 participants for whom follow-up data was
available. The results served to further undermine the utility of ASD to predict PTSD. ASD
was found to have modest positive predictive power, with the majority of studies
demonstrating that only 50% of individuals who received a diagnosis of ASD subsequently
developed PTSD. The sensitivity of ASD was also found to be poor with just 48% of those
who eventually received a diagnosis of PTSD initially satisfying the criteria for ASD in the
first month post-trauma. These results served to demonstrate that an ASD diagnosis fails
to identify more than half of all individuals who will subsequently develop PTSD.
A number of plausible explanations have been advanced for the poor
predictive ability of ASD. Bryant’s (2011) review indicated that the sensitivity of ASD could
be improved by adopting a subsyndromal classification in which the dissociation criteria
were ignored. By adopting a conceptualisation of ASD that more closely represents the
PTSD diagnostic model, the predictive ability of ASD was found to be improved. It has also
been suggested that the less restrictive diagnostic criteria for ASD relative to PTSD,

Different Profiles of Acute Stress Disorder 6
particularly with respect to the arousal and avoidance symptoms, is a cause of the poor
predictive power. The less restrictive diagnostic criteria for ASD means that while a person
could meet the criteria for ASD three weeks post-trauma, that person would not meet the
criteria for PTSD one week later even if their symptoms remained constant (Bryant,
Friedman, Spiegel, Ursano, & Strain, 2011).
In light of the evidence that ASD fails to adequately predict the subsequent
development of PTSD, Bryant and colleagues (2011) have recommended abandoning the
predictive role of ASD and instead solely focusing on ASD as a method of capturing acute
stress responses to traumatic life events. However, the failure of ASD to predict
subsequent PTSD may be due to the underlying assumption that ASD is dimensional in
nature, that is, that people will differ only quantitatively. The assumption that differences in
severity of disorders can only be described quantitatively has been challenged by recent
studies that have reported different ‘types’ of PTSD. For example, Maguen et al. (2013)
conducted a latent class analysis of PTSD symptoms using a sample of Iraq and
Afghanistan Veterans and found three groups that differed quantitatively in symptom
severity (High Symptom, Intermediate Symptom, and Low Symptom groups). The fourth
group was similar to the Intermediate Symptom group but differed qualitatively due to
having very low probabilities of endorsing three emotional numbing symptoms; this group
was labelled ‘Intermediate Symptom with Low Emotional Numbing’. Similarly, Wolf et al.
(2012) conducted a latent class analysis on items from the Clinician-Administered PTSD
Scale (Weathers, Ruscio, & Keane, 1999) using a sample of veterans and argued for a
Dissociative Subtype of PTSD based on a small group that had elevated probabilities of
endorsing the symptoms related to flashbacks, derealization, and depersonalization.
These studies suggest that PTSD may not be dimensional; rather it could be comprised of
groups that differ qualitatively and quantitatively. There have been no similar studies on

Different Profiles of Acute Stress Disorder 7
ASD to determine if the underlying latent variable is dimensional or categorical. If ASD was
found to be best described by groups that differ qualitatively rather than quantitatively in
overall severity, this may go some way in explaining the poor predictive power of ASD in
predicting PTSD. Particular profiles, or configurations, of symptom severity may confer
greater risk of PTSD than others, even when the overall levels of severity are similar.
The aim of this study is to test the underlying structure of ASD symptoms
using data from a large sample of female sexual victims using latent profile analysis (LPA)
and assess the relationship with PTSD. LPA is a method for identifying homogenous
groups, or latent classes, that share similar symptom profiles. It is predicted that there will
be classes that differ quantitatively, with those classes higher in ASD severity having a
higher probability of subsequently developing PTSD. The relationship between the classes
and the probability of PTSD should be ‘dose-response’ in nature. It is also predicted that
there may be classes that are qualitatively different to the other classes, and that
association with PTSD for these classes would be inconsistent with the ‘dose-response’
relationship of the quantitatively differing classes. This aspect of the study is exploratory as
there are insufficient research findings and theory to guide specific hypotheses about
qualitatively different classes. Large scale meta-analysis (Brewin, Andrews, & Valentine,
2000) and multi-sample studies (Ditlevsen & Elklit, 2010) have indicated that younger age
at exposure to a traumatic event is related to higher levels of posttraumatic stress severity.
As similar findings have been reported for acute stress severity (Cardena, Dennis, Winkel,
& Skitka, 2005; Cohen, 2008) age was used a covariate in the LPA.
Method
Participants
Participants were recruited from the 1,127 female rape victims who contacted
the Centre for Rape Victims (CRV) at the University Hospital of Aarhus (Denmark) from

Different Profiles of Acute Stress Disorder 8
2002 to 2012. The CRV offers help to victims who contact the centre within 30 days after
being raped. During the initial contact (T1) victims were asked to provide demographic
information and details on a number of assault related issues. Within two weeks after
coming into contact with the centre (T2) the participants were asked to complete a short
battery of questionnaires, one of which assessed Acute Stress Disorder (ASD).
Approximately three months later (T3) participants were asked to fill out another
questionnaire which assessed symptoms of PTSD. Information on age was available for all
participants at T1 (N = 590), and complete data at T2 and T3 was available for 471 and
352 participants respectively. The pairwise percentage of data present was high between
age (T1) and T2 scores for Dissociation (80%), Re-experiencing (82%), Avoidance (82%),
and Arousal (80%). The pairwise percentage of data present was lower between PTSD
scores (T3) and age (60%), Dissociation (43%), Re-experiencing (44%), Avoidance (44%),
and Arousal (43%). Listwise deletion would result in a sample size of 237, however full
information maximum likelihood estimation allows all the available information on 590
participants (for whom data was available at T1 and either T2 or T3) to be used in the
analyses as the missingness is only on the endogenous variables under the assumption of
data being missing at random (Schafer & Graham, 2002).
Most victims (61.5%) had experienced an assault that involved penetration.
Other victims had primarily been exposed to attempted rape (12.3%), molestation (8.7%),
or could not remember the specific type of assault they had experienced (9.2%). The
majority (85.5%) were of Danish origin and their ages ranged from 10 to 71 years. The
mean age of the sample was 22.49 years (SD = 9.2). This sample was significantly older
than the remaining women who visited the CRV, t(1125) = 3.71, p < .001, and were not
included in the study, although the difference was small (2.35 years).

Different Profiles of Acute Stress Disorder 9
Measures
The Acute Stress Disorder Scale (ASDS; Bryant et al., 2000). The ASDS is a
19-item self-report measure based on the DSM-IV diagnostic criteria of dissociation (5
items), re-experiencing (4 items), avoidance (4 items), and arousal (6 items) symptoms.
The ASDS used a five-point Likert scale ranging from 1 (not at all) to 5 (very much).
Individual item scores were recoded to indicate the absence (score ≤ 3 = 0) or presence
(score ≥ 4 = 1) of a symptom, and a summed total symptom score for dissociation
(possible scores 0-5), re-experiencing (possible scores 0-4), avoidance (possible scores 0-
4), and arousal (possible scores 0-6) was calculated. A DSM-IV diagnosis of ASD requires
at least one symptom to be present for re-experiencing, avoidance, and arousal, and three
symptoms to be present for dissociation. Bryant et al. (2000) reported high levels of
internal consistency (Cronbach’s alpha) for the total scale (.96) and for the subscales
(dissociation = .84, re-experiencing = .87, avoidance = .92, arousal = .93). Alpha
coefficients in this study were lower (total scale = .84, dissociation = .69, re-experiencing =
.66, avoidance = .66, arousal = .75).
The Harvard Trauma Questionnaire Part IV (HTQ: Mollica et al. 1992). The
HTQ can be used to identify participants reporting symptoms consistent with DSM-IV
PTSD diagnostic criteria and also provides a measure of PTSD severity. The first sixteen
items were derived directly from the seventeen DSM-IV criteria for PTSD. The HTQ uses
one item to assess both psychological and physiological reactions to events that symbolize
or resemble aspects of the traumatic event (in accordance with DSM-IV this item is part of
the Re-experiencing cluster). The items are divided into three subscales that correspond to
the three main symptom groups of PTSD: re-experiencing, avoidance, and arousal. The
HTQ requires the respondents to rate how much each symptom has bothered them in the
last week on a four-point Likert-type scale (‘not at all’ (1), to ‘all the time’ (4)). Mollica et al.

Different Profiles of Acute Stress Disorder 10
(1992) and Elklit and Shevlin (2007) reported high estimates of reliability for each of the
subscales and the scale as a whole. Participants with high likelihood of a diagnosis of
PTSD were identified if they reported at least one re-experiencing symptom, three
avoidance symptoms, and two arousal symptoms as being present. A symptom was rated
as present if the item corresponding to the symptom was scored 3 (‘quite a bit’) or greater.
In this study the internal consistency of the total scale and the three subscales scores
were high (Cronbach’s alpha in parentheses): total scale (.84), re-experiencing (.77),
avoidance (.77), and arousal (.80).
Analysis
Latent profile analysis (LPA) is a statistical method used to identify
homogeneous groups, or classes, from multivariate data. The analysis involved three
linked elements. First, a LPA was conducted to determine the number of classes of ASD,
and assess if they differed qualitatively or quantitatively. The LPA part of the model used
the four total symptom scores for each of the four ASD dimensions. This ensured that
scores captured clinically meaningful responses and also provided the necessary score
variability for the analysis. Second, age was included in the model as a covariate, and third
the PTSD variable was a distal outcome.
The fit of five models (2-class model through to 6-class model) was assessed.
The models were estimated using robust maximum likelihood (Yuan & Bentler, 2000). To
avoid solutions based on local maxima, 500 random sets of starting values were used
initially and 100 final stage optimizations. The relative fit of the models were compared by
using three information theory based fit statistics: the Akaike Information Criterion (AIC;
Akaike, 1987), the Bayesian Information Criterion (BIC; Schwartz, 1978) and sample size
adjusted Bayesian Information Criterion (ssaBIC; Sclove, 1987). The model that produces
the lowest values can be judged the best model. Evidence from simulation studies have

Different Profiles of Acute Stress Disorder 11
indicated that the BIC was the best information criterion for identifying the correct number
of classes (Nylund, Asparouhov, & Muthén, 2007). In addition the Lo-Mendell-Rubin
adjusted likelihood ratio test (LMR-A; Lo, Mendell, & Rubin, 2001) and the bootstrapped
likelihood ratio test (BLRT; McLachlan & Peel, 2000) were used to compare models with
increasing numbers of latent classes. When a non-significant value (p > .05) occurs this
suggests that the model with one less class should be accepted. All analyses were
conducted using Mplus 7.00 (Muthén &Muthén, 2012).
Results
Most of the participants reported one or more symptoms of dissociation
(77.5%; M = 3.50, SD = 1.36), re-experiencing (93.8%; M = 2.45, SD = 1.21), and
avoidance (91.9%; M = 2.59, SD = 1.25), and three or more symptoms of arousal (97.7%;
M = 4.17, SD = 1.65), while 68.8% reported combined symptoms consistent with ASD
diagnostic criteria. Almost half of the participants (48.3%) who completed the HTQ (N =
352) reported symptoms consistent with PTSD diagnostic criteria. A cross-tabulation of
variables representing ASD and PTSD was statistically significant (N= 237: 2(1)=16.11, p
< .01) and indicated that 79.8% of those with a high likelihood of PTSD initially reported
symptoms consistent with ASD diagnostic criteria, and 45.1% failed to meet the diagnostic
criteria for PTSD and ASD. The percentage of participants with a high likelihood of ASD
but who did not meet the diagnostic criteria for PTSD was 54.9%, and 20.2% of individuals
did not report symptoms consistent with ASD or PTSD.
The fit statistics for the LPA are presented in Table 1. The BIC is lowest for
the 4 class model and the LMR-A indicated that there was no significant improvement in fit
for the 5 class model. However, the AIC and the ssaBIC both decrease for models with 2
through to 6 classes, however the decrease is markedly smaller after 4 classes. The BLRT
values were similar to those for the LMR-A but remained statistically significant for all

Different Profiles of Acute Stress Disorder 12
models. Although the BLRT has been reported to perform well in a simulation study
(Nylund, Asparouhov, & Muthén, 2007) it also has been reported to be inconsistent with
the LMR-A by remaining statistically non-significant (Statmodel.com, 2013). On the basis
of this the 4 class solution was considered the best fitting model.
Table 1 about here
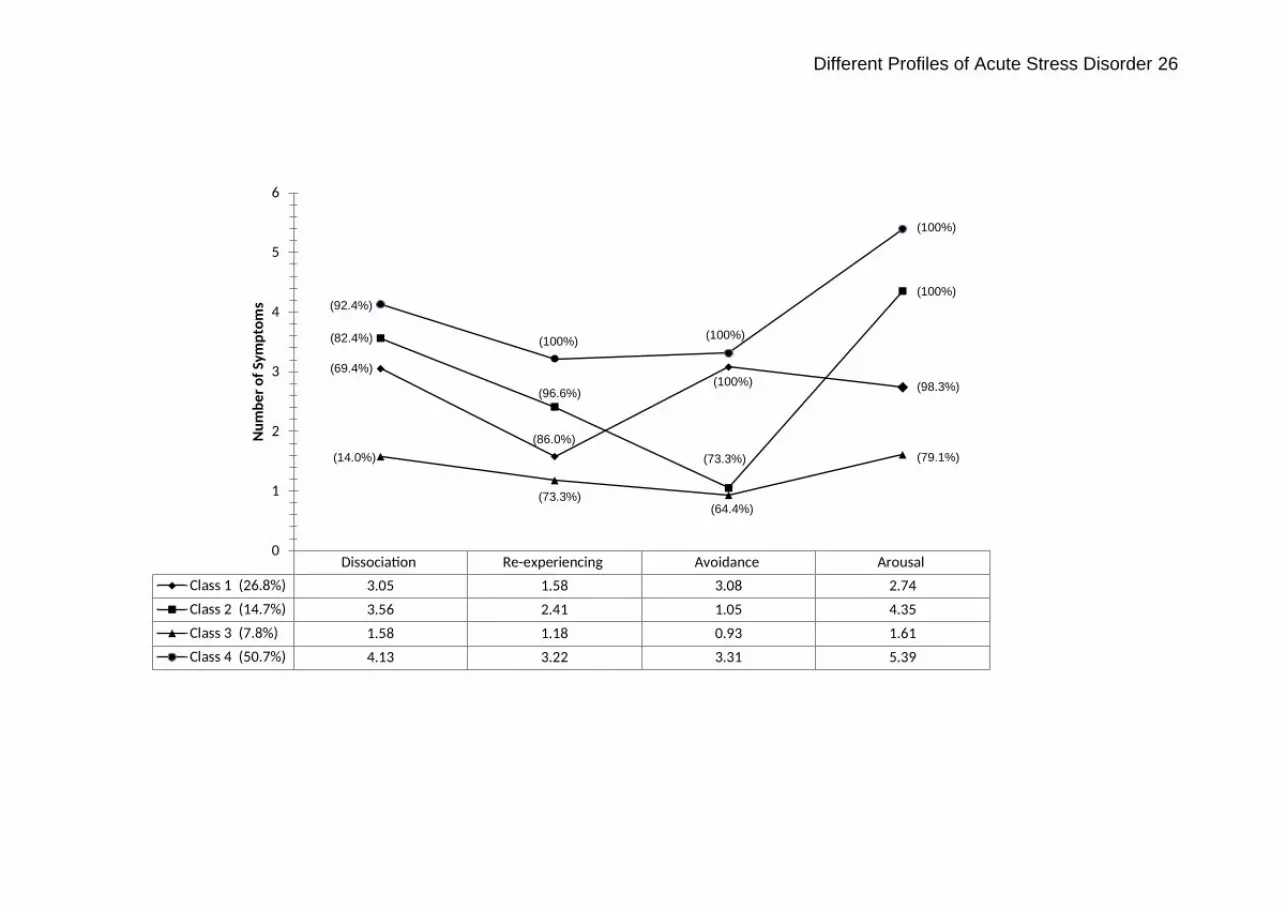
Figure 1 shows the profile plot for the 4 class solution. Class 4 (N = 299,
50.7%) was the largest, and was characterized by high mean scores on all ASD symptom
clusters. This class was labeled ‘High ASD’. Class 3 (N = 46, 7.8%) was the smallest, and
was characterized by low mean scores on all ASD symptom clusters. This class was
labeled ‘Low ASD’. There were two intermediate classes that were similar in the mean
number of Dissociation and Re-experiencing symptoms. Class 2 (N = 87, 14.7%) differed
from class 1 with a lower number of avoidance symptoms and higher number of arousal
symptoms, and was labeled ‘Low Avoidance, High Arousal’. Class 1 was labeled
‘Intermediate’ class (N = 158, 26.8%).
Figure 1 about here
The association between age and class membership was estimated as a
multinomial logistic regression. Using the ‘Low ASD’ class as a reference category, age
significantly decreased the likelihood of membership of the ‘Intermediate’ class (OR =
0.93, 95%CI = .88 - .99, p < .05) but did not significantly predict membership of the other
two classes.
Table 2 shows the conditional probabilities for having a high likelihood of
PTSD diagnosis based on class membership. For the ‘Low ASD’ group the probability was
not significantly different from zero, and for the ‘High ASD’ group the probability was high
(Pr =. 701). For the two intermediate groups, the ‘Low Avoidance, High Arousal’ group had
a higher probability than the ‘Intermediate’ group, and the difference in the probabilities
Different Profiles of Acute Stress Disorder 13
equates to the ‘Low Avoidance, High Arousal’ group being almost 3 times more likely to
report symptoms consistent with PTSD diagnostic criteria than the ‘Intermediate’ group
(OR = 2.97, 95%CI = 1.20 - 7.35, p < .05).
Table 2 about here
Discussion
The primary purpose of the current study was to investigate the assumed dimensional
structure of ASD. In order to test our hypothesis of the presence of both quantitatively and
qualitatively distinct latent classes of ASD, LPA was conducted on data from the ASDS
(Bryant et al., 2000) based on a large sample of female sexual trauma victims. Results
indicated the presence of four latent classes. The High ASD class was the largest group
accounting for slightly more than half of the sample. These participants displayed high
levels of dissociation, reexperiencing, avoidance, and arousal symptoms. The Low ASD
class included the fewest number of participants and this class exhibited low levels of each
of the four symptoms groups. Two intermediate classes were observed, one of which was
comprised of a group of individuals who displayed moderate levels of dissociation,
reexperiencing and arousal symptoms, and comparatively higher levels of avoidance
symptoms (Intermediate Class). The second intermediate class (Low Avoidance, High
Arousal) was comparable to the Intermediate class in that participants displayed moderate
levels of dissociation and reexperiencing symptoms, however this class was characterised
by very low level of avoidance symptoms, akin to those observed in the Low ASD class,
and very high levels of arousal symptoms, similar to those observed within the High ASD
class.
The symptom profiles for the High ASD and Low ASD classes were similar
and suggest a quantitative distinction between these classes. Contrastingly, the
Different Profiles of Acute Stress Disorder 14
Intermediate and Low Avoidance, High Arousal classes displayed qualitatively distinct
symptom profiles from each other, and each class also possessed qualitatively distinct
profiles from the High and Low ASD classes, respectively. These findings are consistent
with the study’s initial hypothesis and provide the first piece of empirical evidence that the
latent structure of ASD is best explained by qualitatively and quantitatively differing
subgroups rather than dimensional scores. Current results are therefore congruent with
recent findings from the wider trauma literature which suggests that PTSD is not
dimensional in nature but is rather comprised of a series of qualitatively distinct classes or
‘subtypes’ (e.g., Maguen et al., 2013; Wolf et al., 2012; Shevlin & Elklit, 2012).
Probabilities of reporting symptoms consistent with PTSD diagnostic criteria
were subsequently investigated based upon membership of each of the four classes. With
respect to the quantitatively distinct classes (the High ASD and Low ASD classes) a clear
‘dose-response’ effect was observed. Individuals belonging to the Low ASD class had a
probability of developing PTSD that was not significantly different from zero whereas
membership of the High ASD class conferred a 70% probability of developing PTSD. Also
in line with predictions, the probabilities of self-reported PTSD based upon membership of
the two qualitatively differing intermediate classes did not follow a traditional ‘dose-
response’ relationship. Individuals belonging to the Intermediate class had a 25%
probability of developing PTSD whereas the probability for the Low Avoidance, High
Arousal class twice as high (49%).
The results indicate that although individuals in each of the two intermediate
classes experience very similar overall levels of distress, a person’s risk of later
developing PTSD is doubled if they report experiencing high levels of arousal. The LPA
showed that it is the combinations of high levels of arousal and low levels of avoidance
that defines members of this class, and variable-centred rather than person-centred

Different Profiles of Acute Stress Disorder 15
analyses could not have identified this. This suggests that symptoms of arousal, rather
than symptoms of dissociation, may be the most critical factor in the prediction of PTSD.
Previous findings have suggested that improvements in the classification of ASD, and its
predictive power, could be obtained by shifting the emphasis from dissociation to arousal
symptoms (Brewin, Andrews, Rose, & Kirk, 1999; Harvey & Bryant, 1999). Current and
past findings therefore support the recent revisions to the diagnostic criteria in DSM-5
which has eliminated the emphasis placed on dissociation symptoms as the primary
symptom cluster of ASD.
The present study has a number of important implications for clinical practice.
Current findings indicate that increased levels of physiological arousal in the immediate
aftermath of a trauma are the most prominent factor in identifying those who are most
vulnerable to PTSD. Therefore, when performing initial risk assessments clinicians should
be cognizant that simply determining overall symptom severity is not sufficient for
identifying those who are most at risk of developing PTSD. Clinicians would be advised to
instead take a more symptom-specific perspective, particularly with respect to the arousal
symptoms, in order to identify those who have the highest risk of developing PTSD.
Moreover, treatment strategies that serve to reduce levels of arousal in the acute phase
following exposure to trauma would appear prudent as this would serve to substantially
reduce an individual’s likelihood of going on to develop PTSD.
Conclusions drawn from the current study must necessarily be considered in
light of a number of limitations. First, the nature of the sample is limited to a very specific
group of trauma victims who characteristically display high levels of ASD and PTSD
symptomology. Replication of the current analysis with more diverse trauma populations is
clearly warranted. Additionally, participants were recruited from the Danish population
therefore it is unknown whether current results will generalise to other populations.
Different Profiles of Acute Stress Disorder 16
Second, the analyses for the current study were based upon the use of self-report
measures of ASD (ASDS; Bryant et al., 2000) and PTSD (HTQ; Mollica et al., 1992).
Clinician based measures such as the ASDI (Bryant et al., 1998) and the Clinician-
Administered PTSD scale (Blake et al., 1995) would have been preferable. Third, the
reliability of the ASDS subscales were low compared to those reported in previous ASD
studies. This may be attributable to the varied forms of sexual victimization experienced by
the participants, whereas previous samples have experienced the same event such as
bushfire survivors (Bryant et al., 2000).
In conclusion, this study found that symptom endorsement that is consistent
with ASD has strong predictive power for identifying female sexual trauma victims who will
later have a high likelihood of a diagnosis of PTSD. Additionally, the latent structure of
ASD was found to consist of a series of distinct classes that differed not only quantitatively
but also qualitatively. It was notable that although the two intermediate classes were
comparable in overall severity of ASD, their unique symptom profiles resulted in
substantially different probabilities of developing PTSD. A clear pattern was identified
across the four latent classes which indicated that higher levels of arousal symptoms were
associated with increased probabilities of being diagnosed with PTSD. These results offer
additional evidence that arousal symptoms, rather than dissociation symptoms, are the
most important component of ASD in predicting the subsequent emergence of PTSD.

Different Profiles of Acute Stress Disorder 17
References
Akaike, H. (1987). Factor analysis and the AIC. Psychometrika, 52, 317-332.
American Psychiatric Association (1994). Diagnostic and statistical manual of mental
disorders. (4th ed.). Washington, DC: Author.
American Psychiatric Association (2013). Diagnostic and statistical manual of mental
disorders. (5th ed.). Washington, DC: Author.
Armour, C., Elklit, A., & Shevlin, M. (2011). The latent structure of acute stress disorder: A
posttraumatic stress disorder approach. Psychological Trauma: Theory, Research,
Practice, and Policy, 5, 18-25.
Bovin, M. J., & Weathers, F. W. (2012). Assessing PTSD symptoms. In Beck, J. G., &
Sloan, D. M. (Eds.), The oxford handbook of traumatic stress disorders (pp. 235-249).
Oxford: Oxford University Press.
Brewin, C. R., Andrews, B., & Rose, S. (2003). Diagnostic overlap between acute stress
disorder and PTSD in victims of violent crime. American Journal of Psychiatry, 160,
783-785.
Brewin, C. R., Andrews, B., Rose, S., & Kirk, M. (1999). Acute stress disorder and
posttraumatic stress disorder in victims of violent crime. American Journal of Psychiatry,
156, 360-366.
Brooks, R., Silove, D., Bryant, R., O’Donnell, M., Creamer, M., & McFarlane, A. (2008). A
confirmatory factor analysis of the acute stress disorder interview. Journal of Traumatic
Stress, 21, 352–355.

Different Profiles of Acute Stress Disorder 18
Bryant, R. A. (2003). Early predictors of posttraumatic stress disorder. Biological
Psychiatry, 53, 789-795.
Bryant, R. A. (2011). Acute stress disorder as a predictor of posttraumatic stress disorder:
a systematic review. Journal of Clinical Psychiatry, 72, 233-239.
Bryant, R. A., Friedman, M. J., Spiegel, D., Ursano, R., & Strain, J. (2011). A review of
acute stress disorder in DSM-5. Depression and Anxiety, 28, 802-817.
Bryant, R. A., Harvey, A. G., Dang, S. T., & Sackville, T. (1998). Assessing acute stress
disorder: Psychometric properties of a structured clinical interview. Psychological
Assessment, 10, 215-220.
Bryant, R. A., Moulds, M. L., & Guthrie, R. M. (2000). Acute stress disorder scale.
Psychological Assessment, 12, 61–68.
Cardeña, E., Dennis, M. J., Winkel, M., & Skitka, L. J. (2005). A snapshot of terror: acute
posttraumatic responses to the September 11 attack. Journal of Trauma & Dissociation,
6, 69-84.
Cardeña, E., Koopman, C., Classen, C., Waelde, L. C., & Spiegel, D. (2000).
Psychometric properties of the Stanford Acute Stress Reaction Questionnaire (SASRQ):
A valid and reliable measure of acute stress. Journal of Traumatic Stress, 13, 719-734.
Classen, C., Koopman, C., Hales, R. & Spiegel, D. (1998). Acute stress disorder as a
predictor of posttraumatic stress symptoms. American Journal of Psychiatry, 155, 620-
624.

Different Profiles of Acute Stress Disorder 19
Cohen, M. (2008). Acute Stress Disorder in older, middle-aged and younger adults in
reaction to the second Lebanon war. International Journal of Geriatric Psychiatry, 23,
34–40.
Edmondson, D., Mills, M. A., & Park, C. L. (2010). Factor structure of the Acute Stress
Disorder Scale in Hurricane Katrina evacuees. Psychological Assessment, 22, 269-278.
Elklit, A., & Shevlin, M. (2007). The structure of PTSD symptoms: A test of alternative
models using confirmatory factor analysis. British Journal of Clinical Psychology, 46,
299-313.
Hansen, M., Lasgaard, M., & Elklit, A. (2012). The latent factor structure of acute stress
disorder following bank robbery: Testing alternative models in light of the pending DSM-
5. British Journal of Clinical Psychology, 52, 82-91.
Harvey, A. G., & Bryant, R. A. (1998). The relationship between acute stress disorder and
posttraumatic stress disorder: A prospective evaluation of motor vehicle accident
survivors. Journal of Consulting and Clinical Psychology, 66, 507–512.
Harvey, A. G., & Bryant, R. A. (1999). Dissociative symptoms in acute stress disorder.
Journal of Traumatic Stress, 12, 673-680.
Harvey, A. G., & Bryant, R. A. (2002). Acute stress disorder: A synthesis and critique.
Psychological Bulletin, 128, 892–906.
Kangas, M., Henry, J.L., & Bryant, R.A. (2005). The relationship between acute stress
disorder and posttraumatic stress disorder following cancer. Journal of Consulting and
Clinical Psychology, 73, 360-364.

Different Profiles of Acute Stress Disorder 20
Koopman, C., Classen, C., & Spiegel, D. (1994). Predictors of posttraumatic stress
symptoms among survivors of the Oakland/Berkeley, Calif., firestorm. American Journal
of Psychiatry, 151, 888-894.
Lo, Y., Mendell, N., & Rubin, D. B. (2001). Testing the number of components in a normal
mixture. Biometrika, 88, 767–778
Maguen, S., Madden, E., Bosch, J., Galatzer-Levy, I., Knight, S. J., Litz, B. T.,...McCaslin,
S. E. (2013). Killing and latent classes of PTSD symptoms in Iraq and Afghanistan
veterans. Journal of Affective Disorders, 145, 344-348.
McLachlan, G., & Peel, D. (2000). Finite mixture models. NY: Wiley
Mollica, R. F., Caspi-Yavin, Y., Bollini, P., Truong, T., Tor, S., & Lavelle, J. (1992). The
Harvard Trauma Questionnaire: Validating a cross-cultural instrument for measuring
torture, trauma and posttraumatic stress disorder in Indochinese refugees. The Journal
of Nervous and Mental Disease, 180, 111-116.
Muthén L., & Muthén, B. (2012). Mplus User Guide. Version 7. Los Angeles: Statmodel.
Nylund, K. L., Asparouhov, T., & Muthen, B. (2007). Deciding on the number of classes in
latent class analysis and growth mixture modeling. A Monte Carlo simulation study.
Structural Equation Modeling, 14, 535-569.
Schafer, J. L., & Graham, J. W. (2002). Missing data: Our view of the state of the art.
Psychological Methods, 7, 147–177.
Schwartz, G. (1978). Estimating the dimension of a model. The Annals of Statistics, 6,
461-464.

Different Profiles of Acute Stress Disorder 21
Sclove, S. L. (1987). Application of model-selection criteria to some problems in
multivariate analysis. Psychometrika, 52, 333-343.
Shevlin, M. & Elklit, A. (2012). The latent structure of posttraumatic stress disorder:
Different models or different populations? Journal of Abnormal Psychology,
121, 610-615.
Spiegel, D., Koopman, C., Cardena, E., & Classen, C. (1996). Dissociative symptoms in
the diagnosis of acute stress disorder. In L. K. Michelson & W. J. Ray (Eds.), Handbook
of dissociation: Empirical, theoretical, and clinical perspectives (pp. 367-380). New
York: Plenum.
Statmodel.com. (2013). Mplus Discussion >> Diverging LMR and BLRT p-values. [online]
Available at: http://www.statmodel.com/discussion/messages/13/4529.html?1249068
377 [Accessed: 14 Oct 2013].
van der Velden, P. G., Kleber, R. J., Christiaanse, B., Gersons, B. P., Marcelissen, F. G.,
Drogendijk, A. N., & Meewisse, M. L. (2006). The independent predictive value of
peritraumatic dissociation for postdisaster intrusions, avoidance reactions, and PTSD
symptom severity: A 4-year prospective study. Journal of Traumatic Stress, 19, 493–
506.
Wang, L., Li, Z., Shi, Z., Zhang, Y., & Shen, J. (2010). Factor structure of acute stress
disorder symptoms in Chinese earthquake victims. Personality and Individual
Differences, 48, 798–802.

Different Profiles of Acute Stress Disorder 22
Weathers, F. W., Ruscio, A. M., & Keane, T. M. (1999). Psychometric properties of nine
scoring rules for the Clinician-Administered Posttraumatic Stress Disorder Scale.
Psychological Assessment, 11, 124-133.
Wolf, E. J., Miller, M. W., Reardon, A. F., Ryabchenko, K. A., Castillo, D., Freund, R.
(2012). A latent class analysis of dissociation and posttraumatic stress disorder:
Evidence for a dissociative subtype. Archives of General Psychiatry, 69, 698-705.
Yuan, K. H., & Bentler, P. M. (2000). Three likelihood-based methods for mean and
covariance structure analysis with nonnormal missing data. Sociological Methodology,
30, 165-200.

Different Profiles of Acute Stress Disorder 23
Table 1. Fit Statistics for the Latent Profile Analysis of Acute Stress Disorder and Posttraumatic Stress Disorder.
Model Log-
likelihood
AIC BIC ssaBIC LMR-A
p
BLRT
p
2 class -3332.70 6695.41 6761.11 6713.49 406.10
.00
416.71
.00
3 class -3286.98 6615.97 6707.95 6641.28 89.10
.00
91.43
.00
4 class -3249.91 6553.82 6672.08 6586.36 72.26
.01
74.15
.00
5 class -3237.10 6540.21 6684.76 6579.99 24.95
0.58
25.60
.00
6 class -3223.16 6524.33 6695.15 6571.34 27.17
0.23
27.88
.00
Note: AIC = Akaike Information Criterion, BIC = Bayesian Information Criterion, ssaBIC = sample size adjusted Bayesian
Information Criterion, LMR-A Lo-Mendell-Rubin adjusted likelihood ratio test, BLRT = bootstrapped likelihood ratio test.

Different Profiles of Acute Stress Disorder 24
Table 2. Conditional Probability of PTSD Diagnosis Based on Class Membership.
Class Probability of PTSD
conditional on class
membership
Standard
Error
p
1. Intermediate .247 .062 .00
2. Low Avoidance, High Arousal .493 .073 .00
3. Low ASD .114 .075 .13
4. High ASD .701 .047 .00

Different Profiles of Acute Stress Disorder 25
Figure 2. Profile Plot Showing Mean ASD Scores and Percentages Meeting Diagnostic Criteria in Each Class.
Different Profiles of Acute Stress Disorder 26
Dissociation Re-experiencing Avoidance ArousalClass 1 (26.8%) 3.05 1.58 3.08 2.74Class 2 (14.7%) 3.56 2.41 1.05 4.35Class 3 (7.8%) 1.58 1.18 0.93 1.61Class 4 (50.7%) 4.13 3.22 3.31 5.39
0
1
2
3
4
5
6
Num
ber o
f Sym
ptom
s (92.4%)
(14.0%) (100%) .0
(69.4%) (100%) .0
(82.4%) (100%) .0
(100%)
(100%)
(98.3%)
(79.1%)
(100%)
(100%)
(73.3%)
(64.4%)
(100%)
(96.6%)
(86.0%)
(73.3%)


