Embed Size (px)
Citation preview
Differentiation and development of human female germcells during prenatal gonadogenesis: animmunohistochemical study
H.Stoop1*, F.Honecker1,2*, M.Cools1, R.de Krijger1, C.Bokemeyer2 and L.H.J.Looijenga1,3
1Department of Pathology, Josephine Nefkens Institute, Erasmus MC-University Medical Center Rotterdam, Daniel den Hoed Cancer
Center, Rotterdam, The Netherlands and 2Department of Hematology/Oncology, University of Tubingen, Tubingen, Germany*Stoop and Honecker contributed equally to the work.
3To whom correspondence should be addressed: Department of Pathology, Erasmus MC-University Medical Center Rotterdam,
Josephine Nefkens Institute, Room 430b, P.O.Box 1738, 3000 DR Rotterdam, The Netherlands. E-mail: [email protected]
BACKGROUND: In the development of the human ovary, the second trimester includes the transition from oogo-nial replication to primordial follicle formation. The present study was carried out to assess differentiation andproliferation of germ cells in a series of female gonads from 19 fetuses from the second and third trimester, andtwo neonates. METHODS: Using immunohistochemistry, the following markers were studied: placental/germ-likecell alkaline phosphatases (PLAP), the marker of pluripotency OCT3/4, the proliferation marker Ki-67, b-cateninand E-cadherin, the stem cell factor receptor c-KIT, and VASA, a protein specific for the germ cell lineage.RESULTS: PLAP and OCT3/4 were seen during oogenesis, but not in germ cells engaged in folliculogenesis. Asimilar pattern was observed for Ki-67. Loss of pluripotency occurs once oocytes engage in follicle formation,suggesting a role of cell–cell interactions in the process of germ cell maturation. VASA, c-KIT, b-catenin and E-cadherin were found in germ cells at all developmental stages of oogenesis and folliculogenesis. CONCLUSIONS:Immunohistochemically, two groups of germ cells can be distinguished. Germ cells that are predominantly foundin the cortical region of the ovary before weeks 22–24 of gestation, showing an immature phenotype, are mitoti-cally active, and express OCT3/4, a marker of pluripotency. On the other hand, germ cells undergoing folliculogen-esis have lost their pluripotent potential and no longer proliferate.
Key words: differentiation/fetal ovary/germ cells/immunohistochemistry/proliferation
Introduction
In humans and rodents, amongst other species, the embryo-
nic precursors of the gametes are known as primordial
germ cells (PGC) (see Donovan, 1998, for review). These
cells are set aside to an extra-embryonic location early
during embryonic development, and migrate to the area
where the genital ridge will be formed around weeks 5 and
6 of human development (Witschi, 1948). Subsequently,
the gonads and sexual differentiation occur in weeks 6 and
7 (Falin, 1969). Between weeks 7 and 9 during ovarian
development (referred to as prefollicular stage) the germ
cells (oogonia) and granulosa cells characteristically arrange
in cords and sheets without specific organization (Gondos,
1985). The population of oogonia increases by undergoing
multiple divisions, after which they become oocytes, stop
proliferating, and enter the first steps of meiosis. The first
distinctive change in prenatal germ cell development in the
ovary is therefore the onset of meiosis, which starts at
11–12 weeks of gestation and extends into the second tri-
mester (Rabinovici and Jaffe, 1990). Contradictory data
exist with regard to the onset of folliculogenesis, i.e. the
occurrence of primordial follicles, which has been reported
to take place between 16 and 21 weeks of gestation (Kur-
ilo, 1981; Konishi et al., 1986). Due to the proliferation of
premeiotic oogonia on the one hand and the apoptotic
elimination of both oogonia and germ cells at different
stages of folliculogenesis during intrauterine maturation on
the other hand, considerable changes in the total number of
germ cells are seen (De Pol et al., 1997). Whereas at 5
weeks of gestational age an estimated 700–1300 germ
cells are present, germ cell number peaks between weeks
16 and 20, reaching an estimated 6 £ 106 cells per ovary
(Baker, 1963). At birth, the total number of germ cells has
been estimated to be ,1 £ 106 cells, and the number of
follicles has been reported to be in the range of 1.3–
3.8 £ 105, with 95% being represented by primordial
follicles (Baker, 1963; Forabosco et al., 1991). Maturation
is a gradual process, as is demonstrated by the initiation of
Human Reproduction Vol.20, No.6 pp. 1466–1476, 2005 doi:10.1093/humrep/deh800
Advance Access publication February 25, 2005
1466 q The Author 2005. Published by Oxford University Press on behalf of the European Society of Human Reproduction and Embryology. All rights reserved.
For Permissions, please email: [email protected]
Dow
nloaded from https://academ
ic.oup.com/hum
rep/article/20/6/1466/748694 by guest on 25 March 2022
certain stages at certain times, i.e. the temporal regulation
of oocyte development. In humans, this process is not syn-
chronized, as germ cells of different developmental stages
can be detected at the same time in the same prenatal
ovary. This indicates that unknown intracellular mechan-
isms govern the individual pace of maturation (Rabinovici
and Jaffe, 1990).
In order to further investigate the distribution and timing
of proliferation and differentiation, we undertook an exten-
sive study on the presence of a number of markers involved
in either proliferation or maturation of normal female germ
cells spanning the intrauterine period between week 15.5
gestational age and the neonatal period. In the human ovary,
this crucial period includes the transition from oogonial repli-
cation by mitosis to primordial follicle formation. In this
study we investigated the maturation process seen in normal
development of the ovary and assess its potential as a refer-
ence for future identification of pathological processes of
maturation.
Materials and methods
Tissue samples
Use of tissues for scientific reasons has been approved by an insti-
tutional review board (MEC 02.981). The samples are used accord-
ing to the ‘Code for Proper Secondary Use of Human Tissue in the
Netherlands’, as developed by the Dutch Federation of Medical
Scientific Societies (FMWV) (version 2002). Human gonads of 19
females from the second and third trimester after spontaneous or
induced abortions (gestational ages 15.5–40 weeks), or premature
and term neonates that had died shortly after birth were obtained
from post-mortem examinations in our department. Ovaries were
dissected and fixed in 10% formalin and processed into paraffin. To
assure satisfactory quality, poor preservation of tissue samples
assessed by haematoxylin–eosin staining led to exclusion from this
analysis. Cases showing conditions that can possibly affect gonadal
development such as trisomy 18 and 21, hydrocephalus, maldeve-
loped kidneys, or gross intrauterine growth retardation, were
excluded from the study. Gestational ages were calculated in
relation to the mothers’ last menstrual cycle and were in accordance
with the foot length and the crown–heel length measurements at
autopsy.
Histochemical and immunohistochemical stainings
Stainings were performed as described before (Stoop et al., 2001).
For immunohistochemistry, sections were incubated with the pri-
mary antibody overnight at 4 8C [placental/germ-like cell alkaline
phosphatases (PLAP), c-KIT, VASA, b-catenin, E-cadherin] or 2 h
at room temperature (OCT3/4, Ki-67). The primary and secondary
antibodies used are indicated in Table I. All slides were counter-
stained with haematoxylin. For PLAP, b-catenin and E-cadherin,
positive staining of the Fallopian tube, and for c-KIT, the presence
of mast cells were used as an internal positive control. Negative
controls were performed by omitting the primary antibody, resulting
in complete absence of signal.
Double-stainings were performed by using a combination of the
same detection methods but with different substrates: Fast Blue/-
Naphtol ASMX phosphate (F3378 and N500; Sigma, Germany) for
blue staining and 3-amino-9-ethyl-carbazole (A.5754 and D4254;
Sigma)/H2O2 for red staining, without counterstaining. EndogenousTable
I.A
nti
bod
ies
(so
urc
e)an
dd
etec
tio
nm
eth
od
use
dfo
rim
mu
no
his
toch
emis
try
An
tib
od
yC
om
pan
yC
od
eP
re-t
reat
men
tD
ilu
tio
ns
Sec
on
dar
yan
tib
ody
(1:2
00
)(b
ioti
ny
late
d)
Vis
ual
izat
ion
PL
AP
Cel
lM
arq
ue,
Ho
tS
pri
ng
s,A
R,
US
AC
MC
20
3H
IAR
a1
:20
0R
abb
itan
ti-m
ou
se(D
ako
-Cy
tom
atio
n,
E0
413
)A
BC
plx
-ap
b
c-K
ITD
ako
-Cy
tom
atio
n,
Glo
stru
p,
Den
mar
kA
45
02
HIA
R1
:50
0S
win
ean
ti-r
abb
it(D
ako
-Cy
tom
atio
n,
E0
413
)A
BC
plx
-ap
OC
T3
/4S
anta
Cru
zB
io-t
ech
no
log
y,
San
taC
ruz,
CA
,U
SA
sc-8
62
9H
IAR
1:1
00
0H
ors
ean
ti-g
oat
(Vec
tor
Lab
ora
tori
es,
Burl
ing
ame,
CA
,U
SA
,B
A95
00
)A
BC
plx
-hrp
c
VA
SA
Pro
vid
edby
D.C
astr
illo
nd
HIA
R1
:20
00
Sw
ine
anti
-rab
bit
AB
Cp
lx-a
pb
-Cat
enin
Zy
med
Lab
ora
tori
es,
So
uth
San
Fra
nci
sco
,U
SA
CA
T-5
H1
0H
IAR
1:2
00
0R
abb
itan
ti-m
ou
seA
BC
plx
-hrp
c
E-C
adh
erin
Zy
med
Lab
ora
tori
es,
So
uth
San
Fra
nci
sco
,C
A,
US
AH
EC
D-1
HIA
R1
:30
0R
abb
itan
ti-m
ou
seA
BC
plx
-hrp
c
Ki-
67
Dak
o-C
yto
mat
ion
,G
lost
rup,
Den
mar
kA
04
7H
IAR
1:5
0S
win
ean
ti-r
abb
itA
BC
plx
-hrp
aH
eat-
induce
dan
tigen
retr
ieval
(Shiet
al.
,1
99
1).
bA
BC
com
ple
x,
alk
alin
ep
ho
sph
atas
e,D
ako
Cy
tom
atio
n,
Cod
e:K
03
91
.cA
BC
com
ple
x,
ho
rse
rad
ish
per
ox
idas
e,D
ako
Cy
tom
atio
n,
Co
de:
K0
37
7.
dC
astr
illo
net
al.
(20
00).
PL
AP¼
pla
centa
l/ger
m-l
ike
cell
alkal
ine
phosp
hat
ases
.
Differentiation of human female germ cells
1467
Dow
nloaded from https://academ
ic.oup.com/hum
rep/article/20/6/1466/748694 by guest on 25 March 2022
peroxidase activity and/or endogenous biotin was blocked using 3%
H2O2 (for 5 min) and/or a blocking kit for endogenous biotin (Vec-
tor Laboratories, USA) to prevent background staining.
To semiquantitatively assess expression of the markers investi-
gated, cells showing a positive signal were counted in representative
visual fields (magnification £ 200) containing surface areas of both
the medullary and the cortical region of the ovary in comparable
proportions in all cases. In addition, cells positive for PLAP,
OCT3/4 and Ki-67 were counted in three representative high power
fields (magnification £ 400) of both the medullary and cortical
regions of seven cases (gestational ages 15.5, 20, 23, 28, 33, 35 and
36 weeks) to assess regional differences. For quantitative analysis of
OCT3/4, the percentage of positive cells among the total number of
germ cells (as identified by histology) was assessed in three cases
(gestational ages 15.5, 28 and 36 weeks) counting three representa-
tive visual fields (magnification £ 200). The counting was per-
formed independently by three different observers (H.S., F.H. and
M.C.) who were unaware of the gestational age at the time-point of
the investigation.
Results
The presence of a number of markers during normal fetal
and neonatal ovarian development (week 15.5 gestational age
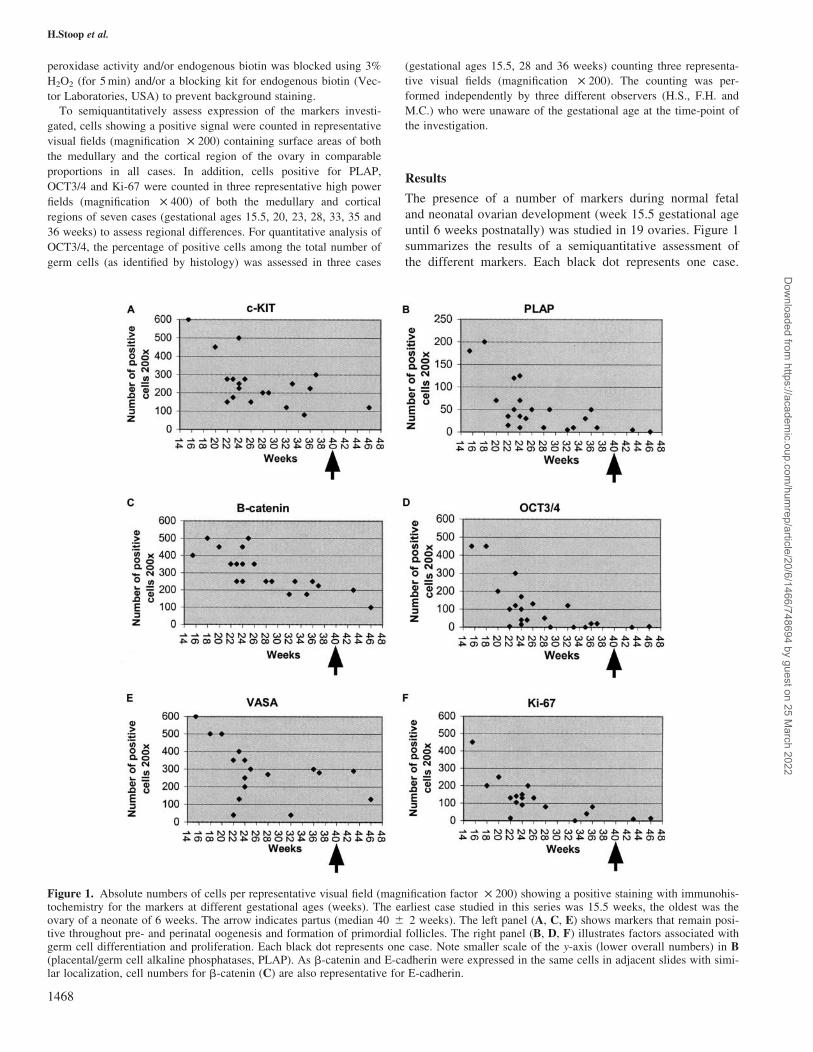
until 6 weeks postnatally) was studied in 19 ovaries. Figure 1
summarizes the results of a semiquantitative assessment of
the different markers. Each black dot represents one case.
Figure 1. Absolute numbers of cells per representative visual field (magnification factor £ 200) showing a positive staining with immunohis-tochemistry for the markers at different gestational ages (weeks). The earliest case studied in this series was 15.5 weeks, the oldest was theovary of a neonate of 6 weeks. The arrow indicates partus (median 40 ^ 2 weeks). The left panel (A, C, E) shows markers that remain posi-tive throughout pre- and perinatal oogenesis and formation of primordial follicles. The right panel (B, D, F) illustrates factors associated withgerm cell differentiation and proliferation. Each black dot represents one case. Note smaller scale of the y-axis (lower overall numbers) in B(placental/germ cell alkaline phosphatases, PLAP). As b-catenin and E-cadherin were expressed in the same cells in adjacent slides with simi-lar localization, cell numbers for b-catenin (C) are also representative for E-cadherin.
H.Stoop et al.
1468
Dow
nloaded from https://academ
ic.oup.com/hum
rep/article/20/6/1466/748694 by guest on 25 March 2022
Table II shows the results of a differential analysis, compar-
ing expression of PLAP, OCT3/4 and Ki-67 in the medullary
and cortical regions of the ovaries of seven cases, aged 15.5,
20, 23, 28, 33, 35 and 36 weeks. Table III gives both the
absolute numbers and the percentage of cells positive for
OCT3/4 in three of these cases, aged 15.5, 28 and 36 weeks.
Illustrations of representative stainings are shown in Figures
2 and 3. Results of single- and double-stainings are described
below. The data in Figure 4 (grey bars) were compared to
previously published findings (black bars). Figure 5 shows a
model of the progression of markers from oogonia to primor-
dial follicles.
Immunohistochemical detection of Ki-67, PLAP andOCT3/4
Ki-67, PLAP and OCT3/4 were all found much more fre-
quently at earlier fetal ages, and expression decreased with
advancing gestational age (Figure 1). The various regions of
the ovary showed different stages of germ cell maturation:
cells positive for Ki-67, PLAP and OCT3/4 were mainly
observed in the cortical region of the developing ovaries, i.e.
the region where most immature germ cells are located
during the process of oogenesis (Tables II and III). In the
medulla, where the majority of maturing germ cells are
found during ovarian development, positive cells were much
less frequent.
The proliferation index was assessed using Ki-67, which
showed a nuclear staining in both early germ cells and inter-
stitial cells throughout the whole period of ovarian develop-
ment investigated in this series. A marked decrease in the
number of positive cells was observed after weeks 22–24 of
gestational age, mainly due to the cessation of mitosis of
germ cells. This indicates that proliferating germ cells con-
tribute significantly to the overall number of Ki-67 positive
cells in fetal ovaries. In germ cells, Ki-67 was observed
mainly in oogonia (see Figure 2A). Yet, whereas the majority
of oocytes engaged in folliculogenesis did not show Ki-67
expression, it was occasionally observed in oocytes of pri-
mordial follicles, where it was strictly confined to the nucleo-
lus. Perinatally, only a few cells, mainly interstitial cells or
granulosa cells, were positive.
The highest number of germ cells positive for PLAP was
seen in the earliest stages of fetal development examined,
and decreased sharply after 25 weeks gestational age (Figure
1). PLAP was detected in early germ cells predominantly
located in the cortical region (Figure 2B and Table II). After
birth, PLAP positive germ cells were hardly ever seen, with
a maximum of one to three positive cells per visual field.
PLAP expression was not restricted to germ cells, but was
also seen in the Fallopian tube and occasionally in the epi-
thelial lining of the ovary.
Nuclear staining for OCT3/4 was restricted to germ cells
and the overall staining pattern was comparable to PLAP, yet
total numbers of germ cells positive for OCT3/4 were some-
what higher (Figure 1 and Table II). In addition to oogonia,
OCT3/4 was occasionally seen in early oocytes, but was
never detectable in cells involved in folliculogenesis (Figure
2C). Similar to the expression pattern of Ki-67 and PLAP, a
decline in the expression of OCT3/4 in fetal ovaries was seen
at ,24 weeks of gestation. At term and in ovaries of neo-
Table II. Differences in the expression of placental/germ-like cell alkaline phosphatases (PLAP), OCT3/4 and Ki-67 between the cortical and the medullaryregion of fetal ovaries aged 15.5–36 weeks
Gestational age (weeks)
15.5 20 23 28 33 35 36
PLAPCortex 94 (72–115) 35 (23–44) 73 (54–85) 9 (3–12) 11 (9–13) 0 14 (12–17)Medulla 34 (12–52) 4 (2–6) 4 (1–6) 5 (1–9) 0 2 (1–3) 3 (2–4)OCT3/4Cortex 131 (106–157) 57 (56–57) 122 (99–162) 32 (29–33) 2 (0–3) 0 9 (1–20)Medulla 49 (36–58) 12 (1–21) 26 (14–43) 8 (2–14) 0 2 (0–5) 4 (1–6)Ki-67Cortex 234 (221–252) 136 (112–148 110 (95–118) 77 (62–98) 4 (2–7) 15 (9–18) 60 (46–75)Medulla 163 (152–172) 86 (70–110) 61 (55–65) 53 (36–75) 0 26 (16–32) 45 (24–69)
The average and the range of cell numbers found positive for the indicated markers in three independent high power magnification fields ( £ 400) is given.Note that expression of the early markers PLAP and OCT3/4 and the proliferation marker Ki-67 is predominantly found in the cortical region. Overall, the num-ber of positive cells decreases between 15.5 and 28 weeks, but shows some inter-individual variation during the third trimester.
Table III. Absolute numbers compared to total present (and percentage) of cells positive for OCT3/4 in three ovaries of 15.5, 28 and 36 weeks gestational age
OCT3/4 Gestational age (weeks)
15.5 28 36
Cortex 231/681 (34%; range 32–38) 5/324 (1.5%; range 0–4) 13/242 (5.4%; range 0–7)Medulla 35/271 (13%; range 6–18) 2/201 (1%; range 0–2) 0/188 (0)
The total number of germ cells, identified by histology, and the number of germ cells expressing OCT3/4 immunohistochemically was assessed in three inde-pendent low power fields (magnification £ 200) in both the cortical and the medullary region of three fetal ovaries. In parentheses, the percentage of germ cellsexpressing OCT3/4 is given, together with the range (as percentage) of three different counts of three different fields per case. Whereas a significant number ofgerm cells express OCT3/4 at 15.5 weeks, predominantly in the cortex, the percentage of positive cells decreases markedly during the third trimester. Note thedecrease in overall numbers of germ cells.
Differentiation of human female germ cells
1469
Dow
nloaded from https://academ
ic.oup.com/hum
rep/article/20/6/1466/748694 by guest on 25 March 2022
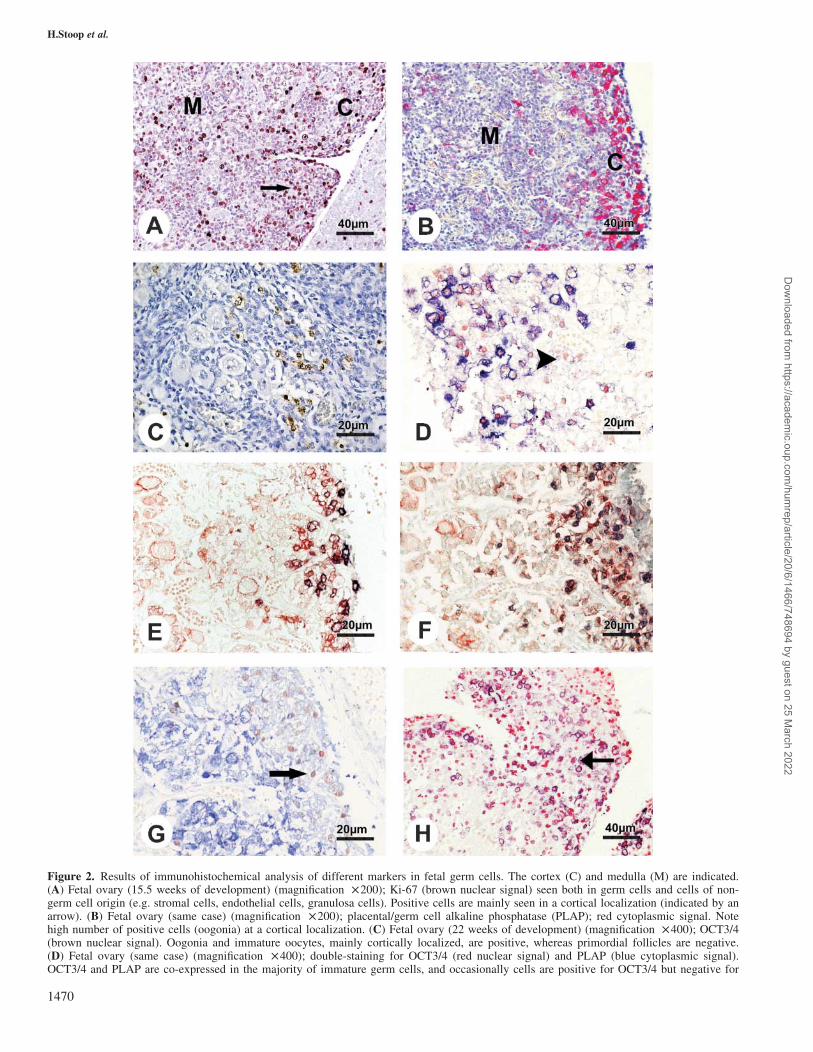
Figure 2. Results of immunohistochemical analysis of different markers in fetal germ cells. The cortex (C) and medulla (M) are indicated.(A) Fetal ovary (15.5 weeks of development) (magnification £200); Ki-67 (brown nuclear signal) seen both in germ cells and cells of non-germ cell origin (e.g. stromal cells, endothelial cells, granulosa cells). Positive cells are mainly seen in a cortical localization (indicated by anarrow). (B) Fetal ovary (same case) (magnification £200); placental/germ cell alkaline phosphatase (PLAP); red cytoplasmic signal. Notehigh number of positive cells (oogonia) at a cortical localization. (C) Fetal ovary (22 weeks of development) (magnification £400); OCT3/4(brown nuclear signal). Oogonia and immature oocytes, mainly cortically localized, are positive, whereas primordial follicles are negative.(D) Fetal ovary (same case) (magnification £400); double-staining for OCT3/4 (red nuclear signal) and PLAP (blue cytoplasmic signal).OCT3/4 and PLAP are co-expressed in the majority of immature germ cells, and occasionally cells are positive for OCT3/4 but negative for
H.Stoop et al.
1470
Dow
nloaded from https://academ
ic.oup.com/hum
rep/article/20/6/1466/748694 by guest on 25 March 2022
nates, hardly any positive germ cells were detectable.
Immunohistochemical detection of c-KIT, b-catenin/E-cadherin and VASA
A comparable staining pattern was seen for c-KIT, b-catenin
and E-cadherin (Figure 3A–F). Both in early, immature
germ cells (oogonia) and at all later stages of folliculogen-
esis, these factors were predominantly localized at the mem-
brane, but sometimes also showed a cytoplasmic localization
(see also Figure 1). In primordial follicles, all three factors
showed strong signal intensity at sites of cell–cell interaction
(Figure 3A–F). As b-catenin and E-cadherin were expressed
in the same cells in adjacent slides in similar localization,
these factors could be linked, forming an E-cadherin–catenin
complex in germ cells. In addition to their presence in germ
cells, these factors were also seen in epithelial cells of the
Fallopian tube, serving as an internal positive control.
VASA was observed in the cytoplasm of germ cells, both
oogonia and oocytes, at all gestational ages and after birth
(Figure 1G and H). In addition to oogonia and early oocytes,
all stages of follicle maturation showed presence of VASA.
Signal intensity varied with maturation of germ cells: early
germ cells showed only weak staining for VASA, and signal
intensity increased with maturation and was strongest in pri-
mordial follicles (Figure 3G). The total number of germ
cells, determined by VASA, decreased with gestational age:
whereas at 15.5 weeks ,600 germ cells, mostly oogonia and
early oocytes, were seen per visual field, the average number
of germ cells at term was ,100–200 per visual field.
Results of double-stainings
Double-stainings were performed to assess correlations or
differences of markers at different stages of maturation. A
total of nine cases of 15.5, 18, 24 (three different cases), 28,
33, 36 weeks gestational age, and a neonate of 2 weeks, born
at term, were stained for six different combinations: OCT3/4
and PLAP, PLAP and c-KIT, OCT3/4 and c-KIT, OCT3/4
and VASA, OCT3/4 and b-catenin, and PLAP and Ki-67
(Figure 2D–H respectively). The results of all double-stain-
ing experiments were in accordance with the results of the
respective single-staining experiments. Staining for OCT3/4
and PLAP revealed that a higher number of germ cells were
positive for OCT3/4 than for PLAP, with a constant ratio of
1.4:1 observed for all ages investigated (Figure 2D). PLAP
was never detected in germ cells negative for OCT3/4, and
expression of OCT3/4 was still observed at later stages of
development, when PLAP was already undetectable. Double-
staining for PLAP and c-KIT showed that at all gestational
ages more germ cells were positive for c-KIT than for PLAP.
PLAP was never detected in oogonia without expression of
c-KIT, but in contrast to PLAP, c-KIT remained positive
throughout maturation, including different stages of folliculo-
genesis (Figure 2E). In accordance with these findings,
OCT3/4 and c-KIT were found in comparable numbers only
in early germ cells, whereas during folliculogenesis, c-KIT
remained positive in germ cells that had already lost OCT3/4
expression (Figure 2F). Similar staining patterns were
observed for the combinations OCT3/4 and VASA, and
OCT3/4 and b-catenin (not shown), where co-expression was
restricted to early germ cells, whereas expression of OCT3/4
was no longer seen at later stages of maturation. Interest-
ingly, an inverse correlation was found between the presence
of OCT3/4 and the staining intensity of VASA. Oogonia
were positive for OCT3/4, but only weakly positive for
VASA, whereas primordial follicles staining strongly for
VASA no longer showed OCT3/4 (Figure 2G). Double-stain-
ing for PLAP and Ki-67 revealed that significantly more cells
were positive for Ki-67 than for PLAP at all ages. Further-
more, not all early germ cells (identified by PLAP
expression) were proliferating at the same time (Figure 2H).
A proportion of germ cells of between 50% at earlier and
37% at later gestational ages showed co-expression of both
markers. This indicates that in addition to a decrease in the
absolute number of early germ cells, these cells are also less
likely to proliferate at later stages of ovarian development.
During the third trimester, expansion of the pool of early
germ cells (indicated by co-expression of Ki-67 and PLAP)
has basically ceased.
Discussion
The aim of this study was to examine the differential
expression of a number of factors involved in proliferation
and differentiation of human fetal germ cells. The findings
give an indication of the temporal scale as well as the
regional differences during the maturation of normal female
germ cells in the human ovary. The overall picture of the
presence of the different factors in fetal and neonatal ovaries
is shown graphically in Figure 4 (grey bars) and compared to
findings in humans published so far in the literature (black
bars). Figure 5 gives a scheme of marker progression during
maturation from oogonia to primordial follicles.
PLAP (indicated by an arrowhead). (E) Fetal ovary (same case) (magnification £ 400); double-staining for PLAP (blue cytoplasmic signal)and c-KIT (red membranous signal). Primordial follicles express only c-KIT, and only a minority of cortically located immature germ cells ispositive for both markers. (F) Fetal ovary (same case) (magnification £ 400); double-staining for OCT3/4 (blue nuclear signal) and c-KIT(red membranous signal). Similar staining pattern as seen in E, but note that more germ cells are positive for OCT3/4 than for PLAP. (G)Fetal ovary (same case) (magnification £ 400); double-staining for OCT3/4 (red nuclear signal) and VASA (blue cytoplasmic signal). Primor-dial follicles, mostly located in the medullary region, show a strong intensity of VASA and are negative for OCT3/4, whereas immature germcells, mostly found in a cortical localization, are positive for OCT3/4 but show only weak VASA staining. (H) Fetal ovary (15.5 weeks ofdevelopment) (magnification £ 200); double-staining for Ki-67 (red nuclear signal) and PLAP (blue cytoplasmic signal). Significantly morecells are positive for Ki-67 than for PLAP. The majority of proliferating cells are of non-germ cell origin, as demonstrated by positive stain-ing for Ki-67 but absence of PLAP; however, a few oogonia (identified by PLAP expression) show co-expression of Ki-67, indicating thatthese immature germ cells are mitotically active (indicated by an arrow).
Differentiation of human female germ cells
1471
Dow
nloaded from https://academ
ic.oup.com/hum
rep/article/20/6/1466/748694 by guest on 25 March 2022
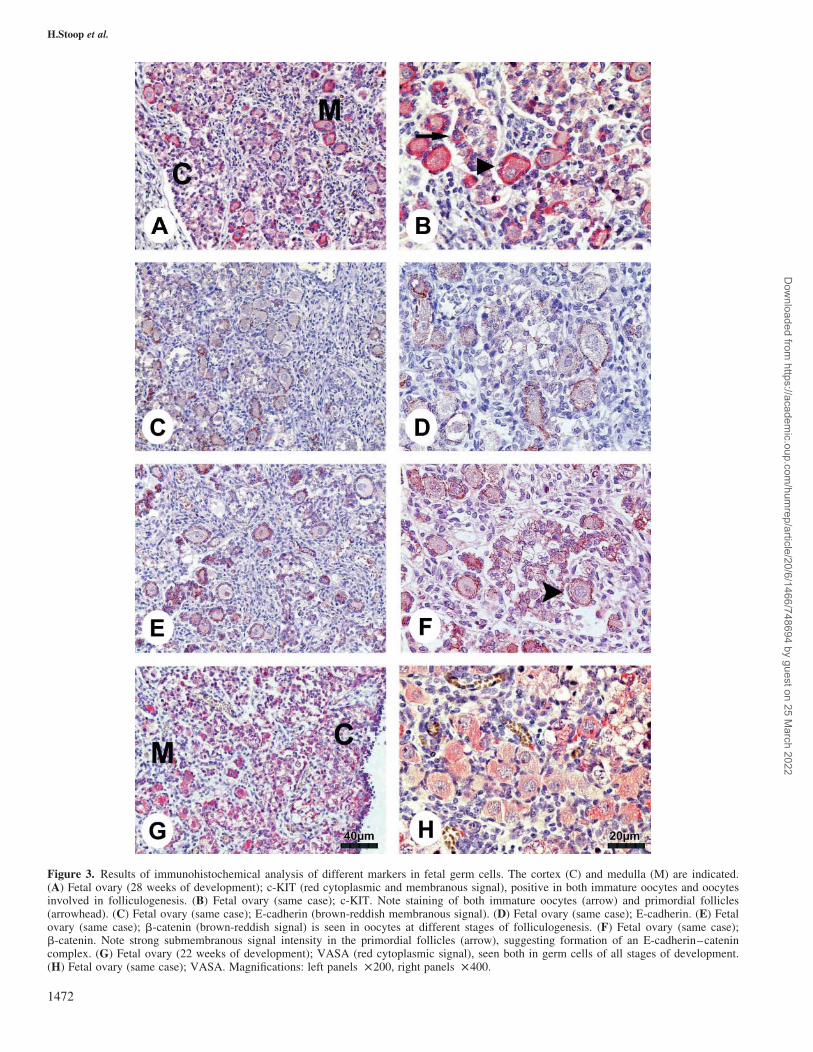
Figure 3. Results of immunohistochemical analysis of different markers in fetal germ cells. The cortex (C) and medulla (M) are indicated.(A) Fetal ovary (28 weeks of development); c-KIT (red cytoplasmic and membranous signal), positive in both immature oocytes and oocytesinvolved in folliculogenesis. (B) Fetal ovary (same case); c-KIT. Note staining of both immature oocytes (arrow) and primordial follicles(arrowhead). (C) Fetal ovary (same case); E-cadherin (brown-reddish membranous signal). (D) Fetal ovary (same case); E-cadherin. (E) Fetalovary (same case); b-catenin (brown-reddish signal) is seen in oocytes at different stages of folliculogenesis. (F) Fetal ovary (same case);b-catenin. Note strong submembranous signal intensity in the primordial follicles (arrow), suggesting formation of an E-cadherin–catenincomplex. (G) Fetal ovary (22 weeks of development); VASA (red cytoplasmic signal), seen both in germ cells of all stages of development.(H) Fetal ovary (same case); VASA. Magnifications: left panels £200, right panels £400.
H.Stoop et al.
1472
Dow
nloaded from https://academ
ic.oup.com/hum
rep/article/20/6/1466/748694 by guest on 25 March 2022
In the following paragraphs, the most interesting findings
of the individual markers included in this study will be dis-
cussed in more detail.
To assess proliferation, we used Ki-67, a nuclear protein
that is present in all phases of the cell cycle, but is absent in
G0-phase cells (Gerdes et al., 1984). Overall expression of
Ki-67 in both germ cells and cells of non-germ cell origin
(mostly interstitial cells and granulosa cells) was highest in
the earliest case investigated (15.5 weeks), and decreased
steadily throughout the second and third trimester. Around
term, almost all germ cells (mostly oocytes in primordial fol-
licles) and the majority of cells of non-germ cell origin have
entered a quiescent phase. Expression of Ki-67 was markedly
higher in the cortex than in the medulla at earlier ages,
whereas no differences between the two regions were found
during the third trimester (Table II). To assess the proportion
of germ cells of overall Ki-67 positive cells and examine the
percentage of proliferating germ cells, we performed double-
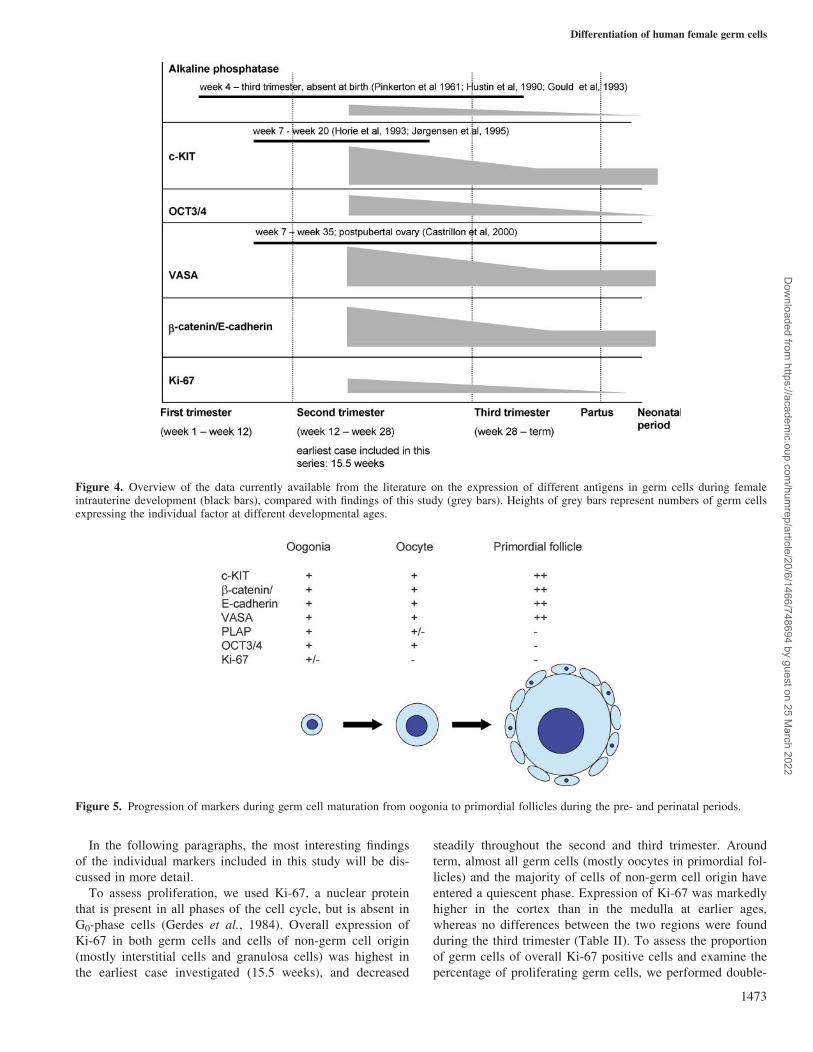
Figure 4. Overview of the data currently available from the literature on the expression of different antigens in germ cells during femaleintrauterine development (black bars), compared with findings of this study (grey bars). Heights of grey bars represent numbers of germ cellsexpressing the individual factor at different developmental ages.
Figure 5. Progression of markers during germ cell maturation from oogonia to primordial follicles during the pre- and perinatal periods.
Differentiation of human female germ cells
1473
Dow
nloaded from https://academ
ic.oup.com/hum
rep/article/20/6/1466/748694 by guest on 25 March 2022
stainings using a combination of PLAP and Ki-67. Of all
cells positive for Ki-67, ,50% were early germ cells. The
percentage of proliferating versus quiescent germ cells was
45 to 50% at 15.5 and 20 weeks, and between 37 and 40%
of the few early germ cells found at week 28 gestation
and 3 weeks after birth respectively. This indicates that
immature germ cells at early stages show strong proliferation
around weeks 15.5 to 20, whereas at later ages both the num-
ber and the fraction of proliferating germ cells decreases. At
term, the expansion of germ cells has almost ceased. This
finding is in line with earlier reports on germ cell numbers
during the prenatal period (for review, see Rabinovici and
Jaffe, 1990). Interestingly, a small number of oocytes in pri-
mordial follicles showed presence of Ki-67 in the nucleolus.
Similar findings have been reported previously, suggesting a
role of this factor not only during mitosis, but also during
meiosis (Wrobel et al., 1996; Traut et al., 2002). The number
of positive meiotic cells was too small to influence the over-
all conclusion, and did not allow conclusions regarding poss-
ible physiological meaning.
Alkaline phosphatases are regarded as archetypal onco-
fetal proteins. They are detectable at the mammalian blasto-
cyst stage and have been described in germ cells of human
embryos of ,4 weeks gestational age (Pinkerton et al.,
1961). PLAP expression has been described in primordial
germ cells at 8–13 weeks and at later ages in human oogonia
not yet engaged in cell–cell interactions with somatic cells,
whereas ovaries of neonates and infants were devoid of any
immunopositivity (Hustin et al., 1990; Gould et al., 2000).
Our finding that PLAP expression is restricted to early germ
cells, most likely oogonia, is in line with these previous
reports. The highest expression was seen in the cortex, where
the number of positive cells decreased steadily with advan-
cing age. In the medulla, differences at different ages were
less pronounced after week 20. In our study, PLAP was still
occasionally detected in germ cells of neonates shortly after
birth, albeit at very low numbers.
OCT3/4 is a transcriptional regulator, expressed exclu-
sively in pluripotent human embryonic stem cells and germ
cells, including PGC (Goto et al., 1999; Hansis et al., 2000).
In addition, presence of OCT3/4 has been described in germ
cell tumour cells with pluripotent potential such as embryo-
nal carcinoma and seminomas (Looijenga et al., 2003). In
fetal human testes, OCT3/4 has been found to be highly
expressed in PGC between weeks 17 and 24 and to a lesser
extent at later stages (Looijenga et al., 2003). Expression of
OCT3/4 in normal and dysgenetic human ovaries has been
reported recently (Rajpert-De Meyts et al., 2004). In our ana-
lysis, OCT3/4 was occasionally seen in early oocytes, but
never in germ cells involved in folliculogenesis, indicating
that human female germ cells irreversibly lose pluripotency
once they progress to meiosis and engage in a close cell–cell
interaction with granulosa cells. It is therefore tempting to
speculate that both the processes of cell–cell interaction and
down-regulation of OCT3/4 are important for germ cell
maturation. It should be noted that this is different from the
situation found in mouse follicles, where germ cells after
completion of meiotic prophase I express OCT3/4 (see Table
IV) (Pesce et al., 1998). However, the exact mechanisms of
interaction are not yet understood, and deserve further inves-
tigation. In this context it is interesting that ovarian teratomas
originate from germ cells at different stages of meiosis (Surti
et al., 1990). The finding that these tumours show a restricted
potential to differentiate and exclusively demonstrate somatic
differentiation is in line with previous reports that the pre-
sence of OCT3/4 in embryonic stem cells is crucial to keep
these cells in an undifferentiated state (Niwa et al., 2000).
We therefore speculate that ovarian teratomas arise from
germ cells that have already lost expression of OCT3/4. Our
findings demonstrate the value of both PLAP and OCT3/4
for the characterization of immature germ cells in the female
gonad and indicate that these markers can be useful for the
identification of developmentally arrested germ cells in
pathological conditions, e.g. in dysgenetic gonads, as has
been described recently (Rajpert-De Meyts et al., 2004).
VASA is a member of the DEAD box family of RNA heli-
cases and is specifically expressed in the germ cell lineage
(Castrillon et al., 2000). Furthermore, VASA expression has
been detected by immunohistochemistry in migratory PGC at
gestational week 7 and in germ cells both before and after
birth (Castrillon et al., 2000). It is most abundantly expressed
in postmeiotic germ cells, i.e. in males in spermatocytes and
in females in mature oocytes. VASA has also been described
in testicular germ cell tumours retaining germ cell
characteristics (Zeeman et al., 2002). Interestingly, in murine
embryonic stem cells, expression of Mvh, the mouse VASA
homologue, has been described as an early event in the com-
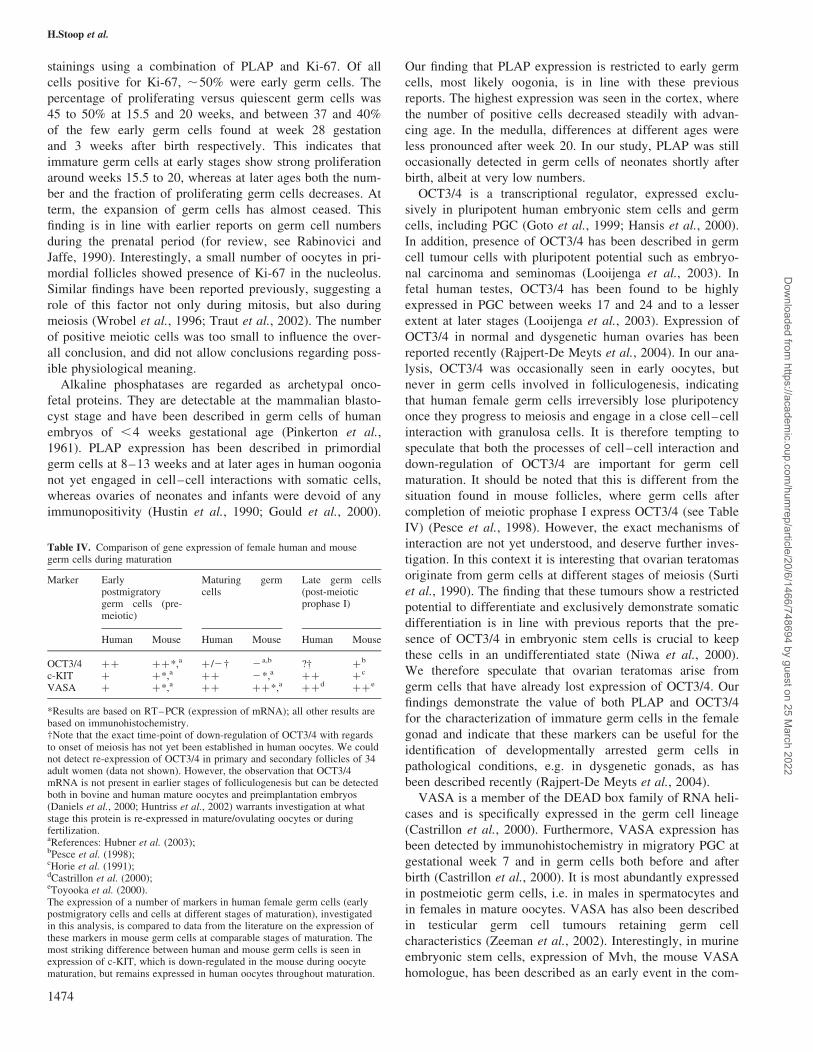
Table IV. Comparison of gene expression of female human and mousegerm cells during maturation
Marker Earlypostmigratorygerm cells (pre-meiotic)
Maturing germcells
Late germ cells(post-meioticprophase I)
Human Mouse Human Mouse Human Mouse
OCT3/4 þþ þþ*,a þ /2† 2a,b ?† þb
c-KIT þ þ*,a þþ 2*,a þþ þc
VASA þ þ*,a þþ þþ*,a þþd þþ e
*Results are based on RT–PCR (expression of mRNA); all other results arebased on immunohistochemistry.†Note that the exact time-point of down-regulation of OCT3/4 with regardsto onset of meiosis has not yet been established in human oocytes. We couldnot detect re-expression of OCT3/4 in primary and secondary follicles of 34adult women (data not shown). However, the observation that OCT3/4mRNA is not present in earlier stages of folliculogenesis but can be detectedboth in bovine and human mature oocytes and preimplantation embryos(Daniels et al., 2000; Huntriss et al., 2002) warrants investigation at whatstage this protein is re-expressed in mature/ovulating oocytes or duringfertilization.aReferences: Hubner et al. (2003);bPesce et al. (1998);cHorie et al. (1991);dCastrillon et al. (2000);eToyooka et al. (2000).The expression of a number of markers in human female germ cells (earlypostmigratory cells and cells at different stages of maturation), investigatedin this analysis, is compared to data from the literature on the expression ofthese markers in mouse germ cells at comparable stages of maturation. Themost striking difference between human and mouse germ cells is seen inexpression of c-KIT, which is down-regulated in the mouse during oocytematuration, but remains expressed in human oocytes throughout maturation.
H.Stoop et al.
1474
Dow
nloaded from https://academ
ic.oup.com/hum
rep/article/20/6/1466/748694 by guest on 25 March 2022
mitment of stem cells to the germ cell lineage (Toyooka
et al., 2000, 2003). In our study, expression of VASA has
been found both in germ cells at all gestational ages. In
accordance with previous reports (Castrillon et al., 2000),
staining intensity was stronger in maturing oocytes than
oogonia. Our results illustrate the usefulness of this protein
as a marker of germ cells at all stages of development and
allow an estimation of germ cell numbers at different ages.
c-KIT, b-catenin, and E-cadherin are all involved in cell
signalling and cell–cell interaction. c-KIT is a type III recep-
tor tyrosine kinase found on early germ cells, whereas the
ligand stem cell factor (SCF or KIT-L) is present in granu-
losa cells (Matzuk et al., 2002, for review). The c-KIT/SCF
system has been found to be involved in survival and pro-
liferation of migrating germ cells in mice (McLaren, 1992).
In human intrauterine gonadogenesis, c-KIT expression has
been described in female PGC at the period of arrival of
PGC at the gonadal ridges at week 7 and later between 13
and 21 weeks of gestational age (Horie et al., 1993; Jørgen-
sen et al., 1995; Robinson et al., 2001). During folliculogen-
esis, c-KIT has been postulated to play a role in germ cell
survival, possibly by up-regulating Mcl-1, an anti-apoptotic
member of the Bcl-2 family (Hartley et al., 2002).
Whereas some data are available on the cadherin–catenin
complex in mouse PGC development and oocyte maturation
(Ohsugi et al., 1999; Di Carlo and De Felici, 2000), little is
known about the role of these factors in human germ cell devel-
opment. In an earlier analysis, the presence of E-cadherin on
human oocytes has been demonstrated (Campbell et al., 1995).
Here we show that c-KIT, b-catenin and E-cadherin are all
present in germ cells throughout all stages of female intra-
uterine development. The presence of these factors not only in
maturing oocytes and germ cells during folliculogenesis, but
also in oogonia could be demonstrated by double-stainings
combining markers for early germ cells such as OCT3/4 and
PLAP with c-KIT and b-catenin. As oogonia are often found in
clusters, these factors seem to be involved in signalling between
neighbouring immature germ cells. In primordial follicles,
expression of these factors was predominantly seen in oocytes
at the site of cell–cell interaction with granulosa cells. This
suggests that cell–cell contacts play an important role, both for
immature germ cells and later between oocytes and surrounding
granulosa cells. In fact, E-cadherin has been reported to be
required for germ cell determination in PGC (Okamura et al.,
2003), and in oocyte growth and acquisition of meiotic compe-
tence in mice (Carabatsos et al., 2000). The functional import-
ance of E-cadherin has further been demonstrated by
dissociation/reassociation experiments in a mouse model: disso-
ciated cells from gonads were unable to reform their initial
contacts when cultured in the presence of an antibody to
E-cadherin (Mackay et al., 1999).
The total numbers of germ cells seen in one visual field, as
assessed by either c-KIT, b-catenin or VASA at different
gestational ages (see Figure 1), are in accordance with pre-
vious reports, where a steady decrease of germ cells from
around weeks 18–20 gestational age resulted in numbers that
were only one-sixth of peak values at term (Baker, 1963).
We therefore conclude that assessment of cell numbers in
one representative visual field at magnification £ 200 and
including comparable surface areas of cortical and medullary
areas is a reliable method for semiquantitative analyses. Our
results allow some interesting comparisons with data on
mouse germ cell maturation (see Table IV).
Taken together, our data provide a number of interesting
findings regarding the development and differentiation of
human germ cells in the fetal ovary. Immature germ cells are
characterized by expression of PLAP and show pluripotent
potential, as is illustrated by the expression of OCT3/4.
During the first part of the second trimester included in our
study (gestational ages of weeks 15.5–20), the number of
immature germ cells is high, and the pool of these cells
decreases significantly after weeks 22–24. In accordance
with previous reports, regional differences in the number of
immature germ cells were found when comparing the cortex
and medulla of the ovary. This finding supports the model of
compartmentalization, in which the cortex is the area where
expansion of immature germ cells take place, the medulla
providing the environment needed for germ cell maturation.
Accompanying the gradual shift from oogonia and early
oocytes to germ cells engaged in formation of primordial fol-
licles, loss of expression of first PLAP and consecutively
OCT3/4 can be observed. Interestingly, in male fetal germ
cells loss of pluripotency as judged by loss of OCT3/4 is
observed at the time when gonocytes become attached to the
basal membrane of the seminiferous tubules and come into
close contact with nurturing Sertoli cells (Honecker et al.,
2004). As down-regulation of OCT3/4 in female germ cells
occurs at a time when oocytes become surrounded by granu-
losa cells and start to form primordial follicles, a major role
of cell–cell interactions in the maturation of germ cells in
both sexes can be postulated. Expression of c-KIT, b-catenin,
and E-cadherin in germ cells at all stages of germ cell devel-
opment points towards a role of these factors for germ cell
survival and maturation. Our findings help to define normal
germ cell development and maturation in the human fetal
ovary and will serve as a reference for further analyses inves-
tigating both normal and pathological processes in germ cell
maturation, i.e. in dysgenetic gonads or in individuals show-
ing chromosomal aberrations (Kersemaekers et al., 2005,
M.Cools et al., unpublished data).
Acknowledgements
We thank Diego Castrillon, Department of Pathology, University ofTexas Southwestern Medical Center, Dallas, USA, for providing thepolyclonal VASA antibody; Axel Themmen, Department of InternalMedicine, Erasmus MC, Rotterdam, The Netherlands, for criticallyreading the manuscript; and F.v.d. Panne for technical assistancewith the illustrations. This work was supported by the Dutch CancerSociety (H.S., L.H.J.L.), Deutsche Krebshilfe, Dr Mildred ScheelStiftung (F.H.), and the European Society for Pediatric Endocrin-ology, ESPE (M.C.).
References
Baker TG (1963) A quantitative and cytological study of germ cells inhuman ovaries. Proc R Soc Lond B Biol Sci 158,417–433.
Campbell S, Swann HR, Seif MW, Kimber SJ and Aplin JD (1995) Celladhesion molecules on the oocyte and preimplantation human embryo.Hum Reprod 10,1571–1578.
Differentiation of human female germ cells
1475
Dow
nloaded from https://academ
ic.oup.com/hum
rep/article/20/6/1466/748694 by guest on 25 March 2022
Carabatsos MJ, Sellitto C, Goodenough DA and Albertini DF (2000)Oocyte-granulosa cell heterologous gap junctions are required for thecoordination of nuclear and cytoplasmic meiotic competence. Dev Biol226,167–179.
Castrillon DH, Quade BJ, Wang TY, Quigley C and Crum CP (2000) Thehuman VASA gene is specifically expressed in the germ cell lineage. ProcNatl Acad Sci USA 97,9585–9590.
Daniels R, Hall V and Trounson AO (2000) Analysis of gene transcription inbovine nuclear transfer embryos reconstructed with granulosa cell nuclei.Biol Reprod 63,1034–1040.
De Pol A, Vaccina F, Forabosco A, Cavazzuti E and Marzona L (1997)Apoptosis of germ cells during human prenatal oogenesis. Hum Reprod12,2235–2241.
Di Carlo A and De Felici M (2000) A role for E-cadherin in mouse primor-dial germ cell development. Dev Biol 226,209–219.
Donovan PJ (1998) The germ cell—the mother of all stem cells. Int J DevBiol 42,1043–1050.
Falin LI (1969) The development of genital glands and the origin of germcells in human embryogenesis. Acta Anat (Basel) 72,195–232.
Forabosco A, Sforza C, De Pol A, Vizzotto L, Marzona L and Ferrario VF(1991) Morphometric study of the human neonatal ovary. Anat Rec231,201–208.
Gerdes J, Lemke H, Baisch H, Wacker HH, Schwab U and Stein H (1984)Cell cycle analysis of a cell proliferation-associated human nuclear antigendefined by the monoclonal antibody Ki-67. J Immunol 133,1710–1715.
Gondos B (1985) Development of the reproductive organs. Ann Clin Lab Sci15,363–373.
Goto T, Adjaye J, Rodeck CH and Monk M (1999) Identification of genesexpressed in human primordial germ cells at the time of entry of thefemale germ line into meiosis. Mol Hum Reprod 5,851–860.
Gould DA, Moscoso GJ, Young MP and Barton DP (2000) Human first tri-mester fetal ovaries express oncofetal antigens and steroid receptors. J SocGynecol Invest 7,131–138.
Hansis C, Grifo JA and Krey LC (2000) Oct-4 expression in inner cell massand trophectoderm of human blastocysts. Mol Hum Reprod 6,999–1004.
Hartley PS, Bayne RA, Robinson LL, Fulton N and Anderson RA (2002)Developmental changes in expression of myeloid cell leukemia-1 inhuman germ cells during oogenesis and early folliculogenesis. J ClinEndocrinol Metab 87,3417–3427.
Honecker F, Stoop H, De Krijger RR, Lau Y-FC, Bokemeyer C and Looi-jenga LHJ (2004) Pathobiological implications of the expression of mar-kers of testicular carcinoma in situ by fetal germ cells. J Pathol203,849–857.
Horie K, Takakura K, Taii S, Narimoto K, Noda Y, Nishikawa S, NakayamaH, Fujita J and Mori T (1991) The expression of c-kit protein duringoogenesis and early embryonic development. Biol Reprod 45,547–552.
Horie K, Fujita J, Takakura K, Kanzaki H, Suginami H, Iwai M, NakayamaH and Mori T (1993) The expression of c-kit protein in human adult andfetal tissues. Hum Reprod 8,1955–1962.
Hubner K, Fuhrmann G, Christenson LK, Kehler J, Reinbold R, De LaFuente R, Wood J, Strauss JF, 3rd, Boiani M and Scholer HR (2003) Deri-vation of oocytes from mouse embryonic stem cells. Science300,1251–1256.
Huntriss J, Gosden R, Hinkins M, Oliver B, Miller D, Rutherford AJ andPicton HM (2002) Isolation, characterization and expression of the humanFactor In the Germline alpha (FIGLA) gene in ovarian follicles andoocytes. Mol Hum Reprod 8,1087–1095.
Hustin J, Gillerot Y, Collette J and Franchimont P (1990) Placental alkalinephosphatase in developing normal and abnormal gonads and in germ-celltumours. Virchows Arch 417,67–72.
Jørgensen N, Rajpert-De Meyts E, Graem N, Muller J, Giwercman A andSkakkebæk NE (1995) Expression of immunohistochemical markers fortesticular carcinoma in situ by normal fetal germ cells. Lab Invest72,223–231.
Kersemaekers AM, Honecker F, Cools M, Stoop H, Molier M, WolffenbuttelKP, Bokemeyer C, Li Y, Lau Y-FC, Oosterhuis JW and Looijenga LHJ(2005) Identification of germ cells at risk for neoplastic transformation ingonadoblastomas: an immunohistochemical study for OCT3/4 and TSPY.Hum Pathol in press.
Konishi I, Fujii S, Okamura H, Parmley T and Mori T (1986) Developmentof interstitial cells and ovigerous cords in the human fetal ovary: an ultra-structural study. J Anat 148,121–135.
Kurilo LF (1981) Oogenesis in antenatal development in man. Hum Genet57,86–92.
Looijenga LHJ, Stoop H, De Leeuw PJC, De Gouveia Brazao CA, GillisAJM, Van Roozendaal KEP, Van Zoelen EJJ, Weber RFA, WolffenbuttelKP, Van Dekken H et al. (2003) POU5F1 (OCT3/4) identifies cells withpluripotent potential in human germ cell tumors. Cancer Res63,2244–2250.
Mackay S, Nicholson CL, Lewis SP and Brittan M (1999) E-cadherin in thedeveloping mouse gonad. Anat Embryol (Berl) 200,91–102.
Matzuk MM, Burns KH, Viveiros MM and Eppig JJ (2002) Intercellularcommunication in the mammalian ovary: oocytes carry the conversation.Science 296,2178–2180.
McLaren A (1992) Development of primordial germ cells in the mouse.Andrologia 24,243–247.
Niwa H, Miyazaki J and Smith AG (2000) Quantitative expression of Oct-3/4 defines differentiation, dedifferentiation or self-renewal of ES cells.Nat Genet 24,372–376.
Ohsugi M, Butz S and Kemler R (1999) Beta-catenin is a major tyrosine-phosphorylated protein during mouse oocyte maturation and preimplanta-tion development. Dev Dyn 216,168–176.
Okamura D, Kimura T, Nakano T and Matsui Y (2003) Cadherin-mediatedcell interaction regulates germ cell determination in mice. Development130,6423–6430.
Pesce M, Wang X, Wolgemuth DJ and Schøler H (1998) Differentialexpression of the Oct-4 transcription factor during mouse germ cell differ-entiation. Mech Dev 71,89–98.
Pinkerton JH, Mc KD, Adams EC and Hertig AT (1961) Development of thehuman ovary—a study using histochemical techniques. Obstet Gynecol18,152–181.
Rabinovici J and Jaffe RB (1990) Development and regulation of growth anddifferentiated function in human and subhuman primate fetal gonads.Endocr Rev 11,532–557.
Rajpert-De Meyts E, Hanstein R, Jorgensen N, Graem N, Vogt PH and Skak-kebaek NE (2004) Developmental expression of POU5F1 (OCT3/4) innormal and dysgenetic gonads. Hum Reprod 19,1338–1344.
Robinson LL, Gaskell TL, Saunders PT and Anderson RA (2001) Germ cellspecific expression of c-kit in the human fetal gonad. Mol Hum Reprod7,845–852.
Shi SR, Key ME and Kalra KL (1991) Antigen retrieval in formalin-fixed,paraffin-embedded tissues: an enhancement method for immunohistochem-ical staining based on microwave oven heating of tissue sections. J Histo-chem Cytochem 39,741–758.
Stoop H, Van Gurp RHJ,LM, De Krijger R, Geurts van Kessel A, Koberle B,Oosterhuis JW and Looijenga LHJ (2001) Reactivity of germ cell matu-ration stage-specific markers in spermatocytic seminoma: diagnostic andetiological implications. Lab Invest 81,919–928.
Surti U, Hoffner L, Chakravarti A and Ferrell RE (1990) Genetics andbiology of human ovarian teratomas. I. Cytogenetic analysis and mechan-ism of origin. Am J Hum Genet 47,635–643.
Toyooka Y, Tsunekawa N, Takahashi Y, Matsui Y, Satoh M and Noce T(2000) Expression and intracellular localization of mouse Vasa-homologueprotein during germ cell development. Mech Dev 93,139–149.
Toyooka Y, Tsunekawa N, Akasu R and Noce T (2003) Embryonic stemcells can form germ cells in vitro. Proc Natl Acad Sci USA100,11457–11462.
Traut W, Endl E, Scholzen T, Gerdes J and Winking H (2002) The temporaland spatial distribution of the proliferation associated Ki-67 protein duringfemale and male meiosis. Chromosoma 111,156–164.
Witschi E (1948) Migration of the germ cells of the human embryos fromthe yolk sac to the primitive gonadal folds. Contrib Embryol 209,67–80.
Wrobel KH, Bickel D and Kujat R (1996) Immunohistochemical study ofseminiferous epithelium in adult bovine testis using monoclonal antibodiesagainst Ki-67 protein and proliferating cell nuclear antigen (PCNA). CellTissue Res 283,191–201.
Zeeman AM, Stoop H, Boter M, Gillis AJM, Castrillon DH, Oosterhuis JWand Looijenga LHJ (2002) VASA is a specific marker for both normal andmalignant human germ cells. Lab Invest 82,159–166.
Submitted on February 19, 2004; resubmitted on December 24, 2004;accepted on January 20, 2005
H.Stoop et al.
1476
Dow
nloaded from https://academ
ic.oup.com/hum
rep/article/20/6/1466/748694 by guest on 25 March 2022


