Embed Size (px)
Citation preview
RAPID COMMUNICATIONS IN MASS SPECTROMETRY
Rapid Commun. Mass Spectrom. 2006; 20: 1429–1440
) DOI: 10.1002/rcm.2463
Published online in Wiley InterScience (www.interscience.wiley.comDifferentiation of estriol glucuronide isomers by
chemical derivatization and electrospray tandem
mass spectrometry
Matilda Lampinen-Salomonsson1, Ulf Bondesson1,2, Carl Petersson3
and Mikael Hedeland2*1Division of Analytical Pharmaceutical Chemistry, Uppsala University, Biomedical Centre, Box 574, SE-751 23 Uppsala, Sweden2Department of Chemistry, National Veterinary Institute (SVA), SE-751 89 Uppsala, Sweden3DMPK & BAC, AstraZeneca R&D Sodertalje, SE-151 85 Sodertalje, Sweden
Received 23 December 2005; Revised 27 February 2006; Accepted 28 February 2006
*CorrespoNationalE-mail: M
This paper describes a way of differentiating between the three isomers of estriol glucuronide by the
use of chemical derivatization and liquid chromatography/electrospray tandem mass spectrometry
(MS/MS). In their native form, these isomers gave rise to almost identical product ion spectra,
involving the neutral loss of 176Da (i.e. monodehydrated glucuronic acid), whichmade it impossible
to determine the position of conjugation by MS/MS alone. In order to change the fragmentation
pathways, positive charges were introduced into the analytes by chemical derivatization. The
following reagents were tested: 2-chloro-1-methylpyridinium iodide, 1-ethyl-3-(3-dimethylamino-
propyl)carbodiimide and 2-picolylamine. Interestingly, derivatization using a combination of all
three reagents gave a selective fragmentation pattern that could differentiate between the isomers
estriol-16-glucuronide and estriol-17-glucuronide. Estriol-3-glucuronide, which lacks a free phenolic
group, could be differentiated through a different type of reaction product when exposed to 2-chloro-
1-methylpyridinium iodide. Furthermore, in order to assist structural assignment of the fragments,
their accurate masses were determined using a hybrid quadrupole time-of-flight mass spectrometer
and fragmentation pathways were elucidated by the use of MS3 on an ion trap mass spectrometer.
Copyright # 2006 John Wiley & Sons, Ltd.
Estriol (3,16a,17b-trihydroxy-1,3,5(10)-estratriene), the
natural female estrogen hormone, is formed via 16a
hydroxylation of estrone in the ovaries and through 16a-
hydroxydehydroepiandrosterone in the placenta of pregnant
women.1 Estrogens are primarily excreted in the urine after
conjugation, i.e. as sulfates and glucuronides.2 The isomeric
forms of estriol glucuronides are estriol 3b-D-glucuronide
(E3G), estriol 16a-(b-D-glucuronide) (E16G) and estriol-17b-
(b-D-glucuronide) (E17G)2,3 (Fig. 1).
The use of tandemmass spectrometry for the identification
of drugs and their metabolites is a well-known approach.
However, the limitation of this technique alone becomes
evident in the fragmentation pattern of conjugates, such as
glucuronides. The neutral loss of 176Da, i.e. monodehy-
drated glucuronic acid, at low collision energies is a general
feature in this context. This gives a problem with the
determination of the position of glucuronidation.4,5 Nuclear
magnetic resonance (NMR) spectroscopy is another tech-
nique for structural determination,6 but it requires larger
amounts of sample material than mass spectrometry, and
this can be difficult to accomplish in bioanalytical appli-
cations.4,5 Determining the exact position of glucuronidation
ndence to: M. Hedeland, Department of Chemistry,Veterinary Institute (SVA), SE-751 89Uppsala, [email protected]
is important from a biochemical and pharmacological point
of view, as different isomers may have different toxicological
or pharmacological activities. One example is morphine-6-
glucuronide, which is more pharmacologically active than
morphine itself, and morphine-3-glucuronide, which has
been claimed to antagonize the analgesic effect.1 Regulatory
authorities are becoming increasingly more stringent regard-
ing exposure to metabolites.7 Metabolic studies require
synthetic standards and, in order to synthesize these, exact
knowledge of the structures are required.
Chemical derivatization in combination with liquid
chromatography coupled to tandem mass spectrometry
(LC/MS/MS) for the enhancement of detection sensitivity
is a well-established technique.8–13 Introduction of an easily
ionizable function or a constantly charged group effectively
increases the sensitivity of detection of steroids in electro-
spray ionization mass spectrometry (ESI-MS),14 and the
fragmentation pattern can also be affected due to the ‘charge
remote fragmentation’ phenomenon.15 Leavens et al.8 used 2-
chloro-1-methylpyridinium iodide (CMP) in combination
with triethylamine (TEA) for the activation of carboxylic
acids before introducing tris(trimethoxyphenyl)phosphonium
(TMPP), an ionic species, for sensitivity enhancement in
Copyright # 2006 John Wiley & Sons, Ltd.

Figure 1. Structures of estriol and its metabolites estriol-3-
glucuronide, estriol-16-glucuronide and estriol-17-glucuronide.
1430 M. Lampinen-Salomonsson et al.
LC/ESI-MS/MS. Quirke et al.13 improved the detection
sensitivity of steroids by using the reagent 2-fluoro-1-
methylpyridium p-toluenesulfonate (FMP).13 Many com-
pounds used for these applications, e.g. 1-ethyl-3-(3-dimethy-
laminopropyl)carbodiimide (EDC)16,17 andCMP,18,19 arewell-
known activating reagents for subsequent fluorescence
tagging.20
There have been a few reports on the use of derivatization
for the structural evaluation of conjugated metabolites. Cui
and Harvison21 used a reaction with 3-pyridylcarbinol in
order to determine the site of glucuronidation for N-(3,5-
dichlorophenyl)succinimide. Selective acetylation with
acetic anhydride was proven to be successful by Schaefer
et al.22 for discriminating between different possible
isomers of the glucuronides of carvedilol, and Kondo
et al.23 described the structures of two conjugated
metabolites of candesartan cilexetil by methylation with
diazomethane.
The aim of the present study was to investigate if mass
spectral differentiation between the three isomers of estriol
glucuronide could be imposed by chemical derivatization.
The collision-induced dissociation (CID) spectra of estriol, its
metabolites and their different derivatives have been
compared and evaluated. The occurrence of selective
fragmentation as well as differences in reactivity was
studied. Furthermore, in order to facilitate the structural
assignment of the product ions, data from different mass
spectrometers, such as triple quadrupole, quadrupole time-
of-flight and ion trap, have been used in combination.
EXPERIMENTAL
Chemicals and materialsThe model compounds p-nitrophenyl b-D-glucuronide
(NPG), estriol (3,16a,17b-trihydroxy-1,3,5(10)-estratriene)
and its metabolites estriol 3b-D-glucuronide sodium salt
(E3G), estriol 16a-(b-D-glucuronide) (E16G) and estriol-17b-
(b-D-glucuronide) (E17G) were all purchased from Sigma-
Aldrich (Steinheim, Germany). The chemical derivatization
reagents 2-chloro-1-methylpyridinium iodide (CMP), 2-
picolylamine (PA) and 1-ethyl-3-(3-dimethylaminopropyl)-
carbodiimide hydrochloride (EDC) were also purchased
from Sigma-Aldrich. Triethylamine (TEA) and polyethyle-
neglycol (PEG) 200, 400 and 600 were obtained from
Copyright # 2006 John Wiley & Sons, Ltd.
Fluka Chemika (Buchs, Switzerland). The internal calibrant-
clemastine fumarate was purchased from Novartis
Sweden AB (Taby, Sweden), 4-acetaminophen was obtained
from Sigma-Aldrich and codeine phosphate hemihydrate
was a gift from AstraZeneca (Sodertalje, Sweden). The water
was purified using a Milli-Q water purification system
(Millipore, Bedford, MA, USA). All other chemicals were of
analytical reagent grade or better and used without further
purification.
Liquid chromatographyA Jasco liquid chromatography system (Jasco, Tokyo, Japan)
with two PU-1585 pumps, a DG-1580-53 degasser, a HG-
1580-32 dynamic mixer and a Rheodyne 7725i (Rheodyne,
Cotati, CA, USA) injector or an Agilent 1100 series system
(Agilent Technologies, Waldbronn, Germany) with a degas-
ser, a binary pump, a well-plate autosampler and a column
conditioner set at 258C was used. For chromatographic
separation a Synergi Polar reversed-phase (RP) column
(Phenomenex, Torrance, CA, USA) with a particle diameter
of 4mm and dimensions of 2.0mm� 150mm (i.d.� length)
or a Zorbax Eclipse XDB-C18 column (Agilent Technologies)
with a particle diameter of 3.5mm and dimensions of
2.1mm� 100mm (i.d.� length) was used. Both were
equipped with a C18 precolumn (Phenomenex) with
dimensions 2.0mm i.d.� 4mm. The mobile phase compo-
sition methanol/0.1% acetic acid in Milli-Q water was varied
for the different columns but mainly the combination was
50:50 v/v and 40:60 v/v for the Synergi Polar RP column and
the Zorbax Eclipse XDB-C18 column, respectively. The flow
rate was 0.2mL/min and the injection volume was 20mL.
Mass spectrometryThree different electrospraymass spectrometers were used, a
triple quadrupole mass spectrometer (TSQ 7000), an ion trap
(LCQ) (both ThermoFinnigan, San Jose, CA, USA) and a
hybrid quadrupole time-of-flight mass spectrometer (Q-TOF
I) (Micromass, Waters, Manchester, UK).
TSQ 7000The software for controlling the TSQ 7000 instrument and for
data evaluation, processing and integration of peaks was
Xcalibur 1.2 (ThermoFinnigan). For mass calibration of the
instrument in both positive and negative ionmode, a 100mM
NaI solution in isopropanol/water (50:50, v/v) was used. In
negative ion mode, a standard solution (30mM) of one of the
model compounds (E17G) was used for tuning. Due to the
low response for themodel compounds in positive ionmode,
tuning was done with the NaI solution (Na5I4þm/z 622.5667).
The tuning was performed by direct infusion with a syringe
pump (Harvard Apparatus pump II, Holliston, MA, USA).
The syringe pump flow (10mL/min) was mixed in a
connecting T with the LC flow before entering the mass
spectrometer (total flow rate 0.2mL/min). The ESI source
parameters were capillary temperature 2508C, sheath gas 56
psi, and spray voltage 4.5 kV. The collision gas was argon at
1.15mTorr and the collision energy was varied between 5 and
75V. The multiple-ion detector was set at 1400V for MS1
analysis and 1700V for product ion analysis. The instrument
mode was varied between negative/positive MS1 in scan
Rapid Commun. Mass Spectrom. 2006; 20: 1429–1440
DOI: 10.1002/rcm

Differentiation of estriol glucuronide isomers 1431
mode, negative product ion mode and positive product ion
mode.
LCQThe ion trap mass spectrometer used was an LCQ
(ThermoFinnigan). The software for instrument control
and data acquisition was Xcalibur v.1.3 (ThermoFinnigan).
The LCQ was tuned with constant infusion of metoprolol
(3.7mM) from a syringe pump (10mL/min) mixed in a
connecting T with the LC flow (total flow rate 0.2mL/min).
The ESI source parameters were spray voltage 6.0 kV,
capillary temperature 2508C, capillary voltage 45V, tube
lens offset 5.0, sheath gas flow 80, and auxiliary gas flow 10
(the two latter in arbitrary units). The instrument was used in
MS1 scan mode, MS2 scan mode and MS3 scan mode.
Q-TOFFor accurate mass determinations, a Q-TOF I instrument,
upgraded with a 3.6 GHz time-to-digital converter card, was
used (Micromass, Manchester, UK). The controller for this
instrument was a PC with MassLynx v. 3.4 software. This
program was also used for data acquisition and processing.
The calibration was performed by direct infusion to the mass
spectrometer with a syringe pump (Harvard Apparatus
pump II). The mass calibration for negative ion analysis was
done with NaI (100mM) in isopropanol/water (50:50, v/v)
and for positive ion analysis with PEG 200/400/600 (1 nM) in
ammonium formate (2mM) in water and acetonitrile (50:50,
v/v). The source block temperature and desolvation
temperature were 120 and 3508C, respectively, and the
nebulizer and desolvation gas flows were 15 and 350 L/h.
The instrument parameter settings in negative mode were
capillary voltage 3000V, cone 40V, extractor 0V, and MCP
2700V and in positive mode capillary voltage 3500V, cone
25V, extractor 2V, and MCP 2700V.
As internal calibrants in negative mode, I�m/z 126.9045, 4-
acetaminophen [M–H]�m/z 150.0555 and NaI2�m/z 276.7987
were used. In positive mode 4-acetaminophen [MþH]þm/z
152.0711, codeine [MþH]þm/z 300.1599, clemastine
[MþH]þm/z 344.1781, and PEG 200/400/600 m/z 371.2281
were used. The internalmass calibrants were directly infused
through a connecting T and mixed with the LC flow post-
column. The acquisition was done using product ion scan
mode with separate acquisition channels for the internal
calibrants and the analyte. The collision energy for the
internal calibrants was 4 eV and for the analyte the collision
energy was varied. As the data from the analyte and internal
calibrant ended up in two different spectra when running
MS/MS, the acquisition channels were added with the
command ‘combine functions’. This was done in order to
obtain the analyte and the internal calibrant peaks in the
same spectrum, a prerequisite for lock mass recalibration.
The spectra were combined, smoothed and centered
according to the following software settings. The TOF
constants, resolution and number of pushes correction factor
(Npmultiplier) were set to zero. The procedure was repeated
once with the TOF constants set to 5000 and 0.7, resolution
and Np multiplier, respectively, to check that no dead time
distortion was present (the m/z values should be the same in
both centered spectra).24 To achieve an acceptable calibration
Copyright # 2006 John Wiley & Sons, Ltd.
for accurate mass measurements (mean residual <3mTh) a
polynomial fit of 5 was used according to the recommen-
dations of the manufacturer.
Possible empirical formulae for the fragments were
calculated using the software SoftShell MS Calculator v.
1.3 (SoftShell International Ltd., Grand Junction, CO, USA).
The maximum tolerated m/z deviation used was 10 mTh.
Constraints regarding atom types and number of atoms were
set taking the composition of the precursor ion, MS3 data and
the nitrogen rule into account.
Derivatization method developmentNPA (0.06mM) was used as a model compound to test the
derivatization conditions.The tested concentrations of TEA,
CMP, EDC and PA were evaluated by comparison of the
chromatographic peak areas of the derivatives as a relative
measure of the reaction yield. An overview of the intended
reactions is given in Fig. 2.
The conditions for the reaction involving activation with
CMP and substitution with PAwere studied as follows. First,
the CMP concentration in the reaction tubes was held
constant at 23mM and the PA concentration was varied in
the interval 10–60mM. Secondly, the PA concentration was
held constant at 23mM and the CMP concentration was
varied between 3 and 33mM. The TEA concentration was
also varied in the interval 3–100mMwith constant CMP and
PA concentrations (3 and 23mM, respectively).
The conditions for the reaction involving activation with
EDC and substitution with PAwere also evaluated. The EDC
concentration was varied between 5 and 35mM at constant
PA concentration (22.5mM). The PA concentration was also
varied between 7.5 and 45mM at constant EDC concen-
tration (35mM). The reaction conditions selected for the
further experiments and the procedures are given separately
for the different reactions in the sections below.
Derivatization with CMPStandard solutions of the model compounds (NPG, estriol,
E3G, E16G and E17G) were prepared in acetonitrile. To an
aliquot ofmodel compound solution (200mL, 0.03mM), CMP
(70mM) and TEA (140mM) in acetonitrile (200mL) and pure
acetonitrile (200mL) were added. Thus, the final concen-
trations of the compounds in the reaction tubes were
0.01:23:47mM model compound/CMP/TEA. The samples
were placed in an ultrasonic bath for 30min and then
evaporated at 658C to dryness under a flow of nitrogen. The
residues were dissolved in acetic acid (0.1M) in Milli-Q
water (200mL) and vortexed.
Activation with CMP and substitution with PAThe (CMP)-PA derivatization (the parentheses symbolize
that the activator was exchanged by substitution of PA) was
performed as follows. To an aliquot of model compound
solution (200mL, 0.03mM), CMP (10mM) and TEA (20mM)
in acetonitrile (200mL) and PA (70mM) in acetonitrile
(200mL) were added. Thus, the final concentrations of the
compounds in the reaction tubes were 0.01:3:7:23mMmodel
compound/CMP/TEA/PA. The samples were placed in an
ultrasonic bath for 30min and then evaporated at 658C to
dryness under a flow of nitrogen. The residues were
Rapid Commun. Mass Spectrom. 2006; 20: 1429–1440
DOI: 10.1002/rcm
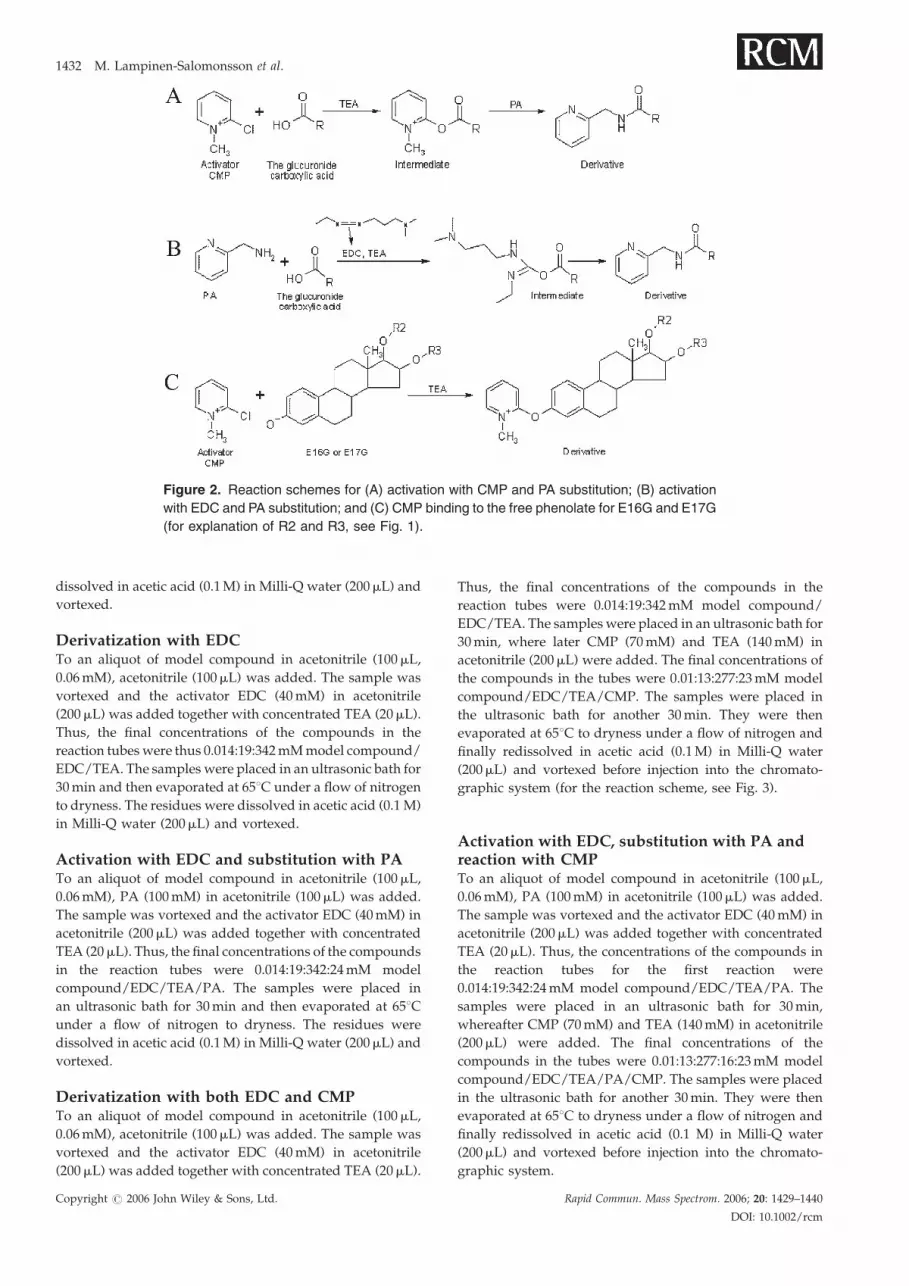
Figure 2. Reaction schemes for (A) activation with CMP and PA substitution; (B) activation
with EDC and PA substitution; and (C) CMP binding to the free phenolate for E16G and E17G
(for explanation of R2 and R3, see Fig. 1).
1432 M. Lampinen-Salomonsson et al.
dissolved in acetic acid (0.1M) in Milli-Q water (200mL) and
vortexed.
Derivatization with EDCTo an aliquot of model compound in acetonitrile (100mL,
0.06mM), acetonitrile (100mL) was added. The sample was
vortexed and the activator EDC (40mM) in acetonitrile
(200mL) was added together with concentrated TEA (20mL).
Thus, the final concentrations of the compounds in the
reaction tubeswere thus 0.014:19:342mMmodel compound/
EDC/TEA. The samples were placed in an ultrasonic bath for
30min and then evaporated at 658C under a flow of nitrogen
to dryness. The residues were dissolved in acetic acid (0.1 M)
in Milli-Q water (200mL) and vortexed.
Activation with EDC and substitution with PATo an aliquot of model compound in acetonitrile (100mL,
0.06mM), PA (100mM) in acetonitrile (100mL) was added.
The sample was vortexed and the activator EDC (40mM) in
acetonitrile (200mL) was added together with concentrated
TEA (20mL). Thus, the final concentrations of the compounds
in the reaction tubes were 0.014:19:342:24mM model
compound/EDC/TEA/PA. The samples were placed in
an ultrasonic bath for 30min and then evaporated at 658Cunder a flow of nitrogen to dryness. The residues were
dissolved in acetic acid (0.1M) in Milli-Q water (200mL) and
vortexed.
Derivatization with both EDC and CMPTo an aliquot of model compound in acetonitrile (100mL,
0.06mM), acetonitrile (100mL) was added. The sample was
vortexed and the activator EDC (40mM) in acetonitrile
(200mL) was added together with concentrated TEA (20mL).
Copyright # 2006 John Wiley & Sons, Ltd.
Thus, the final concentrations of the compounds in the
reaction tubes were 0.014:19:342mM model compound/
EDC/TEA. The sampleswere placed in an ultrasonic bath for
30min, where later CMP (70mM) and TEA (140mM) in
acetonitrile (200mL) were added. The final concentrations of
the compounds in the tubes were 0.01:13:277:23mM model
compound/EDC/TEA/CMP. The samples were placed in
the ultrasonic bath for another 30min. They were then
evaporated at 658C to dryness under a flow of nitrogen and
finally redissolved in acetic acid (0.1M) in Milli-Q water
(200mL) and vortexed before injection into the chromato-
graphic system (for the reaction scheme, see Fig. 3).
Activation with EDC, substitution with PA andreaction with CMPTo an aliquot of model compound in acetonitrile (100mL,
0.06mM), PA (100mM) in acetonitrile (100mL) was added.
The sample was vortexed and the activator EDC (40mM) in
acetonitrile (200mL) was added together with concentrated
TEA (20mL). Thus, the concentrations of the compounds in
the reaction tubes for the first reaction were
0.014:19:342:24mM model compound/EDC/TEA/PA. The
samples were placed in an ultrasonic bath for 30min,
whereafter CMP (70mM) and TEA (140mM) in acetonitrile
(200mL) were added. The final concentrations of the
compounds in the tubes were 0.01:13:277:16:23mM model
compound/EDC/TEA/PA/CMP. The samples were placed
in the ultrasonic bath for another 30min. They were then
evaporated at 658C to dryness under a flow of nitrogen and
finally redissolved in acetic acid (0.1 M) in Milli-Q water
(200mL) and vortexed before injection into the chromato-
graphic system.
Rapid Commun. Mass Spectrom. 2006; 20: 1429–1440
DOI: 10.1002/rcm

Figure 3. Derivatization reaction scheme for the double reaction of E16G. The same
procedure was applied for E17G.
Differentiation of estriol glucuronide isomers 1433
Figure 4. Mass spectra from (A) the negative product ion
mode analysis with precursor ion m/z 287 [M–H]� of estriol
and with a collision energy of 40 eV and (B) the positive
product ion mode analysis with precursor ion m/z 289
[MþH]þ of estriol and with a collision energy of 20 eV
(Q-TOF instrument).
RESULTS AND DISCUSSION
Two different mass spectrometers, the TSQ 7000 and the
Q-TOF, were used for the evaluation of the fragmentation of
underivatized estriol and estriol glucuronides in both
negative and positive product ion mode. These initial
experiments were performed in order to obtain reference
data for comparison with the fragmentation of the deriva-
tives, as well as to demonstrate the difficulty in establishing
the position of glucuronidation by mass spectrometry alone.
Fragmentation of estriolEstriol fragmentation was investigated and used as a
reference for the further structural evaluation of the product
ions of the glucuronides and their derivatives. The TSQ
instrument could not detect estriol at the investigated
concentrations (120mM). The Q-TOF instrument on the
other hand gave a signal for this compound in both negative
and positive ion mode with precursors m/z 287 for [M–H]�
andm/z 289 for [MþH]þ, respectively, but the signal intensity
in positive ion mode was low.
The product ion spectrum of estriol in negative mode is
shown in Fig. 4(A). Structures for the ions atm/z 143, 145 and
171 have previously been proposed by Croley et al.25 The
corresponding positive product ion spectrum of estriol
agreed well with previous studies26,27 (Fig. 4(B)). These
fragments were subjected to accurate mass measurement,
using the Q-TOF. Suggested formulae and structures of the
ions together withm/z differences compared with theoretical
values are given in Tables 1 and 2. Different collision energies
were used in some of the accurate mass determinations in
order to regulate the relative abundance, and thereby the
mass accuracy, of different product ions.
Copyright # 2006 John Wiley & Sons, Ltd.
Fragmentation of estriol glucuronidesStandards of the metabolites E3G, E16G and E17G (30mM)
were chromatographed and analyzed in both negative and
positive product ion mode with precursor ions m/z 463 [M–
H]� and m/z 465 [MþH]þ, respectively. Fragmentation
patterns for the metabolites were compared at different
collision energies (15, 35, 55, and 75 V with the TSQ
Rapid Commun. Mass Spectrom. 2006; 20: 1429–1440
DOI: 10.1002/rcm

Table 1. Accurate mass determination and proposed formulae of estriol ions in negative ion ESI. As internal mass calibrants,
I�m/z 126.9045, 4-acetaminophen [M–H]�m/z 150.0555 and NaI�2m/z 276.7987 were used. Proposed structures for negatively
charged estriol ions are also shown
MS determined (m/z) Internal calibrant ions (m/z) Proposed fragments Theoretical mass (m/z) Mass difference (mTh)
287.1645 276.7987 C18H24O3 [M–H]� 287.164716 0.2
171.0798 150.0555 CH2
O
C12H11O25
171.080990 1.2
169.0607 150.0555 CH2
O
C12H9O
169.065339 4.6
145.0661 150.0555
O
C10H9O25
145.065339 0.8
143.0517 150.0555
O
C10H7O25
143.049689 2.0
119.0483 126.9045 CH2
O
C8H7O
119.049689 1.8
1434 M. Lampinen-Salomonsson et al.
instrument and 15, 25, 35, 45, 55 and 65 eV with the Q-TOF
instrument).
No significant differences in fragmentation could be
observed between the three estriol glucuronides using any
of the instruments in the negative ion mode (Q-TOF spectra
are shown in Fig. 5). The accurate masses of the negative ESI
product ions from E16G were also determined using the Q-
TOF (Table 3). Almost all the proposed theoreticalm/z values
of the ions were in good agreement with the determined
ones. The deviations were between 2.3 and 4.2mTh, except
for m/z 113. The chemical structures of some of the product
ions of E16G are proposed in Table 3. The m/z 175 ion
originated from the glucuronic acid,m/z 113 corresponds to a
loss of CO2 and water from m/z 175,28 and m/z 85 to a loss of
CO fromm/z 113.4,28 Thus, the estriol glucuronides produced
mainly the aglycone and fragments from the glucuronic acid
in negative ion mode. One exception was m/z 171, which
resulted from fission of the steroid skeleton.
The conjugated metabolites were also analyzed in positive
product ionmode (Q-TOF spectra are shown in Fig. 6). Many
of the product ions were formed from the aglycone, as they
were also observed in the positive product ion spectrum of
estriol (cf. Fig. 4(B)). E3G also had product ions atm/z 313, 355
and 411, which were not observed for E16G and E17G, but
the signal intensity was very low, making these data
uncertain. The accurate masses of the positive product ions
Copyright # 2006 John Wiley & Sons, Ltd.
were also determined, and the differences between the
determined m/z values and the theoretical ones for the
suggested ions were lower than the corresponding results
from negative mode (Table 4).
From these analyses, all three conjugated estriol metab-
olites could not be differentiated from each other according
to their fragmentation patterns. Furthermore, E16G and
E17G could not be separated from each other chromato-
graphically (Fig. 7).
The present case was thus a further example of the general
phenomenon with structural evaluation of glucuronides
using MS/MS, i.e. the loss of 176Da at low collision
energies.5,21 This makes the determination of the position
of glucuronidation impossible. In order to determine
whether this problem could be solved by chemical
derivatization, different reaction procedures were tested.
The hypothesis was that introduction of a positive charge
into the steroid glucuronides would alter their fragmentation
pattern due to the possibility of a charge remote mechan-
ism.15 This would also increase their detection sensitivity in
positive ion ESI.
Choice of derivatization conditionsThe limited availability of model compounds is a general
problem when developing methods for phase II metabolites.
NPA was therefore used as a model compound for
Rapid Commun. Mass Spectrom. 2006; 20: 1429–1440
DOI: 10.1002/rcm

Table 2. Accurate mass determination and proposed formulae of estriol product ions in positive ion ESI with collision energy
10 eV and 20 eV. As internal mass calibrants, 4-acetaminophen [MþH]þm/z 152.0711 and codeine [MþH]þm/z 300.1599 were
used. Proposed structures for positively charged estriol product ions are also shown
MS determined(m/z) 10 eV
MS determined(m/z) 20 eV
Internal calibrantions (m/z)
Proposedfragments
Theoretical(m/z)
Mass difference(mTh) 10 eV
Mass difference(mTh) 20 eV
289.1791 289.1824 300.1599 C18H25O3 [MþH]þ 289.180369 1.3 2.0
271.1702 — 300.1599 C18H23O2 [M–H2OþH]þ 271.169805 0.4 —
253.1600 253.1603 300.1599CH
+
HO
CH3
C18H21O[M – 2 H2O+H]+
253.159240 0.8 1.0
159.0835 159.0784 152.0711
OH
CH2
+
C11H11O
159.080990 2.5 2.6
157.0632 157.0643 152.0711
OH
CH2
+
C11H9O
157.065339 2.1 1.0
133.1065 133.0647 152.0711
OH
CH2
+
C9H9O27
133.065339 41.2 0.6
107.0615 107.0556 152.0711C
+
CH3OH
C7H7O
107.049689 11.8 5.9
Figure 5. Mass spectra from the negative product ion mode
with precursor ionm/z 463 [M–H]� for E3G, E16G and E17G,
and with a collision energy of 35 eV (Q-TOF instrument).
Copyright # 2006 John Wiley & Sons, Ltd.
Differentiation of estriol glucuronide isomers 1435
development of the reaction conditions, due to its availability
and low cost. No full optimization of reaction conditions was
performed, as the aim of this study primarily was qualitative.
Two different activation methods for the carboxylic acid
were tested, reactions with CMP or EDC (Fig. 2(A) and 2(B)).
Both reagents form an ester with the model compound for
further nucleophilic substitution by PA. TEAwas added as a
catalyst for the activation. The carboxylic acid activation
method with CMP was slightly modified from an earlier
method developed by Leavens et al.8
Themethod development data for the activationwith CMP
and substitution with PA showed that there was a slight
increase in the amount of PA derivative formed at low CMP
concentration in the mixture at constant PA concentration
(results not shown). A variation in the PA concentration with
constant CMP concentration gave on the other hand no
significantly increased amount of the PA derivative (results
not shown). The variation in TEA concentration did not have
a significant effect on the reaction yield, and a concentration
in the lower part of the tested region was selected. The
chosen concentrations of the reagents in the reaction tubes for
Rapid Commun. Mass Spectrom. 2006; 20: 1429–1440
DOI: 10.1002/rcm

Table 3. Accurate mass determination of the estriol-16-glucuronide ions in negative ion ESI. As internal calibrants, I�m/z
126.9045, 4-acetaminophen [M–H]�m/z 150.0555 and NaI�2m/z 276.7987 were used
Mass determined(m/z)
Internal calibrantions (m/z)
Proposedfragments
Theoreticalmass (m/z)
Mass difference(mTh)
287.1670 276.7987 CH3
O
OH
OH
C18H23O3
287.164716 2.3
175.0266 150.0555
O
OH
OHOH
O
O
C6H7O64, 28
175.024263 2.3
171.0784 150.0555 CH2
O
C12H11O
171.080990 2.6
117.0146 126.9045 C4H5O4 117.018783 4.2
113.0143 126.9045 O
-O O m/z 113C5H5O3
28
113.023869 9.6
Nd O
-O m/z 85C5H8O
4
nd¼ accurate mass not determined, ion only acquired on TSQ 7000 with unit mass resolution.
Figure 6. Mass spectra from the positive product ion mode
analysis with precursor ion m/z 465 [MþH]þ for E3G, E16G
and E17G, and with a collision energy of 10 eV (Q-TOF
instrument).
1436 M. Lampinen-Salomonsson et al.
further experiments were 3mM CMP (containing 7mM
TEA) and 23mM PA. When CMP was used as the sole
reagent, its concentration was changed to 23mM, as this
concentration was found to increase the amount of CMP
derivative formed.
Copyright # 2006 John Wiley & Sons, Ltd.
No significant effect on the product yield was obtained
from the variation of the reagent concentration for the
activation with EDC and substitution of PA (result not
shown). The chosen concentrations for the future derivatiza-
tions were 19mM EDC and 24mM PA (concentrations in the
reaction tubes).
Derivatization with CMPCMP was first tested as a sole reagent in the absence of a
nucleophile for further substitution.10 The quaternary
products (denoted EXG-CMP) were observed in positive
product ion mode with m/z of 556 Mþ for E16G-CMP and
E17G-CMP. However, for E3G-CMP, only traces were found.
The products were further studied by CID. The collision
energy was set at 15, 35 or 55V. The major product ion from
E16G-CMP and E17G-CMP was m/z 380, which corre-
sponded to the loss of 176Da, i.e. the monodehydrated
glucuronic acid (Fig. 8). This observation led to the suspicion
that the CMP was coupled to the phenol in the 3-position for
E16G and E17G instead of to the intended carboxylic acid (cf.
Figs. 2(A) and 2(C)). This was probably due to the fact that
the 3-phenolate was a stronger nucleophile than the
carboxylate. Leavens et al.8 also reported a low recovery
when coupling CMP to glucuronic acid. As CMP apparently
could bind in two different positions for E16G and E17G, i.e.
Rapid Commun. Mass Spectrom. 2006; 20: 1429–1440
DOI: 10.1002/rcm

Table 4. Accurate mass determination of the estriol-16-glucuronide product ions in positive ion ESI with collision energy 10 or
20 eV. As internal calibrants, 4-acetaminophen [MþH]þm/z 152.0711, codeine [MþH]þm/z 300.1599 and clemastine [MþH]þm/z
344.1781 were used
Mass determined(m/z) 10 eV
Mass determined(m/z) 20 eV
Internal calibrantions (m/z)
Proposedfragments
Theoreticalmass (m/z)
Mass difference(mTh) 10 eV
Mass difference(mTh) 20 eV
465.2119 465.3241 344.1781 C24H33O9 [MþH]þ 465.212457 0.5 111.7447.2005 — 344.1781 C24H31O8 [M–H2OþH]þ 447.201893 1.4 —429.1891 429.1898 344.1781 C24H29O7 [M–2H2OþH]þ 429.191328 2.2 1.5411.1931 — 344.1781 C24H27O6 [M–3H2OþH]þ 411.180763 12.4 —289.1821 289.1803 300.1599 C18H25O3 [AglyconeþH]þ 289.180369 1.7 0.07271.1704 271.1698 300.1599 C18H23O2 [Aglycone–H2OþH]þ 271.169805 0.6 0.005253.1595 253.1585 300.1599 C18H21O [Aglycone–2H2OþH]þ 253.159240 0.3 0.7159.0268 159.0278 152.0711
OH
CH2
+
C11H11O
159.080990 54.2 53.2
Figure 7. E3G, E16G and E17G 15mM injected separately
and analyzed with MS scan (m/z 50–750) (TSQ instrument).
Extracted ion chromatogram for m/z 463.3 is shown.
Figure 8. Mass spectrum from positive product ion analysis
of precursor ion m/z 556 (Mþ of E17G-CMP) with a collision
energy of 35V (TSQ instrument).
Figure 9. Mass spectrum from positive product ion analysis
of precursor ion m/z 380 (Mþ of estriol-CMP) with a collision
energy of 45 eV (TOF instrument).
Differentiation of estriol glucuronide isomers 1437
to the phenol in the 3-position and/or to the carboxylic acid
on the glucuronide, these reactions could thus theoretically
result in a bis-CMP product, but no such peaks were
observed. Furthermore, no significant differences were
Copyright # 2006 John Wiley & Sons, Ltd.
found between the product ion spectra for E16G-CMP and
E17G-CMP. E3G-CMP, with the glucuronic acid attached to
the 3-phenolic position, gave no product ion at m/z 380.
Instead a product ion at m/z 110 was found, which
corresponded to 2-hydroxy-1-methylpyridinium. The
absence of a neutral loss of 176Da indicated that CMP
had bound to the glucuronic acid on this compound.
To confirm the hypothesis that CMP could bind to the 3-
phenol, the derivatization was also performed on estriol. An
ion at m/z 380 was then observed in MS1, corresponding to
Mþ of an estriol-CMP product. This ion was fragmented in
positive product ion mode with collision energies up to
65 eV, using the Q-TOF. The m/z 380 ion was very stable;
however, some product ions could be observed, such as m/z
110, which corresponded to 2-hydroxy-1-methylpyridinium
(Fig. 9). These results strengthened the hypothesis that CMP
could react in the 3-phenolic position. This derivative had a
higher response in positive ionMS1 than estriol itself, and the
accurate masses of the ions from the product ion analysis
(precursor ion m/z 380) were determined (Table 5).
Although no tuning could be performed with the
derivatives, both E16G-CMP and E17G-CMP had a higher
response in positive ion mode than the E16G and E17G in
either positive or negative ion mode. In conclusion, the CMP
reaction was very useful as an aid to the use of mass
spectrometry to discriminate phenols from alcohols, in
Rapid Commun. Mass Spectrom. 2006; 20: 1429–1440
DOI: 10.1002/rcm

Table 5. Accurate mass determination of estriol-CMP product ions in positive ion ESI with collision energy 45 eV. Internal
calibration substance, clemastine [MþH]þm/z 344.1781
Mass determined (m/z) Internal calibrant ions (m/z) Proposed fragments Theoretical mass (m/z) Mass difference (mTh)
380.2222 344.1781 See Fig. 9 for suggested structure. 380.222569 0.4C24H30NO3
362.2125 344.1781 C24H28NO2 [M–H2O]þ 362.212004 5.0348.1966 344.1781 C23H26NO2 [M–CH4O]þ 348.196354 0.25
Figure 10. Mass spectrum from positive product ion analysis
of precursor ion m/z 555 ([MþH]þ of E17G-(EDC)-PA) with a
collision energy of 35 V (TSQ instrument).
1438 M. Lampinen-Salomonsson et al.
addition to the increased detection sensitivity in positive ion
ESI.
Activation with CMP and substitution with PACMP activation followed by derivatization with PA (Fig. 2(A))
should theoretically give a protonated molecule at m/z 555.
This derivative was found for E3G but not for E16G and
E17G. An explanation for this is that CMP reacted quickly
with the phenolic group in the 3-position for the two latter
metabolites creating a stable derivative, and that no
activation of the carboxylate occurred. Other possible
derivatives could be those with CMP attached to the 3-
position and with PA bound to the glucuronic acid, but no
indications of this kind of product were found. The E3G
carboxylic acid group was, on the other hand, activated by
CMP, followed by substitution with PA. Interestingly, the
E3G-(CMP)-PA derivative gave a more intense signal than
E3G-CMP. It also gave a higher response than E3G itself in
the positive ion scan mode.
Derivatization with EDCAs CMP bound to the phenolic position, a more selective
reagent than CMPwas needed. EDC, a well-known carboxylic
acid activator,16,17,20 was therefore tested (Fig. 2(B)).
EDC appeared to give a stable product ([MþH]þm/z 620.6)
with all three metabolites, and the positive product ionmode
gave ions at m/z 129, 261 and 549. The m/z 380 ion (loss of
176Da) which appeared with CMP bound to the phenol in
E16G and E17G could not be found, indicating that the
glucuronic acids had been derivatized by EDC. The
responses for E16G-EDC and E17G-EDC were somewhat
lower than for E16G-CMP and E17G-CMP, respectively. This
could be explained by the fact that the CMPderivatives had a
constantly positively charged pyridinium group, or by
differences in reaction yield.
Activation with EDC and substitution with PAEDC activation followed by PA substitution should give the
same product for E3G as (CMP)-PA derivatization. As
expected, a comparison of the product ionmass spectra of the
E3G-(CMP)-PA and E3G-(EDC)-PA derivatives showed no
significant differences. As mentioned above, for E16G and
E17G no (CMP)-PA-derivative could be found, but, when
using EDC as an activator of the carboxylic acid, PA could
bind to all three isomers. However, there were no significant
differences in their fragmentation patterns. As an example,
the product ion spectrum of E17G-(EDC)-PA together with
suggested structures of the ions are shown in Fig. 10. It is
notable that the fragmentation was significantly different
than for estriol and the native estriol glucuronides. Most
product ions from this derivative seemed to contain the PA
Copyright # 2006 John Wiley & Sons, Ltd.
and glucuronyl residues. This was probably a result of the
pyridine nitrogen carrying the positive charge.
Derivatization with both EDC and CMPTo enhance the possibility of obtaining significant differences
in fragmentation between E16G and E17G, a double reaction
was tested (see the reaction scheme in Fig. 3). First, EDC
derivatization was performed, and this was followed by
reaction with CMP. The results from these experiments
showed that CMP and EDC had both bound to E16G and
E17G, forming a product with m/z 711.6 for Mþ and 356.4 for
[MþH]2þ in the spectrum recorded with the TSQ 7000 mass
spectrometer. The derivatives were analyzed in positive
product ion mode with precursor ions m/z 711.6 and 356.4,
respectively. The collision energy was varied from 5 to 55V
and the product ion from the doubly charged molecules
agreed with the fragmentation of the singly charged
molecules. No significant fragmentation differences were
found between E16G-EDC-CMP and E17G-EDC-CMP
(results not shown).
Activation with EDC, substitution with PA andreaction with CMPThe EDC-CMP derivatization, described above, was
extended by substitution of EDC with PA for E16G and
E17G (Fig. 3). Both a singly charged derivative (m/z 646.8Mþ)
and a doubly charged derivative (m/z 323.7 [MþH]2þ) were
formed with identical product ion spectra for the respective
isomer. Interestingly, however, the fragmentation patterns
differed for the E16G and E17G derivatives on all three
instruments. The data obtained from the Q-TOF and the ion
trap are shown in Figs. 11 and 12, respectively. The major
product ion from the E16G-(EDC)-PA-CMP derivative was
m/z 306, which could not be found for E17G-(EDC)-PA-CMP.
Rapid Commun. Mass Spectrom. 2006; 20: 1429–1440
DOI: 10.1002/rcm

Figure 11. Mass spectra from product ion analysis of pre-
cursor ion m/z 646 (Mþ) with a collision energy of 55 eV (Q-
TOF instrument) for the E16G-(EDC)-PA-CMP and E17G-
(EDC)-PA-CMP derivatives.
Figure 12. Mass spectra from product ion analysis of pre-
cursor ion m/z 646 (Mþ) with a collision energy of 55% (LCQ
ion trap) for the E16G-(EDC)-PA-CMP and E17G-(EDC)-PA-
CMP derivatives.
Differentiation of estriol glucuronide isomers 1439
Furthermore, m/z 362 was significantly more abundant for
E16G-(EDC)-PA-CMP, whereas the opposite situation
occurred for m/z 348. The product ion spectra differed
somewhat between the Q-TOF and the ion trap in the higher
mass region, probably due to somewhat different fragmenta-
tion mechanisms, but the occurrence of the above-mentioned
characteristic product ions was the same for both instrument
types. This important finding thus made mass spectrometric
differentiation between these two isomers possible.
In order to aid elucidation of the structures of the
characteristic product ions, accurate mass measurements
and MS3 experiments were performed on the Q-TOF and the
ion trap, respectively. The ion at m/z 380 probably resulted
Copyright # 2006 John Wiley & Sons, Ltd.
from the loss of monodehydrated glucuronic acid and PA
from the derivative, yielding estriol-CMP (Table 6, cf. Fig. 9).
The formation of the characteristic ion at m/z 306 indicated
a neutral loss of 74 Da fromm/z 380. However, as expected,
MS3 experiments performed on the ion trap did not
demonstrate that this ion was formed from m/z 380.
Assuming that m/z 306 was an even-electron ion, it should
contain an odd number of nitrogen atoms according to the
nitrogen rule. Taking the proposed structure of the E16G
derivative into account, it would be most probable that m/z
306 contained only one and not three nitrogen atoms, as the
mass difference from the precursor ion was 340Da.
Calculations of possible elemental compositions based
on the determined accurate mass, assuming that the
remaining nitrogen was on the pyridinium ring, did not
yield any realistic formula other than C21H24NO, using a
tolerated m/z difference of �10mTh. A further notable
observation was that this characteristic ion was not formed
from the other derivatives of E16G or E17G with a CMP
group in the 3-position (cf. Fig. 8). This implies that the
remote pyridine of the PA groupwas somehow involved in
the formation of m/z 306.
The m/z 362 ion indicated a loss of water (18Da) from m/z
380 (Table 6). MS3 experiments performed on the ion trap
confirmed thatm/z 362 was a secondary fragment of m/z 380.
Using this information as a constraint, there were no other
probable elemental compositions than the expected
C24H28NO2, using a tolerated m/z difference of �10mTh
from the determined accurate mass. However, there must be
alternative mechanisms for its formation, as the ion was
significantly more abundant for the E16G derivative.
The E17G-(EDC)-PA-CMP derivative gave two product
ions, m/z 346 and 348, which were less abundant for the
E16G-(EDC)-PA-CMP derivative (Table 7 and Fig. 11). MS3
experiments showed that m/z 348 was a secondary product
ion from m/z 380. Calculations of the accurate mass data,
taking this fact into account, gave C23H26NO2 as the only
realistic formula, indicating a neutral loss of CH4O from m/z
380. This hypothesis was strengthened by the fact that this
ion also was formed from estriol-CMP (cf. Fig. 9 and Table 5),
with a determined accurate mass that even more closely
matched a loss of CH4O.
The ion at m/z 346 was more difficult to explain, as the
measurement difference was very high when assuming a net
loss of CH6O (34Da) from m/z 380 (Table 7). Furthermore,
there were no indications from the MS3 experiments that this
ion was formed from m/z 380. Assuming that m/z 346 was an
even-electron ion, it should contain an odd number of
nitrogen atoms. As discussed above for m/z 306, the only
realistic possibility is thus that it only has the pyridinium
nitrogen remaining. However, a calculation of different
possible empirical formulae within am/z error of 10 mTh did
not give rise to any composition that could yield a realistic
structure. One remaining possibility is that m/z 346 was an
odd-electron ion.
CONCLUSIONS
Chemical derivatization has been successfully utilized in
order to enable structural discrimination between isomeric
Rapid Commun. Mass Spectrom. 2006; 20: 1429–1440
DOI: 10.1002/rcm

Table 6. Accurate mass determination of the E16G-(EDC)-PA-CMP product ions in positive ion ESI with collision energy 55 eV.
Internal calibration substance, clemastine [MþH]þm/z 344.1781
Mass determined(m/z)
Internal calibrantions (m/z)
Proposedfragments
Theoreticalmass (m/z)
Mass difference(mTh)
380.2279 344.1781 See Fig. 9 for suggested structure. C24H30NO3 380.222569 5.3
362.2202 344.1781 C24H28NO2 [M–266–H2O]þ 362.212004 8.2
306.1944 344.1781
N+
CH3
CH3
O
C21H24NO
306.185789 8.6
Table 7. Accurate mass determination of E17G-(EDC)-PA-CMP product ions in positive ion ESI with collision energy 55 eV.
Internal calibration substance, clemastine [MþH]þm/z 344.1781
Mass determined(m/z)
Internal calibrantions (m/z)
Proposedfragments
Theoretical mass(m/z)
Mass difference(mTh)
380.2289 344.1781 See Fig. 9 for suggested structure. C24H30NO3 380.222569 6.3348.2032 344.1781 C23H26NO2 [M–266–CH4O]þ 348.196354 6.8346.2238 344.1781 (C23H24NO2)
� 346.180704 43.1
�This is not a suggested fragment, only the atomic composition of the theoretical m/z used for the calculation of the m/z difference.
1440 M. Lampinen-Salomonsson et al.
glucuronides by mass spectrometry. Estriol-16-glucuronide
(E16G) and estriol-17-glucuronide (E17G) could be differ-
entiated from each other by collision-induced dissociation
(MS/MS) only after a certain covalent modification. A
characteristic base peak product ion for the E16G derivative
was found at m/z 306, which could not be observed for the
E17G derivative. Furthermore, estriol-3-glucuronide (E3G)
could be selectively detected by a different type of reaction
product, due to the absence of a free phenol function.
AcknowledgementsThe authors are grateful to Professor Dr. Wilfried Niessen
(hyphenMassSpec, The Netherlands) for fruitful discussions
on fragmentation pathways.
REFERENCES
1. Rang HP, Dale MM, Ritter JM. Pharmacology (4th edn).Churchill Livingstone: Edinburgh, 1999.
2. Shimada K, Mitamura K, Higashi T. J. Chromatogr. A 2001;935: 141.
3. Levitz M, Kadner S, Young BK. J. Steroid Biochem. 1984; 20:971.
4. Levsen K, Schiebel HM, Behnke B, Dotzer R, Dreher W,Elend M, Thiele H. J. Chromatogr. A 2005; 1067: 55.
5. Liu DQ, Hop CECA. J. Pharm. Biomed. Anal. 2005; 37: 1.6. Yingiu W, Waters JM, Blackwell LF. J. Chem. Soc. Perkin
Trans. 2 1996; 1449.7. U.S. Department of Health and Human Services F, June
2005. Available: http://www.fda.gov/cder/guidance/index.htm.
Copyright # 2006 John Wiley & Sons, Ltd.
8. Leavens WJ, Lane SJ, Carr RM, Lockie AM, Waterhouse I.Rapid Commun. Mass Spectrom. 2002; 16: 433.
9. Barry SJ, Carr RM, Lane SJ, LeavensWJ,Manning CO,MonteS, Waterhouse I. Rapid Commun. Mass Spectrom. 2003; 17: 484.
10. Barry SJ, Carr RM, Lane SJ, Leavens WJ, Monte S, Water-house I. Rapid Commun. Mass Spectrom. 2003; 17: 603.
11. Van Berkel GJ, Quirke JM, Adams CL. Rapid Commun. MassSpectrom. 2000; 14: 849.
12. Van Berkel GJ, Quirke JM, Tigani RA, Dilley AS, Covey TR.Anal. Chem. 1998; 70: 1544.
13. Quirke JME, Adams CL, Van Berkel GJ. Anal. Chem. 1994; 66:1302.
14. Higashi T, Shimada K. Anal. Bioanal. Chem. 2004; 378: 875.15. Cheng C, Gross ML. Mass Spectrom. Rev. 2000; 19: 398.16. Iwata T, Hirose T, YamaguchiM. J. Chromatogr. B Biomed. Sci.
Appl. 1997; 695: 201.17. Iwata T, Hirose T, Nakamura M, Yamaguchi M. J. Chroma-
togr. B Biomed. Sci. Appl. 1994; 654: 171.18. Rahavendran SV, Karnes HT. Anal. Chem. 1997; 69: 3022.19. Wu ST, Benet LZ, Lin ET. J. Chromatogr. B Biomed. Sci. Appl.
1997; 692: 149.20. Toyo’oka T, Ishibashi M, Takeda Y, Nakashima K, Akiyama
S, Uzu S, Imai K. J. Chromatogr. 1991; 588: 61.21. Cui D, Harvison PJ. Rapid Commun. Mass Spectrom. 2000; 14:
1985.22. SchaeferWH, Goalwin A, Dixon F, Hwang B, Killmer L, Kuo
G. Biol. Mass Spectrom. 1992; 21: 179.23. Kondo T, Yoshida K, Yoshimura Y,Motohashi M, Tanayama
S. J. Mass Spectrom. 1996; 31: 873.24. Sundstrom I, HedelandM, Bondesson U, Andren PE. J. Mass
Spectrom. 2002; 37: 414.25. Croley TR, Hughes RJ, Koenig BG, Metcalfe CD, March RE.
Rapid Commun. Mass Spectrom. 2000; 14: 1087.26. Lagana A, Fago G, Marino A, Santarelli D. Anal. Lett. 2001;
34: 913.27. Lagana A, Bacaloni A, Fago G, Marino A. Rapid Commun.
Mass Spectrom. 2000; 14: 401.28. Gu J, ZhongD, Chen X. Fresenius J. Anal. Chem. 1999; 365: 553.
Rapid Commun. Mass Spectrom. 2006; 20: 1429–1440
DOI: 10.1002/rcm


