Embed Size (px)
Citation preview

2017 Digital Marketing Analytics Performance Report 1
Digital Marketing Analytics Performance Report
2017
2017 Digital Marketing Analytics Performance Report 2
Introduction
How do the best businesses build their brands on digital channels?To find out, we used the TrackMaven marketing analytics platform to analyze 12 months of digital marketing data — including social media performance, blog performance, public relations performance, and website health metrics — from over 700 leading businesses.
The findings highlight the big-picture trends in digital marketing effectiveness today, and provide benchmarks and in-depth analysis of the most effective marketing channels across 13 industries and 39 sub-sectors.
The industries analyzed in this report include:
Accommodation and Food Services
Finance and Insurance
Business Services
Construction Equipment
Higher Education
Healthcare
Media and Publishing
Wellness
Real Estate
Retail
Consumer Goods Software and Applications
Sports and Entertainment
Learn which channels drive the greatest impact for your peers, and see how your business measures up against the essential digital marketing metrics in your industry.
2017 Digital Marketing Analytics Performance Report 3
TABLE OF CONTENTS
SOCIAL MEDIA PERFORMANCE....................................................................................... 4
The Social Media Marketing Landscape in One Chart.............................................. 4
Social Media Audience Size by Industry............................................................................ 6
Social Media Engagement by Industry............................................................................... 8
BLOG PERFORMANCE.................................................................................................................. 10
Blog Performance by Industry.............................................................................................. 10
PR PERFORMANCE...................................................................................................................... 12
PR Performance by Industry.................................................................................................. 12
WEBSITE HEALTH........................................................................................................................... 14
Moz Domain Authority by Industry...................................................................................... 14
Moz Domain Authority vs. PR Performance by Industry................................................ 16
INDUSTRY BENCHMARKS........................................................................................................... 18
Accommodation and Food Services................................................................................... 18
Business Services.................................................................................................................... 19
Construction Products............................................................................................................ 20
Consumer Goods..................................................................................................................... 21
Finance and Insurance........................................................................................................... 22
Healthcare................................................................................................................................ 23
Higher Education..................................................................................................................... 24
Media and Publishing............................................................................................................. 25
Real Estate................................................................................................................................ 26
Retail......................................................................................................................................... 27
Software and Applications.....................................................................................................28
Sports and Entertainment...................................................................................................... 29
Wellness..................................................................................................................................... 30
DATA APPENDIX.............................................................................................................................. 31
2017 Digital Marketing Analytics Performance Report 4
I. SOCIAL MEDIA PERFORMANCE
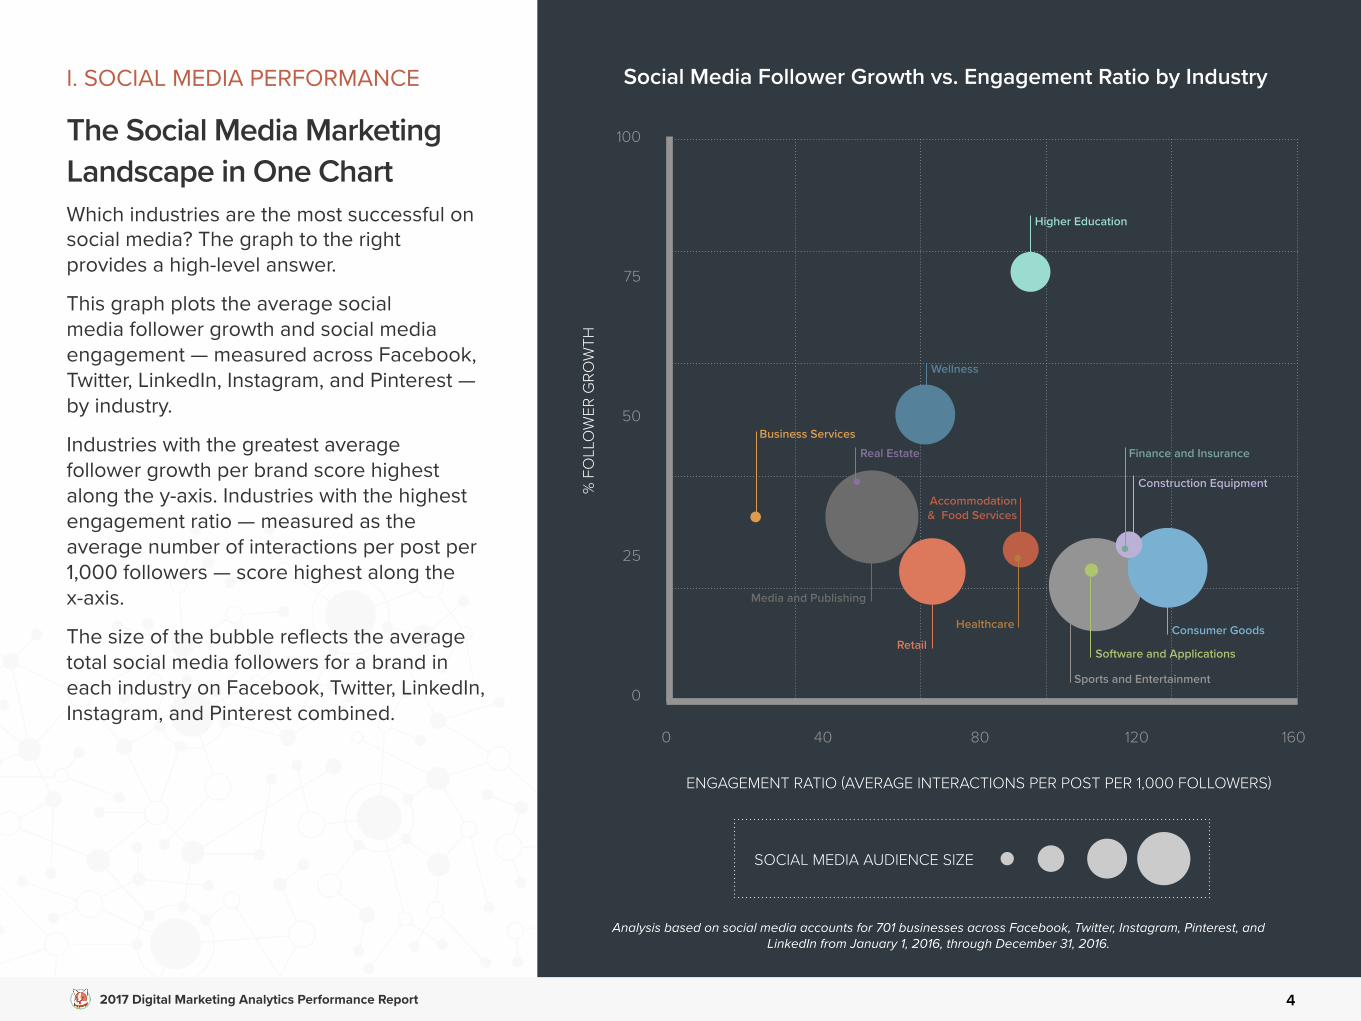
The Social Media Marketing Landscape in One ChartWhich industries are the most successful on social media? The graph to the right provides a high-level answer.
This graph plots the average social media follower growth and social media engagement — measured across Facebook, Twitter, LinkedIn, Instagram, and Pinterest — by industry.
Industries with the greatest average follower growth per brand score highest along the y-axis. Industries with the highest engagement ratio — measured as the average number of interactions per post per 1,000 followers — score highest along the x-axis.
The size of the bubble reflects the average total social media followers for a brand in each industry on Facebook, Twitter, LinkedIn, Instagram, and Pinterest combined.
Social Media Follower Growth vs. Engagement Ratio by Industry
100
0 40 80 120 160
0
75
50
25
% F
OLL
OW
ER G
ROW
TH
ENGAGEMENT RATIO (AVERAGE INTERACTIONS PER POST PER 1,000 FOLLOWERS)
Finance and Insurance
Business Services
Construction Equipment
Healthcare
Real Estate
Wellness
Media and Publishing
RetailConsumer Goods
Software and Applications
Sports and Entertainment
Higher Education
Accommodation& Food Services
Analysis based on social media accounts for 701 businesses across Facebook, Twitter, Instagram, Pinterest, and LinkedIn from January 1, 2016, through December 31, 2016.
SOCIAL MEDIA AUDIENCE SIZE
KEY
TAKE
AWAY
S
5
THE SOCIAL MEDIA MARKETING LANDSCAPE
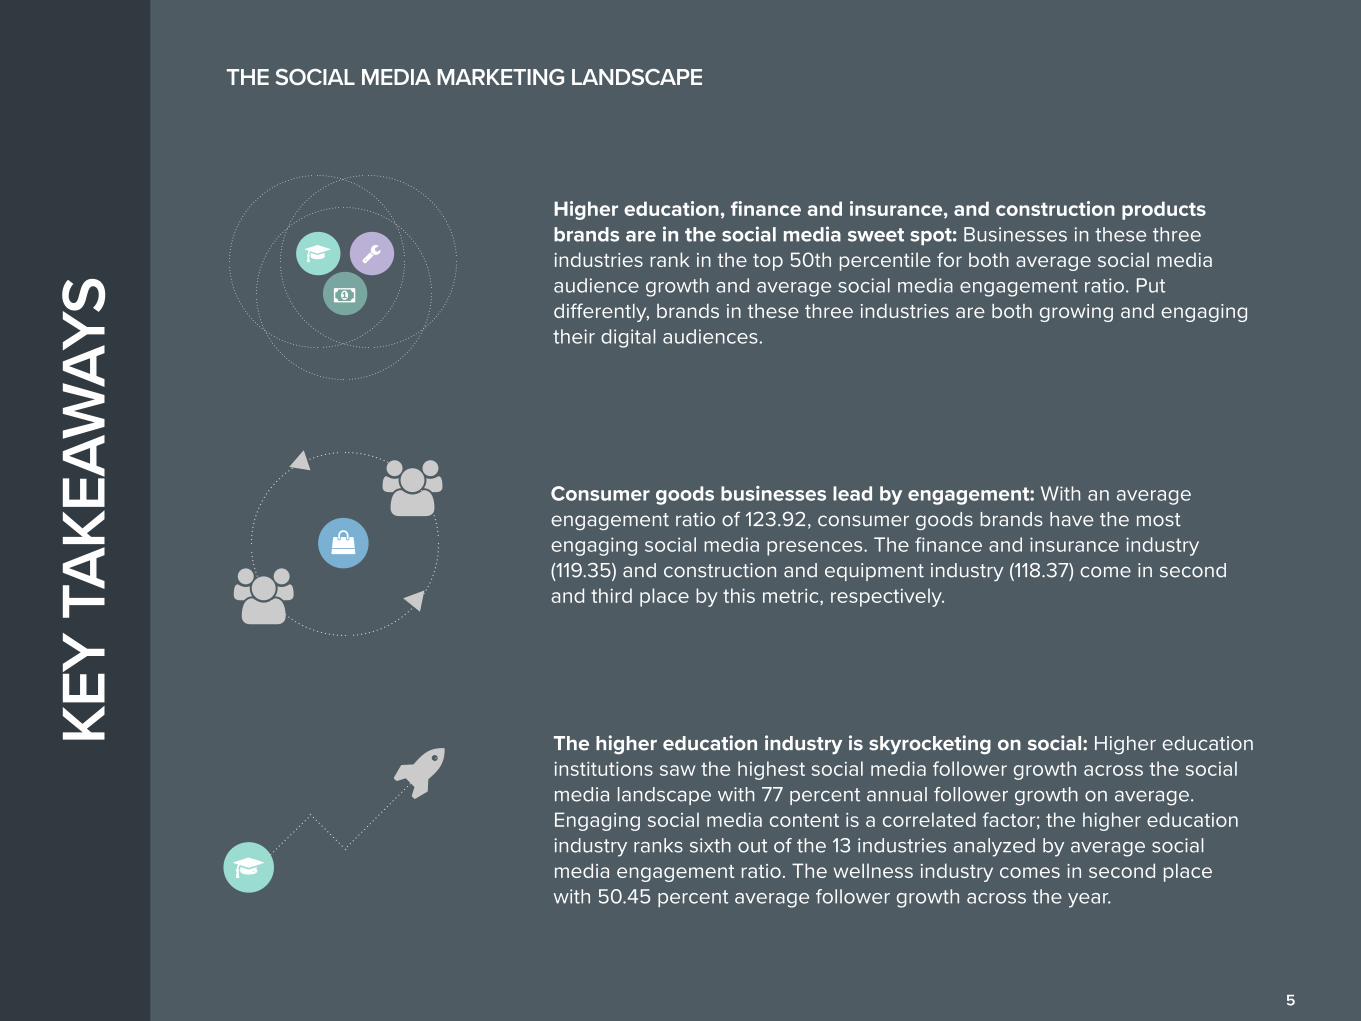
Higher education, finance and insurance, and construction products brands are in the social media sweet spot: Businesses in these three industries rank in the top 50th percentile for both average social media audience growth and average social media engagement ratio. Put differently, brands in these three industries are both growing and engaging their digital audiences.
Consumer goods businesses lead by engagement: With an average engagement ratio of 123.92, consumer goods brands have the most engaging social media presences. The finance and insurance industry (119.35) and construction and equipment industry (118.37) come in second and third place by this metric, respectively.
The higher education industry is skyrocketing on social: Higher education institutions saw the highest social media follower growth across the social media landscape with 77 percent annual follower growth on average. Engaging social media content is a correlated factor; the higher education industry ranks sixth out of the 13 industries analyzed by average social media engagement ratio. The wellness industry comes in second place with 50.45 percent average follower growth across the year.
2017 Digital Marketing Analytics Performance Report 6
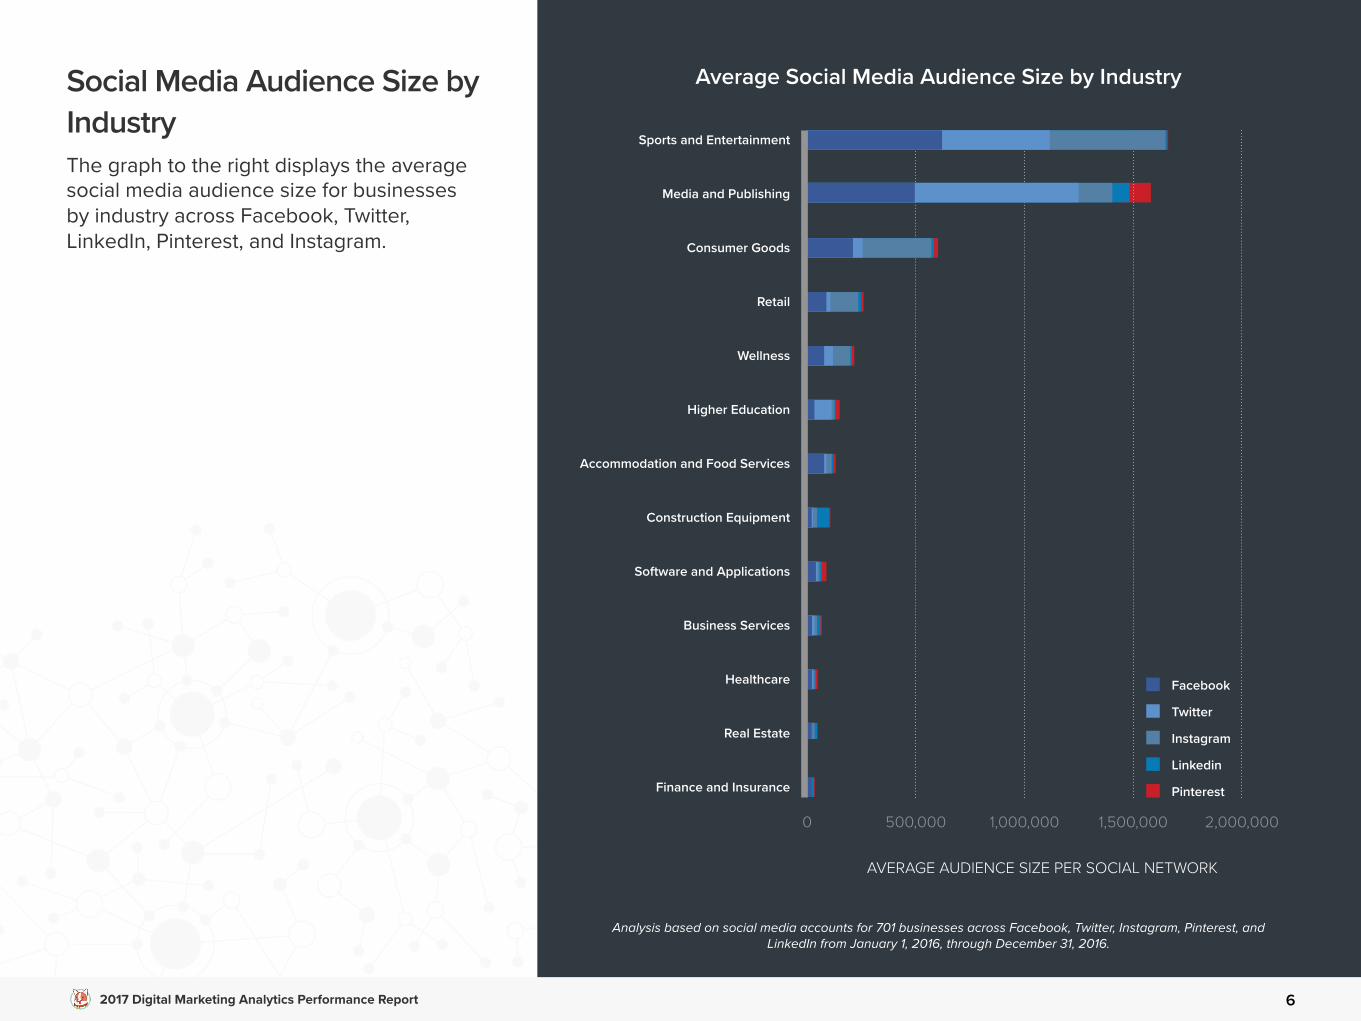
Social Media Audience Size by IndustryThe graph to the right displays the average social media audience size for businesses by industry across Facebook, Twitter, LinkedIn, Pinterest, and Instagram.
Analysis based on social media accounts for 701 businesses across Facebook, Twitter, Instagram, Pinterest, and LinkedIn from January 1, 2016, through December 31, 2016.
Average Social Media Audience Size by Industry
0 500,000 1,000,000 1,500,000 2,000,000
AVERAGE AUDIENCE SIZE PER SOCIAL NETWORK
Sports and Entertainment
Media and Publishing
Consumer Goods
Retail
Wellness
Higher Education
Accommodation and Food Services
Construction Equipment
Software and Applications
Business Services
Healthcare
Real Estate
Finance and Insurance
KEY
TAKE
AWAY
S
7
SOCIAL MEDIA AUDIENCE SIZE BY INDUSTRY
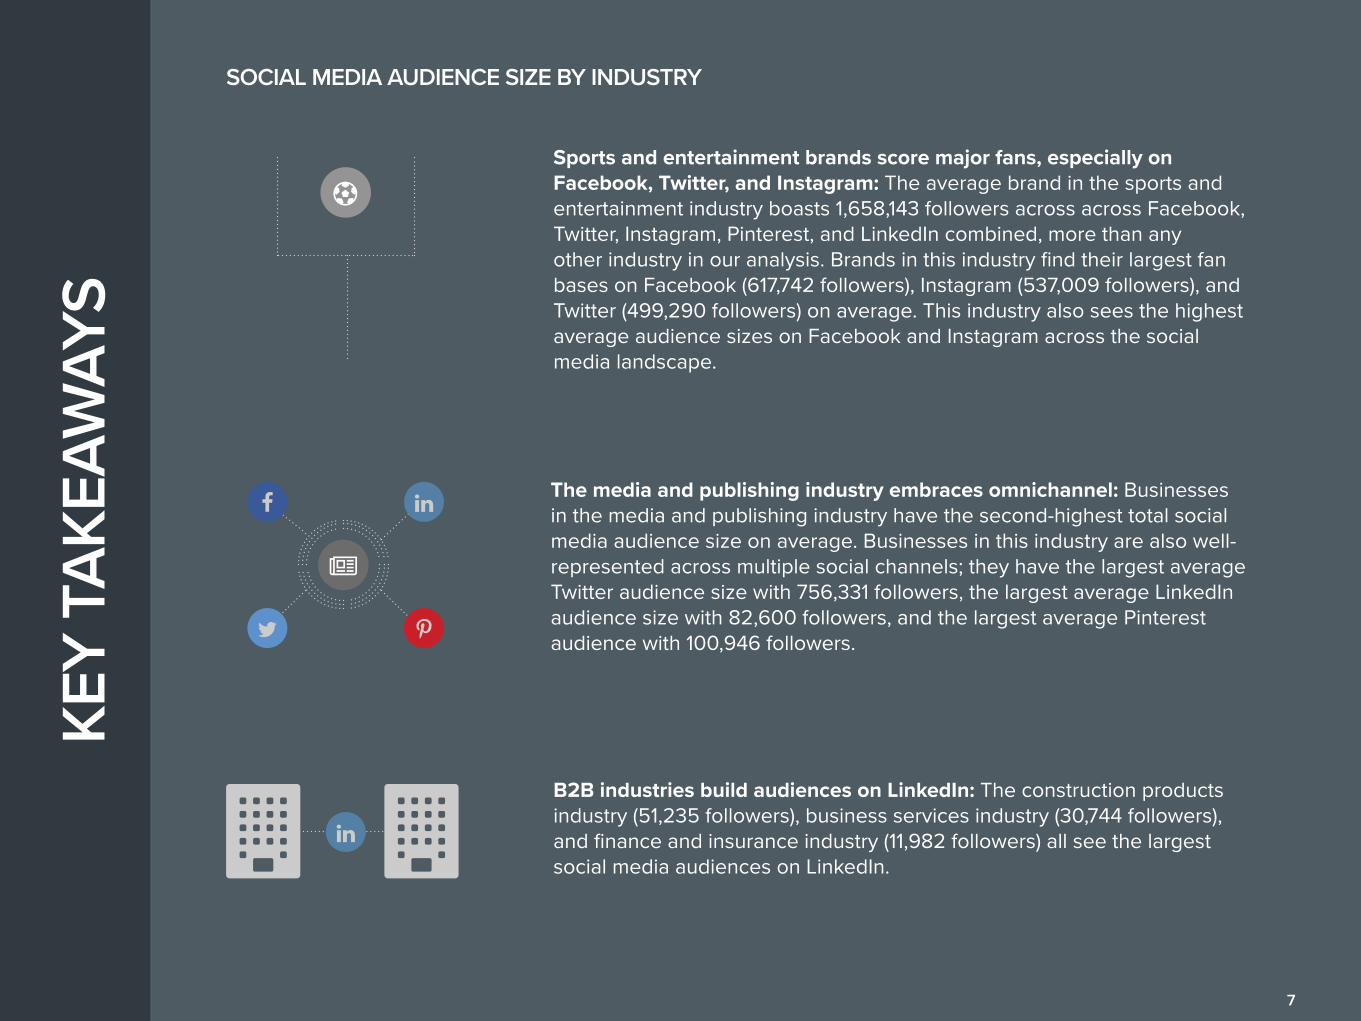
Sports and entertainment brands score major fans, especially on Facebook, Twitter, and Instagram: The average brand in the sports and entertainment industry boasts 1,658,143 followers across across Facebook, Twitter, Instagram, Pinterest, and LinkedIn combined, more than any other industry in our analysis. Brands in this industry find their largest fan bases on Facebook (617,742 followers), Instagram (537,009 followers), and Twitter (499,290 followers) on average. This industry also sees the highest average audience sizes on Facebook and Instagram across the social media landscape.
The media and publishing industry embraces omnichannel: Businesses in the media and publishing industry have the second-highest total social media audience size on average. Businesses in this industry are also well-represented across multiple social channels; they have the largest average Twitter audience size with 756,331 followers, the largest average LinkedIn audience size with 82,600 followers, and the largest average Pinterest audience with 100,946 followers.
B2B industries build audiences on LinkedIn: The construction products industry (51,235 followers), business services industry (30,744 followers), and finance and insurance industry (11,982 followers) all see the largest social media audiences on LinkedIn.
2017 Digital Marketing Analytics Performance Report 8
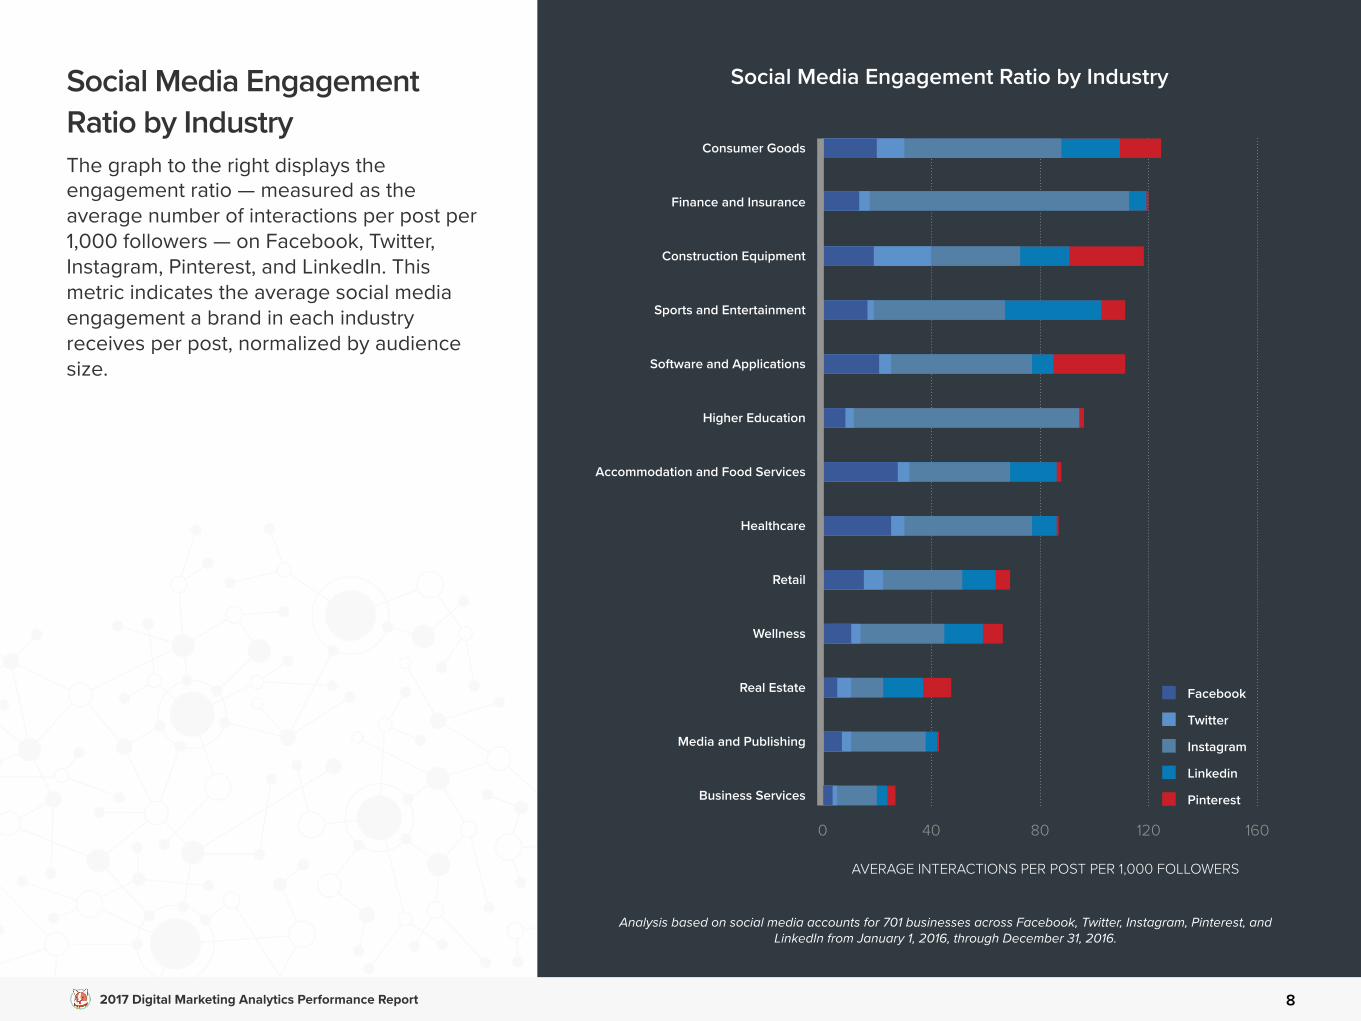
Social Media Engagement Ratio by IndustryThe graph to the right displays the engagement ratio — measured as the average number of interactions per post per 1,000 followers — on Facebook, Twitter, Instagram, Pinterest, and LinkedIn. This metric indicates the average social media engagement a brand in each industry receives per post, normalized by audience size.
Analysis based on social media accounts for 701 businesses across Facebook, Twitter, Instagram, Pinterest, and LinkedIn from January 1, 2016, through December 31, 2016.
Social Media Engagement Ratio by Industry
AVERAGE INTERACTIONS PER POST PER 1,000 FOLLOWERS
0 40 80 120 160
Consumer Goods
Finance and Insurance
Construction Equipment
Sports and Entertainment
Software and Applications
Higher Education
Accommodation and Food Services
Healthcare
Retail
Wellness
Real Estate
Media and Publishing
Business Services
KEY
TAKE
AWAY
S
9
SOCIAL MEDIA ENGAGEMENT BY INDUSTRYKE
Y TA
KEAW
AYS
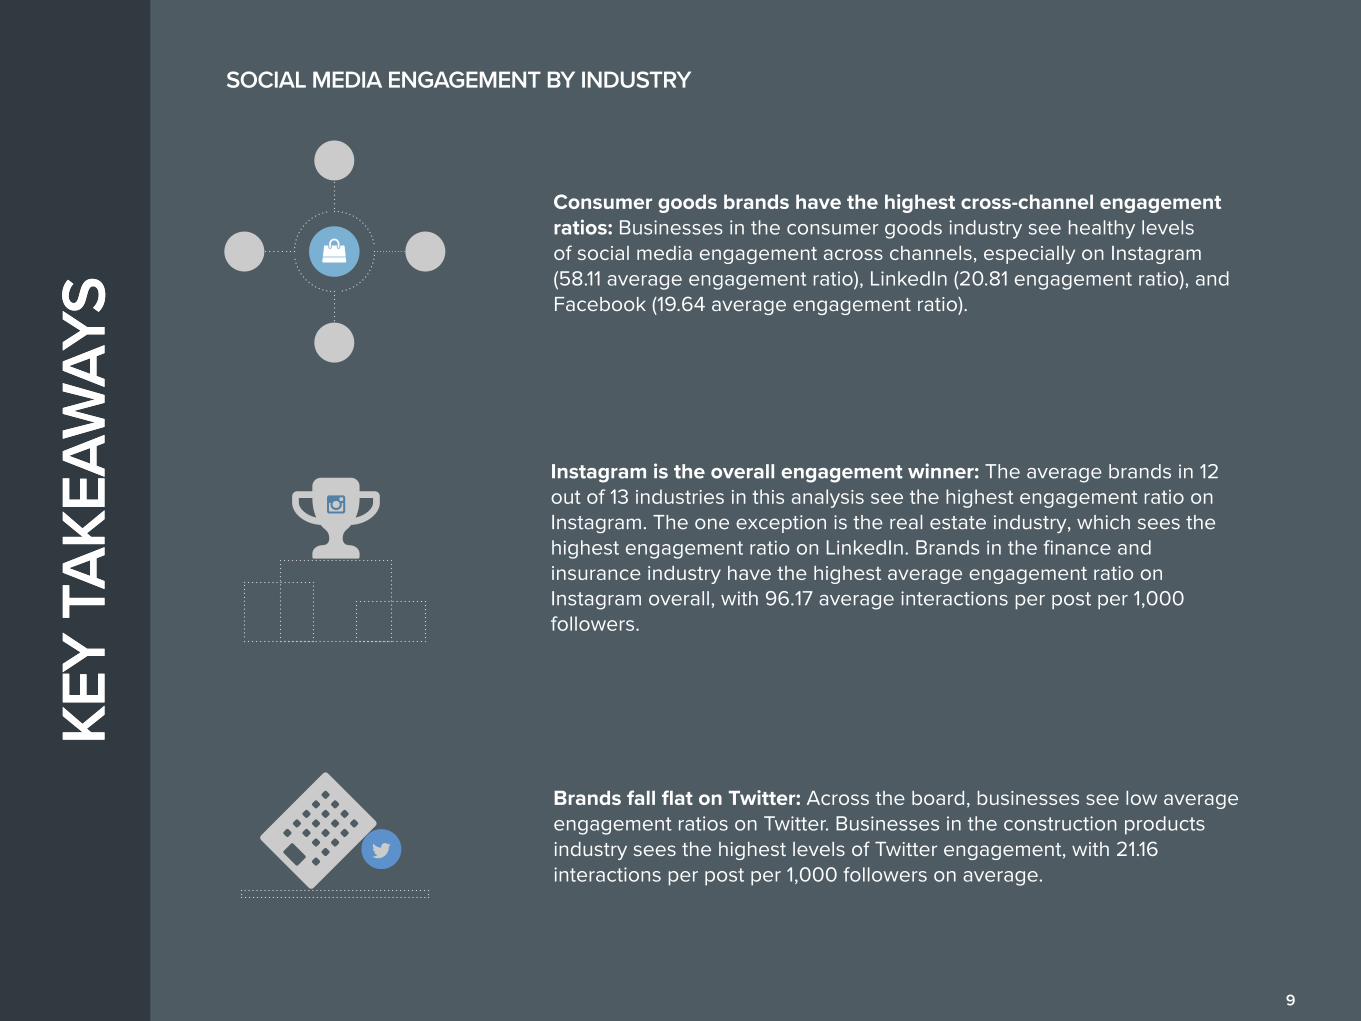
Consumer goods brands have the highest cross-channel engagement ratios: Businesses in the consumer goods industry see healthy levels of social media engagement across channels, especially on Instagram (58.11 average engagement ratio), LinkedIn (20.81 engagement ratio), and Facebook (19.64 average engagement ratio).
Instagram is the overall engagement winner: The average brands in 12 out of 13 industries in this analysis see the highest engagement ratio on Instagram. The one exception is the real estate industry, which sees the highest engagement ratio on LinkedIn. Brands in the finance and insurance industry have the highest average engagement ratio on Instagram overall, with 96.17 average interactions per post per 1,000 followers.
Brands fall flat on Twitter: Across the board, businesses see low average engagement ratios on Twitter. Businesses in the construction products industry sees the highest levels of Twitter engagement, with 21.16 interactions per post per 1,000 followers on average.
2017 Digital Marketing Analytics Performance Report 10
II. BLOG PERFORMANCE
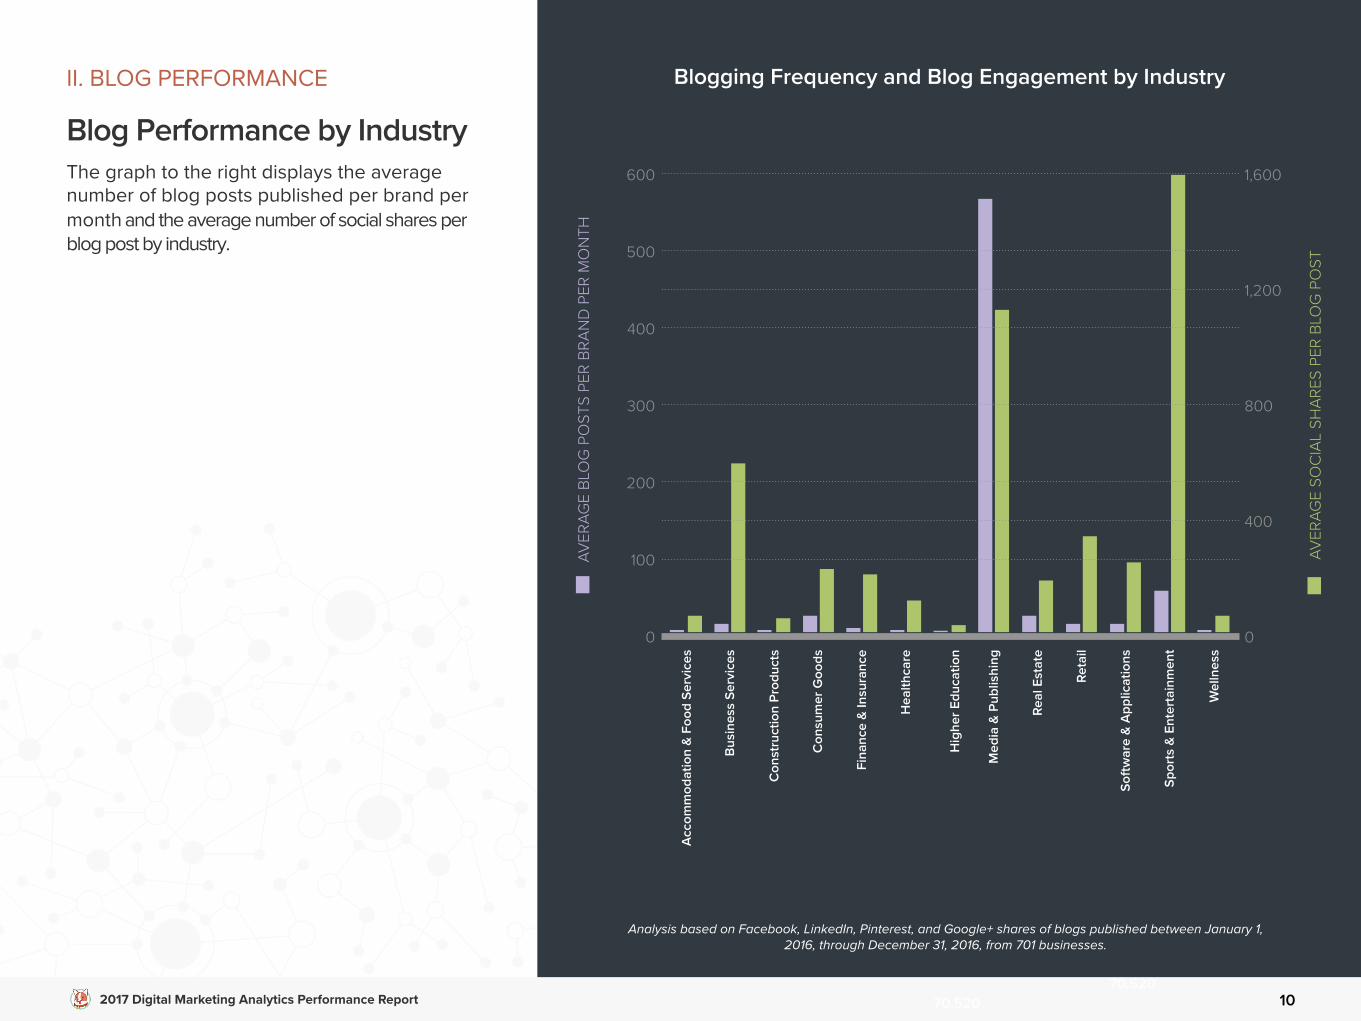
Blog Performance by IndustryThe graph to the right displays the average number of blog posts published per brand per month and the average number of social shares per blog post by industry.
Analysis based on Facebook, LinkedIn, Pinterest, and Google+ shares of blogs published between January 1, 2016, through December 31, 2016, from 701 businesses.
70,52070,520
Blogging Frequency and Blog Engagement by Industry
Med
ia &
Pub
lishi
ng
Spor
ts &
Ent
erta
inm
ent
Real
Est
ate
Con
sum
er G
oods
Soft
war
e &
App
licat
ions
Bus
ines
s Se
rvic
es
Reta
il
Fina
nce
& In
sura
nce
Hea
lthca
re
Con
stru
ctio
n Pr
oduc
ts
Wel
lnes
s
Acc
omm
odat
ion
& F
ood
Serv
ices
Hig
her E
duca
tion
600 1,600
400
800
200
400
0 0
1,200
300
100
500
AVER
AGE
BLO
G P
OST
S PE
R BR
AND
PER
MO
NTH
AVER
AGE
SOC
IAL
SHAR
ES P
ER B
LOG
PO
ST
KEY
TAKE
AWAY
S
11
BLOG PERFORMANCE BY INDUSTRY
Sports and entertainment brand blogs go viral: With 12,098 average social shares per blog post, the sports and entertainment industry sees over 10 times as many social shares per blog than any other industry. Within this industry, the sports teams sub-industry sees the highest average shares per blog post with 15,412 average social shares per blog post.
Blogs by higher education institutions are dormant: Higher education institutions post only one blog post per month on average, and see only 25 social shares per post on average. These findings are likely a reflection of the decentralization of blogs and social channels across departments and subdomains within higher education institutions.
The media and publishing industry published over 10 times more content per month than any other industry. It should come as no surprise that media and publishing brands create the most new blog content per month, with 575 posts per brand per month on average. The sports and entertainment industry comes in second place by this metric, with 55 average blog posts per brand per month.
ZZZ
Z
2017 Digital Marketing Analytics Performance Report 12
III. PUBLIC RELATIONS PERFORMANCE
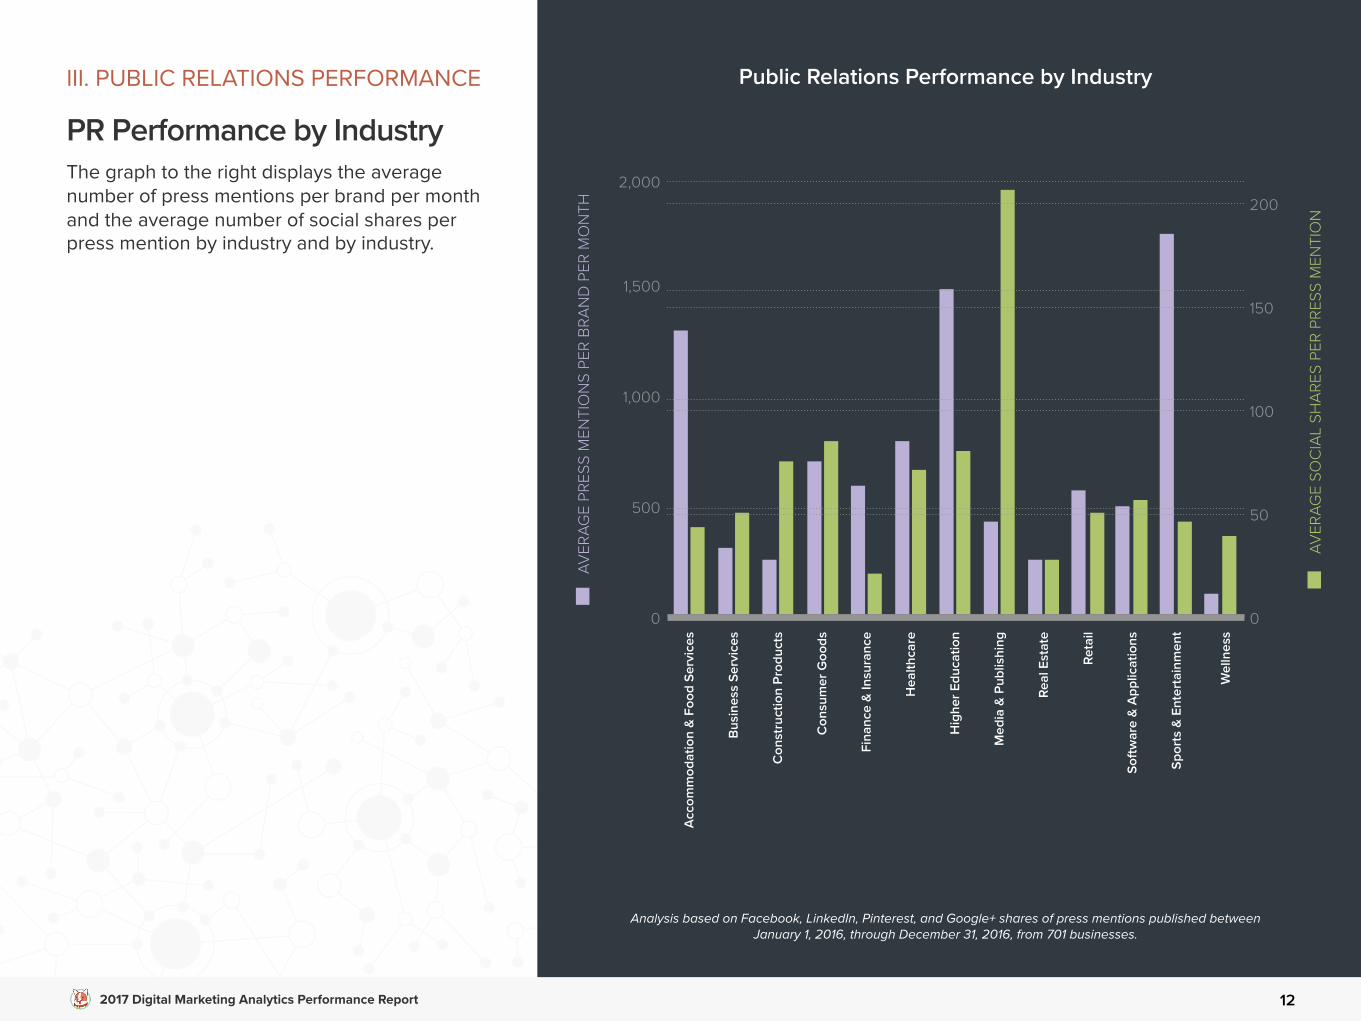
PR Performance by IndustryThe graph to the right displays the average number of press mentions per brand per month and the average number of social shares per press mention by industry and by industry.
Analysis based on Facebook, LinkedIn, Pinterest, and Google+ shares of press mentions published between January 1, 2016, through December 31, 2016, from 701 businesses.
Public Relations Performance by Industry
AVER
AGE
PRES
S M
ENTI
ON
S PE
R BR
AND
PER
MO
NTH
AVER
AGE
SOC
IAL
SHAR
ES P
ER P
RESS
MEN
TIO
N
Acc
omm
odat
ion
& F
ood
Serv
ices
Bus
ines
s Se
rvic
es
Con
stru
ctio
n Pr
oduc
ts
Con
sum
er G
oods
Fina
nce
& In
sura
nce
Hea
lthca
re
Hig
her E
duca
tion
Med
ia &
Pub
lishi
ng
Real
Est
ate
Reta
il
Soft
war
e &
App
licat
ions
Spor
ts &
Ent
erta
inm
ent
Wel
lnes
s
2,000
1,500
1,000
500
0 0
200
150
100
50
KEY
TAKE
AWAY
S
13
PR PERFORMANCE BY INDUSTRY
NOTE: TrackMaven conducted this analysis after the removal of Twitter’s share count feature. As a result, Twitter shares of blog posts are not included. To see benchmarks for social shares of blog posts including Twitter shares, please see our Blogging for Business Report.
The sports and entertainment industry is most newsworthy: The sports and entertainment industry sees 1,774 press mentions per brand per month on average, followed by higher education institutions with 1,520 press mentions per brand per month on average. The accommodation and food services industry comes in third place with 1,337 press mentions per brand per month on average.
The media and publishing industry gets the most impactful press mentions. While media and publishing brands average only 433 press mentions per brand per month, each press mention averages 208 social shares. This finding likely reflects the citation of news reports and articles as sources of reference.
Higher education, media and publishing, and sports and entertainment brands see the greatest PR amplification overall: On average, higher education institutions have the best overall PR performance with 121,594 social shares from press mentions per month. Media and publishing brands see 90,095 social shares from press mentions per month on average, and sports and entertainment brands see 79,839 social shares from press mentions per month on average. The wellness industry has the least impactful PR performance with only 4,014 social shares from press mentions per month on average.
2017 Digital Marketing Analytics Performance Report 14
IV. WEBSITE HEALTH
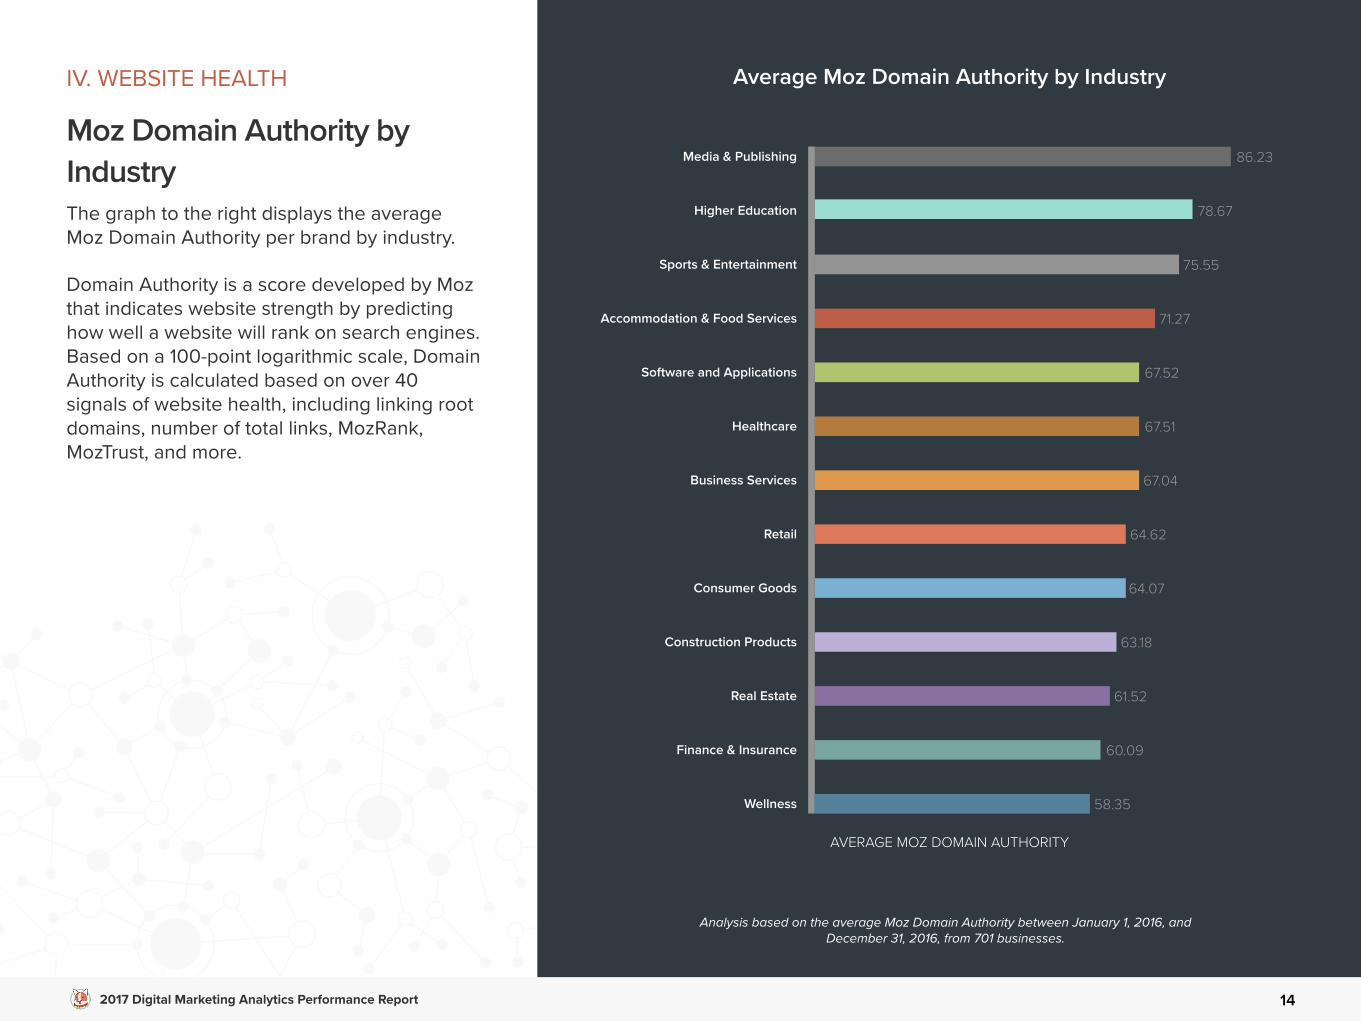
Moz Domain Authority by Industry The graph to the right displays the average Moz Domain Authority per brand by industry.
Domain Authority is a score developed by Moz that indicates website strength by predicting how well a website will rank on search engines. Based on a 100-point logarithmic scale, Domain Authority is calculated based on over 40 signals of website health, including linking root domains, number of total links, MozRank, MozTrust, and more.
Average Moz Domain Authority by Industry
Analysis based on the average Moz Domain Authority between January 1, 2016, and December 31, 2016, from 701 businesses.
Media & Publishing
Higher Education
Sports & Entertainment
Accommodation & Food Services
Software and Applications
Healthcare
Business Services
Retail
Consumer Goods
Construction Products
Real Estate
Finance & Insurance
Wellness
78.67
75.55
71.27
67.52
67.51
67.04
64.62
64.07
63.18
61.52
60.09
58.35
86.23
AVERAGE MOZ DOMAIN AUTHORITY
KEY
TAKE
AWAY
S
15
WEBSITE HEALTH BY INDUSTRY
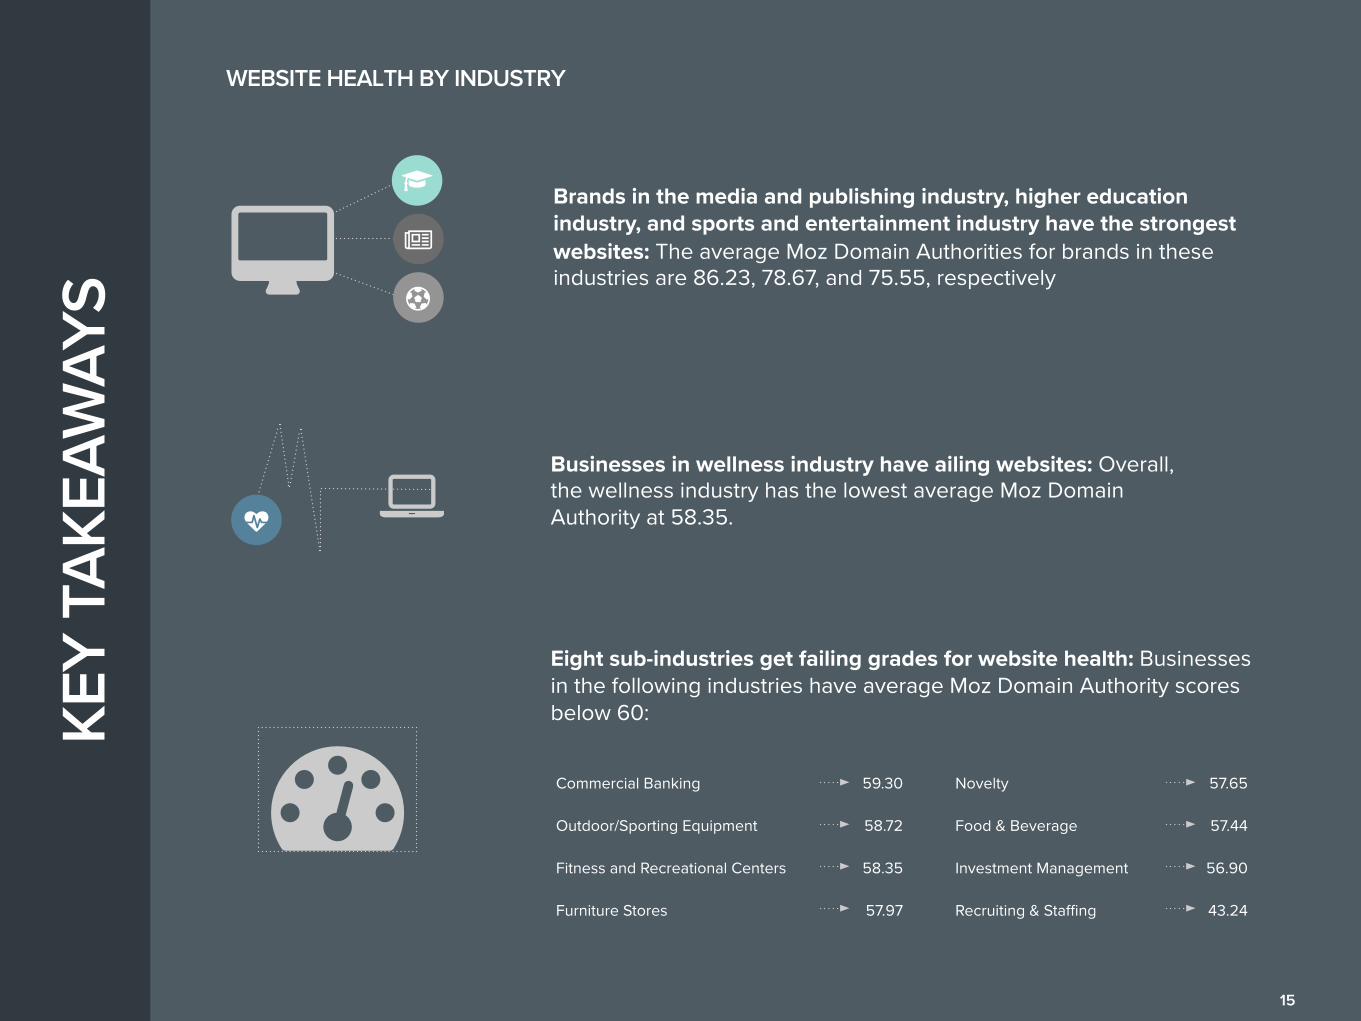
Brands in the media and publishing industry, higher education industry, and sports and entertainment industry have the strongest websites: The average Moz Domain Authorities for brands in these industries are 86.23, 78.67, and 75.55, respectively
Businesses in wellness industry have ailing websites: Overall, the wellness industry has the lowest average Moz Domain Authority at 58.35.
Eight sub-industries get failing grades for website health: Businesses in the following industries have average Moz Domain Authority scores below 60:
Commercial Banking 59.30
Outdoor/Sporting Equipment 58.72
Fitness and Recreational Centers 58.35
Furniture Stores 57.97
Novelty 57.65
Food & Beverage 57.44
Investment Management 56.90
Recruiting & Staffing 43.24
2017 Digital Marketing Analytics Performance Report 16
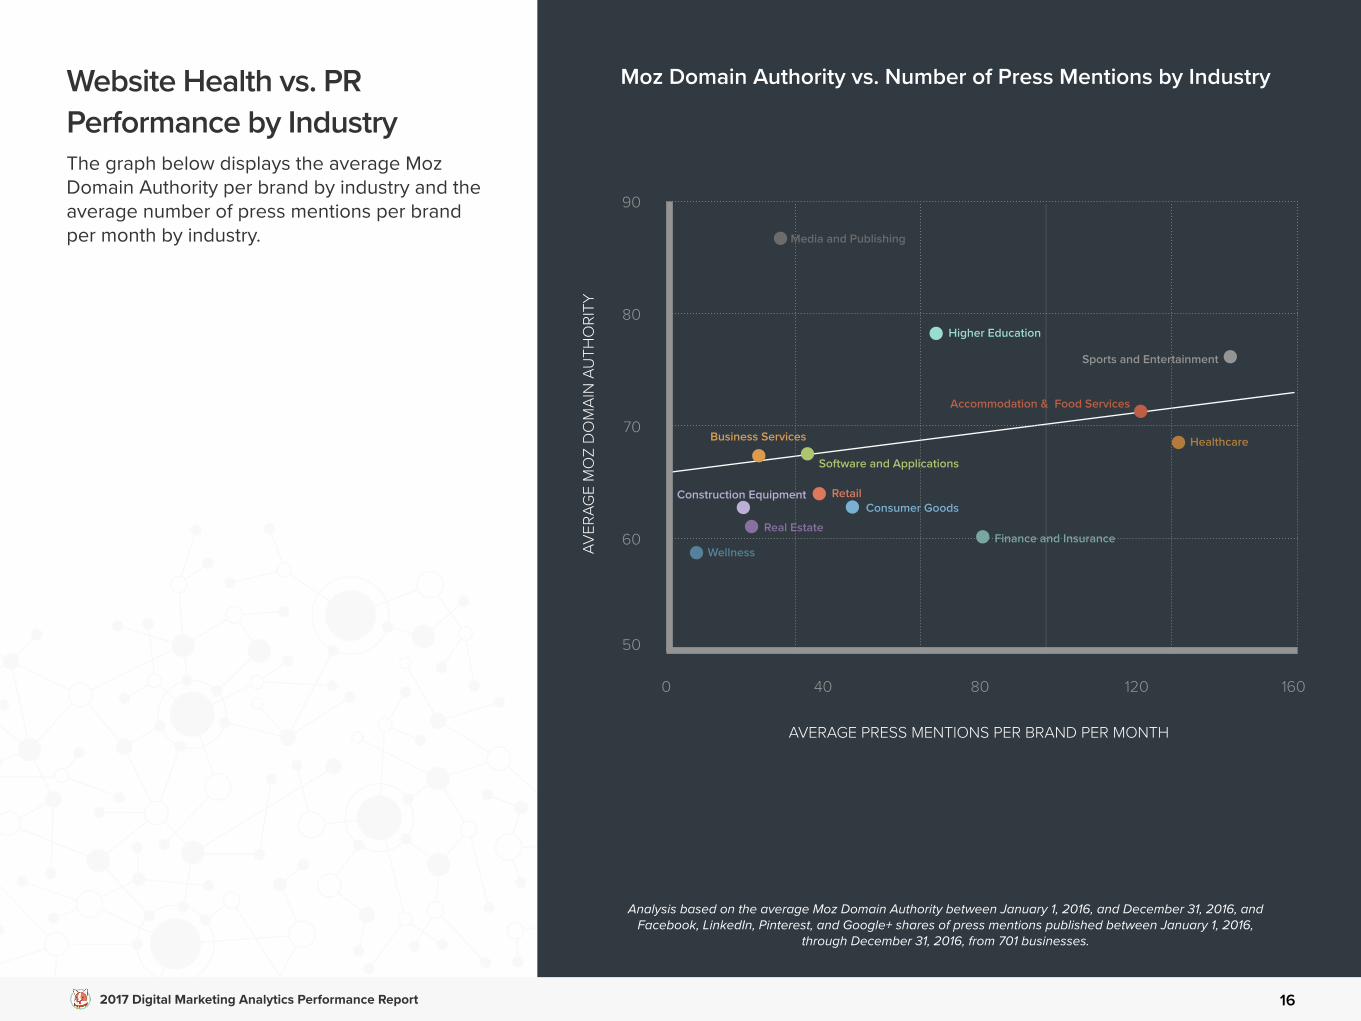
Website Health vs. PR Performance by IndustryThe graph below displays the average Moz Domain Authority per brand by industry and the average number of press mentions per brand per month by industry.
Moz Domain Authority vs. Number of Press Mentions by Industry
90
0 40 80 120 160
50
80
70
60AVER
AGE
MO
Z D
OM
AIN
AU
THO
RITY
AVERAGE PRESS MENTIONS PER BRAND PER MONTH
Finance and Insurance
Construction EquipmentConsumer Goods
Software and Applications
Sports and Entertainment
Higher Education
Wellness
Media and Publishing
Real Estate
Retail
Accommodation & Food Services
HealthcareBusiness Services
Analysis based on the average Moz Domain Authority between January 1, 2016, and December 31, 2016, and Facebook, LinkedIn, Pinterest, and Google+ shares of press mentions published between January 1, 2016,
through December 31, 2016, from 701 businesses.
KEY
TAKE
AWAY
S
17
WEBSITE HEALTH VS. PR PERFORMANCE BY INDUSTRY
Overall, there is a strong correlation between an industry’s PR performance and average website Domain Authority. The media and publishing industry and higher education industry are two outliers; brands in each industry see high Moz Domain Authorities on average, despite a comparatively low volume of press mentions. This finding underscores the importance of high-impact press mentions; a smaller number of high quality press mentions can have an outsized impact of website health.
2017 Digital Marketing Analytics Performance Report 18
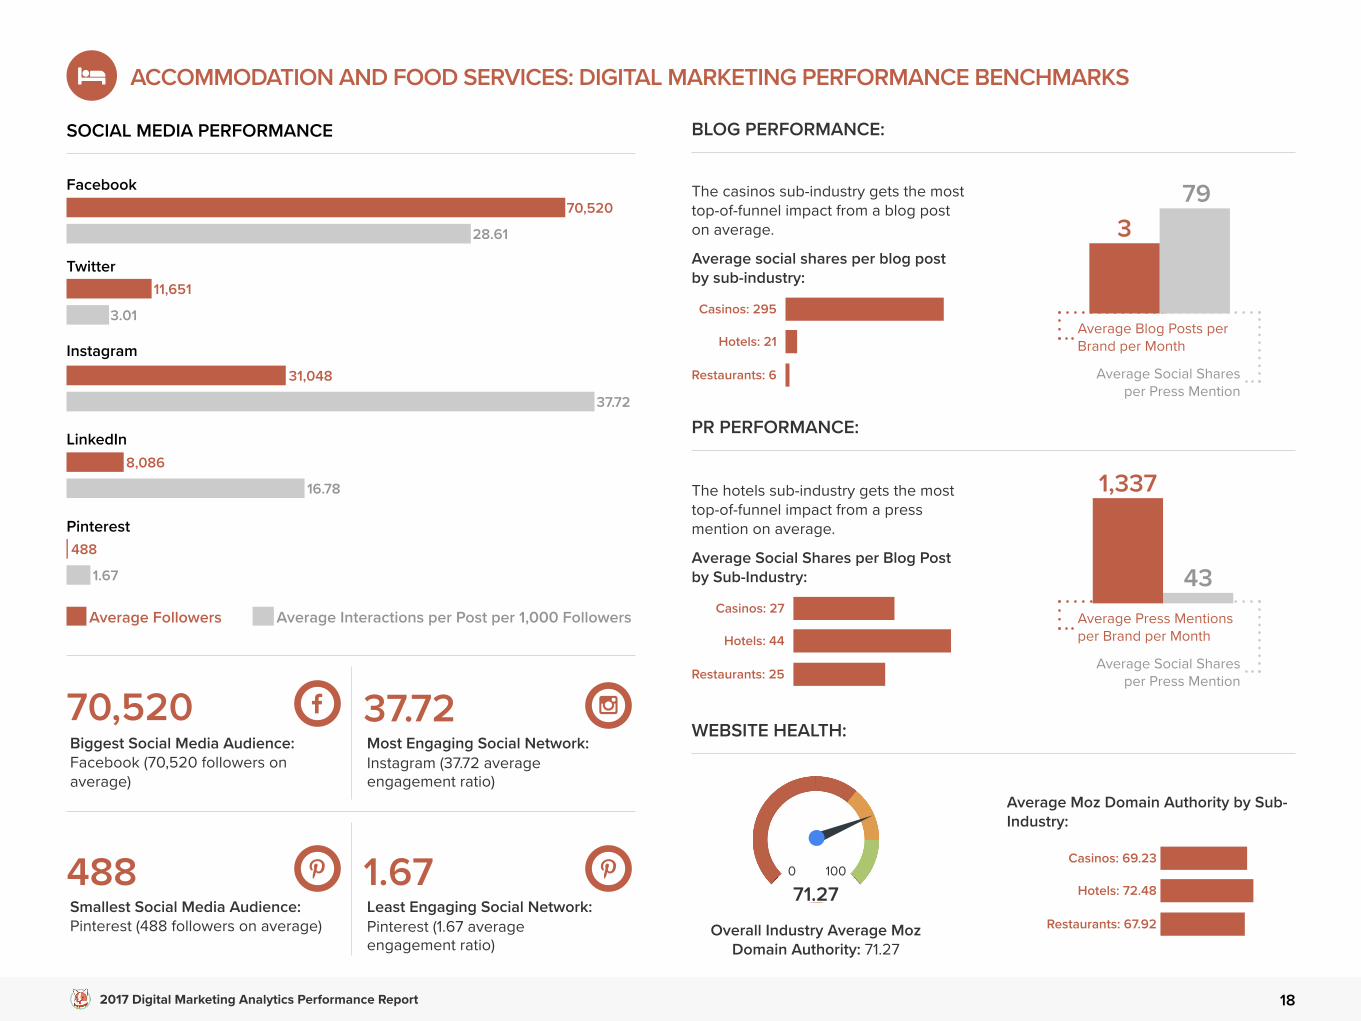
SOCIAL MEDIA PERFORMANCE
Average Followers Average Interactions per Post per 1,000 Followers
70,520
1.67
488
16.78
8,086
37.72
31,048
3.01
11,651
28.61
70,520Biggest Social Media Audience: Facebook (70,520 followers on average)
37.72Most Engaging Social Network: Instagram (37.72 average engagement ratio)
488Smallest Social Media Audience: Pinterest (488 followers on average)
1.67Least Engaging Social Network: Pinterest (1.67 average engagement ratio)
WEBSITE HEALTH:
ACCOMMODATION AND FOOD SERVICES: DIGITAL MARKETING PERFORMANCE BENCHMARKS
BLOG PERFORMANCE:
The casinos sub-industry gets the most top-of-funnel impact from a blog post on average.
Average social shares per blog post by sub-industry:
Casinos: 295
Restaurants: 6
Hotels: 21
PR PERFORMANCE:
The hotels sub-industry gets the most top-of-funnel impact from a press mention on average.
Average Social Shares per Blog Post by Sub-Industry:
Casinos: 27
Restaurants: 25
Hotels: 44
Average Moz Domain Authority by Sub-Industry:
Casinos: 69.23
Restaurants: 67.92
Hotels: 72.48
Overall Industry Average Moz Domain Authority: 71.27
0 100
71.27
Average Social Shares per Press Mention
Average Blog Posts per Brand per Month
793
Average Social Shares per Press Mention
Average Press Mentions per Brand per Month
43
1,337
2017 Digital Marketing Analytics Performance Report 19
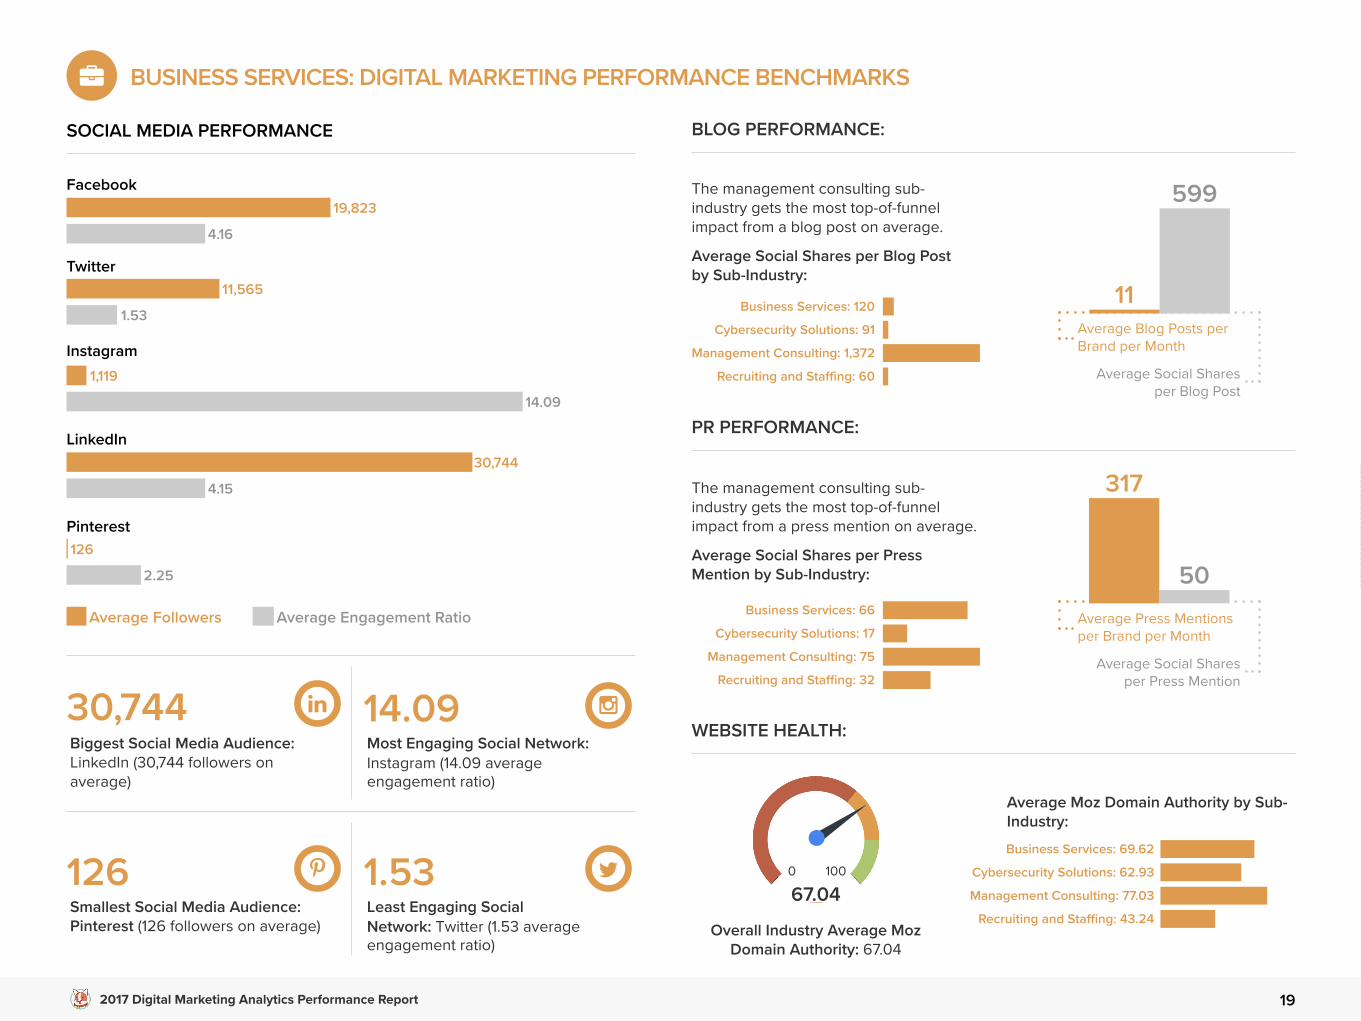
SOCIAL MEDIA PERFORMANCE
Average Followers Average Engagement Ratio
19,823
2.25
126
4.15
30,744
14.09
1,119
1.53
11,565
4.16
30,744Biggest Social Media Audience: LinkedIn (30,744 followers on average)
14.09Most Engaging Social Network: Instagram (14.09 average engagement ratio)
126Smallest Social Media Audience: Pinterest (126 followers on average)
1.53Least Engaging Social Network: Twitter (1.53 average engagement ratio)
WEBSITE HEALTH:
BUSINESS SERVICES: DIGITAL MARKETING PERFORMANCE BENCHMARKS
BLOG PERFORMANCE:
PR PERFORMANCE:
Average Moz Domain Authority by Sub-Industry:
Overall Industry Average Moz Domain Authority: 67.04
0 100
67.04
The management consulting sub-industry gets the most top-of-funnel impact from a blog post on average.
Average Social Shares per Blog Post by Sub-Industry:
Business Services: 120
Management Consulting: 1,372
Cybersecurity Solutions: 91
Recruiting and Staffing: 60
The management consulting sub-industry gets the most top-of-funnel impact from a press mention on average.
Average Social Shares per Press Mention by Sub-Industry:
Business Services: 66
Management Consulting: 75
Cybersecurity Solutions: 17
Recruiting and Staffing: 32
Business Services: 69.62
Management Consulting: 77.03
Cybersecurity Solutions: 62.93
Recruiting and Staffing: 43.24
Average Social Shares per Blog Post
Average Blog Posts per Brand per Month
599
11
Average Social Shares per Press Mention
Average Press Mentions per Brand per Month
50
317
2017 Digital Marketing Analytics Performance Report 20
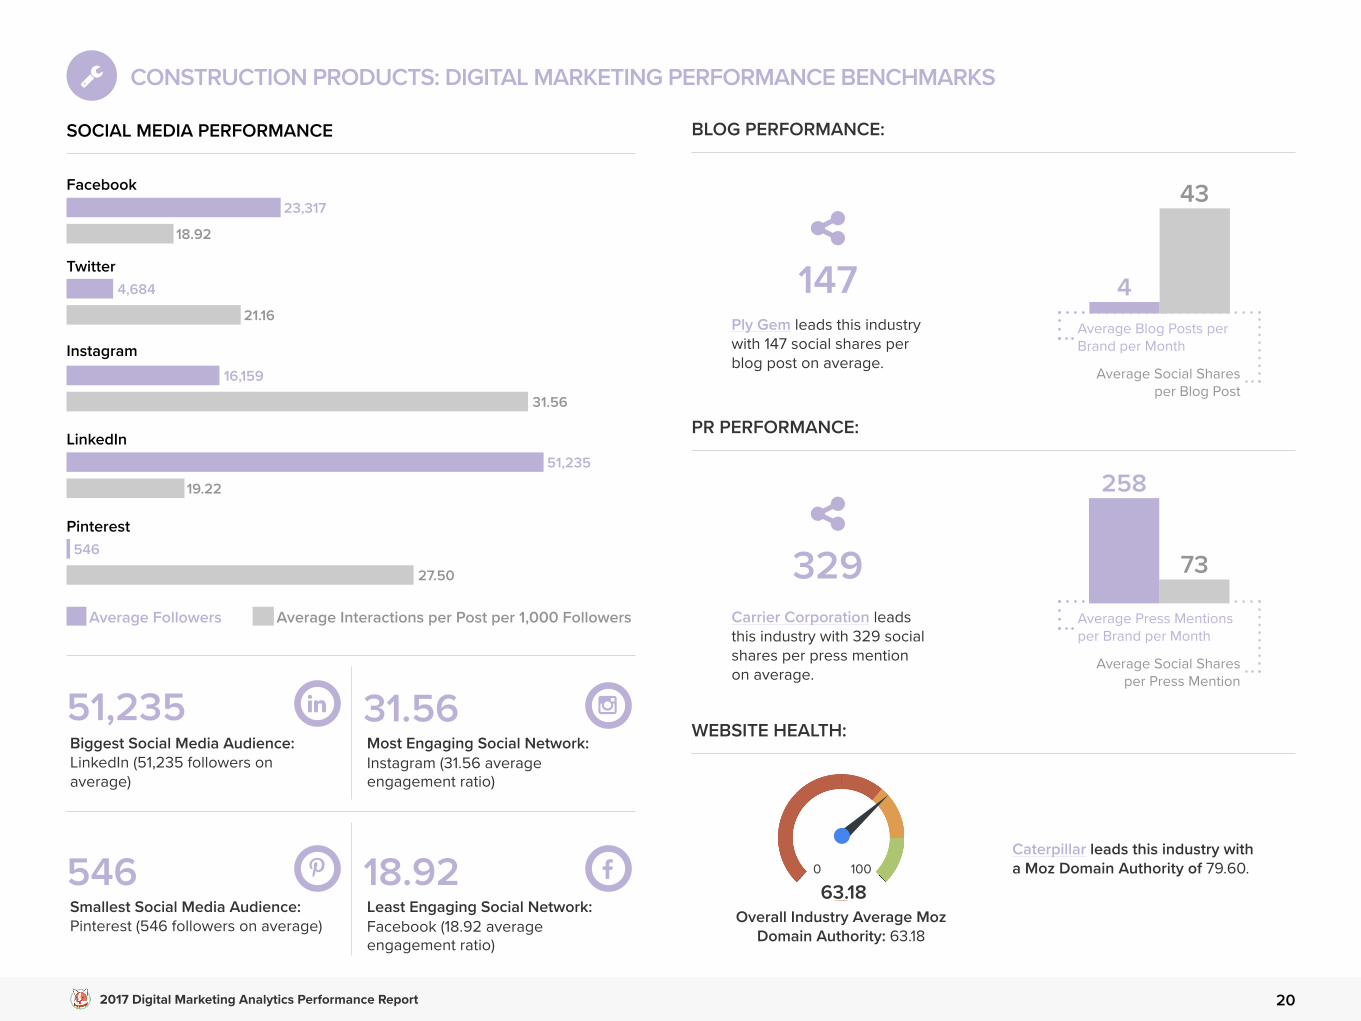
SOCIAL MEDIA PERFORMANCE
Average Followers Average Interactions per Post per 1,000 Followers
23,317
27.50
546
19.22
51,235
31.56
16,159
21.16
4,684
18.92
51,235Biggest Social Media Audience: LinkedIn (51,235 followers on average)
31.56Most Engaging Social Network: Instagram (31.56 average engagement ratio)
546Smallest Social Media Audience: Pinterest (546 followers on average)
18.92Least Engaging Social Network: Facebook (18.92 average engagement ratio)
WEBSITE HEALTH:
CONSTRUCTION PRODUCTS: DIGITAL MARKETING PERFORMANCE BENCHMARKS
BLOG PERFORMANCE:
PR PERFORMANCE:
Ply Gem leads this industry with 147 social shares per blog post on average.
147
Carrier Corporation leads this industry with 329 social shares per press mention on average.
329
Average Social Shares per Blog Post
Average Blog Posts per Brand per Month
43
4
Average Social Shares per Press Mention
Average Press Mentions per Brand per Month
73
258
Caterpillar leads this industry with a Moz Domain Authority of 79.60.0 100
63.18Overall Industry Average Moz
Domain Authority: 63.18
2017 Digital Marketing Analytics Performance Report 21
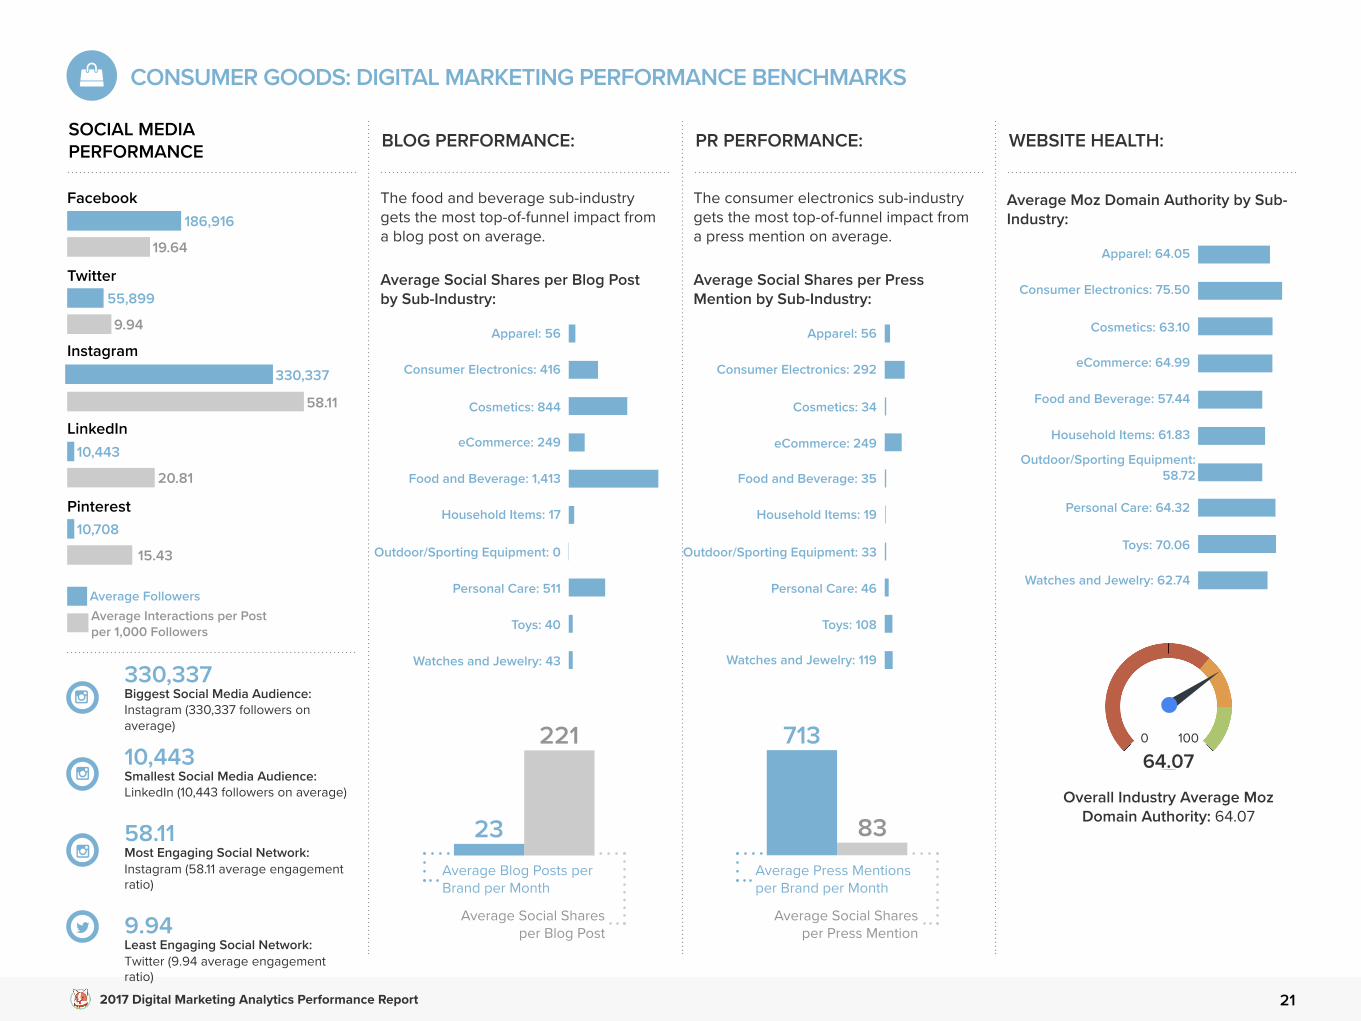
SOCIAL MEDIAPERFORMANCE BLOG PERFORMANCE: PR PERFORMANCE: WEBSITE HEALTH:
CONSUMER GOODS: DIGITAL MARKETING PERFORMANCE BENCHMARKS
58.11
330,337
Average FollowersAverage Interactions per Postper 1,000 Followers
186,916
15.43
10,708
20.81
10,443
9.94
55,899
19.64
330,337Biggest Social Media Audience: Instagram (330,337 followers on average)
10,443Smallest Social Media Audience: LinkedIn (10,443 followers on average)
58.11Most Engaging Social Network: Instagram (58.11 average engagement ratio)
9.94Least Engaging Social Network: Twitter (9.94 average engagement ratio)
The food and beverage sub-industry gets the most top-of-funnel impact from a blog post on average.
Average Social Shares per Blog Post by Sub-Industry:
Apparel: 56
Cosmetics: 844
Consumer Electronics: 416
eCommerce: 249
Food and Beverage: 1,413
Outdoor/Sporting Equipment: 0
Household Items: 17
Personal Care: 511
Toys: 40
Watches and Jewelry: 43
The consumer electronics sub-industry gets the most top-of-funnel impact from a press mention on average.
Average Moz Domain Authority by Sub-Industry:
Overall Industry Average Moz Domain Authority: 64.07
0 100
64.07
Apparel: 56
Cosmetics: 34
Consumer Electronics: 292
eCommerce: 249
Food and Beverage: 35
Outdoor/Sporting Equipment: 33
Household Items: 19
Personal Care: 46
Toys: 108
Watches and Jewelry: 119
Apparel: 64.05
Cosmetics: 63.10
Consumer Electronics: 75.50
eCommerce: 64.99
Food and Beverage: 57.44
Outdoor/Sporting Equipment: 58.72
Household Items: 61.83
Personal Care: 64.32
Toys: 70.06
Watches and Jewelry: 62.74
Average Social Shares per Press Mention by Sub-Industry:
Average Social Shares per Blog Post
Average Blog Posts per Brand per Month
221
23
Average Social Shares per Press Mention
Average Press Mentions per Brand per Month
83
713
2017 Digital Marketing Analytics Performance Report 22
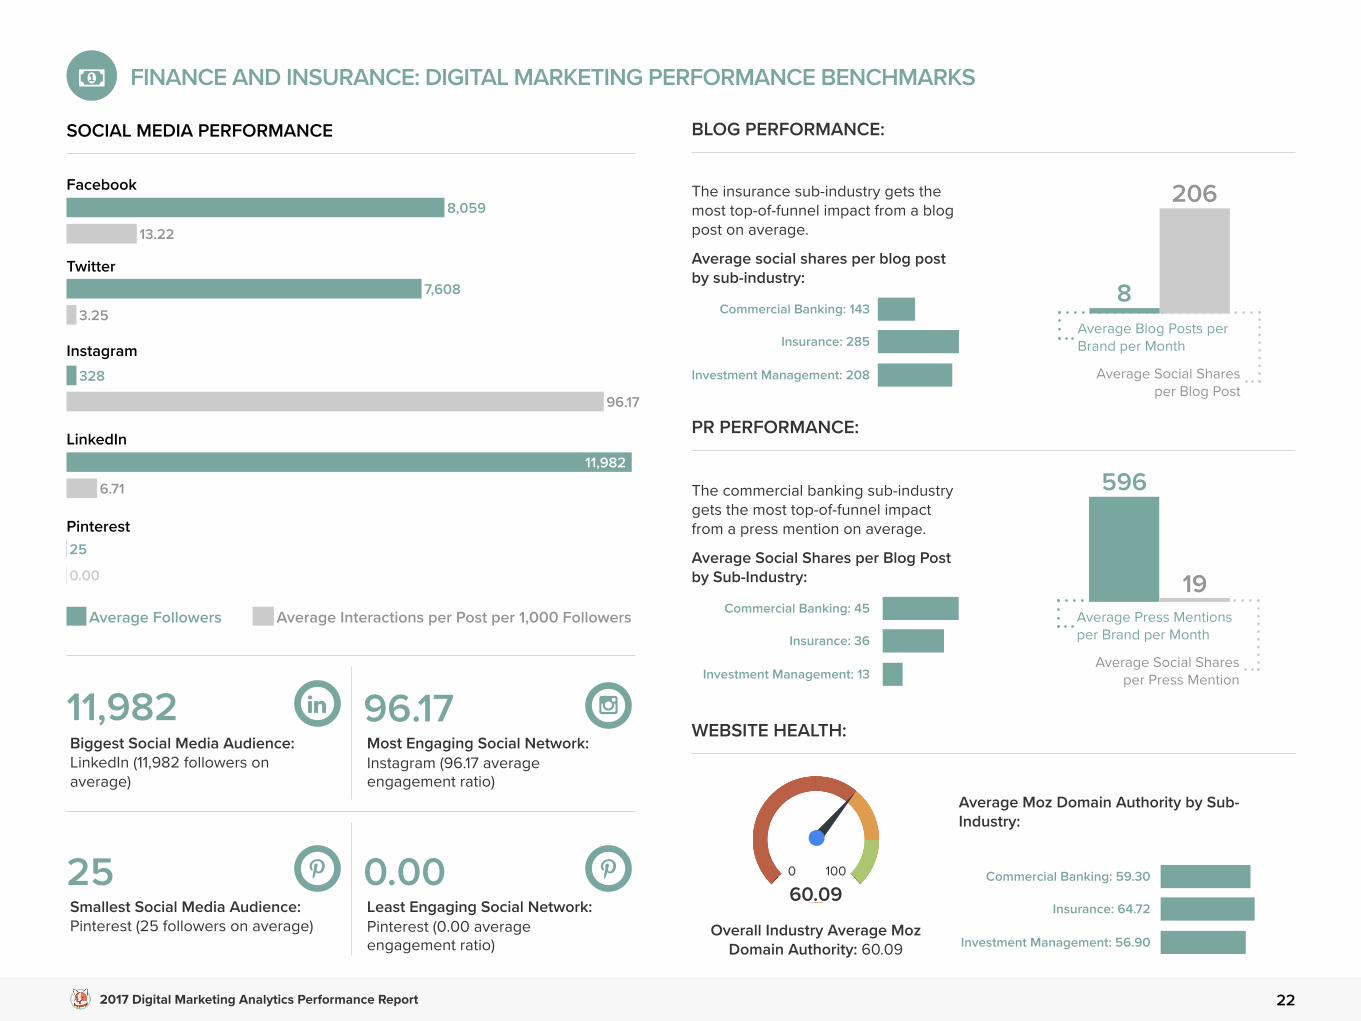
SOCIAL MEDIA PERFORMANCE
Average Followers Average Interactions per Post per 1,000 Followers
8,059
0.00
25
6.71
11,982
96.17
328
3.25
7,608
13.22
11,982Biggest Social Media Audience: LinkedIn (11,982 followers on average)
96.17Most Engaging Social Network: Instagram (96.17 average engagement ratio)
25Smallest Social Media Audience: Pinterest (25 followers on average)
0.00Least Engaging Social Network: Pinterest (0.00 average engagement ratio)
WEBSITE HEALTH:
FINANCE AND INSURANCE: DIGITAL MARKETING PERFORMANCE BENCHMARKS
BLOG PERFORMANCE:
The insurance sub-industry gets the most top-of-funnel impact from a blog post on average.
Average social shares per blog post by sub-industry:
PR PERFORMANCE:
The commercial banking sub-industry gets the most top-of-funnel impact from a press mention on average.
Average Social Shares per Blog Post by Sub-Industry:
Commercial Banking: 143
Investment Management: 208
Insurance: 285
Commercial Banking: 45
Investment Management: 13
Insurance: 36
Average Moz Domain Authority by Sub-Industry:
Overall Industry Average Moz Domain Authority: 60.09
0 100
60.09 Commercial Banking: 59.30
Investment Management: 56.90
Insurance: 64.72
Average Social Shares per Blog Post
Average Blog Posts per Brand per Month
206
8
Average Social Shares per Press Mention
Average Press Mentions per Brand per Month
596
19
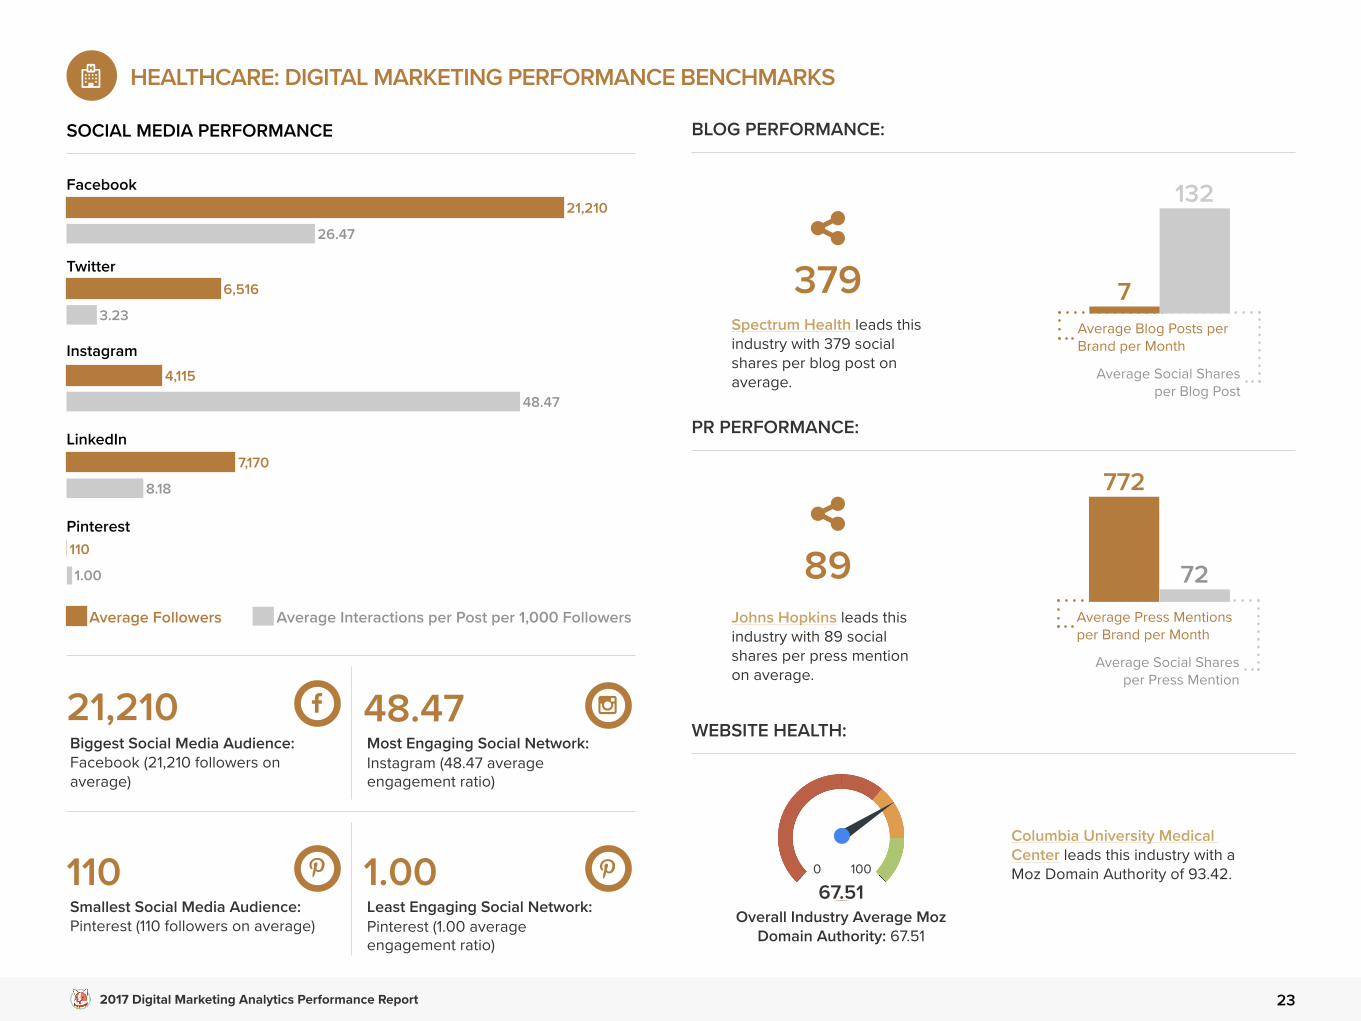
2017 Digital Marketing Analytics Performance Report 23
SOCIAL MEDIA PERFORMANCE
Average Followers Average Interactions per Post per 1,000 Followers
21,210
1.00
110
8.18
7,170
48.47
4,115
3.23
6,516
26.47
21,210Biggest Social Media Audience: Facebook (21,210 followers on average)
48.47Most Engaging Social Network: Instagram (48.47 average engagement ratio)
110Smallest Social Media Audience: Pinterest (110 followers on average)
1.00Least Engaging Social Network: Pinterest (1.00 average engagement ratio)
WEBSITE HEALTH:
HEALTHCARE: DIGITAL MARKETING PERFORMANCE BENCHMARKS
BLOG PERFORMANCE:
PR PERFORMANCE:
Columbia University Medical Center leads this industry with a Moz Domain Authority of 93.42.
Spectrum Health leads this industry with 379 social shares per blog post on average.
379
Johns Hopkins leads this industry with 89 social shares per press mention on average.
89
Average Social Shares per Blog Post
Average Blog Posts per Brand per Month
132
7
Average Social Shares per Press Mention
Average Press Mentions per Brand per Month
772
72
0 100
67.51Overall Industry Average Moz
Domain Authority: 67.51
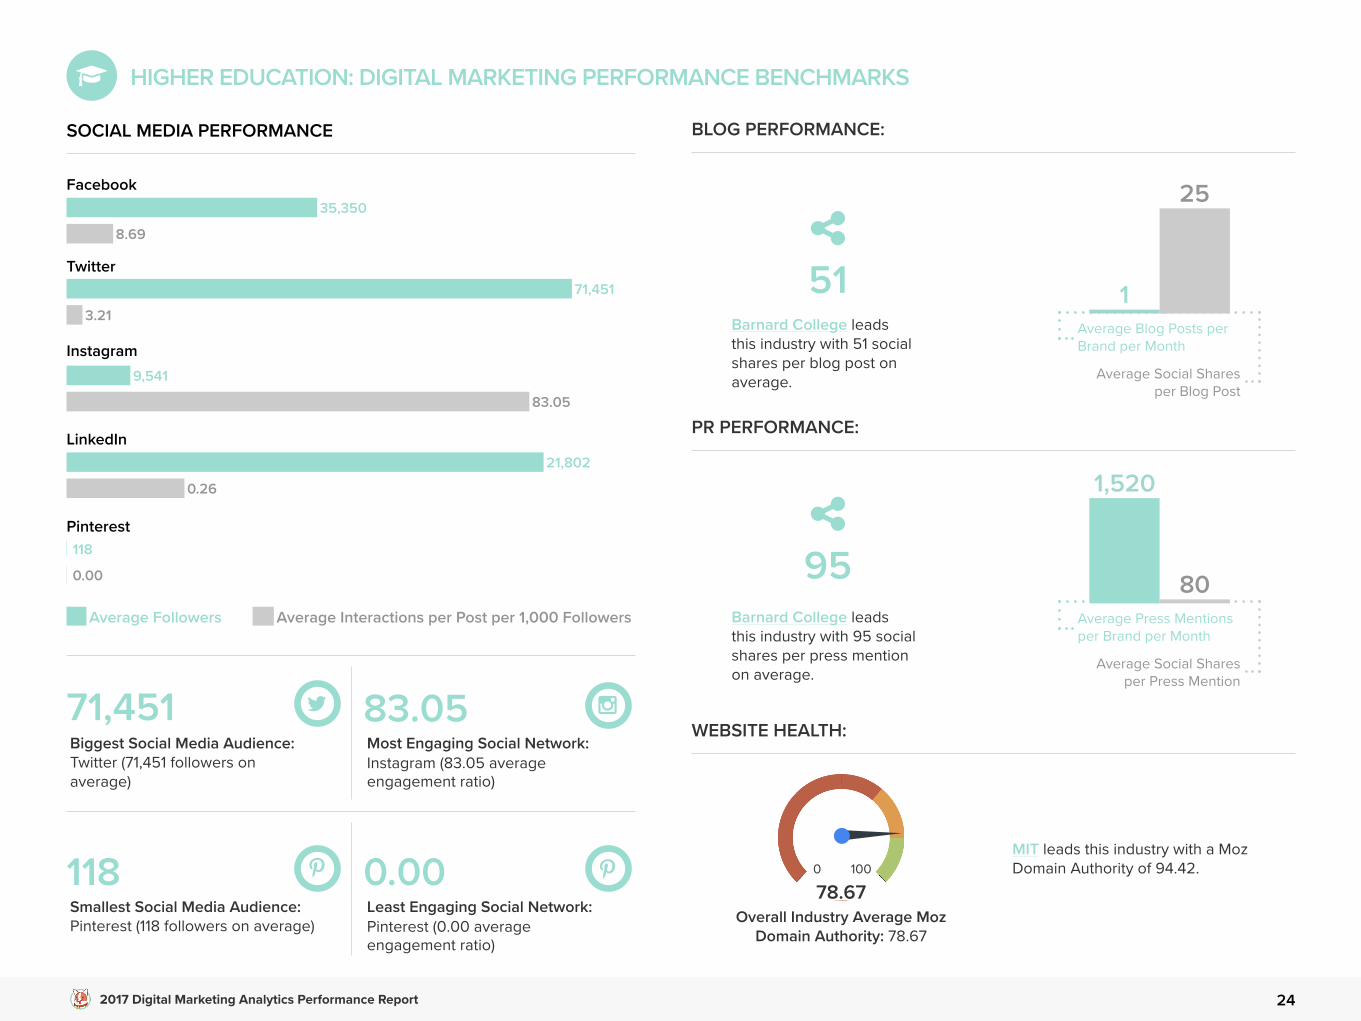
2017 Digital Marketing Analytics Performance Report 24
SOCIAL MEDIA PERFORMANCE
Average Followers Average Interactions per Post per 1,000 Followers
35,350
0.00
118
0.26
21,802
83.05
9,541
3.21
71,451
8.69
71,451Biggest Social Media Audience: Twitter (71,451 followers on average)
83.05Most Engaging Social Network: Instagram (83.05 average engagement ratio)
118Smallest Social Media Audience: Pinterest (118 followers on average)
0.00Least Engaging Social Network: Pinterest (0.00 average engagement ratio)
WEBSITE HEALTH:
HIGHER EDUCATION: DIGITAL MARKETING PERFORMANCE BENCHMARKS
BLOG PERFORMANCE:
PR PERFORMANCE:
MIT leads this industry with a Moz Domain Authority of 94.42.
Barnard College leads this industry with 51 social shares per blog post on average.
51
Barnard College leads this industry with 95 social shares per press mention on average.
95
Average Social Shares per Blog Post
Average Blog Posts per Brand per Month
25
1
Average Social Shares per Press Mention
Average Press Mentions per Brand per Month
1,520
80
0 100
78.67Overall Industry Average Moz
Domain Authority: 78.67
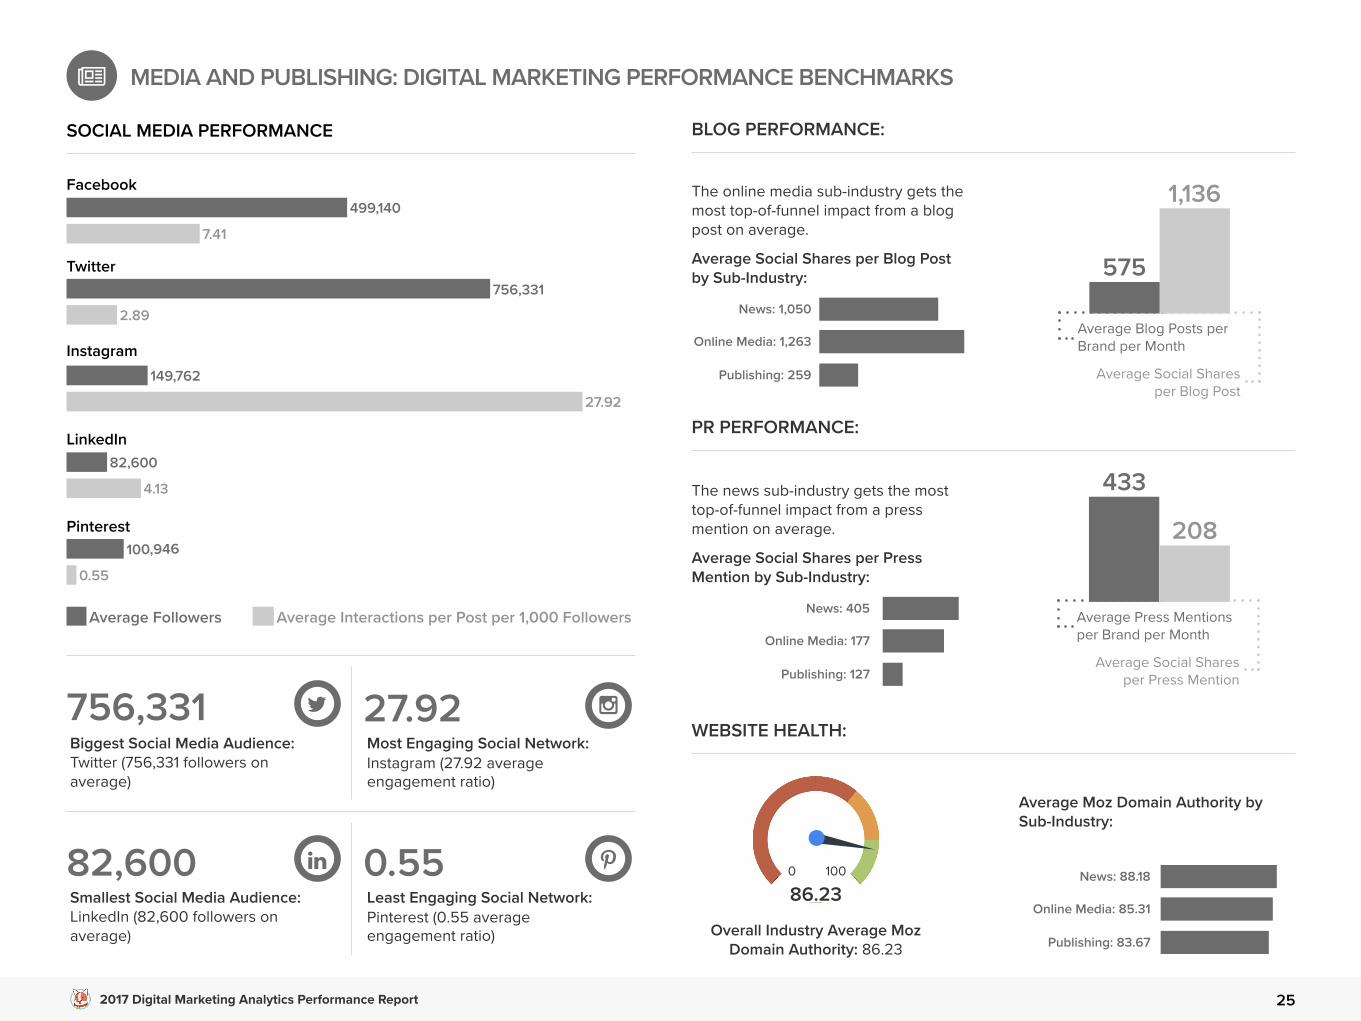
2017 Digital Marketing Analytics Performance Report 25
SOCIAL MEDIA PERFORMANCE
Average Followers Average Interactions per Post per 1,000 Followers
499,140
0.55
100,946
4.13
82,600
27.92
149,762
2.89
756,331
7.41
756,331Biggest Social Media Audience: Twitter (756,331 followers on average)
27.92Most Engaging Social Network: Instagram (27.92 average engagement ratio)
82,600Smallest Social Media Audience: LinkedIn (82,600 followers on average)
0.55Least Engaging Social Network: Pinterest (0.55 average engagement ratio)
WEBSITE HEALTH:
MEDIA AND PUBLISHING: DIGITAL MARKETING PERFORMANCE BENCHMARKS
BLOG PERFORMANCE:
The online media sub-industry gets the most top-of-funnel impact from a blog post on average.
Average Social Shares per Blog Post by Sub-Industry:
PR PERFORMANCE:
The news sub-industry gets the most top-of-funnel impact from a press mention on average.
Average Social Shares per Press Mention by Sub-Industry:
News: 1,050
Publishing: 259
Online Media: 1,263
News: 405
Publishing: 127
Online Media: 177
Average Moz Domain Authority by Sub-Industry:
Overall Industry Average Moz Domain Authority: 86.23
0 100
86.23
News: 88.18
Publishing: 83.67
Online Media: 85.31
Average Social Shares per Blog Post
Average Blog Posts per Brand per Month
1,136
575
Average Social Shares per Press Mention
Average Press Mentions per Brand per Month
433
208
2017 Digital Marketing Analytics Performance Report 26
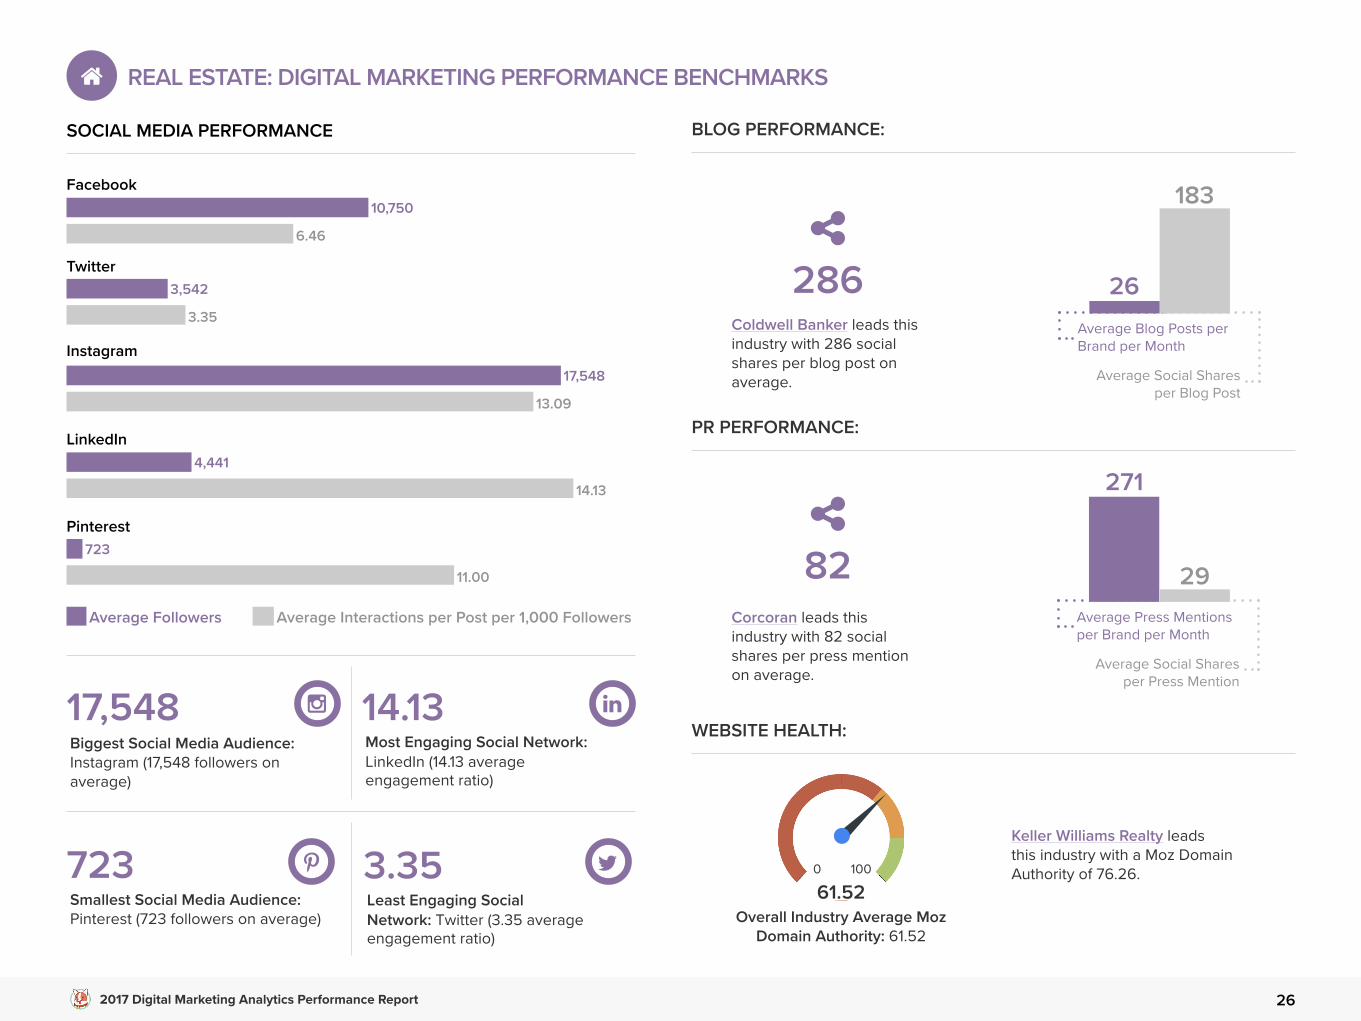
SOCIAL MEDIA PERFORMANCE
Average Followers Average Interactions per Post per 1,000 Followers
10,750
11.00
723
14.13
4,441
13.09
17,548
3.35
3,542
6.46
3.35Least Engaging Social Network: Twitter (3.35 average engagement ratio)
17,548Biggest Social Media Audience: Instagram (17,548 followers on average)
723Smallest Social Media Audience: Pinterest (723 followers on average)
WEBSITE HEALTH:
REAL ESTATE: DIGITAL MARKETING PERFORMANCE BENCHMARKS
BLOG PERFORMANCE:
PR PERFORMANCE:
14.13Most Engaging Social Network: LinkedIn (14.13 average engagement ratio)
Keller Williams Realty leads this industry with a Moz Domain Authority of 76.26.
Coldwell Banker leads this industry with 286 social shares per blog post on average.
286
Corcoran leads this industry with 82 social shares per press mention on average.
82
Average Social Shares per Blog Post
Average Blog Posts per Brand per Month
183
26
Average Social Shares per Press Mention
Average Press Mentions per Brand per Month
271
29
0 100
61.52Overall Industry Average Moz
Domain Authority: 61.52
2017 Digital Marketing Analytics Performance Report 27
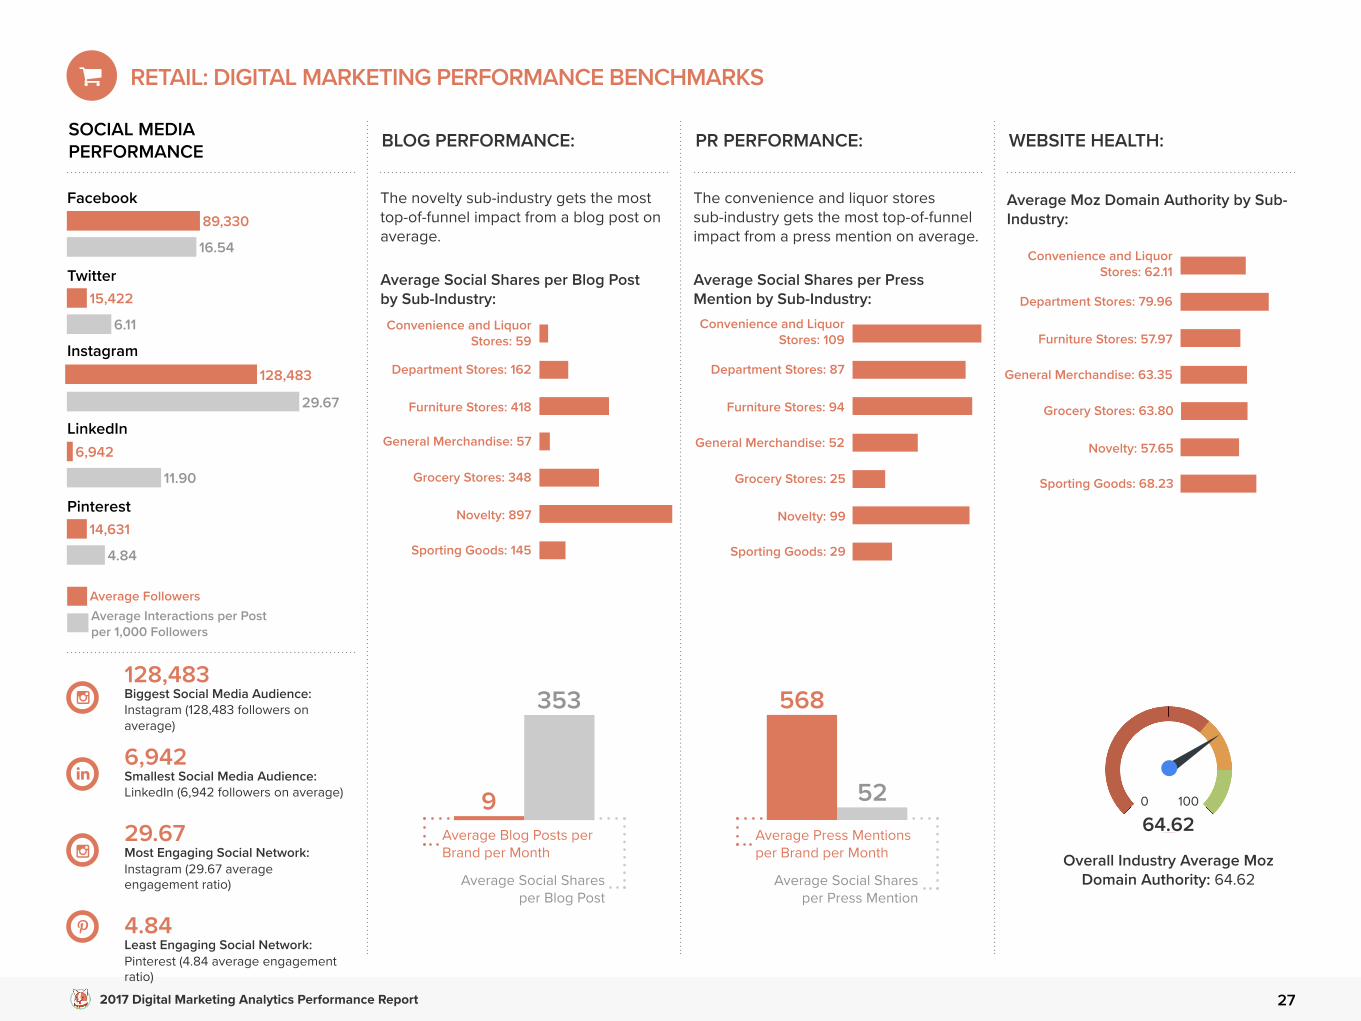
Convenience and LiquorStores: 59
RETAIL: DIGITAL MARKETING PERFORMANCE BENCHMARKS
29.67
128,483
Average FollowersAverage Interactions per Postper 1,000 Followers
89,330
4.84
14,631
11.90
6,942
6.11
15,422
16.54
128,483Biggest Social Media Audience: Instagram (128,483 followers on average)
6,942Smallest Social Media Audience: LinkedIn (6,942 followers on average)
29.67Most Engaging Social Network: Instagram (29.67 average engagement ratio)
4.84Least Engaging Social Network: Pinterest (4.84 average engagement ratio)
The novelty sub-industry gets the most top-of-funnel impact from a blog post on average.
Average Social Shares per Blog Post by Sub-Industry:
The convenience and liquor stores sub-industry gets the most top-of-funnel impact from a press mention on average.
Average Moz Domain Authority by Sub-Industry:
Overall Industry Average Moz Domain Authority: 64.62
0 100
64.62
Average Social Shares per Press Mention by Sub-Industry:
Furniture Stores: 418
Department Stores: 162
General Merchandise: 57
Novelty: 897
Grocery Stores: 348
Sporting Goods: 145
Convenience and LiquorStores: 109
Furniture Stores: 94
Department Stores: 87
General Merchandise: 52
Novelty: 99
Grocery Stores: 25
Sporting Goods: 29
Convenience and LiquorStores: 62.11
Furniture Stores: 57.97
Department Stores: 79.96
General Merchandise: 63.35
Novelty: 57.65
Grocery Stores: 63.80
Sporting Goods: 68.23
Average Social Shares per Blog Post
Average Blog Posts per Brand per Month
353
9
Average Social Shares per Press Mention
Average Press Mentions per Brand per Month
52
568
SOCIAL MEDIAPERFORMANCE BLOG PERFORMANCE: PR PERFORMANCE: WEBSITE HEALTH:
2017 Digital Marketing Analytics Performance Report 28
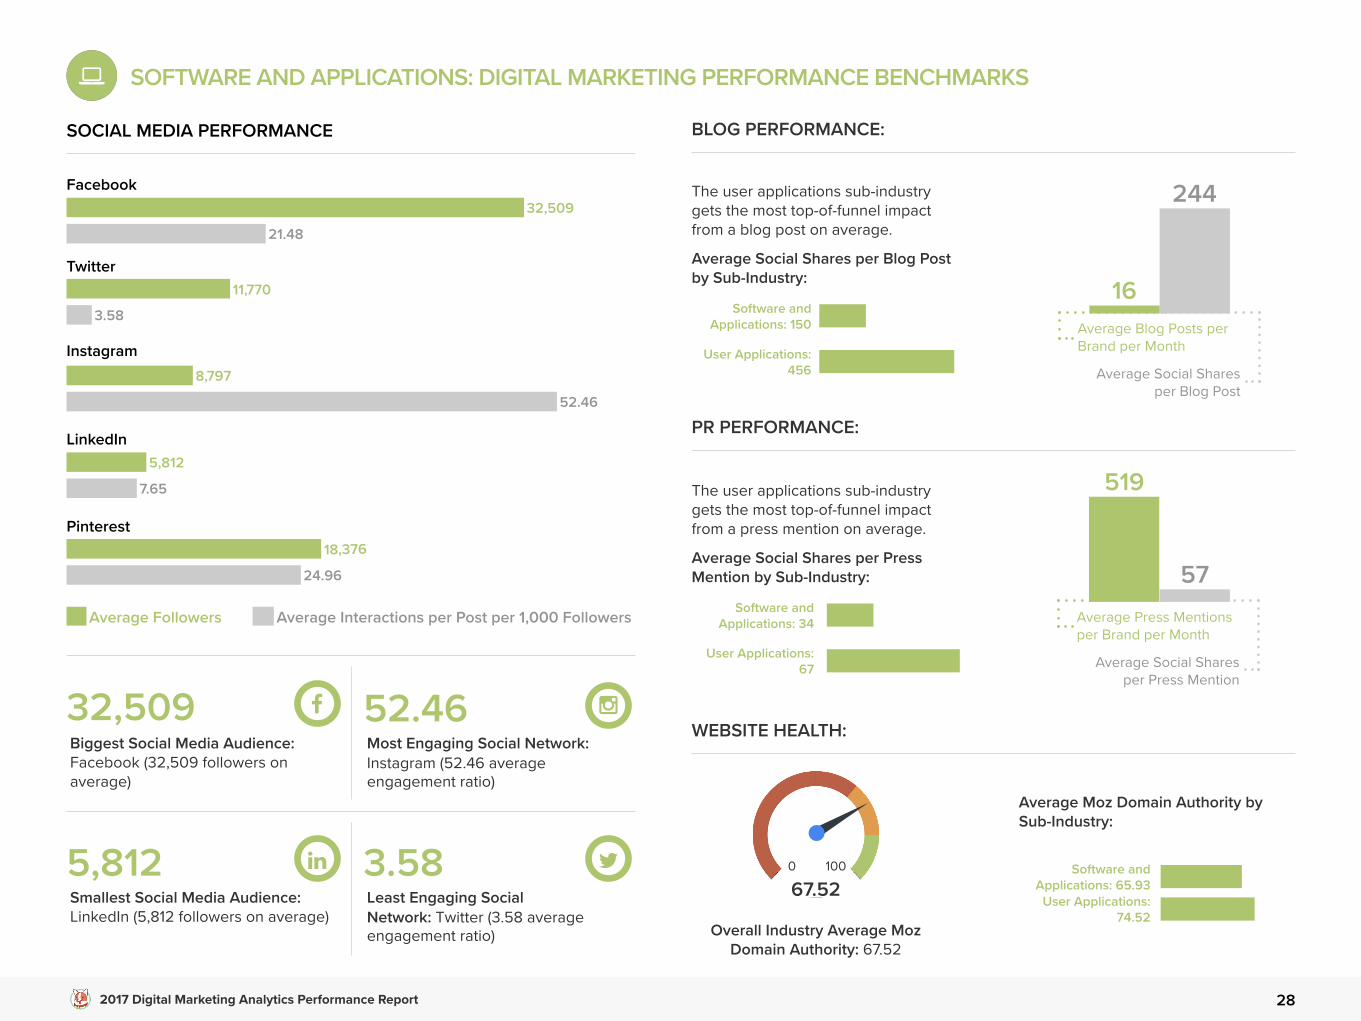
SOCIAL MEDIA PERFORMANCE
Average Followers Average Interactions per Post per 1,000 Followers
32,509
24.96
18,376
7.65
5,812
52.46
8,797
3.58
11,770
21.48
32,509 Biggest Social Media Audience: Facebook (32,509 followers on average)
52.46Most Engaging Social Network: Instagram (52.46 average engagement ratio)
5,812Smallest Social Media Audience: LinkedIn (5,812 followers on average)
3.58Least Engaging Social Network: Twitter (3.58 average engagement ratio)
WEBSITE HEALTH:
SOFTWARE AND APPLICATIONS: DIGITAL MARKETING PERFORMANCE BENCHMARKS
BLOG PERFORMANCE:
The user applications sub-industry gets the most top-of-funnel impact from a blog post on average.
Average Social Shares per Blog Post by Sub-Industry:
PR PERFORMANCE:
The user applications sub-industry gets the most top-of-funnel impact from a press mention on average.
Average Social Shares per Press Mention by Sub-Industry:
Software and Applications: 150
User Applications:456
Average Moz Domain Authority by Sub-Industry:
Overall Industry Average Moz Domain Authority: 67.52
Software and Applications: 34
User Applications:67
Software and Applications: 65.93
User Applications:74.52
0 100
67.52
Average Social Shares per Blog Post
Average Blog Posts per Brand per Month
244
16
Average Social Shares per Press Mention
Average Press Mentions per Brand per Month
519
57
2017 Digital Marketing Analytics Performance Report 29
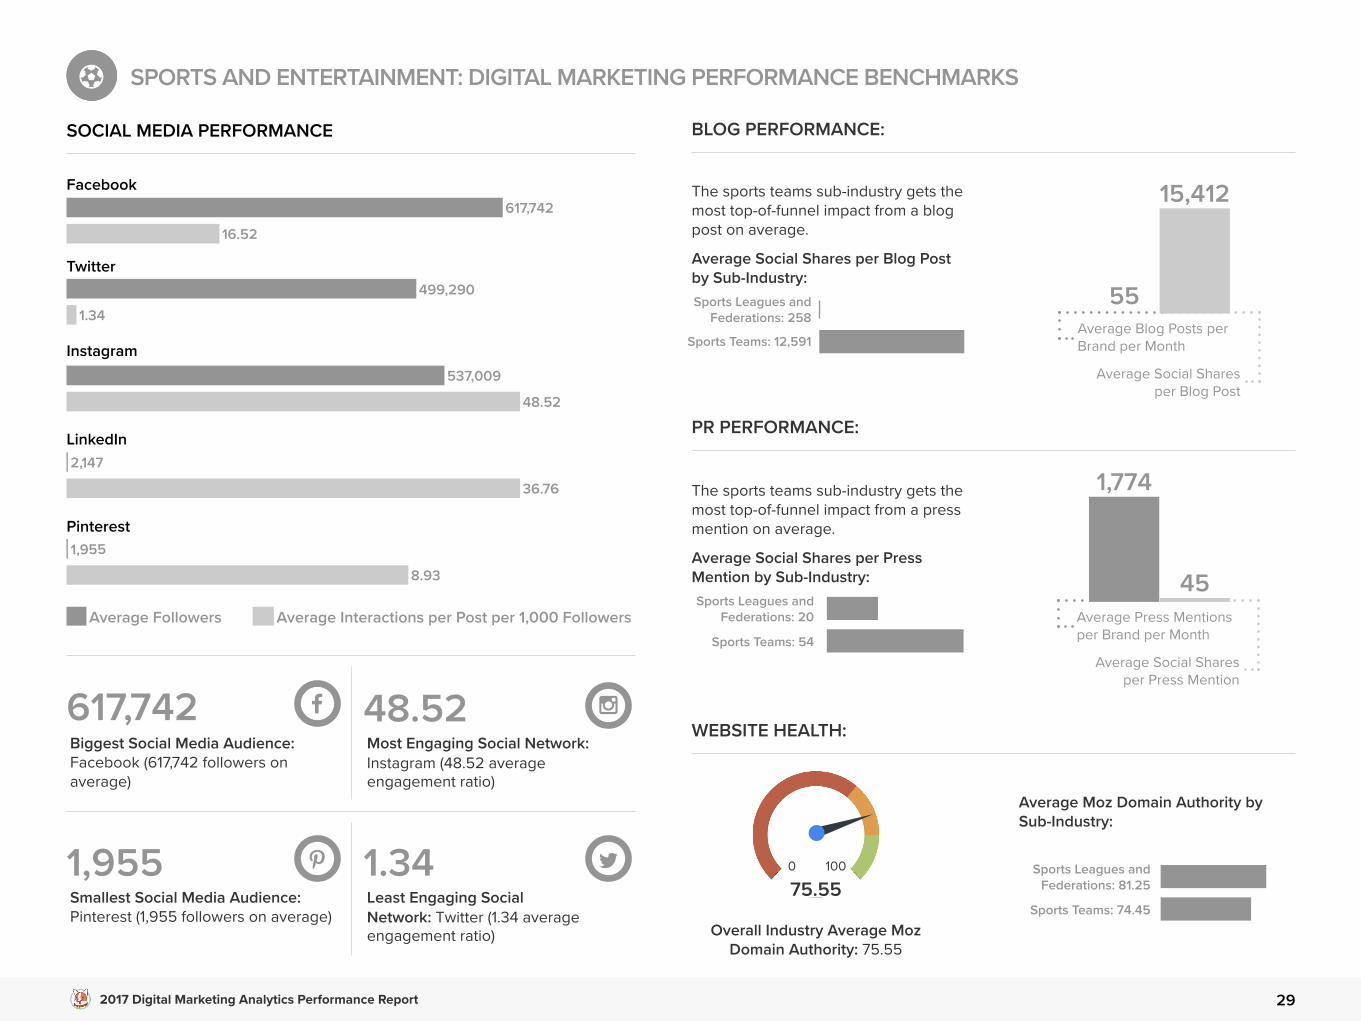
SOCIAL MEDIA PERFORMANCE
Average Followers Average Interactions per Post per 1,000 Followers
617,742
8.93
1,955
36.76
2,147
48.52
537,009
1.34
499,290
16.52
617,742Biggest Social Media Audience: Facebook (617,742 followers on average)
48.52Most Engaging Social Network: Instagram (48.52 average engagement ratio)
1,955Smallest Social Media Audience: Pinterest (1,955 followers on average)
1.34Least Engaging Social Network: Twitter (1.34 average engagement ratio)
WEBSITE HEALTH:
SPORTS AND ENTERTAINMENT: DIGITAL MARKETING PERFORMANCE BENCHMARKS
BLOG PERFORMANCE:
The sports teams sub-industry gets the most top-of-funnel impact from a blog post on average.
Average Social Shares per Blog Post by Sub-Industry:
PR PERFORMANCE:
The sports teams sub-industry gets the most top-of-funnel impact from a press mention on average.
Average Social Shares per Press Mention by Sub-Industry:
Sports Leagues and Federations: 258
Sports Teams: 12,591
Average Moz Domain Authority by Sub-Industry:
Overall Industry Average Moz Domain Authority: 75.55
Sports Leagues and Federations: 20
Sports Teams: 54
Sports Leagues and Federations: 81.25
Sports Teams: 74.45
0 100
75.55
Average Social Shares per Blog Post
Average Blog Posts per Brand per Month
15,412
55
Average Social Shares per Press Mention
Average Press Mentions per Brand per Month
1,774
45
2017 Digital Marketing Analytics Performance Report 30
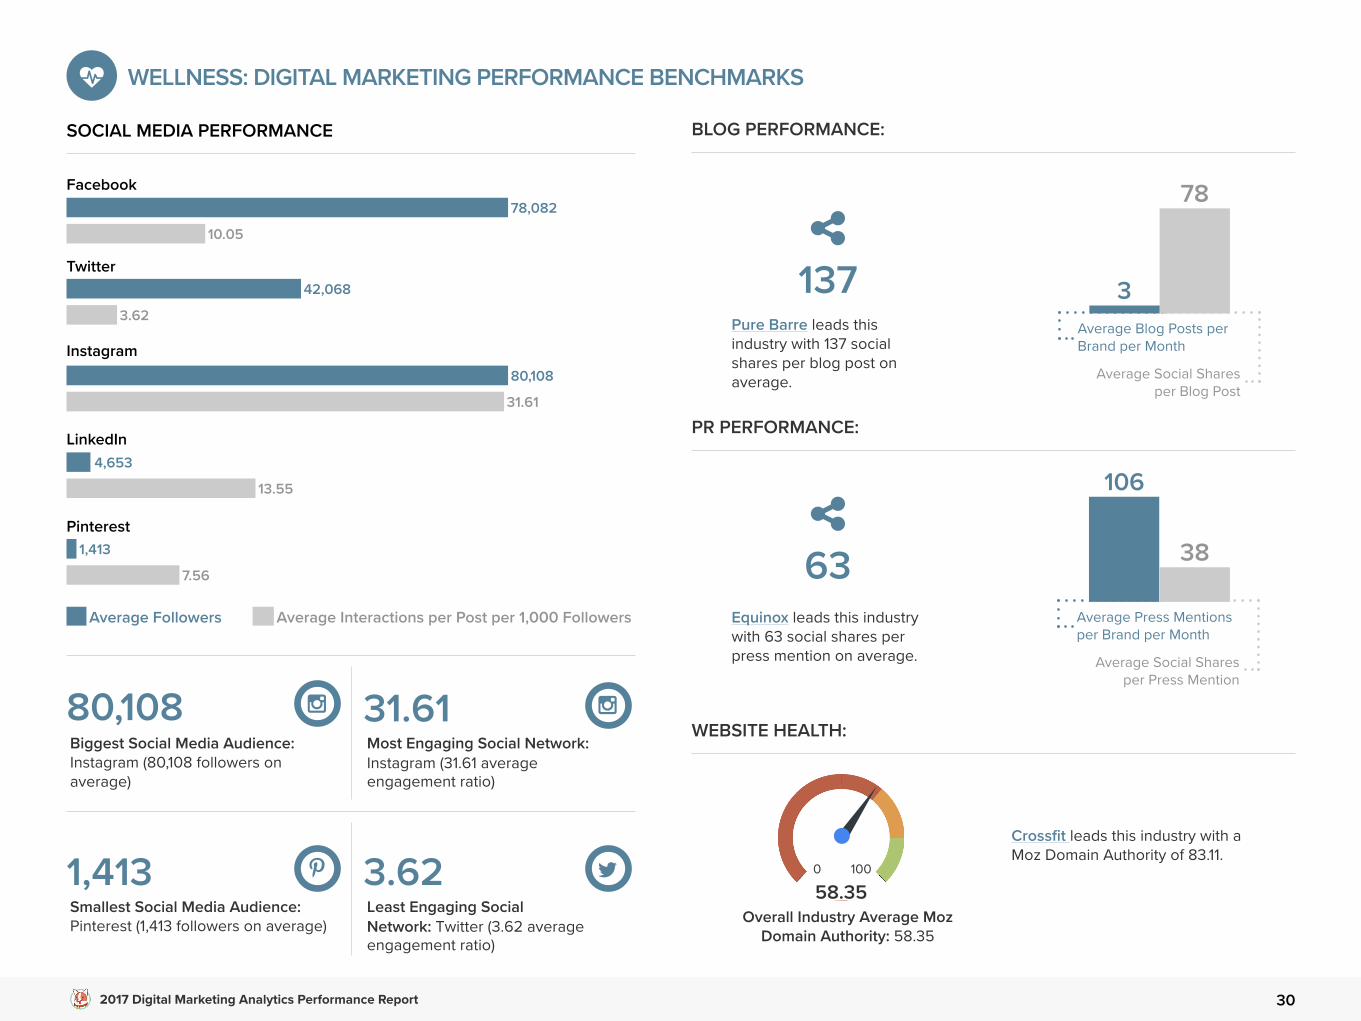
SOCIAL MEDIA PERFORMANCE
Average Followers Average Interactions per Post per 1,000 Followers
78,082
7.56
1,413
13.55
4,653
31.61
80,108
3.62
42,068
10.05
80,108Biggest Social Media Audience: Instagram (80,108 followers on average)
31.61Most Engaging Social Network: Instagram (31.61 average engagement ratio)
1,413Smallest Social Media Audience: Pinterest (1,413 followers on average)
3.62Least Engaging Social Network: Twitter (3.62 average engagement ratio)
WEBSITE HEALTH:
WELLNESS: DIGITAL MARKETING PERFORMANCE BENCHMARKS
BLOG PERFORMANCE:
PR PERFORMANCE:
Crossfit leads this industry with a Moz Domain Authority of 83.11.
Pure Barre leads this industry with 137 social shares per blog post on average.
137
Equinox leads this industry with 63 social shares per press mention on average.
63
Average Social Shares per Blog Post
Average Blog Posts per Brand per Month
78
3
Average Social Shares per Press Mention
Average Press Mentions per Brand per Month
106
38
0 100
58.35Overall Industry Average Moz
Domain Authority: 58.35
2017 Digital Marketing Analytics Performance Report 31
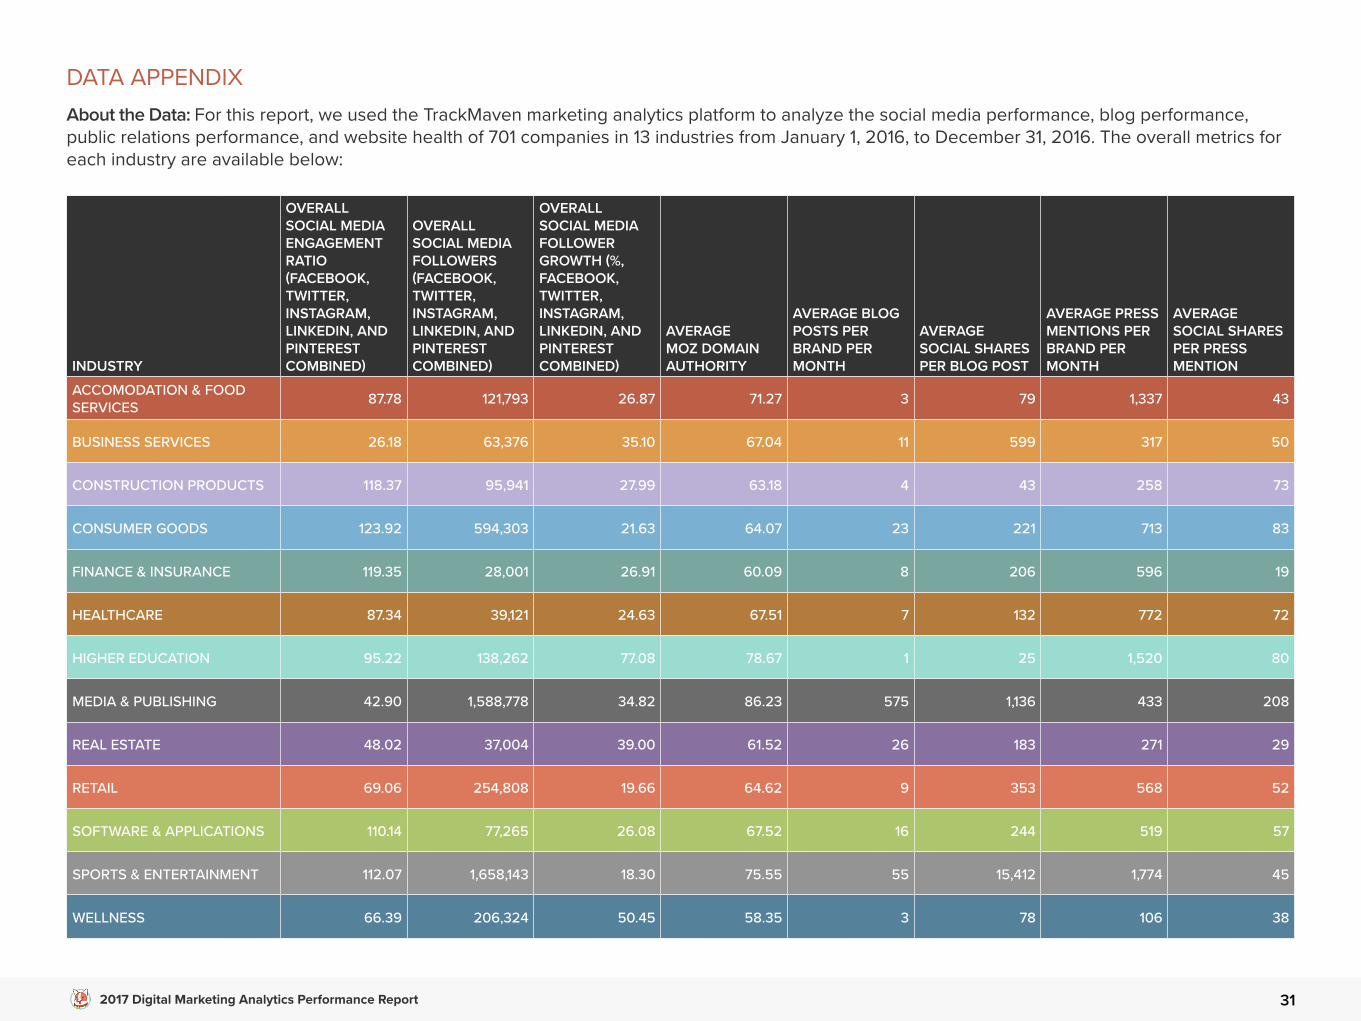
INDUSTRY
OVERALL SOCIAL MEDIA ENGAGEMENT RATIO (FACEBOOK, TWITTER, INSTAGRAM, LINKEDIN, AND PINTEREST COMBINED)
OVERALL SOCIAL MEDIA FOLLOWERS (FACEBOOK, TWITTER, INSTAGRAM, LINKEDIN, AND PINTEREST COMBINED)
OVERALL SOCIAL MEDIA FOLLOWER GROWTH (%, FACEBOOK, TWITTER, INSTAGRAM, LINKEDIN, AND PINTEREST COMBINED)
AVERAGE MOZ DOMAIN AUTHORITY
AVERAGE BLOG POSTS PER BRAND PER MONTH
AVERAGE SOCIAL SHARES PER BLOG POST
AVERAGE PRESS MENTIONS PER BRAND PER MONTH
AVERAGE SOCIAL SHARES PER PRESS MENTION
ACCOMODATION & FOOD SERVICES 87.78 121,793 26.87 71.27 3 79 1,337 43
BUSINESS SERVICES 26.18 63,376 35.10 67.04 11 599 317 50
CONSTRUCTION PRODUCTS 118.37 95,941 27.99 63.18 4 43 258 73
CONSUMER GOODS 123.92 594,303 21.63 64.07 23 221 713 83
FINANCE & INSURANCE 119.35 28,001 26.91 60.09 8 206 596 19
HEALTHCARE 87.34 39,121 24.63 67.51 7 132 772 72
HIGHER EDUCATION 95.22 138,262 77.08 78.67 1 25 1,520 80
MEDIA & PUBLISHING 42.90 1,588,778 34.82 86.23 575 1,136 433 208
REAL ESTATE 48.02 37,004 39.00 61.52 26 183 271 29
RETAIL 69.06 254,808 19.66 64.62 9 353 568 52
SOFTWARE & APPLICATIONS 110.14 77,265 26.08 67.52 16 244 519 57
SPORTS & ENTERTAINMENT 112.07 1,658,143 18.30 75.55 55 15,412 1,774 45
WELLNESS 66.39 206,324 50.45 58.35 3 78 106 38
DATA APPENDIXAbout the Data: For this report, we used the TrackMaven marketing analytics platform to analyze the social media performance, blog performance, public relations performance, and website health of 701 companies in 13 industries from January 1, 2016, to December 31, 2016. The overall metrics for each industry are available below:
2017 Digital Marketing Analytics Performance Report 32
TrackMaven’s marketing analytics platform provides best-in-class competitive intelligence, marketing attribution, and analytics across 18 digital channels including social media, ads,
PR, marketing automation, CRM, and more.
Want to prove how you outperform the competition and improve your market position?
Visit trackmaven.com to request your free demonstration!


