Embed Size (px)
Citation preview
Disaster Prevention in Urban
Planning
September 2019
Dr. Lee, Byoung Jae
2019 KOICA-UN ESCAP Capacity Building on Drought Monitoring and Early Warning
2019 KOICA-UN ESCAP Capacity Building on Drought Monitoring and Early Warning
Lecturers
Name: Lee, Byoung Jae Department: GDPC, KRIHSContact: +82-44-960-0211 E-mail: [email protected]
<Education Background- BA on Seoul National University (Landscape Architecture) - MA on State University of New York at Buffalo (Geography)- Ph.D on State University of New York at Buffalo (Geography)
<Research>- Disaster Vulnerability Analysis, Disaster Preventive Urban
Planning Consulting Project, 2015- Urban Design Technique Development Adapting to Climate
Change Driven Heavy Rainfall Disaster, 2011~2014
2019 KOICA-UN ESCAP Capacity Building on Drought Monitoring and Early Warning
Contents
I. Climate Change and State of Disaster in Korea
II. Urban Disaster Prevention Strategy
III. Disaster Risk Analysis and Planning
IV. Urban Disaster Prevention Policies and Practices in Korea
Ⅰ. Climate Change and State
of Disaster in Korea
5
1. State of Climate Change and Trend
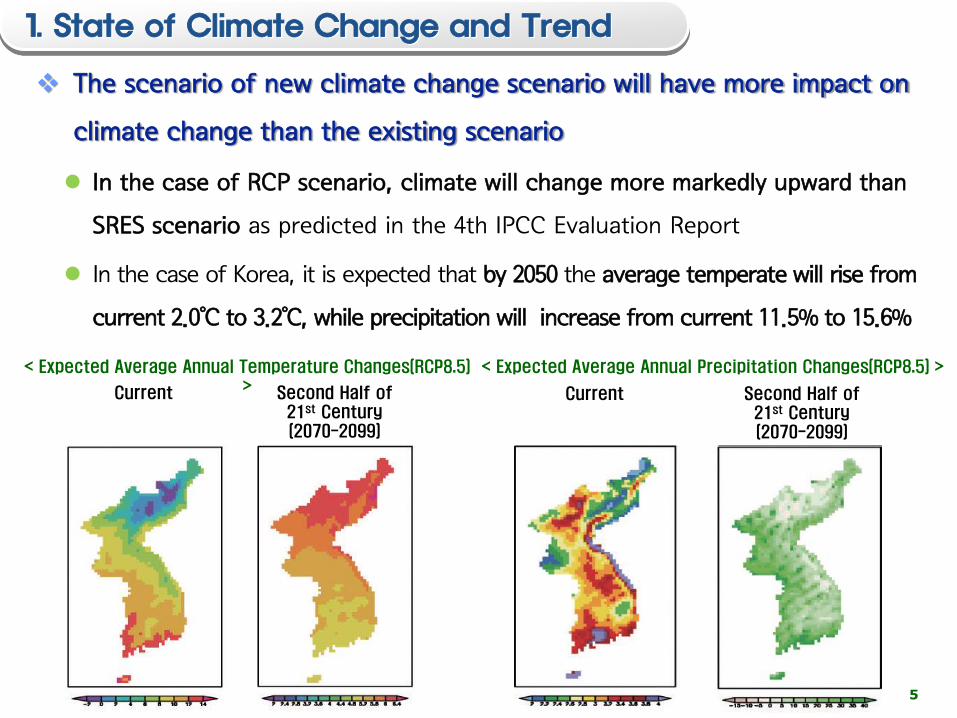
The scenario of new climate change scenario will have more impact on
climate change than the existing scenario
In the case of RCP scenario, climate will change more markedly upward than
SRES scenario as predicted in the 4th IPCC Evaluation Report
In the case of Korea, it is expected that by 2050 the average temperate will rise from
current 2.0℃ to 3.2℃, while precipitation will increase from current 11.5% to 15.6%
< Expected Average Annual Temperature Changes(RCP8.5) > Second Half of
21st Century(2070-2099)
Current
< Expected Average Annual Precipitation Changes(RCP8.5) >
Current Second Half of 21st Century(2070-2099)
6
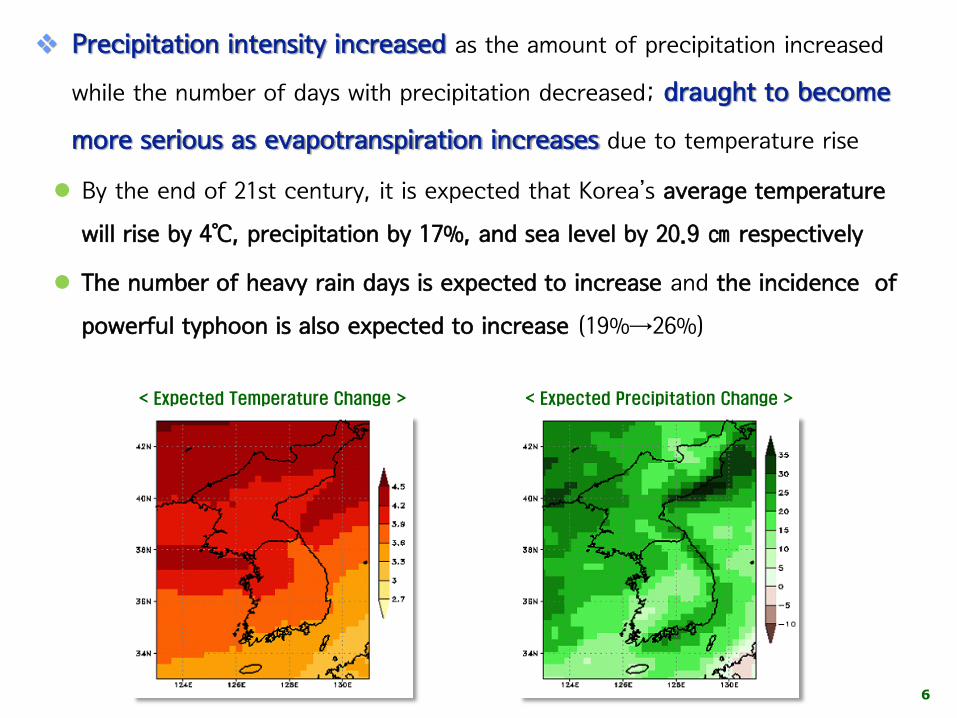
Precipitation intensity increased as the amount of precipitation increased
while the number of days with precipitation decreased; draught to become
more serious as evapotranspiration increases due to temperature rise
By the end of 21st century, it is expected that Korea’s average temperature
will rise by 4℃, precipitation by 17%, and sea level by 20.9 ㎝ respectively
The number of heavy rain days is expected to increase and the incidence of
powerful typhoon is also expected to increase (19%→26%)
< Expected Precipitation Change >< Expected Temperature Change >
7
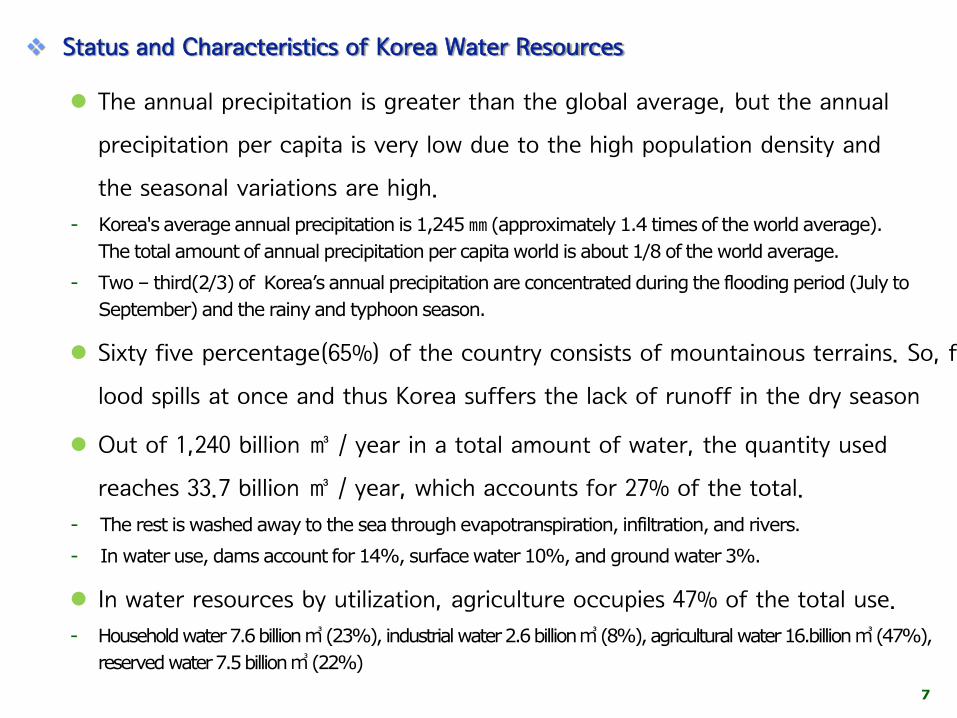
The annual precipitation is greater than the global average, but the annual
precipitation per capita is very low due to the high population density and
the seasonal variations are high.
- Korea's average annual precipitation is 1,245 ㎜ (approximately 1.4 times of the world average).
The total amount of annual precipitation per capita world is about 1/8 of the world average.
- Two – third(2/3) of Korea’s annual precipitation are concentrated during the flooding period (July to
September) and the rainy and typhoon season.
Sixty five percentage(65%) of the country consists of mountainous terrains. So, f
lood spills at once and thus Korea suffers the lack of runoff in the dry season
Out of 1,240 billion ㎥ / year in a total amount of water, the quantity used
reaches 33.7 billion ㎥ / year, which accounts for 27% of the total.
- The rest is washed away to the sea through evapotranspiration, infiltration, and rivers.
- In water use, dams account for 14%, surface water 10%, and ground water 3%.
In water resources by utilization, agriculture occupies 47% of the total use.
- Household water 7.6 billion ㎥(23%), industrial water 2.6 billion ㎥(8%), agricultural water 16.billion ㎥(47%),
reserved water 7.5 billion ㎥ (22%)
Status and Characteristics of Korea Water Resources
8
2. State of Korea’s Disaster in Recent Years
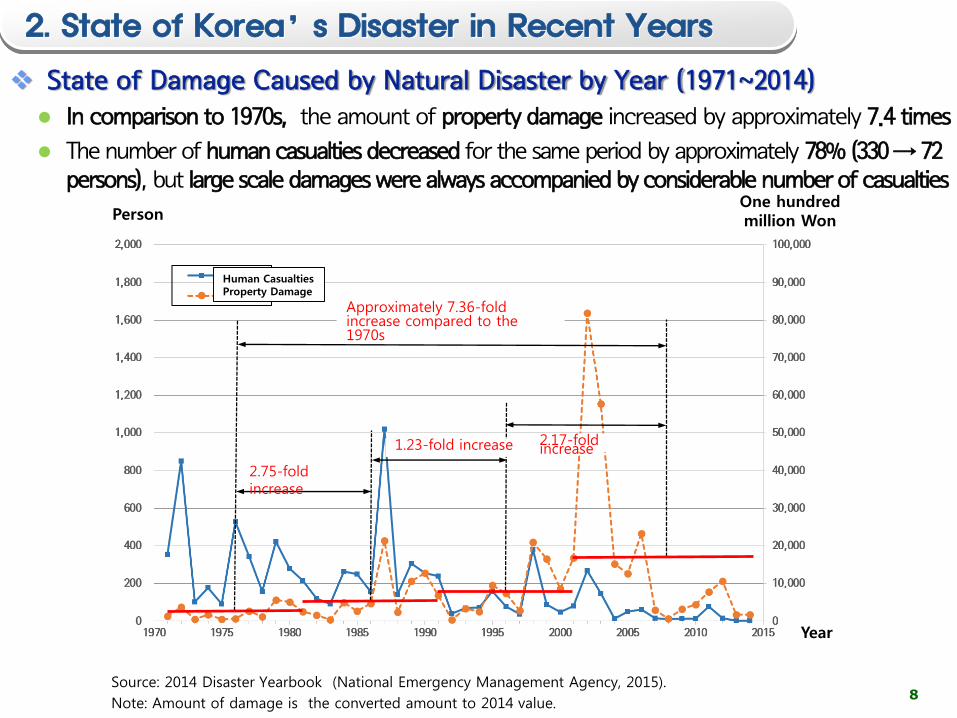
State of Damage Caused by Natural Disaster by Year (1971~2014)
In comparison to 1970s, the amount of property damage increased by approximately 7.4 times
The number of human casualties decreased for the same period by approximately 78% (330 → 72 persons), but large scale damages were always accompanied by considerable number of casualties
Source: 2014 Disaster Yearbook (National Emergency Management Agency, 2015).
Note: Amount of damage is the converted amount to 2014 value.
2.75-fold increase
1.23-fold increase 2.17-fold increase
Approximately 7.36-fold increase compared to the 1970s
Human CasualtiesProperty Damage
One hundred million WonPerson
Year
9
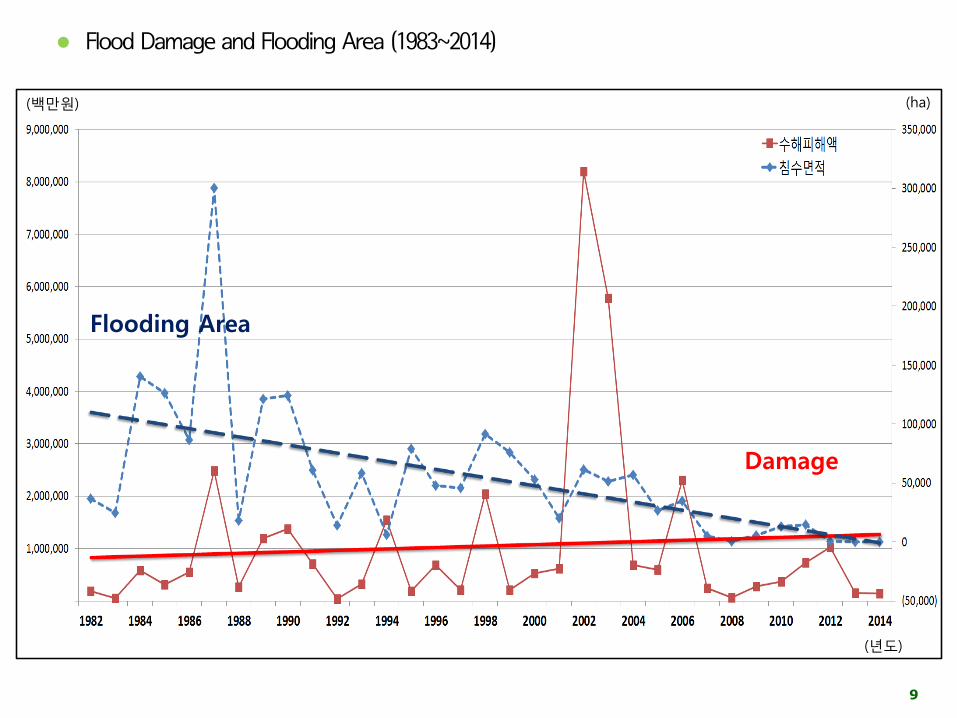
Flood Damage and Flooding Area (1983~2014)
(백만원) (ha)
Flooding Area
Damage
(년도)
10
Characteristics of Disasters Caused by Climate Change
Frequent occurrences of unprecedented massive disasters across the globe
In the past, natural disasters like floods and droughts occurred most often, but
now diverse calamities frequently occur such as heat waves, heavy snows, strong
winds, and rising sea levels
Disasters resulting from climate change have uncertainties about when they will
happen. Therefore, responding measures should be thought of in advance
In addition, it is also difficult to expect which places will experience disasters
due to climate change
- There are possibilities of occurrence of disasters in vulnerable places not to
mention already affected areas. Therefore, preventive measures against
consequences due to climate change should be made
※ Potential areas with vulnerabilities to heat waves: Regions with high impermeability, and high
density populations, etc.
11
Korea lacks in policies considering the regional drought vulnerability
- It lacks in policies considering the characteristics of its regional vulnerability to drought, and in the
differentiation in policies between local government.
Korea also lacks in connection with drought polices and land use.
- Measures in terms of structures, such as rivers, reservoirs, etc. are a large part of Korea’s policies in water
resources.
- The lack of of policy in terms of land use, including water source conservation, maintenance of cities and
enhancement of water running, sound water circulation systems, etc.
Korea’s policy in water resources is insufficient in terms of measures for the
agricultural water in spite of a high proportion of resources utilization.
- Agricultural water accounts for 47% out of a total of 33.7 billion tons in water resources used, but Korea’s
policy in water use is not satisfactory in efficiency
Being unsatisfactory in basin-wide comprehensive water resources planning
- There is no water resources planning for river basins regarded as an intermediate concept of between the
national and local governmental units, so Korea has limits in establishing drought policies or comprehensive
measures for upstream and downstream, through regional cooperation.
Problems with Policies against Drought in Korea
12
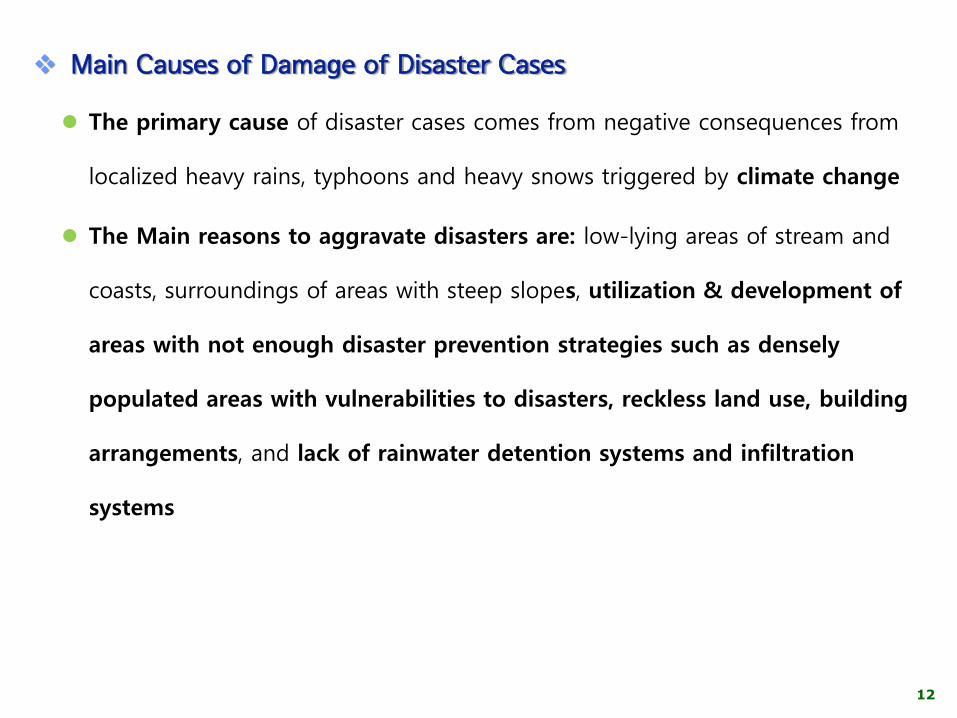
Main Causes of Damage of Disaster Cases
The primary cause of disaster cases comes from negative consequences from
localized heavy rains, typhoons and heavy snows triggered by climate change
The Main reasons to aggravate disasters are: low-lying areas of stream and
coasts, surroundings of areas with steep slopes, utilization & development of
areas with not enough disaster prevention strategies such as densely
populated areas with vulnerabilities to disasters, reckless land use, building
arrangements, and lack of rainwater detention systems and infiltration
systems
Ⅱ. Urban Disaster
Prevention Strategy
14
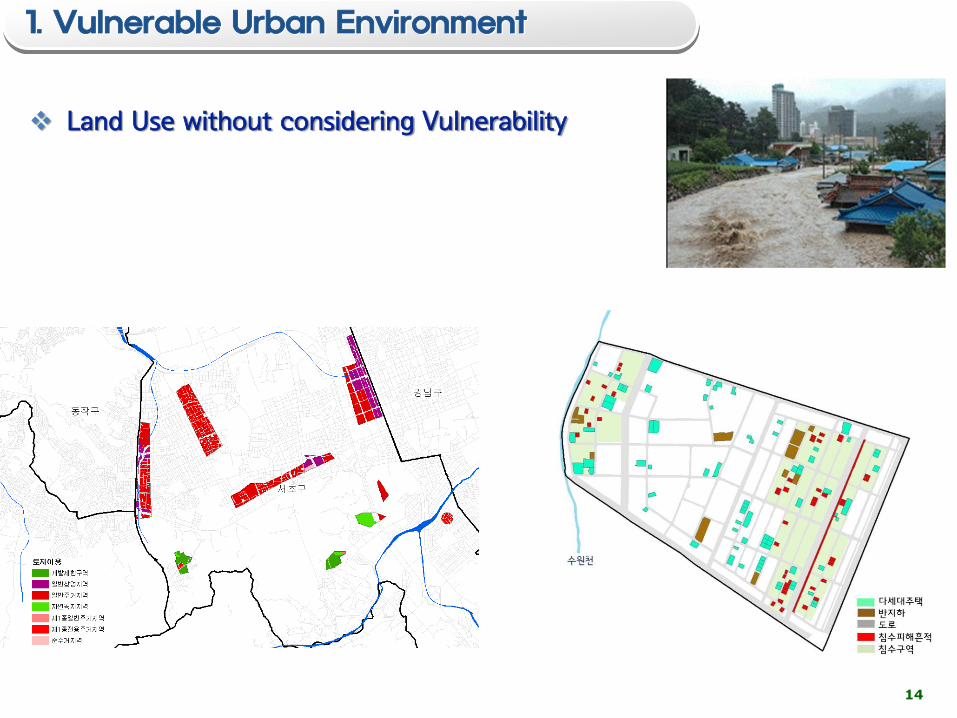
Land Use without considering Vulnerability
1. Vulnerable Urban Environment
15
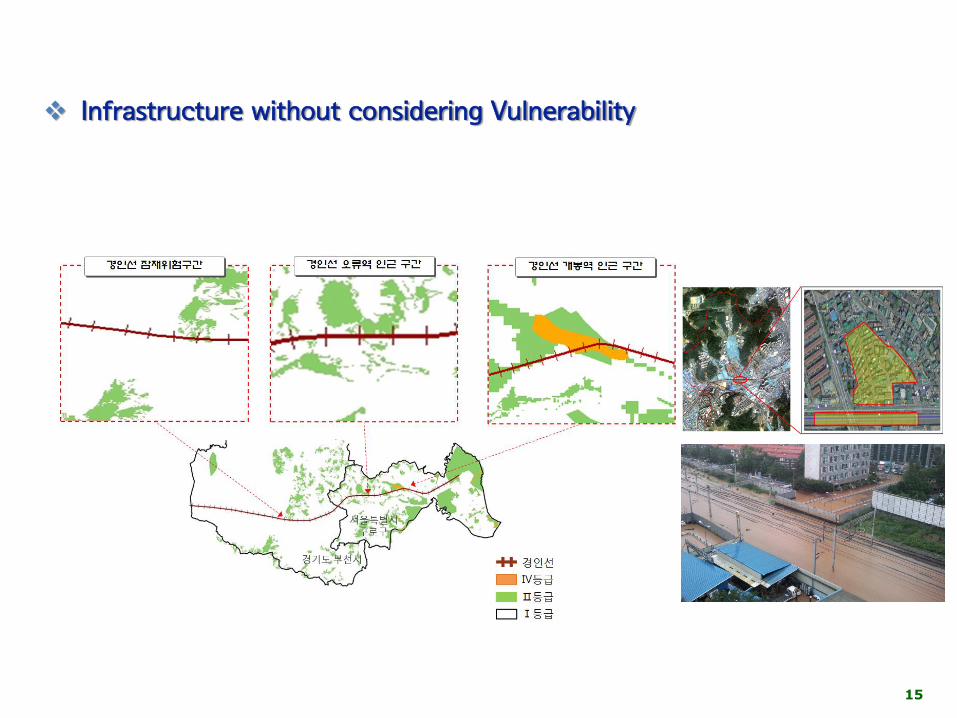
Infrastructure without considering Vulnerability
16
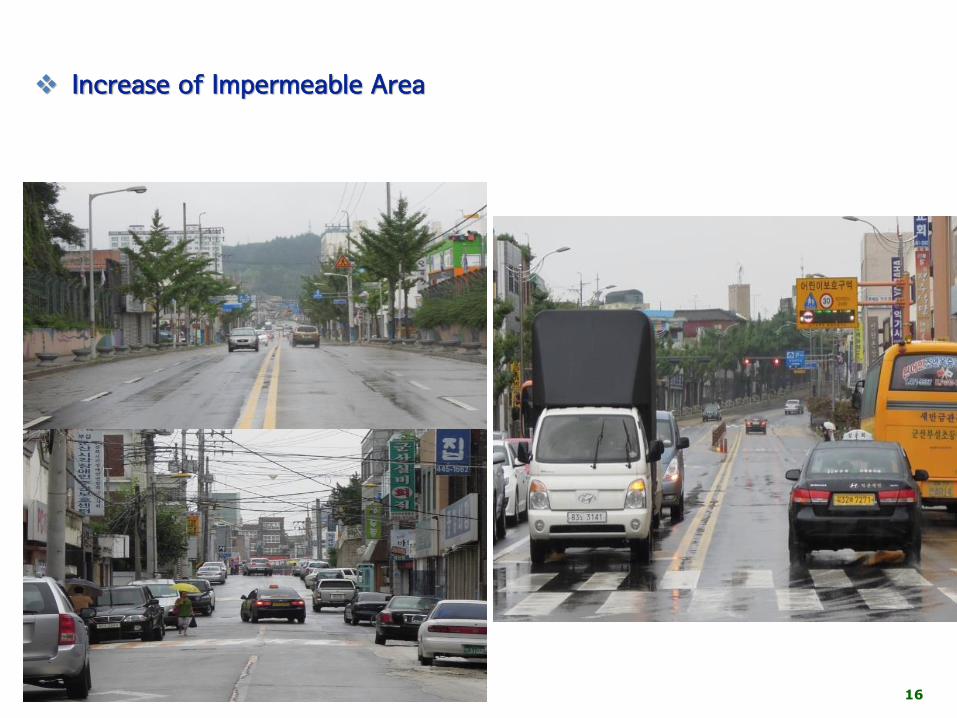
Increase of Impermeable Area
17
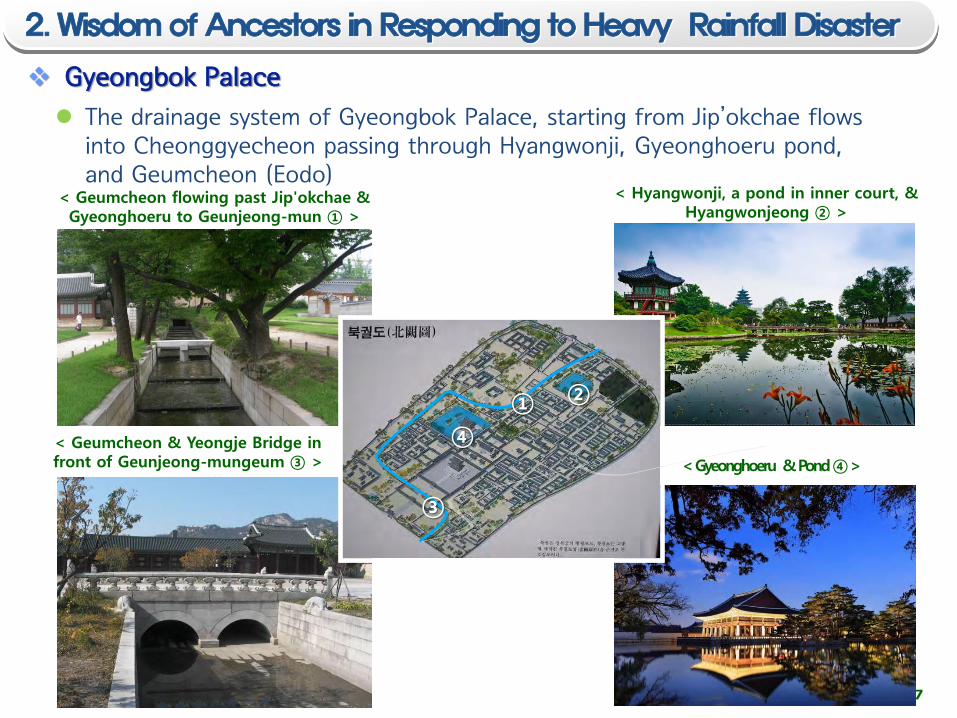
Gyeongbok Palace
The drainage system of Gyeongbok Palace, starting from Jip’okchae flows into Cheonggyecheon passing through Hyangwonji, Gyeonghoeru pond, and Geumcheon (Eodo)
< Geumcheon & Yeongje Bridge in front of Geunjeong-mungeum ③ >
< Hyangwonji, a pond in inner court, & Hyangwonjeong ② >
< Geumcheon flowing past Jip'okchae & Gyeonghoeru to Geunjeong-mun ① >
< Gyeonghoeru & Pond④>
2. Wisdom of Ancestors in Responding to Heavy Rainfall Disaster
②
④
①
③
18
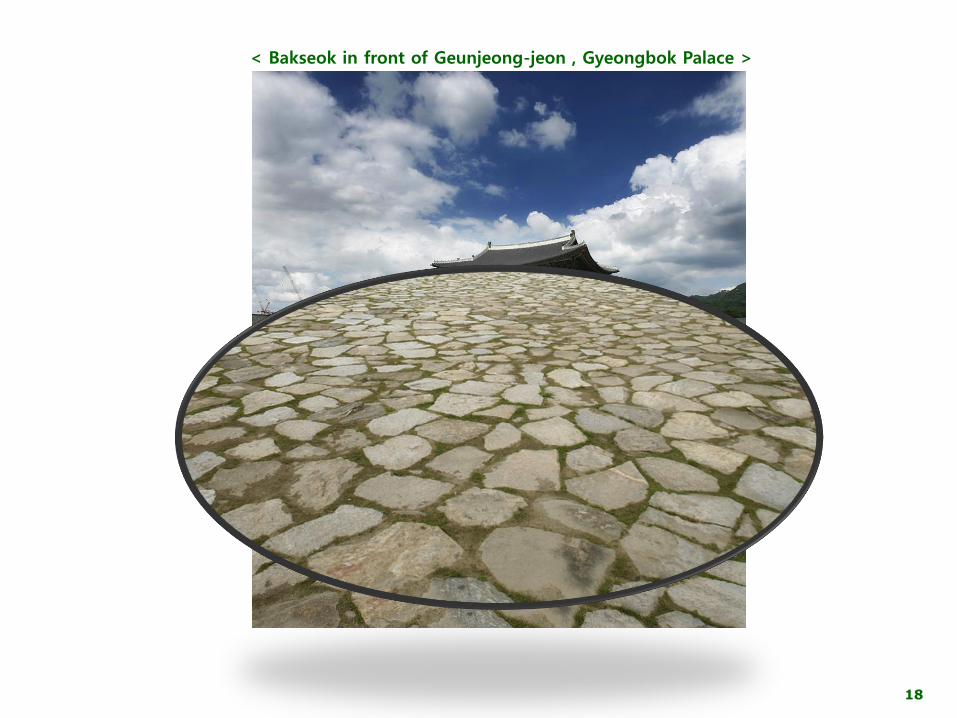
< Bakseok in front of Geunjeong-jeon , Gyeongbok Palace >
19
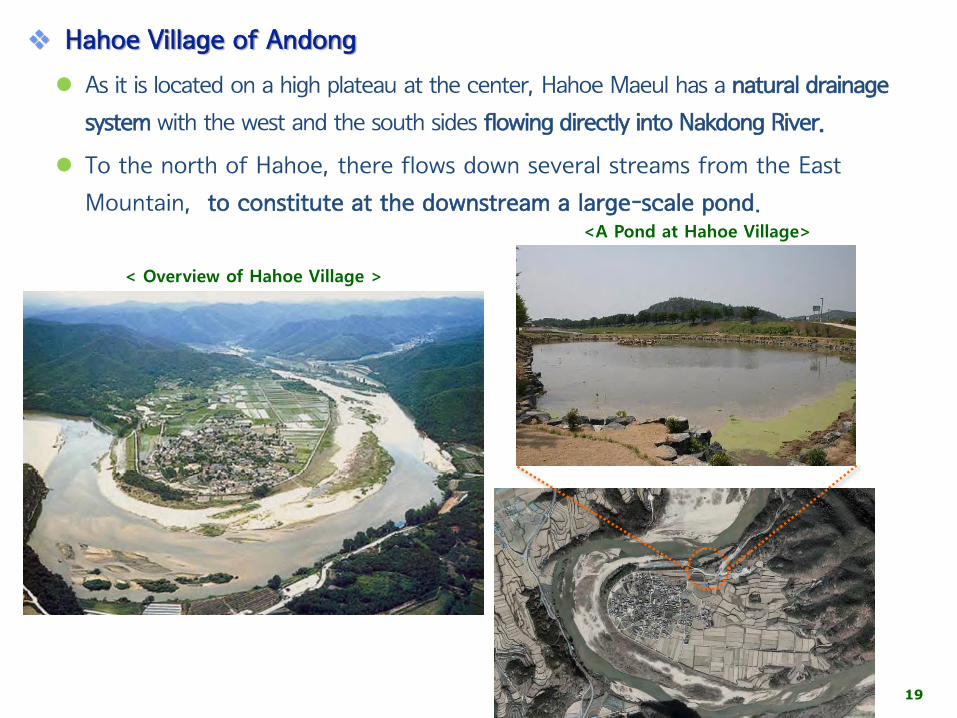
Hahoe Village of Andong
As it is located on a high plateau at the center, Hahoe Maeul has a natural drainage
system with the west and the south sides flowing directly into Nakdong River.
To the north of Hahoe, there flows down several streams from the East
Mountain, to constitute at the downstream a large-scale pond.
< Overview of Hahoe Village >
<A Pond at Hahoe Village>
20
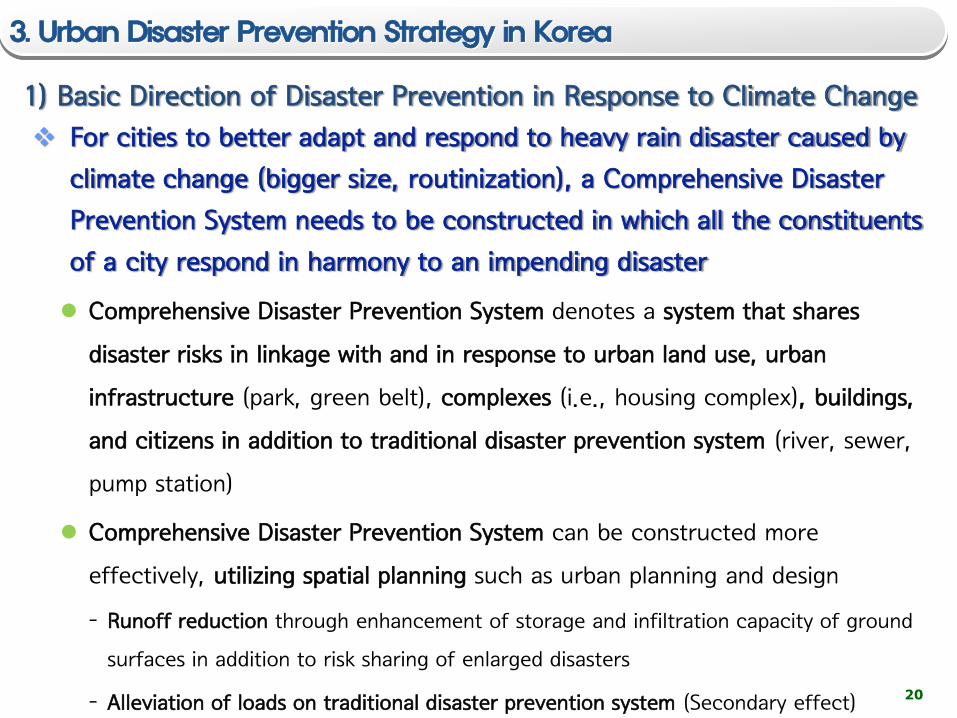
For cities to better adapt and respond to heavy rain disaster caused by
climate change (bigger size, routinization), a Comprehensive Disaster
Prevention System needs to be constructed in which all the constituents
of a city respond in harmony to an impending disaster
Comprehensive Disaster Prevention System denotes a system that shares
disaster risks in linkage with and in response to urban land use, urban
infrastructure (park, green belt), complexes (i.e., housing complex), buildings,
and citizens in addition to traditional disaster prevention system (river, sewer,
pump station)
Comprehensive Disaster Prevention System can be constructed more
effectively, utilizing spatial planning such as urban planning and design
- Runoff reduction through enhancement of storage and infiltration capacity of ground
surfaces in addition to risk sharing of enlarged disasters
- Alleviation of loads on traditional disaster prevention system (Secondary effect)
3. Urban Disaster Prevention Strategy in Korea
1) Basic Direction of Disaster Prevention in Response to Climate Change
21
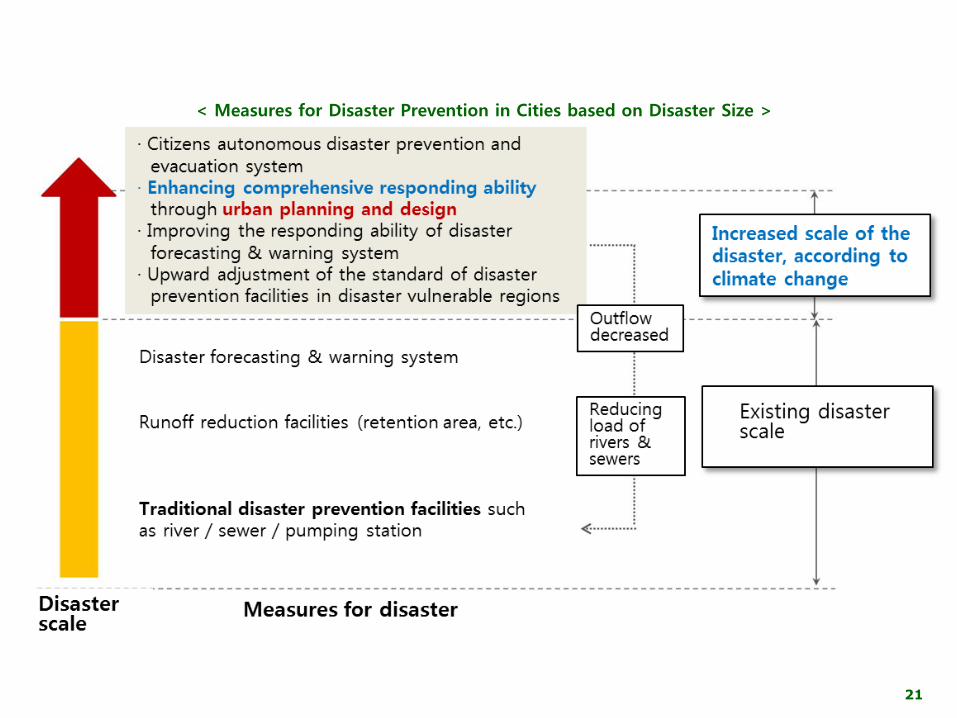
< Measures for Disaster Prevention in Cities based on Disaster Size >
22
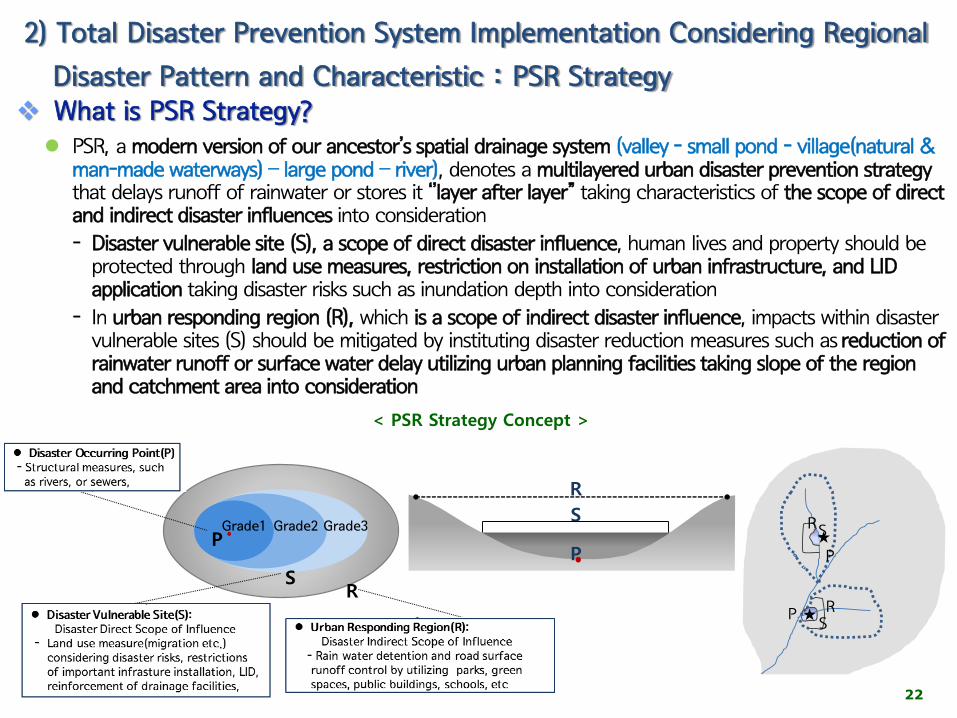
What is PSR Strategy? PSR, a modern version of our ancestor’s spatial drainage system (valley - small pond - village(natural &
man-made waterways) – large pond – river), denotes a multilayered urban disaster prevention strategy that delays runoff of rainwater or stores it ‘’layer after layer” taking characteristics of the scope of direct and indirect disaster influences into consideration
- Disaster vulnerable site (S), a scope of direct disaster influence, human lives and property should be protected through land use measures, restriction on installation of urban infrastructure, and LID application taking disaster risks such as inundation depth into consideration
- In urban responding region (R), which is a scope of indirect disaster influence, impacts within disaster vulnerable sites (S) should be mitigated by instituting disaster reduction measures such as reduction of rainwater runoff or surface water delay utilizing urban planning facilities taking slope of the region and catchment area into consideration
< PSR Strategy Concept >
P ★S
RS
R
★P
R
P
S
Grade1 Grade2 Grade3
R
S
P
2) Total Disaster Prevention System Implementation Considering Regional
Disaster Pattern and Characteristic : PSR Strategy
23
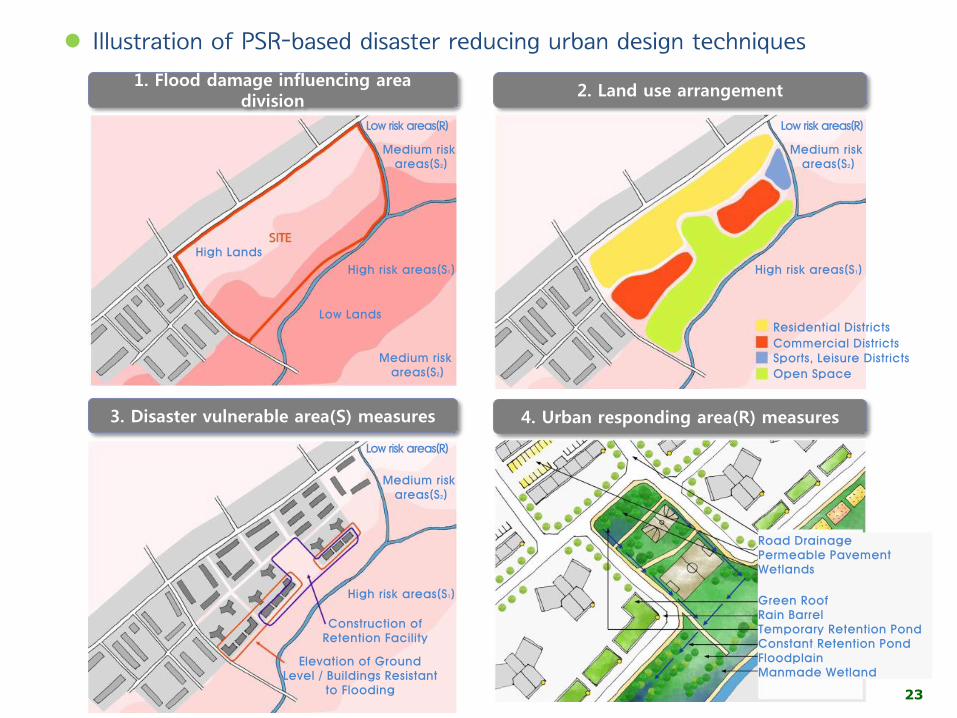
Illustration of PSR-based disaster reducing urban design techniques
1. Flood damage influencing area division
2. Land use arrangement
3. Disaster vulnerable area(S) measures 4. Urban responding area(R) measures
Low risk areas(R)
Medium risk areas(S2)
High risk areas(S1)
Low Lands
High Lands
Medium risk areas(S2)
Low risk areas(R)
Medium risk areas(S2)
High risk areas(S1)
Construction of Retention Facility
Elevation of Ground Level / Buildings Resistant
to Flooding
Low risk areas(R)
Medium risk areas(S2)
High risk areas(S1)
Residential Districts
Commercial DistrictsSports, Leisure Districts
Open Space
Road DrainagePermeable PavementWetlands
Green RoofRain BarrelTemporary Retention PondConstant Retention PondFloodplainManmade Wetland
24
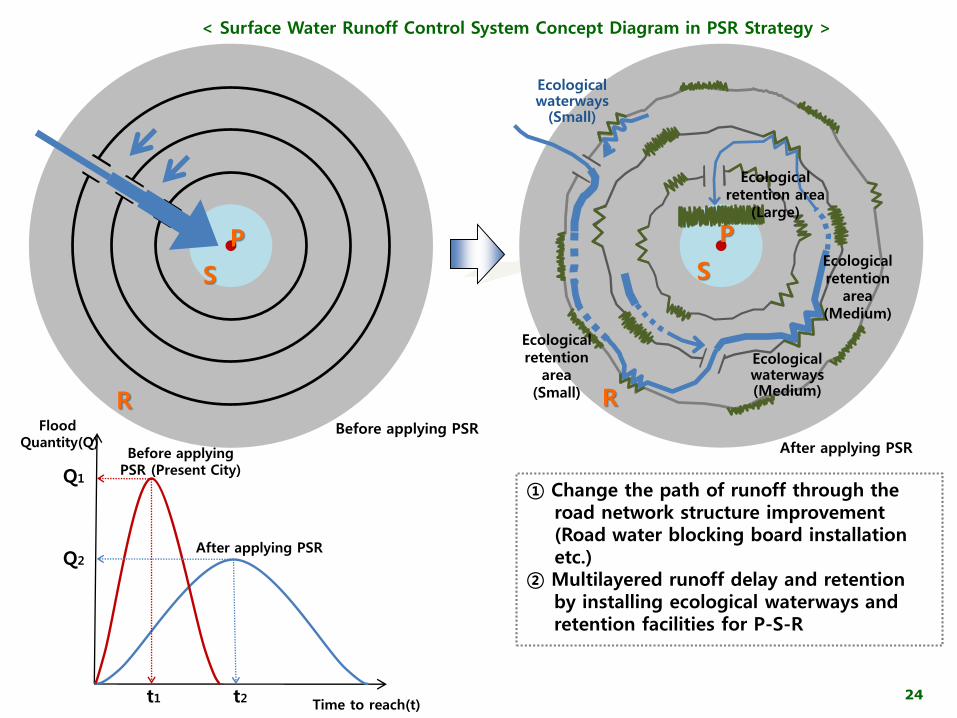
① Change the path of runoff through the road network structure improvement (Road water blocking board installation etc.)
② Multilayered runoff delay and retention by installing ecological waterways and retention facilities for P-S-R
Flood Quantity(Q)
Time to reach(t)
Q1
Q2
t1 t2
Before applying PSR (Present City)
After applying PSR
< Surface Water Runoff Control System Concept Diagram in PSR Strategy >
Before applying PSR
After applying PSR
zP
S
R
P
S
R
Ecological retention
area(Small)
Ecological waterways
(Small)
Ecological waterways (Medium)
Ecological retention
area(Medium)
Ecological retention area
(Large)
25
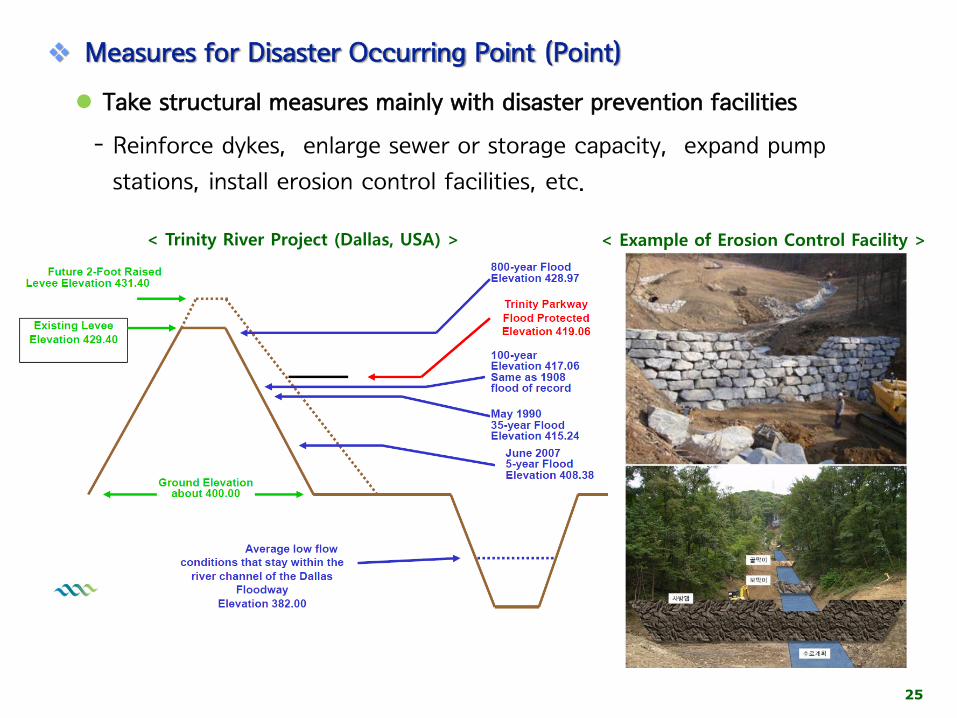
< Trinity River Project (Dallas, USA) > < Example of Erosion Control Facility >
Measures for Disaster Occurring Point (Point)
Take structural measures mainly with disaster prevention facilities
- Reinforce dykes, enlarge sewer or storage capacity, expand pump
stations, install erosion control facilities, etc.
26
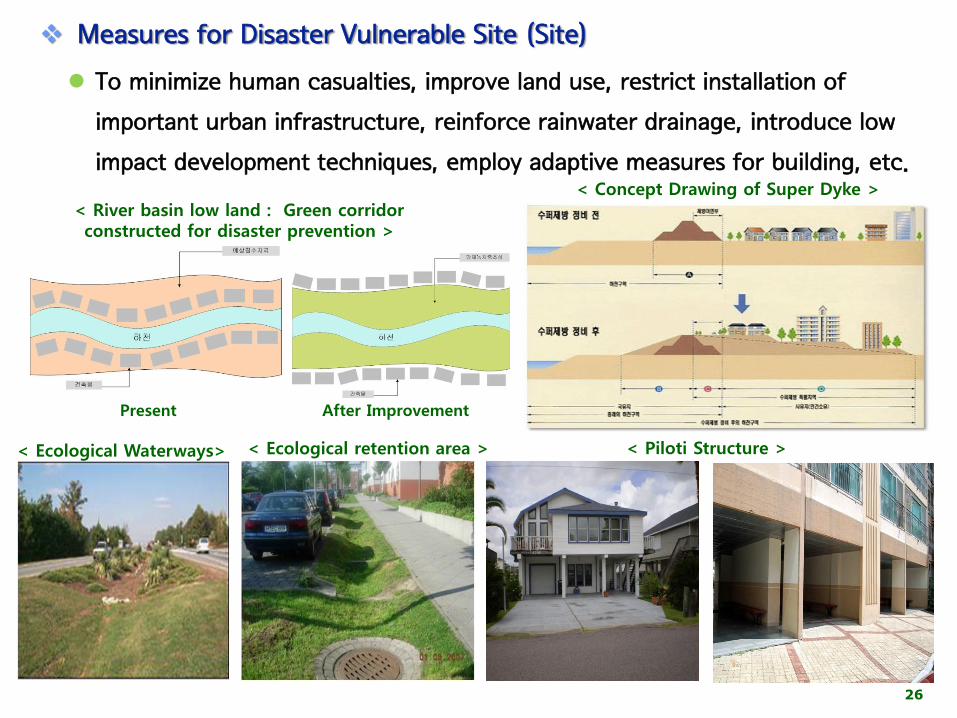
Measures for Disaster Vulnerable Site (Site)
To minimize human casualties, improve land use, restrict installation of
important urban infrastructure, reinforce rainwater drainage, introduce low
impact development techniques, employ adaptive measures for building, etc.
< River basin low land : Green corridor constructed for disaster prevention >
< Concept Drawing of Super Dyke >
Present After Improvement
< Ecological Waterways> < Ecological retention area > < Piloti Structure >
27
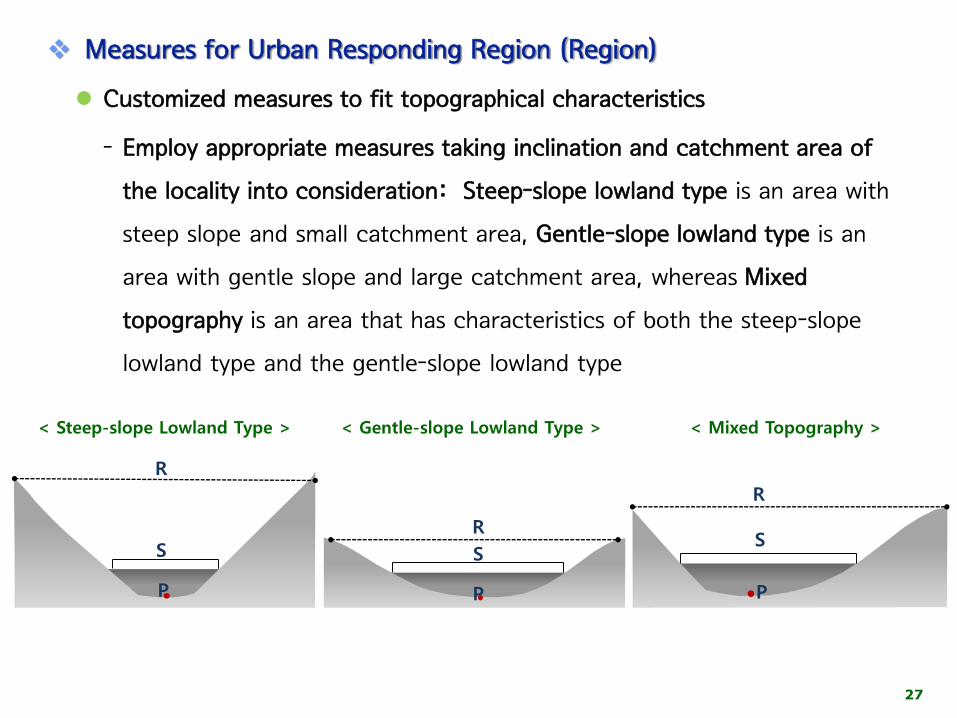
Measures for Urban Responding Region (Region)
Customized measures to fit topographical characteristics
- Employ appropriate measures taking inclination and catchment area of
the locality into consideration: Steep-slope lowland type is an area with
steep slope and small catchment area, Gentle-slope lowland type is an
area with gentle slope and large catchment area, whereas Mixed
topography is an area that has characteristics of both the steep-slope
lowland type and the gentle-slope lowland type
< Steep-slope Lowland Type > < Gentle-slope Lowland Type > < Mixed Topography >
R
S
PP
R
S
P
R
S
28
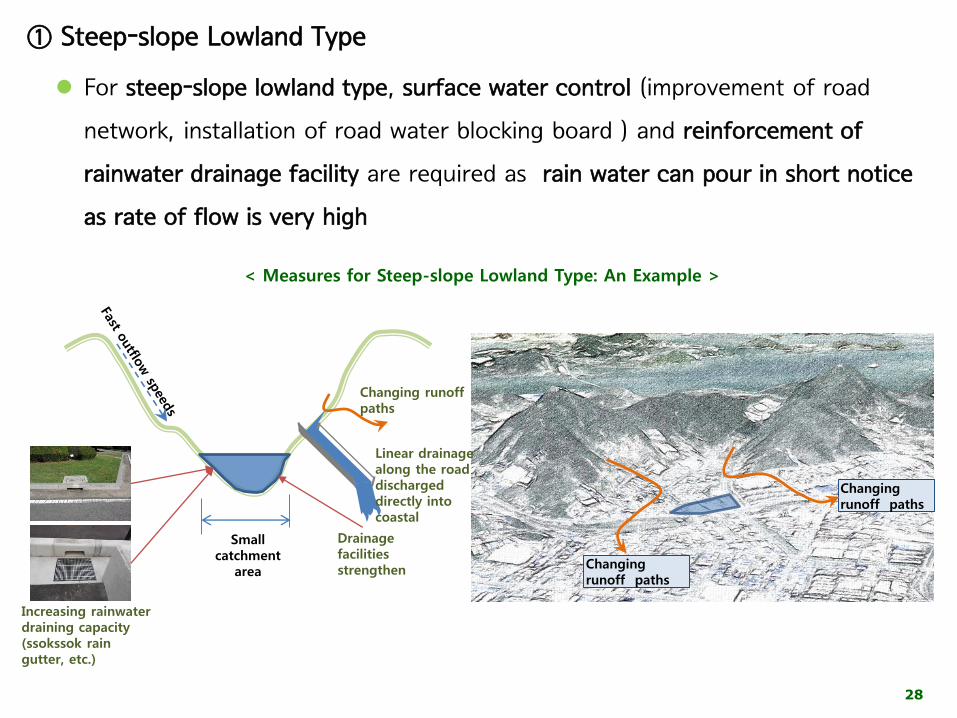
① Steep-slope Lowland Type
For steep-slope lowland type, surface water control (improvement of road
network, installation of road water blocking board ) and reinforcement of
rainwater drainage facility are required as rain water can pour in short notice
as rate of flow is very high
Small catchment
area
Changing runoff paths
Changing runoff paths
Drainage facilities strengthen
Changing runoff paths
Increasing rainwater draining capacity (ssokssok rain gutter, etc.)
Linear drainage along the road , discharged directly into coastal
< Measures for Steep-slope Lowland Type: An Example >
29
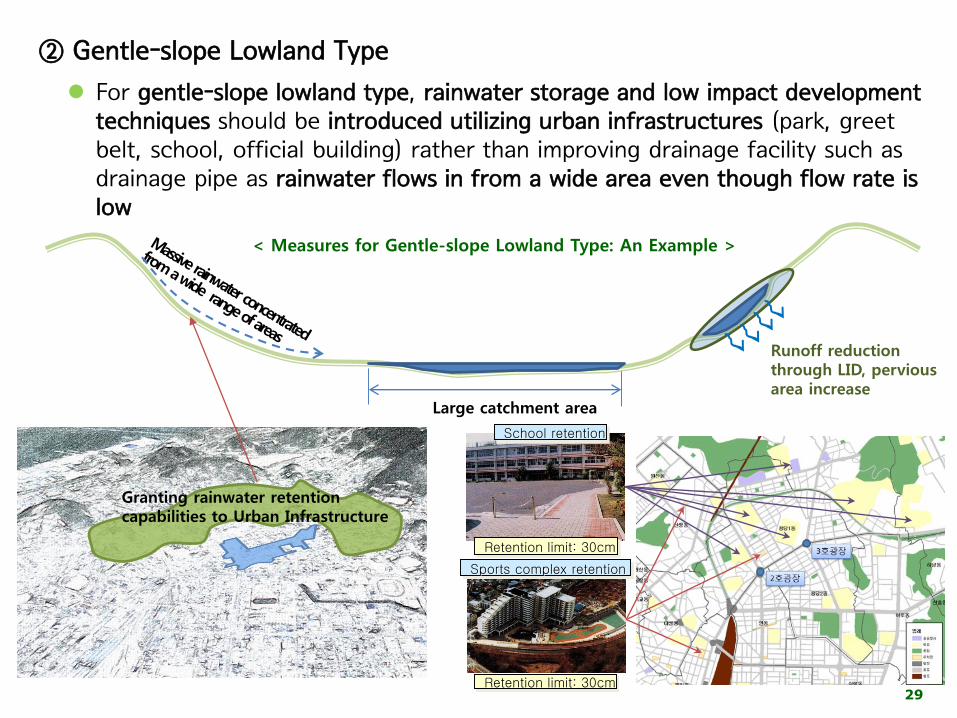
② Gentle-slope Lowland Type
For gentle-slope lowland type, rainwater storage and low impact development techniques should be introduced utilizing urban infrastructures (park, greet belt, school, official building) rather than improving drainage facility such as drainage pipe as rainwater flows in from a wide area even though flow rate is low
Large catchment area
Sports complex retention
School retention
Retention limit: 30cm
Retention limit: 30cm
Granting rainwater retention capabilities to Urban Infrastructure
Runoff reduction through LID, pervious area increase
< Measures for Gentle-slope Lowland Type: An Example >
30
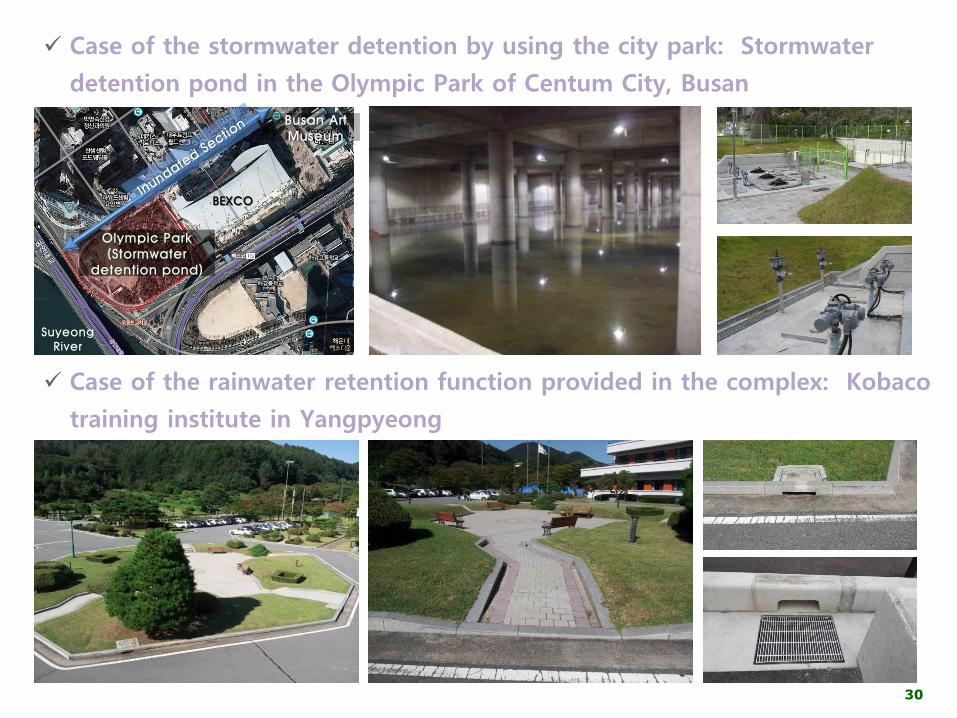
Case of the rainwater retention function provided in the complex: Kobaco
training institute in Yangpyeong
Olympic Park(Stormwater
detention pond)
BEXCO
SuyeongRiver
Busan Art Museum
Case of the stormwater detention by using the city park: Stormwater
detention pond in the Olympic Park of Centum City, Busan
31
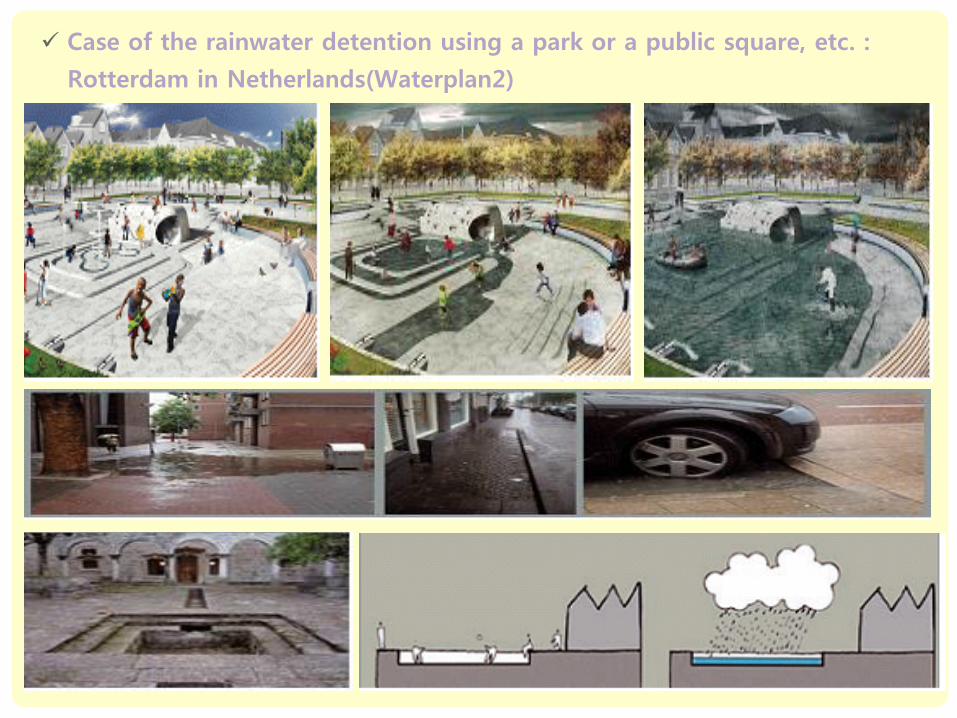
Case of the rainwater detention using a park or a public square, etc. :
Rotterdam in Netherlands(Waterplan2)
Ⅲ. Disaster Risk Analysis
and Planning
33
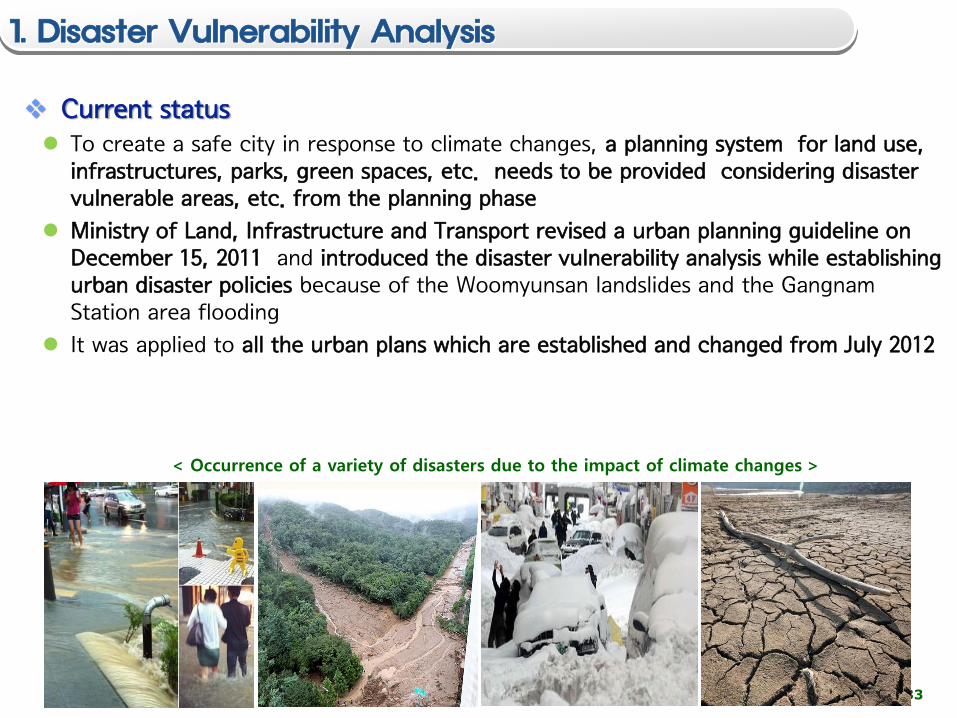
Current status
To create a safe city in response to climate changes, a planning system for land use, infrastructures, parks, green spaces, etc. needs to be provided considering disaster vulnerable areas, etc. from the planning phase
Ministry of Land, Infrastructure and Transport revised a urban planning guideline on December 15, 2011 and introduced the disaster vulnerability analysis while establishing urban disaster policies because of the Woomyunsan landslides and the Gangnam Station area flooding
It was applied to all the urban plans which are established and changed from July 2012
< Occurrence of a variety of disasters due to the impact of climate changes >
1. Disaster Vulnerability Analysis
34
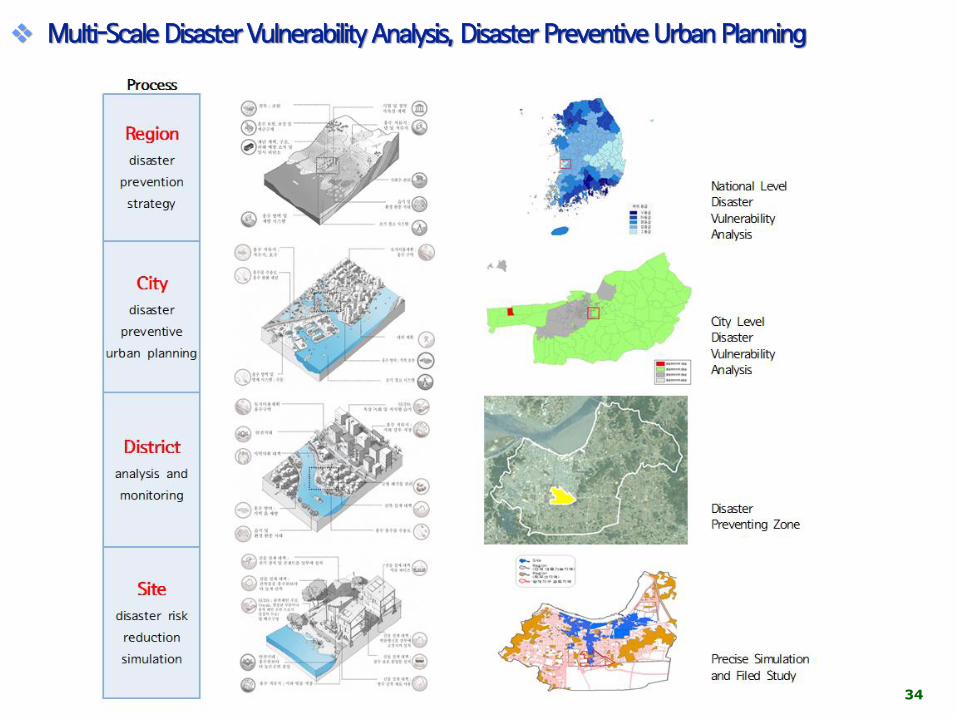
Multi-Scale Disaster Vulnerability Analysis, Disaster Preventive Urban Planning
35
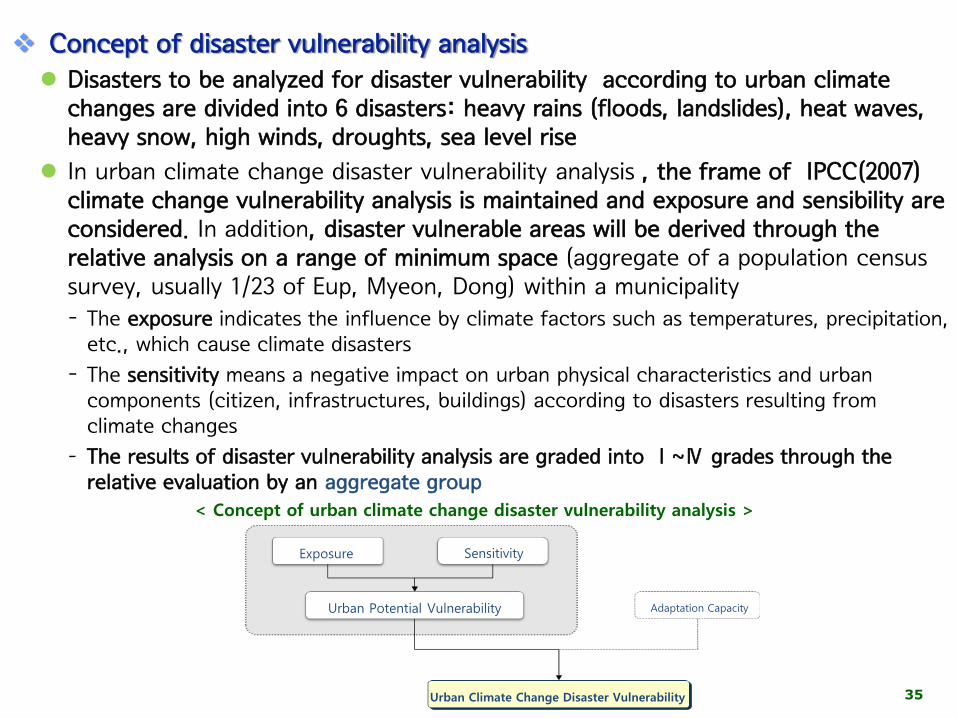
Concept of disaster vulnerability analysis
Disasters to be analyzed for disaster vulnerability according to urban climate changes are divided into 6 disasters: heavy rains (floods, landslides), heat waves, heavy snow, high winds, droughts, sea level rise
In urban climate change disaster vulnerability analysis , the frame of IPCC(2007) climate change vulnerability analysis is maintained and exposure and sensibility are considered. In addition, disaster vulnerable areas will be derived through the relative analysis on a range of minimum space (aggregate of a population census survey, usually 1/23 of Eup, Myeon, Dong) within a municipality
- The exposure indicates the influence by climate factors such as temperatures, precipitation, etc., which cause climate disasters
- The sensitivity means a negative impact on urban physical characteristics and urban components (citizen, infrastructures, buildings) according to disasters resulting from climate changes
- The results of disaster vulnerability analysis are graded into Ⅰ~Ⅳ grades through the relative evaluation by an aggregate group
< Concept of urban climate change disaster vulnerability analysis >
Exposure Sensitivity
Urban Potential Vulnerability Adaptation Capacity
Urban Climate Change Disaster Vulnerability
36
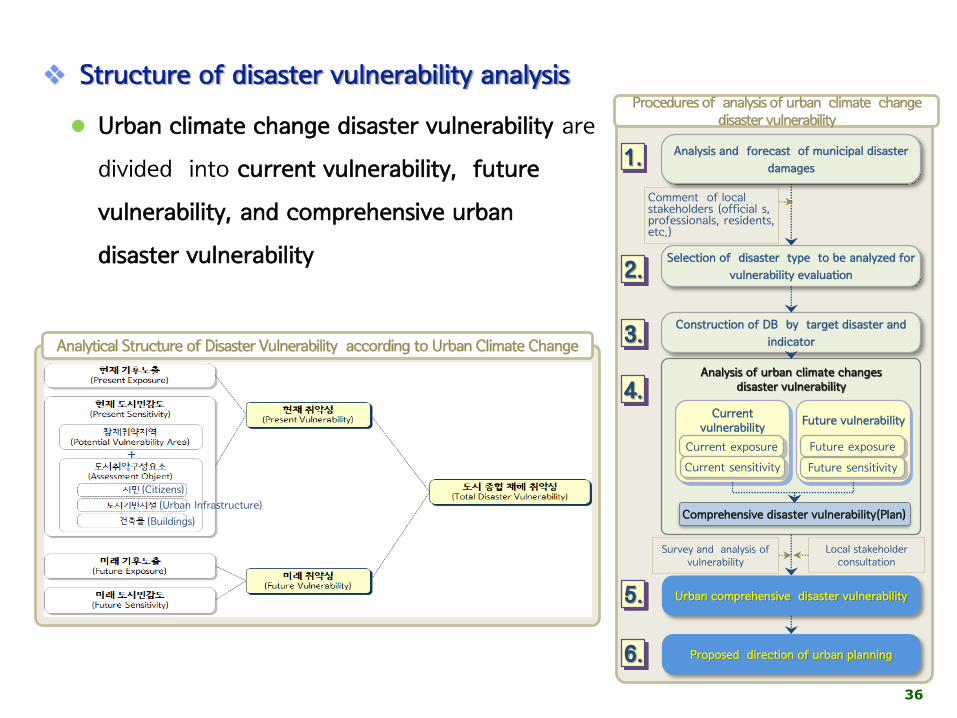
Analytical Structure of Disaster Vulnerability according to Urban Climate Change
Procedures of analysis of urban climate change disaster vulnerability
Analysis and forecast of municipal disaster
damages
Construction of DB by target disaster and
indicator
Proposed direction of urban planning
Selection of disaster type to be analyzed for
vulnerability evaluation
1.
2.
3.
4.
5.
6.
Comment of local stakeholders (official s, professionals, residents, etc.)
Urban comprehensive disaster vulnerability
Analysis of urban climate changes disaster vulnerability
Current vulnerability
Current exposure
Current sensitivity
Future vulnerability
Future exposure
Future sensitivity
Comprehensive disaster vulnerability(Plan)
Local stakeholder consultation
Survey and analysis of vulnerability
(Citizens)
(Urban Infrastructure)
(Buildings)
Structure of disaster vulnerability analysis
Urban climate change disaster vulnerability are
divided into current vulnerability, future
vulnerability, and comprehensive urban
disaster vulnerability
37
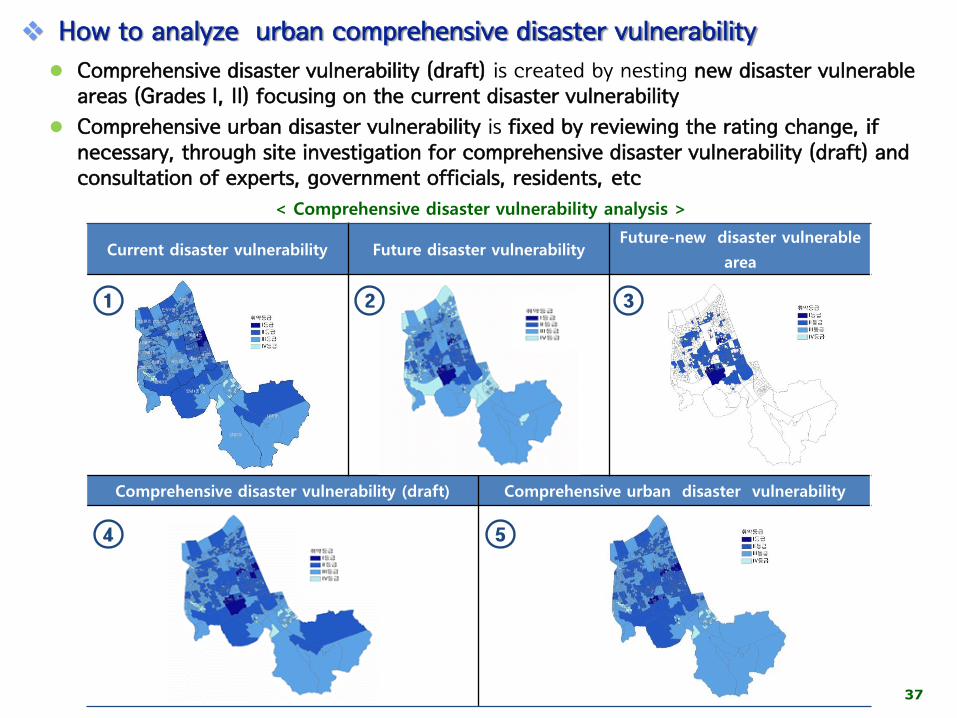
< Comprehensive disaster vulnerability analysis >
Current disaster vulnerability Future disaster vulnerability Future-new disaster vulnerable
area
Comprehensive disaster vulnerability (draft) Comprehensive urban disaster vulnerability
1 2 3
4 5
How to analyze urban comprehensive disaster vulnerability
Comprehensive disaster vulnerability (draft) is created by nesting new disaster vulnerable areas (Grades I, II) focusing on the current disaster vulnerability
Comprehensive urban disaster vulnerability is fixed by reviewing the rating change, if necessary, through site investigation for comprehensive disaster vulnerability (draft) and consultation of experts, government officials, residents, etc
38
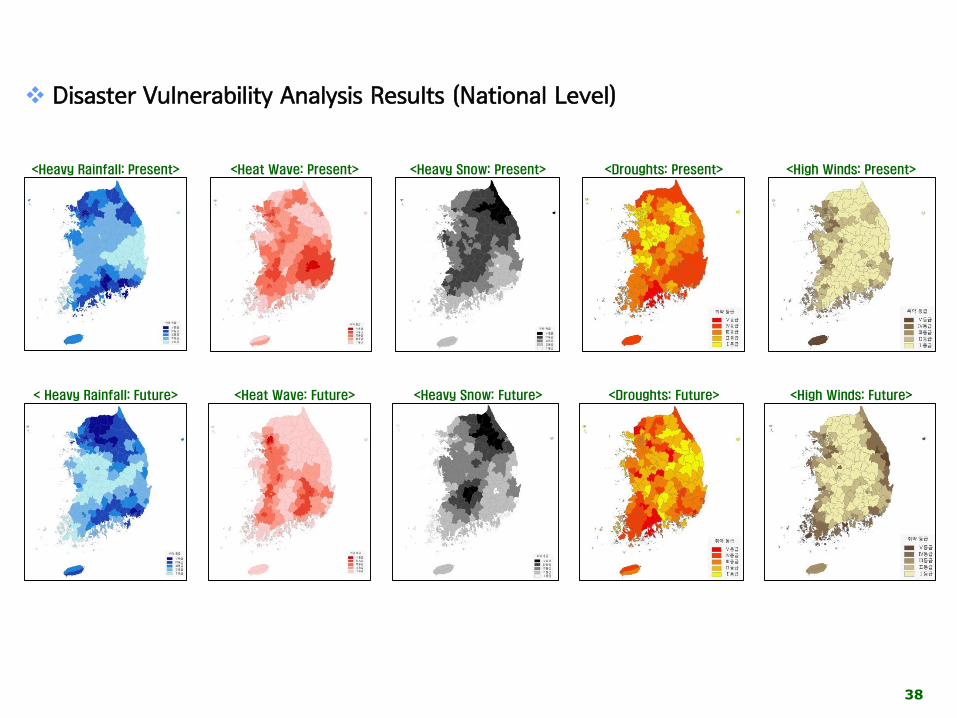
Disaster Vulnerability Analysis Results (National Level)
<Heavy Rainfall: Present> <Heat Wave: Present> <Heavy Snow: Present> <Droughts: Present> <High Winds: Present>
< Heavy Rainfall: Future> <Heat Wave: Future> <Heavy Snow: Future> <Droughts: Future> <High Winds: Future>
39
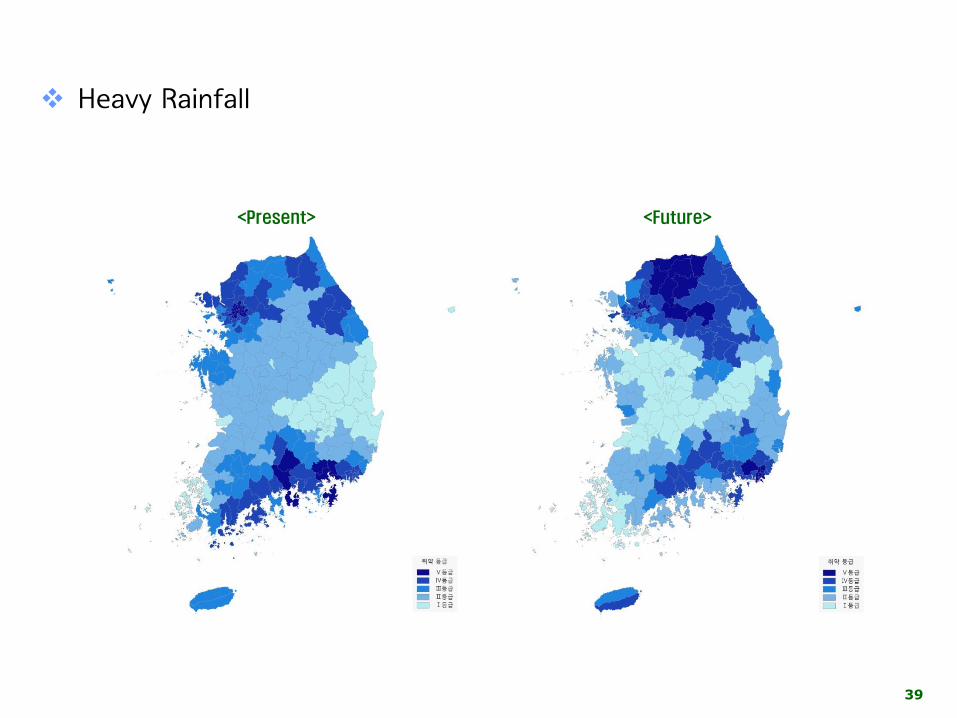
Heavy Rainfall
<Present> <Future>
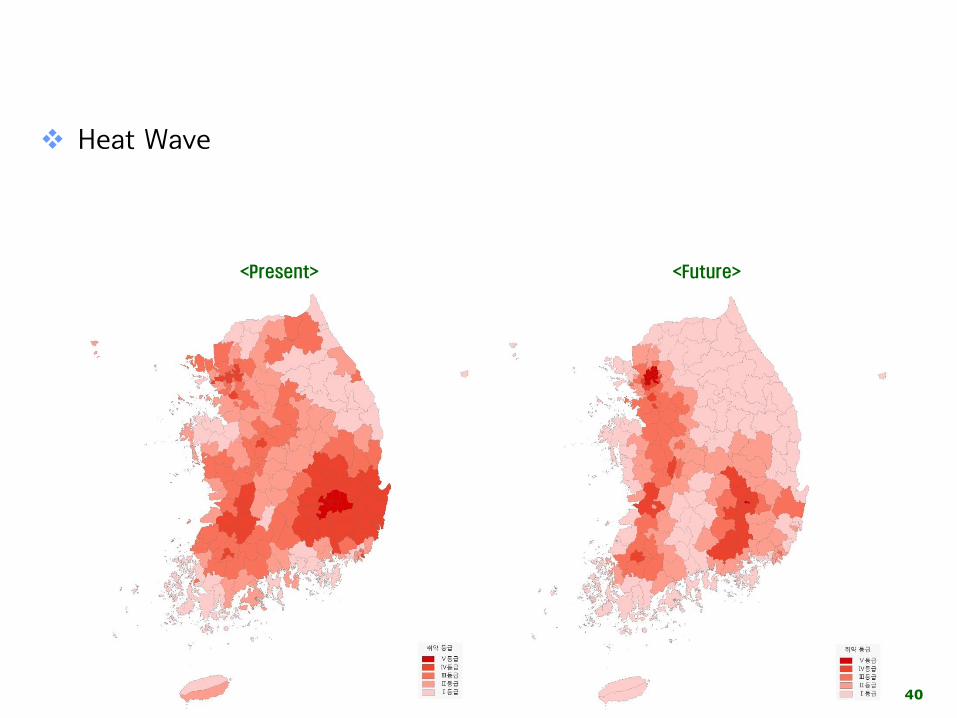
40
Heat Wave
<Present> <Future>
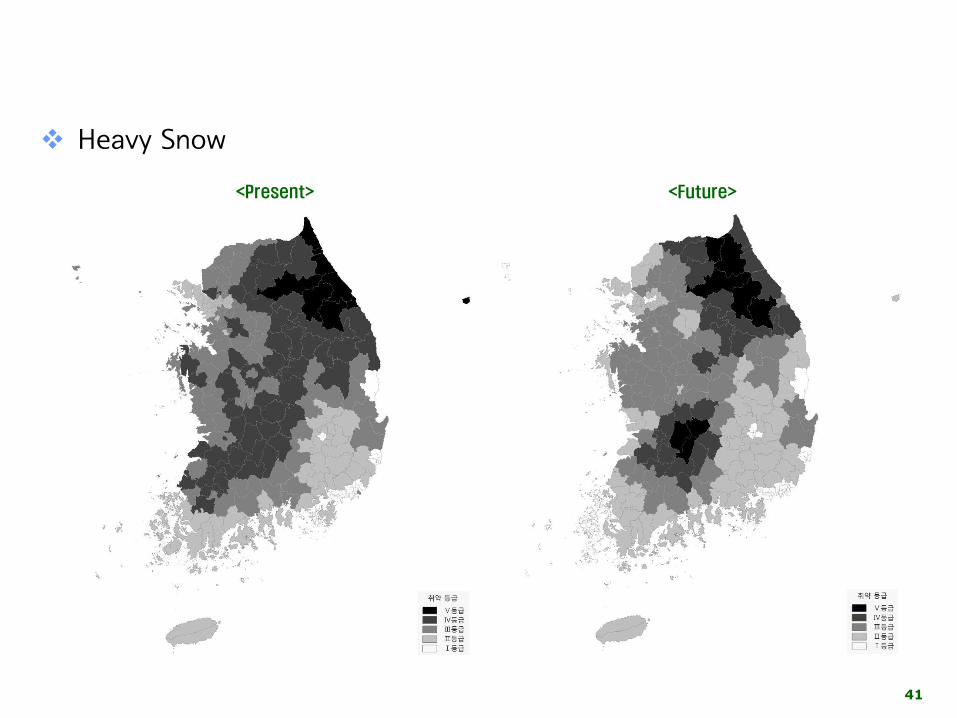
41
Heavy Snow
<Present> <Future>
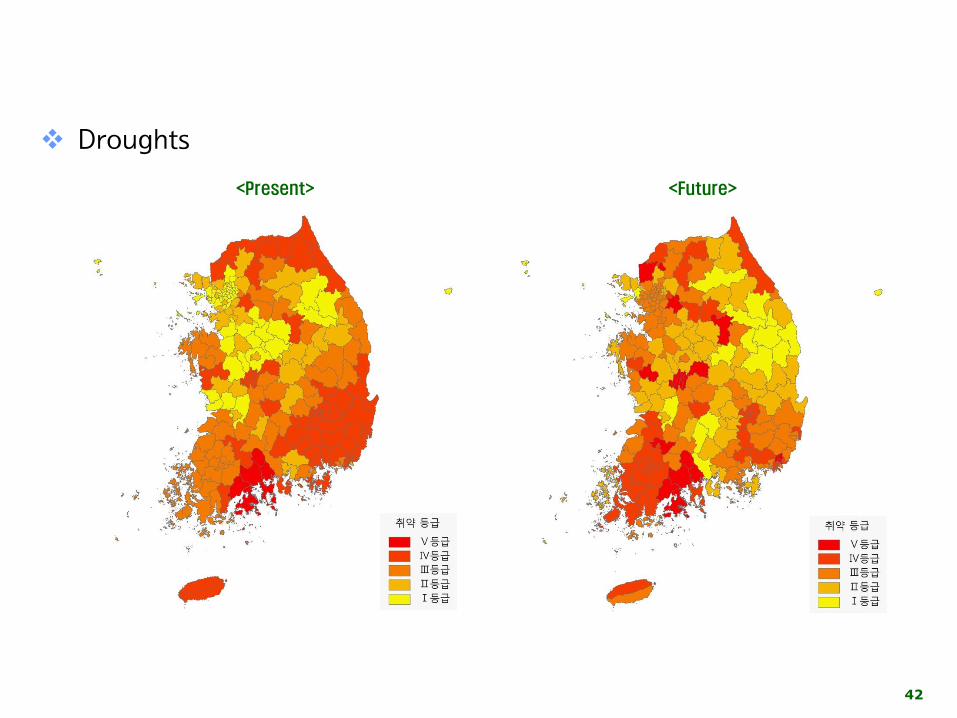
42
Droughts
<Present> <Future>
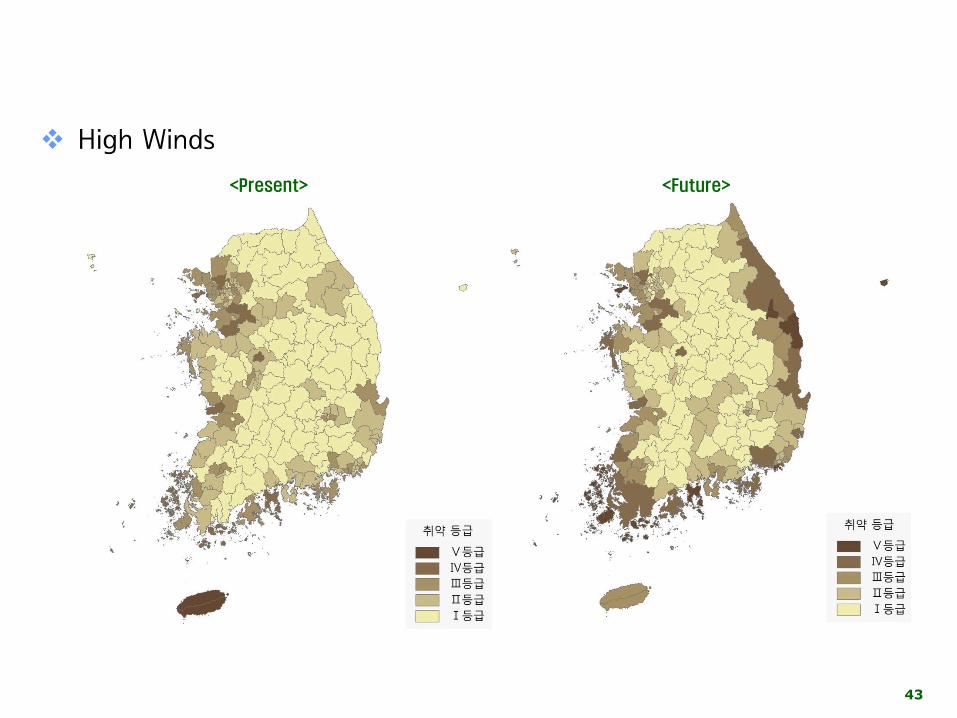
43
High Winds
<Present> <Future>
44
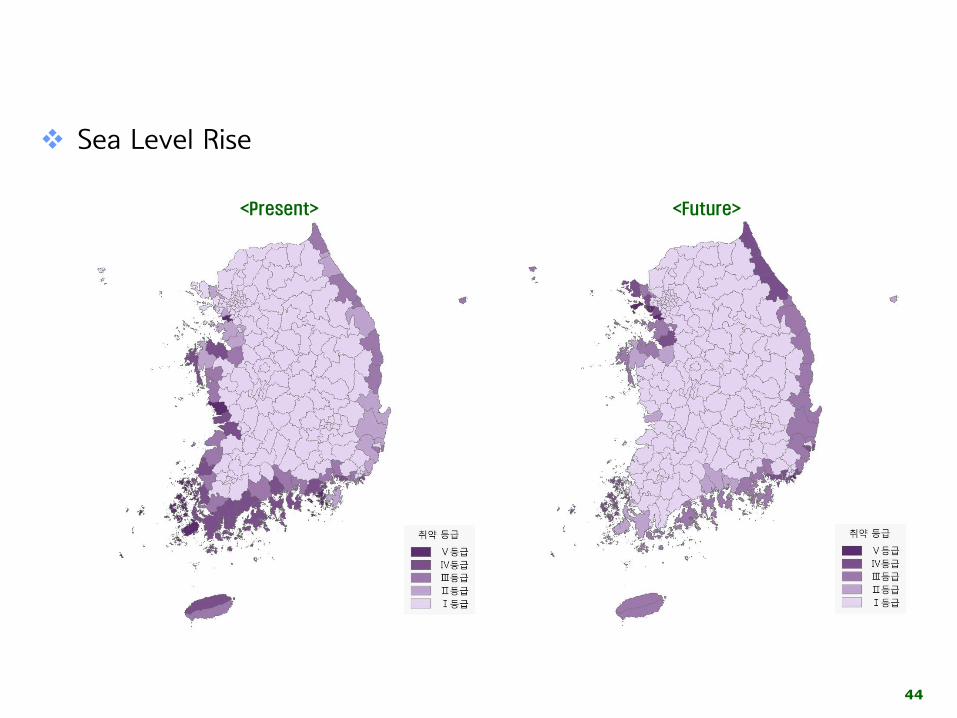
Sea Level Rise
<Present> <Future>
45
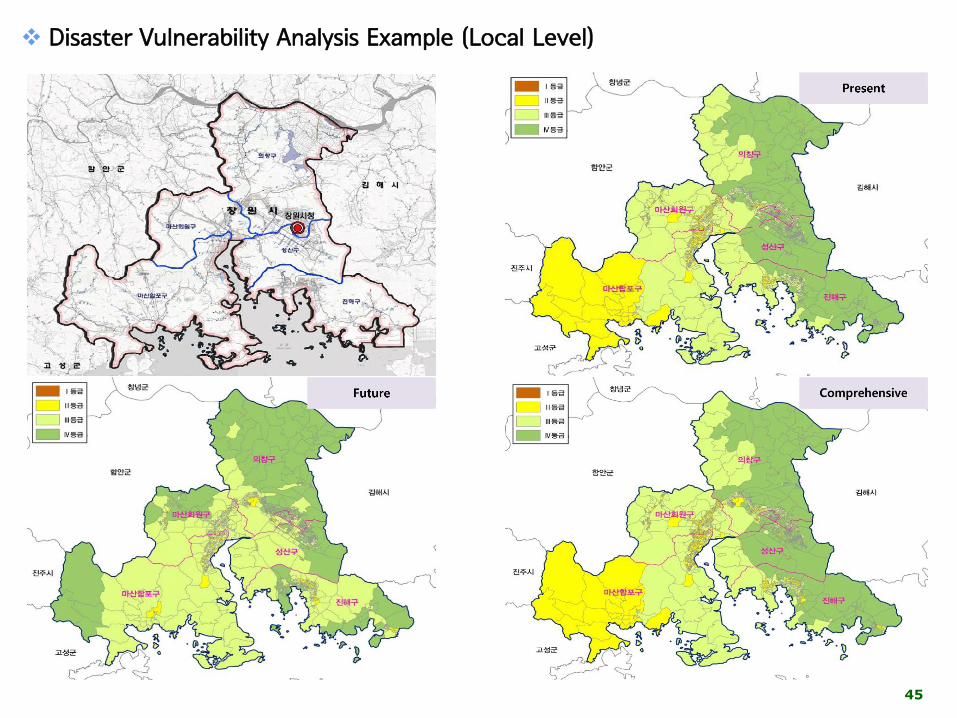
Disaster Vulnerability Analysis Example (Local Level)
46
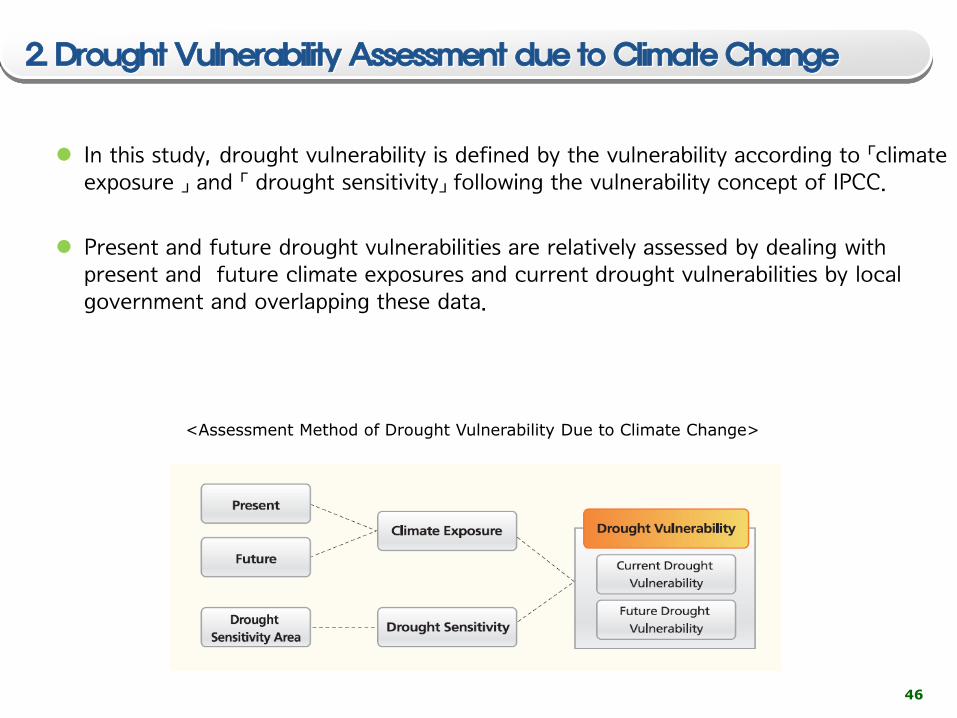
2. Drought Vulnerability Assessment due to Climate Change
In this study, drought vulnerability is defined by the vulnerability according to 「climate exposure 」 and 「 drought sensitivity」 following the vulnerability concept of IPCC.
Present and future drought vulnerabilities are relatively assessed by dealing withpresent and future climate exposures and current drought vulnerabilities by local government and overlapping these data.
<Assessment Method of Drought Vulnerability Due to Climate Change>
47
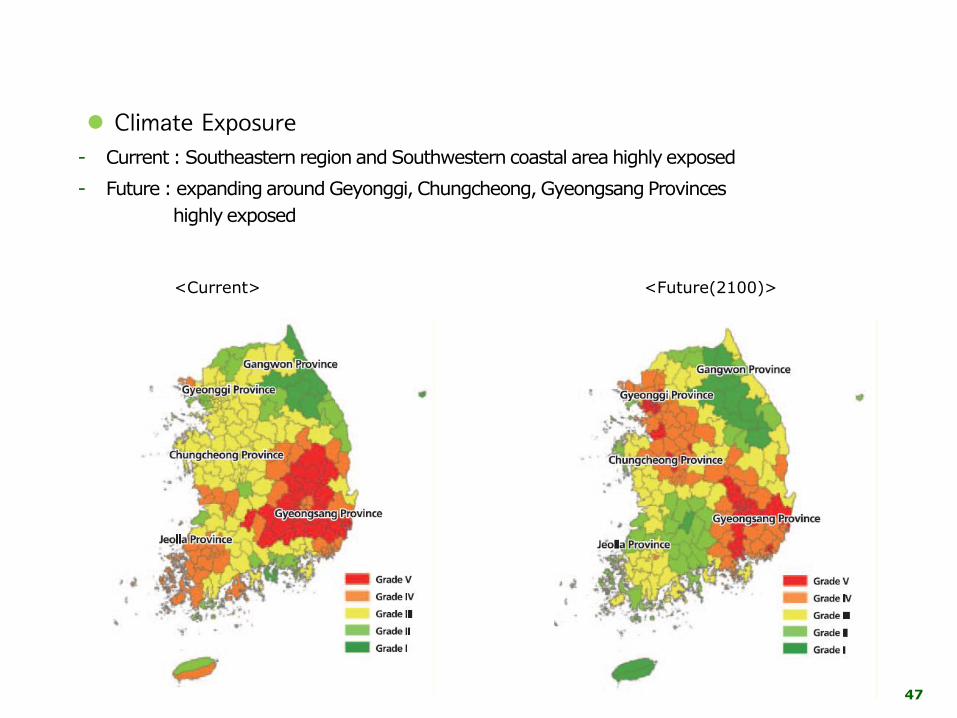
<Current> <Future(2100)>
Climate Exposure
- Current : Southeastern region and Southwestern coastal area highly exposed
- Future : expanding around Geyonggi, Chungcheong, Gyeongsang Provinces
highly exposed
48
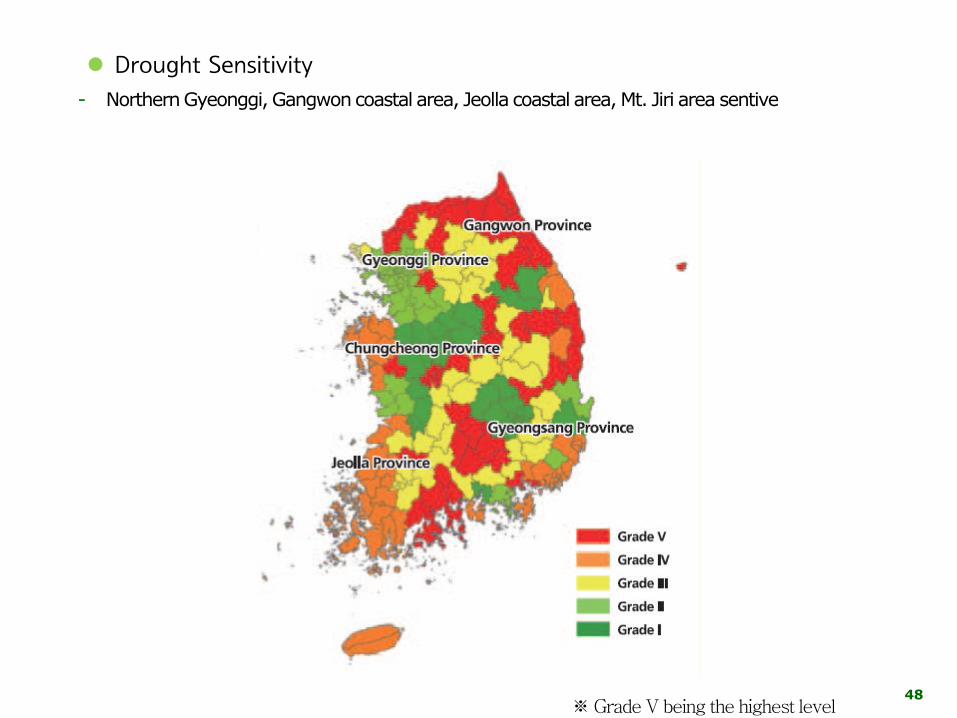
Drought Sensitivity
- Northern Gyeonggi, Gangwoncoastal area, Jeolla coastal area, Mt. Jiri area sentive
※ Grade V being the highest level

49
<current vulnerability> <future vulnerability>
Drought Vulnerability
- Current : Northern Gyeonggi, Northern Gangwon, Gangwon coastal area, Gyeongsang coastal area,
Jeolla coastal area, Chungcheong, Mt. Jiri area vulnerable
- Future: Similar to current vulnerability(Gangwon , Mt. Jiri area alleviated)
※ Grade V being the highest level
50
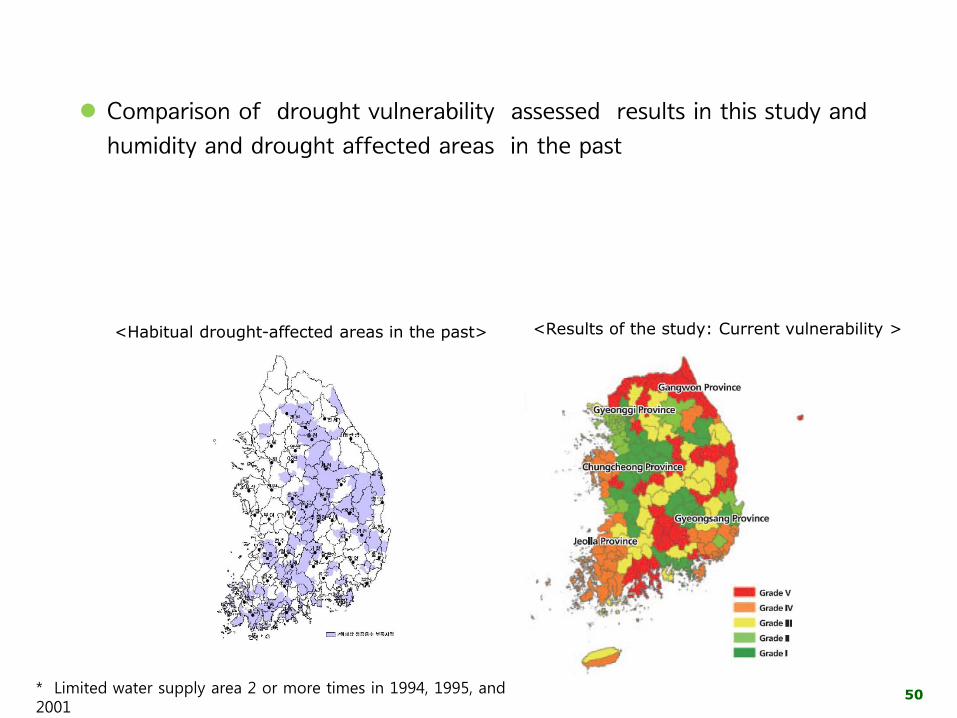
Comparison of drought vulnerability assessed results in this study and
humidity and drought affected areas in the past
<Habitual drought-affected areas in the past> <Results of the study: Current vulnerability >
* Limited water supply area 2 or more times in 1994, 1995, and 2001
51
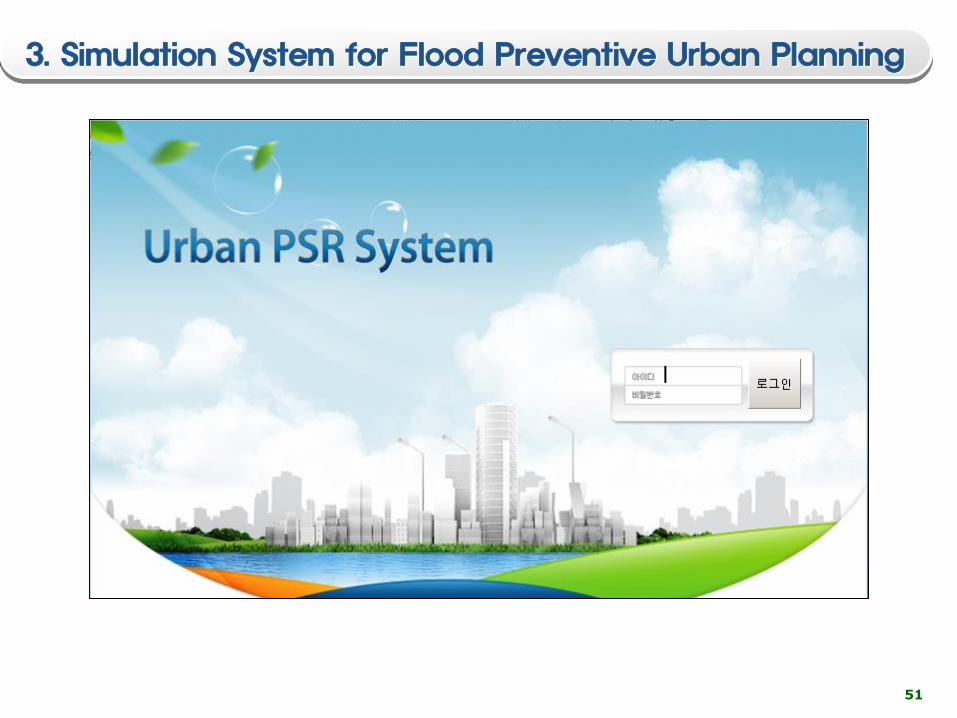
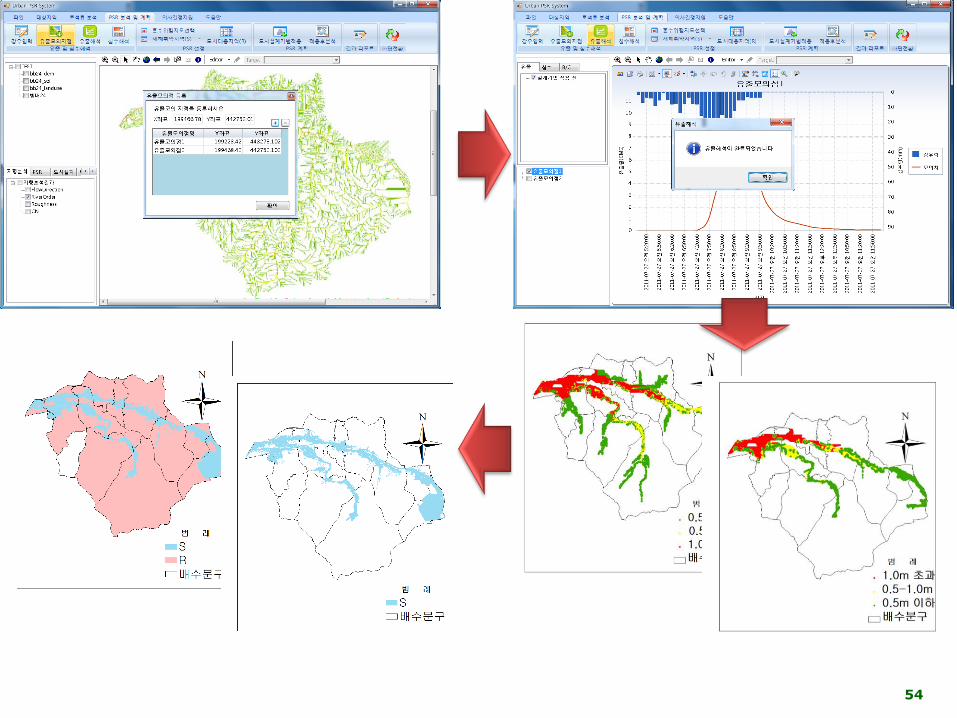
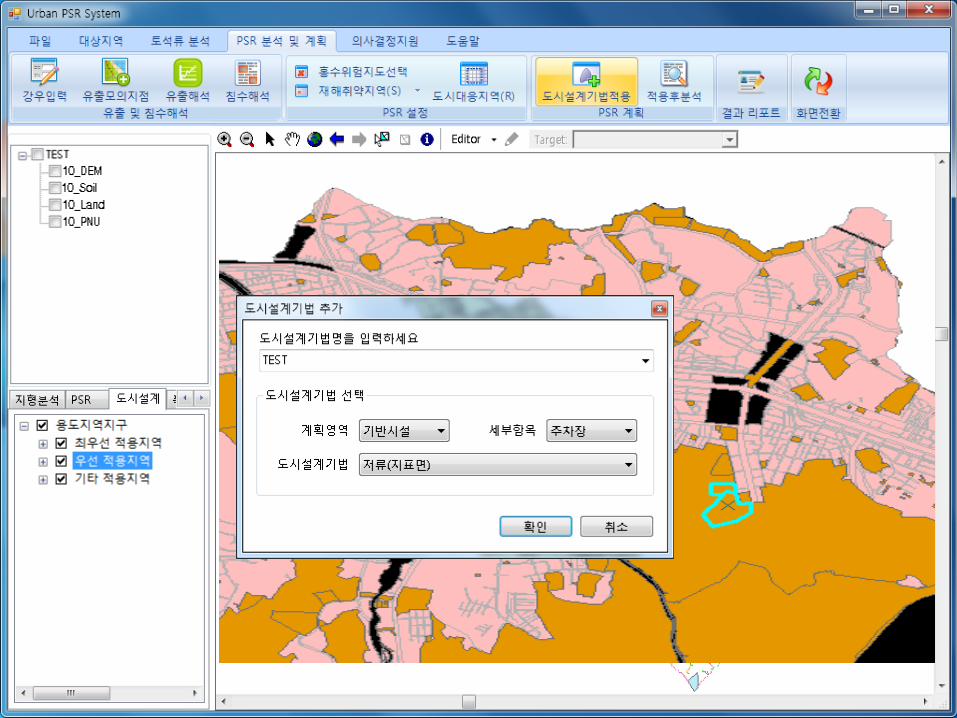
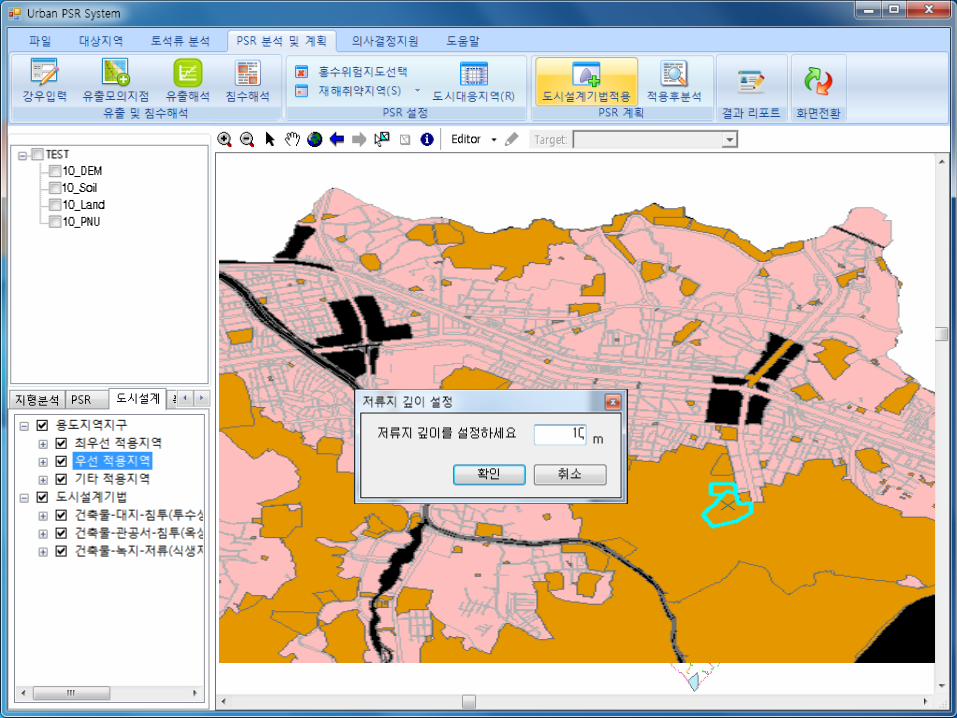
3. Simulation System for Flood Preventive Urban Planning
52
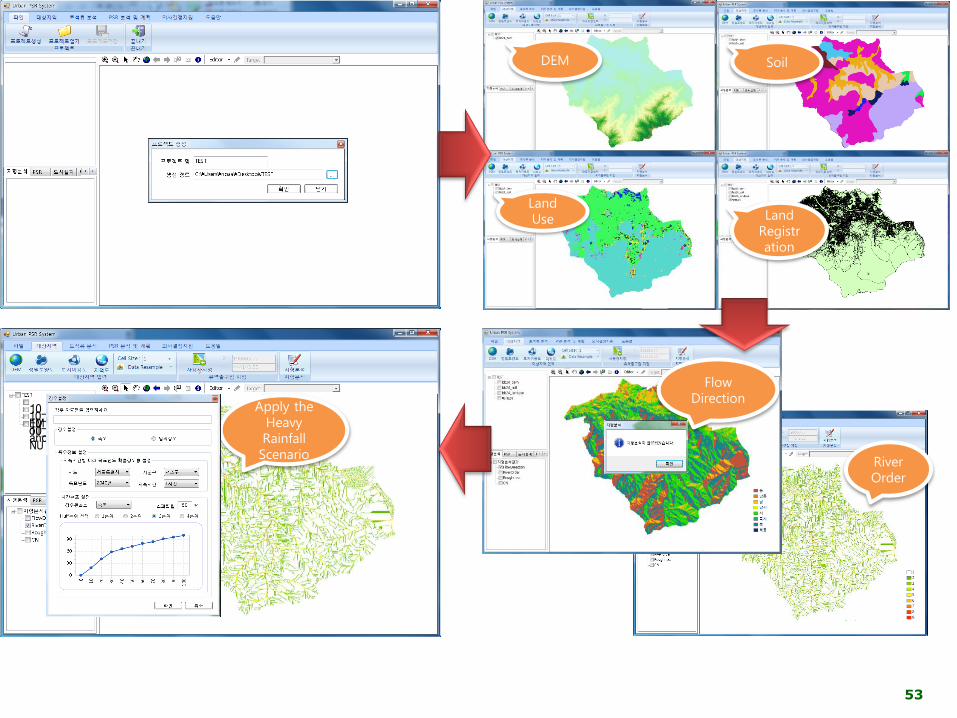
53
DEM10_Soil
10_DEM
Soil
Land Use Land
Registration
River Order
Flow Direction
Apply the Heavy Rainfall Scenario
10_PNU
10_Land
10_Soil
10_DEM
54
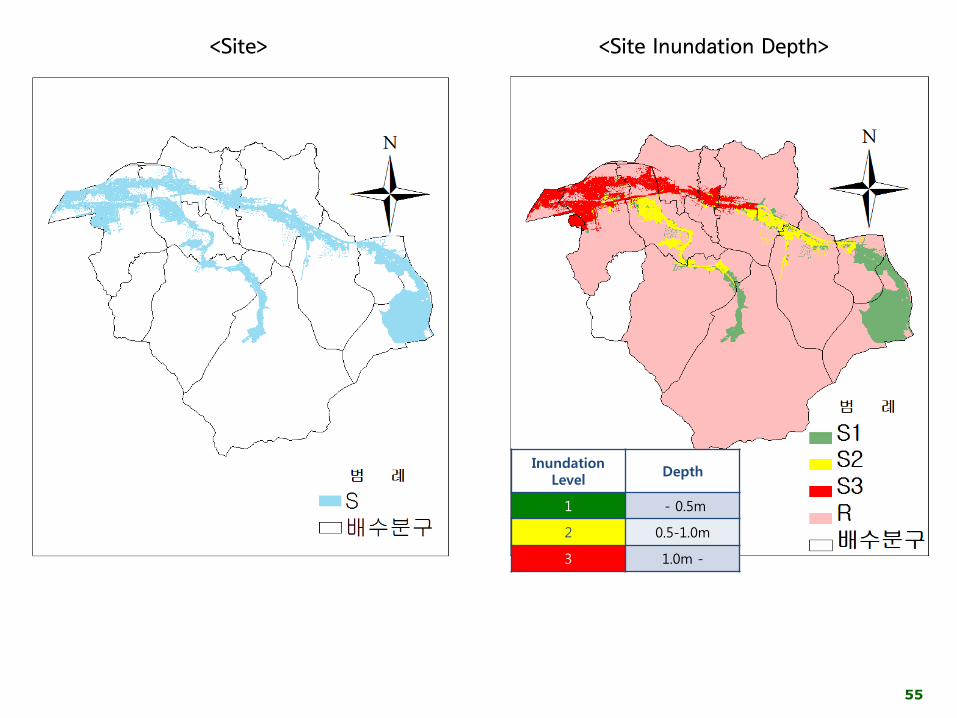
55
<Site> <Site Inundation Depth>
Inundation Level
Depth
1 - 0.5m
2 0.5-1.0m
3 1.0m -
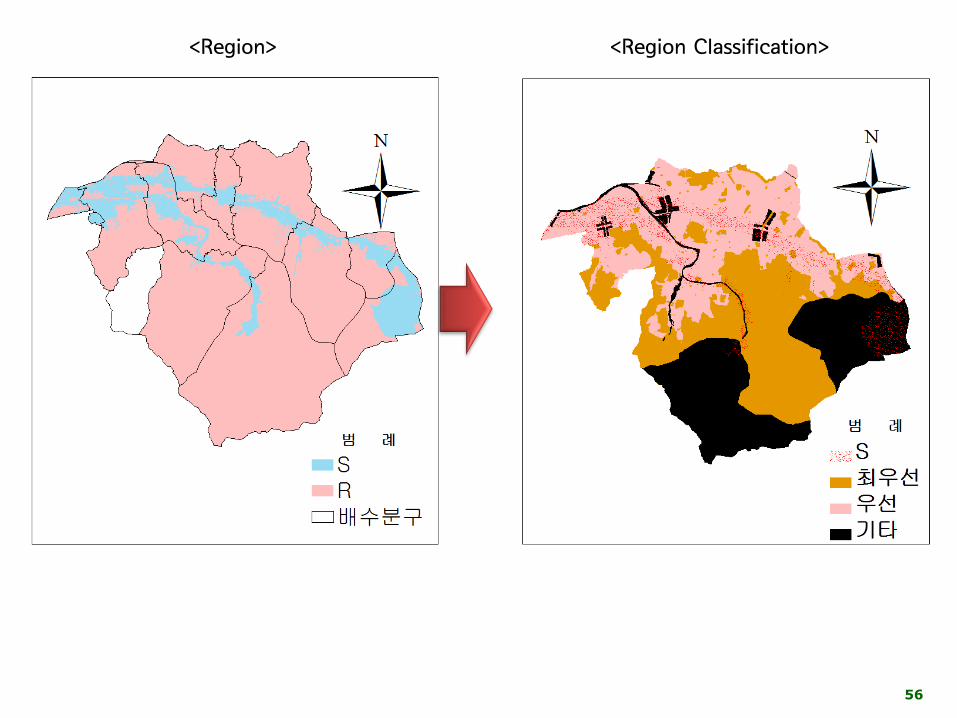
56
<Region> <Region Classification>
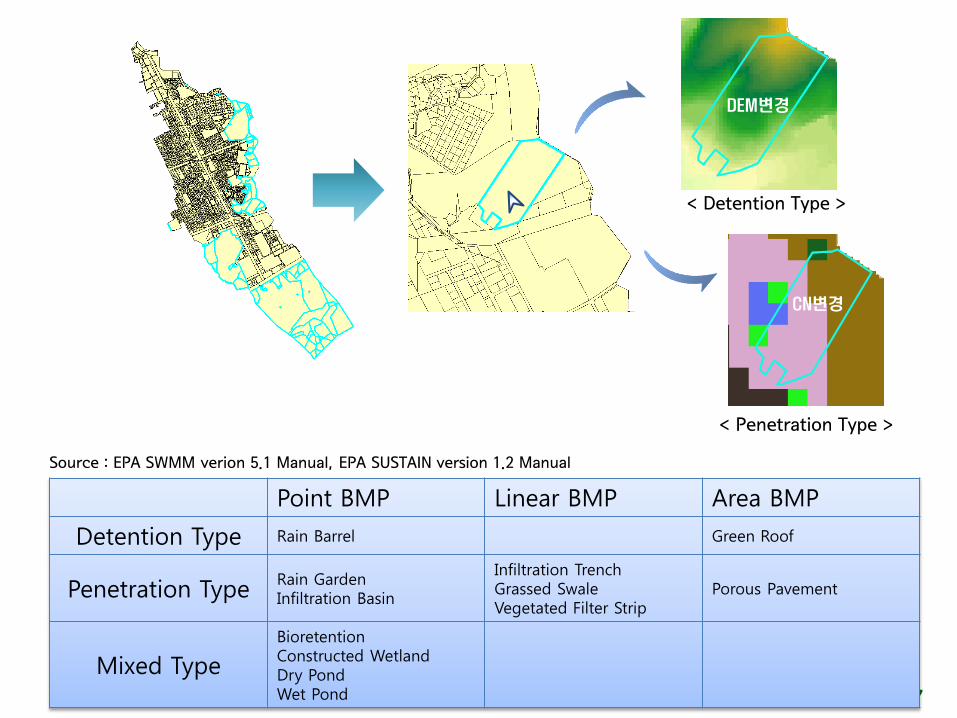
57
< Detention Type >
DEM변경
CN변경
< Penetration Type >
Point BMP Linear BMP Area BMP
Detention Type Rain Barrel Green Roof
Penetration TypeRain GardenInfiltration Basin
Infiltration TrenchGrassed SwaleVegetated Filter Strip
Porous Pavement
Mixed Type
BioretentionConstructed WetlandDry PondWet Pond
Source : EPA SWMM verion 5.1 Manual, EPA SUSTAIN version 1.2 Manual
58
59
60
61
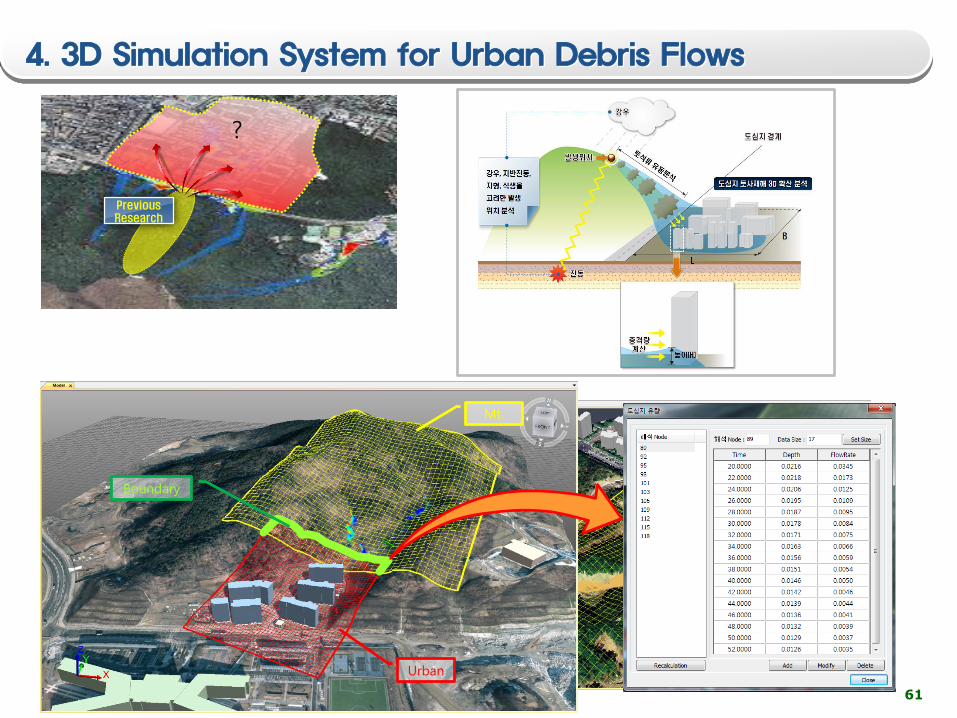
4. 3D Simulation System for Urban Debris Flows
?
Previous Research
산지부 결과
도심지 결과
통합 결과
Mt.
Urban
Boundary
62
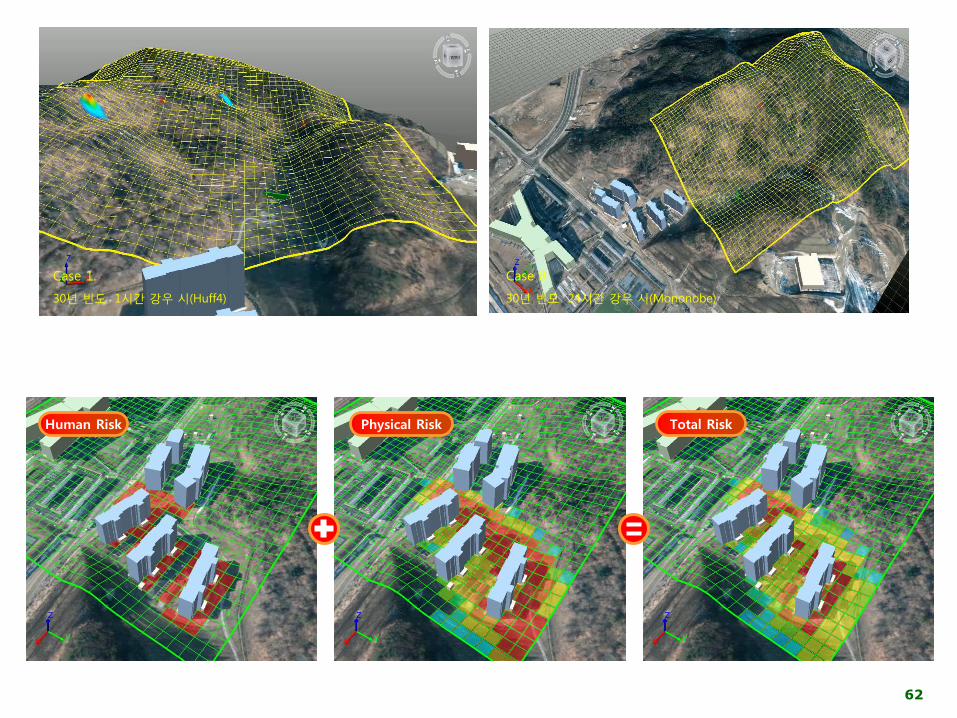
Human Risk Total RiskPhysical Risk
Case 8.
30년 빈도 24시간 강우 시(Mononobe)
Case 1.
30년 빈도 1시간 강우 시(Huff4)
63
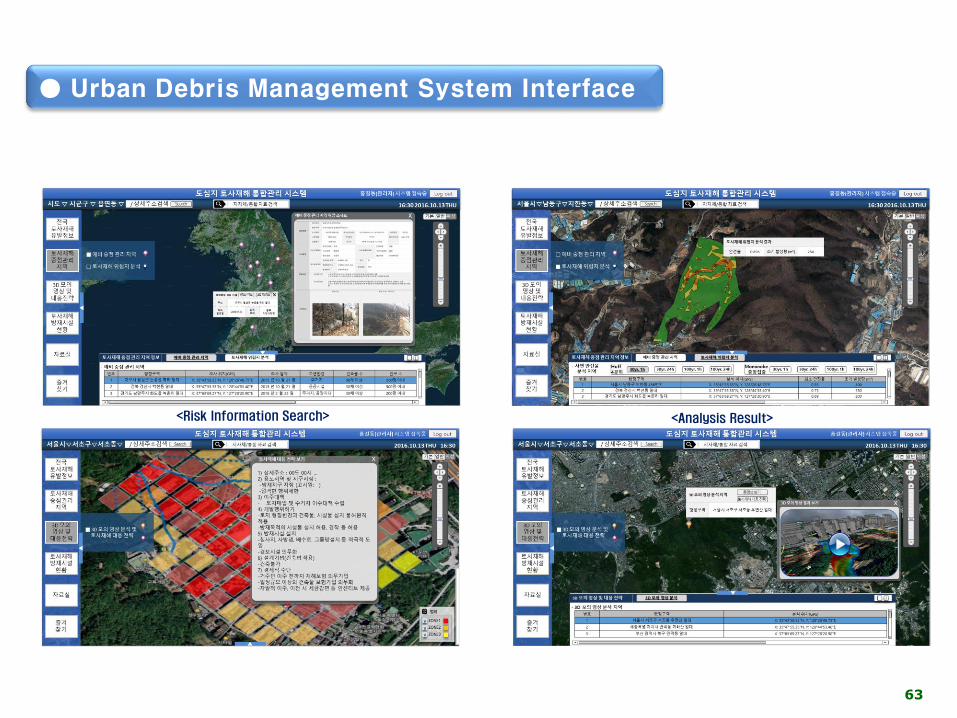
● Urban Debris Management System Interface
<Risk Information Search> <Analysis Result>
64
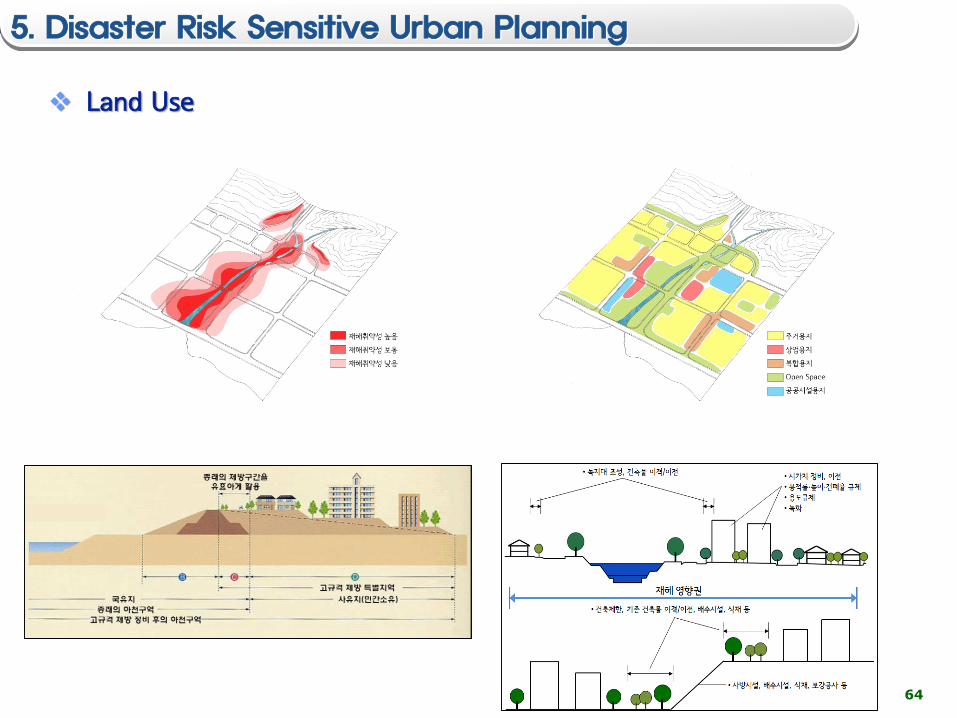
Land Use
5. Disaster Risk Sensitive Urban Planning
65
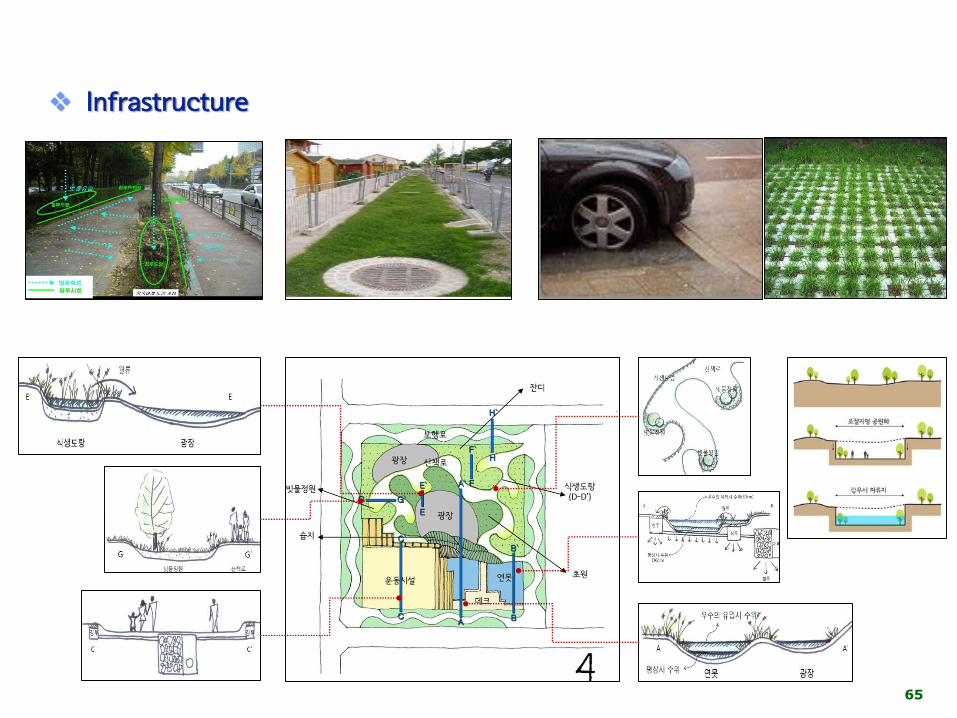
Infrastructure
66
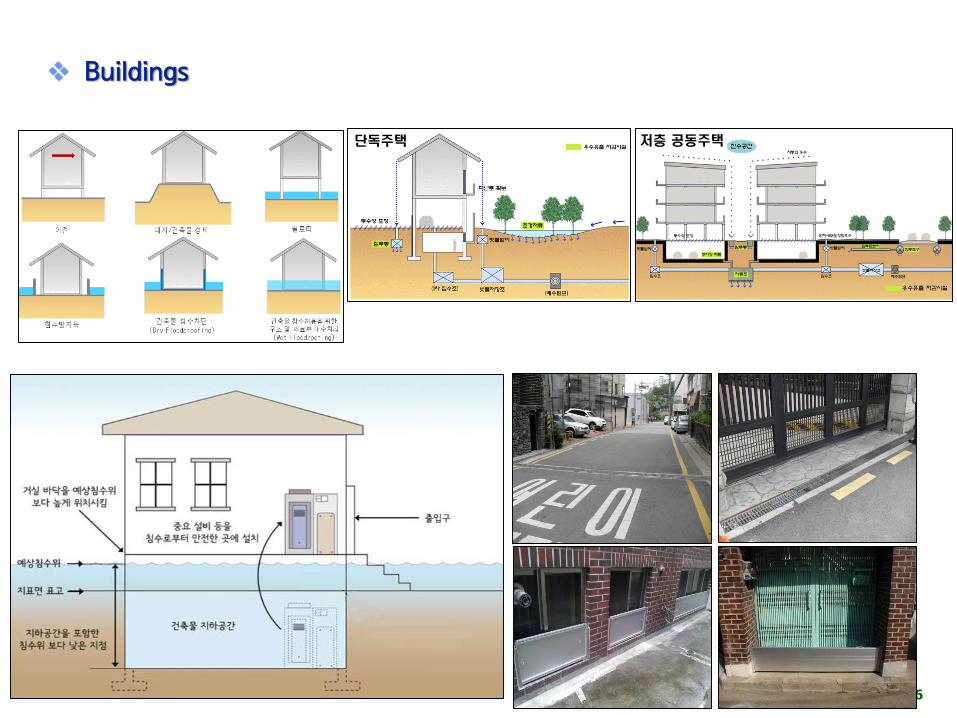
단독주택 저층 공동주택
Buildings
67
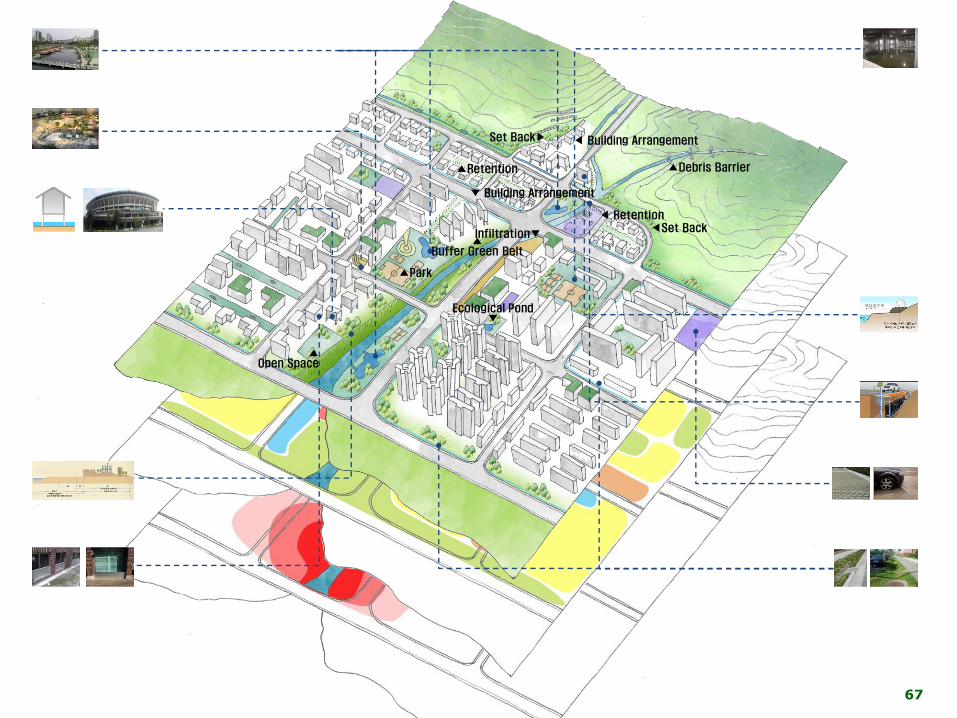
▲Debris Barrier
Infiltration▼◀Set Back
Set Back▶
▲Park
Ecological Pond▼
▲Open Space
▲Retention
◀ Retention
▼ Building Arrangement
▲Buffer Green Belt
예상침수위
◀ Building Arrangement
Ⅳ. Urban Disaster Prevention
Policies and Practices in Korea
69
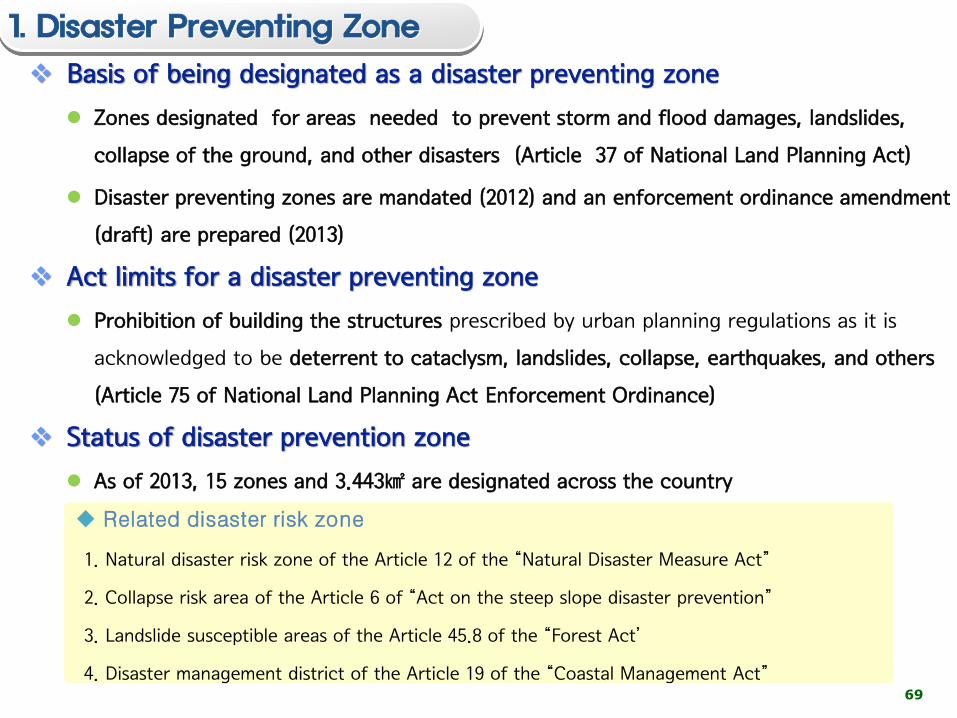
Related disaster risk zone
1. Natural disaster risk zone of the Article 12 of the “Natural Disaster Measure Act”
2. Collapse risk area of the Article 6 of “Act on the steep slope disaster prevention”
3. Landslide susceptible areas of the Article 45.8 of the “Forest Act’
4. Disaster management district of the Article 19 of the “Coastal Management Act”
Basis of being designated as a disaster preventing zone
Zones designated for areas needed to prevent storm and flood damages, landslides,
collapse of the ground, and other disasters (Article 37 of National Land Planning Act)
Disaster preventing zones are mandated (2012) and an enforcement ordinance amendment
(draft) are prepared (2013)
Act limits for a disaster preventing zone
Prohibition of building the structures prescribed by urban planning regulations as it is
acknowledged to be deterrent to cataclysm, landslides, collapse, earthquakes, and others
(Article 75 of National Land Planning Act Enforcement Ordinance)
Status of disaster prevention zone
As of 2013, 15 zones and 3.443㎢ are designated across the country
1. Disaster Preventing Zone
70
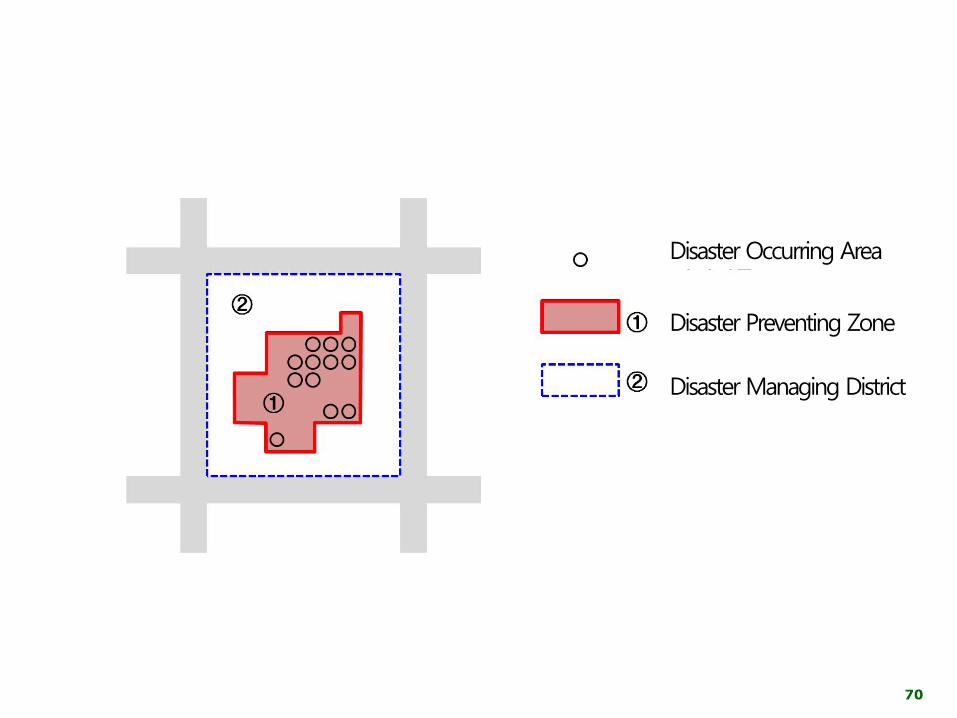
Disaster Occurring Area
Disaster Preventing Zone
Disaster Managing District
71
72
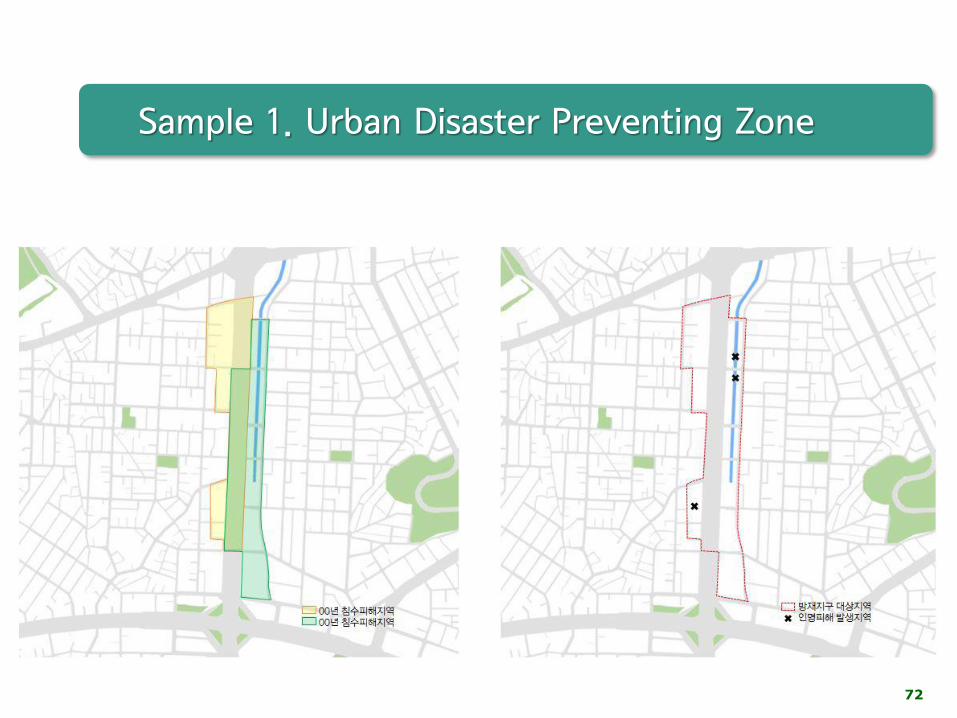
Sample 1. Urban Disaster Preventing Zone
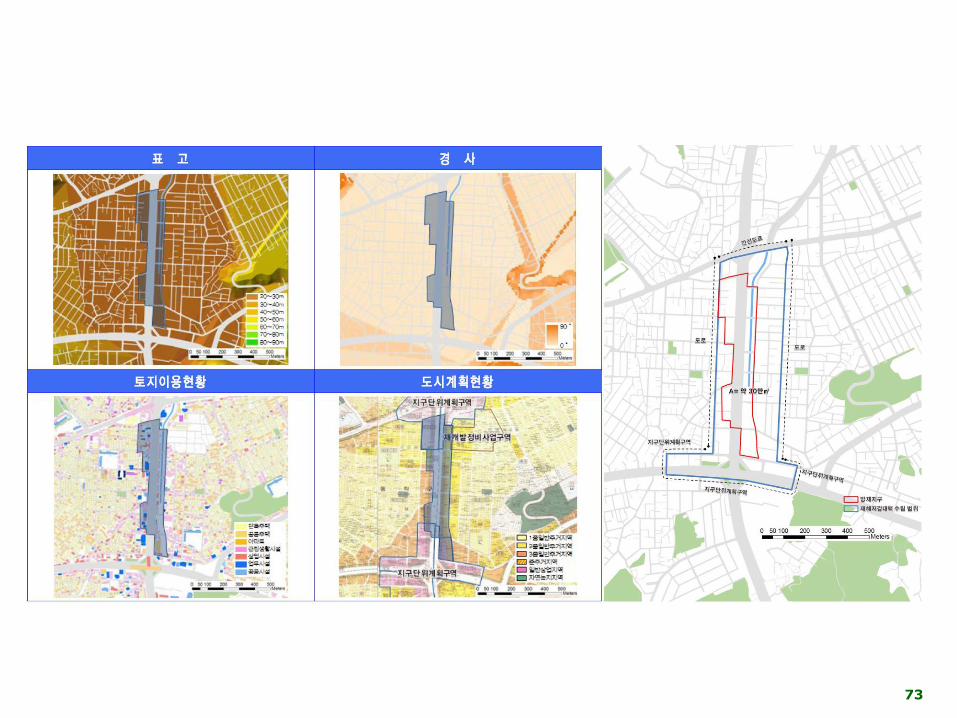
73
74
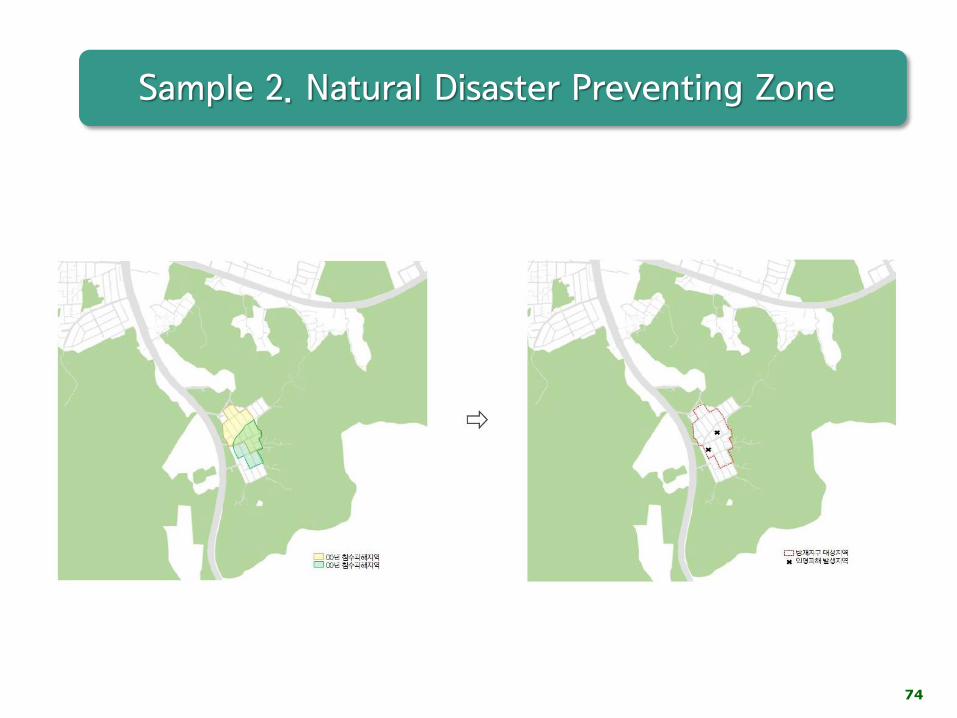
Sample 2. Natural Disaster Preventing Zone
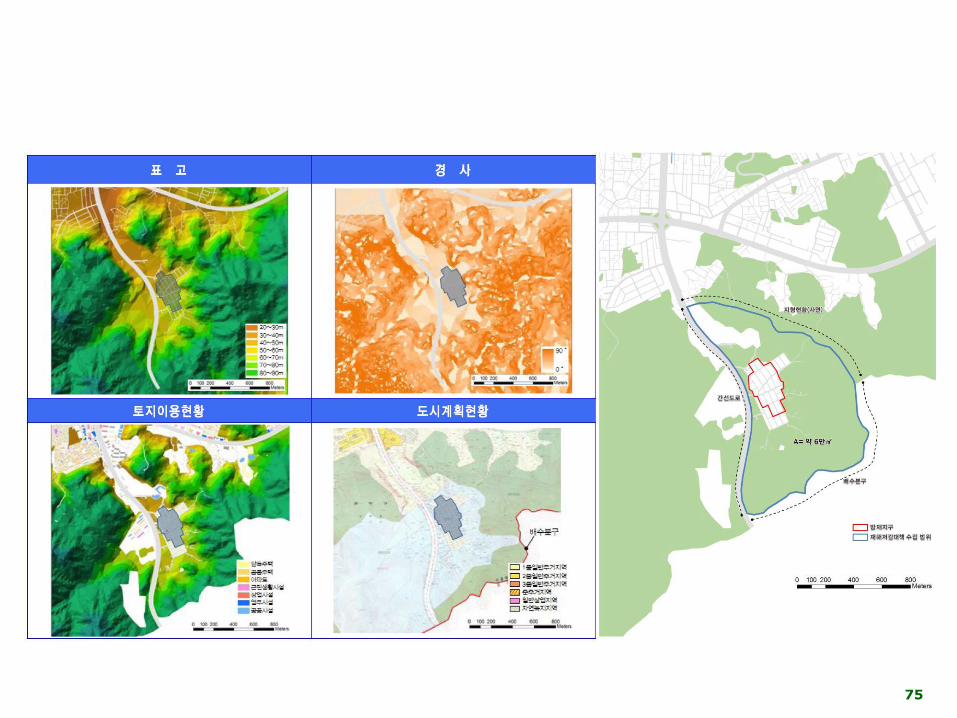
75
76
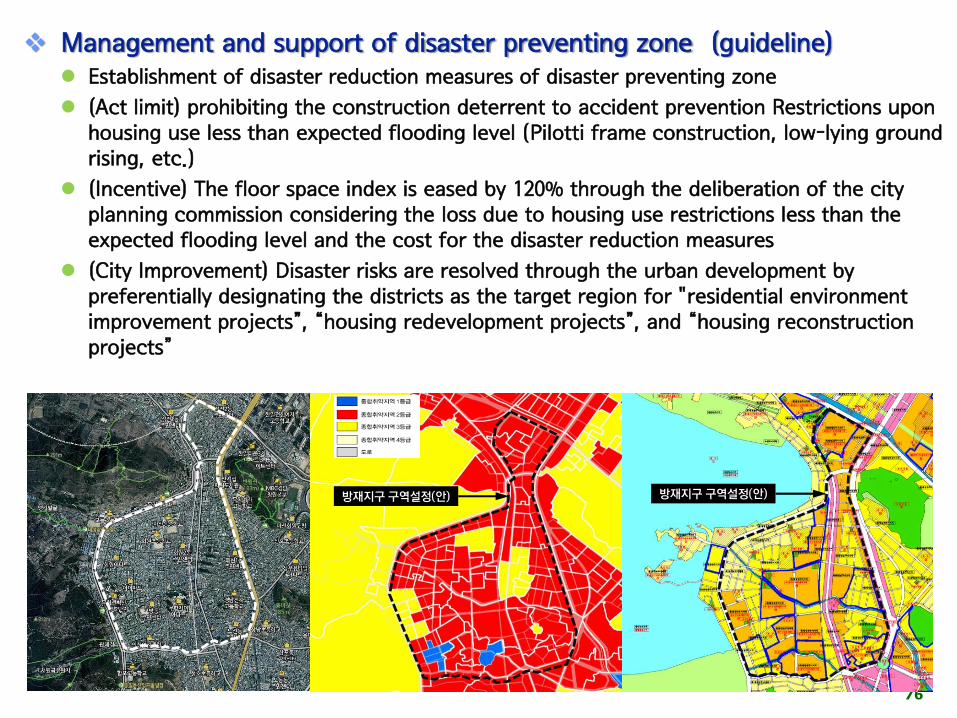
Management and support of disaster preventing zone (guideline) Establishment of disaster reduction measures of disaster preventing zone
(Act limit) prohibiting the construction deterrent to accident prevention Restrictions upon housing use less than expected flooding level (Pilotti frame construction, low-lying ground rising, etc.)
(Incentive) The floor space index is eased by 120% through the deliberation of the city planning commission considering the loss due to housing use restrictions less than the expected flooding level and the cost for the disaster reduction measures
(City Improvement) Disaster risks are resolved through the urban development by preferentially designating the districts as the target region for "residential environment improvement projects”, “housing redevelopment projects”, and “housing reconstruction projects”
방재지구구역설정(안)방재지구구역설정(안)
77
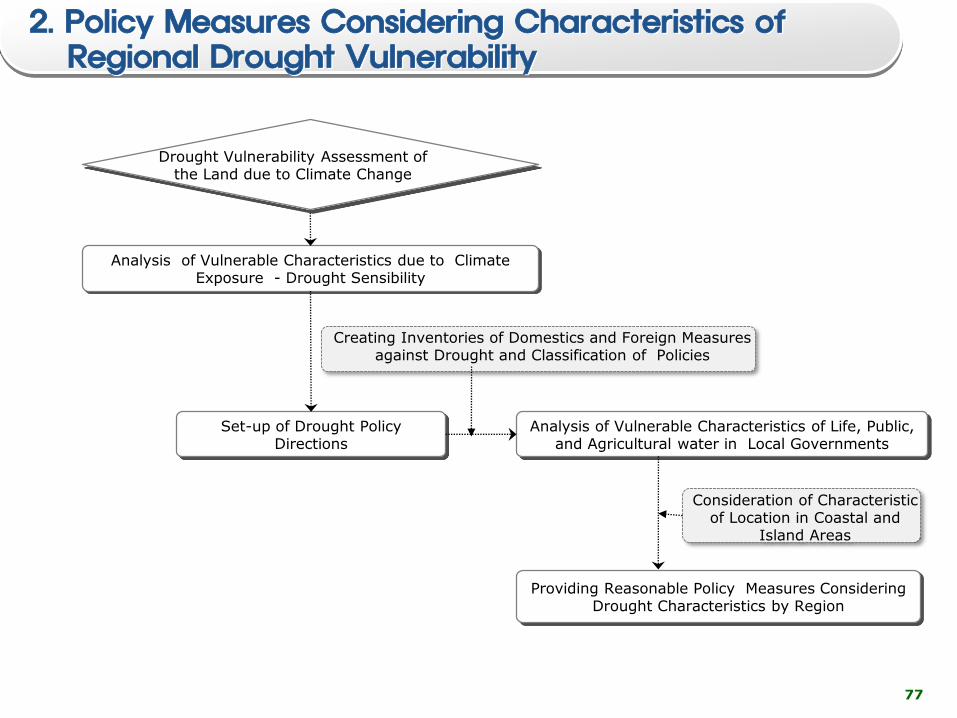
2. Policy Measures Considering Characteristics of Regional Drought Vulnerability
Analysis of Vulnerable Characteristics due to Climate Exposure - Drought Sensibility
Set-up of Drought Policy Directions
Analysis of Vulnerable Characteristics of Life, Public, and Agricultural water in Local Governments
Consideration of Characteristic of Location in Coastal and
Island Areas
Providing Reasonable Policy Measures Considering Drought Characteristics by Region
Creating Inventories of Domestics and Foreign Measures against Drought and Classification of Policies
Drought Vulnerability Assessment of the Land due to Climate Change
78
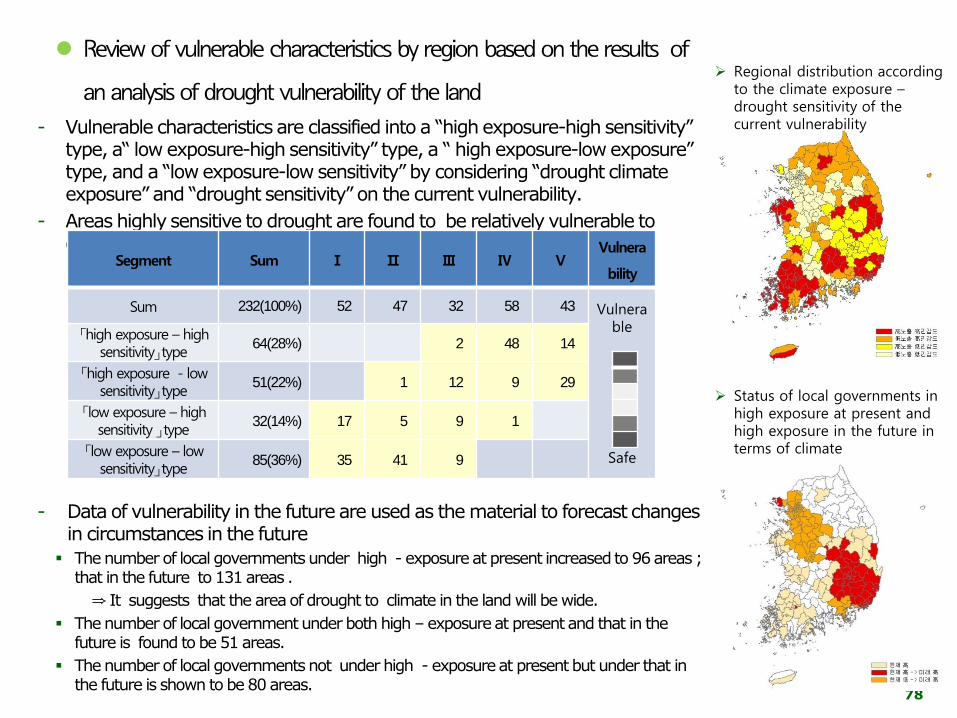
Regional distribution according to the climate exposure –drought sensitivity of the current vulnerability
Status of local governments in high exposure at present and high exposure in the future in terms of climate
Review of vulnerable characteristics by region based on the results of
an analysis of drought vulnerability of the land
- Vulnerable characteristics are classified into a “high exposure-high sensitivity” type, a“ low exposure-high sensitivity” type, a “ high exposure-low exposure” type, and a “low exposure-low sensitivity” by considering “drought climate exposure” and “drought sensitivity” on the current vulnerability.
- Areas highly sensitive to drought are found to be relatively vulnerable to drought.
- Data of vulnerability in the future are used as the material to forecast changes in circumstances in the future
The number of local governments under high - exposure at present increased to 96 areas ; that in the future to 131 areas .
⇒ It suggests that the area of drought to climate in the land will be wide.
The number of local government under both high – exposure at present and that in the future is found to be 51 areas.
The number of local governments not under high - exposure at present but under that in the future is shown to be 80 areas.
Segment Sum Ⅰ Ⅱ Ⅲ Ⅳ ⅤVulnera
bility
Sum 232(100%) 52 47 32 58 43 Vulnerable
Safe
「high exposure – high sensitivity」type
64(28%) 2 48 14
「high exposure - low sensitivity」type
51(22%) 1 12 9 29
「low exposure – high sensitivity 」type
32(14%) 17 5 9 1
「low exposure – low sensitivity」type
85(36%) 35 41 9
79
Policy direction considering drought vulnerability according to climate
change by region
- 「high exposure– high sensitivity 」type,「low exposure - high sensitivity」type
⇒ Structure – related drought response systems to be preferentially established due to the high
drought sensitivity.
Establishment of wide-area water supply system, improving a water supply rate, new
development of new environment-friendly small dams and reservoirs, etc.
- 「high exposure - low sentivity」 type
⇒ Focused on lowering the urban temperature or establishing sound water circulations systems by
improving the efficiency of the existing systems and being linked to spatial planning
Improvement of multipurpose dam operating systems, integrated management of groundwater
and surface water, water demand management, construction of green networks such as parks,
green spaces, etc.
- 「low exposure – low sensitivity 」type
⇒ Focused on the practice of water demand management
※ Areas under high exposure to climate in the future
⇒ It is required to establish continuous monitoring systems, as the impact on drought will increase.
※ Areas turning into high exposure in the future from low exposure at present.
⇒ It is needed to reduce the impact of climate change through monitoring and spatial planning.
80
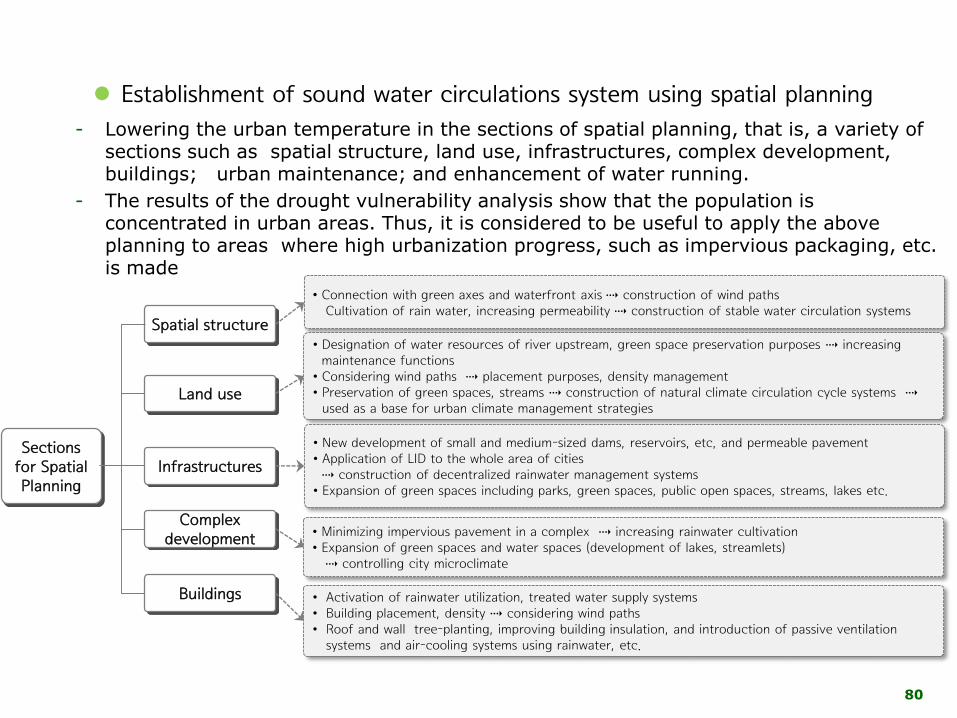
• Connection with green axes and waterfront axis ⇢ construction of wind pathsCultivation of rain water, increasing permeability ⇢ construction of stable water circulation systems
• Designation of water resources of river upstream, green space preservation purposes ⇢ increasing maintenance functions
• Considering wind paths ⇢ placement purposes, density management • Preservation of green spaces, streams ⇢ construction of natural climate circulation cycle systems ⇢
used as a base for urban climate management strategies
• New development of small and medium-sized dams, reservoirs, etc, and permeable pavement • Application of LID to the whole area of cities⇢ construction of decentralized rainwater management systems
• Expansion of green spaces including parks, green spaces, public open spaces, streams, lakes etc.
• Minimizing impervious pavement in a complex ⇢ increasing rainwater cultivation • Expansion of green spaces and water spaces (development of lakes, streamlets)
⇢ controlling city microclimate
• Activation of rainwater utilization, treated water supply systems• Building placement, density ⇢ considering wind paths• Roof and wall tree-planting, improving building insulation, and introduction of passive ventilation
systems and air-cooling systems using rainwater, etc.
Spatial structure
Land use
Infrastructures
Complex development
Buildings
Sections for Spatial Planning
Establishment of sound water circulations system using spatial planning
- Lowering the urban temperature in the sections of spatial planning, that is, a variety of sections such as spatial structure, land use, infrastructures, complex development, buildings; urban maintenance; and enhancement of water running.
- The results of the drought vulnerability analysis show that the population is concentrated in urban areas. Thus, it is considered to be useful to apply the above planning to areas where high urbanization progress, such as impervious packaging, etc. is made
81
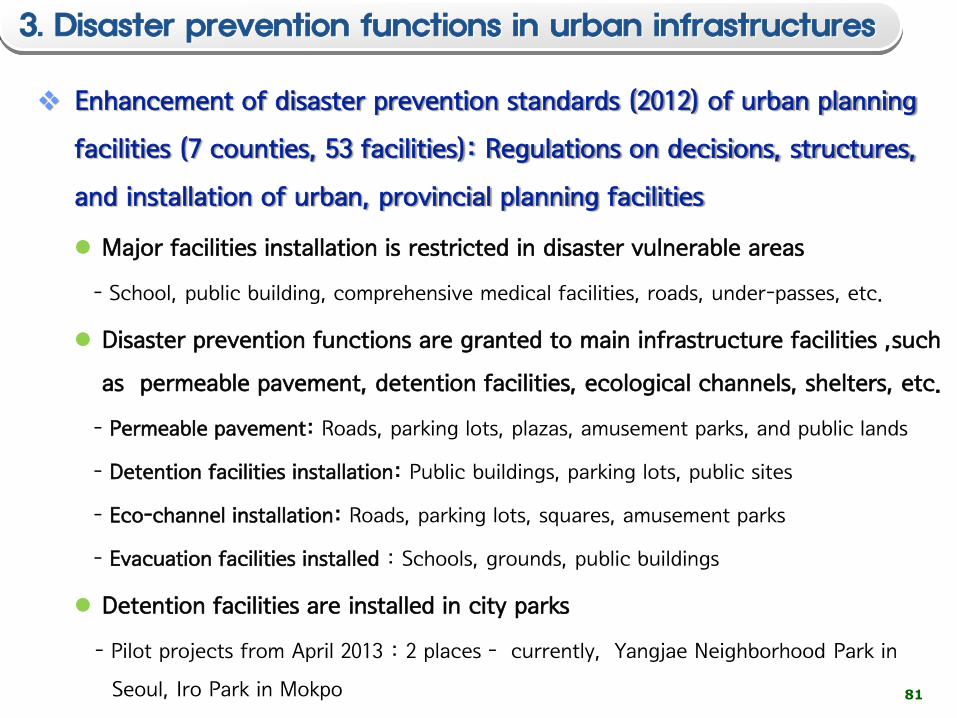
Enhancement of disaster prevention standards (2012) of urban planning
facilities (7 counties, 53 facilities): Regulations on decisions, structures,
and installation of urban, provincial planning facilities
Major facilities installation is restricted in disaster vulnerable areas
- School, public building, comprehensive medical facilities, roads, under-passes, etc.
Disaster prevention functions are granted to main infrastructure facilities ,such
as permeable pavement, detention facilities, ecological channels, shelters, etc.
- Permeable pavement: Roads, parking lots, plazas, amusement parks, and public lands
- Detention facilities installation: Public buildings, parking lots, public sites
- Eco-channel installation: Roads, parking lots, squares, amusement parks
- Evacuation facilities installed : Schools, grounds, public buildings
Detention facilities are installed in city parks
- Pilot projects from April 2013 : 2 places - currently, Yangjae Neighborhood Park in
Seoul, Iro Park in Mokpo
3. Disaster prevention functions in urban infrastructures
82
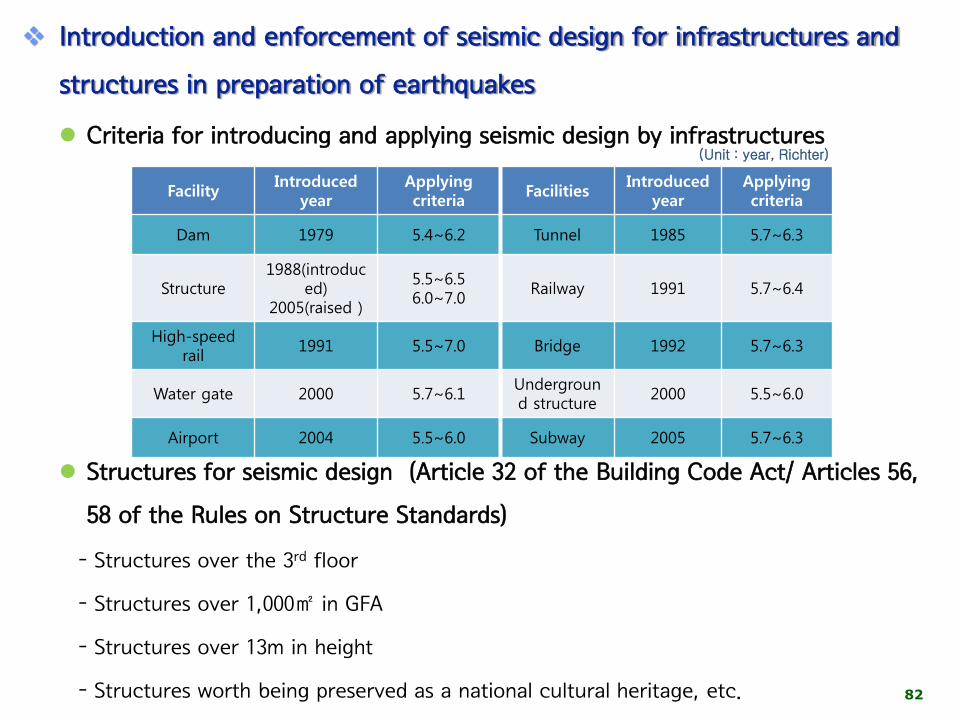
Introduction and enforcement of seismic design for infrastructures and
structures in preparation of earthquakes
Criteria for introducing and applying seismic design by infrastructures
Structures for seismic design (Article 32 of the Building Code Act/ Articles 56,
58 of the Rules on Structure Standards)
- Structures over the 3rd floor
- Structures over 1,000㎡ in GFA
- Structures over 13m in height
- Structures worth being preserved as a national cultural heritage, etc.
FacilityIntroduced
year Applying criteria
Facilities Introduced
yearApplying criteria
Dam 1979 5.4~6.2 Tunnel 1985 5.7~6.3
Structure1988(introduc
ed)2005(raised )
5.5~6.56.0~7.0
Railway 1991 5.7~6.4
High-speed rail
1991 5.5~7.0 Bridge 1992 5.7~6.3
Water gate 2000 5.7~6.1Underground structure
2000 5.5~6.0
Airport 2004 5.5~6.0 Subway 2005 5.7~6.3
(Unit : year, Richter)
83
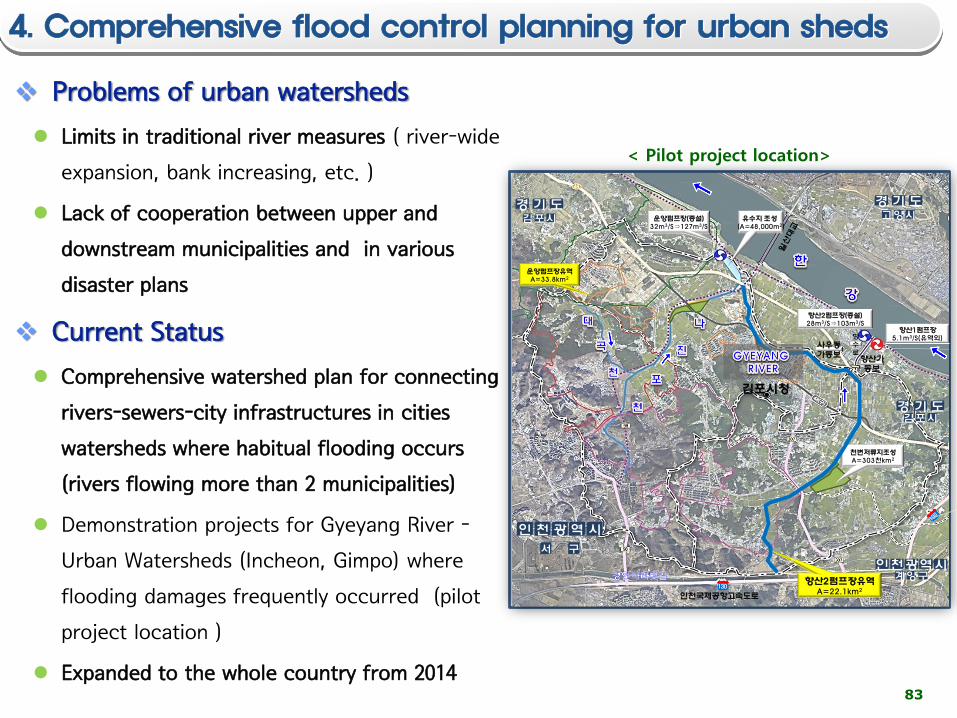
Problems of urban watersheds
Limits in traditional river measures ( river-wide
expansion, bank increasing, etc. )
Lack of cooperation between upper and
downstream municipalities and in various
disaster plans
Current Status
Comprehensive watershed plan for connecting
rivers-sewers-city infrastructures in cities
watersheds where habitual flooding occurs
(rivers flowing more than 2 municipalities)
Demonstration projects for Gyeyang River -
Urban Watersheds (Incheon, Gimpo) where
flooding damages frequently occurred (pilot
project location )
Expanded to the whole country from 2014
< Pilot project location>
김포시청
경 기 도고양시
경 기 도김포시
천 광 역
서 구
인 시
천광역계양구
인 시
경 기 도김포시
운양펌프장유역A=33.8km2
인천국제공항고속도로
운양펌프장(증설)32m3/S⇒127m3/S
향산2펌프장(증설)28m3/S⇒103m3/S
향산1펌프장5.1m3/S(유역외)
유수지 조성(A=48,000m2)
향산2펌프장유역A=22.1km2
사우동가동보
향산가동보
방수로
천변저류지조성A=303천km2
4. Comprehensive flood control planning for urban sheds
84
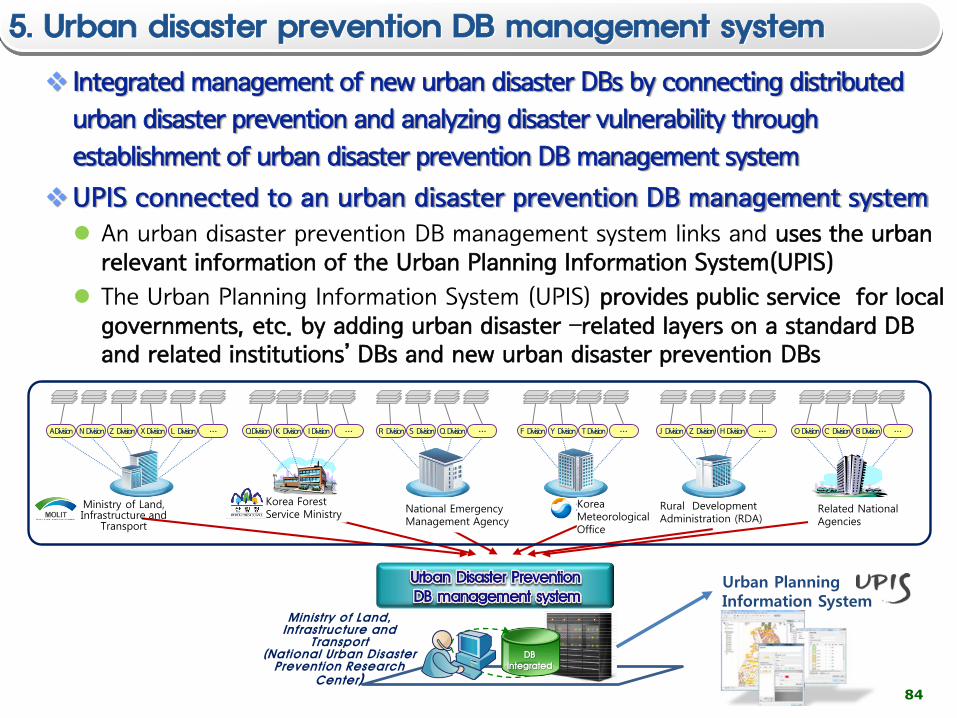
Integrated management of new urban disaster DBs by connecting distributed
urban disaster prevention and analyzing disaster vulnerability through
establishment of urban disaster prevention DB management system
UPIS connected to an urban disaster prevention DB management system
An urban disaster prevention DB management system links and uses the urban relevant information of the Urban Planning Information System(UPIS)
The Urban Planning Information System (UPIS) provides public service for local governments, etc. by adding urban disaster –related layers on a standard DB and related institutions’ DBs and new urban disaster prevention DBs
DB Integrated
Ministry of Land, Infrastructure and
Transport(National Urban Disaster
Prevention Research Center)
N Division Z Division X Division L DivisionA Division … F Division Y Division T Division … J Division Z Division H Division …R Division S Division Q Division … O Division C Division B Division …
관련 국가기관
QDivision K Division I Division …
Ministry of Land, Infrastructure and
Transport
Korea Forest Service Ministry
National Emergency Management Agency
Korea Meteorological Office
Rural Development Administration (RDA)
Related National Agencies
Urban Planning Information System
5. Urban disaster prevention DB management system

2019 KOICA-UN ESCAP Capacity Building on Drought Monitoring and Early Warning
Q & A

2019 KOICA-UN ESCAP Capacity Building on Drought Monitoring and Early Warning
THANK YOU!