Embed Size (px)
Citation preview

CanadianAssociationon Gerontology
Associationcanadiennede gérontologie
PUBLISHED BY/ PUBLIÉE PAR
Volume / volume 24 Supplement / supplément 1, 2005
CANADIANJOURNALONAGING
LA REVUE CANADIENNEDUVIEILLISSEMENT
Health and Health Care Use Among OlderAdults: Using Population-Based InformationSystems to Inform Policy in Manitoba
Les soins de santé et leur utilization par lesaînés: L’utilisation de systèmes d’informa-tion fondés sur la santé de la populationpour guider l’élaboration de politiques auManitoba
CANADIAN JOURNAL ON AGING / LA REVUE CANADIENNE DU VIEILLISSEMENTEDITORIAL BOARD / COMITE DE REDACTION
Editor-in-Chief/Redacteur en chefMark Rosenberg, Queen’s University
Managing Editor/EditriceAnne Marie Corrigan, University of Toronto Press
Health Sciences and Biological Sciences/Sciences de la sante et sciences biologiques Psychology/PsychologieCarole Cohen, University of Toronto Thomas Hadjistavropoulos, University of ReginaSocial Policy and Practice/Politiques et pratiques sociales Norm O’Rourke, Simon Fraser University at Harbour CentreDaniel W.L. Lai, University of Calgary Social Sciences/Sciences socialesEducational Gerontology/Gerontologie educative Ingrid Arnet Connidis, University of Western OntarioElaine Gallagher, University of Victoria Book Reviews/Comptes rendus
Lucie Richard, Universite de Montreal
The Canadian Journal on Aging is a refereed, quarterly publication of the Canadian Association on Gerontology. It publishes manuscripts on aging concerned withbiology, educational gerontology, health sciences, psychology, social sciences, and social policy and practice. Acceptance or rejection of manuscripts will be on therecommendation of Editors representing the five divisions of the CAG, in consultation with reviewers. Normally, two or more reviewers, in addition to the Editors,will review the manuscript. The Canadian Association on Gerontology and the Editors accept no responsibility for views and statements of the authors.
The journal is currently indexed and abstracted in / Les articles sont resumes et indexes clans Abstracts in Social Gerontology, AgeInfo CD-ROM, Ageline, AustralasianMedical Index, Bibliographic internationale de la litterature periodique, Bibliographie internationale des recensions, Canadian Periodical Index, Current Index to Journals inEducation, EMBASE/ Excerpta Medica, Index to Periodical Literature on Aging, Index de Periodiques canadiens, International Bibliography of Book Reviews, InternationalBibliography of Periodical Literature, New Literature on Old Age, PAIS Bulletin, Psychological Abstracts, Science Culture, Social Work Research and Abstracts, SociologicalAbstracts, Social Sciences Citation Index and Current Contents, Social and Behavioural Sciences.
La Revue canadienne du vieillissement, revue trimestrielle dotee d’un comite de lecture; est l’organe de 1’Association canadienne de gerontologie. La revue publiedes articles sur le vieillissement clans les disciplines suivantes: biologie, gerontologie educative, sciences de la sante, psychologie, sciences sociales et politiques etpratiques sociales. Les manuscrits sent acceptes ou refuses sur la recommandation des redacteurs representant chacune des cinq sections de 1’ACG, et apresconsultation avec les membres du comite de lecture. Les manuscrits sont normalement soumis a l’approbation des redacteurs et de deux lecteurs ou plus. Lesopinions exprimees dans la revue n’engagent que leurs auteurs.
Published quarterly by Revue trimestrielle publiee parthe Canadian Association on Gerontology l’Association canadienne de gerontologieMembers of CAG, membership $135.00 Membres de 1’ACG, inscription 135.00 $(www.cagacg.ca) includes $40 for the Journal (www.cagacg.ca) dont 40 $ pour la RevueAnnual Subscription: (þ7% GST) Abonnement annuel: (þ7% TPS)Canada / Outside Canada (US dollars) Canada / EU et autre pays (US$)Individuals $55.00 Personnel 55.00 $(Payable by personal cheque, VISA, MC, and AMEX) (Payer seulement par cheque personnel, VISA, MC, et AMEX)Students $30.00 Etudiants 30.00 $Institutions $85.00 Institutions 85.00 $Single Copy $25.00 Prix de 1’exemplaire 25.00 $
Correspondence/Correspondance Orders, Advertising/Abonnements, PubliciteAddress all correspondence concerning Address all correspondence concerning subscriptions,editorial matters to:/Priere d’adresser toute reprints, back issues, advertising to:/Priere d’adressercorrespondance concernant le contenu de la revue toute correspondance concernant les abonnements,(manuscrits, comptes rendus, etc.) a: tires a part, numeros deja parus, ainsi que la publicite a:
Mark Rosenberg, CJA/RCV CJA/RCVEditor-in-Chief, Canadian Journal on Aging Redacteur en chef de la Revue canadienne du vieillissementDepartment of Geography Department of GeographyQueen’s University Universite Queen’sKingston, ON K7L 3N6 Kingston ON K7L 3N6E-Mail/Courriel: [email protected] E-Mail/Courriel [email protected]
Copyright: Canadian Association on Gerontology. All correspondence relating to reprinting articles should be addressed to the Business Office./Droit d’auteur:l’Association canadienne de gerontologie. Toute correspondance ayant trait aux reimpressions des articles doit etre adressee au Bureau de redaction.
CANADIAN POSTMASTER: Send address changes to:Name of the journal Canadian Journal on Aging University of Toronto Press Inc.Publication Mail Agreement Number 40010098 5201 Dufferin Street, Toronto, ON M3H5T8
PAP Registration Number 09457/PAP enregistrement no. 09457. We acknowledge the financial assistance of the Government of Canada, through the PublicationsAssistance Program (PAP), toward our mailing costs./Nous reconnaissons l’aide financiere du gouvernement du Canada, par l’entremise du Programme d’aide auxpublications (PAP), pour nos depenses d’envoi postal. Supported in part by grants from the Social Sciences and Humanities Research Council of Canada and theCanadian Institutes of Health Institute of Aging/ Revue subventionnee par le Conseil de recherches en sciences humaines du Canada et l’Institut du vieillissementdes Instituts de recherche en sante du Canada.
SUPPLEMENT/SUPPLEMENT 1, 2005 ISSN 0714-9808

CANADIAN JOURNAL ON AGINGLA REVUE CANADIENNE DU VIEILISSEMENT
Volume 24 Supplement 1 Spring/printemps 2005 volume 24 supplement 1
Contents/Sommaire
This issue is dedicated to Betty Havens, who died on March 1, 2005
Articles
IntroductionVerena H. Menec 1
Trends in the Health Status of Older Manitobans, 1985 to 1999Verena H. Menec, Lisa Lix, and Leonard MacWilliam 5
Trends in the Utilization of Specific Health Care Services among Older Manitobans:1985 to 2000Marcia Finlayson, Lisa Lix, Gregory S. Finlayson, and Terry Fong 15
Use of Physician Services by Older Adults: 1991/1992 to 2000/2001Diane E. Watson, Petra Heppner, Robert Reid, Bogdan Bogdanovic, and Noralou Roos 29
Growing Old Together: The Influence of Population and Workforce Aging on Supply andUse of Family PhysiciansDiane E. Watson, Robert Reid, Noralou Roos, and Petra Heppner 37
Non-Clinical Factors Associated with Variation in Cataract Surgery Waiting Timesin ManitobaCarolyn De Coster 47
Patterns in Home Care Use in ManitobaLori Mitchell, Noralou P. Roos, and Evelyn Shapiro 59
Regional Variation in Home Care Use in ManitobaSandra Peterson, Evelyn Shapiro, and Noralou P. Roos 69
Pharmaceutical Use among Older Adults: Using Administrative Data to ExamineMedication-Related IssuesColleen Metge, Ruby Grymonpre, Matthew Dahl, and Marina Yogendran 81
Use of Acute Care Hospitals by Long-Stay Patients: Who, How Much, and Why?Carolyn De Coster, Sharon Bruce, and Anita Kozyrskyj 97
Discharge Outcomes in Seniors Hospitalized for More than 30 DaysAnita Kozyrskyj, Charlyn Black, Dan Chateau, and Carmen Steinbach 107
Exploring Reasons for Bed Pressures in Winnipeg Acute Care HospitalsVerena H. Menec, Sharon Bruce, and Leonard MacWilliam 121

Anticipating Change: How Many Acute Care Hospital Beds Will ManitobaRegions Need in 2020?Gregory S. Finlayson, David Stewart, Robert B. Tate, Leonard MacWilliam,and Noralou Roos 133
A Methodology for Estimating Hospital Bed Need in Manitoba in 2020Robert B. Tate, Leonard MacWilliam, and Gregory S. Finlayson 141
Data Quality in an Information-Rich Environment: Canada as an ExampleLeslie L. Roos, Sumit Gupta, Ruth-Ann Soodeen, and Laurel Jebamani 153
CommentaryBetty Havens 171

Introduction
Verena H. Menec, Guest Editor
University of Manitoba
That the population is aging is a well-known fact, andmuch has been written about the potential impact thismight have on the health care system and society as awhole. It is therefore becoming increasingly importantto have an understanding of trends in health andhealth care use, as well as factors related to them – allin an attempt to inform policy decisions that haveimplications for current and future cohorts of seniors.
The papers in this special issue all examine health andhealth care use among older adults in Manitoba. Likethe other provinces and territories, Manitoba has seena steady increase in the proportion of seniors, with theproportion of adults aged 65 or over increasing from11.9 per cent in 1981 to 13.5 per cent in 2001. Manitobacurrently ranks second among the provinces andterritories in the proportion of older adults; onlySaskatchewan has a higher proportion. As is the casefor the other provinces, the proportion of older adultsis expected to rise substantially in the next 20 years inManitoba. Thus while the papers in this special issuefocus on Manitoba’s seniors, the research clearly hasimplications beyond Manitoba’s borders, as research-ers and policy makers across the country grapple withsimilar issues related to the implications that theaging population will have on the health care systemand society.
Besides their focus on health and health care use,another common theme of the papers in this specialissue is that they are all based on work by researchersat the Manitoba Centre for Health Policy (MCHP), auniversity-based research unit within the Departmentof Community Health Sciences at the University ofManitoba. Most of the papers come out of reports thatMCHP conducted as part of its contract with theprovincial Health Ministry. Each year, MCHP con-ducts five major reports for the ministry, with thetopics being identified in discussion with policymakers.
The research is built around the extensive andwell-developed administrative data available inManitoba, the Population Health Research DataRepository, which is housed at MCHP (see http://www.umanitoba.ca/centres/mchp for further infor-mation). Administrative data are data that arecollected not for research purposes specifically, but
rather as part of administering the health caresystem. For example, each time a patient sees aphysician, a claim is filed by the physician with theprovincial Health Ministry for reimbursement.Similarly, each hospitalization is recorded on ahospital discharge abstract. Administrative datafiles, therefore, contain virtually complete recordsof encounters with the publicly funded health caresystem in Manitoba. The Population Health ResearchData Repository contains a wide range of data,including hospital, physician, and nursing homefiles, as well as the population registry. Morerecently, home care data and prescription drug datahave been added to the repository. Public accessCensus data can be linked to these data to allowexamination of potential socio-economic differentialsin health and health care use.
A strength of these data is that they are population-based, which means that virtually the entire popula-tion of Manitoba – or senior population as the casemay be – can be included in studies. Moreover, theyallow examination of trends over time (papers in thisissue extend over as many as 15 years) and space (e.g.,across regional health authorities). Are recent cohortsof seniors healthier than the previous cohorts? Howdoes the changing age structure of the population andphysician workforce relate to physician visits? Doeshome care use vary across regional health authorities?How many hospital beds will be needed in differentregions of Manitoba in 2020? These are just some ofthe questions that are addressed in this issue, usingthe repository.
Repository data are supplemented in three papers byadditional sources of information to allow moredetailed examination of specific issues. The additionof the Cataract Surgery Waiting List Registry allowsexamination of waiting times for cataract surgery. Itillustrates the rich data environment that can becreated by linking clinical databases to administrativedata. Actual reviews of patient hospital charts providea fuller picture of hospital use in two papers – inthis case, appropriateness of hospital admissions andstays – than is possible using administrative dataalone. It is another example of how administrativedata can usefully be supplemented by other sourcesof data.
Canadian Journal on Aging / La Revue canadienne du viellissement 24 (Suppl. 1) : 1 - 2

The papers in this special issue cover a broad rangeof topics – from trends in health status and selectsurgical procedures, such as knee and hip replace-ments, to trends in family physician use and homecare use, to predictors of cataract waiting times, tocase studies illustrating the use of the prescriptiondrug data. Several papers focus on hospital use,including an examination of long-stay patients –those in hospital more than 30 days – and the factorsthat predict discharge outcome, as well as some ofthe reasons for winter bed pressures in acute carehospitals. Two companion papers project into thefuture, addressing the question of the number ofacute care beds needed in 2020; one paper presentsthe results, the second in detail the methodologyused to derive projection estimates. Last, the issueconcludes with a review paper on the quality ofadministrative data.
Together, the papers identify areas that policy makersin Manitoba and elsewhere should pay attention to,such as the implications of an aging family physicianworkforce, and ways to ensure that patients who donot require acute care can be discharged to alternativelevels of care in a timely manner, to name just two,as well as areas where the system appears to beworking, as evidenced by the lack of regionalvariation in home care use, for instance. These areimportant conclusions that an information-rich envi-ronment makes possible, which have implications forpolicy decisions in Manitoba and can inform policy inother jurisdictions.
The peer review process for all the manuscriptsin this issue was handled by the CanadianJournal on Aging’s former Editor-in-Chief,Carolyn J. Rosenthal
2 Canadian Journal on Aging 24 (Suppl. 1) V. H. Menec

Introduction
Verena H. Menec, Redactrice d‘invitee
Universite du Manitoba
Le vieillissement de la population est un fait bienconnu et ses retombees sur le systeme de sante enparticulier, et la societe en general, ont fait coulerbeaucoup d’encre. Il est donc de plus en plusimportant de savoir interpreter les tendances enmatiere de sante et d’utilisation des services desante et les facteurs connexes, si l’on veut faciliterl’elaboration des politiques qui auront des repercus-sions sur les cohortes actuelles et futures de personnesagees.
Les articles retrouves dans ce numero special traitenttous de la question de la sante et de l’utilisation desservices de sante chez les aınes manitobains. Commedans les autres provinces et territoires, le nombrede personnes agees augmente regulierement auManitoba ; le pourcentage d’adultes de 65 ans etplus est passe de 11,9% en 1981 a 13,5% en 2001. LeManitoba est, apres la Saskatchewan, la provincecanadienne ayant le plus fort pourcentage d’aıneset, comme dans les autres provinces et territoires,on s’attend a ce que leur nombre augmente defacon notable au cours des vingt prochaines annees.Les articles presentes ici sont axes sur les aınesmanitobains, mais il est clair que la recherche a desimplications qui depassent les limites du Manitoba.Les chercheurs et les decideurs des quatre coins dupays sont aux prises avec les memes questions lieesaux retombees du vieillissement de la population surle systeme de sante et la societe.
En plus d’examiner la question de la sante etl’utilisation des services de sante, tous les articlessont le resultat de travaux effectues par des cherch-eurs du Manitoba Centre for Health Policy (MCHP),une unite de recherche universitaire du Departmentof Community Health Sciences de l’Universite duManitoba. La plupart des articles sont tires derapports soumis par le MCHP dans le cadre de soncontrat avec le ministere de la Sante provincial.Chaque annee, le MCHP prepare cinq grands rap-ports pour le ministere, les sujets etant choisis aucours de discussions avec les decideurs.
La recherche s’articule autour des nombreuses don-nees administratives bien documentees disponiblesau Manitoba, soit le Population Health Research DataRepository (une base de donnees centrale) qui se
trouve au MCHP (pour de plus amples renseigne-ments, consultez le site : <http://www.umanitoba.ca/centres/mchp>). Les donnees administratives sontdes donnees qui ne sont pas recueillies exclusivementa des fins de recherche, mais plutot dans le cadre de lagestion du systeme de sante. Ainsi, chaque fois qu’unpatient consulte un medecin, ce dernier remplit unedemande de reglement qu’il transmet au ministere dela Sante provincial. De meme, chaque hospitalisationest enregistree dans une base de donnees une fois leconge d’hopital recu par le patient. Les banques dedonnees administratives contiennent donc le registrequasi-integral des activites du systeme de sante publicdu Manitoba. Le Population Health Research DataRepository contient une multitude de donnees, parmilesquelles les dossiers des hopitaux, des medecins etdes maisons de soins infirmiers, ainsi que le registrede la population. Recemment, on y a ajoute lesdonnees sur les soins a domicile et les medicamentsd’ordonnance. En reliant les donnees publiques derecensement a ces donnees, on peut etudier lesfacteurs socio-economiques susceptibles d’influer surla sante et l’utilisation des services de sante.
L’un des grands avantages de ces donnees est qu’ellessont basees sur un echantillon representatif de lapopulation, c’est-a-dire que la quasi-totalite de lapopulation du Manitoba – ou de la population d’aınesselon le cas – peut etre incluse dans les etudes. Quiplus est, elles permettent d’examiner les tendances ala fois dans le temps (certains des articles portent surdes etudes menees sur 15 ans) et dans l’espace (p. ex.,entre autorites sanitaires regionales). Les cohortesrecentes de personnes agees sont-elles en meilleuresante que les precedentes ? En quoi les nouvellestendances du vieillissement de la population et desmedecins en exercice influent-elles sur les consulta-tions medicales ? Utilise-t-on differemment les soins adomicile d’une autorite sanitaire regionale a l’autre ?De combien de lits d’hopitaux aura-t-on besoin dansles differentes regions du Manitoba en 2020 ? Ce nesont la que quelques-unes des questions abordees apartir de la base de donnees centrale.
Dans trois articles, on utilise les donnees de la basecentrale parallelement a d’autres sources d’informa-tion pour examiner plus a fond certaines questions,
Canadian Journal on Aging / La Revue canadienne du viellissement 24 (Suppl. 1) : 3 - 4

comme le registre des delais d’attente pour uneoperation de la cataracte. Ce registre est un bonexemple des possibilites innombrables qu’offrel’association des bases de donnees cliniques a desdonnees administratives. Deux articles se penchentsur les dossiers des hopitaux – et notamment sur lapertinence des admissions et des sejours a l’hopital –et dressent un portrait beaucoup plus precis del’utilisation de ce type de services que ne lepermettrait les seules donnees administratives,preuve que ces donnees peuvent etre avantageuse-ment etayees par d’autres sources d’information.
Les articles publies dans ce numero special couvrentun vaste eventail de sujets : tendances liees a l’etat desante et a certaines interventions chirurgicales,comme les operations du genou ou de la hanche ;tendances en matiere d’utilisation des servicesmedicaux et des soins a domicile ; predire les delaisd’attente pour une operation de la cataracte ; etudesde cas expliquant a quoi servent les donnees sur lesmedicaments d’ordonnance. Plusieurs articles s’inter-essent a l’utilisation des services hospitaliers, notam-ment aux sejours de longue duree – ceux qui durentplus de 30 jours – et aux facteurs permettant deprevoir les resultats de la mise en conge, et explorentcertaines des raisons qui font que le taux d’occupationdes lits de soins actifs est plus eleve pendant les mois
d’hiver. Deux articles complementaires font desprojections sur le nombre de lits de soins actifs donton aura besoin en 2020 ; un article presente lesresultats, l’autre explique en detail la methodologieemployee pour obtenir ces projections. Le numerospecial se termine enfin par une synthese sur laqualite des donnees administratives.
Ensemble, les articles cernent non seulement lesquestions sur lesquelles les decideurs du Manitobaet d’ailleurs devront se pencher (les retombees duvieillissement des medecins de famille en exercice, etles strategies a mettre en place afin que les patientsqui n’ont pas besoin de soins actifs puissent etrerapidement achemines vers d’autres niveaux de soins,par exemple), mais aussi des secteurs ou le systemesemble etre performant, comme en temoigne l’utilisa-tion uniforme des soins a domicile d’une region al’autre. Ces precieuses conclusions, que l’on doit al’abondance des donnees disponibles, seront impor-tantes pour la prise de decisions au Manitoba etl’elaboration de politiques dans d’autres competences.
Les evaluations des articles pour cette numeroont ete coordonnees par Carolyn J. Rosenthal,redactrice en chef de precedente, La Revuecanadienne du vieilissement
4 Canadian Journal on Aging 24 (Suppl. 1) V. H. Menec

Trends in the Health Status ofOlder Manitobans, 1985 to 1999
Verena H. Menec, Lisa Lix, and Leonard MacWilliam
University of Manitoba
RESUMELes tendances relatives a l’etat de sante de toute la population du Manitoba agee de 65 ans ou plus ont ete etudiees surune periode de 14 ans, au moyen de donnees administratives (environ 150 000 personnes). Des gains considerables ensante ont ete observes pour un certain nombre d’indicateurs, notamment du point de vue des infarctus aigus dumyocarde, des accidents cerebraux vasculaires, des cancers et des fractures de la hanche. Cependant, certains de cesgains n’ont ete observes que dans les zones urbaines. Les ameliorations relatives a ces indicateurs de la sante sontimportantes, puisqu’elles peuvent avoir des consequences majeures sur les besoins des personnes en matiere de soinsde sante et sur leur aptitude a vivre de facon autonome. Par contre, la prevalence de maladies chroniques a augmente ;le diabete, l’hypertension et la demence ayant augmente de facon substantielle au cours de la periode de 14 ans. Cestendances laissent supposer qu’il faut mettre l’accent sur les politiques de prevention, afin notamment de reduire laprevalence de l’obesite, qui constitue l’un des facteurs de risque du diabete. Par ailleurs, il faudra se pencher sur laquestion de savoir si l’on dispose de suffisamment d’options en matiere de soins pour le nombre croissant de personnesatteintes de demence.
ABSTRACTTrends in the health status of the entire senior population aged 65 years or older in Manitoba were examined over a14-year period (1985–1999) using administrative data (about 150,000 individuals). Significant health gains wereapparent for a number of important indicators, including acute myocardial infarction, stroke, cancer, and hip fractures,although some of these gains were restricted to urban areas. Improvements in these health indicators are significant, asthey can have major implications for individuals’ need for health services and ability to live independently. In contrast,chronic diseases were on the rise, with the prevalence of diabetes, hypertension, and dementia increasing substantiallyover the 14-year period. These trends suggest a need for a policy emphasis on prevention, such as reducing theprevalence of obesity, which is one risk factor for diabetes. Moreover, having sufficient care options in place for thegrowing number of individuals with dementia is an issue that will have to be addressed.
Manuscript received: / manuscrit recu : 15/02/03
Manuscript accepted: / manuscrit accepte : 04/03/04
Mots cles : analyse des tendances; compression de la morbidite; donnees administratives; maladies chroniques; vieillissement
Keywords: trend analysis; compression of morbidity; administrative data; chronic diseases; aging
Requests for offprints should be sent to: / Les demandes de tires-a-part doivent etre addressees a :
Verena H. Menec, Ph.D.Department of Community Health SciencesUniversity of Manitoba750 Bannatyne AvenueWinnipeg, MB R3E ON3([email protected])
IntroductionThat the Canadian population is aging is a certainty.In Manitoba, the proportion of individuals aged 65and over is expected to increase from 13.5 per cent in2000, to 17.8 per cent in 2020, to 22.5 per cent in 2040(Manitoba Bureau of Statistics, 2000; Robson, 2001).
What is uncertain, however, is what impact theincreasing senior population will have on the healthcare system. One view is that the growth in the seniorpopulation will have a major negative effect. Indeed,the aging population is already blamed for currentpressures on the health care system, ranging from
Canadian Journal on Aging / La Revue canadienne du viellissement 24 (Suppl. 1) : 5 - 14

overcrowding of emergency rooms (Mackenzie &Wild, 1998) to the escalation of health care costs(Northcott, 1994). Even more dire consequences arepredicted for the future, with the increasing healthexpenditures, it is argued, being no longer sustain-able, given the current organization and funding ofthe health care system in Canada (Foot & Stoffman,1996). The term apocalyptic demography has beencoined to refer to this doomsday scenario (Gee &Gutman, 2000).
The logic behind the apocalyptic scenario is straight-forward: health declines with age and, consequently,health care use increases as people get older. Overtime, as the number of seniors rises, more health careservices will therefore be required, which will con-sequently place an increasing burden on the healthcare system. While nobody would question thathealth declines and health care use increases withage, at the heart of the population aging debate is thequestion of the magnitude of the problem that theincreasing senior population will pose for the healthcare system. As Barer and his colleagues put it, thequestion is whether the effects of the demographictrends move like glaciers or like avalanches (Barer,Evans, & Hertzman, 1995). Proponents of theapocalyptic scenario clearly favour the avalancheview.
A more optimistic alternative to the apocalypticscenario has also been proposed, however. Thismore moderate view takes several important factorsinto account. First, most older adults, particularlyyoung-old individuals – those 65 to 74 years of age –have few health problems and disabilities andcontinue to live independent and healthy lives intoold age (National Advisory Council on Aging, 2001).Second, increases in health care use may be driven notso much by an increasing number of seniors, but by ahealth care system that does much more for them nowthan was the case even a decade ago (Barer et al.,1995). Indeed, research indicates that the agingpopulation has contributed only minimally to theincrease in health care cost (Evans, McGrail, Morgan,Barer, & Hertzman, 2001).
Third, the health status of older adults seems to beimproving. Over 20 years ago, Fries (1983) argued thatpeople will not only live longer, but that the onset ofdiseases will occur later, with morbidity beingcompressed into a shorter period before death.Consistent with this compression of morbidityhypothesis, studies indeed show that healthy ordisability-free life expectancy has been increasing inCanada (Manuel & Schultz, 2001; Martel & Belanger,1999) and elsewhere (Crimmins & Saito, 2001;Doblhammer & Kytir, 2001). Moreover, several studies
show that the functional status of recent cohorts ofolder adults is better than that of previous cohorts(Chen & Millar, 2000; Cutler, 2001; Manton, Stallard,& Corder, 1998; Statistics Canada, 1999; Waidman &Liu, 2000).
The present study was designed to further examinetrends in the health status of older adults among theentire Manitoba senior population to determine ifrecent cohorts of older adults are healthier than theircounterparts in the past. Specifically, we were inter-ested in trends in a range of health indicators,including mortality, acute conditions such as heartattacks, and chronic diseases like diabetes. Given thatolder adults are not a homogenous group of individ-uals, we examined trends across different age groups –young-old (65–74 years old), middle-old (75–84 yearsold), and old-old (85 years old and over) seniors – andacross different geographic regions of the province(rural versus urban areas). Of particular interest inthe present study was whether health gains wouldbe evident across all three age groups and both ruraland urban regions.
Methods
Data Sources
We used anonymized administrative data to examinehealth trends between 1985 and 1999. Previousresearch shows that administrative data can effec-tively be used to measure prevalence and incidence ofcertain health conditions (see Roos, Gupta, Soodeen,& Jebamani, this issue). For instance, hospitalizationsfor myocardial infarction and stroke tend to reflect theincidence of disease, given that there is consensus onthe need for hospitalization (Wennberg, Freeman, &Culp, 1987; Wennberg, Freeman, Shelton, & Bubolz,1989). Similarly, administrative data have been usedto identify individuals with chronic conditions, suchas diabetes and hypertension (Black, Roos, Fransoo, &Martens, 1999; Blanchard et al., 1996; Hux & Tang,2002; Robinson, Young, Roos, & Gelskey, 1997).
Study data were obtained from the following files ofthe Population Health Research Data Repositoryhoused at the Manitoba Centre for Health Policy:Vital Statistics records, hospital separation abstracts,physician billing claims, and population registry.These data have been found to be a complete, valid,and reliable source of data (Roos & Nicol, 1999).
Mortality data were obtained from computerizeddeath records maintained by the Vital StatisticsBranch. Each record contains information on thedate and cause of death. Deaths of Manitoba residentsthat occurred outside of the province and deaths
6 Canadian Journal on Aging 24 (Suppl. 1) V. H. Menec et al.

occurring in Manitoba to non-residents were excludedfrom this study.
The population registry contains one record for eachManitoba resident eligible to receive insured healthcare services. It was used to obtain population countsfor each study year by age, sex, and location ofresidence. Location of residence was defined usingregional health authority (RHA) boundaries. Urbanregions encompassed the two major urban centres inManitoba (Winnipeg and Brandon), while ruralregions included all remaining Manitoba RHAs.
Measures
Mortality
Trends in all-cause mortality were investigated, aswere trends for select leading causes (Menec,MacWilliam, Soodeen, & Mitchell, 2002; StatisticsCanada, 1995), including cardiovascular disease(ICD-9 codes 390–459); cerebrovascular disease, asubset of cardiovascular disease that includes stroke(430–438); cancer (140–239); pneumonia and influenza(480–487); chronic obstructive pulmonary diseases(COPD), such as chronic bronchitis and asthma(490–496); and injuries (800–999).
Hospitalizations for Acute Conditions
Trends in hospitalizations were examined for acutemyocardial infarction (AMI) (ICD-9-CM code 410);stroke (430–432, 434, 436); hip fractures (820); cancer(140–239); and injuries (800–999). With the exceptionof injuries, we identified patients with these condi-tions using the diagnosis that at discharge fromhospital was deemed responsible for the patient’shospital stay.
Chronic Disease Diagnoses
The following chronic diseases were identified basedon diagnoses: diabetes (ICD-9-CM code 250), hyper-tension (401–402), congestive heart failure (428),COPD (490–496), and dementia (290–292, 294, 331,and 797). In keeping with previous research(Blanchard et al., 1996; Robinson et al., 1997), diabeticswere defined as individuals with either two physicianvisits or one hospitalization during a 3-year periodwith the relevant ICD-9-CM diagnosis (e.g., 1985–1987, 1988–1990, etc.). Note that this definition doesnot differentiate between Type 1 and Type 2 diabetes.Similarly, consistent with previous research (e.g.,Black et al., 1999), congestive heart failure, hyper-tension, and COPD were defined in terms of at leasttwo physician visits with a relevant diagnosis duringa 3-year period.
A slightly broader definition was used for dementia,in that we classified individuals with either onephysician visit or one hospitalization with one of therelevant diagnostic codes in a 3-year period as havingdementia. Nursing home residents were excludedfrom these analyses, as we likely underestimatedementia prevalence in nursing homes using admin-istrative data. This definition was chosen because itprovided prevalence estimates that quite closelycorresponded to those derived from the CanadianStudy on Health and Aging (CSHA) in whichdementia diagnoses were based on clinical assess-ments (Canadian Study of Health and Aging WorkingGroup, 1994). For instance, while the CSHA (com-munity sample) demonstrated a dementia prevalenceof 173 per 1,000 among men 85 years or older in 1991,our prevalence for the 1991–1993 period was 186 per1,000 population. Similarly, among women aged85 years or older, the dementia prevalence was 180per 1,000 in the CSHA, compared to 160 per 1,000 inour study.
Data Analyses
Regression techniques for correlated data were usedto model measures of health status as a function of theindependent variables of age, sex, location of resi-dence, and time period (Carriere, Roos, & Dover,2000). The data were analysed from a generalizedlinear models (GLM) perspective, using generalizedestimating equations (GEE) to account for the cor-related structure of the data (Liang & Zeger, 1986).Under a GLM framework, the data distribution isspecified – a Poisson distribution for the presentdependent variables – along with a link function,which describes the relationship between the depen-dent and independent variables, given the nature ofthe data distribution.
The unit of analysis was a segment of the populationdefined by age, sex, and region of residence, and thedependent variable was the rate of a health event forthat segment of the population. Age was entered intothe regression models as a categorical variable withthree levels: 65–74 years, 75–84 years, and 85 yearsand over. Location of residence was as a dichotomousvariable: urban versus rural. Year was also treated as acategorical variable in the regression models to allowcomparisons of specific time periods. As well, by nottreating year as a continuous variable in the model,the assumption that the effect of time has beenconstant and incremental was avoided.
All regression models contained the main effects ofage, sex, region, and year, as well as the age-by-yearand region-by-year interactions. Focused contrastswere used to test for differences in the rates of a health
Trends in the Health Status La Revue canadienne du viellissement 24 (Suppl. 1) 7

event over time for each age group and region. Morespecifically, we were interested in testing whether thedifference in a health event for one age group or oneregion was constant for the most recent 6 years (1994to 1999) relative to the earliest 6 years (1985 to 1990).Combining several years of data is advantageous,given the small number of events for some indicators(e.g., injury deaths) in each age by sex by regionstratum in a given year.
We report trends in terms of relative risk/rate (RR),which describes the rate of a health event in oneperiod relative to another. A relative rate above 1indicates that the rate of a given health event washigher in the most recent period relative to thereference period; a relative rate lower than 1 indicatesthat the rate was lower. All significance tests wereperformed at �¼ .05 using a Wald test statistic thatfollows a �2 distribution with a single degree offreedom. The Bonferroni multiple comparison pro-cedure was used to control the Type I error rate(Dunn, 1961).
ResultsTable 1 provides descriptive information for allmeasures for the most recent year (1999) or, in thecase of chronic diseases, period (1997–1999). Bothage-specific rates (per 1,000 population) and actualnumber of cases are shown. Noteworthy is the highprevalence of chronic diseases. For instance, 342 per1,000 65- to 74-year-olds had a hypertension diagnosisin 1997–1999; the rate increased to 420 per 1,000 75- to84-year-olds, and 372 per 1,000 85-year-olds and older.Other chronic diseases were also very prevalent. Forexample, 223 per 1,000 of those who were 85 and olderand were dwelling in the community had a dementiadiagnosis.
Trends in Mortality
Table 2 presents the results of the contrasts that wereused to test for differences in all-cause and cause-specific mortality between the most recent 6-yearperiod (1994–1999) and the earliest 6-year period(1985–1990) of the study for each age group andthe two regions. Relative death rates declined sig-nificantly among young-old individuals (those aged65 to 74) for all causes, cerebrovascular diseases(primarily stroke), cardiovascular diseases (whichinclude stroke and all forms of heart disease, includ-ing heart attacks), pneumonia and influenza, andinjuries. For the middle-old and old-old age groupsthere were statistically significant decreases only incardiovascular disease death rates.
Although the relative risk of death due to pneumoniaand influenza and injuries decreased among
young-old individuals, it should be kept in mindthat these causes of death constituted relatively smallproportions of all deaths. For example, in 1999,pneumonia and influenza and injury deaths com-bined constituted only 5.4 per cent of all deathsamong 65- to 74-year-old Manitobans, in contrast tocardiovascular disease, which made up 33.9 per centof all deaths in that age group.
It is noteworthy that among the oldest-old individ-uals, injury deaths increased. Examination ofspecific causes of injury deaths showed that, overthe 15 years, falls were responsible for 75.4 per centof all injury deaths among the oldest-old. Men hadhigher rates of injury deaths; this was the case for allindividuals over 65, as well as more specificallyamong those 85 years and older. For example, therelative risk of dying of an injury was 22 per centhigher among men than among women. A secondregression model was used to tease out the specificnature of this effect; this model included all maineffects, as well as the age-by-gender-by-year three-way interaction and all relevant two-way interactions.Contrasts were used to test for a difference in injurymortality rates over time for men and women in thisoldest age group. This analysis revealed that theincreasing trend in injury deaths was evident forwomen aged 85 and over (RR¼ 1.11, p¼ .024) but notfor men (RR¼ 1.02, ns).
Results for location of residence (see Table 2) showedthat death rates declined primarily in urban areas forall causes, cerebrovascular disease, cardiovasculardisease, and pneumonia and influenza. In contrast,although the relative risk of dying of cardiovasculardisease and pneumonia and influenza also declined inrural areas, the relative risk of cancer deaths increasedsignificantly. To further explore this effect, we con-ducted a supplementary regression analysis. The ruralregion was consequently classified into threeareas: North, Centre, and South based on RHAboundary definitions that have been used in previousresearch to examine health status disparities for theentire population (Brownell et al., 2003). A regressionmodel that contained main effects as well as theregion-by-year and age-by-year interactions was used.Results indicated that relative cancer mortality ratesincreased in Northern areas from the earliest to themost recent time period (RR 1.31, p¼ .019); cancertrends were largely stable from the earliest to the mostrecent period in both the South (RR¼ 1.07, p¼ .032)and Centre (RR¼ 1.06, p¼ .059).
Trends in Hospitalizations for Acute Conditions
As Table 3 shows, declines in AMI and strokehospitalization rates were apparent among young-old
8 Canadian Journal on Aging 24 (Suppl. 1) V. H. Menec et al.

Table 1: Descriptive information for outcome measures – Rates per 1000 population and number of cases
65–74 Years 75–84 Years 85þ Years
Rate per 1000 No. of Cases Rate per 1000 No. of Cases Rate per 1000 No. of Cases
Mortality (1999)
All causes 20.9 1659 51.2 2844 149.9 3004
Cancer 8.3 656 14.5 806 21.7 434
Cerebrovascular 1.0 79 4.3 236 17.2 344
Cardiovascular 7.1 563 20.3 1127 68.8 1379
COPD 0.9 74 2.8 158 8.0 160
Pneumonia & flu 0.5 36 2.3 128 14.1 283
Injury 0.7 54 1.3 72 4.9 98
Hospitalizations (1999)
AMI 7.8 620 11.1 618 13.3 266
Stroke 5.3 417 10.5 581 17.2 344
Cancer 39.2 3112 48.6 2703 36.9 740
Hip fracture 2.2 178 9.2 513 26.9 539
Injury 14.3 1136 25.2 1403 43.7 876
Chronic Diseases (1997–99)
Hypertension 342.3 27443 420.6 23243 372.4 7107
Congestive heart failure 38.6 3092 100.6 5561 229.0 4369
COPD 131.4 10537 171.1 9459 219.8 4194
Diabetes 144.9 11616 153.5 8485 128.0 2443
Dementiaa 27.0 2172 89.8 4863 222.7 3563
Rates are age-specific crude rates per 1000 population.COPD¼ chronic obstructive pulmonary diseases; AMI¼acute myocardial infarctionaDementia cases and rates do not include nursing home residents.
Table 2: Relative risk of mortality by age group and location of residence, 1994–1999 versus 1985–1990
All Causes Cancer Cerebro-vascular CVD COPD P & I Injury
Age Group*
65–74 years 0.91 1.02 0.87 0.82 0.98 0.67 0.82
75–84 years 0.95 1.06 0.97 0.86 1.04 0.94 1.00
85þ years 0.99 1.02 0.96 0.94 1.15 0.96 1.40
Location of Residencey
Rural 0.97 1.08 0.94 0.88 1.00 0.92 0.99
Urban 0.93 0.99 0.93 0.86 1.11 0.78 1.10
CVD¼ cardiovascular diseases; COPD¼ chronic obstructive pulmonary diseases; P & I¼pneumonia and influenza*Bold values are statistically significant at �¼ .017 (.05/3)yBold values are statistically significant at �¼ .025 (.05/2)
Trends in the Health Status La Revue canadienne du viellissement 24 (Suppl. 1) 9

and middle-old seniors and in urban regions, albeitnot among the oldest-old and in rural areas. Therelative risk of being admitted for cancer also declinedin two of the three age groups and in urban areas. Therisk of being admitted for a hip fracture declinedamong the oldest-old. It also declined in urbanregions by 11 per cent, but increased in rural regionsby 6 per cent. A regression model was used toexamine the specific nature of this effect. Again, weused a model in which the rural region wassubdivided into South, Centre, and North areas, andwhich contained all main effects as well as the region-by-year and age-by-year interactions. The contraststhat compared the rate of hip fracture hospitaliza-tions between the first and last 6-year periods ofthe study indicated that the increase was restrictedto Southern areas, where the relative risk of a hipfracture admission increased by 12 per cent over time( p< .0001).
Trends in Chronic Conditions
In Table 4 we present results for relative changes inchronic conditions over time. Evident are theincreases in the relative rates of hypertension,diabetes, and dementia across all age groups andboth rural and urban areas (see also Figure 1 foroverall trends). The increases were substantial. Forinstance, the relative risk of diabetes increased by 29per cent among the young-old, by 15 per cent amongthe middle-old, and by 11 per cent among the oldest-old. The relative risk of dementia increased by 30, 38,and 26 per cent for young-old, middle-old, and oldest-old individuals, respectively.
DiscussionSeniors in Manitoba are living longer than ever(Manitoba Health, 2002; Menec et al., 2002), as is thecase nationwide. The present study shows that therelative risk of all-cause mortality correspondinglydeclined for individuals aged 65 to 74 (by 9% between1994–1999 and 1985–1990). This drop was primarilythe result of a decline in deaths due to cardiovasculardiseases, which decreased by 18 per cent whencomparing 1994–1999 to 1985–1990. This change is inline with previous research showing that death ratesdue to heart disease have been declining in Canadaand the United States (Heart and Stroke Foundation,1999; Sahyoun, Lentzner, Hoyert, & Robinson, 2001).Consistent with the mortality trends for heart disease,hospitalizations for AMIs and strokes also declined.In combination, these findings may reflect bothhealthier lifestyles of more recent cohorts of seniors,as well as better treatment for heart attacks andstrokes, which may prevent deaths.
Although these are clearly encouraging trends, it isimportant to note that our regional analysis indicatesthat health gains related to heart disease wereobserved primarily in urban areas; no similar gainsemerged in rural areas. Whether this differencerelates to lifestyle factors or access to health careservices cannot be determined from the present data.However, socio-economic factors may well play arole. Northern Manitoba in particular is a socio-economically depressed area, with residents being inconsiderably poorer health than in the rest ofManitoba (Martens et al., 2002). In this respect, thepresent study also shows that the relative rate ofcancer deaths actually increased in Northern areas.This difference may be related to socio-economicallyrelated factors, which may be taking their toll in morerecent cohorts of seniors.
In contrast to cancer mortality rates, which,except for the North, remained constant, hospitaliza-tions for cancer showed downward trends for twoof the age groups (young-old and oldest-old) andin urban areas. This change is consistent withCanadian data that suggest that the incidence ofcertain cancers has been declining, such as lungcancer among men (Health Canada, 2001). Aswith heart disease–related events, however, nosimilar declines emerged in rural areas. Again,the cause of this discrepancy between rural andurban areas cannot be determined from thedata, but it is clearly a topic that needs to beexamined further. For instance, regional disparitiesin socio-economic status might explain some of theurban–rural differences.
Table 3: Relative rate of hospitalizations for selectacute conditions by age group and location ofresidence, 1994–1999 versus 1985–1990
AMI Stroke CancerHipFractures Injury
Age Group*
65–74 years 0.84 0.90 0.96 0.98 1.17
75–84 years 0.86 0.96 0.94 0.99 1.10
85þ years 0.95 1.01 0.86 0.96 1.09
Location ofResidencey
Rural 0.98 0.99 0.94 1.06 1.06
Urban 0.80 0.92 0.89 0.89 1.17
AMI¼Acute myocardial infarction*Bold values are statistically significant at �¼ .017 (.05/3)yBold values are statistically significant at �¼ .025 (.05/2)
10 Canadian Journal on Aging 24 (Suppl. 1) V. H. Menec et al.

In contrast to the downward trends for some ofthe mortality and hospitalization measures, chronicdiseases, specifically hypertension, diabetes, anddementia, showed clear and consistent increasesover time for all age groups and both in rural andurban areas. The finding for diabetes corroboratesprevious research that also demonstrates the rising
prevalence of this disease in Canada and othercountries (Chen & Millar, 2000; Mokdad et al., 2000;Statistics Canada, 1999).
Do the present findings suggest that recent cohorts ofseniors are sicker than cohorts in the past? That maybe the case, in part. For example, the prevalence of
0.40
0.60
0.80
1.00
1.20
1.40
1.60
1985–87 1987–90 1991–93 1994–96 1997–99
Rel
ativ
e R
ate
(Co
mp
ared
to
198
5–87
)
Dementia DiagnosesDiabetes DiagnosesHypertension Diagnoses
Figure 1: Trends in chronic disease diagnoses among Manitobans aged 65þ, 1985–1987 to 1997–1999
Table 4: Relative rate of select chronic disease diagnoses by age group and location ofresidence, 1994–1999 versus 1985–1990
HypertensionCongestiveHeart Failure COPD Diabetes Dementia
Age Group*
65–74 years 1.07 1.07 1.09 1.29 1.30
75–84 years 1.15 1.15 1.12 1.15 1.38
85þ years 1.28 1.28 1.01 1.11 1.26
Location ofResidencey
Rural 1.18 1.18 1.03 1.19 1.24
Urban 1.14 1.14 1.11 1.17 1.39
COPD¼ chronicobstructive pulmonary diseases*Bold values are statistically significant at �¼ .017 (.05/3)yBold values are statistically significant at �¼ .025 (.05/2)
Trends in the Health Status La Revue canadienne du viellissement 24 (Suppl. 1) 11

obesity, a risk factor for diabetes and heart disease,has been increasing in Canada (Katzmarzyk, 2002).Obesity-related morbidity can therefore also beexpected to increase. However, this is unlikely to bethe only explanation for the upward trends in chronicdiseases found here. Given that we identify individ-uals with these conditions using diagnoses, trendslikely to a large extent also reflect changes in howphysicians diagnose patients, rather than trueincreases in morbidity. For example, guidelines fordiagnosing diabetes have changed, and would resultin more individuals being identified as having thedisease (Meltzer et al., 1998). Moreover, greaterawareness of dementia and having treatment optionsfor it may encourage physicians to diagnose patientswith suspected dementia. Indeed, the positive aspectof upward trends in chronic diseases may be thatchanges in physician diagnosing and better treatmentoptions may result in better control of chronicconditions, thereby allowing people to remainhealthier longer. Research shows, for instance, thatpeople live longer with diabetes now than in thepast (Hux & Tang, 2002).
A few additional findings warrant discussion at thispoint. Hospitalizations for injuries increased amongall age groups and both in rural and urban areas. Therelative risk of dying of an injury also increasedamong the oldest-old women. The majority of injurydeaths and hospitalizations involved falls. It is notclear why these rates increased. One possibility isthat, given that the oldest-old in Manitoba are livingin the community longer now than in the past (Menecet al., 2002), the risk of falls may correspondinglyincrease among community residents. Alternatively,the findings may reflect regional differences inhospital admission patterns.
Nevertheless, these trends suggest the need for acontinued – and increasing – emphasis on fall preven-tion, as older adults are living in the communitylonger. In this respect, it is also noteworthy thatalthough hip fractures, which are a common outcomeof falls among older adults (Menec et al., 2002),declined among the oldest-old, they were still quitecommon. In 1999, for instance, almost three per centof Manitobans aged 85 or older were hospitalizedfor a hip fracture. Hip fractures are a particularconcern because they often lead to functional decline,ultimately requiring nursing home admission (Dunn,Furner, & Miles, 1993; Kiel, O’Sullivan, Teno, & Mor,1991).
Last, the findings for dementia warrant highlighting.The relative risk of dementia diagnoses increasedmarkedly over time. For example, the relative riskamong those 85 and over increased by 22 per cent
between 1985–1990 and 1994–1999. Given the agingpopulation, and assuming that incidence remainsconstant, the number of older adults with dementiacan therefore be expected to increase substantially inthe coming decades. Previous research suggests thatthe number of individuals with dementia will likelyalmost triple by 2030 in Canada (Canadian Study ofHealth and Aging Working Group, 1994). Providingformal and informal care options for these individualswill be a challenge for families and the health caresystem that will have to be addressed.
From a methodological perspective, it is noteworthythat the dementia prevalence obtained in the presentstudy was remarkably similar to estimates for thecommunity sample of the Canadian Study of Healthand Aging (CSHA) (Canadian Study of Health andAging Working Group, 1994). Although studies likethe CSHA that included clinical assessments ofdementia are clearly useful and needed, they aretime consuming and costly and, therefore, not easilyrepeated. Thus, the present findings suggest thepotential usefulness of administrative data in study-ing dementia.
In sum, the present findings suggest that predictionsof the apocalyptic impact of the aging population onthe health care system are overstated, given that thehealth of older adults appears to be improving interms of a number of important indicators, includingacute myocardial infarction, stroke, cancer, and hipfractures. Improvements in these health indicators aresignificant, as they can have major implications forindividuals’ need for health services and ability to liveindependently. At the same time, however, the risingprevalence of several chronic diseases (hypertension,diabetes, and dementia) warrants concern as theyaffect the demand for health services. Although thesetrends may in part reflect changes in physiciandiagnosing (Meltzer et al., 1998), they do suggest theneed for a policy emphasis on prevention, such asreducing the prevalence of obesity, which is one riskfactor for diabetes. Moreover, having sufficient careoptions in place for the growing number of individ-uals with dementia is an issue that will have to beaddressed.
ReferencesBarer, M.L., Evans, R.G., & Hertzman, C. (1995). Avalanche
or glacier? Health care and the demographic rhetoric.Canadian Journal on Aging, 14(2), 193–224.
Black, C., Roos, N.P., Fransoo, R., & Martens, P. (1999).Comparative indicators of population health and healthcare use for Manitoba’s Regional Health Authorities: APOPULIS project. Winnipeg: Manitoba Centre forHealth Policy.
12 Canadian Journal on Aging 24 (Suppl. 1) V. H. Menec et al.

Blanchard, J.F., Ludwig, S., Wadja, A., Dean, H.,Anderson, K., Kendall, O., & Depew, N. (1996).Incidence and prevalence of diabetes in Manitoba,1986–1991. Diabetes Care, 19, 807–811.
Brownell, M., Lix, L., Ekuma, O., Derksen, S., De Haney, S.,Bond, R., Fransoo, R., MacWilliam, L., & Bodnarchuk, J.(2003). Why is the health status of some Manitobans notimproving? The widening gap in the health status ofManitobans. Winnipeg: Manitoba Centre for HealthPolicy.
Canadian Study of Health and Aging Working Group.(1994). Canadian Study of Health and Aging: Studymethods and prevalence of dementia. Canadian MedicalAssociation Journal, 150, 899–913.
Carriere, K.C., Roos, L.L., & Dover, D.C. (2000). Across timeand space: Variations in hospital use during Canadianhealth reform. Health Services Research, 35, 467–487.
Chen, J., & Millar, W.J. (2000). Are recent cohorts healthierthan their predecessors? Health Reports, 11(4), 9–23.
Crimmins, E.M., & Saito, Y. (2001). Trends in healthy lifeexpectancy in the United States, 1970–1990: Gender,racial, and educational differences. Social Science &Medicine, 52, 1629–1641.
Cutler, D.M. (2001). Declining disability among the elderly.Health Affairs, 20, 11–27.
Doblhammer, G., & Kytir, J. (2001). Compression orexpansion of morbidity? Trends in healthy lifeexpectancy in the elderly Austrian populationbetween 1978 and 1998. Social Science and Medicine, 52,385–391.
Dunn, O.J. (1961). Multiple comparisons amongmeans. Journal of the American Statistical Association, 56,52–64.
Dunn, J.E., Furner, S.E., & Miles, T.P. (1993). Do falls predictinstitutionalization in older persons? An analysis ofdata from the Longitudinal Study of Aging. Journal ofAging and Health, 5, 194–207.
Evans, R.G., McGrail, K.M., Morgan, S.G., Barer, M.L., &Hertzman, C. (2001). Apocalypse no: Population agingand the future of health care systems. Canadian Journalon Aging, 20 (Suppl. 1), 160–191.
Foot, D.K., & Stoffman, D. (1996). Boom, bust, and echo:How to profit from the coming demographic shift. Toronto:MacFarlane Walter & Ross.
Fries, J.F. (1983). The compression of morbidity. MilbankQuarterly, 61, 397–419.
Gee, E.M., & Gutman, G.M. (2000). The overselling ofpopulation aging: Apocalyptic demography, intergenerationalchallenges, and social policy. Don Mills, ON: OxfordUniversity Press.
Health Canada. (2001). Canadian cancer statistics 2001.Ottawa: Author, National Cancer Institute of Canada.
Heart and Stroke Foundation. (1999). The changingface of heart disease and stroke in Canada 2000. Ottawa:Author.
Hux, J.E., & Tang, M. (2002). Patterns of prevalence andincidence of diabetes. In J. E. Hux, G. Booth, &A. Laupacis (Eds.), Diabetes in Ontario: An ICES practiceatlas (module 1). Toronto: Institute for ClinicalEvaluative Sciences.
Katzmarzyk, P.T. (2002). The Canadian obesity epidemic,1985–1998. Canadian Medical Association Journal, 166,1039–1040.
Kiel, D.P., O’Sullivan, P., Teno, J.M., & Mor, V. (1991). Healthcare utilization and functional status in the aged fol-lowing a fall. Medical Care, 29, 221–228.
Liang, K.S., & Zeger, S.L. (1986). Longitudinal dataanalysis using generalized linear models. Biometrika,78, 13–22.
MacKenzie, G., & Wild, S. (1998, February 19). Crowdingforces ER patients into hallways, lengthens wait.Winnipeg Free Press, p.A3.
Manitoba Bureau of Statistics. (2000). Manitoba HealthRegions population projections June 1, 1998–June 1, 2025.Winnipeg: Government of Manitoba.
Manitoba Health. (2002). Manitoba’s health indicators report.Winnipeg: Author.
Manton, K.G., Stallard, E., & Corder, L.S. (1998). Thedynamics of dimensions of age-related disability 1982to 1994 in the U.S. elderly population. Journal ofGerontology: Biological Sciences, 53A, B59–B70.
Manuel, D.G., & Schulz, S.E. (2001). Adding years to life andlife to years: Life and health expectancy in Ontario. Toronto:Institute for Clinical Evaluative Sciences.
Martel, L., & Belanger, A. (1999). An analysis of the changein dependence-free life expectancy in Canada between1986 and 1996. Report on the Demographic Situation inCanada 1998–1999 (Catalogue 91-209-XPE). Ottawa:Statistics Canada.
Martens, P., Bond, R., Jebamani, L., Burchill, C., Roos, N.,Derksen, S., Beaulieu, M., Steinbach, C., MacWilliam, L.,Walld, R., Dik, N., Sanderson, D., Information andResearch Committee, Assembly of Manitoba Chiefs,Tanner-Spence, M., Leader, A., Elias, B., & O’Neil, J.(2002). The health and health care use of registered FirstNations people living in Manitoba: A population-basedstudy. Winnipeg: Manitoba Centre for Health Policy.
Meltzer, S., Leiter, L., Daneman, D., Gerstein, H.C., Lau, D.,Ludwig, S., Yale, J.F., Zinman, B., & Lillie, D. (1998).1998 clinical practice guidelines for the management ofdiabetes in Canada. Canadian Medical AssociationJournal, 159(Suppl. 8), S1–S29.
Menec, V.H., MacWilliam, L., Soodeen, R.A., & Mitchell, L.(2002). The health and health care use of Manitoba’s
Trends in the Health Status La Revue canadienne du viellissement 24 (Suppl. 1) 13

seniors: Have they changed over time?Winnipeg: ManitobaCentre for Health Policy.
Mokdad, A.H., Ford, E.S., Bowman, B.A., Nelson, D.E.,Engelgau, M.M., Vinivor, F., & Marks, J.S. (2000).Diabetes trends in the U.S.: 1990–1998. Diabetes Care,23, 1278–1283.
National Advisory Council on Aging. (2001). Report CardSeniors in Canada. Ottawa, ON: Minister of Public Worksand Government Services Canada.
Northcott, H.C. (1994). Public perceptions of the populationaging ‘‘crisis.’’ Canadian Public Policy, 20, 66–77.
Robinson, J.R., Young, T.K., Roos, L.L., & Gelskey, D.E.(1997). Estimating the burden of disease: Comparingadministrative data and self-reports. Medical Care, 35,932–947.
Robson, W.B.P. (2001). Will the baby boomers bust the healthbudget? Demographic change and health care financingreform. Ottawa: Renouf.
Roos, L.L., & Nicol, J.P. (1999). A research registry: Uses,development, and accuracy. Journal of ClinicalEpidemiology, 52, 39–47.
Sahyoun, N.R., Lentzner, H., Hoyert, D., & Robinson, K.N.(2001, March). Trends in causes of death among theelderly. Washington, D.C.: Department of Health andHuman Services, Centers for Disease Control andPrevention.
Statistics Canada. (1995). Canadian statistics: Selected leadingcauses of death by sex, Canada, 1997. Retrieved October 5,2000 from http://www.statcan.ca/english/pgdb/health36.htm.
Statistics Canada. (1999). Health among older adults. HealthReports, 11, 47–61.
Waidman, T.A., & Liu, K. (2000). Disability trends amongelderly persons and implications for the future. Journalof Gerontology: Social Sciences, 55B, S298–S307.
Wennberg, J.E., Freeman, J.L., & Culp, W.J. (1987). Arehospital services rationed in New Haven or over-utilized in Boston? Lancet, 1, 1185–1189.
Wennberg, J.E., Freeman, J.L., Shelton, R.M., & Bubolz, T.A.(1989). Hospital use and mortality among Medicarebeneficiaries in Boston and New Haven. New EnglandJournal of Medicine, 321, 1168–1173.
14 Canadian Journal on Aging 24 (Suppl. 1) V. H. Menec et al.
Trends in the Utilization of Specific HealthCare Services among Older Manitobans:1985 to 2000
Marcia Finlayson,1,2 Lisa Lix,2 Gregory S. Finlayson,2 and Terry Fong1
RESUMECet article porte sur les tendances 16 annees en matiere d’utilisation des hopitaux et des services medicaux par desManitobains ages de 75 ans ou plus. Les donnees ont ete tirees du Manitoba Population Health Research DataRepository. Les tendances sont etudiees en fonction de cinq mesures relatives aux services hospitaliers (les conges deshopitaux, les sejours de courte duree, les sejours de longue duree, les operations de la cataracte ainsi que lesremplacements de la hanche ou du genou) de meme que de deux mesures relatives aux soins prodigues par desmedecins (le nombre global de consultations ainsi que la proportion de personnes qui ont sept consultations ou plus).Les resultats demontrent des changements, au cours du temps, dans l’utilisation de ces services par les personnes ageesvivant au Manitoba, l’etendue de ces changements variant selon le service etudie, l’age et le lieu de residence. Desdifferences autrefois considerables en matiere d’utilisation sont en train de diminuer, notamment le taux d’operationsde la cataracte selon les regions ainsi que la frequence des visites chez le medecin selon l’age. Pour d’autres services,notamment le taux de remplacements de la hanche ou du genou, les differences entre les regions sont en train des’accroıtre. Les resultats indiquent que les generalisations relatives a l’impact des personnes agees sur le systeme desante peuvent etre remises en question, puisque les differences entre les regions et entre les groupes d’age (75 a 84,85 ou plus) peuvent etre considerables.
ABSTRACTThis paper examines 16-year trends in the utilization of hospital and physician services by Manitobans aged 75and more, using data from the Manitoba Population Health Research Data Repository. Trends are examined acrossfive measures of hospital services (separations, short-stay days, long-stay days, cataract surgeries, and hip/kneereplacements) and two measures of physician care (overall visit rate, and proportion having seven or more visits).Results show changes in the utilization of these services among older adults living in Manitoba over time, with theextent of change varying with the service under consideration, age, and location of residence. Previously largeutilization differentials are shown to be shrinking; for example, cataract surgery rates across regions and physicianvisit rates by age. For other services, such as the rates of hip or knee replacement surgery, the differences acrossregions are increasing. Findings indicate that global generalizations about the impact of older adults on the healthcare system are subject to question, as regional differences and differences between age groups (75–84, 85þ) can besignificant.
1 Department of Occupational Therapy, University of Illinois at Chicago
2 Department of Community Health Sciences, University of Manitoba
Manuscript received: / manuscrit recu : 01/04/03
Manuscript accepted: / manuscrit accepte : 23/06/04
Mots cles : soins de sante pour les aınes; hospitalisation : tendances et utilisation; visites chez le medecin : tendances etutilisation; excision de la cataracte : tendances et utilisation; chirurgie orthopedique : tendances et utilisation; vieillissement
Keywords: health services for the aged; hospitalization, trends & utilization; physician use, trends & utilization; cataractextraction, trends & utilization; orthopedic surgery, trends & utilization; aging
Canadian Journal on Aging / La Revue canadienne du viellissement 24 (Suppl. 1) : 15 - 27

Requests for offprints should be sent to: / Les demandes de tires-a-part doivent etre addressees a :
Marcia Finlayson, Ph.D.Department of Occupational TherapyUniversity of Illinois at Chicago1919 West Taylor StreetChicago, IL 60612-7250([email protected])
IntroductionFor over 20 years there has been discussion anddebate about the implications of an aging populationon health care utilization; for example, primary care,specialist services, and acute, chronic, and long-termcare. Some authors have argued that the growingnumber of older adults, an aging baby boomer cohort,and more expensive health care services will ulti-mately break the Canadian health care system if noaction is taken (Robson, 2001). Others have suggestedthat improvements in the health status of the olderpopulation and the increasing evidence supportingthe compression of morbidity hypothesis mean thatthe impact of the aging population on the health caresystem will be more gradual (Barer, Evans, &Hertzman, 1995; Chen & Millar, 2000; Doblhammer& Kytir, 2001; Hubert, Bloch, Oehlert, & Fries, 2002).
This paper examines differences in health careutilization between 1985 and 2000, by region andage, among Manitobans aged 75 to 84, and 85 andover, in order to contribute to a longitudinal analysisto the literature on the impact of population aging onhealth care use. People aged 75 years and older wereselected for this study because they are the heaviestusers of health care services (Menec, MacWilliam,Soodeen, & Mitchell, 2002) and because their relativesize in the population has grown substantially duringthis 16-year period. People aged 75 years and overrepresented only 3.3 per cent of the total Manitobapopulation in 1985, but approximately 5.5 per cent by2000 – an increase of slightly more than 65 per cent.Patterns of growth of the group aged 75 and over inManitoba are similar to what has been seen in mostother Canadian provinces (Statistics Canada, 2004).The time period (1985–2000) was selected for studybecause it encapsulates a series of important healthcare delivery changes, for example, hospital bedclosures, increasing emphasis on primary care andday surgeries, and the shift to regional healthauthorities. These changes also occurred in themajority of other Canadian provinces within thistime frame. Consequently, by investigating this agegroup and period, this paper explores how the rapidincrease in the relative numbers of the heaviest usersof health care (i.e., those 75þ), influenced rates ofutilization in one Canadian province. By considering
health care use in this population regionally, thispaper also provides an opportunity to examine theaccuracy of global generalizations of the impact ofpopulation aging on health care use.
Literature ReviewThe use of health care services among older adults isknown to be influenced by factors such as age, sex,residential location (e.g., rural versus urban), socio-economic status, the nature of social support, andhealth related factors (e.g., functional status, presenceof specific diseases, self-rated health). Utilization ofhospital and physician services among older adultshas been examined in a wide variety of ways in theliterature, for example, intensity of use (e.g., numberof visits in a specified period, length of stay), length oftime since the most recent visit, or simple use versusnon-use over a specified period (Blazer, Landerman,Fillenbaum, & Horner, 1995; Chi, Brayne, Todd, &Pollitt, 1995; Schwarz, 2000; Wolinsky, Stump, &Johnson, 1995). Regardless of how the service ismeasured, overall research shows that utilization isinfluenced by both age and sex. These influencesoccur cross-sectionally as well as over time, althoughthe nature of the relationships varies by the type ofservice under consideration.
Younger age (within the 65þ group) has been found tobe associated with higher volume of hospital admis-sions, if other factors such as insurance and previoushospitalizations are not considered (Wolinsky et al.,1995), while older age has been linked to greaterphysician utilization (Black, Roos, Havens, &MacWilliam, 1995; Dansky, Brannon, Shea, Vasey, &Dirani, 1998). Using Manitoba data, the work of Blacket al. (1995) examined trends in utilization and foundthat the relative increase in use over time was greatestfor persons over the age of 85. When considering theinfluence of sex on utilization, Blazer et al. (1995)found that older females were less likely to receiveoutpatient treatment in a hospital setting, while Lumet al. (1999) found that being male was associatedwith greater hospital use. Trend studies of hip andknee arthroplasties have generally found that womenare more likely to receive these surgeries, but whenmen receive them, the surgeries are done at a younger
16 Canadian Journal on Aging 24 (Suppl. 1) M. Finlayson et al.

age (Balasegaram, Majeed, & Fitz-Clarence, 2001;Madhok et al., 1993).
Residence location, which has been used as a proxyfor socio-economic status as well as a measure ofproximity to health care resources, has also beenexamined in numerous studies of the use of healthcare services among older adults. Older persons inrural areas in the United States have been found tohave lower rates of utilization of both hospitalsand physicians, compared to their urban counter-parts, using measures of hospital days and physicianoffice visits (Dansky et al., 1998), and of outpatientcare in a hospital setting, ambulatory visits, and singlenights in a hospital (Blazer et al., 1995). Otherresearchers found that urban residents were morelikely than their rural counterparts to use physicianservices for their arthritis care (Saag et al., 1998). Inonly one study was the rural–urban utilizationfinding going in the opposite direction. An Irishstudy found that older persons in rural areas weremore likely to receive total hip arthroplasties thantheir urban counterparts (Willis, Kee, Beverland, &Watson, 2000). Research in the United States focusingon knee replacements has shown steady increases inthe rates of these surgeries over time, but that therelative increases vary significantly across regions(Katz et al., 1996). No rural–urban pattern differenceswere identified. Across all of these studies examiningrural–urban differences in utilization, it is unclearwhether the differences found are a function ofresource proximity, availability of individual socio-economic resources (which often vary by region), ortheir interaction.
Based on this literature, and the types of dataavailable in the Manitoba Population HealthResearch Data Repository, this research focused onthe use of hospital-related services, selected high-profile surgical procedures, and physician utilization.Specifically, we examined hospital separations, daysfor short hospital stays (<30 days), days for longhospital stays (�30 days), cataract extraction, hip andknee replacements, total physician visits per person,and the proportion of the population having sevenor more physician visits in one year. These serviceswere selected because the literature suggests that theyare the ones that have been significantly influencedby changes over time in technology, the acceptedthresholds for treatment, and overall professionalpractice patterns (Black et al., 1995; Dada & Sindhu,1999; Madhok et al., 1993). In addition, they areservices that are known to be influenced by age,sex, and residence location (Blazer et al., 1995;Dansky et al., 1998; Lum et al., 1999; Wolinsky et al.,1995).
The questions guiding our analyses were: Do changesin the utilization of services over the past 16 yearsamong people aged 75 and over who are living inManitoba vary as a function of age group or region?Overall, have there been any significant changes inthe utilization of these services over the past 16 yearsamong older Manitobans? Together, these two ques-tions provide the opportunity to examine whether therapid increase in the relative numbers of the heaviestusers of health care (i.e., those 75þ) influenced rates ofhealth care utilization, and if global generalizationsregarding the impact of population aging on healthcare use can be empirically supported.
Methods
Data Sources and Definitions
The Manitoba Population Health Research DataRepository is a unique administrative data sourcethat can be used to examine key population factors(e.g., age, sex) known to influence health servicesutilization as well as system factors such asregionalization. Study data were obtained from thefollowing files of this repository: hospital separationabstracts, physician billing claims, and populationregistry. Approval for the research was obtainedfrom the Health Research Ethics Board, Universityof Manitoba. Approval was also obtained from theManitoba Health Information Privacy Committee,in keeping with the protocol for the use of thesedata.
Three measures of hospital use were generated fromhospital separation abstracts for fiscal years 1985/1986 to 2000/2001. The first was the rate of hospitalseparations – the number of hospital discharges per1,000 population. This measure includes both inpa-tient hospitalizations and day surgeries, but does notinclude non-surgical outpatient health services. Thenext two measures were the rates of short-stay andlong-stay hospital days (i.e., the number of days perperson). To calculate these measures, each inpatient(i.e., day surgery cases were not included) hospitalseparation was defined as either a short-stay separa-tion (less than 30 days in length) or a long-stayseparation (30 days or more in length). Counts of thenumber of days were compiled for each type ofseparation. In-year days were calculated, rather thantotal days. In-year days are those days assigned to theyear in which they were incurred, not the year inwhich the separation occurred (Roos et al., 2001). Forexample, if an individual had a total length of stay of10 days, with 5 days occurring in 1 fiscal year and 5in the following fiscal year, then 5 days would beapportioned to each of these years. Long-stay days areundercounted in the last year of the study period
Trends in Health Care Utilization La Revue canadienne du viellissement 24 (Suppl. 1) 17

because data from the subsequent year (2001/2002)were not available for calculating in-year days for2000/2001. Accordingly, in-year days for long-stayhospitalizations during 2000/2001 were excludedfrom the analysis.
Two measures of surgical procedure use were alsoincluded: rates of cataract and total hip or kneereplacement surgical procedures (i.e., the number ofsurgical procedures per 1,000 population). In the1991/1992 fiscal year, there were changes in theICD-9-CM codes used to identify these surgicalprocedures. Therefore, to ensure the comparabilityof these measures over time, the data were compiledonly for the period 1992/1993 to 2000/2001. Theselected codes1 were consistent with those adoptedin other Manitoba studies (see Brownell, Roos, &Burchill, 1999; Roos & Mustard, 1997).
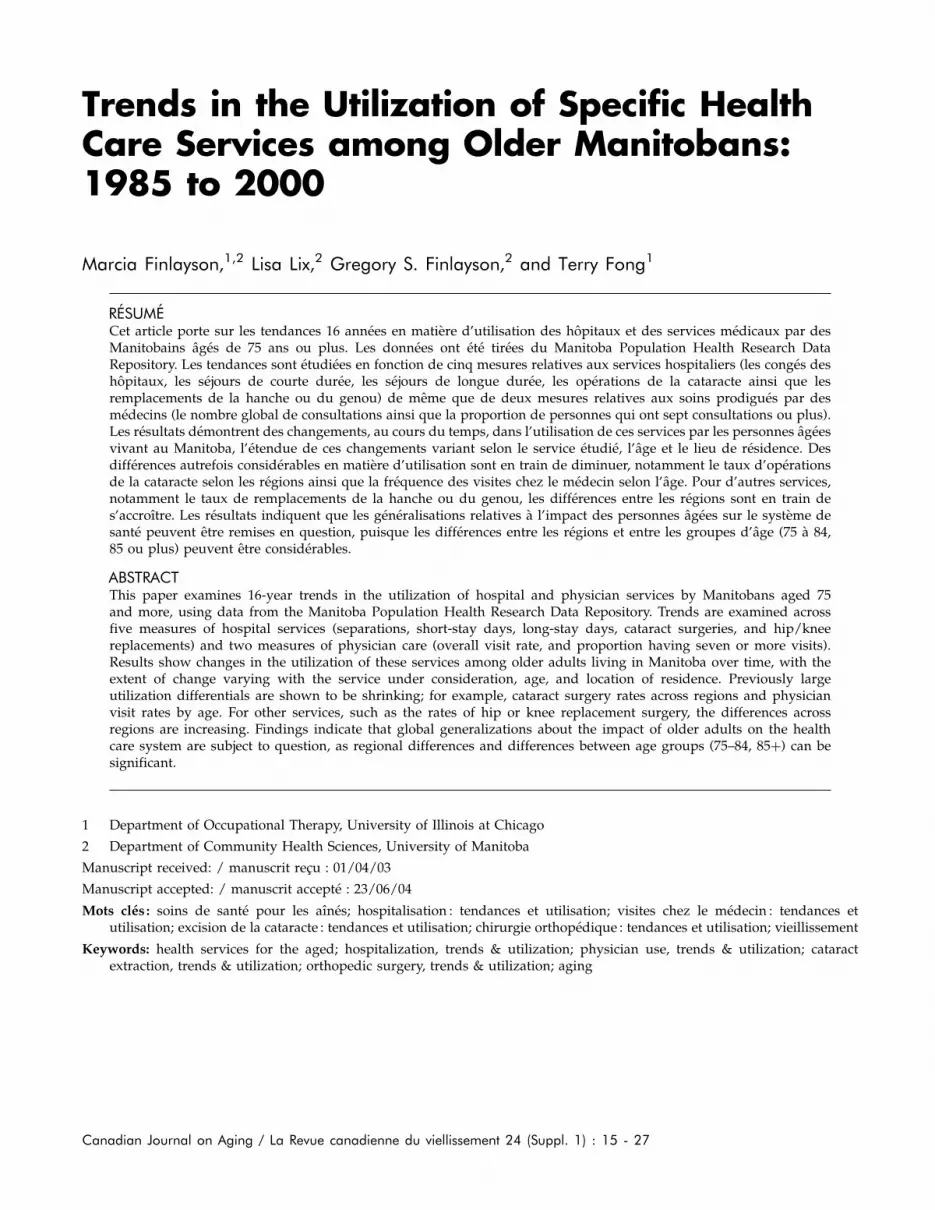
Two measures of physician use were developed fromphysician billing claims for 1985/1986 to 2000/2001.The first was the physician visit rate, that is, thenumber of physician visits (including both general/family physicians and specialists) per person. Thesecond was the proportion of the population havingseven or more visits in a given year; this measurefocuses on intensive use of physician services. Thismeasure was developed after empirically examiningthe frequency of physician visits in the population.Almost all individuals 75 years of age and older visita physician at least once or twice each year, whileapproximately half had more than six visits. Allfee-for-service physicians submit billing claims, andmost salaried physicians submit parallel ‘‘evaluation’’claims (Roos et al., 1993). Physician visits excludeinpatient hospital visits, but include virtually all otherphysician encounters (i.e., office visits, consultations,outpatient and emergency department visits, visits topatients in nursing homes, and visits to patients intheir own homes).
The population registry, which captures all Manitobaresidents eligible to receive insured health careservices in the province, was used to obtain annualregional population counts to generate the denomi-nator for each of the rates described above. Region ofresidence was defined using regional health authority(RHA) boundaries. Winnipeg is the largest RHA inManitoba with a population of about 650,000, and theremaining 11 RHAs are in rural areas. The RHA ofresidence was defined at December 31 in each studyyear, using the most current boundary definitions. Asa population-level analysis, it is important to note thatthe calculated rates do not track individuals over timeor across regions over time. Rather, utilization ratesare based on counts of use within a region at a giventime.
Data Analyses
Regression techniques for correlated data were usedto model rates of health care use for the population 75years of age and older as a function of the predictorvariables of age, sex, region, and year (Carriere, Roos,& Dover, 2000). The data were analysed from ageneralized linear models (GLM) perspective, usinggeneralized estimating equations (GEE) to account forthe correlated structure of the data (Liang & Zeger,1986). Under a GLM framework, the following arespecified: the outcome and predictor variables, thedistribution of the data, a link function that describesthe relationship between the outcome and predictorvariables, and a correlation structure.
The units of analysis were population strata definedby age, sex, and region of residence. The dependentvariable was the rate of a health care event (e.g., long-stay day rate) in a stratum. The surgical procedurerates were modelled using the negative binomialdistribution; this distribution is an appropriate choicefor events that occur infrequently, but are highlyvariable across the population (Carriere et al., 2000).The physician use and hospital day rates were highlyskewed, and therefore they were first transformedusing a logarithmic function, and then modelledusing the normal distribution. An exchangeablecorrelation structure was adopted, which assumesthat measurements in successive years are equallycorrelated.
All regression models contained the main effects ofage, sex, region, and year, as well as the age*year andregion*year interactions. Age was entered into theregression models as a dichotomous variable, withcategories of 75–84 years and 85 years and over. Forthe analyses of surgical procedure rates, region was adichotomous variable, with categories of WinnipegRHA and non-Winnipeg RHAs. For the analyses ofthe remaining rates of hospital and physician use,non-Winnipeg RHAs were further classified into threegeographic regions: Northern (Nor-Man, Burntwood,Churchill RHAs), Central (Central, Interlake,Marquette, North Eastman, Parkland RHAs),and Southern (Brandon, South Eastman, SouthWestman RHAs). These three regions have verydifferent population health status, using the prema-ture mortality rate (PMR) as the index of healthstatus. The Northern region exhibits the highest PMRsand the Southern exhibits the lowest (Roos et al.,2001).
Contrasts of the year regression coefficients were usedto test for differences over time between age groupsand regions. Specifically, interaction contrasts (Lix,Ekuma, Brownell, & Roos, 2004) were used to testwhether the magnitude of the difference in health
18 Canadian Journal on Aging 24 (Suppl. 1) M. Finlayson et al.

service use between two age groups or regions wasthe same for two periods of time. This is equivalentto a hypothesis of parallelism of slopes for two agegroups or regions. In addition, linear contrasts wereused to test for differences between two time periodsfor the entire province, and between two age groupsor regions in one period. For the hospital andphysician measures, the periods were 1985/1986–1991/1992 and 1992/1993–2000/2001. These 7- and9-year periods were of interest because 1992/1993was the year in which health reform resulted in asignificant number of hospital bed closures in theWinnipeg RHA. For long-stay days, the second periodwas only 1992/1993 to 1999/2000 because of under-counting in 2000/2001 (see descriptions of countingin-year days, above). For the surgical measures, wheredata were available only from 1992/1993 to 2000/2001, temporal differences were tested between two4-year periods of 1992/1993–1995/1996 and 1997/1998–2000/2001.
The interaction contrast results for testing differencesin use between age groups and regions for the twoperiods are reported in tabular form. Exponentiationof an interaction contrast coefficient gives an estimateof the relative rate (RR), that is, the change in healthcare use between two periods for one age group orregion relative to another. For example, if the rateof surgeries is estimated to increase by 30 per centbetween two periods for region A, and 20 per centhigher for region B, then the RR for Region B is 1.08using Region A as the reference group.
All significance tests were performed at �¼ .05. Tocontrol the Type I error rate when multiple tests wereperformed for a single hypothesis, the Bonferronimultiple comparison procedure was adopted (Dunn,1961). For example, �¼ .05/3¼ .017 when we testedfor differences across the Southern, Central, andNorthern regions of Manitoba.
For each outcome of interest, descriptive data on therates of utilization per person or per 1,000 people havebeen included as Appendix 1 to this paper for thosereaders who are interested.
Results
Hospital Utilization
Hospital SeparationsRates of hospital separations (per 1,000 people) forthe entire province as well as each region of theprovince for the 16-year study show that these rateswere higher for populations of non-Winnipeg regionsthan for the population of Winnipeg RHA (seeAppendix 1).
Regression analyses confirm that there was a smallbut statistically significant increase in utilization(RR¼ 1.03, p< .0001) for the entire province betweenthe two study periods (1985/1986–1991/1992 and1992/1993–2000/2001). However, there were regionalvariations. Non-Winnipeg regions experienced astatistically significant decrease in use between thetwo periods relative to Winnipeg (Table 1). For non-Winnipeg regions, compared to the Southern, bothNorthern and Central regions experienced a statisti-cally significant decrease between the two periods.The Northern region also experienced a statisticallysignificant decrease relative to the Central region.
Analyses also uncovered variability by age in thatutilization was found to be significantly higher forthe group older than 85 than for those 75 to 84 (RR¼1.32 for 1985/1986–1991/1992, p< .0001; RR¼ 1.35 for1992/1993–2000/2001, p< .0001). However, there wasno significant difference in the magnitude of theincrease over time for the two age groups (Table 1).
Hospital DaysThe average number of short-stay (<30 days) andlong-stay (�30 days) hospital days per person arereported for the entire province as well as each regionof the province, in Appendix 2. There was asubstantial decline in the rate of hospital days forboth short- and long-stay separations across theprovince over time. The rate of long-stay daysdeclined substantially between 1992/1993 and 1993/1994, when closures of Winnipeg hospital beds wereinitiated. However, it is evident that for bothmeasures of hospital use, the decline began prior tobed closures.
Despite the overall decline in the rate of short-stayhospital days across the province, the rate wassignificantly higher for non-Winnipeg regional popu-lations than for the Winnipeg RHA population for theentire 16 years of the study (RR¼ 1.76, p< .0001).For both measures the magnitude of the decreasebetween the two periods was non-significant forWinnipeg RHA populations compared to non-Winnipeg (Table 1). Among the populations of thenon-Winnipeg RHAs, however, the decline in therate of short-stay days between 1985/1986–1991/1992 and 1992/1993–2000/2001 was greater for theNorthern region than for the Central region. It wasalso greater for the Southern than for the Centralregion. On the other hand, there were no differencesbetween the population of the Northern region andeither Central or Southern regions in the rate oflong-stay hospital days (Table 1).
Short-stay day rates were significantly higher for thegroup aged 85 and more than for the 75–84 age groupin both periods (RR¼ 1.44 for 1985/1986–1991/1992,
Trends in Health Care Utilization La Revue canadienne du viellissement 24 (Suppl. 1) 19

Table 1: Regression results – Interaction contrast estimates of the relative rate (RR) of health service usea
RR v2 Pb
Hospital Separations
Non-Winnipeg (reference: Winnipeg) 0.93 14.75 .0001*
Northern MB (reference: Southern MB) 0.92 23.88 <.0001*
Central MB (reference: Southern MB) 0.96 8.64 .0033*
Northern MB (reference: Central MB) 0.95 6.66 .0100*
85þ years (reference: 75–85 years) 0.98 2.57 .1092
Short-Stay Hospital Days
Non-Winnipeg (reference: Winnipeg) 0.97 0.87 .3504
Northern MB (reference: Southern MB) 0.91 18.08 <.0001*
Central MB (reference: Southern MB) 0.97 2.64 .1041
Northern MB (reference: Central MB) 0.94 6.13 .0133*
85þ years (reference: 75–85 years) 1.02 1.23 .2678
Long-Stay Hospital Days
Non-Winnipeg (reference: Winnipeg) 1.03 0.64 .4238
Northern MB (reference: Southern MB) 0.97 0.40 .5265
Central MB (reference: Southern MB) 0.95 4.88 .0272
Northern MB (reference: Central MB) 1.02 0.13 .7165
85þ years (reference: 75–85 years) 0.98 0.33 .5657
Cataract Extraction
Non-Winnipeg (reference: Winnipeg) 0.88 6.36 .0117*
85þ years (reference: 75–84 years) 1.04 0.57 .4512
Total Hip or Knee Replacement
Non-Winnipeg (reference: Winnipeg) 0.89 6.68 .0098*
85þ years (reference: 75–84 years) 1.01 0.01 .9279
Average Number of Physician Visits
Non-Winnipeg (reference: Winnipeg) 1.03 1.74 .1866
Northern MB (reference: Southern MB) 0.92 2.87 .0900
Central MB (reference: Southern MB) 0.94 3.88 .0487
Northern MB (reference: Central MB) 0.98 0.21 .6453
85þ years (reference: 75–85 years) 0.87 26.23 <.0001*
Proportion with Seven or More Physician Visits
Non-Winnipeg (reference: Winnipeg) 0.99 0.32 .5709
Northern MB (reference: Southern MB) 0.94 2.73 .0987
Central MB (reference: Southern MB) 0.98 1.00 .3179
Northern MB (reference: Central MB) 0.96 1.05 .3064
85þ years (reference: 75–85 years) 0.94 9.77 .0018*
aThe RR is presented for 1985/1986–1991/1992 and 1992/1993–2000/2001 for all measures, with the exception ofcataract extraction and total hip or knee replacement, where the periods are 1992/1993–1995/1996 and 1997/1998–2000/2001.bResults that are starred (*) are statistically significant.
20 Canadian Journal on Aging 24 (Suppl. 1) M. Finlayson et al.

p< .0001; RR¼ 1.41 for 1992/1993–1999/2000, p<.0001). Long-stay day rates were also much higherfor the group aged 85 and more than for the 75–84group in both periods (RR¼ 2.74 for 1985/1986–1991/1992, p< .0001; RR¼ 2.69 for 1992/1993–2000/2001,p< .0001). However, there were no significant differ-ences in the magnitude of the decrease over timefor either measure of hospital days (Table 1).
Surgical Procedures
Rates of cataract and hip/knee surgeries performedbetween 1992/1993 and 2000/2001 per 1,000 peopleare provided in Appendix 3 for the entire province,and for Winnipeg and non-Winnipeg regions. Thesedescriptive data reveal substantial increases for bothage groups in Winnipeg and non-Winnipeg regions.The differences in procedure rates for Winnipeg andnon-Winnipeg regions are more pronounced forcataracts, where they are substantially higher forWinnipeg, than for hip and knee replacements, wherethere is little difference between the two regions.
When examining variation across regions, the rate ofthese procedures was consistently lower for non-Winnipeg than for Winnipeg RHA populations. Thechange in the rate between the two periods wasestimated to be significantly smaller for non-Winnipeg RHA populations than for the WinnipegRHA population (Table 1).
While cataract rates were substantially higher for theyounger age group than for the older age group, theincrease in rates between the two periods was similarfor both age groups. As a result, the magnitude of thedifference in the rate of increase was non-significant(Table 1). For hip and knee replacements, rates werealso higher for the younger age group than for theolder, and again, the increase in rates between the twoperiods was similar for both age groups (Table 1).
Physician Utilization
The average number of physician visits per Manitobaresident aged 75 and more during the study period,and the per cent of people 75 and more who hadseven or more physician visits, are provided in theAppendix 4 & 5. Descriptively, the 85þ group hadgreater contact with physicians than the 75–84 yearold age group in all years. A greater proportion of theWinnipeg population than of the non-Winnipegpopulation make intensive use of physicians eachyear.
Regression analyses revealed that visit rates wereestimated to have declined a statistically significantamount between the first and last study periods forthe entire province (RR¼ .96, p¼ .001). The propor-tion of the population having seven or more visits
increased by one per cent between the two periods( p< .0001). Although this is a statistically significantresult, it is not likely to be clinically or practicallymeaningful.
Looking regionally, there were no significant dif-ferences in the magnitude of the change between thetwo periods for non-Winnipeg relative to Winnipegregions for either the visit rate or the proportion ofthe population having seven or more visits (Table 1).Furthermore, for both measures there were nodifferences between the populations of the Northernand Central regions, Northern and Southern regions,or Central and Southern regions.
The group aged 85 and over exhibited a higher visitrate than those aged 75–84 in both the first (RR¼ 1.25,p< .0001) and second periods (RR¼ 1.08, p< .0001).However, the magnitude of the difference between thetwo age groups narrowed over time (Table 1). Therewas also a higher proportion of those aged 85 andover than 75–84 year olds having seven or morephysicians per year in both the first (RR¼ 1.12,p< .0001) and second periods (RR¼ 1.05, p¼ .006).The magnitude of the difference for the age groupsalso narrowed over time (Table 1).
DiscussionThe purpose of this paper was to contribute alongitudinal analysis to the literature on the impactof population aging on health care use and to examinethe accuracy of global generalizations of the impact ofpopulation aging on health care use. Using data fromthe Manitoba Population Health Research DataRepository, we investigated whether any significantchanges had occurred over the 16-year period of 1985to 2000 among Manitobans aged 75 and over in sevenmeasures of health care use. We also sought todetermine whether changes had occurred in theutilization of services over time varied as a functionof age or region.
Overall, the findings show changes in the utilizationof health services by people 75 years and older, over16 years. Furthermore, findings clearly show thatexamining utilization data at the provincial level forpeople in the same group masks important differencesin the direction or the extent of change over timethat emerges when regional or age group comparisonsare made.
For the hospital stay variables, findings indicate thatthe overall use of hospitals for inpatient care hasshown a substantial and consistent decrease over the16 years of the study, with 53 per cent fewer long-staydays in 1999/2000 when compared to 1985/1986, and25 per cent fewer short-stay days when comparing
Trends in Health Care Utilization La Revue canadienne du viellissement 24 (Suppl. 1) 21

1985/1986 to 2000/2001. Age and time did notinteract in the regression models, and therefore themagnitude of the decreases observed in hospitalstays was consistent across individuals 75 to 84 andthose 85 and over. In the same period, the rate ofseparations has increased significantly (15 per centincrease), with no significant trend differences by age.The opposite trends in separations (increase) and daysstay (decrease) could reflect a number of factors,including changes in practice patterns (e.g., emphasison primary care and availability of home care),hospital downsizing, an overall shift toward shorterstays for surgery (exclusive of outpatient surgery),and increased use of technology (e.g., diagnostictools). Of note is the fact that the decreases ininpatient days started even before the permanentbed closures that occurred in Manitoba between1992/1993 and 1993/1994. Thus, the decline cannotbe attributed exclusively to downsizing.
In terms of regional differences in hospitalizations,older residents of the major urban area were found tohave fewer short-stay hospital days in comparison totheir non-urban counterparts, even though there wereno differences observed for long-stay hospital stays.These findings could be a consequence of the greaterbed supply in the rural areas, and therefore a greaterwillingness of physicians to keep older adults in ahospital for observation, specialized assessment ortreatment, or waits prior to transfers or otheradmissions (e.g., transfer to Winnipeg hospital forsurgery or for admission to a nursing home). Inprevious research, Dansky et al. (1998) found thatolder adults in rural areas used fewer hospital daysthan urban-dwelling older adults, and Blazer et al.(1995) reported similar findings. It appears that thefindings of this study contradict these previousfindings, although differences in health care policy(e.g., bed supply or payment policies), outcomemeasurement, sampling, study duration, and countryof origin may be playing a role in these apparentdifferences.
Overall, the most substantial utilization changes overthe study period have occurred for cataract surgeryand hip/knee replacement surgery. Between 1992/1993 and 2000/2001, the rate of cataract proceduresincreased by 61 per cent while the rate of hip/kneereplacement surgeries increased by 81 per cent. Twolikely contributors to these increases are improvedtechnology and changes in physician practice pat-terns. These hypotheses are consistent with thewritings of Black et al. (1995), Dada & Sindhu(1999), and Madhok et al. (1993).
For the surgical outcomes examined in this study,both age and region played a role in understanding
utilization as well as trends in utilization over time.Important age-related differences were found for ratesof cataract surgery. Overall, the older age group (85þ)had a rate for cataract surgery that was 70 per centless than the younger age group. One potentialexplanation is that once cataract surgery is done, itis not typically redone. Further research is needed todetermine if this hypothesis is supported if anindividual’s use of services is tracked over time. Therate of hip and knee replacement surgeries is 32 percent less in the older age group than the younger one– perhaps reflecting the greater risk associated withthese procedures. In addition to age-related differ-ences, the surgical procedures discussed in this studyalso showed significant differences in the magnitudeof change in utilization that was associated withlocation of residence, but for the two types of surgerythe results were opposite. For cataract surgery, theWinnipeg versus non-Winnipeg gap was reducedby 12 per cent over time, while for hip and kneereplacement surgery the gap expanded. A variety offactors could contribute to this finding, includingavailability of specialized facilities and physicians,access to follow-up services (e.g., rehabilitationservices following orthopedic surgery), or differingpriorities of regional health authorities.
While the physician visit rate did not show asignificant increase over the time of the study, therehas been a small but significant increase in theproportion of ‘‘high-intensity users,’’ which, for thepurposes of this study, include those people who see aphysician seven or more times a year. Furthermore,although the number of physician visits per persondid not change overall, the data show that the rate forthe population over 85 decreased, while it increasedfor those aged 75 to 84. In addition, while therehas been steady growth in the proportion of high-intensity users, the greatest increase has been in the 75to 84 year age group – with the increase in the olderage group 6 per cent less than in the younger group.Together, these findings point to the importance ofexamining trends in utilization over time across agesubgroups within the older population to increase thechances that key age-related program and policydecisions are fully informed.
ConclusionThe findings of this study demonstrate that significantchanges have been occurring in the utilization ofhealth care services among older adults living inManitoba over the last 16 years. The nature and extentof utilization changes vary, depending on the healthcare service under consideration, age, and location ofresidence. Although each Canadian province has
22 Canadian Journal on Aging 24 (Suppl. 1) M. Finlayson et al.

unique features in the provision of health careservices to older adults, and has specific issues relatedto service access, availability, and funding priorities,this Manitoba study does offer two important butrelated messages. First, changes in health care utiliza-tion among older adults are service specific. Second,global generalizations about the impact of olderadults on the health care system are subject to seriousquestion. Against this backdrop, the findings pre-sented point to the need to be sensitive to regionaldifferences in population distribution, utilizationpatterns, and local health care priorities when plan-ning health services to meet the needs of older adultsin Manitoba and elsewhere in Canada.
Note1 Cataract surgeries were identified from physician
tariff codes 5611 and 5612, and procedure codesfrom hospital separations 13.11, 13.19, 13.41, 13.42,13.59, 13.2–13.29, 13.3–13.39; total hip replacement,ICD-9-CM codes 81.51 and 81.53; total kneereplacement, ICD-9-CM codes 81.54 and 81.55.
References
Balasegaram, S., Majeed, A., & Fitz-Clarence, H. (2001).Trends in hospital admissions of the hip and femur inEngland, 1989–1990 to 1997–1998. Journal of PublicHealth Medicine, 23(1), 11–17.
Barer, M.L., Evans, R.G., & Hertzman, C. (1995). Avalancheor glacier? Health care and demographic rhetoric.Canadian Journal on Aging, 14(2), 193–224.
Black, C., Roos, N.P., Havens, B., & MacWilliam, L. (1995).The rising use of physician services by the elderly:The contribution of morbidity. Canadian Journal onAging, 14(2), 225–244.
Blazer, D., Landerman, L., Fillenbaum, G., & Horner, R.(1995). Health services access and use among olderadults in Northern Carolina: Urban vs. rural residents.American Journal of Public Health, 85(10), 1384–1390.
Brownell, M., Roos, N.P., & Burchill, C. (1999). Monitoringthe Winnipeg hospital system: 1990–91 through 1996–97.Winnipeg: Manitoba Centre for Health Policy andEvaluation.
Carriere, K.C., Roos L.L., & Dover, D.C. (2000). Across timeand space: Variations in hospital use during Canadianhealth reform. Health Services Research, 35(2), 467–487.
Chen, J., & Millar, W.J. (2000). Are recent cohorts healthierthan their predecessors? Health Reports, 11(4), 9–23.
Chi, L., Brayne, C., Todd, C., & Pollitt, P. (1995). Predictors ofhospital contact of very elderly people: A pilot studyof a cohort of people aged 75 years and older. Age andAgeing, 24, 382–388.
Dada, V.K., & Sindhu, N. (1999). Management of cataract:A revolutionary change that occurred during last twodecades. Journal of the Indian Medical Association, 97(8),313–317.
Dansky, K., Brannon, D., Shea, D., Vasey, J., & Dirani, R.(1998). Profiles of hospital, physician, and homehealth service use by older persons in rural areas.Gerontologist, 38(3), 320–330.
Doblhammer, G., & Kytir, J. (2001). Compression orexpansion of morbidity? Trends in healthy life expec-tancy in the elderly Austrian population between 1978and 1998. Social Science and Medicine, 52, 385–391.
Dunn, O.J. (1961). Multiple comparisons among means.Journal of American Statistical Association, 56, 52-64.
Gentleman, J.F., Vayda, E., Parsons, G.F., & Walsh, M.N.(1996). Surgical rates in subprovincial areas acrossCanada: Rankings of 39 procedures in order ofvariation. Canadian Journal of Surgery, 39(5), 361–367.
Hubert, H.B., Bloch, D.A., Oehlert, J.W., & Fries, J.F. (2002).Lifestyle habits and compression of morbidity. Journalsof Gerontology, Series A: Biological Sciences & MedicalSciences, 57(6), M347–M351.
ICES Practice Atlas. (1996). Patterns of health care in Ontario,1996. Toronto: Author.
Katz, B.P., Freund, D.A., Heck, D.A., Dittus, R.S., Paul, J.E.,Wright, J., Coyte, P., Holleman, E., & Hawker, G. (1996).Demographic variation in the rate of knee replacement:A multi-year analysis. Health Services Research, 31(2),125–140.
Liang, K.S., & Zeger, S.L. (1986). Longitudinal data analysisusing generalized linear models. Biometrika, 78, 13–22.
Lix, L.M., Ekuma, O., Brownell, M., & Roos, L. (2004). Aframework for modelling differences in regional mor-tality over time. Journal of Epidemiology and CommunityHealth, 58(5), 420–425.
Lum, Y., Chang, H., & Ozawa, M. (1999). The effects of raceand ethnicity on use of health services by olderAmericans. Journal of Social Services Research, 25(4),15–42.
Madhok, R., Lewallen, D.G., Wallrichs, S.L., Ilstrup, D.M.,Kurkland, R.L., & Melton, L.J., 3rd. (1993). Trendsin the utilization of primary total hip arthroplasty,1969 through 1990: A population-based study inOlmstead County, Minnesota. Mayo Clinic Proceedings,68, 11–18.
Manitoba Bureau of Statistics. (2000). Winnipeg: Author.Manitoba Health Regions Population ProjectionsJune 1, 1998–June 1, 2025.
Menec, V.H., MacWilliam, L., Soodeen, R.A., & Mitchell, L.(2002). The health and health care use of Manitoba’s seniors:Have they changed over time? Winnipeg: Manitoba Centrefor Health Policy.
Trends in Health Care Utilization La Revue canadienne du viellissement 24 (Suppl. 1) 23

Robson, W.B.P. (2001). Will the baby boomers bust the healthbudget? Demographic change and health care financingreform. Ottawa: Renouf.
Roos, L.L., Fisher, E.S., Brazauskas, R., Sharp, S.M., &Shapiro, E. (1992). Health and surgical outcomes inCanada and the United States. Health Affairs (Millwood),11(2), 56–72.
Roos, L.L., Fisher, E.S., Sharp, S.M., Newhouse, J.P.,Anderson, G., & Bubolz, T.A. (1990). Postsurgicalmortality in Manitoba and New England. Journal ofthe American Medical Association, 263(18), 2453–2458.
Roos, L.L., Mustard, C.A., Nicol, J.P., McLerran, D.F.,Malenka, D.J., Young, T.K., & Cohen, M.M. (1993).Registries and administrative data: Organization andaccuracy. Medical Care, 31, 201–212.
Roos, N.P., & Mustard, C. (1997). Variation in health andhealth care use by socio-economic status in Winnipeg,Canada: The system works well? Yes and no. MilbankQuarterly, 75(1), 89–111.
Roos, N.P., Shapiro, E., Bond, R., Black, C., Finlayson, G.,Newburn-Cook, C., MacWilliam, L., Steinbach, C.,Yogendran, M., & Walld, R. (2001). Changes in health
and health care use of Manitobans, 1985–1998. Winnipeg:Manitoba Centre for Health Policy and Evaluation.
Saag, K., Doebbeking, B., Rohrer, J., Kolluri, S., Mitchell, T.,& Wallace, R. (1998). Arthritis health service utilizationamong the elderly: The role of urban-rural residenceand other utilization factors. Arthritis Care and Research,11(3), 177–185.
Schwarz, K. (2000). Predictors of early hospital readmissionsof older adults who are functionally impaired. Journalof Gerontological Nursing, 26(6), 29–36.
Statistics Canada. 2004. CANSIM II table 0510001: Estimatesof population, by age group and sex, Canada, provincesand territories. Retrieved January 19, 2004, from, http://cansim2.statcan.ca/cgi-win/CNSMCGI.EXE
Willis, C.E., Kee, F., Beverland, D., & Watson, J.D. (2000).Urban-rural differences in total hip replacements:The next stage. Journal of Public Health Medicine, 22(3),435–438.
Wolinsky, F., Stump, T., & Johnson, R. (1995). Hospitalutilization profiles among older adults over time:Consistency and volume among survivors and dece-dents. Journal of Gerontology, 50B(2), S88–S100.
Appendices: Descriptive data
Appendix 1: Hospital separation rates (per 1,000 population for Manitoba residents 751 years of age, 1985/1986–2000/2001)
Winnipeg Southern MB Central MB Northern MB Province
Year 75–84 851 75–84 851 75–84 851 75–84 851 75–84 851
1985/86 342 419 586 763 635 811 893 1160 470 594
1986/87 356 415 560 804 614 822 803 1183 465 607
1987/88 363 426 566 733 627 844 792 1032 473 600
1988/89 349 444 541 792 616 864 798 1073 457 628
1989/90 357 451 551 801 605 818 739 983 459 622
1990/91 345 438 540 728 579 820 629 883 442 594
1991/92 366 471 561 774 622 842 730 885 469 627
1992/93 366 463 586 793 640 866 755 1004 478 634
1993/94 361 460 590 801 624 846 750 1098 472 630
1994/95 375 455 602 789 629 855 843 941 485 622
1995/96 389 466 580 767 625 840 736 935 485 621
1996/97 386 482 592 821 606 829 760 870 482 637
1997/98 389 472 584 779 651 841 750 931 490 624
1998/99 398 520 619 788 640 867 800 840 500 655
1999/00 396 501 630 819 624 772 656 1080 494 636
2000/01 387 498 595 789 601 802 748 891 478 629
24 Canadian Journal on Aging 24 (Suppl. 1) M. Finlayson et al.

Appendix 2: Rates (days per person) of short- and long-stay hospital days for Manitoba residents 751 years of age,1985/1986–2000/2001
Winnipeg Southern MB Central MB Northern MB Province
Year 75–84 851 75–84 851 75–84 851 75–84 851 75–84 851
Long-Stay Days
1985/86 5.4 14.7 5.1 13.6 4.5 10.1 5.8 20.7 5.2 13.6
1986/87 5.2 14.8 4.8 12.1 3.6 11.0 6.5 21.6 4.8 13.4
1987/88 5.2 12.7 4.2 11.3 3.9 10.6 8.1 17.0 4.8 12.0
1988/89 4.5 13.6 4.4 11.0 3.3 9.9 6.2 16.8 4.3 12.2
1989/90 4.6 13.7 4.3 12.3 3.9 11.3 7.3 21.8 4.4 13.0
1990/91 4.4 12.5 4.0 9.8 3.3 10.0 7.9 25.4 4.2 11.6
1991/92 4.5 12.0 4.2 11.1 3.8 9.1 7.3 17.9 4.3 11.3
1992/93 4.2 12.6 3.7 9.4 3.8 9.6 6.0 18.8 4.1 11.3
1993/94 3.4 9.9 3.8 9.7 3.1 8.3 5.6 21.4 3.5 9.7
1994/95 4.0 9.1 3.5 9.8 2.7 7.8 6.7 21.2 3.7 9.2
1995/96 3.8 9.2 3.3 10.0 2.9 8.4 6.3 17.3 3.5 9.4
1996/97 3.6 8.3 3.4 9.9 2.7 7.5 5.3 15.2 3.4 8.6
1997/98 3.6 8.8 3.8 9.1 2.7 6.5 5.0 11.0 3.5 8.5
1998/99 3.6 9.5 3.8 8.7 2.9 6.7 4.3 12.7 3.5 8.8
1999/00 3.6 9.9 3.3 8.2 2.6 6.3 4.4 15.8 3.3 8.9
Short-Stay Days
1985/86 2.7 3.3 4.5 5.9 4.6 6.3 6.9 10.1 3.6 4.7
1986/87 2.7 3.1 4.1 6.3 4.5 6.4 5.9 9.1 3.4 4.7
1987/88 2.6 3.2 4.0 5.6 4.5 6.5 5.3 6.9 3.4 4.5
1988/89 2.6 3.3 3.9 6.1 4.4 6.5 5.7 7.4 3.3 4.7
1989/90 2.5 3.3 3.9 6.1 4.3 6.2 5.2 6.1 3.3 4.6
1990/91 2.3 3.1 3.8 5.4 3.9 5.9 4.2 6.2 3.0 4.3
1991/92 2.4 3.3 3.7 5.7 4.1 5.9 4.9 6.1 3.1 4.5
1992/93 2.2 3.0 3.7 5.7 4.0 6.0 4.9 5.8 3.0 4.3
1993/94 2.2 2.9 3.6 5.3 3.7 5.5 4.7 6.9 2.9 4.1
1994/95 2.1 2.9 3.6 5.3 3.9 5.8 5.0 5.8 2.9 4.1
1995/96 2.1 2.8 3.3 5.1 3.6 5.3 4.7 5.9 2.7 3.9
1996/97 2.1 2.8 3.4 5.1 3.6 5.3 4.2 5.7 2.7 3.9
1997/98 2.1 2.9 3.3 5.1 3.7 5.3 4.1 6.3 2.7 4.0
1998/99 2.1 3.2 3.4 5.1 3.5 5.3 4.3 4.8 2.7 4.1
1999/00 2.1 3.0 3.4 5.3 3.5 4.7 3.4 5.2 2.7 3.9
2000/01 1.9 2.8 3.0 4.6 3.1 4.8 4.0 4.2 2.4 3.7
Trends in Health Care Utilization La Revue canadienne du viellissement 24 (Suppl. 1) 25

Appendix 3: Rates of surgical procedures (per 1,000 population) for Manitoba residents 751 years of age, 1992/1993–2000/2001
Non-Winnipeg Winnipeg Province
Year 75–84 851 75–84 851 75–84 851
Cataract Extraction
1992/93 26 25 42 39 35 32
1993/94 31 29 43 39 38 34
1994/95 36 29 46 43 41 37
1995/96 39 32 57 55 49 45
1996/97 33 30 52 48 43 40
1997/98 39 37 54 42 48 40
1998/99 44 40 53 44 50 42
1999/00 46 41 55 48 51 45
2000/01 51 41 56 50 54 46
Total Hip or Knee Replacement
1992/93 6 3 5 4 6 4
1993/94 6 2 6 3 6 2
1994/95 8 4 7 3 7 4
1995/96 8 3 7 2 7 3
1996/97 8 4 9 5 8 4
1997/98 9 4 10 5 10 4
1998/99 11 4 10 5 11 5
1999/00 11 5 13 7 12 6
2000/01 10 4 10 5 10 5
Appendix 4: Average number of physician visits per Manitoba resident 751 years of age, 1985/1986–2000/2001
Winnipeg Southern MB Central MB Northern MB Province
Year 75–84 851 75–84 851 75–84 851 75–84 851 75–84 851
1985/86 9.5 14.2 7.9 10.6 8.0 10.4 8.4 11.8 8.8 12.5
1986/87 9.5 12.9 8.0 10.4 8.0 9.8 8.7 11.8 8.8 11.6
1987/88 9.1 11.8 7.7 9.4 7.9 9.3 8.6 12.1 8.6 10.7
1988/89 9.0 11.5 7.6 9.1 8.0 9.7 9.2 12.0 8.5 10.6
1989/90 9.0 11.4 7.8 9.1 8.1 9.4 9.0 11.5 8.5 10.4
1990/91 8.9 11.0 8.0 9.3 8.2 9.6 8.7 9.7 8.6 10.3
1991/92 9.2 11.2 8.0 9.4 8.5 9.6 8.4 10.3 8.8 10.4
1992/93 9.0 10.3 8.1 9.3 8.4 8.7 9.0 10.0 8.7 9.7
1993/94 9.0 10.1 8.1 9.3 8.4 8.3 8.4 10.9 8.6 9.6
1994/95 9.0 10.0 8.1 9.3 8.3 8.2 8.4 10.5 8.6 9.5
(continued)
26 Canadian Journal on Aging 24 (Suppl. 1) M. Finlayson et al.
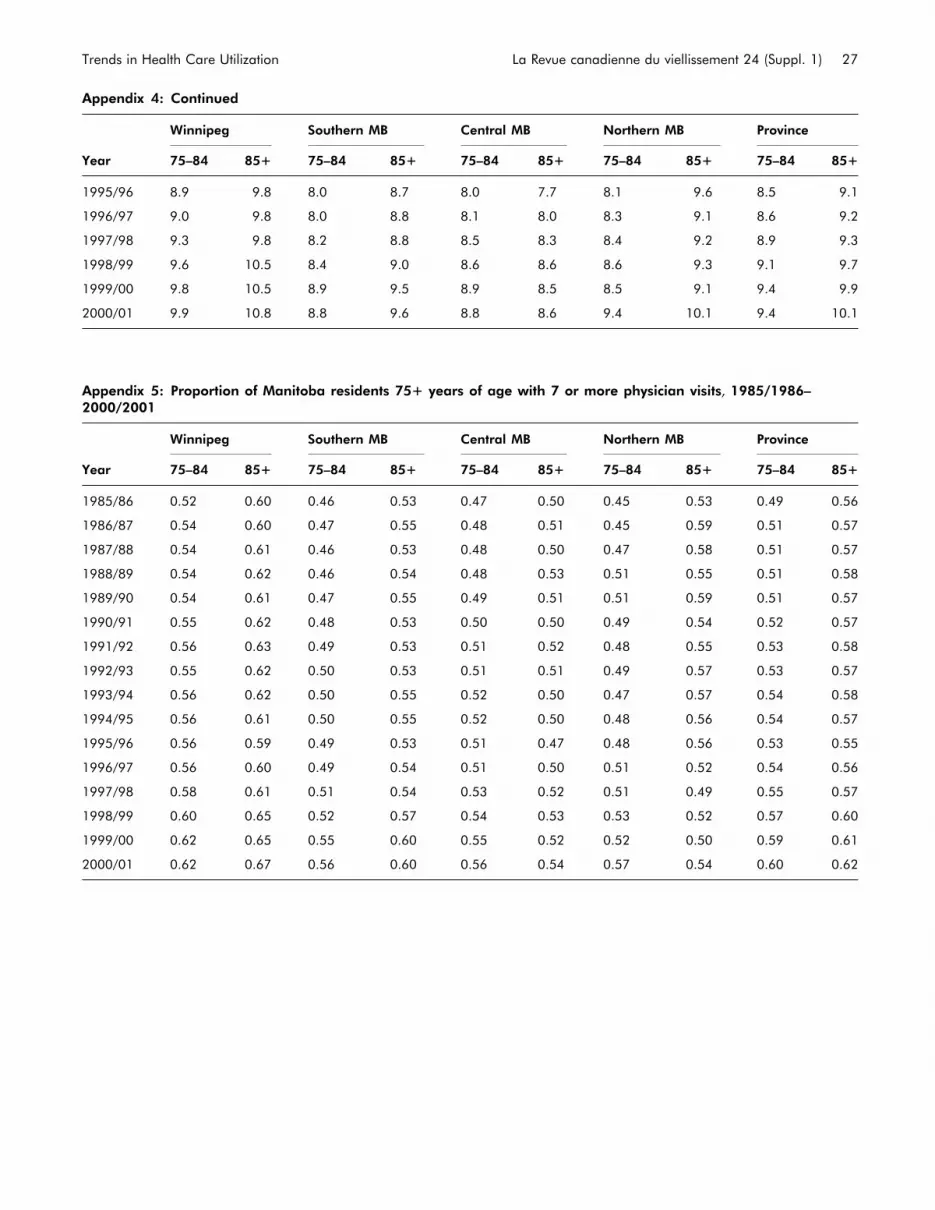
Appendix 4: Continued
Winnipeg Southern MB Central MB Northern MB Province
Year 75–84 851 75–84 851 75–84 851 75–84 851 75–84 851
1995/96 8.9 9.8 8.0 8.7 8.0 7.7 8.1 9.6 8.5 9.1
1996/97 9.0 9.8 8.0 8.8 8.1 8.0 8.3 9.1 8.6 9.2
1997/98 9.3 9.8 8.2 8.8 8.5 8.3 8.4 9.2 8.9 9.3
1998/99 9.6 10.5 8.4 9.0 8.6 8.6 8.6 9.3 9.1 9.7
1999/00 9.8 10.5 8.9 9.5 8.9 8.5 8.5 9.1 9.4 9.9
2000/01 9.9 10.8 8.8 9.6 8.8 8.6 9.4 10.1 9.4 10.1
Appendix 5: Proportion of Manitoba residents 751 years of age with 7 or more physician visits, 1985/1986–2000/2001
Winnipeg Southern MB Central MB Northern MB Province
Year 75–84 851 75–84 851 75–84 851 75–84 851 75–84 851
1985/86 0.52 0.60 0.46 0.53 0.47 0.50 0.45 0.53 0.49 0.56
1986/87 0.54 0.60 0.47 0.55 0.48 0.51 0.45 0.59 0.51 0.57
1987/88 0.54 0.61 0.46 0.53 0.48 0.50 0.47 0.58 0.51 0.57
1988/89 0.54 0.62 0.46 0.54 0.48 0.53 0.51 0.55 0.51 0.58
1989/90 0.54 0.61 0.47 0.55 0.49 0.51 0.51 0.59 0.51 0.57
1990/91 0.55 0.62 0.48 0.53 0.50 0.50 0.49 0.54 0.52 0.57
1991/92 0.56 0.63 0.49 0.53 0.51 0.52 0.48 0.55 0.53 0.58
1992/93 0.55 0.62 0.50 0.53 0.51 0.51 0.49 0.57 0.53 0.57
1993/94 0.56 0.62 0.50 0.55 0.52 0.50 0.47 0.57 0.54 0.58
1994/95 0.56 0.61 0.50 0.55 0.52 0.50 0.48 0.56 0.54 0.57
1995/96 0.56 0.59 0.49 0.53 0.51 0.47 0.48 0.56 0.53 0.55
1996/97 0.56 0.60 0.49 0.54 0.51 0.50 0.51 0.52 0.54 0.56
1997/98 0.58 0.61 0.51 0.54 0.53 0.52 0.51 0.49 0.55 0.57
1998/99 0.60 0.65 0.52 0.57 0.54 0.53 0.53 0.52 0.57 0.60
1999/00 0.62 0.65 0.55 0.60 0.55 0.52 0.52 0.50 0.59 0.61
2000/01 0.62 0.67 0.56 0.60 0.56 0.54 0.57 0.54 0.60 0.62
Trends in Health Care Utilization La Revue canadienne du viellissement 24 (Suppl. 1) 27

CANADIANJOURNALONAGING
LA REVUECANADIENNEDUVIEILLISSEMENT

Use of Physician Services by Older Adults:1991/1992 to 2000/2001
Diane E. Watson,1 Petra Heppner,1 Robert Reid,2 Bogdan Bogdanovic,3 and Noralou Roos3
RESUMELes Canadiens et Canadiennes ont exprime des inquietudes au sujet de la diminution de l’acces aux medecins defamille (MF). Des donnees sur les services fournis entre 1991/1992 et 2000/2001, par des medecins dont le nom n’a pasete divulgue, ont ete utilisees pour evaluer les changements en matiere d’effectifs disponibles ainsi que la frequence desconsultations de MF et de specialistes, en fonction de l’age des patients, a Winnipeg, au Manitoba. La proportion demedecins dans la population a diminue de 7,5 p. 100, celle de MF, de 4,8 p. 100 et celle de specialistes, de 10,0 p. 100.Dans la population en general, la frequence des visites chez des MF a diminue de 3 p. 100. Chez les personnes agees, lafrequence des visites chez le medecin a augmente de 2,3 p. 100, celle des visites chez des MF a augmente de 10,9 p. 100et celle des visites chez des specialistes a diminue de 15,7 p. 100. Par comparaison, nous constatons des diminutionsdans la consultation de MF chez les enfants de moins de cinq ans (25,5 p. 100) et chez les jeunes de 6 a 19 ans (18,6p. 100). Des augmentations dans la consultation des MF et des diminutions dans la consultation des specialistes ontsurtout ete constatees chez les personnes agees de 65 a 84 ans. En 2000/2001, les personnes agees representaient25 p. 100 de toutes les visites chez un MF. L’accroissement de la consultation des MF par des personnes agees decoulemoins de la croissance du nombre d’aınes que du fait qu’ils sont plus nombreux a consulter un MF chaque annee et,dans certains cas, a remplacer les soins primaires par des soins secondaires.
ABSTRACTCanadians have expressed concern that access to family physicians (FP) has declined. Anonymized physician servicesdata for 1991/1992 to 2000/2001 were used to evaluate changes in supply and age-specific rates of use of FPs andspecialists in Winnipeg, Manitoba. Physician-to-population ratios declined 7.5 per cent, FP-to-population ratiosdeclined 4.8 per cent, and specialist-to-population ratios declined 10.0 per cent. Among the general population, FP visitrates declined 3 per cent. Among older adults, physician visit rates increased 2.3 per cent, FP visit rates increased 10.9per cent, and specialist visit rates declined 15.7 per cent. By comparison, we document declines in FP use by thoseyounger than 5 years (25.5%) and those 6 to 19 years of age (18.6%). Increases in FP and declines in specialist useoccurred primarily among those aged 65 to 84 years. By 2000/2001 older adults accounted for 25 per cent of all FPencounters. Gains in FP use among older adults was less attributable to the presence of more seniors and more relatedto the fact that a higher proportion of them are visiting a FP each year and, potentially, substituting primary forsecondary care.
1 University of British Columbia
2 Group Health Cooperative of Puget Sound
3 University of Manitoba
Manuscript received: / manuscrit recu : 01/04/03
Manuscript accepted: / manuscrit accepte : 10/09/04
Mots cles : medecins de famille; specialistes; utilisation des services; effectifs de medecins; vieillissement
Keywords: family physicians; specialists; service utilization; physician supply; aging
Requests for offprints should be sent to: / Les demandes de tires-a-part doivent etre addressees a :
Diane Watson, Ph.D., M.B.A., B.Sc.O.T.Centre for Health Services and Policy ResearchUniversity of British Columbia4th Floor, 2194 Health Sciences MallVancouver, BC V6T 1Z3([email protected])
Canadian Journal on Aging / La Revue canadienne du viellissement 24 (Suppl. 1) : 29 - 36

IntroductionA large and growing number of people in Canadahave expressed concern that access to physiciansin their communities, particularly general practi-tioners and family physicians (FP), is deteriorating(Conference Board of Canada, 2001). Perceptions ofproblems are so widespread that the nation’s minis-ters increased investments in primary health care toenhance ‘‘access to a health provider 24 hours a day,7 days a week’’ (Health Canada, 2003). A number ofprovincial and federal committees and organizationshave responded to current perceptions of physicianshortages by recommending increases in both medicalschool enrolments and external recruitment (ExpertPanel on Health Professional Human Resources, 2001;Standing Senate Committee on Social Affairs, Scienceand Technology, 2002).
All this concern and recent fast-track policies toenhance physician supply have arisen despite afundamentally puzzling fact: physician-to-populationratios across Canada have remained relatively stablesince the early 1990s when physicians, at least inurban areas, were considered to be in oversupply(Chan, 2002; Watson, Roos, Katz, & Bogdanovic,2003). But if overall physician supply has notchanged, what underlies the shifts from historicwidespread perceptions of physician surpluses tocurrent views of shortage? It could ‘‘feel’’ as if there isa physician shortage despite stable supply if patternsof delivery have changed in ways that influence thevolume of care received by particular groups ofpatients. In other words, significant increases in useof care by one population (e.g., older adults) couldcreate problems in access to services for otherpopulations (e.g., the young).
Per capita use of physicians, and FP services inparticular, steadily increased in Canadian provincesfrom the late 1970s to the early 1990s. During thisperiod, people of all ages visited physicians morefrequently, but annual rates increased most rapidly forolder adults. Thus, seniors consumed an increasingproportion of all physician services (Barer, Evans, &Hertzman, 1995; Black, Roos, Havens, & MacWilliam,1995; Demers, 1996; Eyles, Birch, & Newbold, 1995).These increases in use, however, occurred at a timewhen physician-to-population ratios and serviceoutput per physician (particularly specialists) wasalso increasing. Since there was greater supply to beused by the population, visit rates increased accord-ingly (Evans, McGrail, Morgan, Barer, & Hertzman,2001; Rosenberg & James, 2000). While patterns ofphysician use by older adults during these his-toric periods are well understood, temporal patternsof FP and specialist use over the past decade in
Canada have not been documented (Rosenberg &James, 2000).
The greying of the Canadian population – coupledwith observations that older people have greaterillness burdens and use more services than theiryounger counterparts, and that the intensity of thiscare has increased over time – has prompted some tospeculate that population aging will threaten thesustainability of a health care system that permitsuniversal access. In fact, 30 per cent of Canadiansbelieve that population aging is the key factorresponsible for current health care budget pressures(POLLARA Research, 2002). During a period of stableper capita physician supply, it is certainly plausible,and indeed likely, that providing more care to olderpersons may mean that younger people would exper-ience difficulties accessing services. Yet temporalpatterns of older adults’ use of FP and specialistservices during the 1990s has not been documented.
The health status of recent cohorts of older adults(and thus their need for care) has changed in recentyears in ways likely to influence seniors’ use ofphysician services. Research increasingly supports thenotion that people live longer and the onset of chronicdiseases occurs later in life such that morbidity iscompressed into shorter periods before death (Fries,1980, 2002). The vast majority of older adults haverelatively few health problems, and the health ofrecent cohorts of older adults is improved relative totheir predecessors (Chen & Millar, 2000; Freedman,Martin, & Schoeni, 2002; Menec, MacWilliam,Soodeen, & Mitchell, 2002). In Canada, improvedoverall health of seniors is evidenced by declines inage-specific mortality and increases in dependence-free life expectancy (Martel & Belanger, 2000). Yethave these changes altered use of FP and specialistservices?
The purposes of this paper are (1) to evaluate theextent and nature of physician use among olderadults over a period of enhanced health status andrelatively stable FP-to-population ratios, and (2) toconsider the potential impact of any change in FPutilization on perceptions of adequacy of physiciansupply and access to primary care. We focus on theuse of FP services, since primary care largely serves asthe entry point to the health system, and the vastmajority of people visit a FP once a year(Jaakkiamainen, 2001; Sanmartin, Houle, Berthelot, &White, 2002). We also assess use of specialists todetermine if older adults contact these practitionersmore (or less) over time as their contacts with FPschange. This population-based study was undertakenusing data from Winnipeg, MB – a city, like others inCanada, where FPs and citizens express frustration
30 Canadian Journal on Aging 24 (Suppl. 1) D. E. Watson et al.

about access to FPs, and journalists document widelyheld views that many FP practices restrict access tonew patients (Square, 2001). Student enrolment in thecity’s medical school was cut in the early 1990s as aresult of prevailing perceptions of adequate physiciansupply (Bueckert, 1993) and increased in the late 1990sin response to perceptions of insufficient supply(Square, 2001). We hypothesized that FP and specialistuse among older adults increased over the period.
MethodsWe used anonymized population registry and physi-cian utilization data for people who resided in theWinnipeg Regional Health Authority any fiscal yearfrom 1991/1992 to 2000/2001 (Watson, Bogdanovic,Heppner, Katz, Reid, & Roos, 2003). Winnipegresidents represent roughly two thirds of the popula-tion of the province of Manitoba. The majority ofphysicians practise in this capital city, and theirservices are covered under a universal health planthat has no deductible or co-payment. All measureswere derived from billing data from physicians whoworked on a fee-for-service (FFS) basis or whoreceived alternative types of remuneration and sub-mitted ‘‘evaluation claims’’ (i.e., roughly 7% of FPs in2000/2001 and 2% of total billings). The completenessand validity of the population registry and physicianbilling data have been assessed (Robinson, Young,Roos, & Gelskey, 1997; Roos et al., 1993).
For each year, we provide descriptive analysis tomeasure the proportion of people making at least onevisit and the mean number of visits per annum forWinnipeg residents stratified by patient age andphysician type (i.e., FP versus specialist). The propor-tion of people who visited a FP was calculated bydividing the number of residents who made at leastone visit to a physician during the year by the totalnumber of residents in Manitoba Health registrationfiles. The count of visits per population was calculatedby dividing the sum of all visits received by residentsduring a fiscal year by the size of the population. Inorder to differentiate whether changes in per popula-tion utilization were attributed to the proportion ofolder adults who had at least one visit or to theaverage number of visits made by those using thesystem (i.e., patients), we counted the number of visitsper patient. This figure was calculated by dividing thesum of all visits received by residents by the numberof patients who visited at least once. When we reportper cent changes in rates, these values reflect changeon the basis of age and gender standardized calcula-tions using the direct method and the 1991/1992Winnipeg population as the standard. Visits weredefined as any face-to-face contact between a
Winnipeg resident and a physician that occurredwhile the patient was not a hospital inpatient.Contacts may have occurred in physician offices,personal care homes, outpatient departments, or ateither of the two largest emergency departments inWinnipeg. Visits for prenatal and postpartum care arenot included as a result of data limitations.
FindingsThe size of the Winnipeg population remained stableover the study period (N¼ 653,452 in 1991/1992,N¼ 654,930 in 2000/2001), but the age structurechanged. The size of the population less than 44years declined 8 per cent, while that aged 45 to 64years (i.e., baby boomers) increased 25 per cent. Thepopulation 65 to 74 years old declined 6 per cent, yetthe population 75 to 84 years of age increased 19 percent, and the population aged 85 or more increased 42per cent. By 2000/2001 adults aged 65 to 74, 75 to 84,and 85 or more years represented 7, 5, and 2 per centof the Winnipeg population, respectively. Overall,Winnipeggers aged 65 or more years represented 14per cent of the population in 2000/2001, compared to13 per cent in 1991/1992.
The number of Winnipeg FPs who billed ManitobaHealth (or submitted ‘‘evaluation’’ claims) in a fiscalperiod declined 4.6 per cent from 634 to 605 in 1991/1992 and 2000/2001. FP-to-population ratios declined4.8 per cent from 97 to 92 per 100,000, but averageworkloads per FP remained relatively stable (Watson,Roos, et al., 2003). Over the same period, the numberof Winnipeg specialists declined 9.8 per cent from 661to 596, and specialist-to-population ratios declined 10per cent from 101 to 91 per 100,000. Overall physician-to-population ratios declined 7.5 per cent (Figure 1).
The vast majority of older adults visited a FP at leastonce per year, and this proportion increased graduallyover the study period. More specifically, in 2000/2001,88.5 per cent of seniors visited a FP, representing an8 per cent increase in the standardized rate since1991/1992. Across the age groups, the proportion ofWinnipeg residents visiting FPs was 86.4 per cent(aged 65 to 74 years), 89.0 per cent (75 to 84 years),and 94.5 per cent (85þ years) (Table 1). In 2000/2001,59.7 per cent of older adults visited a specialist at leastonce — a figure virtually unchanged since 1991/1992.Across the age groups, the proportion of Winnipegresidents visiting a specialist was 56.5 per cent(age 65 to 74 years), 62.6 per cent (75 to 84 years),and 63.9 per cent (85 years and more).
Older adult patients who visited a FP at least oncereceived slightly more of these services by the end ofthe 10-year period. More specifically, in 2000/2001
Use of Physician Services by Older Adults La Revue canadienne du viellissement 24 (Suppl. 1) 31

seniors who visited a FP at least once visited an aver-age of 7.1 times, representing a 4.7 per cent increase inthe standardized rate since 1991/1992. Across the agegroups, crude visit rates per patient in 2000/2001were 6.3 visits (age 65 to 74 years), 7.6 (age 75 to 84years), and 8.4 (age 85 years and more), representingan increase in standardized rates from 3.6, 7.0 and 9.8per cent in each age group, respectively, in 1991/1992.
The population of older adults contacted physiciansjust as often in 2000/2001 as they did 10 years prior,
but they visited FPs more often and specialists lessoften. In 2000/2001, adults aged 65 or more made anaverage of 8.51 physician visits, a gradual increaseof 2.3 per cent over the decade. An average of 6.28of these visits were made to FPs, a gradual increase of10.9 per cent over the decade. Conversely, olderadults made 2.23 specialist visits in 2000/2001, adecline of 15.7 per cent since 1991/1992. Increases inuse of FPs and declines in use of specialists wereparticularly pronounced among those 65 to 84 years(Table 2).
Supply of FP and Specialists in Winnipeg, Manitoba, 1991/92-2000/01
40
50
60
70
80
90
100
110
120
1991/92 1992/93 1993/94 1994/95 1995/96 1996/97 1997/98 1998/99 1999/00 2000/01
Specialist-to-population
Specialist FTE-to-population
FP-to-population
FP FTE-to-population
Figure 1: Supply of FPs and specialists in Winnipeg, MB, 1991/1992–2000/2002
Table 1: Utilization of FP services by Winnipeg residents, by age, 2000/2001(N¼654,930)
2000/2001 RatesChange in Standardized Rates1991/1992–2000/2001
PopulationVisited atLeast Once (%)
Visits perPopulation (#)
Visited at LeastOnce (%)
Visits perPopulation (#)
0–5 Years 62.4 2.39 �11.1 �25.5
6–19 Years 62.6 1.83 �6.9 �18.6
20–44 Years 74.7 3.10 �4.0 �10.6
45–64 Years 79.1 4.04 1.9 0.2
65–74 Years 86.4 5.48 7.3 11.1
75–84 Years 89.0 6.73 8.4 16.0
85þ Years 94.5 7.96 12.6 1.5
Winnipeg 74.6 3.61 �1.0 �3.1
32 Canadian Journal on Aging 24 (Suppl. 1) D. E. Watson et al.

By 2000/2001, the population aged 65 or more yearswere responsible for 25.5 per cent of all visits madeto Winnipeg FPs (Figure 2). This represents a 5.2percentage point increase in the ‘‘greying’’ of visitssince 1991/1992. The increase in the number andproportion of FP encounters with older adults wasinfluenced more by an increase in the number of FPvisits per population than by the growth in the size ofthe older population. Moreover, increases in FP visitsper population appear more attributable to increasesin the proportion contacting a FP at least once, than byincreases in the number of visits per patient. By 2000/2001, after accounting for increases in the numbers ofManitobans over age 65, the hypothetical proportionof FP encounters made by older adults would havebeen 21.9 per cent (rather than 25.5%) if there hadbeen no increase in the visit rate per population andthe proportion of older adults who contacted FPs attheir 1991/1992 rates (Figure 2).
As also illustrated in Figure 2, we found that as therelative proportion of care delivered by FPs to seniorsincreased, there was a simultaneous decline in theoverall proportion of visits made by children andadolescents. And the proportion of encountersbetween FPs and adults aged 20 to 44 years declinedover the same period. Conversely, the proportion ofencounters with adults aged 45 to 64 years increased.An analysis of age-specific rates of FP use by differentage populations, as illustrated in Table 2, suggests thatincreases of FP use among older adults occurredconcurrent with declines in use among pediatric andadolescent populations.
DiscussionWe document increased use of FPs among olderadults during a decade of enhancements in theirhealth status, relatively stable FP-to-population ratiosand workloads per FP, and growth in public percep-tions of restrained access to primary care. In compar-ison to increases in age-specific FP visit rates amongolder adults (10.9%), we documented declines inspecialist visit rates over the study period (15.7%).While we did not explore hypotheses as to why thismight have occurred or what impacts on healthoutcomes may have resulted, it could be that temporaltrends in utilization relate to either (or both) changingdemands by older adults or changing patterns ofpractice among physicians.
While the overall physician visit rates of older adultswere relatively unchanged over the period, seniorsused more primary and less specialty care. One couldargue that continuity of care may increase when agreater proportion of overall care is delivered by FPs,or that quality of care is compromised when special-ists provide a lower proportion of overall care.Alternatively, there may be little or no effect oftemporal shifts in the mix of providers who delivercare. Substitution of FP for specialist services shouldbe assessed in relation to quality of care delivered,and ultimately health outcomes. Should FPs be able to‘‘substitute’’ lower-cost services that would otherwisebe provided by specialists, without adversely affect-ing quality or health outcomes, these shifts representmore cost-effective delivery of physician servicesamong seniors.
Table 2: Physician visits per older adult population, by type of physician,1991/1992–2000/2001
Visit Rates perPopulation (#)
Change (%)*Age of Resident Type of Physician 1991/1992 2000/2001 1991–2001
65–74 years FP** 4.94 5.48 11.1
Specialist 2.50 2.09 �16.4
75–84 years FP 5.81 6.73 16.0
Specialist 2.99 2.42 �19.1
85þ years FP 7.98 7.96 1.5
Specialist 2.29 2.21 �4.5
65þ years FP 5.55 6.28 10.9
Specialist 2.64 2.23 �15.7
All physicians 8.19 8.51 2.3
*Change in standardized rates **FP¼ family physicians and general practitioners
Use of Physician Services by Older Adults La Revue canadienne du viellissement 24 (Suppl. 1) 33
Our analyses demonstrate that the face of primarycare has rapidly become more ‘‘grey’’ – older adultsnow account for one quarter of all encounters withFPs, compared to about one fifth 10 years earlier.Furthermore, these shifts are more attributable toincreases in the proportion of older adults who visitFPs than increase in visit rates among users. Anotherimportant finding is that FP visit rates increasedamong older adults at the same time there weredeclines in FP use among children and adolescents.The reason children saw FPs less often over the studyperiod was not because they saw pediatricians orother specialists more often (Watson, Bogdanovic,et al., 2003). The provision of a disproportionate shareof services to older adults is likely appropriate, giventheir higher burden of illness and co-morbidityrelative to younger age groups (Iezzoni, 1997). Butfurther research is required to determine the effects ofthis generational trade-off – providing ever more FPservices to older adults at the expense of less care tochildren and adolescents – on the accessibility ofprimary care and the health of the population.
Increases in per capita use of FP services amongolder adults may be appropriate if they respond tochanging patterns of health among the population.For example, seniors may increasingly require orreceive more curative or rehabilitation treatments,have access to interventions directed toward healthprotection, or have health conditions best served byFPs versus specialists. Menec et al. (2002) found thatthe greatest health improvements among older adultsin Manitoba were among those 65 to 74 years of age,and that the treatment prevalence of chronic diseaseincreased among this cohort. Could more aggressivescreening for and treatment of chronic conditions by
FPs among the cohort 65 to 74 years account for thesimultaneous increases in chronic disease treatmentprevalence and improvements in health status? Oralternatively, is the increased intensity of care pro-vided by FPs to this cohort of older adults largelyindependent of their overall health gains? Moreresearch is needed to clarify these questions, particu-larly as the policy and practice community plan toensure adequacy of future physician supply for anaging population. Interestingly, research has demon-strated that roughly 30 per cent of the increase inphysician visits among older adults in Manitobabetween 1973 and 1983 was attributable to individualsin good health (Black et al., 1995).
What about stable FP visit rates among the oldest-old?If the compression of morbidity hypothesis is true,then one might expect physician visit rates amongolder adults to rise over time during the periodshortly before death. Additionally, should morbidityduring the period before death be higher amongrecent cohorts relative to their predecessors, then onemight expect visit rates during this time to increaseover the period. Might this explain our finding ofincreases in visit use among older adults? Wecalculated FP visit rates among the population in theyear before death, and found these rates to be 1.6times higher than visit rates among other older adults.However, while people receive significantly more FPservices in the year before death, these patterns of FPuse were stable over the study period (Watson,Bogdanovic, et al., 2003).
There are important limitations of this study: ouranalyses are limited to utilization of physicianservices, we did not attempt to measure the healthof different age cohorts, this project represents a case
7.6% 4.9% 6.2%
9.6%11.2%
40.1%
33.3%35.4%
20.7%
26.7%25.3%
20.3%25.5% 21.9%
0%
10%
20%
30%
40%
50%
60%
70%
80%
90%
100%
Visits Visits Expected Visits
1991/92 Observed (crude) 2000/01 Observed (crude) 2000/01 Expected (standardized)
65+ years
45-64 years
20-44 years
6-19 years
0-5 years
11.3%
Figure 2: Proportion of total FP visits, by age, 1991/1992–2000/2001, observed and expected
34 Canadian Journal on Aging 24 (Suppl. 1) D. E. Watson et al.

study in one Canadian city, and we could not measuredemand for care. Indeed, we know little aboutdifficulties (if any) people may encounter in arrangingto visit a physician, were unable to assess issues ofoveruse or underuse, and did not assess the relation-ships among utilization, health status, and patientoutcomes.
ConclusionThe findings of this study are important to policydebates and analyses regarding the current andpotential impact of an aging population on accessand availability of FPs. Over the past decade, wedocument an increase in FP visit rates and decline inspecialist visit rates among older adult populations,and an increase in the proportion of primary careencounters that are between FPs and older adults.These findings suggest that over time FP supply andavailability are increasingly important to the care ofolder populations. But as an increasing proportion ofFP encounters are with older adults, physicians (andother people) may increasingly believe that demo-graphic changes are the culprit. Such is not the case.Increases in encounters with older adults are lessattributable to the presence of more seniors, butrelated more to the fact that seniors are visiting FPsmore frequently and, potentially, substituting primaryfor secondary care.
All these changes have occurred at the same time assubstantive reductions in FP service levels amongchildren and adolescents. Increases in one popula-tion’s use of FPs can create problems in accessibilityor reductions in access for other populations during aperiod of stable supply of these practitioners.Therefore, temporal shifts between generations inrates of FP use point to the necessity of understandingthe relationship between health and levels of carefor age-specific groups, and shifts in consumption ofFPs between age cohorts on the health of thepopulation.
References
Barer, M.L., Evans, R.G., & Hertzman, C. (1995). Avalancheor glacier? Health care and the demographic rhetoric.Canadian Journal on Aging, 14, 193–224.
Black, C., Roos, N.P., Havens, B., & MacWilliam, L. (1995).Rising use of physician services by the elderly: Thecontribution of morbidity. Canadian Journal on Aging, 14,225–244.
Bueckert, D. (1993, June 22). Foreign MDs limit backed insurvey: Canadian doctors feel job crunch. Winnipeg FreePress, p.A2.
Chan, B. (2002). From perceived surplus to perceived shortage:What happened to Canada’s physician workforce in the1990s? Ottawa: Canadian Institute for HealthInformation.
Chen, J., & Millar, W.J. (2000). Are recent cohorts healthier thantheir predecessors? (Report No. 11-4). Ottawa: StatisticsCanada.
Conference Board of Canada. (2001). Canadians’ values andattitudes on Canada’s health care system: A synthesis ofsurvey results. Ottawa: Author.
Demers, M. (1996). Factors explaining the increase in cost forphysician care in Quebec’s elderly population. CanadianMedical Association Journal, 155, 1555–1623.
Evans, R.G., McGrail, K.M., Morgan, S.G., Barer, M.L., &Hertzman, C. (2001). Apolcalyse no: Population agingand the future of health care systems. Canadian Journalon Aging, 20 (Suppl. 1), 160–191.
Expert Panel on Health Professional Human Resources &Ministry of Health & Long Term Care. (2001). ShapingOntario’s physician workforce. Toronto: Author.
Eyles, J., Birch, S., & Newbold, K.B. (1995). Delivering thegoods? Access to family physician services in Canada:A comparison of 1985 to 1991. Journal of Health andSocial Behavior, 36, 322–332.
Freedman, V.A., Martin, L.G., & Schoeni, R.F. (2002). Recenttrends in disability and functioning among older adultsin the United States. Journal of the American MedicalAssociation, 288, 3137–3146.
Fries, J.F. (1980). Aging, natural death and the compressionof morbidity. New England Journal of Medicine, 303,130–135.
Fries, J.F. (2002). Reducing disability in older age. Journal ofthe American Medical Association, 288, 3164–3165.
Health Canada. (2003). 2003 First ministers’ accord on healthcare renewal. Retrieved February 24, 2003, from http://www.hc-sc.gc.ca/english/hca2003/accord.html
Iezzoni, L.I. (1997). The risks of risk adjustment. Journal of theAmerican Medical Association, 278, 1600–1607.
Jaakkimainen, L. (2001). Primary care visits: How manydoctors do people see? Hospital Quarterly, 5(1), 17.
Martel, L., & Belanger, A. (2000). Dependency-free lifeexpectancy in Canada (Report No. 11-008). Ottawa:Statistics Canada.
Menec, V.H., MacWilliam, L., Soodeen, R., & Mitchell, L.(2002). The health and health care use of Manitoba’s seniors:Have they changed over time? Winnipeg: Manitoba Centrefor Health Policy.
POLLARA Research. (May 2002). Health Care in CanadaSurvey 2002. Retrieved March 24, 2003, from http://www.pollara.ca/new/Library/SURVEYS/Healthcare2002.pdf
Use of Physician Services by Older Adults La Revue canadienne du viellissement 24 (Suppl. 1) 35

Robinson, J.R., Young, T.K., Roos, L.L., & Gelskey, D.E.(1997). Estimating the burden of disease: Comparingadministrative data and self-reports. Medical Care, 9,932–947.
Roos, L.L., Mustard, C.A., Nicol, J.P., McLerran, D.F.,Malenka, D.J., Young, T.K., Cohen, M.M. (1993).Registries and administrative data: Organization andaccuracy. Medical Care, 31, 201–212.
Rosenberg, M.W., & James, A.M. (2000). Medical servicesutilization patterns by seniors. Canadian Journal onAging, 19.1, 125–142.
Sanmartin, C., Houle, C., Berthelot, J.M., & White, K. (2002).Access to health care services in Canada, 2001. Ottawa:Statistics Canada.
Standing Senate Committee on Social Affairs, Science andTechnology. (2002). The health of Canadians: The federalrole, final report (Rep. No. 6: Recommendations forReform). Ottawa: Author.
Square, D. (2001). Manitoba increased medical schoolenrolment in attempt to fight doctor deficit. CanadianMedical Association Journal, 164, 395.
Watson, D.E., Bogdanovic, B., Heppner, P., Katz, A., Reid, R.,& Roos, N.P. (2003). Supply, availability and use of familyphysicians in Winnipeg: 1991/92–2000/01. Winnipeg:Manitoba Centre for Health Policy.
Watson D.E., Roos, N.P., Katz, A., & Bogdanovic, B. (2003). Isa 5% decline in physician supply significant? Yes or No.Canadian Family Physician, 49, 366–367.
36 Canadian Journal on Aging 24 (Suppl. 1) D. E. Watson et al.

Growing Old Together: The Influence ofPopulation and Workforce Aging onSupply and Use of Family Physicians
Diane E. Watson,1 Robert Reid,2 Noralou Roos,3 and Petra Heppner1
RESUMELes Canadiens ont exprime des preoccupations quant a la diminution rapide de l’acces aux medecins de famille (MF).Pourtant, la proportion de MF par rapport a la population est restee relativement stable au cours de la dernieredecennie. Par ailleurs, il y a dix ans, les gens avaient l’impression qu’il y avait un surplus de medecins, du moinsdans les milieux urbains. Nous avons etudie les changements demographiques parmi les patients et les MF, ainsi quela quantite de soins fournis et recus au cours de cette periode, afin de determiner si cela avait contribue a ceparadoxe. Compte tenu du rapport entre l’age et les visites chez les MF au cours de l’exercice 1991/1992, levieillissement de la population aurait du engendrer une augmentation de 2 p. 100 des visites chez le medecin en2000/2001. De meme, compte tenu du rapport entre l’age des medecins et les charges de travail en 1991/1992, cevieillissement des effectifs aurait du engendrer une augmentation de 12 p. 100 dans la prestation de services dixans plus tard. Pourtant, la frequence des visites et la charge de travail moyenne des MF n’ont pas change. Il y a euune augmentation du nombre de visites chez les MF pour les personnes agees et une diminution de la frequencedes visites chez les plus jeunes, ainsi qu’une augmentation de la charge de travail propre a certains groupes d’age,les MF les plus ages fournissant beaucoup plus de services que leurs predecesseurs (30 p. 100) tandis que les plusjeunes MF en fournissaient beaucoup moins (20 p. 100). Du point de vue de l’incidence sur les besoins a venir enmatiere de MF, les changements lies au taux de consultations par categorie d’age et les changements dans laproductivite des MF selon leur age prennent tous les deux le dessus sur le vieillissement de la population a titre defacteurs fondamentaux.
ABSTRACTCanadians have expressed concern that access to a family physician (FP) has declined precipitously. Yet FP-to-population ratios remained relatively stable over the last decade, and there were perceptions of physician surpluses, atleast in urban centres, 10 years ago. We evaluated whether demographic changes among patients and FPs, and in thevolume of care received and provided over the period, contribute to this paradox. Given the relationship between ageand FP use in fiscal year 1991/1992, an aging population should have been associated with a 2 per cent increase in visitsby 2000/2001. Likewise, given the relationship between FP age and workloads in 1991/1992, an aging workforceshould have been associated with a 12 per cent increase in service provision a decade later. Yet visit rates and averageFP workloads remained unchanged. There was an increase in age-specific rates of FP use among older adults and adecline in rates among the young, and an increase in age-specific workloads such that older FPs provided many moreservices than their predecessors (30%) and younger FPs provided many fewer (20%). In terms of impact on futurerequirements for FPs, both changes in age-specific rates of use, and changes in age-specific patterns of FP productivity,trump population aging as key drivers.
1 University of British Columbia
2 Group Health Cooperative of Puget Sound
3 University of Manitoba
Manuscript received: / manuscrit recu : 01/04/04
Manuscript accepted: / manuscrit accepte : 10/09/04
Mots cles : vieillissement de la population; medecins de famille; acces; utilisation des services; effectifs de medecins
Keywords: aging population; family physicians; access; use; physician supply
Canadian Journal on Aging / La Revue canadienne du viellissement 24 (Suppl. 1) : 37 - 45

Requests for offprints should be sent to: / Les demandes de tires-a-part doivent etre addressees a :
Diane E. Watson, Ph.D., M.B.A., B.Sc.O.T.Centre for Health Services and Policy ResearchUniversity of British Columbia4th Floor, 2194 Health Sciences MallVancouver, BC V6T 1Z3([email protected])
IntroductionOver the last several decades, the age structures ofthe population, and the physicians who serve thatpopulation, have changed. The baby boomer genera-tion will be reaching the age of 65 between 2010and 2030, and doomsday predictions regarding theincreased demands an aging population will place onthe health care system are commonplace (Gee &Gutman, 2000). Receiving far less attention is the factthat family physicians (FPs) are also, for the most part,part of the boomer generation, and the FP workforceis aging. If the age structure of the populationinfluences the rate at which physician services areneeded and used, and the age structure of theworkforce influences the rate at which services areprovided, both factors must be taken into account inassessing requirements for FPs. The purposes of thispaper are to describe changes over the last decade inthe demographics and utilization patterns of an agingpopulation, and in the demographics and workloadpatterns of an aging FP workforce; and to estimatethe relative impact of different demographic-relateddeterminants of access to and availability of FPservices.
In 2001, older adults comprised 12 per cent of theCanadian population and by 2020 are expected torepresent roughly 20 per cent (National AdvisoryCouncil on Aging, 2002). An aging population,coupled with the observation that older people usemore health care services than those who are younger,has prompted some to question the sustainability ofuniversal access to Canadian health care. Researchevidence has consistently shown that it is notdemographic changes per se that are the primarydrivers of increasing health care use; rather, it isbecause physicians are doing much more to (and for)older adults that the proportion of visits attributableto this population has increased so dramatically.Indeed, age-specific per capita use of FP services inCanada has increased for older adults since the 1970s(Barer, Evans, & Hertzman, 1995; Black, Roos, Havens,& MacWilliam, 1995; Demers, 1996; Eyles, Birch, &Newbold, 1995), and none of this increase isattributable to changes in gender mix (Watson,
Bogdanovic et al., 2003). Accordingly, it is critical totake account of trends in age-specific rates of FP usewhen making predictions about future utilization(Evans, McGrail, Morgan, Barer, & Hertzman, 2001).
At the same time, Canadians are expressing increas-ing concern that access to primary care is deteriorat-ing (Conference Board of Canada, 2001), and thenation’s health ministers have publicly committedto enhancing access to primary care (Health Canada,2003). The medical profession and a number of healthsystem review committees point to critical shortagesof FPs and recommend increasing the number ofundergraduate and postgraduate physician train-ing positions (College of Family Physicians ofCanada [CFPC], 2001, 2002; Expert Panel on HealthProfessional Human Resources, 2001; Standing SenateCommittee on Social Affairs, Science and Technology,2002). Meanwhile, academic health centres are experi-encing increasing problems in attracting medicalgraduates into family practice residency positions(Branswell, 2003; Picard, 2003). Paradoxically, currentviews of acute physician shortage come close on theheels of widespread perceptions expressed 10 yearsago of surpluses, particularly in urban jurisdictions.Shifts from perceptions of surpluses to shortagescontradict empirical measures of supply indicatingthat FP-to-population measures have declined onlyslightly over the decade (Canadian Institute forHealth Information [CIHI], 2000; Chan, 2002;Kazanjian, Reid, Pagliccia, Apland, & Wood, 2000).Clearly, something other than minimal declines in thenumbers of physicians per capita underlies thesedramatically altered perceptions of access and theadequacy of FP supply.
Changes in the age structure of the FP workforce overthe past decade have resulted in an increasedproportion of FPs being in their most productiveyears (CIHI, 2001). Research indicates that therelationship between physician age and workloads(i.e., age-specific workloads) is an inverted U-shape,such that doctors are most productive in mid-career(CIHI, 2001; Chan, 2002; Kazanjian et al., 2000). Ifanything, therefore, one might have expectedincreases in aggregate workforce productivity over
38 Canadian Journal on Aging 24 (Suppl. 1) D. E. Watson et al.

this period due to an aging population of FPs.However, these increases did not materialize(Watson, Roos, Katz, & Bogdanovic, 2003). By com-parison, changes in the gender structure of theworkforce, with an increasing proportion of women,may have thwarted available supply, since femalestend to have lower workloads than males (ExpertPanel on Health Professional Human Resources, 2001;Norton, Dun, & Soberman, 1994).
These facts and trends, taken together, suggest thatthe availability of FP services, now and in the future,is a complex function of temporal changes in the sizeof the population and workforce, the age and genderstructure of the population and workforce, therelationship between patient age/gender and utiliza-tion, and the relationship between physician age/gender and workloads. Any realistic attempts toestimate future patterns of use, or requirements forFP services, must simultaneously consider temporalchanges in all these factors.
To illustrate how expectations of future utilizationand supply might vary with changes in thesedeterminants, we present three hypothetical scenar-ios. In all scenarios, we assumed the following: (a)the population aged, (b) age-specific rates of useamong seniors increased, since research documentsthese trends in prior periods, and (c) physician-to-population ratios remain stable – as has been the casein Canada over the last decade. In the first scenario,use of services increases as a result of an agingpopulation and service intensification among olderadults (increased demand), but the demographicstructure of the workforce remains unchanged. Inthe second scenario, both use and delivery ofservices increase as the result of an aging popula-tion and workforce. In this scenario, we assume thatthe gender structure of the workforce remainsunchanged. And in the third scenario, use increasesas the result of an aging population coupled withservice intensification among older adults, andeffective supply decreases as the result of anincreasing proportion of female physicians. In thisscenario, we assume that the age structure of theworkforce is unchanged (Table 1). Other scenarios arepossible, and indeed likely, but these illustrate themain points.
In the first scenario we consider demographic shiftsamong patients while holding FP-to-population ratiosand demographic characteristics of physicians con-stant. If the proportion of the population aged 65or more and age-specific rates of FP use amongolder adults increases (scenario 1, Table 1), then onewould expect increased service use over time. But
such increased service use can occur only if thepractice patterns of FPs make it possible. Otherwise,one might expect patients to experience reducedaccess and use (e.g., wait-lists, fewer than expectedvisits) or reductions in service levels per encounterwith a FP (e.g., less time per visit). Alternatively, onesegment of the population might ‘‘lose’’ in relation toothers (e.g., younger vs. older patients).
In scenarios 2 and 3, we relax the assumptions aboutstable FP workforce demographics. Should the work-force age (no change in gender mix) such that thelargest cohort of FPs enters their most productiveyears, one might expect an increase in effective supply(scenario 2, Table 1). Recall that the relationshipbetween physician age and workload reveals aninverted U-shape such that doctors are most produc-tive in their 40s and 50s (CIHI, 2001; Chan, 2002;Kazanjian et al., 2000). Should the workforce increas-ingly comprise female FPs (no change in agestructure), one might expect a decline in effectivesupply (scenario 3, Table 1), since female physicianstend to carry lighter workloads than their malecounterparts (as measured by full-time equivalents,services per year, total billings, or total hours of work)(CIHI, 2001; Norton et al., 1994; Woodward & Hurley,1995). Of course, the last two scenarios are based onassumptions that age-specific and gender-specificmeasures of workload documented in cross-sectionalanalyses hold true for physicians (particularly theboomer generation cohort of FPs) over time.
One can envision other scenarios in which the sizeof the population or workforce increases or declinesand under conditions of differing magnitudes ofdemographic change. Our key point is that anyattempts to project utilization trends depend onexpected changes in the make-up of the prospectivepatient population and temporal changes in supply.Furthermore, these scenarios are based solely ondemographic profiling and do not consider temporalpatterns in health and need for care, advances intreatments, changes in scope of practice, and/or shiftsin the use of substitute or alternative providers.Health care workforce planning must consider allthese important determinants.
In this paper, we examine data from Winnipeg, MB,over the fiscal years 1991/1992 to 2000/2001, in aneffort to ascertain the relative importance of demo-graphic factors that could underlie perceptions ofcurrent and future access pressures on FP services.During this period, FP-to-population ratios declinedonly slightly, and the average age of the popula-tion and workforce increased in the city. Similar
Growing Old Together La Revue canadienne du viellissement 24 (Suppl. 1) 39

Table
1:Shifts
intheage/g
enderstru
cture
ofthephysician
workforce–Threescenarios
PotentialSourcesofShifts
inthePopulation
PotentialSourcesofShifts
inPhysicians
Sce
narios
Sizeof
Population
Age/G
ender
Structure
Age-Specific
Use
Rates*
Gender-
Specific
Use
Rates
Sizeof
Workforce
Age/G
ender
Structure
Age-Specific
Workloads**
Gender-Specific
Workloads
Exp
ectationsof
Demand
and
Supply
1Stable
relative
tophysician
supply
Aging
populatio
nServiceintensifica
tion
amongolderadults
Stable
Stable
relative
topopulatio
nStable
Stable
Stable
Demandincreases,
supply
stable
2Sameas
Scenario1
Sameas
Scenario1
Aging
physicians
Sameas
Scenario1
Demandincreases,
supply
increases
3Sameas
Scenario1
Sameas
Scenario1
Increased
proportion
offemales
Sameas
Scenario1
Demandincreases,
supply
decreases
*Therelationsh
ipbetw
eenageandutiliza
tionofFPservicesis
U-shaped:yo
ungerch
ildrenandolderadultsuse
more
care
thanotheragegroups.
**Therelationsh
ipbetw
eenFPageandworkloadsis
aninve
rtedU-shape:physiciansbetw
een49
and60
are
more
productivethanotheragegroups.
40 Canadian Journal on Aging 24 (Suppl. 1) D. E. Watson et al.

trends have been documented elsewhere in Canada(CIHI, 2001; Chan, 2002).
MethodsWe used anonymized administrative data for peoplewho resided in Winnipeg, and for Winnipeg FPs(practitioners whose patients resided primarily inWinnipeg). Winnipeg residents represent roughly twothirds of the population of the province of Manitoba,and live in the only large metropolitan area in theprovince. The majority of FPs practise in this capitalcity, and their services are covered under a universalhealth plan that has no deductible or co-payment.All measures were derived from billing data fromphysicians who worked on a fee-for-service (FFS)basis or who received alternative types of remunera-tion and submitted ‘‘evaluation claims’’ (roughly 7%of FPs in 2000/2001 and 2% of total billings, versus5% of FPs in 1991/1992). The registry of patientsand providers in the province has been previouslyvalidated for its completeness and accuracy (Roos,Mustard, et al., 1993).
Measures of service utilization were derivedfrom encounter data between Winnipeggers (includ-ing residents of continuing care facilities) and FPswhose services were covered under Manitoba’suniversal health plan. Measures of physicianworkload were derived from encounters betweenWinnipeg FPs and any person, irrespective of thegeographic residence of the patient. Although wereport here on the first and last years, measures ofuse and supply were analysed for fiscal 1991/1992to 2000/2001 (Watson et al., 2003). In a companionpaper in this issue (Watson et al., 2003) we examinein more detail the changes in rates of FP and specialistuse among older adults.
The count of visits per population was calculated bydividing the sum of all visits received by residentsduring a fiscal year by the number of residents. Visitsinclude any face-to-face ambulatory care contacts thatmay have occurred in physician offices, personal carehomes, outpatient departments, or at either of the twolargest emergency departments. While fewer FPsnow provide inpatient services, the total volume ofinpatient (or outpatient) FP care has remainedrelatively stable over the period, suggesting thatthese particular shifts in practice patterns are unlikelyto affect findings. Visits for prenatal and postnatalcare were not included, as a result of data limitations.We report visit rates to FPs that are age standardized(direct method), using the 1991/1992 population ofWinnipeg residents as the standard.
To gauge temporal changes in workloads, wecounted the number of visits provided by FPs in
each fiscal year, divided by the number of FPs,stratified by physician age groups. Changes overtime in the relationship between FP age and work-load were gender standardized (direct method) toisolate the effect of age and account for temporalincreases in younger female FPs. In order to comparehow FP workloads changed over time, we alsoestimated the total expected visits provided in 2000/2001, using the age and workload relationship of1991/1992, and compared it to the actual number ofvisits delivered in 2000/2001 (not gender standar-dized).
FindingsTemporal Shifts: Demographics of the WinnipegPopulation and Their Use of FP ServicesThe size of the Winnipeg population according to ourregistry remained stable over the 10-year study period(N¼ 653,452 in 1991/1992; n¼ 654,930 in 2000/2001),but the age structure changed in important ways.The proportion less than 44 years of age declined 8per cent, whereas the proportion aged 45 to 64 years(i.e., baby boomers) increased 25 per cent. Theproportion of older adults aged 65 to 74 declined6 per cent, yet the proportion aged 75 to 84 yearsgrew 19 per cent. The proportion aged 85 or moregrew 42 per cent.
Between 1991/1992 and 2000/2001, age-specific visitrates to FPs increased among older adults butdeclined among those less than 45 years of age. Thelargest increase occurred among those aged 65 to 74years, while the largest decline occurred amongchildren and adolescents (Figure 1). While femalesvisited FPs more often than males did, gender-specific rates of use were stable over the period.Despite increases in the number of older adults andtheir high (and increasing) rates of FP use, if age-specific rates of use in 1991/1992 were used to predictuse of FP services in 2000/2001, we would haveexpected a modest two per cent increase in useattributable to population aging. However, we foundthat actual FP visit rates across all age groupsdeclined three per cent. In other words, actual visitsin 2000/2001 were somewhat fewer than what wewould have expected if age-specific rates of use in1991/1992 had been applied to the population ofWinnipeggers 10 years later.
Temporal Shifts: Demographics of FP Population andTheir WorkloadsThe size of the population of Winnipeg FPs changedlittle between 1991/1992 and 2000/2001, but theage structure and age-specific workloads changedsubstantially. In 2000/2001, the number of WinnipegFPs was 605 (5% relative decline from 1991/1992),
Growing Old Together La Revue canadienne du viellissement 24 (Suppl. 1) 41

and FP-to-population ratios were 92 per 100,000population (5% relative decline from 1991/1992).The number of FPs younger than 40 years olddeclined substantially, while baby boomer FPs (i.e.,40 and 59 years) increased substantially (Figure 2).Over the period, average age of FPs increased from42.6 to 46.4 years.
The relationship between FP age and workloadswas an inverted-U shape. However, the shape of therelationship changed substantially over the period(Figure 3). In 2000/2001, FPs between the age of 30and 49 years provided approximately 20 per centfewer visits per annum than their same age peers didin 1991/1992. FPs aged 50 to 59 years provided 5 per
0.00
1.00
2.00
3.00
4.00
5.00
6.00
7.00
8.00
9.00
00-01 02-05 06-11 12-19 20-24 25-44 45-64 65-74 75-84 85-+
Population Age
19912000
Figure 1: FP visits per annum per Winnipeg resident, 1991/1992 and 2000/2001
85
17
248
153
234
70
109
6568
2824
138
0
100
200
300
400
500
600
700
1991/92 2000/01
>70 years
60-69 years
50-59 years
40-49 years
30-39 years
<30 years
Figure 2: Number of practising Winnipeg FPs, by age category, 1991/1992 and 2000/2001
42 Canadian Journal on Aging 24 (Suppl. 1) D. E. Watson et al.

cent fewer visits, FPs aged 60 or more provided 33 percent more visits, and FPs aged 70 or more provided46 per cent more visits in 2000/2001 than did FPsof the same age in 1991/1992. This pattern of reduc-tions in workload among younger FPs in 2000/2001,relative to their same age peers in 1991/1992, was truefor both male and female FPs (a gender-neutralphenomenon).
While these findings point to differences betweensame-age cohorts, workloads within each generationof FPs remained stable. Consider the generation ofFPs aged 30 to 39 years in 1991/1992 who became40 to 49 years in 2000/2001. At the beginning andend of the decade this cohort delivered roughly thesame number of visits per annum (roughly 4,000 inboth periods). The generation of FPs aged 40 to 49 in1991/1992 who became 50 to 59 years in 2000/2001provided only slightly more visits per annum over thedecade (roughly 5,500 in 2000/2001). Last, FPs aged50 to 59 in 1991/1992 who became 60 to 69 years in2000/2001 provided slightly fewer visits per annumover the decade (roughly 5,500 in 2000/2001).
We found no significant temporal changes in thegender structure or gender-specific workloads ofWinnipeg FPs. The proportion of females FPsincreased only slightly from 29 to 31 per cent. Theworkloads of females FPs were approximately 80 percent that of their male counterparts, and the relation-ship between gender and workload held constantover the decade.
DiscussionWe found that a combination of circumstancesdescribed in the scenarios in Table 1 materialized in
Winnipeg between 1991/1992 and 2000/2001: theFP-to-population ratio remained relatively stable,age-specific rates of FP use among older adultsincreased, both the population and FP workforceaged (scenario 2), and the FP workforce includedmore females (scenario 3). The net effect was a relativehomeostasis in aggregate and average FP supply anduse between 1991/1992 and 2000/2001. Barer et al.(2004) document similar stability in aggregate-levelmeasures of physician services in British Columbiabetween 1985/1986 and 1996/1997. Perhaps the mostintriguing result to emerge from our analyses wasthat, despite aggregate stability, dramatic shifts inage-specific patterns of ‘‘who’’ is delivering ‘‘howmany services’’ and ‘‘who’’ is receiving ‘‘how manyservices’’ (Watson et al., 2004).
As the average age of the workforce increased as theresult of aging of baby boomer FPs, most of theworkforce were in, or moved into, their mostproductive years by the end of the period. If age-specific measures of workload in 1991/1992 wereused to predict ‘‘effective’’ supply in 2000/2001, wewould have expected a 12 per cent increase over theperiod – even with no change in the absolute numberof FPs. However, these gains did not materialize;instead, the number of visits generated by WinnipegFPs declined 3 per cent (despite the 2% expectedincrease predicted from an aging patient population).In essence, the use of cross-sectional, age-specificmeasures of workload to predict effective supplywould have resulted in substantial overestimates.Such overestimations relate to the dramatic temporalshifts in age-specific rates of service provision. Whileothers have documented the importance of account-ing for temporal trends in age-specific rates of FP
100
1000
2000
3000
4000
5000
6000
7000
<30 years 30-39 years 40-49 years 50-59 years 60-69 years >70 years
1991/92 Crude 2000/01 Standardized 2000/01
-23%
+33%
-5%
-21%
Figure 3: Mean visits per annum for Winnipeg FP, by age, 1991/1992 and 2000/2001
Growing Old Together La Revue canadienne du viellissement 24 (Suppl. 1) 43

use when predicting utilization (Evans et al.,2001), we document evidence of the importance tosimultaneously account for trends in age-specificworkloads to predict future service supply.
Contrary to popular perceptions that a majority of FPsare on the brink of retirement, the number andproportion of FPs aged 60 or more was stable. Buttemporal trends indicate that FPs aged 60 or more areassuming an increasing burden of service delivery.This important finding, coupled with persistingincreases in age-specific patterns of use among olderadults, is potentially alarming. We found FPs aged 60to 69 years (11% of the workforce) to be providing, onaverage, 1.5 times the number of services relative toFPs aged 30 to 39, and shouldering the heaviestworkload. Each retiring FP will likely be unable tofind a younger replacement willing to carry anequivalent workload. Additionally, since older physi-cians tend to serve patients who are older than thoseserved by their younger colleagues (Monette et al.,1993), an increasing numbers of older adults can beexpected to be seeking such younger FPs when theircurrent physicians retire.
Should trends in age-specific workloads persistfollowing retirement of the oldest cohort of FPs, weexpect substantial declines in the availability of FPservices in the coming years. Given the long lagsbetween some changes to physician supply policy andchanges in effective supply (e.g., to the result of thelength of time to train physicians), current perceptionsof FP shortages and complaints of high workloads arelikely, on the basis of this analysis, to get worse beforethey get better. That is not to say that the situation ishopeless. The use of alternative primary care pro-viders, or other mechanisms to enhance the efficiencyof FP patterns of service delivery, will be requiredto compensate for the trends exposed here. We doknow that physicians have discretion over thecomprehensiveness of care provided (Chan, 2002)and the frequency of care provided to certain patients(Roos, Carriere, & Friesen, 1998). Additionally,research increasingly points to methods of servicedelivery that can improve the accessibility andefficiency of primary care (Murray & Berwick, 2003;Pinnock et al., 2003).
We expected a two per cent increase in FP use asthe result of population aging. If we used averageworkloads of a full-time FP in 1991/1992 to forecastthe number of practitioners required to providethe same aggregate service levels in 2000/2001, anadditional seven full-time FPs would have beenneeded for Winnipeg’s population of 650,000. Thisfinding of a relatively trivial effect of an agingpopulation on future requirement for physicians
parallels earlier estimates, and provides furtherevidence to support the weight of evidence that theaging population will not place undue pressure onphysician services (Demers, 1996; Denton, Gafni, &Spencer, 2001; Evans et al., 2001). We document thefact that population aging and persisting increases inage-specific rates of use among older adults hascoincided with substantive reductions in use amongthe young. The importance of this discovery isdiscussed in a companion article in this issue(Watson, Heppner, Reid, Bogdanovic, & Roos., 2004).
An important limitation of our study is that it is a casestudy of one urban city in Canada, and the externalvalidity of our findings to other jurisdictions isunknown. Indeed, analyses of temporal trends inage-specific workloads among urban (or rural) FPs(or specialists) have not been conducted elsewhere.Clearly, the magnitude of the trends we document inWinnipeg warrant investigation elsewhere.
Physician resource planning requires simultaneousconsideration of all of the demographic determinantsof use noted in this paper as outlined in Table 1. Wehave discovered that it is misleading to presume that(a) aging of the population is the demographic factorof primary concern, (b) aging of the physician work-force is the demographic factor of primary concern onthe supply side, or (c) FP-to-population ratios are thebest metric to monitor or project physician resources.It is clear that changes in age-specific rates of use, andchanges in age-specific patterns of FP productivity,will trump population aging as key drivers of futurerequirements for FPs.
ReferencesBarer, M.L., Evans, R.G., & Hertzman, C. (1995). Avalanche
or glacier? Health care and the demographic rhetoric.Canadian Journal on Aging, 14, 193–224.
Barer, M.L., Evans, R.G., McGrail, K.M., Green, B.,Hertzman, C., & Sheps, C. (2004). Beneath the calmsurface: The changing face of physician-service use inBritish Columbia, 1985/86 versus 1996/97. CanadianMedical Association Journal, 170, 803–807.
Black, C., Roos, N.P., Havens, B., & MacWilliam, L. (1995).Rising use of physician services by the elderly: Thecontribution of morbidity. Canadian Journal on Aging, 14,225–244.
Branswell, H. (2003, March 5). Few medical students choosefamily practice: 24 per cent opted for family medicine,and the rate of decline is continuing. Vancouver Sun,p.A14.
Canadian Institute for Health Information. (2000). Supply,distribution and migration of Canadian physicians. Ottawa:Author.
44 Canadian Journal on Aging 24 (Suppl. 1) D. E. Watson et al.

Canadian Institute for Health Information. (2001). Thepractising physician community in Canada, 1989/90 to1998/99. Ottawa.
Chan, B. (2002). From perceived surplus to perceived shortage:What happened to Canada’s physician workforce in the1990s? Ottawa: Canadian Institute of HealthInformation (CIHI).
College of Family Physicians of Canada (CFPC). (2001,October 25). Not enough family physicians to meetpatient needs. Retrieved October 25, 2001, fromhttp://www.cfpc.ca/communications/newsreleases/nr250ctober2001.asp
College of Family Physicians of Canada (CFPC). (2002,November 7). 4.5 million Canadians not able to get afamily physician. Retrieved February 23, 2003, fromhttp://www.cfpc.ca/communications/newsreleases/nr06november2002.asp
Conference Board of Canada. (2001). Canadians’ values andattitudes on Canada’s health care system: A synthesis ofsurvey results. Ottawa: Author.
Demers, M. (1996). Factors explaining the increase in cost forphysician care in Quebec’s elderly population. CanadianMedical Association Journal, 155, 1555–1623.
Denton, F.T., Gafni, A., & Spencer, B.G. (2001). Populationchange and the requirements for physicians: The caseof Ontario. Canadian Public Policy, 27, 469–481.
Evans, R.G., McGrail, K.M., Morgan, S.G., Barer, M.L., &Hertzman, C. (2001). Apolcalypse no: Population agingand the future of health care systems. Canadian Journalon Aging, 20(Suppl. 1), 160–191.
Expert Panel on Health Professional Human Resources &Ministry of Health & Long Term Care. (2001). ShapingOntario’s physician workforce. Toronto: Author.
Eyles, J., Birch, S., & Newbold, K.B. (1995). Deliveringthe goods? Access to family physician services inCanada: A comparison of 1985 to 1991. Journal ofHealth and Social Behavior, 36, 322–332.
Gee, E.M., & Gutman, G.M. (2000). The overselling of popula-tion aging: Apocalyptic demography, intergenerationalchallenges and social policy. Don Mills, ON: OxfordUniversity Press.
Health Canada. (2003). Health care renewal accord. RetrievedFebruary 24, 2003, from http://www.hc-sc.gc.ca/english/hca2003/accord.html
Kazanjian, A., Reid, R.J., Pagliccia, N., Apland, L., &Wood, L. (2000). Issues in physician resources planning inBritish Columbia: Key determinants of supply and distribu-tion, 1991–1996 (Report No. HHRU 00:2). Vancouver:University of British Columbia.
Monette, J., Tamblyn, R.M., McLeod, P., Gayton, D.,Abrahamowicz, M., & Berkson, L. (1993). Profile ofhigh risk psychotropic drug prescribers. Clinical &Investigative Medicine, 16, B59.
Murray, M., & Berwick, D.M. (2003). Reducing waiting anddelays in primary care. Journal of the American MedicalAssociation, 289, 1035–1040.
National Advisory Council on Aging. (2002). Working forCanada’s seniors today and tomorrow. Ottawa: HealthCanada.
Norton, P.G., Dun, E.V., & Soberman, L. (1994). Familypractice in Ontario: How physician demographicsaffect practice patterns. Canadian Family Physician, 40,249–256.
Picard, A. (2003, March 5). Decline of the family doctor:Study says students shun general practice. Globe andMail, p.A1.
Pinnock, H., Bawden, R., Proctor, S., Wolfe, S., Scullion, J.,Price, D., & Sheikh, A. (2003). Accessibility, accept-ability, and effectiveness of primary care of routinetelephone review of asthma: Pragmatic, randomisedcontrolled trial. British Medical Journal, 326, 411–477.
Roos, L.L., Mustard, C.A., Nicol, J.P., McLerran, D.F.,Malenka, D.J., Young, T.K., & Cohen, M.M. (1993).Registries and administrative data: Organization andaccuracy. Medical Care, 31, 201–212.
Roos, N.P., Carriere, K.C., & Friesen, D. (1998). Factorsinfluencing the frequency of visits by hypertensivepatients to primary care physicians in Winnipeg.Canadian Medical Association Journal, 159, 777–783.
Standing Senate Committee on Social Affairs, Science andTechnology. (2002). The health of Canadians: The federalrole; Final report. (Report No. 6: Recommendations forreform). Ottawa: Author
Watson, D.E., Bogdanovic, B., Heppner, P., Katz, A., Reid, R.,& Roos, N.P. (2003). Supply, availability and use of familyphysicians in Winnipeg, 1991/92–2000/01. Winnipeg:Manitoba Centre for Health Policy.
Watson, D.E., Roos, N.P., Katz, A., & Bogdanovic, B. (2003).Is a 5% decline in physician supply significant? Yes orno. Canadian Family Physician, 49, 366–367.
Watson, D.E., Katz, A., Reid, R., Bogdanovic, B.,Roos, N.P., & Heppner, P. (2004). Family physicianworkloads and access to care in Winnipeg: 1991to 2001. Canadian Medical Association Journal, 171,339–342.
Woodward, C.A., & Hurley, J. (1995). Comparison of activitylevel and service intensity of male and female physi-cians in five fields of medicine in Ontario. CanadianMedical Association Journal, 153, 1097–1106.
Growing Old Together La Revue canadienne du viellissement 24 (Suppl. 1) 45

CANADIANJOURNALONAGING
LA REVUECANADIENNEDUVIEILLISSEMENT

Non-Clinical Factors Associatedwith Variation in Cataract SurgeryWaiting Times in Manitoba
Carolyn De Coster
Department of Community Health Sciences, University of Manitoba
RESUMEL’operation de la cataracte constitue l’intervention chirurgicale la plus repandue au Canada, plus de 200 000 operationsde ce genre etant effectuees chaque annee, la plupart du temps (85 p. 100) sur des gens de 65 ans ou plus. Desinquietudes ont ete soulevees au sujet des delais d’attente pour subir cette procedure. Cette etude traite des liens entreles delais d’attente pour les operations de la cataracte au Manitoba et diverses caracteristiques, notamment l’age, lesexe, la situation socioeconomique, la region de residence, l’etat de sante, le chirurgien ainsi que le nombre de cas que lechirurgien doit traiter. L’etude portait sur 6 114 sujets ayant subi une premiere operation de la cataracte entre le 1er
novembre 1998 et le 31 mars 2000, a Winnipeg, au Manitoba. Parmi les facteurs permettant de predire la variation desdelais d’attente, on compte l’age, le sexe, le chirurgien et le fait d’etre hospitalise pendant l’attente. Le modele elaborepermettait d’expliquer la variation des delais d’attente dans 32,5 p. 100 des cas ; le choix du chirurgien permettaitd’expliquer a lui seul 29,5 p. 100 de la variation. Le delai d’attente moyen variait beaucoup selon les chirurgiens, allantde 61 a 399 jours. Les patients et les medecins traitants devraient avoir acces aux donnees concernant les differentsdelais d’attente prevus selon les chirurgiens.L’auteure remercie Lorne Bellan et Julie Gorofolo pour leur aide dans l’explication et la consultation du CataractSurgery Waiting List Registry ; Natalia Dik et Dan Chateau pour la programmation de meme que leur aide et leursconseils en matiere de statistiques ; ainsi que le ministere de la Sante du Manitoba qui a finance une partie de cetterecherche au moyen de son contrat avec le Manitoba Centre for Health Policy. Les resultats et les conclusionsn’engagent que l’auteure et ne sont en aucun cas endosses par le ministere de la Sante du Manitoba.
ABSTRACTCataract surgery is the highest-volume surgical procedure in Canada, with over 200,000 performed annually, mostly(85%) on persons aged 65 or older. Concerns have been raised about wait times to access this procedure. This studyexplores the relationship between waiting times for cataract surgery in Manitoba and a variety of characteristics,including age, sex, socio-economic status, region of residence, health status, surgeon, and surgeon’s caseload. Thestudy included 6,114 individuals who had first-eye cataract surgery between November 1, 1998, and March 31, 2000, inWinnipeg, MB. Significant predictors of variation in wait times were age, sex, having a hospitalization while waiting,and surgeon. The model explained 32.5 per cent of the variance in wait times; specific surgeon independently explained29.5 per cent of the variance. Median waiting times varied widely by surgeon, ranging from 61 to 399 days. Differencesin surgeons’ expected wait times should be available to patients and referring clinicians.
* The author acknowledges Lorne Bellan and Julie Gorofolo for their assistance in explaining and accessing the CataractSurgery Waiting List Registry; Natalia Dik and Dan Chateau for their programming and statistical advice and assistance;and Manitoba Health that in part supported this research through its contract with the Manitoba Centre for Health Policy.The results and conclusions are those of the author, and no official endorsement by Manitoba Health was intended or shouldbe inferred.
Manuscript received: / manuscrit recu : 01/04/03
Manuscript accepted: / manuscrit accepte : 04/05/04
Mots cles : personnes agees; vieillissement; excision de la cataracte; Manitoba; analyse multifactorielle; registres; etudesretrospectives; listes d’attente
Keywords: aged; aging; cataract extraction; multivariate analysis; registries; retrospective studies; waiting lists
Canadian Journal on Aging / La Revue canadienne du viellissement 24 (Suppl. 1) : 47 - 58

Requests for offprints should be sent to: / Les demandes de tires-a-part doivent etre addressees a :
Carolyn De Coster, Ph.D., R.N.Manitoba Centre for Health PolicyDepartment of Community Health SciencesUniversity of Manitoba727 McDermot Avenue, Suite 408Winnipeg, MB R3E 3P5([email protected])
Introduction and Background‘‘When I was a kid, we all had our tonsils out, then itwas our gallbladders, now it’s our cataracts.’’ So saida senior overheard in a coffee shop. Indeed, cataractsurgery is currently the most commonly performedsurgical procedure in Canada, and it is performedprimarily on older adults. Concerns have been raisedabout lengthy waits to obtain what is arguably a verysafe procedure that can substantially improve vision(Desai, 1993; Wright & Robens-Paradise, 2002). Littleis known about the actual waiting times, or about thepatient or physician characteristics that influencethose waits. This paper analyses Manitoba’s CataractSurgery Waiting List Registry, combined with admin-istrative data, to begin to answer these questions.
Cataract surgery is the highest-volume surgicalprocedure in Canada, with over 200,000 performedannually (Wright & Robens-Paradise, 2001). Approx-imately 85 per cent of cataract surgery patients areaged 65 or older (De Coster, 2002; Minassian, Reidy,Desai, Farrow, Vafidis, & Minassian, 2000). A cataractis an opacification of the normally clear lens of theeye, which prevents light from passing through. Theresult is blurred vision, sensitivity to light and glare,increasing nearsightedness, and visual distortion(American Academy of Ophthalmology, 2003). Insurgery, the clouded lens is removed and a plasticone inserted. Surgery is usually done on an outpatientbasis, and recovery is quick, with very good results(Alberta Medical Association, 1999).
Concerns have been voiced about long waits to accesscataract surgery (Dunn, Black, Alonso, Norregaard, &Anderson, 1997). Cataract surgery is not a life-savingprocedure, therefore it does not command the publicor political attention that, say, coronary artery bypasssurgery does. However, cataracts can place a sig-nificant burden of illness on the older population;patients waiting for cataract surgery may be sufferingfrom visual impairment severe enough to interferewith their daily activities and, particularly in theoldest-old, their independence. A study on Finnishpatients estimated that the mean waiting time thereof 13 months represented 13 per cent of the patients’remaining life (Leinonen & Laatikainen, 1999).Minassian and colleagues (2000) estimated that
between 1997 and 2001 in England and Wales, aboutthree quarters of a million people suffering visualimpairment from cataracts would die without havingreceived surgery. Thus failure to access cataractsurgery can result in a substantial individual andsocietal burden.
In Canada, medically necessary services are providedto all residents through its publicly financed healthcare system. The Canada Health Act promises thathospital and physician services are to be accessible toall, based on medical necessity. In a statement issuedin September 2000, Canada’s first ministers reaffirmedthat one of the goals of the health care system is ‘‘toensure that Canadians have reasonably timely accessto a . . . range of health services anywhere in Canada,based on their need, not their ability to pay’’ (FirstMinisters, 2000). This statement embodies the valuethat patients with a greater need for care shouldreceive higher priority, and therefore have shorterwaits. It also implies that Canadians with the samelevel of need should be treated equitably, that is, theirwait times should be similar; characteristics like socio-economic status, age, region of residence, or choice ofprovider should not be associated with differences inaccess, as evidenced by differences in waiting times. Itshould be noted that ‘‘need’’ may go beyond medicalsymptoms and include measures like the ability towork or live independently (Hadorn & SteeringCommittee of the Western Canada Waiting ListProject, 2000).
There is evidence that waiting times do vary forreasons other than urgency, even in publicly fundedhealth care systems, such as those in Canada, theUnited Kingdom, New Zealand, and Australia. Anumber of patient, provider, and system char-acteristics have been explored. Patient characteristicsinclude age, sex, socio-economic status, employmentstatus, risk factors such as obesity, smoking, familyhistory, living alone, and region of residence (Alter,Naylor, Austin, & Tu, 1999; Churchill, Vize, Stewart, &Backhouse, 2000; De Coster, Carriere, Peterson, Walld,& MacWilliam, 1999; Imamura, Gair, McKee, & Black,1996; Kee & Gaffney, 1995; Kee, McDonald, & Gaffney,1997; Mariotto, De Leo, Buono, Favaretti, Austin, &Naylor, 1999; Pell, Pell, Norrie, Ford, & Cobbe, 2000).
48 Canadian Journal on Aging 24 (Suppl. 1) C. De Coster

Provider characteristics are two types: those related tothe hospital (e.g., type of hospital, available resources,length of stay) (Aiono, Faber, & Galland, 2000; Harley,2001; Martin, 1995; Singh, Gupta, Fell, & Gangbar,1999), and those related to the surgeon (e.g., volumeof patients) (Hadjistavropoulos, Snider, & Bartlett,1998). System characteristics include rate of surgery,presence of competition, and year of surgery(Armstrong, 2000; De Coster, MacWilliam, & Walld,2000; Goddard & Tavakoli, 1998; Hamblin, Harrison,& Boyle, 1998).
This paper explores the relationship between waitingtimes for cataract surgery in Manitoba and a variety ofnon-clinical characteristics. Data from the ManitobaCataract Surgery Waiting List Registry (CSWLR) weremerged with Manitoba administrative health servicedata to explore a variety of patient, provider, andsystem characteristics; clinical data on visual acuity ordysfunction did not form part of this study.
Methods
Data Source and Study Population
The CSWLR contains records of all cataract surgerypatients undergoing surgery in Winnipeg, approxi-mately 95 per cent of the province’s cataract surgery.Patients’ names are sent by each ophthalmic surgeonto the CSWLR office when the decision is made toproceed with surgery. Included in the CSWLR aredemographic data, relevant dates, prioritizationinformation, surgery information, and explanationsfor unusual circumstances. A prioritization score isautomatically calculated for each patient, based onvisual dysfunction and length of time in the registry.The level of visual dysfunction is assessed through aquestionnaire administered by CSWLR staff over thetelephone and entered directly into the computerizeddatabase. The instrument used to measure visualimpairment is the VF-14 (Castells et al., 2000), withadditional questions related to problems withemployment and driving.
The CSWLR office sends each ophthalmologist thepriority scores for his/her patients monthly. (TheCSWLR software automatically identifies any patientwho might be listed for the same procedure for twodifferent surgeons, and the staff follow up when thisoccurs. Thus, there is no double-booking in thesystem.) Data on wait times for different surgeonsare not available to referring physicians or to patients.There is no requirement that surgeons book patientsin order of their priority scores, but it appears thatthey do so: because of the time it took to enter the datainto the CSWLR of all patients waiting, scores wereavailable both before and after the data were being fed
back to the surgeons; whereas scores on the VF-14,and driving and employment questions were notcorrelated with time on the waiting list before feed-back, after feedback of prioritization scores to theophthalmic surgeons began, there was a significantcorrelation between these questions and waiting times(Bellan & Mathen, 2001). Patients’ data are archivedwhen they are removed from the active waiting list,either because they have received the surgery, or theprocedure has been cancelled.
Anonymized data from the CSWLR archives weremerged with administrative data from the PopulationHealth Research Data Repository, and a project filewas created using individual-specific anonymizedidentifiers. The repository is a comprehensive, anon-ymized database of all patient contacts with hospitals,physicians, and nursing homes. Files used were thehospital discharge abstracts, the health insuranceregistry, medical claims file, long-term care file,pharmaceutical claims, and public-use Census 1996files. The reliability and validity of the data have beenwell documented (Roos et al., 1993; Roos, Sharp, &Cohen, 1991; Williams & Young, 1997). This study wasapproved by the University of Manitoba’s HealthResearch Ethics Board and by the Health InformationPrivacy Committee of Manitoba Health.
Archived patients who had been removed from theactive waiting list (that is, they had received surgeryor were cancelled) between November 1998 and May2001 were available for analysis. Administrative datawere available only until March 31, 2000. Therefore,patients who had received their surgery on or beforeMarch 31, 2000, were included in the study. Only thefirst appearance in the CSWLR was included. Thirty-five per cent of patients in the archives had twoprocedures, and of these, 61 per cent were listed forboth eyes simultaneously. Surgery is never done onboth eyes at the same sitting. Therefore, when botheyes are listed simultaneously, the wait for the secondeye would be inaccurately extended. Hence, only thefirst eye was included. Data from CSWLR weremerged with administrative data with a 97 per centsuccess rate. The final cohort for analysis consisted of6,114 individuals who had first-eye cataract surgerybetween November 1998 and March 2000.
Measures
Fields available from the CSWLR were limited to therelevant dates (beginning of wait and date of surgery)and a few identifiers, such as sex and birthdate; accessto patients’ priority scores was not permitted forthis project. Variables available from the repositoryincluded age at date of surgery, sex, socio-economicstatus (SES), region of residence, measures of general
Cataract Surgery Waiting Times La Revue canadienne du viellissement 24 (Suppl. 1) 49

health status, surgery location, specific surgeon,and surgeon characteristics. (See Table 1 for list ofexplanatory variables.) Socio-economic status wasmeasured with the Socioeconomic Factor Index, anecologic measure of socio-economic factors indicatingpoor population health (Frohlich, Fransoo, & Roos,2001). It consists of six variables derived fromcensus data: the age dependency ratio, percentageof single-parent households, percentage of femalesingle-parent households, labour force participationrate by females, unemployment rate, and high schoolcompletion. Region of residence was defined in twoways: first, according to residence in Winnipeg or not;second, according to the regional health authorityin which the patient lived if outside Winnipeg, or ifthe patient lived in Winnipeg, 1 of its 12 communityareas.
Measures of health status included number ofdifferent drugs, residence in a long-term care facility(nursing home or chronic care), being hospitalizedduring the wait, and number of ambulatory diagnos-tic groups (ADGs). Number of ADGs is based onthe Johns Hopkins Adjusted Clinical Group (ACG)
system, which quantifies morbidity by groupingindividuals on the basis of their age, gender, and allknown medical diagnoses assigned over a definedperiod of time, typically one year (Reid, MacWilliam,Roos, Bogdanovic, & Black, 1999). The first step inassigning ACGs is to assign patients into ambulatorydiagnostic groups (ADGs); there are 32 ADGs, andpatients can be in none or all of them. Individualswith a higher number of ADGs can be expected tohave more health problems. Number of differentdrugs in the year before surgery was another measureof general health status. It correlated highly withnumber of ADGs in this cohort; the correlationcoefficient was 0.58 ( p< 0.0001).
Surgeon characteristics included volume of surgery,and practice type: whether the surgeon operated ina privately owned ambulatory clinic as well as ahospital outpatient department. In Winnipeg, cataractsurgery is performed at one hospital and twoprivately owned clinics. In earlier research it wasfound that surgeons who operated at both anambulatory clinic and a hospital had longer waitsthan surgeons who operated only in the hospital
Table 1: Variables potentially associated with differences in cataract surgery waiting times
Variable Definition
Age Age at date of surgery
Sex
SES* Socio-economic status
Region of Residence* Where patient lived at date of surgery:
� Winnipeg/non-Winnipeg
� Residence by non-Winnipeg RHAs or 12 community areas in Winnipeg
Health Measures
Number of ADGs* Number of ambulatory diagnostic groups in year of surgery
Number of Drugs Number of different drugs prescribed in year of surgery
Residence in LTC Individuals residing in either a nursing home or a chronic care facility on the dateof surgery
Hospitalization Patients who had at least one hospitalization with a stay of more than 1 day betweenbeginning of waiting time and date of surgery
Surgery Location Public hospital or a clinic
Individual MD Surgeon who performed the surgery
Volume � Surgeons who performed more than 500 procedures in the total cohort weredefined as high volume
� Actual caseload
Practice Type* Whether MD did surgery at public hospital only, or both public hospital and clinic(all surgeons operate in public hospital)
*Described further in text
50 Canadian Journal on Aging 24 (Suppl. 1) C. De Coster

(De Coster, Carriere, Peterson, Walld, & MacWilliam,1998; De Coster et al., 2000). However, at the time ofthose earlier analyses, surgeons were permitted tocharge a facility fee of approximately $1,000 topatients who opted for the private clinic (thesurgeons’ fees were paid by Manitoba Health). SinceJanuary 1999 – hence, for this study cohort – this is nolonger an option: Manitoba Health pays all costs. Itwas not known if the difference between these twopractice types persisted with the change in policy.
Analytic Approach
Regression models were developed using a forwardstepwise regression technique. The outcome was thenatural log of the waiting time; waiting time waslogged because it was not normally distributed.Models were developed on a randomly generated50 per cent subsample of the cohort, and then testedon the remaining half. The distributions of character-istics between the split samples were compared usingFisher’s exact test, with Bonferroni adjustment formultiple comparisons. There were no significantdifferences in the distributions between the first-halfand second-half data sets. Age, sex, and SES werecontrol variables.
For the purposes of building the regression models,each individual variable was first regressed againstthe outcome (logged wait time); this was doneprimarily for the purposes of building the stepwisemultivariate model. To develop the multivariatemodel, each variable with a minimum p-value (0.10)in the univariate models was entered sequentially, inthe order of the proportion of the variance itexplained (R2) in the univariate analyses. As eachvariable was added, if the proportion of the varianceexplained improved significantly ( p<0.05), it waskept in the multivariate model.
FindingsTables 2a and 2b show the distribution of patients aswell as the median waiting time according to severalpatient and surgeon characteristics. The overallmedian waiting time was 163 days. Almost twothirds of the patients were women, and their waitstended to be longer than those for men: 173 versus 147days. Almost 85 per cent of patients were 65 years orolder; wait times were 168 and 169 days for patientsaged 65–84, and 85 and over, respectively, comparedto 144 days for patients aged 51–64, and 128 days forthe 3.7 per cent of patients aged 50 or younger.Patients having their surgery in a hospital waitedlonger (167 days) than those who had surgery in aclinic (155 days). Winnipeg residents and non-Winnipeg residents had similar median waiting
times: 164 and 161 days, respectively. Wait times forthe 11 Manitoba regional health authorities and 12community areas of Winnipeg did not demonstrate adiscernible pattern (data not shown). Over half of thepatients had between 8 and 10 ADGs, and one fifth
Table 2a: Patient characteristics for 6,114 cataractsurgery patients having surgery in Winnipeg,Manitoba, between November 1998 and March 2000
PatientCharacteristics
Number ofProcedures
Per cent ofProceduresin Period
MedianWait(Days)
Overall 6114 100.0% 163
Gender
Females 3860 63.1% 173
Males 2254 36.9% 147
Age
0–50 227 3.7% 128
51–64 752 12.3% 144
65–84 4320 70.7% 169
85þ 810 13.2% 168
Site
Hospital 4902 80.2% 167
Clinic 1212 19.8% 155
Residence
Winnipeg 4145 67.8% 164
Non-Winnipeg 1969 32.2% 161
No. of ADGs
1–3 ADGs 1029 16.8% 161
4–7 ADGs 459 7.5% 162
8–10 ADGs 3313 54.2% 167
11þ ADGs 1191 19.5% 160
Unassigned 122 2.0% 133
No. of drugs
1–4 drugs 1572 25.7% 170
5–9 drugs 2747 44.9% 164
10þ drugs 1795 29.4% 156
Hospitalized During Wait
Yes 542 8.9% 258
No 5566 91.1% 156
Resided in LTC
Yes 127 2.1% 154
No 5987 97.9% 163
Cataract Surgery Waiting Times La Revue canadienne du viellissement 24 (Suppl. 1) 51

had 11 or more ADGs. Given this number of differentdiagnostic conditions, it is perhaps not surprising thatthree fourths of the patients used five or moredifferent drugs in the year before surgery. There didnot appear to be differences in waits according tonumber of ADGs or number of different drugs. Fewerthan 10 per cent of patients had a hospitalizationwhile waiting; these patients had a wait of 258 days,compared to 156 for those who were not hospitalizedwhile waiting. Only 2 per cent of patients resided in aLTC facility, and they appeared to have a slightlyshorter wait.
Median waiting times varied considerably by sur-geon, ranging from a low of 61 (MD11) to a high of 399days (MD19). For this table, surgeons were dividedinto high- and low-volume; high-volume surgeonswere defined as those who performed 500 or moreprocedures. This definition was based on a review ofthe data: surgeons were grouped into volume cate-gories (< 100, 100–199, 200–299, 300–399, 400–499,500–599, 600þ), and there was a marked jump inwait times with volumes of 500 or more. High-volumesurgeons had longer waits, as did surgeons whooperated in both hospital and clinic. There wasconsiderable overlap between practice type andvolume: all high-volume surgeons operated at boththe hospital and clinic; 8 of the 11 low-volumesurgeons operated only at the hospital.
Univariate linear models were developed for eachvariable, to determine if the variable explained asignificant proportion of the variance in wait times.Variables that were found to be significant at the 0.10level are listed in Table 3 along with the proportion ofthe variance (R2) in logged waiting times eachexplained. (In this table, surgeon and region ofresidence were coded as categorical variables andentered as a group, resulting in 18 surgeon variablesand 21 residence variables.) The variables associatedwith surgeons (specific surgeon, volume, and practicetype) explained a relatively large proportion of thevariance in waiting times. Age, sex, socio-economicstatus (SES), region of residence, and being hospital-ized while waiting each explained only a smallproportion of the variance in waiting times. None ofthe other ‘‘health status’’ measures (number of ADGs,number of different drugs, residence in long-termcare) were found to be significant. Neither was thelocation of surgery – clinic or hospital.
In the multivariate stepwise regression model, thevariables that remained significant were age, sex,specific surgeon, and being hospitalized while wait-ing (hosp). The model explained 32.5 per cent of thevariance in waiting times (Model degrees of freedom,22; F-Value, 66.29; p< .0001). Specific surgeonexplained most of that; it accounted for 29.5 per centof the variance in waiting times. All first-orderinteractions were tested, and none were significant.The parameter estimates are in Table 4. The modelwas tested against the second-half sample, where itexplained 34.3 per cent of the variance.
Although volume and practice location were signifi-cant in the univariate models, they were not includedin the final model because they were highly inter-correlated with the surgeon variable. A secondanalytic technique, called multi-level modelling,takes advantage of the hierarchical structure of the
Table 2b: Provider characteristics for 6,114 cataractsurgery patients having surgery in Winnipeg, Manitoba,between November 1998 and March 2000
SurgeonCharacteristics
Number ofProcedures
Per cent ofProceduresin Period
MedianWait(Days)
Surgeon
MD1 651 10.6% 272
MD2 179 2.9% 109
MD3 552 9.0% 212
MD4 575 9.4% 191
MD5 40 0.7% 117
MD6 751 12.3% 161
MD7 78 1.3% 73
MD8 76 1.2% 64
MD9 81 1.3% 109
MD10 304 5.0% 76
MD11 150 2.5% 61
MD12 372 6.1% 280
MD13 148 2.4% 154
MD14 316 5.2% 97
MD15 82 1.3% 62
MD16 61 1.0% 86
MD17 626 10.2% 151
MD18 511 8.4% 205
MD19 561 9.2% 399
Practice location
Hospital 1123 18.4% 87
Hospitaland clinic
4991 81.6% 191
Volume
High 4227 69.1% 197
Low 1887 30.9% 99
52 Canadian Journal on Aging 24 (Suppl. 1) C. De Coster

Table 4: Parameter estimates from generalized linear model
Parameter Estimate Standard Error t-Value pr > | t |
Intercept 5.0002 0.0823 60.73 <0.001
Age 0.0039 0.0010 3.72 0.002
Sex 0.1041 0.0225 4.62 <0.001
SES �0.0108 0.0113 �0.96 0.3369
Hosp 0.3382 0.0380 8.90 <0.001
MDI �0.7014 0.0680 �10.33 <0.001
MD2 �0.2929 0.0479 �6.11 <0.001
MD3 �0.3837 0.0470 �8.17 <0.001
MD4 �0.9060 0.1361 �6.66 <0.001
MD5 �0.3626 0.0440 �8.24 <0.001
MD6 �1.1811 0.0989 �11.95 <0.001
MD7 �1.2337 0.1093 �11.28 <0.001
MD8 �0.7071 0.0958 �7.38 <0.001
MD9 �1.1068 0.0613 �18.05 <0.001
MD10 �1.2218 0.0780 �15.67 <0.001
MD11 �0.0958 0.0551 �1.74 0.0819
MD12 �0.3608 0.0792 �4.55 <0.001
MD13 �0.8879 0.0580 �15.32 <0.001
MD14 �1.3215 0.0957 �13.81 <0.001
MD15 �0.6312 0.1126 �5.61 <0.001
MD16 �0.3546 0.0456 �7.77 <0.001
MD17 �0.1759 0.0481 �3.66 0.003
MD18 0.2380 0.0474 5.02 <0.001
Table 3: Variables that were significant (at p<0.10) in the univariate models
VariableDegrees ofFreedom F-Value P-Value
VarianceExplained
Sex 1 20.26 <.0001 0.7%
Age 1 20.32 <.0001 0.7%
Socio-economic Status 1 3.60 .058 0.1%
Region of Residence (RHAand 12 CAs of Winnipeg)
21 2.36 .0004 1.6%
Region (Winnipeg vs.non-Winnipeg)
1 2.82 .0933 0.1%
Hospitalized During Wait 1 97.62 .0001 3.1%
Volume (high vs. low) 1 471.03 <.0001 13.3%
Practice Type 1 461.27 <.0001 13.1%
Surgeon 18 71.41 <.0001 29.7%
Cataract Surgery Waiting Times La Revue canadienne du viellissement 24 (Suppl. 1) 53

data, wherein patient characteristics are nestedwithin surgeon characteristics. Using this techniquedid not change the findings, except that it demon-strated that surgical volume explained part of thevariance among surgeons. Put another way, waitingtimes varied significantly between surgeons, and partof that difference was explained by the surgeon’scaseload: surgeons with heavier caseloads had longerwaits.
DiscussionAmong a variety of patient and provider char-acteristics studied, the single most important factorin determining the length of waiting time forManitoba cataract surgery patients was the surgeonwho performed the surgery. Specific surgeonsaccounted for the single largest amount of theexplained variation (roughly 30%) in cataract surgerywaiting times, and surgeon-specific median waitingtimes ranged from 61 to 399 days. Although it is acommon perception that different surgeons havedifferent waiting times, it has not often been reportedin the literature. A study of patients having cataractsurgery in Saskatchewan found that one of the mostsignificant predictors of a long wait was if the surgeonhad a long list; 12 per cent of the variance wasexplained by list length (Hadjistavropoulos et al.,1998). Similarly, in the current study, the use of multi-level modelling demonstrated that volume of surgerywas a significant predictor of surgeons with higherwaiting times.
The median wait time for this cohort of patients was163 days; for low-volume surgeons it was 99 days,and for high-volume, 197 days. If caseloads weremore evenly distributed among surgeons, waitingtime variation might be less, and overall waiting timesmight be lower: even though the wait for low-volumesurgeons would likely increase, the wait for high-volume surgeons would decrease. In Ontario, forpatients referred to a regional coordinating officefor coronary artery bypass surgery, mean waits were22.7 days if the referral office was allowed to find asurgeon or interventional cardiologist, and 35.3 daysif a specific provider was requested (after adjustmentfor urgency scores) (Naylor et al., 1993). Surgeons mayresist the notion of redistributing patients; for some itcould increase their workload to a level that is greaterthan they desire, and for others, it could lead to a lossof patients. However, if waiting time informationwere shared with referring physicians and patients,they could choose to contact a surgeon with a shorterwait. Furthermore, central registries could take on agreater management role, wherein patients wouldbe prioritized on the basis of standardized criteria.
The CSWLR currently does not perform either aninformation-sharing or a management role.
More research is necessary to understand the char-acteristics that explain variation among surgeons.The multi-level analysis demonstrated that the differ-ences in wait times between surgeons could not beexplained by patient characteristics, like age, sex, orgeneral health status. That is, surgeons with longerwaits did not treat patients who were somehowdifferent on average with respect to age, gender, orgeneral health than did surgeons with shorter waits;these patient characteristics were distributed homo-geneously among practices.
Sub-specialization is one possible explanation forsurgeon variation. Surgeons with shorter waitingtimes often have sub-specialty surgical interests, andthey keep operating room time open to accommodatethese interests. These open slots, if not used forspecialized surgery, may shorten waits for cataractpatients. A comparison between CSWLR and claimsdata showed that physician style varied in visitpatterns and listing in the registry (De Coster, 2002);this could be explored further. Another characteristicmight be average visual dysfunction score. Onesomewhat dated study in the United Kingdomfound that ophthalmologists listed patients for sur-gery with differing degrees of impairment; some hadlonger lists of less-impaired patients and some hadshorter lists of more-impaired patients. Yet patients ofboth types of surgeons came to surgery with about thesame level of symptoms and impairment (Sanderson,1982).
Other possible relevant factors are outcomes andreferral patterns. Maybe surgeons with high volumeshave better outcomes, and consequently moreclinicians refer to them. Referral patterns may reflecthabit, or they may reflect a more formal relationship:a business partnership between optometrists andophthalmologists. In either event, these may beresistant to change. Other important surgeon char-acteristics might be age, gender, or even somepsychosocial variables like desire for status (longwaiting lists are seen as a status symbol) (Pope &Roberts, 1991), or need for security (anecdotally,surgeons have stated that their waiting list representstheir future income flow).
A limitation of this study is that visual dysfunction,visual acuity, and ocular co-morbidity data werenot available. It is assumed that these characteristicsare distributed evenly among patients. This assump-tion might be false. It might be that some surgeonssee patients with a generally higher level of symp-toms, thus helping to explain some of the variationbetween surgeons. However, Hadjistavropoulos and
54 Canadian Journal on Aging 24 (Suppl. 1) C. De Coster

colleagues found that visual function, visual acuity,and the severity of cataract symptoms were notpredictive of variation in cataract surgery waitingtimes in Regina, SK (Hadjistavropoulos et al., 1998).Furthermore, a recent study showed visual function tobe generally very high in patients undergoing cataractsurgery in Canada (Wright & Robens-Paradise, 2001),suggesting that the addition of this variable would notchange the results dramatically.
Being hospitalized during the wait was found topredict a longer waiting time. Nearly nine per centof patients were hospitalized while waiting, and ofthese, three quarters were hospitalized only once.Given the long waiting times, it is somewhat surpris-ing that the relatively rare occurrence of a hospi-talization while waiting could have a significantimpact, yet it explained about two per cent of thevariation in waiting times in the multivariate linearmodel. Other studies have found that a schedulingdelay was associated with longer waiting times(Hadjistavropoulos et al., 1998; Sobolev, Brown, &Zelt, 2001). That may explain why a hospitalizationwhile waiting predicted longer waiting times. TheCSWLR contains data on the reason for a postpone-ment of surgery; it would be instructive to be able touse these data to confirm if hospitalization did resultin a scheduling delay.
Age and sex were also found to be significant, withfemales and older individuals waiting longer. Theseare unusual findings. A Swedish study that exploredvisual problems before and after cataract surgeryfound that fewer problem areas were reported withincreasing age (Lundstrom, Fregell, & Sjoblom, 1994).If that were true for this cohort of patients, they wouldhave better visual function, hence lower priority andpossibly longer waits. There is some evidence that ageis a predictor for poorer outcomes in cataract surgery,even after adjusting for other risk factors (Norregaardet al., 1998; Wong, 2001). Surgeons may therefore giveolder patients lower priority, in light of their poorerexpected outcomes. That possibility seems unlikely inthis study though, since the Cataract Surgery WaitingList Registry specifically excluded age as a prioritiza-tion criterion, because it was felt that it would be‘‘socially unacceptable to penalize older patients’’(Bellan & Mathen, 2001). Points are given forthreatened loss of employment, which may lead toshorter waits for younger patients who are morelikely to be employed. Having the scores from thevisual function questions would permit testing of thishypothesis.
Why would women have longer waits than men?It seems unlikely that males would systematicallybe entered into the registry at higher levels of
dysfunction than females. On the contrary, theSwedish study cited above found that womenreported more problem areas than men (Lundstromet al., 1994). The visual impairment instrument usedin Manitoba (VF-14) has been tested internationallyand has been found to have a high degree of reliability(Alonso et al., 1997; Cassard et al., 1995). Therefore, itis unlikely that the VF-14 is biased in favour of males.However, the prioritization score gives weight to thethreatened loss of a driving licence, and to threatenedloss of employment. In older patients, it may be thatwomen are less likely to drive or to be employed,so these criteria may have the effect of favouring menover women.
Also interesting in this study are the characteristicsthat were found not to be significant. In earlierManitoba research, public-sector waiting times werelongest for surgeons who also had a private practice(De Coster, et al., 1999). At that time, patients who hadsurgery in a clinic were required to pay a fee ofapproximately $1,000; however, in this cohort, extrabilling had been banned. With the government payingall costs, regardless of site, waiting times for surgeryat a clinic or hospital were similar. This findingsupports the argument by ophthalmologists that theprevious difference in public-sector waiting timesreflected volume of surgery, not having a privatepractice. There is, however, an alternative interpreta-tion. Previously, there was an incentive to have longpublic-sector waits, to encourage patients to havesurgery privately. Now that incentive has beenremoved; a difference in waiting time between thehospital and the clinics is no longer of value to thesurgeons.
Measures of general health status (number of differentdrugs, number of ADGs, residence in a long-term carefacility) also had no relationship to differences inwaiting time. Poorer general health status has beenfound to be related to poorer outcomes of cataractsurgery (Norregaard et al., 1998). Thus, it might beexpected that patients with poorer general healthwould wait longer. Also, since cataract surgery is aquality-of-life procedure, it would not be surprising ifpatients who were in poorer health were at adisadvantage in waiting for surgery. On the otherhand, one might argue that patients who have anumber of other conditions are in greater need ofhaving their cataracts operated on, so that poor visiondoes not contribute to any existing difficulties inperforming the activities of daily living. Othercharacteristics found not to be significant wereregion of residence and socio-economic status, sug-gesting that the publicly financed health care systemis working the way it should.
Cataract Surgery Waiting Times La Revue canadienne du viellissement 24 (Suppl. 1) 55

The mean wait time for the patients in this studywas 190 days. Dunn and colleagues found that waittimes of 3 months were acceptable, but as waits grewlonger than 6 months, they were poorly tolerated(Dunn et al., 1997). Tolerance for the wait decreased asvisual dysfunction increased. Perhaps it is important,therefore, to develop wait time targets given aspecified level of patient urgency. The WesternCanada Waiting List project – a four-provincecollaboration of research organizations, provincialgovernments, regional health authorities, and medicalassociations – has developed point count scores toassess the degree of urgency for several services:cataract surgery, hip and knee replacement, children’smental health, and general surgery (Noseworthy,McGurran, Hadorn, & Steering Committee ofthe Western Canada Waiting List Project, 2003;Romanchuk, Sanmugasunderam, Hadorn, & SteeringCommittee of the Western Canada Waiting ListProject, 2002; Western Canada Waiting List Project,2001). The project is currently working towardestablishing benchmarks, that is, targeted wait timesfor different levels of urgency as measured by thepoint count score. Inputs that are being used toestablish the benchmarks are patient opinion, clinicalexpertise, public opinion, and research evidence.
In summary, specific surgeon accounted for a largeamount of the explained variation in cataract surgerywaiting times in Manitoba. The stepwise generalizedlinear model with patient and provider characteristicsexplained 32.5 per cent of the variation in waitingtimes; specific surgeon explained 29.5 per cent of thevariation. Median waits varied substantially betweensurgeons: the lowest median wait was 61 days and thehighest 399 days. The big differences that patients canexpect to wait, depending on the surgeon they see,is a subject that merits further investigation. In theinterests of informed decision making, average wait-ing times for individual surgeons should be madeavailable to referring clinicians and to patients.
ReferencesAiono, S., Faber, R.G., & Galland, R.B. (2000). Surgeons have
little control over general surgical waiting lists. Annalsof the Royal College of Surgeons of England, 82, 304–307.
Alberta Medical Association. (1999). Information for patients:Cataracts in adults with otherwise health eyes. Edmonton:Author.
Alonso, J., Espallargues, M., Andersen, T.F., Cassard, S.D.,Dunn, E., Bernth-Petersen, P., Norregaard, J.C., Black, C.,Steinberg, E.P., & Anderson, G. (1997). Internationalapplicability of the VF-14: An index of visual functionin patients with cataracts. Ophthalmology, 104, 799–807.
Alter, D.A., Naylor, C.D., Austin, P., & Tu, J.V. (1999). Effectsof socioeconomic status on access to invasive cardiac
procedures and on mortality after acute myocardialinfarction. New England Journal of Medicine, 341(18),1359–1367.
American Academy of Ophthalmology. Age-relatedcataract? [Online]. 2003. Available from http://www.medem.com/medlb/article_detaillb.cfm?article_ID¼ZZZJOJW8OPC&sub_cat¼1119
Armstrong, W. (2000). The consumer experience with cataractsurgery and private clinics in Alberta: Canada’s canary inthe mine shaft. Edmonton: Alberta Chapter of theConsumers Association of Canada.
Bellan, L., & Mathen, M. (2001). The Manitoba cataractwaiting list program. Canadian Medical AssociationJournal, 164(8), 1177–1180.
Cassard, S.D., Patrick, D.L., Damiano, A.M., Legro, M.,Tielsch, J.M., Diener-West, M., Schein, O.D., Javitt, J.C.,Bass, E.B., & Steinberg, E.P. (1995). Reproducibility andresponsiveness of the VF-14: An index of functionalimpairment in patients with cataracts. Archives ofOphthalmology, 113(12), 1508–1513.
Castells, X., Alonso, J., Ribo, C., Nara, D., Teixido, A., &Castilla, M. (2000). Factors associated with second eyecataract surgery. British Journal of Ophthalmology, 84(1),9–12.
Churchill, A.J., Vize, C.J., Stewart, O.G., & Backhouse, O.(2000). What factors influence cataract waiting list time?British Journal of Ophthalmology, 84(4), 429–431.
De Coster, C. (2002). Measurement and factors relating tovariation in cataract surgery waiting times in Manitoba.Unpublished doctoral dissertation, University ofManitoba.
De Coster, C., Carriere, K.C., Peterson, S., Walld, R., &MacWilliam, L. (1998). Surgical waiting times inManitoba. Winnipeg: Manitoba Centre for HealthPolicy and Evaluation.
De Coster, C., Carriere, K.C., Peterson, S., Walld, R., &MacWilliam, L. (1999). Waiting times for surgicalprocedures. Medical Care, 37(Suppl. 6), JS187–JS205.
De Coster, C., MacWilliam, L., & Walld, R. (2000).Waiting times for surgery: 1997/98 and 1998/99 update.Winnipeg: Manitoba Centre for Health Policy andEvaluation.
Desai, P. (1993). National cataract surgery survey: II Clinicaloutcomes. Eye, 7, 489–494.
Dunn, E., Black, C., Alonso, J., Norregaard, J.C., &Anderson, G.F. (1997). Patients’ acceptance of waitingfor cataract surgery: What makes a wait too long?Social Science and Medicine, 44, 1603–1610.
First Ministers. (2000). First ministers’ meeting:Communique on health. September 11, 2000.
Frohlich, N., Fransoo, R., & Roos, N.P. (2001). Indicators ofhealth status and health service use for the Winnipeg
56 Canadian Journal on Aging 24 (Suppl. 1) C. De Coster

Regional Health Authority. Winnipeg: Manitoba Centrefor Health Policy and Evaluation.
Goddard, J.A., & Tavakoli, M. (1998). Referral rates andwaiting lists: Some empirical evidence. HealthEconomics, 7(6), 545–549.
Hadjistavropoulos, H.D., Snider, B., & Bartlett, G. (1998).Measuring the quality of performance in the manage-ment of waiting lists: Using cataract surgery as anexample. Joint Commission Journal on QualityImprovement, 24(8), 407–422.
Hadorn, D.C., & Steering Committee of the Western CanadaWaiting List Project. (2000). Setting priorities forwaiting lists: Defining our terms. Canadian MedicalAssociation Journal, 163, 857–860.
Hamblin, R., Harrison, A., & Boyle, S. (1998). Waiting lists:The wrong target. Health Services Journal, 108(5598),28–31.
Harley, M. (2001). Waiting lists: Bone of contention. HealthServices Journal, 111(5755), 22–25.
Imamura, K., Gair, R., McKee, M., & Black, C. (1996).Appropriateness of total hip replacement in the UnitedKingdom. World Hospitals and Health Services, 32(2),10–14.
Kee, F., & Gaffney, B. (1995). Priority for coronary arterysurgery: Who gets by-passed when demand outstripscapacity. Quarterly Journal of Medicine, 88, 15–22.
Kee, F., McDonald, P., & Gaffney, B. (1997). Prioritising thecardiac surgery waiting list: The angina patient’sperspective. Heart, 77(4), 330–332.
Leinonen, J., & Laatikainen, L. (1999). The decrease of visualacuity in cataract patients waiting for surgery. ActaOphthalmologica Scandinavica, 77(6), 681–684.
Lundstrom, M., Fregell, G., & Sjoblom, A. (1994). Visionrelated daily life problems in patients waiting for acataract extraction. British Journal of Ophthalmology,78(8), 608–611.
Mariotto, A., De Leo, D., Buono, M.D., Favaretti, C.,Austin, P., & Naylor, C.D. (1999). Will elderly patientsstand aside for younger patients in the queue forcardiac services? Lancet, 354(9177), 467–470.
Martin, M. (1995). Quebec hopes to overcome province’ssurgical-delay problem. Canadian Medical AssociationJournal, 153(7), 1001–1002.
Minassian, D.C., Reidy, A., Desai, P., Farrow, S., Vafidis, G.,& Minassian, A. (2000). The deficit in cataract surgery inEngland and Wales and the escalating problem ofvisual impairment: Epidemiological modelling of thepopulation dynamics of cataract. British Journal ofOphthalmology, 84(1), 4–8.
Naylor, C.D., Morgan, C.D., Levinton, C.M., Wheeler, S.,Hunter, L., Klymciw, K., Baigrie, R.S., & Goldman, B.S.(1993). Waiting for coronary revascularization in
Toronto: 2 years’ experience with a regional referraloffice. Canadian Medical Association Journal, 149(7),955–962.
Norregaard, J.C., Hindsberger, C., Alonso, J., Bellan, L.,Bernth-Petersen, P., Black, C., Dunn, E., Andersen, T.F.,Espallargues, M., & Anderson, G.F. (1998). Visualoutcomes of cataract surgery in the United States,Canada, Denmark, and Spain: Report from theInternational Cataract Surgery Outcomes Study.Archives of Ophthalmology, 116(8), 1095–1100.
Noseworthy, T.W., McGurran, J.J., Hadorn, D.C., & SteeringCommittee of the Western Canada Waiting List Project.(2003). Waiting for scheduled service in Canada:Development of priority-setting scoring systems.Journal of Evaluation in Clinical Practice, 9, 23–31.
Pell, J.P., Pell, A.C., Norrie, J., Ford, I., & Cobbe, S.M. (2000).Effect of socioeconomic deprivation on waiting timefor cardiac surgery: Retrospective cohort study. BritishMedical Journal, 320, 15–19.
Pope, C., & Roberts, J.A. (1991). Dissecting a waiting list.Health Service Management Research, 4(2), 112–119.
Reid, R., MacWilliam, L., Roos, N.P., Bogdanovic, B., &Black, C. (1999). Measuring morbidity in populations:Performance of the Johns Hopkins Adjusted Clinical Group(ACG) Case-Mix Adjustment System. Winnipeg:Manitoba Centre for Health Policy and Evaluation.
Romanchuk, K., Sanmugasunderam, S., Hadorn, D.C., &Steering Committee of the Western Canada Waiting ListProject. (2002). Developing cataract surgery prioritycriteria: Results from the Western Canada Waiting ListProject. Canadian Journal of Ophthalmology, 37, 145–154.
Roos, L.L., Sharp, S.M., & Cohen, M.M. (1991). Comparingclinical information with claims data: Some similaritiesand differences. Journal of Clinical Epidemiology, 44(9),881–888.
Roos, L.L., Mustard, C.A., Nicol, J.P., McLerran, D.F.,Malenka, D.K., Young, K.T., & Cohen, M.M. (1993).Registries and administrative data: Organization andaccuracy. Medical Care, 31(3), 201–212.
Sanderson, H.F. (1982). What’s in a waiting list. BritishMedical Journal, 285, 1368–1369.
Singh, N., Gupta, M., Fell, D., & Gangbar, E. (1999). Impactand inequity of inpatient waiting times for advancedcardiovascular services in community hospitals acrossthe greater Toronto area. Canadian Journal of Cardiology,15(7), 777–782.
Sobolev, B., Brown, P., & Zelt, D. (2001). Potential for bias inwaiting time studies: Events between enrolment andadmission. Journal of Epidemiology and CommunityHealth, 55, 891–894.
Western Canada Waiting List Project. (2001). From chaos toorder: Making sense of waiting lists in Canada: Final Report.Edmonton: Author.
Cataract Surgery Waiting Times La Revue canadienne du viellissement 24 (Suppl. 1) 57

Williams, J.I., & Young, W. (1997). Inventory of studies onthe accuracy of Canadian health administrative databases.Toronto: Institute for Clinical Evaluative Sciences.
Wong, T.Y. (2001). Regular review: Effect of increasing ageon cataract surgery outcomes in very elderly patients.British Medical Journal, 322(7294), 1104–1106.
Wright, C.J., & Robens-Paradise, Y. (2001). Evaluation ofindications and outcomes in elective surgery. Vancouver:Vancouver/Richmond Health Board.
Wright, C.J., & Robens-Paradise, Y. (2002). Evaluation ofindications for and outcomes of elective surgery.Canadian Medical Association Journal, 167(5), 461–466.
58 Canadian Journal on Aging 24 (Suppl. 1) C. De Coster
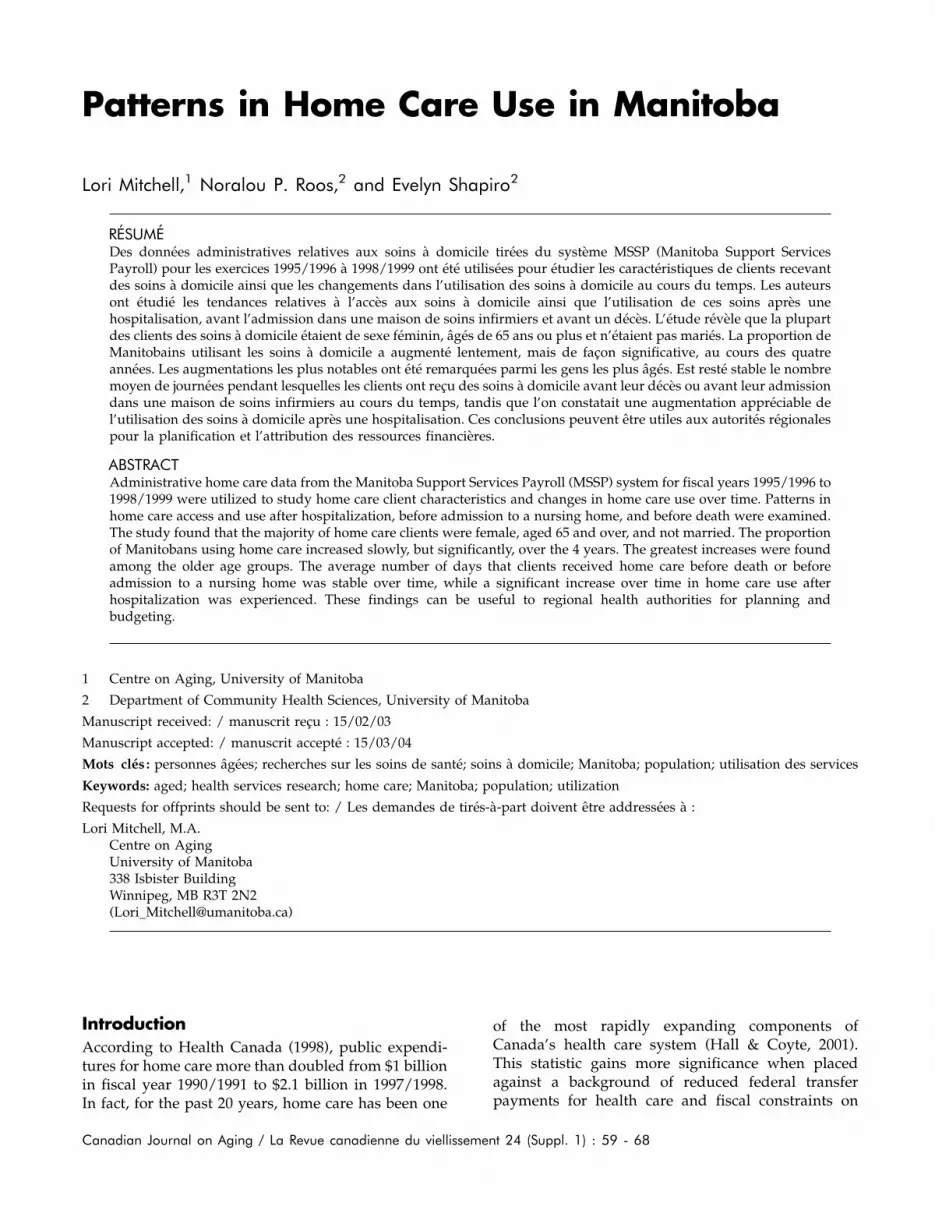
Patterns in Home Care Use in Manitoba
Lori Mitchell,1 Noralou P. Roos,2 and Evelyn Shapiro2
RESUMEDes donnees administratives relatives aux soins a domicile tirees du systeme MSSP (Manitoba Support ServicesPayroll) pour les exercices 1995/1996 a 1998/1999 ont ete utilisees pour etudier les caracteristiques de clients recevantdes soins a domicile ainsi que les changements dans l’utilisation des soins a domicile au cours du temps. Les auteursont etudie les tendances relatives a l’acces aux soins a domicile ainsi que l’utilisation de ces soins apres unehospitalisation, avant l’admission dans une maison de soins infirmiers et avant un deces. L’etude revele que la plupartdes clients des soins a domicile etaient de sexe feminin, ages de 65 ans ou plus et n’etaient pas maries. La proportion deManitobains utilisant les soins a domicile a augmente lentement, mais de facon significative, au cours des quatreannees. Les augmentations les plus notables ont ete remarquees parmi les gens les plus ages. Est reste stable le nombremoyen de journees pendant lesquelles les clients ont recu des soins a domicile avant leur deces ou avant leur admissiondans une maison de soins infirmiers au cours du temps, tandis que l’on constatait une augmentation appreciable del’utilisation des soins a domicile apres une hospitalisation. Ces conclusions peuvent etre utiles aux autorites regionalespour la planification et l’attribution des ressources financieres.
ABSTRACTAdministrative home care data from the Manitoba Support Services Payroll (MSSP) system for fiscal years 1995/1996 to1998/1999 were utilized to study home care client characteristics and changes in home care use over time. Patterns inhome care access and use after hospitalization, before admission to a nursing home, and before death were examined.The study found that the majority of home care clients were female, aged 65 and over, and not married. The proportionof Manitobans using home care increased slowly, but significantly, over the 4 years. The greatest increases were foundamong the older age groups. The average number of days that clients received home care before death or beforeadmission to a nursing home was stable over time, while a significant increase over time in home care use afterhospitalization was experienced. These findings can be useful to regional health authorities for planning andbudgeting.
1 Centre on Aging, University of Manitoba
2 Department of Community Health Sciences, University of Manitoba
Manuscript received: / manuscrit recu : 15/02/03
Manuscript accepted: / manuscrit accepte : 15/03/04
Mots cles : personnes agees; recherches sur les soins de sante; soins a domicile; Manitoba; population; utilisation des services
Keywords: aged; health services research; home care; Manitoba; population; utilization
Requests for offprints should be sent to: / Les demandes de tires-a-part doivent etre addressees a :
Lori Mitchell, M.A.Centre on AgingUniversity of Manitoba338 Isbister BuildingWinnipeg, MB R3T 2N2([email protected])
IntroductionAccording to Health Canada (1998), public expendi-tures for home care more than doubled from $1 billionin fiscal year 1990/1991 to $2.1 billion in 1997/1998.In fact, for the past 20 years, home care has been one
of the most rapidly expanding components ofCanada’s health care system (Hall & Coyte, 2001).This statistic gains more significance when placedagainst a background of reduced federal transferpayments for health care and fiscal constraints on
Canadian Journal on Aging / La Revue canadienne du viellissement 24 (Suppl. 1) : 59 - 68

provincial budgets. The province of Manitoba is noexception to this trend in increases in home care. From1990/1991 to 1998/1999, the number of home carerecipients increased by 34 per cent, and expendituresfor home care services increased by 121 per cent(Manitoba Health, 1991a; Manitoba Health, 1991b;Manitoba Health, 1999a; Manitoba Health, 1999b).Obviously, the province’s home care is playing anexpanding role in the provincial health care budget.
The Canadian Home Care Human Resources Study(2002) offers a number of reasons for recent trends inhome care growth and future pressure for continuedgrowth: an increase in demand for home care servicesdue to population aging and individuals’ increasedpreference for health care in the home; advancesin medical technology and pharmacology thathave increased the possibility of home health careinstead of health care in an acute or long-term caresetting; use of home care as a less costly alternativeto acute care or long-term care; fewer informalcaregivers to provide unpaid family care, which arethe result of changing family patterns and decreasedfertility rates.
Most emphasis is placed on population aging asthe driver for growth in home care. In Canada, thepercentage of seniors (adults age 65 years of ageand older) in the population has increased fromjust under 5 per cent in 1921 to over 12 per cent in2001. By 2026, 20 per cent of Canadians will be seniors(Health Canada, 2002). With the majority of home careclients being seniors, it is evident why populationaging has received so much attention in the home caresector.
Along with home care’s growth has been an increasein home care–related research. As the CanadianInstitute for Health Information (2001) points out,lack of good information on home care use is a barrierto effective planning, management, and evaluation ofhome care services. Canadian research on home carehas been conducted in areas such as associated healthoutcomes (Health Services Utilization and ResearchCommission, 2000), cost-effectiveness (Hollander,2001), home care labour market needs (CanadianHome Care Human Resources Study, 2002), regionalvariations in use after hospitalization (Coyte & Young,1999), home care indicator development (CanadianInstitute for Health Information, 2001), and identifica-tion of client characteristics associated with home careuse (Hall & Coyte, 2001; Wilkins & Park, 1998).
Home care program planning and resource forecast-ing requires not only the type of information fromstudies cited, but also information on trends in homecare use that a province is experiencing. Patterns ofhome care use over time have not been systematically
studied in Manitoba or in most other provinces. Oneexception is Ontario, where the trends and patterns inhome care use between 1993 and 1998 were recentlystudied (Croxford, 2002). Home care trends wereexamined from the point of view of clients, thecommunity care access centres, and the population.The portion of the population that is receiving at leastone home care visit in a year increased from 2 per centin 1993 to 3 per cent in 1998 in Ontario. The increasewas most evident in the senior populations, particu-larly seniors aged 85 years or older. The portion of thisage group receiving at least one home care visit ina year increased from 21 per cent to 33 per cent overthe 5 years studied.
This study describes home care clients in Manitobaand examines use of home care over time, with aspecific focus on seniors’ use of home care. Home careuse over time in relation to specific situations – beforeentry into a nursing home, after discharge from ahospital, and prior to death – is also examined. Thisstudy was undertaken as part of a larger initiative toadd home care information to the Manitoba Centre forHealth Policy’s (MCHP) Population Health ResearchData Repository (Roos, Stranc, et al., 2001). Theaddition of home care data to the repository providesa missing piece in MCHP’s ability to analyse thepopulation’s use of health care services and therelationship between health care expenditures andhealth. This study represents a first step in lookingat home care clients in Manitoba home care use overtime, using a population perspective.
Manitoba Home Care Program
The Manitoba Home Care Program was establishedin 1974 – part of the Continuing Care spectrumthat also includes supportive housing, chronic care,and long-term care facilities such as nursing homes.The Manitoba Continuing Care Program operatesa single-entry system in which access to home careand to long-term care facilities is determined by aprofessional assessment of needs. Decisions aboutthe type and amount of home care services providedat home are based on the assessed need by casecoordinators, in collaboration with clients and theirinformal caregivers. If the individual is assessed asrequiring home care, the home care services areprovided free of charge. Home care may be deliveredto persons of any age, including children, andreferrals or requests for access to the Home CareProgram may come from any source. Reassessmentsat predetermined intervals are the basis for decisionsby case coordinators to discharge individuals from theprogram or to change the type or amount of servicesdelivered.
60 Canadian Journal on Aging 24 (Suppl. 1) L. Mitchell et al.

Methods
Data Sources
Data from the Manitoba Support Services Payroll(MSSP) system were used to identify Manitobans’use of home care between fiscal years 1995/1996 and1998/1999. The MSSP system is an administrativedatabase developed by Manitoba Health in 1988 as apayroll system for direct service workers employedby the Department of Health. The MSSP system alsoserves as a master file for clients of the ProvincialHome Care Program. The home care informationthat is captured in the MSSP system consists ofemployee data, time sheet (service) data, and limited,non-clinical client data. The MSSP data do notinclude home care information on residents livingin First Nations communities, whose health careneeds are the responsibility of the federal govern-ment. To assess the accuracy of the MSSP data, MSSPclient figures were compared to continuing careclient figures compiled by Manitoba Health atmonth-end. It was found that, across Manitoba, theMSSP data underestimated the number of clients by7 per cent in 1995/1996 to 10 per cent in 1998/1999.It was revealed that some of these differences mayresult from different practices across the province’sregions in reporting continuing care cases and inhow information is entered into the MSSP databasefor these clients. Nonetheless, based on the results ofthe reliability checks, the data from 1995/1996through to 1998/1999 were found to be sufficientlyaccurate to support a descriptive study of home careacross the province.
Hospital claims provided information on home careclients’ hospital contacts (both inpatient and out-patient). Nursing home files were used for informa-tion on the supply and utilization of nursing homes inManitoba. Of particular interest for this study was theinformation on waiting times and admission dates toa nursing home. Vital Statistics records were usedto identify home care clients who died. These threefiles were also used to verify the closing date of homecare episodes. Both the hospital and nursing homeadministrative files have been established previouslyas reliable and valid for examining health care use(Roos, Black, et al., 1995).
Definitions and Measures
Definitions of home care clients and home care‘‘episodes’’ were developed, and measures fordescribing the population’s use of services – suchas access and intensity of use – that had beenpreviously developed, were adapted for use withhome care data.
Definitions
Home Care ClientsAny Manitoban who was registered as a home careclient in the MSSP data for at least one day betweenApril 1, 1995, and March 31, 1999, was included in anMCHP home care client file. Individuals wereidentified as new clients if they were not registeredfor home care on April 1 of the particular year, butwere subsequently registered with the programduring the year.
Home Care EpisodesThe MSSP data identified start and end dates forepisodes of home care. Because there were incon-sistencies in the closing of home care episodes, theend date for each home care episode was comparedagainst files that held information on admission tonursing homes, coverage cancellation, and death.Where necessary, the end date was corrected. Whena home care episode was closed, one of four potentialendpoints was identified: hospitalization, death,nursing home entry, or remained in the community.Analyses using the limited services data availableconfirmed that the length of time an individual was ahome care client did not necessarily reflect the numberor frequency of services received.
HospitalizationsFor this study, examination of home care followinghospitalization focused on an individual’s first hospi-talization episode or surgical outpatient procedurein a given fiscal year. Residents were considered tobe home care recipients after hospitalization if theyregistered for home care within 30 days afterdischarge. We included both residents who werereceiving home care before the hospital episode andthen continued on home care after discharge, andresidents who began receiving home care servicesonly after hospitalization.
Nursing Home Panelling and AdmissionOne focus of this study is to describe the use of homecare services before panelling for nursing homeplacement and also between the time of panellingand admission to a facility. In Manitoba, a home careassessor first assesses an individual for nursing homeplacement. If the individual is found to need nursinghome placement, the home care assessor submits thefile to a panel of experts to review the need fornursing home care. When referring to ‘‘panelling’’ oran individual being ‘‘panelled,’’ we are referring tothe date when the panel of experts recommended thatthe individual be admitted to a nursing home.
Marital StatusMarital status can provide a rough indication ofavailable home support, although it is recognized thatmarital status does not indicate if the client resides
Patterns in Home Care Use La Revue canadienne du viellissement 24 (Suppl. 1) 61

with an adult child, relative, or friend, or has otherinformal sources of support. In this study, maritalstatus is categorized as married (which includescommon-law relationships) or non-married (whichincludes individuals who were never married, orwere widowed or divorced). For the analyses, maritalstatus was determined at the beginning of the fiscalyear or, if the individual was not yet a home careclient, at the beginning of the home care episode forthe fiscal year in question. The recording of maritalstatus was compared against primary data collectionsources (i.e., data from the Aging in Manitoba study, alongitudinal study of Manitoba’s seniors, and infor-mation from the National Population Health Survey)to verify accuracy.
Measures of Home Care Use
To describe a population’s use of home care werequired indicators of access to home care andintensity of use expressed per unit of population(per 100 Manitobans).
Access to Home CareAccess was defined as the percentage of thepopulation that were registered with the HomeCare Program for at least one day during thefiscal year. This measure provides a useful indicatorof the rate at which home care services are beingaccessed.
New ClientsNew clients were measured as the number of newclients per 100 residents per year. We identifiedindividuals as new clients if they were not registeredfor home care on April 1 of the particular year, butwere subsequently registered with the programduring the year.
Days ‘‘Open’’ to Home CareThis measure identifies the number of days residentswere enrolled in the Home Care Program per 100Manitobans per year. This population-based measurecaptures and is influenced by both the proportion ofresidents who were registered at least one day in theprogram during the year, and the duration of theperiod over which they were registered to receiveservices in the year (possibly from multiple episodesover the year). The numerator is calculated bysumming the number of days registered for homecare for the year, across all clients; the denominator isbased on Manitoba population counts as of December31 of the year. If an individual was hospitalized whilethe home care file was ‘‘open,’’ the days spent inhospital were included in the numerator for thismeasure if he/she continued with home care afterdischarge. While this measure does not reflect theamount of home care services delivered to clients, it
captures the length of time over which residents wereassessed as needing services.
Analytic Approach
PopulationHome care use was examined for all Manitobaresidents over fiscal 1995/1996–1998/1999. Popula-tion counts were based on Manitoba Health counts asof December 31 of the appropriate year. Many of theanalyses broke down the population by age groups sothat older Manitobans’ use of home care could beexamined.
Time PeriodThe description of Manitoba’s home care clients isbased on those receiving services during the fiscalyear 1998/1999. Analyses of access measures overtime are based on home care records during fiscalyears 1995/1996–1998/1999 (April 1, 1995, to March31, 1999). Analyses of home care use over time afterhospitalization, before nursing home admission, andbefore death are reported for fiscal years 1996/1997 to1998/1999.
RatesFor ‘‘over time’’ comparisons, adjusted rates arecalculated for each year using the direct methodof standardization. This procedure mathematicallyremoves the effects of different population structuresthat may influence overall rates of use of health care.The adjusted rates are calculated with reference to astandard population and year in Manitoba to permitcomparisons which will not be affected, for example,by the aging of the population. For this study all datafor the years examined were age and sex standardizedto Manitoba’s population in the 1998/1999 fiscal year.
Significance TestingTrend tests were used to determine if changesfound over time in patterns of home care use werestatistically significant (using a p-value of lessthan .05).
Results
Home Care Clients in Manitoba
In the fiscal year 1998/1999 there were over 31,000home care clients across Manitoba. A description ofhome care clients is shown in Table 1. AcrossManitoba, 63 per cent of home care clients werefemale. The majority of home care users (79%) wereaged 65 or older. Older adults aged 75 to 84 comprisedthe largest group of home care clients (37% of allclients). Of all home care clients, 44 per cent were newclients. Across Manitoba, 71 per cent were neithermarried nor in a common-law relationship. The greatmajority of home care clients (76%) were receiving
62 Canadian Journal on Aging 24 (Suppl. 1) L. Mitchell et al.

long-term care at home (enrolled in the home careprogram for more than 60 days). More than one thirdof home care clients were registered in home care forthe full 1998/1999 fiscal year. The average duration ofhome care use increased with age, ranging from anaverage of 174 days for clients under age 65 to 229days for clients aged 75 or older.
Of all the clients who received home care in 1998/1999, 8 per cent were admitted to a nursing home in
1998/1999 (Table 2). By summing the total number ofdays that home care files were open in 1998/1999,we obtained the total number of ‘‘days open’’ in 1998/1999 for all clients who were registered in 1998/1999(over 6.6 million days). Similarly, we obtained thetotal number of days open during the 4-year periodfor all clients who were registered in 1998/1999 (over17.6 million days). Home care clients who wereadmitted to a nursing home in 1998/1999 accountedfor 6 per cent of the total home care days in 1998/1999and 9 per cent of the days over the 4-year period. Over13,000 individuals were identified as home careclients within 30 days of discharge from their firsthospitalization or outpatient surgical procedure in1998/1999. They represented 43 per cent of all homecare clients in 1998/1999. This group was separatedinto those who were clients of home care before theyentered hospital (within 30 days prior to hospitaliza-tion) (55%) and those who were not home care clientsjust prior to their hospitalization (45%). The clientswho were already on home care accounted for 24 percent of all home care clients and used 34 per cent ofthe total home care days in 1998/1999 and 36 per centof the total days of home care over the 4-year period.Clients whose home care episode started within 30days after their hospitalization, but who were not onhome care immediately prior to the start of thehospitalization (19%), accounted for 9 per cent of thetotal home care days in 1998/1999 and 4 per cent overthe 4-year period. Nine per cent of home care clientsdied while on home care, accounting for 6 per cent ofthe home care days in 1998/1999 and 8 per cent of thedays over the 4-year period. Forty-six per cent ofhome care clients in 1998/1999 did not enter a nursinghome, or have a home care episode associated withtheir first hospitalization, or die while on home care in1998/1999. These clients accounted for 50 per cent ofthe home care days in 1998/1999 and 49 per cent overthe 4-year period.
Use of Home Care over Time
AccessThe proportion of Manitobans using home care wasfound to be slowly increasing over time, from 2.3per cent in 1995/1996 to 2.7 per cent in 1998/1999.Trend tests indicate that this increase was significant( p< .05). Among Manitoba seniors,1 those aged 85and older experienced the largest increase of just over3 per cent, growing from 33 per cent in 1995/1996 to36 per cent in 1998/1999. The significant trendupward is being experienced in every older agegroup (Figure 1).
New AdmissionsThe upward trend in rates of new admissions per 100residents over time since 1995/1996 was small but
Table 1: Description of home care clients in Manitoba,1998/1999
Number of Clients 31,298
Gender
Male 37%
Female 63%
Age Groups
0–18 1%
19–44 6%
45–64 13%
65–74 19%
75–84 37%
85þ 23%
0–64 21%
65þ 79%
75þ 60%
New Clients (all ages)
Yes 44%
No 56%
Marital Status (aged 19þ)
Married 29%
Other 71%
Duration of Use
1–60 Days 25%
61–180 Days 20%
181–364 Days 19%
Full Year 37%
Mean Duration of Use by Age Groups
All Ages 212
0–64 174
65þ 222
75þ 229
Patterns in Home Care Use La Revue canadienne du viellissement 24 (Suppl. 1) 63
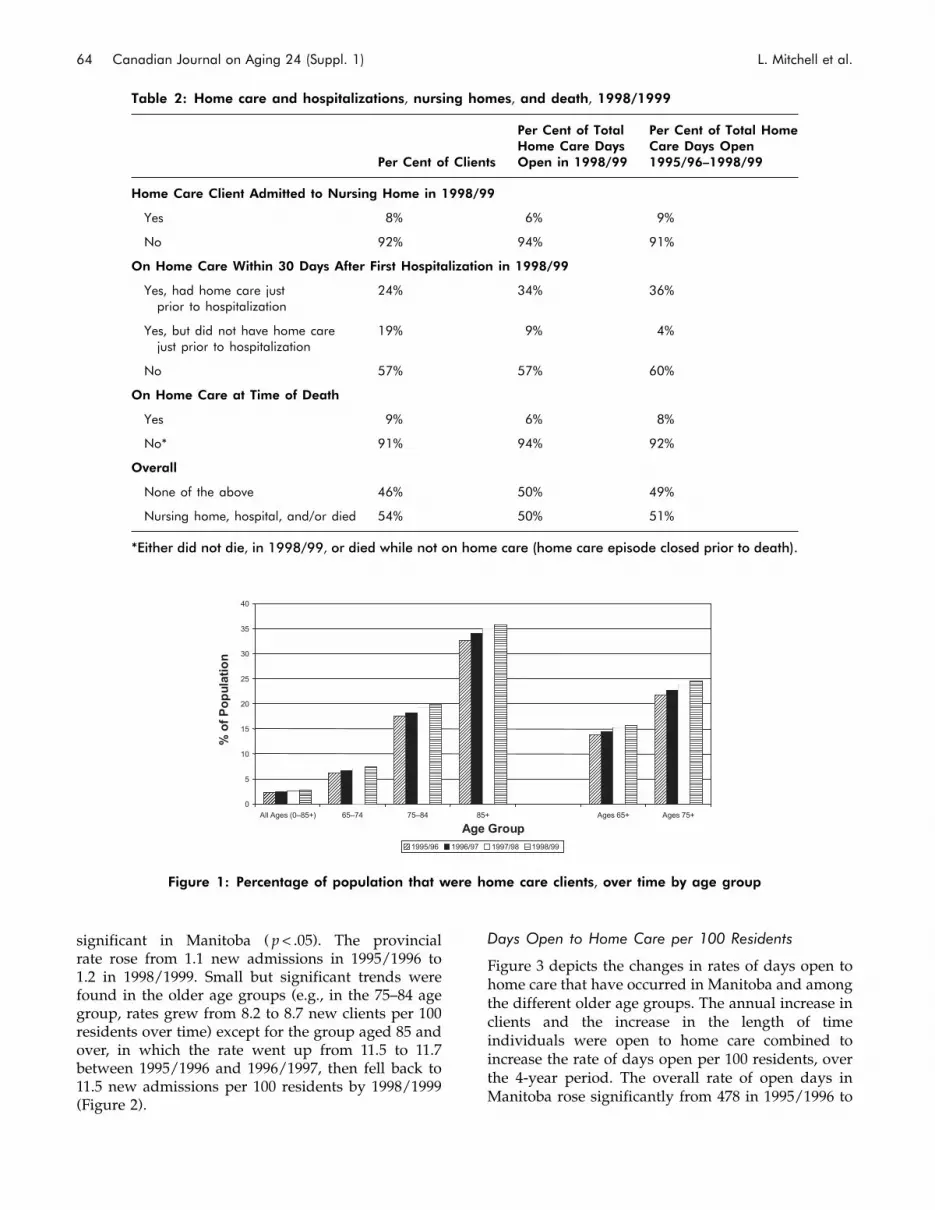
significant in Manitoba ( p< .05). The provincialrate rose from 1.1 new admissions in 1995/1996 to1.2 in 1998/1999. Small but significant trends werefound in the older age groups (e.g., in the 75–84 agegroup, rates grew from 8.2 to 8.7 new clients per 100residents over time) except for the group aged 85 andover, in which the rate went up from 11.5 to 11.7between 1995/1996 and 1996/1997, then fell back to11.5 new admissions per 100 residents by 1998/1999(Figure 2).
Days Open to Home Care per 100 Residents
Figure 3 depicts the changes in rates of days open tohome care that have occurred in Manitoba and amongthe different older age groups. The annual increase inclients and the increase in the length of timeindividuals were open to home care combined toincrease the rate of days open per 100 residents, overthe 4-year period. The overall rate of open days inManitoba rose significantly from 478 in 1995/1996 to
0
5
10
15
20
25
30
35
40
All Ages (0–85+) 65–74 75–84 85+ Ages 65+ Ages 75+
Age Group
% o
f P
op
ulat
ion
1995/96 1996/97 1997/98 1998/99
Figure 1: Percentage of population that were home care clients, over time by age group
Table 2: Home care and hospitalizations, nursing homes, and death, 1998/1999
Per Cent of Clients
Per Cent of TotalHome Care DaysOpen in 1998/99
Per Cent of Total HomeCare Days Open1995/96–1998/99
Home Care Client Admitted to Nursing Home in 1998/99
Yes 8% 6% 9%
No 92% 94% 91%
On Home Care Within 30 Days After First Hospitalization in 1998/99
Yes, had home care justprior to hospitalization
24% 34% 36%
Yes, but did not have home carejust prior to hospitalization
19% 9% 4%
No 57% 57% 60%
On Home Care at Time of Death
Yes 9% 6% 8%
No* 91% 94% 92%
Overall
None of the above 46% 50% 49%
Nursing home, hospital, and/or died 54% 50% 51%
*Either did not die, in 1998/99, or died while not on home care (home care episode closed prior to death).
64 Canadian Journal on Aging 24 (Suppl. 1) L. Mitchell et al.

578 days per 100 residents in 1998/1999, an increaseof 21 per cent. The rate of days open has increasedannually for each older age group, and all increaseswere significant ( p< .05). The 65–74 age groupreported the largest percentage increase. The 65–74age group increased from 1,159 to 1,462 days (26%rise), the 75–84 age group rose from 3,641 to 4,316days (19% rise), and group aged 85 and overincreased from 7,552 to 8,545 (13% rise) days openper 100 residents.
Home Care Use Before Nursing Home Panellingand Admission
Overall, no change in the average number of daysclients were registered for home care in the year priorto nursing home admission was found over time inManitoba for the time period examined (266 days in1996/1997 and 266 days in 1998/1999). A differentpattern was found over the same period in theaverage number of days clients were registered forhome care in the year prior to being panelled for
nursing home placement. Overall the Manitobaaverages were 212 days in 1996/1997 and increasedsignificantly to 230 days by 1998/1999. Conversely,Manitoba has experienced a (non-significant) declinein the average number of home care days betweenpanelling and placement since 1996/1997, droppingfrom 193 days to 178 days by 1998/1999 (an 8%decrease). The cause of the decline in number of homecare days between panelling and placement is likelynot a reflection of availability of home care, but more aresult of decline in waiting times between panellingand placement. Review of the average number of daysbetween panelling home care clients and placementinto a nursing home revealed that Manitoba hasexperienced a successive annual decline in thisaverage wait time since 1996/1997, dropping from237 days in 1996/1997 to 195 days by 1998/1999.
Hospital Discharge and Home Care Use
Home care use after hospital discharge focused on thefirst hospitalization episode or surgical outpatient
0
2
4
6
8
10
12
14
All Ages (0–85+) 65–74 75–84 85+ Ages 65+ Ages 75+
Age Group
% o
f P
op
ulat
ion
1995/96 1996/97 1997/98 1998/99
Figure 2: Percentage of population who were new home care clients, over time by age group
0
1000
2000
3000
4000
5000
6000
7000
8000
9000
All Ages (0-85+) 65-74 75-84 85+ Ages 65+ Ages 75+
Age Group
Day
s p
er 1
00 R
esid
ents
1995/96 1996/97 1997/98 1998/99
Figure 3: Number of days open to home care per 100 residents, over time by age group
Patterns in Home Care Use La Revue canadienne du viellissement 24 (Suppl. 1) 65

procedure that Manitobans had in fiscal years 1996/1997 to 1998/1999. The proportion of those hospital-ized who were discharged to home care hasincreased significantly over time (from 7.7% in1996/1997 to 9.4% in 1998/1999). Again, this analysisincludes both residents who were receiving homecare before the hospital episode and then continuedon home care after discharge, and residents whobegan receiving home care services only afterhospitalization.
Home Care Use Before Death
Review of the average number of days open to homecare in the year before death shows stability in therates over time for fiscal years 1996/1997 to 1998/1999. Manitoba averaged 226 days each year on homecare before death.
DiscussionDespite the fact that home care is provided at nocharge to persons assessed as requiring services toreturn to or remain at home, this study revealed thatfew Manitobans, 2.7 per cent, were registered in theHome Care Program in 1998/1999. The majority ofclients are receiving long-term care (>60 days) ratherthan short-term home care episodes, but the per-centage of both short- and long-term clients increasedsignificantly over the study period.
Examination of those who received home caresuggests that the system, to which clients areadmitted on the basis of assessed ‘‘need’’ for care,works well. While those aged 64 and youngerinfrequently received home care services, approxi-mately one third of those aged 85 years and older(36%) were receiving home care services in 1998/1999.Also, those who were not married, and hence wereprobably less likely to have resources at home forassisting in their care, were more likely to beregistered with home care than those who weremarried. The finding that the majority of Manitoba’shome care clients are older and not married is inkeeping with other studies that have also revealedthat age and marital status are important factors inhome care use (Hall & Coyte, 2001; Langa, Chernew,Kabeto, & Katz, 2001; Wilkins & Park, 1998). Some ofthe characteristics of Manitoba’s home care clients aresimilar to those of a national profile of Canadianhome care users. On the basis of 1994/1995 NationalPopulation Health Survey (NPHS) data, 2.4 per cent ofpeople aged 18 and older reported receiving formalhome care in the year before the survey (Wilkins &Park, 1998). Similarly, 67 per cent of home care usersin the national survey were women, compared to 63
per cent being women in Manitoba. Manitoba homecare users differ from the national profile in thepercentage of seniors receiving home care. Sixty-fourper cent of national users were aged 65 or older, whilethis age group comprised 79 per cent in Manitoba in1998/1999. Home care may be serving a more seniorpopulation in Manitoba, although this proportion isnot markedly different from an Alberta finding that73.4 per cent of home care clients were aged 65 andolder in 1994/1995 (Saunders et al., 2001).
Trends in home care use across the province are goingup slowly in most areas studied. The upward trend inrates of access (the proportion of Manitobans usinghome care) and in rates of new admissions to homecare over time was small but significant.
The increases in access rates that we found in ourstudy are very similar to increases in home care usefound in Ontario, both at the population level overalland by different age groups. The Ontario study foundthat the percentage of the population that is receivingat least one home care visit in a year increased from2 per cent in 1993 to 3 per cent in 1998 (Croxford,2002). In a smaller time period, we found an increasefrom 2.3 per cent in 1995/1996 to 2.7 per cent in 1998/1999. Similar to those in Ontario, it was individualsaged 85 and older who were experiencing the largestincrease in home care use.
The upward trend in the rate of days open to homecare per 100 residents was particularly notable. Thisincrease in the Manitoba population’s use of homecare was due in part to the small but steady increasein admission rates to home care over time, which isresulting in an increase in the total home carecaseload. Also notable is the increase Manitoba isexperiencing in the proportion of patients whobecame (or continued as) home care clients afterbeing hospitalized, increasing from 7.7 per cent to 9.4per cent. Increase in use of home care after hospital-ization is not unique to Manitoba. An Ontario study ofhome care use after inpatient stays or same-daysurgery also found that home care use after hospital-ization is increasing over time (Coyte & Young, 1999).A factor that could be contributing to the increase inhome care use after hospitalization is hospital beddownsizing. An examination of the number ofhospital beds available in Manitoba between 1990/1991 and 1998/1999 found that the number of bedshas decreased by nearly 24 per cent (Roos, Stranc,et al., 2001). The growing reliance on home care afterhospital episodes is not going unnoticed. Nationalattention was recently brought to this situationthrough a government report that proposes creationof a national program to provide publicly funded
66 Canadian Journal on Aging 24 (Suppl. 1) L. Mitchell et al.

insurance coverage for post-acute home care(Standing Senate Committee on Social Affairs,Science and Technology, 2002). However, as thispresent study indicates, post-acute home care, partic-ularly for clients new to home care after hospitaliza-tion, is not the dominant reason for use of home care.Post-acute home care services (services that wereinitiated only after hospitalization) met the needs offewer than 20 per cent of Manitoba’s home care clientsin 1998/1999.
Overall, the average number of days a home careclient was registered for home care in the year prior tonursing home admission was stable over time, as wasthe number of home care days before death. On theother hand, the overall trend in the number of daysclients were registered for home care services betweenpanelling and nursing home placement was down-ward. This downward trend parallels a decline inwaiting time between nursing home panelling andadmission. This decline was balanced by an increasein the average number of days clients who wereregistered for home care in the year prior to beingpanelled for nursing home placement. Therefore, aneffort to maintain individuals in the communitylonger before admission to a nursing home is evidentin the form of increased home care use before nursinghome panelling. This effort may be a factor behind thefinding that, in Manitoba, the age of admission to anursing home has been steadily increasing. A recentstudy indicated that the mean age of nursing homeadmission in 1985 was 81.3 and by 1999 the agehad risen to 83.1 (Menec, MacWilliam, Soodeen, &Mitchell, 2002). During the same time period, the rateof nursing home use declined. The number ofresidents in nursing homes per 1,000 persons aged75 or older decreased from 143.5 in 1985 to 133.4 in1998 (Roos, Shapiro, et al., 2001). Moreover, anexamination of the number of nursing home bedsper 1,000 residents over the age of 75 in Manitobafound that the number of beds has decreased bynearly 7 per cent between 1990/1991 and 1998/1999(Roos, Stranc, et al., 2001). The decline in nursinghome bed rates and rate of nursing home use could befurther indication of a commitment to maintainingindividuals in the community with home care anddecreased reliance on nursing home care.
One limitation of the study was that the amount ofhome care services used over time could not beexamined. Changes in the amount of services thatclients are receiving are an important indication of theHome Care Program’s activity levels. Unfortunatelythe MSSP data do not allow such an evaluationbecause there are gaps in service data. Hours of direct
home care service are not recorded in the MSSPsystem for each client. For example, when a singleworker serves a group of home clients, such as in asenior citizens housing complex, the services that the‘‘block care’’ clients receive are not recorded byindividual. This limitation in the data does notallow us to examine the relationship between theassessed need for services and the intensity of servicesprovided. While the length of clients’ home careepisodes can be determined, length of time is not aproxy for intensity of service use, since most clientsdo not receive home care on every day they areregistered. Strong recommendations were made to theprovince on the need to fill in the gaps in how servicedata are collected. Service data at the population levelwould provide important insight for planners. Asecond limitation of the study is the lack of clinicalinformation available in the administrative data.Given that the MSSP data are for payroll purposes,limited home care client information is entered intothe system. No clinical data are gathered, such asfunctional status or severity ratings, which wouldfurther explain why home care is being used at therates revealed by this study.
Despite the data limitations, the results of the studyprovide some insight into the growth of public homecare in Manitoba. This study is unique in that itprovides a picture of the relationship of home careservices to other health services. Expanding the focusto include use before nursing home admission andafter hospitalization allows for a greater understand-ing of health care scenarios that are contributing tohome care growth. The trends identified in this studycan be useful to regional health authorities forplanning and budgeting.
Policy Implications
In addition to the reasons cited by the CanadianHome Care Human Resources Study (2002) for theincrease in the use of home care, two major policyshifts by Manitoba and indeed by most of theprovinces across Canada have had an impact inincreasing the use of both short-term and long-termhome care. First, the downsizing of the hospital sectorhas put pressure on hospitals to reduce hospital staysand to tighten their admission criteria. This pressurehas encouraged and will continue to encouragehospitals to take more advantage of the servicesavailable from the home care program.
Second, the policy decision made by Manitoba and byother provinces has been to reduce the ratio ofnursing home beds to the population aged 75 ormore, largely by not increasing the number of beds in
Patterns in Home Care Use La Revue canadienne du viellissement 24 (Suppl. 1) 67

line with the growth of that segment of the popula-tion. This reduction is reflected in the decrease in therate of nursing home use over time (Roos, Shapiro,et al., 2001) and is likely an important factor in thegrowth of long-term home care clients. However,considering the findings of Hollander (2001) on thecost-effectiveness of home care in comparison withinstitutional care, this policy shift may not onlyrespond to the preference of persons to remain athome as long as possible but may also result in costsavings.
There is a relatively new but growing trend for theprovinces to encourage the growth of both for-profitand non-profit assistive living arrangements. Howthis development will affect both the future use ofhome care and the welfare of the persons who areserved by these facilities certainly merits increasedresearch attention.
Note1 Over-time analyses for younger age groups are not
reported here (21% of home care clients in 1998/1999were aged 0–64). For descriptions of home careuse over time by clients less than 65 years of age,see Roos, Stranc et al. (2001).
ReferencesCanadian Home Care Human Resources Study. (2002).
Setting the stage: What shapes the home care labour market?Ottawa: Author.
Canadian Institute for Health Information. (2001).Development of national indicators and reports for homecare: Final project report, April 2001. Ottawa: Author.
Coyte, P., & Young, W. (1999). Regional variations in the useof home care services in Ontario, 1993/95. CanadianMedical Association Journal, 161(4), 376–380.
Croxford, R. (2002, April). Trends and patterns in home careuse: Ontario, 1993–1998. Paper presented at the meetingof Health Canada, Toronto.
Hall, R., & Coyte, P. (2001). Determinants of home careutilization: Who uses home care in Ontario? CanadianJournal on Aging, 20(2), 175–192.
Health Canada. (1998). Public home care expenditures inCanada, 1975–76 to 1997–98. Fact Sheets No. H39-432/1998. Ottawa: Policy and Consultative Branch, Ministerof Public Works and Government Services.
Health Canada. (2002). Canada’s aging population. Ottawa:Minister of Public Works and Government ServicesCanada.
Health Services Utilization and Research Commission.(2000). The impact of preventive home care and seniorshousing on health outcomes. Summary Report No. 14,May 2000. Saskatoon: Author.
Hollander, M. (2001). Substudy 1: Final report of the study onthe comparative cost analysis of home care and residentialcare services. Victoria, B.C.: National Evaluation of theCost-Effectiveness of Home Care.
Langa, K., Chernew, M., Kabeto, M., & Katz, S. (2001). Theexplosion in paid home health care in the 1990s: Whoreceived the additional services? Medical Care, 39(2),147–157.
Manitoba Health. (1991a). Annual report: 1991–1992.Winnipeg: Author.
Manitoba Health. (1991b). Annual statistics: 1991–1992.Winnipeg: Author.
Manitoba Health. (1999a). Annual report: 1998–1999.Winnipeg: Author.
Manitoba Health. (1999b). Annual statistics: 1998–1999.Winnipeg: Author.
Menec, V., MacWilliam, L., Soodeen, R., & Mitchell, L.(2002). The health and health care use of Manitoba’s seniors:Have they changed over time?Winnipeg: Manitoba Centrefor Health Policy.
Roos, N., Black, C., Frohlich, N., De Coster, C., Cohen, M.,Tataryn, D., Mustard, C., Toll, F., Carriere, K.C.,Burchill, C., MacWilliam, L., & Bogdanovic, B. (1995).A population-based health information system. MedicalCare, 33(Suppl. 12), DS13–DS20.
Roos, N., Shapiro, E., Bond, R., Black, C., Finlayson, G.,Newburn-Cook, C., MacWilliam, L., Steinbach, C.,Yogendran, M., & Walld, R. (2001). Changes in healthand health care use of Manitobans: 1985–1998. Winnipeg:Manitoba Centre for Health Policy.
Roos, N., Stranc, L., Peterson, S., Mitchell, L., Bogdanovic,B., & Shapiro, E. (2001). A look at home carein Manitoba. Winnipeg: Manitoba Centre for HealthPolicy.
Saunders, L., Alibhai, A., Hogan, D., Maxwell, C., Quan, H.,& Johnson, D. (2001). Trends in the utilization of healthservices by seniors in Alberta. Canadian Journal onAging, 20(4), 493–516.
Standing Senate Committee on Social Affairs, Science andTechnology. (2002). The health of Canadians – the federalrole: Final report on the state of the health care system inCanada. Ottawa: Queen’s Printer.
Wilkins, K., & Park, E. (1998). Home care in Canada. HealthReports, 10(1), 29–37.
68 Canadian Journal on Aging 24 (Suppl. 1) L. Mitchell et al.

Regional Variation in Home CareUse in Manitoba
Sandra Peterson, Evelyn Shapiro, and Noralou P. Roos
University of Manitoba
RESUMEDes recherches anterieures avaient fait etat de variations geographiques en ce qui a trait a l’utilisation des services desoins a domicile. Au Manitoba, les soins a domicile font partie des services essentiels que les douze autorites regionalesdes soins de sante (RHA) du Manitoba sont tenues de fournir. Les RHA du Manitoba gerent aussi bien des regionsrurales du nord et du sud qu’une grande ville, ce qui entraıne des defis differents pour la prestation de soins adomicile. Compte tenu de l’inegalite potentielle en matiere de prestation de services ainsi que des conclusionsprealables en matiere de variation regionale dans un autre contexte, l’objectif de cette etude etait de mesurer etd’evaluer la variation dans l’utilisation des soins a domicile dans l’ensemble des RHA du Manitoba. Les chercheurs sesont servis de donnees tirees du registre des clients du Provincial Home Care Program, d’autres bases de donneesadministratives en sante ainsi que du Bureau de l’etat civil. L’utilisation des soins a domicile a ete mesuree au moyende multiples indicateurs, notamment la frequence de l’utilisation dans la population, de l’utilisation apres unehospitalisation, avant l’admission dans un etablissement de soins de longue duree et avant un deces. Bien que l’etudeait revele certaines differences importantes, dans l’ensemble, nous avons constate que les soins a domicile etaientutilises de facon comparable partout au Manitoba.
ABSTRACTPrevious studies report geographic variation in the use of home care services. In the province of Manitoba, home care isa core service that Manitoba’s twelve regional health authorities (RHAs) are obligated to deliver. Manitoba’s RHAsrange from remote northern and rural southern regions to a major city, resulting in different challenges for deliveringhome care. Given this potential for inconsistent delivery and the previous findings of regional variation in othersettings, the objective of this study was to measure and assess variation in the use of home care across Manitoba’sRHAs. We used data from the Provincial Home Care Program’s client registry, other health care administrativedatabases, and Vital Statistics. Home care use was measured using multiple indicators, including rates of populationuse, use after hospitalization, before entry to a long-term care facility, and before death. While some importantdifferences emerged, overall we found comparable use of home care across Manitoba.
Manuscript received: / manuscrit recu : 15/02/03
Manuscript accepted: / manuscrit accepte : 15/03/04
Mots cles : soins a domicile; variation regionale; acces; recherches sur les soins de sante; donnees administratives; vieillissement
Keywords: home care; regional variation; access; health services research; administrative data; aging
Requests for offprints should be sent to: / Les demandes de tires-a-part doivent etre addressees a :
Sandra Peterson, M.Sc.Manitoba Centre for Health PolicyDepartment of Community Health SciencesUniversity of Manitoba727 McDermot Avenue, Suite 408Winnipeg, MB R3E 3P5([email protected])
Canadian Journal on Aging / La Revue canadienne du viellissement 24 (Suppl. 1) : 69 - 80

IntroductionHome care programs can provide three types ofservices: (1) post-acute recovery services at home, (2)maintenance or palliative home care to functionallydisabled or frail individuals who need help to remainat home, and (3) services to individuals awaiting long-term care (LTC) placement. The role of home care inCanada has grown, causing policy makers across thecountry to seek more information on how the homecare sector is performing. For example, between 1990and 1997, public expenditures across Canada on homecare have more than doubled. Manitoba was noexception to this trend: over the period 1990/1991 to1998/1999 the province experienced a 34 per centgrowth in the number of home care clients and a121 per cent increase (in constant dollars) in expendi-tures (Roos et al., 2001, p. 9). Factors that may havecontributed to this growth include a 24 per centdecrease in hospital beds, a 7 per cent reduction in theratio of LTC beds to the population aged 75 or more, a13 per cent decrease in the number of persons waitingfor LTC placement, and a 20 per cent increase in thenumber of persons aged 75 or more (the predominantusers of home care and LTC) (Roos et al., 2001, p. 9).In Manitoba, the government wanted to know ifManitobans have reasonably similar access to homecare services, regardless of where they live. Therefore,this study used the available home care data tomeasure and assess geographic variation in access to,and use of, home care across the province.
Previous studies have shown geographic variation inthe use of home care services. Canadian studiesexamining the regional variation in the use of homecare have concentrated on the use of home carefollowing hospitalization (Coyte & Axcell, 1998; Coyte& Young, 1999; Young, Coyte, Jaglal, DeBoer, &Naylor,1999). Among geographic regions in Ontario, widevariations were found in the use of home care servicesfollowing hospitalization. For example, Coyte andYoung (1999) found that age- and sex-adjusted rates ofhome care use within 30 days of an inpatientseparation varied by a factor of 3.5 across the 38Home Care Program regions in Ontario. For same-daysurgery separations, the rate of receiving home carewithin 30 days varied by a factor of 7.0 between theregion with the highest rate and the region with thelowest rate. Moderate to substantial variations inhome care use were also found when the analyseswere divided by major clinical categories for inpatientseparations and by various same-day surgery proce-dures (Coyte & Young, 1999). Young et al. (1999)found considerable variation across the DistrictHealth Council regions of Ontario in the use ofhome care following inpatient hospitalizations forcardiovascular disease. In addition to examining
geographic variations in the rate of home care usefollowing hospitalization for musculoskeletal condi-tions, Coyte and Axcell (1998) also looked at geo-graphic variations in the tendency to use particularcategories of home care services and in the intensity ofuse of each of the services. Moderate to large regionalvariations between the 38 Home Care Programregions were found in both the propensity to usehome care and in service intensity following acutecare for musculoskeletal conditions, with the extent ofvariation depending on the clinical category ofhospitalization (Coyte & Axcell, 1998).
Somewhat less variation in home care use was foundacross the 16 regions of Quebec. A study by theAssociation des centres locaux de services commu-nautaires (CLSC) et des centres d’hebergement et desoins de longue duree (CHSLD) du Quebec (2001)looked at home care use per 100 residents, and theaverage hours of home care services per home careclient. Home care use per 100 residents of each regionvaried by a factor of 3.1 between the region with thehighest rate and the region with the lowest rate,and average hours of home care services varied by afactor of 2.2 (Association des CLSC et des CHSLDdu Quebec, 2001).
Welch, Wennberg, and Welch (1996) looked at varia-tions in home care use across the United States. Theyfound considerable variation among states in the 1993age- and sex-adjusted rate of home care visits per1,000 Medicare enrolees. There was almost a 10-folddifference between the state with the most visits perenrolee and the state with the fewest, as well as highregional variation in expenditures for home care.Kenney (1993a, 1993b) and Kenney & Dubay (1992)found that Medicare beneficiaries in rural areas wereless likely to be home care clients, compared tobeneficiaries in urban areas. External factors such asMedicare ceilings and number of home healthagencies per beneficiary explain much of this varia-tion, suggesting that rural areas may have inadequateaccess to Medicare home health care services (Kenney,1993a; Kenney & Dubay, 1992).
While the several studies mentioned above, as well asothers, have looked at a population’s use of home careor home care use after hospitalization, little attentionhas been paid to patterns of use before death or beforeentering a LTC facility. The objective of this study isto measure and assess the geographic variation inseveral types of home care across the regions ofManitoba. In this study, home care use is measuredusing multiple indicators, including rates of overallpopulation use, home care use after hospitalization,home care use before LTC entry, and home care usebefore death.
70 Canadian Journal on Aging 24 (Suppl. 1) S. Peterson et al.

Methods
The Context of the Study
The Manitoba Home Care Program is part of thecontinuing care spectrum that also includes support-ive housing, chronic care and LTC facilities. Access tohome care and to LTC is determined by a professionalassessment of needs. If the individual is assessedas requiring home care, the home care services areprovided free of charge, with no service limits.
Home care is considered a core service thatManitoba’s 12 regional health authorities (RHAs) areobligated to deliver. Since 1997, the RHAs have beenresponsible for the assessment, coordination, anddelivery of home care services and for maintainingstandards, with Manitoba Health retaining respon-sibility for overall policy and program standards.Manitoba’s largest city, Winnipeg, contains approxi-mately 60 per cent of the population of Manitoba andis considered to be one RHA. Winnipeg is also thesite of the province’s two teaching hospitals and fiveof the six urban community hospitals.
Data Source and Sample
Home care data for these analyses came from theManitoba Support Service Payroll (MSSP) system. Adescription of this database can be found in Mitchell,Roos, and Shapiro (2005).
Other sources of data used in this study include healthcare administrative data and Vital Statistics data.The health care administrative data originate fromManitoba Health and are anonymized encounter-based records of Manitobans’ interactions withthe health care system. These data are housed in thePopulation Health Research Data Repository at theManitoba Centre for Health Policy. These adminis-trative databases have been found to be both reliableand valid for examining health and health care use(Muhajarine, Mustard, Roos, Young, & Gelskey, 1997;Roos, Nicol, & Cageorge, 1987; Roos, Roos, Mossey, &Havens, 1988). Specific health care administrativedata used include the hospital discharge abstract filesand the LTC files. Vital Statistics measures were usedto obtain the date of death.
Individuals who were home care clients in 1998/1999were identified using the MSSP client registry, whichwas updated where necessary using LTC files andVital Statistics records (see Mitchell, Roos, & Shapiro,2005, this issue for further details). Rates of fouraspects of home care use are examined across theRHAs: the population’s use of home care, home careuse after hospitalization, home care use before LTCentry, and home care use before death.
Measures
Population Use of Home CareThree measures of population access to home carewere calculated. Population counts are based onManitoba Health counts as of December 31, 1998.Access to home care was defined as the percentage ofthe population1 age 65 and older who were clients ofthe home care program for at least one day during thefiscal year (also described for residents aged 75 andolder and for residents under age 65). The number ofnew home care clients per year (those aged 65 andolder per 100 residents aged 65 and older) was alsoidentified. New clients were those not registered forhome care on April 1 of the particular year, butsubsequently registered with the program during theyear. Individuals were counted only once as a newclient, regardless of the number of episodes of homecare they had during the year. The third measure ofthe population’s use of home care is the number ofdays the client’s file was ‘‘open’’ in the Home CareProgram per 100 residents aged 65 and over per year.This figure provides information on the length of timeover which individuals were assessed as eligible toreceive home care services. The numerator is calcu-lated by summing the number of days registered inhome care across individuals; the denominator isbased on Manitoba population counts as of December31, 1998. Days open to home care does not indicate theintensity or frequency of care (services) that a clientactually received, or the type of services the client isreceiving. For example, two people could be clients ofhome care for the same duration, but one might bereceiving housekeeping services once every 2 weeks,while the other may be receiving housekeepingservices more frequently as well as weekly visitsfrom a nurse and a physiotherapist.
Home Care Use After HospitalizationExamination of home care following hospitaliza-tion focused on an individual’s first hospitalizationepisode or surgical outpatient procedure in 1998/1999, and whether he or she was a client of thehome care program within 30 days of dischargefrom hospital. We divided these individuals intotwo groups. The Pre-and-Post Hospitalization groupcomprised individuals who had already beenreceiving home care before they were admitted tohospital or had outpatient surgery and who con-tinued receiving home care after discharge. The Post-Hospitalization group comprised individuals whohad not been registered as home care clients for atleast 30 days prior to being hospitalized and who thenbegan receiving home care services after theirhospitalization/outpatient episode (within 30 daysof discharge). While the analyses for this section were
Regional Variation in Home Care Use La Revue canadienne du viellissement 24 (Suppl. 1) 71

not limited to individuals aged 65 and older, themajority of these individuals are older adults.
Home Care Use Prior to LTC EntryHome care use prior to entry to LTC facilities was alsoexamined (again, these analyses have not been limitedto older adults; however, very few home care clientsadmitted to a LTC facility in 1998/1999 were underthe age of 65). For clients who were admitted to a LTCfacility in 1998/1999, we calculated the total numberof days they were clients of home care in the 365 dayspreceding LTC entry and the total number of daysthey were in hospital over the same time period.
Home Care Use Prior to DeathHome care use prior to death was also examined (thisanalysis included both older and younger individ-uals; however, the majority of these individuals wereolder adults). For individuals who died while clientsof home care in 1998/1999, we calculated the totalnumber of days they were clients of home care in the365 days preceding death and the total number ofdays spent in hospital in the 365 days precedingdeath. The average duration of home care use prior todeath, as well as time spent in hospital before deathfor home care clients are both examined.
Analysis
Individuals were assigned into their appropriate RHAusing either postal or municipality code of theirresidence. Of the 12 regions, the northern RHAs,particularly Burntwood, contain a relatively highproportion of individuals living in First Nationscommunities, where health care is a federal respon-sibility. Therefore home care rates for Burntwoodare under-reported and are thus not included in thegraphs or text, although they are included in theoverall Manitoba rates. In addition, the northern RHAof Churchill has a small population, particularly thenumber of older adults. Thus Churchill RHA is alsoexcluded from the graphs and text, but included inthe overall Manitoba rates.
Rates were directly age- and sex-adjusted. Use ofadjusted rates is preferable to crude rates, since if onearea had a very young population and another a largepercentage of older adults, a simple ‘‘crude’’ com-parison of their population’s rate of using home carewould not make sense. By mathematically adjustingfor varying age- and sex-distributions we can gen-erate rates that permit comparison of one regionrelative to another – as if each had the samepopulation structure.
In most cases we have used statistical techniques toidentify rates that are significantly different (that is,unlikely to be due to chance) from the Manitoba rate,using 99 per cent confidence intervals. That is, 99 per
cent confidence intervals around the rates for eachRHA were calculated and compared to the Manitobarate. Areas whose confidence intervals do not includethe Manitoba rate are statistically significantly differ-ent. The use of 99 per cent confidence intervals, ratherthan 95 per cent, reflects a Bonferroni correctionfactor, used in situations of multiple testing in orderto maintain the overall level of Type I error at 95per cent. Based on the 99 per cent confidence intervalsused, there is a 95 per cent certainty that anysignificant differences represent real differences inrates.
Rates obtained for each RHA have been compared tothe Manitoba average. Rates significantly above orbelow the Manitoba average are marked in the graphswith an asterisk, with the exception of the stacked bargraph. Occasionally areas with rates that are muchhigher or lower than the Manitoba rate are notstatistically significantly different. This typicallyoccurs when the population used to calculate therate was small; since small population numbersproduce large confidence intervals, it would beincorrect to assume that the rate is not truly differentfrom the Manitoba rate. Winnipeg rates are alsocompared to non-Winnipeg rates, where non-Winnipeg is composed of the other 11 RHAs.
Results
Population Use of Home Care
Overall, 15.7 individuals aged 65 and older per 100residents aged 65 and older were clients of the HomeCare Program in Manitoba for at least one day during1998/1999. Figure 1 shows the distribution of thispopulation by RHA. Use of home care was slightlyhigher for Winnipeg residents than for non-Winnipegresidents – 16.6 per 100 Winnipeg residents aged 65and older were home care clients in 1998/1999,compared with 14.6 for non-Winnipeg. This differenceis, in fact, remarkably small, but because we areworking with population data, even small differencescan appear as significant. Rates of use across theprovince vary from a high of 18.0 to a low of 11.4 per100 aged 65 and older – a ratio of high use to low useof just 1.6, demonstrating that across the RHAs, olderManitobans have relatively similar access to homecare.
Very similar patterns of use to those presented inFigure 1 were found when analyses focused on thepopulation aged 75 and older (data not shown). Forthis age group, Winnipeg residents also had a slightlyhigher rate of using home care in 1998/1999 than non-Winnipeg residents did, at 25.5 per 100 Winnipegresidents aged 75 years and older, compared with 23.1
72 Canadian Journal on Aging 24 (Suppl. 1) S. Peterson et al.

for non-Winnipeg. When analyses focused on thepopulation ages 64 and under (data not shown), verylow use was found. Overall, 0.7 individuals aged 64and under per 100 residents were home care clientsin 1998/1999; this varied from a low of 0.1 amongthose 0 to 18 years old, to 0.4 among those 19 to 44, to1.7 among those 45 to 64 years old. Slightly higheruse by Winnipeg residents aged 64 and under com-pared to non-Winnipeg residents aged 64 and under(0.7 versus 0.6) was found.
In 1998/1999, 6.5 per cent of Manitobans aged 65 andolder were new clients (Figure 2). Again, only data onthe population aged 65 years and older is presented,although patterns across the RHAs were very similarfor those aged 75 years and older. The rate of newclients was similar across the province: 7.0 per 100Winnipeg residents aged 65 and older were newclients as compared with 5.7 per 100 non-Winnipegresidents aged 65 and older (a statistically significantdifference). The range in the rate of new clients acrossthe RHAs varied from a high of 7.6 to a low of 5.0 per100 residents aged 65 and older (a ratio of 1.5).
Figure 3 shows the number of days open in the HomeCare Program per 100 residents aged 65 and older in1998/1999 by RHA. The number of days clients wereeligible for services from the Home Care Program in1998/1999 per 100 Manitobans aged 65 and older was3,486. Days open to home care per 100 residents isinfluenced both by the number of individuals in eacharea who have accessed home care during the yearand the average number of days their file was open. Ingeneral, areas that had a high number of days per 100
residents were the same areas that had a relativelyhigher proportion of their population receiving atleast 1 day of home care. Winnipeg residents had3,593 days in the Home Care Program per 100residents aged 65 and older, compared with 3,344days per 100 non-Winnipeg residents aged 65 andolder (a small but statistically significant difference).Across the ten RHAs, the ratio of the highest rate tothe lowest rate was 1.7.
Home Care Use After Hospitalization
One of the important roles of home care is to providehome care services to persons assessed as havinginadequate informal resources to return home fromhospital. Overall, 9.4 per cent of Manitoba residentshospitalized or having an outpatient procedure in1998/1999 (first episode only) were discharged tohome care (Figure 4). This figure varied across theRHAs2 from a high of 10.3 per 100 hospitalizedresidents to a low of 6.3 per 100 hospitalized residentswho were admitted to home care after hospital – aratio of high to low use of 1.6.
If we focus on those individuals who had not beenreceiving home care before the hospitalization (thePost-Hospitalization group at the bottom area of thebar graph, Figure 4), 4.2 per 100 Manitobans becamehome care clients following discharge from hospital.Winnipeg had a significantly higher proportion ofPost-Hospitalization clients (5.1 per 100 dischargedpatients) than non-Winnipeg (3.2), a larger differencebetween the Winnipeg/non-Winnipeg rates than isseen for the other measures. The rates across the
0
2
4
6
8
10
12
14
16
18
20
South
Eastm
an
Centra
l
Brand
on
South
Wes
tman
Winn
ipeg
Mar
quett
e
North
Eastm
an
Inter
lake
Parkla
nd
Nor-M
an
Man
itoba
Non-W
innipe
g
Winn
ipeg
Per
cen
t
Manitoba Average
**
*
**
*
*
** *
*Significantly different from the Manitoba rate
Figure 1: Per cent of residents aged 651 who were home care clients in 1998/1999, by region
Regional Variation in Home Care Use La Revue canadienne du viellissement 24 (Suppl. 1) 73

RHAs varied from a high of 5.1 to a low of 2.7 (a ratioof 1.9).
Home Care Use Before LTC Entry
Another important aspect of home care is assessmentand placement of individuals in LTC if and whenhome care services cannot maintain them at homesafely and/or economically, and provision of home
care services until they are placed. The vast majority(93 per cent) of all individuals who entered a LTCfacility in 1998/1999 were clients of home care prior toentry. Figure 5 shows the average lengths of timeindividuals were home care clients and in hospitalover the 365 days preceding LTC entry. These days ofhospital or home care may have been one continuousepisode, or may have been several separate episodes.Note that two additional regions are not displayed,
0
1
2
3
4
5
6
7
8
South
Eastm
an
Centra
l
Brand
on
South
Wes
tman
Winn
ipeg
Mar
quet
te
North
Eastm
an
Inte
rlake
Parkla
nd
Nor-M
an
Man
itoba
Non-W
innipe
g
Winn
ipeg
Per
cen
t
Manitoba Average
*
*
*
*
*
*
*
*Significantly different from the Manitoba rate
Figure 2: Per cent of residents aged 651 who were new home care clients in 1998/1999, by region
0
500
1000
1500
2000
2500
3000
3500
4000
4500
South
Eastm
an
Centra
l
Brand
on
South
Wes
tman
Winn
ipeg
Mar
quet
te
North
Eastm
an
Inte
rlake
Parkla
nd
Nor-M
an
Man
itoba
Non-W
innipe
g
Winn
ipeg
Day
s pe
r 10
0 R
esid
ents
Manitoba Average
*Significantly different from the Manitoba rate
*
*
* *
*
*
* * * *
**
Figure 3: Days open to home care in 1998/1999 per 100 residents aged 651, by region
74 Canadian Journal on Aging 24 (Suppl. 1) S. Peterson et al.

0
2
4
6
8
10
12
South
Eas
tman
Centra
l
Brand
on
South
Wes
tman
Winn
ipeg
Mar
quet
te
North
Eas
tman
Inte
rlake
Parkla
nd
Nor-M
an
Man
itoba
Non-W
innipe
g
Winn
ipeg
Per
cen
t
Post-Hospitalization Group Pre- and Post-Hospitalization Group
Figure 4: Per cent of residents hospitalized in 1998/1999 who registered for home care within 30 days ofdischarge, by region
0
50
100
150
200
250
300
350
South
Eastm
an
Centra
l
Brand
on
South
Wes
tman
Winn
ipeg
Mar
quet
te
Inte
rlake
Parkla
nd
Man
itoba
Non-W
innipe
g
Winn
ipeg
Ave
rag
e D
ays
Home Care Hospital
**
*
*
*
Statistical Significance:* = Manitoba
Figure 5: Average days registered with home care and average hospital days in the 365 days before admission to aLTC facility in 1998/1999, by region
Regional Variation in Home Care Use La Revue canadienne du viellissement 24 (Suppl. 1) 75

because they had low numbers in the denominators(fewer than 50 people in those regions entered a LTCfacility in that year).
Across Manitoba the average number of days spent asa home care client in the year before entry to a LTCfacility was 272 days. There was very little variationacross the province – the ratio of the highest rate tothe lowest rate is just 1.3. For hospital days in the yearbefore entry, there was higher variation among theRHAs. Clients in Brandon spent more days in hospitalas compared to clients in other RHAs (129 days versusthe average of 102), and over twice as long as theclients who live in the RHAwith the lowest number ofhospital days (Interlake, 61 days).
Home Care Use Before Death
Home care plays an important role in enablingindividuals to remain at home during the periodbefore their death. Approximately nine per cent ofhome care clients in 1998/1999 died while their homecare file was active, indicating they were likelyreceiving services3 during this period. The averagenumber of days registered with home care and theaverage number of days in hospital in the year beforedeath are shown in Figure 6. The RHAs were quitesimilar in terms of average days registered with homecare: the ratio of the highest rate to the lowest rate is1:3. However, clients in some areas, such as Brandon,spent fewer days in the Home Care Program in theyear before death than the provincial average (200days versus 227 days) and averaged significantlymore days in hospital (76 days versus a provincialaverage of 51 days).
Ratios of Home Care Utilization Rates
Table 1 summarizes the ratios of high to low rates aswell as the ratios for the Winnipeg to non-Winnipegrates. Despite the different challenges of deliveringhome care in urban versus rural settings, remarkablysimilar access to home care services for older adultsappears to have been achieved across the province ofManitoba. For example, for residents aged 65 yearsand older, 16.6 per 100 Winnipeg residents wereclients of home care in 1998/1999, versus 14.6 per100 non-Winnipeg residents – a Winnipeg to non-Winnipeg ratio of 1:1. Even across RHAs, while thereare important differences, there are also manysimilarities in usage patterns. In fact, the ratios ofhigh to low rates were never off by more than a factorof 2:1.
DiscussionOne important finding that emerged from this studywas that residents of Brandon RHA appear to have
a lower rate of home care use and a higher rate ofhospital use before death, as well as a higher rate ofhospital use before LTC entry, than the Manitobaaverage. This figure suggests that Brandon RHAmight be substituting hospital care for home care,instead of the reverse. Winnipeg was also shown tohave a higher rate of initiation of home care use afterhospitalization than did the non-Winnipeg regions.Since Winnipeg hospitals have higher occupancy rates(Stewart, Tate, Finlayson, MacWilliam, & Roos, 2002)and higher acuity rates (De Coster, Peterson, Carriere,& Kasian, 1999), it makes sense that Winnipegresidents would be more likely to require home careon discharge than would rural residents.
However, across a variety of measures, rates of homecare use were found to be very similar across theprovince, whether one focuses on home care use afterhospitalization, before entry to a LTC facility, or beforedeath. This finding is quite different from what hasbeen found for other jurisdictions. That Manitobanshave similar access to and use of home care,regardless of where they live (with few exceptions),suggests that Manitoba’s single entry system to homecare works, and that home care guidelines are beingsimilarly applied across the province. Several factorsmay contribute to this reliability:
. Manitoba’s province-wide home care program deliver-ing both short- and long-term care, with a commonassessment form and common guidelines (coveringcriteria such as eligibility), has been in existence longerthan is the case in most other provinces.
. Despite the change to regionalization, home care isdefined by the province as a core program.
. Both the case management functions and the servicedelivery functions are performed by public employees.
However, to exactly what extent, if any, the foregoingfactors account for the similar usage patterns acrossRHAs is hard to identify.
In addition, there are some differences in home carepolicies between the provinces, which may explainwhy patterns of use across Manitoba seem similarcompared to the marked variations in use rates foundelsewhere. For example, both Ontario and Quebechave service limits, which may not affect initial accessto home care but would affect the amount and lengthof time over which home care services would beprovided. The Canadian papers reviewed proposedseveral reasons to account for the observed variationsin the use of home care services; these reasons tendedto revolve around several themes. The simplestexplanation was that the availability of home caremight differ by region (Coyte & Axcell, 1998; Coyte &Young, 1999; Young et al., 1999). Another explanation
76 Canadian Journal on Aging 24 (Suppl. 1) S. Peterson et al.

0
50
100
150
200
250
300
South
Eastm
an
Centra
l
Brand
on
South
Wes
tman
Winn
ipeg
Mar
quet
te
North
Eastm
an
Inte
rlake
Parkla
nd
Nor-M
an
Man
itoba
Non-W
innipe
g
Winn
ipeg
Ave
rag
e D
ays
Home Care Hospital
*
*
Figure 6: Average days registered with home care and average hospital days in the 365 days before death for clientswho died in 1998/1999, by region
Table 1: Ratios of home care utilization rates for 1998/1999
Ratio of Highest Rateto Lowest Rate
Ratio of Winnipeg Rate toNon-Winnipeg Rate
Population Use of Home Care in 1998/99 for Residents Aged 65 and older
Access 1:6 1:1
New clients 1:5 1:2
Days 1:7 1:1
Per Cent of Hospitalized Individuals Who Were Home Care Clients Within 30 Days of Discharge
Post-hospitalization* 1:9 1:6
Pre- and post-hospitalization** 1:9 1:0
Days in Year Before Entry to a Long-term Care Facility in 1998/99
Home care days 1:3 0:9
Hospital days 2:1 1:1
Days in Year Before Death in 1998/99
Home care days 1:3 1:0
Hospital days 2:0 0:9
*Post-hospitalization¼ individuals who had not been registered as home care clients for at least 30 days prior to beinghospitalized**Pre- and post-hospitalization¼ individuals who had already been receiving home care before they were hospitalized
Regional Variation in Home Care Use La Revue canadienne du viellissement 24 (Suppl. 1) 77

was that regions might have differences in the extentto which similar services are available through otheragencies4 (Coyte & Axcell, 1998; Coyte & Young,1999). Thus, in regions where use of home care waslow, individuals might be receiving similar carethrough another agency, causing the extent of varia-tion in the receipt of services like home care to beoverestimated. Other explanations of the regionalvariation in home care were that the underlyingneed for home care or patient preference for homecare might differ by region, and/or there might bedifferent referral patterns to home care (Coyte &Axcell, 1998; Young et al., 1999). Eligibility criteriamight also be interpreted differently by region (Coyte& Axcell, 1998). Other, more technical reasons mightalso explain some of the variation found. The validityof the Ontario home care data might be of concern(Coyte & Axcell, 1998; Coyte & Young, 1999), and wasalso a concern for the Manitoba data (see limitationsbelow). The Ontario studies also focused on the use ofhome care for specific clinical categories. Such a focusmight identify more variations in home care deliverythan our more generalized assessment.
Our findings are also in contrast to the moderate toquite large regional variations and urban/ruraldifferences in Medicare home care use that werefound in the United States (Kenney 1993a, 1993b;Kenney & Dubay, 1992; Welch et al., 1996). Several ofthe suggested explanations for the differences givenby the authors of the U.S. studies paralleled those ofthe Canadian studies: for example, access problems,differing availability of substitute services such asLTC facilities, and differences in home health supplyfactors, such as home health agencies per beneficiary.Additional explanations were the existence of differ-ent policies (Kenney 1993a, 1993b; Kenney & Dubay,1992; Welch et al., 1996) and different Medicareceilings (Kenney, 1993a, 1993b; Kenney & Dubay,1992) between the areas and potential differences inbusiness practices (specifically, for-profit agencies)(Welch et al., 1996). In Manitoba, the limits to homecare are the equivalent cost of alternative institutionalcare, and the Provincial Home Care Program does notoperate through for-profit agencies (with the excep-tion of a brief trial period from May 1997 toNovember 1998 in the city of Winnipeg).
Nyman, Sen, Chan, & Commins (1991) also found thatrural residents were less likely to be home health carepatients compared to urban residents, and using the1986–1987 Wisconsin Annual Survey of Home HealthAgencies, they were able to look at demand-sideexplanations as well as supply-side explanations.They found that the characteristics of the rural andurban home health care patients differed – with therural home health care patients having greater
difficulties with instrumental activities of dailyliving (IADLs), and the urban patients having moredifficulties with activities of daily living (ADLs). Theauthors suggested that lesser need in the rural areasmay account for some of the differences in home careuse, and that it would also be important to look atother aspects of need, such as the availability ofinformal caregivers and patient preferences. Thus, it isimportant to look at demand as well as supply whenexplaining variations in home care use across regions(Nyman, Sen, Chan, & Commins, 1991).
This study has several strengths. The home careinformation used in this study is based on the MSSPclient registry. The overriding strength of the MSSPclient registry is that it collects a basic set ofcomparable information across the province onessentially all home care users. The other sources ofdata used in this study were encounter-based healthcare administrative data (hospital and LTC data) thathave been found to be both reliable and valid forexamining health and health care use (Muhajarineet al., 1997; Roos et al., 1987; Roos et al., 1988).
Another important strength in this study was theability to link the hospital, long-term care, andmortality data to the home care data, through theuse of anonymized personal health identificationnumbers. Linking home care data to these other datasets provides a rich overview of home care use.
One of the greatest strengths of this study is the abilityto look at home care use from a population perspec-tive. A population perspective not only focuses onthose who receive services; it also draws attention tothose who do not. Thus, in addition to being able toreport on the characteristics of those who receiveservices, it is possible to report on the proportion ofresidents in various areas of the province who usehome care services. A population perspective enablesus to make comparisons across areas of the province,after controlling for differences in the age and sexcharacteristics of residents. This perspective is criticalfor monitoring access to home care across theprovince.
One limitation of this study is the validity andreliability of the home care database. The MSSPclient registry, while adequate, does undercounthome care clients by approximately 10 per centwhen compared to Manitoba Health tabulatednumbers; this undercounting is not random acrossthe regions, but affects some regions more than others.Note, however, that Winnipeg, the region mostundercounted (by approximately 14 per cent), is alsosignificantly higher or not significantly different fromthe Manitoba average on almost all of the measures. Itis also important to consider that the monthly client
78 Canadian Journal on Aging 24 (Suppl. 1) S. Peterson et al.

counts tabulated by Manitoba Health could not beconsidered a ‘‘gold standard’’ against which MSSPdata could be verified, since inaccuracies in reportingclient counts to Manitoba Health were present.
A potential limitation to this study is that the ratesof home care use are based on the records of theProvincial Home Care Program. This reliance hastwo consequences. First, home care, as well as otherhealth care, is a federal responsibility for individualsliving in First Nations communities; thus, thesecommunities cannot be represented in our analyses.Second, the Provincial Home Care Program does notcapture data on individuals who buy servicesexclusively from private agencies; however, theextent of private home care agencies in Manitoba isvery limited.
Another limitation of this paper is that only rates ofaccess to home care and days registered with homecare are examined. Gaps in the service data as a resultof reporting and recording practices in the Home CareProgram (for example, outside agencies that providehome care services do not report service data back tothe Provincial Home Care Program) prevented usfrom assessing intensity of services (for example,hours or costs of actual services used) or the use ofparticular categories of services (for example, nursingor home support). As well, we could not assessdemand for home care. Thus, the picture provided isincomplete (Coyte & Axcell, 1998; Nyman et al., 1991).
ConclusionThis paper shows how routinely collected provincialdata on home care use can be used to monitor themultiple uses of home care, including rates of overallpopulation use, home care use after hospitalization,home care use before LTC entry, and home care usebefore death. These measures of a population’s accessto and length of use of home care services providepowerful indicators of how a program functionsacross the province and in particular regions.
From the population rates of access to home care, newclients, and days open to home care, it can be seen thatacross the province, older Manitobans have compara-tively similar access to home care. Home care use afterhospitalization was greater for Winnipeg residentsthan non-Winnipeg residents – a not unexpectedresult, given that the demand for hospital beds ishigher in Winnipeg. There was relatively little varia-tion across the province in the length of timeindividuals were home care clients preceding LTCadmission; however, clients in Brandon RHA had ahigher rate of hospital use before LTC entry. While theRHAs were quite similar in average days registered
with home care before death, it was noticed that insome areas, such as Brandon, residents spent fewerdays as home care clients in the year before death butaveraged significantly more days in hospital.
While some important differences emerged, overallthere were many similarities. In contrast, in otherprovinces and particularly in the United States,researchers have found great variation in how homecare is used and in U.S. researchers have suggestedthat these ‘‘dramatic’’ variations may suggest a lack of‘‘consensus’’ about their appropriate use (Welch et al.,1996, p. 327). In the United States, concern over homecare use resulted in major attempts at reform,including an initiative labelled Operation RestoreTrust that focused on uncovering and preventingfraud and waste in home care delivery. In Manitobawe find quite a different story: with few exceptions,residents of Manitoba’s diverse RHAs enjoy com-parable use of home care.
Notes1 Residents of long-term care facilities were included in
the denominator.
2 Individuals who were hospitalized are reportedaccording to their place of residence, not wherehospitalization occurred.
3 Individuals who were admitted to and died in anursing home after receiving home care services werenot included in these analyses.
4 In Ontario, there are both public and private agenciesthat deliver home care services.
ReferencesAssociation des CLSC et des CHSLD du Quebec. (2001). Etat
de situation des programmes de soutien a domicile: CLSC,centres de jour et hopitaux de jour. Montreal: Associationdes CLSC et des CHSLD du Quebec.
Coyte, P.C., & Axcell, T. (1998). The use of and regionalvariations in post-acute rehabilitation services for mus-culoskeletal patients. In E.M. Badley and J.I. Williams(Eds.), Patterns of health care in Ontario: Arthritis andrelated conditions: An ICES practice atlas. Toronto: Institutefor Clinical Evaluative Sciences, 157–170.
Coyte, P.C., & Young, W. (1999). Regional variations in theuse of home care services in Ontario, 1993/95. CanadianMedical Association Journal, 161, 376–380.
De Coster, C., Peterson, S., Carriere, K.C., & Kasian, P.(1999). Assessing the extent to which hospitals are usedfor acute care purposes. Medical Care, 37(Suppl. 6),JS151–JS166.
Kenney, G.M. (1993a). Is access to home health care aproblem in rural areas? American Journal of Public Health,83, 412–414.
Regional Variation in Home Care Use La Revue canadienne du viellissement 24 (Suppl. 1) 79

Kenney, G.M. (1993b). Rural and urban differentials inMedicare home health use. Health Care Financing Review,14, 39–57.
Kenney, G.M., & Dubay, L.C. (1992). Explaining areavariation in the use of Medicare home health services.Medical Care, 30, 43–57.
Mitchell, L., Roos, N.P., & Shapiro, E. (2005). Patterns inhome care use in Manitoba. Canadian Journal on Aging,24 (Suppl. 1), 59–68.
Muhajarine, N., Mustard, C.A., Roos, L.L., Young, T.K., &Gelskey, D.E. (1997). Comparison of survey data andphysician claims data for detecting hypertension.Journal of Clinical Epidemiology, 50, 711–718.
Nyman, J.A., Sen, A., Chan, B.Y., & Commins, P.P. (1991).Urban/rural differences in home health patients andservices. Gerontologist, 31, 457–466.
Roos, L.L., Nicol, J.P., & Cageorge, S.M. (1987). Usingadministrative data for longitudinal research:Comparisons with primary data collection. Journal ofChronic Diseases, 40, 41–49.
Roos, N.P., Roos, L.L., Mossey, J., & Havens, B. (1988). Usingadministrative data to predict important health out-comes: Entry to hospital, nursing home, and death.Medical Care, 26, 221–239.
Roos, N.P., Stranc, L., Peterson, S., Mitchell, L., Bogdanovic,B., & Shapiro, E. (2001). A look at home care in Manitoba.Winnipeg: Manitoba Centre for Health Policy.
Stewart, D.K., Tate R., Finlayson, G., MacWilliam, L., &Roos, N.P. (2002). Projecting hospital bed needs for2002. Winnipeg: Manitoba Centre for Health Policy.
Welch, H.G., Wennberg, D.E., & Welch, W.P. (1996). The useof Medicare home health care services. New EnglandJournal of Medicine, 335, 324–329.
Young, W., Coyte, P.C., Jaglal, S., DeBoer, D., & Naylor, C.D.(1999). Home Care utilization following a hospital-ization for cardiovascular disease. In C.D. Naylor(Ed.), Patterns of health care in Ontario: Cardiovasculardisease and related conditions: An ICES practice atlas.Toronto: Institute for Clinical Evaluative Sciences,319–333.
80 Canadian Journal on Aging 24 (Suppl. 1) S. Peterson et al.

Pharmaceutical Use among Older Adults:Using Administrative Data to ExamineMedication-Related Issues
Colleen Metge,1,2 Ruby Grymonpre,2 Matthew Dahl,1,2 and Marina Yogendran1,2
RESUMELa consommation de medicaments est reconnue comme la prestation de soins la moins chere et la plus rentable. Celaest particulierement important chez les aınes, puisqu’il s’agit des personnes qui consomment le plus de medicamentssur ordonnance. Nous decrivons un ensemble de donnees qui sont liees, y compris des donnees fournies par l’industriepharmaceutique, les medecins et les hopitaux, de maniere a etudier la consommation de produits pharmaceutiqueschez les personnes agees, puis nous fournissons plusieurs exemples de mise en œuvre. Des indicateurs permettant dedeterminer la consommation de medicaments globale dans la population ainsi qu’une consommation appropriee decertains medicaments ont ete elabores. Les indicateurs relatifs a une consommation appropriee sont decrits en fonctionde la distribution de benzodiazepines a des personnes agees. Nous avons decouvert qu’une proportion appreciable desnouveaux utilisateurs de benzodiazepines (plus de 10 p. 100) recoivent encore des ordonnances pour une version aaction prolongee, ce qui semble temoigner d’une mauvaise utilisation potentielle. Les donnees permettent egalementde decrire certaines consequences graves de la consommation de produits pharmaceutiques comme des deces, desfractures ainsi que des mesures cliniques fondees sur la population, le cas echeant.
ABSTRACTMedication use is recognized as the least expensive, most cost-effective health care intervention. In older adults this isespecially important, as they are the largest consumer of prescription medications. We describe the use of a linked dataset including pharmaceutical, medical, and hospital claims to examine pharmaceutical use in the population of olderadults and then give several examples of its application. Indicators to describe the population’s overall use ofmedication and the appropriate use of specific medication have been developed. Indicators of appropriate use arecharacterized using the dispensation of benzodiazepines to older adults. We have found that a significant proportion ofnew users of benzodiazepines are still prescribed a long-acting version (over 10%), signifying potential inappropriateuse. The data are also able to describe some significant outcomes from the use of pharmaceuticals such as death,fracture, and population-based clinical measures where available.
1 Department of Community Health Sciences, Faculty of Medicine, University of Manitoba
2 Faculty of Pharmacy, University of Manitoba
Manuscript received: / manuscrit recu : 21/04/03
Manuscript accepted: / manuscrit accepte : 15/05/04
Mots cles : medicaments sur ordonnance; consommation de medicaments; pertinence; donnees administratives
Keywords: prescription drugs; utilization; appropriateness; administrative data
Requests for offprints should be sent to: / Les demandes de tires-a-part doivent etre addressees a :
Colleen Metge, Ph.D.Manitoba Centre for Health PolicyDepartment of Community Health SciencesUniversity of Manitoba727 McDermot Avenue, Suite 408Winnipeg, MB R3C 3P5([email protected])
Canadian Journal on Aging / La Revue canadienne du viellissement 24 (Suppl. 1) : 81 - 95

IntroductionMedication use is recognized as the least expensive,most cost-effective component of health care expendi-tures (Medication Working Group, 1988). Its appro-priate use is an important preventative as well ascurative strategy in maintaining health. Therefore,optimal therapy in the older adult is especiallyimportant, since this population is, proportionately,the largest consumer of prescription medications.Although comprising about 13 per cent of theCanadian population (Statistics Canada, 2003), olderadults are consumers of over one third of all prescrip-tions (Metge, Kozyrskyj, Dahl, Yogendran, & Roos,2003). Coupled with this imbalance in the burden ofmedication-taking is an impending growth in the next40 years of the numbers of persons over the age of 65as a proportion of the population, and the recognizedhigher prevalence of medication-related problemsin this segment of the population compared to thegeneral population (Chutka, Takahashi, & Hoel, 2004;Liu & Christensen, 2002; Shimp, Scione, Glazer, &Atwood, 1985).
Observational studies suggest that comprehensivemedication reviews conducted by pharmacists iden-tify potential or actual medication-related issues in atleast 80% of the older adults reviewed (Grymonpre,Williamson, Huynh, & Desilets, 1994; Kassam et al.,2001; Lipton, Bero, Bird, & McPhee, 1992; Sellors et al.,2003; Grymonpre, Sitar, Montgomery, Mitenko, &Aoki, 1991). For example, between 12 and 46 percent of drugs prescribed for older persons have beenestimated to be either inappropriate or unnecessary(Futterman, Fillit, & Roglieri, 1997; Spore, Mor, Larrat,Hawes, & Hiris, 1997; Stuck et al., 1994; Tamblyn et al.,
1994; Willcox, Himmelstein, & Woolhandler, 1994),about 50 per cent of pharmaceutical users, includingolder adults, do not adhere to prescribed regimens(Coambs et al., 1995), and the incidence of adversedrug events in older outpatients has been reportedto be between 10 and 21 per cent (Hanlon & Lewis,1995). Combined, these drug-related problems areoften significant and can be associated with asignificant increase in the hospitalization of olderadults (Grymonpre, Mitenko, Sitar, Aoki, &Montgomery, 1988).
Using administrative data, however, one canefficiently isolate where the potential or actualmedication-related issues are found or developing(Lipton & Bird, 1993). In the following, we outline howpharmaceutical claims data, along with other healthservices utilization data and pharmacoepidemio-logical approaches, can be used to inform on thequality of pharmaceutical use in older adults.Specifically, we address three attributes of quality:(1) utilization, (2) appropriateness, and (3) effective-ness of the prescription drugs being taken incommunity settings by older adults (�65 years ofage). These three dimensions of quality of pharma-ceutical use mirror the quality of care frameworkfor examining a health care system, such as thatoriginally proposed by Donabedian (1980) and, morerecently, encouraged by Romanow’s health carecommission (Commission on the Future of HealthCare in Canada, 2002). Figure 1 draws the parallelbetween Donabedian’s quality of care frameworkand one used by the Manitoba Centre for HealthPolicy (MCHP) in the framing of questions relatedto pharmaceutical use by the population.
DDDDoooonnnnaaaabbbbeeeeddddiiiiaaaannnn’’’’ssss MMMMooooddddeeeellll oooonnnn MMMMeeeeaaaassssuuuurrrreeeessss ooooffff HHHHeeeeaaaalllltttthhhh CCCCaaaarrrreeee QQQQuuuuaaaalllliiiittttyyyy
SSSSttttrrrruuuuccccttttuuuurrrreeee PPPPrrrroooocccceeeessssssss OOOOuuuuttttccccoooommmmeeee
PPPPrrrrooooppppoooosssseeeedddd MMMMooooddddeeeellll oooonnnn MMMMeeeeaaaassssuuuurrrreeeessss ooooffff tttthhhheeee QQQQuuuuaaaalllliiiittttyyyy ooooffff tttthhhheeee PPPPooooppppuuuullllaaaattttiiiioooonnnn’’’’ssss UUUUsssseeee ooooffff PPPPhhhhaaaarrrrmmmmaaaacccceeeeuuuuttttiiiiccccaaaallllssss
UUUUttttiiiilllliiiizzzzaaaattttiiiioooonnnn AAAApppppppprrrroooopppprrrriiiiaaaatttteeeennnneeeessssssss EEEEffffffffeeeeccccttttiiiivvvveeeennnneeeessssssss
*Measures of outcome typically used to describe either outcome or effectiveness are the five D’s:death, disease including a co-morbid condition like side effects, disability or loss of optimalfunctioning, discomfort, and dissatisfaction (Lohr & Donaldson, 1990).
Professional and organizational resources associated with the provision of care
Things done to and for the patient in the course of treatment
Desired states resulting from care, including a decrease in morbidity/mortality and an increase in quality of life
Quantitative data on the access, extent, variability, and cost of the use of pharmaceuticals
Determination of whether the right drug was prescribed to the right person at the right time and dose
Outcomes or the net of benefit and harm* when a pharmaceutical is prescribed, dispensed, and taken under real-life circumstances
Figure 1: A model of a quality of care framework for examining a population’s use of pharmaceuticals
82 Canadian Journal on Aging 24 (Suppl. 1) C. Metge et al.

Tognoni (1983) notes that before one can measure themedical and social consequences of pharmaceuticaluse, quantitative data need to be obtained on theextent and variability in the usage and costs ofdrug therapy. We call this an examination of pharma-ceutical utilization. Appropriateness is a processmeasure; it is the subset of quality that is concernedwith determining whether the right thing wasdone for the patient (Institute of Medicine, 2001). Ina health system performance sense, it is the provisionof care or interventions (including pharmaceuti-cals) based on established standards or evidence.Effectiveness, on the other hand, concerns the resultsor outcomes achieved in the actual practice ofhealth care, or dispensation of prescription drugs,with typical patients and providers (Laupacis,Paterson, Mamdani, Rostom, & Anderson, 2003;Rawson, 2001).
Within a framework of evaluating the quality ofpharmaceutical use, a question about pharmaceuticaleffectiveness could be, ‘‘To what extent is the care orintervention achieving the desired outcome(s)?’’Using the prescription of the lipid-lowering drugs,statins, for example, a utilization measure would bethe rate at which these drugs are prescribed across aprovince within different regions or according todiffering levels of co-morbidity; an appropriatenessmeasure would be the rate at which statins areprescribed after an acute myocardial infarction, ascompared to the rate expected under best practice andthe prescribing of a lipid-lowering drug that isoptimal for a given patient (that is, the right drugat the right dose, well tolerated, good adherence);and an effectiveness measure would be a decrease incoronary heart disease events and premature mortal-ity (death before age 75) in those prescribed the statins(MacWilliam, 1999; Eyles, Birch, Chambers, Hurley, &Hutchinson, 1993).
The purpose of this paper is to illustrate howutilization, appropriateness, and effectiveness link ina framework for examining the quality of pharma-ceutical use, using administrative data. First, wedescribe the data set we use to examine quality ofmedication use in older adults and then give thereader two examples of how the framework can beapplied in determining quality of pharmaceutical usein older adults, using administrative data.
Source of Pharmaceutical Use DataPharmaceutical quality indicators of utilization,appropriateness, and effectiveness are identifiedfrom a previously described population-based admin-istrative data repository for all Manitoba Healthregistrants (Roos & Shapiro, 1999) housed at MCHP.
This data repository captures provincially reimbursedphysician services, hospitalizations, and pharmaceu-tical dispensations, and includes information on theidentity of the patient, the date of service, servicesprovided or drugs dispensed, and diagnoses asInternational Classification of Disease-9-Clinical Modifica-tion (ICD-9-CM) codes. The accuracy of these admin-istrative data has been established for a wide rangeof clinical disorders, including outcomes followinghip fracture (Roos, Sharp, & Wajda, 1989; Roos, Walld,Romano, & Roberecki, 1996).
Specifically, pharmaceutical use is reported within apopulation-based framework, meaning that virtuallyall prescriptions claims to Manitoba residents thatare registered by the province’s Drug ProgramsInformation Network (DPIN) can be counted. Ratesof drug utilization are based on dispensed prescrip-tion claims submitted to Manitoba Health by about300pharmaciesprovidingpharmaceuticals toManitobaresidents. In-hospital use of prescription drugs is notcaptured by DPIN and is excluded from any dataanalyses; however, use by residents of personal carehomes (n¼ 9400) not affiliated with acute carehospitals is captured in the data.
Data DescriptionThe pharmaceutical data have information aboutprescriptions, persons, and the drug prescribed.Prescription data include drug identification number(DIN) – a key variable linking the drug dispensed toother drug descriptors like dosage form, date pro-vided, days of medication supplied, metric quantityclaimed, ingredient cost, and dispensing fee paid, anda prescribing physician identification code scrambledfor confidentiality. Pharmacy and pharmacist codesare also provided but not currently under use.Prescription data do not include reasons for use orinstructions for use.
Person-based data per prescription comprises theprovincial health information number (PHIN) –which is scrambled and used as a key linking variablewithin the pharmaceutical use data (e.g., for compila-tion of longitudinal dispensations of one drug for oneperson over time) – and other MCHP-held databaseslike the Manitoba Health Registry. The registry is usedto access the person’s birthdate, sex, and first threedigits of his/her postal code (forward sortation area).
Pharmaceutical use by Manitoba residents is reportedaccording to the area of an individual’s residence, notaccording to the site where the prescription medica-tion is purchased. Specifically, residents of Manitobaare identified and information about region ofresidence is obtained using the Manitoba municipal
Pharmaceutical Use among Older Adults La Revue canadienne du viellissement 24 (Suppl. 1) 83

code on the Manitoba Health Registry file as ofDecember 31 of a specified fiscal year, except forTreaty First Nations residents. For these individuals,postal code information is used to assign region ofresidence. Individuals are grouped by age andassigned, usually, a 5-year age-group based on ageat first prescription dispensed in the fiscal yearstudied or reported on.
The descriptors for each drug dispensed in the systemare read from a master DIN file. This file contains thegeneric or chemical name of the product dispensed,its brand name in English and French, strength of theactive ingredient (for single entity products), dosageroute (e.g., orally or rectally administered), dosageform, and way in which the drug is supplied (as atablet or liquid). Classification codes from HealthCanada’s Drug Products Database file (HealthCanada) are added to each DIN in the file after thedata are received by MCHP. Two primary classifica-tion codes are used: WHO’s Anatomical-Therapeutic-Chemical (ATC) classification and the AmericanHospital Formulary System (AHFS) (Sketris, Metge,Blackburn, & MacCara, 2004).
The ATC classification system for human medicinesfrom WHO’s Collaborating Centre for Drug StatisticsMethodology is used to classify drug entities in ourmaster list of pharmaceuticals (WHO, 2003; WorldHealth Organization, n.d., 1995). We use this classifi-cation system to group different drugs used forsimilar indications. The ATC classification systemdivides drugs into different groups according to theorgan or system on which they act, or on theirtherapeutic and chemical characteristics. The firstlevel of the code is based on a letter for the anatomicalgroup, e.g., N for nervous system; the second level ofthe code is the therapeutic main group, e.g., N05for psycholeptics (includes antipyschotics, anxiolytics,hypnotics, and sedatives); the third level of the code isthe pharmacological subgroup, e.g., N05 B foranxiolytics, including the benzodiazepine derivativeValium�. We use the fourth level or chemicalsubgroup for our measure of ‘‘number of differentdrugs,’’ e.g., N05 BA is a category called benzodiaze-pine derivatives; the fifth (and last) level of classifica-tion is at the drug molecule or specific chemicalsubstance level (e.g., diazepam).
The DDD is the assumed average maintenance doseper day for a drug used for its main indication inadults. The rate of the number of DDDs dispensedto the population (of residents or users) per dayand per year can be calculated to measure variousaspects of intensity of pharmaceutical use. Forexample, the number of DDDs used per prescribedday per pharmaceutical user should equal one (¼ 1),
if the drug or groups of drugs being examined areprimarily used for the main indication at therecommended dose (Metge, Black, Peterson, &Kozyrskyj, 1999; Sketris et al., 2004). A clinicalmeasure of prescribed doses per day (PDD) byindividual drug (e.g., diazepam) can also be calcu-lated, although the measure is not a metric that canbe summed across different drugs and drug groups(Metge et al., 1999).
The data field used to describe metric quantitydispensed contains inconsistencies that render non-discrete dosage forms (e.g., creams, ointments, eyedrops, reconstitutable antibiotic powders) unusablefor calculation of defined daily doses (DDD). DDDs,therefore, are calculated using about 65 per cent oftotal claims available for analyses. Other utilizationrate calculations, like indicators of ‘‘access to pharma-ceuticals’’ (defined as dispensation of at least oneprescription drug in a year) and expenditure, are notaffected by this limitation.
Finally, the data are used to describe the population’suse of pharmaceuticals via indicators of utilization,appropriateness, and effectiveness. Usually, rates ofthese indicators are reported on a per fiscal-year basis,which corresponds to the timing of the receipt of ourdata files from Manitoba Health. Denominators arebased on counts of individuals resident in one of 11rural regions or 12 urban (Winnipeg) regions, as perthe population registry information of June 30 in eachfiscal year. The numerators for pharmaceutical utiliza-tion rates, for example, are calculated by counting oradding individuals, prescription claims, number ofdifferent drugs at Anatomical-Therapeutic-Chemicalclassification level 4 (ATC-4), defined daily doses, andexpenditures during the year for individuals accord-ing to their area of residence.
The following two questions are examples of howpharmaceutical data can be used within the qualityevaluation framework as proposed in Figure 1. Usingthe data structure as described above, we describe themethods and results of two questions about pharma-ceutical use in Manitoba. All study protocols for thequestions posed were approved by the HealthResearch Ethics Committee, University of Manitoba,and permission to access the data was obtained fromthe Manitoba Health’s Health Information PrivacyCommittee.
How has the use of pharmaceuticals changedwithin Manitoba’s population over a period offour years (1996 to 2000) according tomeasures of access, intensity, and cost?
Measuring drug utilization indicators creates a‘‘quality assurance’’ system that satisfies the need
84 Canadian Journal on Aging 24 (Suppl. 1) C. Metge et al.

for accountability (Starfield et al., 1985). Indicators ofaccess, for example, describe for us the persons andthe prescribers of their drugs that account for thelargest share of pharmaceutical use or expenditures.Measures of access and utilization are importantto determine the attainment of attributes of quality,like contact with care (access to pharmaceuticals) andcomprehensiveness (insurance coverage for pharma-ceuticals deemed ‘‘medically necessary’’ by theinsurer). The following highlights our developmentof indicators of drug utilization and the potential ofcombining them to inform on equitable distribution ofpharmaceutical resources.
MethodsThe data for this question were obtained from DPINdata fiscal years April 1 to March 31, 1996/1997 to1999/2000. The utilization rates shown in this reporthave been age- and sex-adjusted to account for thedifferences in demography across Manitoba regions.For comparison, some analyses report pharmaceuticaluse by all ages; utilization rates for those aged 65 andover (age as of December 31 in any fiscal year) arereported separately.
Three categories of drug utilization indicators areillustrated: (1) access to prescription drugs defined asthe per cent of the population having at least oneprescription drug dispensed per year, which approx-imates other population-based measures of ‘‘access’’used by the centre (Roos et al., 2001), (2) measuresof intensity of use by therapeutic class (ATC)and population descriptors like age and sex and aco-morbidity descriptor like Adjusted Clinical Groups(ACGs), and (3) expenditures or costs of prescriptiondrugs, regardless of government’s fiduciary respon-sibility, and reportable by income quintile andage categories. Some of the measures, like DDDs,number of different drugs, and expenditures arecombined to illustrate the value of the utilizationindicators. Figure 2 is a representation of the data’spossible combinations.
Access to prescription drugs is shown by age andsex groupings. Number of prescriptions dispensedper unit of population is the usual measure ofintensity of use for pharmaceuticals. It is a proble-matic measure, because the metric quantity of theprescription (e.g., tablets, capsules, etc.) varies fromprescription to prescription. However, the defineddaily dose measure helps to standardize pharmaceu-tical use across a population by totalling individualdosage units and then ascribing total DDDs (ormaintenances doses of a number of drugs) dispensedper resident.
‘‘Number of different drugs’’ is yet another measureof intensity. A ‘‘different’’ drug is defined at the fourthlevel of Anatomical-Therapeutic-Chemical classifica-tion system, that is, at the chemical subgroup but notat the drug molecule level; individuals are assigned avalue for number of different drugs dispensed withinone year. We demonstrate how closely this measurecorresponds to the categorization of individuals usingthe Adjusted Clinical Group adjustment tool.
A commonly referred to limitation of pharmacoepi-demiologic studies using administrative data post-approval is called channelling bias. It has beendescribed as the propensity of ‘‘sicker’’ patients tobe prescribed disproportionately the newer andperceived to be more potent medications differentially(Metge et al., 2003). We illustrate the use of a strati-fication variable called the Adjusted Clinical Group(ACG) with an intensity of use measure for pharma-ceuticals – number of different drugs. Assignment ofan ACG to Manitoba residents is the applicationof a population/patient case-mix adjustment sys-tem developed by researchers at Johns HopkinsUniversity School of Hygiene and Public Health inBaltimore (Starfield, Weiner, Mumford, & Steinwachs,1991). The ACG system quantifies morbidity bygrouping individuals by their age and gender andall known medical diagnoses (which have beenassigned over a defined period of time, typically oneyear). International Classification of Disease-9-ClinicalModification (ICD-9-CM) diagnosis codes for similarconditions are clustered on the basis of expectedconsumption of health care resources and short-termclinical outcomes. An ACG assigned to an individual,then, represents a combination of one or morediagnostic groups (up to 32) and their age andgender. Adjusted Clinical Groups help to quantifymorbidity on a population basis for the purposes ofstratifying individuals by their level of co-morbidity(Reid, Roos, MacWilliam, Frohlich, & Black, 2002).
Finally, a variety of utilization measures are reportedon using ‘‘income quintiles.’’ These are geographicarea measures of socio-economic status derived fromCanadian 1996 census data. Census-derived house-hold income data, aggregated to the geographic unitof the enumeration area, are used to rank neighbour-hoods by average household income. The average(mean) household income of residents living inspecific neighbourhoods is ranked from poorest towealthiest, and then grouped into five incomequintiles (1 being poorest and 5 being wealthiest),each quintile containing approximately 20 per cent ofthe population. Income quintiles are available for bothurban and rural populations, although usually onlyWinnipeg is reported on (Metge et al., 2003; Metgeet al., 1999).
Pharmaceutical Use among Older Adults La Revue canadienne du viellissement 24 (Suppl. 1) 85

ResultsPopulation-based measures of outpatient pharmaceu-tical use in Manitoba are based on the dispensing ofover 8 million prescriptions per year and costingabout $286 million (based on 1999/2000 data). Table 1is a summary of the drug utilization indicators used todescribe Manitobans’ use of prescription drugs fromApril 1, 1996, to March 31, 2000.
At least two thirds of Manitobans (67.3%) had accessto pharmaceuticals (i.e., were dispensed at leastone prescription per year) in 1999/2000. However,approximately 85 per cent of older Manitobans(�65 years old) are pharmaceutical users in anyone year (in 1996/1997, 84.4%; in 1999/2000, 87.0%).Figure 3 is a graphic representation of the proportionof the population using at least one prescription drugper year by age and sex categories.
The mean number of different drugs dispensedper pharmaceutical user was 3.7 in 1999/2000 – anincrease of 9.1 per cent over the 1996/1997 baselinevalue of 3.3 in the data. The mean number of differentdrugs dispensed to older pharmaceutical userswas 5.9 in 1999/2000 – an increase of 15.7 per centover the 1996/1997 baseline value of 5.1. Meannumber of different drugs mirrors the otherco-morbidity measure used to describe Manitoba’spopulation, ‘‘Adjusted Clinical Group’’ (ACG),(�2¼ 0.0005, df¼ 4, ns).
Expenditure indicators describe the dollar costsof prescription drugs to pharmaceutical users andon a per capita basis. The mean expenditure per
prescription was $32.61 in 1999/2000 – an increaseof 18.7 per cent over the baseline value of $27.47.The price per prescription varies little betweenthose Manitobans less than 65 years old and those65 years of age and older (Table 1). Total expendituresfor pharmaceuticals per capita and pharmaceuticaluser were $249 and $370, respectively, for the 1999/2000 fiscal year. However, when one compares theamount spent per capita by the older versus theyounger adult population, we see that those 65 yearsof age cost approximately four times more ($708:$177in 1999/2000).
Figure 4 shows a combination of two measures:intensity of use and expenditures. It appears thatolder residents of Manitoba pay four times more perperson for pharmaceuticals in a year than youngerresidents, and the dollars spent per defined daily dose(DDD) is 20 per cent more for younger residents.Table 2 describes measures of pharmaceutical use(access, intensity, and expenditure) by income quin-tile, including expenditures.
Conclusion and DiscussionThese measures of a population’s access to andintensity of use of pharmaceuticals provide powerfulindicators of how a program functions across theprovince, while also providing a basis for benchmark-ing the use of pharmaceuticals. The administrativedata are able to produce valid measures of utilizationacross the population. One of the more powerfullimitations to the data is that we do not know the
Region of residenceIncome quintile
Age/sexSex
Age
Access
Intensity of use
Expendituresper capitaX
AllUse
NursingHome
OutpatientUse
Figure 2: Analysis orientation for describing drug utilization
86 Canadian Journal on Aging 24 (Suppl. 1) C. Metge et al.

proportion of medications prescribed and not dis-pensed, or if the medication dispensed is actuallytaken.
Perhaps one of the most compelling ways ofdescribing pharmaceutical use and the response ofpolicy decisions to ensuring equitable distributionof pharmaceuticals is through an examination of theexpenditures incurred by residents with differentsocio-economic characteristics. For example, the dis-pensation of pharmaceuticals according to a variety ofutilization measures appears to be responsive to need
as shown by the measures in the lowest incomequintile compared to the other income quintiles.
This responsiveness is supported by previous workwe have done with this population descriptor. Wehave compared the health and health care usepatterns of Winnipeg residents according to theaverage household income in the neighbourhood ofresidence. There is a marked difference in healthstatus as measured by age/sex standardized deathrates across the Winnipeg population. Individualsin middle-income neighbourhoods (quintile 3)
Table 1: Population-based measures of pharmaceutical use (1996–2000)
ResidentsPharmaceuticalUsersAll <65 Years Old �65 Years Old
Access indicator 1996/97 66.0 N¼1,144,460 63.0 N¼89,8570 84.4 N¼154,890 N/A
Users of dispensed 1997/98 65.7 N¼1,143,117 62.6 N¼987,210 84.9 N¼155,907
pharmaceuticals 1998/99 66.9 N¼1,143,614 63.9 N¼987,574 86.1 N¼156,040
(per 100 residents) 1999/00 67.3 N¼1,148,074 64.2 N¼991,527 87.0 N¼156,547
Intensity of Use Indicators
Mean number of 1996/97 6.2 4.6 16.6 9.5
prescriptions per year 1997/98 6.6 4.8 17.9 10.1
1998/99 7.0 5.1 19.1 10.5
1999/00 7.6 5.5 21.1 11.4
Mean number of 1996/97 3.3 2.9 5.1 3.3
different drugs 1997/98 3.4 3.0 5.3 3.4
used per year (users) 1998/99 3.5 3.0 5.5 3.5
1999/00 3.7 3.2 5.9 3.7
Mean number of 1996/97 120 76 405 223
defined daily 1997/98 133 83 447 247
doses (DDDs/year)* 1998/99 142 89 473 257
1999/00 154 97 511 276
Expenditure Indicators
Mean dollars ($) 1996/97 171 123 480 260
per year 1997/98 191 136 539 290
1998/99 216 154 607 322
1999/00 249 177 708 370
Mean dollars ($) per 1996/97 27.47 26.65 28.92 27.47
prescription 1997/98 28.75 27.96 30.09 28.75
1998/99 30.63 29.97 31.76 30.63
1999/00 32.61 32.02 33.58 32.61
*Based on approximately 65 per cent of total prescriptions dispensed (see text)
Pharmaceutical Use among Older Adults La Revue canadienne du viellissement 24 (Suppl. 1) 87

0
10
20
30
40
50
60
70
80
90
100
0-2 3-4 5-9 10-
14
15-
19
20-
24
25-
29
30-
34
35-
39
40-
44
45-
49
50-
54
55-
59
60-
64
65-
69
70-
74
75-
79
80-
84
85-
89
90-
94
95+
Age (in years) Categories
pe
r ce
nt
Males
Females
Figure 3: Per cent population with access to at least one prescription by age and sex in Manitoba, 1999/2000
0
100
200
300
400
500
600
700
800
1996/97 1997/98 1998/99 1999/2000
$/ye
ar
0
0.2
0.4
0.6
0.8
1
1.2
1.4
1.6
1.8
$/D
DD
$/yr<65 years old
$/yr>=65 years old
$/DDD<65 years old
$/DDD>=65 years old
Figure 4: Dollars spent per younger Manitoba resident and per older resident per year and per defined daily dose,1996–2000 (age- and sex-adjusted)
88 Canadian Journal on Aging 24 (Suppl. 1) C. Metge et al.

have higher mortality rates than do individuals inthe highest-income neighbourhoods (quintile 5),whereas those in the poorest neighbourhoods demon-strate the highest rates (Metge et al., 2003; Metgeet al., 1999).
Also, the finding that younger Manitobans take fewermedication doses but cost more than do olderManitobans may be explained by the types of drugsthat are more likely to be prescribed when one isin either a younger or older age group. A nationalsurvey of prescribing done yearly in the United Statesfound that the therapeutic class with the largestincrease in drug use for older adults (65þ) is forhematologic agents or blood-thinners, a class of drugsthat has been on the market for many years (Burt,2002). However, the largest increase in prescribing foryounger adults was in new molecular entities likelipid-lowering drugs and selective serotonin reuptakeinhibitors for depression; both are classes of drugsthat are proportionately prescribed more infrequentlyin older adults but that cost more per dose (Metgeet al., 2003; Metge et al., 1999). More study is requiredto determine if more expensive medications are beingprescribed to younger people than those prescribedto those older persons within therapeutic classes andon a cost per dose basis.
What proportion of older adults are newlyprescribed a long-acting benzodiazepine?
Appropriateness measures examine whether the rightdrug has been prescribed for the right indication, forthe right person, and at the right time and dose,usually according to evidence-based guidelines. Onetop candidate for examining appropriate prescribingis the use of the anti-anxiety agents – benzodiazepines(e.g., Ativan�, Valium�) – particularly those that arelong-acting and those that are prescribed for longerthan safely indicated.
The benzodiazepines (Bz) rank among the mostfrequently prescribed medication class in the olderpopulation, being the agents of choice for thetreatment of anxiety and acute insomnia (Kalvik,Isaac, & Janecek, 1996; Nowell et al., 1997). In 1989,20 per cent of older women and 12 per cent of oldermen living in Saskatchewan received at least oneprescription for a Bz (Quinn, Baker, & Evans, 1992).A 1996 study of pharmaceutical use in Manitobasuggests that this prevalence of use in the olderpopulation has been maintained (Metge et al., 1999).Use appears to be more prevalent in older personstaking multiple medications, placing them at aneven greater risk for drug-related problems fromthis ‘‘high risk’’ drug category (Metge et al., 2003).
While these agents have a definite place in thetreatment of anxiety and in the management ofshort-term (3–4 weeks) insomnia, it is suspected thata large proportion of patients use Bz for the manage-ment of long-term insomnia. At this time, there is alack of evidence supporting the efficacy of chronicbenzodiazepine use, and continuous use beyond 2–4weeks is not recommended (Holbrook, Crowther,Lotter, Cheng, & King, 2000; Kupfer & Reynolds,1997). One study conducted in 1994 found that30.8 per cent of older persons in Quebec receiveda benzodiazepine for more than 30 consecutivedays (Tamblyn et al., 1994). In a separate study, theprevalence of continuous, long-term (>180 days) Bzuse in older community-dwelling persons (65þ) inQuebec was 20 per cent (Egan, Moride, Wolfson, &Monette, 2000).
The association of Bz with potentially serious adverseeffects calls the widespread chronic use of theseagents in the older adult into question. Dose-relatedside effects most commonly affect the central nervoussystem and include unsteadiness, somnolence, fati-gue, cognitive impairment, and difficulty concen-trating (Salzman, 1999). The author suggested that
Table 2: Pharmaceutical use measures by income quintile, Winnipeg, 1999/2000 (age- andsex-adjusted)
Access: % Using at LeastOne Prescription per Year
Use: # DifferentDrugs
Expenditures (in dollars)
/User /Resident /User
Q5 (highest income) 66.4 3.0 223.17 306.43
Q4 68.0 3.2 228.41 309.25
Q3 68.5 3.3 239.15 318.11
Q2 68.9 3.4 252.67 335.62
Q1 (lowest income) 71.2 4.0 297.12 392.34
Pharmaceutical Use among Older Adults La Revue canadienne du viellissement 24 (Suppl. 1) 89

these responses are most likely due to a combinationof increased receptor sensitivity and reduced meta-bolic clearance. Long-term use of Bz may exacerbatean underlying dementia and may often lead to theaddition of a drug to treat Bz side effects – anundesirable consequence in a segment of the popula-tion already subject to polymedicine. Several studiesfound an improvement in measures of memory andcognition after discontinuation of Bz therapy (Larson,Kukull, Buchner, & Reifler, 1987; Salzman, 1999;Salzman, Nobel, Glassman, Wolson, & Kelley, 1992).Perhaps more alarming is the link between Bz usein older persons and an increased risk of falls andfractures, and motor vehicle accidents (Holbrooket al., 2000). The risk of being in an automobileaccident is 50 per cent greater in older adults who useBz versus those who do not use Bz, and older personswho take long-acting Bz have a 70 per cent higher riskof sustaining a hip fracture (Kalvik et al., 1996). As aresult of these clinical findings, we were interestedin assessing changes in the utilization and appro-priateness of benzodiazepines in older Manitobansover time.
MethodsThe data for this question were obtained from DPINdata using the fiscal years of April 1 to March 31,1996/1997 to 1999/2000. The utilization rates for thosenewly prescribed benzodiazepines aged 65 and over(age as of December 31 in any fiscal year) are reportedseparately. New use was defined as no mention of abenzodiazepine dispensation in the first 4 months of afiscal year (FY), April 1 to July 31, and at least oneprescription for a benzodiazepine in the last 8 monthsof the fiscal year, August 1 to March 31. For example,if we found a first dispensation for diazepam for anindividual dated September 20, 1998, ‘‘new use’’ wasdesignated if there were no other dispensations forbenzodiazepines from April 1, 1998, to July 31, 1998.
To analyse the appropriateness of any single group ofdrugs, one needs to separate them from all of theother drug products listed in the DPIN system; thesenumber in excess of 5,000. To identify all of thebenzodiazepine solid forms dispensed in Manitoba,we first grouped all products using the Anatomical-Chemical-Therapeutic classification system. Forpsycholeptics like benzodiazepines this would be allDINs with the designated code of (N05). Long-actingbenzodiazepines like diazepam (N05BA01) and flur-azepam (N05CD01) share the first two levels of theATC code, but the third and subsequent levels aredifferent (WHO Collaborating Centre for DrugStatistics Methodology). Therefore, we also generatean alphabetical list by generic or chemical name to
ensure that no drugs have been missed because ofmiscoding by ATC grouping code. Once the DINs forthe benzodiazepines were identified, we pulled allprescription claims, grouped them by claimant (usingthe scrambled personal health identification number),and applied our algorithm for ‘‘new use.’’
Once identification of ‘‘new use’’ was accomplished,we categorized new use by the pharmacologicalaction of the benzodiazepine as short-acting,intermediate-acting, and long-acting. Long-actingbenzodiazepines included diazepam (Valium�)and flurazepam (Dalmane�); intermediate-actingbenzodiazepines included alprazolam (Xanax�)and lorazepam (Ativan�); and short-acting benzodi-azepines included triazolam (Halcion�) and zopiclone(Imovane�).
ResultsTable 3 shows that close to 6.5 per cent of persons 65years of age and older resident in Manitoba in anysingle year are newly prescribed benzodiazepines. Ifwe examine the distribution of type of benzodiaze-pine being newly prescribed, we observe a downwardtrend in new prescriptions for long-acting benzodia-zepines as a proportion of all new benzodiazepinesprescribed to this population. Figure 5 shows thatwhile the rate of prescribing for long-acting benzo-diazepines has fallen by about a quarter (23.3%) overthe 4 years of analysis, this decrease has been takenup through an increased prescribing of short-actingbenzodiazepines (e.g., triazolam, zopiclone) shown asa 29.7 per cent increase in the prescribing ofthese drugs over the same period. The significanceof these changes has not been determined. A follow-up analysis to determine how long these newusers are maintained on these anti-anxiety agents isunderway.
Conclusion and DiscussionThe data show us that long-acting benzodiazepinescontinue to be prescribed, perhaps inappropriately,in older adults resident in Manitoba. The rates of usein those persons aged 65 and older and ratio ofintermediate/short-acting Bz use to long-acting Bzcompares with those of other Canadian studies(Hogan, Maxwell, Fung, & Ebly, 2003; Laurier,Moride, & Kennedy, 2002; Tu, Mamdani, Hux, & Tu,2001). Yet there currently appears to be limitedevidence supporting the efficacy of chronic contin-uous benzodiazepine use in older adult insomniacs,as well as substantial evidence pointing to the risksassociated with such therapy (Ashton, 1995). Acrossthe world, working groups, task forces, and profes-sional organizations have published guidelines and
90 Canadian Journal on Aging 24 (Suppl. 1) C. Metge et al.

consensus papers in an attempt to promote rationalprescribing and outline strategies for Bz withdrawal(Health Care Committee Expert Advisory Panel onAlcohol and Drug Use, 1991; Holbrook et al., 2000;Marks, 1988; National Institutes of Health, 1990).Although these protocols emphasize the importanceof gradual withdrawal to minimize symptoms thatresult from physiological dependence, the continuedhigh prevalence of benzodiazepine prescribing in theolder adult suggests that these recommendations arenot being implemented in current medical practice.
ConclusionUsing a large administrative database and differentattributes of utilization and appropriateness, we have
demonstrated how the evaluation of the quality ofpharmaceutical use in older adults might be under-taken. For example, pharmaceutical use data held byMCHP can describe population-based patterns ofprescription drug utilization by Manitobans aged65 years and more, from April 1, 1996 onwards.Indicators of utilization like access, intensity, andexpenditure are reportable by age, sex, geographicregion, income quintile, and co-morbidity status asdescribed here.
However, there are limitations in the ability of thistype of analysis to completely describe the utilizationof pharmaceuticals. For example, from the perspectiveof access to pharmaceuticals, there is significantunder-reporting in a least two northern regions of
0%
10%
20%
30%
40%
50%
60%
70%
80%
90%
100%
FY1996/97 FY1997/98 FY1998/99 FY1999/00
Short-acting
Intermediate-acting
Long-acting
Figure 5: Per cent of new users by type of benzodiazepine prescribed, 1996–2000
Table 3: Distribution of benzodiazepine use in older Manitoba adults* by sex, 1996–2000 (age- and sex-adjusted)
Long-ActingBenzodiazepines Intermediate-Acting
Short-ActingBenzodiazepines Total(s)
1996/1997 N¼10,130 Males 608 (6.0%) 2218 (21.9%) 529 (5.2%) 3355 (33.1%)
Females 1210 (11.9%) 4625 (45.7%) 940 (9.3%) 6775 (66.9%)
1997/1998 N¼9754 Males 577 (5.9%) 2179 (22.3%) 532 (5.5%) 3288 (33.7%)
Females 984 (10.1%) 4533 (46.5%) 949 (9.7%) 6466 (66.3%)
1998/1999 N¼9807 Males 518 (5.3%) 2182 (22.2%) 625 (6.4%) 3325 (33.9%)
Females 948 (9.7%) 4472 (45.6%) 1062 (10.8%) 6482 (66.1%)
1999/2000 N¼9890 Males 488 (4.9%) 2149 (21.7%) 657 (6.6%) 3294 (33.3%)
Females 880 (8.9%) 4519 (45.7%) 1197 (12.1%) 6596 (66.7%)
*Baseline population of Manitoba residents aged 65 and over: 154,890 (1996/97), 155,907 (1997/98), 156,040 (1998/99),and 156,547 (1999/2000)
Pharmaceutical Use among Older Adults La Revue canadienne du viellissement 24 (Suppl. 1) 91
the province. The amount of underreporting in thetwo areas (20%) would account for approximately1 per cent of residents and prescription claims overall;the numbers of persons over age 65 is small in boththese areas. The exclusion of unsolid dosage formsfrom the defined daily dose (DDD) rate calculationslimits the full characterization of intensity of use of atleast three classes of drugs, unless substantial recod-ing is done of the data: (1) those for asthma and otherchronic respiratory conditions using an inhalerdosage form, (2) insulin for diabetics, and (3) oralliquid antibiotics, which are also commonly used forolder adults. As well, expenditure data has to beimputed for 15 per cent of the prescription claimswhere the government has no fiduciary responsibilitybut the prescription claim information is captured ina compulsory drug utilization review query made bythe pharmacist to the Drug Programs InformationNetwork (DPIN) system at the time of dispensation(Metge et al., 1999).
Measuring the appropriateness of prescribing is alsopossible, using this data set. Our analyses suggest thatlong-acting benzodiazepines continue to be pre-scribed, perhaps inappropriately. The ‘‘new’’ use ofbenzodiazepines in older adults is unabated, despitea favourable decline in new prescriptions for long-acting benzodiazepines (Hogan et al., 2003; Laurieret al., 2002; Tu et al., 2001). Future analysis is requiredto understand how long and at what dose older adultsin Manitoba are kept on all benzodiazepines. Accessto this kind of systematic information about the extentto which standard processes of pharmaceutical care,like the prescribing of benzodiazepines, are being met(Institute of Medicine 2001) is essential to identifyingwhere gaps are occurring between what we know‘‘works,’’ or a standard process of care based onscientific evidence, and what is actually being done(McGlynn, Asch, & Adams, 2003). In addition,appropriate prescribing, as defined by applyingevidence-based guidelines to actual patient care, hasbeen linked to desirable therapeutic outcomes (Brook,McGlynn, & Shekelle, 2000). As such, potentiallyinappropriate prescribing could pose serious threatsto the health and well-being of those treated withprescription medication.
The data are also able to describe some significantoutcomes from the use of pharmaceuticals such asdeath, fracture, and some population-based clinicalmeasures where available. Such ‘‘effectiveness’’ oroutcome measures are currently being investigated byongoing studies at MCHP (Ho, Hamilton, & Roos,2000; Kaul et al., 2002; Martens, Brownell, &Kozyrskyj, 2002). One strength of the data receivedfrom Manitoba Health is the ability to link them withother population-based data of clinical measures,
such as bone mineral density values (Leslie, Metge,& Ward, 2003), for analysis of appropriateness andeffectiveness. A search for other population-basedmeasures of clinical measures is ongoing; their usewill help in describing more fully the quality ofpharmaceutical use, particularly its effectiveness,using the Donabedian-like framework proposedearlier.
Finally, a call for the power of multiple data sources toinform on the quality of a health system has run intosignificant obstacles over the past 10 years (Berger,2000; Fineberg, 2002; Willison, 2003; Wolfson, 1994).This is no less true with the kinds of data held byMCHP on pharmaceutical use. We have found thatoften the data are simply unavailable, especially forthe determination of appropriateness and effective-ness, or confidentiality and privacy concerns overcombining different data sources outweigh theirusefulness as means to inform on quality. However,MCHP will continue to address issues surroundingthe quality of pharmaceutical use, despite theselimitations: a longitudinal analysis of drug utiliza-tion spanning 8 years is now possible (1996–2004);identification of medications used inappropriately isongoing (Leslie et al., 2001; Metge et al., 2002); andusing the data to inform on pharmaceutical outcomesor effectiveness – like care gaps and areas need-ing clinical intervention – promise contributions toidentification of the harms and benefits of the use ofpharmaceuticals in populations.
ReferencesAshton, H. (1995). Toxicity and adverse consequences of
benzodiazepine use. Psychiatric Annals, 25, 158–165.
Berger, E. (2002). Attitudes to privacy, health records andinterconnection: Implications for healthcare organiza-tions. Hospital Quarterly, 5(4), 40–45.
Brook, R.H., McGlynn, E.A., & Shekelle, P.G. (2000).Defining and measuring quality of care: A perspectivefrom U.S. researchers. International Journal for QualityHealth Care, 12(4), 281–295.
Burt, C.W. (2002). National trends in use of medications inoffice-based practices, 1998–1999. Health Affairs, 21(4),206–214.
Chutka, D.S., Takahashi, P.Y., & Hoel, R.W. (2004).Inappropriate medications for elderly patients. MayoClinic Procedures, 79(1), 122–139.
Coambs, R., Jensen, P., Her, M.H., Ferguson, B.S., Jarry, J.L.,Wong, J.S.W., & Abrahamsohn, R.V. (1995). Review ofthe scientific literature on the prevalence, consequences,and health costs of noncompliance and inappropriate useof prescription medication in Canada. Toronto: Universityof Toronto Press.
92 Canadian Journal on Aging 24 (Suppl. 1) C. Metge et al.

Commission on the Future of Health Care in Canada. (2002).Building on values: The future of health care in Canada –Final report. Ottawa: Queen’s Printer.
Donabedian, A. (1980). Explorations in quality assessmentand monitoring. Volume 1: The definition of qualityand approaches to its assessment. Chicago: HealthAdministration Press.
Egan, M.P., Moride, Y.P., Wolfson, C.P., & Monette, J. (2000).Long-term continuous use of benzodiazepines by olderadults in Quebec: Prevalence, incidence and riskfactors. Journal of the American Geriatrics Society, 48,811–816.
Eyles, J., Birch, S., Chambers, J., Hurley, J., & Hutchinson, B.(1993). A needs-based methodology for allocatinghealth care resources in Ontario, Canada: Develop-ment and an application. Social Science and Medicine,33, 489–500.
Fineberg, A.D. (2002). The Personal Information Protectionand Electronic Documents Act: Physician prescriptiondata and Canadian health system reviews. Health Lawin Canada, 23(1), 1–10.
Futterman, R., Fillit, H., & Roglieri, J.L. (1997). Use ofineffective or unsafe medications among members of aMedicare HMO compared to individuals in a Medicarefee-for-service program. American Journal of ManagedCare, 3, 569–575.
George, M. (1994). Population projections for Canada, provinceand territories 1993–2016. Ottawa: Statistics Canada.
Grymonpre, R.E., Mitenko, P.A., Sitar, D.S., Aoki, F.Y., &Montgomery, P.R. (1988). Drug-associated hospitaladmissions in older medical patients. Journal of theAmerican Geriatrics Society, 36, 1092–1098.
Grymonpre, R.E., Sitar, D.S., Montgomery, P.R., Mitenko,P.A., & Aoki, F.Y. (1991). Prescribing patterns for olderheavy drug users living in the community. DrugIntelligence and Clinical Pharmacy, 25, 186–190.
Grymonpre, R.E., Williamson, D.A., Huynh, D.H., &Desilets, L.M. (1994). A community-based pharmaceu-tical care model for the elderly: Report on a pilotproject. International Journal of Pharmacy Practice, (2),229–234.
Hanlon, J.T., & Lewis, J.K. (1995). Adverse drug reactions.In J. Delafuente & R.B. Stewart (Eds.), Therapeuticsin the elderly. Cincinnati: Harvey Whitney Books,212–227.
Health Canada. (n.d.). Drug product database. RetrievedDecember 18, 2003, from http://www.hc-sc.gc.ca/hpb/drugs-dpd/
Health Care Committee Expert Advisory Panel on Alcoholand Drug Use. (1991). Guidelines for the prevention andmanagement of benzodiazepine dependence. NationalHealth and Medical Research Council. Canberra:Australian Government Publishing Service.
Ho, V., Hamilton, B.H., & Roos, L.L. (2000). Multipleapproaches to assessing the effects of delays for hipfracture patients in the United States and Canada.Health Services Research, 34(7), 1499–1518.
Hogan, D.B., Maxwell, C.J., Fung, T.S., Ebly, E.M. (2003).Prevalence and potential consequences of benzodiaze-pine use in senior citizens: Results from the CanadianStudy of Health and Aging. Canadian Journal of ClinicalPharmacology, 10(2), 72–77.
Holbrook, A.M., Crowther, R., Lotter, A., Cheng, C., &King, D. (2000). The diagnosis and management ofinsomnia in clinical practice: A practical evidence-based approach. Canadian Medical Association Journal,162, 216–220.
Institute of Medicine. (2001). Crossing the quality chasm: Anew health system for the 21st century. Washington, D.C.:National Academy Press.
Kalvik, A., Isaac, P., & Janecek, E. (1996). Benzodiazepines:Treatment of anxiety, insomnia and alcohol withdrawal.Communications (March/April), 7–24.
Kassam, R., Farris, K.B., Burback, L., Volume, C.I., Cox, C.E.,& Cave, A. (2001). Pharmaceutical care research andeducation project: Pharmacists’ interventions. Journalof the American Pharmaceutical Association, 41(3),401–410.
Kaul, P., Saunders, L.D., Roos, L.L., Kephart, G., Ghali, W.A.,Walld, R., & Warren, J. (2002). Trends in utilization ofcoronary artery bypass surgery and associated out-comes: Alberta, Manitoba, and Nova Scotia. AmericanJournal of Medical Quality, 17(3), 103–112.
Kupfer, D.J., & Reynolds, C.F. (1997). Management ofinsomnia. New England Journal of Medicine, 336, 341–346.
Larson, E.B., Kukull, W.A., Buchner, D., & Reifler, B.V.(1987). Adverse drug reactions associated with globalcognitive impairment in elderly persons. Annals ofInternal Medicine, 107, 169–173.
Laupacis, A., Paterson, J.M., Mamdani, M., Rostom, A., &Anderson, G.M. (2003). Gaps in the evaluation andmonitoring of new pharmaceuticals: Proposal for adifferent approach. Canadian Medical Association Journal,169(11), 1170–1171.
Laurier, C., Moride, Y., & Kennedy, W.A. (2002). Healthsurvey data on potentially inappropriate geriatric druguse. Annals of Pharmacotherapy, 36(3), 404–409.
Leslie, W.D., Metge, C.J., Kvern, B., Anderson, W.A.,Manness, L.J., & Yuen, C.K. (2001). Population-basedprevalence of clinical risk factors from the MaximizingOsteoporosis Management in Manitoba (MOMM)Project. Journal of Bone and Mineral Research,16(Suppl. 1), S137–604.
Leslie, W.D., Metge, C., & Ward, L. (2003). Establishing aregional bone density program: Lessons from the
Pharmaceutical Use among Older Adults La Revue canadienne du viellissement 24 (Suppl. 1) 93
Manitoba experience. Journal of Clinical Densitometry,6(3), 275–282.
Lipton, H.L., Bero, L.A., Bird, J.A., & McPhee, S.J. (1992).The impact of clinical pharmacists’ consultations onphysicians’ geriatric drug prescribing: A randomizedcontrolled trial. Medical Care, 30, 646–658.
Lipton, H.L., & Bird, J.A. (1993). Drug utilization reviewin ambulatory settings: State of the science anddirections for outcomes research. Medical Care, 31,1069–1082.
Liu, G.G., & Christensen, D.B. (2002). The continuingchallenge of inappropriate prescribing in the elderly:An update of the evidence. Journal of the AmericanPharmaceutical Association, 42(6), 847–857.
Lohr, K.N., & Donaldson, M.S. (1990). Assuring quality ofcare for the elderly. Law Med Health Care, 18(3), 244–253.
MacWilliam, L. (1999). Premature mortality. Manitoba Centrefor Health Policy, Concept Dictionary. RetrievedDecember 18, 2003, from http://www.umanitoba.ca/academic/centres/mchp/concept/dict/premature.mortality.html
Marks, J. (1988). Techniques of benzodiazepine withdrawalin clinical practice: A consensus workshop report.Medical Toxicology and Adverse Drug Experience, 3,324–333.
Martens, P.J., Brownell, M.D., & Kozyrskyj, A. (2002). Thevirtual classroom: A summary of child health indica-tors. Canadian Journal of Public Health, 93(Suppl. 2),S77–S80.
McGlynn, E.A., Asch, S.M., & Adams, J. (2003). The qualityof health care delivered to adults in the United States.New England Journal of Medicine, 348(26), 2635–2645.
Medication Working Group. (1988). Surgeon general’sworkshop. Health Promotion and Aging Proceedings.Washington, D.C.: U.S. Department of Health andHuman Services.
Metge, C.J., Black, C., Peterson, S., & Kozyrskyj, A.L. (1999).The population’s use of pharmaceuticals. Medical Care,37, JS42–JS59.
Metge, C.J., Kozyrskyj, A., Dahl, M., Yogendran, M., &Roos, N.P. (2003). Pharmaceuticals: A focus on appropriateuse. Winnipeg: Manitoba Centre for Health Policy.
Metge, C.J., Yogendran, M., Doupe, M., Katz, M., Kvern, B.,& Thomson, G. (2002). Preparing administrative claimsdata for evaluation of limited use criteria: A case fornonsteroidal antiinflammatory drugs. Canadian Journalof Clinical Pharmacology, 9(1), 44.
Nowell, P.D., Mazumdar, S., Buysse, D.J., Dew, M.A.,Reynolds, C.F., & Kupfer, D.J. (1997). Benzodiazepinesand zolpidem for chronic insomnia: A meta-analysis oftreatment efficacy. Journal of the American MedicalAssociation, 278, 2170–2177.
Quinn, K., Baker, M.J., & Evans, B. (1992). A population-wide profile of prescription drug use in Saskatchewan,1989. Canadian Medical Association Journal, 146,2177–2186.
Rawson, N.S.B. (2001). ‘‘Effectiveness’’ in the evaluation ofnew drugs: A misunderstood concept? Canadian Journalof Clinical Pharmacology, 8(2), 61–62.
Reid, R., Roos, N.P., MacWilliam, L., Frohlich, N., &Black, C. (2002). Assessing population need using aclaims-based ACG morbidity measure: A validationanalysis in the province of Manitoba. Health ServicesResearch, 37(5), 1345–1364.
Roos, L.L., Sharp, S.M., & Wajda, A. (1989). Assessing dataquality: A computerized approach. Social Science andMedicine, 28, 175–182.
Roos, L.L., Walld, R.K., Romano, P.S., & Roberecki, S. (1996).Short-term mortality after repair of hip fracture: DoManitoba elderly do worse? Medical Care, 34, 310–326.
Roos, N.P., & Shapiro, E. (1999). Revisiting the ManitobaCentre for Health Policy and Evaluation and itspopulation-based health information system. MedicalCare, 37, JS10–JS14.
Roos,N.P., Stranc,L., Peterson, S.,Mitchell, L., Bogdanovic, B.,& Shapiro, E. (2001). A look at home care in Manitoba.Retrieved December 18, 2003, from Manitoba Centre forHealth Policy Web site: http://www.umanitoba.ca/centres/mchp/reports/reports_01/homecr.htm
Salzman, C. (1999). An 87-year-old woman taking abenzodiazepine. Journal of the American MedicalAssociation, 281, 1121–1125.
Salzman, C.,Nobel, K., Glassman, R.,Wolson,A., &Kelley,M.(1992). Cognitive improvement following benzodia-zepine discontinuation in elderly nursing home resi-dents. International Journal of Geriatric Psychiatry, 7, 89–93.
Sellors, J., Kaczorowski, J., Sellors, C., Dolovich, L.,Woodward, C., Willan, A., Goeree, R., Cosby, R., Trim,K., Sebaldt, R., Howard, M., Hardcastle, L., & Poston, J.(2003). A randomized controlled trial of a pharmacistconsultation program for family physicians and theirelderly patients. Canadian Medical Association Journal,169(1), 30–31.
Shimp, L.A., Scione, F.J., Glazer, H.M., & Atwood, B.F.(1985). Potential medication-related problems in non-institutionalized elderly. Drug Intelligence and ClinicalPharmacy Drug, 19, 766–772.
Sketris, I.S., Metge, C.J., Blackburn, J., & MacCara, M.E.(2004). Using the World Health Organization (WHO)ATC and DDD system in a Canadian context. DrugInformation Journal, 38(1), 15–28.
Spore, D.L., Mor, V., Larrat, P., Hawes, C., & Hiris, J. (1997).Inappropriate drug prescriptions for elderly residentsof board and care facilities. American Journal of PublicHealth, 87, 404–409.
94 Canadian Journal on Aging 24 (Suppl. 1) C. Metge et al.

Starfield, B., Egbuonu, L., Farfel, M., Hutton, N., Joffe, A., &Wissow, L.S. (1985). The effectiveness of medical care:Validating medical wisdom. Baltimore: Johns HopkinsUniversity Press.
Starfield, B., Weiner, J., Mumford, L., & Steinwachs, D.(1991). Ambulatory care groups: A categorization ofdiagnoses for research and management. Health ServicesResearch, 26(1), 53–74.
Statistics Canada. (2003). Population by sex and age group2003. Retrieved December 18, 2003, from http://www.statcan.ca/eeenglish/Pgdb/dem0311.htm
Stuck, A.E., Beers, M.H., Steiner, A., Aronow, H.U.,Rubenstein, L.Z., & Beck, J.C. (1994). Inappropriatemedication use in community-residing older persons.Archives of Internal Medicine, 154, 2195–2200.
Tamblyn, R.M., McLeod, P.J., Abrahamowicz, M., Monette,J., Gayton, D.C., Berkson, L., Dauphinee, W.D., Grad,R.M., Huang, A.R., Isaac, L.M. (1994). Questionableprescribing for elderly patients in Quebec. CanadianMedical Association Journal, 150, 1801–1809.
The treatment of sleep disorders of older people. (1990).National Institutes of Health, 8, 1–22.
Tognoni, G. (1983). Drug use and monitoring. InW.W. Holland (Ed.), Evaluation of health care (p. 207).London: Oxford University Press.
Tu, K., Mamdani, M.M., Hux, J.E., & Tu, J.B. (2001).Progressive trends in the prevalence of benzodi-azepine prescribing in older people in Ontario,Canada. Journal of the American Geriatrics Society,49(10), 1341–1345.
Willcox, S.M.M., Himmelstein, D.U., & Woolhandler, D.(1994). Inappropriate drug prescribing for thecommunity-dwelling elderly. Journal of the AmericanMedical Association, 272(July 27), 292–296.
Willison, D.J. (2003). Privacy and the secondary use of datafor health research: Experience in Canada and sug-gested directions forward. Health Service Research andPolicy, 8(Suppl. 1), S117–S123.
Wolfson, M. (1994). Social proprioception: Measurement,data and information from a population health per-spective. In R.G. Evans, M.L. Barer, & T.R. Marmor(Eds.), Why are some people healthy and others not? Thedeterminants of health of populations. New York: Aldinede Gruyter, 287–316.
World Health Organization. (1995). WHO’s Centre for DrugStatistics Methodology: Guidelines for ATC classificationand DDD assignment. Oslo: Author.
World Health Organization Collaborating Centre for DrugStatistics Methodology. (n.d.) Retrieved December 18,2003, from http://www.whocc.no/atcddd/
Pharmaceutical Use among Older Adults La Revue canadienne du viellissement 24 (Suppl. 1) 95
CANADIANJOURNALONAGING
LA REVUECANADIENNEDUVIEILLISSEMENT

Use of Acute Care Hospitals by Long-StayPatients: Who, How Much, and Why?
Carolyn De Coster, Sharon Bruce, and Anita Kozyrskyj
Department of Community Health Sciences, University of Manitoba
RESUMEResume; Les consequences des hospitalisations a long terme peuvent etre graves, particulierement chez les personnesagees. Au Manitoba, entre les exercices 1991/1992 et 1999/2000, 40 p. 100 des journees d’hospitalisation de courte dureeont ete utilisees par 5 p. 100 des patients qui avaient eu des hospitalisations prolongees, c’est-a-dire des sejours de plusde 30 jours. Ces proportions etaient remarquablement stables, malgre des changements importants quant au nombre delits disponibles. Environ les deux tiers des patients de longue duree etaient ages de 75 ans ou plus. L’etude des dossiersmedicaux d’un petit echantillon des patients de longue duree, ages de 75 ans ou plus, a revele que 42 p. 100 desjournees passees a l’hopital avaient ete passees soit a attendre un transfert vers un autre niveau de soins (soins adomicile, maison de soins infirmiers ou soins aux malades chroniques) soit a attendre en raison de facteurs propres al’hopital, notamment l’attente pour des consultations, des examens ou des traitements. Les systemes d’information deshopitaux ainsi que la planification des conges precoces des hopitaux permettraient eventuellement d’alleger les longuesattentes de conges et d’offrir de meilleurs soins a ces patients.
ABSTRACTThe effects of long-term hospitalizations can be severe, especially among older adults. In Manitoba, between fiscal years1991/1992 and 1999/2000, 40 per cent of acute care hospital days were used by the 5 per cent of patients who had longstays, defined as stays of more than 30 days. These proportions were remarkably stable, despite major changes in thebed supply. Approximately two thirds of long-stay patients were aged 75 or older. Medical record review for a smallsample of long-stay medical patients aged 75 or older revealed that 42 per cent of the days spent in hospital were spenteither awaiting transfer to another level of care (home care, nursing home, or chronic care), or were due to in-hospitalfactors, such as awaiting consults, tests, or treatments. Hospital information systems and early discharge planning mayhelp to alleviate lengthy discharge delays and result in better care for these patients.
Manuscript received: / manuscrit recu : 01/04/03
Manuscript accepted: / manuscrit accepte : 10/11/04
Mots cles : adultes; personnes agees; personnes de 80 ans ou plus; Canada; soins de sante pour les aınes; hospitalisation/statistiques et donnees numeriques; hospitalisation/consommation de medicaments; duree de sejour/statistiques etdonnees numeriques; maisons de soins infirmiers; patients/classement
Keywords: adult; aged; Health Services for the Aged; hospitalization/statistics and numerical data; hospitalization/utilization;length of stay/statistics and numerical data; nursing homes; patients/classification
Requests for offprints should be sent to: / Les demandes de tires-a-part doivent etre addressees a :
Carolyn De Coster, Ph.D., R.N.Manitoba Centre for Health PolicyDepartment of Community Health SciencesUniversity of Manitoba727 McDermot Avenue, Suite 408Winnipeg, MB R3E 3P5([email protected])
Canadian Journal on Aging / La Revue canadienne du viellissement 24 (Suppl. 1) : 97 - 106

IntroductionResearch undertaken by the Manitoba Centre forHealth Policy (MCHP) has found that long-staypatients use a considerable proportion of acute carehospital resources in Manitoba. Black and colleaguesreported that about 2 per cent of fiscal year 1991/1992separations from Manitoba hospitals were for long-stay patients (defined in that study as 60 days ormore), and they consumed 40 per cent of the hospitaldays (Black, Roos, & Burchill, 1993). Rates of long-stayhospital use were highest among persons aged 75years or older: rates were four to five times higherfor this age group compared to persons less than 75years old.
The effects of long-term hospitalization can be severe,especially among older persons. Older patients aremore susceptible to adverse events that can occurduring a hospitalization, irrespective of the under-lying disease (Giraud et al., 1993). Examples of theseadverse events include confusion, phlebitis, urinarytract infection, diarrhea, drug reactions, fractures, andacute renal failure (Kohli et al., 2000; McFarland, 1995;Tepp & Voitk, 1999). Many of these are associatedwith an increased length of stay (Rissanen, Aro, &Paavolainen, 1996), which can be both a risk factorand a result of the adverse event. Hospitalization canbe the initiating event of a treacherous downwardspiral: either the hospitalization itself or the under-lying illness can lead to, say, confusion, which leads toa longer stay, which increases the risk of other adverseevents.
An issue relevant to the discussion of long-staypatients is the appropriateness of their hospitalstays. Some long stays are appropriate and unavoid-able. On the other hand, research has demonstratedthat many long-stay days are consumed by patientswho no longer require acute care. Avoidable hospitaldays may be the result of delays in the system oradministration, such as unavailable outside resources,poor discharge planning, or waits for necessary med-ical orders or consults (Anders, 1993). In a reviewof extended hospital stays in St. John’s, NF, Barrettand colleagues reported that at least 21 per cent ofavoidable hospital days occurred as a result of delaysin discharge planning (Barrett, McDonald, & Parfrey,1994). Mayo and colleagues examined length of stayfor stroke patients in Montreal, and concluded thatthe strongest factors contributing to non-medicallynecessary stays were system-related, not patient-related (Mayo, Wood-Dauphinee, Gayton, & Scott,1997). Similarly, Tracey and colleagues reported thatlong delays in discharge planning were responsiblefor increasing lengths of stay in Belfast (Tracey, Taylor,& McConnell, 1998).
One significant issue for long-stay patients in acutecare hospitals is that of cost. In general, patientswho have longer hospital stays cost more thanpatients with the same condition but shorter stays(Lyketsos, Sheppard, & Rabins, 2000; Stern, Singer& Weissman, 1995; Yuen, Zisselman, Louis, &Rovner, 1997). Furthermore, if patients are waitingin hospital for other arrangements to be made, suchas home care or transfer to a nursing home, the costper day of these alternatives has been found to belower than the marginal cost per hospital day formost diagnoses (Jacobs, Shanahan, Roos, &Farnworth, 1999). On the other hand, long-staypatients consume few of the diagnostic and otherhigh-technology resources in the hospital; if theywere to be discharged and replaced by patientswhose acute care needs were more intense, no costsavings would result (Fine et al., 2000; Hochstein,1985).
This paper will describe the use of Manitoba hospitalsby long-stay patients. First, there will be a descriptionof trends in long-stay hospital use over time, usingadministrative data. Second, some of the factors thatcontribute to long stays will be described; thesefindings are from a review of medical records oflong-stay patients in Winnipeg. Although earlier workat MCHP had defined a long-stay patient as onestaying more than 60 days (Black et al., 1993), for thisstudy a long hospital stay was defined as lastinglonger than 30 days. This change in the definition wasbased on the advice of a working group establishedfor the project, and was supported by earlier researchdemonstrating that after 30 days, only 20 per cent ofmedical patients still needed acute care (De Coster,Peterson, & Kasian, 1996).
MethodsData sources for this study were of two types:medical records of patients hospitalized in Winnipegin 1998/1999, and administrative data from thePopulation Health Research Data Repository(Repository) at MCHP. The repository is a compre-hensive, anonymized database of all patient contactswith hospitals, physicians, and nursing homes. Thehospital discharge file, the health insurance registry,the personal care home (nursing home) file andpublic-use Census 1996 files were used. The reli-ability and validity of the data have been welldocumented (Roos, Sharp, & Cohen, 1991; Rooset al., 1993; Williams & Young, 1997). Both studiesthat contributed to the contents of this paper wereapproved by the University of Manitoba’s HealthResearch Ethics Board.
98 Canadian Journal on Aging 24 (Suppl. 1) C. De Coster et al.

Historical Trends
For the historical trends, the study population wasall adult (18 years or older) long-stay patientshospitalized for a medical or surgical diagnosis ina Manitoba acute care facility between 1991/1992and 1999/2000. The determination of ‘‘medical’’ or‘‘surgical’’ was made on the basis of the mostresponsible diagnosis in the hospital abstract.Psychiatric and obstetric long-stay patients wereexcluded, as were patients in designated long-termcare beds within the acute care system.
The period of the study, 1991/1992 through 1999/2000, was chosen to observe long-stay use before,during, and after major changes in the hospitaland nursing home bed supply. Because long-stayseparations frequently span more than one fiscal year(April 1 to March 31), an ‘‘in-year’’ calculation wasperformed, in which days and patients were allocatedto the fiscal year in which they occurred. For example,if a patient was admitted to hospital on February 15,1997, and discharged on May 15, 1998, there wouldbe 45 days counted in 1996/1997, 365 in 1997/1998,and 45 in 1998/1999.
Medical Record Review
The chart review of long-stay patients was a com-ponent of a larger study assessing the acuity ofpatients hospitalized in Winnipeg in 1998/1999 (Bruceet al., 2001). The charts from a sample of medicalpatients were reviewed using the InterQual utilizationreview instrument. Medical patients were definedaccording to primary service codes, which refer tothe hospital services under which the patient wastreated for the greatest length of time. At least 150records were randomly selected from each ofWinnipeg’s six acute care hospitals, for a totalsample of 907. The sample, generated from thehospital files in the Repository, was representative ofall 1998/1999 medical separations on the followingvariables: mean length of stay, age, sex, mostresponsible diagnosis, and proportion of short- andlong-stay hospitalizations.
InterQual’s 1999 ISD Clinical Decision SupportCriteria were used to assess the appropriateness ofmedical hospitalizations (InterQual, 1999). Thesecriteria have been used in previous Canadian studies(ACCRM, 1997; De Coster, Peterson, Carriere, &Kasian, 1999; Health Services Utilization andResearch Commission, 1994; Joint Policy andPlanning Committee, 1997; Trerise, Dodek, Leung, &Spinelli, 1999; Wright & Cardiff, 1998) and have beenexternally validated (Inglis, Coast, Gray, Peters, &Frankel, 1995; Strumwasser, Paranjpe, Ronis, Share, &Sell, 1990). The InterQual ISD criteria are used to
assess the appropriateness of admission, continuedcare at a particular level, and discharge. In order to bedefined as an appropriate admission, a patient mustpresent to hospital with certain clinical indicators(e.g., abdominal pain), and receive specific treatmentsand/or medications to address the presenting illness.On subsequent days of stay, the patient must receivespecified treatments and/or medications in order tobe assessed as appropriate for an acute care setting.When the patient no longer receives the types andlevels of treatments and/or medications required ofan acute care setting, discharge screens are appliedto determine if a level of physiological stability hasbeen attained that warrants discharge or transfer toanother level of care.
Two Level of Care criteria sets were used for thisstudy: ISD-AC� Acute Care and ISD-SAC� SubacuteCare. The subacute criteria are designed for patientswho require a slower-paced recovery and may be atrisk for acute exacerbation. Although some jurisdic-tions may have separate institutions to provide sub-acute care, in Winnipeg that level of care is providedin acute care hospitals. Therefore, for this study, it wasconsidered appropriate for patients assessed as receiv-ing subacute care to be in an acute care hospital.
The criteria were reviewed by a working group ofmedical and nursing staff, and assessed to beapplicable to the Winnipeg practice environment.The working group also developed a set ofAlternate Level of Care Criteria specific to theWinnipeg practice environment, which were assignedwhen a patient was assessed as not requiring careusing the acute or subacute InterQual criteria sets. Thealternate level of care categories included outpatientservices (primarily diagnostic tests and procedures),home care, palliative care, rehabilitation, personalcare home (nursing home), chronic care, minimalsupervision residence (e.g., supportive housing), andhome.
Three data abstractors completed the medical recordreviews between April and September 2000.Admission was defined as the first 24 hours frompresentation to hospital. Each day after the day ofadmission was termed a ‘‘subsequent day.’’ Each dayof the hospitalization was reviewed using theInterQual criteria sets until the patient was assessedas no longer requiring acute or subacute care. At thispoint, if the patient passed the discharge screen andwas therefore stable enough for discharge, an alter-nate level of care was assigned. Further review of therecord was completed to determine if the patient hadan acute exacerbation; however, if none occurred,there was no further abstraction of data, andall remaining days in hospital were considered
Long-Stay Patients La Revue canadienne du viellissement 24 (Suppl. 1) 99

non-acute. Importantly, if a patient was assessed as nolonger requiring care at the acute or subacute levels,but was also too unstable for discharge, the day wasassessed as an appropriate acute/subacute day.
Within the total sample of 907 records, there were 75patients with stays of longer than 30 days. Fifty-eightrecords of these long-stay patients were randomlyselected for more in-depth review of the factorsrelating to their long stays in hospital. The purposeof this analysis was to inform our understanding ofthe factors that contributed to long stays; it was notintended that the sample be representative of thepopulation. A pilot review of 30 long-stay hospitaliza-tions at one of Winnipeg’s teaching hospitals had beencompleted by one of the authors (SB) in January 2000.This pilot review identified broad factors associatedwith long stays, and guided the development of along-stay data-abstraction instrument used for theanalysis described in this paper. The instrumentcontained information on
1. Patient history: age, sex, reason for hospitalization,past medical history, type of residence pre-admission,discharge destination, functional status pre-admission
2. Course in hospital: consultations, treatments received,in-hospital events, status reports
3. Discharge planning: details of all discussion regardingdischarge (including dates), disciplines involved, datesarrangements were initiated, dates services were inplace, role of family in discharge plans, any barriers todischarge
Qualitative content analysis was completed todevelop categories of reasons for long hospital stays.In addition, non-acute days were quantified into thecorresponding broad qualitative categories. Of the 58long-stay records in the in-depth review, 39 records(67%) were for patients aged 75 or older, and will bedescribed in this paper. The selection of that age wasbased on an earlier study, which demonstrated thatpatients aged 75 or older consumed a significantlyhigher proportion of non-acute days than patientswho were younger (De Coster, Roos, Carriere, &Peterson, 1997).
Findings
Historical Trends
The population of Manitoba in June 2000 was 1.15million people, of which 650,000 (57%) lived in theprovincial capital, Winnipeg. Approximately sevenper cent of Manitoba’s population was aged 75 yearsor older. The province comprised 12 regional healthauthorities (RHAs), one of them being Winnipeg.The other RHAs ranged in population size from
1,000 to 97,000. The distribution of hospital bedsreflected the population distribution: as of March 31,2000, there were nearly 4,000 acute care hospitalbeds in Manitoba, 56 per cent in Winnipeg. Twoteaching, tertiary-care hospitals are in Winnipeg.Outside of Winnipeg, the only urban communityhospital is located in Brandon, the province’s second-largest city.
From 1991/1992 through 1999/2000, there were47,379 long-stay adult medical or surgical patients inManitoba acute care hospitals, and they consumed4,075,828 days. Sixty-three per cent of both cases anddays took place in Winnipeg acute care hospitals. Thepattern for long-stay medical days followed thedistribution of the population: about 45 per centtook place in non-Winnipeg hospitals and 55 per centin Winnipeg. However, roughly 85 per cent of long-stay surgical days occurred in Winnipeg hospitals.
The proportion of cases and days that were usedby long-stay patients remained remarkably stableover the study period. In each year in Manitoba,five per cent of acute hospital patients and roughly40 per cent of acute hospital days were for patientswho stayed longer than 30 days. Patterns weresimilar in Winnipeg and non-Winnipeg hospitals(Figure 1). In Winnipeg, five to seven per cent ofcases and 37 to 43 per cent of days were long-stay,while in the rest of Manitoba the proportions wereslightly lower: four to five per cent of cases and 35 to41 per cent of days. Although there were noticeablefluctuations from year to year for each RHA outsideof Winnipeg (data not shown), as a whole the non-Winnipeg area was stable.
One might expect that with changes in the bed supply,there would be changes in the extent to which acutecare hospitals are used by long-stay patients. Table 1shows the proportion of acute hospital days that wereattributed to long-stay patients in each year, alongwith the changes in the hospital and nursing home(NH) bed supply. Over the study period, 808 (26.6%)hospital beds closed, and 994 nursing home beds wereadded, a 21.6 per cent increase. Yet consistently, about40 per cent of acute care hospital days in Winnipegwere consumed by patients who stayed longer than 30days. As an example, over 1992/1993 and 1993/1994,509 hospital beds closed and 288 nursing home bedsopened. This big shift in resources was accompaniedby a drop in the proportion of long-stay days of only3.5 per cent, from 40.1 per cent in 1992/1993 to 36.6per cent in 1993/1994, and it rebounded to 40 per centin the subsequent two years.
Table 2 shows similar data for non-Winnipeg hospi-tals. In general, the proportion of acute care hospitaldays used by long-stay patients is slightly lower
100 Canadian Journal on Aging 24 (Suppl. 1) C. De Coster et al.

outside Winnipeg, at roughly 36 per cent, comparedto Winnipeg at approximately 40 per cent. Similar tothose of Winnipeg, though, the proportions remainedstable despite net closures of 501 hospital beds,representing a 22.4 per cent decrease from 2,240 to
1,739 beds. The nursing home bed supply increasedby 5.6 per cent from 3,813 to 4,027.
The issue of long stays in acute care hospitals isrelevant for older adults. In this study, 62.4 per cent of
0%
5%
10%
15%
20%
25%
30%
35%
40%
45%
1991/92 1992/93 1993/94 1994/95 1995/96 1996/97 1997/98 1998/99 1999/00
Per
cen
t o
f al
l cas
es a
nd
day
s th
at w
ere
lon
g s
tay
Wpg cases Wpg days Non-Wpg cases Non-Wpg days
Figure 1: Long stay cases and days, per cent of all cases and days in Winnipeg and non-Winnipeg acute carehospitals, 1991/1992–1999/2000.
Table 2: Long-stay days and changes in hospital andnursing home (NH) bed supply, non-Winnipeg
Non-WinnipegChange inHospital Beds
Change inNH Beds
Long-StayDays (% ofall days)
Number at Start 2,240 3,813
91/92 �8 (� 0.4%) þ89 (2.3%) 37.7%
92/93 �83 (�3.7%) þ59 (1.5%) 36.1%
93/94 �73 (�3.4%) þ9 (0.5%) 37.3%
94/95 �9 (�0.4%) �6 (�0.2%) 36.4%
95/96 �106 (�5.1%) þ27 (0.7%) 39.7%
96/97 �102 (�5.2%) þ27 (0.7%) 40.5%
97/98 �89 (�4.8%) �6 (�0.2%) 37.8%
98/99 þ34 (1.9%) �25 (�0.6%) 38.0%
99/00 �65 (�3.6%) þ30 (0.8%) 35.0%
Cumulative �501 (�22.4%) þ214 (5.6%)
Number at End 1,739 4,027
Table 1: Long-stay days and changes in hospital andnursing home (NH) bed supply in Winnipeg
WinnipegChange inHospital Beds
Change inNH Beds
Long-StayDays (% ofall days)
Number at Start 3,042 4,598
91/92 �29 (�1.0%) þ58 (1.3%) 39.0%
92/93 �306 (�10.2%) þ52 (1.1%) 40.1%
93/94 �209 (�7.7%) þ236 (5.0%) 36.6%
94/95 �38 (�1.5%) �2 (0.0%) 38.8%
95/96 �76 (�3.1%) �47 (�1.0%) 39.8%
96/97 �73 (�3.1%) þ30 (0.6%) 41.0%
97/98 þ4 (0.2%) þ193 (3.9%) 40.9%
98/99 �146 (�6.3%) þ280 (5.5%) 42.8%
99/00 þ65 (3.0%) þ194 (3.6%) 41.6%
Cumulative �808 (�26.6%) þ994 (21.6%)
Number at End 2,234 5,592
Long-Stay Patients La Revue canadienne du viellissement 24 (Suppl. 1) 101

the long-stay patients were aged 75 or older and theyconsumed 67.1 per cent of the long-stay days. Thedistribution of days used by medical and surgicalpatients differed between those aged 75 or older andthose who were younger. Whereas 38.7 per cent oflong-stay days were for surgical reasons in patientsless than 75 years old, only 23.6 per cent of long-staydays were for surgical diagnoses for patients aged 75or older. The distribution between Winnipeg and non-Winnipeg hospitals was also different. In Winnipeghospitals, 58.2 per cent of the long-stay cases wereaged 75 or older, and they consumed 63.6 per centof the long-stay days, whereas in non-Winnipeghospitals, 69.6 per cent of the long-stay caseswere aged 75 or older, consuming 73.0 per cent ofthe long-stay days.
Administrative data can tell us that a large proportionof long-stay cases and days were for persons aged 75or older, but administrative data cannot tell us whythese patients had long stays and whether or not theywere appropriate. Medical record review providessome indications of the reasons that older patientshad long stays in hospital.
Medical Record Review
An in-depth review of medical records was conductedfor 39 long-stay patients who were aged 75 years orolder; 21 (54%) were female and 18 were male. Theages of patients included in the review ranged from 77to 98 years; the mean and median ages were 84.6 and84.0 years, respectively. The majority of patients
(34/39, or 87%) were admitted to hospital fromhome. Fourteen patients (36%) were functioningindependently prior to their admission, meaningthey were independent in the management of theiractivities of daily living and were not receiving anyoutside services such as home care. Eighteen patients(46%) were receiving home care services, while theremaining seven patients were dependent on theirfamilies for their everyday care or were residents ofsome type of care facility. At separation, 17 patients(44%) were discharged home, 15 (38%) were dis-charged to a nursing home, and the remaining sevenpatients went to rehabilitation hospitals or supportivehousing, or died.
This group of 39 patients spent a total of 3,381 daysin hospital. The length of stay ranged from 31 to 263days; the mean and median were 86.7 and 64.5 days,respectively. Thirty-five per cent (1,193/3,381) of thetotal in-hospital days were assessed as either acute orsubacute, and 65 per cent (2,188/3,381) of in-hospitaldays were assessed as non-acute and requiring ser-vices provided in an alternate setting. The remainderof the discussion relates to the 65 per cent of daysassessed as requiring an alternate level of care.
Content analysis of medical records revealed fourmajor categories of factors associated with extendedstays by non-acute patients on acute care medicalunits (see Figure 2):
1. Patients receiving rehabilitation and assessment forappropriate discharge destination
Days spent awaiting NH orchronic care placement
46%
Days assigned to rehabilitationservices
30%
Days related to in-hospital factors10%
Days assigned to palliative care5%
Days spent awaiting home care8%
Days spent awaiting bed inanother hospital
1%
Figure 2: Factors associated with non-acute days spent in hospital by long-stay patients aged 75 or older, Winnipeg,1998/1999 (39 patients, 2188 non-acute days)
102 Canadian Journal on Aging 24 (Suppl. 1) C. De Coster et al.

2. Medically stable patients for whom the dischargeprocess had begun and who were:
. Awaiting panelling (i.e., approval by a review panelfor nursing home admission)
. Awaiting placement post-panel
. Awaiting arrangement of home care services and/orcommunity placement
. Awaiting a bed in a non-panel situation (e.g.,another hospital)
3. Medically stable patients remaining in hospital becauseof in-hospital factors
4. Patients receiving palliative care
Over half (55%) of the non-acute days were spentawaiting placement at another level of care, includingnursing home or chronic care (46%), home care orother community placement (8%), or an acute bedin another hospital (1%). These were patients whowere assessed as medically stable, and for whomdischarge arrangements had begun. Of the daysspent awaiting transfer to a nursing home or chroniccare, 17 per cent of all non-acute days were spentafter the application forms were submitted butprior to approval, and a further 29 per cent of non-acute days were spent awaiting placement afterapproval.
Thirty per cent (657/2,188) of the non-acute daysspent in acute care medical beds were assigned topatients receiving rehabilitation services provided byphysiotherapy to increase strength and enduranceprior to discharge. These patients were also beingassessed for services such as occupational therapy,geriatrics, and home care to determine functionalstatus for a safe discharge location. Five per cent ofnon-acute days (105/2,188) spent in acute caremedical beds were assigned to patients who requiredin-hospital palliative care services.
Ten per cent (229/2,188) of non-acute days weredetermined to be the result of in-hospital factorssuch as delays in response to consultations, andtime spent waiting for diagnostic tests, treatments,and procedures. A delayed response to a consulta-tion was determined on the basis of an accompany-ing note in the patient record indicating that aparticular care giver perceived the response byanother professional member to be slow. Anotheraspect to this category concerns patients whoremained in hospital awaiting a diagnostic test,treatment, or procedure, but were otherwise readyfor discharge. Examples of diagnostic tests includebiopsy, bronchoscopy, and angiogram. Patients alsoremained in hospital awaiting coronary bypasssurgery, and outpatient radiation therapy at anotherfacility.
DiscussionA considerable proportion of acute care hospital daysin Manitoba are consumed by a small proportion ofpatients with stays greater than 30 days: from 1991/1992 through 1999/2000, approximately five per centof patients consumed 40 per cent of hospital days.Two-thirds of these long-stay days were spent bypatients who were aged 75 or older. This finding issimilar to the age-distribution for overall hospital use:Menec and colleagues, in their study on the health ofManitoba seniors, noted that two thirds of all hospitaldays were used by persons aged 65 or older (Menec,MacWilliam, Soodeen, & Mitchell, 2002).
A medical record review of a sample of long-staymedical patients aged 75 or older in Winnipegdemonstrated that 35 per cent of their days of staywere acute or subacute. This is an important finding.There may be a prevailing notion that long-staypatients, especially older long-stay patients, areoccupying beds unnecessarily. The analysis of medicalrecord data indicated that although these patientsdid consume a disproportionate share of hospitalresources, at least one third of the days they con-sumed required a level of care available only inan acute care hospital. Furthermore, although 65 percent of the long-stay days did not require the levelof services available only in an acute care hospitalunit, most of these non-acute days (90%) were spentbecause some form of care was required, whether itwas rehabilitation, palliation, long-term institution-alization, or home care. The question arises as towhether an acute care hospital unit was the best placefor these patients to be. In Winnipeg, rehabilitationand palliation are provided in specialized units inacute care hospitals; however, the patients in thischart review were not in those specialized units, butinstead, occupied acute care medical beds whilereceiving palliation or rehabilitation. The type ofnursing, medical care, and support services requiredby patients who need rehabilitation or palliation isdifferent from acute medical care; therefore, thesepatients may not have been receiving optimal care.
Long hospital stays carry considerable risks topatients, especially to older patients. As Kozyrskyjand colleagues illustrated in their analysis of dis-charge outcomes for long-stay patients, longer staysare associated with a higher likelihood of either deathor institutionalization, even after adjusting for age,sex, diagnosis, and the presence of co-morbidities(Kozyrskyj, Black, Chateau, & Steinbach, 2005, thisissue). Older patients are at increased risk of anadverse event, and the risk increases with the lengthof stay in hospital. Rates of adverse events vary.Studies have cited rates in the older population of
Long-Stay Patients La Revue canadienne du viellissement 24 (Suppl. 1) 103

from five per cent to as high as 58 per cent (Brennanet al., 1991; De la Sierra et al., 1989; Lefevre et al., 1992;Thomas & Brennan, 2000). Estimates of the rate ofpreventable adverse events vary from a low ofthree per cent to a high of 36 per cent (Leape et al.,1991; Lefevre et al., 1992; Thomas & Brennan, 2000).Age is often described as a risk factor for adverseevents, although when adjustments are made forother risk factors, age is less important (De la Sierra etal., 1989; Thomas & Brennan, 2000). Whether or notage is truly an independent risk factor, older personsare more likely to be at greater risk because of theirhigher level of illness and the presence of moreco-morbidities.
Long-stay patients awaiting transfer to a long-term-care institution, such as a nursing home or chroniccare, used the largest proportion (46%) of the non-acute hospital days. Yet the degree to which hospitalsare used by long-stay patients seemed virtuallyunaffected by an increase in the number of nursinghome beds available. In Winnipeg, the nursing homebed supply increased 22 per cent over the periodunder study, yet the proportion of hospital days usedby long-stay patients remained stable.
There may be several reasons why opening morenursing home beds did not ‘‘solve the problem’’ oflong-stay patients in acute care hospitals. First, whilethe nursing home bed supply increased, so too did thepopulation aged 75 or older, by 26 per cent overthe time period. Hence, there was a net 3.6 per centdecrease in the number of beds per 1,000 popula-tion aged 75 or older. Nevertheless, Winnipeg andManitoba are well-supplied with nursing home beds;the Canadian average in 2000 was 101 nursing homebeds per 1,000 persons aged 75 or older, whereasManitoba’s ratio was 126, and Winnipeg’s 128(Winnipeg Regional Health Authority, 2001).Another reason that the increase in nursing homebeds did little to affect the proportion of hospital daysused by long-stay patients is that the majority of long-stay patients do not go to a nursing home. Manitobadata have shown that only about 15 per cent of long-stay patients are discharged to a nursing home,whereas approximately half go home (De Coster &Kozyrskyj, 2000; Kozyrskyj et al., 2005, this issue).Therefore, reducing the use of hospital beds by long-stay patients is a complex issue, and the availabilityof nursing home beds appears to be only part of thesolution.
While some research suggests that the use of acutecare hospital resources by long-stay patients is a costissue, the evidence, as noted earlier, is equivocal inthat regard. Rather, the issue is one of quality: long-stay patients awaiting transfer to another level of care
may not be receiving care that is appropriate to theirneeds. In fact, patients who are waiting for transfer toanother facility or who are waiting for dischargehome with home care may actually suffer setbackswhile they are waiting. The hospital environmentdoes not generally promote the restoration of inde-pendence and the resumption of activities of dailyliving that occur at home, nor does it typically offerthe social, occupational, and recreational programsthat are available in nursing homes (Campion, Bang,& May, 1983; Palmer, 1995).
The medical record review found that 10 per cent ofthe non-acute long-stay days were a result ofhospital factors; this finding may be the mostamenable to modification. There were two maincategories of in-hospital delays. First, there weredelays in response to a request for a consultation, asituation that might be improved by better informa-tion management systems. A delayed consultationcould be identified only by an abstractor based on anote in the patient record, a definition that likelymissed some delayed responses for which there wasno accompanying note. Therefore, the magnitude ofthis delay might in fact be even greater than ourestimate.
The second reason for in-hospital delays was wait-ing for a test, treatment, or procedure, a result ofhospital policies that give hospitalized patientspriority over outpatients. On the face of it, thispolicy makes sense, because it assumes that patientswho are in hospital are sicker than patients who arenot hospitalized. On the other hand, this policy canresult in perverse incentives to keep patients, whoare otherwise ready for discharge, in hospital longerthan necessary. It should be noted that discharge wasnot contingent on the results of the tests; patientswere discharged after the test had taken place butbefore the results had been received. A system thatused standardized criteria to prioritize patientsmight help to reduce this inappropriate use ofhospital beds.
In summary, a considerable proportion of acute carehospital days in Manitoba are consumed by a fewpatients (5%) who have stays longer than 30 days.Over 60 per cent of these long-stay patients were aged75 or older. Medical record review suggests that manyof these days are spent by patients who do not requirethe level of care that can be found only in a hospital:for a small sample of long-stay medical patients aged75 or older, 42 per cent of the days spent in hospitalwere spent either awaiting transfer to another type ofcare (home care, nursing home, or chronic care), orwere due to in-hospital delays. Unnecessarily longstays place patients, especially older patients, at
104 Canadian Journal on Aging 24 (Suppl. 1) C. De Coster et al.

greater risk of deterioration, functional decline, or anadverse hospital event. Hospital information systemsand early discharge planning may help to alleviatelengthy discharge delays and result in better care forthese patients.
References
Advisory Committee on Clinical Resource Management.(1997). Acute medical beds: How are they used in BritishColumbia? Victoria, BC: Ministry of Health and MinistryResponsible for Seniors.
Anders, R.L. (1993). Administrative delays: Is there adifference between for-profit and non-profit hospitals?Journal of Nursing Administration, 23(11), 42–50.
Barrett, B.J., McDonald, J.R., & Parfrey, P.S. (1994). Extendedstay in acute care hospitals: A study to identifydeterminants and potential interventions. Annals(Royal College of Physicians and Surgeons of Canada),27(3), 140–144.
Black, C.D., Roos, N.P., & Burchill, C.A. (1993). Utilization ofhospital resources: Vol. 2. Methods and tables. Winnipeg:Manitoba Centre for Health Policy and Evaluation.
Brennan, T.A., Leape, L.L., Laird, N.M., Hebert, L.,Localio, A.R., Lawthers, A.G., Newhouse, J.P.,Weiler, P.C., & Hiatt, H.H. (1991). Incidence ofadverse events and negligence in hospitalizedpatients: Results of the Harvard Medical PracticeStudy I. New England Journal of Medicine, 324(6),370–376.
Bruce, S., De Coster, C., Trumble Waddell, J., Burchill, C.A.,& De Haney, S. (2001). Acuity of patients hospitalizedfor medical conditions at Winnipeg acute care hospitals.Winnipeg: Manitoba Centre for Health Policy andEvaluation.
Campion, E.W., Bang, A., & May, M.I. (1983). Why acutecare hospitals must undertake long-term care. NewEngland Journal of Medicine, 308(2), 71–75.
De Coster, C., & Kozyrskyj, A. (2000). Long-stay patients inWinnipeg acute care hospitals. Winnipeg: ManitobaCentre for Health Policy and Evaluation.
De Coster, C., Peterson, S., Carriere, K.C., & Kasian, P.(1999). Assessing the extent to which hospitals areused for acute care purposes. Medical Care, 37(Suppl. 6),JS151–JS166.
De Coster, C., Peterson, S., & Kasian, P. (1996). Alternatives toacute care. Winnipeg: Manitoba Centre for Health Policyand Evaluation.
De Coster, C., Roos, N.P., Carriere, K.C., & Peterson, S.(1997). Inappropriate hospital use by patients receivingcare for medical conditions: Targeting utilizationreview. Canadian Medical Association Journal, 157(7),889–896.
De la Sierra, A., Cardellach, F., Cobo, E., Bove, A., Roige, M.,Santos, M.J., Ingelmo, M., & Urbano-Marquez, A.(1989). Iatrogenic illness in a department of generalinternal medicine: A prospective study. Mount SinaiJournal of Medicine, 56(4), 267–271.
Fine, M.J., Pratt, H.M., Obrosky, D.S., Lave, J.R.,McIntosh, L.J., Singer, D.E., Coley, C.M., & Kapoor,W.N. (2000). Relation between length of hospital stayand costs of care for patients with community-acquiredpneumonia. American Journal of Medicine, 109(5),378–385.
Giraud, T., Dhainaut, J.F., Vaxelaire, J.F., Joseph, T.,Journois, D., Bleichner, G., Sollet, J.P., Chevret, S., &Monsallier, J.F. (1993). Iatrogenic complications in adultintensive care units: A prospective two-center study.Critical Care Medicine, 21(1), 40–51.
Health Services Utilization and Research Commission.(1994). Barriers to community care. Saskatoon: Author.
Hochstein, A. (1985). Treating long-stay patients in acutehospital beds: An economic diagnosis. Gerontologist,25(2), 161–165.
Inglis, A.L., Coast, J., Gray, S.F., Peters, T.J., & Frankel, S.(1995). Appropriateness of hospital utilization. MedicalCare, 9, 952–957.
InterQual. (1999). ISD-AC Intensity of Service Severityof Illness Discharge Services. Marlborough, MA:InterQual, Division of Access Health, Inc.
InterQual. (1999). ISD-SAC Intensity of Service Severityof Illness Discharge Services. Marlborough, MA:InterQual, Division of Access Health, Inc.
Jacobs, P., Shanahan, M., Roos, N.P., & Farnworth, M.G.(1999). Cost list for Manitoba Health Services. Winnipeg:Manitoba Centre for Health Policy and Evaluation.
Joint Policy and Planning Committee. (1997). Non-acutehospitalization report (adult). Toronto: Author.
Kohli, H.S., Bhaskaran, M.C., Muthukumar, T., Thennarasu,K., Sud, K., Jha, V., Gupta, K.L., & Sakhuja, V. (2000).Treatment-related acute renal failure in the elderly: Ahospital-based prospective study. Nephrology, Dialysis,Transplantation, 15(2), 212–217.
Kozyrskyj, A., Black, C., Chateau, D., & Steinbach, C. (2005).Discharge outcomes in seniors hospitalized for morethan 30 days. Canadian Journal of Aging, 24(Suppl. 1),107–119.
Leape, L.L., Brennan, T.A., Laird, N., Lawthers, A.G.,Localio, A.R., Barnes, B.A., Hebert, L., Newhouse, J.P.,Weiler, P.C., & Hiatt, H. (1991). The nature of adverseevents in hospitalized patients: Results of the HarvardMedical Practice Study II. New England Journal ofMedicine, 324(6), 377–384.
Lefevre, F., Feinglass, J., Potts, S., Soglin, L., Yarnold, P.,Martin, G.J., & Webster, J.R. (1992). Iatrogenic
Long-Stay Patients La Revue canadienne du viellissement 24 (Suppl. 1) 105

complications in high-risk, elderly patients. Archives ofInternal Medicine, 152(10), 2074–2080.
Lyketsos, C.G., Sheppard, J.M., & Rabins, P.V. (2000).Dementia in elderly persons in a general hospital.American Journal of Psychiatry, 157(5), 704–707.
Mayo, N.E., Wood-Dauphinee, S., Gayton, D., & Scott, S.C.(1997). Nonmedical bed-days for stroke patientsadmitted to acute care hospitals in Montreal, Canada.Stroke, 28(3), 543–549.
McFarland, L.V. (1995). Epidemiology of infectious andiatrogenic nosocomial diarrhea in a cohort of generalmedicine patients. American Journal of Infection Control,23(5), 295–305.
Menec, V.H., MacWilliam, L., Soodeen, R., & Mitchell, L.(2002). The health and health care use of Manitoba’s seniors:Have they changed over time? Winnipeg: Manitoba Centrefor Health Policy.
Palmer, R.M. (1995). Acute hospital care of the elderly:Minimizing the risk of functional decline. ClevelandClinic Journal of Medicine, 62(2), 117–128.
Rissanen, P., Aro, S., & Paavolainen, P. (1996). Hospital- andpatient-related characteristics determining lengthof hospital stay for hip and knee replacements.International Journal of Technology Assessment in HealthCare, 12(2), 325–335.
Roos, L.L., Mustard, C.A., Nicol, J.P., McLerran, D.F.,Malenka, D.K., Young, K.T., & Cohen, M.M. (1993).Registries and administrative data: Organization andaccuracy. Medical Care, 31(3), 201–212.
Roos, L.L., Sharp, S.M., & Cohen, M.M. (1991). Comparingclinical information with claims data: Some similaritiesand differences. Journal of Clinical Epidemiology, 44(9),881–888.
Stern, S.H., Singer, L.B., & Weissman, S.E. (1995).Analysis of hospital cost in total knee
arthroplasty: Does length of stay matter? ClinicalOrthopedics, 321, 36–44.
Strumwasser, I., Paranjpe, N.V., Ronis, D.L., Share, D., &Sell, L.J. (1990). Reliability and validity of utilizationreview criteria. Medical Care, 28, 95–109.
Tepp, J., & Voitk, A. (1999). Hip fracture as a complicationof hospitalization. International Journal of Health CareQuality Insurance Incorporating Leadership in HealthServices, 12(6–7), x–xiii.
Thomas, E.J., & Brennan, T.A. (2000). Incidence and typesof preventable adverse events in elderly patients:Population based review of medical records. BritishMedical Journal, 320(7237), 741–744.
Tracey, F., Taylor, I.C., & McConnell, J.G. (1998). Aprospective study of the process of assessmentand care management in the discharge of elderlypatients from hospital. Ulster Medical Journal, 67(1),36–40.
Trerise, B., Dodek, P., Leung, A., & Spinelli, J.J. (1999).Inappropriate underutilization of services in an acute carehospital. Vancouver: Centre for Health Evaluation andOutcome Sciences.
Williams, J.I., & Young, W. (1997). Inventory of studies onthe accuracy of Canadian health administrative databases.Toronto: Institute for Clinical Evaluative Sciences.
Winnipeg Regional Health Authority. (2001). Strategic direc-tions for the Personal Care Home Program. Winnipeg:Author.
Wright, C.J., & Cardiff, K. (1998). The utilization of acute caremedical beds in Prince Edward Island. Vancouver: Centrefor Health Services and Policy Research.
Yuen, E.J., Zisselman, M.H., Louis, D.Z., & Rovner, B.W.(1997). Sedative-hypnotic use by the elderly: Effects onhospital length of stay and costs. Journal of Mental HealthAdministration, 24(1), 90–97.
106 Canadian Journal on Aging 24 (Suppl. 1) C. De Coster et al.

Discharge Outcomes in Seniors Hospitalizedfor More than 30 Days
Anita L. Kozyrskyj,1,2 Charlyn Black,3 Dan Chateau,1 and Carmen Steinbach1
RESUMEL’hospitalisation constitue un precurseur de la perte d’autonomie pour de nombreux aınes. Cette etude sur leshospitalisations de longue duree (plus de 30 jours) visait a determiner les facteurs de risque qui incitent les personnesagees a ne pas retourner a la maison, de determiner les caracteristiques des patients ayant des facteurs de risque et quiont choisi de retourner a la maison ainsi que de decrire les consequences pouvant survenir dans l’annee qui suit lasortie de l’hopital. A l’aide des bases de donnees sur les soins de sante du Manitoba, les probabilites d’un deces al’hopital, d’un conge vers une maison de soins infirmiers et d’un transfert vers un autre hopital ont ete determineespour un ensemble de facteurs de risques chez les aınes ayant subi des hospitalisations de longue duree dans leshopitaux de courte duree de Winnipeg. Des 17 984 personnes hospitalisees pour une longue periode entre1993 et 2000,45 p. 100 ont pu retourner chez elles, 20 p. 100 sont decedees et 30 p. 100 ont ete transferees dans une maison de soinsinfirmiers ou un autre hopital. Les aınes qui avaient recu des soins a domicile avant leur hospitalisation avaient plus dechances d’obtenir un conge dans une maison de soins infirmiers ou de mourir a l’hopital que de retourner chez elles. Laprobabilite d’etre envoye dans une maison de soins infirmiers augmentait dans le cas d’accidents cerebraux vasculaireset de troubles cognitifs. Les aınes atteints de tumeurs, de multiples comorbidites et qui sont restes plus de 120 joursetaient plus susceptibles de mourir a l’hopital. Les patients de longue duree qui avaient des facteurs de risque et quisont retournes chez eux avaient peu de comorbidites. Dans l’annee qui a suivi la sortie de l’hopital, 20 p. 100 des aınessont decedes, 5 a 15 p. 100 d’entre eux ont ete admis dans une maison de soins infirmiers ou un etablissement de soinsde longue duree et 26 a 35 p. 100 des personnes ont ete de nouveau hospitalisees a partir de leur domicile. Enfin, 37p. 100 des personnes n’ont subi aucune de ces consequences. Nos conclusions mettent l’accent sur des moyenspossibles de reduire les consequences notees apres un sejour a l’hopital et d’ameliorer les services de soutien pour lesaınes.
ABSTRACTHospitalization is a sentinel event that leads to loss of independence for many seniors. This study of long-stayhospitalizations (more than 30 days) in seniors was undertaken to identify risk factors for not going home, tocharacterize patients with risk factors who did go home and to describe one year outcomes following home discharge.Using Manitoba’s health care databases, the likelihood of death in hospital, discharge to a nursing home, and transfer toanother hospital was determined for a set of risk factors in seniors with long-stay hospitalizations in Winnipeg’s acutehospitals. Of the 17,984 long-stay hospitalizations during 1993–2000, 45 per cent were discharged home, 20 per centdied, and 30 per cent were discharged to a nursing home or another hospital. Seniors who received home care prior tohospitalization were more likely to be discharged to a nursing home or die in hospital than to go home. Stroke andcognitive impairment increased the likelihood of discharge to a nursing home. Seniors with neoplasms, multipleco-morbidities, and length-of-stay more than 120 days were more likely to die in hospital. Long-stay patients withrisk factors who did go home had few co-morbidities. Within one year of home discharge, 20 per cent of seniors died,5–15 per cent were admitted to a nursing home or long-term care institution, and 26–35 per cent of persons werere-hospitalized from home. A full 37 per cent experienced none of these outcomes. Our findings point to opportunitiesto improve discharge outcomes and plan support services for seniors.
1 Manitoba Centre for Health Policy, Department of Community Health Services, University of Manitoba
2 Faculty of Pharmacy, University of Manitoba
3 Centre for Health Services and Policy Research, University of British Columbia
Manuscript received: / manuscrit recu : 01/04/03
Manuscript accepted: / manuscrit accepte : 10/02/04
Mots cles : personnes agees; hospitalisation; maisons de soins infirmiers; mortalite; services de soins a domicile; comorbidite
Keywords: aged; hospitalization; nursing homes; mortality; home care services; co-morbidity
Canadian Journal on Aging / La Revue canadienne du viellissement 24 (Suppl. 1) : 107 - 119

Requests for offprints should be sent to: / Les demandes de tires-a-part doivent etre addressees a :
Anita L. Kozyrskyj, B.Sc.Phm., Ph.D.Manitoba Centre for Health PolicyDepartment of Community Health SciencesUniversity of Manitoba727 McDermot Avenue, Suite 408Winnipeg, MB R3E 3P5([email protected])
BackgroundIndependent living in the community, which is adesirable state for many seniors, may be interruptedby a change in health status, leading to hospitaliza-tion, nursing home placement, functional impairment,and death. Hospitalization is a sentinel event thatfrequently marks a transition from independent livingto institutionalized long-term care or death (Miller &Weissert, 2000). Two Manitoba studies and one inNova Scotia have documented that, independentof other risk factors, admission to hospital resultedin a twofold increase in the probability of place-ment in a long-term care facility or nursing home(Glazebrook, Rockwood, Stolee, Fisk, & Gray, 1994;Shapiro & Tate, 1985; Tomiak, Berthelot, Guimond, &Mustard, 2000).
A number of Canadian studies of elder cohorts livingin the community have identified the following socialand health conditions as risk factors for nursing homeor long-term care facility residence: increasing age,living alone/absence of caregiver, limitations inactivities of daily living, self-reported poor health,urban residence, and lower socio-economic status(Carriere & Pelletier, 1995; Glazebrook et al., 1994;Mustard, Finlayson, Derksen, & Berthelot, 1999;Rockwood, Stolee & McDowell, 1996; Shapiro &Tate, 1985; Tomiak et al., 2000; Trottier, Martel,Houle, Berthelot, & Legare, 2000). Similar predictorsof institutionalized care have been reported in otherWestern countries (Breeze, Sloggett, & Fletcher, 1999;D’Agostino, Belanger, Markson, Kelly-Hayes, &Wolf, 1995; Glazebrook et al., 1994). Specific medicalconditions that have promoted the institutionalizationof seniors have included stroke, dementia, andurinary incontinence (Glazebrook et al., 1994;Rockwood et al., 1996; Thom, Haan, & Van DenEeden, 1997; Tomiak et al., 2000; Trottier et al., 2000).Use of home care in the community has also predictednursing home admission (Liu, Coughlin, & McBride,1991).
Evaluations of outcomes following hospitalizationof seniors have documented similar predictors ofnursing home placement: increasing age, femalegender, the presence of a chronic condition, livingalone, impaired cognitive status, limitation in daily
activities, and number of medications (Alarcon,Barcena, Gonzalez-Montalvo, Penalosa, & Salgado,1999; Kane, Matthias, & Sampson, 1983; Wachtel,Derby, & Fulton, 1984; Wolinsky, Callahan, Fitzgerald,& Johnson, 1992; Zureik et al., 1995). Many of thesefactors are pre-admission characteristics. However,loss of function during hospitalization, including thatresulting from iatrogenic complications, can compro-mise the outcome of hospitalization, especially in theelderly. According to Palmer (1995), 25–60 per cent ofolder patients in hospital for an acute illness risk someloss of independent physical functioning. In-hospitalcomplication rates – such as falling, confusion, andnot eating – have been reported to be higher in elderlythan in younger patients (Gillick, Serrell, & Gillick,1982). Rudberg Sager, & Zhang (1996) categorizeddeterminants of hospital discharge into pre-hospitaland post-hospital events and found that increasingage, living alone, hospital site, and pre-hospitallimitations in activity predicted discharge to a nursinghome (Rudberg, Sager, & Zhang, 1996). Independentof pre-hospital measures, increased length of hospitalstay and diminished function over the hospitalizationwere also significantly associated with nursing homeplacement.
Socio-demographic factors such as low-income statusor living alone are well known to increase mortalityamong the middle-aged and elderly (Breeze et al.,1999). Additional factors that increase the risk amongseniors of requiring assistance and dying in the com-munity include older age, male gender, limitations inactivity, and use of home care (Liu et al., 1991). Oncehospitalized, patients with multiple co-morbidities,functional impairment, or polypharmacy (receivingmore than five drugs) are more likely to die (Alarconet al., 1999; Inouye et al., 1999). For hospitalizedpatients in whom death is not unexpected, researchindicates that fewer people are able to die at homethan would wish to. Persons living alone, olderpatients, and women are more likely to die in hospitalthan at home (Grande, Addington-Hall, & Todd,1998). Others have found that younger age, notbeing married, and non-cancer diagnoses were asso-ciated with an increased risk of in hospital death;however, the strongest predictor of dying in hospital
108 Canadian Journal on Aging 24 (Suppl. 1) A. L. Kozyrskyj et al.

was the hospital referral region (Pritchard et al., 1998).Lower socio-economic status has been found to beassociated with a lower likelihood of dying at home inpersons with cancer (Higginson, Jarman, Astin, &Dolan, 1999).
Previous research at the Manitoba Centre for HealthPolicy (MCHP) (De Coster & Kozyrskyj, 2000) hasdocumented that among Manitobans hospitalized formore than 30 days, 13 per cent of patients weredischarged to a nursing home, 20 per cent died inhospital, and 14 per cent were transferred to anotherinstitution. However, over 50 per cent of long-staypatients did go home. What factors predict whichseniors will be discharged home or who will beinstitutionalized? Could this knowledge improve thehospital discharge process to ensure that seniorsreceive the necessary services in the community orin the institution? Could knowledge of the risk factorsresult in health system modifications to decreaseunnecessary institutionalization? These questionsmotivated us to investigate factors predicting dis-charge outcomes in a cohort of seniors who had long-stay hospitalizations. The objectives of this study wereto (1) determine the risk factors for discharge to anursing home, death in hospital, or transfer to anotherinstitution versus discharge home, in a population ofseniors who stayed in acute care Winnipeg hospitalsfor more than 30 days, (2) describe the characteristicsof seniors with risk factors who were dischargedhome, and (3) document the 1-year outcomes ofseniors discharged home.
Research MethodsThe population of interest was all seniors with amedical or surgical diagnosis who were dischargedfollowing a long-stay hospitalization in seven acutecare hospitals in Winnipeg between fiscal years 1993/1994 and 1999/2000. Long-stay was defined as a stayof more than 30 days. Seniors were those aged 65years or older at the separation date. The determina-tion of medical or surgical was made on the basis ofICD-9-CM diagnoses. Psychiatric and obstetric long-stay patients were excluded. Patients in designatedlong-term care beds within the acute care hospitalswere excluded, since the focus of our study wasacute care beds. Only seniors who were living in thecommunity prior to the hospitalization event wereincluded in the analysis. This excluded personsadmitted to hospital from a nursing home or a long-term care hospital.
Data were obtained from the Population HealthResearch Data Repository at MCHP. The reliabilityand validity of the data have been extensivelyestablished (Roos et al., 1993; Roos, Sharp, & Cohen,
1991; Williams & Young, 1996). The hospital file wasthe main file used for this research; other data filesused were the population registry, personal carehome, home care, prescription, and public accesscensus 1996 files. The hospital file is built on the basisof patient separations from hospital, and includessuch information as dates of admission and separa-tion (i.e., discharge, transfer, or death); up to 16diagnoses; up to 12 procedures; and up to sixservices/subservices (e.g., geriatric).
Study Measures
Four discharge outcome variables were enumeratedover the period 1993/1994–1999/2000: dischargehome, discharge to a nursing home, death in hospital,and transfer to another institution (acute careand long-term care hospitals in and outsideWinnipeg). This period was selected to describeoutcomes in a health care environment followingmajor additions to the nursing home bed supply,which occurred in 1993/1994 and between 1997 and2000. On the basis of the literature on dischargeoutcomes of long-stay hospitalizations, the followingcategories of explanatory measures were related todischarge outcomes:
. Socio-demographic (age, gender, living alone/livingwith someone, Winnipeg/non-Winnipeg residence,neighbourhood income)
. Health status (receipt of home care in the past year,number of hospitalizations in the past year, numberof different prescription medications in the past year,most responsible diagnostic group for hospitalization,hospitalization for stroke and cognitive impairment,level of co-morbidity)
. Hospital factors (medical or surgical patient, geriatric ornon-geriatric unit, dialysis treatment, PEG [percuta-neous endoscopic gastrostomy] tube insertion, rehabili-tation therapy, occurrence of in-hospital fall, length ofstay, hospital of stay, and year of discharge [1993, 1994,1995, 1996, 1997, 1998, 1999, 2000])
All variables were derived from health care records,and the majority were in a dichotomous form.Specific definitions for the variables can be foundon pp. 110–111. In the analysis of one-year outcomesof persons discharged home, the following six cat-egories of outcomes were reported: death, admissionto a nursing home, admission to a long-termcare hospital, receipt of home care, re-hospitalization,and none of the above.
Data Analysis
In expectation that determinants of dischargeoutcomes would differ by age, separate analyseswere conducted by three age groups: 65–74 years
Discharge Outcomes in Hospitalized Seniors La Revue canadienne du viellissement 24 (Suppl. 1) 109

Definition of variables
Variable Type and Description How Defined
Discharge Outcomes
Died in Hospital As recorded under the separation variable in the hospitalabstract record
Discharge to Nursing Home Admitted to NH, as recorded in the NH file, during hospitalstay or within 7 days of discharge
Transfer to Other Institution As recorded under the transfer variable in the hospital abstractrecord if no death or admission to NH
Discharge Home In the absence of a hospital death, discharge to NH and transferto other institution
Pre-Hospital Socio-Demographic Factors
Age 18–64, 65–74,75–84, 85þ
Age on admission as recorded in the hospital abstract record
Gender Male/female As recorded in the hospital abstract record
Living Arrangements Living alone/notliving alone
Using marital status in the Manitoba Health registry, patients whowere recorded as being married or living with children wereclassified as ‘‘not living alone’’; all others were classified as‘‘living alone’’
Residence LocationPrior to Admission
Winnipeg/non-Winnipeg Classified according to postal code
Neighbourhood Income Income quintile(rural and urbancombined)
Average household income data by enumeration area, as provided bythe 1996 Canadian census, were used to rank neighbourhoodsinto five income quintiles
Pre-Hospital Health Status
Prior HospitalAdmissions
Number in year priorto long-stay
Record of hospital admission(s) in the hospital abstract file
Prior Medications Number of differentprescriptions in yearprior to long-stay
Number of prescriptions at the ATC4 level classification recorded inthe prescription database
Prior Home Care Home care visit in yearprior to long-stay
Record of receipt of home care documented in the home care file
Responsible Diagnosis Infection, neoplasm,disorders of theendocrine, nervous,circulatory, mental,respiratory, genito-urinary, digestive,musculoskeletal systems,injury
Major disease groupings of the ICD9 Classification System
Stroke Yes/no Patients with a stroke diagnosis in the first position, indicatingmost responsible1
Cognitive Impairment Yes/no Patients with diagnoses for dementia and other cognitiveimpairment (290.0–290.9, 291.1, 291.2, 292.82,292.83, 294.0, 294.1, 294.8, 294.9, 331.0, 331.1,331.3, 331.7, 331.9, 797, 7993) in any of the16 diagnosis fields on hospital abstract record
(continued)
110 Canadian Journal on Aging 24 (Suppl. 1) A. L. Kozyrskyj et al.

old, 75–84 years old, and 85 years old or greater.Long-stay seniors in Winnipeg acute care beds from1993/1994 to 1999/2000 were categorized by theirdischarge outcomes. In comparison to being dis-charged home, the likelihood of being dischargedto a nursing home or another institution, or of dyingin hospital was determined for the explanatoryvariables of interest. The likelihood was reportedas an odds ratio and 95 per cent confidence interval.An odds ratio significantly greater than ‘‘1’’ indicatedthat the likelihood of the outcome was increased incomparison to being discharged home. An odds ratiosignificantly less than ‘‘1’’ indicated that the like-lihood of the outcome was decreased in comparisonto being discharged home. Significance is achieved ifthe value of ‘‘1’’ is not included in the confidence
interval. Odds ratios were derived from multivariatemodels to control for the effect of other variables. Inother words, reported odds ratios could be attributedsolely to the effect of the relevant explanatoryvariable.
Polytomous logistic regression analysis was usedin the modelling to select odds ratios that werestatistically significant. Unlike the more familiarbinary logistic regression, multiple outcomes can beconsidered simultaneously in polytomous regression,with the actual probability of each outcome factoredinto the calculations. This represents the real-lifescenario of hospitalized patients in which any of thedischarge outcomes could occur and is the besttechnique for determining which factors, if any, can
Continued
Variable Type and Description How Defined
Hospital Factors
Co-morbidity/Complications
No co-morbidities,some co-morbidities(1–3), multipleco-morbidities (4–11)
Diagnoses of the long-stay admission were classified by theCharlson index, which contains 19 categories of co-morbidity,using ICD-9-CM diagnosis codes. Each category has anassociated weight that is based on the adjusted risk of 1-yearmortality. For the regressions, patients were either categorizedas having no or any co-morbidities
Length of Stay <60 days, 61–90 days,91–120 days, >120 days
As recorded in the hospital abstract
Rehabilitation Care Yes/no Presence of rehabilitation care in any of the 16 diagnosis fields1 orthe 12 procedure fields2 in hospital abstract record
Dialysis Yes/no Dialysis recorded in any of 16 diagnosis fields or 12 procedure fieldsin hospital abstract record
PEG Tube Insertion Yes/no PEG tube insertion (percutaneous endoscopic gastrostomy) in any of12 procedure fields in hospital abstract record
In-Hospital Fall Yes/no Presence of an injurious fall diagnosis in any of the 16 diagnosisfields, and accident location recorded as ‘‘hospital’’
Geriatric Unit Yes/no If primary service code, i.e., the service code where patient spent mostdays, was geriatric or long-stay unit in hospital abstract record(09, 72, 73, 70, 71; subservice codes; 77, 78–87 [HSC only],93, 94, 95, 96, 97, 98, 99)
Type of Patient Medical/surgical Based on the DRG classification of medical and surgical diagnosis
Year of Discharge Categorical variable 1993, 1994, 1995, 1996, 1997, 1998, 1999, 2000 (first3 months only)
Hospital of Stay Grace, Misericordia,St. Boniface, Victoria,Concordia, Seven Oaks,Health Sciences
From hospital identifier in hospital abstract record, Misercordiahospitalizations excluded after December 1998
1The hospital abstract record has room for 16 diagnosis codes. The code that appears first is the most responsible, that isone that contributed the most to the patient’s stay in hospital.2The hospital abstract record has room for 12 procedure codes. The code that appears first is the one that is the primaryprocedure.
Discharge Outcomes in Hospitalized Seniors La Revue canadienne du viellissement 24 (Suppl. 1) 111

indicate the likely outcome for a patient. Explanatoryvariables in the model were retained at the 95 per centlevel of confidence (indicating statistical significance)using the backwards elimination process.
In addition, a description of the characteristics ofpatients discharged home, but possessing risk factorsfor non-home discharge, was obtained. This includedthe frequency distribution of health (co-morbidity),hospital (length of stay), and socio-demographic(gender, living arrangements, income) characteristicsof these patients. Descriptive statistics were alsoobtained for one-year outcomes following dischargehome, according to six categories: death, admission toa nursing home, admission to a long-term carehospital, receipt of home care, re-hospitalization,and none of the above. They were reported as thefrequency of home discharges for which theseoutcomes were a final event in the year followingdischarge. Final event indicates the last outcometo occur within one year of discharge, using thefollowing hierarchy: died, admitted to long-term care,admitted to a nursing home, readmitted to hospital,and home care. For example, if a person washospitalized following admission to a nursing home,he/she would be counted in the nursing homecategory. If a person was not admitted to anyinstitution and received home care, he/she wasplaced in the home care category.
ResultsOver the period 1993/1994 to 1999/2000, there were22,689 hospitalizations of adults in seven acute careWinnipeg hospitals that lasted more than 30 days.Eighty per cent (n¼ 17,984) of these hospitalizationswere seniors. Approximately 40 per cent of thesehospitalizations were persons 75–84 years of age,one third were persons 85 years or older, and theremaining quarter were in the youngest age group.Almost half of the long-stay seniors were dischargedhome, 22 per cent died in hospital, 19 per cent wereadmitted to a nursing home, and 14 per cent weretransferred to another institution. The percentage ofseniors discharged home decreased, while the per-centage going to a nursing home increased withadvancing age. The majority (63%) of transfers toother hospitals were to long-term care facilities inWinnipeg, 20 per cent of seniors went to acute careWinnipeg hospitals, and 14 per cent were transferredto acute care hospitals outside Winnipeg. The per-centage of patients transferred to long-term careincreased, and conversely, transfers to acute carehospitals decreased with age.
Table 1 reports socio-demographic, health status, andhospital factors associated with an increased risk
(odds ratio) of discharge to a nursing home, death inhospital, or transfer to another institution in seniorshospitalized for more than 30 days. The referentcategory is discharge home. To simplify the reportingof the results, only odds ratios for associationscommon across most age groups are reported inTable 1. Blank spaces in the table represent non-significant effects, but the variables have beenretained in the models. Other significant variablesretained in the models are listed as footnotes to thetable. Some hospital factors listed in the footnoteswere associated with a decreased likelihood of a non-home outcome (or increased likelihood of goinghome), including being a surgical patient, beinghospitalized on a geriatric unit, and receiving reha-bilitation therapy. The complete models, reporting theodds ratios for all factors significantly associated withany of the discharge outcomes in age-specific groups,can be obtained from the authors.
Seniors aged 64–74 were more likely to be dischargedto a nursing home or another institution than home ifthey lived alone. Discharge to a nursing home wasalso more likely among seniors 75 years and olderliving in low-income neighbourhoods. Seniors whoreceived home care within the year prior to hospitaladmission were approximately 1.5 times as likely asnon-users to die or be discharged to an institutionthan go home. Among the diagnoses responsible forthe hospitalization, neoplasms and stroke and/orother nervous system disorders increased the like-lihood for seniors of dying in hospital. Cognitiveimpairment, stroke, and other nervous system dis-orders increased the likelihood of transfer to a nursinghome or another institution. Disorders of the circula-tory, respiratory, and genitourinary system alsoincreased the likelihood of dying in hospital forseniors more than 85 years of age. The presence ofmultiple co-morbidities increased the likelihood ofdying in hospital among seniors, as did a lengthof stay (LOS) beyond four months. As the LOSincreased beyond four months, the likelihood ofbeing transferred to a nursing home or anotherinstitution was also increased.
The strongest predictors of mortality in hospital werea cancer diagnosis and the presence of multipleco-morbidities. In comparison to seniors with otherconditions, those with cancer had twice the risk ofdying in hospital than of going home. The risk ofdying in hospital was approximately twofold higheramong seniors with multiple co-morbidities whencompared to those with no co-morbidities. Dischargeto a nursing home was associated with a LOS of morethan 120 days and diagnoses of cognitive impairmentor stroke/other nervous system disorders to a greaterextent than other factors. The latter were also the
112 Canadian Journal on Aging 24 (Suppl. 1) A. L. Kozyrskyj et al.
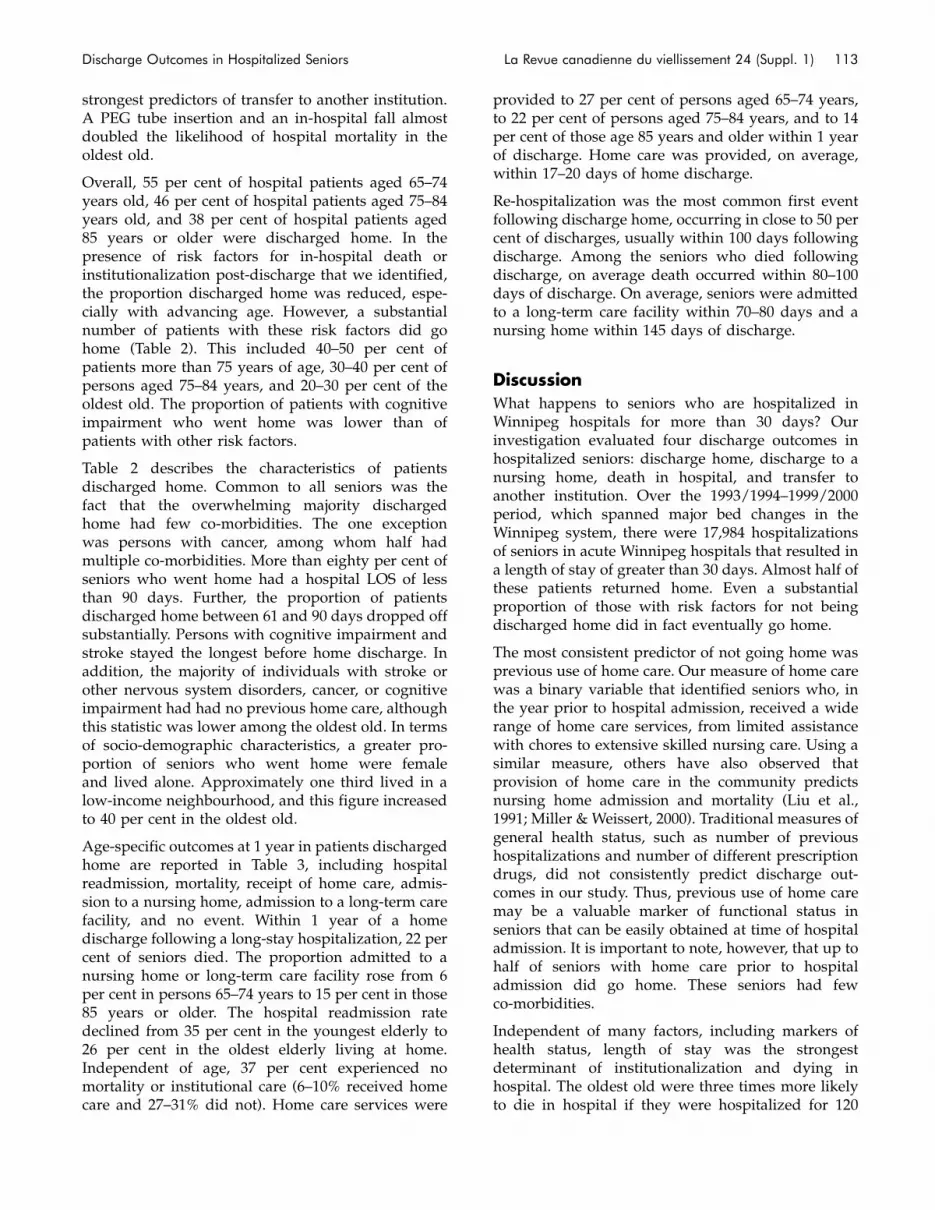
strongest predictors of transfer to another institution.A PEG tube insertion and an in-hospital fall almostdoubled the likelihood of hospital mortality in theoldest old.
Overall, 55 per cent of hospital patients aged 65–74years old, 46 per cent of hospital patients aged 75–84years old, and 38 per cent of hospital patients aged85 years or older were discharged home. In thepresence of risk factors for in-hospital death orinstitutionalization post-discharge that we identified,the proportion discharged home was reduced, espe-cially with advancing age. However, a substantialnumber of patients with these risk factors did gohome (Table 2). This included 40–50 per cent ofpatients more than 75 years of age, 30–40 per cent ofpersons aged 75–84 years, and 20–30 per cent of theoldest old. The proportion of patients with cognitiveimpairment who went home was lower than ofpatients with other risk factors.
Table 2 describes the characteristics of patientsdischarged home. Common to all seniors was thefact that the overwhelming majority dischargedhome had few co-morbidities. The one exceptionwas persons with cancer, among whom half hadmultiple co-morbidities. More than eighty per cent ofseniors who went home had a hospital LOS of lessthan 90 days. Further, the proportion of patientsdischarged home between 61 and 90 days dropped offsubstantially. Persons with cognitive impairment andstroke stayed the longest before home discharge. Inaddition, the majority of individuals with stroke orother nervous system disorders, cancer, or cognitiveimpairment had had no previous home care, althoughthis statistic was lower among the oldest old. In termsof socio-demographic characteristics, a greater pro-portion of seniors who went home were femaleand lived alone. Approximately one third lived in alow-income neighbourhood, and this figure increasedto 40 per cent in the oldest old.
Age-specific outcomes at 1 year in patients dischargedhome are reported in Table 3, including hospitalreadmission, mortality, receipt of home care, admis-sion to a nursing home, admission to a long-term carefacility, and no event. Within 1 year of a homedischarge following a long-stay hospitalization, 22 percent of seniors died. The proportion admitted to anursing home or long-term care facility rose from 6per cent in persons 65–74 years to 15 per cent in those85 years or older. The hospital readmission ratedeclined from 35 per cent in the youngest elderly to26 per cent in the oldest elderly living at home.Independent of age, 37 per cent experienced nomortality or institutional care (6–10% received homecare and 27–31% did not). Home care services were
provided to 27 per cent of persons aged 65–74 years,to 22 per cent of persons aged 75–84 years, and to 14per cent of those age 85 years and older within 1 yearof discharge. Home care was provided, on average,within 17–20 days of home discharge.
Re-hospitalization was the most common first eventfollowing discharge home, occurring in close to 50 percent of discharges, usually within 100 days followingdischarge. Among the seniors who died followingdischarge, on average death occurred within 80–100days of discharge. On average, seniors were admittedto a long-term care facility within 70–80 days and anursing home within 145 days of discharge.
DiscussionWhat happens to seniors who are hospitalized inWinnipeg hospitals for more than 30 days? Ourinvestigation evaluated four discharge outcomes inhospitalized seniors: discharge home, discharge to anursing home, death in hospital, and transfer toanother institution. Over the 1993/1994–1999/2000period, which spanned major bed changes in theWinnipeg system, there were 17,984 hospitalizationsof seniors in acute Winnipeg hospitals that resulted ina length of stay of greater than 30 days. Almost half ofthese patients returned home. Even a substantialproportion of those with risk factors for not beingdischarged home did in fact eventually go home.
The most consistent predictor of not going home wasprevious use of home care. Our measure of home carewas a binary variable that identified seniors who, inthe year prior to hospital admission, received a widerange of home care services, from limited assistancewith chores to extensive skilled nursing care. Using asimilar measure, others have also observed thatprovision of home care in the community predictsnursing home admission and mortality (Liu et al.,1991; Miller & Weissert, 2000). Traditional measures ofgeneral health status, such as number of previoushospitalizations and number of different prescriptiondrugs, did not consistently predict discharge out-comes in our study. Thus, previous use of home caremay be a valuable marker of functional status inseniors that can be easily obtained at time of hospitaladmission. It is important to note, however, that up tohalf of seniors with home care prior to hospitaladmission did go home. These seniors had fewco-morbidities.
Independent of many factors, including markers ofhealth status, length of stay was the strongestdeterminant of institutionalization and dying inhospital. The oldest old were three times more likelyto die in hospital if they were hospitalized for 120
Discharge Outcomes in Hospitalized Seniors La Revue canadienne du viellissement 24 (Suppl. 1) 113

Table 1: Likelihood (odds ratio, 95% confidence interval) of three discharge destinations versus going home,by risk factors
Discharge to Nursing Home Hospital Death Transfer to Institution
Age 65–74
Living alone 1.27 [1.08–1.48] 1.12 [1.01–1.23]
Not alone 1.00 1.00
Prior home care 1.55 [1.31–1.83] 1.13 [1.02–1.25]
No home care 1.00 1.00
Neoplasm 2.21 [1.71–2.85]
Stroke 1.83 [1.33–2.53] 1.29 [1.05–1.58] 2.17 [1.78–2.63]
Nervous system disorder* 2.08 [1.21–3.57] 2.26 [1.49–3.42]
Cognitive impairment 2.42 [1.65–3.56] 1.63 [1.12–2.38]
Other diagnosis 1.00 1.00 1.00
Multiple co-morbidity (4þ) 2.68 [2.28–3.14]
Some co-morbidity (1–3) 1.33 [1.04–1.69] 0.84 [0.74–0.96]
No co-morbidity 1.00 1.00
PEG tube insertion 1.36 [1.08–1.71] 1.34 [1.07–1.68]
No PEG tube 1.00 1.00
LOS >120 days 6.65 [5.10–8.67] 1.85 [1.44–2.37] 1.50 [1.15–1.97]
LOS 91–120 days 1.69 [1.24–2.31]
LOS 61–90 days 0.71 [0.54–0.92]
LOS 31–60 days 1.00 1.00 1.00
Age 75–84
Lowest income 1.18 [1.01–1.37]
Highest income 1.00
Previous home care 1.48 [1.34–1.62] 1.21 [1.13–1.30] 1.14 [1.05–1.23]
No home care 1.00 1.00 1.00
Neoplasm 2.18 [1.78–2.67] 1.38 [1.06–1.79]
Stroke 1.93 [1.59–2.33] 1.23 [1.07–1.41] 1.98 [1.70–2.32]
Nervous system disorders* 3.05 [2.08–4.46] 1.51 [1.02–2.23]
Cognitive impairment 2.75 [2.16–3.50] 1.40 [1.06–1.84]
Other diagnosis 1.00 1.00 1.00
Multiple co-morbidity (4þ) 0.73 [0.56–0.95] 2.21 [1.94–2.51]
Some co-morbidity (1–3) 0.90 [0.82–0.98]
No co-morbidity 1.00 1.00
PEG tube insertion 1.46 [1.19–1.79] 1.41 [1.13–1.75]
No PEG tube 1.00 1.00
In-hospital fall 1.25 [1.01–1.55] 1.67 [1.38–2.03] 1.38 [1.05–1.81]
No fall 1.00 1.00 1.00
(continued)
114 Canadian Journal on Aging 24 (Suppl. 1) A. L. Kozyrskyj et al.
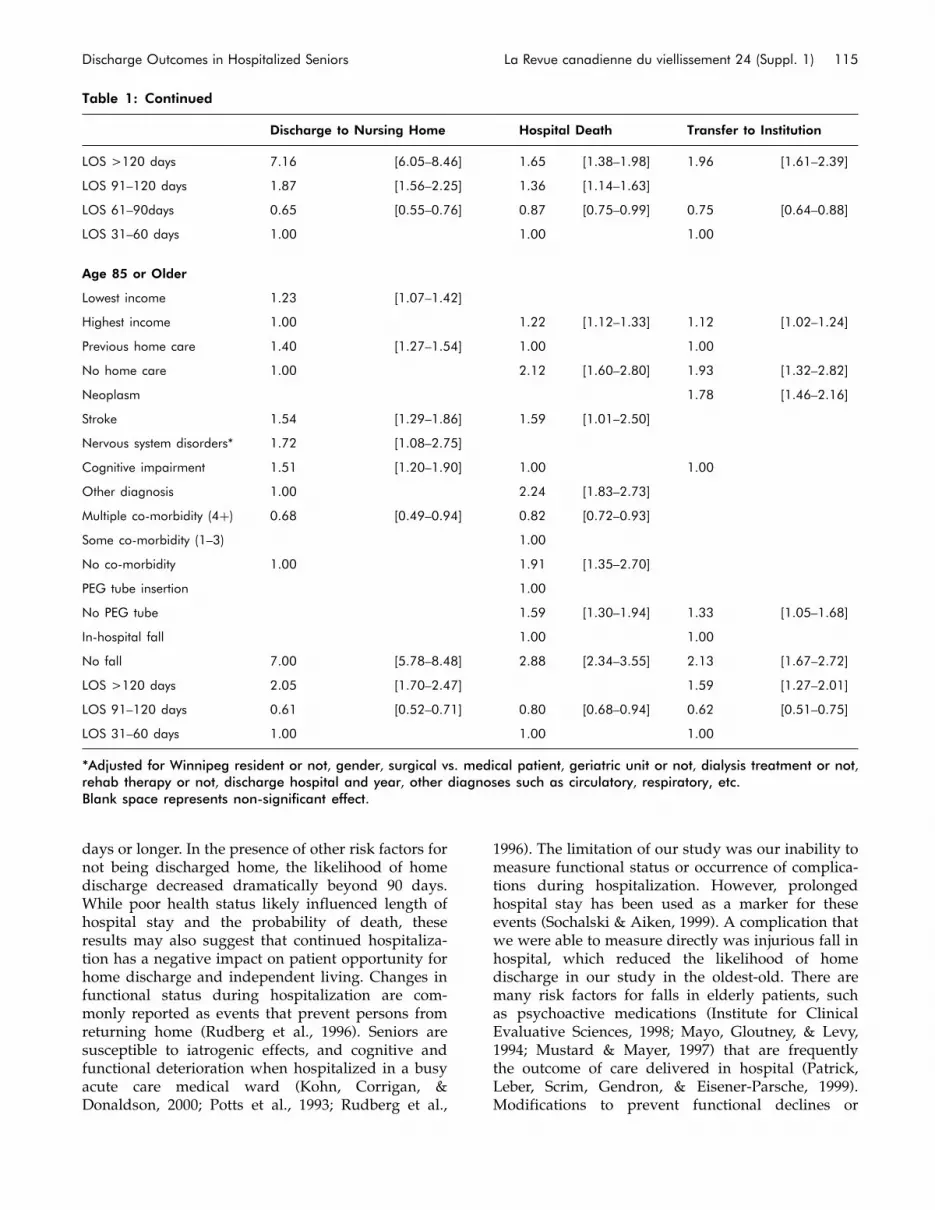
days or longer. In the presence of other risk factors fornot being discharged home, the likelihood of homedischarge decreased dramatically beyond 90 days.While poor health status likely influenced length ofhospital stay and the probability of death, theseresults may also suggest that continued hospitaliza-tion has a negative impact on patient opportunity forhome discharge and independent living. Changes infunctional status during hospitalization are com-monly reported as events that prevent persons fromreturning home (Rudberg et al., 1996). Seniors aresusceptible to iatrogenic effects, and cognitive andfunctional deterioration when hospitalized in a busyacute care medical ward (Kohn, Corrigan, &Donaldson, 2000; Potts et al., 1993; Rudberg et al.,
1996). The limitation of our study was our inability tomeasure functional status or occurrence of complica-tions during hospitalization. However, prolongedhospital stay has been used as a marker for theseevents (Sochalski & Aiken, 1999). A complication thatwe were able to measure directly was injurious fall inhospital, which reduced the likelihood of homedischarge in our study in the oldest-old. There aremany risk factors for falls in elderly patients, suchas psychoactive medications (Institute for ClinicalEvaluative Sciences, 1998; Mayo, Gloutney, & Levy,1994; Mustard & Mayer, 1997) that are frequentlythe outcome of care delivered in hospital (Patrick,Leber, Scrim, Gendron, & Eisener-Parsche, 1999).Modifications to prevent functional declines or
Table 1: Continued
Discharge to Nursing Home Hospital Death Transfer to Institution
LOS >120 days 7.16 [6.05–8.46] 1.65 [1.38–1.98] 1.96 [1.61–2.39]
LOS 91–120 days 1.87 [1.56–2.25] 1.36 [1.14–1.63]
LOS 61–90days 0.65 [0.55–0.76] 0.87 [0.75–0.99] 0.75 [0.64–0.88]
LOS 31–60 days 1.00 1.00 1.00
Age 85 or Older
Lowest income 1.23 [1.07–1.42]
Highest income 1.00 1.22 [1.12–1.33] 1.12 [1.02–1.24]
Previous home care 1.40 [1.27–1.54] 1.00 1.00
No home care 1.00 2.12 [1.60–2.80] 1.93 [1.32–2.82]
Neoplasm 1.78 [1.46–2.16]
Stroke 1.54 [1.29–1.86] 1.59 [1.01–2.50]
Nervous system disorders* 1.72 [1.08–2.75]
Cognitive impairment 1.51 [1.20–1.90] 1.00 1.00
Other diagnosis 1.00 2.24 [1.83–2.73]
Multiple co-morbidity (4þ) 0.68 [0.49–0.94] 0.82 [0.72–0.93]
Some co-morbidity (1–3) 1.00
No co-morbidity 1.00 1.91 [1.35–2.70]
PEG tube insertion 1.00
No PEG tube 1.59 [1.30–1.94] 1.33 [1.05–1.68]
In-hospital fall 1.00 1.00
No fall 7.00 [5.78–8.48] 2.88 [2.34–3.55] 2.13 [1.67–2.72]
LOS >120 days 2.05 [1.70–2.47] 1.59 [1.27–2.01]
LOS 91–120 days 0.61 [0.52–0.71] 0.80 [0.68–0.94] 0.62 [0.51–0.75]
LOS 31–60 days 1.00 1.00 1.00
*Adjusted for Winnipeg resident or not, gender, surgical vs. medical patient, geriatric unit or not, dialysis treatment or not,rehab therapy or not, discharge hospital and year, other diagnoses such as circulatory, respiratory, etc.Blank space represents non-significant effect.
Discharge Outcomes in Hospitalized Seniors La Revue canadienne du viellissement 24 (Suppl. 1) 115

adverse events are characteristic of geriatric units, butincorporating them into general medical units thattreat elderly patients may improve discharge out-comes in the elderly.
Seniors with neoplasms were twice as likely to die inhospital as to go home. Fewer than one third ofseniors with cancer went home. The associationbetween cancer and death is not a surprising one,but many argue that the hospital is not the best placeto die, and patient preferences for place of deathshould be respected. Patients who are dying mightbe more appropriately cared for by home care ifthey wish to die at home, or in a hospice (Grandeet al., 1998). The literature documents that manypatients expressing a preference for dying at homeactually die in hospital (Pritchard et al., 1998). Deathin hospital occurs less often in areas with an increased
availability of hospice care. Because cancer patientshave high risk of dying in hospital, dischargeplanning for those who are near the end oftherapy should consider community-based palliativecare.
Stroke and cognitive impairment in seniors increasedthe likelihood of being institutionalized. No morethan one third of seniors with cognitive impairmentwent home following a long hospital stay. However,up to 40 per cent of stroke patients did go home,mainly patients with few co-morbidities who did notreceive home care prior to hospitalization. Organizedstroke unit care, such as that provided by one of theteaching hospitals in Winnipeg, has been shown toreduce the need for dependency and institutional carefollowing hospital discharge (Lincoln et al., 2000;Stroke Unit Trialists’ Collaboration, 1997). Some
Table 2: Characteristics of seniors with risk factors, in those discharged home
In Those with Risk Factors Who Went Home
% HomeNo PreviousHome Care
FewCo-morbidities
LOS30–60
LOS61–90
Risk Factor Discharge % % % %
Age 65–74
Previous home care 50 86 67 19
Stroke diagnosis 40 81 97 53 23
Nervous system 39 48 100 62 23
Cancer diagnosis 35 78 46 77 14
Cognitive impairment 30 54 98 52 23
Multiple co-morbidities 38 72 79 11
Age 75–84
Previous home care 42 92 67 19
Stroke diagnosis 34 66 99 56 26
Nervous system 28 39 99 64 17
Cancer diagnosis 28 72 50 82 12
Cognitive impairment 21 40 95 61 22
Multiple co-morbidities 33 63 77 13
Age 85 or older
Previous home care 35 96 68 20
Stroke diagnosis 16 43 97 57 22
Nervous system 21 26 100 60 16
Cancer diagnosis 28 55 60 77 15
Cognitive impairment 17 29 98 64 17
Multiple co-morbidities 25 52 74 19
LOS¼ length of stay (in days)
116 Canadian Journal on Aging 24 (Suppl. 1) A. L. Kozyrskyj et al.

stroke patients will require care in long-term facilitiesthat can accommodate special needs, such as PEGtube feeding (Mayo et al., 1994). Comprehensiveassessment of disability from stroke should be madeas soon as the patient’s medical status has beenstabilized. At that time interventions being providedto the patient should be evaluated and matched to thecare environment that can best provide that service.Further, programs to reduce anxiety and confusion inpersons with cognitive impairment should be imple-mented (Inouye et al., 1999).
A full 40 per cent of seniors did not die, were notinstitutionalized, and were not readmitted to hospital
within 1 year of hospital discharge. Seniors dis-charged home following a long stay were generallyhealthier than those not discharged home; even thosewith risk factors such as stroke had few otherco-morbidities. One third were again admitted tohospital from home, usually within 100 days follow-ing discharge home, indicating that deterioration inhealth status did not occur right away. This findingprovides reassurance that long-stay patients were notdischarged home prematurely. It also presents timelyopportunities for intervention, as readmission canlead to another long-stay hospitalization and notreturning home.
Approximately 20 per cent of persons dischargedhome received home care. Home care services forthe elderly need to focus on disease managementand activities of daily living to prevent institutiona-lization. In addition, some persons may require end-of-life care. The social characteristics of personsdischarged home also provide valuable informationto the planning of home care services. Female seniorsliving alone or those who have low incomes may alsorequire social support. Having low income was a riskfactor for not going home, and it may be that thisgroup of patients, who likely do not have the means topay for formal support services, could be targeted forhome care services post-discharge.
As the population ages, the transition from indepen-dent living to hospital, then dependence or death, willcontinue to gain in importance. Within the limitationsof using health care administrative records to studythe effects of factors such as cognitive impairment,our findings on the determinants of discharge out-comes and one-year outcomes following home dis-charge indicate the type of support services that maybe required by seniors in the community. Further, ourpopulation-based approach provides a system-wideperspective of how long-stay hospitalizations affectoutcomes in seniors and points to opportunities forimproving discharge outcomes. A more thoroughunderstanding of factors that best predict the transi-tion from independent living to institutional care inseniors is indispensable to improving the continuumof health care in the population.
Notes1 The hospital abstract record has room for 16 diagnosis
codes. The code that appears first is the mostresponsible, that is, the one that contributed the mostto the patient’s stay in hospital.
2 The hospital abstract record has room for 12 procedurecodes. The code that appears first is the one that is theprimary procedure.
Table 3: One-year outcomes in seniors dischargedhome
Final Event%
Age 65–74
Died 22.3
Admitted to LTC 3.1
Admitted to NH 2.6
Admitted to hospital 34.7
Home care only 10.1
No event 27.3
Total 100.0
Age 75–84
Died 22.0
Admitted to LTC 4.3
Admitted to NH 5.9
Admitted to hospital 30.6
Home care only 9.0
No event 28.1
Total 100.0
Age 85 or older
Died 22.1
Admitted to LTC 4.3
Admitted to NH 10.9
Admitted to hospital 26.5
Home care only 5.7
No event 30.5
Total 100.0
Discharge Outcomes in Hospitalized Seniors La Revue canadienne du viellissement 24 (Suppl. 1) 117

References
Alarcon, T., Barcena, A., Gonzalez-Montalvo, J.I., Penalosa,C., & Salgado, A. (1999). Factors predictive of outcomeon admission to an acute geriatric ward. Age and Ageing,28(5), 429–432.
Breeze, E., Sloggett, A., & Fletcher, A. (1999). Socioeconomicand demographic predictors of mortality and institu-tional residence among middle aged and older people:Results from the Longitudinal Study. Journal ofEpidemiology and Community Health, 53(12), 765–774.
Carriere, Y., & Pelletier, L. (1995). Factors underlying theinstitutionalization of elderly persons in Canada.Journals of Gerontology: Series B, Psychology Sciences andSocial Sciences, 50(3), S164–S172.
D’Agostino, R.B., Belanger, A.J., Markson, E.W.,Kelly-Hayes, M., & Wolf, P.A. (1995). Development ofhealth risk appraisal functions in the presence ofmultiple indicators: The Framingham Study nursinghome institutionalization model. Statistics in Medicine,14(16), 1757–1770.
De Coster, C., & Kozyrskyj, A. (2000). Long-stay patients inWinnipeg acute care hospitals. Winnipeg: ManitobaCentre for Health Policy and Evaluation.
Gillick, M.R., Serrell, N.A., & Gillick, L.S. (1982). Adverseconsequences of hospitalization in the elderly. SocialScience and Medicine, 16(10), 1033–1038.
Glazebrook, K., Rockwood, K., Stolee, P., Fisk, J., &Gray, J.M. (1994). A case control study of the risks forinstitutionalization of elderly people in Nova Scotia.Canadian Journal on Aging, 13(1), 104–117.
Grande, G.E., Addington-Hall, J.M., & Todd, C.J. (1998).Place of death and access to home care services: Arecertain patient groups at a disadvantage? Social Scienceand Medicine, 47(5), 565–579.
Higginson, I.J., Jarman, B., Astin, P., & Dolan, S. (1999). Dosocial factors affect where patients die? An analysis of10 years of cancer deaths in England. Journal of PublicHealth Medicine, 21(1), 22–28.
Inouye, S.K., Bogardus, S.T., Charpentier, P.A., Leo-Summers, L., Acampora, D., Holfrod, T.R., &Cooney, L.M., Jr. (1999). A multicomponent interven-tion to prevent delirium in hospitalized older patients.New England Journal of Medicine, 340(9), 669–676.
Institute for Clinical Evaluative Sciences. (1998). Get up andgo! Identifying risk factors and preventing falls inelderly patients. Informed, 4(4), 1–3.
Kane, R.L., Matthias, R., & Sampson, S. (1983). The risk ofplacement in a nursing home after acute hospitaliza-tion. Medical Care, 21(11), 1055–1061.
Kohn, L.T., Corrigan, J.M., & Donaldson, M.S. (Eds). (2000)To err is human. Washington, D.C.: National AcademyPress.
Lincoln, N.B., Husbands, S., Trescoli, C., Drummond, A.E.R.,Gladman, J.R.F., & Berman, P. (2000). Five year followup of a randomised controlled trial of a strokerehabilitation unit. British Medical Journal, 320, 549.
Liu, K., Coughlin, T., & McBride, T. (1991). Predictingnursing-home admission and length of stay: A durationanalysis. Medical Care, 29(2), 125–141.
Mayo, N.E., Gloutney, L., & Levy, A.R. (1994). A randomizedtrial of identification bracelets to prevent falls amongpatients in a rehabilitation hospital. Archives of PhysicalMedicine and Rehabilitation, 75, 1302–1308.
Miller, E.A., & Weissert, W.G. (2000). Predicting elderlypeople’s risk for nursing home placement, hospitaliza-tion, functional impairment, and mortality: A synthesis.Medical Care Research and Review, 57(3), 259–297.
Mustard, C., Finlayson, M., Derksen, S., & Berthelot, J.M.(1999). What determines the need for nursinghome admission in a universally insured population?Journal of Health Services and Research Policy, 4(4),197–203.
Mustard, C.A., & Mayer, T. (1997). Case-control studyof exposure to medication and the risk of injuriousfalls requiring hospitalization among nursing homeresidents. American Journal of Epidemiology, 145(8),738–745.
Palmer, R.M. (1995). Acute hospitals care of the elderly:Minimizing the risk of functional decline. ClevelandClinic Journal of Medicine, 62(2), 117–128.
Patrick, L., Leber, M., Scrim, C., Gendron, I., & Eisener-Parsche, P. (1999). A standardized assessment andintervention protocol for managing risk of falls on ageriatric rehabilitation unit. Journal of GerontologyNursing, 25(4), 40–47.
Potts, S., Feinglass, J., Lefevere, F., Kadah, H., Branson, C., &Webster, J. (1993). A quality-of-care analysis of cascadeiatrogenesis in frail elderly hospital patients. QualityReview Bulletin, 19(6), 196–198.
Pritchard, R.S., Fisher, E.S., Teno, J.M., Sharp, S.M.,Reding, D.J., Knaus, W.A., Wennberg, J.E., & Lynn, J.(1998). Influence of patient preferences and local healthsystem characteristics on the place of death: SUPPORTInvestigators; Study to Understand Prognoses andPreferences for Risks and Outcomes of Treatment.Journal of the American Geriatric Society, 46(10),1242–1250.
Rockwood, K., Stolee, P., & McDowell, I. (1996). Factorsassociated with institutionalization of older peoplein Canada: Testing a multifactorial definition offrailty. Journal of the American Geriatric Society, 44(5),578–582.
Roos, L.L., Mustard, C.A., Nicol, J.P., McLerran, D.F.,Malenka, D.J., Young, T.K., & Cohen, M.M. (1993).Registries and administrative data: Organization andaccuracy. Medical Care, 31(3), 201–212.
118 Canadian Journal on Aging 24 (Suppl. 1) A. L. Kozyrskyj et al.

Roos, L.L., Sharp, S.M., & Cohen, M.M. (1991). Comparingclinical information with claims data: Some similaritiesand differences. Journal of Clinical Epidemiology, 44(9),881–888.
Rudberg, M.A., Sager, M.A., & Zhang, J. (1996). Risk factorsfor nursing home use after hospitalization for medicalillness. Journal of Gerontology: Series A, Biological Sciencesand Medical Sciences, 51(5), M189–M194.
Shapiro, E., & Tate. R. (1985). Predictors of long-term carefacility use among the elderly. Canadian Journal onAging, 4, 11–19.
Sochalski, J., & Aiken, L.H. (1999). Accounting for variationin hospital outcomes: A cross-national study. HealthAffairs, 18, 256–259.
Stroke Unit Trialists’ Collaboration. (1997). Collaborativesystematic review of the randomised trials of organisedinpatient (stroke unit) care after stroke. British MedicalJournal, 314, 1151.
Thom, D.H., Haan, M.N., & Van Den Eeden, S.K. (1997).Medically recognized urinary incontinence and risks ofhospitalization, nursing home admission and mortality.Age and Ageing, 26(5), 367–374.
Tomiak, M., Berthelot, J.M., Guimond, E., & Mustard, C.A.(2000). Factors associated with nursing-home entry for
elders in Manitoba, Canada. Journal of Gerontology:Series A, Biological Sciences and Medical Sciences, 55(5),M279–M287.
Trottier, H., Martel, L., Houle, C., Berthelot, J.M., & Legare, J.(2000). Living at home or in an institution: Whatmakes the difference for seniors? Health Report, 11(4),49–61.
Wachtel, T.J., Derby, C., & Fulton, J.P. (1984). Predicting theoutcome of hospitalization for elderly persons: Homeversus nursing home. Southern Medical Journal, 77(10),1283–1285, 1290.
Williams, J.I., & Young, W. (1996). Inventory of studies onthe accuracy of Canadian health administrative databases(Pub. No. 96-03-TR). North York, ON: Institute forClinical Evaluative Sciences.
Wolinsky, F.D., Callahan, C.M., Fitzgerald, J.F., & Johnson,R.J. (1992). The risk of nursing home placement andsubsequent death among older adults. Journal ofGerontology, 47(4), S173–S182.
Zureik, M., Lang, T., Trouillet, J.L., Davido, A., Tran, B.,Levy, A., & Lombrail, P. (1995). Returning home afteracute hospitalization in two French teaching hospitals:Predictive value of patients’ and relatives’ wishes.Age and Ageing, 24(3), 227–234.
Discharge Outcomes in Hospitalized Seniors La Revue canadienne du viellissement 24 (Suppl. 1) 119

CANADIANJOURNALONAGING
LA REVUECANADIENNEDUVIEILLISSEMENT

Exploring Reasons for Bed Pressures inWinnipeg Acute Care Hospitals*
Verena H. Menec, Sharon Bruce, and Leonard MacWilliam
University of Manitoba
RESUMELa surpopulation des hopitaux constitue un fleau a Winnipeg et dans d’autres villes canadiennes depuis des annees.Cette etude aborde divers facteurs lies a cette surpopulation. Les dossiers des hopitaux ont servi a l’evaluation desfluctuations relativement a l’utilisation des hopitaux pour les exercices 1996/1997 a 1999/2000. Un examen des dossiersa ete mene afin de determiner la pertinence des admissions et des sejours a l’hopital pendant une semaine de forteaffluence. Les resultats revelent que les periodes d’affluence du systeme hospitalier etaient dues a l’afflux de personnesagees souffrant de maladies respiratoires associees a la grippe. Par ailleurs, l’examen d’une semaine de forte affluenceen particulier a revele qu’au moins une centaine de lits etaient occupes par des patients qui n’avaient probablement pasbesoin de soins de courte duree. L’examen des dossiers a revele qu’une proportion substantielle de jours-patients quin’etaient pas de courte duree ont ete passes a attendre des soins a domicile, des soins de longue duree ou des examensparacliniques. Ces conclusions semblent indiquer que l’on pourrait eviter d’eventuelles periodes de forte affluence aumoyen de vaccinations contre la grippe ainsi que d’une augmentation de la disponibilite des autres niveaux de soins etde transferts rapides vers ceux-ci.Cette recherche decoule de projets entrepris par le Manitoba Centre for Health Policy en vertu d’un contrat avecle ministere de la Sante du Manitoba. Les resultats et les conclusions n’engagent que les auteurs, et le ministere de laSante du Manitoba n’a pas endosse cette etude de quelque maniere que ce soit. Le Dr Menec a obtenu le prixNew Investigator Career de la part des Instituts de recherche en sante du Canada.
ABSTRACTHospital overcrowding has plagued Winnipeg and other Canadian cities for years. This study explored factors relatedto overcrowding. Hospital files were used to examine patterns of hospital use from fiscal years 1996/1997 to 1999/2000.Chart reviews were conducted to examine appropriateness of admissions and hospital stays during one pressure week.Results indicate that pressure periods in the hospital system were driven by an influx of older adults with influenza-associated respiratory illnesses. Moreover, examination of one specific pressure week showed that at least 100 bedswere occupied by patients who likely did not require acute care. The chart review revealed that a substantial proportionof non-acute patient-days were spent awaiting home care, long-term care, or diagnostic testing services. These findingssuggest future bed pressures might be prevented through influenza vaccination and an increase in the availabilityof – and timely transfer to – alternative levels of care.
* This research resulted from projects undertaken by the Manitoba Centre for Health Policy under contract to ManitobaHealth. The results and conclusions are those of the authors, and no official endorsement by Manitoba Health was intendedor should be inferred. Dr. Menec holds a New Investigator Career Award from the Canadian Institutes of Health Research.
Manuscript received: / manuscrit recu : 01/04/03
Manuscript accepted: / manuscrit accepte : 04/03/04
Mots cles : vieillissement, autres niveaux de soins, surpopulation des hopitaux, maladies associees a la grippe
Keywords: aging; alternative levels of care; hospital overcrowding; influenza-associated illnesses,
Requests for offprints should be sent to: / Les demandes de tires-a-part doivent etre addressees a :
Verena H. Menec, Ph.D.Department of Community Health SciencesUniversity of Manitoba750 Bannatyne AvenueWinnipeg, MB R3E ON3([email protected])
Canadian Journal on Aging / La Revue canadienne du viellissement 24 (Suppl. 1) : 121 - 131

IntroductionReports of hospital bed crises have increasingly beenappearing in Canada since the 1990s in academicjournals and the popular media (e.g., Fayerman,1999; Gray, 2000; Mitchell, 1998). Bed crises manifestthemselves in overcrowded emergency departments(EDs), with patients who require admission tohospital being boarded in the ED – often in hallways –sometimes for days. The problem of hospital over-crowding is not unique to Canada, but has alsogained publicity in the United States and Europe(e.g., Derlet & Richards, 2000; Graff, 1999; Hanratty &Robinson, 1999).
Numerous explanations have been offered for bedcrises, ranging from a shortage of beds, to popula-tion aging, to influenza. In general, it appears thatED overcrowding must be viewed in relation to thehospital system as a whole (Espinosa, Miro,Sanchez, Coll-vinent, & Milla, 2002; Feferman &Cornell, 1989; Schneider et al., 2001). As Dickinson(1989) put it, ‘‘The ‘overcrowded emergency roomdepartment’ [is] really an inpatient facility operatinginefficiently and beyond the limits of its resources.’’Consistent with this view, one of the most commonlyproposed causes of overcrowding is the lack ofbeds for admitted patients, which means thatpatients cannot be transferred to a ward (CanadianAssociation of Emergency Physicians, 2000; Derlet &Richards, 2000; Fatovich, 2002).
Various reasons that beds are unavailable have beensuggested. One frequently voiced opinion is that thelack of available hospital beds is due to hospitalrestructuring whereby hospital beds were perma-nently closed (Schull, Szalai, Schwartz, & Redelmeier,2001). Such downsizing of the hospital sector occurredacross Canada in the 1990s (e.g., Brownell, Roos,Burchill, 1999; Sheps et al., 2000). Contrary to thisview, however, a recent study conducted in Winnipegindicates that bed pressures in the hospital systemoccurred before and after downsizing, suggesting thatit is not the absolute number of beds that contributesto bed crises (Menec, Roos, & MacWilliam, 2002).Similarly, the fact that reports of ED overcrowdingappeared before the major restructuring of thehospital system suggests that overcrowding predatesbed closures (Dickinson, 1989; Feferman & Cornell,1989).
Although overcrowding is therefore not linked to theabsolute number of beds in the hospital system, thereal problem may lie in the inefficient use of acutecare beds. Research indeed suggests that a consider-able proportion of patients occupying acute care bedsare not acute, but could be cared for with alternativeservices, such as those provided by nursing homes,
home care, rehabilitation, and so forth. A review ofEuropean studies suggests that up to 61 per centof hospital days could be provided in alternativesettings (Hensher, Fulop, Coast, & Jefferys, 1999).Similar findings were obtained in Canada, withstudies showing that 27–66 per cent of hospital dayswere non-acute (Anderson, Sheps, & Cardiff, 1993;Bruce, De Coster, Trumble Waddell, Burchill, & DeHaney, 2002; De Coster, Peterson, Carriere, & Kasian,1999; Health Services Utilization and ResearchCommission, 1994). Studies conducted in Manitobafurther showed that acuity declined rapidly withlength of stay in hospital. Among medical patientswho were acute at admission, 24 per cent who hadbeen in hospital for 8 days were found to be no longeracute (Bruce, De Coster, Trumble Waddell, Burchill, &De Handy, 2001; see also De Coster, Roos, Carriere, &Peterson, 1997). Among patients in their 30th day inhospital, 49 per cent were no longer acute.
Thus, patients who are no longer acute – sometimesreferred to as ‘‘bed blockers’’ – are likely oneimportant cause of ED overcrowding. Anotherreason appears to be respiratory illnesses, specificallythose related to influenza (Hanratty & Robinson, 1999;Kendrick, Frame, & Povey, 1997; Menec et al., 2002).The relation between influenza-associated respiratoryillnesses and high-volume periods in the hospitalsystem – periods when there were an unusually highnumber of patients in hospital – was demonstrated ina recent study focusing on Winnipeg hospitals (Menecet al., 2002). The study examined seasonal variationin hospital use between 1987 and 1998. A first findingwas that high-volume periods occurred only amongemergency medical patients (those admitted asemergent or urgent), but not among other types ofpatients, such as surgical patients. Moreover, virtuallyall high-volume periods among emergency medicalpatients occurred during influenza seasons, withpatients with influenza-associated illnesses to a largeextent driving the increased volume of emergencymedical patients. This finding suggests that the influxof patients during influenza seasons contributed tothe filling of available beds, creating a potentialbacklog of patients in the ED.
In sum, bed pressures – and ED overcrowding – arebest viewed in relation to overall hospital use, ratherthan as a problem that occurs in one department only,with problems created by both the increase in thevolume of admissions during influenza seasons, andinpatients who are no longer acute. One objective ofthe present study was to extend previous research onthe impact of influenza-associated illnesses on theWinnipeg hospital system, by focusing specifically onthe contribution of older adults. Given that the risk ofsevere morbidity due to influenza-associated illnesses
122 Canadian Journal on Aging 24 (Suppl. 1) V. H. Menec et al.

increases with age (Barker, 1986; Lui & Kendal, 1987;Menec, MacWilliam, Black, & Aoki, 2003), one mightexpect that older adults constitute a large propor-tion of patients admitted for influenza-associatedillnesses, thereby contributing disproportionately tobed pressures. A second objective of the study wasto examine more specifically the appropriateness ofhospital admissions and hospital stays during onepressure week.
Overview of the Present StudyObjective 1, focusing on the impact of older adultson pressure periods in the Winnipeg hospital system,was examined over four fiscal years – 1996/1997 to1999/2000 – using administrative data (hospitaldischarge files) for all Winnipeg acute care hospitals.Objective 2, focusing on appropriateness of hospitaladmissions and stays, was addressed by examininghospital use for the week of January 2, 1999. Wechose this week because local newspaper articlespublished during this period vividly described acrisis, as exemplified by the headlines: ‘‘No roomfor dignity in ERs hallway,’’ (‘‘No room,’’ 1999).Hospital discharge files provided an overview ofhospital use during these seven days. Specifically, wewere interested in estimating how many patientslikely were no longer acute. A chart review was alsoconducted to explore two issues. First, how appro-priate were hospital admissions at a time of intensebed pressures? In other words, were only thosepatients who truly needed acute care admittedduring that week, or were individuals admittedwho could have been cared for outside an acutecare setting? Second, how appropriate were hospitalstays of individuals who had already been in hospitalat least a week prior to the start of the pressureperiod? For example, were there individuals in acutecare hospitals who might have been cared for inalternative settings?
Methods
Administrative Data
Hospital UseData were drawn from hospital discharge files forall acute care hospitals in Winnipeg. These files havebeen found to be a reliable and valid source of data(e.g., Roos & Nicol, 1999). We tracked hospital useweekly over four years (1996/1997 to 1999/2000).Weeks were defined from Saturday to Friday. Wedefined hospital use in two different ways. Admissionsprovide insights into how many people came into thehospital system during a given week. A patient countprovides an estimate of how many patients were
actually in hospital, on average, on a given day. Thismeasure was determined based on admissions andseparations data, counting the number of patientswho had an admission date less than or equal to achosen date and a separation date greater than thatdate. This measure therefore corresponds directly tothe number of beds filled, on average, on a given day.It should be noted that patients waiting in emergencyrooms for beds are captured in both the admissionand patient counts if an admit order had been issued.
High-Volume PeriodsConsistent with previous research (Menec et al., 2002),we identified pressure periods – which we refer to ashigh-volume periods – in the Winnipeg hospitalsystem as the weeks during which the average dailynumber of emergency medical inpatients (see defini-tion below) rose above the mean plus one standarddeviation, for at least two consecutive weeks. Theweeks outside the high-volume periods are referred toas low-volume periods. Given that it is difficult todetermine retrospectively the exact time during whichthe hospital system was in crisis, Menec et al. (2002)validated this definition by conducting a systematicreview of all newspaper articles published in thelargest local newspaper. The results showed that theweeks identified as high-volume periods corre-sponded very closely to periods of local media storiesdescribing the hospital system as being in crisis.
Emergency Medical PatientsThe Diagnostic Related Group (DRG) system is amethod that allows categorization of patients accord-ing to type of care, using diagnosis and procedurecodes (Fetter & Freeman, 1989). Patients are classifiedas either medical, surgical, obstetrical, psychiatric, ornewborn. Using this method, we identified medicalcases, which were then further classified as emergent/urgent (as opposed to scheduled) on the basis ofadmission status reported on the hospital dischargeabstract. We refer to these individuals as ‘‘emergency’’medical patients.
Influenza-Associated Respiratory IllnessesEmergency medical patients were further sub-divided into those with influenza-associated res-piratory illnesses versus those with any other illness.Influenza-associated illnesses were defined usingdiagnostic categories typically included in epidemio-logic studies (e.g., McBean, Babish, & Warren, 1993;Menec et al., 2003; Simonson & Fukuda, 2000),including pneumonia and influenza (ICD-9-CMcodes 480–487), acute respiratory diseases (codes460–466), and chronic lung disease (codes 490–496).We focused only on the diagnosis that, after discharge,was identified as most responsible for the patient’shospital stay.
Bed Pressures La Revue canadienne du viellissement 24 (Suppl. 1) 123

Chart Review
SampleThe chart review of patients in hospital during a high-volume period was completed as part of a largerstudy assessing the acuity of patients hospitalized atWinnipeg acute care facilities during the 1998/1999fiscal year (Bruce et al., 2001). For our purposes, thechart review was designed to address two issues:appropriateness of admissions during a week ofintense bed pressures (January 2–8, 1999), and appro-priateness of hospital stays among patients who werealready in hospital during that week. Two randomsamples were therefore drawn from administrativefiles: (1) 73 adult medical patients who were admittedto hospital during the pressure, whose length of staydid not exceed 30 days; and (2) another 71 patientswho were admitted to hospital prior to January 2,1999, had a hospitalization of at least 8 days but notgreater than 30 days, and remained in hospital forsome portion of the week of January 2–8.1 Medicalpatients were defined according to primary servicecodes, which refer to the service under which thepatient was treated for the greatest length of time.2
InterQualInterQual’s 1999 ISD Clinical Decision SupportCriteria (InterQual,TM 1999) were used to assessthe appropriateness of medical hospitalizations.These criteria have been used extensively in previousresearch (e.g., Health Services Utilization andResearch Commission, 1994; Joint Policy andPlanning Committee, 1997; Trerise, Dodek, Leung, &Spinelli, 1999; Wright & Cardiff, 1998). The InterQualISD criteria are used to assess the appropriateness ofadmission, continued stay in hospital, and discharge,based on a diagnosis-free assessment of severity ofillness and/or intervention. To be classified as anappropriate admission, a patient must present tohospital with certain clinical indicators (e.g., abdomi-nal pain with an elevated temperature) and receivespecific treatments and/or medications to address thepresenting illness. When subsequent days of stay areexamined, the patient must receive specified treat-ments and/or medications in order to be assessedas appropriate for an acute care setting. When thepatient no longer receives the types and levels oftreatments and/or medications required of an acutecare setting, an assessment is made as to whether alevel of physiological stability has been attained thatwarrants discharge or transfer to another level of care.
Two Level of Care criteria sets were used: ISD-AC�
Acute Care (which includes observation-level care)and ISD-SAC� Subacute Care. The sub-acute criteriaare designed for patients who require a slower-pacedrecovery and may be at risk for acute exacerbation.
Patients assessed as requiring care at the subacutelevel were deemed to have appropriately receivedthat care in acute care hospitals. The 1999 versions ofthese criteria underwent thorough review by a work-ing group, comprising medical and nursing staff, toassess their applicability to the Winnipeg practicesetting. The criteria were assessed to be relevant to theWinnipeg practice environment with only two minormodifications. The working group also developed aset of Alternate Level of Care criteria specific to theWinnipeg practice environment, which were assignedwhen a patient was not assessed as requiring careat the acute, subacute, or observation levels. TheAlternate Level of Care categories included outpatientservices (primarily diagnostic tests and procedures),home care, palliative care, rehabilitation, nursinghome, chronic care, minimal supervision residence(e.g., supportive housing), and home.
Data CollectionThree data abstractors completed the chart reviews.Admission was defined as the first 24 hours afterpresentation to hospital, with each day after the dayof admission termed a subsequent day. For therandomly selected patient samples, each day of thehospitalization was reviewed with the InterQualcriteria sets until the patient was no longer assessedas requiring acute, subacute, or observation-level care.If the patient was stable enough for discharge, analternate level of care was assigned at this point. Themedical record was also reviewed to determine if thepatient had an acute exacerbation; if none occurred,no further abstraction of data was completed, andall remaining days in hospital were considered non-acute. However, if a patient was assessed as notrequiring acute, subacute, or observation-level care,but was also too unstable for discharge, the day wasassessed as an appropriate acute or subacute day.Thus, our assessment of non-acute days was, ifanything, conservative.
Reliability AssessmentInter-rater reliability tests were completed on eachabstractor’s records on two to three occasions perabstractor, with at least 20 records being reviewed oneach occasion. Reliability was assessed by comparingreviews completed by each abstractor against thoseby one of the authors (SB). Reliability was evaluatedon two measures: (1) crude agreement; and (2)Cohen’s kappa coefficient, a measure of agreementthat corrects for chance (Fleiss, 1981). Initial levels ofcrude agreement ranged from 40 to 90 per cent. Therecords for which the level of crude agreement wasless than 85 per cent were abstracted a second time bythe data abstractors. The levels of crude agreement onsubsequent evaluations ranged from 90 to 95 per cent.Cohen’s kappa coefficient ranged from 0.71 to 0.81,
124 Canadian Journal on Aging 24 (Suppl. 1) V. H. Menec et al.

representing good to very good agreement beyondchance.
Findings
Patterns of Hospital Use from 1996/1997 to1999/2000
Figure 1 illustrates patterns of hospital use for emer-gency medical patients with influenza-associatedrespiratory illnesses, differentiating between thoseless than 65 years of age versus those over 65.Marked spikes are apparent in all years, especiallyamong those over 65, but particularly in the mostrecent three years. Superimposed (shaded areas) arethe high-volume periods among all emergency med-ical patients. Peaks in influenza-associated respiratoryillnesses corresponded very closely to high-volumeperiods. They also corresponded to influenza seasons,suggesting that the respiratory illnesses identifiedwere linked to influenza viruses (Health Canada,2002). The spikes in patient counts were substantial.During the worst week in 1998/1999, for instance,there was a total of 259 patients with influenza-associated illnesses in hospital on average per day(193 aged over 65, 66 aged less than 65). This totalrepresented 21 per cent of all emergency medicalpatients during that week. The pattern was similar foradmissions for influenza-associated respiratory ill-nesses, with distinct spikes being apparent each yearduring the high-volume periods.
To what extent did older adults contribute to high-volume periods? Table 1 shows descriptive statisticsof the average daily number of emergency medicalpatients in hospital, as well as average weekly
emergency medical admissions (as averaged acrossthe four study years). Data are provided for influenza-associated respiratory illnesses and all other ill-nesses during low-volume and high-volume periods.For example, as averaged across the four years, 99patients were in hospital for respiratory illnesses perday during low-volume periods. The number morethan doubled during high-volume periods, rising to192. Note that, as was evident in Figure 1, the increasewould be much higher if we were to focus on the peakweek only. A large proportion of patients in hospitalfor influenza-associated illnesses or other illnesseswere 65 years of age or older. For instance, duringlow-volume periods, 73.7 per cent of patients withinfluenza-associated illnesses were 65 and older,whereas during high-volume periods the proportionwas 76 per cent. The proportion of patients withinfluenza-associated respiratory illnesses increasedsubstantially during high-volume periods, essentiallydoubling for all age groups (11–20.6% for all agescombined).
For admissions, noteworthy is again the increase inthe proportion of patients admitted for influenza-associated illnesses during high-volume periods.While 13 per cent of all emergency medical admis-sions during low-volume periods were due toinfluenza-associated illnesses, the proportion rose to24.5 per cent during high-volume periods.
To examine more directly whether older adultswere more likely to be hospitalized for respiratoryillnesses during high-volume periods, as comparedto younger adults, we conducted two logistic regres-sions, one for the patient count of emergencymedical patients, the second for emergency medical
0
50
100
150
200
250
1 9 17 25 33 41 49 57 65 73 81 89 97 105 113 121 129 137 145 153 161 169 177 185 193 201 209
Ave
rag
e D
aily
Nu
mb
er o
f P
atie
nts
in H
osp
ital
Age 65+
Age < 65
1996/97 1997/98 1998/99 1999/00
Week
Figure 1: Average number of emergency medical patients in hospital per day for respiratory illnesses, 1996/1997 to1999/2000 Note: Shaded areas represent high-volume periods among all emergency medical patients.
Bed Pressures La Revue canadienne du viellissement 24 (Suppl. 1) 125

admissions. Time period (high- versus low-volume),age (<65, 65þ) and their interaction were thereforeregressed onto the dichotomous outcome variableof being in hospital for respiratory versus non-respiratory illnesses. Odds ratios > 1 reflect increasedodds of being hospitalized for influenza-associatedrespiratory illnesses.
The results of the regression for patient countsshowed that both main effects, although not theinteraction, were significant. The odds of being inhospital for respiratory illnesses was greater for olderadults, as compared to younger individuals (adjustedodds ratio, AOR¼ 1.30, p< .001) and greater duringhigh-volume than low-volume periods (AOR¼ 1.82,p< .001).
Both main effects and the interaction were signifi-cant for admissions. The odds of being admittedto hospital were markedly higher for older than foryounger adults (AOR¼ 6.85, p< .001) and was ele-vated during high-volume relative to low-volumeperiods (AOR¼ 1.62, p< .001). Moreover, the signifi-cant interaction ( p< .001) indicates that the odds ofbeing admitted for influenza-associated respiratoryillnesses were particularly high among older adultsduring high-volume periods.
Hospital Use During a Pressure Week
We next wanted to examine more specifically hospitaluse during a week when the hospital system wasexperiencing intense bed pressures. Given that pre-vious research shows that level of acuity decreasesrapidly with length of stay (Bruce et al., 2001;De Coster et al., 1997), we first examined the lengthof time that patients had been in hospital when thecrisis week started. Thus, a patient who was admittedon the first day of crisis week was counted as being inDay 1; a patient admitted a day prior to the first dayof the crisis week was counted as being in Day 2, andso forth. As we were particularly interested in howmany patients in hospital were likely no longer acute,we restricted the analysis to patients who wereadmitted prior to or on the day of the crisis andwho were still in hospital after the crisis week. Of the1,248 patients in hospital on average per day duringthat week, 733 patients met this criterion (58.7%).
Among these 733 patients, 30 per cent were in theirfirst to seventh day in hospital; 14.5 per cent were intheir 8th to 14th day, 16 per cent were in their 15th to30th day, and 39.6 per cent had been in hospital for 31days or longer (see Table 2). Thus, almost two thirdsof patients had already been in hospital for a week or
Table 1: Emergency medical patients: A comparison of of low-volume versus high-volume periods,1996/97 to 1999/00
Influenza-Associated Respiratory Illnesses All Other Illnesses
Low-Volume Periods High-Volume Periods Low-Volume Periods High-Volume PeriodsLow-VolumePeriods
High-VolumePeriods
Age N % N % N % N % % IAI % IAI
Average Number of Patients in Hospital per Day1
<65 26 26.3% 46 24.0% 276 30.8% 272 29.2% 9.4% 16.9%
65þ 73 73.7% 146 76.0% 620 69.2% 660 70.8% 11.8% 22.1%
65–74 20 20.2% 37 19.3% 161 18.0% 160 17.2% 12.4% 23.1%
75–84 33 33.3% 68 35.4% 268 29.9% 295 31.7% 12.3% 23.1%
85þ 20 20.2% 41 21.4% 191 21.3% 205 22.0% 10.5% 20.0%
Total 99 100% 192 100% 896 100% 932 100% 11.0% 20.6%
Average Weekly Number of Admissions1
<65 37 46.3% 56 37.6% 378 61.3% 362 59.4% 9.8% 15.5%
65þ 43 53.8% 93 62.4% 239 38.7% 247 40.6% 18.0% 37.7%
65–74 14 17.5% 27 18.1% 87 14.1% 82 13.5% 16.1% 32.9%
75–84 19 23.8% 44 29.5% 101 16.4% 108 17.7% 18.8% 40.7%
85þ 10 12.5% 22 14.8% 51 8.3% 57 9.4% 19.6% 38.6%
Total 80 100% 149 100% 617 100% 609 100% 13.0% 24.5%
1Averages are rounded to the nearest integer; IAI¼ influenza-associated respiratory illnesses.
126 Canadian Journal on Aging 24 (Suppl. 1) V. H. Menec et al.

longer when the crisis week started. Table 2 furthershows that adults 75 or older constituted alarge proportion of longer stay patients: 60.4 percent of patients in their 8th to 14th day, 71.8 per centof patients in their 15th to 30th day, and 72.1 per centof those in their 31st day or more. Overall, 64.8per cent of individuals in hospital were 75 years orolder.
Level of Acuity During a Pressure Week: Results fromthe Chart Review
We examined level of care for two samples: patientsadmitted during the crisis week (median age¼ 72years, age range¼ 22 to 95) and patients already inhospital for at least 8 days (median age¼ 76; agerange¼ 32 to 94). Figure 2 shows level of care on theday of admission. The total acuity during this periodwas 80 per cent; 77 per cent of the patients admittedduring this crisis week were assessed as requiringacute-level care, and another 3 per cent were assessedas requiring care at the subacute level. An additional16 per cent required the services provided in anobservation setting. Therefore, 96 per cent of medi-cal patients admitted during this crisis week wereadmitted appropriately, as they indeed required theservices provided in an acute care facility. Only 4 percent of medical patients admitted during this crisisweek were non-acute and required an alternate levelof care.
In Figure 3 we display the levels of care required forpatients who were admitted prior to the crisis week,but were still in hospital during the pressure week.Note that we report here the level of acuity for thedays incurred by these patients. The total acuity for thesample’s patient-days was 69 per cent (38% acute and31% subacute). Thirty-one per cent of patient-daysspent on acute care medical wards during this crisisweek were assessed as non-acute and requiring an
alternate level of care. Nine per cent of patient-dayswere spent awaiting home care and 8 per cent waitingfor diagnostic testing services to be arranged. Anadditional 8 per cent of patient-days were spent by
Acute77%
Subacute3%
Observation16%
Alternate Level of Care4%
Figure 2: Patient acuity for individuals admitted duringa pressure week – Level of care at admission
Acute38%
Subacute31%
Home Care9%
Long-Term Care8%
Palliative Care5%
Other1%
Outpatient8%
Figure 3: Acuity of patient-days of individuals inhospital at the start of the pressure week – Levelof care on days after admission
Table 2: Patients who were admitted before and discharged after the week of January 2 to 8, 1999, a crisis weekin the Winnipeg hospital system
Day in Hospital on First Day of Crisis Week
<¼7th Day 8th–14th Day 15th–30th Day 31st Day or Longer Total
Age N % N % N % N % N %
<65 61 45.9% 22 16.5% 15 11.3% 35 26.3% 133 100%
65–74 41 32.8% 20 16.0% 18 14.4% 46 36.8% 125 100%
75–84 72 27.6% 25 9.6% 50 19.2% 114 43.7% 261 100%
85þ 46 21.5% 39 18.2% 34 15.9% 95 44.4% 214 100%
Total 220 30.0% 106 14.5% 117 16.0% 290 39.6% 733 100%
Bed Pressures La Revue canadienne du viellissement 24 (Suppl. 1) 127

patients whose care needs could have been betterserved on a long-term care unit, specifically nursinghome and rehabilitation facilities. Five per cent ofdays spent in hospital during this time could havebeen more appropriately spent in a palliative caresetting.
DiscussionHospital overcrowding is a serious problem that hasplagued Winnipeg and many other Canadian citiesfor many years. Hospital bed crises manifestthemselves in emergency department (ED) over-crowding, which has gained much publicity inboth academic journals and the popular media, aspatients are sometimes stranded for days in thehallways of EDs (e.g., Fayerman, 1999). The reasonsfor overcrowding are clearly complex. The presentstudy highlights two problem areas: influenza-associated respiratory illnesses and individuals inacute care hospitals who could be cared for inalternate settings.
Influenza-Associated Illnesses
High-volume periods were linked to an influx ofpatients with influenza-associated illnesses in all fourstudy years. Older adults were particularly at risk ofbeing hospitalized for influenza-associated illnesses,consistent with previous research (Barker, 1986; Lui &Kendal, 1987, Menec et al., 2003). Influenza vaccina-tion is currently the best method to reduce influenza-associated morbidity. Studies focusing on older adultsindicate that vaccination reduces hospitalization forpneumonia and influenza by 17 to 57 per cent andhospitalizations for all respiratory conditions by 17to 39 per cent (for reviews, see Gross, Hermogenes,Sacks, Lau, & Levandowski, 1995; Nichol, 1998).Hospitalizations for congestive heart failure werereduced by 27 to 38 per cent. Influenza vaccinationalso reduced influenza-related mortality by 41 percent and all-cause mortality by 27 to 75 per cent(Nichol, 1998). Cost-effectiveness studies show thatinfluenza vaccination provides cost savings. Forexample, Nichol, Margolis, Wuorenma, & VonSternberg (1994) showed that reduced hospitaliza-tions for pneumonia and influenza due to influenzavaccination translated into savings of US$117 perperson per year.
Thus, one approach to preventing winter bed pres-sures – or at least reducing their likelihood – is toensure high levels of influenza vaccination coverage.Although influenza vaccination coverage for targetedgroups, particularly individuals aged 65 and over,has been rising – from 51 per cent in 1996/1997to 65 per cent in 2000/2001 – it is still below
recommended levels in Manitoba and other provinces(Canadian Institute for Health Information, 2002).Thus, continuing emphasis needs to be placed onfurther increasing coverage.
Alternatives to Acute Care
While influenza-associated illnesses are one contribu-tor to hospital pressures, they are only part of theoverall picture. Indeed, an increase in admissionsshould not cause any problems if hospital occupancyrates are low and, therefore, a sufficient number ofbeds are available. Given that Winnipeg hospitals arefunctioning at close to 100 per cent capacity through-out the year, there is no such flex in the system, andeven a small increase in admissions can createproblems.
Do all patients who occupy acute care beds reallyneed acute care? The present study clearly suggeststhat they do not, consistent with previous research(e.g., De Coster et al., 1999; Hensher et al., 1999). Ourchart review of patients who were in hospital whenthe Winnipeg hospital system was in crisis showedthat 31 per cent of hospital days did not require acutecare, but rather required alternative levels of care,such as home care or long-term care. It is noteworthythat these findings are very similar to results for othertimes during the year (see Bruce et al., 2001). Thisdiscovery suggests that no adjustments were madeduring the crisis week by increasing the efficiencyof discharging or transferring patients to alternativesettings or services.
The chart review also indicates that virtually allhospital admissions during the pressure week indeedrequired acute care. Thus the problem area does notlie at the admission stage, but rather at the dischargestage, in that patients remain in an acute care settingwhen alternative services would be more appropriate.Previous research (Bruce et al., 2001) indicates thatonly 75 per cent of patients in their 8th day of stay inhospital were still acute; the proportion dropped to 51per cent for patients in their 30th day. Applied to thefigures obtained in the present study, these findingssuggest that over 100 patients in hospital during anintense pressure week were likely no longer acuteand could have been cared for in alternative settings.Thus, over 100 beds might have been freed up duringthe pressure week by discharging patients to alternatecare settings. InterQual criteria or some other utiliza-tion management tool might be used to assess theacuity of patients, seasonally or year round, particu-larly for patients who have been in hospital 8 daysor longer.
Being able to discharge patients to alternative caresettings presumes that such care settings are readily
128 Canadian Journal on Aging 24 (Suppl. 1) V. H. Menec et al.

available, as well as that efficient discharge servicesare in place that allow timely transfer to them.Our finding that a substantial proportion of patient-days were spent awaiting home care services, transferto long-term care, or diagnostic testing servicessuggests that these are areas that warrant furtherresearch. For example, research is needed thatexplores the reasons for delays in setting up homecare services.
Limitations
It is important to note several limitations of thepresent study. First, while we were able to identifythe proportion of non-acute patient-days, as well asthe alternate levels of care that would be required,such as home care or long-term care, we did notexamine why there might have been delays in gettingpatients discharged. That issue will require furtherresearch. Second, although we link respiratoryillnesses to influenza viruses, given that they occurredduring influenza seasons, some of the morbiditymight have been caused by other viruses, such asparainfluenza virus, which also tends to be presentduring influenza seasons. Last, while we capturepatients who are boarded in the emergencydepartment (ED) once an admit order has beenissued, it was not possible to specifically identifythese individuals and determine, for instance, forhow long they were in the ED before being transferredto a ward. Similarly, patients might have spent time inthe ED before being officially admitted; these days arenot captured in the administrative data. Indeed, ourchart review revealed 8 individuals who spent up to 4days in the ED before being officially admitted tohospital.
Conclusion
In sum, the present study contributes to the literatureby identifying reasons for hospital overcrowding,thereby suggesting potential ways to prevent thisserious problem in the future. In particular, it pointsto the need to increase influenza vaccination coverageand increase the availability of – and timely dischargeto – alternatives to acute care, such as home care orlong-term care. A particular strength of the study isthat it combines administrative data analyses with achart review. While administrative data are usefulin providing a general overview of hospital use –their particular strong points being that they allowpopulation-based analyses over many years – chartreviews can provide an in-depth picture of patientacuity. The combination of the two methods creates apowerful paradigm that allows insights that couldotherwise not be gained.
Notes1 The chart review subsequently revealed that
8 patients had in fact lengths of stay longer than30 days (maximum length of stay¼ 39 days).This sampling error occurred because theseindividuals spent time in the ER before anadmit order was issued.
2 The definition of medical patients for the chartreview component of this study differs from thatfor the remainder of the study. Primary servicecodes reflect categories of medical practice specialties(e.g., internal medicine, cardiology), whereas theDRG system provides groupings of medical diagnosesbased on the diagnosis that was considered to bemost responsible for the patient’s stay in hospital.Hospital service codes were useful for this portionof the study because we were interested in samplinga broad selection of medical conditions.
ReferencesAnderson, G., Sheps, S., & Cardiff, K. (1993). Evaluation of
Vi-Care: A utilization management program of theGreater Victoria Hospital Society. Vancouver: Universityof British Columbia.
Barker, W.H. (1986). Excess pneumonia and influenzaassociated hospitalization during influenza epidemicsin the Unites States, 1970–78. American Journal of PublicHealth, 6, 761–765.
Brownell, M.D., Roos, N.P., & Burchill, C. (1999).Monitoring the impact of hospital downsizing onaccess to care and quality of care. Medical Care,6(Suppl.), JS135–JS150.
Bruce, S., De Coster, C., Trumble Waddell, J.,Burchill, C., & De Haney, S. (2001). Acuity ofpatients hospitalized for medical conditions at Winnipegacute care hospitals. Winnipeg: Manitoba Centre forHealth Policy.
Bruce, S., De Coster, C., Trumble Waddell, J., Burchill, C., &De Haney, S. (2002). Patients hospitalized for medicalconditions in Winnipeg, Canada: Appropriatenessand level of care. Health Care Management Forum,Winter(Suppl.), 53–57.
Canadian Association of Emergency Physicians. (2000).Position statement: Emergency department overcrowding.Retrieved December 17, 2004, from http://www.caep.ca/002.policies/002-1.guidelines/overcrowding.htm
Canadian Institute for Health Information. (2002). Healthcare in Canada. Ottawa: Statistics Canada.
De Coster, C., Peterson, S., Carriere, K.C., & Kasian, P.(1999). Assessing the extent to which hospitals areused for acute care purposes. Medical Care, 37(Suppl.),JS151–JS166.
De Coster, C., Roos, N.P., Carriere, K.C., & Peterson, S.(1997). Inappropriate hospital use by patients
Bed Pressures La Revue canadienne du viellissement 24 (Suppl. 1) 129

receiving care for medical conditions: Targeting utiliza-tion review. Canadian Medical Association Journal, 157,889–896.
Derlet, R.W., & Richards, J.R. (2000). Overcrowding in thenation’s emergency departments: Complex causesand disturbing effects. Annals of Emergency Medicine,35, 63–68.
Dickinson, G. (1989). Emergency department overcrowding.Canadian Medical Association Journal, 140, 270–271.
Espinosa, G., Miro, O., Sanchez, M., Coll-vinent, B., &Milla, J. (2002). Effects of external and internal factorson emergency department overcrowding. Annals ofEmergency Medicine, 39, 693–695.
Fatovich, D.M. (2002). Emergency medicine. British MedicalJournal, 324, 958–962.
Fayerman, P. (1999, February 11). Hospital squeeze putspatients in linen closets, storage areas. Vancouver Sun,p.A1.
Feferman, I., & Cornell, C. (1989). How we solved theovercrowding problem in our emergency department.Canadian Medical Association Journal, 140, 273–276.
Fetter R., & Freeman, J. (1989).DRG refinement with diagnosticspecific comorbidities and complications: A synthesis ofcurrent approaches to patient classification (Final report:The Health Care Financing Administration CooperativeAgreement, No. 15-C-98930/1–01 and 17-C-98930/1–0251). New Haven: Health Systems ManagementGroup.
Fleiss, J.L. (1981). Statistical methods for rates and proportions.New York: John Wiley & Sons.
Graff, L. (1999). Overcrowding in the ED: An internationalsymptom of health care system failure. American Journalof Emergency Medicine, 17, 208–209.
Gray, C. (2000). Hospital crisis? What crisis? CanadianMedical Association Journal, 162, 1043.
Gross, P.A., Hermogenes, A.W., Sacks, H.S., Lau, J., &Levandowski, R.A. (1995). The efficacy of influenzavaccine in elderly persons: A meta-analysis and reviewof the literature. Annals of Internal Medicine, 123,518–527.
Hanratty, B., & Robinson, M. (1999). Coping with winterbed crises. British Medical Journal, 319, 1511–1512.
Health Canada. (2002). Influenza in Canada: 2000–2001season. Canada Communicable Disease Report, 28, 17–28.
Health Services Utilization and Research Commission.(1994). Barriers to community care. Saskatoon: Author.
Hensher, M., Fulop, N., Coast, J., & Jefferys, E. (1999).Better out than in? Alternatives to acute hospitalcare. British Medical Journal, 319, 1127–1130.
InterQual. (1999a). ISD-AC Instensity of Service Severityof Illness Discharge Services. Marlborough, MA:InterQual, Division of Access Health, Inc.
InterQual. (1999b). ISD-AC Intensity of Service Severity ofIllness Discharge Services. Malborough, MA: InterQual,Division of Access Health, Inc.
Joint Policy and Planning Committee. (1997). Non-acutehospitalization report (adult). Toronto.
Kendrick, S., Frame, S., & Povey, C. (1997). Beds occupiedby emergency patients: Long term trends in patternsof short term fluctuations in Scotland. Health Bulletin,55, 167–175.
Lui, K., & Kendal, A.P. (1987). Impact of influenzaepidemics on mortality in the United States fromOctober 1972 to May 1985. American Journal of PublicHealth, 77, 712–716.
McBean, A.M., Babish, J.D., & Warren, J.L. (1993). Theimpact and cost of influenza in the elderly. Archivesof Internal Medicine, 153, 2105–2111.
Menec, V.H., MacWilliam, L., Black, C., & Aoki, F.(2003). The impact of influenza-associated respiratoryillnesses on hospitalizations, physician visits, emer-gency room visits, and mortality. Canadian Journal ofPublic Health, 94, 59–63.
Menec, V.H., Roos, N.P., & MacWilliam, L. (2002).Seasonal patterns of hospital use in Winnipeg:Implications for managing winter bed crises.Health Care Management Forum, Winter(Suppl.),58–64.
Mitchell, C. (1998, February 19). No room for dignity in ERshallways. Winnipeg Free Press, p.A1.
Nichol, K.L. (1998). Efficacy/clinical effectiveness ofinactivated influenza virus vaccines in adults. InK.A. Nicholson, R.G. Webster, & A.J. Hay (Eds.),Textbook of influenza. Oxford: Backwell Science,358–372.
Nichol,K.L.,Margolis,K.L.,Wuorenma, J.,&VonSternberg,T.(1994). The efficacy and cost effectiveness ofvaccination against influenza among elderly personsliving in the community. New England Journal ofMedicine, 331, 778–784.
No Room for Dignity in ERs Hallways. (1999, January 8).Winnipeg Free Press, p.A1.
Roos, L.L., & Nicol, J.P. (1999). A research registry:Uses, development, and accuracy. Journal of ClinicalEpidemiology, 52, 39–47.
Schneider, S., Zwemer, F., Doniger, A., Dick, R.,Czapranski, T., & Davis, E. (2001). Rochester, NY:A decade of emergency department overcrowding.Academic Emergency Medicine, 8, 1044–1050.
130 Canadian Journal on Aging 24 (Suppl. 1) V. H. Menec et al.

Schull, M.J., Szalai, J.P., Schwartz, B., & Redelmeier, D.A.(2001). Emergency department overcrowding followingsystematic hospital restructuring: Trends at twentyhospitals over ten years. Academic Emergency Medicine,8, 1037–1043.
Sheps, S.B., Reid, R.J., Barer, M.L., Krueger, H.,McGrail, K.M., Green, B., Evans, R.G., & Hertzman, C.(2000). Hospital downsizing and trends in healthcare use among elderly people in British Columbia.Canadian Medical Association Journal, 163, 397–401.
Simonson, L., & Fukuda, K. (2000). The impact of influenzaepidemics on hospitalizations. Journal of InfectiousDisease, 181, 831–837.
Trerise, B., Dodek, P., Leung, A., & Spinelli, J.J. (1999).Inappropriate underutilization of services in an acutecare hospital. Vancouver: Centre for Health Evaluationand Outcome Sciences.
Wright, C.J., & Cardiff, K. (1998). The utilization of acute caremedical beds in Prince Edward Island. Vancouver: Centrefor Health Services and Policy Research.
Bed Pressures La Revue canadienne du viellissement 24 (Suppl. 1) 131

CANADIANJOURNALONAGING
LA REVUECANADIENNEDUVIEILLISSEMENT

Anticipating Change: How Many AcuteCare Hospital Beds Will ManitobaRegions Need in 2020?
Gregory S. Finlayson,1 David Stewart,2 Robert B. Tate,1
Leonard MacWilliam,1 and Noralou Roos1
RESUMEPouvoir anticiper les besoins a venir en matiere de services de sante constitue un defi pour les personnes responsablesde la planification en matiere de sante. Au moyen des previsions demographiques existantes, cette etude presente deuxmethodes visant a evaluer la demande en matiere de lits d’hopitaux dans les regions du Manitoba en 2020. La premieremethode, qui s’appuie sur une projection fondee sur l’utilisation actuelle, consiste tout simplement a effectuer uneprojection dans l’avenir a partir de l’utilisation moyenne au cours d’une periode de trois ans. La deuxieme methode,une analyse des tendances sur dix ans, utilise la methode de regression de Poisson pour determiner les besoins futurs.La projection fondee sur l’utilisation actuelle revele une augmentation substantielle des besoins en matiere de litsd’hopitaux, tandis que l’analyse des tendances prevoit une diminution. Les dernieres previsions concordent avecl’augmentation constante du nombre de chirurgies d’un jour et la diminution de la duree des sejours. Les previsionsfondees sur l’utilisation actuelle doivent etre envisagees dans le cadre des taux d’occupation relativement bas dans leshopitaux ruraux et des recherches anterieures sur la pertinence des sejours dans des hopitaux de soins de courte duree.Si, a l’avenir, des mesures sont prises pour assurer une utilisation plus appropriee des lits destines aux soins de courteduree, les previsions des penuries de lits fondees sur l’utilisation actuelle ne representent pas une source d’inquietudes.
ABSTRACTBeing able to anticipate future needs for health services presents a challenge for health planners. Using existingpopulation projections, two models are presented to estimate the demand for hospital beds in regions of Manitoba in2020. The first, a current-use projection model, simply projects the average use for a recent three-year period into thefuture. The second, a 10-year trend analysis, uses Poisson regression to project future demand. The current-useprojection suggests a substantial increase in the demand for hospital beds, while the trend analysis projects a decline.The last projections are consistent with ongoing increases in rates of day surgeries and declines in lengths of stay. Thecurrent-use projections need to be considered in the context of relatively low occupancy rates in rural hospitals andprevious research on appropriateness of stays in acute care hospitals. If measures are taken to ensure more appropriateuse of acute care hospital beds in the future, then the current-use projections of bed shortages are not a cause forconcern.
1 Department of Community Health Sciences, University of Manitoba
2 Department of Political Studies, University of Manitoba
Manuscript received: / manuscrit recu : 01/04/03
Manuscript accepted: / manuscrit accepte : 07/04/04
Mots cles : lits d’hopitaux; vieillissement de la population; previsions
Keywords: hospital beds; population aging; forecasting
Requests for offprints should be sent to: / Les demandes de tires-a-part doivent etre addressees a :
Gregory S. Finlayson, B.A., C.A.E.Manitoba Centre for Health PolicyDepartment of Community Health SciencesUniversity of Manitoba727 McDermot Avenue, Suite 408Winnipeg, MB R3E 3P5([email protected])
Canadian Journal on Aging / La Revue canadienne du viellissement 24 (Suppl. 1) : 133 - 140

IntroductionThe Canadian health care system is currently under-going extensive public scrutiny. A federal commissionon health care recommended a number of changesin financing to ensure the continued ability of thesystem to meet Canadians’ needs (Romanow, 2002).The report is both an acknowledgment of, and aresponse to, public concerns about health care. A keycomponent of the concerns about the sustainabilityof the Canadian health care system is hospital care.Hospital expenditures remain the single largestexpense in the health care system (Maioni, 2002),and the universal, comprehensive coverage for allhospital visits is an important part of Canada’smedicare system. Underlying much of the concernabout sustainability of the health care system are fearsabout the effect that demographic changes will haveover the next quarter of a century. Statistics Canadaestimates that 12.8 per cent of Canadians were overthe age of 65 years in 2003, and has projected that21.4 per cent of the Canadian population will be overage 65 by 2026 (Statistics Canada, 2001). Recentanalyses of health services utilization have shownthat those over the age of 65 use a disproportionatenumber of hospital days, and medical services moregenerally (Direction de la sante publique, 1999). Thefear then is that hospitals specifically, and the healthsystem more generally, will be overwhelmed by anaging population.
The issue is much discussed in the United States.One example is Victor Fuchs’s ‘‘Health Care for theElderly: How Much? Who Will Pay For It?’’ whichwarns that health care costs for older Americanswill increase by 172 per cent between 1995 and 2020,based on current trends (Fuchs, 1999). In Canada,public attention was focused on this issue by anumber of high-profile publications, including theC.D. Howe Institute’s ‘‘Will the Baby Boomers Bustthe Health Budget?’’ This report describes how theproportion of older people is expected to show asubstantial increase in coming years, and that thisage group consumes more health services thando younger people (Robson, 2001). Furthermore,the Report of the Premier’s Advisory Council onHealth in Alberta warned that the current health caresystem would not be able to continue withoutfundamental changes in how we pay for healthservices (Mazankowski, 2001). In February 2001 theauditor general of Canada urged the federal govern-ment to focus on the long-term implications of anaging population. Given public concerns about thehealth care system and the prospect of an agingpopulation, a need to try to assess the impact ofdemographic change has, not surprisingly, beenidentified.
Impact of Demographic Change on Hospital Use
On average, older people use more health servicesthan do younger people (Barer, Evans, & Hertzman,1995; Evans, McGrail, Morgan, Barrer, & Hertzman,2001), including hospital care, physician services,and prescription drugs. As Carriere (2000) found,hospitalization rates are positively related with age(excluding newborns). Denton and Spencer (1995)discuss the impact of an aging population on thehealth care system and project a 35.1 per cent shortfallin the number of acute care beds that would beneeded in Ontario in 2010, based on the assumption of1990 utilization rates. The impact of age goes beyondhospital admission rates, since the average length ofa hospital stay also increases with the age of a patient(Carriere, 2000). A review article of the use of medicalcare by older adults by Rosenberg and James (2000)describes people over the age of 75, and womenin particular, as being among the heaviest users ofphysician, hospital, and ambulatory services. Theyfurther report that research on patterns of hospitalcare through the 1970s and 1980s shows the increas-ing lengths of stay by older adults (Rosenberg &James, 2000). Despite widespread agreement on thesematters, there remain many questions about whatfuture impact the growth of the older adult popula-tion will have on the need for health services.
Manitoba Population Projections
The population projections developed by theManitoba Bureau of Statistics (MBS) utilized theirPopulation Cohort Projection model (ManitobaBureau of Statistics, 2000). This model takes the basepopulation and adds or subtracts the components ofannual population change (international migration,inter-provincial migration, intra-provincial migration,and natural increase [births minus deaths]) by age andsex. Specifically, the components were estimated asfollows:
Migration
July 1, 1998, Statistics Canada census divisionpopulation estimates for migration and 1996 censussubdivisions were used to estimate in- and out-migration for each regional health authority (RHA).The migration rate was assumed to remain stablefrom 2002 to 2020.
Deaths
Three years of deaths (1995–1997) were used tocalculate life expectancies for 5-year age groups foreach RHA. Regions with similar life expectancieswere grouped together.
134 Canadian Journal on Aging 24 (Suppl. 1) G. S. Finlayson et al.
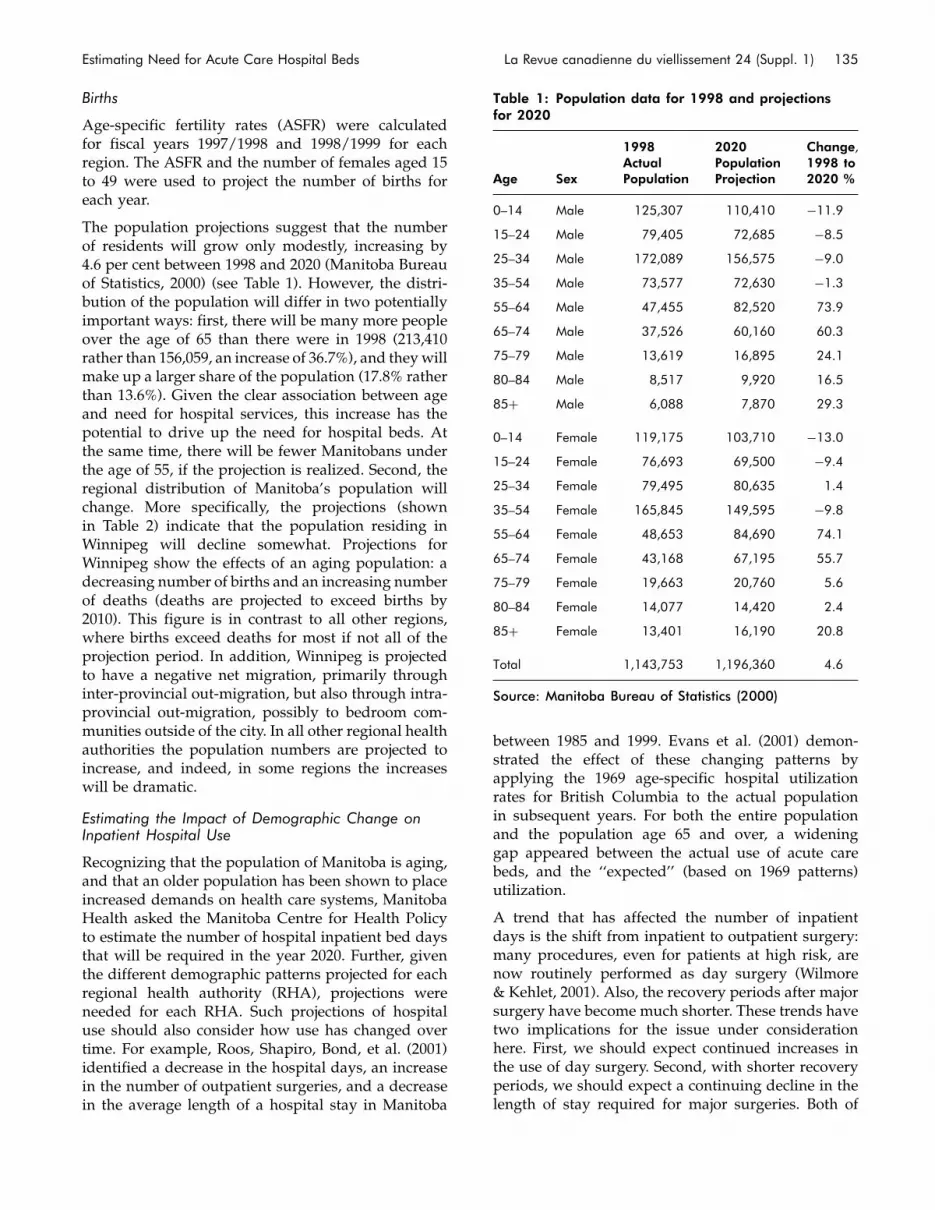
Births
Age-specific fertility rates (ASFR) were calculatedfor fiscal years 1997/1998 and 1998/1999 for eachregion. The ASFR and the number of females aged 15to 49 were used to project the number of births foreach year.
The population projections suggest that the numberof residents will grow only modestly, increasing by4.6 per cent between 1998 and 2020 (Manitoba Bureauof Statistics, 2000) (see Table 1). However, the distri-bution of the population will differ in two potentiallyimportant ways: first, there will be many more peopleover the age of 65 than there were in 1998 (213,410rather than 156,059, an increase of 36.7%), and theywillmake up a larger share of the population (17.8% ratherthan 13.6%). Given the clear association between ageand need for hospital services, this increase has thepotential to drive up the need for hospital beds. Atthe same time, there will be fewer Manitobans underthe age of 55, if the projection is realized. Second, theregional distribution of Manitoba’s population willchange. More specifically, the projections (shownin Table 2) indicate that the population residing inWinnipeg will decline somewhat. Projections forWinnipeg show the effects of an aging population: adecreasing number of births and an increasing numberof deaths (deaths are projected to exceed births by2010). This figure is in contrast to all other regions,where births exceed deaths for most if not all of theprojection period. In addition, Winnipeg is projectedto have a negative net migration, primarily throughinter-provincial out-migration, but also through intra-provincial out-migration, possibly to bedroom com-munities outside of the city. In all other regional healthauthorities the population numbers are projected toincrease, and indeed, in some regions the increaseswill be dramatic.
Estimating the Impact of Demographic Change onInpatient Hospital Use
Recognizing that the population of Manitoba is aging,and that an older population has been shown to placeincreased demands on health care systems, ManitobaHealth asked the Manitoba Centre for Health Policyto estimate the number of hospital inpatient bed daysthat will be required in the year 2020. Further, giventhe different demographic patterns projected for eachregional health authority (RHA), projections wereneeded for each RHA. Such projections of hospitaluse should also consider how use has changed overtime. For example, Roos, Shapiro, Bond, et al. (2001)identified a decrease in the hospital days, an increasein the number of outpatient surgeries, and a decreasein the average length of a hospital stay in Manitoba
between 1985 and 1999. Evans et al. (2001) demon-strated the effect of these changing patterns byapplying the 1969 age-specific hospital utilizationrates for British Columbia to the actual populationin subsequent years. For both the entire populationand the population age 65 and over, a wideninggap appeared between the actual use of acute carebeds, and the ‘‘expected’’ (based on 1969 patterns)utilization.
A trend that has affected the number of inpatientdays is the shift from inpatient to outpatient surgery:many procedures, even for patients at high risk, arenow routinely performed as day surgery (Wilmore& Kehlet, 2001). Also, the recovery periods after majorsurgery have become much shorter. These trends havetwo implications for the issue under considerationhere. First, we should expect continued increases inthe use of day surgery. Second, with shorter recoveryperiods, we should expect a continuing decline in thelength of stay required for major surgeries. Both of
Table 1: Population data for 1998 and projectionsfor 2020
Age Sex
1998ActualPopulation
2020PopulationProjection
Change,1998 to2020 %
0–14 Male 125,307 110,410 �11.9
15–24 Male 79,405 72,685 �8.5
25–34 Male 172,089 156,575 �9.0
35–54 Male 73,577 72,630 �1.3
55–64 Male 47,455 82,520 73.9
65–74 Male 37,526 60,160 60.3
75–79 Male 13,619 16,895 24.1
80–84 Male 8,517 9,920 16.5
85þ Male 6,088 7,870 29.3
0–14 Female 119,175 103,710 �13.0
15–24 Female 76,693 69,500 �9.4
25–34 Female 79,495 80,635 1.4
35–54 Female 165,845 149,595 �9.8
55–64 Female 48,653 84,690 74.1
65–74 Female 43,168 67,195 55.7
75–79 Female 19,663 20,760 5.6
80–84 Female 14,077 14,420 2.4
85þ Female 13,401 16,190 20.8
Total 1,143,753 1,196,360 4.6
Source: Manitoba Bureau of Statistics (2000)
Estimating Need for Acute Care Hospital Beds La Revue canadienne du viellissement 24 (Suppl. 1) 135

these factors can be expected to reduce the overallnumber of hospital days required for surgical cases inthe future, for a given population.
Against the backdrop of projected demographicchange in Manitoba and changing practice in hospi-tals, estimates have been developed for the number ofinpatient bed days that will be required in each regionof Manitoba in the year 2020. Detailed information onestimates (including estimates by RHA, gender, agegroup, and surgical/non-surgical care) are presentedin Stewart, Finlayson, MacWilliam, & Roos (2002).
MethodsThe methods used in developing the estimatespresented here are described in detail elsewhere inthis issue (Tate, MacWilliam, & Finlayson, 2005). Tosummarize, regional population estimates by ageand sex for each year between 1998 and 2020 wereobtained from the Manitoba Bureau of Statistics. Twoalternative methods were used to estimate thedemand for acute care inpatient bed days in 2020:
. The ‘‘current use’’ approach assumes that average use in2020 will be exactly the same for each age-gender groupin each RHA as it was in 1996 to 1998. That is, if thepopulation of an age-gender group in a particular RHAis projected to increase by eight per cent by 2020, itsdemand for inpatient bed days would increase byeight per cent. This approach takes into account theknown differences in hospital use by different age-gender groups, and populations in different RHAs.
. The ‘‘trend analysis’’ approach reflects not only theprojected changes in age-gender population size in eachRHA but also assumes a continuation of the trends inhospital care that were seen over the 10-year periodbetween 1989 and 1998.
For both approaches, individual hospital caseswere classified as ‘‘surgical’’ or ‘‘non-surgical.’’ Thenon-surgical category includes medical, obstetric,and psychiatric cases. Separate projections wereconstructed for surgical and non-surgical cases.
ResultsThe results of both the current use and trend analysisprojections for the province as a whole are presentedin Table 3.
As Table 3 shows, the current-use model suggests asubstantially higher demand for hospital beds in 2020,as compared to 1998. While the population increasesby 4.6 per cent, the combined number of non-surgicaland surgical bed days required increases by 27 percent. The projected increase is especially large forsurgical bed days.
The more sophisticated trend analysis approachsuggests that the aging of the Manitoba populationwill place few pressures on hospital beds. If thechanging use patterns that were experienced between1989 and 1999 continue, Manitobans will actuallyrequire 20 per cent fewer hospital bed days in 2020than in 1998.
Overall, the trend analysis projects that the numberof bed days required for non-surgical cases will be17 per cent fewer than in 1998, and for surgical cases,30 per cent fewer. This decline does not apply equallyto all age groups. Our model projects more non-surgical bed days data (not shown) for both men andwomen aged 85 or older, and an increase of morethan 10,000 days for women aged 55–64. The declinefor surgical bed days (see Table 4) is greatest in the0–14 age group for both males and females, and leastfor 55–64-year-old males and females.
The surgery projections can be better understood bydistinguishing between outpatient and inpatientcases. As Table 5 shows, we are projecting a 72 percent increase in the number of surgeries. But thisincrease does not translate into a similar increase inthe number of surgical bed days. Instead, much of theincrease will be in the number of outpatient surgeries,with only moderate growth in the number of inpatientcases. Moreover, the trends in average length of staysuggest that those who require inpatient surgery willstay for shorter times. For non-surgical cases, thereductions in length of stay are not expected to beas great.
The trend analysis projections for 2020 show declinesin every region (see Table 2). This finding is reassur-ing in that it indicates that the capacity to meet thehospital needs of 2020 is already present, if utilizationtrends continue. However, to provide a more con-servative look at the future, we asked what wouldhappen if this trend does not continue. That is, if theuse of hospitals by today’s population were projected,looking only at demographic changes in the provin-cial population, would Manitoba still be able to meetthe demand for hospital beds?
As Table 2 shows, roughly 300 beds (107,097 bed daysper year) would be needed to handle the demand.However, there are clear differences among theregions. In seven regions, the capacity in 1998 wasalready in excess of the projected requirementsfor 2020, and three others would need only a fewhospital beds (fewer than 25) to meet the demand.In Winnipeg, however, almost 600 additional bedswould be required. The results for Winnipeg mayseem surprising, since Winnipeg is the only RHA inthe province in which a decline in population size isprojected. However, because Winnipeg is the major
136 Canadian Journal on Aging 24 (Suppl. 1) G. S. Finlayson et al.

tertiary care centre in the province, the use non-residents make of city facilities indicates that popula-tion change is not the only relevant factor.
DiscussionOur results show that if only changes in populationsize, age, sex, and region of residence are considered,substantially more hospital bed days would beneeded in 2020. However, experience has shownthat other factors affect the demand for inpatientbeds. Indeed, important changes in utilization ofhealth services have occurred in Manitoba duringthis period (Finlayson, Lix, Finlayson, & Fong, 2005;Roos, et al., 2001). Trends toward increased out-patient surgery and shorter lengths of stay have hadan impact on hospital bed needs in the past, and arelikely to do so in the future (Wilmore & Kehlet, 2001).
Technological advances are continuously beingmade to increase efficiency in health care. Further-more, deliberate plans that are being implemented toimprove the management of the health care system(including use of hospital beds) will continue to havean impact. As a result, the trend analysis approachprovides a more credible estimate of future need forhospital beds.
It is very difficult to predict future hospital needs,even given projected future population levels. It isthus important that no single projection be acceptedas a basis for policy making. We suggest that the issueof population change and hospital use should berevisited frequently. That would provide opportu-nities for assessing and, if necessary, revising thepopulation projections and the projection model asappropriate to capture changing hospital use patterns.
Table 2: Comparison of population, 1998 capacity, current-use projection, and trend analysis estimate
Population Bed Days Current-Use Approach (bed days) Trend Analysis (bed days)
1998 2020 1998 Capacity*2020Projection
Excess/Shortage
2020Estimate
Excess/Shortage
Central 97,050 108,485 118,900 105,023 13,877 62,143 56,757
North Eastman 38,757 47,025 29,200 32,545 23,345 19,899 9,301
South Eastman 52,713 68,930 37,960 47,526 29,566 31,927 6,033
Interlake 74,482 86,800 68,255 64,589 3,666 40,545 27,710
Nor-Man 25,347 28,180 38,325 35,184 3,141 24,635 13,690
Parkland 43,376 44,500 86,140 63,489 22,651 40,935 45,205
Burntwood/Churchill 45,929 61,715 47,450 42,240 5,210 25,721 21,729
Marquette 37,691 38,940 80,300 46,399 33,901 29,601 50,699
South Westman 34,674 36,375 73,365 36,721 36,644 21,762 51,603
Brandon 46,817 50,545 90,155 98,958 28,803 56,360 33,795
Winnipeg 646,917 624,865 791,685 996,158 2204,473 646,879 144,806
Total 1,145,751 1,198,380 1,461,735 1,568,832 2107,097 1,000,407 461,328
*Capacity is defined as the number of ‘‘setup beds’’ multiplied by 365 days.
Table 3: Projections for hospital bed use
Projections, 2020 Change, 1998 to 2020
Actual, 1998Current-UseApproach Trend Analysis
Current-UseApproach % Trend Analysis %
Surgical Hospital Days 273,628 369,808 192,515 35 �30
Non-Surgical Hospital Days 939,047 1,169,869 777,745 25 �17
Total 1,212,675 1,539,677 970,260 27 �20
Estimating Need for Acute Care Hospital Beds La Revue canadienne du viellissement 24 (Suppl. 1) 137
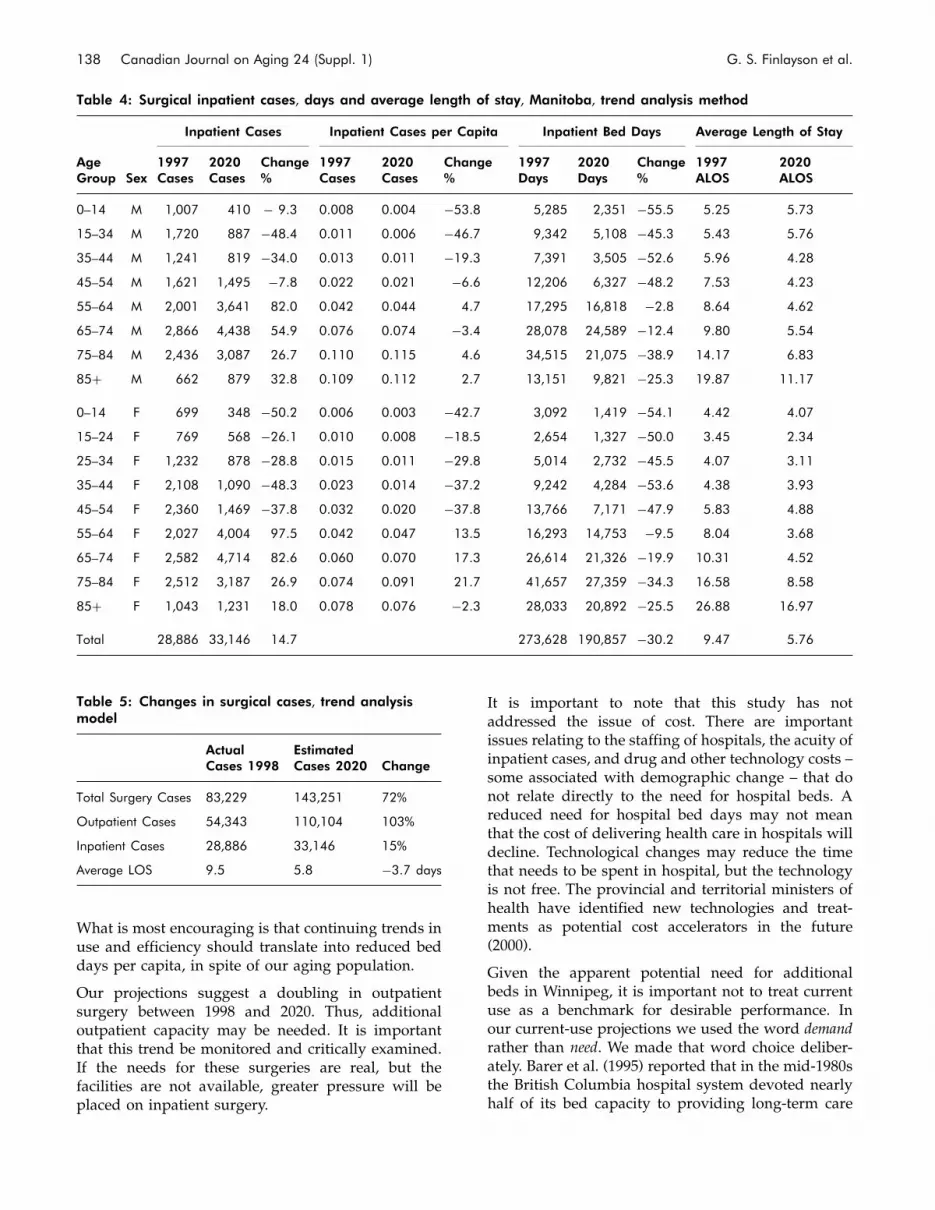
What is most encouraging is that continuing trends inuse and efficiency should translate into reduced beddays per capita, in spite of our aging population.
Our projections suggest a doubling in outpatientsurgery between 1998 and 2020. Thus, additionaloutpatient capacity may be needed. It is importantthat this trend be monitored and critically examined.If the needs for these surgeries are real, but thefacilities are not available, greater pressure will beplaced on inpatient surgery.
It is important to note that this study has notaddressed the issue of cost. There are importantissues relating to the staffing of hospitals, the acuity ofinpatient cases, and drug and other technology costs –some associated with demographic change – that donot relate directly to the need for hospital beds. Areduced need for hospital bed days may not meanthat the cost of delivering health care in hospitals willdecline. Technological changes may reduce the timethat needs to be spent in hospital, but the technologyis not free. The provincial and territorial ministers ofhealth have identified new technologies and treat-ments as potential cost accelerators in the future(2000).
Given the apparent potential need for additionalbeds in Winnipeg, it is important not to treat currentuse as a benchmark for desirable performance. Inour current-use projections we used the word demandrather than need. We made that word choice deliber-ately. Barer et al. (1995) reported that in the mid-1980sthe British Columbia hospital system devoted nearlyhalf of its bed capacity to providing long-term care
Table 4: Surgical inpatient cases, days and average length of stay, Manitoba, trend analysis method
Inpatient Cases Inpatient Cases per Capita Inpatient Bed Days Average Length of Stay
AgeGroup Sex
1997Cases
2020Cases
Change%
1997Cases
2020Cases
Change%
1997Days
2020Days
Change%
1997ALOS
2020ALOS
0–14 M 1,007 410 � 9.3 0.008 0.004 �53.8 5,285 2,351 �55.5 5.25 5.73
15–34 M 1,720 887 �48.4 0.011 0.006 �46.7 9,342 5,108 �45.3 5.43 5.76
35–44 M 1,241 819 �34.0 0.013 0.011 �19.3 7,391 3,505 �52.6 5.96 4.28
45–54 M 1,621 1,495 �7.8 0.022 0.021 �6.6 12,206 6,327 �48.2 7.53 4.23
55–64 M 2,001 3,641 82.0 0.042 0.044 4.7 17,295 16,818 �2.8 8.64 4.62
65–74 M 2,866 4,438 54.9 0.076 0.074 �3.4 28,078 24,589 �12.4 9.80 5.54
75–84 M 2,436 3,087 26.7 0.110 0.115 4.6 34,515 21,075 �38.9 14.17 6.83
85þ M 662 879 32.8 0.109 0.112 2.7 13,151 9,821 �25.3 19.87 11.17
0–14 F 699 348 �50.2 0.006 0.003 �42.7 3,092 1,419 �54.1 4.42 4.07
15–24 F 769 568 �26.1 0.010 0.008 �18.5 2,654 1,327 �50.0 3.45 2.34
25–34 F 1,232 878 �28.8 0.015 0.011 �29.8 5,014 2,732 �45.5 4.07 3.11
35–44 F 2,108 1,090 �48.3 0.023 0.014 �37.2 9,242 4,284 �53.6 4.38 3.93
45–54 F 2,360 1,469 �37.8 0.032 0.020 �37.8 13,766 7,171 �47.9 5.83 4.88
55–64 F 2,027 4,004 97.5 0.042 0.047 13.5 16,293 14,753 �9.5 8.04 3.68
65–74 F 2,582 4,714 82.6 0.060 0.070 17.3 26,614 21,326 �19.9 10.31 4.52
75–84 F 2,512 3,187 26.9 0.074 0.091 21.7 41,657 27,359 �34.3 16.58 8.58
85þ F 1,043 1,231 18.0 0.078 0.076 �2.3 28,033 20,892 �25.5 26.88 16.97
Total 28,886 33,146 14.7 273,628 190,857 �30.2 9.47 5.76
Table 5: Changes in surgical cases, trend analysismodel
ActualCases 1998
EstimatedCases 2020 Change
Total Surgery Cases 83,229 143,251 72%
Outpatient Cases 54,343 110,104 103%
Inpatient Cases 28,886 33,146 15%
Average LOS 9.5 5.8 �3.7 days
138 Canadian Journal on Aging 24 (Suppl. 1) G. S. Finlayson et al.
(as opposed to acute care). Investigations focusingon the acuity of patients hospitalized for medicalconditions in Winnipeg hospitals have found thatalmost one quarter of medical patients admitted toWinnipeg acute care hospitals were not assessed asacute. Moreover, almost half (45%) of days in acutecare hospital beds after admission were classified asnot needing these beds (Bruce, De Coster, TrumbleWaddell, Burchill, & Dehaney, 2001; see also DeCoster, Bruce, & Kozyrskyj, 2005, and Menec, Bruce,& MacWilliam, 2005). De Coster, Peterson, and Kasian(1996) estimated that one third of all acute carehospital days were consumed by patients withmedical conditions that could have been treated inanother setting. Among people over age 75 who wereadmitted to a hospital, the authors found that 70 percent of the days spent in acute care beds did notrequire acute care. Hospitals outside of urban areaswere particularly likely to have patients classified asnot needing acute care: fewer than 30 per cent of themedical days in rural hospitals were classified asacute. Such hospitals are numerous in Manitoba andhave patterns of use that could be made more efficient(Stewart, Black, Martens, Peterson, & Friesen, 2000).Given the evidence that many acute care beds arenot currently needed, the current-use projectionscannot be considered an estimate of need in thefuture. Rather, this estimate represents what would bedemanded if there were no changes in the use pat-tern of hospitals. The presence in acute care beds ofpatients who do not need such care means that thestarting point upon which our projections are basedis overstated. A more appropriate use of acute carebeds would have resulted in lower current-use modelprojections for 2020, such that even Winnipeg hospi-tals might already have sufficient capacity to handlethe 2020 demand. Thus, present patterns of hospitaluse should not be the standard to apply in the future.It is clearly important that the health care systemmake a continuing effort to monitor the use of acutecare beds and reduce the number and proportionof long-stay patients. The Winnipeg Regional HealthAuthority is aware of this need and is acting on itsimplications (Postl, 2002). Improvements in this areawould yield immediate as well as long-term benefits.
Hospital use is not the only aspect of health care thatrequires planning. Projections of the need for nursinghomes must also be undertaken (Frohlich, De Coster,& Dik, 2002). If there are not enough nursing homebeds available for the increasingly older population,it seems likely that people who need such beds willinstead spend more time in acute care hospital beds.Thus, it is critical that the system look beyond acutecare and plan for the health care system as a whole.Denton and Spencer (1995) encourage viewing health
care as an integrated system, dealing with both thehealth care requirements and the availability ofpersonnel and facilities. The increasing proportion ofolder people in the population will have an impact onthe health care system that goes far beyond the needfor acute care beds. Barer et al. (1995) note that therelatively rapid growth in size of the oldest agegroups (those 85 years of age and over) will continueto place demands on all aspects of the long-term caresystem, including institutional care and community-based services. Failure to meet the needs of thesepopulations will have clear implications for hospitals.
Finally, planning could usefully extend beyond 2020.By 2020 the largest population increases will be in the55–64 age group. The use that this cohort will makeof the health care system as it ages requires attention.The decades following 2020 could see increasedpressure for health services. The trends in healthstatus and utilization leading up to 2020 shouldprovide important information about expected needsin the ensuing years. The approach that has beentaken here to develop estimates for hospital usemay be applied to revised population and utilizationtrends in future years. Other jurisdictions wherehealth utilization administrative data are availablemay also find this approach helpful in planning fortheir future hospital needs.
While there is no dramatic need for increasednumbers of acute care beds, the implications of anaging population and changing utilization patternsrequire an ongoing commitment to monitoring andplanning.
ReferencesBarer, M.L., Evans, R.G., & Hertzman, C. (1995). Avalanche
or glacier? Health care and the demographic rhetoric.Canadian Journal on Aging, 14(2), 193–224.
Bruce, S., De Coster, C., Trumble Waddell, J., Burchill, C.,& DeHaney, S. (2001). Acuity of patients hospitalizedfor medical conditions at Winnipeg acute care hospitals.Winnipeg: Manitoba Centre for Health Policy andEvaluation and Winnipeg Regional Health Authority.
Carriere, Y. (2000). The impact of population aging andhospital days. In E.M. Gee and G.M. Gutman (Eds.),The overselling of population aging. Don Mills, ON:Oxford University Press, 26-44.
De Coster, C., Bruce, S., & Kozyrskyj, A. (2005). Use ofacute-care hospitals by long-stay patients: Who, howmuch, andwhy?Canadian Journal on Aging, 25 (Suppl. 1),97–106.
De Coster, C., Peterson, S., & Kasian, P. (1996). Alternatives toacute care. Winnipeg: Manitoba Centre for Health Policyand Evaluation.
Estimating Need for Acute Care Hospital Beds La Revue canadienne du viellissement 24 (Suppl. 1) 139

Denton, F.T., & Spencer, B.G. (1995). Demographic changeand the cost of publicly funded health care. CanadianJournal on Aging, 14(2), 174–192.
Direction de la sante publique. (1999). Annual reporton the health of the Montreal population: Prevent, cure,care challenges of an ageing society. Montreal: Regieregionale de la sante et des services sociaux deMontreal-Centre.
Evans, R.G., McGrail, K.M., Morgan, S.G., Barer, M.L., &Hertzman, C. (2001). Apocalypse no: Population agingand the future of health care systems. Canadian Journalon Aging, 20(Suppl. 1), 160–191.
Finlayson, M., Lix, L., Finlayson, G., & Fong, T.(2005). Trends in the utilization of specifichealth care services among older Manitobans:1985 to 2001. Canadian Journal on Aging, 25(Suppl. 1),15–27.
Frohlich, N., De Coster, C., & Dik, N. (2002). Estimatingpersonal care home bed requirements. Winnipeg: ManitobaCentre for Health Policy.
Fuchs, V. (1999). Health care for the elderly: How much?Who will pay for it? Health Affairs, 18(1), 11–21.
Maioni, A. (2002). Health care in the new millennium.In H. Bakvis & G. Skogstad (Eds.), Canadian federalism:Performance, effectiveness and legitimacy. Don Mills, ON:Oxford University Press. 87–104.
Manitoba Bureau of Statistics. (2000). Manitoba healthregions population projections June 1, 1998–June 1, 2025.Winnipeg: Author.
Mazankowski, D. (2001). A framework for reform: Report ofthe Premier’s Advisory Council on Health. Edmonton:Premier’s Advisory Council on Health.
Menec, V., Bruce S., & MacWilliam, L. (2005). Exploringreasons for bed pressures in Winnipeg acutecare hospitals. Canadian Journal on Aging, 24(Suppl. 1),121–131.
Postl, B. (2002). Foreword. Healthcare Management Forum.(Winter), 6–8.
Provincial and Territorial Ministers of Health. (2000).Understanding Canada’s health care costs: Finalreport. Ottawa: Canadian Intergovernmental AffairsConference Secretariat. Retrieved April 7, 2004, fromwww.scics.gc.ca/pdf/850080012e.pdf
Robson, W.B.P. (2001). Will the baby boomers bust the healthbudget? Demographic change and health care financingreform (C.D. Howe Institute Commentary, No. 148).Toronto: C.D. Howe Institute.
Romanow, R.J. (2002). Commission on the future of health carein Canada. Ottawa: Queen’s Printer.
Roos, N.P., Shapiro, E., Bond, R., Black, C., Finlayson, G.,Newburn-Cook, C., MacWilliam, L., Steinbach, C.,Yogendran, M., & Walld, R. (2001). Changes inhealth and health care use of Manitobans, 1985–1998.Winnipeg: Manitoba Centre for Health Policy andEvaluation.
Rosenberg, M.W., & James, A.M. (2000). Medical servicesutilization patterns by seniors. Canadian Journal onAging 19(1), 125–142.
Statistics Canada. (2001). Population projections for 2001,2006, 2011, 2016, 2021 and 2026, at July 1. RetrievedJanuary 6, 2005, from http://www.statcan.ca/english/Pgdb/demo23a.htm
Stewart, D., Black, C., Martens, P., Peterson, S., & Friesen, D.(2000). Assessing the performance of rural and northernhospitals in Manitoba: A first look. Winnipeg: ManitobaCentre for Health Policy and Evaluation.
Stewart, D., Finlayson, G., MacWilliam, L., & Roos, N.P.(2002). Projecting hospital bed needs for 2020. Winnipeg:Manitoba Centre for Health Policy.
Tate, R., MacWilliam, L., & Finlayson, G. (2005). Amethodology for estimating hospital bed need inManitoba in 2020. Canadian Journal on Aging,25(Suppl. 1), 141–151.
Wilmore, D.W., & Kehlet, H. (2001). Recent advances:Management of patients in fast track surgery. BritishMedical Journal, 322, 473–476.
140 Canadian Journal on Aging 24 (Suppl. 1) G. S. Finlayson et al.

A Methodology for Estimating Hospital BedNeed in Manitoba in 2020
Robert B. Tate, Leonard MacWilliam, and Gregory S. Finlayson
Faculty of Medicine, University of Manitoba
RESUMEUne equipe de chercheurs du Manitoba Centre for Health Policy de l’universite du Manitoba ont ete amenes a prevoirle nombre de lits d’hopitaux necessaires aux soins de courte duree pour les habitants de la province du Manitoba en2020. Parmi les considerations methodologiques relatives a cette demande, on compte l’identification des facteurspouvant eventuellement influencer l’utilisation des lits ainsi que la maniere de justifier ces facteurs. L’objectif de cetarticle est de decrire ces considerations methodologiques, la maniere dont les decisions ont ete prises et les etapessuivies dans le cadre de notre approche du probleme. Les previsions existantes et leurs repercussions font l’objet d’uneautre contribution a ce numero de la revue (Finlayson, Stewart, Tate, MacWilliam et Roos, 2005).
ABSTRACTA team of health researchers of the Manitoba Centre for Health Policy at the University of Manitoba was asked toforecast the number of acute care hospital beds that will be required to meet the needs of residents of the province ofManitoba by the year 2020. Methodological considerations for this request included identification of factors expected toaffect bed use in the future, and how to account for these factors. The objective of this paper is to describe thesemethodological considerations, how decisions were made, and steps taken in our approach to this problem. The actualprojections and their implications are the subject of another contribution in this issue of the journal (Finlayson, Stewart,Tate, MacWilliam & Roos, 2005).
Manuscript received: / manuscrit recu : 01/04/03
Manuscript accepted: / manuscrit accepte : 07/04/04
Mots cles : vieillissement; previsions; lits d’hopitaux
Keywords: aging; forecasting; hospital beds
Requests for offprints should be sent to: / Les demandes de tires-a-part doivent etre addressees a :
Robert B. Tate, Ph.D.Department of Community Health SciencesFaculty of Medicine, University of Manitoba770 Bannatyne Avenue, Suite T148Winnipeg, MB R3E 0W3([email protected])
IntroductionHealth care planners have long recognized the needto accurately forecast need or use of hospital bedsby the population. In many jurisdictions, this questionhas resurfaced in recent years with the recognition ofrapidly changing demographic compositions of popu-lations. While there have been numerous attemptsto forecast requirements for hospital beds, there isno agreed-upon methodological approach to thisproblem. Generally agreed is the notion that futureneed for hospital beds should be some function ofcurrent, or historical, per person bed use and the size
of the population to be served. However, as succinctlystated by Walsh and Bicknell, ‘‘The essential dilemmaof forecasting, particularly when change is sought,is to make constructive use of experience withoutbecoming captive of the past’’ (Walsh & Bicknell,1977).
A review of hospital bed planning in Canada(LeTouze, 1984) was undertaken to understand themethods used in different provinces across Canada.Four methods were identified: the formula method,the regression method, the stochastic method, and
Canadian Journal on Aging / La Revue canadienne du viellissement 24 (Suppl. 1) : 141 - 151

simulation. The formula method multiplies currentrates of service use by the size of a projectedpopulation, with some scaling for occupancy. TheLeTouze (1984) survey was conducted in 1984 andconcluded that the formula method was the mostcommon method applied across Canada, and that noother method ‘‘appeared to be used at the provinciallevel.’’ In that respect, Canada was very similar toother countries in methodology.
In a U.S. setting, Walsh & Bicknell (1977) considered aforecasting procedure of bed need over 10 years.Inpatient days per person, average length of stay,hospital occupancy rate, and the composition of thepopulation to be served were all considered. Theyalso considered trends for decreases in admissionrates for non-elderly patients, and increases inadmission rates for elderly patients. A time-seriesanalysis approach has been implemented in theNetherlands (Postma, Ruwaard, & Jager, 1995) toproject hospital bed days needed for specific diseases.National Insurance Scheme Health Services Researchin Norway has developed a centralized computermodel to project hospital beds and hospital stays.They feel the most complicated part of any projec-tion model is the handling of the effects of medicaltechnology (Petersen, 1999). Projections of hospitaladmissions and bed requirements for the year 2011in Greece essentially used the ‘‘formula method,’’with current rates of age-sex specific use determinedby averaging the previous 10 years’ experience andthe population size projections based on the logisticmodel (Mouza, 2002).
The specific problem faced by a team of healthresearchers of the Manitoba Centre for Health Policy(MCHP) at the University of Manitoba was to forecastthe number of acute care hospital beds that will berequired to meet the needs of residents of the provinceof Manitoba in 2020. Some questions faced by theresearch team were how to make use of the historicalinformation on bed use, what part of the pastexperience is important in projecting future use,what factors need to be considered, and in whatway these factors should be accounted.
Three methods of estimating utilization wereconsidered:
. The Status Quo model assumes that utilization perperson in 2020 will be the same as current utilization.Simply stated, the projected province-wide populationincrease of 4.6 per cent will result in a 4.6 per centincrease in the number of acute care beds neededbeyond those currently available. We view this modelas far too simplistic to be useful because it takes intoaccount only projected population size and currenthospital use, while giving no consideration to changing
age, sex, or regional distribution of the population, orany change in hospital use.
. The Current Use Projection model recognizes not onlythat the population size will increase by 2020, but alsothat the demographic composition will change. Currentage-sex-region specific per person acute care bed userates were multiplied by the projected number ofresidents in each of the corresponding combinationsand aggregated to provide an estimate of the number ofacute care beds needed. This current-use projectionmodel suggested an overall increase of 35 per centsurgical and 25 per cent non-surgical bed days overcurrent use (see Finlayson, Stewart, Tate, MacWilliam &Roos in this issue).
. The Trends in Acute Care Bed Use model considersthe patterns in acute care hospital bed use thatwere observed over a 10-year period (1989/1990 to1998/1999), with the premise that some patterns fromthe past will help inform the future. Influencing factors,and direction and rate of change associated with thesetrends are considered, using stratified regressionmodels. This method resulted in an estimate for 2020of 30 per cent fewer surgical and 17 per cent fewer non-surgical bed days than are currently being used. Thismethod is described in detail in the following section.
The actual projections and their implications are thefocus of a companion paper in this issue (Finlaysonet al., 2005). The purpose of this paper is to describethe development of the methodology used to producethe Trends in Acute Care Bed Use projections.
Developing a Method for EstimatingFuture Hospital Bed Need
Data Source
In Manitoba, the Population Health ResearchData repository contains anonymous encounter-based records of individuals’ interactions with theprovincial health care system. It is derived frominformation contained in the Manitoba HealthServices Insurance Plan registry, and from healthinsurance claims routinely filed by physicians, andfrom discharge information from health care facilitieswith Manitoba Health.
The annual number of acute care bed days used by allManitoba residents was determined for each of the 10fiscal years between 1989/1990 and 1998/1999 usingthis data repository. The annual hospital separationdata files consist of patient discharge records gener-ated when each patient is discharged from hospital. Ifa patient’s stay extended over the end of one or morefiscal years, the appropriate length of stay during eachof the separate fiscal years was determined. Forexample, if a patient entered hospital 10 days beforethe end of a fiscal year and was discharged 40 dayslater, 10 of the inpatient days were counted in the first
142 Canadian Journal on Aging 24 (Suppl. 1) R. B. Tate et al.

fiscal year, with the remaining 30 days of this stayattributed to the following fiscal year, rather than all40 days being included in the fiscal year of discharge.For this study a long-stay case was defined as acontinuous hospital stay lasting 30 days or more. Inthe preceding example, the patient’s stay would belabelled as a long stay in both fiscal years.
Estimation of the Demographic Composition ofManitoba in 2020
The population of Manitoba in 1997 was 1,143,753persons. The Manitoba Bureau of Statistics (MBS) wascontracted by Manitoba Health to project that pop-ulation year by year to 2025 (Manitoba Bureau ofStatistics, 2000). They estimated a modest increasein size of 4.6 per cent to 1,196,360 persons, but theirprojection suggests a very different demographiccomposition in age and geographical distribution ofthe Manitoba population. The MBS projection sees a15 per cent increase in the number of people aged75 years and older, and a decline of 5.5 per centin the major urban population (Winnipeg) partiallyoffsetting an overall 10 per cent increase in rural andnorthern areas (see Figure 1). Much of the decline in
Winnipeg’s population is expected to come fromits residents moving to other provinces (79 per centof the decline) and the remainder (21 per cent)moving to other areas in Manitoba.
At the time this work was undertaken, Manitoba wasdivided into 12 geographically distinct regional healthauthorities (RHAs). The terms region and RHA areused interchangeably throughout this paper. Our taskwas to estimate the number of acute care bed daysrequired in Manitoba in 2020. Per person estimates ofacute care bed use were multiplied by age-sex-regionspecific projected number of residents provided byMBS to provide estimates of number of acute care beddays needed for residents of each region (Finlayson etal., 2005).
Identification of Factors Known to Affect Acute CareBed Use in Manitoba
The task of identifying factors that could affect acutecare bed use was approached through a series ofinterdisciplinary team discussions. The team of dis-cussants consisted of physicians, health economists,epidemiologists, demographers, statisticians, andhealth policy analysts. Factors known to affect either
Data Source: Manitoba Bureau of Statistics Population Projections (December 1999)
-5.5
8.4
25.9
38.2
19.6
14.5
3.96.1
2.7
12.6
44.1
4.8
-10
0
10
20
30
40
50
Winnipeg Brandon North South Interlake Central Marquette South Parkland Norman Burntwood/ Manitoba Eastman Eastman Westman Churchill
% Change
Figure 1: Projected regional per cent change in population size, Manitoba, 1998–2025
Methods for Projecting Hospital Bed Need La Revue canadienne du viellissement 24 (Suppl. 1) 143

likelihood of admission to an acute care bed, or toaffect the length of stay once admitted were identifiedfrom the medical literature and health care manage-ment and clinical experiences.
Age of an individual is known to be positivelyassociated with both hospital admission and patientlength of stay (Black, Roos & Burchill, 1993; Carriere,2000; Rosenberg & James, 2000). This relationship isdifferent for males and females. A typical representa-tion of this variation with age in Manitoba duringa recent fiscal year (1998/1999) is shown in Figure 2.In Manitoba there is also variation in acute carebed use for residents of the major urban area(Winnipeg) and rural/northern residents. The popu-lation size of some non-Winnipeg regions is relativelysmall. It was determined that more stable estimatescould be obtained by aggregating all hospitalizationsfor people living outside of Winnipeg into a ‘‘non-Winnipeg’’ group. Since previous analysis had shownthat the residents of different regions have differentpatterns of acute care bed use (Black, Roos, Fransoo, &Martens, 1999; Stewart, Black, Martens, Peterson, &Friesen, 2000), adjustments were subsequently madeto reflect different utilization patterns by residents ofdifferent northern and rural regions. For example,in the 2003 report, Martens et al. showed a range in
age- and sex-adjusted separation rates between rural/northern RHAs in 1999–2001 of 162.4 to 298.1 per1,000 residents, short-stay rates (less than 30 days)of 546.3 to 942.1 days per 1,000 residents, and long-stay rates of 275.6 to 1,016.3 days per 1,000 residents.This range indicates differences in hospital useeven after adjusting for age and sex differences. Thecorresponding crude rates were 166.2 to 258.3 separa-tions, 489.0 to 920.2 short-stay days, and 148.3 to 734.7long-stay days. Further, population projections devel-oped by MBS show that current differences observedin age and sex distribution of the populations inRHAs are expected to continue in the future.
Two recent trends that have had substantial impactson the number of inpatient days are the shift frominpatient to more outpatient surgery (Wilmore &Kehlet, 2001) and the decreasing length of stay forpatients (Roos et al., 2001). Cognizant of thesechanges, we conducted analyses for three clinicallydefined groups. Hospital services consumed bypatients requiring acute care beds were classifiedas non-surgical, surgical-inpatient, and surgical-outpatient. Non-surgical cases included medical,obstetric, and psychiatric cases. Surgical-outpatientprocedures were each counted as a one bed-daysurgical case in this analysis. The separation was
0
2
4
6
8
10
12
14
16
18
0–14 15–24 25–34 35–54 55–64 65–74 75–79 80–84 85+
Age Group
Day
s p
er p
erso
n
NonWinnipeg-Males NonWinnipeg-Females Winnipeg-Males Winnipeg-Females
Figure 2: Age-sex specific non-surgical inpatient days per person, Manitoba, 1998/1999
144 Canadian Journal on Aging 24 (Suppl. 1) R. B. Tate et al.

made to recognize the different characteristics ofhospital stays for these types of admissions. Anexample of these differences is presented in Figure 3.Acute care bed use is also recognized to vary betweenWinnipeg and rural/northern areas in Manitoba(Black et al., 1993).
The effect of technological advances on acute care beduse are easily recognized and understood, but verydifficult to quantify. There is general agreement thattechnology has produced reductions in both fre-quency of admission and length of stay. As is alsoapparent from Figure 3, some of the decreasing trendsin inpatient acute care bed use are associated with anincrease in outpatient surgery (Brownell, Roos, &Burchill, 1999).
Manitoba residents frequently access hospital servicesoutside of their own RHA. As shown in Table 1,during 1997/1998–1999/2000 the most common out-of-region use of services is by non-Winnipeg residentswho use services in Winnipeg. Some specializedservices are available only in Winnipeg, and alltertiary care is provided in Winnipeg. Further,Winnipeg residents may also require acute care bedsin rural areas, and rural RHA residents may ‘‘crossboundaries’’ and be admitted to an acute care bed inanother rural RHA. An objective of this research
project was to estimate the number of days ofinpatient hospital care that would be used in eachRHA in Manitoba in 2020, regardless of where thepatient lived. Estimates were first made of the numberof acute care bed days that would be needed toaccommodate the residents of each RHA. Thepopulation-based estimate of use was then combinedwith age-sex specific historical patterns of where RHAresidents were actually hospitalized, to obtain anestimate of the number of bed-days that would beused in each RHA in 2020.
Methodological Approach for the Trends in AcuteCare Bed Use Model
As discussed above, age, sex, region of residence, typeof clinical care, technological advance, out-of-regionuse, and historical trends in hospital admissions andlengths of stay are all known to affect per person acutecare bed use. The data were stratified by age, sex,region of residence, and hospital service type, basedon our observations of within-group similarities inpast hospital inpatient use. The unit of analysis wasthe individual. The following age-sex groups weredefined on the basis of observed patterns of use. Fornon-surgical inpatient care, both males and femaleswere classed in nine age categories: 0–14, 15–24,25–34, 35–54, 55–64, 65–74, 75–79, 80–84, and 85 years
0
5
10
15
20
25
30
35
40
45
50
1989/90 1990/91 1991/92 1992/93 1993/94 1994/95 1995/96 1996/97 1997/98 1998/99
Year
Bed
day
s p
er 1
00 p
op
ula
tio
n
Non-Surgical Inpatient
Surgical Inpatient
Surgical Outpatient
Non-Winnipeg
Winnipeg
Winnipeg
Non-Winnipeg
Non-Winnipeg
Winnipeg
Figure 3: Hospital days by type of admission, Manitoba males, aged 55–64
Methods for Projecting Hospital Bed Need La Revue canadienne du viellissement 24 (Suppl. 1) 145

or older. For surgical inpatient care, females wereclassed in nine different age categories: 0–14, 15–24,25–34, 35–44, 45–54, 55–64, 65–74, 75–84, and 85 yearsor older. For surgical inpatient care, males wereclassed in eight age categories: 0–14, 15–34, 35–44,45–54, 55–64, 65–74, 75–84, and 85 years or older.Thus, prior to regional considerations, 35 separatestrata were defined by age, sex, and inpatient servicetype. These strata were defined separately forWinnipeg and non-Winnipeg, resulting in a total of70 strata. The non-Winnipeg strata were subsequentlyadjusted to make estimates specific to each of the10 rural RHAs (Burntwood and Churchill, twonorthern RHAs, were combined because of theirsmall populations). Hospital use patterns vary byregion. To make our estimates as robust as possible,all of these differences were incorporated intothe model by developing estimated bed dayrequirements per person for each of the 385 (35 inWinnipeg, plus 350 in the 10 rural RHAs) differentRHA, age, sex, and surgical or non-surgical inpatientgroups.
Strata-Specific Poisson Regression Modelling
An examination of the Manitoba patterns of hospitalbed days across time from 1989/1990 to 1998/1999,within the 70 strata, revealed that almost all agegroups, bothmen andwomen, experienced a decliningrate of days per person for both surgical and non-surgical cases. The patterns tended to follow anexponential decline, with relatively sharp decreases
in the earlier years of the 10-year period, followed by asmall decline or levelling off in the most recent years.An example of two of the strata is shown in Figure 4.
This non-linear relationship can be modelled byequating the natural logarithm of a rate (bed daysper person) to a linear function of independentvariables thought to influence the rate. We viewedthis Poisson regression model as preferable to anymultiple linear regression modelling procedure,because bed days per person is a rate and does notfollow a normal distribution. Also, since the trendover time for bed days per person has been declining,a negative coefficient for year would be estimated.Hence, any straight line regression model wouldeventually produce less than zero predicted estimatesof future bed days per person.
The mathematical form of our basic Poisson regres-sion model is:
in ðbed days per personÞ ¼ aþ b1x1 þ b2x2 þ b3x3 . . .
Which is equivalent to:
bed days per person ¼ expðaþ b1x1 þ b2x2 þ b3x3 . . .ÞWhere in¼natural logarithm
exp ¼ 2:7 . . . ,
a ¼ intercept
x1 ¼ year
x2, x3 . . . ¼ factors thought to influence beduse per person
Table 1: In-region vs. out-of-region non-surgical hospital days 1997/1998–1999/2000
Patient‘s Region of Residence
# of Days In-Region # of Days Out-of-Region
Winnipeg Other MB
N % N % N %
Central 73296 80.7 12618 13.9 4924 5.4
North Eastman 17541 57.0 11176 36.3 2077 6.7
South Eastman 24643 70.2 8860 25.3 1583 4.5
Interlake 37030 67.3 16949 30.8 1025 1.9
Nor-Man 17445 77.0 4301 19.0 915 4.0
Parkland 51546 89.8 3475 6.1 2400 4.2
Burnt/Churchill 16651 56.5 12130 41.2 668 2.3
Marquette 39786 80.0 1848 3.7 8111 16.3
South Westman 35008 76.8 2066 4.5 8490 18.6
Brandon 43810 92.0 1952 4.1 1844 3.9
Non Manitoba na 14957 59.6 10130 40.4
Winnipeg 475883 98.4 na 7659 1.6
Note: na - is not applicable
146 Canadian Journal on Aging 24 (Suppl. 1) R. B. Tate et al.
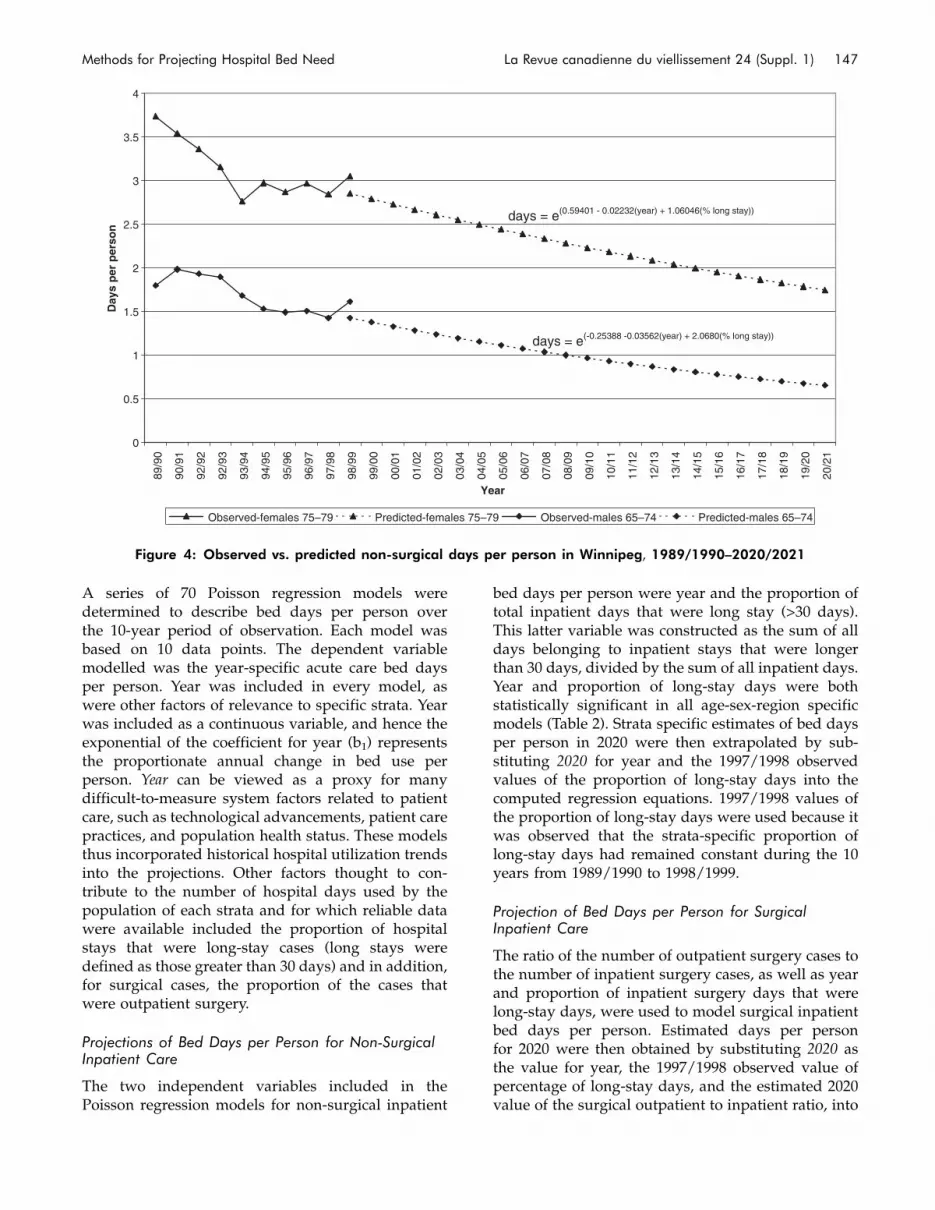
A series of 70 Poisson regression models weredetermined to describe bed days per person overthe 10-year period of observation. Each model wasbased on 10 data points. The dependent variablemodelled was the year-specific acute care bed daysper person. Year was included in every model, aswere other factors of relevance to specific strata. Yearwas included as a continuous variable, and hence theexponential of the coefficient for year (b1) representsthe proportionate annual change in bed use perperson. Year can be viewed as a proxy for manydifficult-to-measure system factors related to patientcare, such as technological advancements, patient carepractices, and population health status. These modelsthus incorporated historical hospital utilization trendsinto the projections. Other factors thought to con-tribute to the number of hospital days used by thepopulation of each strata and for which reliable datawere available included the proportion of hospitalstays that were long-stay cases (long stays weredefined as those greater than 30 days) and in addition,for surgical cases, the proportion of the cases thatwere outpatient surgery.
Projections of Bed Days per Person for Non-SurgicalInpatient Care
The two independent variables included in thePoisson regression models for non-surgical inpatient
bed days per person were year and the proportion oftotal inpatient days that were long stay (>30 days).This latter variable was constructed as the sum of alldays belonging to inpatient stays that were longerthan 30 days, divided by the sum of all inpatient days.Year and proportion of long-stay days were bothstatistically significant in all age-sex-region specificmodels (Table 2). Strata specific estimates of bed daysper person in 2020 were then extrapolated by sub-stituting 2020 for year and the 1997/1998 observedvalues of the proportion of long-stay days into thecomputed regression equations. 1997/1998 values ofthe proportion of long-stay days were used because itwas observed that the strata-specific proportion oflong-stay days had remained constant during the 10years from 1989/1990 to 1998/1999.
Projection of Bed Days per Person for SurgicalInpatient Care
The ratio of the number of outpatient surgery cases tothe number of inpatient surgery cases, as well as yearand proportion of inpatient surgery days that werelong-stay days, were used to model surgical inpatientbed days per person. Estimated days per personfor 2020 were then obtained by substituting 2020 asthe value for year, the 1997/1998 observed value ofpercentage of long-stay days, and the estimated 2020value of the surgical outpatient to inpatient ratio, into
0
0.5
1
1.5
2
2.5
3
3.5
4
89/9
0
90/9
1
92/9
2
92/9
3
93/9
4
94/9
5
95/9
6
96/9
7
97/9
8
98/9
9
99/0
0
00/0
1
01/0
2
02/0
3
03/0
4
04/0
5
05/0
6
06/0
7
07/0
8
08/0
9
09/1
0
10/1
1
11/1
2
12/1
3
13/1
4
14/1
5
15/1
6
16/1
7
17/1
8
18/1
9
19/2
0
20/2
1
Year
Day
s p
er p
erso
n
Observed-females 75–79 Predicted-females 75–79 Observed-males 65–74 Predicted-males 65–74
days = e(0.59401 - 0.02232(year) + 1.06046(% long stay))
days = e(-0.25388 -0.03562(year) + 2.0680(% long stay))
Figure 4: Observed vs. predicted non-surgical days per person in Winnipeg, 1989/1990–2020/2021
Methods for Projecting Hospital Bed Need La Revue canadienne du viellissement 24 (Suppl. 1) 147

Table 2: Poisson regression coefficients
Winnipeg Non-Winnipeg
Age Group Gender Intercept Year % Long Stay Intercept Year % Long Stay
Non-Surgical Hospital Days
0–14 Males �0.802 �0.046 0.425 �0.391 �0.061 0.280
15–24 Males �2.437 �0.017 1.319 �2.057 �0.033 1.305
25–34 Males �2.350 �0.011 2.018 �1.796 �0.009 0.994
35–54 Males �1.438 �0.034 1.461 �1.028 �0.030 1.372
55–64 Males �0.927 �0.029 1.651 �0.255 �0.027 1.228
65–74 Males �0.254 �0.036 2.068 0.173 �0.019 2.150
75–79 Males 0.076 �0.019 2.296 0.965 �0.011 1.534
80–84 Males 1.183 �0.021 1.159 1.465 �0.022 1.576
85þ Males �0.074 �0.005 3.569 1.867 �0.017 1.603
0–14 Females �0.914 �0.042 0.469 �0.626 �0.067 1.412
15–24 Females �1.210 �0.026 1.485 �0.582 �0.040 1.400
25–34 Females �0.805 �0.035 2.553 �0.123 �0.040 0.705
35–54 Females �2.043 �0.010 3.032 �0.977 �0.021 1.262
55–64 Females �1.225 �0.007 1.695 �0.260 �0.023 1.085
65–74 Females �0.228 �0.023 1.277 0.705 �0.026 0.363
75–79 Females 0.594 �0.022 1.060 0.308 �0.009 2.568
80–84 Females �0.581 �0.011 3.335 1.362 �0.025 1.455
85þ Females �2.132 0.008 5.723 1.815 �0.020 1.448
Winnipeg Non-Winnipeg
Age Group Gender Intercept Year% LongStay
Out:InRatio Intercept Year
% LongStay
Out:InRatio
Surgical Hospital Days
0–14 Males �2.720 ns 1.560 �0.382 �2.448 �0.019 1.064 �0.429
15–34 Males �2.370 �0.081 1.501 �0.125 �2.146 �0.069 1.477 �0.138
35–44 Males �2.170 �0.057 1.633 �0.126 �1.808 �0.056 0.608 �0.095
45–54 Males �1.383 �0.123 0.398 0.296 �1.464 �0.044 1.201 �0.136
55–64 Males �0.891 �0.070 1.594 ns �0.794 �0.046 0.835 ns
65–74 Males �0.503 �0.060 2.199 ns �0.182 �0.044 1.595 �0.194
75–84 Males 0.279 �0.038 1.451 �0.197 0.481 ns 0.989 �0.600
85þ Males �0.449 ns 3.042 �0.650 0.483 �0.024 1.119 �0.396
0–14 Females �2.864 �0.020 0.773 �0.358 �3.152 �0.076 1.550 ns
15–24 Females �2.382 �0.098 0.760 �0.065 �1.844 �0.062 0.445 �0.286
25–34 Females �1.997 �0.090 2.211 �0.136 �1.537 �0.070 1.929 �0.237
35–44 Females �1.301 �0.093 1.094 �0.140 �1.111 �0.073 0.772 �0.186
45–54 Females �1.243 �0.116 1.644 0.090 �0.391 �0.044 ns �0.453
55–64 Females �1.025 �0.066 1.462 ns �0.543 �0.027 0.412 �0.246
65–74 Females �0.583 �0.034 1.446 �0.107 0.115 �0.026 0.268 �0.399
75–84 Females �0.599 0.027 2.585 �0.574 0.181 ns 0.891 �0.387
85þ Females �1.668 0.013 4.211 �0.648 �0.130 ns 1.795 �0.463
Note: ns–coefficient was not significant
148 Canadian Journal on Aging 24 (Suppl. 1) R. B. Tate et al.
the regression equation. Estimates for the outpatient-to-inpatient ratios were obtained separately by fitt-ing linear regression models, with year as theonly independent variable, to the Winnipeg/non-Winnipeg, age- and sex-specific data over the 10 years1989/1990 to 1998/1999. Substituting the value 2020for year into the regression equations provided theestimates. After discussion with surgical consultants,it was decided to constrain the outpatient-to-inpatientratio to be no more than double the observed 1998/1999 ratio. Thus, if an age-sex-region specific 2020estimate of the outpatient-to-inpatient ratio was morethan twice the 1998/1999 ratio, then twice the 1998/1999 ratio was used as the 2020 estimate. Thecoefficients from the age-sex strata specific Poissonregression models are provided in Table 2. As wewere using Poisson regression (i.e., bed daysper person¼ exp (aþ b1x1þ b2x2þ b3x3 . . .)), negativeintercepts in Table 2 indicate that the exponentiatedintercepts will be greater than zero but less than one.Positive intercepts in Table 2 will result in exponen-tiated intercepts greater than one. A negative value ofa regression coefficient indicates that as values of thecorresponding variable increase, fewer hospital dayswill be expected. A positive value of a regressioncoefficient will result in the opposite pattern.Regression coefficients with a value of ns in Table 2indicate that a change in the corresponding variable ispredicted to have no effect on hospital days. Thenegative signs of the coefficients for ‘‘Year’’ and for‘‘Out:In Ratio’’ in Table 2 are consistent with thehypothesis that later years and larger outpatient-to-inpatient ratios in general would be associated withdecreases in bed days per person. The positive coef-ficients for proportion of long stays would implygreater predicted bed days per person if the propor-tion of long stays increases.
Projection of Bed Days per Person for SurgicalOutpatient Cases
The estimated number of outpatient surgery caseswas obtained by first estimating total surgery (inpa-tient plus outpatient) and then applying the estimatedoutpatient-to-inpatient ratios that were developedwhen estimating the inpatient surgery days. Using amethod similar to the inpatient days estimates, wecalculated the total number of surgeries per resident(by age and sex and Winnipeg/non-Winnipeg) over10 years (1989/90–1998/99) using Poisson regressionmodels, with year as the independent variable. Theper person total surgery estimates were then multi-plied by the 2020 population estimates. The totalsurgery estimates were in turn multiplied by theestimated proportions of total surgery that will be
outpatient surgery, to arrive at the estimated numberof outpatient surgeries in 2020.
Adjustment Factors for Non-Winnipeg RHA Estimates
Regression models were derived for only two regionalstrata: Winnipeg (urban) residents and non-Winnipeg(rural/northern) residents. Hence an adjustment wasneeded for the rural/northern estimates to obtainestimates specific for residents of each of the 10 non-Winnipeg RHAs. Age-sex specific rates of inpatientdays over the 10 years (1989/90 to 1998/99) in eachnon-Winnipeg RHA were modelled, using Poissonregression, relative to the overall non-Winnipeg rates,to arrive at non-Winnipeg RHA-age-sex specificcoefficients. These were then used to ‘‘adjust’’ (inflateor deflate proportionately) the estimated 2020 non-Winnipeg age-sex specific inpatient days per personrates. For example, the regression ‘‘adjustment’’ factorfor non-surgical utilization among South Westmanmales aged 0–14 was 0.7428. Thus the 2020 estimatedrate per person for South Westman males aged 0–14was computed as 0.7428 times the estimated malesaged 0–14 non-Winnipeg rate. Similar calculationswere made across all non-Winnipeg RHAs, for all agegroups for both men and women.
Estimates of In-Region and Out-of-Region HospitalBed Days
The projections described thus far pertain to theprojected need for acute care beds by the residents ofa particular region. Not all inpatient acute care beddays will be ‘‘consumed’’ within the patient’s regionof residence. It was therefore necessary to determinethe region in which the care would occur. Theinpatient days that are projected to be required in allhospitals in a given region were calculated as follows:Inpatient days projected for residents of a region,minus inpatient days for residents that occur outsideof their region, plus inpatient days of residents ofanother Manitoba region who receive care in theregion, plus inpatient days of individuals from outsideof Manitoba who receive care in the region.
Inpatient days required in each region were deter-mined by applying current in-region and out-of-region proportionate use of hospital bed days byresidents to our 2020 estimates, rather than attempt-ing to estimate such usage in 2020. Furthermore, toobtain a more stable measure of current in-regionversus out-of-region use, we used 3 years of hospitaldischarge claims (1997/1998–1999/2000) rather thanonly 1 (the most recent) year. As an example, let usassume residents of the Central RHA used a total of100 days over these 3 years, with 80 of these days inhospitals in Central RHA, 12 days in Winnipeghospitals, 6 days in Brandon hospitals, and the
Methods for Projecting Hospital Bed Need La Revue canadienne du viellissement 24 (Suppl. 1) 149

remaining 2 days in South Westman RHA hospitals.We used these proportions (for our residents ofCentral RHA example: 80% in Central hospitals,12% in Winnipeg, 6% in Brandon, and 2% in SouthWestman) to assign the 2020 estimated days bythe residents of each RHA to days used in thehospitals of each RHA. The proportions (and assign-ments) were calculated separately for each RHA,surgical/non-surgical, age-sex strata. The results werethen summed over all age-sex groups and for eachRHA and for surgical/non-surgical hospital bed days,to obtain 2020 RHA estimates.
Adjustment for Acute Care Bed Days Used by Non-Manitobans
Finally, estimates of the number of bed days used bynon-Manitobans in all of the hospitals in each RHAwere added to the RHA hospital days projections.This involved taking 3 fiscal years (1997/1998–1999/2000) of hospital claims and computing the averageannual number of days used by non-Manitobans(all ages and both sexes combined) in the hospitalsof each RHA. Separate estimates were derived fornon-surgical and surgical days. These average annualdays were then added to the above 2020 RHAestimates.
Discussion
There is no single ‘‘correct way’’ of forecasting acutecare bed use. The approach we took was to assemblea multidisciplinary team and compile an inventory offactors known to influence the use of acute care bedsin our setting. We made methodological choicesto address these factors. Analyses were stratified byage, sex, region, and service type. Historical trendsin bed use per person were considered throughregression modelling with 10 years of data. Systemchanges, including trends of a greater outpatient-to-inpatient ratio, decreasing prevalence of long-staypatients, and decreasing lengths of stay weremodelled as independent variables as warranted.It is important to recognize that ‘‘year,’’ itself, in aregression model can be interpreted as a proxy forotherwise immeasurable technological advances lead-ing to declining bed use per person in recent yearswithin most strata.
As a means to validate our methodology we model-led trends from 1985/1986 through 1996/1997 to esti-mate bed use per person in 1999/2000. These 3-yearprojections compared well with actual utilization in1999/2000. A limitation of this validation is, of course,that these projections were only 3 years, not 20 yearsinto the future.
There are a number of other factors whose impacts onthe need for inpatient hospital beds in the futurecould not be estimated in these models. For example,advances in health promotion reflecting awareness ofhealthy lifestyles through smoking declines,improved dietary considerations, and increases inphysical activity will ultimately reduce prevalence ofmany diseases, and hence reduce use of hospital beds.Hence it will be important to continue to monitorthe health care sector, and revise and refine theassumptions made.
ReferencesBlack, C., Roos, N.P., & Burchill, C. (1993). Utilisation of
hospital resources. Volume 1: Key findings. Winnipeg:Manitoba Centre for Health Policy and Evaluation.
Black, C., Roos, N.P., Fransoo, R., & Martens, P.(1999). Comparative indicators of population health andhealth use for Manitoba’s regional health authorities.Winnipeg: Manitoba Centre for Health Policy andEvaluation.
Brownell, M.D., Roos, N.P., & Burchill, C.A. (1999).Monitoring the Winnipeg hospital system: 1990/91 through1996/97. Winnipeg: Manitoba Centre for Health Policyand Evaluation.
Carriere, Y. (2000). The impact of population aging andhospital days: Will there be a problem?. In E.M. Gee &G.M. Gutman (Eds.), The overselling of population aging:Apocalyptic demography, intergenerational challenges, andsocial policy. Toronto, ON: Oxford University Press,26–44.
Finlayson, G., Stewart, D.K., Tate, R.B., MacWilliam, L.,& Roos, N.P. (2005). Anticipating change: Howmany acute care hospital beds will Manitoba needin 2020? Canadian Journal on Aging, 25(Suppl. 1),133–140.
LeTouze, D. (1984). Hospital bed planning in Canada: Asurvey analysis. International Journal of Health Services,14(1), 105–126.
Manitoba Bureau of Statistics. (2000). Manitoba healthregions population projections June 1, 1998–June 1, 2025.Winnipeg: Government of Manitoba.
Martens, P.J., Fransoo, R., The Need to Know Team,Burland, E., Jebamani, L., Burchill, C., Black, C.,Dik, N., MacWilliam, L., Derksen, S., Walld, R.,Steinbach, C., & Dahl, M. (2003). The Manitoba RHAindicators atlas: Population-based comparisons of healthand health care use. Winnipeg: Manitoba Centre forHealth Policy.
Mouza, A.M. (2002). Estimation of the total number ofhospital admissions and bed requirements for 2011: Thecase for Greece. Health Services Management Research,15(3), 186–192.
150 Canadian Journal on Aging 24 (Suppl. 1) R. B. Tate et al.

Petersen, S.O. (1999). NISPLAN: Projecting hospital bedsand hospital stays. Studies in Health Technology andInformatics, 68, 591–593.
Postma, M.J., Ruwaard, D., & Jager, H.C., Jr. (1995).Projecting utilisation of hospital in-patient days inthe Netherlands: A time-series analysis. IMA Journalof Mathematics Applied in Medicine and Biology, 12,185–202.
Roos, N.P., Shapiro, E., Bond, R., Black, C., Finlayson, G.,Newburn-Cook, C., MacWilliam, L., Steinbach, C.,Yogendran, M., & Walld, R. (2001). Changes in healthand health care use of Manitobans, 1985–1998. Winnipeg:Manitoba Centre for Health Policy.
Rosenberg, M.W., & James, A.M. (2000). Medical servicesutilisation patterns by seniors. Canadian Journal onAging, 19(Suppl. 1), 125–142.
Stewart, D.K., Black, C.D., Martens, P.J., Peterson, S., &Friesen, D. (2000). Assessing the performance of rural andnorthern hospitals in Manitoba: A first look. Winnipeg:Manitoba Centre for Health Policy and Evaluation.
Walsh, D.C., & Bicknell, W.J. (1977). Forecasting the need forhospital beds: A quantitative methodology. PublicHealth Reports, 92(3), 199–210.
Wilmore, D.W., & Kehlet, H. (2001). Management of patientsin fast track surgery. British Medical Journal, 322, 473–476.
Methods for Projecting Hospital Bed Need La Revue canadienne du viellissement 24 (Suppl. 1) 151

CANADIANJOURNALONAGING
LA REVUECANADIENNEDUVIEILLISSEMENT

Data Quality in an Information-RichEnvironment: Canada as an Example
Leslie L. Roos,1 Sumit Gupta,2 Ruth-Ann Soodeen,1 and Laurel Jebamani1
RESUMECette etude vise a evaluer la qualite des donnees administratives disponibles dans les provinces canadiennes, tout enmettant l’accent sur les renseignements necessaires pour creer des systemes integres. Nous comparons explicitementdiverses approches en matiere de mesure de la qualite, en indiquant dans quel cas le couplage des dossiers peut ou nonse substituer a la methode plus onereuse de la seconde saisie des dossiers. Quarante-neuf etudes originales visant aevaluer les donnees administratives canadiennes (registres, resumes d’hospitalisation, demandes des medecins etmedicaments sur ordonnance) sont resumees de maniere structuree. Les registres, les resumes d’hospitalisation et lesdossiers des medecins semblent generalement de qualite satisfaisante, bien qu’il reste beaucoup de travail a accomplir.La qualite des donnees n’a pas fait l’objet de variations systematiques entre les provinces. Des donnees primairesdoivent etre recueillies afin de verifier les lieux de residence et effectuer un suivi longitudinal dans les registresprovinciaux. Les verifications initiales des donnees pharmaceutiques se sont revelees prometteuses et doivent etrepoursuivies. Etant donne que les etudes fondees sur le couplage des dossiers etaient �prudentes� dans leursconclusions en matiere de fiabilite, la reduction du nombre de secondes saisies qui prennent beaucoup de tempssemblerait faisable dans bien des cas. Enfin, il pourrait etre possible d’etendre la portee des donnees administratives demaniere a etudier l’etat de sante, ainsi que les soins de sante pour certaines conditions chroniques. Le potentiel derecherche des milieux riches en informations qui sont en train d’etre crees permet de souligner l’importance de laqualite des donnees.Les auteurs tiennent a remercier le centre de recherche de l’hopital St. Boniface General pour l’aide fournie. Lesauteurs remercient egalement Jo-Anne Baribeau et Phyllis Jivan pour la preparation du manuscrit. Une partie decette etude a ete presentee, en 2001, au symposium de Statistique Canada intitule « 18th International Symposiumon Methodological Issues and Workshops », tenu a Ottawa, du 16 au 19 octobre 2001.
ABSTRACTThis review evaluates the quality of available administrative data in the Canadian provinces, emphasizing theinformation needed to create integrated systems. We explicitly compare approaches to quality measurement, indicatingwhere record linkage can and cannot substitute for more expensive record re-abstraction. Forty-nine original studiesevaluating Canadian administrative data (registries, hospital abstracts, physician claims, and prescription drugs) aresummarized in a structured manner. Registries, hospital abstracts, and physician files appear to be generally ofsatisfactory quality, though much work remains to be done. Data quality did not vary systematically among provinces.Primary data collection to check place of residence and longitudinal follow-up in provincial registries is needed.Promising initial checks of pharmaceutical data should be expanded. Because record linkage studies were‘‘conservative’’ in reporting reliability, the reduction of time-consuming record re-abstraction appears feasible inmany cases. Finally, expanding the scope of administrative data to study health, as well as health care, seems possiblefor some chronic conditions. The research potential of the information-rich environments being created highlights theimportance of data quality.
1 Department of Community Health Sciences, University of Manitoba
2 Faculty of Medicine, University of Toronto
* The authors gratefully acknowledge the help of the St. Boniface General Hospital Research Centre. The authors also thankJo-Anne Baribeau and Phyllis Jivan for manuscript preparation. A portion of this work was presented at the StatisticsCanada 2001 Symposium, 18th International Symposium on Methodological Issues andWorkshops, held in Ottawa, October16–19, 2001. This work was partially funded by the Institute for Health Economics, Edmonton, AB.
Manuscript received: / manuscrit recu : 01/03/03
Manuscript accepted: / manuscrit accepte : 16/06/04
Canadian Journal on Aging / La Revue canadienne du viellissement 24 (Suppl. 1) : 153 - 170

Mots cles : qualite des donnees; donnees administratives; utilisation des soins de sante; registre; resumes d’hospitalisation;demandes des medecins; vieillissement
Keywords: data quality; administrative data; health care utilisation; registry; hospital abstracts; physician claims; aging
Requests for offprints should be sent to: / Les demandes de tires-a-part doivent etre addressees a :
Leslie L. Roos, Ph.D.Manitoba Centre for Health PolicyDepartment of Community Health SciencesFaculty of Medicine, University of Manitoba4th Floor Brodie Centre, Room 408, 727 McDermot AvenueWinnipeg, MB R3E 3P5([email protected])
IntroductionPopulation-based administrative data are currentlyused to facilitate innovative analyses of health andhealth care in a number of countries (Holman, Bass,Rouse, & Hobbs, 1999; Roos & Shapiro, 1999; Sheps etal., 2000). Canada’s single-payer financing and severalprovincial initiatives have facilitated the creationof the pieces – registries, claims files, and so on –necessary to produce world-class information systems(Naylor, 1999).
Population registries can provide not only standarddemographic data, but also location of residence,length of residence in a given location, marital status,and family size. Incorporating substantive filesaround such a central registry (Figure 1) can generateinformation for all people enrolled, with full protec-tion of individual privacy and confidentiality.Negotiated relationships with other organizationsproviding clinical, educational, socio-economic, andfamily services data further magnify the researchpossibilities (Roos, Menec, & Currie, 2004).
Quality concerns are critical for health care assess-ment and for increased research productivity. The
Canadian Institute for Health Information (CIHI) andMaclean’s have been using administrative data to rankhealth care across different jurisdictions over the lastseveral years (Hawaleshka, 2002). Such efforts arevaluable, but variation in reporting among provinces(and among institutions within a province) presentproblems here. In 2000, the Conference of DeputyMinisters defined a series of health indicators ‘‘to beregularly reported to Canadians’’; many of thesemeasures depend on information from registries andVital Statistics (mortality and follow-up), from hospi-tal discharge abstracts (diagnoses and procedures),and from physician claims (surveillance and someimmunization reporting systems). Auditors in eachprovince expressed concern about data quality; inManitoba, the auditor was ‘‘unable to form an opinionon the accuracy of the data or on the adequacy ofdisclosure’’ vis-a-vis 21 of 56 health indicators used inthe provincial report (Manitoba Health, 2002).
Assessing the quality of large administrative datasets is not easy. One reviewer has argued thatvalidity can be assessed only by determining ‘‘if thediagnostic records themselves were correct, throughan extensive review of the chart. Even then, it wouldnot be the same as seeing the patient.’’ Given suchconcerns, this paper refers to reliability – theagreement between data sources – throughout. Weconcentrate upon the quality of specific provincialdatabases, the databases that have accounted for theoverwhelming majority of Canadian papers relyingon administrative data. In the 1994–2002 periodalone, 146 and 138 such publications usingManitoba and Ontario data, respectively, wereidentified (Roos, Menec, & Currie, 2004). Thisreview evaluates the reliability of four importantCanadian data sets: registries, hospital dischargeabstracts, physician visits, and prescription drugs.Different approaches to measurement are compared,noting important strategic issues and making judg-ments about cost-effectiveness.
VitalStatistics
Home Care
ProviderPharmacy
Hospital Physician
Population-BasedResearchRegistry
PersonalCare Home
Figure 1: An ideal administrative database
154 Canadian Journal on Aging 24 (Suppl. 1) L. L. Roos et al.

Method
Data Collection
We searched for original papers and reports(up to the end of 2002) dealing with the qualityof Canadian databases. The National Library ofMedicine’s PubMed was searched using the keywordsadministrative data quality and Canadian administrativedata. Research centres in Manitoba and Ontario alsoprovided lists of published papers. Senior authors ofrelevant papers were queried about studies that mighthave been missed. Forty-five papers relevant to dataquality were located using this methodology. Becausethe British Columbia database provides anonymizeddata sets to researchers in Canada and elsewhere,project by project, a separate effort was made to findall papers published using administrative data fromBritish Columbia in the 1994–2002 period. Thirty-onesuch studies were identified, starting from a list ofinvestigators provided by the data holder (the Centrefor Health Services and Policy Research at theUniversity of British Columbia); papers by listedresearchers and their co-investigators were locatedusing PubMed. Four of these papers provided someadditional information on data quality (Anderson &Kerluke, 1996; Dimich-Ward et al., 1996; Hertzmanet al., 1997; Rankin et al., 1999).
Combining lists from research centres with searchesusing PubMed keywords is the most practical wayto locate studies on health and health care, butimportant research can be missed. Many projectsundertaken by government agencies are never pub-lished as academic papers. Most conference proceed-ings, book chapters, and certain journals (includingthe Canadian Journal on Aging) are not covered inPubMed (Roos, Menec, & Currie, 2004). Nonetheless,its broad coverage of peer-reviewed papers and theirassociated keywords makes PubMed indispensablefor literature reviews. Some papers are no doubtmissed, but considerable effort has been expended indata collection.
Measuring Agreement
Administrative data are generally evaluated on thecompleteness of the data set (Are all residentsincluded in the registry? Are all inpatients includedin the hospital data set?) and the quality of the specificinformation recorded.
A gold standard is typically ‘‘a definitive diagnosisattained by biopsy, surgery, autopsy, long-termfollow-up or other acknowledged standard’’ (Sackett,Haynes, Guyatt, & Tugwell, 1991). The best practicaltechnology (hospital charts) is generally used to
measure diagnostic accuracy. For example, whencomputerized hospital discharge abstracts arecompared with physician claims, the number ofrecords with concordant information is divided bythe total number of hospital records to calculate percent agreement. Other investigators have treatedhospital and physician data more equally, usingeach type of record as the standard and comparingthe results (Iron, Goel, & Williams, 1995; Roos, Sharp,& Wajda, 1989).
The kappa measure adjusts for rare conditions bypresenting the proportion of potential agreementbetween data sources beyond chance. A kappa of.0–.2 has been noted as ‘‘slight’’ agreement, .2–.4¼‘‘fair,’’ .4–.6¼ ‘‘moderate,’’ .6–.8¼ ‘‘substantial,’’ and.8–1.0¼ ‘‘almost perfect’’ (Sackett et al., 1991). Whencases with particular procedures or diagnoses are firstidentified for re-abstraction or linkage, kappa cannotbe calculated because ‘‘true negative’’ cases – caseswhere both records are negative – are not available.Although per cent agreement can be calculated insuch circumstances, the comparability of the data isunclear (Edouard & Rawson, 1996; Rawson &Malcolm, 1995a, 1995b; Rawson, Malcolm, & D’Arcy,1997; Roos, Roos, Cageorge, & Nicol, 1982; Roos,Walld, Wajda, Bond, & Hartford, 1996). On the otherhand, when relatively rare conditions are studiedusing a population or population-based sample, thehigh proportion of true negative cases (cases withoutthe condition) will lead to an artificially high per centagreement. This emphasizes the need to calculatekappa when possible, but only occasionally wassufficient information available to permit producingthis statistic when the calculation was not doneoriginally.
Approaches
The two major approaches used to evaluate dataquality are record linkage and re-abstraction.
Record linkage joins two or more separate sourcesof information to specify individuals present onboth files (Acheson, 1967; Fellegi & Sunter, 1969;Howe, 1998; Newcombe, 1988; Wajda, Roos, Layefsky,& Singleton, 1991). When both files are supposedto contain the same individuals, the overall matchgives an indication of completeness. For matchedindividuals, the degree of agreement between itemson both records provides a measure of reliability.Although neither source may ‘‘faithfully representan individual’s state of health,’’ the economiesinvolved have popularized this technique (Potvin &Champagne, 1986).
Re-abstraction focuses on how reliably information(generally from hospital charts or physician records)
Evaluating Canadian Data Quality La Revue canadienne du viellissement 24 (Suppl. 1) 155

moves into computerized form (Potvin & Champagne,1986). Costs associated with re-abstraction varywith the information needed, charges assessed byhospital record rooms, and so forth, but are almostinvariably higher than those generated by recordlinkage.
Results
Registries
A registry based on a defined population providesflexibility in tracking both users and non-users ofcare, while accurate identifiers permit linkages withsubstantive files for reliability checks and ongoingresearch (Table 1) (Roos & Nicol, 1999). Onlyrelatively small numbers of military personnel, theRCMP, and prison inmates are not included inprovincial registries. Checks against a registry (anddemographic data generally) are typically not subjectto the ‘‘rare diagnosis’’ problem. For example, sincebirthdate is to be entered on each record, per centagreement can be a useful statistic. Discrepanciesin mortality information between registries andVital Statistics of 1 or 2 per cent have been found inrecent years (Hatcher & Hervas, 2001; Roos & Nicol,1999; Wajda et al., 1991). British Columbia andSaskatchewan comparisons matching unique personalidentifiers have reported between 96 and 99þ per centagreement on individuals on the health registry andon substantive files (Chamberlayne et al., 1998; Risch& Howe, 1994). Capabilities to match by name proveduseful in several complicated checks performed inBritish Columbia (Dimich-Ward et al., 1996; Hertzmanet al., 1997).
In Manitoba, all available information (snapshotregistries produced every 6 months, retroactivecancellations, deaths in hospitals and personal carehomes) has been used to build a research registry.Checks have shown:
. Research registry counts by subgroup exceededWinnipeg census figures, with differences diminishingover time and varying from 4.1 per cent (males in 1986)to 2.1 per cent (females in 1996).
. Differences were greatest for the age group with thegreatest mobility: those aged 15 to 24.
The reliability of critical registry variables – place ofresidence (in-province or out-of-province) and migra-tion (both out-of-province and in-province) – needs tobe explored. Ministry mailings that update registriescan help. Manitoba primary data collection foundapproximately 98 per cent of deaths and out-of-province moves (migration) to be recorded within 1year after the event: British Columbia data suggestsomewhat longer reporting lags in that province
(Hertzman et al., 1997; Roos & Nicol, 1999; Roos,Sharp, & Cohen, 1991; Wajda & Roos, 1987).
Other information on registry quality has focused lesson time lags. Comparisons involving the CanadianMortality Data Base have suggested relatively fewmoves out of British Columbia; for example, betweenfour and five per cent of the deaths of sawmillworkers who once lived in BC have been reportedas occurring elsewhere in Canada (Hertzman et al.,1997). Analyses of emigration patterns of cancer casesin Alberta have provided estimates of error in boththe health insurance plan registry and the cancerregistry (Hatcher & Hervas, 2001).
Finally, reporting may require linking files organizedat different times. One study relied on an alternativepostal code (from ‘‘place of residence’’ a year beforeor after the index date) in about 7 per cent of thecases to provide high-quality matches (Houle et al.,1999; Roos & Nicol, 1999). About 12 per cent ofManitobans appear to move among postal codesannually, with up to half of these codes subject tochange after late reporting.
Hospital Discharges
With few explicit checks being done, researchershave generally assumed that hospital databases areessentially complete in recording inpatient stays. Inone example using record linkage, maternal deliveryrecords accounted for more than 99 per cent ofManitoba births from 1989 to 1991 (Mustard,Harman, Hall, & Derksen, 1995). In some circum-stances, counts may be too large. Because proceduresinvolving short-term transfers (typically done just inteaching hospitals) may be recorded in more than onehospital, double-counting of such procedures needs tobe checked (Roos et al., 1996).
Four Saskatchewan studies combined record linkageand re-abstraction approaches, showing generallysimilar results vis-a-vis demographic and clinicalinformation; the linkage-based studies occasionallyproduced less concordance (for example, in diagnosesaccompanying hysterectomy) (Table 2) (Edouard &Rawson, 1996; Rawson & Malcolm, 1995a; Rawsonet al., 1997; Rawson & Malcolm, 1995b).
Five stand-alone comparisons linked hospital andphysician data, using large numbers of records,procedures, and diagnoses (table available from thesenior author) (Iron et al., 1995; Roos et al., 1989).Agreement on the procedure undertaken – chole-cystectomy, hysterectomy, coronary artery bypasssurgery, coronary angiography, hip replacement,knee replacement, and so on – was generally wellover 90 per cent (Iron et al., 1995; Rawson & Malcolm,
156 Canadian Journal on Aging 24 (Suppl. 1) L. L. Roos et al.

Table
1:Registrych
eck
s
Author
Cro
ss-Sectional
Linkage-B
ase
dPro
vince
Reco
rdsExa
mined
Years
Exa
mined
vs.Lo
ngitudinal
Identifiers
Use
dAgreement
Bryant&
Brasher,
1995
Alberta
11,000breast
augmentatio
npatie
nts
1973–1
990
Cross-sectional
Name,birth
date,Alberta
Health
Care
number,
birth
name
95%
Dim
ich-W
ard
etal.,
1996
British
Columbia
19,675births(from
9,512fathers)
1952–1
988
Longitu
dinal
Uniquebirth
registratio
nnumber,
birth
date,
gender,
gestatio
nalage,
birth
weight
14ca
sesdisagreed
onboth
birth
date
andgender
ofchild
Hertzm
anetal.,
1997
British
Columbia
26,487sawmill
workers
1950–1
990
Longitu
dinal
Name,birth
date,social
insurance
number
(check
with
Statistics
Canada)
Vita
lstatusnot
verifiable
for
14%
ofco
hort
Chamberlayne
etal.,1998
British
Columbia
700,000hospita
lseparatio
ns
(dischargesplusdeaths);
50millionphysicianclaim
s;20,000deaths;
40,000births;
16,000long-term
care
servicesrecipients;4.5
million
elderlyprescriptio
ndrug
recipients
1985–1
995,
1985–1
997,
1995–1
997
Cross-sectional
Name,gender,
birth
date,
postalco
de,Personal
Health
Number(PHN),
MedicalServicesPlan(M
SP)
identitynumber
96%–9
9.8%
Cohen,1993
Manito
ba
30,000reco
rdsin
acervical
cancerstudy
1982
Cross-sectional
Manito
bafamily
registratio
nnumber
95%
(cases)
99.8%
(controls)
Cohenetal.,1996
Manito
ba
10,107womenenrolledin
abreast
screeningstudy
1992
Cross-sectional
Registratio
nnumber,
birth
date,
initial,postalco
de
97%
Hatcher&
Hervas,
2001
Alberta
83,446ca
sesfrom
CancerRegistry
1985–1
993
Longitu
dinal
Name,gender,
birth
date,PHN,
AlbertaHealth
Care
Number,
loca
tion(Albertaorleftblank)
99%
Muhajarineetal.,
1997
Manito
ba
2,275participants
inthe
Heart
Health
Survey
1987–1
990
Cross-sectional
Yearofbirth,gender,
registratio
nnumber
98%
Contined
Evaluating Canadian Data Quality La Revue canadienne du viellissement 24 (Suppl. 1) 157

Table
1:Continued
Risch
&Howe,1994
Saskatchewan
allwomenin
Saskatchewan
1976–1
990
Successive
cross-sectional
Name,date
ofbirth,registratio
nbeneficiary
number
>99.99%
Robinsonetal.,
1997
Manito
ba
2,792participants
inthe
Heart
Health
Survey
1990
Cross-sectional
Encryp
tedPHN
98%
Roos&
Nicol,1999
Manito
ba
1,961individuals
with
malig
nanciesofthelung,
colon,andbreast
(from
Cancer
Registry)
1990
Cross-sectional
Yearandmonth
ofbirth,gender,
registratio
nnumber,
initial
98%
Roos&
Wajda,1991
Manito
ba
8,000deathstakenfrom
vitalstatistics
1973,1986,1987
Cross-sectional
Registratio
nnumber,
initial,
gender,
yearofbirth
92%–9
9%
Roosetal.,1985
Manito
ba
51,075reco
rdsfrom
the
Health
ServicesCommission
1970–1
982
Cross-sectional
Registratio
nnumber,
initial,
gender,
yearofbirth
91%
Houle
etal.,1999
Manito
ba
261,861individuals
inCanadiancensus
1986
Cross-sectional
Yearofbirth,gender,
postalco
de,
maritalstatus,
yearofbirth
ofspouse
andchild
ren*
74%
Primary
Data
Collection
Roos&
Nicol,1999
Manito
ba
4,387individuals
hospita
lizedforacute
myo
cardialinfarctio
n,hip
fracture,
andcertain
cancerco
nditions
1992–1
995
Longitu
dinal
Registratio
nnumber,
manuallooku
patManito
baHealth
99.8–1
00%
*This
istheonly
studythatlinkedreco
rdswithoutafamilyregistrationorpersonalidentifica
tionnumber.
158 Canadian Journal on Aging 24 (Suppl. 1) L. L. Roos et al.

Table
2:Hosp
italdisch
arg
eabstra
cts,
comparing
linkage-b
ase
dand
re-a
bstra
ction
appro
ach
es
Author
Abstra
ctsExa
mined
(l¼linked,r¼re-a
bstra
cted)
Variable
Exa
mined
Agreement(Linkage
with
Physician
Claim
s)Agreement(Re-a
bstra
ction)
Edouard
&Rawson,
1996
Hysterectomy(1,537–l;226–r)
Diagnosis,
procedure
56%
(diagnosis)
–98%
(typ
eofhysterectomy)
85%
(diagnosis)
–97%
(typ
eof
hysterectomy)
Rawson&
Malcolm
,1995a
Cholecystectomy(1,957–l;218–r)
Diagnosis,
procedure
6–7
1%
(diagnosis)
–90–9
9%
(procedure)
From
87%
(diagnosis)
to100%
(procedure)
Rawson&
Malcolm
.1995b
Ischaemic
heart
disease
and
chronic
obstructivepulm
onary
disease
(9,537–l,acute
myo
cardialinfarctio
n,224–r;
chronic
airways
obstruction,225–r)
Diagnosis
85–9
4%
(ischaemic
heart
disease);
80–9
5%
(chronic
obstructive
pulm
onary
disease)
97%
(acute
myo
cardialinfarctio
n);
94%
(chronic
airways
obstruction);
Rawsonetal.,1997
Depressivedisorderandschizophrenia
(1,474–l;281–r)
Diagnosis
67–9
3%
(depressivedisorder);
62–8
9%
(schizophrenia)
58–9
4%
(depressivedisorder);77–9
4%
(schizophrenia)
The
same
data
on
hysterectomywere
used
inthe
Edouard
&Rawso
n(1996)and
the
Rawso
n&
Malcolm
(1995a)studies.
Only
the
cholecystectomydata
are
presentedunderthelatterstudy.
Evaluating Canadian Data Quality La Revue canadienne du viellissement 24 (Suppl. 1) 159

1995a; Roos et al., 1982; Roos et al., 1996). Vascularsurgery, biliary tract operations other than chole-cystectomy, and radical versus modified mastectomyshowed lower agreement. Specificity of a codewas sometimes an issue. For example, satisfactoryagreement between Ontario hospital abstractsand physician claims could be produced only byaggregating various breast surgery procedures into an‘‘other’’ category (Iron et al., 1995).
Analysis of diagnoses among individuals hospitalizedfor a particular reason (such as for a specific surgicalprocedure) has strengths and weaknesses. Such aconvenient strategy produces a diagnostic mixunrepresentative of the hospitalized population as awhole. On the other hand, because the diagnosesstudied (i.e., obstetrical diagnoses accompanying ahysterectomy) are generally not rare in the populationstudied, inflation of the per cent agreement measure islimited. One Manitoba study of 11 surgical proceduresshowed 75 per cent success in finding the onediagnosis on the physician claim (at the three-digitlevel of ICD-9-CM) for surgery among the up to16 diagnoses on the discharge abstract (Roos et al.,1989). Diagnoses other than the primary or ‘‘mostresponsible’’ diagnosis show less accuracy. Chartreviews (from regional, inpatient, and outpatientservices) of recipients of mental health servicesshowed 76 per cent agreement on primary ICD-9-CM diagnosis at the five-digit level and 83 per centon three-digit level diagnosis (Robinson & Tataryn,1997). Co-morbid diagnoses agreed 55 per cent and57 per cent at the five- and three-digit levels,respectively.
Twelve stand-alone re-abstraction studies (table avail-able from the senior author) showed required demo-graphic items to be quite accurate (Hawker, Coyte,Wright, Paul, & Bombardier, 1997; Rawson et al.,1997). Such items are supposed to be included on allcharts, so the issue of ‘‘rare conditions’’ is not ofconcern. Slightly lower agreement levels (84% for dateof birth and 86% for marital status) were foundbetween charts and computerized records of mentalhealth service recipients (Robinson & Tataryn, 1997).
The importance of a diagnosis affects reliability.Among 236 patients hospitalized with a hip fracturenoted on the abstract, all but one were found tohave this chart diagnosis: agreements of 95 per centfor asthma, 76 per cent for non-asthma respiratorydiagnoses, and 93 per cent for non-respiratorydiagnoses (Delfino, Backlake, & Hanley, 1993;Rawson & Malcolm, 1995b). Diagnoses had lowerconcordance among hospitalized psychiatric patients:94 per cent agreement for schizophrenia but only 58per cent for depressive disorder (Rawson et al., 1997).
Co-morbidities sometimes show less agreement; oneearly study found agreement ranging from 88 percent (.56 kappa) for chronic obstructive pulmonarydisease to 99 per cent (.78 kappa) for tumours (Houleet al., 1999; Humphries et al., 2000; Malenka,McLerran, Roos, Fisher, & Wennberg, 1994; Virnig &McBean, 2001).
Using a sample of all hospitalized patients avoidsbias associated with a specific type of patient. Arecent Alberta paper using such a sample showedencouraging improvements in agreement betweenhospital discharge abstracts and chart review for the17 co-morbidities making up the Charlson index, afrequently used measure specifying co-morbiditiesknown to be important in predicting outcomes(Quan, Parsons, & Ghali, 2002). Several Canadianstudies have shown substantial agreement (kappascores in the .60–.80 range) between diagnoses notedon the computerized hospital discharge abstract andthose identified by chart re-abstraction (Austin, Daly,& Tu, 2002; Quan et al., 2002). Such agreement hasbeen noted for acute myocardial infarction, diabetes,and several other conditions.
Finally, the central problem with identifyingco-morbidities from computerized discharge abstractsis a lack of sensitivity; more co-morbidities arenoted from detailed chart abstraction than in thecomputerized abstracts. However, the more impor-tant diagnoses seem to be recorded; the power ofcomputerized diagnoses in predicting mortality isalmost identical to that of the (greater number of)diagnoses generated by re-abstraction (Quan et al.,2002; Stukenborg, Wagner, & Connors, 2001; Tu et al.,2001).
Physician Visits
Outside of fee-for-service payment, completeness ofclaims may be a problem. More monitoring of‘‘evaluation claims’’ generated by capitation – basedpayments or lump sum payments to clinics needed,although Papanicolaou testing was appropriatelyrecorded at one Manitoba clinic (Cohen, 1993).Primary care reform – a popular topic in Canada –may increase the need for such monitoring, ifmovement away from fee-for-service payment issubstantial.
Procedures and service dates on physician claimsappear to be accurately reported (Table 3). OneQuebec paper combined diagnostic and procedurecodes in physician claims to assess injury ascertain-ment using the emergency room clinical record as thestandard for comparison (Tamblyn, Reid, Mayo,McLeod, & Churchill-Smith, 2000). Analysing physi-cian claims using a ‘‘test-retest’’ methodology has
160 Canadian Journal on Aging 24 (Suppl. 1) L. L. Roos et al.

Table
3:Reliabilityofphysician
claim
s
Author
Pro
vince
Reco
rdsExa
mined
Years
Exa
mined
Variable
Exa
mined
Data
forCompariso
nAgreement
Blanchard
etal.,
1997
Manito
ba
Claim
sfor434child
ren
(0–1
4years
ofage)
1985–1
993
Diagnosisofdiabetes
DiabetesEduca
tion
ResourceDatabase
Ascertainmentrate
of95%
for
incidentca
ses
Muhajarineetal.,
1997
Manito
ba
Claim
sfor2,275survey
respondents
1987–1
990
Diagnosisofhyp
ertension
Heart
Health
Survey,
clinical
measures
.56ka
ppa(82%
agreement)for
survey;
.60ka
ppa(85%)for
clinicalmeasures
Pinfold
etal.,2000
Ontario
735womenwith
node-negative
breast
cancer
1991
Procedure
Medicalchart
95%
(most
definitive
procedure);
98%
(breast
surgery
type)
Robertsetal.,1994
Manito
ba
253claim
sin
theManito
ba
Immunisatio
nMonito
ring
System
1980–1
994
Child
hoodim
munizatio
ns,
servicedates
Medicalchart
98%
(servicedates);>98%
(immunizatio
ns)
Roosetal.,1979
Manito
ba
Claim
s(4,757pairs)
for
respiratory
problems
1972–1
974
Diagnoses
Twoclaim
swith
ina14-day
period(test-retest)
69–7
0%
diagnostic
agreement,
2observatio
ns,
2MDs;
93%
agreement,2observatio
ns,
sameMD
Roosetal.,1979
Manito
ba
Claim
sfor101tonsillectomy/
adenoidectomypatie
nts
1973
Diagnoses,
procedures
Claim
sForm
sBetterthan99%
incheck
for
transcriptio
nerror
Tamblynetal.,
2000
Quebec
Claim
sfor1,181elderly
treatedin
loca
lemergency
room
1993–1
994
Diagnosisofinjury
typeand
associatedprocedure
Clin
icalreco
rdoftype
anddate
ofinjury
Variatio
nin
sensitivity
from
26%
(thoraxfractures)
to97%
(hip
fracture);
81%
overall
Evaluating Canadian Data Quality La Revue canadienne du viellissement 24 (Suppl. 1) 161
found respiratory diagnoses to be of fairly highreliability (Roos, Nicol, Johnson, & Roos, 1979).
Prescriptions
Only Saskatchewan and Manitoba have prescriptiondatabases for almost the entire population (Miller,Blatman, & Einarson, 1996). However, Saskatchewandoes not track medication use by First Nationsresidents (approximately 7.7% of the population)(Statistics Canada, 2001; Thiessen, Wallace, Blackburn,Wilson, & Bergman, 1990). Almost complete programdata are available for British Columbia and Quebec(both provinces have prescription coverage forresidents aged 65 or older), while New Brunswickprovides coverage for elders not in nursing homes(Anderson, Kerluke, Pulcins, Hertzman, & Barer,1993; Davidson, Molloy, Somers, & Bedard, 1994;Tamblyn, Lavoie, Petrella, & Monette, 1995).
Relatively little information is available on complete-ness and quality of the prescription databases.Primary data collection has been important in asses-sing the completeness of these databases. InManitoba, given mandatory program participation,93 per cent of events found in a manual audit hadbeen computerized. Optional participation or FirstNations membership lowered agreement with themanual audit to 90 per cent and 80 per cent,respectively (Kozyrskyj & Mustard, 1998). OneBritish Columbia study noted that 93 per cent oftheir pharmaceutical claims had information onnumber and speciality of the prescriber ‘‘that couldbe linked to both the patient registry and uniquephysician identifiers’’ (Anderson & Kerluke, 1996).
Case IdentificationUsing information on contact with the health caresystem to study health as well as utilization markedlyextends the reach of administrative data. A particularcondition, such as acute myocardial infarction, maysometimes be reliably identified using just hospitaldata (Austin et al., 2002; Cox, Melady, Chen, & Naylor,1997; Levy, Tamblyn, Fitchett, McLeod, & Hanley,1999).
Accumulating physician claims or hospital abstractsover two or more years provides better case ascertain-ment for chronic conditions (such as asthma, diabetes,hypertension, and inflammatory bowel disease)involving extended contact with the health caresystem (Bernstein, Blanchard, Rawsthorne, & Wajda,1999; Brownell & Yogendran, 2001; Kozyrskyj,Mustard, Cheang, & Simons, 2001; Muhajarine et al.,1997; Robinson et al., 1997). Algorithms (the accep-tance of one or more diagnoses on claims abstracts asindicating the condition) can be adjusted with a goal
of high kappa scores and prevalence estimatesthat show substantial agreement between adminis-trative data and such data sources as surveys.Comparisons of hospital and physician files with thepopulation-based Manitoba Heart Health Survey for6 conditions varying in frequency found agreementranging from 79 per cent (.40 kappa) for elevatedcholesterol to 84 per cent (.59 kappa) for hypertension,and 96 per cent (.72 kappa) for diabetes (Muhajarineet al., 1997; Young, Roos, & Hammarstrand, 1991).To provide perspective, a number of conditionshave shown kappas comparing diagnoses of twophysicians to be about .60 (Koran, 1975; Sackett et al.,1991).
Sensitivity and specificity can often be ‘‘traded off’’using administrative data and record linkage. Thus,two sets of algorithms (to minimize false positivesand false negatives) were developed to assessdepression using physician speciality, diagnosesfrom physician claims, and pharmaceutical data(West et al., 2000).
Linkage of pharmaceutical data and physician claimscan help more generally with case identification(Table 4). Case identification can be complicated;for example, attention-deficit hyperactivity disorder(ADHD) was frequently diagnosed without aprescription claim for stimulant medication(Brownell & Yogendran, 2001). Moreover, if laboratorytest results (rather than clinical signs and symptoms)are critical, high concordance values may mislead forsome conditions. Aplastic anemia and agranulocyto-sis were definitely confirmed in only about 45 per centof Saskatchewan cases, despite over 90 per centagreement between charts and computerized hospitalabstracts (Rawson & D’Arcy, 1998). Such findingsraise concerns about the extent to which diagnosticvalidity can be assessed.
Finally, a contact-based measure of individual healthstatus, the Adjusted Clinical Group (ACG) case-mixadjustment system, has built on diagnostic informa-tion from hospital abstracts and physician claims.Fewer than two per cent of the diagnostic codesfrom British Columbia and Manitoba were leftunassigned (Reid, MacWilliam, Verhulst, Roos, &Atkinson, 2001). The high correlation between theACG measure (aggregated to small areas) andpremature mortality suggests high construct validity(Reid, Roos, MacWilliam, Frohlich, & Black, 2002).
Discussion
National Efforts
The Canadian Institute for Health Information (CIHI)works toward improving the quality of the hospital
162 Canadian Journal on Aging 24 (Suppl. 1) L. L. Roos et al.

Table
4:Case
identifica
tion
using
physician
claim
sand
otherso
urces
Author
Manitoba
Reco
rdsExa
mined
Years
Exa
mined
Variable
Exa
mined
Data
forCompariso
nAgreement
Blanchard
etal.,
1996
Manito
ba
Claim
sanddischarge
abstractsfor1,267
(1986)and2,595
(1991)adults
1984–1
992
Diagnosisofdiabetes
DiabetesEduca
tion
ResourceDatabase
Ascertainmentrates96–9
8%
Bernstein
etal.,
1999
Manito
ba
Claim
sanddischarge
abstractsfor2,725
surveyrespondents;
448forchart
review
DiagnosisofCrohn’s
disease
orulcerativeco
litis
Survey,
medicalcharts
Sensitivity/specificity
of
.89/.90–.91
(Crohn’s
disease)and.74–.88/
.91–.94(ulcerative
colitis)
Brownell&
Yogendran,
2001
Manito
ba
Claim
sand/orpharm
aceutical
data
for4,787child
ren
(0–1
9years
ofage)
1994–1
995
Diagnosisofattentio
n-deficit
hyp
eractivity
disorder(ADHD),
reco
rdofprescribedstim
ulant
medicatio
n
Claim
s,pharm
aceutical
data
87%
ofprescriptio
nsfor
stim
ulantmedicatio
nlin
kable
toprevious
claim
sforADHD
or
conduct
disorders
(80%
inprioryear)
Robinsonetal.,
1997
Manito
ba
Claim
sanddischarge
abstractsfor2,792
surveyrespondents
1987–1
990
Diagnosisofdiabetes,
hyp
ertension,
highcholesterol,stroke,
ormyo
cardialinfarctio
n
Heart
Health
Survey
From
.38ka
ppa/87%
(otherheart
disease)
to.72ka
ppa/96%
(diabetes)
West
etal.,
2000
Saskatchewan
Claim
sandpharm
aceutical
data
for587adults
1994–1
995
Primary
diagnosisofdepression,
reco
rdofnew
antid
epressant
use
Medicalchart
.54ka
ppa/77%
(depression).50ka
ppa/
76%
(depressionwith
anxiety)
Youngetal.,
1991
Manito
ba
Claim
sanddischarge
abstractsfor1,227
surveyrespondents
1971,1983
Diagnosisofdiabetes
Manito
baLo
ngitu
dinal
StudyonAging
Sensitivity
of84%;
specificity
of96%
Evaluating Canadian Data Quality La Revue canadienne du viellissement 24 (Suppl. 1) 163

discharge abstracts. One re-abstraction study sampled18 hospitals from a database, including 550 hospitalsgenerating 75 per cent of Canadian hospital dis-charges; facilities in Quebec and some in Manitobadid not submit data (Richards, Brown, & Homan,2001). Not surprisingly, ‘‘diagnoses with morecomplex treatment protocols and those that are lesseasily defined such as pneumonia, injuries andambulatory care conditions showed a higher degreeof discrepancies’’ (p. 5). Some disagreements betweencoder and re-abstractor on the ‘‘principal’’ procedureperformed, the diagnosis ‘‘most responsible’’ for thehospitalization, and the patient’s residential postalcode were also noted. With Canada now using theICD-10 coding system, both CIHI and at least oneinvestigator funded by the Canadian Institutes forHealth Research are evaluating the effectiveness ofimplementation of the new standards. Substantialwork will be needed to ensure high standards!
Accessibility and peer review have been a problemwith the national efforts. Although Web-site postingprovides one channel for dissemination, little workon the quality of the Canadian Hospital DischargeDatabase has been published in a format accessiblethrough PubMed or the Institute for ScientificInformation. Concerted work on the part of thoseworking with CIHI data could remedy this obstacle.The federally sponsored Canadian Health ServicesResearch Foundation successfully expanded its‘‘Mythbusters’’ review series from a ‘‘grey literature’’newsletter into a regular journal format (CanadianHealth Services Research Foundation, 2003). Manyacademics would agree with Davidoff’s (2000, p. 58)conclusion that ‘‘a scientific discovery does not existuntil it is safely in print.’’ Dissemination throughchannels that include academic publication wouldmaximize visibility of valuable work.
Work in Five Provinces
Table 5 summarizes data quality work in the fiveprovinces in which most of the studies using admin-istrative data have been conducted. The provincialpopulation registries seem quite complete, but onlythree provinces (Alberta, British Columbia, andManitoba) have reported systematic checks onregistry quality. Research on the reliability of bothregistry follow-up and residential information wouldincrease the range of substantive studies. Givenregistries’ importance, the lack of detailed systematic,attention to their quality (except in Manitoba) repre-sents a major problem that may hold back research.For example, the new field of social epidemiology islikely to use improved registry data to help add alongitudinal dimension and facilitate linkage withcommunity characteristics (Berkman & Kawachi,
2000; Veugelers, Yip, & Kephart, 2001; Roos,Magoon, Gupta, Chateau, & Veugelers, 2004).
The lack of attention to registries is not the result ofchance. Registries are not as immediately recogniz-able as critical for research on health and health careas are substantive files. Registries point toward long-term studies, toward epidemiology rather thantoward much of health services research. Whereregistry access is more constrained than access toother files, motivation to explore these issues isdecreased. Increased database research should befacilitated by less-expensive checks on reliability:linkage-based methods appear practical in manycases. When necessary, problems highlighted bylinkage could be further explored using primarydata collection or re-abstraction. Inexpensive test-retest methods, applicable to several types of sub-stantive files, might be used more extensively (Rooset al., 1979). Although a number of checks ondiagnoses and procedures have been made, manydiagnoses have not been studied. Promising analysesof the quality of pharmaceutical data need tobe expanded, both substantively and across moreprovinces.
The FutureOver time, the growth of electronic medical recordsand the availability of detailed clinical informationshould reduce the need to compare hospital andphysician information for consistency between thewritten chart and the computerized record (Tamblyn,2002). While greater standardization of coding shouldimprove data quality, differences among physiciansin diagnosing disease will continue. Well-organizedsystems will facilitate checking sources and pro-viders against each other and evaluating informationfrom a multi-method perspective; work continues ondeveloping appropriate algorithms (Huzel, Roos,Anthonisen, & Manfreda, 2003; Kozyrskyj et al.,2001). Case identification using administrative data –combined with sensitivity testing vis-a-vis the algo-rithms used – can generate important comparativeinformation. Canadian Regional Health Authoritiesare particularly interested in such findings (Kozyrskyj& Hildes-Ripstein, 2002; Roberts, Fransoo, Black,Roos, & Martens, 2002). With care, longitudinalstudies of cases identified from administrative datacan produce valuable insights (Roos, Carriere, &Friesen, 1998).
Administrative data are critical for the study ofrisk-adjusted outcomes, even though hospital dis-charge abstracts (in both Canada and the UnitedStates) underestimate the number of associatedco-morbidities (Humphries et al., 2000; Levy et al.,
164 Canadian Journal on Aging 24 (Suppl. 1) L. L. Roos et al.

Table
5:Data
quality
check
sin
five
pro
vince
s–An
ove
rview
Pro
vince
Registry
Hosp
ital
Physician
Prescription
BritishColumbia
Needchecksonfollo
w-up
andresidentia
lidentifiers
Checksondiagnosesand
proceduresweak
Unava
ilable
Unava
ilable
Saskatchewan
Notava
ilable;needpublicatio
nofspecificchecksperform
ed
Checksmadeondiagnoses
andprocedures
Checksmadeondiagnoses
andprocedures
Somesubstantivechecks
Manito
ba
Needadditionalcheckson
residentia
lidentifiers
Checksmadeondiagnoses
andprocedures
Checksmadeondiagnoses
andprocedures
Checksmadeonclaim
sfiles;
somesubstantivechecks
Ontario
Unava
ilable
Checksmadeondiagnoses
andprocedures
Checksmadeonprocedures
Unava
ilable
Quebec
Unava
ilable
Checksmadeondiagnoses
andprocedures
Checksmadeondiagnoses
andprocedures
Checksmadeonclaim
sfiled
This
table
summarizesdata
quality
checkspublish
edto
theendof2002.
Evaluating Canadian Data Quality La Revue canadienne du viellissement 24 (Suppl. 1) 165

1999; Malenka et al., 1994; Quan et al., 2002; Virnig &McBean, 2001). Algorithms selecting appropriateco-morbidities both explain considerable variation inoutcomes and work across several sites (Ghali et al.,2000; Tu et al., 2001). Although imperfect, codingimprovements suggest possibilities for reducingexpensive primary data collection (Ghali, Quan, &Brant, 2002; Quan et al., 2002). As discussed earlier,recent modelling efforts show few differencesbetween adjustment using administrative data andthat relying on more costly data collection.
The information-rich environments highlighted inFigure 1 offer great economies of effort, the ability toconsider entire populations, and a large number ofcases. As noted with genetic research, population-oriented work can tolerate a higher degree of errorthan can that more tightly focused on the individual(Kohler, 1994). Efficient approaches to generating datahave proved revolutionary in certain life sciences(Brown, 2000; Weiner, 1999). This paper representsone step toward constructing a methodology builtaround appropriately organizing the available admin-istrative data.
Such work should enable small jurisdictions withlimited funding to creatively develop informationinfrastructures and improve research productivity.Although heterogeneity in diffusion of health caredatabases is seen in Australia and the United States,interest has been growing among Australian states(particularly Western Australia and South Australia)(Armstrong & Kricker, 1999; Holman et al., 1999;Starr, 1997). Successful integrated systems providegeographic and socio-economic information at thelowest possible level of aggregation to facilitatedevelopment of denominators and allow flexibilityin ‘‘building’’ small areas up to different levels. InCanada, common areas for within-province analysisinclude regional health authorities, districts within theregional health authorities, and physician serviceareas (Roos & Shapiro, 1999).
Provincial and national cost data estimated at themicro-level are being incorporated in ongoingresearch (Jacobs, Blanchard, James, & Depew, 2001,Jacobs & Roos, 1999). In Manitoba, for example,home care data are being evaluated; efforts tomonitor adult, as well as childhood, immunizationshave also been initiated. Major efforts at linkingadministrative and clinical data are underway inQuebec. Such information-rich environments areshaping research in health policy, clinical epidemiol-ogy, and health services (Roos & Shapiro, 1999;Naylor & Slaughter, 1999; Canadian Institute forHealth Information, 2000). The issues highlightedhere will remain topical in the foreseeable future.
ReferencesAcheson, E.D. (1967). Medical record linkage. London: Oxford
University Press.
Anderson, G., & Kerluke, K. (1996). Distribution ofprescription drug exposures in the elderly: Descriptionand implications. Journal of Clinical Epidemiology, 49,929–935.
Anderson, G.M., Kerluke, K.J., Pulcins, I.R., Hertzman, C., &Barer, M.L. (1993). Trends and determinants ofprescription drug expenditures in the elderly: Datafrom the British Columbia Pharmacare Program.Inquiry, 30, 199–207.
Armstrong, B.K., & Kricker, A. (1999). Record linkage:A vision renewed. Australian New Zealand Journal ofPublic Health, 23, 451–452.
Austin, P.C., Daly, P.A., & Tu, J.V. (2002). A multicenterstudy of the coding accuracy of hospital dischargeadministrative data for patients admitted to cardiaccare units in Ontario. American Heart Journal, 144,290–296.
Berkman, L.F., & Kawachi, I. (Eds.). (2000). Socialepidemiology. New York: Oxford University Press.
Bernstein, C.N., Blanchard, J.F., Rawsthorne, P., & Wajda, A.(1999). Epidemiology of Crohn’s disease and ulcerativecolitis in a central Canadian province: A population-based study. American Journal of Epidemiology, 149,916–924.
Blanchard, J.F., Ludwig, S., Wajda, A., Dean, H.,Anderson, K., Kendall, O., & Depew, N. (1996).Incidence and prevalence of diabetes in Manitoba,1986–1991. Diabetes Care, 19, 807–811.
Blanchard, J.F., Dean, H., Anderson, K., Wajda, A.,Ludwig, S., & Depew, N. (1997). Incidence andprevalence of diabetes mellitus in children 0–14 yearsin Manitoba, Canada 1985–1993. Diabetes Care, 20,512–515.
Bryan, H., & Brasher, P. (1995). Breast implants and breastcancer: Re-analysis of a linkage study. New EnglandJournal of Medicine, 332, 1535–1539.
Brown, K. (2000). The human genome business today.Scientific American, 283, 50–55.
Brownell, M., & Yogendran, M. (2001). Attention-deficithyperactivity disorder in Manitoba children: Medicaldiagnosis and psychostimulant treatment rates.Canadian Journal of Psychiatry, 46, 264–272.
Canadian Health Services Research Foundation. (2003). Userfees would stop waste and ensure better use of thehealth care system. Journal of Health Services ResearchPolicy, 8, 105–107.
Canadian Institute for Health Information. (2000). Healthcare in Canada 2000: A first annual report. Ottawa:Author.
166 Canadian Journal on Aging 24 (Suppl. 1) L. L. Roos et al.

Chamberlayne, R., Green, B., Barer, M.L., Hertzman, C.,Lawrence, W.J., & Sheps, S.B. (1998). Creating apopulation-based linked health database: A newresource for health services research. Canadian Journalof Public Health, 89, 270–273.
Cohen, M.M. (1993). Using administrative data forcase-control studies: The case of the Papanicolaousmear. Annals of Epidemiology, 3, 93–98.
Cohen, M.M., Kaufert, P.A., MacWilliam, L., & Tate, R.B.(1996). Using an alternative data source to examinerandomization in the Canadian National BreastScreening Study. Journal of Clinical Epidemiology, 49,1039–1044.
Cox, J.L., Melady, M.P., Chen, E., & Naylor, C.D. (1997).Towards improved coding of acute myocardialinfarction in hospital discharge abstracts: A pilotproject. Canadian Journal of Cardiology, 13, 351–358.
Davidoff, F. (2000). Suppose there were no printers. Annals ofInternal Medicine, 133, 57–58.
Davidson, W., Molloy, W., Somers, G., & Bedard, M.(1994). Relation between physician characteristicsand prescribing for elderly people in NewBrunswick. Canadian Medical Association Journal, 150,917–921.
Delfino, R J., Backlake, M.R., & Hanley, J.A. (1993).Reliability of hospital data for population-based studiesof air pollution. Archives of Environmental Health, 48,140–146.
Dimich-Ward, H., Hertzman, C., Teschke, K., Hershler, R.,Marion, S.A., Ostry, A., & Kelly, S. (1996). Reproduc-tive effects of paternal exposure to chlorophenatewood preservatives in the sawmill industry.Scandinavian Journal of Work Environment and Health,22, 267–273.
Edouard, L., & Rawson, N.S.B. (1996). Reliability of therecording of hysterectomy in the Saskatchewan healthcare system. British Journal of Obstetrics and Gynaecology,103, 891–897.
Fellegi, I.P., & Sunter, A.B. (1969). A theory for recordlinkage. Journal of the American Statistical Association,(328), 1183–1210.
Ghali, W.A., Rothwell, D.M., Quan, H., Brant, R., Tu, J.V., &Steering Committee of the Cardiac Care Network ofOntario. (2000). A Canadian comparison of data sourcesfor coronary artery bypass surgery outcome ‘‘reportcards.’’ American Heart Journal, 140, 402–408.
Ghali, W.A., Quan, H., & Brant, R. (2002). Risk adjustmentusing administrative data: Impact of a diagnosis-typeindicator. Journal of General Internal Medicine, 16,519–524.
Hatcher, J., & Hervas, M. (2001). Emigration patterns ofcancer cases in Alberta, Canada. Chronic Diseases inCanada, 22, 12–17.
Hawaleshka, D. (2002). The Maclean’s Health Report:Measuring health care: North and West Vancouver,Edmonton, Victoria, Kelowna, B.C.—Western centrestop the list, Maclean’s, June 17, 23–31.
Hawker, G.A., Coyte, P.C., Wright, J.G., Paul, J.E.,& Bombardier, C. (1997). Accuracy of administrativedata for assessing outcomes after knee replacementsurgery. Journal of Clinical Epidemiology, 50, 265–273.
Hertzman, C., Teschke, K., Ostry, A., Hershler, R.,Dimich-Ward, H., Kelly, S., Spinelli, J.J., Gallagher,R.P., McBride, M., & Marian, S.A. (1997). Mortalityand cancer incidence among sawmill workers exposedto chlorophenate wood preservatives. American Journalof Public Health, 87, 71–79.
Holman, C.D.J., Bass, A.J., Rouse, I.L., & Hobbs, M.S.T.(1999). Population-based linkage of health records inWestern Australia: Development of the health servicesresearch linked database. Australian New Zealand Journalof Public Health, 23, 453–459.
Houle, C., Berthelot, J.-M., David, P., Wolfson, M.C.,Mustard, C.A., & Roos, L.L. (1999). Matching censusdatabase and Manitoba health care files. In Recordlinkage techniques – 1997: Proceedings of an internationalworkshop and exposition. Washington, D.C.: NationalAcademy Press, 305–318.
Howe, G.R. (1998). Use of computerized record linkage incohort studies. Epidemiologic Reviews, 20, 112–121.
Humphries, K.H., Rankin, J.M., Carere, R.G., Buller, C.E.,Kiely, F.M., & Spinelli, J.J. (2000). Co-morbidity datain outcomes research: Are clinical data derived fromadministrative databases a reliable alternative to chartreview? Journal of Clinical Epidemiology, 53, 343–349.
Huzel, L., Roos, L.L., Anthonisen, N.R., & Manfreda, J.(2003). Diagnosing asthma: The fit between survey andadministrative database. Canadian Respiratory Journal,9, 407–412.
Iron, K., Goel, V., & Williams, J.I. (1995). Concordance ofhospital discharge abstracts and physician claims for surgicalprocedures in Ontario. (ICES working paper series #42.)North York: Institute for Clinical Evaluative Sciences inOntario.
Jacobs, P., Blanchard, J.F., James, R., & Depew, N. (2001).Excess costs of diabetes in the aboriginal populationof Manitoba, Canada. Canadian Journal of Public Health,91, 298–301.
Jacobs, P., & Roos, N.P. (1999). Standard cost lists for healthcare in Canada: Issues in validity and interprovincialconsolidation. Pharmacoeconomics, 15, 551– 560.
Kohler, R.E. (1994). Lords of the fly. Chicago: University ofChicago Press.
Koran, L.M. (1975). The reliability of clinical methods, dataand judgements (Part 1). New England Journal ofMedicine, 293, 642–646.
Evaluating Canadian Data Quality La Revue canadienne du viellissement 24 (Suppl. 1) 167

Kozyrskyj, A., & Hildes-Ripstein, G.E. (2002). Assessinghealth status in Manitoba children: Acute andchronic conditions. Canadian Journal of Public Health,93, S63–S69.
Kozyrskyj, A., & Mustard, C.A. (1998). Validation of anelectronic, population-based prescription database.Annals of Pharmacotherapy, 32, 1152–1157.
Kozyrskyj, A., Mustard, C.A., Cheang, M.S., & Simons, F.E.R.(2001). Income-based drug benefit policy: Impacton receipt of inhaled corticosteroid prescriptionsby Manitoba children with asthma. Canadian MedicalAssociation Journal, 165, 897–902.
Levy, A.R., Tamblyn, R., Fitchett, D., McLeod, P.J., & Hanley,J.A. (1999). Coding accuracy of hospital discharge datafor elderly survivors of myocardial infarction. CanadianJournal of Cardiology, 15, 1277–1282.
Malenka, D.J., McLerran, D.F., Roos, N.P., Fisher, E.S.,& Wennberg, J.E. (1994). Using administrative datato describe casemix: A comparison with the medicalrecord. Journal of Clinical Epidemiology, 47, 1027–1032.
Manitoba Health. (2002). Manitoba’s health indicators report.Winnipeg: Author.
Miller, E., Blatman, B., & Einarson, T.R. (1996). A survey ofpopulation-based drug databases in Canada. CanadianMedical Association Journal, 154, 1855–1864.
Muhajarine, N., Mustard, C.A., Roos, L.L., Young, T.K., &Gelskey, D.E. (1997). Comparison of survey data andphysician claims data for detecting hypertension.Journal of Clinical Epidemiology, 50, 711–718.
Mustard, C.A., Harman, C.R., Hall, P.F., & Derksen, S.(1995). Impact of a nurses’ strike on the cesarean birthrate. American Journal of Obstetrics and Gynecology, 172,631–637.
Naylor, C.D. (1999). Health care in Canada: Incrementalismunder fiscal duress. Health Affairs (Millwood), 18, 9–26.
Naylor, C.D., & Slaughter, P.M. (Eds.). (1999). Cardiovascularhealth & services in Ontario: An ICES atlas. Toronto:Institute for Clinical Evaluative Sciences.
Newcombe, H.B. (1988). Handbook of record linkage. NewYork: Oxford University Press.
Pinfold, S.P., Goel, V., & Sawka, C. (2000). Quality of hospitaldischarge and physician data for types of breast cancersurgery. Medical Care, 38, 99–107.
Potvin, L., & Champagne, F. (1986). Utilization of adminis-trative data files in health research. Social IndicatorsResearch, 18, 409–423.
Quan, H., Parsons, G.A., & Ghali, W.A. (2002). Validity ofinformation on comorbidity derived from ICD-9-CCMadministrative data. Medical Care, 40, 675–685.
Rankin, J.M., Spinelli, J.J., Carere, R.G., Ricci, D.R., Penn, I.M.,Hilton, J.D., Henderson, M.A., Hayden, R.I., &
Buller, C.E. (1999). Improved clinical outcome afterwidespread use of coronary-artery stenting in Canada.New England Journal of Medicine, 341, 1957–1965.
Rawson, N.S.B., & D’Arcy, C. (1998). Assessing the validityof diagnostic information in administrative healthcare utilization data: Experience in Saskatchewan.Pharmacoepidemiology & Drug Safety, 7, 389–398.
Rawson, N.S.B., & Malcolm, E. (1995a). Validity of therecording of cholecystectomy and hysterectomy in theSaskatchewan health care datafiles. (Technical reportseries report #3). Saskatoon: PharmacoepidemiologyResearch Unit.
Rawson, N.S.B., & Malcolm, E. (1995b). Validity of therecording of ischaemic heart disease and chronicobstructive pulmonary disease in the Saskatchewanhealth care datafiles. Statistics in Medicine, 14,2627–2643.
Rawson, N.S.B., Malcolm, E., & D’Arcy, C. (1997). Reliabilityof the recording of schizophrenia and depressivedisorder in the Saskatchewan health care datafiles.Social Psychiatry and Psychiatric Epidemiology, 32,191–199.
Reid, R.J., MacWilliam, L., Verhulst, L., Roos, N.P., &Atkinson, M. (2001). Performance of the ACG Case-Mix System in two Canadian provinces. Medical Care,39, 86–99.
Reid, R.J., Roos, N.P., MacWilliam, L., Frohlich, N., &Black, C. (2002). Assessing population health care needusing a claims-based ACG morbidity measure: Avalidation analysis in the province of Manitoba. HealthServices Research, 37, 1345–1364.
Richards, J., Brown, A., & Homan, C. (2001). The dataquality study of the Canadian discharge abstract database.Proceedings of the Statistics Canada’s 2001 SymposiumOctober 16–19, ‘‘Achieving Data Quality in a StatisticalAgency: A Methodological Perspective.’’ Ottawa:Statistics Canada.
Risch, H.A., & Howe, G.R. (1994). Menopausal hormoneusage and breast cancer in Saskatchewan: A record-linkage cohort study. American Journal of Epidemiology,139, 670–683.
Roberts, J.D., Poffenroth, L.A., Roos, L.L., Bebchuk, J.D., &Carter, A.O. (1994). Monitoring childhood immuniza-tions: A Canadian approach. American Journal of PublicHealth, 84, 1666–1668.
Roberts, J.D., Fransoo, R., Black, C., Roos, L.L., & Martens, P.(2002). Research meets reality: Administrative datato guide planning for Canadian Regional HealthAuthorities. Healthcare Management Forum, 15, 13–21.
Robinson, J.R., & Tataryn, D.J. (1997). Reliability of theManitoba Mental Health Management InformationSystem for Research. Canadian Journal of Psychiatry,42, 744–749.
168 Canadian Journal on Aging 24 (Suppl. 1) L. L. Roos et al.

Robinson, J.R., Young, T.K., Roos, L.L., &Gelskey, D.E. (1997).Estimating the burden of disease: Comparing adminis-trative data and self-reports. Medical Care, 35, 932–947.
Roos, L.L., Magoon, J., Gupta, S., Chateau, D., &Veugelers, P.J. (2004). Socioeconomic determinants ofmortality in two Canadian provinces: Multilevelmodelling and neighborhood context. Social Scienceand Medicine, (7), 1435–1447.
Roos, L.L., Menec, V., & Currie, R.J. (2004). Policy analysis inan information-rich environment. Social Science andMedicine, (11), 2231–2241.
Roos, L.L., Nicol, J.P. & Wajda, A. (1985). Improving thequality of data banks through linkage. Chronic Diseasesin Canada, 5, 81–82.
Roos, L.L., & Nicol, J.P. (1999). A research registry: Uses,development, and accuracy. Journal of ClinicalEpidemiology, 52, 39–47.
Roos, L.L., Nicol, J.P., Johnson, C., & Roos, N.P. (1979).Using administrative data banks for research andevaluation: A case study. Evaluation Quarterly, 3,236–255.
Roos, L.L., Roos, N.P., Cageorge, S.M., & Nicol, J.P. (1982).How good are the data? Reliability of one health caredata bank. Medical Care, 20, 266–276.
Roos, L.L., Sharp, S.M., & Cohen, M.M. (1991). Comparingclinical information with claims data: Some similaritiesand differences. Journal of Clinical Epidemiology, (9),881–888.
Roos, L.L., Sharp, S.M., & Wajda, A. (1989). Assessingdata quality: A computerized approach. Social Scienceand Medicine, 28, 175–182.
Roos, L.L., & Wajda, A. (1991). Record linkage strategies:Part I. Estimating information and evaluatingapproaches. Methods of Information in Medicine, 30,117–123.
Roos, L.L., Walld, R., Wajda, A., Bond, R., & Hartford, K.(1996). Record linkage strategies, outpatient pro-cedures, and administrative data. Medical Care, 34,570–582.
Roos, N.P., Carriere, K.C., & Friesen, D. (1998). Factorsinfluencing the frequency of visits by hypertensivepatients to primary care physicians in Winnipeg.Canadian Medical Association Journal, 159, 777–783.
Roos, N.P., & Shapiro, E. (Eds). (1999). Academics at thepolicy interface: Revisiting the Manitoba Centre forHealth Policy and Evaluation and its population-basedhealth information system. Medical Care, 37(Suppl. 6),JS1–JS308.
Sackett, D.L., Haynes, R.B., Guyatt, G.H., & Tugwell, P.(Eds.). (1991). Clinical epidemiology: A basic science forclinical medicine (2nd ed.). Boston: Little, Brown andCompany.
Sheps, S.B., Reid, R.J., Barer, M.L., Krueger, H., McGrail,K.M., Green, B., Evans, R.G., & Hertzman, C. (2000).Hospital downsizing and trends in health care useamong elderly people in British Columbia. CanadianMedical Association Journal, 163, 411–412.
Starr, P. (1997). Smart technology, stunted policy:Developing health information networks. HealthAffairs (Millwood), 16, 91–105.
Statistics Canada. (2001). Population by aboriginal group,1996 Census. Retrieved December 14, 2004, from http://www.statcan.ca/english/Pgdb/People/Population/dem039a.htm
Stukenborg, G.J., Wagner, D.P., & Connors, A.F., Jr. (2001).Comparison of the performance of two comorbiditymeasures, with and without information from priorhospitalizations. Medical Care, 39, 727–739.
Tamblyn, R. (2002). The new millennium model for healthcare and research. In J. Downey & L. Claxton (Eds),Innovation: Essays by leading Canadian researchers.185–193. Toronto: Key Porter Books Ltd.
Tamblyn, R., Lavoie, G., Petrella, L., & Monette, J.(1995). The use of prescription claims databases inpharmacoepidemiological research: The accuracy andcomprehensiveness of the prescription claims databasein Quebec. Journal of Clinical Epidemiology, 48, 999–1009.
Tamblyn, R., Reid, T., Mayo, N.E., McLeod, P.J., &Churchill-Smith, M. (2000). Using medical servicesclaims to assess injuries in the elderly: Sensitivityof diagnostic and procedure codes for injuryascertainment. Journal of Clinical Epidemiology, 53,183–194.
Thiessen, B.Q., Wallace, S.M., Blackburn, J., Wilson, T.W., &Bergman, U. (1990). Increased prescribing of anti-depressants subsequent to B-blocker therapy. Archivesof Internal Medicine, 150, 2286–2290.
Tu, J.V., Austin, P.C., Walld, R., Roos, L.L., Agras, J., &McDonald, K.M. (2001). Development and validation ofthe Ontario acute myocardial infarction mortalityprediction rules. Journal of the American College ofCardiology, 37, 992–997.
Veugelers, P.J., Yip, A.M., & Kephart, G. (2001). Proximateand contextual socioeconomic determinants of mortal-ity: Multilevel approaches in a setting with universalhealth care coverage. American Journal of Epidemiology,154, 725–732.
Virnig, B.A., & McBean, M. (2001). Administrative data forpublic health surveillance and planning. Annual Reviewof Public Health, 22, 213–230.
Wajda, A., & Roos, L.L. (1987). Simplifying record linkage:Software and strategy. Computers in Biology andMedicine, 17, 239–248.
Wajda, A., Roos, L.L., Layefsky, M., & Singleton, J.A. (1991).Record linkage strategies, part 2: Portable software and
Evaluating Canadian Data Quality La Revue canadienne du viellissement 24 (Suppl. 1) 169

deterministic matching. Methods of Information inMedicine, 30, 210–214.
Weiner, J. (1999). Time, love, memory: A great biologist andhis quest for the origins of behavior. New York: AlfredA. Knopf.
West, S.L., Richter, A., Melfi, C.A., McNutt, M.,Nennstiel, M.E., & Mauskopf, J.A. (2000). Assessing
the Saskatchewan database for outcomes researchstudies of depression and its treatment. Journal ofClinical Epidemiology, 53, 823–831.
Young, T.K., Roos, N.P., & Hammarstrand, K.M.(1991). Estimated burden of diabetes mellitus inManitoba according to health insurance claims:A pilot study. Canadian Medical Association Journal,144, 318–324.
170 Canadian Journal on Aging 24 (Suppl. 1) L. L. Roos et al.

Commentary
Betty Havens
University of Manitoba
Researchers from the Manitoba Centre for HealthPolicy (MCHP), a research unit of the Departmentof Community Health Sciences of the University ofManitoba, have produced this fascinating set ofarticles. The centre has become the repository of theadministrative data from Manitoba Health, andMCHP researchers have created what has becomeknown as the Population Health Research DataRepository (PHRDR). This resource is used not onlyfor governmental deliverables and by researchersfrom MCHP, but is also used by researchers outsidethe centre and for internal and external research thatis funded by a variety of non-governmental sources,including CIHR, SSHRC, and various foundations.The scholarly research that has been produced withor based on these data is truly a laudable enterpriseby myriad scientists. It is worth noting that all ofthe research undertaken with this rich repositorymust be approved by the Health Ethics ReviewBoard in the Faculty of Medicine at the universityand by the Health Information Privacy Committeein Manitoba Health before any research can bepursued.
The articles in this supplement focus on olderManitobans, as is appropriate for the CanadianJournal on Aging, defined as 65 and over, unlessotherwise noted in a specific article. All of thesearticles use the longitudinal strengths of the reposi-tory, except the second home care article, whichfocuses on the regional variations with a cross-sectionof clients (Peterson et al.), and the two methodologicalarticles (Tate et al., Roos, et al.). In the best of allpossible worlds, I would have loved to see each ofthem use the same longitudinal period and the samegeographic descriptors; however, that was not thecase, here. Therefore, each article must stand alone,although there is a modicum of similarity amongthem. About half of the articles relate to the wholeprovince and the others refer only to Winnipeg. I amsure some readers will consider this article indepen-dence to be a strength.
The first article, by Menec and colleagues, does anexcellent job of demonstrating the capacity of theadministrative data, especially in identifying healthstatus. This article also provides an introduction to the
scope of data that are available to the researchersrepresented in the supplement as provided by theMCHP repository. This article also has a good newsconclusion in finding that the health status of olderManitobans is improving, contrary to unsubstantiatedconventional wisdom, best expressed as apocalypticdemography.
The next set of seven articles analyse the use of healthservices, physician services, especially the agingworkforce of family physicians, cataract surgery,home care, and prescription drugs by olderManitobans. As noted earlier, these analyses usediffering years of records, differing age of olderManitobans, with four being province-wide andthree restricted to Winnipeg. It is too bad, given thescope of the repository, that there is no article that isbased on the residential long-term care (known aspersonal care homes in Manitoba, and nursing homesin most other jurisdictions). It would also have beeninteresting to have an article that compared cataractsurgery to other surgeries, such as hip and kneereplacements, selected heart surgeries, and cancersurgeries.
The next four articles are all related to the use ofhospital services and beds by older Manitobans. Thefirst and last of this set of articles deal with Manitobaas a whole, and the other two are restricted toWinnipeg. They analyse three to nine years of datain responding to questions about bed blocking, long-stay patients, and use of emergency departments asthese services and patients relate to acute hospital bedsupply. The final article (Finlayson et al.) in this setlooks ahead, in this case to 2020, relative to projectedsupply of acute care beds to satisfy needs in thefuture. An additional article (Tate et al.) presents themethodologies that were considered and selected forthe projection article.
The final article deals with the Canadian environmentas an example of an information-rich environment.This article (Roos et al.) broadens the discussionbeyond Manitoba and provides an assessment of thedata quality of five Canadian provinces. It is a niceconclusion to the supplement that started by identify-ing the scope and potential of the repository data(Menec et al.). I was particularly struck by a comment
Canadian Journal on Aging / La Revue canadienne du viellissement 24 (Suppl. 1) : 171 - 172

by Roos and associates: ‘‘Systems based on recordlinkage offer the researcher great economies of effort,the ability to consider an entire population, and alarge number of cases’’ (Roos et al., p. 153). Thenumber of articles that were based on analyses ofmore that one data source and within which therequisite data sets were linked to answer the ques-tions posed for analysis reinforces the statement byRoos and colleagues. For example, there wereanalyses that required data linked from the DrugPrescription Information Network (DPIN), others thatrelied on the home care payroll data (MSSP), andanother on the Cataract Surgery Waitlist Registry.
It is, perhaps, too bad that there was not room formore articles, as none of these demonstrated theexplanatory power of linking the administrative datato data from interview sources; for example, the
research that has been undertaken using Agingin Manitoba (AIM) longitudinal interview dataand the health services administrative databases.Given that the University of Manitoba is blessedwith so many excellent longitudinal interviewdata sources relative to older adults, it may bethat a companion issue should be developed tohighlight these studies and data sets. For example,there are the Manitoba/Canada Study of Health andAging (M/CSHA), the Canadian Aging Researchnetwork data set, several smaller sets relating today programs, housing, etc. The Manitoba Follow-upStudy (MFUS), a study of men who were examined,first during the Second World War, is now contribut-ing to our understanding of male aging, havingpreviously contributed to understanding cardiacdisease.
172 Canadian Journal on Aging 24 (Suppl. 1) B. Havens


CANADIAN JOURNAL ON AGINGGeneral information and Instructions to Authors
The Canadian journal on Aging is a refereed, quarterly publication of theCanadian Association on Gerontology. It publishes manuscripts on agingconcerned with biology, health sciences, psychology, social sciences, andsocial policy and practice. The journal welcomes articles reporting originalresearch, as well as conceptual and theoretical papers which significantlyadvance knowledge or understanding in gerontology. Although focused onCanadian research, manuscripts from authors outside Canada are welcome.Authors are asked to bear in mind the multidisciplinary nature of thereadership when writing their manuscripts. In particular, care should be takento draw out the implications of the analysis for readers in other fields andother disciplines.
Journal space is also available for research notes, brief reports and clinicalcase studies with theoretical and/or practical implications. The maximumlength for these submissions is 10–12 manuscript pages including references,figures and tables. This section can be used to present important case studies,psychometric reports, Canadian norms for standardized tests, assessment ofmethodological approaches, findings from pilot and replication studies, andsummaries of program evaluation studies. Authors of a brief report mustindicate, when applicable, that a more detailed report will be provided uponrequest
1. Submission and acceptance of manuscriptsManuscripts may be submitted as electronic copy by e-mail or as hard copy byregular mail. All manuscripts should be addressed to the Editor-in-Chief:Mark RosenbergEditor-in-Chief, Canadian Journal on AgingDepartment of GeographyQueen’s University, Kingston, ON [email protected]
Submission of a paper to the CJA implies that it has not been published, noris it under consideration by another journal; and if accepted by the CJA it isnot to be published elsewhere (except as a conference proceedings) withoutpermission.
2. Manuscript preparationa. Preparing the manuscript. It is recommended that PC-compatible software beused; authors must supply their final version in Word. Articles should be printeddouble spaced. Articles should generally contain between 3,000 and 10,000 words.Number pages consecutively, beginning with the title page and including allpages. Five (5) copies must be submitted. A condensed title for a running head,not to exceed 40 letters and spaces should be supplied, and up to six (6) key wordsfor abstracting purposes.
b. Title page. Two of the copies must include a title page containing name of author,highest degree awarded, name and address of institutional affiliation, e-mail, FAXand telephone numbers.
c. Author anonymity. Three of the submitted copies must include a blinded titlepage, with title only.
d. Abstract. Each author is required to furnish, on a separate sheet, an abstract ofnot more than 100–150 words. A French translation of the abstract is necessary.The author may provide this or accept the expense of the translation of theabstract.
e. Acknowledgements. These should be added on a separate page and will beincorporated in a preliminary note on the first printed page of the article.
f. Notes. All notes should be entered as endnotes and should appear immediatelybefore the References. Footnotes are not acceptable.
g. References. The articles submitted should be written in either the AmericanPsychological Association (1984) style or the Vancouver style of referencing.More information regarding this may be obtained by writing to the Editorialoffice.
h. Tables. Tables should be typed on separate sheets. Electronic files should be inWord table format.
i. Figures. Camera ready figures should be submitted with the final version of thepaper in the following size: 43 picas/7 1/4 in. wide max. 58 picas/7 3/4 in. depth.Image files should be in *.tif format. If figures have been created with Excel, pleasesubmit the original Excel file and the chart that has been generated.
3. DiskettesOnce a paper is accepted the author must supply a copy of the paper on diskettein Word format.
4. Author’s alterationsAlterations to page proofs which are not required to correct material will becharged to the author.
5. CopyrightAuthors of articles or reviews accepted for publication will be asked to assigncopyright, on certain conditions, to the Canadian Association on Gerontology.
6. Sexist languageAuthors should avoid using sexist language in their manuscripts. For furtherclarification, please refer to the APA guidelines.
LA REVE CANADIENNE DU VIEILLISSEMENTRenseignments generaux et protocole de presentation
La Revue canadienne du vieillissement est une publication trimestrielle del’Association canadienne de gerontologie, dotee d’un comite de lecture. Elle pubiedes articles qui portent sur le vieillissement dans les disciplines suivantes: biologie,politique et pratique sociales, psychologie, sciences de la sante et sciences sociales.La Revue accepte les comptes rendus de recherches originales ainsi que les textesconceptuels on theoriques qui font avancer de facon appreciable les connaissancesou la vision de la gerontologie. Bien qu’elle soit une revue canadienne, les auteursd’autres pays sont encourages a y soumettre leur travaux de recherche. Ondemande aux auteurs de tenir compte de la multidisciplinarite du lectorat. Il pents’averer particulierement approprie de relier certains aspects de l’analyse a d’autresdomaines de savoir.
Il est egalement possible de proposer a la Revue des notes de recherche, desrapports sommaires, ainsi que des etudes de cas cliniques, accompagnees de leursretombees theoriques et/ou pratiques. Les articles ne doivent pas depasser 10 a 12pages manuscrites, references, illustrations et tableaux compris. Cette rubriquepeut servir a presenter divers documents : importantes etudes de cas, rapportspsychometriques, normes canadiennes regissant les tests standardises, evaluationd’approches methodologiques, resultats d’etudes pilotes et repetees, et resumesd’etudes d’evaluation de programme. Les auteurs de rapports sommaires doiventindiquer, le cas echeant, qu’ils sont prets a fournir un rapport plus detaille surdemande.
1. Presentation et acceptation des manuscritsLes manuscrits peuvent etre soumis electroniquement par courriel ou sous formede copie papier envoyee par la poste. Tons les manuscrits doivent etre adresses ala redacteur en chef:Mark RosenbergRedacteur en chef de la Revue canadienne du vieillissementDepartment of Geography, Universite Queen’s, Kingston, ON [email protected]
La revue n’accepte que des manuscrits inedits qui n’ont pas etre soumis a uneautre revue. Les manuscrits acceptes par la RCV ne peuvent etre publies ailleurssans autorisation (exception faites des actes de congres).
2. Preparation des manuscritsa. Preparation des manuscrits. On recommande l’utilisation de logiciels compatiblesavec PC. Les versions finales doivent nous parvenir en Word, a double interligne(12 pt. font). Les articles qui ne doivent pas compter plus de 24 pages (ci-inclus lesReferences et les Appendices) et doivent etre soumettre en cinq (5) exemplaires.Les auteurs sont pries de numeroter toutes les pages consecutivement, y comprisla page de titre. Les manuscrits doivent etre accompagnes d’un titre resume quiservira dans l’entete contenant on maximum de 40 lettres et espaces, et six (6) motscles pour le classement analytique.
b. La page titre. Les articles doivent etre accompagnes d’un page titre et comporterles mentions suivantes: nom de l’auteur, dernier diplome obtenu, nom et adressede l’employeur, adresse electronique, numero de telecopieur, numero detelephone.
c. Anonymat de l’auteur. La page de titre de trois des exemplaires soumis doit porterseulement le titre du manuscrit et etre depouillee de tons les autres elementsexiges.
d. Resume. Les manuscrits doivent etre accompagnes, sur une feuille separee, d’unresume de 100 a 150 mots. Il devra etre accompagne d’une traduction anglaise,sinon les frais de traduction seront assumes par l’auteur (35 $).
e. Remerciements. Les remerciements doivent figurer sur une feuille separee. Ilsseront inseres en guise de preliminaire a la premiere page du texte imprime.
f. Notes. Les notes doivent figurer a la fin du texts, immediatement avant labibliographie. Nous ne pouvons accepter les notes en bas de page.
g. References. (maximum 40) Les references doivent etre conforme au protocole de1’American Psychological Association ou au protocols de Vancouver. Pour obtenirde plus amples reseignements sur ce point consulter la redaction.
h. Tableaux. Les tableaux doivent etre presentes sur des feuilles separes. Dans votrefichier electronique, servez-vous de la fonction Tableau pour creer vos tableaux.
i. Figures. Les illustrations doivent etre pretes a photographier et soumises enmeme temps que la version finale du texte. Format max.: 43 picas/ 7 po 1/4 lar.sur 58 picas/ 9 po 3/4 haut. Les fichiers electroniques contenant des images,doivent etre en format TIFF.
3. DisquetteUne fois le texte accepte, t’auteur doit en fournir un exemplaire sur disquette deformat PC en Word.
4. Modifications de l’auteurLes corrections effectuees par 1’auteur a la lecture d’epreuve seront portees a soncompte.
5. Droits d’auteurLes auteurs dent les articles on les resumes sont publies doivent ceder, a certainesconditions, leurs droits d’auteur a La Revue canadienne du vieillissement.
6. Formulation sexiste ou discriminatoireLes auteurs doivent eviter l’emploi de tournures sexistes ou discriminatoires.Pour plus de renseignements, priere de consulter les directives de l’APA.


