Embed Size (px)
Citation preview

RESEARCHPAPER
Disease alters macroecological patternsof North American batsWinifred F. Frick1*, Sébastien J. Puechmaille2,3,4, Joseph R. Hoyt1,
Barry A. Nickel5, Kate E. Langwig1, Jeffrey T. Foster6,7, Kate E. Barlow8,
Tomáš Bartonicka9, Dan Feller10, Anne-Jifke Haarsma11, Carl Herzog12,
Ivan Horácek13, Jeroen van der Kooij14, Bart Mulkens15, Boyan Petrov16,
Rick Reynolds17, Luísa Rodrigues18, Craig W. Stihler19, Gregory G. Turner20
and A. Marm Kilpatrick1
1Department Ecology and Evolutionary Biology,
University of California, Santa Cruz, Santa Cruz, CA
95064, USA, 2Zoology Institute, Ernst-Moritz-Arndt
University, 17489 Greifswald, Germany, 3UCD School of
Biology and Environmental Science, University College
Dublin, Belfield, Dublin 4, Ireland, 4Groupe Chiroptères
de Midi-Pyrénées (CREN-GCMP), Toulouse, France,5Center for Integrated Spatial Research, University of
California, Santa Cruz, Santa Cruz, CA 95064, USA,6Center for Microbial Genetics and Genomics, Northern
Arizona University, Flagstaff, AZ 86011, USA,7Department of Molecular, Cellular, and Biomedical
Sciences, University of New Hampshire, Durham, NH
03824, USA, 8Bat Conservation Trust, Quadrant House,
250 Kennington Lane, London SE11 5RD, UK,9Department of Botany and Zoology, Masaryk
University, Kotlárská 2, CZ 611 37 Brno, Czech
Republic, 10Maryland Department of Natural Resources,
Appalachian Laboratory, Wildlife and Heritage Service,
301 Braddock Rd., Frostburg, MD 21532, USA,11Department of Animal Ecology and Ecophysiology,
Radboud University Nijmegen, P.O. Box 9010, Nijmegen,
The Netherlands, 12Wildlife Diversity Unit, New York
State Department of Environmental Conservation, 625
Broadway, Albany, NY 12233, USA, 13Department of
Zoology, Charles University, Vinicná 7, CZ 128 44
Praha, Czech Republic, 14Norwegian Zoological
Society, PB 102 Blindern, 0314 Oslo, Norway,15Vleermuizenwerkgroep Natuurpunt VZW, Coxiestraat
11, 2800 Mechelen, Belgium, 16National Museum of
Natural History, Tsar Osvoboditel 1, Sofia 1000,
Bulgaria, 17Virginia Department of Game and Inland
Fisheries, 517 Lee Highway, Verona, VA 24482, USA,18Instituto da Conservação da Natureza e das Florestas,
Av. da República 16-16B, 1050-191 Lisboa, Portugal,19West Virginia Division of Natural Resources, Wildlife
Resources Section, Elkins, WV 26241, USA, 20Wildlife
Diversity Division, Pennsylvania Game Commission,
2001 Emerton Avenue, Harrisburg, PA 16669, USA
ABSTRACT
Aim We investigated the effects of disease on the local abundances and distribu-tions of species at continental scales by examining the impacts of white-nosesyndrome, an infectious disease of hibernating bats, which has recently emerged inNorth America.
Location North America and Europe.
Methods We used four decades of population counts from 1108 populations tocompare the local abundances of bats in North America before and after theemergence of white-nose syndrome to the situation in Europe, where the disease isendemic. We also examined the probability of local extinction for six species ofhibernating bats in eastern North America and assessed the influence of wintercolony size prior to the emergence of white-nose syndrome on the risk of localextinction.
Results White-nose syndrome has caused a 10-fold decrease in the abundance ofbats at hibernacula in North America, eliminating large differences in speciesabundance patterns that existed between Europe and North America prior todisease emergence. White-nose syndrome has also caused extensive local extinc-tions (up to 69% of sites in a single species). For five out of six species, the risk oflocal extinction was lower in larger winter populations, as expected from theory,but for the most affected species, the northern long-eared bat (Myotisseptentrionalis), extinction risk was constant across winter colony sizes, demon-strating that disease can sometimes eliminate numerical rarity as the dominantdriver of extinction risk by driving both small and large populations extinct.
Main conclusions Species interactions, including disease, play anunderappreciated role in macroecological patterns and influence broad patterns ofspecies abundance, occurrence and extinction.
KeywordsDisease ecology, extinction risk, macroecology, population monitoring,Pseudogymnoascus destructans, white-nose syndrome.
*Correspondence: Winifred F. Frick, Department
Ecology and Evolutionary Biology, University of
California, Santa Cruz, Santa Cruz, CA 95064, USA.
E-mail: [email protected]
bs_bs_banner
Global Ecology and Biogeography, (Global Ecol. Biogeogr.) (2015)
© 2015 John Wiley & Sons Ltd DOI: 10.1111/geb.12290http://wileyonlinelibrary.com/journal/geb 1

INTRODUCTION
Abundance of organisms varies enormously both within and
among species, and group sizes range from solitary individuals
to aggregations of millions, which are often patchily distributed
across seemingly suitable habitats. Although characterizing pat-
terns in sociality, abundance and distribution has long fasci-
nated ecologists, understanding the mechanisms that underlie
these patterns remains challenging, in part due to the difficulty
in quantifying species interactions across broad temporal and
spatial scales (Brown & Maurer, 1989; Brown, 1999; Gaston &
Blackburn, 2000; Smith et al., 2008). Identifying the mecha-
nisms that drive macroecological patterns can improve our
understanding of the forces that shape ecological communities
(Brown, 1995; Kerr et al., 2007) and aids conservation by iden-
tifying species at risk of extinction (Johnson, 1998).
Infectious diseases are important conservation threats and
produce effects at scales from individuals to ecosystems (Daszak
et al., 2000; Tompkins et al., 2011). The fungal disease
chytridiomycosis, for example, has caused population declines
and extinctions of amphibian populations across the world
(Lips et al., 2006; Skerratt et al., 2007; Kilpatrick et al., 2010).
The role of disease in shaping macroecological patterns has not
been well documented, however. This is despite substantial
theoretical work on the role of disease in population regulation
and as a driver of extinction risk (Anderson & May, 1979; de
Castro & Bolker, 2004) and empirical work on the population
ecology of invasive species that have escaped their pathogens
(Torchin et al., 2003). Theory suggests that disease can regulate
host abundance to much lower levels when transmission
increases with host density (Anderson & May, 1979), but rela-
tively few empirical examples exist of host regulation by disease
(Hudson et al., 1998; Hochachka & Dhondt, 2000) and none has
examined the role of disease in regulating abundance for taxa
across multiple continents. Disease can also drive species extinct
if transmission does not decrease as hosts become rare, which
can be caused by social interactions among hosts (e.g. mate-
seeking), alternative hosts or abiotic reservoirs (de Castro &
Bolker, 2004; McCallum, 2012). The importance of disease in
determining macroecological patterns has been difficult to
quantify, because host–pathogen dynamics are often difficult to
isolate from other ecological factors that influence population
abundance, especially at broad spatial scales. The introduction
of a novel pathogen to a new continent can provide an oppor-
tunity to quantify the potential impact of disease on patterns of
abundance and distribution.
White-nose syndrome (WNS), a multihost disease of hiber-
nating bats caused by the fungal pathogen Pseudogymnoascus
destructans (Blehert & Gargas) Minnis & D. L. Lindner (formerly
Geomyces destructans), emerged in North America in 2006
(Blehert et al., 2009). The disease is characterized by cutaneous
infection (Meteyer et al., 2009) during hibernation (Langwig
et al., 2015), disrupting natural torpor cycles and causing mor-
bidity and mortality (Warnecke et al., 2012). WNS caused
massive initial declines in bat populations in the three years after
it was first detected in North America (Frick et al., 2010;
Langwig et al., 2012). In contrast, although P. destructans infects
numerous hibernating bat species throughout Europe there
have been no reports of mass mortality, despite decades of
population monitoring (Martínková et al., 2010; Puechmaille
et al., 2010, 2011a; Wibbelt et al., 2013).
We used four decades of population-monitoring data across
1108 winter colonies of 16 hibernating bat species in North
America and Europe to assess how the emergence of disease has
altered local abundance patterns. We hypothesized that disease
emergence would reduce the abundance of bats in eastern
North America to levels similar to those in Europe, where the
disease is endemic (Martínková et al., 2010; Puechmaille et al.,
2011a,b; Pikula et al., 2012; Bandouchova et al., 2014; Zukal
et al., 2014). We compared colony sizes in North America
before and after the emergence of WNS to colony sizes in
Europe, accounting for differences in habitat and climate, in
order to determine the effects of disease on species abundance
patterns. We also hypothesized that disease emergence would
alter the distributions of species by causing local extinctions at
hibernacula, and that the probability of local extinction
through disease would be lower where colonies were larger
prior to the disease’s emergence.
MATERIALS AND METHODS
Species selection and estimating local abundance
No bat species occur in both North America and Europe, so we
focused on species in the family Vespertilionidae, which has
members from multiple genera on both continents (Fig. S1 in
Supporting Information). We estimated local abundance for 10
species in Europe and six species in North America using annual
counts of hibernating bats from 1976 to 2013 at 468 winter
colonies in six US states where WNS has been present for at least
four years (Vermont, New York, Pennsylvania, Maryland, West
Virginia and Virginia) and 640 colonies in eight European coun-
tries (United Kingdom, Norway, the Netherlands, Belgium,
France, Portugal, the Czech Republic and Bulgaria). Infections
of P. destructans have been confirmed in bats in each of these
European countries except Norway, where no surveys for the
pathogen/disease have yet been completed. We use the term
white-nose syndrome (WNS) to refer to the disease defined by
cutaneous infection, as described by Meteyer et al. (2009).
We determined winter colony size by estimating the carrying
capacity at a site from repeated annual surveys (5–26 annual
surveys per site; mean, 8 surveys per site), using three different
methods to account for differences in data availability (Fig. S2).
We use colony size synonymously with local abundance to
describe species-specific aggregations of individuals at a hiber-
nation site. We estimated the carrying capacity rather than
average counts in order to eliminate temporal trends (increasing
or decreasing) in the raw count data (Frick et al., 2010; Langwig
et al., 2012). We restricted analyses to sites where we had at least
five annual counts, although this did not alter our qualitative
conclusions (see data subset comparison below; Fig. S4). For
sites where we had consecutive winter counts, we estimated the
W. F. Frick et al.
Global Ecology and Biogeography, © 2015 John Wiley & Sons Ltd2

carrying capacity for each species at each site with the discrete-
time, density-dependent model Nt+1 ∼ Nt + r × Nt × (1 − Nt/K,
where Nt is the count in year t, and r and K are parameters fitted
with a negative binomial distribution by maximum-likelihood
estimation (Fig. S2a). For sites where we had non-consecutive
year counts, we calculated the average of the upper quartile of
counts (Fig. S2b). Finally, we estimated K at sites in eastern
North America where WNS had been detected for at least three
years by using the most recent count (Fig. S2c). Previous analy-
ses suggested that most populations stabilized or were extirpated
within four years of WNS being detected (Langwig et al., 2012).
Data subset comparison
We restricted our analyses to sites with at least five annual counts
in order to provide robust estimates of colony size that
accounted for temporal trends in the raw data. If abundance at
a site were to influence annual survey frequency, then restricting
the data to well-sampled sites could introduce bias. For example,
sites with large populations take substantial effort to count accu-
rately and if large sites were therefore counted less frequently
they could have been excluded from our analysis (e.g. a few large
colonies of Pipistrellus pipistrellus were not included in our
A North Americapre-WNS WNS WNS
Europe
10000
1000
Col
ony
size
100
10
C
1000
100
10
1
Mea
n co
lony
siz
e
B
Figure 1 Changes in colony sizes of hibernating bats in North America, before and after the emergence of white-nose syndrome (WNS),compared to Europe. (a) Colony sizes of species in North America, before and after the emergence of WNS, compared to European species,where the disease is endemic. In each boxplot, box hinges show first and third quartiles, black horizontal lines show medians, and points arethe estimated colony sizes. (b) Mean colony sizes for bat species in North America pre-WNS (brown), North America WNS (orange) andEurope WNS (red), calculated using the best-fitting model equation and continent-specific averages of ecological covariates measured athibernacula. Error bars are standard errors. Photos above bars show representative aggregations of hibernating bats. From left to right:Myotis lucifugus hibernating in Vermont before WNS, the same colony after WNS, and Myotis myotis in the Czech Republic. (c) Myotisseptentrionalis with WNS. This species is proposed for listing as endangered under the Endangered Species Act in the USA due to concernsabout its global extinction risk from WNS. Photographs provided by A. Hicks and I. Horácek. Full species names are provided in Fig. S1.
Disease alters macroecology of bats
Global Ecology and Biogeography, © 2015 John Wiley & Sons Ltd 3

dataset; Nagy & Szántó, 2003; Nagy & Postawa, 2010). Con-
versely, sites with small colonies may not be prioritized for sam-
pling in areas where larger aggregations are available for
population monitoring. We tested whether excluding infre-
quently sampled sites (fewer than five annual surveys) biased
our comparison between North American and European abun-
dances. We calculated an arithmetic mean of annual counts for
colonies surveyed in fewer than five years (n = 1728). We fitted a
linear mixed-effects model with dataset (full versus restricted)
and continent as fixed effects, and site and species as random
effects, and found qualitatively identical results to those from
analyses using the more robust subset (Fig. S3).
Phylogenetic analysis
We created a pruned phylogenetic tree for the 16 species ana-
lysed (6 North American, 10 European; Fig. S1) and tested for
phylogenetic signal in the species-abundance data based on this
tree to examine whether abundance patterns were strongly
influenced by phylogeny (Felsenstein, 1985). We retrieved
sequences for the 16 focal species and six closely related or
outgroup species from GenBank. The sequence data included
the full cytochrome b mitochondrial gene (cytb; 1140 bp) and
partial sequences of the recombination activator 2 gene (RAG2;
1151 bp). We retrieved both genes for all species, although some
were not of full length and were completed with Ns. We con-
ducted a Bayesian analysis in beast 1.7.5 using the Akaike infor-
mation criterion in jModelTest 2.1.5, and determined
GTR + Γ + I to be the best substitution model. We applied a
strict molecular clock, did not specify an outgroup, and used the
Yule process as a tree prior. The unweighted pair group method
with arithmetic averages (UPGMA) was used to construct the
starting tree. We ran 10,000,000 Markov chain Monte Carlo
generations, sampling every 500 generations, and discarding the
first 10% as burn-in. We performed three replicate analyses to
ensure convergence, and combined the results of all three. We
visually checked traces for convergence, and the effective sample
sizes (ESS) of all parameters were greater than 800. We tested for
phylogenetic signal in the species-abundance data using
phylogenetically independent contrasts relative to tip-shuffling
randomization (Blomberg et al., 2003) using the ‘phylosignal’
function in the picante package (Kembel et al., 2010) in R 3.0.2
(R Core Team, 2013), and found no evidence of phylogenetic
signal either before or after the emergence of WNS (European
and North American pre-WNS, K = 0.54, P = 0.42; European
and North American post-WNS, K = 0.47, P = 0.64). Although
the number of species in our analysis is relatively low, reducing
our ability to detect phylogenetic signal, the representation of
members in multiple genera from both continents and the very
weak evidence for phylogenetic signal (P > 0.4 in both cases)
suggest that phylogeny is unlikely to be driving the observed
patterns.
Habitat and climate covariates
To account for ecological factors that could influence local
abundance at hibernation sites, we included eight variables
related to habitat and climatic conditions as covariates in our
general linear mixed-effects model that compared abundances
between North America, before and after WNS emergence, and
Europe (Table S1). We measured habitat and climate variables
within 140 km of a hibernaculum to represent the landscape
that bats experience year-round, based on the distance between
winter and summer colonies (Davis & Hitchcock, 1965;
Hutterer et al., 2005). We included five habitat variables related
to bat activity and habitat use (Walsh & Harris, 1996; Gehrt &
Chelsvig, 2003; Mehr et al., 2011; Akasaka et al., 2012), includ-
ing land cover of agriculture, forest and impervious surface area
(a measure of urban area) as well as the surface areas of rivers
and other bodies of water (Table S1). We used the total area of
karst within the 140-km radius as an approximate measure of
available hibernacula habitat. We note that bats also use
anthropogenic structures, such as mines, tunnels and military
bunkers for hibernacula in North America and Europe, but geo-
graphical data layers for mines and bunkers were not available at
the geographical scope of this analysis. These structures are
likely to constitute an important element of bats’ winter habitat
availability that is unaccounted for in our analysis. We used
average annual temperatures and precipitation over the period
1950–2000 to characterize climate.
Statistical analyses
We compared local abundances in North America, both before
and after WNS emerged, to those in Europe, using linear mixed-
effects models with species and site as random effects, and con-
Table 1 Estimated model coefficients and standard errors fromthe best-fitting model and continent-specific means for eachecological variable used to estimate the mean abundance of sixhibernating bats in North America prior to white-nose syndrome(WNS), in North America after WNS emergence, and in Europe,where the disease is endemic. Europe WNS was used as thereference group.
Model term Coefficient
Std.
error
Means
Europe
North
America
Intercept – Europe WNS −0.59 0.38
North America WNS −0.45 0.24
North America pre-WNS 0.58 0.24
Agriculture 5.24 0.85 0.49 0.04
Agriculture2 −6.07 1.12 0.27 0.00
Forest 1.51 0.27 0.17 0.89
Impenetrable surface area −0.16 0.05 4.39 2.84
Impenetrable surface area2 0.02 0.01 21.44 12.65
Precipitation 0.03 0.01 66.85 102.07
Precipitation2 0.00 0.00 4871 10434
(log10River)2 −0.06 0.01 32.06 28.15
(log10Water)2 0.08 0.01 15.48 13.35
log10Karst 0.11 0.02 4.78 5.26
W. F. Frick et al.
Global Ecology and Biogeography, © 2015 John Wiley & Sons Ltd4
tinent, disease and the ecological variables described above as
fixed effects. We used manual backwards selection by removing
parameters with t-values less than 2 – which corresponds to
P < 0.05 for large sample sizes – to find the best-fitting model
(Ramsey & Schafer, 2002). We used a likelihood-ratio test to
compare the best-fitting model to a model without the group
term of continent–WNS status, and Tukey’s honestly significant
difference method (Crawley, 2007) for post-hoc independent
contrasts among continent–disease groups (pre-WNS North
America, WNS North America and WNS Europe). We estimated
differences among groups using the best-fitting model equation
and continent-specific means for each ecological variable meas-
ured at hibernacula. We also compared the variation in median
abundances among species in North America, before and after
WNS emergence, and species in Europe, using a modified robust
Brown–Forsythe Levene-type test for homogeneity of variance
using group medians (Ramsey & Schafer, 2002).
We analysed local extinctions in North America by fitting
generalized linear models with a binomial distribution and logit
link to the presence or absence of each species three years after
the detection of WNS at sites that were occupied by a given
species for at least five years prior to the emergence of WNS. We
compared five a priori candidate models (Table 2) to determine
the influence of colony size and species effects on the probability
of extinction. All statistical analyses were conducted in R 3.0.2
(R Core Team, 2013). We used the package bbmle (Bolker & R
Development Core Team, 2013) for maximum-likelihood
estimation.
RESULTS
Species abundances
WNS caused an order-of-magnitude decrease in colony size
within seven years of detection in North America and elimi-
nated differences in local abundance between North America
prior to WNS emergence and Europe (Fig. 1). The best-fitting
model for explaining the variation in local abundance included
Myotis septentrionalis Myotis leibii
Myotis sodalis Eptesicus fuscus
Perimyotis subflavus Myotis lucifugus
Pre-WNS Colony Size
Post-WNS Status
69% extinct
21% extinct
17% extinct
11% extinct
10% extinct
6% extinct
< 10 bats 10-99 bats 100-999 bats 1,000-9,999 bats >10,000 bats
Extinct Extant
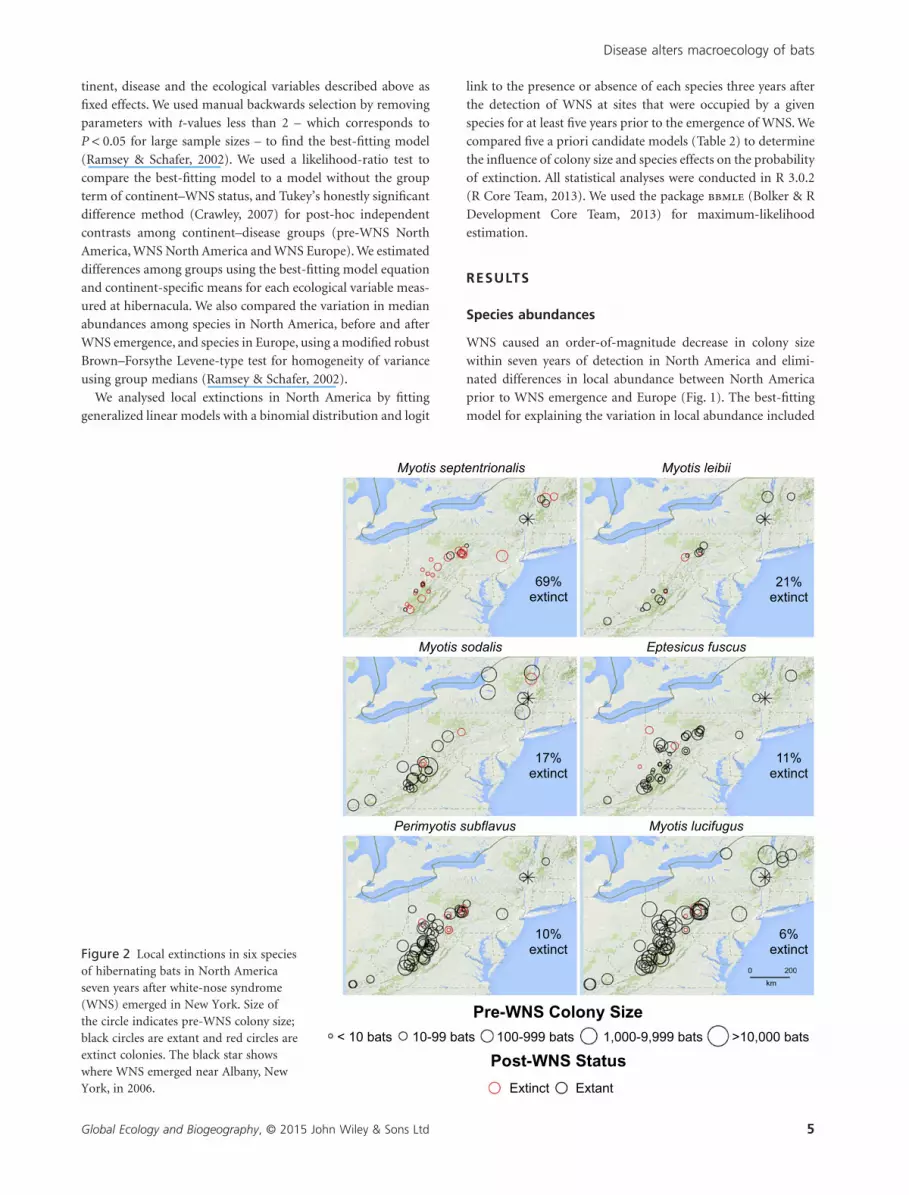
Figure 2 Local extinctions in six speciesof hibernating bats in North Americaseven years after white-nose syndrome(WNS) emerged in New York. Size ofthe circle indicates pre-WNS colony size;black circles are extant and red circles areextinct colonies. The black star showswhere WNS emerged near Albany, NewYork, in 2006.
Disease alters macroecology of bats
Global Ecology and Biogeography, © 2015 John Wiley & Sons Ltd 5

seven habitat and climatic variables (Fig. S4, Table 1). There
were continental differences in some land-cover types, including
much higher forest cover and less agricultural area in eastern
North America than in Europe (Fig. S4), but these were not
sufficient to explain the continental differences in local abun-
dance patterns (likelihood-ratio test of models with and without
continent–disease: χ2 = 244, d.f. = 2, P < 0.0001). After account-
ing for mean habitat and climatic conditions, colony sizes were
10 times larger in eastern North America prior to WNS than in
Europe (Tukey’s HSD, P < 0.03), whereas after WNS emergence,
there was no significant difference between colony sizes in
eastern North America and Europe (Tukey’s HSD, P < 0.13).
Declines in median abundances occurred in all North American
species and ranged from 60% to 98%.
Variation in median abundances among species in North
America prior to WNS (variance = 0.40) was significantly
greater than in Europe (variance = 0.06; Brown–Forsythe
Levene test: 6.3, P = 0.02). The emergence of WNS in North
America eliminated this difference between continents in the
variation in median abundances between species (vari-
ance = 0.17, Brown–Forsythe Levene test: 2.0, P = 0.18).
Distributions and extinctions
Local extinctions occurred in all six species in North America,
with the highest probability of extinction occurring in Myotis
septentrionalis (Trouessart, 1897), which has disappeared from
69% of its former known hibernacula (Fig. 2). The probability of
local extinction was significantly related to the colony size prior
to the emergence of WNS for five of the six species affected by
WNS, such that extinction probability was highest in colonies
that were small before WNS emerged. In contrast, there was no
significant relationship between pre-WNS colony size and
extinction risk for M. septentrionalis (Fig 3., Table 2). The results
from model comparisons after removing M. septentrionalis
showed little support for the inclusion of a species term (Table 2),
suggesting that the other five species exhibited the same relation-
ship between probability of extinction and pre-WNS colony size.
DISCUSSION
The emergence of WNS altered the macroecological patterns of
hibernating bats in North America by reducing local abundance
by an order of magnitude and causing extensive local extinc-
tions. The impact of WNS emergence on North American bats
raises the question of whether hibernating bat colonies in
Europe were substantially larger and more variable prior to the
presence of the disease in Europe and, more broadly, whether
disease is a hidden force behind macroecological patterns across
continents in other taxa and regions. Furthermore, extensive
local extinctions and predicted global extinction of
M. septentrionalis due to WNS (Langwig et al., 2012) highlights
the possibility that past extinctions of bat species may have
occurred when the disease first emerged in Europe.
Myotis septentrionalis Myotis leibii
Myotis sodalis Eptesicus fuscus
Perimyotis subflavus Myotis lucifugus
0.00
0.25
0.50
0.75
1.00
0.00
0.25
0.50
0.75
1.00
0.00
0.25
0.50
0.75
1.00
10 100 1000 10000 10 100 1000 10000pre−WNS colony size
Pro
babi
lity
of lo
cal e
xtin
ctio
n
Figure 3 Probability of local extinctionand local abundance of hibernating batsin North America. Line and 95%confidence bands show the fittedrelationship [probability of extinction= 1/(1 + e0.33−1.59×colony size) wherea = 0.33−1.59 × colony size] for the fivespecies where colony size influencedextinction probability, based on thebest-fitting model after removingM. septentrionalis (Table 2).
W. F. Frick et al.
Global Ecology and Biogeography, © 2015 John Wiley & Sons Ltd6

Theory and extensive empirical work both suggest that small
populations are generally at greater risk of extinction (Lande,
1993; Purvis et al., 2000; de Castro & Bolker, 2004). We found
that the probability of local extinction decreased with colony
size for all six species, except M. septentrionalis, and those five
species all showed the same relationship between local extinc-
tion and abundance, with larger colonies less likely to go locally
extinct (Fig. 3, Table 2). Abundance prior to WNS detection had
no significant effect on the probability of local extinction for
M. septentrionalis. In fact, M. septentrionalis was subject to a
much higher extinction probability than the two other species
that had similar pre-WNS colony sizes: M. leibii Audubon &
Bachman, 1842 and Eptesicus fuscus (Palisot de Beauvois, 1796)
(Fig. 3). This result, which is at odds with theory on extinction
risk from stochastic factors, is partly explained by previous work
showing that the initial impacts of disease were greater in larger
colonies of M. septentrionalis (Langwig et al., 2012). Density-
dependent declines in this species eliminated the influence of
numerical rarity as a driver of extinction risk by making the
probability of local extinction equally high for large and small
colonies.
In addition to disease, colony sizes are also influenced by
ecological, social and environmental differences between Europe
and North America. Our comparisons accounted for some eco-
logical factors related to bat–habitat interactions (Walsh &
Harris, 1996; Mehr et al., 2011), but other factors that influence
local abundance (e.g. differences in roost quality and availabil-
ity) were difficult to measure and could not be included. None-
theless, the patterns shown here suggest that disease may indeed
be an important driver of macroecological patterns and can
rapidly alter local abundance patterns for a suite of species.
There are numerous examples of unexplained variation in the
abundance of closely related and ecologically similar taxa across
or between continents (Brown, 1995; Gaston & Blackburn,
2000; Smith et al., 2008), and species distributions often have
substantial gaps that are often difficult to explain with simple
measures of climate, habitat or other abiotic factors. Species
interactions have been proposed as a possible cause for these
differences in abundance and gaps in distributions, but their role
is difficult to demonstrate due to their often invisible nature
(Travis, 1996). Our results demonstrate how disease can be a
strong force in shaping macroecological patterns by altering
host abundances and distribution across sites at broad spatial
scales.
ACKNOWLEDGEMENTS
We thank B. Fenton, C. McCain, D. Currie and two anonymous
referees for helpful comments. We thank Charente Nature/
Laurent Precigout for data from France, Zdenek Buric, Daniel
Horácek, Martin Koudelka and Jaroslav Veselý for data from the
Czech Republic, and numerous unnamed volunteers in Europe
and the United States who contributed to field data collection.
Natália Martínková facilitated data acquisition from the Czech
Republic and provided comments on an earlier draft. Funding
was provided by National Science Foundation grants DEB-
1115895 and DGE-0741448, IRCSET-Marie Curie International
Mobility Fellowships in Science, Engineering and Technology to
S.J.P., and a Czech Science Foundation grant P506/12/1064 to
I.H and T.B.
REFERENCES
Akasaka, T., Akasaka, M. & Nakamura, F. (2012) Scale-
independent significance of river and riparian zones on three
sympatric Myotis species in an agricultural landscape. Biologi-
cal Conservation, 145, 15–23.
Anderson, R.M. & May, R.M. (1979) Population biology of
infectious diseases: part I. Nature, 280, 361–367.
Bandouchova, H., Bartonicka, T., Berkova, H., Brichta, J., Cerny,
J., Kovacova, V., Kolarik, M., Köllner, B., Kulich, P.,
Martínkova, N., Rehak, Z., Turner, G.G., Zukal, J. & Pikula, J.
(2014) Pseudogymnoascus destructans: evidence of virulent
Table 2 Influence of colony size andspecies differences on probability ofextinction for six hibernating bats inNorth America. Best-fitting models inbold. Likelihood-ratio test (LRT) resultsshown for models with ΔAIC < 4 frombest-fitting model.
Model AIC χ2 (d.f.) LRT
All species included
Pr(extinction) ∼ species × log10(pre-WNS colony size) 185.9
Pr(extinction) ∼ species + log10(pre-WNS colony size) 189.8 13.8 (5) P = 0.017*
Pr(extinction) ∼ species 205.2
Pr(extinction) ∼ log10(pre-WNS colony size) 215.4
Pr(extinction) ∼ null 248.1
Excluding Myotis septentrionalis
Pr(extinction) ∼ log10(pre-WNS colony size) 136.8
Pr(extinction) ∼ species + log10(pre-WNS colony size) 137.9 6.9 (4) P = 0.14†
Pr(extinction) ∼ species × log10(pre-WNS colony size) 143.2
Pr(extinction) ∼ null 159.9
Pr(extinction) ∼ species 163.4
*Likelihood-ratio test (LRT) P-value represents significant support for inclusion of the interactionterm between species and log10(pre-WNS colony size). †LRT P-value represents no statistical supportfor inclusion of additive species effect.
Disease alters macroecology of bats
Global Ecology and Biogeography, © 2015 John Wiley & Sons Ltd 7
skin invasion for bats under natural conditions, Europe.
Transboundary and Emerging Diseases, doi:10.1111/
tbed.12282.
Blehert, D.S., Hicks, A.C., Behr, M., Meteyer, C.U.,
Berlowski-Zier, B.M., Buckles, E.L., Coleman, J.T.H., Darling,
S.R., Gargas, A., Niver, R., Okoniewski, J.C., Rudd, R.J. &
Stone, W.B. (2009) Bat white-nose syndrome: an emerging
fungal pathogen? Science, 323, 227.
Blomberg, S.P., Garland, T. & Ives, A.R. (2003) Testing for
phylogenetic signal in comparative data: behavioral traits are
more labile. Evolution, 57, 717–745.
Bolker, B.M. & R Development Core Team (2013) bbmle: tools
for general maximum likelihood estimation. Available at: http://
cran.r-project.org/package=bbmle (accessed 20 September
2013).
Brown, J.H. (1995) Macroecology. University of Chicago Press,
Chicago, IL.
Brown, J.H. (1999) Macroecology: progress and prospect. Oikos,
87, 3–14.
Brown, J.H. & Maurer, B.A. (1989) Macroecology: the division
of food and space among species on continents. Science, 243,
1145–1150.
de Castro, F. & Bolker, B. (2004) Mechanisms of disease-induced
extinction. Ecology Letters, 8, 117–126.
Crawley, M.J. (2007) The R book. John Wiley & Sons, Chichester,
UK.
Daszak, P., Cunningham, A.A. & Hyatt, A.D. (2000) Emerging
infectious diseases of wildlife – threats to biodiversity and
human health. Science, 287, 443–449.
Davis, W.H. & Hitchcock, H.B. (1965) Biology and migration of
the bat, Myotis lucifugus, in New England. Journal of
Mammalogy, 46, 296–313.
Felsenstein, J. (1985) Phylogenies and the comparative method.
The American Naturalist, 125, 1–15.
Frick, W.F., Pollock, J.F., Hicks, A.C., Langwig, K.E., Reynolds,
D.S., Turner, G.G., Butchkoski, C.M. & Kunz, T.H. (2010) An
emerging disease causes regional population collapse of a
common North American bat species. Science, 329, 679–682.
Gaston, K.J. & Blackburn, T.M. (2000) Patterns and process in
macroecology. Blackwell Science, Cambridge, UK.
Gehrt, S.D. & Chelsvig, J.E. (2003) Bat activity in an urban
landscape: patterns at the landscape and microhabitat scale.
Ecological Applications, 13, 939–950.
Hochachka, W.M. & Dhondt, A.A. (2000) Density-dependent
decline of host abundance resulting from a new infectious
disease. Proceedings of the National Academy of Sciences USA,
97, 5303–5306.
Hudson, P.J., Dobson, A.P. & Newborn, D. (1998) Prevention of
population cycles by parasite removal.Science, 282, 2256–2258.
Hutterer, R., Ivanova, T., Meyer-Cords, C. & Rodrigues, L.
(2005) Bat migrations in Europe: a review of banding data and
literature. Federal Agency for Nature Conservation, Bonn.
Johnson, C.N. (1998) Species extinction and the relationship
between distribution and abundance. Nature, 394, 272–274.
Kembel, S.W., Cowan, P.D., Helmus, M.R., Cornwell, W.K.,
Morlon, H., Ackerly, D.D., Blomberg, S.P. & Webb, C.O.
(2010) Picante: R tools for integrating phylogenies and
ecology. Bioinformatics, 26, 1463–1464.
Kerr, J.T., Kharouba, H.M. & Currie, D.J. (2007) The
macroecological contribution to global change solutions.
Science, 316, 1581–1584.
Kilpatrick, A.M., Briggs, C.J. & Daszak, P. (2010) The ecology
and impact of chytridiomycosis: an emerging disease of
amphibians. Trends in Ecology and Evolution, 25, 109–118.
Lande, R. (1993) Risks of population extinction from demo-
graphic and environmental stochasticity and random catas-
trophes. The American Naturalist, 142, 911–927.
Langwig, K.E., Frick, W.F., Bried, J.T., Hicks, A.C., Kunz, T.H. &
Kilpatrick, A.M. (2012) Sociality, density-dependence and
microclimates determine the persistence of populations suf-
fering from a novel fungal disease, white-nose syndrome.
Ecology Letters, 15, 1050–1057.
Langwig, K.E., Frick, W.F., Reynolds, R., Parise, K.L., Drees,
K.P., Hoyt, J.R., Cheng, T.L., Kunz, T.H., Foster, J.T. &
Kilpatrick, A.M. (2015) Host and pathogen ecology drive the
seasonal dynamics of a fungal disease, white-nose syndrome.
Proceedings of the Royal Society B: Biological Sciences, 282,
20142335.
Lips, K.R., Brem, F., Brenes, R., Reeve, J.D., Alford, R.A., Voyles,
J., Carey, C., Livo, L., Pessier, A.P. & Collins, J.P. (2006) Emerg-
ing infectious disease and the loss of biodiversity in a
Neotropical amphibian community. Proceedings of the
National Academy of Sciences USA, 103, 3165–3170.
McCallum, H. (2012) Disease and the dynamics of extinction.
Philosophical Transactions of the Royal Society B: Biological
Sciences, 367, 2828–2839.
Martínková, N., Backor, P., Bartonicka, T. et al. (2010) Increas-
ing incidence of Geomyces destructans fungus in bats from the
Czech Republic and Slovakia. PLoS ONE, 5, e13853.
Mehr, M., Brandl, R., Hothorn, T., Dziock, F., Förster, B. &
Müller, J. (2011) Land use is more important than climate for
species richness and composition of bat assemblages on a
regional scale. Mammalian Biology, 76, 451–460.
Meteyer, C.U., Buckles, E.L., Blehert, D.S., Hicks, A.C., Green,
D.E., Shearn-Bochsler, V., Thomas, N.J., Gargas, A. & Behr,
M.J. (2009) Histopathologic criteria to confirm white-nose
syndrome in bats. Journal of Veterinary Diagnostic Investiga-
tion, 21, 411–414.
Nagy, Z.L. & Postawa, T. (2010) Seasonal and geographical dis-
tribution of cave-dwelling bats in Romania: implications for
conservation. Animal Conservation, 14, 74–86.
Nagy, Z.L. & Szántó, L. (2003) The occurrence of hibernating
Pipistrellus pipistrellus (Schreber, 1774) in caves of the Carpa-
thian Basin. Acta Chiropterologica, 5, 155–160.
Pikula, J., Bandouchova, H., Novotný, L., Meteyer, C.U., Zukal,
J., Irwin, N.R., Zima, J. & Martínková, N. (2012) Histopathol-
ogy confirms white-nose syndrome in bats in Europe. Journal
of Wildlife Diseases, 48, 207–211.
Puechmaille, S.J., Verdeyroux, P., Fuller, H., Ar Gouilh, M.,
Bekaert, M. & Teeling, E.C. (2010) White-nose syndrome
fungus (Geomyces destructans) in bat, France. Emerging Infec-
tious Diseases, 16, 290–293.
W. F. Frick et al.
Global Ecology and Biogeography, © 2015 John Wiley & Sons Ltd8

Puechmaille, S.J., Wibbelt, G., Korn, V. et al. (2011a) Pan-
European distribution of white-nose syndrome fungus
(Geomyces destructans) not associated with mass mortality.
PLoS ONE, 6, e19167.
Puechmaille, S.J., Frick, W.F., Kunz, T.H., Racey, P.A., Voigt, C.C.,
Wibbelt, G. & Teeling, E.C. (2011b) White-nose syndrome: is
this emerging disease a threat to European bats? Trends in
Ecology and Evolution, 26, 570–576.
Purvis, A., Gittleman, J.L., Cowlishaw, G. & Mace, G.M. (2000)
Predicting extinction risk in declining species. Proceedings of
the Royal Society B: Biological Sciences, 267, 1947–1952.
R Core Team (2013) R: a language and environment for statistical
computing. R Foundation for Statistical Computing, Vienna.
Ramsey, F.L. & Schafer, D.W. (2002) The statistical sleuth: a
course in methods of data analysis, 2nd edn. Duxbury
Thomson Learning, Pacific Grove, CA.
Skerratt, L.F., Berger, L., Speare, R., Cashins, S., McDonald, K.R.,
Phillott, A.D., Hines, H.B. & Kenyon, N. (2007) Spread of
chytridiomycosis has caused the rapid global decline and
extinction of frogs. EcoHealth, 4, 125–134.
Smith, F.A., Lyons, S.K., Ernest, S.K.M. & Brown, J.H. (2008)
Macroecology: more than the division of food and space
among species on continents. Progress in Physical Geography,
32, 115–138.
Tompkins, D.M., Dunn, A.M., Smith, M.J. & Telfer, S. (2011)
Wildlife diseases: from individuals to ecosystems. Journal of
Animal Ecology, 80, 19–38.
Torchin, M.E., Lafferty, K.D., Dobson, A.P., McKenzie, V.J. &
Kuris, A.M. (2003) Introduced species and their missing para-
sites. Nature, 421, 628–630.
Travis, J. (1996) The significance of geographical variation in
species interactions. The American Naturalist, 148, S1–S8.
Walsh, A.L. & Harris, S. (1996) Factors determining the abun-
dance of vespertilionid bats in Britain: geographical, land class
and local habitat relationships. Journal of Applied Ecology, 33,
519–529.
Warnecke, L., Turner, J.M., Bollinger, T.K., Lorch, J.M., Misra, V.,
Cryan, P.M., Wibbelt, G., Blehert, D.S. & Willis, C.K.R. (2012)
Inoculation of bats with European Geomyces destructans sup-
ports the novel pathogen hypothesis for the origin of white-
nose syndrome. Proceedings of the National Academy of
Sciences USA, 109, 6999–7003.
Wibbelt, G., Puechmaille, S.J., Ohlendorf, B., Mühldorfer, K.,
Bosch, T., Görföl, T., Passior, K., Kurth, A., Lacremans, D. &
Forget, F. (2013) Skin lesions in European hibernating bats
associated with Geomyces destructans, the etiologic agent of
white-nose syndrome. PLoS ONE, 8, e74105.
Zukal, J., Bandouchova, H., Bartonicka, T., Berkova, H., Brack,
V., Brichta, J., Dolinay, M., Jaron, K.S., Kovacova, V., Kovarik,
M., Martínková, N., Ondracek, K., Rehák, Z., Turner, G.G. &
Pikula, J. (2014) White-nose syndrome fungus: a generalist
pathogen of hibernating bats. PLoS ONE, 9, e97224.
SUPPORTING INFORMATION
Additional supporting information may be found in the online
version of this article at the publisher’s web-site.
Figure S1 Phylogeny of European and North American bat
species.
Figure S2 Three methods used to estimate winter colony size in
bat populations.
Figure S3 Comparison of mean winter colony sizes for
restricted and full datasets.
Figure S4 Ecological variables associated with variation in
winter colony size.
Table S1 Ecological variables used in analysing local
abundances.
BIOSKETCH
Winifred F. Frick is an Assistant Adjunct Professor in
Ecology and Evolutionary Biology at University of
California, Santa Cruz. Her research investigates species
interactions at multiple scales and in different
ecological contexts in order to discover patterns and
processes in ecology that inform conservation.
A. Marm Kilpatrick is an Associate Professor in
Ecology and Evolutionary Biology at University of
California, Santa Cruz. His research unites theory and
empirical work to address basic and applied questions
in the ecology of infectious diseases, population
biology, evolution, behaviour and conservation.
Authors contributions: A.M.K. conceived the idea;
W.F.F., A.M.K., K.E.L., S.J.P and J.T.F. designed the
study; S.J.B.,I.H., T.B., K.E.B, A.J.H, J.K., L.R., B.M.,
B.P., C.H., R.R., C.W.S., G.C.T and D.F. contributed
data for the study; W.F.F., A.M.K. S.J.P., J.R.H and
B.A.N. performed analyses; W.F.F and A.M.K. wrote the
manuscript and all coauthors provided input.
Editor: Christy McCain
Disease alters macroecology of bats
Global Ecology and Biogeography, © 2015 John Wiley & Sons Ltd 9


