Embed Size (px)
Citation preview

De
La
b
a
ARR1AA
KAPTSC
1
tWsphtoaTtmsfiet1c
ao
0d
Electrochimica Acta 58 (2011) 322– 329
Contents lists available at SciVerse ScienceDirect
Electrochimica Acta
j ourna l ho me pag e: www.elsev ier .com/ locate /e lec tac ta
issolution and passive film formation of Sn and Sn coated steel using atomicmission spectroelectrochemistry
. Jianga, P. Volovitcha, U. Sundermeierb, M. Wolpersb, K. Oglea,∗
Chimie-ParisTech, ENSCP, UMR7045, 11 rue Pierre et Marie Curie, Paris 75005, FranceHenkel AG & Co. KGaA, Adhesive Technologies, 67 Henkelstraße, 40191, Düsseldorf, Germany
r t i c l e i n f o
rticle history:eceived 7 June 2011eceived in revised form8 September 2011ccepted 19 September 2011vailable online 29 September 2011
a b s t r a c t
Atomic emission spectroelectrochemistry (AESEC) was used to quantify simultaneously the rates of Sndissolution and SnO2 film formation for Sn and Sn coated steel in carbonate solution at pH 11.2. Thetechnique is demonstrated by applying different potentiostatic treatments (variable potential and time)and measuring the amount of oxide formed and Sn dissolved during the treatment, and subsequentlymeasuring the open circuit dissolution rate following the treatment. It is observed that the degree of
eywords:nodizationassivationin
passivation is a strong function of potential and time. Cathodic and low potential anodic potentiostatictreatments lead to a dissolution–precipitation mechanism that does not significantly passivate the sur-face. The stability of the passive film was investigated as a function of the quantity of oxide generated.
© 2011 Elsevier Ltd. All rights reserved.
pectroelectrochemistryorrosion. Introduction
Tin coatings on steel are frequently used in the food and elec-ronic industry because tin is nontoxic, ductile and easy to solder.
hen exposed to the atmosphere, a tin oxide film is formed on theurface that reduces the corrosion rate to moderate levels, enhancesolymer adhesion, and reduces tarnishing. For many applications,owever, the oxide film does not give sufficient corrosion protec-ion and a supplementary passivation step is required [1]. The statef the art passivation methodology in use today involves forming
Cr(III) hydroxide film using a secondary chromate post-rinse [2].his may be done using either electrodeposition to reduce Cr(VI)o Cr(III) and Cr(0), or alternatively, by simple exposure to a chro-
ate solution followed by a rinse with a citric acid or gluconic acidolution to reduce excess Cr(VI) to Cr(III). In recent years the searchor non chromate based passivation treatments has become fash-onable and the idea of simply reinforcing the native SnO2 film bylectlectrochemical anodization has regained interest [3] althoughhe method is quite old with the earliest patents dating back to the930s [4]. In particular, carbonate solutions are among the mostommonly used electrolytes for this application [5–7].
An extensive literature exists on the kinetics of tin passivationnd the nature of the passive film and Ref. [8] gives a fairly thor-ugh review up to 1989. The basic structure of the passive film in
∗ Corresponding author.E-mail address: [email protected] (K. Ogle).
013-4686/$ – see front matter © 2011 Elsevier Ltd. All rights reserved.oi:10.1016/j.electacta.2011.09.046
alkaline solution was proposed by Kapusta and Hackerman [9] andconfirmed by subsequent authors. In alkaline solution, it is wellestablished that the oxide film consists primarily of SnO2 whenformed at high anodic potentials although a thin layer of SnO hasbeen detected at the interface Sn/oxide [10,11]. The ratio of Sn(IV)to Sn(II) increases markedly as the anodization potential becomeshigher; and at more negative potentials it is thought that a SnOor Sn(OH)2 film dominates, most likely formed through a disso-lution precipitation mechanism [12]. The amorphous Sn(OH)2 andSn(OH)4 films have been described as a “prepassive” film. The final-ized passive film is formed when Sn(II) is oxidized to Sn(IV) and thehydroxide species are dehydrated to the oxide [13].
Despite the extensive literature and kinetic models based onfilm growth and dissolution, to our knowledge, the relationshipbetween the state of the passive film and the dissolution rate ofthe underlying substrate has never been determined experimen-tally due to the difficulty of measuring simultaneous dissolutionand film formation. This is an important omission in that the ulti-mate goal of a passivation treatment on a plating line is to reducethe corrosion rate. Further, due to high line speeds (up to 3 m/s)the passivation treatment must be obtained in a very short timeperiod, on the order of seconds, and under conditions which maynot be optimum for passivation. In this work, we aim to measure thetotal electrical current and the dissolution rate of Sn independently
during and after electrochemical treatment of the Sn. This allowsus to measure the effect of the electrochemical treatment on thesubsequent Sn dissolution rate. Further, this methodology permitsan improved quantitative estimate of the amount of oxide on the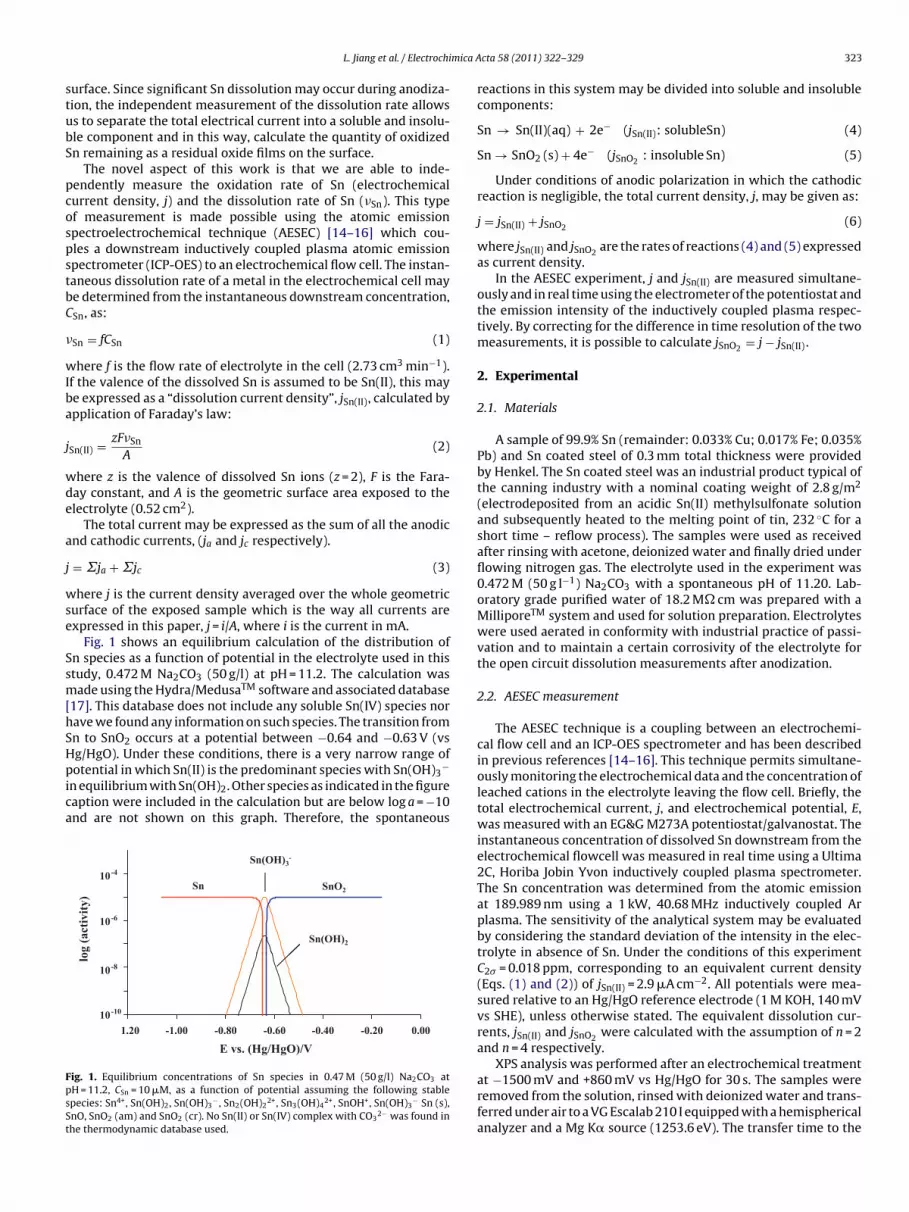
mica A
stubS
pcospstbC
�
wIba
j
wde
a
j
wse
Ssm[hSHpica
FpsSt
L. Jiang et al. / Electrochi
urface. Since significant Sn dissolution may occur during anodiza-ion, the independent measurement of the dissolution rate allowss to separate the total electrical current into a soluble and insolu-le component and in this way, calculate the quantity of oxidizedn remaining as a residual oxide films on the surface.
The novel aspect of this work is that we are able to inde-endently measure the oxidation rate of Sn (electrochemicalurrent density, j) and the dissolution rate of Sn (�Sn). This typef measurement is made possible using the atomic emissionpectroelectrochemical technique (AESEC) [14–16] which cou-les a downstream inductively coupled plasma atomic emissionpectrometer (ICP-OES) to an electrochemical flow cell. The instan-aneous dissolution rate of a metal in the electrochemical cell maye determined from the instantaneous downstream concentration,Sn, as:
Sn = fCSn (1)
here f is the flow rate of electrolyte in the cell (2.73 cm3 min−1).f the valence of the dissolved Sn is assumed to be Sn(II), this maye expressed as a “dissolution current density”, jSn(II), calculated bypplication of Faraday’s law:
Sn(II) = zF�Sn
A(2)
here z is the valence of dissolved Sn ions (z = 2), F is the Fara-ay constant, and A is the geometric surface area exposed to thelectrolyte (0.52 cm2).
The total current may be expressed as the sum of all the anodicnd cathodic currents, (ja and jc respectively).
= ˙ja + ˙jc (3)
here j is the current density averaged over the whole geometricurface of the exposed sample which is the way all currents arexpressed in this paper, j = i/A, where i is the current in mA.
Fig. 1 shows an equilibrium calculation of the distribution ofn species as a function of potential in the electrolyte used in thistudy, 0.472 M Na2CO3 (50 g/l) at pH = 11.2. The calculation wasade using the Hydra/MedusaTM software and associated database
17]. This database does not include any soluble Sn(IV) species norave we found any information on such species. The transition fromn to SnO2 occurs at a potential between −0.64 and −0.63 V (vsg/HgO). Under these conditions, there is a very narrow range of
−
otential in which Sn(II) is the predominant species with Sn(OH)3n equilibrium with Sn(OH)2. Other species as indicated in the figureaption were included in the calculation but are below log a = −10nd are not shown on this graph. Therefore, the spontaneousSnOSn 2
Sn(OH)3-
10-4
Sn(OH)2
10-6
log
(act
ivity
)
10-8
-10
1.20 0.00-0.20-0.40-0.60-0.80-1.0010
E vs. (Hg/HgO)/V
ig. 1. Equilibrium concentrations of Sn species in 0.47 M (50 g/l) Na2CO3 atH = 11.2, CSn = 10 �M, as a function of potential assuming the following stablepecies: Sn4+, Sn(OH)2, Sn(OH)3
− , Sn2(OH)22+, Sn3(OH)4
2+, SnOH+, Sn(OH)3− Sn (s),
nO, SnO2 (am) and SnO2 (cr). No Sn(II) or Sn(IV) complex with CO32− was found in
he thermodynamic database used.
cta 58 (2011) 322– 329 323
reactions in this system may be divided into soluble and insolublecomponents:
Sn → Sn(II)(aq) + 2e− (jSn(II): solubleSn) (4)
Sn → SnO2 (s) + 4e− (jSnO2 : insoluble Sn) (5)
Under conditions of anodic polarization in which the cathodicreaction is negligible, the total current density, j, may be given as:
j = jSn(II) + jSnO2 (6)
where jSn(II) and jSnO2 are the rates of reactions (4) and (5) expressedas current density.
In the AESEC experiment, j and jSn(II) are measured simultane-ously and in real time using the electrometer of the potentiostat andthe emission intensity of the inductively coupled plasma respec-tively. By correcting for the difference in time resolution of the twomeasurements, it is possible to calculate jSnO2 = j − jSn(II).
2. Experimental
2.1. Materials
A sample of 99.9% Sn (remainder: 0.033% Cu; 0.017% Fe; 0.035%Pb) and Sn coated steel of 0.3 mm total thickness were providedby Henkel. The Sn coated steel was an industrial product typical ofthe canning industry with a nominal coating weight of 2.8 g/m2
(electrodeposited from an acidic Sn(II) methylsulfonate solutionand subsequently heated to the melting point of tin, 232 ◦C for ashort time – reflow process). The samples were used as receivedafter rinsing with acetone, deionized water and finally dried underflowing nitrogen gas. The electrolyte used in the experiment was0.472 M (50 g l−1) Na2CO3 with a spontaneous pH of 11.20. Lab-oratory grade purified water of 18.2 M� cm was prepared with aMilliporeTM system and used for solution preparation. Electrolyteswere used aerated in conformity with industrial practice of passi-vation and to maintain a certain corrosivity of the electrolyte forthe open circuit dissolution measurements after anodization.
2.2. AESEC measurement
The AESEC technique is a coupling between an electrochemi-cal flow cell and an ICP-OES spectrometer and has been describedin previous references [14–16]. This technique permits simultane-ously monitoring the electrochemical data and the concentration ofleached cations in the electrolyte leaving the flow cell. Briefly, thetotal electrochemical current, j, and electrochemical potential, E,was measured with an EG&G M273A potentiostat/galvanostat. Theinstantaneous concentration of dissolved Sn downstream from theelectrochemical flowcell was measured in real time using a Ultima2C, Horiba Jobin Yvon inductively coupled plasma spectrometer.The Sn concentration was determined from the atomic emissionat 189.989 nm using a 1 kW, 40.68 MHz inductively coupled Arplasma. The sensitivity of the analytical system may be evaluatedby considering the standard deviation of the intensity in the elec-trolyte in absence of Sn. Under the conditions of this experimentC2� = 0.018 ppm, corresponding to an equivalent current density(Eqs. (1) and (2)) of jSn(II) = 2.9 �A cm−2. All potentials were mea-sured relative to an Hg/HgO reference electrode (1 M KOH, 140 mVvs SHE), unless otherwise stated. The equivalent dissolution cur-rents, jSn(II) and jSnO2 were calculated with the assumption of n = 2and n = 4 respectively.
XPS analysis was performed after an electrochemical treatment
at −1500 mV and +860 mV vs Hg/HgO for 30 s. The samples wereremoved from the solution, rinsed with deionized water and trans-ferred under air to a VG Escalab 210 I equipped with a hemisphericalanalyzer and a Mg K� source (1253.6 eV). The transfer time to the
324 L. Jiang et al. / Electrochimica Acta 58 (2011) 322– 329
a3
200 µA cm-2
a1
a2
j
jSn(II)
A. 99.9% Sn
a1
a3
c2
c1jjSn(II)c3
B. Sn coating
-1500 -1100-1300 -900 -700 -500 -100-300 100 300 500
E vs. (Hg/HgO) / mV
F steel
c e bee(
idaa
3
3
Stdbcaavcso(
tttte
ig. 2. Cyclic AESEC polarization curves for (A) 99.9% Sn (upper) and (B) Sn coatedurves were obtained on an identical potential and current scale although they hava3) for the Sn coating.
nitial vacuum system was less than 3 min. Photoelectrons wereetected with a 100 eV pass energy. The vacuum conditions for thenalyzer chamber were nearly 10−10 mbar during analysis and thenalyzed area was about 1 mm2.
. Results
.1. Cyclic voltammetry of Sn and Sn coatings
Fig. 2 shows the AESEC polarization curves measured for 99.9%n and Sn coated steel at a 1 mV/s sweep rate. It is clear thathe two curves are nearly identical within experimental repro-ucibility and we conclude that there is no significant differenceetween the electrochemical properties of 99.9% Sn and the Snoated steel in this electrolyte. The cyclic voltammograms of Snnd Sn coated steel are characterized by two anodic peaks (a1nd a2) followed by a passive domain (a3) consistent with pre-ious studies of passivation in alkaline solutions [13,18–20]. Theathodic sweep shows a plateau for oxygen reduction (c1) and onemall peak (c2) which has been attributed to the reduction of Snxides [5]. The onset of water reduction occurs at the cathodic limitc3).
The comparison of the electrical current, j, and the dissolu-ion current, jSn(II), demonstrates that Sn dissolution is significant
hroughout the anodic peak. The presence of oxygen in the elec-rolyte makes it impossible to perform a real mass balance duringhe linear potential scan as the total current density may be under-stimated due to simultaneous cathodic reactions. The dissolved(lower). The dashed lines indicate the zero current value for each experiment. Then offset for clarity. The inset (upper right) shows a blow up of the passive domain
Sn is removed from the electrochemical cell explaining why theSn oxide reduction peak, c2, is comparatively small. Similar resultswere observed by Do Duc and Tissot [21] using a rotating ring diskelectrode to measure dissolved Sn throughout a similar polariza-tion experiment. In agreement with the thermodynamic argumentspresented earlier, it has been established that the major dissolvedspecies is Sn(OH)3
− [22].In the passive domain (inset, Fig. 2), j and jSn(II) no longer follow
each other (see inset to Fig. 1). During the anodic sweep, the jSn(II) isapproximately 7 ± 3 �A cm−2 while the electrical current increasescontinuously, reaching a maximum of 35 �A cm−2 at 500 mV vsHg/HgO. The increasing difference between j and jSn(II) suggeststhat the passive film growth rate increases with potential whilethe dissolution rate is independent of potential. During the cathodicsweep, jSn(II) drops to below the detection limit (2.9 �A cm−2) and,j, decreases to nearly 1.3 �A cm−2. Similar results were obtainedfor Zn passivation [23]. They demonstrate that film formation andfilm dissolution are no longer related, the first probably occur-ring at the metal/oxide interface while the second occurs at themetal/electrolyte interface.
3.2. The active and passive states of Sn
Figs. 3–6 show the effect of a potentiostatic pretreatment on the
open circuit corrosion rate of the Sn coated steel. The experiment isperformed in four time periods as indicated in Fig. 3: (a) the signalintensity of pure electrolyte (defines zero and detection limit); (b)open circuit potential when the electrolyte contacts the Sn surface;
L. Jiang et al. / Electrochimica Acta 58 (2011) 322– 329 325
(a)
blank
(b)
E = Eoc
(c)
E = -1500 mV vs Hg/HgO
(d)
E = Eoc
60
75
-400
0
E
E vs
30
45
-800
-400E
jSn(II)
A cm
-2. (H
g/HgO
15
-120 0
j/ µ
A O) / m
V
-15
0
-1600j
0 20 0 40 0 60 0 80 0 100 0 120 0t / s
Fig. 3. Activation of the Sn surface: the dissolution of Sn at the open circuit potential before (a) and after (c) an applied potential of E = −1500 mV (300 s) vs Hg/HgO (b). Thetotal current during the cathodic step was around −660 �A cm−2 and was off the scale of this figure.
(a)
blank
(b)
E = Eoc
(c)
E = 300 mV vs Hg/HgO
(d)
E = Eoc
80
100
200
400
vs Hg /Hg O
E
60
80
0
m-2
E vs. (H
g/H
20
40
-40 0
-20 0E jSn(II) j
j/ µ
A c
mH
gO) / m
V
-20
0
-80 0
-60 0
V
0 10 0 20 0 30 0 40 0 50 0 60 0 70 0 80 0 90 0 100 0
t / s
Fig. 4. Passivation of the Sn surface: the dissolution of Sn at open circuit potential before and after an applied potential of E = +300 mV (300 s) vs Hg/HgO. The total peakcurrent during the anodic potential step was 285 �A cm−2 and was off the scale of this figure.
(a) (b) (c) (d)(a)
blank
(b)
E = Eoc
(c)
E = 860 mV vs Hg/HgO
(d)
E = Eoc
80
100
800
1200
E vs. (
40
60400
Ej
µA c
m-2 (H
g/HgO
)
0
20
-400
0jSn(II)j
j/ µ
) / mV
-200 200 400 600 800 1000 1200
-800
t / s
Fig. 5. Passivation of the Sn surface: the dissolution of Sn at open circuit potential before and after an applied potential of E = +860 mV vs Hg/HgO for 300 s. The total peakcurrent during the anodic potential step was 1670 �A cm−2 and was off the scale of this figure.

326 L. Jiang et al. / Electrochimica Acta 58 (2011) 322– 329
(a)
blank
(b)
E = Eoc
(c)
E = -550 mV vs Hg/HgO
(d)
E = Eoc
200
-100
100j
E vs
100
150
-300
EjSn(II)
-2 . (Hg/H
g
50
-700
-500
j / µ
A c
mO
) / mV
-50
0
120010008006004002000-900
t / s
it pot
(tf
ai(attcetivmUflFnw
itoTrctltb
TCm
−
Fig. 6. Intermediate passivation of the Sn surface: dissolution of Sn at open circu
c) applied potential; (d) open circuit potential. Table 1 summarizeshe open circuit potentials and dissolution currents in period (d)ollowing the various potential steps in period (c).
Fig. 3 demonstrates that cathodic polarization results in thectivation of Sn dissolution. The surface was initially passive asndicated from the data in period (b): a low dissolution rate<10 �A cm−2, although the rate did increase slightly with time)nd a high potential (approximately −670 mV vs Hg/HgO). Duringhe applied cathodic potential of −1500 mV vs Hg/HgO (period (c)),he dissolution rate approaches the detection limit while the totalurrent is cathodic (∼ −660 �A cm−2), off the scale of Fig. 3. How-ver, following the return to the open circuit potential (period (d))he surface is activated: the dissolution rate increases approach-ng 63 �A cm−2 while the open circuit potential is at −841 mVs Hg/HgO. This represents the highest dissolution rate and theost negative open circuit potential obtained for Sn in this work.nfortunately, we cannot determine whether or not oxide films are
ormed during the −1500 mV vs Hg/HgO since j < 0 and no disso-ution occurs. However consideration of the polarization curves inig. 2 and the equilibrium calculations in Fig. 1 would suggest thato oxide is formed during this period. Rather any preexisting oxideould be reduced to the metallic state.
The passivating effect of anodic polarizations is demonstratedn Figs. 4 and 5. Fig. 4 gives the results of an anodic polarizationo +300 mV vs Hg/HgO. A very sharp anodic current transient isbserved during this period without any detectable Sn dissolution.his suggests that at +300 mV vs Hg/HgO, all of the electrical cur-ent leads to the formation of the passive film, whose presence islearly indicated by the positive shift of the open circuit potentialo ∼ −118 mV vs Hg/HgO combined with an undetectable Sn disso-
ution rate. Similar results are observed in Fig. 5 after a polarizationo +860 mV vs Hg/HgO. There is a sharp anodic transient with aarely detectable Sn dissolution peak followed by an open circuitable 1orrosion rates, jSn(II) , and potentials, Eoc, observed after a potentiostatic pretreat-ent at an applied potential of Eap for 300 s. All potentials are given vs. (Hg/HgO).
Eap (300 s)/mV Eoc/mV jSn(II)/�A cm−2
1500 −840 63−550 −731 22
300 −118 <2860 186 <2
ential before and after an applied potential of E = −550 mV vs Hg/HgO for 300 s.
potential of ∼ +186 mV vs Hg/HgO. Integration of the total currentobtained at +300 mV and +860 mV would suggest an SnO2 film ofapproximately 2.0 nm and 3.4 nm respectively assuming a perfectlyuniform film with the standard bulk density of SnO2, 6.95 g/cm3.These values underestimate the thickness of the passive film sincethe initial surface was already partially passivated. A more accuratemeasurement is made in Section 3.3 by reducing the surface in apreliminary step.
Fig. 6 shows the results of applying an intermediate potentialof −550 mV vs Hg/HgO, corresponding to the middle of the broadpotential domain of the second maximum in the current potentialprofile (feature a2 in Fig. 2). During the application of this potential,both j and jSn(II) increase steadily. However j remains significantlylarger than jSn(II) and if we assume that only Sn(II) species are sol-uble, this result demonstrates that insoluble Sn oxidation productsare formed in a much higher quantity than was necessary to passi-vate the surface at higher potential. These products however do notappear to be efficient at blocking Sn dissolution since the dissolu-tion rate continues to increase throughout the applied potentialtime period. The effect is a surface state intermediate betweenactive and passive. In this case, the open circuit dissolution rate andopen circuit potential were 22 �A cm−2 and −731 mV vs Hg/HgO,respectively, placing the system in between activation at −1500 mVvs Hg/HgO (Fig. 3) and passivation at the more positive values ofanodization in Figs. 4 and 5.
The results of Figs. 3–6 show that the nature of the oxide filmand the degree of passivation depend upon the conditions underwhich the passive film was formed. At least two “forms” of oxideare possible: a weakly passivating oxide formed in relatively largequantities at −550 mV vs Hg/HgO, (14 mC cm−2 of insoluble Sn and45 mC cm−2 total) and a strongly passivating oxide formed in nano-metric quantities at 300 mV and above. To gain further insight intothe nature of the passive film, Fig. 7 shows the Sn 3d5/2 and O1s XPS spectra of a surface after anodic passivation (+860 mV for30 s) and cathodic activation (−1500 mV for 30 s). Literature val-ues for the different oxidation states are 484.6 eV, 485.6 eV, and486.4 eV for Sn(0), Sn(II) and Sn(IV) [10]. The vertical dashed linesin Fig. 7A indicate the estimated positions of the three oxidationstates of Sn. It is apparent that following anodization, the surface
layers are composed essentially of Sn(IV) oxides with only a verylow intensity shoulder that might be attributed to Sn(0). By con-trast, after cathodic activation, the predominant species is Sn(II)although a curve fitting analysis of the peak shows a significant
L. Jiang et al. / Electrochimica Acta 58 (2011) 322– 329 327
Sn4+
Sn2+
Sn0 O2-
Sn
H2O
OH-
5/2
Cathodic
Sn 3d5/2 O 1s
Anodic
491 488489490 485486487 483484 482 480481490 527529531533535537 525
(A) (B)
after
aSn(a
wtFupdwop
3
i−vi2tlp
sodwovtt
second of the applied potential, the broadness of the Sn dissolutionpeak is due to the spreading out of the concentration in the flowsystem. This result eliminates the hypothesis that the film is formed
400
300 s
50 s
0
-4005 s3 s
1 s-800
-1200
-1600
E v
s. (H
g/H
gO) /
mV
0 200100 400300 900800700600500
Binding Energy /eV
Fig. 7. Sn 3d5/2 and O 1s spectra of the Sn surface
mount of Sn(IV) leading to a broadening of the peak. The intensen(0) peak demonstrates that either the film is very thin or at leastot uniform. These conclusions are confirmed by the O 1s spectraFig. 7B). Both samples show water, hydroxide and oxide; howeverfter anodization, the oxide peak is significantly more intense.
In fact, the extent of passivation for the as received surfaceas quite irreproducible with the initial open circuit poten-
ial varying from −220 mV to −430 mV vs Hg/HgO (period b inigs. 3–6). Despite this variation, the initial dissolution rate wasndetectable demonstrating that the surface was at least partiallyassivated. However, after two to three minutes, the potentialropped abruptly to the range of −680 mV to −743 mV vs Hg/HgOith a simultaneous increase in the dissolution rate in the range
f 3 to 5 �A cm−2. This demonstrates that the passive film initiallyresent was unstable in this electrolyte.
.3. The stability of the passive film
The extent of passivation for the as received surface was quiterreproducible with the initial open circuit potential varying from220 mV to −430 mV vs Hg/HgO (period b in Figs. 3–6). Despite thisariation, the initial dissolution rate was undetectable demonstrat-ng that the surface was at least partially passivated. However, after–3 min, the potential dropped abruptly to the range of −680 mVo −743 mV vs Hg/HgO with a simultaneous increase in the disso-ution rate in the range of 3–5 �A cm−2. This demonstrates that theassive film initially present was unstable in this electrolyte.
It is of interest to identify the factors which determine pas-ive film stability. Although a detailed analysis is beyond the scopef this work, a series of simple experiments was undertaken toemonstrate the effect of time. In these experiments the surfaceas first activated for 300 s at −1500 mV vs Hg/HgO to reduce
xides initially present; then the potential was jumped to 300 mVs Hg/HgO for variable times – 1 s, 3 s, 5 s, 50 s, 300 s. Fig. 8 giveshe potential variations observed. t = 0 is defined as the point wherehe potential was jumped from −1500 mV to +300 mV vs Hg/HgO.
Binding Energy /eV
anodic (lower) and cathodic (upper) polarization.
After a 1 s or a 3 s passivation time, the open circuit Sn dis-solution rate remains high (∼11 �A cm−2) while after 300 s, thedissolution rate of Sn is below the detection limit. At intermedi-ate passivation times, intermediate behavior is observed. After a5 s anodization (Fig. 9), there is a passivating effect for about 160 safter which the potential drops and the dissolution rate increases.
These results demonstrate the effect of passivation time on thestability of passive film. Fig. 10 gives the quantity of insoluble SnO2and soluble Sn(II) as a function of time. Note that the square rootof time is shown to give better resolution on the graph at shortertimes. Consistent with the cyclic voltammetry result in Fig. 2 inthe passive domain, the anodic current mainly comes from the for-mation of insoluble Sn(IV) with a small quantity of soluble Sn(II)detected by the ICP. Further, the quantity of soluble Sn is inde-pendent of time and Sn dissolution only occurs during the first
t / s
Fig. 8. Potential transients by applying potential E = −1500 mV for 300 s to reducethe surface; followed by E = +300 mV vs Hg/HgO for variable times as indicated. Only100 s of the cathodic potentiostatic period are shown.

328 L. Jiang et al. / Electrochimica Acta 58 (2011) 322– 329
50 400Transition from passive state
to an intermediate state
400
E-2
E vs. (
20
30
-800
-400
jSn(II)/ µ
A c
m Hg/H
gO)
0
10
-1200
j Sn(
II)
/ mV
-107006005004003002001000-100
-1600
t / s
Fig. 9. Variation of potential and dissolution rate of Sn after application of a E = −1500 mVperiod are shown.
oxidizedSnTotal
-2
15
20
/ mC
cm
Soluble Sn oxidize d
10
QSn
0
5
t / s1/2√√
0 5 10 15 20
Fig. 10. Variation of the total oxidized Sn (integration of the current transient) andthe total soluble Sn (integration of the ICP-OES transient) as a function of the squarero
bw
ddFta
The results presented here are consistent with the above reac-
Fo
oot of time at +300 mV vs Hg/HgO from the experiments of Fig. 8. The square rootf time is shown only to expand the scale for small t values.
y a dissolution–precipitation mechanism since such a mechanismould imply significant dissolution.
From a practical point of view, we are interested in how the Snissolution rate varies with the nature of the oxide film formeduring a passivation treatment. This relationship is investigated in
ig. 11. Following the passivation experiments presented in Fig. 10,he sample was allowed to return to the open circuit potential forbout 500 to 700 s. The average open circuit dissolution rate during2 60
80
5 s
0 s
) / µ
A c
m-2
40
60
1 s
3 s
j Sn(
II)
20
QSnO2/ mC c
0
0 3 6 9
ig. 11. Corrosion potential and Sn dissolution rate as a function of the quantity of SnO2 fof Fig. 8. The durations of the 300 mV polarizations are indicated for each point.
for 300 s followed by E = +300 mV for 5 s. Only 100 s of the cathodic potentiostatic
this period was measured over a 200 s period following stabilizationof the dissolution rate. The graph of Fig. 11 shows the dissolutionrate (expressed as �A cm−2) measured at the open circuit potentialfollowing passivation as a function of the quantity of oxide formed(expressed as mC cm−2) during passivation. (The anodization timeassociated with each point is also shown.) Even after 1 s, significantpassivation is observed but the rate is only reduced to below thedetection limit for QSnO2 > 10 mC cm−2. Also, the potential beginsto increase markedly at this point. These results suggest that thefilm becomes uniform on the surface only at this stage with a muchslower growth rate ensuing.
4. Discussion
It is of interest to interpret our results using the model proposedby Alvarez et al. [13] in which Sn(OH)2 is the intermediate form forall subsequent Sn oxidation products. The model is summarizedbelow (Fig. 12). According to Alverez, Sn(OH)2 is formed by a dis-solution precipitation mechanism and both Sn(OH)2 and Sn(OH)4are amorphous and do not effectively block the surface. The fur-ther transformation to SnO2 is a slow process and requires higherpotential and longer times.
tion sequences. Our results show that during anodic peaks a1and a2, significant insoluble Sn oxidation species are formed,probably through a dissolution–precipitation mechanism. The
E vs. (
-200
050 s
300 s
(Hg/H
gO)600
-400
) / mV
-800
-60 0
m-2
12 15 18
-1000
rmed calculated from the integral of the current transients during the experiments

L. Jiang et al. / Electrochimica A
Sn
-2
Sn(OH)2 SnO
2e
- H2OSn(OH)3-(aq)
S (OH) S O- 2H2O
-2e
Sn(OH)4 SnO22
Fs
rtSpoo(tdp
aaStdw
tminoroiatAttsi
tapppfiie
[
[
[
[
[[
[
[
[[[
ig. 12. Schematic of reactions occurring during the passivation of Sn in alkalineolution, after Alvarez et al. [13].
eduction in rate following the a1 maximum may be attributedo the onset of the formation of an amorphous film ofn(OH)4/Sn(OH)2 which continues to grow through the secondeak (a2). This is associated with the simultaneous formationf Sn(II) as an insoluble species and Sn(IV) in the solid statexide/hydroxide phase. According to Alvarez et al. [13], Sn(OH)4or an amorphous hydrated SnO2) will build-up on the surface andhen start to decompose slowly to SnO2, giving rise to the slowecrease of j (and of course jSn(II) in our work) following the secondeak maximum, a2.
Anodization at intermediate potentials leads to the formation of relatively thick but poorly inhibiting oxide film. This is probablyn amorphous hydroxide film containing a mixture of Sn(II) andn(IV) that forms from a dissolution–precipitation mechanism. Ashe potential of anodization increases the quantity of oxide formedecreases as does the open circuit dissolution rate. This is consistentith the conversion of the oxide film into SnO2.
It is not clear however whether or not the mechanism is sequen-ial as proposed by previous authors or that a second parallel
echanism comes into play involving the direct oxidation of Snnto SnO2. The AESEC experiment offers no direct evidence for theature of the transformations occurring in the oxide film: we cannly observe the effect of the oxide film on the overall dissolutioneaction. It is of interest to note that we recently observed an anal-gous behavior for zinc using the same methodology [23] althoughn that case only the Zn2+ oxidation state is possible. At intermedi-te potentials, zinc dissolution leads to the formation of a relativelyhick zinc hydroxide/oxide film that was inefficient for inhibition.t higher potentials, a thin inhibiting film was formed. However
he results in that paper strongly suggested that the formation ofhe inhibiting zinc oxide film was due to a direct oxidation of theubstrate at higher potential and that the formation of the poorlynhibiting film was not necessary for passivation.
One of the major conclusions of this work is to demonstratehat we can directly determine the rate of Sn dissolution following
passivation treatment. The proposed methodology is far morerecise than simply measuring the open circuit potential and com-aring it with a polarization curve to obtain the rate since theassive film formed during a potentiostatic polarization may differ
rom that formed during a linear polarization experiment. Althoughn the situation described here, only Sn dissolution is observed,t is also possible to measure the dissolution rates of alloyinglements.[
[
[
cta 58 (2011) 322– 329 329
5. Conclusions
The AESEC technique is a promising tool for the characterizationof passivation treatments of Sn.
In this work, the electrochemical properties of 99.9% Sn and Sncoated steel were shown to be nearly identical in 50 g l−1 Na2CO3electrolyte at pH = 11.20. The surface of Sn may show either active,passive or intermediate behavior. A cathodic potentiostatic pulseresults in activation of the surface while an anodic potentiostaticpulse results in passivation. The degree of passivation depends onthe applied potential and the time.
At least two different forms of oxide are obtained, distinguishedby their effect on the kinetics of Sn dissolution. At potentials in theactive region, large amounts of oxide are formed that are appar-ently not efficient for passivation. At higher potentials, the amountof oxide produced is very small, corresponding to approximately2.0–3.4 nm (assuming uniform film growth) and is very efficient atpassivation. The film at high potentials is composed essentially ofSnO2 as indicated by XPS.
The AESEC methodology was used to determine how the thick-ness and stability of the film depends upon the anodization timeat 300 mV. At this potential, the amount of soluble Sn was negligi-bly small and independent of anodization time as compared to thetotal oxidation of Sn which varied from about 7 to 20 mC cm−2, cor-responding to approximately 4 to 11 nm assuming a uniform filmof SnO2.
References
[1] R. Toniolo, A. Pizzariello, F. Tubaro, S. Susmel, N. Dossi, G. Bontempelli, Journalof Applied Electrochemistry 39 (2009) 979.
[2] J.M. Bastidas, J.J. Damborenea, J.A. Gonzalez, E. Otero, M.E. Chacon, W.I. Archer,J.D. Scantlebury, K. Alston, Corrosion Science 30 (1990) 171.
[3] T. Ohga, H. Miyazaki, Z.t. Kankyo, Corrosion Engineering 46 (1997) 771.[4] W.O. Cook, H.E. Romine, Method of treating tin, US 2,312,076 (1943) (2 pp.).[5] C.A. Gervasi, P.E. Alvarez, Corrosion Science 47 (2005) 69.[6] D.R. Gabe, Surface Technology 5 (1977) 463.[7] M. Pugh, L.M. Warner, D.R. Gabe, Corrosion Science 7 (1967) 807.[8] I.A. Ammar, S. Darwish, M.W. Khalil, S. El-Taher, Materials Chemistry and
Physics 21 (1989) 1.[9] S.D. Kapusta, N. Hackerman, Electrochimica Acta 25 (1980) 1625.10] P. Keller, H.-H. Strehblow, Passivity of tin and CuSn alloys in alkaline media
studied by X-ray photoelectron spectroscopy, in: P. Marcus, V. Maurice (Eds.),Passivation of Metals and Semiconductors and Properties of Thin Oxide Layers,Elsevier, 2006.
11] P. Keller, Electrochemische und oberflächenanalytische untersuchungen zuranodischen deckchichtbildung auf zinn und kupfer zim-legierungen, PhD the-sis, Heinrich-Heine Universtät, 2006.
12] M. Drogowska, H. Ménard, L. Brossar, Journal of Applied Electrochemistry 21(1991) 84.
13] P.E. Alvarez, S.B. Ribotta, M.E. Folquer, C.A. Gervais, J.R. Vilche, Corrosion Science44 (2002) 49.
14] K. Ogle, S. Weber, Journal of Electrochemical Society 147 (2000) 1770.15] K. Ogle, J. Baeyens, J. Swiatowska, P. Volovitch, Electrochimica Acta 54 (2009)
5163.16] K. Ogle, M. Serdechnova, M. Mokaddem, P. Volovitch, Electrochimica Acta 56
(2011) 1711.17] I. Puigdomenech, Hydra/Medusa Chemical Equilibrium Database and Plotting
Software, Version 18 August, 2009, KTH Royal Institute of Technology, 2004,database update – 2/21/2011.
18] B.X. Huang, P. Tornatore, Y.-S. Li, Electrochimica Acta 46 (2000) 671.19] P.E. Alvarez, C.A. Gervasi, Corrosion Science 46 (2004) 91.20] C.A. Gervasi, F.E. Varela, J.R. Vilche, P.E. Alvarez, Electrochimica Acta 42 (1997)
537.
21] H. Do Duc, P. Tissot, Journal of Electroanalytical Chemistry 102 (1979)59.22] S.A. Awad, A. Kassab, Journal of Electroanalytical Chemistry and Interfacial
Electrochemistry 20 (1969) 203.23] M. Mokaddem, P. Volovitch, K. Ogle, Electrochimica Acta 55 (2010) 7867.


![Optical Light Curves of the Type I[CLC]a[/CLC] Supernovae SN 1990N and SN 1991T](https://img.pdfslide.net/doc/110x75/634cee107b55c75a3406cc1b/optical-light-curves-of-the-type-iclcaclc-supernovae-sn-1990n-and-sn-1991t.jpg)


