Embed Size (px)
Citation preview
I I I I I
: \
Census of India, 1951
DISTRICT CENSUS
HANDBOO'K
UTfAR PRADESH
8-A&RA DISTRICT
ALLAHABAD:
SUPlilUNTENDEl'IT. PRINTING AND S1"ATlON'ERY, UTTAR P&ADE!>H, INDIA
llHi 5
--~------------------------------- I .....,;",;;;;. __ .oiiiiiiiiiiiiIiiiiiiOiiIIiOii ______ ........ ~~· ___ .. ___ . -- --__ ~
DISTRICT CENSUS HANDBOOK 1951
A GRA DISTRICT

FOREWORD
Several States, including Uttar Pradesh, have been publishing village statistics
by districts at each census. In 1941 they were published in U. P. under the title
"District Census Statistics" with a separate volume for each district. In the 1951
census, when the tabulation has been more elaborate than e~er. in view of the require,
ments of the country, the district ... wise volume has been expanded into a "District
Census Handbook", which now contains the District Census Tables (furnishing
data with break ... up for census tracts within the district), the District Index of Non'
agricultural Occupations. agricultural statistics from 190V02 [0 19$°"'51 and other
miscellaneous statistics in addition to the usual village population statistics. The
village population statistics also are given in an elaborate form giving the division
of the population among eight livelihood classes and other details.
2. It may be added here that a separate set of district ... wise volumes giving only
population figures of rural areas by villages and of urban areas by wards and moha11as
and entitled "District Population Statistics" has already been published. This
separate series was necessitated by the urgent requirements of the U. P. Government
for elections to local bodies.
3. The number of Distnct Census Handbooks printed so far is thirty seven.
Special arrangements for speeding up the printing have now been made and it is
hoped that the remaining Handbooks will be printed before the end of 1955.
RAMPUR: ~
September 30 , 195 S.
RA}ESHW ARI PRASAD, I.A.S.,
Superintendent, Census Operations, Uttar Pradesh.

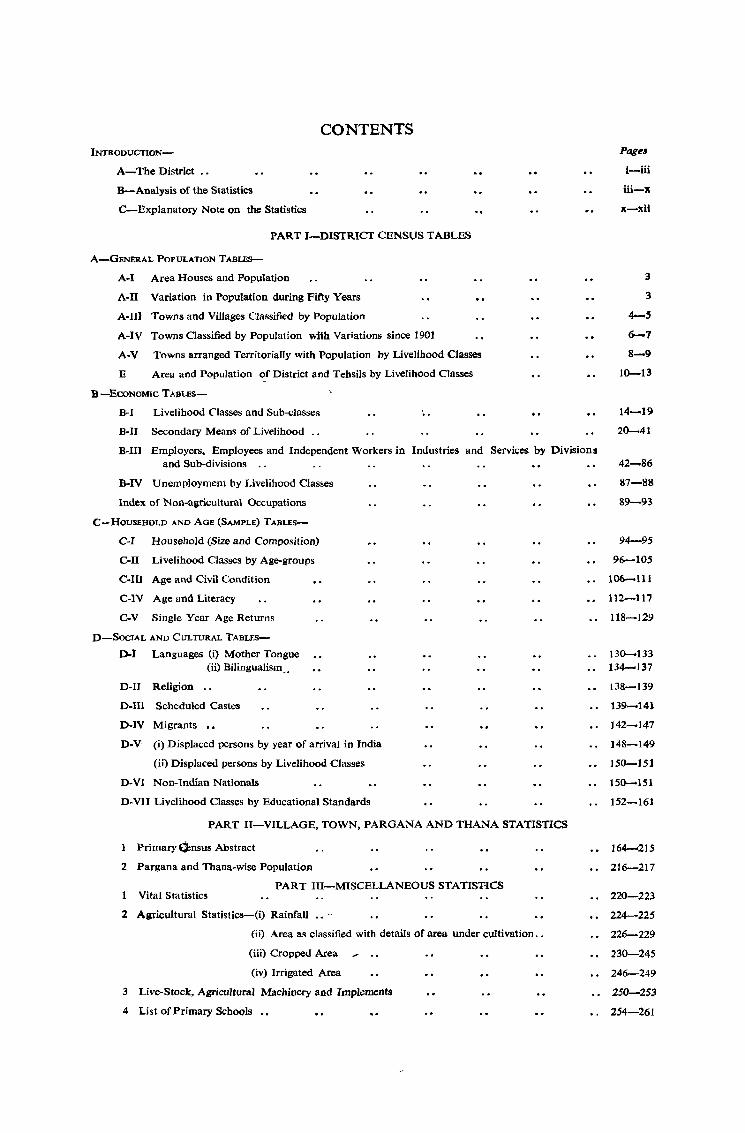
INTRODUCTION-
A-The District
B-Analysis of the Statistics
C--Explanatory Note on the Statistics
CONTENTS
PART I-DISTRICT CENSUS TABLES
A-GENERAL POPULATION TABLES--
A-I Area Houses and Population
A-II Variation in Population during Fifty Years
A-III Towns and Villages Classified by Population
A-IV Towns Classified by Population with Variations since 1901
A-V Towns arranged Territorially with Population by Livelihood Classes
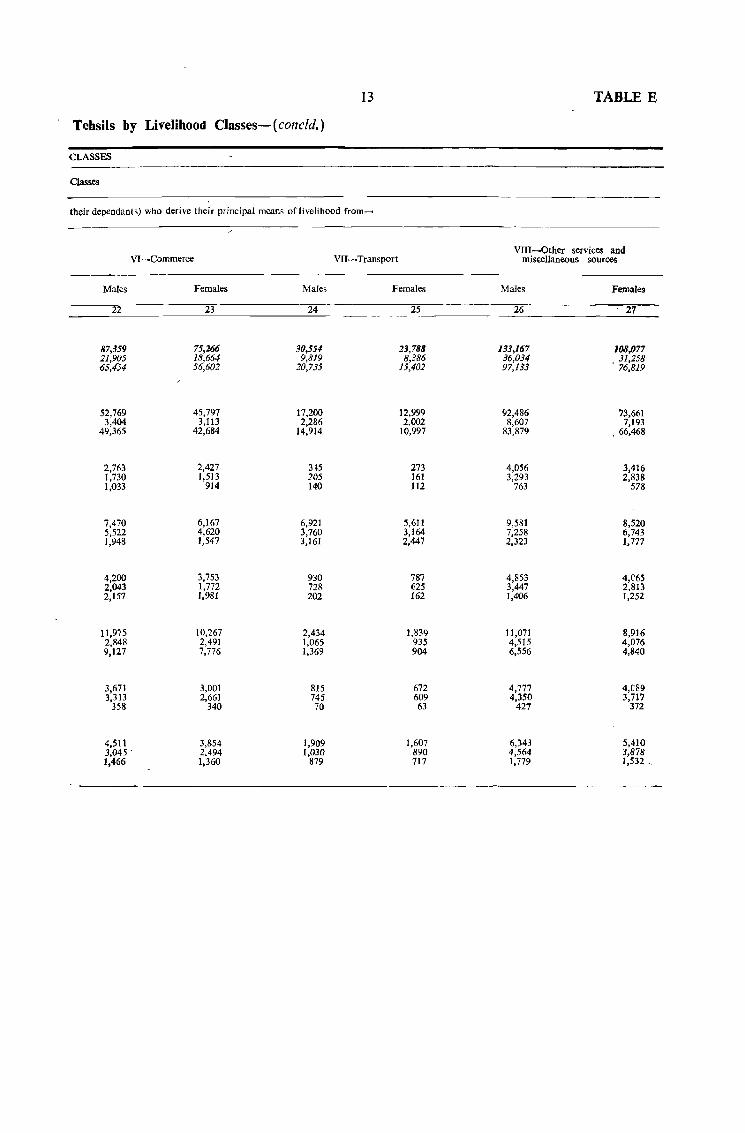
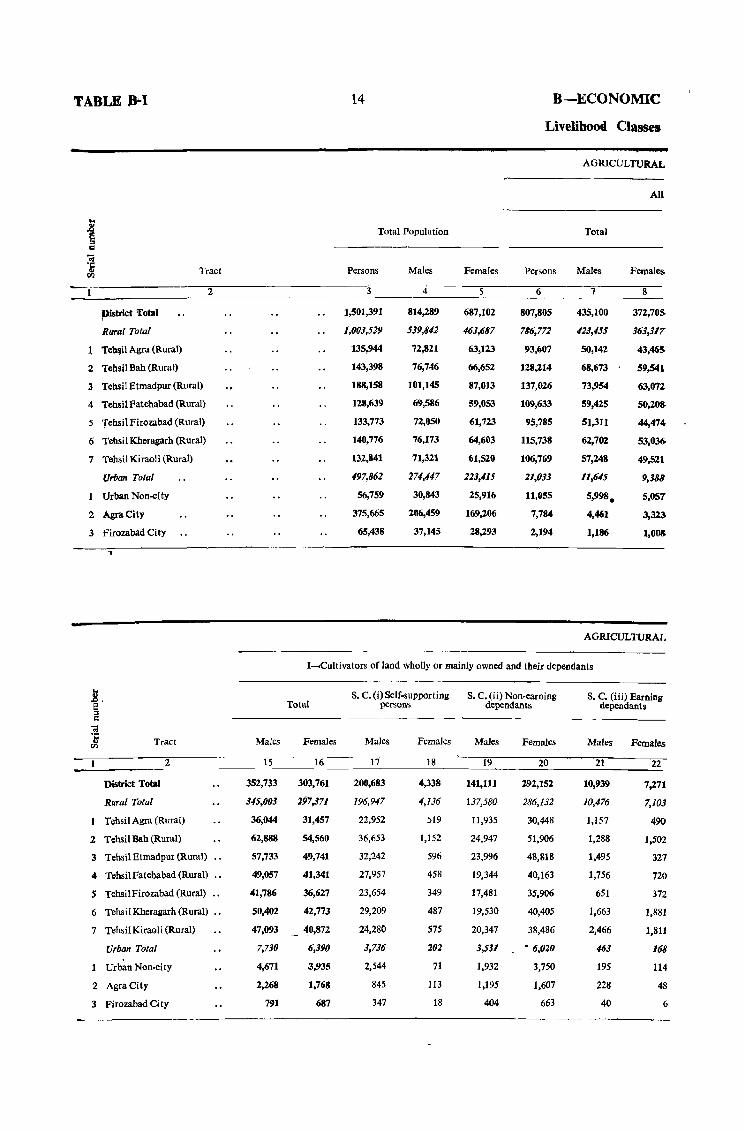
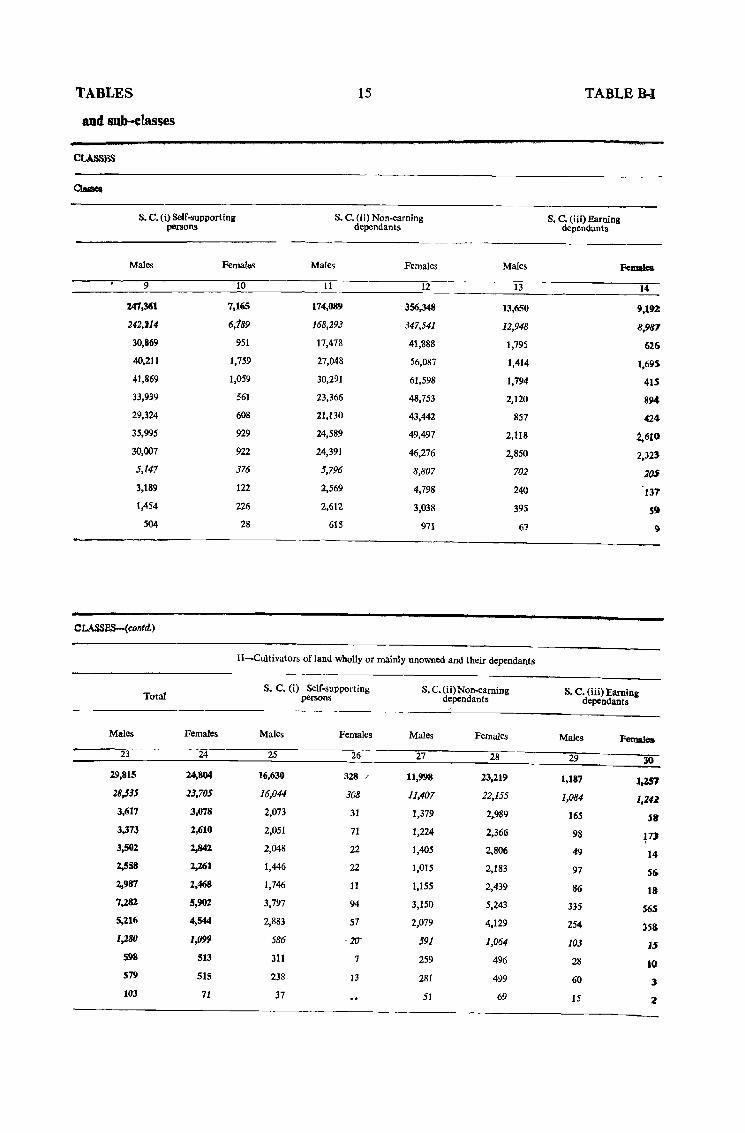
E Area and Population of District and Tehsils by Livelihood Classes
B -ECONOMIC TABLES--
B-1 Livelihood Classes and Sub-classes
B-II Secondary Means of Livelihood ..
B-III Employers, Employees and Independent Workers in Industries and Services by Divisions and Sub-divisions .'
B-IV Unemployment by Livelihood Classes
Index of Non-agricultural Occupations
C-HOUSEHOLD AND AGE (SAMPLE) TABLES
C-I Household (Size and Composition)
C-II Livelihood Classes by Age-groups
CollI Age and Civil Condition
C-IV Age and Literacy
C-V Single Year Age Returns
D-SOCIAL AND CULTURAL TABLf:S-
D-l Languages (i) Mother Tongue (ii) Bilingualism_.
D-H Religion ..
D-m Scheduled Castes
D-IV Migrants ••
D-V (i) Displaced persons by year of arrival in India
(ii) Displaced persons by Livelihood Classes
D-Vl Non-Indian Nationals
D-VlI Livelihood Classes by Educational Standards
PART Il-VILLAGE, TOWN, PARGANA AND THANA STATISTICS
Primary Q:nsus Abstract
2 Pargana and Thana-wise Population
PART III-MISCELLANEOUS STATISnCS Vital Statistics
2 Agricultural Statistics-(i) Rainfall .• -
(ii) Area as classified with details of area under cultivation ..
(iii) Cropped Area
(iv) Irrigated Area
3 Live-Stock, Agricultural Macbil,lery and Implements
4 List of Primary Schools ••
Page8
i-iii
iii-x
x-xii
3
3
4-S
6-7
8-9
10--13
14-19
20--41
42-86
87-88
89-93
94-95
96--105
106-111
112-117
118-129
130--133 134-)37
138-139
139-141
142-147
148-149
150--151
150--151
152-161
164-215
216-217
220-223
224-225
226-229
230-245
246-249
250-253
254-261

INTRODUCTION A-THE DISTRICT
1. The district of Agra occupies the south-west corner of Uttar Pradesh. Two of its tehsils, Etmadpur and Firozabad lie north of the Yamuna and the remaining five, Agra, Fatehabad, Bah, Kheragarh and Kiraoli, south of it. To the north lie the districts of Mathura and Etah , on the east Mainpuri and Etawah, on the south Gwalior, Dholpur and Bharatpur and on the west Bharatpur and Mathura. In 1951 it had a total area of 1,860 sqaure miles which is less than that of the average district area of the State. Its population was 15.01Iakhs. It has 7 parganas and 26 thanas.
2. The various rivers divide the distriCt into natural divisions. Tehsils Etmadpur and Firoza- Topojraph,. bad lie in the Ganga-Yamuna Doab; Bah in the Yamuna-Chambal Doab; Fatehabad, Agra and north-east Kiracrli in Yamuna-Khari Nadi Doab and northern Kheragarh in the Khari Nadi: Gambhir-Banganga Doab. The latter two form the central tract. To these must be added southern Kheragarh which is the valley of Kawar Nadi, and south-western Kiraoli, the area in which the Khari Nadi rises. The Ganga-Yamuna Doab is a level expanse of upland. Here and there may be seen narrow ridges of sandy hillocks, but the soil is for the most part a light yellow loam or piliya. Towards the Yamuna there are extensive ravines. Tbe central tract comprises a uniform upland country, only broken by the Khari nadi and an ill-defined drainage channel known as the Dahar or Nahra and generally termed the western depression. The latter lies between the Khari Nadi and Yamuna and is the old course of the Son Nadi. A few ranges oflow rocky hills crop up out of the level alluvium in the west from Kiraoli to Fatehpur Sikri. As in the GangaYamuna Doab, the edges of this tract are marked by ravines. Along the banks of Yamuna and Utangan there is the usual strip or Khadir or Kachhar. In the Dahar there is a good deal of kans growing sand and some kankar. In northern Kheragarh the soil is more bitter and there are large areas of sand (kansreta) which grows kans. In the north-west corner of Kheragarh drainage is poor, the soil is infertile and mixed with kankar. The tract comprising of the Bah tehsil is a long and narrow strip in the south-east between the Yamuna and Chambal. Half the areas is occupied by the deep and far-spreading ravines of these two rivers and the uplands which form the watershed are a mere ridge. The chambal lowlands are enriched with silt and are productive. In southern Kheragarh the country is affected by hills and isolated eminences scattered over the whole area, as well as the several water Courses by which the tract is traversed. Most of it consists of a heavy, generally bitter, soil known locally as khorili. South-west Kiraoli is also slightly undulating. Like Southern Kheragarh, the chief feature of landscape in this tract is a succession of parallel ridges of red sandstone hills rising two or three hundred feet above the plain. These hills in Southern Kheragarh and south-west Kiraoli are in many places worked for stone, best being obtained from the quarries of Tantpur in Kheragarh. Both of these tracts are extremly precarious.
The bulk of the district does not suffer in any way from defective drainage, and the only portion at all liable to drainage from floods is the upper valley of the Khari Nadi, where the spills of Ban ganga are apt to cause considerable injury to the kharifcrop. But they enable a large area to be sown in rabi. Jhils are extremely rare and the only true JMlin the district is at Sarendha in Kheragarh.
3. The most prevalent soil of the district is the ordinary dumat or loam. The soil in Solis the Ganga-Yamuna Doab consists of a light loam known as piliya from its colour which is reddish yellow. In the north, however, there is a good deal of high bhur with clay or chiknot in the intervening depressions. In Agra-Fatehabad there is hardly any clay and the soil generally resem-bles that of the Doab. In the Dahar there is sand and kankar. In the south-west of Agra and in the north-east of Kiraoli the soil is in some places whitish in colour and slightly bitter. In northern Kheragarh the soil resembles that in Agra but is lighter in colour and more bitter. There are large areas of sand (kansreta). In th~ north-west corner the soil degenerates due to poor drainage and consists of bitter whitish clay or potni which is often mixed with kankars and is infertile. In tehsil Bah the soil in the north is similar to piliya, but in the east it degenerates into a redder and less fertile soil, lalmeta. South of the loam (piliya) is a belt of clay or chokta or chiknot which is sticky when wet and which splits into large holes when dry. This is overlaid in places with sand or kansreta, presumably wind borne from the Yamuna sand hills. It grows kans and is very infertile. The south-west .Of Bah consists almost entirely of a black, generally sticky, soil known as mar or karmata. This grows wheat, juar and gram. It required strong bullocks and its cultivation depends on timeliness of rains. Southern Kheragarh comprises of a heavy bitter soil known as khorib. Near the hills there is red soil. The higher ground in south-west Kiraoli is composed of kansreta and the depressions of chiknot. The intermediate soil is inferior loam of the khorili type. Black soil is also occasionally found.
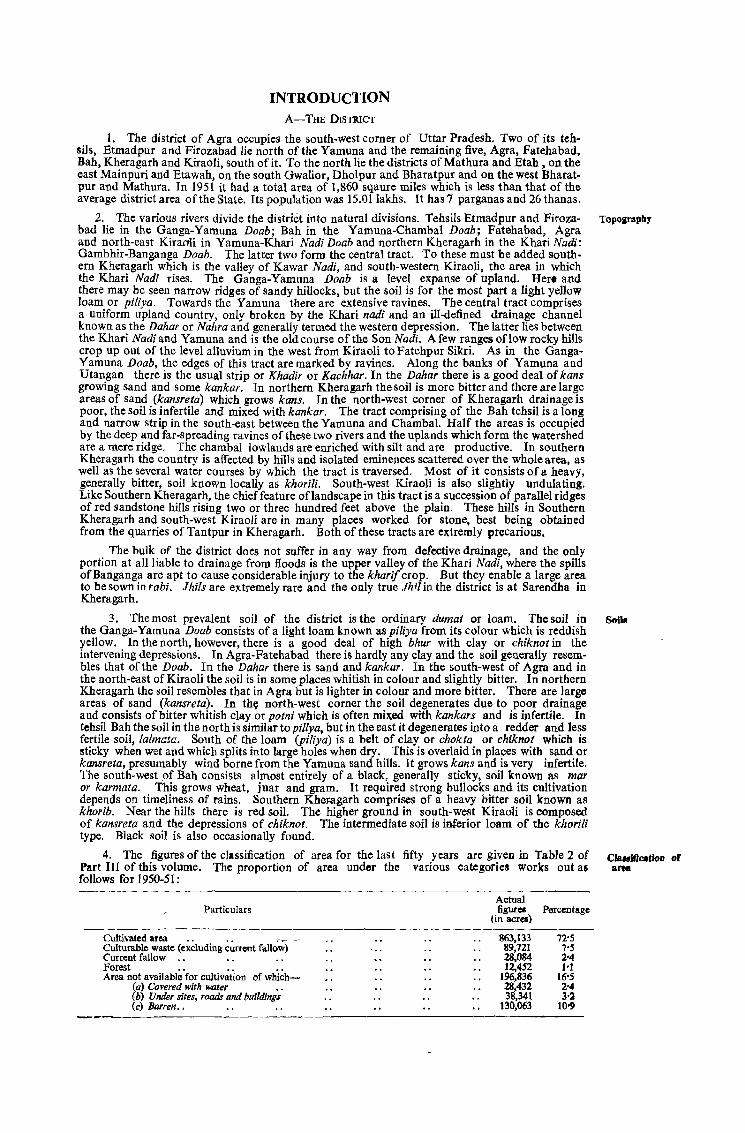
4. The figures of the classification of area for the last fifty years are given in Table 2 of CIa.,Wcation of Part III of this volume. The proportion of area under the various categories works out as area follows for 1950-51:
Particulars
Cultivated area . . . . .-~ --Culturab1e waste (excluding current fallow) Current fallow .• Forest .. .. .. Area not available for cultivation of whicb-
(a) Covered with water •. (b) Under sites, roads and buildings (c) Barren ••
Actual figurec Percentage
(in acres)
863,133 89,721 28,084 12,452
196,836 28,432 38,341
130,063
Climate rainfall
IrrlKstion
and
The figure in the above table regarding culturable waste taken from the Season and Crop Report is, however, misleading. The State Agriculture Department coaducted in 1949-50 a detailed enquiry through the District Officers regarding the nature of this area in each district. The following analysis of the area resulted from this enquiry :
P"rticulars
Total cuIturable waste (A I B -+ C)
A-Area under culturable waste land not avilable for immediate cultivation ..
(i) Forest under any legal enactment
(ii) Groves
(iii) Forest of timber trees
(iv) Thatching grasses, shrubs and bushes
(v) Land kept for grazing
B-Arca under culturable waste land available for immediate cultivation but which could not be cultivated
Of which due to-
(i) /(an< growth
(ii) Threshing floors
(iii) Malaria
(iv) Floods
(v) Lack of drains
(vi) Lack of water
(vii) Distance from abadi
(viii) Damage from wild animals
(ix) Other causes
C-Area under culturable waste land that can be brought under immediate cultivation after some improvements besides the area given against 'B'
Area Percentage (in acres)
99,032 100
17,238 11'41
4,453 4-50
4,952 5-00
28 0'03
7,774 7'85
31 0'03
75,427 76'16
871 0'88
234 0-24
9,543 9'63
340 0-34
860 0'87
63,579 64'20
6,367 6'43
From the above it will appear that of the total area recorded as cultivable waste, only 6-4 percent was really capable of being brought under immediate cultivation after some improvements.
Thus the land area cultivated and cultivable including current fallow per capita works out to 65-3 cents of which 59.4· cents have already been brought under cultivation and only about 0'4 cents can be further brought under the plough after some improvements. It is obvious that the saturation point for cultivation has already been reached in the district_
S- The climate is reported to be healthy. It is drier and hotter than that of any neighbouring district. The hot weather lasts longer than in the north of the- State and the rainfall is decidedly less. Agra may claim to be the warmest station in the State. In January frosts are common.
The district receives a scanty and capricious rainfall. The average annual rainfall for the last quinquennium was 32 inches_ For the last fortyfive years the average rainfall has been 26-37 inches. Variations in rainfall from year to year have been very striking. The wettest years since 1901 are 1917-18 (41-1 inch:es), 1933-34 (39'5 inches), 1936-37 (39-0 inches) and 1949-50 (~0-6 inch~_ The rainfall was the lowest in 1913-14 (9-1 inches)_ In about half the number of years there is no rain in October or November. The average winter rainfall is very low_ If the monsoon is light, the rabi area contracts heavily; the rabi outtum depends on the rabi rains and these fail in one year out of five. The small rainfall would suffice for the district if it came when it was wanted, but the distribution is as faulty as the volume.
6_ In the better portions of the district the dificiency in rain can be supplemented to some extent by irrigation. Out of the upland loam more than half is irrigated regularly or can be irrigated at need; but over the whole area of holdings in 1950-51,620,779 acres or 71·9 per cent. are classed as unirrigated and 242,354 acres or 28-1 per cent_ as irrigated_ The chief source of irrigation is by canals~ weHs_ Of the wet area in 1950-51, 59'7 per cent. was irrigated by canals, 39'1 per cent. by wells and 1·2 per cent. by other sources. Wells are poor and easily fail. In Bah water level is very low; in south-west Kiraoli and Southern Kheragarh water is close to the surface, but the sub-soil is peculiar. It consists of sand. The district does not get sufficient water from tne canals also_ It comes iit the tail end of the canal irrigation system.
*This figure also includes the area classed as current fallow_
Iii
7. More acreage is soWn under kharif crops than in rabi crops. The area under kharif Crops in 1950-51 was 488,151 acres, that under rabi 475,270 acres; and that under zaid crops 3,857 acres. The chief khal if staples are the millets, baj ra and j uar and cotton. The important rabi crops are wheat, gram or mixed crops. Oil seeds are also important. The area under sugar-cane in the
I ast quinquennium (average) was 13,601 acres and that under cotton 3,121 acres. The latter is on the decline.
B-ANALYSIS OF THE STATISTICS
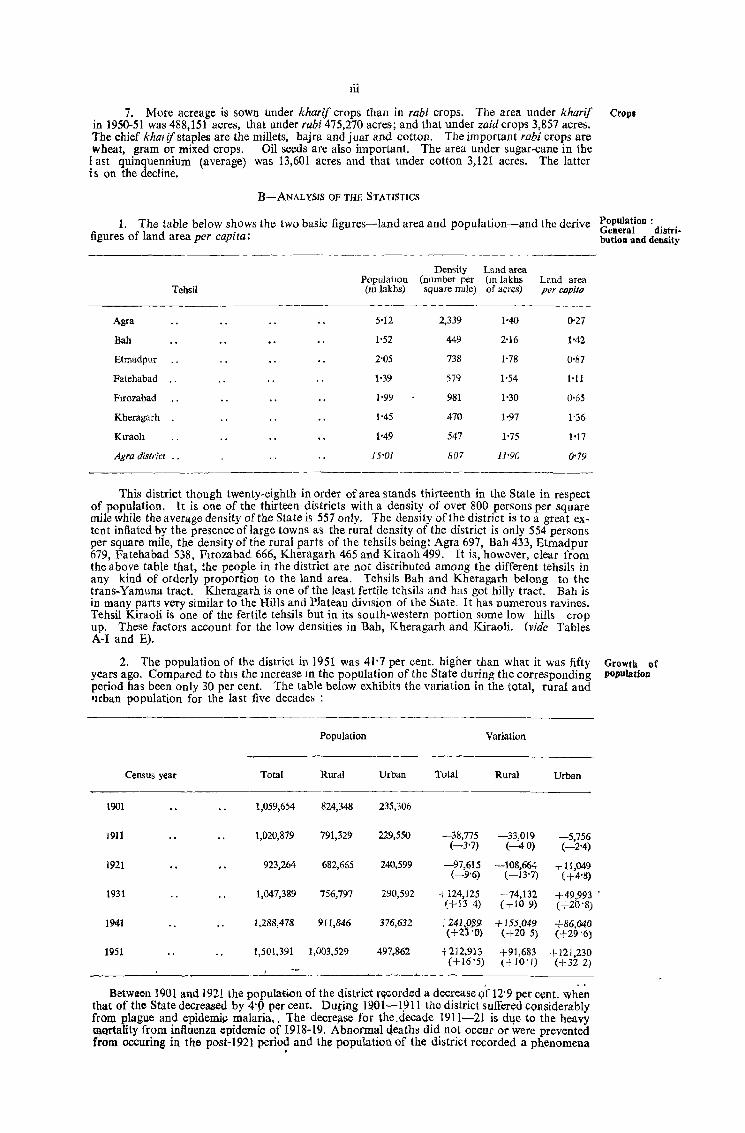
1. The table below shows the two basic figures-land area and population-and the derive ~~~~r~\ion: distri-figures of land area per capita: bution and density
Density Land area PopulatIOn (number per (m lakhs Land area
Tehsil (m lakhs) square mlle) of acres) per capita
~--~--
Agra 5'12 2,339 1'40 0'27
Bah 1'52 449 2-16 1'42
Etmadpur 2'05 738 1'78 0'87
Falehabad ., 1'39 579 1'54 Hi
Frrozabad 1'99 981 1'30 0'65
Kheragarh 1'45 470 1'97 1'36
Klraoh 1'49 547 1'75 1'17
Agra district .. 15'01 807 11'90 0-79
This district though twenty-eighth in order of area stands thirteenth in the State in respect of population. It is one of the thirteen districts with a density of over 800 persons per square mile while the average density of the State is 557 only. The density of the district is to a great extent inflated by the presence of large towns as the rural density of the district is only 554 persons per square mile, the density of the rural parts of the tehsils being: Agra 697, Bah 433, Etmadpur 679, Fatehabad 538, Flfozabad 666, Kheragarh 465 and Kirao11499. It is, however, clear from the above table that, the people in the district are not distributed among the different tehsils in any kind of orderly proportion to the land area. Tehsils Bah and Kheragarh belong to the trans-Yamuna tract. Kheragarh is one of the lcast fertile tehsils and has got hilly tract. Bah is in many parts very similar to the Hills and Plateau diVIsion of the State, It has numerous ravines. Tehsil Kiraoli is one of the fertile tehsils but iu its south-western portiou some low hills crop up. These factors account for the low densities in Bah, Kheragarh and Kiraoli. (vide Tables A-I and E),
2. The population of the district in 1951 was 41-7 per cent. higher than what it was fifty Growth of years ago. Compared to thIS the Increase In the population of the State during the corresponding populatlon period has been only 30 per cent. The table below exhibits the variation in the total, rural and ,uban population for the last five decades :
Population Variation
Census year Total Rural Urban Total Rural Urban --~-~---~
1901 1,059,654 824,348 235,306
1911 1,020,879 791,j29- 229,550 -38,775 -33,019 -5,756 (-3'7) (--40) (-2'4)
1921 923,264 682,665 240,599 -97,615 -108,664 +1l,049 (-9'6) (-13'7) (+4'8)
1931 1,047,389 756,797 290,592 + 124,125 +74,132 +49,993 . (+13 4) (+10 9) (+20'8)
1941 1,288,478 911,846 376,632 +241,O~i): +155,049 +86,040 (+21'0) (+20 5) (+29'6)
1951 1,501,391 1,003,529 497,862 +212,913 +91,683 +121,230 (+16'5) (+ 10'1) (+32 2)
Between 1901 and 1921 the population of the district r'i~orded a decrease Q'f 12'9 per cent. when that of the State decreased by 4'0 per cent, During 1901-1,911 the district suffered considerably from plague and epidemip malaria" The decre~se for the~decade 1911-21 is d1.!e to the heavy ~rtality from influenza epidemic of 1918-19. Abnormal deaths did not occur or were prevented from occuring in the post-192l perio~ and the population of the district recorded a plwnomena
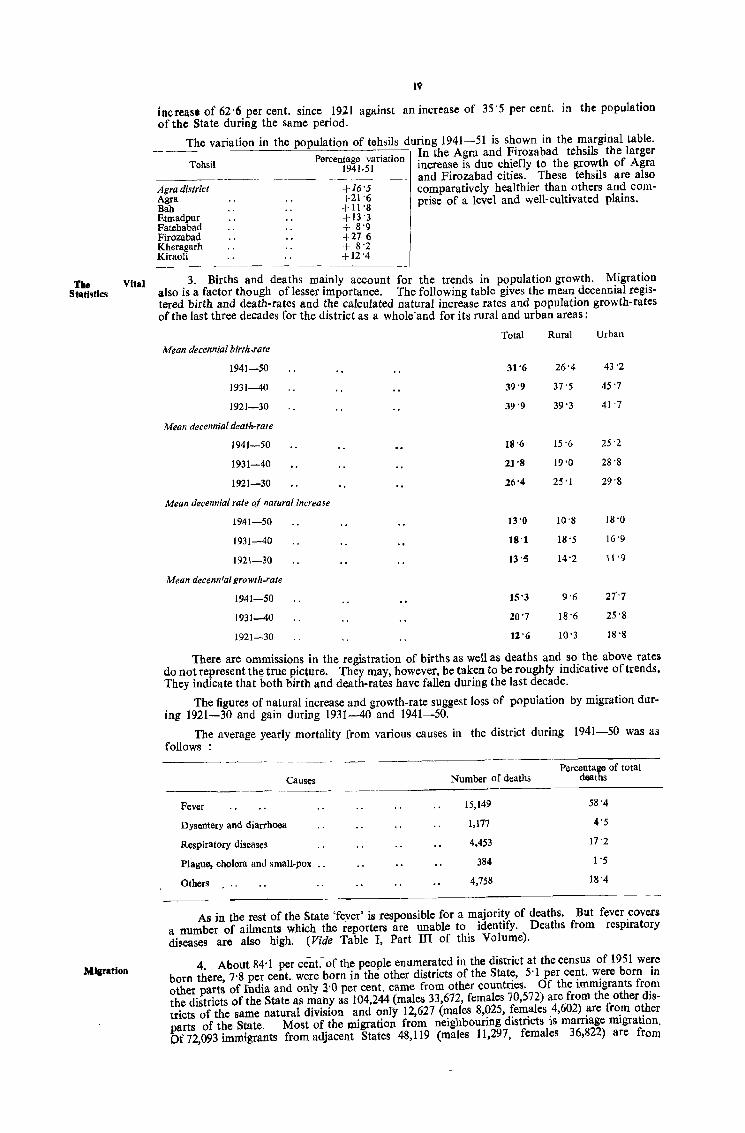
The Statistics
Vital
Mlatation
l\'
increase of 62'6 per cent. since 1921 against an increase of 35'5 per cent. in the population of the State during the same period.
The variation in the population of tehsils during 1941-51 is shown in the marginal table, Percentage variation In the Agra and Firozabad tehsils the larger
Tehsil
Agra district Agra Bah Etmadpur Fatehabad Firozabad Kheragarh Kiraoli
1941.51 increase is due chiefly to the growth of Agra and Firozabad cities. These tehsils are also comparatively healthier than others and comprise of a level and well-cultivated plains.
+16'5 +-21 '6 + 11 '8 +13'3 + 8'9 +276 + 8'2 +12'4
,3. Births and deaths m~inly account for the trends in population growth, Migration also IS ~ factor though of lesser Importance. The following table gives the mean decennial registered birth and death-rates and t!J.e ~alculated natural increase rates and population growth-rates of the last three decades for the dIstrIct as a whole'and for its rural and urban areas:
Total Rural Urban
Mean decennial birth.rate
1941-50 31 '6 26'4 43'2
1931-40 39'9 37'5 45 '7
1921-30 39'9 39'3 41 '7
Mean decennial death-rate
1941-50 18'6 15'6 25'2
1931-40 21'8 19'0 28'8
1921-30 26'4 25'1 29'8
Mean decennial rate of natural increase
1941-50 13'0 10'8 18'0
1931-40 18'1 18'5 16'9
1921-30 13'5 14'2 11 '9
Mean decenn;al growth-rate
1941-50 15'3 9'6 21'7
1931-40 20'7 18'6 25 '8
1921-30 12'6 10'3 18'8
There are ommissions in the registration of births as well as deaths and so the above rates do not represent th!l true picture. They may, however, be taken to be roughly indicative of trends. They indicate that both birth and death-rates have fallen during the last decade,
The figures of natural increase and growth-rate suggest loss of population by migration during 1921-30 and gain during 1931-40 and 1941-50.
The average yearly mortality from various causes in the district during 1941-50 was as follows:
Causes
Fever
Dysentery and diarrhoea
Respiratory diseases
Plague, cholera and small-pox
Others
Number of deaths
15,149
1,177
4,453
384
4,758
Percentage of total deaths
58'4
4'5
17'2
1 '5
18'4
As in the rest of the State 'f~ver' is responsible for a majority of deaths. But fever covers a number of ailments which the reporters are unable to identify. Deaths from respiratory diseases are also high. (Vide Table I, Part m of this Volume),
4. About 84'1 per cent.-of the people enumerated in the district at the census of 1951 were born there, 7'8 per cent.. were born in the other districts of the State, 5'1 per cent. were born in other parts of India and only 3'0 per cent. came from other countries. Of the immigrants from the districts of the State as many as 104.244 (males 33,672, females 70,572) are from the other districts of the same natural division and amy 12,627 (males 8,025, females 4,602) are from other parts of the State, Most of the migration from neighbouring districts is marriage migration. Of 72,093 immigrants from adjacent States 48,119 (males 11,297, females 36,822) are from
v
Rajasthan; 11,355 (males 2,374, females 8,981) are from Madhya Bharat; 6,979 (males 2,926, Miaration-(confli.) females 4,053) are from Punjab and .2,335 (males 1,558, females 777) are from Delhi. The movement to the city of Agra from Rajasthan 7,998 (males 4,086, females 3,912) and Madhya Bharat 2,166 (males 1,205, females 961) al?pea~ to be of se~-permanent type, usually by families and sometimes by males alone. Th~ mlgrabon from Punjab 5,747 (males 2,325, females 3,422) is also mostly labour migration and IS of semi-permanent type. The remainder of the migration is mostly marriage migration.
Of the immigrants who have come from territories beyond India 44,791 (males 25,351, females 19,440) were born in Pakistan and 488. (males 305, females 183) had their birth place in other territories. The Pakistan-born are the displaced persons who number 44,695. Of the immigrants born in other territories 339 (males 189, females 150) are Nepal-born.
Of the 26 non-Indian nationals 16 are British and 7 are Italian.
Unfortunately the figures of emigration from Agra are not available. According to the vital statistics there was a loss of about 9,500 during 1901-tO and a gain of about 30,000 during 1931-40 and of about 31,000 during 1941-50. (Vide Tables D-IV and D~VI).
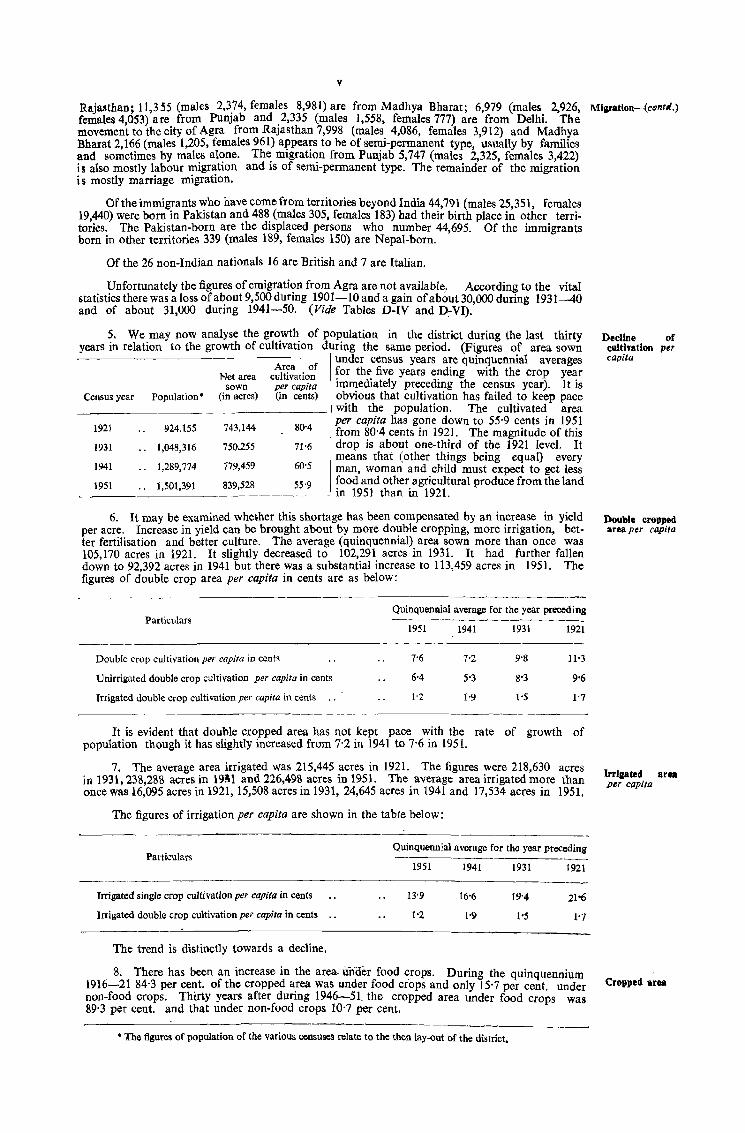
5. We may now analyse the growth of population in the district during the last thirty years in relation to the growth of cultivation during the same period. (Figures of area sown
Census year Population *
1921 924,155
1931 1,048,316
Net area sown
(in acres)
743,144
750.255
Area of cultivation per capita (in cents)
80'4
71'6
1941 .. 1,289,774
under census years are quinquennial averages for the- five years ending with the crop year immediately preceding the census year). It is obvious that cultivation has failed to keep pace with the population. The cultivated area per capita has gone down to 55'9 cents in 1951 from 80'4 cents in 1921. The magnitude of this drop is about one-third of the 1921 leve1. It means that (other things being equal) every
779,459 60'5 man, woman and child must expect to get less
_1_9_51 __ ._. _1,_50_1_,39_1 __ 8_39_,52~ __ ~5_5'9 __ f~ot9~~d t~~:\~g~~~::ural produce from the land
6. Ii may be examined whe~her this shortage has been compensated by an increase in yield per acre. Increase in yield can be brought about by more double cropping, more irrigation, better fertilisation and better culture. The average (quinquennial) area sown more than once was 105,170 acres in 1921. It slightly decreased to 102,291 acres in 1931. It had further fallen down to 92,392 acres in 1941 but there was a substantial increase to 113,459 acres in 1951. The figures of double crop area per capita in cents are as below:
--~--_~-------------------------------
Particulars
Double crop cultivation per capita in cents
Unirrigated double crop cultivation per capita in cents
Irrigated double crop cultivation per capita in cents ...
QuinquenDial average for the year preceding
1951
7'6
6'4
1'2
1941 1931 1921
It is evident that double cropped area has not kept pace with the rate of growth of population though it has slightly increased from 7'2 in 1941 to 7'6 in 1951.
7. The average area irrigated was 215,445 acres in 1921. The figures were 218,630 acres in 1931,238,288 acres in 19~1 and 226,498 acres in 1951. The average area irrigated more than once was 16,095 acres in 1921, 15,508 acres in 1931, 24,645 acres in 1941 and 17,534 acres in 1951.
The figures of irrigation per capita are shown in the table below:
Particulars Quinquennial average for the year preceding
Irrigated single crop cultivation per capita in cents
Irrigated double crop cultivation per capita in cents
The trend is distinctly towards a decline.
1951 1941 1931
19'4
1'5
1921
Decline of eulthatlon per capita
Double cropped area per capita
Irrigated ar .. pu capita
8. There has been an increase in the ar~ unoer food crops. During the quinquennium 1916-21 84'3 per cent. of the cropped area was under food crops and only 15'7 per cent. under Cropped area non-food crops. Thirty years after daring 1946-5L the cropped area under food crops was 89'3 per cent. and that under non-food crops 10'7 per cent.
* The figures of population of the various censuses relate to the then lay-out of the district.
vi
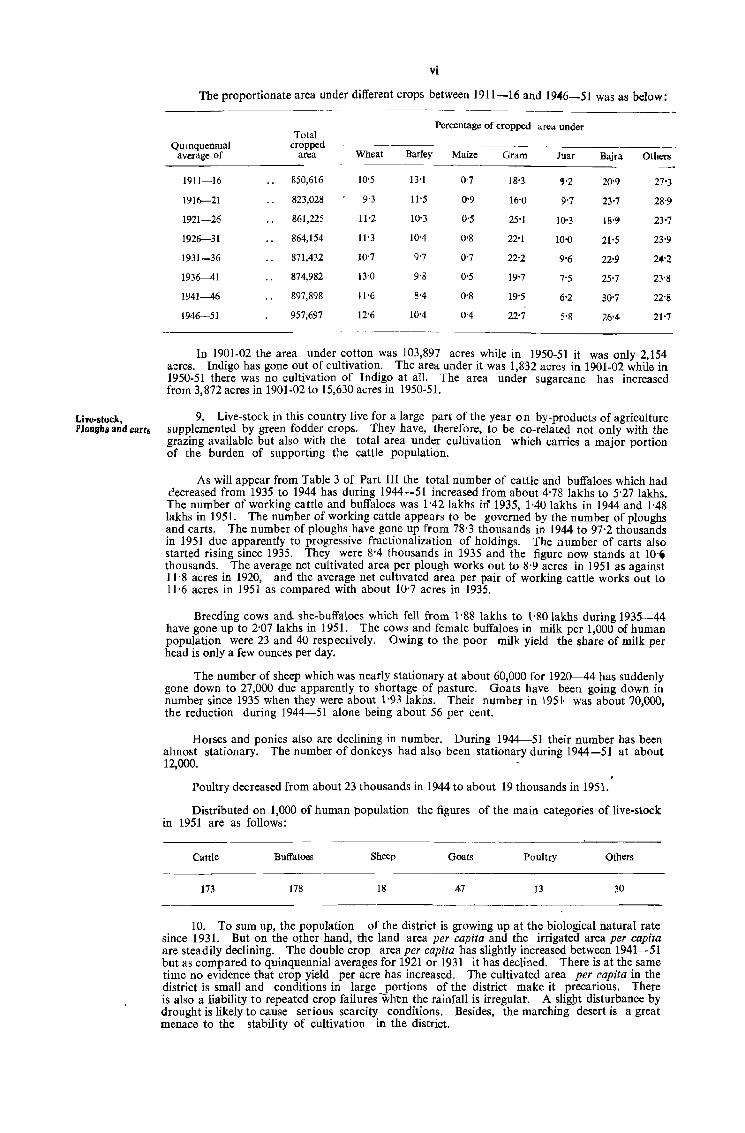
The proportionate area under different crops between 1911-16 and 1946-51 was as below:
Total Percentage of cropped area under
Qumquenmal cropped average of area Wheat Barley Maize Gram Juar Bajra Others
1911-16 850,616 10'5 13'1 0'7 18-3 '!I'2 20'9 27-3
1916-21 823,028 9'3 11'5 0-9 16-0 9'7 23-7 28·9
1921-26 861,225 11'2 10-3 0'5 25'1 10-3 18'" 23-7
1926-31 864,154 11'3 10-4 0'8 22-1 10-0 21-5 23-9
1931-36 871,432 10'7 9'7 0-7 22-2 9-6 22-9 2~'2
1936-41 874,982 i3'0 9'8 0-5 19-7 7-5 25'7 23'8
1941-46 897,898 11'6 8-4 0-8 19'5 6-2 30'7 22'8
1946--51 957,697 12'6 10'4 0'4 22-7 5'8 26-4 21-7 ------------ -
In 1901-02 th.e area under cotton was 103,897 acres while in 1950-51 it was only 2,154 acres. Indigo has gone out of cultivation. The area under it was 1,832 acres in 1901-02 while in 1950-51 there was no cultivation of Indigo at all. The area under sugarcane has increased from 3,872 acres in 1901-02 to 15,630 acres in 1950-5l.
Life-stock, 9_ Live-stock in this country live for a large part of the year on by-products of agriculture Ploughs and carts supplemented by green fodder crops. They have, therefore, to be co-related not only with the
grazing available but also with the total area under cultivation which carries a major portion of the burden of supporting the cattle population.
As will appear from Table 3 of Part III the total number of cattle and buffaloes which had decreased from 1935 to 1944 has during 1944-51 increased from about 4'78 lakhs to 5'27 lakhs_ The number of working cattle and buffaloes was 1'42 lakhs iIf 1935, 1·40 lakhs in 1944 and 1'48 lakhs in 1951. The number of working cattle appears to be governed by the number of ploughs and carts. The number of ploughs have gone up from 78'3 thousands in 1944 to 97'2 thousands in 1951 due apparently to progressive fractionalization of holdings. The number of carts also started rising since 1935. They were 8'4 thousands in 1935 and the figure now stands at 10'_ thousands. The average net cultivated area per plough works out to 8'9 acres in 1951 as against 11'8 acres in 1920, and the average net cultIvated area per pair of working cattle works out to 11'6 acres in 1951 as compared with about 10'7 acres in 1935.
Breeding cows and. she-buffaloes which fell from 1'88 lakhs to l'80lakhs during 1935-44 have gone up to 2'07 lakhs in 1951. The cows and female buffaloes in milk per 1,000 of human population were 23 and 40 respectively. Owing to the poor milk yield the share of milk per head is only a few ounces per day_
The number of sheep which was nearly stationary at about 60,000 for 1920-44 has suddenly gone down to 27,000 due apparently to shortage of pasture. Goats have been going down in number since 1935 when they were about 1·93 lakhs. Their number in 195} was about 70,000, the reduction during 1944-51 alone being about 56 per cent.
Horses and ponies also are declining in number. During 1944-51 their number has been almost stationary_ The number of donkeys had also been stationary during 1944-51 at about 12,000.
Poultry decreased from about 23 thousands in 1944 to about 19 thousands in 1951.
Distributed on 1,000 of human population the figures of the main categories of live-stock in 1951 are as follows:
Cattle Buffaloes Sheep Goats Poultry Others
173 178 18 47 13 30
10. To sum up, the population of the district is growing up at the biological natural rate since 1931. But on the Qther hand, the land area per capita and the irrigated area per capita are steadily declining. The double crop area per capita has slightly increased between 1941-51 but as compared to quinquennial averages for 1921 or 1931 it has declined. There is at the same time no evidence that crop yield per acre has increased. The cultivated area per capita in the district is small and conditions in large portions of the district make it precarious_ Thete is also a liability to repeated crop failures wlren the rainfall is irregular. A slig!Jt disturbance by drought is likely to cause serious scarcity conditions. Besides, the marching desert is a great menace to the stability of cultivation in the district.
vii
11. The district has 1,188 villages and 13 towns. Out of about 15.0 lakhs people who were Villages and towns counted at the census of 1951, 10.0 lakhs were found in villages and 5.0 lakhs in towns, i.e., there are as many as 668 people per 1,000 of the population who live in the rural areas and 332 of them live in ~fte towns. The corresponding figures for the State as a whole are: rural 864, urban 136.
The rural population per inhabited village works out to 845. In most parts of the distr~ct the villages resemble those to be seen throughout the west of the State; they generally conSIst of a single compact site. But all of them do not necessarily comprise of a single .population agglomeration, There are 3,152 hamlets in the district. The population per hamlet IS only 318. The medium-sized village-with inhabitants numbering between 500-2,OOO-is the dominant type in the district. Of the rural population 56·3 per cent. live in such villages; 14'2 per cent. live in small villages of population under 500; 27'0 per cent. live in larger villages of population between 2,000-5,000; and only 2'5 per cent. live in villages of population over 5,000.
Towns vary in number of inhabitants even more widely than villages. Agra city has a population of 375,665, i.e., 75'5 per cent. of the urban population. Only 2'5 per cent. of the urban population lives in towns of population under 5,000 (viz., Bah, Pinhat, Jagner); 8'9 per cent. of the urban popUlation lives in towns of population between 5,000-10,000 (viz., Tundla Railway Colony, Fatehabad, Shamsabad, Tundla, Etmadpur, Achnera, Fatehpur Sikri); and 13.1 per cent. of the population lies in Firozabad city which had a population of 65,438 in 1951.
It is significant to note that Firozabad CIty and Agra city have recorded an increase of 61.3 per cent. and 32'2 per cent. in population respectively since 1941. Fatehpur Sikri, Etmadpur, Shamsabad, Fatehabad and Jagner have also recorded increases in population since 1941. But Achnera, Bah and Pinhat appear to be declining towns. Since 1941 their population have decreased by (i 9 per cent., 4·1 per cent. and 11'7 per cent. respectively. (Vide Tables A-III and A-IV).
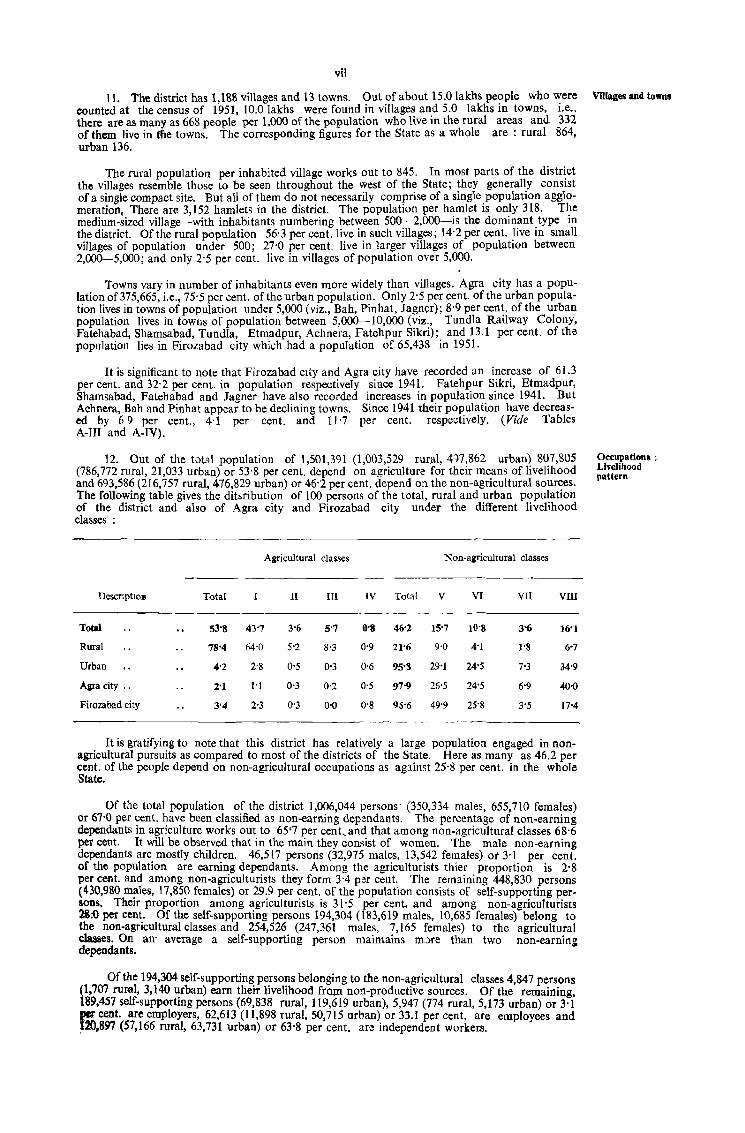
12. Out of the total population of 1,501,391 (1,003,529 rural, 4')7,862 urban) 807,805 (786,772 rural, 21,033 urban) or 53'8 per cent. depend on agriculture for their means of livelihood and 693,586 (216,757 rural, 476.829 urban) or 46'2 per cent. depend on the non-agricultural sources. The following table gives the ditsribution of 100 persons of the total, rural and urban population of the district and also of Agra city and Firozabad city under the different livelihood classes:
A&ricultural classes Non-agricultural classes
Descrlpttoll Total II III IV Total V VI VII VIII
Total S3'S 43'7 3'6 5'7 O'S 46'2 15'7 10'S 3'6 16'1
Rural 78'4 64'0 5'2 8'3 0'9 21'6 9'0 4'1 I'S 6-7
Urban 4'2 2'8 0'5 0'3 0'6 95'S 29'1 24'5 7'3 M'9
A&ra city .. 2'1 1'1 0'3 0'2 0'5 97'9 26'5 24'5 6'9 40'0
Firozabad city 3'4 2'3 0'3 0'0 O'S 96'6 49'9 25'8 3'5 17'4
It is gratifying to note that this district has relatively a large population engaged in nonagricultural pursuits as compared to most of the districts of the State. Here as many as 46.2 per cent. of the people depend on non-agricultural occupations as against 25'8 per cent. in the whole State.
Of the total population of the district 1,006,044 persons' (350,334 males, 655,710 females) or 67'0 per cent. have been classified as non-earning dep~ndants. The percentage of non-earning dependants in agriculture works out to 65'7 per cent .. and that among non-agricUltural classes 68'6 per cent. It will be observed that in the main they consist of women. The male non-earning dependants are mostly children. 46,517 persons (32,975 males, 13,542 females) ot 3'1 per cent. of the population are earning dependants. Among the agriculturists thier proportion is 2'8 per cent. and among non-agriculturists they form 3'4 per cent. The remaining 448,830 persons (430,980 males, 17,850 females) or 29.9 per cent. of the population consists of self-supporting persons. Their proportion among agriculturists is 31'5 per cent. and among non-agriculturists 2&:6 per cent. Of the self-supporting persons 194,304 (183,619 males, 10,685 females) belong to the non-agricultural classes and 254,526 (247,361 males, 7,165 females) to the agricultural daases. On an' average a self-supporting person maintains m:>re than two non-earning dependants.
Of the 194,304 self-supporting persons belonging to the non-agricultural classes 4,847 persons (1,707 rural, 3,140 urban) earn their livelihood frQJJ1 non-productive sources. Of the remaining, 189,457 self-supporting persons (69,838 rural, 119,619 urban), 5,947 (774 rural, 5,173 urban) or 3'1 l* cent. are employers, 62,613 (11,898 rural, 50,715 urban) or 33.1 per cent. are employees and 120,897 (57,166 rural, 63,731 urban) or 63'8 per cent. are independent workers.
Occupations: Livelihood pattern
•• ri.Cion in the li Ye)ihood pattern
HODSed and ho UtelIolds
viii
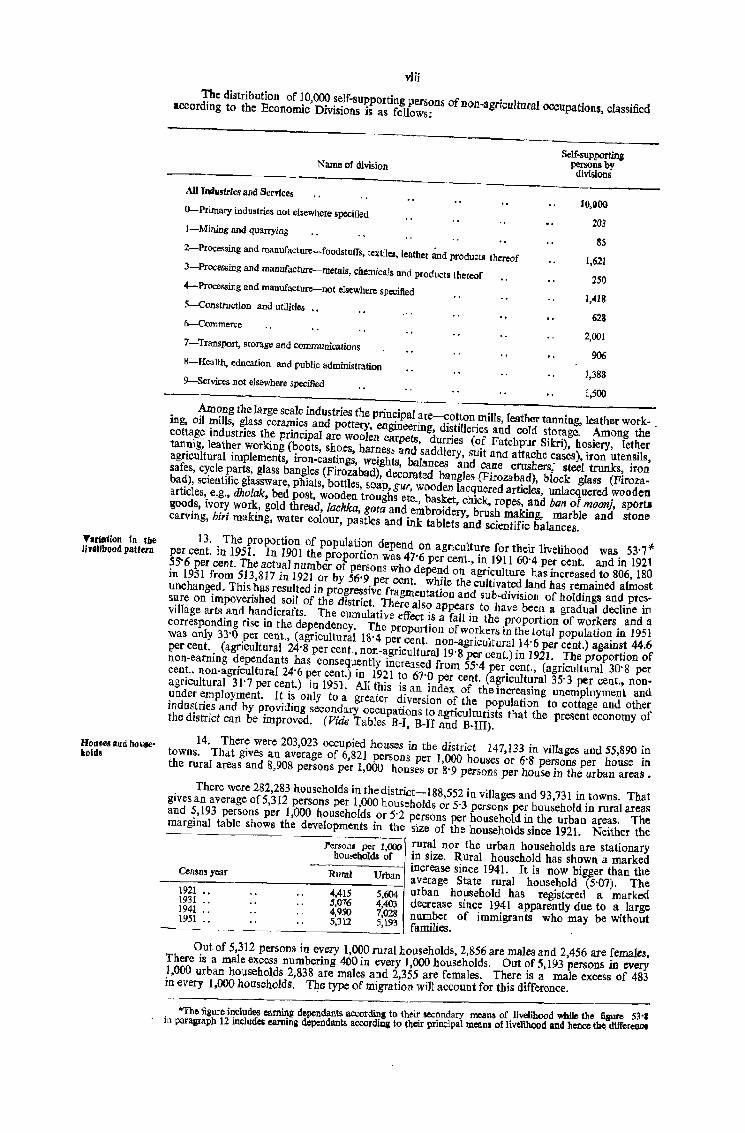
The distribution of 10,000 self-supporting persons of non-agricultural occupations classified according to the Economic Divisions is as follows: '
Name of division
AU Iudustries and Services
O-Prirnary iodustries oot elsewhere specified
I-Mining and quarrying
2-Processing and manufacture-foodstuffs, textile., leather and producu thereof
3-Processing and manufacture-metals, chemicals and products thereof
4-Processing and manufacture-not elsewhere specified
5--Construction and utilities "
6-Cotnmerce
7-Transport, storage and communications
8-Health, education and public administration
9-Services not elsewhere specified
Self-supporting persons by
divisions
10,000
203
85
1,621
250
1,-418
623
2,001
906
1,388
1,500
Among the large scale industries the principal are-cotton mills, leather tanning, leather work- . ing, oil mills, glass ceramics and pottery, engineering, distilleries and cold storage. Among the cottage industries the principal are woolen carpets, durries (of Fatehpur Sikri), hosiery, lether tannig, leather working (boots, sho.es, harness and saddlery, suit and attache cases), iron utensils, agricultural implements, iron-castings, weights, balances and cane crushers - steel trunks, iron safes, cycle parts, glass bangles (Firozabad), decorated bangles (Firozabad), block glass (Firozabad), scientific glassware, phials, bottles, soap, gUt, wooden lacquered articles, unlacquered wooden articles, e.g" dholak, bed post, wooden troughs etc., basket, chick, ropes, and ban of moonj, sport. goods, ivory work, gold thread, /achka, gota and embroidery, brush making, marble and stone carving, biri making, water colour, pastles and ink tablets and scientific balances.
13, The proportion of population depend on agriculture for their livelihood was 53'7* per cent. in 1951. In 1901 the proportion was 47'6 per cenl., in 1911 60'4 per cent. and in 1921 5S'6 per cent. The actual number of persons who depend on agriculture has increased to 806, 180 in 1951 from 513,317 in 1921 or by 56'9 per cent. while the cultivated land has remained almost unchanged. This has resulted in progressive fragmentation and sub-division of holdings and pressure on impoverished soil of the district. There also appears to have been a gradual decline in village arts and handicrafts. The cumulative effect is a fall in the proportion of workers and a corresponding rise in the dependency. The proportion of workers in the total population in 1951 was only 33'0 per cent., (agricultural 18'4 per cent. non-agriCultural 14'6 per cent.) against 44.6 per cent. (agricultural 24'8 per cent., non-agricultural 19' 8 per cent.) in ]921. The proportion of non-earning dependants has consequently increased from 55'4 per cent., (agricultural 30'8 per cent., non-agricultural 24'6 per cent,) in 1921 to 67'0 per cent. (awicultural 35'3 per cent., nonagricultural 31'7 per cent.) in 1951. All this is an index of the Increasing unemployment and under employment. It is only to a greater diversion of the population to cottage and other industries and by providing secondary occupations to agriculturists that the present economy of the district can be improved. (Vide Tables B-1, B-U and B-III).
14. There were 203,023 occupied houses in the district--147,133 in villages and 55,890 in towns. That gives an average of 6,821 persons per 1,000 houses or 6'8 persons per house in the rural areas and 8,908 persons per 1,000 houses or 8'9 persons per house in the urban areas.
There were 282,283 households in the distr:i.ct-188,552 in villages and 93,731 in towns. That gives an average of5.3[2 persons per 1,000 households or 5'3 persons per household in rural areas and 5,193 persons per 1,000 households or 5'2 persons per household in the urban are~s. The marginal table shows the developments in the siz.e of the households since 1921. Neither the
Census year
Persons per 1 000 r rnral nor the urban households are stationary households ;r in size. Rural household has shown a marked
-------1 increase since 1941. It is now bigger than the Rural Urban average State rural household (5'07), The
.-------------.. ,-41-5----1 urban household has registered a marked ~~i~ ., 5,076 ~:~ decrease since 1941 apparently due to a large ]941 " 4,950 7,028 number of immigrants who may be without 1951 .. 5,312 5,193 families. -------------------------------
Out of 5,312 persons in every 1,000 rural households, 2,356 are males and 2,456 are females. There is a male excess numbering 400 in every 1,000 households. Out?f5,193 persons Jll every 1,000 urban households 2,838 are males and 2,355 are females, Th~re ,IS a male excess of 483 tn every 1,000 households. Tl11'1 type of migration will account for this difference.
-The figure includes earning dependants according to their secondary means of . livelihood while the figure 53'S in paragraph 12 includes eamini dependants according to their principal means of Iivcllhood and hence th~ differeD'"
It
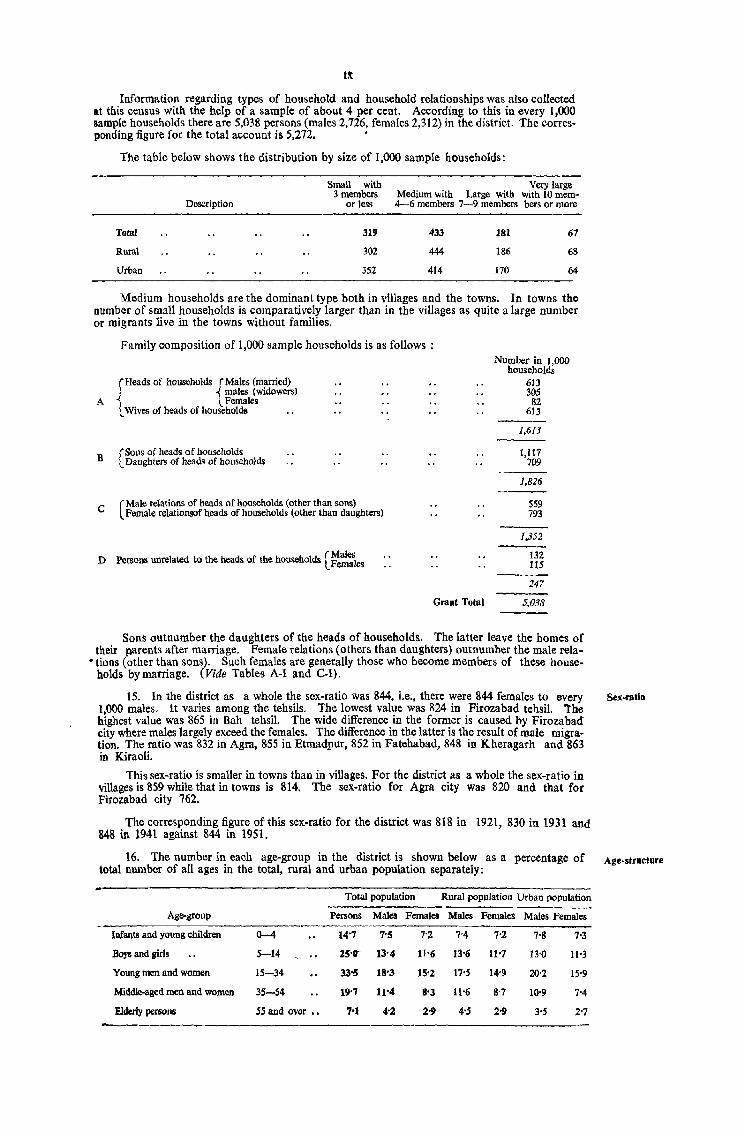
Information regarding types of household and household relationships was also collected at this census with the help of a sample of about 4 per cent. According to this in every 1,000 sample households there are 5,038 persons (males 2,726, females 2,312) in the district. The corres-ponding figure for the total account is 5,272. •
The table below shows the distribution by size of 1,000 sample households:
Small with Very large 3 members Medium with Large with with 10 mem-
Description or less 4-6 members 7-9 members bers or more
Total 319 433 181 67
Rural 302 444 186 68
Urban 352 414 170 64
Medium households are tbe dominant type both in villages and the towns. In towns the number of small households is comparat.ively larger than in the villages -as quite a large number or migrants live in the towns without families.
Family composition of 1,000 sample households is as follows:
rHeads of households (Males (married) . i males (widowers)
A i lFemales L Wives of heads of households ..
B
c
(Sons of heads of households l Daughters of heads of households
(Male relations of heads of households (other than sons) Female relationsof heads of households (other than daughters)
D Persons unrelated to the heads of the households [~~es
Number in 1,000 households
613 305 82
613
1,613
1,117 709
1,826
559 793
1,352
132 ll5
247
Grant Total 5,038
Sons outnumber the daughters of the heads of households. The latter leave the homes of their parents after marriage. Female relations (others than daughters) outnumber the male rela-
• tions (other than sons). Such females are generally those who become members of these households by marriage. (Vide Tables A-I and Col).
15. In the district as a whole the sex-ratio was 844. i.e., there were 844 females to every 1,000 males. It varies among the tehsils. The lowest value was 824 in Firozabad tehsil. 'the highest value was 865 in Bah tehsil. The wide difference in the former is caused by Firozabad city where males largely exceed the females. The difference in the latter is the result of male migration. The ratio was 832 in Agra, 8-55 in Etmadpur, &52 in Fatehabad, 848 in Kheragarh and 863 in Kiraoli.
This sex-ratio is smaller in towns than in villages. For the district as a whole the sex-ratio in villages is 859 while that in towns is 814. The sex-ratio for Agra city was 820 and that for Firozabad city 762.
The corresponding figure of this sex-ratio for the district was 818 in 1921, 830 in 1931 and 848 in 1941 against 844 in 1951.
16. The number in each age-group in the district is shown below as a percentage of total number of all ages in the total, rural and urban population separately:
-Total population Rural population Urban population
-~----Age-group Persons Males Females Males Females Males Females
Infants and young children 0-4 14'7 7'5 7-2 N n 7-8 7'3
Boys and girls S-14 25'~ 13'4 11-6 13-6 11-7 13'0 11'3
Young men and women 15-34 33'5 18'3 15'2 17'S 14-9 20'2 15'9
Middle-aged men and women 35-54 19'7 11"4 8'3 11'6 g'7 10'9 N
Elderly persons 55 and over._ 'N 4'2 2-9 4'5 2-9 3-5 2'7
Sex-ratio
Age-structure
Marital status
Languages
Religion and special groups,
Displaced persons
Literacy
x
It will be seen that the population is progressive. 39'7 per cent. of the population is of age under 15 and only 7'1 per cent. of it consists of elderly persons. Again, it may be noted that proportionately larger numbers in the working ages (15-54) are found in the uran areas. This is the effect of migration of workers to the towns from the villages, many of whom are unaccompanied by their families. (Vide Table C-III).
17. Out of every 10,000 persons in the district there are 5,480 males and 4,520 females. * Among them 2,723 males and 1,919 females are unmarried. If we reckon males and females together, the unmarried people are 46.4 per cent. of the population.
Of the males 49.7 per cent. were unmarried, 42.7 per cent. were married and 7·6 per cent. were widowed or divorced. Among the females 42.5 per cent. were unmarried, 47'1 per cent. were married and 10'4 per cent. were widowed or divorced.
Of the married males 1'2 per cent. were of ages below 15, 52'9 per cent. were of ages 15-34. 36'6 per cent. were of ages 35-54 and 9'3 per cent. were of ages 55 and over. Among the married females 4'0 per cent. were of ages below 15, 63'1 per cent. were of ages 15-34, 28'8 per cent. were of ages 35-54 and 4'1 per cent. were of ages 55 and over.
Marriage is universal. Among males and females aged 35 years and over only 8.4 per cent. of males and 0'5 per cent. of females were found unmarried. Most of the females are married before they attain the age of 25. Child marriage is not very common. Only 1'4 per cent. of the males of ages 0-14 and 4'5 per cent. of the females of ages 0-14 were returned as married. (Vide Table C-IU).
18. Over 96'9 per cent. of the people of the district returned Hindi, Hindustani or Urdu as their mother-tongue. Among the other mother-tongues spoken die main are Punjabi (1'60 per cent.), Sindhi (0'97 per cent.), Bengali (0'21 per cent.), English (0'09 per cent.), Rajasthani-cumMarwari (0'07 per cent.) and Gujarati (0'06 per cent.) Of the 15'01 lakhs of people In the district only 31,934 or 2'1 per cent. were bilingual (in an Indian language). Those wh9se mother-tongue is other than Hindi, Hindustani or Urdu are generally the migrants who are able to speak allY of these as a subsidiary language. Persons returning Hindi, Hindustani or Urdu as secondary language were 28,724 or 89'9 per cent. of those who were bilingual in some Indian language. (Vide Table D-I).
19. Out of 10,000 population pf the district the number of people belonging to different religions is: Hindus 8,862, Muslims 918, Sikhs 76, Jains109 and Christians 35; of 10,000 population in villages the numbers are Hindus 9,500, Muslims 424, Sikhs 14, Jains 51 and Christiam 11; and of 10,000 population in towns the numbers are: Hindus 7,575, Muslims 1,915, Sikhs 200, Jains 227, Christians 81 and others 2. Muslims, Sikhs, Jains and Christians are generally concentrated in the urban areas of the district as is the case in the other units of the State.
There are 282,198 Scheduled Castes in the district. Their number per 10,000 of population works out to 1,880. In villages they are 1,978 for every 10,000 and in the towns their number per 10,000 is only 1,682. In the district there are 507 Anglo-Indians. (Vide Tables D-II and D-I1I).
20. The number of displaced persons in the district at the census was 44,695 (males 24,041, females 20,654) or 9'3 per cent. of the total displaced persons in the State. Of them 43,617 or 97'6 per cent. are concentrated in the urban areas of the district, mainly in Agra city. 93·0 per cent. of the displaced persons in the district have come from West Pakistan, 1'3 per cent. from East Pakistan and 5.7 per cent. from districts which could not be traced. Of them 54'6 per cent. came in 1947 alone. 99.5 per cent. of them follow non-agricultural occupations and only 0'5 per cent. have taken to agricultural pursuits. (Vide Table D.V). ,
21. The percentage of male literacy was 23.4 in the district while that of female literacy was 6.4 only, The percentage of literates among males in 1951 wss 23'4 as against 12'2 in 1931; among females tbe petcentage ofhterates in 19.H was 23.4 as against 2.2t in 1931. On January 1 1951 there were 637 primary schools in the district with enrolment of 64,602 pupils. (Vide Table D-VII). -
C-EXPLANATORY NOTE ON THE STATISTICS
The statistics in this volume have been presented in three parts :
I-District Census Tables II-Village, Town, Pargana and Thana Statistics
III-Miscellaneous Statistics
-The corresponding figures Ior _the total count are 5,424 and 4,576. tThe number per mille (of the 10 percent. sample population) of each sex, aged 5 years and over who were return
ed as literates are as below :
Males Females
1951 1931 1951 1931 ----
264 143 70 26
xi
Parts I and II contain census data. A brief account of the system of sorting of census slips and preparation of tables and abstract therefrom is given below.
Part III contains statistics throwing light on special aspects of population and its growth. These have been derived from miscellaneous sources. Table I, "Vital Statistics", has been prepared from the published and unpublished records of t'le Director of Medical and Health Services, Table 2, "Agricultural Statistics", from the Annual Season and Crop Reports, Table 3, "Live-Stock. Agricultural Machinery and Implements", from the published figures of Live-Stock Census and Table 4, "List of Primary Schools", from information specially supplied by District Inspector of Schools.
2. The census data presented here has been derived from the census slips by a process of Processing of sorting, compilation and tabulation. In previous censuses the slips were first sorted by religion and census data this division was maintained throughout so that all data was cross-tabulated by religion. This pro-cedure has been abandoned at this census and substituted by a division based on economic charac-teristics of the population. The whole population has been divided into eight livelihood classes, four of which are of the agricultural category and four of non-agricultural category' as follows :
Agricultual Classes -
I-Cultivators of land wholly or mainly owned; and their dependants II-Cultivators of land wholly or mainly unowned ; and their dependants
III-Cultivating labourers ; and their dependants IV-Non-cultivating owners of land; agricultural rent receivers; and their dependants
Non-agricultural Classes -
V-Production (other than cutivation) VI-Commerce
VU-Transport VIII-Other services and miscellaneous sources.
Another ~pecial feature of the sorting of this census was the separation, from the very start, of slips of displaced persons and of a 10 per cent. random sample from the remainder. This has enabled the data of displaced persons to be presented separately while the 10 per cent. sample has been utilized for the preparation of Age Tables.
The slips of this census have been copied by households into a National Regiskr of Citizens, which has been prepared village-wise for rural areas and mohalla/ward-wise for urban areas. Taoles C-I is based on a 4 per cent. sample extracted from this register.
3. The slips were first sorted by villages for the preparation of the Primary Census Abstract: F:)f the purpose of further sorting the State was divided into tracts consisting of (a) rural tracts, comprising the rural population of each tehsil, (b) urban city tracts, co,nprising the.population of areas which had been declared as cities, (c) urban non-city tracts, comprising the population of urban areas of a district excluding areas declared as cities. Each tract was treated as a unit for sorting of· slips. All data were compiled first by tracts and then by districts. 'Ibis volume presents the tract-wise data for one district (with the exception of A and E tables, which have been presented tehsil-wise) while the district-wise data for the whole State is contained in the following State vo-lumes : .
Part I-B-Subsidiary Tables Part I1-A-General Population Tables Part I1.B-Economic Tables Part II -C-Age and Social Tables
4. Detailed explanatory notes are appended to each State table in the printed volumes of State tables. They apply to the tables in this volume also and shOUld be referred to when necessary. A few notes of some of the tables are reproduced below:
Table A-I-Column 5 relating to "hamlets" has -beell_introduced for the first time. Any distinctive cluster or agglomeration of houses has been treated as a "hamlet".
A clear distinction has been made in this census between a "House" and a "Household". A house is any human dwelling having a separate main entrance while a household is any commensal unit living in a census house. In previous censuses the figures under "Occupied Houses" used to be that of households, while the figures under columns 7-9 of the present tables refer to occupied census houses as distinct from households. '
The Economic Tables-The Indian Censys Economic Classification ScheIlle, 1951, together with the occupational division and sub-division adopted for this census are given in Pak II-B of b~~ -
Table E-I-Each of the eight livelihood classes Dlentioned above has been divided into three lub-classes, with reference to the economic status, as follows:
(i) Self-supporting persons; (ii) Non-earning dependants; and (iii) Earning dependants.
Tracts
Eli2JIlanatory notes
xii
These were defined in the Instructions to Enumerators as follo liS :
"A 'Self-supporting person' is one who is in receipt of an income and that income is sufficient at least for bis own maintenance. To be 'self-supporting' a person need not be able to support his family. All that is necessary is that he should be earning sufficient for his personal needs. For purposes of this question the person enumerated is the unit and not the family or household. Anyone who is not a 'self-supporting" person in this sense is a 'dependant'. A 'dependant' may be either an 'earning dejJendant' or a 'non-earning dependant'. The test is whether he secures a regular (and not casual) income, even though it may be small. Such income may be in cash or kind; it may be continuous or season].l employment. When the income which he secures is not sufficient to support him that pemon is an 'earning dependant'. A person who does not earn any income either in cash or kind is a 'non-earning dependant'. Where two or more members of a family household jointly cultivate land and secure an income therefrom, each of them should be regarded as earning part of the income. None of them is, theret1>re, a non-earning dependant. Each of them should be classed either a 'self-supporting person' or an 'earning dependant' according to the share of income attributable to each. The same applies to any other business carried on jointly. The share of the income is what the head of household deems it to be. This does not mean that everyone who works is' necessarily a self-supporting person or an earning dependant. Thus, for instance, a housewife who cooks for the family, brings up the children or manages the household is doing very valuable work. Nevertheless, her Economic Status is that of a non-earning dependant, if she does not also earn an income, and should be recorded as such."
Economically active, Semi-active and Passive persons-All non-earning dependants are economically passive. They include persons performing house-work or other domestic or personal services for other members of the same family household. But they do not include "unpaid family workers" or persons who take part along with the members of the family household in carrying on cultivation or a home industry as a family enterprise. All earning dependats are economically semi-active only. Though they contribute to the carrying of economic activities, the magnitude of their individual contribution is deemed to be too small to justify their description as economically active. (Their contribution to economic activity is, however, taken into account in the tabulation of data based on secondary means of livelihood.)
All self-supporing persons are, ordinarily economically active with the exception of the following classes and groups:
(a) All self-supporting persons of agricultural Class IV. (b) -The following groups of self-supporting persons who are included in non-agricultural
Class VIII and derive their principal means of livelihood from miscellaneous sources (otherwise than through economic activity):
(i) Persons living principally on income from non-agricultural property ; (ii) rersons living principally on pensions, remittances, scholarships and funds,
(iii) inmates of alms-houses and recipients of doles; (iv) beggars and vagrants; and (v) all other persons living principally on income derived from non-productive
activities. Table B-II-For a self-supporting person who has more than one means of livelihood
the secondary means of livelihood is the livelihood next in importance to his prinCipal means of livelihood. For an earning dependant it is the source from which he secures his own income, where there are more than one subsidiary occupations only the one providing the largest income has been taken into account.
Table B-IlI-" Employers" , "Employees" and "Independent Workers" have been defined as follows in the Instructions to Enumerators :
An "employer" is only that person who has necessarily to employ other person in order to carryon the business from which he secure~ his livelihood. Thus if a person employes a cook or any other person for domestic services, he should not be recordej as an "empluyer" merely for that reason.
An "employee" is a person who ordinarily works under some other person for a salary or a wage in cash or kind a~ihe means of earning his livelihood. There may be persons who are employed as manager, superintendents, agents, etc., and in that capacity control other workers. Such persons are also employees only and should not be regarded as employers.
An "independent worker" means a person who is no-t employed by anyone else and who also does not employ anybody else in order to earn his livelihood. (Sweepers, dhobies, kahars, etc., who work for several masters are independent workers. If, however, any of them accepts whole-time employment under one master he becomes "employee". Daily wage-earners who work for different masters are likewise independent workers. Bjlt if the¥. accept employment under oUl' master, e.g., under a factory, they become Yemployees"). .
Tables C-II, C-III, C-IV and C-V:;-The figures presented in these tables are based on single yeat age-returns and have- not oeen smoothed.
Tables D-V (i) and (ii)-For the purpose of this table a "displaced person" has been defined. as follows:
"A displaced person means any person who has entered India having left or being compelled to leave his home in Western Pakistan on or after the 1st March, 1947; or his home in Eastern Pakistan on or after the 15th October, 1946, on account of civil disturbances or on account of the setting up of the two Dominions of India and Pakistan."
PART I
DISTRICT CENSUS TABLES

District Total ..
Agra
2 Bah
3 Etmadpur
4 Fatehabad
5 Firozabad
6 Kheragarh
7 Kiraoli
DIStrict Total
Agra
2 Bah
3 Etmadpur
4 Fatehabad
Firozabad
6 Kheragarh
7 Kiraoli
Tehsil
2
Tehsil
2
3 TABLES A-I & A·II
A-GENERAL POPULATION TABLES
A-I-Area, Houses and Population
Area in square miles
3
1,860
219
338
278
241
203
308
273
Persons
Villages Hamlets
4
1,188
136
205
179
162
185
153
168
5
3,152
359
533
597
554
411
393
305
Towns
6
13
2
2
3
2
2
Population
Males
Occupied houses
Total Rural Urban
7
203,023
60,252
22,239
28,810
19,508
27,002
22,169
23,043
8
147,133
22,107
20,939
26,109
17,957
18,061
21,617
20,343
Females
9
55,890
38,145
1,300
2,701
1,551
8,941
552
2,700
Total Rural Urban Total Rural Urban Total Rural Urban
10 11 12 13 14 15 16 17 18
.. 1,501,391 1,003,529 497,862 814,289 539,842 274,<147 687,102 463,687 223,415
511,609 135,944 375,665 279,280 72,821 206,459 232,329 63,123 169,206
151,863 143,398 8,465 81,413 76,746 4,667 70,450 66,652 3,798
205,156 188,158 16,998 110,596 101,145 9,451 94,560 87,013 7,547
139,566 128,639 10,927 75,364 69,586 5,778 64,202 59,053 5,149
199,211 133,773 65,438 109,195 72,050 37,145 90,016 61,723 28,293
144,677 140,776 3,901 78,292 76,173 2,119 66,385 64,603 1,782
149,309 132,841 16,468 80,149 71,321 8,828 69,160 61,520 7,640
NOTS-The ar~a fi!lUr!5 given in column 3 are based 0'1 the district r~cords of teh,il areas. The area of the district as com nuni_ated by the Surveyor General ofIndia is 1,860 square miles.
1901
IlIll
1921
IN!
USI
A-II-Variation in population during Fifty Years
Years
Net Variation
Persons Variation 1901-1951 Males Variation Females Variation
2 3 4 5 6 7 8
1,059,654 568.355 491,299
1,020,879 -38,775 556,801 -11,554 464,078 -27,221
923,264 ~97,615 507,812 -48,989 415,452 -48.626
1,047,389 +124,125 572,441 +64,629 474,948 -t 59.496
1,288,478 +241,089 697.273 +124,832 591,205 +116.257
1.501,391 +212,913 +441,737 814,289 +117.016 687.102 +95,897
TABLE A-IV 6
Towns Classified by Population with Variations since 1901
Towns TehsiI, etc.
2 3
Class I (100,000 and over)
AGRA
1901 1911 1921 1931 1941 1951
AoRA
. . City Total .. Municipality .. Cantonment
Class II (50,000 to 100,000)
2 FlRozABAD
1901 1911 1921 1931 1941 1951
FIROZABAD
City Municip~iity
Class V (5,000 to 10,000)
3 FATEHPUR SIKRI
1901 1911 1921 1931 1941 1951
4 ACHNERA
1901 1911 1921 1931 1941 1951
S ETMADPUR
1901 1911 1921 1931 1941 1951
6 SHAMSHABAD
1901 1911 1921 1931 1941 1951
7 TuNoLA
1901 1911 1921 1931 1941 1951
8 FATEHABAD
1901 1911 1921 1931 1941 1951
KIRAOLI
.. Municipality
KIRAoLl
.. TownArea ..
ETMADPUR
" TownArea .•
FATEHABAD
TownArea ..
ETMADPUIl
Town Area
PATEHABAD
TownArca
Net Variation
Persons Variation 1901-1951
4
188,022 185,449 185,532 229,764 284,149 375,665 333,530
42,135
16,849 13,571 20,183 23,154 40,572 65,438
7,147 6,132 5,173 6,998 8,1% 8,959
5,375 4,884 5,121 5,670 8,069 7,509
5,322 3,758 4,352 4,900 5,383 6,098
3,380 3,057 5,077 5,653
3,ll63 3,352 2,716 7,318 5,651
4,673 3,611 3,857 3,967 5,101 5,274
5
-2,573 +83
+44,232 -1-54,385
6
+ 91,516 + 187,643
-3,278 +6,612 +2,971
+17,418 +24,866
-1,015 -959
+1,825 +1,198
+763
-491 +237 +549
-1-2,399 -560
-1,564 +594 +548 +483 +715
-323 +2,020
+576
-5ii -636
+4,602 -1,667
-1,062 +246 +110
+1,134 +173
+48,589
+ 1,812
+2,134
+776
+601
Males
7
99,903 101,335 104,051 127,736 156,302 206,459 181,393 25,066
8,775 7,184
11,240 13,053 21,039 37,145
3,715 3,262 2,760 3,795 4,371 4,775
2,899 2,675 2,802 3,116 4,242 4,053
2,787 1,988 2,328 2,718 2,669 3,280
l,7ii 1,595 2,658 2,961
2,100 2,046 1,521 4,138 3,132
2,461 1,971 2,091 2,170 2,779 2,817
Variation
8
+1,432 +2,716
+23,685 -128,566 +50,157
-1,591 +4,056 + 1,813 +7,986
+ 16,106
-453 -502
+1,035 +576 +404
-224 +127 +314
+1,126 --189
-799 +340 +390 -49
+611
-117 +1,063
+303
-54 -525
+2,617 -1,006
-490 +120
+79 +609 +38
Females Variation
9
88,119 84,114 81,481
102,028 127,847 169,206 152,137 17,069
8,074 6,387 8,943
10,101 19,533 28,293
3,432 2,870 2,413 3,203 3,825 4,184
2,476 2,209 2,319 2,554 3,827 3,456
2,535 1,770 2,024 2,182 2,714 2,818
1,668 1,462 2,419 2,692
1,763 1,306 1,195 3,180 2,519
2,212 1,640 1,766 1,797 2,322 2,457
10
--4,005 -2,633 + 20,547 +25,819 +41,359
-1,687 +2,556 +1,158 +9,432 +8,760
-562 -457 +790 +622 +359
-267 +110 +235
+ 1,273 -371
-765 +254 +158 +532 +104
-206 -t 957 +273
-457 -111
+1,985 -661
-572 +126 + 31 +525 +135
7 TABLE A-IV
Towns Classified by Population with Variations since 1901
b .c §
Net 1:1 <a Variation ] TOWIlS T ehsil, etc. Persons Variation 1901-1951 Males Variation Females Variation
2 3 4 5 6 7 8 9 10
9 TUNDLA RAILWAY ETMADPUR COLONY
1901 1911 1921 1931 1941 19.51 Town 5,249 3,039 2,210
Class VI (under S,ooO}
10 BAH BAH
1901 3,867 1,966 +235
1,901 1911 4,005 +138 2,20! 1,804 -97 1921 3,049 -956 1,661 -540 1,388 -416 1931 3,713 +664 2,010 +349 1,703 +315 1941 4,738 +1,025
+676 2,814 +804 1,924 +221
1951 .. Town Area .. 4,543 -195 2,536 -278 2,007 + 83
11 PINHAT BAH
1901 1911 1921 3,501 1,879 1,622 1931 3,760 +259 2,055 +176 1,705 +83 1941 4,441 +681 2,398 +343 2,043 +338 1951 Town Area 3,922 -519 2,131 -267 1,791 -252
12 JAONER KHERAGAlUf
1901 4,051 2,150 1,901 1911 4,277 +226 2,296 +146 1,981 +80 1921 3,099 -1,178 1,674 -622 1,425 -556 1931 2,893 -206 1,599 - 75 1,294 -131 1941 3,648 +755
-150 1,956 +357 1,692 +398
19.51 Town Area 3,901 +253 2,119 +163 1,782 +90
TABLE A-V 8
Towns 8fJ'anged TerritoriaJly with
Population LIVELIHOOD
Non-agricultural
Persons (including their dependants) who
!> .0 '''v-
~ Production other VI-
than cultivation Commerce
t;
~ Name of Town Persons Males Femlles Males Females Males Females
2 3 4 5 6 7 8 9
District Total 497,862 274,447 223,415 79,480 65,204 65,454 56,602
AgraCity 375,665 206,459 169,206 53,840 45,734 49,365 42,684
Agra(M. B.) 333,530 181,393 151,137 50,225 42,586 45,423 39,515
Agra (Cantt ) .. 42,135 15,066 17,069 3,615 3,148 3,942 3,169
2 FiroLabad City (M. B.) 65,438 37,145 28,293 Ig,907 13,765 9,127 7,776
3 Agra (Cantt.) 42;135 25,066 17,069 3,615 3,148 3,942 3,169
4 Fatehpur Sikri (M. B.) 8,959 4,775 4,184 2,107 1,730 811 782
5 Achnera (T. A.) 7,509 4,053 3,456 770 669 655 578
6 Etmadpur (T. A.) 6,098 3,280 2,818 723 640 840 731
7 Shamshabad (T. A.) 5,653 2,961 2,692 551 511 1,268 1,173
8 Tundla (T. A.) 5,651 3,132 2,519 513 454 1,083 800
9 Fatehabad (T. A.) 5,274 2,817 2,457 429 398 889 808
10 TUNDLA RLY. COLONY 5,249 3,039 2,210 192 Hill 25 16
11 Bah(T.A.) 4,543 2,536 2,007 622 416 655 572
12 Pinhat (T. A.) 3,922 2,131 1,791 431 383 378 342
13 Jagner (T. A.) 3,901 2,119 1,782 395 338 358 340
Population by Livelihood Classes
CLASSES
Classes
derive their principal means of livelihood from-
Males
10
20,735
14,914 12,403 2,511 1,369 2,511
209 670 252
98 675 104
2,234 95 45 70
vuTransport
Females
11
15,402
10,997 9,650 1,347
904 1,347
171 546 198 87
569 75
1,680 71 41 63
VIII·~ Other services and
miscellaneous sources
Males
12
97,133
83,879 69,069 14,810 6,556
14,810 882 897 947 626 797 780 579 443 320 427
Females
13
76,819
66,468 57,240
9,228 4,840 9,228
752 780 781 582 649 670 347 331 247 372
9 TABLE A-V
Agricultural Classes
IV-Non-culti vating owners of land;
agricultural rent receivers; and their dependants
Males
14
1,868
1,248 1,171
77 273
77 30 23 30 17 48 64
7 46 42 40
Females
15
1,239
711 633
78 240
78 26 16 32 11 32 59
36 36 40
I-III -Cultivators, cultivating labourers and their dependants
Males
16
9,777
3,213 3,102
111 913 111 736
1,038 488 401
16 551
2 615 915 829
Females
17
8,149
2,612 2,513
99 768
99 723 867 436 328
15 447
1 581 742 629
TABLE E 10
Area and Population of' District and
Population Percentage
1 1951 1941 a " = oa Area in square 'H District and tebsil miles Persons Males Females Persons 1941-51 <Il
2 4 5 6 7 8
District Total 1,860 1,501,391 814,289" 687,102 1,288,478 +16'5 Rural Total 1,812 1,003,529 539,842 463,687 911,846 +10'] Urban Total 48 497,862 274,447 223,415 376,632 +32'2
Agra-
. Total 219 511,609 279,280 232,329 420,816 +21'6 Rural 195 135,944 72,821 63,123 136,667 -'5 Urban 24 375,665 206,459 169,206 284,149 +32'2
2 Bah-
Total 338 151,863 81,413 70,450 135,809 +11'8 Rural 331 143,398 76,746 66,652 126,690 +13'2 Urban 7 8,465 4,667 3,798 9,119 -7'2
3 Etmadpur-
Total 278 205,156 110,596 94,560 181,017 +13'3 Rural 277 188,158 101,145 87;013 168,3-16 +11'8 Urban 1 16,998 9,451 7,547 12,701 +33'8
.. Fatehabad-
Total 241 139,566 75,364 64,202 128,101 +8'9 Rural 239 128,639 69,586 59,053 117,923 +9'1 Urban 2 10,927 5,778 5,149 10,178 +7'4
5 Firozabad-
Total 203 199,211 109,195 90,016 156,159 +27'6 Rural 201 133,773 72,050 61,723 115,587 +15'7 Urban 2 65,438 37,145 28,293 40,572 +61'3
6 Kheragarh-
Total 308 144,677 78,292 66,385 133,692 +8'2 Rural 303 140,776 76,173 64,603 130,044 +8'3 Urban 5 3,901 2,119 1,782 3,648 +6'9
7 Kiraoli-
Total 273 149,309 80,149 69,160 132,884 +11'4 Rural 266 132,841 71,321 61,520
llt619 +13'9 Urban 7 16,468 8,828 7,640 1 265 +1'3
- NOTE-The area figures given in column 3 are based on the district records of tehsil areas,
11 TABLE E
TeIisils by Livelibood Classes
LIVELIHOOD CLASSES
Variation Demity Agricultural Classes
I-Cultivators of land II-Cultivators of land wholly or mainly owned wholly or mainly unowned
and the,r dependants and their dependants
1931-41 1951 1941 Males Females Males Females
9 10 11 12 13 14 IS
+23'0 807 693 352,733 303,761 29,815 24,1D1 +20'5 554 503 345,003 297,371 28,535 23,705 +29'6 10,437 7,996 7,730 6,390 1,280 1,099
+24'8 2,339 1,924 38,312 33,225 4,196 3,593 +27'1 697 701 36,044 31,457 3,617 3,078 +23'7 15,851 11,989 2,268 1,768 579 515
+18'8 449 402 64,315 55,711 3,531 2,716 +18'6 433 383 62,888 54,560 3,373 2,610 .j. 22'0 1,209 1.,303 1,427 1,211 158 106
+20'0 738 651 58,188 50,155 3,535 2,868 +17'5 679 606 57,733 49,741 3,502 2,842 +66'8 16,998 31,753 455 414 33 26
+21'6 579 532 49,916 42,024 2,622 2,328 +19'9 538 493 49,057 41,341 2,558 2,261 +44'9 5,464 5,089 859 68~ 64 67
+31'1 981 769 42,517 37,314 3,090 2,539 +20'4 666 575 41,786 36,627 2,987 2.468 +75'2 32,719 20,286 791 687 103 71
+19'2 470 434 51,080 43,245 7,397 6,016 +19'0 465 429 50,402 42,773 7,282 5,902 +2~'1 780 730 678 472 115 114
+22'8 547 487 48,345 42,027 5,444 4.744 +22'0 499 438 47,093 40,872 5,216 4,544 +IN 2,353 2,324 1,252 1,155 228 200
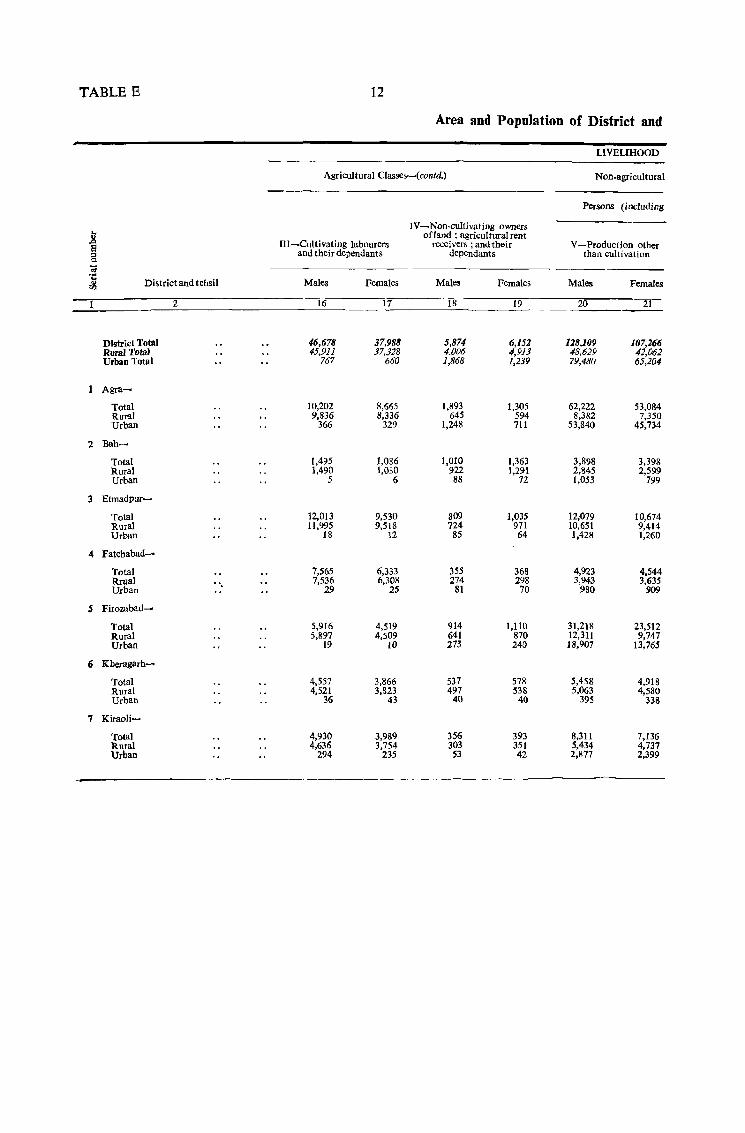
TABLE E 12
Area and Population of District and
LIVELIHOOD
Agricultural Classes-(colltd.) Non-agricultural
Persons (including
IV-Non-cultivating owners
.8 ofland ; agricultural rent
S III -Cultivating labourers receivers; and their V-Production other ::I and their dependants dependants than cultivation C1
d
~ District and tehsil Males Females Males Females Males Females
2 16 17 18 19 20 21
District Total 46,678 37,988 5,874 6,152 128,109 107,266 Rural Total 45,911 37,328 4,006 4,913 48,629 42,062 Urban Total 767 660 1,868 1,239 79,480 65,204
Agra-
Total 10,202 8,665 1,893 1,305 62,222 53,084 Rural 9,836 8,336 645 594 8,382 7,350 Urban 366 329 1,248 711 53,840 45,734
2 Bah-
Total 1,495 1,036 1,010 1,363 3,898 3,398 Rural 1,490 1,030 922 1,291 2,845 2,599 Urban 5 6 88 n 1,053 799
:3 Etmadpur-
Total 12,013 9,530 809 1,035 12,~79 10,674 Rural 11,995 9,518 724 971 10,651 9,414 Urban 18 12 85 64 1,428 1,260
4 Fatehabad-
Total 7,565 6,333 355 368 4,923 4,544 Rrual .. 7,536 6,308 274 298 3,943 3,635 Urban 29 25 81 70 980 909
5 Firozabad-
Total 5,916 4,519 914 1,110 31,218 23,512 Rural 5,897 4,509 641 870 12,311 9,747 Urban 19 10 273 240 18,907 13,765
6 Kheragarh-
Total 4,557 3,866 537 578 5,458 4,918 Rural 4,521 3,823 497 538 5,063 4,580 Urban 36 43 40 40 395 338
7 Kiraoli-
Total 4,930 3,989 356 393 8,311 7,136 Rural 4,636 3,754 303 351 5,434 4,737 Urban 294 235 53 42 2,877 2,399
13
Tehsils by Livelihood Classes-- ( conc!d.)
CLASSES
Classes
their dependants) who derive their principal means oflivelihood from~
VI~Commerce VII-Transport
Males Females Males Females
22 23 24 25
87,359 75,266 30,554 23,788 21,905 18,664 9,819 8,386 65,454 56,602 20,735 15,402
52,769 45,797 17,200 12,999 3,404 3,113 2,286 2,002
49,365 42,684 14,914 10,997
2,763 2,427 3.5 273 1,730 1,513 J05 161 1,033 914 140 112
7,470 6,167 6,921 ~,611 5,522 4,620 3,760 3,164 1,948 1,547 3,161 2,447
4,200 3,753 9~0 787 2,043 1,772 728 625 2,157 1,981 202 162
11,975 10,267 2,434 1,839 2,848 2,491 1,065 935 9,127 7,776 1,369 904
3,671 3,001 815 672 3,313 2,661 745 609
358 340 70 63
4,511 3,854 1,909 1,607 3,045 ' 2,494 1,030 890 1,466 1,360 879 717
TABLE E
VIII-Other services and miSGellaneous sources
Males Females
26 ' 2'1
133,167 108.077 36,034 , 31,258 97,133 76,819
92,486 73,661 8,607 7,193
83,879 . 66,468
4,056 3,416 3,293 2,838
763 578
9,581 8,520 7,258 6,743 2,323 1.777
4,853 4,1:65 3,447 2,813 1,406 1,252
11,071 8,916 4,515 4,076 6,556 4,840
4,777 4,C89 4,350 3,717
427 372
6,343 5,410 4,564 3,878 1,779 1,532 ,
TABLEJJ-I
Tract
pistrld Total
Rural Total
Teb!jil Agra (Rural)
2 Tebsil Bah (Rural)
3 Tehsil Etmadpur (Rural)
4 Tehsil Fatehabad (Rural)
5 TehsirFirozabad (Rural)
6 Tebsil Kheragarh (Rural)
7 Tehsil Kiraol i (Rural)
Urban Total
Urban Non-city
2 AgraCity
3 Firozabad City
Tract
District Total
Rural Total
2
Tehsi I Agra (Rural)
2 Tebsil Bah (Rural)
3 Tehsil Etmadpur (Rural)
2
4 TehsilFatehabad (Rural) .,
5 TehsilFirozabad (Rural) ••
6 Tehsil Kheragarh (Rural) .,
7 Tehsil Kiraoli (Rural)
Urban Total
Urban Non-city
2 AgraCity
3 Firozabad City
Males
15
352,733
315,003
36,044
62,888
57,733
49,057
41,786
50,402
47,093
7,730
4,671
2,268
791
14
Total Population
Persons Males
3
1,501,391
1,003,529
135,944
143,398
188,158
128,639
133,773
140,776
132,841
497,862
56,759
375,665
65,438
814,289
539,842
72,821
76,746
101,145
69,586
72,050
76,173
71,321
274,447
30,843
206,459
37,145
Females
5
687,102
</63,687
63,123
66,652
87,013
59,053
61.723
64,603
61,520
223,415
25,916
169,206
28,293
B-ECONOMIC
Livelihood Classes
Persons
6
807,805
786,772
93,607
128,214
137,026
109,633
95,785
115,738
106,769
21,033
11,055
7,784
2,194
AGRICULTURAL
All
Total
Males Females.
7 8
435,100 372,705-
</23,155 363,.117
50,141 43,465-
68,673 59,541
73,954 63,072
59,425 SO,20S.
51,311 44,474
62,702 53,036
57,248 49,511
11,6<15 9,388
5,998. 5,057
4,461 3,323-
1,186 1,008
AGRICULTURAL
I-Cultivators of land wholly or mainly owned and their dependants
Total
Females
16
303,761
19~,371
31,457
54,560
49,741
41,341
36,627
42,773
~0,872
6,390
.3,935
1,768
687
S. C. (i) Self-supporting S. C. (ii) Non-earning persons dependants
Males
17
200,683
196,9/7
22,952
36,653
32,242
27,957
23,654
29,209
2~,280
3,736
2,544
845
347
Females
18
4,338
4,136
519
1,152
596
458
349
487
575
202
71
113
18
Males
19
141,111
137,580
11,935
24,947
23,996
19,344
17,481
19,530
20,347
3,531
1,932
1,195
404
Females
20
292,152
286,132
30,448
51,906
48,818
40,163
35,906
40,405
38,486
• 6,020
3,750
1,607
663
S. C. (iii) Earning dependants
Males Females
21
10,939
10,476
1,157
1,288
1,495
1,756
651
1,663
2,466
</63
195
228
40
22
7,271
7,103
490
1,502
327
720
372
1,881
1,811
168
114
48
6
TABLES 15 TABLE B-1
and sub-elasses
CLASSES
a ...
s. C. (i) Self-supporting S. C. (ii) Non-earning S. C. (iii) Earning persons dependants dependants
Males Females Males Females Males Female.
9 10 11 12 13 14
247,361 7,1(15 174,089 356,348 13,650 9,19Z
242,'14 6,189 168,293 347,541 12,948 8,987
30,869 951 17,478 41,888 1,795 626
40,211 1,759 27,048 56,087 1,414 1,69S
41,869 1,059 30,291 61,598 1,794 41S
33,939 561 23,366 48,753 2,120 894
29,324 608 21,130 43,442 857 424
35,995 929 24,589 49,497 2,118 4610
30,007 922 24,391 46,276 2,850 2,32)
5,147 376 5,796 8,807 702 30S 3,189 122 2,569 4,798 240 137 1,454 226 2,612 3,038 395 S~
504 28 615 971 67 90
CLASSB,S-(contd.)
II-Cultivators of land wholly or mainly unowned and their dependants
Total S. C. (i) Self-supporting S. C. (ii) Non-earning S. C. (iii) Earning persons dependants dependants
Males Females Males Females Males Females Males Females
23 24 25 26 27 28 29 30
29,815 24,804 16,630 328 r 11,998 23,219 1,187 1,257 28,535 23,705 16,044 308 11,407 22,155 1,084 1.241 3,617 3m8 2,073 31 1,379 2,989 165 59 3,373 2,610 2,051 71 1,224 2,366 98 F) 3,502 2,842 2,048 22 1,405 2,806 49 14 2,558 2,261 1,446 22 1,015 2,183 91 56 2,987 2,468 1,746 11 1,155 2,439 86 IS 7,282 5,902 3,797 94 3,150 5,243 335 S6S 5,216 4,544 2,883 57 2,079 4,129 254 35& 1,280 1,099 586 ' .zo- 591 1,064 103 15
598 513 311 7 259 496 28 10 579 515 23& 13 281 499 60 3 103 11 31 51 69 15 2
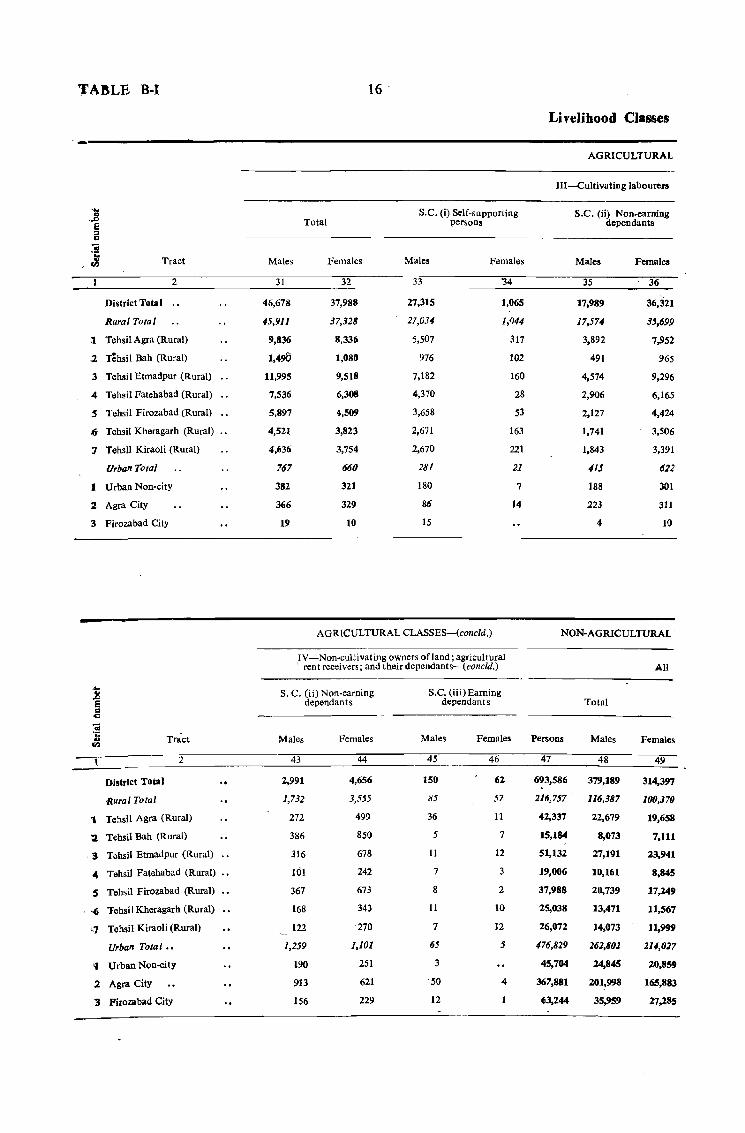
TABLE B-1 16
Livelihood Classes
._.----------------------------------------------------------
Tract
2
District Total
Rural Total
", Tehsil Agra (Rural)
.2 T~hsil Bah (Rural)
3 Tehsil Etmadpur (Rural)
4 Tehsil Fatehabad (Rural)
S Tehsil Firozabad (Rural)
.6- Tehsil Kheragarh (Rural) .•
1 Tehsil Kiraoli (Rural)
Urban Total
1 Urban Non-city
2 Agra City
3 Firozabad City
Tract
District Total
'Rural Total
2
1 Tehsil Agra (Rural)
;Z TehsiI Bah (Rural)
. 3 Tehsil Etmadpur (Rural)
.. Tehsil Fatehabad (Rural)
!i Tehsil Firozabad (Rural)
o(i 'Fehsil Kheragarh (Rural)
'.7 Tehsil Kiraoli (Rural)
Urban Total ..
'1 Urban Non-city
2 Agra City
1 Firozabad City
Males
31
46,678
45,911
',836
1,49i.J
11,995
7,536
5,897
4,521
4,636
767
382
366
19
Total
Females
32
37,988
37,328
8,33Ci
1.080
9,518
6,308
4,509
3,823
3,754
660
321
32,
10
S.C. (i) Self-supporting persons
Males
33
27,315
27,034
5,507
976
7,182
4,370
3,658
2,671
2,670
281
180
86
15
Females
'34
1,065
1,044
317
102
160
28
53
163
221
21
7
14
AGRICULTURAL CLASSES-(conc/d.)
IV -Non-cultivating owners ofland; agricultural , rent receivers; and theirdependants-(concld.)
S. C. (ii) Non-earning dependants
Males
43
2,991
1,732
272
386
316
101
367
168
122
1,259
190
913
156
Females
44
4,656
3,555
499
850
678
242
673
343
'270
1,101
251
621
229
S.c. (iii) Earning dependants
Males
45
150
85
36
5
11
7
8
11
7
65
3
·~o
12
Females
46
62
57
11
7
12
3
2
10
12
5
4
AGRICULTURAL
Ill-Cuitivating labourers
s.c. (ii) Non-earning dependants
Males
35
17,989
17,574
3,892
491
4,574
2.906
2,127
],74]
],843
415
188
223
4
Females
36
36,:J21
35,699
7,,952
965
9,296
6,]65
4,424
3,506
3,391
622
301
311
10
NON-AGRICULTURAL·
Persons
47
693,586
216,757
42,337
15,184
51,132
19,006
37,988
25,038
26,072
176.829
45,704
367,881
(;3,244
Total
Males
48
379,189
116.387
22,679
8,073
27,191
10,161
20,739
13,471
14,073
262,802
24,845
201.998
35,959
All
Females
49
314,397
100,370
19,658
7,111
23,941
8,845
17,249
11,567
11,999
214,027
ZO,859
165,883
27,285
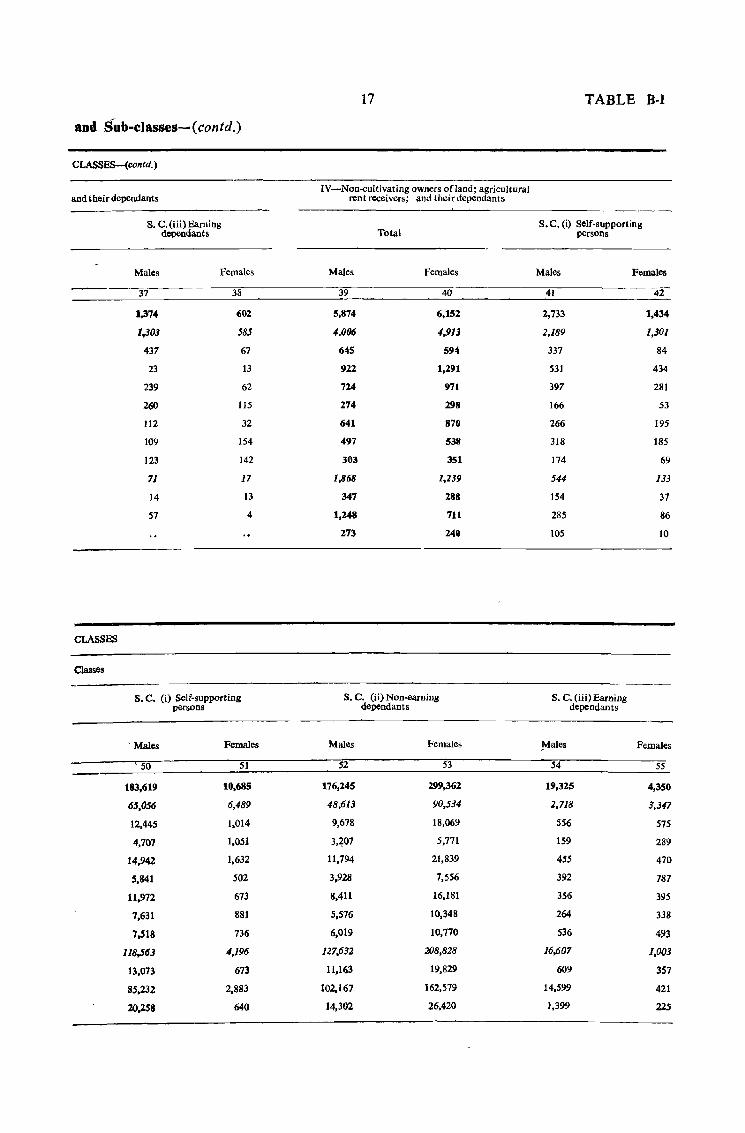
and Sub-classes-(contd.)
CLASS.ES-(contd. )
and their dependants
S. C. (iii) Earning dependants
Males Females
37 38
1.374 602
1,303 585
437 67
23 13
239 62
260 115
112 32
109 154
123 142
71 17
14 13
57 4
CLASSES
Classes
S. C. (i) Self-supporting persons
, Males Females
, 50 51
183,619 10,685
65,056 6,489
12.445 1,014
4,707 1.051
14,942 1.632
5,841 502
11,972 673
7,631 881
7,s18 736
118,563 4,196
13,073 673
85.232 2,883
20,258 640
17 TABLE B-1
IV-Non-cu[tivating owners ofland; agricultural rent receivers; and their dependants
Total S.C. (i) Self-supporting
persons
Males Females Males Females
39 40 41 42
5,874 6,152 2,733 1,434
4.006 4,913 2,189 1,301
645 594 337 84
922 1,291 531 434
724 971 397 281
274 298 166 53
641 870 266 19.5
497 538 318 185
303 351 174 69
1,868 1,239 544 133
347 288 154 37
1,248 711 285 86
273 240 105 10
S. C. (ii) Non-earning dependants
S. C. (iii) Barning dependants
Males Females ~ales Females
52 53 .54 55
176,245 299,362 19,325 4,350
48,613 90,534 2,718 3,347
9,678 18,069 556 .575
3,~07 .5,771 159 289
11,794 21,839 455 470
3,928 7,556 392 787
8,411 16,181 3.56 39.5
5,576 10,348 264 338
6,019 10,170 .536 493
127.632 208.828 16,607 1,003
11,163 19,829 609 357
102,167 162,579 14,599 421
14,302 26,420 1.399 225
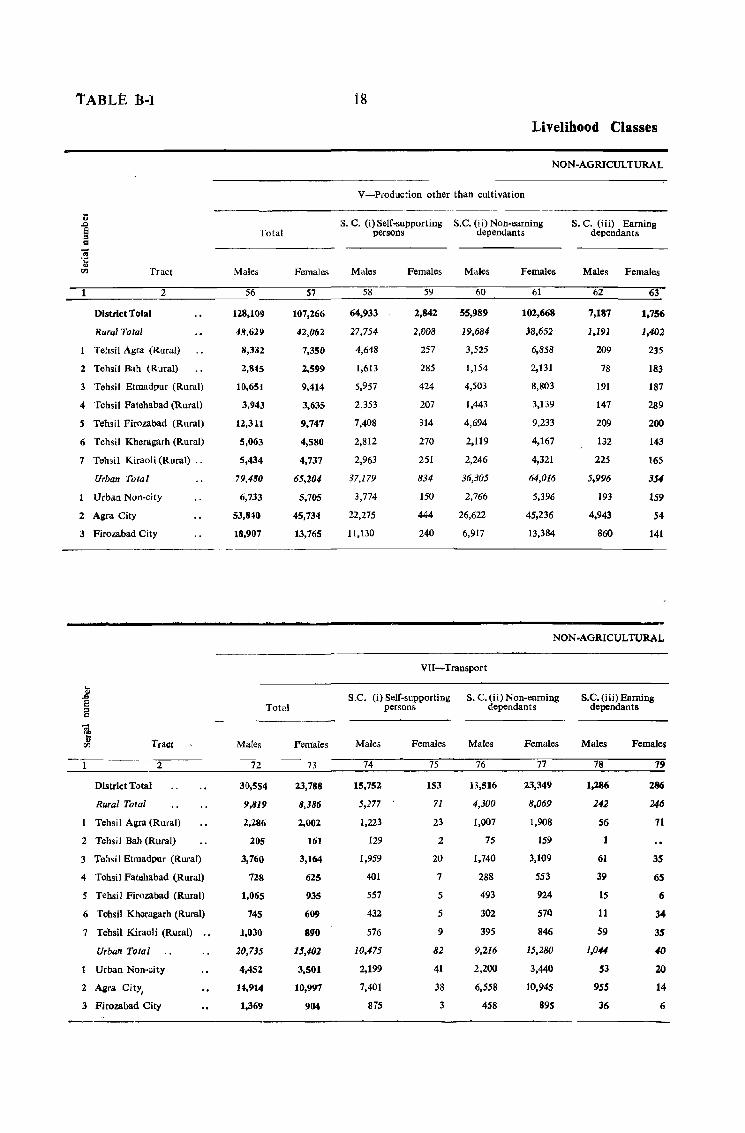
TABLE lJ-l
Tract
District Total
Rural Total
2
TehsiI Agra (Rural)
2 Tehsil Bah (Rural)
3 Tehsil Etmadpur (Rural)
4 Tehsil Fatehabad (Rural)
5 Tehsil Firozabad (Rural)
6 Tehsil Kheragarh (Rural)
7 Tehsil Kiraoli (Rural) ..
Urban lola I
Urban Non-city
2 Agra City
3 Firozabad City
Tract
2
District Total
Rural Total
Tehsil Agra (Rural)
2 Tehsil Bah (Rural)
3 Te:lsil Etmadpur (Rural)
4 Tehsil Fatehabad (Rural)
5 Tehsil Firozabad (Rural)
6 Tehsil Kheragarh (Rural)
7 Tehsil Kiraoli (Rural)
Urban Total
Urban Non-city
2 Agra City,
3 Firozabad City
Total
Males
56
12.8,109
48,629
11,382
2,845
10,651
3,943
12,311
5,063
5,434
79,480
6,733
53,840
18,907
Males
72
Total
39,554
9,819
2,286
l05
3,760
728
1,065
745
1,030
20,735
4,45Z
14,914
1,369
Females
57
107,266
42,062
7,350
2,599
9,414
3,635
9,747
4,580
4,737
65,204
5,705
45,734
13,765
Females
73
23,788
8,386
2,002
161
3,164
625
935
609
890
15,402
3,501
10,997
904
18
Livelihood Classes
NON-AGRICULTURAL
V-Production other than cultivation
s. C. (i) Self-supporting S.C. (ii) Non-earning persons dependants
Males
58
64,933
27,754
4,648
1,613
5,957
2,353
7,408
2,812
2,963
37,179
3,774
22,275
11,130
Females
59
2,842
2,008
257
285
424
207
314
270
251
834
150
444
240
Males
60
55,989
19,684
3,525
1,154
4,503
1,443
4,694
2,119
2,246
36,305
2,766
26,622
6,917
Females
61
102,668
38,652
6,858
2,131
8,803
3,139
9,233
4,167
4,321
64,016
5,396
45,236
13,384
S. C. (iii) Earning dependants
Males Females
62
7,187
1,191
209
78
191
147
209
132
225
5,996
193
4,943
860
63
1,756
1,402
235
183
187
289
200
143
165
354
159
54
141
NON-AGRICULTURAL
VII-Transport
S.C. (i) Self-supporting S. C. (ii) Non-earning persons dependants
Males
74
15,752
5,277
1,223
129
1,959
401
557
432-
576
10,475
2,199
7,401
875
Females
75
153
71
23
2
20
7
5
5
9
82
41
38
3
Males
76
13,516
4,300
1,007
75
1,740
288
493
302
395
9,216
2,200
6,558
458
Females
77
23,349
8,069
1,908
159
3,109
553
924
571)
846
15,280
3,440
10,945
895
S.C. (iii) Earning dependants
Males
78
1,286
242
S6
61
39
15
11
S9
1,044
53
9SS
36
Females
79
286
246
71
3S
65
6
34
35
40
20
14
6
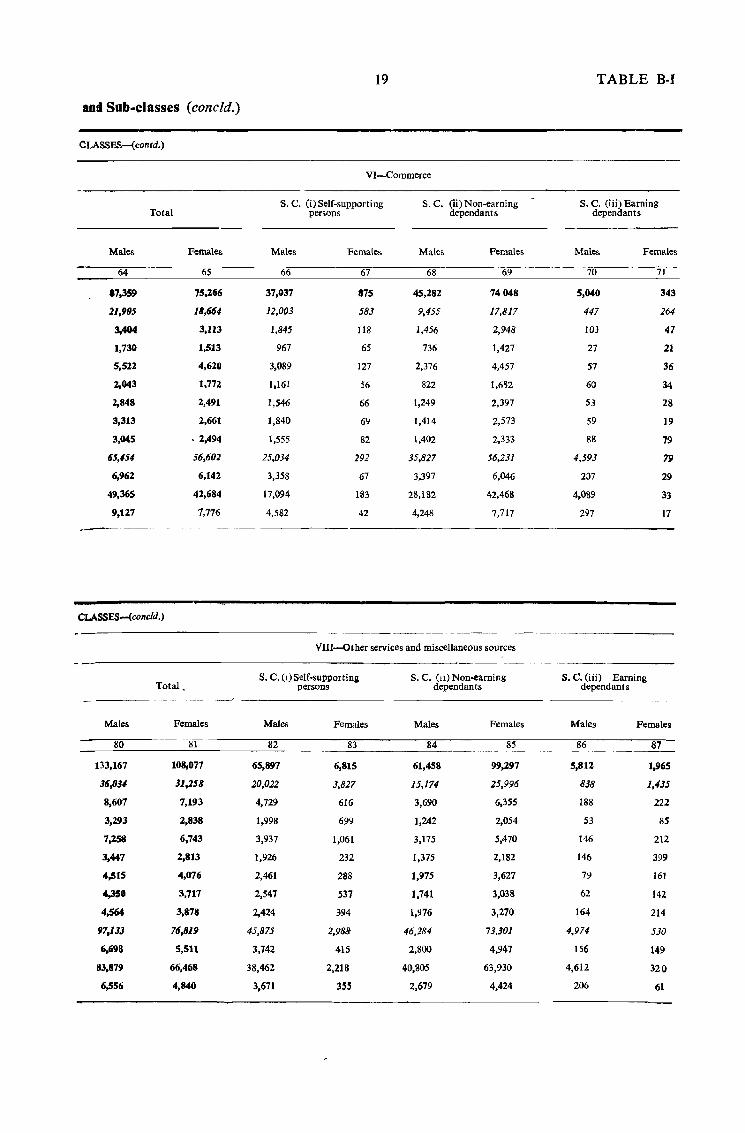
19 TABLE B-1
aod Sub-classes (coneld.)
CLASSBS-{contd.)
VI-Commerce
S. C. (i) Self-supporting S.C. (ii) Non.earning S. C. (iii) Earning Total perSOns dependants dependants
Males Females Males Females Males Females Males Females
64 65 66 67 68 69 70 71
87,359 75,266 37,037 875 45,282 74048 5,040 343
21,905 18,664 12,003 583 9,455 17,817 447 264
3,404 3,113 1,845 118 1,456 2,948 103 47
1,730 1,513 967 65 736 1,427 27 21
5,522 4,620 3,089 127 2,376 4,457 57 36
2,043 1,772. 1,161 56 822 1,682 60 34
2,848 2,491 1,546 66 1,249 2,397 53 28
3,313 2,661 1,840 69 1,414 2,573 59 19
3,045 .2,494 1,555 82 1,402 2,333 88 79
65,454 56,602 25,034 292 35,827 56,231 4,593 79
6,962 6,142 3,358 67 3,397 6,046 207 29
49,365 42,684 17,094 183 28,182 42,468 4,089 33
9,127 7.776 4,582 42 4,248 7,717 297 17
CLASSES-(concld.)
VIU-Qther services and miscellaneous sources
Total. S. C. (I) Self-supporting s. C. (11) Non-earning S. C. (iii) Earning
persons dependants dependants
Males Females Males Females Males Females Males Females
80 81 82 83 84 85 86 87
133,167 101Jj077 65,897 6,815 61,458 99,297 5,812 1,965
36,034 31,258 20,022 3,827 15.174 25,996 838 1,435
8,607 7,193 4,729 616 3,690 6,355 188 222
3,293 2,838 1,998 699 1,242 2,054 53 85
7,258 6,743 3,937 1,061 3,175 5,470 146 212
3,447 2,813 1,926 232 1,375 2,182 146 399
4,515 4,076 2,461 288 1,975 3,627 79 161
4,350 3,717 2,547 537 1,741 3,038 62 142
4,564 3,878 2,424 394 1,976 3,270 164 214
97,133 76,819 45,875 2,988 46,284 73,301 4,974 530
6,698 5,511 3,742 415 2,800 4,947 156 149
83,879 66,468 38,462 2,218 40,805 63,930 4,612 320
6,556 4,840 3,671 355 2,679 4,424 206 61
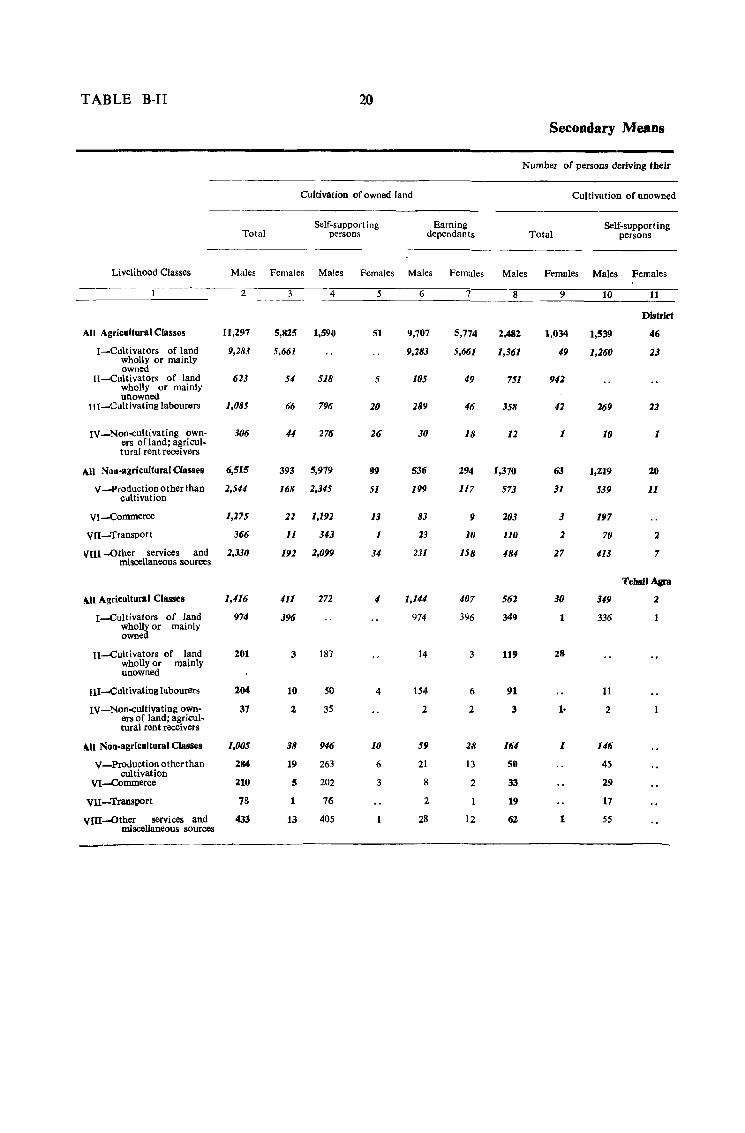
TABLE B-I1 20
Secondary Means
Number of persons deriving their
Cultivation of owned land Cultivation of unowned
Self-supporting Earning Self-supporting Total persons dependants Total persons
Livelihood Classes Males Females Males Females Males Females Males Females Males Females
2 4 5 6 7 8 9 10 11
District
All Agricultural Classes 11,297 5,823 1,590 51 9,707 5,774 2,482 1,034 1,539 46
I-Cultivators of land wholly or mainly
9,183 5,661 9,283 5,661 1,361 49 1,260 23
owned II-Cultivators of land 623 54 518 5 105 49 751 942
wholly or mainly unowned
III-Cultivating labourors 1,085 66 796 20 289 46 358 42 269 22
IV_Non-cultivating own-ers ofland; agricul-
306 # 276 26 30 18 12 1 10 1
tural rent receivers
All Non-agricultural Classes 6,515 393 5,979 99 536 294 1,370 63 1,219 20
V -Production other than 2,544 168 2,345 51 199 117 573 31 539 11 cultivation
VI-Commerce 1,175 22 1,192 13 83 9 203 3 197
VII-Transport 366 11 343 1 23 10 110 2 70 2
VIll -Other services and miscellaneous sounces
2,330 192 2,099 34 231 158 484 27 413 7
Tehall A,ra
0\11 Agricultural Classes 1,416 411 272 4 1,1# 407 562 30 349 :2
I-Cultivalors of land 974 396 974 396 349 336 wholly or owned
mainly
I1-Cultivators of land 201 :3 187 14 3 119 28 wholly or mainly unowned
Ill-Cuitivating labourers 204 10 50 4 154 6 91 11
IV-Non-cultivating own-ers of land; agricul-
37 2 35 2 2 :3 1· 2
tural rent receivers
0\11 Non-agricultural Classes 1,005 38 946 10 59 28 164 1 146
V -Production other than 284 19 263 6 21 13 50 45 cultivation
VI-Commerce 210 5 202 3 8 2 33 29
VII-Transport 78 1 76 2 19 17
vtII-Other services and 433 13 405 28 12 62 1 55 miscellaneous sources
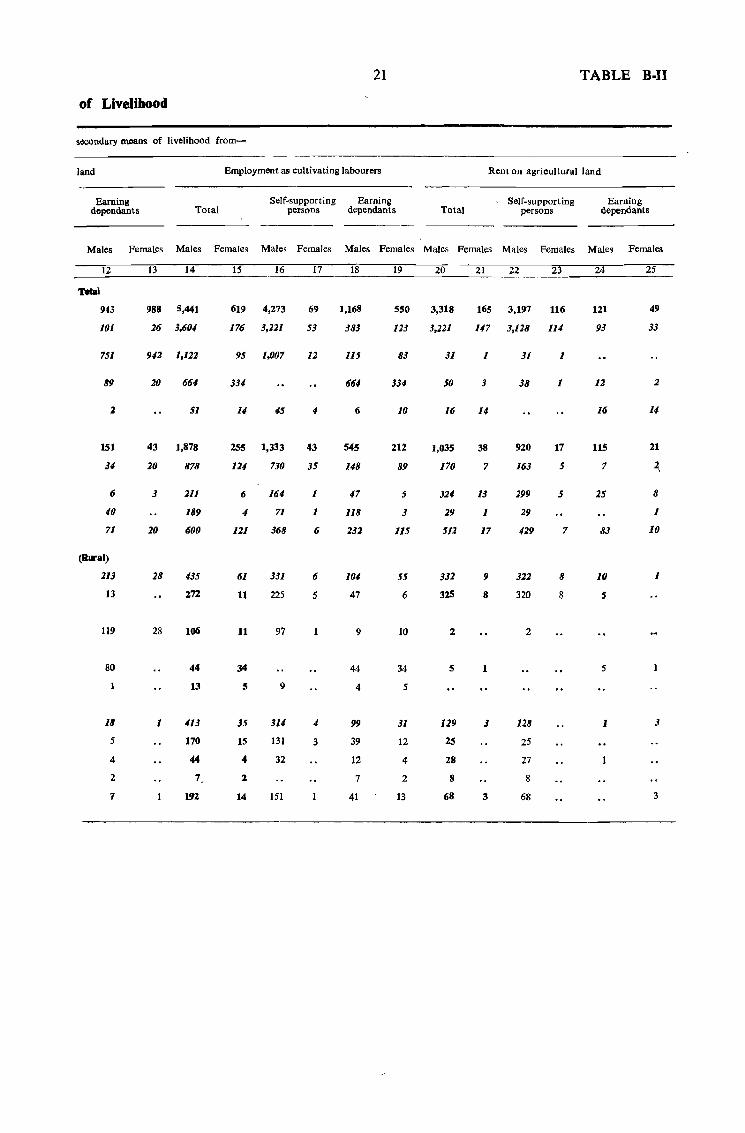
21
of Livelihood
secondary means of livelihood from~
land
Earning dependants Total
Employment as cultivating labourers
Self-supporting Earning persons dependants Total
TABLE B·II
Rent on agricultural land
Self-supporting persons
Earning dependants
Males Females Males Females Males Females Males Females Males Females Males Females Males Females
12
943
101
751
89
151
:U
6
.(0
71
(Rural)
213
13
119
80
18
5
4
2
7
13 14
988 5,441
26 3,60,(
942 1,122
20 664
51
43 1,878
20 878
3 211
20
28
28
1
189
600
435
172
106
44
13
413
170
44
7
192
15 16
619 4,273
176 3,221
95 1,007
33,(
45
255 1,333
124 730
6 164
4
121
61
11
11
35
15
4
1
14
71
368
331
225
97
9
314
131
32
151
17
69
53
12
113
35
1
1
6
6
5
4
3
18
1,168
383
115
661
6
545
148
47
118
232
104
47
9
44
4
99
39
12
7
41
19
550
113
83
334
10
212
89
5
3
115
55
6
10
34
5
31
12
4
2
13
20
3,318
3,221
31
50
16
1,035
170
324
29
512
332
325
2
5
129
25
28
8
68
21 22 23
165 3,197 116
147 3,128 114
1
3
14
38
7
13
1
17
9
8
1
3
3
31
38
920
163
299
29
429
322
320
2
128
25
27
8
68
1
1
17
5
5
7
8
8
24
121
93
12
16
115
7
25
83
10
S
5
1
25
49
33
2
21
8
1
10
1
3
3
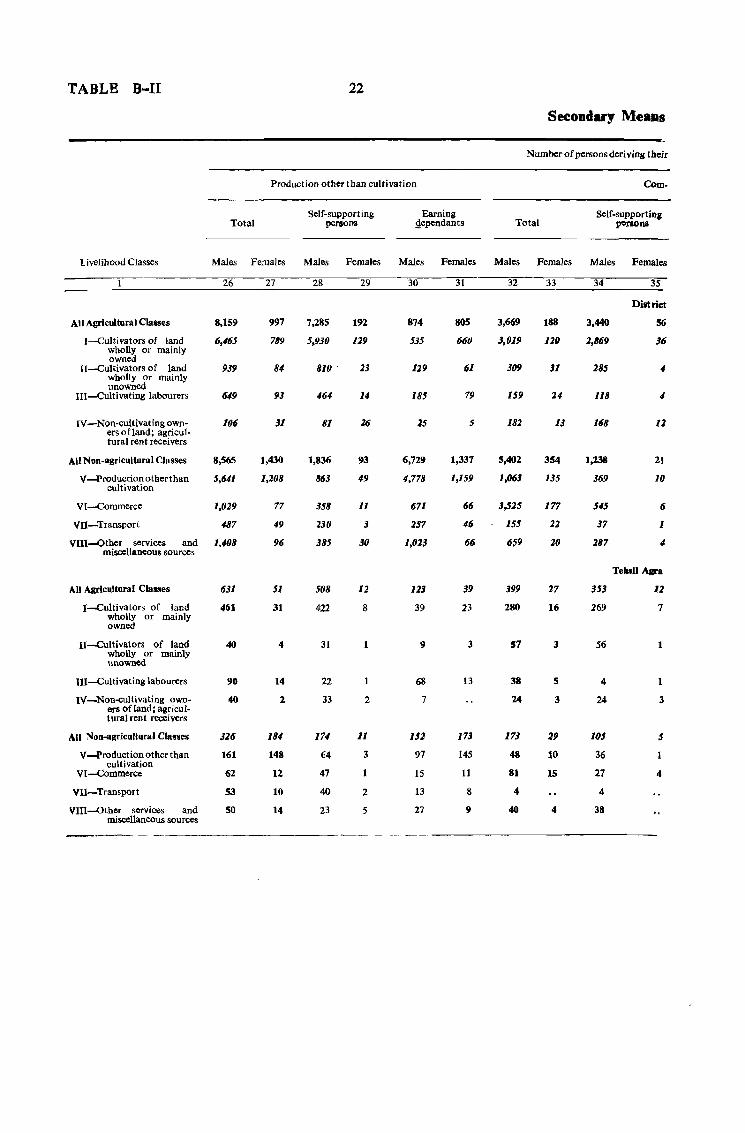
TABLE B-II 22
Secondary ~eaos
N umber of persons deriving their
Production other than cultivation Com.
Self-supporting Earning Self-supporting Total persons gependants Total porsons
Livelihood Classes Males Females Males Females Males Females Males Females Males Females
26 27 28 29 30 31 32 33 34 35
Distriet
All Agricultural Classes 8,159 997 7,285 192 874 805 3,669 188 3,440 56
I-Cultivators of land wholly or mainly owned
6,165 789 5,930 /29 535 66() 3,fJ19 120 2,869 36
U-Cultivators of land 939 84 810 ' 23 129 61 309 Jl 285 " wholly or mainly unowned
III-Cuitivating labourers 649 93 464 14 185 79 159 U 118 4
[V -Non-cultivating own· ers ofland; agricul-
106 31 81 26 25 5 182 13 168 12
tural rent receivers
All Non .agricultural Classes 8,565 1,430 1,836 93 6,729 1,337 5,402 354 1,238 21
V -Production other than 5,641 1,208 863 49 4,778 1,159 1,063 135 369 10 cultivation
VI-Comrnerce 1,029 77 358 11 671 66 3,525 177 545 6
VII-Transport 487 49 230 3 257 46 155 22 37 1
VlII-Other services and 1,408 96 385 30 1,023 66 659 20 287 4 miscellaneous sources
Tehail Agra
All Agricultural Classes 631 51 508 12 123 39 399 27 353 12
I-Cultivators of land 461 31 422 8 39 23 280 16 269 7 wholly owned
or mainly
H-eultivators of land 40 4 31 9 3 57 3 56 1 wholly or mainly unowned
UI-Cultivating labourers 90 14 22 68 13 38 5 4
IV-Non-cultivating own· ers ofland; agricul·
40 2 33 2 7 24 3 24 3
t ural ren t receivers
All Non-agricultural Classes 326 184 174 11 152 173 173 29 105 5
V -Production other than 161 148 64 3 97 145 48 10 36 cultivation
VI-Commerce 62 12 47 15 11 81 IS 27 4
VH-Transport 53 10 40 2 13 8 4 4
VIII-Other services and 50 14 23 5 27 9 40 4 38 miscellaneous sources
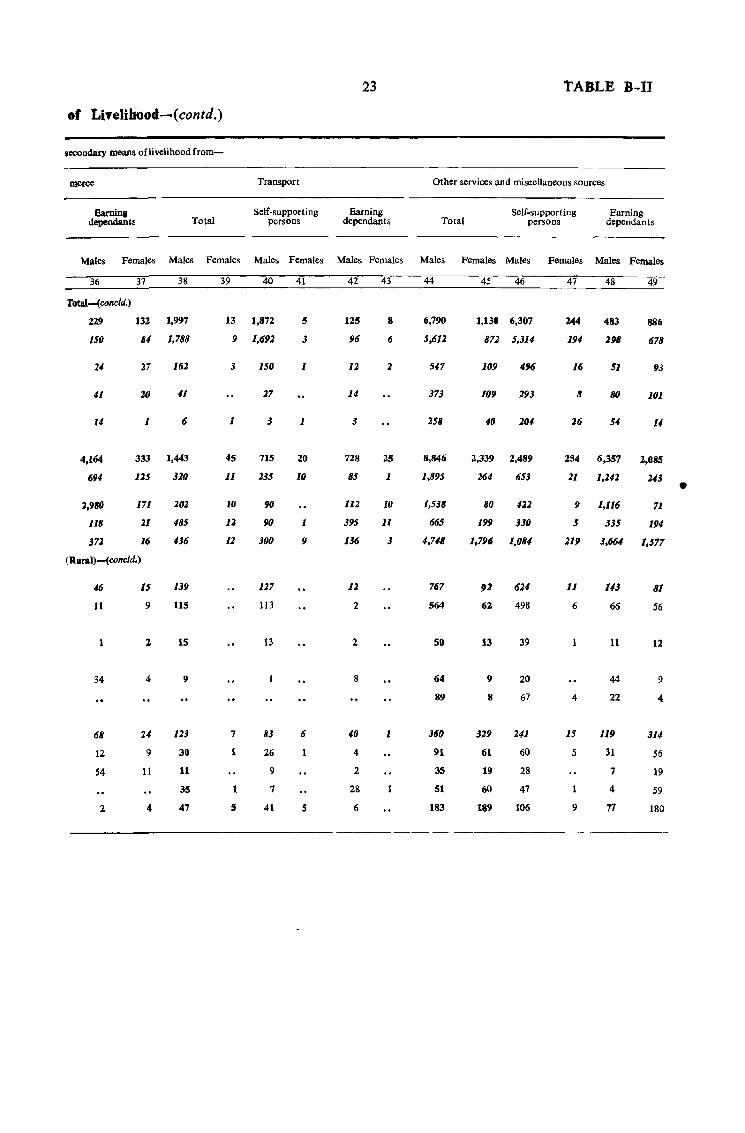
of U,elihood-(contd.)
secondary means oflivelihood from-
merce
Earning dependants Total
Transport
Self-supporting persons
23
Earning dependants
TABLE B-II
Other services and miseellaneous sources
Total Self-supporting
persons Earning
dependants
Males Females Males Females Males Females Males Females Males Females Males Females Males Females
36 37 38
Total-(concld.)
229 132 1,997
150
41
4,164
694
2,980
118
372
84 1,788
27 162
10 41
1 6
333 1,443
125 320
171
21
16
202
485
436
(Rural)-(concld.)
46
11
34
68
12
54
2
15
9
2
4
24
9
11
4
139
115
15
123
30
11
35
47
39 40
13 1,8n
9 1,692
3
1
45
11
10
12
12
7
1
1
5
150
27
3
715
235
90
90
300
127
113
83
26
9
7
41
41
5
3
1
1
20
10
1
9
6
5
42
125
96
12
14
3
728
85
112
395
136
12
2
2
8
40
4
2
28
6
43
8
6
2
25
1
10
11
3
1
44
6,790
5,61Z
547
373
258
8,846
1,895
1,538
665
4,748
767
564
so
64
89
36Q
91
35
51
183
45 46
1.130 6,307
872 5,314
109 496
109 193
40 104
2,339 2,489
264 653
80 412
199 330
1.796 1,084
91
62
13
9
8
329
61
19
60
189
624
498
39
20
67
241
60
28
47
106
47
244
194
16
8
26
48
483
198
51
80
54
49
886
678
93
101
14
254 6,357 2,085
2I 1,241 243
9 1,116 71
5 335 194
219 3,664 1,577
11
6
4
15
5
9
143
66
11
44
22
119
31
7
4
77
81
56
12
9
4
314
56
19
59
180
•

TABLE B-II 24
Secondary Means
Number of persons deriving their
Cultivation of owned land Cultivation of unowned
S~lf-supporting Earning Self-supporting Total persons dependants Total persons
Livelihood Classes Males Females Males Females Males Females Males Females Males Females
2 3 4 5 6 7 8 9 10 II
TehsU Bah
All Agricultural Classes 1,111 1,017 136 16 1,175 I,OJ[ 329 167 239 U
I-Cultivators of land 1,160 1,024 1,160 1,024 227 27 218 12 wholly or mainly owned
II-Cu1tivators of land 59 9 52 3 7 6 " 127 wholly or unowned
mainly
lIl-Cultivating labourers 58 11 51 10 7 21 13 20 12
IV-Non-cultivating own- 34 3 33 3 ers of land; agricul!-tural rent receivers
.\11 Non-agricultural ClaSlies 752 72 711 18 <II 5<1 Il7 9 117 6
V -Production other than 252 19 223 13 29 6 56 56 cultivation
VI-Commerce 87 1 83 4 21 22
VII-Transport 15 14 8 1 8
VIII-Other services and 398 52 '391 4 7 48 41 8 41 5 miscellaneous sources
Tthlil EtmIdpar
All Agrieultura I ClalileS 1,578 218 318 8 1,260 210 285 8 268 l
I-Cultivators of land 1,114 189 1,214 189 238 7 229 wholly or mainly owned
n-Cultivators of land 49 46 3 8 wholly or mainly unowned
IU-Cultivating labourers 2S8 12 220 38 11 3(j 1 36
IV-Non-cultivating own-ers of land; agricul-
57 17 52 7 5 10 3 3
tural rent receivers
All Non-agricultural Classes 860 36 806 18 5<1 18 114 2 111 2
V -Production other than 276 16 267 11 9 5 36 2 36 2 cultivation
VI-COmmerce 142 3 141 3 33 33
VII-Transport 101 99 2 lSI 18
Vm-Other services and 341 17 299 7 42 10 26 24 miscellaneous sources
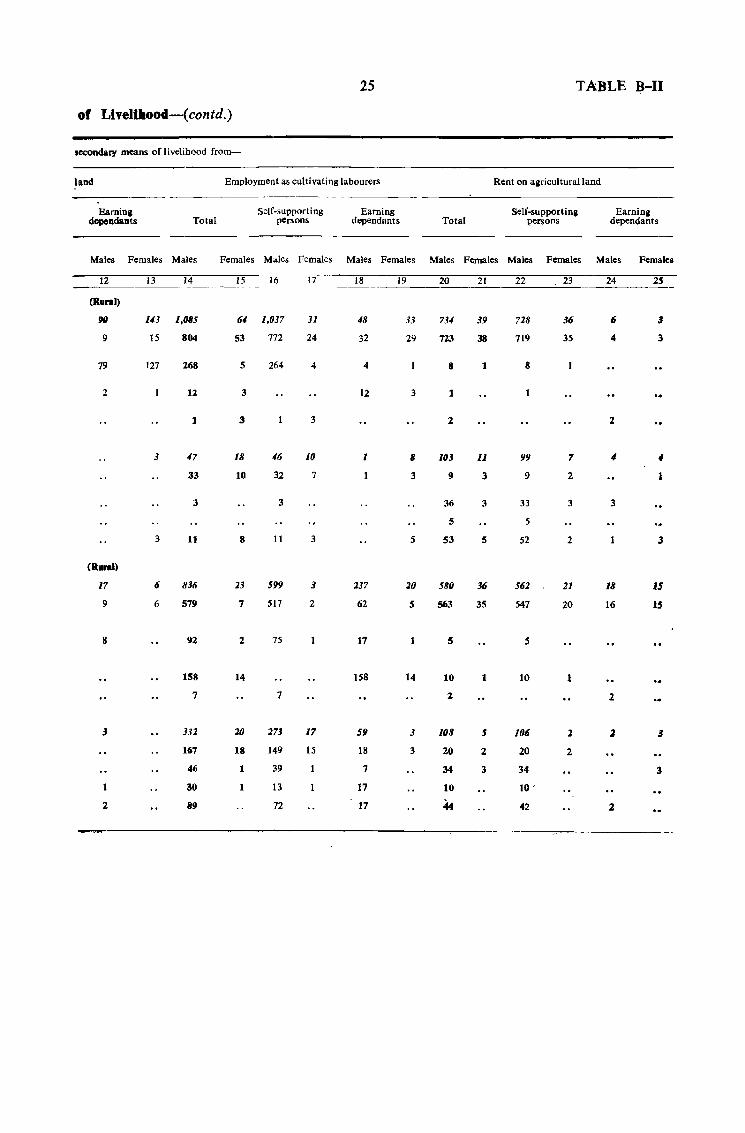
25 TABLE ~-II
of LiveUhood-( contd.)
secondary means of livelihood from-
land Employment as cultivating labourers Rent on agricultural land
Earning Self-supporting Earning Self-supporting Earning dependants Total persons dependants Total persons dependants
Males Females Males Females Males Females Males Females Males Females Males Females Males Females
12 13 14 15 16 17 18 19 20 21 22 23 24 25 -~----
(Rural)
90 143 1,085 64 1,037 31 48 33 734 39 728 36 6 3
9 15 804 S3 772 24 32 29 723 38 719 35 4 3
79 127 268 5 264 4 4 8 1 8
2 12 3 12 3 1
1 3 3 2 2
3 47 18 46 10 1 8 103 11 99 7 " " 33 10 32 7 3 9 3 9 2 1
3 3 36 3 33 3 3
5 5
3 11 8 II 3 5 53 5 52 2 3
(Rural)
17 6 836 23 599 3 237 20 580 36 562 21 18 15
9 6 579 7 517 2 62 5 563 35 547 20 16 15
8 92 2 75 17 5 5
158 14 158 14 10 1 10
7 7 2 2
3 332 20 273 17 59 3 108 5 106 2 2 3
167 18 149 15 18 3 20 2 20 2
46 1 39 7 34 3 34 3
30 1 13 17 10 10 '
2 89 72 17 44 42 2
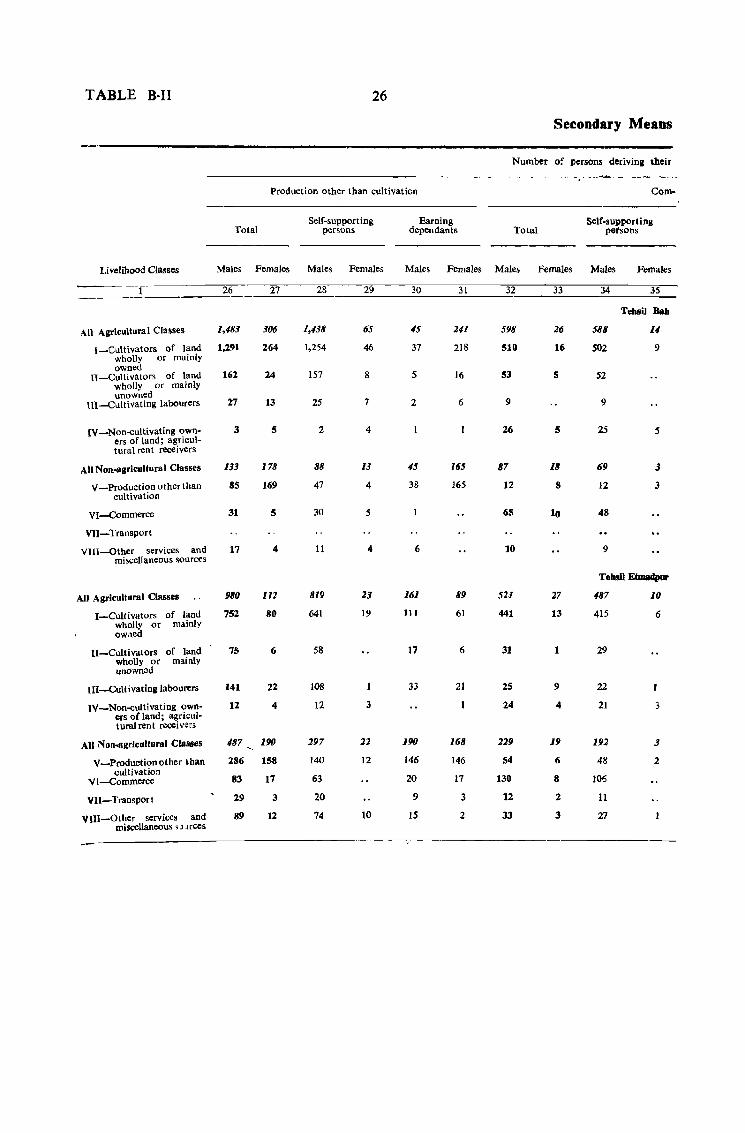
TABLE B-Il 26
Secondary ~eaDS
Number of persons deriving their
Production other than cultivation Com-
Total Self-supporting Earning Self-support i ng
persons dependants Total petsons
Livelihood Classes Males Females Males Females Males Females Males Females Males Females
26 27 28 29 30 31 32 33 34 35
TeJJsi) Bah
All Agricultural Classes 1,483 306 1,438 65 45 UI 598 26 588 U
I_Cultivators of land 1,291 264 1,254 46 37 218 510 16 502 9 wholly or mainly owned
II -Culti valors of land 162 24 157 8 5 16 53 5 52 wholly or mainly unowned
27 {n--Cultivating labourers 13 2S 7 2 6 9 9
IV-Non-cultivating own- 3 5 2 4 26 5 25 5 ers of land; agricul-tural rent receivers
All Non-agricultura I Classes 133 178 88 13 45 165 87 18 69 3
V -Production other than 8S 169 47 4 38 165 12 8 12 3 cultivation
VI-Commerce 31 5 30 5 6S 10 48
VII-Transport
VIII-Other services and 17 4 11 4 6 10 9 miscellaneous sources
Tebsil Etmadpur
All Agricultural Classes 980 112 819 23 161 89 52il 27 487 10
I-Cultivators of land 752 80 641 19 III 61 441 13 415 6 wholly or mainly ow,led
II-Cultivators of land 75 6 58 17 6 31 1 29 wholly or mainly unown"d
III-Cultivating labourers 141 22 108 33 21 2S 9 22
IV-Non-<.:ultivating own- 12 4 12 3 24 4 21 3 ers of land; agriclll-tural rent reoei vers
AU Non-agricultural Classes 487 190 297 22 190 168 229 19 192 3
V-ProductioDother than 286 158 140 12 146 146 S4 6 48 2 cultivation
63 VI-Commerce 83 17 20 17 130 8 106
VII-Transport 29 3 20 9 3 12 2 11
VIII-Other services and miscellaneous n lrCCS
89 12 74 10 15 2 33 3 27
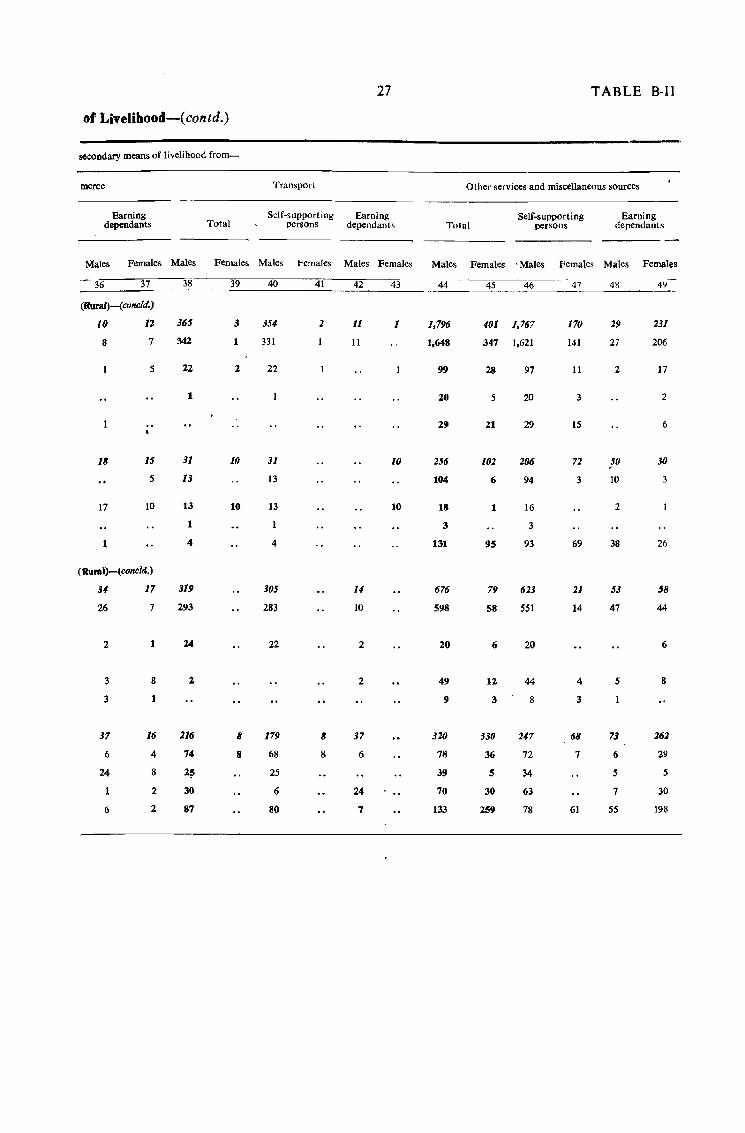
27 TABLE B-ll
of UveIihood-(contd.)
socondary means of livelihood from-
merce Transport Other services and miscellaneous sources
Earning Self-supporting Earning Self-supporting Earning dependants Total persons dependants Total persons dependants
Males Females Males Females Males Females Males Females Males Females -Males Females Males Females
36 37 38 39 40 41 42 43 44 45 46 47 4~ 4~ .. _-_-_--
(Rural)-(evncld.)
10 12 365 3 354 2 11 1 1,796 401 1,767 170 29 231
8 7 342 1 331 11 1,648 347 1,621 141 27 206
5 22 2 22 99 28 97 11 2 17
1 20 5 20 3 2
29 21 29 15 6
18 15 31 10 31 10 256 102 206 72 50 30
5 13 13 104 6 94 3 10 3
17 10 13 10 13 10 18 1 16 2
1 3 3
4 4 131 95 93 69 38 26
(Rural)-( cone/d.)
34 17 319 305 14 676 79 623 21 53 58
26 7 293 283 10 598 58 551 14 47 44
2 24 22 2 20 6 20 6
3 8 1 2 49 12 44 4 5 8
3 9 3 8 3
37 16 216 8 179 8 37 320 330 247 68 73 262
6 4 74 8 68 8 6 78 36 72 7 6 29
24 8 2~ 25 39 5 34 S S
2 30 6 24 70 30 63 7 30
6 2 87 80 7 133 259 78 61 55 198
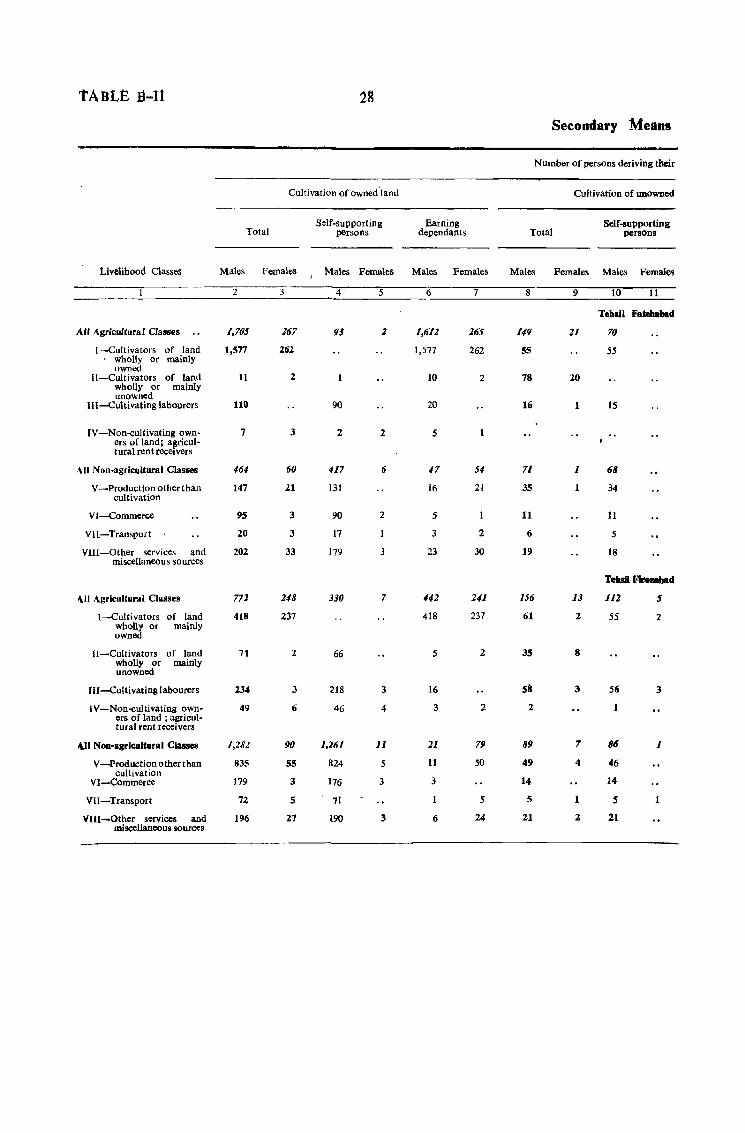
'tABLE .8-11 28
Secondary Means
Number of persons deriving their
Cultivation of owned'land Cultivation of unowned
Self-supporting Earning Self-supporting Total persons dependants Total persons
Livelihood Classes Males Females Males Females Males Females Males Females Males Females
2 3 4 5 6 7 8 9 10 11
Tehan Fatehabad
All Agricultural Classes 1,70S 167 93 1 1,611 165 149 11 70
r-Cultivators of land 1,577 161 1,577 262 55 S5 wholly or mainly owned
II-Cultivators of land 11 1 10 2 78 10 wholly or unowned
mainly
1I1-Cultivating labourers 110 90 20 16 1 15
IV-Non-cultivating own- 7 3 2 2 5 ers of land; agricul-tural rent receivers
All NDn-agricllltural Classes 464 60 417 6 47 54 71 1 68
V -Production other than 147 21 131 16 21 35 34 cultivation
VI-Commerce 95 3 90 2 5 11 11
VU-Transport 20 3 17 3 2 6 5
VIII-Other services and 202 33 179 3 23 30 19 IS miscellaneous sources
Tebsil-Fireabad
<\ II Agricultural Classes 771 148 330 7 142 141 156 13 112 5
I -Cultivators of land 418 237 418 237 61 2 55 2 wholly or owned
mainly
II-Cultivators of land 71 2 66 5 2 35 8 wholly or unowned
mainly
III -Cultivating labourers 234 3 218 3 16 511 3 56 3
IV-Non-cultivating own- 49 6 46 4 3 2 2 ers of land; agricul-tural rent receivers
"-II Noo-agricultural Classes 1,282 90 1,261 II 21 79 89 7 86 1
V-Productionotherthan 835 55 824 5 11 50 49 4 46 cultivation
VI-Commerce 179 3 176 3 3 14 14
VII-Transport 72 5 71 5 5 1 5
VIH-Other services and 196 27 190 3 6 24 21 1 21 miscellaneous sources
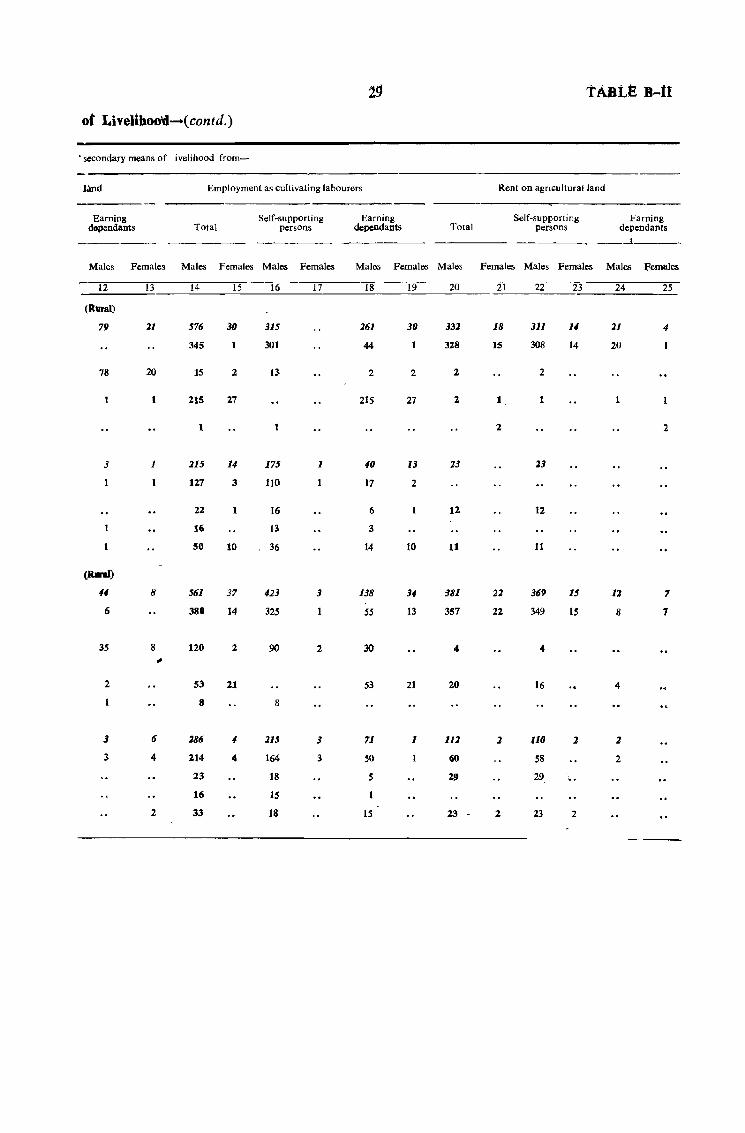
1~ tABLE B-tI
of Livelihoo'd-(contd.)
• secondary means of livelihood from-
land Employment as cultivating labourers Rent on agricultural land
Earning Self-supporting Earning Self-supporting Earning dopendants Total persons dependants Total persons dependants
-------
Males Females Males Females Males Females Males Females Males Females Males Females Males Females
12 13 14 15 16 17 18 19 20 21 22 23 24 25
(Rural)
79 21 576 30 315 261 30 332 18 311 14 21 4
345 301 44 328 IS 308 14 20
78 20 15 2 13 2 2 2 2
215 27 215 27 2 1. t
1 2. 2
3 1 215 14 175 1 40 13 23 23
127 3 110 17 2
22 1 16 6 12 12
16 13 3
50 10 36 14 10 11 11
(RanI)
44 8 561 37 423 3 138 34 l81 22 369 15 12 7
6 388 14 325 55 13 357 22 349 15 8 7
35 8 120 2 90 2 30 4 4 , 2 53 21 53 21 20 16 4
8 8
3 6 286 4 115 3 71 1 112 2 110 2 2
3 4 214 4 164 3 50 60 58 2
23 18 5 29 29 ,
16 15
2 33 18 15 23 2 23 2
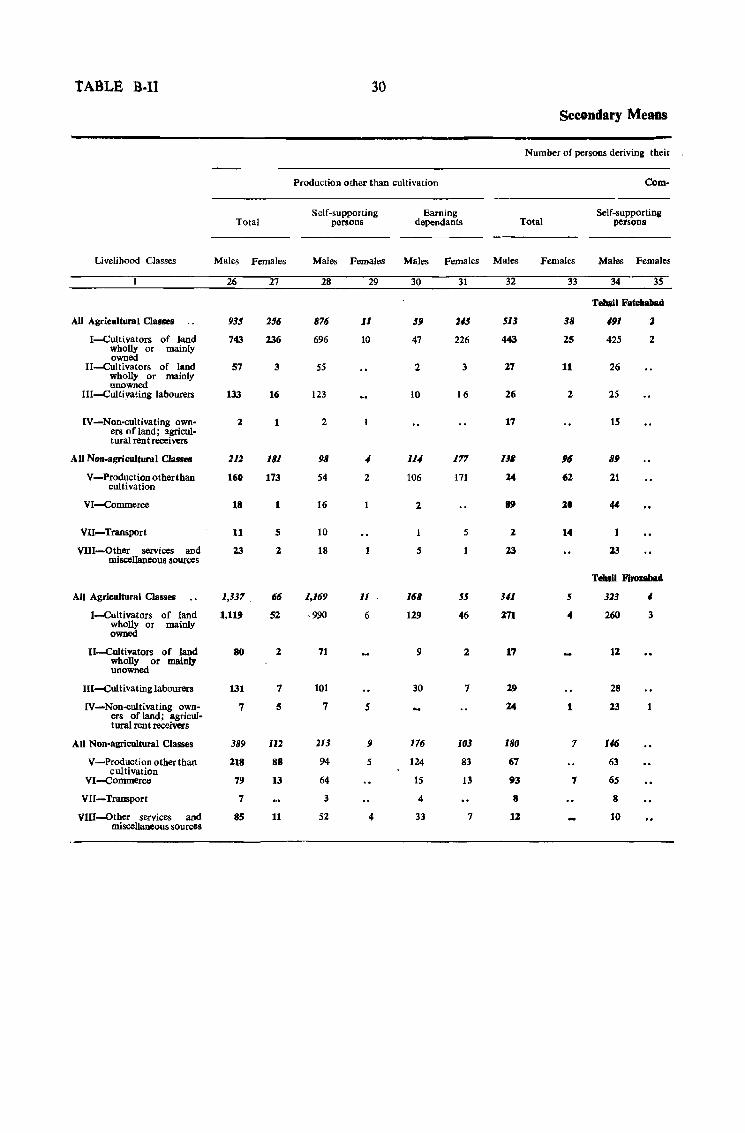
tABLE D·It 30
Secondary ~eans
Number of persons deriving their
ProductioD other than cultivation Com-
Self-supporting Earning Self-supporting Total persons dependants Total persons
Livelihood Classes Males Females Males Females Males Females Males Females Males Females
26 27 28 29 30 31 32 33 34 35
Tehail FateIIaINuJ
All Agricultural Classes 935 256 876 11 59 US 513 38 491 2
I-Culti vators of land 743 236 696 10 47 226 443 2S 42S 2 wholly or owned
mainly
I1-CuItivators of land 57 3 S5 2 3 27 11 26 wholly or mainly unowned
I1I-Cultivating labourers 133 16 123 10 16 16 1 25
IV-Non-cultivating own-ers ofland; ~gricul-
2 1 2 17 15
tural rent receivers
All Non-agricultural Classes 112 181 98 4 114 177 138 16 89
V-Production otherthan 160 173 S4 2 106 171 24 62 21 cultivation
VI-Commerce 18 1 16 2 89 20 «
VII-Transport 11 5 10 5 2 14
VIII-Other services and 23 2 18 5 23 23 miscellaneous sour<:es
Tebsll Flro:rabad
All Agricultura I Classes 1,337. 66 1,169 11 168 55 341 5 323 4
I-Cultivators of land 1,119 52 ,990 6 129 46 271 4 260 3 wholly or mainly owned
II-Cultivators of land 80 2 71 9 2 17 12 wholly or mainly unowned
Ill-Cultivating labourers 131 7 101 30 7 29 28
IV-Non-cultivating own- 7 5 7 S 24 1 23 ers of land; agricul-tural rent receivers
All Non-agricultural Classes 389 112 213 9 176 103 180 7 146
V-Productionotherthan 218 88 94 5 124 83 67 63 cultivation
VI-Commerce 79 13 64 IS 13 93 7 65
VII-Transport 7 3 4 8 8
VIII-Qther services and 85 11 52 4 33 7 12 10 miscellaneous sources
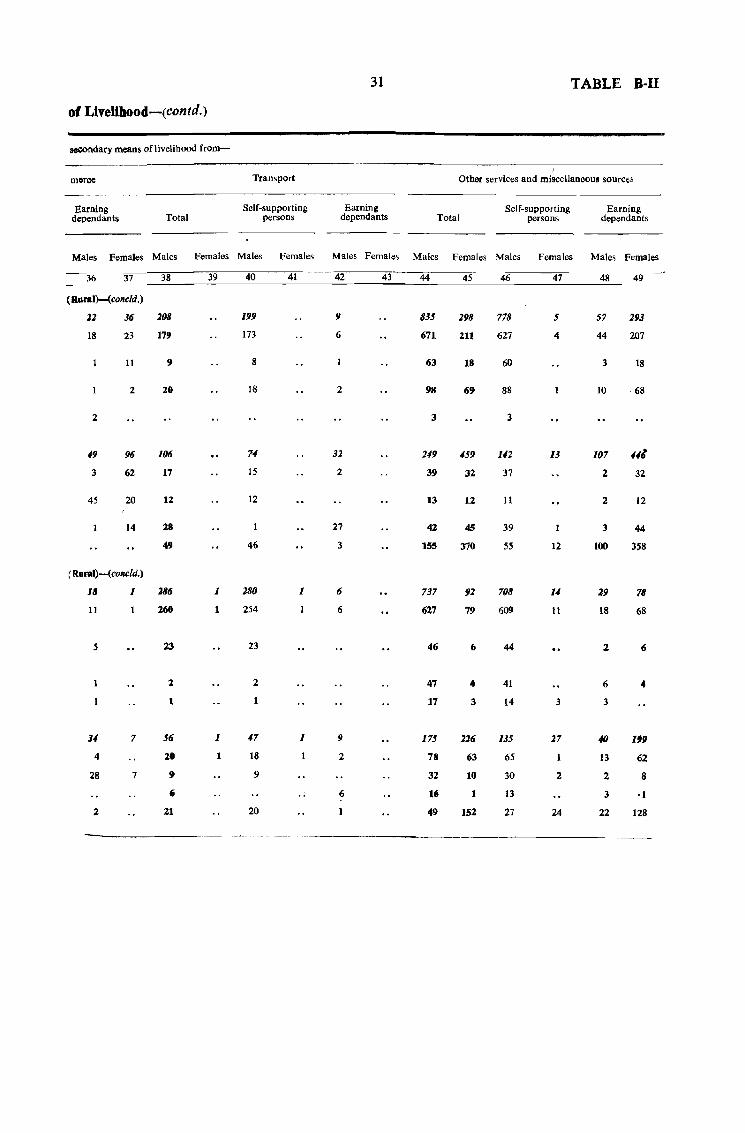
31 TABLE B-II
of Livelihood-(contd.)
~ndary means of livelihood from-
merce Transport Other services and miscellaneous sources
Earning Self-supporting Earning Self-supporting Earning dependants Total persons dependants Total persons dependants
Males Females Males Females Males Females Males Females Males Females Males Females Males Females
36 37 38 39 40 41 42 43 44 45 46 47 48 49
(RuraIHconcfd.)
21 36 108 199 9 835 198 778 5 57 193
18 23 1711 173 6 671 211 627 4 44 207
II 9 8 63 18 60 3 18
2 20 18 2 98 69 88 lO ,68
2 3 3
19 96 106 '11 32 219 159 111 13 107 III
3 62 17 15 2 39 32 37 2 32
45 20 1l 12 13 12 11 2 12
14 28 21 42 45 39 3 44
49 46 3 155 370 55 12 100 358
( Rural).-(concfd.)
11 1 286 1 180 1 6 737 91 708 11 29 78
11 260 1 254 6 627 79 609 11 18 68
5 23 23 46 6 44 2 6
2 2 47 4 41 6 4
1 17 3 14 3 3
31 7 56 1 47 1 9 175 126 135 27 IIJ 199
4 20 1 18 2 78 63 65 13 62
28 7 9 9 32 10 30 2 2 8
6 .. 6 16 1 13 3 ·1
2 21 20 49 152 27 24 22 128
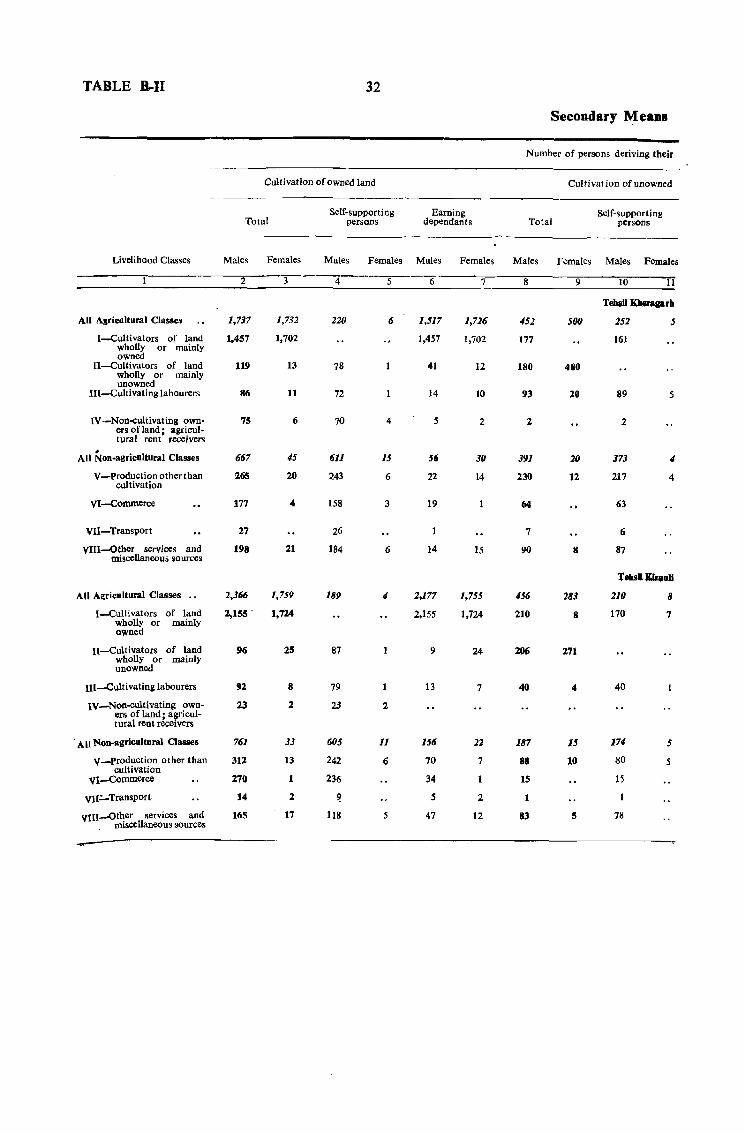
TABLE B..-I1 32
Secondary l\:feanB
Number of persons deriving their
Cultivation of owned land Cultivation of unowned
Self-supporting Earning Self-supporting Total persons dependants Total persons
Livelihood Classes Males Females Males Females Males Females Males Females Males Females
2 3 4 5 6 7 8 9 10 11
Tehan Kheraaarh
All Agricultural Classes 1,737 1,732 220 6 1,517 1,726 452 500 252 5
I-Cultivators of land 1,457 1,702 1,457 1,702 177 161 wholly or mainly owned
Il-Cultivators of land 119 13 78 41 12 180 480 wholly or mainly unowned
III-Cuitivating labourers 86 11 72 14 10 93 20 89 5
IV -Non-cultivating own- 75 6 70 4 5 2 2 2 ers ofland; agricul-tural rent receivers
All Non-agricultural Classes 667 45 611 15 56 30 391 20 373 4
V -Production other than 265 20 243 6 cultivation
22 14 230 12 217 4
VI-Commerce 177 4 158 3 19 64 63
VII-Transport 27 26 7 6
VlII-Other services and 198 21 184 6 14 15 90 8 87 miscellaneous sources
TeJasil~oli
All Agricultural Classes •• 2,366 1,759 189 4 2,177 1,755 456 283 210 8
I-Culli valors of land 2,155 . 1,724 2,155 1,724 210 8 170 7 wholly or mainly owned
U-Cuitivators of land 96 2S 87 9 24 2Il6 271 wholly or mainly unowned
lll-Cuitivating labourers 92 8 79 13 7 40 4 40
Iv-Non-cultivating own- 23 2 23 2 ers of land; agricul-tural rent receivers
. A 11 Non-agricultural ClaSlies 761 33 (j05 11 156 22 187 15 174 5
V_Production other than cultivation
312 13 242 6 70 7 88 10 80 5
VI-Commerce 270 1 236 34 15 IS
VII=-Transport 14 2 9 s 2 1
VIII-Other services and 165 17 118 5 47 12 83 S 78 , miscellaneous sources
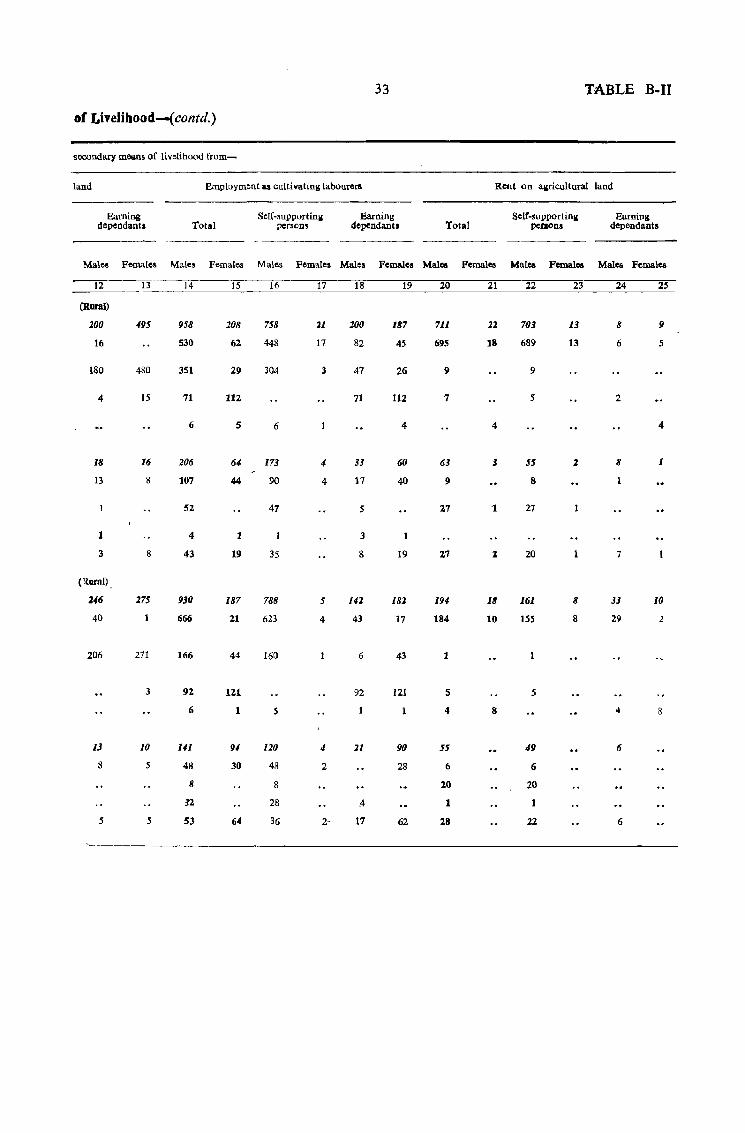
33 TA.BLE B-I1
of Livelihood-( contd.)
sooondary mesns of livelihood from-
land Employment &5 cultivating labourers Rent on allficultural land
Earning Self-supportinll Earning Sclf-supportinll Earning dependants Total person! dcpendants Total persoDS dcpendants
Male8 Femalc& Male& Females Malcs Fcmalcs Males FcnWcs Males Pcmale& Male& Females Males Fcmales
12 13 14 IS 16 17 18 19 20 21 22 23 24 25 "~-~"
(Rural)
200 495 958 208 758 11 200 187 711 12 703 13 If 9
16 530 62 448 17 82 45 695 18 689 13 6 5
180 480 351 29 304 3 47 26 9 9
4 15 71 112 71 112 7 5 2
6 5 6 4 4 4
18 16 206 64 173 4 33 60 63 3 5S 2 8 1
13 8 107 44 90 4 17 40 9 8
52 47 5 27 1 27
4 1 3
3 8 43 19 35 8 19 27 1 20 7
(Rural)
246 275 930 187 788 5 141 181 194 18 161 8 33 10
40 666 21 623 4 43 17 184 10 155 8 29 2
206 271 166 44 160 6 43 1
3 92 121 92 121 5 5
6 1 5 4 8 4 8
13 10 Ul 91 120 4 21 90 55 49 6
8 5 48 30 48 2 28 6 6
8 8 20 20
32 28 A 1
5 5 53 64 36 2- 17 62 28 22 6
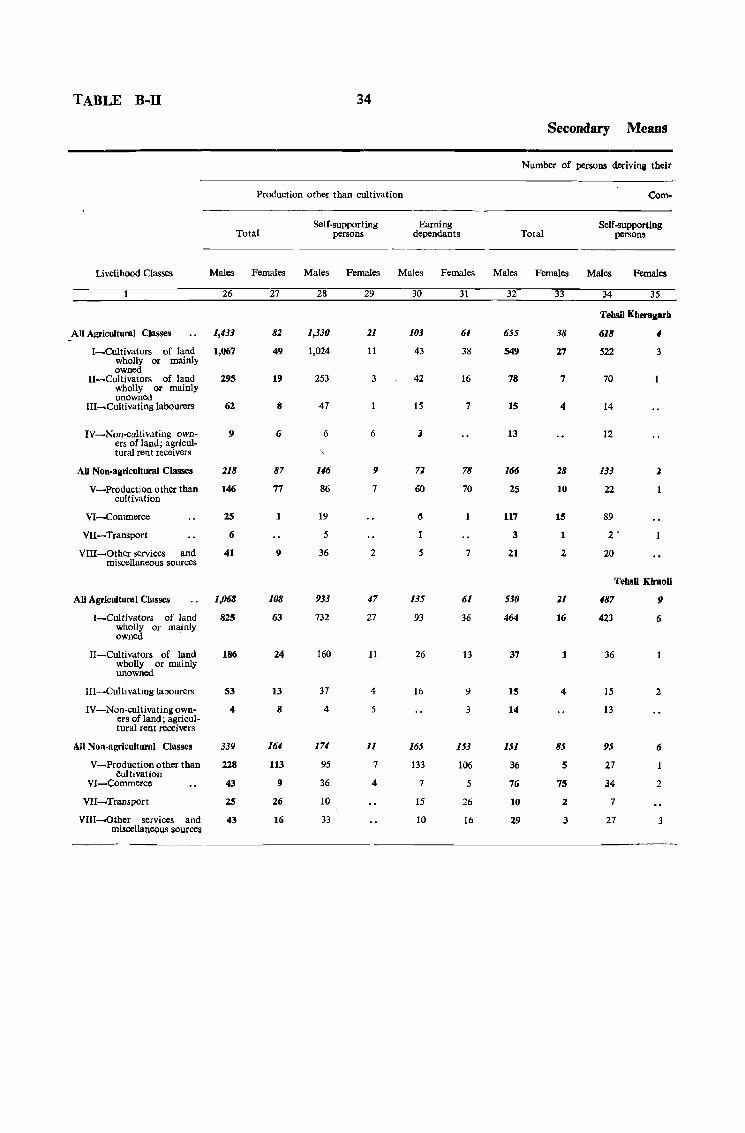
TABLE B-ll 34
Production other than cultivation
Total
Livelihood Classes Males Females
26
All Agricultural Classes 1,433
I-Cultivators of land 1,067 wholly or mainly owned
II-Cultivators of land 295 wholly or mainly unowned
III_Cultivating labourers 62
IY-Non-cultivating owners of land; agricultural rent receivers
AU Nou-agricultural Classes
V-Production other than cultivation
VI-Commerce
VII-Transport
VIII-Other services and miscellaneous sources
9
218
146
25
6
41
All Agricultural Classes 1,068
I-Cultivators of land 825 wholly or mainly owned '
II-Cultivators of land wholly or mainly unowned
III-Cultivating labourers
IV-Non-cultivating owners of land; agricultural rent receivers
All Non-agricultural Classes
V-Production other than cultivation
VI-Commerce
VII-Transport
VIII-Other services and miscellaneous sources
186
53
4
339
228
43
25
43
27
82
49
19
8
6
87
77
1
9
108
63
24
13
8
164
113
9
26
16
Self-supporting persons
Males Females
28
1,330
1,024
253
47
6
146
86
19
5
36
933
732
160
37
4
17<1
95
36
10
33
29
21
11
3
6
9
7
2
47
27
11
4
5
11
7
4
Earning dependants
Males Females
30
103
43
42
15
J
72
60
5
135
93
26
16
165
133
7
15
10
31
61
38
16
7
78
70
7
61
36
13
9
3
153
106
5
26
16
Secondary Means
Number of persons deriving their
Total
Males Females
32
655
549
78
15
13
166
25
117
3
21
530
464
37
15
14
151
36
76
10
29
33
38
27
7
4
28
10
15
1
2
21
16
1
4
85
5
75
2
3
Com-
Self-supporting persons
Males
34
618
522
70
14
12
133
22
89
2'
20
Females
35
4
3
Tebsll Klraoll
487
423
36
15
13
95
27
34
7
27
9
6
2
6
2
3
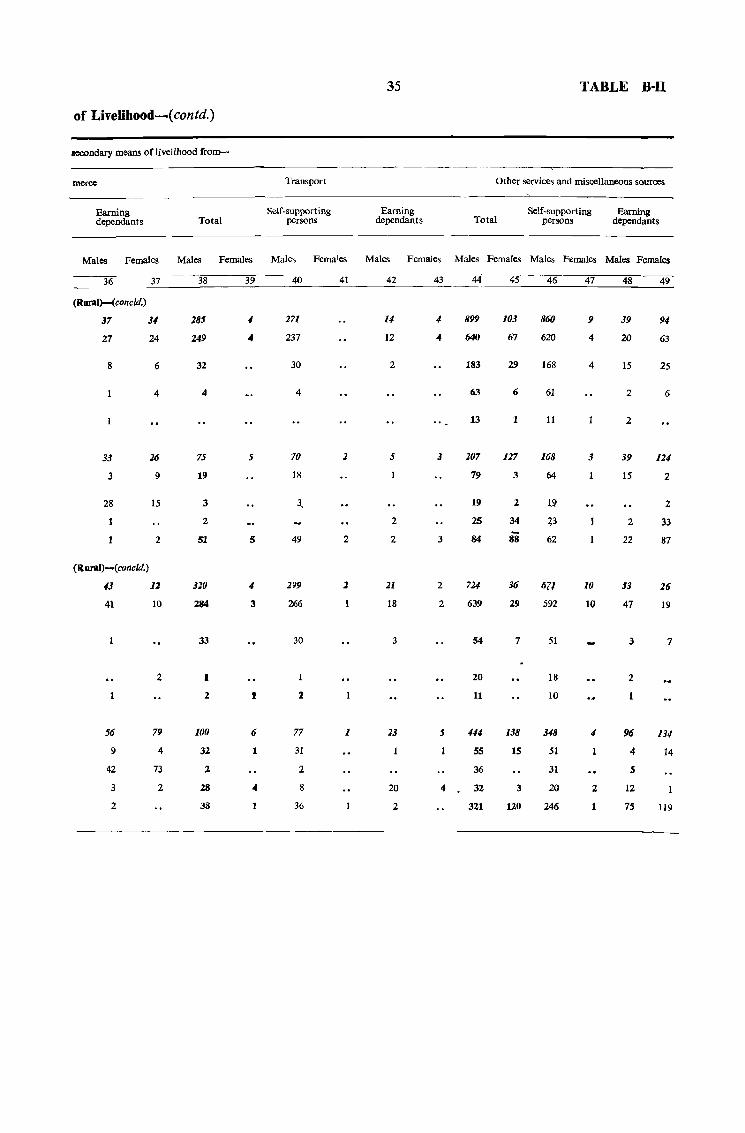
35 TABLE B·ll
of Livelihood-(contd.}
secondary means of livelihood (rom-
merce Transport Other services and miscellaneous sources
Earning Self-supporting Earning Self-supporting Earning dependants Total persons dependants Total persons dependants
Males Females Males Females Males Females Males Females Males Females Males Females Males Females
36 37 38 39 40 41 42 43 44 45 46 47 48 49
(Rural)-(concld.)
37 34 285 -I 271 14 4 899 103 860 9 39 94
27 24 249 4 237 12 -4 640 67 620 4 20 63
8 6 32 30 2 183 29 168 4 15 25
4 4 4 63 6 61 2 6
13 1 11 2
33 26 75 5 70 2 5 3 207 127 168 3 39 124
3 9 19 18 79 3 64 15 2
28 15 3 3. 19 2 151 2
2 2 2S 34 ~3 2 33
2 51 5 49 2 2 3 84 88 62 22 87
(Rural)-(concld.)
43 12 320 4 299 1 21 2 724 36 671 10 53 26
41 10 284 3 266 18 2 639 29 592 10 47 19
33 30 3 54 7 51 3 7
2 1 20 18 2
2 I :z 11 10
56 79 100 6 77 1 23 5 444 138 348 4 96 134
9 4 32 1 31 55 15 51 4 14
42 73 1. 2 36 31 S
3 2 28 4 8 20 4 32 3 20 2 12
2 38 1 36 2 321 120 246 75 119
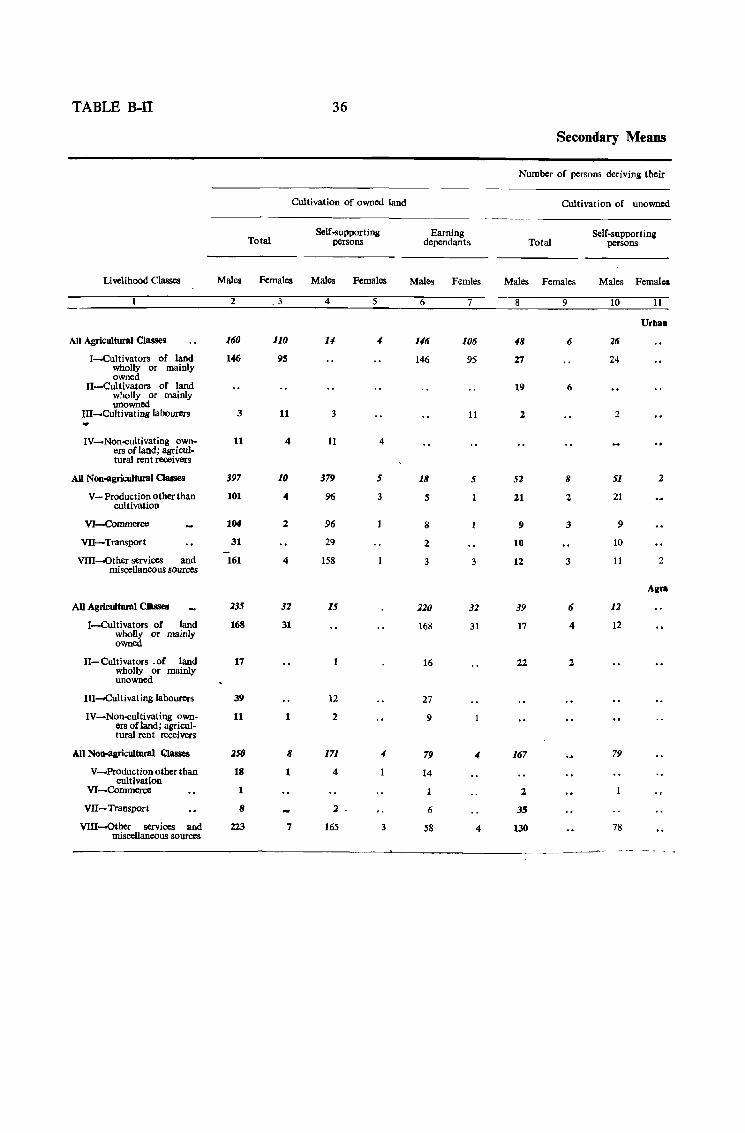
TABLE B-II 36
Secondary ~eans
Number of persons derivini tbeir
Cultivation of owned land Cultivation of unowned
Self-supportini Earning Self-supportina Total persons dependants Total persons
Livelihood Classes Males Females Males Females Males Femles Males Females Males Femalos
2 _ 3 4 5 6 7 8 9 10 11
Urba.
All Agricultural Classes 160 110 11 4 116 106 48 6 26
I-Cultivators of land 146 95 146 95 27 24 wholly or mainly owned
II-Cultivators of land 19 6 wholly or mainly unowned
III-Cultivating labourers 3 11 3 11 2 2
IV_Non-cultivating own- 11 4 11 4 ers ofland; agricul-tural rent receivers
All Non-agricultural Oasses 397 10 379 5 18 5 52 8 51 2
V - Production other than 101 04 96 3 S 21 2 21 cultivation
VI-COmmerce 1004 '2 96 8 9 3 9
VII-Transport 31 29 2 10 10
VlII-other services and 161 4 158 3 3 12 3 11 2 miscellaneous sources
Aira
AU Agricultural CJIsses 235 32 15 220 32 39 6 12
I-Cultivators of land 168 31 wholly or mainly owned
168 31 17 4 12
Il-Cultivators -of land 17 16 22 2 wholly or mainly unowned
Ill-Cultivating labourers 39 12 27
IV-Non-cultivating own- 11 ers of land; agricul-tural rent receivers
1 2 9
AU Non-agricultural Qasses 250 8 171 ., 79 ., 167 79
V-Production other than 18 cultivation
1 4 14
VI-Commerce 1 2
VII-Transport 8 2 6 3S
VIII-Other services and 223 7 miscellaneous sources
165 3 58 4 130 78
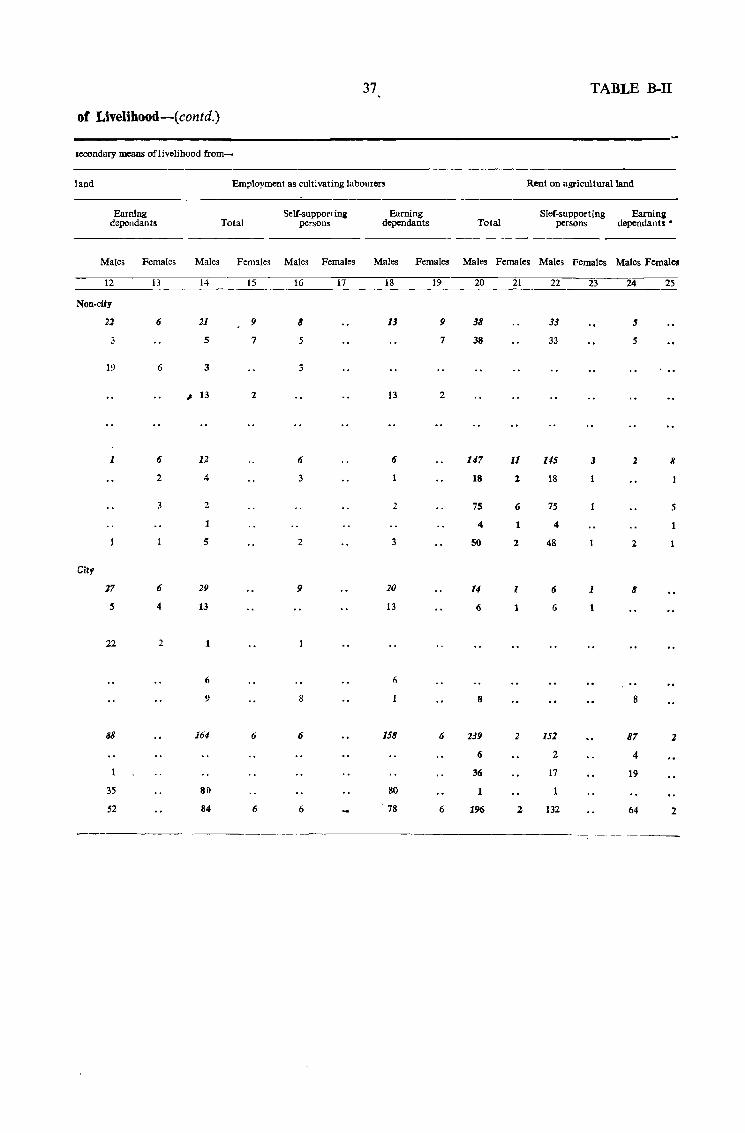
37 TABLE B-II
of Livelihood-(contd.}
aecoodary means oflivclihood from-
land Employment as cultivating labourers Rent 00 agricultural land
Earning Self-supporting Earning Slef-supporting Earning dependants Total persons dependants Total persons dependants •
Males Females Males Females Males Females Males Females Males Females Males Females Males Females
12 13 14 15 16 17 18 19 20 21 22 23 24 25
Non-city
22 6 21 9 8 13 9 38 33 , S 7 5 7 38 33 5
19 6 3 3
, 13 2 13 2
1 6 11 6 6" 147 11 145 3 2 8
2 4 3 18 2 18
3 2 2 7S 6 75 5
1 4 1 4
5 2 3 50 2 48 2
City
27 6 29 9 20 14 1 6 1 8
S 4 13 13 6 1 6
22 2 1
6 6
9 8 8 8
88 164 6 6 158 6 239 2 152 87 2
6 2 4
36 17 19
35 80 80 1
52 84 6 6 78 6 196 2 132 64 2
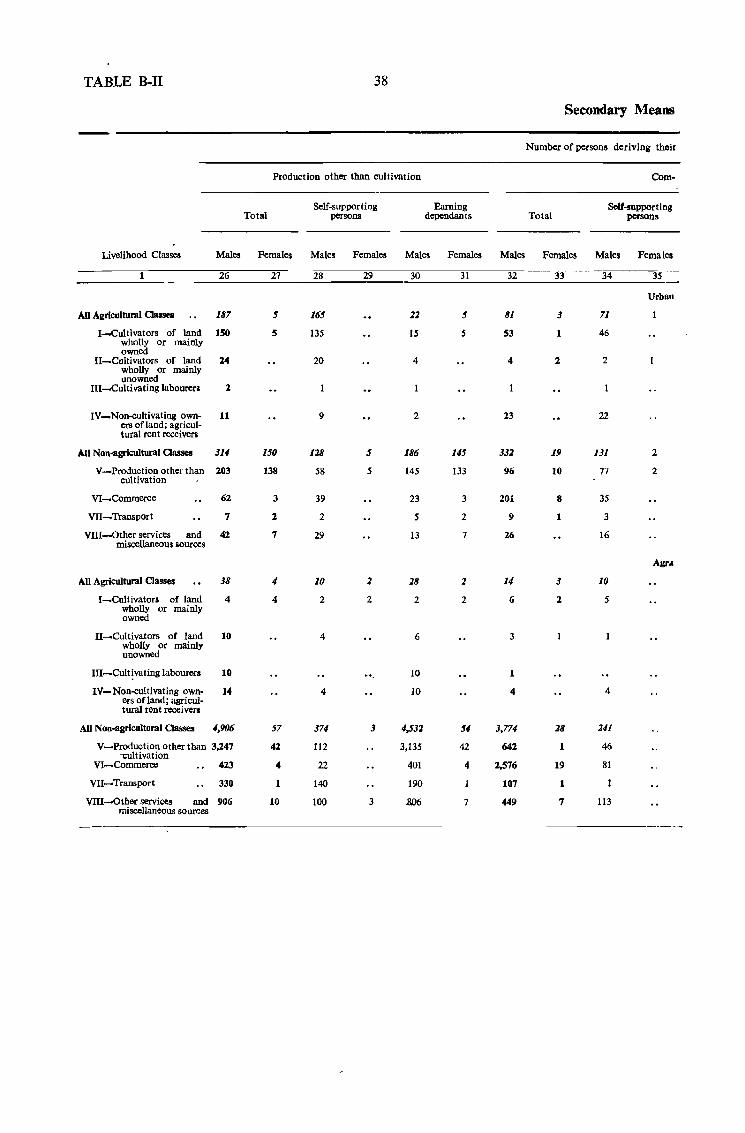
TABLE B-I1 38
Secondary ~eans
Number of persons deriving their
Production other than cultivation Com-
Self-supporting Earning Self-supporting Total persons dependants Total persons
Livelihood Classes Males Females Males Females Males Females Males Females Males Females
26 27 28 29 30 31 32 33 34 35
Urban
All Agricultural Oasses 187 5 165 11 5 81 3 71
I-Cultivators of land 150 5 135 IS 5 53 1 46 wholly or mainly owned
II-Cultivators of land 14 20 4 4 2 2 wholly or mainly unowned
Ill-Cultivating labourers 2
IV_Non-cuitivating own- 11 9 2 23 22 ers of land; agricul-tural rent receivers
Ail Non-agricultural Classes 3U 150 128 5 186 US 331 19 131 2
V-Production other than 203 138 58 5 145 133 96 10 77 2 cultivation
VI-Commerce 62 3 39 23 3 201 8 3S
VII-Transport 7 2 2 5 2 9 1 3
VIII-Dther services and 42 7 29 13 7 26 16 miscellaneous iources
Agra
All Agricultural Classes 38 4 10 1 18 2 14 3 10
I-Cultivators of land 4 4 2 2 2 2 6 2 S wholly or mainly owned
II-Cultivators of land 10 4 6 3 wholly or mainly unowned
II1-Cult!vating labourers 10 .. _ 10 1
IV- Non-cultivating own-ers ofland; agricul·
14 4 10 4 4
tural rent receivers
All Noo-agricultural Classes 4,906 S7 374 3 4,531 54 3,774 18 141
V-Production other than 3,247 42 -cultivation
112 3,135 42 642 1 46
VI-Commerce 423 4 22 401 4 2.576 19 81
VII-Transport 330 1 140 190 107 1
VIII-Other services and 906 10 100 3 .&06 7 449 7 113 miscellaneous sources

39 TABLE B-ll
of Livelihood-(contd.)
IICCOndary means of livelihood from-
meree Transport Other services and miscelIaneouliources
Earning SeIC-lupportinll Earning Self-supportiIll Earninl dependants Total persom dependants Total persons depeDdantl
Males Females Males Females Mal~ Females Males Females Males Females Males Females Males Females
36 37 38 39 40 41 42 43 44 4S 46 47 48 49
NOQ-Clt,. ...... (concld.)
10 2 37 1 33 4 1 212 10 194 2 18 8
7 34 31 3 180 8 164 2 16 6
2 3 1 2 16 2 14 2 2
1
15 15
201 17 56 <I 19 :1 37 2 348 180 190 6 158 1U
19 8 11 6 11 58 14 46 12 14
166 8 6 6 55 9 47 8 9
6 18 3 17 2 43 14 20 23 14
10 13 1 6 9 192 143 77 6 115 137
City-(concld.)
I 3 38 4 3<1 107 17 53 1 54 16
2 32 4 28 33 10 22 11 9
2 1 14 13
2 2 11 4 11 4
3 3 49 3 30 19 3
3,533 28 654 4 130 524 4 6,205 354 607 31 5,598 313
596 94 36 58 1,232 14 96 3 1,136 11
2,49'3 19" 116 10 106 1,178 15 112 5 1,066 10
106 326 4 66 260 4 380 8 102 278 8
336 7 118 18 100 3,415 317 297 23 3,118 294
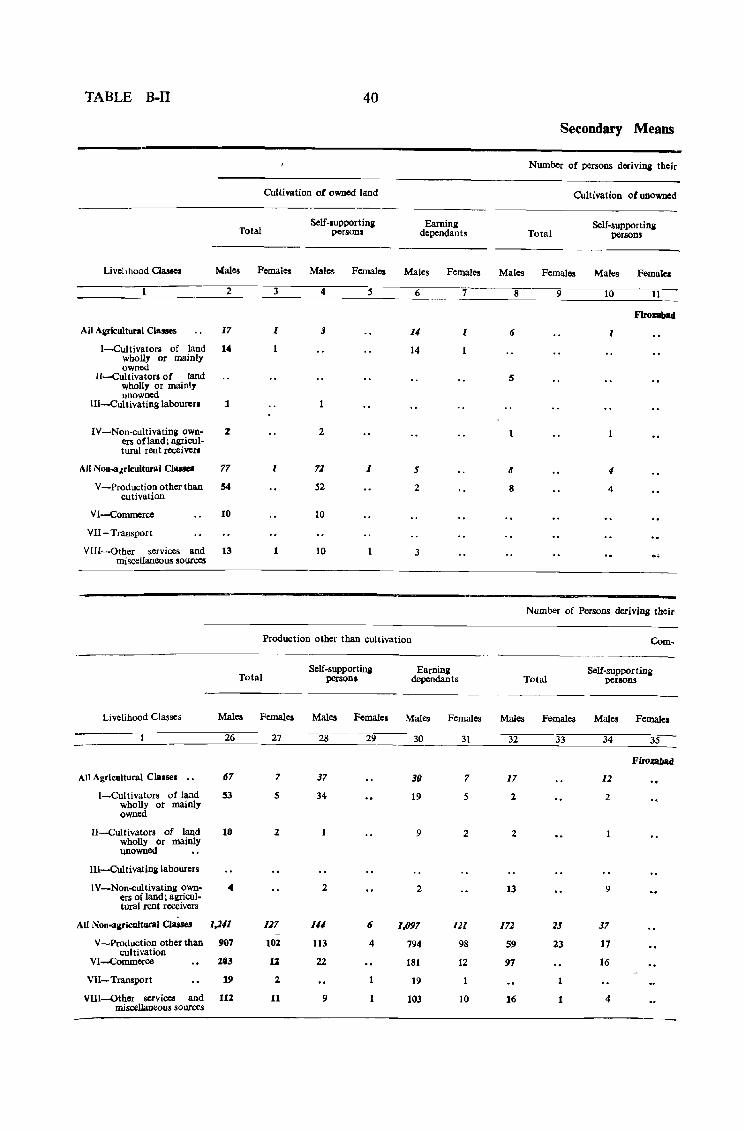
TABLE B-ll 40
Secondary Means
Number of persons de.:ivinS their
Cultivation of owned land Cultivation of unowned
Total Self-supporting Earning Self-supporting
person. dependants Total persons
Livelthood Classes lIlales Females Males Females Males Females Males Females Males Females
2 3 4 ~ 6 7 8 9 10 11
Firozabad
All Agricultural Claues 17 1 3 14 1 6 1
l-Cultivators of land wholly or mainly
14 14
owned II-Cultivators of land
wholly or mainly unowned
5
IIJ-Cultivating labourers 1
IV-Non-cultivating own- :: ers of land; agricul-
2 1
tural rent receivera
All NQn-ll.:ricultural CI_ 77 1 71 1 5 6 <I
V-Production other than 54 52 cutivation
2 8 4
VI-Commerce 10 10
VIl-Transport
YlH-Other services and 13 1 10 3 miscellaneous sources
Number of Persons deriving their
Production other than cultivation Com-
Self-supporting Earning Self-supporting Total persons dependants Total persons
Li velihood Classes Males Females Males Females Males Females Males Females Males Females
26 27 2S 29 30 31 32 33 34 3~
Firozabad
All Agricultural Clalsel .. 67 7 37 30 7 17 12
I-Cultivators of land 53 5 34 19 5 2 2 wholly or mainly owned
II-Cultivators of land 10 2 9 2 .2 wholly or mainly unowned
ill-CUltivating labourers
IV-Non-cultivating own- 4 2 ers of land; agricul-
2 13 9
tural rent receivers
All Non-alilricultural Classes 1,2./1 117 111 6 1,097 121 171 25 37
V-Production other than 907 102 113 4 794 98 S9 23 17 cultivation
VI-Commcrce 203 U 22 181 12 97 16
Vll- Transport 19 2 19 1
VllI-Other services and 112 11 9 103 10 16 1 4 miscellaneous sources
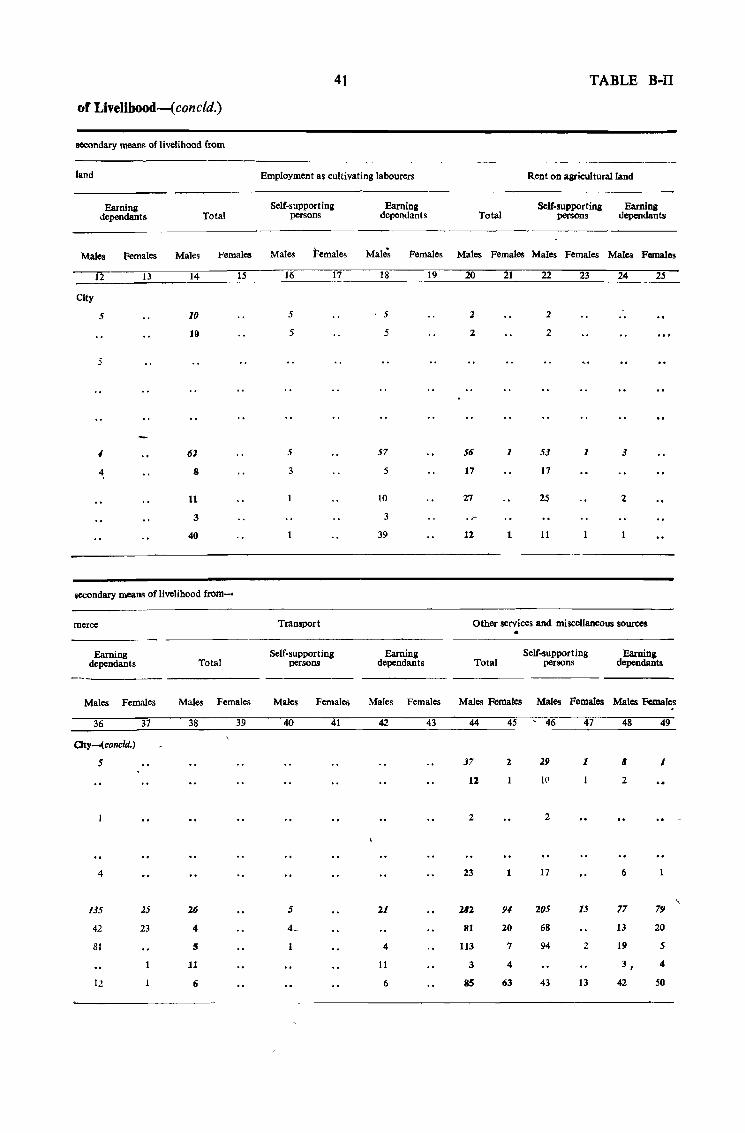
of Livellhood-(concld.)
secondary means of livelihood from
land
Earning dependants
Males Females
12 I3
City
5
Males
14
10
10
62
8
11
3
40
Total
Females
15
secondary means of livelihood from-
merce
Earning dependants
Males Females
36 37
aty-(concld.)
5
4
135
42
81
12
25
23
Total
Males Females
38 39
26
4
S
11
Ci
41
Employment as cultivating labourers
Self-support ing persons
Males Females
16
5
5
5
3
Transport
17
Self-supporting persons
Males Females
40 41
Earning dependants
Male~
18
5
5
57
5
10
3
39
Females
19
Earning dependants
Males
42
21
4
11
6
Females
43
TABLE B-II
Rent on agricultural land
Total Self-supporting Earning
persons dependants
Males Females Males Females Males Females
20
2
2
56
17
27
12
21
1
1
22
2
2
53
17
25
11
23
1
24 25
3
2
Other services and misceUaneous sources
Total
Males Females
44
37
12
2
23
282
81
113
3
85
45
1
1
91
20
7
4
63
Self-supporting persons
Males
- 46
29
[(l
2
17
205
68
94
43
Females
47
1
15
2
13
Earning dependants
Males Females
48
8
2
6
77
13
19
3 t
42
49
1
79
20
5
4
50
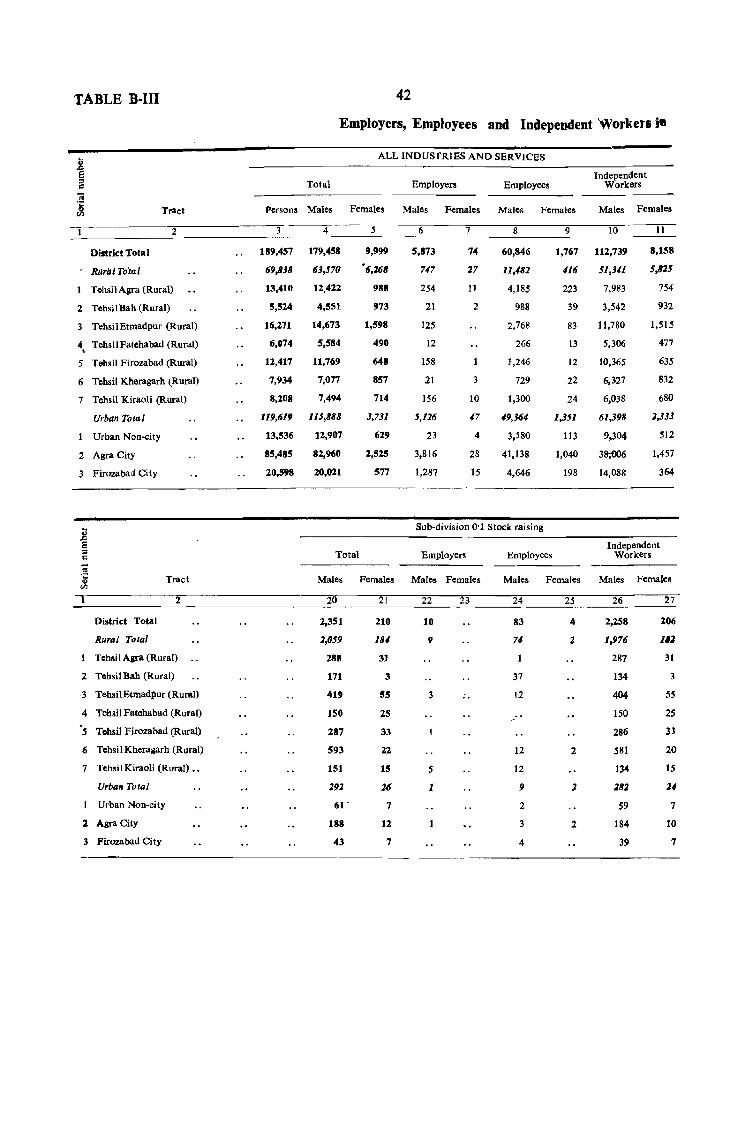
TABLE B-1I1
Tract
42
Employers, Employees and Independent Workers jill
ALL INDUSTRIES AND SERVICES
Total Employers Employees
Persons Males Females Males Females Males Females
Independent Workers
Males Females
__________ ~2~ ____________ ~ ____ ~4 ______ ~5 ______ 6 ______ ~7 ____ ~8~ ____ ~9 ____ ~10~ ____ ~11~
District Total
RaralTotal
Tehsil Agra (Rural)
2 Tehsil Bah (Rural)
3 TehsilEtmadpur (Rural)
4, Tehsil Fatehabad (Rural)
5 Tllhsil Firozabad (Rural)
6 Tehsil Khcragarh {Rural)
7 Tehsil Kiraoli (Rural)
Urban Total
Urban Non-city
2 Agra City
3 Firozabad City
District Total
Rural Total
Tract
2
Tehsil Agra (Rural)
2 Tehsil Bah (Rural)
3 Tehsil Etmadpur (Rural)
" Tehsil Fatehabad (Rural)
5 Tchsil Firozabad (Rural)
6 Tehsil Kherasarh (Rural)
7 Tehsi I Kiraoli (Rural) •.
Urban Total
Urban Non-city
1 AgraCity
3 Firozabad City
189,457 179,458
69,838 63,570
13,410 12,422
5,524 4,551
16,271
6,074
12,417
14,673
5,584
11,769
7,934 7,077
8,208 7,494
119,619 115,888
13,536 12,907
85,485 82,960
20,598 20,021
9,999
'6,268
988
973
1,598
490
648
857
714
3,731
629
2,525
577
5,873
747
254
21
125
12
158
21
156
5,126
23
3,816
1,287
74
27
11
2
10
17
4
28
15
60,846
11,181
4,185
988
2,768
266
1,246
729
1,300
19,361
3,580
41,138
4,646
1,767 112,739
116 51,311
223 7,983
39 3,542
83
13
12
22
24
1,351
113
1,040
198
11,780
5,306
10,365
6,327
6,038
61,398
9,304
38;006
14,088
8,llS8
5,825
754
932
1,515
477
635
832
680
2,333
512
1,457
364
Sub-division 0'1 Stock raising
Total Employers
Males Females Males Females
20
2,351
2,059
288
171
419
150
287
593
151
292
61-
188
43
21
210
181
31
3
55
25
33
22
15
26
7
12
7
22
10
9
3
S
1
Employees Independent
Workers
Males Females Males Females
24
83
71
37
12
12
12
9
2
3
4
25
4
2
2
2
z
26
2,258
1,976
287
134
404
ISO
286
581
134
282
59
184
39
27
206
I" 31
3
55
25
33
20
15
21
7
10
7
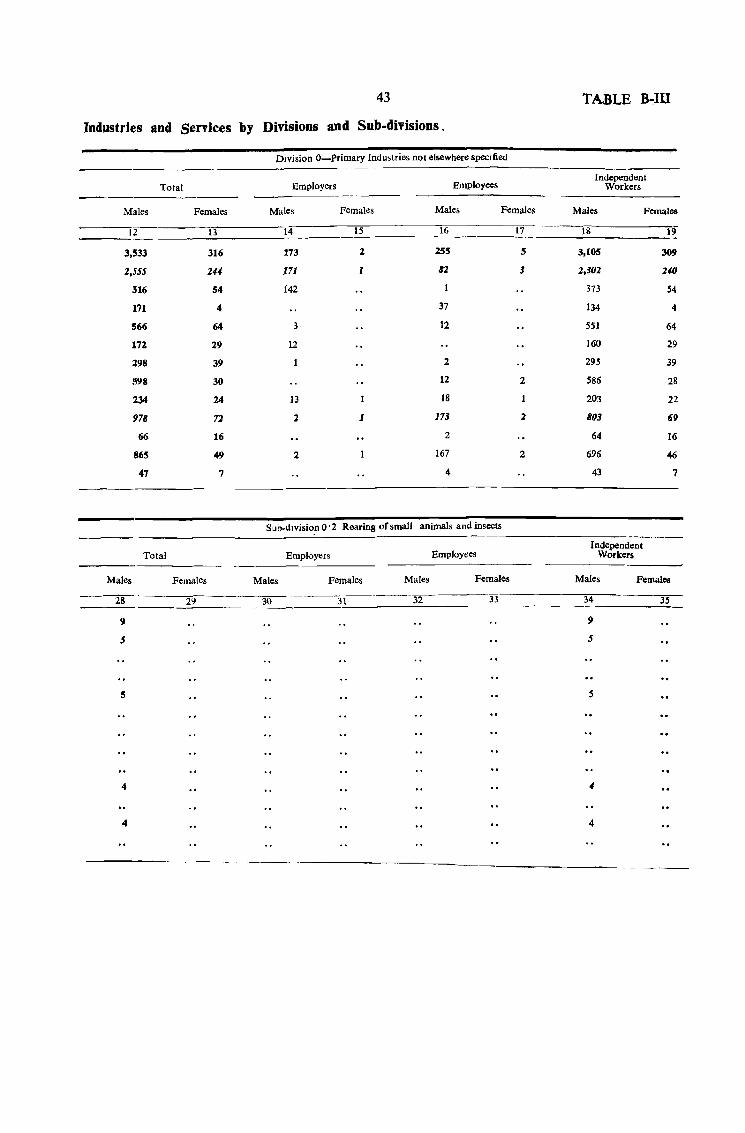
Industries and scnices by
Total
Males Females
12 13
3,533 316
2,,555 244
516 54
171 4
566 64
172 29
298 39
598 30
234 24
978 71
66 16
865 49
47 7
Total
43 TA.BLE ~IU
Divisions and Sub-divisions.
Division O-Primary Industries not elsewhere specified
Employers Employees Independent
Workers
Males Females Males Females Males Females
14 15 16 11 18 19
173 2 255 5 3,10S 309
171 1 82 3 2,302 2#0
142 373 S4
37 134 4
3 12 551 64
12 160 29
2 295 39
12 2 586 28
13 18 203 22
2 1 173 2 803 69
2 64 16
2 167 2 696 46
4 43 7
Sl1b-dlvisio.nO·2 Roaring of small animals and insects
-----------------------------Employers Employees
Independent Workers ---_-
Males
28
9
5
5
4
4
Females Males Females
29 30 3\
Males Females
32 33
Males
34
9
5
s
4
Females
35
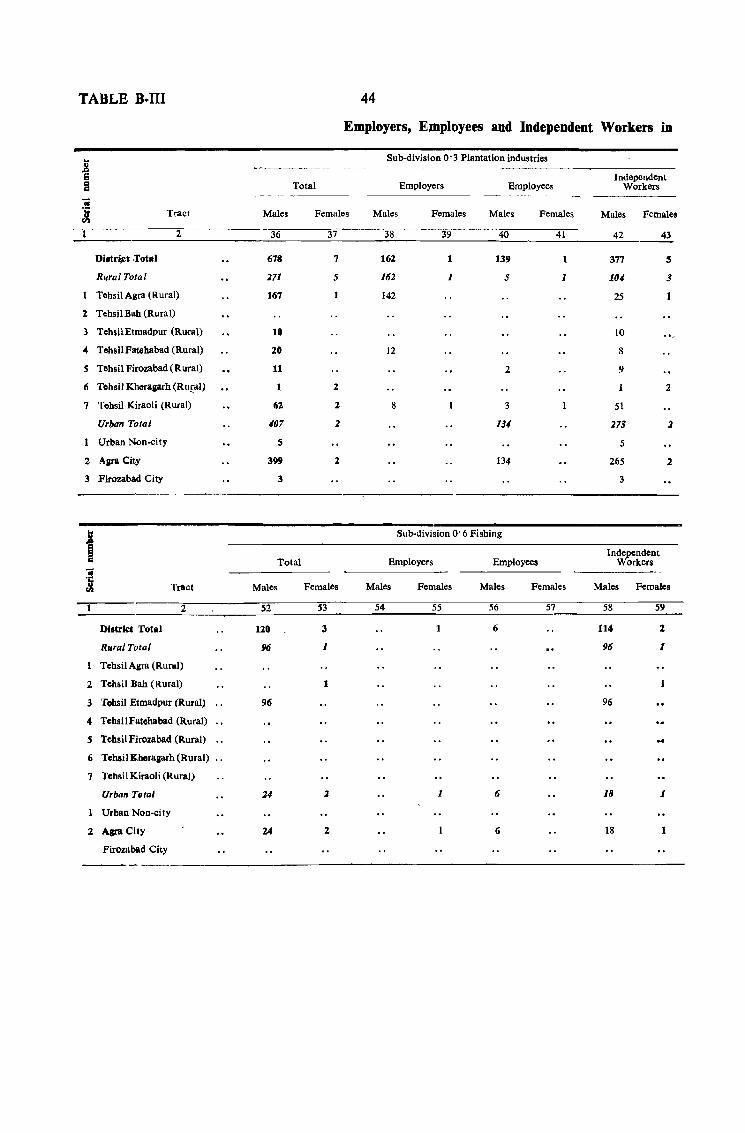
TABLE B·ITI 44
Employers, Employees and Independent Workers in
.8 Sub-division 0·3 Plantation industries
a Independent a Total Employers Employees Workers .. j Tract Males Females Males Females Males Females Males Females
2 36 37 38 39 40 41 42 43
Oi.tr~t :rotal 678 7 162 1 139 1 377 5
Rllrai Total 271 5 162 1 5 1 101 3
TehsiiAgra (Rural) 167 1 142 25
1 Tehsil Bah (Rural)
3 TehsilEtmadpur (Rural) 10 10 00"
4 Tehsil Fatehabad (Rural) 20 12 g
S Tchsil Firozabad (Rural) 11 2 9
6 Tehsil Khoragarh(Ru,(al) 2 2
7 Tehsil Kiraoli (Rural) 62 2 8 3 51
Urban Total 107 2 134 273 J
Urban Non-city 5 5
2 "ara City 399 2 134 265 2
3 Firozabad City 3 3
I Sub-division O· 6 Fishing
Independent a Total Employers Employees Workers
I Tract Males Females Males Females Males Females Males Females
2 52 S3 54 55 56 57 58 59
OJ.trkt Total 120 3 1 6 114 2
Rural Total 96 1 96 1
TehsiiAgra (Rural)
2 Tehsil Bah (Rural) 1
3 'fohsil Etmadpur (Rural) 96 96
4 TehsilFntehabad (Rural)
5 Tehsil Firozabad (Rural)
6 Tehsil Kheragarh (Rural)
7 Tehsil Kiraoli (Rural)
Urban Tlltal 24 2 1 6 18 1
Urban Non-city
2 Aara City 24 2 6 18
Firozlibad City
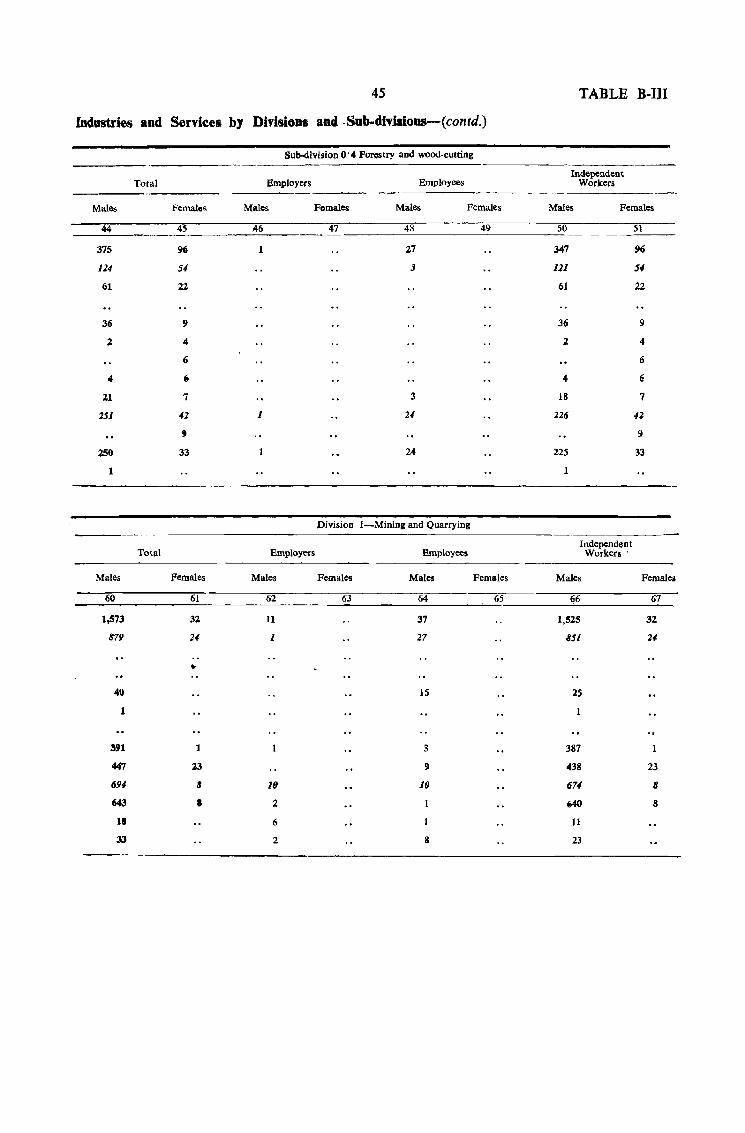
45 TABLE B-UI
Industries and Services by DivisiGIlS and -SalJ..diTisions-(contd.)
Sub-division 0'4 Forestry and wood-cutting
Independent Total Employers Employees Workers
Males Females Males Females Males Females Males Females
44 45 46 47 48 49 50 51
375 96 1 27 347 96
124 54 3 121 54
61 22 61 22
36 9 36 9
2 4 2 4
6 6
4 6 4 Ii
21 7 3 18 7
251 42 1 U 226 41 ., 9
250 33 24 225 33
1
Division I-Mining and Quarrying
Total Employers Employees Independent Workers'
Males Females Males Females Males Females Males Female.
60 61 62 63 64 65 ~6 67
1,573 32 11 37 1,525 32
879 U 1 27 851 U
.. 40 15 25
1
591 1 3 387
447 23 !l 438 23
694 8 16 10 674 8
643 I 2 640 8
11 6 11
13 2 8 23
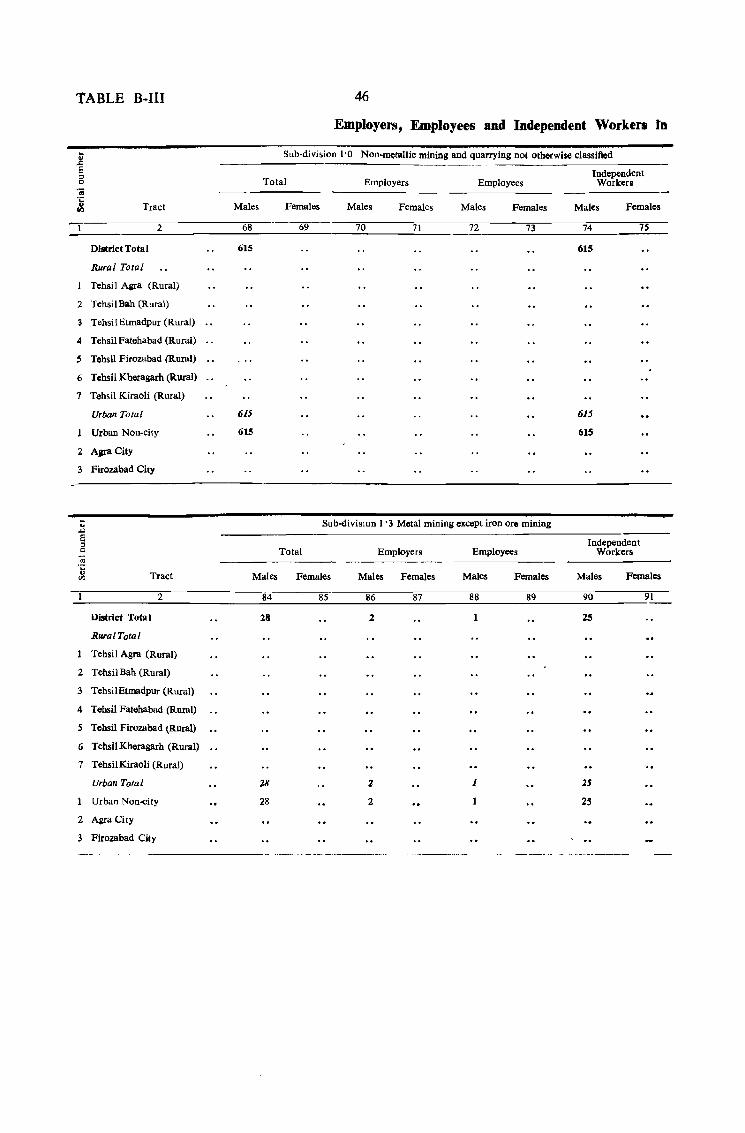
TABLE B-III
.... " ,.0
6
" '" <a "t;
Tract v.I
2
District Total
Rural Total
Tehsil Agra (Rural)
2 TehsilBah (Rural)
TehsilEtmadpur (Rural)
4 TehsilFatehabad (Rural)
5 Tehsil Firozabad (Rural)
6 Tehsil Kheragarh (Rural)
7 Tehsil Kiraoli (Rural)
Urban Total
Urban Non-city
2 Agra City
3 Firozabad City
;; -'" 8 :I
'" '" 'i: 0 Tract 00
2
District Total
Rural Total
Tehsil Agra (Rural)
2 TehsilBah (Rural)
3 TehsilEtmadpur (Rural)
4 Tehsil Fatehabad (Rural)
5 Tehsil Firozabad (Rural)
6 Tehsil Kheragarh (Rural)
7 TehsilKiraoli (Rural)
Urban Total
Urban Non-city
2 AgraCity
3 Firozabad City
46
Employers, Employees and Independent Workers In
Sub-division 1'0 Non-ml)tallic mining and quarrying not otherwise classified
Total Employers Employees Independent Workers
Males
68
615
615
615
Males
84
28
28
28
Females Males Females Males Females
69 70 71 72 73
Sub-divisIon 1 '3 Metal mining except iron ore mining
Total Employers Employees
Females Males Females Males Females
85 26 87 88 89
2 1
2 J
2
Males
74
615
615
615
Females
7S
Independent Workers
Males Females
90 91
25
25
25
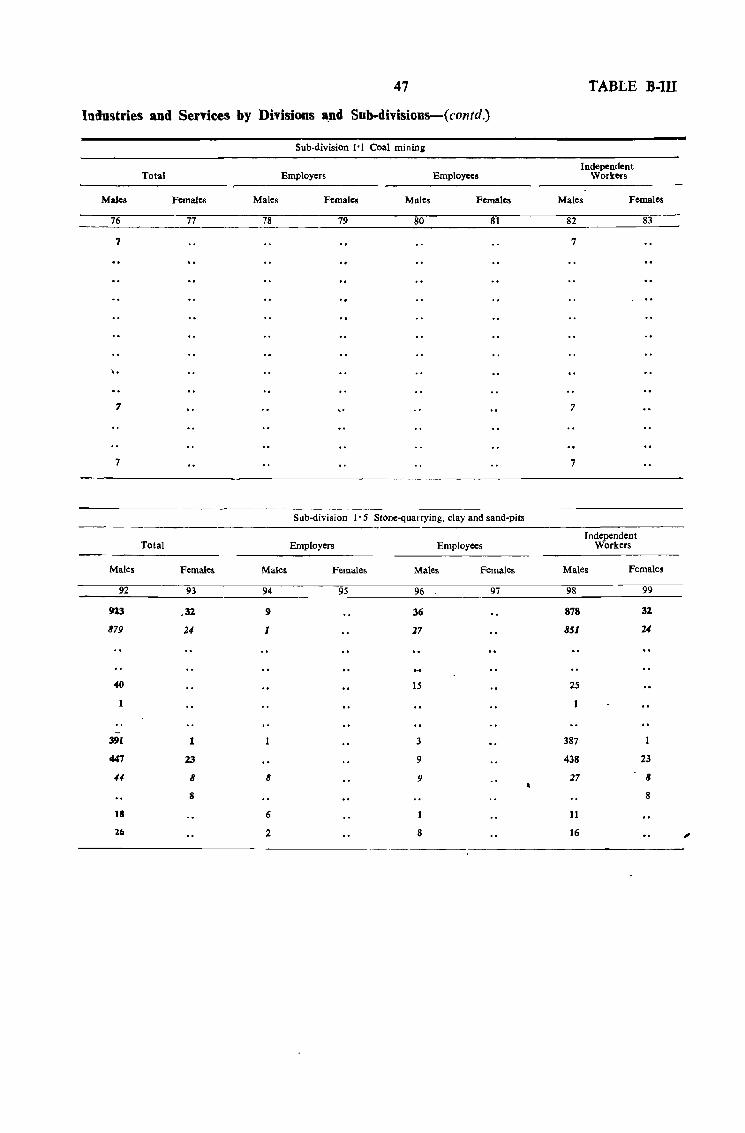
47
Industries and Services by Divisions a,nd Sub-divisions-(contd.)
Males
76
7
.. 7
7
Males
92
913
879
-391
447
44
18
16
Total
Total
Sub-division 1'1 Coal mining
Employers
Females Males Females
77 78 79
---_---Sub-division l' 5
Employers
Females Males Females
93
,32
U
1
23
8
8
94
9
1
8
6
2
95
Employees
Males Females
80 81
Stone-quarrying, clay and sand-pits
Employees
Males Females
96
36
27
15
3
9
9
8
97
TABLE B-1I1
Independent Workers
Males Females
82
7
7
7
Independent Workers
83
Males Females
98 99
878 32
851 24
25
387
438
27
J1
16
23
8
8
,
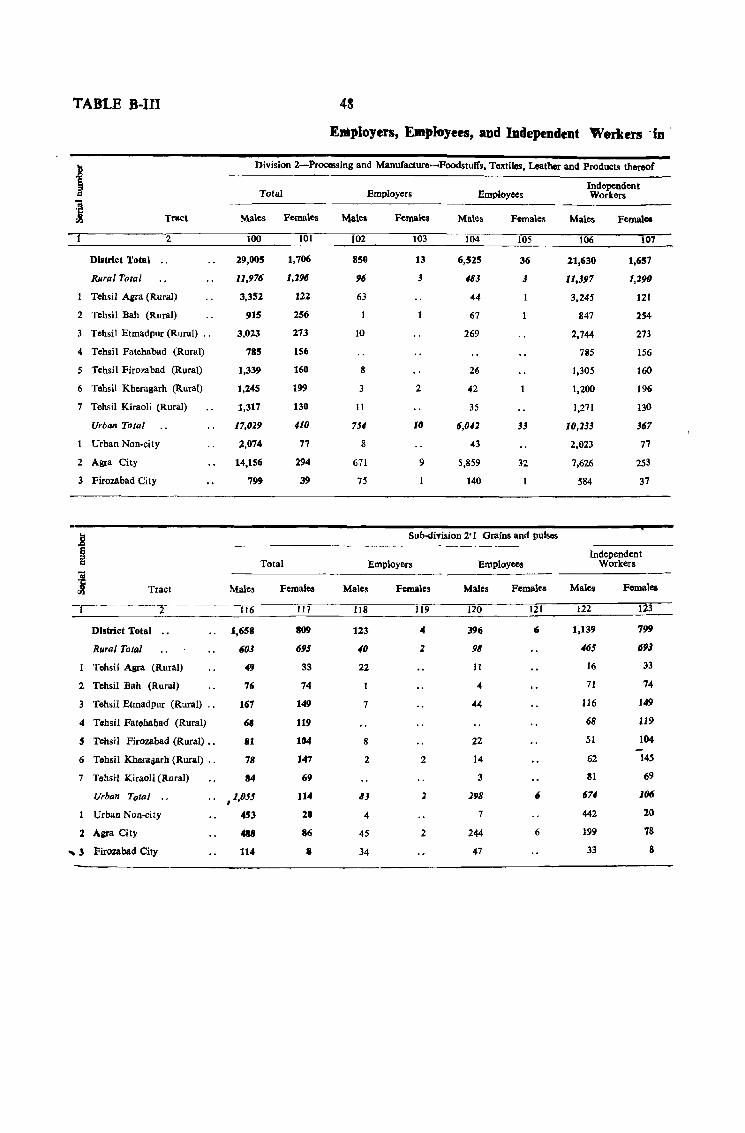
TABLE B-II1 48
Employers, EJIt)tleyees, and Independent 'Werkers -in .
Division 2-Processing and Manufacturo~Foodstuffs. Toxtiles, Leather and Products thereof
Total
Tract Males Females
2
DlIltrlct Total ..
Rural Total
Tehsil Agra (Rural)
2 Tehsil Bah (Rural)
3 Tehsil Etmadpur (Rural) ..
4 Tehsil Fatehabad (Rural)
5 Tehsil Firozabad (Rural)
6 Tohsil Kheragarh (Rural)
7 Tehsil Kiraoli (Rural)
Urban Total
Urban Non-city
2 Agra City
3 Firozabad City
100
29,005
11 ... 976
3,351
915
3,023
785
1,339
1,245
1,317
17,019
2,074
14,156
799
101
1,706
1,196
122
256
273
156
160
199
130
410
77
294
39
Total
Tract
2
District Total . ,
Rural Total
Tehsil Agra (Rural)
2 Tehsil Bah (Rural)
3 Tehsil Etmadpur (Rural) "
4 Tehsil Fatchabad (Rural)
5 Tchsil Firozabad (Rural) "
6 Tehsil Khera&arh (Rural) "
7 TohsH Kiraoli (Rural)
Males
116
1,658
603
49
76
167
6.
81
78
84
Urban Total .•
Urban Non-city
2 Aara City
.... " Firozabad City
.. ,1,055
4!.3
0488
114
Females
117
809
695
33
74
149
119
104
147
69
114
20
86
8
Employers
Males
l02
850
96
63
10
8
3
11
754
8
671
75
Females
103
13
3
2
10
9
Employees
Males
104
6,525
483
44
67
269
26
42
35
6,042
43
5,859
140
Females
105
36
3
33
32
Sub-division 2'1 Grains and pulses
Employers
Males
118
123
40
22
7
8
2
8)
4
45
34
Females
119
4
1
2
2
Employees
Males
120
396
98
11
~
44
22
14
3
198
7
244
47
Females
121
,
6
Independent Workers
Males
106
11,630
11,397
3,245
847
2,744
785
1,305
1,200
1,271
10,133
2,023
7,626
584
107
1,657
1,190
121
254
273
156
160
196
130
367
77
253
37
Independent Workers
Males
122
1,139
165
16
71
116
68
51
62
31
674-
442
199
33
Females
123
799
693
33
74
149
119
104
145
69
l()(j
20
18
8
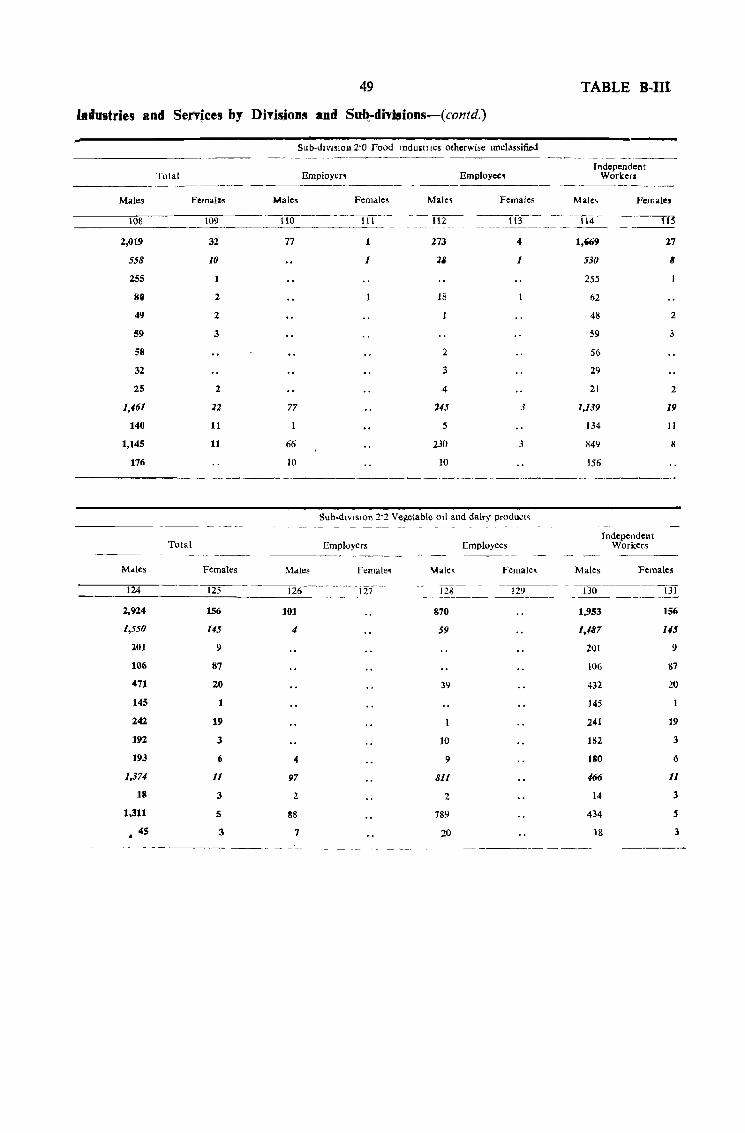
49 TABLE B-III
lRllustries and Senfces by Divisions and S~di'Visions-(contd.)
Sub·dlVISlon 2·0 Food Ifldu,tJ leg otherwise unclassified
Tolal Employer' Employee, Independent
Workers ~-------~
Males Female. Males Females Male~ Females Male, Females
108 109 110 111 -~ 113 -- --n4- -----m -_---"-_-_" - --- - _-- - --- -~ --.-~--- -~~---- -----
2,019 32 77 1 273 4 1,"9 27
558 10 1 11 1 530 IJ
255 255
88 2 18 62
49 2 48 2
59 3 S9 3
58 2 56
32 3 29
25 2 4 21 2
1,461 22 77 145 3 1,139 19
140 11 S 134 11
1,145 11 66 230 3 849 II
176 10 10 156
Sub·dlVISlon 2·2 Vegetable Oil and dairy product~ ------- ------_- - --- ------- - _---- - --~--
__ --
Total Employers Employees Independent
Workers ------- -_-----
Males Females Males Female, Male. Female. Males Females
--- -124 125 126 ---127- 128 129 - -WO------ \3T ----- -_-~-- ---- -_---
2,924 156 101 870 1,953 156
1,550 145 4 59 1,187 U5
201 9 201 9
106 87 106 87
471 20 39 432 20
145 1 145
242 19 241 19
192 3 10 1112 3
193 6 4 9 180 6
1,371 11 97 811 466 11
18 3 2 2 14 3
1.311 5 88 78') 434 S
45 3 7 20 18 3
. - -- ----- ---- --- - -- -------_ ------
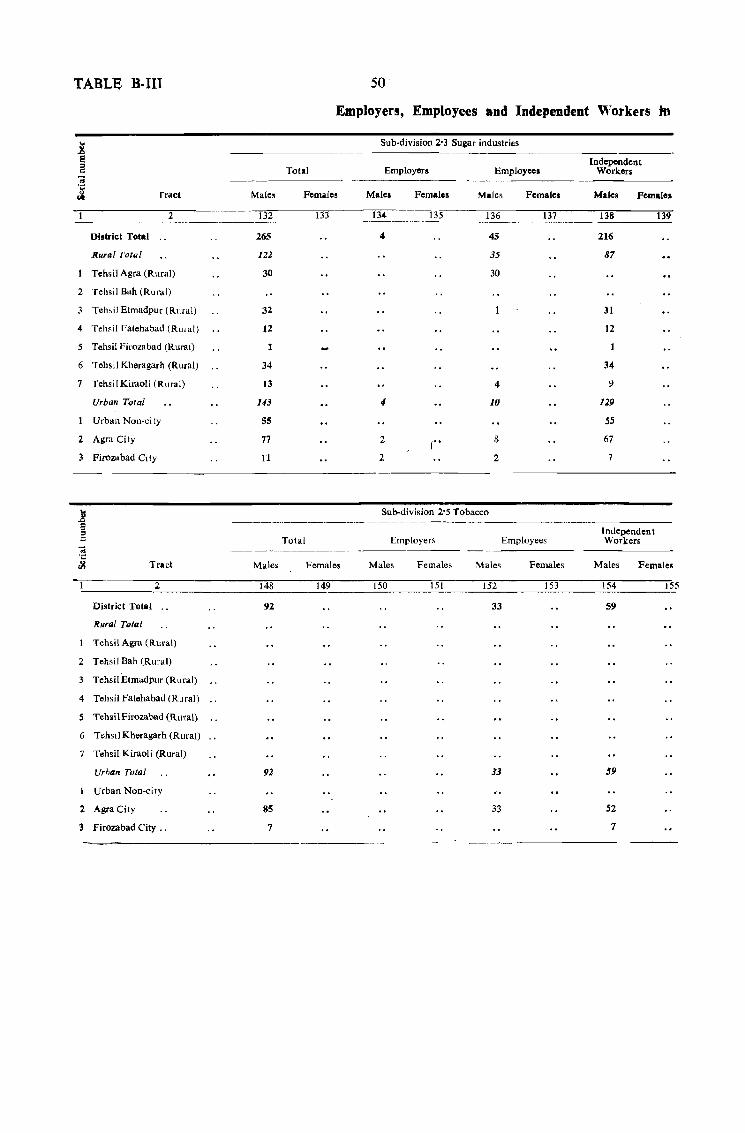
TABLE B·lII 50
Employers, Employees and Independent 'Yorkers In
.8 Sub-division 2"3 Sugar industries
e Independent :::I
" Total Employers Employees Workers OJ ·c 0 Tract Male~ Female. Malcs Females Males Females Ma[es Femalos '"
2 132 133 134 135 136 [37 138 139 -~-------.--..
Ilistrict Total .. 265 4 45 216
Rural Total 122 35 87
Tehsil Agra (Rural) 30 30
2 Tehsil Bah (Rural)
3 Teh'il Etmadpur (Rma!) 32 31
4 Tehsil Fatehahad (Rural) 12 12
5 Tehsil Firozabad (Rural) 1
6 Tehsil Kheragarh (Rural) 34 34
7 Tehsil Kiraoli (RLlra I) 13 4 9
Urban Total U3 <I 10 129
Urban NOll-city 55 55
2 Agra City 77 2 ("" 8 67
3 Firozabad City 11 2 2 7
IS Sub-division 2-5 Tobacco .J:> 8 Independent '" c Total Employers Employees Workers ~ -----~ Tract Males Females Males Females Males Females Males Femaleg
2 148 l49 150 151 152 153 154 155
District Total 92 33 59
RurQ/ TotQI
Tehsil Agra (Rmal)
2 Tehsil Bah (Rural)
Tehsil Etmadpur (Rural)
4 Tehsil Fatehabad (Rural)
5 Tehsil Firozabad (Rural)
6 TehsllKheragarh (Rural)
7 Tehsil Kiraoli (Rural)
Urban Total 92 33 59
Urban Non-city
2 Agra City 85 33 52
3 Firozabad City .. 7 7
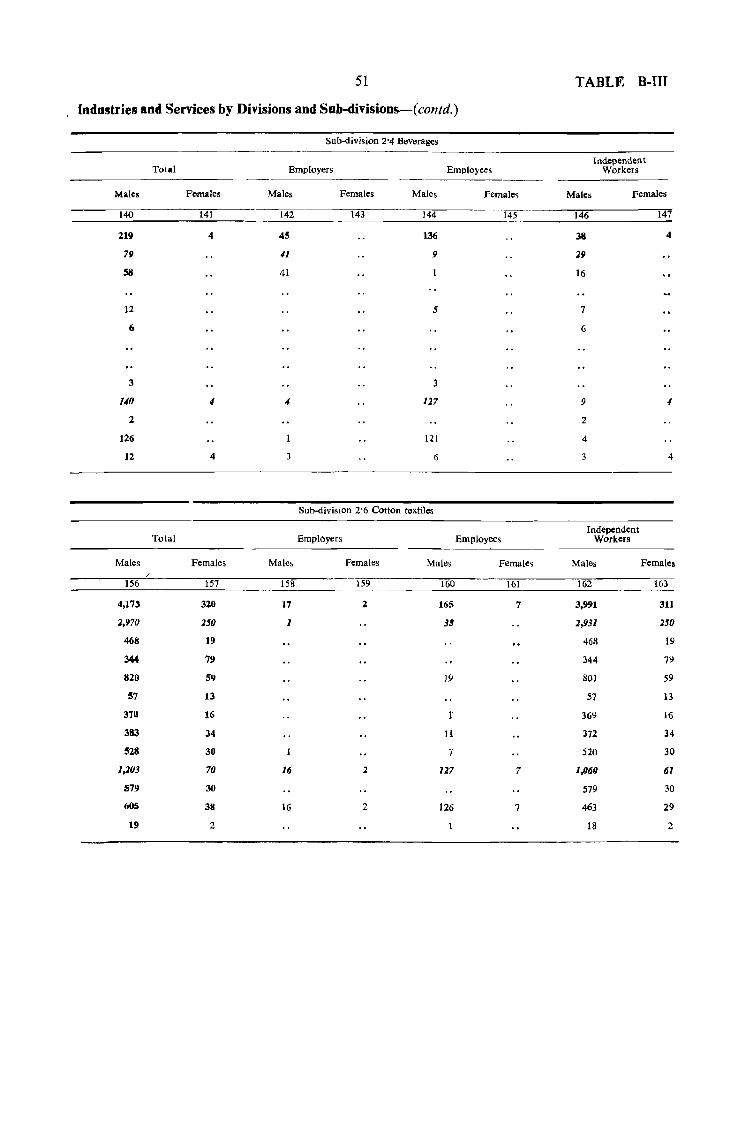
51
Industries and Services by Divisions and SUb-divisions-(contd.)
Males
140
219
79
58
12
6
3
140
2
126
12
Males
156
4,173
2,970
468
344
820
57
370
383
528
1,203
579
60s
19
/
Total
Fomales
141
4
4
Total
Females
157
320
250
19
79
59
13
16
34
30
70
30
38
2
Su b-division 2 '4 Beverages
Employers
Males
142
45
n 41
3
Females
143
Males
144
136
9
5
3
127
121
6
Sub-division 2' 6 Cotton toxtiles
Employers
Employees
Female,
145
Employees
Male. Females Males Female,
158 159 160 161
17 2 165 7
1 38
]9
r 11
7
16 2 127 7
16 2 126 7
TABLE B-III
Independent Workers
Males Females
146
38
29
16
7
6
9
2
4
Independent Workers
Males
162
3,991
2,931
468
344
801
57
369
312
520
1,060
579
463
18
147
4
4
Females
163
311
250
19
79
59
13
16
34
30
61
30
29
2
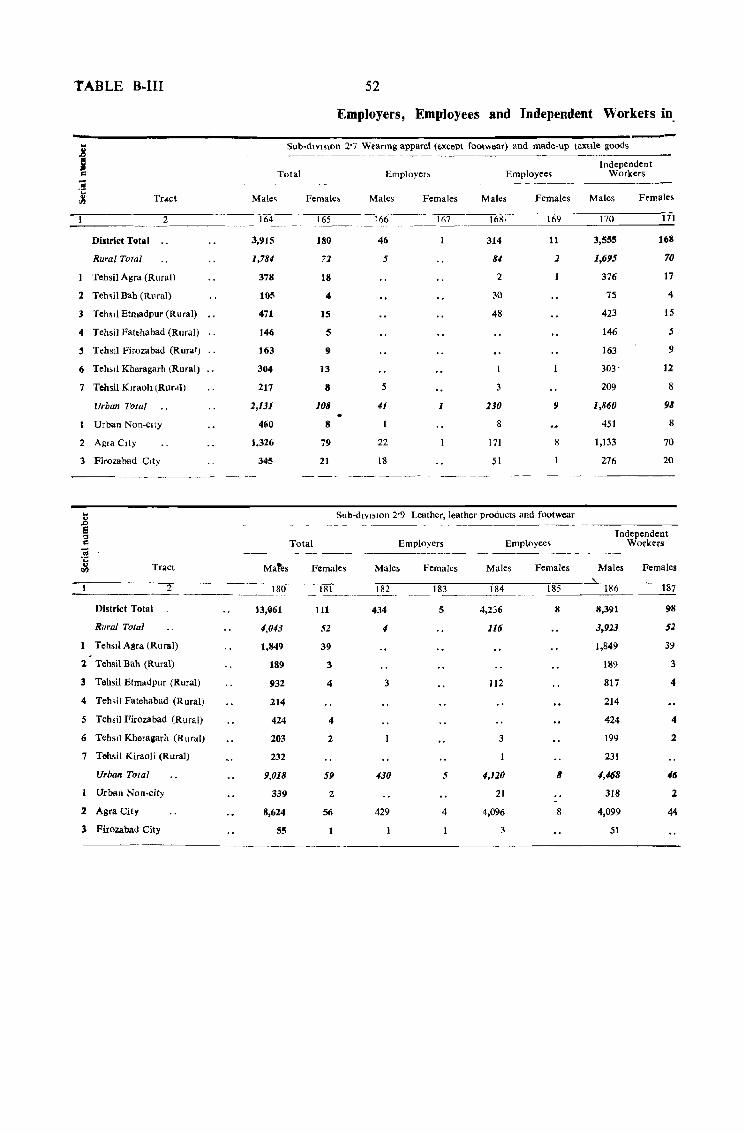
TABLE B-III 52
Employers, Emvloyees and Independent Workers in
~--------------------------------------------------------------------------------------------------Sub-dlvmon 2-7 W .. anng apparel (except footwear) and made-up textile goods
Total
Tract
2 164 ----"---- ---- -
District Total
Rural Total
Tehsil Agra (Rural)
2 Teh~il Bah (Rllral)
3 Tehsll Etmadpur (Rural)
4 Tehsil Fatchabad (Rural)
S Tehsll Firozabad (Rural)
6 Teh"j Kheragarh (Rural)
7 Tehsil Klraoh (Rurdj)
Urban Total
Urban Non-City
2 AgraClty
3 Firozabad CIty
3,915
1,784
378
105
471
]46
163
304
217
2,131
460
1,326
345
Female,
165
180
72
18
4
J5
5
9
13
8
JOB
8
79
21
Employer>
Males
166
46
5
5
41
22
18
Females
167
1
Employee~
Males
168,
314
84
2
30
48
230
8
171
51
Females
169
11
2
9
8
"-----Independent
Workers
Males Females
170
3,555
1,695
376
75
423
146
163
303'
209
1,860
451
1,133
276
171
1(i8
70
17
4
15
5
9
12
8
98
8
70
20
Sub-dIvIsIon 2-9 Leather, leather products and footwear
Total
Tract MaTes Females
2 ----~ 181
111
52
39
3
4
-------District Total
Rural Total
Tehsll Agra (Rural)
2 Tehsil Bah (Rural)
3 Tchsil Etmadpur (Rural)
4 Teh,i) Fatehabad (Rural)
5 Tehsil Firozabad (Rural)
6 TehsJ! Kheragarh (Rural)
7 Tchsil Kiraoli (Rural)
Urban Total
Urban Non-city
2 Agra City
3 Firozabad City
13,061
4,043
1,849
189
932
214
424
203
232
9,018
339
8,624
5S
4
2
59
2
56
1
--~--------- --------
Employers Employees ----" --"---- - ---~--- - -
Males
182
434
4
3
430
429
Females Males
183 184
5
5
4
4,236
116
112
3
4,120
21
4,096
3
Females
185
8
8
8
Independent Workers
Males
186
8,391
3,923
1,849
189
817
214
424
199
231
4,468
318
4,099
51
Females
187
98
52
39
3
4
4
2
46
2
44
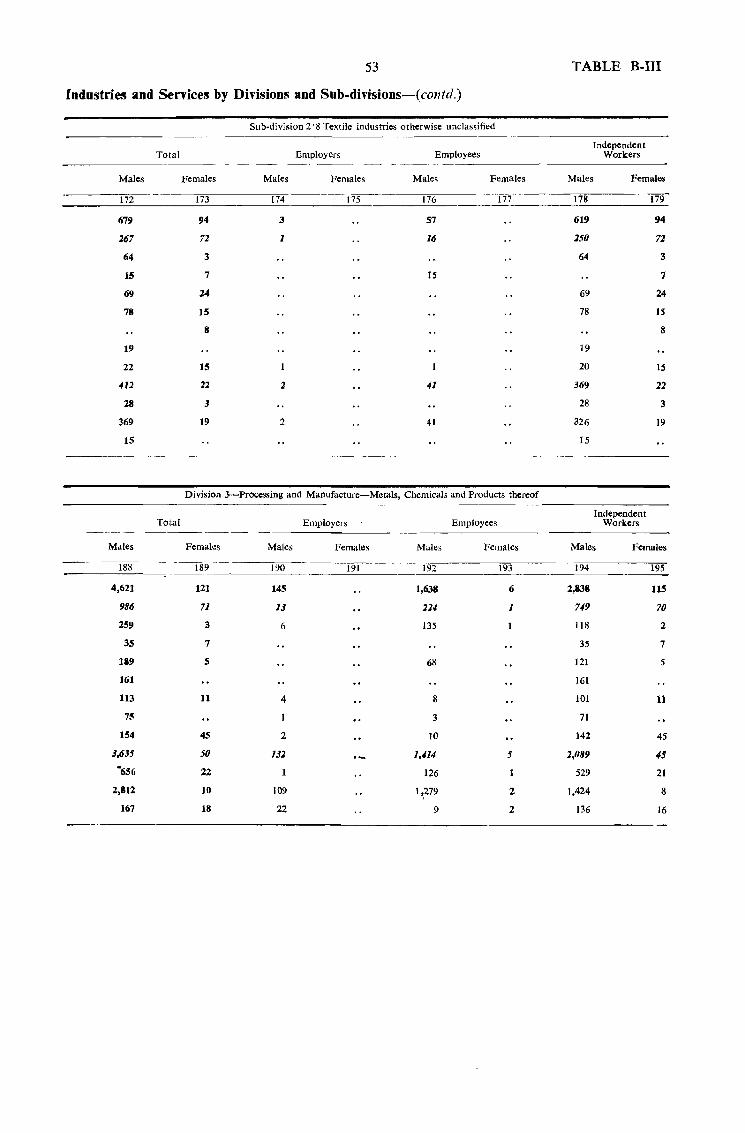
53
Industries and Service~ by Divisions and SUb-divisions-(contd.)
Males
172
679
267
64
15
69
78
19
22
412
28
369
15
Mdles
[88
4,621
986
259
35
ta9
161
113
75
154
],635
·656
2,812
167
Total
Total
Sub-division 2' 8 Textile industries otherwise unclas~ified
Employers Employees
Females Males Females Male~ Females
173 [74 ~~
175 [76 -177
94 3 57
72 1 16
3
7 15
24
15
8
15
12 2 41
3
19 2 4[
Division 3-Processing and Manufacture-Metals, Chemicals and Products thereof
Females
121
71
3
7
5
11
45
50
22
10
18
Ma[es
145
13
6
4
2
132
109
22
Employers
Females
[9[
Males
192
1,638
214
135
68
8
3
10
1,414
126
1 ~279
9
Emp[oyees
Fema[es
193
6
1
5
2
2
TABLE B-III
Independent
Males
178
619
250
64
69
78
19
20
369
28
326
15
Workers
Females
Independent Workers
179
94
72
3
7
24
15
8
IS
22
3
19
Males Fema[es
194
2,838
749
[18
35
121
161
101
71
142
2,089
529
1,424
136
195
115
70
2
7
5
11
45
45
21
8
16
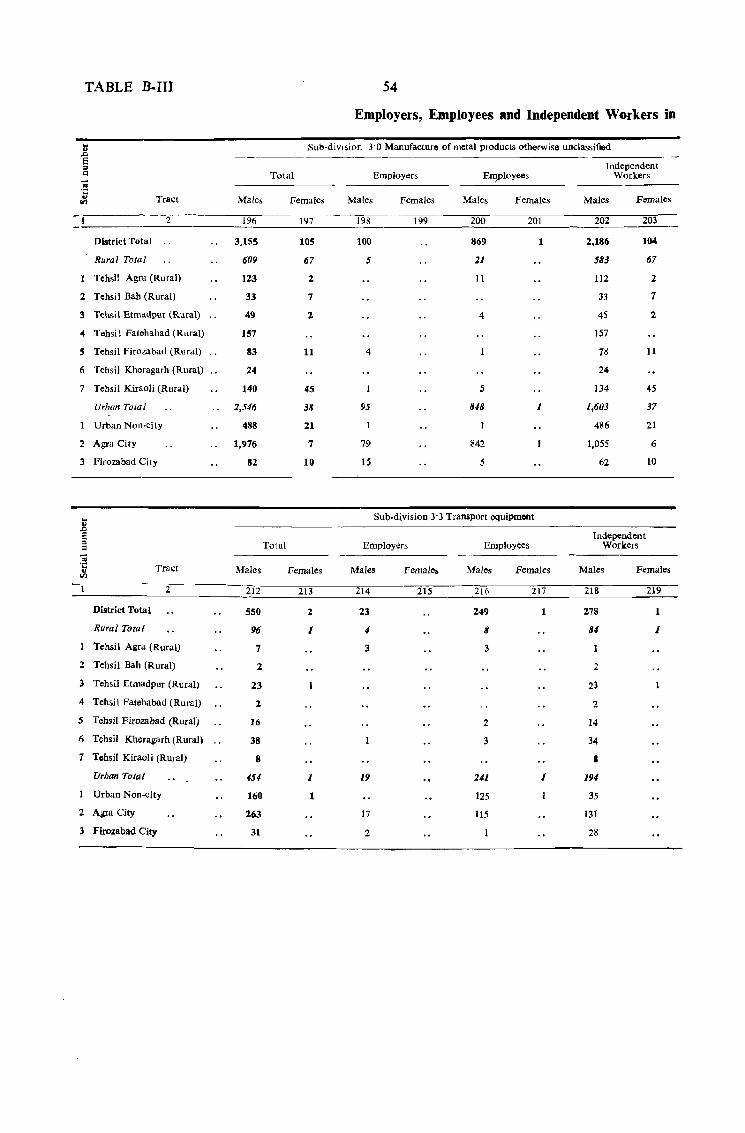
TABLE B-III 54
Employers, Employees and Independent Workers in
t Sub-division 3'0 Manufacture of metal products otherwise unclassified "'" E Independent :::I <1 Total Employers Em,Ployees Workers
·C ., Tract Males Females Males Females Males Females Males Females lin
2 196 197 198 199 200 201 202 203
District Total 3,155 105 100 869 1 2,186 104
Rural Total 609 67 5 21 583 67
Tehsil Agra (Rural) 123 2 11 112 2
2 Tehsil Bah (Rural) 33 7 33 7
3 Tehsil Etmadpur (Rural) 49 2 4 45 2
4 Tehsi I Fatehabad (Rural) 157 157
~ Tehsil Firozabad (Rma!) 83 11 4 n 11
6 Tehsil Kheragarh (Rmal) 24 24
7 Tehsil Kiraoli (Rural) 140 45 5 134 45
Urban Total 2,546 38 95 848 1 1,603 37
Urban Non-city 488 21 486 21
2 Agra City 1,976 7 79 842 1,055 6
3 Firozabad City 82 10 15 .5 62 10
.... Sub·division 3'3 Transport equipment " ,0
S Independent g Total Employers Employees Workers co 'S Tract III
Males Females Males Females Males Females Males Females
2 212 213 214 215 216 217 218 219
District Tota I 550 2 23 249 1 278 1
Rural Total 96 1 4 8 84 1
Tehsil Agra (Rural) 7 3 3
2 Tehsil Bah (Rural) 2 2
3 Tehsil Etmadpur (Rural) 23 1 23
4 Tehsil Fatehabad (Rural) 2 2
5 Tehsil Firozabad (Rural) 16 2 14
6 Tehsil Kheragarh (Rural) 38 3 34
7 Tchsil Kiraoli (Rural) 8 • Urban Total 454 1 19 241 1 194
Urban Non.city 160 1 125 35
2 Agra City 263 17 11.5 131
3 Firozabad City 31 2 28
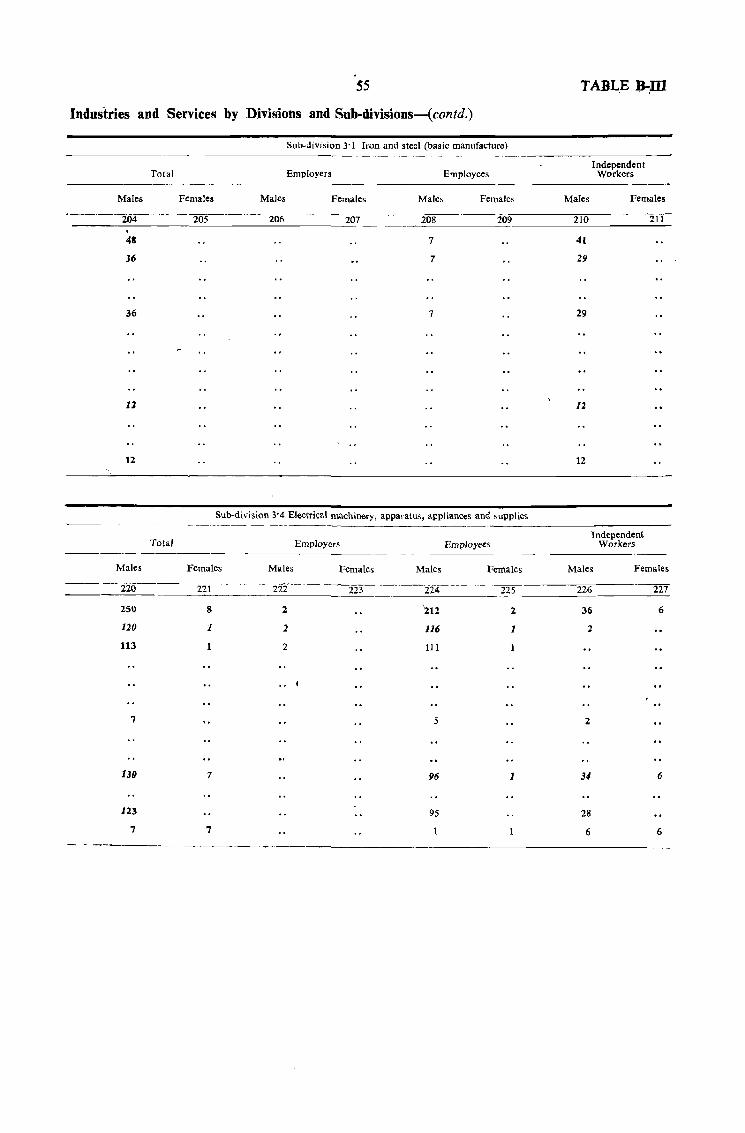
55
Industries and Services by Djvisions and Sub-divisions-(contd.)
Total
Males Females
4S
36
36
12
Sub-division 3-1 Iron and steel (basic manufacture)
Employers Employees
Males Females Males Females
206 207 208 209
7
7
7
Sub-division 3'4 Electrical machinery, apparatus, appliances and supplies
TABL_E ~m
Independent Workers
Males Females
210 ---m-41
29
29
12
12
----------------------------
Males
220
250
120
113
7
130
123
7
Total
Females
221
8
1
1
7
7
_ - _---------------
Employers
Males Females
222 223
2
2
2
Employees
Males Females
224 225
212 2
116 1
111
5
96 1
95
Independent
Males
226
36
2
2
28
6
Workers
Females
227
6
6
6

TABLE B .. ITl
Tract
District Total" "
Rural Total
2
Tehsil Agra (Rural)
2 Tehsil Bah (Rural)
1 Tehsil Etmadpur (Rural)
'" Tehsil Fatehabad (Rural) ""
, Tchsil Firozabad (Rural) ""
6 Tohsil Kheragarh (Rural)" "
7 Tehsil Kiraoli (Rural)
Urban Total
Urban Non-city
2 Agra City
3 Firozabad City
Employers, Employees and Independent Workers in
Sub-dIvision 3"5 Machinery (other than electrical machinery) including engineerinl workshops
Tota! Employers Employees Independent
Workers -------_ ----------Males Females Males Females Males Females Males Females
228 229 230 231 232 233 234 235
337 2 12 249 76 2
84 2 63 21 2
9 '}
60 2 54 6 2
3 3
12 12
253 12 186 55
24!! 11 185 49
II 1 6
---------------------------------__ ------------------------jJ Sub-division 3"7 Medical and pharmaceutical preparations ~ ---------------- Independent
Total Employers Employees Workers
'" "t <Zl Tract Males Females
-1------ 2;------'244,.-;---- 245
2
3
4
5
6
7
2
3
District Total
Rural Total
Tehsil Agra (Rural)
Tehsil Bah (Rural)
Tehsil Etmadpur (Rural)
'rehsil Fat~habad (Rllra!)
Tehsil Firozabad (Rural)
Tehsll Kheragarh (Rural)
Tehsil.Kiraoli (Rural)
Urban Total
Urban Non-city
Agra City
Firozabad City
19
11
5
7
2
5
Males Females Males
246 247 248
2
2
2
Females
24'1
Males
250
17
U
5
7
2
3
3
Females
251
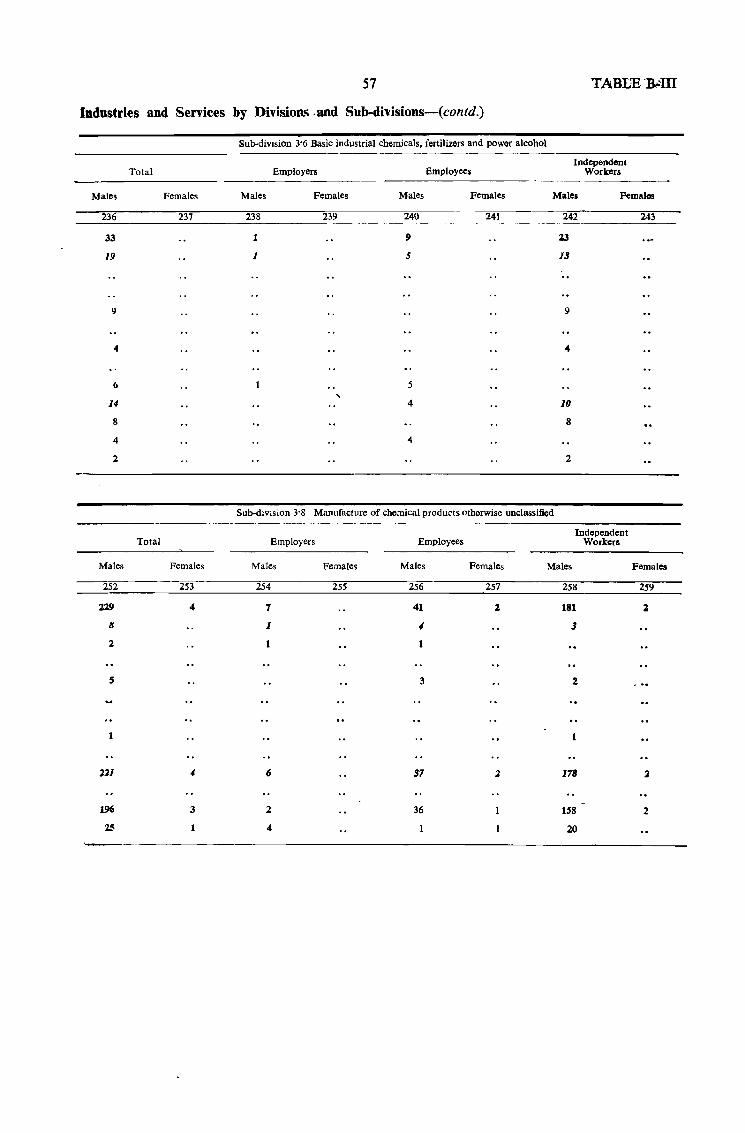
57 TABLE ':0..'111
Industries and Services by Divisions <and Sub-dhisions-(contd.)
Males
236
33
19
4
6
14
8
4
2
Males
252
229
8
2
5
211
196
2S
Total
Total
Females
237
Females
253
4
3
1
Sub-diVIsion 3'6 Basic industrial chemicals, fertilizers and powor alcohol
Independent Employers Employees Workers
Males Females Males Females Males Females
238 239
1
1
'-
240
I'
S
5
4
241 242
13
13
9
10
8
2
Sub-division 3'8 Manufacture of chemical products otherwise unclassified
Employers
Males
254
7
1
6
2
4
Females
255
Employees
Males
256
41
-I
1
3
37
36
Females
257
:&
Males
Independent Workers
258
181
3
2
178
158
20
243
Females
259
2
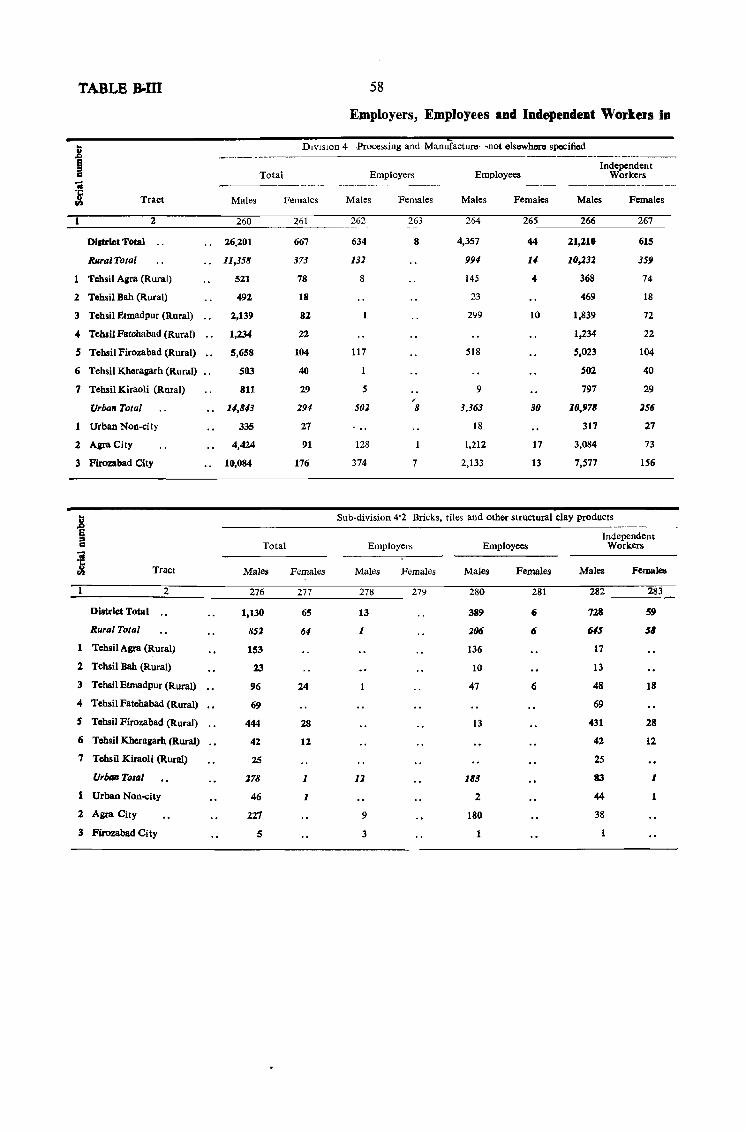
TABLE &In 58
Employers, Employees and Independellt Workers In
b DiViSIOn 4-Processing and Mamifacture-not elsewhere specified oS> .----- ------ -----~---
B Independent II Total Employers Employees Workers .. --------- - -- - ---- -----------'t Tract Males Females Males Females Males Females Males Females 0
2 260 261 262 263 264 265 266 267
District Total 26,201 667 634 8 4,357 44 21,210 615
Rural Total 11,358 373 131 994 14 10,132 359
Tehsil Agra (Rural) 521 78 8 145 4 368 74
2 Tohsil Bah (Rural) 492 18 23 469 18
3 Tehsil Etmadpur (Rural) 2,139 82 299 10 1,839 72
• Tehsil Fatehabad (Rural) 1,234 22 1,234 22
5 Tehsil Firozabad (Rural) 5,658 104 117 518 5,023 104
6 Tehsil Kheragarh (Rural) 503 40 S02 40
7 Tehsil KiraoH (Rural) 811 29 5 9 797 29 , Urba,. Total 14,843 294 502 8 3,363 30 10,978 256
Urban Non-city 335 27 18 317 27
2 Agra City 4,424 91 128 1,212 17 3,084 73
3 Firozabad City 10,084 176 374 7 2,133 13 7,577 156
.. Sub-division 4'2 Bricks, tiles and other structural clay products
~ -----_ Independent
~ Total Employers Employees Workers ;;
~ Tract Males Females Males Females Males Females Males Femalea
2 276 277 278 279 280 281 282 283
District Total .. 1,130 65 13 389 6 728 59
Rural Total 852 64 1 206 6 645 58
1 Tehsil Agra (Rural) 153 136 17
2 Tehsil Bah (Rural) 23 10 13
3 Tehsil Etmadpur (Rural) 96 24 47 6 48 18
4 Tehsil Fatehabad (Rural) 69 69
S Tehsil Firozabad (Rural) 444 28 13 431 28
6 Tebsil .Kheragarh CRural) 42 12 42 12
7 Tehsil Kiraoli (Rural) 25 25
Urball Total 278 1 12 183 83 1
1 Urban Non-city 46 1 2 44
2 Agra City 227 9 180 38
3 Firozabad Ci ty 5 3
59 TABLE B-III
Industries and Services by Divisions and Sub-divisions-(contd.)
Sub-division 4'0 Manutacturing industries otherwise unclassified
Independent Total Employers Employees Workers
---"-~-.--
Males Females Males Femlles Ml1ei Females Males Females
268 269 270 271 272 273 274 275
2,536 91 28 394 5 1,114 86
765 69 :z 16 4 747 65
99 58 4 99 54
92 89
196 10 186
55 55
78 5 77 5
108 1 108
137 5 2 2 133 5
1,771 2:Z 26 378 1 1,367 :Z1
4 4
1,590 14 15 346 1,229 13
180 4 11 32 137 4
Sub-division 4'4 Non-metallic min@ral products
Independent Total Employers Employees Workers
-----Males Females Males Femaks Malc~ Females Males Females
284 285 286 287 288 289 290 291
16,469 333 479 8 2,820 17 13,170 308
6,103 14:1 118 704 3 5,281 139
lOS 12 205 12
164 3 10 154 3
757 23 203 3 554 20
270 12 270 12
4,352 61 117 491 3,744 61
76 19 75 19
279 12 27-J 12
10,366 191 361 8 2,116 14 7,889 169
119 7 14 105 7
615 16 2 r 26 587 14
',632 168 359 7 2,076 13 7,197 148
TABLE B-III 60
Employers, Employees and Independent Workers in
- Sub-division 4·5 Rubber products 11
1 \ndependent ;::I Q Total Employers Employees Workers <i .0:; u Tract Mates Females Maes Females Males Females Males F~malCi (Il
2 292 293 294 295 296 297 298 299
District Total 31 .. 8 19
Rural Total
Tehsil Agra (Rural)
2 Tehsil Bah (Rural)
3 Tehsil Etmadpur (Rural)
4 Tehsil Fatehabad (Rural)
5 Tehsil Firozabad (Rural)
6 Tehsil Kheragarh (Rural) .. 7 Tehsil Kiraoli (Rural)
Urban Total 31 " 8 19
Urban Non-city
2 Agra City .. 31 4 8 19
3 FirOzabad Ci Iy
... Sub-division 4·7 Furniture and fixtures-u ..c S Independent :> c
:3 Total Employers Employees Workers
~ Tract Males Females Males Female~ Males Females Males Females
2 3C8 309 310 311 312 313 314 315
District Total .. 109 14 7 109 17
Rural Total /(J ·10
Tehsil Agra (Rural)
2 Tehsil Bah (Rural)
3 Tehsil Etmadpur (Rurl\l)
4 Tehsil Fatchabad (Ru~!) .. 10 10
5 Tehsil Firozabad (Rural)
6 Tehsil Kheiragarh (Rural) ..
7 Tehsil Kiraoli (Rural)
Urba" Total .. 99 U 7 99 17
Urban Non-city 95 ~5
2 Agra City .. 24 7 4 17
3 Firozabad City
61 TABLE B-III
It1da~ries and Senices by Divisions and Sub-divisions-(contd.)
Sub-divIsion 4'6 Wood and wood product~ other than furnitUf() and fixtures ----_ .. _- ---- -_---_.- ------- - - -. --~ -~-_- -.-_---~------.------_-------- ------- ----Total
Males
300 -----------5,390
3,552
47
213
1,064
829
784
249
366
1,838
74
1,504
260
316
142
37
II
19
4
105
jus
Total
Females
301
147
97
• 15
34
10
10
8
12
50
15
31
4
Females
317
Employers Employees Independent
Workers
Males Females Males Females Males Females
302 303 ---304----- 305 306 307 _________________________ H ______
78 427 5
3 37 1
17
13
3 7
75 390 4
2
75 369 4
19
Sub·divlslOn 4'8 Paper and paper products
Males
318
8
8
8
Employers
Females
319
Males
320
38
3
3
35
35
Employees
Females
321
4,885
3,512
47
213
1,047
829
771
249
356
1,373
72
),060
241
Independent Workers
142
96
8
15
33
10
10
8
12
46
15
27
4
Males Females
322
96
26
3
19
4
70
70
323
TABLE B-III 62
Employers, Employees and Independent Workers in
.... Sub-division 4'9 Printing and allied industries ] E Independent ::I c:: Total Employers Employees Workers
3 i1 Tract Males Females Males Females Males Females Males Females CIl
2 324 325 326 327 328 329 330 331
District Total 394 7 14 181 4 89 3
Rural Total 39 1 28 11 1
Tehsil Agra (Rural) 6 6
2 Tehsil Bah (Rural)
3 Tehsil Etmadpur (Rural) 13 1 22
4 Tehsil Fatehabad (Rural)
5 Tehsil Firozabad (Rural)
6 Tehsil Kheragarh (Rural) 9 9
7 Tehsil Kiraoli (Rural)
Urban Total 355 6 24 253 4 78 2
Urban Non-city
2 AgraCity 348 6 23 248 4 77 l
3 Firozabad City .. 7 5
... Sub-division 5 '1 Construction and maintenance--buildings ] 8 Independent ::I c Total
~ Employers Employees Workers
... Jract Males Females Males Females Males Females Males Females CIl
2 340 341 342 343 344 345 346 347
District Total 4,479 102 15 574 3,890 102
Rural Total 1,777 90 2 210 1,565 90
TehsiI Agra (Rural) 494 205 289
2 Tehsil Bah (Rural) 68 66
3 Tehsil Etmadpur (Rural) 448 5 448 5
4 TehsiI Fatehabad (Rural) 180 84 180 84
5 TehSJI Firozabad (Rural) 203 • 203
6 Tehsil Kberagarh (Rural) 199 198
7 Tehsil Kiraoli (Rural) 185 1 3 181
U,ban Total 2,702 12 13 .364 1,325 12
Urban Non-city 316 316
2 AgraCity 2,110 11 13 363 1,734 11
3 Firozabad City 176 1 275
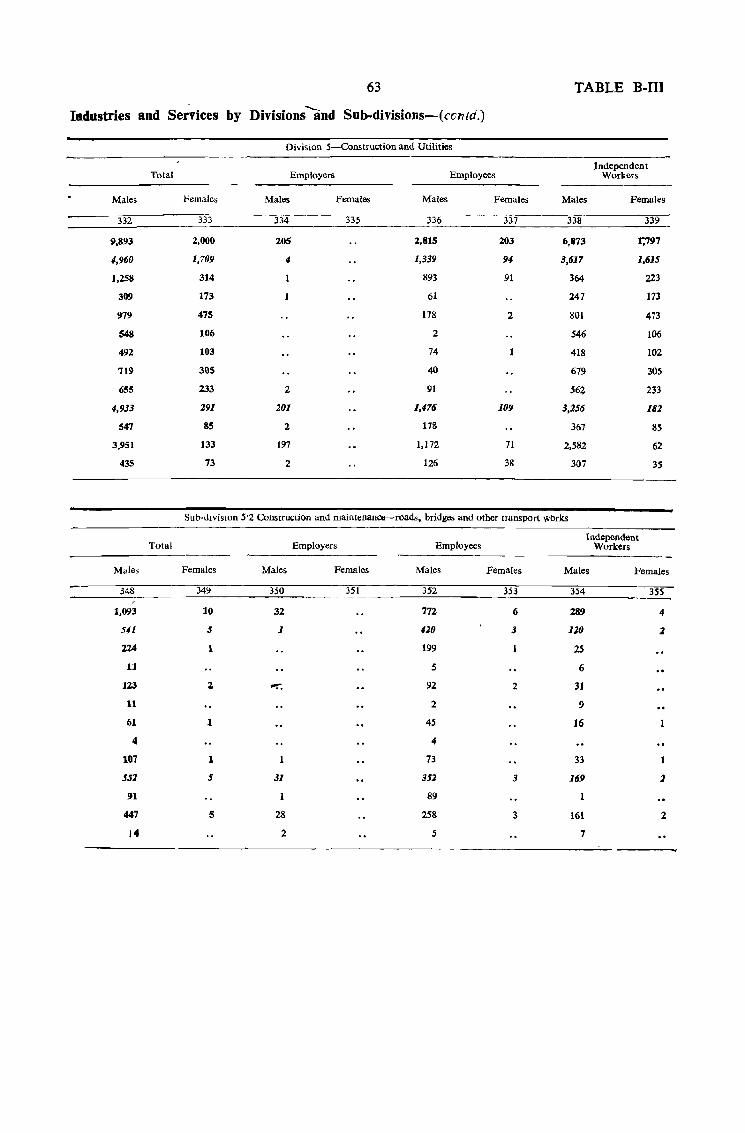
63 TABLE B-III
In.dustries and Services by Divisions -and Sub-divisions-( COll td.)
Division 5-Construction and Utilities
Independent Total Employers Employees Workers
Males Females Males Females Males Females Males Females
332 333 334 335 336 337 338 339
~,893 2,000 205 2.815 203 6,873 r;797
4,960 1.709 4 1,339 94 3,617 1,615
1.258 314 893 91 364 223
309 173 61 241 173
979 475 178 2 801 473
548 106 2 546 106
492 103 74 418 102
119 305 40 679 305
655 233 2 91 562 233
4.933 291 201 1.476 109 3.256 182
547 85 2 178 367 85
3,951 133 197 1.172 71 2,582 62
435 73 2 126 38 307 35
Sub-dIvisIOn 5·2 Construction and maintenance--roads, bridges and other transport works
Total Employers Employees Independent
Workers
Males Females Males Females Males Females Males Females
348 349 350 351 352 353 354 355
1.093 10 32 772 6 289 4
541 5 1 420 3 120 2
224 1 199 2S
11 S 6
123 Z -.; 92 2 31
11 2 9
61 1 4S 16
4 4
101 1 73 33
552 S 31 352 3 169 1
91 89
447 5 28 258 3 161 2
)4 2 5 7
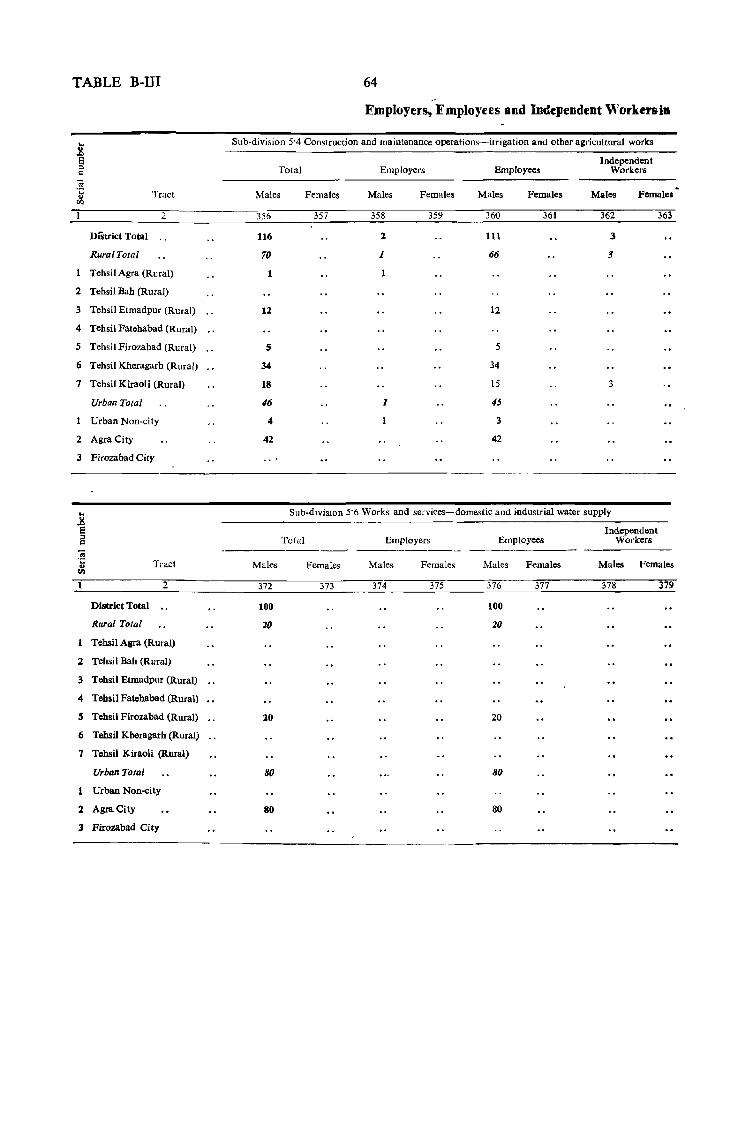
TABLE B-III
t .&J El " c
'" 'ii tf.l
2
3
4
5
6
7
2
3
Tract
2
DiStrict Total
Rural Total
Tebsil Agra (Rural)
TehsiI Bah (Rural)
Tebsil Btmadpur (Rural)
Tebsil Fatebabad (Rural)
Tehsil Firozabad (Rural)
Tehsil Kheragarh (Rural)
Tehsil Kiraoli (Rural)
Urban Total
Urban Non-city
AgraCity
Firozabad City
Tract
District Total
Rural Total
2
Tehsil Agra (Rural)
2 Tehsil Bah (Rural)
3 Tehsil Etmadpur (Rural)
4 Tehsil Fatehabad (Rural)
S Tehsil Firozabad (Rural)
6 Tohsil Kheragarh (Rural)
7 Tehsil Kiraoli (Rural)
Urban Total
Urban Non-city
:1 AgraCity
:3 Firozabad City
64
Employers, Employees and Independellt WorbniD
Sub-division 5'4 Construction and maintenance operations-irrigation and other agricultural works
Total Employers Employees Independent
Workers
Males Females Males Females Males Females Males Females
356 357 358 359 360 361 362 363
116 1 111 3
70 1 66 3
1
12 12
5 5
34 34
18 15 3
16 1 45
4 3
42 42
Sub-dIvisIOn 5'6 Works and services-dome.stic and industrial water supply
Males
372
100
20
10
80
80
Total Employers
Females Males Females
373 374 375
Employees
Males
376
100
20
20
80
80
Females
377
Independent Workers
Males Females
378 379
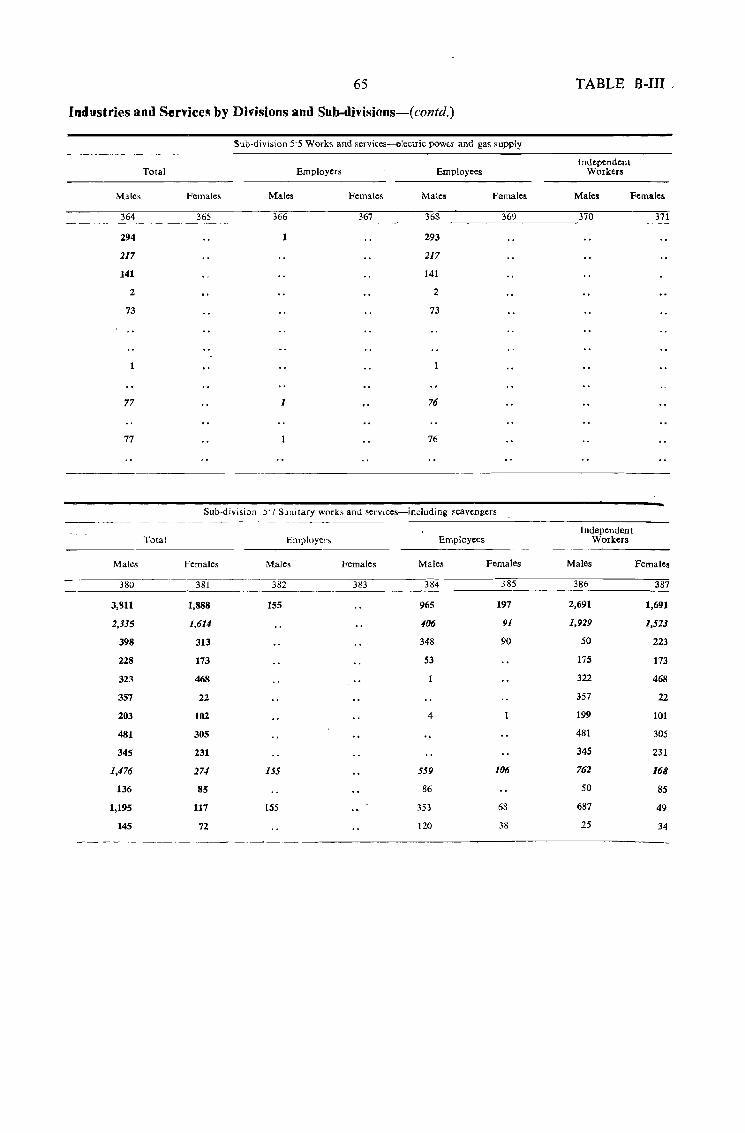
65
Industries and Services by Divisions and Sub-divisions-(contd.)
Males
364
294
217
141
2
73
77
77
Males
380
3,811
2,335
398
228
323
357
203
481
345
1,476
136
1,195
145
Total
Total
Sub-division 5'5 Works and services-e~ectric powor and gas supp1l!
Employers Employees
Females Males Females Malea Females
365 366 367 368 369
1 293
217
141
2
73
1 76
76
SLlb-division 5"7 S~r1itary works and services-including ~cavengers
Employers Employees
Females Males Females Males Females
'--'---'" 381 382 3~3 384 385
1,888 155 965 197
1,614 406 91
313 348 90
173 53
468
22
102 4
305
231
274 155 559 106
85 86
117 155 353 68
n 120 38
TABLE B-III /
Independent Workers
Males Females
370 371
Independent Workers
Males Females
386 387
2,691 1,691
1,929 1,523
50 223
175 173
322 468
357 22
199 101
481 305
345 231
762 168
50 85
687 49
25 34
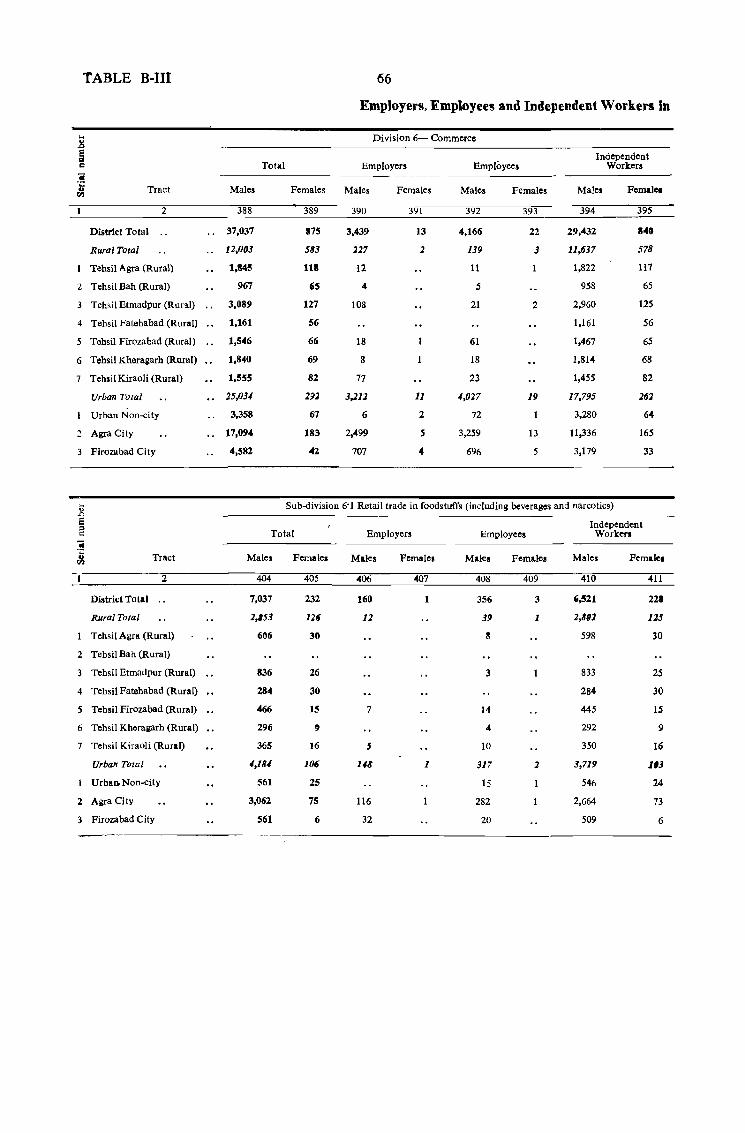
TABLE B-III 66
Employers, Employee!!! and Independent Workers in
... Division 6- Commerce ~
~ Employees
Independent c= Total Employers Workers
:! ;; Tract Males Females Males Females Males Females Males Femlliet ~
2 388 389 390 391 392 393 394 395
District Total " 37,037 1175 3,439 13 4,166 22 29,432 140
Rural Total 12,003 583 127 2 139 3 11,637 578
Tehsil Asra (Rural) 1,845 1111 12 11 1,822 117
2 Tehsil Bah (Rural) 967 CiS 4 5 958 65
3 Tehsil Etmadpur (Rural) 3,089 127 108 21 2 2,960 125
4 Tehsil Fatehabad (Rural) 1,161 56 1,161 56
5 Tehsil Firozabad (Rural) 1,546 66 18 61 1,467 65
6 Tehsil Kheragarh (Rural) 1,840 69 8 18 1,814 68
7 Tehsil Kiraoli (Rural) 1,555 82 77 23 1,455 82
Urba1l Total 25,034 2~2 3,212 11 4,027 19 17,795 262
Urban Non-city 3,358 67 6 2 72 3,280 64
2 AgraCity 17,094 183 2,499 5 3,259 13 11,336 165
3 Firozabad City 4,582 42 707 4 696 5 3,179 33
;:; Sub-division 6'1 Retail trade in foodstuffs (including beverages and narcotics) .n 6 Independent '" 0: Total Employers Employees Workers .. 'C
Tract ~ Males Females Males Females Male. Females Males Female.
2 404 405 406 407 408 409 410 411
District Total 7,037 232 160 1 356 3 ',S21 22.
Rural Total 2,153 12~ 12 3" 1 2,8112 125
Tehsil Agra (Rural) 606 30 8 598 30
2 Tehsil Bah (Rural)
Tehsil Etmadpur (Rural) 836 26 3 833 25
4 Tehsil Fatehabad (Rural) 284 30 284 30
5 Tehsil Firozabad (Rural) 466 15 7 14 445 15
6 Tehsil Kheragarh (Rural) 296 , 4 292 9
7 Tehsil Kiraoli (Rural) 365 16 5 10 350 16
Urban TOlal 4,184 106 148 1 317 2 3,719 1'3
Urban. Non-city 561 25 15 546 24
2 Agra City 3,062 75 116 282 2,664 73
3 Firozabad City 561 6 32 20 509 6
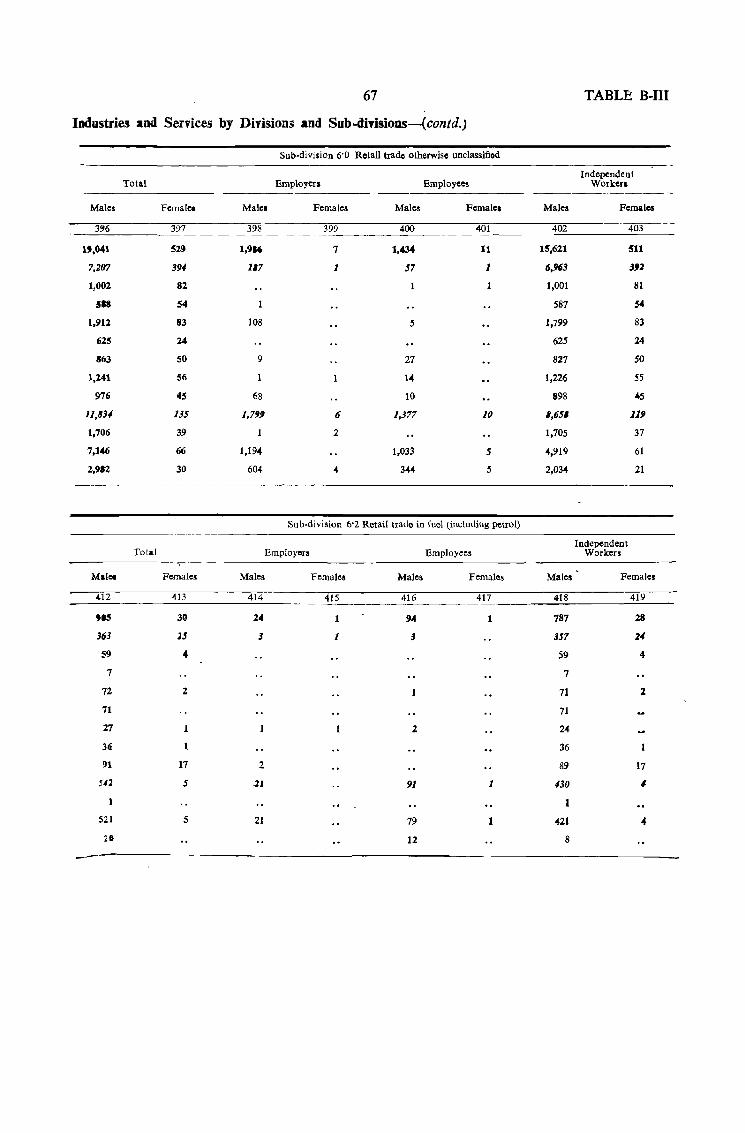
67 TABLE B-III
Industries and Services by Divisions and Sub-diTisions-(contd.)
Sub-division 6'0 Retail trade otherwise unclassified
Independent Total Employers Employees Workera
Males Females Male. Females Males Females Males Females
3.,6 397 398 399 400 401 402 403
1'.041 529 1,9" 7 1,434 11 15,621 511
7,207 394 117 1 57 1 6,963 3J1
1,002 82 1,001 81
518 S4 587 54
1,911 83 108 5 1,799 83
625 24 625 24
863 50 9 27 827 50
1,241 56 14 1,226 55
976 43 68 10 898 45
11,831 135 1,7J9 6 1,377 10 1,6.51 119
1,706 39 2 1,705 37
7,146 66 1,194 1,033 5 4,919 61
2,912 30 604 4 344 5 2,034 21
Sub-division 6'2 Retail trade in fuellincluding petrol)
Independent Total Employers Employees Workers
Malo. Femalea Males Females Males Females Males Females
412 413 414 415 416 417 418 419
,.5 30 24 1 94 1 787 28
363 J5 3 1 3 357 Z4
59 4 59 4
7 7
72 2 71 l
71 71
27 2 24
36 1 36
91 17 2 89 17
~42 5 21 91 1 430 I
521 S 21 79 421 4
20 12 8
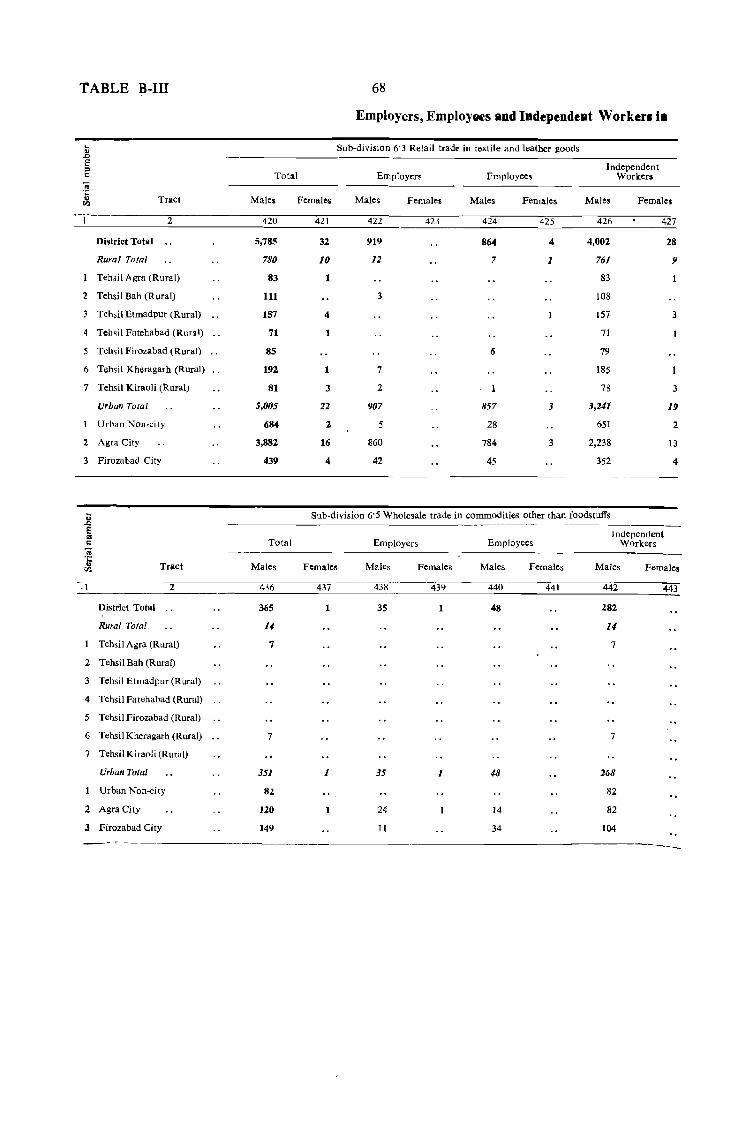
TABLE B-III 68
Employers, Employees and IDdependellt Workers ill
k Sub-division 6"3 Retail trade in textile and leather goods " .0 S Independent " c Total Employer~ Employee~ Workers ~ ~ Tract Males Femaleil Males Females Males Females Males Females
2 420 421 422 42.1 424 425 426 427
District Total 5,785 32 919 864 4 4,002 28
Rural Total 780 10 12 7 1 761 9
Tehsil Agra (Rural) 83 1 83
2 Tehsil Bah (R ural) 111 3 108
Tch"il Etmadpur (Rural) 157 4 157 3
Tel"il Fatehabad (Rur.l) 71 1 71
5 Teh~iJ Firozabad (Rural) 85 6 79
6 Tehsil Kheragarh (Rural) 192 1 7 185
7 Tehsil KiraoH (Rural) 81 3 2 7S 3
Urban Total 5,005 22 907 857 3 3,241 I'J
Urban Non-city 684 2 5 28 651 2
2 Agra City 3,882 16 860 784 3 2,238 13
3 Firozabad City 439 4 42 45 352 4
.. Sllb-dil'ision 6'5 Wholesale trade in commodities other than foodstuffs .0 e Independent ::I c Total Employers Employees Workers 0; ".: .. Tract Males Females Males Females Males Females Males Females <I:l
·1 2 4.16 437 "----;m-.. 43\1 440 441 442 443
District Total 365 1 35 1 48 282
Rural Total 11 14
Tehsil Agra (Rural) 7 7
2 Tehsil Bah (Rural)
3 Tehsil Etmadpur (Rural)
4 Tehsil Fatehabad (Rural)
5 Tehsil Firozabad (Rural)
6 Tehsil Kheragarh (Rural) 7 7
7 Tehsil Kiraoli (Rural)
Urban Total 351 1 35 1 48 268
Urban Non-city 82 .. 82
2 Agra City ]20 1 24 14 82
3 Firozabad City 149 11 34 104
---- -~-
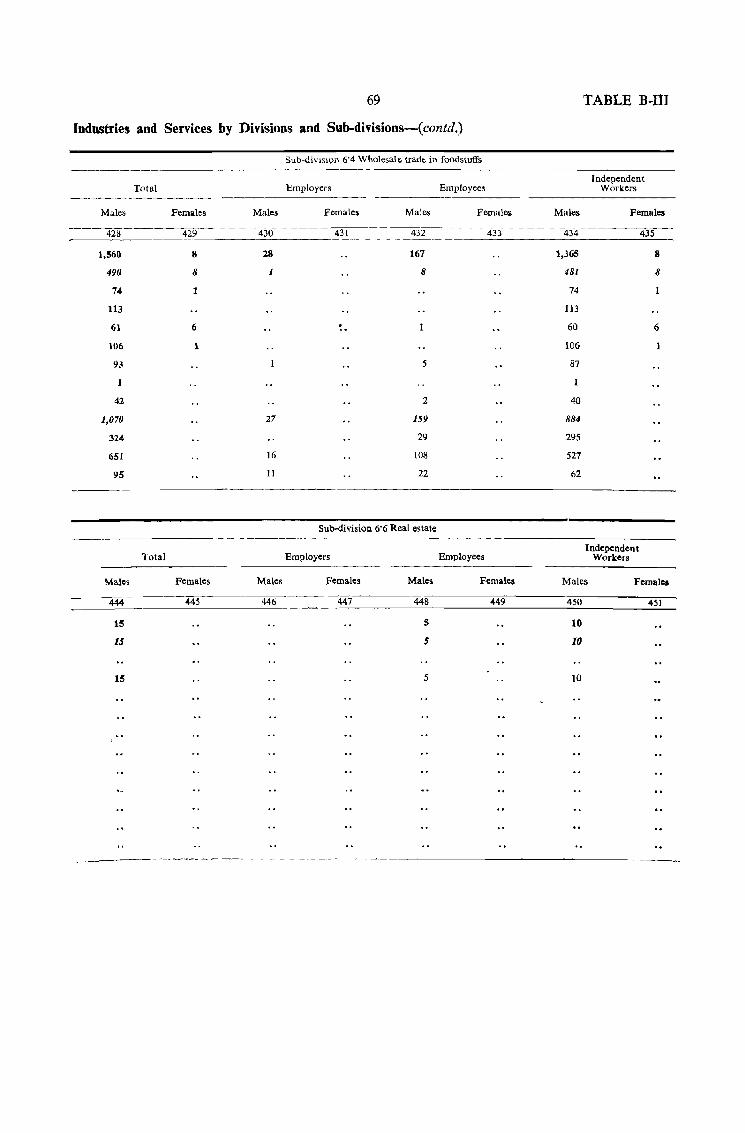
69 TABLE B-III
Industries and Services by Divisions and Sub-divisions-(contd.)
Sub-diV1Sllln 6·4 Wholesale. trade in foodstuffs -------------------------------------------------
-------Males
428
1,560
490
74
113
61
106
93
42
1,070
324
651
95
Males
444
15
15
15
Total
Females
429
8
8
1
6
1
Total
Females
445
Males
430
28
I
27
16
11
Males
446
Employers
Females
431
Males
432
167
8
5
2
159
29
108
22
Sub·divisioll. 6·6 Real estate
Employers
Females Males
441 448
5
5
5
EmpJoyee5
Females
433
Employees
Females
449
Males
434
1,365
481
74
113
60
106
87
40
884
295
527
62
Independent Workers
Females
Indepcndellt Workers
435
8
8
6
Males FemaJIIJ
450 451
10
10
10
-_ ------------------------------------
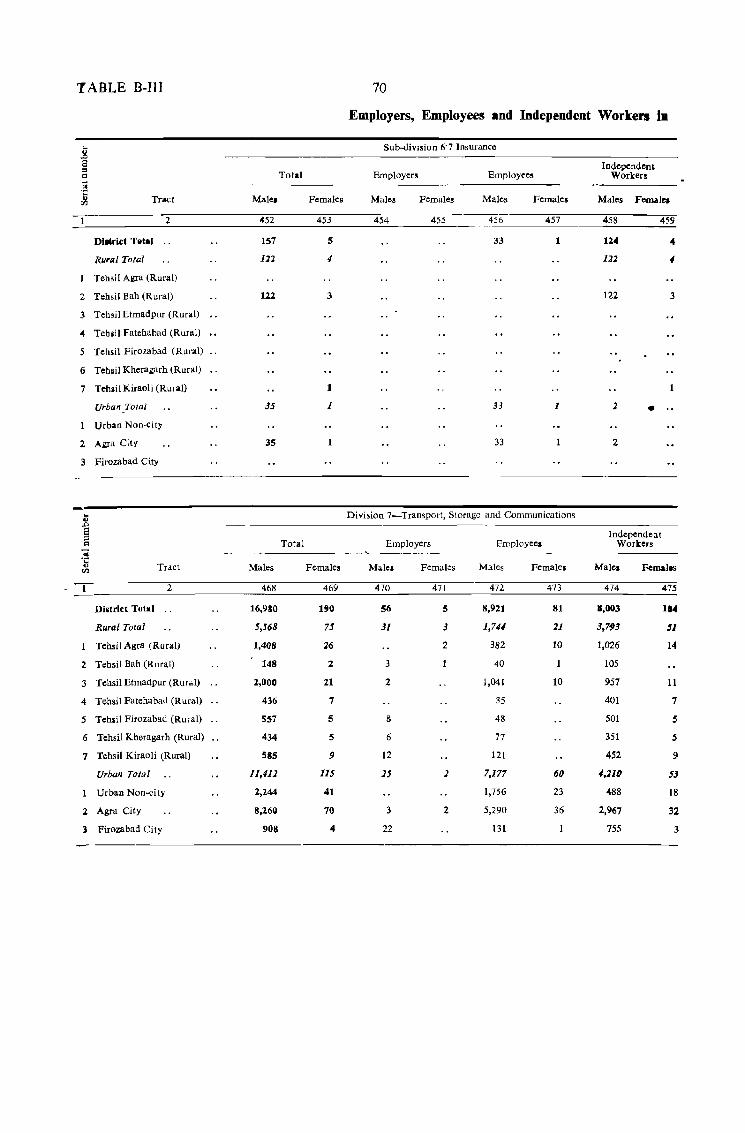
TABLE B-IlI 70
Employers, Employees and Independent Workers i.
_g Sub-division 6·7 Insurance
8 Independent ::I c:I Total Employers Employees Workers ;;;
~ Tract Mal~ Females Males Females Males Females Males Fem.ll~
2 4~2 453 454 455 456 457 458 4~9
Dilllrid Tilt_I 157 5 33 1 124 4
Rural To/al 122 4 122 4
Tehsil Agra (Rural)
2 Tehsil Bah (Rural) 122 3 122 3
3 Tehsil Etmadpur (Rural)
4 Tehsil Fatehabad (Rural)
5 Tehsil Firozabad (Rural)
6 Tehsil Kheragarh (Rural)
7 Tehiil Kiraoli (Rural) 1
Urban _Total 35 1 33 1 2 • Urban Noo-city
2 Agra City 35 1 33 2
3 Firozabad City
... Division 7_Transport. Storage and Communications " .t:J e Independent ::I c:I Total Employers Pmploye~ Workers .. ------ -~ ---
°fi Tract Males Females Males Females Males Females Males Females lJl
2 468 469 470 471 472 473 474 475
Oilltriet Tot,,) 16,910 !!IO 56 5 8,921 81 1,003 114
Rural To/al 5,568 75 31 3 1,7# 21 3,71J3 51
Tehsil Agra (Rural) 1,408 26 2 382 10 1,026 14
2 Tehsil Bah (Rural) 148 :: 3 40 105
3 Tehsil Etmadpur (Rural) 2,000 21 2 1,041 10 957 11
4 Tehsil Fatehabad (Rural) 436 7 35 401 7
5 Tehsil Firozabad (Rural) 557 5 8 48 501 5
6 Tehsil Kheragarh (Rural) 434 5 6 77 351 5
7 Tehsil Kiraoli (Rural) 585 9 12 121 452 9
Urban Total 11,412 115 25 2 7,177 60 4,210 53
Urban Non-city 2,244 41 1,756 23 488 18
2 Agra City 8,269 70 3 2 5,290 36 2,967 32
3 Pirozabad City 908 4 22 131 755 3
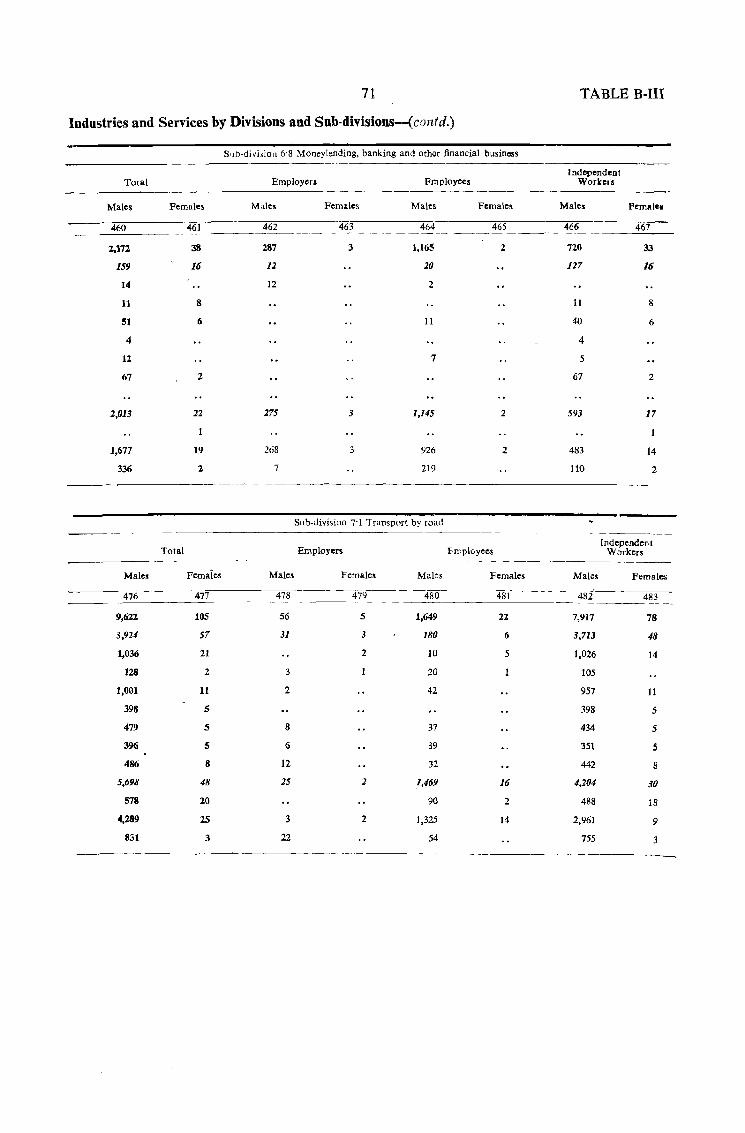
71 TABLE B-III
Industries and Services by Divisions and Sub-divisions-(contd.)
S,.b-divi,ion 6·8 Moneylending, banking and other financial business
Independent Total Employers Fmployees Workers
Males Females Male. Females Males Females Males Femal@1
460 461 462 463 464 465 466 467
2,172 38 287 3 1,165 2 726 33
159 16 12 10 1]7 16
14 12 2
11 8 11 8
51 6 II 40 6
4 4
12 7 5
67 2 67 2
2,013 22 175 3 1,145 2 593 17
1,677 19 268 926 2 483 14
336 2 7 219 110 2
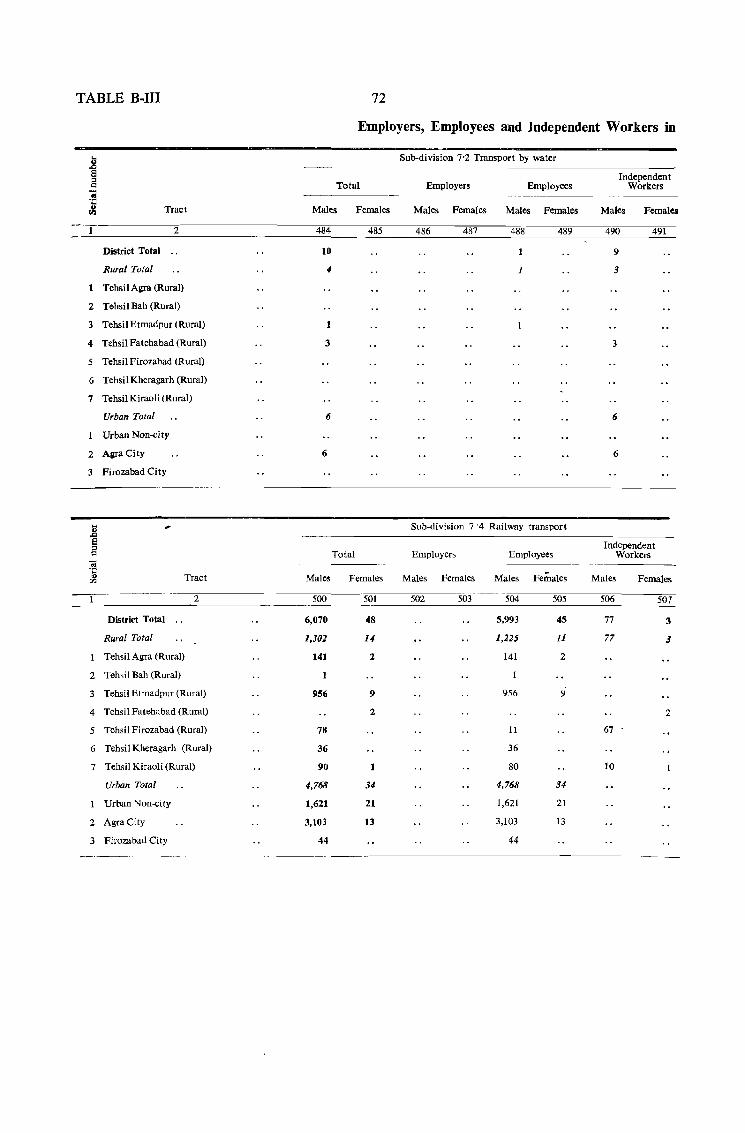
TABLE B-III
,g Ei e .!!! ~ Tract ""
2
District Total
Rural Total
Tehsil Agra (Rural)
2 Tehsil Bah (Rural)
3 Tehsil Etmadpur (Rural)
4 Tehsil Fatehabad (Rural)
5 Tehsil Firozabad (Rural)
6 Tehsil Kheragarh (Rural)
7 Tehsil Kiraoli (Rural)
Urban Total
Urban Non-city
2 AgraCity
3 Firozabad City
~ e " '" 1S ... '" Tract <Il
2
District Total
Rural Total
Tehsil Agra (Rural)
2 Tehsil Bah (Rural)
3 Tehsil Etmadpur (Rural)
4 Tehsil Fatehabad (Rural)
5 Tehsil Firozabad (Rural)
6 Tehsil Kheragarh (Rural)
7 Tehsil Kiraoli (Rural)
Urban Total
Urbao Non-city
2 AgraCity
3 Firozabad City
---------_ ..
72
Employers, Employees and Independent Workers in
Total
Mal~ Females
484
10
"
1
3
6
6
Males
500
6,070
1,302
141
1
956
78
36
90
4,768
1,621
3,103
44
485
Total
Females
501
48
U
2
9
2
1
31
21
13
Sub-division 7·2 Transport by water
Employers Employees
Males Females Males Females
486 487 488 489
1
Sub-division 7·4 Railway transport
Employers Employees
Males Females Males Females
502 503 504 505
5,993 45
1,225 11
141 2
956 9
11
36
80
1,768 31
1,621 21
3,103 13
44
Independent Workers
Males Females
490
9
3
3
6
6
491
Independent Workers
Males Females
506 507
77 3
77 3
2
67
10
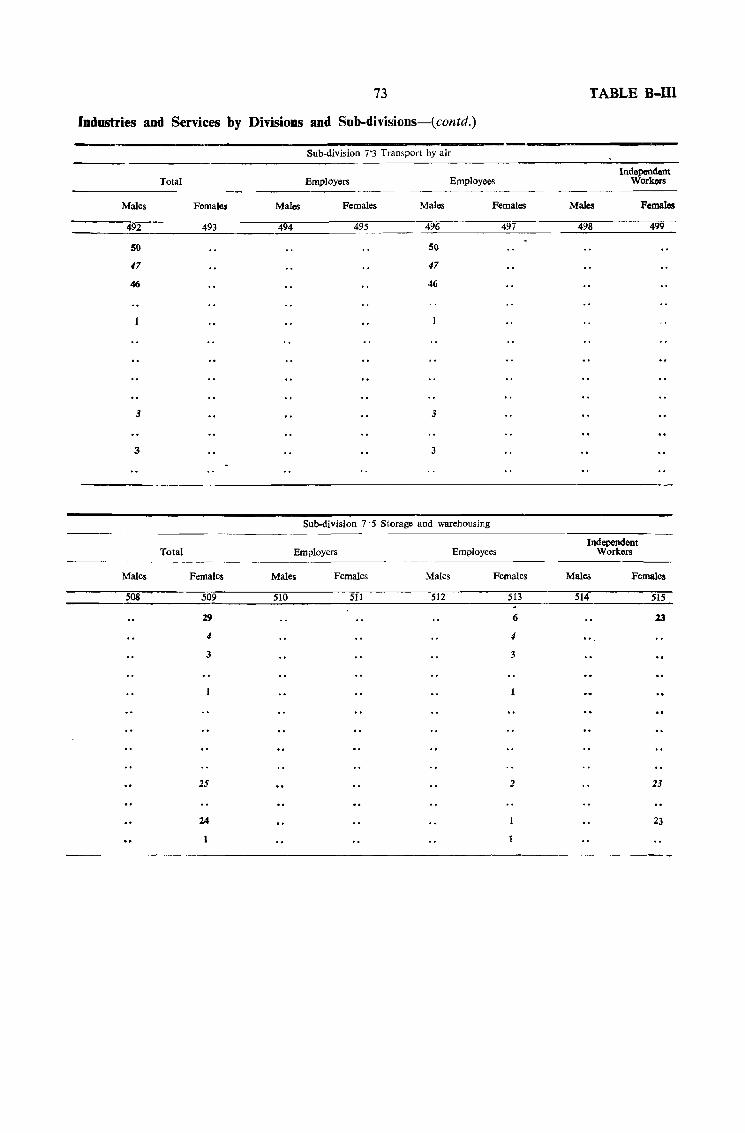
73 TABLE B-IIl
Industries and Services by Divisions and Sub-divisions-(contd,)
Males
492
SO
17
46
3
Males
508
Total
Total
Females
493
---Females
509
19
4
3
25
Sub-division 7'3 Transport by air ---------------------------~--------
Employers
Males Females
494 495
Males
496
50
17
46
3
3
Employees
Females
497
Sub-division 7 '5 Storage and warehousing
Employers Employees
Males Females Males Females
510 511 512 513
6
" 3
2
Males
498
Independent Workers
Females
499
Independent Workers
Males Females
514 515
13
..
23
23
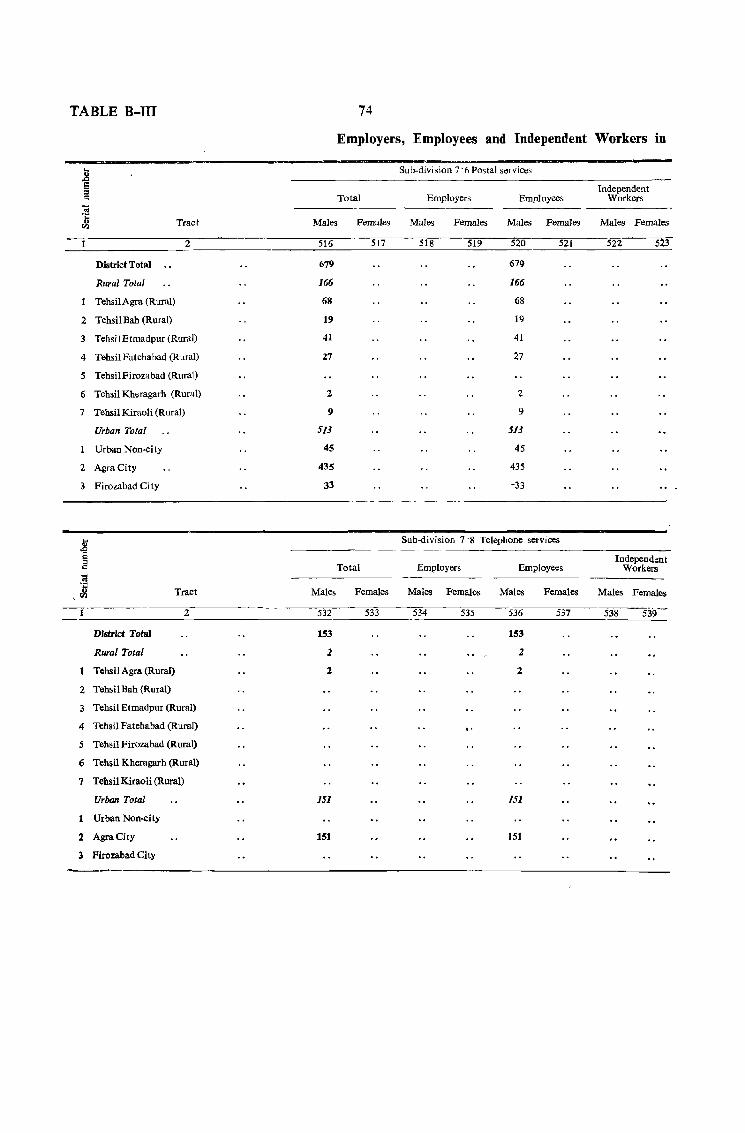
TABLE B-ill
!) ,0
8 :I Q
';;! °t Tract v.>
2
District Total
Rural Total
TehsilAgra (Rural)
2 Tehsil Bah (Rural)
3 Tehsil Etmadpur (Rural)
4 Tehsil Fatehabad (Rural)
5 Tehsil Firozabad (Rural)
6 Tehsil Kheragarh (Rural)
7 Tehsil Kiraoli (Rural)
Urban Total
Urban Non-ci ty
2 AgraCity
3 Firozabad City
~ ~ ]
,J! Tract
--I 2
District Total
Rural Total
Tehsil Agra. (Rural)
2 Tehsil Bah (Rural)
3 Tehsil Etmadpur (Rural)
4 Tehsil Fatebabad (Rural)
5 Tehsil Firozabad (Rural)
6 Tehsil Kheragarh (Rural)
7 Tehsil Kiraoli (Rural)
Urban Total
Urban Non-city
2 AgraCity
3 Firozabad City
74
Employers, Employees and Independent Workers in
Total
Males Females
516
679
166
68
19
41
27
2
9
513
45
435
33
Males
532
153
2
2.
151
151
517
Total
Females
533
Sub-division 7 °6 Postal services
Employers
Males Females
518 519
Employees
Males
520
679
166
68
19
41
27
2
9
513
45
435
-33
Females
521
Sub-division 7 oS Telephone services
Employers Employees
Males Females Males Females
534 535 536 537
153
2
2.
151
'51
Independent Workers
Males Females
522 523
Indepeod.mt Workers
Males Females
538 539--
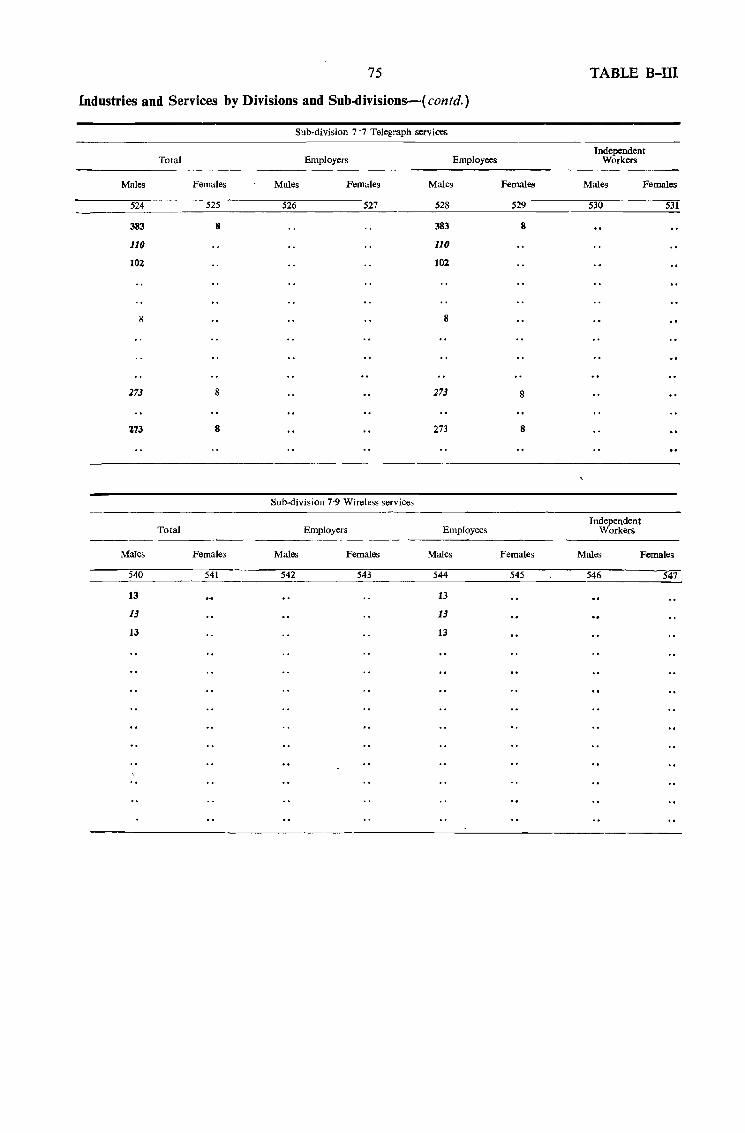
75
Industries and Services by Divisions and Sub-divisions--( contd.)
Total
Males Females
524 525
383 8
110
102
273
173
Males
540
13
13
13
8
8
Total
Females
541
Sub-division 7'7 Telegraph services
Employers
Males Females
526 527
Sub-division 7'9 Wireless services
Employers
Males Females
542 543
Employees
Males
528
383
110
102
8
273
273
Employees
Males
544
13
13
13
Females
529
8
8
8
Females
545
TABLE B-TII
Independent Workers
Males
530
Independent Workers
Females
531
Males Females
546 547
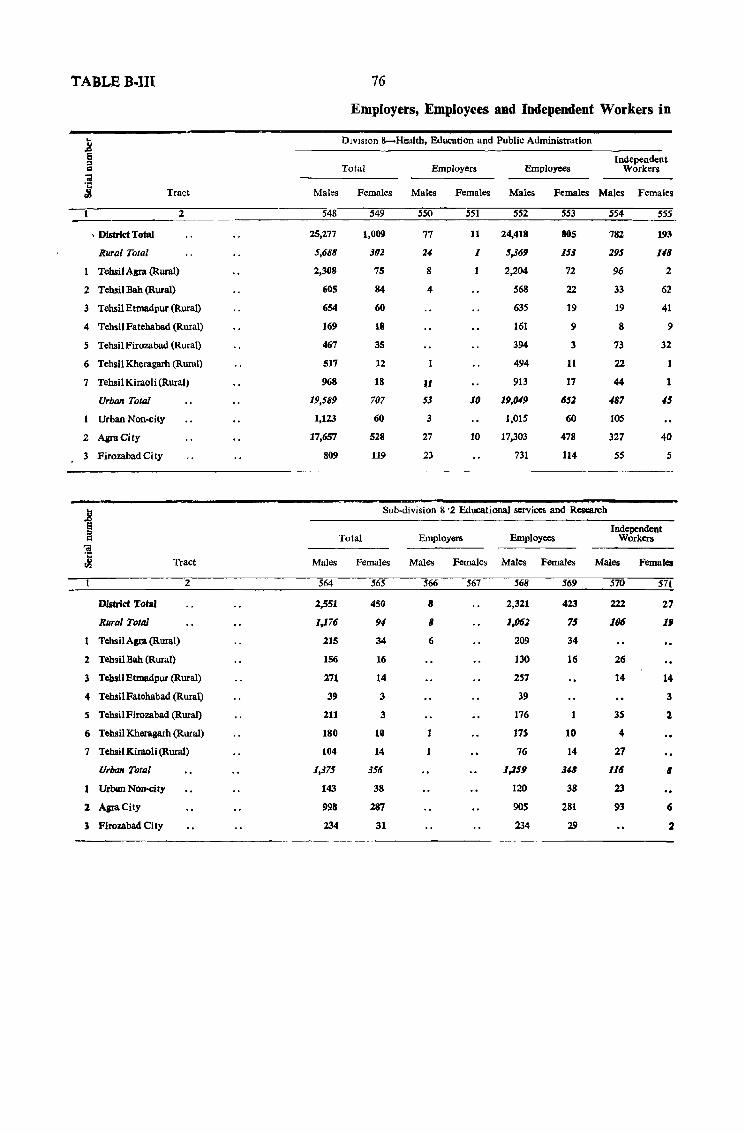
TABLEB .. III 76
Employers, Employees and Independent Workers in
... DIVISIon &-Health, Education and Public Administration ~ Ei Independent ::0 co Total Employers Employees Workers :; ~ Tract Males Females Males Females Males Females Males Females
2 548 549 550 551 552 553 554 555
, District Total 25,277 1,009 77 11 24,411 805 782 193
Rural Total 5,688 302 U 1 5,369 153 295 148
Tehsil Agra (Rural) 2,308 75 8 2,204 72 96 2
2 Tehsil Bah (Rural) 605 84 4 S68 22 33 62
3 Tehsil Etmadpur (Rural) 654 60 635 19 19 41
4 TehsilFatehabad (Rural) 169 II 161 9 8 9
5 Tehsil Firozabad (Rural) 467 3S 394 3 73 32
6 Tehsil Kheragarh (Rural) 517 12 494 Il 22
7 Tehsil Kiraoli (Rural) 968 18 II 913 17 44 1
Urban Total 19,589 707 53 10 19,049 652 487 45
Urban Non-city 1,123 60 3 1,015 60 105
2 AgraCity 17,657 528 27 10 17,303 478 327 40
3 Firozabad Ci ty 809 119 23 731 114 SS S
] Sub-division & ·2 Educational services and Research
~ Total EmPloyers Independent
Employees Workers ~ ... ~ Tract Males Females Males Females Males Females Males Females
2 564 565 566 567 568 569 570 571
District Total 2,551 450 8 2,321 423 222 27
Rural Total 1,176 94 8 1,062 75 106 19
TehsilAgra (Rural) 215 34 6 209 34
2 TehsilBah (Rural) 156 16 130 16 26
3 Tehsil Etmadpur (Rural) 271 14 257 14 14
4 TehsilFatehabad (Rural) 39 3 39 3
S TchsilFirozabad (Rural) 211 3 176 3S l
6 Tchsil Kheralarh (Rural) 180 10 175 10 4
7 Tchsil Kiraoli (Rural) 104 14 76 14 27
U,ban Total 1,375 356 1,259 348 116 8
Urban Non-city 143 38 120 38 23
:2 AgraCity 998 287 90S 281 93 6
:I Firozabad City 234 31 234 29 2
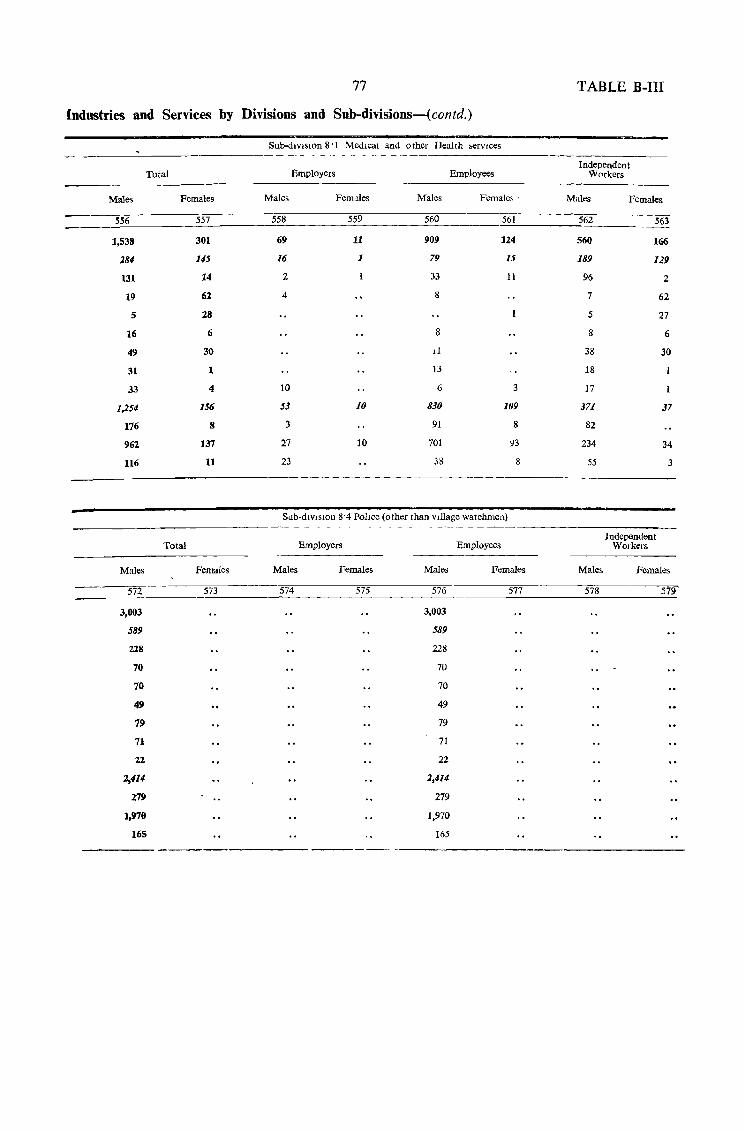
Industries and Services by
Total
Males Females
556 557
1,538 301
281- 145
131 14
19 62
5 28
16 6
49 30
31 1
33 4
1,254 156
176 8
962 137
116 11
Total
Males Females
572 573
3,003
589
228
70
70
49
79
71
22
2,414
279
1,970
165
77
Divisions and Sub-divisions-( contd.)
Sub-d,v,SiOn 8 'I Medical and other Health ,ervlces
Employers Employees
Males Females Males Females,
558 559 560 561
69 11 909 124
16 1 79 15
2 33 11
4 8
8
d
13
10 6 3
53 10 830 109
3 91 8
27 10 701 93
23 38 8
Sub-diVISIOn 8'4 Police (other than village watchmen)
Employers Employees
Males Females Males Females
574 575 576 577
3,003
589
228
70
70
49
79
71
22
2,414
279
1,970
165
TABLE B-III
Independent Workers
Males
562
560
189
96
7
5
8
38
18
17
371
82
234
55
Females
563
166
129
Independent Workers
2
62
27
6
30
37
34
3
Males Females
578 579
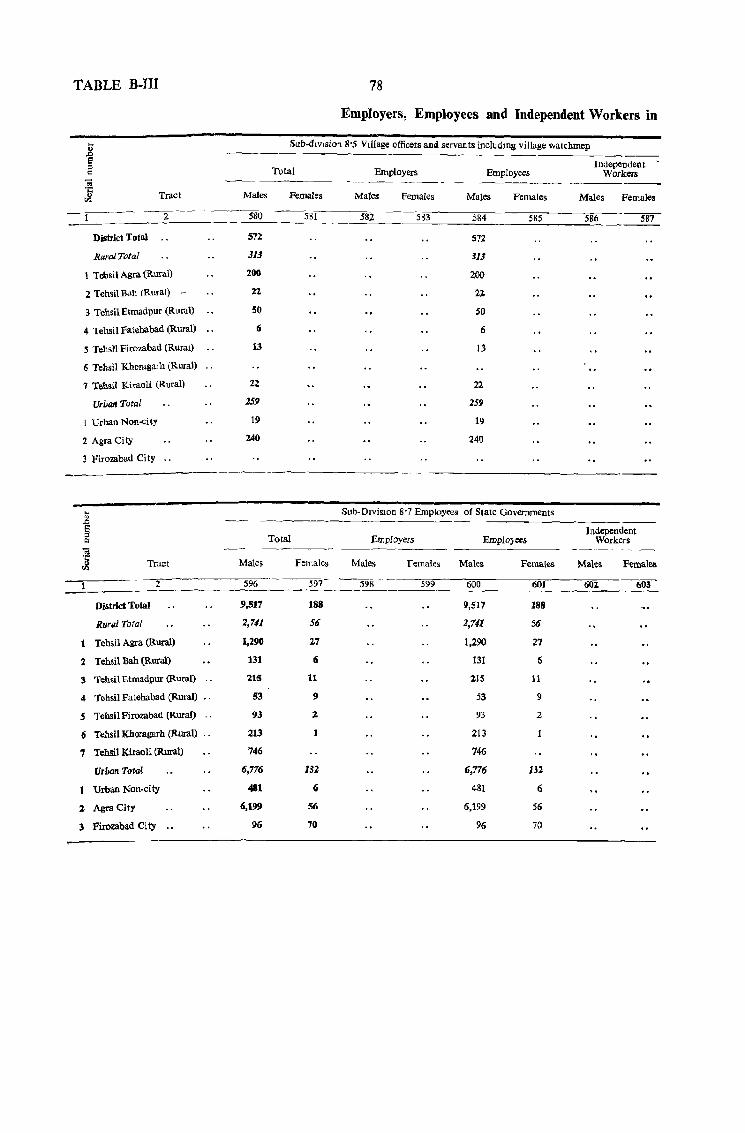
TABLE B-III
Distdct Total
RuralT()tai
Tract
2
1 Tebsil Agra (Rural)
2 Tehsil Bdh (Rural) -
3 TehsilBtmadpur (Rural)
4 Tehsil Fatebabad (Rural) "
5 Tehsll Firozabad (Rural)
6 Tehsil Kheragarh (Rural)
1 Tehsil Kiraoli (Rural)
Urball Total
1 Urban Non-city
2 AgraCity
3 Firozabad City ..
.. ~ S '" Q
~
~ Tract
2
District Total
Rural Total
Tehsil Agra (Rural)
2 Tehsil Bah (Rural)
3 TehsilEtmadpur (Rural) ..
4 Tehsil Fatehabad (Rural) ..
5 Tehsil Firozabad (Rural) .. 6 Tehsil Kheragarh (Rural) ..
7 Tehsil Kiraoli (Rural)
Urban Total
Urban Non-city
1 Agra City
3 Firozabad City
Males
580
572
313
200
:u
50
6
13
22
259
19
240
Males
596
9.517
2,741
1,290
131
215
53
93
213
746
6,776
481
6,199
96
78
Employers, Employees and Independent Workers in
Sub-dIvision 8'5 VIllage officers and servants includIng village watcbmep.
Total
Females
.581
Total
Females
597
188
56
27
6
11
9
2
151
6
S6
70
Employers Employees
Males Females Males Females
582 583 584 585
572
313
200
21.
50
6
13
22
259
19
240
Sub-DivisIOn 8'7 Employees of State Governments
Employers Employees
Males Females Males Females
598 599 600 601
9,517 188
2,741 56
1,290 27
131 6
21S 11
53 9
93 2
213
746
6,776 131
481 6
6,199 56
96 70
Independent Workelll
Males Females
586 587
Independent Workers
----~---~-
Males Females
601. ~
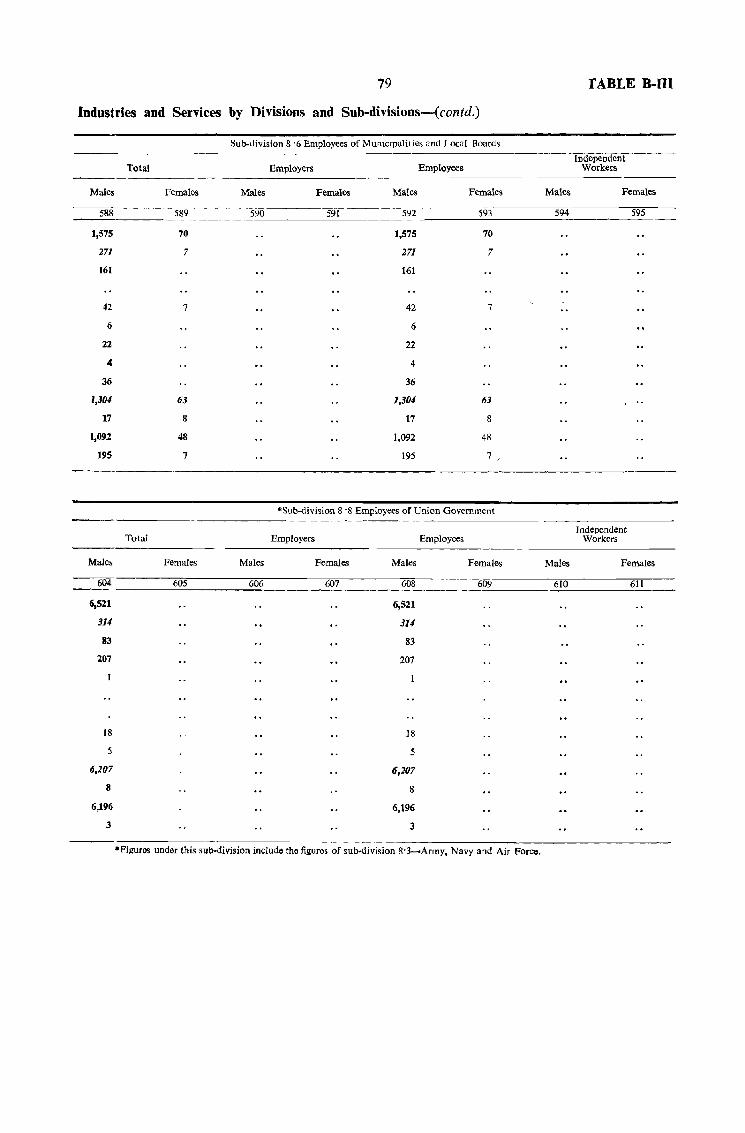
79
Industries and Services by Divisions and Sub-divisions-(contd.)
Males
588
1,575
271
161
42
6
22
4
36
1,304
17
1,092
195
Males
Total
Total
Females
589
70
7
7
63
8
48
7
Females
Sub-division 8 '6 Employees of Muruclpalities and Local Boards
Males
590
Males
Employers
Females
591
Males
592
1,575
271
161
42
6
22
4
36
1,304
17
1,092
195
Employees
Females
593
70
7
7
63
8
48
7
'Sub-division 8 'S Employees of Union Government
Employers Employees
Females Males Females
6M _________ 6_o_5 __________ 6o~6 ________ ~6_07 __________ 6_0_8 ______ __ 609
6,521
314
83
207
18
5
6,207
8
6,196
3
6,521
314
83
207
18
5
6,207
8
6,196
3
*Figures under this sub-division include the figures of sub-division S'3-Army, Navy and Air Force.
Males
594
Males
610
TABLE B-m
Independent Workers
Females
Independent Workers
595
Females
611
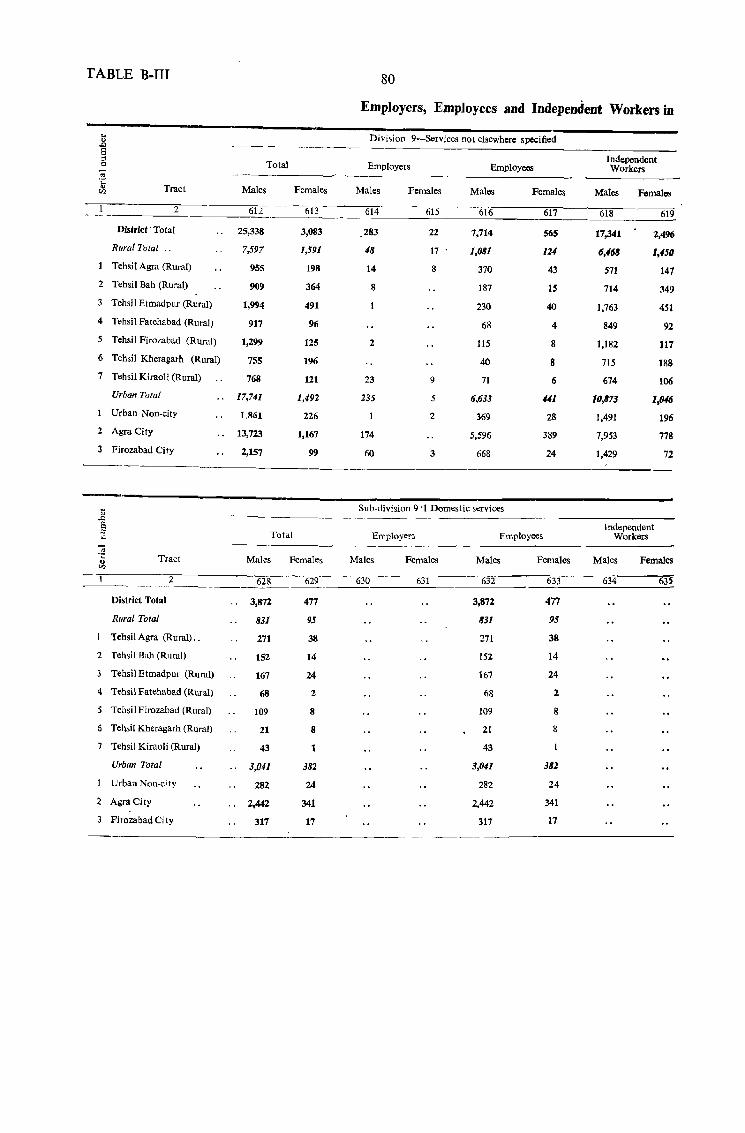
TABLE B-III 80
Employers, Employees and Independent Workers in
!i Division 9-Services not elsewhere specified .r> S
Independent ::s Total c Employers Employees Workers ..
'6 Tract Males Females Males Vl Females Males Females Males Females
2 612 613 614 615 616 617 618 619
District· Total 25,338 3,083 283 22 7,714 565 17,341 2,496
Rural Total .. 7,597 1,591 48 17 1,081 114 6,468 1,450 Tehsil Agra (Rural) 955 198 14 8 370 43 571 147
2 Tehsil Bah (Rural) 909 364 8 187 15 714 349 3 Tehsil Etmadpur (Rural) 1,994 491 230 40 1,763 451
4 Tehsil Fatehabad (Rural) 917 96 68 4 849 92 5 Tehsil Firozabad (Rural) 1,299 125 2 115 8 1,182 117 6 Tehsil Kheragarh (Rural) 755 196 40 8 715 188 7 Tehsil Kiraoli (Rural) 768 121 23 9 71 6 674 106
Urban Total 17,741 1,492 235 5 6,633 441 10,873 1,046 Urban Non-city 1,861 226 2 369 28 1,491 196
2 AgraCity 13,723 1,167 174 5,596 389 7,953 778 3 Firozabad City 2,157 99 60 3 668 24 1,429 72
;:; Sub-division 9'1 Domestic services .r>
Independent S :::J Total Employer:; Employees Workers " .~
Tract Males Females Males Females Males Females Males Females ., '"
2 628 629 630 631 632 633 634 635
District Total 3,872 477 3,872 477
Rural Total 831 95 831 95
Tehsil Agra (Rural), . 271 38 271 38
2 Tehsil Bah (Rural) 152 14 152 14
Tehsil Etmadpur (Rural) 167 24 167 24
4 Tehsil Fatehabad (Rural) 68 2 68 2
5 Tehsil Firozabad (Rural) 109 8 109 8
6 Tehsil Kheragarh (Rural) 21 8 21 8
7 Tehsil Kiraoli (Rural) 43 43
Urban Total 3,041 382 3,041 382
Urban Non-c;ty 282 24 282 24
2 AgraCity 2,442 341 2,442 341
3 flirozabad Ci ty 317 17 317 17
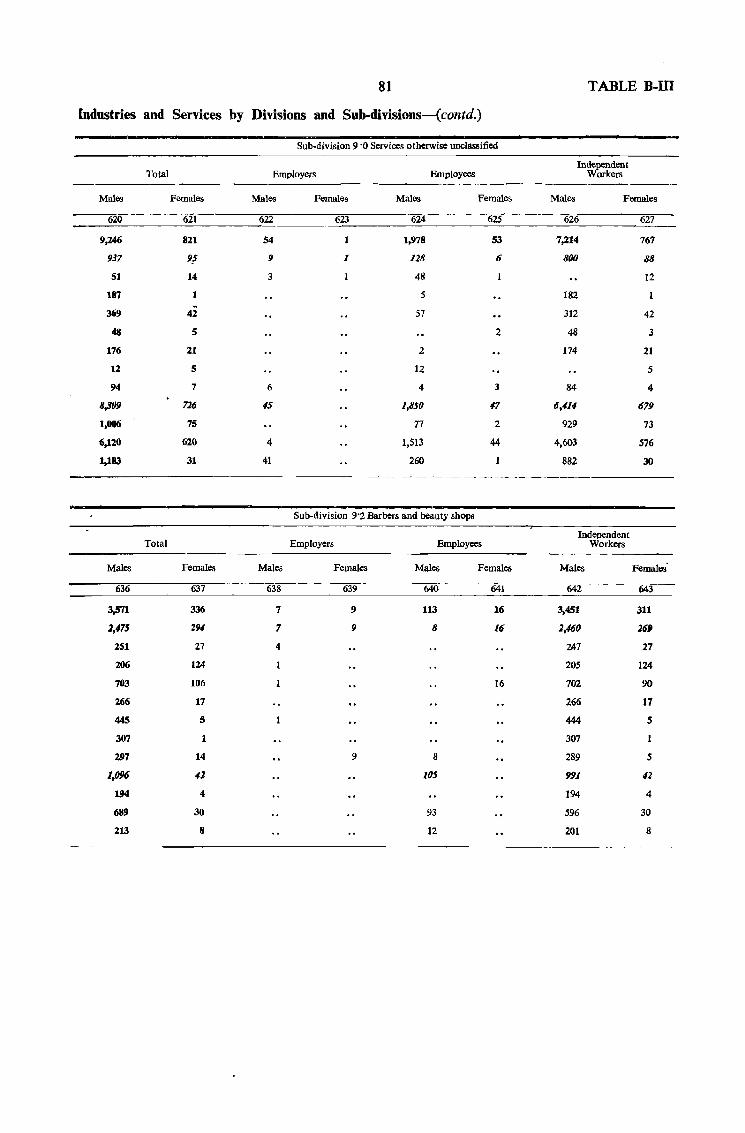
81 TABLE B-Ill
Industries and Services by Divisions and Sub-divisions-(contd.)
Sub-division 9 '0 Services otherwise unclassified
Independent Total Employers Employees Workers
Males Females Males Females Males Females Males Females
620 621 622 623 624 625 626 627
9,246 821 54 1 1,978 53 7,214 767
937 9j 9 1 128 6 800 88
51 14 3 48 12
187 1 5 182
369 42 57 312 42
48 5 2 48 3
176 21 2 174 21
12 5 12 5
94 7 6 4 3 84 4
8,309 726 <IS 1,850 47 6,414 679
1,006 75 77 2 929 73
6,120 620 4 1,513 44 4,603 576
1,183 31 41 260 882 30
Sub-division 9'2 Barbers and beauty shops
Total Employers Employees Independent
Workers
Males Females Males Females Males Females Males Females'
636 637 638 639 640 641 642 643
3,571 336 7 9 113 16 3,451 311
2,475 194 7 9 8 16 2,460 261
251 27 4 247 27
206 124 205 124
703 106 16 702 90
266 17 266 17
445 5 444 S
307 1 307
297 14 9 8 289 5
1,096 42 105 991 42
194 4 194 4
689 30 93 596 30
213 8 12 201 8
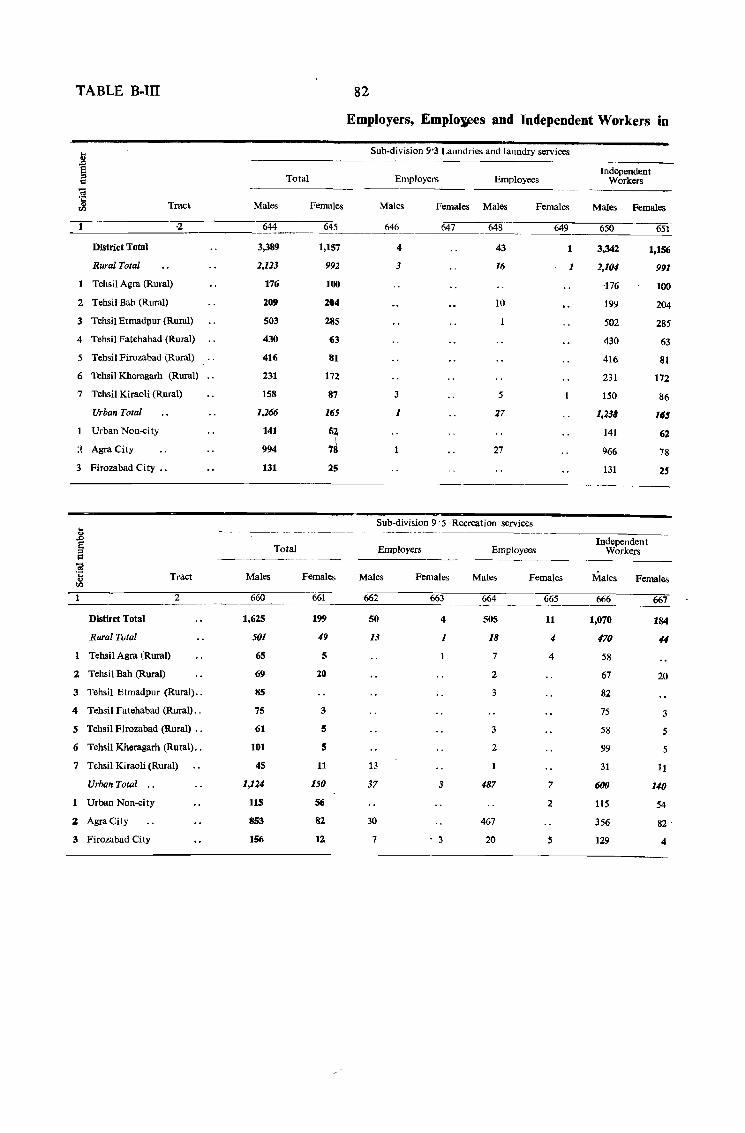
TABLE B-IIT 82
Employers, Emplo~es and Independent Workers in
... Sub-division 9'3 Laundries and laundry services ... ,!:>
Independent § .::: Total Employers Employees Workers
~ Tract Males Females Males Females Males Females Males Females <Il
·2 644 645 646 647 648 649 650 -----m------~-
District Total 3,389 1,157 4 43 1 3,342 1,156
Rural Total 2,123 992 3 16 1 2,104 991
Tehsil Agra (Rural) 176 100 -176 100
2 TehsiI Bah (Rural) 109 204 10 199 204
3 Tehsil Etmadpur (Rural) 503 285 502 285
4 Tehsil Fatehabad (Rural) 430 63 430 63
5 Tehsil Firozabad (Rural) 416 81 416 81
6 Tehsil Kheragarh (Rural) .. 231 172 231 172
7 Tehsil Kiraoli (Rural) 158 87 3 5 150 86
Urban Total 1,266 165 1 27 1,238 IfS
Urban Non-city 141 ~ 141 62
:l Agra City 994 78 27 966 78
3 Firozabad City •. 131 25 131 2S
Sub-division 9 . 5 Recreation services .. <I> ------- ------
,!:> Independent 8 Tolal Employers Employees Workers :::> R ~ "5 Tract Males Females Males Females Males Females Males Females <Il
2 660 - 661 662 663 664 665 666 667 --__ ---
Distirct Total 1,625 199 50 4 505 11 1,070 184
Rural Total 501 49 13 1 18 4 470 1/4
Tehsil Agra (Rural) 65 5 7 4 58
2 Tehsil Bah (Rural) 69 20 2 67 20
3 Tehsil Etmadpur (Rural) •. 85 3 82
4 Tehsil Fatehabad (Rural) .. 75 3 75 3
5 Tehsil Firozabad (Rural) •. 61 5 3 58 5
6 Tehsil Kheragarh (Rural) .. 101 5 2 99 5
7 Tehsil Kiraoli (Rural) 45 11 13 31 11
Urban Total .. 1,124 150 37 3 487 7 600 110
Urban Non-city 115 56 2 115 54
2 AgraCity 853 82 30 467 356 82
3 Fi rozabad City 156 12 7 • 3 20 S 129 4
83
Industries and Services by Divisions and Sub-divisions-( contd.)
Males
652
795
10
3
7
785
5
713
67
Males
668
1.180
59
20
29
6
4
1,121
4
1,090
27
Total
Females
Total
653
6
1
1
5
1
4
Females
669
10
Z
2.
8
7
1
Sub-division 9 '4 Hotels, restaurants and eating houses
Males
654
103
103
96
6
Employers
Females
655
1
1
Males ---_
656
365
3
3
362
2
322
38
Employees
Females
657
Sub-division 9 '6 Legal and business services
Employers Employees
Males Females Males F!!males
670 671 672 673
45 521 1
1 13
9
1
3
44 509 1
42 494
2 15
Males
658
327
7
7
320
2
295
23
TABLE B-III
Independent Workers
Females
659
5
1
4
Independent Workers
Males Females
674 675
613 9
45 2
11 2
28
5
568 7
4
554 7
10
TABLE B.ill 84
Employers, Employees and Independent Workers id
... Sub-division 9 '1 Arts, letters, and journalism .. ,rJ
Independent ~ Total Employers Employees Workers
<iI 't Tract Males Females Males Females Males Females Males Females '"
2 676 677 678 679 680 681 682 683
District Total " 172 1 8 S2 112 1
Rural Total .. 19 7 6 6
Tehsil A&m (Rural) 7 7
2 Tehsil Bah (Rural) 11 S 6
3 Tehsil Etmadpur (Rural)
4 Tehsil Fatehabad (Rural)
5 Tehsil Firozabad (Rural) 1
6 Tehsil Kheragarh (Rural)
7 Tehsil Kiraoli (Rural)
Urban Total " 153 1 1 46 106 1
Urban Non-city
2 AgraCity 149 46 ]02
3 Firozabad City 4 4
85 TABLE B-m Ind~tries and Services by Divisions and Sub-divisions-( concld.)
Sub-division 9 '8 Religious, charitable and welfare services
Independent Total Employers Employees Workers
Males Females Males Females Males Females Males Females
684 685 686 687 688 689 690 691
1,488 76 12 7 264 6 1,212 63
641 63 8 6 58 2 576 55
111 12 6 32 79 6
75 1 7 13 55
138 34 137 34
23 5 23 5
85 5 85 5
83 5 5 78 5
U7 1 1 7 119
846 13 l- I 206 4 636 8
114 4 8 106 3
673 9 192 4 481 5
S9 4 6 49
86
.. NOT.E-Seif-supporting persons who are not economically active have been excluded from the table. Their number for the
distrtct is as follows:
Non-productive sources of livelihood Persons Males Females
2 3 4
I -Persons living princil?ally on income from non-agricul· Total 991 770 221 tural property
Rural 58 47 11
Urban 933 723 210
II-Persons living principally on pensions,remittances, Tota! scholarships and funds
546 507 39
Rural 71 43 28
Urban 475 464 11
I II-Inmates of almshouses and recipients of doles Total 87 54 33
Rural 4. 33 15
Urban 39 21 18
IV -Beggars and vagrants Total 3,029 2,830 199
Rural 1,482 1,363 119
Urban 1,547 1,467 80
V -All other persons living principally on income derived Total 194 194 from non-productive activities
Rural 48 48
Urban 146 146
Total Total 4,847 4,161 686
Rural 1,707 1,486 221
Urban 3,140 2,675 465
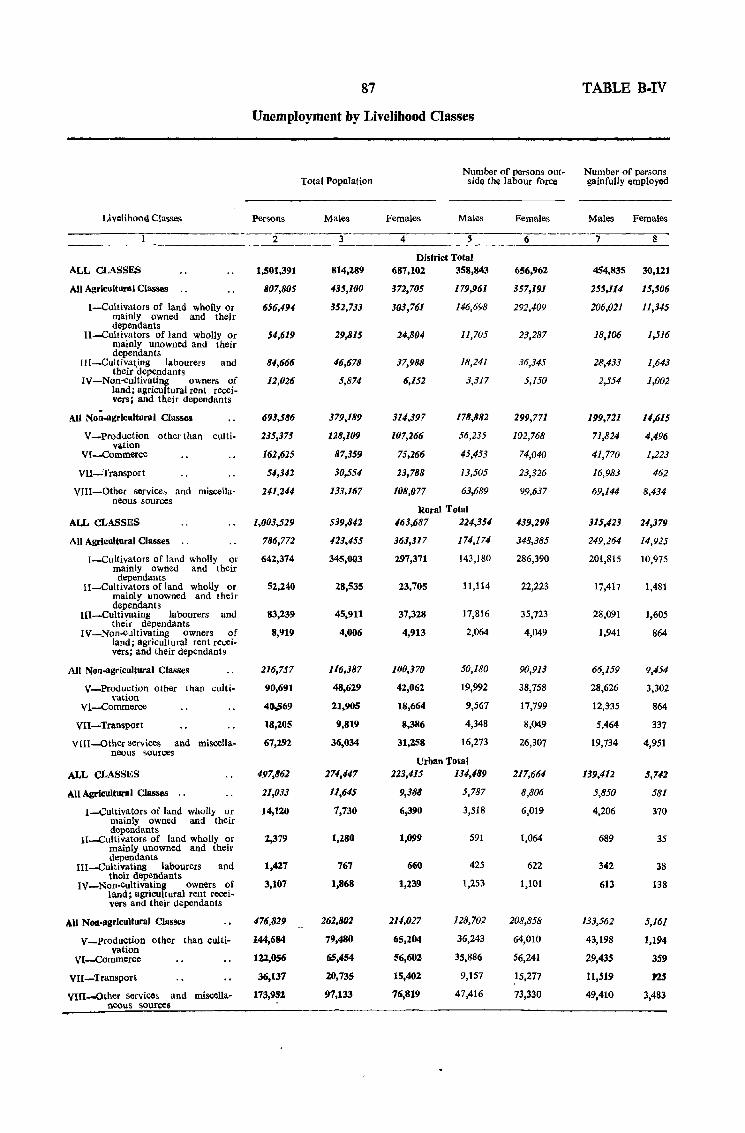
87
Unemployment by Livelihood Classes
Total Population
Livelihood Classes Persons Males
____________ -_-_---2-------3--
ALL CLASSES
All Agricultural Classes
I-Cultivators of land wholly or mainly owned and their dependants
II-Cultivators of land wholly or mainly unowned and their dependants
I([-Culti,,:a~ing labourers and theIr dependants
IV-Non-cultivating owners of land; agricultural rent receivers; and their dependants
All Non-agrlc:ultural Classes
V -Production other than cultiVi-tion
VI-Commerce
VII-Transport
VIII-Other services and miscellaneous sources
ALL CLASSES
All Agricultural Classes
(-Cultivators of land wholly or mainly owned and tbeir dependants
[I-Cultivators of land wholly or mainly unowned and their dependants
III-Cultivating labourers and their dependants
IV-Non-cultivatin8 owners of land; agricultural rent receivers; and their dependants
All Non-agricultural Classes
V_Production other than cultivation
VI-Commerce
VII-Transport
VIII-Other services and miscellaneous sources
ALL CLASSES
All Agricultural Classes
I-Cultivators of land wholly or mainly owned and their dependants
II-Cultivators of land wholly or mainly unowned and their dependants
III-Cuitivating labourers and their dependants
IV_Non-Cultivating owners of land; agricultural rent receivers and their dependants
All Non-agricultural Classes
V_ptoduction other than cultivation
VI-Commerce
VII-Transport
VlU-Other services and miscellaneous sources
1,501,391
807,805
656,494
54,619
81-,666
12,026
693,586
235,375
162,625
51-,31-2
241,241
1,003,529
786,772
642,374
52,240
83,239
8,919
216,757
90,691
4~69
18,1.05
67,1.92
<197,862
21,033
14,120
2,379
1,427
3,107
<176,829
144,684
122,056
3li,137
173,952
814,289
435,100
352,733
29,815
46,678
5,874
379,189
128,109
87,359
30,551-
133,167
539,812
423.455
345,003
28,535
45,911
4,006
116,387
48,629
21,905
9,819
36.034
274,147
11,645
7,730
1,280
767
1,868
262.802
79,480
65,454
20,735
97,133
Number of pflrsons outside the labour force
Females Males
4 s District Total
687,102 358,843
372,705
303,761
24,804
37,988
6,152
314,397
107,266
75,266
23,788
108,077
179,961
146,698
11,705
18,241
3,317
178,882
56,235
45,453
13,505
63,689
Rural Total 463,687 224,354
363,317
297,371
23,705
37,328
4,913
100,170
4Z,062
18,664
8,386
31,258
174,174
143,180
11,114
17,816
2,064
50,180
19,992
9,567
4,348
16,273
Urban Total 223,415 134,489
9,388 5,787
6,390
1,099
660
1,239
214,027
65,204
56,602
15,402
76,819
3,518
591
425
1,253
128,702
36,243
35,886
9,157
47,416
Females
6
656,962
357,191
292,409
23,287
36,345
5,150
299,771
102,768
74,040
23,326
99,637
439,298
348,385
286,390
22,223
35,723
4,049
90,913
38,758
17,799
8,049
26,307
217,664
8,806
6,019
1,064
622
1,101
208,858
64,010
56,241
15,277
73,330
TABLE B·IV
Number of persons gainfully employed
Males Females
8
454,835 30,121
255,114
206,021
18,106
28,433
2,554
199,721
71,824
41,770
16,983
69,144
315,423
249,264
201,815
17,417
28,091
1,941
66,159
28,626
12,335
5,464
19,734
139,412
5,850
4,206
689
342
613
133,562
43,198
29,435
11,519
49,410
15,506
11,345
1,516
1,643
1,002
14,615
4,496
1,223
462
8,434
24,379
14,925
10,975
1,481
1,605
864
9,454
3,302
864
337
4,951
5,742
581
370
35
38
138
5,161
1,194
359
ns 3,483
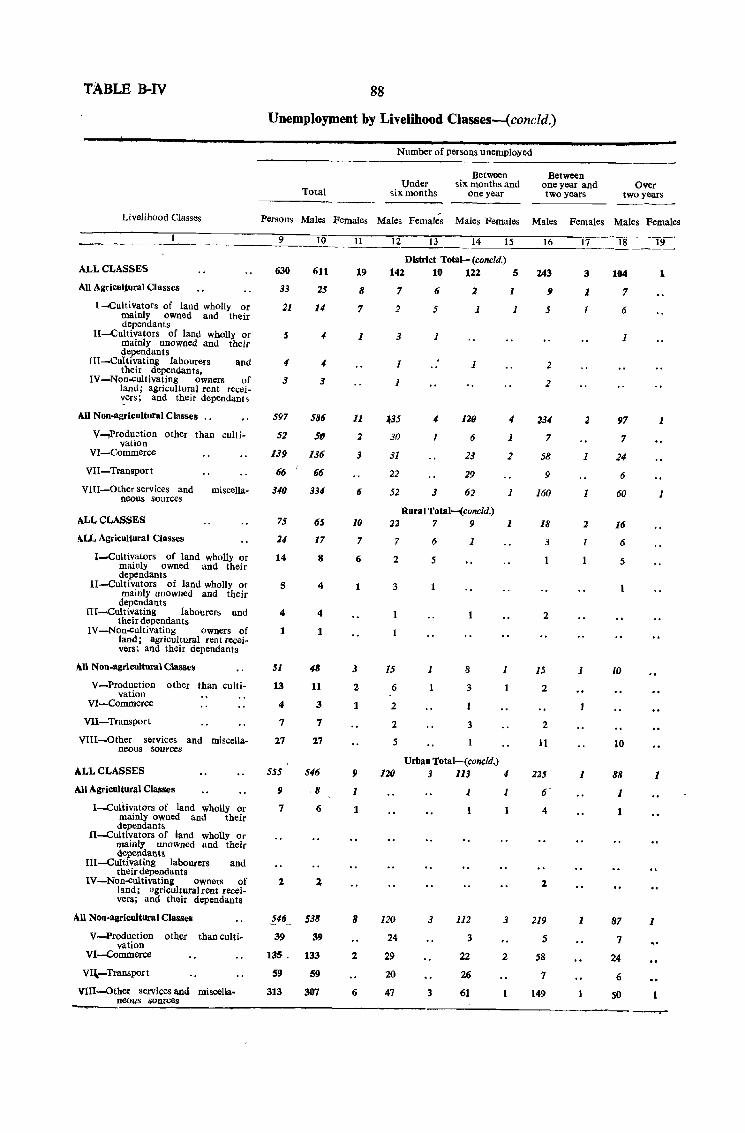
TABLE B-IV
Livelihood Classes
ALL CLASSES
All Agricultural Classes
l-Cultivators of land wholly or mainly owned and their dependants
lI-Cultivators of land wholly or mainly unowned and their dependants
III-Cultivating labourers and their dependants,
IV-Non-eultivating owners of land; agricultural rent receivers; and their dependants
~ll Non-agricuitnral Classes "
V~roduction other than cultivation
VI-Commerce
VII-Transport
VIII-Other services and noous sources
ALL CLASSES
ALL Agricultural Classes
miscella-
I-Cultivators of land wholly or mainly owned and their dependants
Il-CuItivators of land wholly or mainly unowned and their
dependants III-Cultivating labourers and
their dependants IV-Non-eultivating owners of
land; agricultural rent receivers; and their dependants
All Non-agricultoral Classes
V-Production other than cultivation
VI-Commerce
VII-Transport
VIII-Other services and miscellaneous sources
ALL CLASSES
All Agricllltural Classes
I-Cuitivators of land wholly or mainly owned and their dependants
II-Cultivators of land wholly or mainly unowned and their dependa.nts
[lI--Cultivating labourers and their dependa.nts
IV-Non-cultivating owners of land; agricultural rent receivers; and their dependants
.\11 Non.agricllltural Ciassell
V-Production other than cultivation
VI-Commerce
VI~Transport
VIII--Other services and miscella-
88
Unemployment by Livelihood Classes-(concld.)
Total
Number of persons unemployed
Under six months
Between six months and
one year
Between one year and two years
Over two years
Persons Males Females Males Females Males Females Males Females Males Females
9
630
33
21
5
4
3
597
52
139
66
340
75
24
14
5
4
1
51
13
4
7
27
555
II
7
10
611
25
14
<I
<I
3
586
51J
136
66
334
65
17
8
4
4
1
48
11
3
7
27
546
8
6
J46_ 538
39 39
135, 133
59
313
59
307
__ ~1~1 ____ ~12: ___ ~1~3~ ___ ~14~ __ ~15~ __ ~1~6~ __ 17
19
8
7
1
11
2
3
6
10
7
6
1
3
2
1
9
1
1
8
2
6
District Total- (concld.) 142 10 122 5
7
2
3
1
1
435
30
31
22
52
6
5
1
4
1
3
2
1
1
129
6
23
29
62
Rural Total-(concld.)
1
1
4
1
2
1
22 7 9 1
7
2
3
15
6
2
2
5
6
5
1
1
8
3
3
Urban Total-(concld.)
1
120 3 113 4
120
24
29
20
47
3
3
1
112
3
22
26
61
1
3
2
243
9
5
2
2
234
7
58
9
160
18
3
2
15
2
2
11
225
6
4
2
219
5
58
7
149
1
3
1
1
2
1
1
2
1
1
1
18
104
7
6
1
97
7
24
6
60
16
6
5
10
10
88
1
19
1
1
1
1
1
,. 87
7
24
6
50 n~eo~u~s~8=O~~~ce==s __________________________________________________________________________ ____,-
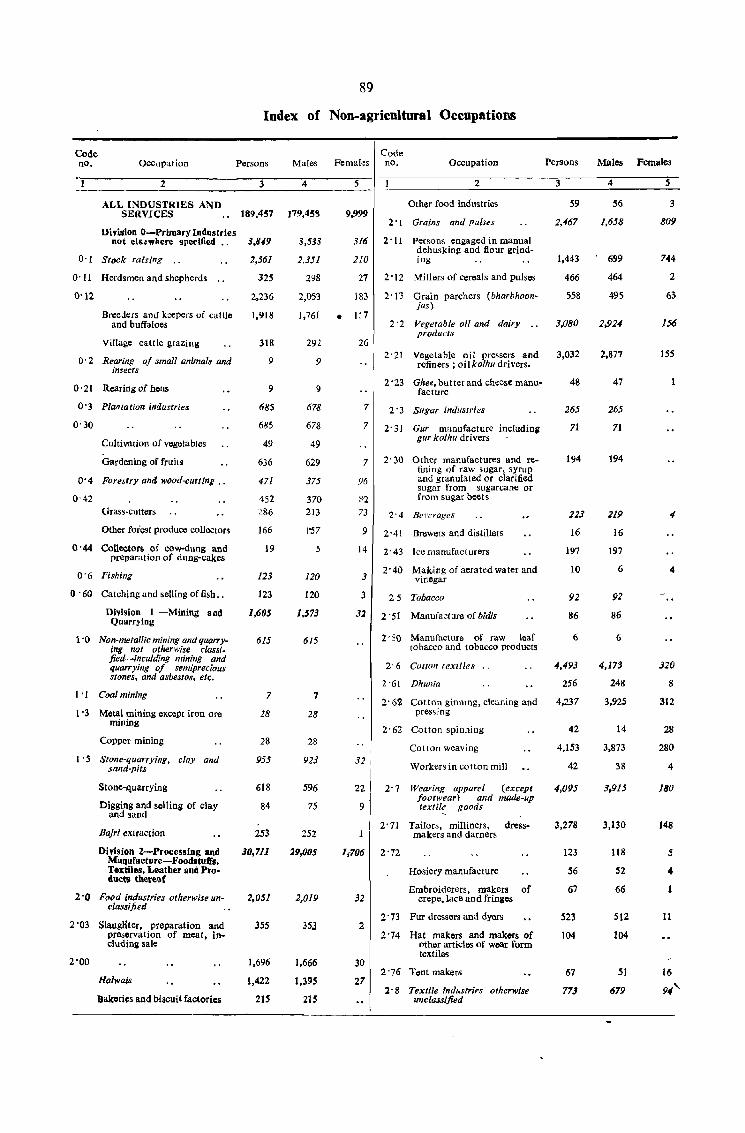
89
Index of Non-agricultural Occupations
Code Code nO. Occupation Persons Males Females no. Occupation
234
ALL INDUSTRIES AND SERVICES 189,457 179,458
Divi.,ion O-Prlmary Industries not els~",llere specified .. 3,849 3,533
0'1 Stock raising .. 2,561 2,351
O' 11 Herdsmen and shepherds
0'12
BreeJers and keepers of cattle and buffaloes
Village cattle grazing
0' 2 Rearing of small animals and insects
O' 21 Rearing of hens
O· 3 Plalltatlon industries
0'30
Cultivation of vegetables
Gardening of fruits
0'4 Forestry and wood-cutting ..
0'42 Grass-cutters
Other foiest produce collectors
0'44 Collectors of cow-dung and preparation of dung-cakes
0'6 Fishillg
() '60 Catching and selling of fish ..
OIvlslon I -Mining ud Quarrying
1'0 Non-metallic milling and quarry. ing not otherwise classi_ fied-incurding mining and quarryillg of semiprecious Slones, and asbestos, etc.
1 • J Coal mining
1'3 Metal mining except iron ore mining
Copper mining
1 . 5 Stolle-quarrying, clay and sand-pits
Stone-quarrying
Digging and selling of clay and sand
DaJri extraction
Di,ision 2-Processing and Maqufacture-Foodstulfs, Tutiles, Leather and ProduetJ tilereo!
2'0 Food industries otherwise unclassified
2 '03 SlaugHter, preparation and preservation of meat, including sale
2'00
Halwais
Bakories and biscuit factories
325
2,236
1,918
318
9
9
685
685
49
636
471
452 ?86
166
19
123
113
1,605
615
7
18
28
955
618
84
253
30,711
2,051
355
1,696
1,422
215
298
2,053
1,761
292
9
9
678
678
49
629
375
370 213
1'57
5
120
120
1,573
615
7
28
28
923
596
75
252
29,005
35J
1,666
1,395
215
5
9,999
316
210
1 2
Other food industries
2'1 Grains and pulses
2 '11 Persons engaged in manual dehusking and flour grinding
27 2 '12 Millers of cereals and pulses
183 2'13 Grain parchers (bharbhvolI-
• 1:7
26
7
7
7
96
73
jus)
2 '2 Vegetable oil and dairy .. products
2' 21 Vegetable oil pressers and refiners; oil kolltu drivers.
2 '23 Ghe., butter and cheese manufacture
2 '3 Sugar Industries
2' 31 Gur manufacture including gur kolhu drivers
2' 30 Other manufactures and refining of raw sugar, syrup and granulated or clarified sugar from sugarcane or from sugar beets
2' 4 Bel'erages
9 2' 41 Brewers and distillers
J 4 2' 43 Ice manufacturers
3 2' 40 Making of aerated water and
vinegar
3 25 Tobacco
32 2 '51 Manufacture of bidis
32
22
9
2' 50 Manufacture of raw leaf to baeco and tobacco products
2' 6 Cuttoll textiles
2'61 Dhu/lia
2' 61\ Cotton ginnmg, cleaning and pres,ing
2' 62 Cotton spinning
Cotton weaving
Workers in cotton mill
2' 7 Wearing apparel (except footwear) alld made-up textile goods
2' 71 Tailors, milliners, dress-makers and darners
1/106 2'72
32
2
30
27
Hosiery manufacture
Embroiderers, makers of crepe,lace and fringes
2' 73 Fur dressers and dyers
2 '74 Hat makers and makers of other articles of wear form textiles
2 . 76 Tent makers
2' 8 Textile industries otherwise unclassified
Persons
3
59
2,467
1,443
466
558
3,080
3,032
48
265
71
194
223
16
197
10
92
86
6
4,493
256
4,237
42
4,153
42
4,095
3,278
123
56
67
523
104
67
773
Males Females
4
56
1,658
699
464
495
2,924
2,877
47
265
71
194
219
16
197
6
92
86
6
4,173
248
3,925
14
3,873
38
3,915
3,130
118
52
66
512
104
51
679
s
3
809
744
2
63
156
155
4
320
8
312
28
280
4
180
148
5
4
11
16
94'
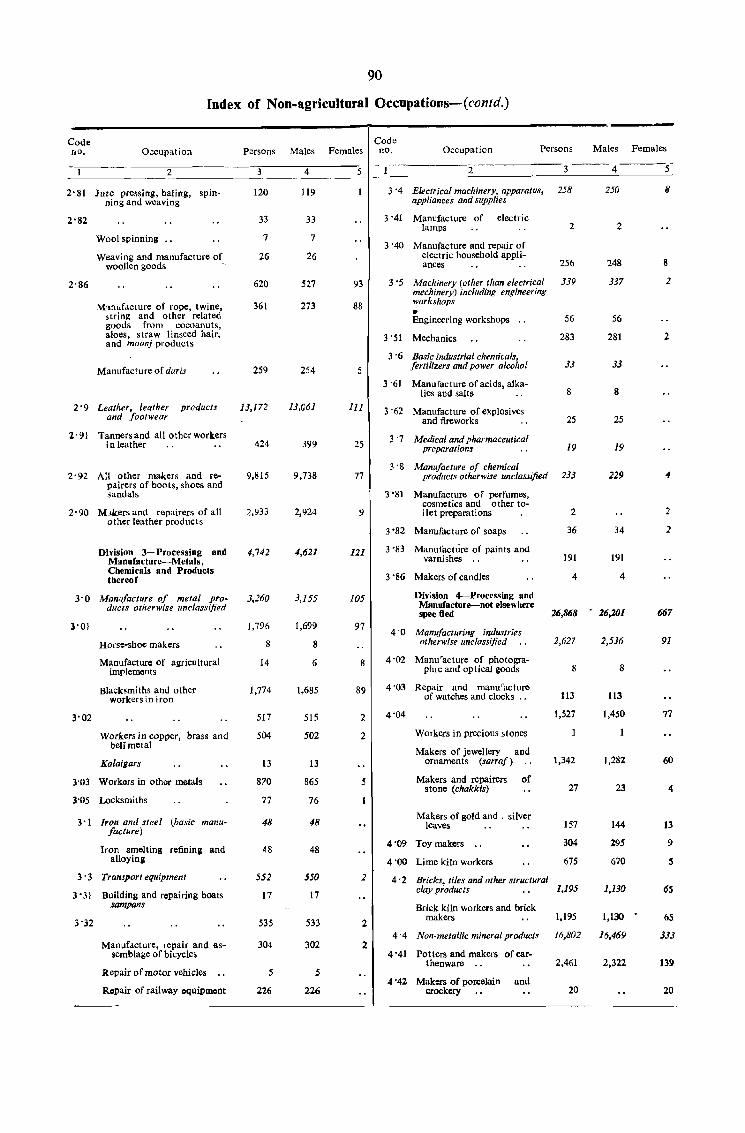
Code (to. Occupation
90
rndex of Non-agricultural Occupations-(contd,)
Code Persons Males Females nO. Occupation Persons Males Females
2 __________ ~~ ____ ~4 _______ 5~1-~----------~2~~------------~3------~4------~5-2'81 Jute pressing, baling, spin
ning and weaving
2'82
Wool spinning
Weaving and manufacture of woollen goods
M:tnufacture of rope, twine, string and other related goods from cocoanuts, aloes, straw linseed hair, and moonj products
Manufacture of daris
2 '9 Leather, leather products and footwear
2' 91 Tanners and a11 other workers in leather
2' 92 All other makers and repairers of boots, shoes and sandals
2' 90 M~ers and repairers of all other leather products
Division 3-Proc~ssing and Manufacture-Metals, Chemicals and Producls thereof
3'0 Manl,facture of metal products otherwise unclassified
3'01
Horse-shoe makers
Manufacture of agricultural imp letrulnts
Blacksmiths and other workers in iron
Workers in copper, brass and belrmetal
Ka/aigars
3'03 Workers in other metals
3'05 Locksmiths
3'1 Iron and steel (basic manufacture)
Iron smelting refining and alloying
3' 3 Transport equipment
3 '31 Building and repairing boats sampans
3'32
Manufacture, repair and assemblage of bicycles
Repair of motor vehicles
Repair of railway equipment
120
33
7
26
620
361
259
13,172
424
9,815
2,933
4,742
3,260
1,796
8
14
1,774
517
504
13
870
77
48
48
552
17
535
304
5
226
119
33
7
26
527
273
254
13,G61
399
9,738
2,924
4,621
3,155
1,699
8
6
1,685
515
502
13
865
76
48
48
550
17
533
302
5
226
93
88
5
111
25
77
121
105
97
8
89
2
2
5
2
2
2
:>'4 Electrical machinery, apparatus, 258 appliances and supplies
:> '41 Manufacture of electric lamps
3 '40 Manufacture and repair of electric household appliances
2
256
3'5 Machinery (other than electrical 339 mechinery) including engineering workshops • Engineering workshops 56
3 '51 Mechanics 283
3'6 Basic industrial chemicals, fertilizers and power alcohol
3 '61 Manufacture of acids, alkalies and salts
3 '62 Manufacture of explosives and fireworks
3'7 Medical and pharmaceutical preparations
33
8
25
19
3'8 Manu/acture of chemical products otherwise unclassified 233
3 '81 Manufacture of perfumes, cosmetics and other to-ilet preparations 2
3 '82 Manufacture of soaps
3 '83 Manufacture of paints and varnishes ..
3 '86 Makers of candles
Div.sion 4--Processing and Manufacture-not elsewhere
36
191
4
spec fled 26,868
4'0 Manufacturing industries otherwise unclassified
4 '02 Manu'acture of photographic and optical goods
4'03 Repair and manu'acture of watches and clocks
4'04
Workers in preciolls stones
Makers of jewellery and ornaments (sarraf)
Makers and repairers of stone (chakkis)
Makers of gold and, silver leaves
4 '09 Toy makers "
4 '00 Lime kiln workers
2,627
8
113
1,527
1,342
27
157
304
675
4'2 Bricks, tiles and other structural clay products , , 1,195
Brick kiln workers and brick makers 1,195
4 -4 Non-metallic mineral products 16,802
4 '41 Potters and makers of ear-thenware , , 2,461
4 '42 Makers of porcelain and crockery 20
250
2
248
337
56
281
33
8
25
19
229
34
191
4
26,201
2,536
8
113
1,450
1,282
23
144
295
670
1,130
1,130 •
16,469
2,322
IJ
8
2
2
4
2
2
667
91
77
60
4
13
9
S
65
65
333
139
20
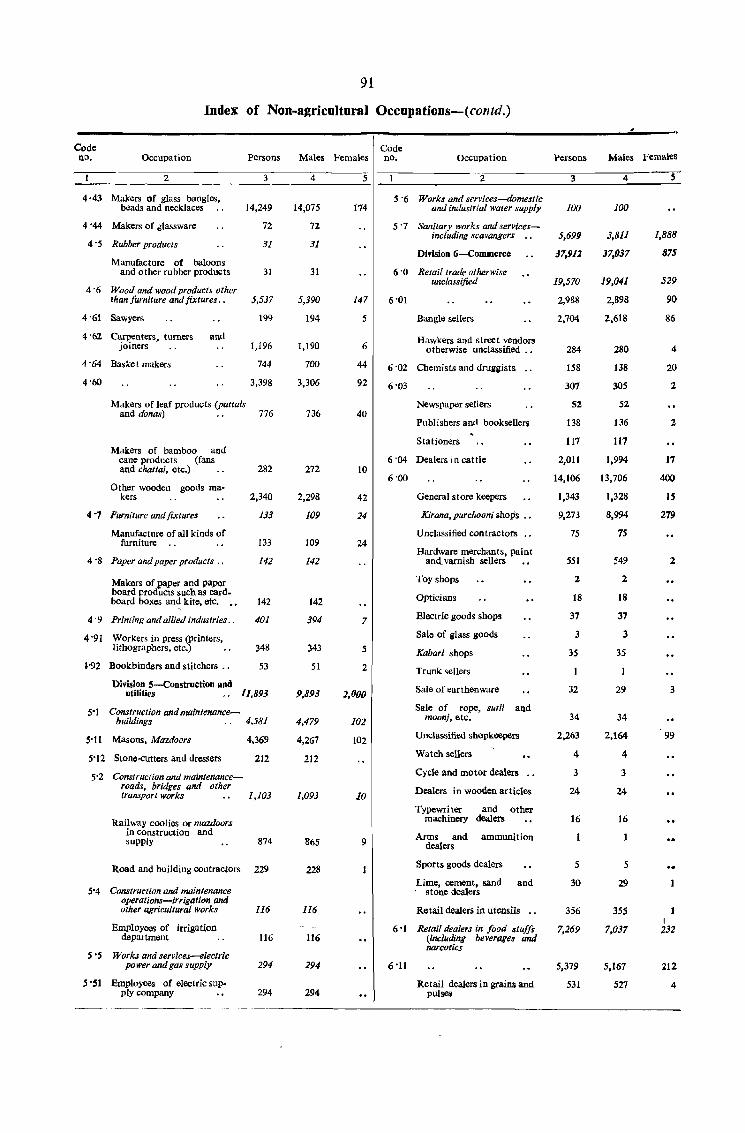
Code no. Occupation
91
Index of Non-agricultural Occupations-(contd.)
Code Persons Males Females no. Occupation Persons Males Females
~~--------~2~------------~3-------~4~----~5 --.------------.2~-----------3~------4~-----S-
- ----__;_---;:_ 4,43 Makers of glass bangles,
beads and necklaces
4'44 Makers of 6(assware
4' 5 Rubber products
Manufacture of baloons and other rubber products
4'6 Wood and wood products other than furniture and fixtures, ,
4 '61 Sawyers
4' 62 Carpenters, turners joiners
and
14,249
72
31
31
5,537
199
1,196
4'64 Basket makers 744
4'60 3,398
Makers of leaf products (pattals and donas) , , 776
Makers of bamboo and cane products (fans and chattai, etc.)
Other wooden goods makers
4 '7 Furniture and fixtures
Manufacture of all kinds of furniture
4'8 Paper and paper products, ,
Makcrs of paper and paper board products such as card. board boxes and kite, etc.
4' 9 Printing and allied industries. ,
4 '91 Workers in press (printers, lithographers, etc.)
~'92 Bookbinders and stitchers "
Division 5-Construction and
282
2,340
133
133
142
142
401
348
53
utilities 11,893
5'1 Construction and maintenance-buildings 4.581
5'11 Masons, Mazdoors
5'12 Stonc-cutters and dressers
5'2 Construction and maintenanceroads, bridges and other
4,369
212
transport works 1,103
Railway coolies or mazdoors in construction and supply 874
Road and building contractors 229
5'4 Construction and maintenance operations-irrigation and other agricultural works 116
Employees of irrigation department
5'5 Works and services-electric power and gas supply
5 '51 Employees of electric sup· ply company
116
294
294
14,075
72
31
31
5,390
194
1,190
700
3,306
736
272
2,298
109
109
142
142
394
343
51
9,893
4,479
4,267
212
1,093
865
228
116
116
294
294
174
147
5
6
44
92
40
10
42
24
24
7
5
2
1,000
102
102
10
9
5'6 Works and services-domestic and industrial water supply
5 ' 7 Sanitary works and servicesincluding scavangers
Division 6-Commerce
6 '0 Retail trade otherwise unclassified
6'01
Bangle sellers
Hawkers and street vendors otherwise unclassified "
6 '02 Chemists and druggists
6'03
Newspaper sellers
Publishers and booksellers
Stationers
6'04 Dealers in cattle
General store keepers
Kirana, purcMoni shops ,"
Unclassified contractors ",
Hardware merchants, paint and. varnish sellers
Toy shops
Opticians
Electric goods shops
Sale of glass goods
Kabari shops
Trunk sellers
Sale of earthenware
Sale of rope, sutli and moonj, etc.
Unclassified shopkeepers
Watch sellers
Cycle and motor dealers ,"
Dealers in wooden articles
Typewriter and other machinery dealers
Arms and ammunition dealers
Sports goods dealers
Lime, cement, sand and , stone dealers
Rctail dealers in utensils ••
6 'I Retail dealers in food stuffs (including beverages and narcotics
6"11
Retail dealers in grains and pulses
]()()
5,699
37,911
19,570
2,988
2,704
284
158
307
52
138
117
2,011
14,106
1,343
9,273
75
551
2
18
37
3
35
32
34
2,263
4
3
24
16
5
30
356
7,269
5,379
531
100
3,811
37,037
19,041
2,898
2,618
280
138
305
52
136
117
1,994
13,706
1,328
8,994
75
549
2
18
37
3
35
29
34
2,164
4
3
24
16
5
29
355
7,037
5,167
527
1,888
875
529
90
86
4
20
2
2
17
400
15
279
2
3
99
I 232
212
4
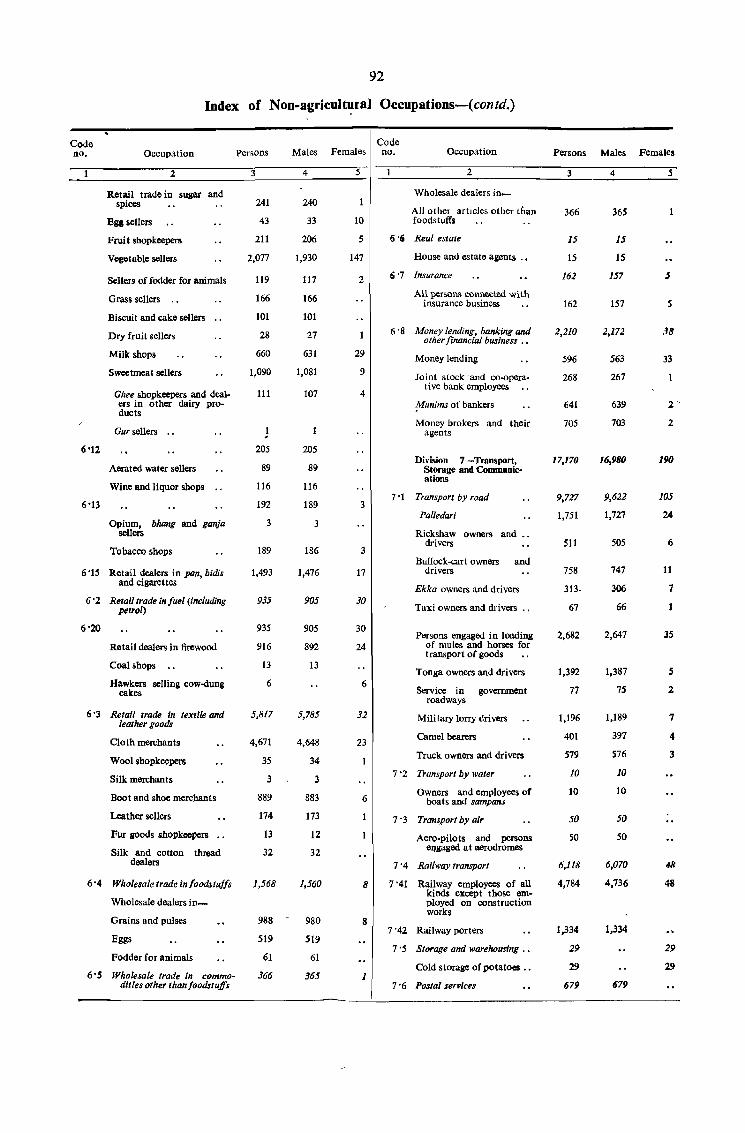
92
Index of Non-agricult~ral Occupations-(contd.)
Code no.
6'12
Occupation
2
Retail trade in sugar and spices
Egg sellers
Frui t shopkeepers
Vegetable sellers
Sellers of fodder for animals
Grass sellers ..
Biscuit and cake sellers
Dry fruit sellers
Milk shops
Sweetmeat sellers
Ghee shopkeepers and dealers in other dairy products
Gur sellers
Aerated water sellers
Wine and liquor shops
Opium, bhang and ganja sellers
Tobacco shops
6 'IS Retail dealers in pan, bidis and cigarettes
6 '2 Retail trade in fuel (including petrol)
6'20
Retail dealers in firewood
Coal shops
Hawkers selling cow-dung cakes
6 '3 Retail trade in textile and leather goods
Cloth merchants
Wool shopkeepers
Silk merchants
Boot and shoe merchants
Leather sellers
Fur goods shopkeepers
Silk and cotton thread dealers
6 '4 Wholesale trade in foodstuffs
Wholesale dealers in
Grains and pulses
Eggs
Fodder for animals
6'S Wholesale trade in commodities other than foodstuffs
Persons
3
241
43
211
2,077
119
166
101
28
660
1,090
111
I . 205
89
116
192
3
189
1,493
935
935
916
13
6
5,817
4,671
35
3
889
174
13
32
1,568
988
519
61
366
Code Males Females no. Occupation
4
240
33
206
1,930
117
166
101
27
631
1,081
107
205
89
116
189
3
186
1,476
905
905
892
13
5,785
4,648
34
3
883
173
12
32
1,560
980
519
61
365
5
10
5
147
2
29
9
4
3
3
17
30
30
24
6
32
23
6
8
8
1
2
Wholesale dealers in_
All other articles other than foodstuffs
6 'Ii Real estate
House and estate agents"
Ii '7 Insurance
All peroorul connected with insurance business
1i'8 Money lending, banking and other financial business , ,
Money lending
Joint stock 'and co-operalive bank employees
Munims of bankers
Money br<lkers and their agents
Division 7 -Transport, Storage and Communications
7 -1 Transport by road
Palledari
Rickshaw owners and " drivers
Bullock-cart owners and drivers
Ekka owners and drivers
Taxi owners and drivers "
Persons engaged in loading of mules and horses for transport of goods
Tonga owners and drivers
Service in government roadways
Mili lary lorry drivers
Camel bearers
Truck owners and drivers
7 '2 Transport by water
Owners and employees of boats and sampans
Transport by air
Aero-pilots and persons eIlgaged at aerodromes
7 '4 Railway transport
7 '41 Railway employees of all kinds except those employed on construction works
7 '42 Railway porters
7'5 Storage and warehousing .•
Cold storage of potatoes ••
7 • 6 Postal services
Persons Males Females
3
366
15
IS
162
162
2,210
596
268
641
705
17,170
9,727
1,751
511
758
311-
67
2,682
1,392
77
1,196
401
579
10
10
50
50
6,118
4,784
1,334
29
29
679
4
365
15
15
157
157
2,172
563
267
639
703
16,980
9,622
1,727
505
747
306
66
2,647
1,387
75
1,189
397
576
10
10
50
50
6,070
4,736
1,334
679
5
s
,18
33
2'
2
190
105
24
6
11
7
35
5
2
7
4
3
48
48
29
29
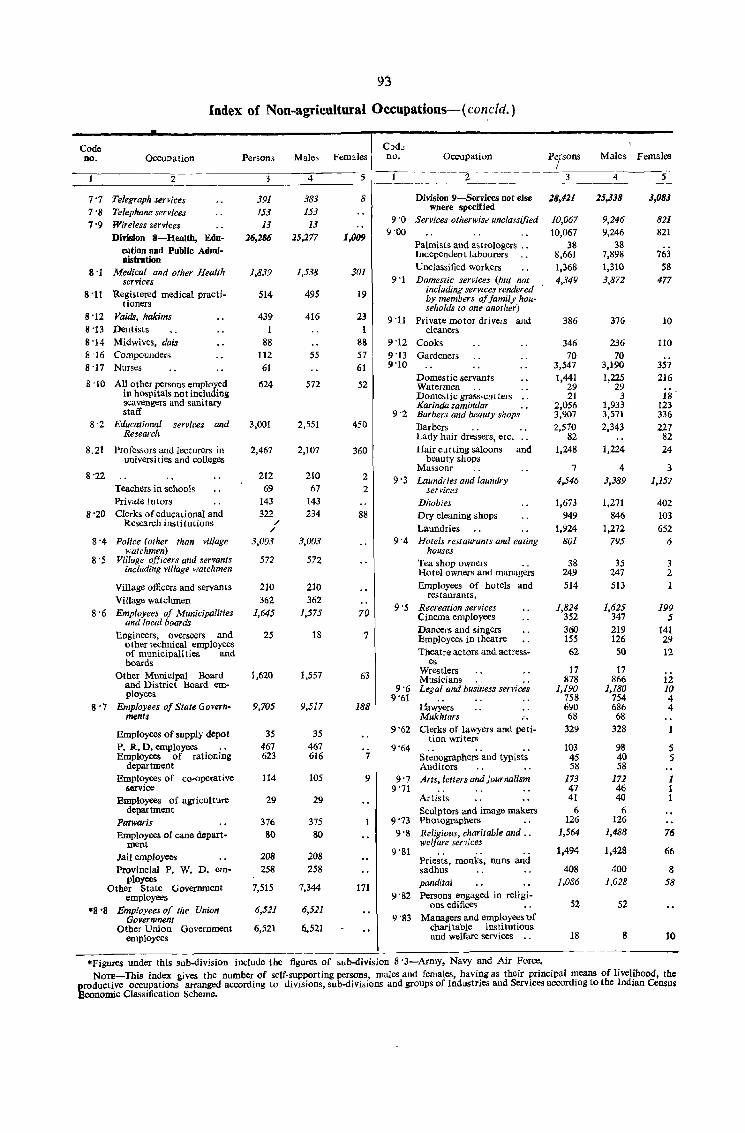
93
Index of Non-agricultural Occupations-( concld.)
Code no. Occupation
2
7 '7 Telegraph services 7'8 Telephone services 7 '9 Wireless services
DiYision 8-Health, Education and Public Administration
8 '1 Medical and other Health services
8 '11 Registered medical practi-tioners
8 '12 Voids, hakims 8 '13 Dentists 8 '14 Midwives, dais 8 '16 Compounders 8 '17 Nurses
8 .j 0 All other persons employed in hospitals not including scavengers and sanitary staff
8'2 Educational services and Research
8.21 Professors and lecturers in universi ties and colleges
8'22 Teachers in schools Private tutors
8 '20 Clerks of educational and Research institutions
8'4 Police (other than village watchmen)
8'5 Village officers and servants including village watchmen
Village officers and servants Village watchmen
8'6 Employees of Municipalities and local boards
Engineers, overseers and other technical employees of munidpali ties and boards
Other Municipal Board and District Board employees
g . 7 Employees of State Governments
Employees of supply depot P. R. D. employees Employees of rationing
department Employees of co-operative
service Employees of agriculture
department Potwar is Employees of cane depart
ment Jail employees Provincial p. W. D. em
ployees Other State Government
employees *8'8 Employees of the Union
Government Other Union Government
employees
Persons
391 153
13 26,286
1,839
514
439
88 112
61
624
3,001
2,467
212 69
143 322
/ /
3,003
572
210
362 1,645
25
1,620
9,705
35 467 623
114
29
376 80
208 258
7,515
6,521
6,521
Males Females
383 153 13
25,277
1,538
495
416
55
572
2,551
2,107
210 67
143 234
3,003
572
210 362
1,575
18
1,557
9,517
35 467 616
105
29
375 80
208 258
7,344
6,521
6.521
8
1,009
301
19
23 1
88 57 61
52
450
360
2 2
88
70
7
63
188
7
9
171
C~d~ no. Occupation
2
Division 9-Services not else wbere specified
9 '0 Services otherwiso! unclassified 9'00
Palmists and astrologers .• Independent labourers .. Unclassified workers
9 'I Domestic services (but not including services rendered by members of family households to one another)
9'11 Private motor drivers and cleaners
9'12 Cooks 9 '13 Gardeners 9'10
Domestic servants Watermen Domes ti e grass-eu t ters Karinda zamindar ..
9'2 Barbers and beauty shops
Barbers " Lady hair dressers, etc. .. Hair cutting saloons and
bcauty shops Massonr
9'3 Laundries and laundry services
Dhobies Dry cleaning shops Laundries
9 . 4 Hotels restaurants and eating houses
Tea shop owners .. Hotel owners and managers Employees of hotels and
restaurants, 9'S Recreation services
Cinema employees
9'6 9'61
9'62
9'64
Dancers and singers Employees in theatre Theatre actors and actress-
es Wrestlers Musicians .. Legal and business services
UiwY~rs Mukhtars .• Clerks of lawyers and peti-
tion writers
Stenographers and typists' Auditors
9'7 Arts, letters and journalism 9'71
Arti~is Sculptors and image makers
9'73 Photographers 9'8 Religious, charitable and ..
welfare services 9'SI
Priests, monks, nuns and sadhus panditai
9 '82 Persons engaged in religioos edifices
9 '83 Managers and employees-uf charitable institutions and welfare services •.
.Figures under this sub-division include the figures of sub-division 8 '3-Army, Navy and Air Force.
3
28,421
10,067 10,067
38 8,661
1,368 4,349
386
346 70
3,547 1,441
29 21
2,056 3,907
2,570 82
1,248
7
4,546
1,673 949
1,924 801
38 249
514
1,824 352 360 155
62
17 878
1,190 758 690 68
329
103 45 58
173 47 41
6 126
1,564
1,494
408 1,086
52
18
Males Females
25,338
9,246 9,246
38 7,898 1,310
3,872
376
236
70 3,190 1,225
29 3
1,933 3,571
2,343
1,224
4 3,389
1,271
846 1,272
795
35 247
513
1,625 347 219 126
50
17 866
1,180 754 686 68
328
98 40 58
172 46 40
6 126
1,488
1,428
400 1,028
52
8
3,083
821 821
763
58 477
10
110
357 216
18 . 123 336
227 82 24
3 1,157
402 103
652 6
3 2
1
199 5
141 29 12
12 10 4 4
5 5
1 1 1
76
66
8 58
10
NOTE-This index gives the number of self-supporting persons, males and females, having as their principal means of livelihood, the productive occupations arranged according to divisions, sub-divisioDS and groups of Industries and Services according to the Indian Census Economic Classification Scheme.
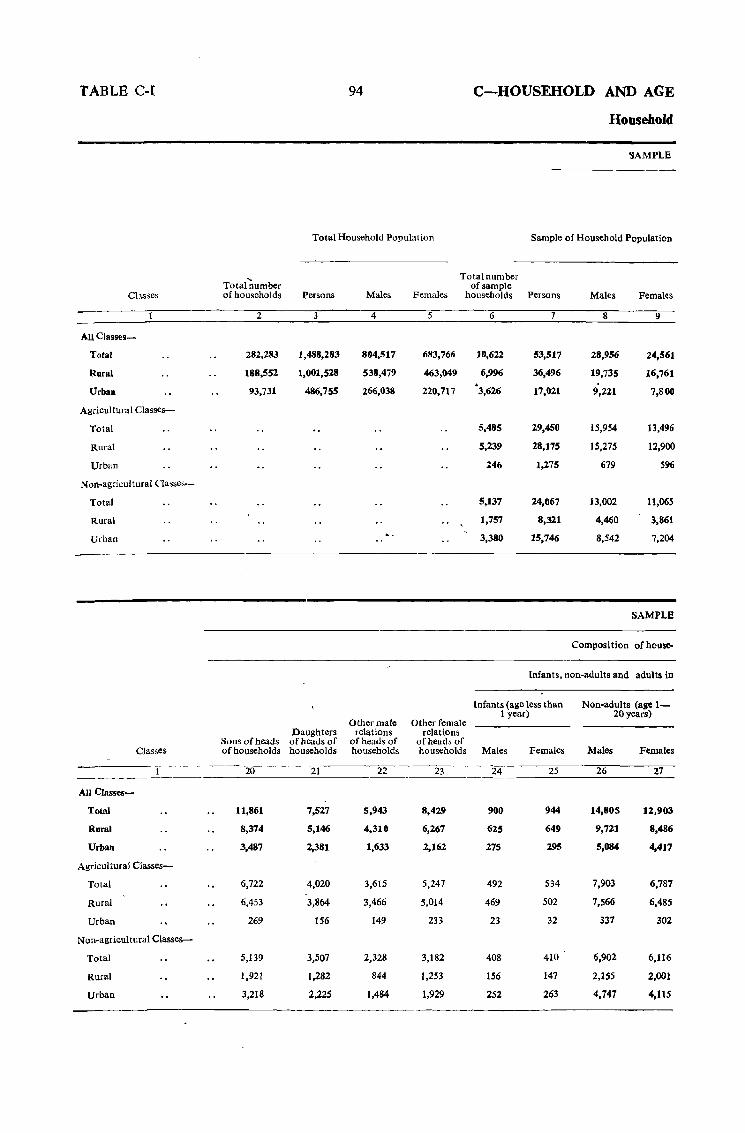
TABLE C-I 94 C-HOVSEHOLD AND AGE
HousehoJd
SAMPLE
Total Household Population Sample of Household Population
Total'number Total number
of sample CLl.sses of households Persons Males Females hOLlseholds Persons Males Females
2 3 4 5 6 7 8 9
All Classes-
Total 282,283 1,488,283 804,517 683,766 10,622 53,517 28,956 24,561
Rural 188,552 1,001,528 538,479 463,049 6,996 36,496 19,735 16,161 . Urban 93,731 486,755 266,038 220,717 3,626 17,021 9,221 7,800
Agricultural Classes-
Total 5,485 29,450 15,954 13,496
Rural 5,239 28,115 15,275 12,900
Urban 246 1,275 679 ~96
Non-agricultural Classes-
Total 5,137 24,067 13,002 11,065
Rural 1,757 8,321 4,460 3,861
Urban 3,380 15,746 8,542 7,204
SAMPLE
Composition of house-
Infants, non-adults and adults in
Infants (age less than Non-adults (agc I-
Other male Other female I year) 20 years)
Daughters relations relations Sons of heads of heads of of heads of of heads of
Classes of households households households households Males Females Males Females
20 21 22 23 24 25 26 27
All Classes-
Total 11,861 7,527 5,943 8,429 900 944 14,805 12,903
Rural 8,374 5,146 4,310 6,267 625 649 9,721 8,486
Urban 3,487 2,381 1,633 2,162 275 295 5,084 4,417
Agricultural Classes-
Total 6,722 4,020 3,615 5,247 492 534 7,903 6,787
Rural 6,453 3,864 3,466 5,014 469 502 7,566 6,485
Urban 269 156 149 233 23 32 337 302
Non-agricultural Classes-
Total 5,139 3,507 2,328 3,182 408 410 6,902 6,116
Rural 1,921 1,282 844 1,253 156 147 2,155 2,001
Urban 3,218 2,225 1,484 1,929 252 263 4,747 4,115
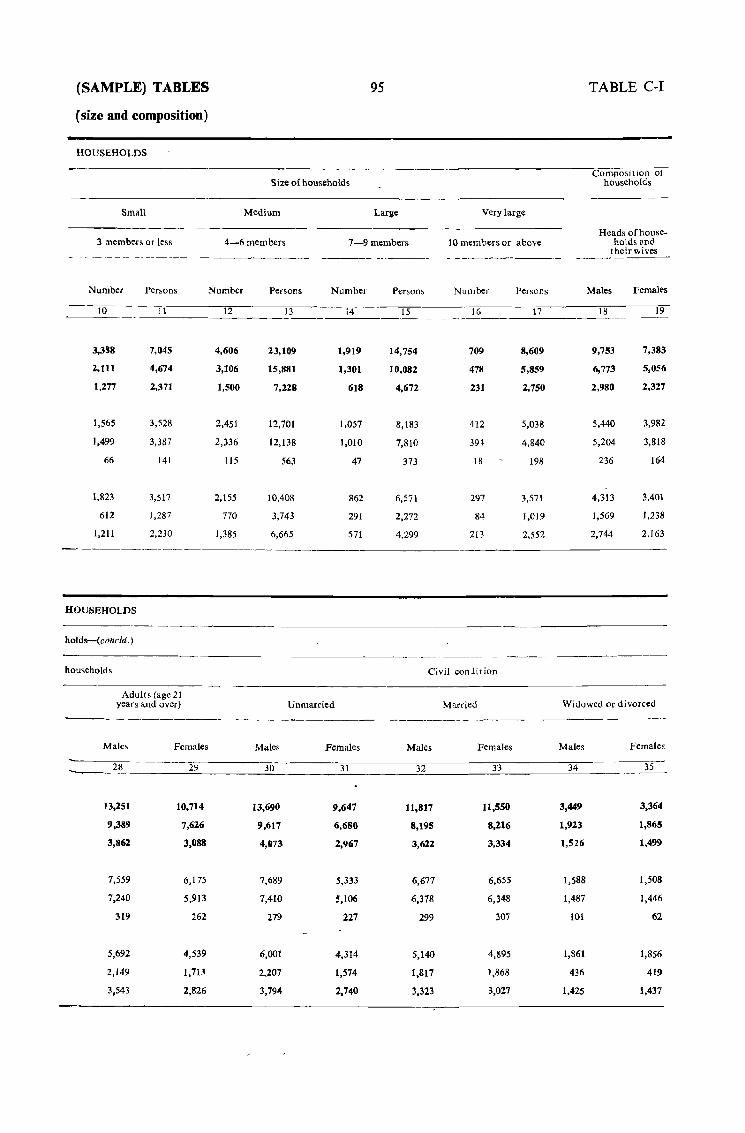
(SAMPLE) TABLES 95 TABLE C-I
(size and composition)
HOUSEHOLDS
Composition oj Size of households households
Small Medium Large Very large
Heads of house-3 members or less 4-6 members 7-9 members 10 members or above holds and
their wives - .- ---.~~-- -------- ------- - - ----_ .. _--- ---------
Number Perwns Number Persons Number Persons Number Persons Males Females
10 11 12 13 14 15 16 17 18 19 ---~---
3,388 7,045 4,606 23,109 1,919 14,754 709 8,609 9,753 7,383
Z.lll 4,674 3,106 15,881 1,301 10,082 478 5,859 6,773 5,056
1.277 2,371 1,500 7,228 618 4,672 231 2,750 2,980 2,327
1,565 3,528 2,451 12,701 1,057 8,183 412 5,038 5,440 3,982
1,499 3,387 2,336 [2,138 1,010 7,810 39t 4,840 5,204 3,818
66 [41 115 563 47 373 18 198 236 164
[,823 3,517 2,155 10,408 862 6,571 297 3,571 4,313 3,401
612 1,287 770 3,743 291 2,272 84 1,019 1,569 1,238
1,211 2,230 1,385 6,665 571 4,299 213 2,552 2,744 2,163
--------------------
HOUSEHOLDS
holds-(concld.)
--------------------households Civil cortlition
Adult s (age 21 years and over) Unmarried Married Widowed or divorced
---------_---- ------------
Male, Females Males Females Males Females Males Females
28 29 30 31 32 33 34 35
13,251 10,714 13,690 9.647 11,817 11,550 3,449 3,364
9,389 7,61.6 9,617 6,680 8,195 8,216 1,91.3 1,865
3,861 3,088 4,073 2,967 3,622 3,334 1,526 1,499
7,559 6,175 7,689 5,333 6,677 6,655 1,588 1,508
7,240 5,913 7,410 5,106 6,378 6,348 1,487 1,446
319 262 279 227 299 307 101 62
5,692 4,539 6,001 4,314 5,140 4,S95 1,861 1,856
2,149 1,713 2,207 1,514 1,817 1,868 436 419
3,543 2,826 3,794 2,740 3,323 3,027 1,425 1,437
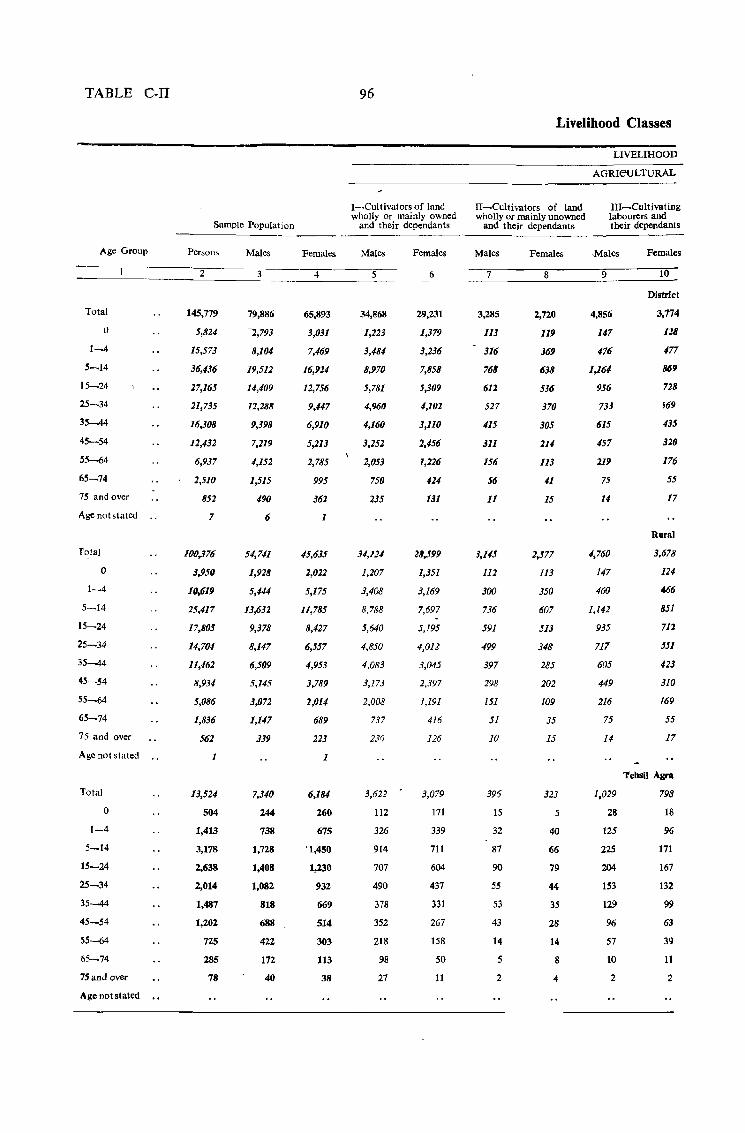
TABLE C-II
Age Group
Total
a
1-4
5-14
15-24
25-34
3:5-44
45-54
55-64
65-74
75 and over
Age not stated ..
Total
o 1-4
5-14
15-24
25-34
35-44
45-54
55-64
65-74
75 and over
Age not stated ..
Total
a 1-4
5-14
15-24
25-34
35-44
45-54
55-64
65-74
75 and over
Age not stated ••
Sample Population
Persons
2
145,779
5,824
15,573
36,436
27,165
21,735
16,308
12,432
6,937
2,510
852
7
100,376
3,950
10.,619
25,417
17,805
14,704
11,462
8,931
5,086
1,836
561
1
13,524
504
1,413
3,178
2,638
2,014
1,487
1,202
725
285
78
Males
3
79,886
~,793
8,104
19,511
1<1,109
12,288
9,398
7,219
4,152
1,515
490
6
54,741
1,928
5,/#
13,632
9,378
8,U7
6,509
5,145
3,072
1,147
339
7,310
244
738
1,728
1,408
1,082
818
688
422
172
40
Females
4
65,893
3,031
7,169
16,924
12,756
9,147
6,910
5,213
2,785
995
362
1
45,6J5
2,022
5,175
11,785
8,427
6,557
1,953
3,789
2,014
689
223
1
6,184
260
675
'1,450
1,230
932
669
514
303
113
38
96
I-·Cultivators of land wholly or mainly owned
and their dependants
Males
5
34,868
1,223
3,484
8,970
5,781
1,960
1,160
3,252
2,053
750
235
34,121
1,207
3,408
8,788
5,640
4,850
4,083
3,173
2,008
737
23f)
3,622
112
326
914
707
490
378
352
218
98
27
Females
6
29,231
1,379
3,236
7,858
5,309
1,102
3,110
2,456
1,226
424
131
28,599
1,351
3,169
7,697
5,195
4,012
3,045
2,397
1,191
416
126
3,079
171
339
711
604
437
331
267
158
50
11
Livelihood Classes
II-Cultivators of land wholly or mainly unowned
and their depf'ndants
Males
7
3,285
113
316
768
612
527
415
311
156
56
11
1,145
112
300
736
591
499
397
298
151
51
10
396
15
32
87
90
55
53
43
14
5
2
Females
8
2,720
119
369
638
536
370
305
214
113
41
15
2,577
113
350
607
513
348
285
202
109
35
15
323
5
40
66
79
44
35
28
14
8
4
LIVELIHOOD
AGRleULTURAL
II1-.Cultivating labourers and their dependants
Males
9
4,856
147
476
1,16~
956
733
615
457
219
75
].I
1,760
147
460
1,142
935
717
605
449
216
75
14
1,029
28
125
225
204
153
129
96
57
10
2
Females
10
District
3,774
128
477
869
728
r69
435
320
176
55
17
Rural
3,678
124
466
851
712
551
423
310
169
55
17
1'ehsil Agra
798
18
96
171
167
132
99
63
39
11
2
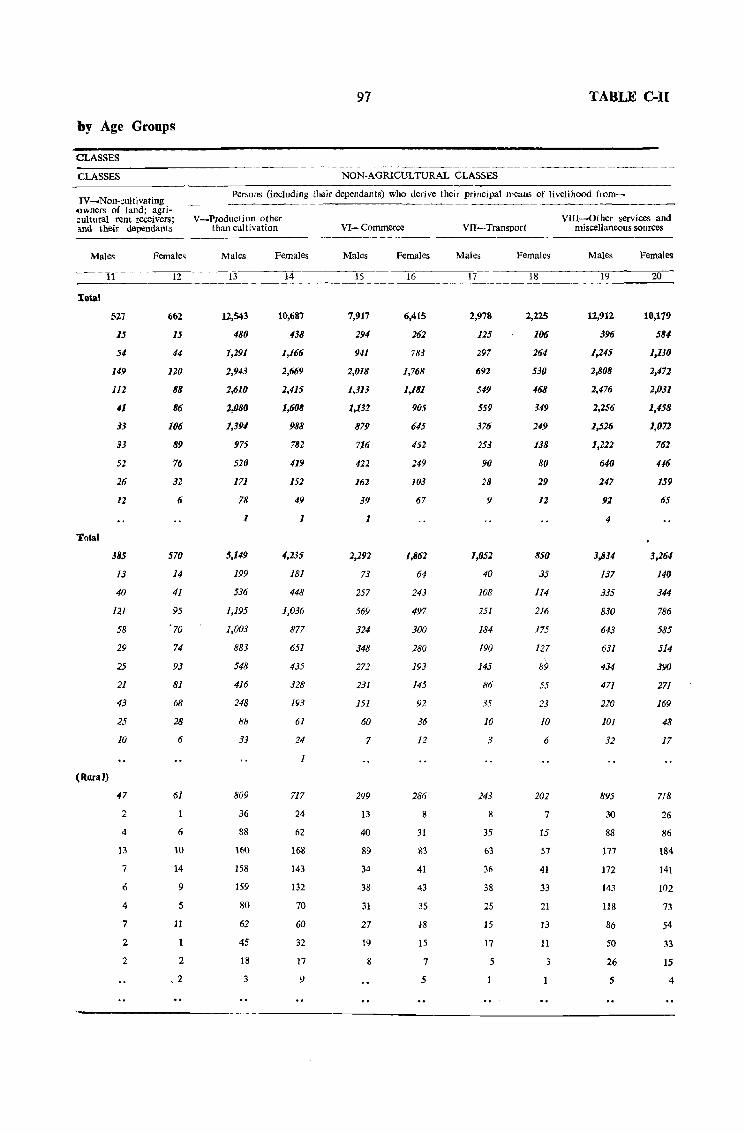
by Age Groups
CLASSES
CLASSES
IY.-... N on-cui ti vating owners of land; agrl:ultural rent receivers; and their dependants
Males
11
Total
Total
(Rllral)
527
15
5~
149
Jl2
41
33
33
52
26
12
385
13
40
121
58
29
25
21
43
25
10
47
2
4
13
7
6
4
7
2
2
Females
12
662
15
44
120
88
86
106
89
76
32
6
570
14
41
95
70
74
93
81
68
28
6
61
6
10
14
9
5
11
2
,2
97 TABLE C-II
NON-AGRICULTURAL CLASSES
Persons (including their dependants) who derive their principal means of livelihood from~
V_Production other than cultivation
Males
12,543
480
1,291
2,943
1,610
1,080
1,394
975
520
171
78
1
5,149
199
536
1,195
1,003
883
548
416
248
88
33
809
36
88
160
158
159
80
62
45
18
3
Females
14
10,687
438
1,166
2,669
2,415
1,608
988
782
419
152
49
1
4,235
181
448
1,036
877
651
435
328
193
61
24
1
717
24
62
168
143
132
70
60
32
17
9
VI- Commerce
Males
15
7,917
194
941
2,018
1,313
1,132
879
716
422
162
39
1
2,292
73
257
569
324
348
272
231
151
60
7
299
13
40
89
34
38
31
27
19
8
Females
16
6,415
262
783
1,768
1,181
905
645
452
249
103
67
1,862
64
243
497
300
280
193
145
92
36
12
286
8
31
83
41
43
35
f8
15
7
5
VII~Transport
Males
17
2,978
125
297
692
549
559
376
253
90
18
9
1,052
40
108
251
184
190
145
86
35
10
3
243
8
35
63
36
38
25
15
17
5
Females
18
2,225
106
2M
530
468
349
24.9
138
80
29
12
850
35
114
216
175
127
8P 55
23
10
6
202
7
15
57
41
33
21
13
11
3
VlII~Other services and miscellaneous sources
Males
19
12,912
396
1,245
2,808
2,476
2,256
1,526
1,222
640
247
92
4
3,834
137
335
830
643
631
434
471
220
101
32
895
30
88
177
172
143
118
86
50
26
5
Females
20
10,179
584
1,130
2,472
2,031
1,458
1,072
762
446
159
65
3,264
140
344
786
585
514
390
271
169
48
17
718
26
86
184
141
102
73
54
33
15
4
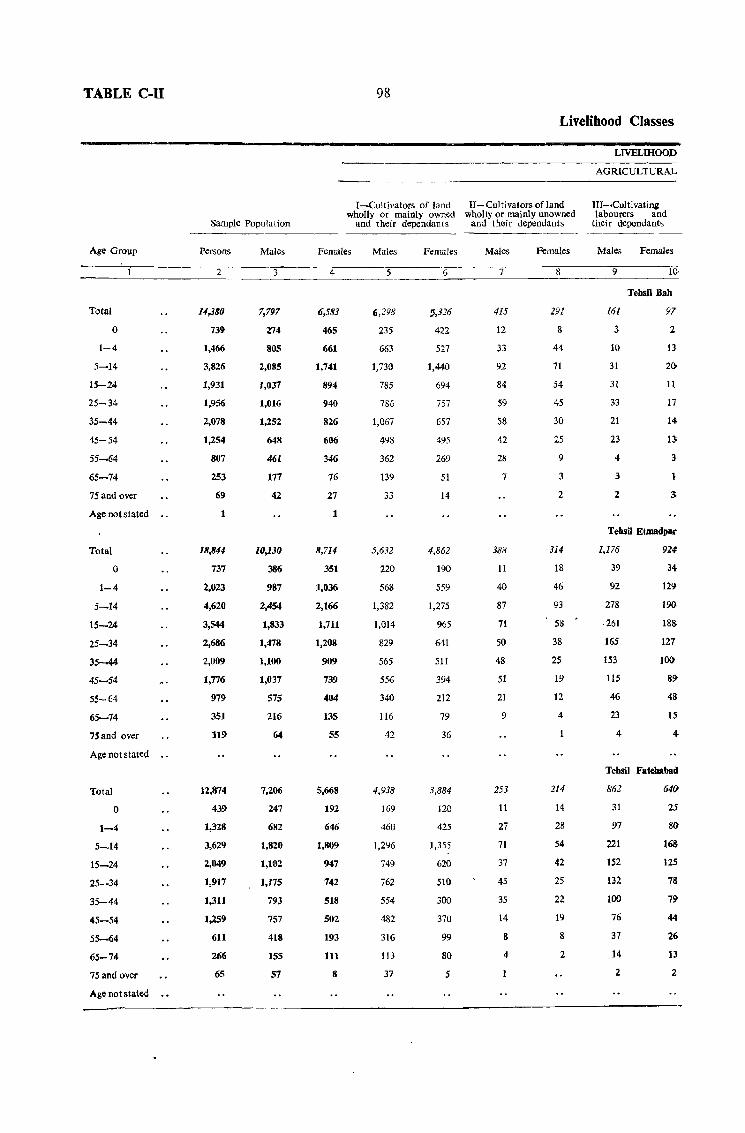
TABLE C-II
Age Group
Total
o 1-4
5-14
15-24
25-34
35~44
45-54
55-64
65-74
75 and over
Age not stated
Total
o 1-4
5-14
15-24
25-34
35--44
45-54
55-64
65-74
75and over
Age not stated
Total
o 1-4
5-14
15-24
25-34
35-44
45-54
55-64
65-74
75 and over
Age not stated
Sample Population
Persons
2
1<1,380
739
1,466
3,826
1,931
1,956
2,078
1,254
807
253
69
1
18,841-
737
2,023
4,620
3,544
2,686
2,009
1,776
979
351
119
12,874
439
1,328
3,629
2,049
1,917
1,311
1,259
611
266
65
Males
3
7,797
274
805
2,085
1,037
1,016
1,252
648
461
177
42
10,130
386
987
2,454
1,833
1,478
1,100
1,037
575
216
64
7,206
247
682
1,820
1,102
1,175
793
757
418
155
57
98
Livelihood Classes
I-Cultivators of land II-Cultivators ofland wholly or mainly owned wholly or mainly unowned
and their dependants and their dependants
Females
4
6,583
465
661
1,741
894
940
826
606
346
76
27
1
8,714
351
1,036
2,166
1,711
1,208
909
739
404
135
55
5,668
192
646
1,809
947
742
518
502
193
111
8
Males
5
6,298
235
663
1,730
785
786
1,067
498
362
139
33
5,632
220
568
1,382
1,014
829
565
556
340
116
42
4,938
169
460
1,296
749
762
554
482
316
113
37
Females
6
:;,326
422
527
1,440
694
757
657
495
269
51
14
4,862
190
559
1,275
965
641
.511
394
212
79
36
3,884
120
425
1,355
620
.510
300
370
99
80
:;
Males
7
415
12
33
92
84
59
58
42
28
7
388
11
40
87
71
50
48
51
21
9
253
11
27
71
37
45
35
14
g
4
Females
8
291
8
44
71
54
45
30
25
9
3
2
314
18
46
93
58
38
25
19
12
4
214
14
28
54
42
25
22
19
8
2
LIVELIHOOD
AGRICULTURAL
III-.Cultivatin8 labourers and
their dependants
Males Females
9
161
3
10
31
31
33
21
23
4
3
2
10.
Tehsil Bah
97
2
n 2()
11
17
14
U
1
3
Tehsll EtlJllldpar
1,176 924
39
92
278
.261
165
153
115
46
23
4
34
129
19{)
18S
127
100
89
48
15
4
Tehsil Fatehabad
862
31
97
221
152
132
100
76
37
14
2
64()
25
SO
168
125
78
79
44
26
13
2
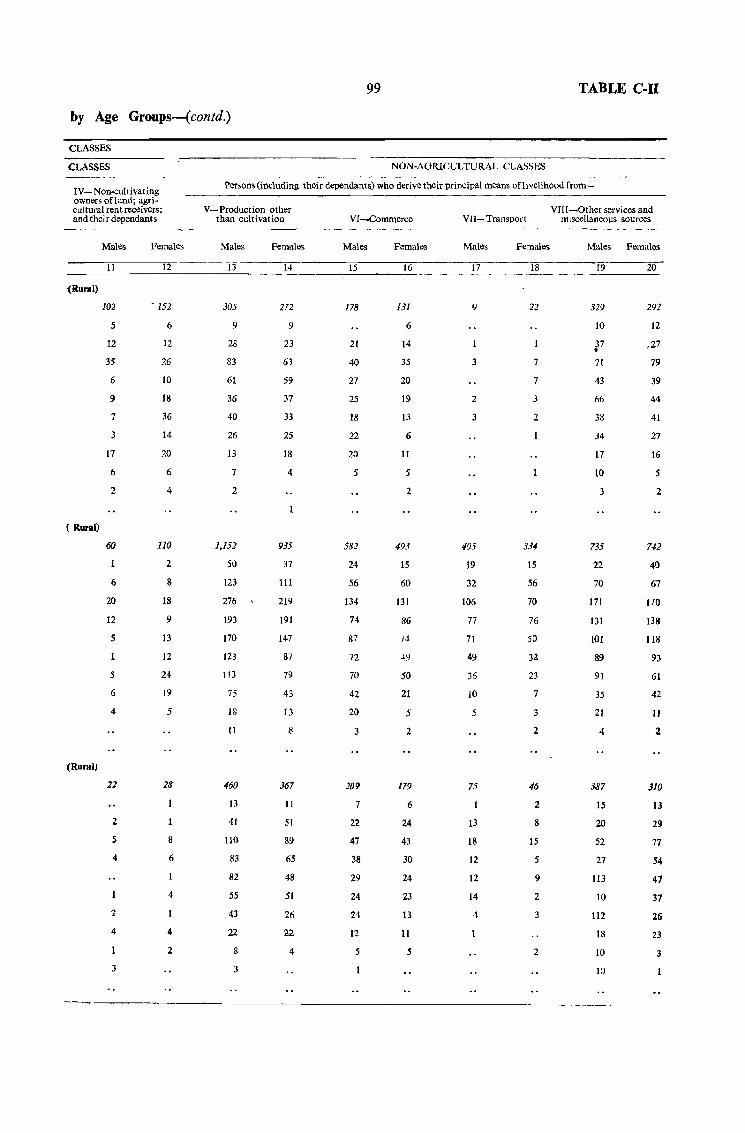
by Age Groups-(contd.)
CLASSES
CLASSES
99 TABLE C-H
NON-AGRICULTURAL CLASSES
IV- Non-cultivating owners ofland; agricultural rent receivers; and their dependants
Persons (including their dependants) who derive their principal means ofhvelihood from-
(Rural)
( Rural)
(Rural)
Males
11
102
5
12
35
6
9
7
3
17
6
2
60
6
20
12
5
5
6
4
2
S
4
2
4
3
Females
12
- 152
6
12
26
10
18
36
14
20
6
4
110
2
8
18
9
13
12
24
19
5
28
8
6
4
4
2
V-ProdllCtion other than cultivation
Males
13
305
9
28
83
61
36
4()
26
I3
7
2
1.152
50
123
276
193
170
123
1t3
75
18
11
460
13
41
110
83
82
55
43
22
8
3
Females
14
272
9
23
63
59
37
33
25
18
4
935
37
111
219
191
147
87
79
43
13
8
367
11
51
89
65
48
51
26
22
4
VI-Commerce
Males
15
178
21
40
27
25
1&
22
20
5
582
24
56
134
74
87
72
70
42
20
3
209
7
22
47
38
29
24
24
12
5
Females
16
131
6
14
35
2()
19
13
6
11
2
493
15
60
131
86
74
~9
50
21
5
2
179
6
24
43
30
24
23
13
11
5
V11- Transport
Males
17
9
3
2
3
405
19
32
106
77
71
49
36
10
5
75
13
18
12
12
14
4
Females
18
22
7
7
3
2
33-1
15
56
70
76
50
32
23
7
3
2
46
2
8
IS
5
9
2
3
2
VIII-Other services and mlscellaneous sources
Males Females
19" 20
329
10
37 • 71
43
66
38
34
17
t()
3
735
22
70
171
131
101
89
91
35
21
4
387
15
20
52
27
113
10
112
18
10
10
292
12
,27
79
39
44
41
27
16
5
2
742
40
67
170
138
118
93
61
42
11
2
310
13
29
77
54
47
37
26
23
3
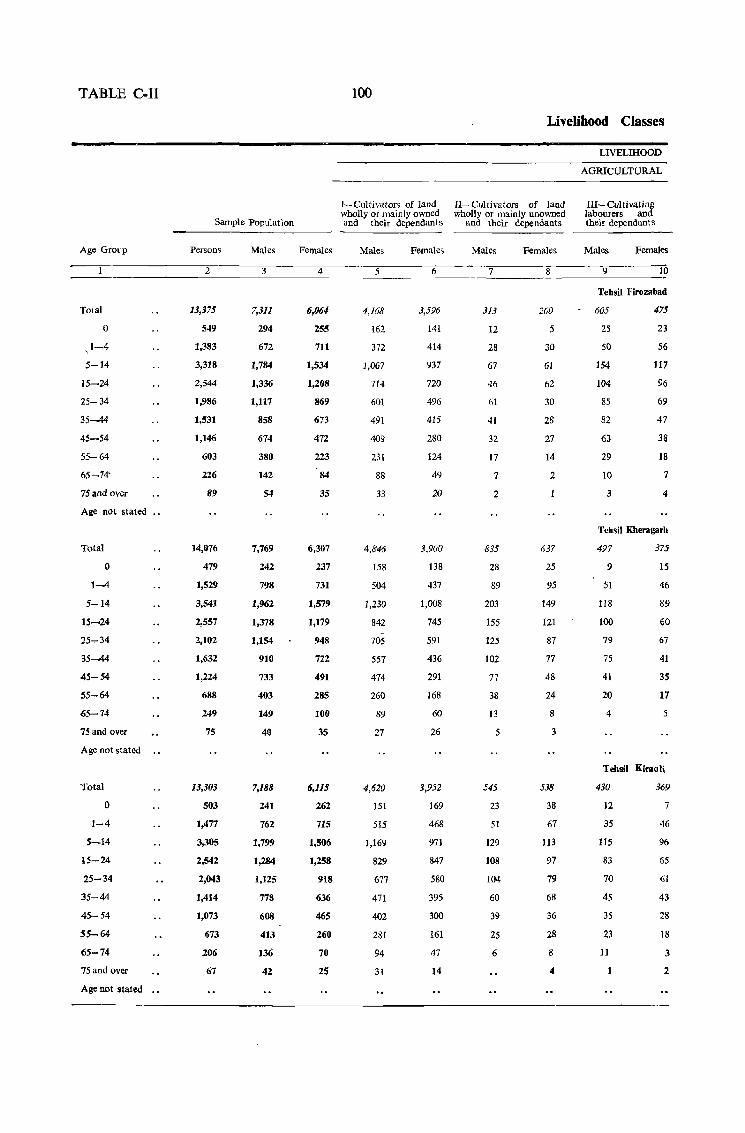
TABLE C-II
Age Group
Total
o ,1-4
5-14
15-24
25-34
35-44
45-54
55-64
65-74'
75and over
Age not stated .•
Total
o 1-4
5-14
15-24
25.,..34
35-44
45-54
55-64
65-74
75 and over
Age not stated
Total
o 1-4
5-14
15-24
25-34
35-44
45-54
55-64
65-74
75 and over
Age nol stated
Sample Population
Persons
2
13,375
549
1,383
3,318
2,544
1,986
1,531
1,146
603
226
89
14,076
479
1,529
3,541
2,557
2,102
1,632
1,224
688
249
75
13,303
503
1,477
3,305
2,542
2,043
1,414
1,073
673
206
67
Males
3
7,311
294
672
1,784
1,336
1,117
858
674
380
142
54
7,769
242
798
1,962
1,378
1,154
916
733
403
149
40
7,188
241
762
1,799
1,284
1,125
778
608
413
136
42
Females
4
6,061
255
711
1,534
1,208
869
673
472
223
84
35
6,307
237
731
1,579
1,179
948
722
491
285
160
35
6,115
262
715
1,566
1,258
918
636
465
260
70
25
100
1-Cultivator, of land wholly or mainly owned and their dependants
Males
5
4,168
162
372
1,067
714
601
491
409
231
88
33
4,846
158
504
1,230
842
705
557
474
260
89
27
4,620
151
515
1,169
829
677
471
402
281
94
31
Females
6
3,596
141
414
937
720
496
415
280
124
49
20
3,900
138
437
1,008
745
591
436
291
168
60
26
3,952
169
468
971
847
580
395
300
161
47
14
Livelihood Classes
1I-Cultivators of land wholly or mainly unowned
and their dependants
Males Females
LIVELIHOOD
AGRICULTURAL
III- Culti valing labourers and their dependants
Males Females
__ 7~ ______ ~8 ______ ~9~ _______ lO
313
12
28
67
46
61
41
32
17
7
2
835
28
89
203
155
125
102
77
38
13
5
545
23
51
129
108
104
60
39
25
6
260
5
30
61
62
30
28
27
14
2
637
25
95
149
121
87
77
48
24
8
3
538
38
67
113
97
79
68
36
28
8
4
Tebsil Firozabad
605
25
50
154
104
85
82
63
29
10
3
475
23
56
117
96
69
47
38
18
7
4
Tebsil Kheragarb
497
9
51
118
100
79
75
41
20
4
375-
15
46
89
60
67
41
35
17
5
Tehsil Kirao Ii
430
12
35
lIS
83
70
45
35
23
11
369
7
46
96
65
61
43
28
18
3
2
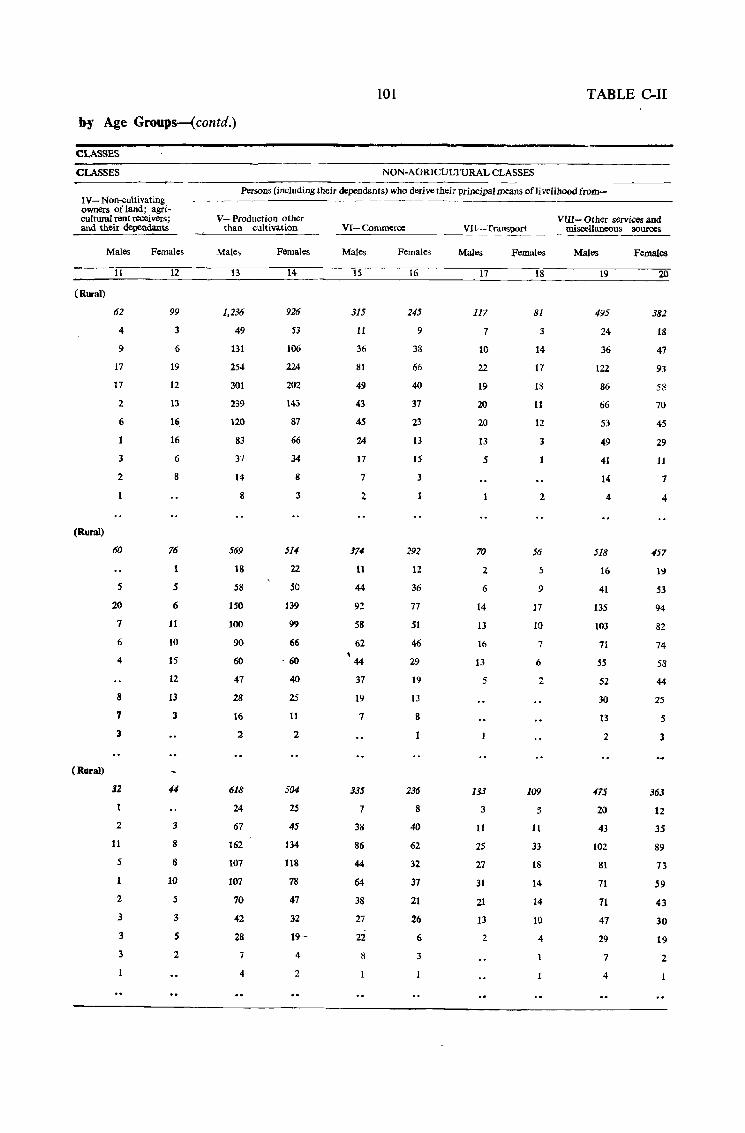
101 TABLE C-II
b-y Age Groups-(contd.)
CLASSES
CLASSES NON-AGRICULTURAL CLASSES
IV - Non..cuitivating owners of land; agricultural rent receivers; and their dependants
Persons (including their dependants) who derive their principal means oflivelihood from-
(Rural)
(Rural)
(Rllral)
Males
11
62
4
9
17
17
2
6
3
2
60
5
20
7
6
4
8
7
3
32
2
11
5
2
.3
3
3
Females
12
99
6
19
12
13
1~
16
6
8
76
5
6
11
10
15
12
13
3
44
3
8
8
10
5
3
5
2
V- Production other than cultivation
Males
13
1,236
49
131
254
301
239
120
83
37
14
8
569
18
58
150
100
90
60
47
28
16
2
618
24
67
162
107
107
70
42
28
7
4
Females
14
926
53
106
224
202
143
87
66
34
8
3
514
22
50
139
99
66
. 60
40
25
11
2
504
25
45
134
118
78
47
32
1<t-
4
2
VI- Commerce
Males
15
315
II
36
81
49
43
4S
24
17
7
374
11
44
92
58
62 , 44
37
19
7
335
7
38
86
44
64
38
27
22
8
Females
16
245
9
38
66
40
37
23
13
15
3
292
12
36
77
51
46
29
19
13
8
236
8
40
62
32
37
21
26
6
3
VII-Transport
Males
17
JJ7
7
10
22
19
20
20
13
5
70
2
6
14
13
16
13
5
133
3
11
25
27
31
21
13
2
Females
18
81
3
14
17
18
11
12
3
2
56
5
9
17
10
7
6
2
109
5
11
33
18
14
14
10
4
VIII- Other services and miscellaneous sources
Males
19
495
24
36
122
86
66
53
49
41
14
4
518
16
41
135
103
71
S5
52
30
13
2
475
20
43
102
81
71
71
47
29
7
4
Females
20
382
18
47
93
58
70
4S
29
11
7
4
457
19
53
94
82
74
58
44
25
5
1
363
12
35
89
73
59
43
30
19
2
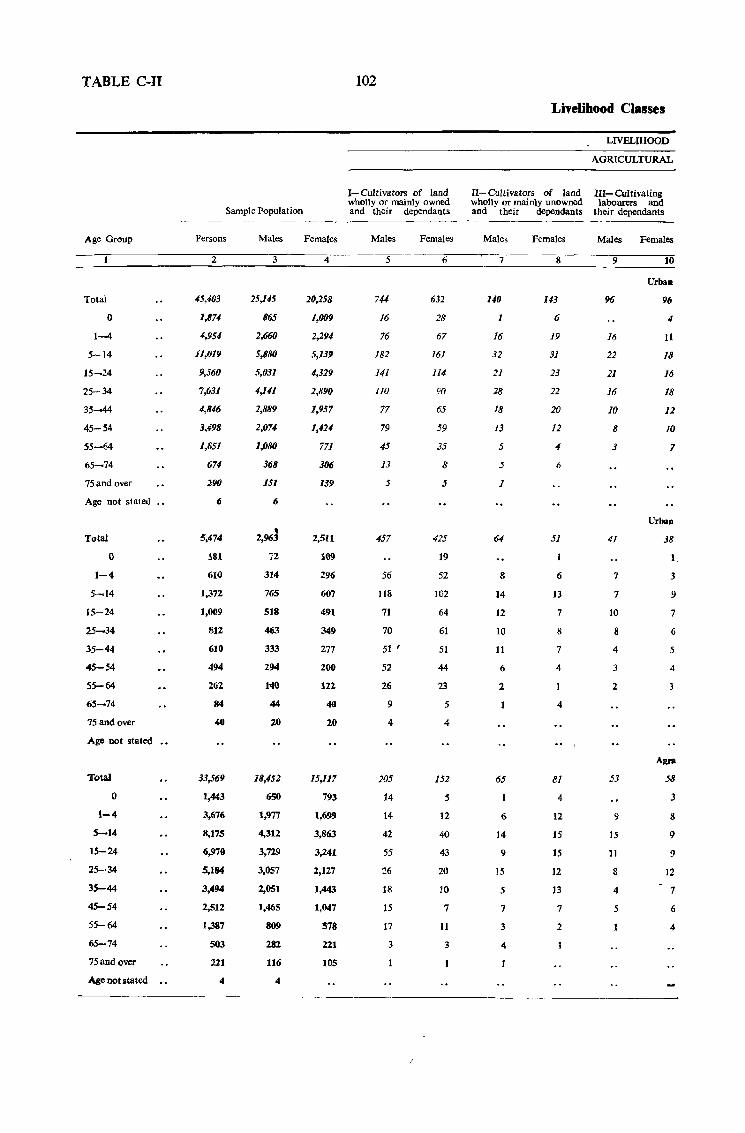
TABLE C-II
Age Group
Total
o 1--4
5-14
15-24
25-34
35--#
45-54
55-64
65-74
75 and oyer
Age not stated .,
Total
o 1-4
5-14
15-24
25-34
35-44
45-54
55-64
65-74
75 and over
Age not stated
'Tota)
o t-4
S--14
15-24
25-34
35-44
45-54
55-64
65-74
75 and over
A$e not stated
Sample Population
Persons Males
2
45,4fJ3
1,874
4,954
11,019
9,360
7,031
4,lJ46
3,498
1,851
674
290
6
5,474
181
610
1,372
1,009
812
610
494
262
84
40
33,569
1,443
3,676
8,175
6,979
5,184
3,494
2,512
1,387
563
221
4
3
25,145
865
2,660
5,880
5,031
4,141
2,889
2,074
1,080
368
151
6
, 2,963
72
314
765
518
463
333
294
140
44
ZO
18,452
650
1,977
4,312
3,729
3,057
2,051
1,465
809
182
116
4
Females
4
20,258
1,009
2,294
5,139
4,329
2,890
1,957
1,424
771
306
139
2,511
109
296
607
491
349
277
200
121
40
20
15,117
793
1,699
3,863
3,241
2,127
1,443
1,047
578
211
105
102
I-Cultivators of land wholly or mainly owned and their dependants
Males
5
744
16
76
182
141
110
77
79
45
13
5
457
56
118
71
70
51 '
52
26
9
4
205
14
14
42
55
26
18
15
17
3
Females
6
632
28
67
161
114
90
65
59
35
8
.5
425
19
52
102
64
61
51
44
23
5
4
152
5
12
40
43
20
10
7
11
3
Livelihood Classes
LIVELIHOOD
AGRICULTURAL
II-Cultivators of land III-Cultivating wholly or mainly unowned labourers and and their dependants their dependants
Males
7
140
1
16
32
21
28
18
13
5
.5
1
8
14
12
10
11
6
2
65
6
14
9
15
5
7
3
4
Females
8
143
6
19
31
23
22
20
12
4
6
51
6
13
7
8
7
4
4
81
4
12
15
15
12
J3
7
2
Males Females
9
96
16
22
21
16
10
8
3
41
7
7
10
8
4
3
2
53
9
15
11
8
4
5
10
Urbao
96
4
11
18
16
18
12
10
7
Urban
38
1.
3
9
7
6
5
4
Agra
58
;l
8
9
9
12
7
6
4
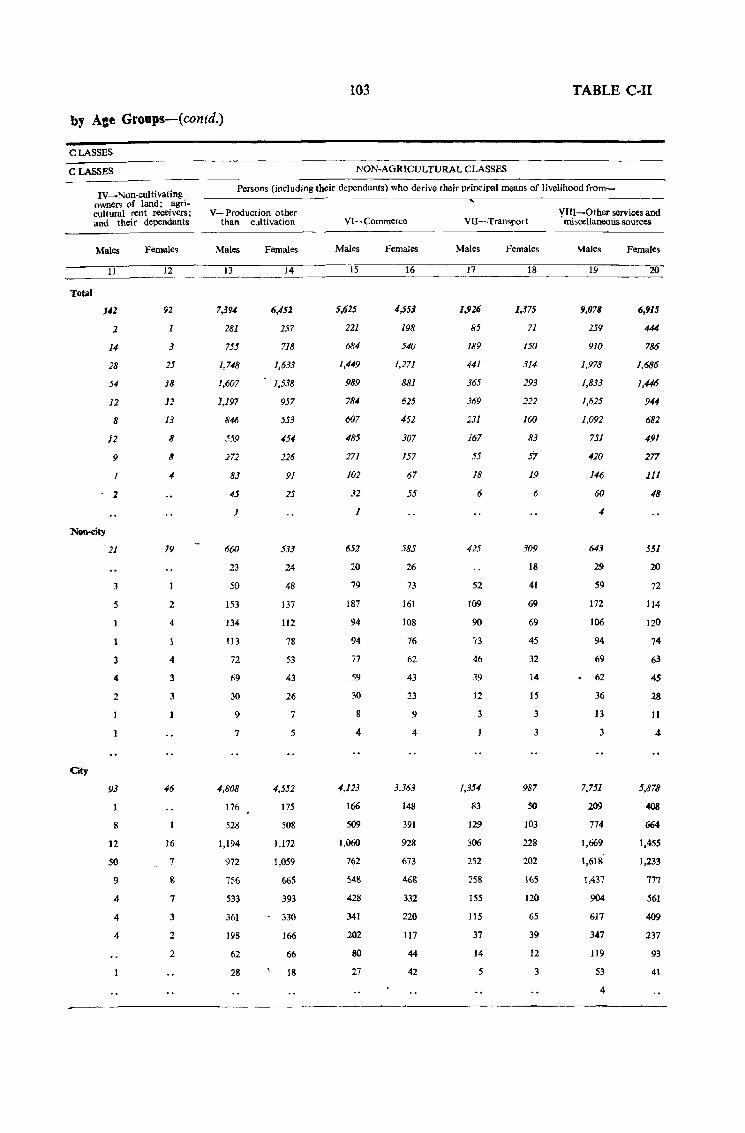
1()3 TABLE C-II
by Age Groups-( contd.)
CLASSES
CLASSES NON-AGRICULTURAL CLASSES
IY ....... Non-cultivating owners of land; agricultural rent receivers; and their dependants
Persons (including their dependants) who derive their principal means of livelihood from-
Total
Males
142
2
14
28
54
12
8
12
9
Non-dty
City
21
3
5
3
4
2
93
S
12
50
9
4
4
4
Females
92
3
25
18
12
J3
8
8
4
19
2
4
4
3
3
46
16
7
g
7
3
2
2
Y- Production other than cultivation
Males
7,394
281
755
1,748
1,607
1,197
846
S59
272
83
45
1
660
23
50
153
134
113
72
69
30
9
7
4,808
176
528
1,194
972
756
533
361
198
62
28
Females
6,452
257
718
1,633
1,538
957
553
454
226
91
15
533
24
48
137
112
78
53
43
26
7
5
4,552
175
508
1,172
1,059
665
393
- 330
166
66
18
YI- Commerce
Males
5,625
221
684
J,449
989
784
607
485
271
102
32
1
652
20
79
187
94
94
77
59
30
8
4
4,123
166
509
1,060
762
548
428
341
2-02
80
27
Females
4,551
198
540
1,271
881
615
452
307
157
67
55
585
26
73
161
108
76
62
43
23
9
4
3,363
148
391
928
673
468
332
220
117
44
42
,
YU-Transport
Males
1,926
85
189
441
365
369
231
167
5.5
18
6
42.5
52
109
90
73
46
39
12
3
1,354
83
129
306
252
258
155
115
37
14
5
Females
1,375
71
150
314
293
222
160
83
5" 19
6
309
18
41
69
69
45
32
14
15
3
3
987
SO
103
228
202
165
120
65
39
12
3
YIII-Other services and . miscellaneous source!>
Males
9,078
259
910
1,978
1,833
1,625
1,092
751
420
146
60
4
643
29
59
172
106
94
69
62
36
13
3
7,751
209
774
1,669
1,618
1,437
904
617
347
119
53
4
Females
6,915
444
786
1,686
1,446
944
682
491
277
111
48
551
20
72
114
120
74
63
45
28
11
4
5,878
408
664
1,455
1,233
777
561
409
237
93
41
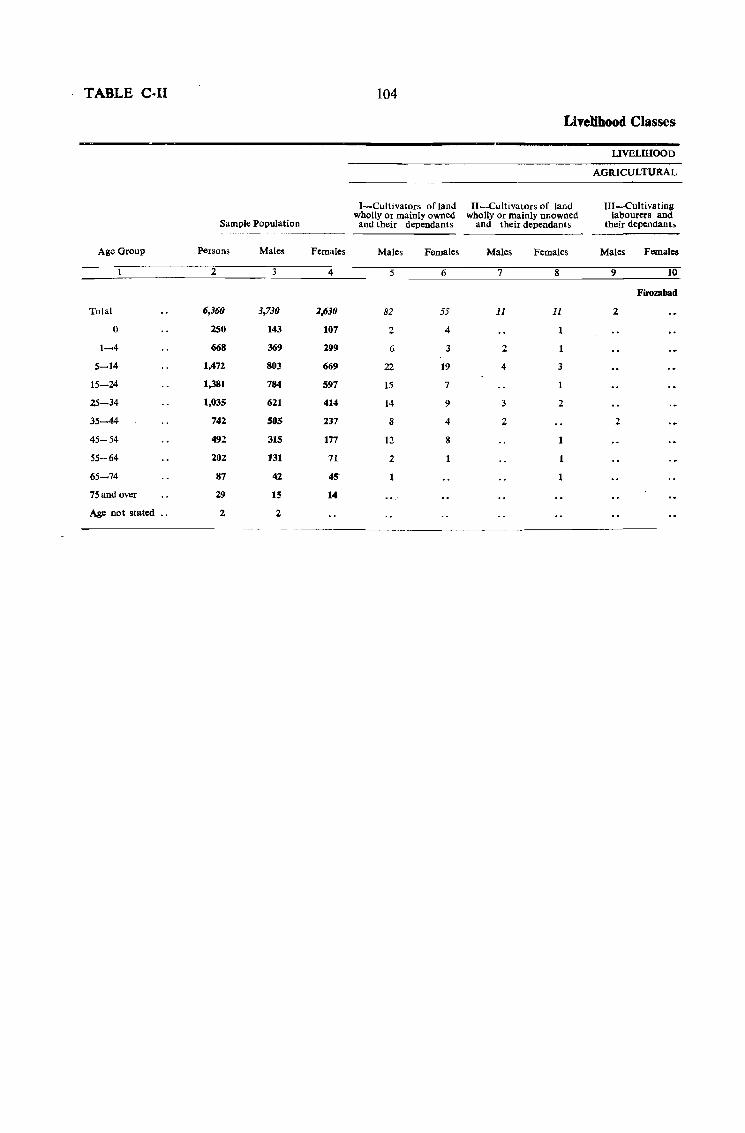
TABLE C-II 104
Livelibood Classes
LIVELIHOOD
AGRICULTURAL
I-Cultivators of land II-Cultivators of land IU-Cultivating wholly or mainly owned wholly or mainly unowned labourers and
Sample Population and their dependants and their dependants their dependants
Age Group Persons Males Females Males Females Males Females Males Females
2 4 5 6 7 8 9 10
Firozabad
Total 6,360 3,730 1,630 82 55 11 11 2
0 250 143 107 2 4
1-4 668 369 299 6 3 2
5-14 1,472 803 669 22 19 4 3
15-24 1,381 784 597 15 7
25-34 1,035 621 414 14 9 3 2
35-44 742 50S 237 8 4 2 2
45-54 492 315 177 12 g
55-64 202 131 71 2
65-74 87 42 45
75 and over 29 15 14
Age not stated 2 2 ------
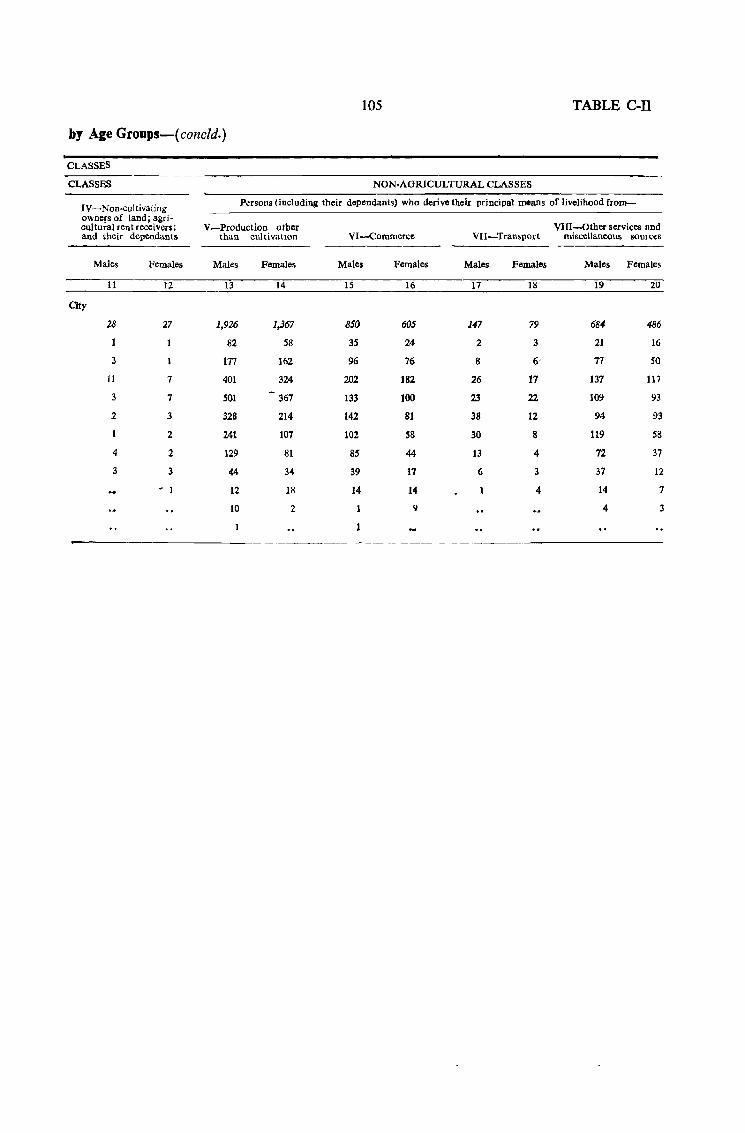
105 TABLE C-ll
by Age Groops-( concld.)
CLASSES
CLASSES NON-AGRICULTURAL CLASSES
IV-Non-cultivating Persons (including their dependants) who derive their principal means of livelihood from-
owners of land; agri-oultural rent receivers; V-Production other VIII-Other services and and their dependants than cultivallon VI-Commerce VII-Transport miscellaneous SOUl ces
Males Females Males Females Males Females Males Females Males Females
11 12 13 14 15 16 17 18 19 20
City
28 27 1,926 1,367 850 60S 147 79 684 486
82 58 3S 24 2 3 21 16
3 177 162 96 76 8 6- 77 50
11 7 401 324 202 182 26 17 137 111
3 7 501 367 133 100 23 22 109 93
2 3 328 214 142 81 38 12 94 93
2 241 107 102 58 30 8 119 58
4 2 129 81 85 44 13 4 72 37
3 3 44 34 39 17 6 3 37 12
- 1 12 18 14 14 4 14 7
10 2 9 4
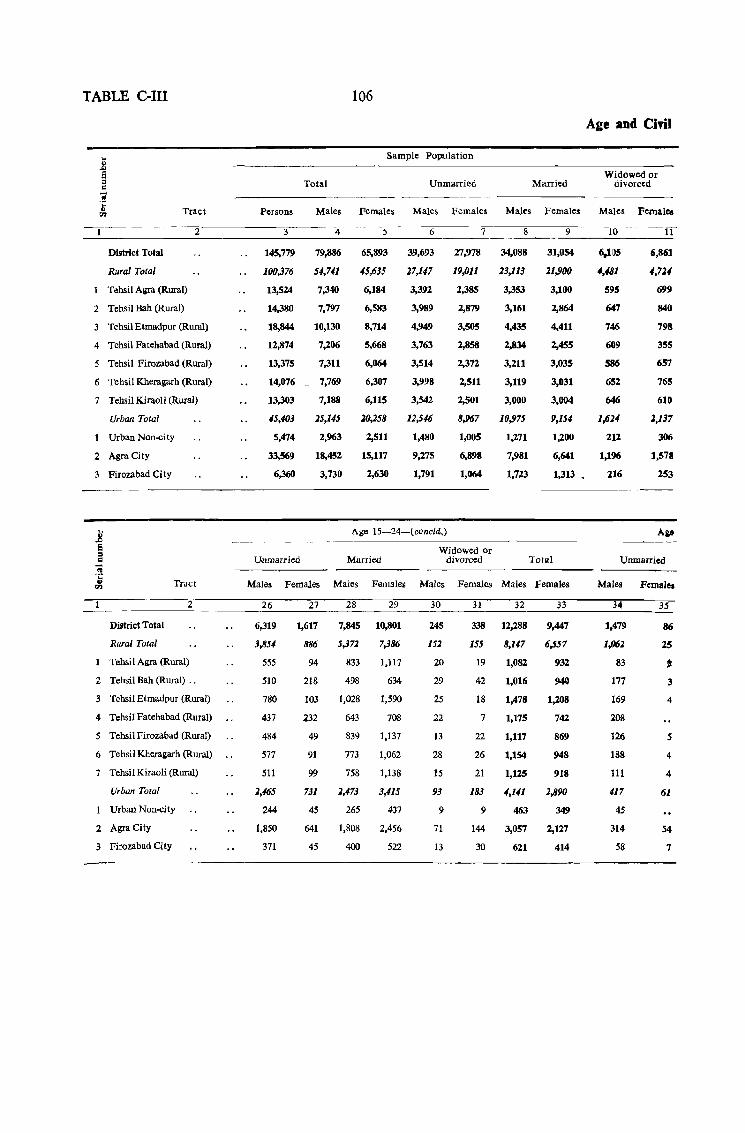
TABLE C-III
Tract
District Total
Rural Total
Tehsil Agra (Rural)
2 Tehsil Bah (Rural)
2
3 Tehsil Etmadpur (Rural)
4 Tehsil Fatehabad (Rural)
5 Tehsil Firozabad (Rural)
6 Tehsil Kheragarh (Rural)
7 Tehsil Kiraoli (Rural)
Urban Total
Urban Non-city
2 Agra City
3 Firozabad City
Tract
District Total
Rural Total
2
Tehsil Agra (Rural)
2 Tehsil Bah (Rural) ..
3 Tehsil Etmadpur (Rural)
4 Tehsil Fatehabad (Rural)
5 Tehsil Firozabad (Rural)
6 Tehsil Kheragarh (Rural)
7 Tehsil Kiraoli (Rural)
Urban Total
Urban Non-city
2 AgraCity
3 Firozabad City
Persons
3
145,779
100,376
13,514
14,380
18,844
12,874
13,375
14,076
13,303
45,403
5,474
33,569
6,360
106
Sample Population
Total Unmarried Married
Age and Chil
Widowed or divorced
Males Females Males Females Males Females Males Femaleos
4
79,886
54,741
7,340
7,797
10,130
7,206
7,311
7,769
7,188
15,145
2,963
18,452
3,730
5
65,893
45,635
6,184
6,583
8,714
5,668
6,064
6,307
6,115
10,258
2,511
15,117
2,630
6
39,693
27,147
3,392
3,989
4,949
3,763
3,514
3,998
3,542
12,546
1,480
9,275
1,791
Age 15-24-(concld,)
7
27,978
19,011
2,385
2,879
3,505
2,858
2,372
2,511
2,501
8,967
1,005
6,898
1,064
8
34,088
23,113
3,353
3,161
4,435
2,834
3,211
3,119
3,000
10,975
1,271
7,981
1,723
9 10
31,054 6,l1J5
21,900 4,481
3,100 595
2,864 647
4,411 746
2,455 609
3,035 586
3,031 652
3,004 646
9,154 1,614
1,200 212
6,641 1,196
1,313 , 216
11
6,861
4,724
699
840
798
355
657
765
610
2,137
306
1,578
253
Unmarried Married Widowed or
divorced Total Unmarried
Males Females Males Females Males Females Males Females
26
6,319
3,854
555
510
780
437
484
577
511
1,465
244
1,850
371
27
1,617
886
94
218
103
232
49
91
99
731
45
641
45
28 29
7,845 10,801
5,371 7,386
833 1,117
498 634
1,028 1,590
643 708
839 1,137
773 1,062
758 1,138
1,473 3,415
265
1,808
400
437
2,456
522
30
145
151
20
29
25
22
13
28
15
93
9
71
13
31 32 33
338 12,288 9,447
155 8,147 6,557
19 1,082 932
42 1,016 940
18 1,478 1,208
7 1,175 742
22 1,117 869
26 1,154 948
21 1,125 918
183 4,Ul 2,890
9
144
30
463
3,057
621
349
2,127
414
Males Females
34
1,479
1,061
83
177
169
208
126
188
111
417
45
314
58
35
86
25
• 3
4
5
4
4
61
54
7
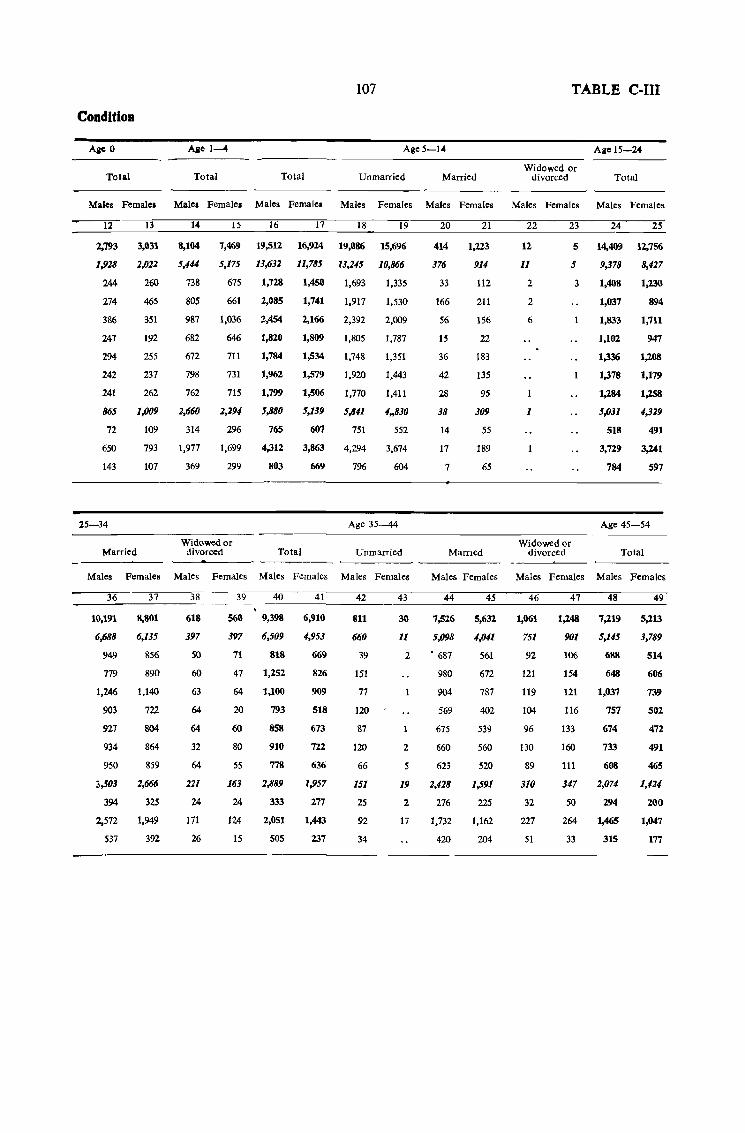
CondltioD
Aze 0 A,ge 1-4
Total Total Total
107
Age 5-14
Unmarried Married
TABLE C-III
Widowed or divorced
Age 15-24
Total
Males Females Males Females Males Females Males Females Males Females Males Females Males Females
12 13 14 15 16 17 18 19
2,793 3,031 8,104 7,469 19,512 16,924 19,086 15,696
1,928 2,022 5,444 5,175 13,632 11,785 13,245 10,866
244 260 738 675 1,728 1,450 1,693 1,335
274
386
247
294
242
241
865
72
650
143
25-34
Married
465
351
192
255
237
262
1,009
109
793
107
805
987
682
672
798
762
2,660
314
1,977
369
661
1,036
646
711
731
71S
2,29"
296
1,699
299
Widowed or divorced
2,085 1,741 1,917 1,530
2,009
1,787
1,351
2,454 2,166 2,392
1,820
1,784
1,809
1,534
1,805
1,748
1,962 1,579 1,920 1,443
1,799 1,506 1,770 1,411
5,880 5,139 5,841 4,,830
765
4,312
803
Total
607 751 552
3,863 4,294 3,674
669 796 604
Age 35-44
Unmarried
20 21
414 1,223
376 914
33 112
166
56
15
36
42
28
38
14
17
7
211
156
22
183
135
95
309
55
189
65
22 23 24 25
12
11
2
2
6
1
Widowed or divorced
5 14,409 12,756
5 9,378 8,427
3 1,408 1,236
1,037
1,833
1,102
1,336
1,378
1,284
5,031
518
3,729
784
894
1,711
947
1,208
1,179
1,258
4,329
491
3,241
597
Age 45-54
Total
Males Females Males Females Males Females Males Females Males Females Males Females Males Females
36 37
10,191 8,801
6,688 6,135
949 856
779
1,246
903
927
890
1,140
722
804
934 864
950 859
3,503 2,666
394 325
2,572 1,949
537 392
38
618
397
50
60
63
64
64
32
64
221
24
171
26
39 40 41
560 9,398 6,910
397 6,509 4,953
71 818 669
47
64
20
60
80
55
163
24
124
15
1,252
1,100
793
858
910
778
2,889
333
2,051
50S
826
909
518
673
722
636
1,957
277
1,443
237
42
811
660
39
151
77
120
87
120
66
151
25
92
34
43 44 45
30
11
2
7,526 5,632
5,098 4,041
• 687 561
980
904
569
675
2 660
5 623
19 2,428
2 276
17 1,732
420
672
787
402
539
560
520
1,591
225
1,162
204
46 47 48
1,061 1,248 7,219
751 901 5,145
92 106 688
121
119
104
96
130
89
310
32
227
51
154 648
121 1,037
116 757
133 674
160 733
111 608
347 2,074
50 294
264 1,465
33 315
49
5,213
3,789
514
606
739
S02
472
491
465
1,<124
200
1,047
177
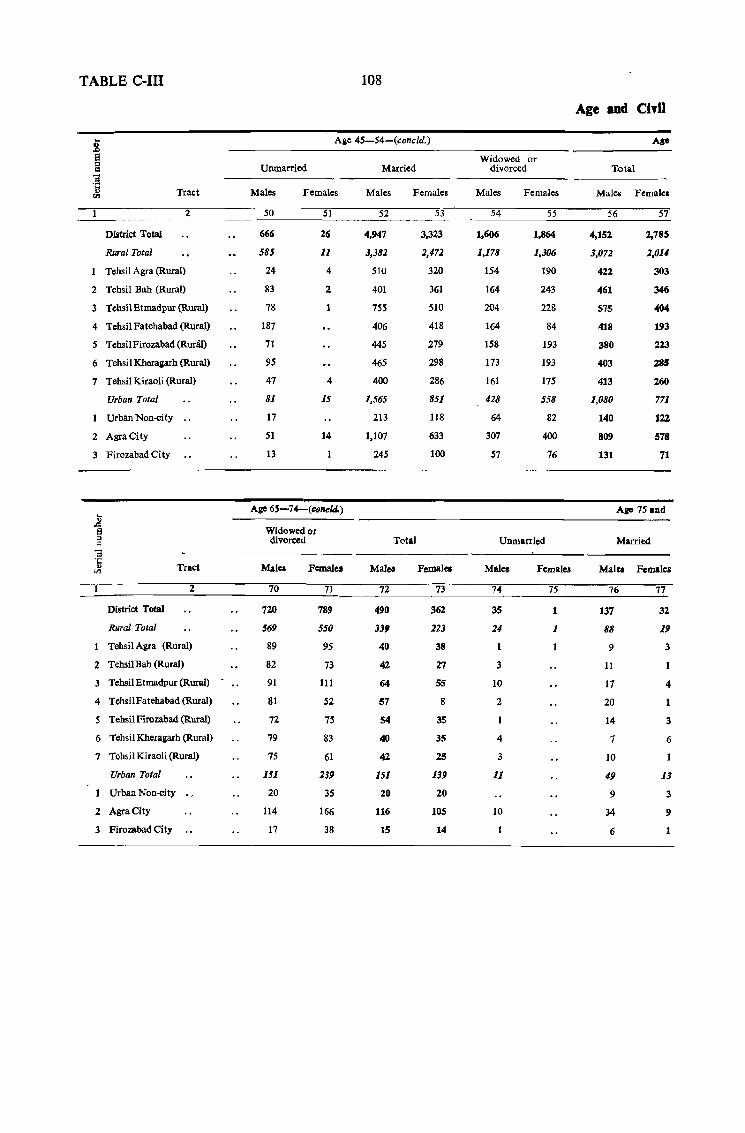
TABLE C-III
District Total
Rural Total
Tract
2
Tehsil Agra (Rural)
2 Tehsil Bah (Rural)
3 TehsilEtmadpur (Rural)
4 Tehsil Fatehabad (Rural)
5 Tehsil Firozabad (Rural)
6 Tehsil Kheragarh (Rural)
7 Tehsil Kiraoli (Rural)
Urban Total
Urban Non-city ..
2 AgraCity
3 Firozabad City
Tract
2
District Total
Rural Total
Tehsil Agra (Rural)
2 TehsilBah(Rural)
3 Tehsil Etrnadpur (Rural)
4 TehsilFatehabad (Rural)
5 Tehsil Firozabad (Rural)
6 Tehsil Kheragarh (Rural)
7 Tehsil KiraoH (Rural)
Urban Total
Urban Non-city
2 AgraCity
3 Firozabad City
108
Aile 45-S4-Cconc/d.)
Unmarried
Males Females
50
666
S8l
24
83
78
187
71
9S
47
81
17
51
13
SI
26
11
4
2
4
15
14
Age 65-7+-(concld.)
Wldowcdor divorced
Malea Females
70
720
569
89
82
91
81
72
79
75
151
20
114
17
71
789
SSO
9S
73
111
52
75
83
61
239
35
166
38
Married
Males Females
52
4,947
3,382
510
401
755
406
44S
465
400
1,565
213
1,107
245
Total
Males
72
490
339
40
42
64
57
54
40
42
151
20
116
15
53
3,323
2,472
320
361
510
418
279
298
286
851
118
633
100
Femalet
73
362
223
38
27
55
8
35
35
25
139
20
105
14
Widowed or divorced
Males
54
1,606
1,178
154
164
204
164
158
173
161
428
64
307
57
Females
55
1,864
1,306
190
243
228
84
193
193
175
558
82
400
76
Unmarried
Males
74
35
24
3
to
2
4
3
11
10
Femalea
75
1
1
Age and ebB
Age
Total
Male!l Female.
56
4,152
3,072
422
461
575
418
380
403
413
1,080
140
809
131
57
2,785
1,014
303
346
404
193
223
285
260
771
122
578
71
Ap 75 and
Married
Mal" Femllc£
76
137
88
9
11
17
20
14
7
10
49
9
34
6
77
32
19
3
4
3
6
13
3
9
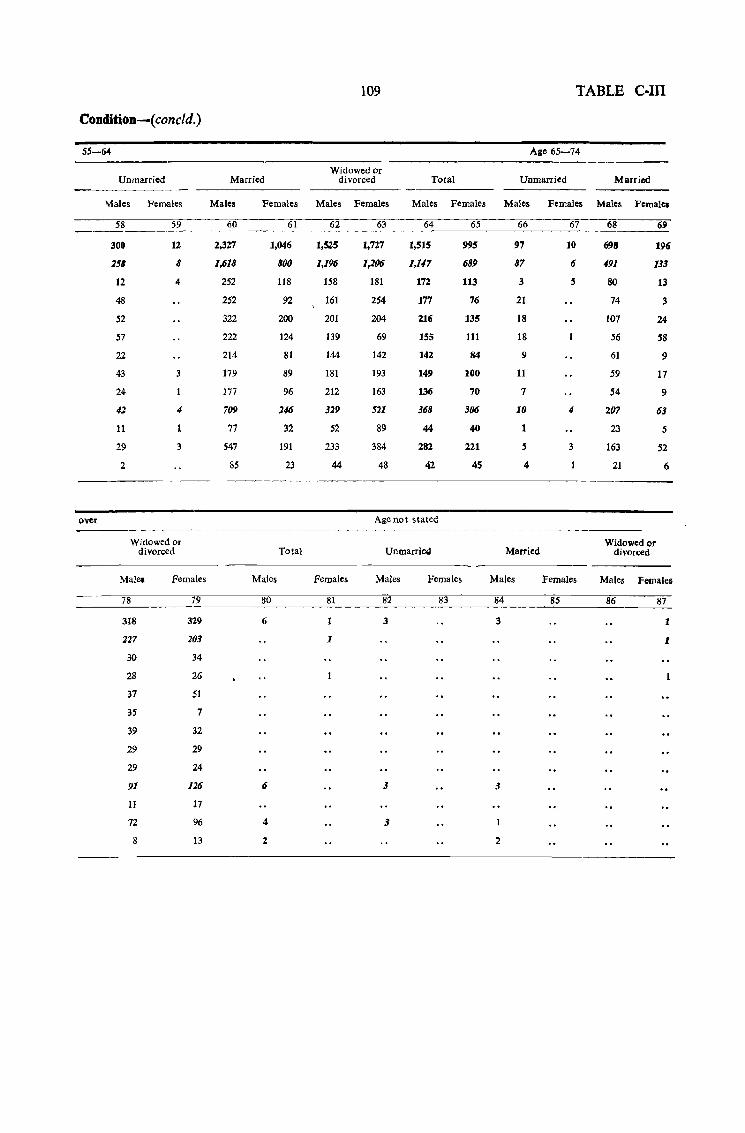
109 TABLE C-III
ConditioD-( concld.)
55-64 Age 65-74
Widowed or Unmarried Married divorced Total Unmarried Married
Males Females Males Females Males Females Males Females Males Females Males Females
58 59 60 61 62 63 64 65 66 67 68 69 -.--300 12 2,327 1,046 1,5Z5 1,727 1,515 995 97 10 698 196
258 8 1,618 800 1,196 1,206 I,U7 689 87 6 191 133
12 4 252 118 158 181 172 113 3 .5 80 13
48 252 92 161 254 177 76 21 74 3
52 322 200 201 204 216 135 18 107 24
57 222 124 139 69 155 III 18 56 58
22 214 81 144 142 142 84 9 61 9
43 3 179 89 181 193 149 100 11 .59 17
24 177 96 212 163 136 70 7 54 9
42 4 709 146 329 511 368 306 10 4 207 63
11 77 32 52 89 44 40 1 23 .5
29 3 547 191 233 384 282 221 5 3 163 52
2 85 23 44 48 42 4S 4 21 6
over Age not stated
Widowed or Widowed or divorced Total Unmarrie4 Married divorced
Males Females Males Females Males Females Males Females Males Females
78 79 80 81 82 83 84 85 86 87
318 329 6 1 3 3 1
227 203 1 1
30 34
28 26
37 51
35 7
39 32
29 29
29 24
91 126 6 3 3
11 17
72 96 4 3
8 13 2 2
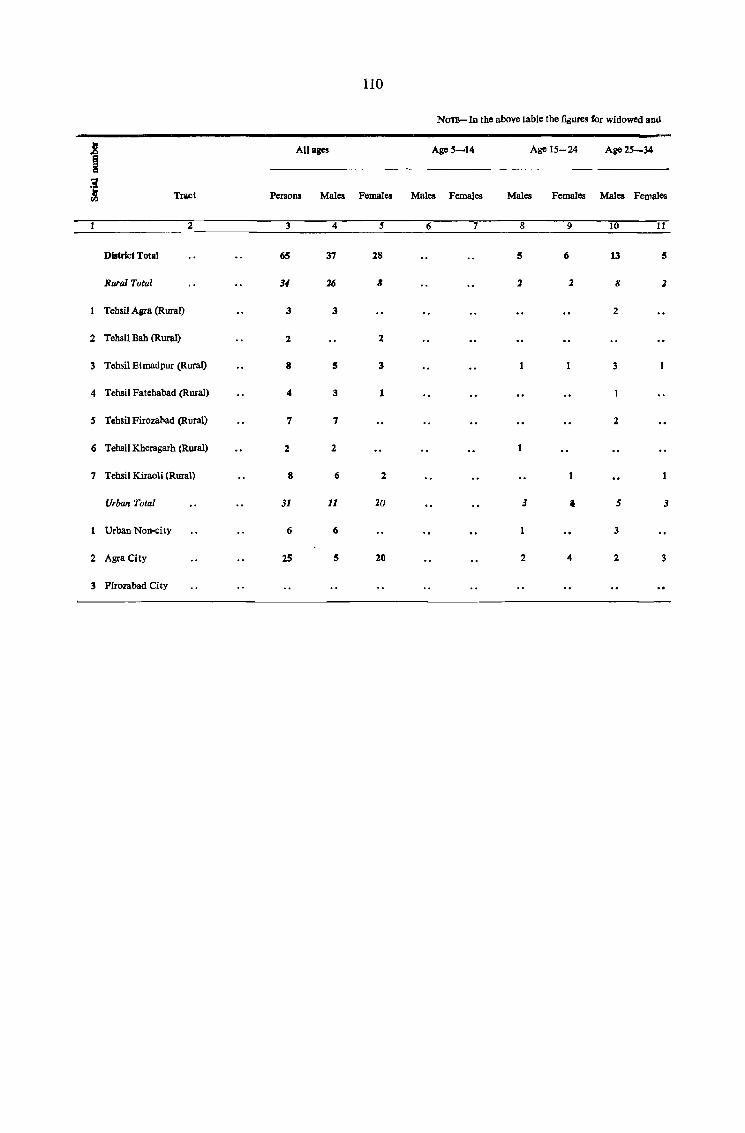
110
NO'J1!-In the above table the figures for widowed and
i All ages AgeS-14 Age 15-24 Age2S-34
:i ~ Tract Persons Males Females Males Females Males Females Males Females
2 3 4 S 6 7 8 9 10 11
District Total 65 37 28 5 6 13 5
Rural Total 34 26 8 2 1 8 1
Tehsil Agra (Rural) 3 3 2
2 Tehsil Bah (Rural) 2 2
3 Tehsil Etmadpur (Rural) 8 5 3 3
4 Tehsil Fatehabad (Rural) 4 3 1
5 Tehsil Firozabad (Rural) 7 7 2
6 Tehsil Kheragarh (Rural) 2 2
7 Tehsil Kiraoli (Rural) 8 6 2
Urban Total 31 11 20 3 • 5 3
Urban Non-city 6 6 3
2 Agra City 25 5 20 2 4 2 3
3 Pirolabad City
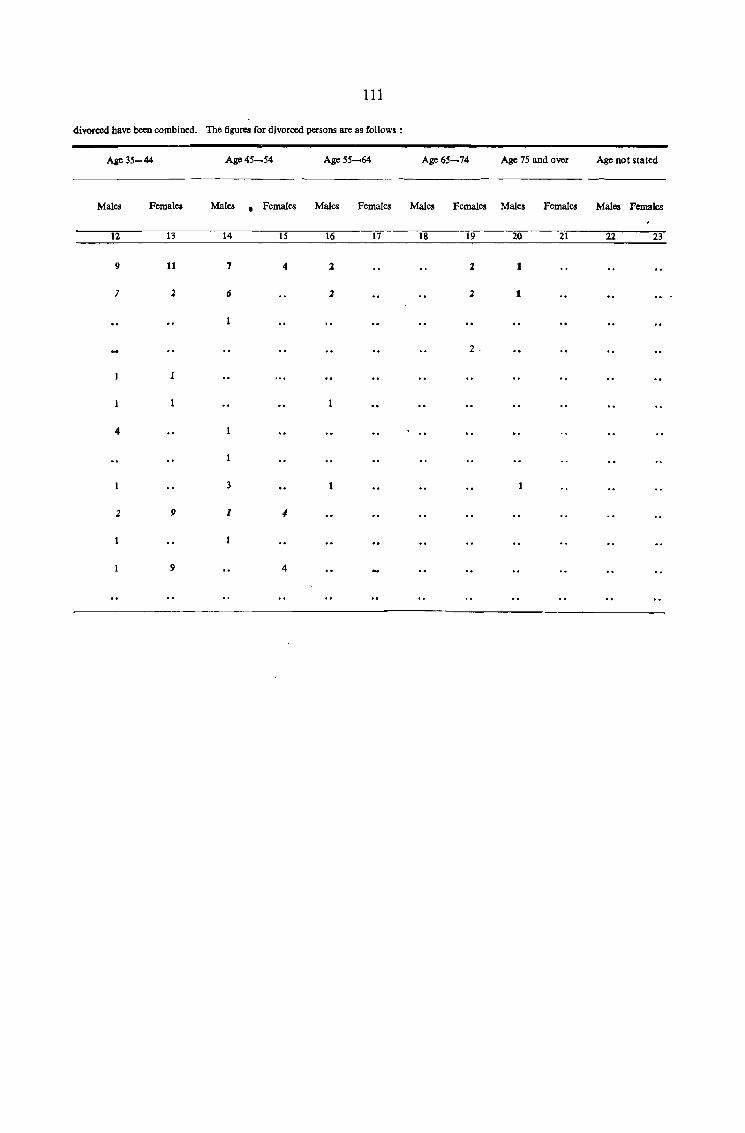
111
divorced have been combined. The figures for diYorced persons are as follows:
Age 35-44
Males
12
9
7
4
2
Females
13
11
:1
9
9
Age 45-54
Males • Females
14
7
6
3
1
15
4
4
Age 55-64
Males Females
16
1
:1
17
Age 65-74 Age 75 and oyer
Males Females Males Females
18 19
2
:1
2.
20
1
1
1
21
Age not stated
Males Females
22 23
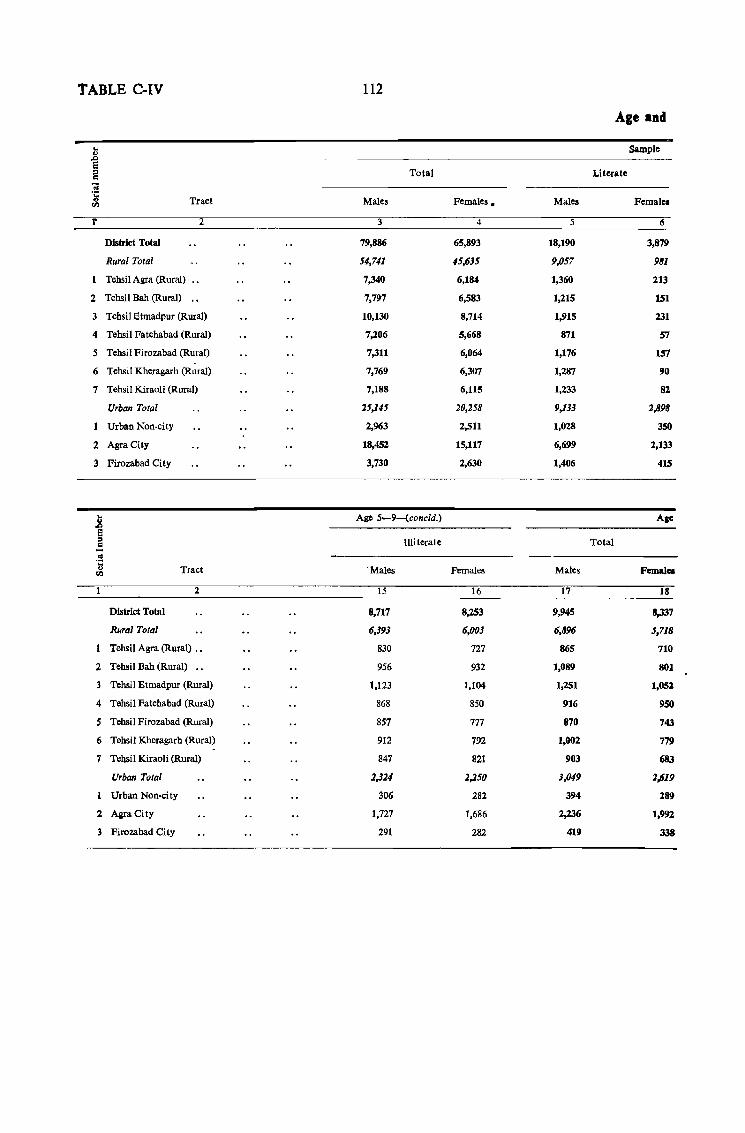
TABLE C-IV 112
Age and
.. Sample " &> 8 g Total Literate '; 'ij Tract Males Females. Males Female. <Il
r 2 3 4 5 6
District Total 79,886 65,893 18,190 3,879
Rural Total 54,741 45,635 9,057 981
Tehsil Agra (Rural) 7,340 6,184 1,360 213
2 Tehsil Bah (Rural) 7,797 6,583 1,215 151
3 Tehsil Etmadpur (Rural) 10,130 8,714 1,915 231
4 Tehsil Fatehabad (Rural) 7,206 5,668 871 57
5 Tehsil Firozabad (Rural) 7,311 6,064 1,176 157 -
6 Tehsil Kheragarh (Rural) 7,769 6,307 1,287 90
7 Tehsil Kiraoli (Rural) 7,188 6,115 1,233 82
Urban Total 25,145 20,258 9,133 2,898
Urban Non-city 2,963 2,511 1,028 350
2 AgraCity 18,452 15,117 6,699 2,133
3 Firozabad City 3,730 2,630 1,406 415
.. Age 5-9-(concld.) Aae ,g 8 a Uliterate Total 01 .~
Tract 'Males Females Males Femalel <Il
2 15 16 17 18
District Total 8,717 8,253 9,945 8,337
Rural Total 6,393 6,003 6,896 5,718
Tehsil Agra (Rural) •• 830 727 865 710
2 Tehsil Bah (Rural) .. 956 932 1,089 801
3 Tehsil Etmadpur (Rural) 1,123 1,104 1,251 1,05)
4 Tehsil Fatehabad (Rural) 868 850 916 950
S Tehsil Firozabad (Rural) 857 777 870 743
6 Tehsil Kheragarh (Rural) 912 792 1,002 779
7 Tehsil Kiraoli (Rural) 847 821 903 683
Urban Total 2,324 2,250 1,049 1,619
Urban NOD-city 306 282 394 289
2 AgraCity 1,727 1,686 2,236 1,992
3 Firozabad City 291 282 419 338
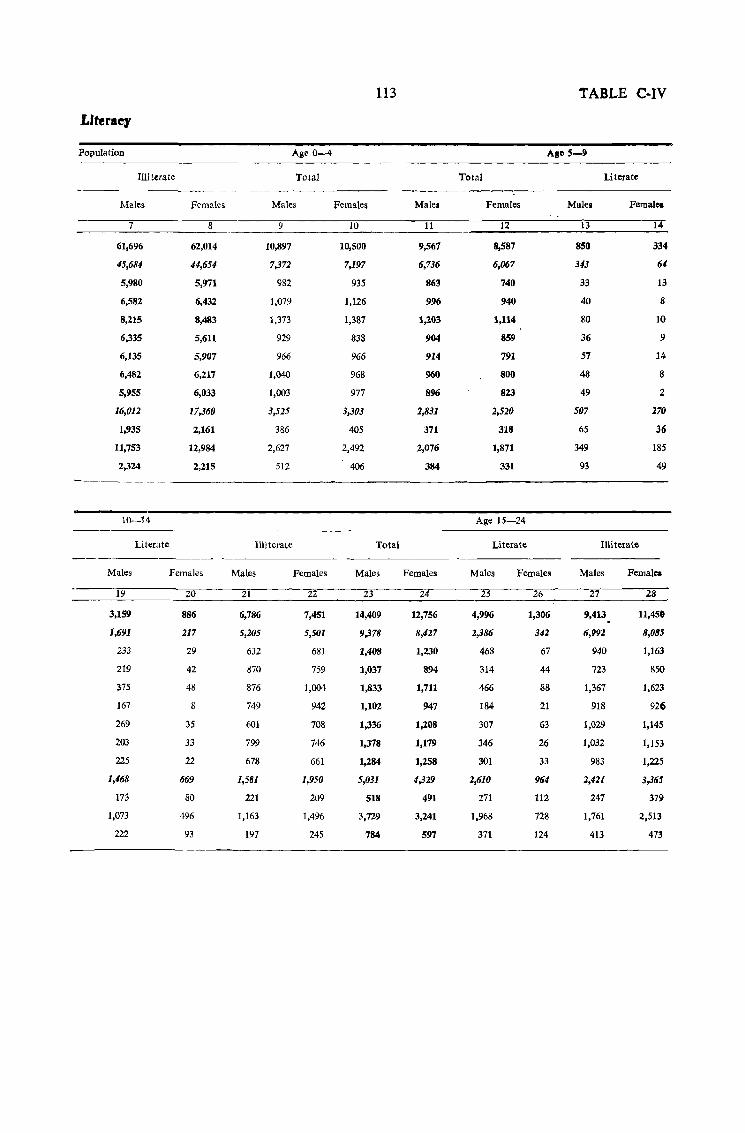
Llteracr
Population
Illiterate
Males
7
61,696
45,684
5,980
6,582
8,215
6,335
6,135
6,482
5,955
16,012
1,935
11,753
2,324
10-14
Literate
Females
8
62,014
44,654
5,971
6,432
8,483
5,611
5,907
6,217
6,033
17,360
2,161
12,984
2,215
Males Females
19
3,159
1,691
233
219
375
167
269
203
225
1,468
173
1,073
222
20
886
217
29
42
48
8
35
33
22
669
80
496
93
Aile 0-4
Total
Males
9
10,897
7,372
982
1,079
1,373
929
966
1,040
1,003
3,525
386
2,627
512
Illiterate
Males
21
6,786
5,205
632
870
876
749
601
799
678
1,581
221
1,163
197
Females
22
7,451
5,501
681
759
1,004
942
708
746
661
1,950
209
1,496
245
Females
10
10,500
7,197
935
1,126
1,387
838
966
968
977
3,303
405
2,492
406
113
Total
Males
23
14,409
9,378
1,408
1,037
1,833
1,102
1,336
1,378
1,284
5,031
518
3,729
784
Males
11
9,567
6,736
863
996
1,203
904
914
960
896
2,831
371
2,076
384
Females
24
12,756
8,427
1,230
894
1,711
947
1,208
1,179
1,258
4,329
491
3,241
597
Total
Females
12
8,587
6,067
740
940
1,114
859
791
800
823
2,520
318
1,871
331
Age 15-24
Literate
Males Females
25
4,996
2,386
468
314
466
184
307
346
301
2,610
271
1,968
371
26
1,306
342
67
44
88
21
63
26
33
964
112
728
124
TABLE C-IV
Literate
Males
13
850
343
33
40
80
36
57
48
49
507
65
349
93
Female.
14
334
64
13
8
10
9
14
8
2
270
36
185
49
Illiterate
Males
27
9,413.
6,992
940
723
1,367
918
1,029
1,032
983
2,421
247
1,761
413
Females
28
11,450
8,085
1,163
850
1,623
926
1,145
1,153
1,225
3,365
379
2,513
473
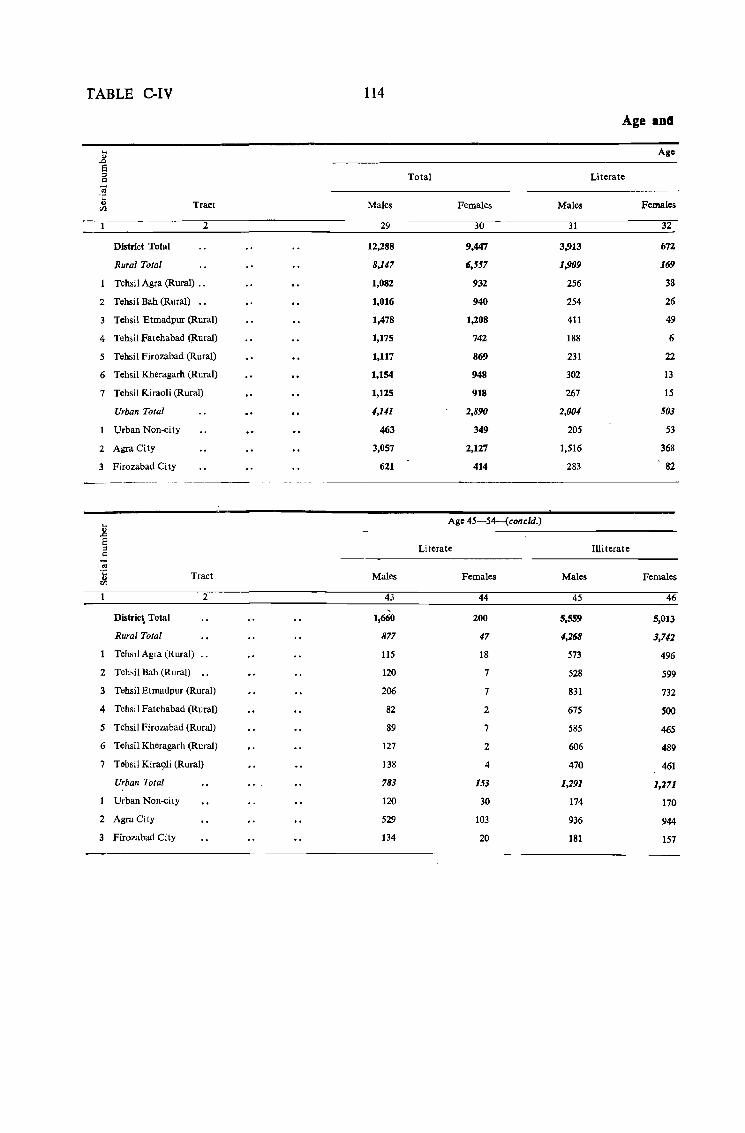
TABLE C-IV 114
Age anG
.... AIIO " .D 8 ::> Total Literate Q
'"iii .~
Tract Males Females Males Females <Il
2 29 30 31 32
District Total 12,288 9,447 3,913 672
Rural Total 8,147 6,557 1,909 169
Tehsil Agra (Rural) .. 1,082 932 256 38
2 Tehsil Bah (Rural) •. 1,016 940 254 26
3 Tehsil Etmadpur (Rural) 1,478 1,208 411 49
4 Tehsil Fatehabad (Rural) 1,175 742 188 6
5 Tehsil Firozabad (Rural) 1,117 869 231 22
6 Tehsil Kheragarh (Rural) 1,154 948 302 13
7 Tehsil Kiraoli (Rural) 1,125 918 267 15
Urban Total 4,141 2,890 2,004 503
Urban Non-city 463 349 205 53
2 Agra City 3,057 2,127 1,516 368
3 Firozabad City 621 414 283 82
... Age 45-54--(concld.)
" .0 8
Literate Illiterate ::> Q
.~ .... Tract Males Females Males Females ~
2 43 44 45 46
District Total 1,660 200 5,559 5,013
Rural Total 877 47 4,268 3,742
Tehsil Agra (Rural) 115 18 573 496
2 Tehsil Bah (Rural) 120 7 528 599
3 Tehsil Etmadpur (Rural) 206 7 831 732·
4 Tehsil Fatehabad (Rural) 82 2 675 500
5 Tehsil Firozabad (Rural) 89 7 585 465
6 Tehsil Kheragarh (Rural) 127 2 606 489
7 Tehsil Kira(}li (Rural) 138 4 470 461
Urban Total 783 153 1,291 1,271
Urban Non-city 120 30 174 170
2 Agm City 529 103 936 944
3 Firozabad City 134 20 181 157
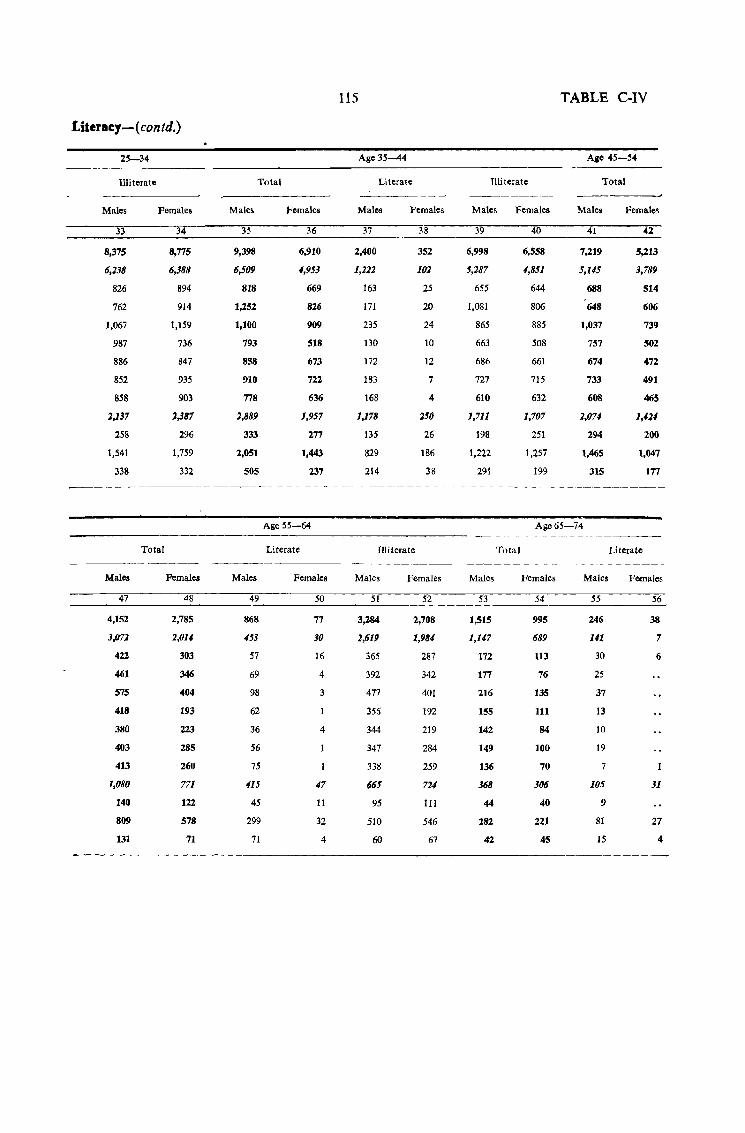
Uteracy-( contd.)
25-34
Illiterate Total
Males
33
8,375
6,238
826
762
1,067
987
886
852
858
2,137
258
1,541
338
Females
Total
34
8,775
6,388
894
914
1,159
736
847
935
903
2,387
296
1,759
332
Males
35
9,398
6,509
818
1,252
1,100
793
858
910
778
2,889
333
2,051
505
Males Females Males
47 48 49 ---------------------------4,152 2,785 868
3,071 l,OU 453
422 303 57
461 346 69
575 404 98
418 193 52
380 223 36
403 285 56
413 260 75
1,080 771 415
140 122 45
809 578 299
131 71 71
Females
36
6,910
1,953
669
826
909
518
673
722
636
1,957
277
1,443
237
Age 55-64
Literate
Females
50
77
30
16
4
3
4
47
11
32
4
115
Age 35-44
Literate
Males
37
2,400
1,211
163
171
235
130
172
183
168
1,178
135
829
214
Females
38
352
102
25
20
24
10
12
7
4
250
26
186
38
Illiterate
Males
51
3,284
2,619
365
392
477
356
344
347
338
665
95
510
60
Females
52
2,708
1,981
287
342
401
192
219
284
259
711
111
546
67
TIliterate
Mates
39
6,998
5,287
655
1,081
865
663
686
727
610
1,711
198
1,222
291
Females
40
6,558
1,851
644
806
885
508
661
715
632
1,707
251
1,257
199
TABLE C-IV
Aile 45-54
Total
Males
41
7,219
5,U5
688
648
1,037
757
674
733
608
2,07'-
294
1,465
315
Females
42
5,213
3,789
514
606
739
502
472
491
465
1,424
200
1,047
177
Age 55-74
Males
53
1,515
I,U7
172
177
216
155
142
149
136
368
44
282
42
Total
Females
54
995
689
113
76
135
111
84
100
70
306
40
221
45
Males
55
246
Ul
30
25
37
13
10
19
7
105
9
81
15
Literate
Females
56
38
7
6
31
27
4
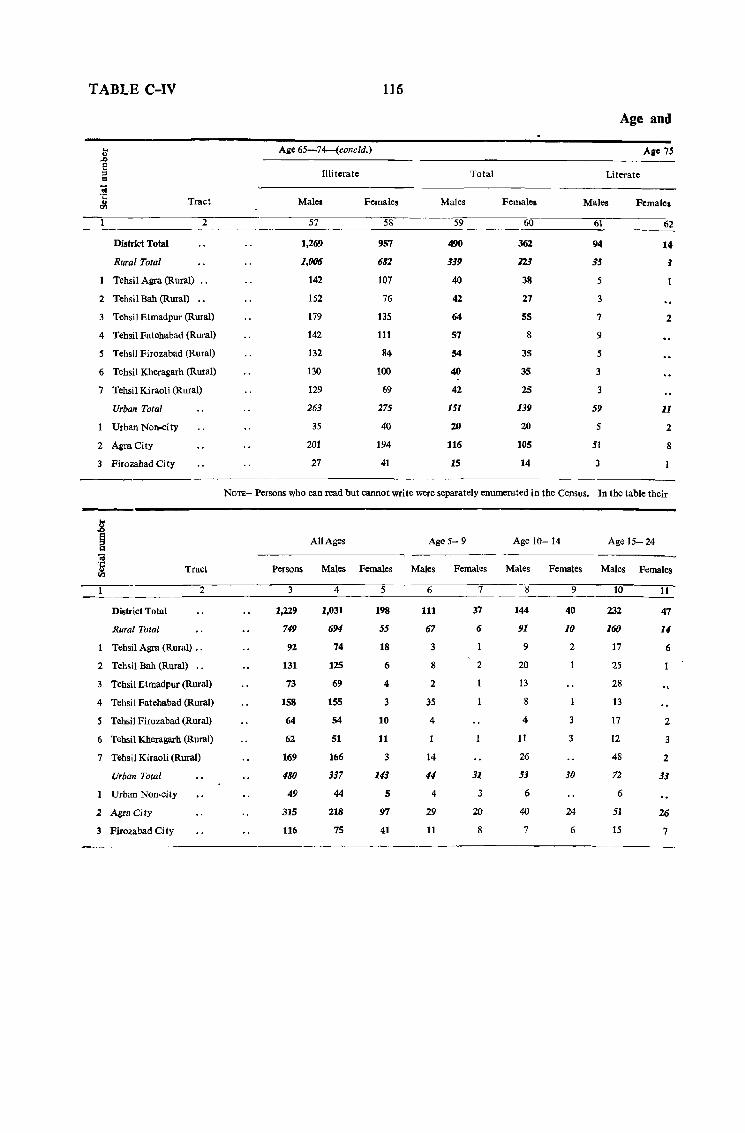
TABLE C-IV
District Total
Rural Total
Tract
2
Tehsil Agra (Rural) ..
2 Tehsil Bah (Rural) ..
3 Tehsil Etmadpur (Rural)
4 Tehsil Fatehabad (Rural)
5 Tehsil Firozabad (Rural)
6 Tehsil Kheragarh (Rural)
7 Tehsil Kiraoli (Rural)
Urban Total
Urban Non-city
2 AgraCity
3 Firo:rabad City
District Total
Rural Total
Tract
2
Tehsil Agra (Rural) ..
2 TehsiJ Bah (Rural) •.
3 Tehsil Etmadpur (Rural)
4 Tehsil Fatehabad (Rural)
5 Tehsi I Firozabad (Rural)
6 Tehsil Kheragarh (Rural)
7 T~sil Kiraoli (Rural)
Urban Total
Urban Non-city
2 Agra City
3 Firozabad City
116
AiC 65-74--{concld.)
ntiterate
Males
57
1,269
1,{)(M
142
152
179
142
132
130
129
263
35
201
27
Females
58
957
682
107
76
135
111
84
100
69
275
40
194
41
Males
59
490
319
40
42
64
57
54
40
42
151
:zg
116
15
Total
Female.
60
362
223
38
27
55
8
35
35
25
139
20
105
14
Age and
A,e 75
Literate
Males
61
94
35
5
3
7
9
5
3
59
5
51
3
Female.
62
14
1
2
11
2
8
NOTE- Persons who can read but cannot wri te were separately enumerated in the Census. In the table their
All Ages Age 5- 9
Persons Males Females Males Females
4 __ ~5 ______ 6~ _____ 7
1,229
749
92
131
73
158
64
62
169
480
49
315
116
1,031
694
74
125
69
155
54
51
166
317
44
218
75
198
55
18
6
4
3
10
11
3
141
5
97
41
111
67
8
2
35
4
14
44
4
29
11
37
6
2
31
3
20
8
Age 10-14
Males Females
8
144
91
9
20
13
8
4
11
26
53
6
40
7
9
40
10
2
3
30
24
6
Age 15-24
Males Females
10
232
160
17
25
28
13
17
12
48
72
6
51
15
11
47
14
6
2
3
2
33
26
7
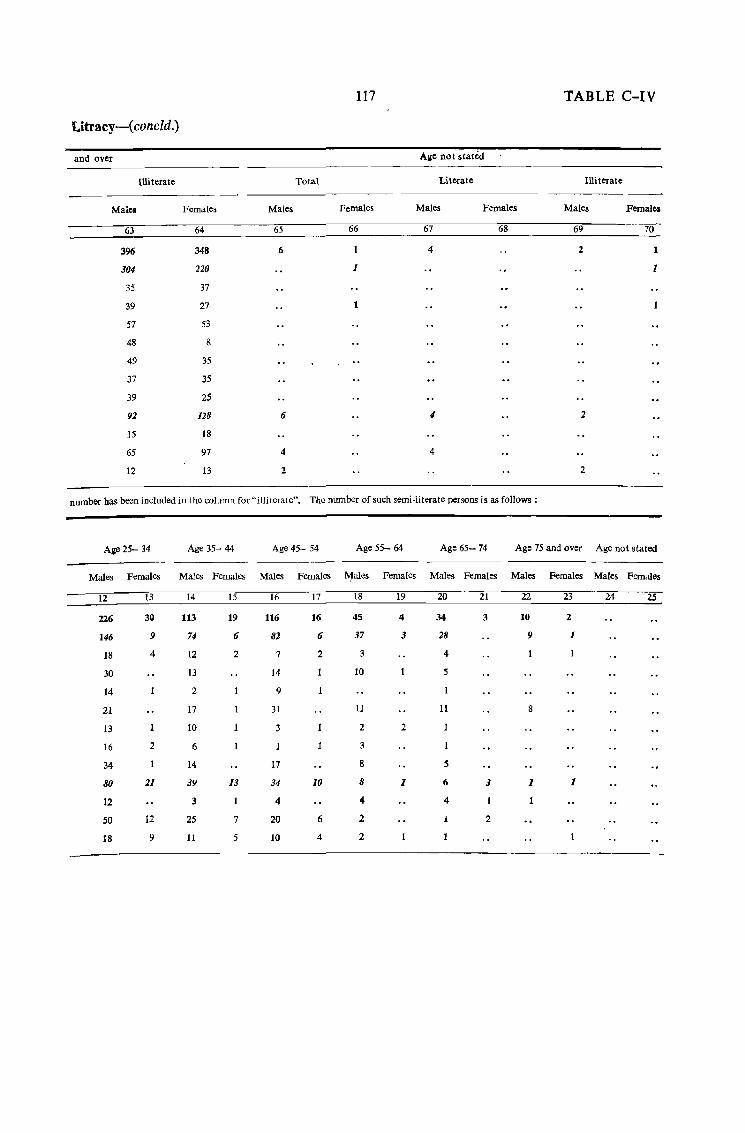
Litracy-(concld.)
and over
Illiterate
Males
63
396
304
35
39
57
48
49
37
39
92
15
65
12
Females
64
348
220
37
27
53
8
35
35
25
128
18
97
13
Males
65
6
6
4
2
Total
117
Females
66
1
1
1
Age not stattid
Literate
Males Females
67 68
4
4
TABLE C-IV
Illiterate
Males
69
2
2
2
Females
70
1
1
number has been included in the column for" illi terate". The number of such semi·literate persons is as follows:
Age 25- 34 Age 35- 44 Age 45- 54 Age 55- 64 Age 65-74 Age 75 and over Age not stated
------Males Females Males Females Males Females l\1a1es Females Males Females Males Females Males Females
12 13 14 15 16 17 18 19 20 21 22 23 24 25
226 30 113 19 116 16 45 4 34 3 10 2
146 9 74 6 82 6 37 J 28 9 1
18 4 12 2 7 2 3 4
30 13 14 10 5
14 2 9
21 17 31 11 11 8
13 10 3 2 2
16 2 6 3
34 14 17 8 5
80 21 39 13 34 10 8 1 6 J 1 1
12 3 4 4 4
50 12 25 7 20 6 2 2
18 9 11 5 10 4 2
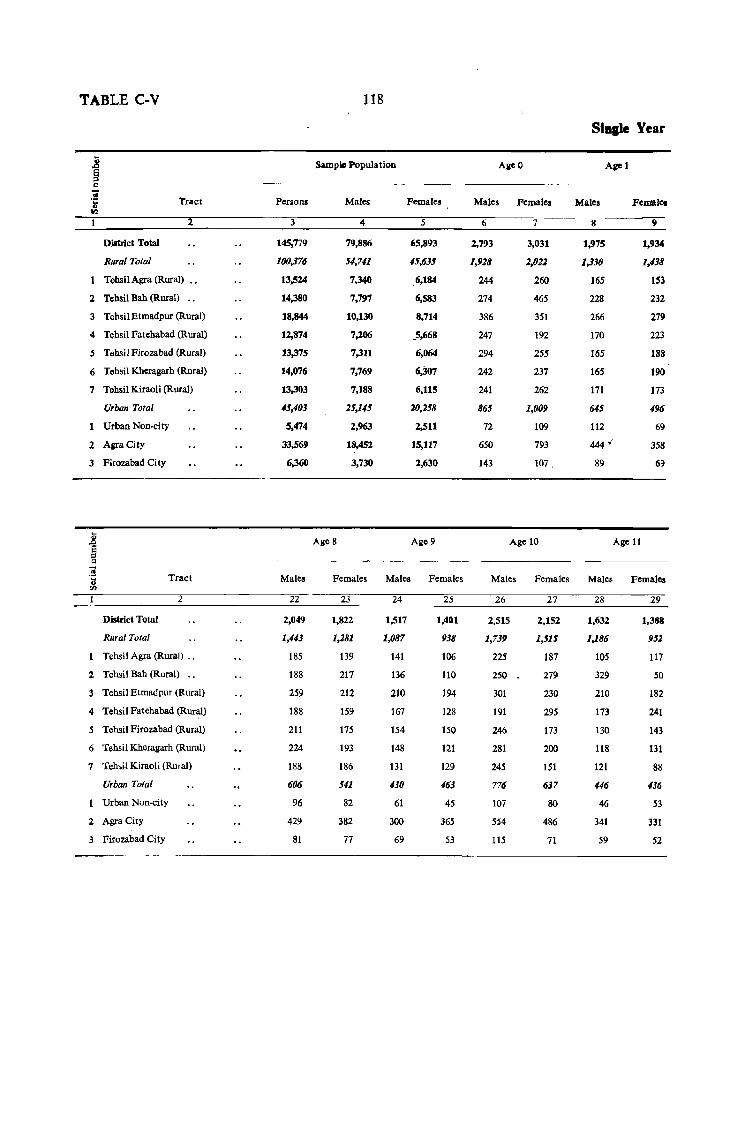
TABLE C-V
District Total
Rural Total
Tract
2
Tehsil Agra (Rural) ..
2 Tehsil Bah (Rural) •.
3 Tehsil Etmadpur (Rural)
4 Tehsil Fatehabad (Rural)
5 Tehsil Firozabad (Rural)
6 Tehail Kheragarh (Rural)
7 Tehsil Kiraoli (Rural)
Urban Total
Urban Non-city
2 AgraCity
3 Firozabad City
Tract
2
District Total
Rural Total
Tehsil Agra (Rural) ..
2 Tehsil Bah (Rural) "
3 Tehsil Etmadpur (Rural)
4 Tehsil Fatehabad (Rur~)
5 Tehsil Firozabad (Rural)
6 Tehsil Kheragarh (Rural)
7 Tehsil Kiraoli (Rural)
Urban Total
Urban Non-city
2 AgraCity
3 Firozabad City
Persons
3
145,779
100,376
13,524
14,380
18,844
12,874
13,375
14,076
13,303
15,403
5,474
33,569
6,360
Males
22
2,049
1,443
IS5
188
259
188
211
224
188
606
96
429
81
118
Sample Population
AgeS
Males
4
79,886
54,741
7,340
7,797
10,130
7,206
7,311
7,769
7,188
25,145
2,963
1~,452
3,730
Females
5
65,893
45,635
,6,184
6,583
8,714
_5,668
6,064
6,307
6,115
20,258
2,511
15,117
2,630
Age 9
Females Males Females
23
1,822
1,281
139
217
212
159
175
193
186
541
82
382
77
24
1,517
1,087
141
136
210
167
154
148
131
430
61
300
69
25
1,401
938
106
110
194
128
150
121
129
463
45
365
53
Aile 0
Males Females
6 7
2,793
1,928
244
274
386
247
294
242
241
865
72
650
143
3,031
2,022
260
465
351
192
255
237
262
1,009
109
793
107,
Age 10
Agel
Males
8
1,975
1,330
165
228
266
170
165
165
171
645
112
444 .,'
89
Femalct
9
1,934
1,438
IS3
232
279
223
188
190
173
496
69
358
69
Age 11
Males Females Males Females
26
2,515
1,739
225
250
301
191
246
281
245
776
107
554
115
27
2,152
1,515
187
279
230
295
173
200
151
637
80
486
71
28
1,632
1,186
105
329
210
173
130
118
121
446
46
341
59
29
1,388
952
117
50
182
241
143
131
88
136
53
331
52
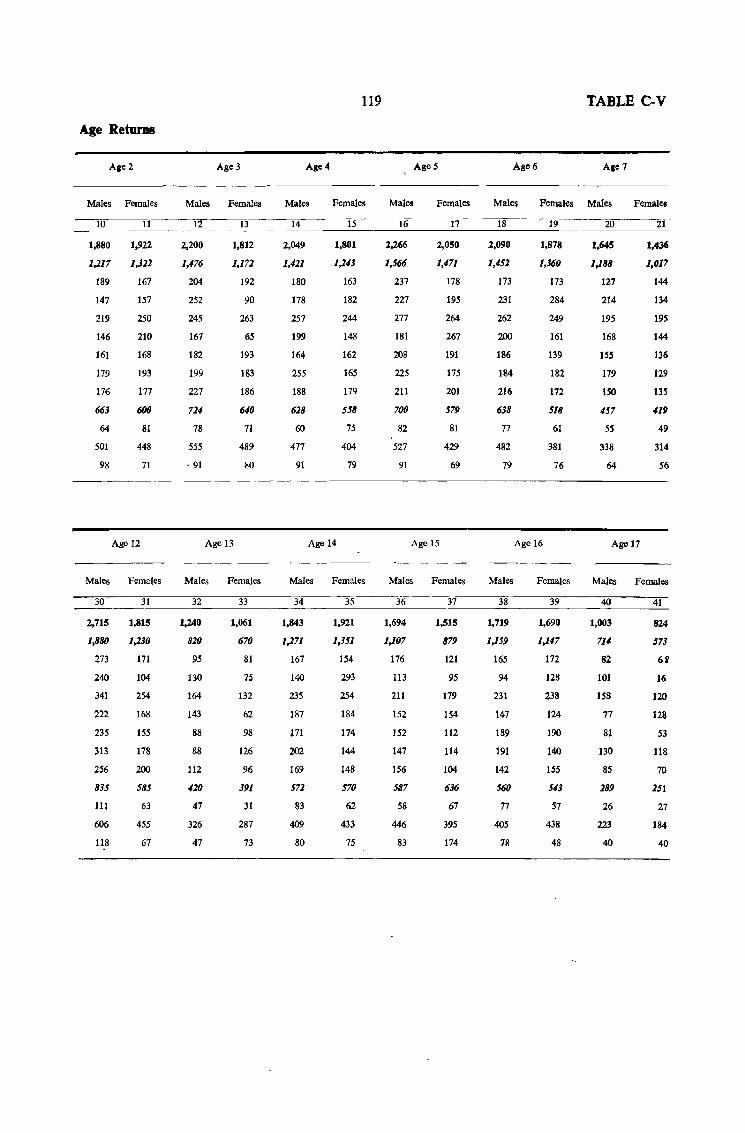
Age Returns
Aie2
Males
10
1,880
1,217
189
147
219
146
161
179
176
663
64
SOl
98
Females
11
1,922
1,322
167
157
250
210
168
193
177
600
81
448
71
Age 12
Males Females
30 31 -----2,715 1,815
1,880 1,230
273 171
240 104
341 254
222 168
235 155
313 178
256 200
8J5 585
111 63
606 455
118 67
Males
12
2,200
1,476
204
252
245
167
182
199
227
72<1
78
555
- 91
Age 3
Females
13
1,812
1,172
192
90
263
65
193
183
186
640
71
489
80
Age 13
Males Females
32
1,240
820
95
130
164
143
88
88
112
420
47
326
47
33
1,061
670
81
75
132
62
98
126
96
391
31
287
73
Age 4
Males
14
2,049
1,421
180
178
257
199
164
255
188
628
60
477
91
119
Females
15
1,801
1,243
163
182
244
148
162
165
179
558
75
404
79
Age 14
Males Females
34
1,843
1,271
167
140
235
187
171
202
169
572
83
409
80
35
1,921
1,351
154
293
254
184
174
144
148
570
62
433
75
Males
16
2,266
1,566
237
227
277
181
208
225
211
700
82
527
91
AgeS
Females
17
2,050
1,471
178
195
264
267
191
175
201
579
81
429
69
Age 15
Age 6
Males
18
2,090
1,152
173
231
262
200
186
184
216
638
77
482
79
Females
19
1,878
1,360
173
284
249
161
139
182
172
518
61
381
76
Age 16
TABLE C-V
A,e 7
Males
20
1,645
1,188
127
214
195
168
ISS
179
150
457
55
338
64
Females
21
1,436
1,017
144
134
195
144
136
129
135
419
49
314
56
Age 17
Males Females Males Females Males Females
:!6--37,-----;;3;o8---~39n----4O"'----,4 .. 1-
1,694
1,107
176
113
211
152
152
147
156
587
58
446
83
1,515
879
121
95
179
154
112
114
104
636
67
395
174
1,719 1,690 1,003 824
1,159 1,147 711 573
165 172 82 6B
94 128 LOI 16
231 238 158 120
147 124 77 128
189 190 81 53
191 140 130 118
142 155 85 70
560 513 289 251
77 57 26 27
405 438 223 184
78 48 40 40
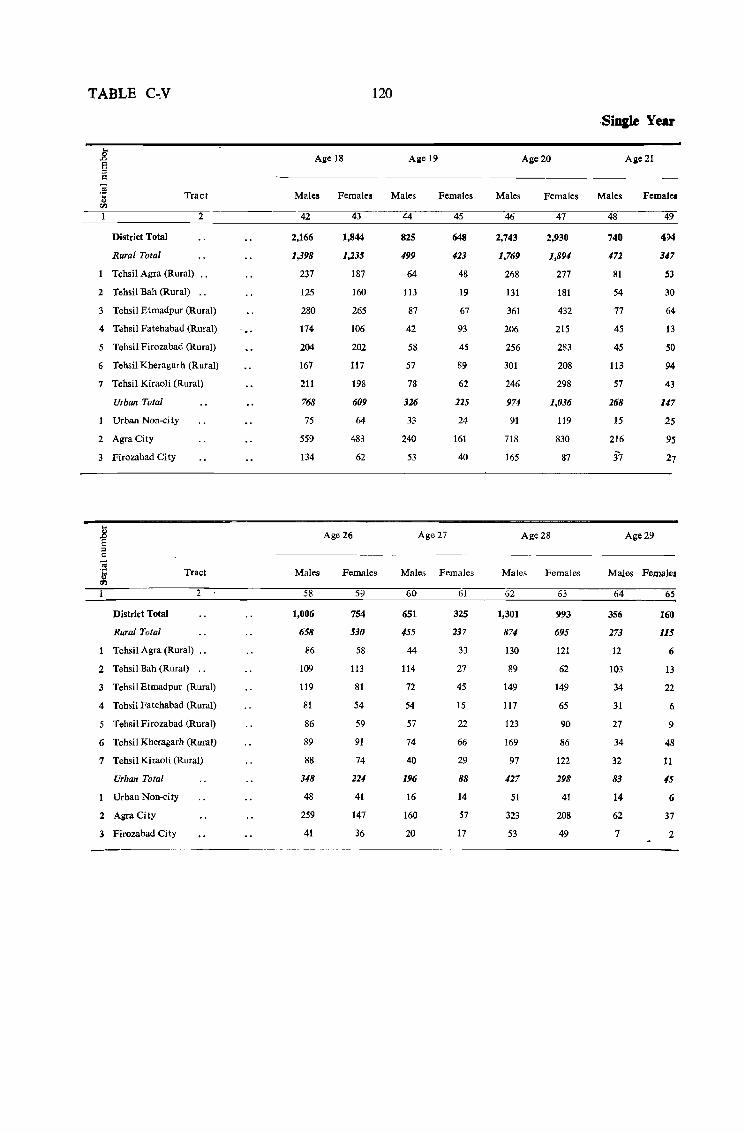
TABLE C-V
District Total
Rural Total
Tract
2
Tehsil Agra (Rural) ..
2 Tehsil Bah (Rural) ..
3 Tehsil Etmadpur (Rural)
4 Tehsil Fatehabad (Rural)
5 Tehsil Firozabad (Rural)
6 Tehsil Kheragarh (Rural)
7 Tehsil Kiraoli (Rural)
Urban Total
Urban Non-city
2 AgraCity
3 Firozabad City
District Total
Rural Total
Tract
2
Tehsil Agra (Rural) ..
2 Tehsil Bah (Rural) ..
3 Tehsil Etmadpur (Rural)
4 Tehsil Fatehabad (Rural)
5 Tehsil Firozabad (Rural)
6 Tehsil Kheragarh (Rural)
7 Tehsil Kiraoli (Rural)
Urban Total
Urban Non-city
2 AgraCity
3 Firozabad City
120
Aile 18
Males Females
42 43
2,166
1,398
237
125
280
174
204
167
211
768
75
559
134
Males
58
1,006
658
86
109
119
81
86
89
88
348
48
259
41
1,844
1,235
187
160
265
106
202
117
198
609
64
483
62
Age 26
Females
59
754
530
58
113
81
54
59
91
74
224
41
147
36
Aile 19
Males
44
825
499
64
113
87
42
58
57
78
326
33
240
53
Females
45
648
423
48
19
67
93
45
89
62
225
24
161
40
Age27
Males Females
60 61
651
455
44
114
72
54
57
74
40
196
16
160
20
325
237
33
27
45
15
22
66
29
88
14
57
17
Sinp Year
Age 20 Aie21
Males Females Males Female.
46 47 48 49
2,743
1,769
268
131
361
206
256
301
246
974
91
718
165
2,930
1,894
277
181
432
215
283
208
298
1,036
119
830
87
Age28
Males Females
62 63
1,301
874-
130
89
149
117
123
169
97
427
51
323
53
993
695
121
62
149
65
90
86
122
298
41
208
49
740
472
81
54
77
45
45
113
57
268
15
216
37
Age 29
4')4
347
S3
30
64
13
50
94
43
147
25
95
27
Males Females
64 65
356
273
12
103
34
31
27
34
32
83
14
62
7
160
115
6
13
22
6
9
48
11
45
6
37
2
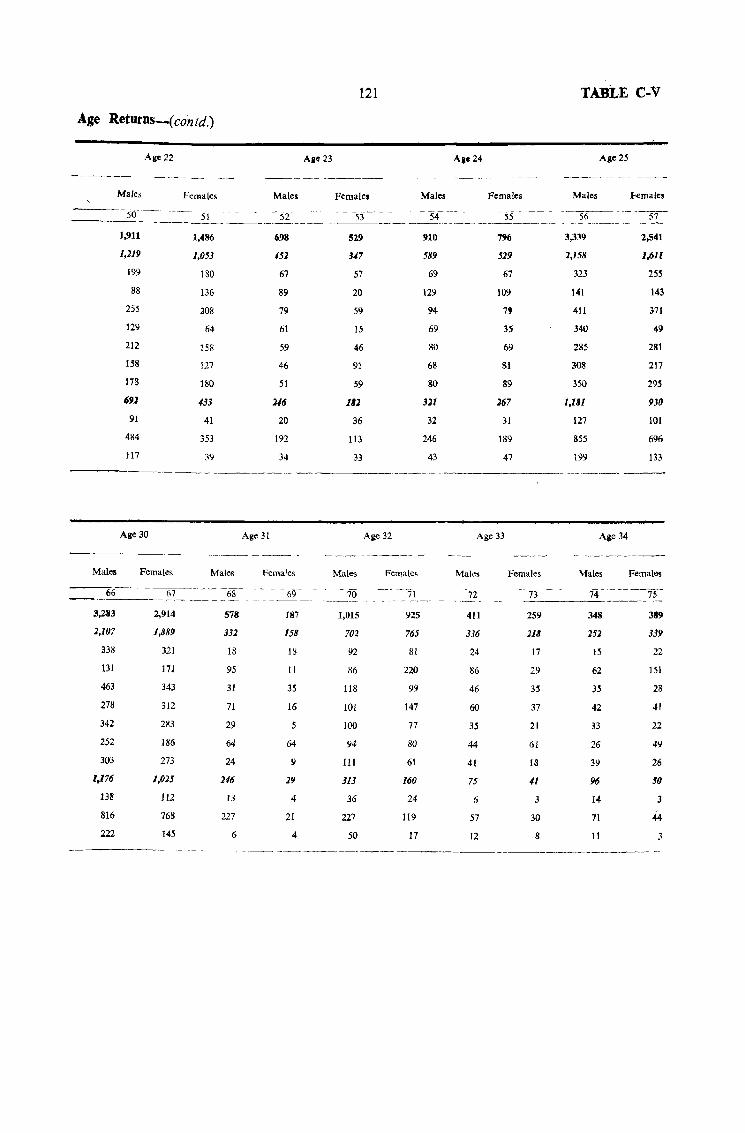
Age Returns_(contd.)
Males
1,911
1,219
199
88
255
]29
212
158
178
691
91
484
117
Age 22
Females
1,486
1,053
180
136
208
64
158
127
180
433
41
353
39
Males
698
151
67
89
79
61
59
46
51
116
20
192
34
------~---- ------
Age 30
Males Females
____ ~6~6 ___ ~67
3,283
2,107
33ll
131
463
278
342
252
303
1.176
138
816
222
2,914
1,889
321
171
343
312
283
186
273
1,025
112
768
145
Males
578
332
18
95
31
71
29
64
24
246
13
227
6
Age 31
Females
187
158
I~
II
35
16
5
64
9
29
4
21
4
Age 23
121
Females
529
347
57
20
59
15
46
91
59
182
36
113
33
Males
1,015
702
92
86
118
101
100
94
111
313
36
227
50
Females
-, --'71
925
765
81
220
99
147
77
80
61
160
24
119
17
Males
910
589
69
129
94
69
80
68
80
321
32
246
43
A8e24
TABLE C-V
Age 25
Females Males remale~
55-- -~-- ---5"1"
796
529
67
109
79
35
69
81
89
267
31
139
47
---3,339
1,158
323
141
411
340
285
308
350
1,181
127
855
199
2,541
1,611
255
143
371
49
281
217
295
930
101
696
133
,----- ----~ ----
Age 33 Age 34
Male,
72
411
336
24
86
46
60
35
44
41
75
6
57
12
Females
73
259
118
17
29
3~
37
21
61
18
41
3
30
8
Males
348
251
15
62
35
42
33
26
39
96
14
71
11
Females
389
339
22
151
28
41
22
49
26
50
3
« 3
-~-- ------------------~~-----------~----- --
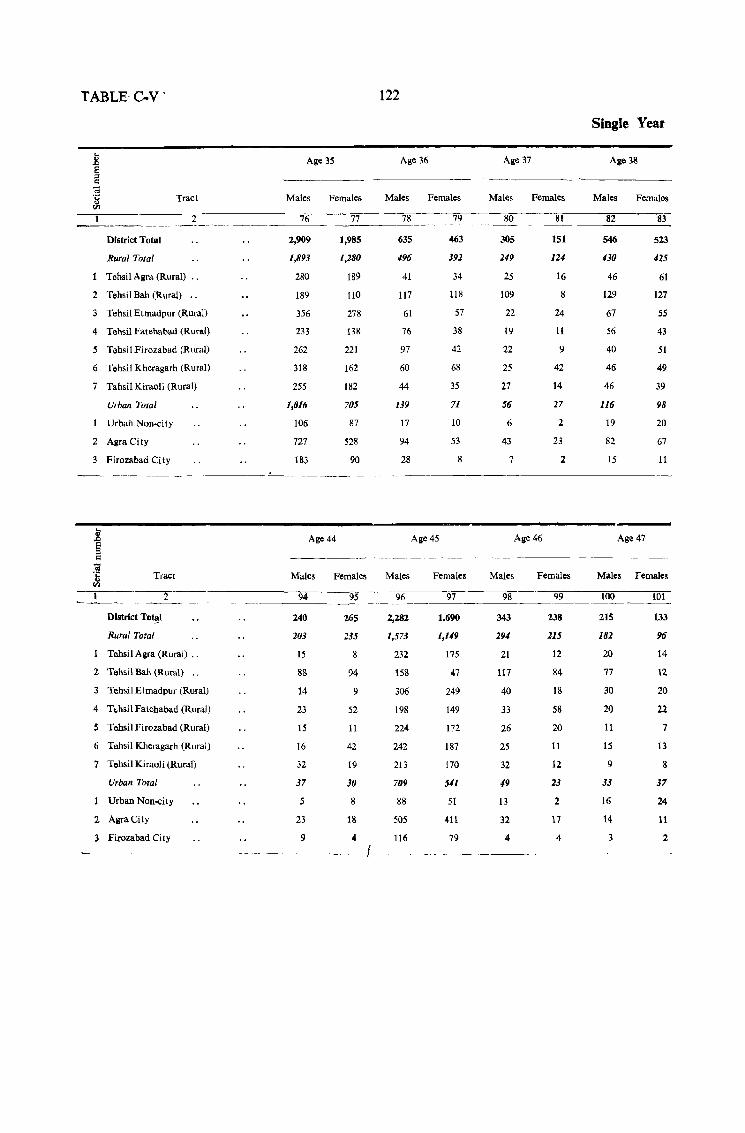
TABLE·C-V·
District Total
Rural Total
Tract
2
Tehsil Agra (Rural) "
:2 Tehsil Bah (Rural) "
3 TehsilEtmadpur (Rural)
4 Tehsil Fatehabad (Rura.l)
5 Tehsil Firozabad (RuraJ)
6 Tehsil Kheragarh (Rural)
7 Tahsil Kiraoli (Rural)
Urban Total
Urban Non-city
2 AgraCity
3 Firozabad City
Tract
2
122
Age 35 Age 36 Age 37
Males Females Males Females Males Females
_______ 7.:_6 ____ 7_7 ____ 7_8 _ __ ]J_ __ 80 81
2,909
1,893
280
189
356
233
262
318
255
1,016
106
727
183
Age 44
1,985
1,280
189
IlO
278
138
221
162
182
705
87
528
90
Males Female~
94 95
635
496
41
117
61
76
97
60
44
H9
17
94
28
Age 45
463 305
392 249
34 25
lI8 109
57 22
38 19
42 22
68 25
35 27
71 56
10 6
53 43
8 7
Agc46
151
114
16
8
24
II
9
42
14
27
2
23
2
Males Females Males Females
96 97 98 99 --------------District ToU!1
Rural Total
Tehsil Agra (Rural) ..
2 Tehsil Bah (Rural) ..
3 Tehsil Etmadpur (Rural)
4 T~hsil Fatehabad (Rural)
S Tehsil Firozabad (Rural)
6 Tehsil Kheragarh (Rural)
7 Tehsil Kiraoli (Rural)
Urban Total
Urban Non-city
:2 AgraCity
3 Firozabad City
240
203
15
88
14
23
15
16
32
37
5
23
9
265 2,282
235 1,573
8 232
94 158
9 306
52 198
11 224
42 242
19 213
30 709
8 88
18 505
4 116
---------- - ----I
1,690
1,149
175
47
249
149
172
187
170
541
51
411
79
343
294
21
117
40
33
26
25
32
49
13
32
4
238
215
12
84
18
58
20
11
12
23
2
17
4
Single Year
Age 38
Males Females
82
546
-130
46
129
67
56
40
46
46
116
19
82
15
Age 47
83
523
425
61
127
S5
43
51
49
39
98
20
67
11
Males Females
100 101 -----215
182
20
77
30
20
11
15
9
33
16
14
3
133
96
14
12
20
22
7
13
8
37
24
11
2
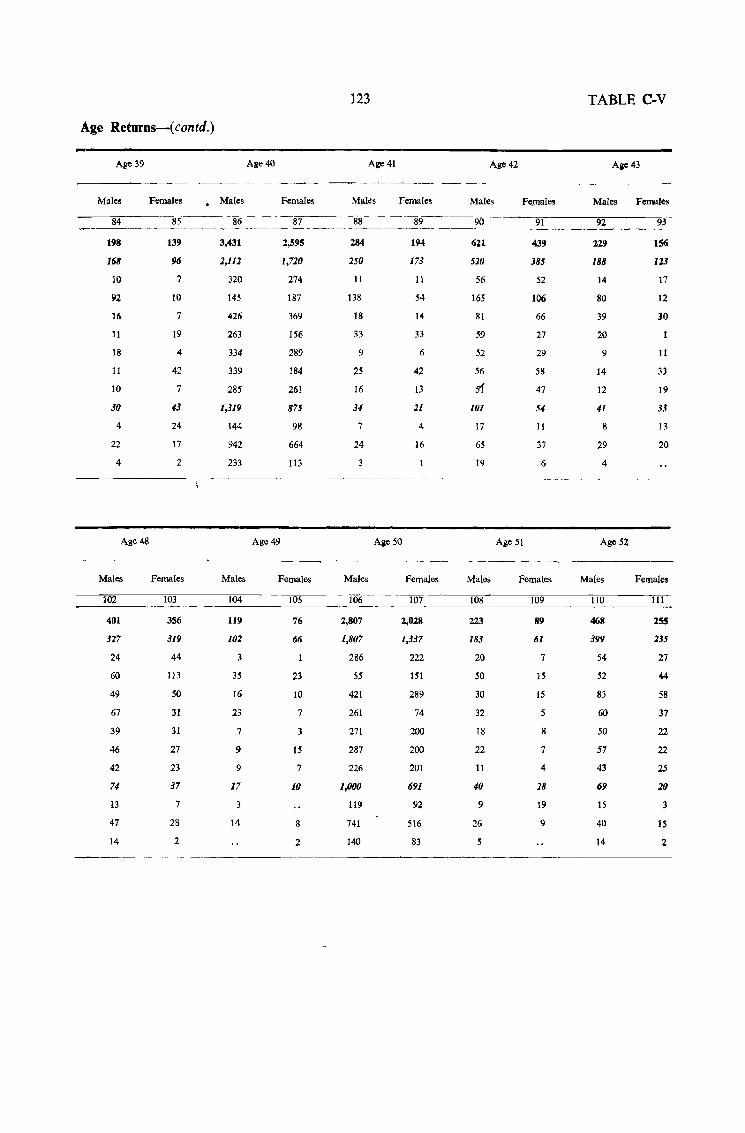
Age Returns-(contd.)
Age 39
Males
84
198
168
10
92
16
11
18
11
10
30
4
22
4
Age 48
Males
102
401
327
24
60
49
67
39
46
42
71
13
47
14
Females
139
96
7
10
7
19
4
42
7
43
24
17
2
Females
103
356
319
44
113
50
31
31
27
23
37
7
28
2
• Males
3,431
2,111
320
145
426
263
334
339
285
1,319
144
942
233
Males
104
119
102
3
35
16
23
7
9
9
17
3
14
Age 40
Age 49
Females
87
2,595
1,720
274
187
369
156
289
184
261
875
98
664
113
Females
105
76
66
23
10
7
15
7
10
8
2
123
Age 41
Males
284
250
11
138
18
33
9
25
16
34
7
24
Females
194
173
11
54
14
33
6
42
13
21
4
16
Age 50
Males
106
2,807
1,807
286
55
421
261
271
287
226
1,000
119
741
140
Females
107
2,028
1,337
222
151
289
74
200
200
201
691
92
516
83
Age 42
Males
90
611
510
56
165
81
59
52
56
51 101
17
65
19
Females
AgeSl
91
439
385
52
106
66
27
29
58
47
54
11
37
6
TABLE C-V
Aile 43
Males Females
92
229
188
14
80
39
20
9
14
12
41
8
29
4
Age 52
93
156
123
17
12
30
11
33
19
33
13
20
- - ---- - -- ~ _-------
Males
108
223
183
20
50
30
32
18
22
11
40
9
26
5
Females
109
89
61
7
15
15
5
8
7
4
18
19
9
Males
110
468
399
54
52
83
60
50
57
43
69
IS
40
14
Females
111
255
235
27
44
58
37
22
22
25
20
3
IS
2
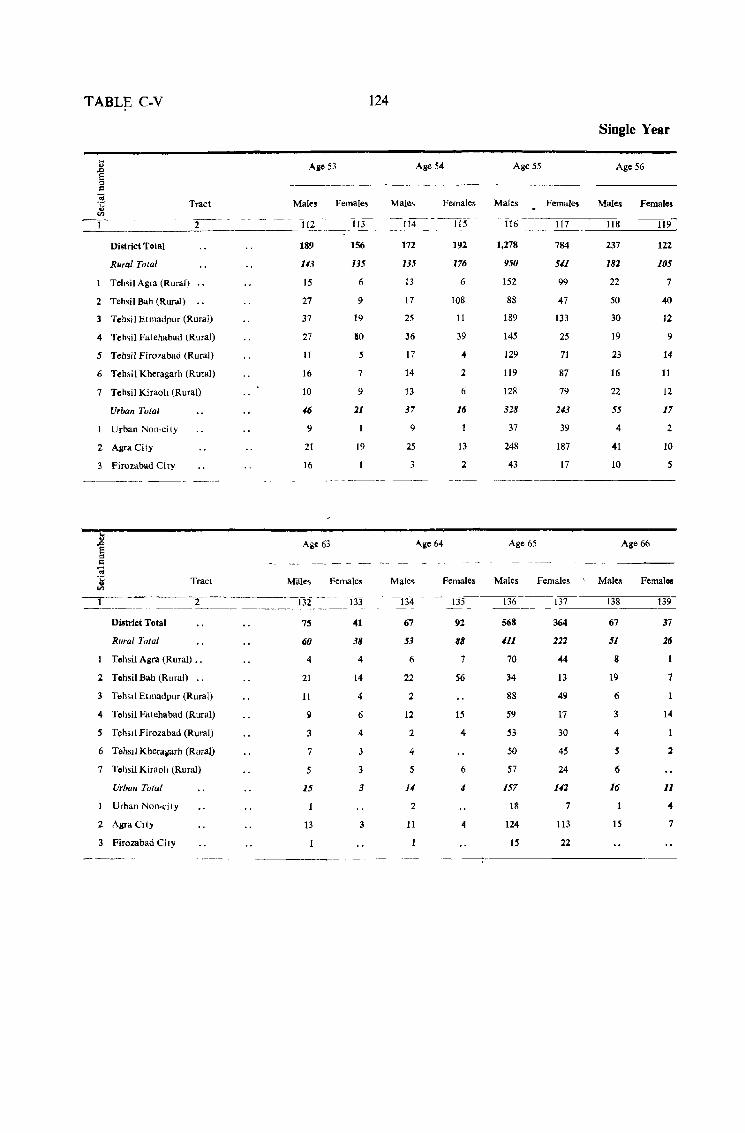
TABLE C-V
:1 'E ::> .: co ~
124
Aile 53
Tract Males Females
--1--- -- -2-- - - 112 113 _.:__------=------- -----_-
District Total
Rurt~l Total
Teh~i I Agra (Rural)
2 Tehsi) Bah (Rural)
3 Tebsj] Etmadpur (Rural)
4 Teh~il Fatehabad (Rural)
5 Tohsil Firo7abad (Rural)
6 Tehsil Kheragarh (Rural)
7 Tehsil Kiraoh (Rural)
Urban Total
Urban Non-city
2 Agra City
3 Firozabad City
District Total
RI/ral Total
Tract
Tehsil Agra (Rural) ..
:2 Tehsil Bah (Rural) ..
:3 TehSllElmadpur (Rural)
4 Tehsil Fatehabad (Rural)
5 Tehsll Firozabad (Rural)
6 TehsIl Kheragarh (Rural)
7 Tehsil Kiraoll (Rural)
Urban Total
Urban Non-city
2 AgraClty
Firozabad City
189
U3
15
27
37
27
11
16
10
16
9
21
16
Age 63
]56
135
6
9
19
ao 5
7
9
21
19
MaIes Females
75
60
4
21
11
51
3
7
5
15
13
41
38
4
14
4
6
4
3
3
3
3
Single Year
Age 54 Age 55 Age 56
Males Females Males Females Males Females
~_1_14 ___ -=_-~5_=_ __ --1__-1_C---_ ____:_1.:.:17:__ __ ~11'.::8 __ ___:1c!.19;:_
172
135
13
17
25
36
17
14
13
37
9
25
3
Age 64
192
176
6
108
11
39
4
:2
6
16
13
2
Male~ Females
67
53
6
22
2
12
2
4
5
14
2
11
92
88
7
56
15
4
6
1/
4
],278
950
152
88
189
145
129
119
128
328
37
248
43
Age 65
784
511
99
47
133
25
71
87
79
243
39
187
17
Males Females
568
111
70
34
88
59
53
50
57
157
18
124
15
364
122
« 13
49
17
30
45
24
U1
7
113
22
237
182
22
50
30
19
23
16
22
55
4
41
10
Age 66
122
105
7
40
12
9
14
11
]2
17
2
10
5
Males Femalos
67
51
8
19
6
3
4
5
6
16
IS
37
16
7
14
2
11
4
7
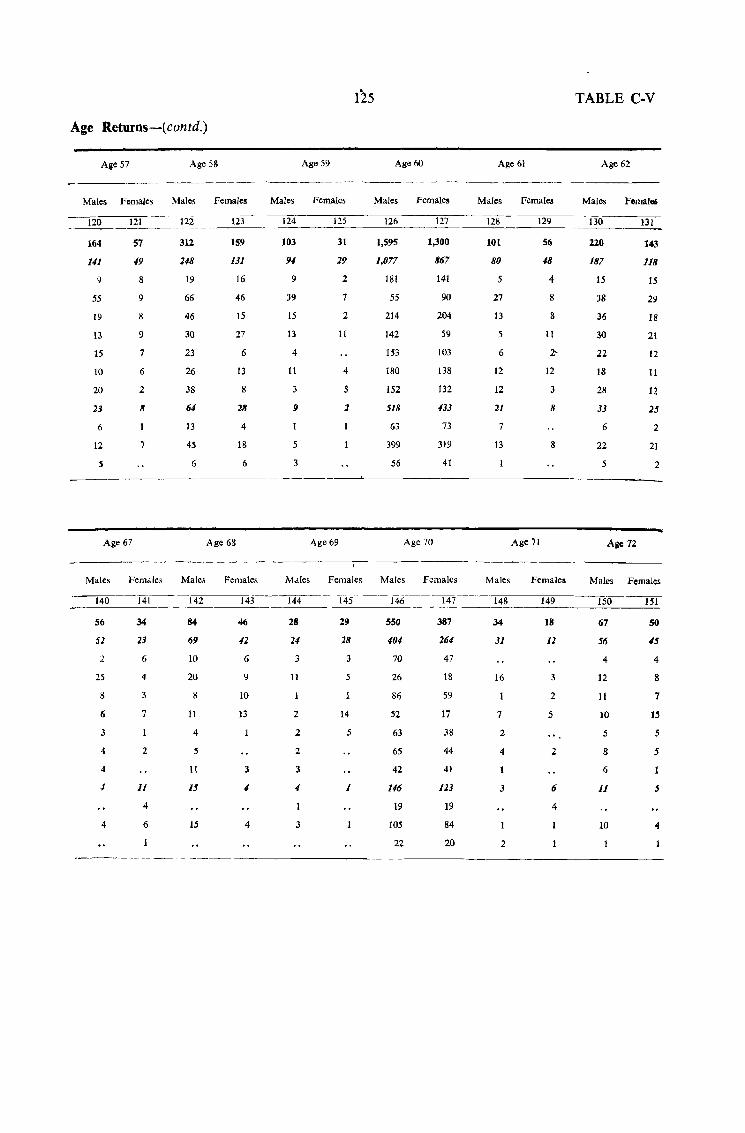
Age Returns-(contd.)
Age 57 Age 58
Males Females Males Females
120 121 122 123
164
141
9
5S
19
13
15
10
20
13
6
12
Age 67
57
19
8
9
8
9
7
6
2
8
7
312.
:118
19
66
46
30
23
26
38
(j4
13
45
6
159
131
16
46
15
27
Age 68
6
13
8
28
4
18
6
Males Females Males Females
140
56
s:z 2
25
8
6
J
4
4
" 4
14'-- --142
34
23
6
4
7
2
11
4
6
84
69
10
20
8
11
4
5
Il
15
1.5
143
46
42
6
9
10
13
3
4
4
Age 59
Males Females
124 125
103
94
9
39
15
13
4
11
3
9
5
3
31
29
2
7
2
Age69
11
4
3
:1
Age IiO
Males Females
126 127
1,595
1,077
181
55
214
142
153
180
152
518
63
399
56
1,300
867
141
90
Age 70
204
59
103
138
132
133
73
319
41
Males Females Males Females
Age 61
Males Females
128 129
101
80
5
27
13
5
6
12
12
21
7
13
Males
Age 71
56
48
4
8
8
11
2-
12
3
8
8
Females
TABLE C-V
Age 62
Males Fornal.
130 131
220
187
15
38
36
30
22
18
28
33
6
22
5
Age 72
143
118
15
29
18
21
12
11
12
25
2
21
2
M al~s Females
~1~4~4 ______ 1~45~·_· ___ -~i4~6~---__ -___ 1_4_7 _____ 148 149 ______ 1-'5_0 ____ -=-:15..;;..1
28
24
3
11
2
2
2
3
4
3
29
28
3
5
14
5
1
550
404
70
26
86
52
63
65
42
146
19
105
22
387
264
47
18
59
17
38
44
41
123
19
84
20
34
31
16
7
2
4
3
2
18
12
3
2
5
2
6
4
67
56
4
12
11
10
5
8
6
11
10
SO
45
4
8
7
1.5
.5
5
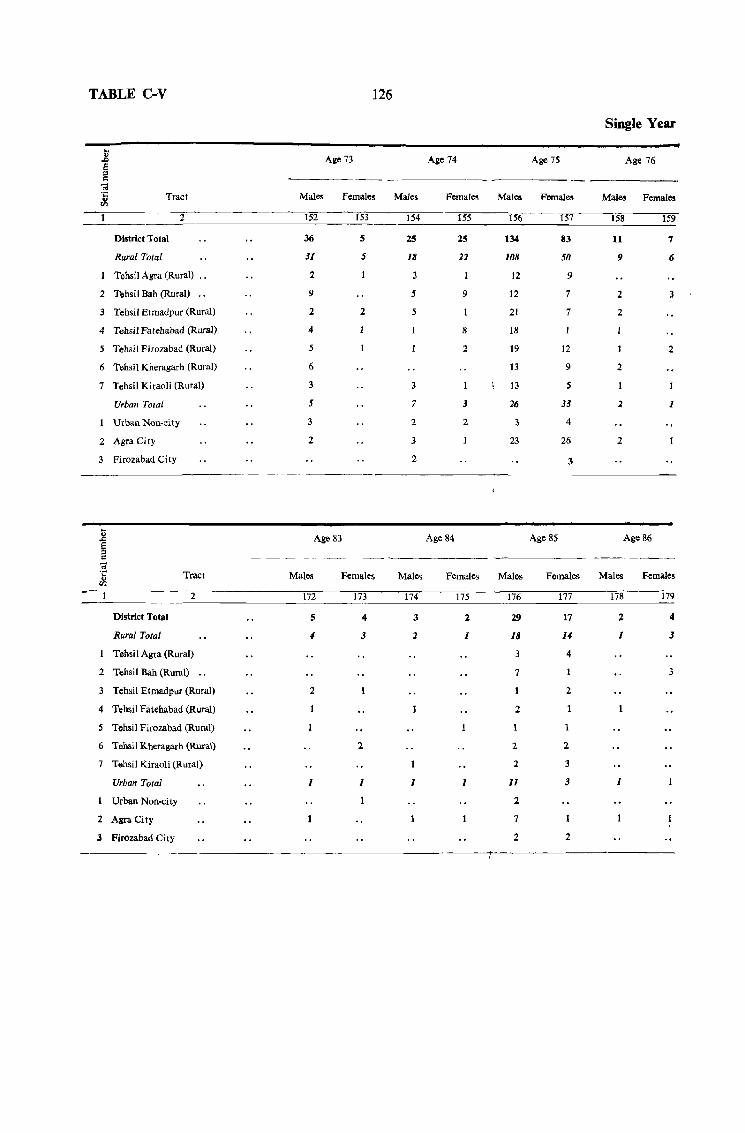
TABLE C-V 126
Single Year
... ., Age 13 Age 14 Age 15 Age 16 .0
§ '" -;
~ Tract Males Female~ Males Females Males Female~ Males Females
2 152 153 154 155 156 151 158 159
District Total 36 5 25 25 134 83 11 7
Rural Total 31 5 111 21 108 50 9 6
Tehsil Agra (Rural) .. 2 3 12 9
2 Thhsil Bah (Rural) .. 9 5 9 12 1 2
3 Tehsil Etmadpur (Rural) 2 2 5 21 1 2
4 Tehsil Fatehabad (Rural) 4 8 18
5 Tehsil Firozabad (Rural) 5 2 19 12 2
6 Tehsil Kheragarh (Rllral) 6 13 9 2
1 Tehsil Kiraoli (Rural) 3 13 5
Urban Total 5 7 3 26 33 2 1
Urban Non-city 3 2 2 3 4
2 Agra City 2 3 23 26 2
3 Firozabad City 2 3
t> Aae 83 Age 84 Age 85 Age 86 .Q e
::> c -; '5 Tract Males Femal~s Males Females Males Females Males Females rn
2 172 173 174 175 176 177 118 179
District Total 5 4 3 2 29 17 2 4
Rural Total -I 3 2 1 18 14 1 3
Tehsil Aara (Rural) 3 4
2 Tehsil Bah (Rural) .. 7 3
3 Tehsil Etmadpur (Rural) 2 2
4 Tehsil Fatehabad (Rural) 2
5 Tchsil Firozabad (Rural)
6 Tehsil Kheragarh (Rural) 2 2 2
7 TehsiJ Kiraoli (Rural) 2 3
Urban Total 1 1 1 1 11 3 1
Urban Non-city 2
2 Agra City 7
3 Firozabad City 2 2
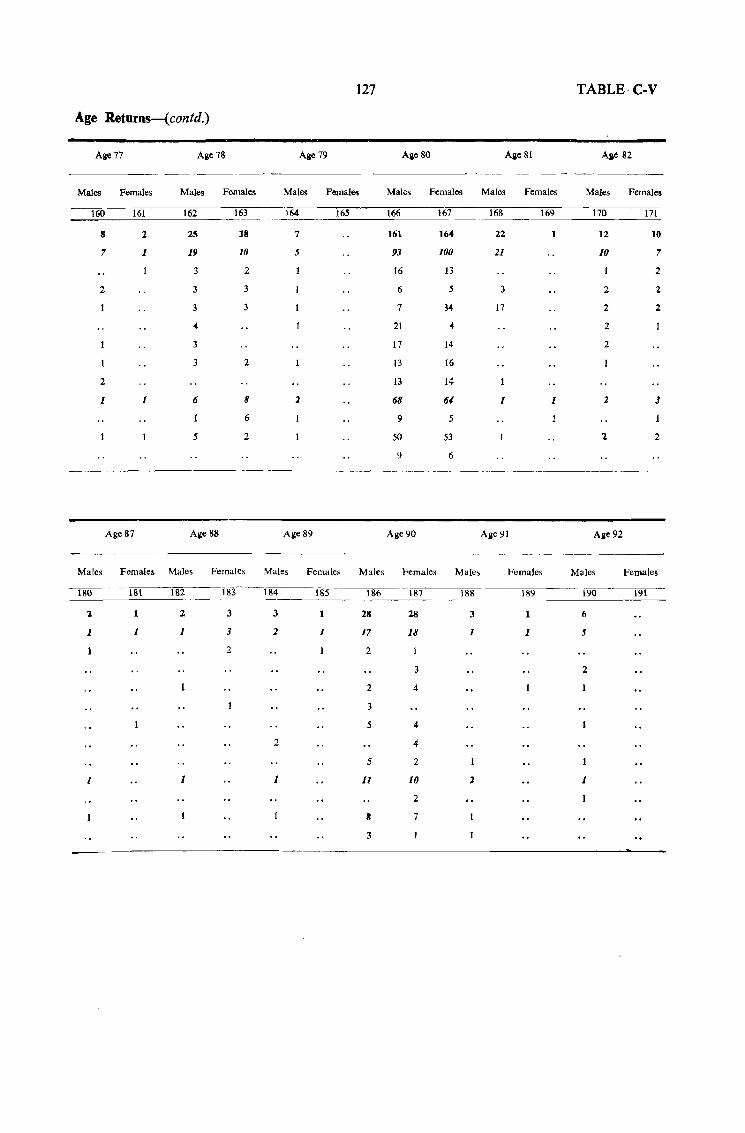
127 TABLE-C-V
Age Retums-(contd.)
Age 77 Age 78 Age 79 Age 80 AgeSI AF 82
Males Females Males Females Males Females Males Females Males Females Males Females
160 161 162 163 164 165 166 167 168 169 170 171
8 2 25 18 7 161 164 22 1 12 10
7 1 19 10 5 93 100 21 10 7
3 2 16 13 2
2 3 3 6 5 3 2 2
3 7 34 17 2 2
4 21 4 2
3 17 14 2
2 13 16
2 13 14
I 1 6 8 2 68 61 1 1 2 3
6 9 5
5 2 50 53 2 2
9 6
Age 87 Age 88 Age 89 Age 90 Age91 Aile 92
~~---- ---.~- .. -----
Males Females Males Females Males Females Males Females Males Females Males Females
180 181 182 183 184 185 186 187 188 189 190 191
2 1 2 3 3 1 28 28 3 1 6
1 1 1 3 2 1 17 18 1 1 5
2 2
3 2
2 4
3
5 4
2 4
5 2
1 1 11 10 2 1
2
8 7
3
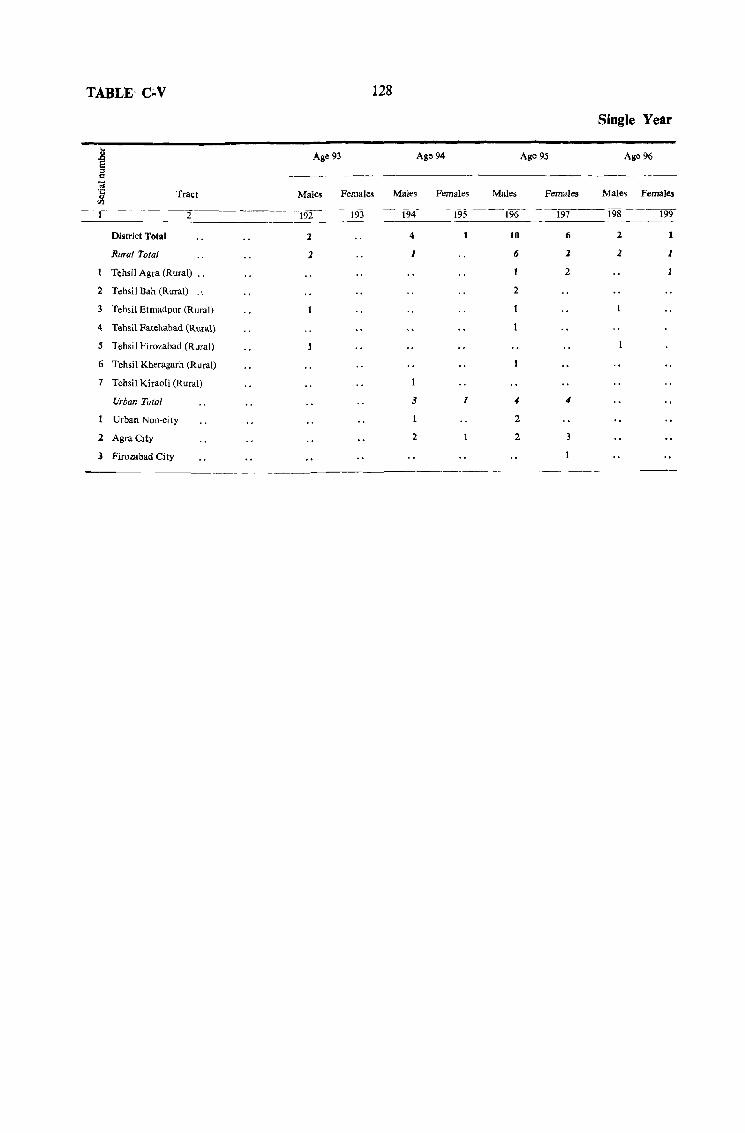
TABLE' C;.V
District Total
Rural Total
Tchsjl Agra (Rural) ..
2 Tehsil Bah (Rural) .. 3 Tehsil Etmadpur (Rural)
4 Tehsil Fatehabad (Rural)
5 Tehsil Firozabad (Rural)
6 Tehsil Kheragarh (Rural)
7 Tehsil Kiraoli (Rural)
Urban Total
Urban Non-city
2 AgraClty
.) Firozabad Ci ty
:1.
J
128
Age 94
Males Females
4
3 1
2
Males
10
6
2
" 2
2
Age 95
Females
6
J
2
3
Single Year
Age 96
Males Females
198
2
1
199
1
1
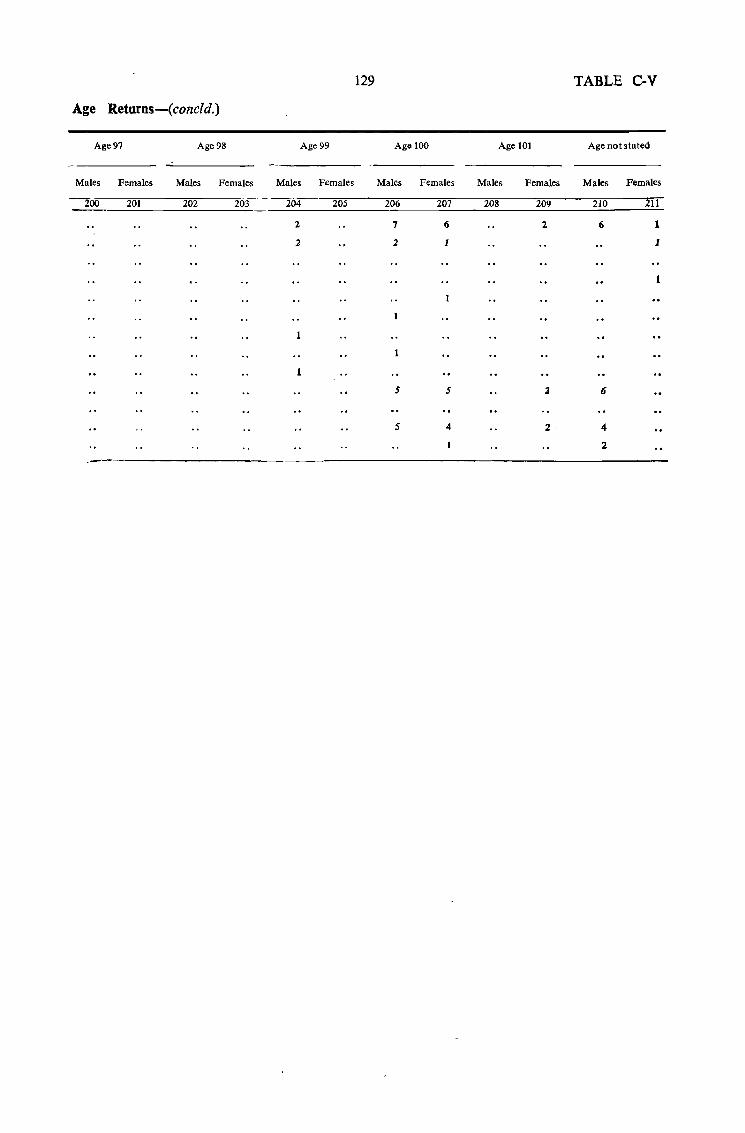
129 TABLE CV
Age Returns-(concld.)
Age 97 Age 98 Age 99 Age 100 Age 101 Age not stated
Males Females Males Females Males Females Males Females Males Females Males Females
--~200 201 202 203 ----204~--~2~0~5-----02~06~----~20w7~--~20ru8~----2ruO~9~----"2~10~----~2'"11' --~~.----~----~~
276 261
2 2 1 1
5 5
5 4 2
6
4
2
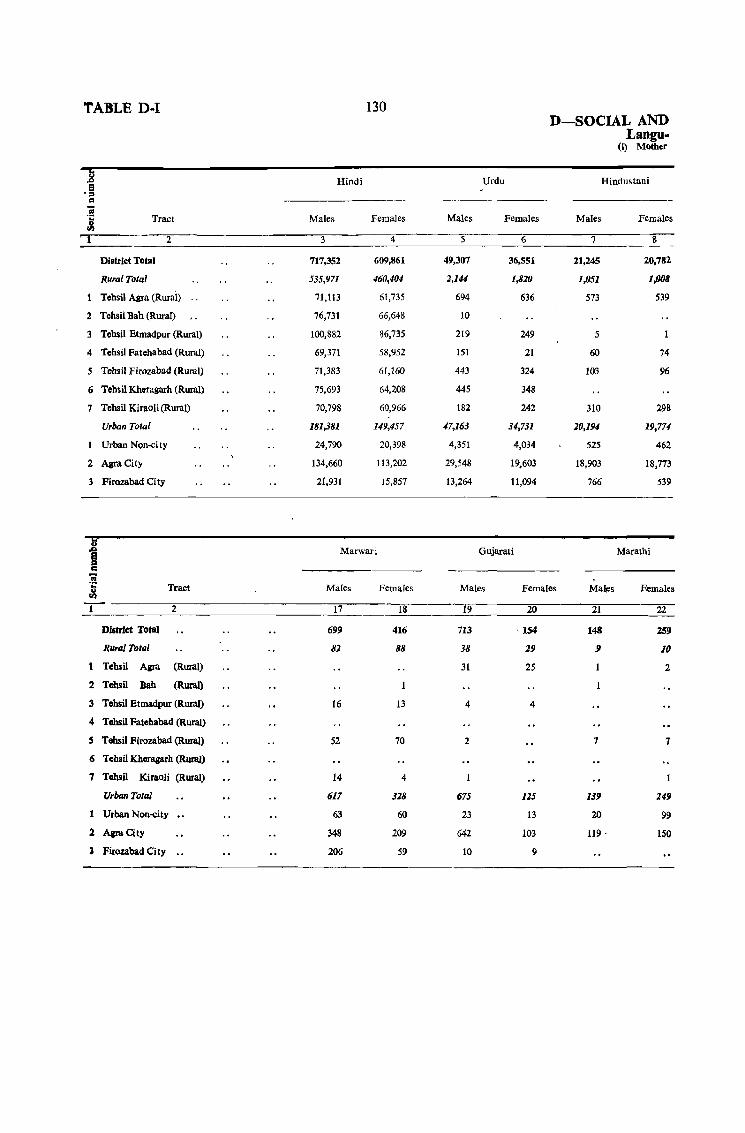
TABLE D·l 130 D-SOCIAL AND
Langu-(i) Mother
,J:> Hindi Urdu Hindustani a -::I
CI
.~ Tract Males Females Males Females Males Females .i
2 3 4 6 7 8
District Total 717,352 609,861 49,307 36,551 21,245 20,782
Rural Total 535,971 460,404 2,1# 1,820 1,051 1,008
Tehsil Agra (Rurai) " 71,113 61,735 694 636 573 539
2 Tehsil Bah (Rural) 76,731 66,648 10
3 Tehsil Etmadpur (Rural) 100,882 86,735 219 249 5
4 Tchsil Fatehabad (Rural) 69,371 58,952 151 21 60 74
5 Tebsil Firozabad (Rural) 71,383 61,160 443 324 103 96
6 Tehsil KhQragarh (Rural) 75,693 64,208 445 348
7 Tehsil Kiraoli (Rural) 70,798 60,966 182 242 310 298
Urban Total 181,381 149,457 <17,163 34,731 20,194 19,774-
Urban Non-ci ty 24,790 20,398 4,351 4,034 525 462
2 Agra City 134,660 113,202 29,548 19,603 18,903 18,773
3 Firozabad City 21,931 15,857 13,264 11,094 766 539
1 Marwari Gujarati Marathi ::t I:;
.\11 Tract t Males Females Males Females MaI!:s Rernales
~
-1- 2 17 18 19 20 21 22
Dlstdct Total 699 416 713 ,154 148 259
Rural Total 82 88 38 29 9 10
Tehsil Agra (Rural) 31 25 2
2 Tehsil Bah (Rural)
3 Tahsil Etmadpur (Rural) 16 13 4 4
4 Tahsil Fatehabad (Rural)
S Tehsil Firozabad (Rural) 52 70 2 7 7
6 Tehsil Kheragarh (Rural)
7 Tehsil Kiraoli (Rural) 14 4
Urban Tolal 617 328 675 125 139 249
1 Urban Non-city 63 60 23 13 20 99
2 AaraCity 348 209 642 103 119· ISO
3 Firozabad City 206 59 10 9
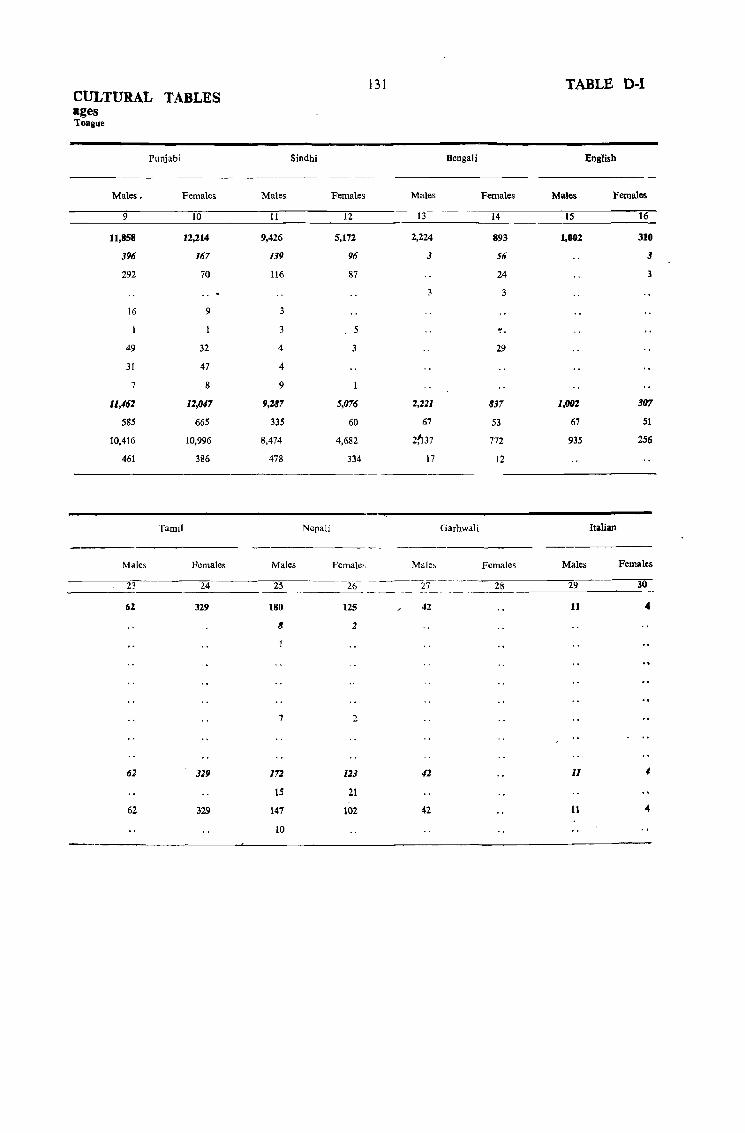
CULTURAL TABLES ages Tongue
Punjabi
Males. Females
9 10
11,858 12,214
396 167
292 70
16 9
49 32
31 47
7 8
11,462 12,647
585 665
10,416 10,996
461 386
Tamil
Males Females
23 24 ----
6.% 329
62 329
62 329
Sindhi
Males
11
9,426
139
116
3
3
4
4
9
9,287
335
8,474
478
Nepali
Males
25
180
8
7
172
15
147
10
Females
12
5,172
96
87
5
3
5,076
60
4,682
334
Female"
125
2
2
123
21
102
131
Bengali
Males
13
2,224
3
2,221
67
2~1.37
17
Garhwali
42
12
42
TABLE D-l
English
Females Males Females
14 15 16
893 1,002 310
56 3
24 3
3
.. 29
837 1,002 307
53 67 51
772 935 256
12
Italian
Females Males Females
28 29 30
11 4
11
11 4
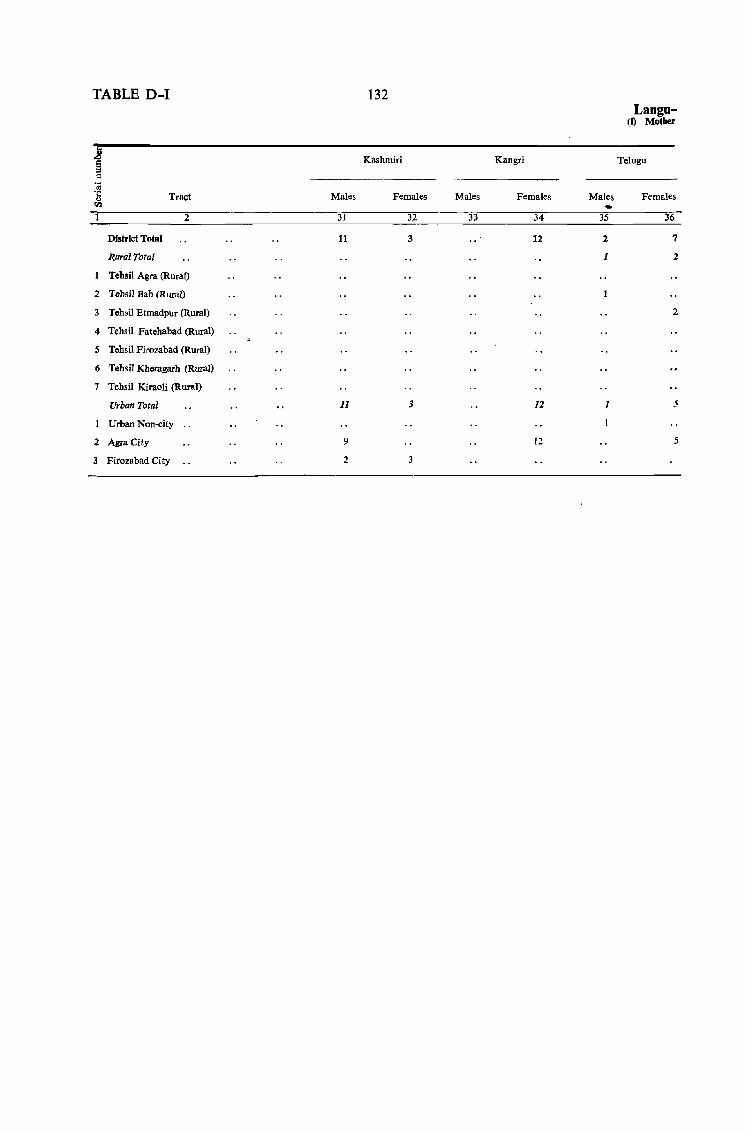
TABLE D-l 132 Langu-
(I) Mother
.8 Kashmiri Kangri Telugu 8 ::I c:: ";; .~ Tract Males Females Males Females Males Females !:II
2 31 32 33 34 35 36
District Total 11 3 12 2 7
Rural Total 1 2
Tehsil Agra (Rural)
2 Tehsil Bah (Rural)
3 Tehsil Etmadpur (Rural) 2
4 Tehsil Fatehabad (Rural)
5 Tehsil Firozabad (Rural)
6 Tehsil Kheragarh (Rural)
7 Tehsil Kiraoli (Rural)
Urban Total 11 3 12 1 5
Urban Non-city
2 AgraCity 9 12 5
3 Firozabad City 2 3
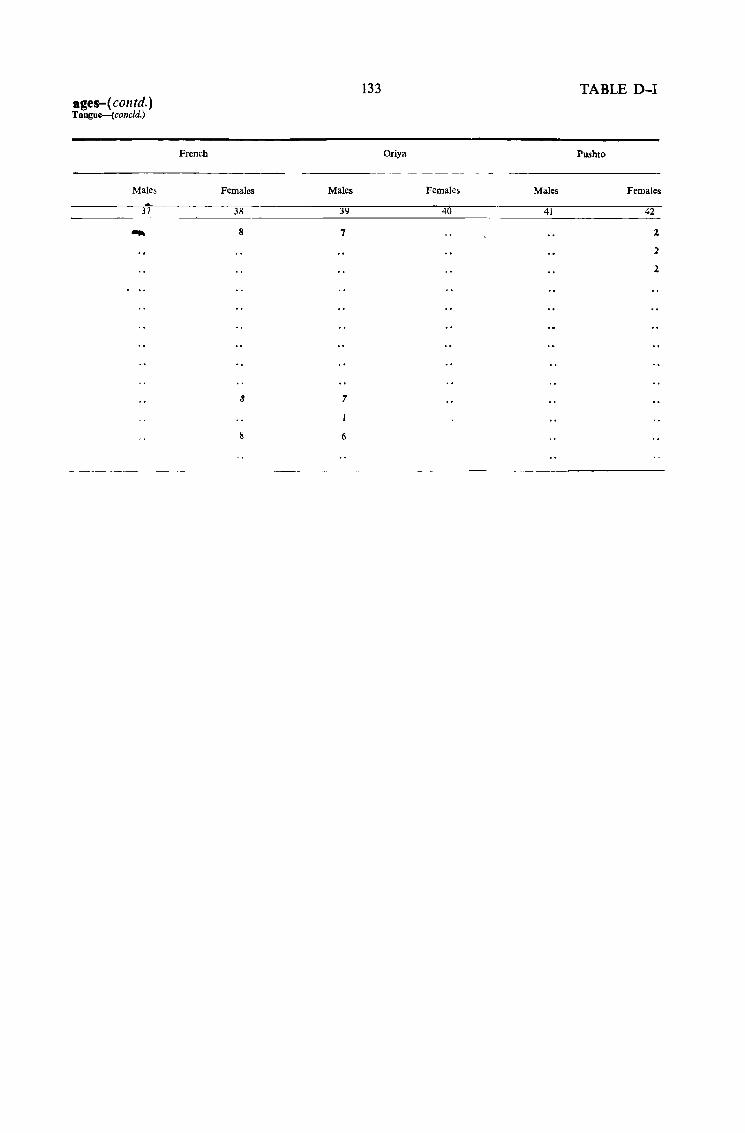
ages-(contd.) Tongue-{conc1d.)
Males
37 -French
Females
38
8
8
Males
311
7
7
6
133
Oriya
Females Males
40 41
TABLE D-I
Pushto
Females
42
2
1
2
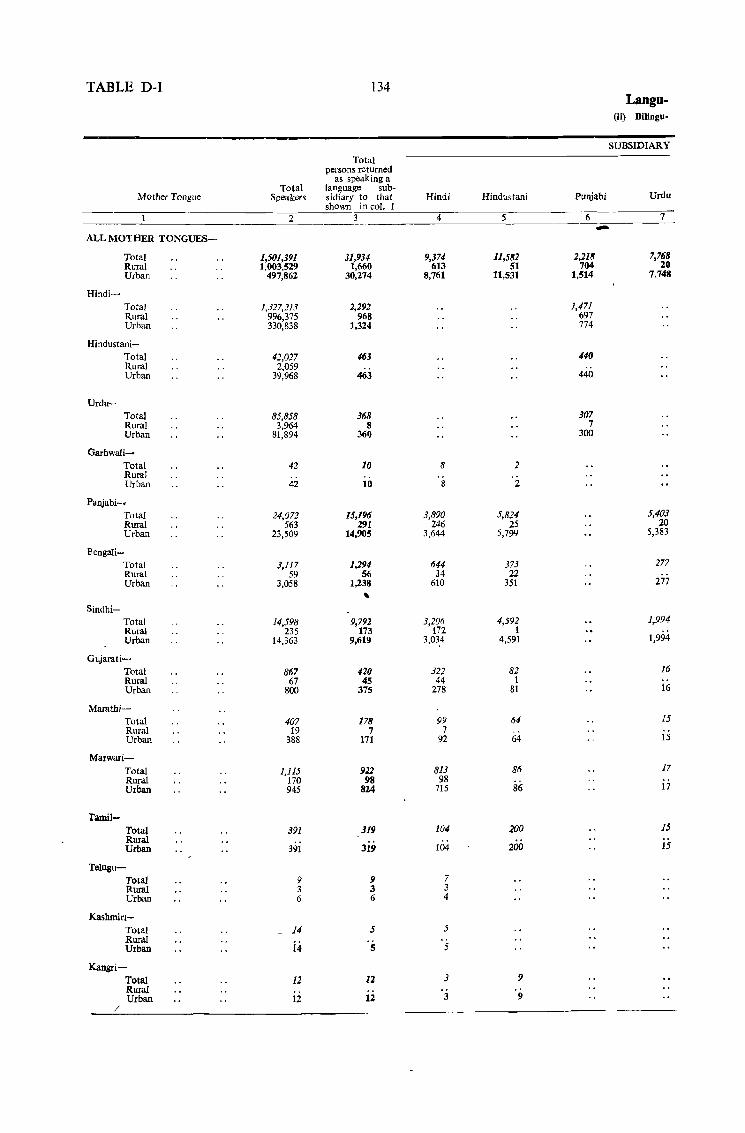
TABLE D-I 134 Langu-
(if) Bilingu-
SUBSIDIARY
Total persons returned
as speaking a Total language sub-
Mother Tongue Speakers sidiary to that Hindi Hindustani Punjabi Urdu shown in col. 1
2 3 4 5 6 7 -ALL MOTHER TONGUES--
Total 1,501,391 31,934 9,374 11,582 2,218 7,768 Rural 1,003.529 1,660 613 51 704 20 Urban 497,862 30,274 8,761 11,531 1,514 7,748
Hindi~
Total 1,327,213 2,292 1,471 Rural 996,375 968 697 Urban 330,838 1,324 774
Hindustani-Total 42,027 463 440 Rural 2,059 Urban 39,968 463 440
Urdu-Total 85,858 368 307 Rural 3,964 8 7 Urban 81,894 360 300
Garhwali-Total 42 10 8 2 Rural Urban 42 10 8 2
Panjabi-. Total 24,072 15,196 3,890 5,824 5,403 Rural 563 291 246 25 20 Urban 23,509 14,905 3,644 5,799 5,383
Bengali-Total 3,117 1,294 644 373 277 Rural 59 56 34 22 Urban 3,058 1,238 610 351 277 ,
Sindhi-Total 14,598 9,792 3,206 4,592 1,994 Rural 235 173 172 I Urban 14,363 9,619 3,03,4 4,591 1,994
Gujarati--Total 867 420 322 82 16 Rural 67 45 44 1 Urban 800 375 278 81 16
Marathi-Total 407 178 99 64 15 Rural 19 7 7 Urban 388 171 92 64 15
Marwari-Total 1,115 922 813 86 17 Rural 170 98 98 Urban 945 824 715 86 17
Tamil-Total 391 319 104 200 15 Rural
, Urban 391 319 104 200 15
TeIugu-Total 9 9 7 Rural 3 3 3 Urban 6 6 4
Kashmin-Total 14 5 5 Rural
i4 Urban 5 5
Kangri-Total 12 1:3 3 9 Rural Urban 12 lZ 3 9
/
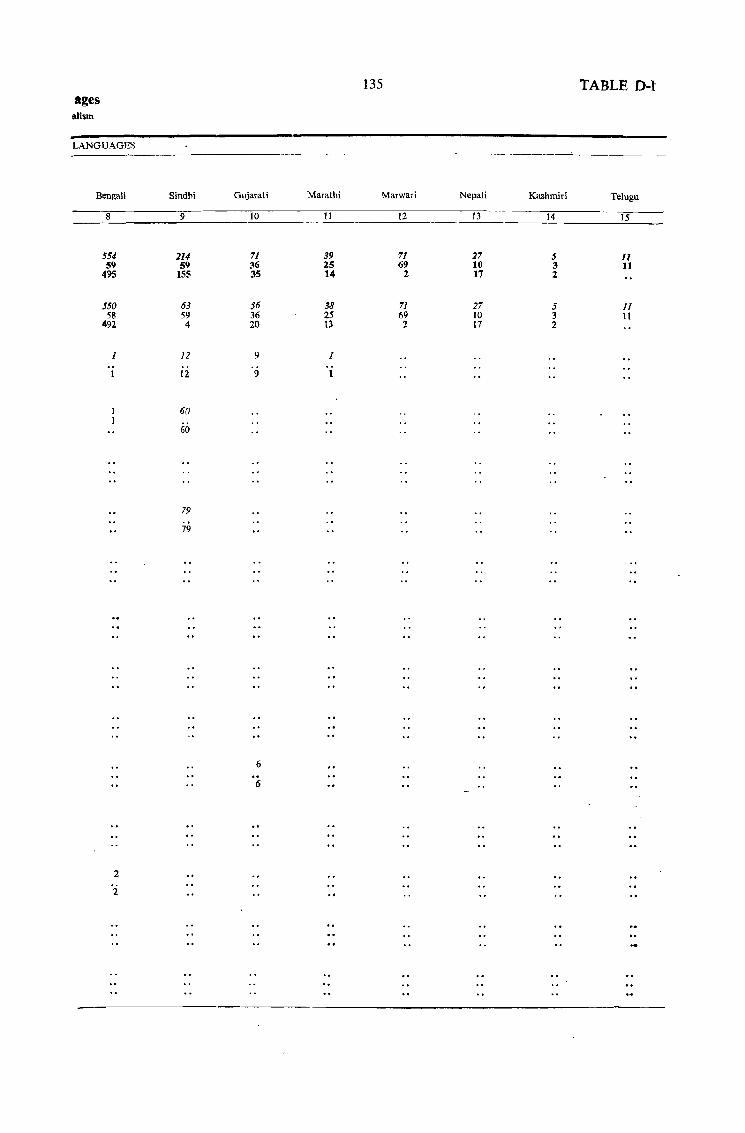
ages l\lism
LANGUAGES
Bengali
8
554 59
495
550 58
492
1
1
2
2
Sindhi
9
214 59
155
63 59 4
lZ
12
60
60
79
79
Gujarati
10
71 36 35
56 36 20
9
9
6
'6
135 TABLE D-I
Marathi Marwari Nepali Kashmiri Telugu
11 12 13 14 15
39 71 27 5 11 25 69 10 3 11 14 2 17 2
38 71 27 5 11 25 69 10 3 11 13 2 17 2
1
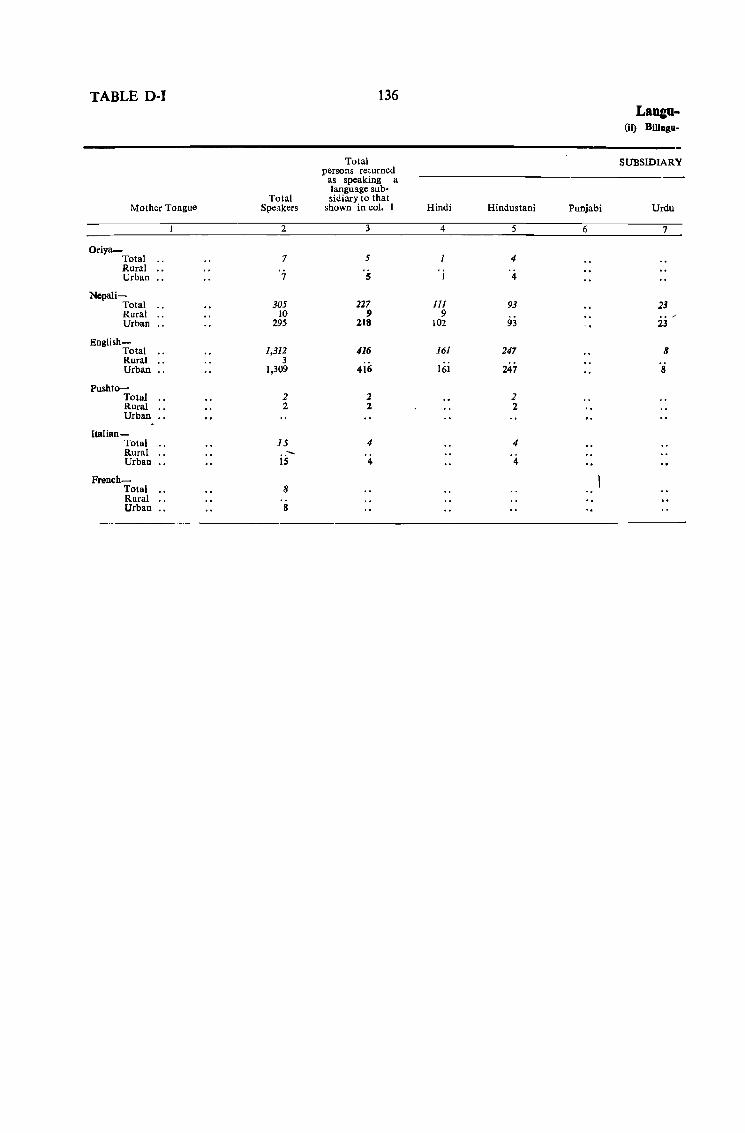
TABLE D-I 136 Lango-
(iI) BiliDgU-
Total persons returned
SUBSIDIARY
as speaking a language sub-
Total sidiary to tha t Mother Tongue Speakers shown in col. I Hindi Hindustani Punjabi Urdu
2 3 4 5 6 7
Oriya-Total .. 7 5 1 4 Rural '4 Urban 7 5 I
Nopali-Total 305 227 III 93 23 Rural 10 9 9 .. /
Urban .. 295 218 102 93 23
English-1,312 Total .. 416 161 247 8
Rural .. 3 ·s Urban 1,309 416 161 247
Pushto-Total 2 2 2 Rural 2 2 2 Urban
Italian-Total 15 4 4 Rural .. - '4 Urban 15 4
French-Total 8 Rural Urban 8
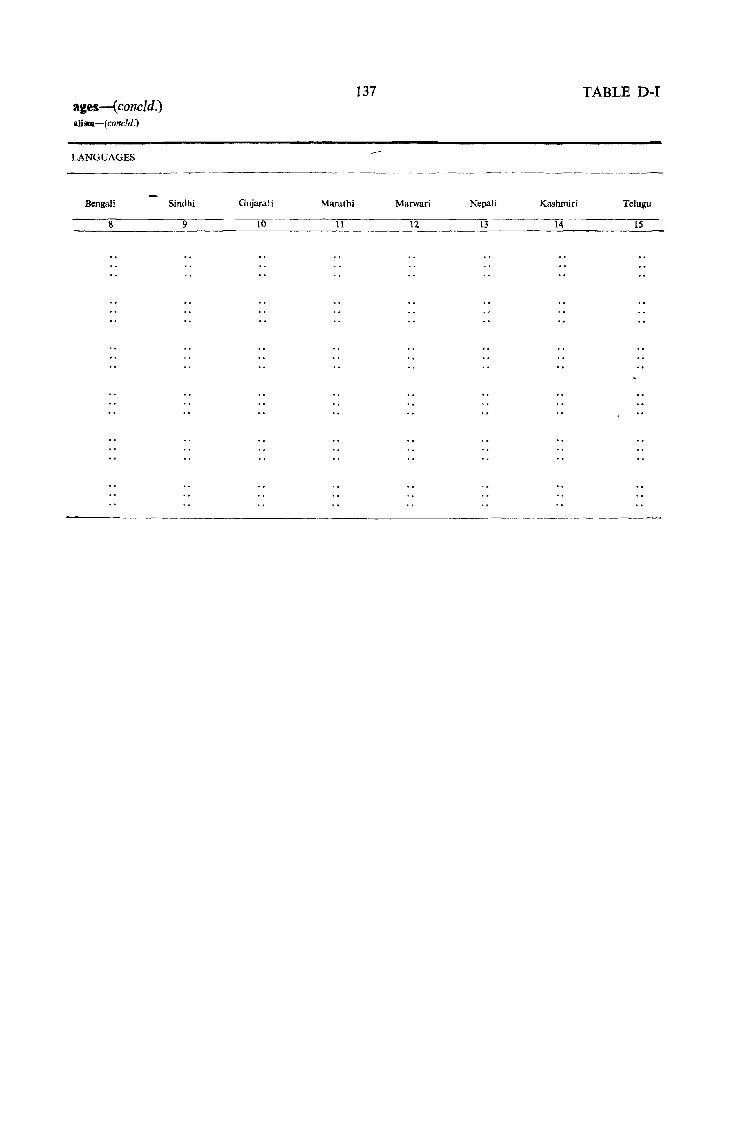
ages-( concld.) llliSlll-(concld.)
LANGUAGES
Bengali
8
Sindhi
9
Gujarati Marathi
10 11
137 TABLE D-I
Marwari Nepali Kashroid Telugu
12 13 14 1S
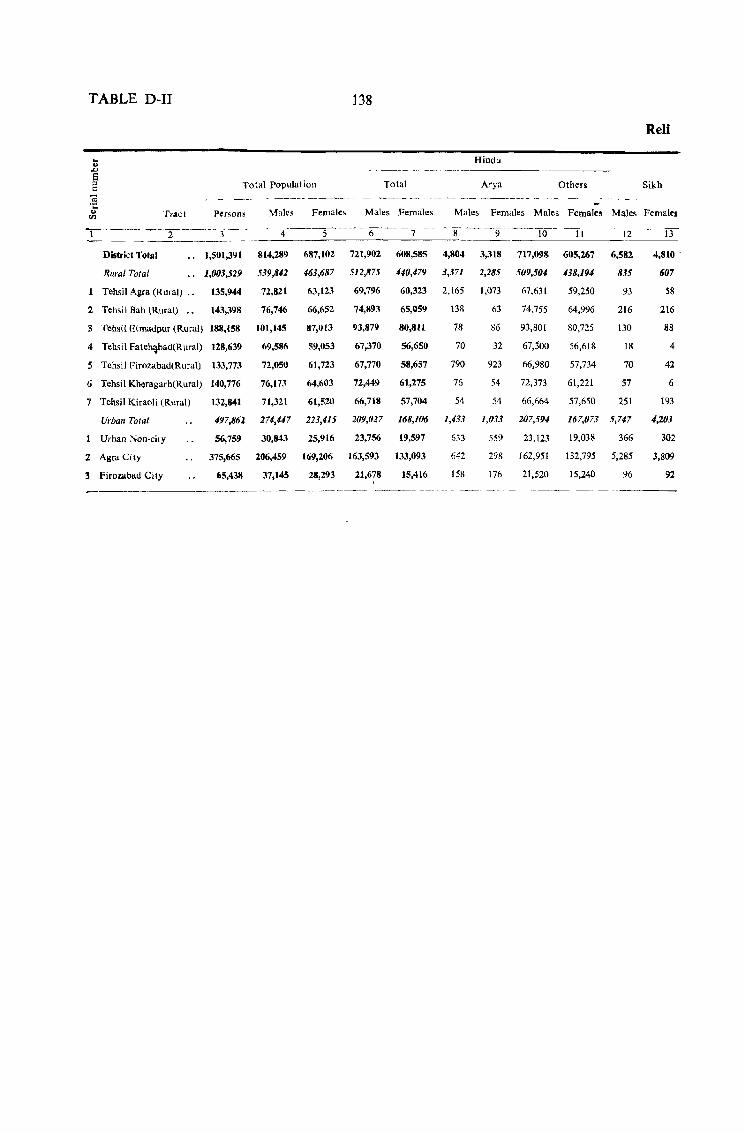
TABLE D-II 138
Reli
Hindu
Total Population Total Arya Others Sikh - _--_--------
Tract Persons Males Females Males Females Males Females Males Females Males Femalell
---2-----3---------- --------- ----
District Total 1,501,391 814,289 687,102 721,902 608,585 4,804 3,318 717,098 605,267 6,582
Rural Total 1,003,529 539,842 463,687 511,875 440,479 3,371 2,285 509,504 438,194 835
Tehsil Agra (Rural) .. 135,944 72,821 63,123 69,796 60,323 2,165 1,073 67,631 59,250 93
2 Tehsil Bah (Rural) .. 143,398 76,746 66,652 74,893 65,059 138 63 74,755 64,996 216
3 Tehsil Etmadpur (Rural) 188,158 101,145
4 Tehsi I Fatehllbad(Rural) 128,639 69,586
5 Tehsil Firozabad(Rural) 133,773 72,050
6 Tehsil Kheragarh(Rural) 140,776 76,173
132,841 71,321
87,013
59,053
61,723
64,603
61,520
93,879
67,370
67,770
72,449
66,718
80,811
56,650
58,657
61,275
57,704
78
70
790
76
54
86
32
923
54
54
93,801
67,500
66,980
72,373
66,664
80,725
56,618
57,734
61,221
57,650
130
18
70
57
251 7 Tehsil Kiraoli (Rural)
Urban Total 497,862 274,#7 213,415 209,017 168,106 J,4.13 1,033 207,594 167,07.1 .5,747
Urban Non-city
2 Agra City
3 Firozabad City
56,759 30,843 25,916 23,756 19,597
375,665 206,459 169,206 163,593 133,093
65,438 37,145 28,293 21,678 15,416
633
642
158
559 23,123 19,038 366
298 162,951 132,795 5,285
176 21,520 15,240 96
4,810 -
607
58
216
88
4
42
6
193
4,1.03
302
3,809
92
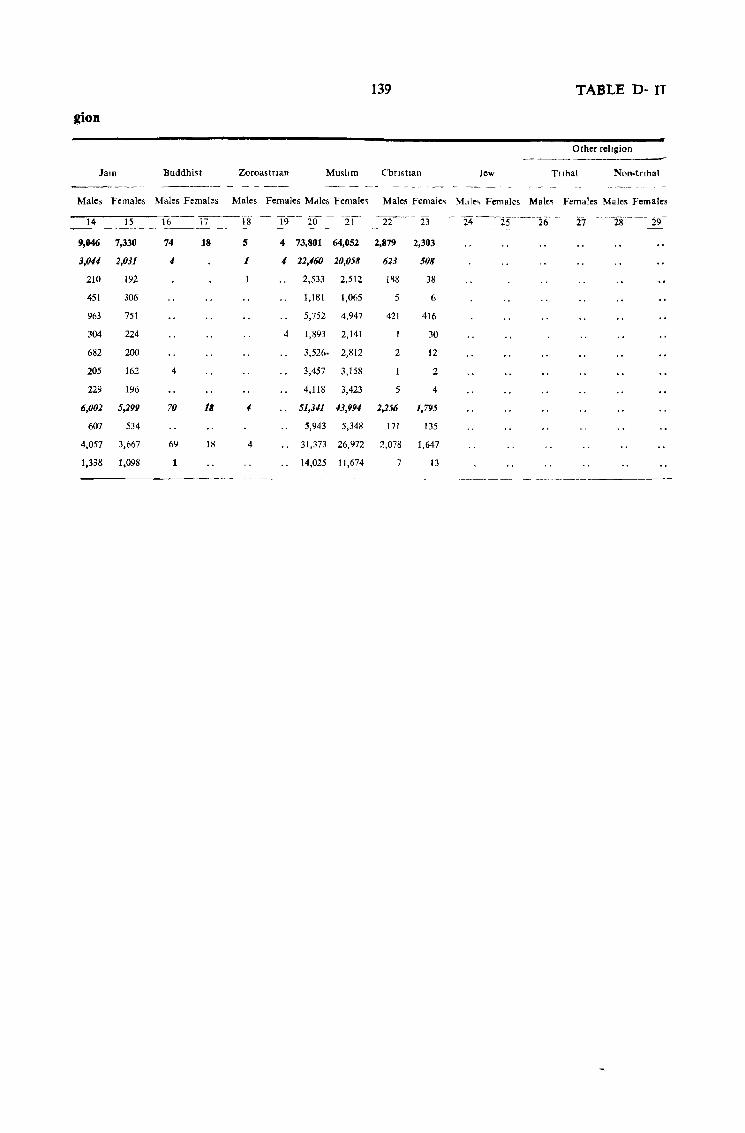
139 TABLE D- II
gion
Other reilgion
Jam Buddhist ZoroastTlan Muslim ChTlst.an Jew Tribal Non-tribal ------ - ~- - _-- ----- - --- - -----
Males Females Males Females Males Females Mdles Female~ Males Fcmale~ M"l~, Females Male~ Females Males Females
14 IS 16 17--]8- - 19-- 20- 21 ~-23 - 24--25--26- 27 --28 29 -- ---~---- -
9,046 7,330 74 18 5 4 73,801 64,052 2,879 2,303
3,0# 2,031 4 1 .f 22,460 20,058 623 508
210 192 2,533 2,512 188 38
451 306 1,181 1,065 5 6
963 751 5,752 4,947 421 416
304 224 4 1,893 2,141 30
682 200 3,526. 2,812 2 12
205 162 4 3,457 3,158 2
229 196 4,118 3,423 5 4
6,002 5,299 70 18 4 51,341 43,994 2,256 1,795
607 534 5,943 5,348 171 135
4,057 3,667 69 IS 4 31,373 26,972 2,078 1,647
1,338 1,098 1 14,025 11,674 7 13
- - -- - - ._-----__ -_ _ .. - .. ---- -------------
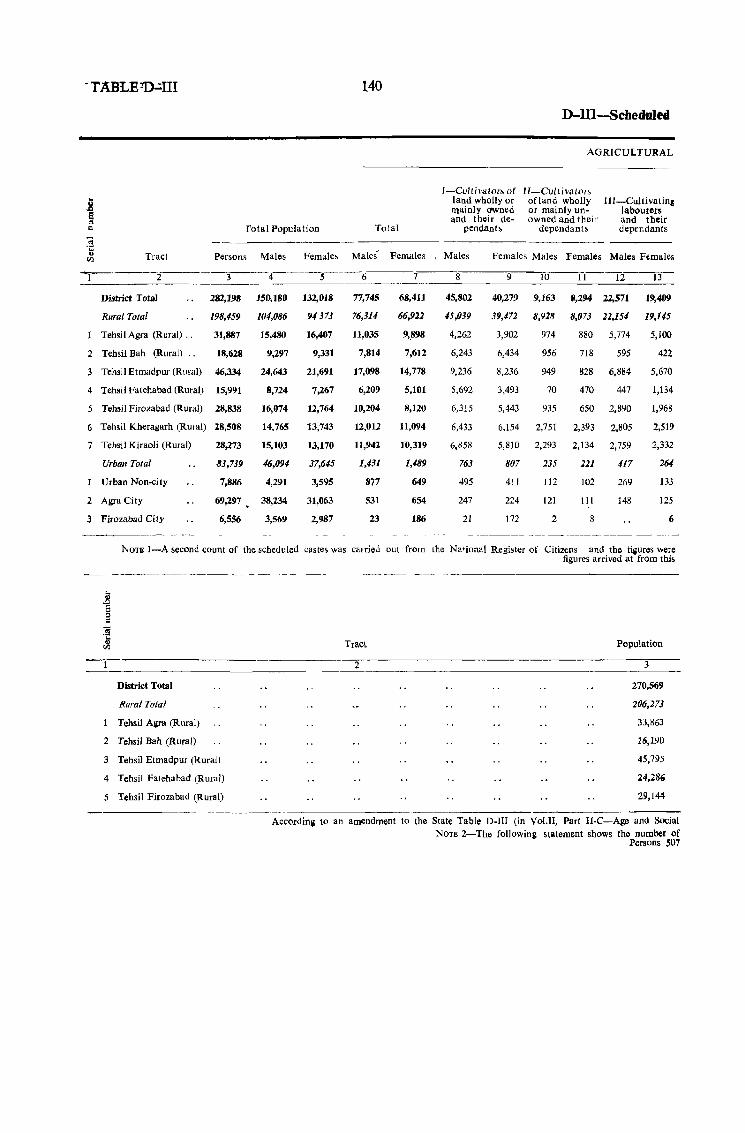
-TABLE n--III 140
I-Cultivator, of land wholly or mainly O'Wned and t hei r de-
D-IIl--ScbeduJed
AGRICULTURAL
lI-Ctiltivalol> of land wholly or mainly unowned and their
fatal Population Total pendant~ dependant'
HI-Culti vatinl labourers and their dependants
Tract Persons Males Female, Males Females Males Females Males Females Males Females
-1--- 2 3 4----5----6 7 8 9 10 11 12 13 --_ .. _--_ .. District Total 28.2.198 150,180 132,018 77,745 68,411 45,802 40,279 9,163 8,294 22,571 19,4()!l
Rural Total 198,459 104,086 94373 76,314 66,922 45,039 39,472 8,928 8,073 22,154 19,145
Tehsil Agra (Rural) .. 31,887 15,480 16,407 11,035 9,.898 4,262 3,902 974 880 5,774 5,100
2 Tehsil Bah (Rural) .. 18,628 9,297 9,331 7,814 7,612 6,243 6,434 956 718 595 422
3 Tehsil Etmadpur (Rural) 46,334 24,643 21,691 17,()!l8 14,778 9,236 8,236 949 828 6,884 5,670
4 Tehsil Fatehabad (Rural) 15,991 8,724 7,267 6,209 5,101 5,692 3,493 70 470 447 1,134
5 Tehsi1 Firozabad (Rural) 28,838 16,074 12,764 10,204 8,120 6,315 5,443 935 650 2,890 1,96B
6 Tehsil Kheragarh (Rulal) 28,508 14.765 13,743 12,012 11,094 6,433 6.154 2,751 2,393 2,805 2,519
7 Tehsil Kirao)i (Rural) 28,273 15,103 13,170 11,942 llJ,319 6,858 5,810 2,293 2,134 2,759 2,332
Urban Total 83,739 46,094 37,645 1,431 1,489 763 807 235 221 417 264
Urban Non-city 7,886 4,291 3,595 877 649 495 4Il Il2 102 269 133
2 AgraCity 69,297 38,234 31,063 531 654 247 224 121 111 148 125
:) Firozabad City 6,556 3,569 2,987 23 186 21 172 2 8 6
--.~---- - ~----~--- ----_----- - --NOTE I-A second count of th~ scheduled castes was c31ried out from the National Register of Citizens and the figures were
figures arrived at from this
District Total
Rural Total
Tehsil Agra (Rural)
2 Tehsil Bah (R ura I)
3 Tehsil Etmadpur (Rural)
4 Tehsil Fatehabad (Rural)
5 Tehsil Firozabad (Rural)
----__ - -- ----------------------------------
Tract
2
Population
3
270,569
206,273
33,863
16,190
45,795
24,286
29,144
According to an amendment to the State Table D-JII (in Vol.lI, Part H-C-Age and Social NOTE 2-The following statement shows the number of
Persons 507
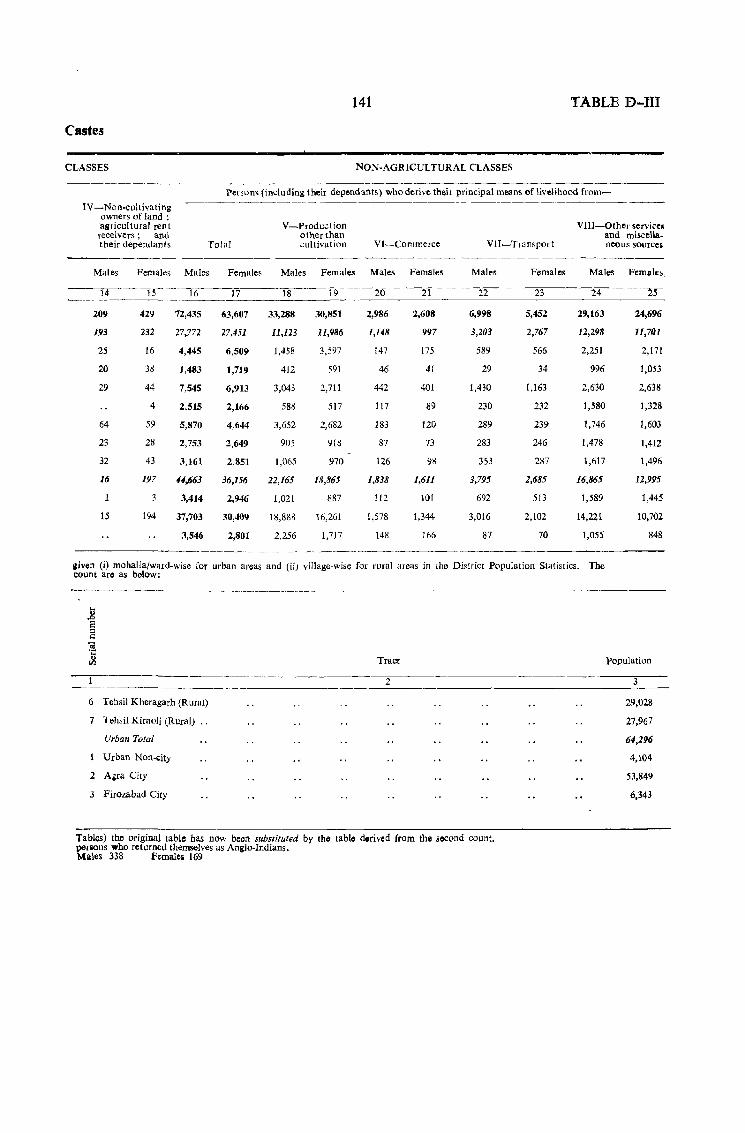
141 TABLE D-JII
Castes
CLASSES NON-AGRICULTURAL CLASSES
Per1Dn, (including their dependants) who derive their principal means of livelihood from~
IV -Non-cultivating ----~-------~.---- --
owners of land ; agricultural rent V-Production Vlll-Other services receivers; and other than and miscella-their dependants Total cultivation VI-Commerce VTI-Twnsport neous sources
-------Males Females Males Females Males Females Males Female~ Males Females Males Females,
14 15 16 17 18 19 20 21 22 23 24 25
209 429 72,435 63,607 33,288 30,851 2,986 2,608 6,998 5,452 29,163 24,696
193 232 27,772 27,451 11,123 11,986 1,148 997 3,203 2,767 12,298 11,701
25 16 4,445 6,509 1,458 3,597 147 175 589 566 2,251 2,171
20 3g 1,483 1,719 412 591 46 41 29 34 996 1,053
29 44 7,545 6,913 3,043 2,711 442 401 1,430 1,163 2,630 2,638
4 2,515 2,166 588 517 117 89 230 232 1,580 1,328
64 59 5,870 4,644 3,652 2,682 183 120 289 239 1,746 1,603
23 28 2,753 2,649 905 918 87 73 283 246 1,478 1,412
32 43 3,161 2,851 1,065 970 126 9g 353 2g7 1,617 1,496
16 197 #,663 36,156 22,165 18,865 1,838 1,611 3,795 2,685 16,865 12,995
3 3,414 2,946 1,021 887 112 101 692 513 1,589 1,445
15 194 37,703 30,409 18,888 16,261 1,578 1,344 3,{)16 2,102 14,221 10,702
3,546 2,801 2,256 1,717 148 166 87 70 1,055 848
----------~
!liven (i) mohalla/ward-wise for lIrban areas and (ii) village-wise for rural areas in the Dis!rict Population Statistics. The count are as below:
-------- - - ----- ---- -------~---- -_ - ----
Tract
2
6 Tehsil Kheragarh (RlIral)
7 Tahsil Kiraoli (Rural) .,
Urban Total
Urban Non-city
2 Agra City
3 Firozabad City
Tables) the original table has now been substituted by the table dorived from the second count, persons who returned themselves as Anglo-Indians. Males 338 Females 169
Population
3
29,028
27,967
64,296
4,104
53,849
6,343
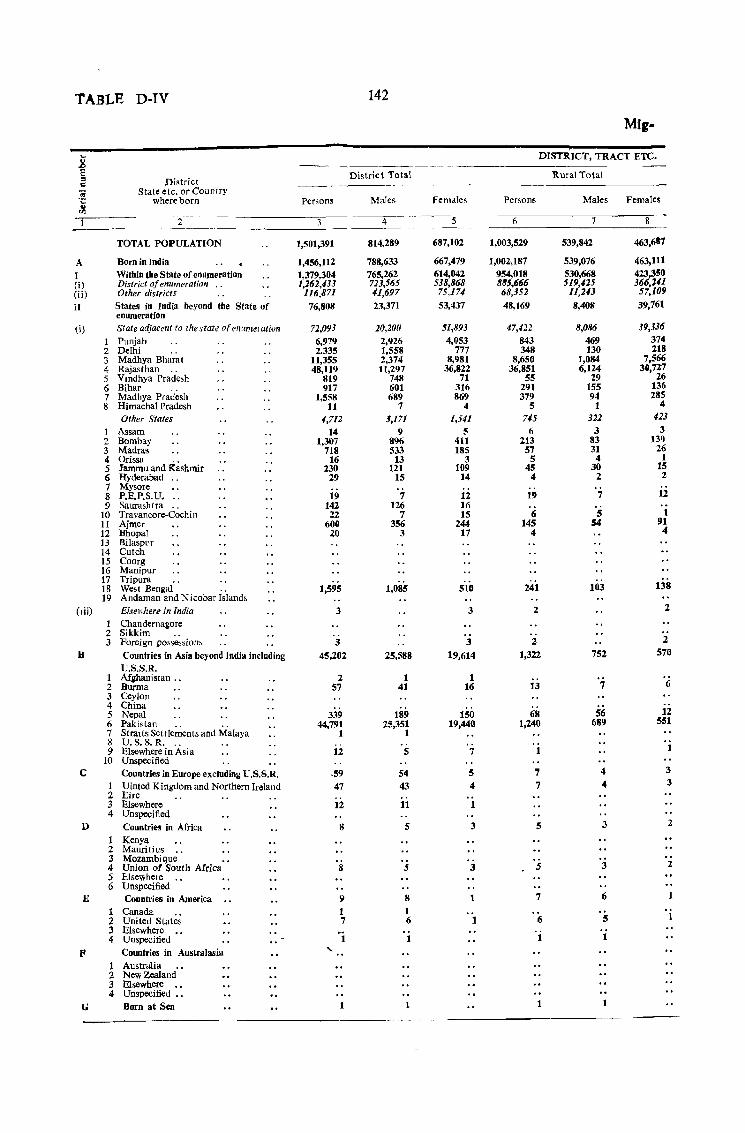
TABLE D-IV
~ " c District
State etc. or Country where born
i
TOTAL POPULATION
A Born in India I Within the State of enumeration (i) District of enumeration .. (i i) Other districts [[ States in India beyond the State of
enumeration (i) State adjacent to the state o{enrllnetation
(Iii)
I Punjab 2 Delhi 3 Madhya Bharat 4 Rajasthan .. 5 Vmdhya Pradesh 6 Bihar .. 7 Madhya Pradesh 8 Himachal Pradesh
Other States
I Assam 2 Bombay 3 Madras 4 Orissa .. 5 Jammu and Kashmir 6 Hyderabad 7 Mysore .. 8 P.E.P.S.U •.. 9 Saurashtra
10 Travancore-Cochin 11 Ajmer 12 Bhopal 13 Bilaspur 14 Cutch 15 Coorg 16 Manipur 17 Tripura .. 18 West Bengal .. 19 Andaman and Nicobar Island;
Elsewhere in India 1 Chandernagore 2 Sikkim .. 3 Foreign possessions
U Countries in Asia beyond India including U.S.S.R.
1 Afghanistan .. 2 Burma 3 Ceylon 4 China 5 Nepal 6 Pakislan .. 7 StraIts Settlements and Malaya 8 U.S.S.R. .. " 9 ElsewhereinAsia
10 Unspecified C iConntries in Europe excluding U.S.S.R.
1 Uinted Kingdom and Northern Ireland 2 Eire .. " .. 3 Elsewhere 4 Unspecified
D Counlrie!! in Africa 1 Kenya 2 Mauritius •. 3 Mozambique •• 4 Union of South Africa 5 Elsewhere 6 Unspecified
I> Countries in America
G
1 Canada .. 2 United States 3 Elsewhere •• 4 Unspecified
Countries in Australasia 1 Australia 2 New Zealand 3 Elsewhere •• 4 Unspecified ••
Born at Sea
Person~
1,501,391
1,456,112 1,379,304 1,161,433
116,871
76,808
72,093 6,979 2.335
11,355 48,119
819 917
1,558 11
1,711 14
1,307 718
16 230
29
19 142 22
600 20
1,595
3
3
4'5,202
2 57
339 44,791
1
12
.59
47
'-
12
8
8
9 1 7
1
1
142
District Total
Males
4
814,289
788,633 765,262 713,565 41,697 23,371
20,200
2,926 1,558 2,374 11,297
748 601 689
7 $,171
9 896 533
13 121
15
7 126
7 356
3
1,085
25,588
1 41
189 25,351
1
5
54 43
11
5
8 1 6
1
1
5
687,102
667,479 614,042 538,868
75,174
53,437
51,893 4,053
777 8,981
36,822 71
316 869
4 1,541
5 411 185
3 109
14
12 16 15
244 17
510
3
3 19,614
1 16
150 19,440
7
5 4
1
3
3
1
1
Mig-
DISTRICT, TRACT ETC.
Persons
6
1,003,529
1,002,187 954,018 885,666 68,352
48,169
17,422
843 348
8,650 36,851
55 291 379
5 7<15
6 213
57 5
45 4
19
6 145
4
241
2
2 1,322
13
68 1,240
1
7 7
5
5
7
6
1
1
Rural Total
Males
7
539,842
539,076 530,668 519,125
11,213
8,408
8,086
469 130
1,084 6,124
29 155 94
1 322
3 83 31
4 30
2
7
5 54
103
752
7
56 689
4
" 3
3
6
5
1
1
Females
8
463,687
463,111 423 350 366:JI1
57,109
39,761
39,336 374 218
7,566 30,727
26 136 285
4 ./23
3 131)
26 1
15 2
12
1 91
"
138
2
2 570
6
12 551
1
3 3
2
2
. i
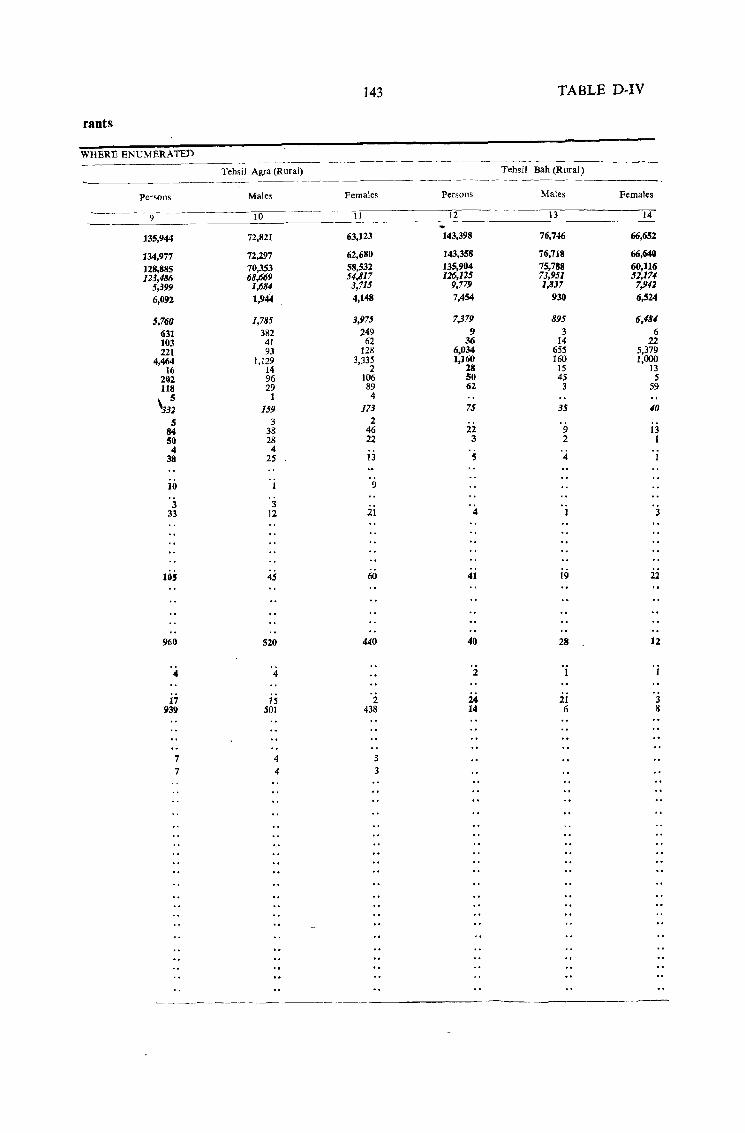
143 TABLE D-IV
rants
WHERE ENUMERATED ------~---------
- ------~-
Tehsil Agra (Rural) Tehsil Bah (Rural) --_-----
Persons Males Females Persons Males Females
9 10 11 12 13 14
135,944 72,821 63,123 143,398 76,746 66,652
134,977 72,297 62,680 143,358 76,718 66,640
128,885 70,353 58,532 135,904 75,788 60,116 123,486 68,669 54,317 116,125 73,951 51,174
5,399 1,684 3,715 9,779 1,837 7,942
6,092 1,944 4,148 7,454 930 6,524
5.760 1,785 3,975 7,379 895 6,484
631 382 249 9 3 6 103 41 62 36 14 22 221 93 128 6,034 655 5,379
4,464 1,129 3,335 1,160 160 1,000 16 14 2 28 15 13
202 96 106 SO 4S S 118 29 89 62 3 59
5 1 4
'.m 159 173 75 3S 40
5 3 2 84 38 46 22 9 13 50 28 22 3 2 1
4 4 ij 38 25 5 4 1
10 1 9
3 3 33 12 21 4 1 3
10.5 4S 60 41 19 22
960 520 440 40 28 12
.. 4 2 'i . i
17 is 2 24 21 3 939 501 438 14 6 8
7 4 3
7 4 3
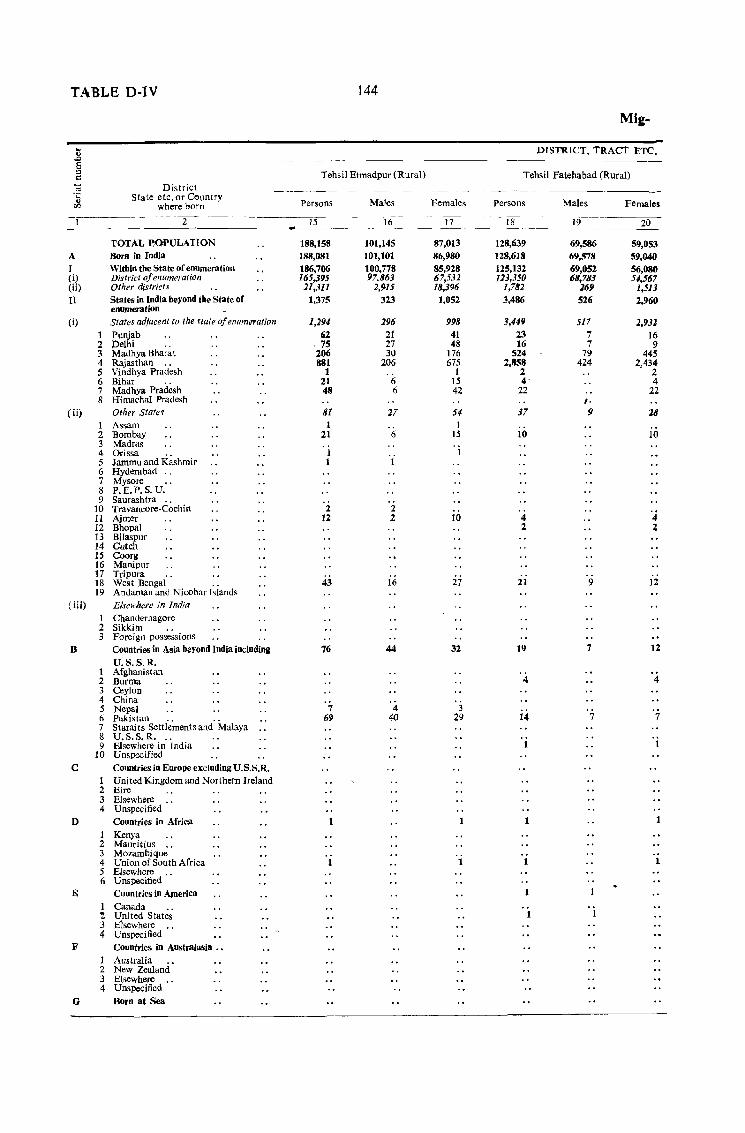
TABLE D·IV
District State etc. or Country
where born
144
Tehsil Etmadpur (Rural)
Persons Males
.,..-------'----2- -------,1-;;5----' -16---
TOTAL P,opULATlON A Born in India I Witbin tbe State of enumeration (i) District of enumeration (ii) Other districts II States in India beyond tbe State of
enumeration (i) States ruliacenl to the flate of enumeration
1 Punjab 2 Delhi 3 Madhya Bharat 4 Rajasthan .. 5 Vindhya Pradesh 6 Bihar 7 Madhya Pradesh 8 Himachal Pradesh
(ii) Other Statef 1 Assam 2 Bombay 3 Madras 4 Orissa 5 Jammu and Kashmir 6 Hyderabad " 7 Mysore 8 P. E.P. S. U. 9 Saurashtra "
10 Travancore-Cochin 11 Ajmer 12 Bhopal 13 Bilaspur 14 Cutch IS Coorg 16 Manipur 17 Tripura 18 West Bengal .. 19 Andaman and Nicobar hlands
(iii) Elsewhere in India
B
1 Chandernagore 2 Sikkirn 3 Foreign possessions
Countries in Asia beyond India includina
U.S.S.R. 1 Afghanistan 2 Burma 3 Ceylon 4 China 5 Nepal 6 Pakistan .. 7 Staraits Settlements and Malaya 8 U.S.S.R ... 9 Elsewhere in j ndia
10 Unspecified
C Countries in EUrope excluding U.S.S.R.
D
E
t United Kingdom and Northern Ireland 2 Eire 3 Elsewhere 4 Unspecified
Countries in Africa 1 Kenya 2 Mauritius .. 3 Mozambique 4 Union of South Africa 5 Elsewhere .. 6 Unspecified
Countries in America
1 Canada 'Z United States 3 Elsewhere 4 Unspecified
F Countries in Australasia .•
1 Australia 2 New Zealand 3 Elsewhere 4 Unspecified
G Born at Sea
188,158 188,081 186,706 165,395
21,311
1,375
1,294
62 .75 206 881
1 21 48
81 1
21
1 1
2 12
43
76
7 69
1
1
101,145 101,101 100,778 97.863
2,915 323
196 21 27 30
206
6 6
27
6
2 2
16
44
4 oW
Mig-
DISTRICT, TRACT ETC.
Tehsil Fatehabad (Rural)
Females Persons
--1-7--- 18 ---
87,013 86,980 85,928 67,532 18,396
1,052
998
41 48
176 675
1 15 42
54 1
15
10
27
32
3 29
1
1
128,639 128,618 125,132 113,350
1,782 3,486
3,449
23 16
524 2,858
2 4'
22
37
10
4 2
21
19
4
14
1
1
1
1
1
Males
19
69,586 69,578
69,052 68,783
169 526
517 7 7
79 424
,. 9
9
7
7
Females
20
59,053 59,040 56,080 54,567
1,513 2,960
2,932 16 9
445 2,434
2 4
22
28
10
12
12
4
7
1
1
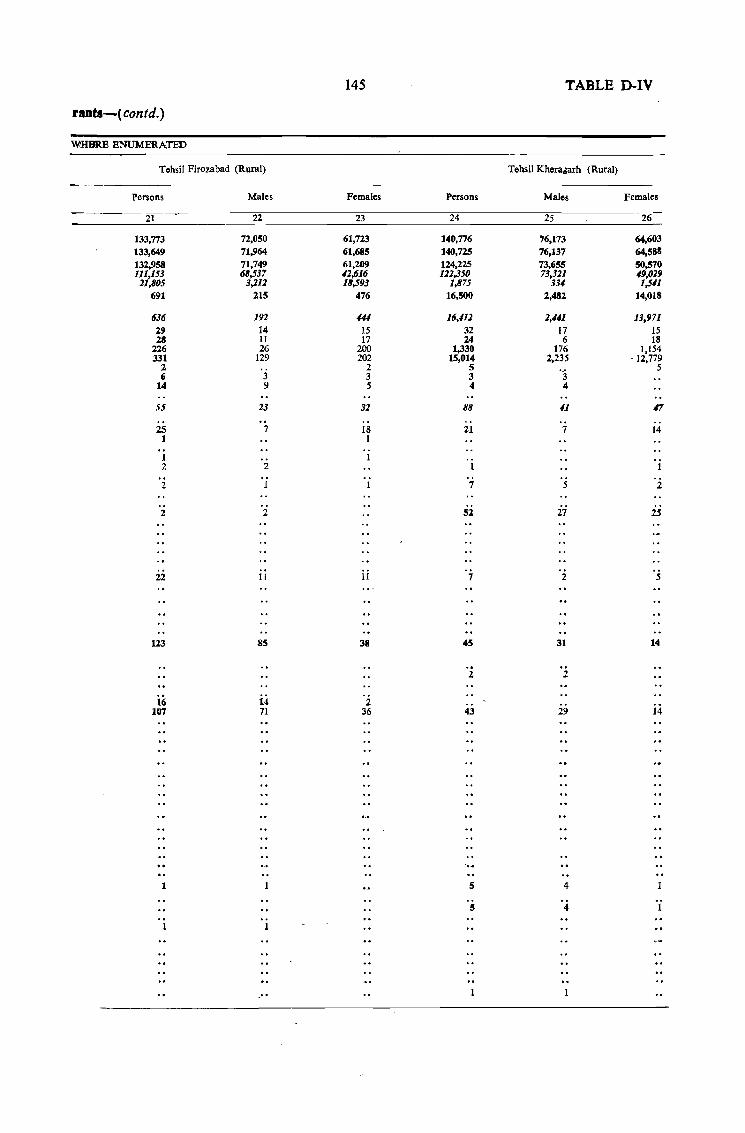
rants-( contd.)
WHBRE ENUMERATED
Tehsil Firozabad (Rural)
Persons
21
133,773 133,649 132,958 111,153
21,805 691
636 29 28
226 331
2 6
14
55
25 1
I 2
2
2
22
113
16 107
1
1
Males
22
72,050 71,964 71,749 68,537
3,212 215
192 14 11 26
129
3 9
23
7
2
2
II
85
14 71
, ..
145
Females
23
61,723 61,685 61,209 </2,616 18,593
476
</# 15 17
200 202
2 3 5
32
18 1
1
11
38
2 36
TABLE D-IV
Tehsil Khera&arh (Rural)
Persons Males Females
24 25 26
140,776 76,173 64,603 140,725 76,137 64,588 124,225 73,655 50,570 122,350 73,321 </9,029
1,875 331 1,5</1 16,500 2,482 14,018
16,412 2,#1 13,971 32 17 15 24 6 18
1,330 176 1,154 15,014 2,235 ' 12,779
5 ·3 5 3 4 4
88 41 17
21 7 14
1
7 5 2
52 27 25
7 2 5
45 31 14
., 2 2
43 29 14
5 4
5 4
1
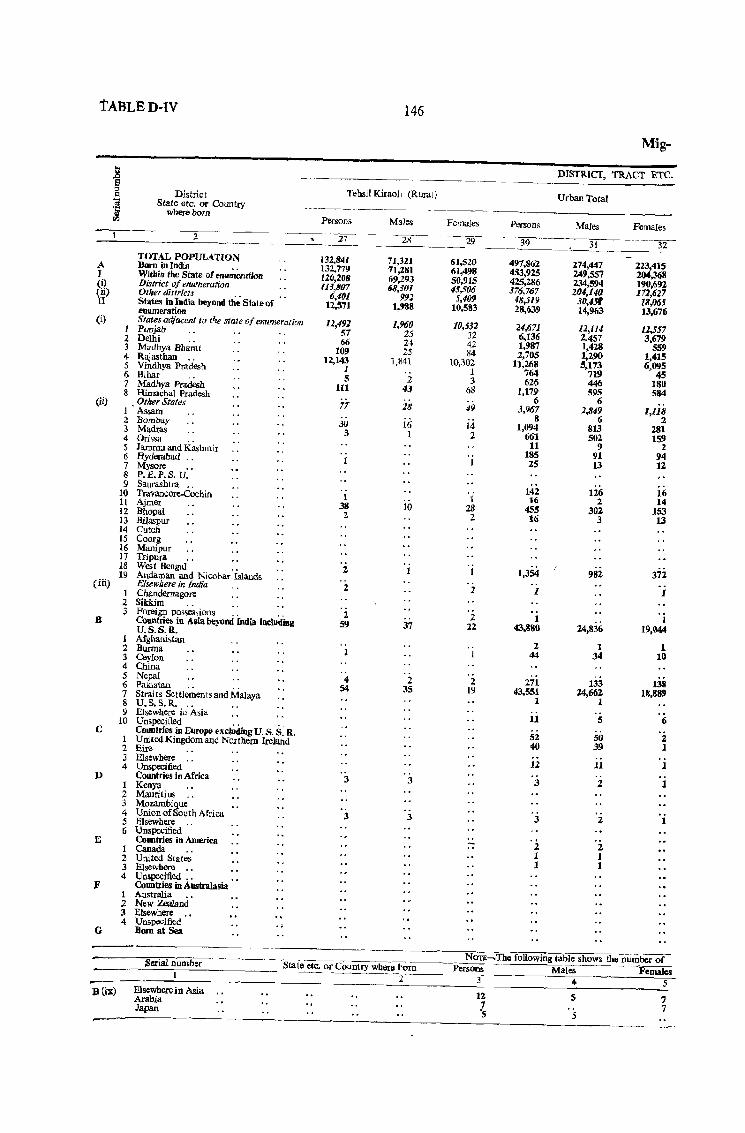
tABLBD-IV 146
A I (i) (Ii) II
(i)
(ii)
(iii)
B
c
D
E
F
G
Mig-
DISTRICT, TRACT ETC.
District Tebsil Kiraoll (Rural) Urban Total State etc. or Country where born ------------------------------- ----------------------------
2
TOTAL POPULATION Born in India .. Within the State of enumeration District of enumeration Olher districts .. States in India beyond the State of enumeration States adjacent to the state o{ enumeration
J Punjab 2 Delhi 3 Madhya Bharat 4 Rajasthan .. 5 Vindhya Pradesh 6 Bihar 7 Madhya Pradesh 8 Himachal Pradesh
Other States l . Assam 2 Bombay 3 Madras 4 Orissa .. 5 Jammu and Kashmir 6 Hyderabad .. 7 Mysore .. 8 p.E.P.S. U. 9 Saurashtra ..
10 Travancore-Cochin 11 Ajrner 12 Bhopal 13 Bilaspur 14 Cutch 15 Coorg 16 Manipur 17 TIipura 18 West Bengal .. 19 Andaman and Nicobar Islands
Elsewhere in India 1 Cbandemagore 2 Sikkim 3 Foreign possessions . . . .
COIIntries in Asia beyond. India including U.S.S.R.
1 Afghani~tan 2 Burma 3 Ceylon 4 China 5 Nepal 6 Pakistan 7 Straits Settlements and Malaya 8 U.S.S.R •. , 9 Elsewhere in Asia
10 Unspecified .. '. Countries in Europe excJuding U. S. S. R.
1 United Kingdom and Northern Ireland 2 Eire 3 Elsewhere 4 Unspecified
Countries in Africa 1 Kenya 2 Mauritius 3 Mozambique 4 UnionQfSouthAfrica j Elsewhere 6 Unspecified
Countries in America 1 Canada 2 United States 3 Elsewhere 4 U nspocified ..
Countries in Australasia 1 AustI3lia 2 New Zealand 3 Elsewhere 4 Unspecified .•
Born at Sea
Persons
27
132,841 132,779 120,208 113,807
6,401 12,571
11,491 51 66
109 12,143
1 5
III
77
3lJ 3
1 38
1.
2
2
2 59
1
4 54
3
3
Males
28
71,321 71,281 69,293 68,JOI
992 1,988
1,960 25 24 25
J,841
2 43
28
ii; 1
10
37
2 3S
3
3
Females
29
61,520 61,498 511,915 45,506 5,W9
10,583
10,532 32 42 84
10,302 1 3
68
49
i4 2
1 28 2
1
2
2 22
2 19
Persons
30
497,862 453,925 425,286 376,767
48,519 28,G3!l
24,671 6.136 1,987 2,705
11,268 764 626
1,179 6
3,967 8
1,094 661
11 185 2S
142 16
455 16
1,354
1
1 43,880
2 44
271 43.,551
1
11
52 40
12
3
3
2 I 1
Males Females
31
274,441 249,557 234,594 204,140 3fJ,4sf' 14,963
12,114 2,457 1,428 1,2.90 5,173
719 446 595
6 2,8<19
6 813 502
9 91 13
126 2
302 3
982
24,836
1 34
133 24,662
1
S
50 39
11
2
2
2 1 1
32
223.,415 204,368 190,692 172,627
18,065 13,676
12,557 3,679
559 1,415 6,095
45 180 584
1,118 2
281 159
.2 94 12
16 14
153 13
372
1
I 19,044
1 10
138 18,889
6
2 1
1
1
1
NOTIl~ The following table shows the number of Serial number State etc. or Country whenJ "om Persons Males Females
------------~1~---------------------------------O2-------- 3 4 5
ElsewhereinAsia 12 5 7 B(ix) A~ 7 7 Japan .s
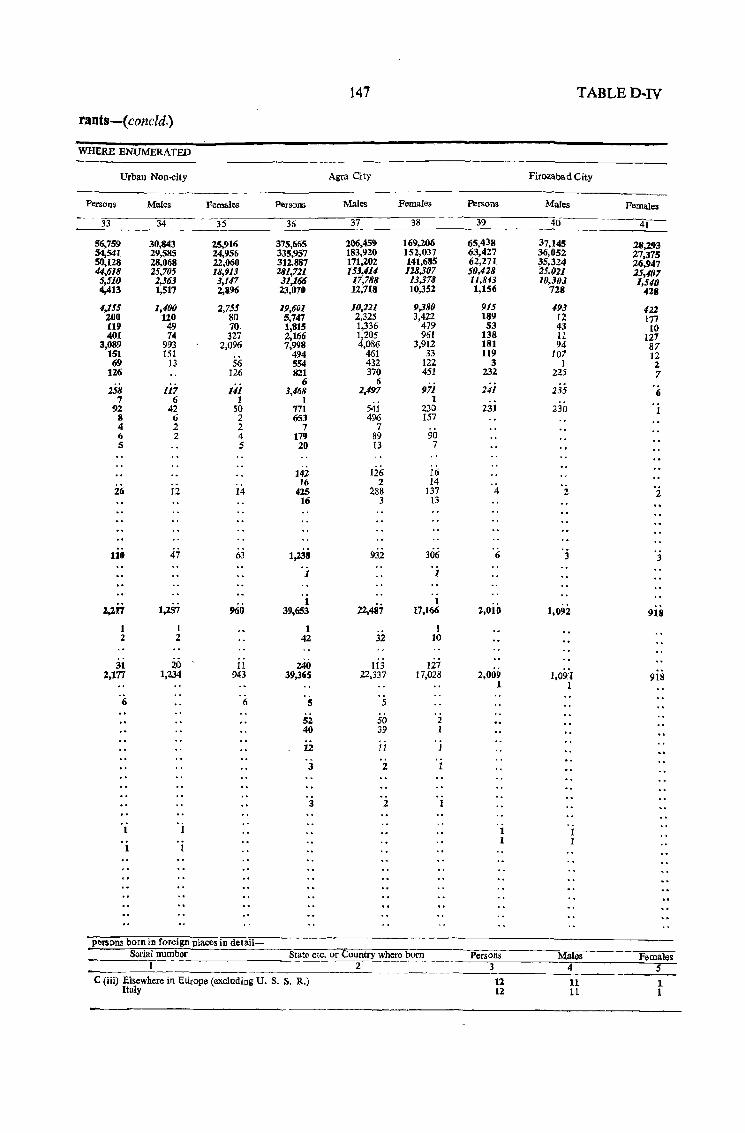
147
rants-(concld.)
WHERE ENUMERATED
Urban Non-city Agra City
Persons Males Females Persons Males Females
33 34 35 36 37 38
56,759 30,843 25,916 375,665 206,459 169,206 54,541 29,585 24,956 335,957 183,920 152,037 50,128 28,068 22,060 312,887 171,202 141,685 44,618 25,705 18,913 281,711 153,414 128,307 5,510 1,$63 3,117 31,166 17,788 13,378 4,413 1,517 2,896 23.070 12,718 10,352
4,155 1,100 2,755 19,601 10,221 9,380 200 120 80 5,747 2,325 3,422 Ll9 49 10. 1,815 1,336 479 401 74 327 2,166 1,205 961
3,089 993 2,096 7,998 4,086 3,912 151 151 494 461 33
69 13 56 554 432 122 126 126 821 370 451
Iii 6 6
258 117 3,468 2,497 971 7 6 1 1 1
92 42 50 771 541 230 8 6 2 653 496 157 4 2 2 7 7 6 2 4 179 89 90 5 5 20 13 7
142 126 iii 16 2 14
26 12 14 425 ~88 137 16 3 13
110 47 63 1,238 9:ii 306
'j 1
1,257 1
22,487 1
%,117 960 39,653 17,166
1 I I 1 2 2 42 32 10
31 20 11 240 113 127 2,177 1,234 943 39,365 22,337 17,028
6 6 5 5
52 SO 2 40 39 1
12 ii 1
3 2 1
3 2
1 1
1
persons born in foreign ]llaces in detail &rial number Stat" etc, or Country where born
C (iii) Elsewhere in EUrope (excluding U, S. s, R,) Italy
2
Persons
39
65,438 63,427 62,271 50,428 lI,8"3 1,156
915 189 53
138 181 119
3 232
14i
231
4
'6
2,010
2,009 1
1 1
Persons 3
12 12
TABLED·IV
Firozabad City
Males
40
37,145 36,052 35,324 "25,021 10,303
728
191 12 43 11 94
107 1
225
235
230
2
3
1,092
l,O~J 1
1 1
Males 4
11 11
Females
41
28,293 27,375 26,947 15,407 1,5</0
428
121 177 10
127 87 12 2 7
6
' i
'2
'j
918
918
Females 5
1 1
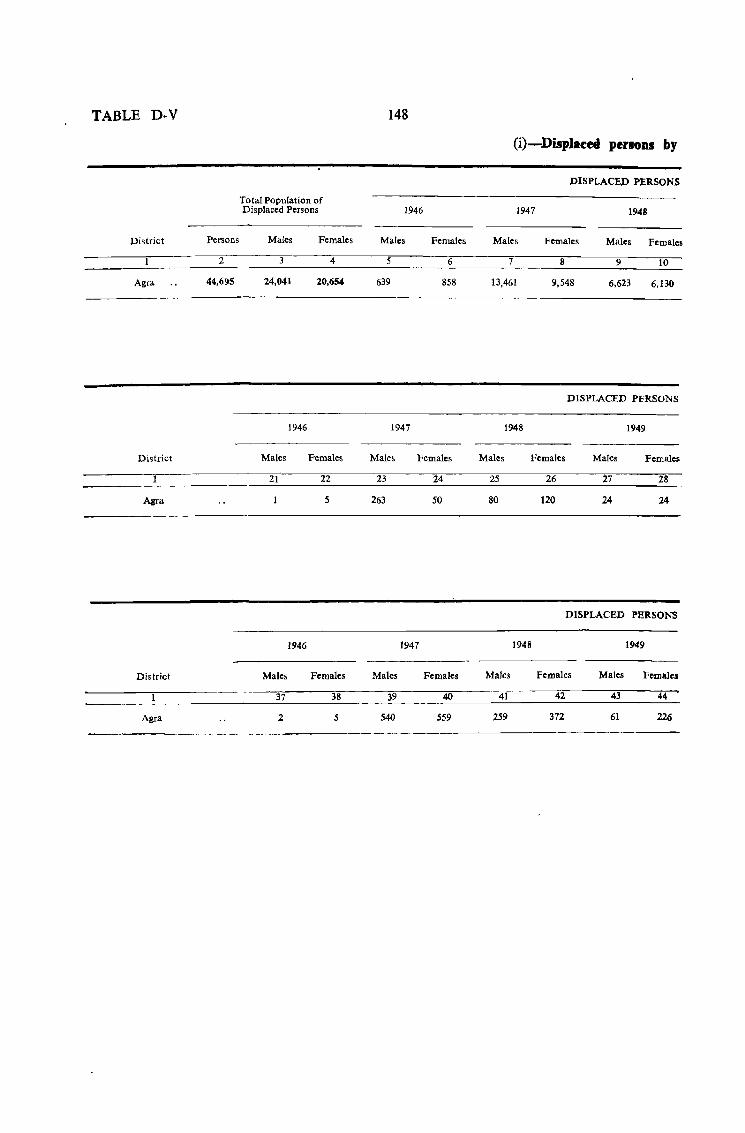
TABLE D-V 148
(i)-DispJaeed penODS by
DISPLACED P'ERSONS
Total Population of Displaced Persons 1946 1947 1948
District Persons Males Females Males Females Males Females Males Females
2 4 5 6 7 8 9 10
Agra 44,695 24,041 20,654 639 858 13,461 9,548 6,623 6,130
DISPLACED PERSONS
1946 1947 1948 1949
District Males Females Males Females Males Females Males Females
21 22 23 24 25 26 27 28
Agra s 263 50 80 120 24 24
DISPLACED PERSONS
1946 1947 1948 1949
District Males Females Males Females Males Females MaJes Females
37 38 39 40 41 42 43 44
Agra 2 5 540 559 259 372 61 226
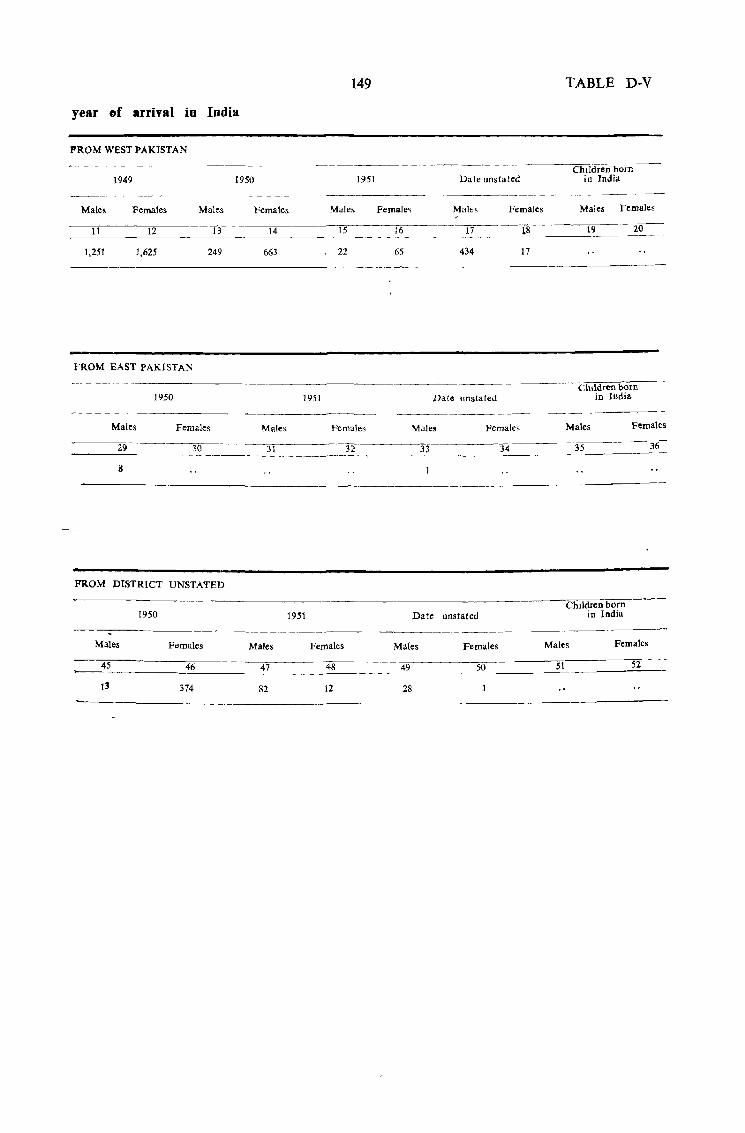
year of arrint in India
PROM WEST PAKISTAN
1949 1950
Males Females Males Females
11 12 13 14
1,251 1,625 249 663
FROM EAST PAKISTAN
1950 1951
Males Females
149
1951
Males
15 16
22 65
Females
Date unstated
Males Females
17 18
434 17
Date unstated
Males Females
TABLE D-V
Children born in India
Males Females
19 20
Children born in India
Males Females
29 30 31 32 33~--------~34'---------'35----------~-----------------~------~~------~=-~----~
8
FROM DISTRICT UNSTATED
Children born 1950 1951 Date unstated in India
Males Females Males Females Males Females Males Females
45 46 47 48 49 50 51 52
13 374 82 12 28
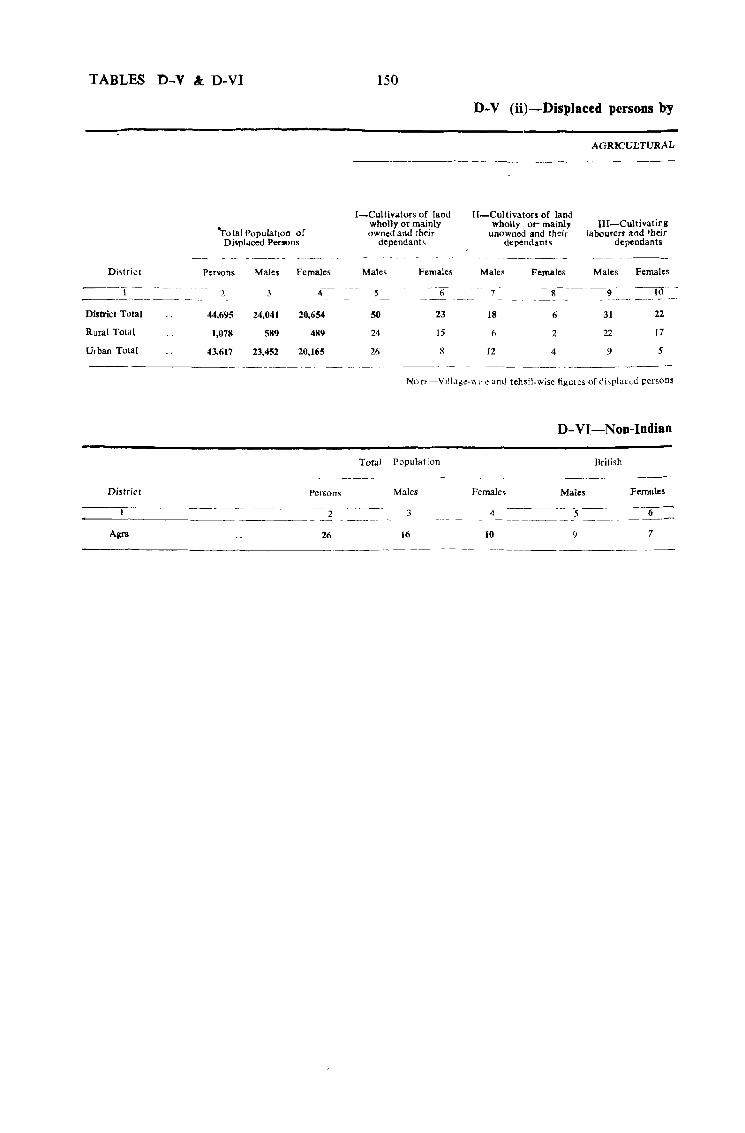
TABLES !>-Y k D-VI
Di.trict
---T-- -----------~-----
District Total
Rural ToM
Urban Total
District
----1--
'rotal Population of Displaced Persons
Persons Males Females
2 4
44,695 24,041 20,654
1,0711 589 489
43.617 23,452 20,165
Persons
2
26
150
I-Cultivators of land wholly or mainly owned and Ehf'ir
dependanb
Males Females
-----6
50 23
24 15
26 8
D-V (ii)-Displaced persons b,
II-Cultivators of land wholly or- mainly
unowned and their dependants
Males Females
AGRlCVI.;TURAL
lII-Cultivating labourers and their
dependants
Males Females
- 8-------9- 10
18
6
12
6
2
4
31
22
9
22
17
5
NOTF-Vlil,lge-\\ ,. e and tehsil-wise figures of displacLd persons
D-VI-Non-Indian
Total Population British
Males Fernale~ Males Females
3
16 10 9 7
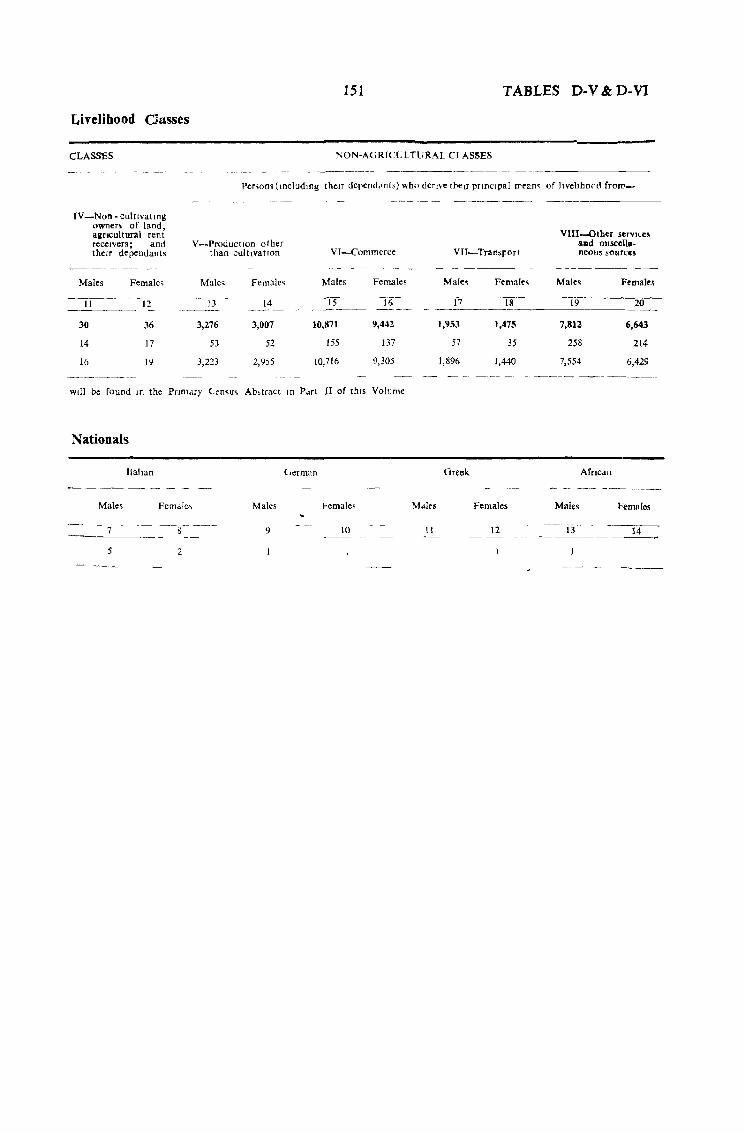
151 TABLES D-V & D-VI
Livelihood Classes
CLASSES NON-AGRICULTURAL CLASSES
Per~on~ (lncludtng {hen dependJnts) who dertve thelT prmclpal rr~"m of ltvehhord frorn_
IV-Non - cultlVatlng owners of land, agricultural rent receIvers; and their dependants
Males Fernale,
----II 12
30 36
14 17
16 19
V-ProductlOn other than cultivation
Male, Female.
13 14 ---- -----3,276 3,007
53 52
3,223 2,955
VJ-Commerce
Males Females
~15 16 ~-~~
10,871 9,442
155 137
10,716 9,305
Will be found m the Pn01ary (en'lls Ab,tract In Part U of thIS Volume
Nationals
lIahan German
-------
Male, Males l'crnales
7 9 10
5 2
VlII-Otl,er sefVKes alld mlsc~lla.
VTI-Transport nrous soureu
----- ------ -~
Male. Fernales Male. Females
17 -18- 19 20
1,953 1,475 7,812 6,643
57 35 258 214
1,896 1,440 7,554 6,429
Greek Afncan
Females Males Females
11 12 14
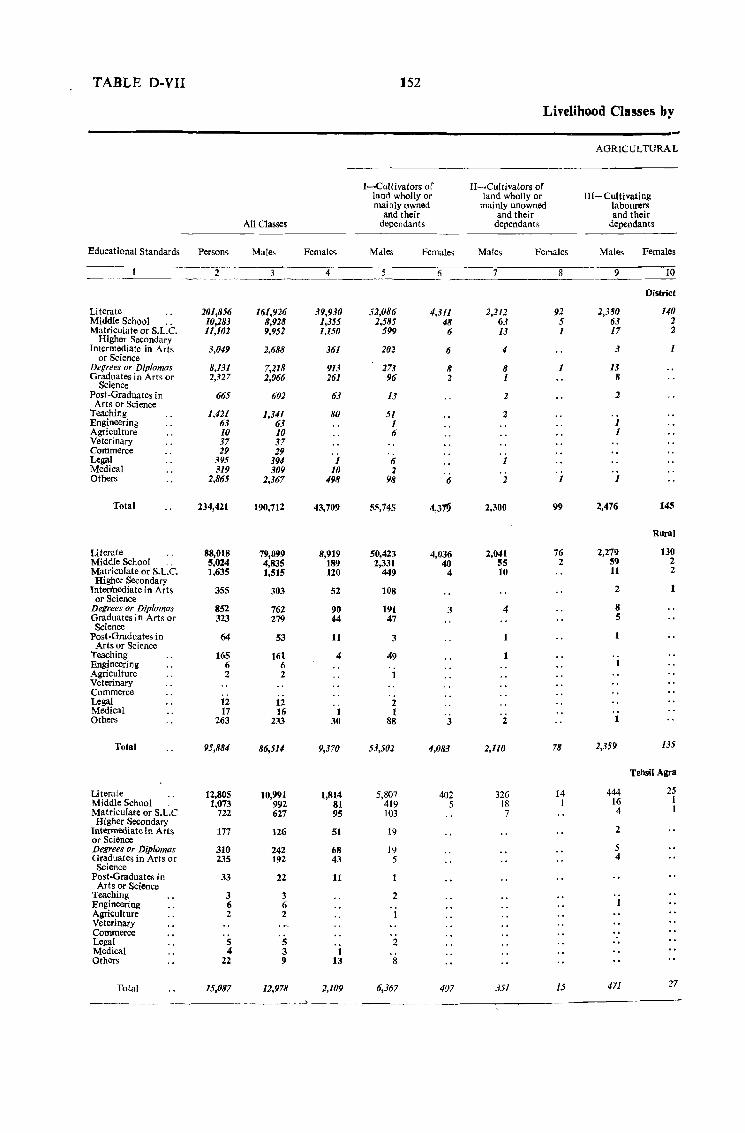
TABLE D-VII 152
Livelihood Classes by
AGRICULTURAL
I-Cultivators of II-·Cultivators of land wholly or land wholly or III- Cultivating mainly owned mainly unowned labourers
and their and their and their All Classes dependants dependants dependants
Educational Standards Person, Males Femal~ Males Female, Males Females Males Females
2 3 4 5 6 7 8 9 10
District
Literate 201,856 161,926 39,930 52,086 4,311 2,212 92 2,380 140 Middle School 10,283 8,928 1,355 2,585 48 63 5 63 2 Matriculate or S.L:C. 11,102 9,952 1,150 599 6 13 1 17 2
Higher Secondary Intermediate in Arts .1,049 2,688 361 202 6 4 3 1
or Science Degrees Or Diplomas 8,131 7,218 913 273 8 8 1 13 Graduates in Arts or 2,327 2,066 261 96 2 1 8
Science Post-Graduates in 665 602 63 13 2 2
Arts or Sci ence Teaching 1,421 1,341 80 51 2 Engineering 63 63 1 1 Agriculture 10 10 6 1 Veterinary 37 37 Commerce 29 29 Legal 395 394 1 6 1 Medical 319 309 10 :2 Others 2,865 2,367 498 98 6 2 1 1
Total 234,421 190,712 43,709 55,745 4,311) 2,300 99 2,476 145
Rural
Literate 88,018 79,099 8,919 50,423 4,036 2,041 76 2,279 130 Middle School 5,024 4,835 189 2,331 40 55 2 59 2 Matriculate or S.L·.C. 1,635 1,515 120 449 4 10 11 2 Higher Secondary
Intennediate in Arts 355 303 52 108 2 or Science
Dellrees Or Diplomas 852 762 90 191 3 4 8 Graduates in Arts or 323 279 44 47 5 Science
Post-Graduates in 64 53 1l 3 1 1 Arts or Science
Teaching 165 161 4 49 Engineering 6 6 Agriculture Veterinary
2 2 1
Commerce Legal 12 12 2 Medical 17 16 1 t Others 263 233 30 88 3 2 1
Total 95,884 86,5U 9,370 53,502 4,083 2,110 78 2,359 135
Tehsil Agra
Literate 12,805 10,991 1,814 5,807 402 326 14 444 25 Middle School 1,073 992 81 419 5 18 I 16 1 Matriculate or S.L~C 722 627 95 103 7 4 1 Higher Secondary
Intermediate in Arts 177 126 51 19 2 or Science Degrees Or Diplomas 310 242 68 19 5 Graduates in Arts or 235 192 43 5 4
Science Post-Graduates in 33 22 11
Arts or Science Teaching 3 3 2 Engineering 6 6 Agriculture Veterinary
2 2
Commerce Legal 5 5 2 Medical 4 3 1 Others 22 9 13
Total 15,087 12,978 2,109 6,367 407 351 15 471 27
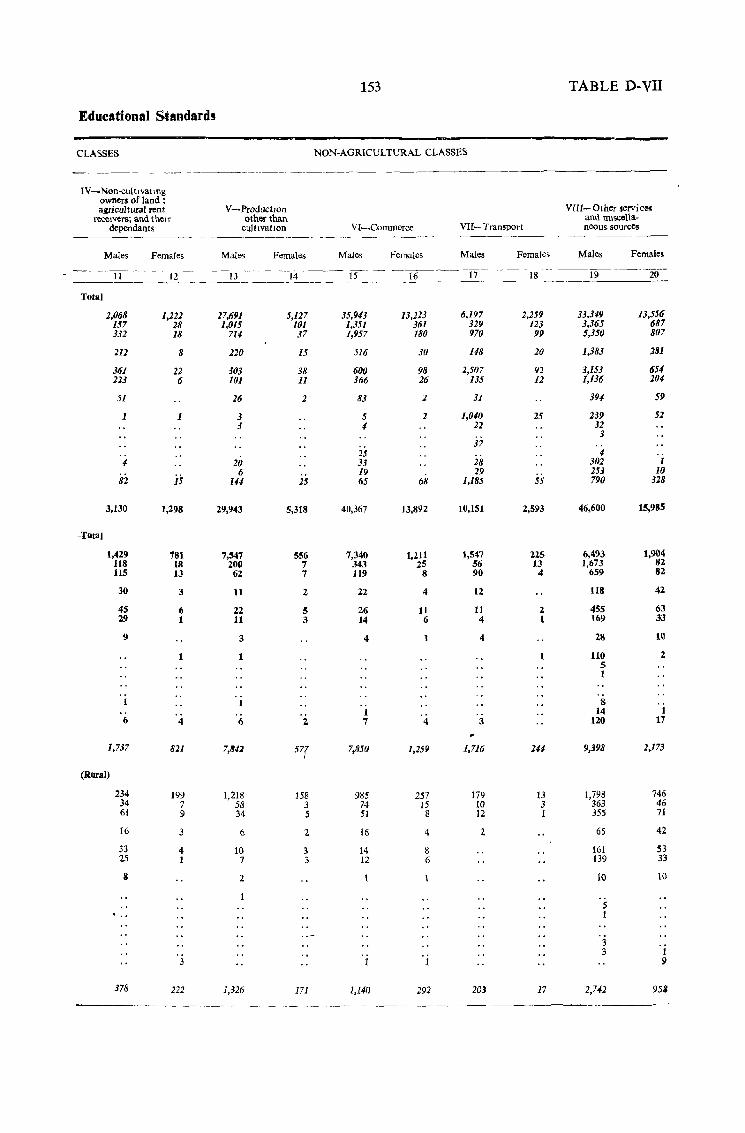
153
Educational Standards
CLASSES NON·AGRICULTURAL CLASSES
IV-Non-cultlvatmg owners of land; agricultural rent
recelvers: and thelf dependants
Total
Males
11
2,068 157 332
212
361 213
51
1
4
82
3,130
1,429 118 115
30
4S 29
9
1
6
1,737
(Rural)
234 34 61
16
33 25
II
...
378
Females
12
1,222 28 18
8
2Z 6
1
is-
1,298
781 18 13
3
6 1
1
4
821
199 7 9
3
4 1
3
222
V-ProductlOlI other than
culttvatlOn
Males
27,691 1,015
711
220
303 101
26
3 3
20 6
144
29,943
7,547 200
62
11
22 II
3
1
1
6
7,842
1,218 58 34
6
10 7
2
1,326
Females
5,127 101 37
15
38 11
2
25
5,318
556 7 7
2
S 3
2
158 3 5
2
3 3
171
VI-Commerce
Males
35,943 1,351 1,957
516
600 366
83
5 4
25 33 19 65
4U,367
7,340 343 119
22
26 14
4
1 7
7,850
985 74 51
16
14 12
1,140
Females
13,223 361 180
30
98 26
2
2
68
B,892
1,211 25
8
4
11 6
1
4
1,259
257 15
8
4
g 6
292
--~---_ -_---- ----
VII- Transport
Males
6,197 329 970
148
2,507 135
31
1,040 22
37
28 29
1,185
10,151
1,547 56 90
12
11 4
4
3
1,716
179 10 12
2
203
Females
2,259 123
99
20
92 12
25
55
2,593
225 13
4
2 1
2#
13 3 1
17
TABLE D-VII
VIII- Other services and mlscella. neous sources
Males Females
19 20
33,349 3,365 5,350
1,383
3,153 1,136
394
239 32
3
4 302 253 790
46,600
6,493 1,673
659
118
455 169
28
110 5 1
8 14
120
9,398
1,798 363 355
65
161 139
10
5 1
3 3
2,742
13,556 687 807
181
654 204
59
52
1 10
318
15,985
1,904 82 82
42
63 33
10
2
1 17
2,173
746 46 71
42
53 33
10
1 9
95&
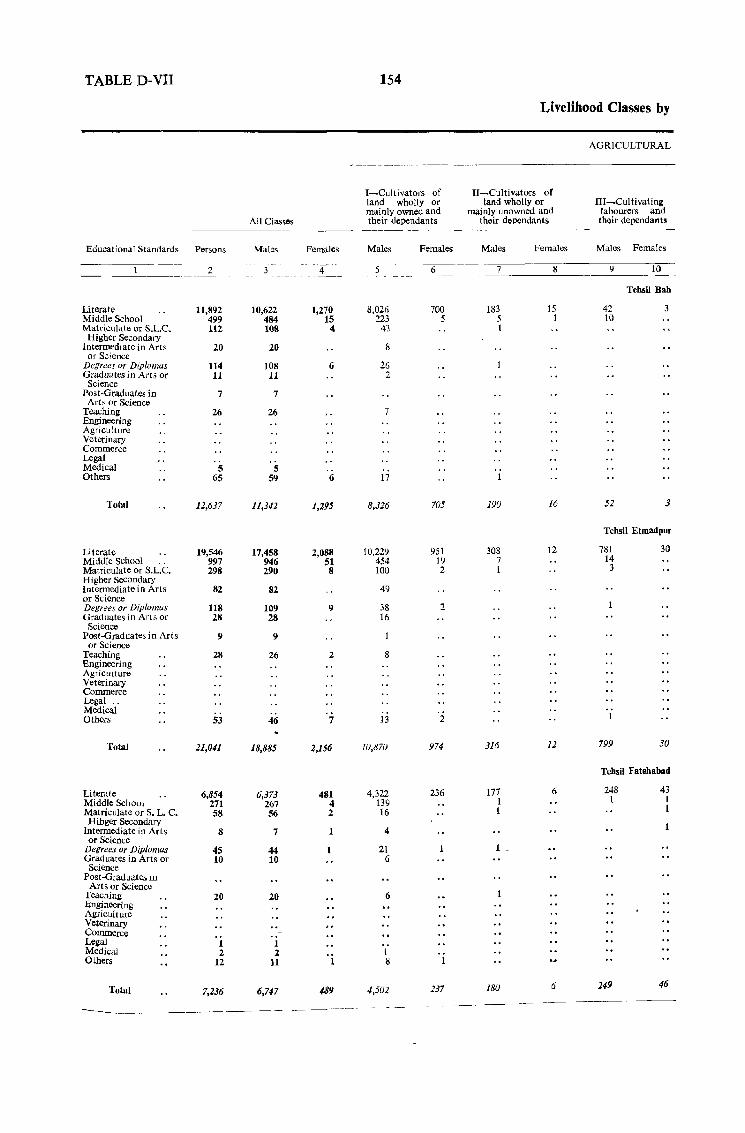
TABLE D-VII
Educational Standards Persons
--~--1~ ~---2
Literate Middle School Mat~iculate or S.L.C.
Higher Secondary Intermediate in Arts or Science
Degrees or Diplomas Graduates in Arts or
Science Post-Graduates in
Arts or Science Teaching Engineering Agriculture Veterinary Commerce Legal Medical Others
Total
Literate Middle School Matriculate or S.L.e. Higher Secondary Intermediate in Arts or Science Degrees or Diplomas Graduates in Arts or
Science Post-Graduates in Arts
or Science Teaching Engineering Agriculture Veterinary Commerce Legal .. Medical Others
Total
Literate Middle School Matriculate or S. L. C. Hihger Secondary
Intermediate in Arts or Science
Degrees Or Diplomas Graduates in Arts or
Science Post-Graduates III
Arts or Science Teaching Engineering Agriculture Veterinary Commerce Legal Medical Others
Total
11,892 499 112
20
114 11
7
26
5 65
11,637
19,546 997 298
82
118 28
I)
28
53
21,041
6,854 271 58
8
45 10
20
1 2
12
7,236
All Classes
Males
3
10,622 484 lOS
20
108 11
7
26
5 59
11,342
17,458 946 290
82
109 28
9
26
46
18,885
6,373 267 56
7
44 10
20
1 2
11
6,747
-- -------------
Fem,des
4
1,270 15
4
6
6
1,295
2,088 51 8
9
2
7
2,156
481 4 2
1
1
'i
489
154
I-Cultivators of land wholly or mainly owned and their dependants
Males Females
Livelihood Classes by
II-Cultivators or land wholly or
mainly unowned and their dependants
Males Females
AGRICULTURAL
III~Cultivating labourers and their dependants
Males Females
5 -~6=~_-_-~-::-_ ----=7========8=_-~~_:--9---I-O-
8,026 223
41
8
26 2
7
17
8,326
10,229 454 100
49
38 16
8
13
JU,870
4,322 139 16
4
21 6
6
1 8
4,502
700 5
705
951 1'1 2
2
2
974
236
237
183 5 I
190
308 7 1
316
171 1 1
18U
15 1
16
12
12
6
6
42 10
52
Tehsil Bah
3
3
Tchsil Etmadpur
781 14 3
799
30
30
Tebsil Fatehabad
248 1
249
43 I 1
46
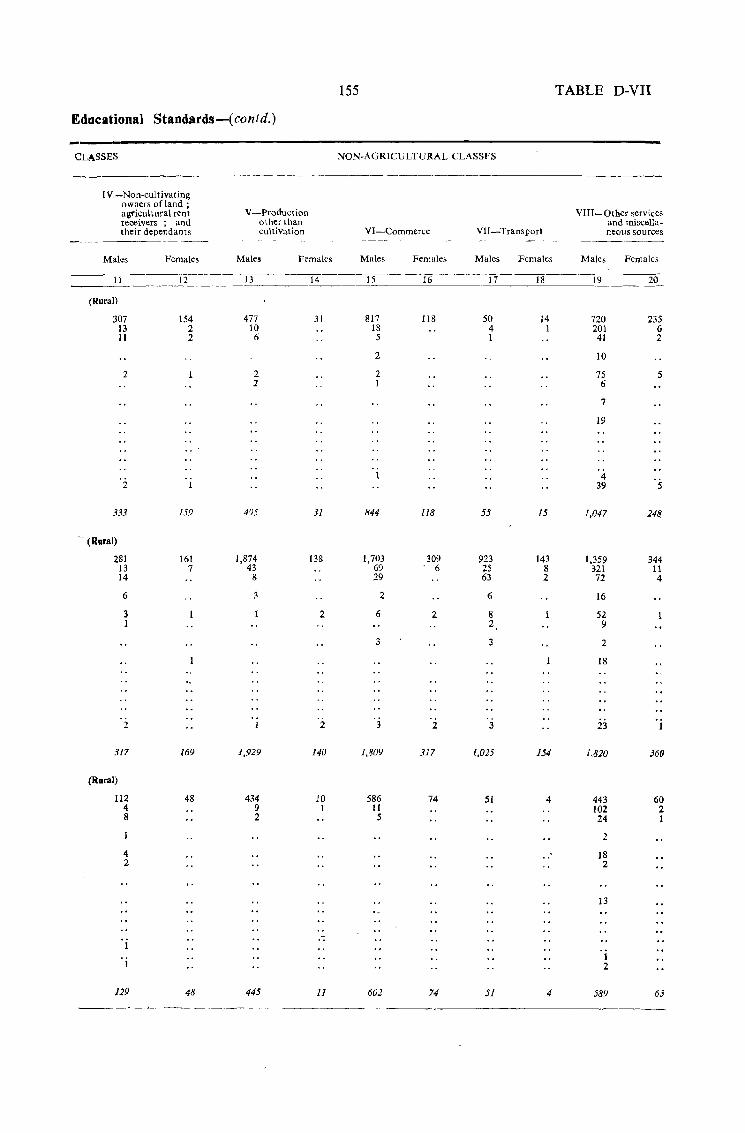
155
Educational Standards-( cont d,)
CLASSES NON-AGRICULTURAL CLASSES
IV -Non-cultivating owners of land; agricultural rent receivers ; and their dependants
Males Females
V -Production other than cultivation
Male. Females
VI-Commerce
Males Females
13 14 15 16 II 12 '---- "----------"-----
(Rural)
307 154 477 31 817 118 13 2 10 18 11 2 6 5
2
2 2 2 2 I
'2 1
333 159 495 31 844 118
- (RUral)
281 161 1,874 138 1,703 309 13 7 43 69 6 14 8 29
6 3 2
3 2 6 2 1
3
2 2 3 2
317 169 1,929 140 1,809 317
(RuraJ)
112 48 434 10 586 74 4 9 1 11 8 2 5
4 2
, i "
'j
129 48 445 11 602 74
V 11-Transport
Males Females
17 18
50 14 4 1 1
55 15
923 143 25 8 63 2
6
8 2
3
3
1,025 154
51 4
51 4
TABLE D-Vn
VIn-Other services and miscellaneous sources
Males Females
19 20
720 235 201 6 41 2
10
75 5 6
7
19
4 39 5'
1,047 248
1,359 344 321 11 72 4
16
52 9
2
18
23
1,820 360
443 60 102 2 24 1
2
18 2
13
1 2
589 63
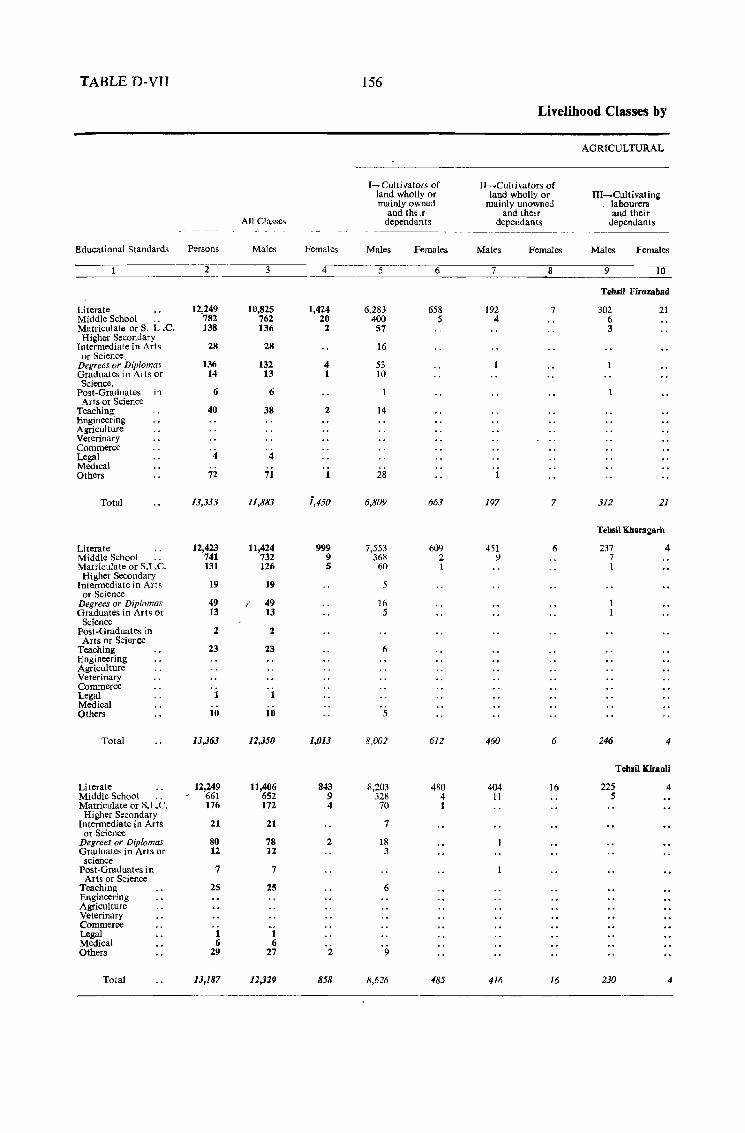
TABLE D-VII 156
Livelihood Classes by
AGRICULTURAL
I- Cultivators of H-..Culti vators of land wholly or land wholly or III-Cultivating mainly owned mainly unowned . labourers
and tht;lf and their and their All Classes dependants dependants dependants
f!.ducational Standards Persons Males Females Males Females Males Females Males Females
2 3 4 5 6 7 8 9 10
Tebsll Firozabad
Literate 12,249 10,825 1,424 6,283 658 192 7 302 21 Middle School 782 762 20 400 5 4 6 Matriculate or S. L .C. 138 136 2 57 3 Higher Secondary
Intermediate in Arts 28 28 16 or Science.
Degrees or Diplomas 136 132 4 53 Graduates in Arts or 14 13 1 10 Science.
Post-Graduates in 6 6 Arts or Science
Teaching 40 38 2 14 Engineering Agriculture Veterinary Commerce Legal 4 4 Medical Others 72 71 1 28
Total 13,333 11,883 i,450 6,809 663 197 7 312 21
Tehsil Kherllllllrh
Literate 12,423 11,424 999 7,553 609 451 6 237 4 Middle School 741 732 9 368 2 9 7 Matriculate or S.L.C. 131 126 5 60 1 1
Higher Secondary Intermediate in Arts 19 19 5
or Science Degrees or Diplomas 49 f 49 16 Graduates in Art~ or 13 13 5
Science Post-Gmduates in 2 2 Arts or Science
Teaching 23 23 6 Engineering Agriculture Veterinary Commerce Legal 1 1 Medical Others 10 10 5
Total 13,363 12,350 1,013 8,002 612 460 6 246 4
Tehsill(Jraoli
Literate 12,249 11,406 843 8,203 480 404 16 225 4 Middle School 661 652 9 328 4 11 5 Matriculate or S.L.e. 176 172 4 70 1 Higher Secondary
Intermediate in Arts 21 21 7 or Science
Degrees or Diplomas 80 78 2 18 Graduates in Arts or 12 12 3
science Post-Graduates in 7 7
Arts or Science Teaching 25 25 6 Engineering Agriculture Veterinary Commerce Legal 1 1 Medical 6 6 Others 29 27 2 9
Total 13,187 12,329 858 8,626 485 416 16 230 4
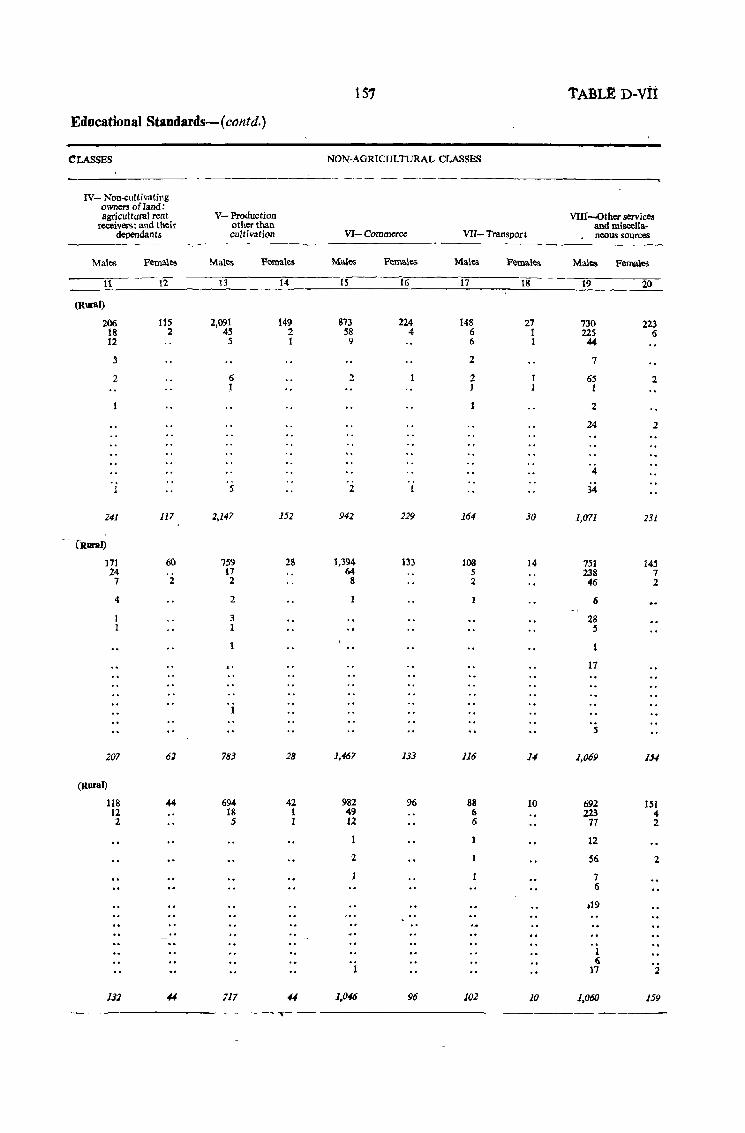
157 TABLE D-Vii
Educational Standards-{contd.)
CLASSES NON-AGRICULTURAL CLASSES
IV- Non-cultivating owners ofland: agricultural rent v- Production VIU-other services
receivers: and their other than and miscella-dependants cultivation VJ- Commerce VII- Transport neous sources
Males Females Males Females Male<> Females Males Females Males Females
11 12 13 14 15 16 17 18 19 20
(R\ll'al)
206 115 2,091 149 873 224 148 27 730 223 18 2 45 2 58 4 6 1 225 6 12 .5 1 9 6 I 44
3 2 7
2 6 2 2 65 2 ) 1 1
2
24 2
4
S 2 1 34
241 117 2,147 152 942 229 164 30 1,071 231
(Rural)
171 60 7S~ 28 1,394 133 108 14 7.51 145 24 17 64 S 238 7 7 2 2 8 2 46 2
4 2 6
3 28 1 5
17
1
.5
207 61 783 28 1,467 133 116 U 1,069 154
(Rural)
118 # 694 42 982 96 88 10 692 151 12 IS 1 49 6 223 .. 2 S 1 12 6 77 2
12
2 56 2
7 6
.19
1 6
17 2
J:J1 44 717 44 1,046 96 102 10 1,060 159
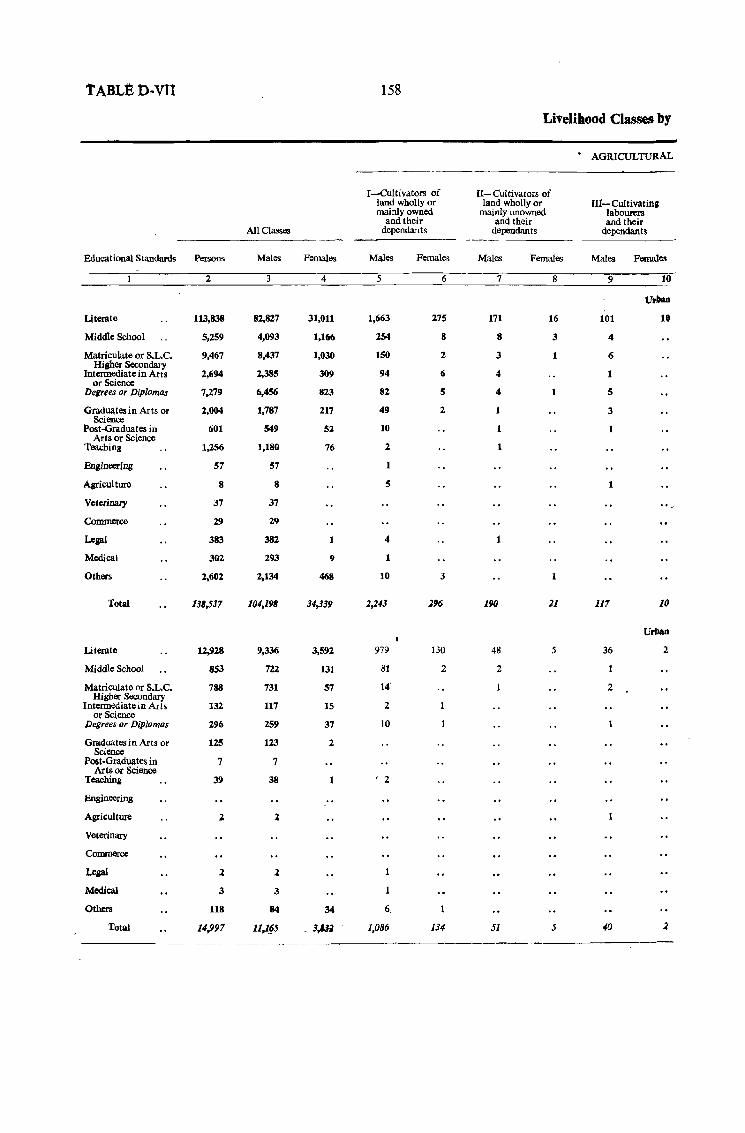
TABL£D-VlI 158
Livelihood Classes by
~
AGRICULTURAL
I-Cultivators of II- Cultivators of land wholly or land wholly or III- CultivatinJ mainly owned mainly unowned labourers
and their and their and their All Classes dependants dependants dependants
Educational Standards Persons Males Females Males Females Males Females Males Females
2 3 4 5 6 7 8 9 10
Urban
Uterate 113,838 82,827 31,011 1,663 275 171 16 101 10
Middle School 5,259 4,093 1,166 254 8 8 3 4
Matriculate or S.L.C. 9,467 8,437 1,030 150 2 3 1 6 Higher Secondary
Intermediate in Arts 2,694 2,385 309 94 6 4 1 or Science
Degrees or Diplomas 7,279 6,456 823 82 5 4 1 5
Graduates in Arts or 2,004 1,787 217 49 2 1 3 Science
Post-Gra.duates in 601 549 52 10 1 1 Arts or Science
'teaching 1,256 1,180 76 2 1
Engineering 57 57 1
Agriculture 8 8 5 1
Veterinary 37 37 "-
Commerce 29 29
Legal 383 382 4 1
Medical 302 293 9 1
Others 2,602 2,134 468 10 3
Total 138,537 104,198 34,339 2,243 296 190 21 117 10
Urban
Literate 12,928 9,336 3,592 979 130 48 5 36 2
Middle School 853 722 131 81 2 2
Matriculate or S.L.C. 788 731 57 14' 2 Higher Secondary
Intermediate in Arts 132 117 15 2 or Science
Decrees or Dip/omas 296 259 37 10
Graduates in Arts or 125 123 2 Science
Post-Graduates in 7 7 Arts or Science
Teachina 39 38 1 • 2
Engineering
Agriculture 1. 1.
Veterinary
Commerce
Legal 2 1
Medical 3 3
Others 118 84 34 6.
Total 14,,97 11,1§5 . J,m 1,086 134 51 5 40 .2
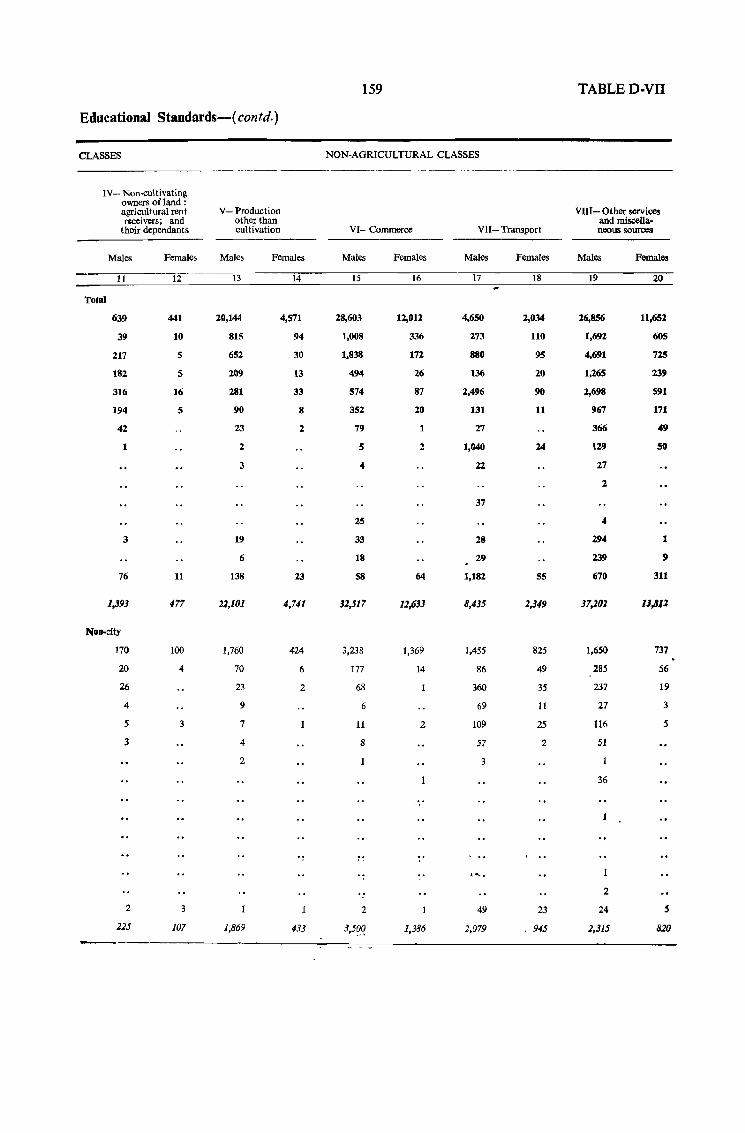
159 TABLED-VII
Educational Standards--( contd. )
CLASSES NON-AGRICULTURAL CLASSES
IV- Non-cultivating owners ofJand : agricultural rent v- Production VIII - Other scrv ices receivers; and other than and miscella-
their dependants cultivation V[- Commerce VU- Transport neous sources
Males Females Males Females Males Females Males Females Males Females
11 12 13 14 15 16 17 18 19 20
Total
639 441 20,144 4,571 28,603 12,012 4,650 2,034 26,856 11,652
39 10 815 94 1,008 336 273 110 1,692 60s
217 5 652 30 1,838 172 880 9S 4,691 725
182 5 209 13 494 26 136 20 1,265 239
316 16 281 33 574 87 2,496 90 2,698 591
194 5 90 8 352 20 131 11 967 171
42 23 2 79 1 27 366 49
1 2 5 2 1,040 24 129 50
3 .. 22 27
2
37
25 4
3 19 33 28 294 1
6 18 29 239 9
76 11 138 23 58 64 1,182 55 670 311
1,393 477 11,101 4,741 32,517 12,633 8,435 1,349 37,101 U,812
Non-city
170 100 1,760 424 3,238 1,369 1,455 825 1,650 731
20 .. 70 6 177 14 86 49 285 56
26 23 2 68 360 3S 237 19
4 9 6 69 11 27 3
5 3 7 11 2 109 25 116 5
3 4 8 57 2 51
2 3
36
"
.,
..... 2
2 3 2 49 23 24 5
225 107 1,869 433 3,5~q 1,386 1,079 945 2,315 820
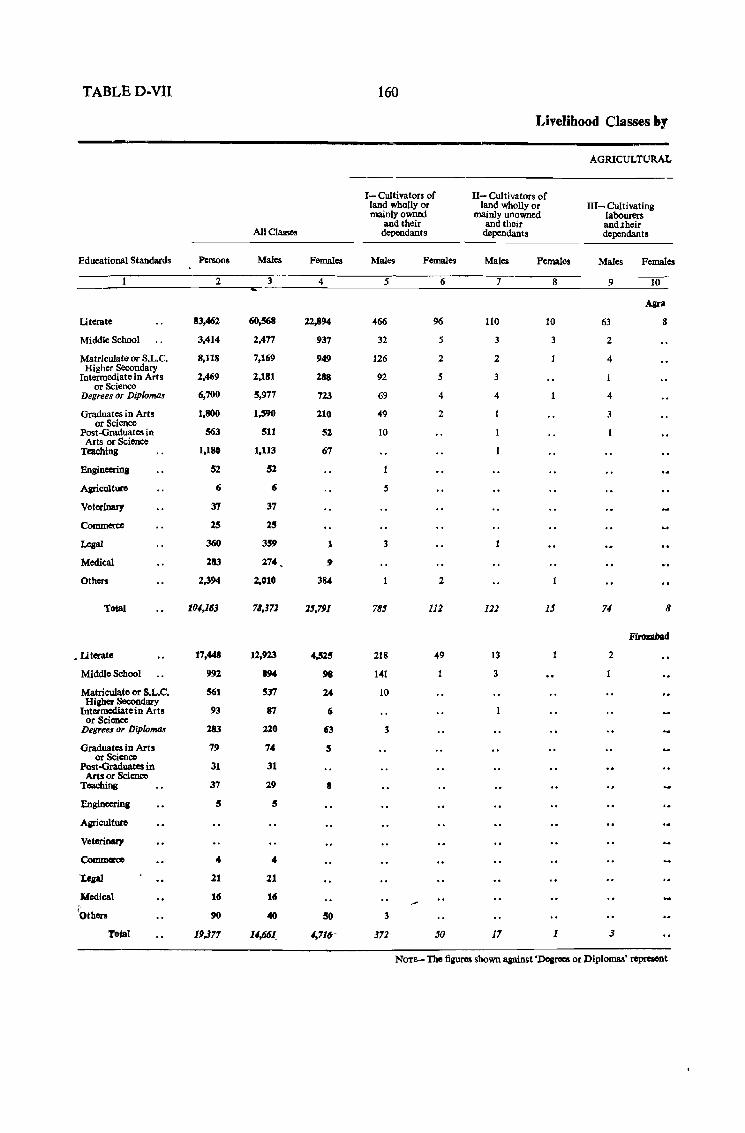
TABLED-VII 160
Livelihood Classes hy
AGRICULTURAL
1-Cultivators of II- Cultivators of land wholly or land wholly or ill- Cultivating mainly owned mainly unowned labourers
and their and their and.their All Classes dependants dependants dependants
EdLlClltional Standards Persons Males Females Males Females Males Females Males Females
2 3 4 5 6 7 8 9 10
Agra
Uttrate 83,462 60,568 22,8'" -466 96 110 10 63 8
Middle School 3,414 2,477 937 32 5 3 3 2
Matriculate or S.L.C. 8,118 7,169 949 126 2 2 4 Higher Secondary
Intermediate in Art s 2,469 2,181 288 92 S 3 or Science
Degrees or Diploma! 6,700 5,977 723 69 4 4 4
Graduates in Arts 1,800 1,590 210 49 2 3 or Science
Post-Graduates in 563 511 52 10 Arts or Science
Teaching 1,180 1,113 67
Engineering 52 51
Agriculture 6 6 S
Veterinary 37 37
Commerce 25 25
Lesal 360 359 1 3
Medical 283 274, 9
Others 2,394 1,010 384 2
Total 101,163 78,371 :JJ,791 785 112 122 15 74 8
Firozabad
• littrate 17,448 12,923 4,525 218 -49 13 2
Middle School 992 '''' 98 1-41 3
Matriculate or S.L.C. 561 537 24 10 Higher Secondary
Intermediate in Arts 93 87 6 or Science
Degrees O~ DiplomaJ 283 220 63 3
Graduates in Arts 79 74 5 or Science
Post-Graduates in 31 31 Arts or Science
Teaching 37 29 8
Engineerinl 5 5
Agriculture
Veterinary
Commerce 4 .. 'toga! 21 21
Medical 16 16
IQthers 90 040 50 3
Total 19,377 11,661_ 4,716-- 372 50 17 1 J
NOTE-The fiJlll'Cl shown a~nst 'Dear- or Piplomas' represent
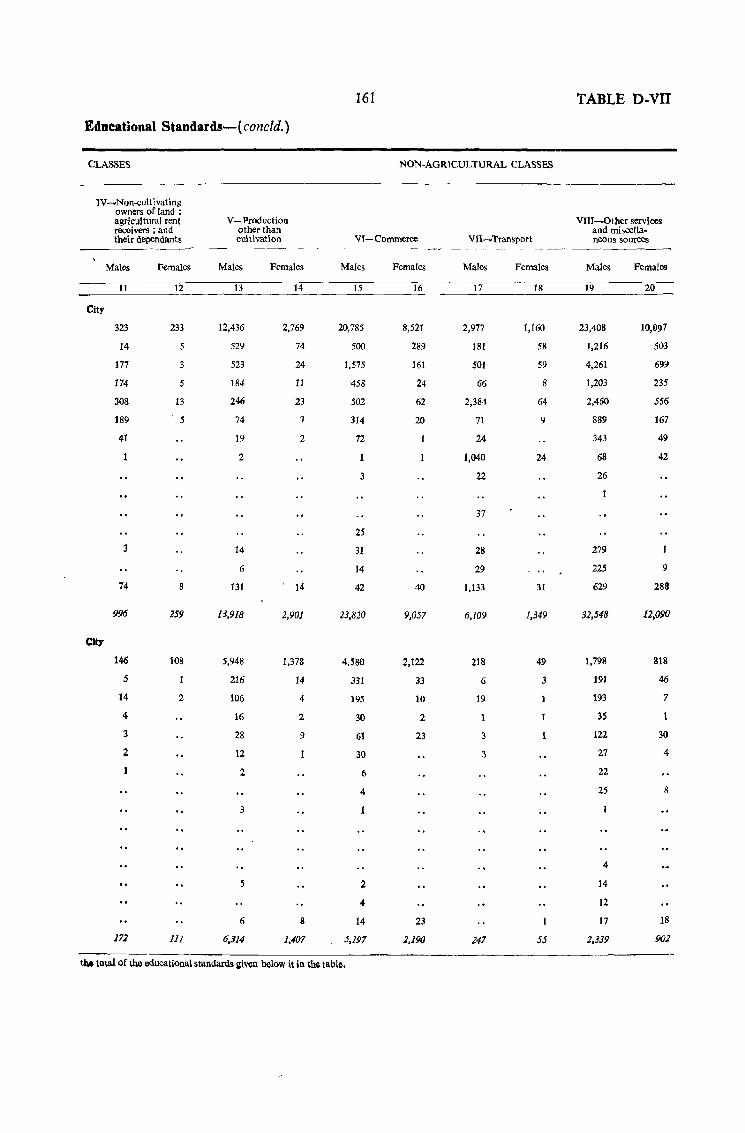
Educational Standards-( concld.)
CLASSES
IV-Non-cultivating owners of land; agricultural rent recei vers ; and their dependants
Males Females
11 12
City
323 233
14 5
177 3
174 5
308 13
189 5
41
3
74 8
996 259
City
146 108
5
14 2
4
3
2
172 111
V- Production other than cultivation
Males Females
13
12,436
529
523
184
246
74
19
2
14
6
131
13,918
5,948
216
106
16
28
12
2
3
5
6
6,314
14
2,769
74
24
11
23
7
2
14
2,901
1,378
14
4
2
9
8
1,407
161
NON-AGR1CULTURAL CLASSES
VI-Commerce
Males
15
20,785
500
1,575
'458
502
314
72
3
25
31
14
42
23,820
4,580
331
195
30
61
30
6
4
2
4
14
5,197
Females
16
8,521
289
161
24
62
20
40
9,057
2,122
33
10
2
23
23
2,190
VII-Transport
Males Females
17 18
2,977 1,160
181 58
501 59
66 8
2,384 64
71 9
24
1,040 24
22
37
28
29
1,133 31
6,109 1,349
218 49
6 3
19
3
3
247 55
tn. total of the educational standards given below it in the table.
TABLE D-VII
VIII-Other services and miscella-neous sources
Males
19
23,408
1,216
4,261
1,203
2,460
889
343
68
26
279
225
629
32,548
1,798
191
193
35
122
27
22
2S
4
14
12
17
2,339
Females
20
10,1)97
503
699
235
556
167
49
42
9
288
12,090
818
46
7
30
4
8
18
902

PART II
VILLAGE, TOWN, PARGANA AND THANA STATISTICS
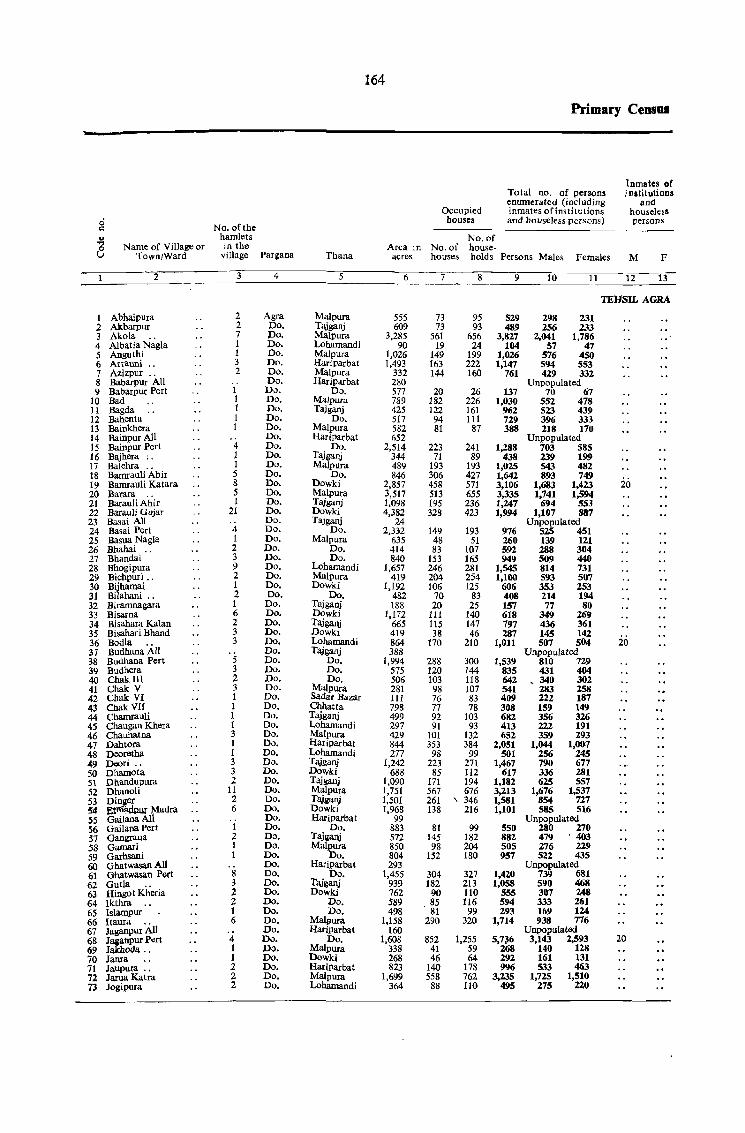
164
Primary CeDSO.
Inmates of Total no. of persons j nstitutions enumerated (including and
Occupied inmates ofinstit1.llions houseless ci houses and houseless persons) persons <=: No. of the ... hamlets No. of ." Name of Village or in the Area in No. of house-0 U Town/Ward village Pargana Thana acres houses holds Persons Males Females M F
2 3 4 5 6 7 8 9 10 11 12 13
TEHSIL AGRA
1 Abhaipura 2 Agra Malpura 555 73 95 529 298 231 2 Akbarpur 2 Do. Tajganj 609 73 93 489 256 233 3 Akola 7 Do. Malpura 3,285 561 656 3,827 2,041 1,786 4 Albatia Nagja 1 Do. Lohamandi 90 19 24 104 57 47 5 Anguthi 1 Do. Malpura 1,026 149 199 1,026 576 4SO 6 Artauni .. 3 Do. Hariparbat 1,493 163 222 1,147 594 553 7 Azizpur .. 2 Do. Malpura 332 144 160 761 429 332 8 Babarpur All Do. HariParbat 280 Unpopulated 9 Babarpur Pert I Do. Do. 577 20 26 137 70 67
10 Bad 1 Do. Malpura 789 182 226 1,030 552 478 11 Bagda 1 Do. Tajganj 425 122 161 962 523 439 12 Bahenta 1 Do. Do. 517 94 111 729 396 333 13 Bainkhera 1 Do. Malpura 582 81 87 388 218 170 14 Bainpur All Do. Hariparbat 652 Unpopulated 15 Bainpur Pert 4 Do. Do. 2,514 223 241 1,288 703 585 16 Bajhera :. 1 Do. Tajganj 344 71 89 438 239 199 17 Balehra .. 1 Do. Malpura 489 193 193 1,025 543 482 18 Bamrauli Ahir 5 Do. Do. 846 306 427 1,642 893 749 19 Bamrauli Katara 8 Do. Dowki 2,857 458 571 3,106 1,683 1,423 20 20 Barara 5 Do. Malpura 3,517 513 655 3,335 1,741 1,594 21 Barauli Ahir 1 Do. Tai!rdnj 1,098 195 236 1,247 694 553 22 Barauli Gujar 21 Do. Dowki 4,382 328 423 1,994 1,107 887 23 Basai All Do. Tajganj 24 Unpopulated 24 Basai Pert 4 Do. Do. 2,332 149 193 976 525 451 25 BasuaNagla 1 Do. Malpura 635 48 51 260 139 121 26 Bhabai .. 2 Do. Do. 414 83 107 592 288 304 27 Bhandai 3 Do. Do. 840 153 165 949 509 440 28 Bhogipura 9 Do. Lohamandi 1,657 246 281 1,545 814 731 29 BichQuri .. 2 Do. Malpura 419 204 254 1,100 593 507 30 Bijhamai 1 Do. Dowki 1,192 106 125 606 353 253 31 Bilahani ., 2 Do. Do. 482 70 83 408 214 194 32 Biramnagara 1 Do. Tajganj 188 20 25 157 77 80 33 Bisarna 6 Do. Dowki 1,172 111 140 618 349 269 34 Bisahara Kalan 2 Do. Tajganj 665 115 147 797 436 361 35 Bisahari Bhand 3 Do. Dowkt 419 38 46 287 145 142 36 Bodla 3 Do. Lohamandi 864 170 210 1,011 507 504 26 37 Budhana'All Do. Tajganj 388 UnpopLilated 38 Budhana Pert 5 Do. Do. 1,994 288 300 1,539 810 729 39 Budhera 3 Do. Do. 575 120 144 835 431 404 40 Chak III 2 Do. Do. 506 103 118 642 , 340 302 41 Chak V 3 Do. MaJpura 281 98 107 541 283 2S8 42 Chak VI 1 Do. Sadar Bazar 111 76 83 409 222 187 43 ChakVII 1 Do. Chhatta 798 77 78 308 159 149 44 Chamrauli 1 Do. Tajganj 499 92 103 682 356 326 45 Chaugan Khera I Do. Lohamandi 297 91 93 413 222 191 46 Chauhatna 3 Do. Malpura 429 101 132 652 359 293 47 Dahtora 1 Do. Hariparbat 844 353 384 2,051 1,044 1,007 48 Deoretha I Do. Lohamandi 277 98 99 SOl 256 245 49 Deori .. 3 Do. Tajganj 1,242 223 271 1,467 790 677 50 Dhamota 3 Do. Dowki 688 85 112 617 336 281 51 Dhandupura 2 Do. Tajganj 1,090 171 194 1,182 625 557 52 Dhanoli 11 Do. MaJpura 1,751 567 676 3,213 1,676 1,537 53 Dinger 2 Do. Tajganj 1,501 261 \ 346 1,581 854 727 54 ~Madra 6 Do. Dowki 1,968 138 216 1,101 58S 516 55 GailanaAil Do. Hariparbat 99 Unpopulated 56 Gailana Pert 1 Do. Do. 883 81 99 550 280 270 57 Gangraua 2 Do. Tajganj 572 145 182 882 479 . 403 58 Gamari 1 Do. Malpura 850 98 204 505- 276 229 59 Garhsani 1 Do. Do. 804 152 180 957 522 435 60 Ghatwasan All Do. HariParbat 293 Unpopulated 61 Ghatwasan Pert 8 Do. Do. 1,455 304 327 1,420 739 681 62 Gutla 3 Do. Tajllanj 939 182 213 1,058 590 468 63 Hingo! Kheria 2 Do. Dowki 762 90 110 555 307 248 64 lkthra 2 Do. Do. 589 85 116 594 333 261 65 Islampur I Do. Do. 498 81 99 293 169 124 66 ltaura .. 6 Do. MaIpura 1,158 290 320 1,714 938 776 67 Jaganpur All Do. Hariparbat 160 Unpopulated 68 Jaganpur Pert 4 Do. Do. 1,608 852 1,255 5,7'J6 3,143 2,593 20 69 Jakhoda .. 1 Do. Malpura 338 41 59 268 140 128 70 Jama 1 Do. Dowki 268 46 64 292 161 131 71 Jaupura .. 2 Do. HariParbal 823 140 178 996 533 463 72 Jama Katra 2 Do. Malpura 1,699 558 762 3,235 1,725 1,510 73 Jogipura 2 Do. Lohamandi 364 88 110 495 275 220
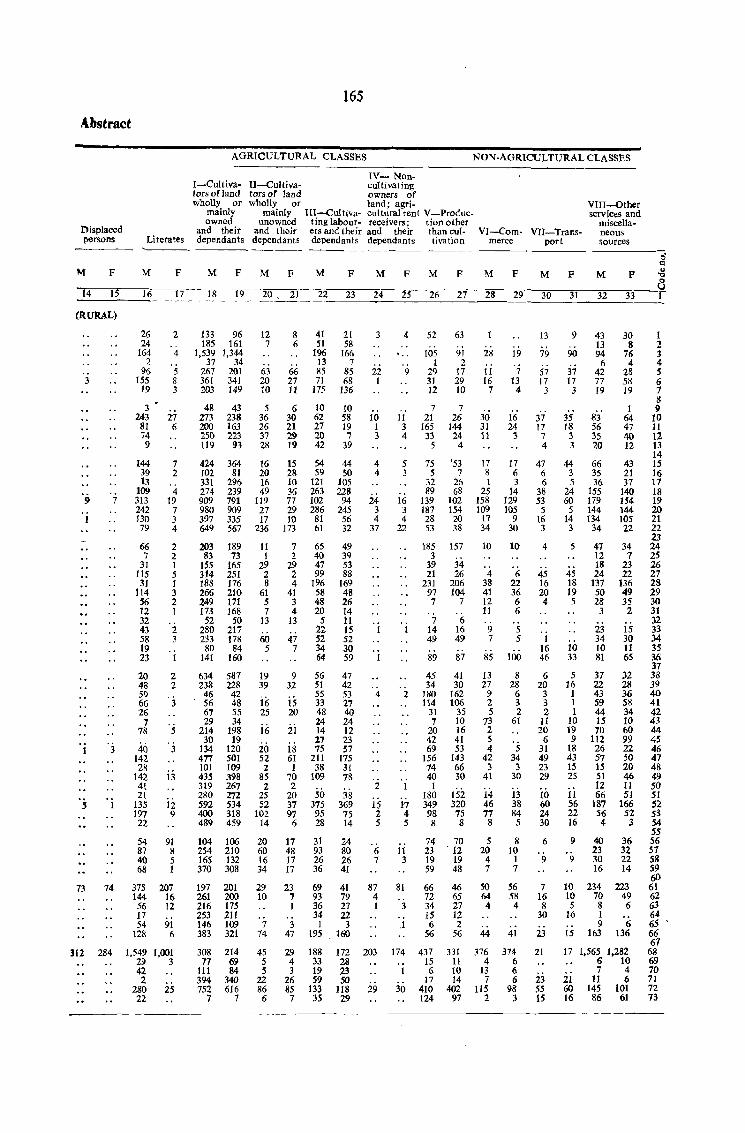
Abstract
nisplaced persons
165
AGRICULTURAL CLASSES
I-Cultivators orland wholly or
IV- Non-II-Cultiva- cultivating tors or land owners of wholly Dr land; agri-
NON-AGRICULTURAL CLASSES
mainly owned
and their dependants
mainly III-Cuitiva- cultural rent V-Prodllc-VlII..,...()ther scrv ices and
miscella-
Literates
unowned ting labour- receivers; tion other and their ers and their and their than rul-dependants dependants dependants tivation
~--- ---_ ----- ----- ----- ----
VI-C.om- VII-Trans-merce port
neous sources
o CI
M F M F MFMF M F MFMF MF MF M P ~ 1"3
_1_4 __ 1_5_~16~_1_77_-_-1~8'-~1~9~'2ffiO',--2"1-'2M2--~2~3-'2~4-'2~5--'2~6-'2~7--'2>O8-'2~9--'3~0-'371--'3~2--'3'3--¥1
(RURAL)
3
'9 7
1
5 I
73 74
1I2 284
26 2 24
164 4 2
96 S 155 8
19 3
3 243 27
81 6 74 9
144 7 39 2 13
109 4 313 19 242 7 130 3 79 4
66 2 7 2
31 1 115 5 31 1
114 3 56 2 12 1 32 43 2 58 3 19 23 I
20 2 48 2 59 66 '3 26
7 78 '5 40 '3
142 28
142 i3 41 21
135 12 197 9 n 54 91 87 8 40 5 68 1
375 207 144 16 56 12 17 54 91
128 6
1,549 1,001 29 3 42 2
280 25 22
133 96 185 161
1,539 1,344 37 34
267 201 361 341 203 149
48 43 273 238 200 163 250 223 119 93
424 364 102 81 331 296 274 239 909 791 980 909 397 335 649 567
203 189 83 73
155 165 314 251 188 176 266 210 249 171 173 168 52 50
280 217 233 178 80 84
141 160
634 587 238 228 46 42 56 48 67 5S 29 34
214 198 30 19
134 120 477 501 101 109 435 398 319 267 280 272 S92 534 400 318 489 459
104 106 254 210 165 132 370 308
197 201 261 200 216 175 253 211 146 109 383 321
308 214 77 69
III 84 394 340 752 616
7 7
12 7
63 20 10
5 36 26 37 28
16 20 16 49
119 27 17
236
II 1
29 2 8
61 5 7
13
60 5
19 39
iii 25
if;
io 52 2
85 2
25 52
102 14
20 60 16 34
29 10
7 74
45 5 5
22 86 6
8 6
66 27 11
6 30 21 29 19
15 28 10 36 77 29 10
173
7 2
29 2 4
41 3 4
13
47 7
9 32
is 20
ii 18 61 1
70 2
20 37 97
6
17 48 17 17
23 7 1
3 47
29 4 3
26 85 7
41 51
196 13 85 71
175
10 62 27 20 42
S4 59
121 263 102 286
81 61
65 40 47 99
196 58 48 20
5 22 52 34 64
56 51 55 33 48 24 14 27 75
211 38
109
SO 375 95 28
31 93 26 36
69 93 36 34
1 195
188 33 19 59
133 3.5
21 58
166 7
85 68
136
10 58 19 7
39
44 50
105 228
94 245 56 32
49 3<) 53 88
169 48 26 14 11 15 52 30 59
47 42 53 27 40 24 12 23 57
175 31 78
38 369 75 14
24 80 26 41
41 79 27 22
3 160
172 28 23 50
118 29
22 1
10 I 3
4 4
24 3 4
37
4
2
is 2 5
6 7
87 4 1
203
29
4
9
ii 3 4
5 3
16 3 4
22
2
1
17 4 5
11 3
81
3
J
174
1
30
52
105 1
29 31 12
7 21
165 33
5
75 5
32 89
139 187 28 53
185 3
39 21
231 97 7
7 14 49
89
45 34
180 114
31 7
20 42 69
156 74 40
I 180 349 98 8
74 23 19 59
66 72 34 15 6
56
437 15 6
17 410 124
63
91 2
17 29 10
7 26
144 24
4
'53 7
26 68
102 154 20 38
157
34 26
206 104
7
6 16 49
87
41 30
162 106
35 10 16 41 53
143 66 30
IS2 320 75 8
70 - 12
19 48
46 65 27 12 2
56
331 11 10 14
402 97
28
11 16
7
30 31 11
17 8 1
25 158 109
17 34
10
4 38 41 12 11
9 7
85
13 27
9 2 5
73 2 5 4
42 3
41
i4 46 77 8
5 20
4 7
50 64 4
44
376 4
13 7
115 2
19
7 13
4
16 24
:I
17 6 3
14 129 105
9 30
10
6 22 36 6 6
5 5
100 8
28 6 3 2
61
5 34 3
30
13 38 84 5
8 10 I 7
56 58 4
41
374 6 6 6
98 3
13
79
57 17 3
37 17
7 4
47 6 6
38 53
5 16 3
4
45 16 20 4
I 16 46
6 20
3 3 2
11 20
6 31 49 23 29
io 60 24 30
6
9
7 16 8
30
23
21
23 55 15
9
90
37 17 3
35 18 3 3
44 3 5
24 60
5 14 3
5
45 18 19 5
10 33
5 16
1 1 1
10 19 9
18 43 15 2S
11 56 22 16
9
9
10 10
.5 16
15
43 13 94
6 42 77 19
83' 56 35 20
66 35 36
155 179 144 134
34
47 12 18 24
137 50 28
3
23 34 10 81
37 22 43 59 44 15 70
112 26 57 15 51 12 66
187 56 4
40 23 30 16
234 70 8 I 9
163
30 8
76 4
28 58 19
I 64 47 40 12
43 21 37
140 154 144 105 22
34 7
23 22
136 49 35 2
15 30 11 65
32 28 36 58 34 10 60 99 22 50 20 46 11 51
166 52 3
36 32 22 14
223 49 6
6 136
17 1.565 1.282 6 10 7 4
21 11 6 60 145 101 16 86 61
1 2 3 4 .5 6 7 8 I}
10 11 12 13 14 15 16 17 18 19 20 21 22 23 24 2S 26 27 28 29 3D 31 32 33 34 35 36 37 38 39 40 41 42 43 44 45 46 47 48 49 50 51 52 53 54 55 56 57 58 59 60 61 62 63 64 65 66 61
68 69 70 71 72 73
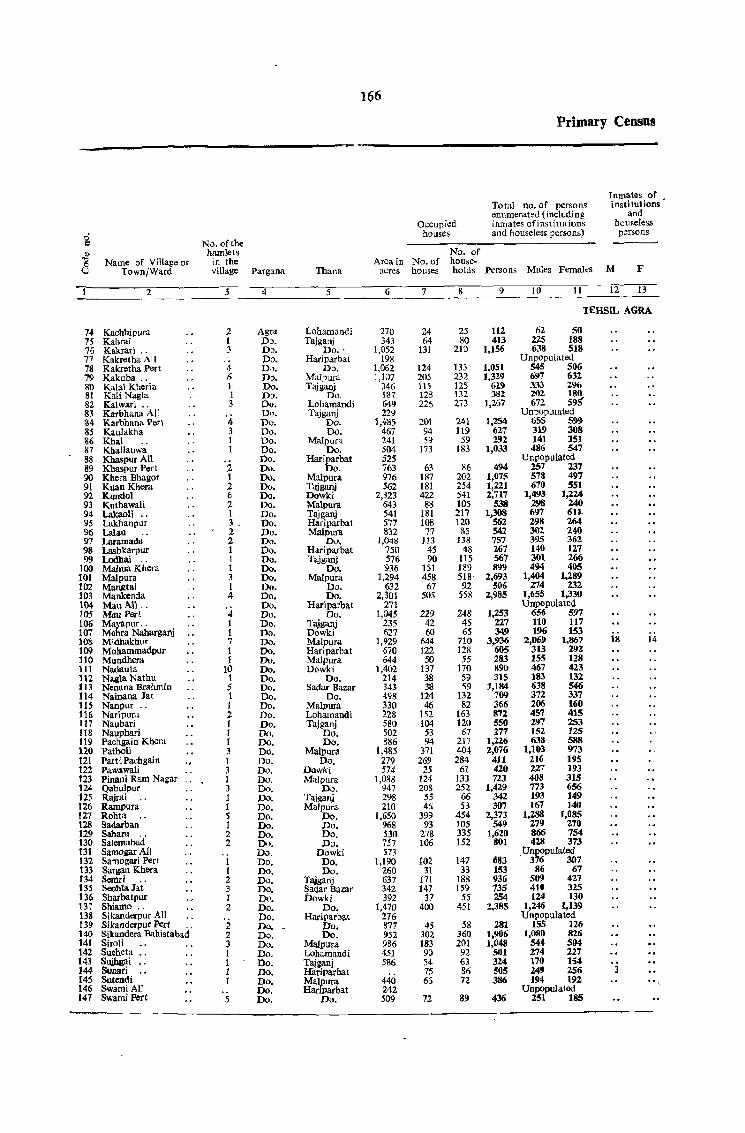
166
Prbnary Census
Inmates of Total no. of persons institutions' enumerated (including and
Occupied inmates of institutions houseless
0 hOllses and houseless persons) persons
'" No. of the
" hamlets No. of
8 Name of Village or in the Area in No. of house· Town/Ward village Pargana Thana acres houses holds Persons Males Females M F
2 3 4 5 6 7 S 9 10 II 12 13
'IEHSIL AGRA
74 Kachlri pura 2 Agrll Lohamandi 270 24 25 112 62 50 75 Kahrai t Do. Tajganj 343 64 80 413 225 188 76 Kakrari ., :> Do. Do •. 1,052 131 210 1,156 638 518 77 Kakre t ha All Do. Hariparbat 198 Unpopulated 78 Kakretha Pert 4 DCI. Do. 1,062 124 133 1,051 S45 506 79 Kakuba ., 6 DD. Malpura 1,107 205 232 1,329 697 632 SO Kalal Kheria 1 Do. Tajganj 346 115 125 629 333 296 81 Kali Nagla 1 Do. Do. 187 123 132 38l lO2 180 82 Kalwari .. 3 Do. Lohamandi 649 226 273 1,267 672 595 83 Karbhana All Do. Tajganj 229 UnpopUlllted 34 Karbhana Pert 4 Do. Do. 1,435 201 241 1,254 655 5'>'}
85 Kaulakha 3 Do. Do. 467 94 119 627 319 308 86 Kha.1 1 Do. Malpura 241 59 59 292 141 lSI 87 Khallauwa 1 Do. Do. 504 173 183 1,033 486 547 88 Khaspur AI! Do. Hariparbat 525 Unpopulated 89 Khaspur Pert 2 Do. Do. 763 63 86 494 257 237 90 Khera Bhagor 1 Do. Ma,ipura 976 187 202 1,075 578 497 91 KuaD Khera 2 Do. Tajganj 562 181 254 1,221 670 SSl 92 Kundol 6 Do. Dowki 2,323 422 541 2,717 1,493 1,224 93 Kuthawali 2 Do. Malpura 643 88 105 538 298 240 94 Lakaoli .. 1 Do. Tajganj 541 181 217 1,308 697 611 95 Lakhanpur 3 . Do. Hariparbat 577 108 120 562 298 264 96 Lalau 2 Do. Malpura 832 77 SS 542 302 240 97 Laramadll 2 Do. Do. 1,048 113 138 757 395 362 98 Lashkarpur 1 Do. Hariparbat 750 45 48 267 140 127 99 Lodhai i Do. Tajganj 576 90 115 567 301 266
100 MahuaKhera I Do. Do. 936 151 189 899 494 405 101 Malpura 3 Do. Malpura 1,294 458 518 2,693 1,404 1,289 102 Mangtai 1 Do. Do. 632 67 92 506 274 232 103 Mankenda 4 Do. Do. 2,301 505 558 2,985 1,655 1,330 104 MauMl .. '4 Do. Hariparbat 271 Unpopulated 105 MauPert Do. Do. 1,045 229 248 1,2:53 656 597 106 Mayapur .. 1 Do. Tajganj 235 42 45 227 110 117 101 Mohra Naharganj 1 Do. Dowki 627 60 65 349 196 153
i8 14 10& Midhakhur 7 Do. Malpura ],929 644 710 3,936 2,069 1,867 109 Mohammadpur t Do. Hariparbat 670 122 128 60S 313 292 110 Mundhera J Do. Malpura 644 50 55 283 155 128 111 Nadauta 10 Do. Dowki 1,402 137 170 890 467 423 112 Nagla Nathu 1 Do. Do. 214 38 59 315 183 132 113 Nenana Brahmin 5 Do. Saclar Baza r 343 38 59 1,184 638 S46 114 NaiDana Sat 1 Do. Do. 498 124 132 709 372 337 ll~ Nanpur .. 1 Do. Malpura 330 46 82 366 206 160 Wi Naripura 2 Do. Lohamandi 228 152 163 872 457 415 117 Naubari J Do. Tajganj 580 104 120 550 297 253 118 Nauphari 1 Do. Do. 502 53 67 277 152 125 119 Pachgain Khera 1 Do. Do, 886 94 217 1,226 638 588 120 Patholi 3 Do. Malpura t,485 371 404 2,076 1,103 973 121 PaUl Pachgain 1 Do. Do. 279 269 284 411 216 195 122 Pawawali 3 Do. Dowki 574 25 61 420 227 193 123 Plnani Ram Nagar .. I Do. Malpura 1,088 124 133 723 408 JIS 124 Qabulpur 3 Do. Do. 947 20B 252 1,429 773 656 125 Rajrai 1 Do. Tajgarij 298 55 66 342 193 149 126 Rampura 1 Do. Malpura 210 4fi 53 307 167 140 127 Rohta 5 Do. Do. 1,650 399 454 2,373 1,288 1,085 128 Sadarban 1 Do. Do. 968 93 105 549 279 270 129 Sahara 2 Do. Do. 530 278 335 1,620 866 754 130 Salemabad 2 Do. Do. 757 106 152 801 428 373 131 Samegar All Do. Dowki S73 . Unpopulated 132 Samogari Pert 1 Do. Do. 1,190 102 147 683 376 307 133 Sargan Khera 1 Do. Do. 260 31 33 153 86 67 134 Semri 2 Do. Tajganj 637 17l 188 936 509 427 135 Seohla Jat 3 Do. ~adar Bazar 342 147 159 735 410 325 136 Sharbatpur 1 Do. Dowki 392 37 55 254 124 130 137 Shiamo ., 2 Do. Do. 1,470 400 451 2,385 1,246 1,139 138 Sikanderpur All Do. Hariparbat 276 Unpopulated 139 Sikaaderpur Pert 2 Do. ~ Do. 877 45 58 281 155 126 140 Sikandera Bahistabad' 2 Do. Do. 952 302 360 1,906 .,080 826 141 SiroH 3 Do. Malpura 986 183 201 1,048 544 504 142 Sucheta .. 1 Do. Lohamandi 451 9() 92 SOl 274 227 t43 Sujhgai ., 1 Do. Tajganj 586 54 63 324 170 154 144 Sunari .. 1 Do. H'ariparbat 75 1>6 505 249 256 145 Sutendi 1 Do. Malpura 440 66 72 386 194 192 146 Swami All Do. HariParbat 242 Unpopulated t47 Swami Pert 5 Do. Do. 509 72 89 436 251 185
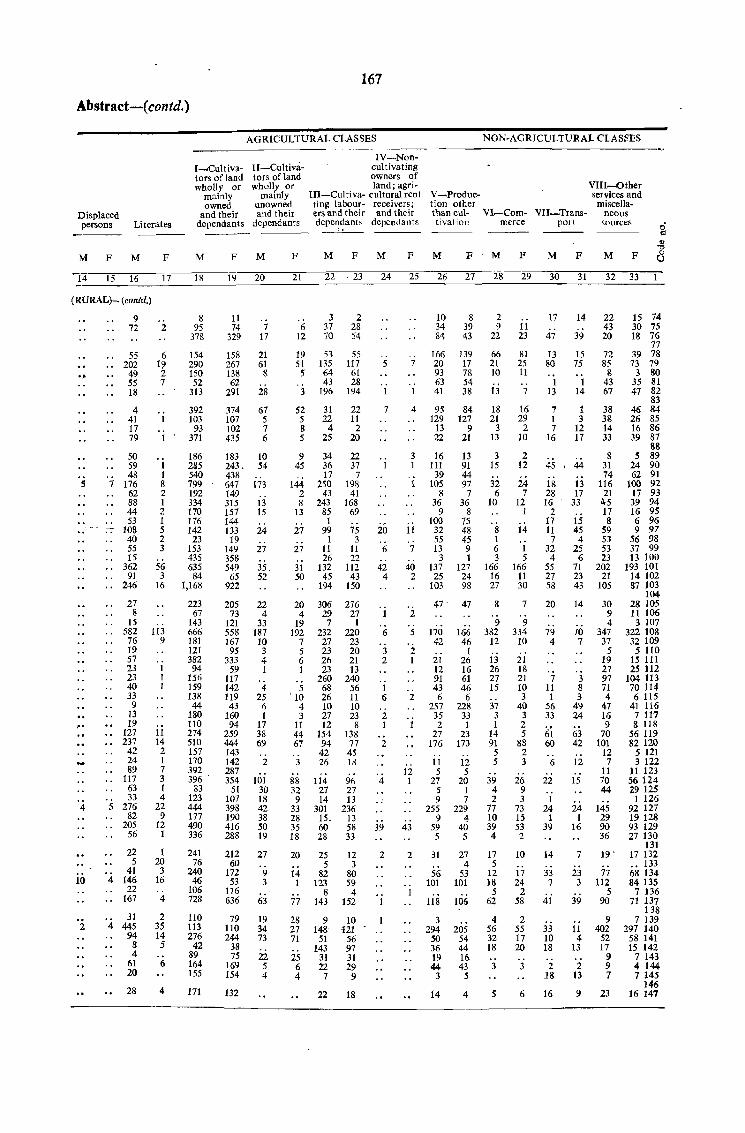
167
Abstract-(contd.)
AGRICULTURAL CLASSES NON-AGRICULTURAL CLASSES
Displaced persons Literates
M F M
14 15 16
(RURAL)- (contd.)
9
.,
s
,.
4
io
2
72
55 .. 202
49 55 18
4 41 17 79
50 59 48
7 176 62 88 44 53
108 40 55 15
.. 362 91
246
27 8
15 .. 582
76 19 57 23 23 40 33 9
13 19
127 237
42 24 89
.. 117 63 33
5 276 82
.. 205 56
22 5
41 4 146
22 167
31 4 445
94 8 4
61 20
28
F
17
2
6 19 2 7
1 1 8 2 1 2 I 5 2 3
56 3
16
113 9
11 14 2 I 7 3 1 4
22 9
12 1
1 20
3 16
4
2 35 14 5
6
4
I-Cultivators ofland wholly or
mainly owned
and their dependants
II-Cultivators of land wholly or
mainly unowned and their
dependants
M F M F
18
8 95
378
154 290 150 52
313
392 103
93 371
186 2~5 540 799 192 334 170 176 142 23
153 435 635
84 1,168
223 67
143 666 181 121 382 94
156 159 138 44
180 110 274 510 157 170 392 396 .
83 123 444 177 490 336
241 76
240 46
106 728
110 113 276
42 89 164 155
171
19 20
11 74
329
158 267 138 62
291
374 107 102 435
183 243. 438 647 149 315 157 144 133 19
149 358 549 65
922
205 73
121 558 167 95
333 59
117 142 119 43
160 94
259 444 143 142 287 354
51 107 398 190 416 288
212 60
172 53
116 636
79 110 244
38 75
169 154
132
7 17
21 61 8
28
67 5 7 6
10 54
173
13 15
24
27
35. 52
22 4
33 187. 10 3 4 I
4 25
6 I
17 38 69
2
loi 30 18 42 38 50 19
27
9 3
63
19 34 73
22 5 4
21
6 12
19 51
5
3
52 5 8 5
9 45
144 2 8
13
27
27
31 50
20 4
19 192
7 5 6 1
5 , 10
4 3
11 44 67
3
88 32 9
33 28 35 18
20
14 1
77
28 27 71
25 6 4
IV-Noncultivating owners of land; agri-
III-Cultiva- cultural rent ling labour- receivers; ers and their and their depe~?ants dependants
V-Produclion other than cul-tivation
VI-Com- VII-Trans-merce port
M F M F M F M F M F
VIII-Other services and miscella-
neous SOllTceS
~ M F (3
22 ~ 23 24 25 26 27 28 29 30 31 32 33
3 37 70
53 135 64 43
196
31 22 4
25
34 36 17
250 43
243 85 I
99 1
11 26
132 45
194
306 29
7 232 27 23 26 23
260 68 26 10 27 12
154 94 42 26
114 27 14
301 15. 60 28
25 5
82 123
8 143
9 148-
51 143
31 22
7
22
2 28 54
55 117 61 28
194
22 11 2
20
22 37
7 198
41 168
69
75 3
11 22
112 43
150
276 27
1 220 23 20 21 13
240 56 II 10 23
8 138 77 45 18
96 27 13
236 13 58 33
12 3
80 59
4 152
10 ~121
56 97 31 29 9
18
5
I
7
20
6
42 4
I
6
3 2
1 6
2 1
2
4
39
2
1
1.
7
1
4
3 1
1
11
7
40 2
2
5
2 1
2
12 1
43
2
10 34 84
166 20 93 63 41
95 129
13 22
16 III 39
105 8
36 9
100 32 55 13
3 137 25
103
47
170 42
21 12 91 43 6
257 35 2
27 176
11 5
27 5 9
255 9
59 5
31
56 101
118
3 294
50 36 19 44
3
14
8 39 43
139 17 78 54 38
84 127
9 21
13 91 44 97
7 36
8 75 48 45 9 1
127 24 98
47
166 46
I 26 16 61 46 6
228 33 1
23 173
12 5
20 1 7
229 4
40 5
27 4
53 101
106
205 54 44 16 43
5
4
2 9
22
66 21 10
13
18 21
3 13
3 15
32 6
10
8 I 6 3
166 16 27
8
9 382
12
13 26 27 15
37 3 1
14 91
5 5
39 4 2
77 10 39 4
17 5
12 18
5 62
4 56 32 18
3
s
11 23
81 25 11
7
16 29 2
10
2 12
24 7
12 1
14
1 5
166 11 30
7
9 334
10
21 18 21 10 3
40 3 2 5
88 2 3
26 9 3
73 15 53 2
10
17 24
2 58
2 55 17 20
3
6
17
47
13 80
1 13
7 1 7
16
45
18 28 16
2 17 11 7
32 4
55 27 58
20
79 4
7 11 1
56 33
iii 60
6
22
1 24
1 39
14
33 7
4i
33 10 18
2 18
16
14
39
15 75
1 14
1 3
12 17
44
13 17
33
15 45
4 25
6 71 23 43
14
70 7
3 8 3
49 24
63 42
12
15
24 I
16
7
23 3
39
11 4
13
2 13
9
22 43 20
72 85
8 43 67
38 38 14 33
8 31 74
116 21
"'5 17 8
59 53 53 23
202 21
105
30 9 4
347 37
5 19 27 97 71 4
47 16 9
70 101
12 7
11 70 44
145 29 90 36
19 .
77 112
5 90
9 402
52 17
9 9 7
23
15 74 30 75 18 76
77 39 78 73 79
3 80 35 81 47 82
83 46 84 26 85 16 86 39 87
88 5 89
24 90 62 91
100 92 17 93 39 94 16 95 6 96 9 97
56 98 37 99 13 100
193 101 14 102 87 103
104 28 105 11 106 3 107
322 108 32 109
5 110 15 III 25 112
104 113 70 114 6 115
41 116 7 117 8 118
56 119 82 120
5 121 3 122
11 123 56124 29 125
1 126 92 127 19 128 93 129 27 130
131 17 132 .. 133 68 134 84 135
7 136 71 137
138 7 139
297 140 58 141 15 142
7 143 4 144 7 145
146 16 147
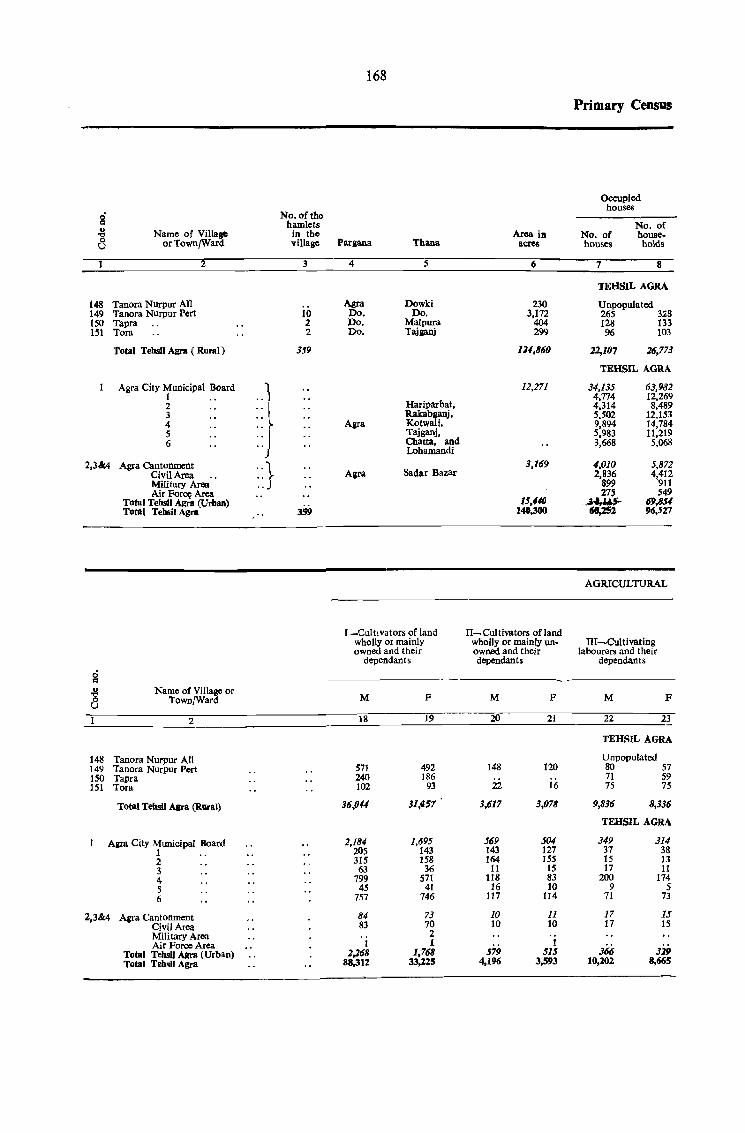
168
Primary Census
OC'CUpied houses
g No. of tho hamlets No. of
'8 Name of Villa,., in the Area ill No. of house-to) or TownfWard village Pargana Thana acres houses holds
2 3 4 5 6 7 8
TEHSIL AGRA
148 Tanora Nurpur All Agra Dowki 230 Unpopulated 149 Tanora Nurpur Pert 10 Do. Do. 3,172 265 32S 150 Tapra :2 Do. Malpura 404 128 133 151 Tora 2 Do. Tajganj 299 96 103
Total Tehsil Agra ( Rural) 359 11/,860 22,107 26,773
TEHSIL AGRA
Agra City Municipal Board 1 12,271 34,135 63,982 1 .,1 4,774 12,269 2
" ~ Hariparbat, 4,314 8,489
3 " Rakabganj, 5,502 12,153
4 Agra Kotwali, 9,894 14,784 5 Tajganj, 5,983 11,219 6 "J Chatta, and 3,668 5,068
Lohamandi
2,3&4 Agra Cantonment .. } 3,169 4,010 5,872 Civil Area .. Agra Sadar Bazar 2,836 4~12 Military Area' , 899 11 AirFo~Area 275 549
Total Tebsll Agra (Urban) 15,110 .~ 69,851 Total Tehsil Agra 359 140,300 96,527
AGRICULTURAL
l_CultlVators of land II-Cultivators ofland wholly or mainly wholly or mainly un- III-Cultivating owned and their owned and their labourers and their
dependants dependants dependants
g
~ Name of Village or
Town/Ward M F M F M F
1 2 18 J9 20 21 22 23
TEHSIL AGRA
148 Tanora Nurpur All Unpopulated 149 Tanora Nurpur Pert S71 492 148 120 80 57 150 Tapra 240 186
ii; 71 59
151 Tora 102 93 22 75 75
Total Tehsil Agra (Rural) 36,014 31,"7 3,617 3,078 9,836 8,336
TEHSIL AGRA
Agra City Municipal Board 2,184 1,695 569 504 349 314 1 205 143 143 127 37 38 2 315 158 164 155 15 13 3 63 36 11 15 17 11 4 799 S71 118 83 200 174 5 45 41 16 10 9 5 6 757 746 117 114 71 73
2,3&4 Agra Cantonment 84 73 10 11 17 15 Civil Area 83 70 10 10 17 15 Military Area 2 Air Force Area 1 1 1 3ii Total Tehsll Agra (Urban) 2,268 1,768 579 515 366
Total Tebsll Agra 38,312 33,225 4,196 3,593 10,202 8,665
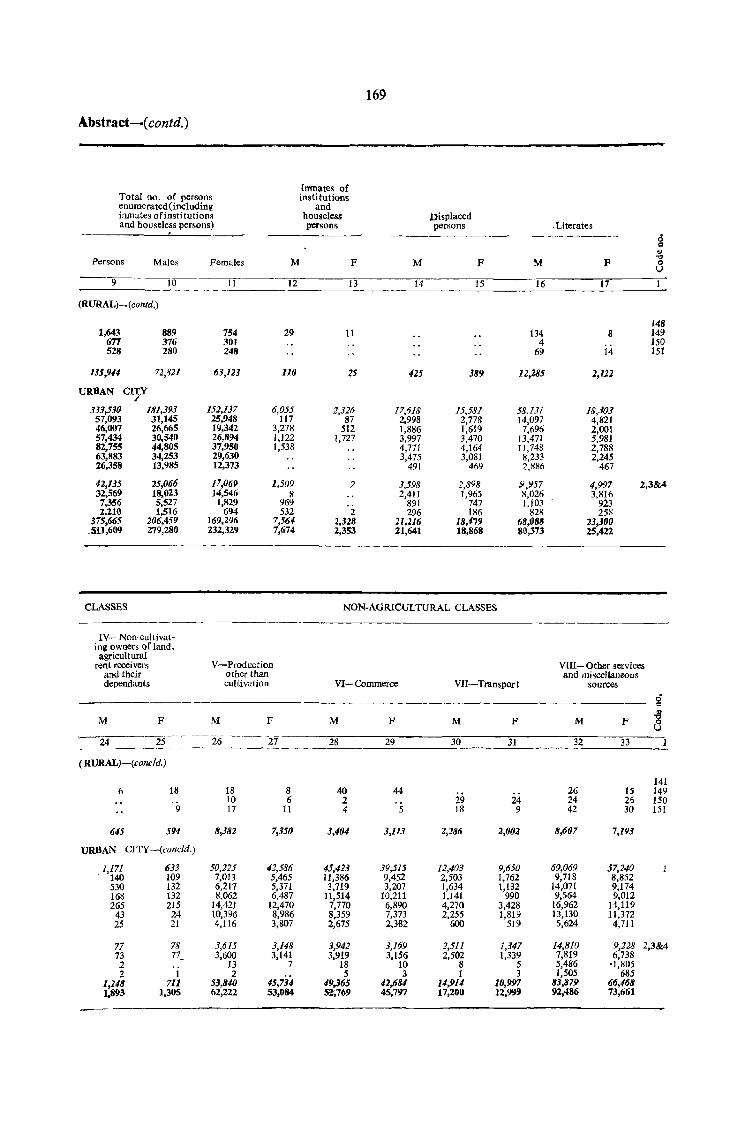
169
Abstract-( contd.)
Inmates of Total no. of persons institutions enumerated(inc1uding and inmates ofinsti tutions houseless Displaced and houseless persons) persons persons .Literates
d = " Persons Males Females M F M F M F "" 8
9 10 II 12 13 14 15 16 17
(RURAL)-.(contd.)
148 1,643 889 754 29 11 134 8 149
677 376 30t 4 150 528 280 248 69 14 151
135,944 72,811 63,123 no 25 425 389 12,285 2,122
URBAN CI1:Y /
333,530 181,393 152,137 6,055 2,326 17,618 15,581 58,13! 18,303 57,093 31,145 25,948 117 87 2,998 2,778 14,097 4,821 46,007 26,665 19,342 3,278 512 1,886 1,619 7,696 2,001 57,434 30,540 26,894 1,122 1,727 3,997 3,470 13,471 5,981 82,755 44,805 37,950 1,538 4,771 4,164 11,748 2,788 63,883 34,253 29,630 3,475 3,081 8,233 2,245 26,358 13,985 12,373 491 469 2,886 467
$2,135 25,066 17,069 1,509 2 3,598 2,898 Ii ,'J57 4,997 2,3&'" 32,569 18,023 14,546 S 2,411 1,965 8,026 3,816 7,356 5,527 1,829 969 891 747 1,103 923 2,210 1,516 694 532 2 296 186 828 258
375,665 206,459 169,21J6 7,564 2,328 21,216 18,n9 68,088 23,300 __ SU.609 279,280 232,329 7,674 2,353 21,641 18,868 80,373 25,422
CLASSES NON-AGRICULTURAL CLASSES
--------~---
IV- Non-cllltivat-ing owners of land, agricultural
rent receivers V-Prodllction VIII- Other services and their other than and miscellaneous dependants cultivation VI-Commerce VII-Transport sources
g ., M F M F M F M F M F
'0 0 U
24 25 -----26
27 28 29 30 31 32 33 1
( RURAL)-(concld.)
141 6 18 18 8 40 44 26 15 149
10 6 2 29 24 24 25 150 9 17 11 4 5 18 9 42 30 151
645 594 8,381 7,350 3,404 3,113 1,286 2,001 8,607 7,193
URBAN CITY-(concld.)
1,171 633 50.225 42.586 45,423 39,515 12,403 9,650 69,069 57,240 140 109 7,013 5,465 11,386 9,452 2,503 1,762 9,718 8,852 530 132 6,217 5,371 3,719 3,207 1,634 1,132 14,071 9,174 168 132 8,052 6,487 11,514 10,211 1,141 990 9,564 9,012 265 215 14,421 12,470 7,770 6,890 4,270 3,428 16,962 14,119
43 24 10,396 8,986 8,359 7,373 2,255 1,819 13,130 11,372 25 21 4,116 3,807 2,675 2,J82 600 519 5,624 4,711
77 78 3,615 3,148 3,942 3,169 2,511 1,347 14,810 9.228 2,3&4 73 77_ 3,600 3,141 3,919 3,156 2,502 1,339 7,819 6,738 2 13 7 18 10 8 5 5,486 '1,805 2 1 2 5 3 1 3 1,505 685
1,248 711 53,840 45,734 49,365 42,684 ]4,914 10,997 83,879 66,$68 1,893 1,305 62,222 53,084 51:,769 45,797 17,200 12,999 92,486 73,661
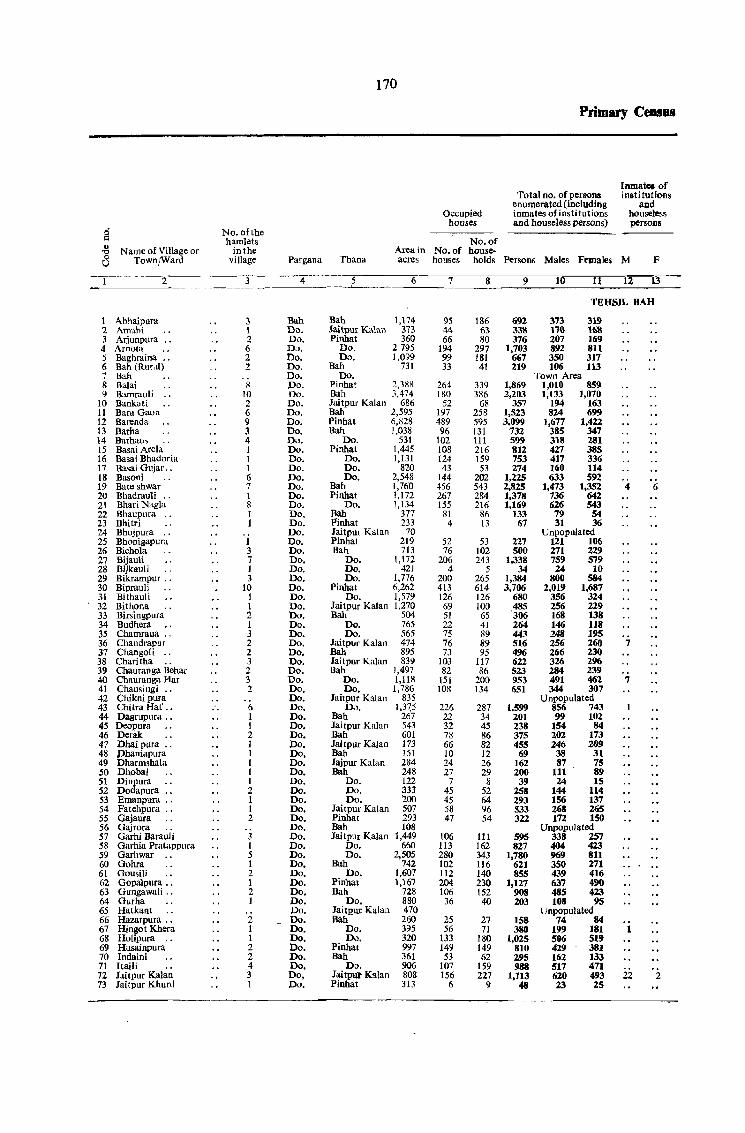
170
Primary CeaS8S
Inmate. of Total no. ofpersQns insti tutions
enumerated (including and Occupied inmates of institutions houseless
houses and houseless persons) persons g No. of the
hamlets No. of .. N arne of Village or inthe Area in No. of house--0 0 Town/Ward village Pargana Thana acres houses holds Persons Males Females M F U
-1- 2 ---)-- 4 5 6 7 8 9 10 II 12 13
TEHSIL BAH
1 Abhaipura 3 Bah Bah 1,174 95 186 692 373 319 2 Am\lhi 1 Do. Jaitpur Kalan 373 44 63 338 l1Q 168 3 Arjunpura .. 2 Do. Pinhat 360 66 80 376 207 169 4 Arnota 6 Do. Do. 2.795 194 297 1,703 892 811 5 Baghraina ., 2 Do. Do. 1.099 99 181 667 350 317 6 Bah (Ruf<ll) 2 Do. Bah 731 33 41 219 106 113 7 Bah Do. Do. Town Area 8 Balai 8 Do. Pinhat 2,388 264 339 1,869 1,010 859 9 Bamraul; .. 10 Do. Bah 3,474 180 386 2,203 1,133 1,070
10 Bankati 2 Do. Jaitpur Kalan 686 52 68 357 194 163 11 Bara Gaon 6 Do. Bah 2,595 197 258 1,523 824 699 12 Barenda 9 Do. Pinhat 6,828 489 595 3,099 1,677 1,422 13 Barha 3 Do. Bah 1,038 96 131 732 385 347 14 Barhaus 4 Do. Do. 531 102 111 599 318 281 15 Basai Arela 1 Do. Pinhat 1,445 108 216 812 427 38S 16 Basai Bhadoria 1 Do. Do. 1,131 124 159 753 417 336 17 Basai Gujar .. 1 Do. Do. 820 43 53 274 160 114 18 Basoni 6 Do. Do. 2,548 144 202 1,225 633 592 19 Bate shwar 7 Do. Bah 1,760 456 543 2,825 1,473 1,352 4 6 20 Bhadrauli I Do. Pinhat 1.172 267 284 1,378 736 642 21 BhariNag\a 8 Do. Do. 1,134 155 216 1,169 626 543 22 Bhaupura .. I Do. Bah 377 81 86 133 79 54 23 Bhitri 1 Do. Pinhat 233 4 13 67 31 36 24 Bhojpura ., Do. Jaitpur Kalan 70 Unpopulated 25 Bhonigapura 1 Do. Pinhat 219 52 53 227 121 106 26 Bichola 3 Do. Bah 713 76 102 500 271 229 27 Bijauli 7 Do. Do. 1,172 206 243 1,338 759 579 28 Bijkauli 1 Do. Do. 421 4 5 34 24 10 29 Bikrampur .. 3 Do. Do. 1,776 200 265 1,384 800 584 30 BiprauJi 10 Do. Pinhat 6,262 413 614 3,706 2,019 1,687 31 BithauIi 1 Do. Do. 1,579 126 126 680 356 324 32 Bithona 1 Do. Jaitpur Kalan 1,270 69 100 485 256 229 33 Birsingpura 2 Do. Bah 504 51 65 306 168 138 34 Budhera I Do. Do. 765 22 41 264 146 118 35 Chamraua .. 3 Do. Do. 565 75 89 443 248 195 36 Chandrapur 2 Do. Jaitpur Kalan 474 76 89 516 256 260 7 37 Changoli .. 2 Do. Bah 895 73 95 496 266 230 38 Charitha 3 Do. Jai tpur Kalan 839 103 117 622 326 296 39 Chauranga Behar 2 Do. Bah 1,497 82 86 523 284 239 40 Chauranga Har 3 Do. Do. 1,118 151 200 953 491 462 7 41 Chausingi .. 2 Do. Do. 1,786 108 134 651 344 307 42 Chiknipura Do. Jaitpur Kalan 835 Unpopulated 43 ChitraHat' .• .. 6 Do. Do. 1,3~5 226 287 1,599 856 743 44 Dagrupura .. I Do. Bah 267 22 34 201 99 102 45 Deopura 1 Do. Jaitpur Kalan 543 32 45 238 154 84 46 Derak 2 Do. Bah 601 78 86 375 202 173 47 Dhaipura ., 1 Do. Jai tpur Kalan 173 66 82 455 246 209 48 Phaniapura I Do, Bah 151 10 12 69 38 31 49 Dharmshala 1 Do. Jajpur Kalan 284 24 26 162 87 75 50 Dhobai 1 Do. Bah 248 27 29 200 111 89 51 Dinpura I Do. Do. 122 7 8 39 24 15 52 Dodapura .. 2 Do. Do. (133 45 52 258 144 114 53 Emanpura ., 1 Do. Do. 200 45 64 293 156 137 54 Fatehpura .. 1 Do. Jaitpur Kalan 507 58 96 533 268 265 55 Gajaura 2 Do. Pinhat 293 47 54 322 172 150 56 Gajrora Do. Bah 108 Unpopulated 57 Garhi Barauli 3 Do. Jaitpur Kalan 1,449 106 111 59S 338 257 58 Garhia Pratappura I Do. Do. 660 113 162 827 404 423 59 Garhwar .. 5 Do. Do. 2,505 280 343 1,780 969 811 60 Gohra 1 Do. Bah 742 102 116 621 350 271 61 Gousili 2 Do. Do. 1,607 112 140 855 439 416 62 Gopalpura .. 1 Do. Pinhat 1,167 204 230 1,127 637 490 63 Gungawali .. 2 Do. Bah 728 106 152 908 485 423 64 Gurha 1 Do. Do. 880 36 40 203 108 95 65 Hatkant Do. JaitQIJr Kalan 470 Unpopulated 66 Hazarpura .. 2 Do. Bah 260 25 27 158 74 84 67 Hingot Khera 1 Do. Do. 395 56 71 380 199 181 1 68 Holipura ., 1 Do. Do. 320 133 180 1,025 506 519 69 Husainpura 2 Do. Pinhat 997 149 149 810 429 381 70 Indaini 2 Do. Bah 361 53 62 295 162 133 71 HaiJi 4 Do. Do. 906 107 159 988 517 471 72 Jaitpur Kalan 3 Do, Jaitpur Kalan 808 156 227 1,113 620 493 22 2 73 Jaitpur Khurd 1 Do. Pinhat 313 6 9 48 23 25
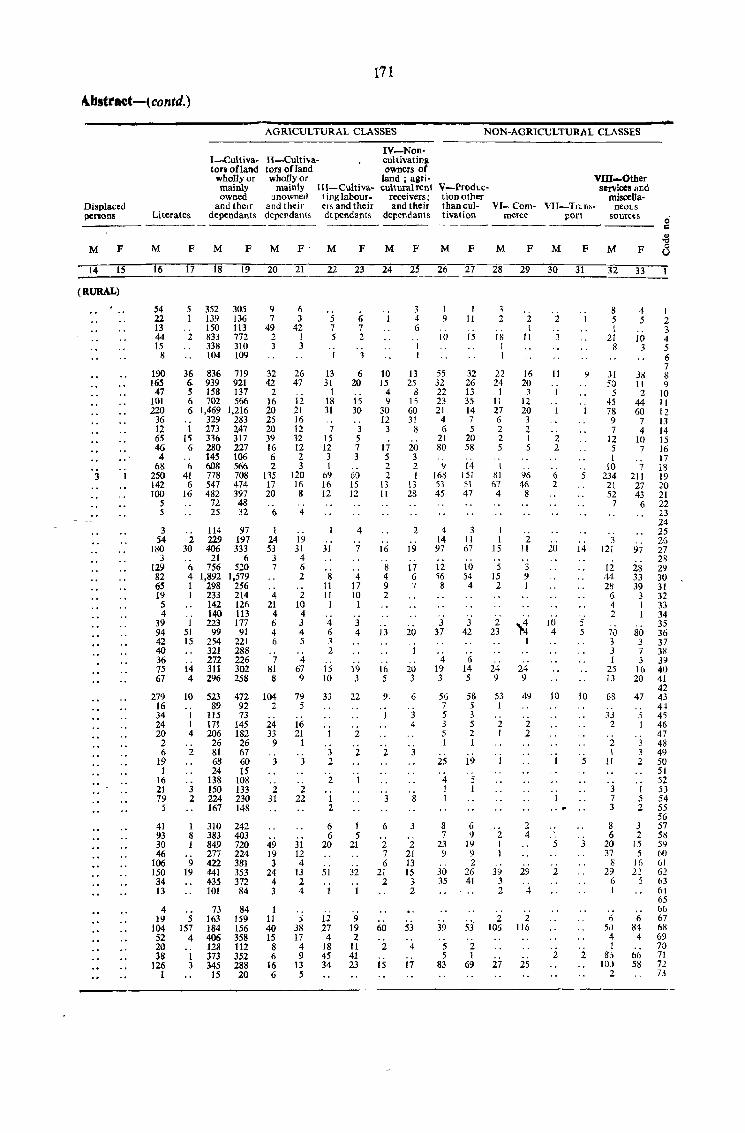
Abstraet-tcontd.)
Displaced persons Literates --------
I-Cultivators ofland
wholly or mainly owned
and their dependants
171
AGRICULTURAL CLASSES
IV-Non-lI-Cultiva- cultivating tors ofland owners of wholly or land; agrj·
mainly IU-·Cultiva- cuituralrenl unowned 1 inglabour- receivers;
and their ers and their and their dependant 5 dependants dependants
M F M F M F M F' M F M F
NON-AGRICULTURAL CLASSES
V-ProdLction other than cultivation
M F
VIII-Other services and
miscellaVI_Com- VII-Tras- neol.S
rnerce port sources o "
M F M F M ~
F 8 ~1~4_~1~5 ___ 1_6 ____ t7 ___ 18 __ t9 __ 20~_2_1 ____ 2~2_~2~3_~2_4 __ ~2_5 __ 26~ __ 27 __ 28~_2~9 __ 3~0 __ 3~1~_32 33
(RURAL)
3
54 22 13 44 15
8
190 165
47 101 220
36 12 65 46 4
68 250 142 100
5 5
3 54
180 3
129 82 65 19
5 4
39 94 42 40 36 75 67
279 16 34 24 20
2 6
19 1
16 21 79
5
41 93 30 46
106 150 34 13
5 1
2
352 139 150 833 338 104
36 836 6. 939 5 158 6 702 6 1,469
1 15
6 .. 6
41 6
16
329 273 336 280 145 608 778 547 482
72 25
114 2 229
30 406 21
6 756 4 1,892 1 298 1 233
142 140
1 223 51 99 15 254
321 272
14 311 4 296
10
1 1 4
2
3 2
1 8 1
9 19
523 89
115 171 206 26 81 68 24
138 150 224 167
310 383 849 277 422 441 435 101
305 136 113 772 310 109
719 921 137 566
1,216 283 247 317 227 106 566 708 474 397 48 32
97 197 333
6 520
1,579 256 214 126 113 177
91 221 288 226 302 258
472 92 73
145 182 26 67 60 15
108 133 230 148
242 403 720 224 381 353 372 84
4 73 84 19 5 163 159
104 157 184 156 52 4 406 358 20 128 112 38 1 373 352
126 3 345 288 1 IS 20
9 7
49 2 3
32 42
2 16 20 25 20 39 16 6 2
135 17 20 .. 6
1 24 53
3 7
4 21
4 6 4 6
7 81 8
104 2
24 33
9
3
2 31
49 19 3
24 4 3
1 11 40 15 8 6
16 6
6 3
42 1 3
26 47
12 21 16 12 32 12 2 3
120 16 8
4
19 31
4 6 2
2 10 4 3 4 5
4 67 9
79 5
16 21
1
3
2 22
31 12 4
13 2 4
5 38 17 4 9
13 S
5 7 5
1
13 31
1 18 31 .. 7
15 12 3 1
69 16 12
31
8 11 11 1
4 6 3 2
15 10
33
'j
3 2
2
1 2
6 6
20
51
I
1J 27
4 18 45 34
6 7 2
3
6 20
15 30
3 5 7 3
60 15 12
4
7
4 17 10 1
3 4
19 3
22
2
2
1 5
21
32
1
9 19 2
11 41 23
10 15
4 9
30 12
3
17 5 2 2
13 11
16
8 4 9 2
13
Hi 5
9.
1
2
3
6
2 7 6
21 2
60
2
15
3 4 6
I I
13 25
8 15 60 31
8
20 3 2 J
13 28
2
19
17 6 7
20
I
20 3
6
3 4
3
8
3
2 21 13 15
3 2
53
4
17
1 9
10
55 32 22 23 21
4 6
21 80
9 168 53 45
4 14 97
12 56
8
3 37
4 19 3
56 7 5 3 5 1
25
4 1 1
8 7
23 9
30 35
39
5 5
83
I 11
15
32 26 13 35 14 7 5
20 58
14 151 51 47
3 11 67
10 54 4
3 42
6 14 5
58 5 3 5 2 1
19
5 I
6 9
19 9 2
26 41
53 2 1
69
3 2
18 [
I
22 24
I 11 27 6 2 2 5
.. 1
81 67 4
I 1
IS
5 15 2
2 23
24 9
53 I
2 I
2 1 1
39 3 2
2 106
27
2 I
11
16 20
3 12 20 3 2 1 5
96 46
8
2 11
3 9 I
..,.: 1
24 9
49
2 2
2 4
29
4
.. 2
1J6
25
2 1
3
[1 9
1 .. .. J 1
2 2
6 5 2
20 14
JO 5 4 5
10 10
I 5
,. - ..
5 3
2
2 2
8 5 1
21 8
31 50
5 45 78 9 7
12 5 1
10 234
21 52
7
3 121
12 44 28
6 4 2
7i) 3 3 1
25 13
68
33 2
2 I
11
3 7 3
8 6
20 37
8 29
6 1
6 5J
4 1
8il 10.)
2
4 I 5 2
3 10 4
3 5 6 7
38 8 11 9 2 10
44 11 60 12 7 13 4 14
10 IS 7 16
17 7 18
211 19 27 20 43 21 6 22
23 24 25 26
97 27 n
28 29 33 30 39 31
3 32 I 33 I 34
35 80 36 3 37 7 38 3 39
16 40 20 41
42 47 43
44 j 45 1 46
47 3 43 3 49 2 50
51 52
1 53 5 54 2 55
56 3 57 2 58
15 59 5 60
16 61 22 62
6 84
4
66 58
63 61 65 b(J 67 68 69 70 71 72 7j
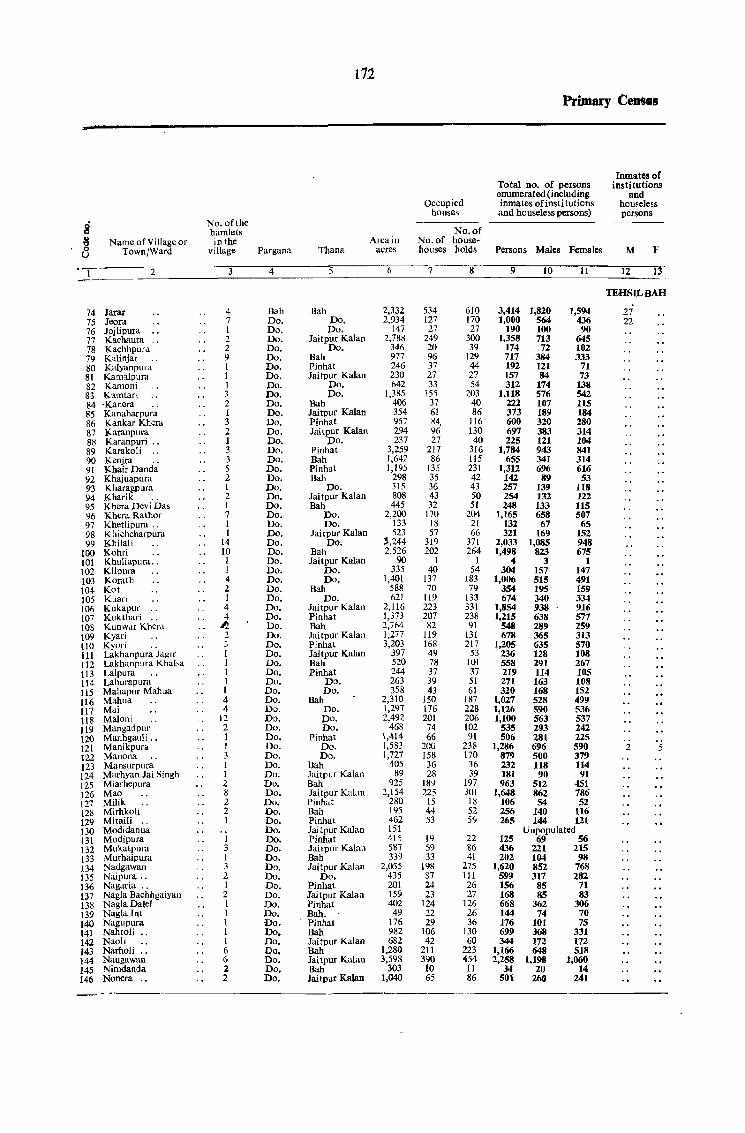
112
Primary CenfiBs
Inmates of Total no. of persons insti tutions enumerated (including and
Occupied inmates of institutions homeless houses and houseless persons) persons
8 No. of the hamlets No.of
~ Name of Village or inthe Area in No. of house-
8 Town/Ward village Pargana Thana acres houses holds Persons Males Females M F
2 3 4 5 6 '7 8 9 10 II 12 13
TEHSILBAH
74 Jarar 4 Bah Bah 2,332 534 610 3,414 1,820 1,594 27 75 Jeora 7 Do. Do. 2,934 127 170 1,000 564 436 22 76 Jojlipura 1 Do. Do. 147 27 27 190 100 90 77 Kachaura 2 Do. Jaitpur Kalan 2,788 249 300 1,358 713 645 78 Kachhpura 2 Do. Do. 346 20 39 174 72 102 79 Kllinjar 9 Do. Bah 977 96 129 717 384 333 80 Kalyanpura 1 Do. Pinhat 246 37 44 192 121 71 81 Kama1pura I Do. Jaitpur Kalan 230 27 27 157 84 73 82 Kamoni 1 Do. Do. 642 33 54 312 174 138 83 Kamtari 3 Do. Do. 1,385 155 203 1,118 576 542 84 -Kanera 2 Do. Bah 406 37 40 222 107 115 85 Kanaharpura 1 Do. Jaitpur Kalan 354 61 86 373 189 184 86 Kankar Khcra 3 Do. Pinha! 957 84. 116 600 320 280 87 Karanpura 2 Do. Jaitpur Kalan 294 96 130 697 383 314 88 Karanpuri .. 1 Do. DO. 237 27 40 225 121 104 89 Karakoli .. 3 Do. Pinhat 3,259 217 316 1,784 943 841 90 Kenjra 3 Do. Bah 1,642 86 115 655 341 314 91 Khair Danda 5 Do. Pinhat 1,195 135 231 1,312 696 616 92 Khajuapura 2 Do. Bah 298 35 42 142 89 53 93 Kharagpura 1 Do. po. 315 36 43 257 139 U8 94 Kharik 2 Do. Jaitpur Kalan 808 43 50 254 132 122 95 Khera Devi Das I Do. Bah 445 32 51 248 133 115 96 Khera Rathor 7 Do. Do. 2,200 170 204 1,165 658 507 97 Khetlipura .. 1 Do. Do. 133 18 21 132 67 65 98 Khichcharpura I Do. Jaitpur Kalan 523 57 66 321 169 152 99 Khilali 14 Do. Do. '-,244 319 371 2,033 1,085 948
100 Kohri 10 Do. Bah 2,526 102 264 1,498 823 675 101 Khuliapura .. 1 Do. Jaitpur Kalan 90 1 1 4 3 1 102 Kilpura 1 Do. Do. 335 40 54 304 157 147 103 Korath 4 Do. Do. 1,401 137 183 1,006 515 491 104 Kot 2 Do. Bah 588 70 79 354 195 159 105 Kuafl 1 Do. DO. 621 119 133 674 340 334 106 Kukapur 4 00. Jai tpur Kalan 2,116 223 331 1,854 938 - 916 107 Kukthari 4 Do. Pinhat 1,373 207 238 1,215 638 577 108 Kunwar Kher,\ ~ Do. Bah 2,764 82 91 548 289 259 109 Kyari 2 Do. Jaitpur Kalan 1,277 119 131 678 365 313 110 Kyori } Do. Pinhat 3,203 168 217 1,205 635 570 111 Lakhanpura Jaglr 1 Do. Jaitpur Kalan 397 49 53 236 128 108 112 Lakhanpura Khalsa I Do. Bah 520 78 101 558 291 267 113 Lalpura I Do. Pinhat 244 37 37 219 114 105 \14 Lahurapura 1 Do. DO. 263 39 51 271 163 108 115 Mahapur Mahua 1 Do. Do. 358 43 61 320 168 152 116 Mahua 4 Do. Bah 2,310 150 187 1,027 528 499 117 Mdi 4 Do. Do. 1,297 176 228 1,126 590 536 118 Maloni 12 Do. DO. 2,492 201 206 1,100 563 537 lIlJ MangadplIl' 2 Do. Do, 468 74 102 535 293 242 120 Manhgauli .. I Do. Pinhat 1,414 66 91 506 281 225 121 Manikpura I Do. Do. 1,583 200 238 1,286 696 590 2 5 122 Manona 3 Do. Do. 1,727 158 170 879 500 379 123 MansLlrpura I Do. Bah 405 36 36 232 U8 114 124 Marhyan Jai Singh 1 Do. Jaitpllr Kalan 89 28 39 181 90 91 125 Miarhepura 2 Do. Bah 925 189 197 963 512 451 126 Mao 8 Do. Jaitpur Kalan 2,154 225 301 1,648 862 786 127 Milik 2 Do. Pinhat 280 15 18 106 54 52 128 Mirhkoli 2 Do. Bah 1'15 44 52 256 140 116 129 Mitaili I Do. Pinhat 462 53 59 265 144 121 130 Modidanua Do. Jaitpur Kalan 151 Unpopulated [31 Modipura I Do. Pinhat 415 1'1 22 125 69 56 132 Mukatpura 3 Do. Jai tpur Kalan 587 59 86 436 221 215 133 Murhaipura 1 Do. Bah 339 33 41 202 104 98 134 Nadgawan 3 Do. Jaitpur Kalan 2,055 198 275 1,620 852 768 135 Naipura .. 2 Do. Do. 435 87 111 599 317 282 136 Nagaria " 1 Do. Pinha! 201 24 26 156 85 71 137 Nag1a Bachhgaiyan 2 Do. Jaitpur Kalall 159 23 27 168 85 83 138 NaglaDalel I Do. Pinhat 402 124 126 668 362 306 139 Naglalnt 1 Do. Balt. 49 22 26 144 74 70 140 Nagupura 1 no. Pinha! 176 29 36 176 101 75 141 Nahloli " 1 Do. Bah 982 106 130 699 368 331 142 Naoli 1 Do. Jaitpur Kalan 682 42 60 344 172 172 143 Narholi .. 6 Do. Bah 1,280 211 223 1,166 648 518 144 Naugawan 6 Do. Jaitpur Kalan 3,598 390 454 2,258 1,198 1,060 145 Nimdanda 2 Do. Bah 303 to 11 34 20 14 146 Nonera 2 Do. Jaitpur Kalan 1,040 65 86 501 260 241 -_ .......
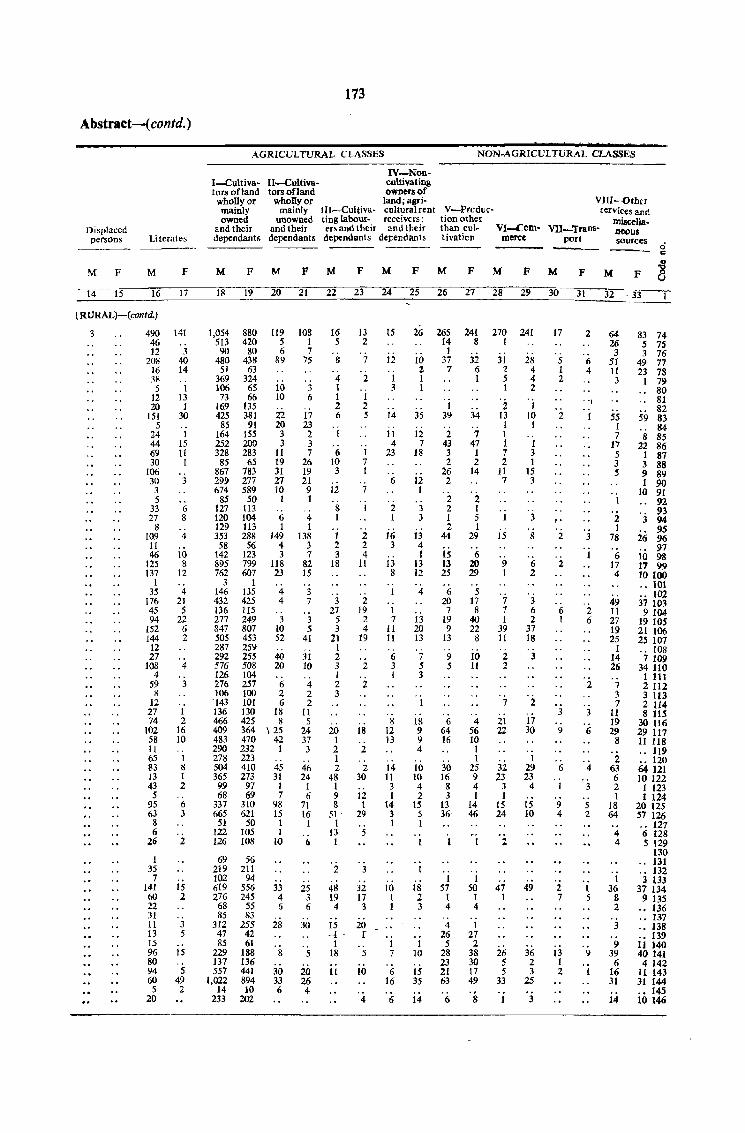
173
Abstract-( contd,)
AGRICULTURAL CLASSES NON-AGRICULTURAL CLASSES
Displaced persons
M F
Literates
M F
I-Cultivators ofland whoUyor mainly owned
and their dependants
M F
IV-Non-II-Cultiva- cultivating tors ofland owners of
wholly or land; agri-mainly nr-Cultiva- cultural rent V-Prcrlllc-
VIII-{)thcT !ervices and
miscellaVI-Com- Vll-Tmn~- neous
unowned ting labour- receivers; tion other and their erS and their and their than cuI-dependants dependants derendants tivaticn meree )l()rt sources.,;
" M F M F M F M F M F M F M F
14 15 16 17 18 19 20 21 22 23 24 25 26 27 28 29 30 31 32 - 33 ~~--~------------------
l RURAL)-(contd,)
3 490 46 12
208 16 38 5
12 20
151 5
24 44 69 30
106 30 3 5
33 27
8 109
11 46
125 137
1 35
176 45 94
152 144 12 27
108 4
59 8
12 27 74
102 58 11 65 83 13 43 5
95 63 8 6
26
1 35 7
141 60 22 31 11 13 15 96 80 94 60 5
20
141
3 40 14
1 13 1
30
1 15 11 1
3
6 8
4
10 8
12
4 21 5
22 6 2
4
3
I 2
16 10 --I 8 1 2
6 3
2
15 2
3 5
15
5 49 2
1,054 513 90
480 51
369 106 73
169 425
85 164 252 328 85
867 299 674
85 127 120 129 353 58
142 895 762
3 146 432 136 277 847 505 287 292 576 126 276 106
-143 136 466 409 483 290 278 504 365 99 68
337 665
51 122 126
69 219 102 619 276
68 85
312 47 85
229 137 557
1,022 14
233
880 420
80 438 63
324 65 66
135 381 91
155 200 283
65 783 277 589
50 113 104 113 288 56
123 799 607
1 135 425 115 249 807 453 259 255 508 104 257 100 101 130 425 364 470 232 223 410 273
97 69
310 621
50 105 108
56 211
94 556 245
55 83
255 42 61
188 136 441 894 10
202
119 5 6
89
10 10
Z2 20
3 3
11 19 31 27 10
1
6 I
149 4 3
118 23
4 4
3 10 52
40 20
6 2 6
18 8
\ 25 42 1
--45 31
I 7
98 15 1 I
10
33 4 6
28
8
30 33 6
108 I 7
75
3 6
17 23 2 3 7
26 19 21 9 1
4 1
138 3 7
82 15
3 7
3 5
41
31 10
4 2 2
11 5
24 37 3
46 24 I 6
71 16 1
6
25 3 6
30
5
20 26 4
16 5
8
4 I 1 2 6
1
6 10 3
12
8 I
1 2 3
18
3 27
5 3
21 1 2 3 1 2 3
20 1 2 1 2
48 1 9 8
51 ' 1
13 I
2
48 19 4
15 -1 '
1 18
11
13 2
7
2
1 2 5
1 7 1
7
1
2 2 4
11
2 19 2 4
19
2
2
18
2
2 30
12 1
29
5
3
32 17 3
20 r 5
10
4
15
12
1 3
14
11 4
23
6
2 I
16 3
!3 8
1
1 7
11 11
6 3 1
8 12 13
14 11
3 I
14 3 I
10 1 I
1 7
6 16
6
26
io 2 I 1
35
12 7
18
12 1
3 3
13 4 1
13 12
4
13 20 13
7 5 3
1
18 9 9 4
10 10 4 2
15 5 1
I
1
18 2 3
1 10
15 35
i4
265 14
1 37
7
1 39
2 43 3 2
26 2
2 2 1 2
44
15 13 25
6 20 7
19 9
13
9 5
6 64 16
30 16
8 3
13 36'
1 57
I 4
4 26 5
28 23 21 63
6
241 8
32 6 I
34
7 47 1 2
14
2 I 5 1
29
6 20 29
5 17 8
40 22 8
10 11
4 56 10 1 1
25 9 4 1
14 46
I 50
1 4
1 27 2
38 30 17 49
8
270 I
31 2 5 1
2 13 1 I 1 7 2
11 7
1
15
9 I
7 7 I
39 11
2 2
7
21 22
32 23
3 1
15 24
2
47 1
26 5 5
33
241
28 4 4 2
1 10 I
1 3 1
15 3
3
8
6 2
3 6 2
37 18
3
2
17 30
1 29 23
4
15 10
49
36 2 3
25
3
17
"
5 I 2
2
2
2
6 1
3
9
6
1
9 4
2 7
13 1 2
2
6 4
--,
3
1
2 6
2
3
6
4
3
5 2
I 5
9
1
64 26
3 51 !l 3
55 1 7
17 5 3 5
1
2 1
78
6 17 4
49 11 27 19 25
1 14 26
7 3 7
11 19 29
8
2 63 6 2 I
18 64
4 4
1 36
8 2
3
9 39
6 1'6 31
14
83 74 5 75 3 76
49 77 23 78 1 79
80 81 82
59 83 84
8 85 22 86
1 87 3 88 9 89 1 90
10 91 92 93
-j 94 9S
26 96 97 io 98
17 99 10100 .• 101 ., 102 37 103 9104
19 lOS 21 106 25 107 _. 108 7 109
34 110 1 III 2112 3 113 2 114 8 liS
30 116 29 117 11 118 .• 119 ., 120 64 121 10 122 1 123 I 124
20 125 57 126 .• 127 6 128 S 129
130 ., 131 .• 132 3 133
37 134 9 135
., 136 -. 137 " 138 ., 139 11140 40 141 4 142
11 143 31 144 ., 145 10 146
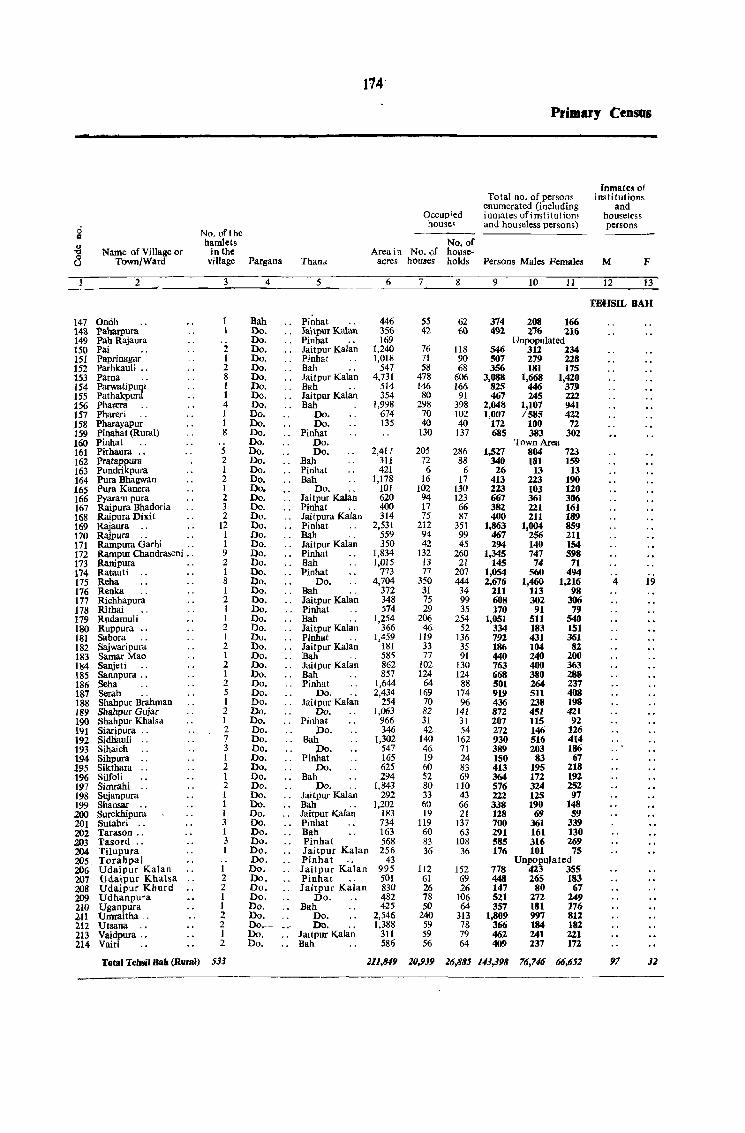
Primary Census
Inmates of Total no. of persons institutions
enumerated (including and Occllpied inmates ofimtitutiom houselcss
0 house' and houseless persons) persons
No.oflhe .. hamlets No. of
~ Name of Village or in the Area in No. of house-<:)
Town/Ward village Pargana Thana acres houses holds Persons Males Females M F U
2 3 4 5 6 7 8 9 10 11 12 13
TEHSIL BAH
147 Ondh Bah .. Pi~hat 446 55 62 374 208 166 14% Pabarpura no. .. Jaitpul Kalan 356 42 60 4l}2 276 216 149 Pah Rajaura Do. Pinhat 169 Unpopulated 150 Pai 2 Do. .. Jaitpur Kalan 1,240 76 118 546 312 234 151 Paprinagar 1 Do. Pinhat 1,018 71 90 507 279 228 152 Parhkauli .. 2 Do. Bah 547 58 68 356 181 175 153 Parna 8 Do. .. Jaitpur Kalan 4,731 478 606 3,088 1,668 1,420 154 ParwatiPuT 1 Do. Bah 514 146 166 825 446 379 155 Pathakpur 1 Do. .. Jaitpur Kalan 354 80 91 467 245 222 156 Pharera 4 Do. .. Bah 1,998 298 398 2,048 1,107 941 157 Phareri 1 Do. Do. 674 70 102 1,007 1585 422 158 Pharayapur 1 Do. Do. 135 40 40 172 100 72 159 Pinahat (Rural) 8 Do. .. Pinhat 130 137 685 383 302 160 Pinhat Do. Do. Town Area 161 Pirhaura .. 5 Do. Do. 2,417 205 286 1,527 804 723 162 Pratappura 2 Do. .. Bah 311 72 88 340 181 159 163 Pundrikpura I Do. .. Pinhat 421 6 6 26 13 13 164 Pura Bhagwan 2 Do. .. Bah 1,178 16 17 413 223 190 165 Pura Kanera I Do. Do. 101 102 130 223 103 120 166 Pyarampura 2 Do. .. Jaitpur Kalan 620 94 123 667 361 306 167 Raipura Bhadoria 3 Do. .. Pinha! 400 17 66 382 221 161 168 Raipura Dixit 2 Do. .. Jaitpura Kalan 314 75 87 400 211 189 169 Rajaura .. 12 Do. .. Pinhat 2,531 212 351 1,863 1,004 859 170 Rajpura .. 1 Do. .. Bah 559 94 99 467 256 211 171 Rampura Garhi 1 Do. .. Jaitpur Kalan 350 42 45 294 140 154 172 Rampur Chandraseni .. 9 00. .. Pinhat 1,834 132 260 1,345 747 598 173 Ranipura 2 Do. .. Bah 1,015 13 21 145 74 71 174 Ratauti I Do. Pinhat 773 77 207 1,054 560 494 175 Reha 8 00. Do. 4,704 350 444 2,676 1,460 1,216 4 19 176 Renka 1 Do. .. Bah 372 31 34 211 113 98 177 Richhapura 2 Do. .. Jaitpur Kalan 348 75 99 608 302 306 178 Rilhai I Do. Pinhat 574 29 35 170 91 79 179 Rudamuli 1 Do. .. Bah 1,254 206 254 1,051 511 540 180 Ruppura .. 2 Do. .. Jai tpur Kalan 366 46 52 334 183 151 181 Sabora 1 Do. .. Pinhat 1,459 119 136 792 431 361 182 Sajwaripura 2 Do. .. Jaitpur Kalan 181 33 35 186 104 82 183 Samar Mao I Do. .. Bah 585 77 91 440 240 200 184 Sanjeti .. 2 Do. .. Jaitpur Kalan 862 102 130 763 400 363 185 Sannpura .. 1 Do. .. Bah 857 124 124 668 380 288 186 Seha 2 Do. .. Pinhat 1,644 64 88 501 264 237 187 Serab 5 Do. Do. 2,434 169 174 919 511 408 188 Shahpur Brahman 1 Do. .. Jailpuf Kalan 254 70 96 436 238 198 189 Shahpur Gujar 2 no. Do. 1,063 82 141 872 451 421 190 Shahpur Khalsa I Do. .. Pinhat 966 31 31 207 115 92 191 SiarlPura .. 2 Do. Do. 346 42 54 272 146 126 192 Sidhauli .. 7 Do. .. Bah 1,302 140 162 930 516 414 193 Sihaich 3 Do. Do. 547 46 71 389 203 186 194 Sihpura .. I Do. .. Pinhat 165 19 24 ISO 83 67 195 Sikthara .. 2 Do. Po. 625 60 83 413 195 218 196 Silfoli I Do. .. Bah 294 52 69 364 172 19Z 197 Simrahi .. 2 Do. Do. 1,843 80 110 576 324 252 198 Sujanpura I Do. .. Jaitpu.r Kalan 292 33 43 222 125 97 199 Shansar I Po. .. Bah 1,202 60 66 338 190 148 200 Surekhipura 1 Do. .. Jaitpur Kal~~ 183 19 21 128 69 S9 201 Sutahri .. 3 Do. Pinhat 734 119 137 700 361 339 202 Tarason .. 1 Do. .. Bah 163 60 63 291 161 130 203 Tasord .. 3 Do. Pinhat 568 83 108 585 316 269 204 Tilupura 1 Do. Jaitpur Kalan 256 36 36 176 101 75 205. Torahpal Do. Pinhat 43 Unpopulated 206 Udaipur Kalan 1 Do. .. Jaitpur Kalan 995 112 152 778 423 355 207 Udaipur Khalsa .. 2 Do. Pinhat 501 61 69 448 265 183 208 Udaipur Khurd 2 Do. .. Jaitpur Kalan 830 26 26 147 80 67 209 Udhanpura I Do. Do. 482 78 106 521 272 249 210 Uganpura 1 Do. .. Bah 425 50 64 357 181 176 2H Umraitha .. 2 Do. Do. 2,546 240 313 1,809 997 811 212 Utsana 2 Do~- Do.· 1,388 59 78 366 184 182 213 Vaidpura .. 1 Do. .. Jaltpur Kalan 311 59 79 462 241 221 214 Vairi 2 Do. Bah 586 56 64 409 237 172
Total Tehsil Bah (Rural) 533 211,849 20,939 26,885 U3,398 76,746 66,652 97 32
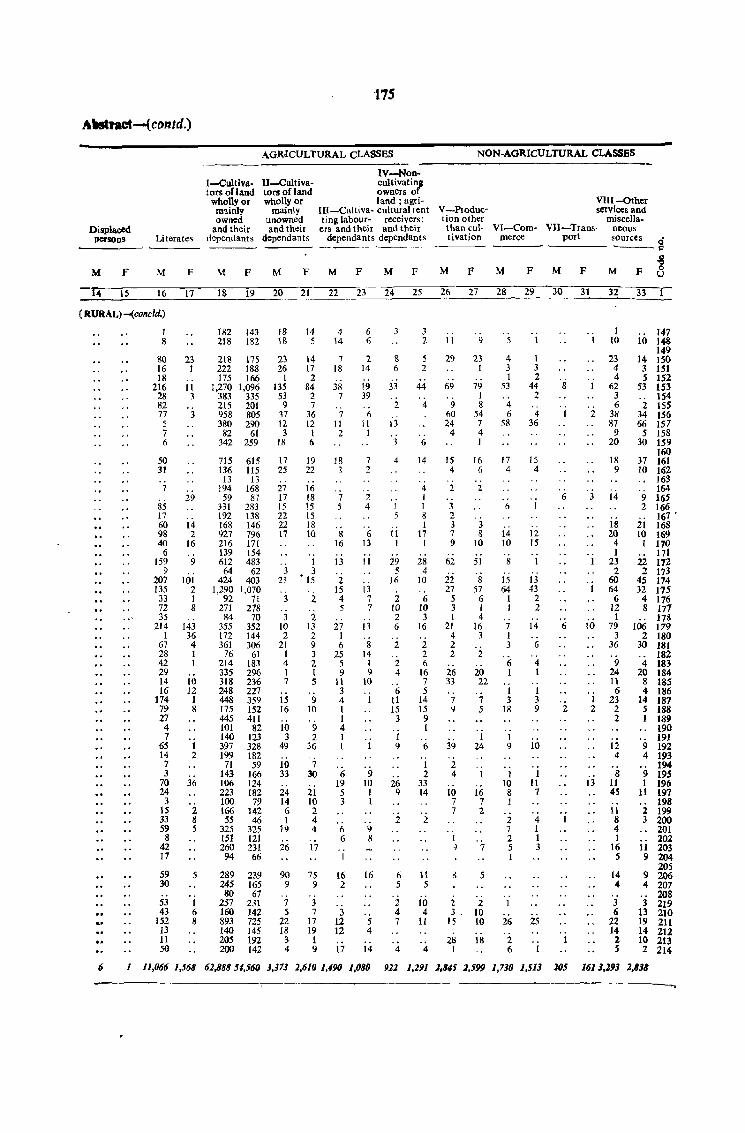
AMtnct-(contd.)
Displaced penons Literates
M F M F
14 15 16 17
( RURAL) -(cofield.)
1 8
80 16 18
216 28 82 77 5 7 6
50 31
7
85 17 60 98 40
6 159
9 207 135 33 72 35
214 I
67 28 42 29 14 16
174 79 27 4 7
65 14 7 3
70 24
3 15 33 59 8
42 17
59 30
53 43
152 13 11 50
23 I
11 3
3
29
14 2
16
9
101 2 1 8
143 36 4 1 1
10 12
I 8
1 2
36
2 8 5
5
1 6 8
I-Cultiv4-tors of land whoUyor
mainly owned
and their dependants
175
AGRICULTURAL CLASSES
II-Gultivators of land wholly or
mainly unowned and their
dependants
IV-Nancultivatinl owners of land; agri-
Ill--Cultiva- cultural rent ting labour- receivers; ers and their and their
dependants dependants ---- ---- ----
M F M F M F M F
NON-AGRICULTURAL CLASSES
V-Ploduction other
VIII-Qther services and
misceJIa-than cui· VI~Com- VII-Trans- neous tivation merce port sources.
---- ----- .....______ g
M F M F M F M i u F
18 19 20 21 22 23 24 25 26 27 28 29 30 31 32 33
182 218
218 222 175
1,270 383 215 958 380
82 342
715 136
13 194
59 331 192 168 927 216 139 612 64
424 1,290
92 271
84 355 172 361
76 214 335 318 248 448 175 445 101 140 397 199
71 143 106 223 100 166 55
325 151 260 94
289 245 80
257 160 893 140 205 200
143 182
175 188 166
1,096 335 201 80S 290
61 259
615 115
13 168 87
283 138 146 796 171 154 483
62 403
1,070 7l
278 70
352 144 306
61 183 296 236 227 359 152 411
82 123 328 182 59
166 124 182
79 142 46
325 121 231 66
239 165 67
231 142 72S 145 192 142
18 18
23 26
1 135
53 9
37 12 3
18
17 25
27 17 15 22 22 17
3 21
3
3 10 2
21 1 4 I 7
15 16
10 3
49
10 33
24 14 6 1
19
26
90 9
7 5
22 18
3 4
14 5
14 17 2
84 2 7
36 12
1 6
19 22
16 18 15 15 18 10
1 3
'15
2
'2 13 2 9 3 2 1 S
9 10
9 2
36
7 30
21 10 2 4 4
17
75 9
3 7
17 19 1 9
4 14
7 18
38 7
7 II 2
18 3
7 5
8 16
13
2 15 4 5
27 1 6
25 5 9
11 3 4 1 I 4 1 I
6 19
5 3
6 6
1
16 2
3 12 12
17
6 6
2 14
19 39
6 11
I
7 2
2 4
6 13
11
13 7 7
13
8 14
I 9
10
1
9 to I 1
9 8
16
5 4
14
3
8 6
33
2
13
3
4
1 5
11 1
29 5
16
2 10 2 6
2
2 4
6 11 15
3
1 9
26 9
2
6 5
2 4 7
4
J 2
5 2
44
4
6
14
4 I I 8 1
17 I
28 4
10
6 10 3
16
2 2 6
16 7 5
14 15 9 1
6
I 2
33 14
2
It 5
10 4
11
4
11
29
69
9 60 24
4
15 4
2
3 2 3 7 9
62
22 27
5 3 1
21 4 2 2
26 33
7 9
39
2 4
10 7 7
9
23 I
79 1 8
54 7 4 1
16 6
2
3 8
10
51
8 57
6 I 4
16 3
2
20 22
7 5
1 24
1
16 7 2
7
5
2 2 3. 10
15 10
28 18 1
5
4 3 1
53
4 6
58
17 4
-' Il
14 10
8
15 64
I 1
7 1 3
6 1
1 3
18
1 9
1 10 8 1
2 7 2 5 I
26
2 6
1
1 3 2
44 2
4 36
15 4
12 15
1
13 43
2 2
14
6
4 I
1 3 9
10
1 11 7
4 1 1 3
25
8
-. 1
6
6
2
2
3
10
1 2
13
1 10
23 4 4
62 3 6
38 87
9 20
18 9
14
18 20 4 1
23 2
60 64
6 12 1
79 3
36
9 24 11 6
23 2 2
12 4
8 11 45
11 8 4 1
16 5
14 4
3 6
22 14 2 5
147 10 148
149 14 150 3 151 :5 152
53 153 154
2 155 34 156 66 157
5 158 30 159
160 37 161 10 162 .. 163
164 9 165 2 166
167 • 21 168 to 169 1 170
171 22 172 2 173
45 174 32 175 4 176 8 177
17S 106 179
2 180 30 181
182 4 183
20 184 8 185 4 186
14 187 :5 188 1 189
_. 190 191
9 192 4 193
194 9 195 1 196
11 197 198
2 199 3 200
201 202
11 203 9 204
205 9 206 4 207
208 3 219
13 210 19 211 14 212 10 213 2 214
6 1 11,066 1,568 61,88851,560 J,373 2.6JO 1,490 1.080 912 1.291 1.&1; ~,599 1,730 1.513 205 1613,293 2.838
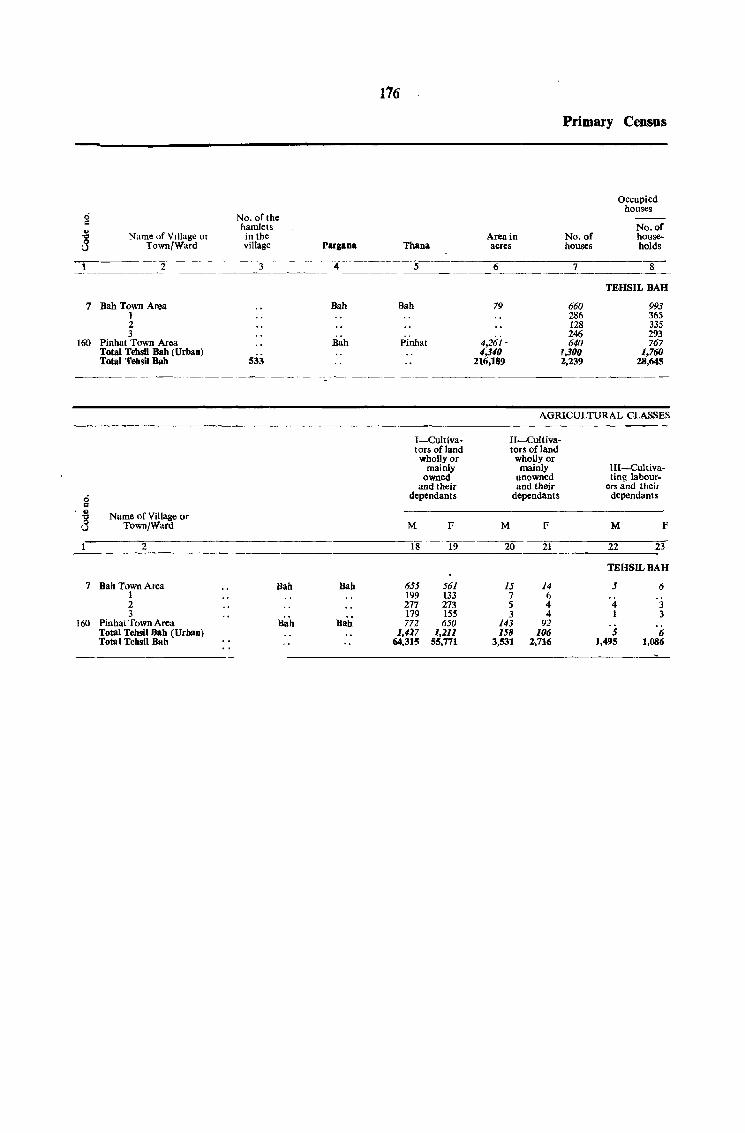
176
Primary Census
Occupied houses
0 No. of the c hamlets No. of " 8 Name of VIllage or in the Area in No. of house-
Town/Ward village Parpna Thana acres houses holds
2 3 4 5 6 7 8
TEHSIL BAH
7 Bah Town Area Bah Bah 79 660 993 1 286 365 2 128 335 3
Piimat 246 293
160 Pinhat Town Aroa Bah 4,261- 640 767 Total TehsH Bab (Urban)
533 4,:UO r,300 1,76(J
Total TebsH Bab 216,189 2,239 28,645
AGRICULTURAL CLASSES
I-Cultiva- II-Cultiva-tors orland tors orland
wholly or wholly or mainly mainly Ill-Cuitiva-
owned unowned ting labour-and their and their ers and theil
0 dependants dependants dependants = ~ Name of Village or
Town/Ward M F M F M F
2 18 19 20 21 22 23
TEHSILBAH
7 Bah Town Area Bah Bah 655 561 15 14 5 6 1 199 l33 7 6 2 217 273 5 4 4 3 3
B~h 179 ISS 3 4 1 3
160 Pinhat Town Area Bah 772 650 143 92 Total Tehsil Bah (Urban) 1,427 1,211 IS8 106 S 6 Totol Tehsil Bah 64,315 55,771 3,531 2,716 1,495 1,086
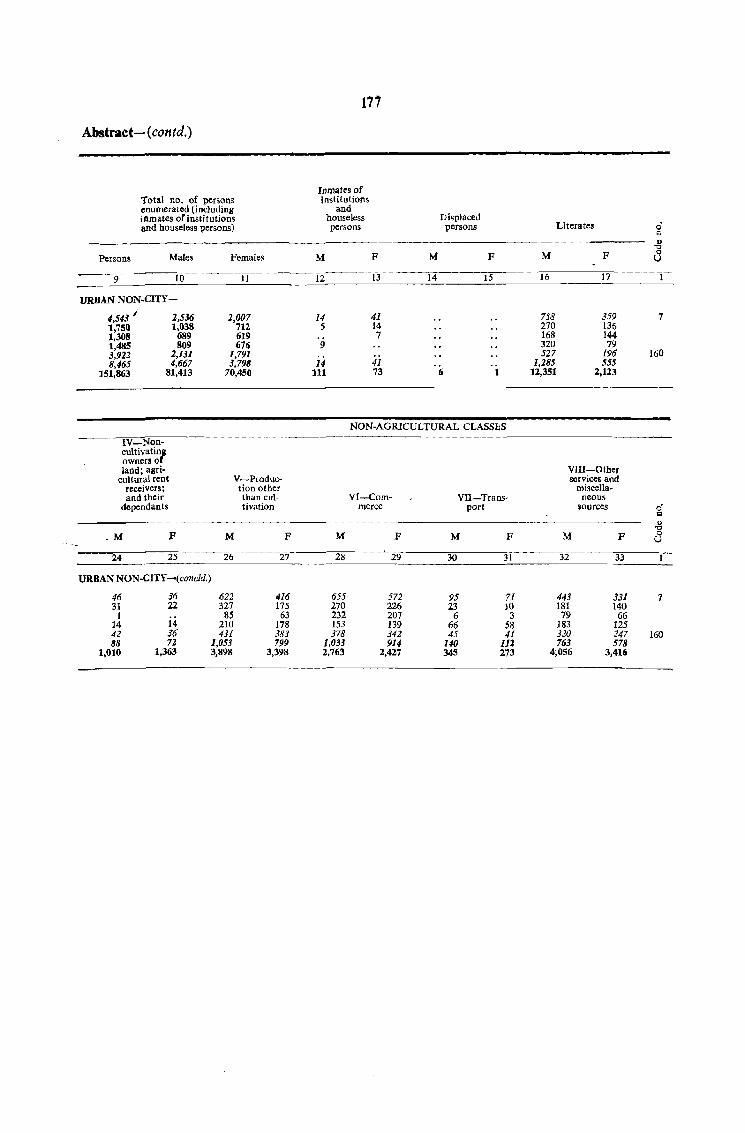
171
Abstraet- (co n td.)
l!lmatesof 'fatal no. of persons institutions enumerated (including and inmates of institutions houseJess Displaced and houseless persons) persons persons Literates 0
'" " .",
Persons Males Females M F M F M F r3 9 10 11 12 13 14 15 16 17
URBAN NON·CITY-
4,5<13/ 2,536 2,007 14 41 758 359 7 1,750 1,038 712 5 14 270 136 1,308 689 619 7 168 144 1,485 809 676 9 320 79 3,922 2,131 1,791 527 196 160 8,465 4,667 3,798 14 41 1,285 555
151,863 81,413 70,450 111 73 6 1 12,351 2,123
NON-AGRICULTURAL CLASSES
IV-Non· cultivatinB owners or land; agri· VIII-Otber
cultural rent V-Produc- services and receivers; tion other miscella-and their tban cuI· VI-Com- VII-Trans· neous
dependants tivation merce port sources o· tl
" "0 _M F M F M F M F M F 0
U
24 25 26 27 28 29 30 31 32 33
URBAN NON·CITY-(conc1d.)
46 16 622 416 655 572 95 71 443 331 7 31 22 327 175 270 226 23 10 181 140
1 85 63 232 207 6 3 79 66 14 14 210 178 153 139 66 58 183 125 42 36 431 383 378 342 45 41 320 247 160 88 72 1,053 799 1,033 914 140 III 763 578
1,010 1,363 3,898 3,398 2,763 2,427 345 273 4;056 3,416
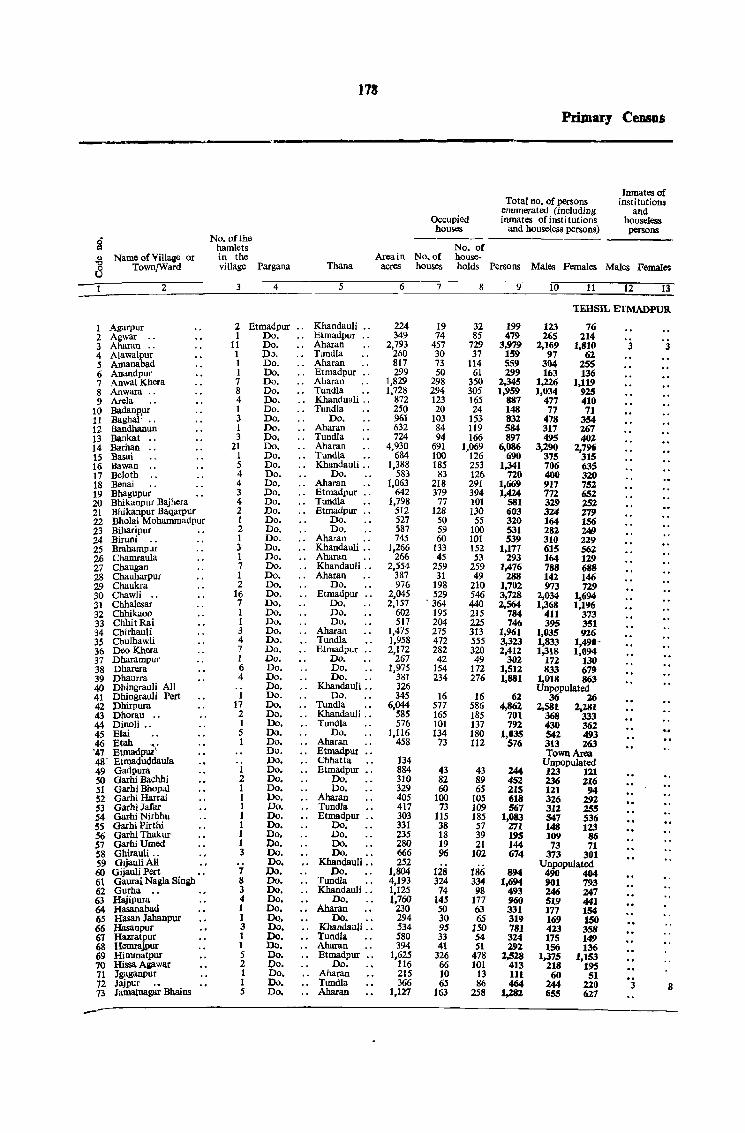
178
Prlmar~ Censos
Jnmatesof Total no. of persons institutions
enumerated (including and Occupied inmates of insti tutions h9useless houses and houseless persons) persons
ci No.ofthe ------t:I hamlets No. of
" Name of Village or in the Area in No. of house-'0 Town/Ward village Pargana Thana acres houses holds Persons Males Females Males Females 0 U
2 3 4 5 6 7 8 9 10 11 12 13
TEHSIL ETMADPUR
1 Agarpur 2 Etmadpur .. Khandauli ., 224 19 32 199 123 76 2 Agwar .. 1 Do. ., Etmadpur 349 74 85 479 265 214 3 Aharan .. 11 Do. ., Aharan 2,793 457 729 3,979 2,169 1,810 3 '.1 4 Alawalpur 1 D:>. .. Tllndla 260 30 37 159 97 62 5 Amanab<!d 1 Do. Aharan 817 73 114 559 304 255 6 Anandpur 1 Do. Etmadpur ., 299 50 61 299 163 136 7 AnwalKhera 7 Do. ., Aharan 1,829 298 350 2,345 1,226 1,119 8 Anwara .. 8 Do. Tundla 1,728 294 305 1,959 1,034 925 9 Arela 4 Do. Khanduali ., 872 123 165 887 477 410
10 Badanppr 1 Do. Tundla 250 20 24 148 77 71 11 Baghai' •. 3 Do. Do. 961 103 153 832 478 354 12 Bandhanun 1 Do. Aharan 632 84 119 584 317 267 13 Bankat .. 3 Do. Tundla 724 94 166 897 495 402 14 Barhan 21 Do. Aharan 4,930 691 1,069 6,086 3,290 2,796 15 Basai 1 Do. ., Tundla 684 100 126 690 375 315 16 Bawan .. 5 Do. .. Khandauli .. 1,388 185 253 1,341 706 635 17 Beloth 4 Do. Do. 583 83 126 720 400 320 18 Benai .. 4 Do. Aharan 1,063 218 291 1,669 917 752 19 Bhagupur 3 Do. .. Btrnadpur 642 379 394 1,424 772 6S2 20 Bhikanpur Bajhera 4 Do. .. Tundla 1,798 77 101 581 329 ZSZ 21 Bhikanpur Baqarpur 2 Do. Btrnadpur 512 128 130 603 324 Z79 22 Bholai Mohammadpur 1 Do. Do. 527 50 55 320 164 156 23 Biharipur 2 Do. Do. 587 59 100 531 282 249 24 Biruni 1 Do. Aharan 745 60 101 539 310 229 25 Brahampur 3 Do. Khandauli :: 1,266 133 152 1,177 615 S62 26 Chamraula 1 Do. Aharan 266 45 53 293 164 129 27 Chaugan 7 Do. Khandauli : : 2,554 259 259 1,476 788 688 28 Chauharpur I Do. Aharan 387 31 49 288 142 146 29 Chaukra 2 Do. Do. 976 198 210 1,702 973 729 30 Chawli 16 Do. Etmadpur .. 2,045 529 546 3,728 2,034 1,694 31 Chhalesar 7 Do. Do. 2,157 . 364 440 2,564 1,368 1,196 32 Chhikaoo 1 Do. Do. 602 195 215 784 411 373 33 ChhitRai 1 Do. Do. 517 204 225 746 395 351 34 Chirhauli 3 Do. Aharan 1,475 275 313 1,961 1,035 926 35 Chulhawli 4 Do. Tundla 1,958 472 555 3,323 1,833 1,490-36 Deo Khera 7 Po. Etmadpur 2,172 282 320 2,412 1,318 1,094 37 Dharampur 1 Do. Do. 267 42 49 302 172 130 38 Dharera 6 Do. Do. 1,975 154 172 1,512 833 679 39 Phaurra 4 Do. Do. 381 234 276 1,881 1,018 863 40 Dhingrauli All Do. Khandauli .. 326 Unpopulated 41 Dhingrauli Pert 1 Do. Do. 345 16 16 62 36 l6 42 Dhirpura 17 Do. Tundla 6,044 577 586 4,862 2,581 2,281 43 Dhorau .. 2 Do. Khandauli .. 58.5 165 185 701 368 333 44 Dinoli .• 1 Do. Tundla 576 101 137 792 430 362 45 B1ai 5 Do. Do. 1,116 134 180 1,035 542 493 46 Etah ~. 1 Do. Aharan 458 73 112 576 313 263
"47 B_tmadpur Do. Etmadpur Town Area 48' Etmaduddaula Do. .. Chhatta 134 Unpopulated 49 Gadpura 1 Do. .. Etmadpur 884 43 43 244 123 121 50 Garhi Bachhi 2 Do. Do. 310 82 89 452 236 216 51 Garhi Bhopal I Do. Do. 329 60 65 21S 121 94 52 Garhi Harrai 1 Do. Aharan 405 100 105 618 326 292 53 GarhiJafar 1 Do. TundJa 417 73 109 567 312 2S5 54 Garbi Nirbhu 1 Do. Etmadpur .• 303 115 185 1,083 547 536 55 Garhi Pirthi 1 Do. Do. 331 38 57 271 148 123 56 Garbi Thakur 1 Do. Do. 235 18 39 195 109 86 57 GarhiUmed 1 00. Do. 280 19 21 144 73 71 58 Ghirauli .. 3 Do. Do. 666 96 102 674 373 301 59 GJjauHAM 00. Khandauli: : 252 Unpopulated 60 Gijauli Pert 7 Do. Do. 1,804 128 186 894 490 404 61 Gaurai Nagla Sinsh 8 Do. Tundla 4,193 324 334 1,694 901 793 62 Gurha 3 Do. Xhandauli : : 1,125 14 98 493 246 247 63 Hajipura 4 Do. Do. 1.760 145 177 960 519 441 64 Hasanabad 1 Do. Aharan 230 50 63 331 177 154 65 Hasan Jahanpur I DQ. Do. 294 30 65 319 169 150 66 lIasanpur 3 Do. Khandauli .• 534 95 150 781 423 358 67 Hazratpur 1 Do. Tundla 580 33 54 324 175 149 68 Hemrajpur 1 Do. Aharan 394 41 51 292 156 136 69 Himmatpur 5 Do. Etmadpur 1,625 326 478 2,528 1,375 1,153 70 Hissa Apwar 2 Do. Do. 116 66 101 413 218 195 71 Jgaganpur 1 Do. Aharan 215 10 13 111 60 51 .. 72 Jajpur .• 1 00. Tundla 366 65 86 464 244 220 3 8 73 Jamalnagar Bhains .5 Do • Aharan 1,127 163 2.58 1,282 655 621
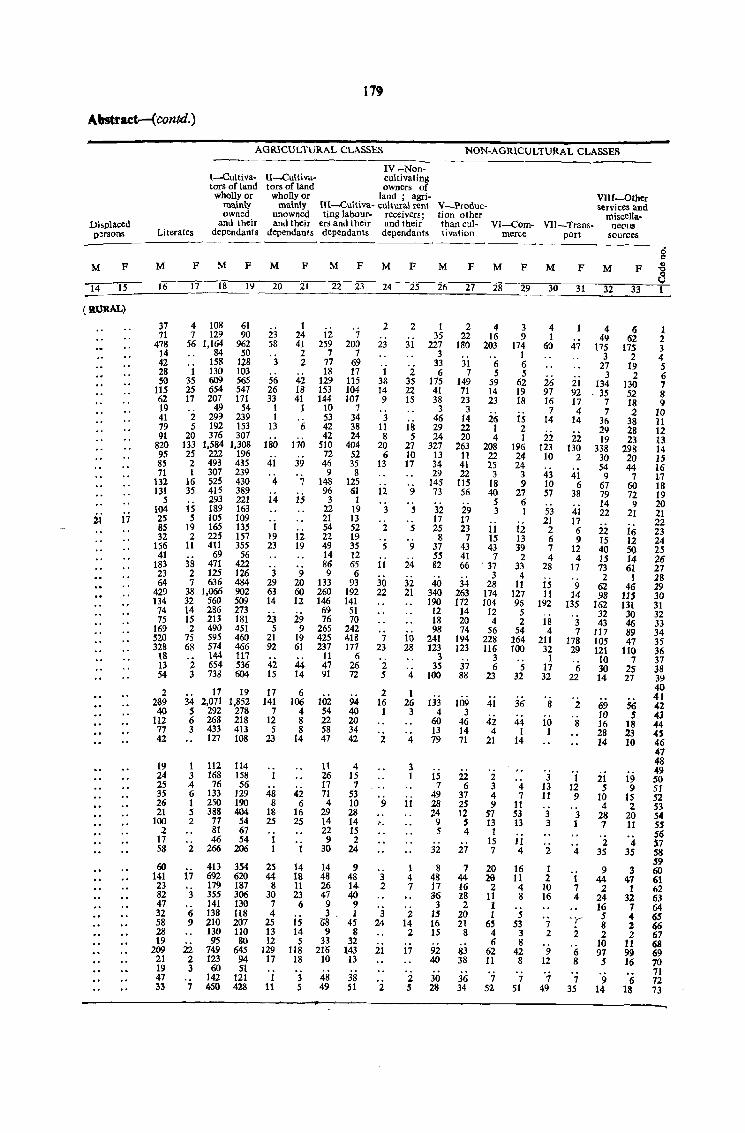
lJbplaced p~rsons
M F
14 15
(RURAL)
17
17'
AGRICULTURAL CLASSES
I-Cultivators of land
wholly or 1I13.inly owned
and their
IV -Non-II-Cultiva- cultivating tors of land owners of
wholly or land ; agri-
NON-AGRICULTURAL CLASSES
VIlI-Other services and
miscella-
Literates dependants
mainly IU-Cultiva- cultural rent unowned ting labour- receiven; and their ers and their and their
dependants dependants dependants
V-Produclion other than cultivation
Vl-Com- VII-Trans- neous meree port sources
M
16
37 71
478 14 42 28 SO
115 62 19 41 79 91
820 95 85 71
132 131
5 104 25 85 32
156 41
183 23 64
429 134 74 75
169 52.0 328 18 13 S4
2 289 40
112 77 42
19 24 25 3S 26 21
100 2
17 58
60 141 23 82 47 32 58 28 19
209 21 19 47 33
F M
17 18
4 108 7 129
56 1,164 84
158 1 130
35 609 25 654 17 207
49 2 299 5 192
20 376 133 1,584 25 222 2 493 1 307
16 525 35 415
293 15 189 5 105
19 165 2 225 tl 411
69 38 471 2 125 7 636
38 1,066 32 560 14 286 15 213 2 490
75 595 68 574
144 2 654 3 738
17 34 2,071
5 292 6 268 3 433
127
1 112 3 168 4 76 6 133 1 250 5 388 2 77
81 46
2 266
413 17 692
179 3 355
141 6 138 9 210
130 95
22 749 2 123 3 60
142 7 450
F M
19 20
61 90
962 50
128 103 565 547 171
54 239 153 307
1,308 196 435 239 430 389 221 163 109 135 157 355
56 422 126 434 902 509 273 181 451 460 466 117 536 604
19 1,852
278 218 413 108
114 158 56
129 190 404 54 67 S4
206
354 620 187 306 130 118 207 110 80
645 94 SI
121 428
23 58
3
56 26 33
1 I
13
180
41
'4 14
1 19 23
3 29 63 14
23 5
21 92
42 15
17 141
7 12 5
23
1
48 8
18 25
1 I
25 44
8 30
7 4
25 13 12
129 17
1 11
F
21
1 24 41 2 2
42 18 41
1
6
170 39 , ;
15
ii 19
9 20 60 12
i9 9
19 61
44 14
6 106
4 8 8
14
42 6
16 25
1
14 18 11 23
6
15 14 5
lI8 18
3 5
M F
22 23
12 7 259 200
7 7 77 69 18 17
129 115 153 104 144 107
10 7 53 34 42 38 42 24
510 404 72 52 46 35 9 8
148 125 96 61
3 1 22 19 21 13 S4 52 22 19 49 35 14 12 86 65 9 6
133 93 260 192 146 141 69 51 76 70
265 242 425 418 237 177
11 6 47 26 91 72
102 94 54 40 22 20 58 34 47 42
11 4 26 15 17 7 71 53 4 10
29 28 14 14 22 15 9 2
30 24
14 9 48 48 26 14-47 40 9 9 3. 1
(is 45 9 8
31 32 216 143
10 13
48 38 49 51
M
24
2
23
1 38 14 9
3 11 8
20 6
13
12
3
2
S
ii 30 22
7 23
2 S
2 16 1
2
9 .,
3 2
3 24
21
2
F
25
2
31
'2 3S 22 IS
18 5
27 10 17
9
S
5
9
24
32 21
10 28
4
1 26 3
4
3 1
11
1 4 7
2 14
2
17
2 5
M
26
1 35
227 3
33 6
175 41 38
3 46 29 24
327 13 34 29
145 73
32 17 25
8 37 55 82
40 340 190
12 18 98
241 123
3 35
100
133 4
60 13 79
15 7
49 28 24
9 5
32
8 48 17 U 3
15 16 15
9i 40
30 28
F M
27 28
2 4 22 16
180 203
3i 6 7 5
149 59 71 14 23 23
3 14 26 22 1 20 4
263 208 11 22 41 25 22 3
115 18 56 40
5 29 3 17 23 11
7 IS 43 43 41 7 66 . 37
3 34 28
263 174 172 104 14 12 20 4 74 56
194 228 123 116
3 37 6 88 23
tOO 3
46 14 71
22 6
37 25 12
5 4
27
7 44 16 28 2
20 21
8
83 38
36 34
41
4i 4
21
2 3 4 9
57 13
1 15 7
20 ze
2 11 1 1
65 4 6
62 11
7 52
F M
29 30
3 9
174 1 6 5
62 19 18
is 2 1
196 24 24
3 9
27 6 I
12 13 39 2
33 4
11 127 95
5 2
54 154 100
5 32
.36
44 1
14
4 7
11 53 13
11 4
16 11
4 8
5 53
3 8
42 8
7 51
4 1
60
26 97 16
7 14
22 123
10
43 10 57
53 21 2 6 7 4
28
15 11
192
18 4
211 32
1 17 32
8
10 1
3 13 11
3 3
2
1 2
10 16
7 2
9 12
7 49
F
31
M
32
4 49
47 175 3
27 3
21 134 92 ,35 17 7 4 7
14 36 29
22 19 130 338
2 30 54
41 9 5 67
38 79
4i ~~ 17 6 22 9 15
12 40 4 15
17 73 2
9 62 14 98
135 162 32
3 43 7 117
178 105 29 121
10 6 30
22 14
2
8
'i 12 9
3 1
4
t 7 4
2
6 8
7 35
69 10 16 28 14
ii 5
10 4
28 7
2 35
9 44
2 24 16 5 8 2
10 97 5
9 14
F
33
6 62
175 2
19 2
130 52 18 2
38 28 23
298 20 44
7 60 72 9
21
16 12 50 14 61
1 46
US 131 30 46 89 47
110 7
25 27
56 5
18 23 10
19 9
15 2
20 11
4 35
3 47 1
32 7 4 2 2
11 99 16
6 18
1 2 3 4 5 6 7 8 9
10 11 12 13 14 15 16 17 18 19 20 21 22 23 24 25 26 27 28 29 30 31 32 33 34 35 35 37 38 39 40 41 42 43 44 45 46 47 48 49 SO 51 52 53 54 55 56 57 58 59 60 61 62 63 64 65 66 67 68 69 70 71 72 73
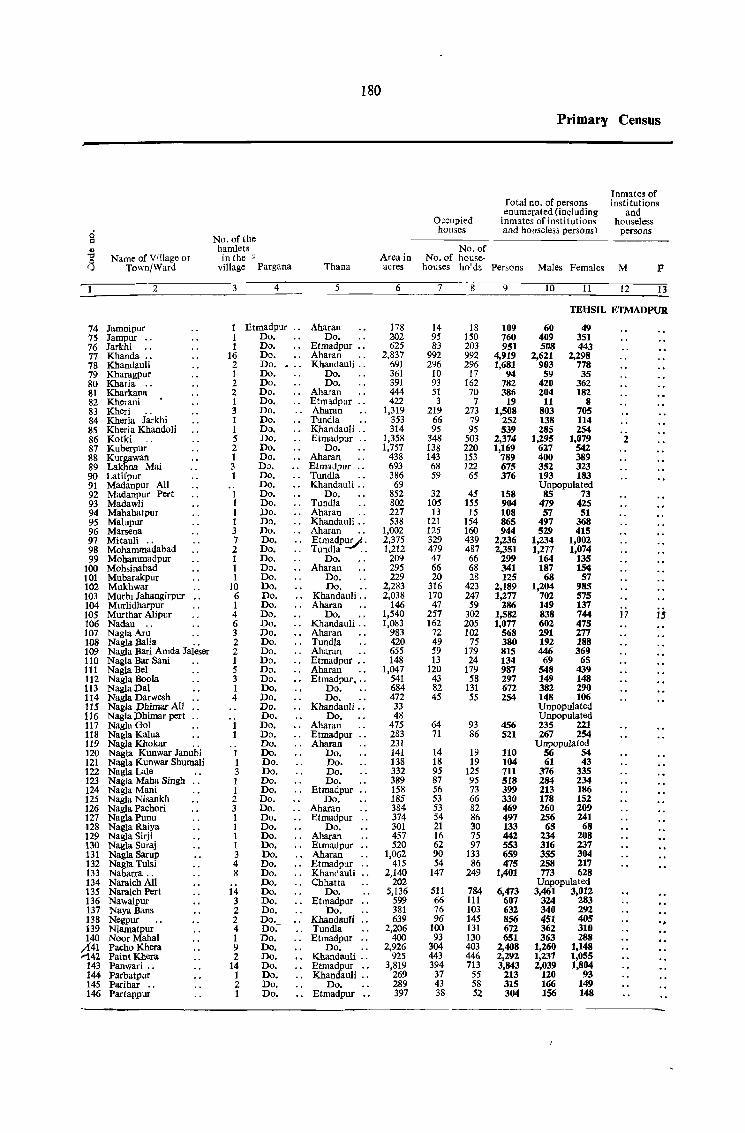
Name of Village or Town/Ward
74 Jamnipur 7S Jampur .. 76 Jarkhi 77 Khanda .. 78 Khandauli 79 Kharagpur 80 Kharia 81 Kharkana 82 Kh_erani 83 Kheri
2
84 Kheria Jarkhi 8S Kheria Khandoli 86 Kotki 87 Kuberpur 88 Kurgawan 89 Lakhna Mai 90 Latifpur 91 Madanpur All 92 Madanpur Pert 93 Madawli 94 Mababatpur 95 Malupur 96 Marsena 97 Mitauli 98 Mohammadabad 99 Mohammadpur
100 Mohsinabad 101 Mubarakpur 102 Mukhwar 103 Murbl Jahangirpur .. 104 Murlidharpur 105 Murtbar Alipur 106 Nadau 107 Nagla Aru .. 108 Nagla Balia .. 109 Nagla Bari Amda Jaleser 110 Nagla Bar Saui 111 Nagla Bel 112 Nagla Boola 113 Nagla Dal 114 Nagla Darwesh 115 Nagla Dhimar All 116 Nagla Dhimar pert .. 117 Nagla Gol 118 Nagla Kalua 119 Nagla Khokar .. 120 Nagla Kunwar Janubi 121 Nasla Kunwar Shumali 122 Nagla Lale 123 Nagla Maha Singh 124 Nagla Mani 125 Nagla Nisankh 126 Nagla Pachori 127 Nagla Punu 128 Nagla Raiya 129 Nagla Sirji 130 Nagla Suraj 131 Nagla Sarup 132 Nagla Tulsi 133 Nabarra .. 134 Naraich AIl 135 Naraich Pert 136 Nawalpur 137 Naya Bans 138 Negpur 139 Niamatpur 140 Noor Mabal
;141 Pacho Khera '142 Paint Khera
143 Panwari .• 144 Parbatpur 145 Parihar 146 Partappur
No. of the hamlets in the
village Pargana
3 4
Thana
5
180
Area in acres
6
1 Etmadpur .. Aharan Do.
178 202 625
1 Do. 1 Do.
16 Do. 2 Do. 1 Do. 2 Do. 2 Do. 1 Do. 3 Do. 1 Do. I Do. 5 Do. 2 Do. 1 Do. 3 0:>. 1 Do.
1 1 1 1 3 7 2 1 1 1
10 6 1 4 6 3 2 2 1 5 3 I 4
1 I 3 1 I 2 3 1 1 1 1 3 4 8
14 3 2 2 4 1 9 2
14 1 2 1
Do. Do. Do. Do. Do. Do. Do. Do. Do. Do. Do. Do. Do. Do. Do. Do. Do. Do. Do. Do. Do. Do. Do. Do. Do. Do. Do. Do. Do. Do. Do. Do. Do. Do. Do. Do. Do. Do. Do. Do. Do. Do. Do. Do. Do. Do. Do. Do. 00.Do. Do. Do. Do. Do. Do. Do.
.. Etmadpur .. Abaran .. Khandauli ..
Do. Do.
.. Aharan Etmadpur
.. Aharan .. Tundla .. Khandauli .. .. Etmadpur ..
Do. Aharan
.. Etmadpur .. Tundla Khandauli ..
Do. .. Tundla .. Abaran .. " Khandauli .. .. Aharan .. EtmadpV·
Tundla .. Do.
.. Abaran Do. Do.
. . Khandauli .. Aharan
Do. Khandauli .. Aharan
.. Tundla
.. Aharan
.. Etmadpur •.
.. Abaran Etmadpur •..
Do. Do. .•
.. Khandauli •. Do.
.. Aharan
.. Etmadpur Aharan
Do. Do. Do. Do.
.. Etmadpur .. Do.
Aharan Etmadpur ..
Do. Aharan Etmadpur Aharan
.. Etmadpur " Khandauli
" Chhatta Do.
Etmadpur .. Do.
. . KhandanTi .• Tundla Etmadpur ..
Do. Khandauli .. Etmadpur Khandauli ..
Do. Etmadpur •.
2,837 691 361 391 444 422
1,319 353 314
1,358 1,757
438 693 386 69
852 802 227 538
1,002 2,375 1,212
209 295 229
2,283 2,038
146 1,540 1,083
983 420 655 148
1,047 541 684 472 33 48
475 283 231 141 138 332 389 158 185 384 374 301 457 520
1,062 415
2,140 202
5,136 599 381 639
2,206 400
2,926 925
3,819 269 289 397
Primar,! Censns
O;cupied houses
No. of No. of house-
rotal no. of persons enumerated (including
inmates ofinstitutions and hOllseless persons)
houses ho'ds Persons Males Females
Inmates of institutions
and houseless
persons
M F
7 8 ~9 ______ ~IO~ __ ~I~I ____ ~12~ ___ 13
14 95 83
992 296
10 93 51 3
219 66 95
348 138 143 68 59
32 105
13 121 125 329 479 47 66 20
316 170 47
257 162
72 49 59 13
120 43 82 45
64 71
14 18 95 87 56 53 53 54 21 16 62 90 54
147
511 66 76 96
100 93
304 443 394
37 43 38
18 109 150 760 203 951 992 4,919 296 1,681
17 94 162 782 70 386 7 19
273 1,508 79 252 95 539
503 2,374 220 1,169 153 789 122 675
65 376
45 158 155 904
IS 108 154 865 160 944 439 2,236 487 2,351 66 299 68 341 28 125
423 2,189 247 1,277 59 286
302 1,582 205 1,077 102 568 75 380
179 815 24 134
179 987 58 297
131 672 55 254
93 456 86 521
19 110 19 104
125 711 95 518 73 399 66 330 82 469 86 497 30 133 75 442 97 553
133 659 86 475
249 1,401
784 6,473 III 607 103 632 145 856 131 672 130 651 403 2,408 446 2,292 713 3,843
55 213 58 315 52 304
TEHSIL ETMADPUR
60 49 409 351 508 443
2,621 2,298 903 778 59 35
420 362 204 182
11 8 803 705 138 114 285 254
1,295 1,079 627 542 400 389 352 323 193 183 Unpopulated 85 73
479 425 57 51
497 368 529 415
1,234 1,002 1,277 1,074
164 135 187 154
68 57 1,204 985
702 575 149 137 838 744 602 475 291 277 192 188 446 369 69 65
548 439 149 148 382 290 148 106 Unpopulated Unpopulated 235 221 267 254
Unpopulated 56 54 61 43
376 335 284 234 213 186 178 152 260 209 256 241
65 68 234 208 316 237 355 304 258 217 773 628
Unpopulated 3,461 3,012
324 283 340 292 451 405 362 310 363 288
1,260 1,148 1,237 1,055 2,039 1,804
120 93 166 149 156 148
2
17
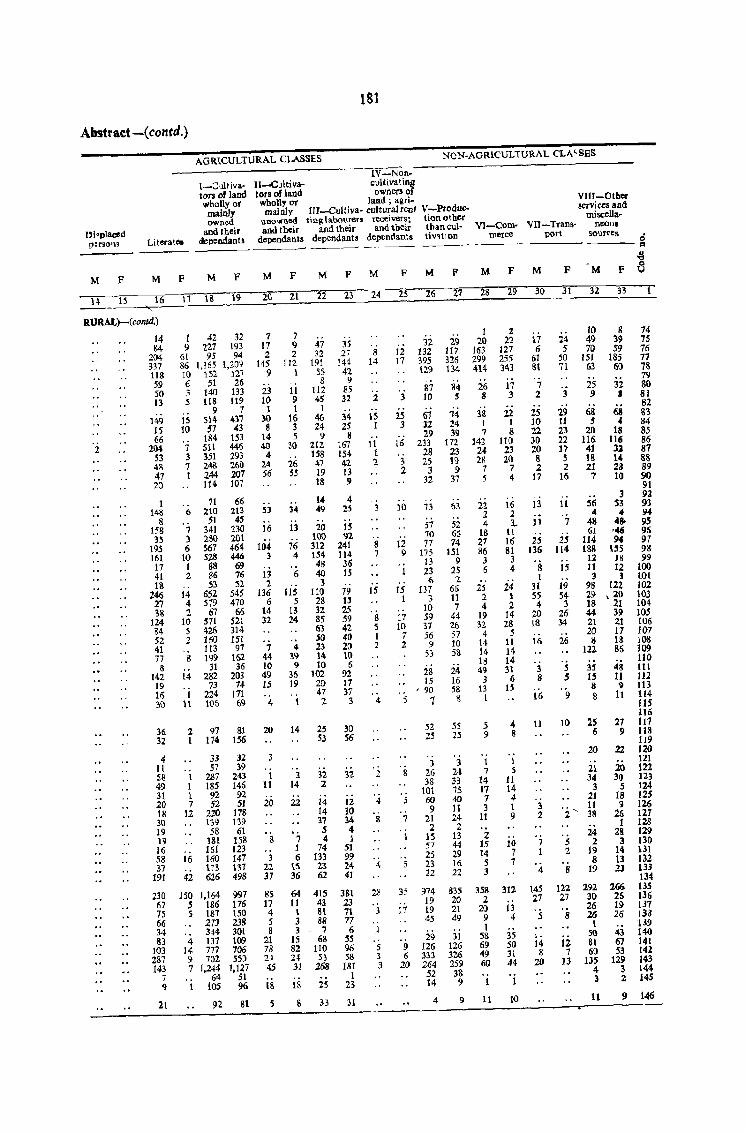
181
Ahstrad-(colltd.)
AGRICULTURAL CLASSES NCN-AGRICULTURAL CLI\<SES
Hi 'placed 1'''5<)113 Literate.
(_;::,_lltiva· tors of land wholly ot mainly owned
and their dependants
IV-Non-lI--Cultiva- cult ivat injJ tors of land owners of wholly or land; agri· mainly Ill-Cultiva- cultural rent V-Produc-
unowned t,n1t1abourero receivers; tionother and their and their and their than cul-
dependants dependants depem1ants tiv9tlon
VIn-Other servi ces and
miscella-Vl-Com- VIJ-Trans- nCOIlI
rnerce port sour~es ~~-~----g
-3
M F MF MF MF MFM FMF MFM F MF8
14 _1~5 __ ~~16~~17 __ ~18~~19_~2~O--~2~1_~U~~23~_2~4~_2~5--~2~6--~2~7 __ ~2~8_~2~~_~30~~31~-=32~_3~3~~
RURAL)-(contd.)
14 84-
204 337 118 59 SO 13
2
149 15 66
204 53 48 47 20
1 148
8 158 35
195 161 17 41 1%
246 27 38
124 84 52 41 77
8 142 19 16 3(l
36 32
4 11 58 49 31 20 18 30 19 19 16 58 :'1
11}1
230 67 7S 66 34 83
103 287 143
7 9
21
1 42 32 9 227 193
6[ 95 94 86 1,365 1,209 10 152 127 6 51 26 3 140 133 5 118 119
9 7 15 514 4li 10 57 43
184 153 7 511 446 3 351 293 7 24& 260 1 244 2()7
114 107
71 66 6 210 213
51 45 7 341 230 3 2SO 201 6 567 464
10 528 446 1 88 69 2 86 76
53 52 14 652 545 4 579 470 2 67 66
10 511 52[ 5 426 314 2 160 151
113 97 8 199 162
31 36 14 282 203
73 74 I 224 171
11 106 69
2 97 81 1 114 156
33 32 57 39
1 287 243 1 185 146 1 92 92 7 52 51
12 220 118 139 139 58 61
181 158 161 123
16 160 147 113 137
42 626 498
150 1,164 997 5 186 175 5 181 150
273 23g '. 344 301 4 137 109
14 777 106 9 7Jl 5Sa 7 1,244 1,127
64 51 1 t05 96
92 Sl
7 17 2
145 9
23 10
1 )0 8
14 40
4 24 56
53
16
104 3
13 2
136 6
14 32
7 44 10 49 15
4
20
3
1 II
20
8
3 22 31
85 17 4 5 8
21 78 2} 4S
18
7 9 2
1I2 1
11 9 1
16 3 5
30
26 5S
34
41 32
19\ 55 8
112 4S
1 46 24
9 212 ISS 47 19 18
1<4 49
13 20 100
76 312 4 154
48 6 40
3 115 110
5 28 13 32 24 85
63 SO
4 23 39 14 9 10
36 102 19 20
47 1 2
14
3 14
22
7 1 6
15 36
2S 53
32 2
14 14 37 5 4
74 133 23 62
64 415 11 43 1 til 3 88 3 - 7
15 68 82 110 2l 53 31 268
18 is
3S 27
144 42
9 85 32
34 25
8 167 154 42 13 9
4 25
[5 92
241 114 36 15
79 13 25 59 42 4() 20 10
6 92 11 31
3
30 56
32
12 10 34 4 1
51 99 24 41
381 23 71 77 6
S5 96 58
181 1
23
8 33 31
S 14
2
15 !
11 1 2
S 7
15
8 5 1 2
4
2
4
8
4
28
3
)
5 3 3
12 17
3
is l
16
3 2
10
12 9
(5 I
17 10
7 2
8
5
7
1
35
17
32 132 395 129
87 10
61 32 29
233 28 25
3 32
73
57 70 77
175 13 23 {;
137 3
10 59 37 56 9
53
28 15
, 90
1
52 25
3 26 38
101 60 9
21 2
IS 57 25 23 22
974 19 19 45
29 9 126 6 333
20 264 52 14
4
29 117 326 134
84 5
14 24 39
172 23 tC} 9
37
63
52 6S 74
151 9
25 2
66 11 7
44 26 57 10 58
24 16 58
8
55 25
3 24 33 75 40 11 24 2
13 44 29 16 22
835 20 21 49
31 126 326 259
38 9
1 20
163 299 414
26 8
:\8 1 1
142 24 28
7 5
22 2 4
18 21 86 3 6
25 2 4
19 32
4 14 14-18 49
3 13
1
5 9
1 7
14 17 7 3
11
X 15 14 5 3
358 2
20 9 1
58 69 49 60
1
2 22
127 255 343
17 3
22 1 8
IlCl 23 2()
7 4
16 2 3..
11 16 81
3 4
i4 I 2
14 28
5 11 14 14 31
6 15
4 8
1 S
11 14 4 1 9
10 7 7
312
13 4
35 SO 31 44
, i
9 11 10
17 6
61 81
7 2
25 10 22 30 20 8 Z
17
t:!
11
25 136
·s 1
31 55 4
20 18
16
3 8
16
11
3 2
7 1
'4 145 27
'5 ,. 14
8 20
24 5
SO 71
3
29 11 23 22 n ~ 2
16
1l
7
is 114
15
J9 54
:> 26 34
26
5 5
9
10
10 49 70
151 63
25 9
6& 5
20 116
41 IS 21 7
S6 4
<48 61
114 188
]2 11 3
93 29 18 44 21 20 8
122
35 J5 g 8
2S 6
20
21 34
3 2J
·z' ~~
5 2
8
122 27
8
ii 7
13
24 2
19 8
19
292 30 26 26
1 50 81 6()
135 4 3
11
8 39 51}
1115 60
32 • 68 4
18 11& 31 14 28 10
3 53 4
48< ·46 94 1~5
18 12
3 122
,2.0 21 39 21 17 ts 86
48 11
1)
11
27 9
22
20 30
5 18 9
26 1
28 3
14 13 2)
266 26 19 26
4i 67 53
129 3 2
74 7S 76 77 78 79 80 81 82 83 84 85 86 87 88 89 90 91 92 93 94 95 96 97 98 99
100 tOI 102 103 104 105 106 J07 lOS 109 110 111 112 113 114 liS 116 117 11& 119 120 121 122 123 124 125 126 127 128 129 130 131 132 133 134 13S 136 131 /;U 139 140 141 14Z 143 [44 145
9 146
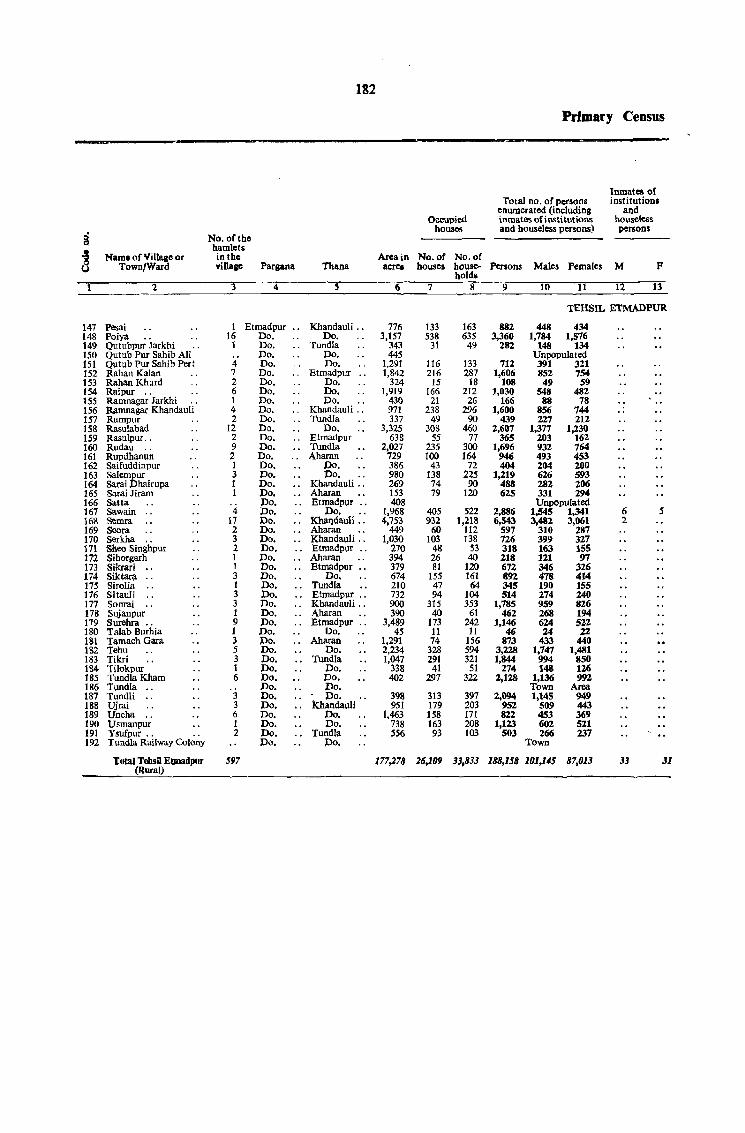
182
Primal'Y Census
Inmates of Total no. of persons institutions
enumerated (including and Occupied inmates ofinstitutions houseless
8 houses and houseless persons) persons
No. of the hamlets
~ Name of Village or inthe Area in No. of No. of Town/Ward villaae Pargana Thana acres houses house- Persons Males Females M P
holds 2 3 4 S 6 7 8 9" 10 11 12 13
TEHSIL ETMADPUR
147 Pesai 1 Etmadpur .. Khandauli .. 776 133 163 882 448 434 148 Poiya .. 16 Do. Do. 3,157 538 635 3,360 1,784 1,576 149 Qutubpur Jarkhi 1 Do. .. Tundla 343 31 49 282 148 134 150 Qutub Pur Sahib All Do. Do. 445 Unpopulated 151 Qutub PUf Sahib Pert 4 Do. Do. 1,291 116 133 712 391 321 152 Rahan Kalan 7 Do. .. Etmadpur .. 1,842 216 287 1,606 852 754 153 Rahan Khurd 2 Do. Do. 324 15 18 108 49 59 154 Raipur 6 Do. Do. 1,919 166 212 1,030 548 482 155 Ramnagar Jarkhi 1 Do. Do. 430 21 26 166 88 78 156 RIlmnagar Khandauli 4 Do. Khandauli :: 971 238 296 1,600 856 744 .. 157 Rampur 2 Do. .. Tundla 337 49 90 439 227 212 158 Rasulabad 12 Do. Do. 3,325 308 460 2,607 1,377 1,230 159 Rasulpur .. 2 Do. Etmadpur 638 55 77 365 203 162 160 Rudau 9 Do. Tundla 2,027 235 300 1,696 932 764 161 Rupdhanun 2 Do. Aharan 729 100 164 946 493 453 162 Saifuddinpur I Do. Do. 386 43 72 404 204 200 163 Salempur 3 Do. Do. 980 138 225 1,219 626 593 164 Sarai Dhairupa 1 Do. Khandauli .. 269 74 90 488 282 206 165 SaraiJiram I Do. Aharan 153 79 120 625 331 294 166 Satta Do. .. Etmadpur .. 408 Unpopulated 167 Sawain .. 4 Do. Do. 1,968 405 522 2,886 1,545 1,341 6 5 168 SemTa 17 Do. ~dauli .. 4,753 932 1,218 6,543 3,482 3,061 2 169 Soora 2 Do. Aharan 449 60 112 597 310 287 170 Serkha 3 Do. o. Khandauli .. 1,030 103 138 726 399 327 171 Shoo Singhpur 2 Do. Etmadpur .. 270 48 53 318 163 ISS 172 Sihorgarh 1 Do. Aharan 394 26 40 218 121 97 173 Sikrari .. 1 Do. o. Etmadpur .. 379 81 120 672 346 326 174 Siktar;l. 3 Do. Do. 674 155 161 8n 478 414 175 Sirolia o. 1 Do. Tundla 210 47 64 345 190 155 176 Silauli .. 3 Do. Etmadpur .. 732 94 104 514 274 240 177 Sonrai 3 Do. .. Khandauli .. 900 315 353 1,785 959 826 178 Sujanpur 1 Do. .. Aharan 390 40 61 462 268 194 179 Surehra .. 9 Do. .. Etmadpur :: 3,489 173 242 1,146 624 522 180 Talab Burhia 1 Do. 00. 45 11 11 46 24 22 181 Tamach Gara 3 DO. Aharan 1,291 74 156 873 433 440 182 Tehu 5 Do. Do. 2,234 328 594 3,228 1,747 1,481 183 Tikri 3 Do. Tundla 1,047 291 321 1,844 994 850 184 Tilokpur I Do. Do. 338 41 51 274 148 126 185 Tundla Kham 6 Do. Do. 402 297 322 2,128 1,136 992 186 Tundla Do. ;Do. Town Area 187 Tundli .. 3 Do. Do. 398 313 397 2,094 1,145 949 188 Ujrai 3 Do. Khandauli 951 179 203 952 509 443 189 Uncha 6 Do. .Do. 1,463 158 171 822 453 369 190 Usmanpur 1 Do. Do. 738 163 208 1,123 602 521 191 Ysufpur .. 2 .Do. Tundla 556 93 103 503 266 237 192 Tundla Railway Colony Do. Do. Town
Total Tehsll EtJDadpur 597 177,278 26,109 (Rural)
33,833 188,158 101,145 87,013 33 31
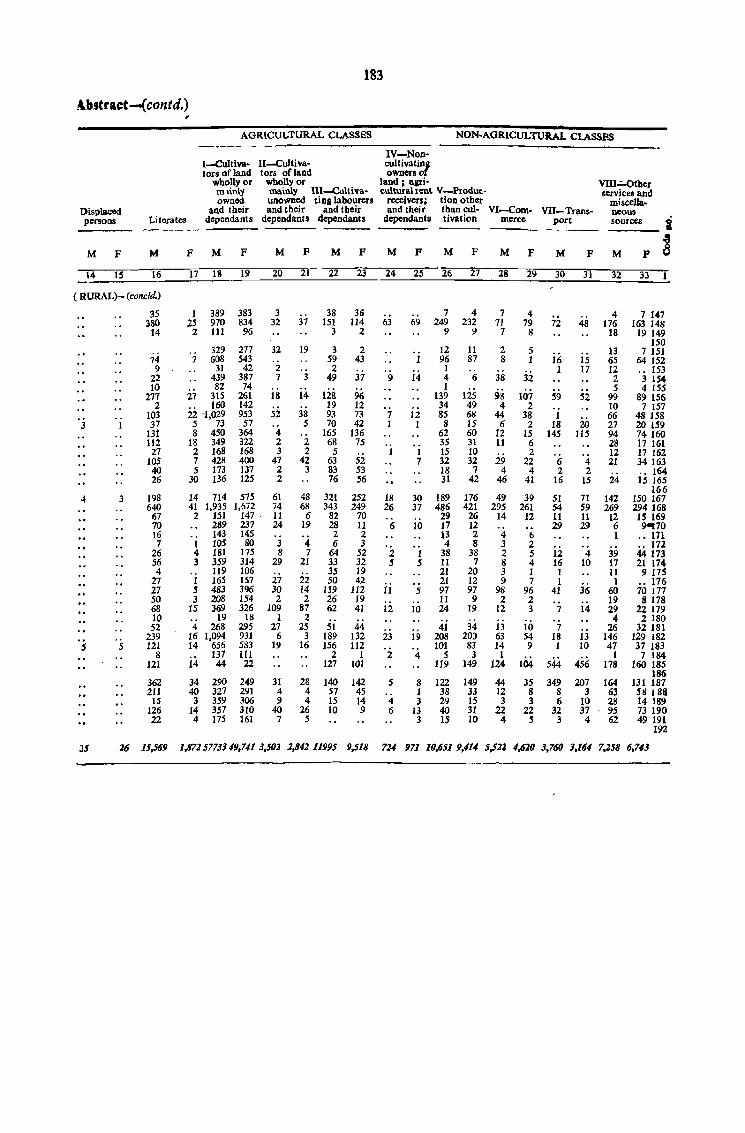
183
1\bstraet-{contd,) "
AGRlCULTURAL CLASSES NON-AGRICULTURAL CLASSF.s
IV-Nan-l-Cultiva- II-Cultiva- cultivatinf tors of land tors ofland owners 0
wholly or whoUyor land; api- Vlll.;;...()ther mlinly mainly lll-Cultiva,- culturalrent V-Produc- services and owned unowned tinglabourels receivers; tion other miscella-
Displaced and their and their and their and their than cui- VI--Com- VII-TrlU\s- neous persons Literates dependants dependants dependants dependants tivalion meree port sources i ---M F M F M F M F M F M F M F M F M F M P ~ \4 15 16 17 18 19 20 21 22 23 24 25 26 27 28 29 30 31 32 33
( RURAL)- (concld,)
35 1 389 383 3 38 36 7 4 7 4 4 7 147 380 25 970 834 32 37 151 114 63 69 249 232 71 79 72 48 176 163 148
14 2 III 96 3 2 9 9 7 8 18 19 149 ISO
329 277 32 19 3 2 12 11 2 5 13 7 151 74 7 608 543 59 43 96 87 8 1 16 15 65 64 152 9 31 42 2 'j 2 I 1 17 12 ., 153
22 439 387 7 49 37 9 14 4 6 38 32 2 3 154 10 82 74
128 96 1 lis 9S 5 4 155
277 27 315 261 18 14 139 107 59 52 99 89 156 2 160 142 19 12 34 49 4 2 10 7 157
103 22 -1,029 953 52 38 93 73 7 12 85 68 44 38 1 66 48 158 3 I 37 5 73 57 5 70 42 1 I 8 15 6 2 18 20 27 20 159
131 8 450 364 4 165 136 62 60 12 15 145 ll5 94 74 160 112 18 349 322 2 2 68 75 35 31 11 6 28 17 161
27 2 168 168 3 2 5 1 1 15 10 2 12 17 162 105 7 428 400 47 42 63 52 7 32 32 29 22 6 4 21 34163 40 5 173 137 2 3 83 53 18 7 4 4 2 2 " 164 26 30 136 125 2 76 56 31 42 46 41 16 15 24 15 165
166 4 3 198 14 714 575 61 48 321 252 18 30 189 176 49 39 51 71 142 150 167
640 41 1,935 1,672 74 68 343 249 26 37 486 421 295 261 54 59 269 294 168 67 2 151 147 . 11 6 82 70 29 26 14 12 11 11 12 15 169 70 289 237 24 19 28 11 6 10 17 12 29 29 6 94'r70 16 143 145 2 2 13 2 4 6 1 .. 171 7 1 105 80 3 4 6 3 4 8 3 2 ., 172
26 4 181 175 8 7 64 52 2 1 38 38 2 5 12 4 39 44 173 56 3 359 314 29 21 33 32 5 5 II 7 8 4 16 10 17 21 174 4 119 106 35 19 21 20 3 1 1 11 9 175
27 1 165 157 27 22 50 42 ij
21 12 9 7 1 1 .. 176 27 5 483 396 30 14 139 112 5 97 97 98 96 41 36 60 70 177 50 3 208 154 2 2 26 19 11 9 2 2 19 8 178 .. 68 15 369 326 109 87 62 41 12 10 24 19 12 3 7 14 29 22119 10 19 18 I 2
34 i:i 4 2 180
52 4 263 295 27 25 51 44 41 10 7 26 32 181 239 16 1,094 931 6 3 189 132 23 19 208 200 63 54 13 13 146 129 182
5 5 121 14 656 583 19 16 156 112 101 83 14 9 1 10 47 37 183 8 131 111 2 1 2 4 5 3 1
544 456 1 7 184
121 14 44 22 127 101 119 149 124 104 178 160 185 186
362 34 290 249 31 28 140 142 5 8 122 149 44 35 349 207 164 131 187 211 40 327 291 4 4 57 45 1 38 33 12 8 8 3 63 51! 18S
IS 3 359 306 9 4 15 14 4 3 29 15 3 3 6 10 28 14 189 126 14 357 310 40 26 10 9 6 13 40 31 22 22 32 37 95 73 190 22 4 175 161 7 5 3 IS 10 4 5 3 4 62 49 191
192
35 26 15,569 1,8725773) 49,741 3,5OJ 2,842 11995 9,518 724 971 10,651 9,114 5,522 4,610 3,760 3,164 7,J58 6,743
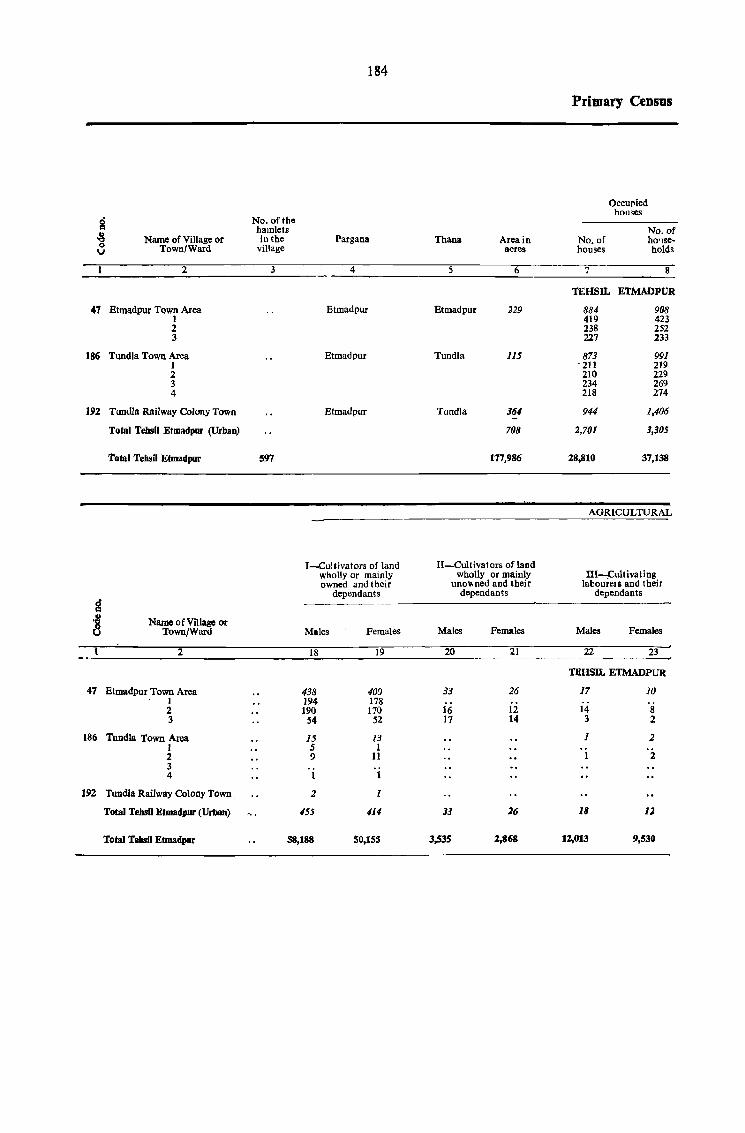
184
Primary Census
Occul'ied houses
9 No.oftbe hamlets No. of
oS Name of Village or in the Pargana Thana Area in No. of hO'lse· 0 Town/Ward village acres houses holds IJ
2 3 4 5 6 ~ 8 ,
TEHSIL ETMADPUR
47 Etmadpur Town Area Etmadpur Etmadpur 229 884 908 I 419 423 2 238 252 3 227 233
186 Tundla Town Area Etmadpur Tundla 115 873 991 I . 211 219 2 210 229 3 234 269 4 218 274
192 Tundla Railway Colony Town Etmadpur Tundla 364 944 1,406
Total Tehsll Etmadpur (Urban) 708 2,701 3,305
Total Tehsil Etmadpur 597 177,986 28,810 37,138
AGRICULTURAL
I-Cultivators of land II-Cultivators ofland wholly or mainly wholly or mainly III--;Cultivating owned and their uno\\ned and their laboure. s and their
dependants dependants dependants g ..
Name of Village or 8 Town/Ward Males Females Males Females Males Females
2 18 19 20 21 22 23
TEHSIL ETMADPUR
47 Etmadpur Town Area 438 400 33 26 17 10 1 194 178 2 190 170 16 12 14 8 3 54 52 17 14 3 2
186 Tundla Town Area 15 13 1 2 1 5 1 2 9 11 2 3 4 1 1
192 TundJa Railway Colony Town. 2 1
Total Tehsll Etmadpur (UrbaD) 455 1]4 33 26 18 11
Total Tehsll Etmadpur 58,188 50,155 3,535 2,868 12,013 9,530
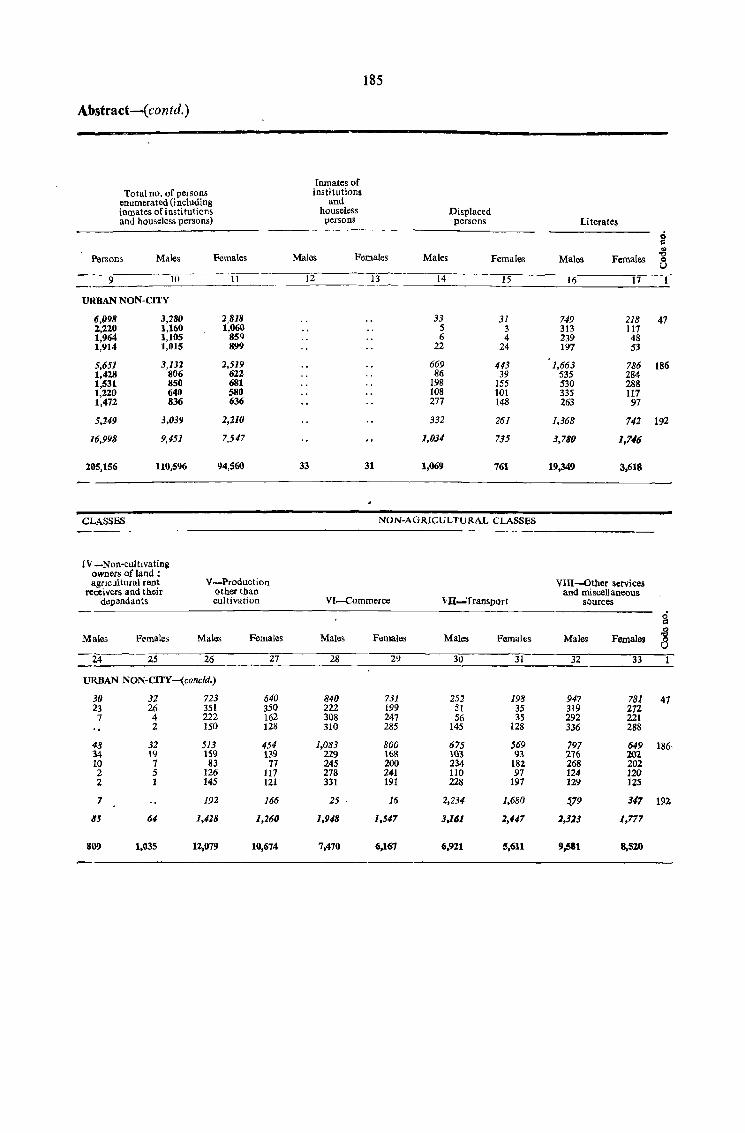
185
Abstract-( contd.)
Inmates of Total no. of persons institutions
enumerated (including and inmates of institutions houseless Displaced and houseless persons) persons persons Literates
<$ c=
Persons Males Females Malos Females Males Females Males Females -8 8
9 10 11 12 13 14 15 16 17 1
URBAN NON-CITY
6,098 3,280 2,818 33 31 749 218 47 1,220 1,160 1,060 5 3 313 117 1,964 1,105 85'1 6 4 239 48 1,914 1,015 899 22 24 197 53
5,651 3,132 2,519 669 443 1,663 786 186 1,428 806 622 86 39 53S 284 1,531 850 681 198 ISS 530 288 1,220 640 580 108 101 335 117 1,472 836 636 277 148 263 97
5,249 3,039 2,210 332 261 1,368 742 192
16,998 9,451 7,547 1,034 735 3,780 1,716
205,156 110,596 94,560 33 31 1,069 761 19,349 3,618
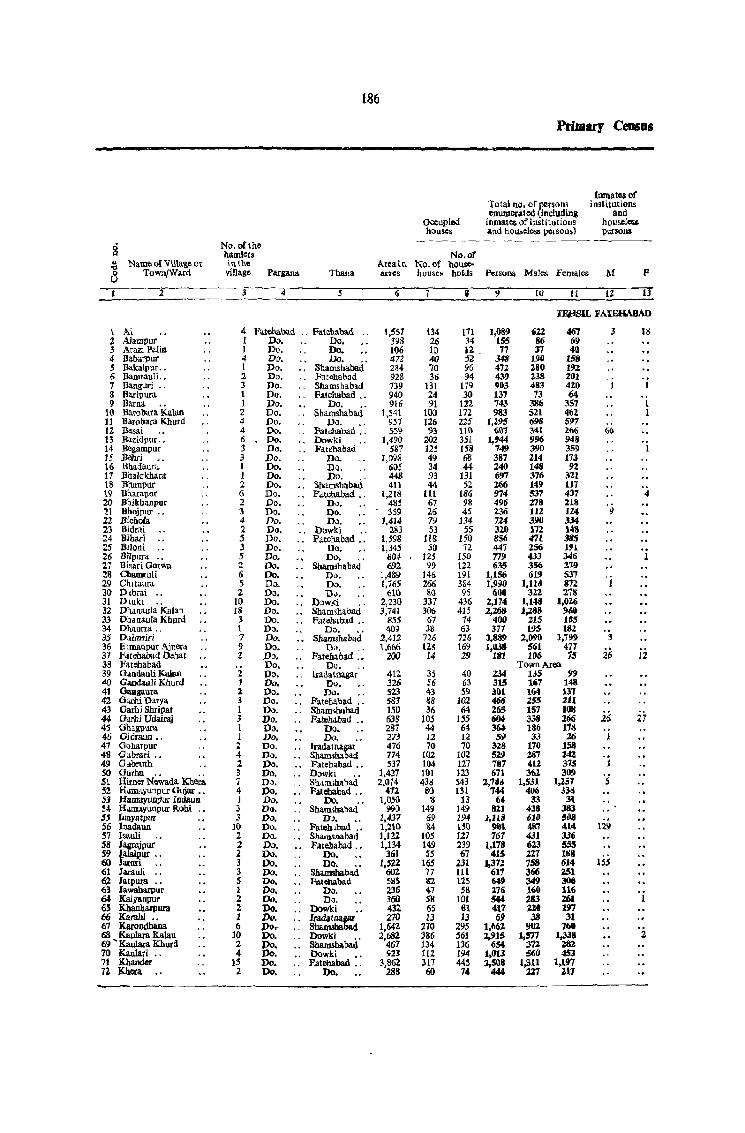
8 .g Name of Village or t3 Town/Ward
1 2
1 A.\ 2 AlalllPur 3 Araoi Palia 4 Bablil1'ur 5 Bakalpur .. 6 BamrauIi.. 7 Banguri .. 8 Ba.ri]Jura 9 Ba.rna
10 Barobara Kalan II B:atobara Khlll'd 12 Basai 13 Bazidpur .• 14 Begampur 15 Behri .. 16 Bhadaura. 17 Bhalokhara 18 Rltanpur 19 Bhrapur 20 B~;khanpur 21 Bhojpur .. 2Z Bicflola 23 Bidrai 24 Bihari 25 Dlloni .. 26 Bilpura .. 27 Sisar; Gorwa 28 Ommruli 29 CIlL tallra 30 Dlbrai " 31 DlUki 32 Dhanaula Kalan 33 D:uuaula Khllrd 34 Dhaurra .. 35 D.lim;iri 36 E tmadpur Ajnera 37 Foltehabad l)3Mt 38 Fatehabad 39 Ga.udauli Kahtn 40 G.wdauli Kb.llrd 41 Gangaura 42 Garro Daryl'. 43 Garhi Shripat 44 Garhi Uclairaj 4S Ghlgpura 46 OJ draun •. 47 Goharpur 48 Gubrari " 49 Glibruth SO Gurha " .. 51 Rirner Ncwada Khe,a 52 R~ma:runpur Gujar " 53 Humayunpllr IndAllD S4 H=aYllupur Rilbi .• 55 Inayatpur 56 Inadaun 51 lsauli " S8 l&grajpur 59 1atall!ut .. 61 flltan .. 61 JarauJi 62 Jatpura .• 61 Jawaba.rpur 64 Kalyanpur 65 Khanharpura 66 Karabi .. t[/ Karondhana 68 Kau1ara Kalan 69 ' Kaulara.lthurd 70 Kawlal'i .. 71 Khander 72. Khera
186
No. ofth~ hamlets lutM villa.ge Pargana
3 4
Thana
5
4 Fa.te!lal:lad.. Fat~habad .. 1 Po. Do. I Do. Do. 4 Do. Dc... 1 Po. . . Shamshabad 2. Do. Fatehabad 3 Po. . . Shamshablld 1 Do. . . Fatehabad .. 1 Po. Do... 2. 00. .. Shamshabad 4 Do. Do... 4 Po. " Falehabad .. 6 Do. " Dowki 3 Do. . . Fatehabad 3 Do. Do. I 00. Do. I Po. Do... 2 po. " Shamshabad 6 Do. .. Fatehabad .. 2 Po. Do.
Occupied houses
No. of Areaiu ~o.()f houseacres houses holds
1,551 3gB 1% 472 284 ns 139 940 916
1,541 951 559
1,490 587
L09S 6(15 44S 411
1,218 485
t34 26 10 40 70 36
131 24 91
100 126 93
202 125 49 34 93 44
i
111 34 12 52 96 94
179 30
122 172 225 nil 3S1 ISS 68 44
131 52
186
3 Do. Do. ., 359
HI 67 26 79 53
98 4S
134 4 Do. 01). 2 DCI. " bawki ., S Po. .. Fatehabad .. 3 Po. Do. 5 Po. Do. 2 Do. Shamshabad 6 Po. DOo. 5 Do. Da. 2. Do. n".
10 Po. .• D~wki .' 18 D(). .. Shamlhahad 3 Do. .. Fatellabad .• 1 Do. Do. 7 Do. Sbamslmbad 9 Do. Da... 2 D(). .. Fatehabad .•
2 1 1 3 1 3 1 1 2 4 2 3 1 4 1 3 3
]0 2 2 2 3 3 S 1 2 2 1 6
10 2 4
15 2
00. Do... Po. . . Irada tna.gar Do. Do. Do. jJo... Do. .• Fatehabad •. 00. . . Sham.habad Do. . . Fdtebabad .• D(). D:.l. Da. Da. Do. .. Imdatnasar D .. , Shamsluba.d Do. .. Fatehabad •• Do. .. Dowki .. D·). .• Sh<l.m;habad Po. . • Fa! dJabad ., Da. Do. .. Do. Shammabad 1)0, DJ, •. Do. .. Fatll}ubad .• 00. Shaaas!labad DD. • . Fatehabad .• Do. Do. DO. Do. Po. . . Sha.mshabad Po. " Fatcbabad Po. Do. Po. DIJ. Do. .. llowki " Do. lra.dalnagu Do.- 8l!am!babad Po. Dowki •. Po. .. Shamshabad 01>. • . Oowki •• Po. " F.atebabad •. Po. Do.
1,414 283
1,598 1,345
804 692
1,489 1,765
61(1 2,230 3,741
855 40)
2.412 1.666
200
412 :326 523 SS3 lSI} 638 281 273 476 774 537
1.421 2,074
411 1,(15(1
990 1,437 1,21(1 1,122 1,134
361 I,m
602 585 236 .3"00 432 ZlfJ
1,642 2,682
461 923
3,862 288
lIS 5(1
125 99
146 266 8()
337 306 67 38
726 US 14
3S S6 43 88 36
105 44 12 70
102 104 101 438
80 8
149 69 M
105 149 5S
165 77 82 47 58 65 13
270 386 134 !lZ 317 60
55 150
1'1. 150 122 191 384 9S
436 415
74 63
726 169 29
40 63 59
102 64
lSS 64 12 70
102 127 123 543 131
13 149 194 lS{) 127 239 61
231 111 125 58
101 81 13
295 561 136 194 445 74
Primary Celllas
Total no. of persons enUllleraled (including
inmate& of institutions and hQu.elcss persons)
Persons Males Females
9 10
Inmates of institutions
and houselClii persona
M
12
p
lJ
I.FJ:1SlL FATEHABAD
1,089 ISS 77
348 472 439 903 137 743 983
r,295 (i1l1
1,944 749 381 240 6'17 266 974 496 236 114 320 856 447 779 635
1,156 1,990
600 2,174 2,268
400 311
3,889 1,038
181
2J4 315 )(11
466 265 604 3604 59
328 519 787 671
2,7dll 744
64 821
1,118 9&1 161
1,178 415
1,372 617 649 1.76 SI4 417 69
1,661. l,915
654 1,(lIl :J,508
444
(i22 4f>7 3 IS 86 69 37 4\)
m 158 :no 191 .l38 2(11 483 420 73 64
3S6 357 521 461 698 597 3(1 ~ 996 948 390 359 Z14 173 148 92 376 321 149 111 537 437 278 218 112 124 390 3J4 1n 143 411 J85 1.56 191 433 346 356 279 619 537
1,118 812 31.2 278
1,143 1,026 1,l38 9.iO
215 1115 195 182
2,0!)11 l,7~ 561 477 106 75
Town Area IJS 99
148 131 211 108 266 173 26
158
167 164 255 157 338 186 JJ
170 287 4U 3bl
1,531 406
33 438 filO 487 43J 623 227 758 366 349 160 283 m 38
902 1.511
311. 560
1,311 2'1.7
l4l 375 309
1,257 33S
31 383 5il8 414 3.36 555 IM8 614 2.S1 300 116 261 197 31
760 1,338
281. 453
1,197 1.17
9
'j
i6
1
's
129
15$
1 1
4
12
27
. i
2
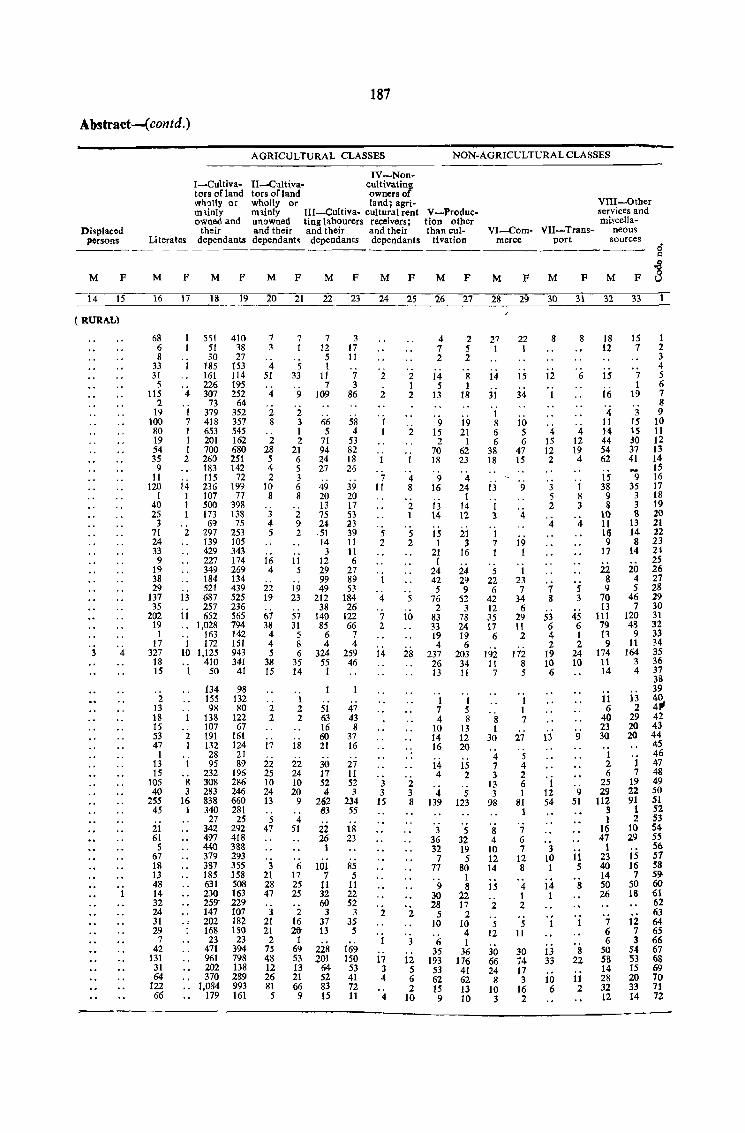
187
Abstract-(contd.}
AGRICULTURAL CLASSES NON-AGRICULTURAL CLASSES
Displaced persons Literates
----------M F M F
IV-Non-I-Cultiva- n-Cultiva- cultivating lors of land tors of land owners of wnClUy or wholly or land; agri-rnlinly rnlinly Ill-Cultiva- culturalrenl V-Produc-owned and unowned ling labourers receivers; tion other
their and their and their and their than cuIdependants dependanh dependants dependants tivation
M F M F M F M F M F
VI-Com- VII-Trans-merce port
M F M F
VIII_Other services and miscelIa-
neous sources
M F
14 15 16 17 18 19 20 21 22 23 24 25 26 27 28 29 30 31 32 33
( RURA.L)
3 4
68 6 8
33 31
5 115
2 19
100 80 19 54 35 9
11 120
I 40 25
3 71 24 33 9
19 38 29
137 35
202 19
I 17
327 18 15
2 t3 18 15 53 47
1 13 15
105 40
255 45
21 61 5
67 18 13 48 14 32 24 31 29
7 42
131 31 64
122 66
551 51 30
'i 185 161 226
4 307 73
1 379 7 418 I 653 1 201 1 700 2 260
183 115
i4 236 1 107 1 500 1 173
69 2 297
139 429 227 349 184 521
13 687 257
11 652 " 1,028
163 1 172
10 1,125 410
1 50
J34 155 98
1 138 107
2 191 1 132
28 1 95
232 8 308 3 283
16 838 1 340
27 342 497 440 379 387 185 631 230 259' 147
., 202 168 23
471 961 202 370
" 1,084 179
410 38 27
153 114 195 252
64 352 357 545 162 680 251 142
72 199
77 398 138 75
253 105 343 174 269 134 439 525 236 565 794 142 151 943 341
41
98 132 80
122 67
161 124 21 89
196 286 246 660 281 25
292 418 388 293 355 158 508 163 229 101 182 ISO 23
394 798 138 289 993 161
7 3
4 51
4
2 8
2 28 5 4 2
10 8
3 4 5
16 4
22 19
67 38
4 4 5
38 15
2 2
17
22 25 10 24 13
5 47
3 21 28 47
3 21 21 2
75 48 12 26 81 5
7 1
5 33
9
2 3 1 2
21 6 5 3 6 8
2 9 2
11 5
19 23
57 31
5 8 6
35 14
1 2 2
18
22 24 10 20 9
4 51
7 12
5 1
11 7
109
66 5
71 94 24 27
49 20 13 75 24 ,51 14
3 12 29 99 49
212 38
140 85
6 4
324 55 1
51 63 16 60 21
30 17 52 4
262 63
22 26 1
6 101 17 7 25 11 25 32
60 2 3
16 37 26- 13
1 69 228 53 101 13 64 21 52 66 83 9 15
3 17 II
'1 3
86
58 4
53 82 18 26
39 20 17 53 23 39 11 11 6
27 89 53
184 26
122 66
7 4
259 46
47 43 8
37 16
21 11 52 3
234 55
18 23
85 5
11 22 52
3 35 5
169 150
53 41 72 11
2
2
1
7 11
5 2
1
4
7 2
i4
3 3
15
2
1
17 3 4
4
2 1 2
2
I
4 8
2 1
5 2
5
10
28
2 3 8
2
3
ii 5 6 2
10
4 7 2
14 5
13
9 15
2 70 18
9 16
13 14
15 1
21 r
24 42 5
76 2
83 33 19 4
237 26 13
1 7 4
10 14 16
14 4
4 139
3 36 32 7
77
9 30 28
5 10
6 35
193 53 62 15 9
2 5 2
8 1
18
19 21
1 62 23
4 24
I 14 12
21 3
16
24 29 9
52 3
78 24 19 6
203 34 11
I 5 8
13 12 20
15 2
5 123
5 32 19
5 80
1 8
22 17
2 10 4 1
36 176
41 62 13 10
27 1
14
31
I 8 6 6
38 18
13
I 3
1 7 I
5 22 6
42 12 35 17
6
192 11 7
8 I
30
4 7 3
13 3
98
8 4
10 12 14
15
2
5 12
30 66 24
8 10 3
22 1
15
34
10 5 6
47 15
9
4
19 1
1 23 7
34 6
29 t 1 2
172 8 5
I 1 7
27
5 4 2 6 1
81 1
7 6 7
12 8
4 1 2
5 11
30 74 17 3
16 2
8
12
I
4 15 12 2
3 5 2
'4
7 8
53 6 4 2
19 10
6
, i 12 54
3 10 1
14 1
., 1
13 33
10 6
8
6
4 12 19 4
'i 8 3
4
5 3
45 6 1 2
24 10
9
9 51
11 5
8
8 22
11 2
18 12
15
16
4 11 14 44 54 62
1$ 38 9 8
HI 11 16 9
17
22 8 9
70 13
111 79 13 9
174 11 14
11 6
40 23 30
1 2 6
25 29
112 3 1
16 47
1 23 40 14 50 26
1 6 6
50 58 14 28 32 12
15 7
7 1
19
3 IS 15 30 37 41
9 35
3 3 S
13 14 8
14
20 4 5
46 7
120 48
9 11
164 3 4
13 2
29 20 20
1 7
19 22 91
1 2
10 29
15 16 7
50 18
12 7 3
54 ;3 15 20 33 14
-_._---- -----------------------
1 2 3 4 5 6 7 8 9
10 11 12 13 14 15 16 17 18 19 20 21 22 23 24 2S 26 27 28 29 30 31 32 33 34 35 36 31 38 39
~~ 42 43 44 45 46 47 48 49 50 51 52 53 54 55 56 51 58 59, 60 61 62 63 64 65 66 67 68 69 70 11 72
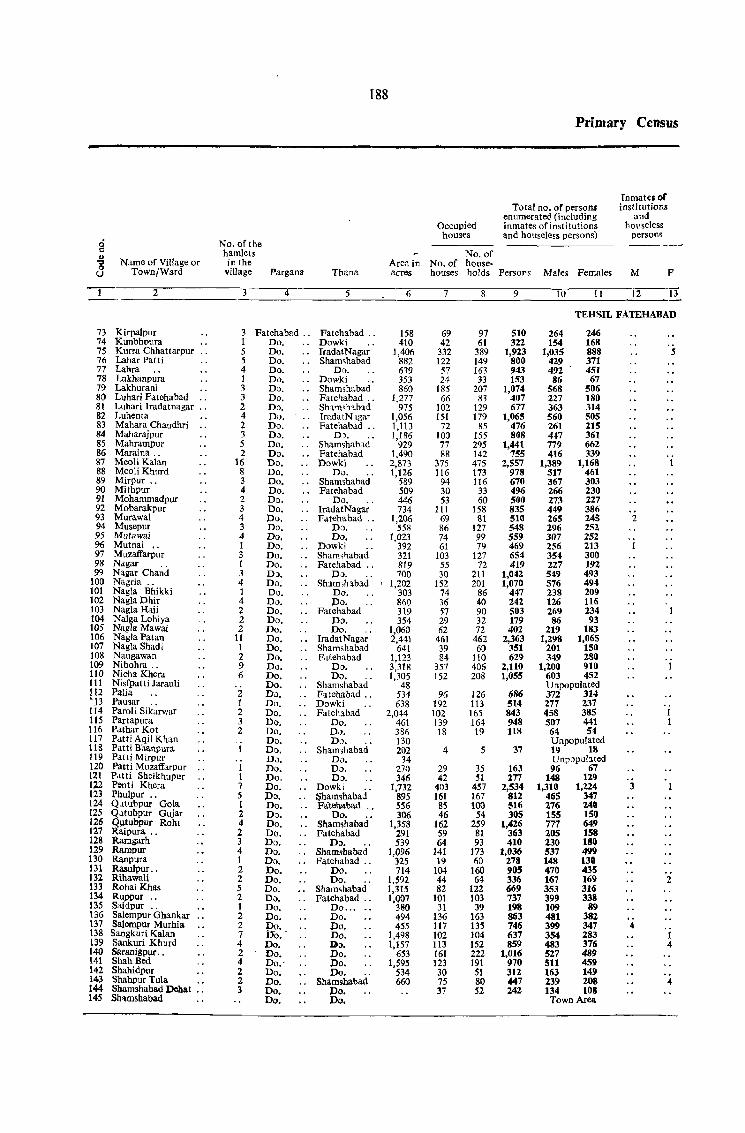
ci c::
~ U
Name of Village or Town/Ward
No. of the hamlets in the
village Pargana Thana
188
Primary Census
Occupied houses
No. of Area in No. of house·
Total no. of persons enuQlerated (including inQlates of institutions and houseless persons)
acres houses holds Persons Males Females
Tnmates of institutions
and hOtlseless
persons
M F
----~2.-----------"-----.4--------r5--------~6----~7~--~8~--n9~--~1~0~--'I·I----l~2'---13
73 Kirpalpur 74 Kunbhpura 75 Kurra Chhattarpur 76 Lahar Patti 77 Lahra 78 Lakhanpura 79 Lakhurani 80 Luhari Fatehabad 81 Luhari Iradatnagar .. 82 Luhenta 83 Mahara Chaudhri 84 Maharajpur 85 Mahrampur 86 Maraina .. 87 Meoli Kalan 88 Meoli Khurd 89 Mirpur .. 90 Mithpur 91 Mohammadpur 92 Mobarakpur 93 Mllrawal 94 Musepur 95 Mutawai 96 Mutnai 97 Muzaffarpur 98 Nagar .. 99 Nagar Chand
100 Nagria " 101 Nagla Bhikki 102 Nagla Dhir 103 Nagla Haj i 104 NaIga Lohiya 105 Nagla Mawai 106 Nagla Patan 107 Nagla Shadi 108 Naugawan 109 Nibohra .. 110 Nicha Khera 111 Nisfpatti Jarauli 112 Palia .. • j3 Pausar .. 114 Paroli Sikarwar 115 Partapura 116 Pathar Kot 117 PattiAqil Khan 118 Patti Bhanpura 119 PattiMirpur 120 Patti Muzaffarpur 121 Patti Sheikhupur 122 Penti Khera 123 Phulpur .. L24 Qutubpur Gola 125 QLltubpur Gujar 126 Qutubpur Rohl 127 Raipura. .. 128 Ramgarh 129 Rampur 130 Ranpura 131 Rasulpur .. 132 Rihawali 133 Rohai Khas 134 Ruppur .. 135 Saidpur .. 136 SaIempur Ghankar 137 Salempur Murhia 138 Sangkuri Kalan 139 Sankuri Khurd 140 Saranigpur .. 141 ShahBed 142 Shahidpur 143 Shahpur Tula .. 144 Shamshabad Dohat .. 145 Sh"mshabad
3 Fatehabad.. Fatehabad .. 1 Do. .. Dowki 5 Do. lradatNagar 5 Do. . . Sham~habad 4 Do. Dl). 1 Do. Dowki 3 Do. Shamshabad 3 DI). Fatehabad .. 2 DI). Shvm>nbad 4 Do. .. lradatN~gar 2 Do. Fatehabad .. 3 Dc.. DJ. 5 Do. Shamshabad 2 Do. Fatehabad
16 Do. Dowki 8 Do. Do. 3 Do. Shamshabad 4 Do. .. Fatehabad 2 Do. Do. 3 Do. IradatNagar 4 Do. .. Fatehabad .. 3 Do. Do. 4 Do. Do. 1 Do. Dowki 3 Do. Shamshabad I Do. Fatehabad .. 3 D~. Da. 4 Do. Shlffilhabad 1 Do. Do. 4 Do. Do. 2 Do. .. Fatehabad 2 Do. Do. 2 Do. Do.
11 Do. IradatNagar I Do. Shamshabad 2 Do. Fatehabad 9 Do. Do. 6 Do. Do.
Do. Shamshabad 2 Do. Fatehabad .. 1 Do. Dowki 2 Do. Fatehabad 3 Do. Do. 2 Do. Do.
Do. Do. Do. Shamshabad D<J. Do.
I Do. Do. 1 Do. Do. 7 Do. Dowki 5 Do. .. Shamshabad 1 Do. Fa1ehabad .. 2 Da. Do. 4 Do. Shamshabad 2 Do. Fatehabad 3 Do. Do. 4 Do. . . Shamshabad 1 Do. . . Fatehabad .. 2 Do. Do. 2 Do. Do. 5 Do. Shaffishabad 2 Do. .. Fatehabad .. 1 Do. Do ... 2 Do. Do. 2 Do. Do. 7 ITo. - Do. 4 Do. 1)0. 2 Do. Do. 4 00.- Do. 2 Do. Do. 2 Do. Shamshabad 3 Do. Do.
Do. Do.
158 410
1,406 882 639 353 860
1,277 975
1,056 1,113 1,186
929 1,490 2,873 1,126
589 509 446 734
1,206 558
1,023 392 321 819 700
1,202 303 860 319 354
1,060 2,441
641 1.123 3,318 1,305
48 534 638
2,044 461 386 130 202
34 270 346
1.732 895 556 306
1,358 291 539
1,096 325 714
1,592 1,315 I,Q07
380 494 455
1,498 1,157
653 1,595
534 660
69 42
332 122 57 24
185 66
102 151
72 100 77 88
375 116
94 30 53
111 69 86 74 61
103 55 30
152 74 36 57 29 62
461 39 84
357 152
96 192 102 139 18
4
29 42
403 161 85 46
162 59 64
141 19
104 44 82
101 31
136 117 102 113 161 123 30 75 37
97 61
389 149 163 33
207 83
129 179
85 155 295 142 475 173 116
33 60
158 81
127 99 79
127 72
211 201
86 40 90 32 72
462 60
110 406 208
126 113 165 164 19
5
35 SI
4S7 167 100
54 259 81 93
173 60
160 64
122 103
39 163 135 104 152 222 191 51 80 52
510 322
1,923 800 943 153
1,074 407 677
1,065 476 80S
1,441 755
2,557 978 670 496 500 835 510 548 559 469 654 419
1,042 1,070
447 242 503 179 402
2,363 351 629
2,110 1,055
686 514 843 948 llS
37
163 277
2,534 812 516 305
1,426 363 410
1.036 278 90S 336 669 737 198 863 746 637 859
1,016 970 312 447 242
TEHSIL FATEHABAD
264 246 154 168
1,035 888 429 371 492 451 86 67
568 506 227 180 363 314 560 505 261 215 447 361 779 662 416 339
1,389 1,168 517 461 367 303 266 230 273 227 449 386 265 245 296 252 307 252 256 213 354 300 227 192 549 493 576 494 238 209 126 116 269 234 86 93
219 183 1,298 1,065
201 150 349 280
1,200 910 603 452 Unpopulated 372 314 277 237 458 385 507 441 64 54 Unpopulated 19 18 UnpopuI:tted 96 67
148 129 1,310 1,224
465 347 276 240 155 150 777 649 205 158 230 180 537 499 148 130 470 435 167 169 353 316 399 338 109 89 481 382 399 347 354 283 483 376 527 489 511 459 163 149 239 208 134 108 Town Area
2
3
4
5
2
1 4
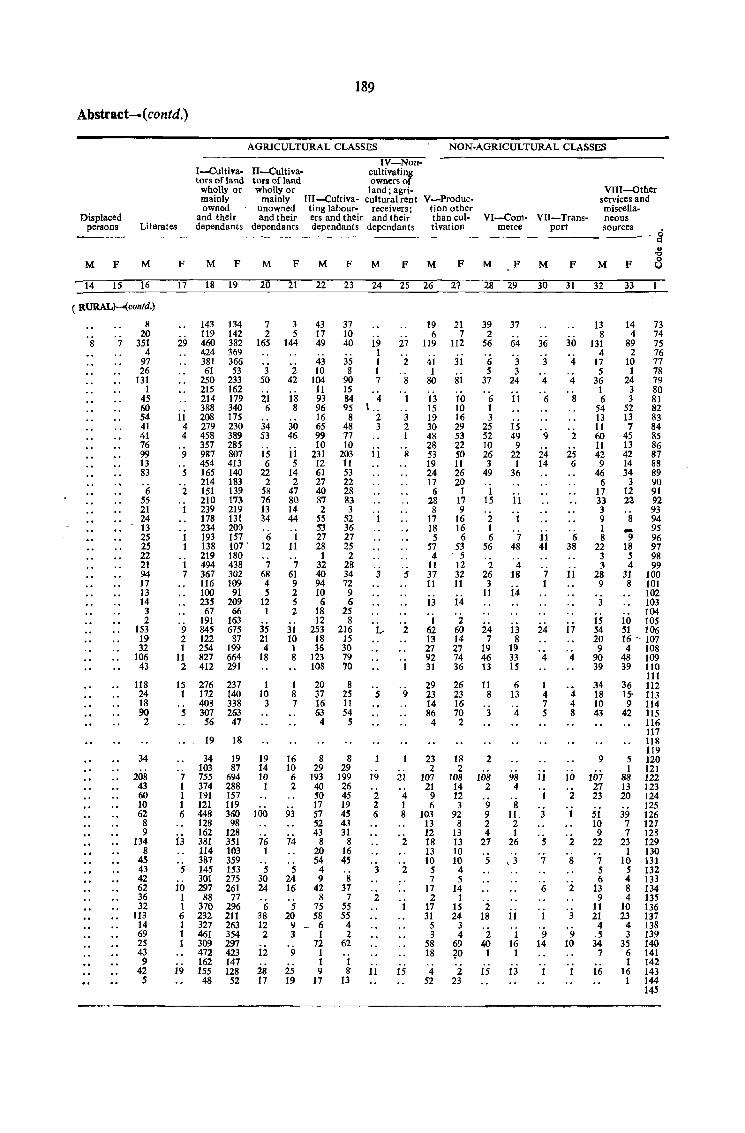
189
Abstract-(contd.)
AGRICULTURAL CLASSES NON-AGRICULTURAL CLASSES
I-Cultiva- II-Cultivators of land tors of land
wholly or wholly or mainly mainly owned ' unowned
and their and their
lV-Noncultivating owners of land; agri-
Displaced persons Literates dependants dependants
ITI-Cultiva- cultural rent ling labour- receivers; ers and their and their dependants dependants
V-Produetion other than cultivation
M F M F M F M F M F M F M F
14 15 16 17 18 19 20 21 22 23 24 25 26 27
( RURAL) ..... (contd.)
8
8 7 20
351 4
97 26
131 1
45 60 54 41 41 76 99 13 83
'6 55 21 24 13 25 25 22 21 94 17 13 14 3 2
153 19 32
106 43
118 24 18 90 2
34
208 43 60 10 62 8 9
134 8
45 43 42 62 36 32
113 14 69 25 43 9
42 5
29
ii 4 4
9
5
2
1 7
9 2 1
II 2
15 I
5
143 119 460 424 381 61
250 215 214 388 208 279 458 357 987 454 165 214 151 210 239 178 234 193 138 219 494 367 116 100 235 67
191 845 122 254 827 412
276 172 408 307 56
19
34 103
7 755 1 374 1 191 1 121 6 448
128 162
13 381 114 387
5 145 301
10 297 I 88 1 370 6 232 1 327 1 461 1 309
472 162
19 155 48
134 7 142 2 382 165 369 366 53 3
233 50 162 179 21 340 6 175 230 34 389 53 285 807 15 413 6 140 22 183 2 139 58 173 76 219 13 131 34 200 157 6 107· 12 180 438 7 302 68 109 4
91 5 209 12 66 I
163 675 35 87 21
199 4 664 18 291
237 1 140 10 338 3 263 47
18
19 19 87 14
694 10 288 I 157 119 360 100 98
128 351 76 103 1 359 153 5 275 30 261 24
77 296 6 211 38 263 12 354 2 297 423 ii 147 128 2S 52 17
3 5
144
2 42
18 8
30 46
i i 5
14 2
47 80 14 44
1 11
7 61 9 2 5 2
31 10 1 8
1 8 7
43 17 49
43 10
104 11 93 96 16 65 99 10
231 12 61 27 40 87 2
55 53 27 28
1 32 40 94 10 6
18 12
253 18 36
123 108
20 37 16 63 4
16 8 10 29 6 193 2 40
50 17
93 57 52 43
74 8 20 54
5 4 24 9 16 42
8 5 75
20 58 9 _ 6 3 1
72 9 I
1 25 9 19 17
37 10 40
35 8
90 15 84 95 8
48 77 10
203 11 53 22 28 83 3
52 36 27 25
2 28 34 72 9 6
25 8
216 15 30 79 70
8 25 11 54
5
8 29
199 26 45 19 45 43 31
8 16 45
8 37
7 55 55
4 2
62
1 8
13
19 1 1 1 7
4
2 3
11
3
1 ....
5
19
2 2 6
3
2
11
27
2
8
1
3 2 I
8
5
2
9
21
4 1 8
2
2
15
19 6
119
41 1
80
13 15 19 30 48 28 53 19 24 17
6 28 8
17 18
5 57 4 II 37 11
13
1 62 13 27 92 31
29 23 14 86
4
23 2
107 21 9 6
103 13 12 18 13 10
5 7
17 2
17 31
5 3
58 18
4 52
21 1
112
31
81
10 10 16 29 53 22 50 11 26 20
I 17 9
16 16 6
53 5
12 32 11
i4 2
60 14 27 74 36
26 23 16 70 2
18 2
108 14 12 3
92 8
13 13 10 10
4 5
14 1
15 24
3 4
69 fO 2
23
VI-Corn- VII-Trans-meree port
M F M F
VIII-Other services and miscellaneous sources
M F
28 29 30 31 32 33
39 2
56
6 5
37
6 1 3
25 52 10 26 3
49
I 15
2 1 6
56
2 26 3
11
24 7
19 46 13
11 8
3
2
108 2
9 9 2 4
27
5
2 18
2 40
1
15
37
64
3 3
24
11
15 49 9
22 1
36
11
1
7 48
4 18
i4
13 8
19 33 15
6 13
4
98 4
8 11. 2 1
26
,3
11
1 16
1
13
36
3
4
6
9
24 14
11 41
7 1
24
4
I 4 7 .5
11
1
3
5
7
6
9 14
30 4
4
8
2
25 6
6 38
11
17
4
4 4 8
10
2
1
2
8
2
3
'9 10
13 8
131 4
17 .5
36 1 6
54 13 11 60 11 42 9
46 6
17 33 3 9 1 8
22 3 3
28 9
3
15 54 20 9
90 39
34 18 10 43
9
107 27 23
51 10 9
22
7 5 6
13 9
11 21
4 ,5 34
7
16
14 4
89 2
10 1
24 3 3
52 13 7
45 13 42 14 34
3 12 22
73 74 75 76 77 78 79 80 81 82 83 84 85 86 87 88 89 90 91 92 93
8 94 -9 18 5 4
31 8
95 96 97 98 99
100 101 102 103 104
10 105 51 106 16 - 107 4 108
48 109 39 110
36 IS. 9
42
5 1
88 13 20
39 7 7
23 1
10 5 4 8 4
10 23
4 3
35 6 1
16 1
111 112 113 114 115 116 117 118 119 120 121 122 123 124 125 126 127 128 129 130 131 132 133 134 135 136 137 138 139 140 141 142 143 144 145
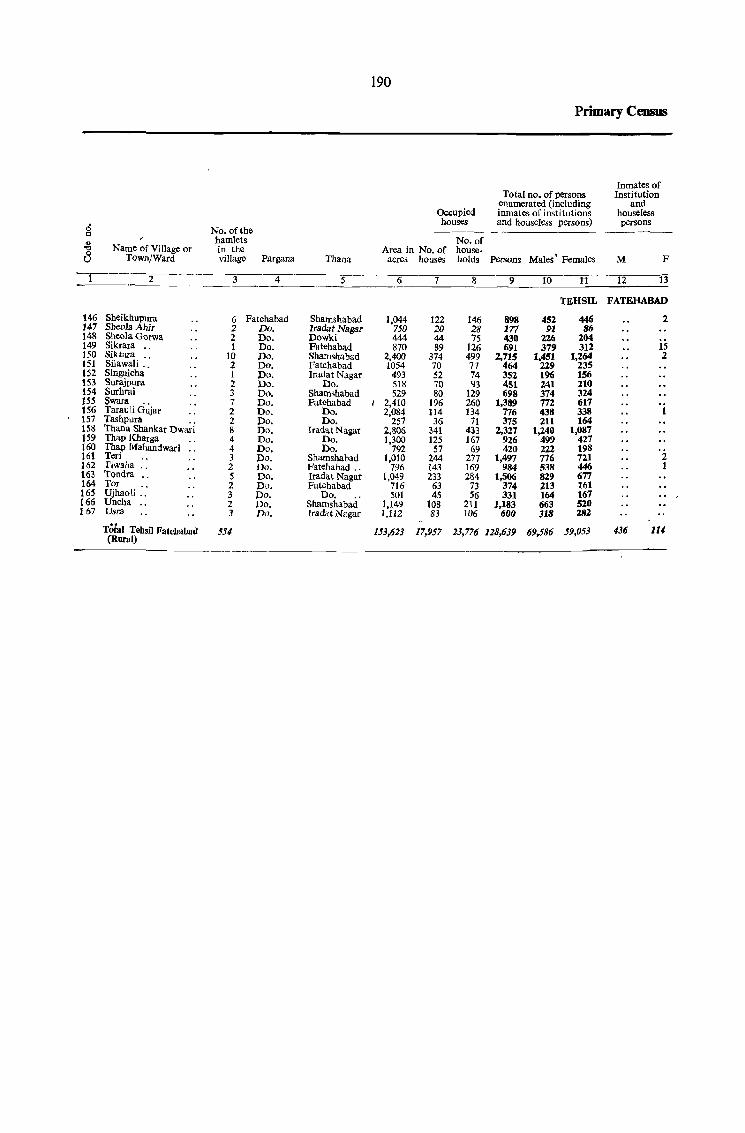
190
Primary Census
Inmates of Total no. of persons Insti tution
enumerated (including and Occupied inmates of institutions houseless
15 houses and houseless persons) persons
<=l No. of the
.g hamlets No. of Name of Village or in the Area in No. of house-
8 Town/Ward village Pargana Thana acres houses holds Persons Male$ \ Females M F
-1---- 2 4 5 6 7 8 9 10 11 12 13
TEHSIL FATEHABAD
146 Sheikhupura 6 Fatehabad Shamshabad 1,044 122 146 898 452 446 2 147 SbeolaAhir 2 Do. lradat Nagar 750 20 28 177 91 86 148 Sheela Gorwa 2 Do. Dowki 444 44 75 430 226 204 is 149 Sikrara " 1 Do. Fatehabad 870 89 126 691 379 312 150 Siktllxa 10 Do. Shamshabad 2,400 374 499 2,715 1,451 1,264 2 151 Silawali :: 2 Do. Fatehabad 1054 70 77 464 229 235 152 Singaicha 1 Do. lradat Nagar 493 52 74 352 196 156 153 Surajpura 2 Do. DD. 518 70 93 451 241 210 154 Surhrai 3 Do. Shamshabad 529 80 129 698 374 324 155 Swara 7 Do. Fatehabad I 2,410 196 260 1,389 772 617 156 Tarau Ii G~jar 2 Do. Do. 2,084 114 134 776 438 338 157 Tashptlra 2 Do. Do. 257 36 71 375 211 164 ISS Thana Shankar Dwa~i 8 Do. Iradat Nagar 2,806 341 433 2,327 1,240 1,087 IS9 Thap Kharga 4 Do. Do. 1,300 125 167 926 499 427 160 Thap Mahandwari 4 Do. Do. 792 57 69 420 222 198 161 Teri 3 Do. Shamshabad 1,010 244 277 1,497 776 721 2 162 Tiwaha :: 2 Do. Fatehabad " 796 143 169 984 538 446 1 163 Tondra " 5 Do. Iradat Nagar 1,049 233 284 1,506 829 677 164 Tor 2 DD. Fatehabad 716 63 73 374 213 161 165 Ujhaoli :: 3 Do. Do. 501 45 56 331 164 167 165 Uncha .. 2 Do. Shamshabad 1,149 108 211 1,183 663 520 167 Usra 3 Do. Iradat Nagar 1,112 83 106 6(JQ 318 282
Total Tehsil Fatehabad (Rural)
551 153,623 17,957 23,776 128,639 69,586 59,053 136 114
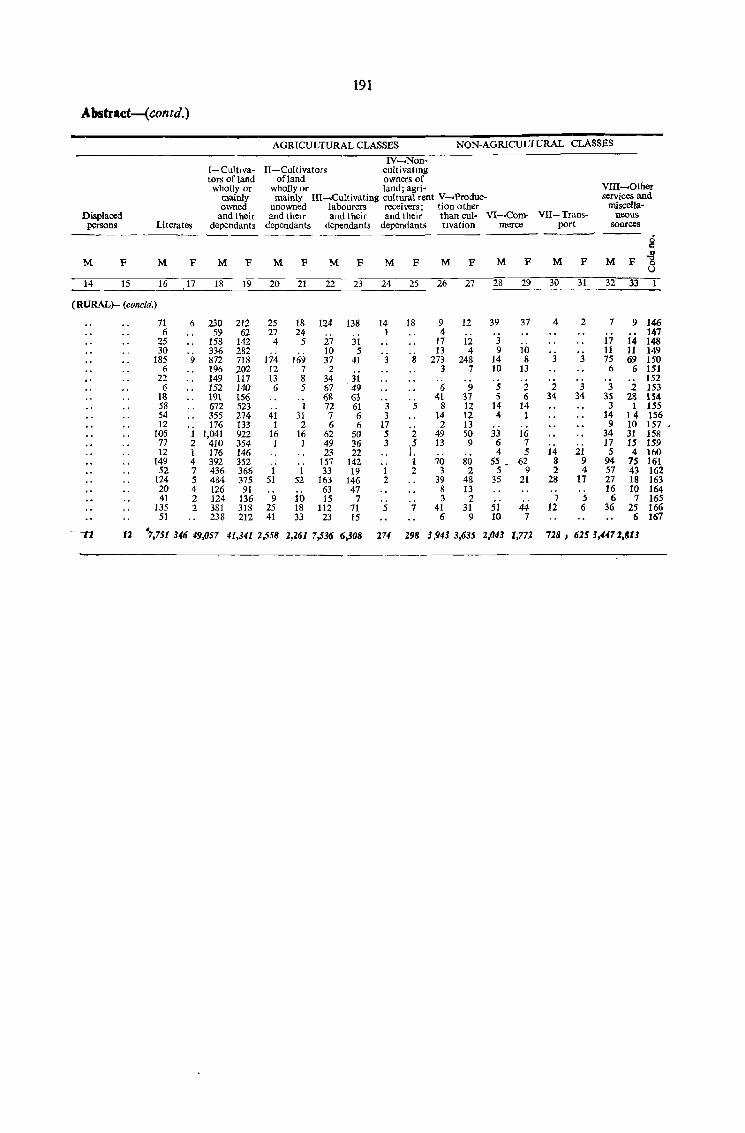
191
Abstract-(contd.)
AGRICULTURAL CLASSES NON-AGRICULTURAL CLASSES
IV--Non-I-Culttva- II-Cultivators cultivatmg tors of land ofland owners of wholly or wholly or land; agri- VIII--Other
mainly mainly III-Cultivating cultural rent V-Produc- services and owned unowned labourers receivers; tion other miscella-
Displaced and their and then and their and their than cuI- VI-·Com- VII-Trans- neous !lI)rsons Literates dependants dependants de!ll)ndants dependants tlvation merce port sources
----- 8 M F M F M F M F M F M F M F M F M F M F .g
U
14 15 16 17 18 19 20 21 22 23 24 25 26 27 28 29 30 31 32 33
(RURAL)- (concld.)
71 6 230 212 25 18 124 138 14 18 9 12 39 37 4 2 7 9 146 6 59 62 27 24 1 4 147
25 158 142 4 5 27 31 17 12 3 17 14 148 30 336 282 10 5 13 4 9 10 II 11 149
185 9 872 718 174 169 37 41 8 273 248 14 8 3 3 75 69 150 6 196 202 12 7 2 3 7 10 13 6 6 151
22 149 117 13 8 34 31 152 6 152 140 6 5 67 ' 49 6 9 5 2 2 3 3 2 153
18 191 156 68 63 41 :n 5 6 34 34 35 28 154 58 672 523 I 72 61 3 5 8 12 14 14 3 1 155 54 355 274 41 31 7 6 3 14 12 4 1 14 14 156 12 176 133 1 2 6 6 17 2 13 9 10 157
105 1 1,041 922 16 16 62 50 5 2 49 50 33 16 34 31 158 77 2 410 354 1 1 49 36 3 ,5 13 9 6 7 17 15 159 12 1 176 146 23 22 J. 4 5 14 21 5 4 160
149 4 392 352 157 142 1 70 80 55 • 62 8 9 94 1S 161 52 7 436 366 1 1 33 19 1 2 3 2 S 9 2 4 57 43 162
124 5 484 375 51 52 163 146 2 39 48 35 21 28 17 27 18 163 20 4 126 91 63 47 8 13 16 10 164 41 2 124 136 9 10 15 7 .. 3 2 7 5 6 7 165
135 2 381 318 25 18 112 71 5 7 41 31 51 44 12 6 36 2S 166 51 238 212 41 33 23 15 6 9 10 7 6 167
---11 U ·7,751 346 49,057 41,341 2,558 2,261 7,536 6,308 274 298 3,943 3,635 2,043 1,772 728, 6253,4472,813
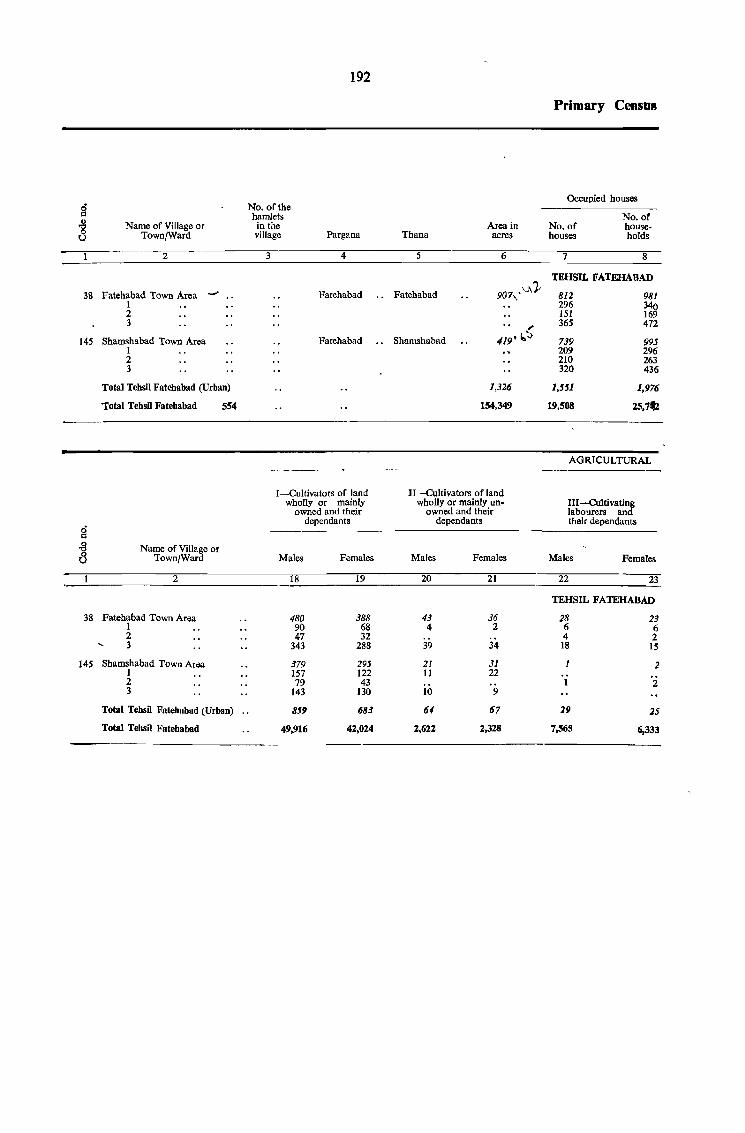
192
Primary Census
0 No. of the Occupied houses
= hamlets No. of ~ Name of Village or in the Area in No. of house-0 Town/Ward village Pargana Thana acres houses holds U
2 3 4 5 6 7 8
TEHsn.. FATEHA8AD
38 Fatehabad Town Area _,
Fatehabad .. Fatehabad 907,' VI} 812 981 1 296 340 2 151 169 3
". 365 472
145 Shamshabad Town Area Fatehabad .. Shamshabad 419' ",':> 739 995 1 209 296 2 210 263 3 320 436
Total Tehsil Fatehabad (Urban) 1,326 1,551 1,976
Total Tehsil Fatehabad 554 154,349 19,508 25,141
AGRICULTURAL
I-Cultivators of land II-Cultivators of land wholly or mainly wholly or mainly un- III-Cuttivatin!
owned and their owned and their labourers an
g dependants dependants their dependants
~ Name of Village or (3 Town/Ward Males Females Males Females Males Females
2 18 19 20 21 22 --2-3
TEHSIL FATEHABAD
38 Fatehabad Town Area 480 388 43 36 28 23 1 90 68 4 2 6 6 2 47 32 4 2 3 343 288 39 34 18 15
145 Shamshabad Town Area 379 295 21 31 1 2 1 157 122 11 22 2 79 43 2 3 143 130 10 9
Total Tehsil Fatehabad (Urban) .. 859 683 64 67 29 25
Total Tehsil Fatehabnd 49,916 42,024 2,622 2,328 7,565 6,333
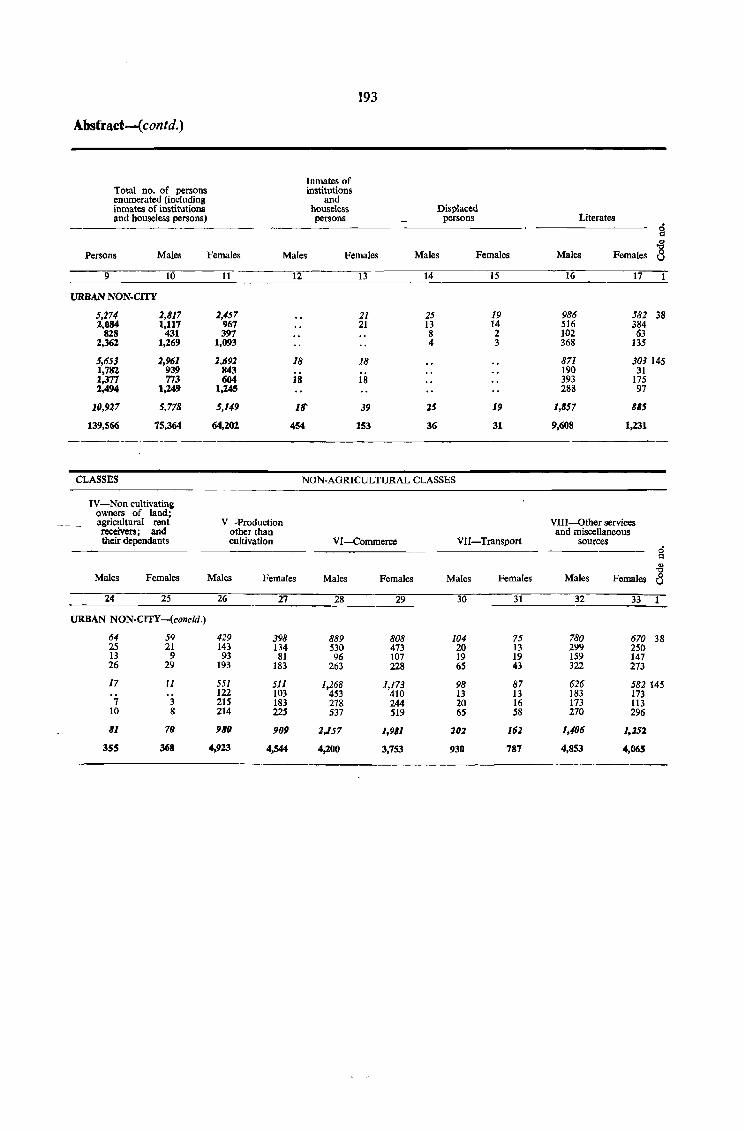
193
Absfract-( contd.)
Inmates of Total no. of persons institutions enumerated (including and inmates of institutions houseless Displaced and houseless persons) persons persons Literates
g .g
Persons Males Females Males Females Males Females Males Females 8 9 to 11 12 13 14 15 16 17
URBAN NON·CITY
5,274 2,817 U57 21 25 19 986 582 38 2,084 1,117 967 21 13 14 516 384
828 431 391 8 2 102 63 2,362 1,269 1,093 4 3 368 135
5,653 2,961 2,692 18 18 871 301145 1,782 939 843 190 31 1,377 773 604 18 18 393 175 2,494 1,249 1,245 288 97
10,927 5,778 5,149 II' 39 25 19 1,857 885
139,566 75,364 64,202 454 153 36 31 9,608 1,231
CLASSES NON-AGRICULTURAL CLASSES
IV-Non cultivating owners of land; agricnltural rent V -Production VIII-Other services receivers; and other than and miscellaneous their dependants cultivation VI-Commerce VII-Transport sources
0 1'1 .. "" Males Females Males Females Males Females Males Females Males Females 8
24 25 26 27 28 29 30 31 32 33
URBAN NON-CITY-(concld.)
64 5Q 429 398 889 808 104 75 780 670 38 25 21 143 134 530 473 20 13 299 25t} 13 9 93 81 96 107 19 19 159 147 26 29 193 183 263 228 6S 43 322 273
17 11 551 sJl 1,268 1,173 98 87 626 582 145 122 103 453 410 13 13 183 173
7 3 215 183 278 244 20 16 173 113 10 8 214 225 537 519 65 58 270 296
81 70 980 909 2,157 1,9'1 202 162 1,406 1,252
355 368 4,923 4,544 4,200 3,753 930 787 4,853 4,065
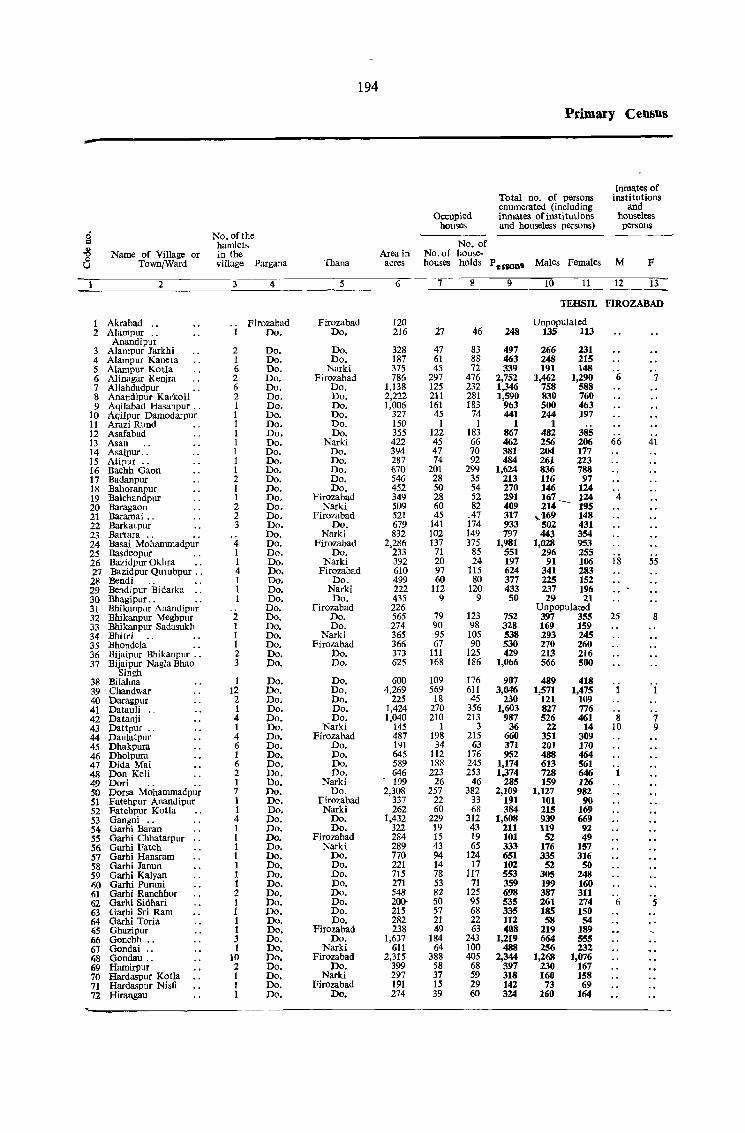
Name of Village or Town/Ward
1 Akrabad ., 2 Alampllr ..
Anandipur
2
3 Alampur Jarkhi 4 Alampur Kaneta 5 Alampur Kotla 6 Alinagar Kenjra 7 Allahdadpur 8 Anandipur Karkoli 9 Aqilabad Hasanpur ..
10 Aqilpur Damodarpur 11 Arazi Rund 12 Asafabad 13 Asan 14 Asalpur .. 15 Atipllr .. 16 Bachh Gaon 17 Badanpur 18 Bahoranpur 19 BaJchandpur 20 Baragaon 21 Baramai .. 22 Barkatpur 23 Bartara .. 24 Basai Mohammadpur 25 Basdeopur 26 Bazidpur Okhra .. 27 Bazidpur Qutubpur .. 28 Bendi.. .. 29 Bendipur Bidarka .. 30 Bhagipur.. . . 31 Bhikanpllr Anandipur 32 Bhikanpur Meghpur 33 Bhikanpur Sadasukh 34 Bhitr; 35 Bhondcla 36 Bijaipur Bhikanpur .. 37 Bijaipur Nagla Bhao
Singh 38 Bilahua 39 Chandwar 40 Daragpur 41 Datauli .. 42 Datanii 43 Dattpur .. 44 Daulatpur 45 Dhakpura 46 Dholpura 47 Dida Mai 48 Don Keli 49 Dori 50 Dorsa Mohammadpur 51 Fatehpur Anandipur 52 Fatehpur Kotla 53 Gangni .. 54 Garhi Baran 55 Garhi Chhatarpur .. 56 Garhi Fateh 57 Garhi Hansram 58 Garhi Janun 59 Garhi Kalyan 150 Garhi Purani 61 Garhi Ranchhor 62 Garhi Sidhari 63 Garhi Sri Ram 64 Garhi Toria "i5 Ghazipur 66 Gonchh .. 67 Gondai .. Al8 Gondau .. 69 Hamirpur 70 Hardaspur Kalla 71 Hardaspur Nisfi 72 Hirangau
No. of the hamlets in the village Pargana
3
1
2 1 6 2 6 2 1 I 1 1 1 1 1 1 2 1 1 2 2 3
4 1 1 4 1 I 1
2 I 1 1 2 3
I 12 2 1 4 1 4 6 1 6 2 1 7 1 1 4 1 1 1 1 1 1 1 2 1 1 1 1 3 1
10 2 1 I 1
4
Firozabad Do.
Do. Do. Do. Do. Do. Do. Do. Do. Do. Do. Do. Do. Do. Do. Do. Do. Do, Do. Do. Do. Do. Do. Do. Do. Do. Do. Do. Do. Do. Do. Do. Do. Do. Do. Do.
Do. Do. Do. Do. Do. Do. Do. Do. Do. Do. Do. Do. Do. Do, Do. Do. Do. Do. Do. Do. Do. Do. Do. Do. Do. Do. Do. Do. Do. Do. Do. Do. Do. Do. Do.
194
Thana
5
Firozabad Do.
Do. Do.
Narki Firozabad
Do. Do. Do. Do. Do. Do.
Narki Do. Do. Do. Do. Do.
Firozabad Narki
Firozabad Do.
Narki Firozabad
Do. Nark!
Firozabad Do.
Nark! Do.
Firozabad Do. Do.
Narki Firozabad
Do. Do.
Do. Do. Do. Do. Do.
Narki Firozabad
Do. Do. Do. Do.
Narki Do.
Firozabad Narki
Do. Do.
Firozabad Narki
Do. Do. Do. Do. Do. Do. Do. Do.
Firozabad Do.
Narki Firozabad
Do. Narki
Firozabad Do.
Area in acres
6
120 216
328 187 375 786
1,138 2,222 1,006
327 150 355 422 394 287 670 546 452 349 509 521 679 832
2,286 233 392 610 499 222 435 226 565 274 365 366 373 625
600 4,269
225 1,424 1,040
145 487 191 645 589 646 199
2,308 337 262
1,432 322 284 289 770 221 715 271 548 200-215 282 238
1,637 611
2,315 399 297 191 274
Occupied houses
No. of No. of house-
Primary Census
Total no. of persons enumerated (including inmates of institutions and houseless persons)
Inmates of insti tutions
and houseless persons
houses holds P • 'SOil· Males Females M F
7
27
47 61 45
297 125 211 161 45
I 122 45 47 74
201 28 50 28 60 45
141 102 137
71 20 97 60
112 9
79 90 95 67
111 168
109 569
18 270 210
1 198 34
112 188 223
26 257
22 60
229 19 15 43 94 14 78 53 81 50 57 21 49
184 64
388 58 37 15 39
8
46
83 88 72
476 232 281 183
74 1
183 66 70 92
299 35 54 52 82
.47 174 149 375
85 24
115 80
120 9
123 98 105 90
125 186
176 611 45
356 213
3 215
63 176 245 253
46 382
33 68
312 43 19 65
124 17
117 71
125 95 68 22 63
243 100 405 68 59 29 60
9
248
497 463 339
2,752 1,346 1,590
963 441
1 867 462 381 484
1,624 213 270 291 409 317 933 797
1,981 551 197 624 377 433 50
752 328 538 530 429
1,066
907 3,046
230 1,603
987 36
660 371 952
1,174 1,374
285 2,109
191 384
1,608 211 101 333-651 102 553 359 698 535 335 112 408
1,219 488
2,344 397 318 142 324
10 11 12 13
TEHSIL FIROZABAD
Unpopulated 135 113
266 248 191
1,462 758 830 500 244
1
231 215 148
1,290 588 760 463 197
482 385 256 206 204 177 261 223 836 788 116 97 146 124 1f.7 _ 124 214 :t95
",169 148 502 431 443 354
1,028 953 296 255
91 106 341 283 225 152 237 196 29 21
Unpopulated 397 355 169 159 293 245 270 260 213 216 566 500
489 418 1,571 1,475
121 109 827 776 526 461
22 14 351 309 201 170 488 464 613 561 728 646 159 126
1,127 982 101 90 215 169 939 669 119 92 52 49
176 157 335 316 52 50
305 248 199 160 387 311 261 274 185 150 58 54
119 189 664 555 256 232
1,268 1,076 230 167 160 158 73 69
160 164
6
66
4
18
25
8 10
6
7
41
55
8
7 9
5
-,
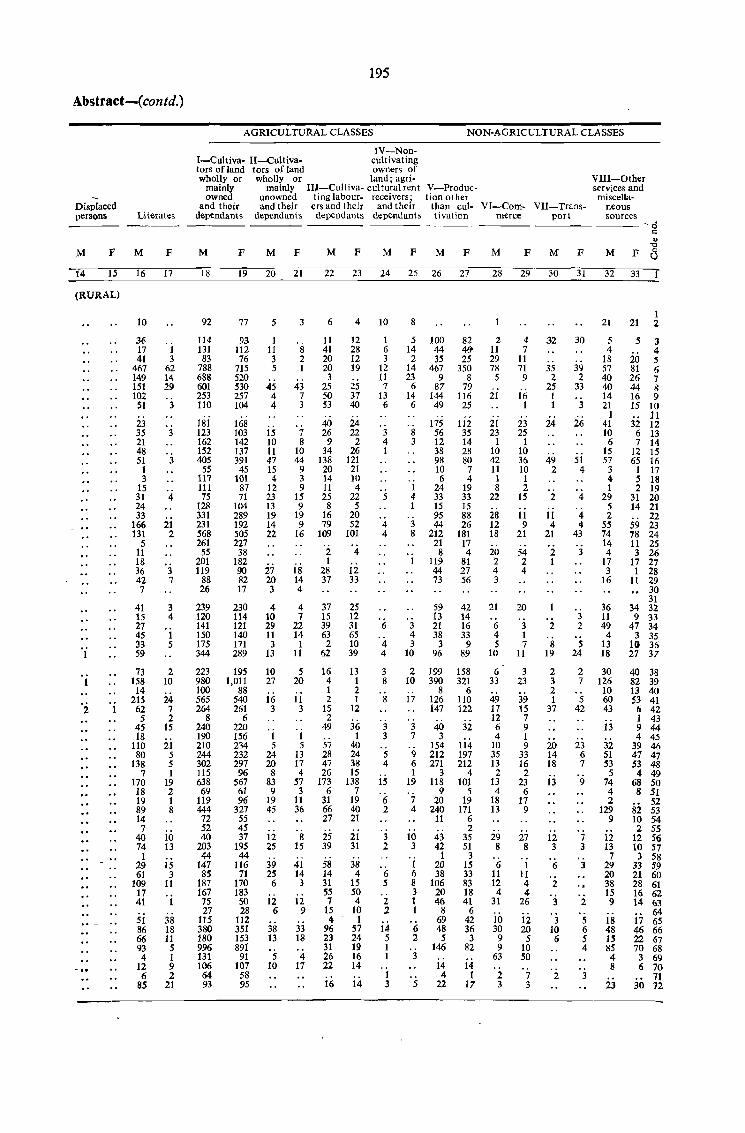
Abstract-{contd,)
Displaced persons Literates
M F M F
14 15 [6 [7
(RURAL)
'i
'i 'i
10
36 17 41
467 149 151 102
51
23 35 21 48 51 I 3
15 31 24 33
166 131
5 11 18 36 42 7
41 15 27 45 33 S9
73 158 14
215 62 5
4S 18
110 80
138 7
170 18 19 89 14 7
40 74 1
29 61
109 17 41
51 86 66 93 4
12 6
85
I 3
62 14 29
3
3
3
4
21 2
3 7
3 4
1 5
2 10
24 7 2
15
21 5 5 1
19 2 1 8
10 13
15 3
11
1
38 18 11 5 I 9 2
21
195
AGRICULTURAL CLASSES NON-AGRICULTURAL CLA SSES
IV-Non-I-Cultiva- II-Cultiva- cultivating tors of land tors of land owners of wholly or wholly or land; agri-
mainly mainly II~-Cultiva- cultural rent V-Produc-owned unowned ting [abour- receivers; tion other
VIII-Other services and miscella-
and their and their ers and their and their than cul- VI-Com- VII-Trans- neous sources dependants dependants dependants dependunts tivation merce port
M
18
92
114 131 83
788 688 601 253 110
uii 123 162 152 405
55 117 111 75
128 331 231 568 261 55
201 119
88 26
239 120 141 150 175 344
223 980 100 565 264
8 240 190 210 244 302 115 638 69
119 444
72 52 40
203 44
147 85
187 167 75 27
115 380 180 996 131 106 64 93
F M F
19 2U 2[
77
93 112 76
715 520 530 257 104
168 103 142 137 391 45
101 87 71
104 289 192 505 227 38
182 90 82 17
230 114 121 140 171 289
195 1,011
88 S40 261
6 220 156 234 232 297 96
567 61 96
327 55 45 37
195 44
116 71
170 183 50 28
112 351 153 891
91 107 58 95
5
1 11 3 5
45 4 4
15 10 11 47 15 4
12 23 13 19 14 22
27 20 3
4 10 29 11 3
13
10 27
16 3
1 5
24 20 8
83 9
19 45
12 25
39 25 6
12 6
38 13
S 10
8 2 1
43 7 3
7 8
10 44
9 3 9
15 9
19 9
16
18 14 4
4 7
22 14 1
11
5 20
11 3
I 5
13 17 4
57 3
11 36
8 15
41 14 3
12 9
33 18
4 17
M F M F M F
22 23 24 25 26 27
6
11 41 20 20 3
25 50 53
40 26
9 34
138 20 14 11 25 8
16 79
109
2 I
28 37
37 15 39 63 2
62
16 4 1 2
15 2
49
57 28 47 26
173 6
31 66 27
25 39
58 14 31 55 7
15 4
96 23 31 26 22
ii;
4 10
12 28 12 19
25 37 40
24 22
2 26
121 21 10 4
22 5
20 52
101
4
12 33
25 12 31 65 10 39
13 1 2 1
12
36 1
40 24 38 15
138 7
19 40 21
ii 31
38 4
15 50 4
10 r
57 24 19 16 14
14
1 6 3
12 11 7
13 6
3 4 1
5
4 4
6
4 4
3 8 , 8
. :3 3
5 4
is 6 2
3 2
6 5
2 2
14 5 1 I
. i 3
8
5 14 2
14 23
6 14 6
8 3
1 4 1
3 8
3 4 3
10
2 10
17
3 7
9 6 1
19
7 4
10 3
1 6 8 3 1 1
6 2
3
5
100 82 44 4& 35 25
467 350 9 8
87 79 144 116 49 25
175 112 56 35 12 14 38 28 98 80 10 7 6 4
24 19 33 33 15 15 95 88 44 26
212 181 21 17 8 4
119 81 44 27 73 56
S9 42 13 14 21 16 38 33
3 9 96 89
199 390
8 126 147
40 3
154 212 271
3 118
9 20
240 11
43 42
1 20 38
106 20 46
8 69 48 5
146
14 4
22
158 321
6 110 122
32
114 197 212
4 101
5 19
171 6 2
35 51
3 15 33 83 18 41
6 42 36 3
82
14 1
17
.--- ------- '0 c:
" 't:l
M FMF MFa
28 29 3U 31 32 33
2 11 29 78
5
21
21 23
1 10 42 11 1 8
22
28 12 18
20 2 4 3
21
6 4 5
10
6 33
49 17 12 6 4
10 35 13 2
13 4
18 13
29 8
6 11 12 4
31
io 30 9 9
63
2 3
4 7
11 71 9
16 I
23 25
1 10 36 10 1 2
15
ii 9
21
54 2 4
20
3 1 7
11
3 23
39 15 7 9 1 9
33 16 2
23 6
17 9
27 8
1 II 4 4
26
12 20
5 10 50
7 3
32
35 2
25 1 1
24
49 2
2
ii 4
21
2 I
2
8 19
2 3 2 1
37
20 14 18
13
12 3
6
2
3
3 10 6
2
30
39 2
33
3
26
si 4
4
4 4
43
3
3 2
5 24
2 7
5 42
23 6 7
9
7 3
3
2
5 6 5 4
3
1 21 21 2
5 4
18 57 40 40 14 21
]
41 10
6 ]5 57
3 4 1
29 5 2
55 74 14 4
17 3
16
36 11 49
4 13 18
30 126 10 60 43
13
32 51 53
5 74 4 2
129 9
12 13
7 29 20 38 15 9
18 48 15 85 4 8
23
5 3
20 ~ 81 6 26 7 44 8 16 9 15 10
11 32 12 6 13 7 14
12 15 65 16 1 17 5 18 2 19
31 20 14 21
22 59 23 78 24 11 25 3 26
17 27 1 28
11 29 30 31
34 32 9 33
47 34 3 35
10 36 27 37
40 38 82 39 13 40 53 41
6 42 1 43 9 44 4 45
39 46 47 47 53 48 4 49
68 50 8 51
52 82 53 10 54 2 55
12 56 10 57 3 58
33 59 21 60 28 61 16 62 14 63
64 17 65 46 66 22 67 70 68 3 69 6 70
71 30 72
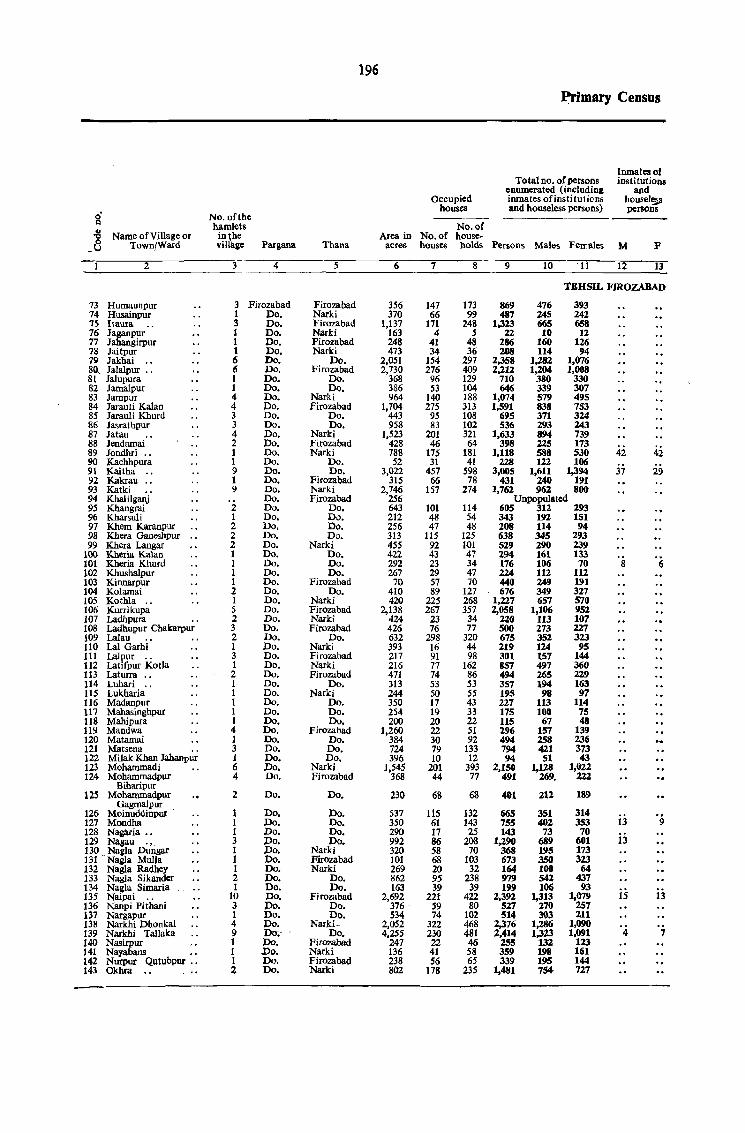
8' .. -g Name of Village or _ U Town/Ward
2
73 Humaunpur 74 Husainpur 15 !taura 76 Jaganpur 17 Jahangirpur 78 Jaitpur 19 Jakhai 8~ Jalalpur .. 81 Jalupura 82 Jamalpur 83 Jampur 84 Jarauli Kalan 85 Jarauli Khurd 86 Jasrathpur 87 Jatau 88 Jendamai 89 Jondhri .• 90 Kachhpura 91 Kaitha 92 Kakrau .. 93 Katki 94 Khalilganj 95 Khangrai 96 Kharsuli 97 Khem Karanpur 98 Khera Ganeshpur 99 Khera Langar
100 Kheria Kalan 101 Kheria Khurd 102 Khushalpur 103 Kinnarpur 104 Kolamai 105 Kothla 106 Kurrikupa 107 Ladhpura 108 Ladhupur Chakarpur 109 Lalau 11 0 Lal Garhi 111 Lalpur .• 112 Latifpur Kotla 113 Laturra •• 114 Luhari .. 115 Lukharia 116 Madanpur 117 Mahasinghpuc liS Mahipura 119 Mandwa 120 Matamai 121 Matsena .. 122 Milak Khan Jahanpur 123 Mohanunadi 124 Mohammadpur
Biharipur 125 Mohanunadpur
Gagmalpur 126 Moinuddinpur 127 Mondha 128 Nagana •• 129 Nagau .,. 130, Nagla Dungar 131 Nagla Mulla 132 Nagla Radhey 133 Nagla Sikander 134 Nagla Simaria 135 Naipai .. 136 Nanpi Pithani 137 Nargapur 138 Narkhi Dbonkal 139 Narkhi Tallaka 140 Nasirpur 141 Nayabans •. 142 Nurpur Qutubpur .• 143 Okhra
No. of the hamlets in the v mage Pargana
3 4
3 Firozabad 1 Do. 3 Do. t Do. I Do. I Do. 6 Do. IS Do. I Do. I Do. 4 Do. 4 Do. 3 Do. 3 Do. 4 Do. 2 Do. 1 Do. 1 Do. 9 Do. 1 Do. 9 Do.
Do. 2 Do. 1 Do. 2 Do. 2 Do. 2 Do. I Do. 1 Do. 1 Do. 1 Do. 2 Do. 1 Do. 5 Do. 2 Do. 3 Do. 2 Do. 1 Do. 3 Do. 1 Do. 2 Do. 1 Do. 1 Do. 1 Do. I Do. I Do. 4 Do. 1 Do. 3 Do. 1 Po. 6 Do. 4 Do.
2 Do.
I Do. 1 Do. I Do. 3 Do. I Do. I Do. 1 Do. 2 Do. I Do.
10 Do. 3 Do. 1 Po. 4 Do. 9 00;-I Po. I -Do. 1 Do. 2 Po.
Thana
Firozabad Narki Firozabad Narki Firozabad Narki
Do. Firozabad
Do. Do.
Narki Firozabad
Do. Do.
Narki Firozabad Narki
Do. Do.
Firozabad Narki Firozabad
Do. Do. Do. Do.
Narki Do. Do. Do.
Firozabad Do.
Narki Firozabad Narki Firozabad
Do. Narki Firozabad Narki Firozabad
Do. Narki
Do. Do. Do.
Firozabad Do. Do. Do.
Narki Firozabad
Do.
Do. Do. Do. Do.
Narki Firozabad Narki
Do. Do.
Firozabad Do. Do.
Narki-Do.
FircmIDad Narki Firozabad Narki
196
Occupied houses
No. of Area in No. of house.
~JDary Census
Total no. of persons enumerated (including inmates ofinstitulicns and houseless persons)
Inmateao! institutions
and houseJe~ persons
acres houses bolds Per&ons Males Fen-.ales M F
6
356 370
1,137 163 248 473
2,051 2,730
368 386 964
1,704 443 958
1,523 428 788 52
3,022 315
2,746 256 643 212 256 313 455 422 292 267 70
410 420
2,138 424 426 632 393 217 216 471 313 244 350 254 200
1,260 384 724 395
1,545 368
230
537 350 290 992 320 101 269 862 163
2,692 376 -534
2,052 4,255
247 136 238 802
7
147 66
171 4
41 34
154 276 96 S3
140 275 95 83
201 46
175 31
457 66
157
101 48 47
115 92 43 23 29 57 89
225 267
23 76
298 16 91 77 74 53 50 17 19 20 22 30 79 10
201 44
68
115 61 17 86 58 68 20 95 39
221 59 74
322 230 22 41 56
178
8
173 99
248 5
48 36
297 409 129 104 188 313 108 102 321 64
181 41
598 78
274
114 54 48
125 101 47 34 47 70
127 268 357
34 77
320 44 98
162 86 53 55 43 33 22 51 92
133 12
393 77
68
132 143 25
208 70
103 32
238 39
422 80
102 468 481 46 58 65
235
9 10 '11 12 13
TEHSIL FIROZABAD
869 476 393 487 245 242
1,323 66S 658 22 10 12
286 160 126 208 114 94
2,358 1,282 1,076 2,212 1,204 1,008
710 380 330 646 33~ 307
1,074 579 495 1,591 838 753
695 371 324 536 293 243
1,633 894 739 3~8 225 173
1,118 588 530 228 122 106
3,005 1,611 1,394 431 240 191
1,762 962 800 Unpopulated
665 312 343 192 208 114 638 345 529 290 294 161 176 106 224 112 440 24~ 676 349
1,227 657 2,058 1,106
220 113 500 273 675 352 219 124 301 157 857 497 494 .265 357 194 1~5 98 227 113 175 100 115 67 296 157 494 258 794 421 94 51
2,150 1,128 491 269.
41)1
665 755 143
1,290 368 673 164 979 199
2,392 527 514
2,376 2,414
2SS 359 339
1,481
212
351 402 73
689 1~5 350 100 54l 106
1,313 270 303
1,286 1,323
132 198 195 754
:Z~3 151 94
293 23~ 133 70
112 1~1 327 570 ~52 107 227 323 ~5
144 360 229 163 97
114 75 48 13~ 236 373 43
1,022 22l
189
314 353 70
601 173 323
64 437 93
1,079 257 211
1,090 1,091
123 161 144 727
42
37
8
13
13
15
4
42 29
6
9
13
7
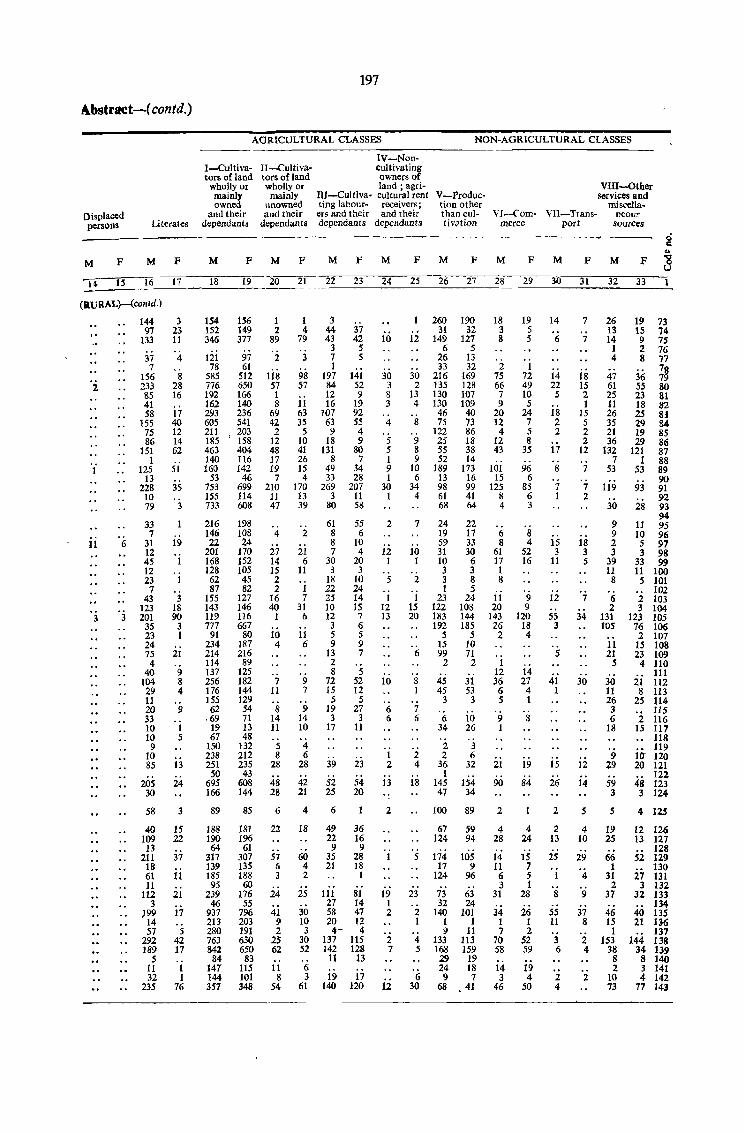
Abstract-{ contd.)
Displaced persons Literates
197
AGRICULTURAL CLASSES
I-Cultivators of land wholly or mainly owned
and their dependants
II-Cultivators of land wholly or
mainly IInowned and their
dependants
IV-Noncultivating owners of land; agri-
IlJ-Cultiva- cultural renl ting labour- receivers; ers and their and their dependants dependants
NON-AGRICULTURAL CLASSES
V-Productionother than cultivJtion
VIII-Other services and
miscella-VI-Com- VII-Trans- neOUf
merce port sources
g .. M F MF M FMF MFM FM FM PM FM F;j
~1C-:~--;1"'5--;1"6-'11'i7--1i18;-----;l;o9-20 21 22 23 24 25 26 27 28 29 30 31 32 33 1
(IilURAL).-(conldo )
6
3 3
144 97
133
37 7
156 233 85 41 58
155 75 86
151 1
125 13
228 10 79
33 7
31 12 45 12 23
7 43
123 201
35 23 24 75 4
40 104 29 11 20 33 10 10 9
10 85
205 30
58
40 109
13 211
18 61 11
1I2 3
)~ 57
292 189
5 11 32
235
3 23 11
4
8 28 16
17 40 12 14 62
51
35
3
19
1
1
3 18 90
3 1
21
9 8 4
9
1 5
13
24
3
15 22
37
H
21
17
5 42 17
1 1
76
154 152 346
Iii 78
585 776 192 162 293 605 211 185 463 140 160
53 753 155 733
216 146 22
201 168 128 62 87
155 143 119 777
91 234 214 114 137 256 176 155 62
069 19 67
150 238 251 50
695 166
89
188 190 64
317 139 185 95
239 46
937 213 280 763 842 84
147 144 357
156 149 377
97 61
512 650 166 140 236 541 203 158 404 116 142
46 6!19 114 608
198 108 24
170 152 105 45 82
127 146 116 667
80 187 216
89 125 182 144 129 54 71 13 48
132 212 235 43
608 144
85
181 196
61 307 135 188 60
176 55
796 203 191 630 650 83
115 101 348
1 2
89
2
lis 57 1 8
69 42 2
12 48 17 19 7
210 11 47
4
27 14 15 2 2
16 40 1
io 4
7 11
8 14 11
5 8
28
48 28
6
22
57 6 3
24
41 9 2
25 62
11 8
54
1 4
79
3
98 57
11 63 35 5
10 41 26 15 4
170 13 3!1
2
21 6
11
1 7
31 6
11 6
9 7
9 14 10
4 6
28
42 21
4
18
60 4 2
25
30 10 3
3D 52
6 3
61
3 44 43
3 7 1
197 84 12 16
107 63
9 18
131 8
49 33
269 3
80
61 8 8 7
30 3
18 22 25 10 12
3 5 9
13 2 8
72 15 5
19 3
17
39
52 25
6
37 42
5 5
141 52 9
19 92 55 4 9
80 7
34 28
207 11 58
55 6
10 4
20 3
10 24 14 15 7 6 5 9 7
5 52 12
5 27
3 11
23
54 20
49 36 22 16 9 9
35 28 21 18
I
111 ii 27 14 58 47 20 12 4- - 4
137 115 142 128
11 13
19 17 140 120
10
30 3 8 3
4
5 5 1 9 1
30 1
2
12 1
5
I 12 13
10
6 6
1 2
13
2
19 1 2
2 7
12
12
30 2
13 4
8
9 8 9
10 6
34 4
7
10 1
2
I 15 20
6
8 I
7 6
2 4
18
5
23
2 1
4 5
6 30
260 31
149 6
26 33
216 135 130 130 46 75
122 25 55 52
189 13 98 61 68
24 19 59 31 10 3 3 1
23 122 183 192
.5 15 99
2
45 45
3
6 34
2 2
36 1
145 47
190 32
127 5
13 32
169 128 107 109
40 73 86 18 38 14
173 16 99 41 64
22 17 33 30 6 3 8 5
24 108 144 185
5 10 71
2
31 53
3
10 26
3 6
32
154 34
100 89
67 59 124 94
t74 105 17 9
124 96
73 63 32 24
140 101 1 1 9 11
133 113 168 159 29 19 24 18 9 7
68 41
18 3 8
2 75 66 7 9
20 12
4 12 43
101 15
125 8 4
6 8
61 17 1 8
11 20
143 26 2
1 12 36 6 5
9 1
21
90
2
4 28
14 11 6 3
31
34 1 7
70 58
14 3
46
19 5 5
1 72 49 10 5
24 7 5 8
35
96 6
85 6 3
8 4
52 16
9 9
120 18 4
14 27 4 1
8
19
84
4 24
15 7 5 1
28
26 1 2
52 59
19 4
50
14
6
14 22 5
18 2 2
17
8
7 1
is 3
11
12
55 3
5
41 1
15
26
2
2 13
25
8
55 11
3 6
2 4
7
7
is 15 2 1
15 5 2 2
12
7
7 2
18 3 5
7
34
30
12
14
5
4 10
29
4
9
37 8
2 4
2
26 13 14
1 4
47 61 25 11 26 35 21 36
132 7
53
Ii.)
30
9 9 2 3
39 11 8
6 2
131 tos
11 21
S
30 11 26 3 6
18
9 29
59 3
5
19 25
66 1
31 2
37
46 15
1 153
38 8 2
10 73
19 73 15 74 9 75 2 76 8 77
78 36 79 55 80 23 81 18 82 25 8J 29 84 19 85 29 86
121 87 1 88
53 89 90
93 91 92
28 93 94
11 95 10 96
5 97 3 98
33 99 11 100 5 101
102 2 103 3 104
123 105 76 106 2 107
15 108 23 109
4 110 111
2J 112 8 113
25 114 115
2 116 15 117
118 119
1(r 120 20 121
40
8' In
123 3 124
4 125
12 126 13 127
128 52 129
130 27 131
3 132 32 133
134 40 135 21 136
137 144 138
34 139 8 140 3 141 4 142
77 143
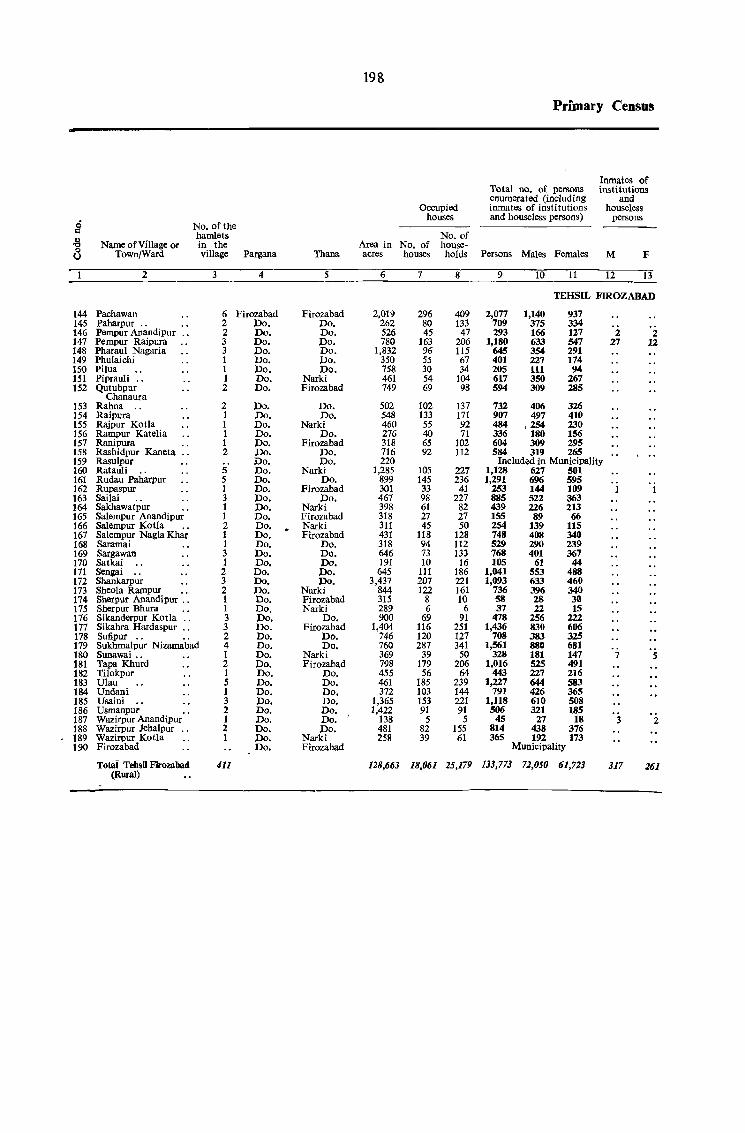
Name of Village or Town/Ward
No. of the hamlets in the
2
144 Pachawan 145 Paharpur.. . . 146 Pempur Anandipur .. 147 Pempur Raipura 148 Pharaul Nagaria 149 Phulaichi 150 Pilua 151 Piprauli ., 152 Qutubpur
Chanaura 153 Rahna .. 154 Raipura 155 Rajpur Kolla 156 Rampur Katelia 157 Ranipura 158 Rashidpur Kaneta 159 Rasulpur 160 Ratauli 161 Rudau Paharpur 162 Rupaspur 163 Sailai 164 Sakhawatpur .. 165 Salempur Anandipur 166 SaIempur Kotla .. 167 Salempur Nagla Khar 168 Saramai 169 Sargawan 170 Satkai .. 171 Sengai 172 Shankarpur 173 Sheola Rampur .. 174 Sherpur Anandipur ., 175 Sherpur Bhura .. 176 Sikanderpur Kotla .. 177 Sikahra Hardaspur .. 178 Sufipur .. .. 179 Sukhmalpur Nizamabad 180 Sunawai .. 181 Tapa Khurd 182 Tilokpur 183 Ulau 184 Undani 185 Usaini 186 Usmanpur .. 187 Wazirpur Anandipur 188 Wazirpur Jehalpur 189 Wazirpur Kotla 190 Firozabad
Total Tehsil Firozabad (Rural)
village Pargana
3 4
6 Firozabad 2 Do. 2 Do. 3 Do. 3 Do. 1 Do. 1 Do. 1 Do. 2 Do.
2 1 1 1 1 2
5 5 1 3 1 1 2 1 1 3 1 2 3 2 1 1 3 3 2 4 1 2 1 5 1 3 2 1 2 1
411
Do. Do. Do. Do. Do. Do. Do. Do. Do. Do. Do. Do. Do. Do. Do. Do. Do. Do. Do. Do. Do. Do. Do. Do. Do. Do. Do. Do. Do. Do. Do. Do. Do. Do. Do. Do. Do. Do.
Thana
5
Firozabad Do. Do. Do. Do. Do. Do.
Narki Firozabad
Do. Do.
Narki Do.
Firozabad Do. Do.
Narki Do.
Firozabad Do.
Narki Firozabad Narki Firozabad
Do. Do. Do. Do. Do.
Narki Firozabad Narki
Do. Firozabad
Do. Do.
Narki Firozabad
Do. Do. Do. Do. Do. Do. / Do.
Narki Firozabad
198
Occupied houses
No. of Area in No. of houseacres houses holds
6
2,019 262 526 780
1,832 350 758 461 749
502 548 460 276 318 716 220
1,285 899 301 467 398 318 311 431 318 646 191
645 3,437
844 315 289 900
1,404 746 760 369 798 455 461 372
1,365 1,422
138 481 258
7
296 80 45
163 96 55 30 54 69
102 133 55 40 65 92
105 145 33 98 61 27 45
118 94 73 10
111 207 122
8 6
69 116 120 287
39 179 56
185 103 153 91
5 82 39
8
409 133
47 206 115 67 34
104 98
137 171 92 71
102 112
227 236
41 227
82 27 50
128 112 133
16 186 221 161 10
6 91
251 127 341
50 206
64 239 144 221 91
5 ISS 61
Pn)nary Census
Total no. of persons enumerated (including inmates of institutions and houseless persons)
Persons Males Females
9 10 11
Inmates of institutions
and houseless
persons
M F
12 13
2,077 709 293
1,140 375 166 633 354 227 111 350 309
TEHSIL FIROZABAD
937
1,180 645 401 205 617 594
334 127 547 291 174 94
267 285
732 406 326 907 497 410 484 1254 230 336 180 156 604 309 295 584 319 265
Included in Municipality 1,128 627 501 1,291 696 595
253 144 109 885 522 363 439 226 213 155 89 66 254 139 115 748 408 340 529 290 239 768 401 367 105 61 44
1,041 553 488 1,093 633 460
736 396 340 58 28 30 37 22 15
478 256 222 1,436 830 606
708 383 325 1,561 880 681
328 181 147 1,016 525 491
443 227 216 1,227 644 583
791 426 365 1,118 610 508 506 321 185
45 27 18 814 438 376 365 192 173
Municipality
2 27
'i
7
3
2 12
s
2
128,663 18,061 25,179 133,773 72,050 61,713 317 261
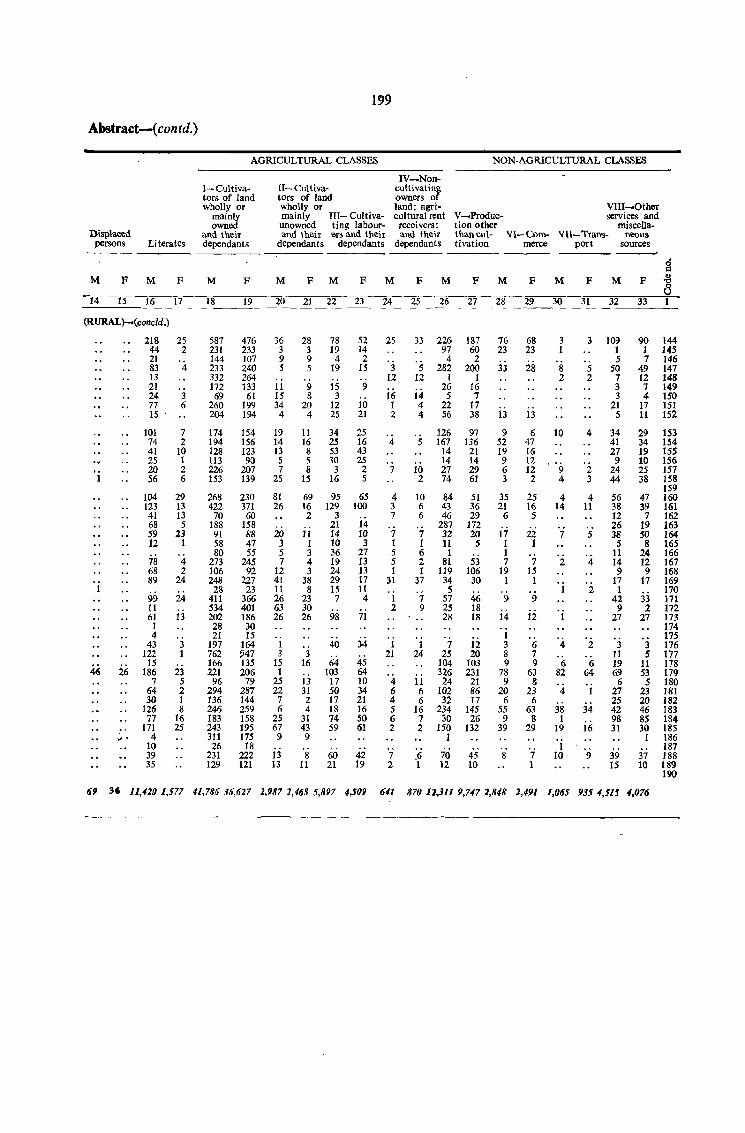
1~9
Abstract-( contd.)
AGRICULTURAL CLASSES NON-AGRICULTURAL CLASSES
IV-Non-I-Cultiva- 1l~ Cultiva- cui ti vating tors of land tors of land owners of wholly or wholly or land; agri- VIII-Other
mainly mainly JII- Cult iva- cultural rent V-Produc- services and owned unowned ting Iabour- receivers; tion other miscella-
Displaced and their and their elS and their and their than cul- VI-Com- VII-Trans- neous persons Literates dependants dependants dependants dependants tivation merce port sources
8 M F M F M F M F M F M F M F M F M F M F .g
8 14 15 16 17 18 19 20 21 22 23 24 25 26 27 28 29 30 31 32 33 1
(RURAL)-(concld.)
218 25 581 476 36 28 78 52 25 33 226 187 76 68 3 3 109 90 144 44 2 231 233 3 3 19 14 97 60 23 23 1 1 1 145 21 144 107 9 9 4 2 4 2
jj 5 7 146
83 4 233 240 5 5 19 15 3 5 282 200 28 8 5 50 49 147 13 332 264 12 12 I 1 2 2 7 12 148 21 172 133 11 9 15 9 26 16 3 7 149 24 3 69 61 15 8 3 16 14 5 7 3 4 150 77 6 260 199 34 20 12 10 1 4 22 17 21 17 151 15 204 194 4 4 25 21 2 4 56 38 13 13 5 11 152
101 7 174 154 19 11 34 25 126 97 9 6 10 4 34 29 153 74 2 194 156 14 16 25 16 4 5 167 136 52 47 41 34 154 41 10 128 123 13 8 53 43 14 21 19 16 27 19 155 25 1 113 90 5 5 30 25 14 14 9 12 9 10 156 20 2 226 207 7 8 3 2 7 10 27 29 6 12 9 2 24 25 157
1 56 6 153 139 25 15 16 5 2 74 61 3 2 4 3 44 38 158 159
104 29 268 230 81 69 95 65 4 10 84 51 35 25 4 4 56 47 160 123 13 422 371 26 16 129 100 3 6 43 36 21 16 14 11 38 39 161 41 13 70 60 2 3
i4 7 6 46 29 6 5 12 7 162
68 5 188 158 21 . ., 287 172 26 19 163 59 23 91 88 20 11 14 10 7 32 20 17 22 7 5 38 50 164 12 1 58 47 3 1 10 3 1 1 11 5 1 1 5 8 165
80 55 5 3 36 27 5 6 1 1 11 24 166 78 4 273 245 7 4 19 13 5 2 81 53 7 7 2 4 14 12 167 68 2 106 92 12 3 24 13 1 1 119 106 19 15 9 9 168 89 24 248 227 41 38 29 17 31 37 34 30 1 1 17 17 169
28 23 11 8 15 11 5 1 2 1 33
170 99 24 411 366 26 23 7 4 1 7 57 46 9 9 42 171 11 534 401 63 30 2 9 25 18
ii 9 2 172
61 13 202 186 26 26 98 71 28 18 14 27 27 173 1 28 30 174 4 21 15 I 175
43 3 197 164 1 40 34 1 1 7 12 3 6 4 2 3 3 176 122 1 762 ?47 3 3 21 24 25 20 8 7 !1 5 177
46 15 166 135 15 16 64 45 104 103 9 9 6 6 19 11 178
26 186 23 221 206 1 103 64 326 231 78 63 82 64 69 53 179 7 5 96 79 25 13 17 10 4 11 24 21 9 8 6 5 180
64 2 294 287 22 31 50 34 6 6 102 86 20 23 4 1 27 23 181 30 1 136 144 7 2 17 21 4 6 32 17 6 6 25 20 182
126 8 246 259 6 4 18 16 5 16 234 145 55 63 38 34 42 46 183 77 16 183 158 25 31 74 50 6 7 30 26 9 8 1 98 85 184
171 25 243 195 67 43 59 61 2 2 150 132 39 29 19 16 31 30 185 ,.. 4 311 175 9 9 1 1 186 10 26 18 1 187 39 231 222 13 8 60 42 7 .6 70 45 8 7 10 9 39 37 188 35 129 121 13 11 21 19 2 1 12 10 1 IS 10 189
190
69 36 11,410 1,577 41,786 36,617 1,987 1,46/1 5,897 4,509 641 870 11,311 9,747 1,848 1,491 1,065 9354,515 4,076
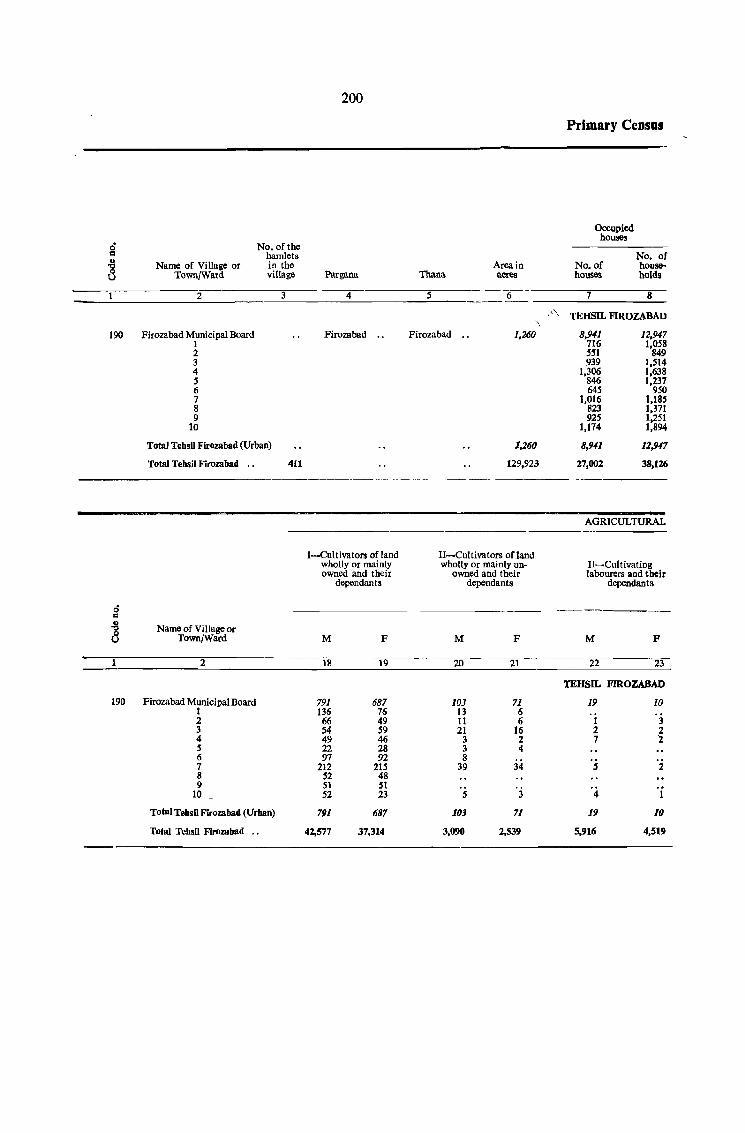
200
Primary Censos
Occupied houses
" No. of the l:l hamlets No. of
~ Name of Village or in the Area in No. of house-Town/Ward village Pargana Thana acres houses holds
2 3 4 5 6 7 8
"'\ TEHSIL FIROZABAD \
190 Firozabad Municipal Board Firozabad .. Firozabad .. 1,260 8,941 12,947 1 716 1,058 2 551 849 3 939 1,514 4 1,306 1,638 S 846 1,237 6 645 950 7 1,016 1,185 8 823 1,371 9 92S 1,251
10 1,174 1,894
Total Tehsil Firozabad (Urban) 1,260 8,91/ 12,917
Total Tehsil Firozabad .. 411 129,923 27,002 38,126
AGRICULTURAL
I-Cultivators ofland II-Cultivators ofland wholly or mainly wholly or mainly un- II-Cultivating owned and their owned and their labourers and their
dependants dependants dependants
05 = .g Name of Village or 8 Town/Ward M F M F M P
2 18 19 20 21 22 23
TEHSIL FIROZABAD
190 Firozabad Municipal Board 791 687 103 71 19 10 1 136 76 13 6 2 66 49 11 6 1 3 3 54 S9 21 16 2 2 4 49 46 3 2 7 '2 5 22 28 3 4 6 97 92 8
34 7 212 215 39 5 2 8 52 48 9 51 51
10 52 23 5 3 4 1
Total Tehsil Firozabad (Urban) 791 687 103 71 19 10
Total Tehsil Firozabad .. 42,577 37.314 3,090 2,539 5,916 4,519
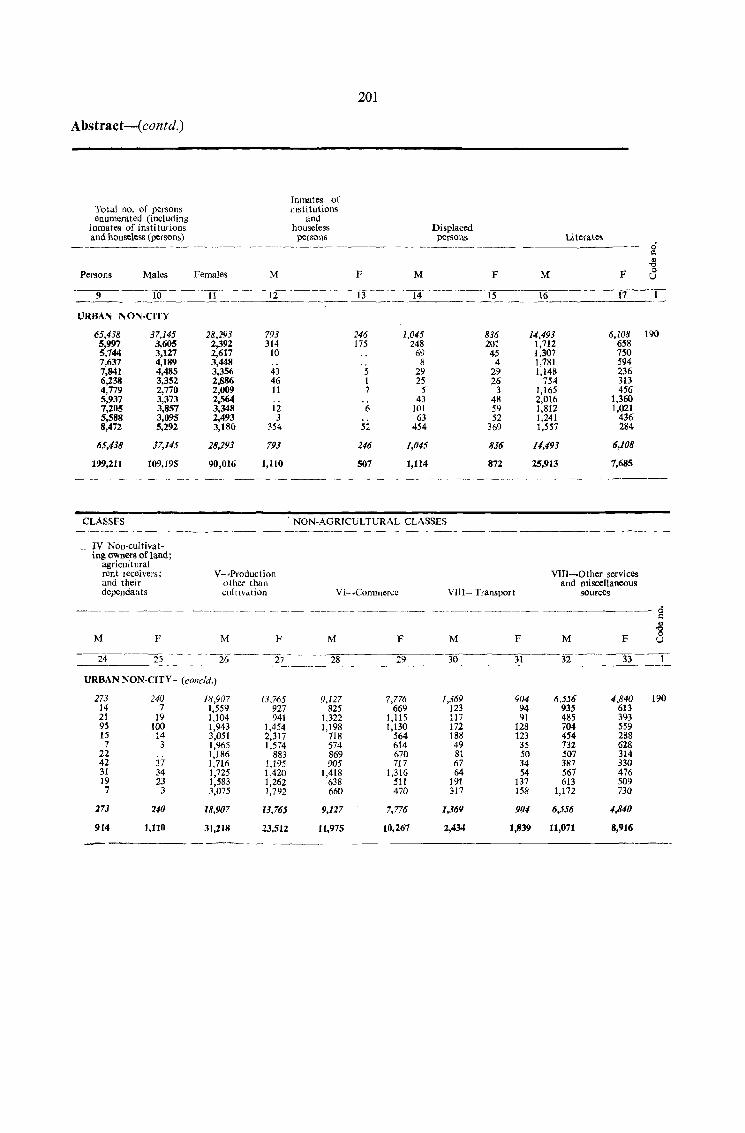
Abstract-(contd.)
Total no. of persons enumerated (including
inmates of institutions and houseless (persons)
Inmates of insti tutions
and houseless persons
201
--_------ -- ---- --------------- -
Persons Males Females M p M
Displaced persons
F
Literates
M F
9 fo- --Tf----lZ--_-_--____ l_c_3 __ ----y;r-------1S--- 16 17
URBAN NON·CITY
65,438 37,145 28,]93 793 246 1,045 836 14.493 6,108 5,997 3,605 2,392 314 175 248 201 1,712 658 5,744 3,127 2,617 10 69 45 1,307 750 7,637 4,189 3,448 8 4 1,781 594 7,841 4,485 3,356 43 5 29 29 1,148 236 6,238 3,352 2,886 46 1 25 26 754 313 4,779 2,770 2,009 11 7 5 3 1,165 456 5,937 3,373 2,564 43 48 2,016 1,360 7,205 3,857 3,348 12 6 101 59 1,812 1,021 5,588 3,095 2,493 3 63 52 1,241 436 8,472 5,292 3,180 354 52 454 369 1,557 284
65,438 37,145 28,293 793 246 1,015 836 /1,493 6,108
199,211 109,195 90,016 1,110 507 1,114 872 25,913 7,685
----~~--~-.- ---_---- ~-------- . ---.--~---- --- ---~~- -_-_------_"
CLASSES NON·AGRICULTURAL CLASSES ---------~- -_- -'~- _-_---
_ IV Non·cultivat· ing owners of land;
agricultural rent Icceivers; V-'Production VIII-Other services and their other than and miscellaneous dependants "ultlvation V [-.Comlfler<:e VIlI- Transport sources
-_._- -_-- -- -_._-_- ---~- --------
M F M F M F M F M F
--i4----25- -- 2-6----5;7- 28 29 30 31 32 33 --~-- ------'-~ --~--
URBAN NON·CITY-(concld.)
273 240 18,907 13,765 9,127 7,776 1,369 904 6,556 4,840 14 7 1,559 927 825 669 123 94 935 613 21 19 1,104 941 1,322 1,115 117 91 485 393 95 100 1,943 1,454 1,198 1,130 172 128 704 559 15 14 3,051 2,317 718 564 188 123 454 288 7 3 1,965 1,574 574 614 49 3S 732 628
22 1,186 883 869 670 81 50 507 314 42 37 1,716 1,195 90S 717 67 34 387 330 31 34 1,725 1,420 1,418 1,315 64 54 567 476 19 23 1,583 1,262 638 511 191 137 613 509 7 3 3,075 1,792 660 470 317 158 1,172 730
l73 240 18,907 13,765 9,127 7,776 1,369 904 6,556 4,840
914 l,llO 31,218 23,512 11,975 10,267 2,434 1,839 11,071 8,916
190
0 l'l 0
"" 0 u
190
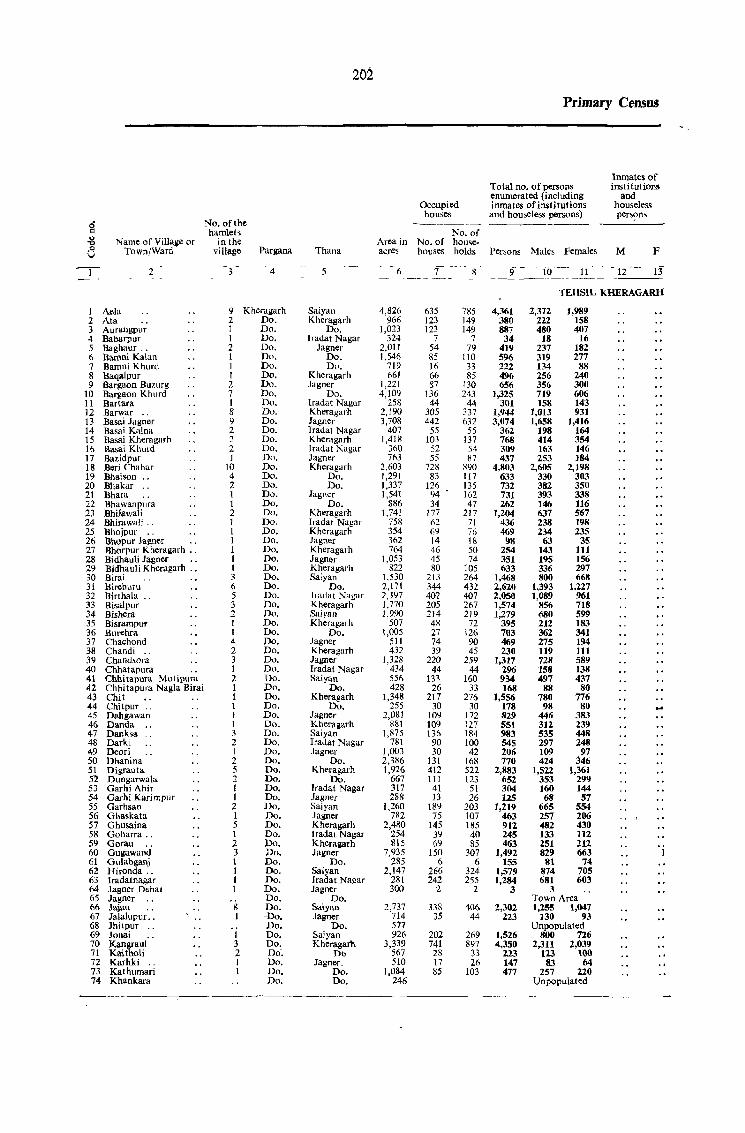
202
Primary Census
Inmates of Total no. of persons insli lulions enumerated (including and
Occupied inmates of institutions houseless houses and houseJess persons) perS?DS
8 No. of the ---~---
hamlets No. of u Name of Village or in the Area in No. of hOllSe-..., e Town/Ward village Pargana Thana acres houses holds Persons Males Females M F
~1- 2 3 4 5 ~ ~
Ii T ---- 8- --9 --IO~-I-I-~ 12 13 ----~- -- ----- ~-~-
TEHSIL KHERAGARH
1 Aela 9 Kheragarh Satyan 4,826 635 785 4,361 2,372 1,989 2 Ata 2 Do. Kheragarh 966 123 149 380 222 158 3 Aurangpllf 1 Do. Do. 1,023 123 149 887 480 407 4 Babarpllr 1 Do. I radat Nagar 324 7 7 34 18 16 5 Baghaur .. 2 Do. Jagner 2,011 54 79 419 237 182 6 Barnni Kalan 1 Do. Do. 1,546 85 110 596 319 277 7 Baroni Khurd 1 Do. Do. 719 16 33 222 134 88 8 Baqalpur 1 Do. Kheragarh 661 66 85 496 256 240 9 Bargaon BlIzurg 2 Do. Jagner 1,22! 87 130 656 356 300
10 Bargaon Khurd 7 Do. Do. 4,109 136 243 1,325 719 606 11 Bartara I Do. Iradat Nagar 258 44 44 301 158 143 12 Barwar 8 Do. Kheragarh 2,190 305 337 1,944 1,013 931 13 Basai Jagner 9 Do. Jagner 3,708 442 632 3,074 1,658 1,416 14 Basai Kalna 2 Do. Iradat Nagar 407 55 55 362 198 164 15 Basai Kheragurh 2 Do. Kheragarh 1,418 103 137 768 414 354 16 Basai Khurd 2 Do. lradat Nagar 360 52 54 309 163 146 17 Bazidpur 1 Do. Jagner 763 55 87 437 253 184 18 Beri Chahar 10 Do. Kheragarh 2,603 728 890 4,803 2,605 2,198 19 Bhaison .. 4 Do. Do. 1,291 83 117 633 330 303 20 Bhakar .. 2 Do. Do. 1,337 126 135 732 382 350 21 Bhara 1 Do. Jagner 1,541 94 162 731 393 338 22 Bhawanpllra I Do. Do. 886 34 47 262 146 116 23 BhiJawali 2 Do. Kheragarh 1.741 177 217 1,204 637 567 24 Bhir-aw"ji .. I Do. Iradal Nagar 758 62 71 436 238 198 25 BhojplIr 1 Do. Khcragarh 354 69 76 469 234 235 26 Bhopur Jagner 1 Do. Jagner 31i2 14 18 98 63 35 27 Bhorpur Kheragarh " 1 Do. Kheragarh 764 46 50 254 143 111 28 Bidhauli Jagner 1 Do. Jagner 1,053 45 74 351 195 156 29 Bidhauli Kheragarh " 1 Do. Kheragarh 822 80 105 633 336 297 30 Rirai 3 Do. Saiyan 1,530 213 264 1,468 800 668 31 Birehum 6 Do. Do. 2,171 344 432 2,620 1,393 1.227 32 Birthala .. 5 Do. hadal Naga r 2,397 402 407 2,050 1,089 961 33 Bisaiplir 3 Do. Kheragarh 1,770 205 267 1,574 856 718 34 Bishera 2 Do. Saiyan 1,990 214 219 1,279 680 599 35 BisrampUl' 1 Do. Kheragarh 507 48 72 395 212 183 36 Burehra I Do. Do. 1,005 27 J26 703 362 341 37 Chachond 4 Do. Jagner 511 74 90 469 275 194 38 Chandi .. 2 Do. Kheragarh 432 39 45 230 119 111 39 Chandsora 3 Do. Jagner J,328 220 259 1,317 728 589 40 Chhatapura .. 1 Do. Iradal Nagar 434 44 44 296 158 138 41 Chhitapura Motipura 2 Do. Saiyan 556 133 160 934 497 437 42 Chhitapura Nagta Birai 1 Do. Do. 428 26 33 168 88 80 43 Chit 1 Do. Kheragarh 1,348 217 276 1,556 780 776 44 Chitpur .. 1 Do. Do. 255 30 30 178 98 80 45 Dahgawan 1 Do. Jagner 2,081 109 172 829 446 383 46 Danda .. 1 Do. Kheragarh 881 109 127 551 312 239 47 Dank>a 3 Do. Saiyan 1,875 13ri 184 983 535 448 48 Darki 2 Do. Iradal Nagar 781 90 100 54S 297 248 49 Deori 1 Do. Jagncr ],003 30 42 206 109 97 50 Dhanina 2 Do. Do. 2,386 131 168 770 424 346 51 Digrauta 5 Do. Kheragarh 1,926 412 522 2,883 1,522 1,361 52 Dungarwala 2 Do. Do. 667 111 123 652 353 299 53 Garhi Ahir I Do. Iradal Nagar 317 41 51 304 160 144 54 Garhi Karimpur 1 Do. Jagner 288 13 26 125 68 57 55 Garhsan 2 Do. Saiyan 1,260 189 203 1,219 665 554 56 Ghaskata 1 Do. Jagner 782 75 107 463 257 206 57 Ghusaina 5 Do. Kheragarh 2,480 145 185 912 482 430 58 Goharra .. 1 Do. I radat Nagar 254 39 40 245 133 112 59 Gorau 2 Do. Khcragarh 815 69 85 463 251 212 60 Gugawand 3 Do. Jagner 7,935 150 307 1,492 829 663 1 61 GuJabganj 1 Do. Do. 285 6 6 155 81 74 62 Hironda .. 1 Do. Saiyan 2,147 266 324 1,579 874 705 63 Iradatnagar 1 Do. lradat Nagar 281 242 255 1,284 681 603 64 .1agner Dehat 1 Do. Jagner 300 2 2 3 3 65 Jagner Do. Do. Town Area 66 Jajau .. 8 Do. Saiyan 2,737 338 406 2,302 1,255 1,047 67 Jaia1upur .. 1 -Do. Jagner 714 35 44 223 130 93 68 Jhitpur .. Do. Do. 577 Unpopulated 69 Jonai 1 Do. Saiyan 926 202 269 1,526 800 726 70 Kangraul 3 Do. Kheragam 3,339 741 897 4,350 2,311 2,039 71 Kaitholi 2 Do-. D() 567 2& 33 223 123 100 72 Karhki 1 Do. Jagncr. 510 17 26 147 83 64 73 Kalhumari 1 Do. Do. 1,084 85 103 477 ZS7 220 74 Khankara Do. Do. 246 Unpopulated
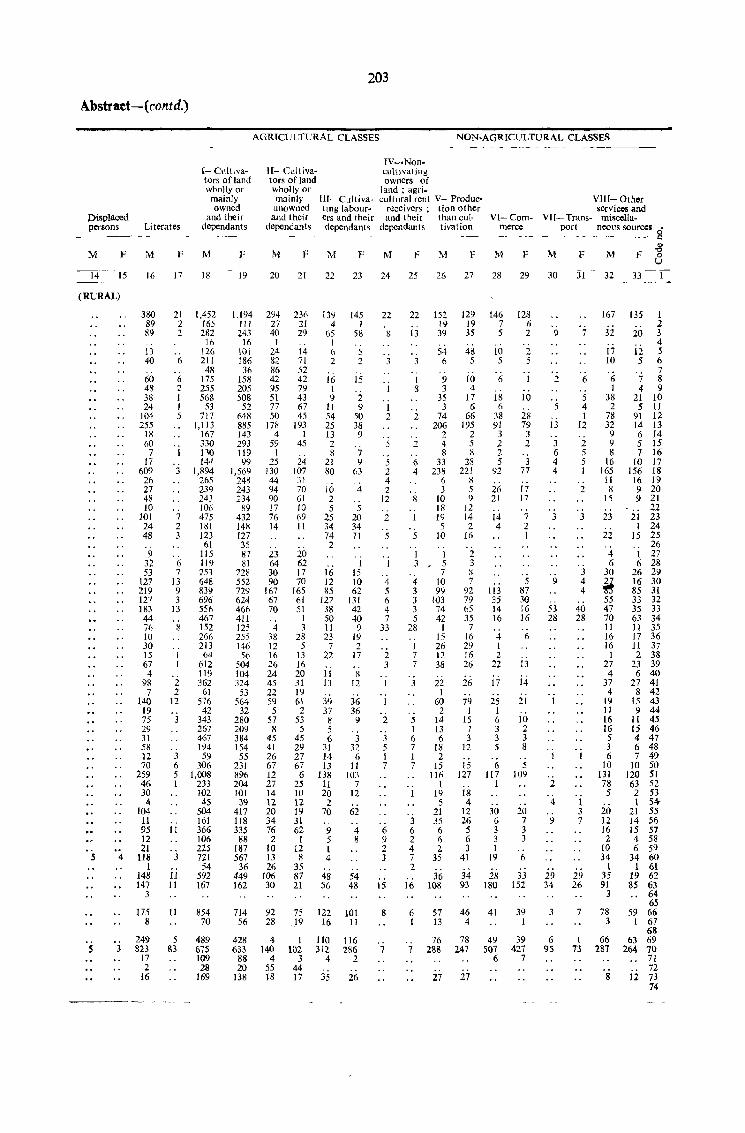
Abstrad-(contd.)
Displaced persons Literates
M F
---r4.. 15
(RURAL)
s
s 3
M
16
380 89 8<1
13 40
60 48 38 24
104 255
IR 60 7
17 609 26 27 4B 10
101 24 48
9 32 53
127 219 127 183 44 76 10 30 15 67 4
9R 7
140 19 75 29 31 5M 12 70
259 46 30
4 104
11 95 12 21
1I1l 1
148 147
3
175 8
249 823
17 2
16
F
17
21 2 2
6
6 2 I 1 5
I
3
7 2 3
6 7
13 'I 3
13
8
1 1
2 2
12
3
3 6 5 I
II
3
Jl II
11
5 83
203
AGRTCULTURAL CLASSES NON-AGRICULTURAL CLASSES
I- Cultivators of land wholly or
mainly owned
and their dependants
M
18
1,452 165 282
In 126 211
48 175 255 568
53 717
1,113 167 330 130 144
1,894 265 239 243 106 475 181 123
61 115 119 253 648 839 696 556 467 152 266 213 64
612 119 362
61 576
42 343 267 467 194
59 306
1,008 233 102 45
504 161 366 t06 225 721 54
592 167
854 70
489 675 109 28
169
F
19
1,194 111 243
16 101 186
36 158 205 508 52
648 885 143 293 119 99
1,569 248 243 234
89 432 148 J27 35 87 81
22g 552 729 624 466 411 125 255 146
56 504 104 324
53 564
32 280 209 384 154
55 231 896 204 101 39
417 118 335
88 187 567
36 449 162
714 56
428 633
88 20
138
-~-~----.---. ~------
11- Cultivators of land wholly or mainly unowned and their
dependants
IV-.Noncllllivating owners of
land; agri_ 11[- Cultiva- cultural rent V- ProductlOg labour- receivers; lion other ers and their and their (han cuI-dependant" dependants tivation
VlII- Other services and
V[- Com- Vll- Trans- rniscella-merce port nCOllS sources ci
- -- - <::
M FM FM PM FMF M F
31
M .g
F 8 20
294 27 40
I 24 82 86 42 95 51 77 50
178 4
59 I
25 130 44 94 90 17 76 14
23 64 30 90
167 67 70
4 38 12 16 26 24 45 22 59
5 57 8
45 41 26 67 12 27 14 12 20 34 76 2
10 13 26
106 30
92 28
4 140
4 55 18
21 22 23 24 25 26 27 28 29
236 21 29
14 71 52 42 79 43 67 45
193 I
45
24 107 31 70 61 10 69 II
20 62 17 70
165 61 51 1 3
28 5
13 16 20 31 19 61 2
53 5
45 29 27 67 6
25 10 12 19 31 62
I 12
S 35 87 21
75 _19
I 102
3 44 17
139 4
65 I 6 2
16 1 9
11 54 25 13 2 8
21 80
]0 2 5
25 34 74 2
16 12 ~5
127 38 50 II 23
7 :!2
11 13
39 37 8 5 6
31 14 13
138 11 20
2 70
9 5 1 4
48 56
122 16
110 3D.
4
35
145 1
58
5 2
15
2 9
50 38 9
7 9
63
4
5 20 34 71
1 15 to 62
131 42 40 9
19 2
17 .. S
12
36 36
9
3 32
6 II
103 7
12
62
4 8
54 48
101 II
116 286
2
26
22
~
I
I 2
5
5 2 4 2
12
2
5
I
4 5 6 4 7
33
2 3
2
3 5 1 7
6
" 2 3
15
8
7
22
13
"
I 8
2
2 '. 6 4
8
I
5
152 19 39
S4 6
9 3
35 3
74 206
2 4 8
33 238
6 3
10 18 19 5
to
1 1 3 F 5
7 4 10 3 99 3 103 3 74 5 42
28 I 15
1 26 7 12 7 38
5 I 6 7 1 7
3 6 2 4 7 2
16
6 I
7
22 I
60 2
14 13 6
18 2
15 116
I 19 5
21 35 6 (,
2 35
36 108
57 13
76 288
27
129 19 35
48 5
10 4
17 6
66 195
2 5 8
28 221
8 5 ')
12 14 2
16
2 3 8 7
92 79 65 35 7
16 29 16 26
26
79 1
15 7 3
12
15 127
18 4
12 26 5 6 3
41
34 93
46 4
78 247
27
146 7 5
10 5
6
18 6
38 91
3 :2 2 5
92
26 21
14 4
113 35 14 16
4 I 2
22
17
25 I 6 3 3 5
6 117
I
30 6 3 3 1
19
28 180
41
4'1 507
6
128 (,
2
2 5
I
10
28 79 3 2
3 77
17 17
7 2
5 87 30 16 16
6
13
14
21
10 2 3 8
5 109
20 7 3 3
6
33 152
39 I
39 427
7
30
9
2
5
13
3 6 4 4
3
9
53 28
2
4
9
29 34
3
6 9S
7
6
5 4 1
12
2 5 5 I
2
3
3 4 4
40 28
1 3 7
29 26
7
I 73
32
167
32
17 10
6 1
38 2
78 32 9 9 8
16 165 II 8
15
23
22
4 6
30
~ 55 47 70 11 16 16
1 27 4
37 4
19 II 16 16 5 3 6
10 131 78 5
20 12 16 2
10 34
1 35 91
3
78 3
66 287
8
33 -~l
135 1 2
20 3 4
12 5 5 6
7 7 8 4 9
21 10 5 11
91 12 14 !3 6 14 5 15 7 16
10 17 156 18 16 19 9 20 9 21
22 21 23
I 24 15 25
26 1 27 6 28
26 29 16 30 85 31 33 32 35 33 63 34 11 35 17 36 11 37 2 38
23 39 6 40
27 41 8 42
15 43 9 44
11 45 15 46 4 47 6 48 7 49
10 50 120 51 63 52 2 53 1 54
21 55 14 56 15 57 4 58 6 59
34 60 1 61
19 62 85 63 .. 64
65 59 66
I 67 68
63 69 264 70
71 72
12 73 74
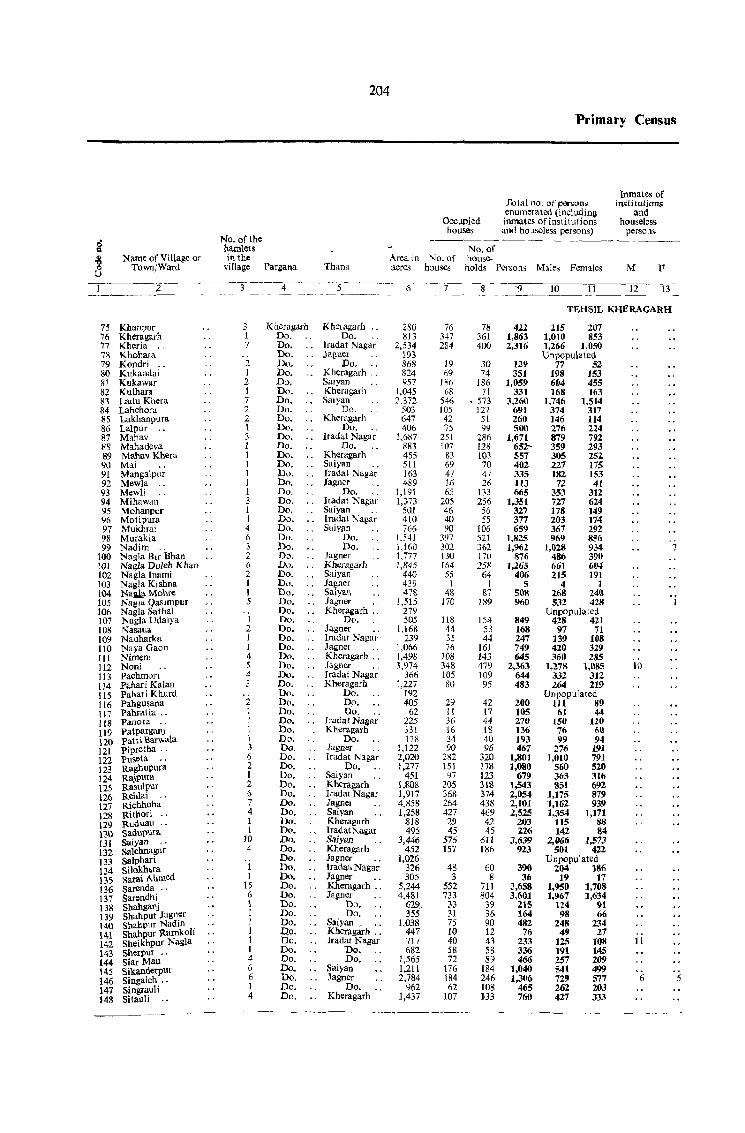
Name of Village or Town/Ward
z
75 Khanpn[" 76 Kheragarh 77 Khcria .. 78 Khohara 79. Kondri 80 Kukandai 81 Kukawar 82 Kulhara 83 Ladu Khera 84 Lahchora 85 Lakhanpura 86 Lalpur .. 87 Mahav 88 Mahadeva 89 Mahav Khera 90 Mai 91 Mangalpllr 92 Mewla .. 93 Mewl; 94 Mihawan 95 Mohanpur 96 Motipura 97 Mukhra: 98 Murakia 99 Nad;m
100 Nag\a Blr Bhan 101 Nagia Duleh Khan 102 Nagta Inami 103 NagJa Kishna 104 Nail.!). Mahre 105 NagJii Qaslmpur 106 Nagla Satha! 107 Nagla Udaiya 108 Nasaua 109 Nauharka 110 Naya Gaon III Nimeo, 112 Noni 113 Pachman 114 Pahari Kalan 11 5 Pahar i Khurd 116 Pahgusana 117 Pahrat ia .. 118 Panola 119 Patparganj 120 Patti Earwala 121 Pipretha .. 122 puseta .. 123 Raghupura 124 Rajpura 125 Rasulpur 126 Rehlai 127 Richhoha 128 Rithori ., 129 Ruduau ., no saduj)ura J31 Saiyan ., 132 Salebnagar 133 Salphari 134 Silokht.ra 135 sarai Ahmed I 36 Sarenda ., 13 7 Sarendhi 138 Sbahganj 139 Sbahpur Jagner 140 Sbahpur Nadin . 141 Sbahpur Ramkoh 142 Sheikhpur Nagla 143 Sberpur .. 144 Siar Mau 145 Sikanderpur 146 Singaich .. 147 Singrauli 148 Sitauli
No. of the hamlets in the
204
Occupied hOllses
No. of Area in No. of house-
Primary Census
Inmates of inStitutions
and houseless
persons
village Pargana Thana acres hOllses holds Persons Males Fem~les M F
3 1 7
2 I 2 1 7 2 2 1 3 I I 1 I I I 3 I I 4 6 3 2 I> 2 I I 5
2 ] ]
4 5 4 3
2 1 1 1 I 3 6 2 I 2 6 7 4 1 I
10 4
1 I
15 6 1 I 1 1 1 1 4 6 6 I 4
Khelagar11 " Do.
lradat Nagar Jagner
Do. Kheragarh '. Salyan
" Kheragarh Salyan
Do.
Khcragal'h Do. Do. Do. Do. Do. Do. Do. Do. Do. Do. Do. Do. Do. Do. Do. Do. Do. Do. Do. Do. Do. Do. Do. Do. Do. Do. Do. Do. Do. Do. Do. Do. Do. Do. 00. Do. 00. Do. Do. Do. Do. Do. Do. Do. Do. Do. Do. Do. 00. Do. Do. Do. Do. Do. Do. Do. 00. Do. Do. Do. Do. 00. Do. Do. Do. D.p. Do. Do. Do. Do. Do. Do. Do.
Kheragarh Do.
Iradat Nagar Do.
" Kheragarh '. Saiyan "
Tradal Nagar Jagner
Do ... Tradat Nagar
'. Saiyan '. tradal Nagar
" Saiyan Do. Do.
Jagnel' Khcragarh Saiyan Jagner
.. Saiyall Jagner ..
. . Kheragarh .. Do.
Jagner " . . !radat Na.,'ar
Jagner .. Kheragarh ..
" Jagner " Jradal Nagar
Kheragarh Do. Dp. Do. "
Jradat Na.gar Khcragarh
Do. Jagner Iradal Nagar
Do. " Saiyan
Kheragarh Iradal Nagar
" Jagner Saiyan Kheragarh Iradat Nagar Saiyan Khemgarh Jagner " Tradal. Nagar Jagner .. Kheragarh .. Jagner
Do. Do.
Saiyan. .. . . Kheragarh .. . . Tradat Nagar
Do. Do.
Saiyan '. Jagner
Do. .. Kheragarh
280 813
2,534 193 868 824 957
1.045 2.372
503 647 406
I,G87 883 455 511 163 489
],191 1,373
501 410 7~6
1.541 1,160 1,777 1,845
440 439 47&
1,515 279 50S
1,168 239
1,066 1,498 3,974
366 1,227
192 405
62 225 33 \ 17R
1.122 2,020 1,277
451 1,808 1,917 4.858 1.258
818 495
3,446 452
1,026 326 305
5,244 4,481
629~ 355
1,038 447 717 682
1,565 1,211 2,784
962 1,437
76 347 284
19 69
Wi 68
546 105 42 'is
251 107
83 69 47 16 65
205 46 40 90 3~7 302 130 164
55 I
48 170
118 44 35 76
108 348 105 80
29 11 36 16 34 90
282 151
97 305 368 264 427 29 45
576 157
4& 3
552 733 33 31 75 10 40 58 72
176 184 62
107
8
78 361 400
30 74
186 71
• 573 127
51 99
286 128 103 70 47 26
133 256 56 55
106 521 362 170 258
64 1
%7 189
154 58 44
161 143 479 109 95
42 17 44 18 40 96
320 178 123 318 374 438 469 42 45
611 186
60 8
711 804
39 36 90 12 43 S8 89
184 246 108 H3
422 1,863 2,316
129 351
1,059 331
3,260 691 260 500
1,671 652-557 402 335 113 665
1,351 327 3n 659
1,825 1.962
876 J,265
406 5
50S 960
849 168 247 749 645
2,363 644 483
200 105 270 136 193 467
1,801 1,080
679 1,543 2,054 2,101 2,525
203 226
3,639 923
390 36
3,658 3,601
215 164 482
76 233 336 466
1,040 1,306
465 760
10 11 12 13
TEHSlL KHERAGARH
2J5 207 1,010 853 1,266 J,05O Unpopulated
77 52 198 153 604 455 168 163
1,746 1,514 374 317 146 114 276 224 879 792 359 293 305 252 227 175 182 153
72 41 353 312 727 624 178 149 203 114 367 292 969 856
1,028 934 7 486 390 661 604 215 191
4 1 268 2,w 532 428
Unpopulated 428 421
'J7 71 139 108 420 329 360 285
1,278 1,085 10 332 312 264 219
Unpopulated Jll 89 61 44
150 120 76 60 99 94
276 191 1,010 791
560 520 363 316 851 692
1,175 879 1,162 939 1,354 1,171
115 88 142 84
2,006 1,573 501 422
Unpopulated 204 186
19 17 1,950 1,708 1,967 1,634
124 91 98 66
248 234 49 27
125 108 11 191 145 257 209 541 499 729 577 6 262 203 427 333
5
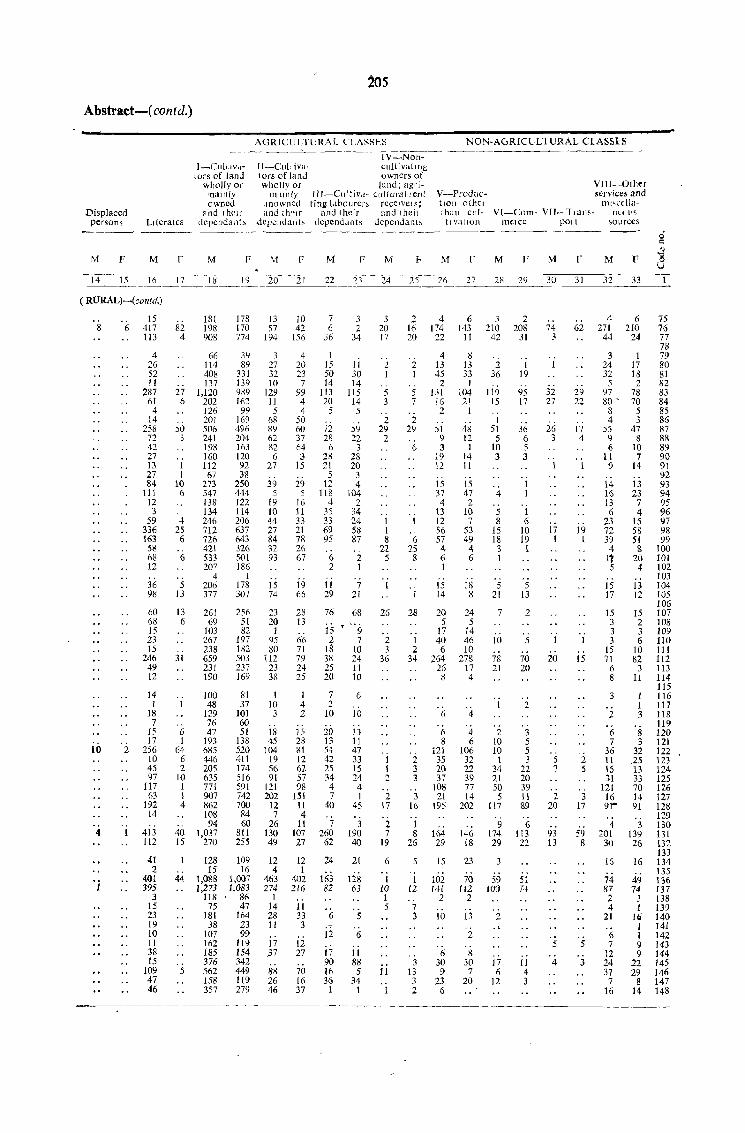
Abstract-( contd.)
Displaced persoll>
M F
14 15
Llterales
M F
16 17
J-CUltlV.,tors of land
wholly or mainly owned
~nd t hell' dependant'
M F
1 ~ 19
( RURAL)-(contd.)
8 6
10 2
4
. i
15 417 113
4 26 52 11
287 61
4 14
258 72 42 27 13 27 84
111 12 3
59 336 163
58 68 12
36 98
60 68 15 23 15
246 49 12
14 1
18 7
15 17
256 10 45 97
117 63
192 14
413 112
41 2
40[ 395
3 15 23 19 10 11 38 15
109 47 46
82 4
27 6
50 3
1 I
10 6
4 25 6
6
5 13
13 6
31
181 198 90S
66 114 408 137
1,120 202 126 201 506 241 198 160 112
67 273 547 138 134 246 712 726 421 533 207
4 206 377
261 69
103 267 238 659 231 190
100 1 48
129 76
6 47 I 193
64 685 6 446 2 205
10 635 1 771 1 907 4 862
108 '14
40 1,037 IS 270
128 15
44 1,088 1,273
118 75
181 38
107 162 185 376
5 562 158 357
178 170 774
3Y 89
331 139 989 162 99
169 496 204 Hi3 120 92 38
250 444 122 114 206 637 643 326 501 18~
I 178 307
256 51 82
197 182 503 237 169
81 37
101 60 51
138 520 411 174 516 59l 742 700 84 60
811 255
109 16
1,007 1,083
86 47
164 23 99
119 154 342 449 119 279
~05
AGRICULTURAL CLASSES
IV-Non-H-Cultiva- cultivalmg tors of land ownerS of wholly Of land; agrj-
en lilliy ll[~-Cllltrv,,- cllllurairent unowned ling 1,lbourer, rCC~lvel~; and th"lr and their and therl
.dependants depcnddllts dependanls
NON-AGRlCUL1 URAL CLASSES
V~ProductJOn (llhel thall clll-
tlvatJOJ1
Vlll-Other SCrv;.es and
ml,cclla-VI-Com- VII_118m· Ill( 1"
melee POI t sources ~-- ~----~ --- ---_---
M F M F M
20 21--22- ..:.23_.......c2_4_ ...... 25
13 57
194
3 27 32 10
129 11 5
68 89 62 82 6
27
39 5
19 10 44 27 84 32 93
15 74
23 20
1 95 80
112 23 38
1 10 3
18 45
104 19 56 91
121 202
12 7
26 130 49
12 4
463 274
1 14 28 11
17 .37
88 26 46
10 42
156
4 20 23 7
99 4 4
50 60 37 64 3
15
29 5
16 11 33 21 78 26 67
19 66
28 13
66 71 79 24 25
1 4 2
15 28 81 12 62 57 98
151 11 4
11 107 27
12 I
402 216
11 33 3
12 27
70 16 37
7 3 6 2
36 34
1 15 11 50 30 14 14
113 115 20 14
5 5
72 S~ 28 22
6 3 28 28 21 20
5 3 12 4
118 104 4 2
35 34 33 24 69 58 95 87
6 2 2 1
11 7 29 21
76 68
15 • ,. (;
2 7 18 10 38 24 25 11 20 10
7 6 2
10 10
20 13 13 II 54 47 42 33 25 15 34 24 4 4 7 1
40 45
7 3 260 190 62 40
24 21
163 (28 82 63
6 5
12 6
17 11 90 88 16 5 36 34 1 1
3 20 17
2 1
5 3
2 29
2
1 1 8
22 5
26
2 3
36
I 1 2
. 2 17
2 7
19
6
1 10 I 5
II
1
2 16 20
2 1
5 7
2 29
6
1
6 2S 8
28
1 2
34
2 3 3
3 16
1 8
26
1 12
7 3
3 13 3 2
M
26
4 [74 22
4 13 45
2 131
16 2
51 9 3
19 12
15 37 4
13 12 56 57 4 6 I
15 14
20 5
17 40 6
264 26 8
(i
6 8
121 35 20 37
108 21
195
164 29
15
102 141
2
10
6 30 9
23 6
F
27
6 143
11
8 13 33
1 104 21
1
48 12 1
14 11
15 47 2
10 7
53 49
4 6
18 8
24 5
14 46 10
278 17 4
4
4 6
106 32 22 39 77 14
202
146 18
23
70 ti2
2
i3 2
8 30 7
20
M F M F M F
28 29 3D 31 32 33 ---------------~--------
3 210
42
2 36
ti9 15
1 51
5 10 3
4
5 8
IS 18
3 1
5 21
7
10
78 21
2 10 10
1 34 21 50 5
117
9 174 29
59 J(J()
2
17 6
12
2 208
31
1 19
95 17
36 6 5 3
1 I
1 6
10 19
1
5 13
2
5
70 20
2
3 5 5 3
22 20 39 11 89
6 113 22
51 74
11 4 3
74 3
32 27
26 3
17 1
1
20
5 7
2 20
93 13
5
4
62
29 22
17 4
19 1
I
15
2 5
3 17
59 8
5
3
4 271
44
3 24 32 5
97 80 •
8 4
55 9 6
II 9
14 16 13 6
23 72 39
4 I' 5
15 17
15 3 3 3
15 71
6 8
2
6 7
36 11 15 31
121 16 91"'
4 201
30
16
74 87 2 4
21
6 7
12 24 37
7 16
6 210
24
1 17 18 2
78 70
5 3
47 8
10 7
14
13 23
7 4
15 58 51
8 20 4
13 12
15 2 3 6
10 82
3 11
I 1 3
8 3
32 .25 13 33 70 14 91
3 139 26
16
49 74
3 1
Iii 1 1 9 9
22 29
8 14
75 76 77 78 79 80 81 82 83 84 85 86 87 88 89 90 91 92 93 94 95 96 97 98 99
100 101 102 103 104 105 106 107 108 109 110 111 112 113 114 115 116 117 118 119 120 121 122 123 124 125 126 127 128 129 130 131 132 133 134 135 136 137 138 139 140 141 142 143 144 145 146 147 148
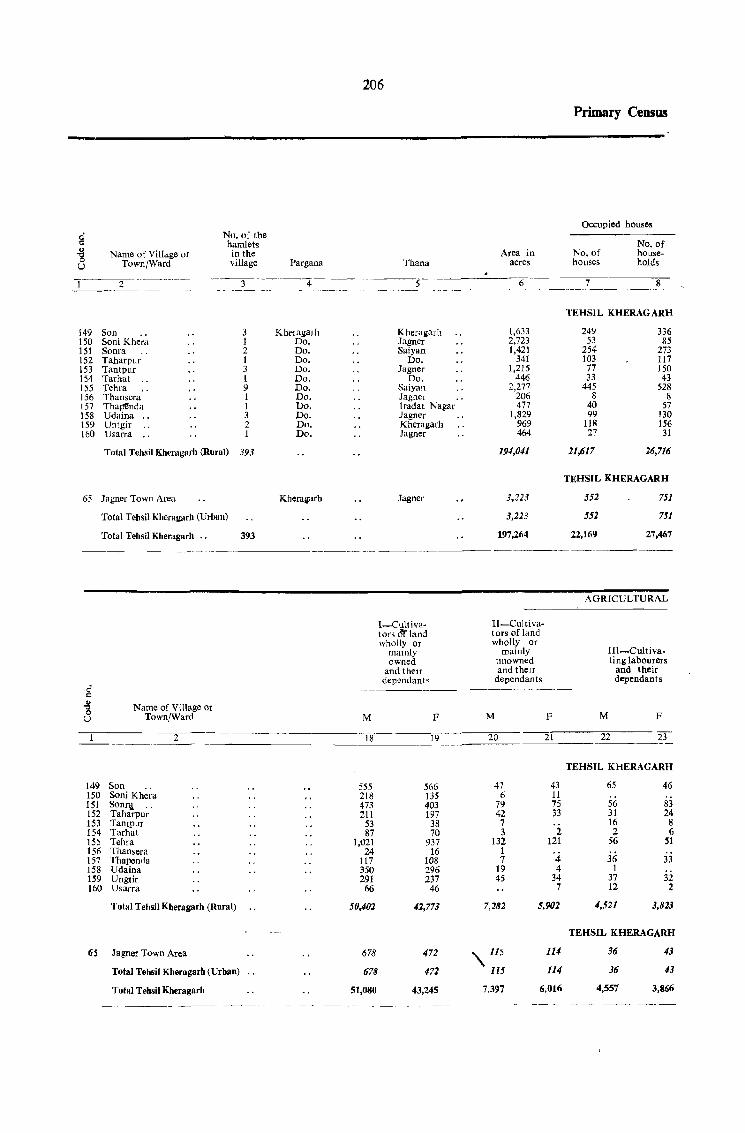
206
Primary Ceos\lS
Occupied houses
g No. of the hamlets No. of
" '0 Name of Villli.ge or in the Area in No. of house-0 Town/Ward village Pargana Thana acres houses holds U
1-~~2-- ---------- ----3-- 4 5 6 7 8 -----~--~- -- ~ -- ---~ _-- - ~---- - -- -_-- --- ~---~ - ------- -_----- ----
TEHSIL KHERAG ARH
149 Son 3 Khl"lagalh Kheragarh 1,633 249 336 150 Soni Khera 1 Do. Jagner 2,723 53 85 151 Sonra 2 Do. Saiyan 1,421 254 273 152 Taharpur 1 Do. Do. 341 103 117 153 Tantpur 3 Do. Jagner 1,215 77 150 154 Tarhat ., 1 Do. Do. 446 33 43 155 Tehra 9 Do. Saiyan 2,277 445 528 156 Thansera 1 Do. Jagner 206 8 8 157 Tha~nda 1 Do. lradat Nagar 477 40 57 158 Waina 3 Do. Jagner 1,829 99 130 159 Untgir ., 2 Do. Kheragarh 969 118 156 160 Usarra ., 1 Do. Jagner 464 27 31
Total Tehsil Kherugaflt (Rural) 393 194,041 21,617 26,716
TEHSIL KHERAGARH
65 Jagner Town Area Klteragarh Jagner 3,223 552 751
Total Tehsil Khcragarlt (Urban) 3,223 552 751
Total Tebsil Kheragarlt 393 197,264 22,169 27,467
----- -- ------------~-- -- ----------~
AGRICULTURAL
l-Cllltiva- lI-Cultiva-t or~ d'f land tors of land wholly or wholly or
malllly mainly II1-Cultiva-owned unowned ting labourers
and thelT and theIr and their
g dependants dependants dependants
.g Name of Village or 0 U Town/Ward M F M F M F
2 18 19 20 21 22 23
TEHSIL KHERAGARH
149 Son 555 566 47 43 65 46 150 Soni Khera 218 135 6 11 151 Sonr,! 473 403 79 75 56 83 152 Taltarpllf 211 197 42 33 31 24 153 Tantpur 53 38 7 16 8 154 Tarhat 87 70 3 2 2 6 155 Tehra 1,021 937 132 121 56 51 156 Thansera 24 16 1 '4 33 157 Thapencta 117 108 7 36 158 lJdaina 350 296 19 4 I 159 Ungtir 291 237 45 34 37 32 160 Usarra 66 46 7 12 2
Total Tehsil Kheragarh (Rural) 50,402 42,773 7,282 5,902 4,521 3,823
TEHSlL KHERAGARH
(is Jagner Town Area 678 472 ,\115 114 36 43
Total Tehsil Kheragarh (Urban) .. 678 </72 115 114 36 43
Total Tehsil Kheragarh 51,080 43,245 7.397 6,016 4,557 3,866 ---~~--
-~- ----_ -~~ ------ -----
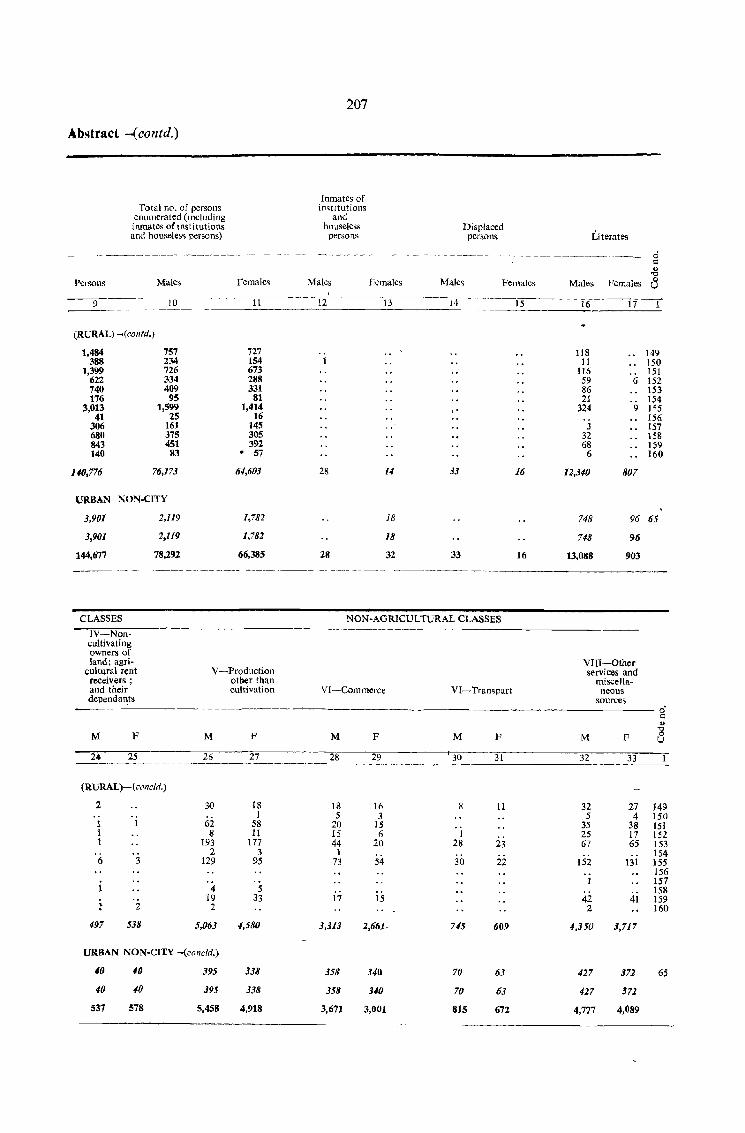
207
Abstract -(contd.)
Inmates of Total no. of persons in~tltutions
enumerated (Including and inmates ofmstitutions houseless Displaced and houseles. persons) persons persons Literates
---- ------- ----- ---~--- - -- ------ -~----.-- ci c: ..,
"" Persons Males Femalc~ Males Females Male~ Female, Males Females 8 ---~-- .------- -_ --9----- --ro ---11 12 13 14 15 16 17
(RURAL) -(conld.)
1,484 757 727 118 149 388 234 154 11 150
1,399 726 673 116 151 622 334 288 59 6 152 740 409 331 86 153 176 95 81 21 154
3,013 1,599 1,414 "
324 9 1'5 41 25 16 156
306 161 145 3 157 680 375 305 32 158 843 451 392 68 159 140 83 . 57 6 160
110,776 76,173 64,603 28 14 .U 16 11,340 807
URBAN NON-CITY
3,901 2,119 1,781 18 748 96 65
3,901 1,119 1,782 18 748 96
144,677 78,292 66,385 28 32 33 16 13,088 903 -------"----- ------ -------.~-
CLASSES NON-AGRICULTURAL CLASSES
IV-Non-cultivating owners of land; agri- VIII-Other
cultural rent V-Production services and receivers; other than misceIla-and their cultivation VI-Commerce VI-Trampart neous dependants sources
o· Q
" "" M F M P M F M F M F 0 U
24 25 26 27 28 29 30 31 32 33
(RURAL)-(c,wcld.)
2 30 18 18 16 8 11 32 27 149 1 5 3 5 4 150
1 62 58 20 15 35 38 151 1 8 II 15 6 1 25 17 152 1 193 177 44 20 28 23 67 65 153
2 3 1 154 6 3 129 95 73 54 30 22 152 131 155
156 157
4 5 158 19 33 17 15 42 41 159
! 2 2 2 160
497 538 5,063 4,580 3,313 2,661- 745 609 4,350 3,717
URBAN NON-CITY-{concld.)
40 40 395 338 358 340 70 63 427 372 65
40 .f0 395 338 358 340 70 63 427 372
537 578 5,458 4,918 3,671 3,001 815 672 4,777 4,089
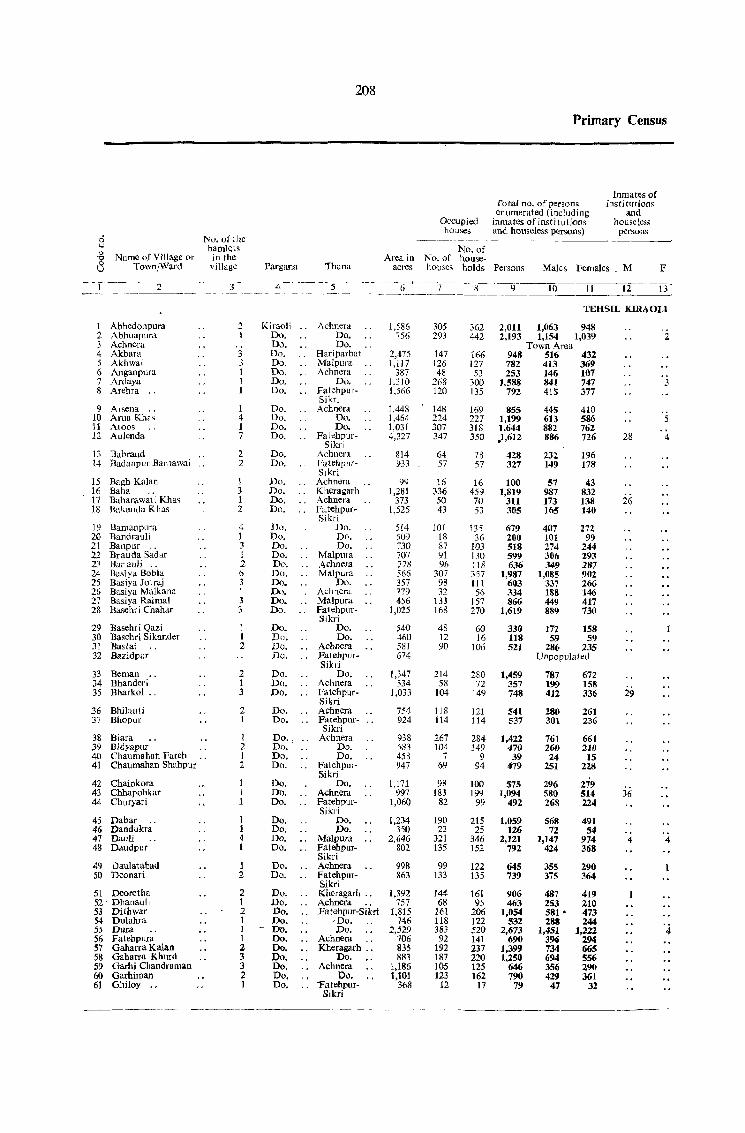
208
Primary Census
Inmates of Total no. of persons institutions enumerated (including and
Occupied inmates of institutions hous'less houses and houseless persons) persons
0 No. of the -----~-- ----~ -_ ----t::I hamlets No. of Q
Name of VllIage or in the Area in "'0. of house-8 Town/Ward village Pargana Thana acres houses holds Persons Males Females .M F
-1'----2- -- Y --4"" --- -5----- ---6 -7 -- - l{- 12-- -IT 9 10 II -------~~--- ~---~ -- -- -- _,- - --~-----------
TEHSIL KIRAOLI
I Abhcdonpura 2 Kiraoli Achnera 1,586 305 362 2,011 1,063 948 2 Abhuapura I Do. Do. 756 293 442 2,193 1,154 1,039 2 3 Achnera Do. Do. Town Area 4 Akbara 3 Do. Hariparbat 2,475 147 166 948 516 432 5 Akhwai 3 Do. Malpllra 1,117 126 127 782 413 369 6 Anganpura Do. Achnera 387 48 53 253 146 107 7 Ardaya Do. Do. 1,310 20S 300 1,588 841 747 3 3 Arehra ., Do. Fatehpur- 1,56(, 120 135 792 415 377
Sikri \I Arsena 1 Do. Achnera 1,448 148 169 855 445 410
10 Arua Khas 4 Do, Do. 1,464 224 227 1,199 613 586 5 11 Aloos 1 Do. Do. 1,03! 307 318 1,644 882 762 12 Aulcnda 7 Do. Falehpur- 4,327 347 350 ),612 886 726 28 4
Sikri 13 Babraud 2 Do. Achnera 8!4 64 78 428 232 196 14 Badanpur Barnawai 2 Do. FatehpUf- 93J 57 57 327 149 178
SIkri 15 Bagh Kalan 1 Do. _, Achnera 99 16 16 100 57 43 16 Baha 3 Do. ,. Kheragarh 1,281 336 459 ],819 987 832 17 Baharaw~ti Kha~ 1 Do. Achnera 373 50 70 311 173 138 26 18 Bakanda Khas 2 Do. _, Fatehpur-
Sikri 1,525 43 53 305 ]65 ]40
19 BamanpLlra 4 Do. Do. 514 lOT 135 679 407 272 20 Bandrauli 1 Do. Do. 509 18 36 2110 101 99 21 Banpllr 3 Do. Do. 730 87 103 518 274 244 22 Brauda Sadar 1 Do. .. Malpura 707 91 DO 599 306 293 23 Barauli 2 Do. Achnera 778 96 J18 636 349 287 24 Basiva Bobla 6 Do. ,. Malpura 566 307 357 1,987 1,085 902 25 Basiya Jot raj 3 Do. Do. 357 98 II! 603 337 266 26 Basiya Malkana 1 Do. Achnera 779 32 56 334 188 146 27 Basiva Raimal 3 Do. .. Malpura 456 133 157 866 449 417 28 Basehri Chahar 3 Do. FalehpuT- 1,025 168 270 1,619 889 730
Sikri 29 Basehr i Qazi 1 Do. Do. 540 48 60 330 172 158 30 Basehri Sikander 1 Do. Do. 460 12 16 118 59 59 31 Bastai 2 Do. Acbnera 581 90 106 521 286 235 32 Bazidpur Do. Fatehpur- 674 Unpopulated
Sikd 33 Beman " 2 Do. Do. 1,347 214 280 1,459 787 672 34 Bhanderi 1 Do. ,. Aclmera 534 58 72 357 199 158
29 35 Bharkol .. 3 Do. Fatehpur- 1,033 104 149 748 412 336 Sikri
36 Bhilauli 2 Do. Achnera 754 11 S 121 541 280 261 37 Bhopm 1 Do. FatehpUf- _, 924 114 114 537 301 236
Sikri 38 Biara 1 Do., Achnera 938 267 284 1,422 761 661 39 BidY<lpur 2 Do. Do. ('H3 104 149 470 260 210 40 Chaumahan Fareh 1 Do. Do. 458 7 9 39 24 15 41 Chaumahan Shabpu! 2 Do. _, Fatehpur- ~47 69 94 479 251 228
Sikri 42 Chainkora Do. Do. 1,i71 98 100 575 296 279 43 Chhapohkar Do. Achnera 997 183 199 1,094 580 514 36 44 Churyari Do. .. Fatehpur- 1,060 82 99 492 268 224
Sikri 45 Dabar 1 Do. Do. 1,234 190 215 1,059 568 491 46 Dandukni' 1 Do. Do. 350 22 25 126 72 54 47 Dauli 4 Do. Malpura 2,646 321 346 2,121 1,147 974 4 4 48 Daudpur 1 Do. Fatehpur- 802 135 152 792 424 368
Sikri 49 Daulatabad 1 Do. Achnera 998 99 122 645 355 290 50 Deonari 2 Do. .. Fatehpur- 863 133 135 739 375 364
Sikri 51 Deoretha 2 Do. Khera!!arh " 1,392 144 161 906 487 419 52' Dhanallii 1 Do. Achnera " 757 68 95 463 253 210 53 Dithwar 2 Do. Fatehpur-Sikri 1,815 161 206 1,054 581- 473 54 Dulahra 1 Do. ,Do. 746 llS 122 532 288 244
'4 55 Dura J - Do. Do. 2,529 383 520 2,673 1,451 1,222 56 Fatehpura 1 Do. Achnera 706 92 141 690 396 294 57 Gaharra Kalan 2 Do. Kheragarh .. 835 192 237 1,399 734 665 58 Gabarra Khurd 3 Do. Do. 883 187 220 1,250 694 556 59 Garhi Chandraman 3 Do. Achnera 1,186 105 125 646 356 290 60 Garhiman 2 Do. Do. t,lOl t23 162 790 429 361 61 Ghiloy .. 1 Do. ratehpur- 368 12 17 79 47 32
Sikri
-- ----~ ~----
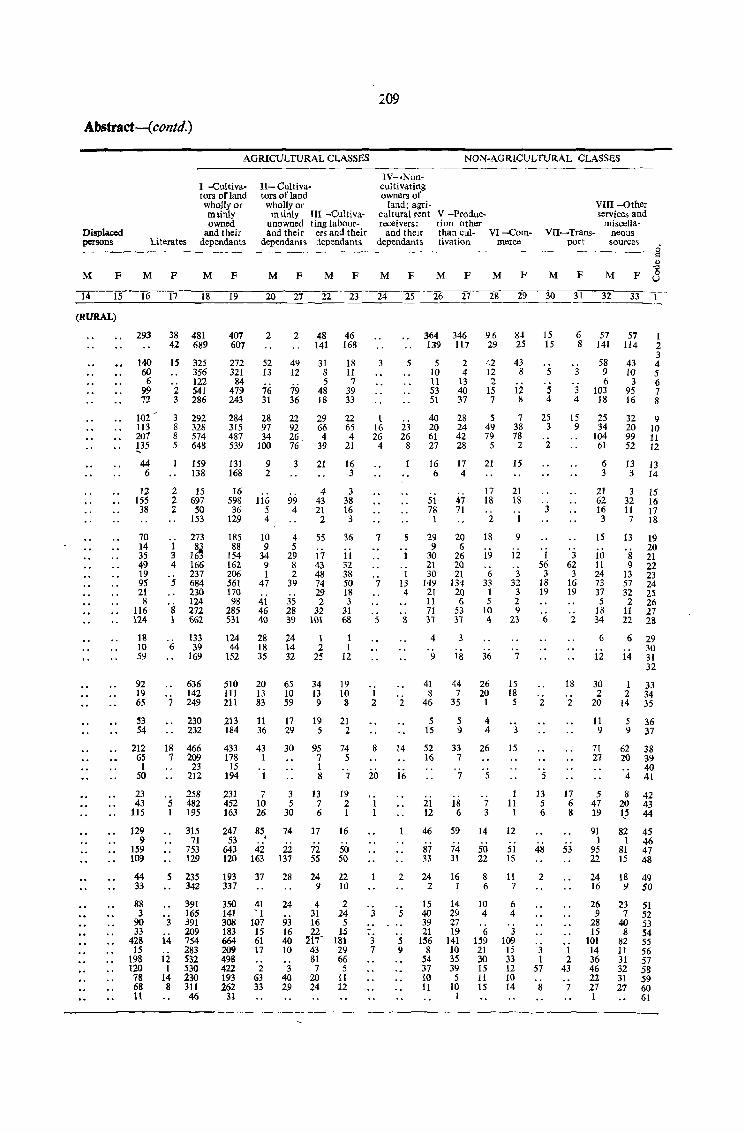
Abstract-( contd.)
AGRICULTURAL CLASSES
Displaced persons Literates
I -Cliitivators orland wholly or mliniy owned
and their dependants
---- -_---- ----
II- Cultivators of land
wholly or m tinly III -Cultiva
unowned ling labourand their ers and their
dependants dependants ~--------
209
NON-AGR[CULTURAL CLASSES
IV-.Nonculli vating owners of
land; agri-cultural rent V -Produc-receivers: tion other
and thelr than cul-dependants tivation
VI-Commerce
VUI-Other services and
miscella-VII~Trans- neous
port sources ---------
" M F M F M F M F M F M F M F M F M F M F8
14 15- 16 17 18 19 20 27 22 23 24 25 26 27 28 29 30 31 32 33
(RURAL)
293
140 60
6 99 7'}.
102 113 201 p5 44 6
12 155
38
70 14 35 49 19 95 21 8
116 124
18 10 59
92 19 65
53 54
212 65 1
50
23 43
115
129 9
159 109
44 33
88 3
90 33
428 15
198 120 78 68 11
38 42
15
'2 3
3 8 8 5
481 689
325 356 122 541 286
292 328 574 648
159 138
2 15 2 697 2 50
1 3 4
5
's 1
6
7
18 7
. 5 1
153
273
I~~ 166 237 684 230 124 272 662
133 39
169
636 142 249
230 232
466 209 23
212
258 482 195
315 71
753 129
5 235
3
14
12 1
14 8
342
391 165 391 209 754 283 532 530 230 311 46
407 607
272 321 84
479 243
284 315 487 539
131 168
2
52 13
76 31
28 97 34
100
9 2
2
49 12
79 36
22 92 26_ 76
48 141
31 8 5
48 18
29 66 4
39
3 21
46 168
18 11 7
39 33
22 65 4
21
16 3
16 4 3 598 116 99 43 38 36 5 4 21 16
129 4 2 3
185 88
154 162 206 561 170 98
285 531
124 44
152
510 111 211
10 9
34 9 1
47
41 46 40
28 18 35
20 I3 83
4 5
29 8 2
39
35 28 39
24 14 32
65 10 59
55
17 43 48 74 29 2
32 101
1 2
25
34 13 9
36
11 32 38 50 18 3
31 68
1 I
12
19 10 8
213 11 17 19 21 184 36 29 5 2
433 178 15
194
231 452 163
43 1
1
7 10 26
30
3 5
30
95 7 1 8
13 7 6
74 5
7
19 2 1
247 85, 74 17 16 53
643 42 22 72 50 120 163 137 55 50
193 37 28 24 22 337 9 IO
350 141 308 183 664 209 498 422 193 262
31
41 • 1
107 15 61 17
2 63 33
24
93 16 40 10
3 40 29
4 2 31 24 16 5 22 15
117- 181 43 29 81 66 7 5
20 II 24 12
3
t 16 26
4
7
7
5
I 2
8
20
3
3 7
5
23 26
8
5
1
1 I3 4
s
2
14
i6
364 346 139 117
5 2 10 4 11 13 53 40 51 37
40 28 20 24 61 42 27 28
96 29
42 12 2
15 7
5 49 79
5
84 25
43 8
12 8
7 38 78
2
16 17 21 15 6 4
51 47 78 71 1
29 9
30 21 30
149 21 11 71 37
4
9
41 8
46
5 15
52 16
21 12
20 6
26 20 21
134 20 6
53 37
3
18
44 7
35
5 9
33 7
7
18 6
17 21 18 18
2 1
18
19
6 33 1 5
10 4
36
26 20
1
4
9
12
3 32
3 2 9
23
7
15 18 5
4 3
26
5
7 3
15
1 11 1
46 59 14 12
51 15
87 74 50 33 31 22
2 24 16 8 11
5
5 9
2 1
IS 40 39 21
156 8
54 37 10 11
14 29 27 19
141 10 35 39 5
10 I
6 7
10 4
6 159 21 30 15 11 15
6 4
3 109
15 33 12 10 14
15 15
5
5 4
2S 3
2
3
1 56
3 18 19
2
'5 13 5 6
48
2
3 1
57
8
6 8
3
3 4
15 9
3 62
3 16 19
2
18
2
17 6 8
53
1 2
43
7
57 141
58 9 6
103 18
25 34
104 61
57 114
43 10
3 95 16
32 20 99 52
1 2 3 4 5 6 7 8
9 10 11 12
6 13 13 3 3 14
21 3 15 62 32 16 16 11 17 3 7 18
15
10 11 24 73 37 5
18 34
6
12
30 2
20
11 9
71 27
5 47 19
91 1
95 22
13
8 9
13 57 32 2
11 22
6
14
1 2
14
19 20 21 22 23 24 25 26 }.7
28
29 30 31 32
33 34 35
5 36 9 37
62 20
4
8 20 I?
38 39 40 41
42 43 44
82 45 1 46
81 47 15 48
24 18 49 16 9 SO
26 9
28 15
101 14 36 46 22 27 1
23 7
40 8
82 11 31 32 31 27
51 52 53 S4 55 56 57 58 59 60 61
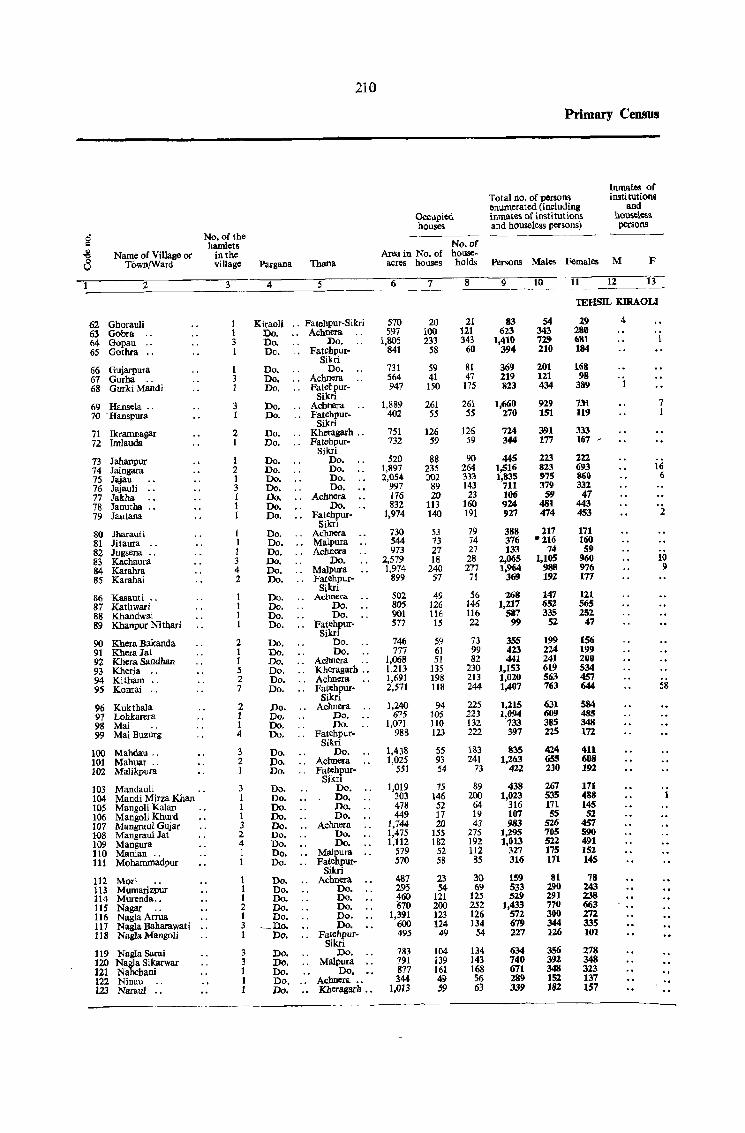
210
Primary Census
Inmates of Total no. of persons institutions enumerated (including and
Occupied inmates of insti tut1on& houseless houses and houseless persons) persons
8 No. of the hamlets No. of
.g Name of Village or in the Area in No. of house-
8 TOv.l1/Ward village Pargl1lla Thl1lla acres houses holds Persons Males Females M F
2 3 4 5 6 7 8 9 10 11 12 13
TEHSIL KIRAOLI
62 Ghorauli I Kiraoli ., Fatebpur-Sikri 570 20 21 83 54 29 4
63 Gobra .. 1 Do . .. Achnera 597 100 121 623 343 28& 64 Gopau .. 3 Do. Do. 1,805 233 34~ 1,411) 729 681
65 Gothra .. I Do • .. FMChpUI- 841 58 60 394 210 184 Sikri
66 Gujarpura 1 Do. Do. 731 59 81 369 201 168 67 Gurha .. 3 Do. Achnera 564 41 47 219 1Z1 98
68 GurkiMandi 1 Do . . , Fatelrpur- 947 150 175 sn 434 389 Si1cri
69 Hansela .. 3 Do. .. Achnera 1,889 261 261 1,660 929 7M 7
70 -Hanspura 1 00 . .. Fatehpur- 402 55 55 270 151 119 1 Sikri
71 Ikr=agar 2 Do. Khcragarh .. 751 126 126 724 391 333
72 Imlauda 1 Do. Fatehpur- 732 59 59 344 177 167 ' Si1cri
73 Jahanpur 1 Do. Do. 520 88 90 44S 223 222 74 Jaingara 2 Do. Do. 1,897 235 264 1,516 823 693 16
75 Jajau 1 00. Do. 2,054 302 333 1,835 975 861) 6
76 Jajauli .. 3 00 • 00. 997 89 143 711 379 332
77 Jakha 1 Do. .. Achnera 176 20 23 106 59 47 78 Janutha " 1 Do. Do. 832 113 160 924 481 443 79 Jautana 1 Do. Fatehpur- 1,974 140 191 927 474 453 2
Sikri 80 Jbarau!i t Do. Acbnera 730 53 79 388 217 171 81 Jitaura 1 00. .. Malpura .. 544 73 74 376 -216 160
82 Jugsena " t 00. Achnera 973 27 27 133 74 59
83 Kachaura 3 00. Do. 2,579 18 28 2,065 1,105 960 10
84 Karahra 4 Do • .. Malpura 1,974 240 277 1,964 9118 976 9 85 Karahai 2 00. ,. Fatehpur- 899 57 71 369 192 177
Sikri 86 Kasauti ,. Do • .. Acbnera 502 49 56 Z68 147 121 87 Kathwari 00. Do. 805 126 146 1,217 652 565 88 Khandwai Do. Do. 901 116 116 587 335 252
89 Khanpur Nithari Do • . , Fatehpur- 577 15 22 99 52 47 Sikri
90 Khera Bakanda 2 Do. Do. 746 59 73 3SS 199 156 91 KheraJat 1 00. Do. 777 61 99 423 224 199
92 Khera Sandhan 1 Do. Aclmera 1,068 51 82 441 241 200
93 Kheria 5 Do. " Kheragarh " '. 1,213 135 230 1,153 619 534
94 Kitham " 2 Do • . , Aclmera 1,691 198 213 1,020 563 457 58 95 Konrai " 7 Do. .. Fatehpur· 2,571 118 244 1,407 763 644
Sikri 96 Kukthala 2 Do • .. Achnera 1,240 94 225 1,215 631 S84
97 Lohkarera 1 00. Do. 675 105 223 1,094 609 485
98 Mai 1 Do. Do. 1,071 110 132 733 385 348
99 MaiBuzurg 4 Do. ,. Fatehpur- 988 123 222 397 22S 172 Sikri
100 Mahdau ,. 3 Do. Do. 1,438 55 183 835 424 411 101 Mahuar " 2 Do • . , Aclmera 1,025 93 241 1,263 6SS 6&8 102 Malikpura 1 Do. .. Fatebpur- 551 54 73 422 230 192
Sikri 103 Mandauli 3 Do. Do. 1,019 75 89 438 267 171 104 Mandi Mirza Khan 1 Do. Do. 303 146 200 1,023 S35 488 105 Mangoli Kalan 1 Do. Da. 478 52 64 316 171 145 106 Mangoli Khurd 1 Do. Do. 449 17 19 107 55 52 107 Mangraul Gujar 3 00 . .. Achnera 1,744 20 43 983 526 457 Hl8 Mangraul Jat 2 Do. Do. 1,475 155 275 1,295 705 S90 109 Mangura 4 Do. Do. 1,112 182 192 1,013 522 491 llO Manian " 1 Do. .. Mlllpura 579 52 112 327 175 152
111 Mohammadpur 1 Do. " Fatehpur- 570 58 85 316 171 145 Sikri
112 Mori 1 00 . .. Achnera 487 23 30 159 81 78 113 Mumarizpur 1 Do. Do. 295 54 69 533 290 Z43 114 Murenda,. 1 00. Do. 460 121 125 529 291 238 115 Nagar .. 2 Do. Do. 670 200 252 1,433 77{J 663 116 NaglaArrua 1 Do. D ... 1,391 123 126 572 300 272 117 Nagla Baharawati 3 -_Do. Do. 600 124 134 679 344 33S 118 Nagla MangoIi 1 Do. ,. Fatehpur- 495 49 54 227 126 101
Sikri 119 NaglaSarai 3 Do. DO. 783 104- 134 634 356 278 120 N~Sikarwar 3 Do. " Malpura .. 791 139 143 740 392 348 121 N bani 1 00. Do, 877 161 168 671 348 323 122 Ninau .. 1 Do • .. Acbnera .• 344 4() 56 289 152 137 123 Naraul .. 1 Do • Kheragarh •. 1,013 59 63 -339 182 151
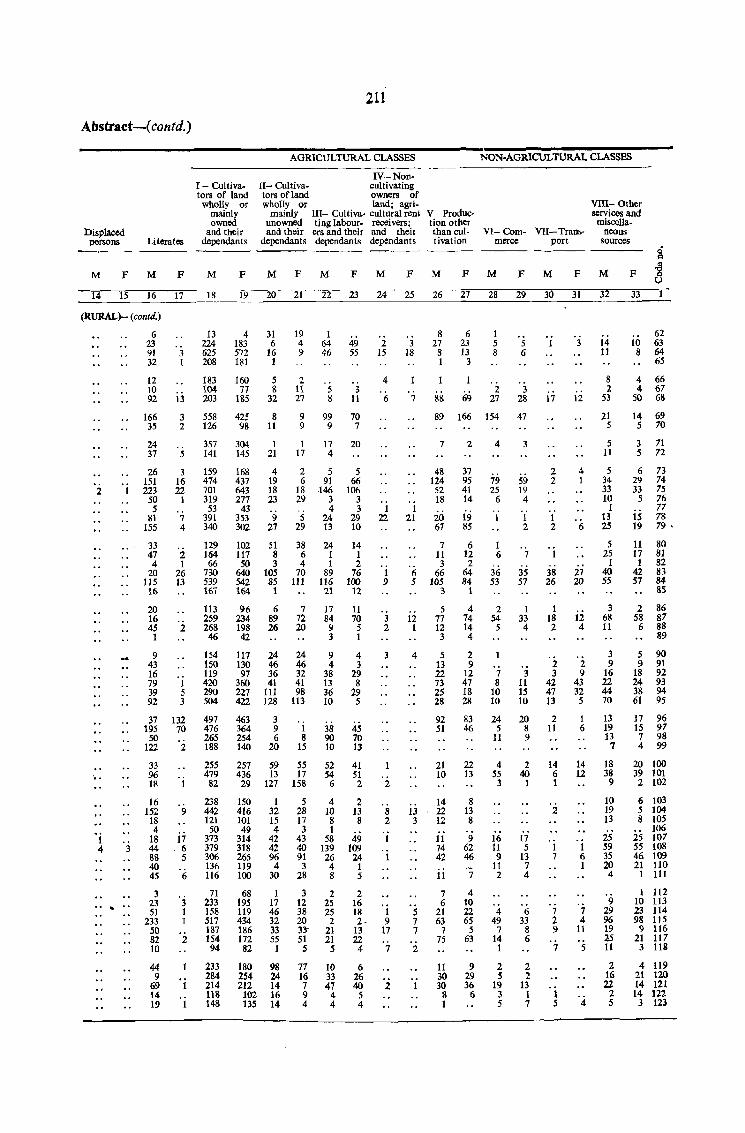
Abstract-( contd.)
Displaced persons Literates
M F M F
I - Cultivators of land
wholly or mainly owned
and their dependants
211
AGRICULTURAL CLASSES
IV-Non-II- Cultiva- cultivating tors of land owners of wholly or land; agri-
mainly IlI- Cultiva- cultural rent V- Produc-unowned ting labour- receivers; tion other and their ers and their and their than cui-
dependants dependants dependants tivation
NON-AGRICULTURAL CLASSES
VIII- Other services and miscella-
VI- Com- VU- Trans- neous merce port sources
g M FM FM FM F~ M F M F M F M
==~14:==~15~==~1~6==~1:7==-_-=1~8~_-_-_-~~19====20====2=1===2~2===2~3===~~==~2~5 __ ~26~ __ 27~~2~8 __ ~2~9 __ ~3~0 __ ~3~1 ___ 3~2 __ ~33
(RURAL)- (contd.)
2
. i 4 3
..
6 23 91 32
12 10 92
166 35
~ 37
26 151 223
50 5
81 155
33 47 4
20 115 16
20 16 45 1
9 43 16 79 39 92
3 1
13
3 2
5
3 16 22
1
7 4
2 1
26 13
2
1 5 3
37 132 195 70
50 122 2
33 96 18
16 152 9 18 4
18 17 44 .6 88 5 40 45 6
3 23 51
233 50 82 10
44 9
69 14 19
3 1 1
2
13 224 625 208
183 104 203
4 183 572 181
160 77
185
558 425 126 98
357 304 141 145
159 474 701 319 53
391 340
129 164 66
730 539 167
113 259 268 46
168 437 643 277
43 353 302
102 117 50
640 542 164
96 234 198 42
31 6
16 1
19 4 9
5 2 8 11
32 27
1 64 46
5 S
49 55
3 11
8 11
9 99 70 997
1 21
4 19 18 23
9 27
51 8 3
105 85
1
6 89 26
1 17 20 17 4
2 5 6 91
18 ,146 29 3
4 5 24
29 13
38 6 4
70 111
7 72 20
24 1 1
89 116 21
17 84 9 3
5 66
106 3 3
29 10
14 1 2
76 100
12
11 70 5 1
154 150 119 420 290 504
117 24 ~ 9 4
4 3 130 46 46
97 36 32 360 41 41 227 111 98 422 128 113
38 13 36 10
29 8
29 5
497 463 3 9 6
38 45 476 364 265 254 188 140 20
1 8
15 90 70 10 13
255 257 59 55 52 41 479 436 13 17 54 51 82 29 127 158 6 2
238 442 121 50
373 379 306 136 116
71
150 416 101 49
314 318 265 119 100
1 32 15 4
42 42 96 4
30
542 28 10 13 17 8 8 3 1
43 58 49 40 139 109 91 26 ~ 341
28 8 5
3 2 12 25
2 16
2 15
4
6
1 22
1 9
3 2
2
8 2
. i
1
233 158 517 187 154
68 195 119 434 186 172
1 17 46 32 33 55
38 25 18 1 20 2 2 9 33- 21 13 17 51 21 22
94 82 1 5 5 4 7
233 180 98 77 10 6 284 254 24 16 33 26 214 212 14 7 47 40 2 118 102 16 9 4 5 148 135 14 444
3 18
7
1 21
6 5
12 1
4
13 3
5 7 7
2
8 27
8 I
8&
6 23 13
3
69
1 5 8
5 6
2 3 27 28
89 166 154 47
724 3
48 m 52 18
20 67
7 11 3
66 105
3
5 77 12 3
5 13 22 73 25 28
92 51
37 95 41 14
icj 85
6 12 2
64 84
1
4 74 14 4
2 9
12 47 18 28
83 46
21 22 10 13
14 22 12
11 74 42
11
7 6
21 63
7 75
8 13 8
9 62 46
7
4 10 22 65
5 63
11 9 30 29 30 36
8 6 1
79 25
6
1
1 6
36 53
2 54 5
7 8
10 10
59 19 4
1 2
7
35 57
1 33
4
3 11 15 10
24 20 5 8
11 9
4 2 55 40 3 1
16 11 9
11 2
4 49
7 14 1
2 5
19 3 5
17 5
13 7 4
6 33
8 6
2 2
13 1 7
17
2 2
1 2
1
38 26
1 18 2
'j
12
4 1
6
27 20
12 4
2 2 3 9
42 43 47 32 13 5
2 11
14 6 1
2
, i 7
7 2 9
7
1 5
1 6
14 12
1 6 1
7 4
11
5
4
14 11
8 2
53
21 5
5 11
5 34 33 10
1 13 25
5 25
1 40 55
3 68 11
3 9
16 22 44 70
13 19 13
7
18 38
9
10 19 13
25 59 35 20 4
9 29 96 19 25 It
2 16 22
2 5
10 8
62 63 64 65
4 66 4 67
50 68
14 69 5 70
3 71 5 72
6 29 33
5
is 19
73 74 75 76 77 78 79.
11 80 17 81 1 82
42 83 57 84
gS
2 86 58 87 6 88
89
5 90 9 91
18 92 24 93 38 94 61 95
17 96 15 97 7 98 4 99
20 100 39 101 2 102
6 103 5 104 8 105
106 25 107 55 108 46 109 21 110
1 111
1 112 10 113 23 114 98 lI5
9 116 21 117 3 118
4 119 21 120 14 121 14 122
3 123
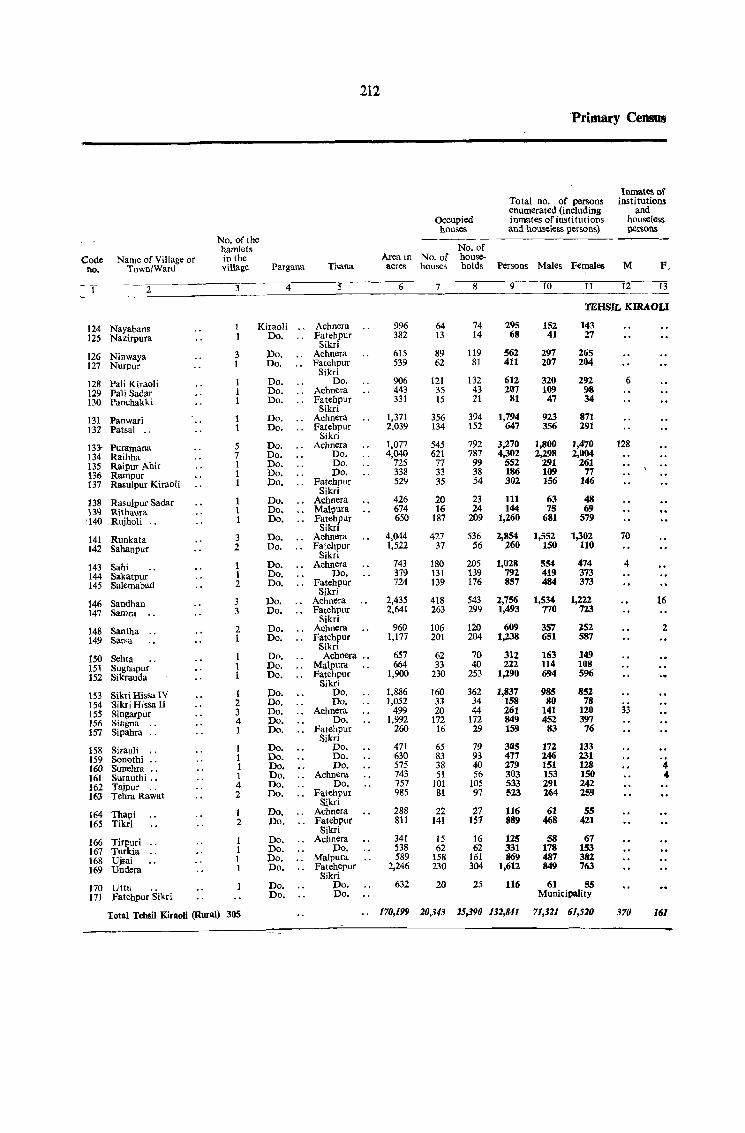
212
'Primary Census
Inmates of Total no. of persons institutions enumerated (including and
Occupied inmates of institutions houseless houses and houseless persons) persons
No. of the ----hamlets No. of
Code N arne of Village or in the Area in No. of house-no. Town/Ward village Pargana Thana acres houses holds Persons Males Females M F,
2 4 5 6 7 8 9 10 II 12 13
TEHSIL KIRAOU
124 Nayabans 1 Kiraoli Achnera 996 64 74 295 152 143
125 Nazirpura I Do. Fatehpur 382 13 14 68 41 27 Sikri
126 Ninwaya 3 Do. ., Achnera 615 89 119 562 297 265 127 Nurpur 1 Do. Fatehpur 539 62 81 411 207 204
Sikri 128 Pali Kiraoli Do. Do. 906 121 132 612 320 292 6 129 Pali Sadar Do. Achnera 443 35 43 207 109 98 130 Panchakki Do. Fatehpur 331 15 21 81 47 34
Sikri 131 Panwari Do. Achnera 1,371 356 394 1,794 923 871 132 Patsal ., Do. Fatehpur 2,039 134 152 647 356 291
Sikri 133- Purarnana 5 Do. Achnera 1,077 545 792 3,270 1,800 1,470 128 134 Raibha 7 Do. Do. 4,040 621 787 4,302 2,298 2,004 135 Raipur Ahir 1 Do. Do. 12S 77 99 552 291 261 136 Rampur 1 Do. Do. 338 33 38 186 109 77 137 Ra.<;ulpur Kiraoli 1 Do. Fatehpur 529 35 54 302 156 146
Sikri 138 Rasulpur Sadar 1 Do. Achnera 426 20 23 111 63 48
1:'.9 Rithaura 1 Do. Malllura 674 16 24 144 75 69
'140 Rujholi .. 1 Do. Fatehpur 650 187 209 1,260 681 579 Sikri
141 Runkata 3 Do. Achnera 4,044 427 536 2,854 1,552 1,302 70 142 Sahanpur 2 Do. Fatehpur 1,522 37 56 260 150 110
Sikri 143 Sahi 1 Do. Achnera 743 180 205 1,028 554 474 4 144 Sakatpur' . 1 Do. po. 379 131 139 792 419 373 145 Salernabad 2 Do. Fatehpur 724 139 176 857 484 373
Sikri 146 Sandhan 3 Do. Achnera 2,435 418 543 2,756 1,534 1,222- 16 147 Samra 3 Do. Fatchpur 2,641 263 299 1,493 770 723
Sikri 148 Santha 2 Do. Achnera 960 106 120 609 357 252 2 149 Sarsa 1 Do. Fatehpur 1,177 201 204 1,238 651 587
Sikri 150 Sehta Do. Achnera 657 62 70 312 163 149
1St Sugnapur Do. .. Malpura 664 33 40 222- 114 108
152 Sikrauda Do. Fatehpur 1,900 230 253 1,290 694 596 Sikri
153 Sikri Hissa IV 1 Do. Do. 1,886 160 362 1,837 985 852
154 Sikri Hissa II 2 Do. Do. 1,052 33 34 158 80 78
155 Singarpur 3 Do. Achnera 499 20 44 261 141 120 33 156 Singna 4 Do. 00. 1,992 172 172 849 452 397
157 Sipahra 1 Do. Fatehpur 260 16 29 159 83 76 Sikri
158 Sirauli 1 Do. Do. 471 65 79 305 172 133
159 Sonothi 1 Do. Do. 630 83 93 477 246 231
160 ~unehra 1 Do. Do. 575 38 40 279 151 128 4 161 Surauthi .. 1 Do. Achnera 743 51 56 303 153 150 4 162 Tajpur 4 Do. Do. 757 101 105 533 291 242
163 Tehra Rawat 2 Do. Fatehpur 985 81 97 523 264 259 Sikri
164 Thapi 1 Po. Achnera 288 22 27 116 61 55
165 Tikri 2 Do. Fatehpur 811 141 157 889 468 421 Sikri
166 Tirpuri I Do. .. Achnera 341 15 16 125 58 67 167 Turkia 1 Do. Do. 538 62 62 331 178 153 168 UjFai 1 Do. Malpura 589 158 161 869 487 382
169 Undera 1 Do. Fatehepur 2,246 230 304 1,612 849 763 Sikri
170 Uttu Do. Do. 632 20 25 116 61 55 171 Fatehpur Sikri Do. Do. Municipality
Total Tebsil KiraoH (Rural) 305 170,199 20,313 25,390 132,841 71,321 61,520 370 161
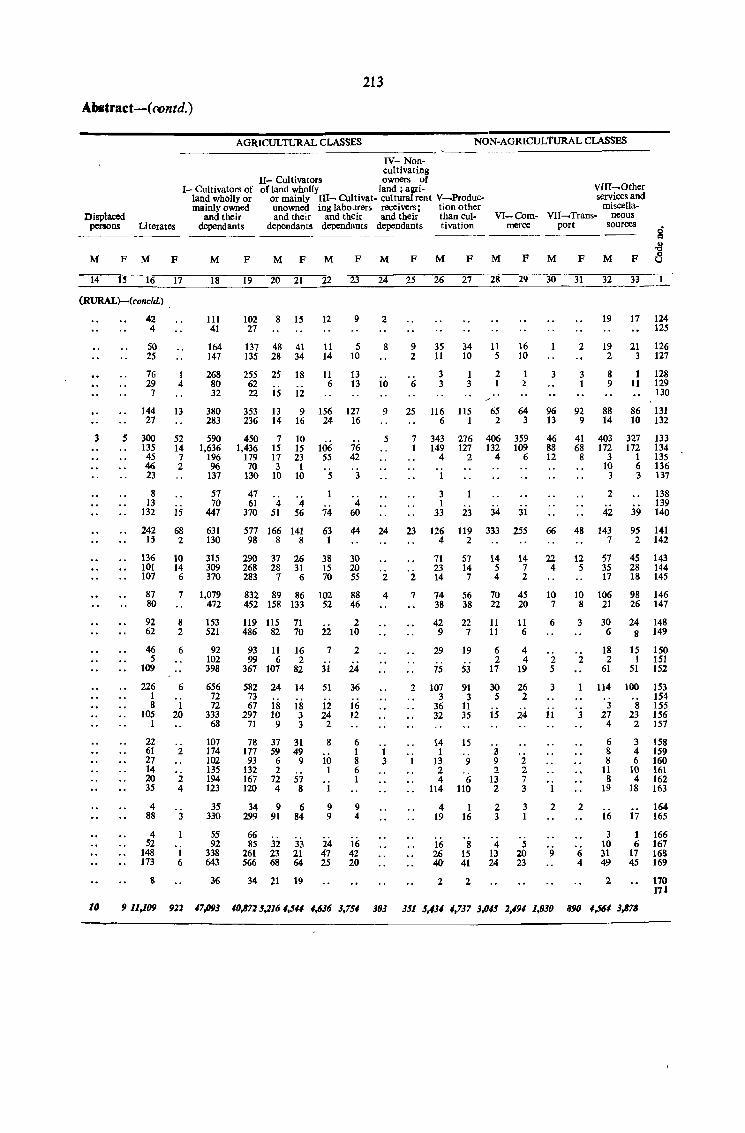
213
Abstrad-( rontd.)
AGRICULTURAL CLASSES
IV- Noncultivating
11- Cultivators owners of
NON-AGRICULTURAL CLASSES
1- Cultivators of ofland wholly land; agri- VIII~Other services and
miscellaVI- Com- VII-Trans- neous
land wholly or or mainly III- Cultivat· cultural rent V-Produc-mainly owned unowned ing labourers receivers; tion other
and their and their and their and their than cul-Displaced persons Literates dependants dependants dependants dependants tivation merce port sources
----- ----- ----"-----
M F M F
14 IS 16 17
(RURAL)-·(l"oncld.)
42
3
4
SO 25
76 29
7
144 27
300 135 45 46 23
8 13
132
1 4
13
52 14 7 2
15
242 68 15 2
136 101 107
10 14 6
M
18
111 41
164 147
268 80 32
380 283
590 1,636
196 96
137
57 70
447
631 130
315 309 370
87 80
7 1,079
92 62
46 5
109
226 1 8
105 1
22 61 27 14 20 35
4 88
4 52
148 173
8
8 2
6
6
1 20
2
2 4
3
1 6
472
153 521
92 102 398
656 72 72
333 68
107 174 102 135 194 123
35 330
55 92
338 643
36
F M F M F
19 20 21
102 8 15 12 9 27
137 48 41 11 5 135 28 34 14 10
255 25 62
18
12
9 16
22 15
353 13 236 14
450 1,436
179 70
130
47
7 10 15 15 17 23 3 1
10 10
11 6
156 24
106 55
5
13 13
127 16
76 42
3
61 4 4 4 370 51 56 74 60
M
2
8
10
9
5
F M F M F
9 35 34 11 16 2 11 10 5 10
6
25
7 1
3 3
116 6
343 149
4
1
3 1
33
1 3
115 1
276 127
2
23
2 1
65 2
1 1.
64 3
406 359 132 109
4 6
34 31
M
3
96 13
46 88 12
F M F
32 33
19 17 124 125
2 19 21 126
3 1
92 9
41 68
8
2 3 127
8 9
88 14
403 172
3 10
3
2
42
I 11
86 10
327 172
1 6 3
128 129 130
131 132
133 134 135 136 137
138 139
39 140
577 166 141 63 44 24 23 126 119 333 255 66 48 143 95 141 98 8 8 1 4 2 7 2 142
290 37 26 268 28 31 283 7 6
38 30 15 20 70 55
832 89 86 102 88 452 158 133 52 46
119 115 71 2 486 82 70 22 10
93 11 16 7 2 99 6 2
367 107 82 31 24
582 24 73 67 18
297 10 71 9
14
18 3 3
78 37 31 177 59 49 93 6 9
132 2 167 72 57 120 4 8
34 9 6 299 91 84
66 85 32 33
261 23 21 566 68 64
34 ;U 19
51
12 24 2
8
10 1
1
9 9
i4 47 25
36
16 12
6 1 8 6 1
9 4
16 42 20
2
4
1 3
2
71 23 14
57 14 7
14 5 4
14 22 7 4 2
12 5
57 35 17
45 143 28 144 18 145
7 74 56 70 45 10 10 106 98 146
2
38 38 22 20 7 8 21 26 147
42 9
29
75
107 3
36 32
22 7
19
53
91 3
11 35
14 15 1
13 9 2 4 6
114 110
4 19
16 26 40
2
1 16
8 15 41
2
11 11
6 2
17
30 5
15
3 9 2
13 2
2 3
4 13 24
11 6
4 4
19
26 2
24
2 2 7 3
3 1
5 20 23
6
2 5
3
11
1
2
9
3
2
3
2
6 4
30 24 148 6 8 149
18 15 ISO 2 1 151
61 51 152
114 100 153 154 155 156 157
3 8 27 23 4 2
6 8 8
11 8
19
16
3 10 31 49
2
3 158 4 159 6 160
10 161 4 162
18 163
17
1 6
17 45
164 165
166 167 168 169
170 111
10 9 11,109 921 47,093 40,8725,2164,5# M36 3,754 303 351 5,411 4,737 3,(H5 2,191 1,030 890 4,564 3,878
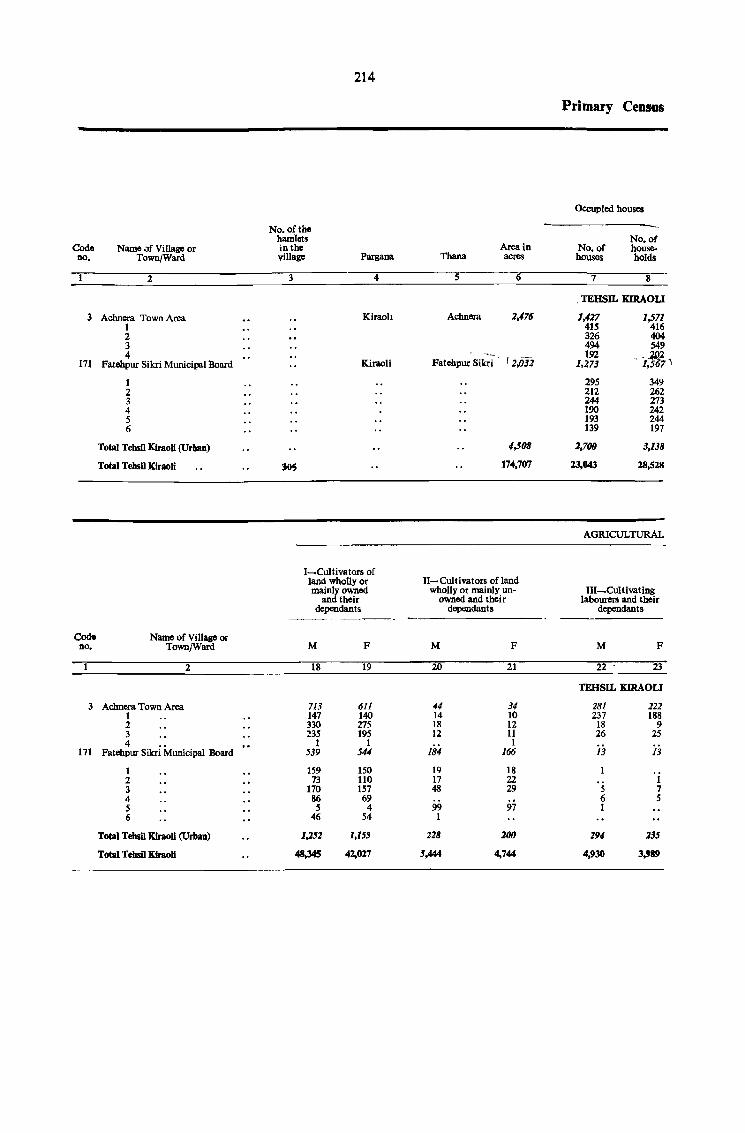
214
Primary Census
Ocrupied houses
No.oftlle hamlets No. of
Code Name Jf Village or in the Area in No. of house-no. Town/Ward village Pargana Thana acres houses holds
2 3 4 5 6 7 8
, mHSIL KIRAOU
3 Achnera Town Area Kiraoh Achnera 2,476 1,427 1,571 1 415 416 2 326 404 3 494 549 4 -_ 192 _~2
171 Fatehpur Sikri Municipal Board Kiraoli Fatehpur Sikri f 2,oj2 1,273 - 1,5 7~
I 295 349 2 212 262 3 244 273 4 190 242 5 193 244 6 139 197
Total Tebsil Kiraoli (Urban) MOB 2,700 3,138
Total Tehsn Kiraoli 30S 174,707 23,043 28,528
AGRICULTURAL
I_,Cultivators of land wholly or 11-Cultivators of land mainly owned wholly or mainly un- III-Cultivating
and their owned and their labourers and their dependants dependants dependants
Cod. Name of Village or no. TownjWard M F M F M F
2 18 19 20 21 22 23
TEHSIL KIRAOLI
3 Achnera Town Area 713 611 44 34 281 222 1 147 140 14 10 237 IS8 2 330 275 18 12 18 9 3 235 195 12 11 26 25 4 1 1
184 1
171 Fatehpur Sikri Municipal Board 539 544 166 13 13
1 159 150 19 18 . i 2 73 110 17 22 3 170 157 48 29 5 7 4 86 69 6 5 5 5 4 99 97 t 6 46 54 1
Total Tehsi1 Kiraoli (Urban) 1,252 1,155 128 200 294 235
Total TehslI Kiraoli 48,34S 42,027 5,444 4,744 4,930 3,989
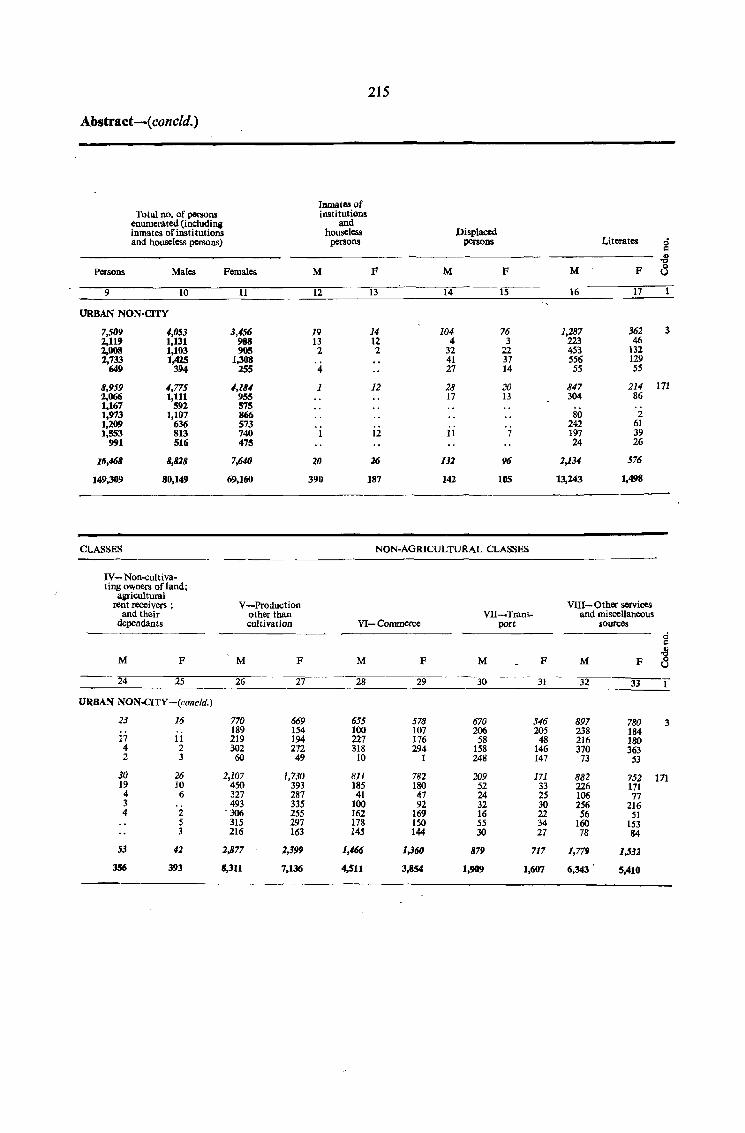
215
Abstract-(concld.)
Inmate3 of Total no. of pel'SOns institutions
enumerated (including and inmates ofinstitutions houseless Displaced and houseless persons) persons persons Literates d
1:1
-8 Persons Males Females M F M F M F 8
9 10 11 12 13 14 15 16 17
URBAN NON·ClTY
7,509 4,053 3,456 19 14 104 76 1,287 362 3 2,119 1,131 988 13 12 4 3 223 46 2,008 1,103 905 2 2 32 22 453 132 2,733 1,425 1,308 41 37 556 129
649 394 25S 4 27 14 55 55
8,959 4,775 -1,184 1 12 28 20 847 214 171 2,066 1,111 955 17 13 304 86 1,167 592 575 1,973 1,107 866 80 2 ),209 636 573 242 61 1,553 813 740 1 12 11 7 197 39
991 516 475 24 26
16,468 8,828 7,640 20 26 132 96 2,134 576
149,309 80,149 69,160 390 ]87 142 105 ]3,243 1,498
CLASSES NON·AGRICULTURAL CLASSES
IV- Non-cultiva· ting owners oCland;
agricultural rent receivers ; V~Production VlII- Other services
and their other than Vll-Trans. and miscellaneous dependants cultil'lltion VI- Commerce port sources
ci c -8
M F M F M F M F M F 8 24 25 26 27 28 29 30 31 32 33
URBAN NON-CITY-(concld.)
23 16 770 669 655 578 670 546 897 780 3 189 154 100 107 206 205 238 184
17 11 219 194 227 176 58 48 216 180 4 2 302 272 318 294 158 146 370 363 2 3 60 49 10 1 248 147 73 53
30 26 2,107 1,730 811 782 209 171 882 752 171 19 10 450 393 185 180 52 33 226 171 4 6 327 287 41 47 24 25 106 77 3 493 335 100 92 32 30 256 216 4 2 • 306 255 162 169 16 22 56 51
5 315 297 178 150 55 34 160 153 3 216 163 145 144 30 27 78 84
53 42 2,877 2,399 1,466 1,360 879 717 1,779 1,532
356 393 8,311 7,136 4,511 3,854 1,909 ],607 6,343 5,410
216
Parlana and Thana-wise Population
(i) P ARGANAS
No. of Population
Serial Villages and No. of no. Name of Pargana Towns houses Persons Males Females
2 3 4 5 6 7
TEHSIL AGRA
1 Agra 138 60,252 511,609 279,280 232,329
TEHSIL BAH
1 Bah 207 22,239 151,863 81,413 70,450
TEHSIL ETMADPUR
Etmadpur 182 28,810 205,156 110,596 94,560
TEHSIL FATEHABAD
Fatehabad 164 19,508 139,566 75,364 _ 64,202
TEHSIL FlROZABAD
1 Firozabad 186 27,002 199,211 109,195 90,016
TEHSIL KHERAGARH
1 Kheragarh 154 22,169 144,671 78,292 66,385
TEllSIL KIRAOLI
1 Kiraoli " 170 23,043 149,309 80,149 69,160
(ii) 'IlHANAS
No. of Population
Serial Village and No. of no. Name of Thana Towns houses Persons Males Females
2 4 5 6 7
TEHSIL AGRA
MaJpura 46 9,535 56,284 30,041 26,243 2 Tajganj (Rural) 35 4,432 28,529 15,304 13,225 3 Loharnandi (Rural) 10 1,204 6,821 3,596 3,225 4 Hmparbat (Rural) 18 3,321 20,685 11,050 9,635 5 I>owki .. 22 3,153 20,280 11,029 9,251 6 Sadar Bazar (Rural) 4 385 3,037 1,642 1,395 7 Chhatta (Rural) 77 308 159 149 8 Rakabganj (CitY) ,,')
9 Kotwali (City)
"t Tajganj (City) .. Lohamandi (City) 2 38,145 375,665 206,459 169,206 Hariparbat (City) .. \ Sadar Bazar (City) "J Chhatta (City) ..
NOTE- The break-up of ci ty population among the thanas is given below. The figures of population have been derived from tho National Register of Citizens and so the ci ty totals do not tally exactly with the fillures in the above table, which are based on the Primary Census Abstract.
Rakabganj 63,553 34,103 29,450
Kotwali .• 61,085 32,765 28,320
Tajganj ., 12,lSS 11,827 10,428
Lobamandi 76,307 41,384 34,923
Hariparbat 46,738 26,449 20,289
• Sadar Bazar 55,083 32,743 22,340
Chhatta •• 48,803 26,654 22,149
217
Pargana and Thana-wise Population
(U) THANAS
Population No. of
Serial Village and No. of no. Name of Thana Towns houses Persons Males Females
2 3 4 5 6 7
TEHSILBAH
Bah 87 8,846 58,851 31,596 27,255
2 Pinhat 61 7,599 53.290 28,782 24,508
3 Gailpur Kalan .• 59 5,794 39,722 21,035 18,687
TEHSIL ETMADPUR
Khandoli 35 6,802 39,522 21,265 18,257
2 Chhatta 815 6,473 3,461 3,012
3 Etmadpur 60 7,422 59,785 32,126 27,659
4 Tundla 35 6,840 47,385 25,833 21,552
5 Aharan 51 6,931 51,991 27,911 24,080
TEflSIL FATEHABAD
Iradat Nagar 18 2,316 14,566 7,865 6,701
2 Fatehabad 84 7,636 56,751 30,732 26,019
3 Shamshabad 47 7,043 50,838 27,517 23,321
4 Dowki 15 2,513 17,411 9,250 8,161
TEHSIL FIROZABAD
Firoza6ad 113 20,912 150,561 82,927 67,634
2 Narki 73 6,090 48,650 26,268 22,382
'l'EHSIL KHERAGARH
Kheragarh 48 7,057 45,523 24,312 21,211
2 Saiyan 29 6,573 42,937 23,166 19,771
3 Iradat ~agar .. 29 3,292 20,921 11,355 9,566
4 Jagoer 48 5,247 35,296 19,459 15,837
TEHSIL KIRAOLI
Kheragarh 7 1,179 7,590 4,094 3,496
2 Hariparbat 2 1,420 9,907 5,291 4,616
3 Fatehpur Sikri 72 7,438 47,803 25,645 22,158
4 Malpura 14 1,948 12,271 6,532 5,739
S Achhnera 75 11,058 71,738 38,587 33,151

PART III
MISCELLANEOUS STATISTICS
Particulars
A-.BirthsLive Births
Still Births
Birth Rate (per 1,000)
B~ Deaths hy age groups-
Under 1 year
1-5
5~10
10-15
15-20
20-30
30-40
40-50
50-60
60 and over
Total
Males
Females
" Total
Males
Females
" Total
Males
Females
Total
Males
Females
Males
Females
" Males
Females
Males
Females
Males
Females
Males
Females
Males
Females
Males
Females
Males
Females
Males
Females
Males
Females C- Deaths from selected causes
Cholera
Small-pox
Plague
Fevers
Dysentery or Diarrhoea
Respiratory diseases
Injuries
Other causes Death rate from all causes (per 1,(00)
Total
Males
Females
Total
2
50,938
27,044
23,894
363
196
167
39'2
20'8
18'4
27,994
14,872
13,122
3,801
3,164
4,265
3,468
608
529
325
349
323
509
766
1,241
692
780
88Z
662
958
656
2,252
1,764
310
15
15,593
1,810
4,763
353
5,150
21'6
21'2
22'0
220
1941
Rural
3
33,167
17,937
15,230
16,446
9,168
7,278
1,995
1,545
2,755
1,923
378
291
218
174
217
226
477
626
457
489
595
445
673
469
1,403
1,090
272
12
14,338
78
118
213
1,415
17'9
Urban
4
17,771
9,107
8,664
11,548
5,704
5,844
1,806
1,619
1,510
1,545
230
238
107
175
106
283
289
615
235
291
287
217
285
187
849
674
38
3
1,255
1,732
4,645
140
3,735
Total
43,117
22,928
20,189
364
204
160
32'6
17'3
15'3
30,090
15,823
14,267
3,800
3,249
3,941
3,525
827
708
483
456
365
558
780
1,269
764
850
946
724
1,182
724
2,735
2,204
115
61
17,830
1,810
4,520
321
5,433
22'8
22'1
23'S
1942
Rural
6
26,327
14,306
12,021
17,885
9,818
8,067
1,951
1,542
2,470
1,961
529
423
343
244
239
277
496
657
475
528
630
489
879
540
1,806
1,406
60
26
16,213
33
125
183
1,245
19'2
Vital
Urban
7
16,790
8,622
8,168
12,205
6,005
6,200
1,849
1,707
1,471
1,564
298
285
140
212
126
281
284
612
289
322
316
235
303
184
929
798
.5S
35
1,617
1,777
4,395-
, 138
4,188
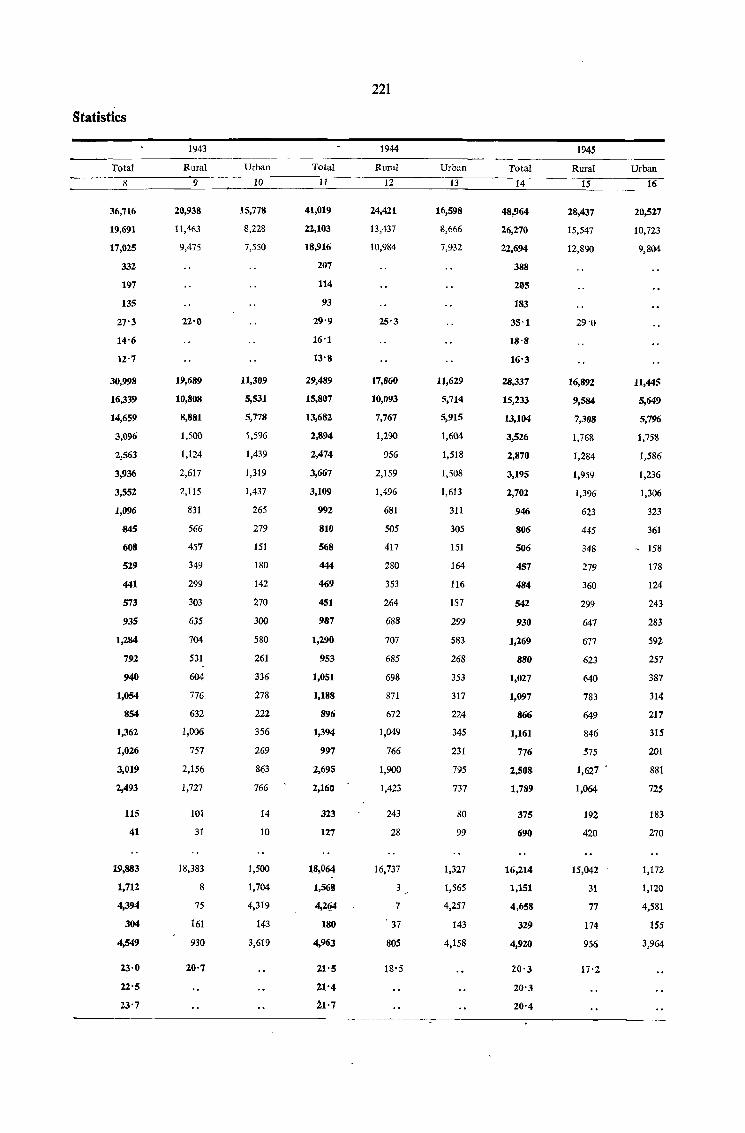
Statistics
Total
8
36,716
19,691
17,625
332
197
135
27-3
14-6
12-7
30,998
16,339
14,659
3,096
2,563
3,936
3,552
1,096
845
608
529
441
573
935
1,284
792
940
1,054
854
1,362
1,026
3,019
2,493
115
41
19,883
1,712
4,394
304
4,549
23-0
22-5
23-7
1943
Rural
9
26,938
11,463
9,475
22-0
19,689
10,808
8,881
1,500
1,124
2,617
2,115
831
566
457
349
299
303
635
704
531
604
776
632
1,006
757
2,156
1,727
101
31
18,383
8
75
161
930
1.0-7
Urban
10
15,778
8,228
7,550
11,309
5,531
5,778
1,596
1,439
1,319
1,437
265
279
151
180
142
270
300
580
261
336
278
222
356
269
863
766
14
10
1,500
1,704
4,319
143
3,619
Total
11
41,019
1.2,103
18,916
207
114
93
29'9
16'1
13-8
29,489
15,807
13,682
2,894
2,474
3,667
3,109
992
810
568
444
469
451
987
1,290
953
1,051
1,188
896
1,394
997
2,695
2,160
323
127
18,064
1,568
4,2C!4
180
4,963
21-5
21·4
il-7
221
1944
Rural
12
24,421
13,437
10,984
25-3
17,860
10,093
7,767
1,290
956
2,159
1,496
681
505
417
280
353
264
688
707
685
698
871
672
1,049
766
1,900
1,423
243
28
16,737
3
7
, 37
805
18-5
Urban
13
16,598
8,666
7,932
11,629
5,714
5,915
1,604
1,518
1,508
1,613
311
305
151
164
116
IS7
299
583
268
353
317
224
345
231
795
737
80
99
1,327
1,565
4,257
143
4,158
1945
Total Rural Urban 14 -------..15~-------·1r-6
48,964
26,276
22,694
388
205
183
35'1
18'8
16-3
28,337
15,233
13,104
3,526
2,870
3,195
2,702
946
806
506
457
484
542
930
1,269
880
1,027
1,097
866
1,161
776
2.508
1,789
375
690
16,214
1,151
4,658
329
4,920
20-3
20-3
20-4
28,437
15,547
12,890
29'0
16,892
9,584
7,308
1,768
1,284
1,959
1,396
623
445
348
279
360
299
647
677
623
640
783
649
846
575
1,627
1,064
192
420
15,042
31
77
174
956
17-2
20,527
10,723
9,804
ll,44!,
5,649
5,796
1,758
1,586
1,236
1,306
323
361
- 158
178
124
243
283
592
257
387
314
217
315
201
881
725
183
270
1,172
1,120
4,581
155
3,964
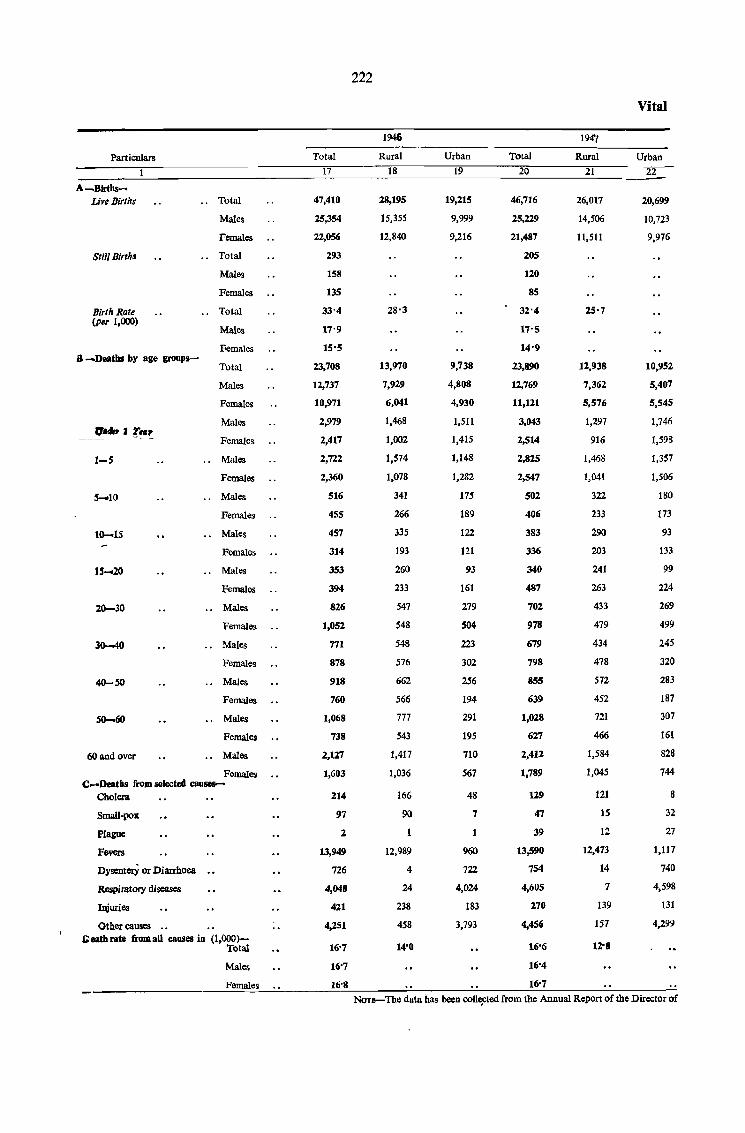
222
Vital
194.6 194'[
Particulars Total Rural Urban Total Rural Urban ________ ~ ________________________ ~1~7 ________ ~18~ ______ ~1~9 ______ ~2~O~ ______ ~2~1 ____ ~
A_Bfrtbs-. Live Births
Still Births
Birth Rate (per 1,000)
a -Deaths by age group_
1-5
5-10
10-1S
15-20
20-30
40-50
50-60
60 and over
Total
Males
Females
Total
Males
Females
,. Total
Males
Females
Total
Males
Females
Males
Females
,. Males
Females
,. Males
Females
•. Males
Females
" Males
Females
" Males
Females
Males
Females
., Males
Females
.' Males
Females
,. Males
Females C-Deaths froJll selected causes.-
Cholera.
Small-pox
Plague
Fevers
DysenterY or Diarrhoea
Respiratory diseases
Injuries
Other causes Geatbrate fromaU eauses iD (1,000)
Total
Males
Females
47,410
25,354
22,056
293
158
135
33'4
17'9
15'5
23,708
12,737
10,971
2,979
2,417
2,722
2,360
516
455
457
314
353
394
826
1,052
771
878
918
760
1,068
738
2,127
1,603
214
97
2
13,949
726
4,048
421
4,251
16'7
16'7
16'8
28,195
15,355
12,840
28'3
13,970
7,929
6,041
1,468
1,002
1,574
1,078
341
266
335
193
260
233
547
548
548
576
662
566
777
543
1,417
1,036
166
90
12,989
4
24
238
458
14'0
19,215
9,999
9,216
9,738
4,808
4,930
1,511
1,415
1,148
1,282
175
189
122
121
93
161
279
504
223
302
256
194
291
195
710
567
48
7
960
722
4,024
183
3,793
46,716
25,229
21,487
205
120
85
32'4
17'5
14'9
23,890
12,769
11,121
3,043
2,514
2,825
2,547
502
406
383
336
340
487
702
978
679
798
855
639
1,028
627
2,412
1,789
129
47
39
13,590
754
4,605
270
4,456
16'6
16'4
16'7
26,017
14,506
11,511
12,938
7,362
5,576
1,297
916
1,468
1,041
322
233
290
203
241
263
433
479
434
478
572
452
721
466
1,584
1,045
121
IS
12
12,473
14
7
139
157
12'8
20,699
10,723
9,976
10,952
5,407
5,545
1,746
1,598
1,357
1,506
180
173
93
133
99
224
269
499
245
320
283
187
307
161
828
744
8
32
27
1,117
740
4,598
131
4,299
NOTl!-The data has been collCfted from the Annual Report of the Director of
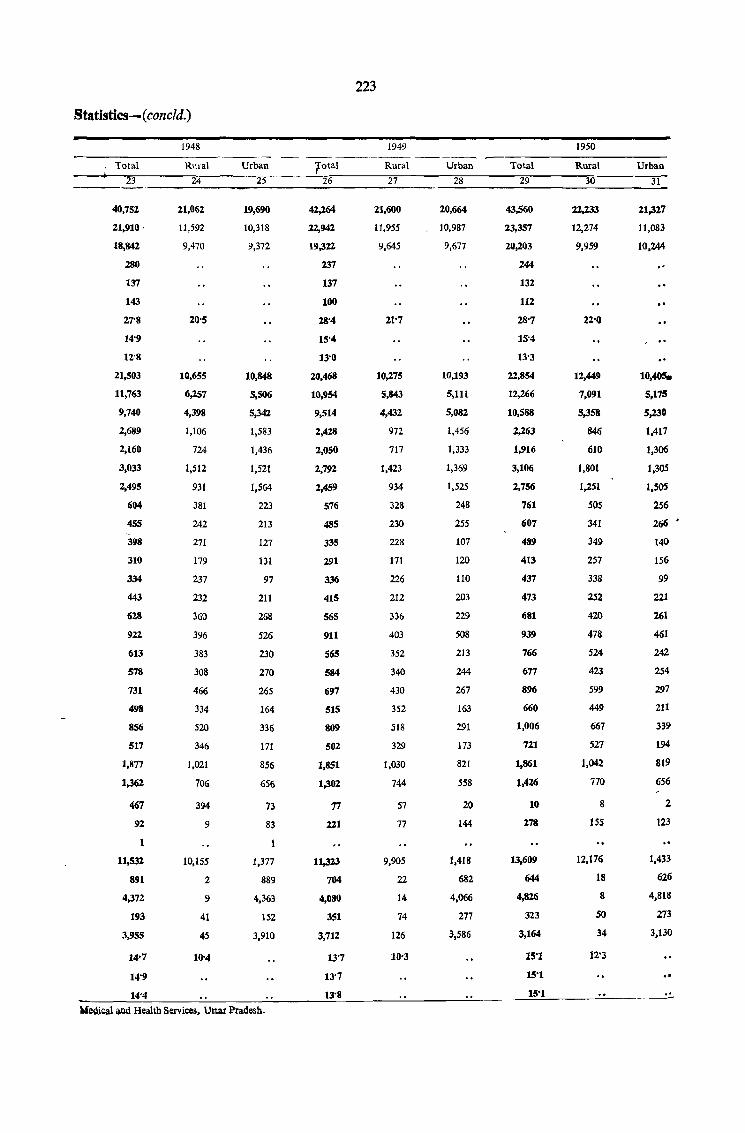
Statistics-(concld,)
Total
40,752
21,910 '
18,842
280
137
143
27'8
14'9
12'8
21,503
11,763
9,740
2,689
2,160
3,033
2,495
604
455
398
310
334
443
628
922
613
578
731
498
856
517
1,877
1,362
467
92
1
11,532
891
4,372
193
3,955
14'7
14'9
14'4
1948
Rural
24
21,062
11,592
9,470
20'S
10,655
6,257
4,398
1,106
724
1,512
931
381
242
271
179
237
232
360
396
383
308
466
334
520
346
1,021
706
394
9
10,155
2
9
41
45
lIN
Urban
25
19,690
10,318
9,372
10,848
5,506
5,342
1,583
1,436
1,521
1,564
223
213
127
131
97
211
268
526
230
270
265
164
336
171
856
656
73
83
1,317
889
4,363
152
3,910
VeQical and Health Services. Uttar Pradesh,
Total
26
42,264
22,942
19,322
237
137
100
28'4
15'4
13'0
20,468
10,954
9,514
2,428
2,050
2,792
2,459
576
485
335
291
336
415
565
911
56S
584
697
515
809
502
1,851
1,302
17
2Z1
11,323
704
4,080
351
3,712
13"7
13'7
13'8
223
1949
Rural
27
21,600
11,955
9,645
10,275
5,843
4,432
972
717
1,423
934
328
230
228
171
226
212
336
403
352
340
430
352
518
329
1,030
744
57
77
9,905
22
14
74
126
10'3
Urban
28
20,664
10,987
9,677
10,193
5,111
5,082
1,456
1,333
1,369
1,525
248
255
107
120
110
203
229
508
213
244
267
163
291
173
821
558
20
144
1,418
682
4,066
277
3,586
Total
29
43,560
23,357
20,203
244
132
112
28'7
15'4
13'3
22,854
12,266
10,588
2,263
1,916
3,106
2,756
761
607
489
413
437
473
681
939
766
677
896
660
1,006
721
1,861
1.4M
10
278
13,609
644
4,826
323
3,164
15'1
15'1
IS'l
1950
Rural
30
22,233
12,274
9,959
12,449
7,091
5,358
846
610
1,801
1,251
50S
341
349
257
338
252
420
478
524
423
599
449
667
527
1,042
770
8
155
12,176
18
8
50
34
12'3
Urban
31
21,327
11,083
10,244
10.40S.
5,175
5,230
1,417
1,306
1,305
1,505
256
266 •
140
156
99
221
261
461
242
254
297
2tl
339
194
819
656
2
123
1,433
626
4,818
273
3,130
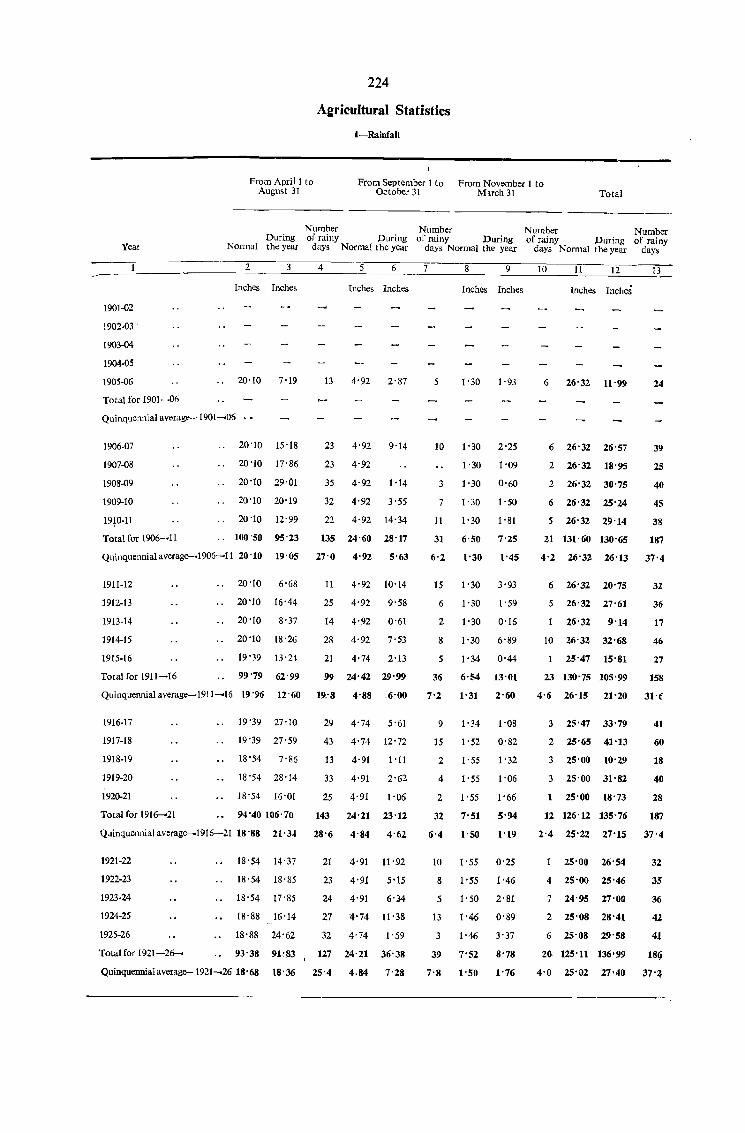
224
AaricuJtural Statistics
I-Rainfall
From April I to August 31
From September I to From November I to October 31 Mlrch 31 Total
Number Number Number Number During of rainy During of rainy During of rainy During of rainy
Year Normal the year days Normal the year days Normal the year days Normal the year days
1901-02
1902·03 .
1903-04
1904·05
1905-06
2
Inches Inches
20'10 7'19
Total for 1901---06
Quinquennial average-1901 ..... 1l6
1906-07
1907-08
1908-09
1909-10
1910-11 , Total for 1906-·11
20'10 15'18
20'10 17'86
20'10 29'01
20'10 20'19
20 '10 12'99
.. 100 '50 95 '23
4 5 6
r nches Inches
13 4'92 2'87
23 4'92 9'14
23 4'92
35 4'92 1'14
32 4'92 3'55
22 4'92 14-34
135 24'60 28-17
Qllinquennialaverage-.1906 ..... 11 20'10 19'05 27'0 4-92 5-63
1911-12
1912-13
1913-14
1914-15
1915-16
Total for 1911~16
20 '10 6'68
20 -10 16-44
20'10 8':n
20-10 18'26
19'39 13'24
99 '79 62'99
II 4-92 10-14
25 4-92 9-58
14 4-92 0'61
28 4-92 7,53
21 4'74 2'13
99 24-42 29'99
Quinquennial average--1911 .... 16 19 '96 12 '60 19:8 4-88 .6-00
1916-17
1917-18
1918-19
1919-20
1920-21
Total for 1916 ..... 21
19-39 27'10
19-39 27-59
18 -54 7-86
18'54 28-14
IS-54 16-01
94-40106-70
29 4-74 5-61
43 4-74 12-72
13 4-91 1-ll
33 4-91 2-62
25 4-91 1-06
143 24-21 23-12
Q.tinqllennial average ..... 1916-21 18 -88 21-34 28-6 4-84 4-62
1921-22
1922-23
1923-24
1924-25
1925-26
Totalfor 1921-26 .....
18-54 14-37
18-54 18-85
18-54 17-85
IS-88 16-14
IS-88 24-62
93-38 91:83
21 4-91 11-92
23 4-91 5'15
24 4-91 6-34
2'1 4'74 11'38
32 4-74 I-59
127 24-21 36-38
Quinquennialaverage-I921-2618-68 18-36 25-4 4-84 7-28
7 8 9
Inches Inches
5 1- 30 1-93
10 1'30 2'25
1-30 1-09
3 1-30 0'60
7 1-30 1'50
11 1-30 1-81
31 6-50 7-25
6-2 1-30 1-45
15 1'30 3'93
6 1-30 I-59
2 1'30 0-16
8
5
1-30 6-89
1'34 0-44
36 6-54 13-01
7'2 1'31 2-60
91-341-08
15 I-52 0-82
2 I-55 1-32
4 1'55 1-06
2 I-55 1-66
32 7-51 5-94
6-4 I-50 1-19
10 I-55 0-25
8 1'55 1-46
5 I-50 2-S1
13 1'46 0'89
3 1-46 3-37
39 7'52 8'78
7-8 I-50 1-76
10 11 12
Inches IncheS
6 26'32 11-99
6 26-32 26-57
2 26-32 18-95
2 26-32 30-75
6 26-32 25'24
5 26'32 21)-14
21 131- 60 130-65
6 26-32 20'75
5 26-32 27-61
26'32 9-14
10 26-32 32'68
25-47 15-81
23 130-75 105'99
13
24
39
25
40
45
38
187
32
36
17
46
27
158
4-6 26-15 21-20 31-1;
3 25-47 33-79
2 25-65 41-13
3 25-00 10-29
3 25-00 31-82
25-00 18-73
12 126-12 135-76
41
60
18
40
28
187
2-4 25-22 27-15 37'4
25-00 26-54
4 25-00 25'46
7 24-95 27'00
2 25-08 28'41
6 25-08 29-58
20 125-11 136'99
32
3S
36
42
41
189
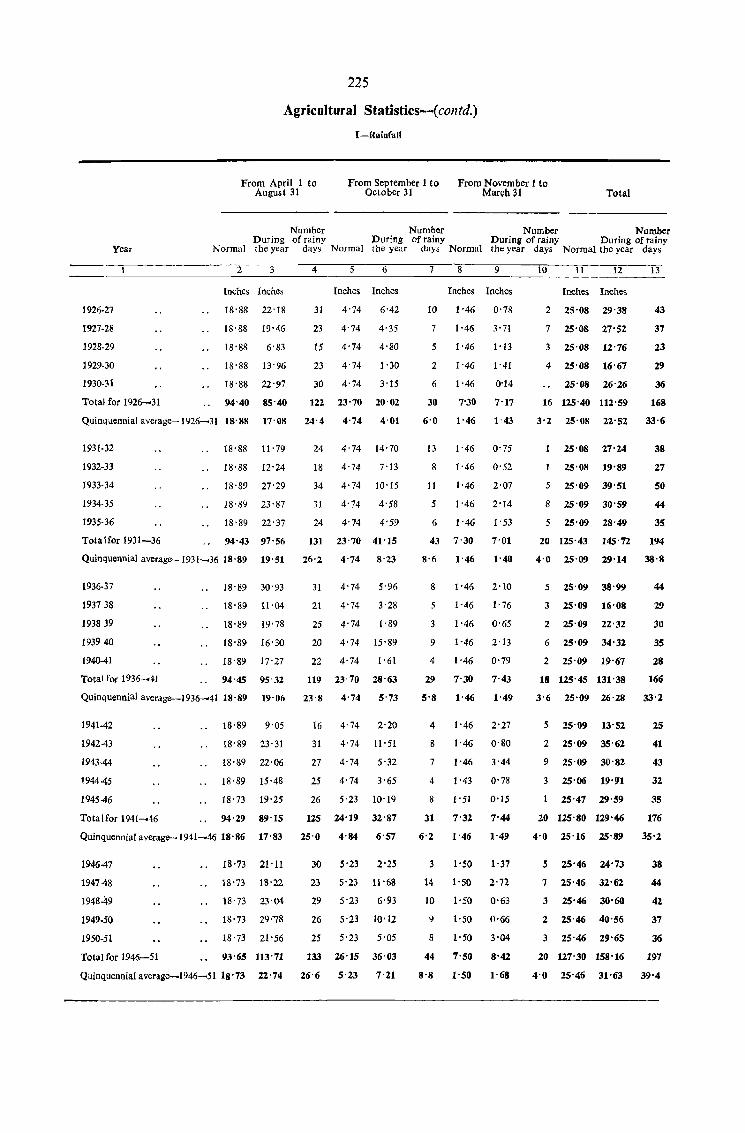
225
Agricultural Statistics--( contd_)
I-Rainfall
From April 1 to August 31
From September 1 to From November 1 to October 31 March 31 Total
Number Number Number Number During of rainy During of rainy During of rainy During of rainy
Normal the year days Normal the year days Normal the year days Normal the year days year
1926·27
1927·28
1928·29
1929-30
1930·31
Total for 1926--31
2
Inches Inches
18-88 22'18
18'88 19'46
18'88 6'83
18'88 13'96
18'88 22'97
94'40 85'40
4 5 6
Inches Inches
31 4'74 6'42
23 4'74 4' 35
15 4'74 4'80
23 4'74 1'30
30 4'74 3'15
122 23'70 20'02
Quinquennial average-1926-31 18'88 17'08 24'4 4'74 4'01
1931,32
1932·33
1933·34
1934·35
1935·36
Tala I for 1931-36
18-88 11'79
18'88 12'24
18-89 27-29
18'89 23-87
18'89 22'37
94'43 97'56
24 4-74 14'70
18 4'74 7'13
34 4-74 10'15
31 4'74 4'58
24 4'74 4-59
131 23-70 41'15
Quinquennial average-1931_36 18'89 19'51 26'2 4'74 8'23
1936·37
193738
193839
193940
1940-41
Total for 1936 .... 41
18'89 30'93
18'89 11'04
18'89 19'78
18'89 16'30
18'89 17-27
94'45 95'32
31 4'74 5'96
21 4'74 3'28
25 4'74 1-89
20 4'74 15'89
22 4-74 1'61
119 23'70 28-63
Quinquennial average-1936 .... 41 18'89 19'06 23'8 4'74 5'73
1941·42
194243
1943-44
194445
194546
Totalfor 1941-46
18'89 9'05
18-89 23'31
18'89 22'06
18'89 15'48
18'73 19'25
94'29 89'15
16 4'74 2'20
31 4'74 11'51
27 4'74 5-32
25 4'74 3'65
26 5 '23 10'19
125 24-19 32'87
Quinquennial average-1941-46 18'86 17'83 25'0 4'84 6'57
194647
194748
1948-49
1949·50
1950·51
Total for 1946-51
18'73 21'11
18-73 18'22
18'73 23'04
18'73 29'78
18'73 21'56
93'65 113-71
30 S'23 2'25
23 5'23 11'68
29 5'23 6-93
26 5'23 10'12
25 5-23 5'05
133 26'15 36'03
Quinquennial avemgc-1946-51 18'73 22-74 26'6 5'23 7'21
7 8 9
Inches Inches
10 1-46 0'78
7 1'46 3'71
5 1'46 1-13
2 1'46 1'41
6 1'46 0'14
30 7'30 7-17
6'0 1'46 1'43
13 1'46 0'75
8 1-46 0'52
11 1'46 2'07
5 1'46 2'14
6 1'46 1'53
43 7'30 7-01
8'6 1'46 1'40
8
5
1-46 2,10
1'46 1'76
3 1'46 0'65
9 1'46 2,13
4 1'46 0'79
29 7'30 7'43
5'8 1'46 1'49
4 1'46 2'27
8 1'46 0'80
7 1'46 3-44
4 1'43 0'78
8 1'51 0'15
31 7'32 7'44
6'2 1'46 1'49
3 1'50 1'37
14 1'50 2'72
10 1'50 0'63
9 1'50 0'66
8 I-50 3-04
44 7-50 8'42
8'8 I-50 1,68
10 1I 12
Inches Inches
2 25'08 29'38
7 25'08 27'52
3 25'08 12'76
4 25'08 16'67
25'08 26'26
16 125'40 112'59
13
43
37
23
29
36
168
3'2 25'08 22'52 33,6
25'08 27'24
25'08 19'89
5 25'09 39'51
8 25'09 30-59
5 25'09 28-49
38
27
50
44
35
20 125'43 145'72 194
4'0 25'09 29'14 38,8
5 25'09 38'99
25'09 16'08
2 25'09 22'32
6 25'09 34'32
2 25'09 19-67
18 125'45 131'38
44
29
30
35
28
166
3'6 25'09 26'28 33'2
5 25'09 13'52
2 25'09 35'62
9 25'09 30'82
3 25-06 19'~1
25'47 29'59
20 125'80 129'46
25
41
43
32
35
176
4-0 25'16 25'89 35'2
5 25'46 24'73
7 25'46 32'62
3 25'46 30'60
2 25'46 40'56
3 25'46 29'65
20 127'30 158'16
38
44
42
37
36
197
4'0 25'46 31'63 39'4
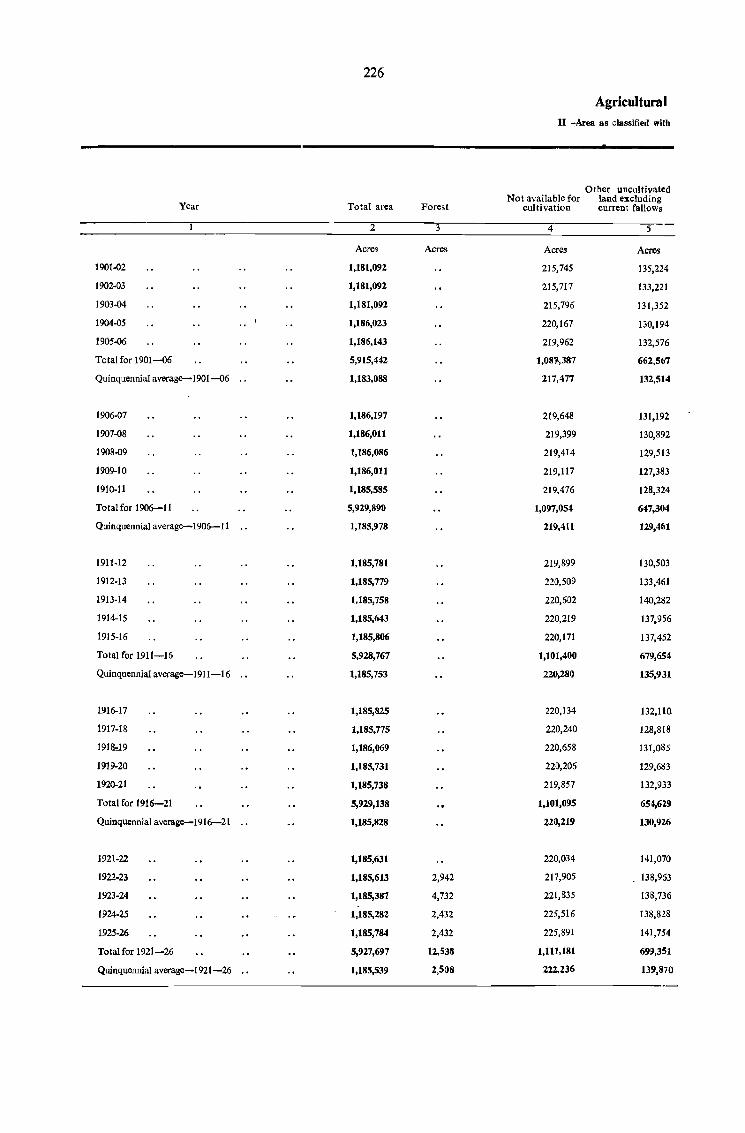
226
Agricultural II -Area as classified with
Other uncultivated Not available for land excluding
Year Total area Forest culti vat ion current fallows
2 3 4 5
Acres Acres Acres Acres
1901-02 1,181,092 215,745 135,224
1902·03 1,181,092 215,717 133,221
1903-04 1,181,092 215,796 131,352
1904·05 1,186,023 220,167 130,194
1905·06 1,186,143 219,962 132,576
Total for 1901--06 5,915,442 1,08~387 662,567
Quinquennial average-1901--06 1,183,088 217,477 132,514
1906-07 1,186,197 219,648 131,192
1907-08 1,186,011 219,399 130,892
1908-09 1,186,086 219,414 129,513
1909-10 1,186,011 219,117 127,383
1910·11 1,185,585 219,476 128,324
Totalfor 1906-11 5,929,890 1,097,054 6"7,30<1
Quinquennial average-1906-11 1,185,978 219,411 129,461
1911-12 1,185,781 219,899 130,503
1912-13 1,185,779 220,509 133,461
1913-14 1,185,758 220,602 140,282
1914-15 1,185,643 220,219 137,956
1915·16 1,185,806 220,171 137,452
Total for 1911-16 5,928,767 1,101,400 679,654
Quinquennial average-1911-16 .. 1,185,753 220,280 135,931
1916·17 1,185,825 220,134 132,110
1917·18 1,185,775 220,240 128,8[8
191&,.19 1,186,069 220,658 131,085
1919·20 1,185,731 220,206 129,683
1920·21 1,185,738 219,857 132,933
Total for 1916-21 5,929,138 1,101,095 654,629
Quinquennial average-1916-2I .. 1,185,828 220,219 130,926
1921·22 1,185,631 220,034 141,070
1922·23 1,185,613 2,942 217,905 138,963
1923·24 1,185,387 4,732 221,835 138,736
1924-25 1,185,282 2,432 225,516 138,828
1925·26 1,185,784 2,432 225,891 141,754
Total for 1921-26 5,927,697 12,538 1,111,181 69)),351
Quinquennial average-1921-26 1,18S,539 2,508 222.236 139,870
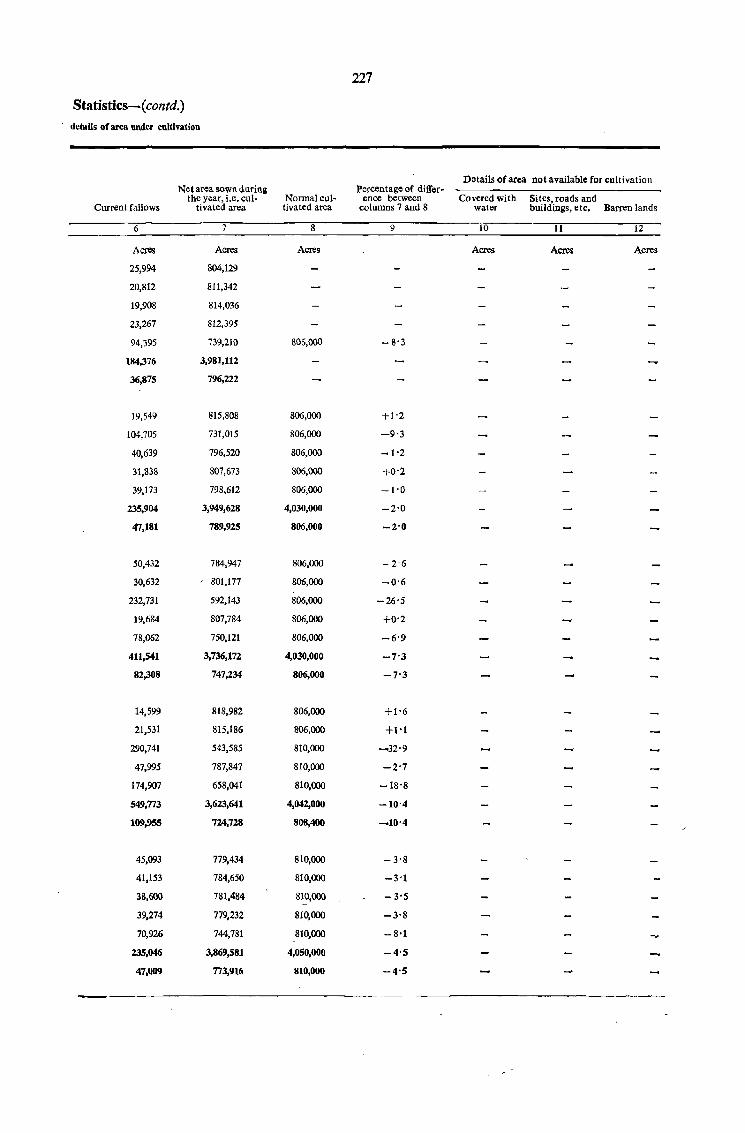
227
Statistics-( contd.) details of area under cultivation
Details of area not available for cultivation Net area sown during Percentage of differ-
the year, i.e. cul- Normal cul- enee between Covered with Si tes, roads and Current fallows ti va ted area tivated area columns 7 and 8 water buildings, etc. Barren lands
6 7 8 9 10 11 12
Acres Acres Acres Acres Acres Acres
25,994 804,129
20,812 811,342
19,908 814,036
23,267 812,395
94,395 739,210 806,000 - 8-3
184,376 3,981,112
36,875 796,222
19,549 815.808 806,000 +1-2
104,705 731,015 806,000 -9-3
40,639 796,520 806,000 -1'2
31,838 807,673 806,000 +0-2
39,173 798,612 806,000 -1'0
235,904 3,949,628 4,030,000 -2-0
47,181 789,925 806,000 -2-0
50,432 784,947 806,000 -2-6
30,632 ' 801,177 806,000 -0-6
232,731 592,143 806,000 -26-5
19,684 807,784 806,000 +0-2
78,062 750,121 806,000 -6'9
411,541 3,736,172 4,030,000 -7-3
82,308 747,234 806,000 -7'3
14,599 818,982 806,000 +1'6
21,531 815,186 806,000 +1-1
290,741 543,585 810,000 -32'9
47,995 787,847 810,000 -2'7
174,907 658,041 810,000 -18'8
549,773 3,623,641 4,042,000 -10'4
109,955 724,728 808,400 --10'4
45,093 779,434 810,000 -3'8
41,153 784,650 810,000 -3'1
38,600 781,484 810,000 - 3'S
39,274 779,232 810,000 -3-8
70,926 744,781 810,000 -8,1
235,046 3,869,581 4,050,000 -4-5
47,009 773,916 810,000 -4-5
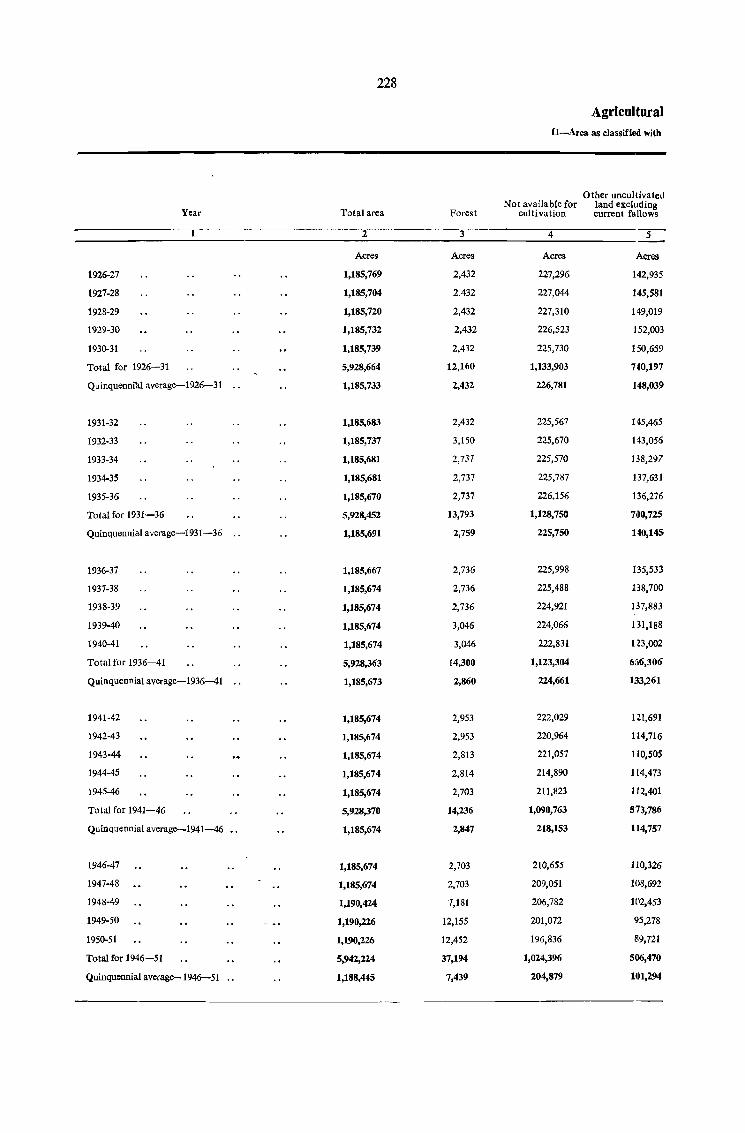
228
Agricultural [I-Area as classified with
Other uncultivated Not available for land excluding
Year Total area Forest cultivation current fa llows
2 3 4 -5-
Acres Acres Acres Acres
1926-27 1,185,769 2,432 227,296 142,935
1927-28 1,185,704 2,432 227,044 145,581
1928-29 1,185,720 2,432 227,310 149,019
1929-30 1,185,732 2,432 226,523 152,003
1930-31 1,185,739 2,432 225,730 150,659
Total for 1926-31 5,928,664 12,160 1,133,903 "0,197
Quinquennful average-1926-31 1,185,733 2,432 226,781 148,039
1931-32 1,185,683 2,432 225,567 145,465
1932-33 1,185,737 3,150 225,670 W,056
1933-34 1,185,681 2,737 225,570 138,297
1934-35 1,185,681 2,737 225,787 137,631
1935-36 1,185,670 2,737 226,156 136,276
Totalfor 1931-36 5,928,452 13,793 1,128,750 700,725
Quinquennial average-1931-36 1,185,691 2,759 225,750 HO,I45
1936-37 1,185,667 2,736 225,998 135,533
1937-38 1,185,674 2,736 225,488 138,700
1938-39 1,185,674 2,736 224,921 137,883
1939-40 1,185,674 3,046 224,066 131,188
1940-41 1,185,674 3,046 222,831 1 ~3,002
Total for 1936-41 5,928,363 14,300 1,123,304 656,306
Quinquennial average-1936-41 1,185,673 2,860 224,661 133,261
1941-42 1,185,674 2,953 222,029 121,691
1942-43 1,185,674 2,953 220,964 114,716
1941-44 1,185,674 2,813 221,057 1 (0,505
1944-45 1,185,674 2,814 214,890 114,473
1945-46 1,185,674 2,703 211,823 112,401
Total for 1941-46 5,928,370 14,236 1,090,763 573,786
Quinquennial average--1941-46 1,185,674 2,847 218,153 114,757
1946-47 1,185,674 2,703 210,655 110,326
1947-48 1,185,674 2,703 209,051 108,692
1948-49 1,190,424 7,181 206,782 102,453
1949-50 1,190,226 12,155 201,072 95,278
1950-51 1,190,226 12,452 196,836 89,721
Total for 1946-51 5,942,224 37,194 1,024,396 506,470
Quinquennial average-1946-51 .. 1,188,445 7,439 204,879 101,294
229
Statistics-(contd.) details of area under eultintiCMI-(concld.)
Delails of arca nol avmlable for cultivation
Net area sown dunnl' Percentage of diffcr-Covered with the year, i.e.cul- Normal cul- eRee between Sites. roads and
Current fallows tivated area It vated area columns 7 and 8 water buildings, etc. Barren lands
6 7 8 9 10 11 12
Acres Acres Acres Acres Acres Acres
46,706 766,400 810,000 -5'4
51,578 759,069 810,000 -6'3
44,853 762,106 810,000 -5'9 30,544 37,611 159,155
85,855 718,919 810,000 -11'2 29,626 37,698 159,199
34,515 772,403 810,000 -4'6 29,772 37,507 158,451
263,507 3,778,897 4,050,000 -6'7
52,70~ 755,779 810,000 -6'7
27,039 785,180 796,000 -1'4 29,856 37,754 157,957
35,917 777,944 796,000 -2'3 30,060 37,789 157,821
22,043 797,034 765,000 +4-2 30,53& 37,&19 157,213
60,183 759,343 765,000 -0-7 30,570 37,907 157,310
41,969 778,532 765,000 +1-8 30,515 37,901 157,740
187,151 3,898,033 3,887,000 +0'3 151,539 189,170 788,041
37,430 779,607 777,400 +0-3 30,308 37,834 157,608 •
35,914 785,486 765,000 +2-7 30,430 38,034 157,534
65,129 753,621 765,000 - 1-5 30,111 38,084 157,293
51,473 768,661 765,000 +0-5 30,087 38,149 156,685
16,378 810,996 765,000 +6'0 29,646 38,170 156,250
19,584 817,211 765,000 +6'8 29,486 38,164 155,18~
188,478 3,935,975 3,825,000 +2'9 149,760 190,601 782,943
37,696 787,195 765,000 +2'9 29,952 38,120 156,5119
93,943 74.5,058 765,000 -2'6 29,245 37,842 154,942
22,777 824,264 765,000 +7'" 29,166 38,134 153,664
30,960 820,339 765,000 +7'2 29,235 38,923 152,899
30,814 822,683 765,000 +7'5 29,329 38,49S 147,063
25,477 833,270 765,000 +8'9 28,949 38,561 144,313
203,971 4,045,614 3,825,000 +5-8 145,924 191,958 752,881
40,794 809,123 765,000 +S'8 29,185 38,392 150,576
35,047 826,943 765,000 +8'1 28,926 38,094 143,635
28,377 836,851 765,000 +9'4 29,034 38,149 141,868
28,207 845,801 798,000 +6'0 28,865 38,079 139,838
26,947 854,774 798,000 +7'1 28,545 38,325 134,202
28,084 863,133 798,000 +8'2 28,432 38,341 130,063
146,662 4,227,502 3,924,000 +7'7 J43,802 190,988 689,606
29,332 845,5IH 784,800 +7'7 28,760 38,198 137,921
1901·02
1902-03
1903-04
1904-05
1905·06
Year
Total for 1901-(}6
Quinquennial average -1901-06
1906-07
1907-08
1908-09
1909-10
1910-11
Total for 1906-11
Quinquennial average--<I906-II
1911-12
1912-13
1913-14
1914-15
1915-16
Total for 1911-16
Quinquennial average-1911-16
1916-17
1917-18
1918·19
1919-20
1920-21
Total for 1916-21
Quinquennial average-1916-21
1921-22
1922·23
1923-24
1924-25
1925-26
Total for 1921-26
Quinquennial average-1921-26
Total
2
Acres
61
56
86
63
55
7
267
53
6
15
10
12
23
66
13
51
42
28
36
36
193
39
29
144
137
- 7
15
332
67
Early
Irrigated
3
Acres
8
40
8
9
2
67
13
3
2
6
12
2
3
20
9
11
44
9
10
5
3
18
4
230
Total
4
Acres
80
80
82
67
51
15
295
59
5
30
18
HI
54
125
25
100
60
14
23
22
219
44
5
9
10
8
24
56
11
Rice
Late
Irrigated
5
Acres
27
26
11
11
4
79
16
2
6
17
8
26
59
12
16
5
7
10
11
49
10
2
6
11
2
Total
6
Acres
233
150
81
174
141
779
156
136
168
130
106
22
562
112
11
45
28
30
77
191
38
151
102
42
59
58
412
83
34
153
147
15
39
388
78
Total
Agricultura] ill-Cropped
Irrigated
7
Acres
35
66
19
20
~
146
19
3
6
20
10
32
71
14
19
6
27
19
22
93
19
12
6
9
29
6
Wheat
Total
8
Acres
101,608
98,747
112,378
108,414
77,867
499,014
99,803
99,010
63,289
73,998
95,713
112,433
444,443
88,889
100,916
107,718
70,221
95,273
71,849
445,977
89,196
84,064
98,602
43,048
83,351
73,276
382,341
76,468
80,519
93,924
102,584
102,924
102,849
482,800
96,560
Statistics-{ contd.}
Area
Irrigated
9
Acres
89,246
61,189
60,850
85,854
94,765
391,904
78,381
82,682
93,044
68,999
81,597
67,462
393,784
78,757
71,175
78,798
42,208
70,113
70,340
332,634
66,527
70,460
83,229
86,947
75,409
93,688
409,733
81,947
Total
10
Acres
77,725
88,301
123,156
102,210
82,446
473,844
94,769
78,250
103,583
91,819
95,511
107,548
476,711
95,342
152,363
98,982
94,206
100,676
110,515
556,742
111,348
118,094
142,699
69,261
73,955
68,441
472,450
94,490
83,248
81,246 "
97,416
100,347
81,710
443,967
88,793
Barley Juar Bajra
Irrigated Total Total
11 12 13
Acres Acres Acres
50,350
101,085
66,113
61,718
45,091
324,357
64,871
40,976
48,937
93,549
55,839
85,631
324,932
64,986
61,108
63,407
68,549
45,403
65,454
304,521
60,904
44,778
41,027
34,030
22,631
44,802
181,268
37,454
108,010 170,591
114,092
114,440
86,838
95,002
518,382
103,676
118,603
84,809
78,644
96,671
88,538
467,265
93,453
56,605
94,842
77,178
81,874
79,200
389,699
77,940
88,686
78,844
62,511
88,264
81,261
399,566
71>,913
79,805
94,932
91,779
97,742
77,498
441,756
8'1,351
181,802
ISO,98S
155,836
166,787
856,001
171,200
190,657
173,493
190,214
179,480
167,255
901,099
180,220
142,075
182,460
136,391
210,108
218,008
889,042
177,808
20<),200
177,097
206,397
205,280
178,671
976,645
195,329
229,903
191,758
177,838
85,706
128,302
813,507
162,701
231
Mandua
Total
14
Acres
205
181
135
64
297
882
176
378
144
219
66
19
826
165
14
22
to
147
195
388
78
77
40
7
113
26
263
53
74
13
14
2
2
lOS
21
Kodon
Total
15
Acres
2,407
2,636
392
4,970
8
2
10
2
4
6 •
1
2
3
1
Sawan
Total
16
Acres
227
428
1,087
466
146
2,354
471
4
246
69
1,173
1,513
3,OOS
601
624
11
19
264
19
937
188
118
61
21
11
10
221
44
Total
17
Acres
9,250
8,599
2,554
6,493
6,487
33,383
6,677
8,403
7,816
9,151
9,013
4,466
38,489
7,770
1,179
6,661
6,006_
7,439
9,864
31,149
6,230
11,819
8,285
2,291
8,875
7,206
38,476
7,695
6,676
3,969
3,426
3,521
4,631
22,223
4,445
Maize
Irrigated
18
1,299
4,118
677
4,909
1,160
12,163
2,433
979
537
3,536
3,406
4,083
12,541
2,508
2,381
1,518
1,746
2,351
2,811
10,807
2,161
1,460
1,021
659
183
384
3,701
741
Year
--------------------
1926-27
1927·28
1928·29
1929·30
1930·31
Total for 1926-31
Quinquennial average-1926-31
1931·32
1932·33
1933·34
1934·35
1935·36
Total for 1931-36
Quinquennial average-·1931-36
1936-37
1937-38
1938·39
1939-40
1940-41
Total for 1936-41
Quinquennial average-1936-41
1941-42
1942-43
1943-44
1944-45
1945-46
Total for 1941-46
Quinquennial ayerage~1941-46
1946-47
1947-48
1948-49
1949·50
1950-51
Total for 1946-51
Quinquennial average-19-t6-51
Total
2
Acres
33
28
42
22 _
,R
163
33
22
20
15
28
3R
123
24
25
31
36
24
19
.13S
27
8
14
37
26
30
115
23
59
96
127
122
445
849
170
Early
23l
Irrigated
Acres
3
24
7
22
57
11
I)
3
4
5
19
4
3
9
14
3
2
4
9
5
II
31
6
15
34
15
J2
65
161
32
Rice
Total
4
31
30
15
12
2'1
ll1
22
22
20
10
32
24
108
22
14
7
10
23
12
66
13
13
12
7
14
14
60
12
19
17
27
29
99
191
38
Late
Irrigated
5
Acres
11
16
6
6
11
50
10
6
2
6
2
17
3
2
3
3
2
10
2
2
2
2
14
3
6
6
3
5
tI
31
6
Agricultural III-Cropped
Wheat
Total
Total Irrigated Total
----c6--------~7.--------8-
Acres Acres
64 12
58 19
57 30
34 13
61 33
274 107
55 21
44
40
25
60
62
231
46
39
38
46
47
31
201
40
21
26
44
40
44
175
35
7R
Il3
154
151
544
1,040
208
12
5
2
10
7
36
7
5
4
12
2
24
5
4
6
12
10
13
45
9
21
40
18
37
76
192
38
Acres
97,386
103,455
115,543
81,377
90,669
488,430
97,686
96,346
92,634
105,130
85,091
86,777
465,978
93,196
97,526
115,554
113,982
121,360
121,026
569,448
113,890
93,132
103,599
107,288
102,459
113,592
520,070
104,014
115,065
107,546
115,243
130,140
134,592
602,586
120,517
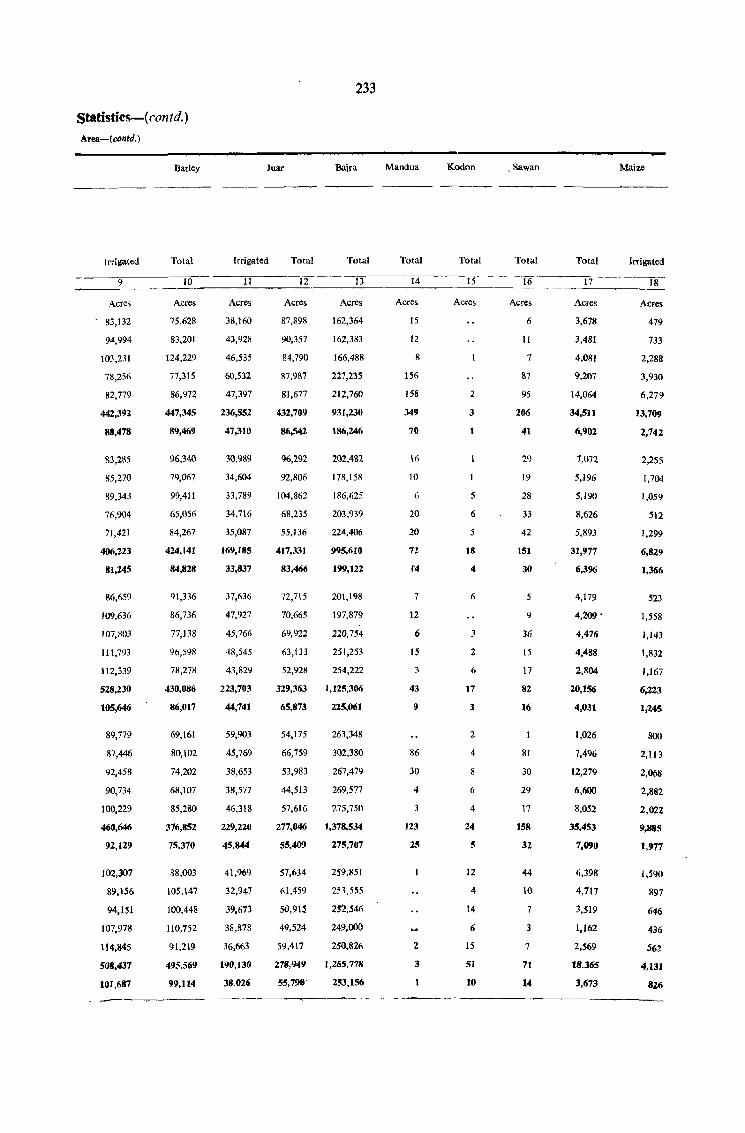
Statistics-{ contd.)
Area-{contd.)
Irrigated
9
Acres
, 83,132
94,994
103,231
78,256
82,779
442,392
88,478
83,285
85,270
89,343
76,904
71,421
406,223
81,245
86,659
109,636
107,803
111,793
112,339
528,230
105,646
89,779
87,446
92,458
90,734
100,229
460,646
92,129
102,307
89,156
94,151
107,978
114,845
SO',437
101,687
Barley
Total
10
Acres
75,628
83,201
124,229
77,315
86,972
447,345
89,469
96,340
79,067
99,411
65,056
84,267
424,141
84,828
91,336
86,736
77,138
96,598
78,278
430,086
86,017
69,161
80,102
74,202
68,107
85,280
376,852
75,370
88,003
105,147
100,448
110,752
91,219
495,569
99,114
Juar
Irrigated Total
11 12
Acres Acres
38,160
43,928
46,535
60,532
47,397
236,552
47,310
30,989
34,604
33,789
34,716
35,087
169,185
33,837
37,636
47,927
45,766
48,545
43,829
223,703
44,741
59,903
45,769
38,653
38,577
46,318
229,220
45,844
41,969
32,947
39,673
38,878
36,663
190,130
38,026
87,898
90,357
84,790
87,987
81,677
432,709
86,542
96,292
92,806
104,862
68,235
55,136
417,331
83,466
72,715
70,665
69,922
63,133
52,928
329,363
65,873
54,175
66,759
53,983
44,513
57,616
277,046
55.409
57,634
61,459
50,915
49,524
59,417
278,949
55,7911'
233
Bajra
Total
13
Acres
162,364
162,383
166,488
221,235
212,760
931,230
186,246
202,482
178,158
186,625
203,939
224,406
995,610
199,122
201,198
197,879
220,754
251,253
254,222
- 1,125,306
225,061
263,348
302,380
267,479
269,577
275,750
1,378,534
275,707
259,851
253,555
252,546
249,000
250,826
1,265,778
253,156
Mandua
Total
14
Acres
15
12
8
156
158
349
70
Hi
10
6
20
20
72
14
1
12
6
15
43
9
86
30
4
3
123
25
2
3
Kodon , Sawan Maize
--_ -~~- ---------
Total
15
Acres
2
3
5
6
5
18
4
6
3
2
6
17
3
2
4
8
6
4
24
5
12
4
14
6
15
51
10
Total
16
Acres
6
11
7
81
95
206
41
29
19
28
33
42
151
30
5
9
36
15
17
82
16
81
30
29
17
158
32
44
10
7
3
7
71
14
Total
17
Acres
3,678
3,481
4,081
9,207
14,064
34,511
6,902
7,012
5.196
5,190
8,626
5,893
31,977
6,396
4,179
4,209 .
4,476
4,488
2,804
20,156
4,031
1,026
7,496
12,279
6,600
8,052
35,453
7,090
6,398
4,717
3,519
1,162
2,569
18,365
3,673
Irrigated
18
Acres
479
733
2,288
3,930
6,279
13,709
2,742
2,255
1,704
1,059
512
1,299
6,829
1,366
523
1,558
1,143
1,832
1,167
6,223
1,145
800
2,113
2,068
2,8112
2,022
9,885
1,977
1,590
897
646
436
562
4,131
826
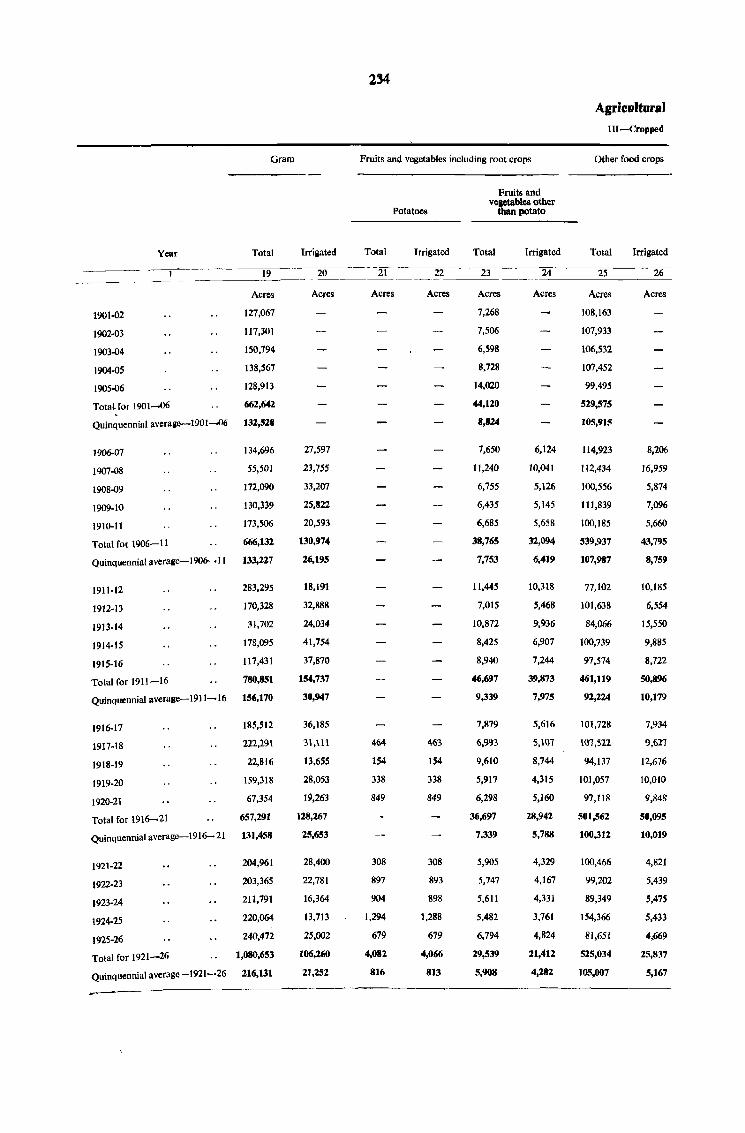
Gram
Year Total Irriaated
Fruits and vegetables including root crops
Potatoes
Total Irrigated
Fruits and veaetables other
than potato
Total Irrigated
24 ______ -----r----~---:1~9-- 20 --zr-- 22 23 - -------- ----- - ----'---
Acres
1901-02 127,067
1902.03 117,301
1903-04 150,794
1904-05 138,567
1905-06 128,913
TotaL for 1901-06 662,642 , Quinquennial averalle-1901-06 132,528
1906-07 134,696
1907-08 55,501
1908.09 172,090
1909.10 130,339
1910-11 173,506
Total for 1906-11 666,132
Quinquennial averalle-I906-11 133,227
1911-12 283,295
1912-13 170,328
1913-14 31,702
1914.15 178,095
1915.16 117,431
Total for 1911-16 780,851
Quinquennial average-1911-16 156,170
1916-17 185,512
1917-18
1918-19
1919-20
1920-21
221,191
22,816
159,318
67,354
Total for 1916-21 657,291
Quinquennial average-1916-21 131,458
1921.22 204,961
1922-23 203,365
1923.24 211,791
1924.25 220,064
1925.26 240,472
Total for 1921-26 1,080,653
Quinquennial average-1921-26 216,131
Acres
27,597
23,755
33,207
25,822
20,593
130,974
26,195
18,191
32,888
24,(}34
41,754
37,870
154,737
30,947
36,185
31,111
13,655
28,053
19,263
128,267
25,653
28,400
22,781
16,364
13,713
25,002
106,UO
21,252
~--------------~----
Acres
464
154
338
849
308
897
904
1,294
679
4,082
816
Acres
463
154
338
849
308
893
898
1,288
679
4,066
813
Acres
7,268
7,506
6,598
8,728
14,020
44,120
8,824
7,650
11,240
6,755
6,435
6,685
38,765
7,753
11,445
7.015
10,872
8,425
8,940
<46,697
9,339
7,879
6,993
9,610
5,917
6,298
36,697
7,339
5,905
5,747
5,611
5,482
6,794
29,539
5,908
Acres
6,124
10,041
5,126
5,145
5,658
32,094
6,419
10,318
5,468
9,936
6,907
7,244
39,873
7,975
5,616
S,lln
8,744
4,315
5,160
28,942
5,788
4,329
4,167
4,331
3,761
4,824
21,412
4,282
Agricultural nr~Cropped
Other food crops
Total
25
Acres
108,163
107,933
106,532
107,452
99.495
529,575
105,915
114,923
112,434
100,556
111,839
100,185
539,937
107,987
77,102
101,638
84,066
100,739
97,574
461,119
92,224
101,728
\{}7,522
94,137
101,057
97,118
501,562
100,312
100,466
99,202
89,349
154,366
81,651
525,034
105,007
Irrigated
--26
Acres
8,206
16,959
5,874
7,096
5,660
43,795
8,759
10,185
6,554
15,550
9,885
8,722
50,896
10,179
7,934
9,627
12,676
10,010
9,848
50,095
10,019
4,821
5,439
5,475
5,433
4,669
25,837
5,167
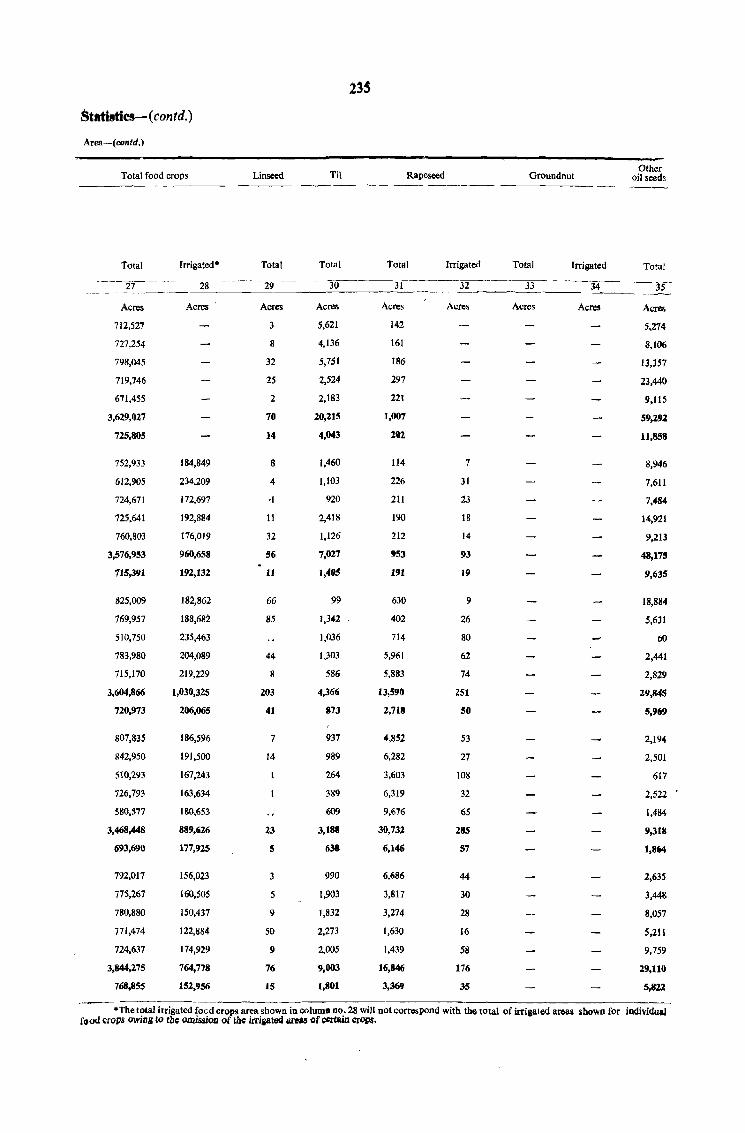
Statistics-(contd.)
Area-(contd.)
Total food crops Linseed
Total frrigated· Total
----2-7------ 28 29 _._--- --_.
Acres Acres Acres
712,527 3
727,254 8
798,045 32
719,746 25
671,455 2
3,629,027 70
725,805 14
752,933 184,849 8
612,905 234,209 4
724,671 172,697 ·1
725.641 192,884 11
760,803 176,019 32
3,576,953 960,658 56
715,391 192,132 11
825,009 182,862 66
769,957 188,682 85
510,750 235,463
783,980 204,089 44
715,170 219,229 8
3,604,866 1,030,325 203
720,973 206,065 41
807,835 186,596 7
842,950 191,500 14
510,293 167,243
726,793 163,634
580,577 180,653
3,468,448 889,626 23
693,690 177,925 5
792,017 156,023
775,267 160,505 5
780,880 150,437 9
771,474 122,884 50
724,637 174,929 9
3,844,275 764,778 76
768,855 152,956 15
235
Til Rapeseed
Total Total
-----30--~-31
Acres Acres
5,621 142
4,136 161
5,751 186
2,524 297
2,183 221
20,215 1,007
4,043 202
1,460 114
1,103 226
920 211
2,418 190
1,126 212
7,027 '53
1,405 191
99 630
1,342 402
1,036 714
1,303 5,961
586 5,883
4,366 13,590
873 2,718
937 4,852
989 6,282
264 3,603
389 6,319
609 9,676
3,188 30,732
638 6,146
990 6,686
1,903 3,817
1,832 3,274
2,273 1,630
2,005 1,439
9,003 16,846
1,801 3,369
Groundnut
Irrigated Total Irrigated
32 33 34
Acres Acres Acres
7
31
23
18
14
93
19
9
26
80
62
74
251
50
53
27
108
32
65
285
57
44
30
28
16
58
176
35
Other oil seeds
Total
35
Acres
5.,274
8,106
13,357
23,440
9,115
59,292
11,858
8,946
7,611
7,484
14,921
9,213
48,175
9,635
18,884
5,631
60
2,441
2,829
29,845
5,969
2,194
2,501
617
2,522
1,4114
9,318
1,864
2,63S
3,448
8,057
5,211
9,759
29,110
5,m
·The total irrigated foed crops area shown in column no. 28 will not correspond with t~ total of irrigated areas shown for individual fllad cropS owinB to the omission of the irrij!&ted are£S of certain crops.
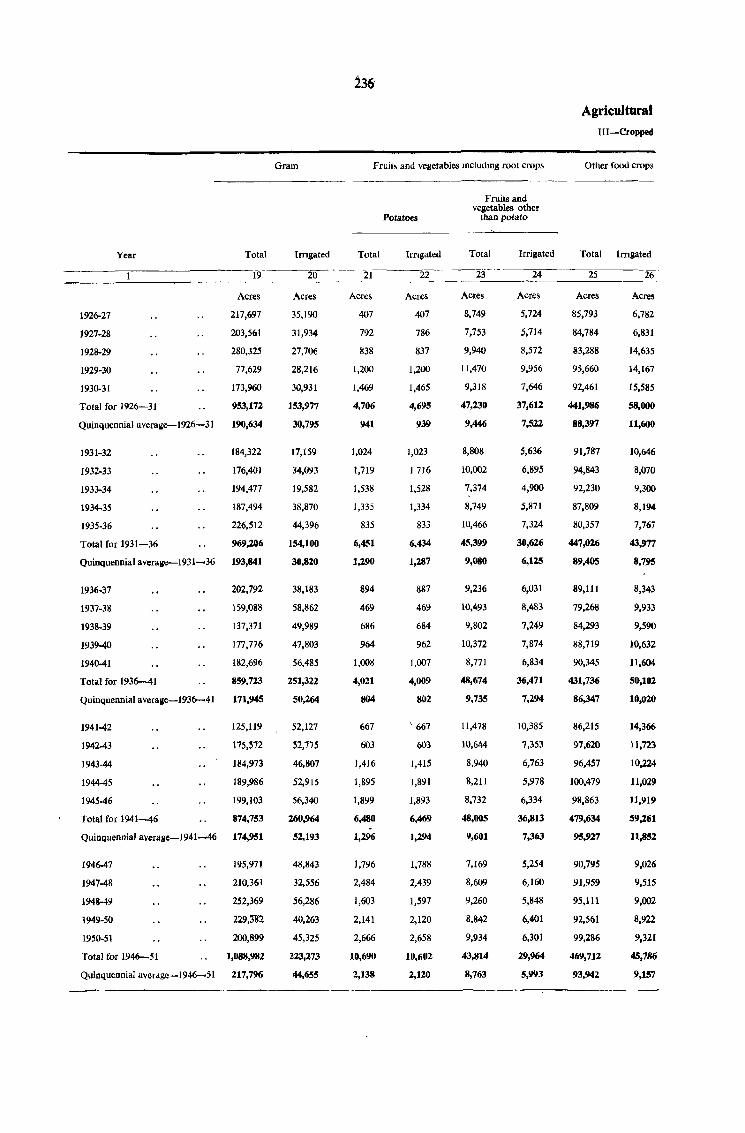
Year Total
19
Acres
1926-27 217,697
1927.28 203,561
1928-29 280,325
1929-30 77,629
1930-31 173,960
Total for J926-31 953,172
Quinquennial averalle-1926-3J 190,634
1931·32 184,322
1932-33 176,401
1933.34 194,477
1934.35 ill7,494
1935·36 226,512
Total for 1931-36 969,206
Quinquennial averaae-i931-36 193,841
1936-37 202,792
1937-38 159,088
1938.39 137,371
1939-40 177,776
1940-41 ill2,696
Total for 193&-41 859.723
Quinquennial average-1936-41 171,945
1941-42 125,119
1942...43 175,572
1943·44 184,973
1944·45 189,986
1945·46 199,103
Total for 1941-46 874,753
Quinquennial aYerage-1941-46 174,951
1946-47 195,971
1947.48 210,361
1948·49 252,369
1949-50 229,182
1950·51 200,899
Total for 194&-51 1,088,982
Quinquennial averdgc-1946-51 217,7%
Gram
Irngated
20
Acres
35,190
31,934
27,706
28,216
30,931
153,977
30,795
17,159
34,093
19,582
38,870
44,396
154,100
30,820
38,183
58,862
49,989
47,803
56,485
251,322
50,264
52,127
52,775
46,807
52,915
56,340
260,964
52,193
48,843
32,556
56,286
40,263
45,325
223,273
44,655
Fruit~ and vegetables Includmg root crops
Total
21
Acres
407
792
838
1,200
1,469
4,706
941
1,024
1,719
1,538
1,335
835
6,451
1,290
894
469
686
964
1,008
4,021
804
667
603
1,416
1,895
1,899
6,480
1,296
1,796
2,484
1,603
2,141
2,666
10,690
2,138
Potatoes
Irngated
22
Acres
407
786
837
1,200
1,465
4,695
939
1,023
1716
1,528
1,334
833
6,434
1,287
887
469
684
962
1,007
4,009
802
\ 667
603
1,415
1,891
1,893
6,469
1,294
1,788
2,439
1,597
2,120
2,658
10,602
2,120
Fruits and vegetables other
than potato
Total
23
Acres
8,749
7,753
9,940
11,470
9,318
47,230
9,446
8,808
10,002
7,374
8,749
10,466
45,399
9,0lI0
9,236
10,493
9,802
10,372
8,771
48,674
9,735
11,478
10,644
8,940
8,211
8,732
48,005
9,601
7,169
8,609
9,260
8,842
9,934
43,814
8,763
Irrigated
24
Acres
5,724
5,714
8,572
9,956
7,646
37,612
7,522
5,636
6,895
4,900
5,871
7,324
30,626
6,125
6,031
8,483
7,249
7,874
6,834
36,471
7,294
10,385
7,353
6,763
5,978
6.334
36,813
7,363
5,254
6,160
5,848
6,401
6,301
29,964
5,993
Agricultural III-Cropped
Other food crops
Total Irngated
25
Acres
85,793
84,784
83,288
95,660
92,461
441,986
88,397
91,787
94,843
92,230
87,809
liU,357
447,026
89,405
89,111
79,268
84,293
88,719
90,345
431,736
86,347
86,215
97,620
96,457
100,479
98,863
479,634
95,927
90,795
91,959
95,111
92,561
99,286
469,712
93.942
26
Acres
6,782
6,831
14,635
14,167
15,585
58,000
11,600
10,646
8,070
9,300
8,194
7,767
43,977
8,795
8,343
9,933
9,590
10,632
11,604
50,102
10,020
14,366
11,723
10,224
11,029
11,919
59,261
11,,852
9,026
9,515
9,002
8,922
9,321
45,786
9,157
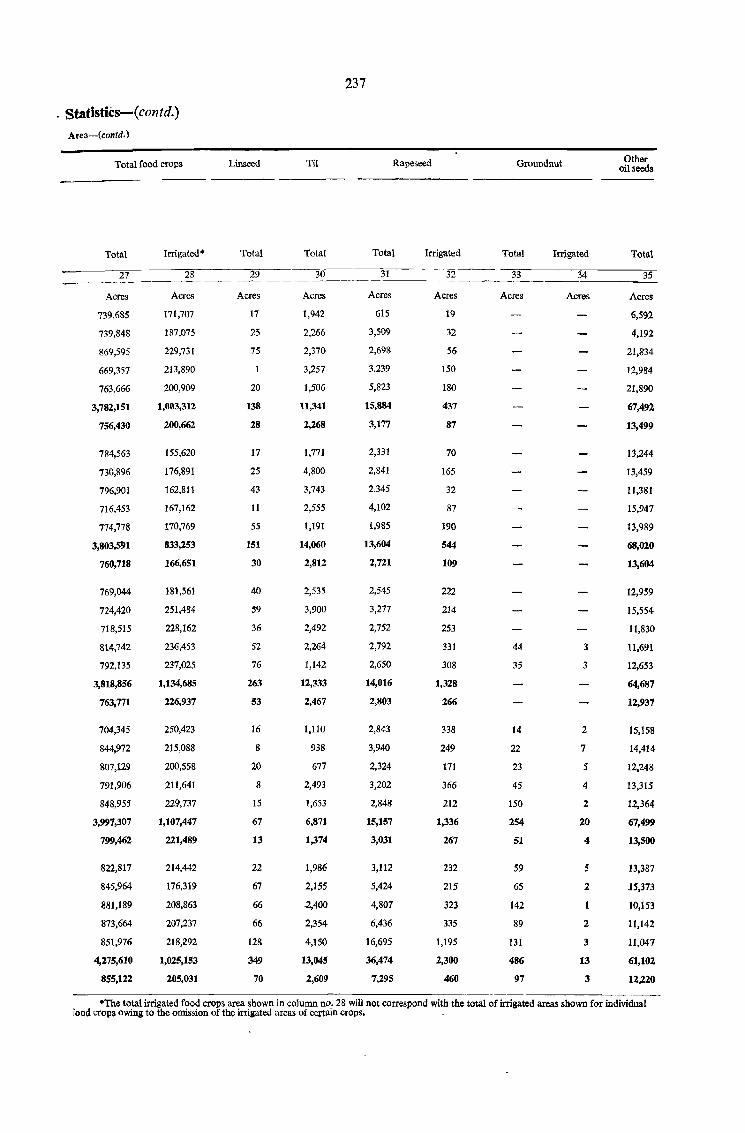
Statistics-(contd.) Area-(contd. )
Total food crops Linseed Til
-------------------
Total
27
Acres
739,685
739,848
869,595
669,357
763,666
3,782,151
756,430
784,563
730,896
796,901
716,453
774,778
3,803,591
760,718
769,044
724,420
718,515
814,742
792,135
3,818,856
763,771
704,345
844,972
807,129
791,906
848,955
3,997,307
799,462
822,817
845,964
881,189
873,664
851,976
4,275,610
855,122
Irrigated" Total
_2-'-8 ____ . 29
Acres
171,707
187,075
229,731
213,890
200,909
1,003,312
200,662
155,620
176,891
162,811
167,162
170,769
833,253
166,651
181,561
251,484
228,162
236,453
237,025
1,134,685
226,937
250,423
215,088
200,558
211,641
229,737
1,107,447
221,489
214,442
176,319
208,863
207,237
218,292
1,025,153
205,031
Acres
17
25
75
20
138
28
17
25
43
11
55
151
30
40
59
36
52
76
263
53
16
8
20
8
15
67
13
22
67
66
66
128
349
70
Total
30
Acres
1,942
2,266
2,370
3,257
1,506
11,341
2,268
1,771
4,800
3,743
2,555
1,191
14,060
2,812
2,535
3,900
2,492
2,264
1,142
12,333
2,467
1,110
938
677
2,493
1,653
6,871
1,374
1,986
2,155
-2,400
2,354
4,150
13,045
2,609
237
Rapeseed
Total
31
Acres
615
3,S(),)
2,698
3,239
5,823
15,884
3,177
2,331
2,841
2,345
4,102
1,985
13,604
2,721
2,545
3,277
2,752
2,792
2,650
14,016
2,803
2,843
3,940
2,324
3,202
2,848
15,157
3,031
3,112
5,424
4,807
6,436
16,695
36,474
7,295
Irrigated
32
Acres
19
32
56
150
180
437
87
70
165
32
87
190
544
109
222
214
253
331
308
1,328
266
338
249
17l
366
212
1,336
267
232
215
323
335
1,195
2,300
460
Groundnut
Total
33
Acres
44
35
14
22
23
45
150
254
51
59
65
142
89
131
486
97
Irrigated
34
Acres
3
3
2
7
5
4
2
20
4
5
2
2
3
13
3
Other oil seeds
Total
35
Acres
6,592
4,192
21,834
12,984
21,890
67,492
13,499
13,244
13,459
11,381
15,947
13,989
68,020
13,604
12,959
15,554
11,830
11,691
12,653
64,687
12,937
15,158
14,414
12,248
13,315
12,364
67,499
13,500
13,387
15,373
10,153
11,142
11,047
61,102
12,220
*The total irrigated food crops area shown in column no. 28 will not correspond with the total of irrigated areas shown for individual rood crops owing to the omission of the irrigated areas of certain crops. -
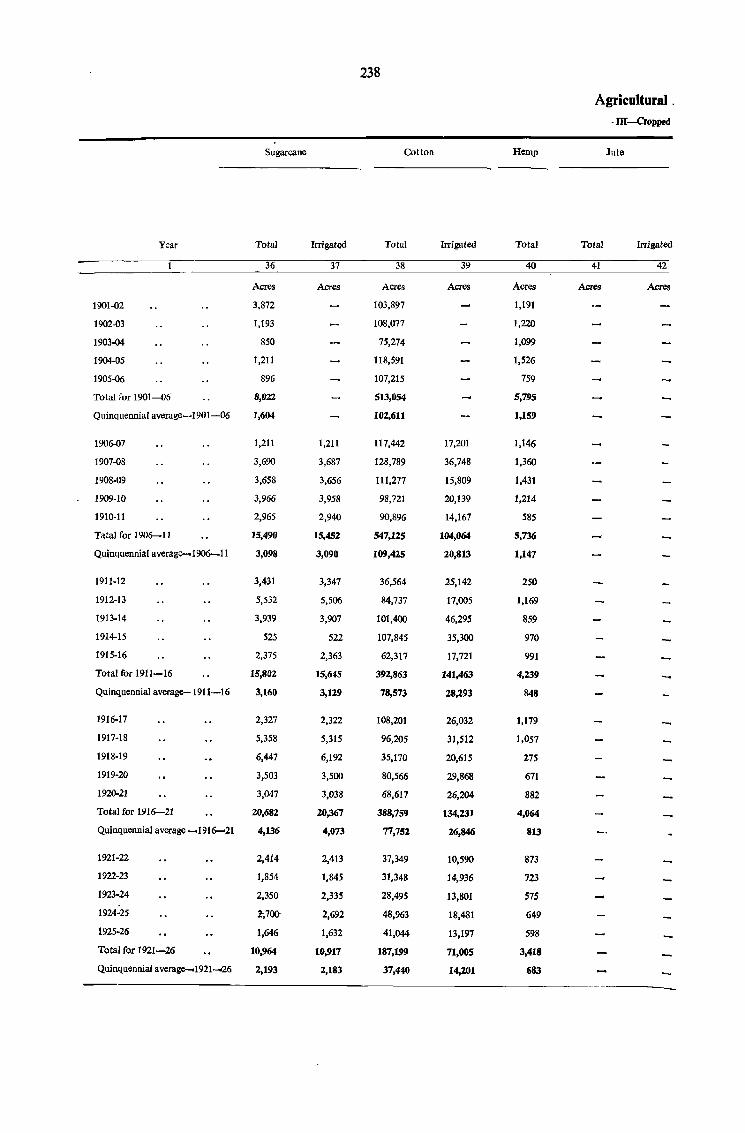
Sugarcane
Y~ar Total Irrigated
36 37
Acres Acres
1901-02 3,872
1902-03 1,193
1903-04 850
1904-05 1,211
1905-06 896
Total for 1901-06 8,022
Quinquennial average-1901-06 1,604
1906-07 1,211 1,211
1907-08 3,690 3,687
1908-09 3,658 3,656
1909-10 3,966 3,958
1910-11 2,965 2,940
Tatal for 1906---11 15,490 15,452
Quinquennial average--l906-11 3,098 3,090
1911-12 3,431 3,347
1912-13 5,532 5,506
1913-14 3,939 3,907
1914-15 525 522
1915-16 2,375 2,363
Total for 1911-16 15,8112 15,645
Quinquennial average-1911-16 3,160 3,129
1916·17 2,327 2,322
1917-18 5,358 5,315
1918-19 6,447 6,192
1919-20 3,503 3,500
1920-21 3,047 3,038
Total for 1916-21 20,682 20,367
Quinquennial average -1916-21 4,136 4,073
1921·22 2,4J4 2,413
1922·23 1,854 1,845
1923·24 2,350 2,335
1924-25 2;700- 2,692
1925·26 1,646 1,632
Total {or 1921-26 10,964 10,917
Quinquennial avera~1921-26 2,193 2,183
238
Cotton
Total Irrigated
38 39
Acres Acres
103,897
108,077
75,274
118,591
107,215
513,054
102,611
117,442 17,201
128,789 36,748
111,277 15,809
98,721 20,139
90,896 14,167
547,125 104,064
109,425 20,813
36,564 25,142
84,737 17,005
101,400 46,295
107,845 35,300
62,317 17,721
392,863 141,463
78,573 28,293
108,201 26,032
96,205 31,512
35,170 20,615
80,566 29,868
68,617 26,204
388,759 134,231
77,752 26,846
37,349 10,590
31,348 14,936
28,495 13,801
48,963 18,481
41,044 13,197
187,199 71,005
37,440 14,201
Hemp
Total
40
Acres
1,191
1,220
1,099
1,526
759
5,795
1,159
1,146
1,360
1,431
1,214
585
5,736
1,147
250
1,169
859
970
991
4,239
848
1,179
1,057
275
671
882
4,064
813
873
723
575
649
598
3,418
683
Agricultural . ·m-cropped
Jute
Total Irrigated
41 42
Acres Acres
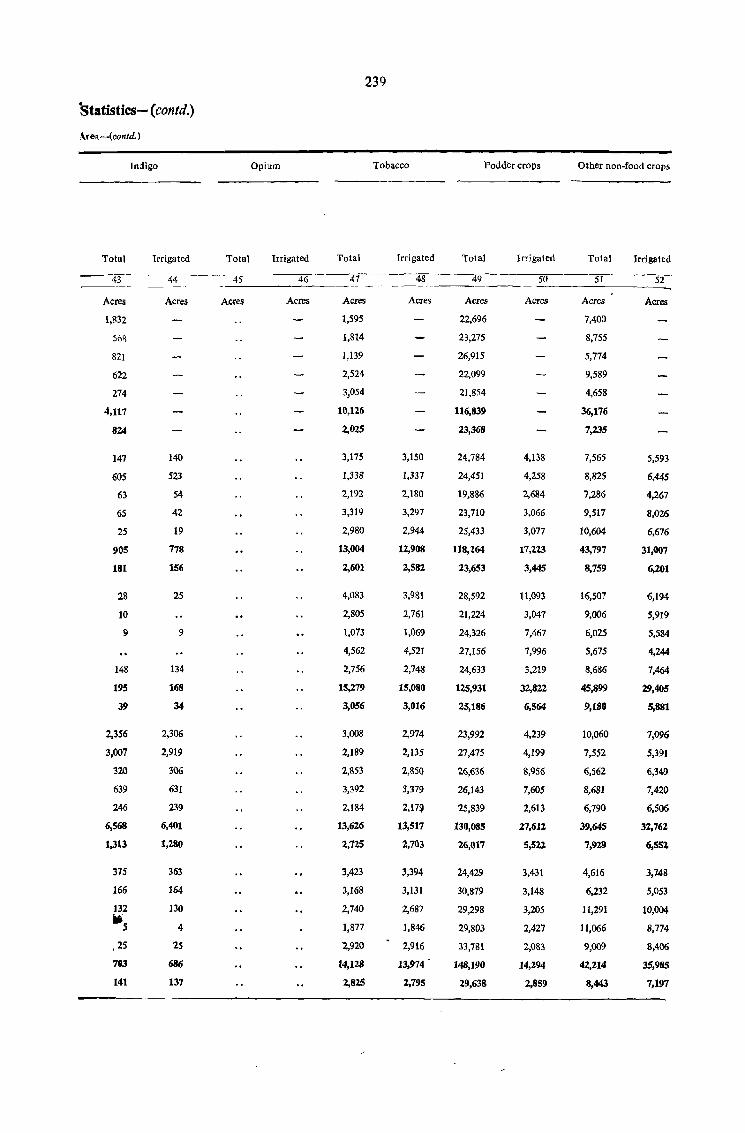
Statistics- (contd.)
.\rea -(contd.)
Total
43
Acres
1,832
568
821
622
274
4,117
824
141
60S
63
65
25
905
181
28
10
9
148
195
39
2,356
3,007
320
639
246
6,568
1,313
375
166
132
-5 ,2S
703
141
Indigo
Irrigated
44
Acres
140
523
54
42
19
718
156
25
9
134
168
34
2,306
2,919
306
631
239
6,401
1,280
363
164
130
4
25
686
137
Total
45
Acres
Opium
Irrigated
46
Acres
239
Tobacco
Total
47
Acres
1,595
1,814
1,139
2,524
3,054
10,126
2,025
3,175
1,338
2,192
3,319
2,980
13,004
2.601
4,083
2,805
1,073
4,562
2,756
15,279
3,056
3,008
2,189
2,853
3,392
2.184
13,626
2,725
3,423
3,168
2,740
1,877
2,920
14,128
2,825
Irrigated
48
Acres
3,150
1,337
2,180
3,297
2,944
12,908
2,582
3,981
2,761
1,069
4,521
2,748
15,080
3,016
2,974
2,135
2,850
3,379
2,17~
13,511
2,703
3,394
3,131
2,687
1,846
2,916
13,974 .
2,795
Fodder crops
Total
49
Acres
22,696
23,275
26,915
22,099
21,854
116,839
23,368
24.784
24.451
19,886
23,710
25,433
118,264
23,653
28,592
21,224
24,326
27,156
24,633
125,931
25,186
23,992
27,475
26,6:'.6
26,143
25,839
130,085
26,017
24,429
30,879
29,298
29,803
33,781
148,190
29,638
Irrigated
50
Acres
4,138
4,258
2,684
3,066
3,077
17,223
3,445
11,093
3,047
7,467
7,996
3,219
32,822
6,564
4,239
4,199
8,956
7,605
2,613
27,612
5,5:U
3,431
3,148
3,205
2,427
2,083
14,294
2,859
Other non-food crops
Total
51
Acres
7,400
8,755
5,774
9,589
4,658
36,176
7,235
7,565
8,825
7,286
9,517
10,604
43,797
8,759
16,507
9,006
6,025
5,675
8,686
45,899
9,180
10,060
7,552
6,562
8,681
6,790
39,645
7,929
4,616
6,232
11,291
11,066
9,009
42,214
8,443
Irrigated
52
Acres
5,593.
6,445
4,267
8,026
6,676
31,007
6,201
6,194-
5,919
5,584
4,244
7,464
29,405
5,881
7,096
5,391
6,349
7,420
6,506
32,762
6,551.
3,'148
5,053
10,004
8,774
8,406
35,985
7,197
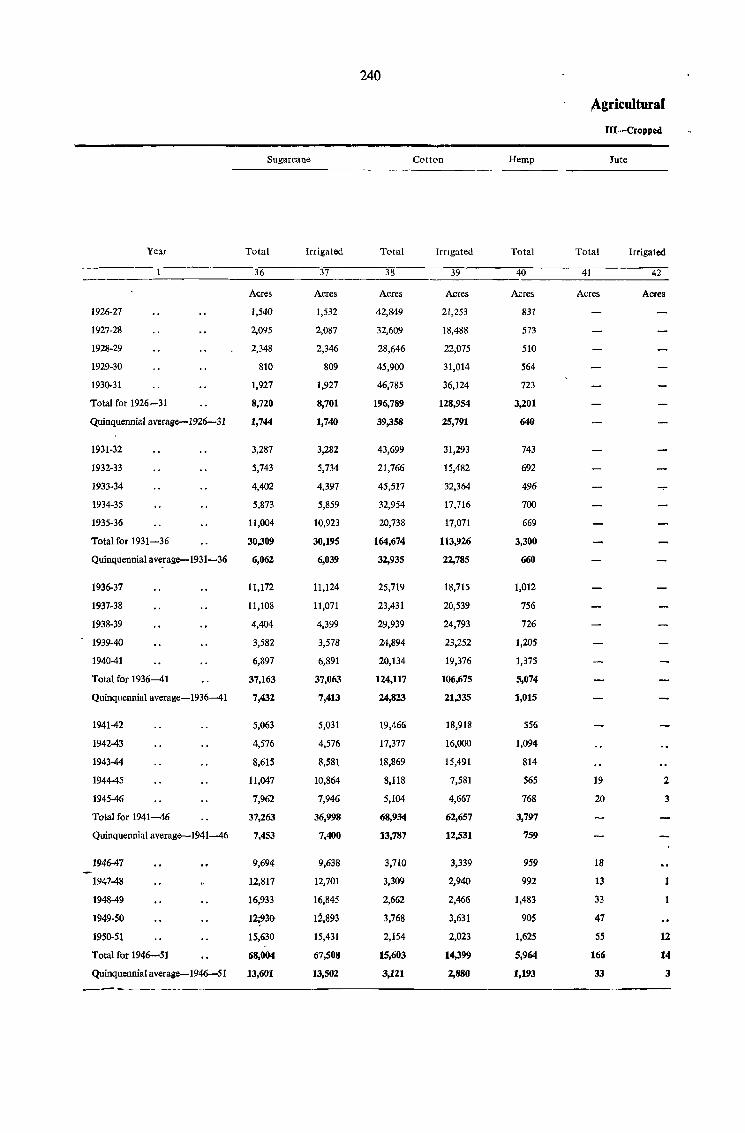
240
,!gricultural
UI--Cropped
Sugarcane Cotton Hemp Jute
Year Total Irrigated Total Irngated Total Total Irrigated
36 37 38 39 40 41 42
Acres Acres Acres Acres Acres Acres Acres
1926-27 1,540 1,532 42,849 21,253 831
1927-28 2,095 2,087 32,609 18,488 573
1928-29 2,348 2,346 28,646 22,075 510
1929-30 810 809 45,900 31,014 564
1930-31 1,927 1,927 46,785 36,124 723
Total for 1926-31 8,720 8,701 196,789 128,954 3,201
Quinquennial average-I926-31 1,744 1,740 39,358 25,791 640
1931·32 3,287 3,282 43,699 31,293 743
1932-33 5,743 5,734 21,766 15,482 692
1933·34 4,402 4,397 45,517 32,364 496
1934-35 5,873 5,859 32,954 17,716 700
1935-36 11,004 10,923 20,738 17,071 669
Total for 1931-36 30,309 30,195 164,674 113,926 3,300
Quinquennial average-1931-36 6,062 6,039 32,935 22,785 660
1936-37 11,172 11,124 25,719 18,715 1,012
1937·38 11,108 11,071 23,431 20,539 756
1938-39 4,404 4,399 29,939 24,793 726
1939-40 3,582 3,578 24,894 23,252 1,205
1940-41 6,897 6,891 20,134 19,376 1,375
Total for 1936-41 37,163 37,063 124,117 106,675 5,074
Quinquennial average-1936--41 7,432 7,413 24,823 21,335 1,015
1941-42 5,063 5,031 19,466 18,918 556
1942-43 4,576 4,576 17,377 16,000 1,094
1943-44 8,615 8,581 18,869 15,491 814
1944·45 11,047 10,864 8,118 7,581 565 19 2
1945-46 7,962 7,946 5,104 4,667 768 20 3
Total for 1941-46 37,263 36,998 68,934 62,657 3,797
Quinquennial average-1941-46 7,453 7,400 13,787 12,531 759
1946-47 9,694 9,638 3,710 3,339 959 18
1947-48 12,817 12,701 3,309 2,940 992 13
1948-49 16,933 16,845 2,662 2,466 1,483 33
1949-50 12~3(} 12,893 3,768 3,631 905 47
1950·51 15,630 15,431 2,154 2,023 1,625 55 12
Total for 1946-51 68,004 67,508 15,603 14,399 5,964 166 14
Quinquennial average-1946-51 13,601 13,502 3,121 2,880 1,193 33 3
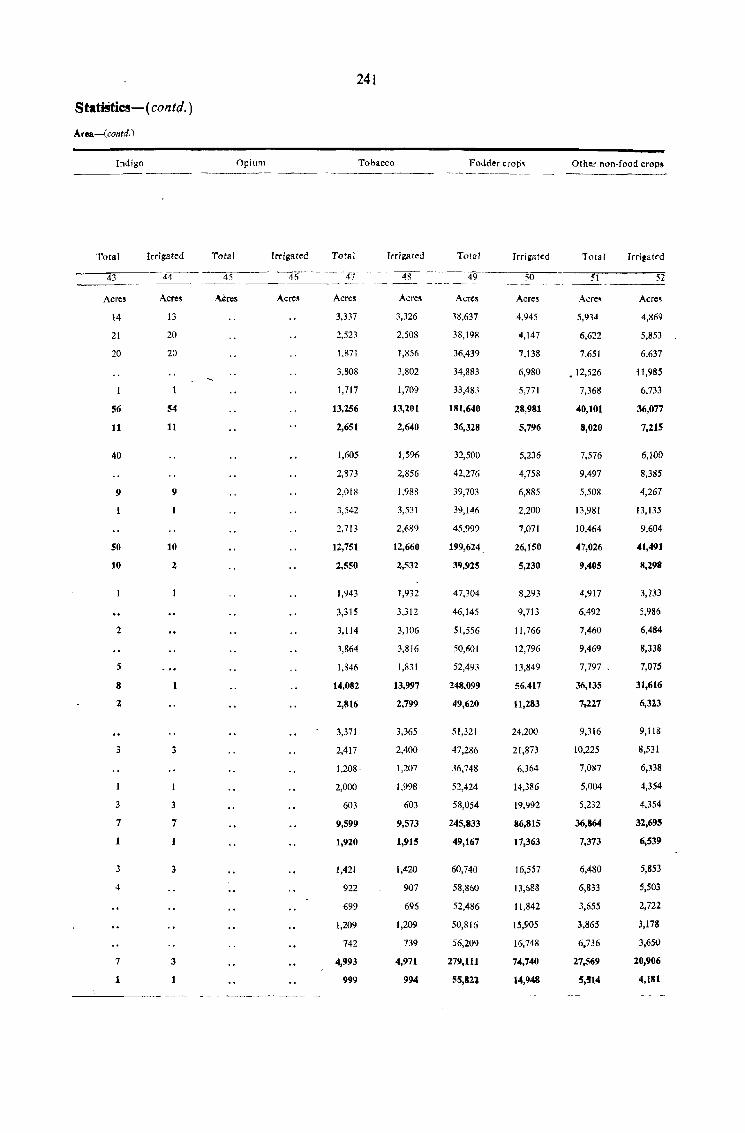
Stansties- ( contd. )
Area-(contd. )
Indigo Opium --------
Total Irrigated Total
43 '44~- 45
Acres Acres A£res
14
21
20
56
11
40
9-
SO
10
2
5
8
2
3
3
7
1
3
4
7
1
13
20
20
54
11
9
10
2
3
3
7
3
3
1
241
Tobacco Fodder crop'~ Other non-food crops
lrrigated Total Irrigated Total Irrigated Total Irrigat~d
'--~----47 .. ---~ ----"---;w---So-----"Sr}----... S2
Acres Acres
3.337
2,523
1,871
3,808
1,717
13,256
2,651
1,605
2,873
2,OI~
3,542
2,713
12,751
2,550
1,943
3,315
3,114
3,864
1,846
14,082
2,816
3,371
2,417
1,208-
2,000
603
9,599
1,920
1,421
922
699
1,209
742
4,993
999
Acres
3,326
2,508
1,856
3,802
1,709
13,201
2,640
1,596
2,856
1,988
3,531
2,689
12,660
2,532
1,932
3,312
3,106
3,816
I,S)I
13,997
2,799
3,365
2,400
1,207
1,998
603
9,573
1,915
1,420
907
696
1,209
739
4,971
994
Acres
38,637
38,198
36,439
34,883
33,483
181,640
36,328
32,500
42,276
39,703
39,146
45,999
199,624.
39,925
47,304
46,145
51,556
50,601
52,493
248,099
49,620
51,321
47,286
36,748
52,424
58,054
245,833
49,167
60,740
58,860
52,486
50,816
56,209
279,111
55,821
- ------- __ -----Acre!
4,945
4,147
7,138
6,980
5,771
28,981
5,796
5,236
4,758
6,885
2.200
7,071
26,150
5,230
8,293
9,713
11,766
12,796
13,849
56,417
11,283
24,200
21,873
6,364
14,386
19,992
86,815
17,363
16,557
13,688
11,842
15,905
16,748
74,740
14,948
5,934
6,622
7,651
.12,526
7,368
40,101
8,020
7,576
9,497
5,508
13,981
10,464
47,026
9.405
4,917
6.492
7,460
9,469
7,797 ,
36,135
7-,227
9,316
10,225
7,Og7
5,004
5,232
36,864
7,373
6,480
6,833
3,655
3,865
6,736
27,569
5,!l14
Acre~
4,869
5,853
6,637
11,985
6,733
36,077
7,215
6,100
8,385
4,267
13,135
9,604
41,491
8,298
3,733
5,986
6,484
8,338
7,075
31,616
6,323
9,118
8,531
6,338
4,354
4,354
32,695
6,539
5,853
5,503
2,722
3,178
3,650
20,906
4,181
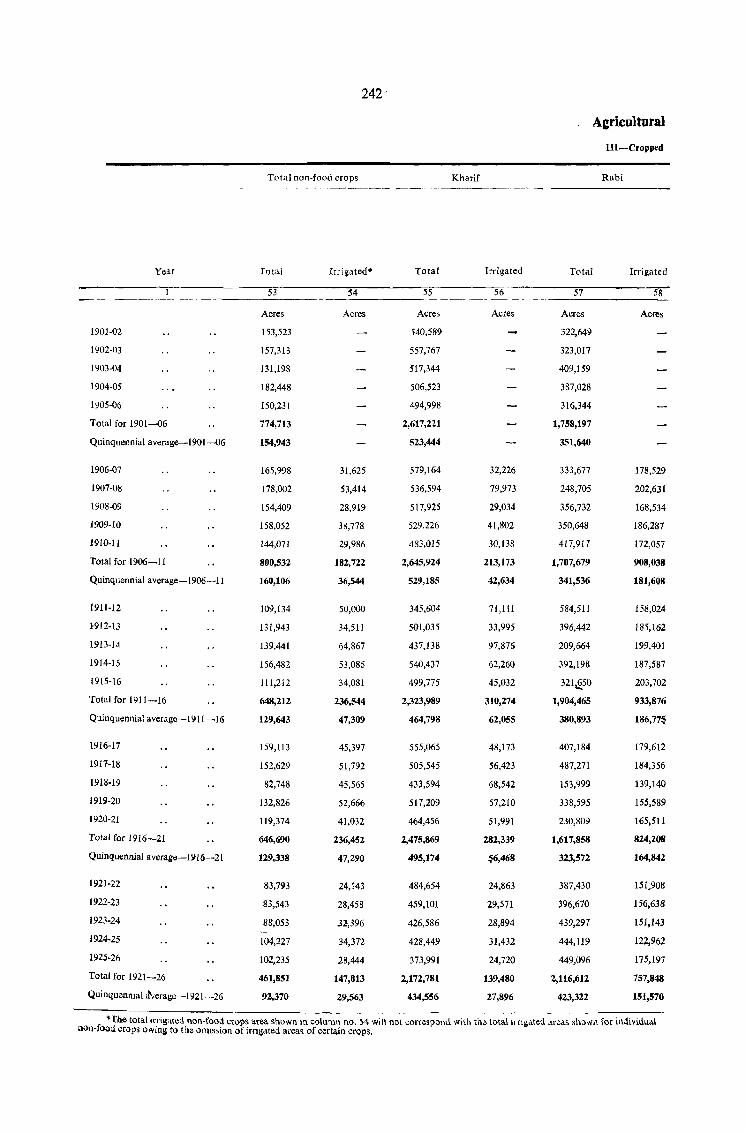
242'
Agricultural
Ill-Cropped
Total non-food crops Kharif Rabi
Year Total Irrigated· Total Irrigated Total Irrigated
53 54 55 56 57 58
Acres Acres Acres Acres Acres Acres
1901-02 153,523 540,589 322,649
1902-03 157,313 557,767 323,017
1903-04 131,198 517,344 409,159
1904-05 182,448 506,523 387,028
1905-06 150,231 494,998 316,344
Total for 1901-06 774,713 2,617,221 1,758,197
Quinquennial average-190l-06 154,943 523,444 351,640
1906-07 165,998 31,625 579,164 32,226 333,677 178,529
1907-08 178,002 53,414 536,594 79,973 248,705 202,631
1908-09 154,409 28,919 517,925 29,034 356,732 168,534
1909-10 158,052 38,778 529,226 41,802 350,648 186,287
1910-11 144,071 29,986 483,015 30,138 417,917 172,057
Total for 1906-11 800,532 182,722 2,645,924 213,173 1,707,679 908,038
Quinquennial average-1906-11 160,106 36,544 529,185 42,634 341,536 181,608
1911·12 109,134 50,000 345,604 71,111 584,511 158,024
1912·13 131,943 34,511 501,035 33,995 396,442 185,162
1913-14 139,441 64,867 437,138 97,876 209,664 199,401
1914·15 156,482 53,085 540,437 62,260 392,198 187,587
1915-16 111,212 34,081 499,775 45,032 321&.50 203,702
Total for 1911-16 648,212 236,544 2,323,989 310,274 ],904,465 933,876
Quinquennial average-19ll-16 129,643 47,309 464,798 62,055 380,893 186,77~
1916-17 159,113 45,397 555,065 48,173 407,184 179,612
1917·18 152,629 51,792 505,545 56,423 487,271 184,356
1918·19 82,748 45,565 433,594 68,542 153,999 139,140
1919·20 132,826 52,666 517,209 57,210 338,595 155,589
1920-21 119,374 41,032 464,456 51,991 230,809 165,511
Total for 1916-21 646,690 236,452 2,475,869 282,339 1,617,858 824,208
Quinquennial average-1916-21 129,338 47,290 495,174 $6,468 323,572 164,842
1921-22 83,793 24,143 484,654 24,863 387,430 151,908
1922·23 83,543 28,458 459,101 29,571 396,670 156,638
1923·24 88,053 32,396 426,586 28,894 439,297 151,143
1924·25 104,227 34,372 428,449 31,432 444,119 122,962
1925·26 102,235 28,444 373,991 24,720 449,096 175,197
Total for 1921-26 461,851 147,813 2,172,781 139,480 2,116,612 757,848
Quinquenmal !verage-1921-26 92,370 29,563 434,556 27,896 423,322 151,570
• fne total Irrigated non-food crops area shown In column no. S4 will not corresp;)(\d with the lotallrng.l.ted Meas shaw'1 for individual Don-fOod crops owing to the omission of irrigated area~ of certain crops.
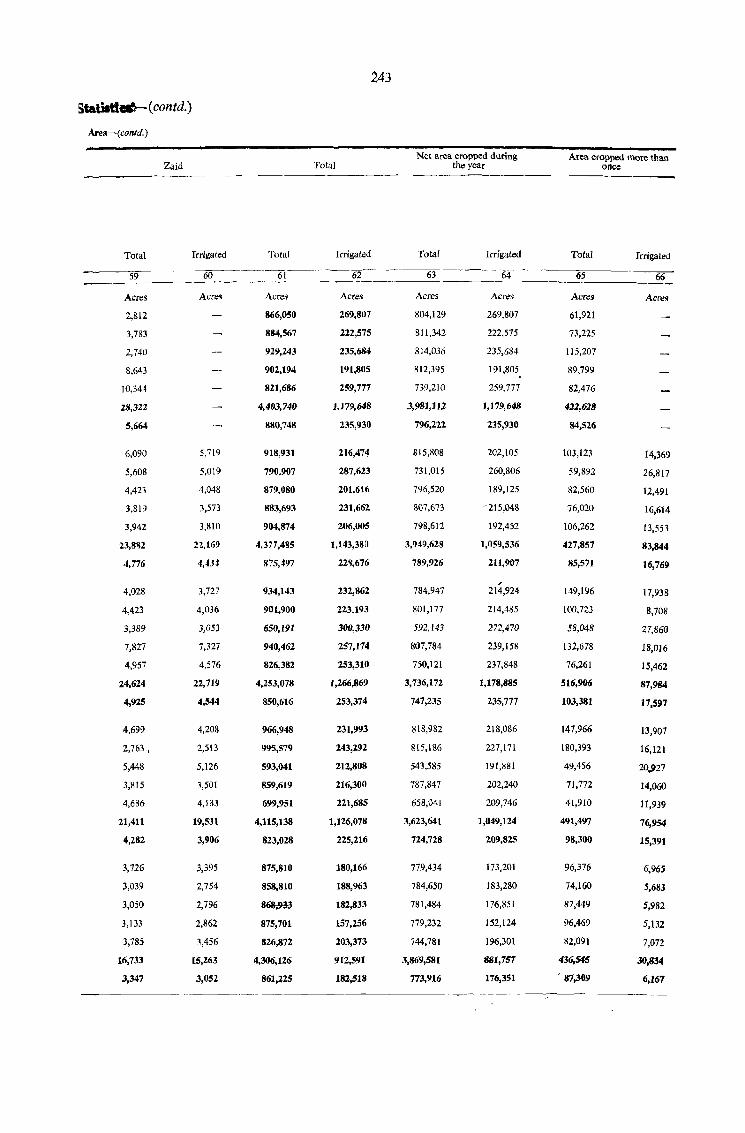
, 243
Statiltt __ (contd.)
AJ:ea-( contd.)
Zaid Total
Total Irrigated Total Irrigated
59 ____ __ 60 ____ _ 6_1 _____ 62
Acres
2,812
3,783
2,740
8,643
10,344
28,322
5,664
6,090
5,608
4,423
3,819
3,942
23,8112
4,776
4,028
4,423
3,389
7,827
4,957
24,624
4,925
4,699
2,763.
5,448
3,815
4,686
21,411
4,282
3,726
3,039
3,050
3,133
3,785
16,733
3,347
Acre.'
5,719
5,019
4,048
3,573
3,810
n,169
4,4.H
3,727
4,036
3,053
7,327
4,576
22,719
4,544
4,208
2,513
5,126
3,501
4,133
19,531
3,906
3,395
2,754
2,796
2,862
3,456
15',263
3,052
Acres
866,050
884,567
929,243
902,194
821,686
4,403,740
880,748
918,931
790,907
879,080
883,693
904,874
4,377,485
875,497
934,143
901,900
650,l91
940,462
826,382
4,253,078
850,616
966,948
995,579
593,041
859,619
599,951
4,115,138
823,028
875,810
858,810
868,93-3
875,701
826,872
4,306,126
861,l25
------_ ---~--.-----
Acres
269,807
222,575
235,684
191,805
259,777
1,179,648
235,930
216,474
287,623
201,616
231,662
206,005
1,143,380
22'J,676
232,862
223,193
300,330
257,174
253,310
1,266,869
253,374
231,993
243,292
212,808
216,300
221,685
1,126,078
225,216
180,166
188,963
182,833
157,256
203,373
912,591
182,518
Net area cropped during the year
Totar
63
Acres
804,129
811,342
814,036
R12,395
739,210
3,981,112
796,222
815,808
731,015
796,520
807,673
798,612
3,949,628
789,926
784,947
801,177
592,143
807,784
750,121
3,736,172
747,235
818,982
815,186
543,585
787,847
658,041
3,623,641
724,728
779,434
784,650
781,484
779,232
744,781
3,869,581
773,916
Irrigated
64
Acres
269,807
222,575
235,684
191,805
259,777
1,179,648
235,930
202,105
260,806
189,125
-215,048
192,452
1,059,536
21t,907
, 214,924
214,485
272,470
239,158
237,848
1,178,885
235,777
218,086
227,171
191,881
202,240
209,746
1,049,124
209,825
173,201
183,280
176,851
152,124
196,301
8tU,757
176,351
Area cropped more than once
Total
65
Acr~~
61,921
73,225
115,207
89,799
82,476
422,628
84,526
103,123
59,892
82,560
76,020
106,262
427,857
85,571
149,196
100,723
58,048
132,678
76,261
516,906
103,381
147,966
180,393
49,456
71,772
41,910
491,497
98,300
96,376
74,160
87,449
96,469
82,091
436,545
. 87,309
Irrigated
66
Acres
14,369
26,817
12,491
16,614
13,553
83,844
16,769
17,938
8,708
27,860
18,016
15,462
87,984
17,597
13,907
16,121
20,927
14,060
11,939
76,954
15,391
6,965
5,683
5,982
5,132
7,072
30,834
6,167
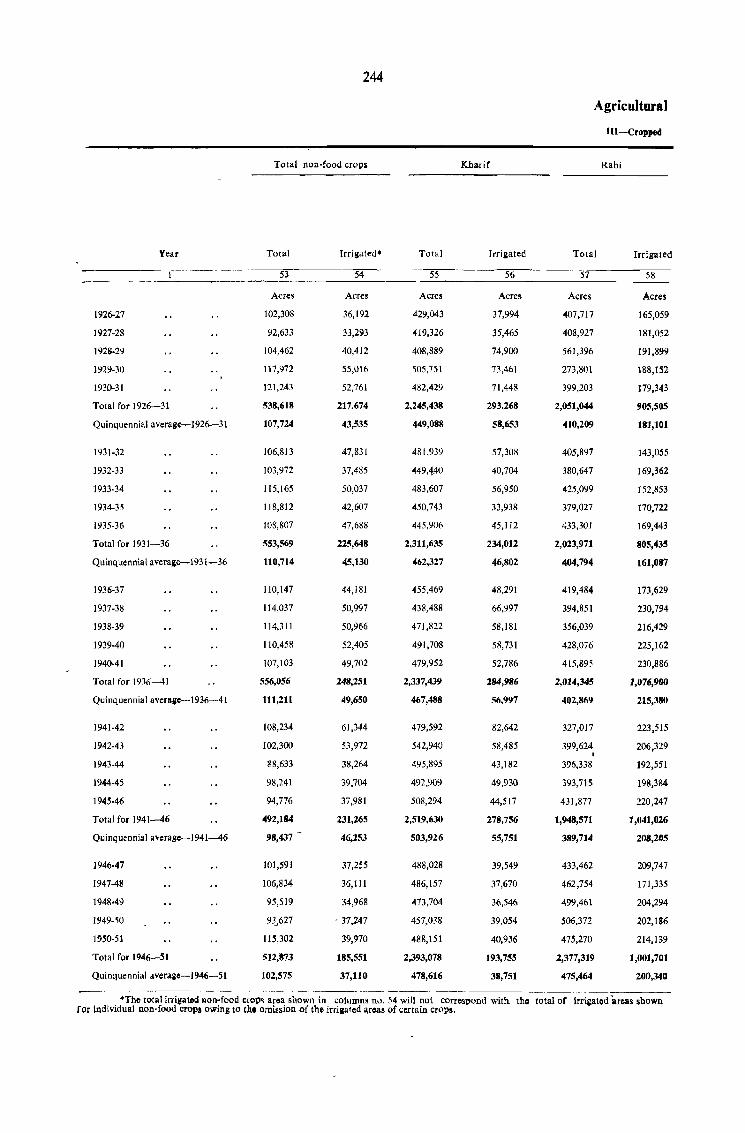
1926-27
1927-28
1928-29
1929-30
1930-31
Year
Total for 1926-31
Quinquennial average-1926-31
1931-32
1932-33
1933-34
1934-35
1935-36
Total for 1931-36
Quinquennial averagc-1931-36
1936-37
1937-38
1938-39
1939-40
1940-41
Total for 19]6--41
Quinquennial averaac-1936-41
1941-42
1942-43
1943-44
1944-45
1945-46
Total for 1941-46
Quinquennial avcrage-1941-46
1946-47
1947-48
194849
1949-50
1950-51
Total for 1946-51
Quinquennial average-l '146-51
244
Total Ilon-food crops
Total
53
Acres
102,308
92,633
104,462
117,972
121,243
538,618
107,724
106,813
103,972
115,165
118,812
108,807
553,569
110,714
110,147
114,037
ll4,311
llO,458
107,103
556,056
111,211
108,234
102,300
88,633
98,241
94,776
492,184
98,437
101,591
106,834
95,519
93,627
115,302
512,373
102,575
Irrigated-
54
Acres
36,192
33,293
40,412
55,016
52,761
217,674
43,535
47,831
37,485
50,037
42,607
47,688
225,648
45,130
44,181
50,997
50,966
52,405
49,702
248,251
49,650
61,344
53,972
38,264
39,704
37,981
231,265
46,253
37,255
36,111
34,96&
- 37,i47
39,970
185,551
37,110
Total
55
Acres
429,043
419,326
408,889
505,751
4S2,429
2,245,438
449,088
481.939
449,4.40
483,607
450,743
445,906
2,311,635
462,327
455,469
438,488
471,822
491,708
479,952
2,337,439
467,488
479,592
542,940
495,895
492,909
508,294
2,519,636
503,926
488,028
486,157
473,704
457,038
488,151
2,393,078
478,616
Kharif
Irrigated
56
Acres
37,994
35,465
74,900
73,461
71,448
293,268
58,653
57,308
40,704
56,950
33,938
45,112
234,012
46,802
48,291
66,997
58,181
58,731
52,786
284,986
56,997
82,642
58,485
43,182
49,930
44,517
278,756
55,751
39,549
37,670
36,546
39,054
40,936
193,755
38,751
Agricultural
Total
57
Acres
407,717
408,927
561,396
273,801
399,203
2,051,044
410,209
405,897
380,647
425,099
379,027
433,301
2,023,971
404,794
419,484
394,851
356,039
428,076
415,895
2,014,345
402,869
327,017
399,624 I
396,338
393,715
431,877
1,948,571
389,714
433,462
462,754
499,461
506,372
475,270
2,377,319
475,464
III-Cropped
Rabi
Irrigated
58
Acres
165,059
181,052
191,899
188,152
179,343
!lOS,505
181,101
143,055
]69,362
152,853
170,722
169,443
805,435
161,087
173,629
230,794
216,429
225,162
230,886
1,076,900
215,380
223,515
206,329
192,551
198,384
220,247
1,041,026
208,2OS
209,747
171,335
204,294
202,186
214,139
1,001,701
200,340
-~~~ ~------------------
"The tota I irrigated non-food crop-; area shown in columns no. 54 will not correspond with tho total of irrigatod areas shown for individual non-food crops owins to the omission of the irrigafed !lrea! of certain crops.
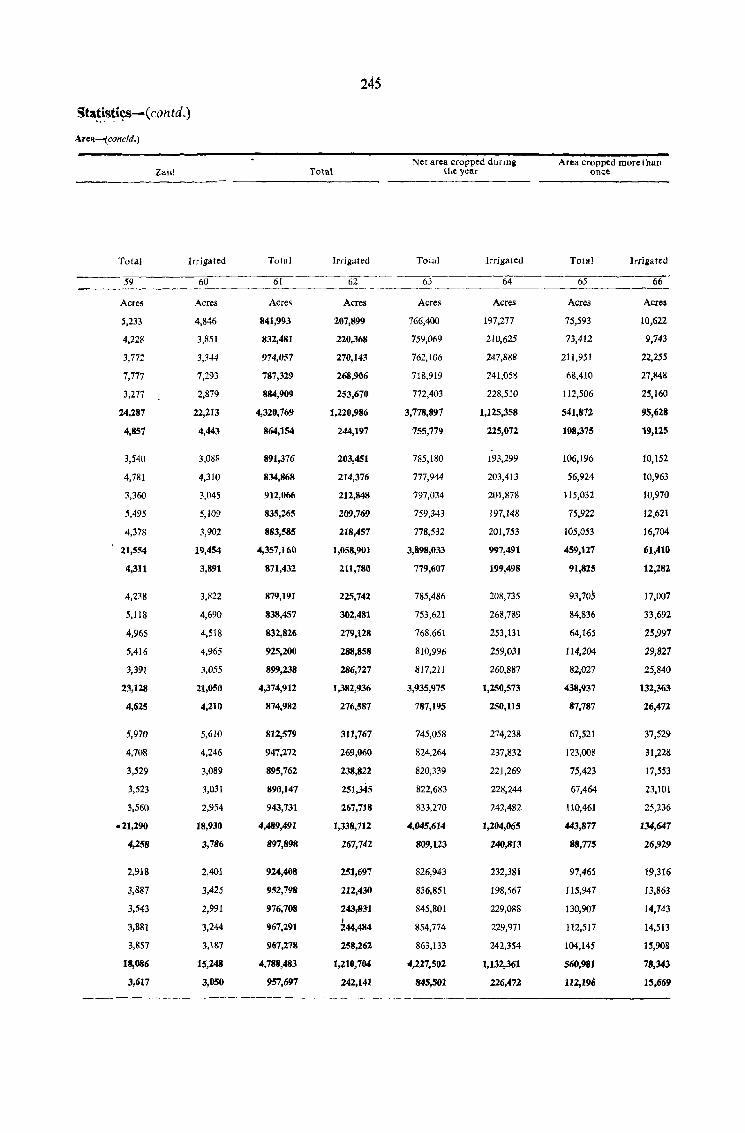
Statlstics-( contd.) ",." ~ ~
t\relt-( concld.)
Total
59
Acres
5,233
4,228
3,772
7,777
3,277
24,287
4,857
3,540
4,781
3,360
5,495
4,378
21,554
4,311
4,238
5,118
4,965
5,416
3,391
23,128
4,625
5,970
4,708
3,529
3,523
3,560
.U,290
4,258
2,918
3,887
3,543
3,881
3,857
18,086
3,617
Zaill
Irrigated
6U
Acres
4,846
3,851
3,344
7,293
2,879
22,213
4,443
3,088
4,310
3,045
5,109
3,902
19,454
3,891
3,822
4,690
4,518
4,965
3,055
21,050
4,210
5,610
4,246
3,089
3,031
2,954
18,930
3,786
2,401
3,425
2,991
3,244
3,187
15,248
3,050
245
Total
Total Irrigated
61 ----62--~
Net area cropped during the year
Total Irrigated
63 64
Area cropped morethan once
Total Irrigated
66 --~- - - - ----~-- --~------- ----------
Acres
841,993
832,481
974,057
787,329
884,909
4,320,769
864,154
891,376
834,868
912,066
835,265
883,585
4,357,160
871,432
879,191
838,457
832,826
925,200
899,238
4,374,912
874,982
812,579
947,272
895,762
890,147
943,731
4,489,491
897,898
924,408
952,798
976,708
967,291
967,278
4,788,483
957,697
Acres
207,899
220,368
270,143
268,906
253,670
1,220,986
244,197
203,451
214,376
212,848
209,769
218,457
1,058,901
211,780
225,742
302,481
279,128
288,858
286,727
1,382,936
276,587
311,767
269,060
238,822
251,345
267,718
1,338,712
267,742
251,697
212,430
243,831 I 244,484
258,262
1,210,704
242,141
Acres
766,400
759,069
762,106
718,919
772,403
3,778,897
755,779
785,180
777,944
797,034
759,343
778,532
3,898,033
779,607
785,486
753,621
768,661
810,996
817,211
3,935,975
787,195
745,058
824,264
820,339
822,683
833,270
4,045,614
809,123
826,943
836,851
845,801
854,774
863,133
-4,2;27,502
845,501
Acres
197,277
210,625
247,888
241,058
228,510
1,125,358
225,072
193,299
203,413
201,878
197,148
201,753
997,491
199,498
208,735
268,789
253,13l
259,031
260,887
1,250,573
250,115
274,238
237,832
221,269
228,244
242,482
1,204,065
240,813
232,381
198,567
229,088
229,971
242,354
1,132,361
226,47;2
Acres
75,593
73,412
211,951
68,410
112,506
541,872
108,375
106,196
56,924
115,032
75,922
105,053
459,127
91,825
93,705
84,836
64,165
114,204
82,027
438,937
87,787
67,521
123,008
75,423
67,464
110,461
443,877
88,775
97,465
115,947
130,907
112,517
104,145
560,981
112,1911
Acres
10,622
9,743
22,255
27,84&
25,160
95,628
19,125
10,152
10,963
10,970
12,621
16,704
61,410
12,282
17,007
33,692
25,997
29,827
25,840
132,363
26,472
37,529
31,228
17,553
23,101
25,236
134,647
26,929
19,316
13,863
14,743
14,513
15,908
78,343
15,669
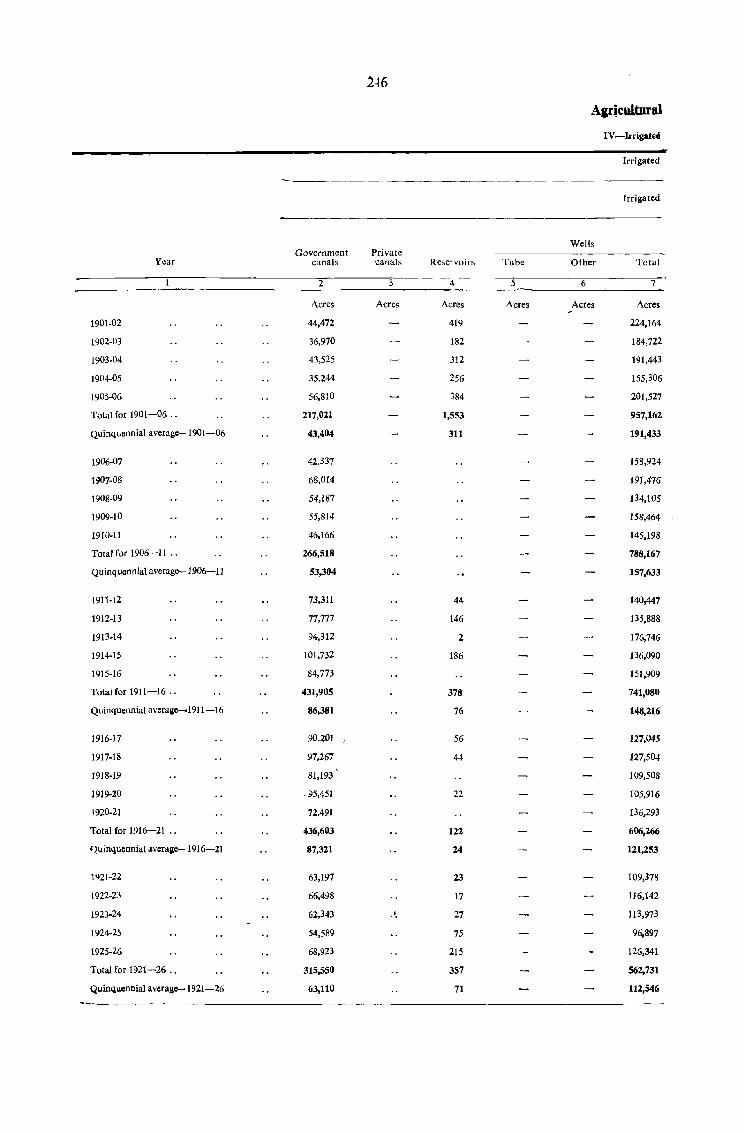
2~6
Alr~cultural
IV-Irrigated
Irrigated
Irrigated
Wells Government Private
Year canals canals Reservoirs Tube Other Total
2 3 4 5 6 7
Acres Acres Acres Acres Acres Acres
1901-02 44,472 419 224,164
1902-0~ 36,970 182 184,722
1903-04 4~,525 312 191,443
1904-05 35,244 256 155,306
1905-06 56,810 384 201,527
Total for 1901-06 .. 217,021 1,553 957,162
Quinquennial average--1901-06 43,404 311 191,433
1906-07 42.337 158,924
1907-08 68,014 191,416
1908-09 54,187 134,105
1909-10 55,814 158,464
1910-11 46,166 145,198
Total for 1906-11 .. 266,518 788,167
Quinquonnial average--1906-11 53,304 157,633
1911-12 73,311 44 140,447
1912-13 77,777 146 135,888
1913-14 94,312 2 176,746
1914-15 101,732 186 136,090
1915-16 84,773 151,909
Total for 1911-16 .. 431,905 378 741,080
Quinquennial averaj!e-.1911-16 86,381 76 148,216
1916-17 90.201 I 56 121,045
1917-18 97,267 44 127,504
1918-19 81,193 109.508
1919-20 ,95,451 22 105.916
1920-21 72,491 136,293
Total for 1916-21 .. 436,603 122 606,266
f),uinqucnniat averajle-1916-21 87,321 24 121,253
1921-22 63,197 23 109,378
1922-23 66,498 17 116,142
1923-24 62,343 .'. 27 113.973
1924-25 54,589 75 96,897
1925-26 68,923 215 126,341
Total for 1921-26 .. 315,550 357 562,731
Quinquennial averaj!e-1921-26 63,110 71 112,546
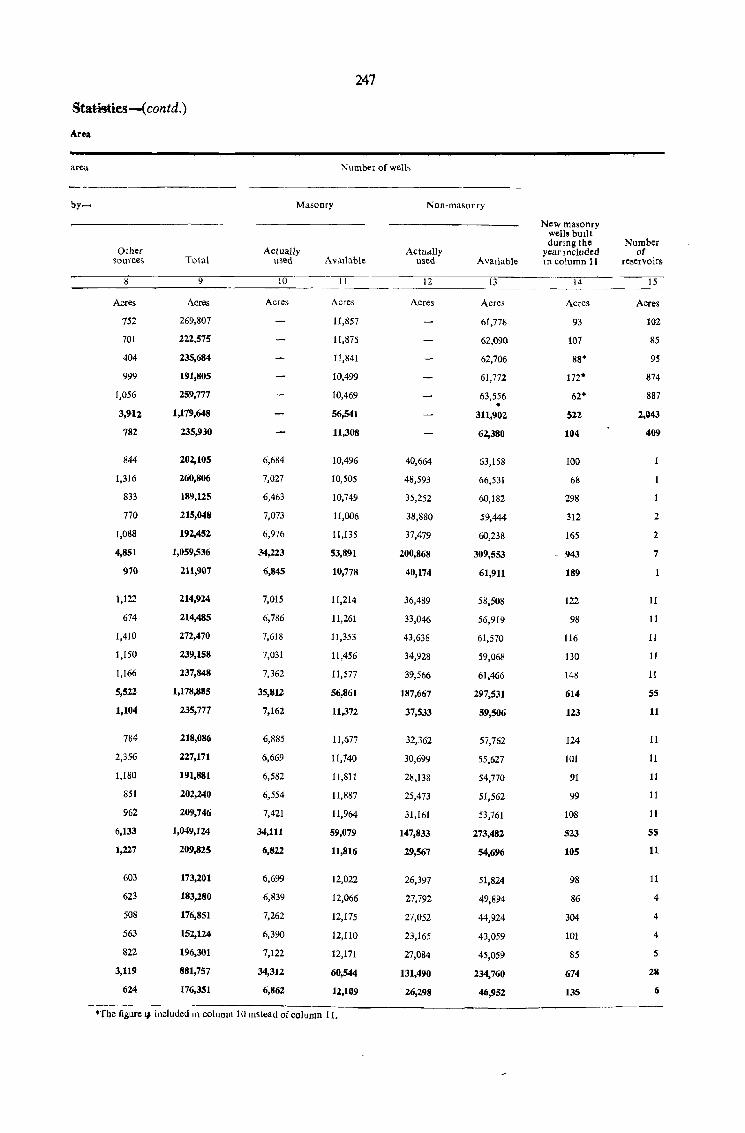
Stat¥.tiies-( cont d,)
Area
area
by-
Other sources Total
247
Number ofwelb
Masonry
Av,lliable
Non-masonry
AvaIlable
New masonry wells bUilt dunngthe
year Included m column 11
Number of
reservoirs
____ 8'--_____ 9 ______ 1_0 ____ 1_1 ______ 1_2 ___ ~. _13'---_____ 1_4 ______ 15_
Acres
752
701
404
999
1,056
3,9tZ
'182
844
1,316
833
770
1,088
4,851
970
1,122
674
1,410
1,150
1,166
5,522
1,104
784
2,356
1,180
851
962
6,133
1,227
603
623
508
563
822
3,119
624
Acres
269,807
222,575
235,684
191,805
259,777
1,179,648
235,930
202,105
260,806
189,125
215,048
192,452
1,059,536
211,907
214,924
214,485
272,470
239,158
237,848
1,178,885
235,771
218,086
227,171
191,881
202,240
209,746
1,049,124
209,825
173,201
183,280
176,851
152,124
196,301
881,757
176,351
Acres
6,684
7,027
6,463
7,073
6,976
34,223
6,845
7,015
6,786
7,618
7,031
7,362
35,812
7,162
6,885
6,669
6,582
6,554
7,421
34,111
6,822
6,699
6,839
7,262
6,390
7,122
34,312
6,862
Acres
11,857
11,875
11,841
10,499
10,469
56,541
11,308
10,496
10,505
10,749
11,006
11,135
53,891
10,778
11,214
11,261
11,353
11,456
11,577
56,861
11,372
11,677
11,740
11,811
11,887
11,964
59,079
11,816
12,022
12,066
12,175
12,110
12,171
60,544
12,109
*The figure 'I included lil column 10 mstead of column 11.
Acres
40,664
48,593
35,252
38,880
37,479
200,868
40,174
36,489
33,046
43,638
34,928
39,566
187,667
37,533
32,362
30,699
28,138
25,473
31,161
147,833
29,567
26,397
27,792
27,052
23,165
27,084
131,490
26,298
Acres
61,778
62,090
62,706
61,772
63,556 . 311,902
62,380
63,158
66,531
60,182
59,444
60,238
309,553
61,911
58,508
56,919
61,570
59,068
61,466
297,531
59,506
57,762
55,627
54,770
51,562
53,761
273,482
54,696
51,824
49,894
44,924
43,059
45,059
234,760
46,952
Acres
93
107
88·
112*
62*
512
104
100
68
298
312
165
- 943
189
122
98
116
130
148
614
123
124
101
91
99
108
523
105
98
86
304
101
85
674
135
Acres
102
85
95
874
887
2,043
409
2
2
7
11
11
11
11
11
55
11
11
11
11
11
11
55
11
11
4
4
4
5
28
6
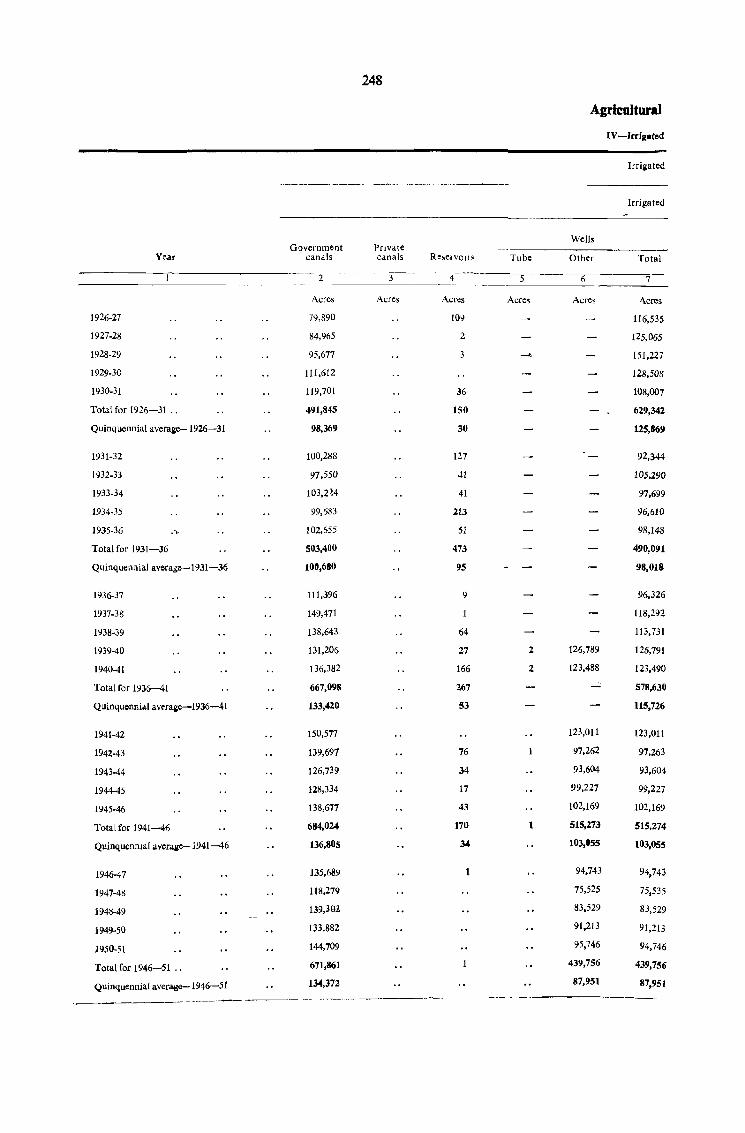
248
Agricultural
IV-Irrigated
Irrigated
Irrigated
Wells Government PrIvate
Year canals canals Re,el VOll$ Tube Other Total
2 4 5 6 7
Acres Acres Acres Acres Acres Acres
1926-27 79,890 109 116,535
1927-28 84,965 2 125,065
1928-29 95,677 3 151,227
I 929-3G 111,612 128,508
1930-31 119,701 36 108,007
Total for 1926-31 .. 491,845 150 629,342
Quinquennial averaiC-I926-31 98,369 30 125,869
1931-32 100,288 127 92,344
1932-33 97,550 41 105.290
1933-34 103,2~4 41 97,699
1934-35 99,683 213 96,610
1935-36 .• 102,655 51 98,148
Total for 1931-36 503,400 473 490,091
Quinquemlial average-1931-36 10~,680 9S 98,018
1936-37 111,396 9 96.326
1937-38 149,471 118,292
1938-39 138,643 64 1l3.731
1939-40 131,206 27 2 126,789 126,791
1940-41 136,382 166 1 123,488 123,490
Total for 1936--41 667,098 267 578,630
Quinqllonni41 averajle-1936-41 133,420 53 115,726
1941-42 150,577 123,011 123,011
1942-43 139,697 76 97.262 97,263
1943·44 126,739 34 93,604 93,604
1944-45 128,334 17 99,227 99,227
1945-46 138,677 43 102,169 102,169
Total for 1941-46 684,024 170 1 515,273 515,274
QuinquenDlaJ averajlo-1941-46 136,805 34 103,055 103,055
1946·47 135,689 94,743 94,743
1947-4~ 118,279 75,525 75,535
1948-49 139,301. 83,529 83,529
1949-50 133,882 91,213 91,213
1950-51 144,709 95,746 94,746
Total for 1946-51 ., 671,861 439,756 439,756
Quinquennial average-1946-51 134,372 87,951 87,951
.. ~.~---
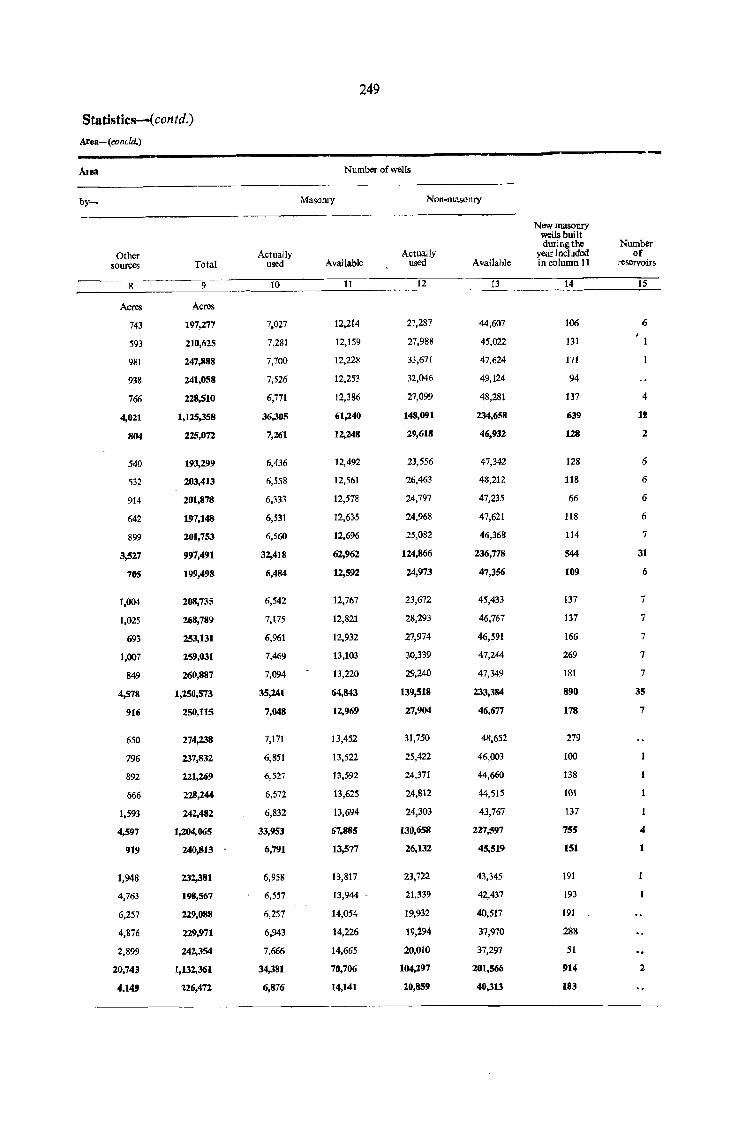
Statistics-( contd.)
Area- (cancld.)
Other sources
8
Total
9
Acres Acres
743
593
981
938
766
4,021
804
540
532
914
642
899
3,527
70S
1,004
1,025
693
1,007
849
4,578
916
650
796
892
666
1,593
4,597
919
1,948
4,763
6,257
4,876
2,899
20,743
4.149
197,277
210,625
247,888
241,058
228,510
1,125,358
225,072
193,299
203,413
201,878
197,148
201,753
997,491
199,498
208,735
268,789
253,131
259,031
260,887
1,250,573
250,115
274,238
237,832
221,269
228,244
242,482
1,204,065
240,813
232,381
198,567
229,088
229,971
242,354
1,132,361
126,472
Actually used
10
7,027
7,281
7,700
7,526
6,771
36,305
7,261
6,436
6,558
6,333
6,531
6,560
32,418
6,484
6,542
7,175
6,961
7,469
7,094
35,241
7,048
7,171
6,851
6,527
6,572
6,832
33,953
6,791
6,958
6,557
6,257
6,943
7,666
34,381
6,876
249
Number of wells
Masonry Non-masonry
Available
11
12,214
12,159
12,228
12,253
12,386
61,240
12,248
12,492
12,561
12,578
12,635
12,696
62,962
12,592
12,767
12,821
12,932
13,103
13,220
64,843
12,969
13,452
13,522
13,592
13,625
13,694
67,885
13,577
13,817
13,944
14,054
14,226
14.665
70,706
14,141
Actually used
12
27,287
27,988
33,671
32,046
27,099
148,091
29,618
23,556
26,453
24,797
24,968
25,082
124,866
24,973
23,672
28,293
27,974
30,339
29,240
139,518
27,904
31,750
25,422
24,371
24,812
24,303
130,658
26,132
23,722
21,339
19,932
19,294
20.0lO
104,297
20,859
Available
13
44,607
45,022
47,624
49,124
48,281
234,658
46,932
47,342
48,212
47,235
47,621
46,368
236,778
47,356
45,433
46,767
46,591
47,244
47,349
233,384
46,677
48,652
46,003
44,660
44,515
43,767
227,597
45,519
43,345
42,437
40,517
37,970
37,297
201,566
40,313
New masonry wells built during the
year included in column 11
14
106
131
171
94
137
639
128
128
118
66
118
114
S44
109
137
137
166
269
181
890
178
279
100
138
101
137
7S5
151
191
193
191
288
51
914
183
Number of
reservoirs
15
6
4
It
Z
6
6
6
6
7
31
6
7
7
7
7
7
35
7
4
2
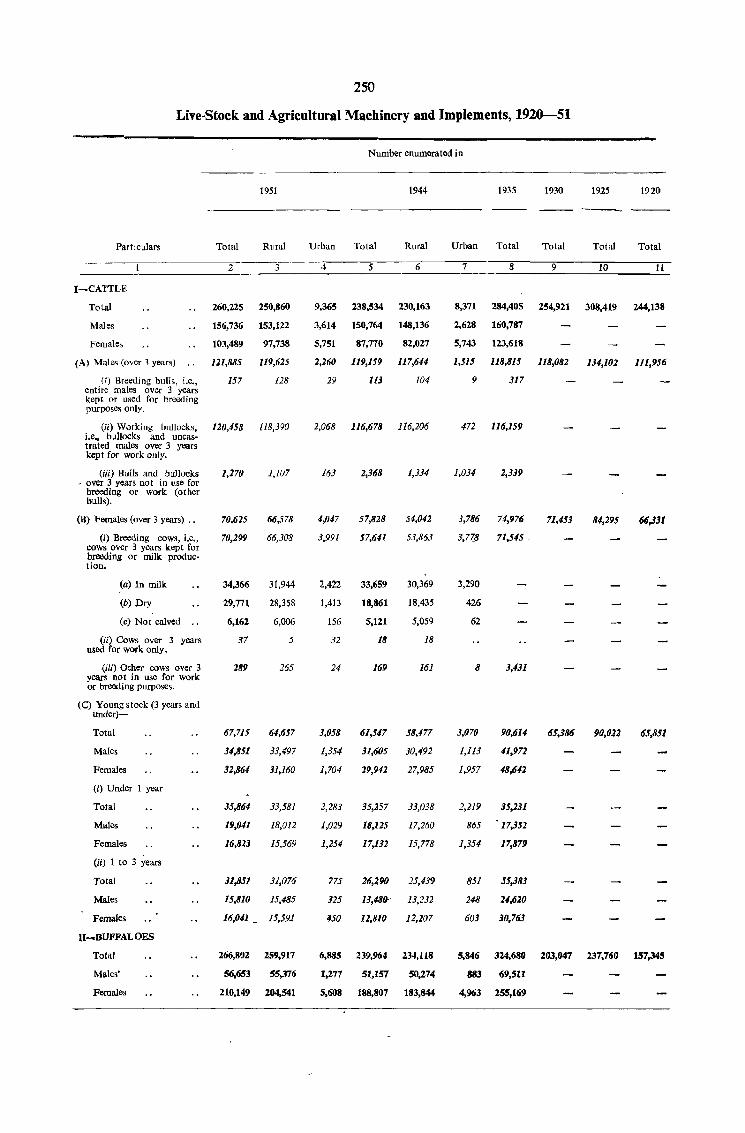
250
Live-Stock and Agricultural Machinery and Implements, 1920-51
Number enumerated in
1951 1944 1935 1930 1925 lno
Particulars Total Rural Urban Total Rural Urban Total Total Total Total
------1-- 2 4 5 6 7 8 9 10 11
I-CATTLE
Total 260,225 250,860 9,365 238,534 230,163 8,371 284,405 254,921 308,419 244,138
Males 156,736 153,122 3,614 150,764 148,136 2,628 160,787
Females 103,489 97,738 5,751 87,770 82,027 5,743 123,618
(A) Males (over 3 years) .. 121,885 119,625 2,260 119,159 117,644 1,515 118,815 118,082 131,102 111,956
U) Breeding bulls, i.e., 157 128 29 113 104 9 317 entire males over 3 years kept or used for breeding purposes only.
(ii) Working bullocks, 120,458 118,390 2,068 116,678 116,206 472 116,159 i.e., bullocks and uncas-trated males over 3 years kept for work only.
(iii) Bulls and bullocks 1,270 1,107 163 2,368 1,334 1,034 2,139 - over 3 years not in use for
breeding or work (other bulls).
(B) Females (over 3 years) ., 70,625 66,578 .f.,On 57,828 54,042 3,786 74,976 71,453 81,295 66,131
(i) Breeding cows .. i.e., 70,299 66,308 3,991 57,641 53,863 3.778 71,515 _ cows over 3 years kept for breeding or milk produc-tion.
(a) In milk 34,366 31,944 2,422 33,659 30,369 3,290
(b) Dry 29,771 28,358 1,413 18,861 18,435 426
(c) Not calved 6,162 6,006 156 5,121 5,059 62
(iI) Cows over 3 years 37 5 32 18 18 used for work only.
-(iii) Other cows over 3 years not in use for work
2119 265 24 169 161 8 1,431
or breeding purposes.
(C) Young stock (3 years and under)-
Total 67,715 M,657 3,058 61,547 58,1.77 1,070 90,611 65,186 90,022 65,851
Males 1/.,851 33,497 1,354 11,605 30,492 1,113 11,972
Females 12,864 31,160 1,704 29,942 27,985 1,957 48,612
(i) Under 1 year
Total 35,864 33,581 2,283 35,257 33,038 2,219 35,231
Males 19,041 18,012 1,029 111,125 17,260 865 17,352
Females 16,823 15,569 1,254 17,112 15,778 1,354 17,879
(ii) 1 to 3 years
Total 31,851 31,076 775 26,290 25,439 851 55,181
Males 15,810 15,485 325 13,411fY 13,232 248 21,620
Females 16,041 _ 15,591 ~50 12,810 12,207 603 30,763
II ..... BUFFALOES
Total 266,802 %59,917 6,885 239,964 234,118 5,846 324,680 203,047 237,760 157,345
Males' 56,653 55,376 1,277 51,157 50,274 883 69,511
Females 210,149 204,541 5,608 188,807 183,844 4,963 255,169
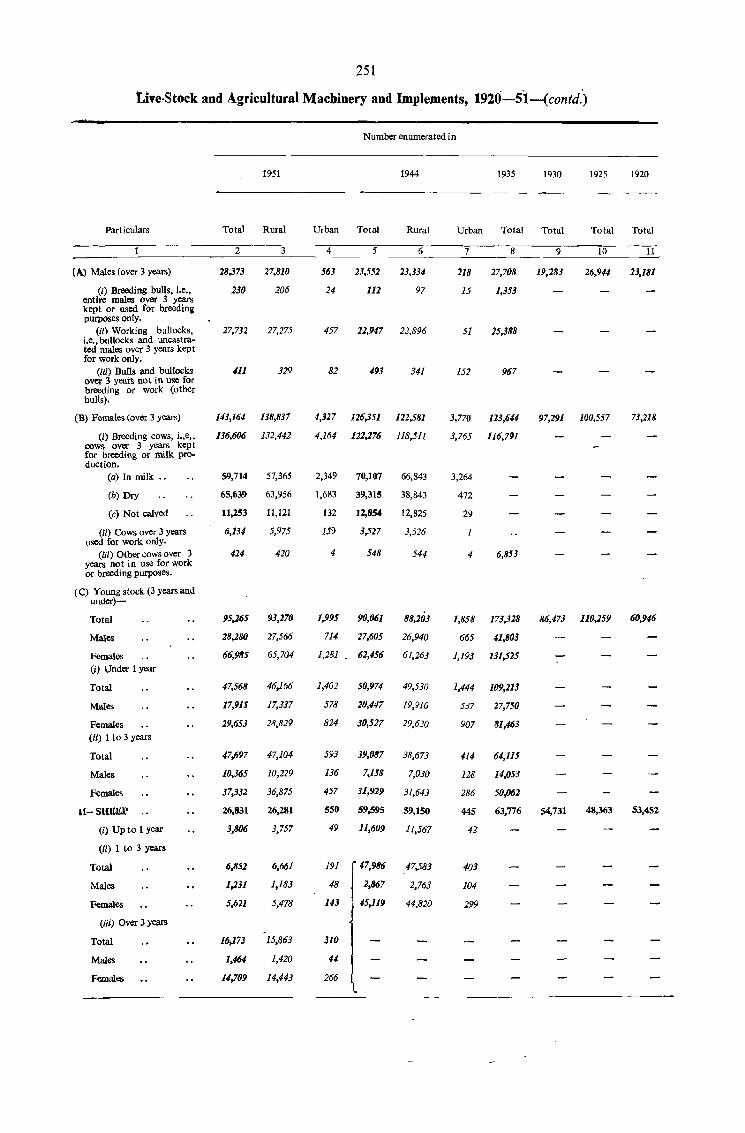
251
Live·Stock and Agricultural Machinery and Implements, 1920-51-(contd.)
Number enumerated in
1951 1944 1935 1930 1925 1920
Part iculars Total Rural Urban Total Rural Urban Total Total Total Total
2 3 4 5 6 7 8 9 10 11
(A) Males (over 3 years) 28,373 27,810 563 23,552 23,334 218 27,708 19,283 26,944 23,181
(i) Breeding bulls, i.e., 230 206 24 112 97 15 1,353 entire males over 3 years kept or used for breeding purposes only.
(II) Working bullocks, 27,732 27,275 457 12,947 22,896 51 25,388 i.e., bullocks and uncastra-ted males over 3 years kept for work only.
(iii) Bulls and bullocks 411 329 82 493 341 152 967 over 3 years not in use for breeding or work (other bulls).
(B) Females (over 3 years) 143,164 138,837 4,327 126,351 122,581 3,770 123,644 97,291 100,557 73,218
(i) Breeding cows, i.,e" 136,606 132,442 cows over 3 years kep t for breeding or milk pro-
4,164 122,276 118,511 3,765 116,791
duction. (a) In milk .• 59,714 57,365 2,349 70,107 66,843 3,264
(b) Dry 65,639 63,956 1,683 39,315 38,843 472
(c) Not calved 11,253 11,121 132 12,854 12,825 29
(ii) Cows over 3 years 6,134 5,975 159 3,527 3,526 used for work only.
(iii) Other cows over 3 421 420 4 548 544 4 6,853 years not in use for work or breeding purposes.
(C) Young stock (3 years and under)-
Total 95,265 93,270 1,995 90,061 88,203 1,858 173,328 86,473 110,259 60,946
Males 28,280 27,566 714 27,605 26,940 665 41,803
Females 66,985 65,704 1,281 62,456 61,263 1,193 131,525 (0 Under 1 year
Total 47,568 46,166 1,402 50,971 49,530 1,444 109,213
Males 17,915 17,337 578 20,447 19,910 537 27,750
Females 29,653 28,829 824 30,527 29,620 907 81,463 (ii) 1 to 3 years
Total 47,697 47,104 593 39,087 38,673 414 64,115
Males 10,365 10,229 136 7,158 7,030 128 14,053
Females 37,332 36,875 457 31,929 31,643 286 50,062
II-SHEEP 26,831 26,281 550 59,595 59,150 445 63,776 54,731 48,363 53,452
(i) Up to 1 year 3,806 3,757 49 11,609 lI,567 42
(ii) 1 to 3 years
Total 6,852 6,661 191
f"'~ 47,583 403
Males 1,231 1,183 48 2,867 2,763 104
Females 5,621 5,478 143 45,119 44,820 299
(iii) Over 3 years
1 Total 16,173 15,863 310
Males 1,464 1,420 44
Females 14,709 14,443 266
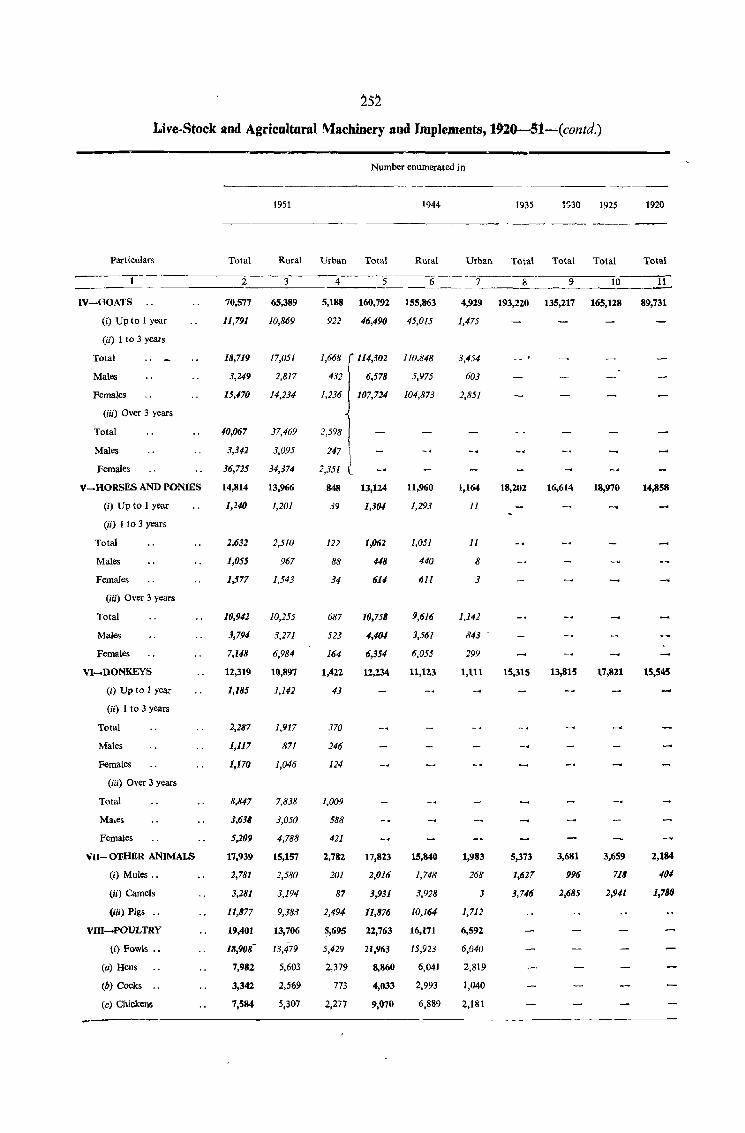
252
Live-Stock and Agricultural Machinery and ImpleJDents, 1920-51--'-(contd.)
Number enumerated in
1951
Part kula!"s Total Rural Urban Total
________________________ ~2~ __ ~3~ ____ ~4_____ 5
IV-GOATS
(i) Up to 1 year
(ii) 1 to 3 years
Total
Males
Females
(iii) Over 3 years
Total
Males
Females
V~HORSES AND PONIES
(i) Up to 1 year
(ii) 1 to 3 years
Total
Males
Females
(iii) Over 3 years
Total
Males
Females
VI-DONKEYS
(i) Up to 1 year
(ii) 1 to 3 years
Total
Males
Females
(iii) Over 3 years
Total
Ma,es
Females
VII- ()'I1HER ANIMALS
(i) Mules ..
(ii) Camels
(iii) Pigs ..
VIII-POULTRY
(i) Fowls .•
(a) Hens
(b) Cocks
(c) Chickens
70,577
11,791
18,719
3,149
15,470
40,067
3,3n
36,725
14,814
1,140
2,632
1,055
1,577
10,942
3,794
7,148
12,319
1,185
2,287
1,117
1,170
8,847
3,638
5,209
17,939
2,781
3,281
11,877
19,401
18,908-
7,982
3,342
7,584
65,389
10,869
17,051
2,817
14,234
37,469
3,095
34,374
13,966
1,201
2,510
967
1,543
10,255
3,271
6,984
10,897
1,142
1,917
871
1,046
7,838
3,050
4,788
15,157
2,580
3,194
9,383
13,706
13,479
5,603
2,569
5,307
5,188
922
1,668
432
1,236
2,598
247
2,351 l 848
39
122
88
34
687
523
164
1,422
43
370
246
124
1,009
588
421
2,782
201
87
2,494
5,695
5,429
2,379
773
2,277
160,792
46,490
114,302
6,578
107,724
13,124
1,304
1,062
<148
614
10,758
4,<104
6,354
12,234
17,823
2,016
3,931
11,876
22,763
21,963
8,860
4,033
9,070
1944 1935 1~30 1925 1920
Rural Urban Total Total Total Total
6 ___ _..:_7 __ ___:8"--___ ..o9 ___ --=1.::.0 ____ ~11;.....
155,863
45,015
110.848
5,975
104,873
11,960
1,29.'1
1,051
440
61l
9,616
.'1,561
6,055
11,123
15,840
1,748
3,928
W,164
16,171
15,923
6,041
2,993
6,889
4,929
1,475
3,454
603
2,851
1,164
11
11
8
3
1,1<12
843
299
1,111
1,983
268
3
1,712
6,592
6,040
2,819
1,040
2,181
193,220
18,202
15,315
5,373
1,627
3,746
135,217 165,128 89,731
16,614
13,815
3,681
996
1,685
18,970
17,821
3,659
718
2,941
14,858
15,545
2,184
404
1,780
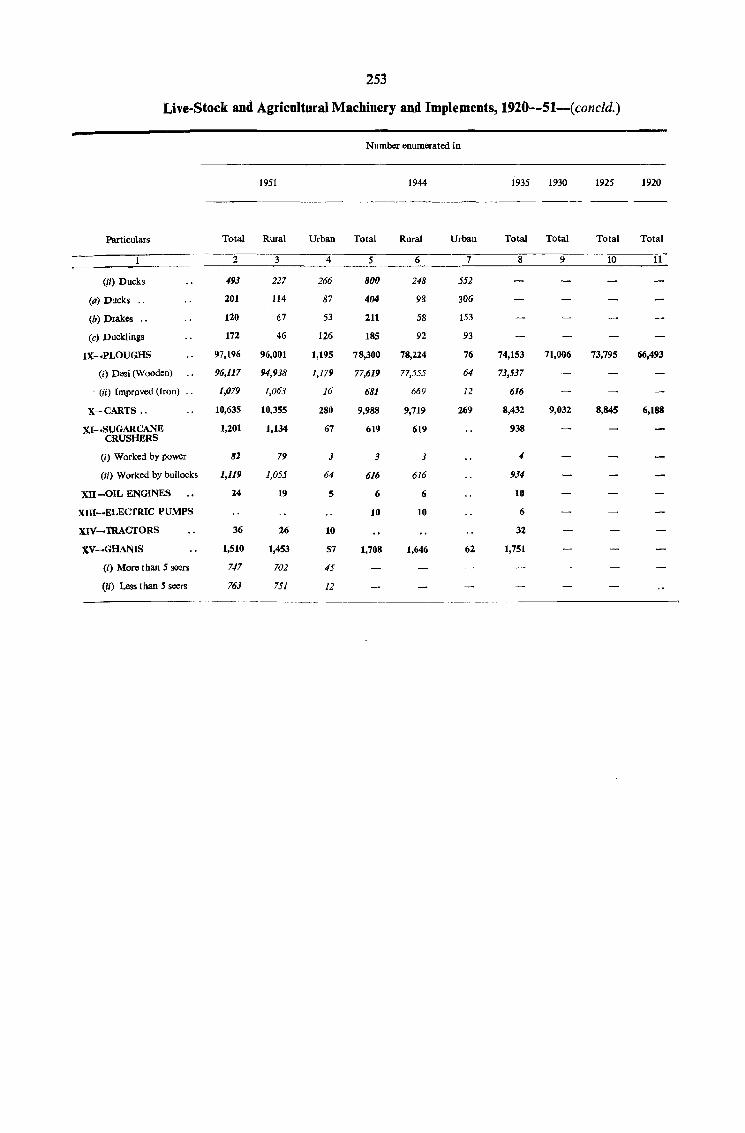
253
Live-Stock and Agricultural Machinery and Implements, 1920--51--(concld.)
Number enumerated in
1951 1944 1935 1930 1925 1920
---.---
Particulars Total Rural Urban Total Rural Urban Total Total Total Total
2 3 4 5 6 7 8 9 10 11
(Ii) Ducks 493 227 266 800 248 552
(0) Ducks .. 201 114 87 404 98 306
(b) Drakes .. 120 67 53 211 58 153
(c) Ducklings 172 46 126 185 92 93
IX-·PLOUGHS 97,196 96,001 1,195 78,300 78,214 76 74,153 71,006 73,795 66,493
(i) Dasi (Wooden) 96,117 94,938 1,179 77,619 77,555 64 73,537
. (ii) [mprQved (Iron) .. 1,079 1,063 16 681 669 12 616
X-CARTS .. 10,635 10,355 280 9,988 9,719 269 8,432 9,032 8,845 6,188
XI-.SUGARCANE 1,201 1,134 67 619 619 938 CRUSHERS
(i) Worked by power 82 79 3 3 3 4
(ii) Worked by bullocks 1,119 1,055 64 6/6 616 934
XII -OIL ENGINES 14 19 5 6 6 10
Xill-ELECTRlC PUMPS 10 10 6
XIV-TRACTORS 36 26 10 32
XV .... GHANIS 1,510 1,453 57 1,708 1,646 62 1,751
(;) More than 5 seers 747 702 45
(II) Less than 5 seers 763 751 12
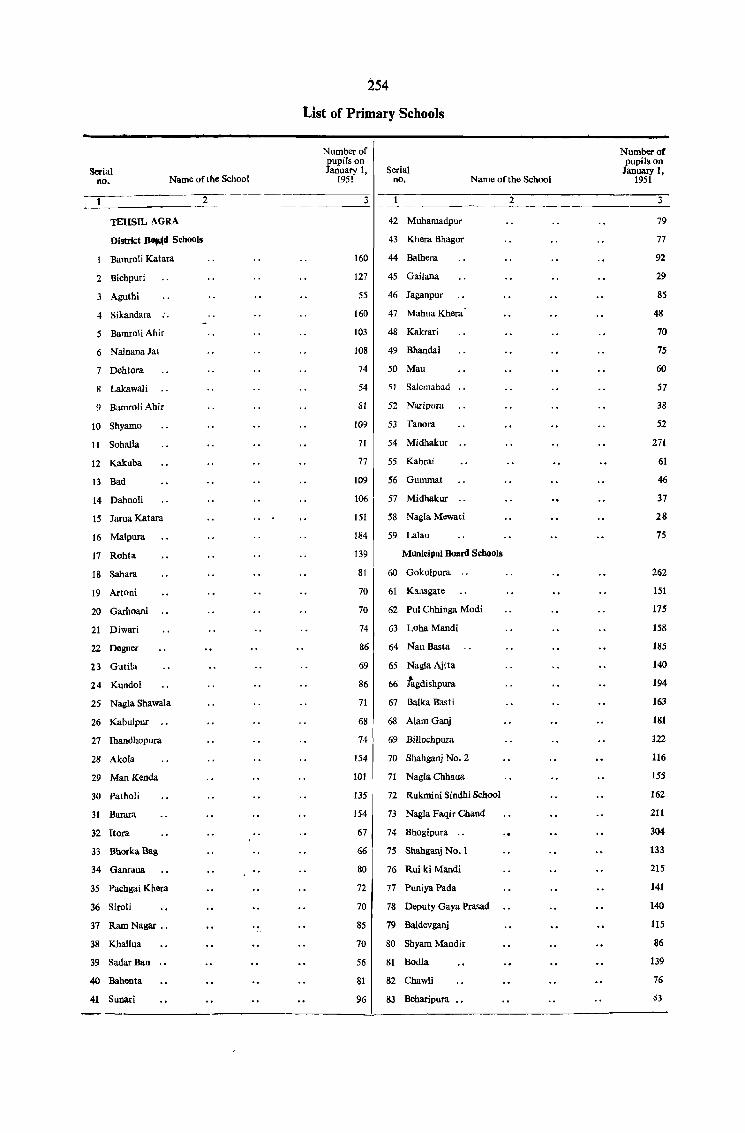
Serial no. Name ofthe School
TEHSIL AGRA
District BoMd Schools
Bamroli Katara
2 Bichpuri
3 Aguthi
4 Sikandara ..
5 Bmoli Ahir
6 Nainana Jat
7 Dehtora
8 Lakawali
9 Bamroli Ahir
10 Shyamo
11 SohaIla
12 Kakuba
13 Bad
14 Dahnoli
15 Jarua Kalara
16 Malpura
17 Rohla
18 Sahara
19 Arloni
20 Garhoani
21 Diwari
22 Degner
23 Gutila
24 Kundol
25 NagJa Shawala
26 Kabulpur
27 lhandhopura
28 Akota
29 Man Kenda
30 Patholi
31 Barara
32 Itora
33 Bhorka Bag
34 Ganraua
35 Pachgai Khera
36 SiroH
37 Ram Nagar ..
38 KhaIlua
39 Sadar Ban
40 Bahenta
41 Sunari
2
~54
List of Primary Schools
Serial
Number of pupils on January 1,
1951 no. Name of the School
3
160
127
55
160
t03
108
74
54
81
109
71
77
109
106
15!
184
139
81
70
70
74
86
69
86
71
68
741
154
101
135
154
67
66
80
72
70
85
70
56
81
96
42 Muhamadpur
43 Khera Bhagor
44 Balhera
45 Gailana
46 Jaganpur
47 Mahua Khera'
48 Kakrari
49 Bhandai
50 Mau
51 Salemabad
52 Naripura
53 Tanora
54 Midhakur
55 Kahrai
56 Gummat
57 Midhakur
58 Nagla Mewati
59 Lalau
Municipal Board SchoOls
60 Gokulpura ' ,
61 Kansgate
62 Pul Chhinga Modi
63 Loha Mandi
64 Nau Basta
65 Nagla Ajita
66 !agdishpura
67 Balka Basti
68 Alam Ganj
69 Billochpura
70 Shahganj No.2
71 Nagta Chhaua
72 Rukrnini Sindhi School
73 Nagla Faqir Chand
74 Bhogipura "
75 Shahganj No.1
76 Rui ki Mandi
77 Puniya Pada
78 Deputy Gaya Prasad
79 Baldevganj
80 Shyam Mandir
81 Bodla
82 Chawli
83 Beharipura
2
Number of pupils on
January I, 1951
3
79
77
92
29
85
48
70
75
60
57
38
52
271
61
46
37
28
75
262
151
175
158
185
140
194
163
181
122
116
155
162
211
304
133
215
141
140
115
86
139
76
~3
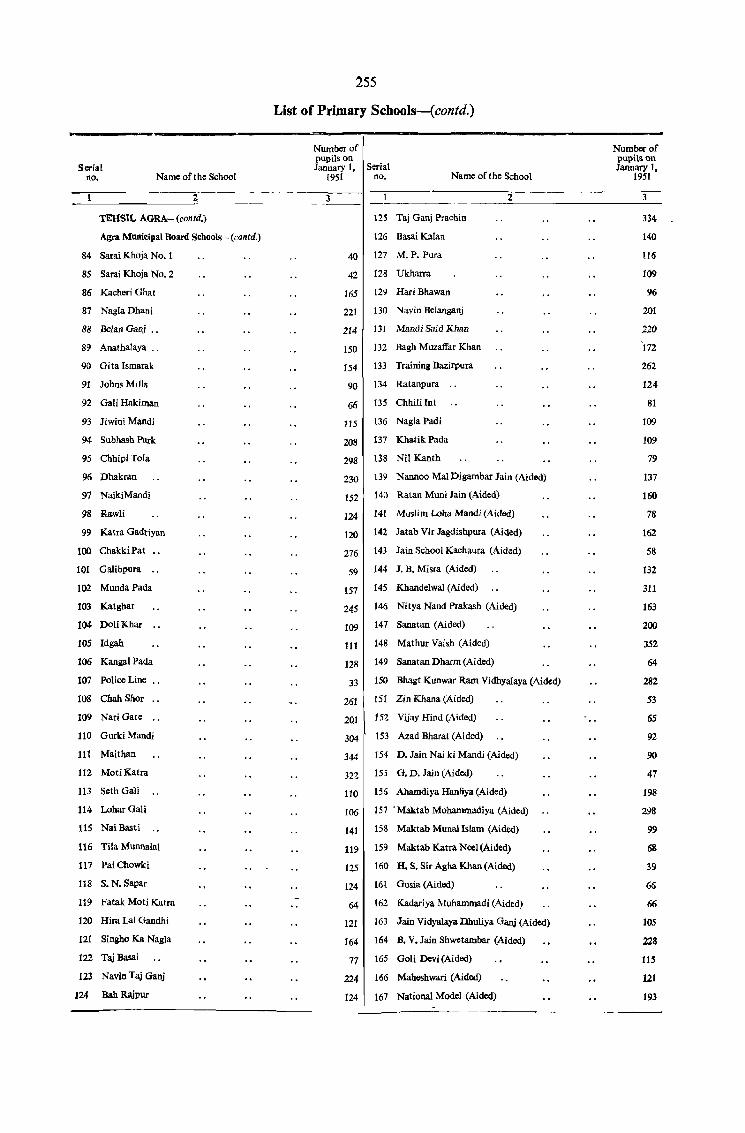
Serial no. Name of the School
TEIISIL AGRA-(cQntd.)
Agra Municipal Board Schools- (contd,)
84 Sarai Khoja No.1
85 Sarai Khoja No.2
86 Kacheri Ghat
87 Nagla Dhaoi
88 &lan Ganj ..
89 Anathalaya ..
90 Gita Ismarak
91 Johns Mill~
92 Gali Hakiman
93 Jiwini Mandi
94 Subhash Park
95 Chhipi Tola
96 Dhakran
97 NaikiMandi
98 Rawli
99 Katra Gadtiyan
100 Chakld Pat
101 Galibpura ..
t02 Munda Pacta
103 Katghar
104 Doli Khar
105 Idgah
106 Kangal Pada
107 Police Line ..
108 Chah Shor ..
109 Nari Gate
110 Gurki Mandi
111 Maithan
112 Moti Katra
113 Seth Gali
114 Lohar Gall
115 Nai Basti
116 Tila MunnaIal
117 Pai Chowki
US S. N. Sapar
119 Fatak Moti Katra
120 Hira La! Gandhi
121 Singho Ka Nagla
122 Taj Basai
123 Navin Taj Ganj
124 Bah IWpur
255
List of Primary Schools-(contd.)
Number of pupils on January I, Serial
19.51 no. Name of the School
3
125 Taj Ganj Prachin
126 Rasai Kalan
40 127 M. P. Pura
42 128 Ukharra
165 129 HariBhawan
221 130 Navin Belanganj
214 131 Mandi Said Khan
150 132 Bagh Muzaffar Khan
154 133 Training Bazirpura
90 134 Ratanpura ,.
66 135 ChhiliInt
115 136 Nagla Padi
208 137 Khatik Pada
298 138 Nil Kanth
2
230 139 Nannoo Mal Digambar Jain (Aided)
152 140 Ratan Muni Jain (Aided)
124 141 Muslim Loha Mandi (Aided)
120 142 Jatab Vir Jagdishpura (Ai <led)
276 143 Jain School Kachaura (Aided)
59 144 J. B. Misra (Aided)
157 14.5 Khandelwal (Aided)
245 146 Nitya Nand Prakash (Aided)
109 147 Sanatan (Aided)
111 148 Mathur Vaish (Aided)
128 149 Sanatan Pharm (Aided)
33 150 Bhagt Kunwar Ram Vidhyalaya (Aided)
261 151 Zin Khana (Aided)
2QI 152 Vijay Hind (Aided)
304 153 Azad Bharat (Aided)
344 154 D. Jain Nai ki Mandi (Aided)
322 155 G. D. Jain (Aided)
110 156 Ahamdiya Hanfiya (Aided)
106 157' Maktab Mohammadiya (Aided)
141 158 Maktab Munal Islam (Aided)
119 159 Maktab Katra Neel (Aided)
125 160 H. S. Sir Agha Khan (Aided)
124 161. Gooia (Ai <led)
64 162 Kadariya Muhammadi (Aided)
121 163 Jain Vidyalaya IlhuJiya Gaqj (Aided)
164 164 B. V. Jain Shwetambar (Aided)
77 165 Goli Deyi (Aided)
224 166 Maheshwari (Aided)
124 167 National Model (Aided)
Number of pupils on January I,
1951
3
334
140
116
109
96
201
220
172 262
124
81
109
109
79
137
160
78
162
58
132
311
163
200
352
64
282
53
65
92
90
47
198
298
99
68
39
66
66
105
228
115
121
193
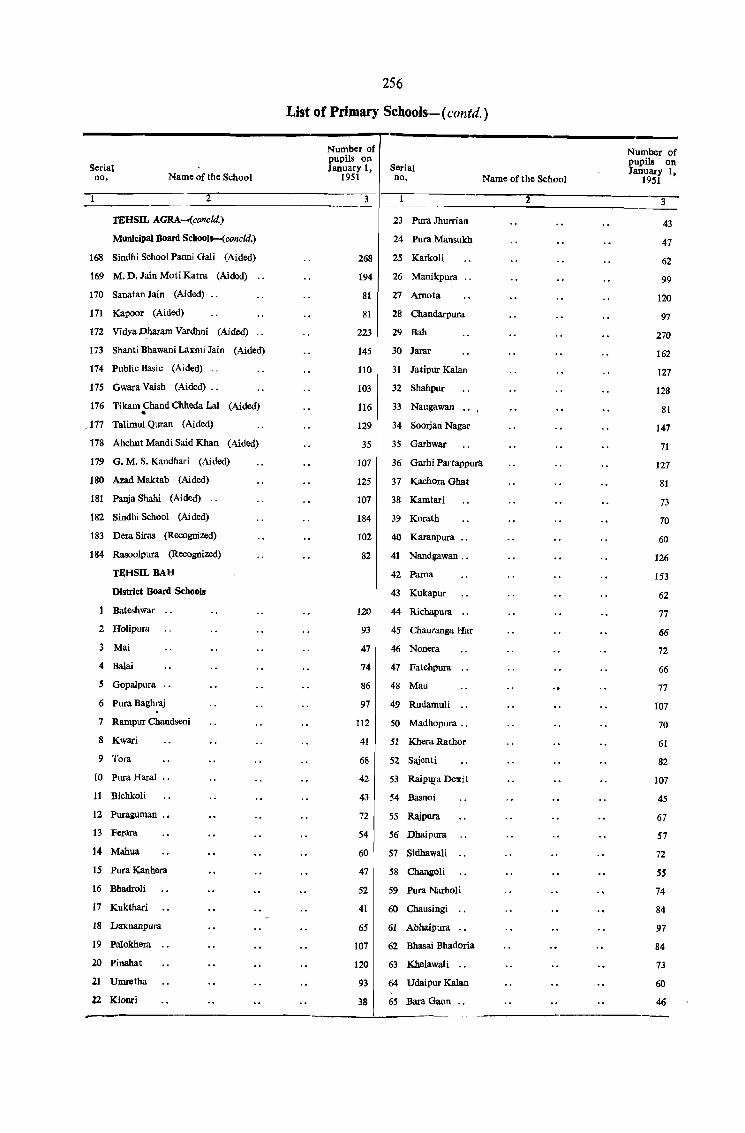
Serial no. Name of the School
2
TEHSIL AGRA--(concld.)
Municipal Board School_(concld.)
16'8 Sindhi School Panni Gali (Aided)
169 M. D. Jain Moti Katra (Aided) ..
170 Sanatan Jain (Aided) ..
171 Kapoor (Aided)
172 Vidya Dharam Vardhni (Aided) ..
173 Shanti Bhawani Laxmi Jain (Aided)
174 Public Basic (Aided) ..
175 Gwara Vaish (Aided) •.
176 Tikam Chand Chheda Lal (Aided) . ,.177 Talimul Quran (Aided)
178 Ahchut Mandi Said Khan (Aided)
179 G. M. S. Kandhari (Aided)
180 Azad Maktab (Aided)
181 P3.l\ia Shahi (Aided) ..
182 Sindhi School (Aided)
183 Dera Siras (Recognized)
184 Rasoolpura (Recognized)
TEHSIL BAH
District Board Schools
Bateshwar
2 Holipura
3 Mai
4 Balai
5 Gopalpura
6 Pura Baghraj
7 Rampur Chandseni
8 Kwari
9 Tora
(0 Pura Haral ..
11 Bichkoli
12 Puraguman .•
13 Ferara
14 Mahua
IS Pura Kanhera
16 Bhadroli
17 Kukthari
18 !JaKnanpura
19 Palokhera
20 Pinahat
21 Umretha
12 Kionri
256
List of Primary Schools- (contd. )
Number of pupils on January 1, Serial
1951 no. Name of the School
3
268
194
81
81
223
145
110
103
116
129
35
107
125
107
184
102
82
120
93
47
74
86
97
112
41
68
42
43
72
54
60
47
52
41
65
107
120
93
38
23 Pora Jhurrian
24 Pura Mansukh
25 Karkoli
26 Manikpura ..
27 Arnota
28 Chandarpura
29 Bah
30 Jarar
31 Jatipur Kalan
32 Shahpur
33 Naugawan
34 Soorjan Nagar
35 Garhwar
36 Garhi Partappura
37 Kachora Ghat
38 Kamtari
39 Korath
40 Karanpura
41 Nandgawan .•
42 Parna
43 Kukapur
44 Richapura
4S Chauranga Har
46 Nonera
47 Fatehpura
48 Mau
49 Rudamuli ..
50 Madhopura ..
51 Khera Rathor
52 Sajenti
53 RaiPWa Dexit
54 Basnoi
55 Rajpura
56 Dhaipura
57 Sidhawali ..
58 ChangOli
59 Pura Narholi
60 Chausingi ..
61 Abhaipura
62 Bhasai Bhadoria
63 Khelawali ..
64 Udaipur Kalan
65 Bara Gaon ..
2
Number of pupils on January I,
1951
3
43
47
62
99
120
97
270
162
127
128
81
147
71
127
81
73
70
60
126
153
62
77
66
72
66
77
107
70
61
82
107
45
67
57
72
SS
74
84
97
84
73
60
46
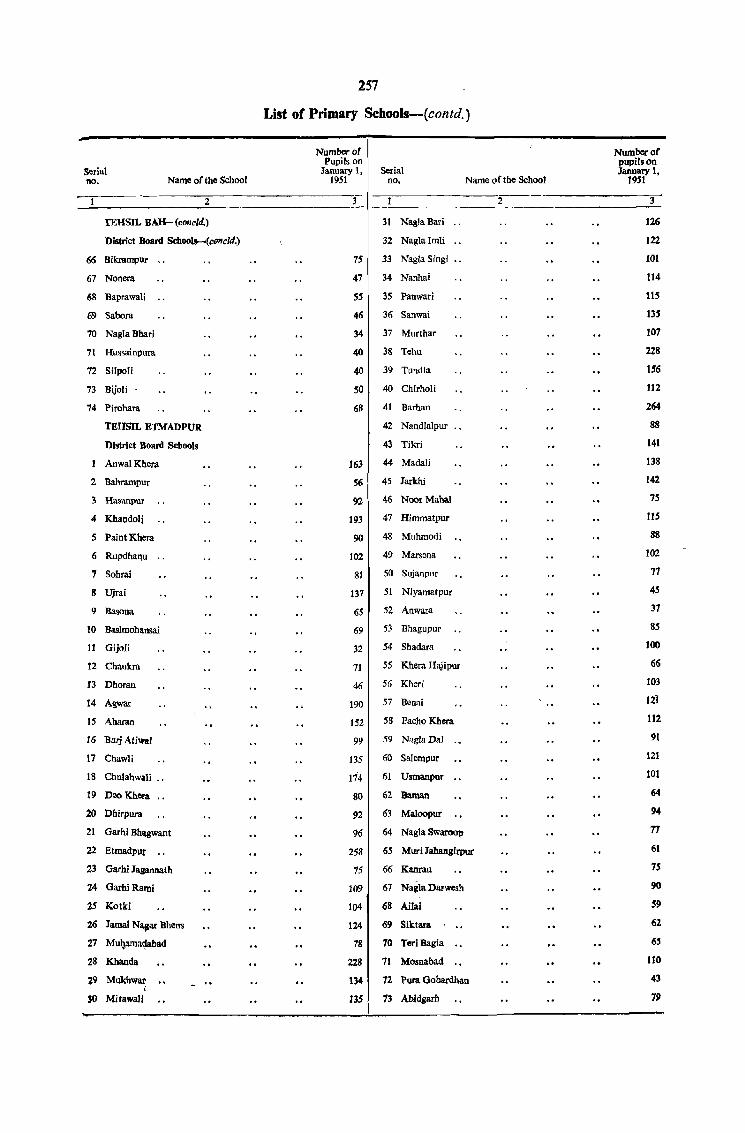
257
List of Primary Schools-(contd.)
Number of Number of Pupils on pupils on
Serial January 1, Serial January 1, no. Name of the School 1951 no. Name or the School 1951
2 3- 2---- 3 ----TEHSIL BAH-(concld.) 31 NaglaBari .. 126
District board SchOOJs.-(COlllcld.) 32 Naglalmli .. 122
66 Bikrampur 75 33 Nagla Singi lOt
67 Nonera 47 34 Nanhai 114
68 Baprawali 55 35 Panwari 115
69 Sabora 46 36 Sanwai 135
10 NaglaBhari 34 37 Murthar 107
11 Hus~aintlura 40 38 Tehu 228
72 Silpoli 40 39 Tundla 156
73 Bijoli - 50 40 Chirholi 112
74 Pirohara 68 41 Barhan 264
TEHSIL ETMADPUR 42 Nandlalpur " 88
District Board Schools 43 Tikri 141
Anwal Khera. 163 44 Madali 138
2 Bahrampur 56 45 Jarkhi 142
3 Hasanpur 92 46 NoorMahal 75
4 Khandoli 193 47 Himmatpur tiS
Paint Khera 90 48 Muhmodi 88
6 Rupdhaqu .. 102 49 Marsena 102
7 Sohrai 8t 50 Sujanpuf 77
8 Ujrai 137 51 Niyamatpur 45
9 Basona 65 52 Anwara 37
10 Basimohansai 69 53 Bhagupur 85
11 Gijoli 32 54 Shadara 100
12 Chaukra 71 55 Khera Hajipur 66
B Dhorau 46 56 Kheri 103
14 Agwar 190 57 Benai 121
15 Aharan 152 58 PachoKhera 112
16 Burj Atiwal 99 59 NaglaDal ., 91
17 Chawli 135 60 Salempur 121
18 Chulahwali .• 174 61 Usmanpur 101
19 Dea KhC!a 80 62 Barnan 64
20 Dhirpura 92 63 Maloopur 94
21 Garhi BhllogWant 96 64 Nagla Swat'OOp 77
22 Etrnadl'ut' .. 258 65 Mud Jahangirpur 61
23 Garhi Jagannath 75 66 Kanrau 7S
24 GarhiRami 109 67 Nagla-Darwesh 90
25 Kotki 104 68 AHai 59
26 Jamal Na~ar Bhens 124 69 Siktara 62
27 Mn4arnEllJabad 78 70 TeriBEIgia 65
28 Khanda 228 71 Mosnabad ItO
29 Mukhwar 134 72 Pura Gobardhan 43 " SO MitawalJ 135 13 AbJdgarh 79
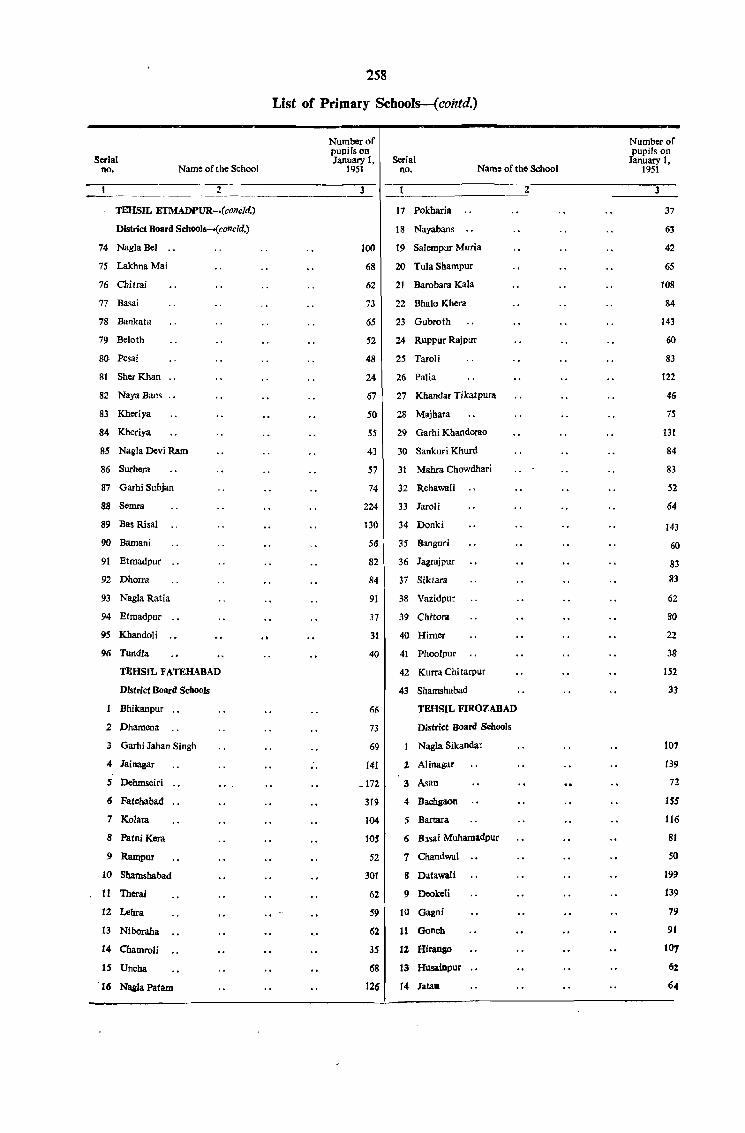
Serial no. Name of the School
2
TEHSIL ETMADPUR-.(conC/d)
District Board Schools--«concld.)
74 Nagla Bel ..
75 Lakhna Mai
76 Chitrai
77 Basai
78 Bankata
79 Beloth
sa Pesai
81 Sher Khan .,
82 Naya Bans ..
83 Kheriya
84 Kheriya
8-5 Nagla Devi Ram
86 Surhcra
87 Garhi Suhjan
88 Semra
89 Bas Risa!
90 Bamani
91 Etmadpur
92 Phorra
93 Nagla Ratia
94 Etmadpur
95 Khandoli
96 Tundla
TEHSIL FATEHABAD
District Board Schools
Bhikanpur ..
2 Phamena
3 Garhi Jahan Singh
4 Jainagar
5 Dehmseiri
6 Fatehabad ..
7 Kolara
8 PatniKcra
9 Rampur
10 Shamshabad
11 Therai
12 Lema
13 Niboraha
J4 ChamroIi
IS Uncha
16 NaaIa Patam
..
258
List of Primary Schools-( contd.)
Number of pupils on January 1. Serial
1951 no. Name of the School
3
17 Pokharia
18 Nayabans
100 19 Salempur Muria
68 20 Tula Shampur
62 21 Barohara Kala
73 22 Bhalo Khera
65 23 Gubroth
52 24 Ruppur Rajpur
48 2S Taroli
24 26 Palia
67 27 Kllandar Tikatpura
50 28 Majllara
55 29 Garhi Khanderao
43 30 Sankuri Khurd
57 31 Mahra Chowdhari
74 32 Rehawali
224 33 Jaroli
130 34 Donki
56 3S Banguri
82 36 Jagrajpur
84 37 Siktara
91 38 Vazidpur
37 39 Chrtora
31
40
66
73
69
14!
_172
319
104
IO~
52
30t
62
59
61
35
68
126
40 Hirner
41 Phoolpur
42 Kurra Chitarpur
43 Sltamshahad
TEHSIL FIROZABAD
District Board Schools
Nagla Sikandar
2 Alinagar
3 Asan
4 Bachgaon
5 Bmara
6 Basal Multama<ipur
7 Cb.andwal
g Datawali
9 Deokeli
10 Gogoi
11 Gonch
12 Hirango
13 HlI8alnpur
14 Jataa
2
Number of pupils on
January 1. 1951
3
37
63
42
65
lOS
84
143
60
83
122
46
75
131
84
83
52
64
143
60
83
83
62
80
22
38
152
33
107
139
72
1SS
116
81
50
199
139
79
91
107
6Z
64
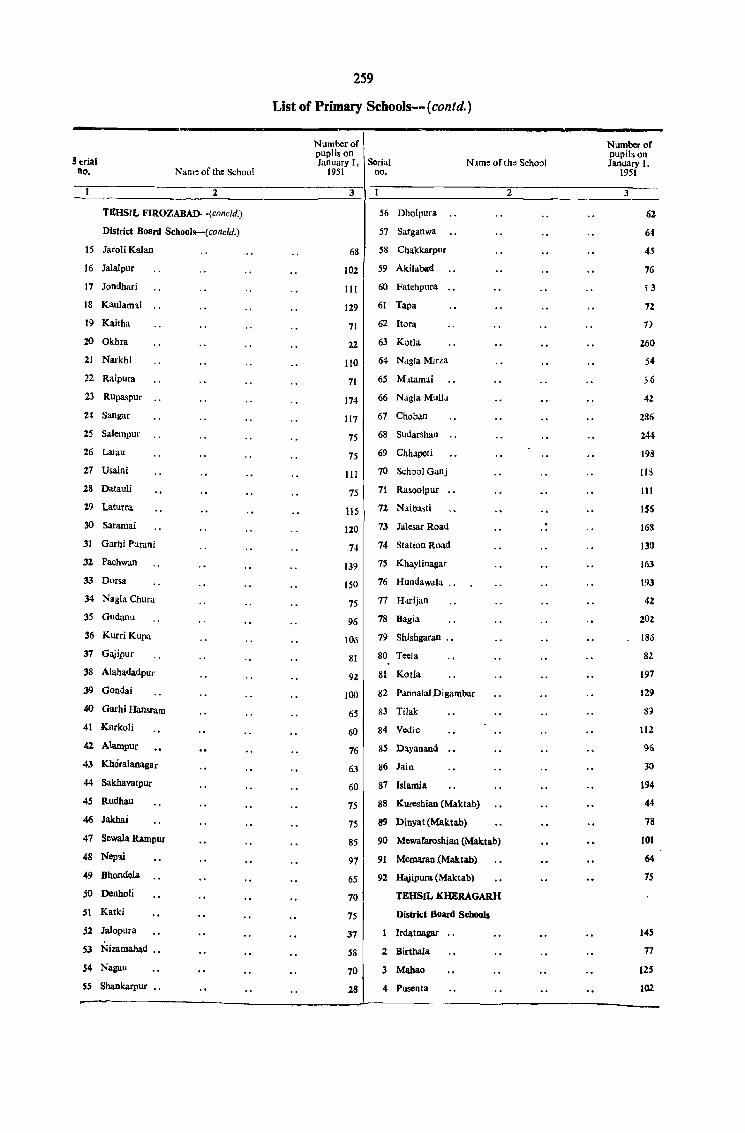
.3 "rial no. Nam~ of the School
2
TEHSIL FIROZABAD-.(concld.)
District Board Scbools-(colIC[d.)
15 Jaroli Kalan
16 Jalalpur
17 Jondhari
18 Kaulam'li
19 Kaitha
ZO Okhra
:U Narkhi
22 Raipura
23 Rupaspur ..
24 Sangar
25 Salempur
26 LaJau
27 Usaini
28 Datauli
29 Laturra
30 Saramai
31 Garhi Purani
32 Pachwan
33 Dorsa
34 Nagla Chura
35 Gudanu
36 Kurri Kupa
37 Gajipur
38 Alahadadpur
39 Gondai
40 Garhi Hansram
41 Karkoli
42 Alampur
43 Khoralanagar
44 Sakhavatpur
45 Rudhau
46 Jakhai
47 Sewala Rampur
48 Nep'li
49 Bhondela
$0 Denholi
51 Katki
52 JaIopura
53 Nizamabad ••
54 Nagau
S5 Shankarpur
259
List of Primary SchooIs-- (contd. )
Number of puplis on January I, Serial N~me of the School
1951 no.
3
68
102
111
129
71
22
110
71
174
117
75
75
111
75
115
120
74
139
150
75
96
106
81
92
100
65
60
76
63
60
7S
7S
85
97
6S
70
7S
37
58
70
28
56 Dholpura
57 Sarganwa
58 Chakkarpur
59 Akilabad
60 Fatehpura
61 Tapa
62 Itora
63 Kotia
64 Nolgla Mirza
65 M!tamai
66 Nolgla Mulla
67 Choban
68 Su<iarshan ..
69 Chhapeti
70 School Ganj
71 Rasoolpur
71. Naiba,ti
73 Jalesar Road
74 Station Road
7S Khaylinagar
76 Hundawala ..
77 Harijan
78 Ragia
79 Shishgaran .•
80 Teela
81 KOlla
82 Pannalal Digambar
83 Tilak
84 Vedic
85 Dayanand
86 Jain
87 Islamia
88 Kureshian (Maktab)
89 Dinyat(Maktab)
90 Mewafaroshian (Maktr.b)
91 Memaran {Maktab)
92 Ha,iipura (Maktab)
TEHSIL KHERAGARH
District Board Schools
Irdatnagar
2 Birthala
3 Mab&o
4 Pusenla
2
Number of pupils on January 1.
1951
3
62
64
45
76
53
7Z
7)
260
54
56
42
286
244
198
113
111
ISS
163
13{)
163
193
42
202
186
82
197
129
8:1
112
96
30
194
44
78
101
64
15
145
77
12S
102
~------------------------------------~-----------------------------------------
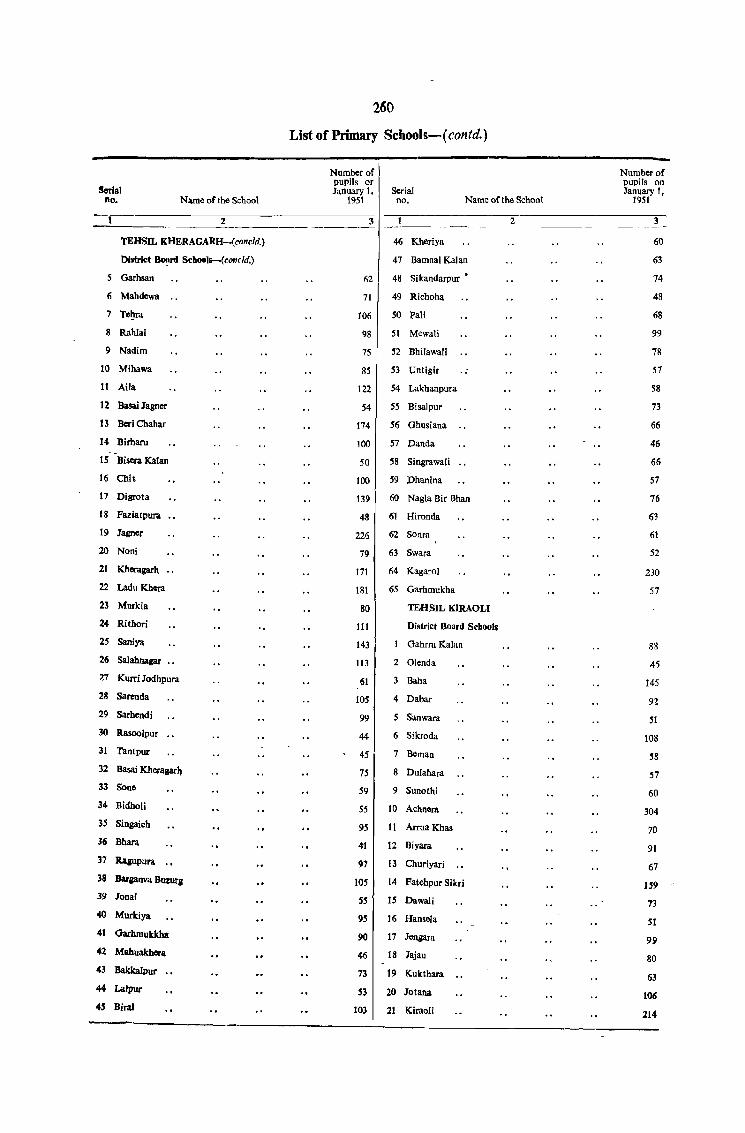
Serial no. Name of the School
2
TEHSIL KHERAGARH-.(concld.}
District Bo!trd ScbOOIs-(concld.}
5 Garhsan
6 Mabdewa
7 Telya
8 Rablai
9 Nadim
10 Mihawa
n Aila
12 Basai Jagncr
13 Beri Chabar
14 Birham
15 Biscra Kalan
16 Chit
17 Digrota
18 Faziatpura
19 Jagncr
20 Noni
21 Khcragarh "
22 Ladu Khera
23 Murkia
24 Rithori
2S Saniya
26 Salahnagar
"7 Kurri Jodhpura
28 Sarcnda
29 Sarhcndi
30 Rasoolpur
31 Tantpur
32 Basai Kheragar~
33 Sone
34 Bidholi
3S Singaich
36 Bhara
37 1laJupura
38 Barpova Buzurg
39 lonai
40 Murkiya
41 Garhmukkba
42 Mahuakhcra
43 Bakkaipur
44 Lalpur
4' Birat
260
List of Primary Schools--( contd.)
Number of pupils or January I, Serial
1951 no.
3
Na.me of the School
2
Number of pupils on January I,
1951
-~-~-----------------
62
71
106
98
75
85
46 Kheriya
47 Bamnai Kalan
48 Sikandarpur'
49 Richoha
50 Pati
51 Mewali
52 Bhilawali
53 Untigir
122 54 Lakhanpura
54 55 Bisalpur
t 74 56 Ghusiana
100 57 Danda
50 58 SingrawaIi ..
100 59 Dhanina
139 60 Nagla Bir Bhan
48 61 Hironda
226 62 Sonra
79 63 Swara
171 64 Kagarol
181 65 Garhmukha
80
111
143
113
61
lOS
99
44
45
75
59
55
95
41
97
lOS
S5
95
90
46
73
53
103
TE;HSIL KIRAOLI
District Board Schools
Gahrra Kalan
2 Olenda
3 Baha
4 Dabar
5 Sanwara
6 Sikroda
7 Beman
8 Dulahara
9 Sunothi
10 Achnera
11 Arrua Khas
12 Biyara
13 Churiyari
14 Fatehpur Sikri
15 Dawali
16 Hansela
17 Jenpra
18 Jajau
19 Kukthara
20 Jotana
21 Kiraoli
60
63
74
48
68
99
78
57
58
73
66
46
66
57
76
63
61
52
230
57
83
45
145
92
51
108
58
57
60
304
70
91
67
lS9
73
51
99
80
63
106
214
261
List of Primary Schools-(concld.)
Number of Number of
Serial pupils on pupils on January 1, Serial January I,
no. Name orthe School 1951 no. Name of the School 1951
2 3 2 3
TEHSIL KIRAOLI-(concld.)
",l 52 Jitora 101
District Board Schools-(concld.) 53 Bharkol 54
22 Karahara ~4 Dithwar 4'
23 Pachora 73 ~5 Baranwara 54
24 Mangora 69 56 Babrod 72
25 Nagar 81 57 Chehpoker 92
26 Raibha 163 58 Arhera 7.'J
27 Runkuta 94 59 Gobra 61
28 Sandhan 101 60 Akbara 61
29 Santha 58 61 Panwari 92
30 Sital Khurd 138 62 Mandi GUT 90
31 Ujrai 80 63 Imlawada 84
32 Undera 75 64 Ninwaha 52
33 Nayabans 65 65 Chomah Shahpur 75
34 Kathwari 71 66 Chenkora 90
35 Garhi Sindhpura 69- 67 Mandi Mirza S4
36 Kithan 67 68 Ardaya 53
37 Mahura 67 69 Pura Mana 62
38 Konrai 57 70 Gaharra Khurd 62
39 Maggral 56 71 Sarsa 38
40 Atoos 88 72 Nagla Baharwali 54
41 Khandwai 50 73 Garhim'l 62
42 Bhilawat 52 74 Lokher ara 75
43 Turkiya 90 7S Nagar 69
44 RajhoJi .. 97 76 Gopau 45
45 Mangrol Gujar 85 77 Arsena 69
46 Akhwai 93 78 Doora 170
47 Deoretha 108 79 Achnera (Depressed) 80
48 Mahdau 49 80 Jaupura 21
49 Deonari 53 81 Achnera (lslamia) 45
50 Sakatpur 56 82 Kiraoli (Islamial 28
51 Tikri 79 83 Mubarikpur 90
PSUP-AP 2 Census-1955-200.


