Embed Size (px)
Citation preview

1 3
Mol Genet GenomicsDOI 10.1007/s00438-014-0969-3
ORIGINAL PAPER
Diversification and distinctive structural features of S‑RNase alleles in the genus Solanum
Lauís Brisolara‑Corrêa · Claudia Elizabeth Thompson · Cláudia Lemelle Fernandes · Loreta Brandão de Freitas
Received: 11 September 2014 / Accepted: 27 November 2014 © Springer-Verlag Berlin Heidelberg 2014
of the positively selected residues was identified adjacent to a conserved strand that is crucial for enzymatic cataly-sis. Additionally, we have shown significant differences in the electrostatic potential among the predicted molecular surfaces in S-RNases. The structural results indicate that local changes in the three-dimensional structure are pre-sent in some regions of the molecule, although the general structure seems to be conserved. No previous study has described such structural variations in S-RNases.
Keywords Allele diversification · Solanum · S-RNase · Molecular modeling · Structural biology · Phylogenetics
Introduction
Several mechanisms have been identified as responsible for stigma and style recognition (Golz et al. 1999). The major-ity of flowering plants have organs with male and female structures simultaneously in the flower. Consequently, genetic self-incompatibility (SI) systems evolved to prevent the detrimental effects of self-fertilization and inbreeding depression. SI occurs when a pollen grain lands on its own stigma or on the stigma of a genetically related plant. In these cases, the pollen will fail to germinate or will germi-nate to produce a pollen tube that grows through the style but does not reach the embryonic sac in the ovary (de Net-tancourt 1977).
In general, SI is a phenomenon in which pistils spe-cifically reject pollens with which they share some alleles. Basically, there are two distinct strategies, sporophytic self-incompatibility (SSI) and gametophytic self-incom-patibility (GSI), the latter of which will be discussed in more detail because it is the mechanism found in Sola-num. GSI is controlled by a multigenic, multiallelic locus
Abstract The multigenic and multiallelic S-locus in plants is responsible for the gametophytic self-incompati-bility system, which is important to prevent the detrimen-tal effects of self-fertilization and inbreeding depression. Several studies have discussed the importance of punctual mutations, recombination, and natural selection in the gen-eration of allelic diversity in the S-locus. However, there has been no wide-ranging study correlating the molecular evolution and structural aspects of the corresponding pro-teins in Solanum. Therefore, we evaluated the molecular evolution of one gene in this locus and generated a statisti-cally well-supported phylogenetic tree, as well as evidence of positive selection, helping us to understand the diversifi-cation of S alleles in Solanum. The three-dimensional struc-tures of some of the proteins corresponding to the major clusters of the phylogenetic tree were constructed and sub-sequently submitted to molecular dynamics to stabilize the folding and obtain the native structure. The positively selected amino acid residues were predominantly located in the hyper variable regions and on the surface of the protein, which appears to be fundamental for allele specificity. One
Communicated by C. Gebhardt.
Electronic supplementary material The online version of this article (doi:10.1007/s00438-014-0969-3) contains supplementary material, which is available to authorized users.
L. Brisolara-Corrêa · L. B. de Freitas (*) Department of Genetics, Laboratory of Molecular Evolution, Universidade Federal do Rio Grande do Sul, Porto Alegre, Brazile-mail: [email protected]
L. Brisolara-Corrêa · C. E. Thompson · C. L. Fernandes Unit of Theoretical and Computational Biology, Biotechnology Center, Universidade Federal do Rio Grande do Sul, Porto Alegre, Brazil

Mol Genet Genomics
1 3
named the S-locus. This locus is highly polymorphic and basically is formed by a block of two genes, of which one is just expressed in the pistil (S-RNase) and another is just expressed in the pollen tube (S-locus F-box or SLF). Both genes are responsible for the protein interaction that results in the SI event. Nunes et al. (2006) showed that the evolu-tionary histories of these two genes are very similar, prob-ably due to a coevolutionary process. The term haplotype has been used to characterize variants of the whole S-locus, and the term allele has been used to determine variants of a given polymorphic gene at the S-locus in association with a specific phenotype (McCubbin and Kao 2000; Ushijima et al. 2003).
GSI is found in self-incompatible species of the Plan-taginaceae, Rosaceae, and Solanaceae families. It has been extensively studied in several genera of Solanaceae, includ-ing Lycium, Nicotiana, Physalis, Petunia, and Solanum, which is the major studied group until now. The high level of variation in S-RNase occurs because new functional mutations are easily fixed in the populations, as the S-locus is presumably submitted to a balancing selection (Charles-worth 2006). The S-loci sequences are highly divergent, with stylar S alleles often differing by 40 % or more.
Comparisons of the deduced amino acid sequences of S-RNases in Solanaceae have revealed five conserved (C1–C5) and two hypervariable (HVa and HVb) regions (Ioerger et al. 1991; Tsai et al. 1992). Some studies have suggested that the hypervariable regions are accountable for the allele specificity in S-RNase (Savage and Miller 2006; Vieira et al. 2007; Paape and Kohn 2011). However, the specific macromolecular interactions and the role of variation in the hypervariable regions remain unknown.
Additionally, results from domain-swapping experi-ments have suggested that point mutations in the S-RNase gene can generate new allelic specificities (Matton et al. 1997). The importance of a point mutation alone or point mutations coupled with positive selection contributing to the generation of allelic diversity remains unclear. Although some functional studies have demonstrated that domain-specific (e.g., in hypervariable regions) point mutations are related to phenotype switching (Matton et al. 1997; Kao and McCubbin 1996; Zurek et al. 1997), we should not undervalue the impact of point mutations in other regions of the protein on its molecular and structural properties.
It is also interesting to evaluate whether positive selec-tion is acting on these proteins to a better understanding of their evolution and potential functional diversification. There are previous studies addressing this theme to assess which codons within S-RNase sequences have been subject to positive selection in S alleles of different taxa (Savage and Miller 2006; Vieira et al. 2007; Paape and Kohn 2011). However, they did not focus on the Solanum genus and
did not correlate the structural variation to the positively selected residues in the S-RNases.
Despite the large number of studies involving the S-RNase alleles, there is not a wide-ranging study corre-lating the molecular evolution and structural aspects of the corresponding proteins in Solanum. The purpose of the pre-sent investigation was to extend early studies of this multi-allelic gene, using molecular evolutionary tools to under-stand S-RNase diversification in Solanum. Specifically, we aimed (a) to identify the evolutionary history of these alleles; (b) to identify the amino acid residues under posi-tive selection; (c) to understand the structural dissimilari-ties between different alleles; and (d) to evaluate the struc-tural impact of some amino acid replacements on both the conserved and hypervariable regions of S-RNase.
Materials and methods
Sequence data set and alignment
All available S-RNase sequences were obtained from pub-lic sequence databases through a Blast search in August 2013, which was conducted using the non-redundant nucle-otide database at the National Center for Biotechnology Information (NCBI) web site. Overall, 189 sequences of Solanum S ribonucleases were obtained from this reposi-tory using the S. peruvianum sequence (GenBank num-ber 2894087) as a query. Of these, 43 sequences showed a signal of pseudogenization (e.g., one or more premature stop codons in the coding region) or were much shorter (less than 150 nucleotides in length) and were excluded from analyses. Duplicated NCBI accession numbers and all identical nucleotide sequences were discarded. Only sequences annotated as S-RNases were used. We selected all Solanum S-RNases sequences, including species from two subgenera (Leptostemonum and Potatoe). Relevant information about the 146 sequences and the species from which they were obtained is described in supplementary table S1 (Online Resource 1).
Multiple alignments were performed using the COBALT web server (Papadopoulos and Agarwala 2007). The align-ment parameters were −11 to the opening and −1 to the extension of gaps. For the end-gap penalties, we chose −5 for the opening and −1 for the gap extension. In relation to the constraint parameters, the RPS BLAST was used to guide the alignment, with an E value of 10−5 and the option of finding the conserved columns and recomputing the alignment. The default parameters were applied for the query clustering. All alignments were visually inspected, and adjustments were made manually when necessary using MEGA 6 (Tamura et al. 2013) package. The stop

Mol Genet Genomics
1 3
codons were excluded from the alignments. All alignments are freely available upon request.
Molecular genealogy of S-RNases
To find a tree that best represents the diversification his-tory of the locus, phylogenetic analysis was performed using two different approaches to reconstruct the evolution-ary history of S-RNases: a distance method represented by neighbor joining (NJ) and a probabilistic method rep-resented by the maximum likelihood(ML) estimation. One of the best-fit evolutionary models previously identi-fied for the jModelTest 2 (Darriba et al. 2012), and Prot-Test 3 (Darriba et al. 2011) software was used in the ML analyses according to the availability in the PhyML 3.0 (http://www.atgc-montpellier.fr/phyml) web server (Guin-don et al. 2010) to determine the nucleotide substitution and amino acid replacement, respectively. However, due to the limitation in the number of models available in the MEGA package, this procedure was not applied for the NJ analyses.
The NJ analysis using MEGA was based on the p-dis-tance matrix, using the nucleotide and protein alignments as inputs. The transitions and transversions for all codon positions were considered in the analysis. The branch sup-port of the NJ phylogenetic tree was estimated by the boot-strap test with 1,500 replicates. Pair wise deletion was used for the treatment of gaps.
The ML analyses were performed for the protein and DNA datasets using PhyML. The initial tree was deter-mined by a NJ fast algorithm (BIONJ), estimating the proportion of invariable sites and the gamma distribution parameter. Four substitution rate categories were used, and the empirical equilibrium frequencies for either the amino acid or nucleotide were estimated. The tree topology was optimized by Subtree Pruning and Regrafting (SPR), which is an approach of topological rearrangements that is usually sufficient to intensively search the tree space. Additionally, the branch lengths and substitution model parameters were also optimized according to the algorithms implemented in PhyML.
A non-parametric bootstrap analysis (Felsenstein 1985) using 1,000 replications was used to evaluate the topology of the resulting trees in the different analyses performed in an effort to estimate the confidence limits of the internal branches. Because the PhyML web server has a limitation in the running time for the bootstrap analysis of amino acid data sets, we performed a likelihood ratio test (LRT) as a substitute for the usual bootstrap-resampling test. A fast approximate likelihood ratio test (aLRT) for the branches is provided by PhyML, and it has been proven to be a good alternative to the bootstrap analysis (Anisimova and Gas-cuel 2006; Anisimova et al. 2011). We used SH-aLRT, a
non-parametric branch support based on a Shimodaira–Hasegawa-like procedure (Shimodaira and Hasegawa 1999), which is implemented in this software and, accord-ing to Anisimova et al. (2011), is the best non-parametric reliability test. All trees were displayed using MEGA.
Maximum likelihood tests of positive selection
To determine whether the S-RNase gene might be evolv-ing under positive selective pressure in the S-locus, we ana-lyzed those data with models of variable ω ratios among sites. We estimated the selective force by comparing the number of nonsynonymous changes with that of synony-mous changes, assuming that the synonymous changes were almost neutral. We calculated the ratio of nonsynony-mous (amino acid altering) to synonymous (silent) substi-tution rates (dN/dS or ω) to evaluate the selection acting on the S-like RNase coding region, expecting dN/dS = 1 for neutrality, dN/dS < 1 for purifying selection, and dN/dS > 1 for positive selection. The analyses of positive selection were conducted using the codeml tool of the PAML pro-gram package (Xu and Yang 2013), which allows the pairs of nested models with and without positive selection to be tested in a likelihood ratio framework. Following the rec-ommendation of several studies (Anisimova et al. 2001; Wong et al. 2004; Bielawski and Yang 2005), we consid-ered three pairs of site-evolution models to test for variable omega among sites: (a) the M1a (Nearly Neutral) and M2a (Positive Selection), (b) the M7 (β) and M8 (β and ω), and (c) the M0 (one-ratio) and M3 (discrete) models.
In all PAML analyses, model comparisons were made using LRTs. For each LRT, twice the log-likelihood dif-ference between the alternative and null models (2Δl) was compared to critical values from an χ2 distribution with degrees of freedom equal to the difference in the number of estimated parameters between both models. In all analyses, the codons containing alignment gaps due to insertion-dele-tion (indel) events among sequences were considered in the pair wise comparisons. Finally, the Naive Empirical Bayes (NEB) and Bayes Empirical Bayes (BEB) approaches were used to calculate the posterior probability (PP) of each site belonging to the site class of positive selection under each model.
Structural analyses
To understand the structural aspects of the S-RNase pro-teins, we predicted their folding pattern through com-parative molecular modeling by homology. A total of 12 sequences representing the clades and subclades of the phylogenetic tree were modeled. The three-dimensional structure of the template was identified using the NCBI BLAST tool (Altschul et al. 1990) against the protein data

Mol Genet Genomics
1 3
bank (PDB) (Berman et al. 2000). The homologous struc-ture of S-RNase from ornamental tobacco—Nicotiana alata (PDB ID: 1IOO), experimentally determined by X-ray diffraction at 1.55 Å resolution (Ida et al. 2001), was chosen as a template to model all 12 S-RNase sequences and presented an identity higher than 40 % in all cases. The Modeller 9.12 (Sali and Blundell 1993) program was used to build the protein models, using a refined protocol for comparative protein structure by homology modeling (Marti-Renom et al. 2000). Five initial models were gen-erated for each sequence, and the best model was selected after validation procedures. The stereochemical and qual-ity and theoretical validation of the models were performed using the MolProbity (http://molprobity.biochem.duke.edu) (Davis et al. 2004; Chen et al. 2010) and SWISS-MODEL (http://swissmodel.expasy.org) (Arnold et al. 2006; Kiefer et al. 2009) web servers.
All theoretical models were submitted to a molecular dynamics (MD) simulation to refine their structures. The calculations were performed using the GROMACS 4.6 sim-ulation suite (van der Spoel et al. 2005) and GROMOS96 force field (van Gunsteren et al. 1996). Briefly, the 3D structures were solvated with Simple Point Charge (SPC) and submitted to an energy minimization using the Steep-est Descents algorithm. Counter ions (Na+ or Cl−) were added to neutralize the systems, and the LINCS method (Hess et al. 1997) was applied to constrain the covalent bond lengths, allowing an integration step of 2 fs after an initial energy minimization. The system reference tempera-ture was adjusted to 300 K. Therefore, it was slowly heated from 50 to 300 K in steps of 5 ps each one increasing the reference temperature by 50 K. The models were submitted to MD simulations of 10 ns employing the Particle Mesh Ewald method (Darden et al. 1993). The temperature and pressure were kept constant by coupling the protein and solvent to the external temperature and pressure baths with coupling constants of t = 0.1 and 0.5 ps, respectively (Ber-endsen et al. 1987).
To evaluate the differences in conformation after the MD simulations, the root mean square deviation (RMSD) was measured, and the regions with a major difference in rela-tion to the initial structures were studied. The RMSD anal-yses were performed in GROMACS. Moreover, the root mean square (RMS) is a measure of how much the position of each atom in a model varies throughout the ensemble. The RMS values for pairwise comparisons of all modeled structures were calculated in DeepView 4.1 (Guex and Pei-tsch 1997). A hierarchical clustering method based on the Euclidian distance of the similarity matrix of RMS values was generated to gain a better understanding of the overall structural similarities among all built S-RNases. This anal-ysis was performed in SPSS 18 (http://www-01.ibm.com/software/analytics/spss). The PyMOL 1.3 software (http://
www.pymol.org) was used to display and visualize the final modeled three-dimensional structures. Additionally, the number of N-glycosylated sites for the modeled structures was predicted using the ScanProsite tool web service (http://prosite.expasy.org), which has an algorithm that pre-dicts with good accuracy the sites at which asparagine resi-dues are in the correct context for glycosylation to occur, based on the known patterns of N-glycosylated proteins. It is important to note that S-RNase is a glycoprotein, and it has been demonstrated that glycosylation is necessary for its enzymatic activity.
Results
Phylogenetic analyses
We analyzed 146 S-RNase sequences from 12 Solanum species (46 S. chilense, 44 S. peruvianum, 18 S. carolin-ense, 14 S. habrochaites, 7 S. stenotomum, 5 S. lycopersi-cum, 4 S. pimpinellifolium, 4 S. chacoense, 1 S. lycopersi-coides, 1 S. neorickii, 1 S. pennellii, and 1 S. tuberosum). More information about the sequences, species, accession numbers, and respective references used in the analyses is available in supplementary table S1 (see Online Resource 1). All alignments were visually verified and manually edited when necessary, resulting in a total of 828 DNA sites, of which 792 were polymorphic. The final protein alignment resulted in 276 deduced amino acid residues, with 261 polymorphic sites. The best models of evolution indicated by jModelTest considering the AICc, AIC, and BIC tests were TVM+G and WAG+G+F for the nucleo-tide and amino acid substitution models, respectively (see Table S2, Online Resource 1). Because the first best-fit model for the nucleotide sequence was not available on the PhyML web service, the generalist third best-fit model GTR+G was applied in the maximum likelihood phyloge-netic reconstruction of the DNA sequences.
The phylogenetic trees obtained using the distance method through the NJ algorithm, p-distance matrix for the DNA and protein data were highly supported (see Figs. S1 and S2, Online Resource 1), especially when using pair-wise deletion for the treatment of gaps. NJ and ML tree topologies did not differ substantially when the eight major clades were considered. Consequently, we selected the ML
Fig. 1 Maximum likelihood (ML) genealogies of Solanum S-RNases. a Evolutionary history of Solanum S-RNases based on nucleotide coding sequences. Only branch-support values higher than 70 % are shown. b Evolutionary history of Solanum S-RNases based on the deduced amino acid sequences. Numbers in the branches rep-resent bootstrap values (1,000 replicates), and only values higher than 70 % are shown. The scale bar indicates the levels of sequence diver-gence. Clade 8 and its subclusters are labeled in the trees
▸

Mol Genet Genomics
1 3

Mol Genet Genomics
1 3
tree for the subsequent analyses of functional diversifica-tion and for the phylogenetic discussions as well.
Clade 1 is well supported and is composed of highly divergent sequences (see Fig. 1a, b; Supplementary Figs. S1 and S2, Online Resource 1). Interesting to notice that the S. peruvianum allele, previously identified as 8 by Igic et al. (2007), formed a cluster with S. chilense alleles. Clade 2 formed a well-supported group with four S-RNase alleles (see Fig. 1a, b; Supplementary Figs. S1 and S2, Online Resource 1). Clade 3 is well supported and it is constituted by two groups: one (3A) consisting of eight alleles and another (3B) with four alleles (Fig. 1a, b; Sup-plementary Figs. S1 and S2, Online Resource 1). Clade 4 is fully supported (see Fig. 1a, b; Supplementary Figs. S1 and S2, Online Resource 1), while Clade 5 is well supported (see Fig. 1a, b; Supplementary Figs. S1 and S2, Online Resource 1).
Clade 6 is well supported and is split into two line-ages subclades 6A and 6B (see Fig. 1a, b; Supplementary Figs. S1 and S2, Online Resource 1). The sequences of 6A subclade have an amino acid substitution (N for D) at the major glycosylation site located in the C2 conserved region. Solanum chilense S25 and S. chilense S34 are two divergent alleles in this subclade, and the latter one also has a substitution (N for Y) in the same glycosylation site. The 6B subclade has one internal, well-supported cluster formed by S. peruvianum alleles. There is an additional group of three S. carolinense sequences that are nearly identical (the Hsc, S–P, and S–O alleles), which have some mutations in the hypervariable regions (see Sup-plementary Fig. S3, Online Resource 1) that may lead to functional divergence.
Clade 7 is fully supported and shows two distinctive sub-clusters (see 7A and 7B, Fig. 1a, b; Supplementary Figs. S1 and S2, Online Resource 1). In the 7A subclade, there is a highly bootstrap-supported group constituted by seven alleles that code very similar amino acid sequences, with the same content in the hypervariable regions S. habro-chaites (ZS2, ZS3, ZS8, and ZS13), S. lycopersicum (ZS11 and ZS12), and S. pimpinellifolium (ZS10).
Clade 8 is well supported and is split into the 8A and 8B subclade clusters (Figs. 1a, b, 2; Supplementary Figs. S1 and S2, Online Resource 1). These two subclades have rep-resentatives from all sequenced Solanum S-RNase groups to date. Additionally, the 8B subclade is divided in three monophyletic groups (8b1, 8b2 and 8b3). The 8b3 subclade is formed by seven S. stenotomum sequences in a single well-supported branch in all analyses.
Maximum likelihood tests of positive selection
Nonsynonymous rate differences are expected in proteins with dissimilar phenotypes in the same locus because
evolution selects for functional evolutionary novelties. For this reason, we tested the hypothesis that some codon sites within the Solanum S-RNase genes have experienced posi-tive selective pressure. A total of 30 amino acid residues of Solanum S-RNases were identified as positively selected (Table 1 and Table S5). Comparison between M1a (nearly neutral) and M2a (positive selection) yielded a significant LRT (313.3), which allows the rejection of the null hypoth-esis of neutrality (p < 0.0001). As result, 1.7 % of the sites showed ω = 2.25, and 28 amino acid residues were identi-fied as being positively selected by BEB, of which 19 had a PP ≥ 99 %. Comparing the M7 (neutral, β) and M8 (selec-tion, β and ω) model sites, we obtained a LRT = 275.3 (p < 0.0001), 1.7 % of the sites with ω = 1.96 and 23 amino acids identified under positive selection according to the BEB (17 of which had a PP ≥ 99 %). Finally, we performed a comparison between M0 (one-ratio, neutral) and M3 (discrete, selection), obtaining a LRT = 4,245.6 (p < 0.0001). According to that comparison, 39 % of the sites showed ω = 1.57, and 60 amino acids were under positive selection, 50 of which had a PP ≥ 99 % by the NEB. For this model, just the NEB was calculated because PAML does not implement BEB for M3 model sites. All model comparisons were highly significant, suggesting that positive selection is a relevant evolutionary phenomenon during S-RNase diversification.
Most of the 28 positively selected amino acid residues identified as being submitted to positive selection by model M2a and BEB were located in coil/turn regions of the pro-teins (18 of them are located on hypervariable domains), and none of them were located in a conserved region (Fig. 3b). The N-terminus and C-terminus portions of the S-RNase three-dimensional structure showed significant values of PP in some sites, indicating that they are under positive selection. However, it is necessary to carefully ana-lyze these sites, considering that most sequences are partial.
Structural analyses
According to our phylogenetic analyses, the Solanum S-RNases formed eight major clades and some subclades (Fig. 1a). Additionally, several amino acid residues seem to have been subjected to functional divergence (Table 1). To evaluate the impact of the positively selected amino acid residues on the S-RNase protein structures, we con-structed three-dimensional models for all clades. In total, twelve structural models were constructed, validated and submitted to molecular dynamics to achieve structural sta-bilization. They represent all major clades in the genealogy of SolanumS alleles, including S. peruvianum (allele 7 of the 7A subclade, S3 of the 3B subclade, S6 of Clade 1, S7 of the 7B subclade, S12-1 of the 6B subclade, and S25 of the 3A subclade), S. chilense (S1b of the 8B subclade), S.

Mol Genet Genomics
1 3
chacoense (allele 2 of Clade 4 and allele 3 of Clade 5), S. tuberosum and S. habrochaites (Shab6 of the 6A subclade). Clade 2 has only four alleles, and the molecular modeling performed for them resulted in poor structural models due to their partial sequences and lack portions of the N-ter-minus and C-terminus sequences. These missing portions seem to be relevant for the establishment of several beta sheet secondary structures. Thus, the modeled protein is very different from the structures predicted for the other clades identified in this genealogy (data not shown).
For the remainder of the genes subjected to the mod-eling, five very similar, high-quality structural models were generated through MODELLER for each subclade. SWISS-MODEL and MolProbity were used to evaluate the theoretical model and stereochemical quality, respectively. The crystal structure of Nicotiana alata SF11-RNase (Ida et al. 2001) was used as a template for the construction of three-dimensional molecular models representing all major clades of the Solanum S-RNase phylogeny. The template has an excellent resolution of 1.5 Å and also belongs to the
S-locus. The main necessary assumptions to apply the tech-nique were satisfied: a functionally related template with good resolution (usually a max of 2.5 Å) and a minimum of 25 % shared identity with the proteins to be modeled (Marti-Renom et al. 2000). These resulting models have provided relevant insights into the spatial arrangements in the variable and conserved regions of the S-RNases.
The five models generated by each modeling were ana-lyzed using the MolProbity and SWISS-MODEL web servers to evaluate the stereochemical quality and obtain theoretical validation of the models, respectively. The Ramachandran plots confirmed the excellent quality of the initial models, with the percentage of residues in most favored and additional allowed regions being no lower than 94 % as can be seen in supplementary table S3 (see Online Resource 1). The RMSD between the backbone atoms of the template and the models were no higher than 3.6 Å (see supplementary table S4, Online Resource 1), where the differences in the loop regions account for the largest differences. These data suggest that the models
Fig. 2 Detailed representation of the phylogenetic relationships within clade 8. a The ML genealogy of the Clade 8 S-RNases is shown based on nucleotide data, showing three well-supported sub-
clusters defined as 8b1, 8b2, and 8b3. b Amino acid sequences, show-ing only two well-supported subgroups

Mol Genet Genomics
1 3
Tabl
e 1
Log
- lik
elih
ood
valu
es a
nd p
aram
eter
est
imat
es f
or th
e S-
RN
ase
alle
les
of S
olan
um
a The
num
ber
afte
r th
e m
odel
cod
e, in
par
enth
eses
, is
the
num
ber
of f
ree
para
met
ers
in th
e ω
dis
trib
utio
nb T
his
d N/d
S ra
tio is
an
aver
age
over
all
site
s in
the
S-R
Nas
e ge
ne a
lignm
ent
c Par
amet
ers
in p
aren
thes
es a
re n
ot f
ree
para
met
ers
and
are
pres
ente
d fo
r cl
arity
d PSS
is
the
num
ber
of p
ositi
ve s
elec
tion
site
s ac
cord
ing
Bay
es E
mpi
rica
l B
ayes
(B
EB
) an
d N
aive
Em
piri
cal
Bay
es (
NE
B).
Num
bers
und
erlin
ed a
re P
SS w
ith p
oste
rior
pro
babi
litie
s ≥
99 %
, an
d th
ose
not u
nder
lined
are
PSS
with
pos
teri
or p
roba
bilit
ies ≥
95 %
. The
num
ber
in p
aren
thes
es is
the
unde
rlin
ed P
SS w
ith p
oste
rior
pro
babi
litie
s ≥
99 %
Nes
ted
mod
el p
airs
l2Δ
l (df
, p v
alue
)d N
/dSb
Para
met
er e
stim
ates
cPS
Sd BE
B/N
EB
BE
B r
esid
ues
NE
B r
esid
ues
M0:
one
-rat
io (
1)a
−32
538.
660.
55ω
= 0
.549
5N
one
––
M3:
dis
cret
e (5
)−
3041
5.84
4,24
5.64
(4,
<0.
0001
)0.
14p 0
= 0
.853
8, p
1 =
0.1
069,
(p
2 =
0.0
393)
ω0 =
0.0
307,
ω
1 =
0.4
973,
ω2 =
1.5
723
NO
/60
(50)
–72
, 73,
75,
85,
91,
92,
97,
98,
99,
10
2, 1
05, 1
07, 1
08, 1
09, 1
10,
111,
112
, 113
, 114
, 115
, 116
, 11
9, 1
21, 1
22, 1
24, 1
29, 1
38,
139,
141
, 142
, 143
, 144
, 145
, 14
6, 1
48, 1
51, 1
62, 1
64, 1
68,
169,
198
, 199
, 207
, 216
, 217
, 22
9, 2
31, 2
33, 2
34, 2
35, 2
38,
246,
247
, 250
, 251
, 263
, 264
, 26
7, 2
68, 2
71
M1a
: nea
rly
neut
ral (
2)−
3060
2.19
0.12
p 0 =
0.9
288,
(p 1
= 0
.071
2)
ω0 =
0.0
586,
(ω
1 =
1)
Not
allo
wed
––
M2a
: pos
itive
sel
ectio
n (4
)−
3044
5.56
313.
26 (
2, <
0.00
01)
0.19
p 0 =
0.9
032,
p1 =
0.0
799,
(p
2 =
0.0
168)
ω0 =
0.0
796,
ω
1 =
1, ω
2 =
2.2
554
28 (
19)/
21 (
17)
72, 7
3, 7
5, 1
02, 1
07, 1
08, 1
09,
110,
111
, 113
, 114
, 115
, 116
, 11
9, 1
22, 1
24, 1
38, 1
39, 1
41,
142,
144
, 151
, 162
, 238
, 264
, 26
7, 2
68, 2
71
73, 1
02, 1
07, 1
08, 1
09, 1
10, 1
11,
113,
114
, 115
, 116
, 122
, 138
, 13
9, 1
41, 1
42, 1
44, 1
51, 1
62,
238,
268
M7:
β (
2)−
3049
7.29
0.12
p =
0.0
301,
q =
0.2
100
Not
allo
wed
––
M8:
β a
nd ω
> 1
(4)
−30
359.
6227
5.34
(2,
<0.
0001
)0.
14p 0
= 0
.983
1, (
p 1 =
0.0
169)
p
= 0
.070
9, q
= 0
.546
3,
ω =
1.9
599
23 (
17)/
25 (
19)
72, 7
3, 1
08, 1
09, 1
10, 1
11, 1
13,
114,
116
, 119
, 122
, 138
, 139
, 14
1, 1
42, 1
44, 1
51, 1
62, 2
38,
264,
267
, 268
, 271
73, 1
02, 1
07, 1
08, 1
09, 1
10, 1
11,
113,
114
, 115
, 116
, 122
, 124
, 13
8, 1
39, 1
41, 1
42, 1
44, 1
45,
148,
151
, 162
, 238
, 264
, 268
Mol Genet Genomics
1 3
were stereochemically validated, being suitable for further sequence-structural analysis.
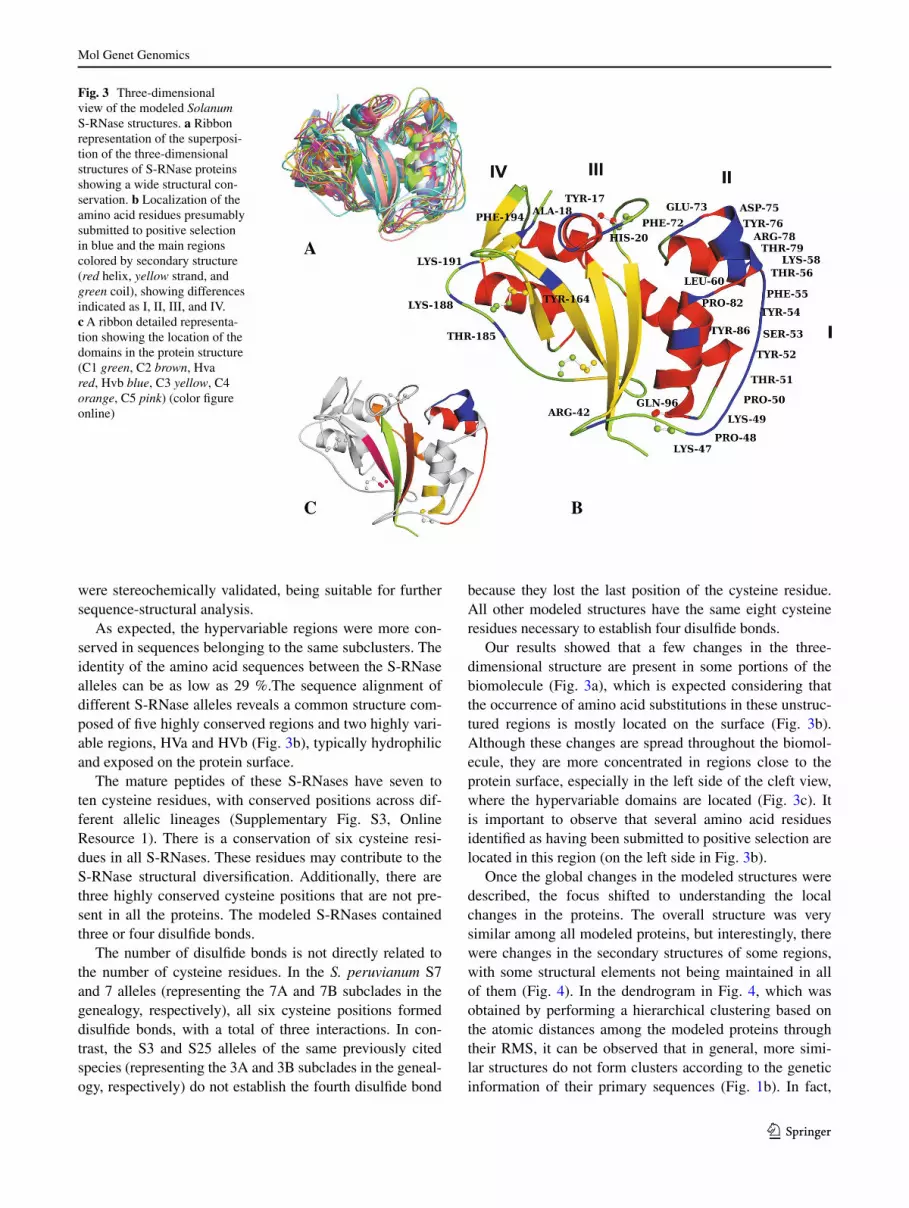
As expected, the hypervariable regions were more con-served in sequences belonging to the same subclusters. The identity of the amino acid sequences between the S-RNase alleles can be as low as 29 %.The sequence alignment of different S-RNase alleles reveals a common structure com-posed of five highly conserved regions and two highly vari-able regions, HVa and HVb (Fig. 3b), typically hydrophilic and exposed on the protein surface.
The mature peptides of these S-RNases have seven to ten cysteine residues, with conserved positions across dif-ferent allelic lineages (Supplementary Fig. S3, Online Resource 1). There is a conservation of six cysteine resi-dues in all S-RNases. These residues may contribute to the S-RNase structural diversification. Additionally, there are three highly conserved cysteine positions that are not pre-sent in all the proteins. The modeled S-RNases contained three or four disulfide bonds.
The number of disulfide bonds is not directly related to the number of cysteine residues. In the S. peruvianum S7 and 7 alleles (representing the 7A and 7B subclades in the genealogy, respectively), all six cysteine positions formed disulfide bonds, with a total of three interactions. In con-trast, the S3 and S25 alleles of the same previously cited species (representing the 3A and 3B subclades in the geneal-ogy, respectively) do not establish the fourth disulfide bond
because they lost the last position of the cysteine residue. All other modeled structures have the same eight cysteine residues necessary to establish four disulfide bonds.
Our results showed that a few changes in the three-dimensional structure are present in some portions of the biomolecule (Fig. 3a), which is expected considering that the occurrence of amino acid substitutions in these unstruc-tured regions is mostly located on the surface (Fig. 3b). Although these changes are spread throughout the biomol-ecule, they are more concentrated in regions close to the protein surface, especially in the left side of the cleft view, where the hypervariable domains are located (Fig. 3c). It is important to observe that several amino acid residues identified as having been submitted to positive selection are located in this region (on the left side in Fig. 3b).
Once the global changes in the modeled structures were described, the focus shifted to understanding the local changes in the proteins. The overall structure was very similar among all modeled proteins, but interestingly, there were changes in the secondary structures of some regions, with some structural elements not being maintained in all of them (Fig. 4). In the dendrogram in Fig. 4, which was obtained by performing a hierarchical clustering based on the atomic distances among the modeled proteins through their RMS, it can be observed that in general, more simi-lar structures do not form clusters according to the genetic information of their primary sequences (Fig. 1b). In fact,
Fig. 3 Three-dimensional view of the modeled Solanum S-RNase structures. a Ribbon representation of the superposi-tion of the three-dimensional structures of S-RNase proteins showing a wide structural con-servation. b Localization of the amino acid residues presumably submitted to positive selection in blue and the main regions colored by secondary structure (red helix, yellow strand, and green coil), showing differences indicated as I, II, III, and IV. c A ribbon detailed representa-tion showing the location of the domains in the protein structure (C1 green, C2 brown, Hva red, Hvb blue, C3 yellow, C4 orange, C5 pink) (color figure online)

Mol Genet Genomics
1 3
some cases showed signals of structural divergence within the same lineage. The Euclidean clusterization of the RMS values (Fig. 4) indicated that molecules representing sub-clusters in the genealogy (3A and 3B; 8A and 8B) are more similar to proteins of other clades than to their own closely related proteins. Although the 3A, 3B, 6A, and 6B subclades did not split in two different groups in the RMS clustering, they were divergent in structure.
The majority of the positively selected residues (ten residues that are directly juxtaposed) are located in region I (Fig. 3b) of the protein, especially in coil structural ele-ments. This area includes the HVa domain. There is a loss of a helix in the HVb domain (region II, Fig. 3b) that may be relevant for the S-RNase structural divergence of the subclusters of Clades 3, 7, and 8, considering that these proteins appear to diverge according to their structural features (Fig. 4). However, this change is most likely not the only factor responsible for the divergence among the S-RNase three-dimensional structures because other pro-teins with similar losses do not cluster together in only one group. In all Clades except for 4, 6A, and 6B, there is a helix in region III of the S-RNases. Additional local change was found in region IV (Figs. 3b, 4), where a helix can be observed in the 8A subclade proteins, whereas 8B proteins do not show this same helix structure. We also noticed a
variation in two small strand elements in the IV region (Fig. 3b), which are present in the 1, 3A, 3B, 6B, and 8B Clades but absent in the 4, 5, 6A, 7A, 7B, and 8A Clades (Fig. 4). In addition, the S. peruvianum allele 7, which rep-resents the 7A subclade, does not establish the third strand of the central β-sheet that is considered one of the most conserved elements in S-RNases. Moreover, the 7A pro-teins showed two small strands that are absent in all other molecules and are located in the turn region between the third and fourth strands of the β-sheet.
In Fig. 5, a simplified phylogenetic tree of Fig. 1a is shown, highlighting the main clades and subclades of S-RNase, and the molecular surface of the modeled pro-teins colored according their electrostatic potential. The main changes on the surfaces of the proteins are related to the regions where positively selected amino acids are pre-dicted and where they present structural variable elements, indicating that these changes could affect the charges on the protein surface. Moreover, when comparing different subclades of the same clade, it is easily visible that they showed significant differences in their electrostatic poten-tial. This is especially true for the 3A and 3B subclusters, which are negatively and positively charged, respectively.
As S-RNase is a glycoprotein, it is interesting to know the number of the N-glycosylated sites in the modeled structures. Our results indicated that there are one to three putative gly-cosylated sites (Supplementary Fig. S5, Online Resource 1) and all are solvent accessible. Carbohydrates are also expected to be a dominant feature on the S-RNase surface.
Discussion
To examine the evolutionary relationships among the S-RNase alleles, we reconstructed phylogenetic trees from a data set of 145 functional and 1 non-functional S-RNase alleles using the NJ and ML methods. Phylogenetic analy-sis is central to understanding the evolutionary dynamics of highly polymorphic loci, such as S-RNase, which has been reported to be one of the most diversified genes in plants. Additionally, we identified several amino residues submitted to positive selection and related those residues to functionally important regions in the theoretically modeled S-RNase three-dimensional structures.
In general, the S-RNase phylogenetic trees were highly supported and formed by eight distinct monophyletic groups. By contrast, in a previous phylogenetic study (Igic et al. 2007) using ML and Bayesian Inference analyses, the clades identified here as 1, 2, 7, and 8 formed an inconsist-ent and polytomic group. In relation to Clade 1, the S. peru-vianum allele (previously identified as 8) formed a cluster with S. chilense alleles. Although this allele is nearly iden-tical to those of S. chilense, the functional histidine residue
Fig. 4 Dendrogram showing structural similarity among the modeled S-RNases. Dendrogram obtained through a hierarchical clustering algorithm using a Euclidean distance method based on the RMS val-ues calculated between overlapping structures. The three-dimensional structures are represented as ribbons. The models are shown in the same orientation, with a cleft view. The secondary structural elements are marked by different colors: yellow strand, red helix, and green coil. The disulfide bonds are labeled as spheres and sticks (color figure online)

Mol Genet Genomics
1 3
was replaced by an asparagine, rendering the protein non-functional (Royo et al. 1994).
In a previous study of Peruvian and Chilean S. peruvi-anum populations (a species in the Lycopersicon group), three of the alleles identified in our study as belonging to Clade 2 clustered in a group with other Solanaceae gen-era (Miller and Kostyum 2011). This same clade was also obtained in another study using the S17 allele of S. chile-nse, which grouped with an allele of Lycium parishii in a fully supported branch (Igic et al. 2007). Clade 3 was also
obtained in two previous studies (Igic et al. 2007; Miller and Kostyum 2011). Miller and Kostyum (2011), who included just four alleles and one species (S. peruvianum) in their analysis, only reported subclade 3A. Igic et al. (2007) reported clades 3A and 3B, represented by an iso-lated line (S. chilense S15). Additionally, Clade 4 is fully supported and is referred as a well-supported clade by Igic et al. (2007) and Miller and Kostyum (2011). Interestingly, Clade 5, which is also well supported, is absent in the pre-viously cited studies.
Fig. 5 Simplified tree based on the S-RNase protein sequences showing the main eight clades and their modeled proteins. The molecular surfaces of the eleven S-RNase models are shown with the electrostatic potentials represented as red (negatively charged), white (neutral), and blue (positively charged). The modeled proteins of Clade 2 had only partial sequences, and consequently, we did not show these results. Most of the charge changes are located on regions enriched in positively selected residues and structurally vari-able areas of the protein (color figure online)

Mol Genet Genomics
1 3
Clade 6 and the subclades 6A and 6B were also iden-tified in previous phylogenetic studies (Igic et al. 2007; Miller and Kostyum 2011). Moreover, all alleles of the 7A and 7B subclades were obtained from species related to wild tomatoes, that is, the Tomato Clade of the Sola-num phylogeny (Särkinen et al. 2013). Miller and Kostyum (2011) have identified only the 7A subclade, while in the study of Igic et al. (2007) the 7A and 7B subclades were present. Finally, the subclades 8A and 8B are also repre-sented in the previously noted studies.
Miller and Kostyum (2011) obtained a tree topology very similar to that obtained in our study but with fewer alleles and some unrepresented groups. All clades obtained in the present work were represented in the Igic et al. (2007) study. However, the polytomy observed in their results was not found here. Interestingly, there is a wide spectrum of allele names for most species, which creates much confusion and leads to proteins having more than one name. It is necessary to improve the standardization of the S-locus allele annotations to avoid having identical alleles with different designations for the same species. Moreover, in the databases, only a few populations appear to have had their S-locus sequenced, and a large portion of species are not represented.
According to Paape et al. (2008), the genealogy of the Solanaceae S alleles shares extensive ancestral polymor-phism among most species, and Solanum is represented by five to seven lineages that arose before the divergence of the Solanaceae genera. In contrast, our reconstructed genealogy for the SolanumS alleles showed eight well-sup-ported clades.
Several alleles used in our study show some substitu-tions in the nucleotide sequences, although they do not show significant difference in their deduced amino acid sequences, indicating mostly synonymous mutations. Addi-tionally, self-incompatible species must maintain variabil-ity in S-RNase sequences to preserve the SI function. How-ever, certain regions in these proteins are under structural constraints over millions of years to avoid the total loss of their functions.
The reconstruction of the genealogy for the Solanum S-RNase alleles revealed a broad sharing of polymor-phisms among species and allele lineages over its evolu-tionary history. There were eight major clusters identified in the highly bootstrap-supported phylogenetic tree. This tree guided the structural analyses that will be subsequently discussed. No monophyletic cluster could be explained only by its taxonomical clustering. Almost all sequences presented a pattern of trans-specific polymorphism.
Trans-specific polymorphism has also been reported for S-RNases among several taxa in other studies. It appar-ently does not interfere in the supra-familiar hierarchies because the evolutionary time that passed during lineage
divergences is higher enough than genetic drift to promote the differentiation of these taxonomical entities. Conse-quently, the S-RNase phylogenies showed a monophyletic pattern in the Solanaceae, Plantaginaceae, and Rosaceae families. The pattern of shared polymorphisms found in the Solanum S-RNases is most likely due to balancing selec-tion effects on the population genetic structure of these spe-cies, which should cause a rare allele to have an advantage resulting from negative frequency-dependent selection.
Balancing selection is often portrayed as diversifying, meaning that there is an advantage for new alleles. This occurs for the plant self-incompatibility alleles, for which the frequency-dependent selective advantage of rare pollen and pistil types leads to the maintenance of many alleles (Vekemans and Slatkin 1994), and for the fungal incom-patibility alleles (May et al. 1999), whose selective main-tenance remains unclear, despite the evident similarity to plant SI. When the same alleles persist for long times, balancing selection may be detectable from its effects at nearby neutral sites. The population genetics of balancing selection shows that in addition to maintaining diversity at the selected sites themselves, general maintenance of dif-ferent amino acids could increase the diversity at closely linked neutral sites (Charlesworth 2006).
An efficient manner of detecting selection leading to amino acid diversification in a specific protein sequence is implemented by PAML through site models, which treats the ω ratio for any codon in the gene as a random varia-ble from a statistical distribution, thus allowing ω to vary among codons (Yang 2007). Positive selection is defined as the presence of some codons at which ω > 1. These models analyze sequence data at the codon level and test whether a hypothesis (alternative model) that allows posi-tive selection (dN/dS > 1 for some codons) is a better fit to the data compared to a null neutral hypothesis model. The statistical significance is determined through a likelihood ratio test (LRT) between the likelihood scores of the null and alternative models. When the LRT suggests positive selection, the Bayes empirical Bayes (BEB) method can be used to calculate the posterior probabilities of each codon being positively selected under models M2a and M8 (Yang et al. 2005). The BEB is an improvement of the early Naive Empirical Bayesian (NEB) method (Nielsen and Yang 1998) and accounts for sampling errors in the ML estimates of parameters in the models. Additionally, NEB is less con-servative and is more prone to error (Yang et al. 2005; Yang 2007).
Our results indicated that the action of positive selec-tion led to the diversification of the amino acid residues present in the S-RNases in the hypervariable and vari-able regions. A total of 30 amino acid residues of Solanum S-RNases were identified as positively selected and most of them were located in coil/turn regions of the proteins (18

Mol Genet Genomics
1 3
of them are located on hypervariable domains). This find-ing is in agreement with other previous studies that ana-lyze the positive selection of S-RNases (Savage and Miller 2006; Miller et al. 2008; Paape and Kohn 2011). Positive selection is related to diversifying selection as negative selection is related to purifying selection. Moreover, it is broadly known that balancing selection promotes a diver-sifying selection, resulting in a significant effect on the gene evolutionary rates (Klein et al. 1998; Richman 2000; Charlesworth 2006). Analyses of adaptive molecular evo-lution, such as the site-specific models implemented in PAML, have proven to be useful for understanding evolu-tionary aspects of molecular adaptation and novel function-ality in protein evolution. However, there is little discussion about the impact of the positively selected amino acid resi-dues and changes in the macromolecular structure of the S-RNases.
Ioerger et al. (1991) characterized portions of the S-RNase sequences based on the polymorphism and varia-tion in the Solanaceae locus. They identified two areas with significant high variability (HVa and HVb) and five con-served regions (C1–C5). Hypervariable domains have been reported to be enriched in positively selected sites (Vieira et al. 2007; Miller et al. 2008, 2011; Miller and Kostyun 2011; Paape and Khon 2011). The role of these variable domains in pollen recognition was tested in domain-swap experiments in genetically transformed plants. In fact, a pair of S-RNase sequences identified in Pyrus was identi-cal in the domains generally described as the most variable, although they are different alleles (Zisovich et al. 2004). Other studies also confirmed that they are involved in pro-tein specificity through functional swap analyses. When two regions of Petunia S-RNase alleles were switched, they found that both regions are required for recognition (Kao and McCubbin 1996). Zurek et al. (1997) presented evidence that all regions contribute to S-RNase recogni-tion and that swapping of any region destroys recognition in Nicotiana. Matton et al. (1997) showed that the func-tion of S. chacoense S11 RNase pollen recognition could be converted to that of S13 RNase by replacing both of the HV regions of S11 RNase with those of S13 RNase. These findings indicated that swapping just four amino acids between very closely related S-RNase proteins in Potato could switch the S specificity of the target protein. Accord-ing to our results, these residues are submitted to positive selection, supporting the hypothesis of their functional role in structural recognition and S specificity. One inner con-served HVa residue (residue no. 112) is not under positive selection and is located in the center of those four previ-ously cited polymorphic residues. Finally, while a small number of residues may distinguish a particular pair of S-RNases, it is not possible to conclude that HVa and HVb domains are enough to determine S specificity.
To evaluate the impact of the positively selected amino acid residues in the protein structure and function, we have modeled the three-dimensional structure of some S-RNase proteins and performed molecular dynamics simulations. Homology modeling (HM) or protein comparative molecu-lar modeling by homology refers to the construction of an atomic-resolution model based on the amino acid sequence of a protein, named target, and a three-dimensional struc-ture of a related homologous protein, named template, obtained through experimental methods. This method is based on the fact that three-dimensional protein structures are evolutionarily more conserved than would be expected based on the primary sequence conservation (Kaczanowski and Zielenkiewicz 2010). Considering that proteins with at least 25 % identity have very similar three-dimensional structures, we constructed models for the S-RNases and conducted molecular dynamics (MD) refinement simula-tions using atomic-based empirical force fields in explicit solvent. The last two modeling steps were optimization and validation, but before that, it was necessary to improve the model by iterating steps in the process. According to Flohil et al. (2002), the optimization process is most often com-pleted by energy minimization combined with MD tech-niques, as performed in our analyses.
All major clades and some subclades in the genealogy of SolanumS alleles were modeled, validated, and submit-ted to molecular dynamics to achieve structural stabiliza-tion, resulting in 12 three-dimensional models of S-RNase. Their hypervariable domains, which are more conserved in sequences belonging to the same subclusters, may be important to ensure the specificity of the mature polypep-tide. It is important to note that changes in the remaining regions of the structure will most likely contribute to the specificity as well. Typically, S-RNase alleles reveal a com-mon structure composed of five highly conserved regions and two highly variable domains, HVa and HVb, as also identified by Tsai et al. (1992). According to Miller and Kostyum (2011), S. peruvianum showed amino acid differ-ences ranging from 8 (SP14 and SP17) to 81 (SP6 and SP12) residues between the least and most divergent S-RNase alleles, respectively. The amino acids of the hypervari-able domains are typically hydrophilic and are exposed on the surface of the molecule, where they presumably inter-act with the pollen component of the S-locus (Anderson et al. 1986). The presence of the hypervariable region on the protein surface depends on the overall structure of the S-RNase, which is in part determined by disulfide bonding. McClure et al. (1989) reported that the structures of fungal RNases and the S-glycoproteins share five cysteine resi-dues. Our results indicated the conservation of six cysteine residues in all S-RNases. The three or four disulfide bonds identified in our theoretical models could be involved with the cohesion of the macromolecule because they

Mol Genet Genomics
1 3
maintain external coils close to more internal structures. It is interesting that the number of disulfide bonds is not directly related to the number of cysteine residues. A pos-sible explanation for this phenomenon is an insertion event located directly before the last cysteine site. It is reason-able that this insertion could elongate the coil bearing it, rendering the space between the cysteine residues insuf-ficient to allow their interaction and the establishment of disulfide bonds. According to Tsai et al. (1992), the number of cysteine residues in the different S-RNases ranged from seven to 10, and the locations of these residues in the pro-tein were generally conserved. Our data are in agreement with these findings, and the modeled structures showed three to four cysteine disulfide bonds. This finding suggests that despite their widely different primary structures, the S-RNases produced by different S alleles have similar ter-tiary structures.
The central structure of the molecule is conserved, with the geometry of the active site totally preserved in all RNase T2 enzymes, in agreement with the studies of Luhtala and Parker (2010) and MacIntosh (2011). This is obviously related to the maintenance of the enzyme func-tionality because the amino acids implicated in the hydrol-ysis of nucleotide bounds in the RNA are located in this region. Maton et al. (1997) have suggested that one reason why the chimeric S-RNases reject the pollen is the fact that the pair of alleles used was quite divergent, leading to pro-tein folding problems. The regular RNase activity of previ-ous chimeric S-RNases suggested that these proteins main-tained their overall conformation unaffected and did not experience folding problems (Kao and McCubbin 1996; Zurek et al. 1997).
The majority of positively selected amino acids are located in S-RNase region I (Fig. 3b), which includes the HVa domain described by Ioerger et al. (1991) as the most polymorphic region in the S-RNase sequences of Solanaceae. Moreover, there is variation in the S-RNase electrostatic potential that needs to be further analyzed through molecu-lar dynamics approaches. We hypothesize that the S-RNase regions I and II directly interact with the SLF complex.
In relation to the protein glycosylation, it is well known that the protein molecular weight is much impacted by the glycan associated with it (Liu et al. 2008). There are sev-eral types of glycosylation, but all S-RNases described are N-glycosylated, as in Nicotiana alata (Woodward et al. 1989, 1992; Oxley et al. 1996). We have identified one to three putative glycosylated sites and all are solvent accessi-ble. Most S-RNases have several predicted sites as potential for the attachment of N-glycans, with one site in the N-ter-minus present in almost all S-RNases sequenced to date (Oxley et al. 1996). It is located in the C2 conserved region of the SolanumS alleles. The structure of the N-linked oli-gosaccharides of several S-RNases from N. alata is known
(Woodward et al. 1992; Oxley et al. 1996) and it will be used in our future studies of S-RNase molecular dynamic simulations.
Our results indicate that a significant proportion of Sola-num S-RNase codon sites are submitted to positive selec-tion (ω > 1). Fifteen of the twenty-eight amino acid sites identified as having experienced positive selection are located in coil/turn regions of the protein, and nineteen are located in the hypervariable domains. These results sug-gest that the amino acid residues present in the conserved secondary structure domains of the S-RNases are more selectively constrained, whereas the amino acid residues in the hypervariable domains evolve more quickly, most likely due to the selective pressure resulting from protein–protein interactions accountable for self-incompatibility specificities. Additional sites under positive selection are also located in other variable regions of the biomolecule and may have a role in the self-incompatibility response as well. Our results suggested that changes affect dif-ferent portions of the protein, although its general struc-ture appears to be conserved. Most of the differences are concentrated in structural regions on the protein surface, mainly in the left side of the cleft view where the hyper-variable regions are located. These findings suggest that the portion of the S-RNase that attaches to the SCF complex (E3 ubiquitin ligase complex of the ubiquitin-26 S protea-some system) is mostly located on the cleft view, interact-ing more strictly with the left side where the hypervaria-ble regions are located, and it is enriched with positively selected sites. Further development of advanced molecu-lar dynamics protocols will help to evaluate the impact of those changes on the S-RNase structures with experimen-tally known self-incompatibility specificities. The specific role of these amino acid residues in the determination of the allelic specificity and the RNase involvement in the pollen recognition will also require the elucidation of the SLF protein structure through experimental methods, such as X-ray crystallography or nuclear magnetic resonance spectroscopy.
Acknowledgments This work was supported by the Conselho Nacional de Desenvolvimento Científico e Tecnológico (CNPq), the Coordenação de Aperfeiçoamento de Pessoal de Nível Supe-rior (CAPES), and the Programa de Pós-Graduação em Genética e Biologia Molecular da Universidade Federal do Rio Grande do Sul (PPGBM-UFRGS).
References
Altschul SF, Gish W, Miller W, Myers EW, Lipman DJ (1990) Basic local alignment search tool. J MolBiol 215:403–410
Anderson MA, Cornish EC, Mau S-L, Williams EG et al (1986) Clon-ing of cDNA for a stylar glycoprotein associated with expression of self-incompatibility in Nicotianaalata. Nature 321:38–44

Mol Genet Genomics
1 3
Anisimova M, Gascuel O (2006) Approximate likelihood-ratio test for branches: a fast, accurate, and powerful alternative. Syst Biol 55:539–552
Anisimova M, Bielawski JP, Yang Z (2001) Accuracy and power of the likelihood ratio test in detecting adaptive molecular evolution. Mol Biol Evol 18:1585–1592
Anisimova M, Gil M, Dufayard JF, Dessimoz C, Gascuel O (2011) Survey of branch support methods demonstrates accuracy, power, and robustness of fast likelihood-based approximation schemes. Syst Biol 60:685–699
Arnold K, Bordoli L, Kopp J, and Schwede T (2006) The SWISS-MODEL workspace: a web-based environment for protein struc-ture homology modelling. Bioinformatics 22:195–201
Berendsen HJC, Grigera JR, Straatsma TP (1987) The missing term in effective pair potentials. J Phys Chem 91:6269–6271
Berman HM, Westbrook J, Feng Z, Gilliland G, Bhat TN, Weissig H, Shindyalov IN, Bourne PE (2000) The protein data bank. Nucleic Acids Res 28:235–242
Bielawski JP, Yang Z (2005) Maximum likelihood methods for detect-ing adaptive protein evolution. In: Nielsen R (ed) Statistical methods in molecular evolution. Springer Verlag Series in Statis-tics for Biology and Health, New York (NY), pp 103–124
Charlesworth D (2006) Balancing selection and its effects on sequences in nearby genome regions. PLoS Genet 2:e64
Chen VB, Arendall WB III, Headd JJ, Keedy DA, Immormino RM, Kapral GJ, Murray LW, Richardson JS, Richardson DC (2010) MolProbity: all-atom structure validation for macromolecular crystallography. Acta Crystallogr D66:12–21
Darden T, York D, Pedersen L (1993) Particle mesh Ewald—an N Log(N) method for Ewald sums in large systems. J Chem Phys 98:10089–10092
Darriba D, Taboada GL, Doallo R, Posada D (2011) ProtTest 3: fast selection of best-fit models of protein evolution. Bioinformatics 27:1164–1165
Darriba D, Taboada GL, Doallo R, Posada D (2012) jModelTest 2: more models, new heuristics and parallel computing. Nat Meth-ods 9:772
Davis IW, Murray LW, Richardson JS, Richardson DC (2004) MOL-PROBITY: structure validation and all-atom contact analy-sis for nucleic acids and their complexes. Nucleic Acids Res 32:W615–W619
de Nettancourt D (1977) Incompatibility in Angiosperms. Springer Verlag, Berlin
Felsenstein J (1985) Confidence limits on phylogenies: an approach using the bootstrap. Evolution 39:783–791
Flohil JA, Vriend G, Berendsen HJC (2002) Completion and refine-ment of 3-D homology models with restricted molecular dynam-ics: Application to targets 47, 58, and 111 in the CASP modeling competition and posterior analysis. Proteins 48:593–604
GolzJF SuV, Clarke AE, Newbegin E (1999) A molecular description of mutations affecting the pollen component of the Nicotianaal-ata S-locus. Genetics 152:1123–1135
Guex N, Peitsch MC (1997) SWISS-MODEL and the Swiss-Pdb viewer: An environment for comparative protein modeling. Elec-trophoresis 18:2714–2723
Guindon S, Dufayard JF, Lefort V, Anisimova M, Hordijk W, Gascuel O (2010) New algorithms and methods to estimate maximum-likelihood phylogenies: assessing the performance of PhyML 3.0. Syst Biol 59:307–321
Hess B, Bekker H, Berendsen HJC, Fraaije J (1997) LINCS: a lin-ear constraint solver for molecular simulations. J Comput Chem 18:1463–1472
Ida K, Norioka S, Yamamoto M, Kumasaka T, Yamashita E, Newbigin ED, Clarke AE, Sakiyama F, Sato M (2001) The 1.55 Å resolu-tion structure of Nicotianaalata SF11-RNase associated with gametophytic self-incompatibility. J Mol Biol 314:103–112
Igic B, Smith WA, Robertson K, Schaal BA, Kohn JR (2007) The population genetics of the self-incompatibility polymorphism in wild tomatoes: I. S-RNase diversity in Solanum chilense (Dun.) Reiche (Solanaceae). Heredity 99:553–561
Ioerger TR, Gohlke JR, Xu B, Kao T-H (1991) Primary structural fea-tures of the self-incompatibility protein in Solanaceae. Sex Plant Reprod 4:81–87
Kaczanowski S, Zielenkiewicz P (2010) Why similar protein sequences encode similar three-dimensional structures? Theor Chem Acc 125:543–550
Kao T-H, McCubbin AG (1996) How flowering plants discriminate between self and non-self pollen to prevent inbreeding. Proc Natl Acad Sci USA 93:12059–12065
Kiefer F, Arnold K, Künzli M, Bordoli L, Schwede T (2009) The SWISS-MODEL Repository and associated resources. Nucleic Acids Res 37:387–392
Klein J, Sato A, Nagl S, O’hUigín C (1998) Molecular trans-species polymorphism. Ann Rev Ecol Syst 29:1–21
Liu B, Morse D, Cappadocia M (2008) Glycosylation of S-RNases may influence pollen rejection thresholds in Solanum chacoense. J Exp Bot 59:545–552
Luhtala N, Parker R (2010) T2 Family ribonucleases: ancient enzymes with diverse roles. Trends BiochemSci35:253-259
MacIntosh GC (2011) RNase T2 family: enzymatic properties, func-tional diversity, and evolution of ancient ribonucleases. Nichol-son AW(ed) Ribonucleases. Springer Verlag Series in Nucleic Acids and Molecular Biology, Berlin, pp 89–114
Marti-Renom MA, Stuart AC, Fiser A, Sanchez R, Melo F, Sali A (2000) Comparative protein structure modeling of genes and genomes. Ann Rev Bioph Biom 29:291–325
Matton DP, Maes O, Laublin G, Xike Q, Bertrand C, Morse D, Cap-padocia M (1997) Hypervariable domains of self-incompatibility RNases mediate allele-specific pollen recognition. Plant Cell 9:1757–1766
May G, Shaw F, Badrane H, Vekemans X (1999) The signature of balancing selection: Fungal mating compatibility gene evolution. Proc Natl Acad Sci USA 96:9172–9177
McClure BA, Haring V, Ebert PR, Anderson MA, Simpson RJ, Sakiy-ama F, Clarke AE (1989) Style self-incompatibility gene products of Nicotianaalata are ribonucleases. Nature 342:955–957
McCubbin AG, T-h Kao (2000) Molecular recognition and response in pollen and pistil interactions. Annu Rev Cell Dev Bi 16:333–364
Miller JS, Kostyum JL (2011) Functional gametophytic self-incom-patibility in a peripheral population of Solanum peruvianum (Solanaceae). Heredity 107:30–39
Miller JS, Levin RA, Feliciano MM (2008) A tale of two continents: Baker’s rule and the maintenance of self-incompatibility in Lycium (Solanaceae). Evolution 62:1052–1065
Miller JS, Kamath A, Damashek J, Levin RA (2011) Out of America to Africa or Asia: inference of dispersal histories using nuclear and plastid DNA and the S-RNase self-incompatibility locus. MolBiolEvol 28:793–801
Murfett J, Atherton TL, Mou B, Gasser CS, McClure BA (1994) S-RNase expressed in transgenic Nicotiana causes S-allele-spe-cific pollen rejection. Nature 367:563–566
Nielsen R, Yang Z (1998) Likelihood models for detecting positively selected amino acid sites and applications to the HIV-1 envelope gene. Genetics 148:929–936
Nunes MDS, Santos RAM, Ferreira SM, Vieira J, Vieira CP (2006) Variability patterns and positively selected sites at the game-tophytic self-incompatibility pollen SFB gene in a wild self-incompatible Prunus spinosa (Rosaceae) population. New Phytol 172:577–587
Oxley D, Munro SLA, Craik DJ, Bacic A (1996) Structure of N-gly-cans on the S3- and S6-stylar self-incompatibility ribonucleases of Nicotianaalata. Glycobiology 6:611–618

Mol Genet Genomics
1 3
Paape T, Kohn JR (2011) Differential strengths of selection on S-RNases from Physalis and Solanum (Solanaceae). BMC Evol-Biol 11:243
Paape T, Igic B, Smith SD, Olmstead R, Bohs L, Kohn JR (2008) A 15-Myr-old genetic bottleneck. Mol Biol Evol 25:655–663
Papadopoulos JS, Agarwala R (2007) COBALT: constraint-based alignment tool for multiple protein sequences. Bioinformatics 23:1073–1079
Richman A (2000) Evolution of balanced genetic polymorphism. Mol Ecol 9:1953–1963
Royo J, Kunz C, Kowyama Y, Anderson M, Clarke AE, Newbigin E (1994) Loss of a histidine residue at the active site of S-locus rib-onuclease is associated with self-compatibility in Lycopersicon peruvianum. Proc Natl Acad Sci USA 91:6511–6514
Sali A, Blundell TL (1993) Comparative protein modeling by satisfac-tion of spatial restraints. J Mol Biol 234:779–815
Särkinen T, Bohs L, Olmstead R, Knapp SD (2013) A phylogenetic framework for evolutionary study of the nightshades (Solan-aceae): a dated 1,000-tip tree. BMC Evol Biol 13:214
Sassa H, Hirano H, Nishino T, Koba T (1997) Style-specific self-compatible mutation caused by deletion of the S-RNase gene in Japanese pear (Pyrus serotina). Plant J12:223–227
Savage AE, Miller JS (2006) Gametophytic self-incompatibility in Lyciumparishii (Solanaceae): allelic diversity, genealogical struc-ture, and patterns of molecular evolution. Heredity 96:434–444
Shimodaira H, Hasegawa M (1999) Multiple comparisons of log-likelihoods with applications to phylogenetic inference. Mol Biol Evol 16:1114–1116
Sukhotu T, Kamijima O, Hosaka K (2006) Chloroplast DNA variation in the most primitive cultivated diploid potato species Solanum stenotomumJuz. etBuk. and its putative wild Ancestral species using high-resolution markers. Genet Res Crop Ev 53:53–63
Tamura K, Stecher G, Peterson D, Filipski A, Kumar S (2013) MEGA6: molecular evolutionary genetics analysis version 6.0. Mol Biol Evol 30:2725–2729
Tsai D-S, Lee H-S, Post LC, Kreiling KM, Kao T-H (1992) Sequence of an S-protein of Lycopersiconperuvianum and comparison with other solanaceous S-proteins. Sex Plant Reprod 5:256–263
Ushijima K, Sassa H, Dandekar AM, Gradziel TM, Tao R, Hirano H (2003) Structural and transcriptional analysis of the self-incom-patibility locus of Almond: identification of a pollen expressed
F-box gene with haplotype-specific polymorphism. Plant Cell 115:771–781
van der Spoel D, Lindahl E, Hess B, Groenhof G, Mark AE, Berend-sen HJC (2005) Gromacs: fast, flexible, and free. J Comput Chem 26:1701–1718
vanGunsteren WF, Billeter SR, Eising AA, Hünenberger PH, Krüger P, Mark AE, Scott WRP, Tironi IG (1996) The GROMOS96 man-ual and user guide. VdfHochschulverlag AG, Zürich
Vekemans X, Slatkin M (1994) Gene and allelic genealo-gies at a gametophytic self-incompatibility locus. Genetics 137:1157–1165
Vieira J, Morales-Hojas R, Santos RAM, Vieira CP (2007) Different positively selected sites at the gametophytic self-incompatibility pistil S-RNase gene in the Solanaceae and Rosaceae (Prunus, Pyrus, and Malus). J Mol Evol 65:175–185
Wong WS, Yang Z, Goldman N, Nielsen R (2004) Accuracy and power of statistical methods for detecting adaptive evolution in protein coding sequences and for identifying positively selected sites. Genetics 168:1041–1051
Woodward JR, Bacic A, Jahnen W, Clarke AE (1989) N-linked glycan chains on S-allele-associated glycoproteins from Nicotiana alata. Plant Cell 1:511–514
Woodward JR, Craik D, Dell A, Khoo K-H, Munro SLA, Clarke AE, Bacic A (1992) Structural analysis of the N-linked glycan chains from a stylar glycoprotein associated with expression of self-incompatibility in Nicotianaalata. Glycobiology 2:241–250
Xu B, Yang Z (2013) pamlX: a graphical user interface for PAML. Mol Biol Evol 30:2723–2724
Yang Z (2007) PAML 4: phylogenetic analysis by maximum likeli-hood. Mol Biol Evol 24:1586–1591
Yang Z, Wong WSW, Nielsen R (2005) Bayes empirical Bayes infer-ence of amino acid sites under positive selection. Mol Biol Evol 22:1107–1118
Zisovich AH, Stern RA, Sapir G, Shafir S, Goldway M (2004) The RHV region of S-RNase in the European pear (Pyruscommunis) is not required for the determination of specific pollen rejection. Sex Plant Reprod 17:151–156
Zurek DM, Mou B, Beecher B, McClure BA (1997) Exchanging sequence domains between S-RNases from Nicotianaalata dis-rupts pollen recognition. Plant J11:797–808


