Embed Size (px)
Citation preview
Journal of Innovative Prospective in Sciences Vol (I), No. 1, March 2016
1
DIVERSITY OF SPIDERS FROM THE FAMILY CLUBIONIDAE (ARANEA) FROMMIDDLE PLAINS OF NARMADA BASIN OF MADHYA PRADESH, INDIA
Amrita Vyas, V. Bhagat and M. V. ShirbhateDepartment of Zoology, Mahatma Fule Arts and Science College, Patur, Dist. Akola, India-444501
Department of Zoology, ShriShivaji College, Akot, Dist. Akola, IndiaDept. of Zoology, Shankarlal Khandelwal Arts, Science and Commerce College, Akola, MS. India
(Corresponding author [email protected],)
ABSTRACTA detail survey of spiders from Clubionidae family was carried out in Narmada basin of Madhya Pradesh.Clubiona is a very short sighted hunting spider that lives on bushes of Narmada basin and constructssilken nets with tunnels formed by rolled up leaves. In the present investigation we have reported onegenus Clubionadrassodes O. P.-Cambridge, 1874 (male) and female holotype are described along withphotographic evidence. The maximum species diversity was noted from August to January, 2012. Riparianand grassland ecosystems are found to be rich in spider fauna.
Keywords:Spiders, Diversity, Taxonomy, Narmada Basin, Madhya Pradesh.
INTRODUCTIONThe sac spiders of the family Clubionidae have a veryconfusing taxonomic history. Once this family was alarge catch-all taxon for a disparate collection of spi-ders, similar only in that they had eight eyes arrangedin two rows, conical anterior spinnerets that touchedand were wandering predators that built silken retreats,or sacs, usually on plant terminals, between leaves,under bark or under rocks. These are now recognizedto include several families, some of which are moreclosely related to the three-clawed spiders, like lynxand wolf spiders, than to true “clubionoids.
MATERIAL AND METHODSStudy Area (River Narmada): The river Narmada is thelongest westerly flowing river of the country, out of atotal length of 1323 kms of the river flowing betweenthe famous Vindhyas and Satpura ranges, 82% of theriver flows through Madhya Pradesh for another 34kms, it forms the boundary between M.P. andMaharashtra and the rest through Maharashtra andGujarat state. The river finally meets the gulf of Cambayin Arabian Sea. Originates from Amarkantak at a heightof 1051M. Afterwards it forms steep fall up. Thereforeit flows in slow gradient upto Barwani in M.P. and inthe same gradient in Maharashtra and Gujarat. It formsan estuary before joining the Arabian sea. The riverNarmada receives 41 principal tributaries 19 (18 in M.P.and 1 in Gujarat) join the river from north and 22 (21 inM.P. and 1 in Gujarat) from south. Besides, there are asmany as 50 rivulets joining directly Narmada river. Thefollowing specimens were collected in the Narmadabasin near Omkareshwar dam longitude 22.2839° N,76.4714° E and latitude 22.2839° N, 76.4714° E (IndiraSagar, Madhya Pradesh, India).
METHODS OF COLLECTION
Following are a few basic methods used while collectingspiders. Spider survey is carried out for ground spidersand spiders along slow flowing shallow streams,spiders from decaying barks of trees, from shrubs andcrevices of rocks. Field Methodsincludes (i) SweepNetting, (ii) Ground Hand Collecting,(iii) Aerial HandCollecting, (iv) Vegetation Beating, (v) Litter samplingetc.
Preservation and Identification of specimens
Collected specimens were transferred to 70% alcohol.All adult specimens are identified to family, genus andspecies level. Species are distinguished by examinationof external and internal genitalia. Sexes are matched bycolour pattern and somatic features. While identifyingstructures like sternum, labium, maxillae, chelicerae,presence or absence of cribellum, leg characters, legformula, eye arrangement, number of eyes etc.
The collected specimens of the spiders are identifiedwith the help of above references and catalogues fromArachnology Laboratory, Department of Zoology, SantGadge Baba Amravati University, Amravati under theguidance of Professor and Head Dr. G. N. Vankhede.
OBSERVATIONS AND RESULTS
Genus- ClubionaLatreille, 1804
The genus Clubionawas erected by Latreille in 1804.Up to the present, 466 species have been recorded inthe world under Clubionaand of these 19 valid speciesoccur in India (Platnick, 2012; Keswaniet al., 2012).From this genus 2 species male & female are reportedduring present investigation.
Journal of Innovative Prospective in Sciences Vol (I), No. 1, March 2016
2
1. Clubionadrassodes O. P. - Cambridge, 1874(female)
Class : Arachnida
Order : Araneae
Suborder : Araneomorphae
Family : Clubionidae
Genus : Clubiona
Species : drassodes(female)
Description:
General: Cephalothorax brownish pale in colour, legsand abdomen cream in colour.
Cephalothorax Abdomen
L = 2.55 mm L = 4.80 mm
W =1.83 mm W = 2.41 mm
Total Body Length = 7.77 mm
Cephalothorax: Brownish cream in colour, longer thanwide, anteriorly narrow, middle broader, clothed withpubescence, mid longitudinal thoracic groove present,cephalic region raised, clothed with pubescence.
Ocular region light brown, ocular quad longer than wideforming trapezium which is narrow anteriorly thanbehind, posterior medians are white, anterior row ofeyes black, both and recurved, posterior row of eyesslightly procurved, anterior laterals are close to anteriormedians, clypeus almost low, three long hairs onanterior margin of carapace.
Sternum: Cream in colour, longer than wide, posteriorend narrow, clothed with hairs, margins dark withprecoxalsclerites.
Labium: Brownish in colour, broad, longer than wide,posterior end narrow, laterally notched, clothed withhairs at distal end, pale in colour.
Endites: Brownish in colour, distal end pale in colourwith scopula and serrula, anteriorly broad, posteriorlynarrow, and clothed with hairs.
Chelicerae: Brownish black in colour, clothed withhairs, dorsum provided with lateral condyle, cheliceralfurrow with scopula, retromargin provided with twoteeth, equal in size, promargin provided with three teethwhich are unequal in size, second one larger than others,fang short and small.
Legs: Cream in colour, two tarsal claws, dented withclaw tufts, leg formula 4213, legs are prograde, legsclothed with hairs, trichobothria and setae, tarsus andmetatarsus with ventral scopula, two rows oftrichobothria on tarsus, metatarsus and tibia, femur
provided with three pairs of setae, two and three pairsof spines present ventrally on tibia and metatarsus, allthe coxae with sternocoxal space.
Leg measurements: (in mm)
Leg segments Leg 1 Leg 2 Leg 3 Leg 4
Coxae 0.55 0.63 0.53 0.72Trochanter 0.30 0.36 0.30 0.36Femur 1.39 1.41 1.13 1.19Patella 0.50 0.66 0.58 0.69Tibia 1.36 1.60 1.17 1.80Metatarsus 0.94 1.22 0.89 1.83Tarsus 0.60 0.46 0.53 0.80Total Length 5.64 6.34 5.13 7.39
Abdomen: Oval, longer than wide, brownish cream incolour, decorated with black patch, and mid longitudinaldorsum clothed with hairs and pubescence, posteriorlynarrower, venter pale in colour, clothed with fine hairs.
Epigyne: Long, spermatheca oval with coiled ducts,pale brown in colour.
Spinnerets: Anterior spinnerets cylindrical, clothedwith hairs, white patch at the base of the spinnerets,posterior spinnerets long, thin and segmented.
Type locality: Omkareshwar dam M. P.
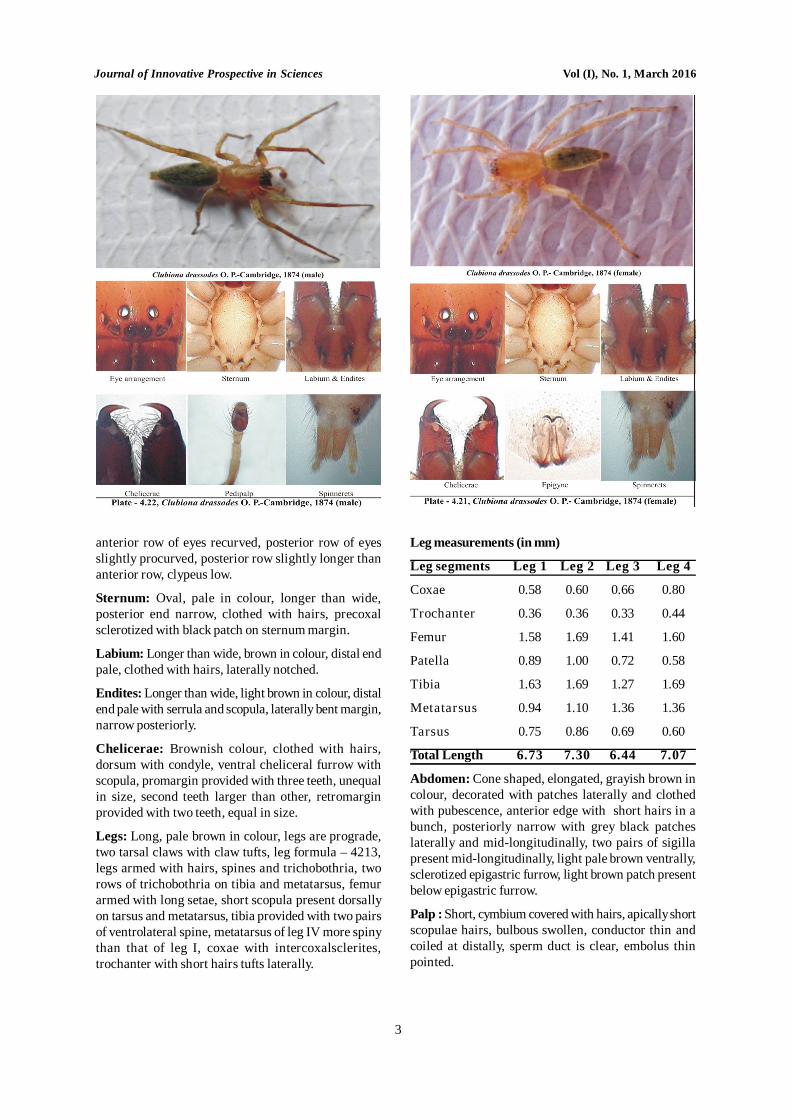
2. Clubionadrassodes O. P.-Cambridge, 1874(male)
Class : Arachnida
Order : Araneae
Suborder : Araneomorphae
Family : Clubionidae
Genus : Clubiona
Species : drassodes (male)
Description:
General: Cephalothorax brownish pale in colour, legsand abdomen blackish brown decorated with patches.
Cephalothorax Abdomen
L= 2.55 mm L= 3.94 mm
W= 1.69 mm W= 1.75 mm
Total Body Length = 6.49 mm
Cephalothorax: Longer than wide, carapace convex,raised, smooth carapace, clothed with pubescence, mid-longitudinal fovea, anteriorly narrow and slightlyforwarded, posterior margin with short hairs bunch.Ocular region light brown, ocular quad longer than wideforming trapezium, anteriorly narrow than behind,
Journal of Innovative Prospective in Sciences Vol (I), No. 1, March 2016
3
anterior row of eyes recurved, posterior row of eyesslightly procurved, posterior row slightly longer thananterior row, clypeus low.
Sternum: Oval, pale in colour, longer than wide,posterior end narrow, clothed with hairs, precoxalsclerotized with black patch on sternum margin.
Labium: Longer than wide, brown in colour, distal endpale, clothed with hairs, laterally notched.
Endites: Longer than wide, light brown in colour, distalend pale with serrula and scopula, laterally bent margin,narrow posteriorly.
Chelicerae: Brownish colour, clothed with hairs,dorsum with condyle, ventral cheliceral furrow withscopula, promargin provided with three teeth, unequalin size, second teeth larger than other, retromarginprovided with two teeth, equal in size.
Legs: Long, pale brown in colour, legs are prograde,two tarsal claws with claw tufts, leg formula – 4213,legs armed with hairs, spines and trichobothria, tworows of trichobothria on tibia and metatarsus, femurarmed with long setae, short scopula present dorsallyon tarsus and metatarsus, tibia provided with two pairsof ventrolateral spine, metatarsus of leg IV more spinythan that of leg I, coxae with intercoxalsclerites,trochanter with short hairs tufts laterally.
Leg measurements (in mm)
Leg segments Leg 1 Leg 2 Leg 3 Leg 4
Coxae 0.58 0.60 0.66 0.80
Trochanter 0.36 0.36 0.33 0.44
Femur 1.58 1.69 1.41 1.60
Patella 0.89 1.00 0.72 0.58
Tibia 1.63 1.69 1.27 1.69
Metatarsus 0.94 1.10 1.36 1.36
Tarsus 0.75 0.86 0.69 0.60
Total Length 6.73 7.30 6.44 7.07
Abdomen: Cone shaped, elongated, grayish brown incolour, decorated with patches laterally and clothedwith pubescence, anterior edge with short hairs in abunch, posteriorly narrow with grey black patcheslaterally and mid-longitudinally, two pairs of sigillapresent mid-longitudinally, light pale brown ventrally,sclerotized epigastric furrow, light brown patch presentbelow epigastric furrow.
Palp : Short, cymbium covered with hairs, apically shortscopulae hairs, bulbous swollen, conductor thin andcoiled at distally, sperm duct is clear, embolus thinpointed.
Journal of Innovative Prospective in Sciences Vol (I), No. 1, March 2016
4
Spinnerets : Spinnerets are long, light brown pale incolour, anterior spinnerets long cylindrical, clothed withhairs and pubescence, median spinnerets thin andshorter than others, posterior spinnerets fairly longerthan anterior and all the spinnerets are scattered, whitecream patch present at the base of the spinnerets.
Type locality: Omkareshwar dam M. P.
REFERENCES
Dippenaar-Schoeman, A. S. and Jocque R. (1997):African Spiders : An identification Manual. PlantProtection Research Handbook no. 9. AgriculturalResearch Council, Pretoria. 392 pp.
Keswani, S.; Hadole P. and Rajoria A. (2012): Checklistof spiders (Arachnida:Araneae) from India-2012.Indian Journal of Arachnology, Vol.1 (1), 1-129.
Platnick, N. I. (1989): Advances in spider Taxonomy1981-1987: A supplement to Brignoli’s, A catalogueof the Araneae described between 1940 and 1981.Manchester Univ. Press, 673pp. Platnick, N. I.(2000): A relimitation and revision of theAustralasian ground spider family Lamponidae(Araneae: Gnaphosoidea). Bull. Am. Mus. nat. Hist.245: 1-330.
Platnick, N. I. (2013): The world spider catalog, version13.0. American Museum of Natural History, onlineat http://research.amnh.org/iz/spiders/catalog/INTRO1. htmlDOI: 10.5531/db.iz.0001.
Pocock, R. I. (1900): The Fauna of British India,Arachnida. Taylor and Francis, London: 279 pp.
Preston-Mafham, R. and Preston-Mafham, K. (1984):Spiders of the World, Blandford Press Ltd, DorsetUK. 191pp.
Gajbe, P. (2003a): Description of a new species of spiderof the genus CastianeiraKeyserling (Araneae:Clubionidae) from Madhya Pradesh. Zoos printJournal 18(3): 1034-1036.
Gajbe, P.U. (2003):Description of a new species of spiderof the genus CastianeiraKeyserling (Araneae:Clubionidae) from Madhya Pradesh. Zoos’ PrintJ., 18: 1034-1036
Simon D. Pollard And Robert R. Jackson (1982): TheBiology of Clubiona Cambridge (Aranea,Clubionidae): Intraspecific Interactions, NewZealand Journal of Ecology, Vol. 5, 1982, 44-50.
Journal of Innovative Prospective in Sciences Vol (I), No. 1, March 2016
5
INTRODUCTION
Lonar crater is situated in village Lonar in the BuldhanaDistrict of Maharashtra, India. It has an almost perfectlycircular shape and accumulated with water in the deeperparts of basin. Rocks in the crater reveal manycharacteristic features of the moon rocks. There aremany old temples on the peripheral boundary of thecrater which have now become roosting places for bats.Ramgaya Temple has become the source of sweetdrinking water, as this is the only sweet water streamavailable in the crater; rest of the crater water is highlysaline. Kamalja Devi temple is situated at the southernbase of the crater. Morache temple (Peafowl’s temple)is now famous for existence of thousands of bats andpeacocks. Waghache temple (Leopards temple) is alsofamous for bats and people have seen leopard foundin it many times.
BAT GUANOThe word guano originated from the Quichua languageof the Inca civilization and means “the droppings ofbat”. The bats forage at night for insects over aparticular area, and they return to the old temples duringthe day to sleep and care for their young. They attachthemselves to ceiling, and their excrement accumulateson the floor below. In some situations the guano canreach a depth of feet in many years and appeared asguano-hip, and it has a valuable importance.
BIOREMEDIATION AND BAT GUANOOne of the most serious universal, internationalproblems facing us today is the removal of harmfulcompounds from the soil. If it is remain in soil longer
period, a process called eutrophication occurs (Prince,2003).
Now a days excessive use of fertilizers, chemicals andpolluted irrigation, the quality of agricultural ecosystem(soil), that degrades the various environments is a vitalconcern to the public. Thus it is crucial to develop andimplement accurate means to clean and preserve ourprecious and deteriorating environment. Althoughthere are many techniques in cleaning environmentalcontaminations, one process has the most potential,namely bioremediation. Bioremediation, or commonlyreferred to as biodegradation, is a process in whichmicrobes such as bacteria, fungi, yeast, or micro algaeare involved in degrading toxic wastes (Pace, 1997 andKnezevich, 2006).
A marvelous symbiosis exits between themicroorganisms and bat guano. Bacteria in themammalian intestinal tract aid in the breakdown of foodduring digestion. These organisms synthesize enzymescapable of degrading a vast array of substances.Innumerable microbes are regularly excreted along withwaste products and together with other organisms;they constitute the microbial population of a bat guanodeposit (Steele, 1989).
Large populations of bat deposit thousands ofkilograms of dropping annually. An ounce of bat guanocontains billions of bacteria, and a single guano depositmay contain thousands of bacterial species. Guanobeing rich in bioremediation microbes cleans up toxicsubstances, (Barry et al., 1997). At present we do notknow these species.
IMPACT OF BAT GUANO ON DEGRADATION OF SOIL POLLUTANTS IN OFMALKAPUR TAHSIL, BULDANA DISTRICT, MS (INDIA)
C. M. BHARAMBE AND DIPALI BORSEDepartment of Zoology, Vidnyan Mahavidyalaya, Malkapur Dist. Buldana (MS)
(Corresponding author [email protected])
ABSTRACTThe word guano originated from the Quichua language of the Inca civilization and means “the droppings of bat”. Thebats forage at night for insects over a particular area, and they return to the old temples during the day to sleep and carefor their young. They attach themselves to ceiling, and their excrement accumulates on the floor below. In somesituations the guano can reach a depth of feet in many years and appeared as guano-hip, and it has a valuableimportance.
Bat guano was collected from the temple of Lonar crater of Lonar, Buldana District, Maharashtra. The bat guano, wasdissolved in soil of Malkapur Tahsil, (100:1000) concentration was prepared and kept undisturbed till 30 days andparameters was noted at an interval of 2 hour and thereafter 5 days for about 24 hours and 30 days respectively.Resulted into increasing in pH and decline in chloride, nitrate, phosphate and sulphate content of soil after the additionof bat guano. Our investigation results indicated that bat guano used for degradation of soil pollutants and bioremediationof agricultural ecosystem.
Key words: Bioremediation, bat guano, Soil pollutants etc.
Journal of Innovative Prospective in Sciences Vol (I), No. 1, March 2016
6
MATERIALS AND METHODS
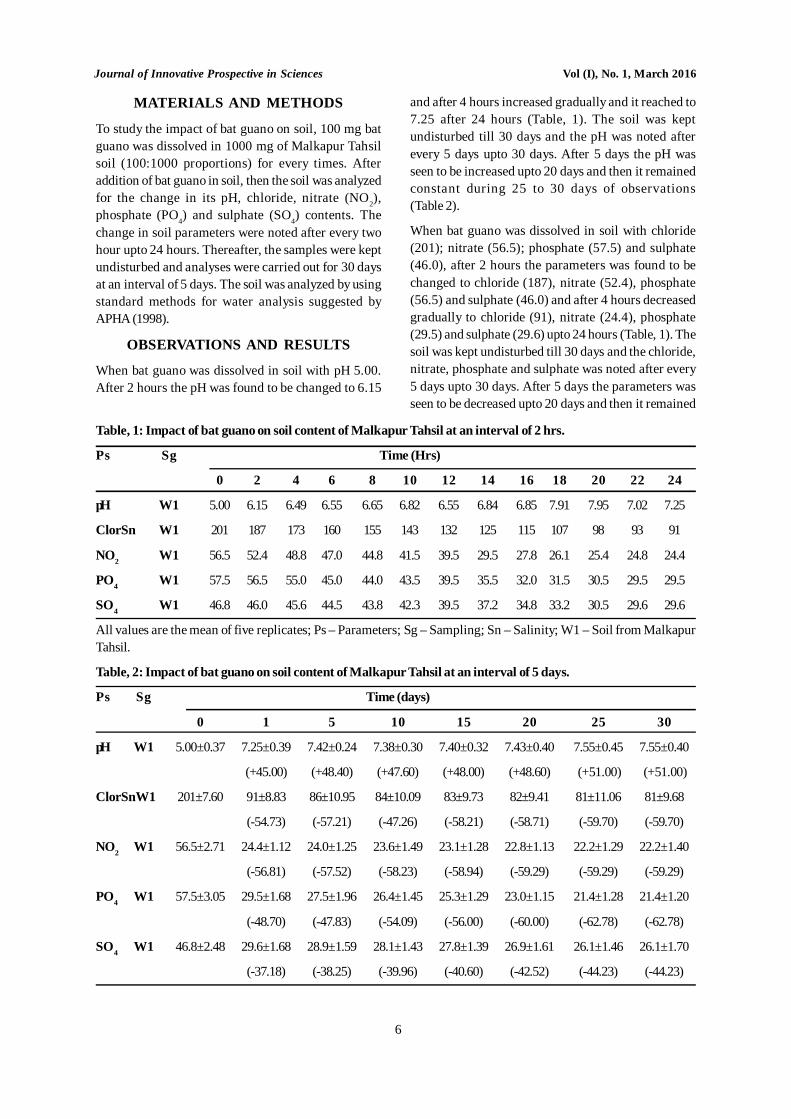
To study the impact of bat guano on soil, 100 mg batguano was dissolved in 1000 mg of Malkapur Tahsilsoil (100:1000 proportions) for every times. Afteraddition of bat guano in soil, then the soil was analyzedfor the change in its pH, chloride, nitrate (NO2),phosphate (PO4) and sulphate (SO4) contents. Thechange in soil parameters were noted after every twohour upto 24 hours. Thereafter, the samples were keptundisturbed and analyses were carried out for 30 daysat an interval of 5 days. The soil was analyzed by usingstandard methods for water analysis suggested byAPHA (1998).
OBSERVATIONS AND RESULTS
When bat guano was dissolved in soil with pH 5.00.After 2 hours the pH was found to be changed to 6.15
and after 4 hours increased gradually and it reached to7.25 after 24 hours (Table, 1). The soil was keptundisturbed till 30 days and the pH was noted afterevery 5 days upto 30 days. After 5 days the pH wasseen to be increased upto 20 days and then it remainedconstant during 25 to 30 days of observations(Table 2).
When bat guano was dissolved in soil with chloride(201); nitrate (56.5); phosphate (57.5) and sulphate(46.0), after 2 hours the parameters was found to bechanged to chloride (187), nitrate (52.4), phosphate(56.5) and sulphate (46.0) and after 4 hours decreasedgradually to chloride (91), nitrate (24.4), phosphate(29.5) and sulphate (29.6) upto 24 hours (Table, 1). Thesoil was kept undisturbed till 30 days and the chloride,nitrate, phosphate and sulphate was noted after every5 days upto 30 days. After 5 days the parameters wasseen to be decreased upto 20 days and then it remained
Table, 1: Impact of bat guano on soil content of Malkapur Tahsil at an interval of 2 hrs.
Ps Sg Time (Hrs)
0 2 4 6 8 10 12 14 16 18 20 22 24
pH W1 5.00 6.15 6.49 6.55 6.65 6.82 6.55 6.84 6.85 7.91 7.95 7.02 7.25
ClorSn W1 201 187 173 160 155 143 132 125 115 107 98 93 91
NO2 W1 56.5 52.4 48.8 47.0 44.8 41.5 39.5 29.5 27.8 26.1 25.4 24.8 24.4
PO4 W1 57.5 56.5 55.0 45.0 44.0 43.5 39.5 35.5 32.0 31.5 30.5 29.5 29.5
SO4 W1 46.8 46.0 45.6 44.5 43.8 42.3 39.5 37.2 34.8 33.2 30.5 29.6 29.6
All values are the mean of five replicates; Ps – Parameters; Sg – Sampling; Sn – Salinity; W1 – Soil from MalkapurTahsil.
Table, 2: Impact of bat guano on soil content of Malkapur Tahsil at an interval of 5 days.
Ps Sg Time (days)
0 1 5 10 15 20 25 30
pH W1 5.00±0.37 7.25±0.39 7.42±0.24 7.38±0.30 7.40±0.32 7.43±0.40 7.55±0.45 7.55±0.40
(+45.00) (+48.40) (+47.60) (+48.00) (+48.60) (+51.00) (+51.00)
ClorSnW1 201±7.60 91±8.83 86±10.95 84±10.09 83±9.73 82±9.41 81±11.06 81±9.68
(-54.73) (-57.21) (-47.26) (-58.21) (-58.71) (-59.70) (-59.70)
NO2 W1 56.5±2.71 24.4±1.12 24.0±1.25 23.6±1.49 23.1±1.28 22.8±1.13 22.2±1.29 22.2±1.40
(-56.81) (-57.52) (-58.23) (-58.94) (-59.29) (-59.29) (-59.29)
PO4 W1 57.5±3.05 29.5±1.68 27.5±1.96 26.4±1.45 25.3±1.29 23.0±1.15 21.4±1.28 21.4±1.20
(-48.70) (-47.83) (-54.09) (-56.00) (-60.00) (-62.78) (-62.78)
SO4 W1 46.8±2.48 29.6±1.68 28.9±1.59 28.1±1.43 27.8±1.39 26.9±1.61 26.1±1.46 26.1±1.70
(-37.18) (-38.25) (-39.96) (-40.60) (-42.52) (-44.23) (-44.23)
Journal of Innovative Prospective in Sciences Vol (I), No. 1, March 2016
7
constant during 25 to 30 days of observations(Table 2).
All values are the mean ±SE of five replicates; Figuresin parenthesis indicate percent change over the resulton 0 day; Ps – Parameters; Sg – Sampling;Sn – Salinity;W1 – Soil from Malkapur Tahsil.
DISCUSSION
Tilak et al. (2005) reported a number of bacterial speciesassociated with the bat guano belonging to genera,Azospirillum, Alcaligens, Arthrobacter, Acinetobacter,Bacillus, Burkholderia, Enterobacter, Erwinia,Flavobacterium, Pseudomonas, Rhizobium andSerratia. He also suggested that this bacterium hashigh bioremediation capacity. Hutchens et al. (2004)had demonstrated aerobic methane oxidizing bacteria,Methylomonas and Methylococcus in bat guano.
The bacterial enzymes capable of degrading a numberof substances (Martin, 1991; Dvorak et al., 1992;Edenborn et al., 1992; Bechard et al., 1994; White andChang, 1996; Frank, 2000; Kaksonen, et al., 2003; Valleroet al., 2003; Boshoff, et al., 2004; Miranda, 2005; Seena,2005; Tilak et al., 2005). Murphy (1989), demonstrateda nutritious broth formation when the bat guano wasadded in water and further he proved that this brothsupported the growth of numerous microbes.
Alley and Mary (1996), stated that an ounce of batguano contains billions of bacteria and thousands ofbacterial species and these bacteria are important tobioremediation. Sridhar et al. (2006), and Pawar et al.(2004), examined the fungal fauna of bat guano andused for bioremediation of Lack soil.
CONCLUSIONS
Excessive use of fertilizers, chemicals, anthropogenicactivities, municipalities, various industries disposingtheir waste into the various water resources which isused for irrigation. It is of utmost importance, hence,to prevent the pollution of various resources and soil,by all possible means to control its quality from furtherdeterioration. Applying microorganisms for soilpollution control is an area of interest all over the world.
In the present investigation is an attempt to study theimpact of bat guano with its rich microbial flora onbioremediation of soil. The results revealed that withina period of 30 days, there was a remarkable reductionin the physico-chemical parameters of river pollutants,thus stabilizing the soil pollutants, suggesting that soilpollutants can be effectively treated by bat guano andis the excellent bioremediatant.
REFERENCES
Aaranson, S. (1970): Experimental Microbial Ecology.Academic Press, New York. pp. 236.
APHA, (1998): Standard methods for the examinationof water and wastewater, 20th ed. APHA, AWWAand WEF New York, Washington DC.
Boyd, S. A. and E. G. Patricia (2005): An Approach toEvaluation of the Effect of Bioremediation onBiological Activity of EnvironmentalContaminants: Dechlorination of PolychlorinatedBiphenyls. Environmental Health Perspectives,Vol. 113, No. 2: pp. 180-185.
Chapelle, F.H.: Bioremediation: Nature’s Way to aCleaner Environment. U. S. Geological Survey.URL: http://water.usgs.gov/wid/html/bioremed.html.
Conde-Costas, C (1991): The effect of bat guano onthe water quality of the Cueva EL Conventostream in Gauayanilla, Puerto Rico. Nss. Bull.53(1):15.
Dash, M. C., Mishra P. C., Kar G. K. and Das R. C.(1986): Hydrobiology of Hirakund Dam Reservoir.In: Ecology and pollution of Indian Lakes andReservoirs. Mishra Publishing House, New Delhi,p. 317-337.
Dilip, K. M. and N. R. Markandey (2002):Microorganisms in Bioremediation/edited by.New Delhi, Capital Pub., viii, 190 p., tables, figs.,ISBN 81-85589-08-9.
Dvorak, D.H.; R. S. Hedin; P. E. McIntire (1992):Treatment of metal contaminated water usingbacterial sulphate reduction: results from a pilot-scale reactor. Biotechnol. Bioeng.40:609-616.
Edenborn, D.H., R. S. Hedin (1992): Treatment of waterby using sulphate reducing bacteria: Biotech.Bioeng. 30:512-516.
Everett, J. W.; J. Gonzales; L, Kennedy (2004): Aqueousand Mineral Intr insic BioremediationAssessment: Natural Attenuation. Journal ofEnvironmental Engineering, Vol. 130 Issue 9, 942-950.
Faison, B. D; and R. B. Knapp (1997): A bioengineeringsystem for in situ bioremediation of contaminatedgroundwater. Source: Journal of IndustrialMicrobiology and Biotechnology, Vol. 18 (2-3).189-197.
Journal of Innovative Prospective in Sciences Vol (I), No. 1, March 2016
8
Keleher, S. (1996): Guano: Bats’ Gifts to Gardeners. 14(1):pp. 15-17.
Knezevich, V.; O. Koren; E. Z. Ron; E. Rosenberg (2006):Petroleum Bioremediation in Seawater UsingGuano. Bioremediation Journal, Vol. 10th Issue 3,p83-91, 9p.
Pace, N. R. (1997): A molecular view of microbialdiversity and the biosphere. Science 276:734-740
Pawar, K. V. and S. S. Deshmukh (2004): Bioremeditionof Lack soil using bat guano. Indian J. Environand Ecoplan. 8(3):699-704.
Pierce, W. (1999) : Speech on ‘’ Bat guano ‘’ Sept.,1999. Cassette from National Vanguard Books,P.O. Box 330, Hillsboro, WV 24946.
Prince, R. C. (2003): Bioremediation in marineenvironments. Prince RC. Exxon Research and
Engineering, Annandale, NJ 08801.Bioremediation.
Steele, D. B. (1989): Bats, Bacteria and Biotechnology.7(1):3-4.
Tuttle, M.D. (1986): Endangered gray bats benefits fromprotection. Bat, Vol. 4(4), 1986.
Vidali, M. (2001): Bioremediation. An overview.Dipartimento di Chimica Inorganica,Metallorganica, e Analitica, Università di PadovaVia Loredan, 435128 Padova, Italy. Pure Appl.Chem., Vol. 73, No. 7, pp. 1163–1172, 2001.
Walecha, V., Vyas V. and Walecha R. (1993):Rehabilitation of the twin lakes of Bhopal. In:Ecology and pollution on Indian lakes andreservoir. Ashish Publishing House New Delhi, p317-337.
Journal of Innovative Prospective in Sciences Vol (I), No. 1, March 2016
9
INTRODUCTION
The extensive application of dyes in printing, dyeing,textiles etc. has created a hugequantity of dyewastewater which may be carcinogenic and toxic.Theelimination of dyes from wastewater turns out to be avital issue in the ecological shield. Moreover, the colourproduced by diminutive amounts of organic dyes inwater is of enormous apprehension as it is aestheticallydisagreeable. This recommends a rigorous search forthe best accessible technology for the exclusion ofdyes.
A number of physico-chemical methods like advancedoxidation and biological process, coagulants, oxidizingagents, membrane, electrochemical, adsorptiontechniques1,2etc have been proposed to satisfy theabove requirements.
Among these methods, the adsorption technique isfound to be a proficient and cost-effective process toremove dyes and also to control the biochemicaloxygen requirement. Various studies have beendedicated to the dyes adsorption kinetics, equilibriummodeling, and mechanism in addition to the aspectsthat influence adsorption.
The inspected adsorbents embrace activated carbon,mesoporous molecular sieves, some natural adsorbentsand agricultural by-products3-5. Amongst theseadsorbents, mont-morillonite has been recognized asone of the suitable inexpensive adsorbents for theexclusion of dyes from waste water6.
In recent times, mesoporous molecular sieves forinstance MCM-41 have as well established asubstantial gratitude owing to their large pore-spaceand special surface property7.
It is recognized that the (-) charge of CFA is balancedby redeemable cations Na+ and Ca++. As CFA havelittle or no affinity for anionic species such as that ofacid dyes, to improve their adsorption ability andcapacity, the replacement of the natural inorganiccations with surfactant cations such as quaternaryammonium compounds was frequently observed andthe obtained surfactant-modified CFA were then usedto adsorb the neutral and anionic organic compounds.
On these applications, it is found that when largerorganic cations HDTMA are used, the hydrophobictails interact with each other producing an organicphase which act as a partition medium into which non-ionic organic molecules partition from water. In additionto the adsorption of nonionic organic compounds,quaternary ammonium compounds-CFA complexeshave been shown to have the ability to removeinorganic anions from aqueous solution with anadsorption mechanism that appears to be replacementof counterion of the surfactant by anionic species.
The innovation of ordered mesoporous materials hasled to the research in the synthesis, characterizationand application of mesoporous materials8,9.Mesoporous material MCM-41 provides exhilaratingprospects for elementary and functional studies onmesoporous materials due to its high surface area, highpore volume.
The inimitable pore structures of MCM-41 offer aspecial atmosphere for chemical severances andreactions. Recently, Ho et al.7 have shown that materialsprepared by grafting amino- and carboxylic-containingfunctional groups onto MCM-41 might be a usefuladsorbent for the removal of Acid Blue 25 andmethylene blue dyes from waste water and these
ADSORPTION OF DYES ONTO A COAL FLY ASH SYNTHESIZED CFA-MCM-41:A CONVERSION OF WASTE TO WEALTH
Manish Deshpande and U.D. JoshiNetaji Subhash Chandra Bose College, Nanded - 431601(MS)
(Corresponding author [email protected])
ABSTRACT
The adsorption of acid dye Amido Naphthol onto hexa-decyl-tri-methyl-ammonium chloride (HDTMAC) modifiedmont-morillonite and basic dye Basic Violet 10, BV10 onto CFA-MCM-41 was premeditated to study its impendingnature for the elimination of acid and basic dye from wastewater. The revolutions of surface and pore structure ofmontmorillonite induced by surfactant modified process were characterized based on the analysis of the N2-isothermsas well as the X-ray diffraction patterns. The adsorption on CFA-MCM-41 with regard to contact time, pH, andtemperature was then measured to provide more information about the adsorption characteristics of CFA-MCM-41.Both Langmuir and Freundlich adsorption models were applied to describe the equilibrium isotherms and the pseudo-second-order kinetic model.
Key Words: CFA-MCM-41, dyes, adsorption, XRD, FTIR etc.
Journal of Innovative Prospective in Sciences Vol (I), No. 1, March 2016
10
adsorbents can be regenerated by simple washing withalkaline or acid solution to recover the adsorbents andadsorbed dyes.
In this study, our intention is to inspect the prospectiveof surfactant modified mont-morillonite and MCM-41for the removal of acid and basic dye, respectively, bymeasuring the adsorption data of Amido Naphthol RedGon CFA and Basic Violet 10 (BV10) on MCM-41.
The changes of surface and pore structure of mont-morillonite induced by surfactant modified processwere characterized based on the analysis of the N2
isotherms as well as the X-ray diffraction (XRD)patterns. The adsorption processes with respect topH, contact time, and temperature were measured toprovide more information about the adsorptioncharacteristics of CFA and MCM-41. The equilibriumdata were fitted into Langmuir and Freundlichequations to determine the correlation between theisotherm models and experimental data. The kinetic andthermodynamic parameters were calculated todetermine the adsorption mechanisms.
MATERIALS AND ADSORPTION ISOTHERMS
Mesoporous MCM-41 has been successfully preparedusing different synthesis procedures and conditions.For this study, the MCM-41 powder was crystallizedfrom an alkaline solution containing cetyl-tri-methyl-ammonium bromide (CTAB, 99%, Merck), sodiumsilicate solution, sulfuric acid (98%, Merck) anddeionized water in the molar ratio of
1.1CTABr: 1.92 Na2O: 6.63 SiO2: 341.53 H2O: 1.25 H2SO4.
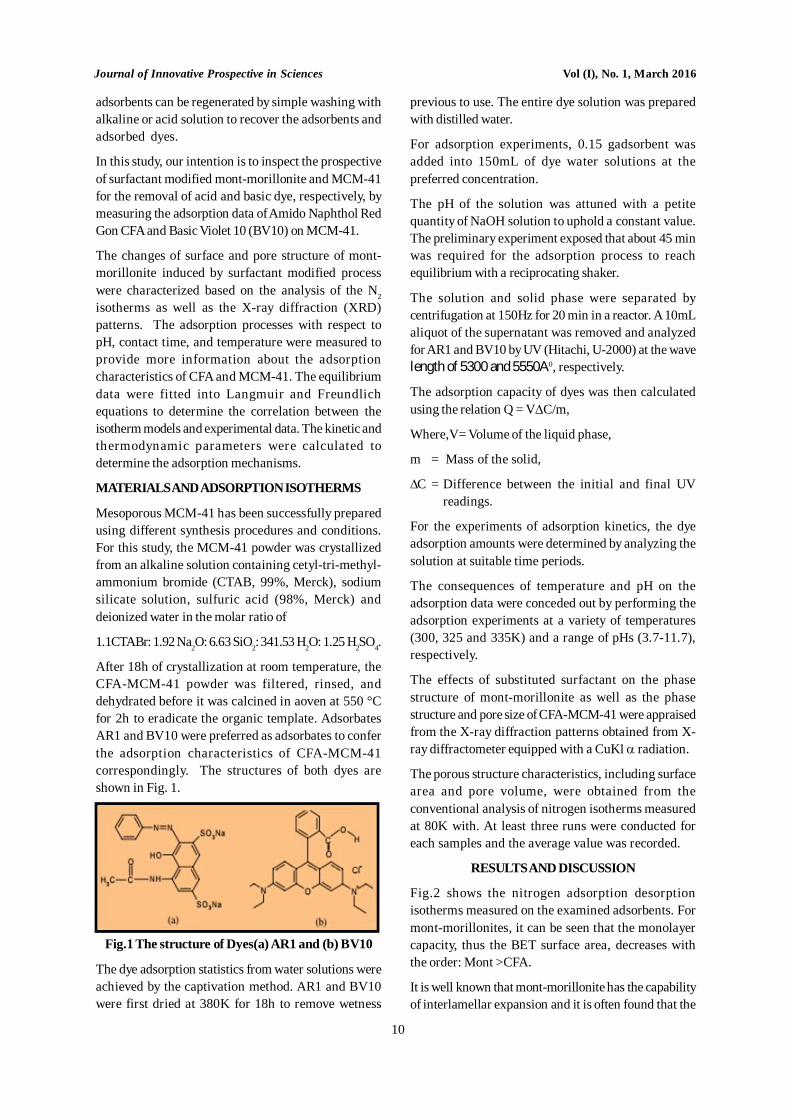
After 18h of crystallization at room temperature, theCFA-MCM-41 powder was filtered, rinsed, anddehydrated before it was calcined in aoven at 550 °Cfor 2h to eradicate the organic template. AdsorbatesAR1 and BV10 were preferred as adsorbates to conferthe adsorption characteristics of CFA-MCM-41correspondingly. The structures of both dyes areshown in Fig. 1.
Fig.1 The structure of Dyes(a) AR1 and (b) BV10
The dye adsorption statistics from water solutions wereachieved by the captivation method. AR1 and BV10were first dried at 380K for 18h to remove wetness
previous to use. The entire dye solution was preparedwith distilled water.
For adsorption experiments, 0.15 gadsorbent wasadded into 150mL of dye water solutions at thepreferred concentration.
The pH of the solution was attuned with a petitequantity of NaOH solution to uphold a constant value.The preliminary experiment exposed that about 45 minwas required for the adsorption process to reachequilibrium with a reciprocating shaker.
The solution and solid phase were separated bycentrifugation at 150Hz for 20 min in a reactor. A 10mLaliquot of the supernatant was removed and analyzedfor AR1 and BV10 by UV (Hitachi, U-2000) at the wavelength of 5300 and 5550A0, respectively.
The adsorption capacity of dyes was then calculatedusing the relation Q = VC/m,
Where,V= Volume of the liquid phase,
m = Mass of the solid,
C = Difference between the initial and final UVreadings.
For the experiments of adsorption kinetics, the dyeadsorption amounts were determined by analyzing thesolution at suitable time periods.
The consequences of temperature and pH on theadsorption data were conceded out by performing theadsorption experiments at a variety of temperatures(300, 325 and 335K) and a range of pHs (3.7-11.7),respectively.
The effects of substituted surfactant on the phasestructure of mont-morillonite as well as the phasestructure and pore size of CFA-MCM-41 were appraisedfrom the X-ray diffraction patterns obtained from X-ray diffractometer equipped with a CuK radiation.
The porous structure characteristics, including surfacearea and pore volume, were obtained from theconventional analysis of nitrogen isotherms measuredat 80K with. At least three runs were conducted foreach samples and the average value was recorded.
RESULTS AND DISCUSSION
Fig.2 shows the nitrogen adsorption desorptionisotherms measured on the examined adsorbents. Formont-morillonites, it can be seen that the monolayercapacity, thus the BET surface area, decreases withthe order: Mont >CFA.
It is well known that mont-morillonite has the capabilityof interlamellar expansion and it is often found that the
Journal of Innovative Prospective in Sciences Vol (I), No. 1, March 2016
11
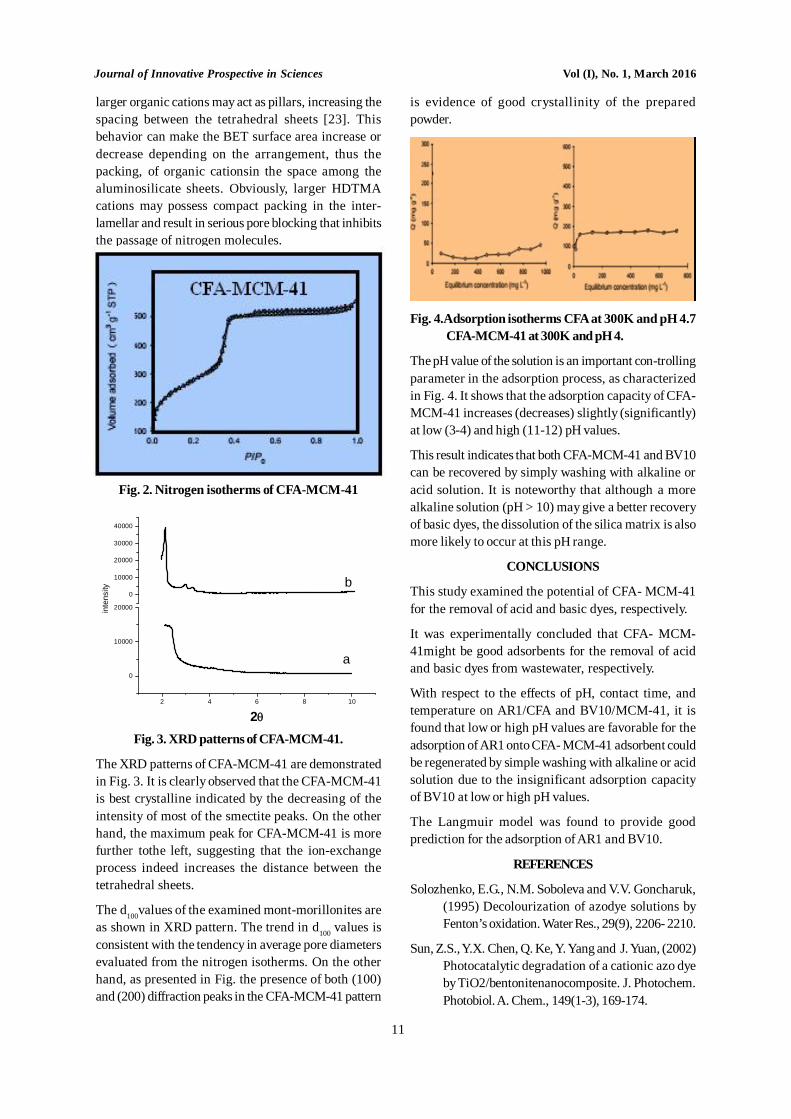
larger organic cations may act as pillars, increasing thespacing between the tetrahedral sheets [23]. Thisbehavior can make the BET surface area increase ordecrease depending on the arrangement, thus thepacking, of organic cationsin the space among thealuminosilicate sheets. Obviously, larger HDTMAcations may possess compact packing in the inter-lamellar and result in serious pore blocking that inhibitsthe passage of nitrogen molecules.
Fig. 2. Nitrogen isotherms of CFA-MCM-41
Fig. 3. XRD patterns of CFA-MCM-41.
The XRD patterns of CFA-MCM-41 are demonstratedin Fig. 3. It is clearly observed that the CFA-MCM-41is best crystalline indicated by the decreasing of theintensity of most of the smectite peaks. On the otherhand, the maximum peak for CFA-MCM-41 is morefurther tothe left, suggesting that the ion-exchangeprocess indeed increases the distance between thetetrahedral sheets.
The d100values of the examined mont-morillonites areas shown in XRD pattern. The trend in d100 values isconsistent with the tendency in average pore diametersevaluated from the nitrogen isotherms. On the otherhand, as presented in Fig. the presence of both (100)and (200) diffraction peaks in the CFA-MCM-41 pattern
is evidence of good crystallinity of the preparedpowder.
Fig. 4.Adsorption isotherms CFA at 300K and pH 4.7CFA-MCM-41 at 300K and pH 4.
The pH value of the solution is an important con-trollingparameter in the adsorption process, as characterizedin Fig. 4. It shows that the adsorption capacity of CFA-MCM-41 increases (decreases) slightly (significantly)at low (3-4) and high (11-12) pH values.
This result indicates that both CFA-MCM-41 and BV10can be recovered by simply washing with alkaline oracid solution. It is noteworthy that although a morealkaline solution (pH > 10) may give a better recoveryof basic dyes, the dissolution of the silica matrix is alsomore likely to occur at this pH range.
CONCLUSIONS
This study examined the potential of CFA- MCM-41for the removal of acid and basic dyes, respectively.
It was experimentally concluded that CFA- MCM-41might be good adsorbents for the removal of acidand basic dyes from wastewater, respectively.
With respect to the effects of pH, contact time, andtemperature on AR1/CFA and BV10/MCM-41, it isfound that low or high pH values are favorable for theadsorption of AR1 onto CFA- MCM-41 adsorbent couldbe regenerated by simple washing with alkaline or acidsolution due to the insignificant adsorption capacityof BV10 at low or high pH values.
The Langmuir model was found to provide goodprediction for the adsorption of AR1 and BV10.
REFERENCES
Solozhenko, E.G., N.M. Soboleva and V.V. Goncharuk,(1995) Decolourization of azodye solutions byFenton’s oxidation. Water Res., 29(9), 2206- 2210.
Sun, Z.S., Y.X. Chen, Q. Ke, Y. Yang and J. Yuan, (2002)Photocatalytic degradation of a cationic azo dyeby TiO2/bentonitenanocomposite. J. Photochem.Photobiol. A. Chem., 149(1-3), 169-174.
2 4 6 8 10
0
10000
20000
a
inte
nsity
2
0
10000
20000
30000
40000
b
Journal of Innovative Prospective in Sciences Vol (I), No. 1, March 2016
12
Walker, G.M. and L.R. Weatherley, (1999) Kinetics ofacid dye adsorption on GAC. Water Res., 33(8),1895-1899.
Mohamed, M.M., (2004) Acid dye removal: Comparisonof surfactant-modified mesoporous FSM-16 withactivated carbon derived from rice husk. J.Colloid Interf. Sci., 272(1), 28-34.
Pollard, S.J.T., G.D. Fowler, C.J. Sollars and R. Rerry,(1992) Low-cost adsorbents for waste andwastewater treatment: A review. Sci. TotalEnviron., 116(1-2), 31-52. Juang et al.: DyesAdsorption onto Organoclay and MCM-41 37
Gemeay, A.H., A.S. El-Sherbiny and A.B. Zaki, (2002)Adsorption and kinetic studies of theintercalation of some organic compounds ontoNa+ - montmorillonite. J. Colloid Interf. Sci.,245(1), 116-125.
Ho, K.Y., G. McKay and K.L. Yeung, (2003) Selectiveadsorbents from ordered mesoporous silica.Langmuir, 19(7), 3019-3024.
Choma, J., M. Jaroniec, W. Burakiewicz-Mortka and M.Kloske, (2002) Critical appraisal of classicalmethods for determination of mesopore size
distributions of MCM-41 materials. Appl. Surf.Sci., 196(1-4), 216-223.
Zhao, X.S., G.Q.M. Lu and G.J. Millar, (1996) Advancesin mesoporous sieve MCM-41. Ind. Eng. Chem.Res., 35 (7), 2075-2090.
Lee, J.F., C.K. Lee and L.C. Juang, (1999) Size effects ofexchange cation on the pore structure andsurface fractality of montmorillonite. J. ColloidInterf. Sci., 217(1), 172-176.
Kaewprasit, C., E. Hequet, N. Abidi and J.P. Gourlot,(1998) Application of methylene blue adsorptionto cotton fiber specific surface area measurement:Part I. Methodology. J. Cotton. Sci., 2(4), 164-173.
Özcan, A.S. and A. Özcan, (2004) Adsorption of aciddyes from aqueous solutions onto acid-activatedbentonite. J. Colloid Interf. Sci., 276(1), 39-46.
Wang, C.C., L.C. Juang, C.K. Lee, T.C. Hsu, J.F. Leeand H.P. Chao, (2004) Effects of exchangedsurfactant cations on the pore structure andadsorption characteristics of montmorillonite. J.Colloid Interf. Sci., 280(1), 27-35.
Journal of Innovative Prospective in Sciences Vol (I), No. 1, March 2016
13
INTRODUCTION
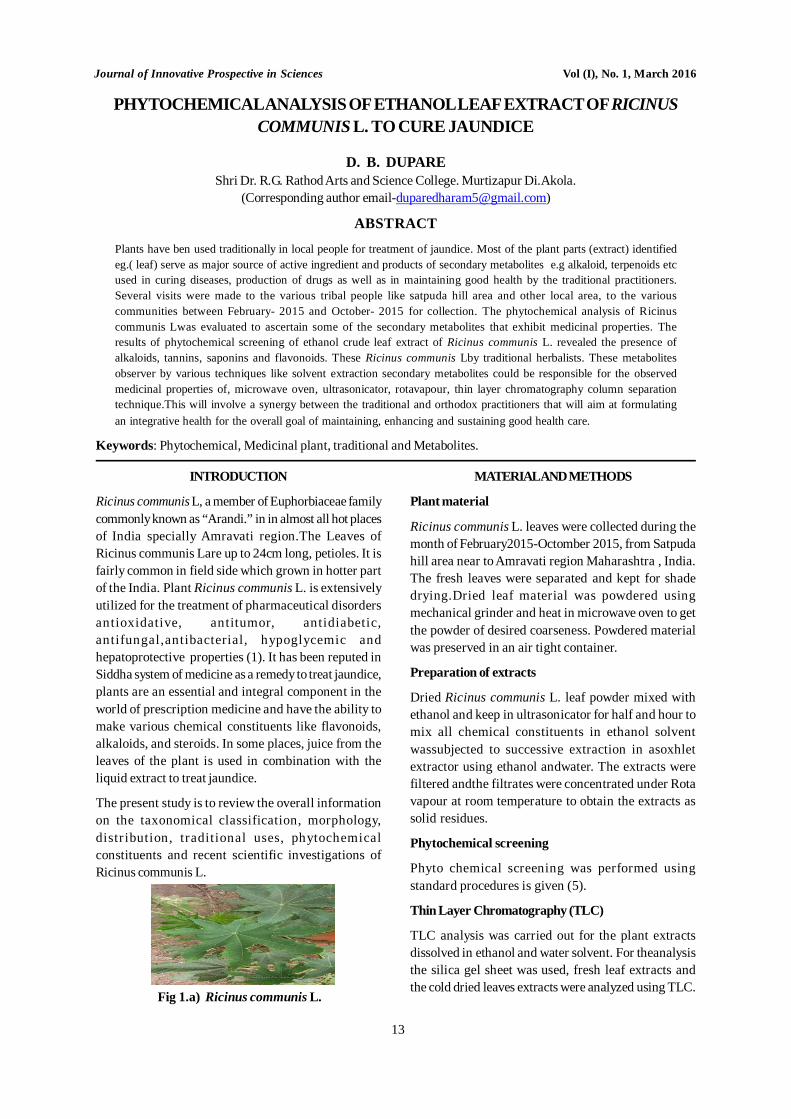
Ricinus communis L, a member of Euphorbiaceae familycommonly known as “Arandi.” in in almost all hot placesof India specially Amravati region.The Leaves ofRicinus communis Lare up to 24cm long, petioles. It isfairly common in field side which grown in hotter partof the India. Plant Ricinus communis L. is extensivelyutilized for the treatment of pharmaceutical disordersantioxidative, antitumor, antidiabetic,antifungal,antibacterial, hypoglycemic andhepatoprotective properties (1). It has been reputed inSiddha system of medicine as a remedy to treat jaundice,plants are an essential and integral component in theworld of prescription medicine and have the ability tomake various chemical constituents like flavonoids,alkaloids, and steroids. In some places, juice from theleaves of the plant is used in combination with theliquid extract to treat jaundice.
The present study is to review the overall informationon the taxonomical classification, morphology,distr ibution, traditional uses, phytochemicalconstituents and recent scientific investigations ofRicinus communis L.
Fig 1.a) Ricinus communis L.
MATERIAL AND METHODS
Plant material
Ricinus communis L. leaves were collected during themonth of February2015-Octomber 2015, from Satpudahill area near to Amravati region Maharashtra , India.The fresh leaves were separated and kept for shadedrying.Dried leaf material was powdered usingmechanical grinder and heat in microwave oven to getthe powder of desired coarseness. Powdered materialwas preserved in an air tight container.
Preparation of extracts
Dried Ricinus communis L. leaf powder mixed withethanol and keep in ultrasonicator for half and hour tomix all chemical constituents in ethanol solventwassubjected to successive extraction in asoxhletextractor using ethanol andwater. The extracts werefiltered andthe filtrates were concentrated under Rotavapour at room temperature to obtain the extracts assolid residues.
Phytochemical screening
Phyto chemical screening was performed usingstandard procedures is given (5).
Thin Layer Chromatography (TLC)
TLC analysis was carried out for the plant extractsdissolved in ethanol and water solvent. For theanalysisthe silica gel sheet was used, fresh leaf extracts andthe cold dried leaves extracts were analyzed using TLC.
PHYTOCHEMICAL ANALYSIS OF ETHANOL LEAF EXTRACT OF RICINUSCOMMUNIS L. TO CURE JAUNDICE
D. B. DUPAREShri Dr. R.G. Rathod Arts and Science College. Murtizapur Di.Akola.
(Corresponding author [email protected])
ABSTRACT
Plants have ben used traditionally in local people for treatment of jaundice. Most of the plant parts (extract) identifiedeg.( leaf) serve as major source of active ingredient and products of secondary metabolites e.g alkaloid, terpenoids etcused in curing diseases, production of drugs as well as in maintaining good health by the traditional practitioners.Several visits were made to the various tribal people like satpuda hill area and other local area, to the variouscommunities between February- 2015 and October- 2015 for collection. The phytochemical analysis of Ricinuscommunis Lwas evaluated to ascertain some of the secondary metabolites that exhibit medicinal properties. Theresults of phytochemical screening of ethanol crude leaf extract of Ricinus communis L. revealed the presence ofalkaloids, tannins, saponins and flavonoids. These Ricinus communis Lby traditional herbalists. These metabolitesobserver by various techniques like solvent extraction secondary metabolites could be responsible for the observedmedicinal properties of, microwave oven, ultrasonicator, rotavapour, thin layer chromatography column separationtechnique.This will involve a synergy between the traditional and orthodox practitioners that will aim at formulatingan integrative health for the overall goal of maintaining, enhancing and sustaining good health care.
Keywords: Phytochemical, Medicinal plant, traditional and Metabolites.
Journal of Innovative Prospective in Sciences Vol (I), No. 1, March 2016
14
The sheets are kept in TLC Chamber for one hour,depending on the polarity of the eluted fractions to beanalyzed. The sheets were treated with 1% ninhydrindiluted to acetone and heated in anoven at 40°C for 30seconds.
Test for Anthraquinones
The 0.5 g of the extract was boiled with 10 ml ofsulphuric acid (H2SO4) and filtered while hot. The filtratewas shaken with 5 ml of chloroform. The chloroformlayer was pipette into another test tube and 1 ml ofdilute ammonia was added. The resulting solution wasobserved for color changes.
Test for Terpenoids (Salkowski test)
The 0.5 g each of the extract was added 2 ml ofchloroform. Concentrated H2SO4 (3 ml) was carefullyadded to form a layer. A reddish brown coloration ofthe interface indicates the presence of terpenoids.
Test for Flavonoids
Three methods were used to test for flavonoids. First,dilute ammonia (5ml) was added to a portion of anaqueous filtrate of the extract. Concentrated sulphuricacid (1 ml) was added. Second, a few drops of 1%aluminium solution were added to a portion of thefiltrate. Third, a portion of the extract was heated with10 ml of ethyl acetate over a steam bath for 3 min. Themixture was filtered and 4 ml of the filtrate was shakenwith 1 ml of dilute ammonia solution. In all the cases, ayellow colorations indicating the presence offlavonoids was observed.
Test for Saponins
The 0.5 g of extract was added 5 ml of distilled water ina test tube. The solution was shaken vigorously andthe mixture is observed for astable persistent froth.The frothing was mixed with 3 drops of olive oil and
shaken vigorously after which it was observed for theformation of an emulsion.
Test for Tannins
The 0.5 g of the extract was boiled in 10 ml of water ina test tube and then filtered. A few drops of 0.1% ferricchloride was added and observed for brownish greenor a blue-black colouration.
Test for steroids (Liebermann-Burchard’stest)
One ml of the extract was dissolved in 10 ml ofchloroform and equal volume of concentrated sulphuricacid was added by sides of the test tube. The upperlayer turns red and sulphuric acid layer showed yellowwith green fluorescence. This indicated the presenceof steroids (7).
RESULTS AND DISCUSSION
Phytochemical investigation:
The Phytochemical screening of Ricinus communis L.showedpositive results as the tests likeAnthraquinone, Terpenoids, Flavonoids,Saponins,Tannins and steroidsofRicinuscommunis L.This dataclear that there is presence of various phytochemicalin Ricinus communis L. plant.
Quantitatives pectrophotometric analysis forphenolic content and flavonoids:
The total phenolic and flavonoids content of plantaqueous extract were determinedspectrophotometrically using the tannic acid andquercetin standard calibration curves, respectively, asper Ranjana sing et al (2015). Both standard curvesshowed linearity with R2 value 0.962 and 0.956. Thetotal phenolic and flavonoids content was found asper given table 3.2 .as antioxidant used in medicinalapplication to cure jaundice.
Table1 : Phytochemical screening of extracts of medicinal plants
S.N. Test perform Ricinus communis L. Ricinus communis L.
leaves ethanolic extract leaves aqueous extract
1 Anthraquinone + +2 Terpenoids + +3 Flavonoids + +4 Saponins + +5 Tannins + +6 Steroids + +
Journal of Innovative Prospective in Sciences Vol (I), No. 1, March 2016
15
Table (3.2): Total phenolic and flavonoids contain inRicinus communis plant
S.N. Plant name Total phenolic Total (ug/ml) flavonoids
(ug/ml)
1 Ricinus communis L. 7.232 8.324
Purification of the extracts
The TLC of ethanolic extract of Ricinuscommunis L.plant is shown in (Figure 3.c) with their RF values.From the figures it isevident that there are manycomponents that are responsible for theantioxidantactivity. Hence, further investigations are requiredtoisolate, purify and characterize those compoundswhich are responsiblefor the antioxidant activity usedin medicinal application to cure jaundice.
Fig 3. TLC purification and partition Ricinuscommunis L.plant
CONCLUSIONS
In the present investigation, Ricinus communis L.Medicinal plant species used to treat jaundice andhepatitis were reported. The uses of these plants totreat various illnesses by the communities, because ofpoor socio-economic conditions, the high cost and adifficult access to allopathic medicines. The majorityof the reported species are wild and rare. These demandan urgent attention to conserve such vital resourcesso as to optimize their use in the primary health caresystem. Now a day, conservation of traditionalknowledge is necessary related to modernization ofthe region and lack of interest in traditional patrician,in transferring it to next generation. In this context,screening for active substances and testing theiractivities against jaundice and hepatitis as aninteresting subject for the feature studies. Furtheradvanced spectroscopic studies are required for thestructural elucidation and identification of compounds.
ACKNOWLEDGEMENT
Author is thankful to UGC for providing the financialassistance for minor research project for phytochemicalstudy of medicinal plant. He also thankful to direct andindirect support to carried research work, field workand characterization and laboratory facilities of variousdepartment.
REFERENCES
Sharma A, Sharma RA, Singh H (2013) Phytochemicaland Pharmacological Profile of Abutilon IndicumL. Sweet: A Review, Int. J. Pharm. Sci. Rev. Res.,20 (1); 120-127.
Yoganarsimham SW (2000) Medicinal plants of India,Vol 2, Cyber Media, Bangalore10 -11
Md. Reyad-ul-ferdous, Mehedi Rahman, Md. KawsarMahamud, Sharmi Sultana Ayshi, Md.Didaruzzaman Sohel, (2015) Pharmacologicalsand Phytochemicals Potential ofAbutilonindicum: A Comprehensive Review, AmericanJournal of Bio Science; 3(2-1): 5-11.
Golwala D.K., Patel L.D.,Vaidya S.K., Bothara S.B., ManiM., Patel P. (2010) Anti convulsant Activity ofAbultion indicum leaf, International J. Pharmcyand Pharmaceutical Science, V-2
Javed Ahmad and Iffat Khan (2012) AntioxidantPotential of Abutilon indicum (L.) Sw. J PlantPathol Microb, 3:3
Saranya S.R., Krishna P.J, Singh R.K, Dhivya M.G andRajasekar. S. (2013) International Journal ofAdvanced Biotechnology and Research ISSN0976-2612, Vol 4, Issue 4, , pp 496-504
Sarkar, R.,Haque, A.; Ranjan, S; Sarker, M.( 2015)Phytochemical Screening, Antioxidant andAntimicrobial Effects Abutilon indicum (L.)Leaves Extracts. J Pharmacology Archives, vol.1,94-103.
Singh, Ranjana and Mendhulkar, V. D. (2015) Journalof Chemical and Pharmaceutical Research,7(6):205-211.
Naikade, S.M.and Meshram M.R. (2014) InternationalJournal of Pharmaceutical Science Invention,2319 – 6718, PP.39-41vol-3 No12.
Dhal, N. K., Panda, S. S. and Muduli S. D. (2015) AsianJournal of Plant Science and Research, 5(2): 27-33.
Maitera, O.N; Khan, M. E and T. F. James (2011) AsianJournal of Plant Sci. and Res.,1 (3):16-22
D. B. Dupare (2016) International Journal of Biolife,2320-4257 4(1):94-99.
Journal of Innovative Prospective in Sciences Vol (I), No. 1, March 2016
16
INTRODUCTION
The use of Ir (III) and Ru (III) in trace amounts as anefficient catalysts in the homogeneous reactionsinvolving Ce (IV) as an oxidant has been reported1,2
several kinetic investigations on redox reactionsinvolving Ce (IV) and different organic and inorganiccompounds including different alcohols have beencarried out3-8.
Kinetic study on the oxidation of ethanol by Ce (IV) inperchloric acid media have been reported by glycolsby Ce (IV) and oxalic acid9, malonic acid10, aliphaticketones and aldehydes11, isobutylic acid and 3-bromopropanoic acid12,13 have been studied. Variousinvestigations are also made on Ce(IV) aqueous H2SO4,where it forms strong sulphato complex14,16. Hence wereported here kinetics and mechanism of Iridium (III)catalyzed oxidation of alcohol and glycol by Ce(IV) inaqueous acidic medium.
The kinetic study shows that oxidation of Alcohol andGlycol by Ce (IV) in aqueous sulphuric acid media isslow but gets catalysed by Ir (III) at trace concentration(10-5 mol dm-3). It prompted us to explore the kineticbehaviour of the title reaction in detail on metal ioncatalysis in Ce (IV) oxidation.
MATERIALS AND METHODSCerium (IV) stock solution was obtained by dissolvingCe (IV) (Himedia A.R.) in 1.0 mol dm-3 sulphuric acid.The stock solutions were kept at room temperature formore than 49 hours to attain equilibrium and wasstandardised with ammonium iron (II) sulphate solutionusing ferroin as an indicator Glycols were of AcrossOrganics grade. Doubly distilled water was used
throughout the experiment. Ir (III) solution was preparedin 1 mol dm-3 H2SO4 solution.
Procedure and Kinetic Measurements:
Kinetic measurements were carried out on a Elico (CL157 Colorimeter). The progress of the reaction wasmonitored by measuring absorbance of at 350 nm. Thekinetic study was carried out under pseudo-first orderconditions using [Glycols] >> [Ce (IV)]. To a thermallyequilibrated solution containing Ce (IV), H2SO4, Ir (III)and glycol solutions were added to form the reactionmixture and progress of the reaction was monitored atregular time intervals by observing variation of opticaldensity with time. H+ ion concentration was maintainedby the addition of required amounts of H2SO4. Thepseudo first order rate constants were computed bythe graphical method and the experimental values werereproducible within +3%.
RESULTS AND DISCUSSIONUnder varying concentration of [Alcohols], [Glycols]and [Ce(IV)] kinetics of Ir (III) catalyzed oxidation ofAlcohol and Glycol by Ce (IV) in aqueous sulphuricacid media was investigated at several concentrationsof the reactants indicating first order kinetics withalcohol and first order with respect to glycol. Theresults are shown in Table 1.
The rates of the reactions were studied under varying[Ce (IV)]. Plots of log [O.D.] versus time were linearindicating a first order dependence in [Ce(IV)] from thepseudo-first order rate constants were computed.Under varying [Ce (IV)]. Plots of log [O.D.] versus timewere indicating first order dependence in [Ce(IV)] withrespect to alcohol and zero order with respect to glycol.
A NEW KINETICS AND MECHANISM STUDY OF IRIDIUM (III) CATALYSEDOXIDATION OF ALCOHOL BY CERIUM (IV) IN AQUEOUS ACIDIC MEDIA
N. K. Halikar*1, G. P. Sadawarte2 and G. S. Khansole3
Department of Chemistry, Dr. Shantilal Dhanji Devesey College Wada, Dist. Palghar (M.S.) India.Department of Chemistry, BP Arts SMA Science & KKC Commerce College, Chalisgaon, Dist- Jalgaon (M.S.)
Department of Chemistry, D.A.B.N. Arts and Science College, Chikhali, Dist. Sangli (M.S.) India.
ABSTRACT
Alcohol has different applications in chemical research and is used extensively at various phases during the drugdevelopment process. Alcohol is used in prediction of drug solubility from structure as solubility of drug is animportant factor affecting its bioavailability. In view of such importance of different alcohols, in the present study theKinetics and mechanism of iridium (III) catalyst used oxidation of alcohol by cerium (IV) in aqueous sulphuric acidmedium have been investigated at different temperatures [Alcohol] >> Ce (IV) >> (IR) (10–5 mol/dm3) in 1 mol dm–3 sulphuric acid medium. The reactions are found to be the zero order with respect to Ce (IV) ion. From the [HSO4]dependence, Ce (IV) has been found kinetically active the proposed mechanism involves a pre-equilibrium interactionbetween the catalyst and substrate. The process is acid catalyzed. Activation parameters have been determined toinvestigate the effect of temperature; and probable rate law and mechanism has been proposed.
Key word: Alcohol = 5-methyl 2-pentanol.
Journal of Innovative Prospective in Sciences Vol (I), No. 1, March 2016
17
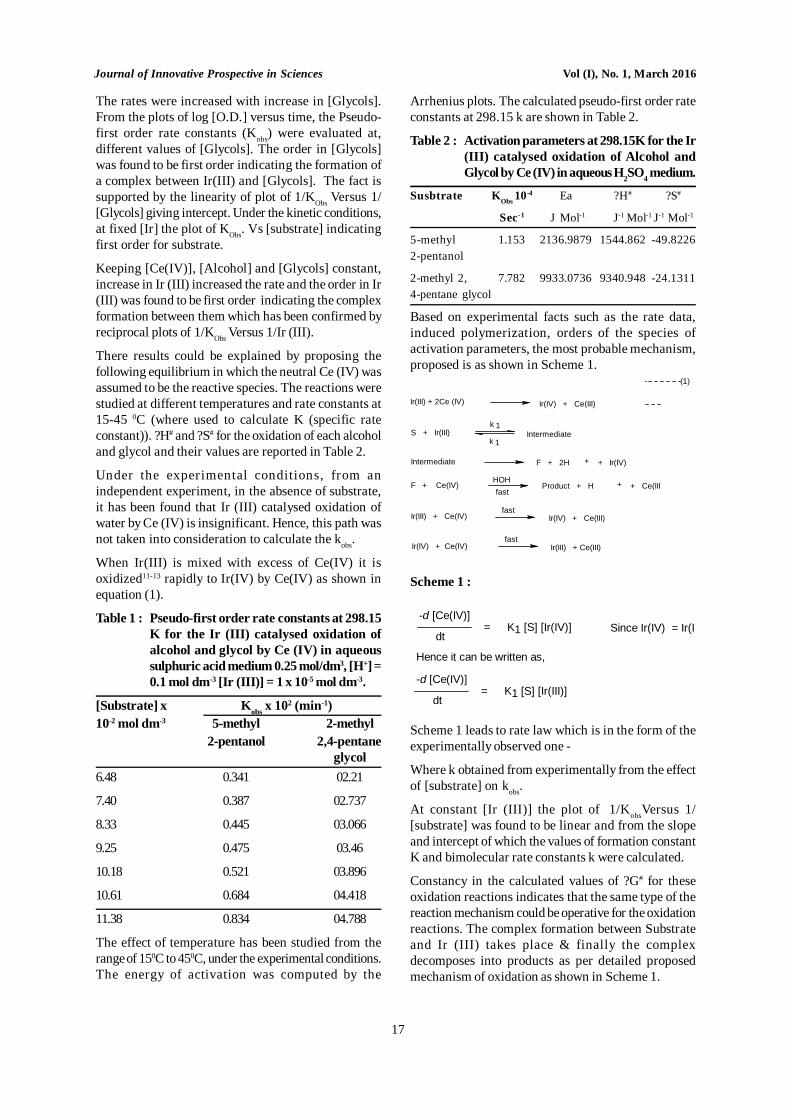
The rates were increased with increase in [Glycols].From the plots of log [O.D.] versus time, the Pseudo-first order rate constants (Kobs) were evaluated at,different values of [Glycols]. The order in [Glycols]was found to be first order indicating the formation ofa complex between Ir(III) and [Glycols]. The fact issupported by the linearity of plot of 1/KObs Versus 1/[Glycols] giving intercept. Under the kinetic conditions,at fixed [Ir] the plot of KObs. Vs [substrate] indicatingfirst order for substrate.
Keeping [Ce(IV)], [Alcohol] and [Glycols] constant,increase in Ir (III) increased the rate and the order in Ir(III) was found to be first order indicating the complexformation between them which has been confirmed byreciprocal plots of 1/KObs Versus 1/Ir (III).
There results could be explained by proposing thefollowing equilibrium in which the neutral Ce (IV) wasassumed to be the reactive species. The reactions werestudied at different temperatures and rate constants at15-45 0C (where used to calculate K (specific rateconstant)). ?H# and ?S# for the oxidation of each alcoholand glycol and their values are reported in Table 2.
Under the experimental conditions, from anindependent experiment, in the absence of substrate,it has been found that Ir (III) catalysed oxidation ofwater by Ce (IV) is insignificant. Hence, this path wasnot taken into consideration to calculate the kobs.
When Ir(III) is mixed with excess of Ce(IV) it isoxidized11-13 rapidly to Ir(IV) by Ce(IV) as shown inequation (1).
Table 1 : Pseudo-first order rate constants at 298.15K for the Ir (III) catalysed oxidation ofalcohol and glycol by Ce (IV) in aqueoussulphuric acid medium 0.25 mol/dm3, [H+] =0.1 mol dm-3 [Ir (III)] = 1 x 10⁻⁵ mol dm-3.
[Substrate] x Kobs x 102 (min-1)10-2 mol dm-3 5-methyl 2-methyl
2-pentanol 2,4-pentaneglycol
6.48 0.341 02.21
7.40 0.387 02.737
8.33 0.445 03.066
9.25 0.475 03.46
10.18 0.521 03.896
10.61 0.684 04.418
11.38 0.834 04.788
The effect of temperature has been studied from therange of 150C to 450C, under the experimental conditions.The energy of activation was computed by the
Arrhenius plots. The calculated pseudo-first order rateconstants at 298.15 k are shown in Table 2.
Table 2 : Activation parameters at 298.15K for the Ir(III) catalysed oxidation of Alcohol andGlycol by Ce (IV) in aqueous H2SO4 medium.
Susbtrate KObs 10-4 Ea ?H# ?S#
Sec-1 J Mol-1 J-1 Mol-1 J-1 Mol-1
5-methyl 1.153 2136.9879 1544.862 -49.82262-pentanol
2-methyl 2, 7.782 9933.0736 9340.948 -24.13114-pentane glycol
Based on experimental facts such as the rate data,induced polymerization, orders of the species ofactivation parameters, the most probable mechanism,proposed is as shown in Scheme 1.
Ir(III) + 2Ce (IV) Ir(IV) + Ce(III)
S + Ir(III) Intermediatek 1
k 1
Intermediate F + 2H + + Ir(IV)
F + Ce(IV) Product + H + + Ce(III)HOHfast
Ir(III) + Ce(IV)fast
Ir(IV) + Ce(III)
Ir(IV) + Ce(IV)fast
Ir(III) + Ce(III)
Scheme 1 :
-d [Ce(IV)]
dt= K1 [S] [Ir(IV)] Since Ir(IV) = Ir(III)
Hence it can be written as,
K1 [S] [Ir(III)]=dt
-d [Ce(IV)]
Scheme 1 leads to rate law which is in the form of theexperimentally observed one -
Where k obtained from experimentally from the effectof [substrate] on kobs.
At constant [Ir (III)] the plot of 1/KobsVersus 1/[substrate] was found to be linear and from the slopeand intercept of which the values of formation constantK and bimolecular rate constants k were calculated.
Constancy in the calculated values of ?G# for theseoxidation reactions indicates that the same type of thereaction mechanism could be operative for the oxidationreactions. The complex formation between Substrateand Ir (III) takes place & finally the complexdecomposes into products as per detailed proposedmechanism of oxidation as shown in Scheme 1.
(1)
Journal of Innovative Prospective in Sciences Vol (I), No. 1, March 2016
18
REFERENCES
Bharat Singh, Meera Singh & Deepmala Kesarwani,(2002) Indian J. Chem., Vol 41A, , 547-549.
Benrath A & Ruland K., Z. Anorg (1920) Chem., 114,267.
Willard H. H. & Young P., (1928) J. Am. Chem. Soc., 50,1322.
Willard H. H. & Young P., (1930) J. Am. Chem. Soc., 52,132.
Yadav R. L. & Bhagwat B. V.,(1964) J. Indian Chem.Soc., 41, 389.
Shorter J & Hinshelwood C. N., (1950) J. Chem. Soc.,3277.
Shorter J., (1950) J. Chem. Soc., 3425.
Singh B., Richards M., Shukla R. K. & Krishna B., (1976)Indian J. Chem. Soc., LIII, 751.
Singh B., Saxena P. K., Shukla R. K., Krishna B., (1977)J. Indian Chem. Soc., LIV, 378.
Hardwick J & Hobbertson N.,(1951) Can. J. Chem., 29,828.
Radhakrishnamurti P. S. & Pati S. N., (1980) Indina J.Chem., 19A, 980.
Yatsimirski K. B., (1974) J. Indian Chem. Soc., 21, 32.
Awasthi A. K. & Upadhyaya S. K., (1985) TransitionMetal Chem., 10, 379.
Martin F. S. , (1954) J Chem Soc., 2564.
Razovski G. I., Roskute Z. & Prokopehie A. Y., (1979)Khim Anal zu, 24, 512, Chem. Abstr, 81(1974), 894.
Bharat Singh, Meera Singh and Deepmali Kesarwani,(2002) Indian J. Chem. Vol-41A, 547.
Journal of Innovative Prospective in Sciences Vol (I), No. 1, March 2016
19
INTRODUCTION
Pusad tahsil is situated on the bank of river Pus and inthe mountainous hilly region in Yavatmal district ofMaharashtra state. The river Pus flows in the cuttinghills of ranges of Satpuda. Although officially a Talukaplace, Pusad is comparable to the size of a District interms of size and revenue. It is located at 19°542 N77°352 Eÿþ / ÿþ19.9°N 77.58°Eÿþ / 19.9; 77.58. It has anaverage elevation of 315 metres (1033 feet). It receivesan average rainfall of about 471mm per year. Climate ofPusad is very high with the temperature going as highas 49 degree Celsius during summers and as low as 5degree during the time of winters. The forest is deepwith teak vegetation with different types of shrubs,tress and climbers. The region is effective for medicinalplants growth and development. Most of the localitypresent in Pusad and around area is of tribal peopleswhich is depend upon the forest resources likefirewood, medicinal plants, etc.
Traditionally from prehistoric times, the use of differentparts of medicinal plants was practiced to cure specificailments evidently due to presence of some bioactivecompounds like alkaloids, flavonoids, essential oil,glycosides, tannins, terpenoids, steroids and others.Many of the drugs, currently in use have been isolatedfrom natural sources based on information aboutcurative agent in folklore medicine (Sameera and
SURVEY OF MEDICINAL PANTS AND THEIR USES FROM PUSAD ANDADJOINING HILLY REGION
P. M. KahateDepartment of Botany, Phulsing Naik Mahavidyalaya, Pusad, Dist. Yavatmal
(Corresponding author [email protected] )
ABSTRACT
Medicinal plants are the basis of traditional medication system of India and other parts of the world. The presentinvestigational survey was carried out to report traditional uses of medicinal plants for the treatment of variousailments in different regions of Pusad and its adjoining forest areas. In this survey 20 plants species like AcaciaArabica, Aloe vera, Asparagus raecemosus, Couroupita guianensis, Lantana camara, Tamarindus indica, Ziziphusmauritiana etc. belongs to 15 families are reported from which some are cultivated and some are widely occur in city,adjoining hilly areas, and waste lands; used by local peoples traditionally in their routine life. Thus the presentinvestigation provides an idea for the discovery of new drugs.
Keywords: Pusad, medicinal plants, tribals, traditional knowledge
Mandakini, 2015). About 47000 plant species are foundin different parts of India, of them 17,000 floweringplants, 6850 species are endemic to India and 8000 areethnobotanically important (Wildlife Institute of India,2007). Singh (1999) reported that out of 250,000 to300,000 total plants of the world, India harbors’ about45,000 plants. Out of 20,000 medicinal plants of theworld, India contributes about 3000-5000 plants.Biodiversity is one of the key components of our basiclife support system. The traditional herbal medicinesare still practiced in large part of our country in tribaland rural areas. The present attempt is to survey ofdifferent regions of Pusad and its surrounding area formedicinal plants and contribution to the knowledge oftraditional uses of medicinal plants of this region.
MATERIALS AND METHODS
For the study of different types of plants author visiteddifferent localities of Pusad and adjoining hilly region.During visits various types of plant were found viz.,trees, shrubs, herbs, grasses, ornamentals & medicinaland aromatic plants. For collection of these plants theauthor was plan to visit different localities at differenttimes. The collected plants at the time of flowering wereidentified with the help of local names and Botanicalflora (Ugemuge, 1986). The medicinal uses of plantsand plant parts were recorded from local peoples andthe literature.
OBSERVATIONS
S. N. Botanical name, Common name, Family Medicinal uses1 Acacia arabica Babul - Mimosaceae The stem bark is astringent, demulcent used in diarrhoea,
dysentery, diabetes as astringent, antihelmentic, in skin disease,cough, bleeding piles, and gonorrhea. The tender twigs are usedas toothbrushes while the thorns are used for joints pains.
Journal of Innovative Prospective in Sciences Vol (I), No. 1, March 2016
20
2. Adhatoda vasica Adulsa - Acanthaceae The plants parts are useful in the treatment of diseases likenervous disorder, diarrhoea, dysentery, tumours, inflammations,tuberculosis and epilepsy.
3. Aloe vera Korphad – Liliaceae It has been used to treat burns, genital herpes, dandruff,osteoarthritis, inflammatory bowel disease, asthma and epilepsy.
4. Asparagus raecemosus Shatawari – This plant is recommended in Ayurvedic tests for prevention Liliaceae and treatment of gastric ulcers, inflammation, nervous disorder,
liver diseases dyspepsia and as a galactogogue.5. Bougainvillea glabra Bougainvillea – It is used in variety of disorders like diarrhoea, reduce stomach
Nyctaginaceae acidity, cough and sore throught; decoction of dried flowers forblood vessels and leucorrohea and decoction of the stem inhepatitis.
6. Butea monosperma Palas - Fabaceae Flowers are astringent to bowel, in cure “Kapha”, leprosy,strangury, gout, skin diseases, thirst; flower juice is useful ineye diseases. Flower is bitter, aphrodisiac, expectorant, tonic,diuretic, good in biliousness, inflammation and gonorrhoea.
7. Carica papaya Papai - Caricaceae It is used in the treatment of a numerous diseases like warts,corns, eczema, cutaneous tubercles, glandular tumors, bloodpressure, dyspepsia, constipation, amenorrhoea, generaldebility, expel worms and stimulate reproductive organs.
8. Bombax ceiba Katesavri - Malvaceae The plant has been used extensively for treatment of somediseases like anti-inflammatory, anti-HIV, hepato-protective,hypotensive, antiangiogenic, antioxidant activities.
9. Couroupita guianensis Canon ball tree - It is used in the treatment of skin infection, odontalgia, Lecythidaceae stomachache, enteral gas formation, tumors, pains, piles, scabies,
hemorrhage, dysentery, scorpion poison, etc.10. Cyperus rotundus Nagarmotha - There are many properties are present like anti-inflammatory,
Cyperaceae antipyretic, anti-diabetic, anti-diarrhoeal, antimicrobial and curegastrointestinal diseases. This plant is used for treating fevers,digestive system disorders, wounds, pain reduction; for musclerelaxation.
11. Cassia tora Tarota - Caesalpinaceae It is used to treat a variety of medical complications likebronchitis, ulcer, hypertension, liver damage, fungal infection,diabetes, ringworm, skin diseases.
12. Ficus benghalensis Wad – Moraceae The barks, leaves, fruits and latex are considered to be veryeffective in various treatments, such as diabetes, skin diseases,ulcers, dysentry, diarrohoea, stomachache, piles, etc.
13. Ficus religiosa Pimpal - Moraceae It is beneficial in the treatment of diseases like diabetes, skininfections, respiratory disorders, central nervous systemdisorder, gastric problems, cough, sexual disorder, etc
14. Hibiscus rosa-sinensis Jaswund - The plant is used in epilepsy, leprosy, bronchial catarrh, diabetes,Malvaceae diarrhea, blackening hair, remove burning of the body, urinary
discharges, seminal weakness, piles, uterine and vaginaldischarges.
15. Lantana camara Ghaneri - Verbenaceae It is used widely to cure a varieties of diseases like cough,incessant high fever, malaria, cervical lymph node tuberculosis,dermatitis, eczema, rheumatism, wounds, tetanus, toothaches,ulcers and swellings.
16. Ocimum sanctum Tulus – Lamiaceae It reduces stress; enhances stamina and endurance; boosts theimmune system; reduces inflammation; protects against
Journal of Innovative Prospective in Sciences Vol (I), No. 1, March 2016
21
radiation damage; lessens aging factors; supports the heart,lungs and liver.
17. Psidium guajava Guava - Myrtaceae This plant is used for treating diarrhea, cancer dysmenorrhoea,bleeding gums, scurvy; hypertension and malaria, etc.
18. Tamarindus indica Chinch - It is for the treatment of cold, fever, stomach disorder, diarrhea,Caesalpinaceae jaundice, yellow fever, blood tonic, gastrointestinal, urinary tract
and wound infections, typhoid fever and skin cleanser.19. Tridax procumbens Kambarmodi - The plant promising wound healing activity, antidiabetic,
Asteraceae hypotensive effect, antimicrobial, insect repellent activity, anti-inflammatory and antioxidant, again use for the treatment ofbronchial catarrh, dysentery, diarrhea.
20. Ziziphus mauritiana Bor - Rhamnaceae It is used for the treatment of various diseases such as digestivedisorders, urinary troubles, diabetes, skin infections, diarrhea,fever, bronchitis, liver complaints, anaemia, etc.
CONCLUSIONS
The plants collected and reported from Pusad, DistrictYavatmal in the present study are used by the localpeoples and tribal in their routine treatment practices.All the traditional drugs obtained from differentmedicinal plants studied in present attempt are veryeffective, cheap and available around agricultural fieldsand in wastelands and surrounded hilly areas. So thetribals are using these plants as alternative to allopathicmedicines. Further research on these plants onscientific lines may help in developing effective drugsfor human health care.
REFERENCES
Anonymous. 2007. Report of Wildlife Institute ofIndia. Dehra Dun. Ministry of Environment andforest, New Delhi.
Apparanatham T., Chelladurai V. 1986. Glimpses of folkmedicines of Dharmapuri forest division, TamilNadu. Ancient Sci Life, 5: 182-185.
Aravind G, Debjit Bhowmik, Duraivel S, Harish G. 2913.Traditional and Medicinal Uses of Carica papaya.Journal of Medicinal Plants Studies, 1 (1): 7-15.
Bashir A, Bushra Sultana, Akhtar FH, Munir A, AmjadM, Qadeer ul Hassan. 2012. Investigation on theAntioxidant Activity of Dheela Grass (Cyperusrotundus). African Journal of Basic & AppliedSciences, 4(1): 01-06.
Brown D J, Dattner AM. 1998. Medical journal articleon herbs for common skin conditions. Arch
Dermatol., 134(11): 1401-1404.
Choudhary M, Gulia Y, Nitesh. 2011. Cassia tora: Itschemistry, medicinal uses and pharmacology.Pharmacolo gyonline.3: 78-96.
Doughari JH. 2006. Antimicrobial Activity ofTamarindus indica Linn. Tropical Journal ofPharmaceutical Research, 5 (2): 597-603.
Elumalai A, M. Chinna Eswariah, VidhyulathaChowdary CH, Kumar R, Anusha M, Naresh K.2012. Screening of thrombolytic activity ofBougainvillea glabra leaves extract by in-Vitro.Asian J. Res. Pharm. Sci. 2(4): 134-136.
Gautam S, Meshram A, Bhagyawant SS, Srivastava N.2014. Ficus religiosa– Potential role inpharmaceuticals. Int. J. Pharma Sci Res. 5(5):1616-1623.
Ghisalberti E L. 2000. Lantana camara L.(Verbenaceae). Fitoterapia, 71(5): 467-486.
Giri S N, Biswas A K, Saha B P, Pal S P. 1998. Studies ofthe anti-inflammatory action of Bougainvilleaglabra leaves. Ind J Pharm Sci. 50: 42-49.
Goyal M, Nagori B P, Sasmal D. 2012. Review onethnomedicinal uses, pharmacological activityand phytochemical constituents of Ziziphusmauritiana (Z. jujuba Lam., non Mill). SpatulaDD, 2: 107-116.
Joseph B, Raj S J. 2010. Phytopharmacological andphytochemical properties of three Ficus species– An overview. International Journal of Pharma
Journal of Innovative Prospective in Sciences Vol (I), No. 1, March 2016
22
and Bio Sciences, 1(4): 246-253.
Kayastha BL. 2014. Queen of herbs tulsi (ocimumsanctum) removes impurities from water andplays disinfectant role. Journal of MedicinalPlants Studies, 2(2): 1- 8.
Kirtikar KR, Basu BD. 1984. Indian medicinal plant partI, II and III. Bishen Singh Mahendra Pal SinghPublication, Dehra Dun.
Mishra, T. and Bhatia, A. 2014. Antiplasmodial effectsof the aqueous ethanolic seed extract of Ziziphusmauritiana against Plasmodium berghei in Swissalbino mice. International Journal ofPharmacological Research, 4 (3): 111-116.
Nisha Kumari, Shetty G, Chaturvedi A. 2013. Psidiumguajava A Fruit or Medicine – An Overview. ThePharma Innovation – Journal 2(8): 63-67.
Qadir MI.2009. Medicinal and CosmetologicalImportance of Aloe vera. International Journal ofNatural Therapy, 2: 21-26.
Raja Sundararajan A, Koduru R. 2014. Comparativeprofile of Couroupita guianensis – Traditionaluses, pharmacological activites, andphytoconstituents. Pharmacophore, 5(1): 147-159.
Saleem R, Ahmad SI, Ahmad M, Faizi Z, Rehman S, AliM, Faizi S. 2003. Hypotensive activity andtoxicology of constituents from Bombax ceibastem bark. Biol Pharm Bull., 26:41-46.
Sameera NS, Mandakini BP. 2015. Investigations intothe antibacterial activity of Ziziphus mauritianaLam. and Ziziphus xylopyra (Retz.) Willd.International Food Research Journal 22(2):849-853.
Sharma AK, Deshwal N. 2011. An Overview: OnPhytochemical and Pharmacological Studies ofButea monosperma. International Journal ofPharmTech Research, 3(2): 864-871.
Sharma PC, Yelne MB, Denis TJ. 2000. Database onmedicinal plants used in Ayurveda. Vol. 1,CCRAS, New Delhi.
Siddiqui MB, Husain W. 1993. Traditional treatment ofgonorrhoea through herbal drug in province ofCentral Uttar Pradesh, India. Fitoterpia, 64: 399-403.
Singh HB. 1999. Alternative source for someconventional drug plants of India. Journal ofEconomic and Taxonomic Botany 23(1): 109-114.
Singh N, Pandey BR, Verma P, Bhalla M, Gilka M. 2012.Phyto-pharmacotherapeutics of Cyperusrotundus Linn. (Motha): An Overview. IndianJournal of Natural Products and Resources, 3(4):467-476.
Sinha S N, Biswas M. 2011. Effect of extracts fromAsparagus racemosus Willd. Root. againstpathogenic bacteria. International Journal ofApplied Biology and Pharmaceutical Technology,2(3): 312-314.
Sujit S. Kale and Amol S. Deshmukh. 2014. Tridaxprocumbens: A medicinal gift of nature. AsianJournal of Research in Biological andPharmaceutical Sciences. 2(4): 159 - 162.
Ugemuge NR. 1986. Flora of Nagpur District,Maharashtra, India. Shree Prakashan, Nagpur.
Journal of Innovative Prospective in Sciences Vol (I), No. 1, March 2016
23
INTRODUCTION
Gossypium hirsutum L. is an important fiber yieldingplant cultivated in many states of India. It is one of themajor cash crops cultivated by the farmers of Vidarbharegion of Maharashtra. G. hirsutum is annual orperennial herb with hairy stem, it is commonly knownas “Cotton”. It is important to study the floweringphenology for higher yield. It is one of the major cashcrops of Vidharbha region of Maharashtra. Most ofthe works on flowering phenology of Gossypium werestudied in European countries and other parts of Indiabut for Vidharbha region very less work was done. Incrop plants, flowers are very diverse in size, shape andcolour. Functionally, a flower is a compound organ inwhich all its structural complexities are presumableadapted to sexual reproduction. Therefore, flowerstructure, phenology and the evolutionary ecology ofpollination partnership are interwoven, so much so thatsystematists rely on floral structure for identificationand phylogentic studies (Kevan, 1984).
To know the possible details and events inreproduction and pollination of crop plant pollinationecology provides the platform. Pollination ecology isa fast growing field which also deals with the interrelationship between plants and insects in environmentin addition to floral biology.
Flowering phenology refers to duration of biologicalevents or seasonal timing of flowering. It is ofsignificance for both ecological and evolutionaryreason. It provides a mechanism for reproductiveisolation or speciation over evolutionary time (Schmitt,1983). Flowering and anthesis of most of the plantssynchronizes with the availability of the pollinators(Sihag, 1993). On the other hand daily flowering has
been regarded as an adaptation for regular attractionof pollinators (Baker, 1961 and Faegri and Pijl, 1979).Therefore, looking into an importance of these aspectsit felt necessary to study the flowering phenologyand flower dynamics of economically important crop.
MATERIALS AND METHODS
The present investigations were being carried outduring the period 2005-2007 at Amravati (20054' to 20057'North Latitude and 77043' to 77048' East Longitude)situated in Amravati district of Maharashtra State. Theobservations were taken from different cultivated fieldsaround Amravati city. Three different study sites wereselected for study. The plant species were visiteddaily or on alternate day for collection of bloomingphonological data. The timing of onset, progress,termination and blooming were observed. Theopening of flower and anthesis were observed withhelp of hand lens (10 x) as per method followed byTidke (2005).
Simple method of Nair and Rastogi (1963) was adoptedto know the pollen production per anther/ flower. Pollenviability rates were observed with tetrazolium (TTC)test method (Loken, 1942) to determine the pollenviability in vitro. By dividing the number of pollengrains produced per flower by the number of ovules inthe flower the pollen: ovule ratio of plants underinvestigation was obtained (Cruden, 1977).
RESULTS AND DISCUSSION
The present research work was initiated with the aimto know the role flowering Phenology in Gossyipumcrop cultivated in Vidarbha and thus to enhance theyield of crops. During the present investigation it isobserved that the first flower opened on 12th
STUDIES ON FLOWERING PHENOLOGY IN GOSSYPIUM HIRSUTUM L.
P. J. KALE and P. P. ULHEDepartment of Botany, Narayanrao Kale Smruti Model College, Karanja Gh. 442203 (M.S.)
(Corresponding author email- [email protected])
ABSTRACT
The present investigations are being carried out during the three successive years at Amravati. In Gossypium hirsutumL. the investigation was done on different aspect of flowering phenology and floral biology. The plant species werevisited daily or on alternate day, for collection of blooming phenology. While carrying out present study it observedthat the first flower opened on 12th September to 28th September. Whereas timing of anthesis and anther dehiscenceobserved 08.30 hrs. The flower opens at 09.00 hrs. and the anther dehisces was noted at 09.30 hrs. The pollenproduction was found to be 13774.22 + 1223.67 to 15299.69 + 1383.88. The pollen: ovule ratio was found to be550.96 to 1235.49. The pollen viability was measured to be 93.58 to 96.54 %.
Keywords- Amravati, Gossypium hirsutum L., anthesis, Pollen.
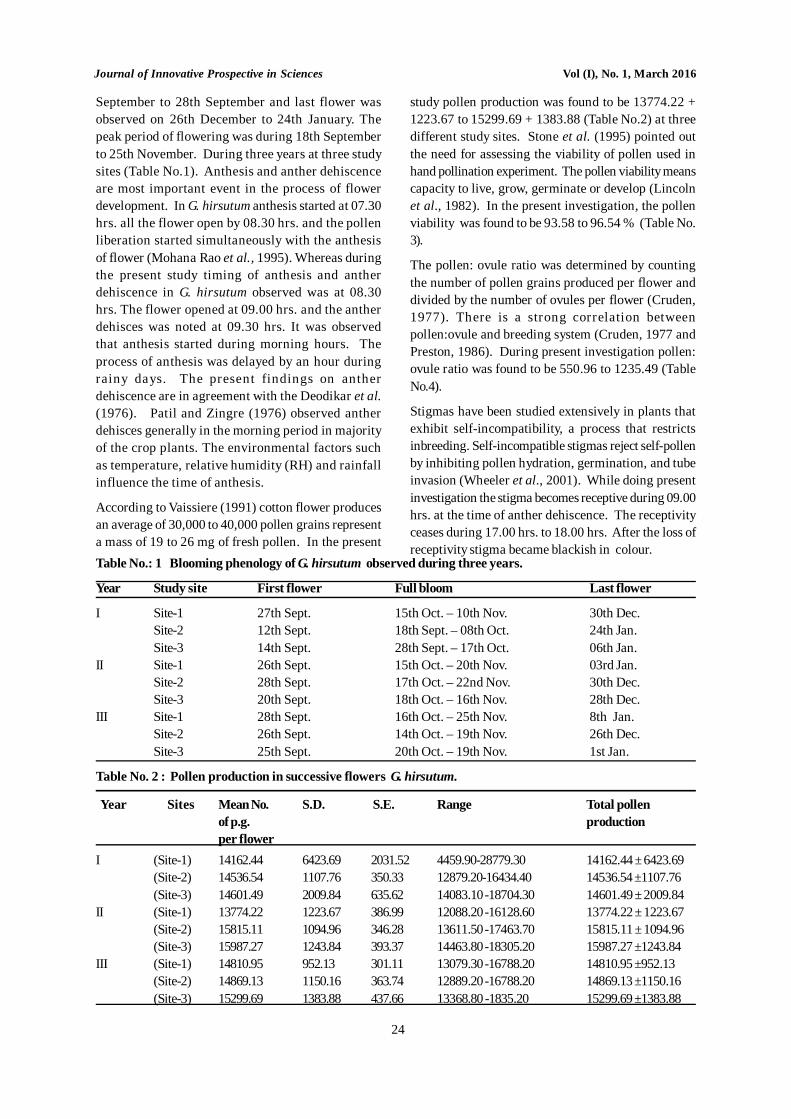
Journal of Innovative Prospective in Sciences Vol (I), No. 1, March 2016
24
September to 28th September and last flower wasobserved on 26th December to 24th January. Thepeak period of flowering was during 18th Septemberto 25th November. During three years at three studysites (Table No.1). Anthesis and anther dehiscenceare most important event in the process of flowerdevelopment. In G. hirsutum anthesis started at 07.30hrs. all the flower open by 08.30 hrs. and the pollenliberation started simultaneously with the anthesisof flower (Mohana Rao et al., 1995). Whereas duringthe present study timing of anthesis and antherdehiscence in G. hirsutum observed was at 08.30hrs. The flower opened at 09.00 hrs. and the antherdehisces was noted at 09.30 hrs. It was observedthat anthesis started during morning hours. Theprocess of anthesis was delayed by an hour duringrainy days. The present findings on antherdehiscence are in agreement with the Deodikar et al.(1976). Patil and Zingre (1976) observed antherdehisces generally in the morning period in majorityof the crop plants. The environmental factors suchas temperature, relative humidity (RH) and rainfallinfluence the time of anthesis.
According to Vaissiere (1991) cotton flower producesan average of 30,000 to 40,000 pollen grains representa mass of 19 to 26 mg of fresh pollen. In the present
study pollen production was found to be 13774.22 +1223.67 to 15299.69 + 1383.88 (Table No.2) at threedifferent study sites. Stone et al. (1995) pointed outthe need for assessing the viability of pollen used inhand pollination experiment. The pollen viability meanscapacity to live, grow, germinate or develop (Lincolnet al., 1982). In the present investigation, the pollenviability was found to be 93.58 to 96.54 % (Table No.3).
The pollen: ovule ratio was determined by countingthe number of pollen grains produced per flower anddivided by the number of ovules per flower (Cruden,1977). There is a strong correlation betweenpollen:ovule and breeding system (Cruden, 1977 andPreston, 1986). During present investigation pollen:ovule ratio was found to be 550.96 to 1235.49 (TableNo.4).
Stigmas have been studied extensively in plants thatexhibit self-incompatibility, a process that restrictsinbreeding. Self-incompatible stigmas reject self-pollenby inhibiting pollen hydration, germination, and tubeinvasion (Wheeler et al., 2001). While doing presentinvestigation the stigma becomes receptive during 09.00hrs. at the time of anther dehiscence. The receptivityceases during 17.00 hrs. to 18.00 hrs. After the loss ofreceptivity stigma became blackish in colour.
Table No.: 1 Blooming phenology of G. hirsutum observed during three years.
Year Study site First flower Full bloom Last flower
I Site-1 27th Sept. 15th Oct. – 10th Nov. 30th Dec.Site-2 12th Sept. 18th Sept. – 08th Oct. 24th Jan.Site-3 14th Sept. 28th Sept. – 17th Oct. 06th Jan.
II Site-1 26th Sept. 15th Oct. – 20th Nov. 03rd Jan.Site-2 28th Sept. 17th Oct. – 22nd Nov. 30th Dec.Site-3 20th Sept. 18th Oct. – 16th Nov. 28th Dec.
III Site-1 28th Sept. 16th Oct. – 25th Nov. 8th Jan.Site-2 26th Sept. 14th Oct. – 19th Nov. 26th Dec.Site-3 25th Sept. 20th Oct. – 19th Nov. 1st Jan.
Table No. 2 : Pollen production in successive flowers G. hirsutum.
Year Sites Mean No. S.D. S.E. Range Total pollenof p.g. productionper flower
I (Site-1) 14162.44 6423.69 2031.52 4459.90-28779.30 14162.44 ± 6423.69(Site-2) 14536.54 1107.76 350.33 12879.20-16434.40 14536.54 ±1107.76(Site-3) 14601.49 2009.84 635.62 14083.10 -18704.30 14601.49 ± 2009.84
II (Site-1) 13774.22 1223.67 386.99 12088.20 -16128.60 13774.22 ± 1223.67(Site-2) 15815.11 1094.96 346.28 13611.50 -17463.70 15815.11 ± 1094.96(Site-3) 15987.27 1243.84 393.37 14463.80 -18305.20 15987.27 ±1243.84
III (Site-1) 14810.95 952.13 301.11 13079.30 -16788.20 14810.95 ±952.13(Site-2) 14869.13 1150.16 363.74 12889.20 -16788.20 14869.13 ±1150.16(Site-3) 15299.69 1383.88 437.66 13368.80 -1835.20 15299.69 ±1383.88
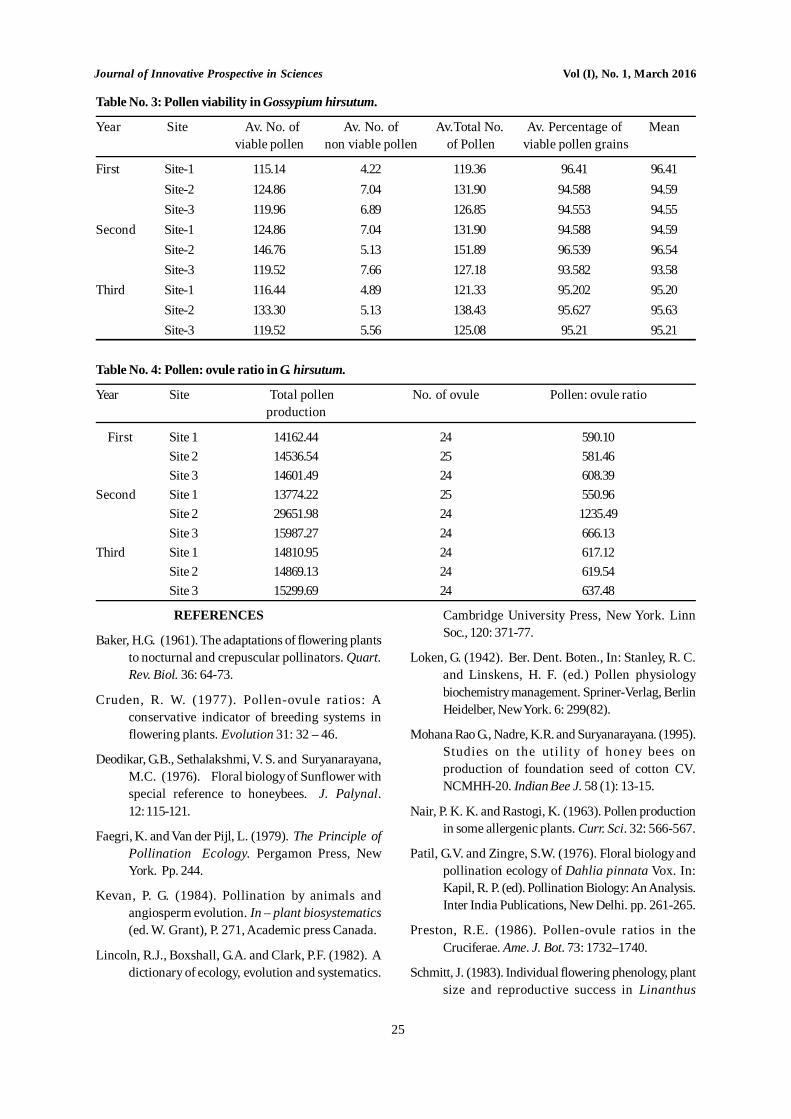
Journal of Innovative Prospective in Sciences Vol (I), No. 1, March 2016
25
Table No. 3: Pollen viability in Gossypium hirsutum.
Year Site Av. No. of Av. No. of Av.Total No. Av. Percentage of Meanviable pollen non viable pollen of Pollen viable pollen grains
First Site-1 115.14 4.22 119.36 96.41 96.41Site-2 124.86 7.04 131.90 94.588 94.59Site-3 119.96 6.89 126.85 94.553 94.55
Second Site-1 124.86 7.04 131.90 94.588 94.59Site-2 146.76 5.13 151.89 96.539 96.54Site-3 119.52 7.66 127.18 93.582 93.58
Third Site-1 116.44 4.89 121.33 95.202 95.20Site-2 133.30 5.13 138.43 95.627 95.63Site-3 119.52 5.56 125.08 95.21 95.21
Table No. 4: Pollen: ovule ratio in G. hirsutum.
Year Site Total pollen No. of ovule Pollen: ovule ratioproduction
First Site 1 14162.44 24 590.10Site 2 14536.54 25 581.46Site 3 14601.49 24 608.39
Second Site 1 13774.22 25 550.96Site 2 29651.98 24 1235.49Site 3 15987.27 24 666.13
Third Site 1 14810.95 24 617.12Site 2 14869.13 24 619.54Site 3 15299.69 24 637.48
REFERENCES
Baker, H.G. (1961). The adaptations of flowering plantsto nocturnal and crepuscular pollinators. Quart.Rev. Biol. 36: 64-73.
Cruden, R. W. (1977). Pollen-ovule ratios: Aconservative indicator of breeding systems inflowering plants. Evolution 31: 32 – 46.
Deodikar, G.B., Sethalakshmi, V. S. and Suryanarayana,M.C. (1976). Floral biology of Sunflower withspecial reference to honeybees. J. Palynal.12: 115-121.
Faegri, K. and Van der Pijl, L. (1979). The Principle ofPollination Ecology. Pergamon Press, NewYork. Pp. 244.
Kevan, P. G. (1984). Pollination by animals andangiosperm evolution. In – plant biosystematics(ed. W. Grant), P. 271, Academic press Canada.
Lincoln, R.J., Boxshall, G.A. and Clark, P.F. (1982). Adictionary of ecology, evolution and systematics.
Cambridge University Press, New York. LinnSoc., 120: 371-77.
Loken, G. (1942). Ber. Dent. Boten., In: Stanley, R. C.and Linskens, H. F. (ed.) Pollen physiologybiochemistry management. Spriner-Verlag, BerlinHeidelber, New York. 6: 299(82).
Mohana Rao G., Nadre, K.R. and Suryanarayana. (1995).Studies on the utility of honey bees onproduction of foundation seed of cotton CV.NCMHH-20. Indian Bee J. 58 (1): 13-15.
Nair, P. K. K. and Rastogi, K. (1963). Pollen productionin some allergenic plants. Curr. Sci. 32: 566-567.
Patil, G.V. and Zingre, S.W. (1976). Floral biology andpollination ecology of Dahlia pinnata Vox. In:Kapil, R. P. (ed). Pollination Biology: An Analysis.Inter India Publications, New Delhi. pp. 261-265.
Preston, R.E. (1986). Pollen-ovule ratios in theCruciferae. Ame. J. Bot. 73: 1732–1740.
Schmitt, J. (1983). Individual flowering phenology, plantsize and reproductive success in Linanthus

Journal of Innovative Prospective in Sciences Vol (I), No. 1, March 2016
26
androsaceus. A California annual Oecologia59: 135- 140.
Sihag, R.C. (1993). Behaviour and ecology of the sub-tropical carpenter bee: Xylocopa fenestrata F. 6.Crop hosts and pollination potential. J. Apic. Res.,32: 94-101.
Stone, J.L., Thompson, J.D. and Dent-Acosta, S. J.(1995). Assessment of pollen viability in hand-pollination experiments: a review. Ame. J. Bot. 82(9): 1186-1197.
Tidke, J.A. (2005). Pollination Ecology of Crotalariasericea Retz.. J. Ind. Bot. Soc. 84:80-84.
Vaissiere, B. E. (1991) Honey bees, Apis mellifera L.(Hymenoptera: Apidae), as pollinators of uplandcotton, Gossypium hirsutm L. (Malvaceae) forhybrid seed production Tex. A & M Univ.,College Station — Ph.D. dissert.
Wheeler, M.J., Franklin-Tong, V.E., and Franklin, F.C.H.(2001). The molecular and genetic basis of pollen-pistil interactions. New Phytol. 151, 565–584.
Journal of Innovative Prospective in Sciences Vol (I), No. 1, March 2016
27
INTRODUCTION
The computers are being widely used because of itsability of operating complex and bulky operations atgreat speed, accuracy, effective communication andlarge storage capacity for the years. Day by day, thesoftwares are updating in features and its portabilityin the sense of quality, reliability, size and cost ofsoftware. Since, the software is artificial, multipart andof large magnitude, hence, the probability of occurringfailures increase is high. It becomes obligatory toproduce the software with better quality which cansatisfy the user’s requirement.
A computer directed by sequence of input instructionsreferred as program, set of such programs fortransforming input to output called software. Thecomputer is made up of hardware and software. Thesoftware play very important role in performing all typesof works when it is supported computers. The softwareis a major part of every computer system. As the softwarebecome larger, the rate of failure increases. The failureof software may caused due to programming errorsrelated to memory, language-specific, calling third partylibraries, extra compilation, standard library etc..Therefore, the reliability of software is essential to beassessed for better results which satisfy the needs ofcustomer.
The research on software reliability has been startedsince 1950’s and lots of researchers have done workon it. Many software reliability models have beendeveloped having different types which can beclassified according to Musa and Okumoto (1984). Herein present paper, types of software reliability models
have been discussed based on the classificationschemes introduced by the many researchers. Softwarereliability also defined as the probability that thesoftware will be functioning without failure under agiven environmental condition during a specifiedperiod of time (c.f. Xie, (1991)). The details aboutsoftware reliability, its modeling and the parametersincluded in the model can be seen from Musa (1998),Musa et al. (1987) etc..
Types of Software Reliability Models:
The software reliability models can be characterizedon the basis of mathematical form of failure intensity.The classification schemes by some researchers are asfollows:
Classification by Gokhale: Gokhale et al. (1996), haveclassified software reliability models in two types theyare Data Domain and Time domain models.
i) Data Domain Models: These models are basedon the set of all input combinations to acomputer program. The estimate of reliabilitycan be obtained by exercising all inputcombinations and observing the outcomes (cf.Gokhale et al. (1996)).
a) Fault Seeding Models: In this type of models,an estimate of the actual number of indigenousfaults is obtained by determining the ratio ofdiscovered seeded faults and discovered actualfaults.
b) Input Domain models: In this type of models,the reliability of software is measured by theratio of the number of inputs that resulted in
SOFTWRE RELIABILITY MODELS: AN INTRODUCTION
RAJESH SINGH1 AND KAILASH R. KALE2
1Department of Statistics, Sant Gadge Baba Amravati University, Amravati. Maharashtra (India)-444 [email protected]
2 Department of Mathematics and Statistics, R. D. and S. H. National College, S. W. A. Science CollegeBandra (W), Mumbai-Maharashtra (India)-50
(Corresponding author email- [email protected])
ABSTRACT
The probability of failure free software operation for a specified period of time in a specified environment is softwarereliability. Software reliability is an important quality characteristic that has been used for quality assurance ofsoftware. The reliability of the software is probably the principal characteristics for defining the assessment criteriasince it represents the user’s view of acceptance/rejection. The number of software failures or the software failuretimes can be modeled using mathematical function called as software reliability model. In present paper, various typesof software reliability models have been introduced.
Keywords: Software reliability, software reliability model, reliability.
Journal of Innovative Prospective in Sciences Vol (I), No. 1, March 2016
28
successful execution to the total number ofinputs which gives an estimate of reliability ofthe software product.
c) The other models: Models which are neither afault seeding nor Input Domain models e.g. errorseeding models.
ii) Time Domain Models: These types of modelsare based on behavior of underlying failureprocess of the software under considerationand use the observed failure history to estimatethe residual number of faults and the timerequired to detect them (see Gokhale et al.(1996)).
a) Homogeneous Markov Models: These modelsassume that the initial number of faults in asoftware product under consideration isunknown but fixed. The failure intensity ortransition rates of the Markov chain dependsupon the number of residual faults in thesoftware.
b) Non-Homogeneous Markov Models: Thesemodels consider that the initial number of faultsin a software product under consideration israndom variable and also known as NHPPmodels.
c) Semi-Markov Models: This class of modelsassumes that the initial number of faults in asoftware product under consideration isunknown but fixed and the failure intensity ortransition rates of the Markov chain dependsnot only on the number of residual faults in thesoftware but also on the time elapsed in thatstate.
d) Other Models: These are time domain modelsbut neither classified as Homogeneous Markovneither Non-homogeneous Markov models andmay include Bayesian models or Time Seriesmodels.
Classification by Musa & Okumoto: Musa andOkumoto (1984) have given the classification schemefor SRGMs which followed by lots of researchers. Thisscheme is as follows:
a) Time: It refers to calendar time or executiontime.
b) Category: Depending upon the failuresexperienced during infinite time which may beclassified in two sub categories i.e. finite Failuresand infinite Failures. The finite category is
further classified in two types i.e. Binomial andPoisson and infinite category as Poisson andOthers.
c) Type: The distribution of the number of failuresexperienced by the time. There are two importanttypes i.e. Binomial Type and Poisson Type.
d) Class: Functional form of failure intensity forfinite failure models only.
e) Family: Functional form of failure intensity forinfinite failure models only.
Other Classification scheme: Some otherclassification of SRGMs are also available which arebriefly discussed here. Goel and Bastani (1985) havegiven two types of classification of software reliabilitymodels:
Software Reliability Growth Models.
Statistical Models.
The software reliability models are also classified bythe Goel (1985) on the basis of failures and nature oftime considered under study whereas Asad et. al. (2004)have classified the software reliability models on thebasis of phases in the development of software lifestyle. The software reliability models are also classifiedby Pham (2000) into different groups as given below.
Error seeding models Failure rate models Curve fitting models Reliability growth models Markov structure models Time-series models Non-homogeneous Poisson process models.
Software Reliability Models with some Imperfect-debugging, Testing Coverage and Removal,Environmental Factors and calibrating have beenprovided by Pham (2006). Singh and Andure (2008)have introduced lognormal class software reliabilitygrowth model using the classification scheme of Musaand Okumoto (1984). Singh and Singh (2012) haveintroduced the concept of length biased softwarereliability models.
REFERENCES
Asad, C. A., Uttah, M. I. Rehman, M. J. (2004), “Anapproach for software reliability modelselection”, Proceedings of the 28thAnnualInternational Computer Software andApplications Conference (COMSAC’04), IEEE,pp 534-539.
Journal of Innovative Prospective in Sciences Vol (I), No. 1, March 2016
29
Goel, A. L. (1985), “Software reliability models:Assumptions, Limitations and Applicability”,IEEE Transactions on software engineering,Vol-SE-II, No.-12, pp 1411-1423.
Gokhale, S. S. Philip T. and Marinos, P. N. (1996), “ANon-Homogeneous Markov SoftwareReliability Model with Imperfect Repair”, InSecond Annual IEEE International ComputerPerformance and Dependability Symposium,pp 262-270.
Musa, J. D. (1998), “Software Reliability Engineering”,McGraw-Hill, New York.
Musa, J., Lannino, A. and Okumoto K. (1987), “SoftwareReliability: Measurement, Prediction,Application”, McGraw-Hill, New York.
Musa, J. D. and Okumoto, K. (1984), “A logarithmicPoisson execution time model for softwarereliability measurement”, Proceedings of
Seventh International conference on softwareengineering Orlando, pp 230-238.
Pham, H. (2000), “Software Reliability”, Springer,London.
Pham, H. (2006), “System Software Reliability”,Springer-Verlag Limited London.
Singh, R. and Andure, N. W. (2008b), “Bayes estimatorsfor the parameters of the Poisson typeexponential distribution”, IAPQR transactions,Vol.- 33, No.-2, pp. 121-128.
Singh, R., and Singh, P. (2012), “Characterization ofsome Software Reliability Growth Models andParameter Estimation”, Major Research ProjectFunded by University Grants Commission,New Delhi. (Unpublished).
Xie, M. (1991), Software reliability modeling, WorldScientific Publishing Company, Singapore
Journal of Innovative Prospective in Sciences Vol (I), No. 1, March 2016
30
INTRODUCTIONThe genus Circumoncobothrium is erected by ShindeG.B. (1968) from the intestine of fresh water fishopniocephalus. Leincanpunctatus as a type speciesC. ophiacephali.
Shinde & Jadhav 1976 reported Circumoncobothriumdescribed two new species of this genus C.aurangabadensis & C. raai from mastacembellus armatusJadhav & Shinde, 1976 reported C. gachuai fromopiacephalus gauchua. Shinde & Chincholikar, 1977described true new species of the genus at S. Shindefrom fresh water fish mastacenbellus armatus C.bagariusi from Bagarius n.Sp. Shinde (1977) reportedC.khami from ophiacephalus striatus C. Yaimaguti(1990) describe by Jadhav et al., from mastacembellusarmatus Shinde et al, 1994 added C. alii frommastacembellus arinatus. Patil el. al (1998) added C.vadeaonensis as a new species C. vadeaonensis as anew species C. Wongsawad & Jadhav, 1998 added C.baimii from Mastacembellus armatus C. Manjari, 2004added by Tat & Jadhav Later s no species is added tothis genus.
MATERIALS AND METHODS
The worims were collected from mann River at Balapur,Dist. Akola from fresh water fish ophiacephalus fixedin 4% formaline, stained with Harris haemotonxylene,dehydrated, cleared in xylene, mounted in D.P.X.Drawings were made with the aid of camera lucida.Identification carried out with the help of systemHelminthes Vol. II Yamaguti, all measurements are inmillimeters.
OBSERVATIONS
The parsite bases on fifteen specimens are collectedfrom the spiral valve at Intestine of ophiacephalus(Shinde, 1968) from mann River at Balapur.
The Scolex is elongated, prolong shape of the scolex isanteriorly narrow, compact measure 6310 (5339-7281)in length and 3203 (2524-3883) breadth.
The scolex bears two botheria which are large in size,sac like in appearance, short from the rostellum,overlapping each other measure 5339 (04854-5825) inlength & 2281 (0.4854-09708) breadth.
The Rostellor hooks are 43-44 in number, spindleshape, hooks are arrange in four quardent, large hooksare 32 in number measure 0.3135 (0.3106-0.3155) inlength and 0.2184 (0.01456-0.02912) in breadth. Thesmaller hooks are 12 in number measure 0.1334 (0.1213-0.1456) in length & 0.5824 (0.09708-0.01941) in breadth.
The Neck are long measure 0.2169 (0.2427-0.2912) inlength & 0.2355 (0.2184-0.2427) in breadth.Segmentation are clearly seen in mature and GravidSegment. The mature segment are broader than longmeasure 0.1174 (1.553-1.796) in length & 0.5487 (0.4126-0.5048) in breadth.
In male reproductive system, Testers are 245-250 innumber, rounded in shape, preovarian, distributedthroughout the segment, arrange in two fields &obliquely place measure 0.2374 in diameter. The cirruspouch is oval in shape situated in center of the segmentmeasure. 0.147 (0.1213-0.1601) in length & 0.10679 (3883-0.6796) in breadth. The cirrus is thin, slightly curvedcontained with in the cirrus pouch & measure 16989(0.08252-0.08737) in length and 0.5632 (9708-1456) inbreadth. Vas deferens are short or curved in shapeattach anteriorly to the cirrus pouch open into the cirrusmeasure 0.4621 (0.02427-0.03398) in length & 0.10193(0.04854-0.09708) in breadth. Vagina reaches into theseminal receptaculum measure. 0.5582 (0.04854-0.06310)in length & 0.5532 (0.09708-0.01456) in breadth. Vaginais a small tube runs posteriorly to the cirrus pouch
A NEW SPECIES OF THE GENUS CIRCUMONCOBOTHRIUM MANNENSISFROM A FRESH WATER FISH OPNIACEPHALUS.
N. M. KANKALEDepartment of Zoology, Gulam Nabi Azad Arts, Commerce & Science College,
Barshitakli Dist. Akola (M.S.) India
ABSTRACT
The present paper deals with the new species of the Cestode from the genus Circumoncobothrium mannensis thisgenus is erected by shinde G.B. (1968) viz Circumoncobothrium n. sp. collected from mann river at Balapur Dist.Akola M.S. India. The present species at the genus in having scolex is elongated, prolong shape, rostellor hooks are 43-44 in number, Neck present, testes are 245-250 is number ovary dumbell shaped, uterus globular, vitellaria follicular(2 or 3 rows)
Key words – fresh water fish Cestode, Opniocephalus & mannensis n.sp
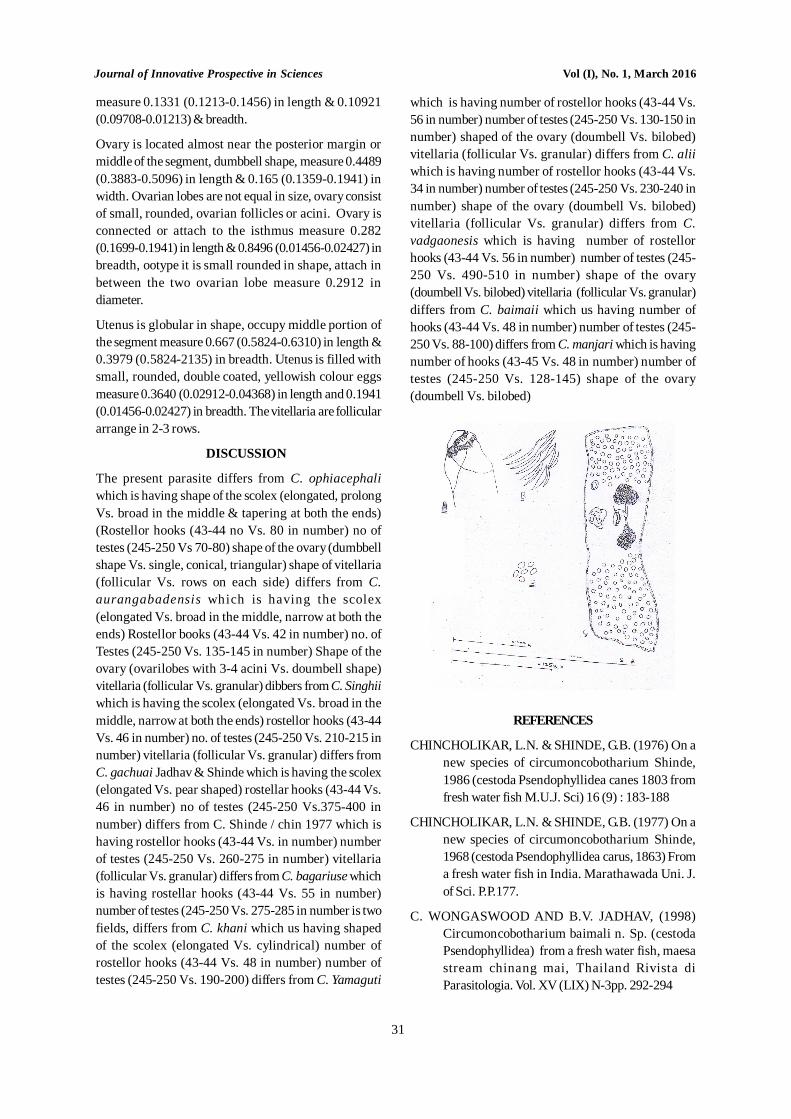
Journal of Innovative Prospective in Sciences Vol (I), No. 1, March 2016
31
measure 0.1331 (0.1213-0.1456) in length & 0.10921(0.09708-0.01213) & breadth.
Ovary is located almost near the posterior margin ormiddle of the segment, dumbbell shape, measure 0.4489(0.3883-0.5096) in length & 0.165 (0.1359-0.1941) inwidth. Ovarian lobes are not equal in size, ovary consistof small, rounded, ovarian follicles or acini. Ovary isconnected or attach to the isthmus measure 0.282(0.1699-0.1941) in length & 0.8496 (0.01456-0.02427) inbreadth, ootype it is small rounded in shape, attach inbetween the two ovarian lobe measure 0.2912 indiameter.
Utenus is globular in shape, occupy middle portion ofthe segment measure 0.667 (0.5824-0.6310) in length &0.3979 (0.5824-2135) in breadth. Utenus is filled withsmall, rounded, double coated, yellowish colour eggsmeasure 0.3640 (0.02912-0.04368) in length and 0.1941(0.01456-0.02427) in breadth. The vitellaria are folliculararrange in 2-3 rows.
DISCUSSION
The present parasite differs from C. ophiacephaliwhich is having shape of the scolex (elongated, prolongVs. broad in the middle & tapering at both the ends)(Rostellor hooks (43-44 no Vs. 80 in number) no oftestes (245-250 Vs 70-80) shape of the ovary (dumbbellshape Vs. single, conical, triangular) shape of vitellaria(follicular Vs. rows on each side) differs from C.aurangabadensis which is having the scolex(elongated Vs. broad in the middle, narrow at both theends) Rostellor books (43-44 Vs. 42 in number) no. ofTestes (245-250 Vs. 135-145 in number) Shape of theovary (ovarilobes with 3-4 acini Vs. doumbell shape)vitellaria (follicular Vs. granular) dibbers from C. Singhiiwhich is having the scolex (elongated Vs. broad in themiddle, narrow at both the ends) rostellor hooks (43-44Vs. 46 in number) no. of testes (245-250 Vs. 210-215 innumber) vitellaria (follicular Vs. granular) differs fromC. gachuai Jadhav & Shinde which is having the scolex(elongated Vs. pear shaped) rostellar hooks (43-44 Vs.46 in number) no of testes (245-250 Vs.375-400 innumber) differs from C. Shinde / chin 1977 which ishaving rostellor hooks (43-44 Vs. in number) numberof testes (245-250 Vs. 260-275 in number) vitellaria(follicular Vs. granular) differs from C. bagariuse whichis having rostellar hooks (43-44 Vs. 55 in number)number of testes (245-250 Vs. 275-285 in number is twofields, differs from C. khani which us having shapedof the scolex (elongated Vs. cylindrical) number ofrostellor hooks (43-44 Vs. 48 in number) number oftestes (245-250 Vs. 190-200) differs from C. Yamaguti
which is having number of rostellor hooks (43-44 Vs.56 in number) number of testes (245-250 Vs. 130-150 innumber) shaped of the ovary (doumbell Vs. bilobed)vitellaria (follicular Vs. granular) differs from C. aliiwhich is having number of rostellor hooks (43-44 Vs.34 in number) number of testes (245-250 Vs. 230-240 innumber) shape of the ovary (doumbell Vs. bilobed)vitellaria (follicular Vs. granular) differs from C.vadgaonesis which is having number of rostellorhooks (43-44 Vs. 56 in number) number of testes (245-250 Vs. 490-510 in number) shape of the ovary(doumbell Vs. bilobed) vitellaria (follicular Vs. granular)differs from C. baimaii which us having number ofhooks (43-44 Vs. 48 in number) number of testes (245-250 Vs. 88-100) differs from C. manjari which is havingnumber of hooks (43-45 Vs. 48 in number) number oftestes (245-250 Vs. 128-145) shape of the ovary(doumbell Vs. bilobed)
REFERENCES
CHINCHOLIKAR, L.N. & SHINDE, G.B. (1976) On anew species of circumoncobotharium Shinde,1986 (cestoda Psendophyllidea canes 1803 fromfresh water fish M.U.J. Sci) 16 (9) : 183-188
CHINCHOLIKAR, L.N. & SHINDE, G.B. (1977) On anew species of circumoncobotharium Shinde,1968 (cestoda Psendophyllidea carus, 1863) Froma fresh water fish in India. Marathawada Uni. J.of Sci. P.P.177.
C. WONGASWOOD AND B.V. JADHAV, (1998)Circumoncobotharium baimali n. Sp. (cestodaPsendophyllidea) from a fresh water fish, maesastream chinang mai, Thailand Rivista diParasitologia. Vol. XV (LIX) N-3pp. 292-294
Journal of Innovative Prospective in Sciences Vol (I), No. 1, March 2016
32
CHINCHOLIKAR, L.N. & SHINDE, G.B. (1976) On anew species of circumoncobotharium Shinde,(1908) (cestoda Psendophyllidea) canes, 1863from a fresh water fish in India MarathawadaUniv. J. of sci Nat. sci 16 (sci) : No.9183 : 186
JADHAV, B.V. & WONGSAWAD, (1998)Circumoncobotharium baimali n. Sp. (cestodaPsendophyllidea) from a fresh water fish, maesastream chiang mai, Rivista di Parasitologia. Vol.XV (LIX) N-3pp. 291-294
JADHAV, B.V. (1998) New species of the genuscircumoncobotharium, Shinde, 1968 (cestodaPsendophyllidea) from a fresh water fish,Maharashtra, India.
JADHAV, B.V. AND SHINDE, G.B. (1976) New speciesof the genus circumoncobotharium, Shinde,1908 (cestoda Psendophyllidea carus 1863) froma fresh water fish, at Aurangabad India. Indian J.Biol. Sci, ASSO 112 : 163-164
PAWAR, S.B. et. Al (2002) A New speciescircumoncobotharium, armatusaen sp. (cestodaPsendophyllidea) from a Mastacembellusarmatus at paithan, India. Riv. Parasit VOL. XX(LXIII) N-3222, 2002
SHINDE, G.B. MOHEKAR A.D. JADHAV, B. ANDHAFEEZULLAH M. (1987) Two new species of
the genus Lytocestus (Lytocestidae from a freshwater fish of Maharashtra, India)
SUPUGADE et. al. (2005) CirumoncobothriumVitellariensis n Sp. (cestoda Psendophyllidea,Lube, 1920) from a Mastacembellus Trajectory,Volume 13 No. 2005 PP 43-49
SHINDE, G.B. ET. AL (1999) A New speciescircumoncobotharium Masta cenbellusae n. Sp.(cestoda Psendophyllidea) from aMastacembellus armatus at paithan, India, Rir.Parasit, VOL. XX (LXIII) N-3,195-198, 2002
SHINDE, G.B. AND JADHAV B.V. (1976) On a newspecies circumoncobotharium Shinde (cestodaPsendophyllidea) from a fresh water fish fromMaharashtra, India Marath Univ. J. Sci. (Nat SCI)VOL XV Sci 8
SHINDE, G.B. (1968) On circumoncobothariumophiocephali n. sp. from a fresh water fishOphiacephalus tencapunctatus in India Riv, Para19(2) : 111-114 Italian Summery PP 114
SHINDE, G.B. (1976) On a new species ofcircumoncobotharium Shinde 1976 (cestodaPsendophyllidea, carus 1863) from a fresh waterfish in India. Ibid 16 (89) : 129-132
Journal of Innovative Prospective in Sciences Vol (I), No. 1, March 2016
33
The Butibori industrial area is the largest in all of Asiain terms of area. The area has largest unit of syntheticpolyester yarn. Other units in Butibori include thepower transmission company RCC Castings plants.
Koradi Thermal Power Station and KhaparkhedaThermal Power Station are the two major thermal powerstations located near Nagpur.
Slum areas around monitoring stations also contributesignificant amount of unburnt carbon and particulatematter along with gaseous pollutants which are carriedover atmosphere with flue gas.
There has been a rapid increase in the number ofvehicle in the city over the past few years. In Nagpurthere are more than 10 lakh vehicle including threewheelers, scooters, cars, motor cycles, trucks andbuses. The diesel powered heavy vehicles add to theair pollution problem by emitting out jet black smoke.
The problem gets accelerated when some vehicle useadulterated petrol mixed with kerosene oil. Theemission from such vehicles is very high in suspendedparticulate matter such as carbon and soot particlesresulting in smoke.
Site Location:
The Hingna Industrial Area has been studied on thebasis of land use pattern and micrometeorologicalconditions. Thus, three stations were set up at thefollowing locations
1) Steel Factory (S-1)2) Maharashtra Bank (S-2)3) Away from industrial area (S-3)
ANALYSIS OF AIR QUALITY IN INDUSTRIAL ENVIRONMENT OF THE CITY OFNAGPUR BY AN APPLICATION OF THE POLLUTION INDEX METHOD
S. V. KHANDAREDepartment of Environmental Science, Ghulam Nabi Azad Arts, Commerce, Science College, Barshitakli, Dist
Akola. 444 401 MS, India(Corresponding author email: [email protected])
ABSTRACT
The present study focuses on ambient air quality status at selected location in the industrial area of Nagpur city. Thearea has been studied on the basis of land use pattern and micrometeorological condition. While selecting the monitoringstations, it has been kept in mind that monitoring should be representing the background of industrial and sensitiveareas. Further the data is interpreted statistically and air quality index is calculated and rated accordingly. It is observedfrom the present study that the SO2 and NO2 concentrations are below the national standards and the SPM concentrationis found to be much excess. All the parameter showed increasing trend in the month of January, February, October,November and December and the trend of RSPM and SPM were increases during the summer seasons.
Key words: Ambient air quality, RSPM, SPM, SO2, NO2, Statistical analysis
INTRODUCTION
About Nagpur
Nagpur is located in Vidarbha Region of Maharashtra.It is a winter capital of the state of Maharashtra, thelargest city in central India and third largest city inMaharashtra after Mumbai and Pune. With a populationof 46,53,171 (Census -2011) Nagpur Metropolitan Areais the 13th largest urban conglomeration in India. Inaddition to being the seat of annual winter session ofMaharashtra state assembly “Vidhan Sabha”, Nagpuris also a major commercial and political centre of theVidarbha region of Maharashtra, and is also famousthroughout the country as “Orange City” for being amajor trade center of oranges that are cultivated in theregion. The location co-ordinates for Nagpur are 21°042N 79°162 E. Nagpur lies precisely at the center of thecountry with the Zero Mile Marker indicating thegeographical center of India. It receives an annualrainfall of 1,205 mm (47.44 in) from monsoon duringJune to September.
Source of Air Pollution:
There has been a rapid growth of industries in city,especially 900 small and medium industrial units. Themajor ones among them are tractor manufacturing plant,casting units, units of International Combustion, Autoparts, large confectionery manufacturing plants, Steelrolling group of companies. Nagpur is home to ice-cream manufacturer, Indian dry food manufacturers,Indian Ready to Cook food manufacturer and somepharmaceutical industries.
Journal of Innovative Prospective in Sciences Vol (I), No. 1, March 2016
34
MATERIALS AND METHODS
SPM in the ambient atmosphere were collected througha size selective inlet by High Volume Sampler througha 20.3 X 25.4 cm filter at a flow rate of 1 m3/ min andestimated gravimetrically. Oxides of nitrogen (NOx)were determined by bubbling the ambient air samplesthrough a solution of sodium arsenite and sodiumhydroxide. Sulphur dioxide (SO2) is determined bybubbling the air samples through solution of sodiumtetra chloro mercurate (TMC) absorbing solution. Bothgaseous protocols were determinedspectrophotometrically as per the CPCB guidelines.
Regular monitoring, sampling and analysis were carriedout at all stations from January 2011 to December2011.The data is presented in the form of annualaverage concentration of these protocols.
Air quality index (AQI): The Air Quality Index (AQI)was calculated using the method suggested by Tiwariand Ali (1987) and followed by Kaushik et al., (2006).For AQI, the air quality rating of each pollutant wascalculated first by the following formula.
Q= [V/V(S)] X 100
Where, Q represents quality rating, V the observedvalue of the pollutant and V(S) the standard valuerecommended for that pollutant. The Vs values usedare the recommended national ambient air qualitystandards (CPCB 1994), for different areas.
RESULTS AND DISCUSSION
The results of this investigation are presented in table1 and 2. The seasonal influence of varying weatherconditions on the SPM, RSPM, SO2 and NO2concentration is well pronounced with their annualcycles showing maximum and minimum
Seasonal Variation:
During monsoon, on an average, the concentration isat the minimum level. The factor responsible may bewashout by the monsoon rains lead to decrease inpollutants. During winter there is a medium range ofparameters. The minimum and maximum average valuesof SPM are 141 µg/m3 and 689 µg/m3 respectively.
During summer February to May, on an average, theconcentration of gaseous pollutants and SPM are atthe maximum level due to high temperature, high winderosion, moderator stability, almost dry atmosphereand less humidity.
Table 1: Annual average concentration of SO2 andNO2 from January- December, 2011
Month of 2011 SO2 (µg/m3) NO2 (µg/m3)S-1 S-2 S-3 S-1 S-2 S-3
January 3 1 2 25 14 9
February 1 1 2 10 16 12
March 4 2 3 21 11 11
April 5 2 2 23 13 12
May 4 2 2 11 12 16
June 4 2 2 11 18 8
July 4 3 3 5 10 10
August 3 1 2 15 9 13
September 6 1 3 29 11 16
October 3 2 2 25 14 10
November 1 1 2 21 10 12
December 2 1 2 22 19 11
Table 2: Annual average concentration of RSPM andSPM from January- December, 2011
Month of 2011 RSPM (µg/m3) SPM (µg/m3)
S-1 S-2 S-3 S-1 S-2 S-3
January 257 93 56 689 283 148
February 238 96 52 701 276 141
March 189 54 50 576 182 153
April 212 104 50 366 322 162
May 168 161 64 514 186 201
June 78 55 48 216 163 153
July 52 51 42 146 151 137
August 62 56 42 201 176 142
September 50 49 44 137 144 193
October 83 83 51 258 237 156
November 80 79 63 240 246 192December 106 102 60 301 291 163
Station wise variations:
As compared within one year results, it is observedthat SO2 and NO2 concentration are well below theprescribed limits, RSPM and SPM shows highconcentration in the atmosphere of studied area.
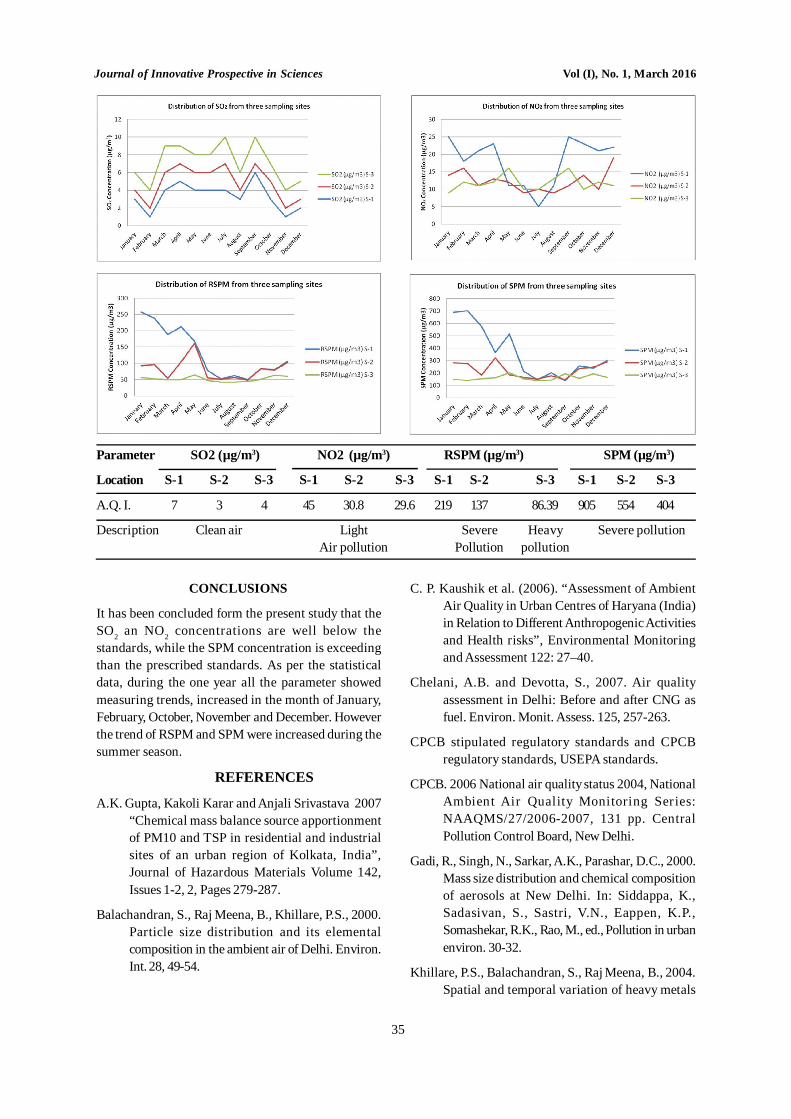
Journal of Innovative Prospective in Sciences Vol (I), No. 1, March 2016
35
C. P. Kaushik et al. (2006). “Assessment of AmbientAir Quality in Urban Centres of Haryana (India)in Relation to Different Anthropogenic Activitiesand Health risks”, Environmental Monitoringand Assessment 122: 27–40.
Chelani, A.B. and Devotta, S., 2007. Air qualityassessment in Delhi: Before and after CNG asfuel. Environ. Monit. Assess. 125, 257-263.
CPCB stipulated regulatory standards and CPCBregulatory standards, USEPA standards.
CPCB. 2006 National air quality status 2004, NationalAmbient Air Quality Monitoring Series:NAAQMS/27/2006-2007, 131 pp. CentralPollution Control Board, New Delhi.
Gadi, R., Singh, N., Sarkar, A.K., Parashar, D.C., 2000.Mass size distribution and chemical compositionof aerosols at New Delhi. In: Siddappa, K.,Sadasivan, S., Sastri, V.N., Eappen, K.P.,Somashekar, R.K., Rao, M., ed., Pollution in urbanenviron. 30-32.
Khillare, P.S., Balachandran, S., Raj Meena, B., 2004.Spatial and temporal variation of heavy metals
Parameter SO2 (µg/m3) NO2 (µg/m3) RSPM (µg/m3) SPM (µg/m3)
Location S-1 S-2 S-3 S-1 S-2 S-3 S-1 S-2 S-3 S-1 S-2 S-3
A.Q. I. 7 3 4 45 30.8 29.6 219 137 86.39 905 554 404
Description Clean air Light Severe Heavy Severe pollutionAir pollution Pollution pollution
CONCLUSIONS
It has been concluded form the present study that theSO2 an NO2 concentrations are well below thestandards, while the SPM concentration is exceedingthan the prescribed standards. As per the statisticaldata, during the one year all the parameter showedmeasuring trends, increased in the month of January,February, October, November and December. Howeverthe trend of RSPM and SPM were increased during thesummer season.
REFERENCES
A.K. Gupta, Kakoli Karar and Anjali Srivastava 2007“Chemical mass balance source apportionmentof PM10 and TSP in residential and industrialsites of an urban region of Kolkata, India”,Journal of Hazardous Materials Volume 142,Issues 1-2, 2, Pages 279-287.
Balachandran, S., Raj Meena, B., Khillare, P.S., 2000.Particle size distribution and its elementalcomposition in the ambient air of Delhi. Environ.Int. 28, 49-54.

Journal of Innovative Prospective in Sciences Vol (I), No. 1, March 2016
36
in atmospheric aerosol of Delhi. Environ. Monit.Assess. 90, 1–21.
P. Goyal, M. P. Singh, T. K. Bandopadhyay, T. V. B. P.S. Rama Krishna, 1995, “Comparative study ofline source models for estimating lead levels dueto vehicular traffic in Delhi “, EnvironmentalSoftware, Volume 10, Issue 4, ,Pages 289-299.
Sharma, M., Bhaskar S., Sengupta, B., 2002. InstitutingAmbient Air Monitoring Protocol: Issues for
Discussion. Indian Journal of Air Pollution Control,April 2002.
Sharma, M., Kiran, Y. N. V. M., Shandilya, K., 2003.Investigations into Formation of Atmospheric Sulfateunder High PM10 Concentration. AtmosphericEnvironment, 37 2005-2017.
Yadav, S., Rajamani, V., 2006. Air quality and tracemetal Chemistry of different size fractions of aerosolsin N-NW India - Implications for source diversity.Atmos. Environ. 40, 698-712.
Journal of Innovative Prospective in Sciences Vol (I), No. 1, March 2016
37
INTRODUCTION
Geologically the area mainly composed of Deccantrapthe rocks belonging to other ages also form animportant part of the geological sequence. They varyright from base with litho units like granites, gneisses,quartzite, and felspathic gneisses and are followed byUpper Gondwanas and Lametas belonging to UpperCretaceous period. This formation is unconformablyoverlained by Deccan traps which in turn is overlainedby the alluvium of Quaternary period. The rocks ofSalbardi area belongs to Archaean and UpperGondwana Super group. The Gondwana sediments ofSalbardi and adjoining region are tectonically disturbedbecause of ENE-WSW trending fault. The Archaeanquartzo-felspathic gneiss and granitic gneisses makesthe basement while in the upper part Gondwana alongwith Lameta are exposed. The rock formation of theSalbardi and adjoining region is overlained by oneanother i.e. Archaeans overlained by younger formationUpper Gondwana and Gondwana overlained by Lametaof Upper cretaceous age with sedimentary rock suchas sandstone, shale and limestone. Next to this, Lametais overlained by Deccan trap of Upper Cretaceous toEocene age and have basaltic rock with porphyritic tonon porphyritic texture. The Deccan is thensuperimposed by Quaternary deposit i.e. soil andalluvium. A small patch of NE-SW trending UpperGondwana succession along with the Lameta is exposedin Salbardi area (Lat. 210 25' 15" N and Long. 780 00' 00"E).Though, the succession showing good preservationof sedimentary structures, patchy lithological units andgrain size variations have not received much attentionfor sedimentological investigations in the study area.However, field based preliminary sedimentologicaldetails were documented about one and a half centuries
back (Blanford, 1869). Subsequently, specific work onthe area is inadequate and mainly focused on regionalgeological set-up, of which the Salbardi area representsa small patch of Upper Gondwana in the vast Deccantrap province and it includes a hot spring near to theSalbardi village (Saxena, 1987 and Ravi Shankar, 1991).The intrusive and extrusive igneous activity in the areai.e. both basalt and doleritic dyke are common andbrought attention to the study area.
STUDY AREA
The study area lies in the Survey of India toposheetNo.55 k/2,55 /k3,55 G/14,55 G/15 and bounded bylatitude and longitude 21020’to 21035’ E and 770 45’to780
10’ N respectively. The area from the present studydivided in to two part i.e. one part comes under thestate of Maharashtra and other falls under the state ofMadhya Pradesh. This fault is probably the easterncontinuation of well known Gavilgrah/Elichpur fault(Rajurkar, 1981; Umak,1994; Manjare, 2013) thesouthern contact of the Proterozoic rocks and Deccantrap is covered under alluvium and possibly is alsofaulted (Fig. 1).
GEOLOGY OF THE STUDY AREA
Due to the tectonic activity in the study area andadjoining region, stratigraphy and geology of the areais very complex. The Upper Gondwana sediments andDeccan trap of the Salbardi and adjoining region aretectonically exposed due to Salbardi strike slip faulttrending roughly ENE-WSW (Ravi Shankar, 1994;Chatopadhya, 2008; Manjare, 2013). The entire area iscriss-crossed by several minor faults, which makes thestratigraphy of the area complicated. However,Archaean quartzo-feldsphathic gneiss and granitic
REVISIT THE SALBARDI AND ADJOINING REGION OF AMRAVATI DISTRICTMAHARASHTRA AND BETUL DISTRICT OF MADHYA PRADESH, INDIA
B. S. MANJAREDepartment of Geology, RTM Nagpur University (MS) India.
Corresponding author email [email protected]
ABSTRACT
The Deccan traps occupy an area of about 500,000 sq. kms in central, western and southern part of India. Deccantraps form flat topped ridges which are due to the presence of more resistant basaltic flow units forming a series ofstep like terraces. The lava flows are spread throughout the study area. The Salbardi and adjoining region is not onlytectonically active but also geologically very attractive. The study area comprised the formation right from Archaeanfelspathic gneiss to Upper Gondwana formation including Lameta, igneous intrusion, Deccan trap and Quaternarysedimentation.
KEYWORDS: Salbardi fault, Geology, Central India
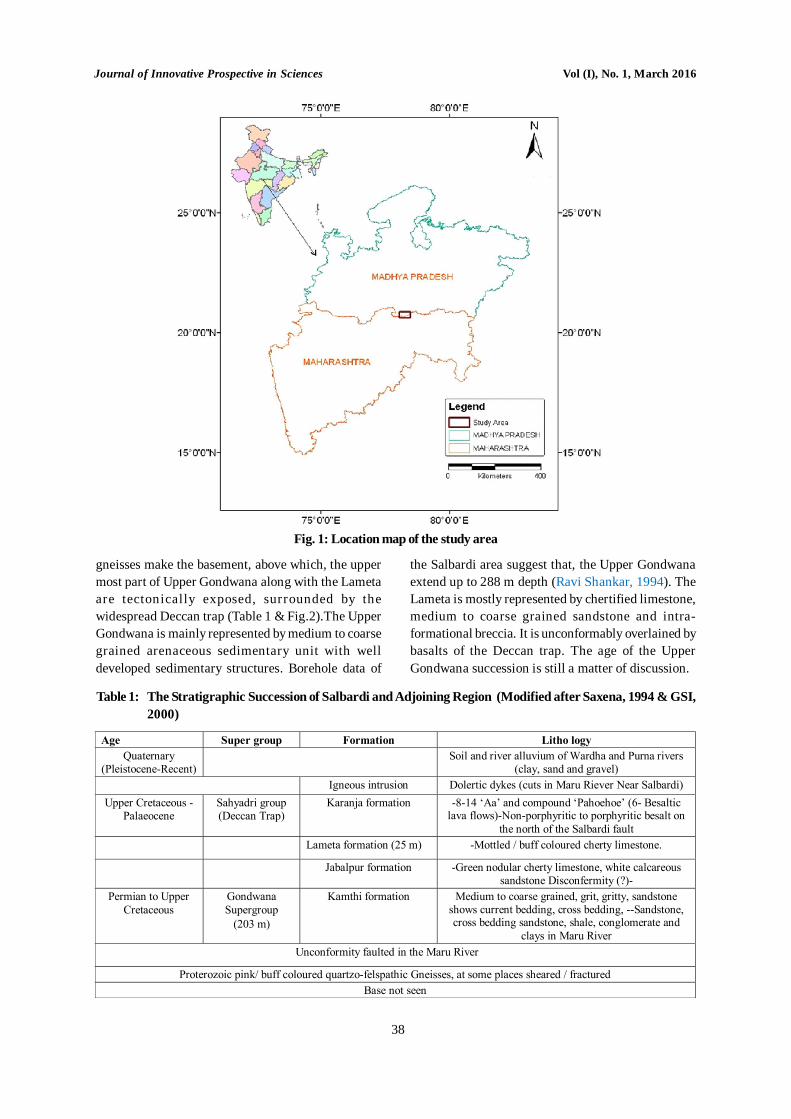
Journal of Innovative Prospective in Sciences Vol (I), No. 1, March 2016
38
gneisses make the basement, above which, the uppermost part of Upper Gondwana along with the Lametaare tectonically exposed, surrounded by thewidespread Deccan trap (Table 1 & Fig.2).The UpperGondwana is mainly represented by medium to coarsegrained arenaceous sedimentary unit with welldeveloped sedimentary structures. Borehole data of
the Salbardi area suggest that, the Upper Gondwanaextend up to 288 m depth (Ravi Shankar, 1994). TheLameta is mostly represented by chertified limestone,medium to coarse grained sandstone and intra-formational breccia. It is unconformably overlained bybasalts of the Deccan trap. The age of the UpperGondwana succession is still a matter of discussion.
Fig. 1: Location map of the study area
Table 1: The Stratigraphic Succession of Salbardi and Adjoining Region (Modified after Saxena, 1994 & GSI,2000)
Journal of Innovative Prospective in Sciences Vol (I), No. 1, March 2016
39
Deccan traps in the area represented by porphyritic tononporphyritic texture overlained Upper Gondwanasuccession and doleritic dyke exposure in the studyarea. The structural disturbance represented byGavilgrah /Salbardi fault along the foot hill of Satpurarange between Narha in the west and Dhamndas in theeast. It is well exposed at Salbardi and Jamkhari. Thearea is of special significance because of hot spring onthe other side of the major fault namely Salbardi faultin the Maru River valley (Ravi Shankar, 1994).
The possibility of subsurface extension of Gondwanarocks below the trap has also been studied throughborehole at 300 m NNE of Salbardi and Jamkhari villageindicating the presence of Upper Gondwana sediments.These coarse grained, grey, pink, color foliated rocksshowing alteration of white and dark color bands. Thebanding consists of schistose and granulose band.Mineralogically it consists of mica and amphibole incase of schistose band and quartz, feldspar in case ofgranulose band. The quartz and feldspar observed havedeveloped a large clot or eye like coarse crystal i.e.which is called as ‘Augen Structure’ and hence therock is commonly known as ‘Augen Gneiss’.
MAJOR LITHOLOGICAL UNITS
Geology of the Salbardi and adjoining region is verycomplex due to presence of Salbardi fault in the studyarea and they comprises formation Archaean toQuaternary. The details of geological formation aregiven as below;
ARCHAEAN FORMATION
Archaean rocks are the oldest rock in peninsular India.It is Archaean rock separated from the other rocks byyounger rocks by ‘Eparchean unconformity’. In thestudy area these rocks are represented by graniticgneiss exposed along the Salbardi fault in to twopatches at about 1000 m and 500 m strike length 100 to200 m width at Salbardi and Jamkhari showing N 500 Eand S 500 W trends with dip of foliation between 450 to550 towards NW(Saxena, 1984). The faulting in the fieldrecognized by the sharing and crushing of the rocksand closed spaced cross joints. The contact betweenalluvium and quartzo-felspathic gneiss are clearly seenin the field (Fig. 3). These rocks are highly sheared,fractured with well developed ‘Augen structure’ andexposed particularly on the left bank of Maru River.These formations are product of regionalmetamorphism. The rocks are essentially coarse grainedwith quartz and feldspars primary minerals (Plagioclase& microcline). The quartz shows undulose extinction,
microcline shows cross hatch twinning whileplagioclase is lath shaped. Other secondary mineralslike hornblende and biotite are also observed.In thestudy area quartzo-felspathic gneiss extends over astrike length of about 700 m and has width of 150 to200 m. It is lensoid body tapering at either end orexposed as a faulted thin wedge (Fig. 3).
In thin section it is coarse grained gneiss composed ofquartz, microcline and plagioclase. Quartz grain showsundulose extinction and is stretched in the direction offoliation. Microcline occurs as thick laths in a strainedcondition with partial distortion of crossed hatchtwinning. The strike varies between N 550 E, S 550 Wand N 750 E, S 750 W with dip of foliation varying 400 to700 towards North West. Pyrite is also seendisseminated in the quartzo-felspathic gneiss. At manyplaces the area gets the fracture quartzo-felspathicgneiss (Fig. 4). The contacts between alluvium andquartzo-felspathic gneiss are seen west to Salbardivillage.
IGNEOUS INTRUSION
The area experienced igneous intrusion activity mostlyrepresented by the Doleritic dyke. In study area dykesare reported near hot spring i.e. on the left bank of theMaru River and cuts Archaean and Upper Gondwanasediments. Dykes are discordant or cross-cuttingtabular intrusion into the country rock and most dykesare vertical or near vertical in orientation. In the studyarea the dyke is emplaced perpendicular to the Salbardifault along Maru River section with NE- SW trendsand crosscutting the country rocks and do not indicateany sharing or crushing (Fig. 6). The dyke prominentlyobserved near Salbardi village (Fig. 5). Near Salbardivillage and extends towards the south west directionand north east direction.
The dyke appears as dark toned feature on the satelliteimagery and occurs having linear, narrow and low-lyingrelief. The thickness of dyke ranging from 6 m to17 mand is dark in appearance with medium grain size andmineralogical consist of plagioclase feldspar (anorthite& labradorite) and presence of other accessory mineralslike olivine, augite and some ferruginous mineralsdepicts Ophitic to sub-Ophitic texture. Some moredykes exposure is also reported from west of Jamkharivillage cutting the Gondwana sandstone along the Paknala section, north of Pandharghat village.Microscopically the dyke shows medium to fine exhibitsOphitic to subophitic, Interseretal and Intergranulartexture.
Journal of Innovative Prospective in Sciences Vol (I), No. 1, March 2016
40
SAHYADRI GROUP (DECCAN TRAP)
The basaltic rock formation covers an area more than500,000 sq. Kms in Maharashtra, Madhya Pradesh somepart of Gujrat, southern part of the India and is themost extensive volcanic eruption in Indian geology.Deccan Traps in the area is represented by massive,coarse grained to fine grain, dark coloured formationwith vesicular and amygdaloidal structure. They alsoshow porphyritic to nonporphyritic texture. TheDeccan traps overlained by Upper Gondwanasuccession and makes a regional exposure (Fig. 2).
KARANJA FORMATION
The Karanja formation recorded as 8 to 14 compounds‘Aa’ and ‘Pahoehoe’ lava flows in the study area (8)which exhibits the rock dark, massive to fine grainedand can be broken in to blocks road metals. Thisformation covers the most part study area. And all thelava flows here are dark, massive, fine grained withmoderately to highly porphyritic showing columnarjointing and with vesicular and amygdaloidal structure(Saxena, 1984; GSI, 2000). The basaltic rocks of thestudy area are highly weathered and dark in nature(Fig. 10).The flow starting from the cretaceous periodand continue up to Eocene. The thickness of basalticrocks in the study area ranging from 300 to 400 m. Thebasaltic lava flow is hard compact and dark colored &both ‘Aa’ and ‘Pahoehoe’ type are reported. Deccantrap in the study area are unconformably overlies theLameta sediments.
The litho unit is exposed in the form of flat top hill andshows the step like terraces due to variation in thehardness in different unit in lava flow. Several flowunits have been identified in the traps exposed on thesouthern part of study area. The thickness of the traprecorded at Salbardi fault (Ravi Shankar, 1994) wasabout 603 m. The basalt is of medium to fine grain;grey black in colour hard and compact porphyritictexture having phenocrysts of plagioclase otherminerals like hornblend, augite and olivine. The pillowand ropy lava structure are very common and these areseen north Ghorpend village. The other structure likecolumnar joints is also present in the study area. Itforms due to contraction and cooling effect of magmaand is seen near Jamkhari village. The basalt of thestudy area consists of highly weathered top withexhibiting spheroidal weathering (Fig. 10). In the studyarea few cavity filling deposit of siliceous quartz andzeolitic material are observed as secondarycrystallization in the basaltic rock (Fig. 9).
UPPER GONDWANA FORMATION
The uppermost Gondwana succession of earlyCretaceous period is well exposed in Salbardi area(latitude 210 25' 15" N and longitude 780 00' 00" E). Thesuccession is represented by 128 m thick pile of mediumto coarse-grained and very coarse grained sandstonesferruginous sandstone clay and pebble horizons. Sofar the litho units received a very casual attention forits sedimentological details, despite frequentlithological variations, good preservation ofsedimentary structures and grain-size variation invertical column (Fig. 11).The Upper Gondwanasuccession in the study area is represent as Jabalpurand Kamthi formation of arenaceous to argillaceoussediments rests unconformably on Archaean rocks. Itis dis-conformably overlain by the calc-marl-arenaceous sediments of the Lameta formation (Fig. 2).The Jabalpur formation lies along the Maru River whichexposed near Pachmari village and some exposurepresent north towards Salbardi village. The rock is inthe form of narrow vertical strip. The Kamthi formationis present in the form of narrow parallel strip with theSalbardi fault lying below the Lameta formation in thestudy area.
The Upper Gondwana succession of Salbardi area isan isolated patch exposed due to roughly E-W trendingSalbardi fault (Ravi Shankar, 1994) which is a part ofthe major tectonic feature namely Satpura fault andbecause of the Satpura fault two other isolated patchesof Upper Gondwana are also exposed at Bairam-Belkherarea (latitude 21° 16' to 21° 22' N and longitude 77° 31'to 78° 37' E) lying at a distance of about 60 kms west ofSalbardi area. These isolated exposures of UpperGondwana were a matter of debate for theircontroversial stratigraphy (Fig. 2). In the study areasandstone is variable colour showing whitish,yellowish-brown to brown, compact to friable in nature.The friable nature of brownish and yellowish sandstoneis because of ferruginous cement whereas whitishsandstone shows silica cementation due to which it iscomparatively hard and compact sand and quartz grainsare mostly angular to sub-angular.
The sandstone lithounit shows good preservation ofsimple, cross and parallel beddings, ripple beddings,mud cracks and ferruginous concretions (Fig. 12). Thelower 55 m. succession is thickly bedded whereas themiddle 30 m unit is mainly thinly-bedded and crossstratified lithounit having clay pockets and clay occursas patches in sandstone horizon. It is mostlyrepresented by soft, flat-bedded, yellowish-pink, and
Journal of Innovative Prospective in Sciences Vol (I), No. 1, March 2016
41
grey to brown lithounit with a tendency to break inelongated fashion. The ferruginous concretion in entiresandy horizon is comparatively more in the upper partwhich is distinctly differentiated in field forming acolumn of 25 m thick concretionary sandstone lithounit(Fig.13). At few places surfaces climbing ripplelaminations have also been recorded (Fig.14). Thepebbly horizons are brownish to reddish and hardconglomeratic beds forming 25 m uppermost part ofthe succession and it is matrix-supported unitcontaining subrounded to rounded pebbles of quartzand feldspar.
LAMETA FORMATION
The Lameta name is derived from the Lameta ghat nearJabalpur (Madhya Pradesh) where they first noticed.In the study area the Lameta formation consist ofgrayish or brownish poorly compacted sandstone andit is exposed near Ghorpend village. It also recorded inadjoining area of east of Belkher and north of Pandhariand north of Kalbhara and Narha village. Thesuccession shows a confirmable relationship withGondwana sediments. It has dip of about 160 to 220 toN and E to W strike. The thickness of Lameta sedimentsis varying from 5 to 6 m however some places thethickness is more than 8 to 9 m thick are recorded.Lameta sediments along with the Upper Gondwanaformation are exposed as tectonic inliers in thewidespread Deccan trap country due to the E–Wtrending Satpura fault (Fig. 2). Two such inliers arelocated at Salbardi and Belkher area of which theprevious lies at about 60 kms east of later. Quartz-feldsphathic gneiss of Archaean age forms thebasement and is well exposed at Salbardi area.Lithosections of the Lameta succession exposed atSalbardi (34 m) and Belkher (47 m) area are more or lesssimilar. The contact of the Upper Gondwana and theLameta rocks is sharp and well exposed in Salbardiarea represented by coarse grained, pebbly sandstonesof Upper Gondwana, underlying the reddish brown,medium grained, poorly cemented sandstones of theLameta formation (Fig. 15).
The lithosections is occupied by 1 to 5 m of moderatelyreddish brown, grayish to brownish black and mediumto coarse grained dominantly thinly bedded sandstoneunits at the base. These are poorly cemented and friableunits. Sedimentary structures are represented bypoorly preserved plane beddings and small scale crossbeddings (Fig.16). The clay rich units of both thesuccessions are grayish green, reddish brown andyellowish in colors with increasing quantity of siliceousand calcareous contents and it grades to siltstone and
marl.Sedimentary structures are showing softhorizontal laminations at a few places and clay is mixedwith whitish thin film of gypsum and the yellowishclay shows sub spherical nodules of 10 to15 cmdiameters. The upper part of both the lithosections arealmost similar and represented by nodular certified andbrecciated limestone. The nodular limestone is bluishgray micritic with varying proportions of chert clasts(Fig. 17). The brecciated limestone is well exposed atSalbardi area in which angular fragments of nodularcherty limestone and dark coloured rock are embeddedin fine grained micritic carbonaceous cementingmaterials. The two calcrete horizons are recorded inSalbardi area. The lower horizon is about 2 m thick andcompact brecciated and micritic in nature (Srivastavaet al., 1995).
Characteristics of the Lameta in the study area are asfallows;i) It is a hard and compact, medium grain sandstone.ii) Calcareous silt with thin bed and presence of
ferruginous nodules.iii) Fine grain green certified limestone with
ferruginous concretion. The contact of upper mosthorizon and Deccan trap is expressed at the baseof 606 trap hill (Fig. 18).
ALLUVIUM
In the study area the black cotton soil and yellowishsoil are common and these are product of basaltic rock,sandstone, metamorphic gneiss. Alluvium is thetransported material due to action of running waterwhich is later on deposited. The beds of alluvium arevarying in the thickness and having the age fromPaleocene to recent which covers large part of thestudy area. The gravel and boulder are also common inthe study area which derived from debris of the traprock from adjoining Purna valley catchment area (Fig.2). The younger alluvium occurs along Wardha, Purnaand Maru River while older alluvial plains are seenalong Purna River. This alluvial plain is a flat surface oflarge aerial extent and gently sloping towards PurnaRivers. It represents earlier cycle of deposition and thebasement rocks beneath this plain are the Deccan trapswith uneven basement topography. The alluvial materialconsists of clays, sand and gravels. Maru River flowingacross the Salbardi area also shows the small patchesof the lose sand and gravel, Neogene boulder bed (Fig.19) and gravel extensively cover the base of Satpuradeposited by stream flowing downwards from themountain hill and makes contacts to the Quaternaryand quartzo-felspathic gneiss near Salbardi village (Fig.20).
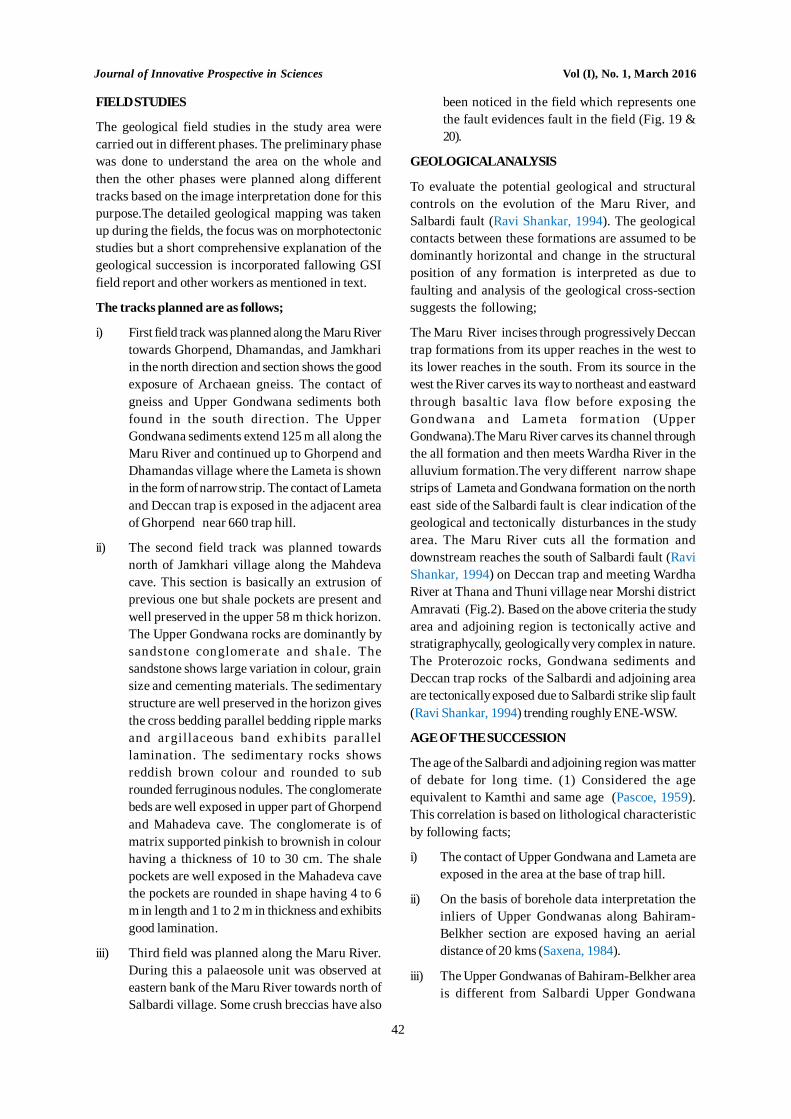
Journal of Innovative Prospective in Sciences Vol (I), No. 1, March 2016
42
FIELD STUDIES
The geological field studies in the study area werecarried out in different phases. The preliminary phasewas done to understand the area on the whole andthen the other phases were planned along differenttracks based on the image interpretation done for thispurpose.The detailed geological mapping was takenup during the fields, the focus was on morphotectonicstudies but a short comprehensive explanation of thegeological succession is incorporated fallowing GSIfield report and other workers as mentioned in text.
The tracks planned are as follows;
i) First field track was planned along the Maru Rivertowards Ghorpend, Dhamandas, and Jamkhariin the north direction and section shows the goodexposure of Archaean gneiss. The contact ofgneiss and Upper Gondwana sediments bothfound in the south direction. The UpperGondwana sediments extend 125 m all along theMaru River and continued up to Ghorpend andDhamandas village where the Lameta is shownin the form of narrow strip. The contact of Lametaand Deccan trap is exposed in the adjacent areaof Ghorpend near 660 trap hill.
ii) The second field track was planned towardsnorth of Jamkhari village along the Mahdevacave. This section is basically an extrusion ofprevious one but shale pockets are present andwell preserved in the upper 58 m thick horizon.The Upper Gondwana rocks are dominantly bysandstone conglomerate and shale. Thesandstone shows large variation in colour, grainsize and cementing materials. The sedimentarystructure are well preserved in the horizon givesthe cross bedding parallel bedding ripple marksand argillaceous band exhibits parallellamination. The sedimentary rocks showsreddish brown colour and rounded to subrounded ferruginous nodules. The conglomeratebeds are well exposed in upper part of Ghorpendand Mahadeva cave. The conglomerate is ofmatrix supported pinkish to brownish in colourhaving a thickness of 10 to 30 cm. The shalepockets are well exposed in the Mahadeva cavethe pockets are rounded in shape having 4 to 6m in length and 1 to 2 m in thickness and exhibitsgood lamination.
iii) Third field was planned along the Maru River.During this a palaeosole unit was observed ateastern bank of the Maru River towards north ofSalbardi village. Some crush breccias have also
been noticed in the field which represents onethe fault evidences fault in the field (Fig. 19 &20).
GEOLOGICAL ANALYSIS
To evaluate the potential geological and structuralcontrols on the evolution of the Maru River, andSalbardi fault (Ravi Shankar, 1994). The geologicalcontacts between these formations are assumed to bedominantly horizontal and change in the structuralposition of any formation is interpreted as due tofaulting and analysis of the geological cross-sectionsuggests the following;
The Maru River incises through progressively Deccantrap formations from its upper reaches in the west toits lower reaches in the south. From its source in thewest the River carves its way to northeast and eastwardthrough basaltic lava flow before exposing theGondwana and Lameta formation (UpperGondwana).The Maru River carves its channel throughthe all formation and then meets Wardha River in thealluvium formation.The very different narrow shapestrips of Lameta and Gondwana formation on the northeast side of the Salbardi fault is clear indication of thegeological and tectonically disturbances in the studyarea. The Maru River cuts all the formation anddownstream reaches the south of Salbardi fault (RaviShankar, 1994) on Deccan trap and meeting WardhaRiver at Thana and Thuni village near Morshi districtAmravati (Fig.2). Based on the above criteria the studyarea and adjoining region is tectonically active andstratigraphycally, geologically very complex in nature.The Proterozoic rocks, Gondwana sediments andDeccan trap rocks of the Salbardi and adjoining areaare tectonically exposed due to Salbardi strike slip fault(Ravi Shankar, 1994) trending roughly ENE-WSW.
AGE OF THE SUCCESSION
The age of the Salbardi and adjoining region was matterof debate for long time. (1) Considered the ageequivalent to Kamthi and same age (Pascoe, 1959).This correlation is based on lithological characteristicby following facts;
i) The contact of Upper Gondwana and Lameta areexposed in the area at the base of trap hill.
ii) On the basis of borehole data interpretation theinliers of Upper Gondwanas along Bahiram-Belkher section are exposed having an aerialdistance of 20 kms (Saxena, 1984).
iii) The Upper Gondwanas of Bahiram-Belkher areais different from Salbardi Upper Gondwana
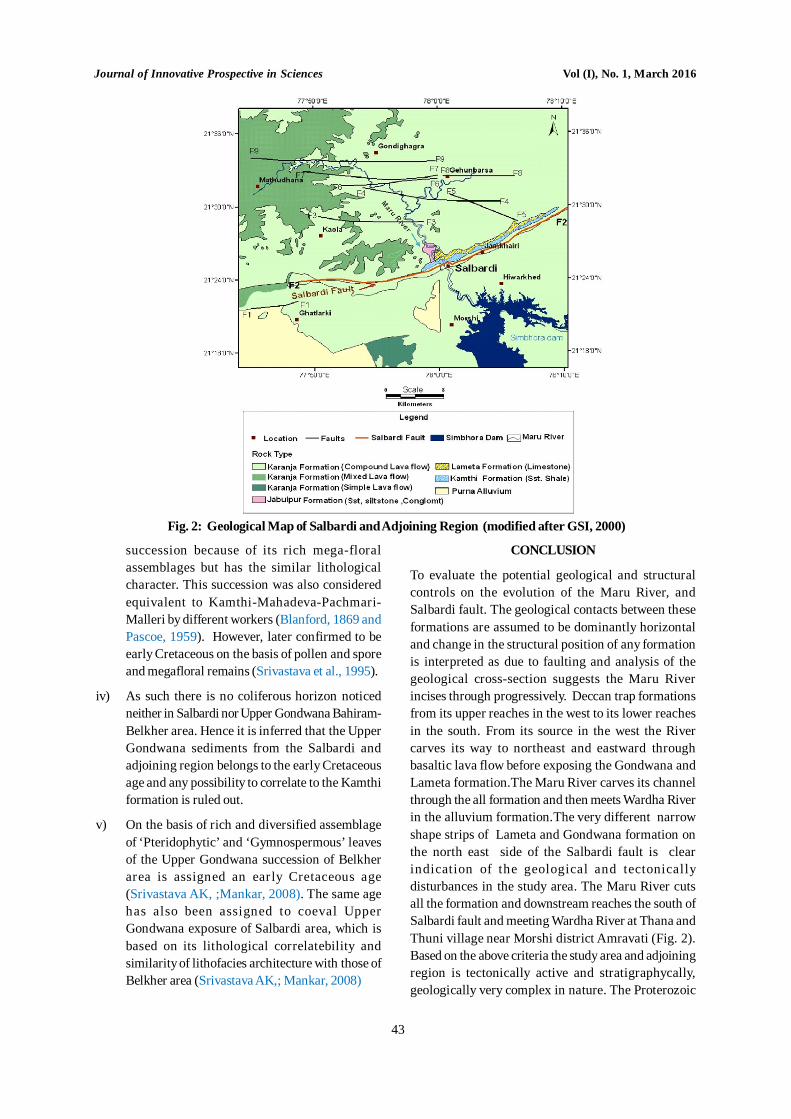
Journal of Innovative Prospective in Sciences Vol (I), No. 1, March 2016
43
Fig. 2: Geological Map of Salbardi and Adjoining Region (modified after GSI, 2000)
succession because of its rich mega-floralassemblages but has the similar lithologicalcharacter. This succession was also consideredequivalent to Kamthi-Mahadeva-Pachmari-Malleri by different workers (Blanford, 1869 andPascoe, 1959). However, later confirmed to beearly Cretaceous on the basis of pollen and sporeand megafloral remains (Srivastava et al., 1995).
iv) As such there is no coliferous horizon noticedneither in Salbardi nor Upper Gondwana Bahiram-Belkher area. Hence it is inferred that the UpperGondwana sediments from the Salbardi andadjoining region belongs to the early Cretaceousage and any possibility to correlate to the Kamthiformation is ruled out.
v) On the basis of rich and diversified assemblageof ‘Pteridophytic’ and ‘Gymnospermous’ leavesof the Upper Gondwana succession of Belkherarea is assigned an early Cretaceous age(Srivastava AK, ;Mankar, 2008). The same agehas also been assigned to coeval UpperGondwana exposure of Salbardi area, which isbased on its lithological correlatebility andsimilarity of lithofacies architecture with those ofBelkher area (Srivastava AK,; Mankar, 2008)
CONCLUSION
To evaluate the potential geological and structuralcontrols on the evolution of the Maru River, andSalbardi fault. The geological contacts between theseformations are assumed to be dominantly horizontaland change in the structural position of any formationis interpreted as due to faulting and analysis of thegeological cross-section suggests the Maru Riverincises through progressively. Deccan trap formationsfrom its upper reaches in the west to its lower reachesin the south. From its source in the west the Rivercarves its way to northeast and eastward throughbasaltic lava flow before exposing the Gondwana andLameta formation.The Maru River carves its channelthrough the all formation and then meets Wardha Riverin the alluvium formation.The very different narrowshape strips of Lameta and Gondwana formation onthe north east side of the Salbardi fault is clearindication of the geological and tectonicallydisturbances in the study area. The Maru River cutsall the formation and downstream reaches the south ofSalbardi fault and meeting Wardha River at Thana andThuni village near Morshi district Amravati (Fig. 2).Based on the above criteria the study area and adjoiningregion is tectonically active and stratigraphycally,geologically very complex in nature. The Proterozoic
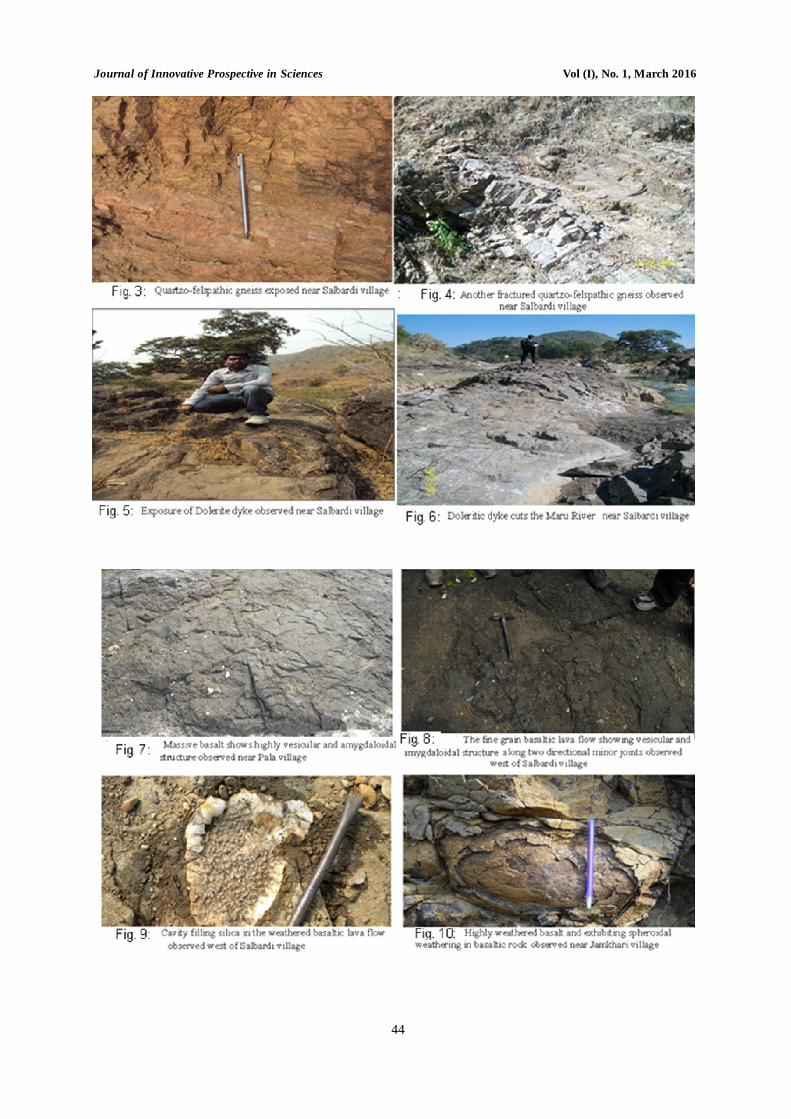
Journal of Innovative Prospective in Sciences Vol (I), No. 1, March 2016
44
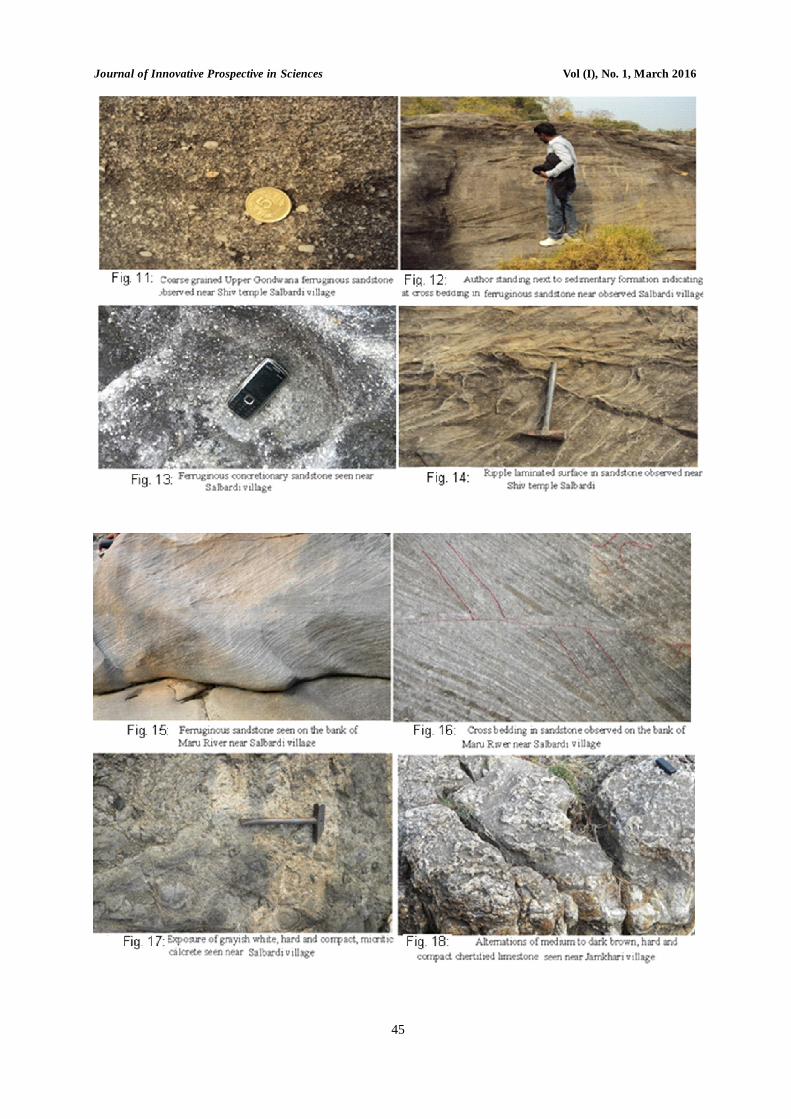
Journal of Innovative Prospective in Sciences Vol (I), No. 1, March 2016
45
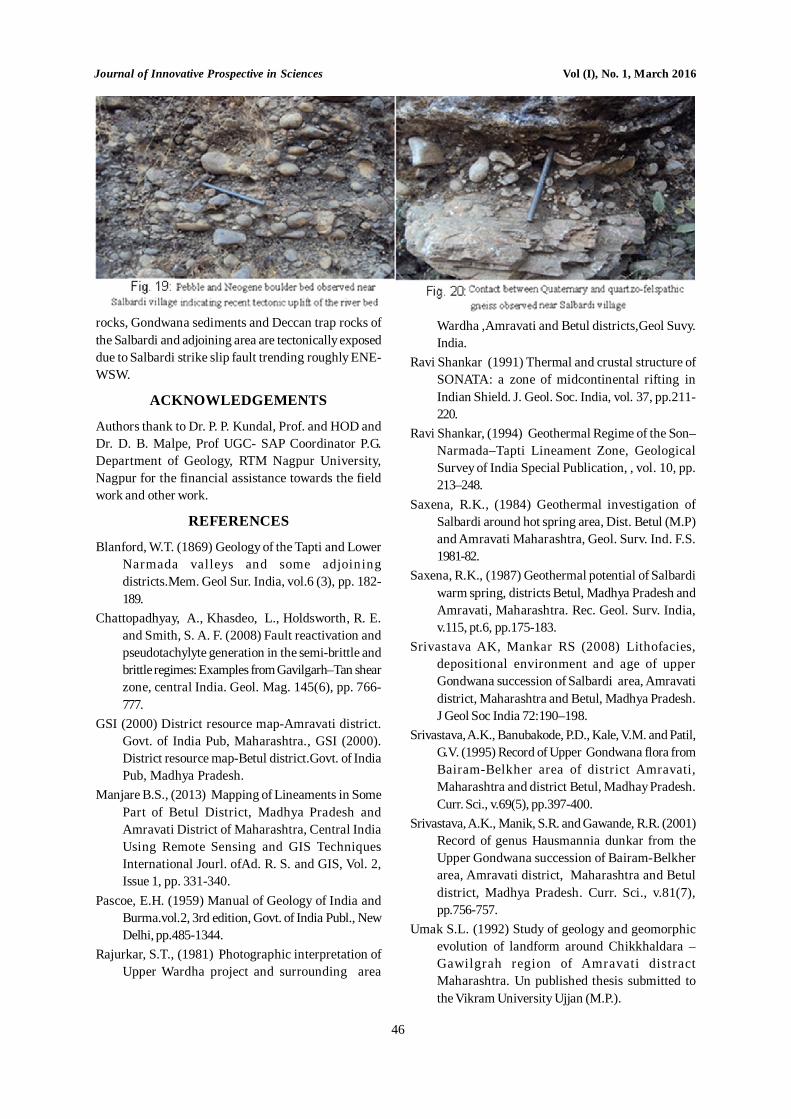
Journal of Innovative Prospective in Sciences Vol (I), No. 1, March 2016
46
rocks, Gondwana sediments and Deccan trap rocks ofthe Salbardi and adjoining area are tectonically exposeddue to Salbardi strike slip fault trending roughly ENE-WSW.
ACKNOWLEDGEMENTS
Authors thank to Dr. P. P. Kundal, Prof. and HOD andDr. D. B. Malpe, Prof UGC- SAP Coordinator P.G.Department of Geology, RTM Nagpur University,Nagpur for the financial assistance towards the fieldwork and other work.
REFERENCES
Blanford, W.T. (1869) Geology of the Tapti and LowerNarmada valleys and some adjoiningdistricts.Mem. Geol Sur. India, vol.6 (3), pp. 182-189.
Chattopadhyay, A., Khasdeo, L., Holdsworth, R. E.and Smith, S. A. F. (2008) Fault reactivation andpseudotachylyte generation in the semi-brittle andbrittle regimes: Examples from Gavilgarh–Tan shearzone, central India. Geol. Mag. 145(6), pp. 766-777.
GSI (2000) District resource map-Amravati district.Govt. of India Pub, Maharashtra., GSI (2000).District resource map-Betul district.Govt. of IndiaPub, Madhya Pradesh.
Manjare B.S., (2013) Mapping of Lineaments in SomePart of Betul District, Madhya Pradesh andAmravati District of Maharashtra, Central IndiaUsing Remote Sensing and GIS TechniquesInternational Jourl. ofAd. R. S. and GIS, Vol. 2,Issue 1, pp. 331-340.
Pascoe, E.H. (1959) Manual of Geology of India andBurma.vol.2, 3rd edition, Govt. of India Publ., NewDelhi, pp.485-1344.
Rajurkar, S.T., (1981) Photographic interpretation ofUpper Wardha project and surrounding area
Wardha ,Amravati and Betul districts,Geol Suvy.India.
Ravi Shankar (1991) Thermal and crustal structure ofSONATA: a zone of midcontinental rifting inIndian Shield. J. Geol. Soc. India, vol. 37, pp.211-220.
Ravi Shankar, (1994) Geothermal Regime of the Son–Narmada–Tapti Lineament Zone, GeologicalSurvey of India Special Publication, , vol. 10, pp.213–248.
Saxena, R.K., (1984) Geothermal investigation ofSalbardi around hot spring area, Dist. Betul (M.P)and Amravati Maharashtra, Geol. Surv. Ind. F.S.1981-82.
Saxena, R.K., (1987) Geothermal potential of Salbardiwarm spring, districts Betul, Madhya Pradesh andAmravati, Maharashtra. Rec. Geol. Surv. India,v.115, pt.6, pp.175-183.
Srivastava AK, Mankar RS (2008) Lithofacies,depositional environment and age of upperGondwana succession of Salbardi area, Amravatidistrict, Maharashtra and Betul, Madhya Pradesh.J Geol Soc India 72:190–198.
Srivastava, A.K., Banubakode, P.D., Kale, V.M. and Patil,G.V. (1995) Record of Upper Gondwana flora fromBairam-Belkher area of district Amravati,Maharashtra and district Betul, Madhay Pradesh.Curr. Sci., v.69(5), pp.397-400.
Srivastava, A.K., Manik, S.R. and Gawande, R.R. (2001)Record of genus Hausmannia dunkar from theUpper Gondwana succession of Bairam-Belkherarea, Amravati district, Maharashtra and Betuldistrict, Madhya Pradesh. Curr. Sci., v.81(7),pp.756-757.
Umak S.L. (1992) Study of geology and geomorphicevolution of landform around Chikkhaldara –Gawilgrah region of Amravati distractMaharashtra. Un published thesis submitted tothe Vikram University Ujjan (M.P.).
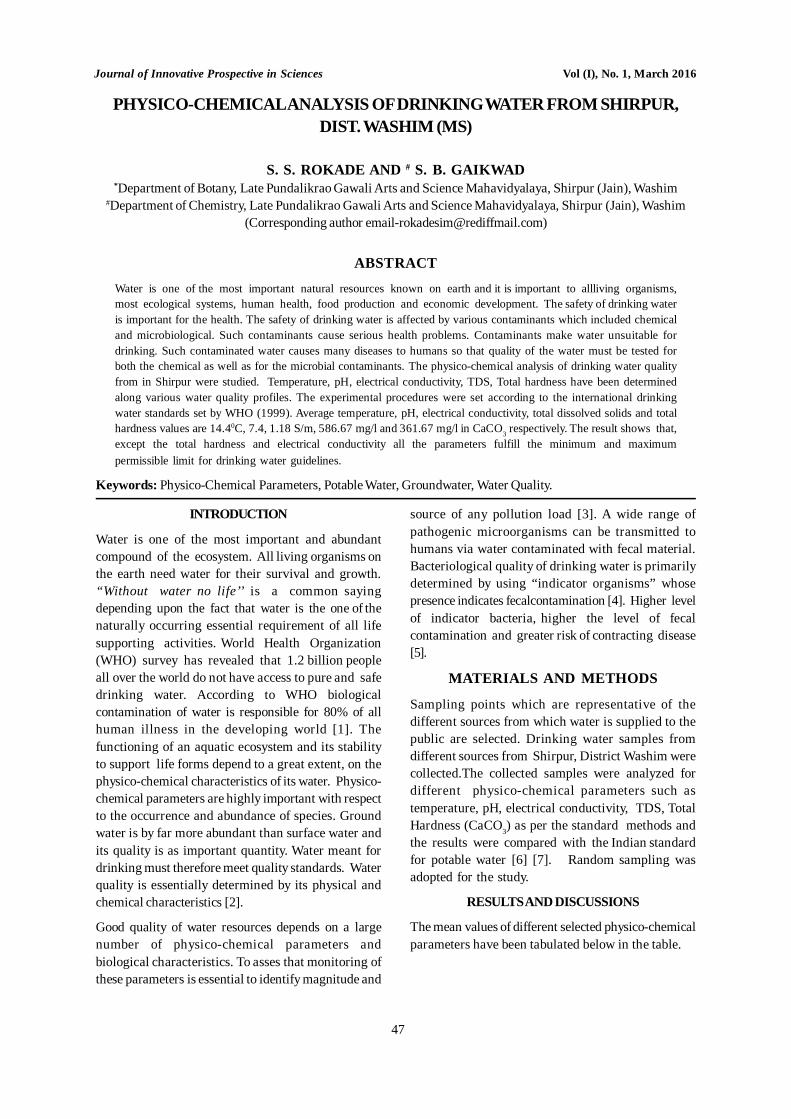
Journal of Innovative Prospective in Sciences Vol (I), No. 1, March 2016
47
INTRODUCTION
Water is one of the most important and abundantcompound of the ecosystem. All living organisms onthe earth need water for their survival and growth.“Without water no life’’ is a common sayingdepending upon the fact that water is the one of thenaturally occurring essential requirement of all lifesupporting activities. World Health Organization(WHO) survey has revealed that 1.2 billion peopleall over the world do not have access to pure and safedrinking water. According to WHO biologicalcontamination of water is responsible for 80% of allhuman illness in the developing world [1]. Thefunctioning of an aquatic ecosystem and its stabilityto support life forms depend to a great extent, on thephysico-chemical characteristics of its water. Physico-chemical parameters are highly important with respectto the occurrence and abundance of species. Groundwater is by far more abundant than surface water andits quality is as important quantity. Water meant fordrinking must therefore meet quality standards. Waterquality is essentially determined by its physical andchemical characteristics [2].
Good quality of water resources depends on a largenumber of physico-chemical parameters andbiological characteristics. To asses that monitoring ofthese parameters is essential to identify magnitude and
source of any pollution load [3]. A wide range ofpathogenic microorganisms can be transmitted tohumans via water contaminated with fecal material.Bacteriological quality of drinking water is primarilydetermined by using “indicator organisms” whosepresence indicates fecalcontamination [4]. Higher levelof indicator bacteria, higher the level of fecalcontamination and greater risk of contracting disease[5].
MATERIALS AND METHODS
Sampling points which are representative of thedifferent sources from which water is supplied to thepublic are selected. Drinking water samples fromdifferent sources from Shirpur, District Washim werecollected.The collected samples were analyzed fordifferent physico-chemical parameters such astemperature, pH, electrical conductivity, TDS, TotalHardness (CaCO3) as per the standard methods andthe results were compared with the Indian standardfor potable water [6] [7]. Random sampling wasadopted for the study.
RESULTS AND DISCUSSIONS
The mean values of different selected physico-chemicalparameters have been tabulated below in the table.
PHYSICO-CHEMICAL ANALYSIS OF DRINKING WATER FROM SHIRPUR,DIST. WASHIM (MS)
S. S. ROKADE AND # S. B. GAIKWAD*Department of Botany, Late Pundalikrao Gawali Arts and Science Mahavidyalaya, Shirpur (Jain), Washim
#Department of Chemistry, Late Pundalikrao Gawali Arts and Science Mahavidyalaya, Shirpur (Jain), Washim(Corresponding author [email protected])
ABSTRACT
Water is one of the most important natural resources known on earth and it is important to allliving organisms,most ecological systems, human health, food production and economic development. The safety of drinking wateris important for the health. The safety of drinking water is affected by various contaminants which included chemicaland microbiological. Such contaminants cause serious health problems. Contaminants make water unsuitable fordrinking. Such contaminated water causes many diseases to humans so that quality of the water must be tested forboth the chemical as well as for the microbial contaminants. The physico-chemical analysis of drinking water qualityfrom in Shirpur were studied. Temperature, pH, electrical conductivity, TDS, Total hardness have been determinedalong various water quality profiles. The experimental procedures were set according to the international drinkingwater standards set by WHO (1999). Average temperature, pH, electrical conductivity, total dissolved solids and totalhardness values are 14.40C, 7.4, 1.18 S/m, 586.67 mg/l and 361.67 mg/l in CaCO3 respectively. The result shows that,except the total hardness and electrical conductivity all the parameters fulfill the minimum and maximumpermissible limit for drinking water guidelines.
Keywords: Physico-Chemical Parameters, Potable Water, Groundwater, Water Quality.
Journal of Innovative Prospective in Sciences Vol (I), No. 1, March 2016
48
Temperature:
The temperatures of the samples were noted at thesampling point itself. The temperature was found to be14.7, 14.3 and 14.20C in the three sites (Fig.1). Duringthe present investigation, there was no great differencebetween the temperatures of the tap water from differentsources of ground water and it is related to the WHOstandards i.e. 15 0c [2].
Hydrogen Ion concentration (pH):
It is an important parameter in evaluating the acid-basebalance of water. Also it is the indicator of acidic oralkaline condition of water status. WHO hasrecommended maximum permissible limit of pH from6.5 to 8.5. Current investigations were 7.3, 7.5 and 7.4and are in the range of WHO standards (Fig.2). Theoverall result indicates that the water sources are withinthe desirable and suitable range [2].
Total Dissolved Solids (TDS):
The water with high TDS value indicates that water ishighly mineralized. Desirable limit for TDS is 500 mg/land maximum limit is 1000 mg/l prescribed for drinkingpurpose. In present study the concentration of TDS isobserved in the range of 575 and 595 mg/l (Fig. 3). Themean total dissolved solids concentration in Shirpurtap water was found to be 586.67 mg/L and it is withinthe limit. High values of TDS in ground water aregenerally not harmful to human beings but highconcentration of these may affect persons, who aresuffering from kidney and heart diseases. Watercontaining high solid may cause laxative orconstipation effects. Potable water should not containmore than 1000 mg/l of total dissolved solids (TDS)[8].
Total Hardness:
The present investigation shows the average value ofhardness361.67 mg/l in CaCO3with in all the sampling
sites (Fig. 4). All of the samples within the maximumpermissible limits of WHO and standards [9].
Electrical Conductivity (EC):
Electrical conductivity (EC) is a measure of watercapacity to convey electric current and depends onthe concentration of ions and load of nutrients. Asmost of the salts in water are present in ionic forms,they make water capable for conducting current. It isalso an excellent indicator of TDS, which is a measureof salinity that affects the taste of potable water.Theconductivity, thus serves as a good and rapid measureof the total dissolved solids in water (Fig. 5). Theelectrical conductivity (EC) of the tap water samplesare 1.15, 1.19 and 1.20 respectively.
Fig. 1: Temperature (0c) values of water sample
Fig. 2: pH values of water samples
Table 1:Physico-chemical parameters for drinking water collected from study sites of Shirpur
S. N. Parameter Obtained values WHO values
S 1 S 2 S 3
1 Temperature 14.70C 14.30C 14.20C Not exceed 150C
2 pH 7.3 7.5 7.4 6.5 to 8.5
3 Total dissolved Solids 590 mg/l 575 mg/l 595 mg/l 500/1000 mg/l
4 Total hardness 360 mg/l CaCO3 350 mg/l CaCO3 375 mg/l CaCO3 500 mg/l
5 Electrical conductivity 1.15 S/m 1.19 S/m 1.20 S/m 3S/m
S-Sample
Journal of Innovative Prospective in Sciences Vol (I), No. 1, March 2016
49
Fig. 3: Total dissolved solids (mg/l) values of watersamples
Fig.4: Total hardness (mg/l in CaCO3) values ofwater samples
Fig .5 : Electrical conductivity (S/m) values of watersamples
CONCLUSIONS
A comparative study of both type of open wellwater was carried out by taking certain importantparameters like temperature, pH, total dissolvedsolid, conductivity and total hardness. The resultobtained during study was compared with ISIstandards. Potable water is water safe enough to beconsumed by humans or used with low risk of
immediate or long term harm. The study assessed theevolution of water quality in tap water from agroundwater source of Shirpur. In this presentinvestigation it was found that the maximum parameterswere not at a level of pollution and water quality ofShirpur region in rural area of well water is not harmfulto human being.
REFERENCES
Wright J., Gundry S. and Conry R. (2004) House holddrinking water in developing countries; Asystemic review of microbiologicalcontamination between source and point ofuse. Trop Med Int Health; 9 (1): 106-117.
WHO, ( 2004) Guidelines for drinking water quality. 3rdedn. World Health Organisation, Geneva.
Ushie F. A. and Amadi, P. A. (2008) Chemicalcharacteristics of ground water from parts ofthe basement complex of Oban massif andObudu Plateau, South Eastern Nigeria.Scientia A fricana; 7 (2):
Duling W. and Wanda F. (2008) Evaluation of mediafor simultaneous enumeration of total coliformand Escherichia Coli in drinking watersupplies by membrane filtration techniques. JEnviron Sci; 20: 273-77.
Alonso J. L., Amoroj I., Chang S. and Garelick H.(1996) Quantitative determination of E. coli inwater using CH-ROM agar E. Coli. JMicrobial Meth; 25: 309-15.
Indian Council of Medical Research (ICMR) (1975)Manual of standard of quality of drinkingwater supplies 2nd ed. Special report series no.44 New Delhi.
APHA, (1998) Standard Methods for the Examinationof Water and Waste Water. 20 th edition,American Public Health AssociationWashington D.C.
Sasikaran S., Sritharan K., Bala kumar S. andArasaratnam V. (2012). Physical, chemical andmicrobial analysis of bottled drinking water.Ceylon Medical Journal. 57(3): 111-116.
Kawther F. and Alwakeel S. (2007) Mineral andmicrobial contents of bottled and tap water inRiyadh, Saudi Arabia. Middle-East Journal ofScientific Research; 3: 151-6.
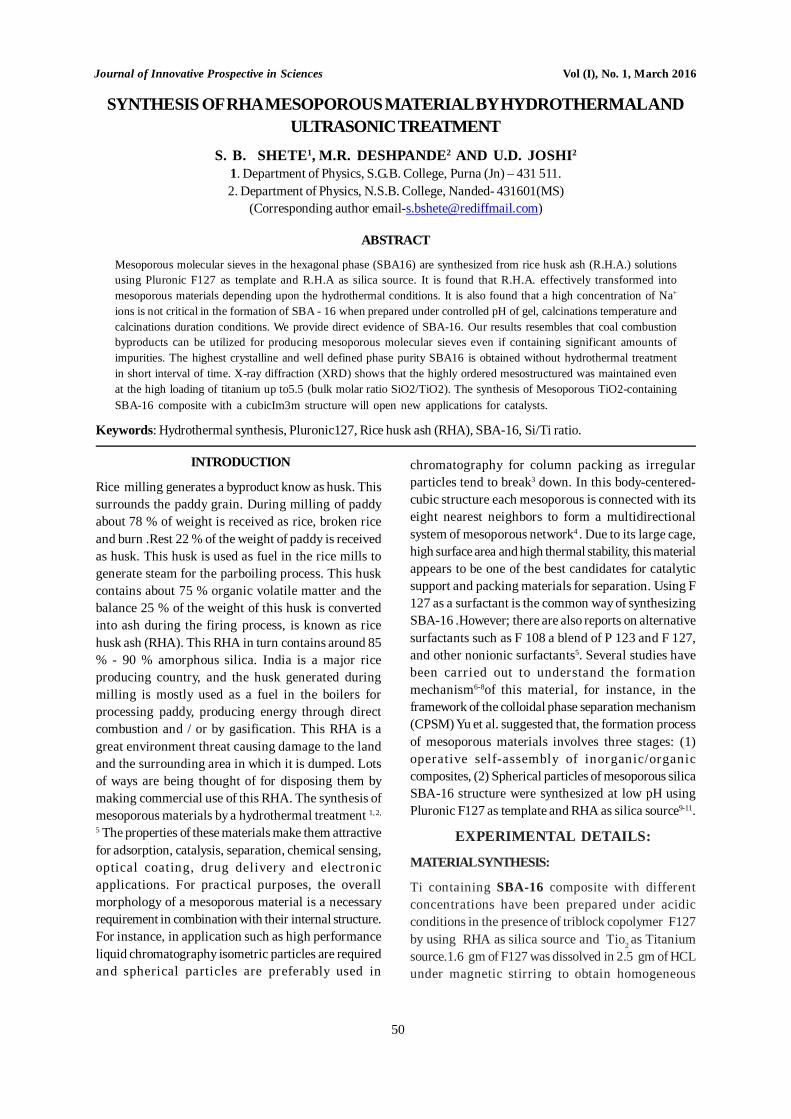
Journal of Innovative Prospective in Sciences Vol (I), No. 1, March 2016
50
INTRODUCTION
Rice milling generates a byproduct know as husk. Thissurrounds the paddy grain. During milling of paddyabout 78 % of weight is received as rice, broken riceand burn .Rest 22 % of the weight of paddy is receivedas husk. This husk is used as fuel in the rice mills togenerate steam for the parboiling process. This huskcontains about 75 % organic volatile matter and thebalance 25 % of the weight of this husk is convertedinto ash during the firing process, is known as ricehusk ash (RHA). This RHA in turn contains around 85% - 90 % amorphous silica. India is a major riceproducing country, and the husk generated duringmilling is mostly used as a fuel in the boilers forprocessing paddy, producing energy through directcombustion and / or by gasification. This RHA is agreat environment threat causing damage to the landand the surrounding area in which it is dumped. Lotsof ways are being thought of for disposing them bymaking commercial use of this RHA. The synthesis ofmesoporous materials by a hydrothermal treatment 1, 2,
5 The properties of these materials make them attractivefor adsorption, catalysis, separation, chemical sensing,optical coating, drug delivery and electronicapplications. For practical purposes, the overallmorphology of a mesoporous material is a necessaryrequirement in combination with their internal structure.For instance, in application such as high performanceliquid chromatography isometric particles are requiredand spherical particles are preferably used in
chromatography for column packing as irregularparticles tend to break3 down. In this body-centered-cubic structure each mesoporous is connected with itseight nearest neighbors to form a multidirectionalsystem of mesoporous network4 . Due to its large cage,high surface area and high thermal stability, this materialappears to be one of the best candidates for catalyticsupport and packing materials for separation. Using F127 as a surfactant is the common way of synthesizingSBA-16 .However; there are also reports on alternativesurfactants such as F 108 a blend of P 123 and F 127,and other nonionic surfactants5. Several studies havebeen carried out to understand the formationmechanism6-8of this material, for instance, in theframework of the colloidal phase separation mechanism(CPSM) Yu et al. suggested that, the formation processof mesoporous materials involves three stages: (1)operative self-assembly of inorganic/organiccomposites, (2) Spherical particles of mesoporous silicaSBA-16 structure were synthesized at low pH usingPluronic F127 as template and RHA as silica source9-11.
EXPERIMENTAL DETAILS:
MATERIAL SYNTHESIS:
Ti containing SBA-16 composite with differentconcentrations have been prepared under acidicconditions in the presence of triblock copolymer F127by using RHA as silica source and Tio2 as Titaniumsource.1.6 gm of F127 was dissolved in 2.5 gm of HCLunder magnetic stirring to obtain homogeneous
SYNTHESIS OF RHA MESOPOROUS MATERIAL BY HYDROTHERMAL ANDULTRASONIC TREATMENT
S. B. SHETE1, M.R. DESHPANDE2 AND U.D. JOSHI2
1. Department of Physics, S.G.B. College, Purna (Jn) – 431 511.2. Department of Physics, N.S.B. College, Nanded- 431601(MS)
(Corresponding author [email protected])
ABSTRACT
Mesoporous molecular sieves in the hexagonal phase (SBA16) are synthesized from rice husk ash (R.H.A.) solutionsusing Pluronic F127 as template and R.H.A as silica source. It is found that R.H.A. effectively transformed intomesoporous materials depending upon the hydrothermal conditions. It is also found that a high concentration of Na+
ions is not critical in the formation of SBA - 16 when prepared under controlled pH of gel, calcinations temperature andcalcinations duration conditions. We provide direct evidence of SBA-16. Our results resembles that coal combustionbyproducts can be utilized for producing mesoporous molecular sieves even if containing significant amounts ofimpurities. The highest crystalline and well defined phase purity SBA16 is obtained without hydrothermal treatmentin short interval of time. X-ray diffraction (XRD) shows that the highly ordered mesostructured was maintained evenat the high loading of titanium up to5.5 (bulk molar ratio SiO2/TiO2). The synthesis of Mesoporous TiO2-containingSBA-16 composite with a cubicIm3m structure will open new applications for catalysts.
Keywords: Hydrothermal synthesis, Pluronic127, Rice husk ash (RHA), SBA-16, Si/Ti ratio.
Journal of Innovative Prospective in Sciences Vol (I), No. 1, March 2016
51
solution at 300c to this solution was added Si/Ti molarratio of 10 after the mixed solution was furthervigorously stirred for 30 min. The mixture solution wasfurther stirred for another 24 hours .Ultrasonic treatmentis given at power 70 for 30 min.Then the solution istaken Teflon coated autoclave and heated at 800c for24h .The synthesized Sio2/ Tio2 mesoporous compositewas filtered and dried in air .The sample is calcined at1.5oc/ min.at 5500c for 6h.
RESULTS AND DISCUSSION
The XRD pattern of rice husk Ash (RHA) shown inFig.1.The different minerals have different unit cellcomposition, therefore XRD technique allows forqualitative identification of the phases present in thecollected mineral. The XRD peak information isimportant to quantity changes in the composition ofQuartz and Mullite reactants that affecting reactionconditions of hydrothermal synthesis of materials andreaction products12-15.
The X-ray pattern of the synthesized mesoporous silicamaterial is highly periodic silica phases which arenormally reflected by the distinct X-RD signatures atlow angles from 10 to 300 as shown in Fig 1. Sharpsignal in XRD spectra indicates the presence of longrange order of uniform hexagonal phase in themesoporous materials. The well defined reflections fromplane are a prime characteristics of the hexagonal latticesymmetry of the SBA16 structure.
The observation of three higher angle reflections otherthan d110 indicates that the product is likely to possessthe symmetrical hexagonal pore structure typical ofSBA16. X-ray diffraction data therefore indicates thatthe supernatant of the fly ash can be successfully usedin the synthesis gel to prepare mesoporous materials16-
18.
CONCLUSIONS
The experimental study it was concluded that pure andordered SBA16 material could be successfullysynthesized from Rice husk ash at room temperatureduring 24 hrs of reaction19,20. The parametric variationssuch as change of calcination temperature, the changeof calcination time duration and the change of initialpH value of gel suggested that from RHA the wellordered mesoporous material SBA16 can besynthesized at 5500C for 4 hrs. The maximum calculatedBET surface area amounts is779.70 m2/g for the SBA16materials keeping pH of gel 6.91, calcination time about4 h. at 5500C.
Fig.1 XRD of RHA-SBA-16
Fig.2 The FT-IR spectra of as synthesized SBA16from Rice husk ash
REFERENCES
F. Hoffmann, M. Cornelius, J. Morell and M. Froba,Angew. 2006 Chem.Int. Ed., 45, 3216.
Q. Yang, J. Liu, L. Zhang and C. Li, 2009 J. Mater.Chem., , 19, 1945.
H. Xiong, Y. Zhang, S. Wang, K. Liew and J. Li, 2008 J.Phys. Chem. C, 112, 9706.
W. Zhou, J. M. Thomas, D. S. Shephard, B. F. G.Johnson, D. Ozkaya, T. Maschmeyer,
R.G. Bell and Q. Ge, 1998 Science, 280, 705.
Journal of Innovative Prospective in Sciences Vol (I), No. 1, March 2016
52
B. J. Scott, G. Wirnsberger and G. D. Stucky, 2001Chem. Mater., 13, 3140.
X. Gao and S. Nie, 2003 J. Phys. Chem. B, 107, 11575.
B. Lei, B. Li, H. Zhang, L. Zhang and W. Li, J. 2007Phys. Chem. C, 111, 11291.
J. Feng, H. J. Zhang, C. Y. Peng, J. B. Yu, R. P. Deng, L.N. Sun and X. M. Guo, 2008, MicroporousMesoporous Mater., 113, 402.
S.Wang, Microporous Mesoporous Mater., 2009, 117,1.
M. Vallet-Regi, F. Balas and D. Arcos, Angew. 2007Chem., Int. Ed., 46, 7548.
J. Kim, Y. Piao and T. Hyeon, 2009, Chem. Soc. Rev., 38,372.
F. Carniato, L. Tei, W. Dastru‘, L. Marchese and M.Botta, 2009 Chem.Commun., 1246.
F. Carniato, C. Bisio, G. Paul, G. Gatti, L. Bertinetti, S.Colucciaand L. Marchese, J. Mater. 2010,Chem., 20(26), 5504.
J. Y. Ying, C. P. Mehnert and M. S. Wong, 1999 Angew.Chem., Int. Ed., 38, 56.
D. Zhao, Q. Huo, J. Feng, B. F. Chmelka and G. D.Stucky, 1998, J. Am. Chem. Soc., 120, 6024.
Y. Wan, Y. Shia and D. Zhao, 2007, Chem. Commun.,897.
F. Kleitz, L. A. Solovyov, G. M. Anilkumar, S. H. Choiand R. Ryoo, 2004, Chem. Commun., 1536.
Y. K. Hwang, J.-S.Chang, Y.-U.Kwon and S.-E. 2004,Park, Microporous Mesoporou Mater., 68, 21.
M.Mesa,L. Sierra, J. PatarinandJ.-L.Guth, Solid StateSci., 7, 990.
D. Li, X. Guan, J. Song, Y. Di, D. Zhang, X. Ge, L. Zhaoand F.-S.Xiao, 2005 Colloids Surf., 272, 194.
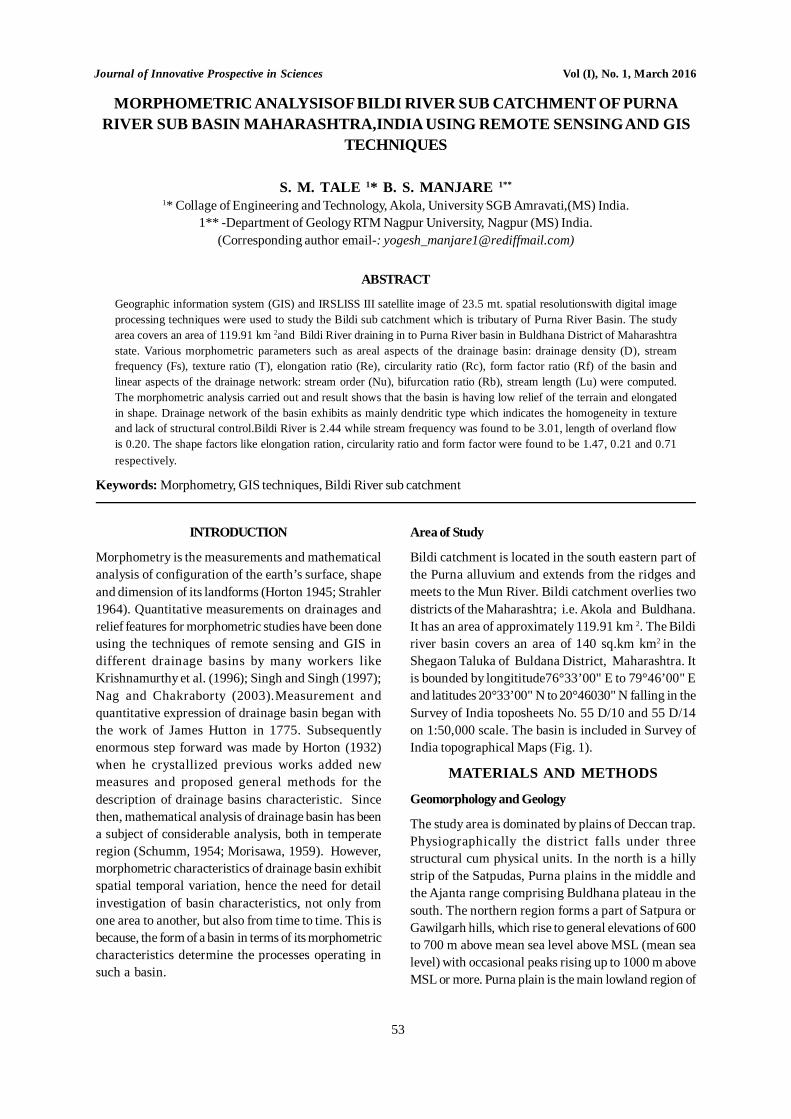
Journal of Innovative Prospective in Sciences Vol (I), No. 1, March 2016
53
INTRODUCTION
Morphometry is the measurements and mathematicalanalysis of configuration of the earth’s surface, shapeand dimension of its landforms (Horton 1945; Strahler1964). Quantitative measurements on drainages andrelief features for morphometric studies have been doneusing the techniques of remote sensing and GIS indifferent drainage basins by many workers likeKrishnamurthy et al. (1996); Singh and Singh (1997);Nag and Chakraborty (2003).Measurement andquantitative expression of drainage basin began withthe work of James Hutton in 1775. Subsequentlyenormous step forward was made by Horton (1932)when he crystallized previous works added newmeasures and proposed general methods for thedescription of drainage basins characteristic. Sincethen, mathematical analysis of drainage basin has beena subject of considerable analysis, both in temperateregion (Schumm, 1954; Morisawa, 1959). However,morphometric characteristics of drainage basin exhibitspatial temporal variation, hence the need for detailinvestigation of basin characteristics, not only fromone area to another, but also from time to time. This isbecause, the form of a basin in terms of its morphometriccharacteristics determine the processes operating insuch a basin.
Area of Study
Bildi catchment is located in the south eastern part ofthe Purna alluvium and extends from the ridges andmeets to the Mun River. Bildi catchment overlies twodistricts of the Maharashtra; i.e. Akola and Buldhana.It has an area of approximately 119.91 km 2. The Bildiriver basin covers an area of 140 sq.km km2 in theShegaon Taluka of Buldana District, Maharashtra. Itis bounded by longititude76°33’00" E to 79°46’00" Eand latitudes 20°33’00" N to 20°46030" N falling in theSurvey of India toposheets No. 55 D/10 and 55 D/14on 1:50,000 scale. The basin is included in Survey ofIndia topographical Maps (Fig. 1).
MATERIALS AND METHODS
Geomorphology and Geology
The study area is dominated by plains of Deccan trap.Physiographically the district falls under threestructural cum physical units. In the north is a hillystrip of the Satpudas, Purna plains in the middle andthe Ajanta range comprising Buldhana plateau in thesouth. The northern region forms a part of Satpura orGawilgarh hills, which rise to general elevations of 600to 700 m above mean sea level above MSL (mean sealevel) with occasional peaks rising up to 1000 m aboveMSL or more. Purna plain is the main lowland region of
MORPHOMETRIC ANALYSISOF BILDI RIVER SUB CATCHMENT OF PURNARIVER SUB BASIN MAHARASHTRA,INDIA USING REMOTE SENSING AND GIS
TECHNIQUES
S. M. TALE 1* B. S. MANJARE 1**
1* Collage of Engineering and Technology, Akola, University SGB Amravati,(MS) India.1** -Department of Geology RTM Nagpur University, Nagpur (MS) India.
(Corresponding author email-: [email protected])
ABSTRACT
Geographic information system (GIS) and IRSLISS III satellite image of 23.5 mt. spatial resolutionswith digital imageprocessing techniques were used to study the Bildi sub catchment which is tributary of Purna River Basin. The studyarea covers an area of 119.91 km 2and Bildi River draining in to Purna River basin in Buldhana District of Maharashtrastate. Various morphometric parameters such as areal aspects of the drainage basin: drainage density (D), streamfrequency (Fs), texture ratio (T), elongation ratio (Re), circularity ratio (Rc), form factor ratio (Rf) of the basin andlinear aspects of the drainage network: stream order (Nu), bifurcation ratio (Rb), stream length (Lu) were computed.The morphometric analysis carried out and result shows that the basin is having low relief of the terrain and elongatedin shape. Drainage network of the basin exhibits as mainly dendritic type which indicates the homogeneity in textureand lack of structural control.Bildi River is 2.44 while stream frequency was found to be 3.01, length of overland flowis 0.20. The shape factors like elongation ration, circularity ratio and form factor were found to be 1.47, 0.21 and 0.71respectively.
Keywords: Morphometry, GIS techniques, Bildi River sub catchment
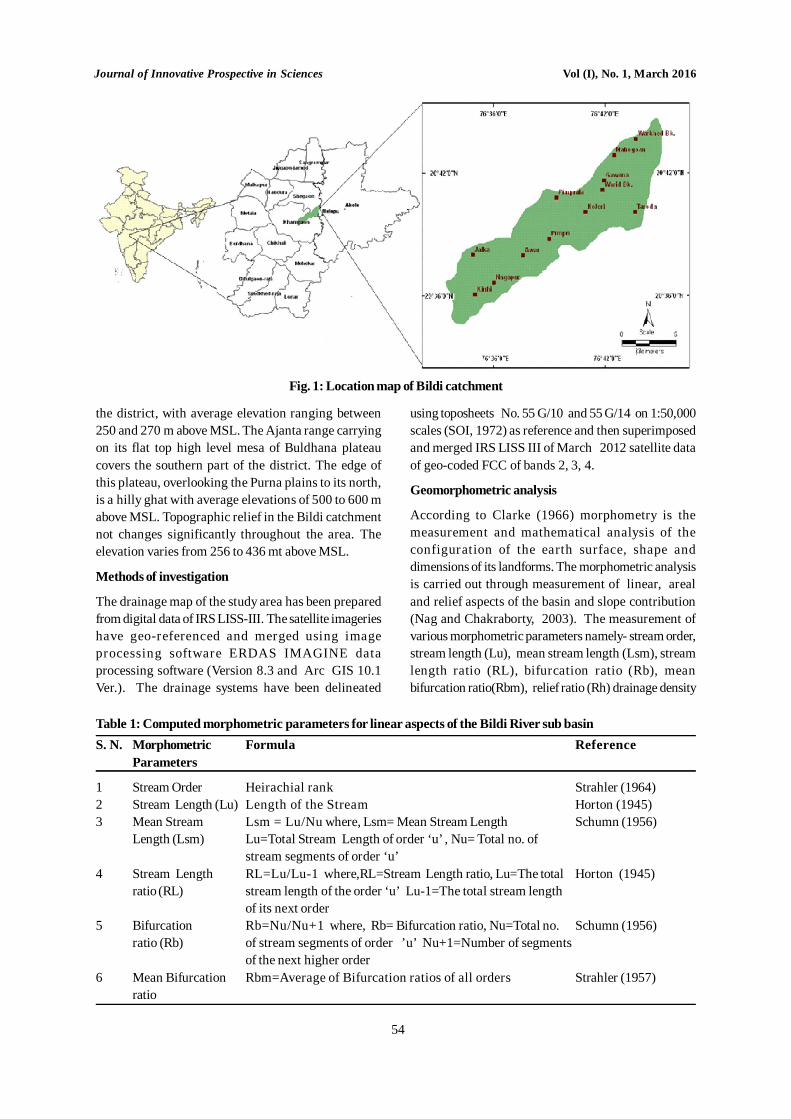
Journal of Innovative Prospective in Sciences Vol (I), No. 1, March 2016
54
the district, with average elevation ranging between250 and 270 m above MSL. The Ajanta range carryingon its flat top high level mesa of Buldhana plateaucovers the southern part of the district. The edge ofthis plateau, overlooking the Purna plains to its north,is a hilly ghat with average elevations of 500 to 600 mabove MSL. Topographic relief in the Bildi catchmentnot changes significantly throughout the area. Theelevation varies from 256 to 436 mt above MSL.
Methods of investigation
The drainage map of the study area has been preparedfrom digital data of IRS LISS-III. The satellite imagerieshave geo-referenced and merged using imageprocessing software ERDAS IMAGINE dataprocessing software (Version 8.3 and Arc GIS 10.1Ver.). The drainage systems have been delineated
using toposheets No. 55 G/10 and 55 G/14 on 1:50,000scales (SOI, 1972) as reference and then superimposedand merged IRS LISS III of March 2012 satellite dataof geo-coded FCC of bands 2, 3, 4.
Geomorphometric analysis
According to Clarke (1966) morphometry is themeasurement and mathematical analysis of theconfiguration of the earth surface, shape anddimensions of its landforms. The morphometric analysisis carried out through measurement of linear, arealand relief aspects of the basin and slope contribution(Nag and Chakraborty, 2003). The measurement ofvarious morphometric parameters namely- stream order,stream length (Lu), mean stream length (Lsm), streamlength ratio (RL), bifurcation ratio (Rb), meanbifurcation ratio(Rbm), relief ratio (Rh) drainage density
Fig. 1: Location map of Bildi catchment
Table 1: Computed morphometric parameters for linear aspects of the Bildi River sub basinS. N. Morphometric Formula Reference
Parameters
1 Stream Order Heirachial rank Strahler (1964)2 Stream Length (Lu) Length of the Stream Horton (1945)3 Mean Stream Lsm = Lu/Nu where, Lsm= Mean Stream Length Schumn (1956)
Length (Lsm) Lu=Total Stream Length of order ‘u’ , Nu= Total no. ofstream segments of order ‘u’
4 Stream Length RL=Lu/Lu-1 where,RL=Stream Length ratio, Lu=The total Horton (1945)ratio (RL) stream length of the order ‘u’ Lu-1=The total stream length
of its next order5 Bifurcation Rb=Nu/Nu+1 where, Rb= Bifurcation ratio, Nu=Total no. Schumn (1956)
ratio (Rb) of stream segments of order ’u’ Nu+1=Number of segmentsof the next higher order
6 Mean Bifurcation Rbm=Average of Bifurcation ratios of all orders Strahler (1957)ratio
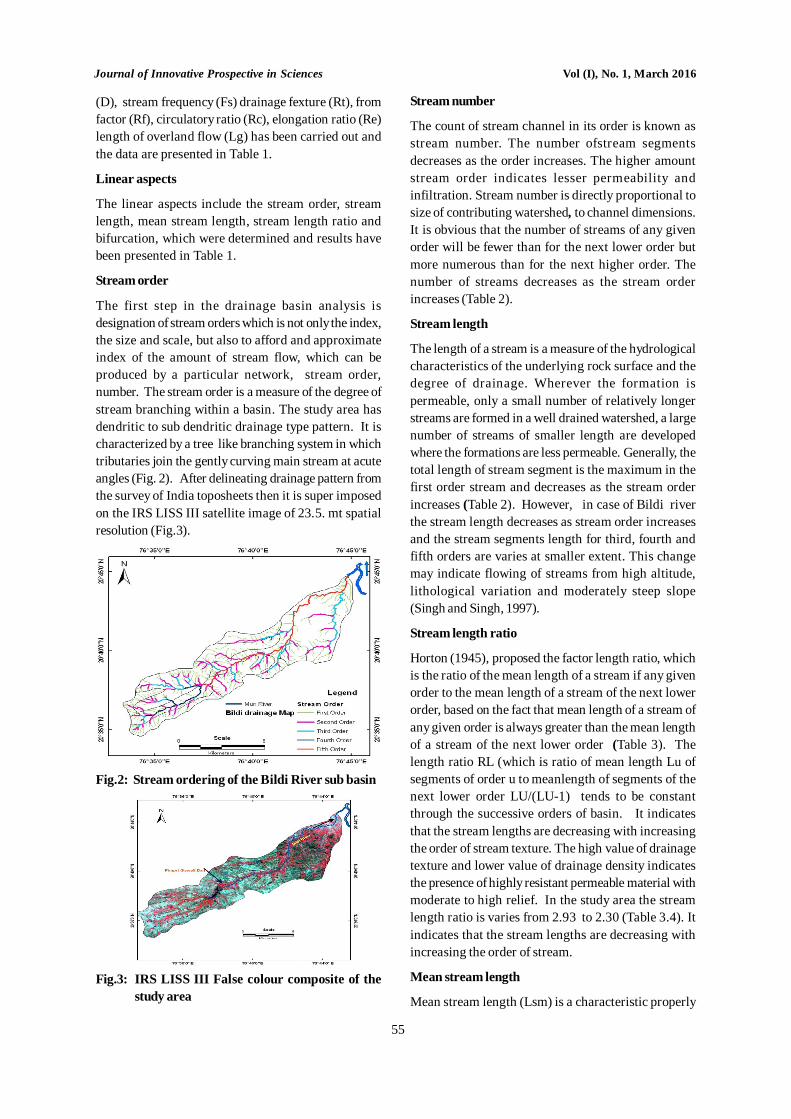
Journal of Innovative Prospective in Sciences Vol (I), No. 1, March 2016
55
(D), stream frequency (Fs) drainage fexture (Rt), fromfactor (Rf), circulatory ratio (Rc), elongation ratio (Re)length of overland flow (Lg) has been carried out andthe data are presented in Table 1.
Linear aspects
The linear aspects include the stream order, streamlength, mean stream length, stream length ratio andbifurcation, which were determined and results havebeen presented in Table 1.
Stream order
The first step in the drainage basin analysis isdesignation of stream orders which is not only the index,the size and scale, but also to afford and approximateindex of the amount of stream flow, which can beproduced by a particular network, stream order,number. The stream order is a measure of the degree ofstream branching within a basin. The study area hasdendritic to sub dendritic drainage type pattern. It ischaracterized by a tree like branching system in whichtributaries join the gently curving main stream at acuteangles (Fig. 2). After delineating drainage pattern fromthe survey of India toposheets then it is super imposedon the IRS LISS III satellite image of 23.5. mt spatialresolution (Fig.3).
Fig.2: Stream ordering of the Bildi River sub basin
Fig.3: IRS LISS III False colour composite of thestudy area
Stream number
The count of stream channel in its order is known asstream number. The number ofstream segmentsdecreases as the order increases. The higher amountstream order indicates lesser permeability andinfiltration. Stream number is directly proportional tosize of contributing watershed, to channel dimensions.It is obvious that the number of streams of any givenorder will be fewer than for the next lower order butmore numerous than for the next higher order. Thenumber of streams decreases as the stream orderincreases (Table 2).
Stream length
The length of a stream is a measure of the hydrologicalcharacteristics of the underlying rock surface and thedegree of drainage. Wherever the formation ispermeable, only a small number of relatively longerstreams are formed in a well drained watershed, a largenumber of streams of smaller length are developedwhere the formations are less permeable. Generally, thetotal length of stream segment is the maximum in thefirst order stream and decreases as the stream orderincreases (Table 2). However, in case of Bildi riverthe stream length decreases as stream order increasesand the stream segments length for third, fourth andfifth orders are varies at smaller extent. This changemay indicate flowing of streams from high altitude,lithological variation and moderately steep slope(Singh and Singh, 1997).
Stream length ratio
Horton (1945), proposed the factor length ratio, whichis the ratio of the mean length of a stream if any givenorder to the mean length of a stream of the next lowerorder, based on the fact that mean length of a stream ofany given order is always greater than the mean lengthof a stream of the next lower order (Table 3). Thelength ratio RL (which is ratio of mean length Lu ofsegments of order u to meanlength of segments of thenext lower order LU/(LU-1) tends to be constantthrough the successive orders of basin. It indicatesthat the stream lengths are decreasing with increasingthe order of stream texture. The high value of drainagetexture and lower value of drainage density indicatesthe presence of highly resistant permeable material withmoderate to high relief. In the study area the streamlength ratio is varies from 2.93 to 2.30 (Table 3.4). Itindicates that the stream lengths are decreasing withincreasing the order of stream.
Mean stream length
Mean stream length (Lsm) is a characteristic properly
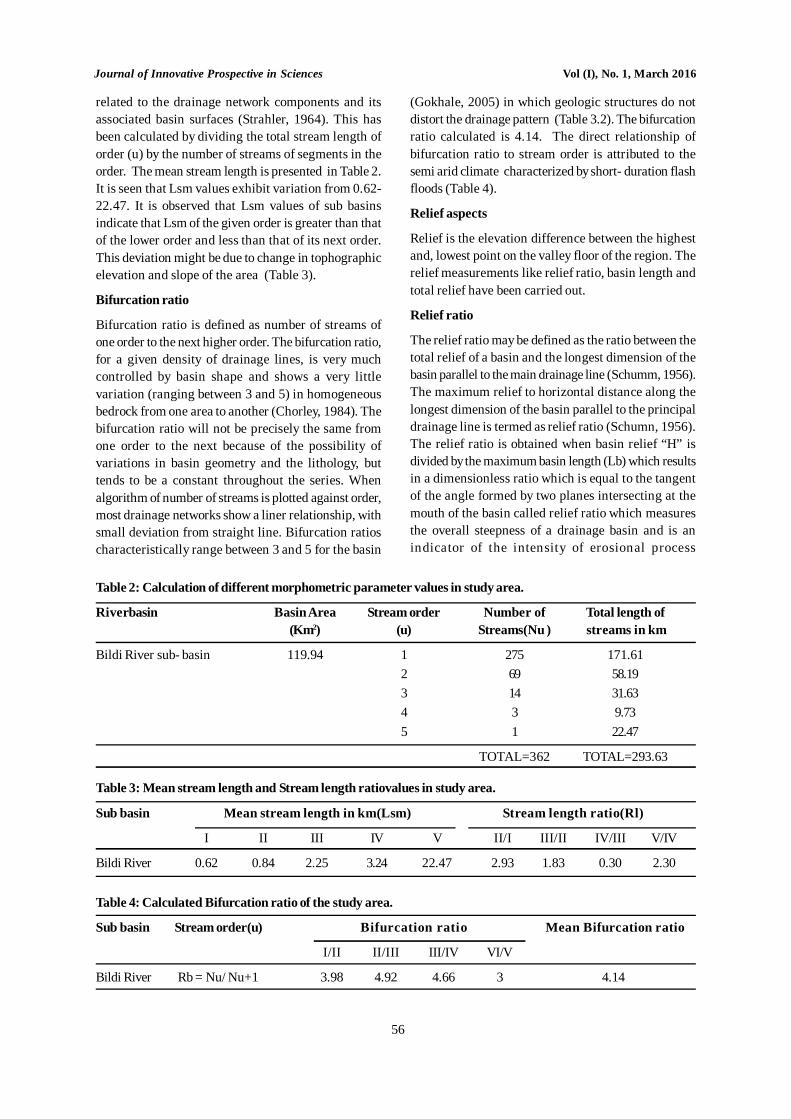
Journal of Innovative Prospective in Sciences Vol (I), No. 1, March 2016
56
related to the drainage network components and itsassociated basin surfaces (Strahler, 1964). This hasbeen calculated by dividing the total stream length oforder (u) by the number of streams of segments in theorder. The mean stream length is presented in Table 2.It is seen that Lsm values exhibit variation from 0.62-22.47. It is observed that Lsm values of sub basinsindicate that Lsm of the given order is greater than thatof the lower order and less than that of its next order.This deviation might be due to change in tophographicelevation and slope of the area (Table 3).
Bifurcation ratio
Bifurcation ratio is defined as number of streams ofone order to the next higher order. The bifurcation ratio,for a given density of drainage lines, is very muchcontrolled by basin shape and shows a very littlevariation (ranging between 3 and 5) in homogeneousbedrock from one area to another (Chorley, 1984). Thebifurcation ratio will not be precisely the same fromone order to the next because of the possibility ofvariations in basin geometry and the lithology, buttends to be a constant throughout the series. Whenalgorithm of number of streams is plotted against order,most drainage networks show a liner relationship, withsmall deviation from straight line. Bifurcation ratioscharacteristically range between 3 and 5 for the basin
(Gokhale, 2005) in which geologic structures do notdistort the drainage pattern (Table 3.2). The bifurcationratio calculated is 4.14. The direct relationship ofbifurcation ratio to stream order is attributed to thesemi arid climate characterized by short- duration flashfloods (Table 4).
Relief aspects
Relief is the elevation difference between the highestand, lowest point on the valley floor of the region. Therelief measurements like relief ratio, basin length andtotal relief have been carried out.
Relief ratio
The relief ratio may be defined as the ratio between thetotal relief of a basin and the longest dimension of thebasin parallel to the main drainage line (Schumm, 1956).The maximum relief to horizontal distance along thelongest dimension of the basin parallel to the principaldrainage line is termed as relief ratio (Schumn, 1956).The relief ratio is obtained when basin relief “H” isdivided by the maximum basin length (Lb) which resultsin a dimensionless ratio which is equal to the tangentof the angle formed by two planes intersecting at themouth of the basin called relief ratio which measuresthe overall steepness of a drainage basin and is anindicator of the intensity of erosional process
Table 2: Calculation of different morphometric parameter values in study area.
Riverbasin Basin Area Stream order Number of Total length of(Km2) (u) Streams(Nu ) streams in km
Bildi River sub- basin 119.94 1 275 171.612 69 58.193 14 31.634 3 9.735 1 22.47
TOTAL=362 TOTAL=293.63
Table 3: Mean stream length and Stream length ratiovalues in study area.
Sub basin Mean stream length in km(Lsm) Stream length ratio(Rl)
I II III IV V II/I III/II IV/III V/IV
Bildi River 0.62 0.84 2.25 3.24 22.47 2.93 1.83 0.30 2.30
Table 4: Calculated Bifurcation ratio of the study area.
Sub basin Stream order(u) Bifurcation ratio Mean Bifurcation ratio
I/II II/III III/IV VI/V
Bildi River Rb = Nu/ Nu+1 3.98 4.92 4.66 3 4.14
Journal of Innovative Prospective in Sciences Vol (I), No. 1, March 2016
57
operating on slope of the basin (Schumn, 1956). Reliefratio has direct relationship between the relief andchannel gradient. The relief ratio normally increaseswith decreasing drainage area and size of thewatersheds of a given drainage basin (Gottaschalk,1964). Difference in the elevation between the highestpoint of a basin (on the main divide) and the lowestpoint on the valley floor is known as the total relief ofthe river basin. The possibility of a close correlationbetween relief ratio and hydrologic characteristics of abasin suggested by scheme who found that sedimentsloose per unit area is closely correlated with relief ratios. In the study area, the values of relief ratio is 5.26. Itis noticed that the high values of Rh indicate steepslope and high relief (250 m ).
Aerial aspects (Basin geometry)
Aerial aspects include different morphometricparameters, like drainage density, texture ratio,streamfrequency, form factor, circulatory ratio, elongationratio and length of the overland flow. The values ofthese parameters are presented in table 5 and discussedand interpreted.
Drainage density
It is measured as a sum of the channel lengths per unitarea and obtained by dividing the total stream lengthby total area of the basin (Table 5) and given by;
D d= Lu /Au
Where LU = Mean channel length and Au = Basinarea
Drainage density is controlled by the type offormations in the basin areas with imperviousformations will have higher drainage density than thosewith pervious formations (Gokhale, 2005). In the Studyarea drainage density is 2.44. In general low drainagedensity is favored in regions of high resistant or highlypermeable sub soil materials, under dense vegetationcover and where relief is low. High drainage density isfavored in regions of weak or impermeable surfacematerials, sparse vegetation, and mountainous relief.The drainage density is governed by the factors likerock type, run off intensity, soil type, infiltrationcapacity and percentage of rocky area (Table 6).
Drainage frequency
It is a measure of number of stream segments per unitarea and is therefore depend on the stream order, whereas drainage density is independent of stream order. Itis obtained by dividing the total number of stream tothe total drainage basin area (Table 5) and given by;
Fs= Nu/A
Where A = Area of the basin, Nu = Stream number
Drainage frequency of the study area is found to be3.01. It is also seen that the drainage density values ofthe sub-basins exhibits +ve correlation with the streamfrequency suggesting that there is an increase in stream
Table 5: Computed morphometric parameters and their respective formulae foraerial aspects of the BildiRiver sub basin (Basin geometry)
S. N. Morphometric Parameters Formula Reference
1 Drainage Density (D) D= Lu/A where, D= Drainage Density, Lu=Total Horton (1945)stream length of all orders, A= Area of the basin (km2)
2 Stream Frequency (Fs) Fs= Nu/A where, Fs= Stream Frequency, Nu=Total Horton (1932)no. of streams of all orders,A= Area of the basin (km2)
3 Drainage Texture (Rt) Rt=Nu/P where, Rt=Drainage Texture,Nu=Total no. Horton (1945)of streams of all orders, P=Perimeter ( Km)
4 Form Factor (Rf) Rf= A/Lb2 where, Rf=Form Factor, A=Area of the Horton (1932)basin (km2), Lb2= Square of Basin length
5 Circulatory Ratio (Rc) Rc=4*Pi*A/P2 where , Rc=Circulatory ratio, Miller (1953)Pi = 3.14, A= Area of the basin (km2), P2=Squareof the perimeter (km)
6 Elongation ratio (Re) Re=2 (A/)/Lb Where.Re=Elongation ratio, Schumn (1956)A=Area of the basin (km2), Pi= 3.14, Lb= Basinlength
7 Length of overland flow (Lg) Lg=1/D*2 where, Lg=Length of overland Horton (1945)flow D= Drainage Density
Journal of Innovative Prospective in Sciences Vol (I), No. 1, March 2016
58
population with respect to increasing drainage density(Table 6).
Drainage pattern
It refers to the orderly spatial arrangement of geologic,topographic or vegetation features. Drainage patternis an important element in geologic interpretation ofaerial photographs. The study area has dendritic tosub dendritic drainage type pattern. It is characterizedby a treelike branching system in which tributaries jointhe gently curving main stream at acute angles.Theoccurrence of this drainage system indicateshomogeneous, uniform soil and rock material(Fig. 2 & 3).
Drainage texture
Drainage texture is the total number of streamsegments of all orders per perimeter of that area(Horton, 1945). Horton (1945) recognized infiltrationcapacity as the single important factor which influencesdrainage texture and considered drainage texture whichincludes drainage density and stream frequency (Table5). The drainage texture depends upon a number ofnatural factors such as climate, rainfall, vegetation, rockand soil type, infiltration capacity, relief and stage ofdevelopment (Smith, 1950). The soft or weak rocksunprotected by vegetation produce a fine texture,whereas massive and resistant rocks cause coarsetexture. Sparse vegetation of arid climate causes finertextures than those developed on similar rocks in ahumid climate. The texture of a rock is commonlydependent upon vegetation type and climate(Dornkamp and King, 1971). Drainage texture is theproduct of drainage density and stream frequency. Itis expressed the same as the drainage and classificationis given below. High relief ratio brings high dischargeof surface water in a short duration. Small relief ratioindicates the erosional development of the drainagebasin. Drainage Texture 1 < 2 Very coarse 2, 2 - 4Coarse , 3 4 - 6 Moderate ,4 6 - 8 Fine, 5 > 8 Very finein the study area the value is 5.70 shows a very coarsetexture (Table 6).
Basin areaThe drainage basin area is one of the importantparameters like that of the length of draining – the basin.The area of a given order is defined as the total areaprojected on a horizontal plane contribution overlandflow to the channel segments of the given order, whichincludes all tributaries of the lower order. The Bildi Subbasin drainage basin area is 119.94 sq. Km. (Table.6).
Form factorForm factor may be defined as the ratio of the area of
the basin and square of basin length (Horton, 1932).It is a less property and is used as a quantitativeexpression of the shape of basin form. <5 low values-have flattered and flow for longer durations >5 highvalues – have high peaks and flows shorter duration(Table 5) and given by; (Table 3.5).
R f = A/Lb2
Where; A = Area of the basin L b2 = square of Basinlength
The value of form factor would always be greater than0.71 (Table 6) for a perfectly circular basin. Smaller thevalue of form factor, more elongated will be the basin.Rf values of in the study area 0.44 .It is noted that theRf values of the study area suggesting that Bildi Riverbasin elongated in shape (Table 6).
Circulatory ratio
The circulatory ratio is mainly concerned with the lengthand frequency of streams, geological structures, landuse/land cover, climate, relief and slope of the basin. Itis the ratio of the area of the basins to the area of circlehaving the same circumference as the perimeter of thebasin (Table 5).
Circulatory ratio (RC) is the ratio of basin area Au, thearea of circle having the same perimeter as the basinand given by;
RC= 4 A/P2
Where; Au = Total basin area and P2 = perimeter
As the basin circulatory ratio reaches unity (one) thebasin attains a fan shape and is prone for highfloods.Circulatory ratio is the ratio of basin area Au,the area of circle Ac having the sameperimeter as thebasin.The Bildi River basin sub-basin has value of Reless than 0.5 indicating that it is elongated, while greatervalue than 0.5 values suggesting that they are more orless circular in shape and are characterised by the highto moderate relief and the drainage system werestructurally controlled.The circulatory ratio of the studyarea is 0.39 (Table 6).
Elongation ratio
Elongation ratio is the ratio between the diameter ofthe circle of the same area as the drainage basin aridthe maximum length of the basin (Table 5). It isexpressed by following equation;
Re=2(A/)/Lb
where, Rf=Form Factor, A=Area of the basin (km2) Lb=Square of basin length
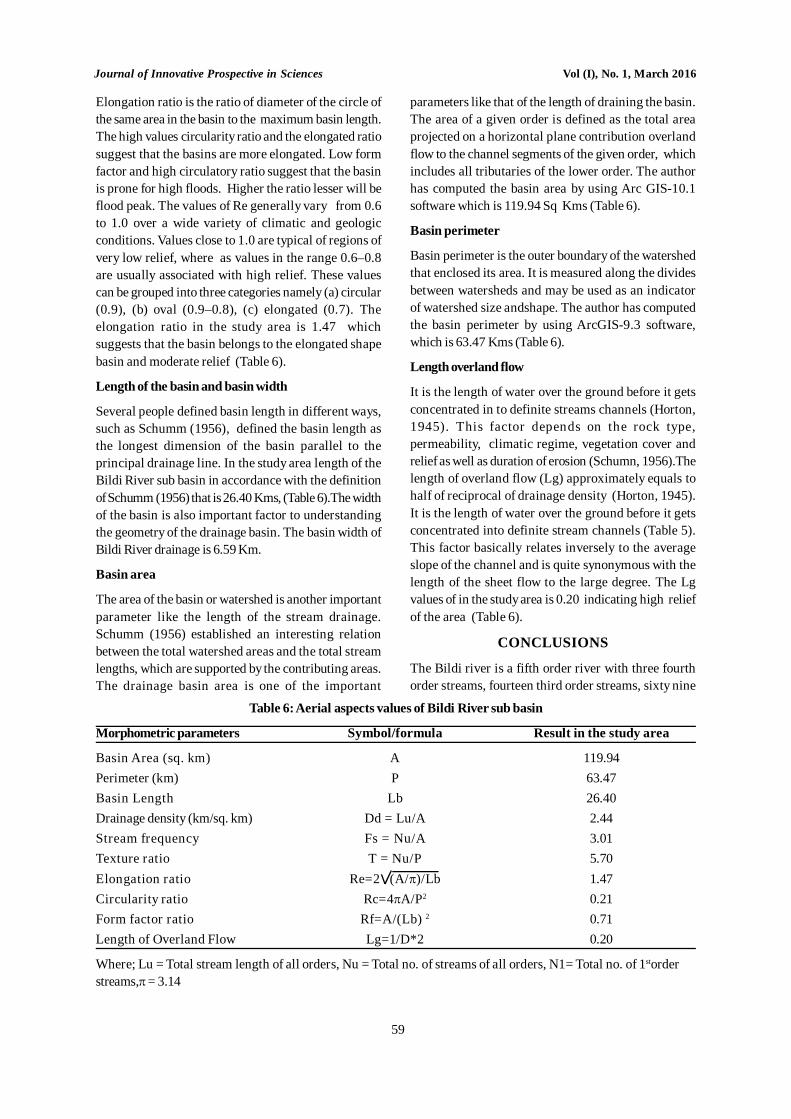
Journal of Innovative Prospective in Sciences Vol (I), No. 1, March 2016
59
Elongation ratio is the ratio of diameter of the circle ofthe same area in the basin to the maximum basin length.The high values circularity ratio and the elongated ratiosuggest that the basins are more elongated. Low formfactor and high circulatory ratio suggest that the basinis prone for high floods. Higher the ratio lesser will beflood peak. The values of Re generally vary from 0.6to 1.0 over a wide variety of climatic and geologicconditions. Values close to 1.0 are typical of regions ofvery low relief, where as values in the range 0.6–0.8are usually associated with high relief. These valuescan be grouped into three categories namely (a) circular(0.9), (b) oval (0.9–0.8), (c) elongated (0.7). Theelongation ratio in the study area is 1.47 whichsuggests that the basin belongs to the elongated shapebasin and moderate relief (Table 6).
Length of the basin and basin width
Several people defined basin length in different ways,such as Schumm (1956), defined the basin length asthe longest dimension of the basin parallel to theprincipal drainage line. In the study area length of theBildi River sub basin in accordance with the definitionof Schumm (1956) that is 26.40 Kms, (Table 6).The widthof the basin is also important factor to understandingthe geometry of the drainage basin. The basin width ofBildi River drainage is 6.59 Km.
Basin area
The area of the basin or watershed is another importantparameter like the length of the stream drainage.Schumm (1956) established an interesting relationbetween the total watershed areas and the total streamlengths, which are supported by the contributing areas.The drainage basin area is one of the important
parameters like that of the length of draining the basin.The area of a given order is defined as the total areaprojected on a horizontal plane contribution overlandflow to the channel segments of the given order, whichincludes all tributaries of the lower order. The authorhas computed the basin area by using Arc GIS-10.1software which is 119.94 Sq Kms (Table 6).
Basin perimeter
Basin perimeter is the outer boundary of the watershedthat enclosed its area. It is measured along the dividesbetween watersheds and may be used as an indicatorof watershed size andshape. The author has computedthe basin perimeter by using ArcGIS-9.3 software,which is 63.47 Kms (Table 6).
Length overland flow
It is the length of water over the ground before it getsconcentrated in to definite streams channels (Horton,1945). This factor depends on the rock type,permeability, climatic regime, vegetation cover andrelief as well as duration of erosion (Schumn, 1956).Thelength of overland flow (Lg) approximately equals tohalf of reciprocal of drainage density (Horton, 1945).It is the length of water over the ground before it getsconcentrated into definite stream channels (Table 5).This factor basically relates inversely to the averageslope of the channel and is quite synonymous with thelength of the sheet flow to the large degree. The Lgvalues of in the study area is 0.20 indicating high reliefof the area (Table 6).
CONCLUSIONS
The Bildi river is a fifth order river with three fourthorder streams, fourteen third order streams, sixty nine
Table 6: Aerial aspects values of Bildi River sub basin
Morphometric parameters Symbol/formula Result in the study area
Basin Area (sq. km) A 119.94Perimeter (km) P 63.47Basin Length Lb 26.40Drainage density (km/sq. km) Dd = Lu/A 2.44Stream frequency Fs = Nu/A 3.01Texture ratio T = Nu/P 5.70Elongation ratio Re=2 (A/)/Lb 1.47Circularity ratio Rc=4A/P2 0.21Form factor ratio Rf=A/(Lb) 2 0.71Length of Overland Flow Lg=1/D*2 0.20
Where; Lu = Total stream length of all orders, Nu = Total no. of streams of all orders, N1= Total no. of 1storderstreams, = 3.14
Journal of Innovative Prospective in Sciences Vol (I), No. 1, March 2016
60
second order and two hundreed seventy five firstorder streams. The total stream length was found to be293.63 km with mean stream length of 0.811 km. Theaverage bifurcation ratio is 4.14. Drainage density is2.44; length of overland flow is 0.20. The total streamlength among third order stream varies from 9.73 to171.61 km. The average bifurcation ratio for third orderbasins is 3.98. Drainage density for ranges from 1.02 to3.38, length of overland flow ranges from 0.15 to 0.49,while slope varies from 2.69 to 56.73 m/km for thirdorder basins. In fourth order basins average bifurcationratio is 4.92. The length of fourth order stream is 9.73km. Drainage density for Bildi River is 2.44 while streamfrequency was found to be 3.01, length of overlandflow is 0.20. The shape factors like elongation ration,circularity ratio and form factor were found to be 1.47,0.21 and 0.71 respectively.
REFERENCES
Chorley, R.J., Donald, E.G., Malm., andPogorzelski,H.A.,(1957) A new standard forestimating
Clarke JI (1966) Morphometry from maps, Essays ingcomorphology, Elscvier Publ. Co., New York,pp 235-274.
Doornkamp, J.C. and King (1971) Numerical Analysisin Geomorphology – An Introduction. EdwardArnold, London. drainage basin shape”, Amer.Jour. Sci.,255, pp 138141.
Gokhale, K.V.G.K. (2005) Principles of EngineeringGeology, B.S. Publications, Hyderabad, 268p.
Gottschalk L.C., (1964) Reservoir sedimentation in :VT Chow (ed) Hand book of AppliedHydrology. McGraw Hill Book Company, NewYork. Section 7-1.
Horton R.E., (1932) Drainage basin characteristics.Trans. Am. Geophys Union 13:350-361
Horton R.E., (1945) Erosional development of streamsand their drainage basins; Hydrophysicalapproach to quantitative morphology. Geol SocAm Bull 56:275-370.
Horton RE, (1945). Erosional development of streamsand their drainage basins hydrophysicalapproach to quantitative morphology. Bull.Geol. Soc. Am., 56: 275-370.
Krishnamurthy, J., G. Srinivas, V. Jayaram and M.G.Chandrasekhar, (1996) Influence of rock typesand structures in the development of drainagenetworks in typical hardrock terrain. ITC J., 3-4:pp. 252-259.
Miller,V.C., (1953) A quantitative geomorphic study ofdrainage basin characteristics in the ClinchMountain area, Varginia and Tennessee”,Project NR 389042, Tech. Rept. ColumbiaUniversity, Department of Geology, ONR,Geography Branch, New York.
Morisawa, M.E., (1959) Relation of morphometricproperties to run off in the Little Mill reek,Ohio, drainge basin. Tech. rep. 17.ColumbiaUniversity, Department of Geology, ONR, NewYork.
Nag SK and Chakraborty S (2003) Influences of rocktypes and structures in the development ofdrainage network in hard rock area. J IndianSoc Remote Sensing, 33 (1):25-3S.
Schumm, S.A., (1956) Evolution of drainage systemsand slopes in bad lands at Perth Amboy, NewJersey. Bull. Geol. Soc. Am., 67: 597-646.
Singh and Sigh M.C (1997) Morphometric analysis ofKanhar river basin. National Geographical J.of India 43(l): 31-43.
Smith K.G., (1950) Standards for grading textures of•erosional topography. Am. Jour. Sci 248:655-668.
Strahler, A.N., (1952) Dynamic basis ofgeomorphology. Bull. Geol. Soc. Am. 63: 923-938.
Strahler, A.N., (1957) Quantitative analysis ofwatershed geomorphology. Trans. Am.Geophys. Union, 38: 913-920.
Strahler, A.N., (1964) Quantitative Geomorphology ofBasins and Channel Networks. In: Chow,V.T.(Ed.), Handbook of Applied Hydrology.Mcgraw Hill Book Company, NewYork.
Journal of Innovative Prospective in Sciences Vol (I), No. 1, March 2016
61
INTRODUCTION
Akola District is located in the Maharashtra state onthe way of Mumbai to Nagpur expressway NH-6.Barshitakli is largest taheshil place in the Akola districthaving big forest area named KATEPURNA. Plantsfound in the region are having various medicinalapplications. Latitude (in Degree) of Barshitakli is20.587137 longitude (in Degree) is 77.06123.
Ricinus communis is a plant of very superior class usedfor the treatments of various diseases. It is used inmedicinal, pharmaceutical and chemical sciences dueto anti-oxidant, anti-microbial, anti-diarrhea, anti-diabetic, anti-inflammatory, hepatoprotective,hypercholesterolemic, antiviral, diuretic, carminativeproperties. Similar work especially on proximate wasfound in the research team of D.T. Tayade in theAmravati District, Morshi and Chandur Rly. Region.
Present research work includes the determination ofmoisture content, Ash content, cold water solubility,Hot water solubility, 1% NaOH solubility, 1% HClsolubility ethanol Solubility, Benzene solubility, Dioxanesolubility and Ether solubility. Moisture and ashcontent in the sample is dependent on the season andsituation of the plant. But, Solubility is not affected byany adverse factors.
The results are helpful to decide the amount of dosefor particular disease. These results are also useful forpredicting drug activity as well as drug effects. Hencecold water, hot water, 1%NaOH, and 1%HCl, ethanol,methanol, benzene, dioxane, petroleum ether, solubilityas well as moisture and ash content of Ricinuscommunis leaves sample have been investigated.
MATERIALS AND METHODS
Preparation of Sample:
1. Initially site is decided.2. The total five leaves were collected from same
region.3. The collection of sample was done in between
15th December 2015 to 20th December 2015.4. Only leaves of Ricinus communis were taken
and shed dried at room temperature.5. The leaves were pulverized in grinding mill
having a screen of 5 mm diameter hole to achieveparticle size 40-50 mesh. This fine powder wastreated as a sample powder for various analyses.
6. All chemicals used are of Mercks chemical PvtLtd. manufactured.
OBESERVATIONS AND CALCULATIONS
Moisture content and ash content:
Ash is prepared with the help of Silica crucible and itwas weighed and kept in oven till it showed constantweight. The leaves sample was analyzed for moistureand ash content by literature method and thepercentage of the moisture and ash of sample iscalculated by applying the following formula,
Loss of weight of sample% of Moisture and Ash= —————————X 100
Weight of sample taken
Solubility’s in cold water , hot water, 1% NaOH, 1%HCl, ethanol, methanol, benzene, dioxane, ether:
The cold water, hot water, 1%NaOH and 1%HClsolubility of leaves sample was analyzed and
STUDIES IN THE PROXIMATE ANALYSIS OF LEAVES OF Ricinus communisFROM BARSHITAKLI IN AKOLA DISTRICT
S. A. WAGHMARE AND V. S. UNDALDepartment of Chemistry, G.NA College, Barshitakli Dist: Akola 444 401 MS
Department of Botany, G.NA College, Barshitakli Dist: Akola 444 401 MSEmail-: [email protected]
ABSTRACT
Plants kingdom is the very potent kingdom on earth containing bioactive molecules. Different parts of plant areemployed for the different purposes. Medicines derived from the plants may be used to treat the diseases directlyon target organ as well as orally. Some of the medicines are derived from the plans leaves by various chemicalprocesses. Hence it is necessary and essential to study the proximate analysis of various parts of the plants.Ricinus communis leaves possess various curative properties. Keeping in consideration all the medicinal properties,present research explores the study of proximate analysis of leaves of Ricinus communis from Barshitakli region inAkola District..
Key words : Barshitakli in Akola, Ricinus communis, Proximate analysis.
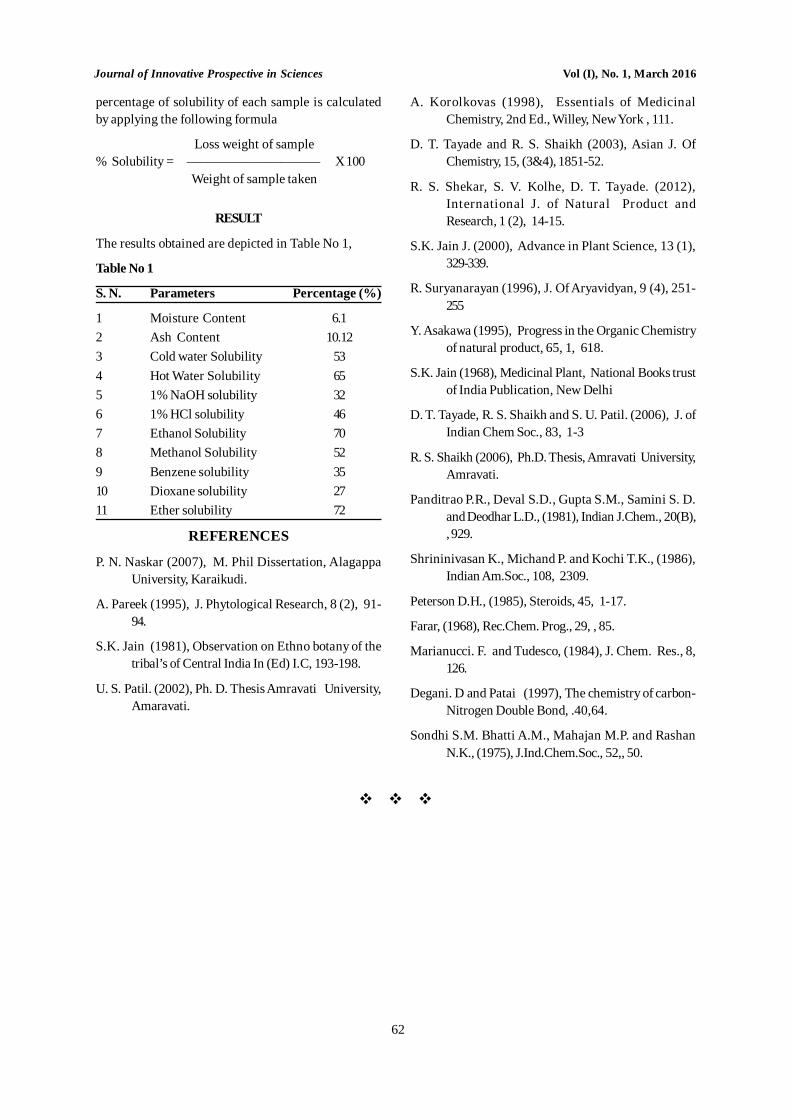
Journal of Innovative Prospective in Sciences Vol (I), No. 1, March 2016
62
percentage of solubility of each sample is calculatedby applying the following formula
Loss weight of sample% Solubility = —————————— X 100
Weight of sample taken
RESULT
The results obtained are depicted in Table No 1,
Table No 1
S. N. Parameters Percentage (%)
1 Moisture Content 6.12 Ash Content 10.123 Cold water Solubility 534 Hot Water Solubility 655 1% NaOH solubility 326 1% HCl solubility 467 Ethanol Solubility 708 Methanol Solubility 529 Benzene solubility 3510 Dioxane solubility 2711 Ether solubility 72
REFERENCES
P. N. Naskar (2007), M. Phil Dissertation, AlagappaUniversity, Karaikudi.
A. Pareek (1995), J. Phytological Research, 8 (2), 91-94.
S.K. Jain (1981), Observation on Ethno botany of thetribal’s of Central India In (Ed) I.C, 193-198.
U. S. Patil. (2002), Ph. D. Thesis Amravati University,Amaravati.
A. Korolkovas (1998), Essentials of MedicinalChemistry, 2nd Ed., Willey, New York , 111.
D. T. Tayade and R. S. Shaikh (2003), Asian J. OfChemistry, 15, (3&4), 1851-52.
R. S. Shekar, S. V. Kolhe, D. T. Tayade. (2012),International J. of Natural Product andResearch, 1 (2), 14-15.
S.K. Jain J. (2000), Advance in Plant Science, 13 (1),329-339.
R. Suryanarayan (1996), J. Of Aryavidyan, 9 (4), 251-255
Y. Asakawa (1995), Progress in the Organic Chemistryof natural product, 65, 1, 618.
S.K. Jain (1968), Medicinal Plant, National Books trustof India Publication, New Delhi
D. T. Tayade, R. S. Shaikh and S. U. Patil. (2006), J. ofIndian Chem Soc., 83, 1-3
R. S. Shaikh (2006), Ph.D. Thesis, Amravati University,Amravati.
Panditrao P.R., Deval S.D., Gupta S.M., Samini S. D.and Deodhar L.D., (1981), Indian J.Chem., 20(B),, 929.
Shrininivasan K., Michand P. and Kochi T.K., (1986),Indian Am.Soc., 108, 2309.
Peterson D.H., (1985), Steroids, 45, 1-17.
Farar, (1968), Rec.Chem. Prog., 29, , 85.
Marianucci. F. and Tudesco, (1984), J. Chem. Res., 8,126.
Degani. D and Patai (1997), The chemistry of carbon-Nitrogen Double Bond, .40,64.
Sondhi S.M. Bhatti A.M., Mahajan M.P. and RashanN.K., (1975), J.Ind.Chem.Soc., 52,, 50.
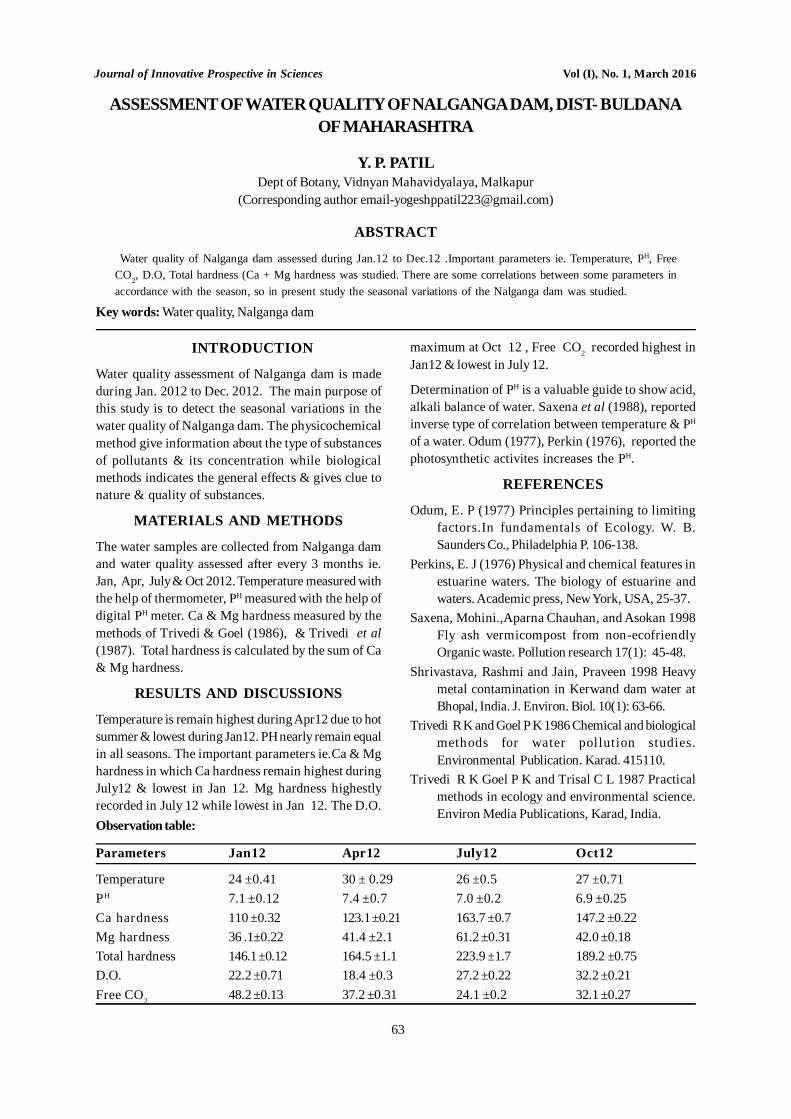
Journal of Innovative Prospective in Sciences Vol (I), No. 1, March 2016
63
INTRODUCTION
Water quality assessment of Nalganga dam is madeduring Jan. 2012 to Dec. 2012. The main purpose ofthis study is to detect the seasonal variations in thewater quality of Nalganga dam. The physicochemicalmethod give information about the type of substancesof pollutants & its concentration while biologicalmethods indicates the general effects & gives clue tonature & quality of substances.
MATERIALS AND METHODS
The water samples are collected from Nalganga damand water quality assessed after every 3 months ie.Jan, Apr, July & Oct 2012. Temperature measured withthe help of thermometer, PH measured with the help ofdigital PH meter. Ca & Mg hardness measured by themethods of Trivedi & Goel (1986), & Trivedi et al(1987). Total hardness is calculated by the sum of Ca& Mg hardness.
RESULTS AND DISCUSSIONS
Temperature is remain highest during Apr12 due to hotsummer & lowest during Jan12. PH nearly remain equalin all seasons. The important parameters ie.Ca & Mghardness in which Ca hardness remain highest duringJuly12 & lowest in Jan 12. Mg hardness highestlyrecorded in July 12 while lowest in Jan 12. The D.O.
maximum at Oct 12 , Free CO2 recorded highest inJan12 & lowest in July 12.
Determination of PH is a valuable guide to show acid,alkali balance of water. Saxena et al (1988), reportedinverse type of correlation between temperature & PH
of a water. Odum (1977), Perkin (1976), reported thephotosynthetic activites increases the PH.
REFERENCES
Odum, E. P (1977) Principles pertaining to limitingfactors.In fundamentals of Ecology. W. B.Saunders Co., Philadelphia P. 106-138.
Perkins, E. J (1976) Physical and chemical features inestuarine waters. The biology of estuarine andwaters. Academic press, New York, USA, 25-37.
Saxena, Mohini.,Aparna Chauhan, and Asokan 1998Fly ash vermicompost from non-ecofriendlyOrganic waste. Pollution research 17(1): 45-48.
Shrivastava, Rashmi and Jain, Praveen 1998 Heavymetal contamination in Kerwand dam water atBhopal, India. J. Environ. Biol. 10(1): 63-66.
Trivedi R K and Goel P K 1986 Chemical and biologicalmethods for water pollution studies.Environmental Publication. Karad. 415110.
Trivedi R K Goel P K and Trisal C L 1987 Practicalmethods in ecology and environmental science.Environ Media Publications, Karad, India.
ASSESSMENT OF WATER QUALITY OF NALGANGA DAM, DIST- BULDANAOF MAHARASHTRA
Y. P. PATILDept of Botany, Vidnyan Mahavidyalaya, Malkapur
(Corresponding author [email protected])
ABSTRACT
Water quality of Nalganga dam assessed during Jan.12 to Dec.12 .Important parameters ie. Temperature, PH, FreeCO2, D.O, Total hardness (Ca + Mg hardness was studied. There are some correlations between some parameters inaccordance with the season, so in present study the seasonal variations of the Nalganga dam was studied.
Key words: Water quality, Nalganga dam
Observation table:
Parameters Jan12 Apr12 July12 Oct12
Temperature 24 ±0.41 30 ± 0.29 26 ±0.5 27 ±0.71PH 7.1 ±0.12 7.4 ±0.7 7.0 ±0.2 6.9 ±0.25Ca hardness 110 ±0.32 123.1 ±0.21 163.7 ±0.7 147.2 ±0.22Mg hardness 36 .1±0.22 41.4 ±2.1 61.2 ±0.31 42.0 ±0.18Total hardness 146.1 ±0.12 164.5 ±1.1 223.9 ±1.7 189.2 ±0.75D.O. 22.2 ±0.71 18.4 ±0.3 27.2 ±0.22 32.2 ±0.21Free CO2 48.2 ±0.13 37.2 ±0.31 24.1 ±0.2 32.1 ±0.27
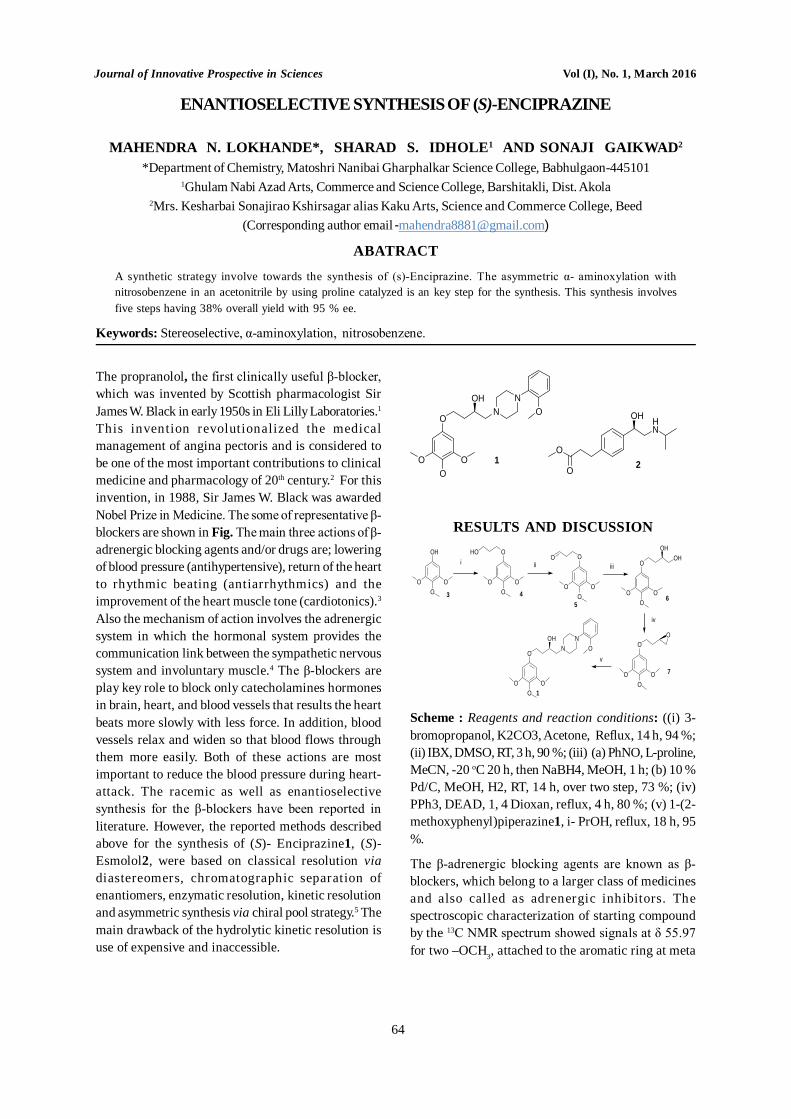
Journal of Innovative Prospective in Sciences Vol (I), No. 1, March 2016
64
The propranolol, the first clinically useful β-blocker,which was invented by Scottish pharmacologist SirJames W. Black in early 1950s in Eli Lilly Laboratories.1This invention revolutionalized the medicalmanagement of angina pectoris and is considered tobe one of the most important contributions to clinicalmedicine and pharmacology of 20th century.2 For thisinvention, in 1988, Sir James W. Black was awardedNobel Prize in Medicine. The some of representative β-blockers are shown in Fig. The main three actions of β-adrenergic blocking agents and/or drugs are; loweringof blood pressure (antihypertensive), return of the heartto rhythmic beating (antiarrhythmics) and theimprovement of the heart muscle tone (cardiotonics).3
Also the mechanism of action involves the adrenergicsystem in which the hormonal system provides thecommunication link between the sympathetic nervoussystem and involuntary muscle.4 The β-blockers areplay key role to block only catecholamines hormonesin brain, heart, and blood vessels that results the heartbeats more slowly with less force. In addition, bloodvessels relax and widen so that blood flows throughthem more easily. Both of these actions are mostimportant to reduce the blood pressure during heart-attack. The racemic as well as enantioselectivesynthesis for the β-blockers have been reported inliterature. However, the reported methods describedabove for the synthesis of (S)- Enciprazine1, (S)-Esmolol2, were based on classical resolution viadiastereomers, chromatographic separation ofenantiomers, enzymatic resolution, kinetic resolutionand asymmetric synthesis via chiral pool strategy.5 Themain drawback of the hydrolytic kinetic resolution isuse of expensive and inaccessible.
ENANTIOSELECTIVE SYNTHESIS OF (S)-ENCIPRAZINE
MAHENDRA N. LOKHANDE*, SHARAD S. IDHOLE1 AND SONAJI GAIKWAD2
*Department of Chemistry, Matoshri Nanibai Gharphalkar Science College, Babhulgaon-4451011Ghulam Nabi Azad Arts, Commerce and Science College, Barshitakli, Dist. Akola
2Mrs. Kesharbai Sonajirao Kshirsagar alias Kaku Arts, Science and Commerce College, Beed(Corresponding author email [email protected])
ABATRACT
A synthetic strategy involve towards the synthesis of (s)-Enciprazine. The asymmetric α- aminoxylation withnitrosobenzene in an acetonitrile by using proline catalyzed is an key step for the synthesis. This synthesis involvesfive steps having 38% overall yield with 95 % ee.
Keywords: Stereoselective, α-aminoxylation, nitrosobenzene.
RESULTS AND DISCUSSION
Scheme : Reagents and reaction conditions: ((i) 3-bromopropanol, K2CO3, Acetone, Reflux, 14 h, 94 %;(ii) IBX, DMSO, RT, 3 h, 90 %; (iii) (a) PhNO, L-proline,MeCN, -20 oC 20 h, then NaBH4, MeOH, 1 h; (b) 10 %Pd/C, MeOH, H2, RT, 14 h, over two step, 73 %; (iv)PPh3, DEAD, 1, 4 Dioxan, reflux, 4 h, 80 %; (v) 1-(2-methoxyphenyl)piperazine1, i- PrOH, reflux, 18 h, 95%.
The β-adrenergic blocking agents are known as β-blockers, which belong to a larger class of medicinesand also called as adrenergic inhibitors. Thespectroscopic characterization of starting compoundby the 13C NMR spectrum showed signals at δ 55.97for two –OCH3, attached to the aromatic ring at meta
O
OO
O
OHN
NO
1O
O
HN
OH
2
OH
OO
O
O
OO
O
HOO
OO
O
OO
OO
O
OHOH
O
OO
O
O
O
OO
O
OHN
NO
i
v
1
3 45
6
7
ii iii
iv
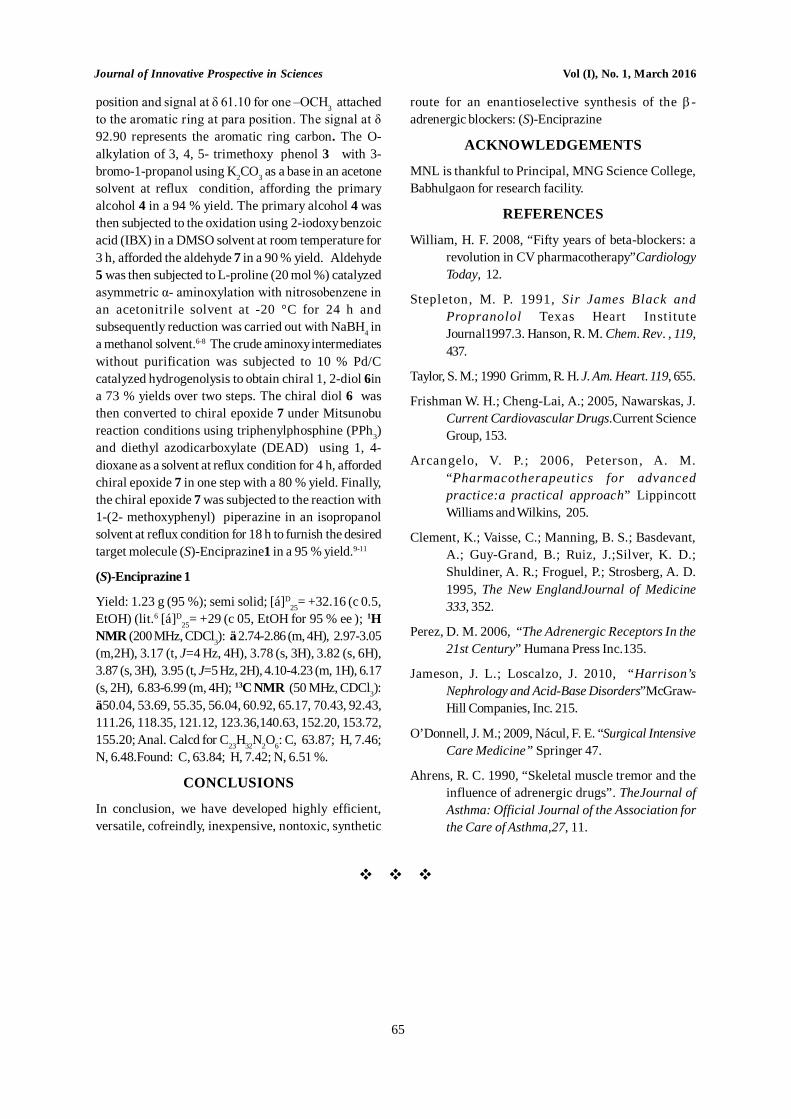
Journal of Innovative Prospective in Sciences Vol (I), No. 1, March 2016
65
position and signal at δ 61.10 for one –OCH3 attachedto the aromatic ring at para position. The signal at δ92.90 represents the aromatic ring carbon. The O-alkylation of 3, 4, 5- trimethoxy phenol 3 with 3-bromo-1-propanol using K2CO3 as a base in an acetonesolvent at reflux condition, affording the primaryalcohol 4 in a 94 % yield. The primary alcohol 4 wasthen subjected to the oxidation using 2-iodoxy benzoicacid (IBX) in a DMSO solvent at room temperature for3 h, afforded the aldehyde 7 in a 90 % yield. Aldehyde5 was then subjected to L-proline (20 mol %) catalyzedasymmetric α- aminoxylation with nitrosobenzene inan acetonitrile solvent at -20 °C for 24 h andsubsequently reduction was carried out with NaBH4 ina methanol solvent.6-8 The crude aminoxy intermediateswithout purification was subjected to 10 % Pd/Ccatalyzed hydrogenolysis to obtain chiral 1, 2-diol 6ina 73 % yields over two steps. The chiral diol 6 wasthen converted to chiral epoxide 7 under Mitsunobureaction conditions using triphenylphosphine (PPh3)and diethyl azodicarboxylate (DEAD) using 1, 4-dioxane as a solvent at reflux condition for 4 h, affordedchiral epoxide 7 in one step with a 80 % yield. Finally,the chiral epoxide 7 was subjected to the reaction with1-(2- methoxyphenyl) piperazine in an isopropanolsolvent at reflux condition for 18 h to furnish the desiredtarget molecule (S)-Enciprazine1 in a 95 % yield.9-11
(S)-Enciprazine 1
Yield: 1.23 g (95 %); semi solid; [á]D25= +32.16 (c 0.5,
EtOH) (lit.6 [á]D25= +29 (c 05, EtOH for 95 % ee ); 1H
NMR (200 MHz, CDCl3): ä 2.74-2.86 (m, 4H), 2.97-3.05(m,2H), 3.17 (t, J=4 Hz, 4H), 3.78 (s, 3H), 3.82 (s, 6H),3.87 (s, 3H), 3.95 (t, J=5 Hz, 2H), 4.10-4.23 (m, 1H), 6.17(s, 2H), 6.83-6.99 (m, 4H); 13C NMR (50 MHz, CDCl3):ä50.04, 53.69, 55.35, 56.04, 60.92, 65.17, 70.43, 92.43,111.26, 118.35, 121.12, 123.36,140.63, 152.20, 153.72,155.20; Anal. Calcd for C23H32N2O6: C, 63.87; H, 7.46;N, 6.48.Found: C, 63.84; H, 7.42; N, 6.51 %.
CONCLUSIONS
In conclusion, we have developed highly efficient,versatile, cofreindly, inexpensive, nontoxic, synthetic
route for an enantioselective synthesis of the -adrenergic blockers: (S)-Enciprazine
ACKNOWLEDGEMENTS
MNL is thankful to Principal, MNG Science College,Babhulgaon for research facility.
REFERENCES
William, H. F. 2008, “Fifty years of beta-blockers: arevolution in CV pharmacotherapy”CardiologyToday, 12.
Stepleton, M. P. 1991, Sir James Black andPropranolol Texas Heart InstituteJournal1997.3. Hanson, R. M. Chem. Rev. , 119,437.
Taylor, S. M.; 1990 Grimm, R. H. J. Am. Heart. 119, 655.
Frishman W. H.; Cheng-Lai, A.; 2005, Nawarskas, J.Current Cardiovascular Drugs.Current ScienceGroup, 153.
Arcangelo, V. P.; 2006, Peterson, A. M.“Pharmacotherapeutics for advancedpractice:a practical approach” LippincottWilliams and Wilkins, 205.
Clement, K.; Vaisse, C.; Manning, B. S.; Basdevant,A.; Guy-Grand, B.; Ruiz, J.;Silver, K. D.;Shuldiner, A. R.; Froguel, P.; Strosberg, A. D.1995, The New EnglandJournal of Medicine333, 352.
Perez, D. M. 2006, “The Adrenergic Receptors In the21st Century” Humana Press Inc.135.
Jameson, J. L.; Loscalzo, J. 2010, “Harrison’sNephrology and Acid-Base Disorders”McGraw-Hill Companies, Inc. 215.
O’Donnell, J. M.; 2009, Nácul, F. E. “Surgical IntensiveCare Medicine” Springer 47.
Ahrens, R. C. 1990, “Skeletal muscle tremor and theinfluence of adrenergic drugs”. TheJournal ofAsthma: Official Journal of the Association forthe Care of Asthma,27, 11.
Journal of Innovative Prospective in Sciences Vol (I), No. 1, March 2016
66
PRELIMINARY PHYTO-CHEMICAL INVESTIGATION OF COMBRETUM ALBIDUMG. DON: AS MEDICINALLY IMPORTANT PLANT
B M BHALERAO AND A B PATIL
Department of Biochemistry, Ghulam Nabi Azad Arts,Commerce & Science College Barshitakli Dist: Akola M.S.
(*Corresponding author Email: [email protected])
ABSTRACTVarious solvent like ethanol, ethyl acetate and hexane used for stem and leaves extracts of medicinal plant Combretumalbidum a member of Combretaceae family were analyzed for phyto-chemical investigation by using standard qualitativemethod protocol and its shows secondary metabolites such as saponins, flavonoids, alkaloids, phenolics, terpenesetc. and chromatographic and spectroscopic TLC, IR investigation all extracts shows various bands and peaks wereobserved among all extracts ethyl acetate extract shows better resolution and obtained fluorescence band and variousfunctional group respectively. In the presence these secondary metabolites applications in as alternative medicines,in agriculture field in pest control management and also used in killing of pathogenic microorganisms.
Key word: Combretum albidum, secondary metabolites, Thin layer chromatography, IR.
INTRODUCTION
The WHO estimate now a day’s near about 80%peoples from all over of the world mostly used plantorigin medicine for their health care ( Batugal et al.2004). In India rural and tribals peoples used traditionalplants for physical and mental fitness without sideeffect and due to this security and cost efficacy dayby day increase the demand of traditional medicinalplants in modern medicine (Koche et al., 2011), while incase of the synthetic drugs used as medicine, whichhaving more side effect on human beings andenvironment (Chanda, 2014) due to which decreasethe demand of these synthetic drugs and urgent needalternative medicines without detrimental effect. TheCombretum albidum G. Don is a wild medicinal plantand it’s belonging to the family Combretaceae,generally renowned as Buffalo calf in English (Kumaret al., 2015) and in Marathi piluki. Its distribution inIndia and Sri Lanka particularly in semi evergreen,deciduous forests (Sreedhar et al., 2012). Diversity ofsecondary metabolites obtained from C. albidum likealkaloids, saponin, Coumarines, tannins, terpenoids,flavonoids etc. (Bruneton, 1999; Trease and Evnas2002; Sreedhar et al., 2013a).Which play a vital role inhealing jaundice (Sreedhar et al., 2012), diarrhea,dysentery (Karupusamy et al., 2007) cough (Punjaji etal., 2012), in malarial fever and eye troubles (Kadavulet al., 2009), skin diseases (Ganesan et al., 2009) etc. Indeveloping countries many types of herbal drugscontaining formulation used in health care agenda. Yetdifficulty behind the acceptance of substitute medicines
in developed countries is the lack of documentationand strict quality control. So, the documentation ofchemical constituents of the raw materials used in herbalmedicine is very essential for the internationalacceptance of this system of medicine (Kumar et al.,2015). Limited work has been reported as detection ofchemical constituents like (alpha)–sitosterol, ursolic,gallic acids only by using qualitative assay and TLCon this plant (Sreedhar et al., 2013b) In this context, wehave chosen one plant for investigate of bioactiveconstituents.
MATERIALS AND METHODS
Materials
The stem and Leaves parts of Combretum albidumwas collected from Barshitakli campus Akola andidentified by an expert botanist. The plant parts usedfor studies were washed thoroughly in running tapwater, shade dried and pulverized to give a fine powder.The chemical used were of AR grades.
Methods
Extraction of secondary metabolites : stem and leavesof C. albidum in powdered form are Soxhlet extractedin three different solvents. The15 g powder wasextracted in 250 ml each of ethanol, ethyl acetate andhexane at 78oC 48oC and 69oC, respectively for 6 hours.The resulted extract was vacuum evaporated(Rotavapour R 24, Buchi, Switzerland). The residueobtained after vacuum evaporation was redissolved inethanol, ethyl acetate and hexane. This solution is used
Journal of Innovative Prospective in Sciences Vol (I), No. 1, March 2016
67
for further studies. Store in brown umber colouredbottle and keep it in refrigerator for further use.
Qualitative Phytochemical Test (Kokate, 1997)
A) Tests for Alkaloids
1) Hager’s Test
To the 2-3 ml of filtrate, 1ml of dil. HCl and Hager’sreagent was added and shake well. Yellow precipitatewas formed showing the presence of alkaloids.
2) Mayer’s Test
To the 2-3 ml of filtrate, 1ml of dil. HCl and Mayer’sreagent was added and shake well. Formation of yellowprecipitate showed the presence of alkaloids.
3) Wagner’s Reagent Test
To the 2-3 ml of filtrate, 1ml of dil. HCl and Wagner’sreagent was added and shake well. Formation of redish-brown precipitate showed the presence of alkaloids.
B) Tests for Tannins and Phenolic Compounds
1) FeCl3 Solution Test
On addition of 5% FeCl3 solution to the extract, deepblue black colour appeared.
2) Lead Acetate Test
On addition of lead acetate solution to the extract whiteprecipitate appeared.
3) Potassium Dichromate Test:
To a few drops of sample, strong Potassium dichromatesolution is added. Yellow colour precipitate indicatespresence of tannins and phenolic compounds.
C) Tests for Flavonoids
1) With Lead Acetate
To the small quantity of extract lead acetate solutionwas added. Formation of yellow precipitate showedthe presence of flavonoids.
D) Test for Steroids
1) Salkowski TestTo 2 ml of extract, 2 ml of chloroform and 2 ml of conc.H2SO4 was added. The solution was shaken well. As aresult chloroform layer turned red and acid layershowed greenish yellow fluorescence.
E) Test for Saponins
1) Foam TestTo 1ml extract 20 ml distilled water was added and shakeswell in measuring cylinder for 15 min. Then 1 cm layerof foam was formed.
Chemical characterization
Thin Layer Chromatography (TLC):
Thin layer chromatography (TLC) was carried out forthe qualitative determination of active secondarymetabolites in the plant extracts. TLC was performedwith standard silica gel 60 F254 plates (10 cm x 10 cm)(Merck, Germany). The extracts were applied with thehelp of a thin capillary in order to concentrate the testsample on plates. The plates were air dried anddeveloped in ascending manner in chromatographytwin trough chamber (CAMAG, Switzerland) pre-saturated for 30 min with the respective mobile phase.The plates were developed using different mobilephases of varying compositions to obtain the bestresolution. After the development, the plates wereobserved either under UV light of short wave length(254 nm) or in visible light after derivatization. Themobile phase giving the best resolution in eachethanolic, ethyl acetate and hexane extracts.
Spectrophotomertic analyses:
For UV visible spectroscopy, the TLC crude leafextracts bands were dissolved in ethyl acetate andscanned between 200 – 800 nm in a single beamscanning spectrophotometer using appropriate control(Shimadzu model 1601, Japan). The FT-IR spectra ofthe dried TLC better resolved crude leaf extract bandsof extracts were recorded between 4000 – 400 cm-1 bya FT-IR spectrophotometer (perkin Elmer, Japan) usingKBr as a matrix.
RESULTS AND DISCUSSION
Chemical characterization:
The preliminary phytochemical and chromatographicanalyses of C. albidum Leaf and Stem extracts showedpresence of alkaloids, tannins, Flavonoids, saponinsand steroids (Table 1). In TLC studies, the extractsshowed presence of fluorescent bands with Rf valuesranging between 0.39-0.59. The TLC Chromatogramof C. albidum is shown in (Figure 1), of the variousmobile phases tried, the best resolution was obtainedwith toluene: ether (1:1, v/v) saturated with 10% aceticacid in our studies there is no different in the bandpattern in thin layer chromatography. Thechromatogram of ethyl acetate extract showed nearlyidentical spectra when scanned in thespectrophotometer not shown. The FT-IR spectra ofC. albidum leaf ethyl acetate extract showed consistentpeak obtained from each extracts indicating presenceof common identical compounds (Figure- 2 ).
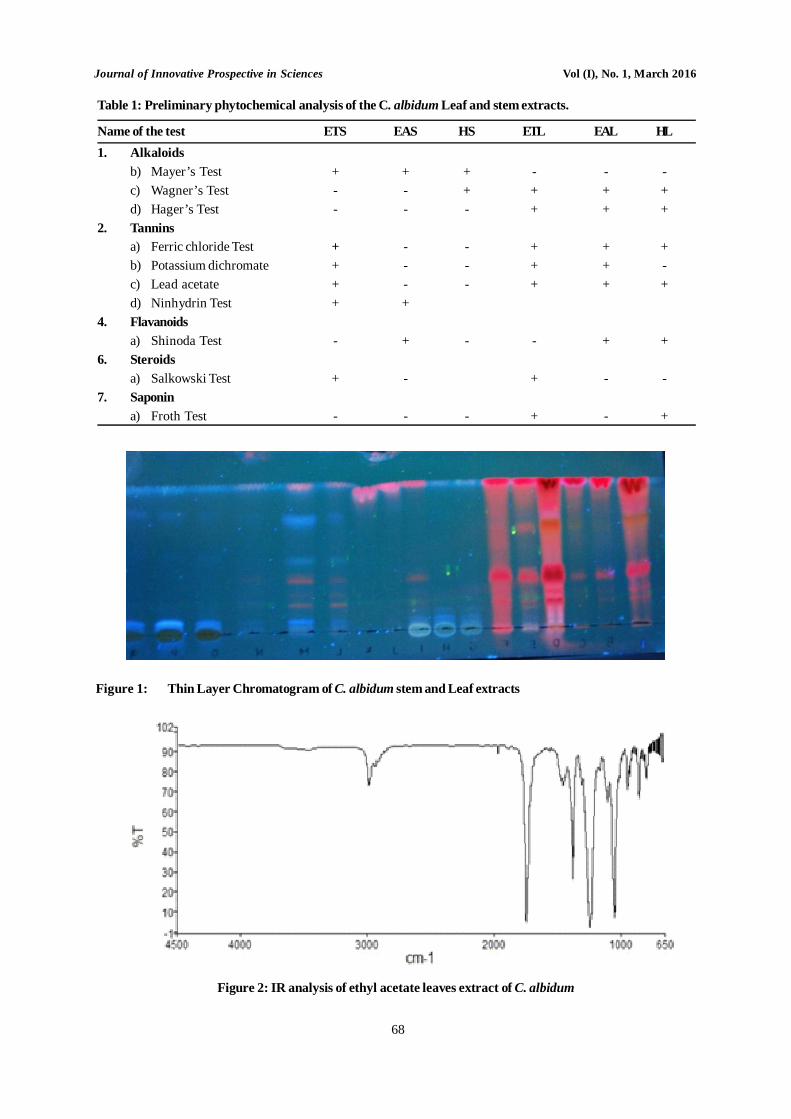
Journal of Innovative Prospective in Sciences Vol (I), No. 1, March 2016
68
Figure 1: Thin Layer Chromatogram of C. albidum stem and Leaf extracts
Figure 2: IR analysis of ethyl acetate leaves extract of C. albidum
Table 1: Preliminary phytochemical analysis of the C. albidum Leaf and stem extracts.
Name of the test ETS EAS HS ETL EAL HL1. Alkaloids
b) Mayer’s Test + + + - - -c) Wagner’s Test - - + + + +d) Hager’s Test - - - + + +
2. Tanninsa) Ferric chloride Test + - - + + +b) Potassium dichromate + - - + + -c) Lead acetate + - - + + +d) Ninhydrin Test + +
4. Flavanoidsa) Shinoda Test - + - - + +
6. Steroidsa) Salkowski Test + - + - -
7. Saponina) Froth Test - - - + - +
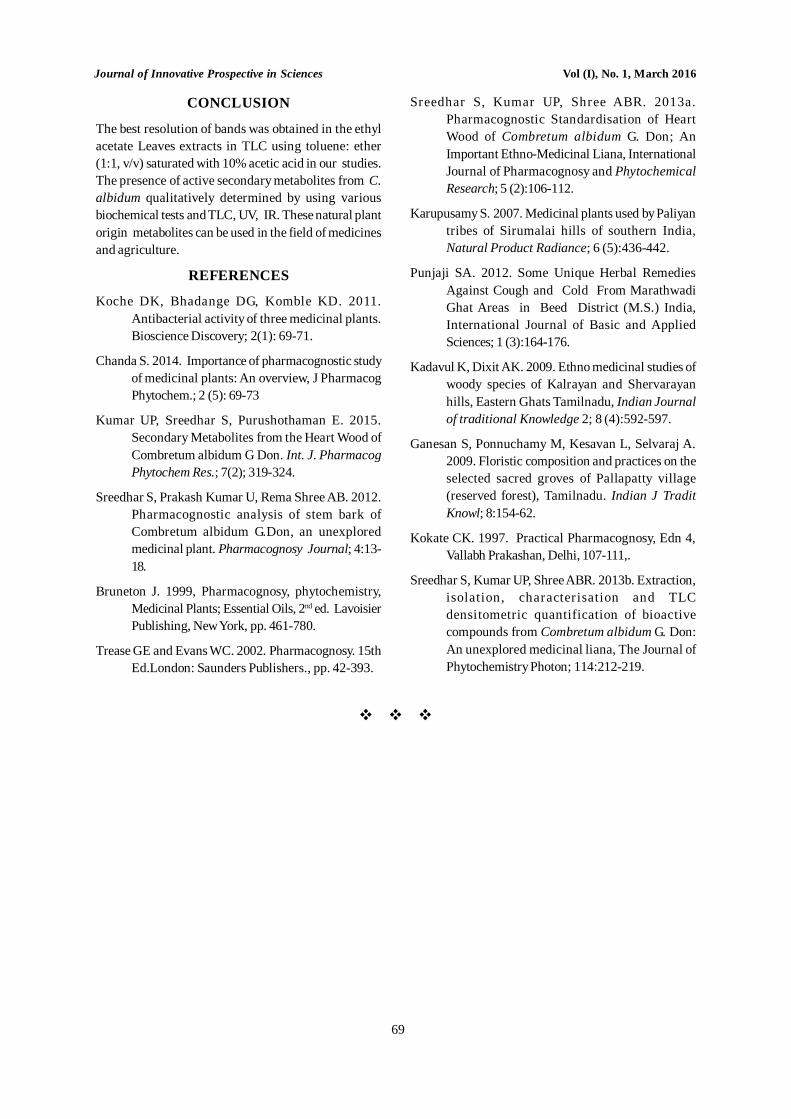
Journal of Innovative Prospective in Sciences Vol (I), No. 1, March 2016
69
CONCLUSION
The best resolution of bands was obtained in the ethylacetate Leaves extracts in TLC using toluene: ether(1:1, v/v) saturated with 10% acetic acid in our studies.The presence of active secondary metabolites from C.albidum qualitatively determined by using variousbiochemical tests and TLC, UV, IR. These natural plantorigin metabolites can be used in the field of medicinesand agriculture.
REFERENCES
Koche DK, Bhadange DG, Komble KD. 2011.Antibacterial activity of three medicinal plants.Bioscience Discovery; 2(1): 69-71.
Chanda S. 2014. Importance of pharmacognostic studyof medicinal plants: An overview, J PharmacogPhytochem.; 2 (5): 69-73
Kumar UP, Sreedhar S, Purushothaman E. 2015.Secondary Metabolites from the Heart Wood ofCombretum albidum G Don. Int. J. PharmacogPhytochem Res.; 7(2); 319-324.
Sreedhar S, Prakash Kumar U, Rema Shree AB. 2012.Pharmacognostic analysis of stem bark ofCombretum albidum G.Don, an unexploredmedicinal plant. Pharmacognosy Journal; 4:13-18.
Bruneton J. 1999, Pharmacognosy, phytochemistry,Medicinal Plants; Essential Oils, 2nd ed. LavoisierPublishing, New York, pp. 461-780.
Trease GE and Evans WC. 2002. Pharmacognosy. 15thEd.London: Saunders Publishers., pp. 42-393.
Sreedhar S, Kumar UP, Shree ABR. 2013a.Pharmacognostic Standardisation of HeartWood of Combretum albidum G. Don; AnImportant Ethno-Medicinal Liana, InternationalJournal of Pharmacognosy and PhytochemicalResearch; 5 (2):106-112.
Karupusamy S. 2007. Medicinal plants used by Paliyantribes of Sirumalai hills of southern India,Natural Product Radiance; 6 (5):436-442.
Punjaji SA. 2012. Some Unique Herbal RemediesAgainst Cough and Cold From MarathwadiGhat Areas in Beed District (M.S.) India,International Journal of Basic and AppliedSciences; 1 (3):164-176.
Kadavul K, Dixit AK. 2009. Ethno medicinal studies ofwoody species of Kalrayan and Shervarayanhills, Eastern Ghats Tamilnadu, Indian Journalof traditional Knowledge 2; 8 (4):592-597.
Ganesan S, Ponnuchamy M, Kesavan L, Selvaraj A.2009. Floristic composition and practices on theselected sacred groves of Pallapatty village(reserved forest), Tamilnadu. Indian J TraditKnowl; 8:154-62.
Kokate CK. 1997. Practical Pharmacognosy, Edn 4,Vallabh Prakashan, Delhi, 107-111,.
Sreedhar S, Kumar UP, Shree ABR. 2013b. Extraction,isolation, characterisation and TLCdensitometric quantification of bioactivecompounds from Combretum albidum G. Don:An unexplored medicinal liana, The Journal ofPhytochemistry Photon; 114:212-219.

Journal of Innovative Prospective in Sciences Vol (I), No. 1, March 2016
70
Journal of Innovative Prospective in Sciences Vol (I), No. 1, March 2016
71
Journal of Innovative Prospective in SciencesUndertaking and Copyright Transfer Form
Manuscript No.: .................................. ................................... Date:. ................................... ...................................
ToThe Editor-in-Chief,Journal of Innovative Prospective in SciencesI/We, the undersigned author(s) of the manuscript entitled ................................... ................................... ................................... ................................... ................................... ................................... ...................................................................... ................................... ................................... ................................... ................................... ................................... ................................... ................................... ................................... ................................... ..........................................
here by declare that the above mentioned manuscript which is submitted for publication in the Journal of InnovativeProspective in Sciences (JIPS) under my/our authorship has not been published or considered for publicationelsewhere. I/We have reviewed the final version of the manuscript and approve it for publication. I undertake thatscientific data and information has not been copied from the other published articles. Additionally I/We attest thatI/We shall produce the data upon which the manuscript is based for examination by the editors or their assignees,if requested. All Authors agree that the contents of the manuscript are secret and will not be copyrighted, submitted,or published elsewhere (including the Internet), in any language, while acceptance by the Journal is underconsideration and after publication in Journal of Innovative Prospective in Sciences (JIPS).I/We, as author/authors, hereby agree to transfer to Journal of Innovative Prospective in Sciences (JIPS) all rights,including those pertaining to electronic forms and transmissions, under existing copyright laws. In connectionwith this assignment, the Author acknowledges that Journal of Innovative Prospective in Sciences (JIPS) will havethe right to print, publish, create derivative works, and sell the work throughout the world, all rights in and to allrevisions or versions or subsequent editions of the work in all languages and media throughout the world and shallbe the sole owner of the copyright in the work throughout the world. We have substantially participated in thecreation of the Work and it represents our original work sufficient for us to claim authorship. The Author/authorshereby guarantees that the manuscript is in no way an infringement of copyright and does not contain any matterof libellous nature and that he shall indemnify the Publisher against all losses and expenses arising out of suchinfringement of copyright or on account of matter of defamatory/ objectionable nature contained in the manuscriptand that All disputes will be settled at Murtizapur/ Akola Jurisdiction only. I/We further warrant and symbolize thatI/We have no economic interest in the subject matter of the work or any affiliation with JIPS.I/we also agree to the authorship of the article in the following series:Author’s name(s) Signatures1. —————————————————— 1.————————————————2. —————————————————— 2.————————————————3. ————————————————— 3.————————————————4. ————————————————— 4.————————————————5. ————————————————— 5.————————————————UNDERTAKING BY MAIN AUTHORI, the main author of the manuscript entitled.......................................................................................................................................................................
...................................................................................................................................................................................................................................................................................
hereby undertake that this manuscript was submitted by me to Journal of Innovative Prospective in Sciences(JIPS) for it’s publication in this journal and all following Co-Authors have participated in the creation of thisresearch/review work and their names have been given in this manuscript by me for their valuable support andguidance during this work.Co-Author’s Name1. ...................................................................................................................................... 2. .........................................................................................................................
3. ...................................................................................................................................... 4. .........................................................................................................................
Name of Main Author................................................................... Signature of Main Author...................................................................
Journal of Innovative Prospective in Sciences Vol (I), No. 1, March 2016
72
Journal of Innovative Prospective in Sciences
Author’s Guidelines
Manuscript must be written on A-4 size paper with 2.00 cm. or 1 inch margin all around, with 12 font size(times new roman), 1.5 spaced in English and should be submitted via email [email protected] or [email protected] manuscript.html jointly with covering letterfrom corresponding author as a file saved in MS Word (.doc) or pdf format. Before submitting spelling,punctuation, sentence structure, italic words and spacing should be properly checked.
Journal of Innovative Prospective in Sciences intend to publish verification based scientific researcharticles from various disciplines of Science, Engineering, Technology and Agriculture fields. The Journalswelcome articles of general interest to the researchers, academicians and students.
Please submit a single word (.doc/ .dox. PDF) version of your manuscript (in soft copy) that include alltables and figures, images at appropriate location. All pages should be numbered successively openingform title page. The file name should contain the name of corresponding author and a keyword from thetitle of your manuscript.
Manuscript should be in following sequence:
Title page Authors details Abstract Keywords Introduction Materials and Methods Results and Discussion Acknowledgements References
Title page: Title page should contain the title of the article, names of all authors, their institutionalaffiliations. The name of corresponding author should be clearly marked by (*) or (**) etc. and his/her full postal address with city, Pin code and country, telephone number and email address should beclearly mentioned.
Abstract: Abstract should be concise not more than 250 words describing purpose, methods, importantresults and derived conclusion of the study.
Keywords: 3 to 6 keywords characterizing the scope of the article and central aspect of the work.
Introduction: The introduction should clearly indicate the aim of the study and necessary back groundinformation. The precise problems that the author mainly likes to solve during study should also bestated. Unnecessary and excessive explanation makes the introduction bulky.
Journal of Innovative Prospective in Sciences Vol (I), No. 1, March 2016
73
Materials and Methods: The clarification of the experimental methods should be short and sufficientfor repetition by other investigators. Protocols/ procedures that have been published earlier should not bedescribed in detail. Sources and grades of chemicals and materials, and make of equipment used duringinvestigation should be indicated. Methods of statistical analysis and type should be described.
Tables and figures: All the tables and figures should be numbered successively and titled rightfully thatcan explain the content and nature of the table and figures. Tables and figures should be cited at appropriatelocations for correct account.
Results and Discussion: It should enclose the scientific interpretation of result and justifications ofresearch. It should also include the key conclusion drawn from results and its contribution to people.
Acknowledgement should be written before References and after the Results and Discussion.
References/ Bibliography at the end of the research/ review papers must be listed in the Alphabeticalorders and will be given in the text by the Author name/s, Year of the publication, Title of the paper/Chapter of Book if any, name of the Journal/ Publication, Volume, Number and Page number in followingformat.
Eg. 1) Morgante M. and Oliveri A.M. (1993) PCR-amplified Microsatellites as markers in plant Genetics.The Plant Journal, 3 (1): 175-182.
2) Williams J.G.K., Kubelik A.R., Livak K.J., Rafalski A. and Tingey S.V. (1990) DNA polymorphismsamplified by arbitrary primers are useful as genetic markers. Nucleic Acids Research, 18: 6531-6535.
Reference from Thesis:
Eg..Sanap S. S. (1999) Synthesis and Assessment of Organo-metallic Compounds for the study itsApplications in different Sectors. Ph.D. Thesis, University of Toronto.
Reference from Books:Eg..Thompson. D. ed., (1995) The Brief Oxford Dictionary of Recent English. Oxford, UK: OxfordUniversity Press, 9th ed. ISBN No.: 0987654.
Reference from Website:Eg..Anonymous, unZign, “Wireless Network for Digitalization”, http://altern.org/net/digital/, (Browsingdate: 23rd September 1997)Publication of the University of Oxford (on digital networking for wireless connections): <http://cuiwww.unige.ch/˜vision/Publications/watermarking_publications.html> (Browsing Date: 4th January 2006
For each paper publication author should submit processing free Rs. 1300/-
Submission of paper include-
1) Soft copy of research paper (not more than 3-4 pages), 2) Certificate of originality of research paper/article, 3) Copyright form, 4) Copy of bank deposit slip etc.
Journal of Innovative Prospective in Sciences Vol (I), No. 1, March 2016
74
The Authors can transfer the publication charges electronically using following Bank/ account detailsare:
ACCOUNT NUMBER 3519127440
ACCOUNT HOLDER V. S. Undal
BANK Central Bank of India
IFSC CODE CBINO282263
MICR CODE 444016285
BRANCH Kaulkhed, Akola
BRANCH CODE 02263
The true copy of Bank deposit slip must be sent along with each research paper/ article
The entire disputes/ legal controversies are subject to the jurisdiction of competent courts inMurtizapur/ Akola.
All editorial quires and communication should be addressed to the
Dr. Vinod S. UndalC/o Principal-Ghulam Nabi Azad Arts, Commerce and Science
College, Mangrulpir Rd., Barshitakli Dist Akola 444 401 MS IndiaFor any support please call to -098233 64032/099230 68493/ 099606 73059.
www. [email protected] or [email protected]
Journal of Innovative Prospective in Sciences Vol (I), No. 1, March 2016
75
Editor in Chief
Dr. Vinod S. UndalDepartment of Botany,
Ghulam Nabi Azad Arts, Commerce and Science College,Barshitakli Dist Akola 444 401 MS India
Journal of Innovative Prospective in Sciences(An Biannual Science, Engineering and Technology Journal)
Executive Editors
Prof. Sharad S. IdholeDepartment of Chemistry,
Ghulam Nabi Azad Arts,Commerce and ScienceCollege,Barshitakli Dist Akola 444 401 India
Dr. Amit B. VairaleDepartment of Zoology,
Ghulam Nabi Azad Arts,Commerce and ScienceCollege, Barshitakli Dist Akola 444 401 India
Associate Editors
Dr. (Mrs.) N. M. KankaleDepartment of Zoology,
Ghulam Nabi Azad Arts,Commerce and ScienceCollege,Barshitakli Dist Akola 444 401 MS India
Prof. A. B. PatilDepartment of Biochemistry, Ghulam Nabi AzadArts, Commerce and Science College, Barshitakli
Dist Akola 444 401 MS India
Dr. S. W. SuradkarDepartment of Botany,
Ghulam Nabi Azad Arts,Commerce and ScienceCollege,Barshitakli Dist Akola 444 401 MS India
Prof. S. A. WaghmareDepartment of Chemistry, Ghulam Nabi Azad
Arts,Commerce and Science College,BarshitakliDist Akola 444 401 MS India
Chief Patron
Dr. Madhukarrao R. PawarFounder President and Principal,
Ghulam Nabi Azad Arts, Commerce and Science College,Barshitakli Dist Akola
ISSN-XXXX-XXXX
Prof. Mrs. S. T. KameDepartment of Home Science,
Ghulam Nabi Azad Arts,Commerce and ScienceCollege,Barshitakli Dist Akola 444 401 MS India
Prof. Kalpana ChavhanDepartment of Mathematics,
Ghulam Nabi Azad Arts,Commerce and ScienceCollege,Barshitakli Dist Akola 444 401 MS India
i
Journal of Innovative Prospective in Sciences Vol (I), No. 1, March 2016
76
Editorial Board
Dr. G. N. WankhedeDepartment of Zoology,
Sant Gadge Baba Amravti University,Amravati 444 602 MS India
Dr. (Mrs.) Varsha RathodDepartment of Botany, Kolhapur University,
Kolhapur (MS) India
Dr. Vinod Bhonde(Department of Physics) Principal,
Yashvantrao Chavan Arts and Science College, MangrulpirDist Washim MS
Dr. Bhasker SatheDepartment of Chemistry,
Dr. Babasaheb Ambedkar Marathwada University,Aurangabad MS India
Dr. S. M. MularDepartment of Biochemistry,
Shri Shivaji College, Akola MS
Dr. R. V. KhandareDepartment of Nanotechnology,
Kolhapur University, Kolhapur MS India
Dr. G. G. MuleyDepartment of Physics,
Sant Gadge Baba Amravati University,Amravati 444 602 MS India
Dr. Manoj Kumar DuttaDepartment of Physics,
BIT Mesra, Deoghar Campus Ratanpur,Jasidih, Bihar, India
Dr. M. S. BhattiDepartment of Botany and Environmental Science,
Guru Nanak Dev University,Amritsar Punjab India
Dr. S. R. ManikDepartment of Botany,
Sant Gadge Baba Amravti University,Amravati 444 602 MS India
Dr. S. R. BhusareDepartment of Chemistry,
Dnyanopasak College,Parbhani 431401 MS India
Dr. R. A. SatputeDepartment of Botany,
Government Institute of Science,Aurangabad MS India
Dr. D. T. TaydeDepartment of Chemistry,
Government Vidarbha Institute of Science and Humanities,Amravati MS India
Dr. B. S. DawaneDepartment of Chemistry,
Swami Ramanand Tirth Marathwada University,Nanded MS
Dr. Kirtivant P. GhadleDepartment of Mathematics,
Dr. Babasaheb Ambedkar Marathwada University,Aurangabad MS India
Dr. P. A. GawandeDepartment of Botany,
Sant Gadge Baba Amravati University,Amravati 444 602 MS India
Prof. Aniket GadeDepartment of Bio-Technology,
Sant Gadge Baba Amravati University,Amravati 444 602 MS India
Dr. Biplab Kumar KuilaDepartment of Applied Chemistry,Central University of Jharkhand,
Ranchi Jharkhand India
Dr. Varsha HutkeDepartment of Botany,
Government Vidarbha Institute of Science andHumanities, Amravati MS India
ii
Journal of Innovative Prospective in Sciences Vol (I), No. 1, March 2016
77
Dr. Anurag LindaDepartment of Environmental Sciences,
Central University of Himachal Pradesh,Dharamshala, Dist Kangra-176215 (HP) India
Dr. U. P. DolhareDepartment of Mathematics,
DSM College, Jintur Dist. Parbhani MS
Dr. Milind ShirbhateDepartment Zoology,
Shankarlal Khandelwal Arts, Science and CommerceCollege, Akola, MS. India-444002
Dr. S. G. BadneDepartment of Chemistry,
Shri Shivaji College, Akola MS
Dr. M. P. Bhole Department of Electronics,
Pratap College, Amalner Dist Jalgaon MS
Dr. Ghulam Mohi-Ud-Din YattoDepartment of Botany,
Government Degree College, Beerwah,Budgam, 193411 Kashmir India
Dr. Gagan MattaDepartment of Environmental Science,
Gurukula Kangri Vishwavidyalay, Haridwar,Uttarakhand India
Dr. M. N. LokhandeDepartment of Chemistry,
Nanibai Gharpalkar College, Babhulgaon,Dist. Yavatmal MS
Dr. Manohar PadulDepartment of Biochemistry,
Dr. Babasaheb Ambedkar Marathwada University,Aurangabad (MS) India
Dr. Kiran F. ShelkeDepartment of Chemistry,
Smt. Pushpadevi Patil College,Risod Dist Washim MS
Dr. Vishal DeshmukhDepartment of Botany,
Jagdamba College, Achalpur City,Dist Amravati MS India
Dr. (Mrs.) R. S. SinghaiRIE, Bhopal MP India
Dr. Yogesh ManjareDepartment of Geology,
Rashtra Sant Tukdoji MaharajUniversity,Nagpur MS India
Dr. T. A. GiteDepartment of Botany,
Vaijanath College, Parali Dist Beed MS India
Dr. M. R. DeshpandeNetaji Subhashchandra Bose College,
Nanded- 431601(MS)
Dr. Vinay Kumar SinhaDepartment of Botany,
BDA College, Pichhri Bermo, Bokaro,Jharkhand India
Advisory Board
Dr. Z. H. Khan, Biochemistry (Akola)Dr. Dilip Dabhade, Zoology (Washim)Dr. Vijay Mangle, Environmental Science (Chikhaldara)
Dr. C. M. Bharmbe, Zoology (Malkapur)Dr. Y. P. Patil, Botany (Malkapur)Dr. P. J. Kale, Botany (Karanja Gh. )Dr. Vijaykumar Patil, Physics (Latur)Prof. Shyam B. Garud, Mathematics (Parbhani)Dr. Pradip D. Satav, Microbiology (Nanded)Dr. Swarad Chaudhari, Comp. Science (Ranchi)Dr. Gopal Chavhan, Comp. (IIT, Mumbai)Dr. Ravi Jagtap, Chemistry (Pune)Dr. Pravin Makade, Zoology (Murtizapur)Dr. G. V. Pradhan, Geology (Amravati)Dr. Ratnadip Sawant, Chemistry (Sauth Korea)Dr. Abhijit Surawase, Biotechnology (Australia)
Dr. S. S. Deshmukh, Geology (Akola)Dr. Nilesh Bhosale, Botany (Jafrabad)Dr. Mrs. Amrita Vyas, Zoology (Patur)Dr. S. P. Phulwale, Chemistry (Kurudwadi, Solapur)Dr. A. T. Shinde, Chemistry (Nanded)Dr. Simeet Rokade, Botany (Malegaon)Dr. Ravi Dhore, Botany (Balapur)Dr. Manish Ahir, Microbiology (Akola)Dr. Kailas Kale, Statistics (Mumbai)Dr. M. T. Jadhao, English (Akola)Dr. P. N. Rathod, English (Akola)Prof. V. N. Khandare, Zoology (Nandurbar)Prof. S. V. Khandare, Environmental Science (Patur)Prof. G. S. Khansole, Chemistry (Shirala, Sangali)Prof. Nilkanth S. Bhalerao, Micro-Biology (Ratnagiri)
Prof. N. N. Ubale, Home Science (Akola)
Peer Review Team
Published by- Principal, Ghulam Nabi Azad Arts, Commerce and Science College, Barshi Takli, Dist. Akola,MS
iii

Journal of Innovative Prospective in Sciences Vol (I), No. 1, March 2016
78
ISSN: XXXX-XXXX
Journal of Innovative Prospective in Sciences (JIPS)(An open access (online in next issue), peer-reviewed, interdisciplinary, Biannual and Journal)
www. gnacollege.com
[email protected] or [email protected]
CALL FOR PAPER
Smooth, simple and timely publishing of review and research articles. We are pleased to inform you that Journal ofInnovative Prospective in Sciences (JIPS) is going to launch its First issue (Volume 01, Number 01, March - 2016).We would like to invite you to contribute your Research Paper for publication in JIPS. Papers published in JIPS willreceive very high publicity and acquire very high reputation. The journal covers all areas of Sciences, Engineering,Technology, Agriculture etc., We publish original research articles, review articles and technical notes. The journalreviews papers within one week of submission and publishes accepted articles on the internet immediately uponreceiving the final versions. Our fast reviewing process is our potency.
Authors are requested to organize their manuscript in JIPS paper format, by using JIPS paper Template. Forauthor’s convenience, we strongly follow the following steps.
1. Response will be given within 24 hours.
2. The paper will be reviewed within one week.
3. Author will get their Acceptance/Rejection Notification within 12 days of submitting paper.
4. All the accepted papers will be open accessible.
The author/s get their published manuscript and entire Journal immediately upon their publication. Moreover theJIPS is releasing its second issue in both Print and Online version next time.
Submit your manuscript through E-mail at: [email protected] or [email protected]
With regards
EDITOR
Journal of Innovative Prospective in Sciences
iv
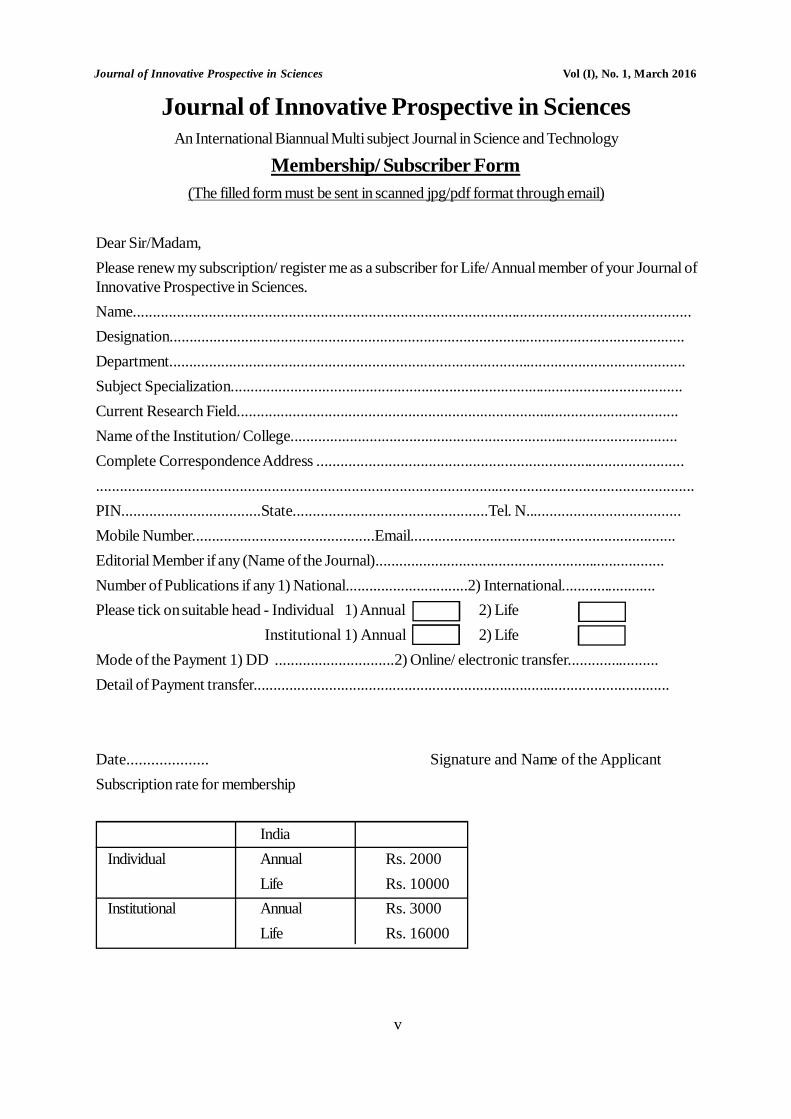
Journal of Innovative Prospective in Sciences Vol (I), No. 1, March 2016
79
Journal of Innovative Prospective in SciencesAn International Biannual Multi subject Journal in Science and Technology
Membership/ Subscriber Form(The filled form must be sent in scanned jpg/pdf format through email)
Dear Sir/Madam,Please renew my subscription/ register me as a subscriber for Life/ Annual member of your Journal ofInnovative Prospective in Sciences.Name............................................................................................................................................Designation..................................................................................................................................Department..................................................................................................................................Subject Specialization..................................................................................................................Current Research Field...............................................................................................................Name of the Institution/ College..................................................................................................Complete Correspondence Address ..................................................................................................................................................................................................................................................PIN...................................State.................................................Tel. N.......................................Mobile Number..............................................Email...................................................................Editorial Member if any (Name of the Journal).........................................................................Number of Publications if any 1) National...............................2) International........................Please tick on suitable head - Individual 1) Annual 2) Life Institutional 1) Annual 2) LifeMode of the Payment 1) DD ..............................2) Online/ electronic transfer.......................Detail of Payment transfer.........................................................................................................
Date.................... Signature and Name of the ApplicantSubscription rate for membership
IndiaIndividual Annual Rs. 2000
Life Rs. 10000Institutional Annual Rs. 3000
Life Rs. 16000
v

Journal of Innovative Prospective in Sciences Vol (I), No. 1, March 2016
80
Certificate of Authorship/Originality
(This form will be sent in filled scanned JPG or PDF format via email)
I /we Prof./ Dr. / Mr. /Mrs .................................................................................................... ................................................
.................................................................................................... .................................................. Certified that the research
paper entitled .................................................................................................... ........................................................................
.................................................................................................... .................................................................................................... ...........
Has not been previously submitted for a degree or it has been submitted as part for publication in any form.
I / we have also declared that the research paper/ article have been written by me/us. In addition, I/ we certified
that, all information sources and literature used are mentioned in the research paper/ article.
Place :
Date : / /20 Signature of Researcher/s, author
Name............................................................
Sign..............................................................
Name............................................................
Sign..............................................................
vi
Journal of Innovative Prospective in Sciences Vol (I), No. 1, March 2016
81
C O N T E N T S
Vol I No. 1 March 2016
DIVERSITY OF SPIDERS FROM THE FAMILY CLUBIONIDAE (ARANEA) FROM MIDDLEPLAINS OF NARMADA BASIN OF MADHYA PRADESH, INDIA
AMRITA VYAS, VIJAY BHAGATAND AND M. V. SHIRBHATE
IMPACT OF BAT GUANO ON DEGRADATION OF SOIL POLLUTANTS IN OF MALKAPURTAHSIL, BULDANA DISTRICT, MS (INDIA)
C. M. BHARAMBE AND DIPALI BORSE
ADSORPTION OF DYES ONTO A COAL FLY ASH SYNTHESIZED CFA-MCM-41:ACONVERSION OF WASTE TO WEALTH
MANISH DESHPANDE AND U.D. JOSHI
PHYTOCHEMICAL ANALYSIS OF ETHANOL LEAF EXTRACT OF RICINUS COMMUNIS L.TO CURE JAUNDICE.
D. B. DUPARE
A NEW KINETICS AND MECHANISM STUDY OF IRIDIUM (III) CATALYSED OXIDATIONOF ALCOHOL BY CERIUM (IV) IN AQUEOUS ACIDIC MEDIA
N.K. HALIKAR, G.P. SADAWARTE AND G.S. KHANSOLE
SURVEY OF MEDICINAL PLANTS AND THEIR USES FROM PUSAD AND ADJOINING HILLYREGION.
P.M. KAHATE
STUDIES ON FLOWERING PHENOLOGY IN GOSSYPIUM HIRSUTUM L.
KALE P. J. AND P. P. ULHE
SOFTWRE RELIABILITY MODELS: AN INTRODUCTION
RAJESH SINGH AND K. R. KALE
A NEW SPECIES OF THE GENUS CIRCUMONCOBOTHRIUM MANNENISIS FROM A FRESHWATER FISH OPNIACEPHALUS
NILIMA M. KANKALE
10. ANALYSIS OF AIR QUALITY IN INDUSTRIAL ENVIRONMENT OF THE CITY OF NAGPURBY AN APPLICATION OF POLLUTION INDEX METHOD
SHARAD V. KHANDARE
REVISIT THE SALBARDI AND ADJOINING REGION OF AMRAVATI DISTRICTMAHARASHTRA AND BETUL DISTRICT OF MADHYA PRADESH, INDIA
B. S. MANJARE
1
5
9
13
16
19
23
27
30
33
37
Journal of Innovative Prospective in Sciences Vol (I), No. 1, March 2016
82
PHYSICO-CHEMICAL ANALYSIS OF DRINKING WATER FROM SHIRPUR, DIST. WASHIM(MS)
S. S. ROKADE AND S. B. GAIKWAD
SYNTHESIS OF RHA MESOPOROUS MATERIAL BY HYDROTHERMAL AND ULTRASONICTREATMENT
S. B. SHETE, M. R. DESHPANDE AND U. D. JOSHI
MORPHOMETRIC ANALYSISOF BILDI RIVER SUB CATCHMENT OF PURNA RIVER SUBBASIN MAHARASHTRA,INDIA USING REMOTE SENSING AND GIS TECHNIQUES
S. M. TALE AND B. S. MANJARE
STUDIES IN THE PROXIMATE ANALYSIS OF LEAVES OF RICINUS COMMUNIS FROMBARSHITAKLI IN AKOLA DISTRICT
S. A. WAGHMARE AND V. S. UNDAL
ASSESSMENT OF WATER QUALITY OF NALGANGA DAM, DIST BULDANA
YOGESH PATIL
ENANTIOSELECTIVE SYNTHESIS OF (S)-ENCIPRAZINE
M. N. LOKHANDE, S. S. IDHOLE AND S. GAIKWAD
PRELIMINARY PHYTO-CHEMICAL INVESTIGATION OF COMBRETUM ALBIDUM G. DON:AS MEDICINALLY IMPORTANT PLANT
B M BHALERAO AND A B PATIL
47
50
53
61
63
64
66


