Embed Size (px)
Citation preview

MINIREVIEW
DNA Arrays in Clinical Oncology: Promisesand Challenges
François Bertucci, Patrice Viens, Rebecca Tagett, Catherine Nguyen,Rémi Houlgatte, and Daniel Birnbaum
Department of Molecular Oncology (FB, DB), Institut Paoli-Calmettes, Department of Medical Oncology (FB, PV),
Institut Paoli-Calmettes, University of Méditerranée-UFR Medicine (FB, PV), Ipsogen SA (RT), ERM206 INSERM
(CN, RH), and U119 INSERM (DB), IFR57, Marseille, France.
SUMMARY: Cancer is a complex genetic disease characterized by the accumulation of multiple molecular alterations. Currentdiagnostic and prognostic classifications, based on clinical and pathologic factors, are insufficient to reflect the whole clinicalheterogeneity of tumors. Most current anticancer agents do not differentiate between cancerous and normal cells, leading sometimesto disastrous adverse effects. Recent advances in human genome research and high-throughput molecular technologies make itpossible finally to tackle the molecular complexity of malignant tumors. With DNA array technology, mRNA expression levels ofthousands of genes can be measured simultaneously in a single assay. Oncology is benefiting on multiple fronts. Gene expressionprofiles are revealing new biologically and clinically relevant tumor subclasses previously indistinguishable and are identifying newdiagnostic and prognostic biomarkers as well as new potential therapeutic targets. Here, we review the technology and present clinicalapplications for which promising results have been obtained. Finally, we discuss issues that must be resolved in the near future to allowDNA arrays to translate into benefits for cancer patients. (Lab Invest 2003, 83:305–316).
C ancer is a complex, polygenic disease that arisesand progresses from the accumulation of multi-
ple genetic and epigenetic anomalies. This combina-torial origin, the heterogeneity of malignant cells, anda variable host background produce multiple tumorsubclasses. Today, cancer classifications are princi-pally based on clinical and morphologic features thatonly partially reflect this heterogeneity, reducing theprobability of the most appropriate diagnostic andtherapeutic strategy for each patient. Most currentanticancer agents do not differentiate between can-cerous and normal cells, resulting in sometimes disas-trous toxicity and an inconstant efficiency. The devel-opment of innovative drugs that selectively targetcancer cells while sparing normal tissues is verypromising as suggested by successful recent exam-ples such as the use of mAb therapy against theERBB2 receptor in breast cancer (O’Dwyer and
Druker, 2000), or the tyrosine kinase inhibitor STI571in chronic myelogenous leukemia (Pegram et al, 1999).
Although a huge amount of biologic studies hasbeen published so far, only a few molecular markersare used routinely in clinical practice. Besides thedisease heterogeneity, there are two main reasons forsuch a paradox. First, traditional molecular analysesare reductionist, assessing only one or a few genes ata time, thus working with a biologic model too specificand limited to confront a process whose clinical out-come is likely governed by the combined influence ofmany genes. Second, most clinical study designshave resulted in conflicting and nonconclusive results.Current research aims to decipher, within the complexmachinery of genes that dictate tumor evolution, newmolecular alterations that would make diagnosticand/or therapeutic interventions more accurate andmore specific.
Modern high-throughput RNA expression measure-ments combined with improved genomic informationallow the genetic complexity of cancer to be investi-gated by simultaneous analysis of tens of thousandsof genes in a single step. During the past few years,several gene expression profiling methods haveemerged and have been applied successfully to can-cer research. These include differential display (Chenget al, 2002), serial analysis of gene expression (SAGE)(Velculescu et al, 1995), and DNA arrays (Granjeaud etal, 1999). DNA arrays have become prominent be-
DOI: 10.1097/01.LAB.0000059936.28369.19
Received November 25, 2002.Work in our laboratories is supported by INSERM, CNRS, Institut Paoli-Calmettes, and grants from Association pour la Recherche contre le Cancer,Fédération Nationale des Centres de Lutte Contre le Cancer, and the LigueContre le Cancer (Comité National et Comité de Corse du Sud).Address reprint requests to: Dr. Daniel Birnbaum, Department of Molec-ular Oncology, Institut Paoli-Calmettes and U119 INSERM, 27 Bd. LeïRoure, 13009 Marseille, France. E-mail: [email protected]
0023-6837/03/8303-305$03.00/0LABORATORY INVESTIGATION Vol. 83, No. 3, p. 305, 2003Copyright © 2003 by The United States and Canadian Academy of Pathology, Inc. Printed in U.S.A.
Laboratory Investigation • March 2003 • Volume 83 • Number 3 305

cause they are easier to use, do not require large-scale DNA sequencing, and allow the parallel quanti-fication of thousands of genes from multiple samples.Compared with conventional methods (eg, Northernblot, PCR analysis of reverse-transcribed RNA), these“molecular portraits” provide a holistic account of themolecular state of the cell type under scrutiny. Be-cause the biologic diversity of tumors can often beaccounted for by changes in gene expression, DNAarrays are expected to result in the identification ofnew diagnostic and prognostic markers and the de-velopment of new specific targeted therapies. Thisreview describes DNA array–based gene expressionprofiling and its clinical applications in oncology, aswell as the challenges that remain for the rapid transferof technology and/or discoveries to clinical practice.
DNA Array Technology for Gene Expression Profiling
Principle. DNA array technology relies on nucleicacid hybridization between labeled free targets de-rived from a biologic sample and an array of manyDNA fragments (the probes, representing genes ofinterest), tethered to a solid surface (Fig. 1). The
targets, produced by reverse transcription and simul-taneous labeling of RNA molecules, are part of acomplex mixture of distinct cDNA fragments thathybridize with their cognate probes during the assay.The signal generated on each probe reflects themRNA expression level of the corresponding gene inthe sample. After detection, quantification, and inte-gration of signals with specialized software, intensitiesare normalized for technical deviations, providing a“gene expression profile” for each sample, compara-ble to profiles from other samples.
Technologic Platforms. Two main implementationsof DNA arrays have been applied with success. Thefirst uses arrays of cDNA clones robotically spotted ona solid surface in the form of PCR products. Severalversions exist, depending on the type of support(nylon, glass) and the type of target labeling (radioac-tivity, colorimetry, fluorescence) (Bertucci et al, 1999b;Chen et al, 1998; Schena et al, 1995). This approach isflexible, allowing researchers to make arrays with theirown gene sets, but it requires accurate collection andstorage of cDNA clones and PCR products, whichmay be avoided by using commercially available ar-rays. Versions such as nylon arrays with radioactivedetection are relatively cheap.
The second implementation uses arrays of oligonu-cleotides either directly synthesized in situ on a sup-port (Hughes et al, 2001; Lockhart et al, 1996) orrobotically spotted (Kane et al, 2000). Probes designrequires knowledge of the gene sequences. Theirlength (oligonucleotides of 20 to 80 bp) allows differ-ential detection of members of gene families or alter-native transcripts not distinguishable by cDNA spottedarrays. The main drawback remains the elevated cost.
Data Analysis. DNA arrays deliver a new type of datawith several thousands of measurements per experi-ment. The analysis, interpretation, and meaningfuldisplay and storage of such a huge volume of data areparticularly challenging. Although genes that displayextreme expression changes between samples mayrequire specific analysis, the true strength of high-throughput experiments in unraveling the complexityof cancer comes through the mathematical identifica-tion of expression patterns or signatures within profil-ing data. Sophisticated dedicated software developedfor this task includes the “unsupervised” and “super-vised” varieties (Brazma and Vilo, 2000). Unsupervisedmethods define classes without any a priori, organiz-ing data by clustering genes and/or samples simply bysimilarities in their expression profiles. Once clustersare delineated, correlations are searched for betweensample clusters and histoclinical parameters, and be-tween gene clusters and functional annotation, chro-mosomal location, or cell type. One of the mostpopular clustering tools is hierarchic clustering (Eisenet al, 1998) coupled with a graphic visualization tool(Fig. 2A). Other methods include K-means clusteringand self-organizing maps. The resulting sample clas-sification often correlates with a histologic character-istic defined by large sets of genes and not necessarilywith the clinical distinction of interest (eg, drug resis-tance) generally governed by a smaller set. By defining
Figure 1.Principle of gene expression measurement with DNA arrays. Each numberdefines an experimental step. 1, DNA fragments are represented by cDNAclones robotically spotted or by oligonucleotides in situ synthesized orrobotically spotted onto solid surface; 2, RNA is extracted from biologicsample; 3, RNA is simultaneously reverse transcribed and labeled; 4, hybrid-ization image is acquired by scanning; 5, hybridization signals are automati-cally quantified and data are normalized.
Bertucci et al
306 Laboratory Investigation • March 2003 • Volume 83 • Number 3
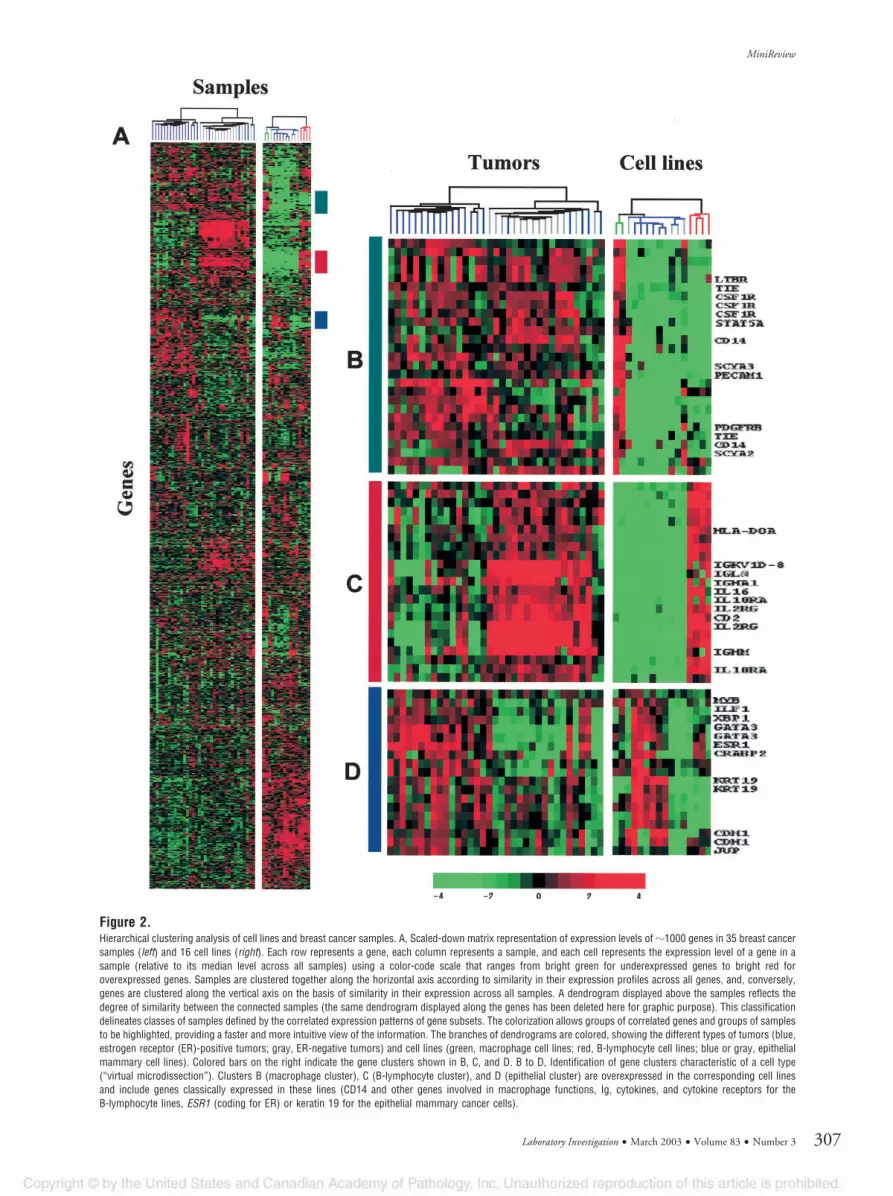
Figure 2.Hierarchical clustering analysis of cell lines and breast cancer samples. A, Scaled-down matrix representation of expression levels of �1000 genes in 35 breast cancersamples (left) and 16 cell lines (right). Each row represents a gene, each column represents a sample, and each cell represents the expression level of a gene in asample (relative to its median level across all samples) using a color-code scale that ranges from bright green for underexpressed genes to bright red foroverexpressed genes. Samples are clustered together along the horizontal axis according to similarity in their expression profiles across all genes, and, conversely,genes are clustered along the vertical axis on the basis of similarity in their expression across all samples. A dendrogram displayed above the samples reflects thedegree of similarity between the connected samples (the same dendrogram displayed along the genes has been deleted here for graphic purpose). This classificationdelineates classes of samples defined by the correlated expression patterns of gene subsets. The colorization allows groups of correlated genes and groups of samplesto be highlighted, providing a faster and more intuitive view of the information. The branches of dendrograms are colored, showing the different types of tumors (blue,estrogen receptor (ER)-positive tumors; gray, ER-negative tumors) and cell lines (green, macrophage cell lines; red, B-lymphocyte cell lines; blue or gray, epithelialmammary cell lines). Colored bars on the right indicate the gene clusters shown in B, C, and D. B to D, Identification of gene clusters characteristic of a cell type(“virtual microdissection”). Clusters B (macrophage cluster), C (B-lymphocyte cluster), and D (epithelial cluster) are overexpressed in the corresponding cell linesand include genes classically expressed in these lines (CD14 and other genes involved in macrophage functions, Ig, cytokines, and cytokine receptors for theB-lymphocyte lines, ESR1 (coding for ER) or keratin 19 for the epithelial mammary cancer cells).
MiniReview
Laboratory Investigation • March 2003 • Volume 83 • Number 3 307

relevant classes before analysis, supervised tech-niques bypass this issue. These algorithms incorpo-rate external information related to samples studied(eg, survival) to identify the optimal set of genes thatbest discriminate between the tumor classes. Theyresult in “molecular classifiers” capable of assigningmembership of an unknown sample to a predefinedclass of interest. Generally, a classifier is derivedthrough training on a random subset of chosen sam-ples with known class memberships (learning set) andthen validated on the remaining subset, or testing set(of known classification). Once validated, it is appliedto classify samples of unknown classification. Super-vised methods include support vector machines,weighted votes (Golub et al, 1999), and neural net-works (Khan et al, 2001).
Clinical Applications of Gene Expression Profilingin Oncology
DNA arrays are tools that are capable of confrontingtumor heterogeneity and of enhancing molecular di-agnoses. Current classifications are insufficient toreflect the diversity of cancer. Ideally, they shouldproduce subclasses of tumors defined by a commonmechanism of malignant transformation. In this case,patients within the same category would probablydisplay a more uniform clinical outcome. Because ofthe complexity of disease, a combination of markersidentified by comprehensive molecular analysis islikely to be more accurate than a single marker.Although there are multiple studies of cancer profilingusing DNA arrays, we present here those that partic-ularly stress a clinical interest for oncology. Morefundamental applications are beyond the scope of thisreview or have been reviewed elsewhere (Clarke et al,2001).
Diagnosis and Screening. The diagnostic interestwas initially suggested by Khan et al (1998), whoseexpression profiling clusters of cancer cell linesagreed with the organ type of origin. This interest wasreinforced by Golub et al (1999), whose tissue sampleprofiles distinguished between acute myeloid leuke-mia and acute lymphoblastic leukemia (ALL). It wasencouraging that diagnostic power was soon beingdemonstrated on a variety of other cancers known fordiagnostic difficulty in clinical practice. Small roundblue-cell tumors of childhood include at least fourtypes: neuroblastoma, rhabdomyosarcoma, non-Hodgkin’s lymphoma, and Ewing sarcoma. Therapeu-tic options, response to therapy, and prognosis de-pend on the type, but unfortunately their appearanceis similar on routine histology. Their distinction is thusprimordial and requires sophisticated techniques thatsometimes fail. Using gene expression signatures of83 samples and neural networks, Khan et al (2001)correctly classified the four types of small roundblue-cell tumors of childhood samples and identifiedthe genes most relevant to the classification. Similarly,Gordon et al (2002) described a classifier of eightgenes whose expression was capable of accurately
distinguishing between malignant pleural mesotheli-oma and adenocarcinoma of the lung.
New subclasses of tumors with biologic relevancehave been revealed and characterized by gene ex-pression profiling. Alizadeh et al (2000) identified twosubclasses of diffuse large B-cell lymphoma derivedfrom different stages of B-cell maturation. Armstronget al (2002) confirmed that ALL with translocationinvolving the mixed-lineage leukemia gene MLL is aunique entity with an expression profile distinct fromboth ALL and acute myeloid leukemia. Sorlie et al(2001) defined five subclasses of breast cancer, in-cluding new ones such as a myoepithelial and aluminal epithelial subclass. Bittner et al (2000) identi-fied two subclasses of cutaneous malignant mela-noma that further showed distinct aggressivepotential.
Another application is to identify, among the thou-sands of tested genes, screening or diagnosis mark-ers by comparing gene expression profiles from nor-mal, premalignant, and malignant tissues from thesame organ. Kim and colleagues (Wong et al, 2001)profiled ovarian cancer cell lines and healthy humanovarian surface epithelial cell cultures and found thatosteopontin had a high cancer/human ovarian surfaceepithelial ratio. In a subsequent study, they foundassociation between osteopontin plasma levels andovarian cancer, suggesting its possible role as ascreening marker (Kim et al, 2002). Similarly, compar-ison of gene expression profiles of prostate samplesfrom different types (normal tissue, benign hyperpla-sia, localized cancer and metastatic hormone-refractory cancer) identified �-methylacyl-CoA race-mase as a potential cancer marker (Rubin et al, 2002).Another original use of DNA arrays for identifyingscreening markers was the comparison of gene ex-pression profiles of blood samples from women withbreast cancer and healthy volunteers (Martin et al,2001). A panel of genes that were overexpressed inthe patients’ blood and accurately separated the twopopulations were identified.
DNA arrays may also contribute to the diagnosis ofmetastases by identifying the tumor tissue origin.Carcinoma of unknown primary site is relatively rare inthe clinic but problematic. Determination of the natureof the original tumor is important for the delivery of anappropriate treatment, but histologically these carci-nomas are often identical. Better tumor markers arerequired to assign metastases to likely primary sites.Studies using cancer cell lines or tumor tissues haveshown the capacity of gene expression profiles toclassify cancers according to their tissue of origin(Giordano et al, 2001; Khan et al, 1998; Ramaswamyet al, 2001; Scherf et al, 2000; Su et al, 2001). Forexample, Giordano et al (2001) measured mRNA ex-pression of �7200 genes in 154 adenocarcinomas ofthe lung, colon, and ovary. Analysis of data correctlyclassified all but two samples in agreement with thepathologic assessment of the primary site. Interest-ingly, further immunohistochemical analysis of the twooutliers revealed a diagnosis consistent with the mo-lecular classification in one case (ovarian metastasis
Bertucci et al
308 Laboratory Investigation • March 2003 • Volume 83 • Number 3

of colon cancer) and a sarcoma in the second case.These studies also showed that metastases generallyconserve the expression profile from the tissue oforigin, thus suggesting the potential of technology foridentifying the tissue origin of carcinoma of unknownprimary site. Similarly, Bhattacharjee et al (2001) dem-onstrated that DNA arrays could discriminate betweenprimary lung adenocarcinomas and metastases ofextrapulmonary origin.
Prognosis. Several studies with cancer cell lineshave suggested the capacity of DNA arrays for iden-tifying gene sets associated with metastasis or re-sponse to treatment. Zajchowski et al (2001) com-pared gene expression profiles of breast cancer celllines with varying potential for invasion. They identified24 genes differentially expressed between weakly andhighly invasive lines and showed that their RNA ex-pression profiles were sufficient to predict the aggres-siveness, as measured in vitro, of previously unchar-acterized cell lines. Other studies have demonstratedcorrelations between gene expression profiles andprofiles of sensitivity of cancer cell lines (NCI60 panel)to certain cytotoxic drugs, among the hundreds orthousands of tested chemical compounds (Scherf etal, 2000; Staunton et al, 2001).
Before any clinical application, these studies mustbe extended to patient tissue samples, but in vivo,additional complicating factors also govern clinicaloutcome, such as tumor environment or anatomic orpharmacologic parameters. However, retrospectivestudies on pretreatment tissue samples have sug-gested the power of gene expression profiles in prog-nostic classification of hematologic malignancies (Al-izadeh et al, 2000; Devilard et al, 2002; Hofmann et al,2002; Rosenwald et al, 2002; Shipp et al, 2002; Yeohet al, 2002) and solid tumors (Ahr et al, 2002; Beer etal, 2002; Bertucci et al, 2002b; Fuller et al, 2002;Garber et al, 2001; Kihara et al, 2001; Pomeroy et al,2002; Singh et al, 2002; Sorlie et al, 2001; Takahashi etal, 2001; van ’t Veer et al, 2002). Characteristics ofthese studies are summarized in Table 1. The mostfrequently analyzed cancers are lymphomas andbreast cancer. The first encouraging study was doneon diffuse large B-cell lymphoma from 40 patientstreated with anthracyclin-based chemotherapy (Aliza-deh et al, 2000). The tumors with a pattern close tothat of germinal center B cells had a significantlybetter survival than the tumors with expression pat-terns corresponding to activated B cells. Rosenwaldet al (2002) recently confirmed and refined this prog-nostic stratification in an expanded study of 240diffuse large B-cell lymphoma samples. They identi-fied 17 genes for which expression predicted survivalafter chemotherapy, independent of the InternationalPrognostic Index. Yeoh et al (2002) used oligonucle-otide arrays to profile leukemia blasts from 360 pedi-atric ALL samples. Expression signatures identifiedthe six major prognostically important subtypes ofleukemia: T-ALL, and B-ALL with a hyperdiploidkaryotype or a BCR-ABL, E2A-PBX1, TEL-AML1, orMLL gene rearrangement. The authors did not identifya single transcriptional signature that predicted re-
lapse irrespective of the genetic subtype. However,distinct expression profiles associated to relapse weredefined within individual subtypes such as T-ALL andhyperdiploid B-ALL.
Similar results have been reported for differentclinical forms of breast cancer (Ahr et al, 2002; Ber-tucci et al, 2002b; Sorlie et al, 2001; van ’t Veer et al,2002). No new histoclinical factor—except the proteinoverexpression of ERBB2 and recently of uPA/PAI-1—has been validated as a prognostic and/or predictivefactor during the past two decades. Although adjuvantchemotherapy improves survival in localized breastcancer, a number of issues remain. In particular,patients with good prognosis need to be more accu-rately identified to avoid potentially toxic treatment,and patients of poor prognosis who will or will notbenefit from the standard adjuvant chemotherapycurrently used need to be determined. AnalyzingmRNA expression of �1000 candidate genes in tumorsamples from 55 women who were treated with adju-vant anthracyclin-based chemotherapy, we identifieda 40-gene set whose expression distinguished threesubclasses of tumors that, although balanced withrespect to clinicopathologic features, showed signifi-cantly different 5-year survival (Bertucci et al, 2002b).van ’t Veer et al (2002) measured the expression of�25,000 unselected genes in tumor samples fromwomen with lymph node-negative good prognosisbreast cancer. They identified a predictor set of 70genes that could discriminate between tumors thatwould be likely to metastasize and need adjuvanttreatment and those that probably would not. Simi-larly, Sorlie et al (2001) defined five subclasses oflocally advanced breast tumors with different survivalafter neoadjuvant doxorubicin. To explore further thevalidity of results, we compared the lists of discrimi-nator genes identified in these breast cancer prognos-tic studies (Ahr et al, 2002; Bertucci et al, 2002b; Sorlieet al, 2001; van ’t Veer et al, 2002). Despite severaldifferent methodologic aspects, 26 genes were foundin at least two lists (Bertucci et al, 2002a). Reassuringis that some have a known prognostic value (eg,ESR1, ERBB2), but most are not yet associated withprognosis but have functions that make them primecandidates for novel therapeutic targets.
Another use of DNA arrays relies on the search forcorrelations between gene expression profiles andhistoclinical prognostic factors. Each of the latterprobably reflects the expression of hundreds of genes.Subtle molecular differences important for clinicaloutcome thus may be hidden by the rough estimatethat these factors provide but be picked up by large-scale expression analyses. Two major prognostic fac-tors of breast cancer have been investigated by com-paring the molecular profiles of estrogen receptor(ER)-positive and ER-negative tumors (Bertucci et al,2000; Gruvberger et al, 2001; Martin et al, 2000; van ’tVeer et al, 2002) and profiles of tumors with andwithout axillary lymph node metastasis (Bertucci et al,2000; West et al, 2001). The determination of lymphnode status currently relies on surgical axillary lymphdissection, which is associated with significant mor-
MiniReview
Laboratory Investigation • March 2003 • Volume 83 • Number 3 309

Tabl
e1.
Canc
er-D
NAAr
rays
:Pro
gnos
ticSt
udie
s
Refe
renc
eCa
ncer
Type
Path
olog
icTy
peTe
sted
Sam
ples
aDN
AAr
ray
Test
edGe
nesb
Clin
ical
End
Poin
tDi
scrim
inat
orGe
nesc
Aliza
deh
etal
,200
0Ly
mph
oma
Non-
Hodg
kin’
sly
mph
oma:
DLBC
L40
cDNA
glas
sflu
o�
18.0
005-
year
surv
ival
�10
0Sh
ipp
etal
,200
2Ly
mph
oma
Non-
Hodg
kin’
sly
mph
oma:
DLBC
L58
olig
ogl
ass
fluo
�7.
000
5-ye
arsu
rviv
al13
Rose
nwal
det
al,2
002
Lym
phom
aNo
n-Ho
dgki
n’s
lym
phom
a:DL
BCL
240
cDNA
glas
sflu
o�
12.0
005-
year
surv
ival
17De
vila
rdet
al,2
002
Lym
phom
a“C
lass
ical
”Ho
dgki
n’s
lym
phom
a21
cDNA
Nylo
nRA
�1.
000
Surv
ival
72Ye
ohet
al,2
002
Leuk
emia
Pedi
atric
T-AL
Lan
dHD
B-AL
L43
and
64ol
igo
glas
sflu
o�
13.0
00Co
ntin
uous
CRvs
rela
pse
7an
d20
Sorli
eet
al,2
001
Brea
stLo
cally
adva
nced
aden
ocar
cino
ma
51cD
NAgl
ass
fluo
�8.
000
Surv
ival
496
Bertu
ccie
tal,
2002
aBr
east
Loca
lized
poor
prog
nosi
sad
enoc
arci
nom
a55
cDNA
Nylo
nRA
�1.
000
5-ye
arsu
rviv
al40
van’
tVee
ret
al,2
002
Brea
stLo
caliz
edgo
odpr
ogno
sis
aden
ocar
cino
ma
97ol
igo
glas
sflu
o�
25.0
00M
etas
tasi
s-fre
esu
rviv
al70
Ahr
etal
,200
2Br
east
Aden
ocar
cino
ma
55cD
NANy
lon
RA�
600
Met
asta
ticre
laps
e41
Kiha
raet
al,2
001
Esop
hage
alSq
uam
ous
cell
carc
inom
a26
cDNA
glas
sflu
o�
9.00
0Su
rviv
al52
Taka
hash
ieta
l,20
01Re
nal
Clea
rce
llad
enoc
arci
nom
a29
cDNA
glas
sflu
o�
22.0
005-
year
surv
ival
51Ga
rber
etal
,200
1Lu
ngAd
enoc
arci
nom
a31
cDNA
glas
sflu
o�
24.0
00Su
rviv
al14
9Be
eret
al,2
002
Lung
Stag
eIa
deno
carc
inom
a67
olig
ogl
ass
fluo
�7.
000
Surv
ival
50Po
mer
oyet
al,2
002
CNS
Med
ullo
blas
tom
a60
olig
ogl
ass
fluo
�7.
000
5-ye
arsu
rviv
al8
Sing
het
al,2
002
Pros
tate
Aden
ocar
cino
ma
21ol
igo
glas
sflu
o�
13.0
00Di
seas
e-fre
esu
rviv
al5
DLBC
L,di
ffuse
larg
eB-
cell
lym
phom
a;flu
o,flu
ores
cenc
e;RA
,rad
ioac
tivity
;ALL
,acu
tely
mph
obla
stic
leuk
emia
;HD,
hype
rdip
loid
;CR,
com
plet
ere
mis
sion
;CNS
,cen
traln
ervo
ussy
stem
.a
Num
ber
ofpa
tient
sin
clud
edin
prog
nosi
san
alys
is(th
eta
ble
islim
ited
tost
udie
sin
clud
ing
20or
mor
epa
tient
s).
bNu
mbe
rof
gene
ste
sted
.c
Num
ber
ofdi
scrim
inat
orge
nes
iden
tifie
d.
Bertucci et al
310 Laboratory Investigation • March 2003 • Volume 83 • Number 3

bidity. Sentinel lymph node biopsy is being evaluatedto replace classical invasive dissection. However, inboth cases, false-negative results are possible. Accu-rate prediction of the axillary status from analysis oftumors would obviate the recourse to lymph nodesurgery. Among differentially expressed genes that weidentified between tumors with and without nodemetastasis, some had a function in agreement with apotential role in invasion (eg, ERBB2, CDH1), whereasfor others (eg, SOX4, GSTP1), the connection was notclear, calling for further investigations (Bertucci et al,2000).
Potential Pitfalls in Gene Expression Profiling ofCancer Samples
Altogether, these studies have revealed the greattranscriptional heterogeneity of tumors. They haveshown the potential of DNA arrays to discriminate,from RNA expression level of dozens of genes andamong classically indistinguishable tumors, new bio-logically and/or clinically relevant subclasses thatprobably represent different diseases that require dif-ferent management. Results, obtained on a relativelysmall number of samples, must now be validated andrefined. Future studies with more samples and moregenes will tell us whether it is possible to improvepredictive power to 100% accuracy, but there is noguarantee (Ince and Weinberg, 2002). Such stratifica-tion, together with the increasing availability of newalternative diagnostic and therapeutic options, is ex-pected to guide patients toward the strategy mostlikely to succeed for them. The characterization ofdiscriminator genes will provide new markers that areuseful for screening, diagnosis, prognosis, and moni-toring and will help in deciphering the pathways in-volved in malignant transformation and in developingnew molecularly targeted anticancer drugs. However,the remaining obstacles must not go unnoticed amidthe enthusiasm generated. Beyond the yet limitedaccess and complexity of DNA array technology, bothof which are now rapidly improving, several experi-mental issues and pitfalls still may complicate inves-tigations with clinical specimens in cancer researchand blur the results.
Tumor Specimens. DNA array experiments requirehigh-quality RNA. Unfortunately, although currentRNA extraction methods work well with frozen tumorspecimens, they perform poorly with formalin-fixed,paraffin-embedded tissues, which constitute the bulkof pathology archives. Although large numbers ofarchival frozen samples are available in many clinicalinstitutions, they are often suboptimal with respect toRNA quality, preservation, or clinical information. To-day, the development of high-throughput molecularanalyses makes researchers even more aware of thecrucial need to collect, identify, and store high-qualityspecimens in tumor banks. Careful and rapid process-ing of specimens from the clinic to the laboratory tothe freezer should obey strict standardized protocols.Banks should be linked to a searchable database thatcontains all appropriate histoclinical information, in-
cluding treatment and outcome. Organized institu-tional ethics, informed patient consents, and patientconfidentiality are important logistical challenges. Thecollection of adequate specimens will be improved ifphysicians and patients are better educated on theone hand and if these procedures and requirementsbecome a component of all ongoing clinical trials onthe other hand.
The small size of many clinical specimens from earlydiagnoses and new minimally invasive diagnostic pro-cedures is another critical issue. Efforts are under wayto reduce the amount of sample required for analysis.Most platforms of DNA array work with a few micro-grams of mRNA, except for nylon microarrays withradioactive detection, which use only a few nano-grams (Bertucci et al, 1999a). One solution is toamplify the sample mRNA using linear amplificationmethods before labeling (Luo et al, 1999).
Variability of Data. There are potential sources ofexperimental and biologic variability in DNA arrayexperiments that may affect and complicate analyses.Because of the numerous error-prone steps in exper-iments, acquisition of valid data requires many qualitycontrols aimed at ensuring excellent hybridizationconditions, correct signal-to-noise ratio, dynamic andlinear range, sensitivity, and reproducibility. Theseissues require experiments to be replicated with non-precious biologic material (eg, cell lines) to understandbetter and eliminate the sources of errors beforeanalysis of precious tumor specimens.
Factors of biologic variability related to tumor tissuesamples include their handling and the heterogeneityof tumor cells. Another factor is that solid tumorscontain several cell types (“normal” and malignantcells) in different proportions and functional status. Anexpression profile from such tissue in fact representsa snapshot of the genes expressed by many cell typesat a given moment. Taking this into consideration, thepathologists should carefully macrodissect zones en-riched in tumor cells before RNA extraction. Thissolution may further be reinforced during data analysisby confronting, with clustering techniques, expressionprofiles of heterogeneous specimens with those of celllines that represent the cell types present in thesample. Such an approach allows the isolation ofindependent gene clusters characteristic of a cell type(Fig. 2, B to D). Another strategy, more drastic but alsomore difficult and labor-intensive, lies in the use oflaser microdissection, which allows the procurementof pure cell subpopulations from frozen or fixed tissue(Emmert-Buck et al, 1996; Lechner et al, 2001). How-ever, the low amount of resulting RNA and its poorquality currently make difficult its application to DNAarray analyses. Moreover, depending on the question,isolation of pure cancer cells may not be desirablebecause tumor development is highly influenced byinteractions of malignant cells with surrounding non-malignant cells.
Handling of Data. All types of DNA array experimentsdepend on the statistical significance of observedcorrelations (Nadon and Shoemaker, 2002), but thegreat dissymmetry of variables poses a statistical
MiniReview
Laboratory Investigation • March 2003 • Volume 83 • Number 3 311

problem: the number of hybridized samples is greatlyinferior to the number of genes being tested (multiplehypothesis testing). This problem can be encounteredby analyzing several hundreds of samples, by confirm-ing correlations on an independent set of cases, or byrandomly permutating the labels of classes and com-paring the correlations obtained with random data andwith actual data. The biologic interpretation of statis-tically validated expression profiles may be enhancedby parallel analysis of cell models that representdifferent stages of tumor maturation or different expo-sures to stimuli as well as by the functional annotationof the discriminator genes (Alizadeh et al, 2000).
A major and critical complication is to produce datathat can be combined and compared within andbetween laboratories. An ideal marker (either singlegene or group of genes) should be consistent acrossall assays, obtained in a reproducible way by anylaboratory, using any platform, but the intrinsic vari-ability of DNA array data, the use of different techno-logic platforms with different experimental conditions,different gene sets, different normalization procedureswithout any all-encompassing standard, and the anal-ysis of samples from different patients make it difficultto combine and compare independent data. Ideally,different platforms should be compared and the pro-tocols should be standardized using the same clinicalspecimens. This is difficult because of the value andrarity of human cancer samples. All data should befreely accessible in the public domain, in an ordered,comprehensive, and standardized form. Internationalefforts are under way notably by the Microarray GeneExpression Database society to create a universalpublic expression database in a fully annotated for-mat, with enough data and experimental informationto allow everyone to reproduce the experiments oranalyses (Brazma et al, 2001). These efforts will facil-itate comparison of the different experimental proce-dures and development of new analytic tools and willhelp scientists to validate observed correlations and toperform meta-analyses.
Another issue is how to use expression profiles ofdiscriminator genes for classifying new samples intodiagnostic or prognostic categories. Current softwareclassifies samples with reference to other samples,the data of which come from previous measurementson the same platform. A recently published alternativeuses pairwise expression ratios of the most discrimi-nator genes and may avoid platform-related problems(Gordon et al, 2002).
Altogether, these issues are leading to new collab-orations between researchers across disciplines (phy-sicians, biologists, mathematicians, statisticians, andcomputer scientists) for the development of adequatelaboratory information management systems that arecapable of confronting the clinical parameters of tu-mors with expression data. Large-scale multicentercancer genomics projects are attempting to take on allof the potential pitfalls. The International GenomicsConsortium (www.intgen.org/), for example, aims toperform gene expression profiles of �10,000 tumor
samples during the next 3 years using standardizedprocedures and storing data in public databases.
Challenges before Clinical Transfer
In addition to the above cited issues, other importantsteps must be addressed before any routine clinicalapplication.
Clinical Trials. Clinical trials will be the first to useDNA arrays for molecular diagnosis. Technologyshould be systematically incorporated both to identifynew markers and to investigate the probability ofobserving an activity of the drug under investigation.Inclusion of patients in therapeutic trials is currentlybased on both clinical and pathologic criteria. Theinterpretation of results—and the future of the testeddrug—will greatly benefit from gene expression datathat may define subclasses of patients for which thedrug seems particularly efficient. Once identified, suchmolecular markers will accelerate and refine the pro-cess of subsequent clinical trials by allowing thedefinition of smaller but truly homogeneous groups ofpatients.
In the past, many barriers have prevented the trans-fer of molecular tests from research to patient man-agement. Statistically valid conclusions could rarelybe reached for several reasons, including the globalincomparability of studies. Divergences could not beinterpreted, and small data sets could not be merged.Today, researchers are poised to learn from pastmistakes and to face the challenges of high-throughput technologies such as DNA arrays. Ongo-ing retrospective large-scale studies will have to con-firm published data and demonstrate the value of thetechnology if patient treatment is to be improved. Ifconfirmed, that clinical utility will have to be assessedin prospective randomized clinical trials. Sensitivity,specificity and reproducibility, technical feasibility out-side large academic centers, and cost will have to beaddressed, and experimental conditions will have tobe standardized. Adequate design will also require asufficient number of carefully selected samples, suffi-ciently long follow-up, and meaningful end points(response rate or survival). A successful example of awell-designed approach is the assessment of uPA/PAI-1 in breast cancer (Janicke et al, 2001).
Combining DNA Arrays with Other High-ThroughputMolecular Analyses. In the future, gene expressionprofiling of clinical specimens will have to be associ-ated with other emergent high-throughput genomeand proteome analyses. Among promising technolo-gies are comparative genomic hybridization arrays(Pinkel et al, 1998), two-dimensional gel electrophore-sis and mass spectrometry, and protein arrays (Lawrieet al, 2001). Coordinated strategies thus are requiredto manage and store samples such that DNA, RNA,and proteins are preserved.
Data Validation. Once a potential marker or targethas been identified, and before clinical application, itneeds to be validated on a wider scale. The first stepis to select, among the numerous identified molecules,the candidate(s) that must be prioritized for future
Bertucci et al
312 Laboratory Investigation • March 2003 • Volume 83 • Number 3

investigations. Genes coding for secreted proteins aregood candidates for screening markers. Genes codingfor membrane-associated proteins or enzymes mayoffer therapeutic targets. Once candidates are se-lected, their clinical value must be evaluated on alarger series of specimens with long follow-up. Tissuemicroarrays offer a potent tool to assess rapidly andefficiently the correlations discovered with DNA arrays(Hoos and Cordon-Cardo, 2001; Nocito et al, 2001;Rimm et al, 2001). These consist of small tissue cores(0.6 mm in diameter) of up to 1000 different formalin-fixed specimens that are arrayed on a glass slide andmay be queried at the DNA (fluorescence in situhybridization), RNA (in situ hybridization), and proteinlevels (immunohistochemistry). Several studies haveshown the potential of combining such technologywith DNA array–based gene expression profiling (Bar-lund et al, 2000; Ginestier et al, 2002). When multiplecandidate genes must be validated or the antibody isnot available, another recently developed tool that canquantify RNA expression level of many separate genesin many samples simultaneously is quantitative PCR ofreverse-transcribed RNA (RQ-PCR) (Gibson et al,1996).
The Future of DNA Arrays
The type of gene expression profiling-based diagnos-tic platform that will be used in routine clinical practiceis not yet defined. Recent studies have shown thatcombined RNA expression of only a few dozen genesmay provide sufficient information for diagnostic andprognostic purposes. Specialized disease-specificDNA arrays that contain only discriminator genes arepresently being developed. Quantitative PCR ofreverse-transcribed RNA is an alternative solution ifthe number of genes is manageable. The strenuousneed for high-quality RNA extracted from frozen spec-imens might make immunohistochemistry more prac-tical in routine, but RNA and protein levels do notalways correlate and immunohistochemistry has somedisadvantages, too: it is not quantitative and may lackdiagnostic information provided by RNA expressionprofiles, it requires production and validation of anti-bodies, and analysis of combinations of proteins onthe same specimen is difficult.
The recent development of high-throughput tech-nologies has opened a new era of biomedical researchand hopefully will boost the exciting field of molecularmedicine. DNA arrays provide unprecedented toolsthat confront the complexity of tumors. Preliminaryresults promise a better approach to cancer manage-ment and cure. The current challenge is to demon-strate the clinical benefits for patients, but the poten-tial is enormous. It is anticipated that measuring thegenetic activity of tumors will lead to more correctdisease diagnoses and treatments. Indeed, futuretherapies may be based on the vulnerable points oftumor progression identified through expression anal-yses. Successful implementation of technology in clin-ical practice will depend on progress in collection ofspecimens and in technology, on collaborations be-
tween scientists from different disciplines, and onwell-designed clinical studies. It is likely that suchmolecular approaches will affect the current genera-tion of physicians in charge of cancer patients, hope-fully transforming cancer management into a morestructured and logical science and a successfulmedicine.
Acknowledgments
We thank Dominique Maraninchi and Claude Ma-was for encouragement.
ReferencesAhr A, Karn T, Solbach C, Seiter T, Strebhardt K, Holtrich U,and Kaufmann M (2002). Identification of high risk breast-cancer patients by gene expression profiling. Lancet 359:131–132.
Alizadeh AA, Eisen MB, Davis RE, Ma C, Lossos IS, Rosen-wald A, Boldrick JC, Sabet H, Tran T, Yu X, Powell JI, YangL, Marti GE, Moore T, Hudson J Jr, Lu L, Lewis DB, TibshiraniR, Sherlock G, Chan WC, Greiner TC, Weisenburger DD,Armitage JO, Warnke R, and Staudt LM (2000). Distinct typesof diffuse large B-cell lymphoma identified by gene expres-sion profiling. Nature 403:503–511.
Armstrong SA, Staunton JE, Silverman LB, Pieters R, denBoer ML, Minden MD, Sallan SE, Lander ES, Golub TR, andKorsmeyer SJ (2002). MLL translocations specify a distinctgene expression profile that distinguishes a unique leukemia.Nat Genet 30:41–47.
Barlund M, Forozan F, Kononen J, Bubendorf L, Chen Y,Bittner ML, Torhorst J, Haas P, Bucher C, Sauter G, Kallion-iemi OP, and Kallioniemi A (2000). Detecting activation ofribosomal protein S6 kinase by complementary DNA andtissue microarray analysis. J Natl Cancer Inst 92:1252–1259.
Beer DG, Kardia SL, Huang CC, Giordano TJ, Levin AM,Misek DE, Lin L, Chen G, Gharib TG, Thomas DG, LizynessML, Kuick R, Hayasaka S, Taylor JM, Iannettoni MD, OrringerMB, and Hanash S (2002). Gene-expression profiles predictsurvival of patients with lung adenocarcinoma. Nat Med8:816–824.
Bertucci F, Bernard K, Loriod B, Chang YC, Granjeaud S,Birnbaum D, Nguyen C, Peck K, and Jordan BR (1999a).Sensitivity issues in DNA array-based expression measure-ments and performance of nylon microarrays for small sam-ples. Hum Mol Genet 8:1715–1722.
Bertucci F, Eisinger F, Houlgatte R, Viens P, and Birnbaum D(2002a). Gene-expression profiling and identification of pa-tients at high risk of breast cancer. Lancet 360:173–174.
Bertucci F, Houlgatte R, Benziane A, Granjeaud S, AdelaideJ, Tagett R, Loriod B, Jacquemier J, Viens P, Jordan B,Birnbaum D, and Nguyen C (2000). Gene expression profilingof primary breast carcinomas using arrays of candidategenes. Hum Mol Genet 9:2981–2991.
Bertucci F, Nasser V, Granjeaud S, Eisinger F, Adelaide J,Tagett R, Loriod B, Giaconia A, Benziane A, Devilard E,Jacquemier J, Viens P, Nguyen C, Birnbaum D, and Houl-gatte R (2002b). Gene expression profiles of poor-prognosisprimary breast cancer correlate with survival. Hum Mol Genet11:863–872.
Bertucci F, Van Hulst S, Bernard K, Loriod B, Granjeaud S,Tagett R, Starkey M, Nguyen C, Jordan B, and Birnbaum D
MiniReview
Laboratory Investigation • March 2003 • Volume 83 • Number 3 313

(1999b). Expression scanning of an array of growth controlgenes in human tumor cell lines. Oncogene 18:3905–3912.
Bhattacharjee A, Richards WG, Staunton J, Li C, Monti S,Vasa P, Ladd C, Beheshti J, Bueno R, Gillette M, Loda M,Weber G, Mark EJ, Lander ES, Wong W, Johnson BE, GolubTR, Sugarbaker DJ, and Meyerson M (2001). Classification ofhuman lung carcinomas by mRNA expression profiling re-veals distinct adenocarcinoma subclasses. Proc Natl AcadSci USA 98:13790–13795.
Bittner M, Meltzer P, Chen Y, Jiang Y, Seftor E, Hendrix M,Radmacher M, Simon R, Yakhini Z, Ben-Dor A, Sampas N,Dougherty E, Wang E, Marincola F, Gooden C, Lueders J,Glatfelter A, Pollock P, Carpten J, Gillanders E, Leja D,Dietrich K, Beaudry C, Berens M, Alberts D, and Sondak V(2000). Molecular classification of cutaneous malignant mel-anoma by gene expression profiling. Nature 406:536–540.
Brazma A, Hingamp P, Quackenbush J, Sherlock G, Spell-man P, Stoeckert C, Aach J, Ansorge W, Ball CA, CaustonHC, Gaasterland T, Glenisson P, Holstege FCP, Kim IF,Markowitz V, Matese JC, Robinson A, Sarkans U, Schulze-Kremer S, Stewart J, Ronald Taylor R, Vilo J, and Vingron M(2001). Minimum Information About a Microarray Experiment(MIAME): Toward standards for microarray data. Nat Genet29:365–371.
Brazma A and Vilo J (2000). Gene expression data analysis.FEBS Lett 480:17–24.
Chen JJ, Wu R, Yang PC, Huang JY, Sher YP, Han MH, KaoWC, Lee PJ, Chiu TF, Chang F, Chu YW, Wu CW, and PeckK (1998). Profiling expression patterns and isolating differen-tially expressed genes by cDNA microarray system withcolorimetry detection. Genomics 51:313–324.
Cheng Q, Lau WM, Tay SK, Chew SH, Ho TH, and Hui KM(2002). Identification and characterization of genes involvedin the carcinogenesis of human squamous cell cervicalcarcinoma. Int J Cancer 98:419–426.
Clarke PA, te Poele R, Wooster R, and Workman P (2001).Gene expression microarray analysis in cancer biology, phar-macology, and drug development: Progress and potential.Biochem Pharmacol 62:1311–1336.
Devilard E, Bertucci F, Trempat P, Bouabdallah R, Loriod B,Giaconia A, Brousset P, Granjeaud S, Nguyen C, BirnbaumD, Birg F, Houlgatte R, and Xerri L (2002). Gene expressionprofiling defines molecular subtypes of classical Hodgkin’sdisease. Oncogene 21:3095–3102.
Eisen MB, Spellman PT, Brown PO, and Botstein D (1998).Cluster analysis and display of genome-wide expressionpatterns. Proc Natl Acad Sci USA 95:14863–14868.
Emmert-Buck MR, Bonner RF, Smith PD, Chuaqui RF,Zhuang Z, Goldstein SR, Weiss RA, and Liotta LA (1996).Laser capture microdissection. Science 274:998–1001.
Fuller GN, Hess KR, Rhee CH, Yung WK, Sawaya RA, BrunerJM, and Zhang W (2002). Molecular classification of humandiffuse gliomas by multidimensional scaling analysis of geneexpression profiles parallels morphology-based classifica-tion, correlates with survival, and reveals clinically-relevantnovel glioma subsets. Brain Pathol 12:108–116.
Garber ME, Troyanskaya OG, Schluens K, Petersen S,Thaesler Z, Pacyna-Gengelbach M, van de Rijn M, RosenGD, Perou CM, Whyte RI, Altman RB, Brown PO, Botstein D,and Petersen I (2001). Diversity of gene expression in ade-nocarcinoma of the lung. Proc Natl Acad Sci USA 98:13784–13789.
Gibson UE, Heid CA, and Williams PM (1996). A novelmethod for real time quantitative RT-PCR. Genome Res6:995–1001.
Ginestier C, Charaffe-Jauffret E, Bertucci F, Eisinger F,Geneix J, Bechlian D, Conte N, Adélaide J, Toiron Y, NguyenC, Viens P, Moziconacci MJ, Houlgatte R, Birnbaum D, andJacquemier J (2002). Distinct and complementary informa-tion provided by use of tissue and DNA microarrays in thestudy of breast tumor markers. Am J Pathol 161:1223–1233.
Giordano TJ, Shedden KA, Schwartz DR, Kuick R, Taylor JM,Lee N, Misek DE, Greenson JK, Kardia SL, Beer DG, RennertG, Cho KR, Gruber SB, Fearon ER, and Hanash S (2001).Organ-specific molecular classification of primary lung, co-lon, and ovarian adenocarcinomas using gene expressionprofiles. Am J Pathol 159:1231–1238.
Golub TR, Slonim DK, Tamayo P, Huard C, Gaasenbeek M,Mesirov JP, Coller H, Loh ML, Downing JR, Caligiuri MA,Bloomfield CD, and Lander ES (1999). Molecular classifica-tion of cancer: Class discovery and class prediction by geneexpression monitoring. Science 286:531–537.
Gordon GJ, Jensen RV, Hsiao LL, Gullans SR, BlumenstockJE, Ramaswamy S, Richards WG, Sugarbaker DJ, andBueno R (2002). Translation of microarray data into clinicallyrelevant cancer diagnostic tests using gene expression ratiosin lung cancer and mesothelioma. Cancer Res 62:4963–4967.
Granjeaud S, Bertucci F, and Jordan BR (1999). Expressionprofiling: DNA arrays in many guises. Bioessays 21:781–790.
Gruvberger S, Ringner M, Chen Y, Panavally S, Saal LH, BorgA, Ferno M, Peterson C, and Meltzer PS (2001). Estrogenreceptor status in breast cancer is associated with remark-ably distinct gene expression patterns. Cancer Res 61:5979–5984.
Hofmann WK, de Vos S, Elashoff D, Gschaidmeier H, HoelzerD, Koeffler HP, and Ottmann OG (2002). Relation betweenresistance of Philadelphia-chromosome-positive acute lym-phoblastic leukaemia to the tyrosine kinase inhibitor STI571and gene-expression profiles: A gene-expression study. Lan-cet 359:481–486.
Hoos A and Cordon-Cardo C (2001). Tissue microarrayprofiling of cancer specimens and cell lines: Opportunitiesand limitations. Lab Invest 81:1331–1338.
Hughes TR, Mao M, Jones AR, Burchard J, Marton MJ,Shannon KW, Lefkowitz SM, Ziman M, Schelter JM, MeyerMR, Kobayashi S, Davis C, Dai H, He YD, Stephaniants SB,Cavet G, Walker WL, West A, Coffey E, Shoemaker DD,Stoughton R, Blanchard AP, Friend SH, and Linsley PS(2001). Expression profiling using microarrays fabricated byan ink-jet oligonucleotide synthesizer. Nat Biotechnol 19:342–347.
Ince TA and Weinberg RA (2002). Functional genomics andthe breast cancer problem. Cancer Cell 1:15–17.
Janicke F, Prechtl A, Thomssen C, Harbeck N, Meisner C,Untch M, Sweep CG, Selbmann HK, Graeff H, and Schmitt M(2001). Randomized adjuvant chemotherapy trial in high-risk,lymph node-negative breast cancer patients identified byurokinase-type plasminogen activator and plasminogen ac-tivator inhibitor type 1. J Natl Cancer Inst 93:913–920.
Kane MD, Jatkoe TA, Stumpf CR, Lu J, Thomas JD, andMadore SJ (2000). Assessment of the sensitivity and speci-ficity of oligonucleotide (50mer) microarrays. Nucleic AcidsRes 28:4552–4557.
Bertucci et al
314 Laboratory Investigation • March 2003 • Volume 83 • Number 3

Khan J, Simon R, Bittner M, Chen Y, Leighton SB, Pohida T,Smith PD, Jiang Y, Gooden GC, Trent JM, and Meltzer PS(1998). Gene expression profiling of alveolar rhabdomyosar-coma with cDNA microarrays. Cancer Res 58:5009–5013.
Khan J, Wei JS, Ringner M, Saal LH, Ladanyi M, WestermannF, Berthold F, Schwab M, Antonescu CR, Peterson C, andMeltzer PS (2001). Classification and diagnostic prediction ofcancers using gene expression profiling and artificial neuralnetworks. Nat Med 7:673–679.
Kihara C, Tsunoda T, Tanaka T, Yamana H, Furukawa Y, OnoK, Kitahara O, Zembutsu H, Yanagawa R, Hirata K, Takagi T,and Nakamura Y (2001). Prediction of sensitivity of esopha-geal tumors to adjuvant chemotherapy by cDNA microarrayanalysis of gene-expression profiles. Cancer Res 61:6474–6479.
Kim JH, Skates SJ, Uede T, Wong KK, Schorge JO, FeltmateCM, Berkowitz RS, Cramer DW, and Mok SC (2002). Os-teopontin as a potential diagnostic biomarker for ovariancancer. JAMA 287:1671–1679.
Lawrie LC, Fothergill JE, and Murray GI (2001). Spot thedifferences: Proteomics in cancer research. Lancet Oncol2:270–277.
Lechner S, Muller-Ladner U, Neumann E, Dietmaier W, WelshJ, Scholmerich J, Ruschoff J, and Kullmann F (2001). Use ofsimplified transcriptors for the analysis of gene expressionprofiles in laser-microdissected cell populations. Lab Invest81:1233–1242.
Lockhart DJ, Dong H, Byrne MC, Follettie MT, Gallo MV,Chee MS, Mittmann M, Wang C, Kobayashi M, Horton H, andBrown EL (1996). Expression monitoring by hybridization tohigh-density oligonucleotide arrays. Nat Biotechnol 14:1675–1680.
Luo L, Salunga RC, Guo H, Bittner A, Joy KC, Galindo JE,Xiao H, Rogers KE, Wan JS, Jackson MR, and Erlander MG(1999). Gene expression profiles of laser-captured adjacentneuronal subtypes. Nat Med 5:117–122.
Martin KJ, Graner E, Li Y, Price LM, Kritzman BM, FournierMV, Rhei E, and Pardee AB (2001). High-sensitivity arrayanalysis of gene expression for the early detection of dissem-inated breast tumor cells in peripheral blood. Proc Natl AcadSci USA 98:2646–2651.
Martin KJ, Kritzman BM, Price LM, Koh B, Kwan CP, ZhangX, Mackay A, O’Hare MJ, Kaelin CM, Mutter GL, Pardee AB,and Sager R (2000). Linking gene expression patterns totherapeutic groups in breast cancer. Cancer Res 60:2232–2238.
Nadon R and Shoemaker J (2002). Statistical issues withmicroarrays: Processing and analysis. Trends Genet 18:265–271.
Nocito A, Kononen J, Kallioniemi OP, and Sauter G (2001).Tissue microarrays (TMAs) for high-throughput molecularpathology research. Int J Cancer 94:1–5.
O’Dwyer ME and Druker BJ (2000). Status of bcr-abl tyrosinekinase inhibitors in chronic myelogenous leukemia. Curr OpinOncol 12:594–597.
Pegram M, Hsu S, Lewis G, Pietras R, Beryt M, SliwkowskiM, Coombs D, Baly D, Kabbinavar F, and Slamon D (1999).Inhibitory effects of combinations of HER-2/neu antibody andchemotherapeutic agents used for treatment of humanbreast cancers. Oncogene 18:2241–2251.
Pinkel D, Segraves R, Sudar D, Clark S, Poole I, Kowbel D,Collins C, Kuo WL, Chen C, Zhai Y, Dairkee SH, Ljung BM,Gray JW, and Albertson DG (1998). High resolution analysisof DNA copy number variation using comparative genomichybridization to microarrays. Nat Genet 20:207–211.
Pomeroy SL, Tamayo P, Gaasenbeek M, Sturla LM, AngeloM, McLaughlin ME, Kim JY, Goumnerova LC, Black PM, LauC, Allen JC, Zagzag D, Olson JM, Curran T, Wetmore C,Biegel JA, Poggio T, Mukherjee S, Rifkin R, Califano A,Stolovitzky G, Louis DN, Mesirov JP, Lander ES, and GolubTR (2002). Prediction of central nervous system embryonaltumour outcome based on gene expression. Nature 415:436–442.
Ramaswamy S, Tamayo P, Rifkin R, Mukherjee S, Yeang CH,Angelo M, Ladd C, Reich M, Latulippe E, Mesirov JP, PoggioT, Gerald W, Loda M, Lander ES, and Golub TR (2001).Multiclass cancer diagnosis using tumor gene expressionsignatures. Proc Natl Acad Sci USA 98:15149–15154.
Rimm DL, Camp RL, Charette LA, Costa J, Olsen DA, andReiss M (2001). Tissue microarray: A new technology foramplification of tissue resources. Cancer J 7:24–31.
Rosenwald A, Wright G, Chan WC, Connors JM, Campo E,Fisher RI, Gascoyne RD, Muller-Hermelink HK, Smeland EB,Giltnane JM, Hurt EM, Zhao H, Averett L, Yang L, Wilson WH,Jaffe ES, Simon R, Klausner RD, Powell J, Duffey PL, LongoDL, Greiner TC, Weisenburger DD, Sanger WG, Dave BJ,Lynch JC, Vose J, Armitage JO, Montserrat E, Lopez-Guillermo A, Grogan TM, Miller TP, LeBlanc M, Ott G, KvaloyS, Delabie J, Holte H, Krajci P, Stokke T, and Staudt LM(2002). The use of molecular profiling to predict survival afterchemotherapy for diffuse large-B-cell lymphoma. N EnglJ Med 346:1937–1947.
Rubin MA, Zhou M, Dhanasekaran SM, Varambally S, Bar-rette TR, Sanda MG, Pienta KJ, Ghosh D, and Chinnaiyan AM(2002). Alpha-methylacyl coenzyme A racemase as a tissuebiomarker for prostate cancer. JAMA 287:1662–1670.
Schena M, Shalon D, Davis RW, and Brown PO (1995).Quantitative monitoring of gene expression patterns with acomplementary DNA microarray. Science 270:467–470.
Scherf U, Ross DT, Waltham M, Smith LH, Lee JK, Tanabe L,Kohn KW, Reinhold WC, Myers TG, Andrews DT, ScudieroDA, Eisen MB, Sausville EA, Pommier Y, Botstein D, BrownPO, and Weinstein JN (2000). A gene expression databasefor the molecular pharmacology of cancer. Nat Genet 24:236–244.
Shipp MA, Ross KN, Tamayo P, Weng AP, Kutok JL, AguiarRC, Gaasenbeek M, Angelo M, Reich M, Pinkus GS, Ray TS,Koval MA, Last KW, Norton A, Lister TA, Mesirov J, NeubergDS, Lander ES, Aster JC, and Golub TR (2002). Diffuse largeB-cell lymphoma outcome prediction by gene-expressionprofiling and supervised machine learning. Nat Med 8:68–74.
Singh D, Febbo PG, Ross K, Jackson DG, Manola J, Ladd C,Tamayo P, Renshaw AA, D’Amico AV, Richie JP, Lander ES,Loda M, Kantoff PW, Golub TR, and Sellers WR (2002). Geneexpression correlates of clinical prostate cancer behavior.Cancer Cell 1:203–209.
Sorlie T, Perou CM, Tibshirani R, Aas T, Geisler S, Johnsen H,Hastie T, Eisen MB, van de Rijn M, Jeffrey SS, Thorsen T,Quist H, Matese JC, Brown PO, Botstein D, Eystein LonningP, and Borresen-Dale AL (2001). Gene expression patterns ofbreast carcinomas distinguish tumor subclasses with clinicalimplications. Proc Natl Acad Sci USA 98:10869–10874.
MiniReview
Laboratory Investigation • March 2003 • Volume 83 • Number 3 315

Staunton JE, Slonim DK, Coller HA, Tamayo P, Angelo MJ,Park J, Scherf U, Lee JK, Reinhold WO, Weinstein JN,Mesirov JP, Lander ES, and Golub TR (2001). Chemosensi-tivity prediction by transcriptional profiling. Proc Natl AcadSci USA 98:10787–10792.
Su AI, Welsh JB, Sapinoso LM, Kern SG, Dimitrov P, Lapp H,Schultz PG, Powell SM, Moskaluk CA, Frierson HF Jr, andHampton GM (2001). Molecular classification of human car-cinomas by use of gene expression signatures. Cancer Res61:7388–7393.
Takahashi M, Rhodes DR, Furge KA, Kanayama H, KagawaS, Haab BB, and Teh BT (2001). Gene expression profiling ofclear cell renal cell carcinoma: Gene identification and prog-nostic classification. Proc Natl Acad Sci USA 98:9754–9759.
van ’t Veer LJ, Dai H, van De Vijver MJ, He YD, Hart AA, MaoM, Peterse HL, van Der Kooy K, Marton MJ, Witteveen AT,Schreiber GJ, Kerkhoven RM, Roberts C, Linsley PS, Ber-nards R, and Friend SH (2002). Gene expression profilingpredicts clinical outcome of breast cancer. Nature 415:530–536.
Velculescu VE, Zhang L, Vogelstein B, and Kinzler KW (1995).Serial analysis of gene expression. Science 270:484–487.
West M, Blanchette C, Dressman H, Huang E, Ishida S,Spang R, Zuzan H, Olson JA Jr, Marks JR, and Nevins JR(2001). Predicting the clinical status of human breast cancerby using gene expression profiles. Proc Natl Acad Sci USA18:18.
Wong KK, Cheng RS, and Mok SC (2001). Identification ofdifferentially expressed genes from ovarian cancer cells byMICROMAX cDNA microarray system. Biotechniques 30:670–675.
Yeoh EJ, Ross ME, Shurtleff SA, Williams WK, Patel D,Mahfouz R, Behm FG, Raimondi SC, Relling MV, Patel A,Cheng C, Campana D, Wilkins D, Zhou X, Li J, Liu H, Pui CH,Evans WE, Naeve C, Wong L, and Downing JR (2002).Classification, subtype discovery, and prediction of outcomein pediatric acute lymphoblastic leukemia by gene expres-sion profiling. Cancer Cell 1:133–143.
Zajchowski DA, Bartholdi MF, Gong Y, Webster L, Liu HL,Munishkin A, Beauheim C, Harvey S, Ethier SP, and JohnsonPH (2001). Identification of gene expression profiles thatpredict the aggressive behavior of breast cancer cells. Can-cer Res 61:5168–5178.
Bertucci et al
316 Laboratory Investigation • March 2003 • Volume 83 • Number 3


