Embed Size (px)
Citation preview
Do compensation consultants enable higher CEO pay?
A disclosure rule change as a separating device
Jenny Chu, Jonathan Faasse, and P. Raghavendra Rau
April 2017
Abstract
We investigate the impact of a firm’s compensation consultant choice on executive
compensation by examining shifts in consultant choice following a 2009 US Securities
Exchange Commission requirement that firms disclose fees paid to compensation consultants
for both consulting and other services. We show that the disclosure rule change acted as a
separating device distinguishing firms likely to have used compensation consultants to extract
rents from shareholders from firms that were likely to have used consultants to optimally set
pay. We conclude that not all multiservice consultants are conflicted while not all specialist
consultants are guardians of shareholder value. Our study provides a more nuanced view of the
association between compensation consultant choices and executive pay.
Keywords: Executive compensation, disclosure, governance, regulatory changes
*Chu and Rau: University of Cambridge, Cambridge Judge Business School, Trumpington Street, Cambridge CB2
1AG, UK; Chu: [email protected]; Rau: +44 1223 761079; [email protected]; Faasse: Independent,
[email protected]. We would like to thank Shiva Rajgopal (the editor), two anonymous referees, Lucian
Bebchuk, Brian Cadman, Steven Crawford, Patricia Dechow, Aditi Gupta, Alan Jagolinzer, S.P. Kothari, Reuven
Lehavy, Gimmy Moore, Richard Sloan, and seminar participants at UC Berkeley, King’s College London, the
American Accounting Association Conference 2015, the Financial Management Association Conference 2015,
and the European Accounting Association Congress 2015 for helpful comments, and the Cambridge Endowment
for Research in Finance (CERF) for financial support.
- 1 -
‘The upshot is that a mediocre-or-worse CEO - aided by his handpicked VP of human
relations and a consultant from the ever-accommodating firm of Ratchet, Ratchet, and
Bingo - all too often receives gobs of money from an ill-designed compensation
arrangement.’
- Warren E. Buffett, Berkshire Hathaway Inc. 2005 annual report, (2006, p.
161)
1. Introduction
How is Chief Executive Officer (CEO) pay set? Economic theory argues that CEO pay is
efficiently set to attract good candidates and provide the optimal level of incentives to motivate
the candidates to increase shareholder value (the optimal contracting hypothesis). A large body
of literature (see Prendergast, 1999 or Core, Holthausen, and Larcker, 1999) has identified
economic determinants of optimal executive compensation. However, an alternative body of
literature (see for example, Bebchuk and Fried, 2003, 2004) has argued that CEOs have a great
deal of power over the pay-setting decision and use their power to extract rents from the board
in the form of excessive pay (the rent extraction hypothesis). As evidence, this literature points
to the rapid growth of CEO pay in both absolute and relative terms. The popular press notes
for example, that in 2013 CEOs of firms in the Standard and Poor’s (S&P) 500 index were
paid, on average, over 200 times the average worker’s salary in their firms2. Business leaders
and politicians, among others, argue that compensation consultants, employed by firms to
advise on executive pay, are at least partly to blame for these apparently excessive pay
arrangements (see for example, the quote above, Crystal, 1991, or Waxman, 2007).
However, despite extensive research, the extant literature on compensation consultants
has found little evidence that hiring consultants leads to higher pay, let alone whether they help
set optimal incentives or help managers extract rents. Prior studies have typically classified
1 Retrieved from: http://www.berkshirehathaway.com/2005ar/2005ar.pdf 2 See for example, Smith, Elliot Blair and Phil Kuntz, 2013, ‘CEO pay 1,795-to-1 multiple of wages skirts U.S.
law’, Bloomberg, April 29, 2013. Retrieved from: https://www.bloomberg.com/news/articles/2013-04-30/ceo-
pay-1-795-to-1-multiple-of-workers-skirts-law-as-sec-delays
- 2 -
consultants on the ex ante likelihood that they will face conflicts of interest in providing advice
on executive compensation. For example, consultants who provide multiple services to the firm
along with those that are hired by the management are typically hypothesized to be ex ante
more conflicted than other consultants. However, whether the consultant is actually conflicted
depends on who made the choice to hire the consultant. If the CEO has relative power over the
board, it is plausible that the multiservice consultant could be influenced to favor managers
(perhaps by offering them other compensated services). If the board has relative power in the
choice, it is plausible that the multiservice consultant provides the best advice at the best price
for the additional services rendered, irrespective of the advice provided on executive
compensation. Since the underlying decision making process to hire a compensation consultant
was unknown, it has been almost impossible for a researcher using standard proxies for
corporate governance and CEO power to distinguish the two. Furthermore, even in firms where
the consultant is hired by the board consultants may be sensitive to CEO influence. As
Bebchuk, Fried, and Walker (2002) note: “even if the CEO is not normally involved in the
selection of the compensation consultant, the threat of his involvement the next time-should
the consultant suggest a package not to his liking-is likely to keep the consultant in line” (page
790). Hence, ex ante classification schemes have proved unable to separate consultants who
have likely been hired to provide optimal compensation schemes from those who have been
hired to facilitate rent extraction.
In our paper, we use a comprehensive longitudinal dataset of over 1,000 unique publicly
listed firms in the United States (US) that hired compensation consultants over the 2006 to
2012 period. This period is characterized by a change in disclosure rule requirements in 2009
that strikingly increased the turnover of compensation consultants at firms. The disclosure rule
change allowed us to separate consultants who were hired for optimal contracting from those
who were likely hired to facilitate rent extraction. Specifically, in July 2009, the Securities
- 3 -
Exchange Commission (SEC) proposed (and subsequently enacted in December 2009)
additional disclosure rules requiring firms that purchase other services from their compensation
consultants to disclose fees paid for both compensation consulting and other services. If the
consultants were retained to solely provide advice on pay, fees did not have to be disclosed.
This rule change expanded an existing requirement to disclose use of a compensation
consultant, enacted in 2006, and was targeted specifically at clients of multiservice firms, as
the significant fees associated with additional services provided by the same firm were
suspected of biasing the consultant to favor executives. To illustrate the relative economic
significance of these other fees, client firms in our sample reported a median of $600,435 of
other fees (i.e., 4.4 times the median compensation consulting fee of $135,380) after the
disclosure rule came into effect.
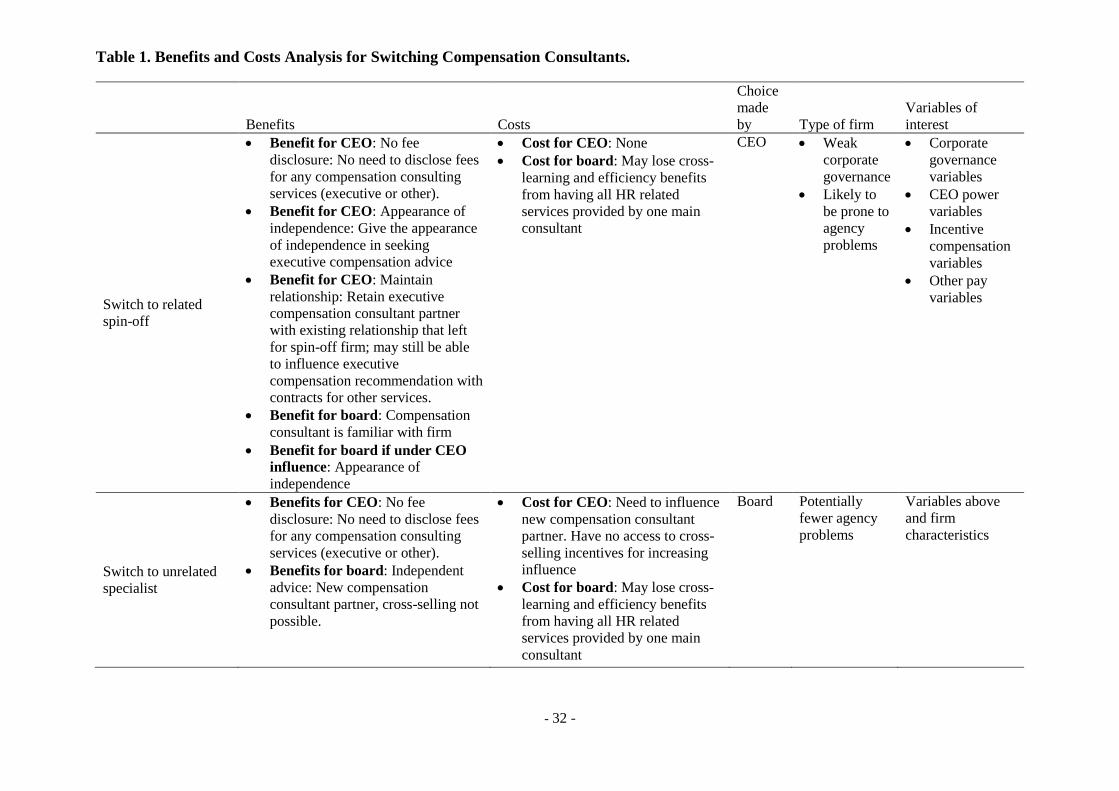
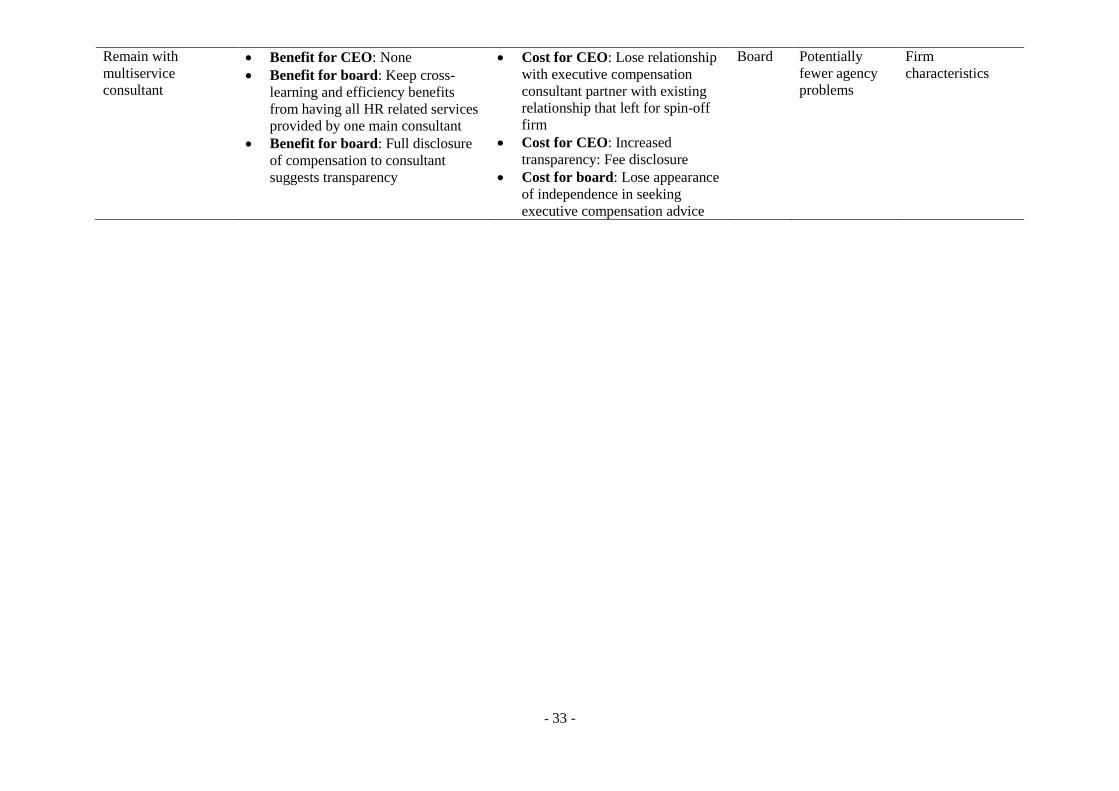
We distinguish between three types of client firms after 2009. Some clients who had
previously used multiservice consultants switched to newly spun-off specialist consultants
(related switchers), while others switched to unrelated specialists (unrelated switchers).
Finally, some stayed with the same multiservice consultants (stayers). Each of these choices
had costs and benefits for both the CEO and the board (see Table 1). The relative magnitude
of these costs and benefits allow us to distinguish firms where the board is likely to have had
power over the choice of consultant from firms where the executive is likely to have had the
power. Specifically, we hypothesize that client firms that switched to the newly spun-off related
specialist consultants are the ones where the CEO has power over the choice of consultant. In
contrast, firms that stayed with their existing multiservice consultants (and explicitly disclosed
the amount of consultant compensation) for both executive compensation and other consulting
services, or firms that switched to unrelated specialists, are likely to be firms where the board
had power over the choice of consultant.
- 4 -
Consistent with the rent extraction hypothesis, we find that client firms where the board
is more likely to be under the influence of the CEO are more likely to switch from a
multiservice compensation consultant to a related, spun-off specialist. Comparing CEO pay
levels at the stayers against the switchers, client firms that remained with multiservice
consultants paid their CEOs 18.32% (median values) less than a matched sample of firms that
switched to the newly spun-off specialist consultants after 2009. In addition, the stayers also
paid their CEOs 13.68% (median values) less in the pre-2009 period. Decomposing total
compensation shows that the pay difference is statistically and economically significant for all
components of non-incentive and incentive pay in both the pre-2009 and the post-switch
periods. This suggests that prior to the rule change, some firms employing multi-service
consultants were already paying their executives significantly smaller salaries but these firms
could not be distinguished from firms that overpaid their executives. As a robustness check,
we also compare CEO pay at stayers against unrelated switchers. Consistent with our
expectations, we do not find a significant difference in pay levels in this setting either before
or after the 2009 disclosure rule change. We conclude that the behaviour of client firms in
response to the 2009 SEC rule change indeed acted as a separating device.
The remainder of this paper is organized as follows. Section 2 reviews the relevant
literature. Section 3 examines the compensation consultant industry while Section 4 discusses
our data. Our empirical findings are discussed in Section 5, and Section 6 concludes.
2. Literature review
A number of business managers, academics, and politicians (including Crystal, 1991;
Murphy, 1999; Bebchuk and Fried, 2003, 2004; Buffett, 2006, and Waxman, 2007) contend
that powerful CEOs use compensation consultants to justify their high compensation levels to
board members, shareholders, and other stakeholders. These critics argue that executives have
an incentive to “camouflage” their extraction of rents by the outsider validation of executive
- 5 -
pay levels. Indeed, this concern contributed to the SEC’s initial decision to require publicly
traded corporations with fiscal closings on or after December 15, 2006 to identify and describe
their use of compensation consultants in their proxy statements.
Subsequent academic studies have examined the effect of consultants on executive
compensation levels, using the 2006 ruling to distinguish those firms that use compensation
consultants solely for compensation advice and those that use such consultants for other
services. They also examine differences between consultants retained by the board and those
retained by management, under the premise that the former are more likely to work in the best
interests of shareholders. Overall, their results are largely inconsistent with the hypothesis that
consultants are used to validate rent extraction.
For example, Cadman, Carter, and Hillegeist (2010) distinguish between consultants that
provide compensation services alone and those that provide non-compensation related advice
such as advice on pension plans, under the assumption that consultants providing other non-
compensation related services will be economically dependent on revenue that is under the
control of the CEO. However, they do not find either higher levels of pay or lower pay-
performance sensitivities for clients of these potentially conflicted consultants. Murphy and
Sandino (2010) distinguish between consultants that are hired by management and those that
are hired by the board under the presumption that the former are likelier to depend on
management favor. Contrary to their hypothesis, they find that pay is lower in US firms when
the consultant works for management, rather than for the board.
Studies in other countries, notably the UK, have also yielded mixed results. For example,
using a sample of firms from the US and the UK, Conyon, Peck, and Sadler (2009) find that
the use of compensation consultants is associated with higher CEO pay after controlling for
firm characteristics. However, they do not find any relation between the use of consultants with
potential ex ante conflicts of interest and CEO pay levels. In another study, Goh and Gupta
- 6 -
(2010) find that UK executives receive higher salary increases after their firms switch
compensation consultants.
The stability of the firm-consultant relationship has caused researchers to attribute the lack
of results to omitted variables. For example, Armstrong, Ittner, and Larcker (2012) (AIL) argue
that while CEO pay is indeed higher in clients of consultant firms than in non-consultant firms,
this difference is driven by weaker corporate governance at the consultant client firms, not by
using consultant firms. AIL find no significant difference in CEO pay levels post-2007 after
controlling for corporate governance characteristics. They interpret this finding as consistent
with the idea that the costs of high compensation may be offset by the benefits of less intensive
monitoring such as greater CEO willingness to share private information with the board (e.g.,
Adams and Ferreira, 2007 or Laux, 2008). They also find no evidence of higher CEO pay levels
at firms that engage multiservice consultants. Murphy and Sandino (2014) document that firms
with ex ante higher levels and more complex forms of CEO pay (before hiring consultants) are
more likely to use consultants ex post to advise on pay.
With the exceptions of Murphy and Sandino (2014) and Li and Zhang (2014), studies on
the role of compensation consultants in the US typically use one or two years of data 2006-
2007 (the period immediately following the SEC’s December 2006 rule that required proxy
statements to disclose which consultants provided compensation advice to the firm.) Li and
Zhang (2014) find no effect of a post-2009 switch to a specialist on firm CEO compensation
levels. However, they expressly exclude firms that switch from multiservice consultants to
newly spun-off specialists. Though studies on non-US firms do use longitudinal data, non-US
CEOs are also typically paid much smaller amounts than US CEOs, weakening the ability of
tests to detect the role played by consultants.
- 7 -
3. The compensation consultant industry and regulatory changes
Compensation consultants can be distinguished according to the types of services they
provide. Specifically, compensation-related advice can include an analysis of the compensation
of the company’s executive officers and board members compared to an appropriate peer
group. It can also involve the design of pay programs that are in alignment with the company’s
business strategy and pay philosophy, industry best practices, compensation trends, and market
survey data. Non-compensation advice can include recommendations related to healthcare and
pension benefits management, Human Resources (HR) technology/software, or risk
management. Typically, the consultant is hired by the compensation committee to provide
compensation advice, while the HR department / management hires the consultant to carry out
non-compensation consulting services. The HR department /management may also recommend
executive compensation consultants to the committee.
Compensation consultants can also be distinguished by whether they have been engaged
by the board or the firm’s managers. However, this is a noisy measure of the potential for
conflicts of interests. Bebchuk, Fried and Walker (2002) note that “compensation consultants
are hired through a company's human resources department, and anecdotal evidence suggests
that some CEOs are heavily involved in the process” (page 790). “Even if the CEO is not
normally involved in the selection of the compensation consultant”, they argue, “the threat of
his involvement the next time - should the consultant suggest a package not to his liking - is
likely to keep the consultant in line”. Hence, it is not clear that consultants hired by the board
are relatively unconflicted relative to consultants hired by management. Even if a consultant is
retained by the board for compensation consulting, management can subsequently influence
the consultant by paying for other services. Likewise, a multiservice consultant engaged to
provide only compensation consulting has an incentive to sell additional non-executive
- 8 -
compensation services to the firm (potentially through the CEO), even though the firm may not
be currently paying for any other services.
Due to the potential conflict of interest in the engagement of multiservice consultants, in
2009 the SEC proposed additional disclosure rules for firms that hired compensation
consultants. The SEC received 130 comment letters in response to its proposed amendments,
with most investors in favor of the amendments and most multiservice consultants against
them.3,4 Specifically, the multiservice firms argued that the amendments would have a negative
economic impact on their future business prospects as firms would be discouraged from using
multiservice compensation consulting firms in more than one capacity.
After receiving the comment letters, the SEC adopted a modified version of the proposed
amendments in December 2009 to take effect for all proxy filings after February 2010. The
modified ruling indicates that if a board’s consultant or its affiliates provide other non-
executive compensation consulting services, the client firm is required to disclose the fees paid
when the non-executive compensation consulting service fees exceed $120,000 during the
fiscal year. If the board does not engage the consultant, then the same disclosure is also required
of consultants that work directly for the company or for management.
The disclosure change was intended to ensure the independence of compensation
consultants hired directly by a firm’s compensation committee. The consultant industry,
especially those multiservice providers most affected by the new disclosure rules, reacted
quickly to this mandate. In February 2010, a select number of principals and consultants left
Hewitt Associates, one of the four largest multiservice consultants by market share, to form
Meridian Compensation Partners LLC, an entity which would operate as an independent
executive compensation consulting firm. According to the related press release:
3 See for example, letters from AFL-CIO, Frank Inman, Hermes Equity Ownership Services Ltd., TIAA-CREF,
and Trillium Asset Management. Retrieved from: https://www.sec.gov/rules/final/2009/33-9089.pdf 4 See for example, letters from ABA, Hewitt, Mercer, Pfizer, Protective Life Corporation, Radford, Towers Perrin,
Value Alliance, and Watson Wyatt. Retrieved from: https://www.sec.gov/rules/final/2009/33-9089.pdf
- 9 -
‘This spin-off keeps those clients’ best interests in mind—they can continue to work
with their current executive compensation advisor and team, without compromising the
appearance of independence…At the same time, it creates opportunities for us to expand
our relationships with those clients that may have felt restricted from engaging Hewitt for
broader consulting and outsourcing work because we were the executive compensation
consultant to their board.’5
Other compensation consultants acted similarly. In 2009, a group of former Mercer partners
launched Compensation Advisory Partners, their own new executive compensation consulting
firm while in 2010, Towers Watson announced that it would partner with a newly created spin-
off, Pay Governance LLC.
Given the resulting structural changes in the compensation consulting industry, the 2009
SEC ruling presents an opportunity for us to study the relation between a firm’s incentives in
engaging a compensation consultant and that firm’s CEO pay level. The choice of a
compensation consultant can either be made by the CEO or the board. Since this choice is
invisible to the econometrician, prior papers were not able to distinguish firms where the board
is likely to have made the choice of consultant from firms where the CEO is likely to have
made the choice.
We hypothesize that the 2009 rule change acts as a natural separating device that separates
firms where the CEO made the choice from firms where the board made the choice. Table 1
sets out our hypotheses for the costs and benefits of each choice and for who is likely to have
made the choice of consultant. Following the rule change, the firm makes one of three
decisions: Switch to a related spin-off consultant, switch to an unrelated specialist, or remain
with a multiservice consultant. Regardless of the actual magnitudes of benefits and costs, only
5 ‘Hewitt Associates announces partial spin-off of its executive compensation consulting business in North
America,’ February 1, 2010, Business Wire. Retrieved from:
http://www.businesswire.com/news/home/20100201005487/en/Hewitt-Associates-Announces-Partial-Spin-Off-
Executive-Compensation
- 10 -
the first decision – to shift to a related spin-off consultant - has no costs for the CEO and
potentially some large benefits. We therefore classify this type of switch as likely to have been
decided by the CEO. Firms characterized by this decision are likely to have weaker corporate
governance and be prone to agency problems. In contrast, firms that stayed with their existing
multiservice consultants (and explicitly disclosed the amount of consultant compensation) for
both executive compensation and other consulting services, seem to offer no incremental
benefit for the CEO and potentially offer incremental costs. We therefore classify firms that
remained with multiservice consultants as firms where the board had power over the choice of
consultant. Finally, firms that switched to unrelated specialists offer some benefits but also
significantly larger incremental costs. We also classify this switch as likelier to have been made
by the board than the CEO.
4. Sample and variables
4.1. Sample construction
To examine this relation, we use a sample of 1,051 unique publicly listed firms and 6,241
firm-years from 2006 to 2012. As in AIL, we exclude firms with fiscal years ending before
December 2006 to ensure that all firms in our sample are subject to the compensation disclosure
requirements that took effect on December 15, 2006.
Our data on compensation consultant usage come from Incentive Lab’s executive
compensation database. This is a proprietary dataset that provides information from firm proxy
statement disclosures regarding their compensation consultant usage, including details on
consultants retained in each fiscal year. From this dataset, we obtain our initial sample of 7,580
firm-years, of which 6,765 disclose the hiring of a compensation consultant. We then eliminate
any firm-years that do not have corresponding data in the ExecuComp database (which details
executive compensation for S&P 1000 firms) to ensure compensation data and CEO
- 11 -
characteristics are consistent with the samples in previous studies. The restriction reduces our
final sample to 1,051 unique firms and 6,241 firm-year observations.
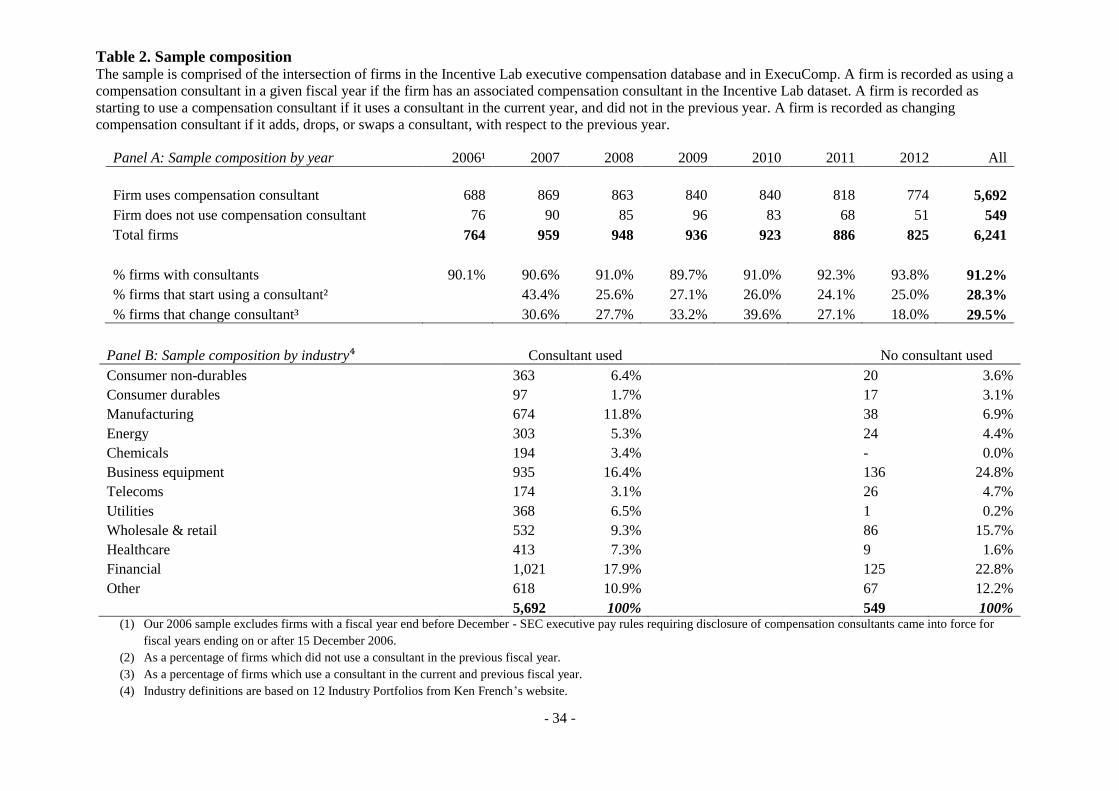
Table 2 Panel A shows the distribution of consultant and non-consultant firms across the
sample period. Over our sample period, we find that approximately 90% of ExecuComp firm-
years disclose the use of compensation consultants. This proportion is consistent with that
found in previous studies on compensation consultants. Furthermore, each year, approximately
28% of those firms not using compensation consultants in the previous year choose to do so
for the first time. Around the time of the disclosure rule change, Table 2 Panel A also shows,
a large proportion of firms switch consultants. Specifically, 33.2% of our firms switch
consultants in 2009 and 39.6% switch in 2010, in contrast to an average of 29.5% over the
entire period. Table 2 Panel B shows that no industry dominates the distribution of firms using
a consultant versus non-consultant firms.
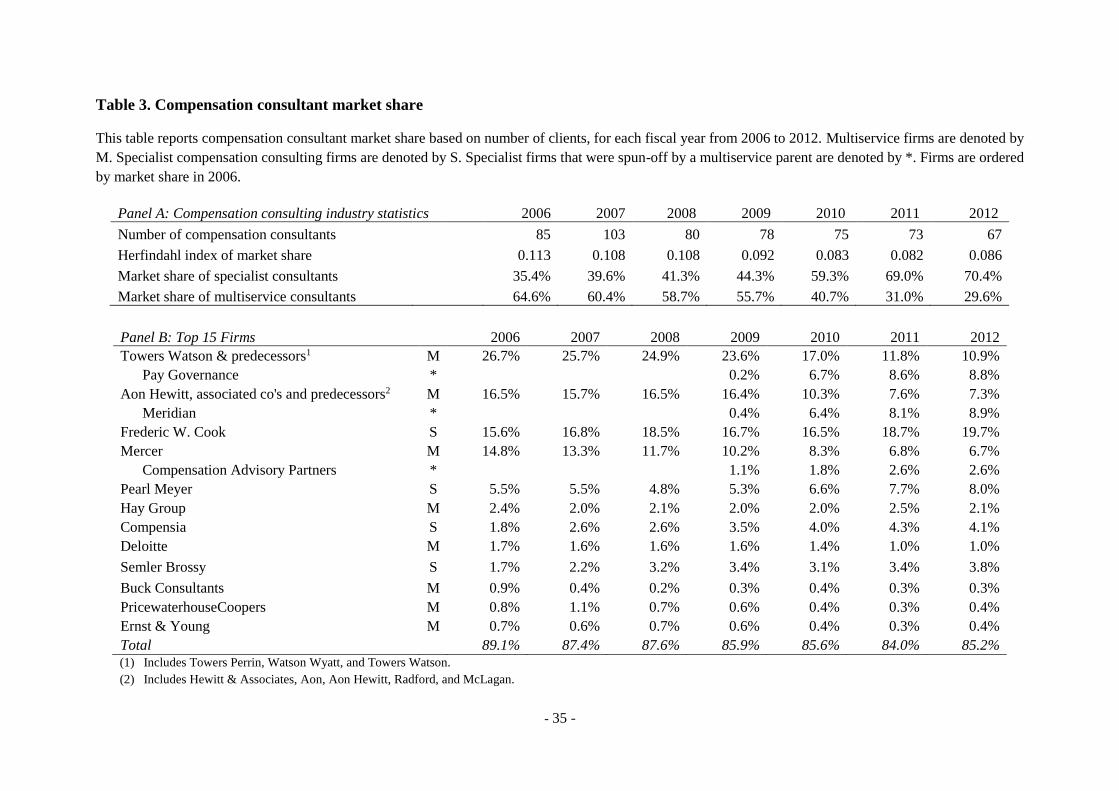
Table 3 presents our summary statistics for the compensation consultant industry.
Averaging across yearly averages in Panel A reveals that specialist consultants represented
38.8% and 60.8% of our sample from 2006-2008 and 2009-2012, respectively. The market
share of specialist consultants increased every year from 35.4% in 2006 to 70.4% in 2012. Of
particular note, there appears to be a sharp structural break in the composition of the industry
in 2010 when the market share of specialist consultants jumped from 44.3% to 59.3%. There
are several reasons for this break. First, following the 2009 SEC ruling, new specialist firms
(Pay Governance, Meridian, and Compensation Advisory Partners) were spun-off from
multiservice providers, accounting for 14.9% of the market in fiscal 2010 and 20.3% by fiscal
2012. Second, Panel B of Table 3 indicates that existing specialist consultants (Frederic W.
Cook, Pearl Meyer, Compensia, and Semler Brossy) also enjoyed an increase in market share
during this time, from 29.1% in fiscal 2008 to 35.6% in fiscal 2012. During this same period,
- 12 -
the large multiservice compensation consultants, Towers Watson, Aon Hewitt and Mercer
dropped from a collective market share of 53.1% in fiscal 2008 to 24.9% in fiscal 2012.
Table 3 Panel B illustrates this market share evolution at the individual compensation
consultant level. Before the 2009 SEC disclosure rule change, Towers Watson’s predecessor
(Towers Perrin), Aon Hewitt’s predecessor (Hewitt & Associates), Frederick W. Cook and
Mercer each accounted for over 10% of the market, while Pearl Meyer accounted for another
4.8%. The rest of the market was fragmented. After the 2009 rule change was announced, the
top three multiservice providers, Towers Watson, Hewitt, and Mercer spun off the
compensation specialist consultants Pay Governance, Meridian, and Compensation Advisory
Partners, respectively. Existing large specialist firms Frederic Cook and Pearl Meyer gained
market share between 2009 and 2012, with Frederic W. Cook becoming the market leader at
19.7% market share in 2012.
Finally, the statistics in Table 4 Panel A1 show that, by 2012, 26.8% of those client firms
affected by the rule change switched to a related spun-off specialist, while Panel A2 shows that
only 2.6% of unaffected client firms did so. Additionally, we find that client firms that engaged
multiservice consultants and were required to disclose fees from 2009 onwards reported
median fees for other services of a magnitude 4.4 times larger than their executive
compensation consulting fees ($600,435 and $135,380, respectively, reported in Table 4 Panel
B).
Taken together, the statistics in Tables 2 and 3 provide preliminary evidence that the
compensation consultant industry experienced significant structural changes in response to the
2009 SEC disclosure requirement.
- 13 -
4.2. Variables and descriptive statistics
As in previous studies, our main variable of interest is the total amount of CEO
compensation at the firm level. To measure CEO compensation, we use the TDC1 variable
from ExecuComp, which includes salary, bonus, non-equity incentive plan compensation,
grant-date fair value of stock awards, grant-date fair value of option awards, deferred
compensation, and other compensation. Note that this definition applies to ExecuComp data
from 2006 onward.
In our study, we control for firm, CEO, ownership, and board characteristics that may
influence both compensation levels and the likelihood of retaining a compensation consultant.
For firm characteristics, we follow AIL and control for firm size using the natural logarithm of
market capitalization, log (market capitalization), at the beginning of the fiscal year; the book-
to-market ratio at the beginning of the fiscal year; return on assets for the prior fiscal year
(ROA), calculated as operating income after depreciation (Compustat OIADP, following the
convention in the accounting literature) for the prior fiscal year scaled by total assets at the end
of the prior fiscal year; the change in return on assets (∆ROA) between the current fiscal year
and the prior fiscal year; and the raw stock return of the prior two fiscal years. Furthermore,
we control for firm complexity using the natural logarithm of the number of business segments,
log (# business segments). We also control for firm growth using asset growth and employee
growth over the prior year. We calculate our accounting variables using data from Compustat
and our market variables using data from the Center for Research in Security Prices (CRSP).
In addition to firm characteristics, we control for several CEO characteristics: the CEO’s
proportion incentive pay, computed as the proportion of long-term incentive compensation
(TDC1 - Salary - Bonus) to total compensation; CEO age; CEO tenure; and whether the CEO
is a new CEO in the current fiscal year. As a measure of the CEO’s equity incentives, we
calculate the CEO’s firm-related wealth, using the methodology outlined in Daniel, Li, and
- 14 -
Naveen (2013) (see also Coles, Daniel, and Naveen, 2013). In addition, we define Founder
CEO following the approach of Bebchuk, Cremers, and Peyer (2011).
We also control for the ownership structure of the firm, specifically the degree of
institutional ownership of a firm as well as the number of block holders (defined as the number
of institutions with 5% or more ownership of outstanding shares), using data obtained from
Thomson Reuters 13F holdings data.
Finally, we control for several board characteristics that have typically been used in the
prior literature as proxies for the strength of corporate governance at the firm. These include
the size of the board of directors, board size; the proportion of board members who are
independent directors, % independent board; the proportion of board members who also serve
on another board, % board busy; the proportion of board members who are at least 69 years of
age, % board old; whether the CEO is also the chairman of the board, CEO is Chairman;
whether board members have staggered election terms, staggered board; and finally whether
there is more than one class of shares, dual class shares. We also control for the proportion of
board members who have joined since the CEO’s tenure began at the firm (% board appointed
by CEO), since these are likely to be board members over which the CEO had influence
(Bebchuk, Fried, and Walker, 2002; Armstrong, Jagolinzer and Larcker, 2010).
Since the consultant’s advice to the board is typically delivered to the compensation
committee, we further control for the following characteristics of the compensation committee:
the proportion of committee members who serve on another committee or board, Comp.
committee % busy; the proportion of committee members who are at least 69 years of age, %
old; and the number of members on the compensation committee, size. With the exception of
our CEO is Chairman variable, which is collected from ExecuComp, all other governance
variables are calculated using data collected from the RiskMetrics Directors and Governance
datasets. (See Appendix II for data definitions.)
- 15 -
As mentioned, we classify the compensation consultants in our study by whether they
provide other consulting services in addition to compensation consulting. Specialist consultants
provide only a narrow range of compensation-related services and include the following firms:
Pay Governance, Meridian, Frederic W. Cook, Compensation Advisory Partners, Pearl Meyer,
Compensia, Semler Brossy, and Exequity6. In contrast, multiservice consultants provide a
range of human resource (HR) and other services in addition to compensation consulting and
include the following firms: Towers Watson (and predecessors Towers Perrin, and Watson
Wyatt), Aon Hewitt (and predecessors), Mercer and Radford, McLagan and Hay7. Appendix I
details how we classify a firm’s switch to a related specialist consultant.
Table 5 reports the descriptive statistics for our sample. From Panel A, we see that firms
that use compensation consultants are, on average, larger, more complex (as measured by the
number of business segments), and have lower asset and employee growth than those that do
not hire compensation consultants, but are otherwise similar in terms of most other firm
characteristics. We find no statistically significant differences in the level of institutional
ownership between consultant client-firms and those that do not engage such consultants.
However, the statistics in Panel A show that the two sets of firms differ substantially on CEO
and corporate governance characteristics. Specifically, CEOs of firms employing consultants
earn higher pay, of which there is a higher proportion of incentive pay, and that they have lower
firm-related wealth. In terms of board characteristics, while these firms are less likely to have
dual class shares, they are more likely to have a staggered board. Firms that retain consultants
have larger boards, a higher proportion of independent directors, and a higher proportion of
busy directors. Turning to the compensation committee more specifically, firms with
consultants have significantly younger, busier, and larger compensation committees.
6 Exequity is not tabulated in Table 3 as it is not one of the top 15 firms by market share. 7 Radford, McLagan, and Hay is not tabulated in Table 3 as it is not one of the top 15 firms by market share.
- 16 -
Panel B of Table 5 presents the summary statistics for our subsample of firms that change
compensation consultants on or after 2009. Overall, firms that switch to related specialist
consultants (column 2) are, on average, larger but less complex. They have higher stock
performance the year prior to the switch and lower operating performance than firms that stay
with multiservice consultants (column 1). Firms that switch to related specialists appear to have
lower institutional ownership and fewer block holders than those who do not change
consultants. Regarding CEO characteristics, firms that switch to related specialists have CEOs
who are older, have been with the firm for a shorter period, and have a higher proportion of
their compensation tied to incentives and firm-related wealth. Regarding board structure, these
firms have boards that are larger, older, busier, and more independent. Overall, our summary
statistics appear to show a similar pattern for consultant-client and non-consultant-client firms
as that found in previous literature, and offer preliminary evidence that weaker governance
does appear to affect the switch to consultant-spinoff matches that might help increase
compensation ex post.
Finally, in untabulated correlation results, we find that compensation is strongly correlated
with consultant use, firm size, firm profitability, the CEO pay mix, and firm-related wealth.
However, it is inversely correlated with a firm’s book-to-market ratio. We also find that total
compensation is positively and significantly correlated with board size, the proportion of
independent directors on the board, the proportion of board members who are busy, and
whether the CEO is also the chairman of the board.
5. Empirical results
5.1. Compensation consultant use and CEO pay
We first examine why firms choose to engage compensation consultants. In previous
research, AIL find that controlling for economic and corporate governance characteristics
mitigates any difference in the level of CEO pay at firms that use compensation consultants. In
- 17 -
other words, the hiring of compensation consultants can be seen as a manifestation of weaker
corporate governance at the firms that hire them. Since the CEOs at these firms would receive
a higher level of pay regardless of whether they engage compensation consultants, the hiring
of such consultants prior to the rule change was likely used to provide external validation of a
CEO’s compensation level to the firm’s board. This argument is consistent with our finding
that firms with consultants also tend to have larger boards, a higher proportion of independent
directors, and a higher proportion of busy directors.
To examine the incentives in choosing to engage a compensation consultant, we follow
AIL’s methodology in matching treatment samples of those firms that hire compensation
consultants with samples of those that do not, using propensity scores of the likelihood of
having a compensation consultant calculated from a combination of economic and corporate
governance factors. Specifically, we pair each treatment firm-year with one control firm-year
(in the same year), using caliper matching (with a caliper of 0.05, without replacement). After
matching, we then compare the covariates between the treatment and control groups with a
two-sample t-test and a two-sample Kolmogorov-Smirnov test. In those cases where the
propensity-based matching yields unbalanced covariates, we calibrate by requiring the
covariates to be within a similar neighborhood. This process slightly reduces our overall sample
size. The number (N) of matched-pairs is reported in tables 6 and 7.
Table 6 presents the results from our logistic regression on the determinants of consultant
use. Following AIL, we present the results on the determinants of whether a firm uses a
compensation consultant in column 1. Consistent with prior research, we find that firms that
hire compensation consultants tend to be those with lower operating performance and greater
reliance on long-term incentive pay. Firms that use compensation consultants also tend to have
CEOs who have a shorter tenure, and lower existing firm-related wealth. We also find that at
- 18 -
compensation consultant client firms, boards tend to be larger and more independent while
members of the compensation committee are younger and busier.
We investigate the determinants of firms switching to a related spun-off consultant rather
than staying with the existing multiservice consultant in column (2). We find that larger, slower
growth, and less profitable firms that pay a bigger proportion of incentive compensation tend
to switch from their multiservice consultants to related, spun-off specialists. These switching
firms also have busier compensation committees and lower institutional ownership. These
results are consistent with the idea that firms where CEO’s influence on boards is higher tend
to switch to the related, spun-off specialists.
We further examine the firms’ choice set in a multinomial ordered logistic regression. We
use an ordered logit in preference to a standard multinomial logit because Table 1 suggests the
likelihood that the CEO chooses the consultant (rather than the board) decreases monotonically
from the decision to switch to a related spun-off consultant to switching to an unrelated
consultant to staying with the multiservice consultant. In the ordered logistic regression, the
baseline is therefore whether the firm switches to a related spinoff specialist. For ease of
interpretation, we code the dependent variable as zero if the firm switches to a related specialist,
1 if it switches to an unrelated specialist, and 2 if it stays with the multiservice consultant. The
results presented in column (3) of Table 6 indicate that firms that are smaller, and higher growth
firms with fewer segments are more likely to stay with multiservice consultants. These firms
also have older CEOs and a lower proportion of incentive pay. In terms of governance
characteristics, and consistent with the idea that firms that choose to stay with multiservice
consultants (and disclose both executive compensation and other consulting fees) have better
governance, these firms have higher institutional ownership and their compensation committee
members are less busy.
- 19 -
We next evaluate the efficacy of our matching algorithm by examining the covariate
balance between the matched pairs within each consultant category. The results in Table 7
Panel A show that our two matched groups (after matching using model (1) in Table 6) appear
similar with respect to their observable contracting environments. The results in Table 7 Panel
B show that CEO pay is significantly higher at firms with consultants even after controlling for
firm, CEO, and governance characteristics (mean and median differences of 22.29% and
21.40%, respectively, significant at 1% confidence levels).8
We then decompose total compensation into salary and benefits (total compensation minus
cash-incentive, and equity based pay), cash-incentive (non-equity incentives and bonus), and
equity (option and stock awards) categories. To mitigate potential outlier effects, we discuss
median differences in the text. Panel B shows that the salary and benefits earned by CEOs at
firms that use compensation consultants is higher by a median 3.55% while equity pay is higher
by a median 15.49%, statistically significant at the 1% level. Furthermore, we find that firms
that use compensation consultants provide greater proportions of incentive and equity incentive
pay but are similar to non-consultant firms in stock returns, ROA, employees, and asset growth.
We also test whether firms with compensation consultants are likely to have more complex
compensation contracts for lower-ranking employees by comparing the percentage of CEO and
top 5 executive option pay as a percentage of the firms’ total stock option expense. If a firm
has more widespread stock-based incentive compensation for employees, the share of CEO and
top 5 executive option pay should be smaller. We do not find a statistically significant
difference in the share of CEO and top 5 executive option pay between the consultant client
firms and matched firms.9
8 In contrast, AIL find that for a sample of S&P1500 firms in 2006, the difference in total compensation between
consultant client firms and matched firms is not statistically significant after controlling for governance
characteristics in the propensity-score matching procedure. 9 An additional possibility is that consultants are specifically hired by firms with hard-to-value tasks such as
repricing underwater options (perhaps because restructuring these options are complex). If this were true, we
should find that there should be significant differences between firms that hire consultants and those that do not
- 20 -
Based on our results, and contrary to previous studies, we conclude that CEO pay levels at
firms that use compensation consultants are economically and statistically significantly higher
than those at firms that do not use consultants.10 However, given the nuanced pay proportion
differences described above, our results can be interpreted as evidence of the existence of either
rent extraction or optimal compensation incentives.
5.2. Multiservice versus specialist consultants
We next turn our attention to the relation between executive compensation and the type of
consultant used by a firm. Previous research (e.g., Crystal, 1991; Bebchuk and Fried, 2004)
posits that multiservice compensation consultants may be influenced by managers who have
the opportunity to engage these consultants for other services. Indeed, this possibility
influenced the 2009 SEC ruling requiring disclosure when the non-compensation consulting
fees paid to a multiservice consultant exceed $120,000 for the year.
To avoid disclosing these fees after the ruling, clients of multiservice firms had the choice
of using a specialist consultant for executive compensation advice while using a multiservice
consultant for other services. In other words, client firms that engaged multiservice consultants
for both executive compensation services and other services before 2009 could choose to
switch to either a related, newly spun-off specialist consultant or an unrelated specialist for
executive compensation advice while using the same or another multiservice consultant.
Alternatively, the client firm could remain with the existing multiservice firm for both
in the level of underwater options in the firm. Since we do not know when the options were granted (and hence
do not know when the options are underwater), we assume a three-year vesting period and compare the stock price
decline for the firm in 2008 relative to its 2005-2007 average (Price in 2008 Relative to 2005-2007 Average).
Consistent with this hypothesis, firms that employee compensation consultants do appear to have significantly
greater price declines than firms who do not hire consultants. 10 Since our matched-pairs methodology reduces our sample size, we also regress total CEO compensation on
firm, CEO, and governance characteristics plus an indicator variable that equals 1 for consultant client firms on
our full sample. In this analysis, we include industry and year fixed effects, and cluster standard errors at the firm
level. The untabulated results, using the full sample of 6,056 firm years, indicate that the coefficient of consultant
usage in the regression using the natural logarithm of total compensation as the dependent variable is 0.30 (p-
value <0.01).
- 21 -
compensation consulting and other services and, as noted above, disclose consultant
compensation if fees for other services exceeded $120,000. (See Appendix I for switching
definitions.)
We hypothesize that firms that originally used multiservice consultants to influence
executive compensation advice upwards should react to the 2009 ruling by switching to spun-
off specialists. In contrast, firms that did not use multiservice consultants to influence executive
compensation should react to the 2009 ruling by either switching to unrelated specialists or
remaining with their multiservice consultants.
The results in Table 8 Panels A1 and A2 show that the difference in total pay between the
treatment group of those who stay with their consultants and the control group of propensity-
score matched switchers is significant both before and after 2009.11 Specifically, we find that
CEOs at firms that remain with multiservice consultants earn a 13.68% lower median pay
before 2009 and a 18.32% lower median pay after 2009 than their peers that switch to related
specialist consultants after 2009. When total pay is further decomposed into salary and benefits,
cash-incentive compensation, and equity pay, firms that switch to related specialists award
higher CEO pay in all three categories, even though firm performance does not consistently
differ across the treatment and matched samples. Importantly, while the dollar amount of
incentive pay was higher for CEOs at these firms, the proportion of incentive pay is not
significantly different. Specifically, while the proportion of incentive pay for firms that
switched to related spun-off consultants was 1.3 percentage points higher prior to 2009, the
difference is no longer statistically significant after 2009. Table 8 Panels A1 and A2 also shows
that other compensation practices such as CEO deferred compensation and options, as well as
11 Untabulated results indicate that our two matched groups have similar covariates for the propensity-score
matching variables that describe firm, CEO, and governance characteristics. We obtain similar results if we
exclude firms with founder CEOs from the sample.
.
- 22 -
firms’ option pay to the top 5 executives and employees do not seem to differ across the
treatment and control groups.
These results support the hypothesis that at least some firms use compensation consultants
to justify executive pay, even when such pay packages are less closely aligned with shareholder
interests. Anecdotal evidence supports this hypothesis. In a number of instances after the 2009
ruling, compensation consultants who enjoyed an especially close relationship with a firm’s
management chose to join specialist firms.12
As a robustness check, we also compare CEO pay at stayers against unrelated switchers.
Consistent with our expectations, the results in Table 8 Panels B1 and B2 show that there are
no significant differences in total and non-incentive compensation levels in this setting either
before or after the 2009 disclosure rule change. Firms that retain their multiservice
compensation consultants after the 2009 ruling, compared to those that switch to unrelated
specialists, have lower cash incentive pay levels and higher equity incentive pay proportions
prior to 2009, and lower equity pay levels after 2009. These results are consistent with the
hypothesis that the switchers to unrelated specialists potentially did so to re-align compensation
component choices between cash incentive pay and equity based incentive compensation, and
that these switchers are unlikely to have switched to enable CEO rent extraction13. Note that
12 For example, the following explanation on consultant turnover is extracted from the fiscal 2009 proxy statement
for Scientific Games Corporation:
‘The Committee has in the past retained Mercer LLC (‘Mercer’) as its outside compensation consultant. In October
2009, the Committee determined to instead engage Compensation Advisory Partners LLC, as the consultant from
Mercer that had traditionally worked with the Committee moved to Compensation Advisory Partners LLC. In
addition, the Committee believed this change would eliminate any appearance that the advice received from its
outside compensation consultant is not independent, since Compensation Advisory Partners LLC provides no
services to the Company other than those provided to the Committee, whereas Mercer has been engaged by
management to provide health and welfare, pension and general compensation consulting services (“Other
Services”).’
Hence Scientific Games Corporation chose to continue working with the lead consultant from Mercer on executive
compensation consulting after the individual moved to a specialist firm but chose to retain Mercer for other
services. 13 In addition, the proportion of CEO deferred compensation at firms that remain with multiservice compensation
consultants after 2009 is higher than those that switch to unrelated specialists. The median differences in the
proportion of CEO deferred compensation is statistically significant (10% confidence levels prior to 2009 and 5%
confidence levels post 2009), but are not economically significant (less than 0.1 percentage points).
- 23 -
we use the stayers as the treatment group in both Panels A and B to ensure that the same group
of firms is compared to the related and unrelated switchers, respectively.
The difference in differences for median values of total and component compensation
levels between the matched groups in Table 8 are not statistically significant between the pre
and post 2009 periods. This suggests that prior to the rule change, some firms employing
multiservice consultants were already paying their executives significantly smaller salaries but
these firms could not be distinguished from firms that overpaid their executives without a way
to separate the two types. Taken together, these results from Table 8 support our conjecture
that the differences in pay before the rule change could have been driven either by the optimal
contracting hypothesis or the rent extraction hypothesis. The rule change acted as a separating
device distinguishing firms that switch to related spun-off specialists to obtain favourable pay
advice from those that stayed with existing multi-service consultants or switched to unrelated
specialists.
5.3. CEO pay effects from the initial use of consultants
In addition to allowing us to better understand the effect of the 2009 ruling on executive
compensation levels, our panel data from 2006-2012 also enables us to relate changes in pay
to the initial adoption of consultants. This in turn helps alleviate concerns over correlated
omitted variables. In one previous study examining the adoption of compensation consultants,
Goh and Gupta (2010) find no significant relationship between first-time compensation
consultant hiring and executive director pay changes for a sample of UK firms. In a study of
US firms, Cadman, Carter, and Hillegeist (2010) find preliminary evidence that adding
compensation consultants is not associated with pay increases for CEOs. However, it should
be noted that there are only 24 firms that started hiring consultants in 2007 in their sample. In
contrast, in our expanded sample, we have 106 firms that started hiring consultants during our
sample period. Thus, we are able to obtain matched control firms based on firm, CEO, and
- 24 -
governance characteristics. We exclude firm-years when a new CEO is hired, as this event may
introduce an endogenous bias regarding CEO pay.14 Finally, to explore whether the initial
hiring of a compensation consultant is associated with a higher increase in total pay, we
compare the total pay of our treatment and propensity-score matched samples.
Table 9 presents the results from our matched-pairs analysis of compensation changes and
initial adoption of consultants for the full 2006-2012 longitudinal dataset.15 The results indicate
that the mean difference in total compensation change upon compensation consultant adoption
is 15.98%, and the difference is statistically significant at the 5% confidence level (the median
difference is not statistically significant at the 10% confidence level)16. In particular, mean
(median) change in equity pay is 19.93% (2.14%) and the change is statistically significant at
5% (10%) confidence levels and the mean (median) change in equity pay as a proportion of
total pay is 6.9 percentage points (0.3 percentage points). There are no significant differences
in total and sub-category compensation levels and proportions before the adoption of
compensation consultants and that firm performance measures are largely not statistically
significantly different across the matched samples. Firms may also hire compensation
consultants due to a need for overall employee compensation advice. Consistent with this
hypothesis, employee growth at firms that adopt compensation consultants is on average 4.1
percentage points higher than the control group, and the difference is statistically significant at
the 5% confidence level (though the median difference is insignificant). When we decompose
total compensation into its non-incentive, cash-incentive, and equity components, we find that
the median difference in compensation changes after the adoption of a compensation consultant
14 Including these firm-years does not change our results. 15 Untabulated analysis shows that the mean and median covariates in terms of firm, CEO, and governance
characteristics between the treatment and control groups are not significantly different. 16 We also rerun our analyses using the regression approach employed by Cadman, Carter, and Hillegeist (2010)
and Goh and Gupta (2010). This approach yields a coefficient of 0.15 for our indicator variable (initial adoption
of a compensation consultant) from an untabulated regression where the dependent variable is the change in
logged total compensation.
- 25 -
appears to be largely driven by an increase in the proportion of the equity component of pay
(6.9 percentage mean and 0.3% median), a result that is consistent with pay being more closely
tied to shareholder value. While there is no difference in CEO’s deferred compensation as a
proportion of total compensation pre-adoption, the deferred compensation proportion
decreased by a mean of 0.7 percentage points which is significant at the 5% confidence level
(median change is statistically insignificant) upon the hiring of compensation consultants. As
discussed previously, the 2009 rule change acts as a natural separating device to separate firms
that are likely to be driven by rent extraction from those who contract optimally with their
CEOs. Firms that initially hire compensation consultants do not necessarily fall into either
bucket and hence it is not surprising that we find evidence of optimal contracting in this setting.
Since firms have different reasons to start hiring compensation consultants, the initial adoption
of compensation consultants appears to provide evidence for both rent extraction and optimal
contracting. Our evidence shows the difficulty prior research has had in distinguishing client
firms that use compensation consultants to justify higher pay from those that use consultants
to structure optimal contracts.
6. Conclusions
While a number of studies have examined the effect of compensation consultants on overall
executive pay levels, this research has largely focused on the one- or two-year period
surrounding the 2006 SEC ruling that firms identify their compensation consultants in their
proxy statements. This limited sample timeframe may explain why previous research has found
little evidence that using compensation consultants leads to higher CEO pay at firms.
In our paper, we expand our timeframe to the period between 2006 and 2012. Using a
dataset of over 1,000 firms, we analyze the relation between consultant use and CEO pay. In
addition, we use the 2009 SEC ruling on the disclosure of non-compensation consulting fees
- 26 -
as a natural device to separate the firms in our study based on their incentives in the choice of
a compensation consultant.
We show that firms that switch to a spun-off specialist after the 2009 ruling pay their CEOs
significantly more than do a matched sample of firms that remain with their multiservice
consultants. We interpret this finding as evidence that firms that switch to spun-off specialists
are motivated by a desire to obtain favorable compensation advice. Over our entire sample
period, we find that firms experience a significant increase in CEO pay when they initially hire
a compensation consultant relative to a propensity-score matched sample, but the increase in
total pay is largely due to higher equity based incentive pay. Overall, our study provides new
and more nuanced empirical evidence that some firms adopt compensation consultants to
design optimal pay packages whereas other firms use compensation consultants as a
justification for higher executive pay levels. On a broader level, our findings suggest that not
all multiservice consultants are conflicted and not all specialist consultants are guardians of
shareholder value.
- 27 -
REFERENCES
Adams, R. B., D. Ferreira. 2007. A theory of friendly boards. Journal of Finance. 62 217-250.
Armstrong, C S., C. D. Ittner, D. F. Larcker. 2012. Corporate governance, compensation
consultants, and CEO pay levels. Review of Accounting Studies. 17 322-351.
Armstrong, C S., A. D. Jagolinzer, D. F. Larcker. 2010. Chief executive officer equity
incentives and accounting irregularities. Journal of Accounting Research. 48 (2) 225-271.
Bebchuk, L. A., K. J. M. Cremers, U. C. Peyer. 2011.The CEO pay slice. Journal of Financial
Economics. 102 199-221.
Bebchuk, L. A., J. Fried. 2003. Executive compensation as an agency problem. Journal of
Economic Perspectives. 17 71-92.
Bebchuk, L. A., J. Fried. 2004. Pay without performance: The unfulfilled promise of executive
compensation. Cambridge: Harvard University Press.
Bebchuk, L. A., J. Fried, D.I. Walker. 2002. Managerial power and rent extraction in the design
of executive compensation. The University of Chicago Law Review. 69 751-846.
Buffett, W. 2006. Berkshire Hathaway Inc 2005 annual report. Available at:
http://www.berkshirehathaway.com/2005ar/2005ar.pdf
Cadman, B., M. E. Carter, S. Hillegeist. 2010. The incentives of compensation consultants and
CEO pay. Journal of Accounting and Economics. 49 263-280.
Coles, J. L., N. D. Daniel, L. Naveen. 2008. Boards: Does one size fit all? Journal of Financial
Economics. 87 329-356.
Coles, J. L., N. Daniel, L. Naveen. 2013. Calculation of compensation incentives and firm-
related wealth using ExecuComp: Data, program, and explanation. Working Paper, available
at http://papers.ssrn.com/sol3/papers.cfm?abstract_id=2296381
Conyon, M., S. Peck, G. Sadler. 2009. Compensation consultants and executive pay: Evidence
from the United States and United Kingdom. Academy of Management Perspectives. 23 43–
55.
Core, J. E., R. W. Holthausen, D. F. Larcker. 1999. Corporate governance, chief executive
officer compensation, and firm performance. Journal of Financial Economics. 51 371-406.
Crystal, G. S. 1991. In search of excess: The overcompensation of American executives. New
York: W.W. Norton.
Daniel, N., Y. Li, L. Naveen. 2016. Asymmetry in pay for luck: A size effect? Working paper,
available at http://papers.ssrn.com/sol3/papers.cfm?abstract_id=2160015
Goh, L., A. Gupta. 2010. Executive compensation, compensation consultants, and shopping
for opinion: Evidence from the UK. Journal of Accounting, Auditing and Finance. 25 607-643.
Laux, V. 2008. Board independence and CEO turnover. Journal of Accounting Research. 46
137-171.
- 28 -
Li, W., H. Zhang. 2014. Does the mandatory conflict-of-interest disclosure affect firms’ choice
of compensation consultants? Working paper, available upon request from
Murphy, K. J. 1999. Executive compensation. Chapter in Ashenfelter, O. and D. Card,
Handbook of Labor Economics 4A. Amsterdam: Elsevier.
Murphy, K. J., T. Sandino. 2010. Executive pay and ‘independent’ compensation consultants.
Journal of Accounting and Economics. 49 247-262.
Murphy, K. J., T. Sandino. 2014. Are consultants to blame for high CEO pay? Working paper,
available at
https://accounting.wharton.upenn.edu/acct/assets/File/Consultants%20Turnover-3-20-2014-
Wharton.pdf
Prendergast, C. 1999. The provision of incentives in firms. Journal of Economic Literature. 37
7-63.
Waxman, H. 2007. Executive pay: Conflicts of interest among compensation consultants.
Committee on Oversight and Government Reform, U.S. House of Representatives.
- 29 -
Appendix I. Switching Definitions.
Switch to a Related Specialist Consultant
For the matched pairs analysis in Table 8A, a firm is defined as switching to a related specialist consultant in
2009 or after if:
a) the firm retains Towers Watson (or one of its predecessors) and no other specialist consultant, and
in the following period retains Pay Governance as a compensation consultant; or
b) the firm retains Hewitt and no other specialist consultant, and in the following period retains
Meridian as a compensation consultant; or
c) the firm retains Mercer and no other specialist consultant, and in the following period retains
Compensation Advisory Partners as a compensation consultant.
This variable is calculated every fiscal year from 2009, and rolled such that once a firm switches to a related
specialist consultant, this variable = 1 in every subsequent fiscal year.
A firm is defined as staying with the same multiservice consultant if it retains the same multiservice consultant
in a given fiscal year from 2009 onwards as it did in 2008 (including predecessor firms). For example, if a
firm retained Mercer and no other specialist consultants in 2008, and in 2009 retained Mercer and no other
specialist consultants, it would be classified as staying with the same multiservice consultant.
This variable is calculated every fiscal year from 2009, and rolled such that once a firm no longer meets the
above criteria, the variable switches to zero and stays at zero in every subsequent fiscal year.
- 30 -
Appendix II. Data Definitions.
Firm characteristics
Log (Market capitalization) is the natural logarithm of market capitalization at the beginning of the fiscal year.
Book-to-market is the book value of equity divided by market value of equity at the beginning of the fiscal year.
ROA is net income divided by end-of-year total assets for the prior fiscal year.
∆ROA is equal to ROA from this fiscal year minus ROA from the previous fiscal year.
Stock return (t-1) is the stock price return over the previous fiscal year. Stock return (t-2) is the stock price return over
the fiscal year two periods ago.
Log (# business segments) is the natural logarithm of the number of business segments or operating segments in
Compustat with positive, non-missing revenue.
Asset growth is the natural logarithm of total assets divided by prior year total assets.
Employee growth is the natural logarithm of number of employees divided by prior year number of employees.
Compensation characteristics
Total compensation is the TDC1 variable from ExecuComp for the current fiscal year.
Non-incentive compensation is total compensation minus cash-incentive and equity-based pay from ExecuComp, for
the current fiscal year.
Cash incentive compensation is the sum of non-equity incentives and bonus, from ExecuComp for the current fiscal
year.
Equity compensation is the sum of the fair value of option awards and stock awards, from ExecuComp for the current
fiscal year.
Proportion Incentive Pay is long-term incentive pay (TDC1 - salary - bonus) as a proportion of total compensation.
Proportion Equity Pay is CEO's equity incentive pay as a proportion of total compensation.
Options as a % of Equity Pay is CEO's option-based compensation as a proportion of total equity (option + equity)
compensation.
Log (firm-related wealth) is the natural logarithm of the value of the CEO’s stock and option portfolio, calculated as per
Daniel, Li, and Naveen (2013).
CEO Deferred Comp (% of Total Comp) is the firm's contribution to CEO's deferred compensation plans as a proportion
of total compensation.
CEO Options (% of Firm's Total Option Exp.) is the CEO's Option Compensation as a proportion of the firm's total
option expense (i.e., value of options paid to all employees).
Top 5 Exec Options (% of Firm's Total Option Exp.) is the sum of option Compensation paid to top 5 executives as a
proportion of the firm's total option expense (i.e., value of options paid to all employees).
- 31 -
Log (CEO's Options Avg. Remaining Vesting Period) is the natural logarithm of the average remaining vesting period
of the CEO's options held.
CEO characteristics
Founder CEO is a dummy variable equal to one if the CEO is the founder of the firm.
CEO age is the CEO’s age in years.
CEO tenure is the number of years the CEO has been in his current role.
New CEO is a dummy variable equal to one if there was a change in CEO during the fiscal year.
Ownership characteristics
Institutional ownership is the percentage of outstanding shares held by institutions at the end of the prior fiscal year.
Block holder is the number of institutions with 5% or more ownership of outstanding shares at the end of the prior fiscal
year.
Board characteristics
% independent board is the proportion of board members who are independent.
Board size is equal to the number of board members.
% board busy is the percentage of board members who serve on another board.
% board old is the percentage of board members who are at least 69 years old.
CEO is Chairman is a dummy variable equal to one if the CEO is also Chairman of the Board.
Dual class shares is equal to one if the firm has multiple classes of shares according to RiskMetrics and zero otherwise.
Staggered board is equal to one if board members’ terms are staggered according to RiskMetrics and zero otherwise.
% board appointed by CEO is the percentage of board members who have joined since the CEO’s tenure at the firm.
Compensation committee characteristics
Comp. committee % busy, % old, and size are the percentage of busy and old (described above) members of the
compensation committee, and the number of board members in the compensation committee.
- 32 -
Table 1. Benefits and Costs Analysis for Switching Compensation Consultants.
Benefits Costs
Choice
made
by Type of firm
Variables of
interest
Switch to related
spin-off
Benefit for CEO: No fee
disclosure: No need to disclose fees
for any compensation consulting
services (executive or other).
Benefit for CEO: Appearance of
independence: Give the appearance
of independence in seeking
executive compensation advice
Benefit for CEO: Maintain
relationship: Retain executive
compensation consultant partner
with existing relationship that left
for spin-off firm; may still be able
to influence executive
compensation recommendation with
contracts for other services.
Benefit for board: Compensation
consultant is familiar with firm
Benefit for board if under CEO
influence: Appearance of
independence
Cost for CEO: None
Cost for board: May lose cross-
learning and efficiency benefits
from having all HR related
services provided by one main
consultant
CEO Weak
corporate
governance
Likely to
be prone to
agency
problems
Corporate
governance
variables
CEO power
variables
Incentive
compensation
variables
Other pay
variables
Switch to unrelated
specialist
Benefits for CEO: No fee
disclosure: No need to disclose fees
for any compensation consulting
services (executive or other).
Benefits for board: Independent
advice: New compensation
consultant partner, cross-selling not
possible.
Cost for CEO: Need to influence
new compensation consultant
partner. Have no access to cross-
selling incentives for increasing
influence
Cost for board: May lose cross-
learning and efficiency benefits
from having all HR related
services provided by one main
consultant
Board Potentially
fewer agency
problems
Variables above
and firm
characteristics
- 33 -
Remain with
multiservice
consultant
Benefit for CEO: None
Benefit for board: Keep cross-
learning and efficiency benefits
from having all HR related services
provided by one main consultant
Benefit for board: Full disclosure
of compensation to consultant
suggests transparency
Cost for CEO: Lose relationship
with executive compensation
consultant partner with existing
relationship that left for spin-off
firm
Cost for CEO: Increased
transparency: Fee disclosure
Cost for board: Lose appearance
of independence in seeking
executive compensation advice
Board Potentially
fewer agency
problems
Firm
characteristics
- 34 -
Table 2. Sample composition The sample is comprised of the intersection of firms in the Incentive Lab executive compensation database and in ExecuComp. A firm is recorded as using a
compensation consultant in a given fiscal year if the firm has an associated compensation consultant in the Incentive Lab dataset. A firm is recorded as
starting to use a compensation consultant if it uses a consultant in the current year, and did not in the previous year. A firm is recorded as changing
compensation consultant if it adds, drops, or swaps a consultant, with respect to the previous year.
Panel A: Sample composition by year 2006¹ 2007 2008 2009 2010 2011 2012 All
Firm uses compensation consultant 688 869 863 840 840 818 774 5,692
Firm does not use compensation consultant 76 90 85 96 83 68 51 549
Total firms 764 959 948 936 923 886 825 6,241
% firms with consultants 90.1% 90.6% 91.0% 89.7% 91.0% 92.3% 93.8% 91.2%
% firms that start using a consultant² 43.4% 25.6% 27.1% 26.0% 24.1% 25.0% 28.3%
% firms that change consultant³ 30.6% 27.7% 33.2% 39.6% 27.1% 18.0% 29.5%
Panel B: Sample composition by industry⁴ Consultant used No consultant used
Consumer non-durables 363 6.4% 20 3.6%
Consumer durables 97 1.7% 17 3.1%
Manufacturing 674 11.8% 38 6.9%
Energy 303 5.3% 24 4.4%
Chemicals 194 3.4% - 0.0%
Business equipment 935 16.4% 136 24.8%
Telecoms 174 3.1% 26 4.7%
Utilities 368 6.5% 1 0.2%
Wholesale & retail 532 9.3% 86 15.7%
Healthcare 413 7.3% 9 1.6%
Financial 1,021 17.9% 125 22.8%
Other 618 10.9% 67 12.2%
5,692 100% 549 100% (1) Our 2006 sample excludes firms with a fiscal year end before December - SEC executive pay rules requiring disclosure of compensation consultants came into force for
fiscal years ending on or after 15 December 2006.
(2) As a percentage of firms which did not use a consultant in the previous fiscal year.
(3) As a percentage of firms which use a consultant in the current and previous fiscal year.
(4) Industry definitions are based on 12 Industry Portfolios from Ken French’s website.
- 35 -
Table 3. Compensation consultant market share
This table reports compensation consultant market share based on number of clients, for each fiscal year from 2006 to 2012. Multiservice firms are denoted by
M. Specialist compensation consulting firms are denoted by S. Specialist firms that were spun-off by a multiservice parent are denoted by *. Firms are ordered
by market share in 2006.
Panel A: Compensation consulting industry statistics 2006 2007 2008 2009 2010 2011 2012
Number of compensation consultants 85 103 80 78 75 73 67
Herfindahl index of market share 0.113 0.108 0.108 0.092 0.083 0.082 0.086
Market share of specialist consultants 35.4% 39.6% 41.3% 44.3% 59.3% 69.0% 70.4%
Market share of multiservice consultants 64.6% 60.4% 58.7% 55.7% 40.7% 31.0% 29.6%
Panel B: Top 15 Firms 2006 2007 2008 2009 2010 2011 2012
Towers Watson & predecessors1 M 26.7% 25.7% 24.9% 23.6% 17.0% 11.8% 10.9%
Pay Governance * 0.2% 6.7% 8.6% 8.8%
Aon Hewitt, associated co's and predecessors2 M 16.5% 15.7% 16.5% 16.4% 10.3% 7.6% 7.3%
Meridian * 0.4% 6.4% 8.1% 8.9%
Frederic W. Cook S 15.6% 16.8% 18.5% 16.7% 16.5% 18.7% 19.7%
Mercer M 14.8% 13.3% 11.7% 10.2% 8.3% 6.8% 6.7%
Compensation Advisory Partners * 1.1% 1.8% 2.6% 2.6%
Pearl Meyer S 5.5% 5.5% 4.8% 5.3% 6.6% 7.7% 8.0%
Hay Group M 2.4% 2.0% 2.1% 2.0% 2.0% 2.5% 2.1%
Compensia S 1.8% 2.6% 2.6% 3.5% 4.0% 4.3% 4.1%
Deloitte M 1.7% 1.6% 1.6% 1.6% 1.4% 1.0% 1.0%
Semler Brossy S 1.7% 2.2% 3.2% 3.4% 3.1% 3.4% 3.8%
Buck Consultants M 0.9% 0.4% 0.2% 0.3% 0.4% 0.3% 0.3%
PricewaterhouseCoopers M 0.8% 1.1% 0.7% 0.6% 0.4% 0.3% 0.4%
Ernst & Young M 0.7% 0.6% 0.7% 0.6% 0.4% 0.3% 0.4%
Total 89.1% 87.4% 87.6% 85.9% 85.6% 84.0% 85.2% (1) Includes Towers Perrin, Watson Wyatt, and Towers Watson.
(2) Includes Hewitt & Associates, Aon, Aon Hewitt, Radford, and McLagan.
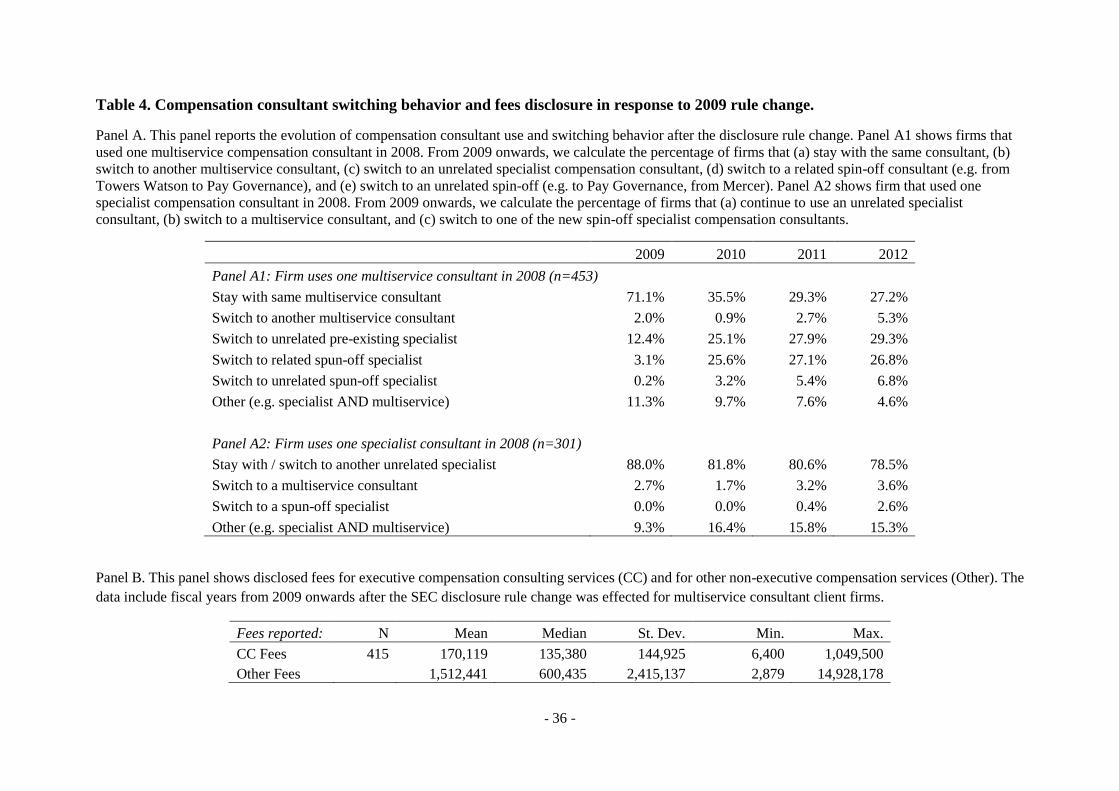
- 36 -
Table 4. Compensation consultant switching behavior and fees disclosure in response to 2009 rule change.
Panel A. This panel reports the evolution of compensation consultant use and switching behavior after the disclosure rule change. Panel A1 shows firms that
used one multiservice compensation consultant in 2008. From 2009 onwards, we calculate the percentage of firms that (a) stay with the same consultant, (b)
switch to another multiservice consultant, (c) switch to an unrelated specialist compensation consultant, (d) switch to a related spin-off consultant (e.g. from
Towers Watson to Pay Governance), and (e) switch to an unrelated spin-off (e.g. to Pay Governance, from Mercer). Panel A2 shows firm that used one
specialist compensation consultant in 2008. From 2009 onwards, we calculate the percentage of firms that (a) continue to use an unrelated specialist
consultant, (b) switch to a multiservice consultant, and (c) switch to one of the new spin-off specialist compensation consultants.
2009 2010 2011 2012
Panel A1: Firm uses one multiservice consultant in 2008 (n=453)
Stay with same multiservice consultant 71.1% 35.5% 29.3% 27.2%
Switch to another multiservice consultant 2.0% 0.9% 2.7% 5.3%
Switch to unrelated pre-existing specialist 12.4% 25.1% 27.9% 29.3%
Switch to related spun-off specialist 3.1% 25.6% 27.1% 26.8%
Switch to unrelated spun-off specialist 0.2% 3.2% 5.4% 6.8%
Other (e.g. specialist AND multiservice) 11.3% 9.7% 7.6% 4.6%
Panel A2: Firm uses one specialist consultant in 2008 (n=301)
Stay with / switch to another unrelated specialist 88.0% 81.8% 80.6% 78.5%
Switch to a multiservice consultant 2.7% 1.7% 3.2% 3.6%
Switch to a spun-off specialist 0.0% 0.0% 0.4% 2.6%
Other (e.g. specialist AND multiservice) 9.3% 16.4% 15.8% 15.3%
Panel B. This panel shows disclosed fees for executive compensation consulting services (CC) and for other non-executive compensation services (Other). The
data include fiscal years from 2009 onwards after the SEC disclosure rule change was effected for multiservice consultant client firms.
Fees reported: N Mean Median St. Dev. Min. Max.
CC Fees 415 170,119 135,380 144,925 6,400 1,049,500
Other Fees 1,512,441 600,435 2,415,137 2,879 14,928,178
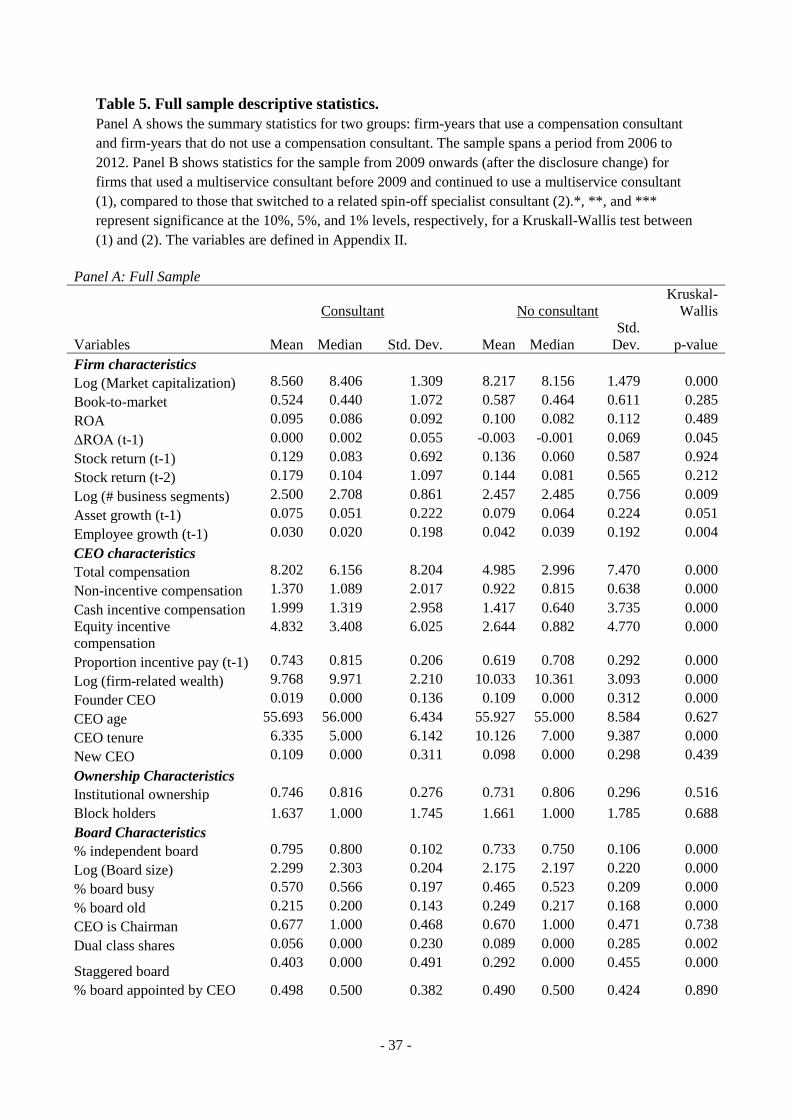
- 37 -
Table 5. Full sample descriptive statistics.
Panel A shows the summary statistics for two groups: firm-years that use a compensation consultant
and firm-years that do not use a compensation consultant. The sample spans a period from 2006 to
2012. Panel B shows statistics for the sample from 2009 onwards (after the disclosure change) for
firms that used a multiservice consultant before 2009 and continued to use a multiservice consultant
(1), compared to those that switched to a related spin-off specialist consultant (2).*, **, and ***
represent significance at the 10%, 5%, and 1% levels, respectively, for a Kruskall-Wallis test between
(1) and (2). The variables are defined in Appendix II.
Panel A: Full Sample
Consultant No consultant
Kruskal-
Wallis
Variables Mean Median Std. Dev. Mean Median
Std.
Dev. p-value
Firm characteristics
Log (Market capitalization) 8.560 8.406 1.309 8.217 8.156 1.479 0.000
Book-to-market 0.524 0.440 1.072 0.587 0.464 0.611 0.285
ROA 0.095 0.086 0.092 0.100 0.082 0.112 0.489
∆ROA (t-1) 0.000 0.002 0.055 -0.003 -0.001 0.069 0.045
Stock return (t-1) 0.129 0.083 0.692 0.136 0.060 0.587 0.924
Stock return (t-2) 0.179 0.104 1.097 0.144 0.081 0.565 0.212
Log (# business segments) 2.500 2.708 0.861 2.457 2.485 0.756 0.009
Asset growth (t-1) 0.075 0.051 0.222 0.079 0.064 0.224 0.051
Employee growth (t-1) 0.030 0.020 0.198 0.042 0.039 0.192 0.004
CEO characteristics
Total compensation 8.202 6.156 8.204 4.985 2.996 7.470 0.000
Non-incentive compensation 1.370 1.089 2.017 0.922 0.815 0.638 0.000
Cash incentive compensation 1.999 1.319 2.958 1.417 0.640 3.735 0.000
Equity incentive
compensation
4.832 3.408 6.025 2.644 0.882 4.770 0.000
Proportion incentive pay (t-1) 0.743 0.815 0.206 0.619 0.708 0.292 0.000
Log (firm-related wealth) 9.768 9.971 2.210 10.033 10.361 3.093 0.000
Founder CEO 0.019 0.000 0.136 0.109 0.000 0.312 0.000
CEO age 55.693 56.000 6.434 55.927 55.000 8.584 0.627
CEO tenure 6.335 5.000 6.142 10.126 7.000 9.387 0.000
New CEO 0.109 0.000 0.311 0.098 0.000 0.298 0.439
Ownership Characteristics
Institutional ownership 0.746 0.816 0.276 0.731 0.806 0.296 0.516
Block holders 1.637 1.000 1.745 1.661 1.000 1.785 0.688
Board Characteristics
% independent board 0.795 0.800 0.102 0.733 0.750 0.106 0.000
Log (Board size) 2.299 2.303 0.204 2.175 2.197 0.220 0.000
% board busy 0.570 0.566 0.197 0.465 0.523 0.209 0.000
% board old 0.215 0.200 0.143 0.249 0.217 0.168 0.000
CEO is Chairman 0.677 1.000 0.468 0.670 1.000 0.471 0.738
Dual class shares 0.056 0.000 0.230 0.089 0.000 0.285 0.002
Staggered board 0.403 0.000 0.491 0.292 0.000 0.455 0.000
% board appointed by CEO 0.498 0.500 0.382 0.490 0.500 0.424 0.890

- 38 -
Compensation Committee Characteristics
Comp. committee - % busy 0.622 0.615 0.253 0.515 0.613 0.272 0.000
Comp. committee - % old 0.252 0.250 0.219 0.302 0.270 0.238 0.000
Log (Comp. committee size) 1.320 1.335 0.252 1.215 1.249 0.238 0.000
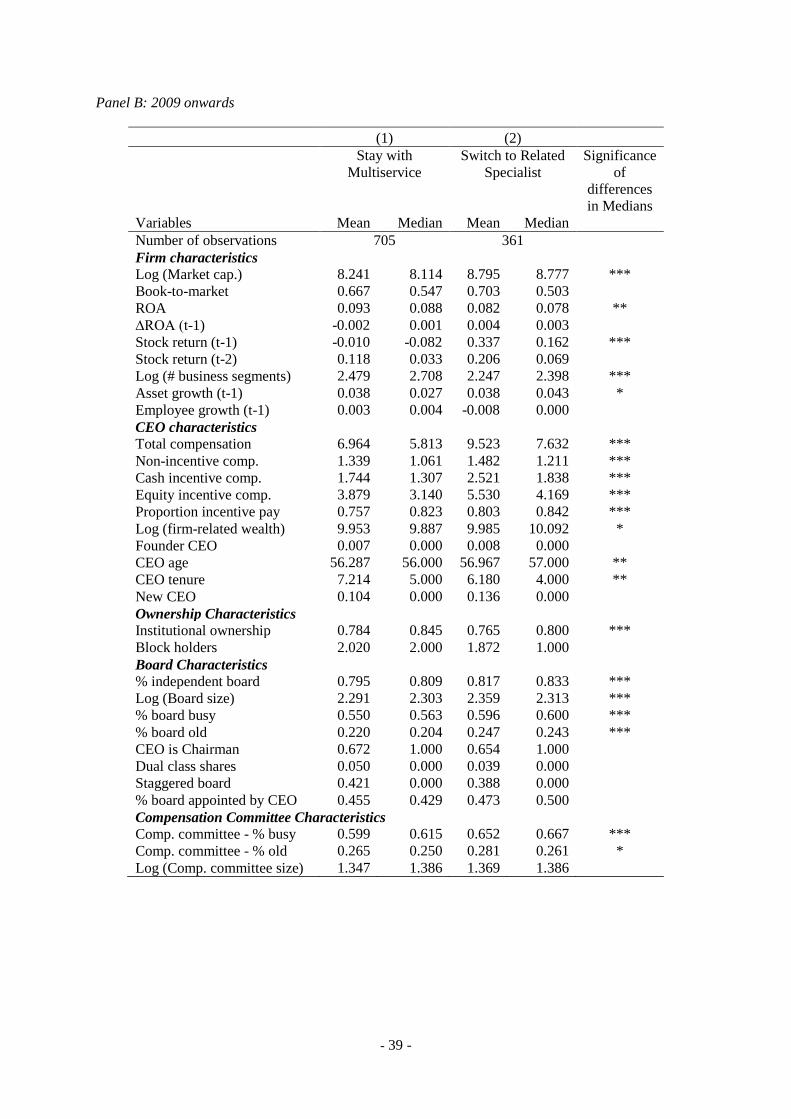
- 39 -
Panel B: 2009 onwards
(1) (2)
Stay with
Multiservice
Switch to Related
Specialist
Significance
of
differences
in Medians
Variables Mean Median Mean Median
Number of observations 705 361
Firm characteristics
Log (Market cap.) 8.241 8.114 8.795 8.777 ***
Book-to-market 0.667 0.547 0.703 0.503
ROA 0.093 0.088 0.082 0.078 **
∆ROA (t-1) -0.002 0.001 0.004 0.003
Stock return (t-1) -0.010 -0.082 0.337 0.162 ***
Stock return (t-2) 0.118 0.033 0.206 0.069
Log (# business segments) 2.479 2.708 2.247 2.398 ***
Asset growth (t-1) 0.038 0.027 0.038 0.043 *
Employee growth (t-1) 0.003 0.004 -0.008 0.000
CEO characteristics
Total compensation 6.964 5.813 9.523 7.632 ***
Non-incentive comp. 1.339 1.061 1.482 1.211 ***
Cash incentive comp. 1.744 1.307 2.521 1.838 ***
Equity incentive comp. 3.879 3.140 5.530 4.169 ***
Proportion incentive pay 0.757 0.823 0.803 0.842 ***
Log (firm-related wealth) 9.953 9.887 9.985 10.092 *
Founder CEO 0.007 0.000 0.008 0.000
CEO age 56.287 56.000 56.967 57.000 **
CEO tenure 7.214 5.000 6.180 4.000 **
New CEO 0.104 0.000 0.136 0.000
Ownership Characteristics
Institutional ownership 0.784 0.845 0.765 0.800 ***
Block holders 2.020 2.000 1.872 1.000
Board Characteristics
% independent board 0.795 0.809 0.817 0.833 ***
Log (Board size) 2.291 2.303 2.359 2.313 ***
% board busy 0.550 0.563 0.596 0.600 ***
% board old 0.220 0.204 0.247 0.243 ***
CEO is Chairman 0.672 1.000 0.654 1.000
Dual class shares 0.050 0.000 0.039 0.000
Staggered board 0.421 0.000 0.388 0.000
% board appointed by CEO 0.455 0.429 0.473 0.500
Compensation Committee Characteristics
Comp. committee - % busy 0.599 0.615 0.652 0.667 ***
Comp. committee - % old 0.265 0.250 0.281 0.261 *
Log (Comp. committee size) 1.347 1.386 1.369 1.386
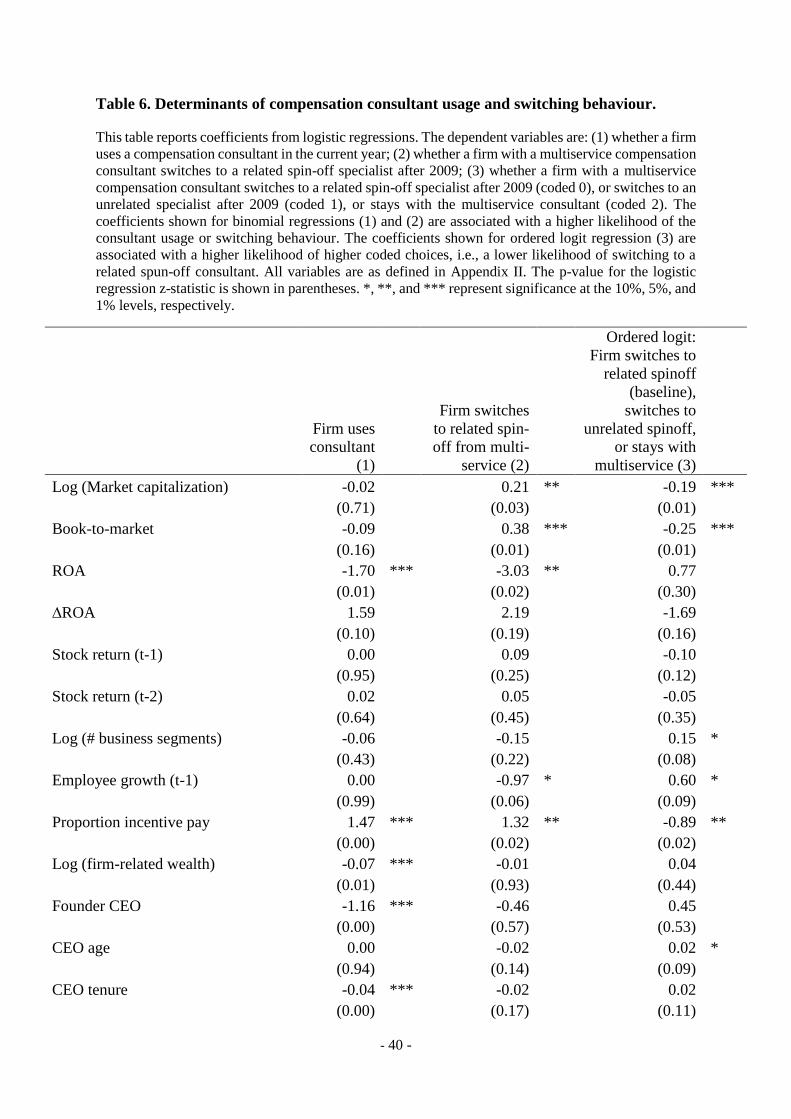
- 40 -
Table 6. Determinants of compensation consultant usage and switching behaviour.
This table reports coefficients from logistic regressions. The dependent variables are: (1) whether a firm
uses a compensation consultant in the current year; (2) whether a firm with a multiservice compensation
consultant switches to a related spin-off specialist after 2009; (3) whether a firm with a multiservice
compensation consultant switches to a related spin-off specialist after 2009 (coded 0), or switches to an
unrelated specialist after 2009 (coded 1), or stays with the multiservice consultant (coded 2). The
coefficients shown for binomial regressions (1) and (2) are associated with a higher likelihood of the
consultant usage or switching behaviour. The coefficients shown for ordered logit regression (3) are
associated with a higher likelihood of higher coded choices, i.e., a lower likelihood of switching to a
related spun-off consultant. All variables are as defined in Appendix II. The p-value for the logistic
regression z-statistic is shown in parentheses. *, **, and *** represent significance at the 10%, 5%, and
1% levels, respectively.
Firm uses
consultant
(1)
Firm switches
to related spin-
off from multi-
service (2)
Ordered logit:
Firm switches to
related spinoff
(baseline),
switches to
unrelated spinoff,
or stays with
multiservice (3)
Log (Market capitalization) -0.02 0.21 ** -0.19 ***
(0.71) (0.03) (0.01)
Book-to-market -0.09 0.38 *** -0.25 ***
(0.16) (0.01) (0.01)
ROA -1.70 *** -3.03 ** 0.77
(0.01) (0.02) (0.30)
∆ROA 1.59 2.19 -1.69
(0.10) (0.19) (0.16)
Stock return (t-1) 0.00 0.09 -0.10
(0.95) (0.25) (0.12)
Stock return (t-2) 0.02 0.05 -0.05
(0.64) (0.45) (0.35)
Log (# business segments) -0.06 -0.15 0.15 *
(0.43) (0.22) (0.08)
Employee growth (t-1) 0.00 -0.97 * 0.60 *
(0.99) (0.06) (0.09)
Proportion incentive pay 1.47 *** 1.32 ** -0.89 **
(0.00) (0.02) (0.02)
Log (firm-related wealth) -0.07 *** -0.01 0.04
(0.01) (0.93) (0.44)
Founder CEO -1.16 *** -0.46 0.45
(0.00) (0.57) (0.53)
CEO age 0.00 -0.02 0.02 *
(0.94) (0.14) (0.09)
CEO tenure -0.04 *** -0.02 0.02
(0.00) (0.17) (0.11)
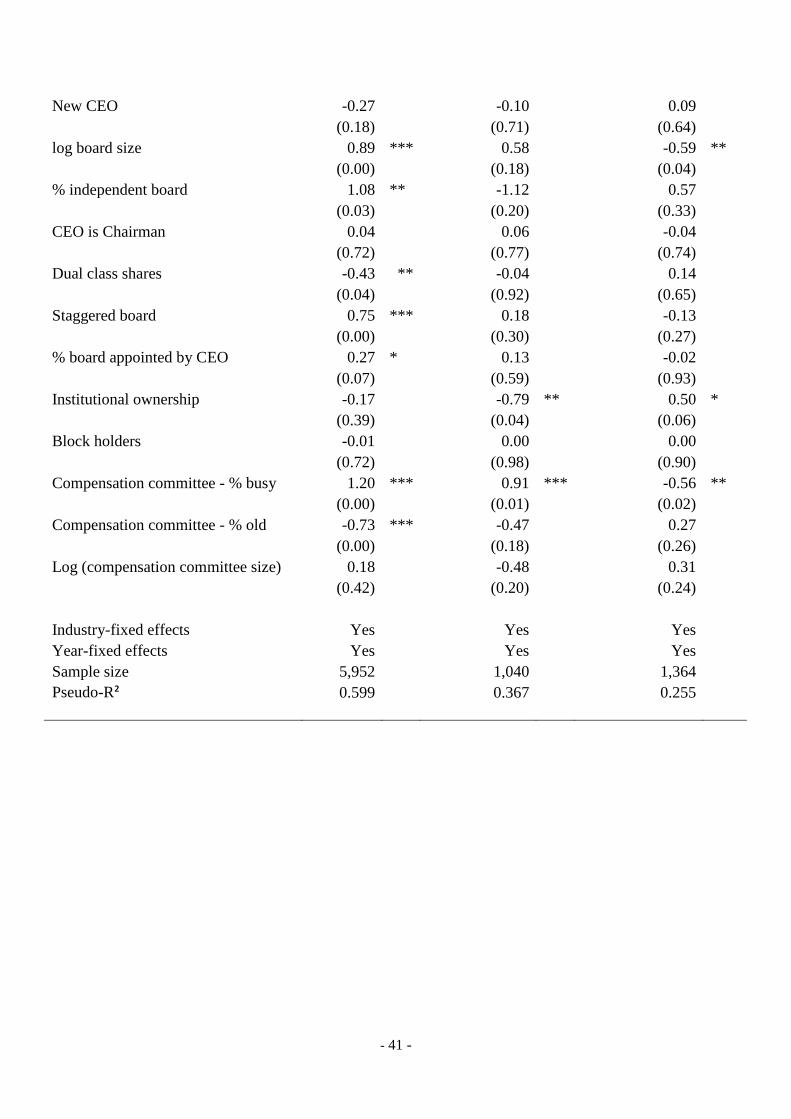
- 41 -
New CEO -0.27 -0.10 0.09
(0.18) (0.71) (0.64)
log board size 0.89 *** 0.58 -0.59 **
(0.00) (0.18) (0.04)
% independent board 1.08 ** -1.12 0.57
(0.03) (0.20) (0.33)
CEO is Chairman 0.04 0.06 -0.04
(0.72) (0.77) (0.74)
Dual class shares -0.43 ** -0.04 0.14
(0.04) (0.92) (0.65)
Staggered board 0.75 *** 0.18 -0.13
(0.00) (0.30) (0.27)
% board appointed by CEO 0.27 * 0.13 -0.02
(0.07) (0.59) (0.93)
Institutional ownership -0.17 -0.79 ** 0.50 *
(0.39) (0.04) (0.06)
Block holders -0.01 0.00 0.00
(0.72) (0.98) (0.90)
Compensation committee - % busy 1.20 *** 0.91 *** -0.56 **
(0.00) (0.01) (0.02)
Compensation committee - % old -0.73 *** -0.47 0.27
(0.00) (0.18) (0.26)
Log (compensation committee size) 0.18 -0.48 0.31
(0.42) (0.20) (0.24)
Industry-fixed effects Yes Yes Yes
Year-fixed effects Yes Yes Yes
Sample size 5,952 1,040 1,364
Pseudo-R² 0.599 0.367 0.255
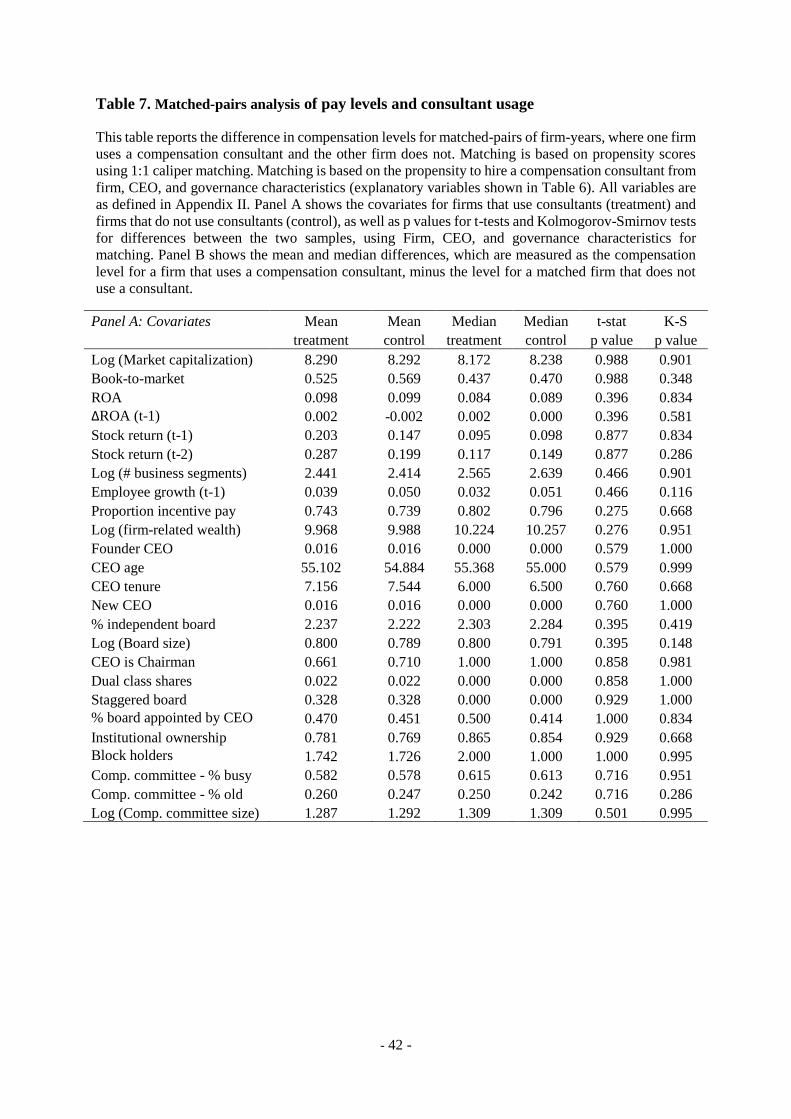
- 42 -
Table 7. Matched-pairs analysis of pay levels and consultant usage
This table reports the difference in compensation levels for matched-pairs of firm-years, where one firm
uses a compensation consultant and the other firm does not. Matching is based on propensity scores
using 1:1 caliper matching. Matching is based on the propensity to hire a compensation consultant from
firm, CEO, and governance characteristics (explanatory variables shown in Table 6). All variables are
as defined in Appendix II. Panel A shows the covariates for firms that use consultants (treatment) and
firms that do not use consultants (control), as well as p values for t-tests and Kolmogorov-Smirnov tests
for differences between the two samples, using Firm, CEO, and governance characteristics for
matching. Panel B shows the mean and median differences, which are measured as the compensation
level for a firm that uses a compensation consultant, minus the level for a matched firm that does not
use a consultant.
Panel A: Covariates Mean Mean Median Median t-stat K-S
treatment control treatment control p value p value
Log (Market capitalization) 8.290 8.292 8.172 8.238 0.988 0.901
Book-to-market 0.525 0.569 0.437 0.470 0.988 0.348
ROA 0.098 0.099 0.084 0.089 0.396 0.834
∆ROA (t-1) 0.002 -0.002 0.002 0.000 0.396 0.581
Stock return (t-1) 0.203 0.147 0.095 0.098 0.877 0.834
Stock return (t-2) 0.287 0.199 0.117 0.149 0.877 0.286
Log (# business segments) 2.441 2.414 2.565 2.639 0.466 0.901
Employee growth (t-1) 0.039 0.050 0.032 0.051 0.466 0.116
Proportion incentive pay 0.743 0.739 0.802 0.796 0.275 0.668
Log (firm-related wealth) 9.968 9.988 10.224 10.257 0.276 0.951
Founder CEO 0.016 0.016 0.000 0.000 0.579 1.000
CEO age 55.102 54.884 55.368 55.000 0.579 0.999
CEO tenure 7.156 7.544 6.000 6.500 0.760 0.668
New CEO 0.016 0.016 0.000 0.000 0.760 1.000
% independent board 2.237 2.222 2.303 2.284 0.395 0.419
Log (Board size) 0.800 0.789 0.800 0.791 0.395 0.148
CEO is Chairman 0.661 0.710 1.000 1.000 0.858 0.981
Dual class shares 0.022 0.022 0.000 0.000 0.858 1.000
Staggered board 0.328 0.328 0.000 0.000 0.929 1.000
% board appointed by CEO 0.470 0.451 0.500 0.414 1.000 0.834
Institutional ownership 0.781 0.769 0.865 0.854 0.929 0.668
Block holders 1.742 1.726 2.000 1.000 1.000 0.995
Comp. committee - % busy 0.582 0.578 0.615 0.613 0.716 0.951
Comp. committee - % old 0.260 0.247 0.250 0.242 0.716 0.286
Log (Comp. committee size) 1.287 1.292 1.309 1.309 0.501 0.995
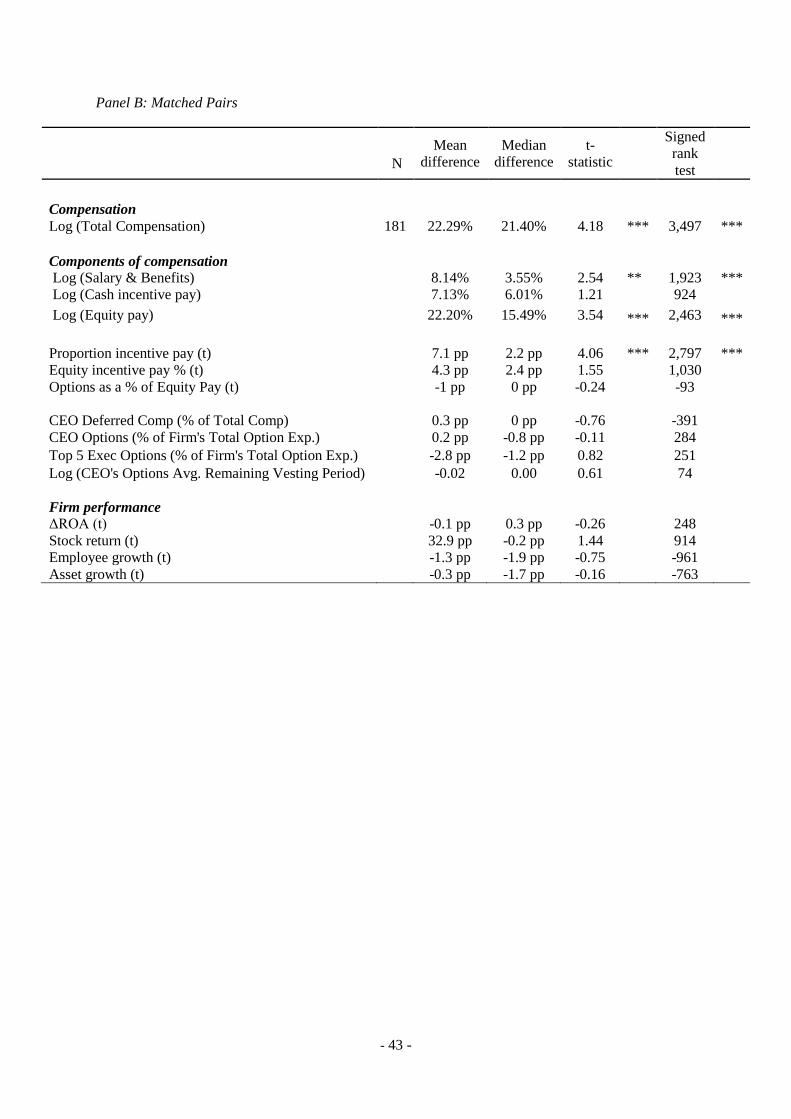
- 43 -
Panel B: Matched Pairs
Mean
difference
Median
difference
t-
statistic
Signed
rank
test
N
Compensation Log (Total Compensation) 181 22.29% 21.40% 4.18 *** 3,497 ***
Components of compensation
Log (Salary & Benefits) 8.14% 3.55% 2.54 ** 1,923 ***
Log (Cash incentive pay) 7.13% 6.01% 1.21 924
Log (Equity pay) 22.20% 15.49% 3.54 *** 2,463 ***
Proportion incentive pay (t) 7.1 pp 2.2 pp 4.06 *** 2,797 ***
Equity incentive pay % (t) 4.3 pp 2.4 pp 1.55 1,030
Options as a % of Equity Pay (t) -1 pp 0 pp -0.24 -93
CEO Deferred Comp (% of Total Comp) 0.3 pp 0 pp -0.76 -391
CEO Options (% of Firm's Total Option Exp.) 0.2 pp -0.8 pp -0.11 284
Top 5 Exec Options (% of Firm's Total Option Exp.) -2.8 pp -1.2 pp 0.82 251
Log (CEO's Options Avg. Remaining Vesting Period) -0.02 0.00 0.61 74
Firm performance
ΔROA (t) -0.1 pp 0.3 pp -0.26 248
Stock return (t) 32.9 pp -0.2 pp 1.44 914
Employee growth (t) -1.3 pp -1.9 pp -0.75 -961
Asset growth (t) -0.3 pp -1.7 pp -0.16 -763
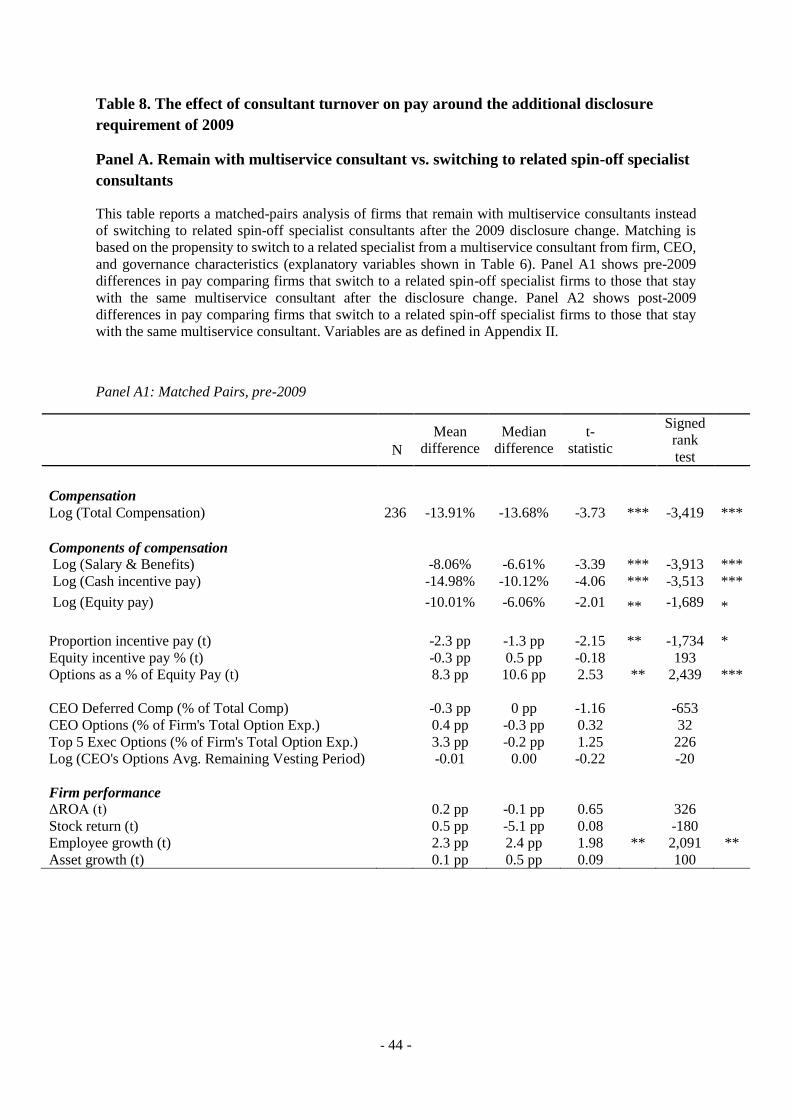
- 44 -
Table 8. The effect of consultant turnover on pay around the additional disclosure
requirement of 2009
Panel A. Remain with multiservice consultant vs. switching to related spin-off specialist
consultants
This table reports a matched-pairs analysis of firms that remain with multiservice consultants instead
of switching to related spin-off specialist consultants after the 2009 disclosure change. Matching is
based on the propensity to switch to a related specialist from a multiservice consultant from firm, CEO,
and governance characteristics (explanatory variables shown in Table 6). Panel A1 shows pre-2009
differences in pay comparing firms that switch to a related spin-off specialist firms to those that stay
with the same multiservice consultant after the disclosure change. Panel A2 shows post-2009
differences in pay comparing firms that switch to a related spin-off specialist firms to those that stay
with the same multiservice consultant. Variables are as defined in Appendix II.
Panel A1: Matched Pairs, pre-2009
Mean
difference
Median
difference
t-
statistic
Signed
rank
test
N
Compensation Log (Total Compensation) 236 -13.91% -13.68% -3.73 *** -3,419 ***
Components of compensation
Log (Salary & Benefits) -8.06% -6.61% -3.39 *** -3,913 ***
Log (Cash incentive pay) -14.98% -10.12% -4.06 *** -3,513 ***
Log (Equity pay) -10.01% -6.06% -2.01 ** -1,689 *
Proportion incentive pay (t) -2.3 pp -1.3 pp -2.15 ** -1,734 *
Equity incentive pay % (t) -0.3 pp 0.5 pp -0.18 193
Options as a % of Equity Pay (t) 8.3 pp 10.6 pp 2.53 ** 2,439 ***
CEO Deferred Comp (% of Total Comp) -0.3 pp 0 pp -1.16 -653
CEO Options (% of Firm's Total Option Exp.) 0.4 pp -0.3 pp 0.32 32
Top 5 Exec Options (% of Firm's Total Option Exp.) 3.3 pp -0.2 pp 1.25 226
Log (CEO's Options Avg. Remaining Vesting Period) -0.01 0.00 -0.22 -20
Firm performance
ΔROA (t) 0.2 pp -0.1 pp 0.65 326
Stock return (t) 0.5 pp -5.1 pp 0.08 -180
Employee growth (t) 2.3 pp 2.4 pp 1.98 ** 2,091 **
Asset growth (t) 0.1 pp 0.5 pp 0.09 100
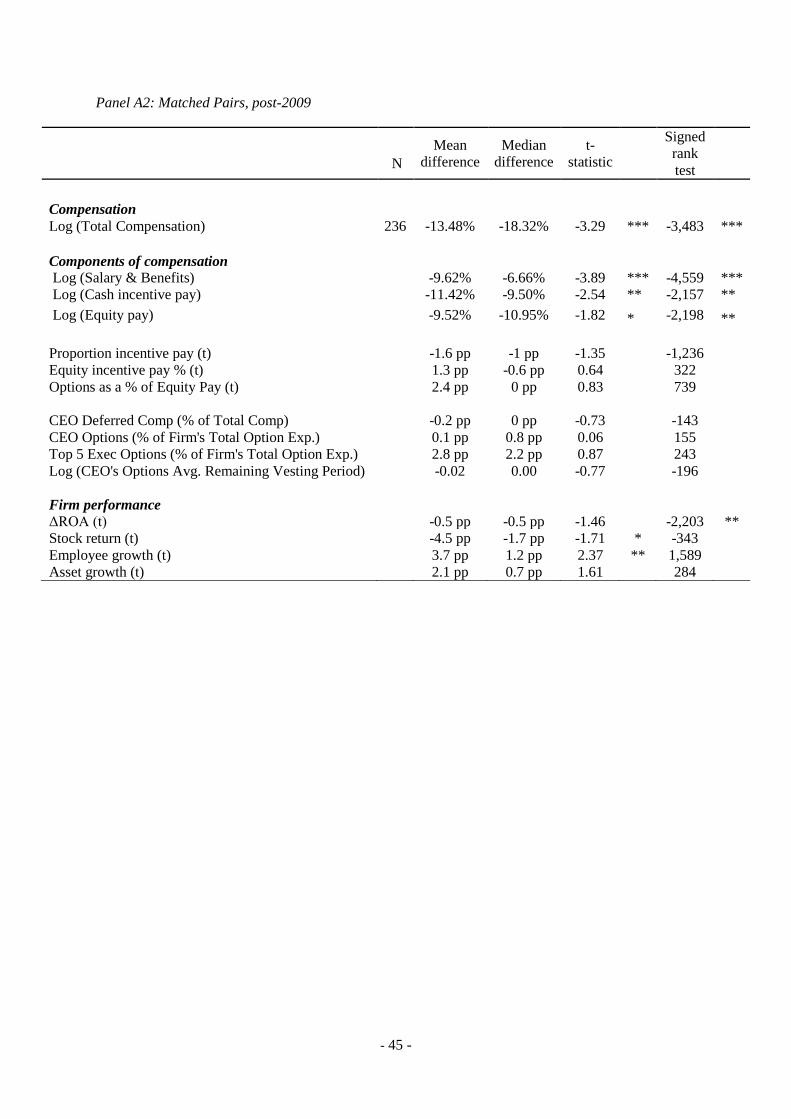
- 45 -
Panel A2: Matched Pairs, post-2009
Mean
difference
Median
difference
t-
statistic
Signed
rank
test
N
Compensation Log (Total Compensation) 236 -13.48% -18.32% -3.29 *** -3,483 ***
Components of compensation
Log (Salary & Benefits) -9.62% -6.66% -3.89 *** -4,559 ***
Log (Cash incentive pay) -11.42% -9.50% -2.54 ** -2,157 **
Log (Equity pay) -9.52% -10.95% -1.82 * -2,198 **
Proportion incentive pay (t) -1.6 pp -1 pp -1.35 -1,236
Equity incentive pay % (t) 1.3 pp -0.6 pp 0.64 322
Options as a % of Equity Pay (t) 2.4 pp 0 pp 0.83 739
CEO Deferred Comp (% of Total Comp) -0.2 pp 0 pp -0.73 -143
CEO Options (% of Firm's Total Option Exp.) 0.1 pp 0.8 pp 0.06 155
Top 5 Exec Options (% of Firm's Total Option Exp.) 2.8 pp 2.2 pp 0.87 243
Log (CEO's Options Avg. Remaining Vesting Period) -0.02 0.00 -0.77 -196
Firm performance
ΔROA (t) -0.5 pp -0.5 pp -1.46 -2,203 **
Stock return (t) -4.5 pp -1.7 pp -1.71 * -343
Employee growth (t) 3.7 pp 1.2 pp 2.37 ** 1,589
Asset growth (t) 2.1 pp 0.7 pp 1.61 284
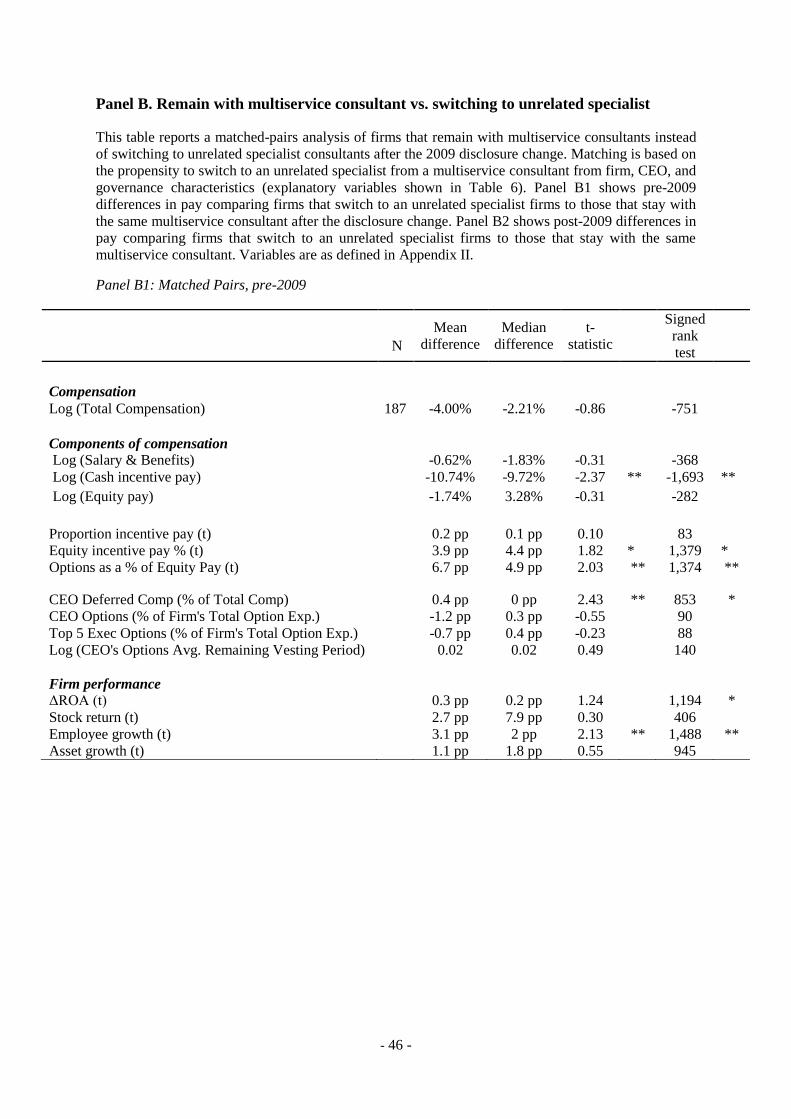
- 46 -
Panel B. Remain with multiservice consultant vs. switching to unrelated specialist
This table reports a matched-pairs analysis of firms that remain with multiservice consultants instead
of switching to unrelated specialist consultants after the 2009 disclosure change. Matching is based on
the propensity to switch to an unrelated specialist from a multiservice consultant from firm, CEO, and
governance characteristics (explanatory variables shown in Table 6). Panel B1 shows pre-2009
differences in pay comparing firms that switch to an unrelated specialist firms to those that stay with
the same multiservice consultant after the disclosure change. Panel B2 shows post-2009 differences in
pay comparing firms that switch to an unrelated specialist firms to those that stay with the same
multiservice consultant. Variables are as defined in Appendix II.
Panel B1: Matched Pairs, pre-2009
Mean
difference
Median
difference
t-
statistic
Signed
rank
test
N
Compensation Log (Total Compensation) 187 -4.00% -2.21% -0.86 -751
Components of compensation
Log (Salary & Benefits) -0.62% -1.83% -0.31 -368
Log (Cash incentive pay) -10.74% -9.72% -2.37 ** -1,693 **
Log (Equity pay) -1.74% 3.28% -0.31 -282
Proportion incentive pay (t) 0.2 pp 0.1 pp 0.10 83
Equity incentive pay % (t) 3.9 pp 4.4 pp 1.82 * 1,379 *
Options as a % of Equity Pay (t) 6.7 pp 4.9 pp 2.03 ** 1,374 **
CEO Deferred Comp (% of Total Comp) 0.4 pp 0 pp 2.43 ** 853 *
CEO Options (% of Firm's Total Option Exp.) -1.2 pp 0.3 pp -0.55 90
Top 5 Exec Options (% of Firm's Total Option Exp.) -0.7 pp 0.4 pp -0.23 88
Log (CEO's Options Avg. Remaining Vesting Period) 0.02 0.02 0.49 140
Firm performance
ΔROA (t) 0.3 pp 0.2 pp 1.24 1,194 *
Stock return (t) 2.7 pp 7.9 pp 0.30 406
Employee growth (t) 3.1 pp 2 pp 2.13 ** 1,488 **
Asset growth (t) 1.1 pp 1.8 pp 0.55 945

- 47 -
Panel B2: Matched Pairs, post-2009
N
Mean
difference
Median
difference
t-
statistic
Signed
rank
test
Compensation Log (Total Compensation) 187 -7.70% -4.53% -1.60 -963
Components of compensation
Log (Salary & Benefits) 0.40% 0.54% 0.17 13
Log (Cash incentive pay) -5.55% -5.81% -1.18 -721
Log (Equity pay) -11.08% -4.05% -1.89 * -1,331 *
Proportion incentive pay (t) -1.7 pp 0.3 pp -1.10 -522
Equity incentive pay % (t) -1 pp -0.5 pp -0.47 -570
Options as a % of Equity Pay (t) 5 pp 0 pp 1.32 723
CEO Deferred Comp (% of Total Comp) 0.5 pp 0 pp 2.22 ** 1,227 ***
CEO Options (% of Firm's Total Option Exp.) 1.9 pp 1.4 pp 0.90 131
Top 5 Exec Options (% of Firm's Total Option Exp.) 1.4 pp 2.7 pp 0.36 104
Log (CEO's Options Avg. Remaining Vesting Period) 0.02 0.04 0.49 98
Firm performance
ΔROA (t) 0 pp -0.1 pp 0.00 -40
Stock return (t) -27 pp -14.4 pp -1.28 -1,026
Employee growth (t) -2 pp -0.4 pp -1.71 * -916
Asset growth (t) -2 pp 0.3 pp -1.62 -489
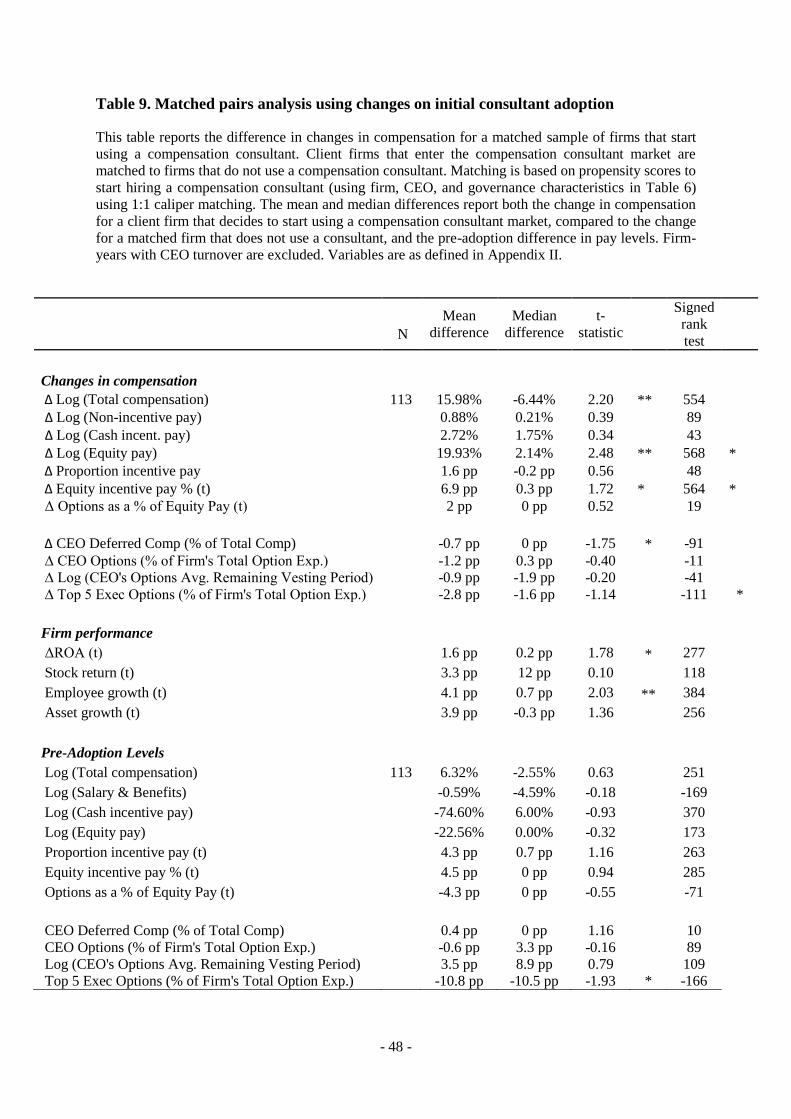
- 48 -
Table 9. Matched pairs analysis using changes on initial consultant adoption
This table reports the difference in changes in compensation for a matched sample of firms that start
using a compensation consultant. Client firms that enter the compensation consultant market are
matched to firms that do not use a compensation consultant. Matching is based on propensity scores to
start hiring a compensation consultant (using firm, CEO, and governance characteristics in Table 6)
using 1:1 caliper matching. The mean and median differences report both the change in compensation
for a client firm that decides to start using a compensation consultant market, compared to the change
for a matched firm that does not use a consultant, and the pre-adoption difference in pay levels. Firm-
years with CEO turnover are excluded. Variables are as defined in Appendix II.
Mean
difference
Median
difference
t-
statistic
Signed
rank
test
N
Changes in compensation
Δ Log (Total compensation) 113 15.98% -6.44% 2.20 ** 554
Δ Log (Non-incentive pay) 0.88% 0.21% 0.39 89
Δ Log (Cash incent. pay) 2.72% 1.75% 0.34 43
Δ Log (Equity pay) 19.93% 2.14% 2.48 ** 568 *
Δ Proportion incentive pay 1.6 pp -0.2 pp 0.56 48
Δ Equity incentive pay % (t) 6.9 pp 0.3 pp 1.72 * 564 *
Δ Options as a % of Equity Pay (t) 2 pp 0 pp 0.52 19
∆ CEO Deferred Comp (% of Total Comp) -0.7 pp 0 pp -1.75 * -91
∆ CEO Options (% of Firm's Total Option Exp.) -1.2 pp 0.3 pp -0.40 -11
∆ Log (CEO's Options Avg. Remaining Vesting Period) -0.9 pp -1.9 pp -0.20 -41
∆ Top 5 Exec Options (% of Firm's Total Option Exp.) -2.8 pp -1.6 pp -1.14 -111 *
Firm performance
ΔROA (t) 1.6 pp 0.2 pp 1.78 * 277
Stock return (t) 3.3 pp 12 pp 0.10 118
Employee growth (t) 4.1 pp 0.7 pp 2.03 ** 384
Asset growth (t) 3.9 pp -0.3 pp 1.36 256
Pre-Adoption Levels
Log (Total compensation) 113 6.32% -2.55% 0.63 251
Log (Salary & Benefits) -0.59% -4.59% -0.18 -169
Log (Cash incentive pay) -74.60% 6.00% -0.93 370
Log (Equity pay) -22.56% 0.00% -0.32 173
Proportion incentive pay (t) 4.3 pp 0.7 pp 1.16 263
Equity incentive pay % (t) 4.5 pp 0 pp 0.94 285
Options as a % of Equity Pay (t) -4.3 pp 0 pp -0.55 -71
CEO Deferred Comp (% of Total Comp) 0.4 pp 0 pp 1.16 10
CEO Options (% of Firm's Total Option Exp.) -0.6 pp 3.3 pp -0.16 89
Log (CEO's Options Avg. Remaining Vesting Period) 3.5 pp 8.9 pp 0.79 109
Top 5 Exec Options (% of Firm's Total Option Exp.) -10.8 pp -10.5 pp -1.93 * -166


