Embed Size (px)
Citation preview
Media Psychology, 10:436–448, 2007
Copyright © Lawrence Erlbaum Associates, Inc.ISSN: 1521-3269 print / 1532-785X online
DOI: 10.1080/15213260701533219
Do Male Politicians Have Big Heads? Face-ismin Online Self-Representations of Politicians
SARA H. KONRATH and NORBERT SCHWARZ
University of Michigan, Ann Arbor
Headshot portraits of all U.S. Governors, Senators, and Represen-
tatives and members of Parliament in Canada, Australia, and
Norway are analyzed. In all countries, male politicians are rep-
resented with higher facial prominence than female politicians,
paralleling a pervasive gender bias in media portraits. For Amer-
ican Congresswomen, high facial prominence is associated with
a more pro-feminist voting record. Finally, anthropometric data
show that gender differences in the facial prominence in portraits
cannot be traced to gender differences in actual body proportions.
Across different media, cultures, and centuries, men are portrayed with morefacial prominence than women in visual representations (Archer, Iritani,Kimes, & Barrios, 1983; Copeland, 1989; Hall & Crum, 1994). This ‘‘face-ism’’ bias1 is assessed with an index that reflects the ratio of the face to thetotal visible body. A parallel bias has been observed for race. Magazines,paintings, and stamps depict African-Americans with less facial prominencethan Caucasians, although this racial difference is not observed in art createdby African-Americans (Zuckerman & Kieffer, 1994). These parallels suggestthat high facial prominence is associated with higher social status.
Differences in facial prominence are unfortunately consequential. Peo-ple rate a given person as more intrapersonally (e.g., intelligent, ambitious)and interpersonally (e.g., aggressive, dominant) powerful when the person isshown with high rather than low facial prominence (e.g., Archer et al., 1983;
Address correspondence to Sara H. Konrath, Department of Psychology, University ofMichigan, Ann Arbor, MI 48109. E-mail: [email protected]
1In the interest of staying consistent with prior research, we use the term ‘‘face-ism’’ throughout
this manuscript to refer to what may more appropriately be called ‘‘body-ism.’’ As one helpful reviewer
pointed out, the use of the term ‘‘face-ism’’ is backward from the way we usually describe disadvantaged
groups in the classic ‘‘isms’’ (e.g. sexism, racism, etc.). Emphasizing someone’s face has been shown to
be advantageous whereas whole-body portrayals are the disadvantaged state, thus ‘‘body-ism’’ may be a
more descriptive term for this phenomenon.
436
Face-ism Online 437
Levesque & Lowe, 1999; Schwarz & Kurz, 1989; Zuckerman, 1986). This ef-fect is observed independent of the observer’s or target person’s gender andobtained even when both portraits are cropped from the same original.
The present studies extend facial prominence research by examiningphotographs of politicians. Drawing on pictures of all U.S. representatives,senators, and governors, as well as members of Parliament in Canada, Aus-tralia, and Norway, we observe that this gender bias is alive and well inpolitics—even under the constraints of headshots provided by the officialsthemselves. Our analyses focus on gender and race differences in facialprominence and relate them to politicians’ education, current office, andvoting record, where available. Before we elaborate on these issues, how-ever, we address a possible methodological objection to face-ism research.
STUDY 1: A MEDIA BIAS OR A GENDER DIFFERENCE
IN BODY PROPORTIONS?
Gender differences in facial prominence in media portrayals presumably re-flect a bias to emphasize women’s bodies and men’s faces. Although thisassumption is highly plausible, it is also conceivable that actual gender dif-ferences in body proportions contribute, at least in part, to the surprisinglyrobust ‘‘face-ism’’ phenomenon. We address this possibility on the basis ofan anthropometric dataset by examining whether men have larger headsthan women relative to the overall size of their bodies.
Method
The Belgian research group DINbelg collected 3-D body scans from a rep-resentative sample of 150,000 Belgian adults (aged 18–65) to build an an-thropometric database for design purposes. Men’s and women’s head heightand total height were retrieved from their website (http://www.dinbelg.be/background.htm).
Results and Discussion
On average, men were taller (M D 1766 mm for total height, � D 76) andhad larger heads (M D 232 mm for head height, � D 11) than women (M D
1646 mm, � D 68 and M D 223 mm, � D 14, respectively), ts(149, 998) D
322.25 and 138.43, respectively, ps < .001. However, when examining theirhead-to-body proportions, women’s heads (M D .1355, � D .2059) wereactually proportionally larger than men’s heads (M D .1314, � D .1447),t (149, 998) D 4.46, p < .001. Thus, gender differences in body proportionsare opposite to the reliable observation that men are portrayed with higherfacial prominence (i.e., a larger head-to-body ratio), confirming that face-ism
438 S. H. Konrath and N. Schwarz
reflects a bias in visual representations. Next, we turn to differences in facialprominence in the political domain.
STUDY 2: AMERICAN POLITICS
For the first time in history, the 1984 U.S. presidential ballot included awoman: Geraldine Ferraro ran for vice-president with Walter Mondale. Chal-lenging the pervasive facial prominence bias otherwise observed in the me-dia, Sparks and Fehlner (1986) reported that Ferraro was portrayed withat least the same amount of facial prominence as her male counterparts.Additional analyses indicated no gender bias in pictures of government of-ficials and journalists. Unfortunately, Sparks and Fehlner’s (1986) analyseswere limited to only two news magazines and four politicians. We revisitthis issue on the basis of a larger database, namely photographs of all majorelected office holders in the United States during the 2000–2004 term, in-cluding 50 governors, 100 senators, and 435 representatives, and find strongsupport for a small but pervasive facial prominence bias. Of interest are(i) gender and (ii) race differences in facial prominence and (iii) the poten-tial moderating roles of politicians’ office and education. We also examine(iv) to what extent facial prominence in congressional self-representations isrelated to politicians’ voting patterns on issues of women’s rights. Becausethe photos used in this study are provided by the politicians themselves,our data also bear on whether (v) female politicians or politicians of color(unknowingly) represent themselves in ways that may give rise to lowerattributions of power and competence.
Method
We retrieved headshot photos of all major political representatives in theUnited States from http://www.congress.org. Politicians’ office and educationwere also available at this website. Following Archer et al. (1983), facialprominence was assessed as a ratio of two measures, namely (i) the distancefrom the visible top of the head, including hair, to the lowest part of the chinand (ii) the total length of the body shown in the photograph (visible top ofthe head to the lowest visible part of the body). All measures were taken inmillimeters. An index value of 1.00 indicates that the picture shows only theface; 0.00 indicates that the face is not shown at all. Inter-coder reliabilitywas calculated on 118 photographs, ˛ D .99.
Finally, we used the 2004 Report Cards of the Voter Information Services(VIS; http://www.vis.org/crc/default.aspx) as a measure of politicians’ votingrecord on women’s issues. VIS provides ‘‘grades’’ (ranging from 0–100%)based on the match between politicians’ voting records and an advocacygroup’s stance. We calculated an overall pro-female score by standardizing
Face-ism Online 439
and averaging the scores from four advocacy groups (˛ D .89): Businessand Professional Women/USA, American Association for University Women,NARAL Pro-Choice America, and National Right to Life Committee (reverse-scored).
Results
Gender and Office
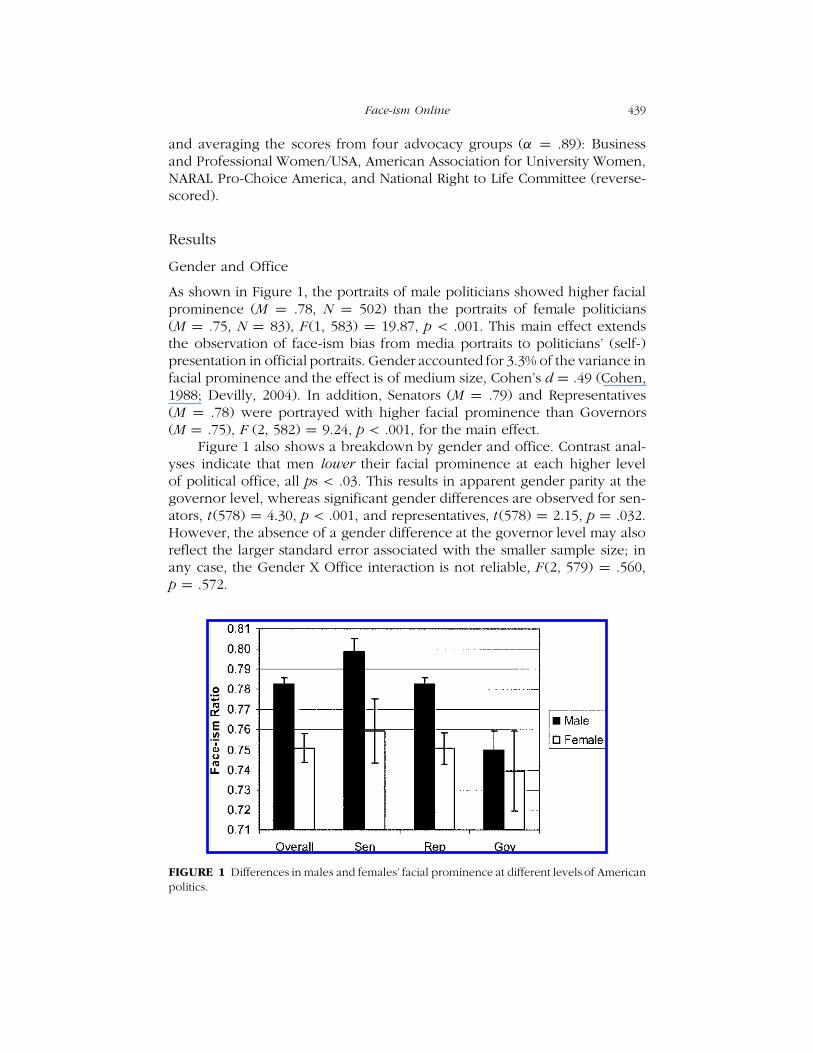
As shown in Figure 1, the portraits of male politicians showed higher facialprominence (M D .78, N D 502) than the portraits of female politicians(M D .75, N D 83), F (1, 583) D 19.87, p < .001. This main effect extendsthe observation of face-ism bias from media portraits to politicians’ (self-)presentation in official portraits. Gender accounted for 3.3% of the variance infacial prominence and the effect is of medium size, Cohen’s d D .49 (Cohen,1988; Devilly, 2004). In addition, Senators (M D .79) and Representatives(M D .78) were portrayed with higher facial prominence than Governors(M D .75), F (2, 582) D 9.24, p < .001, for the main effect.
Figure 1 also shows a breakdown by gender and office. Contrast anal-yses indicate that men lower their facial prominence at each higher levelof political office, all ps < .03. This results in apparent gender parity at thegovernor level, whereas significant gender differences are observed for sen-ators, t (578) D 4.30, p < .001, and representatives, t (578) D 2.15, p D .032.However, the absence of a gender difference at the governor level may alsoreflect the larger standard error associated with the smaller sample size; inany case, the Gender X Office interaction is not reliable, F (2, 579) D .560,p D .572.
FIGURE 1 Differences in males and females’ facial prominence at different levels of American
politics.
440 S. H. Konrath and N. Schwarz
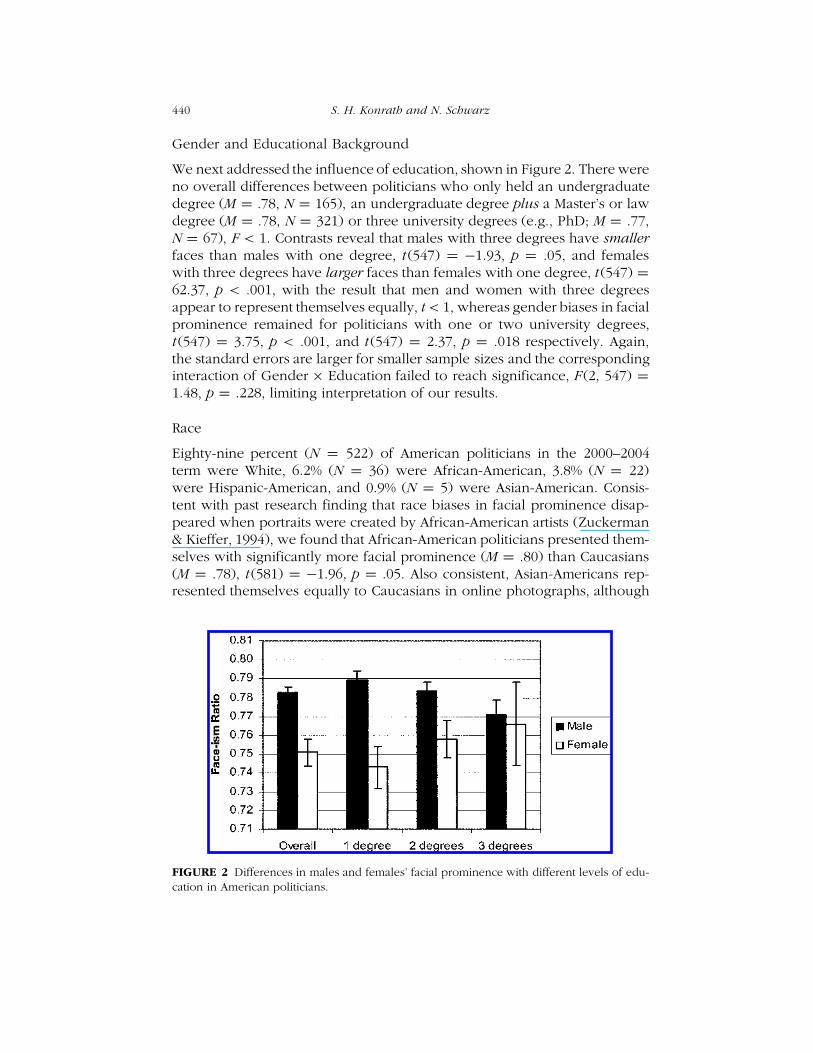
Gender and Educational Background
We next addressed the influence of education, shown in Figure 2. There wereno overall differences between politicians who only held an undergraduatedegree (M D .78, N D 165), an undergraduate degree plus a Master’s or lawdegree (M D .78, N D 321) or three university degrees (e.g., PhD; M D .77,N D 67), F < 1. Contrasts reveal that males with three degrees have smaller
faces than males with one degree, t (547) D �1.93, p D .05, and femaleswith three degrees have larger faces than females with one degree, t (547) D
62.37, p < .001, with the result that men and women with three degreesappear to represent themselves equally, t < 1, whereas gender biases in facialprominence remained for politicians with one or two university degrees,t (547) D 3.75, p < .001, and t (547) D 2.37, p D .018 respectively. Again,the standard errors are larger for smaller sample sizes and the correspondinginteraction of Gender � Education failed to reach significance, F (2, 547) D
1.48, p D .228, limiting interpretation of our results.
Race
Eighty-nine percent (N D 522) of American politicians in the 2000–2004term were White, 6.2% (N D 36) were African-American, 3.8% (N D 22)were Hispanic-American, and 0.9% (N D 5) were Asian-American. Consis-tent with past research finding that race biases in facial prominence disap-peared when portraits were created by African-American artists (Zuckerman& Kieffer, 1994), we found that African-American politicians presented them-selves with significantly more facial prominence (M D .80) than Caucasians(M D .78), t (581) D �1.96, p D .05. Also consistent, Asian-Americans rep-resented themselves equally to Caucasians in online photographs, although
FIGURE 2 Differences in males and females’ facial prominence with different levels of edu-
cation in American politicians.
Face-ism Online 441
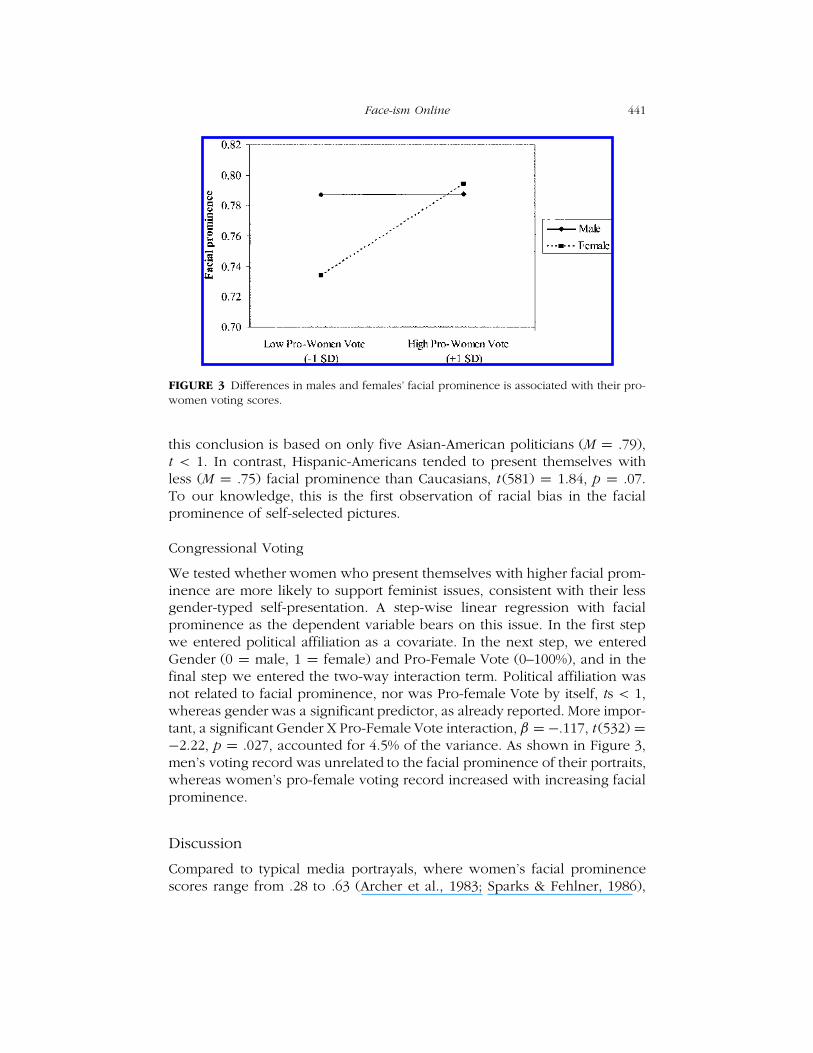
FIGURE 3 Differences in males and females’ facial prominence is associated with their pro-
women voting scores.
this conclusion is based on only five Asian-American politicians (M D .79),t < 1. In contrast, Hispanic-Americans tended to present themselves withless (M D .75) facial prominence than Caucasians, t (581) D 1.84, p D .07.To our knowledge, this is the first observation of racial bias in the facialprominence of self-selected pictures.
Congressional Voting
We tested whether women who present themselves with higher facial prom-inence are more likely to support feminist issues, consistent with their lessgender-typed self-presentation. A step-wise linear regression with facialprominence as the dependent variable bears on this issue. In the first stepwe entered political affiliation as a covariate. In the next step, we enteredGender (0 D male, 1 D female) and Pro-Female Vote (0–100%), and in thefinal step we entered the two-way interaction term. Political affiliation wasnot related to facial prominence, nor was Pro-female Vote by itself, ts < 1,whereas gender was a significant predictor, as already reported. More impor-tant, a significant Gender X Pro-Female Vote interaction, ˇ D �.117, t (532) D
�2.22, p D .027, accounted for 4.5% of the variance. As shown in Figure 3,men’s voting record was unrelated to the facial prominence of their portraits,whereas women’s pro-female voting record increased with increasing facialprominence.
Discussion
Compared to typical media portrayals, where women’s facial prominencescores range from .28 to .63 (Archer et al., 1983; Sparks & Fehlner, 1986),
442 S. H. Konrath and N. Schwarz
the female politicians in our sample presented themselves with high facialprominence, as reflected in a score of .75. Nevertheless, they were still out-done by their male peers, who presented themselves with even higher facialprominence (.78). This pattern replicates the familiar gender difference at anoverall high level of facial prominence and was obtained despite the tightconstraints of professional headshot photographs. It suggests that genderdifferences in facial prominence are alive and well at high levels of pro-fessional standing, in contrast to what Sparks and Fehlner (1986) suggestedtwo decades ago. We return to this issue after examining data from othercountries in Study 3.
Gender differences in facial prominence were not observed amongpoliticians who held three or more university degrees and among gover-nors. In both cases, the absence of gender differences was due to a reducedfacial prominence of males, not an increased facial prominence of females.However, the respective interaction terms were not significant. In Study 3,we revisit this issue on the basis of data sets from other countries and con-duct a meta-analysis of all data sets to determine whether there is a reliableoverall pattern.
Finally, we obtained first evidence that differences in facial prominenceare meaningfully related to consequential real-world behaviors. For femalepoliticians, facial prominence was significantly related to voting behavioron gender issues. Specifically, women who presented themselves with highfacial prominence had a more pronounced pro-female voting record thanwomen who presented themselves with low facial prominence. This pre-sumably reflects that women who hold more feminist beliefs are likely toboth present themselves in less gender-stereotyped ways and to vote infavor of women’s interests.
STUDY 3: CROSS-NATIONAL COMPARISONS
Study 3 extends these analyses to three Western countries in which womenmake up a larger proportion of professional politicians than in the UnitedStates, where only 14% of the representatives and senators, and 18% of thegovernors, were women in 2000–2004. In contrast, women are better rep-resented in the national Parliament of Canada (23.7%), Australia (25.3%),and Norway (38.3%). Of interest is whether the gender bias in facial promi-nence is robust across these countries and whether this bias declines withan increasing number of women in Parliament.
Method
We accessed standard headshot photos of all parliamentary political repre-sentatives from official government websites in Canada (http://www.parl.gc.
Face-ism Online 443
ca), Australia (http://www.aph.gov.au), and Norway (http://www.stortinget.no/english) during January 2005. The measurements follow the proceduresof Study 2. Inter-coder reliability was calculated based on random subsets of20% of the photos; it was ˛ D .98 for Canada (82 photos) and Australia (46photographs) and ˛ D .99 for Norway (33 photos).
Results
In all three countries, a gender bias in facial prominence emerged, replicatingthe American findings (Study 2).
Canada
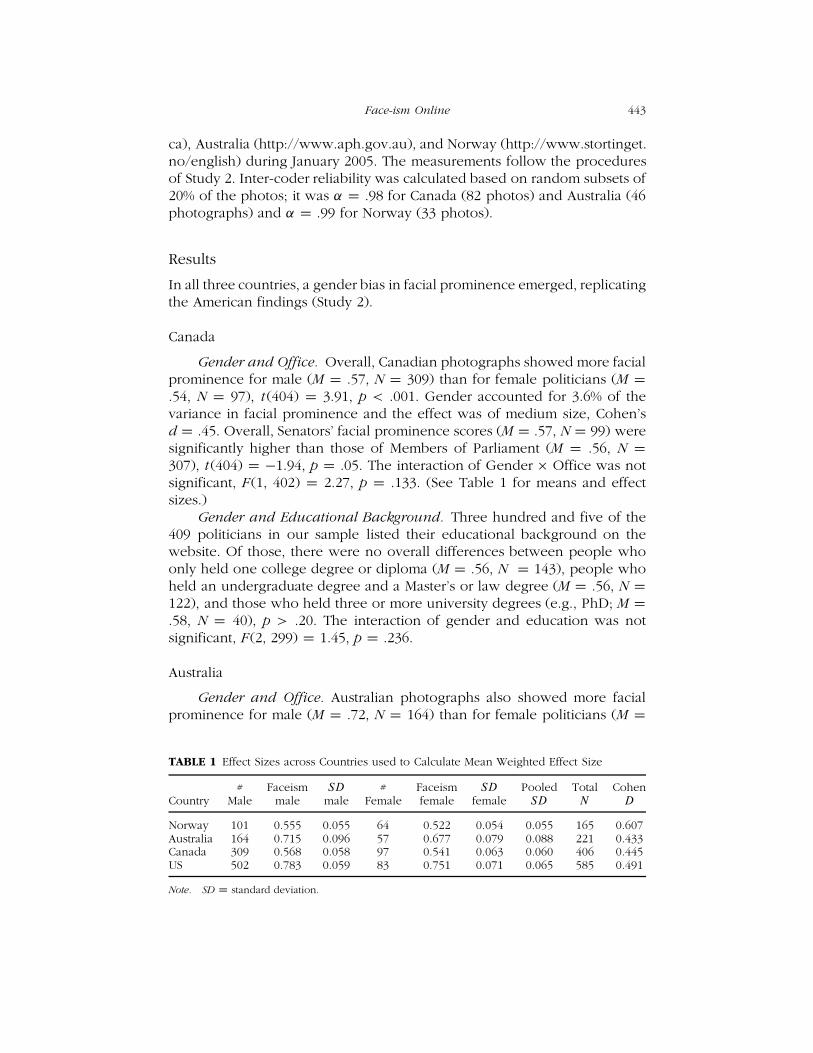
Gender and Office. Overall, Canadian photographs showed more facialprominence for male (M D .57, N D 309) than for female politicians (M D
.54, N D 97), t (404) D 3.91, p < .001. Gender accounted for 3.6% of thevariance in facial prominence and the effect was of medium size, Cohen’sd D .45. Overall, Senators’ facial prominence scores (M D .57, N D 99) weresignificantly higher than those of Members of Parliament (M D .56, N D
307), t (404) D �1.94, p D .05. The interaction of Gender � Office was notsignificant, F (1, 402) D 2.27, p D .133. (See Table 1 for means and effectsizes.)
Gender and Educational Background. Three hundred and five of the409 politicians in our sample listed their educational background on thewebsite. Of those, there were no overall differences between people whoonly held one college degree or diploma (M D .56, N D 143), people whoheld an undergraduate degree and a Master’s or law degree (M D .56, N D
122), and those who held three or more university degrees (e.g., PhD; M D
.58, N D 40), p > .20. The interaction of gender and education was notsignificant, F (2, 299) D 1.45, p D .236.
Australia
Gender and Office. Australian photographs also showed more facialprominence for male (M D .72, N D 164) than for female politicians (M D
TABLE 1 Effect Sizes across Countries used to Calculate Mean Weighted Effect Size
Country#
MaleFaceism
maleSD
male#
FemaleFaceismfemale
SD
femalePooled
SD
TotalN
CohenD
Norway 101 0.555 0.055 64 0.522 0.054 0.055 165 0.607Australia 164 0.715 0.096 57 0.677 0.079 0.088 221 0.433Canada 309 0.568 0.058 97 0.541 0.063 0.060 406 0.445US 502 0.783 0.059 83 0.751 0.071 0.065 585 0.491
Note. SD D standard deviation.
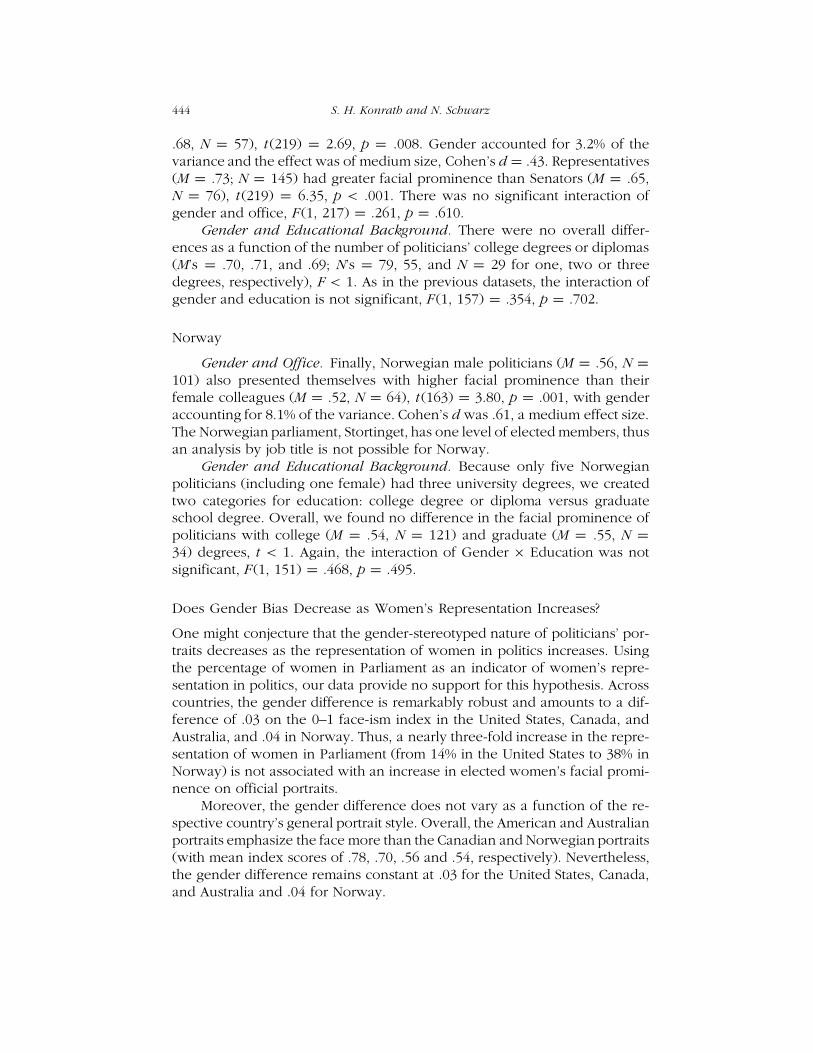
444 S. H. Konrath and N. Schwarz
.68, N D 57), t (219) D 2.69, p D .008. Gender accounted for 3.2% of thevariance and the effect was of medium size, Cohen’s d D .43. Representatives(M D .73; N D 145) had greater facial prominence than Senators (M D .65,N D 76), t (219) D 6.35, p < .001. There was no significant interaction ofgender and office, F (1, 217) D .261, p D .610.
Gender and Educational Background. There were no overall differ-ences as a function of the number of politicians’ college degrees or diplomas(M’s D .70, .71, and .69; N’s D 79, 55, and N D 29 for one, two or threedegrees, respectively), F < 1. As in the previous datasets, the interaction ofgender and education is not significant, F (1, 157) D .354, p D .702.
Norway
Gender and Office. Finally, Norwegian male politicians (M D .56, N D
101) also presented themselves with higher facial prominence than theirfemale colleagues (M D .52, N D 64), t (163) D 3.80, p D .001, with genderaccounting for 8.1% of the variance. Cohen’s d was .61, a medium effect size.The Norwegian parliament, Stortinget, has one level of elected members, thusan analysis by job title is not possible for Norway.
Gender and Educational Background. Because only five Norwegianpoliticians (including one female) had three university degrees, we createdtwo categories for education: college degree or diploma versus graduateschool degree. Overall, we found no difference in the facial prominence ofpoliticians with college (M D .54, N D 121) and graduate (M D .55, N D
34) degrees, t < 1. Again, the interaction of Gender � Education was notsignificant, F (1, 151) D .468, p D .495.
Does Gender Bias Decrease as Women’s Representation Increases?
One might conjecture that the gender-stereotyped nature of politicians’ por-traits decreases as the representation of women in politics increases. Usingthe percentage of women in Parliament as an indicator of women’s repre-sentation in politics, our data provide no support for this hypothesis. Acrosscountries, the gender difference is remarkably robust and amounts to a dif-ference of .03 on the 0–1 face-ism index in the United States, Canada, andAustralia, and .04 in Norway. Thus, a nearly three-fold increase in the repre-sentation of women in Parliament (from 14% in the United States to 38% inNorway) is not associated with an increase in elected women’s facial promi-nence on official portraits.
Moreover, the gender difference does not vary as a function of the re-spective country’s general portrait style. Overall, the American and Australianportraits emphasize the face more than the Canadian and Norwegian portraits(with mean index scores of .78, .70, .56 and .54, respectively). Nevertheless,the gender difference remains constant at .03 for the United States, Canada,and Australia and .04 for Norway.
Face-ism Online 445
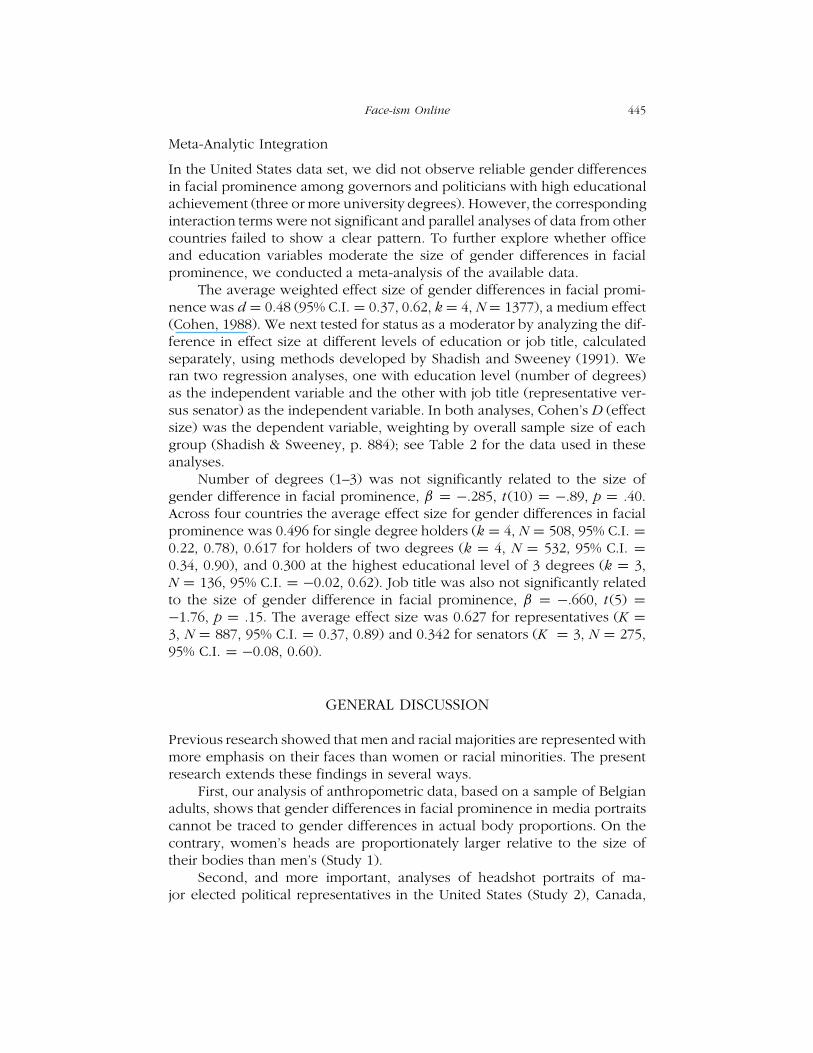
Meta-Analytic Integration
In the United States data set, we did not observe reliable gender differencesin facial prominence among governors and politicians with high educationalachievement (three or more university degrees). However, the correspondinginteraction terms were not significant and parallel analyses of data from othercountries failed to show a clear pattern. To further explore whether officeand education variables moderate the size of gender differences in facialprominence, we conducted a meta-analysis of the available data.
The average weighted effect size of gender differences in facial promi-nence was d D 0.48 (95% C.I. D 0.37, 0.62, k D 4, N D 1377), a medium effect(Cohen, 1988). We next tested for status as a moderator by analyzing the dif-ference in effect size at different levels of education or job title, calculatedseparately, using methods developed by Shadish and Sweeney (1991). Weran two regression analyses, one with education level (number of degrees)as the independent variable and the other with job title (representative ver-sus senator) as the independent variable. In both analyses, Cohen’s D (effectsize) was the dependent variable, weighting by overall sample size of eachgroup (Shadish & Sweeney, p. 884); see Table 2 for the data used in theseanalyses.
Number of degrees (1–3) was not significantly related to the size ofgender difference in facial prominence, ˇ D �.285, t (10) D �.89, p D .40.Across four countries the average effect size for gender differences in facialprominence was 0.496 for single degree holders (k D 4, N D 508, 95% C.I. D
0.22, 0.78), 0.617 for holders of two degrees (k D 4, N D 532, 95% C.I. D
0.34, 0.90), and 0.300 at the highest educational level of 3 degrees (k D 3,N D 136, 95% C.I. D �0.02, 0.62). Job title was also not significantly relatedto the size of gender difference in facial prominence, ˇ D �.660, t (5) D
�1.76, p D .15. The average effect size was 0.627 for representatives (K D
3, N D 887, 95% C.I. D 0.37, 0.89) and 0.342 for senators (K D 3, N D 275,95% C.I. D �0.08, 0.60).
GENERAL DISCUSSION
Previous research showed that men and racial majorities are represented withmore emphasis on their faces than women or racial minorities. The presentresearch extends these findings in several ways.
First, our analysis of anthropometric data, based on a sample of Belgianadults, shows that gender differences in facial prominence in media portraitscannot be traced to gender differences in actual body proportions. On thecontrary, women’s heads are proportionately larger relative to the size oftheir bodies than men’s (Study 1).
Second, and more important, analyses of headshot portraits of ma-jor elected political representatives in the United States (Study 2), Canada,
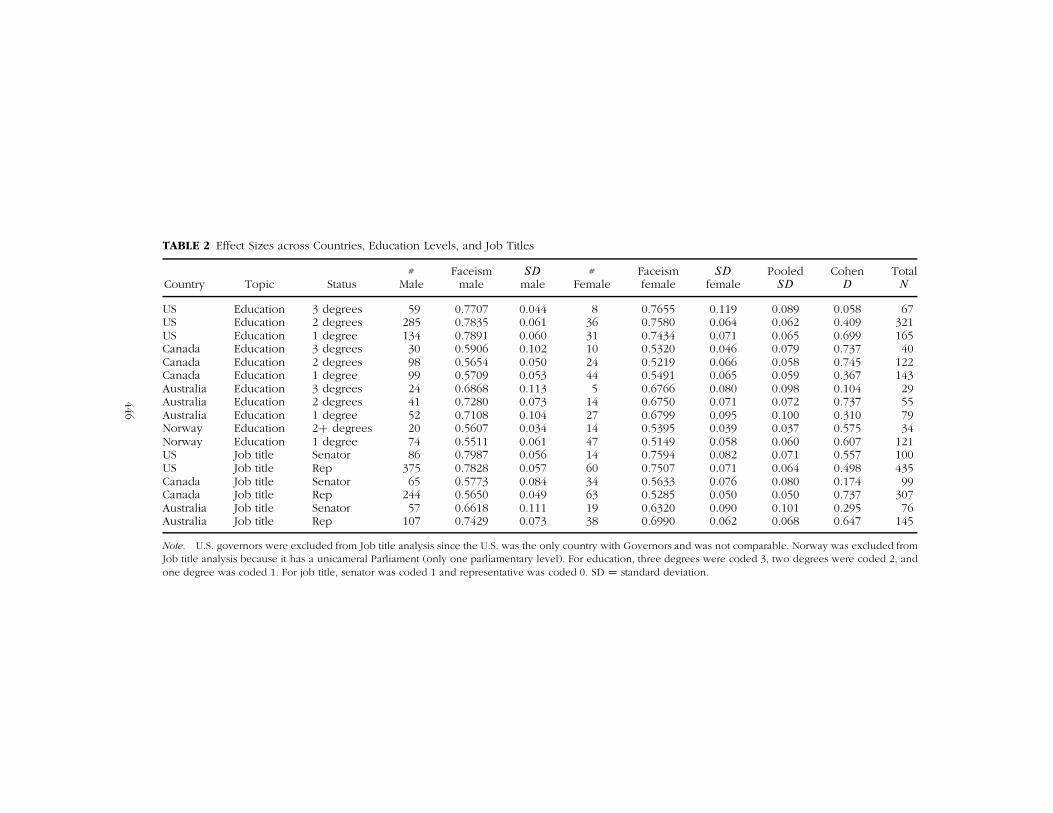
TABLE 2 Effect Sizes across Countries, Education Levels, and Job Titles
Country Topic Status#
MaleFaceism
maleSD
male#
FemaleFaceismfemale
SD
femalePooled
SD
CohenD
TotalN
US Education 3 degrees 59 0.7707 0.044 8 0.7655 0.119 0.089 0.058 67US Education 2 degrees 285 0.7835 0.061 36 0.7580 0.064 0.062 0.409 321US Education 1 degree 134 0.7891 0.060 31 0.7434 0.071 0.065 0.699 165Canada Education 3 degrees 30 0.5906 0.102 10 0.5320 0.046 0.079 0.737 40Canada Education 2 degrees 98 0.5654 0.050 24 0.5219 0.066 0.058 0.745 122Canada Education 1 degree 99 0.5709 0.053 44 0.5491 0.065 0.059 0.367 143Australia Education 3 degrees 24 0.6868 0.113 5 0.6766 0.080 0.098 0.104 29Australia Education 2 degrees 41 0.7280 0.073 14 0.6750 0.071 0.072 0.737 55Australia Education 1 degree 52 0.7108 0.104 27 0.6799 0.095 0.100 0.310 79Norway Education 2C degrees 20 0.5607 0.034 14 0.5395 0.039 0.037 0.575 34Norway Education 1 degree 74 0.5511 0.061 47 0.5149 0.058 0.060 0.607 121US Job title Senator 86 0.7987 0.056 14 0.7594 0.082 0.071 0.557 100US Job title Rep 375 0.7828 0.057 60 0.7507 0.071 0.064 0.498 435Canada Job title Senator 65 0.5773 0.084 34 0.5633 0.076 0.080 0.174 99Canada Job title Rep 244 0.5650 0.049 63 0.5285 0.050 0.050 0.737 307Australia Job title Senator 57 0.6618 0.111 19 0.6320 0.090 0.101 0.295 76Australia Job title Rep 107 0.7429 0.073 38 0.6990 0.062 0.068 0.647 145
Note. U.S. governors were excluded from Job title analysis since the U.S. was the only country with Governors and was not comparable. Norway was excluded from
Job title analysis because it has a unicameral Parliament (only one parliamentary level). For education, three degrees were coded 3, two degrees were coded 2, and
one degree was coded 1. For job title, senator was coded 1 and representative was coded 0. SD D standard deviation.
446
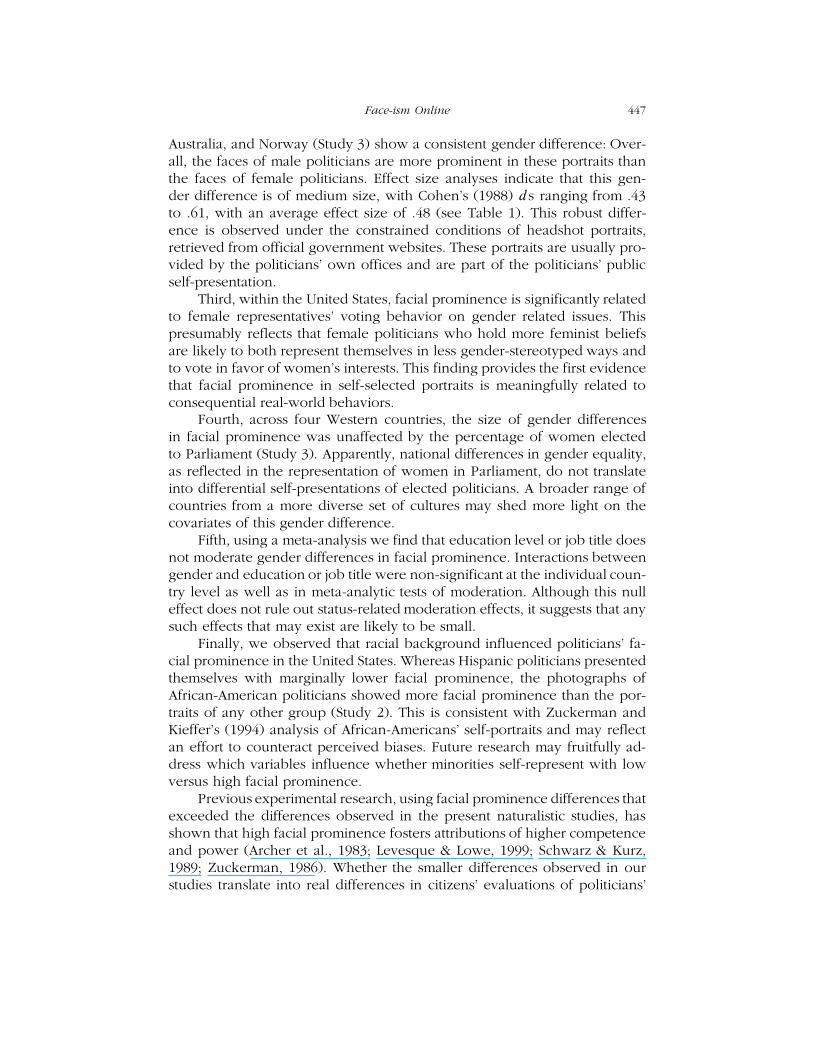
Face-ism Online 447
Australia, and Norway (Study 3) show a consistent gender difference: Over-all, the faces of male politicians are more prominent in these portraits thanthe faces of female politicians. Effect size analyses indicate that this gen-der difference is of medium size, with Cohen’s (1988) ds ranging from .43to .61, with an average effect size of .48 (see Table 1). This robust differ-ence is observed under the constrained conditions of headshot portraits,retrieved from official government websites. These portraits are usually pro-vided by the politicians’ own offices and are part of the politicians’ publicself-presentation.
Third, within the United States, facial prominence is significantly relatedto female representatives’ voting behavior on gender related issues. Thispresumably reflects that female politicians who hold more feminist beliefsare likely to both represent themselves in less gender-stereotyped ways andto vote in favor of women’s interests. This finding provides the first evidencethat facial prominence in self-selected portraits is meaningfully related toconsequential real-world behaviors.
Fourth, across four Western countries, the size of gender differencesin facial prominence was unaffected by the percentage of women electedto Parliament (Study 3). Apparently, national differences in gender equality,as reflected in the representation of women in Parliament, do not translateinto differential self-presentations of elected politicians. A broader range ofcountries from a more diverse set of cultures may shed more light on thecovariates of this gender difference.
Fifth, using a meta-analysis we find that education level or job title doesnot moderate gender differences in facial prominence. Interactions betweengender and education or job title were non-significant at the individual coun-try level as well as in meta-analytic tests of moderation. Although this nulleffect does not rule out status-related moderation effects, it suggests that anysuch effects that may exist are likely to be small.
Finally, we observed that racial background influenced politicians’ fa-cial prominence in the United States. Whereas Hispanic politicians presentedthemselves with marginally lower facial prominence, the photographs ofAfrican-American politicians showed more facial prominence than the por-traits of any other group (Study 2). This is consistent with Zuckerman andKieffer’s (1994) analysis of African-Americans’ self-portraits and may reflectan effort to counteract perceived biases. Future research may fruitfully ad-dress which variables influence whether minorities self-represent with lowversus high facial prominence.
Previous experimental research, using facial prominence differences thatexceeded the differences observed in the present naturalistic studies, hasshown that high facial prominence fosters attributions of higher competenceand power (Archer et al., 1983; Levesque & Lowe, 1999; Schwarz & Kurz,1989; Zuckerman, 1986). Whether the smaller differences observed in ourstudies translate into real differences in citizens’ evaluations of politicians’
448 S. H. Konrath and N. Schwarz
competence is an empirical issue that warrants further testing. For now, ourfindings provide preliminary evidence for what many citizens may suspectabout male politicians: they do indeed have big heads, or at least, theypresent themselves that way.
ACKNOWLEDGMENTS
The authors thank Dave Foldes and Meredith Brooks for coding the U.S.Congress pictures and collecting voting records, respectively. Daniel Albo,Anise Hayes, and Kevin Francies coded pictures from Canada, Australia, andNorway, respectively.
REFERENCES
Archer, D., Iritani, B., Kimes, D. D., & Barrios, M. (1983). Five studies of sex differ-ences in facial prominence. Journal of Personality and Social Psychology, 45,725–735.
Copeland, G. A. (1989). Face-ism and primetime television. Journal of Broadcasting
& Electric Media, 33, 209–214.Cohen, J. (1988). Statistical power analysis for the behavioral sciences (2nd ed.).
Hillsdale, NJ: Lawrence Erlbaum Associates.Devilly, G. J. (2004). The Effect Size Generator for Windows: Version 2.3 (computer
program). Centre for Neuropsychology, Swinburne University, Australia.Hall, C. C. I., & Crum, M. (1994). Women and ‘‘body-isms’’ in television beer com-
mercials. Sex Roles, 31, 329–337.Levesque, M. J., & Lowe, C. A. (1999). Face-ism as a determinant of interpersonal
perceptions: The influence of context on facial prominence effects. Sex Roles,
41, 241–259.Schwarz, N., & Kurz, E. (1989). What’s in a picture? The impact of face-ism on trait
attribution. European Journal of Social Psychology, 19, 311–316.Sparks, G. G., & Fehlner, C. L. (1986). Faces in the news: Gender comparisons of
magazine photographs. Journal of Communication, 4, 70–79.Shadish, W. R., & Sweeney, R. B. (1991). Mediators and moderators in meta-analysis:
There’s a reason we don’t let dodo birds tell us which psychotherapies shouldhave prizes. Journal of Consulting and Clinical Psychology, 59, 883–893.
Zuckerman, M. (1986). On the meaning and implications of facial prominence. Jour-
nal of Nonverbal Behavior, 10, 215–229.Zuckerman, M., & Kieffer, S. (1994). Race differences in face-ism: Does facial promi-
nence imply dominance? Journal of Personality and Social Psychology, 66,
86–92.