Embed Size (px)
Citation preview
THESE
Pour l’obtention du Grade de
DOCTEUR DE L’ECOLE NATIONALE SUPERIEURE DE MECANIQUE ET
D’AEROTECHNIQUE
(Diplôme National – Arrêté du 25 mai 2016)
Ecole Doctorale :
Sciences et Ingénierie en Matériaux, Mécanique, Energétique et Aéronautique
Secteur de Recherche : Fluide, Thermique et Combustion
Présentée par:
Xiaowen QIN
****************************
Modeling study of pyrolysis of composite materials-Application to wood and
carbon/epoxy composite
****************************
Directeur de thèse: Pr. Thomas Rogaume
Co-encadrant: Dr. Franck Richard
Co-encadrant: Dr. Benjamin Batiot
JURY
Rapporteurs:
Pr. Alexis Coppalle Professeur - INSA Rouen (France)
Pr. Bernard Porterie Professeur - Université d’Aix-Marseille (France)
Membres du jury:
Pr. Pascal Boulet Professeur - Université de Lorraine (France)
Dr. Jean Lachaud Maitre de Conférences - Université de Bordeaux (France)
Dr. Virginie Dréan Chef de projet - Efectis France (France)
Pr. Thomas Rogaume Professeur - Université de Poitiers (France)
Dr. Franck Richard Maitre de Conférences - Université de Poitiers (France)
Dr. Benjamin Batiot Maitre de Conférences - Université de Poitiers (France)

Acknowledgements
This thesis would be not completed without the guidance of my supervisors. First
and foremost, I would like to thank Prof. Thomas Rogaume for giving me the chance
and providing a good working environment for pursuing a Ph.D. degree in France,
also the other two supervisors helping me a lot: Franck Richard and Benjamin Batiot.
Among them, I appreciate sincerely and deeply the caring in every aspect from Franck
Richard who is in charge of my work. He spent valuable time concerning experiments,
numerical simulations, and the corresponding discussions. His kindness, knowledge,
and encouragement make me feel inspiring when experiencing the dilemma.
I would like to thank Marc for helping me finish the Cone Calorimeter tests
concerning Carbon/Epoxy composite pyrolysis. I would like to thank Dr. Jean
Lachaud who gave me some useful suggestions when using PATO. I would like to
thank Prof. Bernard Porterie, Prof. Alexis Coppalle, Prof. Pascal Boulet, Dr. Jean
Lachaud, and Dr. Virginie Dréan for being the jury members of my Ph.D. defense.
Their questions and suggestions helped me to improve my knowledge of fire safety
topics. I acknowledge the financial support from the Chinese Scholarship Council
(CSC) for 48 months.
I am thankful to all team members for sharing goodness and enjoyment during the
last four years, including Fabien, Simon, Pierre, Julien, Minh, Jérémy, Tarik, Safae, etc.
Also Chinese friends making my life warm, including Wei He, Xinwen Xie, Mengmeng
Wang, Weiping Zou, etc. Lastly, I am deeply grateful to all my family members,
I always recall my life in Zichang, Shaanxi. I feel quite regretful for my maternal
grandmother who passed away two years ago, her love will bear in my heart forever.

Abstract
Composite materials occupy a critical position in industrial applications or more
broadly in our daily life. Synthetic composites substitute metallic materials due to their
lightweight properties to achieve identical mechanical performance. They are widely
used in the fields of energy transportation and storage. Natural composites (wood) are
also widely used, especially in the construction industry. The disadvantage of these
materials involves the disability in maintaining their mechanical characteristics in a fire
scenario, and the study of their fire resistance is therefore a major issue. This thesis
aims to develop a mathematical model of the thermal decomposition of composite
materials subjected to different heating conditions. The simulations of different cases of
thermal decomposition make it possible to study the interactions among the processes
of heat and mass transfer as well as chemical reactions within the solid. The developed
3D model describes the gas transport within the pores of materials at the Darcy scale.
Thermal conductivity is formulated in a tensor form allowing the definition of heat
transfer in three directions of the domain. For the two types of materials, a multi-step
reaction scheme is defined to describe the pyrolysis process. The cone calorimeter
tests used to validate the model were carried out under an inert atmosphere (Nitrogen)
which makes it possible to eliminate the presence of flame on the material surface
as well as the heterogeneous reactions which can occur in the presence of oxygen.
Therefore, the defined boundary conditions are quite simple and well-controlled to
characterize without considering the unsteady flame. Pyrolysis gasses are assembled
into an inert gas, therefore, the gas reactions in the pore are neglected and the local
thermal equilibrium between the solid and gas phase is assumed. The implementation
vi
of this pyrolysis model follows a scale separation process with two types of materials.
The different heat and mass transfer processes, as well as chemical reactions, are
studied separately to avoid the interactions, then the model is reconstructed to take
these interactions into account. The pyrolysis behavior is firstly studied at a "0D" scale
to develop the part of chemical reactions. The thermogravimetric analysis (TGA) is
used at this scale and related experiments are conducted at different heating rates
under an inert atmosphere. At this scale, only the chemical reactions are involved with
known kinetics, and the heat and mass transport within the solid can be neglected with
homogeneous temperature distribution. The different chemical reactions are described
with the Arrhenius-type equation. The kinetic parameters are calculated by the inverse
modeling method. The influence of the heating rate on the pyrolysis process is analyzed
and 2D simulations are conducted at two heating rates to analyze the evolution of
thermal and pressure gradients within the solid. The phenomena of heat and mass
transport are considered and studied by bench-scale experiments which are conducted
in the cone calorimeter. The corresponding simulations are implemented under two
heat flux. The interactions among the heat and mass transport as well as chemical
reaction processes are studied by analyzing the local time and length scales to identify
what are the dominant phenomena through the whole pyrolysis process.
Keywords: wood combustion, calorimeters, composite materials, fire prevention,
pyrolysis, simulation methods, heat transfer, mass transfer
Table of contents
List of figures xi
List of tables xxiii
Nomenclature xxv
1 Introduction 1
1.1 Background and motivation . . . . . . . . . . . . . . . . . . . . . . . . 1
1.2 Research aim . . . . . . . . . . . . . . . . . . . . . . . . . . . . . . . . 6
1.3 Research methodology . . . . . . . . . . . . . . . . . . . . . . . . . . . 7
1.4 Thesis outline . . . . . . . . . . . . . . . . . . . . . . . . . . . . . . . . 9
2 Literature review 13
2.1 Composite materials: general background . . . . . . . . . . . . . . . . . 13
2.2 Pyrolysis phenomenon in the fire scenario . . . . . . . . . . . . . . . . . 18
2.2.1 Pyrolysis process description . . . . . . . . . . . . . . . . . . . . 18
2.2.1.1 Macroscopic observation of pyrolysis of composite ma-
terials . . . . . . . . . . . . . . . . . . . . . . . . . . . 19
2.2.1.2 Heat and mass transfer aspect . . . . . . . . . . . . . . 21
2.2.1.3 Chemical reaction aspect . . . . . . . . . . . . . . . . 23
2.2.1.4 Physical structure change . . . . . . . . . . . . . . . . 24
2.2.2 Pyrolysis process modeling . . . . . . . . . . . . . . . . . . . . . 29
2.2.2.1 Chemical reaction model . . . . . . . . . . . . . . . . . 34
viii Table of contents
2.2.2.2 Heat and mass transfer model . . . . . . . . . . . . . . 39
2.2.2.3 Physical structure change model . . . . . . . . . . . . 41
2.2.2.4 Boundary conditions . . . . . . . . . . . . . . . . . . . 42
2.2.2.5 Pyrolysis model evaluation . . . . . . . . . . . . . . . . 43
2.3 Multi-scale experiment and parameters estimation . . . . . . . . . . . . 47
2.3.1 Milligram-scale TGA and kinetics . . . . . . . . . . . . . . . . . 48
2.3.2 Bench-scale cone calorimeter . . . . . . . . . . . . . . . . . . . . 50
2.3.3 Parameters estimation . . . . . . . . . . . . . . . . . . . . . . . 54
2.4 Conclusion . . . . . . . . . . . . . . . . . . . . . . . . . . . . . . . . . . 57
3 Description of the PATO solver 59
3.1 The theory of volume averaging . . . . . . . . . . . . . . . . . . . . . . 60
3.2 Pyrolysis kinetics . . . . . . . . . . . . . . . . . . . . . . . . . . . . . . 63
3.3 Conservation equations . . . . . . . . . . . . . . . . . . . . . . . . . . . 67
3.3.1 Solid mass conservation equations . . . . . . . . . . . . . . . . . 67
3.3.2 Gas mass conservation equations . . . . . . . . . . . . . . . . . 67
3.3.3 Gas momentum conservation equations . . . . . . . . . . . . . . 67
3.3.4 Energy conservation equation . . . . . . . . . . . . . . . . . . . 68
3.4 Boundary conditions . . . . . . . . . . . . . . . . . . . . . . . . . . . . 72
3.5 Modeling work protocol . . . . . . . . . . . . . . . . . . . . . . . . . . 73
3.6 Modeling assumption and simulation options . . . . . . . . . . . . . . . 74
3.7 Conclusion . . . . . . . . . . . . . . . . . . . . . . . . . . . . . . . . . . 76
4 Particle scale modeling of the wood pyrolysis 77
4.1 TGA experimental procedure . . . . . . . . . . . . . . . . . . . . . . . 78
4.2 TGA Experimental results . . . . . . . . . . . . . . . . . . . . . . . . . 80
4.3 TGA Pyrolysis modeling study . . . . . . . . . . . . . . . . . . . . . . 86
4.3.1 Numerical comparison under different heating rates . . . . . . . 93
4.3.2 Analysis of the influence of the kinetic parameters . . . . . . . . 96
4.3.3 Analysis of the 0D and 2D modeling influence . . . . . . . . . . 101
Table of contents ix
4.4 Conclusion . . . . . . . . . . . . . . . . . . . . . . . . . . . . . . . . . . 110
5 Cone calorimeter experiments and model validation for wood pyrol-
ysis 113
5.1 CACC experiment description and temperature measurement . . . . . . 114
5.2 Inverse analysis to obtain heat convection coefficient . . . . . . . . . . . 123
5.3 Inverse analysis to obtain wood thermophysical parameters . . . . . . . 127
5.4 Inverse analysis to obtain char thermophysical parameters . . . . . . . 132
5.5 Model validation for moisture evaporation . . . . . . . . . . . . . . . . 137
5.6 Model validation for wood pyrolysis under different scenarios . . . . . . 147
5.6.1 Model validation for temperature and mass loss profiles . . . . . 148
5.6.2 Model validation for char front evolution . . . . . . . . . . . . . 164
5.6.3 Numerical analysis with global and single scalars . . . . . . . . 169
5.7 Conclusion . . . . . . . . . . . . . . . . . . . . . . . . . . . . . . . . . . 182
6 Multi-scale application of the model to carbon/epoxy composite py-
rolysis 185
6.1 TGA experiments and model validation . . . . . . . . . . . . . . . . . . 186
6.2 Cone calorimeter experiments and model validation . . . . . . . . . . . 192
6.2.1 Experimental protocol . . . . . . . . . . . . . . . . . . . . . . . 192
6.2.2 Determination of the thermophysical parameters . . . . . . . . . 193
6.2.3 Experimental and numerical prediction analysis . . . . . . . . . 197
6.3 Conclusion . . . . . . . . . . . . . . . . . . . . . . . . . . . . . . . . . . 207
7 Sensitivity analysis 209
7.1 Kinetic and thermodynamic parameters influence . . . . . . . . . . . . 212
7.1.1 Activation energy influence . . . . . . . . . . . . . . . . . . . . . 213
7.1.2 Pre-exponential factor influence . . . . . . . . . . . . . . . . . . 215
7.1.3 Reaction order influence . . . . . . . . . . . . . . . . . . . . . . 217
7.1.4 The heat of thermal decomposition influence . . . . . . . . . . . 219
x Table of contents
7.2 Thermal and physical parameters influence . . . . . . . . . . . . . . . . 221
7.2.1 Virgin thermal conductivity influence . . . . . . . . . . . . . . . 223
7.2.2 Char thermal conductivity influence . . . . . . . . . . . . . . . . 225
7.2.3 Virgin and char specific heat capacity influence . . . . . . . . . 227
7.2.4 Virgin and char permeability influence . . . . . . . . . . . . . . 230
7.2.5 Char emissivity influence . . . . . . . . . . . . . . . . . . . . . . 234
7.3 Boundary parameters influence . . . . . . . . . . . . . . . . . . . . . . 235
7.4 Water content influence . . . . . . . . . . . . . . . . . . . . . . . . . . . 237
7.5 Conclusion . . . . . . . . . . . . . . . . . . . . . . . . . . . . . . . . . . 239
8 Conclusion and perspective 241
8.1 Conclusion . . . . . . . . . . . . . . . . . . . . . . . . . . . . . . . . . . 241
8.2 Perspective . . . . . . . . . . . . . . . . . . . . . . . . . . . . . . . . . 247
References 251
Appendix A Summary in French for each chapter/Résumé en français
pour chaque chapitre 267
A.1 Chapitre 1: Introduction . . . . . . . . . . . . . . . . . . . . . . . . . . 267
A.2 Chapitre 2: Revue de la littérature . . . . . . . . . . . . . . . . . . . . 271
A.3 Chapitre 3: Description du solveur PATO . . . . . . . . . . . . . . . . 273
A.4 Chapitre 4: Modélisation à l’échelle des particules de la pyrolyse du bois 275
A.5 Chapitre 5: Expériences au cône calorimètre et validation du modèle de
pyrolyse du bois . . . . . . . . . . . . . . . . . . . . . . . . . . . . . . . 279
A.6 Chapitre 6: Modélisation de multi-échelle à la pyrolyse du composite
carbone/époxy . . . . . . . . . . . . . . . . . . . . . . . . . . . . . . . 281
A.7 Chapitre 7: Analyse de sensibilité . . . . . . . . . . . . . . . . . . . . 283
A.8 Chapitre 8: Conclusion et perspective . . . . . . . . . . . . . . . . . . . 285
List of figures
1.1 Fire hazard of timber structures and airplane carbon fiber composite . 3
2.1 Wood composite consisting of hemicellulose, cellulose, and lignin structure 15
2.2 Molecular linkage for thermoplastic and thermoset . . . . . . . . . . . . 16
2.3 The pyrolysis process schematic in case of charring materials (wood) in
fire conditions under bench-scale tests . . . . . . . . . . . . . . . . . . . 18
2.4 Schematic illustration of different zones for charring solid pyrolysis under
1D . . . . . . . . . . . . . . . . . . . . . . . . . . . . . . . . . . . . . . 20
2.5 Porous char residue under heat flux condition for carbon/epoxy composite 22
2.6 Thermal delamination process of carbon fiber reinforced polymer (CFRP)
composite during pyrolysis . . . . . . . . . . . . . . . . . . . . . . . . . 26
2.7 Macroscopic observation of thermal delamination of fiber laminated
composite at different fire heat fluxes . . . . . . . . . . . . . . . . . . . 27
2.8 Microscopic observation of fire-damaged composite . . . . . . . . . . . 28
2.9 One-step global reaction scheme of wood thermal decomposition . . . . 36
2.10 Multi-step reaction schemes of wood thermal decomposition . . . . . . 36
2.11 Parallel reaction schemes of wood thermal decomposition . . . . . . . . 37
2.12 One-step global reaction schemes of epoxy resin decomposition . . . . . 38
2.13 A multiple parallel reaction schemes of epoxy resin (polymer) thermal
decomposition . . . . . . . . . . . . . . . . . . . . . . . . . . . . . . . . 38
2.14 A two-step reaction scheme of epoxy resin thermal decomposition . . . 38
2.15 Chemical reaction/heat transfer map for biomass pyrolysis . . . . . . . 48
xii List of figures
2.16 Experimental and model prediction of mass loss profile of three pseudo-
components of wood pyrolysis . . . . . . . . . . . . . . . . . . . . . . . 50
2.17 Cone Calorimeter setups . . . . . . . . . . . . . . . . . . . . . . . . . . 52
2.18 Heat transfer of the thermocouple junction in solid materials . . . . . . 54
3.1 Principle of the averaging volume containing multiple solid phases and
single gas phase . . . . . . . . . . . . . . . . . . . . . . . . . . . . . . . 61
3.2 Pyrolysis process assumptions with considered and neglected phenomena
in this study . . . . . . . . . . . . . . . . . . . . . . . . . . . . . . . . . 75
4.1 TGA apparatus of Mettler-Toledo type . . . . . . . . . . . . . . . . . . 79
4.2 Average experimental NML at 10 K/min of TGA experiment . . . . . . 80
4.3 Average experimental NML at 50 K/min of TGA experiment . . . . . . 81
4.4 Comparison of experimental NML under 10 K/min and 50 K/min . . . 81
4.5 Experimental MLR under 10 K/min and 50 K/min . . . . . . . . . . . 82
4.6 Experimental MLR under 10 K/min and 50 K/min . . . . . . . . . . . 82
4.7 Deviation of NML and NMLR between 10 K/min and 50 K/min . . . . 84
4.8 Deconvolution of experimental NMLR at 10 K/min and 50 K/min (the
solid line is 10 K/min, the dashed line is 50 K/min) . . . . . . . . . . . 85
4.9 One-step global reaction scheme of wood pyrolysis . . . . . . . . . . . . 88
4.10 Four independent parallel reactions scheme of wood pyrolysis . . . . . . 88
4.11 Experimental and optimized NML under different reaction schemes for
10 K/min . . . . . . . . . . . . . . . . . . . . . . . . . . . . . . . . . . 89
4.12 Experimental and optimized MLR under different reaction schemes for
10 K/min . . . . . . . . . . . . . . . . . . . . . . . . . . . . . . . . . . 90
4.13 Experimental and optimized NML under different reaction schemes for
50 K/min . . . . . . . . . . . . . . . . . . . . . . . . . . . . . . . . . . 90
4.14 Experimental and optimized MLR under different reaction schemes for
50 K/min . . . . . . . . . . . . . . . . . . . . . . . . . . . . . . . . . . 91
List of figures xiii
4.15 NML profile for wood components for 10 K/min (solid lines) and 50
K/min (dashed lines) . . . . . . . . . . . . . . . . . . . . . . . . . . . . 93
4.16 MLR profile of wood components for 10 K/min (solid lines) and 50
K/min (dashed lines) . . . . . . . . . . . . . . . . . . . . . . . . . . . . 94
4.17 NMLR profile of wood components for 10 K/min (solid lines) and 50
K/min (dashed lines) . . . . . . . . . . . . . . . . . . . . . . . . . . . . 95
4.18 Optimized NMLR at 10 K/min (black solid line) and simulated at 10
K/min (black dashed line) with kinetic parameters optimized at 50
K/min (correspondingly for other two curves at 50 K/min) . . . . . . . 97
4.19 NMLR difference between optimization and simulation at 10 K/min
(correspondingly at 50 K/min) . . . . . . . . . . . . . . . . . . . . . . . 98
4.20 Reaction rates of wood components at 10 K/min (optimized and simulated) 98
4.21 Reaction rates of wood components at 50 K/min (optimized and simulated) 99
4.22 The difference of each wood component reaction rate between optimized
and simulated at 10 K/min . . . . . . . . . . . . . . . . . . . . . . . . 99
4.23 The difference of each wood component reaction rate between optimized
and simulated at 50 K/min . . . . . . . . . . . . . . . . . . . . . . . . 100
4.24 Mass evolution for different mesh sizes and time steps . . . . . . . . . . 102
4.25 MLR for 0D and 2D mesh at 10 K/min . . . . . . . . . . . . . . . . . . 103
4.26 MLR for 0D and 2D mesh at 50 K/min . . . . . . . . . . . . . . . . . . 103
4.27 Three characteristic time points for hemicellulose reaction rate . . . . . 104
4.28 Three characteristic time points for cellulose reaction rate . . . . . . . . 105
4.29 Three characteristic time points for lignin reaction rate . . . . . . . . . 105
4.30 Reaction advancement of hemicellulose, cellulose, and lignin through
the sample thickness at the different given characteristic time . . . . . . 106
4.31 Normalized reactions rates of hemicellulose, cellulose, lignin through the
sample thickness at the different given characteristic time . . . . . . . . 107
4.32 Temperature difference for each reaction of hemicellulose, cellulose, lignin
through the sample thickness at the different given characteristic time . 108
xiv List of figures
4.33 Heating rate for each reaction of hemicellulose, cellulose, lignin through
the sample thickness at the different characteristic time . . . . . . . . . 109
5.1 CACC apparatus . . . . . . . . . . . . . . . . . . . . . . . . . . . . . . 115
5.2 Monte-Carlo heat flux distribution at the top surface of axis-symmetry
under 20 kW/m2 . . . . . . . . . . . . . . . . . . . . . . . . . . . . . . 116
5.3 Experimental sample holder of cylindrical silicate . . . . . . . . . . . . 118
5.4 Thermal conductivity of porous silicate . . . . . . . . . . . . . . . . . . 119
5.5 Specific heat capacity of porous silicate . . . . . . . . . . . . . . . . . . 120
5.6 Schematic illustration of temperature measurement for wood pyrolysis . 121
5.7 Schematic of modeling configuration for wood under 1D and 2D axis-
symmetry . . . . . . . . . . . . . . . . . . . . . . . . . . . . . . . . . . 122
5.8 Schematic illustration of temperature measurement for the Al block
sample . . . . . . . . . . . . . . . . . . . . . . . . . . . . . . . . . . . . 124
5.9 Schematic of modeling configuration for Aluminum under 1D and 2D
axis symmetry . . . . . . . . . . . . . . . . . . . . . . . . . . . . . . . . 125
5.10 Temperature evolution between measured and model-predicted for Al
heat conduction under 1D and 2D subjected to incident irradiance of
heat flux of 20 kW/m2 . . . . . . . . . . . . . . . . . . . . . . . . . . . 126
5.11 Experimental and predicted temperature evolution of wood pure heat
conduction at different locations . . . . . . . . . . . . . . . . . . . . . . 129
5.12 Comparison of wood thermal conductivity of reported and predicted
values in this study . . . . . . . . . . . . . . . . . . . . . . . . . . . . . 131
5.13 Comparison of wood specific heat capacity of reported and predicted
values in this study . . . . . . . . . . . . . . . . . . . . . . . . . . . . . 131
5.14 Temperature evolution of char pure conduction at different locations at
the heat flux of 20 kW/m2 . . . . . . . . . . . . . . . . . . . . . . . . . 133
5.15 Temperature evolution of char pure conduction at different locations at
the heat flux of 50 kW/m2 . . . . . . . . . . . . . . . . . . . . . . . . . 133
5.16 Comparison between predicted and reported char thermal conductivity 136
List of figures xv
5.17 Comparison between predicted and reported char specific heat capacity 137
5.18 Mass loss for water evaporation of wet wood under 5 kW/m2 . . . . . . 138
5.19 Mass loss rate for water evaporation of wet wood under 5 kW/m2 . . . 139
5.20 Temperature evolution at different locations for water evaporation of
wet wood under 5 kW/m2 . . . . . . . . . . . . . . . . . . . . . . . . . 139
5.21 Water reaction rate with velocity arrows colored by pressure at three
characteristic time points:500 s (a) . . . . . . . . . . . . . . . . . . . . 141
5.22 Water reaction rate with velocity arrows colored by pressure at three
characteristic time points:1700 s (b) . . . . . . . . . . . . . . . . . . . . 141
5.23 Water reaction rate with velocity arrows colored by pressure at three
characteristic time points:3500 s (c) . . . . . . . . . . . . . . . . . . . . 142
5.24 Experimental temperatures evolution for dry wood and wet wood at
three locations . . . . . . . . . . . . . . . . . . . . . . . . . . . . . . . . 143
5.25 Experimental temperature differences between dry wood and wet wood
at three locations . . . . . . . . . . . . . . . . . . . . . . . . . . . . . . 144
5.26 Predicted reaction rate of wet wood evaporation through the thickness 145
5.27 Predicted temperature evolution through the sample thickness for dry
wood (dashed lines) and wet wood (solid lines) at three characteristic
time points . . . . . . . . . . . . . . . . . . . . . . . . . . . . . . . . . 145
5.28 Predicted temperature differences between dry wood and wet wood
through the sample thickness at three characteristic time points . . . . 146
5.29 Heating rate profiles across the sample thickness for dry wood (dashed
lines) and wet wood (solid lines) at three characteristic time points . . 146
5.30 Experimental heating rates for 20 kW/m2 at three locations . . . . . . 149
5.31 Experimental heating rates for 50 kW/m2 at three locations . . . . . . 149
5.32 Experimental and modeled total mass evolution for dry wood pyrolysis
under 20 kW/m2 . . . . . . . . . . . . . . . . . . . . . . . . . . . . . . 151
5.33 Influence of mesh size and time steps during simulation for 2D model at
20 kW/m2 . . . . . . . . . . . . . . . . . . . . . . . . . . . . . . . . . . 152
xvi List of figures
5.34 Influence of mesh size and time steps during simulation for 2D model at
50 kW/m2 . . . . . . . . . . . . . . . . . . . . . . . . . . . . . . . . . . 152
5.35 Influence of mesh size and time steps during simulation for 1D model at
20 kW/m2 . . . . . . . . . . . . . . . . . . . . . . . . . . . . . . . . . . 153
5.36 Experimental and predicted mass loss profile for wet wood pyrolysis at
the irradiant heat flux of 20 kW/m2 . . . . . . . . . . . . . . . . . . . . 154
5.37 Experimental and predicted mass loss rate for wet wood pyrolysis at the
irradiant heat flux of 20 kW/m2 . . . . . . . . . . . . . . . . . . . . . . 155
5.38 Experimental and predicted temperature evolution for wet wood pyroly-
sis at the irradiant heat flux of 20 kW/m2 . . . . . . . . . . . . . . . . 155
5.39 Experimental and predicted mass loss profile for dry wood at the irradiant
heat flux of 20 kW/m2 . . . . . . . . . . . . . . . . . . . . . . . . . . . 156
5.40 Experimental and predicted mass loss rate for dry wood pyrolysis at the
irradiant heat flux of 20 kW/m2 . . . . . . . . . . . . . . . . . . . . . . 156
5.41 Experimental and predicted temperature evolution for dry wood pyrolysis
at the irradiant heat flux of 20 kW/m2 . . . . . . . . . . . . . . . . . . 157
5.42 Experimental and predicted mass loss for wet wood pyrolysis at the
irradiant heat flux of 50 kW/m2 . . . . . . . . . . . . . . . . . . . . . . 160
5.43 Experimental and predicted mass loss rate for wet wood pyrolysis at the
irradiant heat flux of 50 kW/m2 . . . . . . . . . . . . . . . . . . . . . . 160
5.44 Experimental and predicted temperature evolution for wet wood pyroly-
sis at the irradiant heat flux of 50 kW/m2 . . . . . . . . . . . . . . . . 161
5.45 Experimental and predicted mass loss rate for dry wood pyrolysis at the
irradiant heat flux of 50 kW/m2 . . . . . . . . . . . . . . . . . . . . . . 161
5.46 Experimental and predicted mass loss rate for dry wood pyrolysis at the
irradiant heat flux of 50 kW/m2 . . . . . . . . . . . . . . . . . . . . . . 162
5.47 Experimental and simulated temperature evolution for dry wood pyroly-
sis at the irradiant heat flux of 50 kW/m2 . . . . . . . . . . . . . . . . 162
List of figures xvii
5.48 Charring front propagation at different time (205 s, 605 s, 1005 s, 1805
s, and 2405 s) for wet wood pyrolysis under 20 kW/m2 . . . . . . . . . 166
5.49 Comparison of measured and predicted char depth at different times for
wet wood pyrolysis under 20 kW/m2 . . . . . . . . . . . . . . . . . . . 167
5.50 Charring front propagation at different time (105 s, 405 s, 805 s, 1205 s,
and 1405 s) for wet wood pyrolysis under 50 kW/m2 . . . . . . . . . . . 168
5.51 Comparison of measured and predicted char depth at different times for
wet wood pyrolysis under 50 kW/m2 . . . . . . . . . . . . . . . . . . . 169
5.52 Total mass evolution for dry and wet wood pyrolysis cases at 20 kW/m2
and 50 kW/m2 . . . . . . . . . . . . . . . . . . . . . . . . . . . . . . . 170
5.53 Total Mass loss rate evolution for wet and dry wood pyrolysis cases at
20 kW/m2 . . . . . . . . . . . . . . . . . . . . . . . . . . . . . . . . . . 171
5.54 Total Mass loss rate evolution for wet and dry wood pyrolysis cases at
50 kW/m2 . . . . . . . . . . . . . . . . . . . . . . . . . . . . . . . . . . 172
5.55 Total reaction rates evolution for wet (dashed lines) and dry (solid lines)
wood pyrolysis cases at 20 kW/m2 . . . . . . . . . . . . . . . . . . . . . 172
5.56 Total reaction rates evolution for wet (dashed lines) and dry (solid lines)
wood pyrolysis cases at 50 kW/m2 . . . . . . . . . . . . . . . . . . . . . 173
5.57 Temperature evolution for dry (solid line) and wet (dashed lines) cases
at 20 kW/m2 . . . . . . . . . . . . . . . . . . . . . . . . . . . . . . . . 174
5.58 Temperature evolution for dry (solid line) and wet (dashed lines) cases
at 50 kW/m2 . . . . . . . . . . . . . . . . . . . . . . . . . . . . . . . . 175
5.59 Temperature difference between dry and wet cases for 20 kW/m2 (solid
line) and 50 kW/m2 (dashed lines) . . . . . . . . . . . . . . . . . . . . 175
5.60 Total pressure evolution for wet (dashed lines) and dry (solid lines) cases
at 20 kW/m2 and 50 kW/m2 . . . . . . . . . . . . . . . . . . . . . . . . 177
5.61 Pyrolysis and water evaporation front for dry (top slices) and wet case
(bottom slices) at 20 kW/m2 . . . . . . . . . . . . . . . . . . . . . . . . 179
xviii List of figures
5.62 Pyrolysis and water evaporation front for dry (top slices) and wet case
(bottom slices) at 50 kW/m2 . . . . . . . . . . . . . . . . . . . . . . . . 179
5.63 Reaction rates evolution across the sample thickness for three pyrolysis
front locations for dry (solid lines) and wet (dashed lines) cases at 20
kW/m2 (left plot) and 50 kW/m2 (right plot) . . . . . . . . . . . . . . 181
5.64 Heating rate evolution across the sample thickness for three pyrolysis
front locations for dry (solid lines) and wet (dashed lines) cases at 20
kW/m2 (left plot) and 50 kW/m2 (right plot) . . . . . . . . . . . . . . 181
5.65 Temperature evolution across the sample thickness for three pyrolysis
front locations at 20 kW/m2 (left plot) and 50 kW/m2 (right plot) for
dry (solid lines) and wet (dashed lines) cases . . . . . . . . . . . . . . . 182
6.1 Experimental heating rate evolution at middle locations during cone
calorimeter tests under 20 kW/m2 . . . . . . . . . . . . . . . . . . . . . 187
6.2 Experimental heating rate evolution at middle locations during cone
calorimeter tests under 50 kW/m2 . . . . . . . . . . . . . . . . . . . . . 187
6.3 Two parallel reactions scheme of epoxy resin thermal decomposition . . 188
6.4 Comparison for the measured and simulated mass loss under an inert
atmosphere at 20 K/min in TGA . . . . . . . . . . . . . . . . . . . . . 189
6.5 Comparison for the measured and simulated mass loss under an inert
atmosphere at 50 K/min in TGA . . . . . . . . . . . . . . . . . . . . . 189
6.6 Comparison for measured and simulated mass loss rate under an inert
atmosphere at 50 K/min in TGA . . . . . . . . . . . . . . . . . . . . . 190
6.7 Schematic of experimental preparation of carbon/epoxy composite py-
rolysis in cone calorimeter apparatus . . . . . . . . . . . . . . . . . . . 193
6.8 Specific heat capacity of carbon/epoxy composite from literature and in
this study . . . . . . . . . . . . . . . . . . . . . . . . . . . . . . . . . . 195
6.9 Specific heat capacity of carbon/epoxy composite char from literature
and in this study . . . . . . . . . . . . . . . . . . . . . . . . . . . . . . 195
List of figures xix
6.10 Thermal conductivity at the in-plane direction of carbon/epoxy com-
posite from literature and in this study . . . . . . . . . . . . . . . . . . 196
6.11 Thermal conductivity at the through-thickness direction of carbon/epoxy
composite from literature and in this study . . . . . . . . . . . . . . . . 196
6.12 Thermal conductivity of carbon/epoxy composite char from literature
and in this study . . . . . . . . . . . . . . . . . . . . . . . . . . . . . . 197
6.13 Experimental and prediction of mass loss of carbon/epoxy composite
pyrolysis at 20 kW/m2 with 1D and 3D model . . . . . . . . . . . . . . 198
6.14 Experimental and prediction of mass loss rate of carbon/epoxy composite
pyrolysis at 20 kW/m2 with 1D and 3D model . . . . . . . . . . . . . . 198
6.15 Experimental and prediction of temperature evolutions of carbon/epoxy
composite pyrolysis at 20 kW/m2 with 1D and 3D model (Top location) 201
6.16 Experimental and prediction of temperature evolutions of carbon/epoxy
composite pyrolysis at 20 kW/m2 with 1D and 3D model (Middle location)201
6.17 Experimental and prediction of temperature evolutions of carbon/epoxy
composite pyrolysis at 20 kW/m2 with 1D and 3D model (Bottom location)202
6.18 Experimental and prediction of mass loss of carbon/epoxy composite
pyrolysis at 50 kW/m2 with 1D and 3D model . . . . . . . . . . . . . . 203
6.19 Experimental and prediction of mass loss rate of carbon/epoxy composite
pyrolysis at 50 kW/m2 with 1D and 3D model . . . . . . . . . . . . . . 203
6.20 Experimental and prediction of temperature evolution of carbon/epoxy
composite pyrolysis at 50 kW/m2 with 1D and 3D model (Middle location)204
6.21 Experimental and prediction of temperature evolution of carbon/epoxy
composite pyrolysis at 50 kW/m2 with 1D and 3D model (Bottom location)205
7.1 Influence of activation energy on the mass loss rate and temperature
evolution at heat flux of 20 kW/m2 . . . . . . . . . . . . . . . . . . . . 213
7.2 Influence of activation energy on the mass loss rate and temperature
evolution at heat flux of 50 kW/m2 . . . . . . . . . . . . . . . . . . . . 214
xx List of figures
7.3 Influence of pre-exponential factor on the mass loss rate and temperature
evolution at heat flux of 20 kW/m2 . . . . . . . . . . . . . . . . . . . . 215
7.4 Influence of pre-exponential factor on the mass loss rate and temperature
evolution at heat flux of 50 kW/m2 . . . . . . . . . . . . . . . . . . . . 216
7.5 Influence of reaction order on the mass loss rate and temperature evolu-
tion at heat flux of 20 kW/m2 . . . . . . . . . . . . . . . . . . . . . . . 217
7.6 Influence of reaction order on the mass loss rate and temperature evolu-
tion at heat flux of 50 kW/m2 . . . . . . . . . . . . . . . . . . . . . . . 217
7.7 Influence of decomposition heat factor on the mass loss rate and tem-
perature evolution at heat flux of 20 kW/m2 . . . . . . . . . . . . . . . 219
7.8 Influence of decomposition heat factor on the mass loss rate and tem-
perature evolution at heat flux of 50 kW/m2 . . . . . . . . . . . . . . . 219
7.9 Influence of virgin thermal conductivity on the mass loss rate and
temperature evolution at heat flux of 20 kW/m2 . . . . . . . . . . . . . 223
7.10 Influence of virgin thermal conductivity on the mass loss rate and
temperature evolution at heat flux of 50 kW/m2 . . . . . . . . . . . . . 224
7.11 Influence of char thermal conductivity on the mass loss rate and tem-
perature evolution at heat flux of 20 kW/m2 . . . . . . . . . . . . . . . 225
7.12 Influence of char thermal conductivity on the mass loss rate and tem-
perature evolution at heat flux of 50 kW/m2 . . . . . . . . . . . . . . . 226
7.13 Influence of virgin specific heat capacity on the mass loss rate and
temperature evolution at heat flux of 20 kW/m2 . . . . . . . . . . . . . 227
7.14 Influence of virgin specific heat capacity on the mass loss rate and
temperature evolution at heat flux of 50 kW/m2 . . . . . . . . . . . . . 228
7.15 Influence of char specific heat capacity on the mass loss rate and tem-
perature evolution at heat flux of 20 kW/m2 . . . . . . . . . . . . . . . 228
7.16 Influence of char specific heat capacity on the mass loss rate and tem-
perature evolution at heat flux of 50 kW/m2 . . . . . . . . . . . . . . . 229
List of figures xxi
7.17 Influence of virgin permeability on the mass loss rate and temperature
evolution at heat flux of 20 kW/m2 . . . . . . . . . . . . . . . . . . . . 231
7.18 Influence of virgin permeability on the mass loss rate and temperature
evolution at heat flux of 50 kW/m2 . . . . . . . . . . . . . . . . . . . . 231
7.19 Influence of char permeability on the mass loss rate and temperature
evolution at heat flux of 20 kW/m2 . . . . . . . . . . . . . . . . . . . . 232
7.20 Influence of char permeability on the mass loss rate and temperature
evolution at heat flux of 50 kW/m2 . . . . . . . . . . . . . . . . . . . . 232
7.21 Influence of char emissivity on the mass loss rate and temperature
evolution at heat flux of 20 kW/m2 . . . . . . . . . . . . . . . . . . . . 234
7.22 Influence of char emissivity on the mass loss rate and temperature
evolution at heat flux of 50 kW/m2 . . . . . . . . . . . . . . . . . . . . 234
7.23 Influence of heat convection on the mass loss rate and temperature
evolution at heat flux of 20 kW/m2 . . . . . . . . . . . . . . . . . . . . 236
7.24 Influence of heat convection on the mass loss rate and temperature
evolution at heat flux of 50 kW/m2 . . . . . . . . . . . . . . . . . . . . 236
7.25 Influence of water content on the mass loss rate and temperature evolu-
tion at heat flux of 20 kW/m2 . . . . . . . . . . . . . . . . . . . . . . . 238
7.26 Influence of water content on the mass loss rate and temperature evolu-
tion at heat flux of 50 kW/m2 . . . . . . . . . . . . . . . . . . . . . . . 238

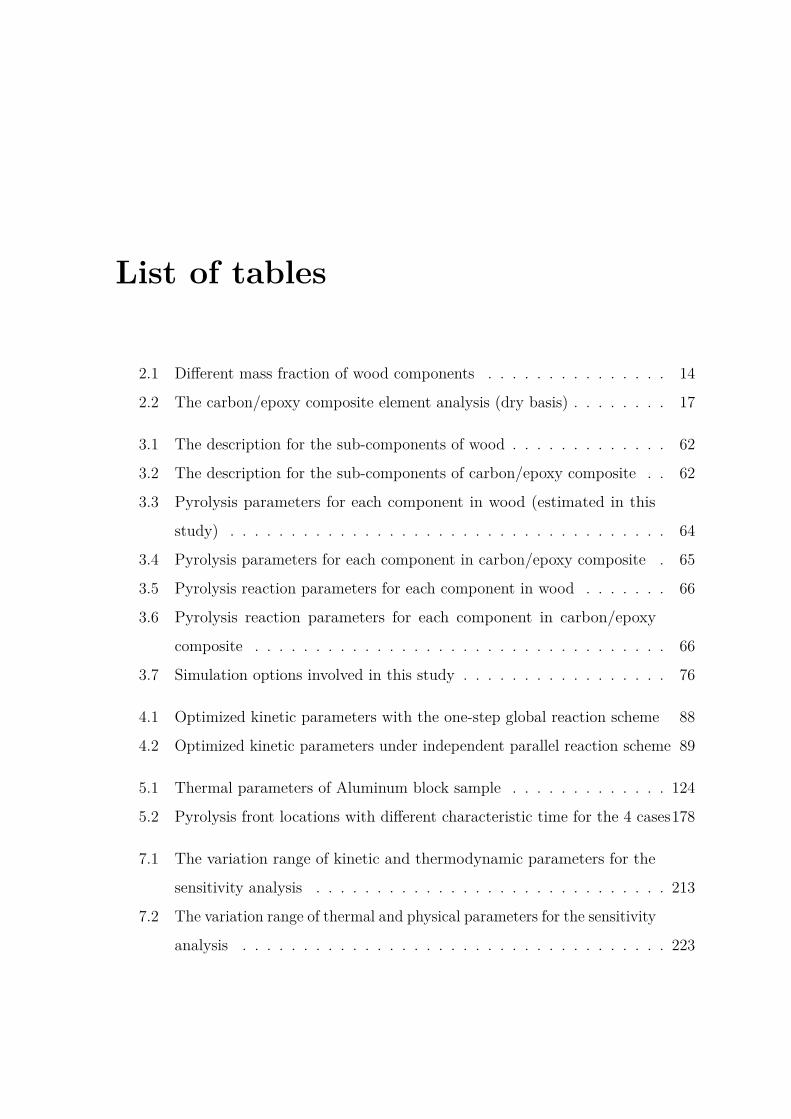
List of tables
2.1 Different mass fraction of wood components . . . . . . . . . . . . . . . 14
2.2 The carbon/epoxy composite element analysis (dry basis) . . . . . . . . 17
3.1 The description for the sub-components of wood . . . . . . . . . . . . . 62
3.2 The description for the sub-components of carbon/epoxy composite . . 62
3.3 Pyrolysis parameters for each component in wood (estimated in this
study) . . . . . . . . . . . . . . . . . . . . . . . . . . . . . . . . . . . . 64
3.4 Pyrolysis parameters for each component in carbon/epoxy composite . 65
3.5 Pyrolysis reaction parameters for each component in wood . . . . . . . 66
3.6 Pyrolysis reaction parameters for each component in carbon/epoxy
composite . . . . . . . . . . . . . . . . . . . . . . . . . . . . . . . . . . 66
3.7 Simulation options involved in this study . . . . . . . . . . . . . . . . . 76
4.1 Optimized kinetic parameters with the one-step global reaction scheme 88
4.2 Optimized kinetic parameters under independent parallel reaction scheme 89
5.1 Thermal parameters of Aluminum block sample . . . . . . . . . . . . . 124
5.2 Pyrolysis front locations with different characteristic time for the 4 cases178
7.1 The variation range of kinetic and thermodynamic parameters for the
sensitivity analysis . . . . . . . . . . . . . . . . . . . . . . . . . . . . . 213
7.2 The variation range of thermal and physical parameters for the sensitivity
analysis . . . . . . . . . . . . . . . . . . . . . . . . . . . . . . . . . . . 223

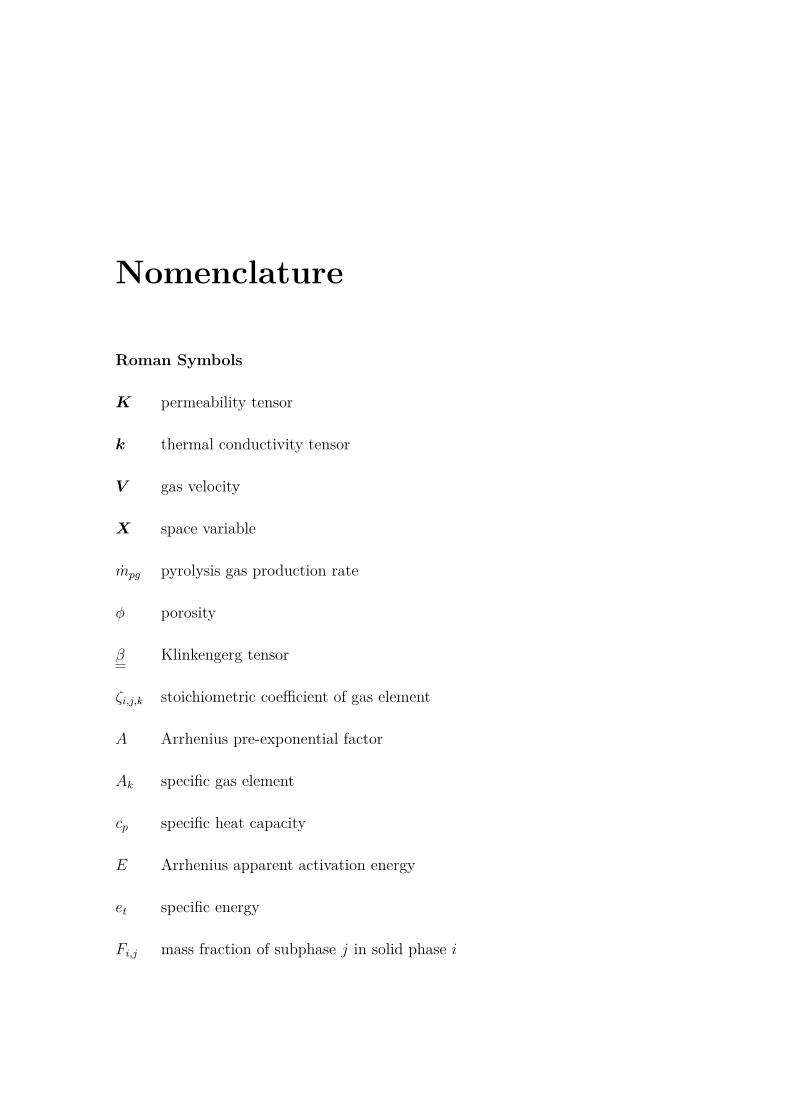
Nomenclature
Roman Symbols
K permeability tensor
k thermal conductivity tensor
V gas velocity
X space variable
mpg pyrolysis gas production rate
ϕ porosity
β Klinkengerg tensor
ζi,j,k stoichiometric coefficient of gas element
A Arrhenius pre-exponential factor
Ak specific gas element
cp specific heat capacity
E Arrhenius apparent activation energy
et specific energy
Fi,j mass fraction of subphase j in solid phase i
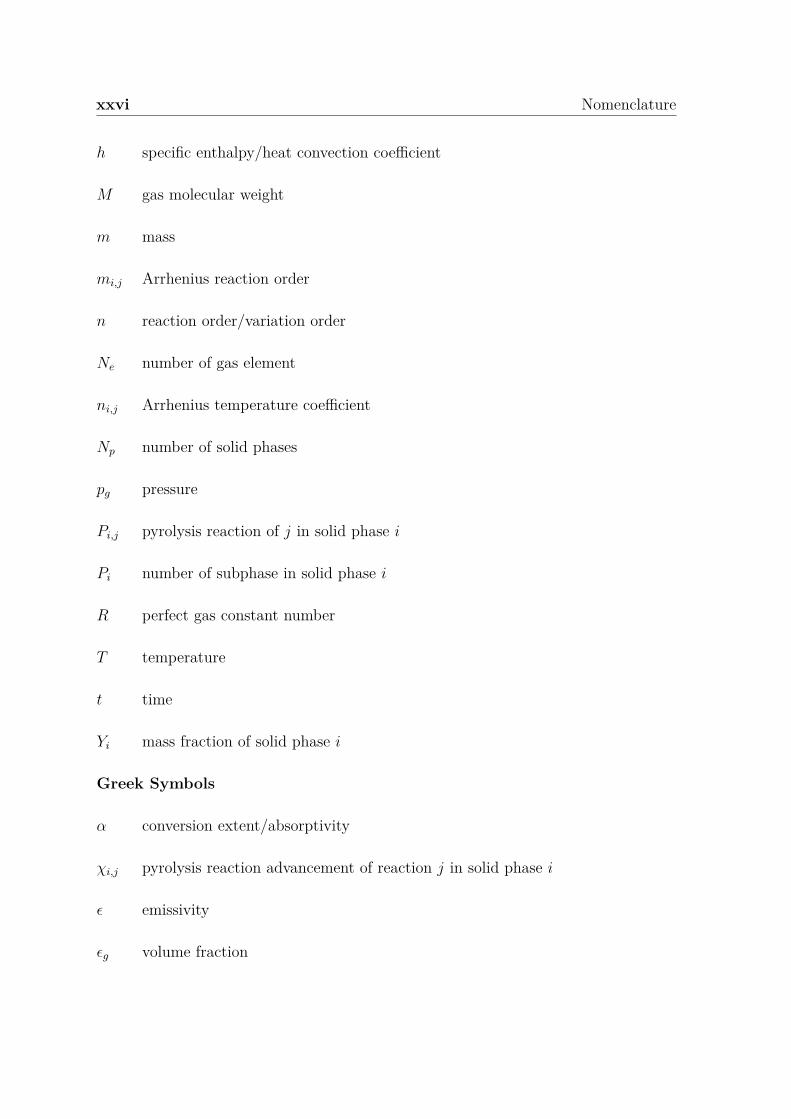
xxvi Nomenclature
h specific enthalpy/heat convection coefficient
M gas molecular weight
m mass
mi,j Arrhenius reaction order
n reaction order/variation order
Ne number of gas element
ni,j Arrhenius temperature coefficient
Np number of solid phases
pg pressure
Pi,j pyrolysis reaction of j in solid phase i
Pi number of subphase in solid phase i
R perfect gas constant number
T temperature
t time
Yi mass fraction of solid phase i
Greek Symbols
α conversion extent/absorptivity
χi,j pyrolysis reaction advancement of reaction j in solid phase i
ϵ emissivity
ϵg volume fraction
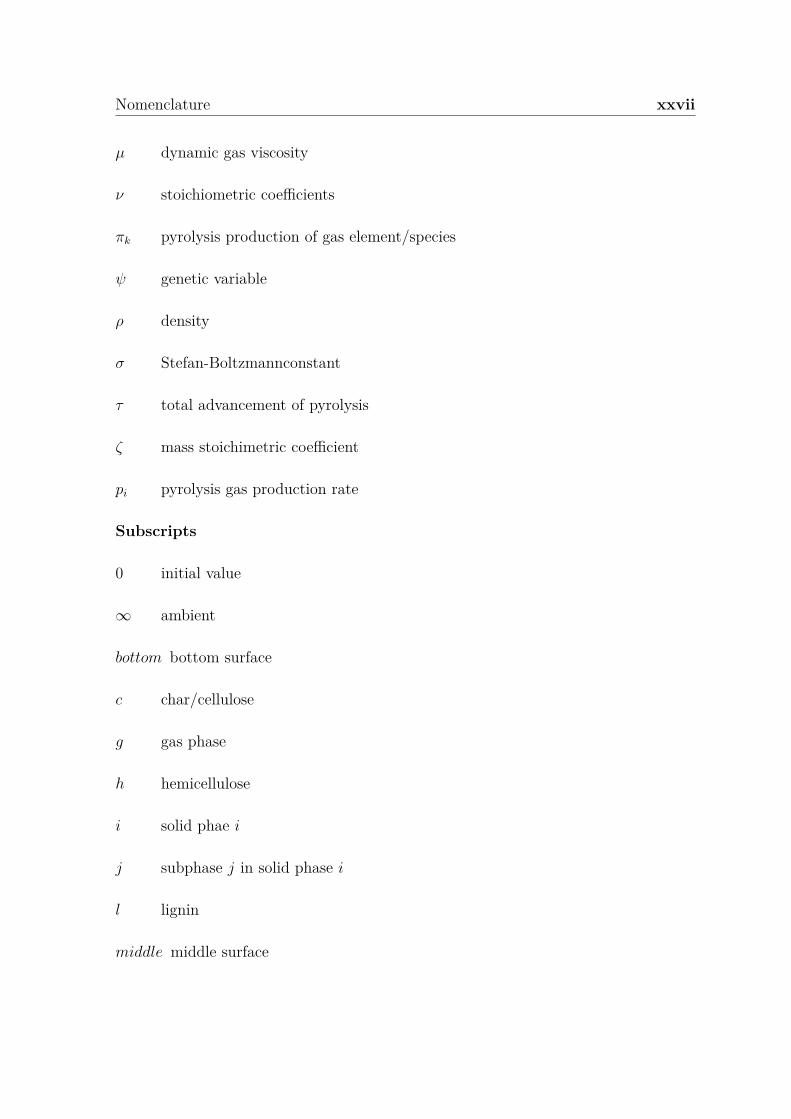
Nomenclature xxvii
µ dynamic gas viscosity
ν stoichiometric coefficients
πk pyrolysis production of gas element/species
ψ genetic variable
ρ density
σ Stefan-Boltzmannconstant
τ total advancement of pyrolysis
ζ mass stoichimetric coefficient
pi pyrolysis gas production rate
Subscripts
0 initial value
∞ ambient
bottom bottom surface
c char/cellulose
g gas phase
h hemicellulose
i solid phae i
j subphase j in solid phase i
l lignin
middle middle surface
xxviii Nomenclature
pg pyrolysis gas
s solid
side side surface
t solid and gas phase
top top surface
v virgin
Other Symbols
mg gas mass flux
ϕ(0) values at reference temperature
ϕ(T ) values as function of temperature
f(α) conversion function
k(T ) reactionrate dependent on temperature
kc reaction rates of char
kg reaction rates of gas
kt reaction rates of tar
Qp endothermic heat of reaction
Tr reference temperature
qe′′ irradiant heat flux
Acronyms / Abbreviations
0D Zero-dimensional
Nomenclature xxix
1D One-dimensional
2D Two-dimensional
3D Three-dimension
CACC Controlled Atmosphere Cone Calorimeter
CFD Compurational Fluid Dynamics
CFRP Carbon Fiber Reinforced Polymer
DSC Differential scanning calorimetry
FDS Fire Dynamic Simulator
FPA Fire Propagation Apparatus
GA Genetic Algorithm
Gpyro General Pyrolysis Model
ML Mass Loss
MLR Mass Loss Rate
NML Normalized Mass Loss
NMLR Normalized Mass Loss Rate
PAN polyacrylonitrile
PATO Porous material Analysis Toolbox based on OpenFOAM
PICA Phenolic Impregnated Carbon Ablator
REV Representative Equivalent Volume
SCE Shuffled Complex Evolution

xxx Nomenclature
SHC Stochastic Hill Climbing
TGA Thermogravimetric Analysis
ThermaKin Thermal Kinetic Model of Burning
wt% mass fraction
Chapter 1
Introduction
1.1 Background and motivation
There are two major sets of fiber-reinforced composite materials, i.e. natural fiber
and synthetic fiber ones [1]. Wood, which is a kind of biomass material, stands for the
most commonly employed natural fiber composites which mainly comprise hemicellulose,
cellulose, and lignin [2]. Wood is one of the most potential sustainable energy for
heat or power through thermal conversion [3] as well as one of the commonly utilized
building structure materials which are environmentally friendly and cost-effective [4].
Synthetic composite materials, which are a combination of some sub-components
in different handling processes, have the potential to be one kind of the most influential
materials used due to their large-scale different application field in the industry. For
example, vehicles and the aerospace industry are employing many composite materials
for their efficiency of lightweight accompanying advanced mechanical properties which
involve the chief consideration [5–10]. Some applications also in fields such as high-
pressure storage containers which care about the thermal resistance performance [11],
while some others regard it as important for the cost-effective advantage when utilizing
these composite materials [12].
Carbon fiber composites represent one of the widely employed synthetic fiber
composites [13]. They tend to be the most successfully applied carbon fiber composites
2 Introduction
that impregnate the carbon fiber with matrix epoxy resin polymers [7]. Carbon/epoxy
composites belong to the thermal set polymer matrix materials and it behaves perfectly
as a type of thermally insulating material due to its thermal and mechanical perfor-
mance [14–19] as well as the light-weight capacity [20]. In addition to the excellent
performance for thermal and mechanical properties, carbon fiber composites can be
repaired quickly and efficiently in the aerospace industry [21].
However, both natural composite and synthetic materials possess a relatively high
potential to induce fire which could produce a large amount of toxic gas and smoke [22].
In the high-pressure industry, the carbon/epoxy composites are employed largely for
hydrogen storage tanks and it could have catastrophic fire and explosion events when
the carbon/epoxy composite is damaged under external heat or mechanical source [23].
Also, the fire disaster ought to be taken into account seriously such as in the airplane
industry which involves a large amount of carbon fiber composite utilization [21]. Wood
pyrolysis and fire safety studies should also be continuously conducted in wildland fire
as well as related fields such as wood thermal treatment and timber building fire [24].
Briefly, all these composite materials have high fire risk which can be seen in Figure
1.1, and fundamental thermophysical as well as chemical processes need to be studied
largely and correspondingly [12, 25].
There are two main research fields concerning composite fire, one involves some
fundamental experimental or theoretical study for the prediction and prevention of
material flammability tendencies such as the fire-retardant research [28]. This concerns
the reaction to fire. The other one is concentrated on fire resistance and concerns fire
structure integrity study such as in infrastructure or transportation industry. Indeed,
due to the fire influence on the composite structure as well as leading to serious
casualties [29], the fire structure studies are partly conducted concerning the material
response from fire heating and exposure time [30]. To conclude, many catastrophic fire
events and risk tendencies involve carbon/epoxy composite and wood in our daily life
or related industrial fields [31].
1.1 Background and motivation 3
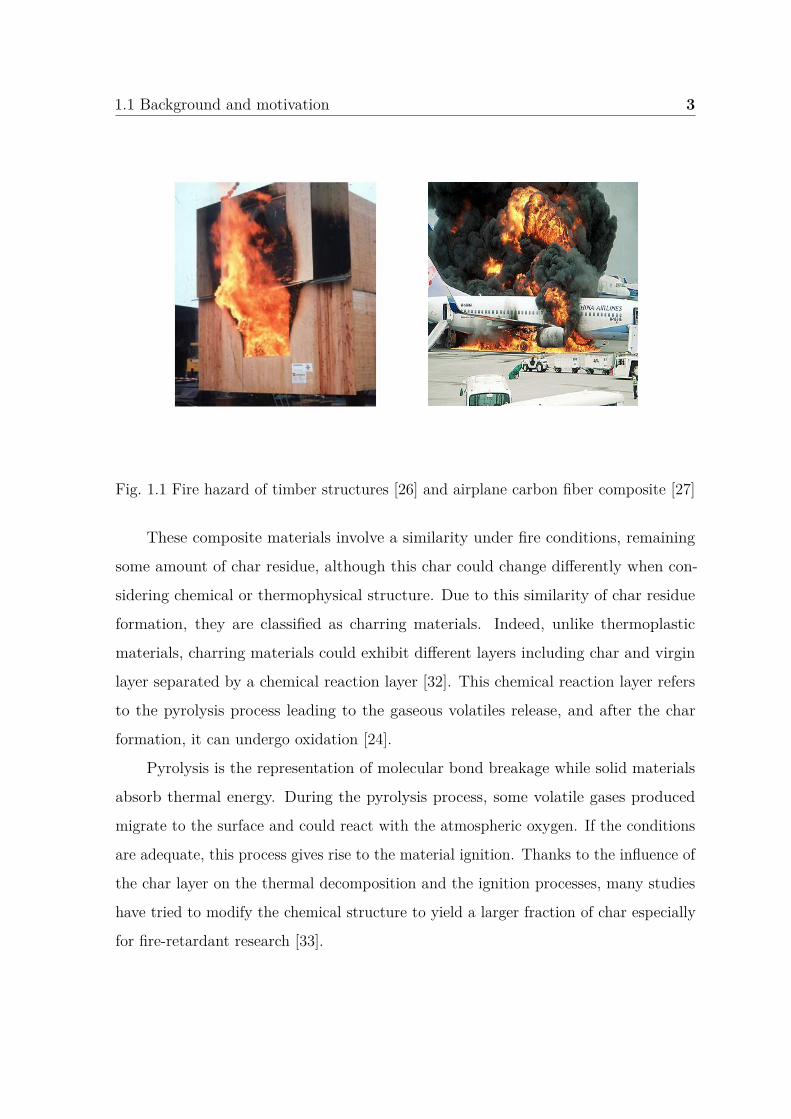
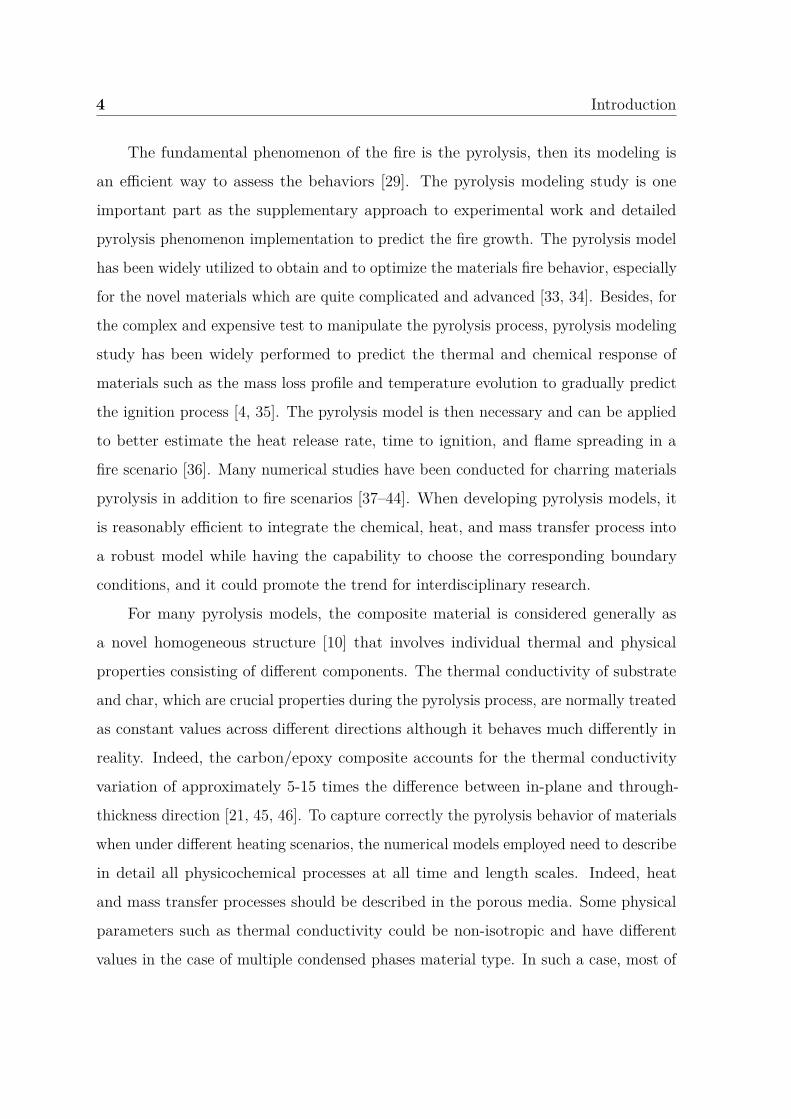
Fig. 1.1 Fire hazard of timber structures [26] and airplane carbon fiber composite [27]
These composite materials involve a similarity under fire conditions, remaining
some amount of char residue, although this char could change differently when con-
sidering chemical or thermophysical structure. Due to this similarity of char residue
formation, they are classified as charring materials. Indeed, unlike thermoplastic
materials, charring materials could exhibit different layers including char and virgin
layer separated by a chemical reaction layer [32]. This chemical reaction layer refers
to the pyrolysis process leading to the gaseous volatiles release, and after the char
formation, it can undergo oxidation [24].
Pyrolysis is the representation of molecular bond breakage while solid materials
absorb thermal energy. During the pyrolysis process, some volatile gases produced
migrate to the surface and could react with the atmospheric oxygen. If the conditions
are adequate, this process gives rise to the material ignition. Thanks to the influence of
the char layer on the thermal decomposition and the ignition processes, many studies
have tried to modify the chemical structure to yield a larger fraction of char especially
for fire-retardant research [33].
4 Introduction
The fundamental phenomenon of the fire is the pyrolysis, then its modeling is
an efficient way to assess the behaviors [29]. The pyrolysis modeling study is one
important part as the supplementary approach to experimental work and detailed
pyrolysis phenomenon implementation to predict the fire growth. The pyrolysis model
has been widely utilized to obtain and to optimize the materials fire behavior, especially
for the novel materials which are quite complicated and advanced [33, 34]. Besides, for
the complex and expensive test to manipulate the pyrolysis process, pyrolysis modeling
study has been widely performed to predict the thermal and chemical response of
materials such as the mass loss profile and temperature evolution to gradually predict
the ignition process [4, 35]. The pyrolysis model is then necessary and can be applied
to better estimate the heat release rate, time to ignition, and flame spreading in a
fire scenario [36]. Many numerical studies have been conducted for charring materials
pyrolysis in addition to fire scenarios [37–44]. When developing pyrolysis models, it
is reasonably efficient to integrate the chemical, heat, and mass transfer process into
a robust model while having the capability to choose the corresponding boundary
conditions, and it could promote the trend for interdisciplinary research.
For many pyrolysis models, the composite material is considered generally as
a novel homogeneous structure [10] that involves individual thermal and physical
properties consisting of different components. The thermal conductivity of substrate
and char, which are crucial properties during the pyrolysis process, are normally treated
as constant values across different directions although it behaves much differently in
reality. Indeed, the carbon/epoxy composite accounts for the thermal conductivity
variation of approximately 5-15 times the difference between in-plane and through-
thickness direction [21, 45, 46]. To capture correctly the pyrolysis behavior of materials
when under different heating scenarios, the numerical models employed need to describe
in detail all physicochemical processes at all time and length scales. Indeed, heat
and mass transfer processes should be described in the porous media. Some physical
parameters such as thermal conductivity could be non-isotropic and have different
values in the case of multiple condensed phases material type. In such a case, most of
1.1 Background and motivation 5
the actual pyrolysis models such as those developed by [42, 43] solve one global energy
conservation equation by dealing with average parameters estimated with all intrinsic
ones for all condensed phases. This treatment of the material properties should be
taken carefully because of the average estimation among quite different components
which behave differently both in the chemical and physical aspect.
The matrix structure change during the pyrolysis process is still a challenge in
modeling. Indeed, it could affect significantly the apparent parameters calculated. The
porous media is also treated most of the time at the “Darcy scale” by using the concept
of “Representative Equivalent Volume” (REV) [47–50] to define apparent properties
from local ones by using upscaling techniques. But, when the structure of the porous
media changes in time and space during the pyrolysis process, the upscaling techniques
could be hard to derive. The homogeneous and heterogeneous reactions within pores
or between gas and solid surface could affect the pyrolysis process.
In addition to the thermophysical parameters, the kinetic parameters are generally
treated as generalized values under different TGA heating rates [51], which is acceptable
due to the relatively small range of heating rates, considering thermal lag influence
under high heating rates. However, it could behave differently under different heating
rates due to the complexity of multiple and overlap kinetics of different components.
For example, the difference of final char yield and porosity under different heating rates
display that quite different kinetic processes take place. Thus, much attention should
be taken when analyzing milligram-scale TGA tests and the bench-scale experiment
such as cone calorimeter for its heating rate difference at different locations. Indeed,
at the initial stage of the pyrolysis process in the cone calorimeter, the experiments
conducted in our team show that the sample top surface heating rate could be much
higher than that at the middle or bottom surface locations.
Many studies have been performed to explore the composite material pyrolysis
behavior, such as TGA experiments for searching kinetics mechanisms, and the cone
calorimeter employed to capture the 1D heat and mass transfer process [52]. However,
many cone calorimeter experiments are conducted under ambient atmosphere to study
6 Introduction
the combustion behavior and limited studies are found under anaerobic conditions.
This is often the right choice when considering the practical fire scenario, but it
could cause much uncertainty when performing pyrolysis model validation due to the
perturbation of flame and char oxidation. Indeed, under an ambient atmosphere, the
flame is controlled by the gas volatiles transportation generated by pyrolysis and the
interaction with oxygen. However, the variation of gas volatile release rate and intensity
is predominant during different stages of pyrolysis. Thus, it is crucial to eliminate
these related uncertainties to maximize the prediction accuracy for pyrolysis model
validation.
When modeling the pyrolysis process concerning some experiments such as cone
calorimeter, it is usually assumed to have an empirical value of heat convection coeffi-
cient [53] which has a substantial effect on the pyrolysis rate and temperature evolution.
Moreover, very few modeling studies consider the side and bottom surface boundary
condition, an assumption of adiabatic or impenetrable is usually performed. This
assumption could give us relatively agreeable results when compared with experimental
data as cone calorimeter can be treated approximately as one-dimensional simulation
cases [43] and the thermal insulation material at the bottom surface involves good
quality [54, 55]. However, it could give us many errors during the model validation
process especially under low heat flux where the corresponding results are seriously
sensitive to the heat convection loss from side and bottom surface.
1.2 Research aim
The research aim of the present work is to develop a comprehensive pyrolysis
model dealing with heat and mass transfers into porous media as well as chemical
reactions involved at the same time.
Wood and carbon/epoxy composite material are chosen to develop a 3D model
including non-isotropic physical parameters. The most important fire prediction
parameters are concentrated including pyrolysis front, mass loss profile, and temperature
1.3 Research methodology 7
distribution at different in-depth locations. The three processes including heat, mass
transfer, and chemical reactions involved are implemented over different time and
length scales which mainly include milligram-scale TGA and bench-scale controlled
atmosphere cone calorimeter tests. The different heating rates employed in the TGA
test are extracted from corresponding cone calorimeter experiments to approach the real
heating behavior. Thermal and boundary parameters are quite uncertain concerning
different test configurations. Therefore, concentration is made to obtain the material
properties exactly employed in this study. Under different fire scenarios, these processes
could interact more or less strongly together. A focus is made on that to point out the
different key parameters involved and investigate their role in these interactions.
1.3 Research methodology
This work focuses on the pyrolysis model validation and related work such as
properties and parameters estimation. A new comprehensive pyrolysis model dealing
with heat and mass transfer through porous media as well as chemical reactions is
developed and proposed. As mentioned above, the process of heat transfer, mass
transfer, and chemical thermal decomposition could interact through many time and
length scales.
The solid combustion process is very complicated because it involves the initial
pyrolysis of the condensed phase, the gas phase combustion, and the interaction between
each one of those 2 phases. In consequence, since a comprehensive numerical model is
usually impractical to characterize the combustion behavior for all phases, classically
the gas and condensed phase are considered separately. Thus, the pyrolysis modeling
in this study does not involve the combustion in the gas phase and char oxidation
which contains much perturbation in the boundary. The thermophysical and chemical
processes are focused in the condensed phase.
To characterize correctly each process and to validate them carefully, they are
investigated one by one at separate scales in time and space. After capturing correctly
8 Introduction
each one by the numerical model, the work is focused on interactions between them.
Some regimes are identified when one of the processes governs the whole pyrolysis part.
In such a case, the key parameters governing the overall pyrolysis are identified and
analyzed by sensitivity analysis.
With respect to the thermally thin theory [38], the milligram-scale TGA experiment
and model fitting method [56] are employed to obtain the exact kinetic parameters
(i.e. activation energy, pre-exponential factor, reaction order) and the final char yield
mass fraction under different heating rates. Two different sets of kinetic parameters
are explored based on different reaction schemes of pyrolysis kinetics. Then, the exact
kinetic parameters and final char yield mass fraction are regarded as input parameters
when analyzing the heat and mass transfer process in bench-scale experiments. At
this “TGA scale”, the physical space is ignored because of the study of a very thin
sample. The assumption of a 0D thermal decomposition is made even though in reality,
some scalar gradients remain, this point is discussed. Thus, only the chemistry part
is investigated through different time scales. The heating rates in TGA involve the
specimen heating rate at the middle location in bench-scale cone calorimeter experiment
under different heat fluxes.
Controlled Atmosphere Cone Calorimeter (CACC) experiments are conducted to
obtain the mass loss rate and the temperature gradient evolution at different locations.
Mass loss rate, temperature evolution, and pyrolysis front are employed to validate
the model and to gain the knowledge of pyrolysis development in detail. Two different
charring materials under different heat flux are considered to study the generality
application of the model: Fir wood and carbon fiber/epoxy composite. The unknown
thermophysical properties such as the specific heat capacity, thermal conductivity, and
the boundary heat convection coefficients are predicted using the inverse modeling
method. Lastly, the different sensitivity analyses of parameters are performed to
characterize the model uncertainty. At the “cone calorimeter scale”, the heat transfer,
mass transfer, and chemical reactions evolve simultaneously. Different conditions of
heating are investigated to vary the intensity and interactions between those processes
1.4 Thesis outline 9
to investigate the role of each process. Modeling have been conducted on the two
materials in 1D and 2D. Firstly, a specific effort has been kept on the description of
the wood pyrolysis at TGA and cone calorimeter scale. Specific attention has been
focused on the humidity influence and on the heat and mass transfer into the wood
sample during its thermal decomposition. Secondly, the model approach developed has
been applied to the carbon fiber/epoxy resin composite.
1.4 Thesis outline
Chapter 2 is dedicated to the literature review in the context of the subject of
the thesis. Detailed materials information is introduced concerning wood and carbon
fiber/epoxy composite in order to have a broad knowledge about their chemical and
physical properties. The pyrolysis process specifically involved in the fire scenario is
discussed including chemical kinetics, heat transfer, and gas transportation, as well
as related boundary conditions and structure change induced. Lastly, the mostly
employed pyrolysis models in the fire community are introduced. The simple and
comprehensive pyrolysis models are compared. Different assumptions during pyrolysis
processes including chemical, heat transfer, and mass transfer process are discussed and
the evaluation for different pyrolysis models are given. The process of input parameters
for model implementation is introduced and some evaluations are made.
Chapter 3 permits to present PATO pyrolysis model. Based on OpenFOAM,
it incorporates complete chemical and thermophysical mechanisms in the condensed
phase. The model assumption concerning volume averaging theory is introduced. Mass,
momentum, and energy conservation equations are presented and the parameters
involved to describe the pyrolysis kinetics concerning wood and carbon/epoxy com-
posite are illustrated. The model assumptions and simulation options to perform the
corresponding equations employed in this study are given.
Chapter 4 concerns the particle scale modeling work for wood pyrolysis. The
kinetics analysis based on the TGA experiment is presented coupling with the op-
10 Introduction
timization method to obtain corresponding parameters. Different heating rates are
involved which are linked to the cone calorimeter experiments at different heat fluxes
presented in Chapter 5. Their corresponding parameters obtained by one-step global
and independent parallel reaction schemes are evaluated. The verification process is
conducted employing kinetic parameters to predict the pyrolysis behavior under the
other heating rate. The influence of heating rates on the reaction of each component is
studied. The TGA simulations concerning the 2D model are made and the influence of
thermal gradients is analyzed.
Chapter 5 focuses on the cone calorimeter experimentation and its modeling study
concerning wood pyrolysis. Different input parameters are estimated firstly by the
inverse analysis which includes heat convection coefficient, specific heat capacity and
thermal conductivity of wood, specific heat capacity and thermal conductivity of char.
The dried wood sample based on cone heating is obtained and the model predicted
water evaporation process is validated against the experimental data. The evaporation
process at different time and length scales is analyzed. Then, the pyrolysis cases
concerning the wet wood and dry wood are studied at different heat fluxes. The
experimental data concerning the mass, temperature, and char front are analyzed
against the predicted data. The water influence and the reaction interaction during
the pyrolysis process at different heat fluxes are discussed.
The multi-scale model validation work for carbon /epoxy composite pyrolysis is
addressed in Chapter 6. Similar to the wood kinetic analysis, different heating rates
are estimated which are linked to the cone calorimeter test. The kinetic parameters
are extracted to predict the experimental curve and some discussions are made. The
bench-scale test in cone calorimeter is made and the model prediction process is
performed. The anisotropic properties concerning thermal conductivity under 3D are
checked and the interaction within the pyrolysis process is compared with 1D. The
model validation process under different heat fluxes is conducted and the corresponding
analysis is performed.
1.4 Thesis outline 11
Chapter 7 permits the sensitivity analysis of the wood pyrolysis process at a
bench scale. The sensitivity of mass loss rate and temperature evolutions at different
in-depth locations and different heat fluxes are analyzed concerning different uncertain
parameters. These uncertain parameters involve chemical, heat of decomposition,
thermal, and physical properties. The sensitivity analysis is conducted at different
time and length scales. Some suggestions concerning the parameters preparation are
made for modeling work in the future.
Lastly, the main conclusions extracted from this work are presented and some
suggestions for modeling work based on this study are given to supplement and achieve
in the future.

Chapter 2
Literature review
2.1 Composite materials: general background
This part presents a broad range of knowledge related to the two charring composite
materials studied, i.e. wood and carbon/epoxy composite, in particular their different
characteristics of components. Then the pyrolysis phenomenon is introduced in the
fire scenario, and the pyrolysis modeling studies are reviewed.
Many charring composite materials could be viewed of interest. The motivation to
select wood and carbon/epoxy composite as our objective is that their differences during
the pyrolysis process tend to stand for two important categories: materials of surface
shrinkage or swelling, and also homogeneous or heterogeneous assumption. Despite the
presence of cracks at surface or interior sites, the thermal delamination of carbon/epoxy
composite could take place in the virgin layer during the pyrolysis process due to
the gas pressure and the bond interaction between carbon fiber and epoxy matrix.
Moreover, the thermal conductivity of wood is treated as homogeneous for most studies
due to the relatively minor difference of longitudinal and radial direction [57–59]. While
for carbon/epoxy composite, the thermal conductivities could exhibit much differently
under in-plane and through-thickness direction [45, 46]. For pyrolysis modeling work,
these involved differences should be put much emphasis to validate the model. Another
consideration is that the post-fire structure difference, the char structures of wood and
14 Literature review
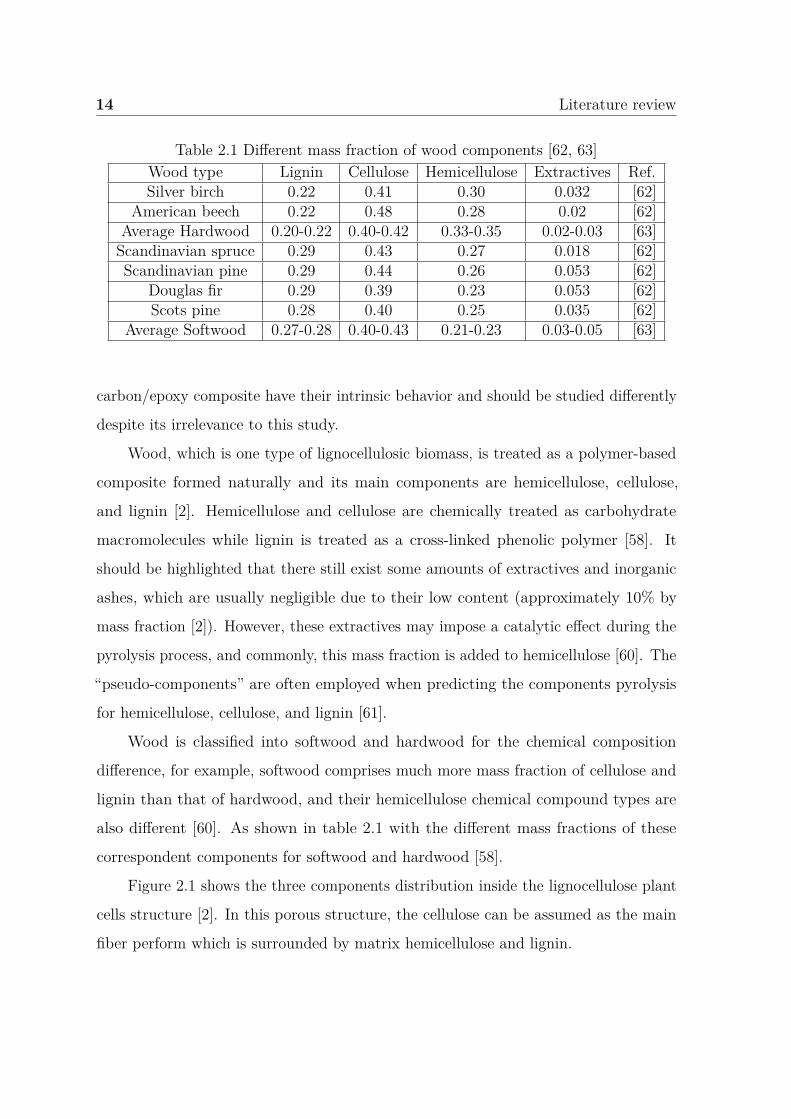
Table 2.1 Different mass fraction of wood components [62, 63]Wood type Lignin Cellulose Hemicellulose Extractives Ref.Silver birch 0.22 0.41 0.30 0.032 [62]
American beech 0.22 0.48 0.28 0.02 [62]Average Hardwood 0.20-0.22 0.40-0.42 0.33-0.35 0.02-0.03 [63]
Scandinavian spruce 0.29 0.43 0.27 0.018 [62]Scandinavian pine 0.29 0.44 0.26 0.053 [62]
Douglas fir 0.29 0.39 0.23 0.053 [62]Scots pine 0.28 0.40 0.25 0.035 [62]
Average Softwood 0.27-0.28 0.40-0.43 0.21-0.23 0.03-0.05 [63]
carbon/epoxy composite have their intrinsic behavior and should be studied differently
despite its irrelevance to this study.
Wood, which is one type of lignocellulosic biomass, is treated as a polymer-based
composite formed naturally and its main components are hemicellulose, cellulose,
and lignin [2]. Hemicellulose and cellulose are chemically treated as carbohydrate
macromolecules while lignin is treated as a cross-linked phenolic polymer [58]. It
should be highlighted that there still exist some amounts of extractives and inorganic
ashes, which are usually negligible due to their low content (approximately 10% by
mass fraction [2]). However, these extractives may impose a catalytic effect during the
pyrolysis process, and commonly, this mass fraction is added to hemicellulose [60]. The
“pseudo-components” are often employed when predicting the components pyrolysis
for hemicellulose, cellulose, and lignin [61].
Wood is classified into softwood and hardwood for the chemical composition
difference, for example, softwood comprises much more mass fraction of cellulose and
lignin than that of hardwood, and their hemicellulose chemical compound types are
also different [60]. As shown in table 2.1 with the different mass fractions of these
correspondent components for softwood and hardwood [58].
Figure 2.1 shows the three components distribution inside the lignocellulose plant
cells structure [2]. In this porous structure, the cellulose can be assumed as the main
fiber perform which is surrounded by matrix hemicellulose and lignin.
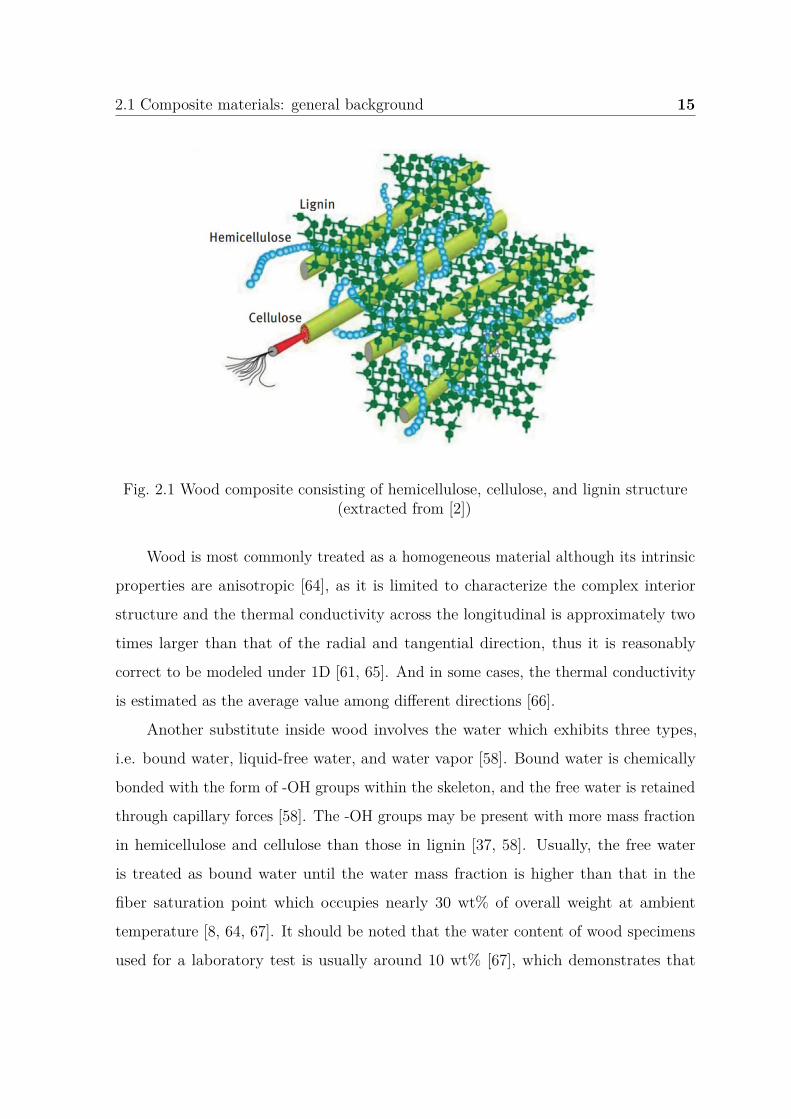
2.1 Composite materials: general background 15
Fig. 2.1 Wood composite consisting of hemicellulose, cellulose, and lignin structure(extracted from [2])
Wood is most commonly treated as a homogeneous material although its intrinsic
properties are anisotropic [64], as it is limited to characterize the complex interior
structure and the thermal conductivity across the longitudinal is approximately two
times larger than that of the radial and tangential direction, thus it is reasonably
correct to be modeled under 1D [61, 65]. And in some cases, the thermal conductivity
is estimated as the average value among different directions [66].
Another substitute inside wood involves the water which exhibits three types,
i.e. bound water, liquid-free water, and water vapor [58]. Bound water is chemically
bonded with the form of -OH groups within the skeleton, and the free water is retained
through capillary forces [58]. The -OH groups may be present with more mass fraction
in hemicellulose and cellulose than those in lignin [37, 58]. Usually, the free water
is treated as bound water until the water mass fraction is higher than that in the
fiber saturation point which occupies nearly 30 wt% of overall weight at ambient
temperature [8, 64, 67]. It should be noted that the water content of wood specimens
used for a laboratory test is usually around 10 wt% [67], which demonstrates that
16 Literature review
these amounts of free water pertain to the bound water. When heated, the bound
water diffuse to liquid-free water, then free water is evaporated to water vapor moving
outwards [68]. However, with the presence of the chemical linkage for bound water
within the wood skeleton, much more energy is needed compared with liquid water for
its two stages transformation [64]. Indeed, the vaporization latent heat is generally
required from liquid water to water vapor, while the desorption heat is added to bound
water to evaporate [64].
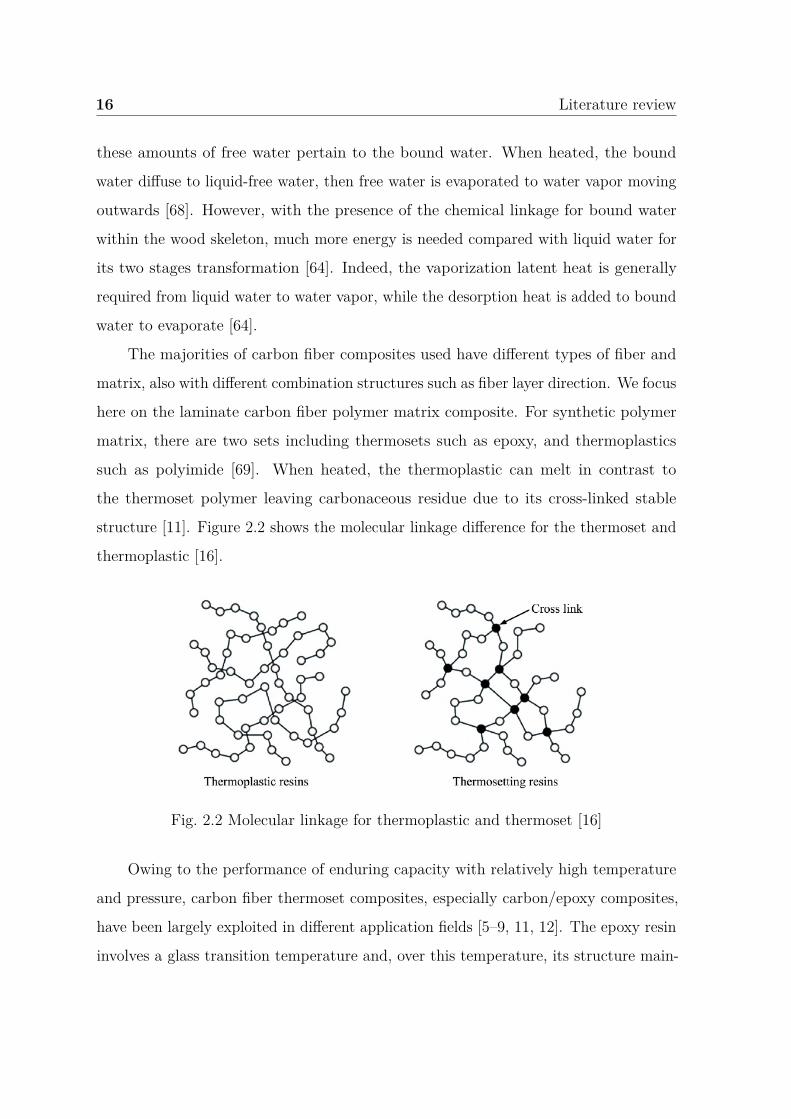
The majorities of carbon fiber composites used have different types of fiber and
matrix, also with different combination structures such as fiber layer direction. We focus
here on the laminate carbon fiber polymer matrix composite. For synthetic polymer
matrix, there are two sets including thermosets such as epoxy, and thermoplastics
such as polyimide [69]. When heated, the thermoplastic can melt in contrast to
the thermoset polymer leaving carbonaceous residue due to its cross-linked stable
structure [11]. Figure 2.2 shows the molecular linkage difference for the thermoset and
thermoplastic [16].
Fig. 2.2 Molecular linkage for thermoplastic and thermoset [16]
Owing to the performance of enduring capacity with relatively high temperature
and pressure, carbon fiber thermoset composites, especially carbon/epoxy composites,
have been largely exploited in different application fields [5–9, 11, 12]. The epoxy resin
involves a glass transition temperature and, over this temperature, its structure main-
2.1 Composite materials: general background 17
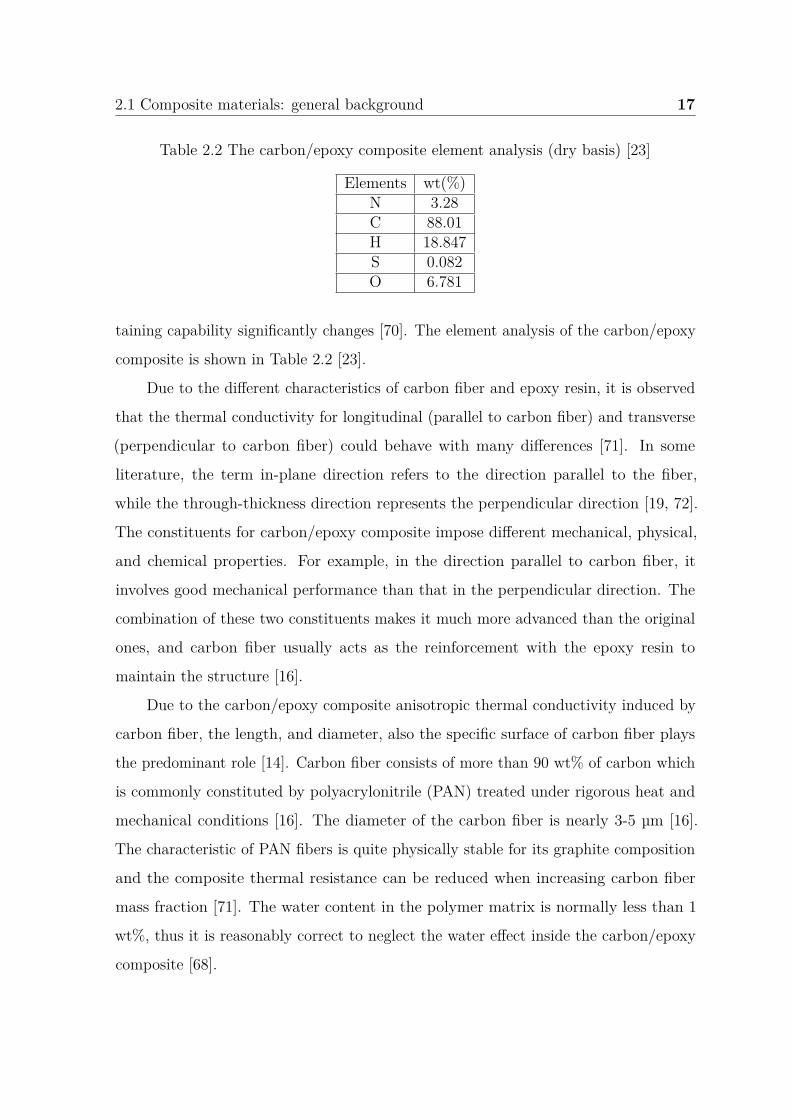
Table 2.2 The carbon/epoxy composite element analysis (dry basis) [23]
Elements wt(%)N 3.28C 88.01H 18.847S 0.082O 6.781
taining capability significantly changes [70]. The element analysis of the carbon/epoxy
composite is shown in Table 2.2 [23].
Due to the different characteristics of carbon fiber and epoxy resin, it is observed
that the thermal conductivity for longitudinal (parallel to carbon fiber) and transverse
(perpendicular to carbon fiber) could behave with many differences [71]. In some
literature, the term in-plane direction refers to the direction parallel to the fiber,
while the through-thickness direction represents the perpendicular direction [19, 72].
The constituents for carbon/epoxy composite impose different mechanical, physical,
and chemical properties. For example, in the direction parallel to carbon fiber, it
involves good mechanical performance than that in the perpendicular direction. The
combination of these two constituents makes it much more advanced than the original
ones, and carbon fiber usually acts as the reinforcement with the epoxy resin to
maintain the structure [16].
Due to the carbon/epoxy composite anisotropic thermal conductivity induced by
carbon fiber, the length, and diameter, also the specific surface of carbon fiber plays
the predominant role [14]. Carbon fiber consists of more than 90 wt% of carbon which
is commonly constituted by polyacrylonitrile (PAN) treated under rigorous heat and
mechanical conditions [16]. The diameter of the carbon fiber is nearly 3-5 µm [16].
The characteristic of PAN fibers is quite physically stable for its graphite composition
and the composite thermal resistance can be reduced when increasing carbon fiber
mass fraction [71]. The water content in the polymer matrix is normally less than 1
wt%, thus it is reasonably correct to neglect the water effect inside the carbon/epoxy
composite [68].
18 Literature review
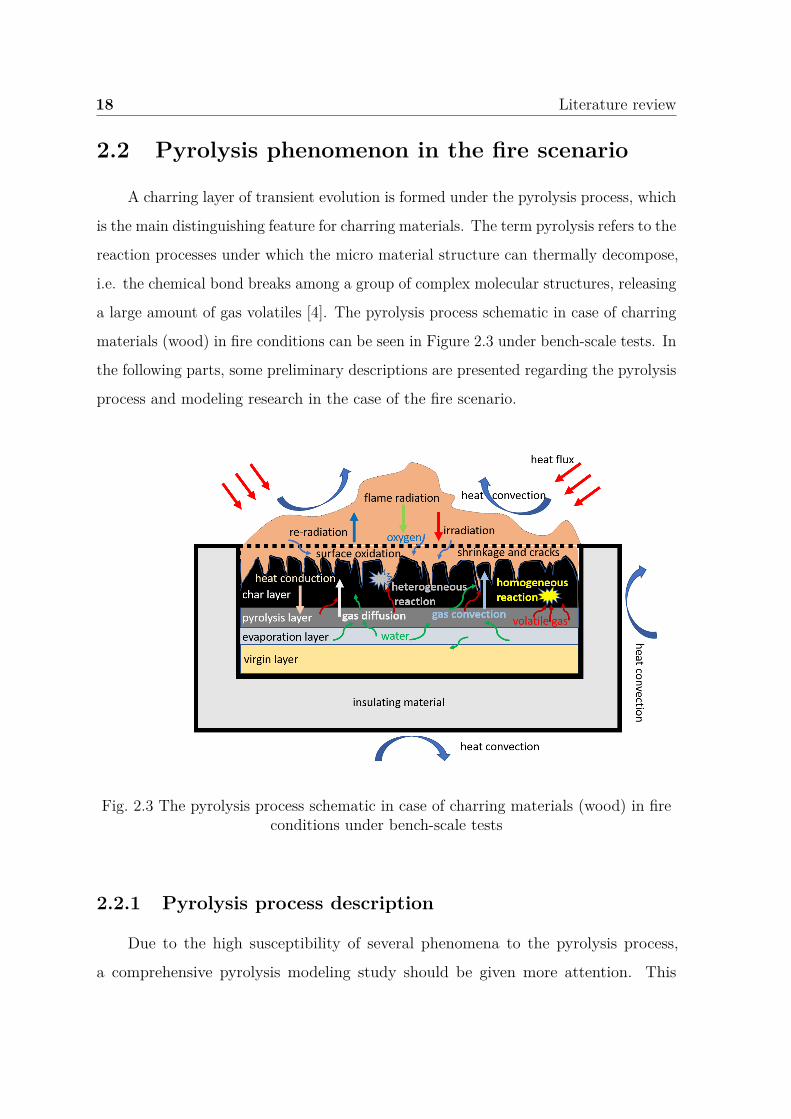
2.2 Pyrolysis phenomenon in the fire scenario
A charring layer of transient evolution is formed under the pyrolysis process, which
is the main distinguishing feature for charring materials. The term pyrolysis refers to the
reaction processes under which the micro material structure can thermally decompose,
i.e. the chemical bond breaks among a group of complex molecular structures, releasing
a large amount of gas volatiles [4]. The pyrolysis process schematic in case of charring
materials (wood) in fire conditions can be seen in Figure 2.3 under bench-scale tests. In
the following parts, some preliminary descriptions are presented regarding the pyrolysis
process and modeling research in the case of the fire scenario.
Fig. 2.3 The pyrolysis process schematic in case of charring materials (wood) in fireconditions under bench-scale tests
2.2.1 Pyrolysis process description
Due to the high susceptibility of several phenomena to the pyrolysis process,
a comprehensive pyrolysis modeling study should be given more attention. This
2.2 Pyrolysis phenomenon in the fire scenario 19
part presents a detailed pyrolysis process (without oxidation) for charring composite
materials concerning wood and carbon/epoxy composite pyrolysis, and their similarities
and differences will be summarized. Different factors influencing the pyrolysis process
are also reviewed. The pyrolysis modeling background and development are presented.
Several assumption considerations of comprehensive pyrolysis models are evaluated,
which focus on the kinetic reactions, heat and mass transfer, the boundary condition,
and the physical structure change. Then, the four principal pyrolysis models in the
fire community are described and evaluated: pyrolysis parts of FDS, FireFOAM,
ThermaKin, and Gpyro.
The complex pyrolysis process of charring materials involves physical, chemical, and
thermal phenomenon, such as heterogeneous or homogeneous reactions, different forms
of heat transfer, complicated decomposition kinetics, internal pressure accumulation, gas
and species transport, moisture evaporation within the wood, the heat of decomposition,
material structure shrinkage and swelling, and overall material properties change at
different pyrolysis stages, etc [65]. The following parts will present the macroscopic
observation, heat, and mass transfer aspects, chemical reaction parts, and physical
structure change aspects during the pyrolysis process. Due to the high similarity
of the pyrolysis process in the fire scenario, they are integrated as one while the
different features are reviewed. Some differences concerning chemical reaction can
be viewed for wood and carbon/epoxy composite. For the heating up process of
carbon/epoxy composite, this material firstly attains the glass transition temperature
before pyrolysis chemical reactions take place [73]. Another very important difference
is the water influence. It deserves much attention for wood, while the water influence
on carbon/epoxy composite is quite minor and can be neglected [32].
2.2.1.1 Macroscopic observation of pyrolysis of composite materials
From a macroscopic view, there exist four layers within charring material pyrolysis
which involve char layer, thermal decomposition layer, evaporation layer, and virgin
layer [61], and sometimes the dried material layer is also included, as for wood. As
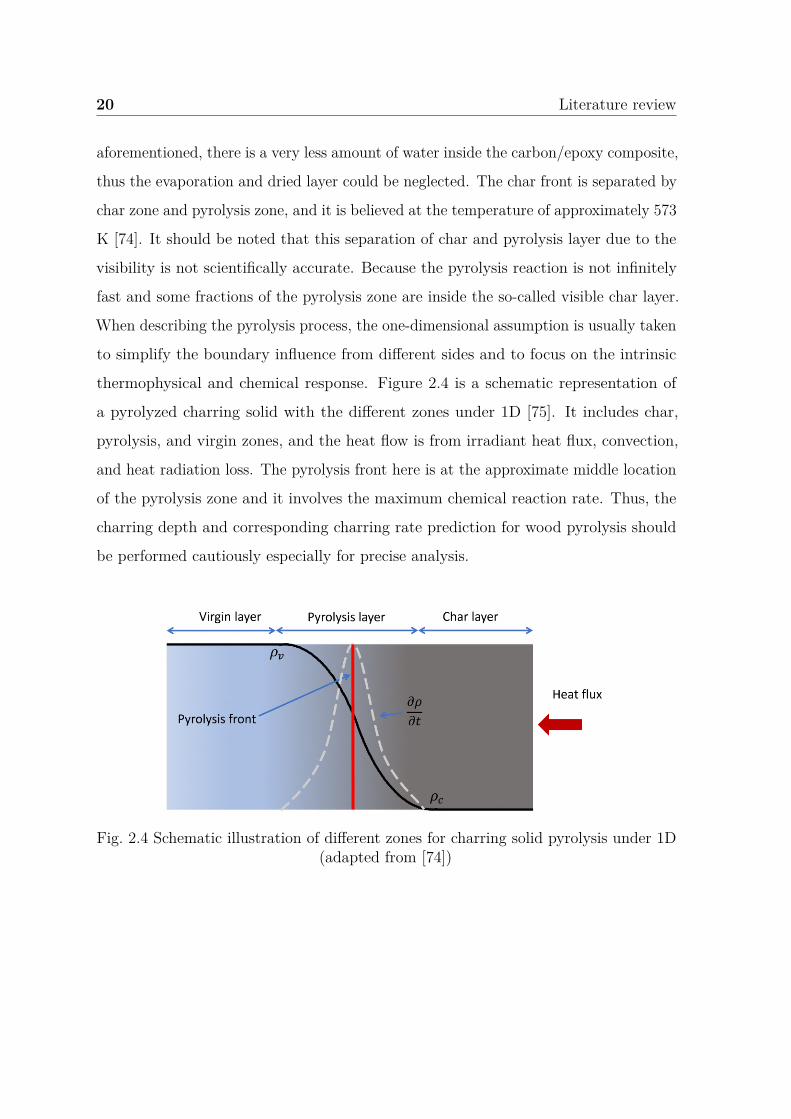
20 Literature review
aforementioned, there is a very less amount of water inside the carbon/epoxy composite,
thus the evaporation and dried layer could be neglected. The char front is separated by
char zone and pyrolysis zone, and it is believed at the temperature of approximately 573
K [74]. It should be noted that this separation of char and pyrolysis layer due to the
visibility is not scientifically accurate. Because the pyrolysis reaction is not infinitely
fast and some fractions of the pyrolysis zone are inside the so-called visible char layer.
When describing the pyrolysis process, the one-dimensional assumption is usually taken
to simplify the boundary influence from different sides and to focus on the intrinsic
thermophysical and chemical response. Figure 2.4 is a schematic representation of
a pyrolyzed charring solid with the different zones under 1D [75]. It includes char,
pyrolysis, and virgin zones, and the heat flow is from irradiant heat flux, convection,
and heat radiation loss. The pyrolysis front here is at the approximate middle location
of the pyrolysis zone and it involves the maximum chemical reaction rate. Thus, the
charring depth and corresponding charring rate prediction for wood pyrolysis should
be performed cautiously especially for precise analysis.
Fig. 2.4 Schematic illustration of different zones for charring solid pyrolysis under 1D(adapted from [74])
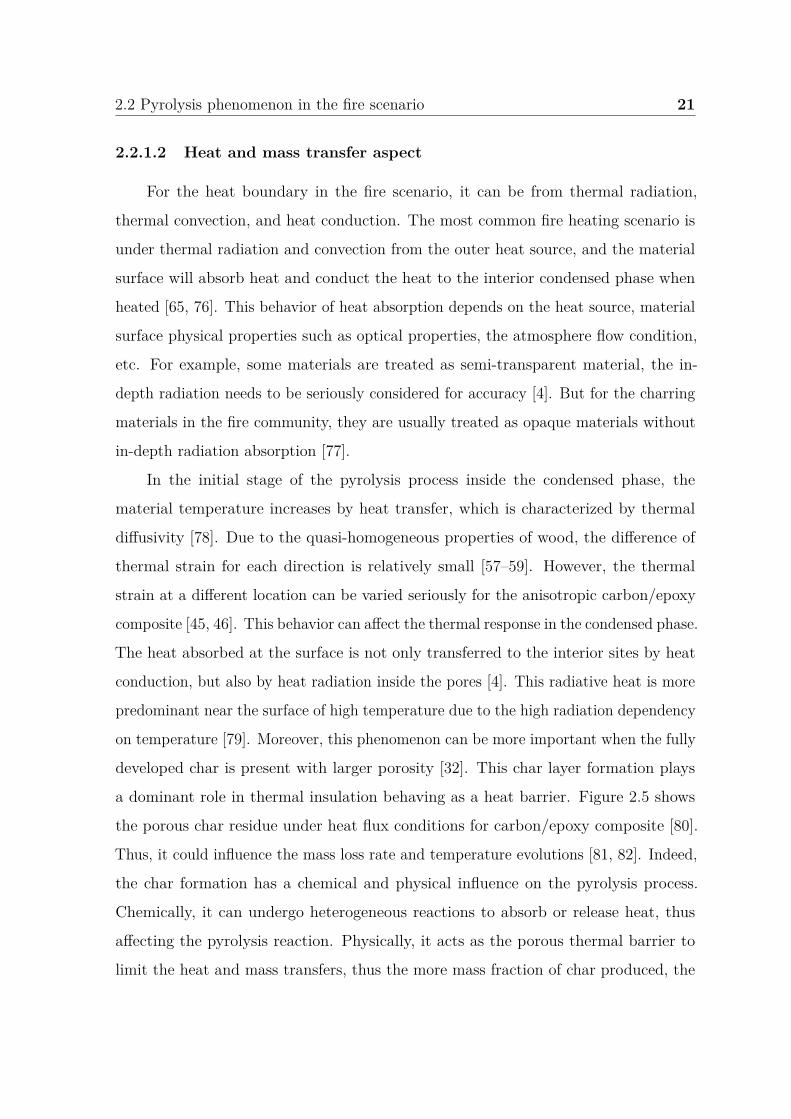
2.2 Pyrolysis phenomenon in the fire scenario 21
2.2.1.2 Heat and mass transfer aspect
For the heat boundary in the fire scenario, it can be from thermal radiation,
thermal convection, and heat conduction. The most common fire heating scenario is
under thermal radiation and convection from the outer heat source, and the material
surface will absorb heat and conduct the heat to the interior condensed phase when
heated [65, 76]. This behavior of heat absorption depends on the heat source, material
surface physical properties such as optical properties, the atmosphere flow condition,
etc. For example, some materials are treated as semi-transparent material, the in-
depth radiation needs to be seriously considered for accuracy [4]. But for the charring
materials in the fire community, they are usually treated as opaque materials without
in-depth radiation absorption [77].
In the initial stage of the pyrolysis process inside the condensed phase, the
material temperature increases by heat transfer, which is characterized by thermal
diffusivity [78]. Due to the quasi-homogeneous properties of wood, the difference of
thermal strain for each direction is relatively small [57–59]. However, the thermal
strain at a different location can be varied seriously for the anisotropic carbon/epoxy
composite [45, 46]. This behavior can affect the thermal response in the condensed phase.
The heat absorbed at the surface is not only transferred to the interior sites by heat
conduction, but also by heat radiation inside the pores [4]. This radiative heat is more
predominant near the surface of high temperature due to the high radiation dependency
on temperature [79]. Moreover, this phenomenon can be more important when the fully
developed char is present with larger porosity [32]. This char layer formation plays
a dominant role in thermal insulation behaving as a heat barrier. Figure 2.5 shows
the porous char residue under heat flux conditions for carbon/epoxy composite [80].
Thus, it could influence the mass loss rate and temperature evolutions [81, 82]. Indeed,
the char formation has a chemical and physical influence on the pyrolysis process.
Chemically, it can undergo heterogeneous reactions to absorb or release heat, thus
affecting the pyrolysis reaction. Physically, it acts as the porous thermal barrier to
limit the heat and mass transfers, thus the more mass fraction of char produced, the
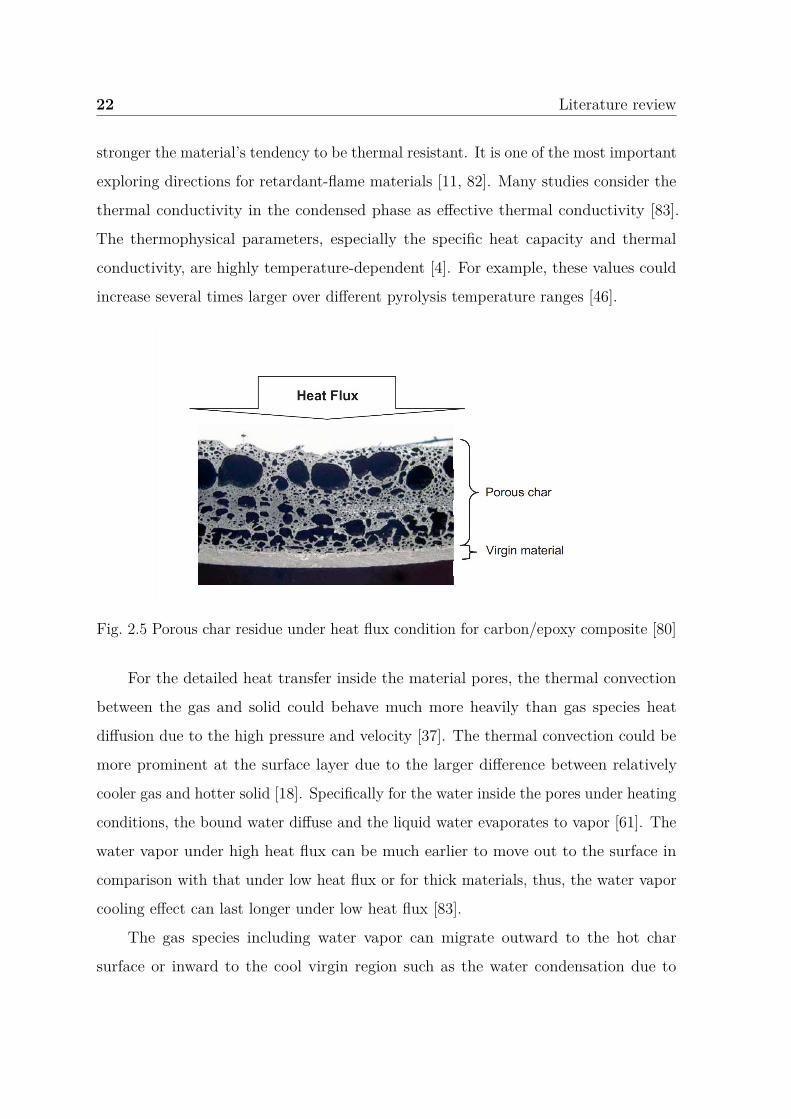
22 Literature review
stronger the material’s tendency to be thermal resistant. It is one of the most important
exploring directions for retardant-flame materials [11, 82]. Many studies consider the
thermal conductivity in the condensed phase as effective thermal conductivity [83].
The thermophysical parameters, especially the specific heat capacity and thermal
conductivity, are highly temperature-dependent [4]. For example, these values could
increase several times larger over different pyrolysis temperature ranges [46].
Fig. 2.5 Porous char residue under heat flux condition for carbon/epoxy composite [80]
For the detailed heat transfer inside the material pores, the thermal convection
between the gas and solid could behave much more heavily than gas species heat
diffusion due to the high pressure and velocity [37]. The thermal convection could be
more prominent at the surface layer due to the larger difference between relatively
cooler gas and hotter solid [18]. Specifically for the water inside the pores under heating
conditions, the bound water diffuse and the liquid water evaporates to vapor [61]. The
water vapor under high heat flux can be much earlier to move out to the surface in
comparison with that under low heat flux or for thick materials, thus, the water vapor
cooling effect can last longer under low heat flux [83].
The gas species including water vapor can migrate outward to the hot char
surface or inward to the cool virgin region such as the water condensation due to
2.2 Pyrolysis phenomenon in the fire scenario 23
the accumulated gas volume pressure. However, a very limited amount of gas species
move inward to the interior sites due to the much larger permeability in the char layer
compared with those in the virgin layer [61, 66]. These gas species can be transported
by convection and species diffusion, and the gas flow could behave differently at a
different location due to the difference of species intensity, species categories, gas
pressure, the porosity of the condensed matrix, etc [37]. It should be highlighted
that the gas blowing effect at the surface could happen and influences the boundary
thermal radiation and convection transfer to the condensed phase. However, due to the
relatively medium heat flux under ambient pressure which is controlled by boundary
heat radiation [58], the gas species velocity at the surface is not very high and this
effect is usually neglected.
2.2.1.3 Chemical reaction aspect
When the temperature attains the threshold of the heat of thermal decomposition,
the chemical reactions take place and different gas volatiles are released due to the
micro molecular bond breakage [84]. For wood and carbon/epoxy composite, the
reaction form could be quite different due to their different chemical structures.
The chemical reactions are finite and experience over different ranges of temper-
ature, which lead to the decreasing of material density, releasing of gas species, and
forming of some portions of carbonaceous residue involving very high porosity [84]. For
example, the temperature ranges for the thermal decomposition of wood components
are estimated as: hemicellulose 200-260 °C, cellulose 240-350 °C, and lignin 280-500
°C [65]. It is predicted that lignin yields more char fraction than that of hemicellulose
and cellulose [66]. It is generally also believed that wood pyrolysis can produce the
final char yield with approximately 20 wt% [58]. Char formation and its properties are
governed by many parameters such as interior pressure and temperature, which also
depend on gas species imposing high reaction tendency within char [84]. The reaction
is controlled by kinetics under low temperature and is governed by heat and mass
transfers under high temperature [58]. It should be highlighted that this char layer
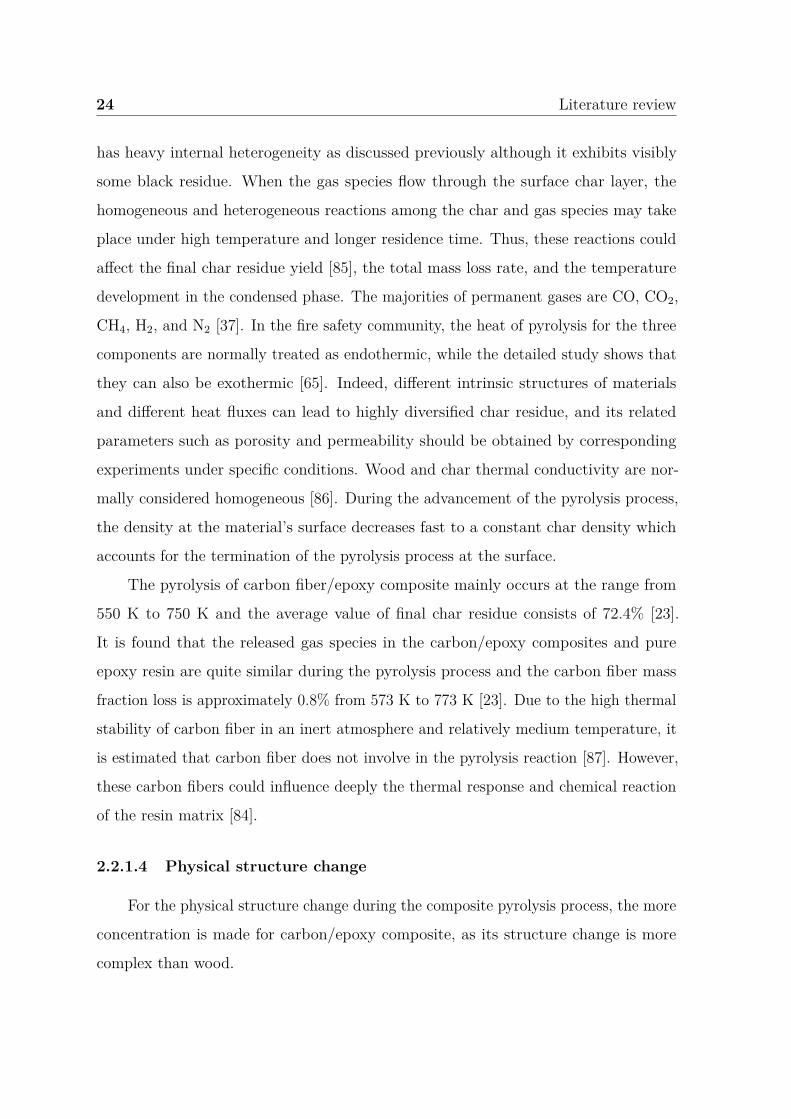
24 Literature review
has heavy internal heterogeneity as discussed previously although it exhibits visibly
some black residue. When the gas species flow through the surface char layer, the
homogeneous and heterogeneous reactions among the char and gas species may take
place under high temperature and longer residence time. Thus, these reactions could
affect the final char residue yield [85], the total mass loss rate, and the temperature
development in the condensed phase. The majorities of permanent gases are CO, CO2,
CH4, H2, and N2 [37]. In the fire safety community, the heat of pyrolysis for the three
components are normally treated as endothermic, while the detailed study shows that
they can also be exothermic [65]. Indeed, different intrinsic structures of materials
and different heat fluxes can lead to highly diversified char residue, and its related
parameters such as porosity and permeability should be obtained by corresponding
experiments under specific conditions. Wood and char thermal conductivity are nor-
mally considered homogeneous [86]. During the advancement of the pyrolysis process,
the density at the material’s surface decreases fast to a constant char density which
accounts for the termination of the pyrolysis process at the surface.
The pyrolysis of carbon fiber/epoxy composite mainly occurs at the range from
550 K to 750 K and the average value of final char residue consists of 72.4% [23].
It is found that the released gas species in the carbon/epoxy composites and pure
epoxy resin are quite similar during the pyrolysis process and the carbon fiber mass
fraction loss is approximately 0.8% from 573 K to 773 K [23]. Due to the high thermal
stability of carbon fiber in an inert atmosphere and relatively medium temperature, it
is estimated that carbon fiber does not involve in the pyrolysis reaction [87]. However,
these carbon fibers could influence deeply the thermal response and chemical reaction
of the resin matrix [84].
2.2.1.4 Physical structure change
For the physical structure change during the composite pyrolysis process, the more
concentration is made for carbon/epoxy composite, as its structure change is more
complex than wood.
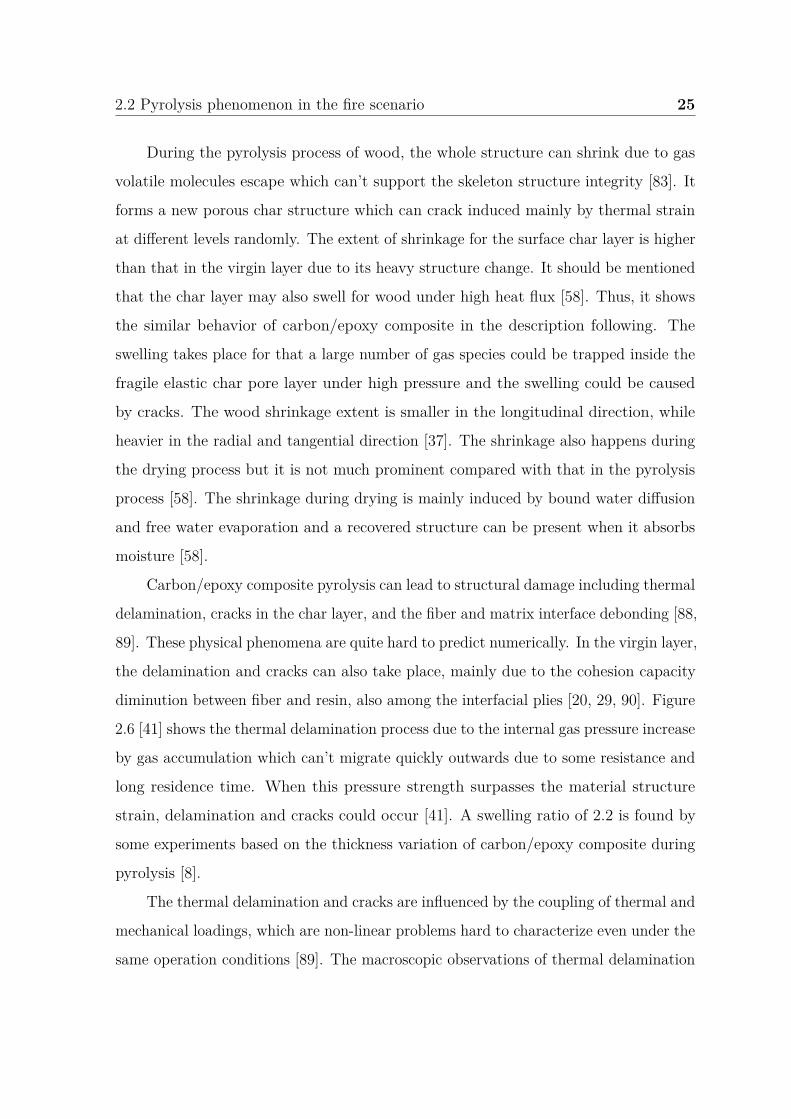
2.2 Pyrolysis phenomenon in the fire scenario 25
During the pyrolysis process of wood, the whole structure can shrink due to gas
volatile molecules escape which can’t support the skeleton structure integrity [83]. It
forms a new porous char structure which can crack induced mainly by thermal strain
at different levels randomly. The extent of shrinkage for the surface char layer is higher
than that in the virgin layer due to its heavy structure change. It should be mentioned
that the char layer may also swell for wood under high heat flux [58]. Thus, it shows
the similar behavior of carbon/epoxy composite in the description following. The
swelling takes place for that a large number of gas species could be trapped inside the
fragile elastic char pore layer under high pressure and the swelling could be caused
by cracks. The wood shrinkage extent is smaller in the longitudinal direction, while
heavier in the radial and tangential direction [37]. The shrinkage also happens during
the drying process but it is not much prominent compared with that in the pyrolysis
process [58]. The shrinkage during drying is mainly induced by bound water diffusion
and free water evaporation and a recovered structure can be present when it absorbs
moisture [58].
Carbon/epoxy composite pyrolysis can lead to structural damage including thermal
delamination, cracks in the char layer, and the fiber and matrix interface debonding [88,
89]. These physical phenomena are quite hard to predict numerically. In the virgin layer,
the delamination and cracks can also take place, mainly due to the cohesion capacity
diminution between fiber and resin, also among the interfacial plies [20, 29, 90]. Figure
2.6 [41] shows the thermal delamination process due to the internal gas pressure increase
by gas accumulation which can’t migrate quickly outwards due to some resistance and
long residence time. When this pressure strength surpasses the material structure
strain, delamination and cracks could occur [41]. A swelling ratio of 2.2 is found by
some experiments based on the thickness variation of carbon/epoxy composite during
pyrolysis [8].
The thermal delamination and cracks are influenced by the coupling of thermal and
mechanical loadings, which are non-linear problems hard to characterize even under the
same operation conditions [89]. The macroscopic observations of thermal delamination
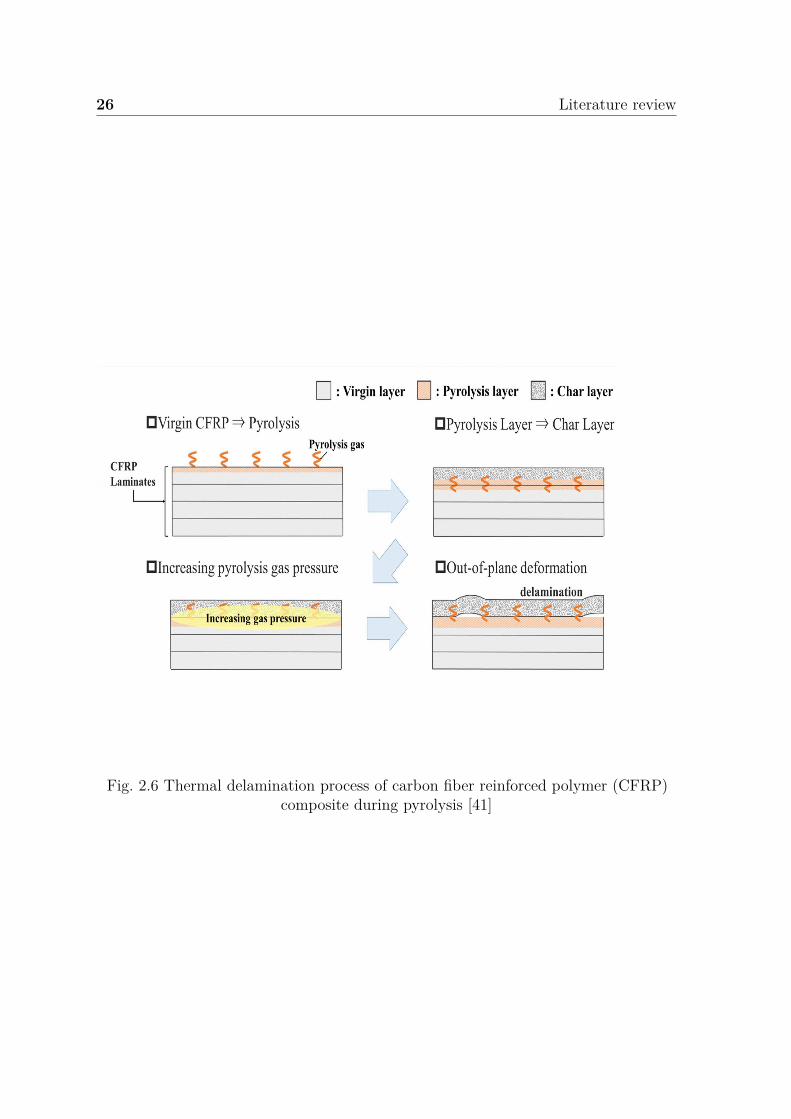
26 Literature review
Fig. 2.6 Thermal delamination process of carbon fiber reinforced polymer (CFRP)composite during pyrolysis [41]
2.2 Pyrolysis phenomenon in the fire scenario 27
of different heat fluxes from 20 kW/m2 to 50 kW/m2 are conducted, as shown in Figure
2.7 [30]. More obvious delamination and cracks can present in the char layer than
that in the virgin layer, which shows that the thermal and mechanical influences are
higher in the char layer. Figure 2.8 illustrates the microscopic cross-sectional view of
the fire-damaged composite laminate [29].
Fig. 2.7 Macroscopic observation of thermal delamination of fiber laminated compositeat different fire heat fluxes [30]
All these physical structure changes in the virgin and char layer, including thermal
delamination, cracks, shrinkage, and swelling, can influence strongly the pyrolysis
process including heat and mass transfers [66, 74, 84]. For example, the shrinkage
effects can lead to lower heat flux absorption from the ambient environment and the
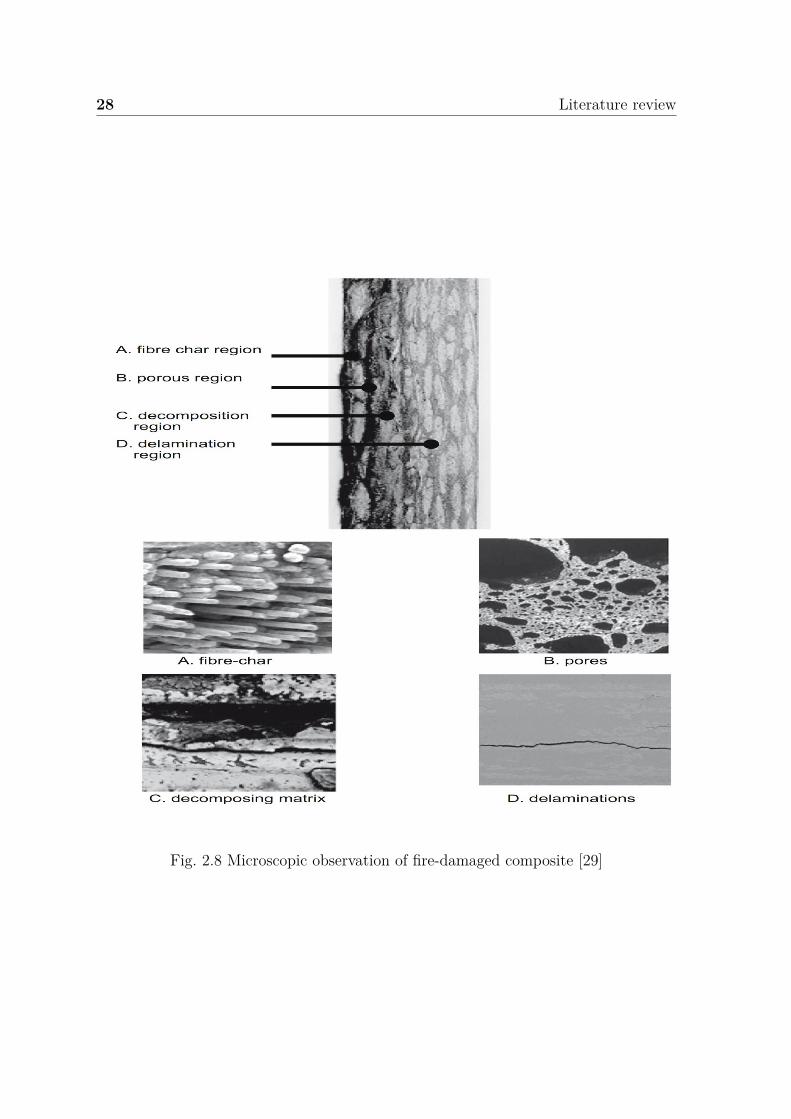
28 Literature review
Fig. 2.8 Microscopic observation of fire-damaged composite [29]
2.2 Pyrolysis phenomenon in the fire scenario 29
delamination can reduce the heat conduction while increasing the permeability for gas
transport.
To summarize the pyrolysis process description of composite materials, in the case
of wood and carbon/epoxy materials, many complex physicochemical processes are
involved during the pyrolysis process. Depending on fire conditions, these processes
are more or less linked and predominant. But to deal with a pyrolysis model able to
describe correctly the wide range of fire conditions, the main physical phenomenon
should be considered with more or less accuracy in the model. This part is described
in the following part.
2.2.2 Pyrolysis process modeling
There are two kinds of pyrolysis models, i.e. semi-empirical pyrolysis models
and comprehensive ones. Semi-empirical models account for the thermal analysis in
a macroscopic view. The material thermal properties can be directly estimated from
the bench-scale experiments [32] and the chemical reaction of infinite-rate or simple
one-step global reaction model is employed [35, 77, 91].
Another classification of pyrolysis models concerns numerical solution methods
which involve the analytical models, integral models, and comprehensive numerical
equation models [92]. Analytical models account for the infinite-rate kinetic model
without gas volatiles convection [66]. As demonstrated, this assumption is not realistic
and can only be used when under high heating rates and materials with larger thickness.
Indeed, these models could be viewed as thermal models neglecting the participation
of microchemical reactions. The integral models also assume the infinite-rate kinetic
model with different temperature distributions in the material [93].
When using the finite-rate kinetic models under one-dimensional configuration,
the pyrolysis reactions occur at a certain range of temperature and moving reaction
zones due to heat transfer. Thus, the instantaneous density can be interpolated by
virgin and char density [75]. While for infinite-rate kinetic models, the virgin and char
layers are simply separated by a thin pyrolysis front. This one has the iso-thermal
30 Literature review
temperature, i.e. pyrolysis temperature [75]. Thus, the infinite-rate kinetic model, or
named the pyrolysis front model, is used mostly under high heating rates for that the
pyrolysis reaction is controlled by heat and mass transfer, i.e. the pyrolysis reaction
is instantaneously terminated due to a much smaller reaction time scale [75]. It can
be concluded at this point that the analytical model, the integral model, and the
semi-empirical model in this work can be viewed as the same category. Thus, only
comprehensive ones, for which the main pyrolysis assumptions are captured to solve
complicated partial differential equations, are focused due to their higher accuracy.
Normally, a comprehensive pyrolysis model includes some procedures for prepa-
ration. For example, the conservation equations for mass, momentum, and energy,
the kinetic and thermo-physical parameters for model inputs. Also, some related
experimental data to validate the model are required [94]. For conservation equations,
they are a set of mathematical expressions that account for the description of different
thermophysical and chemical phenomena occurring inside the condensed phase. Some
complex phenomena such as shrinkage and swelling can also be integrated into some
advanced comprehensive pyrolysis models. Based on the detailed pyrolysis process
understanding, some assumptions are always adopted for their complexity to charac-
terize the real and whole phenomenon involved. As the parameters for modeling input,
they are some basic material properties such as kinetic and thermophysical parameters,
as well as the boundary condition parameters which involve incident heat flux, heat
convection coefficient, ambient temperature, and pressure, etc. The related numerical
parameters are also needed to be set, for example, the time step, the mesh size, and
the discretization parameters. All these procedures are extremely important to account
for some reliable modeling results. Thus, the following parts will present some basic
background and development concerning all these comprehensive pyrolysis modeling
procedures.
There are two sub-models for comprehensive pyrolysis modeling: kinetic model,
heat and mass transfer model. Without heat and mass transfer influence, the kinetic
model is described for obtaining the kinetic parameters under thermally thin theory.
2.2 Pyrolysis phenomenon in the fire scenario 31
The chemical reaction can influence much the heat and mass transfer process, thus
these kinetic parameters can be integrated into the heat and mass transfer model
to calculate them simultaneously. This pyrolysis modeling methodology has been
applied in many studies such as [95]. The consideration points for a comprehensive
pyrolysis model, which is favored firstly under one-dimension including heat conduction,
pyrolysis kinetics, gas mass transport, gas pressure build-up, and some other physical
parameters to characterize such as shrinkage or swelling [74, 88, 96].
The finite-rate kinetic model accounts for the Arrhenius equation by three kinetic
parameters, i.e. the pre-exponential factor, the activation energy, and the reaction
order, which is usually adopted as a first-order reaction model in the fire community [97].
Concerning moisture evaporation modeling, there are three major drying models: the
equilibrium model, the heterogeneous reaction model, and the heat sink model [37].
The equilibrium model assumes that the bound water is in equilibrium with water
vapor which is normally employed in low heating rate conditions. The heterogeneous
reaction model involves the Arrhenius equation by a first-order reaction, which is
usually treated as the fourth component compared with the three components in wood.
This reaction model is employed by many studies due to its simplicity to be integrated
into the pyrolysis model such as [68, 74, 98]. The heat sink method is a semi-empirical
model assuming a specific evaporation temperature and a thin infinite reaction front,
which is applied mostly under high heating rates for large samples [37].
Some statistics show that the most charring material pyrolysis modeling studies
involve wood for the past decades [68, 92]. They include heat conduction, pyrolysis
kinetic reactions, gas volatiles transport, internal pressure distribution, volume variation,
moisture evaporation, physical porosity, and permeability. Concerning the pyrolysis
modeling development history for synthetic composite such as carbon/epoxy composite,
it is firstly based on the one-dimension model describing the wood pyrolysis [29, 84]
of which the heat transfer and the first-order Arrhenius equation is considered as
well as the gas volatiles for immediate outward migration. Detailed development
information can be found in [68]. It could be concluded that wood plays a dominant
32 Literature review
role in test usage during advanced comprehensive pyrolysis modeling development, for
their similarities and relatively high complexity in comparison with other advanced
composite materials.
As noted in [99], for comprehensive pyrolysis modeling work which involves approx-
imately several input parameters (for example, different thermo-physical parameters
components, the kinetic parameters) there are many physical and chemical mechanisms
to be included, such as the in-depth radiation absorption and pore radiation transfer.
However, these input parameters can lead to much uncertainty of the model [100], and
some assumptions are usually adopted during the modeling process. It is reasonably
correct to neglect some phenomena which have minor effects on the pyrolysis process,
depending on the corresponding experiments, and to seek the balance between accuracy
and complexity when analyzing some specific pyrolysis scenarios. There are many
assumptions considered in performing the pyrolysis modeling study, for example, the
thermal equilibrium assumption [41, 87, 98]. When calculating the energy conservation
equations, the local thermal equilibrium assumption between the gas and solid is
considered almost for all pyrolysis models [67]. And when the gases flow out the
surface char layer, the thermal equilibrium is assumed for that the heat capacity of
gas is relatively small in the fire-related boundary condition. Thus, there is no heat
convection consideration between solid and gas [32].
Due to the difference of materials components, some simplifications and approxi-
mations are conducted to be treated as homogenous and isotropic [87, 90] to account
for simplified conservation equations, such as the homogeneous approximation for
wood [32]. The thermophysical parameters of samples are usually considered as
temperature-dependent [87, 91] and the thermal conductivity does not include the pore
radiation [99]. The kinetic reaction schemes are usually treated as single-step [92, 98]
or multi-step [87]. The pyrolysis reaction product is treated as inert gas without
thermal convection [41, 58, 87, 101]. The in-depth radiation absorption is neglected
and the material is treated as non-transparent. This is usually applied in the fire
2.2 Pyrolysis phenomenon in the fire scenario 33
scenarios [36, 32, 87, 101], for example, the charring materials are usually assumed as
non-transparent with the presence of a constant emissivity value [102].
It is always assumed that there is no volume change including shrinkage, swelling,
and cracks [74, 98, 101]. It is also estimated that the volume of the condensed phase
is fixed while the density changes during the pyrolysis of thermally thick materials,
although the shrinkage, swelling, and density variation occur simultaneously in real-
ity [75, 103]. Due to the high porosity and internal pressure, the assumption that the
gas immediately moves outward without resistance is always treated for fire scenarios
to diminish the complexity while not influence too much the accuracy [33, 77, 103].
When considering gas transport, it is usually influenced by pressure and is described by
Darcy’s law [41, 87]. The diffusion of gases is much slower than the convection of gas
volatiles [58, 65, 66, 98], thus the energy and mass of diffusion could be neglected [92].
Indeed, in some studies, the gas transfer coefficient is usually treated as homogenous
with a relatively high value of 2×10⁵ m2/s. Thus, the gas produced is instantaneously
moved out of the material, and its heat and mass transfer is very small to influence the
mass loss rate [36]. The gas species are usually treated as ideal gases with identical
thermophysical properties [41, 74] and the homogenous reactions among gas species
are neglected in the solid [74].
Many comprehensive pyrolysis models have been developed during the last decades
of which some very basic and important mathematical formulations and assumptions
are still being applied to describe the typical physical and chemical phenomenon for
pyrolysis modeling. For example, the pyrolysis models of Kung and Henderson are
integrated into the current generalized pyrolysis models such as FDS, ThermaKin, and
Gpyro [8, 32]. Some new phenomenon expressions are then supplemented, such as
more complicated reaction schemes,the gas transport consideration, etc [32]. The main
points are presented in the following parts.
34 Literature review
2.2.2.1 Chemical reaction model
The kinetic modeling needs to be improved since the pyrolysis process is highly de-
pendent on the thermal decomposition kinetic parameters and the reaction schemes [35].
The kinetics for thermal decomposition can be very complex and the Arrhenius equation
describes the pyrolysis reaction rate based on temperature, mass concentration, and the
related kinetic parameters. The corresponding kinetic parameters are mainly estimated
based on non-isothermal TGA experiments [10, 18, 40, 35, 104].
The thermal decomposition kinetics can be described as follows [23, 105, 106]:
dα/dt = k(T )f(α) (2.1)
α = m0 −m
m0 −mf
(2.2)
f(α) = (1 − α)n (2.3)
Where α denotes the extent of conversion, t the time, T the temperature, f(α) the
conversion function, k(T ) the reaction rate dependent on temperature, n the reaction
order, m0 the initial mass, mf the final mass, m the instantaneous mass. k(T ) can be
expressed by the Arrhenius equation [107] as follows:
k(T ) = A exp(−Ea
RT
)(2.4)
Where A denotes the pre-exponential factor, E the apparent activation energy, R
the universal gas constant which is 8.314 J/(K mol). The final kinetics expression is
formulated as follows:
dα/dt = A exp(−Ea
RT
)(1 − α)n (2.5)
2.2 Pyrolysis phenomenon in the fire scenario 35
The activation energy accounts for the minimum energy for starting the reaction,
higher activation energy implies that the reaction is hard to start and much energy
needs to be absorbed. This is related to environmental pressure, temperature, and
reaction advancement [23, 108]. The pre-exponential factor involves the reaction
frequency which is governed by intrinsic molecular vibration and collision [10, 109]. A
high pre-exponential factor implies that the reaction could take place easily [10]. The
reaction order is the exponent to represent the material mass concentration changing
behavior during thermal decomposition [102].
As aforementioned that the kinetic is usually predicted by the non-isothermal
TGA experiments under given heating rates β.
β = dT/dt (2.6)
Thus, the kinetics can be expressed as:
dα/dT = A
βexp
(−Ea
RT
)(1 − α)n (2.7)
In the fire community, the assumption of first-order kinetics is usually performed by
many studies such as [95, 97]. Some studies show that the nth order kinetic model can’t
employ identical parameters to estimate the kinetics under different heating rates [87].
Some studies show that the nth order reaction scheme is more accurate [2, 11] and
the reaction order can impose much effect on the mass loss. Indeed, the nth order
reaction schemes are employed when prescribing complicated thermal decomposition
with parallel or multi-step reactions [11]. For example, for the pyrolysis of the three
wood components, hemicellulose and cellulose account for the initial mass loss, while
the last phase of mass loss involves the lignin decomposition. Thus, the first-order
model does not fit the multiple independent parallel reaction scheme [67]. Then,
the fourth-order reaction model is employed for carbon/epoxy composite thermal
decomposition study [23].
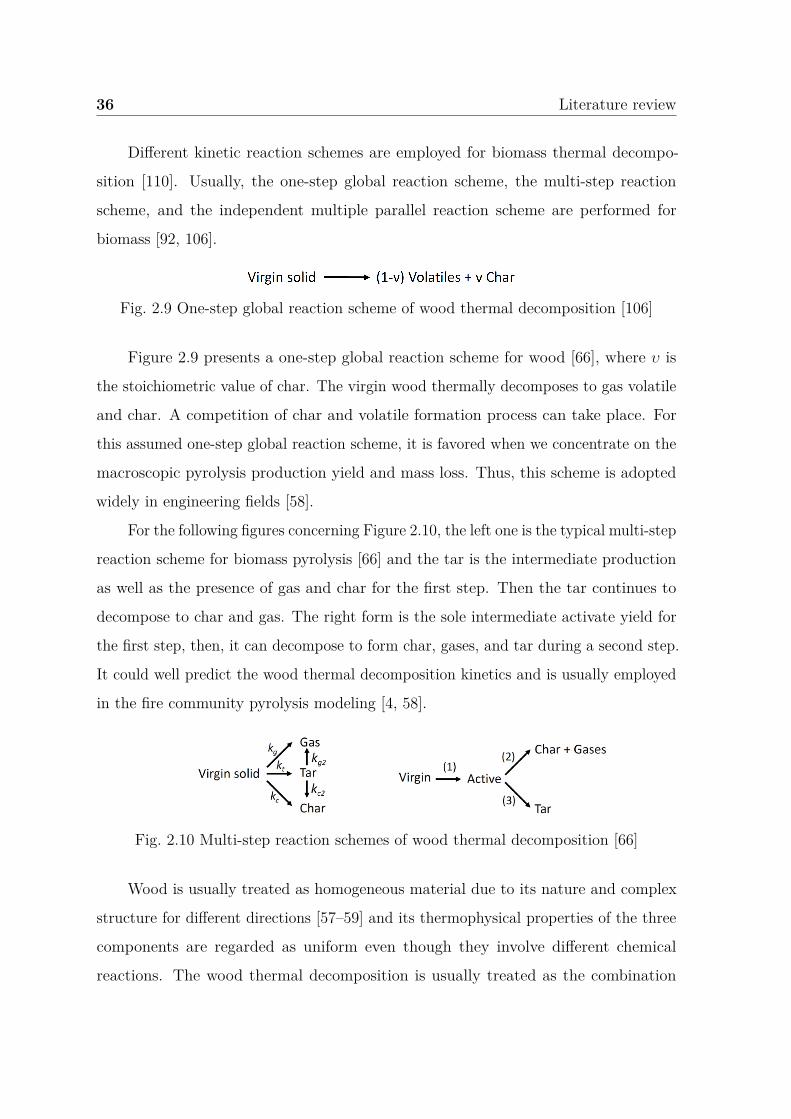
36 Literature review
Different kinetic reaction schemes are employed for biomass thermal decompo-
sition [110]. Usually, the one-step global reaction scheme, the multi-step reaction
scheme, and the independent multiple parallel reaction scheme are performed for
biomass [92, 106].
Fig. 2.9 One-step global reaction scheme of wood thermal decomposition [106]
Figure 2.9 presents a one-step global reaction scheme for wood [66], where υ is
the stoichiometric value of char. The virgin wood thermally decomposes to gas volatile
and char. A competition of char and volatile formation process can take place. For
this assumed one-step global reaction scheme, it is favored when we concentrate on the
macroscopic pyrolysis production yield and mass loss. Thus, this scheme is adopted
widely in engineering fields [58].
For the following figures concerning Figure 2.10, the left one is the typical multi-step
reaction scheme for biomass pyrolysis [66] and the tar is the intermediate production
as well as the presence of gas and char for the first step. Then the tar continues to
decompose to char and gas. The right form is the sole intermediate activate yield for
the first step, then, it can decompose to form char, gases, and tar during a second step.
It could well predict the wood thermal decomposition kinetics and is usually employed
in the fire community pyrolysis modeling [4, 58].
Fig. 2.10 Multi-step reaction schemes of wood thermal decomposition [66]
Wood is usually treated as homogeneous material due to its nature and complex
structure for different directions [57–59] and its thermophysical properties of the three
components are regarded as uniform even though they involve different chemical
reactions. The wood thermal decomposition is usually treated as the combination
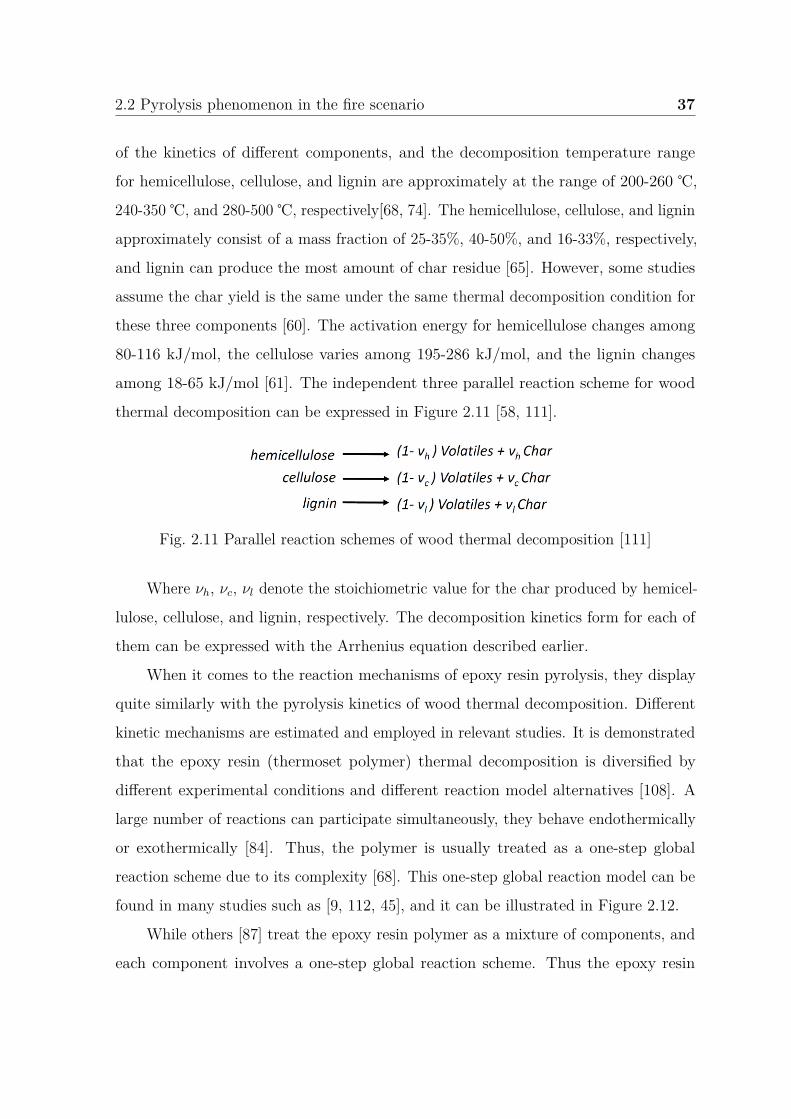
2.2 Pyrolysis phenomenon in the fire scenario 37
of the kinetics of different components, and the decomposition temperature range
for hemicellulose, cellulose, and lignin are approximately at the range of 200-260 ℃,
240-350 ℃, and 280-500 ℃, respectively[68, 74]. The hemicellulose, cellulose, and lignin
approximately consist of a mass fraction of 25-35%, 40-50%, and 16-33%, respectively,
and lignin can produce the most amount of char residue [65]. However, some studies
assume the char yield is the same under the same thermal decomposition condition for
these three components [60]. The activation energy for hemicellulose changes among
80-116 kJ/mol, the cellulose varies among 195-286 kJ/mol, and the lignin changes
among 18-65 kJ/mol [61]. The independent three parallel reaction scheme for wood
thermal decomposition can be expressed in Figure 2.11 [58, 111].
Fig. 2.11 Parallel reaction schemes of wood thermal decomposition [111]
Where νh, νc, νl denote the stoichiometric value for the char produced by hemicel-
lulose, cellulose, and lignin, respectively. The decomposition kinetics form for each of
them can be expressed with the Arrhenius equation described earlier.
When it comes to the reaction mechanisms of epoxy resin pyrolysis, they display
quite similarly with the pyrolysis kinetics of wood thermal decomposition. Different
kinetic mechanisms are estimated and employed in relevant studies. It is demonstrated
that the epoxy resin (thermoset polymer) thermal decomposition is diversified by
different experimental conditions and different reaction model alternatives [108]. A
large number of reactions can participate simultaneously, they behave endothermically
or exothermically [84]. Thus, the polymer is usually treated as a one-step global
reaction scheme due to its complexity [68]. This one-step global reaction model can be
found in many studies such as [9, 112, 45], and it can be illustrated in Figure 2.12.
While others [87] treat the epoxy resin polymer as a mixture of components, and
each component involves a one-step global reaction scheme. Thus the epoxy resin
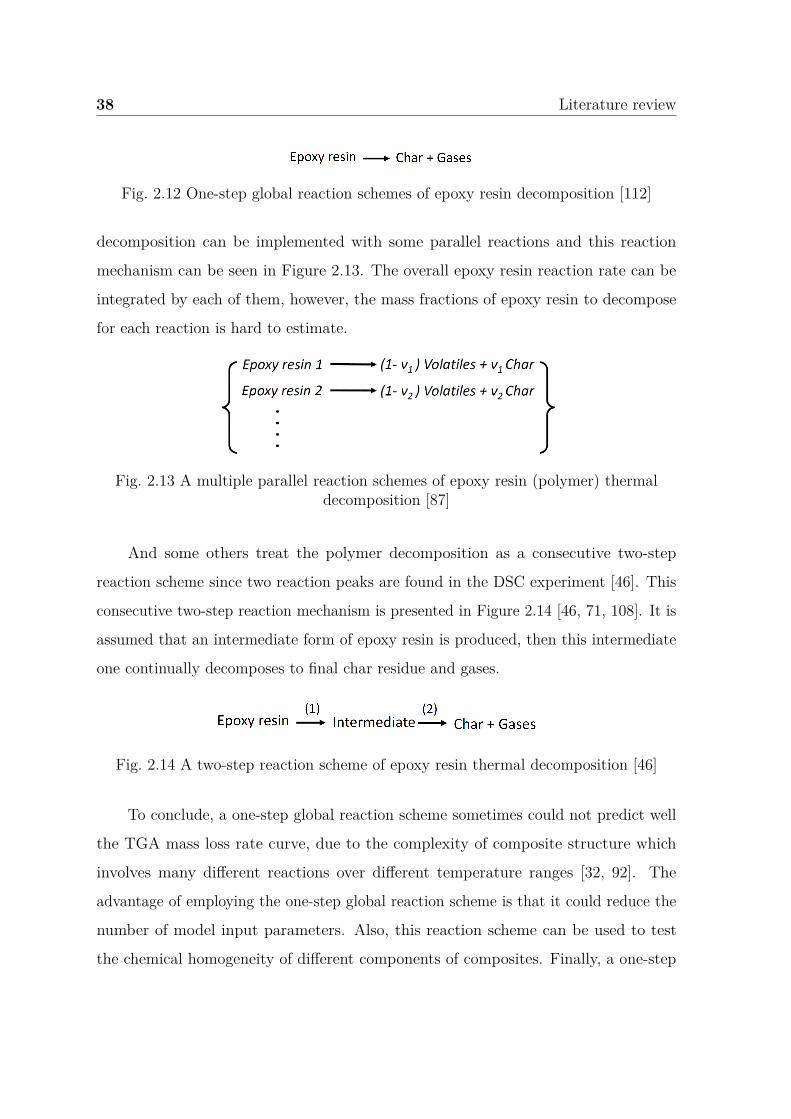
38 Literature review
Fig. 2.12 One-step global reaction schemes of epoxy resin decomposition [112]
decomposition can be implemented with some parallel reactions and this reaction
mechanism can be seen in Figure 2.13. The overall epoxy resin reaction rate can be
integrated by each of them, however, the mass fractions of epoxy resin to decompose
for each reaction is hard to estimate.
Fig. 2.13 A multiple parallel reaction schemes of epoxy resin (polymer) thermaldecomposition [87]
And some others treat the polymer decomposition as a consecutive two-step
reaction scheme since two reaction peaks are found in the DSC experiment [46]. This
consecutive two-step reaction mechanism is presented in Figure 2.14 [46, 71, 108]. It is
assumed that an intermediate form of epoxy resin is produced, then this intermediate
one continually decomposes to final char residue and gases.
Fig. 2.14 A two-step reaction scheme of epoxy resin thermal decomposition [46]
To conclude, a one-step global reaction scheme sometimes could not predict well
the TGA mass loss rate curve, due to the complexity of composite structure which
involves many different reactions over different temperature ranges [32, 92]. The
advantage of employing the one-step global reaction scheme is that it could reduce the
number of model input parameters. Also, this reaction scheme can be used to test
the chemical homogeneity of different components of composites. Finally, a one-step
2.2 Pyrolysis phenomenon in the fire scenario 39
global reaction scheme is also applied in the fire community to represent the charring
material pyrolysis behavior to directly form char and gas [91].
For the multi-step reaction scheme, the kinetics and thermophysical parameters of
intermediate products are quite hard to characterize. For example during wood pyrolysis,
the competitive production, and the reaction of the intermediate liquid tar of which
the properties are sensitive with heating rates [37]. The multiple independent parallel
reaction scheme can represent the composite decomposition behavior with different
kinetics concerning the different components. The advantage of the independent parallel
reaction scheme is that it can be easily employed to predict the specific single component
pyrolysis behavior [2, 106]. However, this kind of scheme involves many kinetic
parameters and the minor interactions for each component are usually neglected [58]. It
should be noted that sometimes, the different reaction schemes adoption such as wood is
quite flexible. For example, hemicellulose thermal decomposition can be assumed with
a two-step reaction scheme with intermediate solid production, cellulose can decompose
with two independent parallel reaction schemes, and lignin can be treated as a one-step
global reaction scheme [65]. As described in the following parts, the different reaction
schemes are employed to fit the TGA mass loss rate curve mathematically to obtain
the kinetics parameters [76]. Then, the reaction schemes can influence the kinetics
significantly, and these kinetic parameters are normally treated as dependent on the
reaction model. For example, the multi-step reaction schemes can lead to a relatively
low decomposition rate, and the heavy reaction overlap accounts for the independent
parallel reaction schemes when under high heating rates [11]. Thus, the first-order
reaction model is commonly applied for the independent parallel reaction scheme [61].
2.2.2.2 Heat and mass transfer model
The heat is transported from the solid surface to the interior location by thermal
conduction, the material absorbs energy to thermally decompose at given conditions [35].
These phenomena are fundamental considerations for comprehensive pyrolysis models.
The pyrolysis model of Kung [113] is one of the most important comprehensive pyrolysis
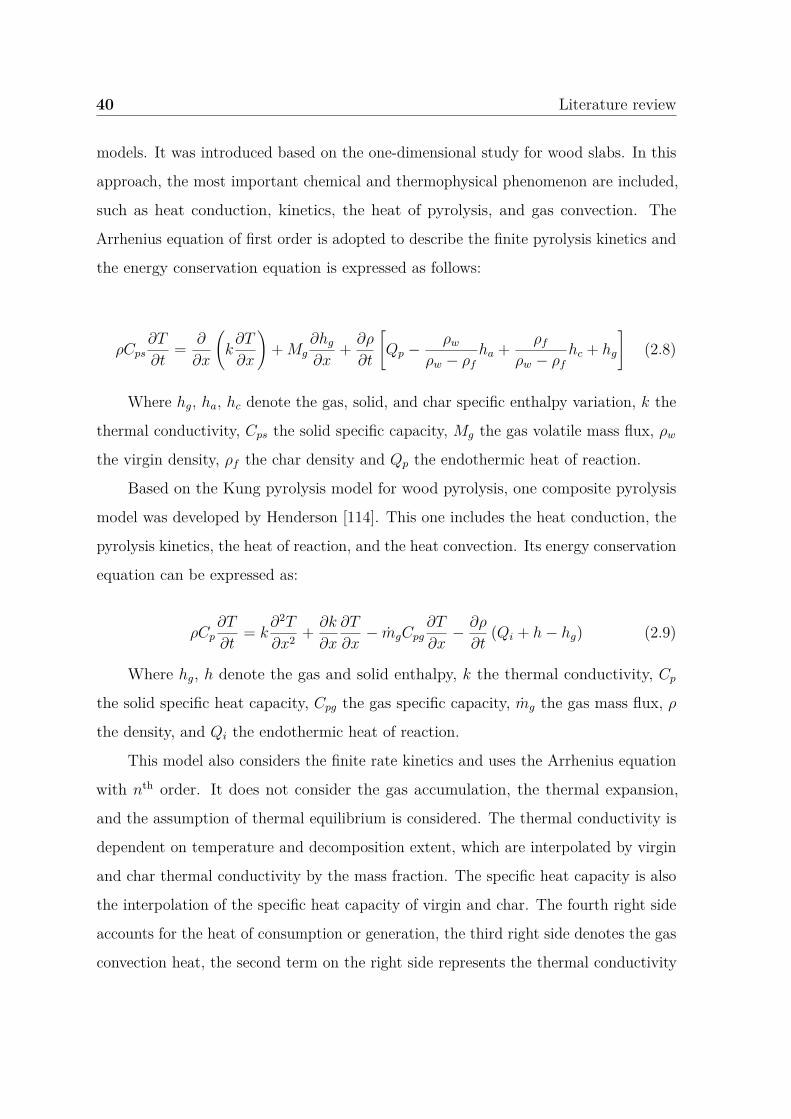
40 Literature review
models. It was introduced based on the one-dimensional study for wood slabs. In this
approach, the most important chemical and thermophysical phenomenon are included,
such as heat conduction, kinetics, the heat of pyrolysis, and gas convection. The
Arrhenius equation of first order is adopted to describe the finite pyrolysis kinetics and
the energy conservation equation is expressed as follows:
ρCps∂T
∂t= ∂
∂x
(k∂T
∂x
)+Mg
∂hg
∂x+ ∂ρ
∂t
[Qp − ρw
ρw − ρf
ha + ρf
ρw − ρf
hc + hg
](2.8)
Where hg, ha, hc denote the gas, solid, and char specific enthalpy variation, k the
thermal conductivity, Cps the solid specific capacity, Mg the gas volatile mass flux, ρw
the virgin density, ρf the char density and Qp the endothermic heat of reaction.
Based on the Kung pyrolysis model for wood pyrolysis, one composite pyrolysis
model was developed by Henderson [114]. This one includes the heat conduction, the
pyrolysis kinetics, the heat of reaction, and the heat convection. Its energy conservation
equation can be expressed as:
ρCp∂T
∂t= k
∂2T
∂x2 + ∂k
∂x
∂T
∂x− mgCpg
∂T
∂x− ∂ρ
∂t(Qi + h− hg) (2.9)
Where hg, h denote the gas and solid enthalpy, k the thermal conductivity, Cp
the solid specific heat capacity, Cpg the gas specific capacity, mg the gas mass flux, ρ
the density, and Qi the endothermic heat of reaction.
This model also considers the finite rate kinetics and uses the Arrhenius equation
with nth order. It does not consider the gas accumulation, the thermal expansion,
and the assumption of thermal equilibrium is considered. The thermal conductivity is
dependent on temperature and decomposition extent, which are interpolated by virgin
and char thermal conductivity by the mass fraction. The specific heat capacity is also
the interpolation of the specific heat capacity of virgin and char. The fourth right side
accounts for the heat of consumption or generation, the third right side denotes the gas
convection heat, the second term on the right side represents the thermal conductivity
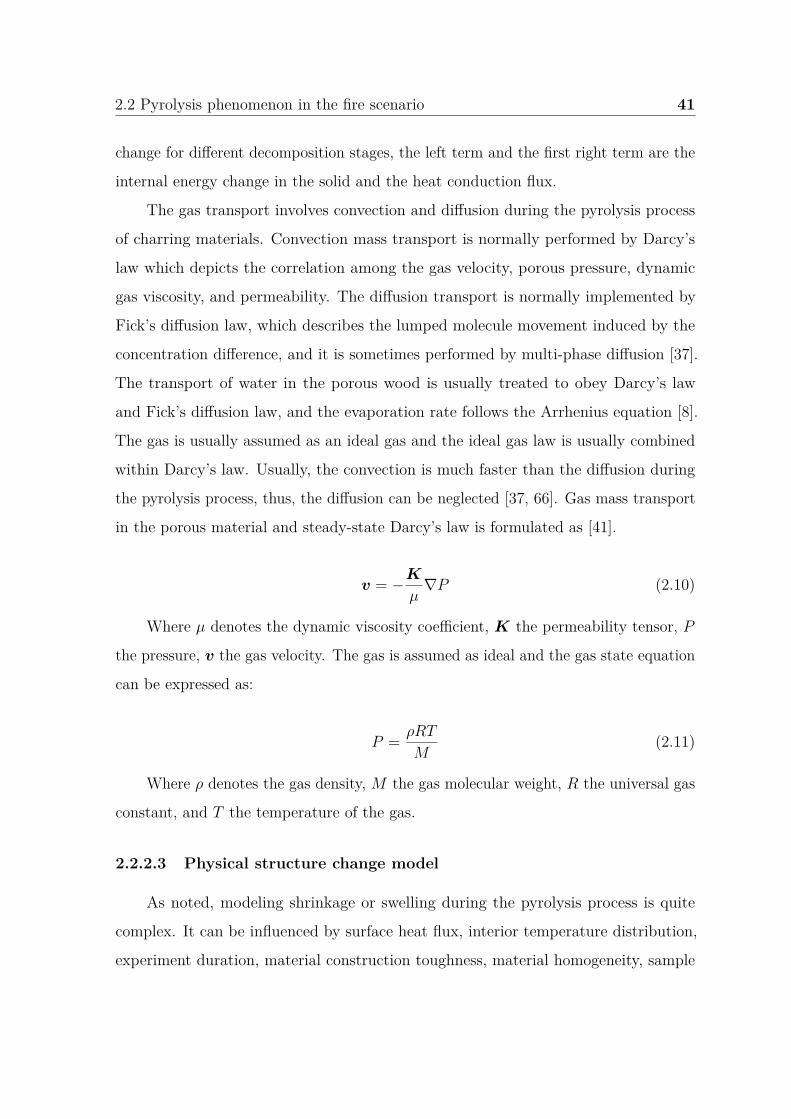
2.2 Pyrolysis phenomenon in the fire scenario 41
change for different decomposition stages, the left term and the first right term are the
internal energy change in the solid and the heat conduction flux.
The gas transport involves convection and diffusion during the pyrolysis process
of charring materials. Convection mass transport is normally performed by Darcy’s
law which depicts the correlation among the gas velocity, porous pressure, dynamic
gas viscosity, and permeability. The diffusion transport is normally implemented by
Fick’s diffusion law, which describes the lumped molecule movement induced by the
concentration difference, and it is sometimes performed by multi-phase diffusion [37].
The transport of water in the porous wood is usually treated to obey Darcy’s law
and Fick’s diffusion law, and the evaporation rate follows the Arrhenius equation [8].
The gas is usually assumed as an ideal gas and the ideal gas law is usually combined
within Darcy’s law. Usually, the convection is much faster than the diffusion during
the pyrolysis process, thus, the diffusion can be neglected [37, 66]. Gas mass transport
in the porous material and steady-state Darcy’s law is formulated as [41].
v = −K
µ∇P (2.10)
Where µ denotes the dynamic viscosity coefficient, K the permeability tensor, P
the pressure, v the gas velocity. The gas is assumed as ideal and the gas state equation
can be expressed as:
P = ρRT
M(2.11)
Where ρ denotes the gas density, M the gas molecular weight, R the universal gas
constant, and T the temperature of the gas.
2.2.2.3 Physical structure change model
As noted, modeling shrinkage or swelling during the pyrolysis process is quite
complex. It can be influenced by surface heat flux, interior temperature distribution,
experiment duration, material construction toughness, material homogeneity, sample
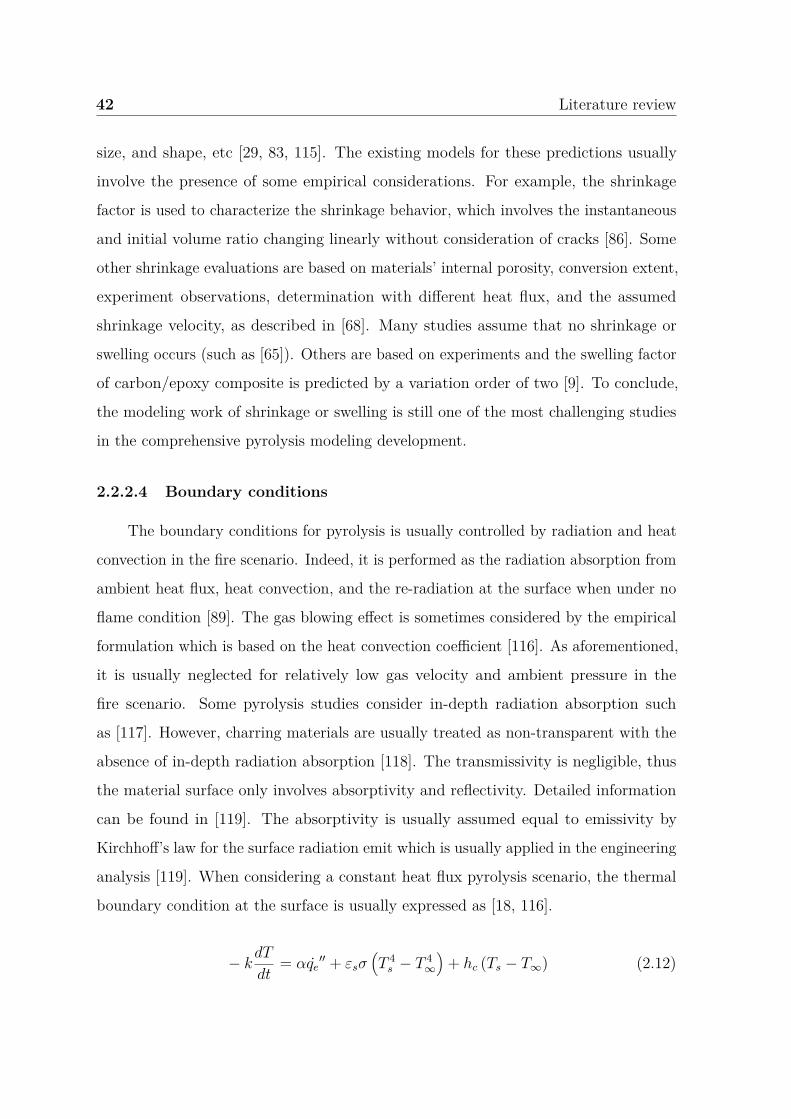
42 Literature review
size, and shape, etc [29, 83, 115]. The existing models for these predictions usually
involve the presence of some empirical considerations. For example, the shrinkage
factor is used to characterize the shrinkage behavior, which involves the instantaneous
and initial volume ratio changing linearly without consideration of cracks [86]. Some
other shrinkage evaluations are based on materials’ internal porosity, conversion extent,
experiment observations, determination with different heat flux, and the assumed
shrinkage velocity, as described in [68]. Many studies assume that no shrinkage or
swelling occurs (such as [65]). Others are based on experiments and the swelling factor
of carbon/epoxy composite is predicted by a variation order of two [9]. To conclude,
the modeling work of shrinkage or swelling is still one of the most challenging studies
in the comprehensive pyrolysis modeling development.
2.2.2.4 Boundary conditions
The boundary conditions for pyrolysis is usually controlled by radiation and heat
convection in the fire scenario. Indeed, it is performed as the radiation absorption from
ambient heat flux, heat convection, and the re-radiation at the surface when under no
flame condition [89]. The gas blowing effect is sometimes considered by the empirical
formulation which is based on the heat convection coefficient [116]. As aforementioned,
it is usually neglected for relatively low gas velocity and ambient pressure in the
fire scenario. Some pyrolysis studies consider in-depth radiation absorption such
as [117]. However, charring materials are usually treated as non-transparent with the
absence of in-depth radiation absorption [118]. The transmissivity is negligible, thus
the material surface only involves absorptivity and reflectivity. Detailed information
can be found in [119]. The absorptivity is usually assumed equal to emissivity by
Kirchhoff’s law for the surface radiation emit which is usually applied in the engineering
analysis [119]. When considering a constant heat flux pyrolysis scenario, the thermal
boundary condition at the surface is usually expressed as [18, 116].
− kdT
dt= αqe
′′ + εsσ(T 4
s − T 4∞
)+ hc (Ts − T∞) (2.12)
2.2 Pyrolysis phenomenon in the fire scenario 43
Where qe′′ denotes the irradiant heat flux, Ts denotes the surface temperature, T∞
the ambient temperature, hc the surface heat convection coefficient, α the absorptivity,
εs the emissivity, and k denotes the thermal conductivity.
At the bottom surface, it is usually assumed impermeable [116] and the thermal
boundary condition is usually performed in two ways: thermal adiabatic, thermal
radiation and convection [119, 120]. However, for many studies concerning pyrolysis in
fire scenarios such as cone calorimeter, the sample back surface is protected by thermal
insulation materials [121]. Due to the low temperature at the back surface of insulation
materials, the bottom surface thermal boundary condition is only influenced by heat
convection [5].
2.2.2.5 Pyrolysis model evaluation
The pyrolysis model in Fire Dynamics Simulator (FDS) [44], Thermal Kinetic
Model of Burning (Thermakin) [122], Gpyro [32], and pyrolysis model in FireFOAM [123]
developed by FM global are the most used pyrolysis models in the fire community.
They are all generalized comprehensive pyrolysis models that integrate the finite rate
reaction, transient heat transfer, and mass transfer to solve different sets of conservation
equations for CFD numerical analysis.
FDS pyrolysis model involves the one-dimensional heat transfer process considering
different pyrolysis reactions. A three-dimensional beta version could be performed
currently and the different gas and solid production occur for the reaction. It can
also consider the in-depth radiation process. The computation domain can be cubic,
cylinder, and spherical. The surface boundary conditions consist of heat convection
and radiation and a similar surface boundary condition or adiabatic can be performed
at the back surface. Several assumptions are taken, for example, gas volatiles release
infinitely to the surface, local thermal equilibrium, no gas mass transport, and negligible
gas condensation. The shrinkage and swelling prediction can be conducted based on
material density variation during the pyrolysis process [44].
44 Literature review
FireFOAM is a large eddy simulation solver permitting to study fire-related
scenarios such as gas and condensed phase. It is developed based on OpenFOAM which
is an open-source CFD package. Only the surface pyrolysis phenomenon is considered,
the interior condensed phase is assumed inert. Thus, energy conservation is exclusively
implemented for the boundary condition [39, 77].
The Thermakin model can implement transient kinetics, heat transfer, and mass
transfer process. For example, the first-order or second-order Arrhenius equation
can be solved, heat convection transfer and in-depth radiation are considered [124].
Currently, it can also study the flame spread [43]. The reaction schemes can be
performed with parallel or multi-step forms [43]. One-dimensional and two-dimensional
pyrolysis processes can be performed and transient swelling problems can also be
estimated [82, 125]. The thermal conductivity and specific heat capacity in Thermakin
are treated as temperature-dependent. Instantaneous heat convection is assumed with
the absence of gas momentum. Gas mass transport is governed by a concentration
gradient [10, 126]. The target material is treated as a mixture containing different layers
of components [76]. These components have their intrinsic properties, for example,
density, specific heat capacity, and thermal conductivity. The boundary conditions of
material sides for Thermakin2D is assumed adiabatic and impenetrable [43]. Inverse
modeling has been widely conducted by using Thermakin, such as the work to estimate
the thermophysical parameters of carbon fiber composite with related experiments [21].
Gpyro is an open-source pyrolysis model, which can study zero-dimensional, one-
dimensional, two-dimensional, and three-dimensional problems, respectively. All the
parameters such as specific heat capacity and thermal conductivity used in Gpyro are
treated by average volume or mass fraction, and thermal equilibrium is assumed for
the finite gas release. The bottom surface is usually treated as impenetrable and only
heat convection is considered due to the low re-radiation under low temperature. The
side surface is considered adiabatic. Material surface regression as well as in-depth
radiation are integrated into the model [60]. The conservation equations in Gpyro
involve gas phase mass and species, condensed phase mass and species, momentum,
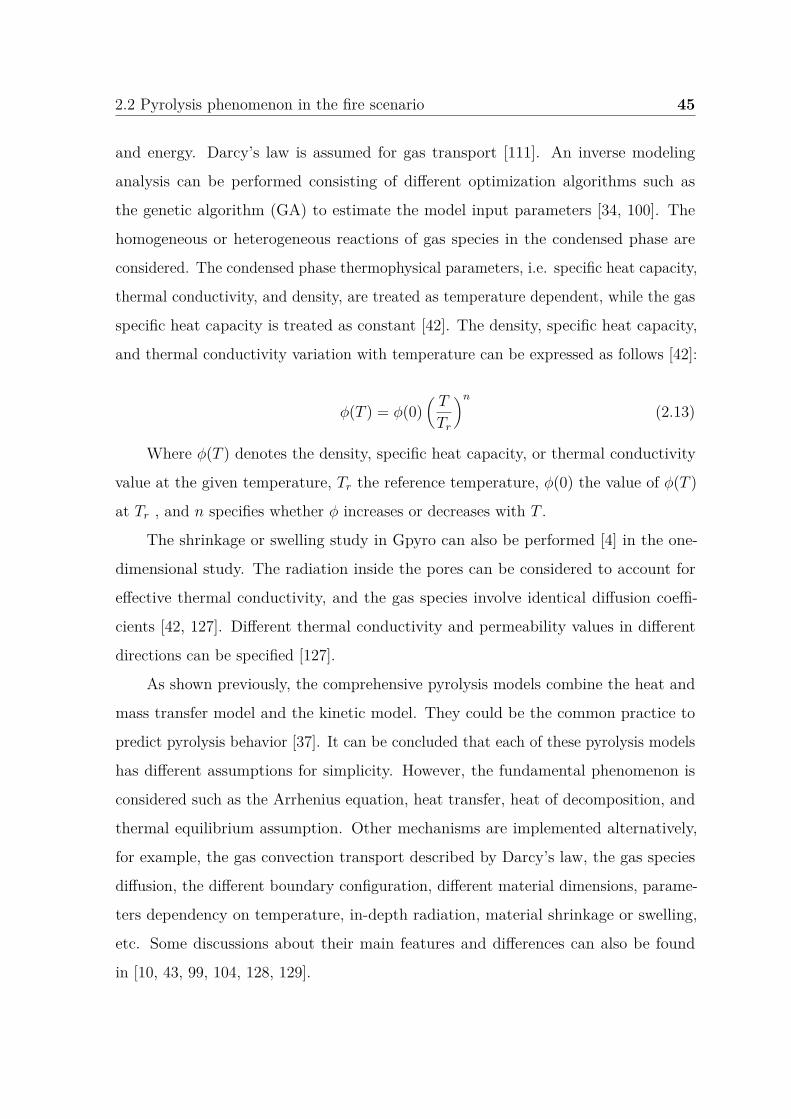
2.2 Pyrolysis phenomenon in the fire scenario 45
and energy. Darcy’s law is assumed for gas transport [111]. An inverse modeling
analysis can be performed consisting of different optimization algorithms such as
the genetic algorithm (GA) to estimate the model input parameters [34, 100]. The
homogeneous or heterogeneous reactions of gas species in the condensed phase are
considered. The condensed phase thermophysical parameters, i.e. specific heat capacity,
thermal conductivity, and density, are treated as temperature dependent, while the gas
specific heat capacity is treated as constant [42]. The density, specific heat capacity,
and thermal conductivity variation with temperature can be expressed as follows [42]:
ϕ(T ) = ϕ(0)(T
Tr
)n
(2.13)
Where ϕ(T ) denotes the density, specific heat capacity, or thermal conductivity
value at the given temperature, Tr the reference temperature, ϕ(0) the value of ϕ(T )
at Tr , and n specifies whether ϕ increases or decreases with T .
The shrinkage or swelling study in Gpyro can also be performed [4] in the one-
dimensional study. The radiation inside the pores can be considered to account for
effective thermal conductivity, and the gas species involve identical diffusion coeffi-
cients [42, 127]. Different thermal conductivity and permeability values in different
directions can be specified [127].
As shown previously, the comprehensive pyrolysis models combine the heat and
mass transfer model and the kinetic model. They could be the common practice to
predict pyrolysis behavior [37]. It can be concluded that each of these pyrolysis models
has different assumptions for simplicity. However, the fundamental phenomenon is
considered such as the Arrhenius equation, heat transfer, heat of decomposition, and
thermal equilibrium assumption. Other mechanisms are implemented alternatively,
for example, the gas convection transport described by Darcy’s law, the gas species
diffusion, the different boundary configuration, different material dimensions, parame-
ters dependency on temperature, in-depth radiation, material shrinkage or swelling,
etc. Some discussions about their main features and differences can also be found
in [10, 43, 99, 104, 128, 129].
46 Literature review
Due to the complexity of the pyrolysis process, it is not possible to consider many
different physical and chemical mechanisms. With the presence of some underlying
phenomenon, it can be quite reasonably acceptable while neglecting the ones imposing
minor effects. Moreover, it can also balance the model uncertainty and computation
cost. The model validation work has been widely conducted to compare the results
performed by different pyrolysis models, they can be found in [34, 128–130]. Indeed,
the model validation process involves many problems, for example, the initial detailed
material properties, char residue uncertainties, shrinkage, crack and swelling, kinetic
parameters, etc [58]. Also, many complicated materials involve anisotropic properties,
then, the consideration of corresponding tensor analysis needs to be specified such
as thermal conductivity and permeability, and some thermophysical parameters are
highly temperature-dependent [58, 89]. For example, the carbon/epoxy composite is
usually assumed as isotropic and this assumption could give us many errors for its
constituents which have distinguished intrinsic properties, such as much higher thermal
conductivity of carbon fiber than that of epoxy matrix [7, 14]. However, very limited
studies concern the anisotropic characteristics of composite materials [58].
The model used in this work has some similarities compared with these mentioned
pyrolysis models. For example, the assumption with no shrinkage/expansion or
crack/delamination is involved. Each elementary reaction is implemented with an nth
reaction model in the Arrhenius equation form. The thermophysical properties, i.e.
specific heat capacity and thermal conductivity, are specified to vary on the dependence
of temperature. Darcy’s law is formulated to characterize the pressure and gas flow
behavior. However, some different features can be found. The thermal conductivity
tensor is inherited to implement the energy conservation equation. Three-dimensional
simulations coupling with flexible boundary condition implementation can be achieved
including thermal radiation and convection boundary condition at different surfaces.
Detailed model description in this study is presented in Chapter 3.
2.3 Multi-scale experiment and parameters estimation 47
2.3 Multi-scale experiment and parameters estima-
tion
There are three main steps for pyrolysis modeling: conservation and boundary
equations, input parameters, and model validation. The conservation and boundary
equations involve different pyrolysis mechanisms and relevant assumptions described
mathematically. The input parameters, for example, the kinetics, thermophysical and
numerical parameters, etc., are employed for model implementation. The validation
work involves a comparison between the model prediction and experimental data [100].
Due to the complexity of overlap thermophysical and chemical mechanisms during
the pyrolysis process, studies at different scales are usually performed to separate
them for simplicity and detailed analysis [10, 130]. For the experimental data used
for model validation, it could be milligram-scale, bench-scale, and large-scale under
different configurations [129]. The milligram-scale and bench-scale studies are commonly
employed for pyrolysis experiments and pyrolysis modeling for their cost efficiency
and scientific accuracy [11, 130]. The TGA and cone calorimeter are widely applied
concerning milligram-scale and bench-scale experiments in the fire community such
as the work from [22, 129]. This multi-scale study is usually adopted for pyrolysis
modeling validation work. The common idea is to obtain the kinetic parameters from
TGA experiments coupling with related model fitting optimization methods. These
kinetic parameters are integrated into thermophysical parameters in order to validate
the heat and mass transfer process in cone calorimeter experiments as noted in [121, 51].
The sample size has a significant effect on pyrolysis behavior such as milligram-scale
TGA and bench-scale cone calorimeter experiments and some dimensionless numbers
or parameters are usually adopted to characterize this behavior. The Py number is
usually applied for describing pyrolysis controlled by heat or by a chemical process,
while the Biot number is used to differentiate the thermally-thin or thermally-thick
materials [37, 38, 58, 131]. The interaction map for Py and Biot number is shown in
Figure 2.15 [38].
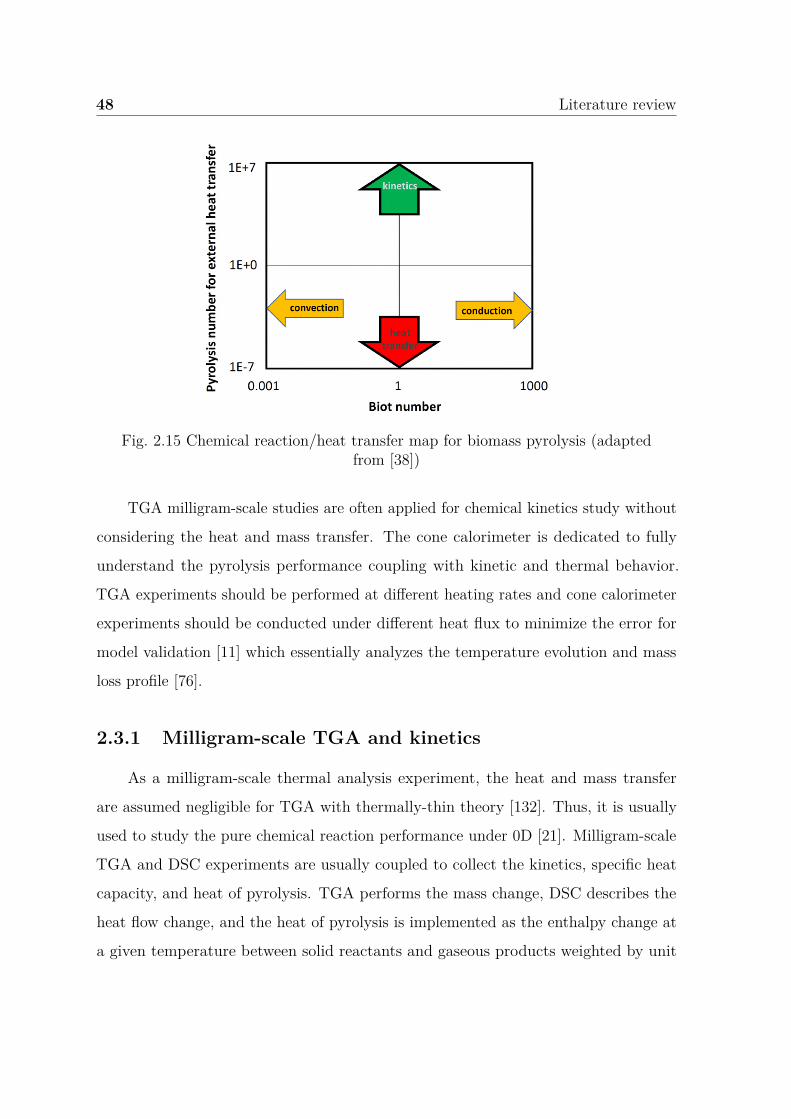
48 Literature review
Fig. 2.15 Chemical reaction/heat transfer map for biomass pyrolysis (adaptedfrom [38])
TGA milligram-scale studies are often applied for chemical kinetics study without
considering the heat and mass transfer. The cone calorimeter is dedicated to fully
understand the pyrolysis performance coupling with kinetic and thermal behavior.
TGA experiments should be performed at different heating rates and cone calorimeter
experiments should be conducted under different heat flux to minimize the error for
model validation [11] which essentially analyzes the temperature evolution and mass
loss profile [76].
2.3.1 Milligram-scale TGA and kinetics
As a milligram-scale thermal analysis experiment, the heat and mass transfer
are assumed negligible for TGA with thermally-thin theory [132]. Thus, it is usually
used to study the pure chemical reaction performance under 0D [21]. Milligram-scale
TGA and DSC experiments are usually coupled to collect the kinetics, specific heat
capacity, and heat of pyrolysis. TGA performs the mass change, DSC describes the
heat flow change, and the heat of pyrolysis is implemented as the enthalpy change at
a given temperature between solid reactants and gaseous products weighted by unit
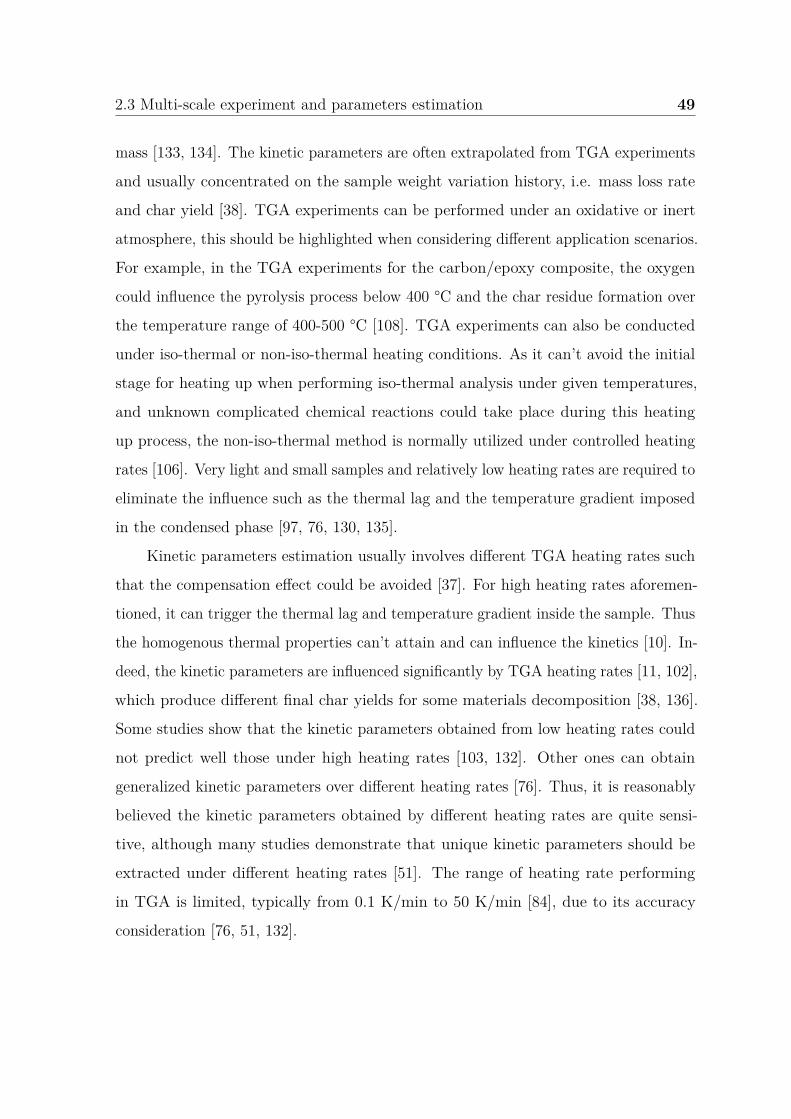
2.3 Multi-scale experiment and parameters estimation 49
mass [133, 134]. The kinetic parameters are often extrapolated from TGA experiments
and usually concentrated on the sample weight variation history, i.e. mass loss rate
and char yield [38]. TGA experiments can be performed under an oxidative or inert
atmosphere, this should be highlighted when considering different application scenarios.
For example, in the TGA experiments for the carbon/epoxy composite, the oxygen
could influence the pyrolysis process below 400 °C and the char residue formation over
the temperature range of 400-500 °C [108]. TGA experiments can also be conducted
under iso-thermal or non-iso-thermal heating conditions. As it can’t avoid the initial
stage for heating up when performing iso-thermal analysis under given temperatures,
and unknown complicated chemical reactions could take place during this heating
up process, the non-iso-thermal method is normally utilized under controlled heating
rates [106]. Very light and small samples and relatively low heating rates are required to
eliminate the influence such as the thermal lag and the temperature gradient imposed
in the condensed phase [97, 76, 130, 135].
Kinetic parameters estimation usually involves different TGA heating rates such
that the compensation effect could be avoided [37]. For high heating rates aforemen-
tioned, it can trigger the thermal lag and temperature gradient inside the sample. Thus
the homogenous thermal properties can’t attain and can influence the kinetics [10]. In-
deed, the kinetic parameters are influenced significantly by TGA heating rates [11, 102],
which produce different final char yields for some materials decomposition [38, 136].
Some studies show that the kinetic parameters obtained from low heating rates could
not predict well those under high heating rates [103, 132]. Other ones can obtain
generalized kinetic parameters over different heating rates [76]. Thus, it is reasonably
believed the kinetic parameters obtained by different heating rates are quite sensi-
tive, although many studies demonstrate that unique kinetic parameters should be
extracted under different heating rates [51]. The range of heating rate performing
in TGA is limited, typically from 0.1 K/min to 50 K/min [84], due to its accuracy
consideration [76, 51, 132].
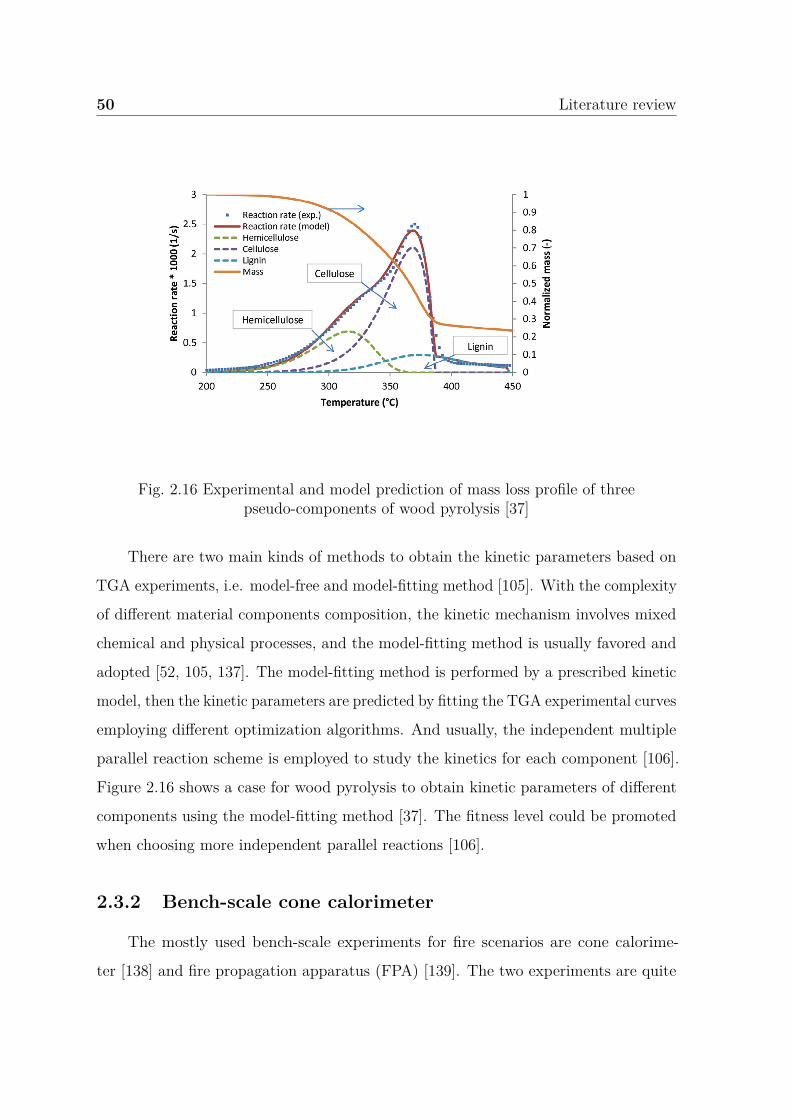
50 Literature review
Fig. 2.16 Experimental and model prediction of mass loss profile of threepseudo-components of wood pyrolysis [37]
There are two main kinds of methods to obtain the kinetic parameters based on
TGA experiments, i.e. model-free and model-fitting method [105]. With the complexity
of different material components composition, the kinetic mechanism involves mixed
chemical and physical processes, and the model-fitting method is usually favored and
adopted [52, 105, 137]. The model-fitting method is performed by a prescribed kinetic
model, then the kinetic parameters are predicted by fitting the TGA experimental curves
employing different optimization algorithms. And usually, the independent multiple
parallel reaction scheme is employed to study the kinetics for each component [106].
Figure 2.16 shows a case for wood pyrolysis to obtain kinetic parameters of different
components using the model-fitting method [37]. The fitness level could be promoted
when choosing more independent parallel reactions [106].
2.3.2 Bench-scale cone calorimeter
The mostly used bench-scale experiments for fire scenarios are cone calorime-
ter [138] and fire propagation apparatus (FPA) [139]. The two experiments are quite
2.3 Multi-scale experiment and parameters estimation 51
similar, they all have a well-defined heat radiation configuration and one-dimensional
heat conduction can be reasonably assumed [43]. The mass loss rate and temperature
evolution data can be gathered [10, 140]. Moreover, many other parameters related to
combustion can be collected such as the time to ignition, heat release rate, etc [102, 140].
The major difference involves the radiant system used by each device. The infrared
lamp heaters in FPA could not guarantee a complete range of radiative wavelength
used in the fire scenario [10, 130], and some theoretical radiation studies show that
this radiation wavelength difference between FPA and cone calorimeter could account
for the different pyrolysis results under the same configurations [94].
The standard cone calorimeter (ISO 5660) [138] is often utilized under ambient
atmosphere, and it involves the sample surface area of 100×100 mm2 with a thickness
of several millimeters. The conical heater is mounted to provide a controlled irradiance
from 0 to 100 kW/m2 by heat flux gauge calibration at the center of the sample top
surface. The distance between the cone heater and sample top surface is usually
fixed to 25 mm [11, 141, 142]. The piloted ignition can be triggered by the spark
igniter [121] and the mass loss history is calibrated by a load cell and related data
collection system [102]. The sample holder and thermal insulation material are usually
wrapped around the sample sides and bottom surface, as aforementioned that the cone
calorimeter is assumed reasonably as one-dimensional. Thus the heating loss from sides
is usually neglected [128]. A schematic of the experiment setup of the cone calorimeter
is shown in Figure 2.17 [54].
In some studies, the sample sides and bottom surface, or just the bottom surface,
are also wrapped with a thin aluminum layer such that no gas can release to the
sample holder to ensure the sample completeness and provide a perfect impenetrable
boundary condition [36, 82, 140, 141, 143]. It could be a factor influencing the in-depth
temperature evolution although it is quite thin and no difference of mass loss rate
present in some work such as [9]. And for the back surface boundary condition, a
heat convection condition is performed [18], or an adiabatic assumption is considered
due to the thermal insulation material [54, 55]. The radiation at the back is usually
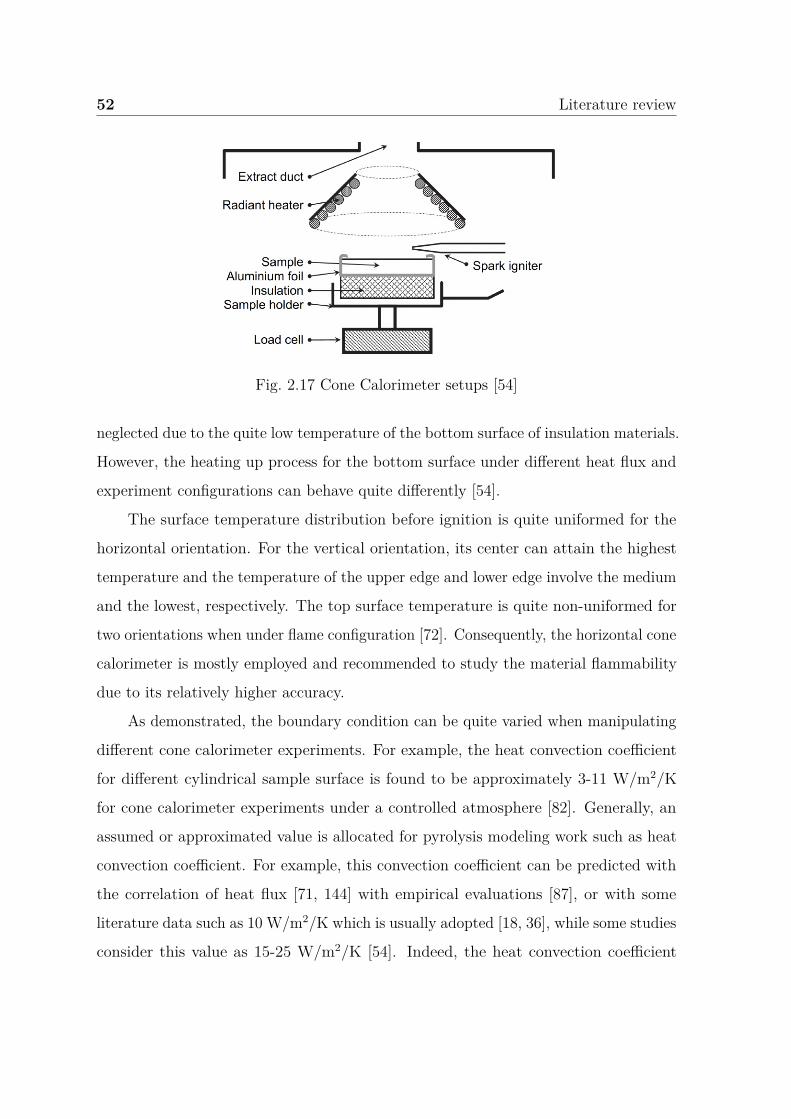
52 Literature review
Fig. 2.17 Cone Calorimeter setups [54]
neglected due to the quite low temperature of the bottom surface of insulation materials.
However, the heating up process for the bottom surface under different heat flux and
experiment configurations can behave quite differently [54].
The surface temperature distribution before ignition is quite uniformed for the
horizontal orientation. For the vertical orientation, its center can attain the highest
temperature and the temperature of the upper edge and lower edge involve the medium
and the lowest, respectively. The top surface temperature is quite non-uniformed for
two orientations when under flame configuration [72]. Consequently, the horizontal cone
calorimeter is mostly employed and recommended to study the material flammability
due to its relatively higher accuracy.
As demonstrated, the boundary condition can be quite varied when manipulating
different cone calorimeter experiments. For example, the heat convection coefficient
for different cylindrical sample surface is found to be approximately 3-11 W/m2/K
for cone calorimeter experiments under a controlled atmosphere [82]. Generally, an
assumed or approximated value is allocated for pyrolysis modeling work such as heat
convection coefficient. For example, this convection coefficient can be predicted with
the correlation of heat flux [71, 144] with empirical evaluations [87], or with some
literature data such as 10 W/m2/K which is usually adopted [18, 36], while some studies
consider this value as 15-25 W/m2/K [54]. Indeed, the heat convection coefficient
2.3 Multi-scale experiment and parameters estimation 53
is influenced by gas velocity, sample geometry, the temperature variation, etc [94].
Thus, it is reasonably correct to consider a higher heat convection coefficient when the
buoyancy effect dominates during the pyrolysis process in comparison with pure heat
conduction tests.
For the sample temperature measurement during the pyrolysis process under cone
calorimeter, the commonly used are the thermocouples embedded in the sample [145]
and the infrared camera to predict the surface temperature such as [10, 82, 89, 96,
145, 120]. The benefit of using an infrared camera during the pyrolysis test is that
the temperature and mass evolution history can be collected simultaneously without
contact with the sample [130]. The sample surface is sometimes painted black during
the pyrolysis process to correct the emissivity which can seriously affect the temperature
evolution [76, 82, 130].
The thermocouple temperature measurement applies the Seebeck thermoelectric
effect for sensing the temperature difference, i.e. the feedback of the junction of two
dissimilar wires [146]. Thus, the junction can determine the accuracy of temperature
measurement results and many factors can influence the junction performance such as
the diameter and environment configuration. Usually, very thin and shield protective
implementations are considered [146]. For the environmental factors of the junction,
many factors can influence the errors of thermocouple measurement. For example, the
catalytic reaction effects, heat flow convection, heat conduction, and radiation, espe-
cially at high temperature and transient chemical reaction scenario [146–149]. As shown
in Figure 2.18 with a schematic of the heat transfer process for a thermocouple [148].
At high temperature and small gas velocity (Ma=0.2), the radiation errors possess
the largest uncertainty of which some energy is radiated to the environment [147], the
conduction and the catalytic effect is relatively quite small [148].
The thermocouple junction contact and its location shift within the material are
quite uncertain due to the complex structure change during pyrolysis [76], especially
at high temperatures [76]. There are two common ways to perform the thermocouple
setup, the first one is to be inserted horizontally which is perpendicular to the gas
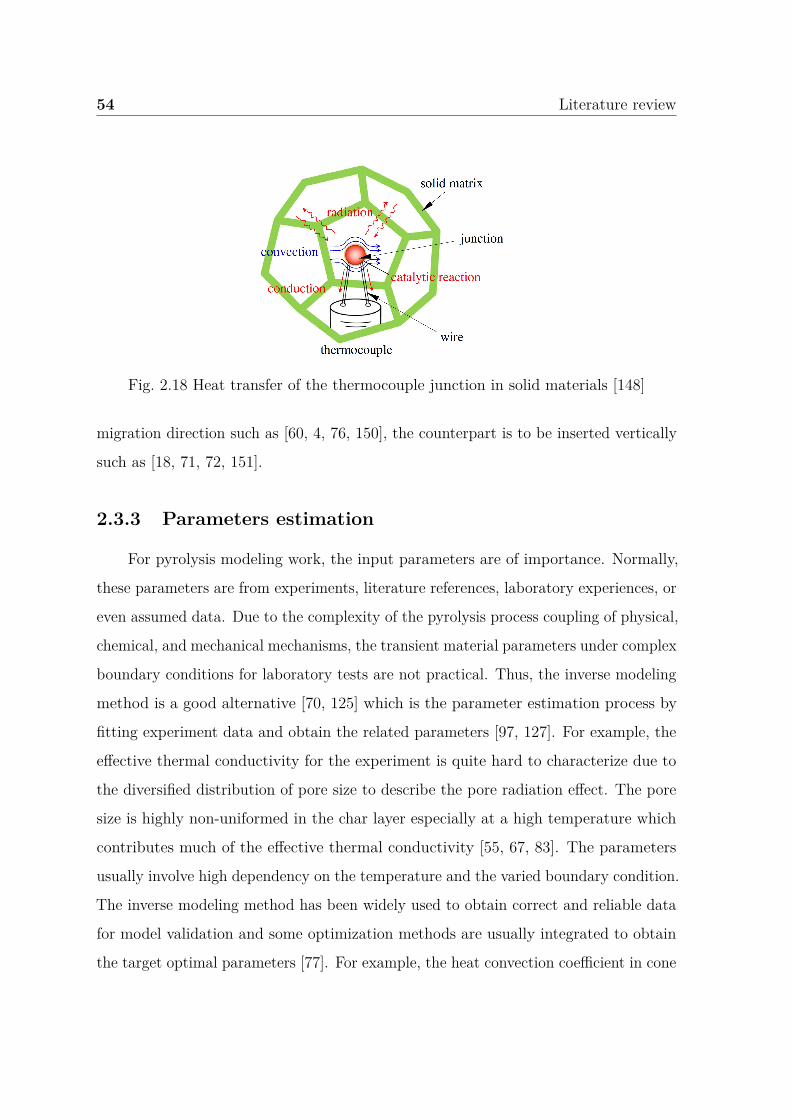
54 Literature review
Fig. 2.18 Heat transfer of the thermocouple junction in solid materials [148]
migration direction such as [60, 4, 76, 150], the counterpart is to be inserted vertically
such as [18, 71, 72, 151].
2.3.3 Parameters estimation
For pyrolysis modeling work, the input parameters are of importance. Normally,
these parameters are from experiments, literature references, laboratory experiences, or
even assumed data. Due to the complexity of the pyrolysis process coupling of physical,
chemical, and mechanical mechanisms, the transient material parameters under complex
boundary conditions for laboratory tests are not practical. Thus, the inverse modeling
method is a good alternative [70, 125] which is the parameter estimation process by
fitting experiment data and obtain the related parameters [97, 127]. For example, the
effective thermal conductivity for the experiment is quite hard to characterize due to
the diversified distribution of pore size to describe the pore radiation effect. The pore
size is highly non-uniformed in the char layer especially at a high temperature which
contributes much of the effective thermal conductivity [55, 67, 83]. The parameters
usually involve high dependency on the temperature and the varied boundary condition.
The inverse modeling method has been widely used to obtain correct and reliable data
for model validation and some optimization methods are usually integrated to obtain
the target optimal parameters [77]. For example, the heat convection coefficient in cone
2.3 Multi-scale experiment and parameters estimation 55
calorimeter can be collected by inverse modeling [144]. The consideration of constant
values for specific heat capacity and thermal conductivity could be the main reasons
accounting for worse prediction of in-depth temperature evolution, and it can influence
the pyrolysis rate [58]. Some parameters estimation are based on the extent of reaction
degrees, such as the specific heat, thermal conductivity, porosity, and permeability
which are treated as the linear interpolation of virgin and char values [41, 92].
However, inverse modeling has some requirements such as the experiment accu-
racy and a comprehensive model. This model can describe multiple physicochemical
processes and specific boundary conditions [32]. Due to the complexity of kinetic
mechanisms, the inverse modeling work for obtaining the kinetic parameters is quite
dependent on the reaction schemes prescribed which could provide some errors. In
order to make the kinetic parameters reliable for different configurations, the kinetic
parameters obtained from inverse modeling are sometimes compared to those calculated
by the model-free method [56, 95]. And the common compensation effect is usually
avoided by conducting the inverse modeling work by different heating rates [152].
Indeed, some parameters obtained from the inverse modeling can be model-specific
due to the uncertainty from many aspects. For example, when using cone calorimeter
experimental mass loss rate and temperature profile coupling with genetic algorithm
method to obtain optimal parameters, it is sensitive to the experiment data, the
model assumption simplicity, and boundary condition [53]. These parameters are
obtained from model estimation and could be of non-physical meaning for practical
usage [153]. However, based on the accurate assumption representation used in the
model, this method has the capability and flexibility to predict different parameters
that have the true physical meaning of materials properties to be applied in a large
range of scenarios as noted in [10, 99, 117]. Indeed, the inverse modeling method can be
applied to predict the parameters based on the milligram-scale and bench-scale experi-
ments. Relevant optimization process are mainly performed by different optimization
algorithms [36, 76, 99, 116, 117, 124].
56 Literature review
Sometimes, the manual optimization way can also provide optimal results [104]
such as the steady or transient heat conduction process. One of the most used
optimization methods is the genetic algorithm (GA) and related comparison between the
experiment data and optimization value can be found [32, 100, 116]. TGA experiments
coupled with the genetic algorithm optimization are usually employed to obtain the
kinetic parameters with different reaction schemes involved [137]. Indeed, in the
fire scenario, the optimization process usually involves the evolution algorithms of
interest which possess the robustness for multi-variable optimization such as GA
(genetic algorithm), Shuffled Complex Evolution (SCE), and Stochastic Hill Climbing
(SHC) [10, 52, 53, 91, 99, 104, 97, 117, 133, 152].Some work shows that GA and SCE
could provide better fitness than SHC [104]. The iteration process for these evolution
algorithms is followed. Firstly, many individuals are initialized which accounts for
the probability of target parameters. Then, the individuals are selected to fit the
experimental data and progress the reproduction toward another generation while
keeping the convergence. Lastly, the optimal parameters can be gained over many
population numbers under prescribed fitness function [10, 104].
The bench-scale experimental data can be applied for parameters estimation, and
it can be also used for model validation while employing micro-scale experiments to
estimate the parameters such as [153]. Indeed, inverse modeling has been used to
obtain the charring material kinetic parameters and heat of reaction using TGA and
DSC experiments with the pyrolysis model Thermakin [132]. The thermal conductivity
and specific heat capacity are obtained under different heat fluxes based on bench-scale
mass loss rate and temperature data at the top surface or bottom surface [32, 125].
Due to the large number of input parameters to be estimated [91, 94], some
priorities should be given. For example, the specific heat capacity of wood and char
play an important role in model validation, while the gas specific heat capacity influence
could be negligible [58]. Thus, it is sensible to predict the most uncertain parameters
such as specific heat capacity, thermal conductivity, boundary parameters, and heat
2.4 Conclusion 57
convection coefficients, while other physical parameters such as density and emissivity
can be captured in advance.
2.4 Conclusion
This chapter provides a complete background for pyrolysis modeling study. Firstly,
the target porous charring materials are focused on wood and carbon/epoxy composite
in this study. Their fundamental chemical and physical properties are evaluated,
especially different components inside the materials. Similarities and differences are
discussed, wood can be assumed as isotropic while carbon/epoxy composite involves
anisotropic properties considering thermal conductivity differences at different direc-
tions.
The pyrolysis processes of these two materials in the fire scenario are described
under chemical, heat, and mass transfer as well as physical structure change aspects.
Similarities of char layer formation pose a great effect on the pyrolysis process, while
wood shrinkage and carbon/epoxy composite delamination make these two materials
pyrolysis with a large difference. Different types of pyrolysis models are evaluated from
simple to comprehensive pyrolysis models. The comprehensive pyrolysis model is given
emphasis which mainly couples with chemical reactions, heat, and mass transfer. The
elementary models concerning these three parts are formulated mathematically which
mainly employ the Arrhenius equation and Darcy’s law. Then the pyrolysis models
developed in the fire community are described briefly, their benefits and inefficiencies
are evaluated.
The pyrolysis model validation process involves the comparison of model prediction
against the experimental data. Milligram-scale TGA and bench-scale experimental cone
calorimeter tests are introduced and described when considering different characteristic
length scales under thermally thin and thermally thick theory. Different input param-
eters to implement the pyrolysis model are discussed, and they are mainly collected
with chemical and thermophysical parameters. The kinetic properties are specified
58 Literature review
to control the pyrolysis reaction while the thermophysical properties determine the
heat and mass transfer process. Kinetic parameters are mainly estimated by TGA
experiments by fitting with the corresponding mass loss profiles based on pyrolysis
modeling. The curve fitting inverse analysis method is usually employed to characterize
the thermophysical properties as a supplementary of the experimental way.
Based on the aforementioned pyrolysis modeling process description with different
aspects, the following chapter will present a new pyrolysis model PATO to overcome
some inefficiencies of current pyrolysis models in the fire community. This model involves
volume averaging theory assumption, and relevant conservation equations containing
thermal conductivity and permeability tensor are described. It can be implemented
with flexible convective boundary conditions on different surfaces. Employing this
model, the kinetic parameters, thermophysical parameters, and boundary condition
parameters are also collected with some level of accuracy. They are estimated with
different simulation options to be inherited as the input parameters to finally validate
this pyrolysis model.
Chapter 3
Description of the PATO solver
The Porous material Analysis Toolbox based on OpenFOAM (PATO) [154] is an
open-source (GNU GPL) numerical solver released by NASA to analyze the heat and
mass transfer process of reactive porous materials, for example, the charring material
pyrolysis behavior. This solver solves the partial differential equations by the finite-
volume method. PATO also integrates Mutation++ as a third party library which is
developed by Von Karman Institute for Fluid Dynamics [155]. The Mutation++ is
used for computing equilibrium chemical reactions which include the database for gas
chemical compositions, thermodynamics, and transport. PATO is developed initially
for the charring ablator, i.e. the Phenolic Impregnated Carbon Ablator (PICA), which
is utilized in the thermal protection system for aerospace vehicle re-entry involving
rigorous boundary heating conditions. This boundary accounts for the high-enthalpy
gas flow. The gas under the aerothermal environment with high pressure and the
temperature is controlled by convection heat flux while radiation heat flux is less
predominant. The boundary layer is treated as thermal equilibrium for chemical
reaction, heat transfer, and mass transfer, which deal with the interaction among
ambient gas, pyrolysis gas, and surface char layer. PATO can solve zero-dimensional,
one-dimensional, two-dimensional, and three-dimensional problems.
The main features and handling process in PATO can be collected as follows:
different solid phases and individual gas phase are introduced in the solver and are
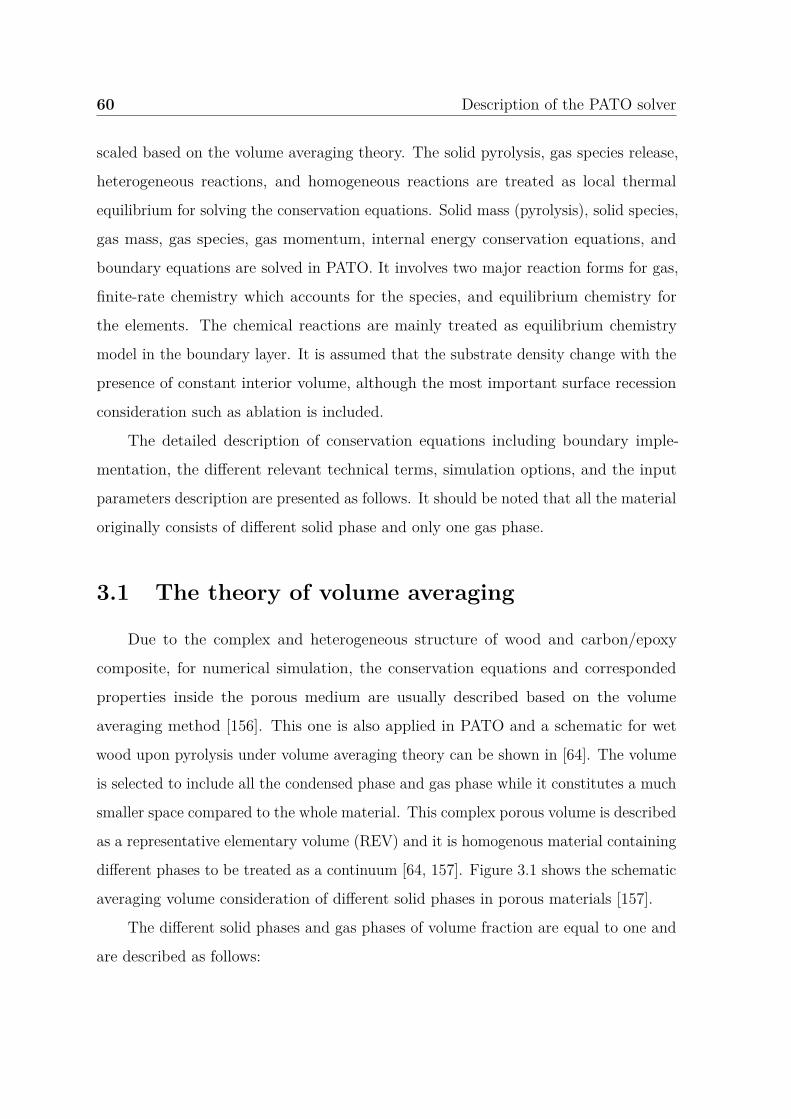
60 Description of the PATO solver
scaled based on the volume averaging theory. The solid pyrolysis, gas species release,
heterogeneous reactions, and homogeneous reactions are treated as local thermal
equilibrium for solving the conservation equations. Solid mass (pyrolysis), solid species,
gas mass, gas species, gas momentum, internal energy conservation equations, and
boundary equations are solved in PATO. It involves two major reaction forms for gas,
finite-rate chemistry which accounts for the species, and equilibrium chemistry for
the elements. The chemical reactions are mainly treated as equilibrium chemistry
model in the boundary layer. It is assumed that the substrate density change with the
presence of constant interior volume, although the most important surface recession
consideration such as ablation is included.
The detailed description of conservation equations including boundary imple-
mentation, the different relevant technical terms, simulation options, and the input
parameters description are presented as follows. It should be noted that all the material
originally consists of different solid phase and only one gas phase.
3.1 The theory of volume averaging
Due to the complex and heterogeneous structure of wood and carbon/epoxy
composite, for numerical simulation, the conservation equations and corresponded
properties inside the porous medium are usually described based on the volume
averaging method [156]. This one is also applied in PATO and a schematic for wet
wood upon pyrolysis under volume averaging theory can be shown in [64]. The volume
is selected to include all the condensed phase and gas phase while it constitutes a much
smaller space compared to the whole material. This complex porous volume is described
as a representative elementary volume (REV) and it is homogenous material containing
different phases to be treated as a continuum [64, 157]. Figure 3.1 shows the schematic
averaging volume consideration of different solid phases in porous materials [157].
The different solid phases and gas phases of volume fraction are equal to one and
are described as follows:
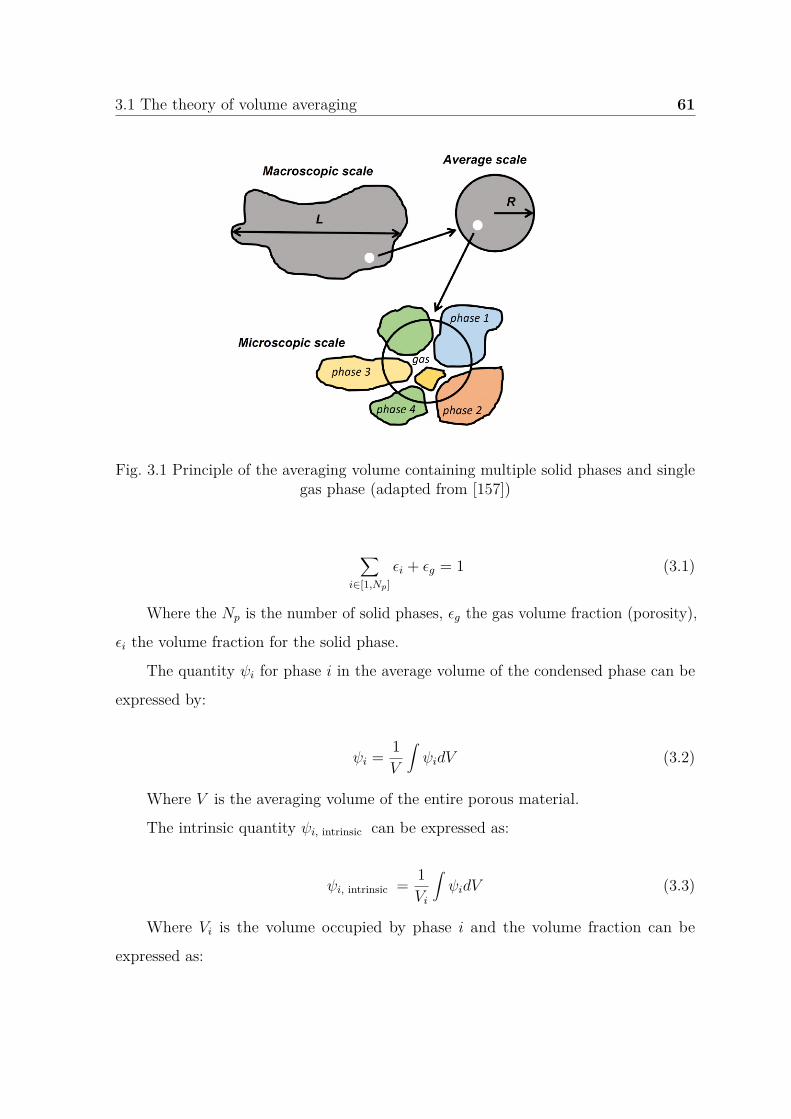
3.1 The theory of volume averaging 61
Fig. 3.1 Principle of the averaging volume containing multiple solid phases and singlegas phase (adapted from [157])
∑i∈[1,Np]
ϵi + ϵg = 1 (3.1)
Where the Np is the number of solid phases, ϵg the gas volume fraction (porosity),
ϵi the volume fraction for the solid phase.
The quantity ψi for phase i in the average volume of the condensed phase can be
expressed by:
ψi = 1V
∫ψidV (3.2)
Where V is the averaging volume of the entire porous material.
The intrinsic quantity ψi, intrinsic can be expressed as:
ψi, intrinsic = 1Vi
∫ψidV (3.3)
Where Vi is the volume occupied by phase i and the volume fraction can be
expressed as:
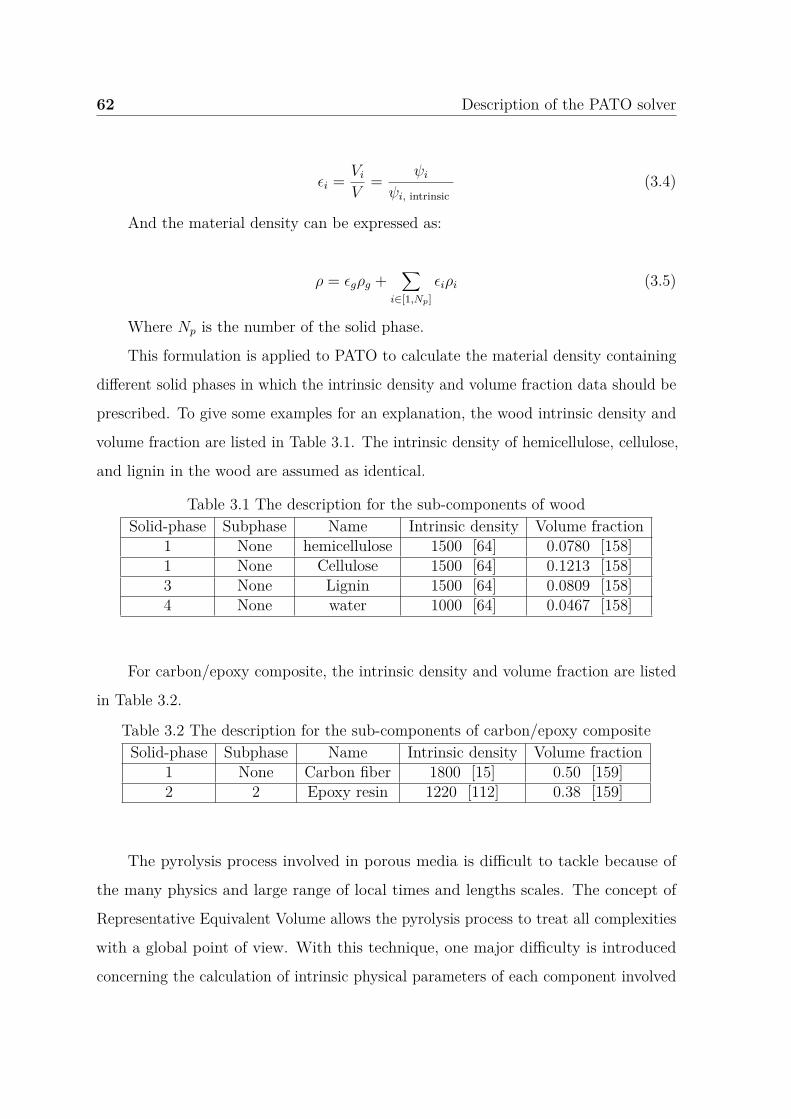
62 Description of the PATO solver
ϵi = Vi
V= ψi
ψi, intrinsic(3.4)
And the material density can be expressed as:
ρ = ϵgρg +∑
i∈[1,Np]ϵiρi (3.5)
Where Np is the number of the solid phase.
This formulation is applied to PATO to calculate the material density containing
different solid phases in which the intrinsic density and volume fraction data should be
prescribed. To give some examples for an explanation, the wood intrinsic density and
volume fraction are listed in Table 3.1. The intrinsic density of hemicellulose, cellulose,
and lignin in the wood are assumed as identical.
Table 3.1 The description for the sub-components of woodSolid-phase Subphase Name Intrinsic density Volume fraction
1 None hemicellulose 1500 [64] 0.0780 [158]1 None Cellulose 1500 [64] 0.1213 [158]3 None Lignin 1500 [64] 0.0809 [158]4 None water 1000 [64] 0.0467 [158]
For carbon/epoxy composite, the intrinsic density and volume fraction are listed
in Table 3.2.
Table 3.2 The description for the sub-components of carbon/epoxy compositeSolid-phase Subphase Name Intrinsic density Volume fraction
1 None Carbon fiber 1800 [15] 0.50 [159]2 2 Epoxy resin 1220 [112] 0.38 [159]
The pyrolysis process involved in porous media is difficult to tackle because of
the many physics and large range of local times and lengths scales. The concept of
Representative Equivalent Volume allows the pyrolysis process to treat all complexities
with a global point of view. With this technique, one major difficulty is introduced
concerning the calculation of intrinsic physical parameters of each component involved
3.2 Pyrolysis kinetics 63
in the condensed phase which is treated as “apparent” values. These values have to
be estimated by using upscaling techniques which are complicated to handle due to
the potential large range of times and length scales involved during pyrolysis. We can
point out that this field is still a challenge in the research community.
3.2 Pyrolysis kinetics
The pyrolysis kinetics of composite materials is a complex process. In the present
study, basic chemical mechanisms for wood and carbon composite are used in which
only parallel reactions are defined. As a first step, these kinds of mechanisms have been
chosen only for their simplicity because of the lack of interactions between components.
This is the first step to achieve before dealing with more complex chemical mechanisms.
Indeed, these models are quite acceptable when the chemistry is infinitely fast and
the overall pyrolysis process still govern by heat transfer into the porous media [75].
But depending on burning conditions, when the chemistry becomes finite rate, such
models are not qualified, and more complex mechanisms should be used to capture the
competition process between chemistry and heat transfer. In that case, the time and
length scales of these two processes are in the same order of magnitude. This aspect
will be discussed in the results part. So, in the following part, the chemical aspect of
the pyrolysis model is introduced through a progress variable dealing only with a set
of parallel reactions.
Each solid-phase i can involve different sub-phase pyrolysis mechanisms, and j
denotes the sub-phase, thus the pyrolysis process can be expressed as:
Pi,j →∑
k∈[1,Ne]ζi,j,kAk (3.6)
Where i ∈ [1, Np] , j ∈ [1, Pi], k denotes the gas element, Ne denotes the number of
gas elements, and Ak is the specific gas element produced by the subphase j in the solid
phase i, ζi,j,k is the related stoichiometric coefficient of the gas element production.
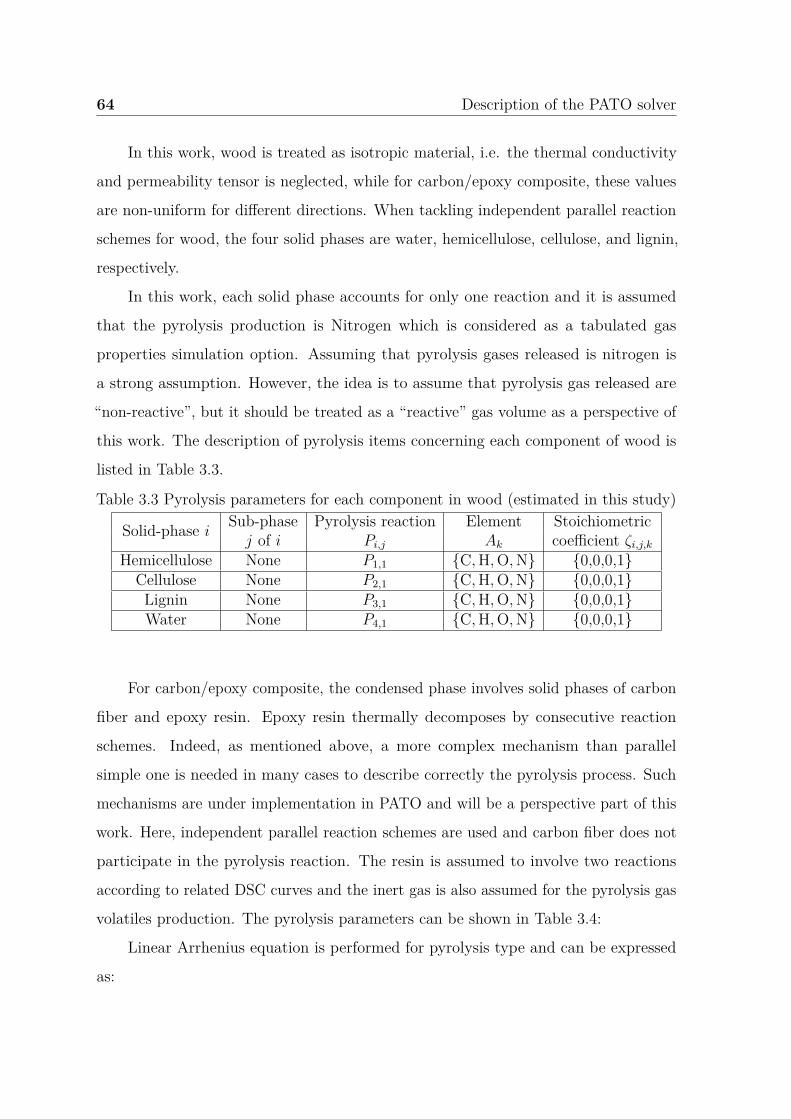
64 Description of the PATO solver
In this work, wood is treated as isotropic material, i.e. the thermal conductivity
and permeability tensor is neglected, while for carbon/epoxy composite, these values
are non-uniform for different directions. When tackling independent parallel reaction
schemes for wood, the four solid phases are water, hemicellulose, cellulose, and lignin,
respectively.
In this work, each solid phase accounts for only one reaction and it is assumed
that the pyrolysis production is Nitrogen which is considered as a tabulated gas
properties simulation option. Assuming that pyrolysis gases released is nitrogen is
a strong assumption. However, the idea is to assume that pyrolysis gas released are
“non-reactive”, but it should be treated as a “reactive” gas volume as a perspective of
this work. The description of pyrolysis items concerning each component of wood is
listed in Table 3.3.
Table 3.3 Pyrolysis parameters for each component in wood (estimated in this study)
Solid-phase i Sub-phase Pyrolysis reaction Element Stoichiometricj of i Pi,j Ak coefficient ζi,j,k
Hemicellulose None P1,1 {C,H,O,N} {0,0,0,1}Cellulose None P2,1 {C,H,O,N} {0,0,0,1}Lignin None P3,1 {C,H,O,N} {0,0,0,1}Water None P4,1 {C,H,O,N} {0,0,0,1}
For carbon/epoxy composite, the condensed phase involves solid phases of carbon
fiber and epoxy resin. Epoxy resin thermally decomposes by consecutive reaction
schemes. Indeed, as mentioned above, a more complex mechanism than parallel
simple one is needed in many cases to describe correctly the pyrolysis process. Such
mechanisms are under implementation in PATO and will be a perspective part of this
work. Here, independent parallel reaction schemes are used and carbon fiber does not
participate in the pyrolysis reaction. The resin is assumed to involve two reactions
according to related DSC curves and the inert gas is also assumed for the pyrolysis gas
volatiles production. The pyrolysis parameters can be shown in Table 3.4:
Linear Arrhenius equation is performed for pyrolysis type and can be expressed
as:
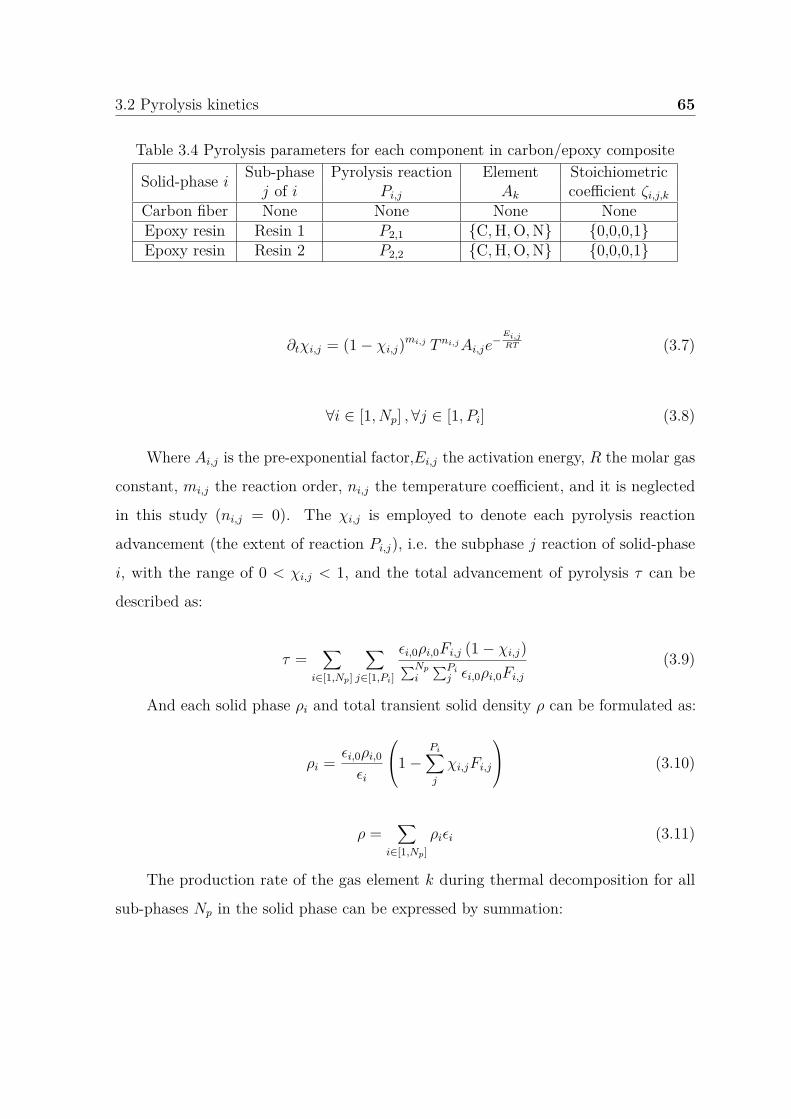
3.2 Pyrolysis kinetics 65
Table 3.4 Pyrolysis parameters for each component in carbon/epoxy composite
Solid-phase i Sub-phase Pyrolysis reaction Element Stoichiometricj of i Pi,j Ak coefficient ζi,j,k
Carbon fiber None None None NoneEpoxy resin Resin 1 P2,1 {C,H,O,N} {0,0,0,1}Epoxy resin Resin 2 P2,2 {C,H,O,N} {0,0,0,1}
∂tχi,j = (1 − χi,j)mi,j T ni,jAi,je−
Ei,jRT (3.7)
∀i ∈ [1, Np] ,∀j ∈ [1, Pi] (3.8)
Where Ai,j is the pre-exponential factor,Ei,j the activation energy, R the molar gas
constant, mi,j the reaction order, ni,j the temperature coefficient, and it is neglected
in this study (ni,j = 0). The χi,j is employed to denote each pyrolysis reaction
advancement (the extent of reaction Pi,j), i.e. the subphase j reaction of solid-phase
i, with the range of 0 < χi,j < 1, and the total advancement of pyrolysis τ can be
described as:
τ =∑
i∈[1,Np]
∑j∈[1,Pi]
ϵi,0ρi,0Fi,j (1 − χi,j)∑Np
i
∑Pij ϵi,0ρi,0Fi,j
(3.9)
And each solid phase ρi and total transient solid density ρ can be formulated as:
ρi = ϵi,0ρi,0
ϵi
1 −Pi∑j
χi,jFi,j
(3.10)
ρ =∑
i∈[1,Np]ρiϵi (3.11)
The production rate of the gas element k during thermal decomposition for all
sub-phases Np in the solid phase can be expressed by summation:
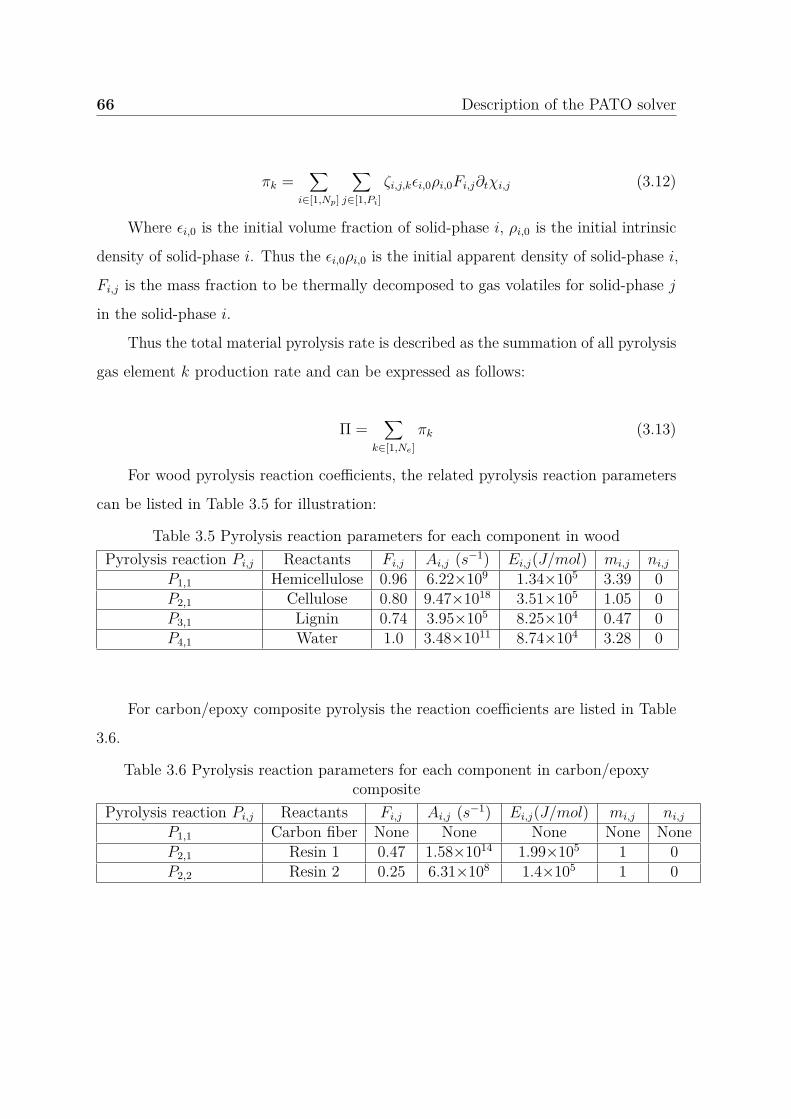
66 Description of the PATO solver
πk =∑
i∈[1,Np]
∑j∈[1,Pi]
ζi,j,kϵi,0ρi,0Fi,j∂tχi,j (3.12)
Where ϵi,0 is the initial volume fraction of solid-phase i, ρi,0 is the initial intrinsic
density of solid-phase i. Thus the ϵi,0ρi,0 is the initial apparent density of solid-phase i,
Fi,j is the mass fraction to be thermally decomposed to gas volatiles for solid-phase j
in the solid-phase i.
Thus the total material pyrolysis rate is described as the summation of all pyrolysis
gas element k production rate and can be expressed as follows:
Π =∑
k∈[1,Ne]πk (3.13)
For wood pyrolysis reaction coefficients, the related pyrolysis reaction parameters
can be listed in Table 3.5 for illustration:
Table 3.5 Pyrolysis reaction parameters for each component in woodPyrolysis reaction Pi,j Reactants Fi,j Ai,j (s−1) Ei,j(J/mol) mi,j ni,j
P1,1 Hemicellulose 0.96 6.22×10⁹ 1.34×10⁵ 3.39 0P2,1 Cellulose 0.80 9.47×10¹⁸ 3.51×10⁵ 1.05 0P3,1 Lignin 0.74 3.95×10⁵ 8.25×10⁴ 0.47 0P4,1 Water 1.0 3.48×10¹¹ 8.74×10⁴ 3.28 0
For carbon/epoxy composite pyrolysis the reaction coefficients are listed in Table
3.6.
Table 3.6 Pyrolysis reaction parameters for each component in carbon/epoxycomposite
Pyrolysis reaction Pi,j Reactants Fi,j Ai,j (s−1) Ei,j(J/mol) mi,j ni,j
P1,1 Carbon fiber None None None None NoneP2,1 Resin 1 0.47 1.58×10¹⁴ 1.99×10⁵ 1 0P2,2 Resin 2 0.25 6.31×10⁸ 1.4×10⁵ 1 0
3.3 Conservation equations 67
3.3 Conservation equations
3.3.1 Solid mass conservation equations
Based on the volume averaging theory, the solid phase mass conservation is
expressed by using the progress variable χi,j derived in the pyrolysis model described
before.
− ∂t (ϵiρi) =∑
j∈[1,Pi]ζi,j,kϵi,0ρi,0Fi,j∂tχi,j (3.14)
3.3.2 Gas mass conservation equations
The gas mass is produced by solid pyrolysis and it varies at different time and
different space locations. It can be expressed as follows:
∂t (ϵgρg) + ∂X (ϵgρgvg) = Π (3.15)
Where ϵg is the gas volume fraction (porosity), ρg the gas density, vg the gas
velocity, Π the pyrolysis term which is described by the Arrhenius equation. The total
and surface pyrolysis rate can be expressed as:
mpg = ϵgρgvg (3.16)
Where mpg is pyrolysis gas production rate, vg the vector gas velocity. The mpg
designates the pyrolysis rate for converting the virgin materials to gas volatiles per
unit second per unit volume.
3.3.3 Gas momentum conservation equations
Momentum conservation equation is used to simulate the pressure and gas velocity
which need to specify the permeability and porosity of virgin and char. The volume-
68 Description of the PATO solver
averaged gas momentum equation in the porous volumes is expressed according to
Darcy’s law, and it can be expressed as:
V g = − 1ϵg
(1µ
K + 1pg
β
)· ∂Xpg (3.17)
Where K is the permeability tensor, β is the Klinkengerg correction to account
for the slip effect in the pore, it is usually neglected when the Knudsen number is
very small. The virgin and char permeability are second-order tensors for wood. In
this work, the permeability for virgin and char are treated as isotropic for wood, and
carbon/epoxy composite with non-isotropic properties in different directions. V g is
the gas velocity, ϵg the gas volume fraction, pg the gas pressure, µ the dynamic gas
viscosity. And the perfect gas law can be expressed as:
pg = ρgRgTg
Mg
(3.18)
Thus:
ρg = Mgpg
RgTg
(3.19)
Where the Rg is the gas constant number, Tg the gas temperature, Mg the
gas molecular weight. The momentum equation can be introduced in the gas mass
conservation equation and described as:
∂t
(ϵgMgpg
RgTg
)− ∂X
(Mgpg
RgTg
(1µ
K + 1pg
β
)· ∂Xpg
)= Π (3.20)
3.3.4 Energy conservation equation
The energy can be consumed or produced in the chemical reaction. In this work,
the endothermic reaction is considered and they are formulated based on the volume
averaging theory as mentioned. The energy conservation is formulated based on the
local thermal equilibrium assumptions, and it can be expressed as:
3.3 Conservation equations 69
∂t (ρtet) + ∂X (ϵgρghgV g) = ∂X ·(k · ∂XT
)+ µϵ2
g
(K−1 · vg
)· vg (3.21)
Where ρt is the total density,et the total energy per unit mass, ϵg the gas volume
fraction, ρg the gas density, hg the gas enthalpy, V g the gas velocity, k the effective
thermal conductivity tensor, Ng the elemental composition of gases k gas element. The
second term on the right denotes the viscous energy dissipation which is very small. In
this work, the wood is treated as isotropic material, thus the thermal conductivity is
identical for the three directions. For laminate carbon/epoxy composite, the thermal
conductivity is treated as a second-order tensor, T is the temperature, and ρtet is the
total energy of all solid phases and the gas phase, and it can be expressed as:
ρtet = ϵgρgeg +∑
i∈[1,Np]ϵiρihi (3.22)
Where i denotes the solid phase, Np the number of solid phases,ϵi the solid phase
volume fraction, ρi the solid phase density, hi the enthalpy solid-phase i and its
evolution can be expressed by specific capacity:
∂thi = cp,i∂tT (3.23)
The previous equation can be rearranged as:
∂t (ρtet) = ∂t
(ϵgρg
(hg − pg
ρg
))+ ∂t
∑i∈[1,Np]
[(cp,iϵiρi∂tT ) + hi∂t (ϵiρi)] (3.24)
A detailed enthalpy implementation is applied and formulated as follows:
hs =∫ T
T0cpdT (3.25)
70 Description of the PATO solver
hdetail = hs + hp (3.26)
Where hdetail is the charring enthalpy for specific solid-phase i, hs the sensible
enthalpy, and hp the decomposition heat for solid-phase i.
The effective thermal conductivity is the most important item for heat transfer
and the energy equation is usually expressed as temperature-dependent and solved
implicitly as follows:
∑i∈[1,Np] [(ϵiρicp,i) ∂tT ] − ∂X ·
(k · ∂XT
)=
−∑i∈[1,Np] [hi∂t (ϵiρi)] − ∂t (ϵgρghg − ϵgpg) + ∂X (ϵgρghgV g)
(3.27)
hg =∫ T
T0cp,gdT (3.28)
Where hg is the gas enthalpy. In this work, the thermal conductivity and specific
heat capacity parameters are temperature-dependent which are the most sensitive
transport parameters. Based on the volume averaging theory, the weight mass averaged
thermal conductivity, specific heat capacity, enthalpy, the volume fraction of gas,
absorptivity, and emissivity can be described as the interpolation with virgin and
char properties based on total pyrolysis advancement in the condensed phase. It
could be emphasized that this technique is the simplest way to obtain “apparent”
parameters when the volume averaging technique is used. Indeed, only the virgin
state and final state of the pyrolysis process are used to handle apparent parameters.
However, during the pyrolysis process, many intermediate states (between virgin
and char) occurs probably affecting “apparent” thermochemical parameters. A more
detailed upscaling technique should be used in perspective to be better described those
“apparent” parameters that could evolve in function of temperature and pyrolysis
states.
cp = τcp,vρv
max (ρv, ρc)+ (1 − τ)cp,c
ρv
max (ρv, ρc)(3.29)
3.3 Conservation equations 71
k = τkvρv
max (ρv, ρc)+ (1 − τ)kc
ρv
max (ρv, ρc)(3.30)
α = ταvρv
max (ρv, ρc)+ (1 − τ)αc
ρv
max (ρv, ρc)(3.31)
ε = τεvρv
max (ρv, ρc)+ (1 − τ)εc
ρv
max (ρv, ρc)(3.32)
h = τhvρv
max (ρv, ρc)+ (1 − τ)hc
ρv
max (ρv, ρc)(3.33)
ϵg = ϵg,c + (ϵg,v − ϵg,c)∑
i∈[1,Np]
∑j∈[1,Pi]
χi,j (3.34)
The mass fraction of different solid phases Yi can be described as:
Yi = ϵiρi
ρ(3.35)
ρ =∑
ϵiρi (3.36)
h =∑
Yihi (3.37)
Where ϵi is the volume fraction of different solid phases, ρi the intrinsic density of
different solid phases, ρ the volume-averaged bulk solid density. Thus the porosity ϕ of
material is given by:
ϕ = 1 −∑ ρs
ρi
(3.38)
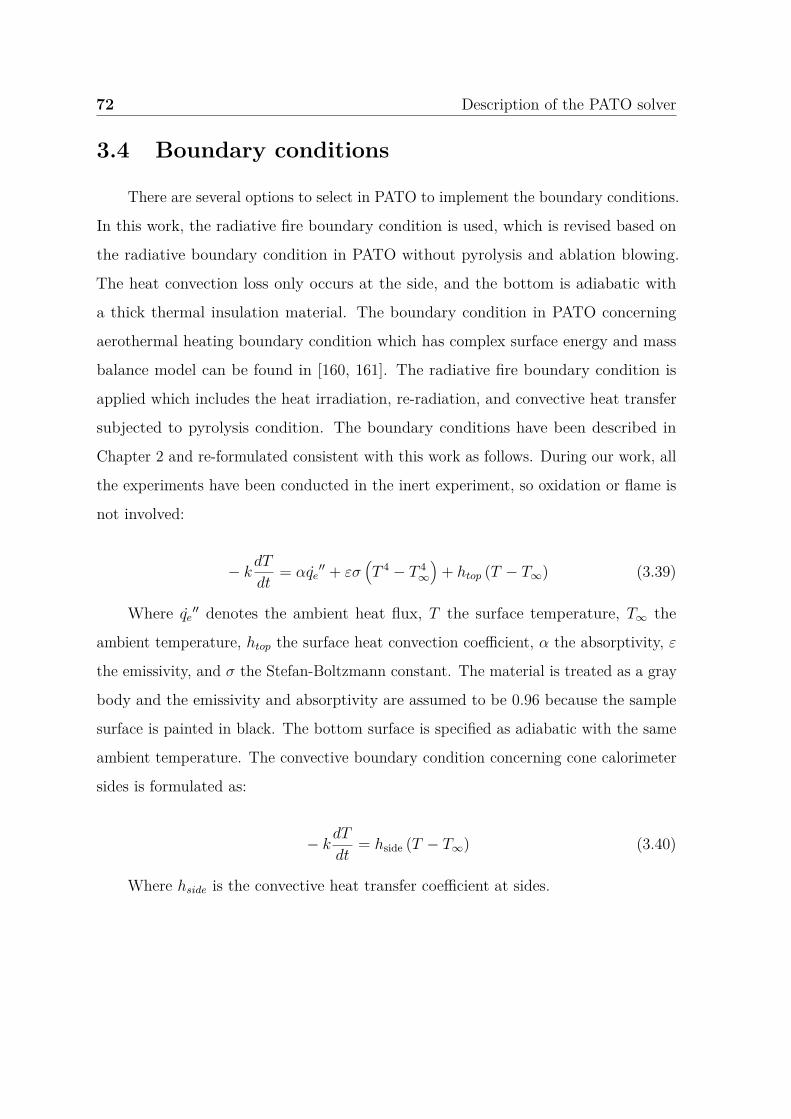
72 Description of the PATO solver
3.4 Boundary conditions
There are several options to select in PATO to implement the boundary conditions.
In this work, the radiative fire boundary condition is used, which is revised based on
the radiative boundary condition in PATO without pyrolysis and ablation blowing.
The heat convection loss only occurs at the side, and the bottom is adiabatic with
a thick thermal insulation material. The boundary condition in PATO concerning
aerothermal heating boundary condition which has complex surface energy and mass
balance model can be found in [160, 161]. The radiative fire boundary condition is
applied which includes the heat irradiation, re-radiation, and convective heat transfer
subjected to pyrolysis condition. The boundary conditions have been described in
Chapter 2 and re-formulated consistent with this work as follows. During our work, all
the experiments have been conducted in the inert experiment, so oxidation or flame is
not involved:
− kdT
dt= αqe
′′ + εσ(T 4 − T 4
∞
)+ htop (T − T∞) (3.39)
Where qe′′ denotes the ambient heat flux, T the surface temperature, T∞ the
ambient temperature, htop the surface heat convection coefficient, α the absorptivity, ε
the emissivity, and σ the Stefan-Boltzmann constant. The material is treated as a gray
body and the emissivity and absorptivity are assumed to be 0.96 because the sample
surface is painted in black. The bottom surface is specified as adiabatic with the same
ambient temperature. The convective boundary condition concerning cone calorimeter
sides is formulated as:
− kdT
dt= hside (T − T∞) (3.40)
Where hside is the convective heat transfer coefficient at sides.
3.5 Modeling work protocol 73
3.5 Modeling work protocol
The general method for pyrolysis modeling work is to predict mainly the ex-
perimental mass loss, mass loss rate, and temperature evolution at surface or bot-
tom [125, 5, 97, 134, 130], and these experiments involve different scales and corre-
sponding data are extracted. However, some studies [162] have demonstrated more
parameters should be taken into account to evaluate the model. Those parameters
can be in-depth temperature evolution at different locations, char or pyrolysis front
evolution, and the ratio variation trend of the pyrolyzing gas species at different time
scales.
As reviewed in [34], pyrolysis modeling work includes different steps. Firstly, the
TGA micro-scale and cone calorimeter bench-scale tests are carried out to obtain the
experimental data, a mathematical pyrolysis model is established combining with the
Arrhenius equation, heat transfer, and mass transfer model, as also showed in the
literature review. Secondly, the parameterization work by numerical optimization or
inverse analysis to fit the experimental data under a comprehensive pyrolysis model.
Finally, some simulations are conducted to obtain the corresponding predicted results
and to analyze the results especially the discrepancies involved.
Thus, this study will concentrate on the application of experiments with different
scales, i.e. milligram-scale TGA and bench-scale cone calorimeter. The TGA experiment
is employed to study the pyrolysis kinetics, heat transfer, and mass transfer phenomena
are preliminarily neglected. Mass loss and derived mass loss rate are extracted to
estimate the kinetic parameters. The cone calorimeter is widely employed to obtain the
corresponding mass loss history, the derived mass loss rate is the elementary pyrolysis
parameter to analyze the heat release rate, this permits to characterize the material
flammability and other fire properties [163, 138]. The temperature evolution and
pyrolysis front propagation can also be studied under different thermal configurations.
Again, these two equipment involve standard experimental manipulation which can
provide reliable boundary conditions and present reproducible results.
74 Description of the PATO solver
As previously reviewed in Chapter 2, wood and carbon/epoxy composite are
chosen in this study as the targeted charring composite materials. The TGA and
cone calorimeter experiments are conducted under an inert environment in this study,
thus without the presence of oxidation and flame. Concerning the parameterization
process for model input at bench scale, the fundamental kinetic parameters are used
to implement the chemical reactions which are estimated by coupling with the Dakota
optimization [164]. The main thermal parameters are obtained by inverse analysis
based on PATO or from reliable reference data. This methodology has been applied
widely in many studies such as the research group [96]. For the inverse analysis work,
the relevant thermal properties and boundary conditions, including heat convection
coefficient, specific heat capacity, the thermal conductivity of virgin and char, are
estimated by fitting the pure heat conduction model prediction against the cone
calorimeter experimental data. The inverse analysis concerning the temperature
evolution is measured by thermocouples. When conducting the inverse analysis of char
thermal properties, the char samples chosen are the final residue after the termination
of the virgin pyrolysis experiment. And the thermocouples setup are fixed from the
virgin to char samples when conducting char inverse study. The strategy used here
is to decouple as much as possible all physical and chemical processes to validate the
model, and then investigate them one by one before investigate their interactions that
could be complex due to the large range of time and length scales involved during
pyrolysis .
3.6 Modeling assumption and simulation options
Due to the complexity of pyrolysis process in fire conditions, some assumptions
are made in this modeling study, and the corresponding phenomena considered and
neglected can be seen in Figure 3.2 based on Figure 2.3 in Chapter 2.
Species or element diffusion is not considered in this work, so the element or
diffusion mass and energy are not solved. No volume moving or change is considered,
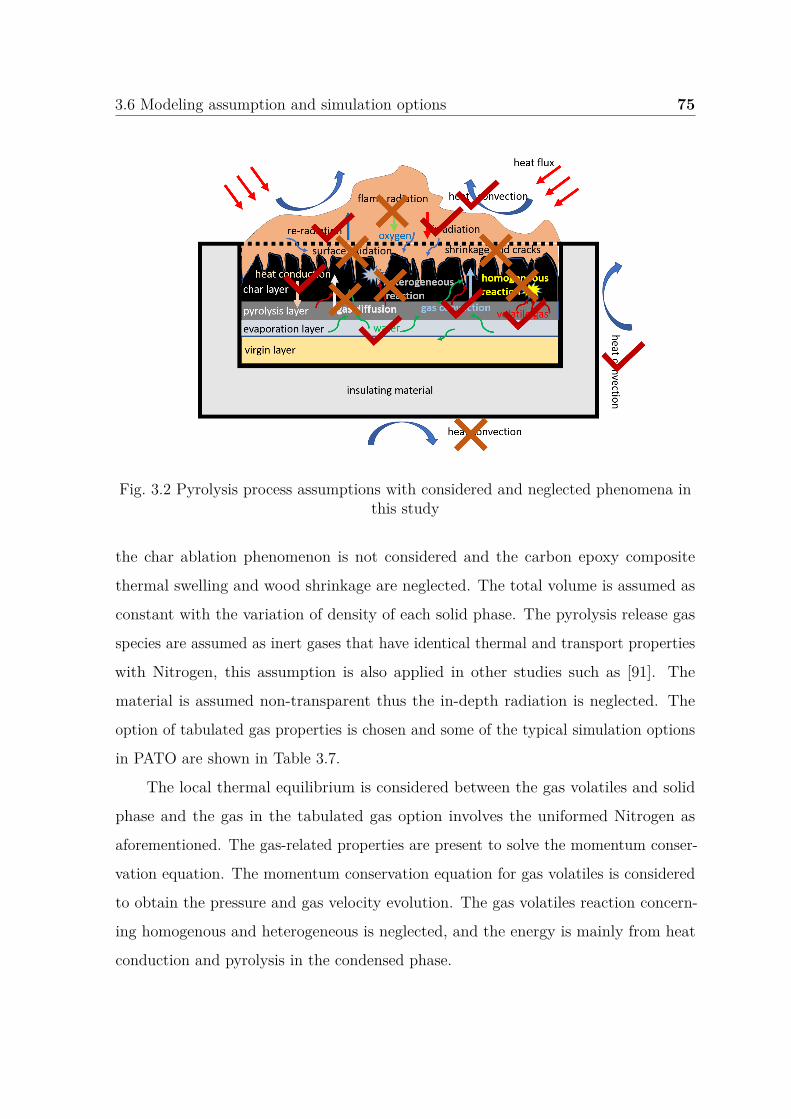
3.6 Modeling assumption and simulation options 75
Fig. 3.2 Pyrolysis process assumptions with considered and neglected phenomena inthis study
the char ablation phenomenon is not considered and the carbon epoxy composite
thermal swelling and wood shrinkage are neglected. The total volume is assumed as
constant with the variation of density of each solid phase. The pyrolysis release gas
species are assumed as inert gases that have identical thermal and transport properties
with Nitrogen, this assumption is also applied in other studies such as [91]. The
material is assumed non-transparent thus the in-depth radiation is neglected. The
option of tabulated gas properties is chosen and some of the typical simulation options
in PATO are shown in Table 3.7.
The local thermal equilibrium is considered between the gas volatiles and solid
phase and the gas in the tabulated gas option involves the uniformed Nitrogen as
aforementioned. The gas-related properties are present to solve the momentum conser-
vation equation. The momentum conservation equation for gas volatiles is considered
to obtain the pressure and gas velocity evolution. The gas volatiles reaction concern-
ing homogenous and heterogeneous is neglected, and the energy is mainly from heat
conduction and pyrolysis in the condensed phase.
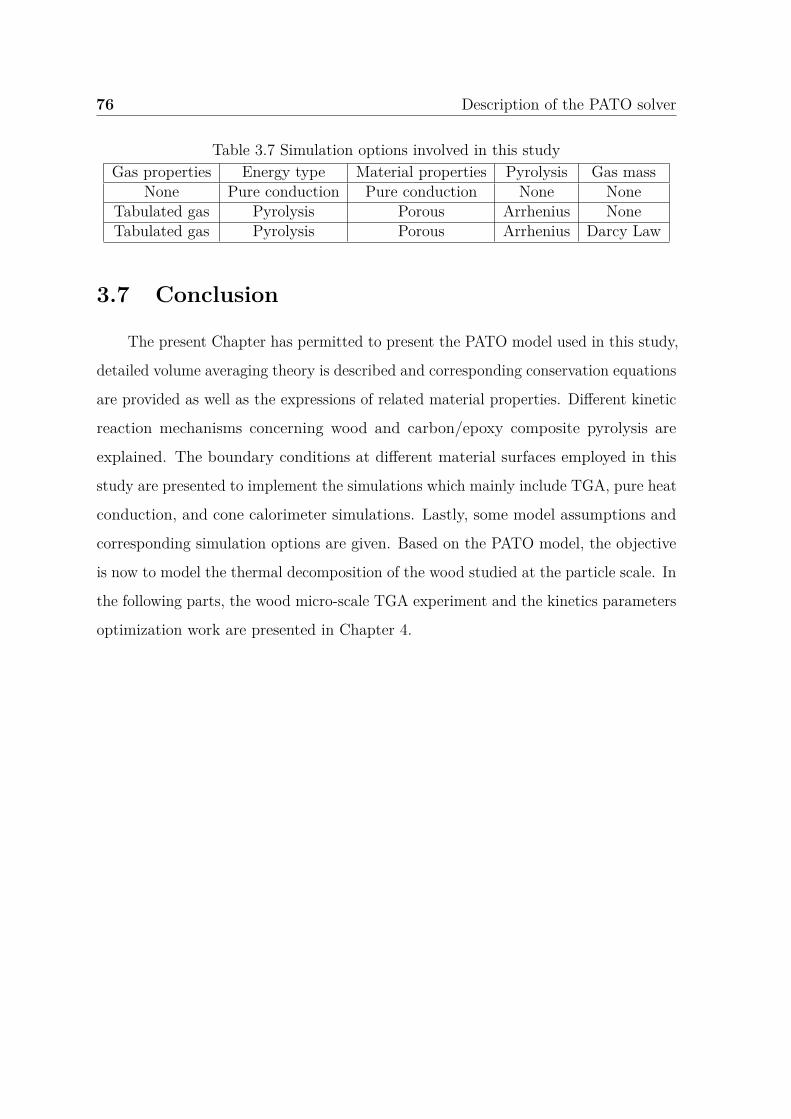
76 Description of the PATO solver
Table 3.7 Simulation options involved in this studyGas properties Energy type Material properties Pyrolysis Gas mass
None Pure conduction Pure conduction None NoneTabulated gas Pyrolysis Porous Arrhenius NoneTabulated gas Pyrolysis Porous Arrhenius Darcy Law
3.7 Conclusion
The present Chapter has permitted to present the PATO model used in this study,
detailed volume averaging theory is described and corresponding conservation equations
are provided as well as the expressions of related material properties. Different kinetic
reaction mechanisms concerning wood and carbon/epoxy composite pyrolysis are
explained. The boundary conditions at different material surfaces employed in this
study are presented to implement the simulations which mainly include TGA, pure heat
conduction, and cone calorimeter simulations. Lastly, some model assumptions and
corresponding simulation options are given. Based on the PATO model, the objective
is now to model the thermal decomposition of the wood studied at the particle scale. In
the following parts, the wood micro-scale TGA experiment and the kinetics parameters
optimization work are presented in Chapter 4.
Chapter 4
Particle scale modeling of the wood
pyrolysis
This chapter is dedicated to the modeling of thermal decomposition of wood at the
particle scale, i.e. at the TGA (Thermogravimetric Analysis) scale. The approach used
is “comprehensive”, it is different from the common manipulation of average kinetic
parameters used for all heating rates [76, 51].
The objective of this part is to define a mechanism of thermal decomposition
of wood to be implemented into the PATO model and then to obtain each set of
parameters for the Arrhenius kinetic equation of each reaction at the corresponding
heating rates. Coupled with the kinetic equation, two different reaction mechanisms
are used: one-global reaction and one independent parallel multi-reaction schemes to
evaluate the effect of reaction schemes choice on the kinetic parameters. The kinetic
parameters are obtained first by one heating rate and after they are analyzed to
simulate another heating rate case. In parallel to the kinetic study, the heating rate
influence on the pyrolysis reaction is also analyzed. Finally, the optimized kinetic
parameters (by model fitting method) are evaluated with those found in the literature.
All this work is conducted with 0D and 2D axis-symmetry TGA simulation cases to
study the heat transfer phenomenon at this scale with the PATO model.
78 Particle scale modeling of the wood pyrolysis
4.1 TGA experimental procedure
When conducting the pyrolysis kinetics study, the Thermogravimetric Analysis
(TGA) is widely studied to extrapolate the kinetics of materials pyrolysis, as discussed
in [100]. Although the TGA experiments are often conducted at multiple heating rates,
it is still concerned that they are applicable to estimate the pyrolysis kinetics to other
heating rates [10]. Indeed experiments at different heating rates are conducted to
quantify the sensitivity of the prescribed kinetic model and to evaluate the validity of
the kinetic parameters [135, 82]. This concern has been called by many studies such
as [108] to acknowledge the influence of heating rates at different pyrolysis conditions.
Even though good fitness can be achieved by the model fitting method to obtain
reliable kinetic parameters, it tends to predict poorly the mass loss rate under given
heat flux for large samples pyrolysis [10, 165]. Indeed, the fact relies on that TGA
heating rates employed are quite different from the heating rates for real materials
pyrolysis such as in cone calorimeter experiments [166]. This observation is also found
from the experimental data in this study. Moreover, similar to TGA experiments,
cone calorimeters are also conducted with multiple heat flux [96, 4, 104] and the low
heating rate is observed at low heat flux while with a high heating rate under high heat
flux [104]. Again, due to the transient temperature evolution trend, the heating rate at
each location within the material can differ seriously versus time [103]. To summarize,
the correlation between heating rate and pyrolysis kinetics need to be studied in detail.
As mentioned before, when a solid is exposed to external heat flux, the heating
condition is a dynamic process and it depends on the pyrolysis state of the solid and
the space location. The heating rates of TGA in this study are linked to the materials
heating behavior in the cone calorimeter under different heat flux (this will be discussed
in Chapter 5). It is observed that the representative heating rate can be around 10
K/min to 20 kW/m2, and more in some specific conditions for example 50 K/min under
50 kW/m2. The choice of these two heating rates could be discussed but a compromise
is made by choosing the most representative value and what is possible to achieve by
experiment in TGA. In order to explore the heating rate influence on the pyrolysis
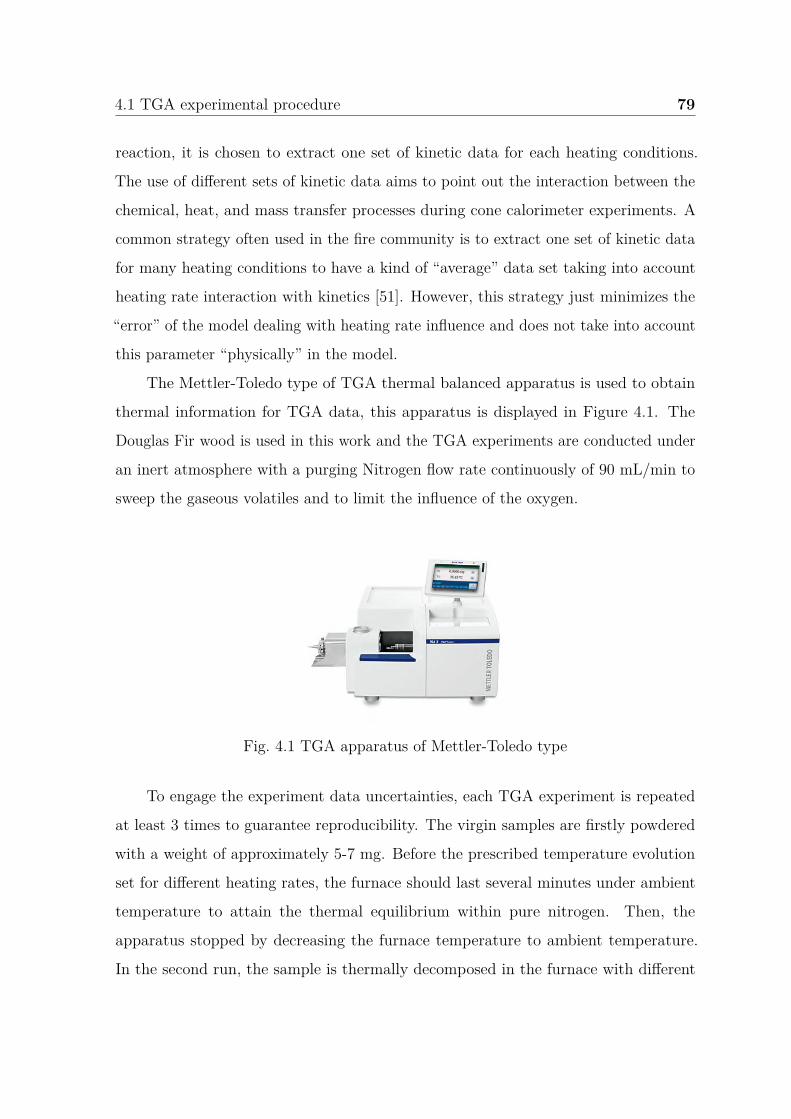
4.1 TGA experimental procedure 79
reaction, it is chosen to extract one set of kinetic data for each heating conditions.
The use of different sets of kinetic data aims to point out the interaction between the
chemical, heat, and mass transfer processes during cone calorimeter experiments. A
common strategy often used in the fire community is to extract one set of kinetic data
for many heating conditions to have a kind of “average” data set taking into account
heating rate interaction with kinetics [51]. However, this strategy just minimizes the
“error” of the model dealing with heating rate influence and does not take into account
this parameter “physically” in the model.
The Mettler-Toledo type of TGA thermal balanced apparatus is used to obtain
thermal information for TGA data, this apparatus is displayed in Figure 4.1. The
Douglas Fir wood is used in this work and the TGA experiments are conducted under
an inert atmosphere with a purging Nitrogen flow rate continuously of 90 mL/min to
sweep the gaseous volatiles and to limit the influence of the oxygen.
Fig. 4.1 TGA apparatus of Mettler-Toledo type
To engage the experiment data uncertainties, each TGA experiment is repeated
at least 3 times to guarantee reproducibility. The virgin samples are firstly powdered
with a weight of approximately 5-7 mg. Before the prescribed temperature evolution
set for different heating rates, the furnace should last several minutes under ambient
temperature to attain the thermal equilibrium within pure nitrogen. Then, the
apparatus stopped by decreasing the furnace temperature to ambient temperature.
In the second run, the sample is thermally decomposed in the furnace with different
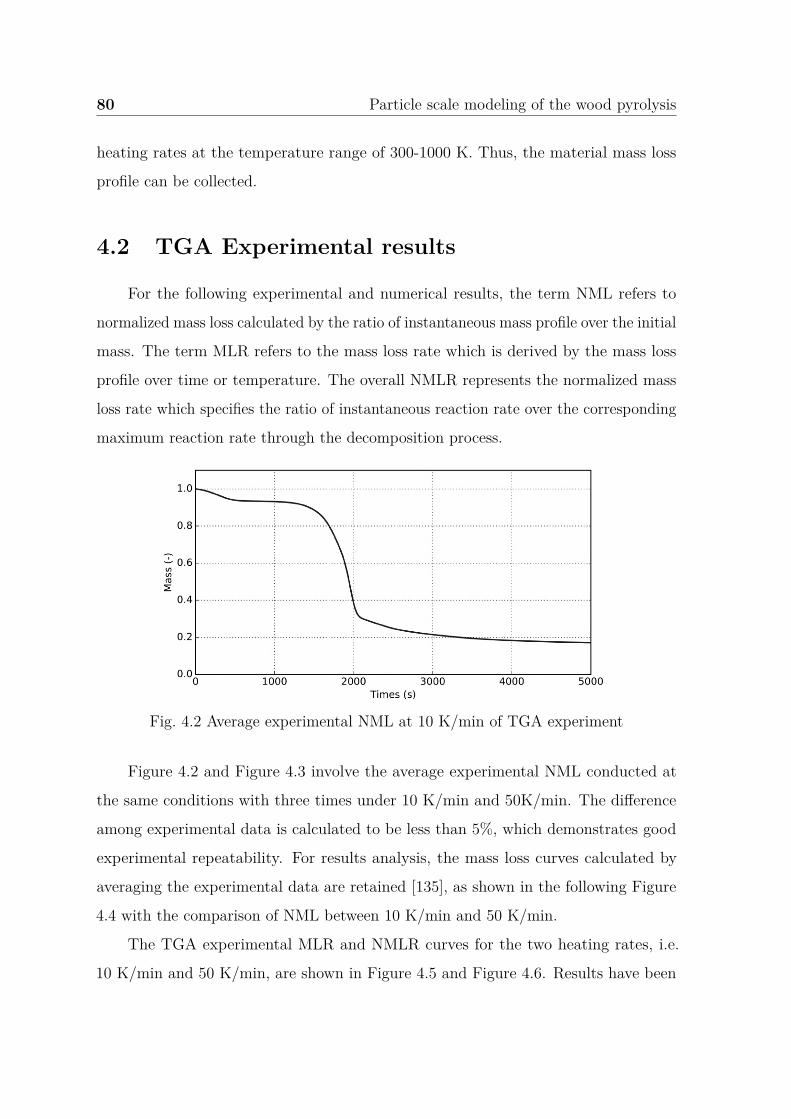
80 Particle scale modeling of the wood pyrolysis
heating rates at the temperature range of 300-1000 K. Thus, the material mass loss
profile can be collected.
4.2 TGA Experimental results
For the following experimental and numerical results, the term NML refers to
normalized mass loss calculated by the ratio of instantaneous mass profile over the initial
mass. The term MLR refers to the mass loss rate which is derived by the mass loss
profile over time or temperature. The overall NMLR represents the normalized mass
loss rate which specifies the ratio of instantaneous reaction rate over the corresponding
maximum reaction rate through the decomposition process.
Fig. 4.2 Average experimental NML at 10 K/min of TGA experiment
Figure 4.2 and Figure 4.3 involve the average experimental NML conducted at
the same conditions with three times under 10 K/min and 50K/min. The difference
among experimental data is calculated to be less than 5%, which demonstrates good
experimental repeatability. For results analysis, the mass loss curves calculated by
averaging the experimental data are retained [135], as shown in the following Figure
4.4 with the comparison of NML between 10 K/min and 50 K/min.
The TGA experimental MLR and NMLR curves for the two heating rates, i.e.
10 K/min and 50 K/min, are shown in Figure 4.5 and Figure 4.6. Results have been
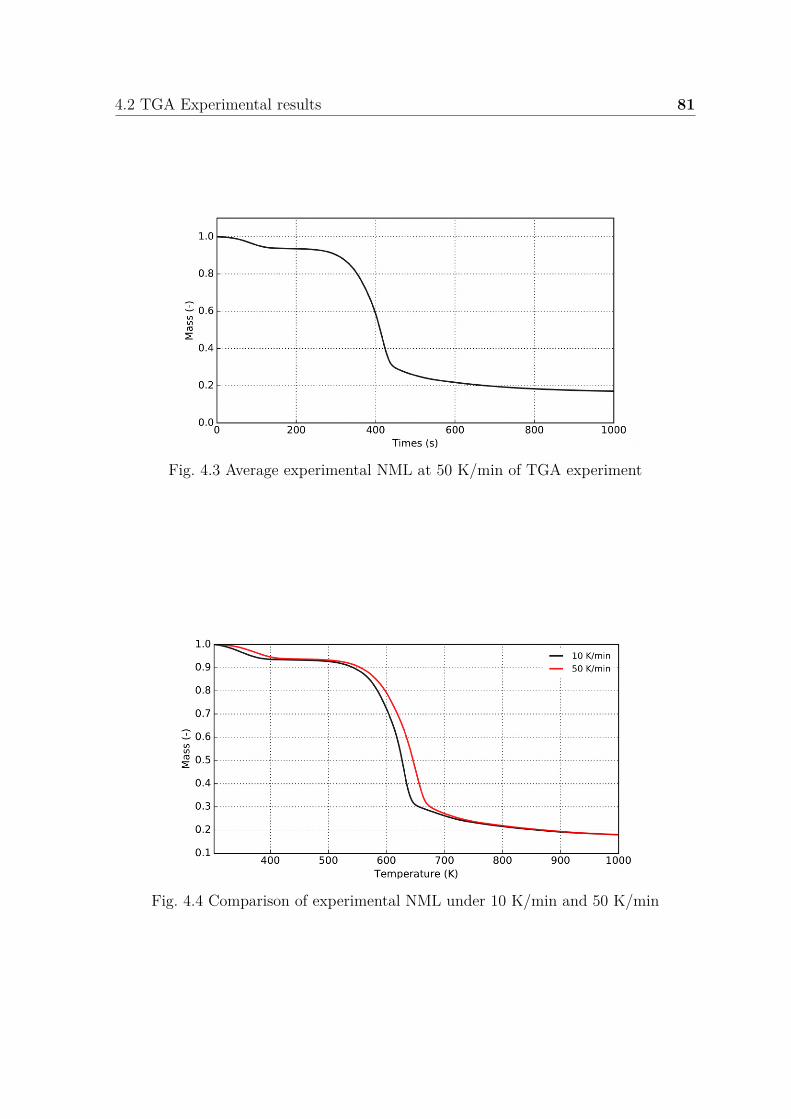
4.2 TGA Experimental results 81
Fig. 4.3 Average experimental NML at 50 K/min of TGA experiment
Fig. 4.4 Comparison of experimental NML under 10 K/min and 50 K/min
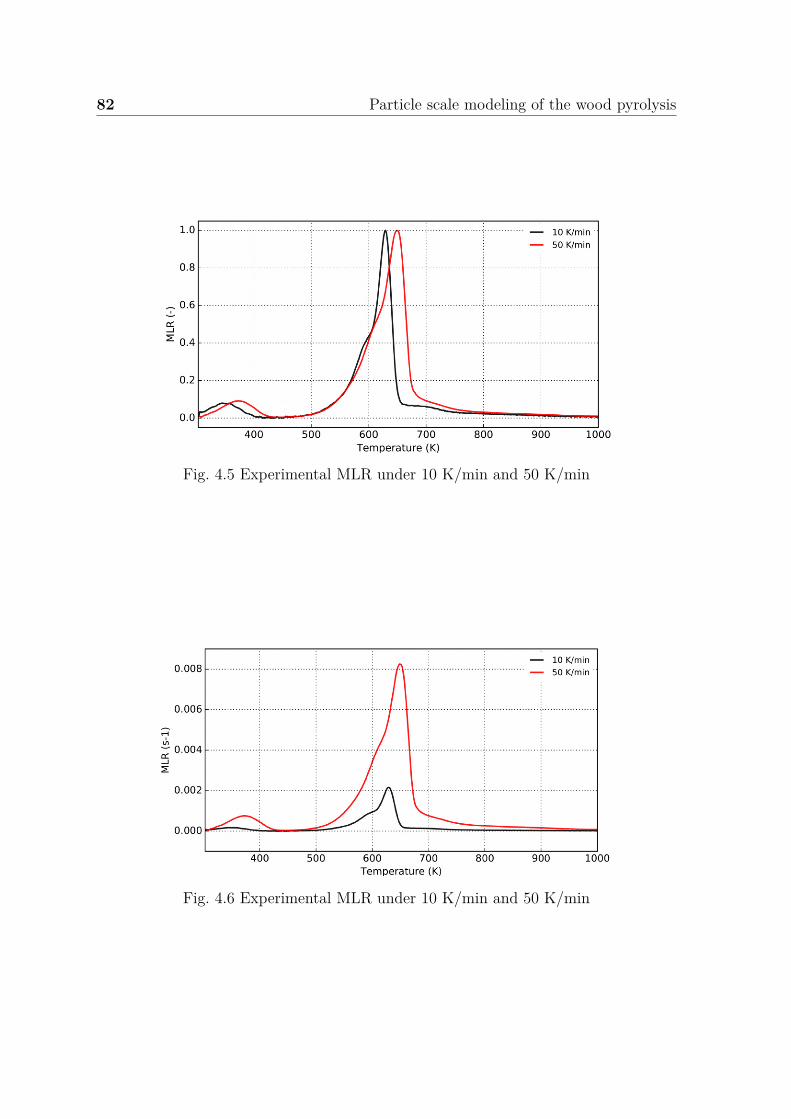
82 Particle scale modeling of the wood pyrolysis
Fig. 4.5 Experimental MLR under 10 K/min and 50 K/min
Fig. 4.6 Experimental MLR under 10 K/min and 50 K/min
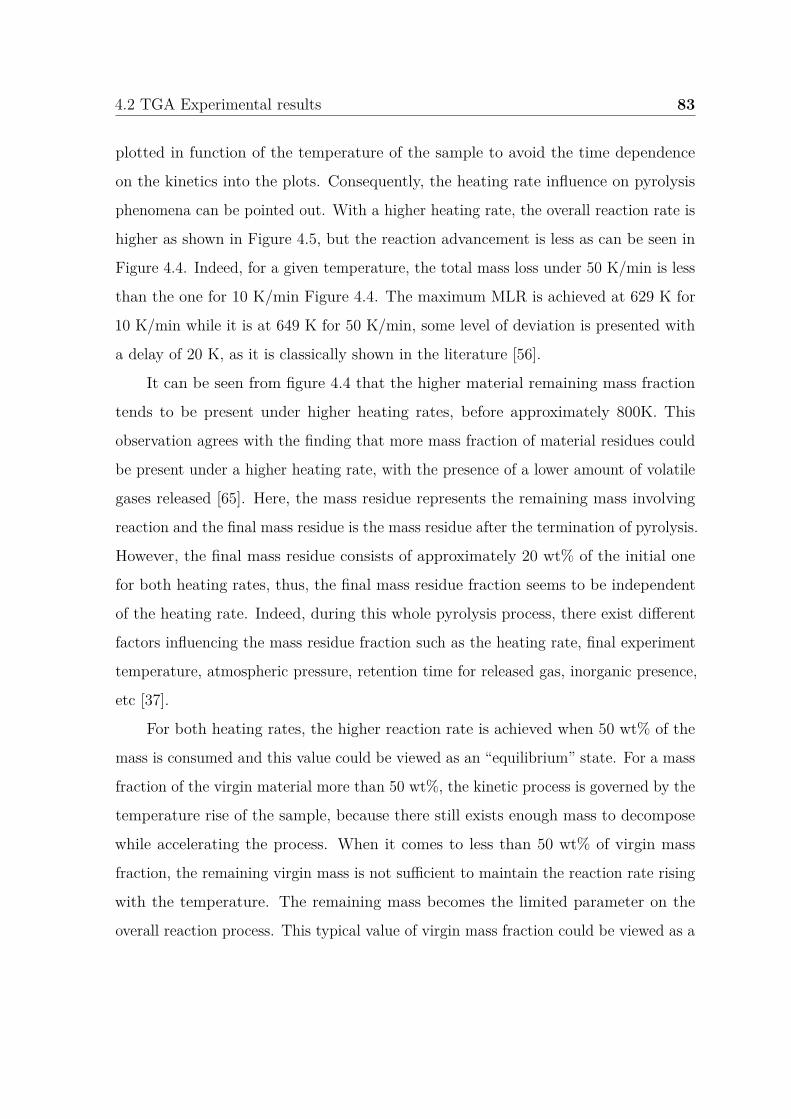
4.2 TGA Experimental results 83
plotted in function of the temperature of the sample to avoid the time dependence
on the kinetics into the plots. Consequently, the heating rate influence on pyrolysis
phenomena can be pointed out. With a higher heating rate, the overall reaction rate is
higher as shown in Figure 4.5, but the reaction advancement is less as can be seen in
Figure 4.4. Indeed, for a given temperature, the total mass loss under 50 K/min is less
than the one for 10 K/min Figure 4.4. The maximum MLR is achieved at 629 K for
10 K/min while it is at 649 K for 50 K/min, some level of deviation is presented with
a delay of 20 K, as it is classically shown in the literature [56].
It can be seen from figure 4.4 that the higher material remaining mass fraction
tends to be present under higher heating rates, before approximately 800K. This
observation agrees with the finding that more mass fraction of material residues could
be present under a higher heating rate, with the presence of a lower amount of volatile
gases released [65]. Here, the mass residue represents the remaining mass involving
reaction and the final mass residue is the mass residue after the termination of pyrolysis.
However, the final mass residue consists of approximately 20 wt% of the initial one
for both heating rates, thus, the final mass residue fraction seems to be independent
of the heating rate. Indeed, during this whole pyrolysis process, there exist different
factors influencing the mass residue fraction such as the heating rate, final experiment
temperature, atmospheric pressure, retention time for released gas, inorganic presence,
etc [37].
For both heating rates, the higher reaction rate is achieved when 50 wt% of the
mass is consumed and this value could be viewed as an “equilibrium” state. For a mass
fraction of the virgin material more than 50 wt%, the kinetic process is governed by the
temperature rise of the sample, because there still exists enough mass to decompose
while accelerating the process. When it comes to less than 50 wt% of virgin mass
fraction, the remaining virgin mass is not sufficient to maintain the reaction rate rising
with the temperature. The remaining mass becomes the limited parameter on the
overall reaction process. This typical value of virgin mass fraction could be viewed as a
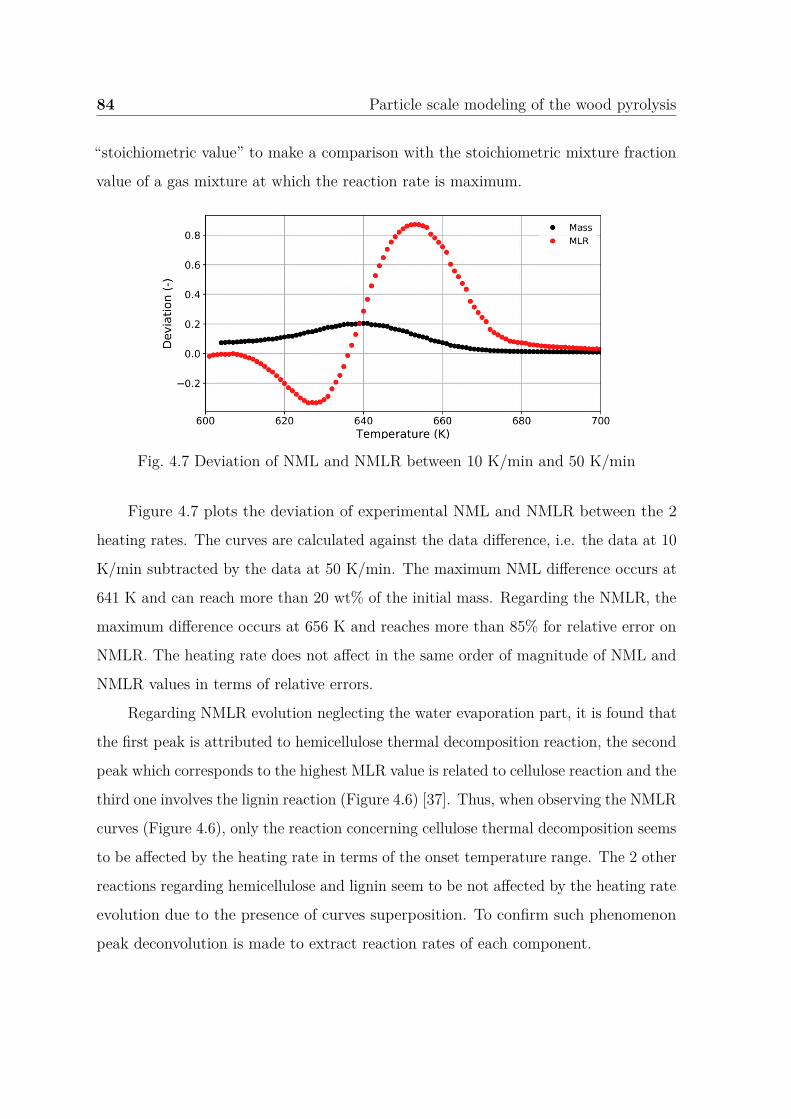
84 Particle scale modeling of the wood pyrolysis
“stoichiometric value” to make a comparison with the stoichiometric mixture fraction
value of a gas mixture at which the reaction rate is maximum.
Fig. 4.7 Deviation of NML and NMLR between 10 K/min and 50 K/min
Figure 4.7 plots the deviation of experimental NML and NMLR between the 2
heating rates. The curves are calculated against the data difference, i.e. the data at 10
K/min subtracted by the data at 50 K/min. The maximum NML difference occurs at
641 K and can reach more than 20 wt% of the initial mass. Regarding the NMLR, the
maximum difference occurs at 656 K and reaches more than 85% for relative error on
NMLR. The heating rate does not affect in the same order of magnitude of NML and
NMLR values in terms of relative errors.
Regarding NMLR evolution neglecting the water evaporation part, it is found that
the first peak is attributed to hemicellulose thermal decomposition reaction, the second
peak which corresponds to the highest MLR value is related to cellulose reaction and the
third one involves the lignin reaction (Figure 4.6) [37]. Thus, when observing the NMLR
curves (Figure 4.6), only the reaction concerning cellulose thermal decomposition seems
to be affected by the heating rate in terms of the onset temperature range. The 2 other
reactions regarding hemicellulose and lignin seem to be not affected by the heating rate
evolution due to the presence of curves superposition. To confirm such phenomenon
peak deconvolution is made to extract reaction rates of each component.
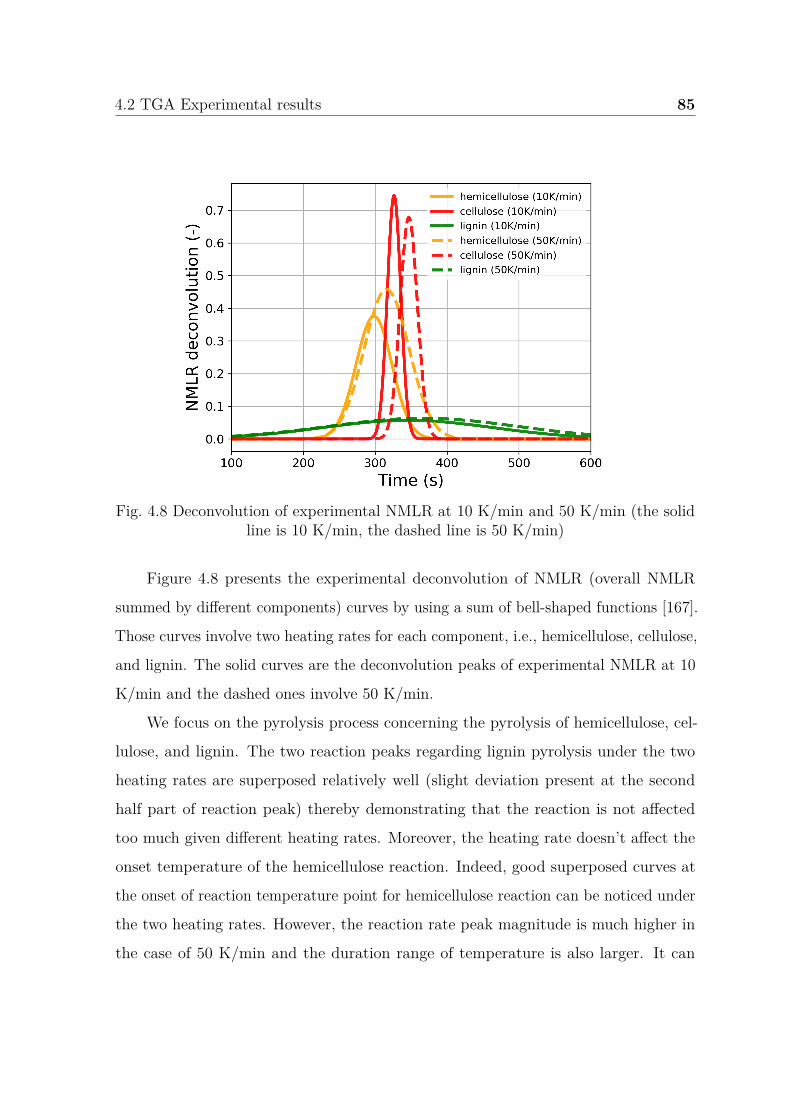
4.2 TGA Experimental results 85
Fig. 4.8 Deconvolution of experimental NMLR at 10 K/min and 50 K/min (the solidline is 10 K/min, the dashed line is 50 K/min)
Figure 4.8 presents the experimental deconvolution of NMLR (overall NMLR
summed by different components) curves by using a sum of bell-shaped functions [167].
Those curves involve two heating rates for each component, i.e., hemicellulose, cellulose,
and lignin. The solid curves are the deconvolution peaks of experimental NMLR at 10
K/min and the dashed ones involve 50 K/min.
We focus on the pyrolysis process concerning the pyrolysis of hemicellulose, cel-
lulose, and lignin. The two reaction peaks regarding lignin pyrolysis under the two
heating rates are superposed relatively well (slight deviation present at the second
half part of reaction peak) thereby demonstrating that the reaction is not affected
too much given different heating rates. Moreover, the heating rate doesn’t affect the
onset temperature of the hemicellulose reaction. Indeed, good superposed curves at
the onset of reaction temperature point for hemicellulose reaction can be noticed under
the two heating rates. However, the reaction rate peak magnitude is much higher in
the case of 50 K/min and the duration range of temperature is also larger. It can
86 Particle scale modeling of the wood pyrolysis
be so demonstrated that a higher heating rate tends to promote the intensity and
duration of hemicellulose reaction. However, the reaction rate peak value is smaller for
cellulose decomposition reaction at 50 K/min and the onset temperature to start the
reaction is higher. Thus, a higher heating rate seems to weaken the cellulose thermal
decomposition process, with a larger temperature range of reaction when the heating
rate increases. This analysis is based on curve deconvolution with a mathematical
method. Regarding such consideration conclusions made should be confirmed with a
physical model involving each reaction.
To summarize this part of experimental results at the TGA scale, wood pyrolysis
is a complex phenomenon involving reactions with its major components, such as
cellulose, hemicellulose, and lignin. It is demonstrated that the heating process can
interact with the global pyrolysis process. However, one part of the overall complexity
is that each reaction of thermal decomposition is not affected in the same way by the
heating process.
The last point is fundamental and involves the complexity to deal with this effect
in a numerical model. As the way to include this dependence into the pyrolysis model
is fundamental, it is chosen in this study to avoid this point for simplicity firstly
(two heating rates chosen to obtain each set kinetics) and it should be treated as a
perspective work.
4.3 TGA Pyrolysis modeling study
Before conducting modeling work, some basic sample information is collected. The
density of the Douglas Fir wood is measured and is equal to 467 kg/m3. The free
moisture content has been measured and varies from 8 to 12 wt% of the virgin wood.
A mean value of 10 wt% has been chosen and is fixed in the numerical model. Such
value is under the classical plot of the equilibrium moisture content (%) as a function
of the temperature and relative humidity of the atmosphere [158]. The initial mass
fraction of components (cellulose, hemicellulose, and lignin) have also been fixed into
4.3 TGA Pyrolysis modeling study 87
the numerical model following [158], which specifies that for each component mass
fraction softwood, it involves around 42 wt% of cellulose, 27 wt% of hemicellulose, 28
wt% of lignin, and 3 wt% of extractives, respectively. In this study, the extractives are
neglected due to their slight mass fraction.
Due to the complexity and uncertainties of kinetics, in order to assess the pre-
dictability for different reaction schemes, simple one-step global and complex indepen-
dent parallel reaction schemes with nth order reaction model are proposed to describe
the material thermal decomposition behavior. To evaluate the assumption without the
presence of heat transfer through the sample in TGA experiments, the specified results
with modeling study of 0D and 2D axis-symmetry are analyzed. For the mass transfer
part in the modeling study of 2D axis-symmetry, it is assumed that the diffusion of gas
species has no effect on thermal decomposition and they are specified as nitrogen. The
model-fitting method is adopted to estimate the kinetic parameters and stoichiometric
coefficient, i.e., A, E, and n, fitting the TGA experiment curves mathematically. This
modeling fitting process is predicted by Genetic Algorithm (GA) [168, 169], which is
performed in the Dakota optimization package [164]. The Genetic Algorithm is widely
used for optimization study to obtain kinetic and thermal parameters in current fire
scenario research [53].
The two reaction schemes are shown in Figure 4.9 with a one-step global reaction
scheme, and in Figure 4.10 with four independent parallel reaction scheme. The
four parallel reactions correspond to four wood components: water, hemicellulose,
cellulose, and lignin, respectively. The overall pyrolysis rate is described by the linear
combination of reaction rate concerning these four pseudo-components, and it can be
seen in Chapter 3 with the PATO model description. The reaction rate concerning
each component obeys the non-linear Arrhenius varying with temperature and mass.
Based on the initial mass for each component, F denotes the mass fraction of gas
volatiles, ν denotes the mass fraction of residue char. And the νh ,νc ,νl are the mass
fraction of residue char produced by hemicellulose, cellulose, and lignin, respectively.
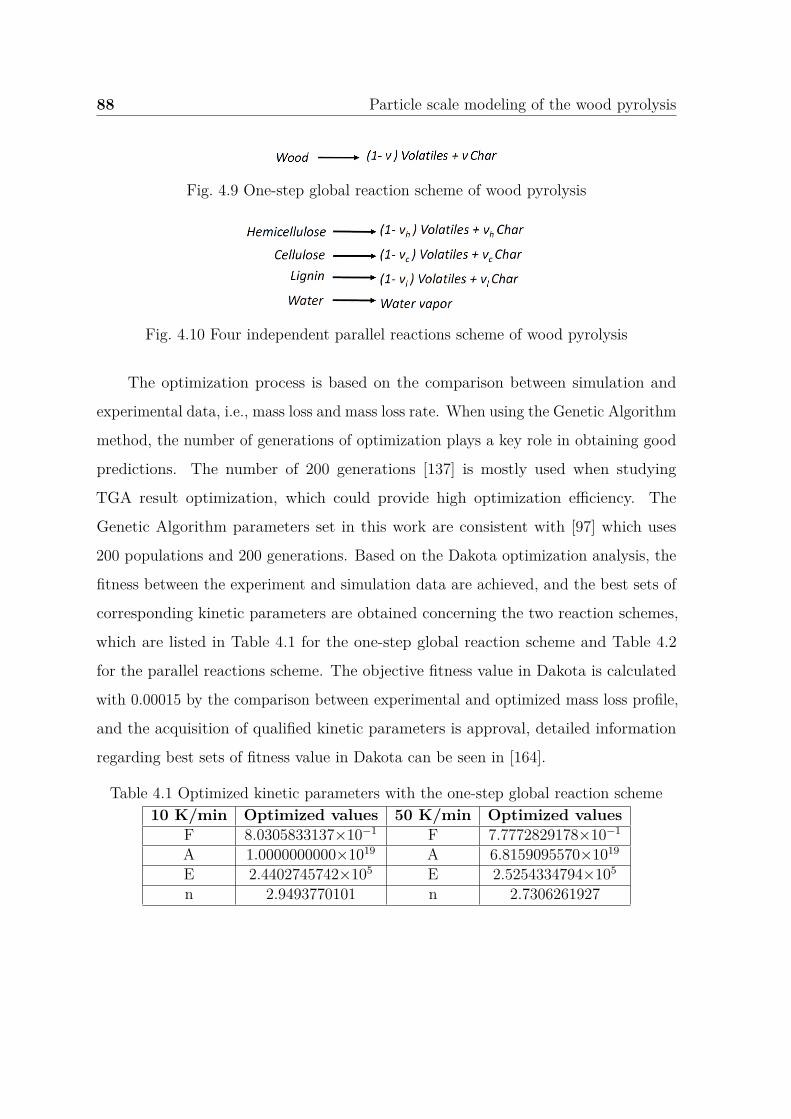
88 Particle scale modeling of the wood pyrolysis
Fig. 4.9 One-step global reaction scheme of wood pyrolysis
Fig. 4.10 Four independent parallel reactions scheme of wood pyrolysis
The optimization process is based on the comparison between simulation and
experimental data, i.e., mass loss and mass loss rate. When using the Genetic Algorithm
method, the number of generations of optimization plays a key role in obtaining good
predictions. The number of 200 generations [137] is mostly used when studying
TGA result optimization, which could provide high optimization efficiency. The
Genetic Algorithm parameters set in this work are consistent with [97] which uses
200 populations and 200 generations. Based on the Dakota optimization analysis, the
fitness between the experiment and simulation data are achieved, and the best sets of
corresponding kinetic parameters are obtained concerning the two reaction schemes,
which are listed in Table 4.1 for the one-step global reaction scheme and Table 4.2
for the parallel reactions scheme. The objective fitness value in Dakota is calculated
with 0.00015 by the comparison between experimental and optimized mass loss profile,
and the acquisition of qualified kinetic parameters is approval, detailed information
regarding best sets of fitness value in Dakota can be seen in [164].
Table 4.1 Optimized kinetic parameters with the one-step global reaction scheme10 K/min Optimized values 50 K/min Optimized values
F 8.0305833137×10⁻¹ F 7.7772829178×10⁻¹
A 1.0000000000×10¹⁹ A 6.8159095570×10¹⁹
E 2.4402745742×10⁵ E 2.5254334794×10⁵
n 2.9493770101 n 2.7306261927
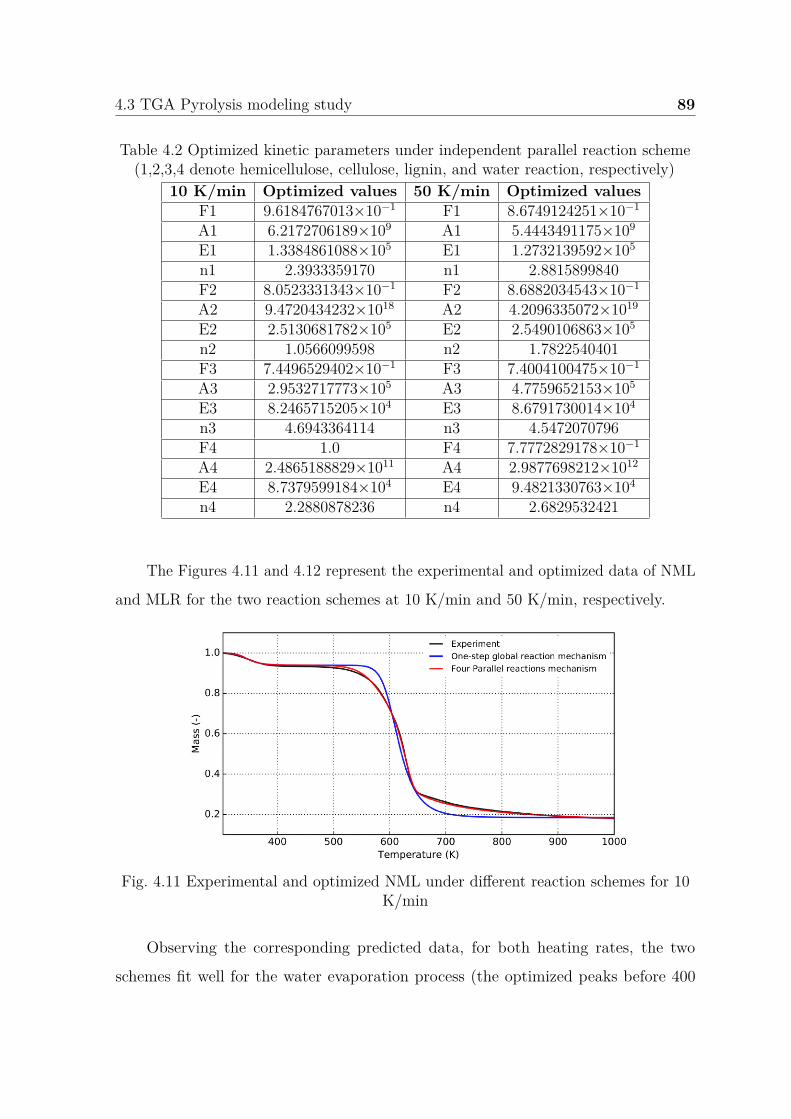
4.3 TGA Pyrolysis modeling study 89
Table 4.2 Optimized kinetic parameters under independent parallel reaction scheme(1,2,3,4 denote hemicellulose, cellulose, lignin, and water reaction, respectively)
10 K/min Optimized values 50 K/min Optimized valuesF1 9.6184767013×10⁻¹ F1 8.6749124251×10⁻¹
A1 6.2172706189×10⁹ A1 5.4443491175×10⁹
E1 1.3384861088×10⁵ E1 1.2732139592×10⁵
n1 2.3933359170 n1 2.8815899840F2 8.0523331343×10⁻¹ F2 8.6882034543×10⁻¹
A2 9.4720434232×10¹⁸ A2 4.2096335072×10¹⁹
E2 2.5130681782×10⁵ E2 2.5490106863×10⁵
n2 1.0566099598 n2 1.7822540401F3 7.4496529402×10⁻¹ F3 7.4004100475×10⁻¹
A3 2.9532717773×10⁵ A3 4.7759652153×10⁵
E3 8.2465715205×10⁴ E3 8.6791730014×10⁴
n3 4.6943364114 n3 4.5472070796F4 1.0 F4 7.7772829178×10⁻¹
A4 2.4865188829×10¹¹ A4 2.9877698212×10¹²
E4 8.7379599184×10⁴ E4 9.4821330763×10⁴
n4 2.2880878236 n4 2.6829532421
The Figures 4.11 and 4.12 represent the experimental and optimized data of NML
and MLR for the two reaction schemes at 10 K/min and 50 K/min, respectively.
Fig. 4.11 Experimental and optimized NML under different reaction schemes for 10K/min
Observing the corresponding predicted data, for both heating rates, the two
schemes fit well for the water evaporation process (the optimized peaks before 400
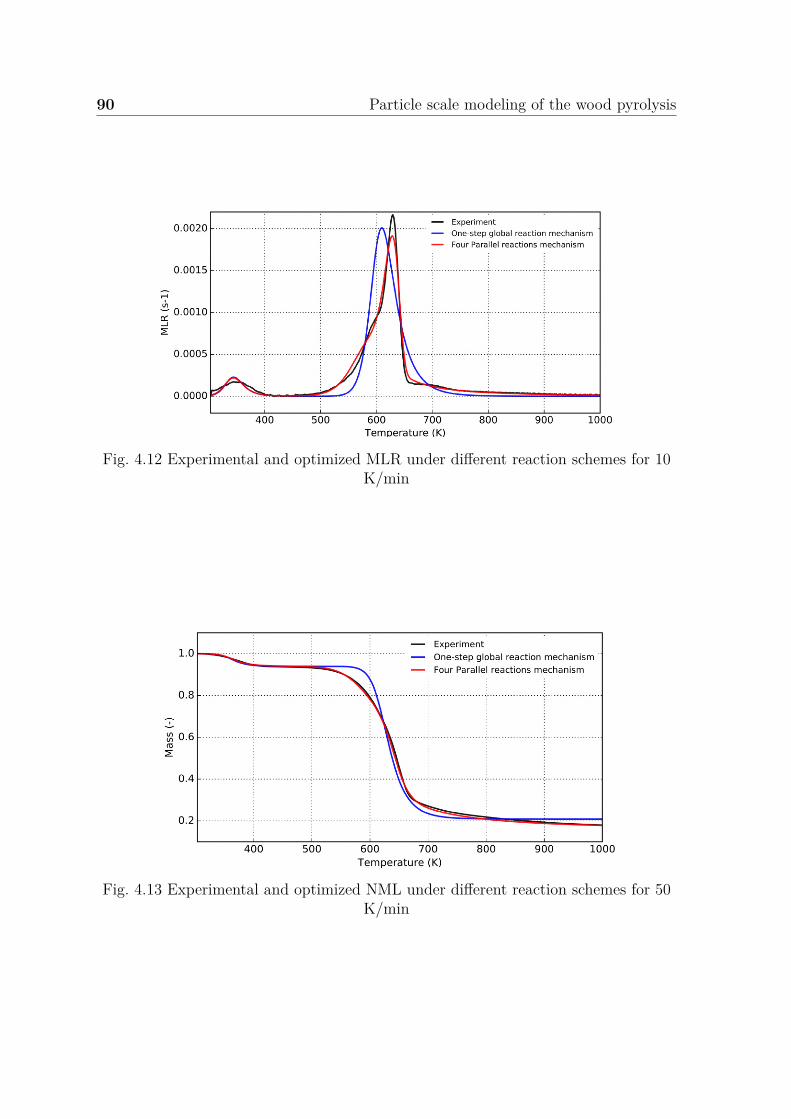
90 Particle scale modeling of the wood pyrolysis
Fig. 4.12 Experimental and optimized MLR under different reaction schemes for 10K/min
Fig. 4.13 Experimental and optimized NML under different reaction schemes for 50K/min
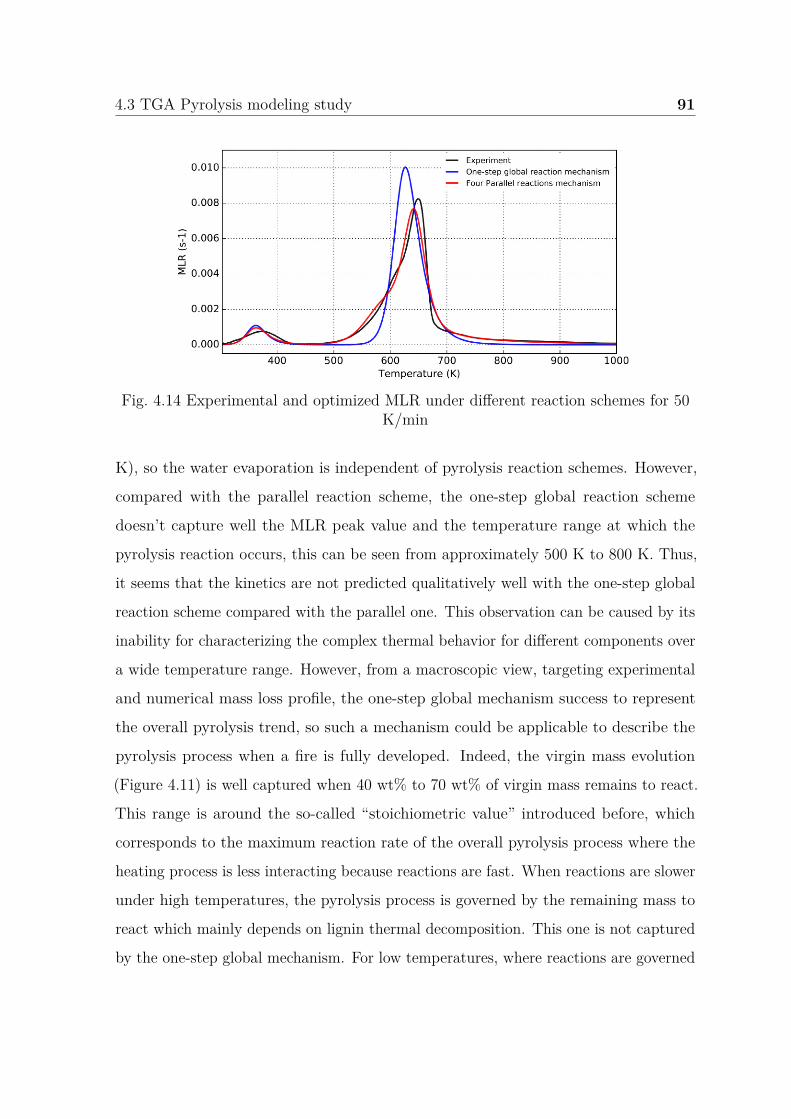
4.3 TGA Pyrolysis modeling study 91
Fig. 4.14 Experimental and optimized MLR under different reaction schemes for 50K/min
K), so the water evaporation is independent of pyrolysis reaction schemes. However,
compared with the parallel reaction scheme, the one-step global reaction scheme
doesn’t capture well the MLR peak value and the temperature range at which the
pyrolysis reaction occurs, this can be seen from approximately 500 K to 800 K. Thus,
it seems that the kinetics are not predicted qualitatively well with the one-step global
reaction scheme compared with the parallel one. This observation can be caused by its
inability for characterizing the complex thermal behavior for different components over
a wide temperature range. However, from a macroscopic view, targeting experimental
and numerical mass loss profile, the one-step global mechanism success to represent
the overall pyrolysis trend, so such a mechanism could be applicable to describe the
pyrolysis process when a fire is fully developed. Indeed, the virgin mass evolution
(Figure 4.11) is well captured when 40 wt% to 70 wt% of virgin mass remains to react.
This range is around the so-called “stoichiometric value” introduced before, which
corresponds to the maximum reaction rate of the overall pyrolysis process where the
heating process is less interacting because reactions are fast. When reactions are slower
under high temperatures, the pyrolysis process is governed by the remaining mass to
react which mainly depends on lignin thermal decomposition. This one is not captured
by the one-step global mechanism. For low temperatures, where reactions are governed
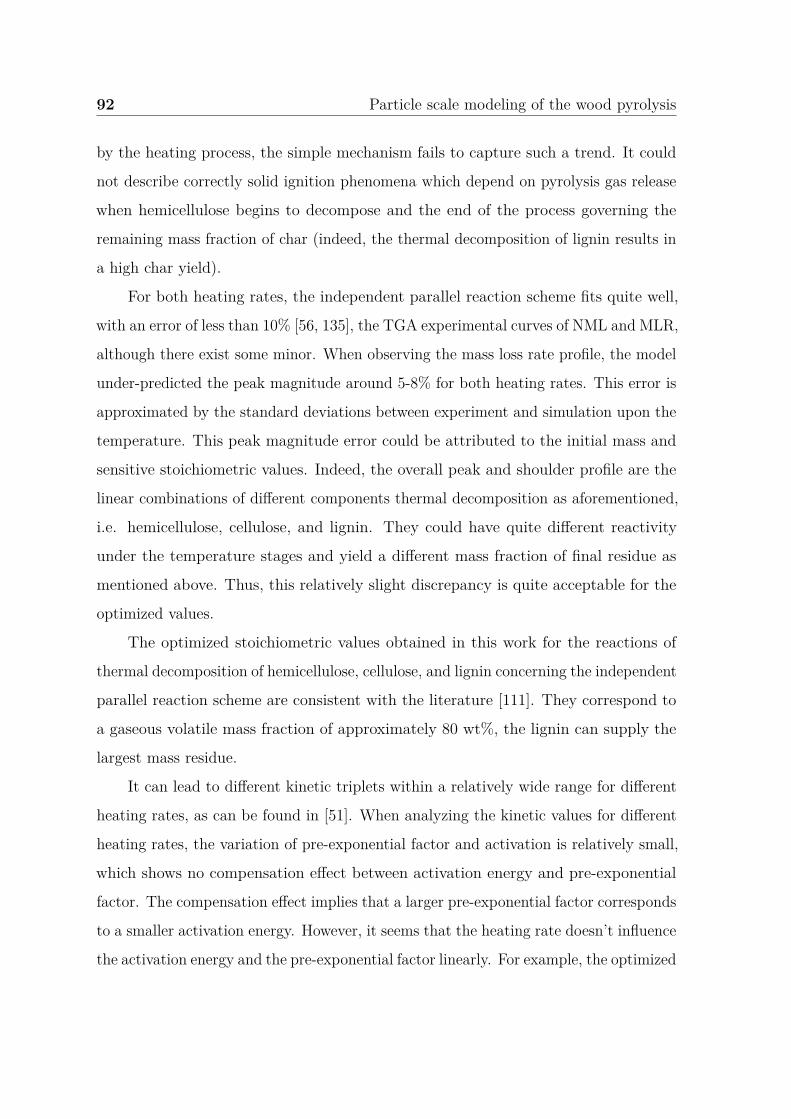
92 Particle scale modeling of the wood pyrolysis
by the heating process, the simple mechanism fails to capture such a trend. It could
not describe correctly solid ignition phenomena which depend on pyrolysis gas release
when hemicellulose begins to decompose and the end of the process governing the
remaining mass fraction of char (indeed, the thermal decomposition of lignin results in
a high char yield).
For both heating rates, the independent parallel reaction scheme fits quite well,
with an error of less than 10% [56, 135], the TGA experimental curves of NML and MLR,
although there exist some minor. When observing the mass loss rate profile, the model
under-predicted the peak magnitude around 5-8% for both heating rates. This error is
approximated by the standard deviations between experiment and simulation upon the
temperature. This peak magnitude error could be attributed to the initial mass and
sensitive stoichiometric values. Indeed, the overall peak and shoulder profile are the
linear combinations of different components thermal decomposition as aforementioned,
i.e. hemicellulose, cellulose, and lignin. They could have quite different reactivity
under the temperature stages and yield a different mass fraction of final residue as
mentioned above. Thus, this relatively slight discrepancy is quite acceptable for the
optimized values.
The optimized stoichiometric values obtained in this work for the reactions of
thermal decomposition of hemicellulose, cellulose, and lignin concerning the independent
parallel reaction scheme are consistent with the literature [111]. They correspond to
a gaseous volatile mass fraction of approximately 80 wt%, the lignin can supply the
largest mass residue.
It can lead to different kinetic triplets within a relatively wide range for different
heating rates, as can be found in [51]. When analyzing the kinetic values for different
heating rates, the variation of pre-exponential factor and activation is relatively small,
which shows no compensation effect between activation energy and pre-exponential
factor. The compensation effect implies that a larger pre-exponential factor corresponds
to a smaller activation energy. However, it seems that the heating rate doesn’t influence
the activation energy and the pre-exponential factor linearly. For example, the optimized
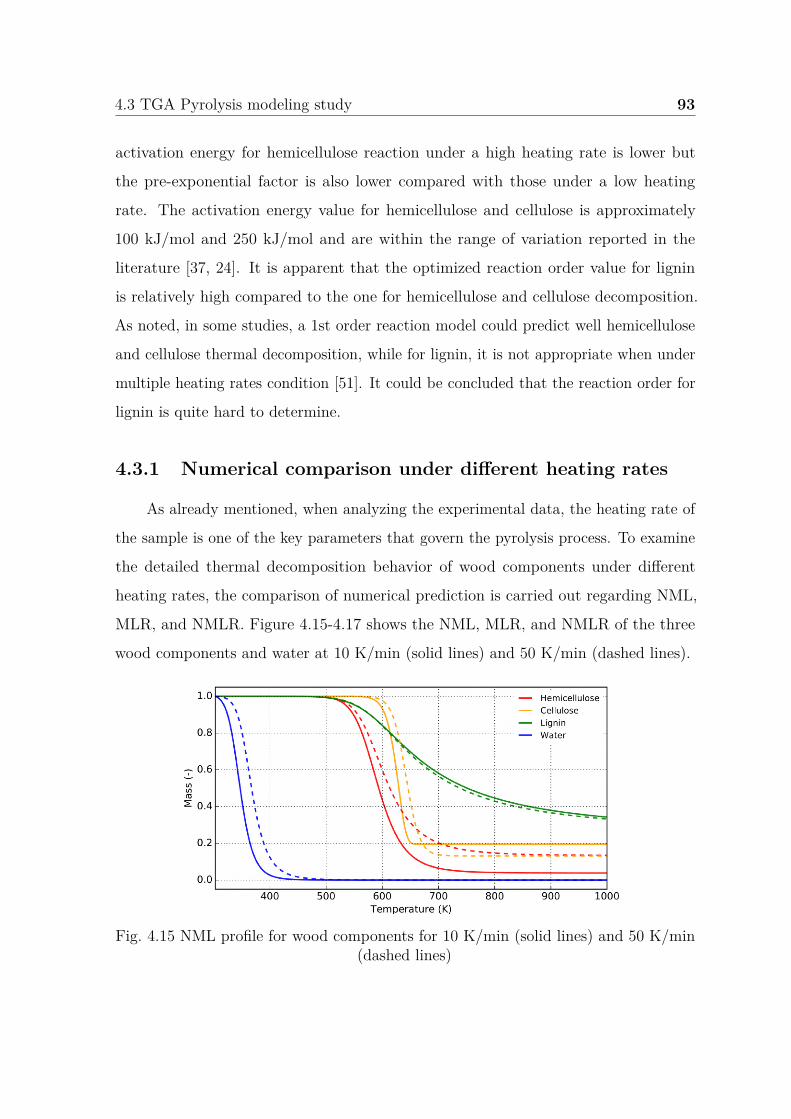
4.3 TGA Pyrolysis modeling study 93
activation energy for hemicellulose reaction under a high heating rate is lower but
the pre-exponential factor is also lower compared with those under a low heating
rate. The activation energy value for hemicellulose and cellulose is approximately
100 kJ/mol and 250 kJ/mol and are within the range of variation reported in the
literature [37, 24]. It is apparent that the optimized reaction order value for lignin
is relatively high compared to the one for hemicellulose and cellulose decomposition.
As noted, in some studies, a 1st order reaction model could predict well hemicellulose
and cellulose thermal decomposition, while for lignin, it is not appropriate when under
multiple heating rates condition [51]. It could be concluded that the reaction order for
lignin is quite hard to determine.
4.3.1 Numerical comparison under different heating rates
As already mentioned, when analyzing the experimental data, the heating rate of
the sample is one of the key parameters that govern the pyrolysis process. To examine
the detailed thermal decomposition behavior of wood components under different
heating rates, the comparison of numerical prediction is carried out regarding NML,
MLR, and NMLR. Figure 4.15-4.17 shows the NML, MLR, and NMLR of the three
wood components and water at 10 K/min (solid lines) and 50 K/min (dashed lines).
Fig. 4.15 NML profile for wood components for 10 K/min (solid lines) and 50 K/min(dashed lines)
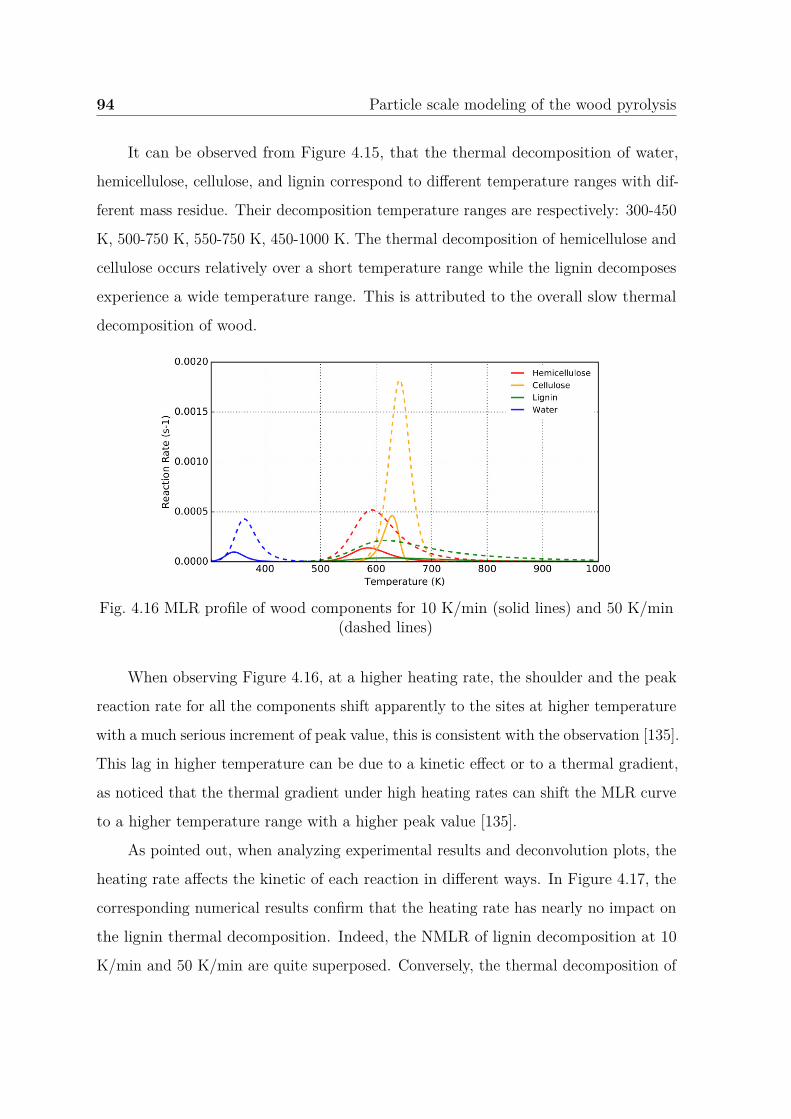
94 Particle scale modeling of the wood pyrolysis
It can be observed from Figure 4.15, that the thermal decomposition of water,
hemicellulose, cellulose, and lignin correspond to different temperature ranges with dif-
ferent mass residue. Their decomposition temperature ranges are respectively: 300-450
K, 500-750 K, 550-750 K, 450-1000 K. The thermal decomposition of hemicellulose and
cellulose occurs relatively over a short temperature range while the lignin decomposes
experience a wide temperature range. This is attributed to the overall slow thermal
decomposition of wood.
Fig. 4.16 MLR profile of wood components for 10 K/min (solid lines) and 50 K/min(dashed lines)
When observing Figure 4.16, at a higher heating rate, the shoulder and the peak
reaction rate for all the components shift apparently to the sites at higher temperature
with a much serious increment of peak value, this is consistent with the observation [135].
This lag in higher temperature can be due to a kinetic effect or to a thermal gradient,
as noticed that the thermal gradient under high heating rates can shift the MLR curve
to a higher temperature range with a higher peak value [135].
As pointed out, when analyzing experimental results and deconvolution plots, the
heating rate affects the kinetic of each reaction in different ways. In Figure 4.17, the
corresponding numerical results confirm that the heating rate has nearly no impact on
the lignin thermal decomposition. Indeed, the NMLR of lignin decomposition at 10
K/min and 50 K/min are quite superposed. Conversely, the thermal decomposition of
4.3 TGA Pyrolysis modeling study 95
Fig. 4.17 NMLR profile of wood components for 10 K/min (solid lines) and 50 K/min(dashed lines)
hemicellulose and cellulose are affected by the heating process. The two reactions are
extended to higher temperatures for higher heating rates. When observing the NMLR
from 10 K/min to 50 K/min in Figure 4.17, the onset of cellulose reaction is shifted to
higher temperatures, thus the beginning of the cellulose reaction is delayed. However,
this variation trend isn’t present for hemicellulose reaction, the beginning reaction
of hemicellulose is not affected too much by the heating process. The reaction rate
concerning the rising part of the hemicellulose decomposition is nearly the same at 10
K/min and 50 K/min. The shift to higher temperatures is observed mainly when the
hemicellulose reaction rate begins to decrease. From Figure 4.17, we also observe the
lignin reaction rate shows a very slight difference under different heating rates, and it
can be specified as invariant when comparing the difference in the case of hemicellulose
and cellulose reaction. As already mentioned, even though the heating rate can affect
the remaining mass fraction, when temperatures reach very high values (approximately
1000 K), the mass fraction of the total char residue is nearly the same for the two
heating rates (Figure 4.4). This can be argued with Figure 4.15. Indeed, the lignin
decomposition can produce the largest mass fraction of char residue at the end of the
pyrolysis process, and this char residue doesn’t change with heating rate. However,
the heating process changes the mass fraction of char residue given by the cellulose
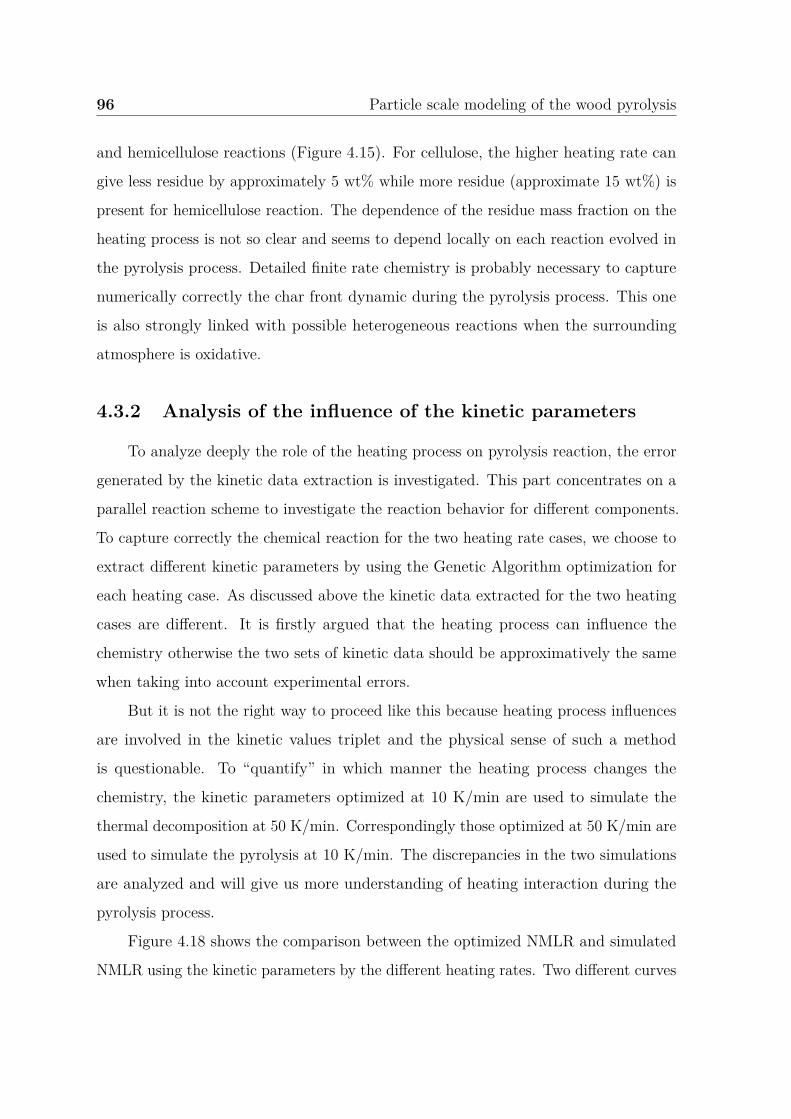
96 Particle scale modeling of the wood pyrolysis
and hemicellulose reactions (Figure 4.15). For cellulose, the higher heating rate can
give less residue by approximately 5 wt% while more residue (approximate 15 wt%) is
present for hemicellulose reaction. The dependence of the residue mass fraction on the
heating process is not so clear and seems to depend locally on each reaction evolved in
the pyrolysis process. Detailed finite rate chemistry is probably necessary to capture
numerically correctly the char front dynamic during the pyrolysis process. This one
is also strongly linked with possible heterogeneous reactions when the surrounding
atmosphere is oxidative.
4.3.2 Analysis of the influence of the kinetic parameters
To analyze deeply the role of the heating process on pyrolysis reaction, the error
generated by the kinetic data extraction is investigated. This part concentrates on a
parallel reaction scheme to investigate the reaction behavior for different components.
To capture correctly the chemical reaction for the two heating rate cases, we choose to
extract different kinetic parameters by using the Genetic Algorithm optimization for
each heating case. As discussed above the kinetic data extracted for the two heating
cases are different. It is firstly argued that the heating process can influence the
chemistry otherwise the two sets of kinetic data should be approximatively the same
when taking into account experimental errors.
But it is not the right way to proceed like this because heating process influences
are involved in the kinetic values triplet and the physical sense of such a method
is questionable. To “quantify” in which manner the heating process changes the
chemistry, the kinetic parameters optimized at 10 K/min are used to simulate the
thermal decomposition at 50 K/min. Correspondingly those optimized at 50 K/min are
used to simulate the pyrolysis at 10 K/min. The discrepancies in the two simulations
are analyzed and will give us more understanding of heating interaction during the
pyrolysis process.
Figure 4.18 shows the comparison between the optimized NMLR and simulated
NMLR using the kinetic parameters by the different heating rates. Two different curves
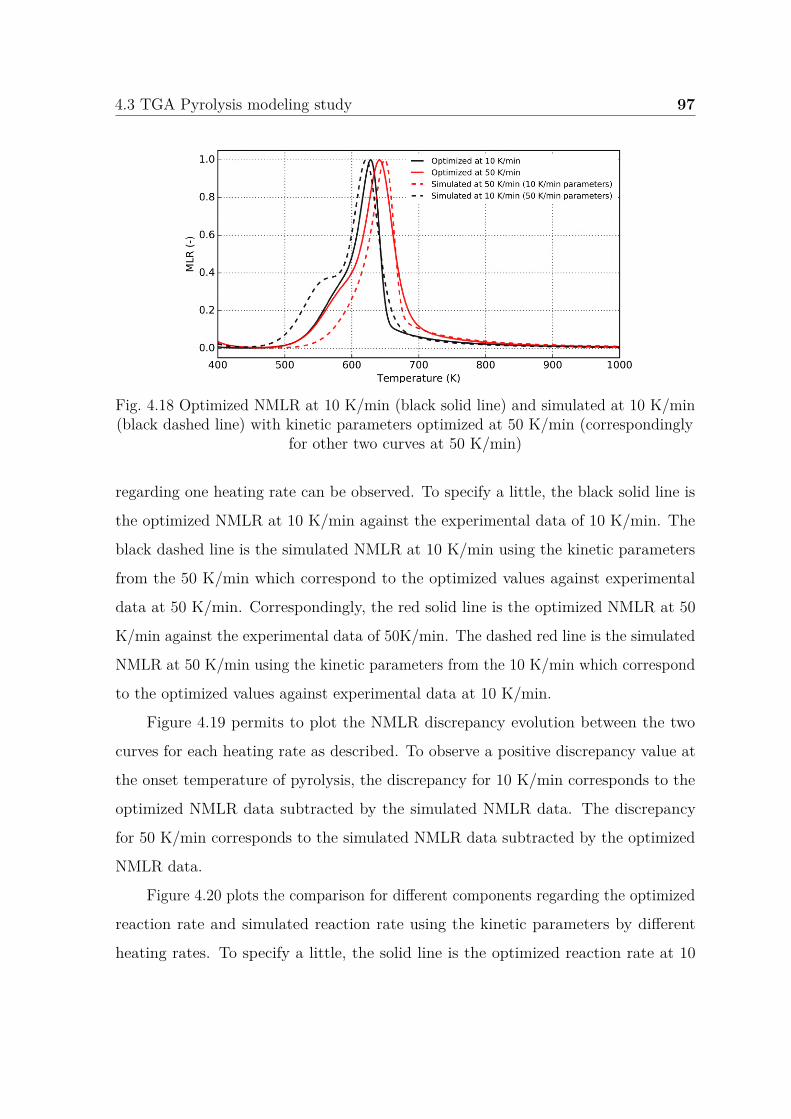
4.3 TGA Pyrolysis modeling study 97
Fig. 4.18 Optimized NMLR at 10 K/min (black solid line) and simulated at 10 K/min(black dashed line) with kinetic parameters optimized at 50 K/min (correspondingly
for other two curves at 50 K/min)
regarding one heating rate can be observed. To specify a little, the black solid line is
the optimized NMLR at 10 K/min against the experimental data of 10 K/min. The
black dashed line is the simulated NMLR at 10 K/min using the kinetic parameters
from the 50 K/min which correspond to the optimized values against experimental
data at 50 K/min. Correspondingly, the red solid line is the optimized NMLR at 50
K/min against the experimental data of 50K/min. The dashed red line is the simulated
NMLR at 50 K/min using the kinetic parameters from the 10 K/min which correspond
to the optimized values against experimental data at 10 K/min.
Figure 4.19 permits to plot the NMLR discrepancy evolution between the two
curves for each heating rate as described. To observe a positive discrepancy value at
the onset temperature of pyrolysis, the discrepancy for 10 K/min corresponds to the
optimized NMLR data subtracted by the simulated NMLR data. The discrepancy
for 50 K/min corresponds to the simulated NMLR data subtracted by the optimized
NMLR data.
Figure 4.20 plots the comparison for different components regarding the optimized
reaction rate and simulated reaction rate using the kinetic parameters by different
heating rates. To specify a little, the solid line is the optimized reaction rate at 10
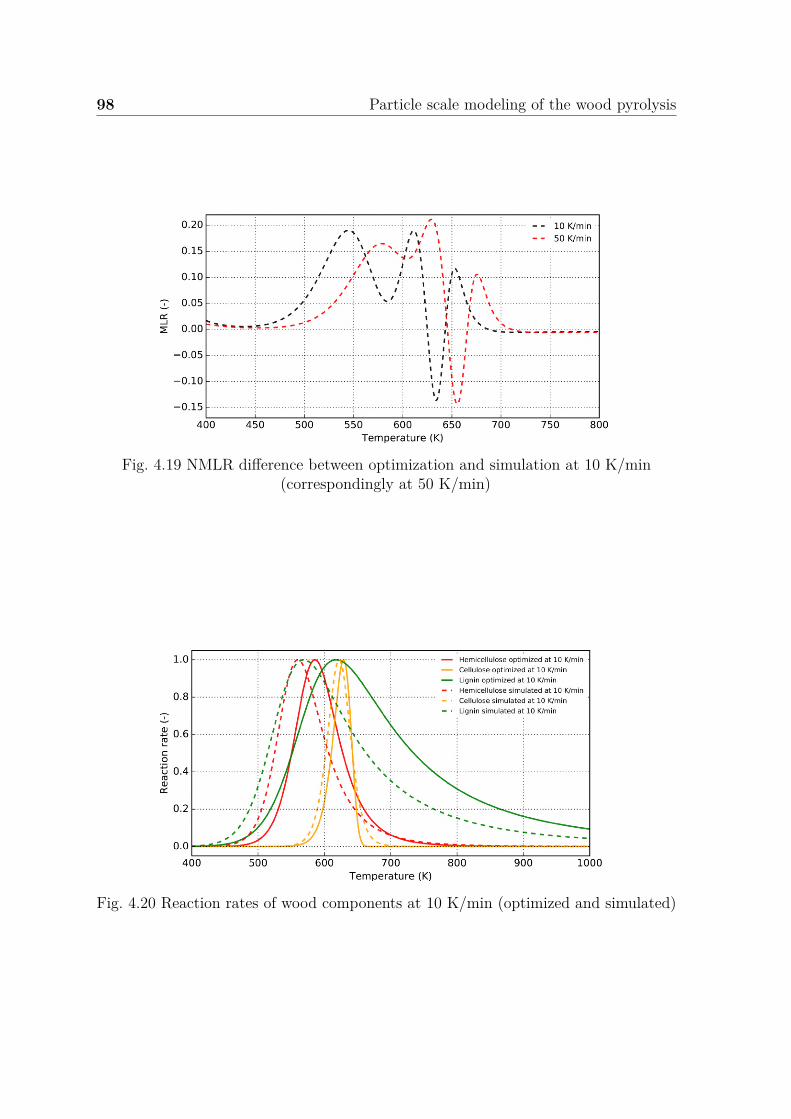
98 Particle scale modeling of the wood pyrolysis
Fig. 4.19 NMLR difference between optimization and simulation at 10 K/min(correspondingly at 50 K/min)
Fig. 4.20 Reaction rates of wood components at 10 K/min (optimized and simulated)
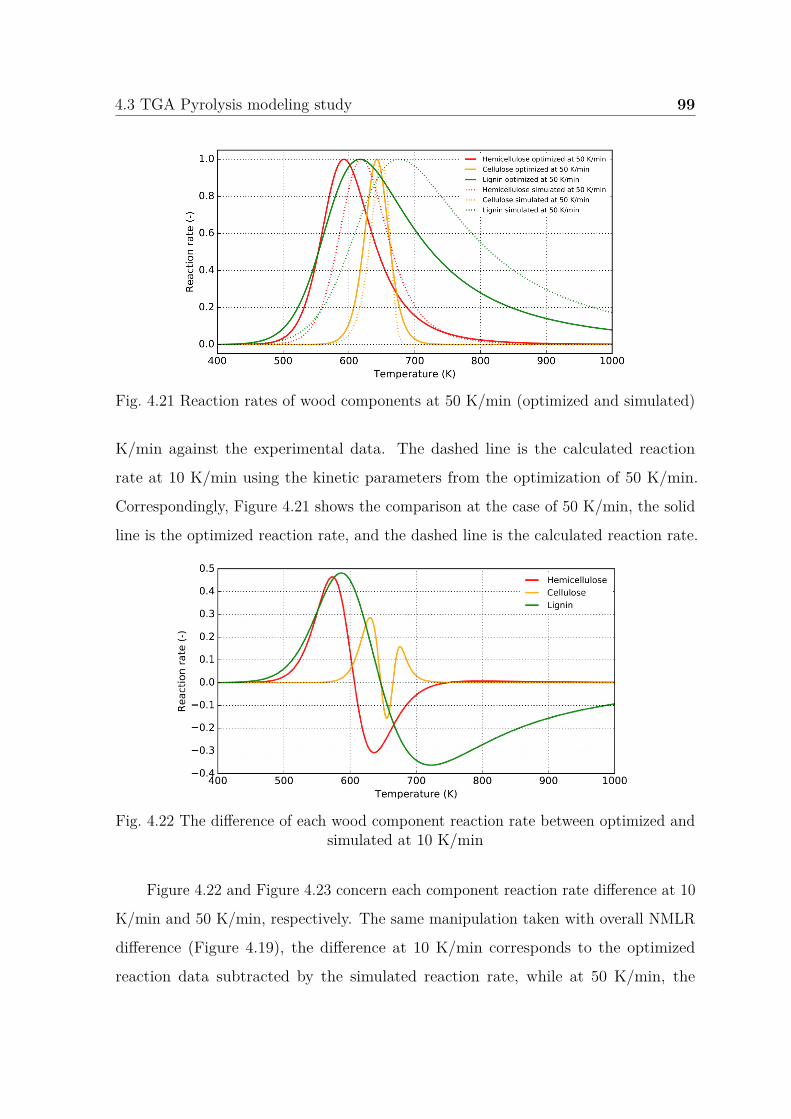
4.3 TGA Pyrolysis modeling study 99
Fig. 4.21 Reaction rates of wood components at 50 K/min (optimized and simulated)
K/min against the experimental data. The dashed line is the calculated reaction
rate at 10 K/min using the kinetic parameters from the optimization of 50 K/min.
Correspondingly, Figure 4.21 shows the comparison at the case of 50 K/min, the solid
line is the optimized reaction rate, and the dashed line is the calculated reaction rate.
Fig. 4.22 The difference of each wood component reaction rate between optimized andsimulated at 10 K/min
Figure 4.22 and Figure 4.23 concern each component reaction rate difference at 10
K/min and 50 K/min, respectively. The same manipulation taken with overall NMLR
difference (Figure 4.19), the difference at 10 K/min corresponds to the optimized
reaction data subtracted by the simulated reaction rate, while at 50 K/min, the
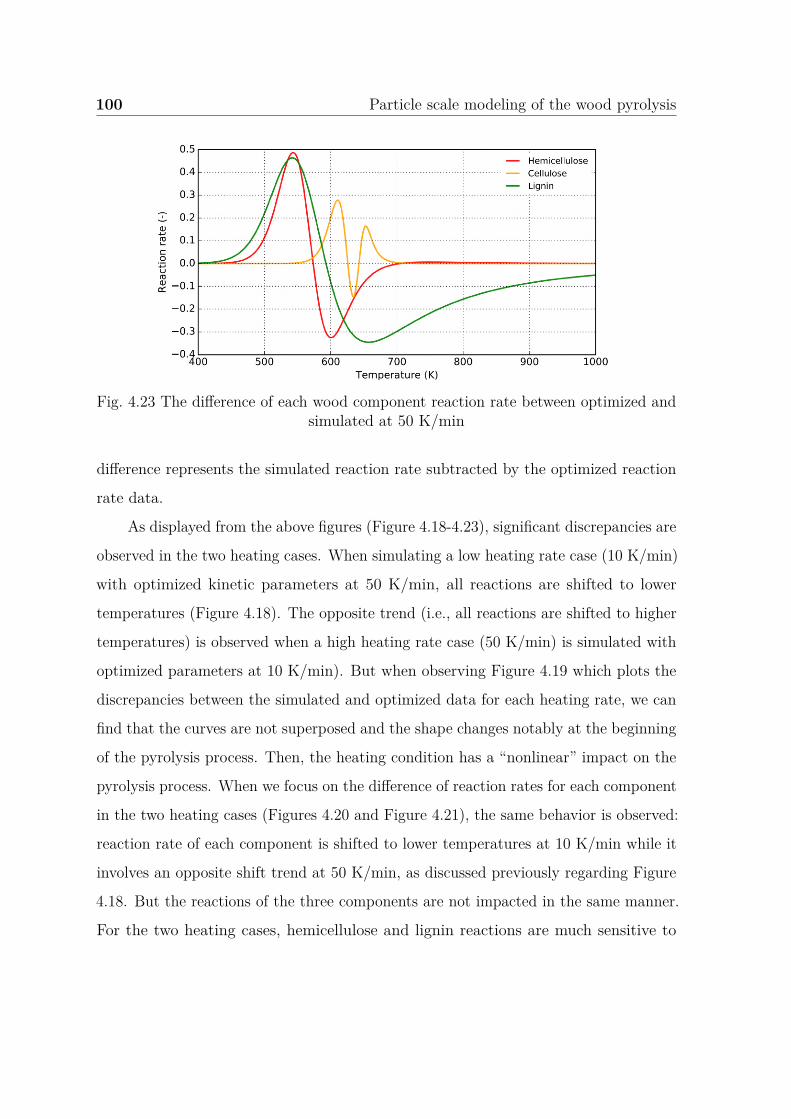
100 Particle scale modeling of the wood pyrolysis
Fig. 4.23 The difference of each wood component reaction rate between optimized andsimulated at 50 K/min
difference represents the simulated reaction rate subtracted by the optimized reaction
rate data.
As displayed from the above figures (Figure 4.18-4.23), significant discrepancies are
observed in the two heating cases. When simulating a low heating rate case (10 K/min)
with optimized kinetic parameters at 50 K/min, all reactions are shifted to lower
temperatures (Figure 4.18). The opposite trend (i.e., all reactions are shifted to higher
temperatures) is observed when a high heating rate case (50 K/min) is simulated with
optimized parameters at 10 K/min). But when observing Figure 4.19 which plots the
discrepancies between the simulated and optimized data for each heating rate, we can
find that the curves are not superposed and the shape changes notably at the beginning
of the pyrolysis process. Then, the heating condition has a “nonlinear” impact on the
pyrolysis process. When we focus on the difference of reaction rates for each component
in the two heating cases (Figures 4.20 and Figure 4.21), the same behavior is observed:
reaction rate of each component is shifted to lower temperatures at 10 K/min while it
involves an opposite shift trend at 50 K/min, as discussed previously regarding Figure
4.18. But the reactions of the three components are not impacted in the same manner.
For the two heating cases, hemicellulose and lignin reactions are much sensitive to
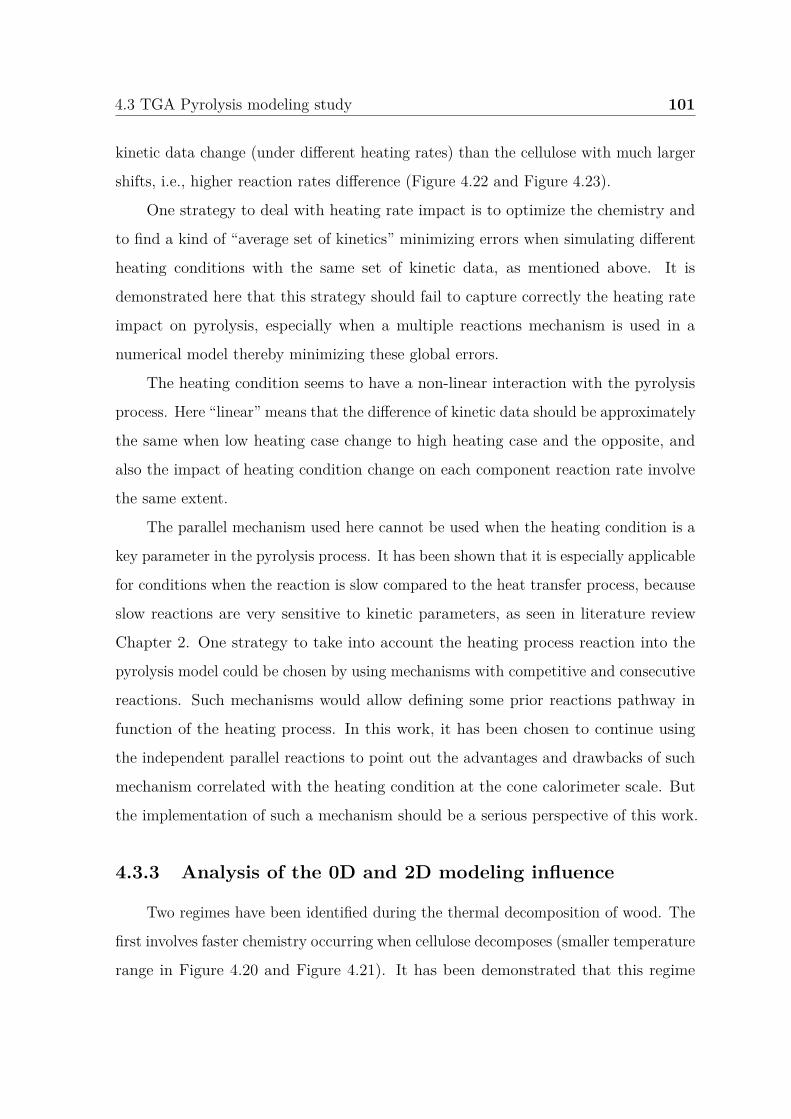
4.3 TGA Pyrolysis modeling study 101
kinetic data change (under different heating rates) than the cellulose with much larger
shifts, i.e., higher reaction rates difference (Figure 4.22 and Figure 4.23).
One strategy to deal with heating rate impact is to optimize the chemistry and
to find a kind of “average set of kinetics” minimizing errors when simulating different
heating conditions with the same set of kinetic data, as mentioned above. It is
demonstrated here that this strategy should fail to capture correctly the heating rate
impact on pyrolysis, especially when a multiple reactions mechanism is used in a
numerical model thereby minimizing these global errors.
The heating condition seems to have a non-linear interaction with the pyrolysis
process. Here “linear” means that the difference of kinetic data should be approximately
the same when low heating case change to high heating case and the opposite, and
also the impact of heating condition change on each component reaction rate involve
the same extent.
The parallel mechanism used here cannot be used when the heating condition is a
key parameter in the pyrolysis process. It has been shown that it is especially applicable
for conditions when the reaction is slow compared to the heat transfer process, because
slow reactions are very sensitive to kinetic parameters, as seen in literature review
Chapter 2. One strategy to take into account the heating process reaction into the
pyrolysis model could be chosen by using mechanisms with competitive and consecutive
reactions. Such mechanisms would allow defining some prior reactions pathway in
function of the heating process. In this work, it has been chosen to continue using
the independent parallel reactions to point out the advantages and drawbacks of such
mechanism correlated with the heating condition at the cone calorimeter scale. But
the implementation of such a mechanism should be a serious perspective of this work.
4.3.3 Analysis of the 0D and 2D modeling influence
Two regimes have been identified during the thermal decomposition of wood. The
first involves faster chemistry occurring when cellulose decomposes (smaller temperature
range in Figure 4.20 and Figure 4.21). It has been demonstrated that this regime
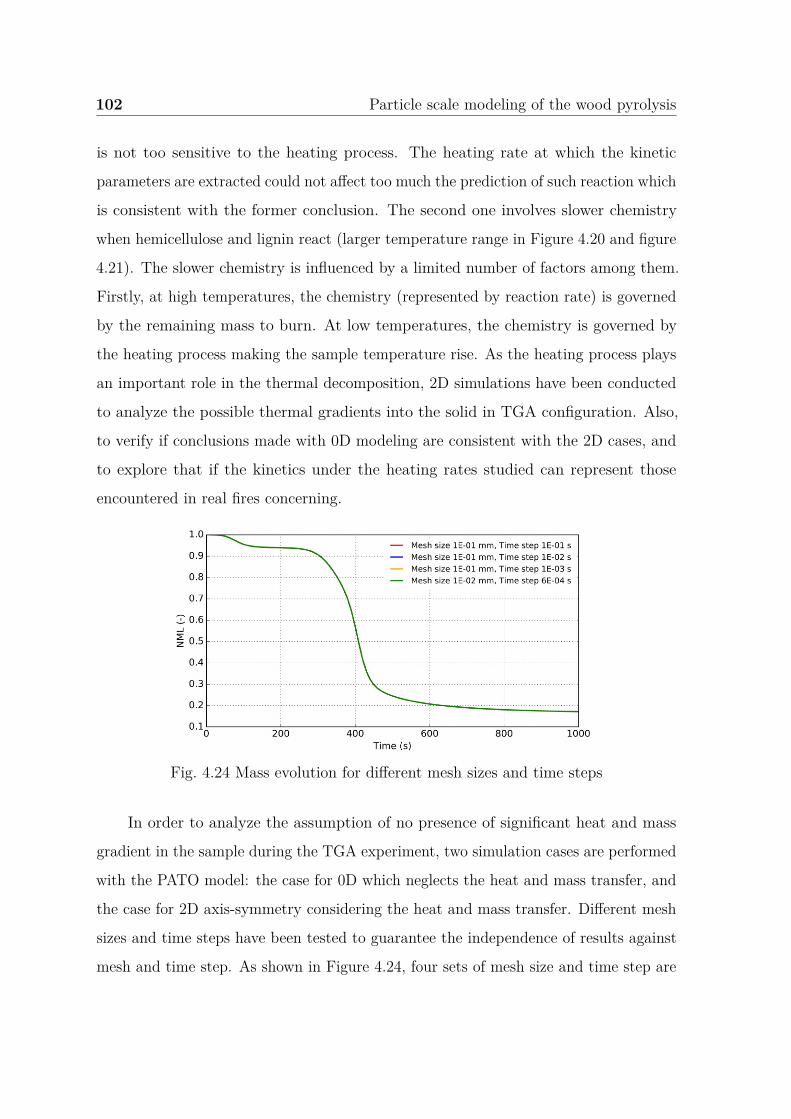
102 Particle scale modeling of the wood pyrolysis
is not too sensitive to the heating process. The heating rate at which the kinetic
parameters are extracted could not affect too much the prediction of such reaction which
is consistent with the former conclusion. The second one involves slower chemistry
when hemicellulose and lignin react (larger temperature range in Figure 4.20 and figure
4.21). The slower chemistry is influenced by a limited number of factors among them.
Firstly, at high temperatures, the chemistry (represented by reaction rate) is governed
by the remaining mass to burn. At low temperatures, the chemistry is governed by
the heating process making the sample temperature rise. As the heating process plays
an important role in the thermal decomposition, 2D simulations have been conducted
to analyze the possible thermal gradients into the solid in TGA configuration. Also,
to verify if conclusions made with 0D modeling are consistent with the 2D cases, and
to explore that if the kinetics under the heating rates studied can represent those
encountered in real fires concerning.
Fig. 4.24 Mass evolution for different mesh sizes and time steps
In order to analyze the assumption of no presence of significant heat and mass
gradient in the sample during the TGA experiment, two simulation cases are performed
with the PATO model: the case for 0D which neglects the heat and mass transfer, and
the case for 2D axis-symmetry considering the heat and mass transfer. Different mesh
sizes and time steps have been tested to guarantee the independence of results against
mesh and time step. As shown in Figure 4.24, four sets of mesh size and time step are
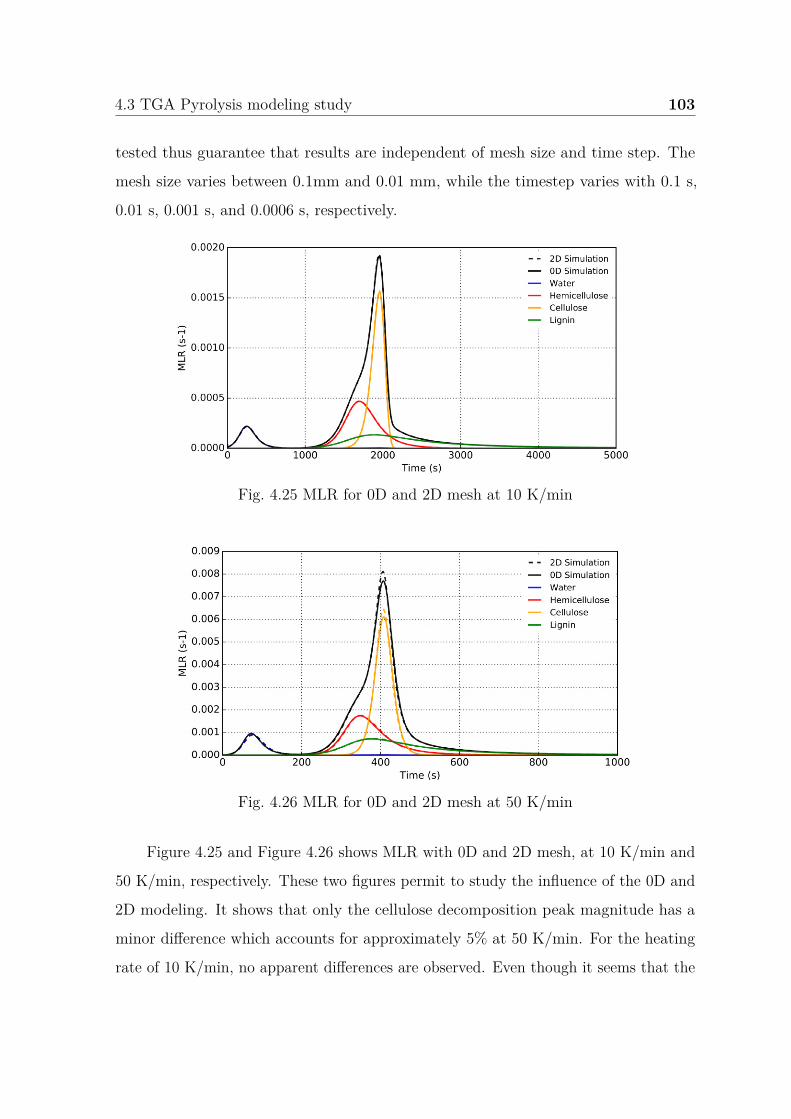
4.3 TGA Pyrolysis modeling study 103
tested thus guarantee that results are independent of mesh size and time step. The
mesh size varies between 0.1mm and 0.01 mm, while the timestep varies with 0.1 s,
0.01 s, 0.001 s, and 0.0006 s, respectively.
Fig. 4.25 MLR for 0D and 2D mesh at 10 K/min
Fig. 4.26 MLR for 0D and 2D mesh at 50 K/min
Figure 4.25 and Figure 4.26 shows MLR with 0D and 2D mesh, at 10 K/min and
50 K/min, respectively. These two figures permit to study the influence of the 0D and
2D modeling. It shows that only the cellulose decomposition peak magnitude has a
minor difference which accounts for approximately 5% at 50 K/min. For the heating
rate of 10 K/min, no apparent differences are observed. Even though it seems that the
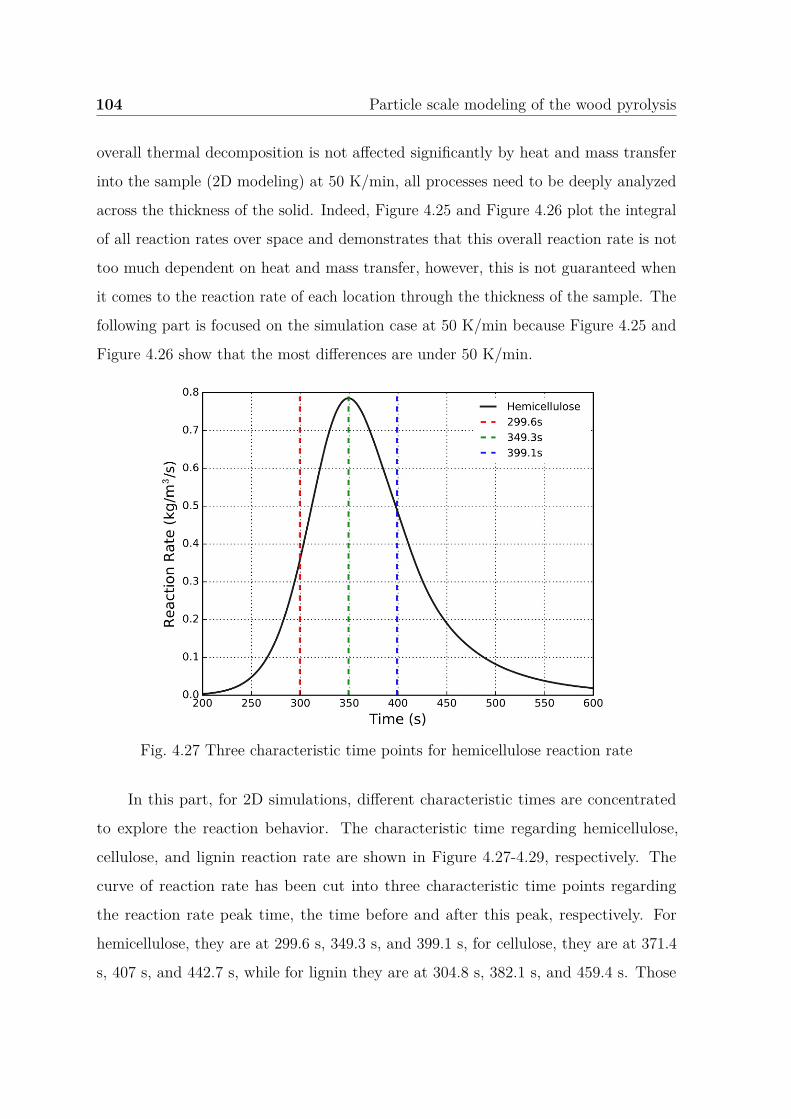
104 Particle scale modeling of the wood pyrolysis
overall thermal decomposition is not affected significantly by heat and mass transfer
into the sample (2D modeling) at 50 K/min, all processes need to be deeply analyzed
across the thickness of the solid. Indeed, Figure 4.25 and Figure 4.26 plot the integral
of all reaction rates over space and demonstrates that this overall reaction rate is not
too much dependent on heat and mass transfer, however, this is not guaranteed when
it comes to the reaction rate of each location through the thickness of the sample. The
following part is focused on the simulation case at 50 K/min because Figure 4.25 and
Figure 4.26 show that the most differences are under 50 K/min.
Fig. 4.27 Three characteristic time points for hemicellulose reaction rate
In this part, for 2D simulations, different characteristic times are concentrated
to explore the reaction behavior. The characteristic time regarding hemicellulose,
cellulose, and lignin reaction rate are shown in Figure 4.27-4.29, respectively. The
curve of reaction rate has been cut into three characteristic time points regarding
the reaction rate peak time, the time before and after this peak, respectively. For
hemicellulose, they are at 299.6 s, 349.3 s, and 399.1 s, for cellulose, they are at 371.4
s, 407 s, and 442.7 s, while for lignin they are at 304.8 s, 382.1 s, and 459.4 s. Those
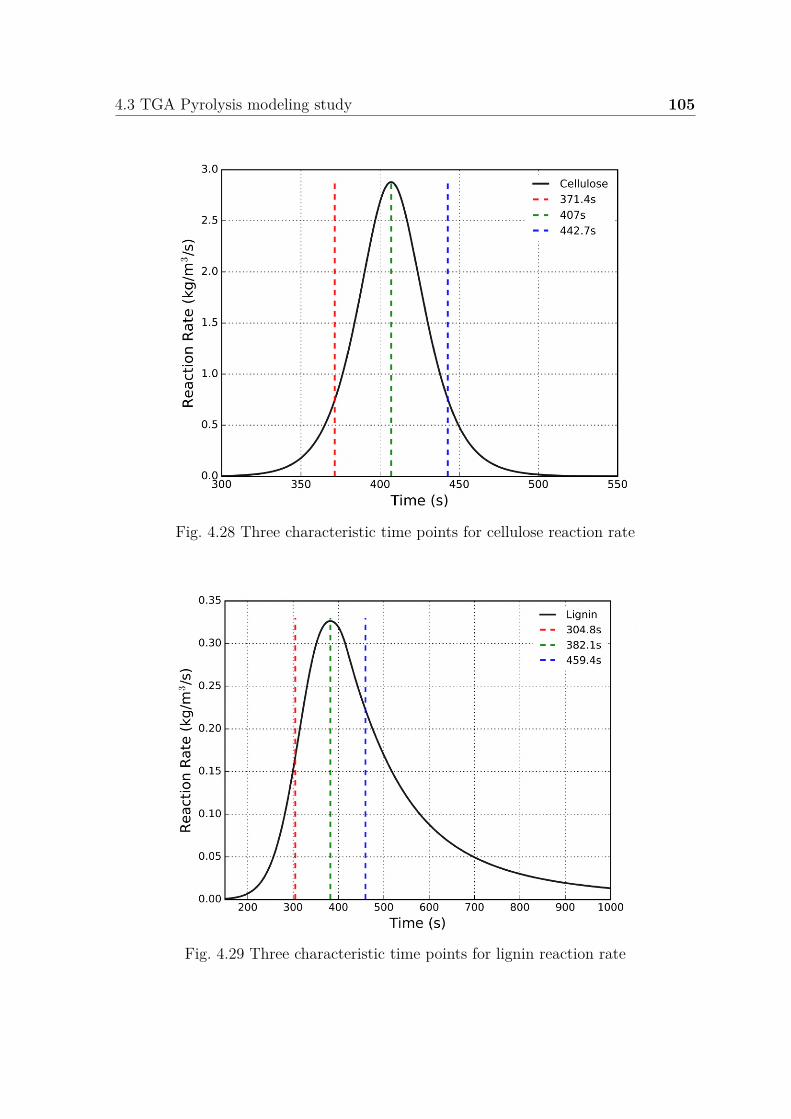
4.3 TGA Pyrolysis modeling study 105
Fig. 4.28 Three characteristic time points for cellulose reaction rate
Fig. 4.29 Three characteristic time points for lignin reaction rate
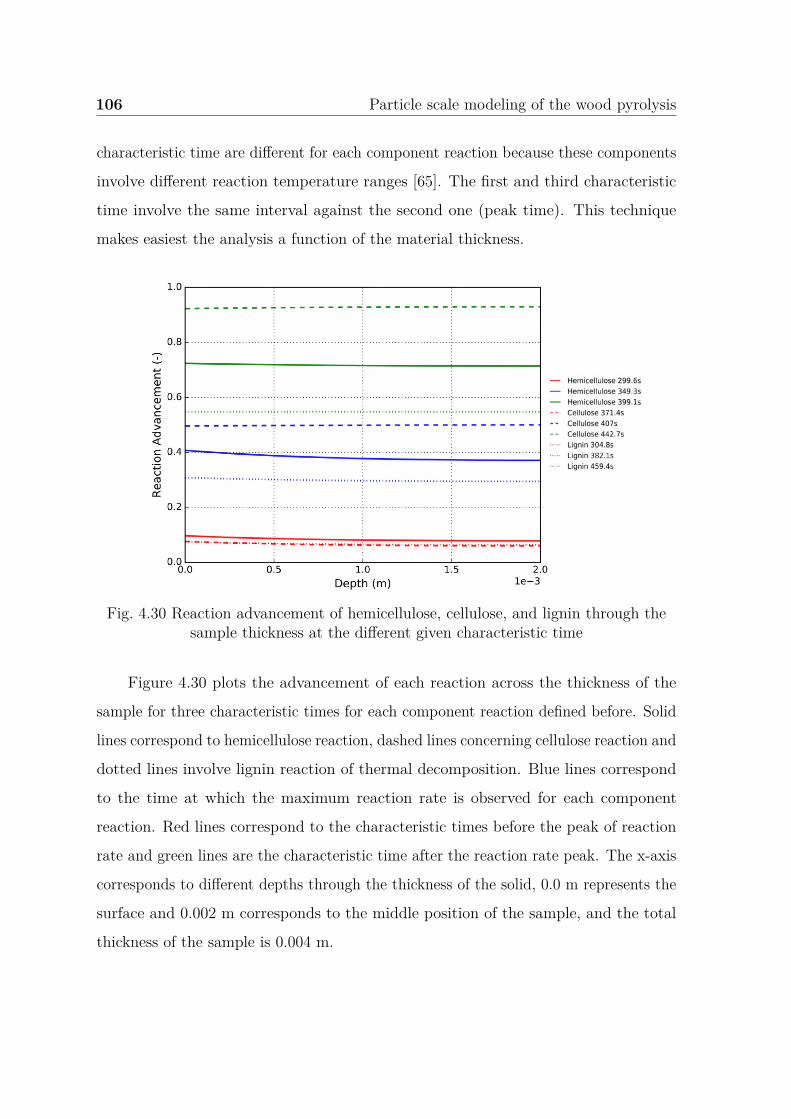
106 Particle scale modeling of the wood pyrolysis
characteristic time are different for each component reaction because these components
involve different reaction temperature ranges [65]. The first and third characteristic
time involve the same interval against the second one (peak time). This technique
makes easiest the analysis a function of the material thickness.
Fig. 4.30 Reaction advancement of hemicellulose, cellulose, and lignin through thesample thickness at the different given characteristic time
Figure 4.30 plots the advancement of each reaction across the thickness of the
sample for three characteristic times for each component reaction defined before. Solid
lines correspond to hemicellulose reaction, dashed lines concerning cellulose reaction and
dotted lines involve lignin reaction of thermal decomposition. Blue lines correspond
to the time at which the maximum reaction rate is observed for each component
reaction. Red lines correspond to the characteristic times before the peak of reaction
rate and green lines are the characteristic time after the reaction rate peak. The x-axis
corresponds to different depths through the thickness of the solid, 0.0 m represents the
surface and 0.002 m corresponds to the middle position of the sample, and the total
thickness of the sample is 0.004 m.
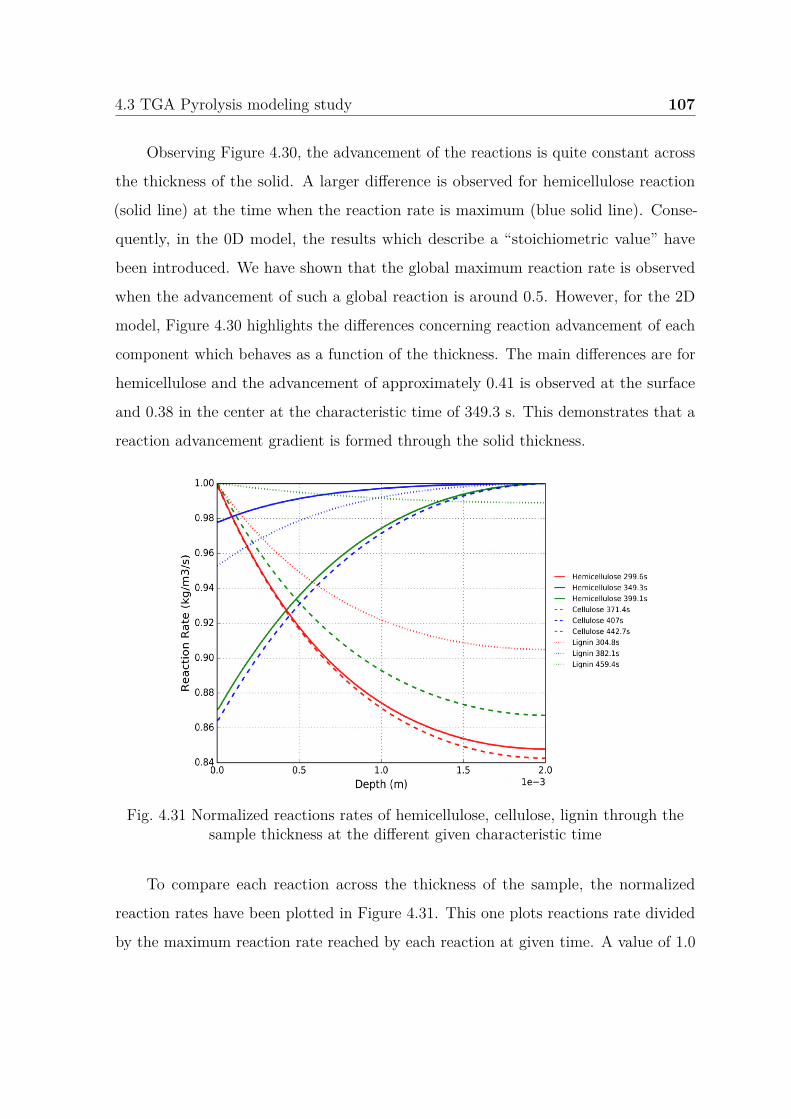
4.3 TGA Pyrolysis modeling study 107
Observing Figure 4.30, the advancement of the reactions is quite constant across
the thickness of the solid. A larger difference is observed for hemicellulose reaction
(solid line) at the time when the reaction rate is maximum (blue solid line). Conse-
quently, in the 0D model, the results which describe a “stoichiometric value” have
been introduced. We have shown that the global maximum reaction rate is observed
when the advancement of such a global reaction is around 0.5. However, for the 2D
model, Figure 4.30 highlights the differences concerning reaction advancement of each
component which behaves as a function of the thickness. The main differences are for
hemicellulose and the advancement of approximately 0.41 is observed at the surface
and 0.38 in the center at the characteristic time of 349.3 s. This demonstrates that a
reaction advancement gradient is formed through the solid thickness.
Fig. 4.31 Normalized reactions rates of hemicellulose, cellulose, lignin through thesample thickness at the different given characteristic time
To compare each reaction across the thickness of the sample, the normalized
reaction rates have been plotted in Figure 4.31. This one plots reactions rate divided
by the maximum reaction rate reached by each reaction at given time. A value of 1.0
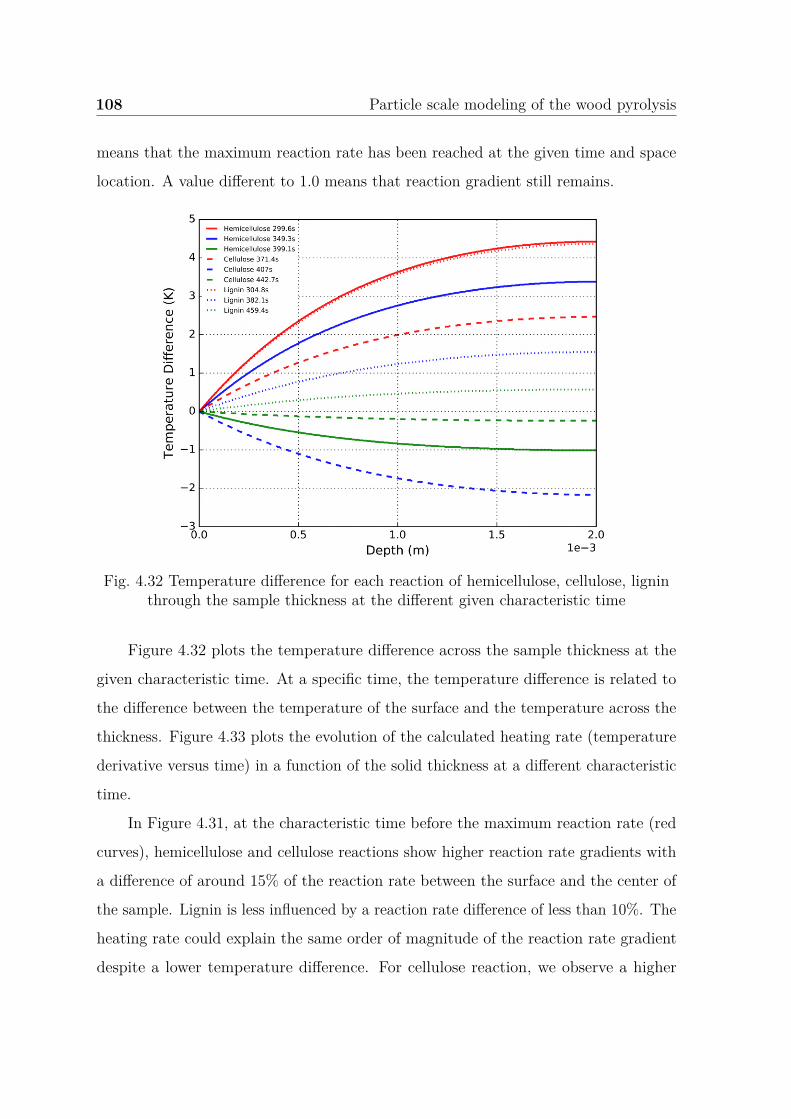
108 Particle scale modeling of the wood pyrolysis
means that the maximum reaction rate has been reached at the given time and space
location. A value different to 1.0 means that reaction gradient still remains.
Fig. 4.32 Temperature difference for each reaction of hemicellulose, cellulose, ligninthrough the sample thickness at the different given characteristic time
Figure 4.32 plots the temperature difference across the sample thickness at the
given characteristic time. At a specific time, the temperature difference is related to
the difference between the temperature of the surface and the temperature across the
thickness. Figure 4.33 plots the evolution of the calculated heating rate (temperature
derivative versus time) in a function of the solid thickness at a different characteristic
time.
In Figure 4.31, at the characteristic time before the maximum reaction rate (red
curves), hemicellulose and cellulose reactions show higher reaction rate gradients with
a difference of around 15% of the reaction rate between the surface and the center of
the sample. Lignin is less influenced by a reaction rate difference of less than 10%. The
heating rate could explain the same order of magnitude of the reaction rate gradient
despite a lower temperature difference. For cellulose reaction, we observe a higher
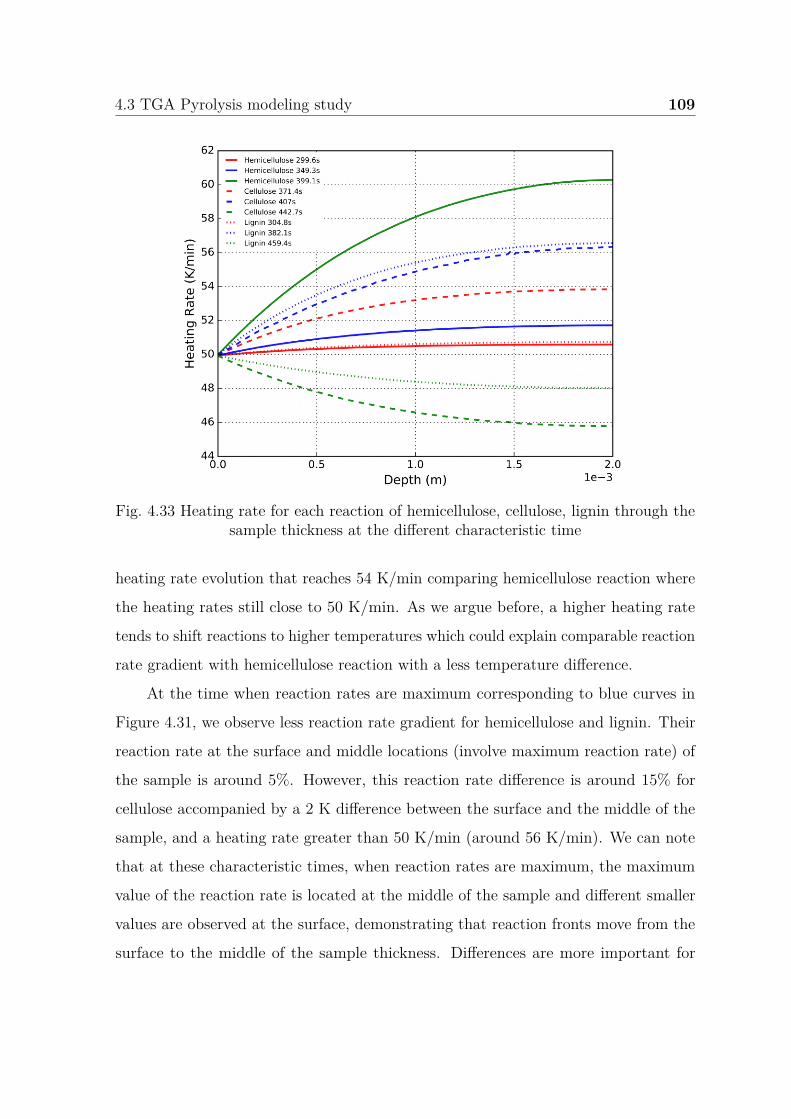
4.3 TGA Pyrolysis modeling study 109
Fig. 4.33 Heating rate for each reaction of hemicellulose, cellulose, lignin through thesample thickness at the different characteristic time
heating rate evolution that reaches 54 K/min comparing hemicellulose reaction where
the heating rates still close to 50 K/min. As we argue before, a higher heating rate
tends to shift reactions to higher temperatures which could explain comparable reaction
rate gradient with hemicellulose reaction with a less temperature difference.
At the time when reaction rates are maximum corresponding to blue curves in
Figure 4.31, we observe less reaction rate gradient for hemicellulose and lignin. Their
reaction rate at the surface and middle locations (involve maximum reaction rate) of
the sample is around 5%. However, this reaction rate difference is around 15% for
cellulose accompanied by a 2 K difference between the surface and the middle of the
sample, and a heating rate greater than 50 K/min (around 56 K/min). We can note
that at these characteristic times, when reaction rates are maximum, the maximum
value of the reaction rate is located at the middle of the sample and different smaller
values are observed at the surface, demonstrating that reaction fronts move from the
surface to the middle of the sample thickness. Differences are more important for
110 Particle scale modeling of the wood pyrolysis
cellulose reaction probably because the reaction front is thinner and when it moves to
the center of the solid, it causes higher reaction rate gradients.
For the characteristic time after the reaction rate peak (green curves), we observe
a similar trend for lignin and cellulose reactions (Figure 4.31). While higher reaction
rate gradients for cellulose reaction, an opposite trend for hemicellulose reaction rate
which could be explained by high heating rate value at that time corresponding to the
solid green line in Figure 4.34.
With such behavior discussed above, we can conclude that heat and mass transfers
interact with pyrolysis reactions when the global heating rate is more than 50 K/min.
However, this can behave in different ways depending on the observation of the kinetic
characteristic of each reaction. Indeed, depending on the characteristic time scale of
the reaction (slow or fast reaction), heat and mass transfers do not have the same
impact on reactions. So the link among reactions, heat, and mass transfers is complex
and it depends locally on characteristic time and length scales of chemical reactions,
heat, and mass transfer processes. These interactions need to be correctly captured by
the model to describe correctly the overall pyrolysis process. Here we point out some
interactions at the TGA scale at 50 K/min. Even though this interaction extent is
quite low because of the small thermal gradients involved, it is necessary to describe it
in our model. Indeed, in the case of cone calorimeter experiments, where high thermal
gradients are involved, the interaction between the heating and pyrolysis reaction
process should become stronger and if the model does not capture it correctly, some
important discrepancies could be involved.
4.4 Conclusion
Chapter 4 is dedicated to the modeling of the thermal decomposition of wood
at the particle scale. Experiments have been performed using the TGA apparatus
under an inert atmosphere, for two heating rates: 10 K/min and 50K/min. From the
mass loss and mass loss rate evolutions, two reactions scheme have been proposed: a
4.4 Conclusion 111
global-one step and multi-parallel reactions. The unknown kinetic parameters have
been determined by the DAKOTA into the PATO model. The modeling evolutions of
the mass loss and the mass loss rates have been compared to the experimental ones
to analyze the influence of the reaction scheme. The influence of the heating rate on
the kinetic parameters is analyzed. Thus, the kinetic parameters optimized by one
heating rate are compared by the kinetic parameters extracted from other heating
rates. Finally, 2D modeling with the PATO model permits to explore the interaction
of the heat and mass transfers at this specific particle scale. Based on this work, the
objective is now to characterize the availability of the model to represent the thermal
decomposition of wood at a larger scale.

Chapter 5
Cone calorimeter experiments and
model validation for wood pyrolysis
Chapter 4 permits to discuss some interesting points about wood pyrolysis at
the TGA scale, which is mainly concentrated on the chemical part. Due to the
strong link between the chemical and thermophysical processes during the real fire
pyrolysis scenario, this chapter focuses on the wood pyrolysis at a larger bench-
scale, with the cone calorimeter apparatus. Experiments are conducted in order to
characterize the thermal decomposition of wood, with both heat and mass transfers. The
kinetic parameters obtained from Chapter 4 are implemented to describe the pyrolysis
phenomena at this larger scale and the material heating process will be discussed. The
boundary convective and thermo-physical parameters are predicted specifically under
the experimental conditions concerning the cone calorimeter. Moisture evaporation is
targeted, the wet wood and dry wood pyrolysis are studied numerically at different
time and length scales.
114 Cone calorimeter experiments and model validation for wood pyrolysis
5.1 CACC experiment description and temperature
measurement
The controlled atmosphere cone calorimeter (CACC) utilized in this work is
developed from the standard cone calorimeter of ISO 5660 [138]. It is applied as a
pyrolysis apparatus characterizing the thermal decomposition of wood samples under
an inert atmosphere. The schematic of CACC is shown in Figure 5.1. In order to
obtain an inert atmosphere for pyrolysis condition, a continuous nitrogen gas flow rate
is kept at approximately 185 L/min in order to maintain a well-ventilated condition.
The oxygen concentration in the CACC chamber is extremely low (< 1 vol%) which
is proved to be reliable for maintaining an inert environment. The surface boundary
condition is relatively uniform and constant, avoiding a flame heat flux which is the
main source of fluctuations during classical cone calorimeter experiments.
The experimental chamber (ambient conditions in the room where the CACC
is placed) involves an ambient temperature of approximately 300 K with 1 atm. To
decrease the radiation from the surrounding wall in the chamber, the inner chamber wall
is coated with black paint with high emissivity (0.9). The water cooling circuit system
is mounted underneath the sample holder. They provide an ambient temperature in
the chamber and limit the radiation transfer between the wall and the sample such
that a well-defined boundary with ambient temperature is obtained. Different heat
fluxes are employed and the setting is realized using a calibrated Schmidt-Boelter gauge
placed above the center and at 25 mm above the sample surface of the top material
surface. The heat flux gauge is also painted black.
In order to have a more complete understanding of the thermal decomposition
of the wood, both the mass loss and the temperature evolution at different places
are measured. The mass loss history is monitored by balance equipment supported
by a load cell. The temperature measurement is conducted through the setting of
thermocouples (Type K) inside the wood sample. For the experimental mass loss
and temperature measurement, at least three times of tests are given to maintain
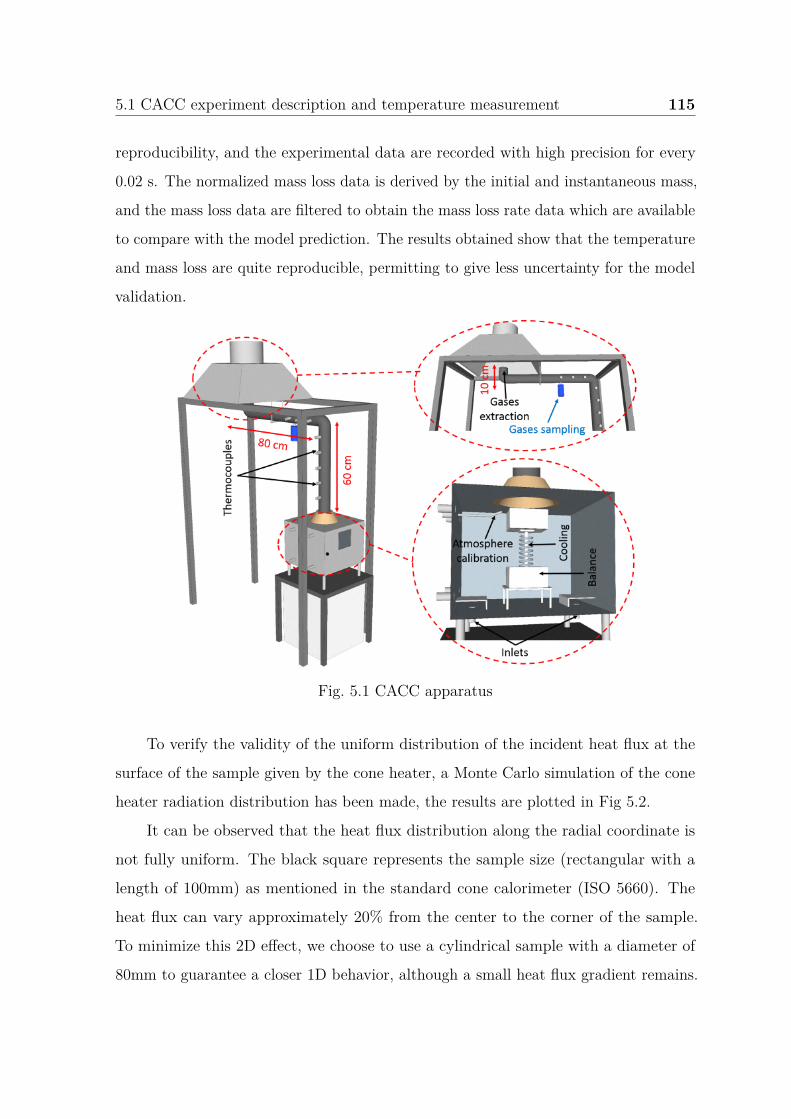
5.1 CACC experiment description and temperature measurement 115
reproducibility, and the experimental data are recorded with high precision for every
0.02 s. The normalized mass loss data is derived by the initial and instantaneous mass,
and the mass loss data are filtered to obtain the mass loss rate data which are available
to compare with the model prediction. The results obtained show that the temperature
and mass loss are quite reproducible, permitting to give less uncertainty for the model
validation.
Fig. 5.1 CACC apparatus
To verify the validity of the uniform distribution of the incident heat flux at the
surface of the sample given by the cone heater, a Monte Carlo simulation of the cone
heater radiation distribution has been made, the results are plotted in Fig 5.2.
It can be observed that the heat flux distribution along the radial coordinate is
not fully uniform. The black square represents the sample size (rectangular with a
length of 100mm) as mentioned in the standard cone calorimeter (ISO 5660). The
heat flux can vary approximately 20% from the center to the corner of the sample.
To minimize this 2D effect, we choose to use a cylindrical sample with a diameter of
80mm to guarantee a closer 1D behavior, although a small heat flux gradient remains.
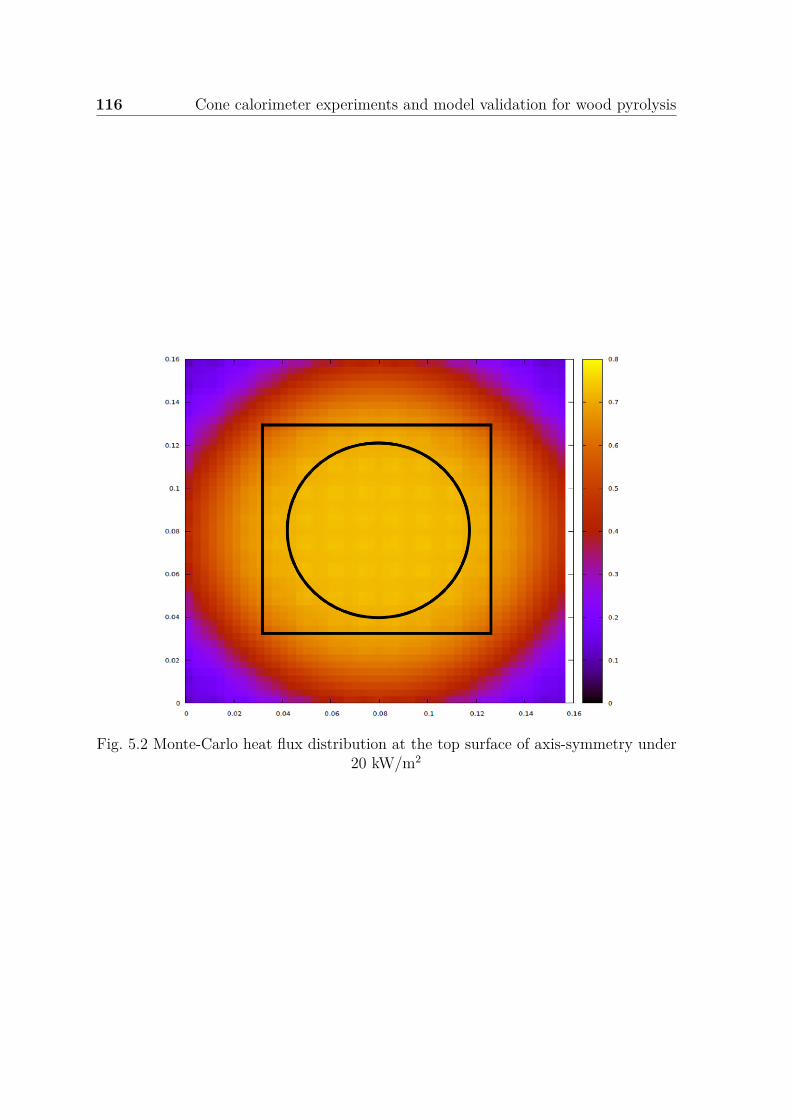
116 Cone calorimeter experiments and model validation for wood pyrolysis
Fig. 5.2 Monte-Carlo heat flux distribution at the top surface of axis-symmetry under20 kW/m2
5.1 CACC experiment description and temperature measurement 117
A function regarding heat flux factor along the radial space is implemented as the
surface boundary condition in the model to take into account these gradients identified
in Figure 5.2 and to reflect the real boundary conditions during the cone calorimeter
experiments.
The sample holder is made of thick cylindrical silicate insulation material. The
Douglas fir wood is selected, cylindrical samples (the diameter and thickness are 80
mm and 21 mm, respectively) are employed due to their facility to prepare and to
adjust fully the real heating condition as mentioned. The specific heat capacity and
thermal conductivity are obtained by inverse modeling, and other related parameters
are based on the previous laboratory experiments and literature.
The original wood samples account for approximately 10 wt% of water content.
A common choice, such as realized by [137], is to employ the drying oven with more
than 24 h or 48 h at about 373K before the cone calorimeter experiments. However,
it has been observed that the delay required to prepare the experiment (so between
the sample extraction of its conditioning and the beginning of the test) favors the
evolution of the humidity content. Then, the humidity considered during the modeling
can be different from the real experimental one. In order to avoid this water influence
for wood pyrolysis, an alternative manipulation is selected in this study, with heating
performed in CACC under 5 kW/m2. The duration of the water evaporation experiment
is prolonged until no apparent mass residue variation is observed. The sample shape
profiles are examined without changing through the water evaporation process. The
surface temperature is tested at approximately 473 K and the bottom temperature
is found to be approximately 400 K. It is specified that the sample doesn’t have any
pyrolysis involvement and a dried wood sample is obtained under such manipulation
condition.
After the evaporation experiment, the cone heater is switched off and the sample
is cooled without moving it from the cone box until to reach the ambient temperature.
The Nitrogen flow is continuously conducted to prevent humidity absorption during
the sample cooling. This method has some advantages. Firstly, it minimizes manual
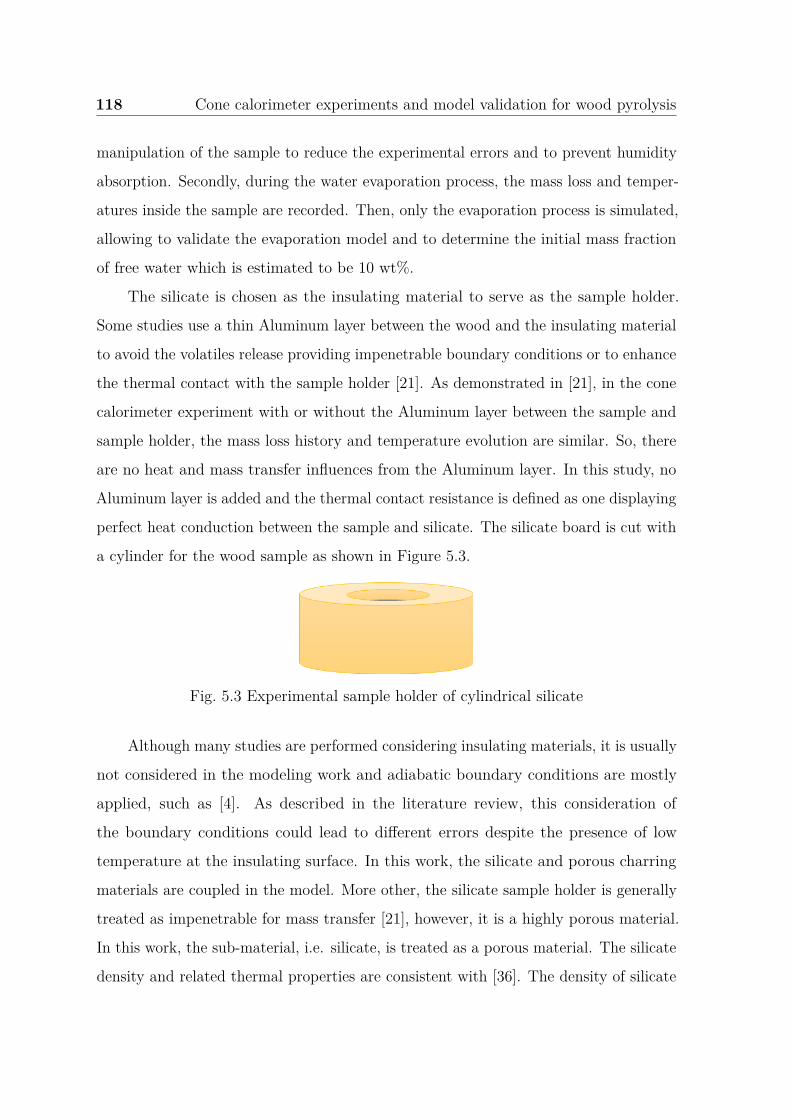
118 Cone calorimeter experiments and model validation for wood pyrolysis
manipulation of the sample to reduce the experimental errors and to prevent humidity
absorption. Secondly, during the water evaporation process, the mass loss and temper-
atures inside the sample are recorded. Then, only the evaporation process is simulated,
allowing to validate the evaporation model and to determine the initial mass fraction
of free water which is estimated to be 10 wt%.
The silicate is chosen as the insulating material to serve as the sample holder.
Some studies use a thin Aluminum layer between the wood and the insulating material
to avoid the volatiles release providing impenetrable boundary conditions or to enhance
the thermal contact with the sample holder [21]. As demonstrated in [21], in the cone
calorimeter experiment with or without the Aluminum layer between the sample and
sample holder, the mass loss history and temperature evolution are similar. So, there
are no heat and mass transfer influences from the Aluminum layer. In this study, no
Aluminum layer is added and the thermal contact resistance is defined as one displaying
perfect heat conduction between the sample and silicate. The silicate board is cut with
a cylinder for the wood sample as shown in Figure 5.3.
Fig. 5.3 Experimental sample holder of cylindrical silicate
Although many studies are performed considering insulating materials, it is usually
not considered in the modeling work and adiabatic boundary conditions are mostly
applied, such as [4]. As described in the literature review, this consideration of
the boundary conditions could lead to different errors despite the presence of low
temperature at the insulating surface. In this work, the silicate and porous charring
materials are coupled in the model. More other, the silicate sample holder is generally
treated as impenetrable for mass transfer [21], however, it is a highly porous material.
In this work, the sub-material, i.e. silicate, is treated as a porous material. The silicate
density and related thermal properties are consistent with [36]. The density of silicate
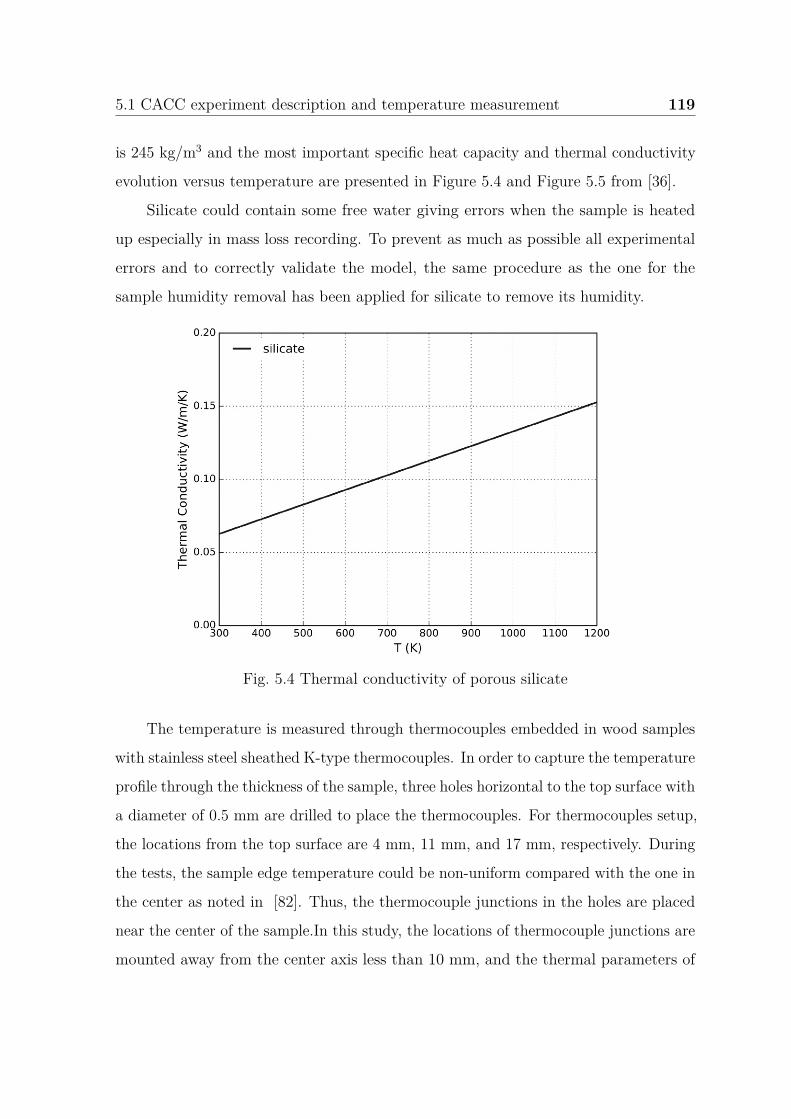
5.1 CACC experiment description and temperature measurement 119
is 245 kg/m3 and the most important specific heat capacity and thermal conductivity
evolution versus temperature are presented in Figure 5.4 and Figure 5.5 from [36].
Silicate could contain some free water giving errors when the sample is heated
up especially in mass loss recording. To prevent as much as possible all experimental
errors and to correctly validate the model, the same procedure as the one for the
sample humidity removal has been applied for silicate to remove its humidity.
Fig. 5.4 Thermal conductivity of porous silicate
The temperature is measured through thermocouples embedded in wood samples
with stainless steel sheathed K-type thermocouples. In order to capture the temperature
profile through the thickness of the sample, three holes horizontal to the top surface with
a diameter of 0.5 mm are drilled to place the thermocouples. For thermocouples setup,
the locations from the top surface are 4 mm, 11 mm, and 17 mm, respectively. During
the tests, the sample edge temperature could be non-uniform compared with the one in
the center as noted in [82]. Thus, the thermocouple junctions in the holes are placed
near the center of the sample.In this study, the locations of thermocouple junctions are
mounted away from the center axis less than 10 mm, and the thermal parameters of
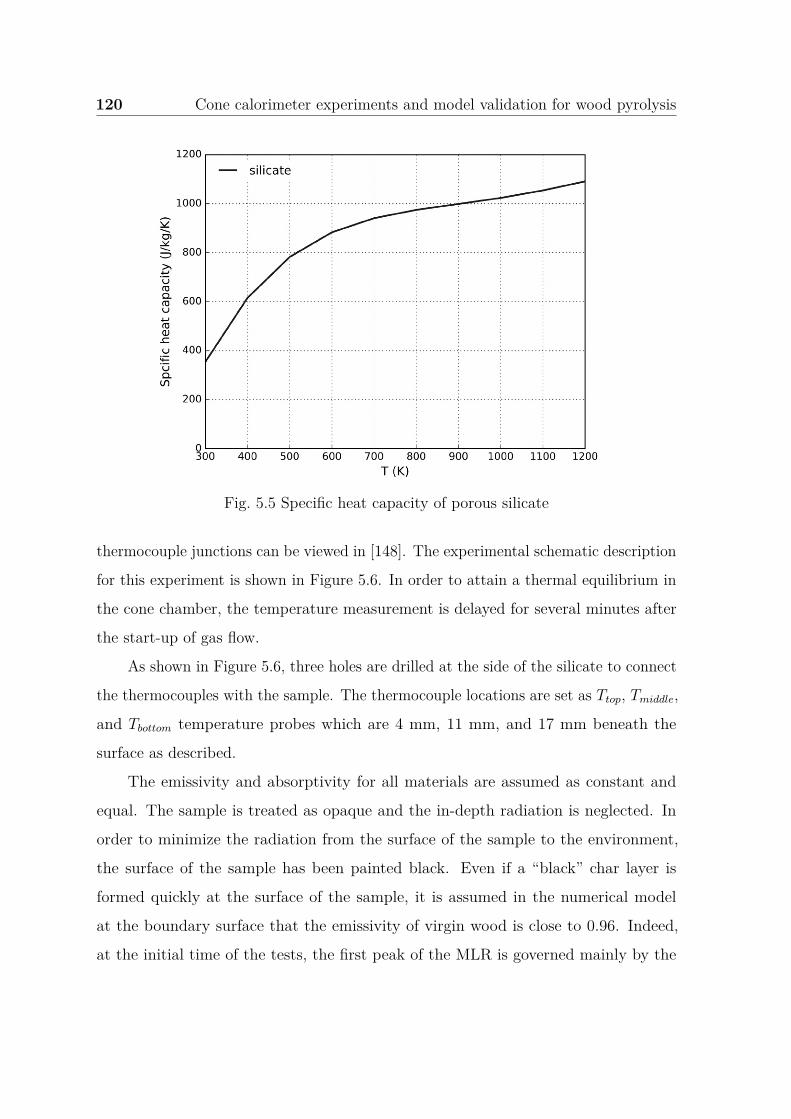
120 Cone calorimeter experiments and model validation for wood pyrolysis
Fig. 5.5 Specific heat capacity of porous silicate
thermocouple junctions can be viewed in [148]. The experimental schematic description
for this experiment is shown in Figure 5.6. In order to attain a thermal equilibrium in
the cone chamber, the temperature measurement is delayed for several minutes after
the start-up of gas flow.
As shown in Figure 5.6, three holes are drilled at the side of the silicate to connect
the thermocouples with the sample. The thermocouple locations are set as Ttop, Tmiddle,
and Tbottom temperature probes which are 4 mm, 11 mm, and 17 mm beneath the
surface as described.
The emissivity and absorptivity for all materials are assumed as constant and
equal. The sample is treated as opaque and the in-depth radiation is neglected. In
order to minimize the radiation from the surface of the sample to the environment,
the surface of the sample has been painted black. Even if a “black” char layer is
formed quickly at the surface of the sample, it is assumed in the numerical model
at the boundary surface that the emissivity of virgin wood is close to 0.96. Indeed,
at the initial time of the tests, the first peak of the MLR is governed mainly by the
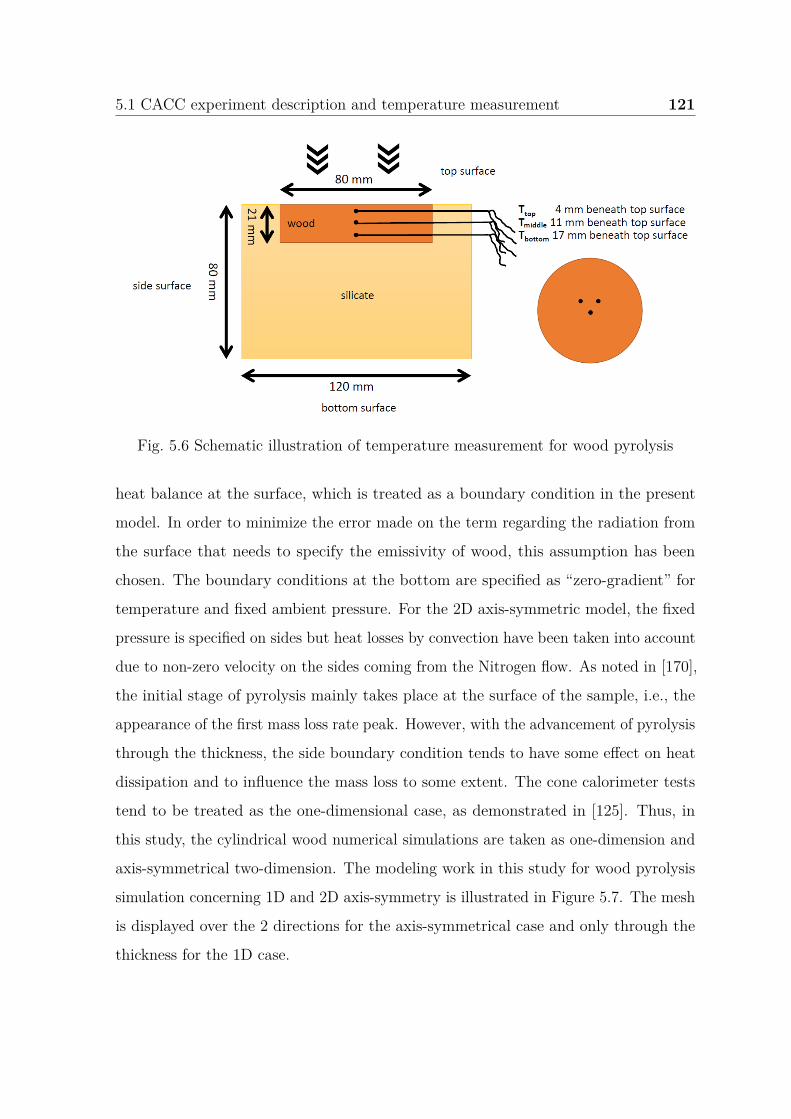
5.1 CACC experiment description and temperature measurement 121
Fig. 5.6 Schematic illustration of temperature measurement for wood pyrolysis
heat balance at the surface, which is treated as a boundary condition in the present
model. In order to minimize the error made on the term regarding the radiation from
the surface that needs to specify the emissivity of wood, this assumption has been
chosen. The boundary conditions at the bottom are specified as “zero-gradient” for
temperature and fixed ambient pressure. For the 2D axis-symmetric model, the fixed
pressure is specified on sides but heat losses by convection have been taken into account
due to non-zero velocity on the sides coming from the Nitrogen flow. As noted in [170],
the initial stage of pyrolysis mainly takes place at the surface of the sample, i.e., the
appearance of the first mass loss rate peak. However, with the advancement of pyrolysis
through the thickness, the side boundary condition tends to have some effect on heat
dissipation and to influence the mass loss to some extent. The cone calorimeter tests
tend to be treated as the one-dimensional case, as demonstrated in [125]. Thus, in
this study, the cylindrical wood numerical simulations are taken as one-dimension and
axis-symmetrical two-dimension. The modeling work in this study for wood pyrolysis
simulation concerning 1D and 2D axis-symmetry is illustrated in Figure 5.7. The mesh
is displayed over the 2 directions for the axis-symmetrical case and only through the
thickness for the 1D case.
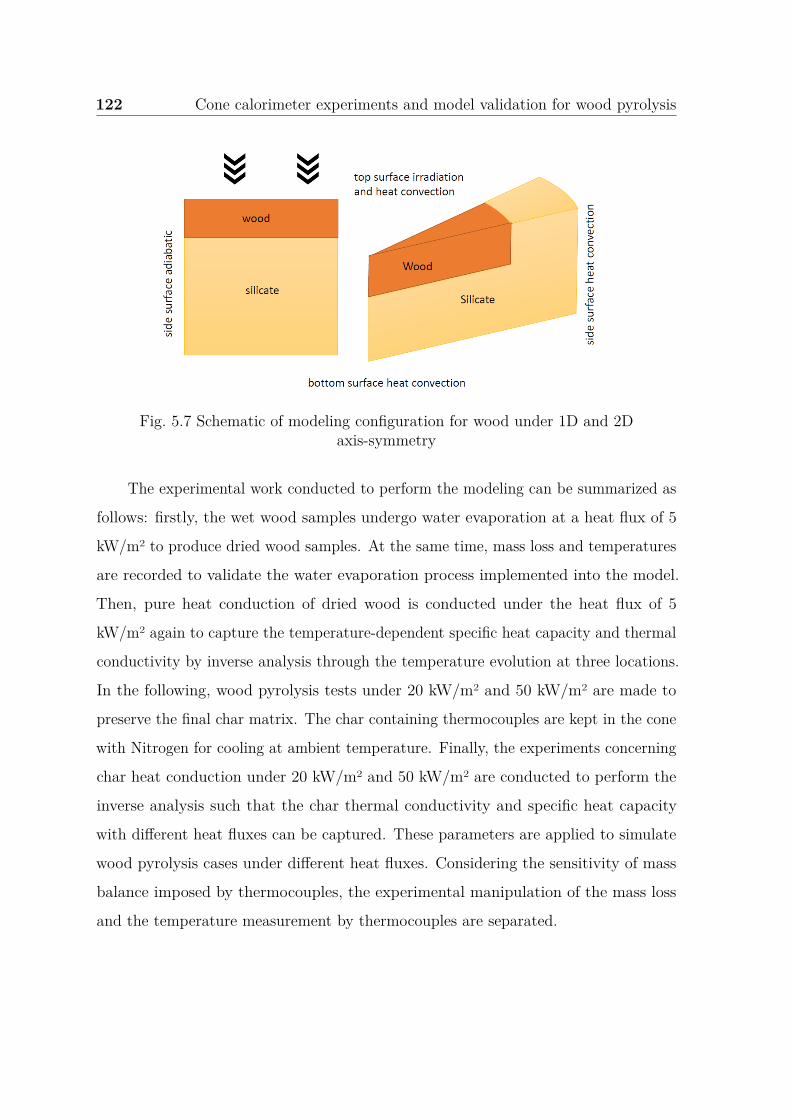
122 Cone calorimeter experiments and model validation for wood pyrolysis
Fig. 5.7 Schematic of modeling configuration for wood under 1D and 2Daxis-symmetry
The experimental work conducted to perform the modeling can be summarized as
follows: firstly, the wet wood samples undergo water evaporation at a heat flux of 5
kW/m2 to produce dried wood samples. At the same time, mass loss and temperatures
are recorded to validate the water evaporation process implemented into the model.
Then, pure heat conduction of dried wood is conducted under the heat flux of 5
kW/m2 again to capture the temperature-dependent specific heat capacity and thermal
conductivity by inverse analysis through the temperature evolution at three locations.
In the following, wood pyrolysis tests under 20 kW/m2 and 50 kW/m2 are made to
preserve the final char matrix. The char containing thermocouples are kept in the cone
with Nitrogen for cooling at ambient temperature. Finally, the experiments concerning
char heat conduction under 20 kW/m2 and 50 kW/m2 are conducted to perform the
inverse analysis such that the char thermal conductivity and specific heat capacity
with different heat fluxes can be captured. These parameters are applied to simulate
wood pyrolysis cases under different heat fluxes. Considering the sensitivity of mass
balance imposed by thermocouples, the experimental manipulation of the mass loss
and the temperature measurement by thermocouples are separated.
5.2 Inverse analysis to obtain heat convection coefficient 123
5.2 Inverse analysis to obtain heat convection co-
efficient
An inverse analysis is conducted in this work with an Aluminum block (AU4G)
to predict the convective heat transfer coefficient. Although some changes can take
place due to the flow scenarios in the chamber during different heat flux and pyrolysis
stages, the convection heat transfer coefficient in this work is assumed as constant.
The Al sample with a cylindrical contour similar to the wood sample is employed
to obtain the temperature at different locations under the heat flux of 20 kW/m2.
The thermocouple setup is also the same as the one for wood. However, the Al heat
conduction thermocouple setup involves a single temperature probe due to its high
thermal conductivity and the corresponding temperature measurement, the illustration
is shown in Figure 5.8. Indeed, it has been verified by experiments in this study
that the temperatures are quite homogeneous along the centerline by measuring the
temperatures at different locations. Thus, only the temperature in the middle of the
Al sample is shown. The boundary condition for pure heat conduction is the same
as that of wood pyrolysis which considers the heat convection of the top surface and
side surface. Due to the low absorptivity and high emissivity of Aluminum which
could lead to high uncertainties interacting with the ambient atmosphere. Before
the measurements, the surface of the Al block is coated with black paint with an
absorptivity and emissivity of approximately 0.96. These two values are assumed to be
identical with those of wood and char surface which are treated as constant in PATO.
The ambient temperature in this study is monitored as 300 K.
In this study, an Al block sample with well-defined thermal properties to reduce
the errors is employed to conduct the inverse analysis. The properties are listed in
Table 5.1 [171].
In this work, the heat convection coefficient is defined as a single constant value
across the sample surface under 1D and 2D. However, the heat loss by convection
depends on many factors and could change over the surface. One of these factors is
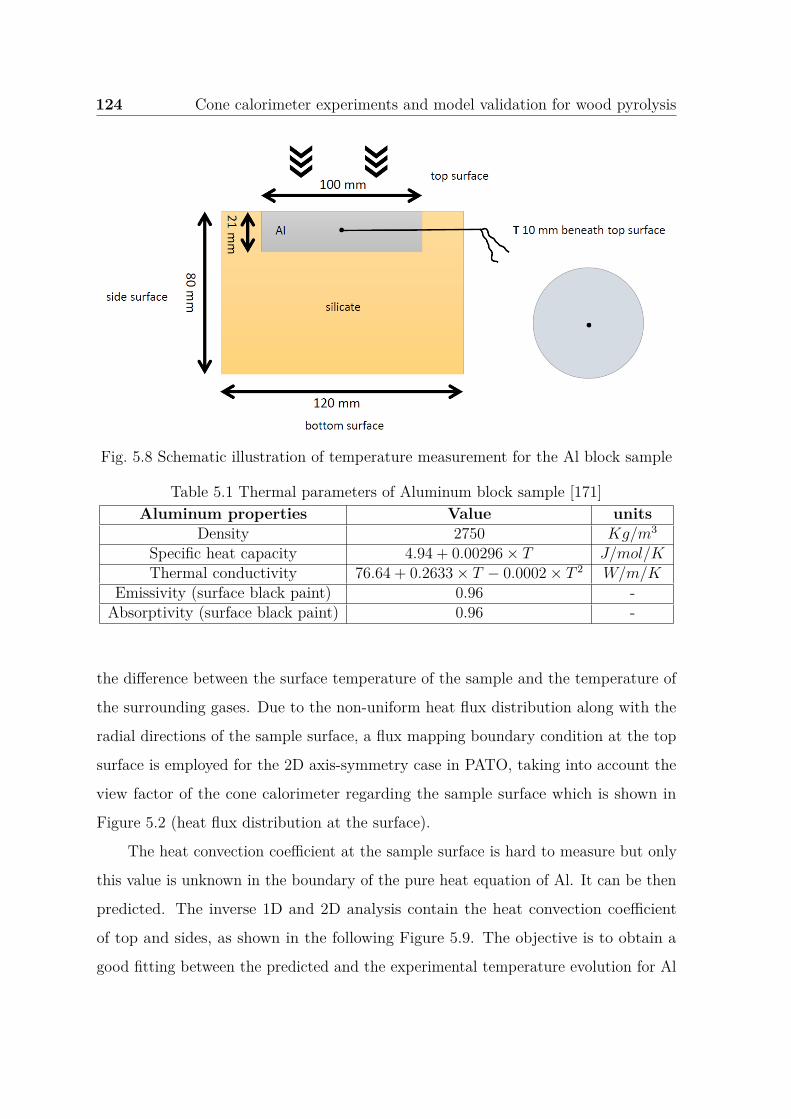
124 Cone calorimeter experiments and model validation for wood pyrolysis
Fig. 5.8 Schematic illustration of temperature measurement for the Al block sample
Table 5.1 Thermal parameters of Aluminum block sample [171]Aluminum properties Value units
Density 2750 Kg/m3
Specific heat capacity 4.94 + 0.00296 × T J/mol/KThermal conductivity 76.64 + 0.2633 × T − 0.0002 × T 2 W/m/K
Emissivity (surface black paint) 0.96 -Absorptivity (surface black paint) 0.96 -
the difference between the surface temperature of the sample and the temperature of
the surrounding gases. Due to the non-uniform heat flux distribution along with the
radial directions of the sample surface, a flux mapping boundary condition at the top
surface is employed for the 2D axis-symmetry case in PATO, taking into account the
view factor of the cone calorimeter regarding the sample surface which is shown in
Figure 5.2 (heat flux distribution at the surface).
The heat convection coefficient at the sample surface is hard to measure but only
this value is unknown in the boundary of the pure heat equation of Al. It can be then
predicted. The inverse 1D and 2D analysis contain the heat convection coefficient
of top and sides, as shown in the following Figure 5.9. The objective is to obtain a
good fitting between the predicted and the experimental temperature evolution for Al
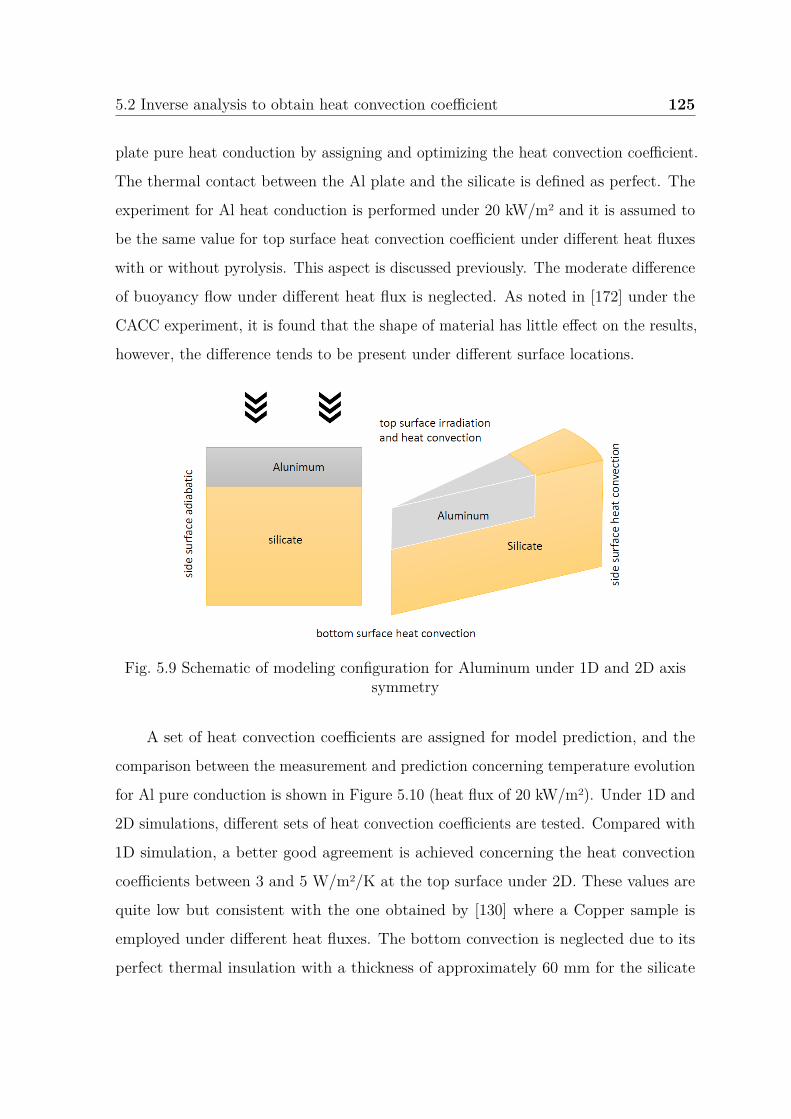
5.2 Inverse analysis to obtain heat convection coefficient 125
plate pure heat conduction by assigning and optimizing the heat convection coefficient.
The thermal contact between the Al plate and the silicate is defined as perfect. The
experiment for Al heat conduction is performed under 20 kW/m2 and it is assumed to
be the same value for top surface heat convection coefficient under different heat fluxes
with or without pyrolysis. This aspect is discussed previously. The moderate difference
of buoyancy flow under different heat flux is neglected. As noted in [172] under the
CACC experiment, it is found that the shape of material has little effect on the results,
however, the difference tends to be present under different surface locations.
Fig. 5.9 Schematic of modeling configuration for Aluminum under 1D and 2D axissymmetry
A set of heat convection coefficients are assigned for model prediction, and the
comparison between the measurement and prediction concerning temperature evolution
for Al pure conduction is shown in Figure 5.10 (heat flux of 20 kW/m2). Under 1D and
2D simulations, different sets of heat convection coefficients are tested. Compared with
1D simulation, a better good agreement is achieved concerning the heat convection
coefficients between 3 and 5 W/m2/K at the top surface under 2D. These values are
quite low but consistent with the one obtained by [130] where a Copper sample is
employed under different heat fluxes. The bottom convection is neglected due to its
perfect thermal insulation with a thickness of approximately 60 mm for the silicate
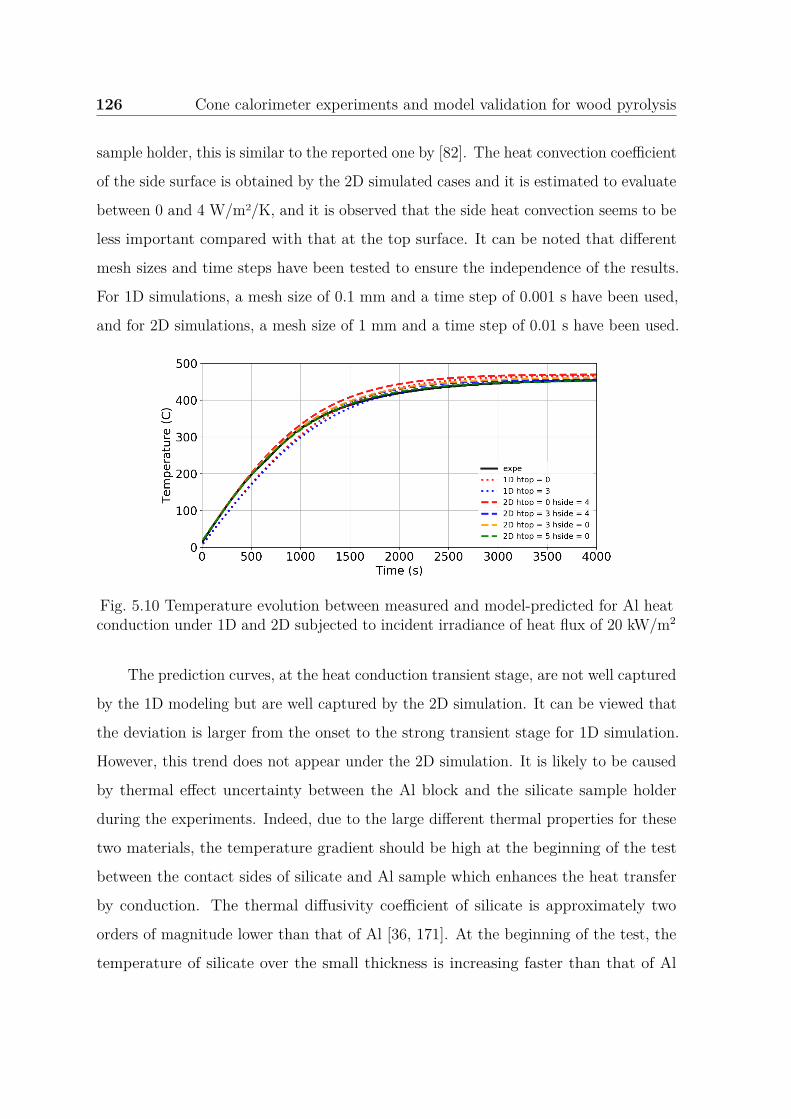
126 Cone calorimeter experiments and model validation for wood pyrolysis
sample holder, this is similar to the reported one by [82]. The heat convection coefficient
of the side surface is obtained by the 2D simulated cases and it is estimated to evaluate
between 0 and 4 W/m2/K, and it is observed that the side heat convection seems to be
less important compared with that at the top surface. It can be noted that different
mesh sizes and time steps have been tested to ensure the independence of the results.
For 1D simulations, a mesh size of 0.1 mm and a time step of 0.001 s have been used,
and for 2D simulations, a mesh size of 1 mm and a time step of 0.01 s have been used.
Fig. 5.10 Temperature evolution between measured and model-predicted for Al heatconduction under 1D and 2D subjected to incident irradiance of heat flux of 20 kW/m2
The prediction curves, at the heat conduction transient stage, are not well captured
by the 1D modeling but are well captured by the 2D simulation. It can be viewed that
the deviation is larger from the onset to the strong transient stage for 1D simulation.
However, this trend does not appear under the 2D simulation. It is likely to be caused
by thermal effect uncertainty between the Al block and the silicate sample holder
during the experiments. Indeed, due to the large different thermal properties for these
two materials, the temperature gradient should be high at the beginning of the test
between the contact sides of silicate and Al sample which enhances the heat transfer
by conduction. The thermal diffusivity coefficient of silicate is approximately two
orders of magnitude lower than that of Al [36, 171]. At the beginning of the test, the
temperature of silicate over the small thickness is increasing faster than that of Al
5.3 Inverse analysis to obtain wood thermophysical parameters 127
causing some temperature gradients between the two materials. At approximately
1700 s, the silicate has sufficient time to heat up and to propagate heat through its
thickness, making temperature gradients with the Al sample (on sides) less important.
The temperature differences given by 1D and 2D models are then negligible. When the
heat transfer attains a steady state, these two models give quite similar results. The
heat convection coefficient extraction is not easy and depends on many parameters, as
discussed in Chapter 2. It has been demonstrated that this coefficient is between 3
and 5 W/m2/K at the surface and between 0 and 4 W/m2/K at the sides. However,
the configuration used to extract these data is a non-reactive case that could differ
from the pyrolysis case. Then, these values should also be used with caution when
simulating a reactive case. Indeed, the heat convection process seems not affecting a
lot the heat transfer in the Al sample. However, this value could affect the pyrolysis
front shape close to the sample sides making the pyrolysis process not a real 1D case,
this is will be discussed in the following part.
5.3 Inverse analysis to obtain wood thermophysical
parameters
Due to the diversity of wood types and the heterogeneity of such material depending
on many parameters (tree growth conditions, humidity, composition, etc.), the range
of physical parameters related to wood is found to be large in literature. Moreover,
physical parameters like heat capacity and conductivity are complicated to measure
due to the high uncertainty of dedicated experimental methods. Char is also a material
that could have a large range of physical values due to the conditions at which they are
obtained as well as the methods of determination. For these reasons, the specific heat
capacity and thermal conductivity for virgin wood and char are quite unreliable. Then,
in this study, similar to Al pure heat conduction conducted to determine the heat
convection coefficient, an inverse analysis is also conducted to predict the specific heat
capacity and effective thermal conductivity for wood and corresponding char samples.
128 Cone calorimeter experiments and model validation for wood pyrolysis
The method concerns the temperature profile at different locations. The numerical
simulations are performed under one-dimensional and two-dimensional axis-symmetry.
The thermal parameters of wood are obtained based on dry wood pure heat
conduction experiments, which need to undergo a drying process under the incident
heat flux of 5 kW/m2 as described earlier. After the termination of the drying
experiment, the hot wood sample attached to the thermocouples is kept to the sealed
cone calorimeter box without oxygen to arrive at ambient temperature. Then, the pure
heat conduction experiments of the dry wood sample are repeated under an identical
heat flux of 5 kW/m2 to avoid the chemical reaction involvement.
It should be noted that this inverse analysis is performed by a manual tuning
process based on the prescribed linear functions dependent on temperature. It has
been tested in this study that constant values of interest could not provide acceptable
fitting with experimental data. Indeed, the temperature has a great influence on their
properties which can involve several times larger than the original value (see Chapter
2). In this study, the specific heat capacity and thermal conductivity are treated to be
dependent on temperature.
The thermal process for temperature evolution can be divided into two stages:
the transient and the steady one, which is only governed by thermal conductivity.As
noted in [61], the variations of specific heat capacity and thermal conductivity involve
a compensation effect. To consider this compensation effect between the thermal
conductivity and the specific heat capacity during thermal process prediction, the
priority is to determine the thermal conductivity which is the most influential parameter
at the final stage (more than the specific heat capacity). Then, based on the reference
data at the room temperature, and the evolution trend dependent on temperature,
the thermal conductivity of the transient stage is extrapolated. Finally, the specific
heat capacity is predicted to fit the experimental temperature curve. The comparison
between experimental and predicted temperature evolution of wood at different locations
is shown in the following Figure 5.11.
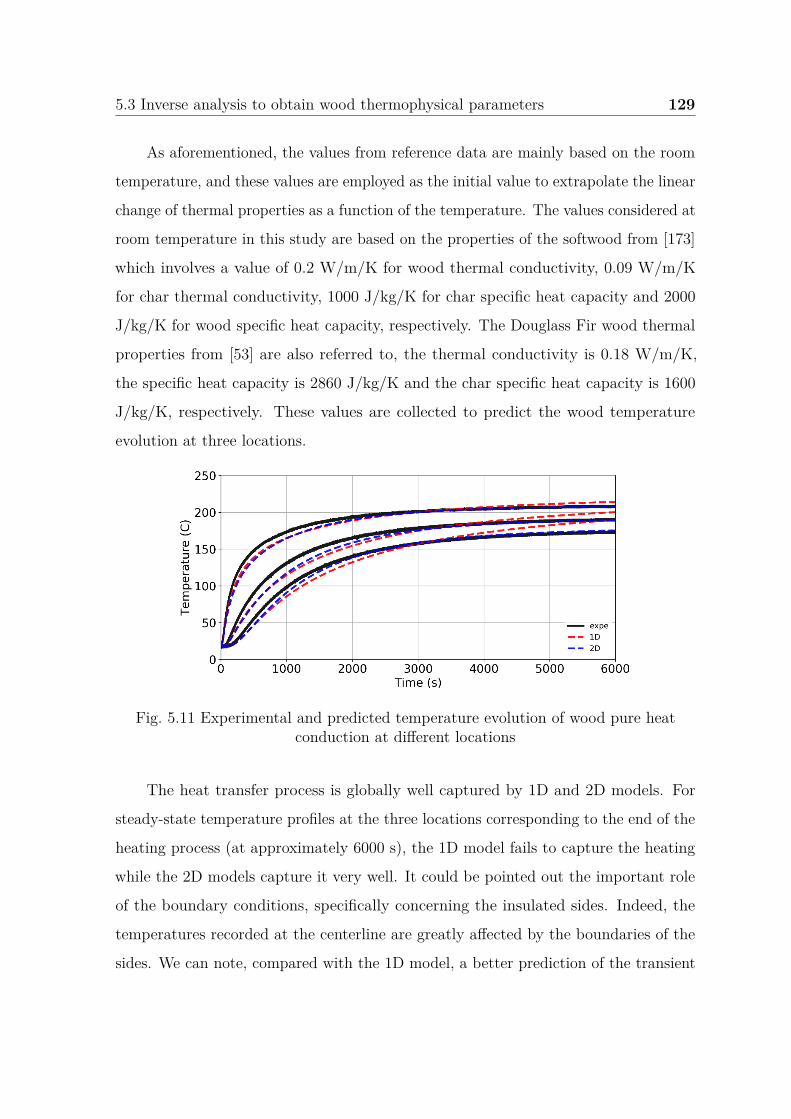
5.3 Inverse analysis to obtain wood thermophysical parameters 129
As aforementioned, the values from reference data are mainly based on the room
temperature, and these values are employed as the initial value to extrapolate the linear
change of thermal properties as a function of the temperature. The values considered at
room temperature in this study are based on the properties of the softwood from [173]
which involves a value of 0.2 W/m/K for wood thermal conductivity, 0.09 W/m/K
for char thermal conductivity, 1000 J/kg/K for char specific heat capacity and 2000
J/kg/K for wood specific heat capacity, respectively. The Douglass Fir wood thermal
properties from [53] are also referred to, the thermal conductivity is 0.18 W/m/K,
the specific heat capacity is 2860 J/kg/K and the char specific heat capacity is 1600
J/kg/K, respectively. These values are collected to predict the wood temperature
evolution at three locations.
Fig. 5.11 Experimental and predicted temperature evolution of wood pure heatconduction at different locations
The heat transfer process is globally well captured by 1D and 2D models. For
steady-state temperature profiles at the three locations corresponding to the end of the
heating process (at approximately 6000 s), the 1D model fails to capture the heating
while the 2D models capture it very well. It could be pointed out the important role
of the boundary conditions, specifically concerning the insulated sides. Indeed, the
temperatures recorded at the centerline are greatly affected by the boundaries of the
sides. We can note, compared with the 1D model, a better prediction of the transient
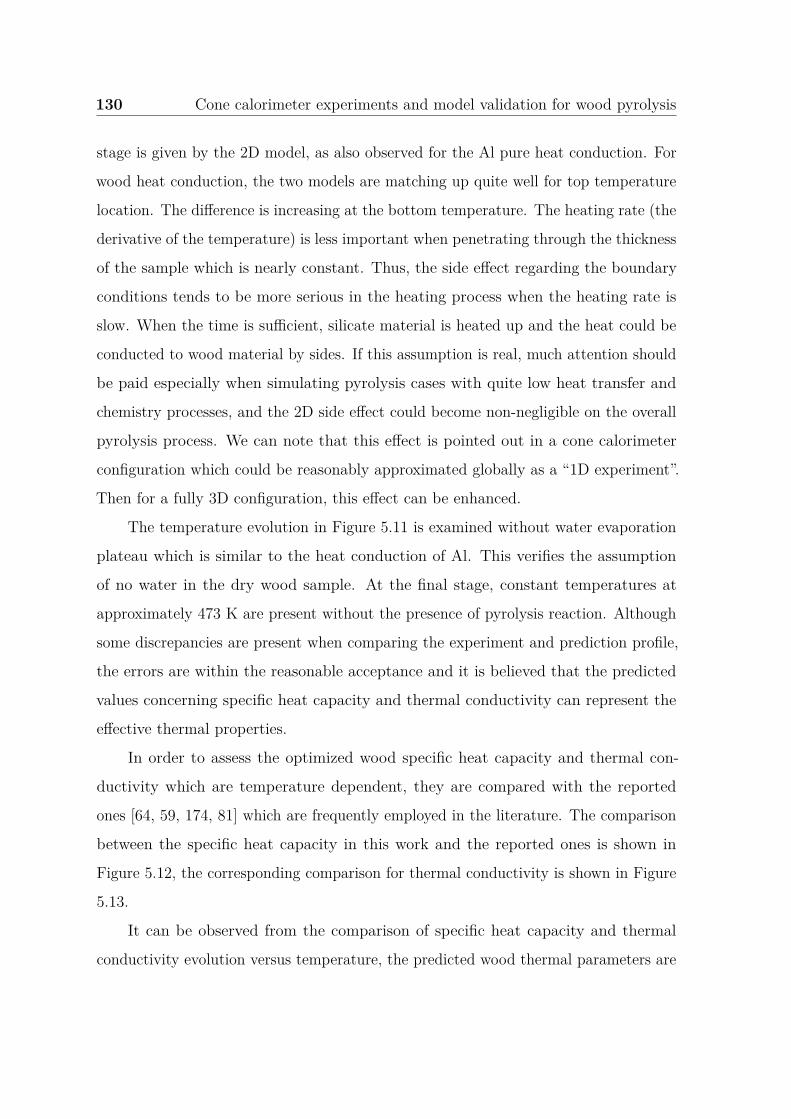
130 Cone calorimeter experiments and model validation for wood pyrolysis
stage is given by the 2D model, as also observed for the Al pure heat conduction. For
wood heat conduction, the two models are matching up quite well for top temperature
location. The difference is increasing at the bottom temperature. The heating rate (the
derivative of the temperature) is less important when penetrating through the thickness
of the sample which is nearly constant. Thus, the side effect regarding the boundary
conditions tends to be more serious in the heating process when the heating rate is
slow. When the time is sufficient, silicate material is heated up and the heat could be
conducted to wood material by sides. If this assumption is real, much attention should
be paid especially when simulating pyrolysis cases with quite low heat transfer and
chemistry processes, and the 2D side effect could become non-negligible on the overall
pyrolysis process. We can note that this effect is pointed out in a cone calorimeter
configuration which could be reasonably approximated globally as a “1D experiment”.
Then for a fully 3D configuration, this effect can be enhanced.
The temperature evolution in Figure 5.11 is examined without water evaporation
plateau which is similar to the heat conduction of Al. This verifies the assumption
of no water in the dry wood sample. At the final stage, constant temperatures at
approximately 473 K are present without the presence of pyrolysis reaction. Although
some discrepancies are present when comparing the experiment and prediction profile,
the errors are within the reasonable acceptance and it is believed that the predicted
values concerning specific heat capacity and thermal conductivity can represent the
effective thermal properties.
In order to assess the optimized wood specific heat capacity and thermal con-
ductivity which are temperature dependent, they are compared with the reported
ones [64, 59, 174, 81] which are frequently employed in the literature. The comparison
between the specific heat capacity in this work and the reported ones is shown in
Figure 5.12, the corresponding comparison for thermal conductivity is shown in Figure
5.13.
It can be observed from the comparison of specific heat capacity and thermal
conductivity evolution versus temperature, the predicted wood thermal parameters are
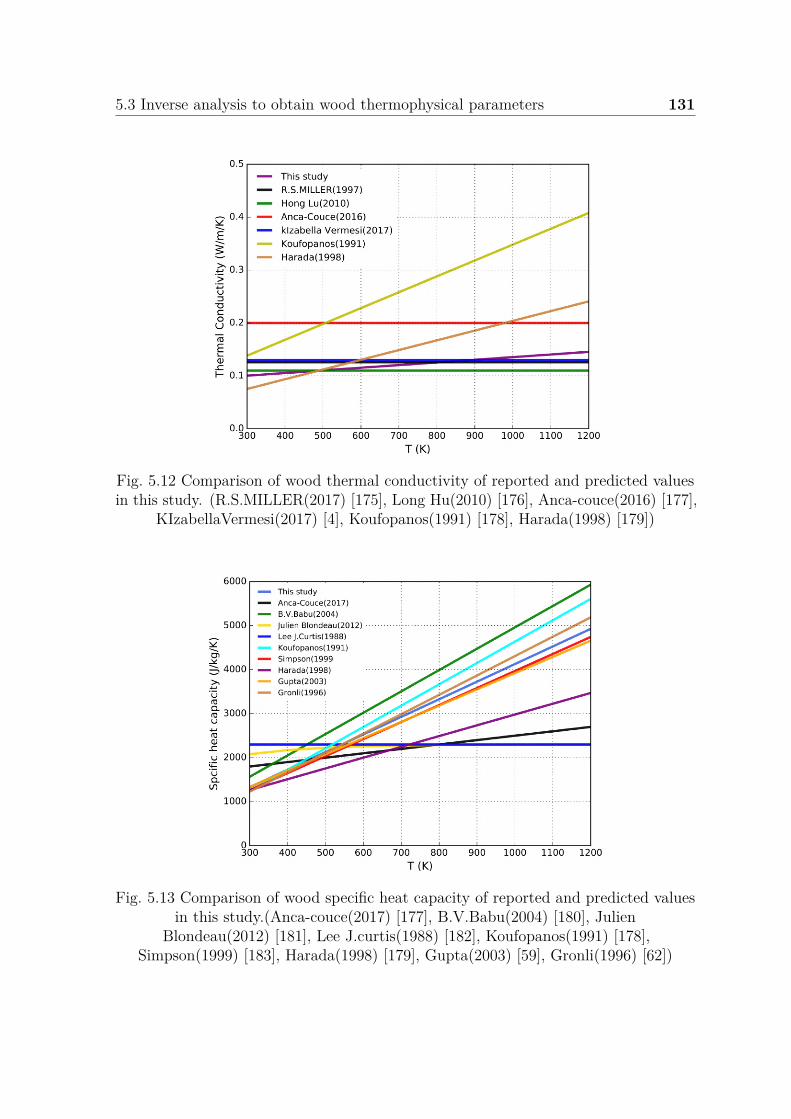
5.3 Inverse analysis to obtain wood thermophysical parameters 131
Fig. 5.12 Comparison of wood thermal conductivity of reported and predicted valuesin this study. (R.S.MILLER(2017) [175], Long Hu(2010) [176], Anca-couce(2016) [177],
KIzabellaVermesi(2017) [4], Koufopanos(1991) [178], Harada(1998) [179])
Fig. 5.13 Comparison of wood specific heat capacity of reported and predicted valuesin this study.(Anca-couce(2017) [177], B.V.Babu(2004) [180], Julien
Blondeau(2012) [181], Lee J.curtis(1988) [182], Koufopanos(1991) [178],Simpson(1999) [183], Harada(1998) [179], Gupta(2003) [59], Gronli(1996) [62])
132 Cone calorimeter experiments and model validation for wood pyrolysis
within the range of uncertainty of reported data, which demonstrates the true physical
behavior is captured in this work. As shown in [135], the predicted parameters are
quite model-specific, thus it is reasonable to display some moderate difference in the
range of values.
5.4 Inverse analysis to obtain char thermophysical
parameters
Due to the fragile and porous structure to sustain a complete material matrix, the
experiments for measuring temperature are quite hard to conduct. Inverse analysis
or literature data is an alternative for reference. The inverse analysis to obtain char
thermal parameters are conducted with the char pure heat conduction. However, the
char structure depends on many parameters such as pyrolysis conditions. Indeed, the
heating conditions and chemical reactions are responsible for char production, the
remaining char matrix could be more or less porous with different mechanical properties
depending on cracks formed perpendicular to virgin wood fibers. Cracks are often
directly related to heat flux received at the surface of the sample. For those reasons,
two tests of pure heat conduction have been performed on two different char matrices
obtained by pyrolysis tests at two heat fluxes, i.e., 20 kW/m2 and 50 kW/m2. The
objective is to verify if the char matrix and the associated thermal parameters are or
not highly dependent on heat flux conducted to form the char matrix.
After the termination of the wood pyrolysis experiment at 20 kW/m2 and 50
kW/m2, the char sample is fixed in the sample holder and in the chamber until
it arrives at the ambient temperature. The comparison between experimental and
predicted for the char thermal parameters under 20 kW/m2 and 50 kW/m2 are shown
in Figure 5.14 and Figure 5.15, respectively.
At the heat flux of 20 kW/m2, the overall model prediction concerning different
locations fits the experimental data fairly well, especially at the transient stage. For the
middle and bottom thermocouple locations, the deviation is quite reasonable to predict
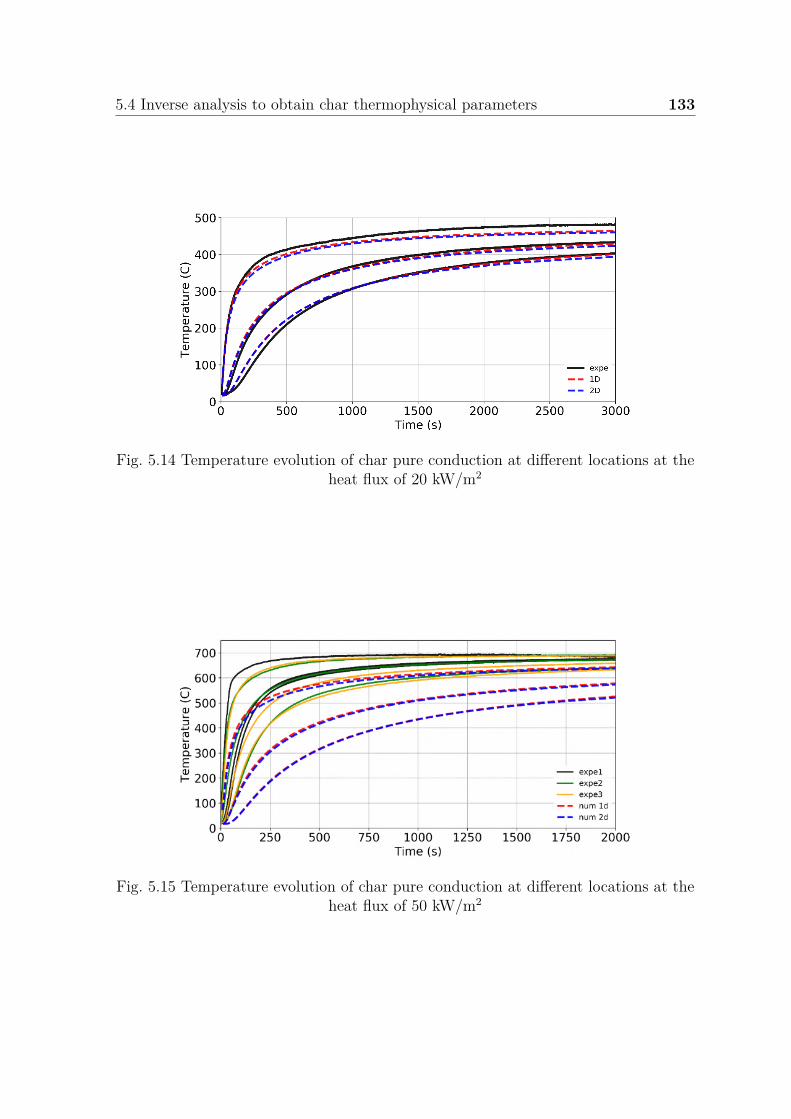
5.4 Inverse analysis to obtain char thermophysical parameters 133
Fig. 5.14 Temperature evolution of char pure conduction at different locations at theheat flux of 20 kW/m2
Fig. 5.15 Temperature evolution of char pure conduction at different locations at theheat flux of 50 kW/m2
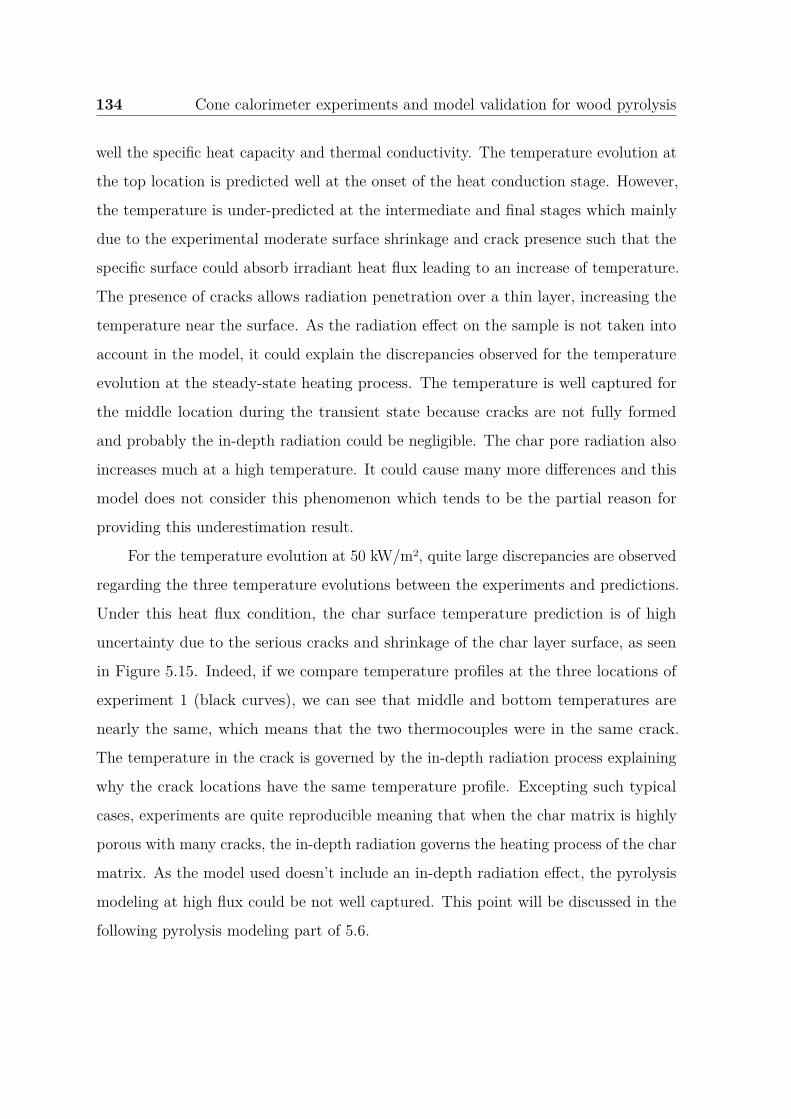
134 Cone calorimeter experiments and model validation for wood pyrolysis
well the specific heat capacity and thermal conductivity. The temperature evolution at
the top location is predicted well at the onset of the heat conduction stage. However,
the temperature is under-predicted at the intermediate and final stages which mainly
due to the experimental moderate surface shrinkage and crack presence such that the
specific surface could absorb irradiant heat flux leading to an increase of temperature.
The presence of cracks allows radiation penetration over a thin layer, increasing the
temperature near the surface. As the radiation effect on the sample is not taken into
account in the model, it could explain the discrepancies observed for the temperature
evolution at the steady-state heating process. The temperature is well captured for
the middle location during the transient state because cracks are not fully formed
and probably the in-depth radiation could be negligible. The char pore radiation also
increases much at a high temperature. It could cause many more differences and this
model does not consider this phenomenon which tends to be the partial reason for
providing this underestimation result.
For the temperature evolution at 50 kW/m2, quite large discrepancies are observed
regarding the three temperature evolutions between the experiments and predictions.
Under this heat flux condition, the char surface temperature prediction is of high
uncertainty due to the serious cracks and shrinkage of the char layer surface, as seen
in Figure 5.15. Indeed, if we compare temperature profiles at the three locations of
experiment 1 (black curves), we can see that middle and bottom temperatures are
nearly the same, which means that the two thermocouples were in the same crack.
The temperature in the crack is governed by the in-depth radiation process explaining
why the crack locations have the same temperature profile. Excepting such typical
cases, experiments are quite reproducible meaning that when the char matrix is highly
porous with many cracks, the in-depth radiation governs the heating process of the char
matrix. As the model used doesn’t include an in-depth radiation effect, the pyrolysis
modeling at high flux could be not well captured. This point will be discussed in the
following pyrolysis modeling part of 5.6.
5.4 Inverse analysis to obtain char thermophysical parameters 135
The experiments for temperature evolution are observed to involve a high degree
of repeatability at 20 kW/m2. When subjected to the high heat flux of 50 kW/m2, the
experiments can involve serious scatter due to its strong unreliable physical boundary
conditions. Indeed, the surface and inner structure of the sample under 50 kW/m2
accounts for poor integrity, and much serious deviation is believed to be present when
simulating based on the original mesh. The char structure for 50 kW/m2 is quite fragile
and many cracks are present, especially at the surface which is quite different from the
original wood sample.
Indeed, using the inverse analysis method to obtain char thermal properties, the
realistic char layer is quite hard to quantify with a relatively large deviation between
experimental and numerical simulation. They could be attributed to the unreliable
rough boundary condition as noted in [82]. And the experiments under well-controlled
boundary conditions could achieve much accuracy for model prediction. At the final
stage, with fully formed porous char, the radiation through the pore dominates the
heat transfer to the back surface. At the heat flux of 50 kW/m2, the char is comprised
of more pores than that at 20 kW/m2 due to the high heating rates especially at the
surface [37], as noted in [82], the char porosity could attain 0.96.
Based on the above analysis regarding the char thermal parameters obtained
under two heat flux different levels of discrepancies are obtained. The values under
50 kW/m2 are quite unreliable compared with reality, and they are not appropriate
to predict the corresponding pyrolysis process at 50 kW/m2. Due to the observation
that the temperature evolution is predicted with higher accuracy under 20 kW/m2,
and the errors are approximately negligible compared with experimental uncertainties.
Thus, the char thermal parameter value obtained by 20 kW/m2 is adopted as the
input parameters to simulate the pyrolysis cases for these two heat fluxes. The char
conductivity extracted is an “apparent” value considering the porous char matrix as
a component. However, the choice has been made without considering the thermal
conductivity value of the in-depth radiation process, because it has been demonstrated
that the in-depth radiation is a key process at high heat fluxes. Then, a physical
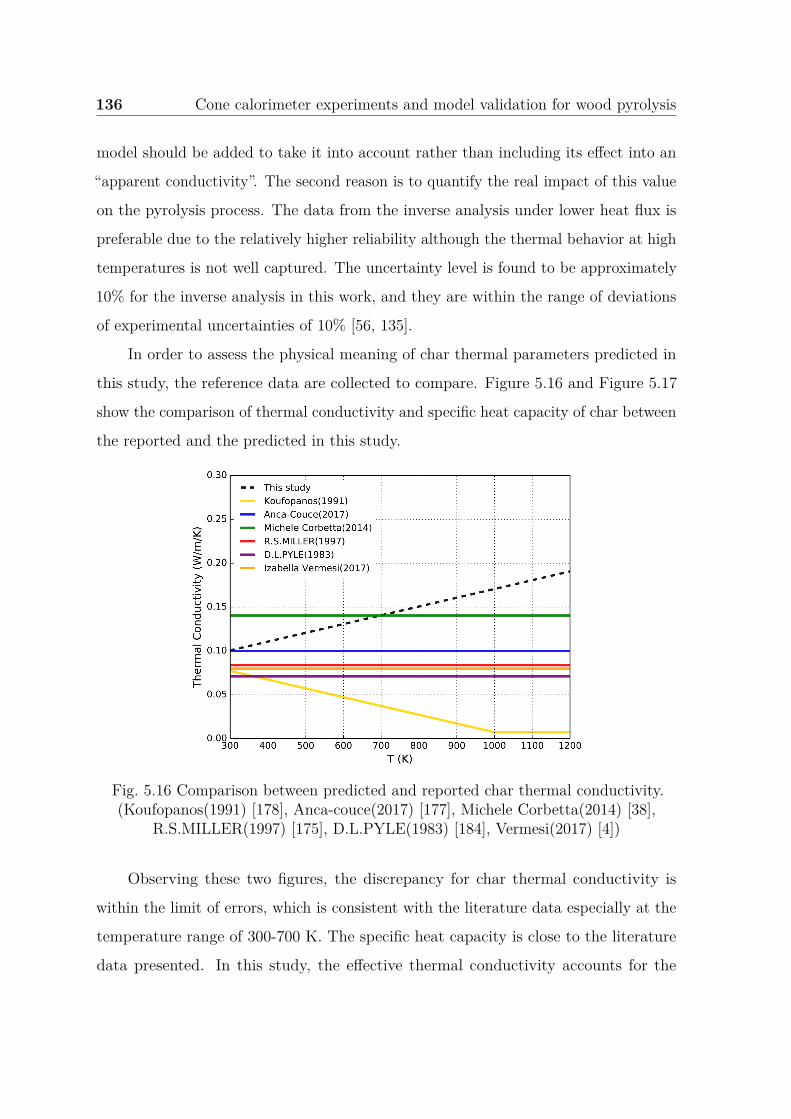
136 Cone calorimeter experiments and model validation for wood pyrolysis
model should be added to take it into account rather than including its effect into an
“apparent conductivity”. The second reason is to quantify the real impact of this value
on the pyrolysis process. The data from the inverse analysis under lower heat flux is
preferable due to the relatively higher reliability although the thermal behavior at high
temperatures is not well captured. The uncertainty level is found to be approximately
10% for the inverse analysis in this work, and they are within the range of deviations
of experimental uncertainties of 10% [56, 135].
In order to assess the physical meaning of char thermal parameters predicted in
this study, the reference data are collected to compare. Figure 5.16 and Figure 5.17
show the comparison of thermal conductivity and specific heat capacity of char between
the reported and the predicted in this study.
Fig. 5.16 Comparison between predicted and reported char thermal conductivity.(Koufopanos(1991) [178], Anca-couce(2017) [177], Michele Corbetta(2014) [38],
R.S.MILLER(1997) [175], D.L.PYLE(1983) [184], Vermesi(2017) [4])
Observing these two figures, the discrepancy for char thermal conductivity is
within the limit of errors, which is consistent with the literature data especially at the
temperature range of 300-700 K. The specific heat capacity is close to the literature
data presented. In this study, the effective thermal conductivity accounts for the
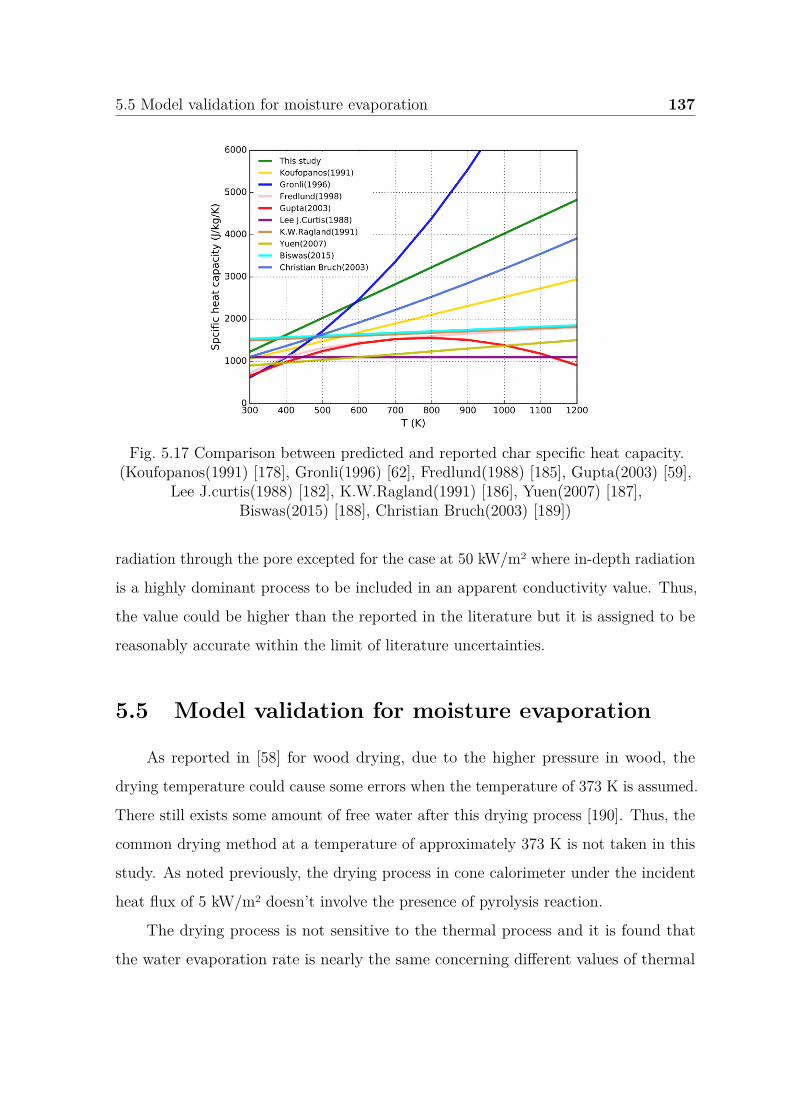
5.5 Model validation for moisture evaporation 137
Fig. 5.17 Comparison between predicted and reported char specific heat capacity.(Koufopanos(1991) [178], Gronli(1996) [62], Fredlund(1988) [185], Gupta(2003) [59],
Lee J.curtis(1988) [182], K.W.Ragland(1991) [186], Yuen(2007) [187],Biswas(2015) [188], Christian Bruch(2003) [189])
radiation through the pore excepted for the case at 50 kW/m2 where in-depth radiation
is a highly dominant process to be included in an apparent conductivity value. Thus,
the value could be higher than the reported in the literature but it is assigned to be
reasonably accurate within the limit of literature uncertainties.
5.5 Model validation for moisture evaporation
As reported in [58] for wood drying, due to the higher pressure in wood, the
drying temperature could cause some errors when the temperature of 373 K is assumed.
There still exists some amount of free water after this drying process [190]. Thus, the
common drying method at a temperature of approximately 373 K is not taken in this
study. As noted previously, the drying process in cone calorimeter under the incident
heat flux of 5 kW/m2 doesn’t involve the presence of pyrolysis reaction.
The drying process is not sensitive to the thermal process and it is found that
the water evaporation rate is nearly the same concerning different values of thermal
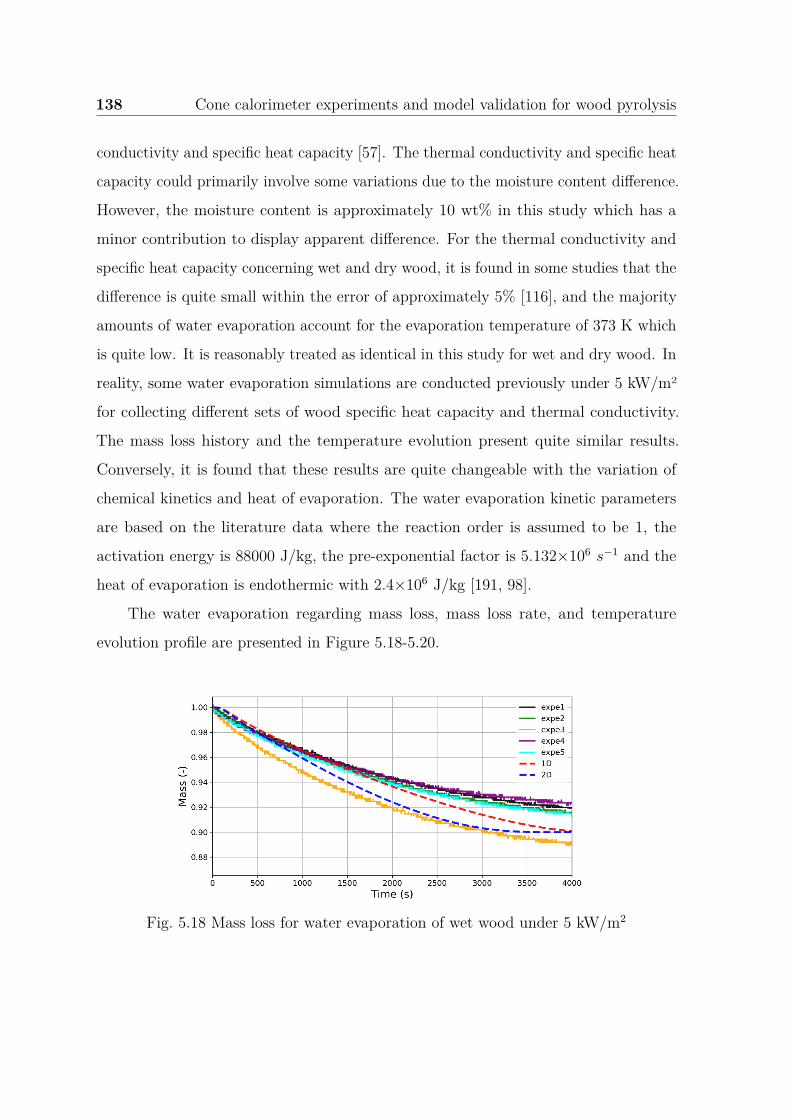
138 Cone calorimeter experiments and model validation for wood pyrolysis
conductivity and specific heat capacity [57]. The thermal conductivity and specific heat
capacity could primarily involve some variations due to the moisture content difference.
However, the moisture content is approximately 10 wt% in this study which has a
minor contribution to display apparent difference. For the thermal conductivity and
specific heat capacity concerning wet and dry wood, it is found in some studies that the
difference is quite small within the error of approximately 5% [116], and the majority
amounts of water evaporation account for the evaporation temperature of 373 K which
is quite low. It is reasonably treated as identical in this study for wet and dry wood. In
reality, some water evaporation simulations are conducted previously under 5 kW/m2
for collecting different sets of wood specific heat capacity and thermal conductivity.
The mass loss history and the temperature evolution present quite similar results.
Conversely, it is found that these results are quite changeable with the variation of
chemical kinetics and heat of evaporation. The water evaporation kinetic parameters
are based on the literature data where the reaction order is assumed to be 1, the
activation energy is 88000 J/kg, the pre-exponential factor is 5.132×10⁶ s−1 and the
heat of evaporation is endothermic with 2.4×10⁶ J/kg [191, 98].
The water evaporation regarding mass loss, mass loss rate, and temperature
evolution profile are presented in Figure 5.18-5.20.
Fig. 5.18 Mass loss for water evaporation of wet wood under 5 kW/m2
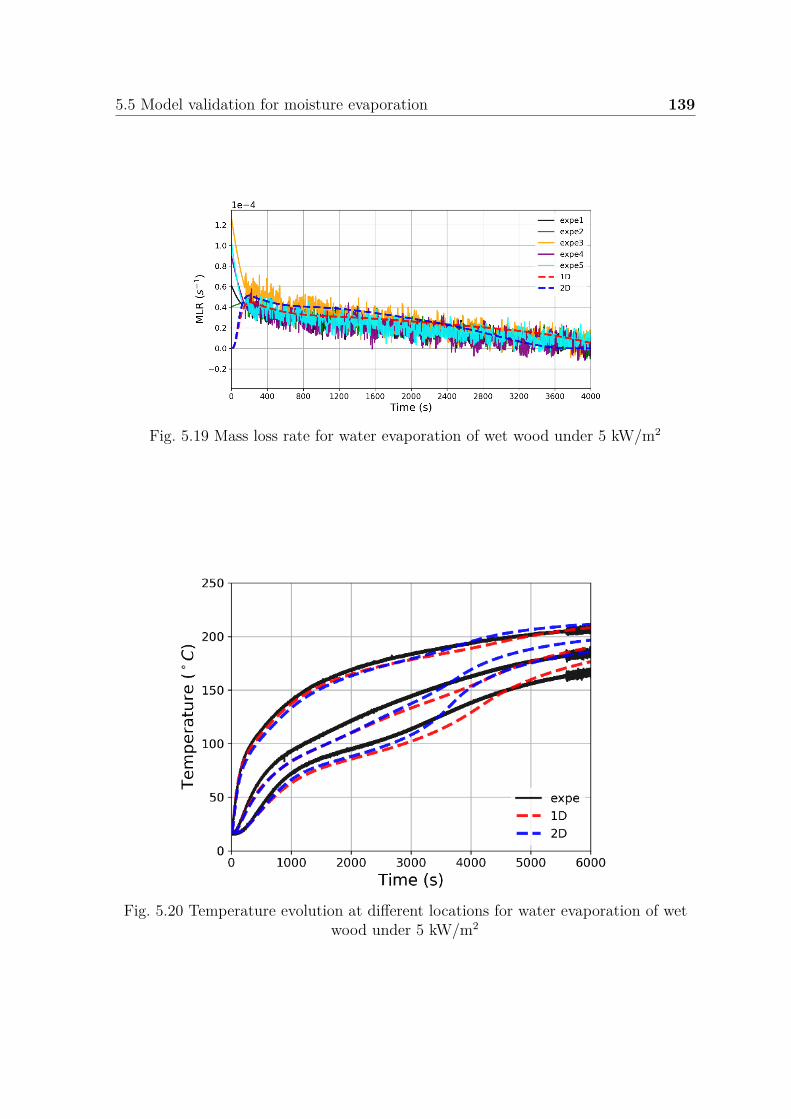
5.5 Model validation for moisture evaporation 139
Fig. 5.19 Mass loss rate for water evaporation of wet wood under 5 kW/m2
Fig. 5.20 Temperature evolution at different locations for water evaporation of wetwood under 5 kW/m2
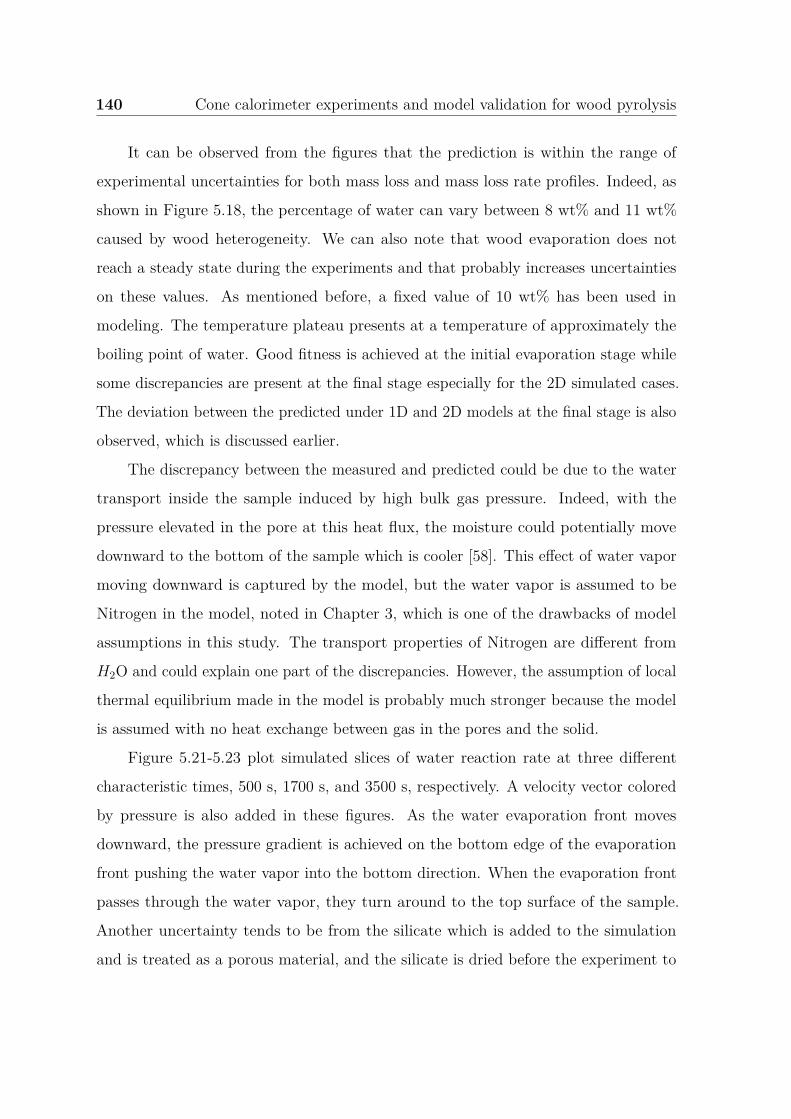
140 Cone calorimeter experiments and model validation for wood pyrolysis
It can be observed from the figures that the prediction is within the range of
experimental uncertainties for both mass loss and mass loss rate profiles. Indeed, as
shown in Figure 5.18, the percentage of water can vary between 8 wt% and 11 wt%
caused by wood heterogeneity. We can also note that wood evaporation does not
reach a steady state during the experiments and that probably increases uncertainties
on these values. As mentioned before, a fixed value of 10 wt% has been used in
modeling. The temperature plateau presents at a temperature of approximately the
boiling point of water. Good fitness is achieved at the initial evaporation stage while
some discrepancies are present at the final stage especially for the 2D simulated cases.
The deviation between the predicted under 1D and 2D models at the final stage is also
observed, which is discussed earlier.
The discrepancy between the measured and predicted could be due to the water
transport inside the sample induced by high bulk gas pressure. Indeed, with the
pressure elevated in the pore at this heat flux, the moisture could potentially move
downward to the bottom of the sample which is cooler [58]. This effect of water vapor
moving downward is captured by the model, but the water vapor is assumed to be
Nitrogen in the model, noted in Chapter 3, which is one of the drawbacks of model
assumptions in this study. The transport properties of Nitrogen are different from
H2O and could explain one part of the discrepancies. However, the assumption of local
thermal equilibrium made in the model is probably much stronger because the model
is assumed with no heat exchange between gas in the pores and the solid.
Figure 5.21-5.23 plot simulated slices of water reaction rate at three different
characteristic times, 500 s, 1700 s, and 3500 s, respectively. A velocity vector colored
by pressure is also added in these figures. As the water evaporation front moves
downward, the pressure gradient is achieved on the bottom edge of the evaporation
front pushing the water vapor into the bottom direction. When the evaporation front
passes through the water vapor, they turn around to the top surface of the sample.
Another uncertainty tends to be from the silicate which is added to the simulation
and is treated as a porous material, and the silicate is dried before the experiment to
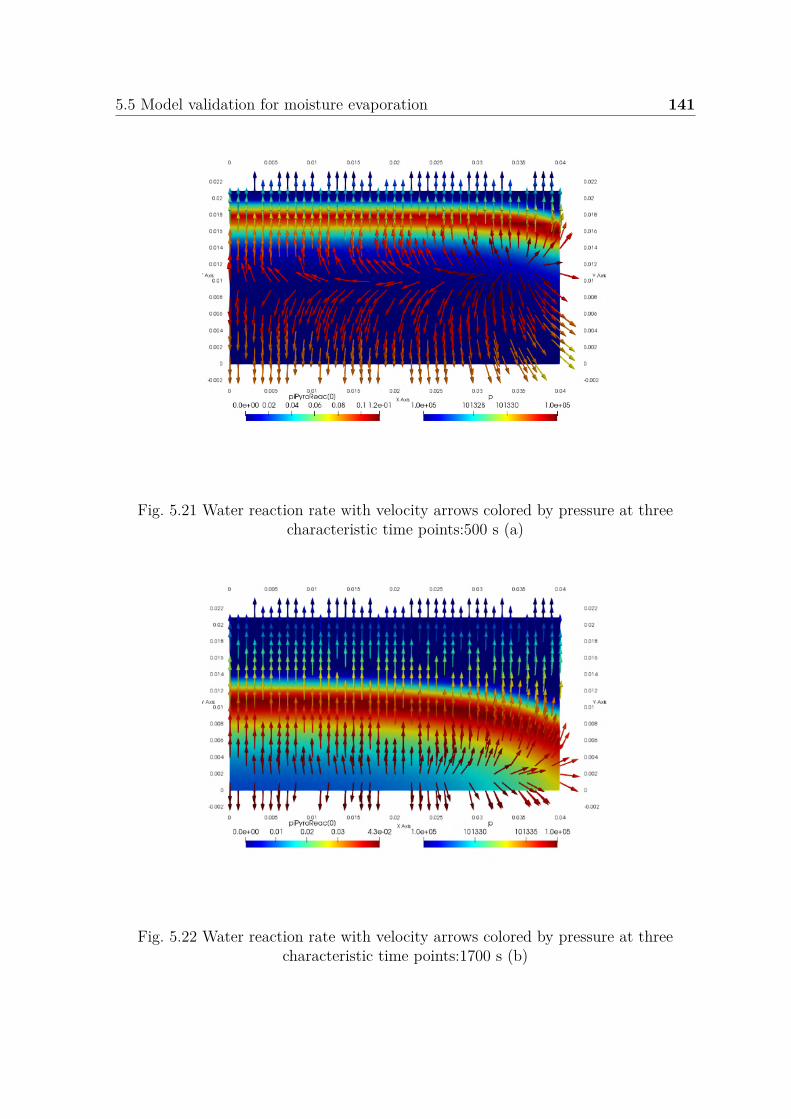
5.5 Model validation for moisture evaporation 141
Fig. 5.21 Water reaction rate with velocity arrows colored by pressure at threecharacteristic time points:500 s (a)
Fig. 5.22 Water reaction rate with velocity arrows colored by pressure at threecharacteristic time points:1700 s (b)
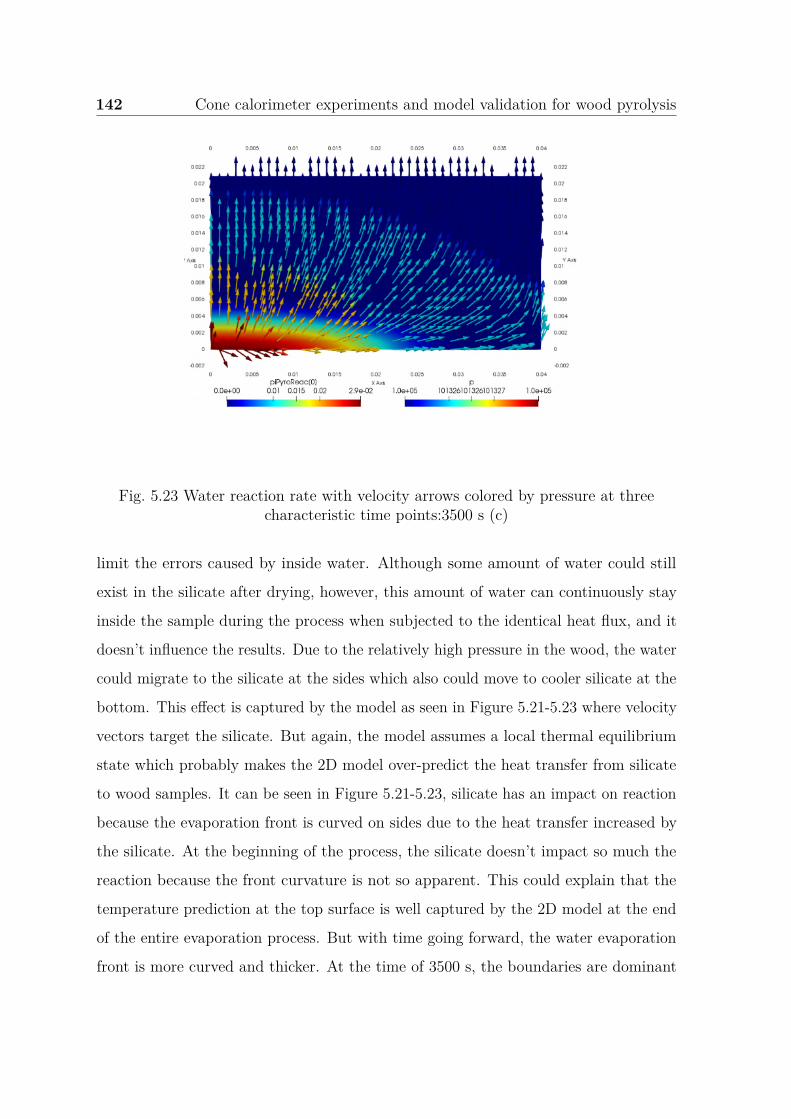
142 Cone calorimeter experiments and model validation for wood pyrolysis
Fig. 5.23 Water reaction rate with velocity arrows colored by pressure at threecharacteristic time points:3500 s (c)
limit the errors caused by inside water. Although some amount of water could still
exist in the silicate after drying, however, this amount of water can continuously stay
inside the sample during the process when subjected to the identical heat flux, and it
doesn’t influence the results. Due to the relatively high pressure in the wood, the water
could migrate to the silicate at the sides which also could move to cooler silicate at the
bottom. This effect is captured by the model as seen in Figure 5.21-5.23 where velocity
vectors target the silicate. But again, the model assumes a local thermal equilibrium
state which probably makes the 2D model over-predict the heat transfer from silicate
to wood samples. It can be seen in Figure 5.21-5.23, silicate has an impact on reaction
because the evaporation front is curved on sides due to the heat transfer increased by
the silicate. At the beginning of the process, the silicate doesn’t impact so much the
reaction because the front curvature is not so apparent. This could explain that the
temperature prediction at the top surface is well captured by the 2D model at the end
of the entire evaporation process. But with time going forward, the water evaporation
front is more curved and thicker. At the time of 3500 s, the boundaries are dominant
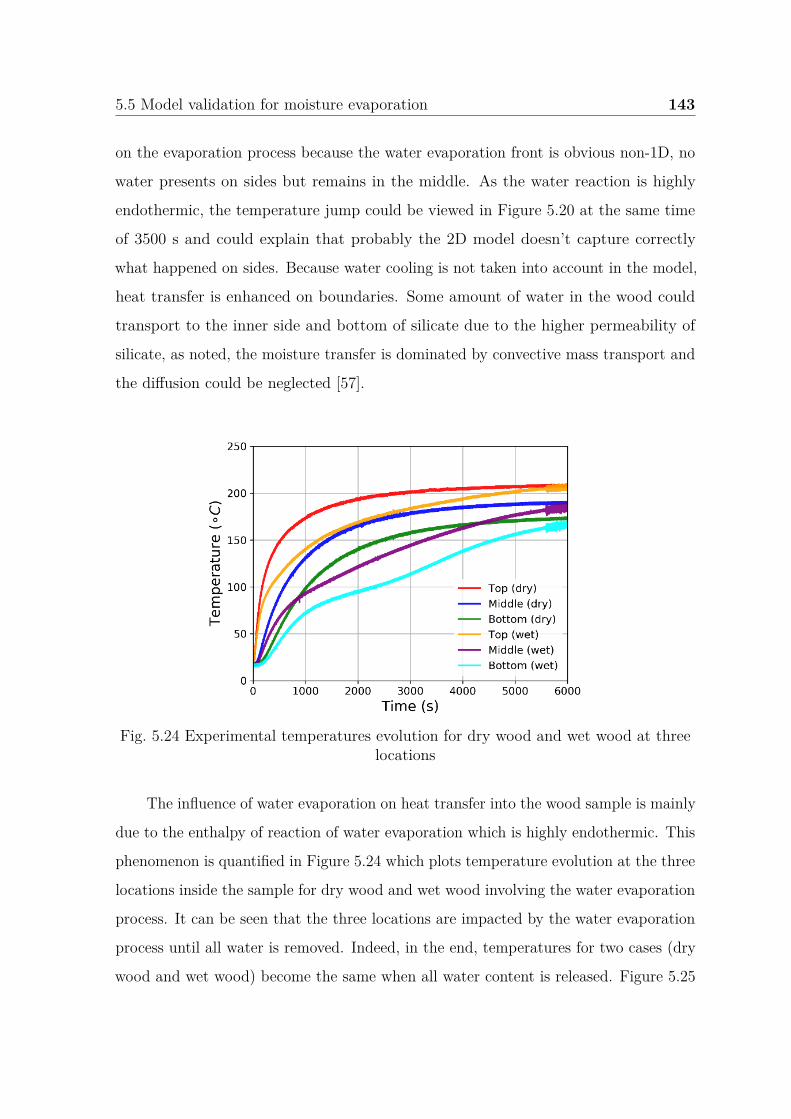
5.5 Model validation for moisture evaporation 143
on the evaporation process because the water evaporation front is obvious non-1D, no
water presents on sides but remains in the middle. As the water reaction is highly
endothermic, the temperature jump could be viewed in Figure 5.20 at the same time
of 3500 s and could explain that probably the 2D model doesn’t capture correctly
what happened on sides. Because water cooling is not taken into account in the model,
heat transfer is enhanced on boundaries. Some amount of water in the wood could
transport to the inner side and bottom of silicate due to the higher permeability of
silicate, as noted, the moisture transfer is dominated by convective mass transport and
the diffusion could be neglected [57].
Fig. 5.24 Experimental temperatures evolution for dry wood and wet wood at threelocations
The influence of water evaporation on heat transfer into the wood sample is mainly
due to the enthalpy of reaction of water evaporation which is highly endothermic. This
phenomenon is quantified in Figure 5.24 which plots temperature evolution at the three
locations inside the sample for dry wood and wet wood involving the water evaporation
process. It can be seen that the three locations are impacted by the water evaporation
process until all water is removed. Indeed, in the end, temperatures for two cases (dry
wood and wet wood) become the same when all water content is released. Figure 5.25
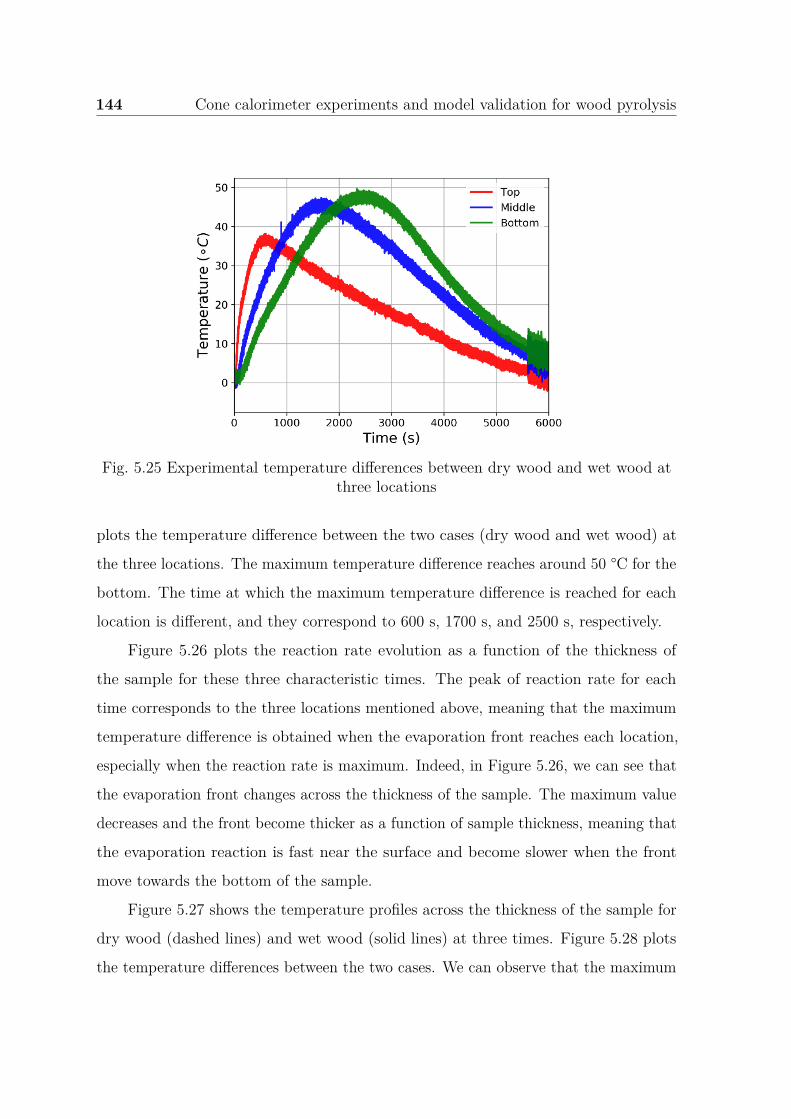
144 Cone calorimeter experiments and model validation for wood pyrolysis
Fig. 5.25 Experimental temperature differences between dry wood and wet wood atthree locations
plots the temperature difference between the two cases (dry wood and wet wood) at
the three locations. The maximum temperature difference reaches around 50 °C for the
bottom. The time at which the maximum temperature difference is reached for each
location is different, and they correspond to 600 s, 1700 s, and 2500 s, respectively.
Figure 5.26 plots the reaction rate evolution as a function of the thickness of
the sample for these three characteristic times. The peak of reaction rate for each
time corresponds to the three locations mentioned above, meaning that the maximum
temperature difference is obtained when the evaporation front reaches each location,
especially when the reaction rate is maximum. Indeed, in Figure 5.26, we can see that
the evaporation front changes across the thickness of the sample. The maximum value
decreases and the front become thicker as a function of sample thickness, meaning that
the evaporation reaction is fast near the surface and become slower when the front
move towards the bottom of the sample.
Figure 5.27 shows the temperature profiles across the thickness of the sample for
dry wood (dashed lines) and wet wood (solid lines) at three times. Figure 5.28 plots
the temperature differences between the two cases. We can observe that the maximum
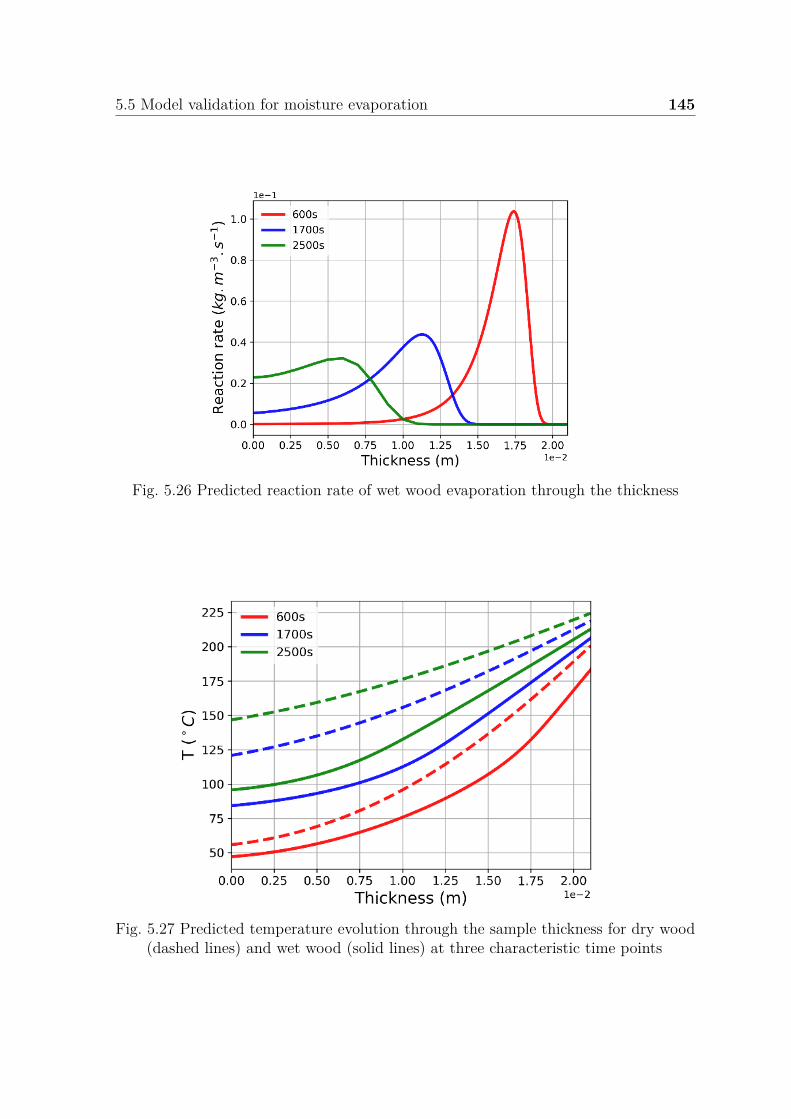
5.5 Model validation for moisture evaporation 145
Fig. 5.26 Predicted reaction rate of wet wood evaporation through the thickness
Fig. 5.27 Predicted temperature evolution through the sample thickness for dry wood(dashed lines) and wet wood (solid lines) at three characteristic time points
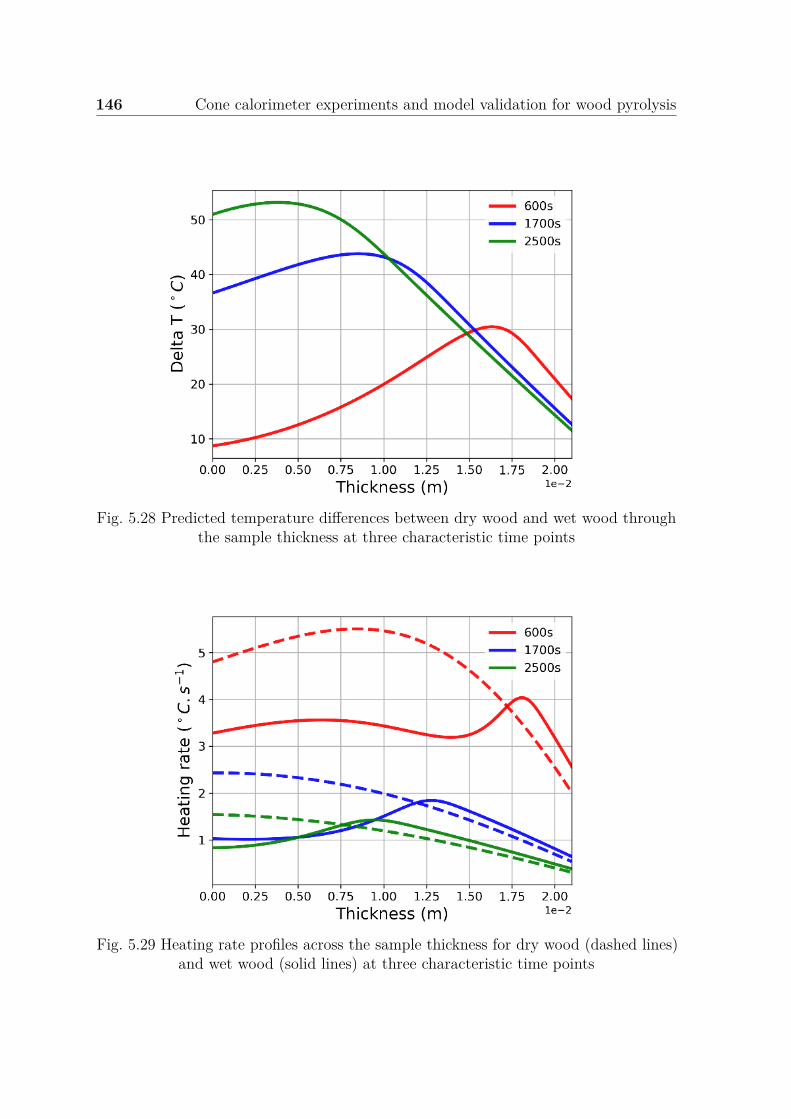
146 Cone calorimeter experiments and model validation for wood pyrolysis
Fig. 5.28 Predicted temperature differences between dry wood and wet wood throughthe sample thickness at three characteristic time points
Fig. 5.29 Heating rate profiles across the sample thickness for dry wood (dashed lines)and wet wood (solid lines) at three characteristic time points
5.6 Model validation for wood pyrolysis under different scenarios 147
difference value for the three locations is close to those extracted by experiments and the
locations of these maximum values correspond to the top, middle, and bottom surface
of measured thermocouple locations. It implies that the dynamic of the evaporation
front along the centerline is well captured by the model.
As pointed out in the TGA chapter, the heating rate is a key factor influencing the
pyrolysis reactions and water evaporation. Figure 5.29 plots the heating rate profile
across the sample thickness for dry wood (dashed lines) and wet wood (solid lines)
at different characteristic times. The peak of solid curves corresponds to the water
evaporation front. Downward the evaporation front for the three times, the heating
rate is lower for the wet wood case because we have demonstrated before that the
pressure in the downward front moves water vapor to the bottom and cool the “virgin”
wet wood. For this reason, the temperature is lower and the heating rate is smaller.
Upward the water evaporation front, the heating for the wet wood cases becomes nearly
equal to the heating rate observed for the dry wood. Indeed, when water is evaporated,
no cooling effect appears and the density of the wet wood becomes the same as the
dry wood case, and a lower density can promote the increase of the heating rate.
5.6 Model validation for wood pyrolysis under dif-
ferent scenarios
Model validation is quite complex work that needs to account for many consid-
erations such as the kinetics validity, parameters accuracy and reliability, boundary
conditions, etc. One of the most uncertain factors should be assessed to validate the
model under multiple heat flux because the interaction between chemistry, heat, and
mass transfer could be more or less strong. Indeed, for high heat flux, the chemistry
and heat transfer processes are rather different at different characteristic time scales.
The chemistry could be fast compared to the heat transfer process. The pyrolysis front
becomes thin and the chemistry could be described by a simple mechanism that is
infinitely fast. However, when heat fluxes are quite low, the time scales of the two
148 Cone calorimeter experiments and model validation for wood pyrolysis
competing processes are in the same order of magnitude and the chemistry becomes
finite rate. To capture this phenomenon, the model needs to deal with more complex
chemistry involving multi-step chemical mechanism.
In this study, the model validation work is conducted regarding wet and dry wood
at the heat flux of 20 kW/m2 and 50 kW/m2. The 20 kW/m2 permits to deal with a
low heat flux just above the critical heat flux for wood ignition (around 12 kW/m2
when thermal decomposition is involved in air atmosphere), and a much higher one (50
kW/m2) that represents the classical average heat flux involved in a real fire. In order
to avoid a flame, tests are performed under an inert atmosphere (Nitrogen). The kinetic
and thermal parameters obtained under a given heat flux are usually employed to assess
the validity at other heat fluxes as noted in [121], but the reliability of those parameters
will be discussed in pyrolysis conditions tested in this study. The heat of decomposition
of Fir wood is prescribed identically as -1.0×10⁵ J/kg to each pseudo component mainly
from the precise experimental data of softwood [56, 192, 75, 110]. The porosity of
wood and char is 0.51 and 0.85, respectively. The wood and char permeability are
estimated with 1.0×10⁻¹² m2 and 1.0×10⁻¹¹ m2, respectively. Nitrogen is prescribed
for the released pyrolysis gas volatiles and its thermal and transport properties are
introduced from [110].
5.6.1 Model validation for temperature and mass loss profiles
As mentioned before, the value of the incident heat flux is one important parameter
governing heat transfer into the solid as the rate of the chemistry. For a fixed incident
heat flux, the rate of chemistry could also change because of the “thermally-thick”
characteristic of the solid involved in the pyrolysis process. Indeed, as temperature
gradients are assumed into the sample, the interaction between heat transfer and
pyrolysis reaction could change and depends on time. Figures 5.30 and Figure 5.31
plot the experimental heating rates of the solid during pyrolysis at the three locations
for the two different heat flux introduced before.
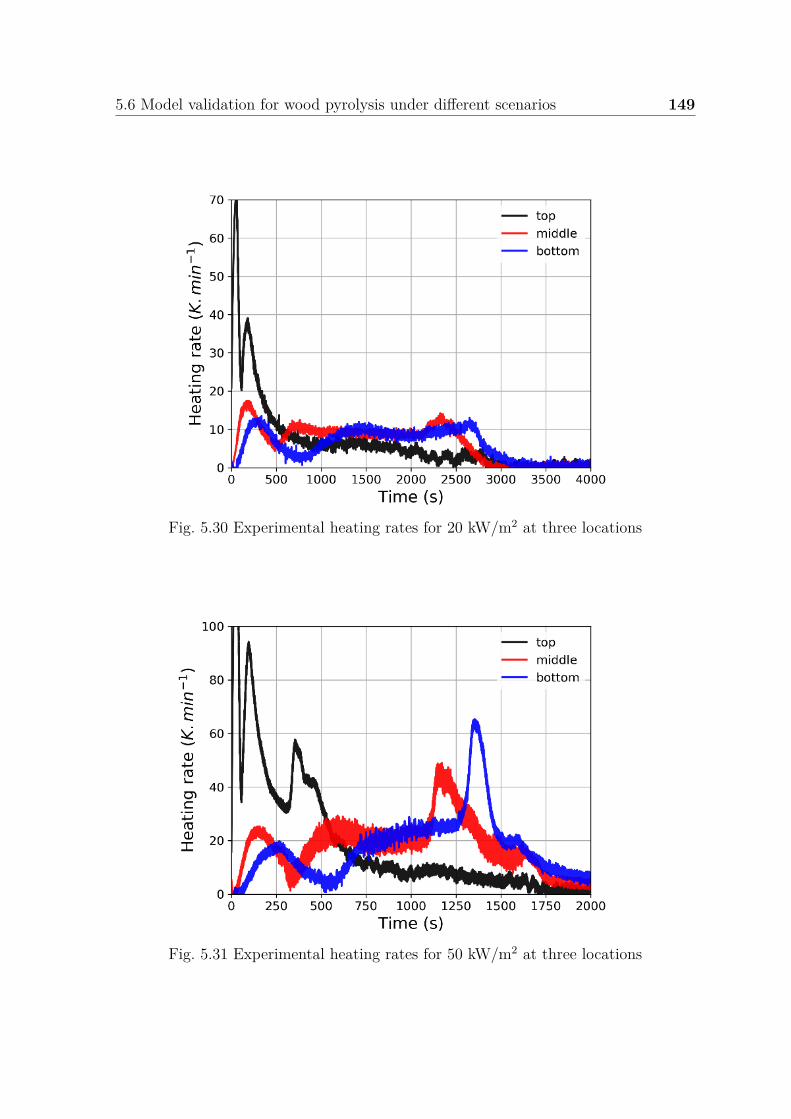
5.6 Model validation for wood pyrolysis under different scenarios 149
Fig. 5.30 Experimental heating rates for 20 kW/m2 at three locations
Fig. 5.31 Experimental heating rates for 50 kW/m2 at three locations
150 Cone calorimeter experiments and model validation for wood pyrolysis
For the two heat flux, a large range of heating rates is involved during the pyrolysis
process, depending on time and space location in the sample. The major role of
the heating rate on the chemical process has been demonstrated in Chapter 4. In
consequence, this large range of heating rates involved when a thick solid is thermally
decomposed which points out the complexity of the chemistry the model needs to
capture. Under higher incident heat flux, the mean heating rate value is higher. It
is interesting to underline that in the two cases, the highest heating rates, as well as
the highest gradient of heating rates, are involved at the beginning of the pyrolysis
process. During this beginning stage, the pyrolysis gases are released governing the
ignition process when the thermal decomposition is involved in air. Then, to capture
correctly the ignition process, the pyrolysis model should describe those first stages
correctly when heating and gradients are high. As a perspective of this study, the
heating parameter should be taken into account carefully in the chemical mechanism.
In this study, as introduced in Chapter 4, we decide to extract kinetic parameters
by two different fixed heating rate values, rather than extracting parameters for a
range of heating rates. Indeed, as parallel reaction mechanisms don’t take into account
heating rate which is a “physical parameter”, we decided to employ two different
constant values to address the role of heating rates in the chemistry description during
the pyrolysis process. We have chosen 10 K/min because this value is an average of
heating rates involved when pyrolysis is under 20 kW/m2. For 50 kW/m2, the average
heating rate is not easy to quite clearly point out but 20 K/min seems to be the mean
value. However, when observing the whole evolution trend, we decided to extract
kinetic data at 50 K/min which is the highest value that can be handled with TGA to
investigate pyrolysis when high heating rates are involved.
One of the most important drawbacks of a parallel reaction mechanism is that it
doesn’t take into account the heating rate into the chemical reaction. It fails to predict
the final residual mass fraction making this mechanism inconsistent in terms of mass
conservation. Figure 5.32 plots experimental and the 1D simulated total mass loss
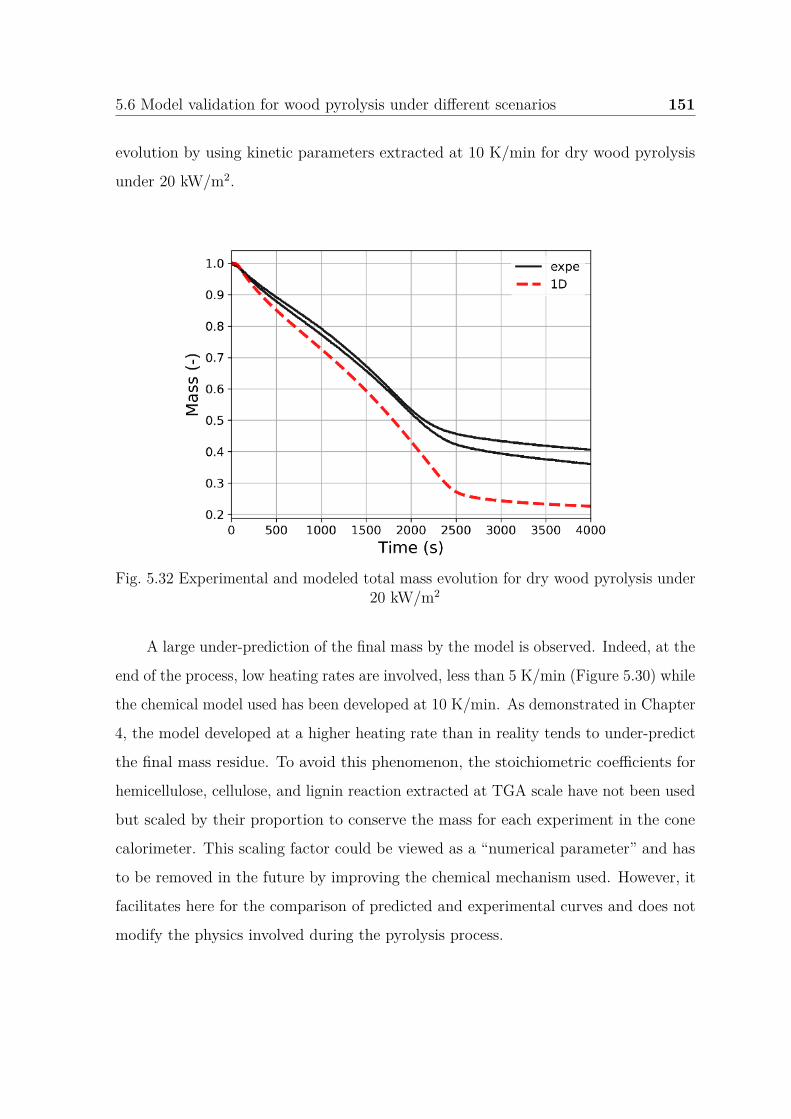
5.6 Model validation for wood pyrolysis under different scenarios 151
evolution by using kinetic parameters extracted at 10 K/min for dry wood pyrolysis
under 20 kW/m2.
Fig. 5.32 Experimental and modeled total mass evolution for dry wood pyrolysis under20 kW/m2
A large under-prediction of the final mass by the model is observed. Indeed, at the
end of the process, low heating rates are involved, less than 5 K/min (Figure 5.30) while
the chemical model used has been developed at 10 K/min. As demonstrated in Chapter
4, the model developed at a higher heating rate than in reality tends to under-predict
the final mass residue. To avoid this phenomenon, the stoichiometric coefficients for
hemicellulose, cellulose, and lignin reaction extracted at TGA scale have not been used
but scaled by their proportion to conserve the mass for each experiment in the cone
calorimeter. This scaling factor could be viewed as a “numerical parameter” and has
to be removed in the future by improving the chemical mechanism used. However, it
facilitates here for the comparison of predicted and experimental curves and does not
modify the physics involved during the pyrolysis process.
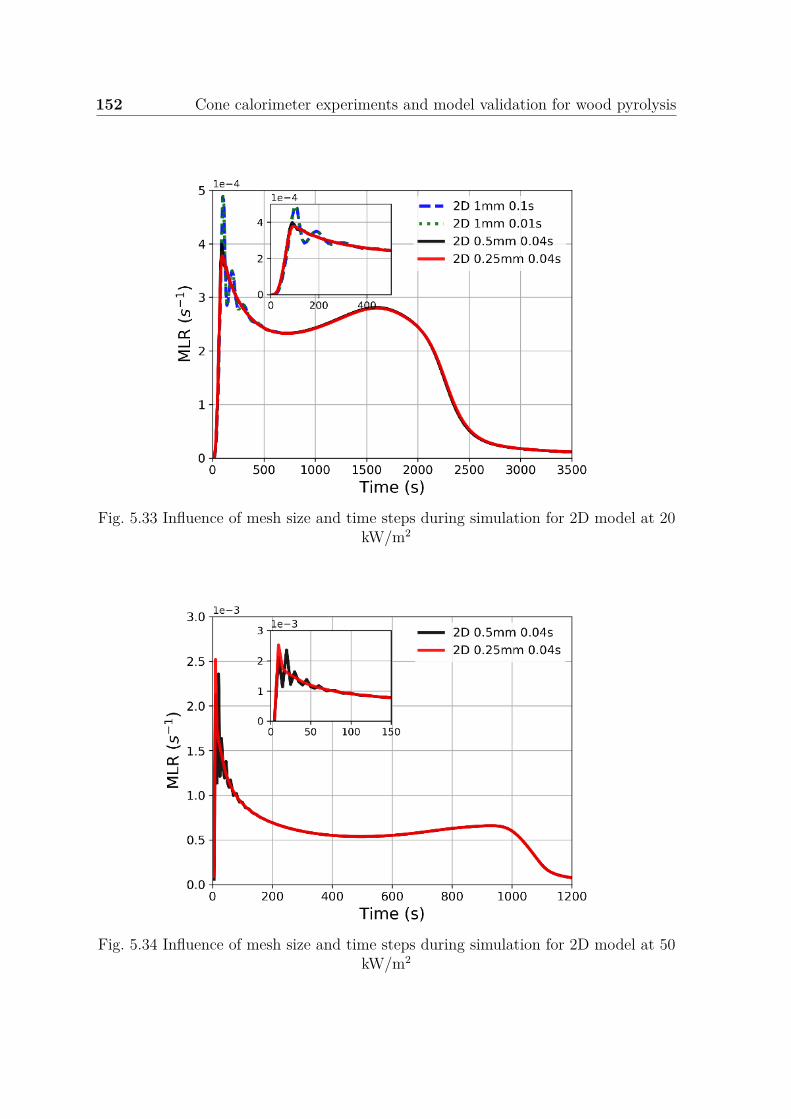
152 Cone calorimeter experiments and model validation for wood pyrolysis
Fig. 5.33 Influence of mesh size and time steps during simulation for 2D model at 20kW/m2
Fig. 5.34 Influence of mesh size and time steps during simulation for 2D model at 50kW/m2
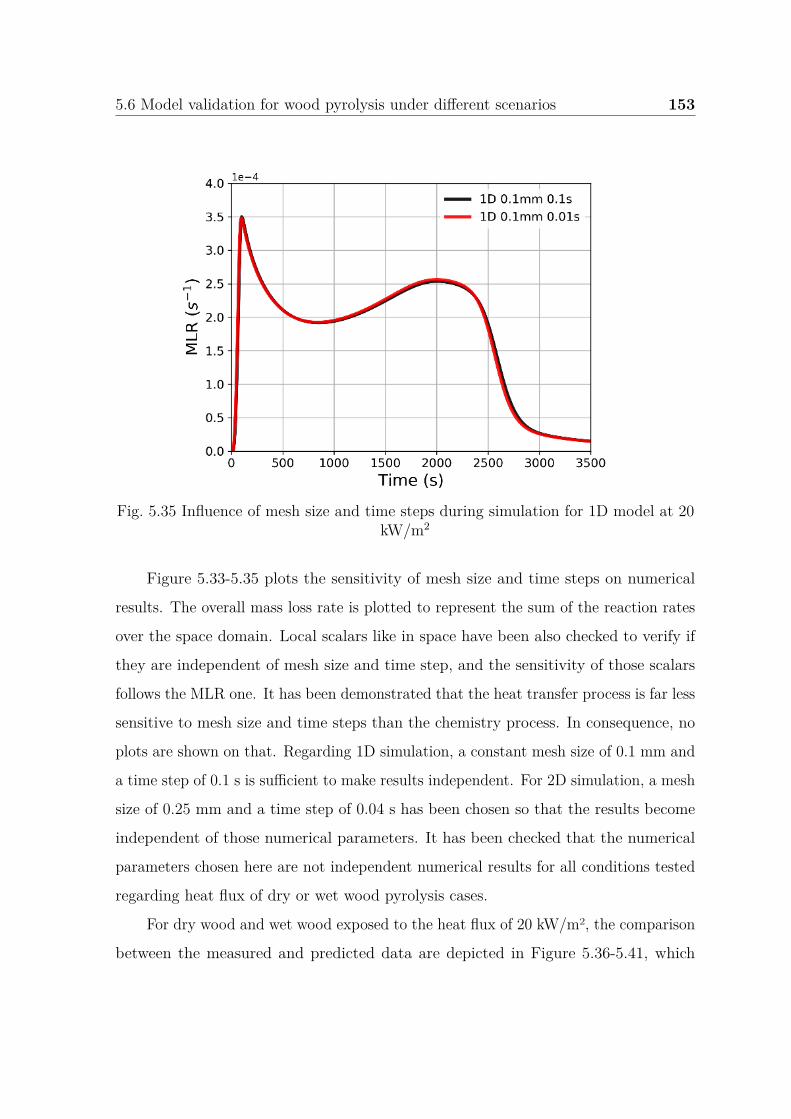
5.6 Model validation for wood pyrolysis under different scenarios 153
Fig. 5.35 Influence of mesh size and time steps during simulation for 1D model at 20kW/m2
Figure 5.33-5.35 plots the sensitivity of mesh size and time steps on numerical
results. The overall mass loss rate is plotted to represent the sum of the reaction rates
over the space domain. Local scalars like in space have been also checked to verify if
they are independent of mesh size and time step, and the sensitivity of those scalars
follows the MLR one. It has been demonstrated that the heat transfer process is far less
sensitive to mesh size and time steps than the chemistry process. In consequence, no
plots are shown on that. Regarding 1D simulation, a constant mesh size of 0.1 mm and
a time step of 0.1 s is sufficient to make results independent. For 2D simulation, a mesh
size of 0.25 mm and a time step of 0.04 s has been chosen so that the results become
independent of those numerical parameters. It has been checked that the numerical
parameters chosen here are not independent numerical results for all conditions tested
regarding heat flux of dry or wet wood pyrolysis cases.
For dry wood and wet wood exposed to the heat flux of 20 kW/m2, the comparison
between the measured and predicted data are depicted in Figure 5.36-5.41, which
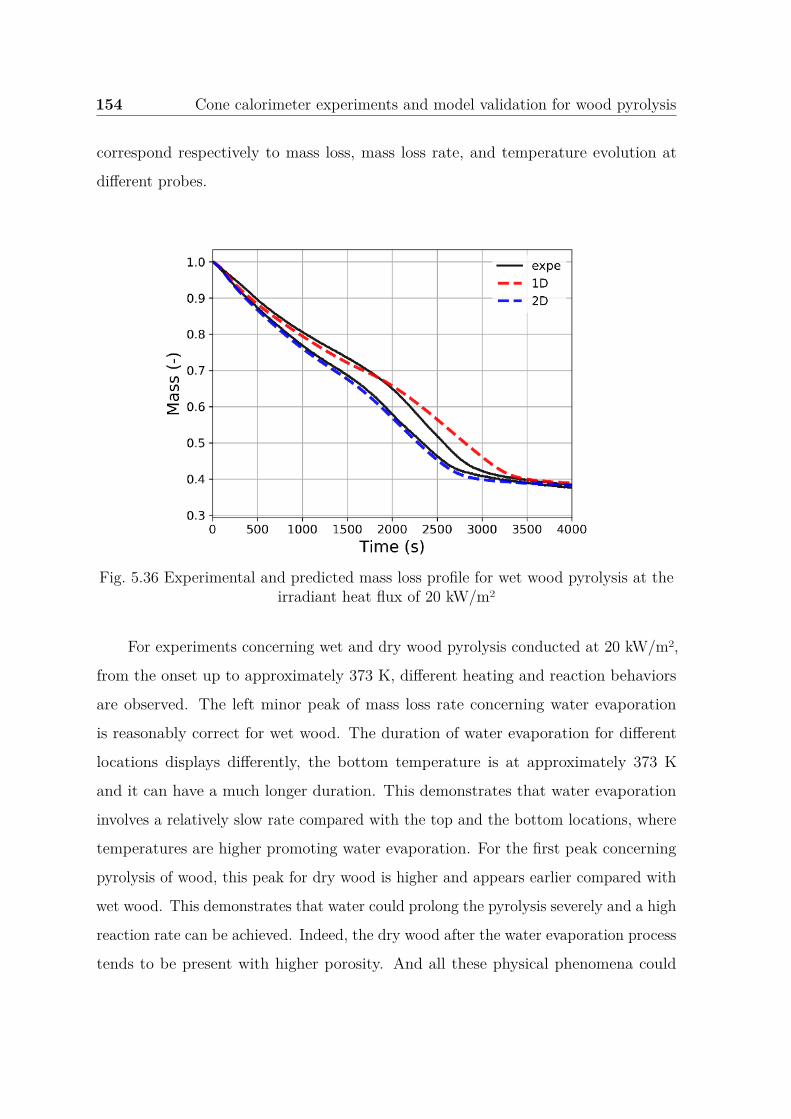
154 Cone calorimeter experiments and model validation for wood pyrolysis
correspond respectively to mass loss, mass loss rate, and temperature evolution at
different probes.
Fig. 5.36 Experimental and predicted mass loss profile for wet wood pyrolysis at theirradiant heat flux of 20 kW/m2
For experiments concerning wet and dry wood pyrolysis conducted at 20 kW/m2,
from the onset up to approximately 373 K, different heating and reaction behaviors
are observed. The left minor peak of mass loss rate concerning water evaporation
is reasonably correct for wet wood. The duration of water evaporation for different
locations displays differently, the bottom temperature is at approximately 373 K
and it can have a much longer duration. This demonstrates that water evaporation
involves a relatively slow rate compared with the top and the bottom locations, where
temperatures are higher promoting water evaporation. For the first peak concerning
pyrolysis of wood, this peak for dry wood is higher and appears earlier compared with
wet wood. This demonstrates that water could prolong the pyrolysis severely and a high
reaction rate can be achieved. Indeed, the dry wood after the water evaporation process
tends to be present with higher porosity. And all these physical phenomena could
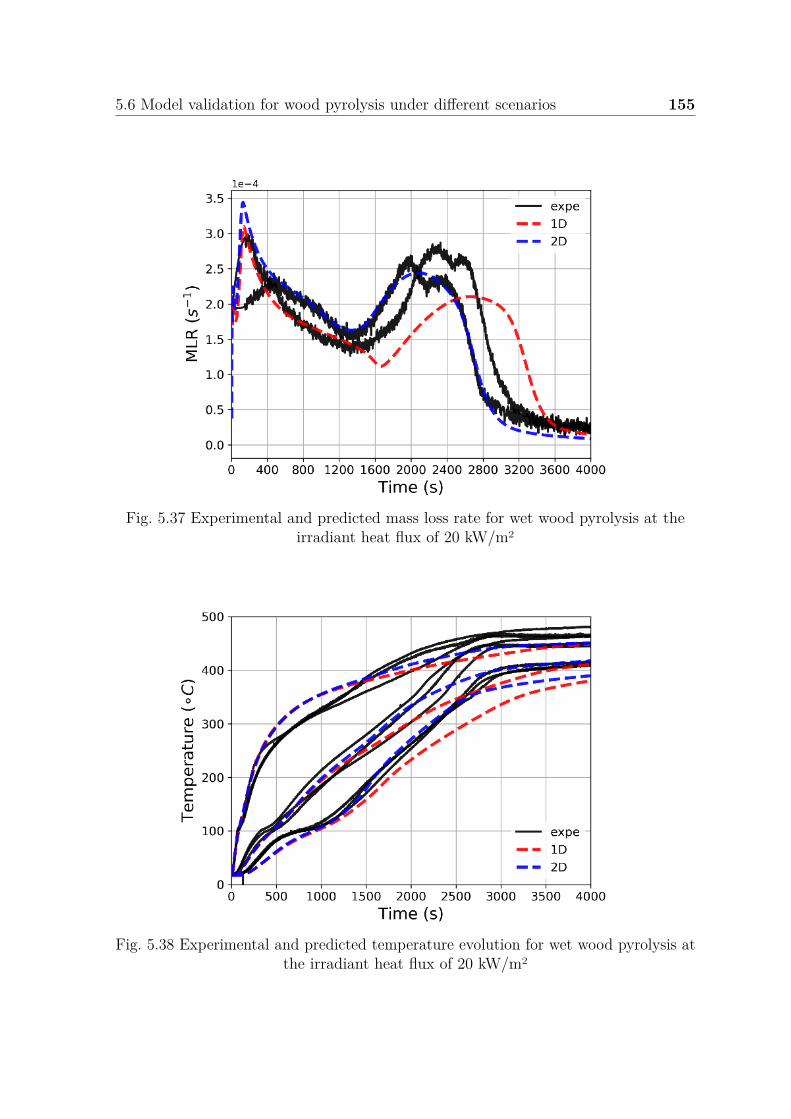
5.6 Model validation for wood pyrolysis under different scenarios 155
Fig. 5.37 Experimental and predicted mass loss rate for wet wood pyrolysis at theirradiant heat flux of 20 kW/m2
Fig. 5.38 Experimental and predicted temperature evolution for wet wood pyrolysis atthe irradiant heat flux of 20 kW/m2
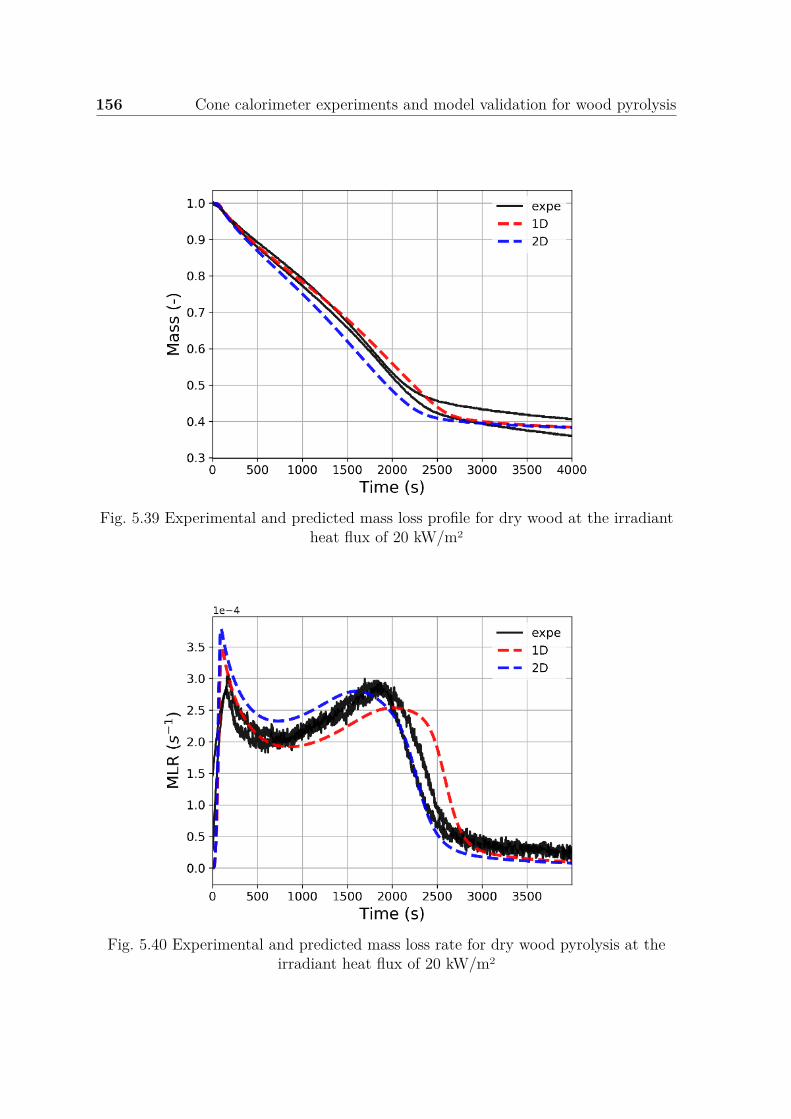
156 Cone calorimeter experiments and model validation for wood pyrolysis
Fig. 5.39 Experimental and predicted mass loss profile for dry wood at the irradiantheat flux of 20 kW/m2
Fig. 5.40 Experimental and predicted mass loss rate for dry wood pyrolysis at theirradiant heat flux of 20 kW/m2
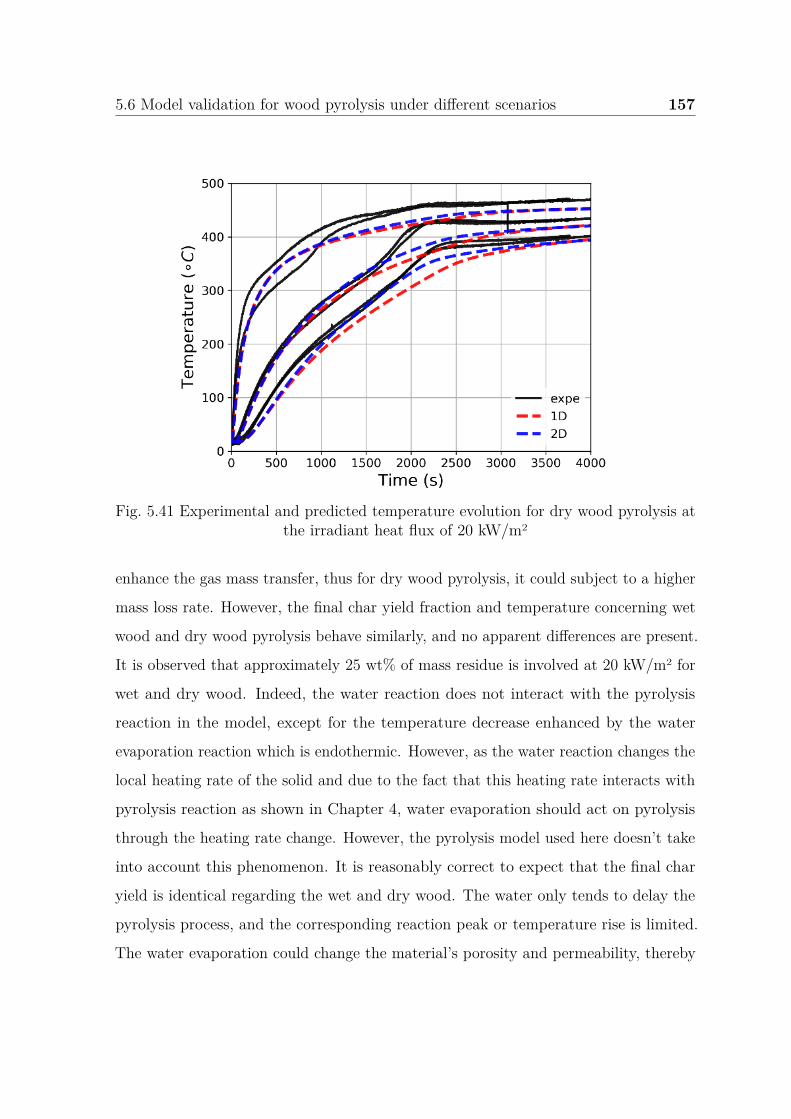
5.6 Model validation for wood pyrolysis under different scenarios 157
Fig. 5.41 Experimental and predicted temperature evolution for dry wood pyrolysis atthe irradiant heat flux of 20 kW/m2
enhance the gas mass transfer, thus for dry wood pyrolysis, it could subject to a higher
mass loss rate. However, the final char yield fraction and temperature concerning wet
wood and dry wood pyrolysis behave similarly, and no apparent differences are present.
It is observed that approximately 25 wt% of mass residue is involved at 20 kW/m2 for
wet and dry wood. Indeed, the water reaction does not interact with the pyrolysis
reaction in the model, except for the temperature decrease enhanced by the water
evaporation reaction which is endothermic. However, as the water reaction changes the
local heating rate of the solid and due to the fact that this heating rate interacts with
pyrolysis reaction as shown in Chapter 4, water evaporation should act on pyrolysis
through the heating rate change. However, the pyrolysis model used here doesn’t take
into account this phenomenon. It is reasonably correct to expect that the final char
yield is identical regarding the wet and dry wood. The water only tends to delay the
pyrolysis process, and the corresponding reaction peak or temperature rise is limited.
The water evaporation could change the material’s porosity and permeability, thereby
158 Cone calorimeter experiments and model validation for wood pyrolysis
influencing the pyrolysis behavior especially the gas flow. It has the trend to lose
mass continuously which accounts for the lignin decomposition at a high-temperature
range, and it could produce a partially charred residue. In this work, the different mass
fractions of char are produced by different sub-components and the final char yield for
different heat flux is treated as different due to the observation of experiment data.
The most apparent discrepancies for the two cases lie in the temperature evolution
especially at the bottom location which is the most susceptible region by heat conduction.
The water is also responsible for the decreasing magnitude of the second peak for wet
wood pyrolysis. As depicted in Figure 5.38 and Figure 5.41, the wet wood involves a
serious temperature evolution plateau especially at the bottom location, while no such
plateau is present for dry wood pyrolysis. As noted that the moisture content accounts
for approximately 10 wt% for wet wood and dry wood is defined to be completely dry,
this plateau is mainly due to the endothermic of water evaporation and can delay the
mass loss process.
The model predictions fit well the experimental mass loss and mass loss rate,
except for the second peak temperature range. The model predicted earlier the mass
loss rate at 20 kW/m2 and this trend is found to be consistent with that at 50 kW/m2
in the following part. As shown in Figure 5.36-5.40, different levels of deviation occur
between the prediction and experimental results, and this deviation increases with
an increase in temperature. Concerning the MLR at the peak temperature range,
slight deviations are observed, and the final temperature stage involve a reasonable
agreement especially in the 2D case. Indeed, the 1D model under-predicts the second
mass loss rate peak magnitude, the time to reach the peak of the second mass loss rate
is predicted with some delay. As we demonstrated in the water evaporation description
part, the experiments in 2D for the boundary condition on sides are influenced by the
silicate: the water evaporation front is curved on sides due to this side effect. For this
reason, the 1D model gives acceptable results except for the end of the pyrolysis process
when this side effect becomes non-negligible. Indeed, at the onset of pyrolysis and the
final stage, no apparent difference is observed. During the temperature range of the
5.6 Model validation for wood pyrolysis under different scenarios 159
second peak, a deviation is present between 1D and 2D models. Some portions of heat
are conducted to the wood side and induce a much higher temperature than at the
center of the wood sample. Even though the 2D model captures better this effect, the
second peak of MLR is well captured by the 2D model and some improvements should
be done because some discrepancies remain for the temperature prediction at the end.
The main cause is not clear to define. We can question if these discrepancies are due
to boundary conditions which are not well defined or if it comes from the pyrolysis
model which is too simple to capture correctly the pyrolysis process when the side
effect becomes strong. However, we can consider globally that the model prediction is
reasonably acceptable and the judgment is believed to comply with the uncertainty of
experiments.
The comparisons between the measured and predicted data for wet wood pyrolysis
under the irradiation of 50 kW/m2 are shown in Figure 5.42 to Figure 5.44, which
involve respectively the mass loss, mass loss rate, and temperature evolution at different
probes. The solid lines correspond to the experimental data and the dashed lines
correspond to the prediction.
The comparisons between the experimental and predicted data for dry wood
pyrolysis under the irradiation of 50 kW/m2 are shown in Figure 5.45 to Figure 5.47,
which correspond to mass loss, mass loss rate, and temperature evolution at different
probes, respectively.
When observing the experimental data for wet and dry wood pyrolysis under
50 kW/m2, the experimental deviations among different runs involve different levels
of discrepancy at different pyrolysis stage concerning the mass loss and the in-depth
temperature evolution at three locations. For the mass loss rate profile following the
first peak, due to the char formation with lower thermal conductivity, the plateau
occurs with less heat conduction while involving endothermic pyrolysis reaction. This
trend could delay for some time until the second peak, with a strong pyrolysis reaction
of large remaining mass fraction due to the thermal feedback influence. The material
temperature continuously increases, at the termination of the second peak, the whole
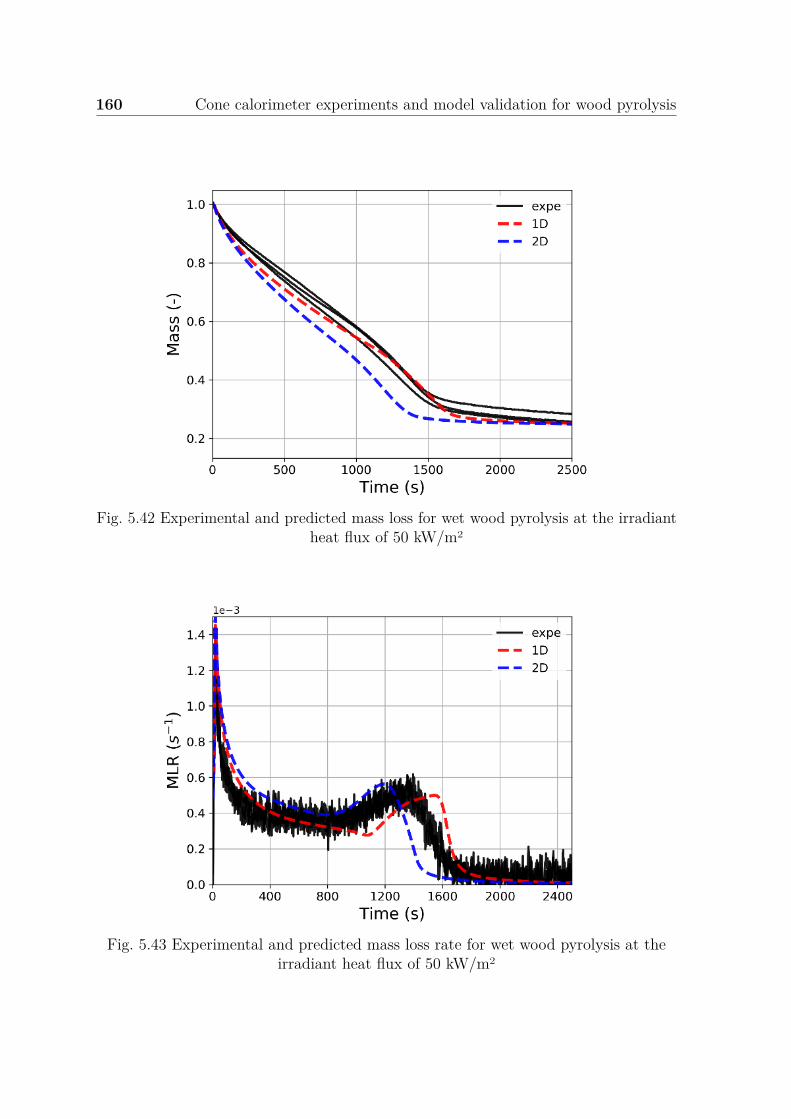
160 Cone calorimeter experiments and model validation for wood pyrolysis
Fig. 5.42 Experimental and predicted mass loss for wet wood pyrolysis at the irradiantheat flux of 50 kW/m2
Fig. 5.43 Experimental and predicted mass loss rate for wet wood pyrolysis at theirradiant heat flux of 50 kW/m2
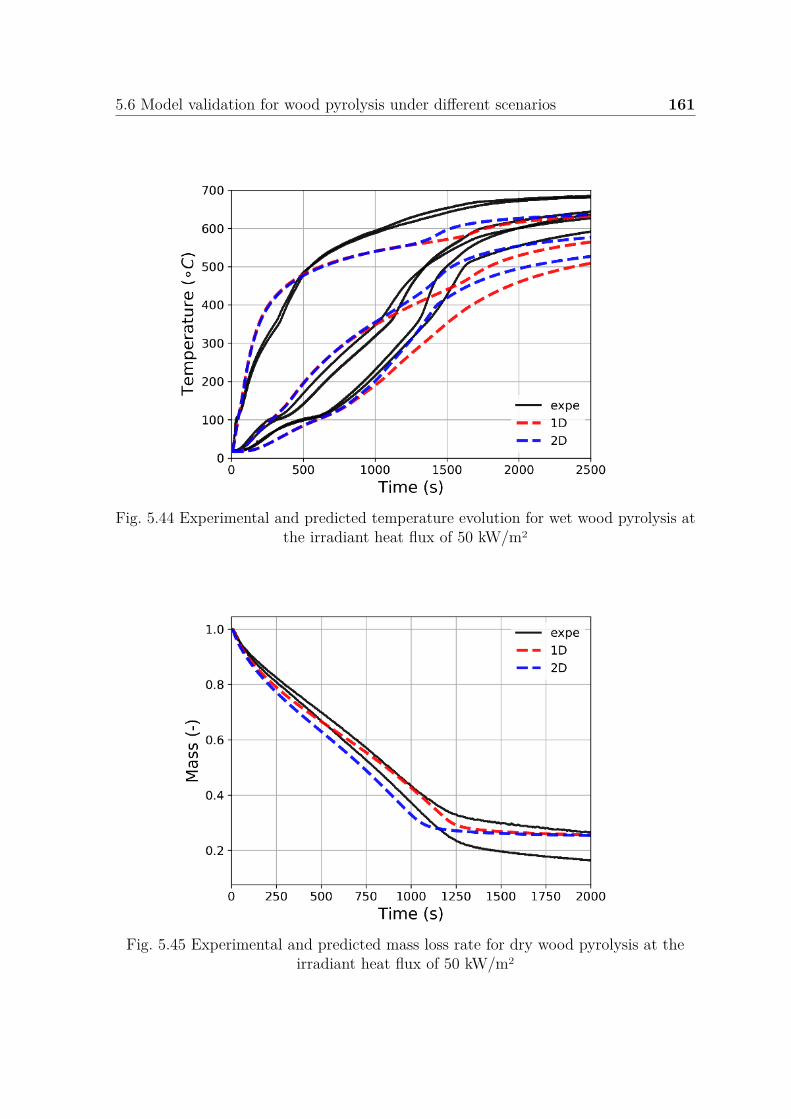
5.6 Model validation for wood pyrolysis under different scenarios 161
Fig. 5.44 Experimental and predicted temperature evolution for wet wood pyrolysis atthe irradiant heat flux of 50 kW/m2
Fig. 5.45 Experimental and predicted mass loss rate for dry wood pyrolysis at theirradiant heat flux of 50 kW/m2
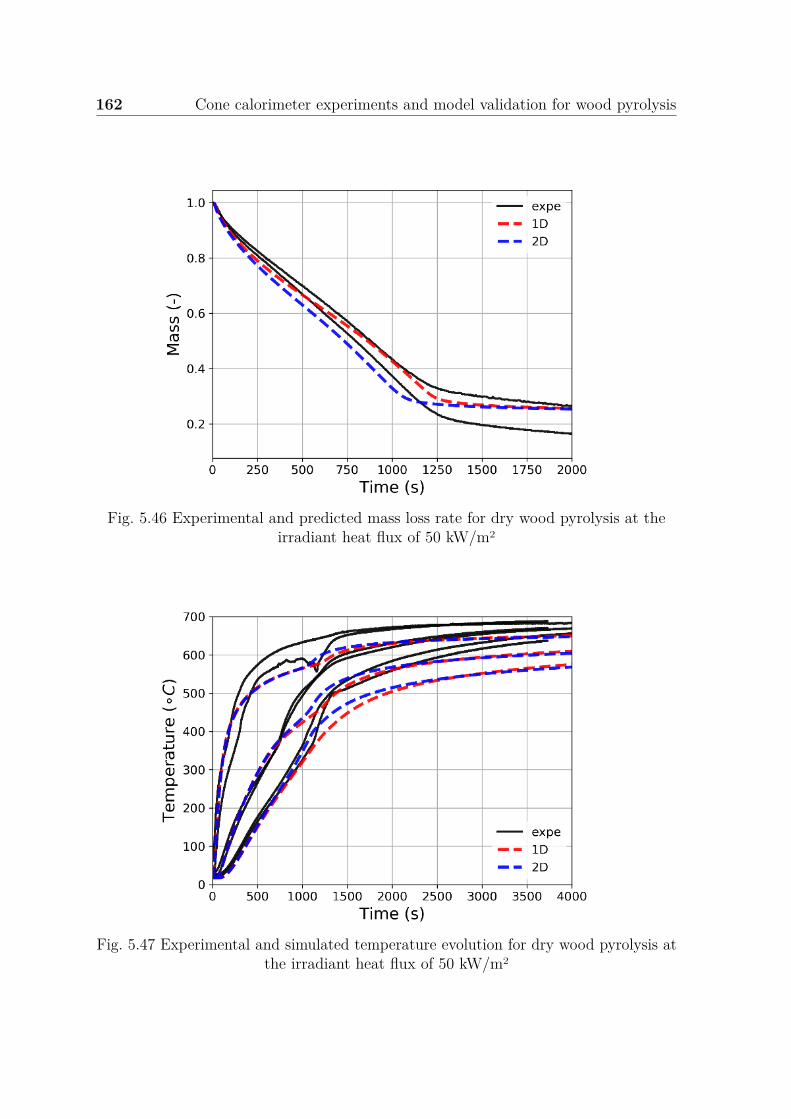
162 Cone calorimeter experiments and model validation for wood pyrolysis
Fig. 5.46 Experimental and predicted mass loss rate for dry wood pyrolysis at theirradiant heat flux of 50 kW/m2
Fig. 5.47 Experimental and simulated temperature evolution for dry wood pyrolysis atthe irradiant heat flux of 50 kW/m2
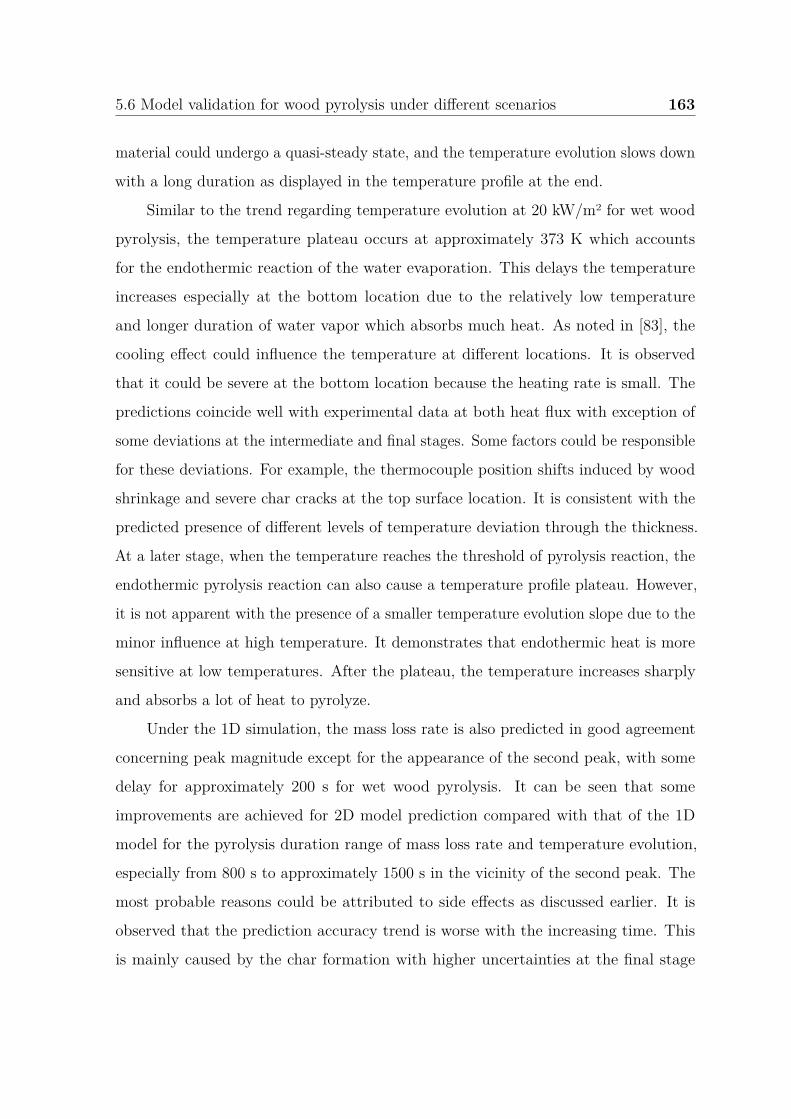
5.6 Model validation for wood pyrolysis under different scenarios 163
material could undergo a quasi-steady state, and the temperature evolution slows down
with a long duration as displayed in the temperature profile at the end.
Similar to the trend regarding temperature evolution at 20 kW/m2 for wet wood
pyrolysis, the temperature plateau occurs at approximately 373 K which accounts
for the endothermic reaction of the water evaporation. This delays the temperature
increases especially at the bottom location due to the relatively low temperature
and longer duration of water vapor which absorbs much heat. As noted in [83], the
cooling effect could influence the temperature at different locations. It is observed
that it could be severe at the bottom location because the heating rate is small. The
predictions coincide well with experimental data at both heat flux with exception of
some deviations at the intermediate and final stages. Some factors could be responsible
for these deviations. For example, the thermocouple position shifts induced by wood
shrinkage and severe char cracks at the top surface location. It is consistent with the
predicted presence of different levels of temperature deviation through the thickness.
At a later stage, when the temperature reaches the threshold of pyrolysis reaction, the
endothermic pyrolysis reaction can also cause a temperature profile plateau. However,
it is not apparent with the presence of a smaller temperature evolution slope due to the
minor influence at high temperature. It demonstrates that endothermic heat is more
sensitive at low temperatures. After the plateau, the temperature increases sharply
and absorbs a lot of heat to pyrolyze.
Under the 1D simulation, the mass loss rate is also predicted in good agreement
concerning peak magnitude except for the appearance of the second peak, with some
delay for approximately 200 s for wet wood pyrolysis. It can be seen that some
improvements are achieved for 2D model prediction compared with that of the 1D
model for the pyrolysis duration range of mass loss rate and temperature evolution,
especially from 800 s to approximately 1500 s in the vicinity of the second peak. The
most probable reasons could be attributed to side effects as discussed earlier. It is
observed that the prediction accuracy trend is worse with the increasing time. This
is mainly caused by the char formation with higher uncertainties at the final stage
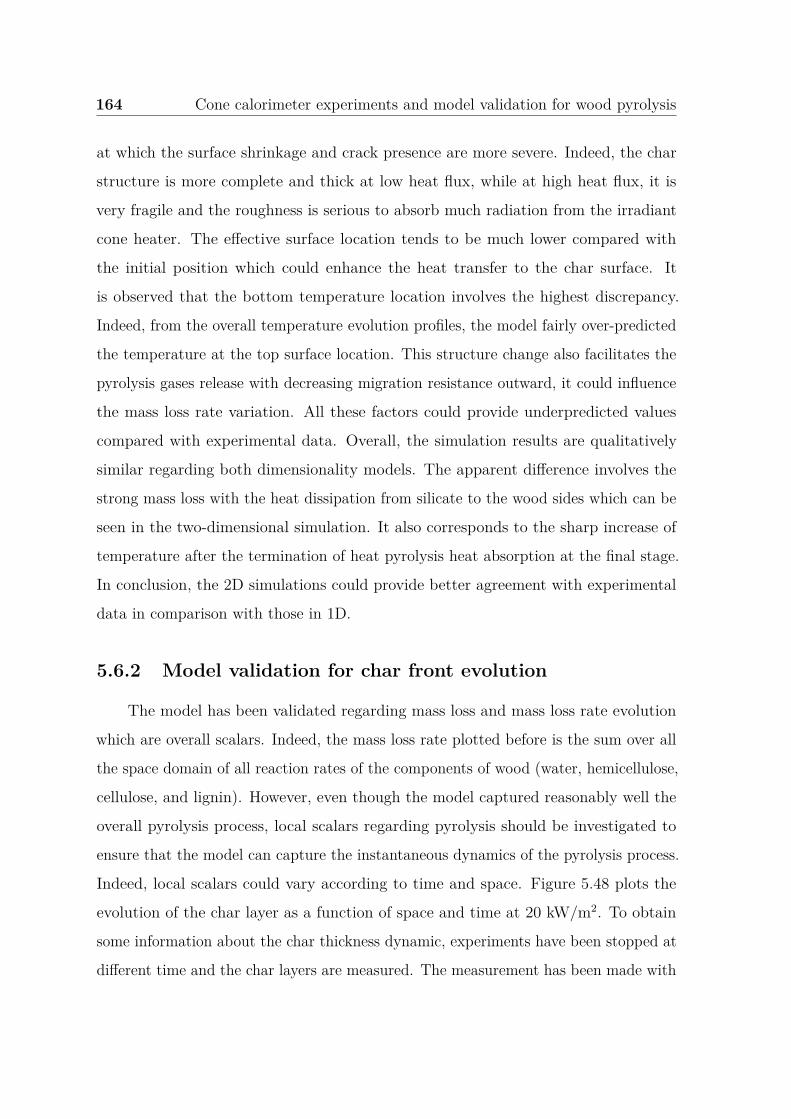
164 Cone calorimeter experiments and model validation for wood pyrolysis
at which the surface shrinkage and crack presence are more severe. Indeed, the char
structure is more complete and thick at low heat flux, while at high heat flux, it is
very fragile and the roughness is serious to absorb much radiation from the irradiant
cone heater. The effective surface location tends to be much lower compared with
the initial position which could enhance the heat transfer to the char surface. It
is observed that the bottom temperature location involves the highest discrepancy.
Indeed, from the overall temperature evolution profiles, the model fairly over-predicted
the temperature at the top surface location. This structure change also facilitates the
pyrolysis gases release with decreasing migration resistance outward, it could influence
the mass loss rate variation. All these factors could provide underpredicted values
compared with experimental data. Overall, the simulation results are qualitatively
similar regarding both dimensionality models. The apparent difference involves the
strong mass loss with the heat dissipation from silicate to the wood sides which can be
seen in the two-dimensional simulation. It also corresponds to the sharp increase of
temperature after the termination of heat pyrolysis heat absorption at the final stage.
In conclusion, the 2D simulations could provide better agreement with experimental
data in comparison with those in 1D.
5.6.2 Model validation for char front evolution
The model has been validated regarding mass loss and mass loss rate evolution
which are overall scalars. Indeed, the mass loss rate plotted before is the sum over all
the space domain of all reaction rates of the components of wood (water, hemicellulose,
cellulose, and lignin). However, even though the model captured reasonably well the
overall pyrolysis process, local scalars regarding pyrolysis should be investigated to
ensure that the model can capture the instantaneous dynamics of the pyrolysis process.
Indeed, local scalars could vary according to time and space. Figure 5.48 plots the
evolution of the char layer as a function of space and time at 20 kW/m2. To obtain
some information about the char thickness dynamic, experiments have been stopped at
different time and the char layers are measured. The measurement has been made with
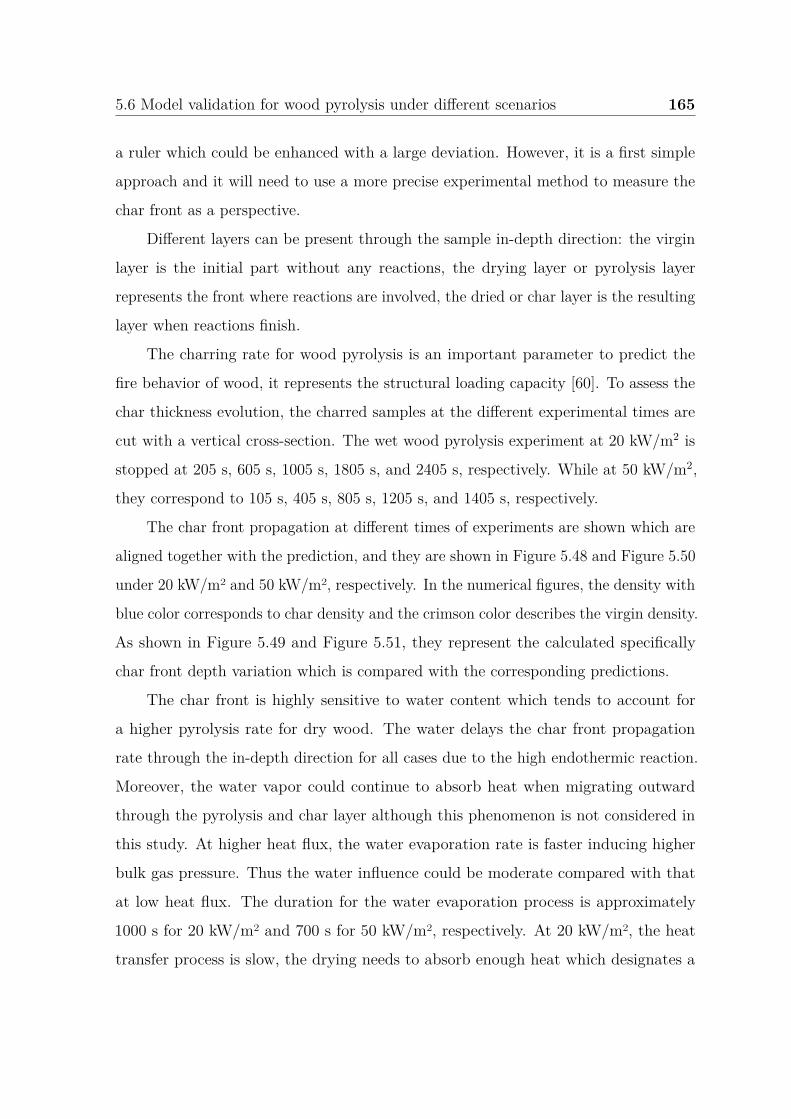
5.6 Model validation for wood pyrolysis under different scenarios 165
a ruler which could be enhanced with a large deviation. However, it is a first simple
approach and it will need to use a more precise experimental method to measure the
char front as a perspective.
Different layers can be present through the sample in-depth direction: the virgin
layer is the initial part without any reactions, the drying layer or pyrolysis layer
represents the front where reactions are involved, the dried or char layer is the resulting
layer when reactions finish.
The charring rate for wood pyrolysis is an important parameter to predict the
fire behavior of wood, it represents the structural loading capacity [60]. To assess the
char thickness evolution, the charred samples at the different experimental times are
cut with a vertical cross-section. The wet wood pyrolysis experiment at 20 kW/m2 is
stopped at 205 s, 605 s, 1005 s, 1805 s, and 2405 s, respectively. While at 50 kW/m2,
they correspond to 105 s, 405 s, 805 s, 1205 s, and 1405 s, respectively.
The char front propagation at different times of experiments are shown which are
aligned together with the prediction, and they are shown in Figure 5.48 and Figure 5.50
under 20 kW/m2 and 50 kW/m2, respectively. In the numerical figures, the density with
blue color corresponds to char density and the crimson color describes the virgin density.
As shown in Figure 5.49 and Figure 5.51, they represent the calculated specifically
char front depth variation which is compared with the corresponding predictions.
The char front is highly sensitive to water content which tends to account for
a higher pyrolysis rate for dry wood. The water delays the char front propagation
rate through the in-depth direction for all cases due to the high endothermic reaction.
Moreover, the water vapor could continue to absorb heat when migrating outward
through the pyrolysis and char layer although this phenomenon is not considered in
this study. At higher heat flux, the water evaporation rate is faster inducing higher
bulk gas pressure. Thus the water influence could be moderate compared with that
at low heat flux. The duration for the water evaporation process is approximately
1000 s for 20 kW/m2 and 700 s for 50 kW/m2, respectively. At 20 kW/m2, the heat
transfer process is slow, the drying needs to absorb enough heat which designates a
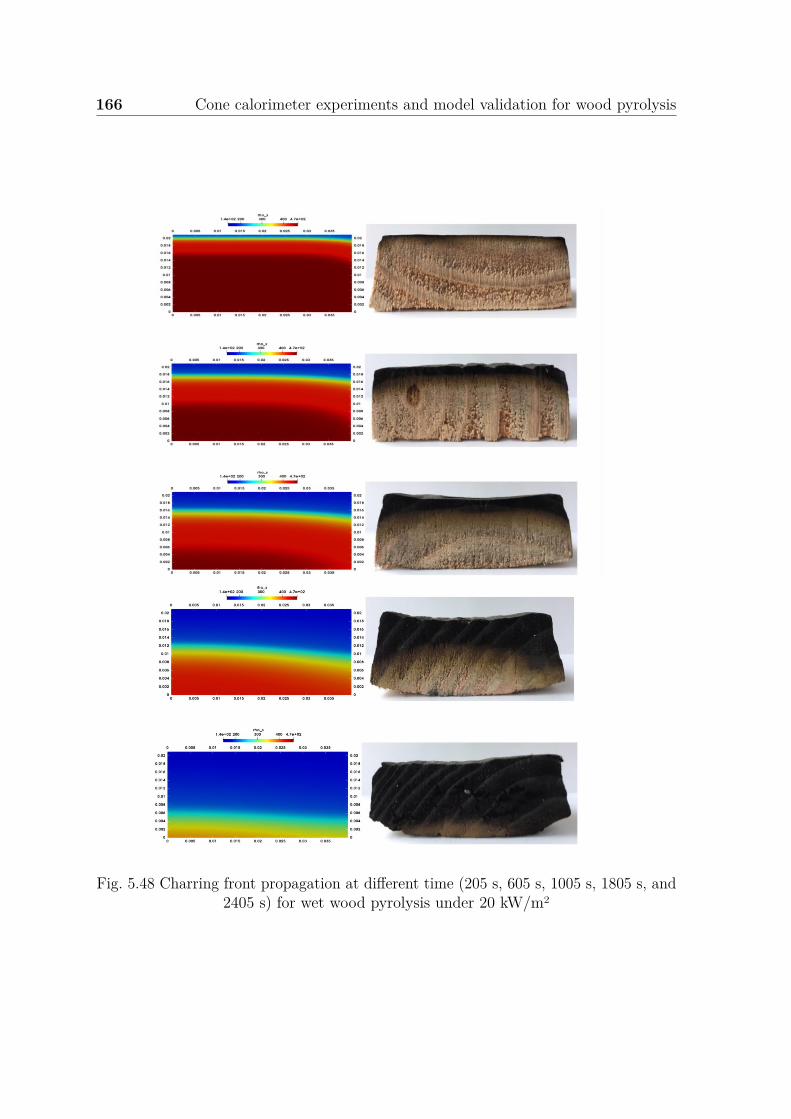
166 Cone calorimeter experiments and model validation for wood pyrolysis
Fig. 5.48 Charring front propagation at different time (205 s, 605 s, 1005 s, 1805 s, and2405 s) for wet wood pyrolysis under 20 kW/m2
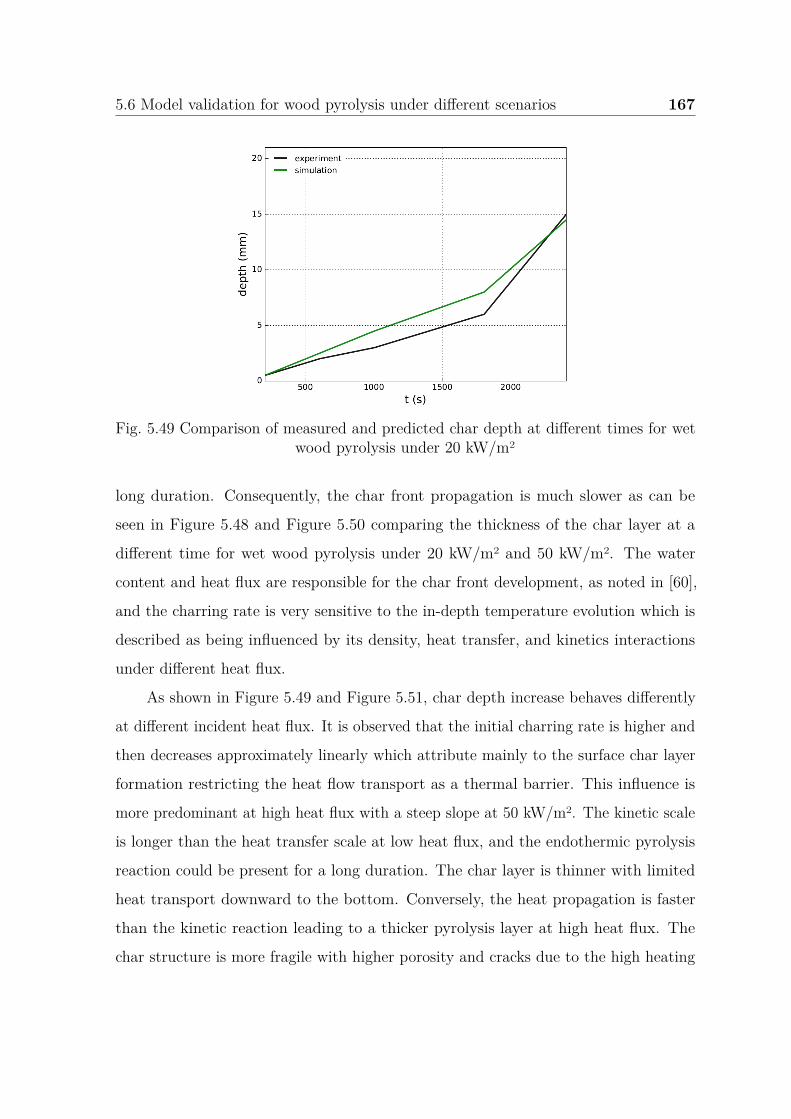
5.6 Model validation for wood pyrolysis under different scenarios 167
Fig. 5.49 Comparison of measured and predicted char depth at different times for wetwood pyrolysis under 20 kW/m2
long duration. Consequently, the char front propagation is much slower as can be
seen in Figure 5.48 and Figure 5.50 comparing the thickness of the char layer at a
different time for wet wood pyrolysis under 20 kW/m2 and 50 kW/m2. The water
content and heat flux are responsible for the char front development, as noted in [60],
and the charring rate is very sensitive to the in-depth temperature evolution which is
described as being influenced by its density, heat transfer, and kinetics interactions
under different heat flux.
As shown in Figure 5.49 and Figure 5.51, char depth increase behaves differently
at different incident heat flux. It is observed that the initial charring rate is higher and
then decreases approximately linearly which attribute mainly to the surface char layer
formation restricting the heat flow transport as a thermal barrier. This influence is
more predominant at high heat flux with a steep slope at 50 kW/m2. The kinetic scale
is longer than the heat transfer scale at low heat flux, and the endothermic pyrolysis
reaction could be present for a long duration. The char layer is thinner with limited
heat transport downward to the bottom. Conversely, the heat propagation is faster
than the kinetic reaction leading to a thicker pyrolysis layer at high heat flux. The
char structure is more fragile with higher porosity and cracks due to the high heating
168 Cone calorimeter experiments and model validation for wood pyrolysis
Fig. 5.50 Charring front propagation at different time (105 s, 405 s, 805 s, 1205 s, and1405 s) for wet wood pyrolysis under 50 kW/m2
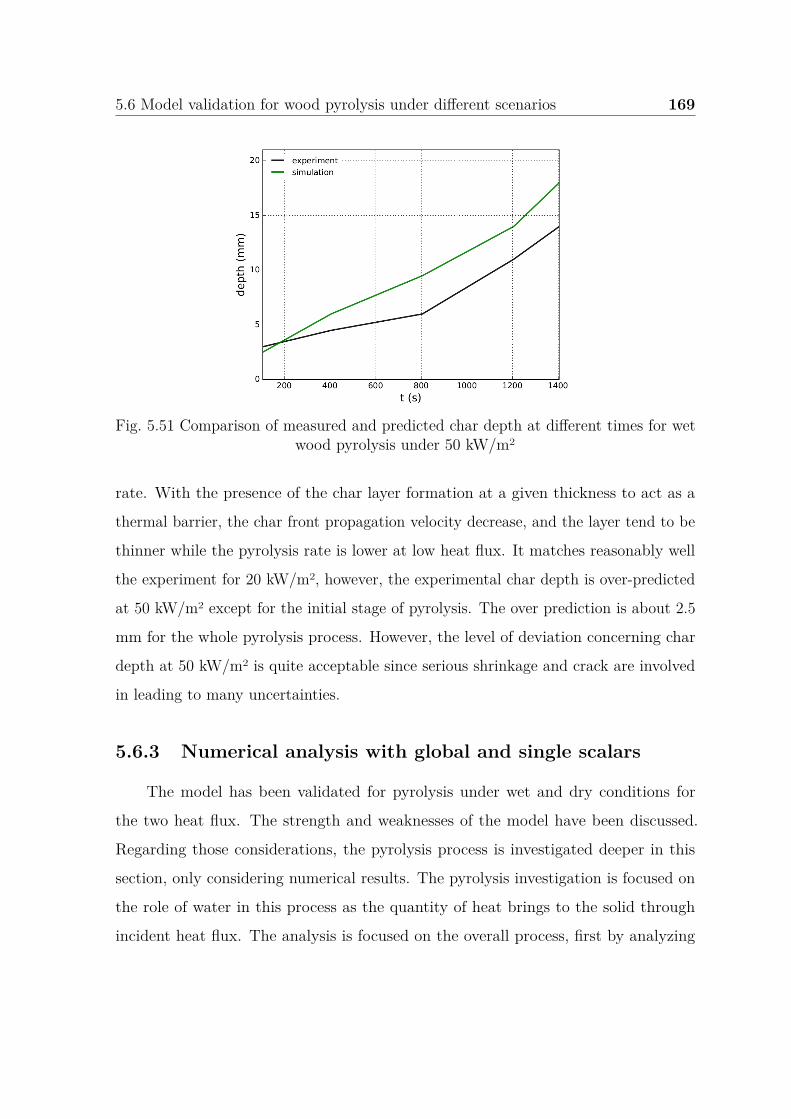
5.6 Model validation for wood pyrolysis under different scenarios 169
Fig. 5.51 Comparison of measured and predicted char depth at different times for wetwood pyrolysis under 50 kW/m2
rate. With the presence of the char layer formation at a given thickness to act as a
thermal barrier, the char front propagation velocity decrease, and the layer tend to be
thinner while the pyrolysis rate is lower at low heat flux. It matches reasonably well
the experiment for 20 kW/m2, however, the experimental char depth is over-predicted
at 50 kW/m2 except for the initial stage of pyrolysis. The over prediction is about 2.5
mm for the whole pyrolysis process. However, the level of deviation concerning char
depth at 50 kW/m2 is quite acceptable since serious shrinkage and crack are involved
in leading to many uncertainties.
5.6.3 Numerical analysis with global and single scalars
The model has been validated for pyrolysis under wet and dry conditions for
the two heat flux. The strength and weaknesses of the model have been discussed.
Regarding those considerations, the pyrolysis process is investigated deeper in this
section, only considering numerical results. The pyrolysis investigation is focused on
the role of water in this process as the quantity of heat brings to the solid through
incident heat flux. The analysis is focused on the overall process, first by analyzing
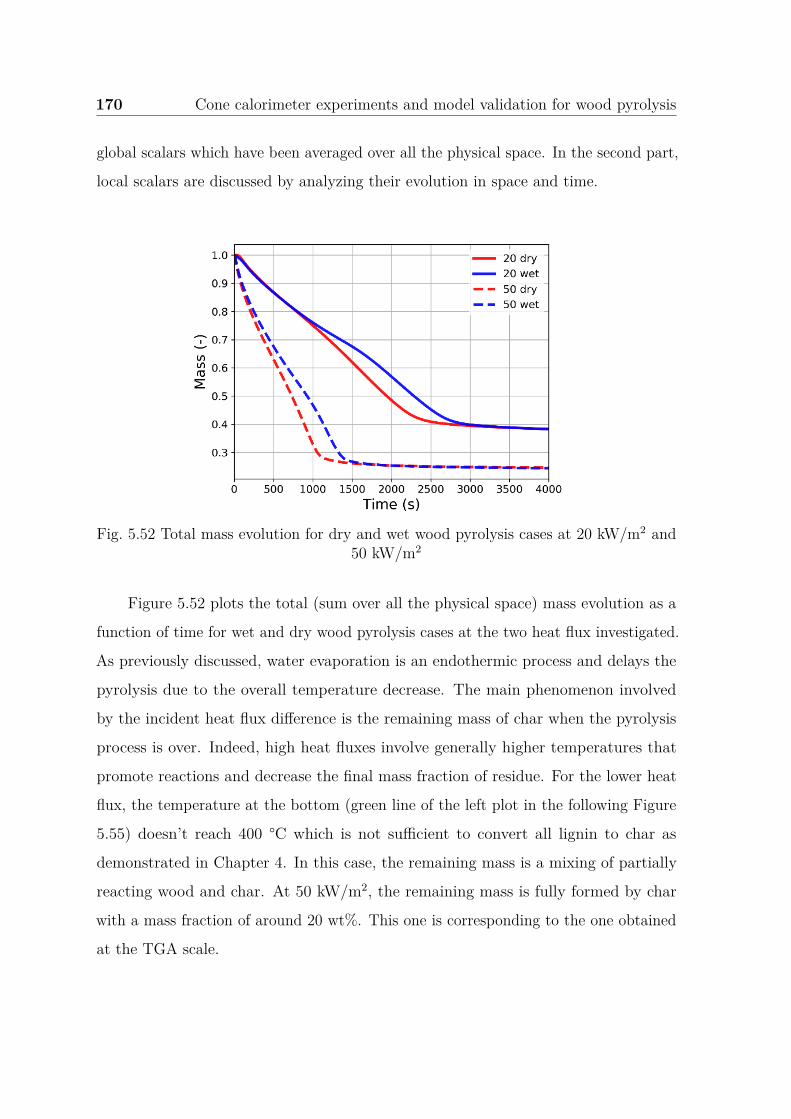
170 Cone calorimeter experiments and model validation for wood pyrolysis
global scalars which have been averaged over all the physical space. In the second part,
local scalars are discussed by analyzing their evolution in space and time.
Fig. 5.52 Total mass evolution for dry and wet wood pyrolysis cases at 20 kW/m2 and50 kW/m2
Figure 5.52 plots the total (sum over all the physical space) mass evolution as a
function of time for wet and dry wood pyrolysis cases at the two heat flux investigated.
As previously discussed, water evaporation is an endothermic process and delays the
pyrolysis due to the overall temperature decrease. The main phenomenon involved
by the incident heat flux difference is the remaining mass of char when the pyrolysis
process is over. Indeed, high heat fluxes involve generally higher temperatures that
promote reactions and decrease the final mass fraction of residue. For the lower heat
flux, the temperature at the bottom (green line of the left plot in the following Figure
5.55) doesn’t reach 400 °C which is not sufficient to convert all lignin to char as
demonstrated in Chapter 4. In this case, the remaining mass is a mixing of partially
reacting wood and char. At 50 kW/m2, the remaining mass is fully formed by char
with a mass fraction of around 20 wt%. This one is corresponding to the one obtained
at the TGA scale.
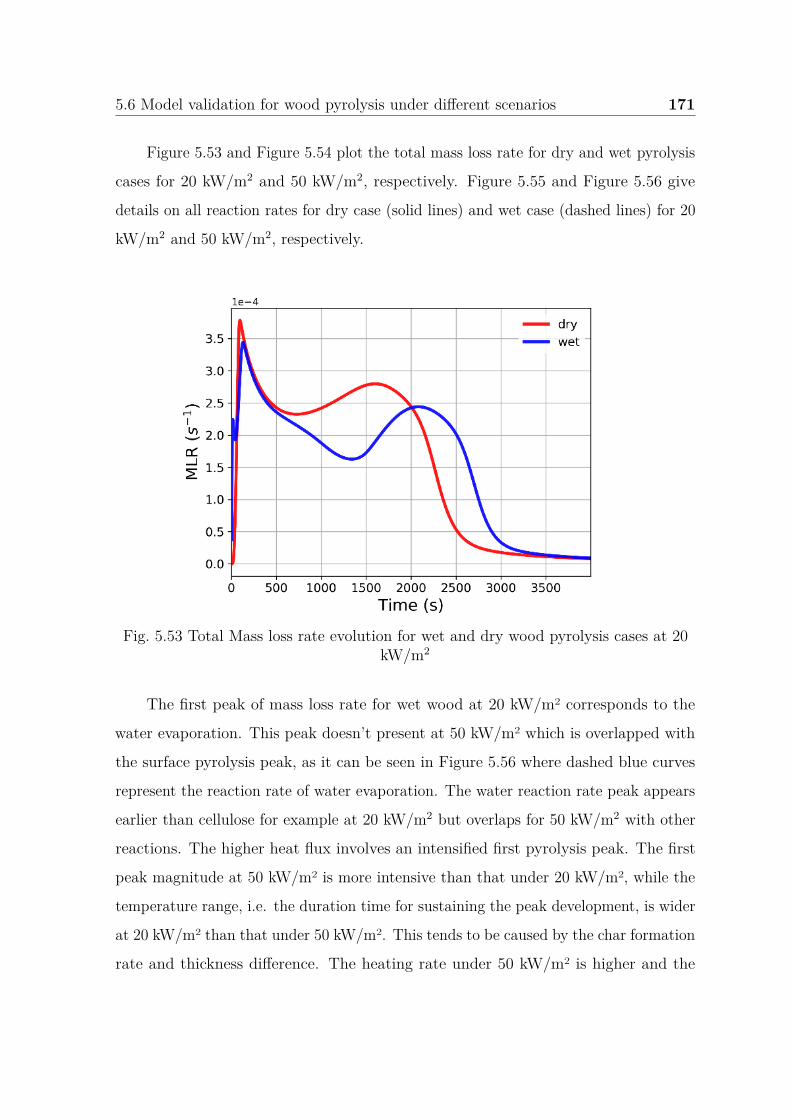
5.6 Model validation for wood pyrolysis under different scenarios 171
Figure 5.53 and Figure 5.54 plot the total mass loss rate for dry and wet pyrolysis
cases for 20 kW/m2 and 50 kW/m2, respectively. Figure 5.55 and Figure 5.56 give
details on all reaction rates for dry case (solid lines) and wet case (dashed lines) for 20
kW/m2 and 50 kW/m2, respectively.
Fig. 5.53 Total Mass loss rate evolution for wet and dry wood pyrolysis cases at 20kW/m2
The first peak of mass loss rate for wet wood at 20 kW/m2 corresponds to the
water evaporation. This peak doesn’t present at 50 kW/m2 which is overlapped with
the surface pyrolysis peak, as it can be seen in Figure 5.56 where dashed blue curves
represent the reaction rate of water evaporation. The water reaction rate peak appears
earlier than cellulose for example at 20 kW/m2 but overlaps for 50 kW/m2 with other
reactions. The higher heat flux involves an intensified first pyrolysis peak. The first
peak magnitude at 50 kW/m2 is more intensive than that under 20 kW/m2, while the
temperature range, i.e. the duration time for sustaining the peak development, is wider
at 20 kW/m2 than that under 50 kW/m2. This tends to be caused by the char formation
rate and thickness difference. The heating rate under 50 kW/m2 is higher and the
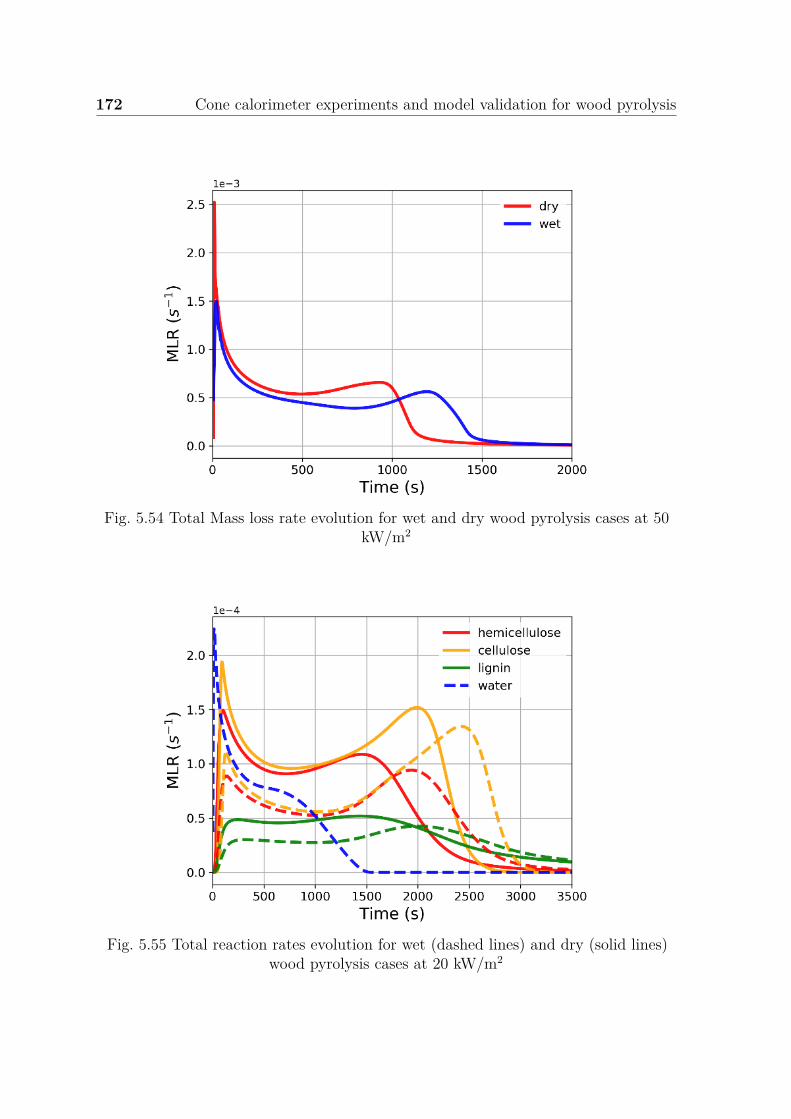
172 Cone calorimeter experiments and model validation for wood pyrolysis
Fig. 5.54 Total Mass loss rate evolution for wet and dry wood pyrolysis cases at 50kW/m2
Fig. 5.55 Total reaction rates evolution for wet (dashed lines) and dry (solid lines)wood pyrolysis cases at 20 kW/m2
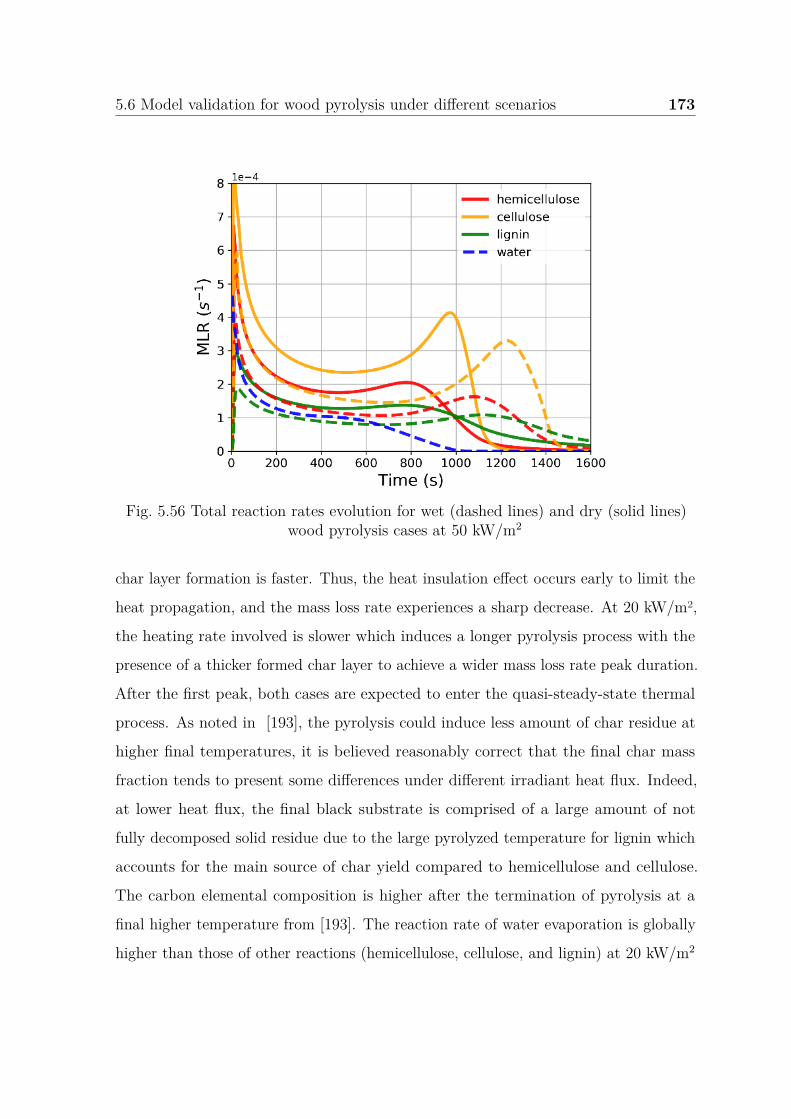
5.6 Model validation for wood pyrolysis under different scenarios 173
Fig. 5.56 Total reaction rates evolution for wet (dashed lines) and dry (solid lines)wood pyrolysis cases at 50 kW/m2
char layer formation is faster. Thus, the heat insulation effect occurs early to limit the
heat propagation, and the mass loss rate experiences a sharp decrease. At 20 kW/m2,
the heating rate involved is slower which induces a longer pyrolysis process with the
presence of a thicker formed char layer to achieve a wider mass loss rate peak duration.
After the first peak, both cases are expected to enter the quasi-steady-state thermal
process. As noted in [193], the pyrolysis could induce less amount of char residue at
higher final temperatures, it is believed reasonably correct that the final char mass
fraction tends to present some differences under different irradiant heat flux. Indeed,
at lower heat flux, the final black substrate is comprised of a large amount of not
fully decomposed solid residue due to the large pyrolyzed temperature for lignin which
accounts for the main source of char yield compared to hemicellulose and cellulose.
The carbon elemental composition is higher after the termination of pyrolysis at a
final higher temperature from [193]. The reaction rate of water evaporation is globally
higher than those of other reactions (hemicellulose, cellulose, and lignin) at 20 kW/m2
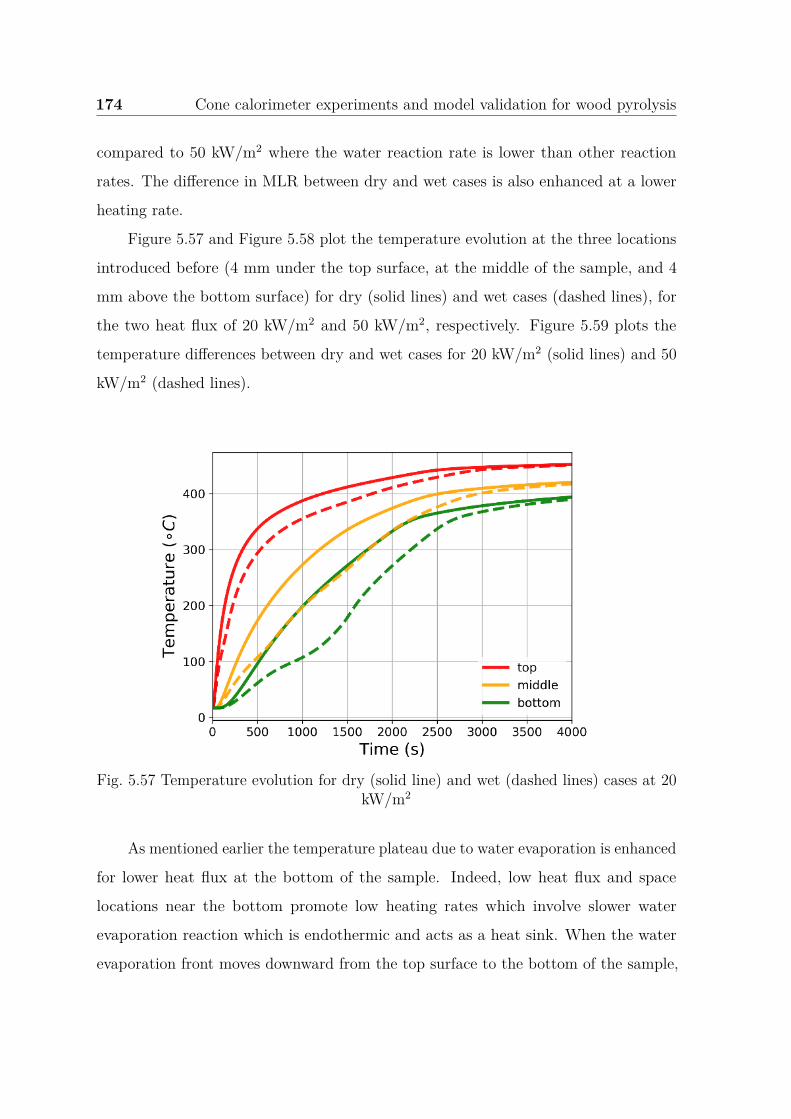
174 Cone calorimeter experiments and model validation for wood pyrolysis
compared to 50 kW/m2 where the water reaction rate is lower than other reaction
rates. The difference in MLR between dry and wet cases is also enhanced at a lower
heating rate.
Figure 5.57 and Figure 5.58 plot the temperature evolution at the three locations
introduced before (4 mm under the top surface, at the middle of the sample, and 4
mm above the bottom surface) for dry (solid lines) and wet cases (dashed lines), for
the two heat flux of 20 kW/m2 and 50 kW/m2, respectively. Figure 5.59 plots the
temperature differences between dry and wet cases for 20 kW/m2 (solid lines) and 50
kW/m2 (dashed lines).
Fig. 5.57 Temperature evolution for dry (solid line) and wet (dashed lines) cases at 20kW/m2
As mentioned earlier the temperature plateau due to water evaporation is enhanced
for lower heat flux at the bottom of the sample. Indeed, low heat flux and space
locations near the bottom promote low heating rates which involve slower water
evaporation reaction which is endothermic and acts as a heat sink. When the water
evaporation front moves downward from the top surface to the bottom of the sample,
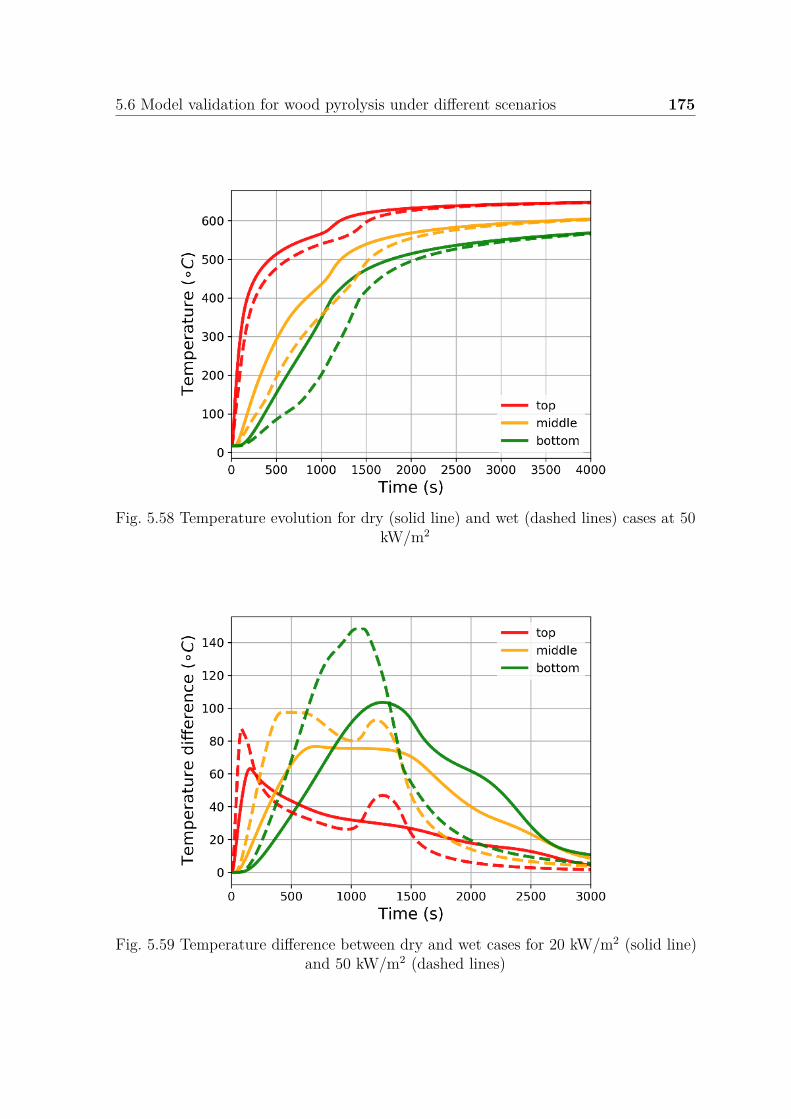
5.6 Model validation for wood pyrolysis under different scenarios 175
Fig. 5.58 Temperature evolution for dry (solid line) and wet (dashed lines) cases at 50kW/m2
Fig. 5.59 Temperature difference between dry and wet cases for 20 kW/m2 (solid line)and 50 kW/m2 (dashed lines)
176 Cone calorimeter experiments and model validation for wood pyrolysis
an over-pressure state is formed on the top edge (where the reaction begins) of the
evaporation front, pushing water vapor formed downward and promoting the cooling
of the sample downward to the evaporation front. This phenomenon could be seen in
the following Figure 5.61. Locations near the bottom of the sample are cooled by this
phenomenon which is taken into account in the model by gas convection effects in the
energy equation.
The end of the pyrolysis process around 1000 s for 50 kW/m2 (Figure 5.54) involves
a temperature jump (Figure 5.58) because of the end of endothermic pyrolysis reactions.
This jump is not visible for 20 kW/m2 but still exists.
The temperature difference between dry and wet increases with the thickness
coordinate, because it is exposed earlier due to a lower heating rate promoting a slower
water evaporation reaction and also promoting the duration time of the heat sink.
The temperature difference is also higher at 50 kW/m2 than at 20 kW/m2, probably
because the heat transfer by convection between water vapor and solid down to the
water evaporation front is higher, and high heat flux can promote high pressure and
also higher velocity into the solid matrix.
The gas transport of internal material is dominated by the pressure difference,
the velocity magnitude is quite consistent with the pyrolysis rate during the pyrolysis
process. Figure 5.60 plots the total pressure through all physical space in the function
of time for wet and dry cases at 20 and 50 kW/m2.
Different pressure peaks appear at different phases of the pyrolysis process under
different heat flux which is consistent with the pyrolysis reaction rate. The pressure
evolution at different heat fluxes is different especially in the vicinity of the duration
of the second peak of mass loss rate. The pressure at 20 kW/m2 increases gradually
to the pressure peak due to the pyrolysis gas accumulation and then drops gradually
to the ambient pressure. While this trend for 50 kW/m2 could display differently
with the presence of a sharp decrease in the pressure after the termination of the
mass loss rate peak of strong reaction. The reaction rate, the density change, and
the reaction advancement of each sub-component are highly correlated to induce the
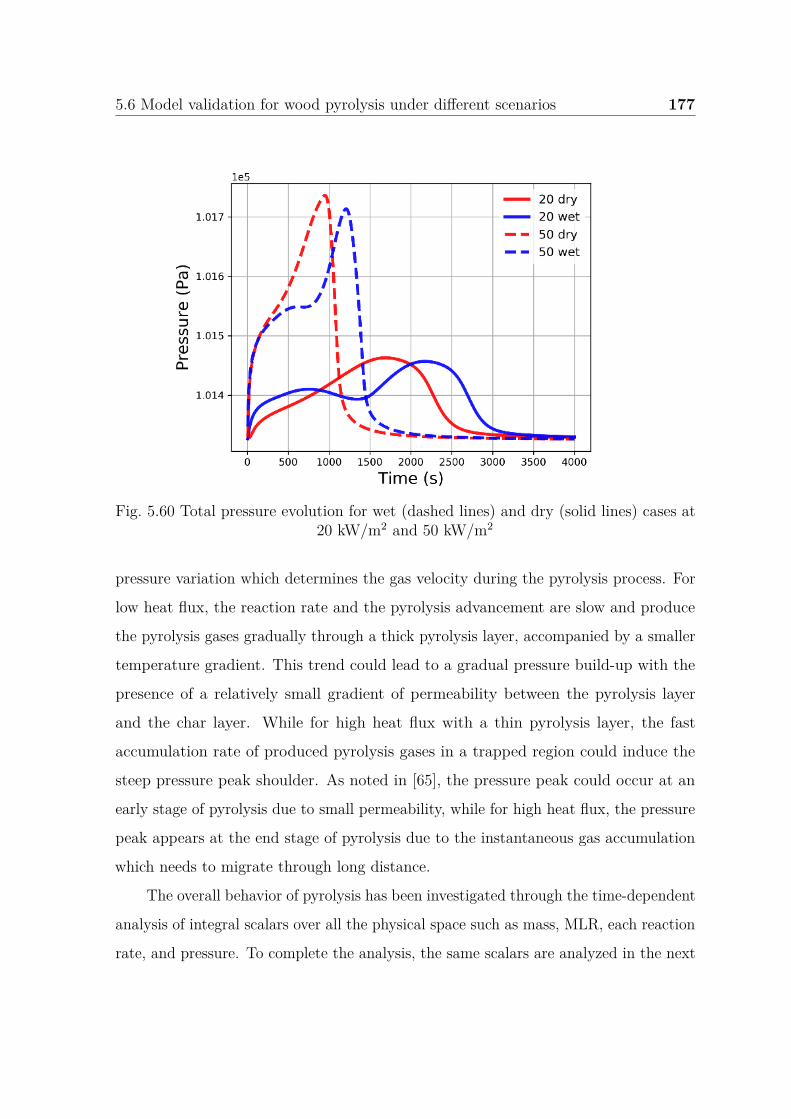
5.6 Model validation for wood pyrolysis under different scenarios 177
Fig. 5.60 Total pressure evolution for wet (dashed lines) and dry (solid lines) cases at20 kW/m2 and 50 kW/m2
pressure variation which determines the gas velocity during the pyrolysis process. For
low heat flux, the reaction rate and the pyrolysis advancement are slow and produce
the pyrolysis gases gradually through a thick pyrolysis layer, accompanied by a smaller
temperature gradient. This trend could lead to a gradual pressure build-up with the
presence of a relatively small gradient of permeability between the pyrolysis layer
and the char layer. While for high heat flux with a thin pyrolysis layer, the fast
accumulation rate of produced pyrolysis gases in a trapped region could induce the
steep pressure peak shoulder. As noted in [65], the pressure peak could occur at an
early stage of pyrolysis due to small permeability, while for high heat flux, the pressure
peak appears at the end stage of pyrolysis due to the instantaneous gas accumulation
which needs to migrate through long distance.
The overall behavior of pyrolysis has been investigated through the time-dependent
analysis of integral scalars over all the physical space such as mass, MLR, each reaction
rate, and pressure. To complete the analysis, the same scalars are analyzed in the next
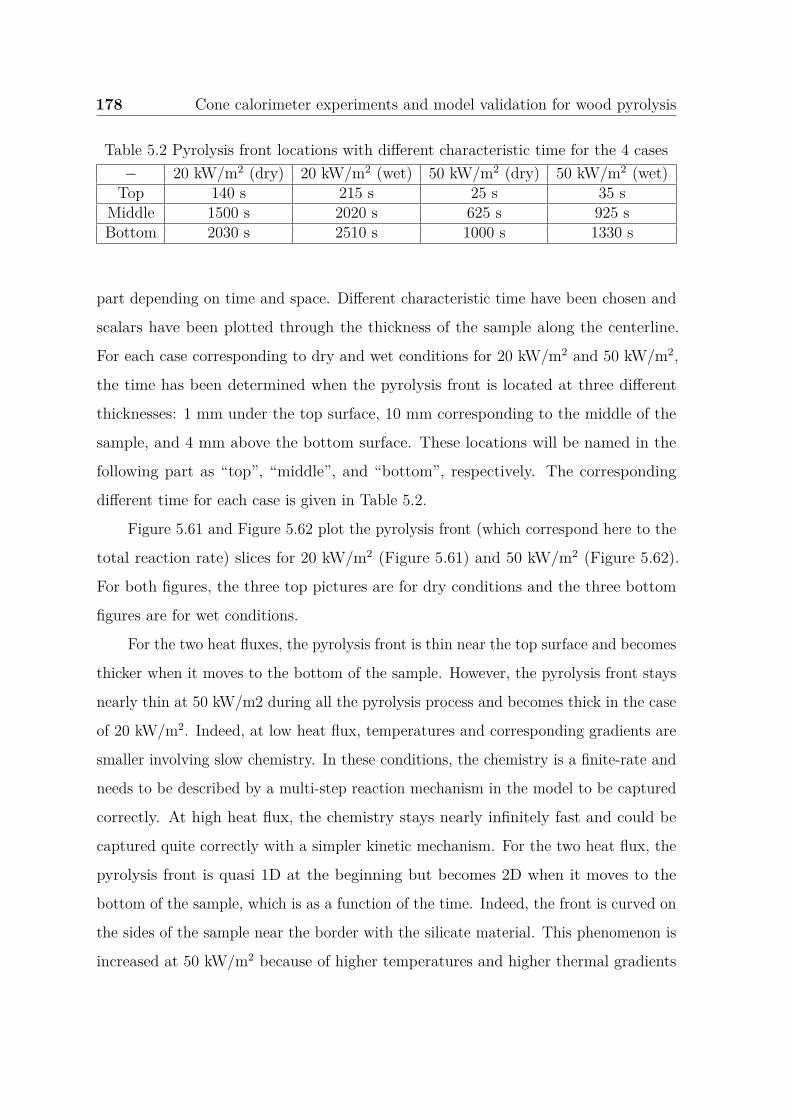
178 Cone calorimeter experiments and model validation for wood pyrolysis
Table 5.2 Pyrolysis front locations with different characteristic time for the 4 cases− 20 kW/m2 (dry) 20 kW/m2 (wet) 50 kW/m2 (dry) 50 kW/m2 (wet)
Top 140 s 215 s 25 s 35 sMiddle 1500 s 2020 s 625 s 925 sBottom 2030 s 2510 s 1000 s 1330 s
part depending on time and space. Different characteristic time have been chosen and
scalars have been plotted through the thickness of the sample along the centerline.
For each case corresponding to dry and wet conditions for 20 kW/m2 and 50 kW/m2,
the time has been determined when the pyrolysis front is located at three different
thicknesses: 1 mm under the top surface, 10 mm corresponding to the middle of the
sample, and 4 mm above the bottom surface. These locations will be named in the
following part as “top”, “middle”, and “bottom”, respectively. The corresponding
different time for each case is given in Table 5.2.
Figure 5.61 and Figure 5.62 plot the pyrolysis front (which correspond here to the
total reaction rate) slices for 20 kW/m2 (Figure 5.61) and 50 kW/m2 (Figure 5.62).
For both figures, the three top pictures are for dry conditions and the three bottom
figures are for wet conditions.
For the two heat fluxes, the pyrolysis front is thin near the top surface and becomes
thicker when it moves to the bottom of the sample. However, the pyrolysis front stays
nearly thin at 50 kW/m2 during all the pyrolysis process and becomes thick in the case
of 20 kW/m2. Indeed, at low heat flux, temperatures and corresponding gradients are
smaller involving slow chemistry. In these conditions, the chemistry is a finite-rate and
needs to be described by a multi-step reaction mechanism in the model to be captured
correctly. At high heat flux, the chemistry stays nearly infinitely fast and could be
captured quite correctly with a simpler kinetic mechanism. For the two heat flux, the
pyrolysis front is quasi 1D at the beginning but becomes 2D when it moves to the
bottom of the sample, which is as a function of the time. Indeed, the front is curved on
the sides of the sample near the border with the silicate material. This phenomenon is
increased at 50 kW/m2 because of higher temperatures and higher thermal gradients
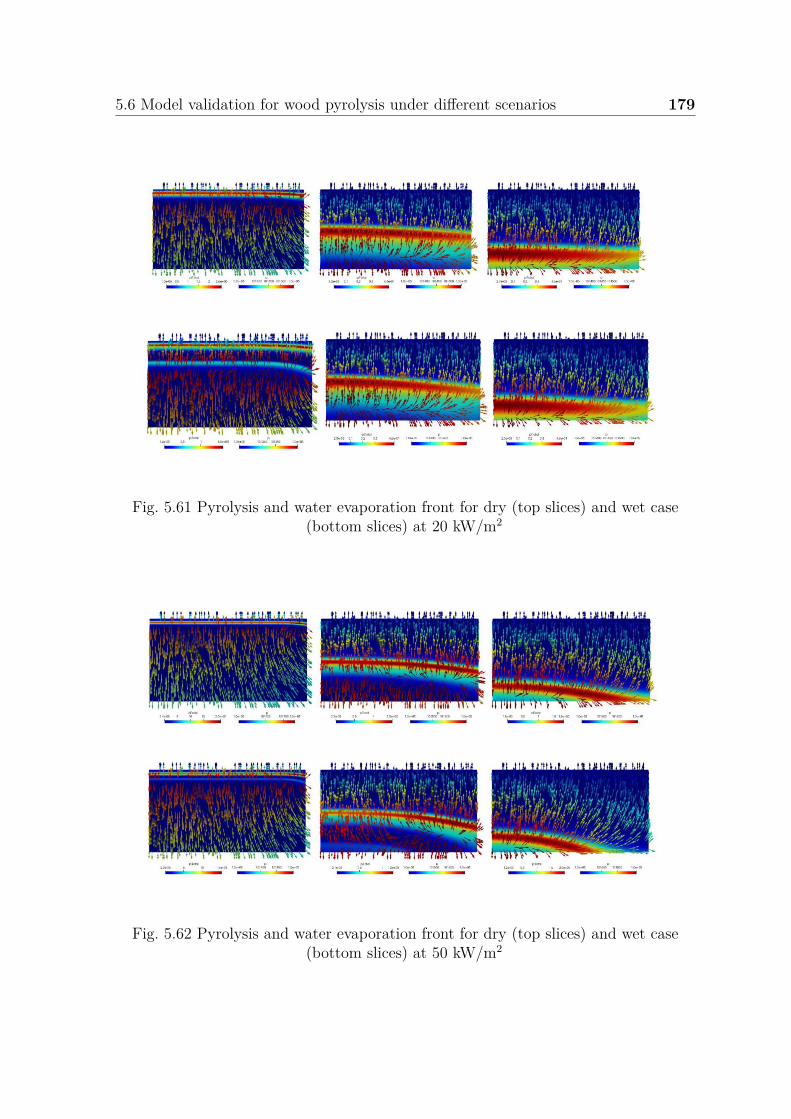
5.6 Model validation for wood pyrolysis under different scenarios 179
Fig. 5.61 Pyrolysis and water evaporation front for dry (top slices) and wet case(bottom slices) at 20 kW/m2
Fig. 5.62 Pyrolysis and water evaporation front for dry (top slices) and wet case(bottom slices) at 50 kW/m2
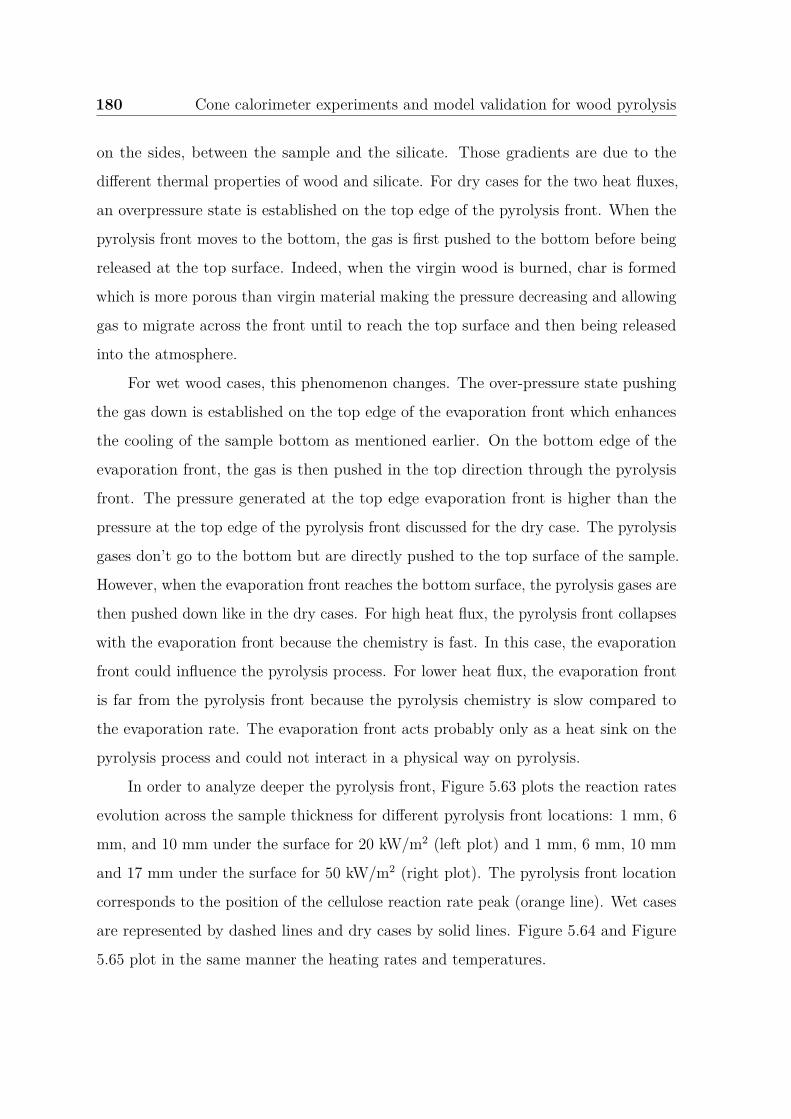
180 Cone calorimeter experiments and model validation for wood pyrolysis
on the sides, between the sample and the silicate. Those gradients are due to the
different thermal properties of wood and silicate. For dry cases for the two heat fluxes,
an overpressure state is established on the top edge of the pyrolysis front. When the
pyrolysis front moves to the bottom, the gas is first pushed to the bottom before being
released at the top surface. Indeed, when the virgin wood is burned, char is formed
which is more porous than virgin material making the pressure decreasing and allowing
gas to migrate across the front until to reach the top surface and then being released
into the atmosphere.
For wet wood cases, this phenomenon changes. The over-pressure state pushing
the gas down is established on the top edge of the evaporation front which enhances
the cooling of the sample bottom as mentioned earlier. On the bottom edge of the
evaporation front, the gas is then pushed in the top direction through the pyrolysis
front. The pressure generated at the top edge evaporation front is higher than the
pressure at the top edge of the pyrolysis front discussed for the dry case. The pyrolysis
gases don’t go to the bottom but are directly pushed to the top surface of the sample.
However, when the evaporation front reaches the bottom surface, the pyrolysis gases are
then pushed down like in the dry cases. For high heat flux, the pyrolysis front collapses
with the evaporation front because the chemistry is fast. In this case, the evaporation
front could influence the pyrolysis process. For lower heat flux, the evaporation front
is far from the pyrolysis front because the pyrolysis chemistry is slow compared to
the evaporation rate. The evaporation front acts probably only as a heat sink on the
pyrolysis process and could not interact in a physical way on pyrolysis.
In order to analyze deeper the pyrolysis front, Figure 5.63 plots the reaction rates
evolution across the sample thickness for different pyrolysis front locations: 1 mm, 6
mm, and 10 mm under the surface for 20 kW/m2 (left plot) and 1 mm, 6 mm, 10 mm
and 17 mm under the surface for 50 kW/m2 (right plot). The pyrolysis front location
corresponds to the position of the cellulose reaction rate peak (orange line). Wet cases
are represented by dashed lines and dry cases by solid lines. Figure 5.64 and Figure
5.65 plot in the same manner the heating rates and temperatures.
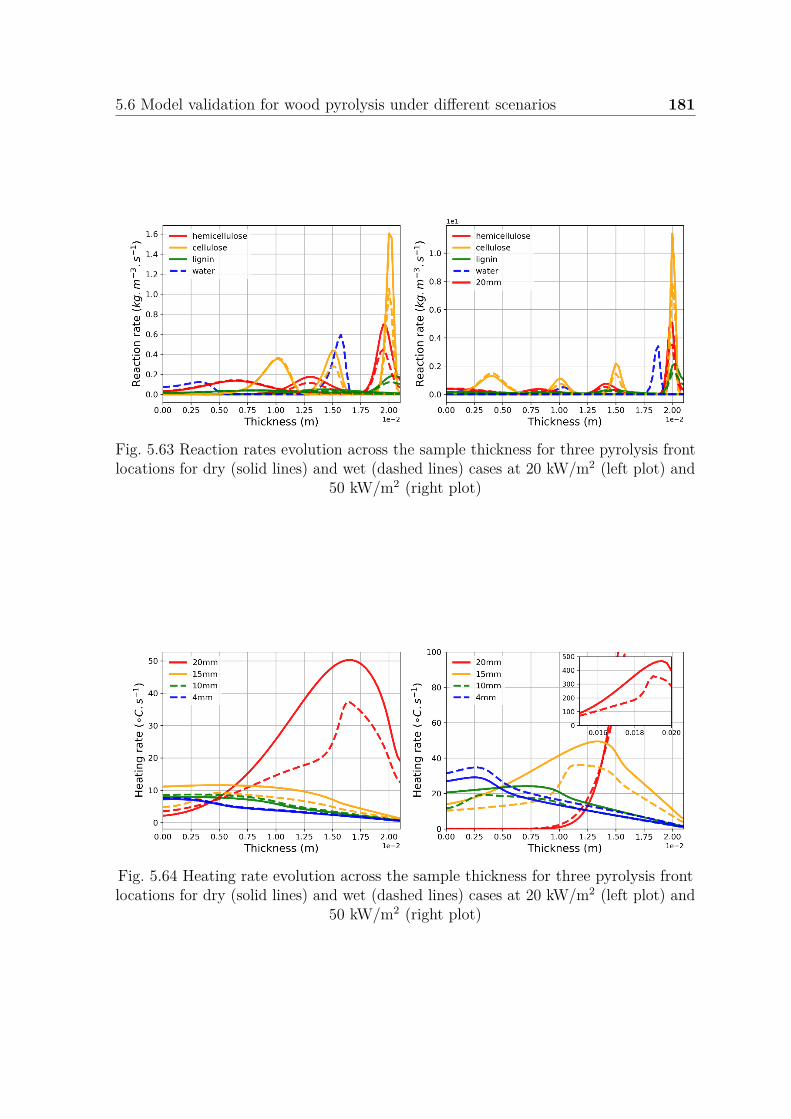
5.6 Model validation for wood pyrolysis under different scenarios 181
Fig. 5.63 Reaction rates evolution across the sample thickness for three pyrolysis frontlocations for dry (solid lines) and wet (dashed lines) cases at 20 kW/m2 (left plot) and
50 kW/m2 (right plot)
Fig. 5.64 Heating rate evolution across the sample thickness for three pyrolysis frontlocations for dry (solid lines) and wet (dashed lines) cases at 20 kW/m2 (left plot) and
50 kW/m2 (right plot)
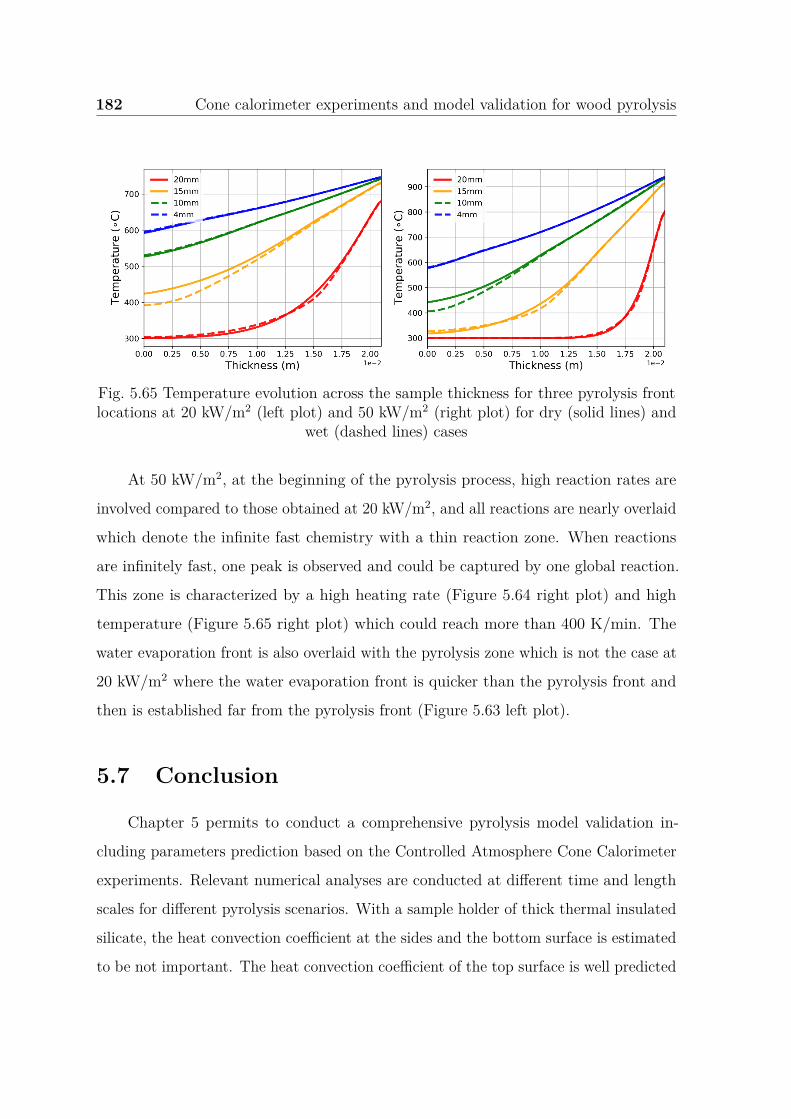
182 Cone calorimeter experiments and model validation for wood pyrolysis
Fig. 5.65 Temperature evolution across the sample thickness for three pyrolysis frontlocations at 20 kW/m2 (left plot) and 50 kW/m2 (right plot) for dry (solid lines) and
wet (dashed lines) cases
At 50 kW/m2, at the beginning of the pyrolysis process, high reaction rates are
involved compared to those obtained at 20 kW/m2, and all reactions are nearly overlaid
which denote the infinite fast chemistry with a thin reaction zone. When reactions
are infinitely fast, one peak is observed and could be captured by one global reaction.
This zone is characterized by a high heating rate (Figure 5.64 right plot) and high
temperature (Figure 5.65 right plot) which could reach more than 400 K/min. The
water evaporation front is also overlaid with the pyrolysis zone which is not the case at
20 kW/m2 where the water evaporation front is quicker than the pyrolysis front and
then is established far from the pyrolysis front (Figure 5.63 left plot).
5.7 Conclusion
Chapter 5 permits to conduct a comprehensive pyrolysis model validation in-
cluding parameters prediction based on the Controlled Atmosphere Cone Calorimeter
experiments. Relevant numerical analyses are conducted at different time and length
scales for different pyrolysis scenarios. With a sample holder of thick thermal insulated
silicate, the heat convection coefficient at the sides and the bottom surface is estimated
to be not important. The heat convection coefficient of the top surface is well predicted
5.7 Conclusion 183
by inverse analysis to change from 3 to 5 W/m2/K for the 2D model, while it is
estimated to be 0 to 3 W/m2/K for the 1D model with less accuracy. The thermal
conductivity and specific heat capacity of wood and char are predicted by inverse
analysis concerning the experimental conditions, and their physical meaning is verified.
The moisture evaporation process of wet wood under an exposition to a heat flux of 5
kW/m2 is analyzed. Good fitness is achieved concerning the mass loss, mass loss rate,
and the temperature evolution at three locations through the thickness of the sample.
Evaporation front is curved with different levels, with an increase of time and space
evolution which is influenced by the side effect imposed by silicate heat conduction in
the 2D model. The evaporation front is thin at top locations and changes to be thick
when moving toward the bottom which is influenced by water endothermic reaction
and heating rate decrease. Based on the analysis of temperature evolution of wet and
dry wood, the water can delay the temperature evolution through the thickness, and
the bottom location is the most influenced. However, the final temperatures of different
locations are not influenced by water.
Based on the observation of water influence, wet and dry wood pyrolysis processes
are analyzed by 1D and 2D modeling at an incident heat flux of 20 kW/m2 and 50
kW/m2. The heating rate is specified as 10 K/min for wet wood pyrolysis at 20
kW/m2, and a heating rate of approximately 50 K/min is estimated at 50 kW/m2.
Compared with wet wood pyrolysis, dry wood experiences a rapid heating process
with an intensified reaction rate and higher temperature evolution. The temperature
evolution involves different levels of the plateau, especially for the bottom locations
at low heat flux. Concerning the model validation, the 2D model can predict better
concerning the mass loss, mass loss rate, and temperature evolution compared with
the 1D model. The model can be validated with more accuracy at lower heat flux
(20 kW/m2) compared with the cases at higher heat flux (50 kW/m2). Similarly, the
experimental char front is validated for the wet wood pyrolysis at 20 kW/m2 and 50
kW/m2 at the different characteristic time and better prediction can be observed at
lower heat flux.
184 Cone calorimeter experiments and model validation for wood pyrolysis
Numerical analysis is conducted with detail concerning the influence of water and
heating process on the global and local scalars. The water can delay the mass loss
process, but a fixed mass fraction of char residue is present for wet and dry wood.
The reaction rate of water evaporation is globally higher initially than those of other
reactions (hemicellulose, cellulose, and lignin) at 20 kW/m2, while for the case of 50
kW/m2, the water reaction rate is lower than the reaction rates of other components.
The difference concerning the mass loss rate between dry and wet wood pyrolysis cases
is more predominant at lower heat flux. The water can provide lower temperature
evolution for wet wood, but the final temperature stays constant compared with the
case of dry wood pyrolysis. More significant temperature differences between wet and
dry wood pyrolysis can be found for the bottom location compared with that at the top
or middle locations. The evaporation and pyrolysis front propagation at the different
characteristic time are studied. The evaporation front is relatively thin through the
whole process and it can interact in a physical way with the pyrolysis process. However,
this evaporation front can change to become very thick when moving down to the
cooler bottom space, and it is far from the pyrolysis front and couldn’t interact with
this pyrolysis process at lower heat flux.
Up to now, the wood pyrolysis has been thoroughly studied at the particle and this
cone calorimeter scale. Different levels of prediction accuracy are achieved and many
kinds of scalars involved are analyzed at different time and length scales. Thus, the
next chapter will explore the pyrolysis process of the synthetic carbon/epoxy composite
which behaves differently from wood in some aspects.
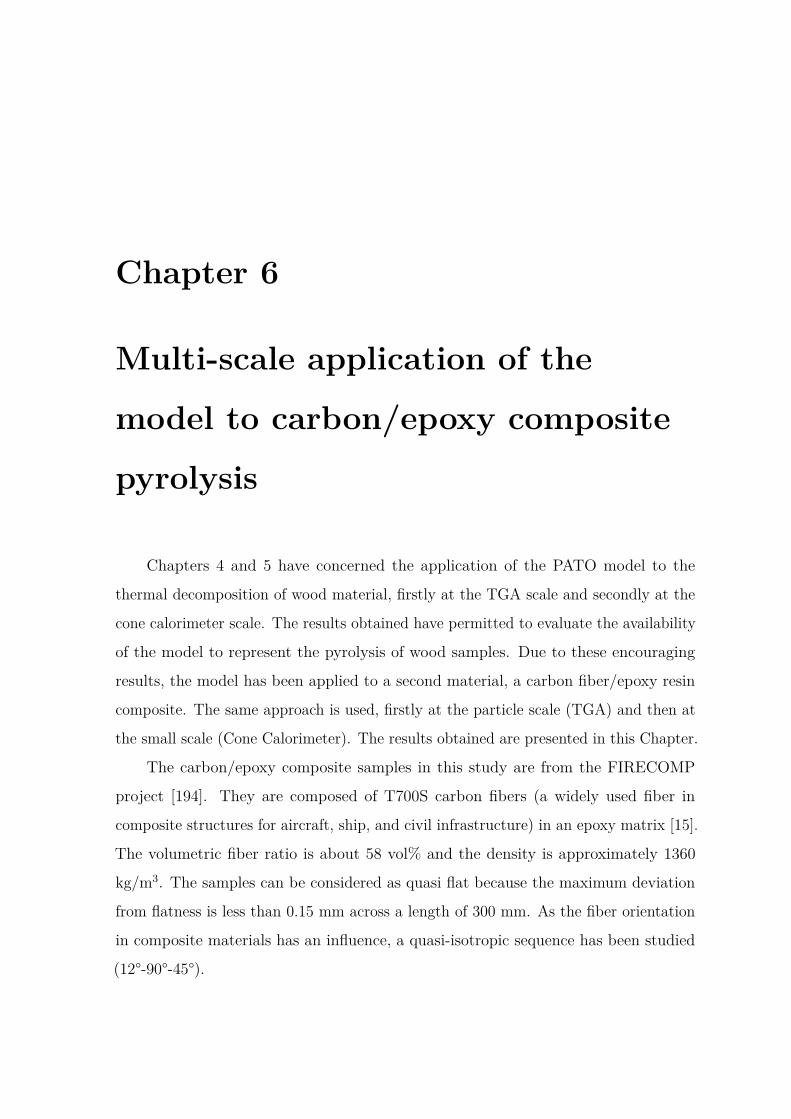
Chapter 6
Multi-scale application of the
model to carbon/epoxy composite
pyrolysis
Chapters 4 and 5 have concerned the application of the PATO model to the
thermal decomposition of wood material, firstly at the TGA scale and secondly at the
cone calorimeter scale. The results obtained have permitted to evaluate the availability
of the model to represent the pyrolysis of wood samples. Due to these encouraging
results, the model has been applied to a second material, a carbon fiber/epoxy resin
composite. The same approach is used, firstly at the particle scale (TGA) and then at
the small scale (Cone Calorimeter). The results obtained are presented in this Chapter.
The carbon/epoxy composite samples in this study are from the FIRECOMP
project [194]. They are composed of T700S carbon fibers (a widely used fiber in
composite structures for aircraft, ship, and civil infrastructure) in an epoxy matrix [15].
The volumetric fiber ratio is about 58 vol% and the density is approximately 1360
kg/m3. The samples can be considered as quasi flat because the maximum deviation
from flatness is less than 0.15 mm across a length of 300 mm. As the fiber orientation
in composite materials has an influence, a quasi-isotropic sequence has been studied
(12°-90°-45°).
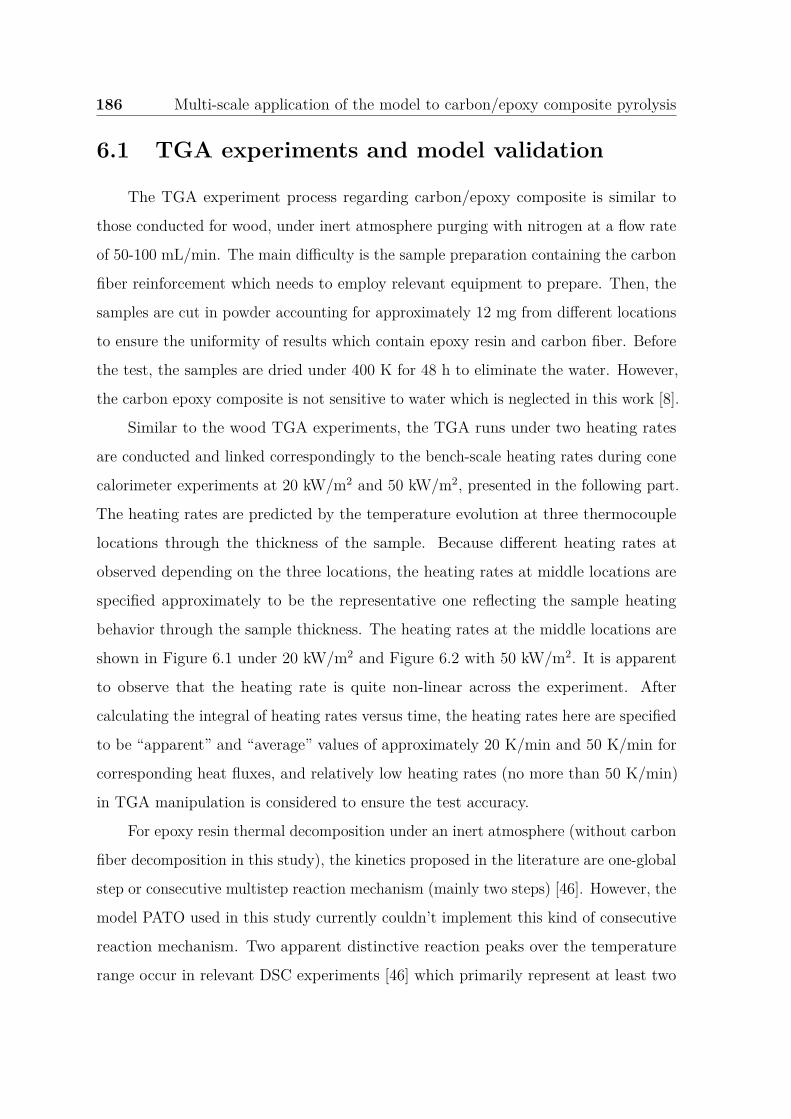
186 Multi-scale application of the model to carbon/epoxy composite pyrolysis
6.1 TGA experiments and model validation
The TGA experiment process regarding carbon/epoxy composite is similar to
those conducted for wood, under inert atmosphere purging with nitrogen at a flow rate
of 50-100 mL/min. The main difficulty is the sample preparation containing the carbon
fiber reinforcement which needs to employ relevant equipment to prepare. Then, the
samples are cut in powder accounting for approximately 12 mg from different locations
to ensure the uniformity of results which contain epoxy resin and carbon fiber. Before
the test, the samples are dried under 400 K for 48 h to eliminate the water. However,
the carbon epoxy composite is not sensitive to water which is neglected in this work [8].
Similar to the wood TGA experiments, the TGA runs under two heating rates
are conducted and linked correspondingly to the bench-scale heating rates during cone
calorimeter experiments at 20 kW/m2 and 50 kW/m2, presented in the following part.
The heating rates are predicted by the temperature evolution at three thermocouple
locations through the thickness of the sample. Because different heating rates at
observed depending on the three locations, the heating rates at middle locations are
specified approximately to be the representative one reflecting the sample heating
behavior through the sample thickness. The heating rates at the middle locations are
shown in Figure 6.1 under 20 kW/m2 and Figure 6.2 with 50 kW/m2. It is apparent
to observe that the heating rate is quite non-linear across the experiment. After
calculating the integral of heating rates versus time, the heating rates here are specified
to be “apparent” and “average” values of approximately 20 K/min and 50 K/min for
corresponding heat fluxes, and relatively low heating rates (no more than 50 K/min)
in TGA manipulation is considered to ensure the test accuracy.
For epoxy resin thermal decomposition under an inert atmosphere (without carbon
fiber decomposition in this study), the kinetics proposed in the literature are one-global
step or consecutive multistep reaction mechanism (mainly two steps) [46]. However, the
model PATO used in this study currently couldn’t implement this kind of consecutive
reaction mechanism. Two apparent distinctive reaction peaks over the temperature
range occur in relevant DSC experiments [46] which primarily represent at least two
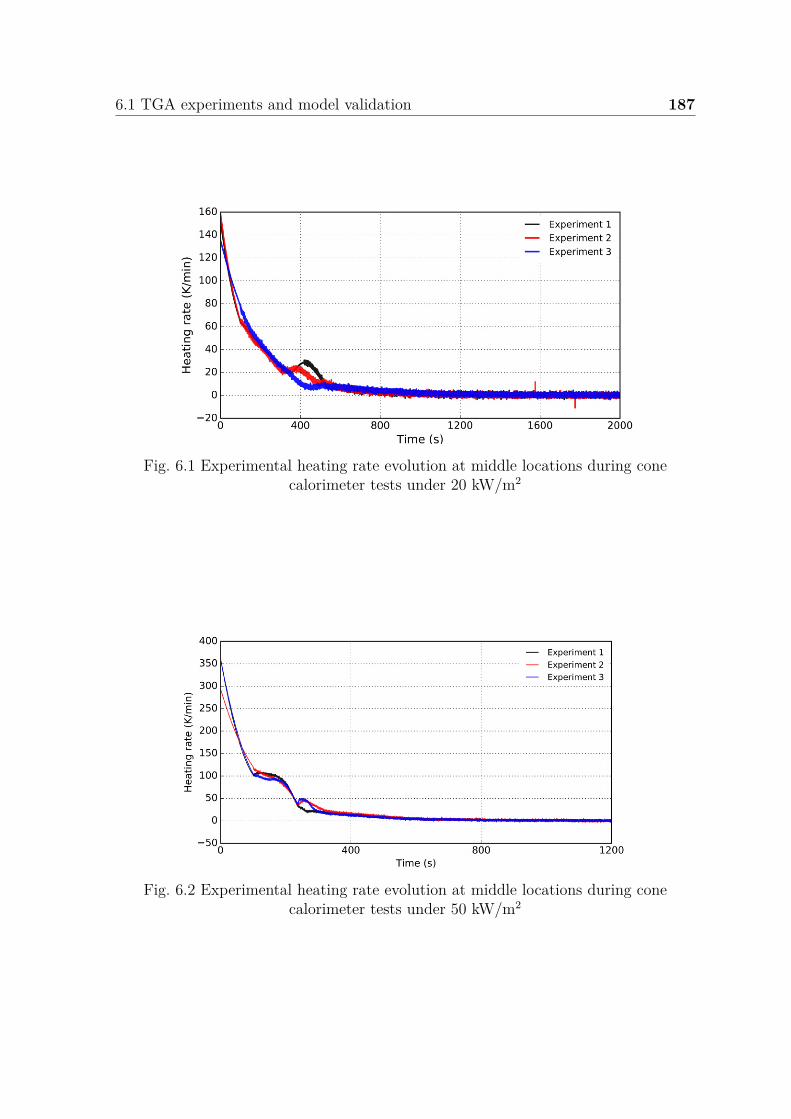
6.1 TGA experiments and model validation 187
Fig. 6.1 Experimental heating rate evolution at middle locations during conecalorimeter tests under 20 kW/m2
Fig. 6.2 Experimental heating rate evolution at middle locations during conecalorimeter tests under 50 kW/m2
188 Multi-scale application of the model to carbon/epoxy composite pyrolysis
reactions involved. Then, a one-step global reaction scheme cannot be assumed due to
its less accuracy to fit the experimental curves [46]. Thus, in this study, an epoxy resin
reaction with the two-parallel reaction scheme is implemented to explore the thermal
decomposition behavior although the consecutive reaction scheme is mostly used in
the literature [46, 10].
Up to now, a two parallel reaction mechanism is chosen, however, the relevant
kinetics information is not available from the literature. Then, the kinetic parameters
employed in this work are based on the previous study concerning the aforementioned
Firecomp project which employed a consecutive mechanism of two reactions mecha-
nism [194]. The kinetic parameters for each reaction in the consecutive mechanism are
extracted to be the kinetic parameters of the two parallel reactions scheme studied,
respectively. The stoichiometric values for each parallel reaction are estimated to reflect
the mass residue history in the TGA experiment. Thus, the kinetic parameters are
analyzed regarding two parallel reactions scheme to validate if it is applicable to fit
the experimental data at both heating rates.
The independent parallel reaction scheme used is similar to the one performed
for wood, however, some differences could display. For wood, each one of the 3 main
components (reactants) involves one reaction. Here, the two parallel reaction concerns
the same reactant, the epoxy resin, at different temperature ranges. This independent
two parallel reaction scheme regarding epoxy resin can be illustrated as following,
where F1 and F2 denote the stoichiometric value for the two reactions. The relevant
parameters obtained previously in the project Firecomp are extracted for capturing
the carbon/epoxy composite pyrolysis behavior.
Fig. 6.3 Two parallel reactions scheme of epoxy resin thermal decomposition
Based on this, the fitting process is implemented to compare the experimental
mass loss and mass loss rate curves. Figure 6.4 and Figure 6.5 show the TGA mass
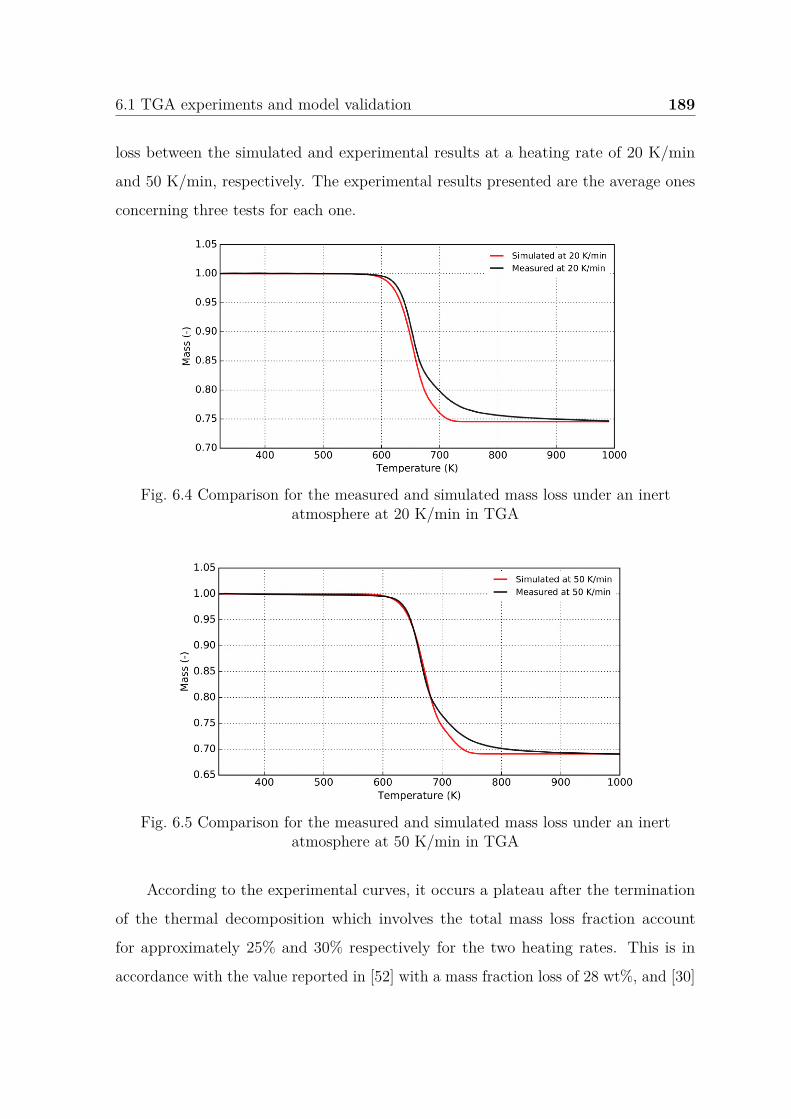
6.1 TGA experiments and model validation 189
loss between the simulated and experimental results at a heating rate of 20 K/min
and 50 K/min, respectively. The experimental results presented are the average ones
concerning three tests for each one.
Fig. 6.4 Comparison for the measured and simulated mass loss under an inertatmosphere at 20 K/min in TGA
Fig. 6.5 Comparison for the measured and simulated mass loss under an inertatmosphere at 50 K/min in TGA
According to the experimental curves, it occurs a plateau after the termination
of the thermal decomposition which involves the total mass loss fraction account
for approximately 25% and 30% respectively for the two heating rates. This is in
accordance with the value reported in [52] with a mass fraction loss of 28 wt%, and [30]
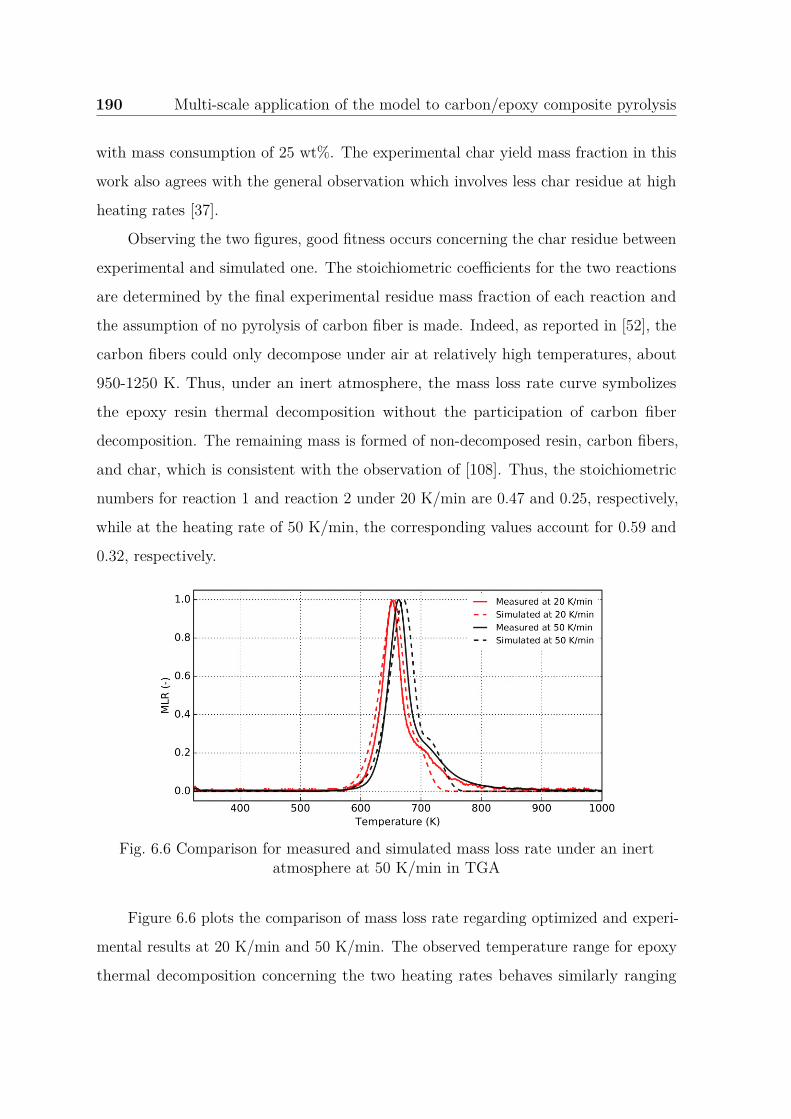
190 Multi-scale application of the model to carbon/epoxy composite pyrolysis
with mass consumption of 25 wt%. The experimental char yield mass fraction in this
work also agrees with the general observation which involves less char residue at high
heating rates [37].
Observing the two figures, good fitness occurs concerning the char residue between
experimental and simulated one. The stoichiometric coefficients for the two reactions
are determined by the final experimental residue mass fraction of each reaction and
the assumption of no pyrolysis of carbon fiber is made. Indeed, as reported in [52], the
carbon fibers could only decompose under air at relatively high temperatures, about
950-1250 K. Thus, under an inert atmosphere, the mass loss rate curve symbolizes
the epoxy resin thermal decomposition without the participation of carbon fiber
decomposition. The remaining mass is formed of non-decomposed resin, carbon fibers,
and char, which is consistent with the observation of [108]. Thus, the stoichiometric
numbers for reaction 1 and reaction 2 under 20 K/min are 0.47 and 0.25, respectively,
while at the heating rate of 50 K/min, the corresponding values account for 0.59 and
0.32, respectively.
Fig. 6.6 Comparison for measured and simulated mass loss rate under an inertatmosphere at 50 K/min in TGA
Figure 6.6 plots the comparison of mass loss rate regarding optimized and experi-
mental results at 20 K/min and 50 K/min. The observed temperature range for epoxy
thermal decomposition concerning the two heating rates behaves similarly ranging
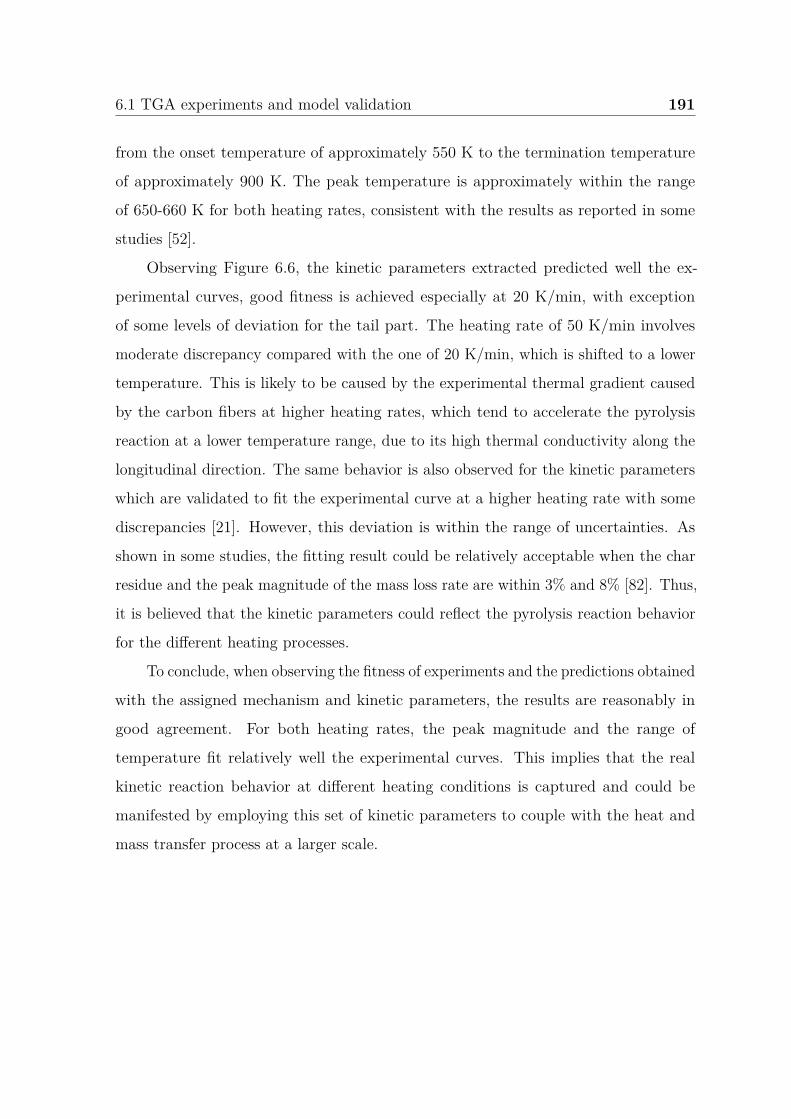
6.1 TGA experiments and model validation 191
from the onset temperature of approximately 550 K to the termination temperature
of approximately 900 K. The peak temperature is approximately within the range
of 650-660 K for both heating rates, consistent with the results as reported in some
studies [52].
Observing Figure 6.6, the kinetic parameters extracted predicted well the ex-
perimental curves, good fitness is achieved especially at 20 K/min, with exception
of some levels of deviation for the tail part. The heating rate of 50 K/min involves
moderate discrepancy compared with the one of 20 K/min, which is shifted to a lower
temperature. This is likely to be caused by the experimental thermal gradient caused
by the carbon fibers at higher heating rates, which tend to accelerate the pyrolysis
reaction at a lower temperature range, due to its high thermal conductivity along the
longitudinal direction. The same behavior is also observed for the kinetic parameters
which are validated to fit the experimental curve at a higher heating rate with some
discrepancies [21]. However, this deviation is within the range of uncertainties. As
shown in some studies, the fitting result could be relatively acceptable when the char
residue and the peak magnitude of the mass loss rate are within 3% and 8% [82]. Thus,
it is believed that the kinetic parameters could reflect the pyrolysis reaction behavior
for the different heating processes.
To conclude, when observing the fitness of experiments and the predictions obtained
with the assigned mechanism and kinetic parameters, the results are reasonably in
good agreement. For both heating rates, the peak magnitude and the range of
temperature fit relatively well the experimental curves. This implies that the real
kinetic reaction behavior at different heating conditions is captured and could be
manifested by employing this set of kinetic parameters to couple with the heat and
mass transfer process at a larger scale.
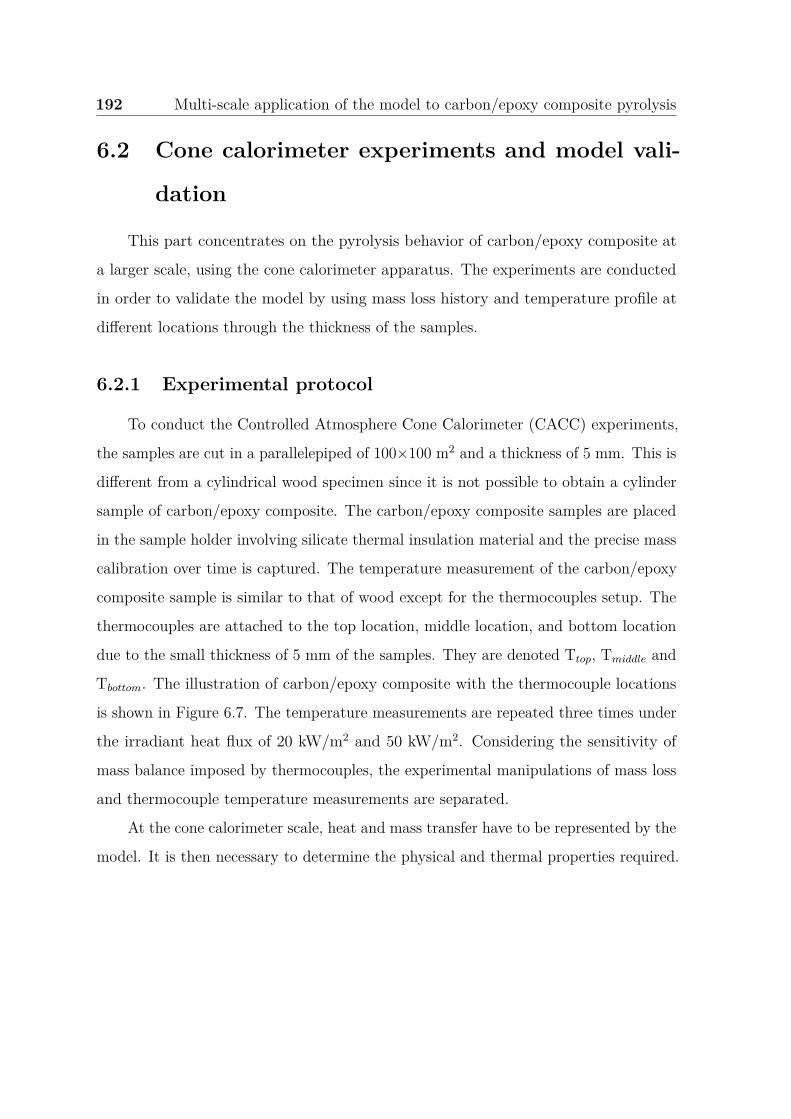
192 Multi-scale application of the model to carbon/epoxy composite pyrolysis
6.2 Cone calorimeter experiments and model vali-
dation
This part concentrates on the pyrolysis behavior of carbon/epoxy composite at
a larger scale, using the cone calorimeter apparatus. The experiments are conducted
in order to validate the model by using mass loss history and temperature profile at
different locations through the thickness of the samples.
6.2.1 Experimental protocol
To conduct the Controlled Atmosphere Cone Calorimeter (CACC) experiments,
the samples are cut in a parallelepiped of 100×100 m2 and a thickness of 5 mm. This is
different from a cylindrical wood specimen since it is not possible to obtain a cylinder
sample of carbon/epoxy composite. The carbon/epoxy composite samples are placed
in the sample holder involving silicate thermal insulation material and the precise mass
calibration over time is captured. The temperature measurement of the carbon/epoxy
composite sample is similar to that of wood except for the thermocouples setup. The
thermocouples are attached to the top location, middle location, and bottom location
due to the small thickness of 5 mm of the samples. They are denoted Ttop, Tmiddle and
Tbottom. The illustration of carbon/epoxy composite with the thermocouple locations
is shown in Figure 6.7. The temperature measurements are repeated three times under
the irradiant heat flux of 20 kW/m2 and 50 kW/m2. Considering the sensitivity of
mass balance imposed by thermocouples, the experimental manipulations of mass loss
and thermocouple temperature measurements are separated.
At the cone calorimeter scale, heat and mass transfer have to be represented by the
model. It is then necessary to determine the physical and thermal properties required.
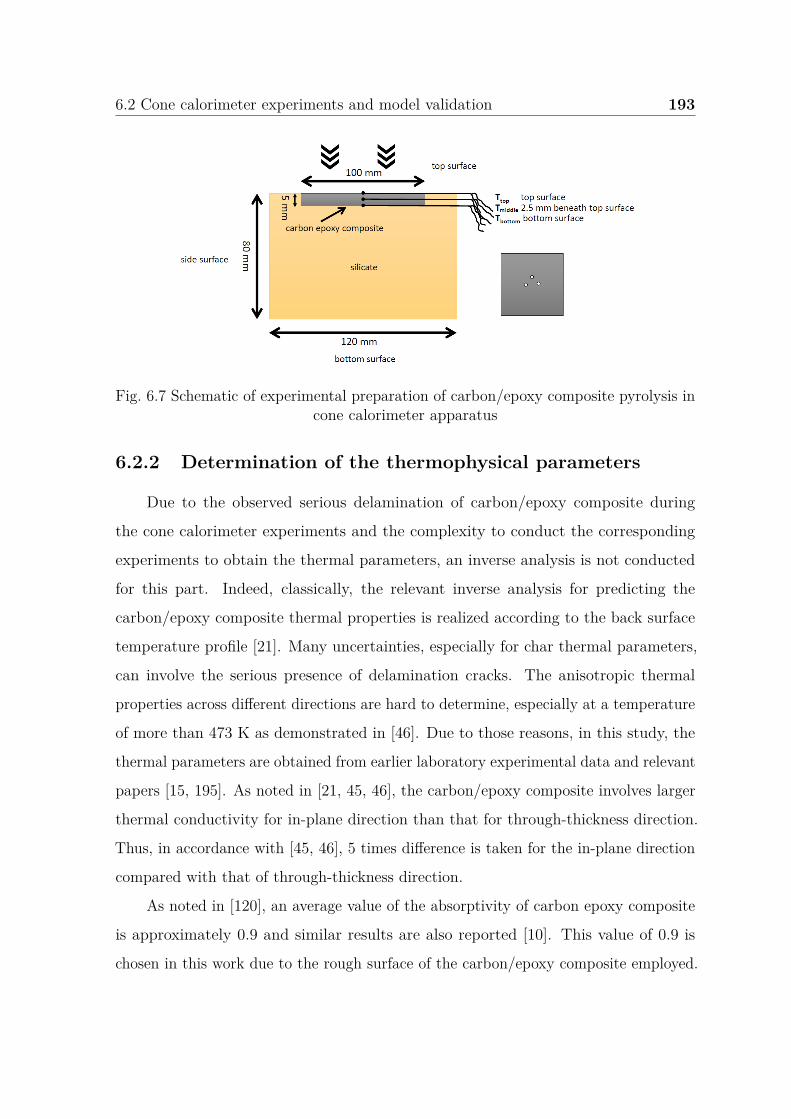
6.2 Cone calorimeter experiments and model validation 193
Fig. 6.7 Schematic of experimental preparation of carbon/epoxy composite pyrolysis incone calorimeter apparatus
6.2.2 Determination of the thermophysical parameters
Due to the observed serious delamination of carbon/epoxy composite during
the cone calorimeter experiments and the complexity to conduct the corresponding
experiments to obtain the thermal parameters, an inverse analysis is not conducted
for this part. Indeed, classically, the relevant inverse analysis for predicting the
carbon/epoxy composite thermal properties is realized according to the back surface
temperature profile [21]. Many uncertainties, especially for char thermal parameters,
can involve the serious presence of delamination cracks. The anisotropic thermal
properties across different directions are hard to determine, especially at a temperature
of more than 473 K as demonstrated in [46]. Due to those reasons, in this study, the
thermal parameters are obtained from earlier laboratory experimental data and relevant
papers [15, 195]. As noted in [21, 45, 46], the carbon/epoxy composite involves larger
thermal conductivity for in-plane direction than that for through-thickness direction.
Thus, in accordance with [45, 46], 5 times difference is taken for the in-plane direction
compared with that of through-thickness direction.
As noted in [120], an average value of the absorptivity of carbon epoxy composite
is approximately 0.9 and similar results are also reported [10]. This value of 0.9 is
chosen in this work due to the rough surface of the carbon/epoxy composite employed.
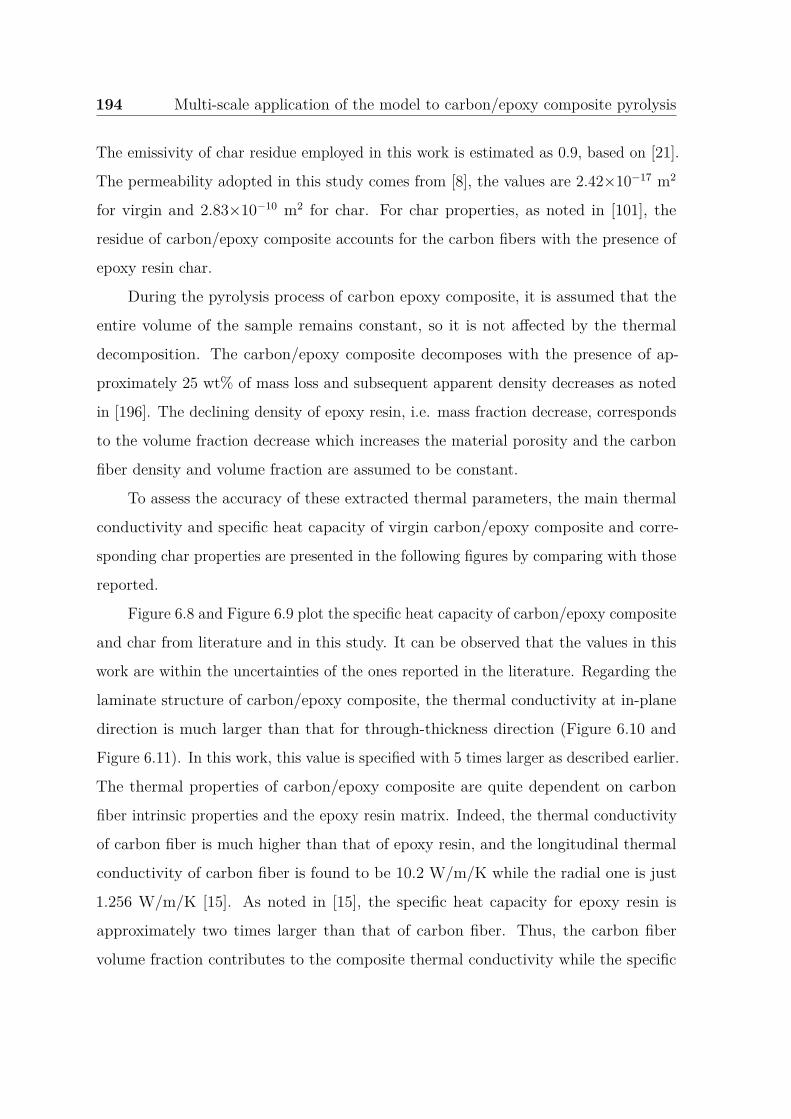
194 Multi-scale application of the model to carbon/epoxy composite pyrolysis
The emissivity of char residue employed in this work is estimated as 0.9, based on [21].
The permeability adopted in this study comes from [8], the values are 2.42×10⁻¹⁷ m2
for virgin and 2.83×10⁻¹⁰ m2 for char. For char properties, as noted in [101], the
residue of carbon/epoxy composite accounts for the carbon fibers with the presence of
epoxy resin char.
During the pyrolysis process of carbon epoxy composite, it is assumed that the
entire volume of the sample remains constant, so it is not affected by the thermal
decomposition. The carbon/epoxy composite decomposes with the presence of ap-
proximately 25 wt% of mass loss and subsequent apparent density decreases as noted
in [196]. The declining density of epoxy resin, i.e. mass fraction decrease, corresponds
to the volume fraction decrease which increases the material porosity and the carbon
fiber density and volume fraction are assumed to be constant.
To assess the accuracy of these extracted thermal parameters, the main thermal
conductivity and specific heat capacity of virgin carbon/epoxy composite and corre-
sponding char properties are presented in the following figures by comparing with those
reported.
Figure 6.8 and Figure 6.9 plot the specific heat capacity of carbon/epoxy composite
and char from literature and in this study. It can be observed that the values in this
work are within the uncertainties of the ones reported in the literature. Regarding the
laminate structure of carbon/epoxy composite, the thermal conductivity at in-plane
direction is much larger than that for through-thickness direction (Figure 6.10 and
Figure 6.11). In this work, this value is specified with 5 times larger as described earlier.
The thermal properties of carbon/epoxy composite are quite dependent on carbon
fiber intrinsic properties and the epoxy resin matrix. Indeed, the thermal conductivity
of carbon fiber is much higher than that of epoxy resin, and the longitudinal thermal
conductivity of carbon fiber is found to be 10.2 W/m/K while the radial one is just
1.256 W/m/K [15]. As noted in [15], the specific heat capacity for epoxy resin is
approximately two times larger than that of carbon fiber. Thus, the carbon fiber
volume fraction contributes to the composite thermal conductivity while the specific
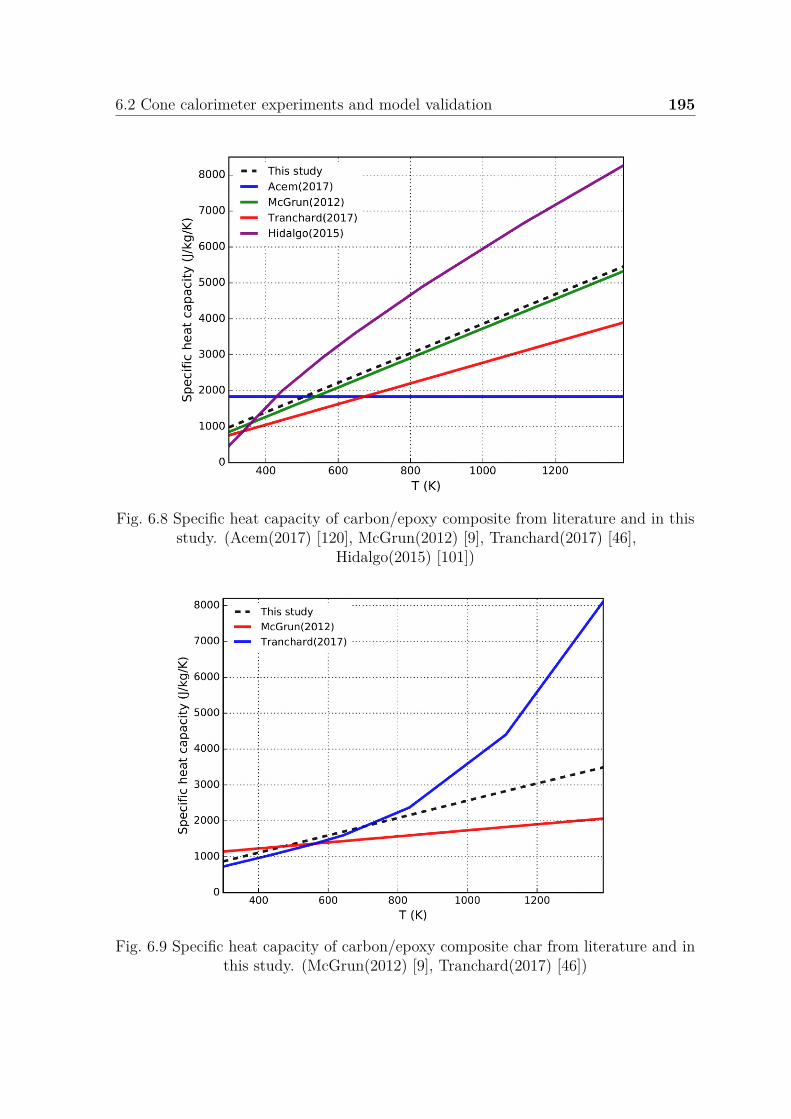
6.2 Cone calorimeter experiments and model validation 195
Fig. 6.8 Specific heat capacity of carbon/epoxy composite from literature and in thisstudy. (Acem(2017) [120], McGrun(2012) [9], Tranchard(2017) [46],
Hidalgo(2015) [101])
Fig. 6.9 Specific heat capacity of carbon/epoxy composite char from literature and inthis study. (McGrun(2012) [9], Tranchard(2017) [46])
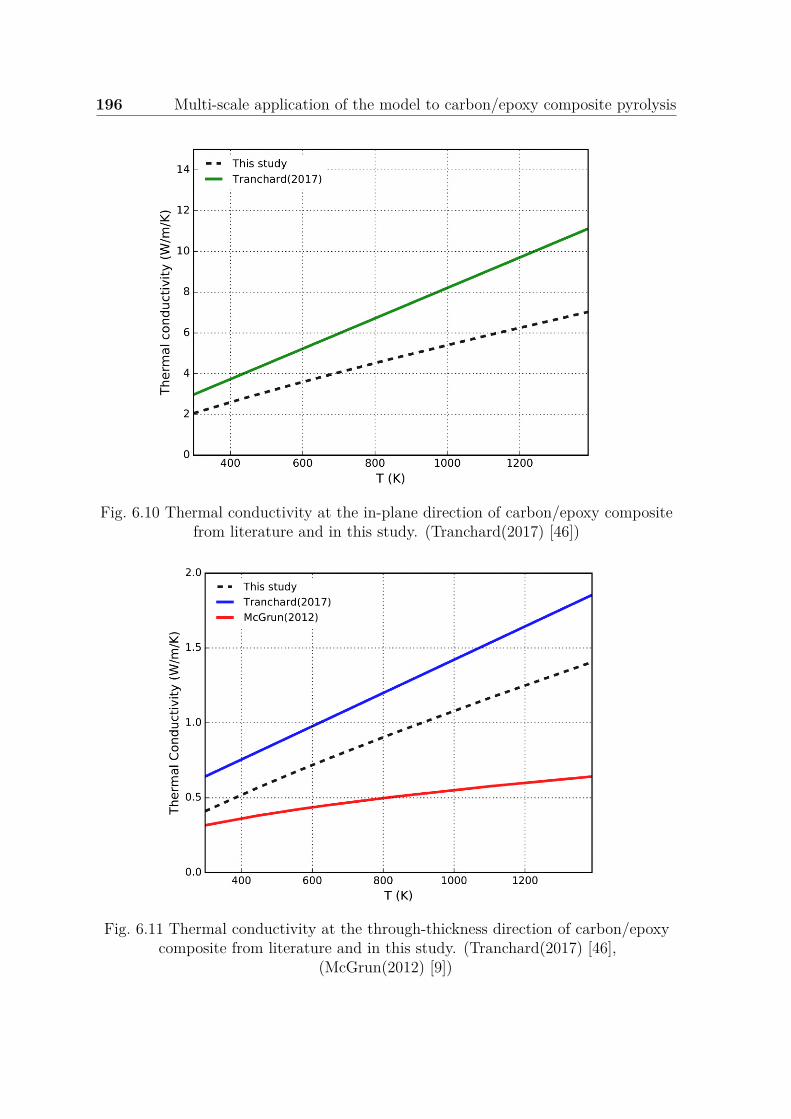
196 Multi-scale application of the model to carbon/epoxy composite pyrolysis
Fig. 6.10 Thermal conductivity at the in-plane direction of carbon/epoxy compositefrom literature and in this study. (Tranchard(2017) [46])
Fig. 6.11 Thermal conductivity at the through-thickness direction of carbon/epoxycomposite from literature and in this study. (Tranchard(2017) [46],
(McGrun(2012) [9])
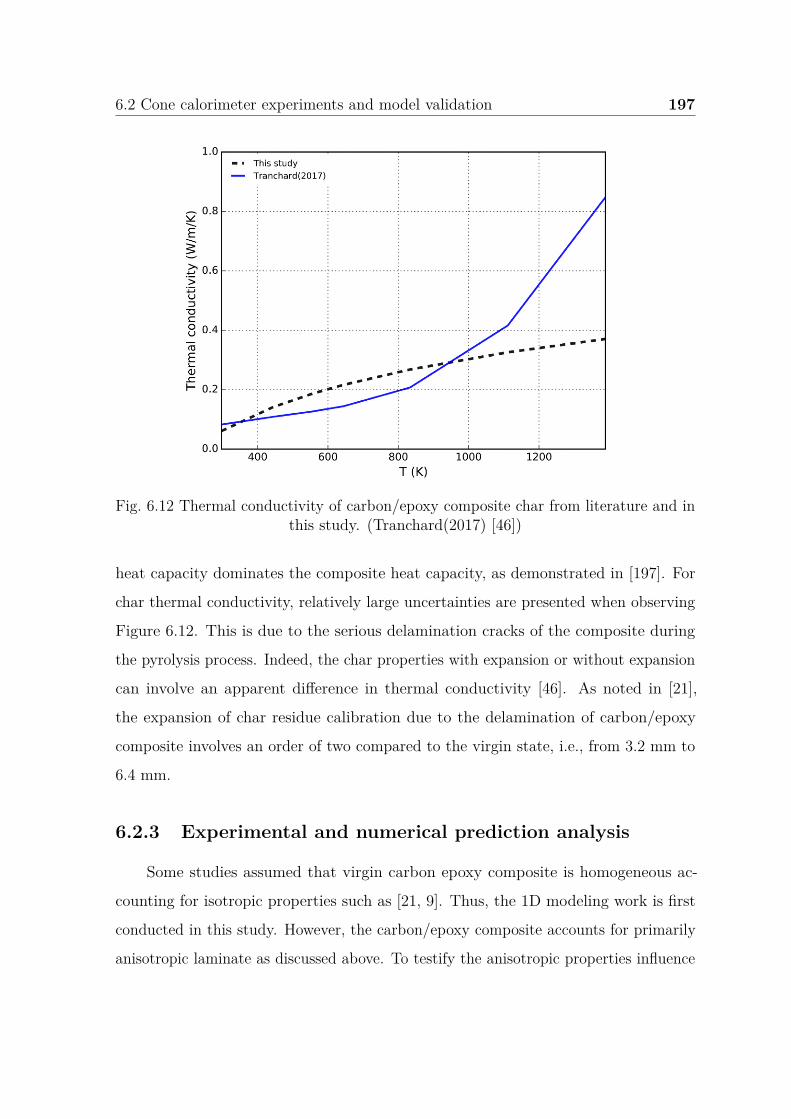
6.2 Cone calorimeter experiments and model validation 197
Fig. 6.12 Thermal conductivity of carbon/epoxy composite char from literature and inthis study. (Tranchard(2017) [46])
heat capacity dominates the composite heat capacity, as demonstrated in [197]. For
char thermal conductivity, relatively large uncertainties are presented when observing
Figure 6.12. This is due to the serious delamination cracks of the composite during
the pyrolysis process. Indeed, the char properties with expansion or without expansion
can involve an apparent difference in thermal conductivity [46]. As noted in [21],
the expansion of char residue calibration due to the delamination of carbon/epoxy
composite involves an order of two compared to the virgin state, i.e., from 3.2 mm to
6.4 mm.
6.2.3 Experimental and numerical prediction analysis
Some studies assumed that virgin carbon epoxy composite is homogeneous ac-
counting for isotropic properties such as [21, 9]. Thus, the 1D modeling work is first
conducted in this study. However, the carbon/epoxy composite accounts for primarily
anisotropic laminate as discussed above. To testify the anisotropic properties influence
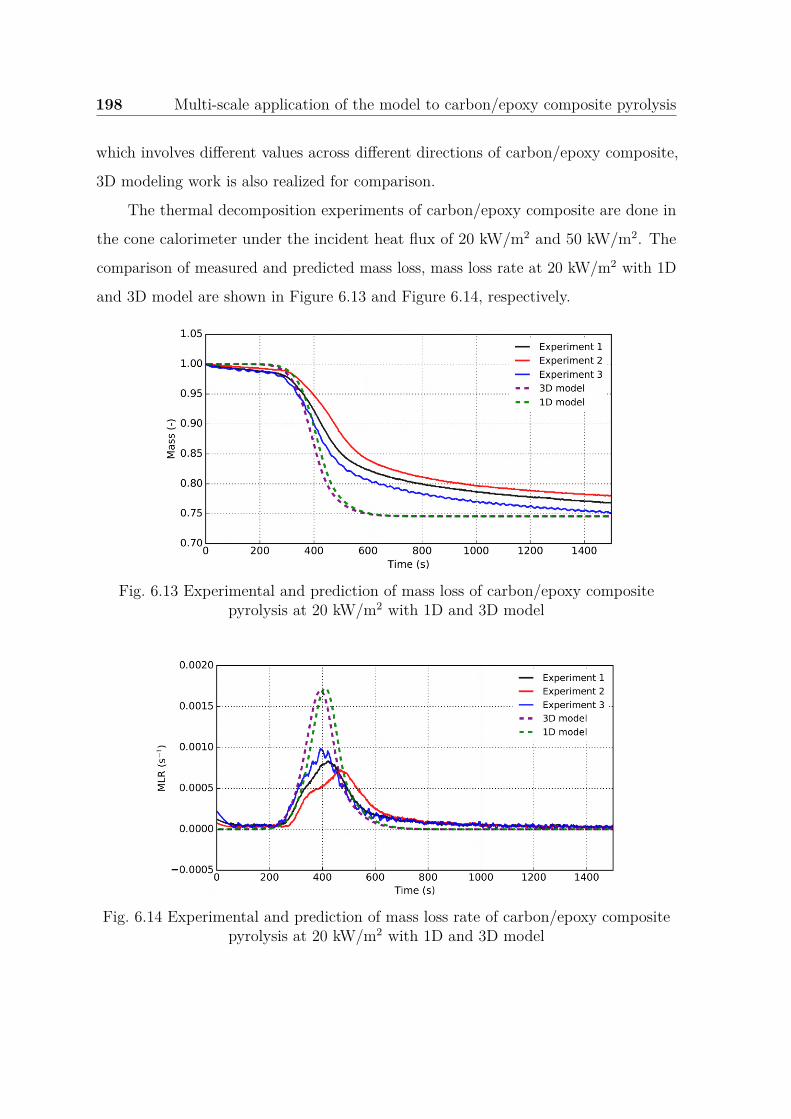
198 Multi-scale application of the model to carbon/epoxy composite pyrolysis
which involves different values across different directions of carbon/epoxy composite,
3D modeling work is also realized for comparison.
The thermal decomposition experiments of carbon/epoxy composite are done in
the cone calorimeter under the incident heat flux of 20 kW/m2 and 50 kW/m2. The
comparison of measured and predicted mass loss, mass loss rate at 20 kW/m2 with 1D
and 3D model are shown in Figure 6.13 and Figure 6.14, respectively.
Fig. 6.13 Experimental and prediction of mass loss of carbon/epoxy compositepyrolysis at 20 kW/m2 with 1D and 3D model
Fig. 6.14 Experimental and prediction of mass loss rate of carbon/epoxy compositepyrolysis at 20 kW/m2 with 1D and 3D model
6.2 Cone calorimeter experiments and model validation 199
Observing the experimental data, the pyrolysis of carbon/epoxy composite at cone
calorimeter scale doesn’t appear the second peak of mass loss rate which is mainly
due to the thin thickness of the sample, as noted in [32]. It can be observed that
the mass loss rate and the temperature prediction under 1D and 3D involve a similar
variation trend which demonstrates that the isotropic assumption does not affect the
simulation of thermal decomposition of carbon/epoxy composite. The carbon fibers
are distributed uniformly within the resin matrix and the thermal conductivity along
the fiber is much higher than that across the fiber direction, as mentioned above. Thus,
the variation of heat dissipation through the thickness can be expected to be very
low compared to the one for the horizontal cross-section direction (parallel to the
top surface). It is reasonably correct to suppose that the temperature distribution
is uniform for the horizontal cross-section direction. This is illustrated by different
studies [10] which show that the thermal conductivity can be 15 times larger for the
in-plane direction than those at the through-thickness direction. This justifies why the
results difference between 1D and 3D can be negligible and the threshold temperature
for 1D and 3D at which the pyrolysis starts to take place present nearly no difference.
The averaged residue mass fraction of carbon/epoxy composite accounts for
approximately 75 wt%, which is consistent with [195]. It is observed that reasonable
agreement is achieved for the normalized mass loss and corresponding mass loss rate,
especially regarding the final char residue mass fraction and the duration range of
mass loss rate peak. The occurrence and the termination of the pyrolysis process are
captured with precision. However, the predicted magnitude of the mass loss rate peak
deviates with relatively large error compared with the experiment data. The detailed
analysis is addressed in the following part.
When comparing the mass loss and mass loss rate between the measured and the
predicted ones, it shows perfect agreement from the onset up to 300 s. It demonstrates
the validity and accuracy of this model at the initial pyrolysis stage. However, during
the experimental peak temperature range, between 300 s to 700 s, the prediction
involves a notable increment compared with peak magnitude. This discrepancy is
200 Multi-scale application of the model to carbon/epoxy composite pyrolysis
likely to be caused by the delamination cracks which induce some air layer limiting
the thermal transport. Thus, the numerical mass loss rate can be higher. Another
reason could be the char density non-uniformity employed at different heat fluxes with
the carbonaceous structure of different levels. The density and porosity at different
heat fluxes could influence the heat and mass transfer, which could contribute to the
majority of discrepancy and the char in this work denotes the fully decomposed ones.
As noted, the char properties are also dominated by the fiber orientation, volume
fraction, and epoxy resin volume fraction which could provide some uncertainties
to lead to this discrepancy. The presence of a low magnitude of experimental mass
loss rate also tends to be caused by the migration of volatile gases downward to the
bottom surface which can delay the mass loss process as noted in [20]. Indeed, the
delamination is observed to increase the permeability of material which takes place at
the bottom sites of carbon/epoxy composite. Thus, the pyrolysis gas could migrate to
the bottom parts of the material to delay the mass loss. The uncertain heat of thermal
decomposition could be a factor that determines the magnitude and duration of the
mass loss rate peak. Indeed, some studies found that epoxy resin thermal decomposition
could involve both exothermic and endothermic reactions [46], which makes the heat
of decomposition quite uncertain. When the absolute value of endothermic heat of
pyrolysis decreases, the mass loss rate curve is expected to occur with shorter peak
duration and larger peak magnitude as well as steeper temperature variation trend.
The comparison of measured and predicted temperature profiles at the top, middle,
and bottom location for 1D and 3D models at 20 kW/m2 are shown in Figure 6.15,
Figure 6.16, and Figure 6.17, respectively. Overall good agreement is achieved when
comparing the temperature evolution between experiments and predictions at the three
locations. The temperature measured for the first experiment at the top location
occurs serious drop after 700 K due to the experimental surface swelling leading to
the thermocouple separation. It is observed that from the onset to approximately 500
s, the model under-predicts the top surface and middle temperatures by about 20 K,
while back surface temperature involves good fitness with experimental data. This is
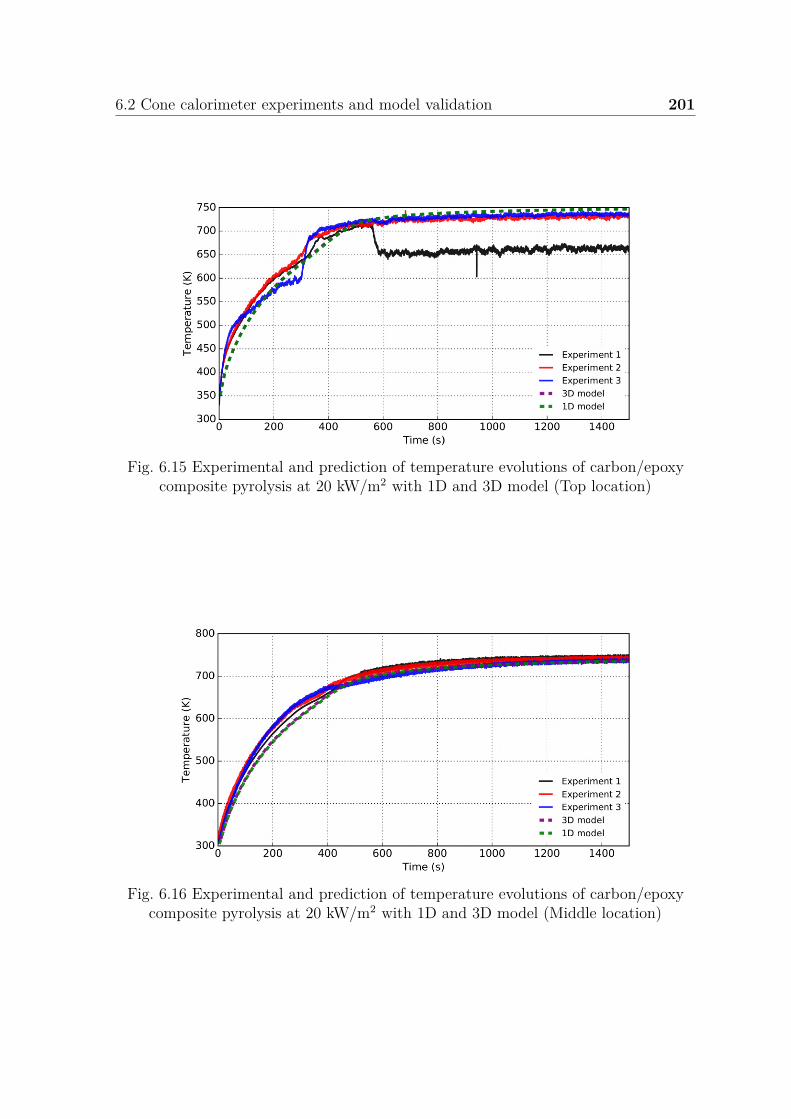
6.2 Cone calorimeter experiments and model validation 201
Fig. 6.15 Experimental and prediction of temperature evolutions of carbon/epoxycomposite pyrolysis at 20 kW/m2 with 1D and 3D model (Top location)
Fig. 6.16 Experimental and prediction of temperature evolutions of carbon/epoxycomposite pyrolysis at 20 kW/m2 with 1D and 3D model (Middle location)
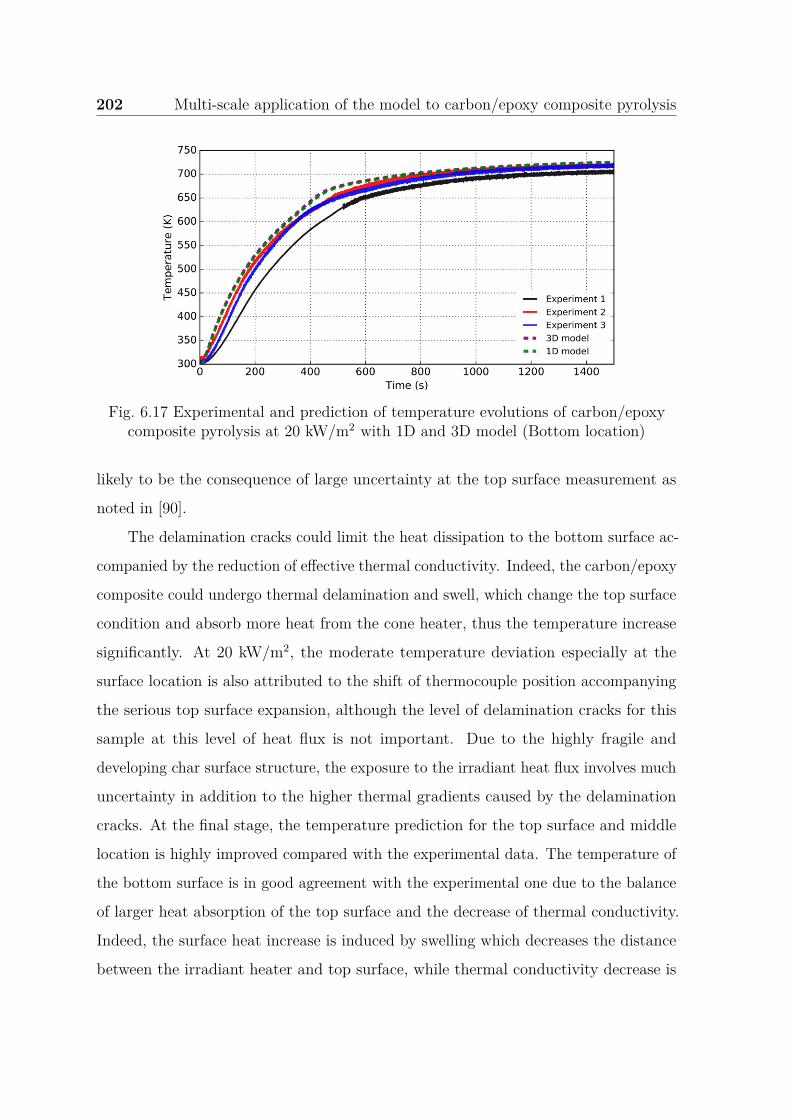
202 Multi-scale application of the model to carbon/epoxy composite pyrolysis
Fig. 6.17 Experimental and prediction of temperature evolutions of carbon/epoxycomposite pyrolysis at 20 kW/m2 with 1D and 3D model (Bottom location)
likely to be the consequence of large uncertainty at the top surface measurement as
noted in [90].
The delamination cracks could limit the heat dissipation to the bottom surface ac-
companied by the reduction of effective thermal conductivity. Indeed, the carbon/epoxy
composite could undergo thermal delamination and swell, which change the top surface
condition and absorb more heat from the cone heater, thus the temperature increase
significantly. At 20 kW/m2, the moderate temperature deviation especially at the
surface location is also attributed to the shift of thermocouple position accompanying
the serious top surface expansion, although the level of delamination cracks for this
sample at this level of heat flux is not important. Due to the highly fragile and
developing char surface structure, the exposure to the irradiant heat flux involves much
uncertainty in addition to the higher thermal gradients caused by the delamination
cracks. At the final stage, the temperature prediction for the top surface and middle
location is highly improved compared with the experimental data. The temperature of
the bottom surface is in good agreement with the experimental one due to the balance
of larger heat absorption of the top surface and the decrease of thermal conductivity.
Indeed, the surface heat increase is induced by swelling which decreases the distance
between the irradiant heater and top surface, while thermal conductivity decrease is
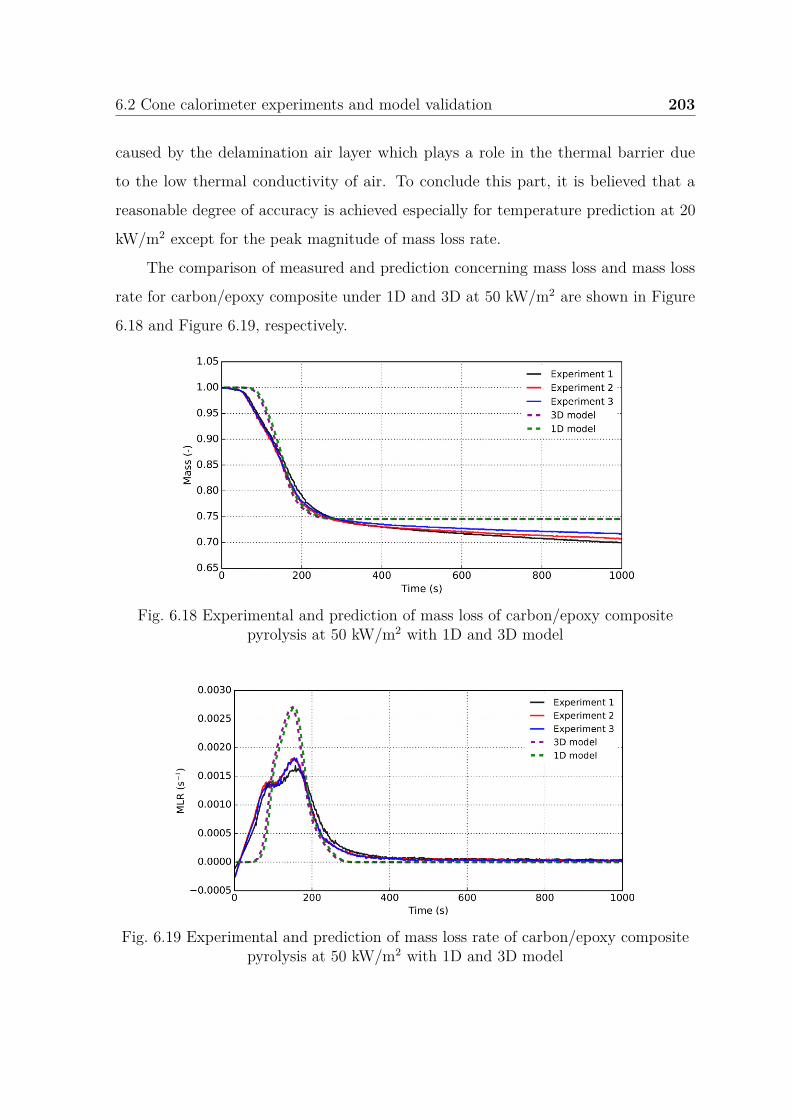
6.2 Cone calorimeter experiments and model validation 203
caused by the delamination air layer which plays a role in the thermal barrier due
to the low thermal conductivity of air. To conclude this part, it is believed that a
reasonable degree of accuracy is achieved especially for temperature prediction at 20
kW/m2 except for the peak magnitude of mass loss rate.
The comparison of measured and prediction concerning mass loss and mass loss
rate for carbon/epoxy composite under 1D and 3D at 50 kW/m2 are shown in Figure
6.18 and Figure 6.19, respectively.
Fig. 6.18 Experimental and prediction of mass loss of carbon/epoxy compositepyrolysis at 50 kW/m2 with 1D and 3D model
Fig. 6.19 Experimental and prediction of mass loss rate of carbon/epoxy compositepyrolysis at 50 kW/m2 with 1D and 3D model
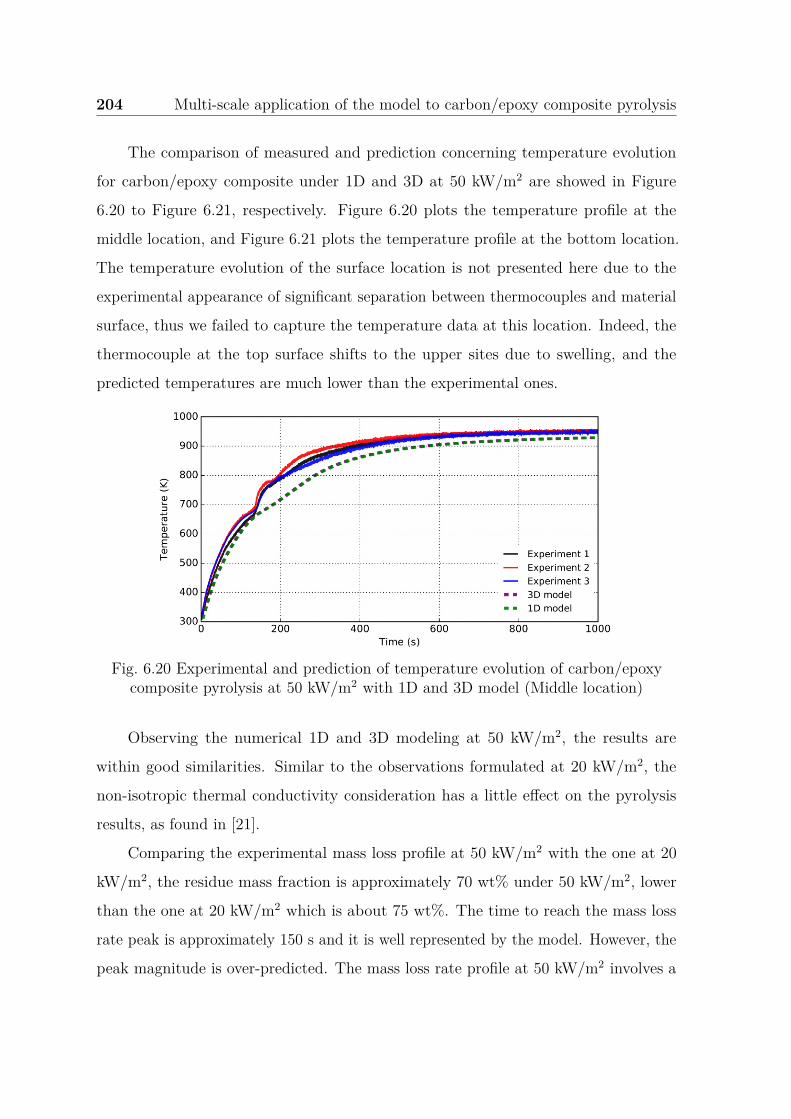
204 Multi-scale application of the model to carbon/epoxy composite pyrolysis
The comparison of measured and prediction concerning temperature evolution
for carbon/epoxy composite under 1D and 3D at 50 kW/m2 are showed in Figure
6.20 to Figure 6.21, respectively. Figure 6.20 plots the temperature profile at the
middle location, and Figure 6.21 plots the temperature profile at the bottom location.
The temperature evolution of the surface location is not presented here due to the
experimental appearance of significant separation between thermocouples and material
surface, thus we failed to capture the temperature data at this location. Indeed, the
thermocouple at the top surface shifts to the upper sites due to swelling, and the
predicted temperatures are much lower than the experimental ones.
Fig. 6.20 Experimental and prediction of temperature evolution of carbon/epoxycomposite pyrolysis at 50 kW/m2 with 1D and 3D model (Middle location)
Observing the numerical 1D and 3D modeling at 50 kW/m2, the results are
within good similarities. Similar to the observations formulated at 20 kW/m2, the
non-isotropic thermal conductivity consideration has a little effect on the pyrolysis
results, as found in [21].
Comparing the experimental mass loss profile at 50 kW/m2 with the one at 20
kW/m2, the residue mass fraction is approximately 70 wt% under 50 kW/m2, lower
than the one at 20 kW/m2 which is about 75 wt%. The time to reach the mass loss
rate peak is approximately 150 s and it is well represented by the model. However, the
peak magnitude is over-predicted. The mass loss rate profile at 50 kW/m2 involves a
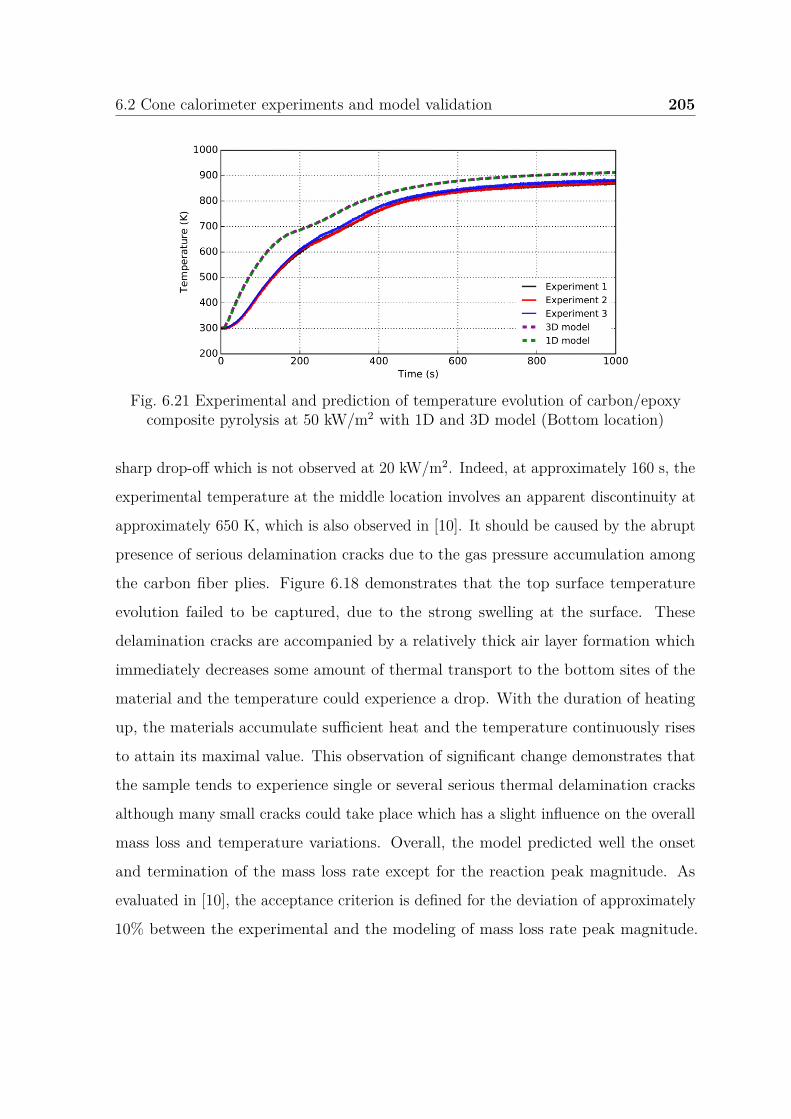
6.2 Cone calorimeter experiments and model validation 205
Fig. 6.21 Experimental and prediction of temperature evolution of carbon/epoxycomposite pyrolysis at 50 kW/m2 with 1D and 3D model (Bottom location)
sharp drop-off which is not observed at 20 kW/m2. Indeed, at approximately 160 s, the
experimental temperature at the middle location involves an apparent discontinuity at
approximately 650 K, which is also observed in [10]. It should be caused by the abrupt
presence of serious delamination cracks due to the gas pressure accumulation among
the carbon fiber plies. Figure 6.18 demonstrates that the top surface temperature
evolution failed to be captured, due to the strong swelling at the surface. These
delamination cracks are accompanied by a relatively thick air layer formation which
immediately decreases some amount of thermal transport to the bottom sites of the
material and the temperature could experience a drop. With the duration of heating
up, the materials accumulate sufficient heat and the temperature continuously rises
to attain its maximal value. This observation of significant change demonstrates that
the sample tends to experience single or several serious thermal delamination cracks
although many small cracks could take place which has a slight influence on the overall
mass loss and temperature variations. Overall, the model predicted well the onset
and termination of the mass loss rate except for the reaction peak magnitude. As
evaluated in [10], the acceptance criterion is defined for the deviation of approximately
10% between the experimental and the modeling of mass loss rate peak magnitude.
206 Multi-scale application of the model to carbon/epoxy composite pyrolysis
Thus the model has the potential to predict the experimental data with quantitative
accuracy provided that some main uncertainties can be manipulated well.
Some different predictions of temperature evolution at the top, middle, and bottom
surface are observed under the heat flux of 20 kW/m2 and 50 kW/m2. At 20 kW/m2, the
top surface of the material could take place moderate swelling with smaller delamination
cracks, as also displayed in the literature review [30]. While the thermocouple at the
middle location is nearly fixed, the experimental data are also relatively higher than
the predicted ones. At the bottom location, a good agreement between predictions and
experiments is observed. It is believed to be the compromise effect between the thermal
barrier formed by the air layer and more heat absorption by swelling as discussed
earlier.
At 50 kW/m2, the top surface can undergo serious swelling with strong delamination
cracks which influence the temperature evolution. For the temperature at the middle
location, a similar compromise effect takes place which yields relatively better agreement,
especially at the initial pyrolysis stage. For the temperature of the bottom location,
it is poorly predicted due to the large cracks of the thermal barrier leading to much
lower experimental temperature.
It can be concluded that serious delamination occurs at different locations through
the thickness in the cases of 20 kW/m2 and 50 kW/m2. Regarding this study, serious
delamination occurs between the top and middle locations at 20 kW/m2. While for 50
kW/m2, this serious delamination occurs between middle and bottom locations.
To conclude this part, a similar prediction level is observed at 20 kW/m2 and
50 kW/m2. Except for the larger discrepancies of mass loss rate peak magnitude
prediction, the prediction at lower heat flux seems to be more accurate when targeting
the temperature evolution.
6.3 Conclusion 207
6.3 Conclusion
This chapter has been dedicated to the modeling of thermal decomposition of
a resin epoxy/carbon fibers composite, firstly at TGA scale and secondly at cone
calorimeter scale. A two parallel mechanism of thermal decomposition has been
employed and the associated kinetic parameters have been validated at the TGA scale
by comparison with the experimental data. The physical and the thermal properties
required for the modeling of thermal decomposition at the cone calorimeter scale has
been determined from different literature sources. The evaluation of the model to
represent the thermal decomposition of the carbon/epoxy composite has been done
addressing the mass loss, the mass loss rate, and the temperature profiles into the
thickness of the composite samples. The comparison of the experimental and the
numerical data shows that the model tends to over-predict, whatever the heat flux
studied, the kinetic of mass loss and the mass loss rate. This is mainly attributed
to the phenomenon of delamination, cracking, char formation, etc. that the model
does not permit to represent. Concerning the temperature evolutions, the accordance
between the model and the experiments is relatively good.

Chapter 7
Sensitivity analysis
Up to now, wood and carbon/epoxy composite pyrolysis behavior under TGA
and Cone Calorimeter scales are conducted by modeling with PATO. In the previous
parts, different levels of discrepancies can be identified in experimental and model
data. Indeed, many input parameters are involved during this modeling study, they
can be collected as chemical, physical, or other parameters. As noted in [104], the
more input parameters are used in the model, the higher uncertainties can be observed.
In order to test how these parameters are linked to the pyrolysis behavior and which
ones are more uncertain, this part of the manuscript is dedicated to a sensitivity
analysis in order to explore their effects. As noted in [118], the sensitivity analysis
could give some knowledge about how parameters influence the results. For example,
during the pyrolysis process, different parameters can play different roles in the results.
Thus, in the future, we can focus on those parameters which have to be determined
properly by numerical or experimental ways such that it can allow to diminish the
model uncertainties caused by input parameters and to improve the model prediction
efficiency.
The bench-scale cone calorimeter simulation couples both processes of kinetics and
heat and mass transfers for pyrolysis modeling. Thus, the cone calorimeter simulations
allow identifying the role of each parameter inside a single pyrolysis model. Moreover,
with this scale, each parameter’s contribution to the overall pyrolysis behavior can
210 Sensitivity analysis
be analyzed to have some knowledge about its contribution to the cone calorimeter
simulation outputs. As noted in [10], the current pyrolysis models are mainly used
in the fire community to predict the mass loss rate and the temperature evolution.
In this sense, the following sensitivity analysis will focus on the mass loss rate and
temperature evolution differences influenced by the corresponding parameters.
It exists two types of sensitivity analysis [198]. The first one is a local sensitivity
analysis where only one parameter varies around its nominal average value (such as
One-At-a-Time, OAT) [199]. The second one is a global sensitivity analysis where all
parameters change simultaneously (such as Sobol sensitivity analysis) [200]. In this
study, the local sensitivity analysis is performed on the pyrolysis model prediction
because we want first to know the influence of each parameter independently from
the others. For this sensitivity analysis, the following important input parameters are
identified during our modeling work: kinetic parameters, thermodynamic parameter
(the heat of thermal decomposition), convection boundary parameters, thermophysical
parameters of virgin and char, and water content.
A similar sensitivity analysis can be found in [118] which focused on the mass loss
rate and surface temperature. As we have shown in earlier chapters, the uncertainty
of parameters presents different levels of influence to the temperature evolution at
different locations through the thickness. Thus, we need to better understand the
nature and the complexity of these parameters influences (inputs) to enhance the result
precision (outputs: MLR, temperature. . . ). Moreover, this analysis is performed with
different heat fluxes. Indeed, as shown in earlier chapters, different heat fluxes involve
different levels of chemical reaction, heat transfer, and mass transfer. By consequences,
the corresponding parameters can also be of different levels of importance as a function
of the heat fluxes.
The first initiative is to decide the type of material to conduct the pyrolysis
modeling work. As shown in earlier chapters, wood and carbon/epoxy pyrolysis are
studied. However, wood shows more complex pyrolysis behaviors and this can be
observed concerning the shape of mass loss rate and temperature profile. In order to
211
deeply analyze the coupling of the thermal and chemical part under a more complex
application scenario, wood is chosen in this study to conduct the sensitivity analysis
on the more complex material (see Chapter 4). However, the variation of simultaneous
reaction of the three components is excluded from this first sensitivity analysis, due to its
complexity. Since cellulose constitutes the majority of the mass fraction (approximately
40 wt%) of wood by approximately two times larger than those of cellulose and lignin, in
a first approach, we assume the assumption that cellulose contributes to the maximum
part of overall wood pyrolysis reaction rate (see Chapter 4). Thus, we focus on the
cellulose reaction kinetics in order to estimate the factors influencing the wood pyrolysis.
Another point is about the model resolution technique used to study the sensitivity
analysis (dimensional model). The common practice is using 1D model to analyze
the sensitivity of the results to different chemical or thermophysical parameters such
as presented in [118]. Two reasons can be given, firstly the previous observation in
Chapter 5 shows quite a similar trend of the pyrolysis process captured under 1D and
2D simulations. Secondly, in this study, the sample holder (thermally insulated silicate)
is relatively thick, the back surface temperature is the ambient one, the side convection
effect is moderate and could be neglected (see Chapter 5). Thus, 1D simulation cases
are conducted for this sensitivity analysis. Furthermore, this kind of simulation presents
the advantage of a low computational cost while involving relatively good prediction
accuracy.
The second initiative for conducting a sensitivity analysis is to choose the param-
eters variation range. In fact, the results are dependent on these ranges and their
roles can be more or less important on the outputs and the sensitivity analysis results
[201]. It is hard to determine the variation criteria concerning the range for each
parameter, these parameters involve their intrinsic properties which show different
levels of uncertainty. Thus, in this work, the choice can be very versatile and flexible
for different parameters with different ranges. For sure, sensitivity analysis is highly
dependent on the parameter range used. The more we increase the range of variations
and the more the sensitivity value obtained increases.
212 Sensitivity analysis
Finally, we use the OAT method to analyze the sensitivity of all pyrolysis model
parameters. This method highlights rapidly the consequences of a parameter variation
(input) on the output data (for example, the mass loss rate and temperature evolution).
In this study, the consequences of the parameter variations are identified by graphical
lecture. Different levels of variation range are selected in order to correctly capture
some differences to study the influence of these parameters on the final pyrolysis results.
7.1 Kinetic and thermodynamic parameters influ-
ence
When conducting sensitivity analysis concerning kinetic parameters [32, 74], the
upper values are usually increased by a factor of 2 based on the average value concerning
the reaction order, and correspondingly, the lower value is decreased by a factor of 2.
While for activation energy, based on the average value, the upper value and lower
value are increased by approximately +10% and –10%, respectively. And for the
pre-exponential factor, based on the average value, it could be increased by a factor of
10 for the upper value, and can be decreased by a factor of 10 for the lower value. The
average values concerning kinetic parameters at two heat fluxes, i.e., 20 kW/m2 and 50
kW/m2, are based on the model optimization values employed in this (see Chapter 4).
Concerning the heat of thermal decomposition, the reported values for softwood
pyrolysis are changing approximately based on -1×10⁵ J/kg (endothermic) [56, 192,
75, 110]. Indeed, the heat of decomposition can vary a lot due to different types of
wood and the variation range is quite large. Concerning the sensitivity analysis of this
parameter, based on the average value, the upper and lower values are changed by a
factor of 2 [32]. Based on the average value employed in this study (-1×10⁵ J/kg), two
values are specified for the lower and upper value to define the range: from -2×10⁵ to
-5×10⁴ J/kg.
The corresponding variation range concerning the parameters studied are listed in
Table 7.1, where A is the pre-exponential factor, E is the activation energy, and n is
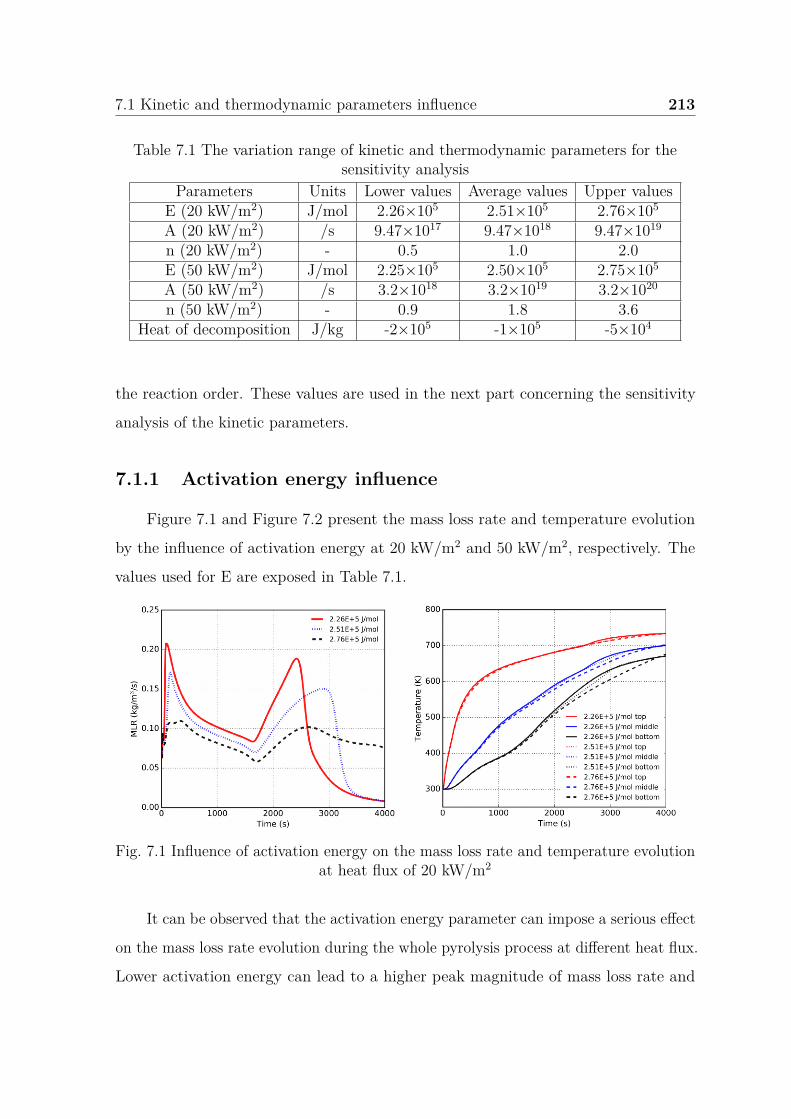
7.1 Kinetic and thermodynamic parameters influence 213
Table 7.1 The variation range of kinetic and thermodynamic parameters for thesensitivity analysis
Parameters Units Lower values Average values Upper valuesE (20 kW/m2) J/mol 2.26×10⁵ 2.51×10⁵ 2.76×10⁵
A (20 kW/m2) /s 9.47×10¹⁷ 9.47×10¹⁸ 9.47×10¹⁹
n (20 kW/m2) - 0.5 1.0 2.0E (50 kW/m2) J/mol 2.25×10⁵ 2.50×10⁵ 2.75×10⁵
A (50 kW/m2) /s 3.2×10¹⁸ 3.2×10¹⁹ 3.2×10²⁰
n (50 kW/m2) - 0.9 1.8 3.6Heat of decomposition J/kg -2×10⁵ -1×10⁵ -5×10⁴
the reaction order. These values are used in the next part concerning the sensitivity
analysis of the kinetic parameters.
7.1.1 Activation energy influence
Figure 7.1 and Figure 7.2 present the mass loss rate and temperature evolution
by the influence of activation energy at 20 kW/m2 and 50 kW/m2, respectively. The
values used for E are exposed in Table 7.1.
Fig. 7.1 Influence of activation energy on the mass loss rate and temperature evolutionat heat flux of 20 kW/m2
It can be observed that the activation energy parameter can impose a serious effect
on the mass loss rate evolution during the whole pyrolysis process at different heat flux.
Lower activation energy can lead to a higher peak magnitude of mass loss rate and
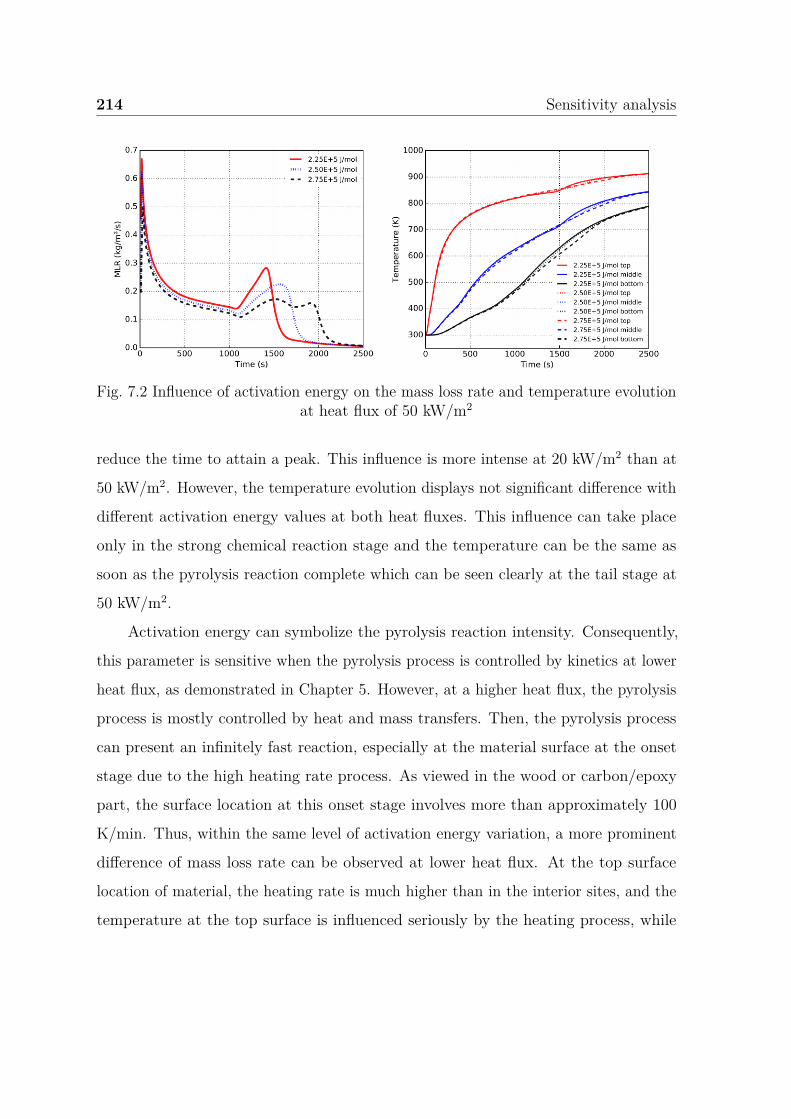
214 Sensitivity analysis
Fig. 7.2 Influence of activation energy on the mass loss rate and temperature evolutionat heat flux of 50 kW/m2
reduce the time to attain a peak. This influence is more intense at 20 kW/m2 than at
50 kW/m2. However, the temperature evolution displays not significant difference with
different activation energy values at both heat fluxes. This influence can take place
only in the strong chemical reaction stage and the temperature can be the same as
soon as the pyrolysis reaction complete which can be seen clearly at the tail stage at
50 kW/m2.
Activation energy can symbolize the pyrolysis reaction intensity. Consequently,
this parameter is sensitive when the pyrolysis process is controlled by kinetics at lower
heat flux, as demonstrated in Chapter 5. However, at a higher heat flux, the pyrolysis
process is mostly controlled by heat and mass transfers. Then, the pyrolysis process
can present an infinitely fast reaction, especially at the material surface at the onset
stage due to the high heating rate process. As viewed in the wood or carbon/epoxy
part, the surface location at this onset stage involves more than approximately 100
K/min. Thus, within the same level of activation energy variation, a more prominent
difference of mass loss rate can be observed at lower heat flux. At the top surface
location of material, the heating rate is much higher than in the interior sites, and the
temperature at the top surface is influenced seriously by the heating process, while
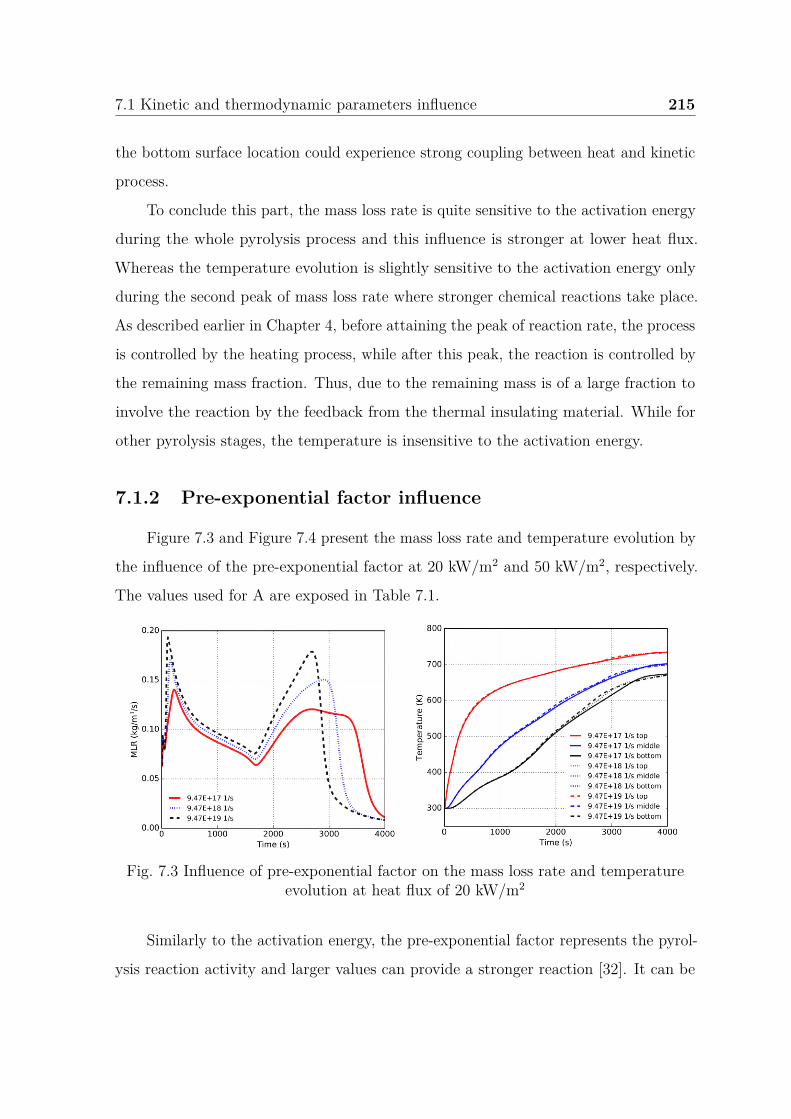
7.1 Kinetic and thermodynamic parameters influence 215
the bottom surface location could experience strong coupling between heat and kinetic
process.
To conclude this part, the mass loss rate is quite sensitive to the activation energy
during the whole pyrolysis process and this influence is stronger at lower heat flux.
Whereas the temperature evolution is slightly sensitive to the activation energy only
during the second peak of mass loss rate where stronger chemical reactions take place.
As described earlier in Chapter 4, before attaining the peak of reaction rate, the process
is controlled by the heating process, while after this peak, the reaction is controlled by
the remaining mass fraction. Thus, due to the remaining mass is of a large fraction to
involve the reaction by the feedback from the thermal insulating material. While for
other pyrolysis stages, the temperature is insensitive to the activation energy.
7.1.2 Pre-exponential factor influence
Figure 7.3 and Figure 7.4 present the mass loss rate and temperature evolution by
the influence of the pre-exponential factor at 20 kW/m2 and 50 kW/m2, respectively.
The values used for A are exposed in Table 7.1.
Fig. 7.3 Influence of pre-exponential factor on the mass loss rate and temperatureevolution at heat flux of 20 kW/m2
Similarly to the activation energy, the pre-exponential factor represents the pyrol-
ysis reaction activity and larger values can provide a stronger reaction [32]. It can be
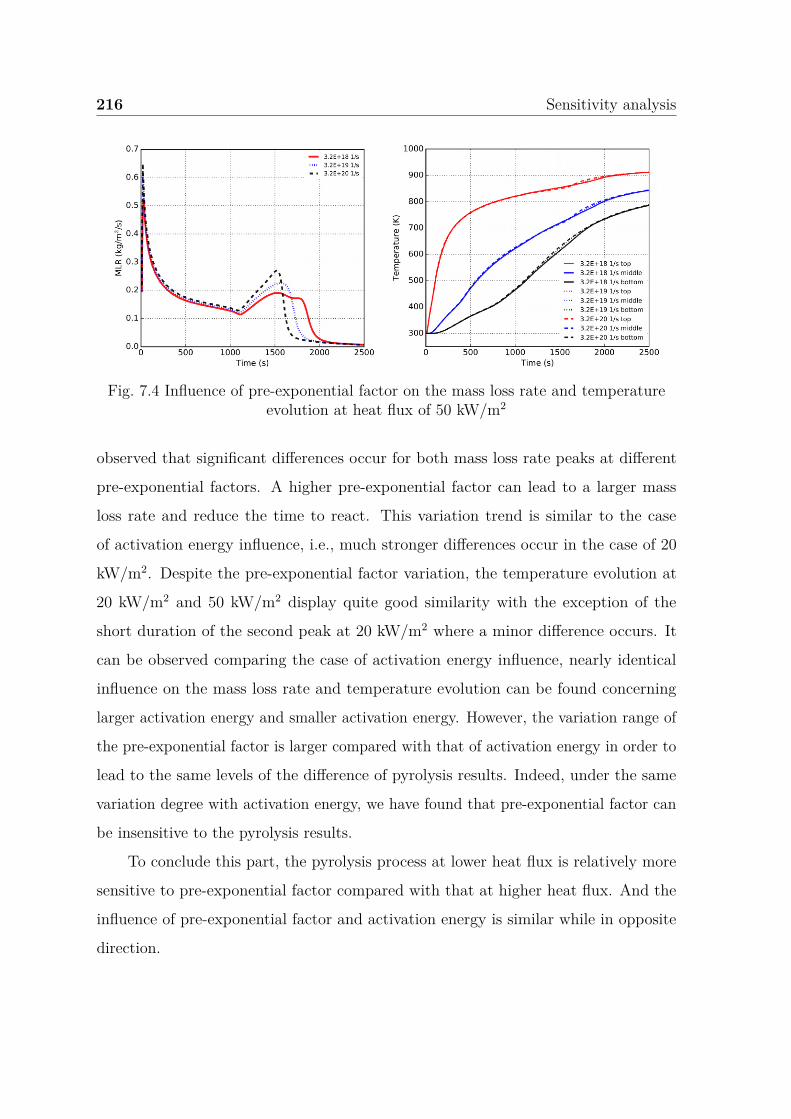
216 Sensitivity analysis
Fig. 7.4 Influence of pre-exponential factor on the mass loss rate and temperatureevolution at heat flux of 50 kW/m2
observed that significant differences occur for both mass loss rate peaks at different
pre-exponential factors. A higher pre-exponential factor can lead to a larger mass
loss rate and reduce the time to react. This variation trend is similar to the case
of activation energy influence, i.e., much stronger differences occur in the case of 20
kW/m2. Despite the pre-exponential factor variation, the temperature evolution at
20 kW/m2 and 50 kW/m2 display quite good similarity with the exception of the
short duration of the second peak at 20 kW/m2 where a minor difference occurs. It
can be observed comparing the case of activation energy influence, nearly identical
influence on the mass loss rate and temperature evolution can be found concerning
larger activation energy and smaller activation energy. However, the variation range of
the pre-exponential factor is larger compared with that of activation energy in order to
lead to the same levels of the difference of pyrolysis results. Indeed, under the same
variation degree with activation energy, we have found that pre-exponential factor can
be insensitive to the pyrolysis results.
To conclude this part, the pyrolysis process at lower heat flux is relatively more
sensitive to pre-exponential factor compared with that at higher heat flux. And the
influence of pre-exponential factor and activation energy is similar while in opposite
direction.
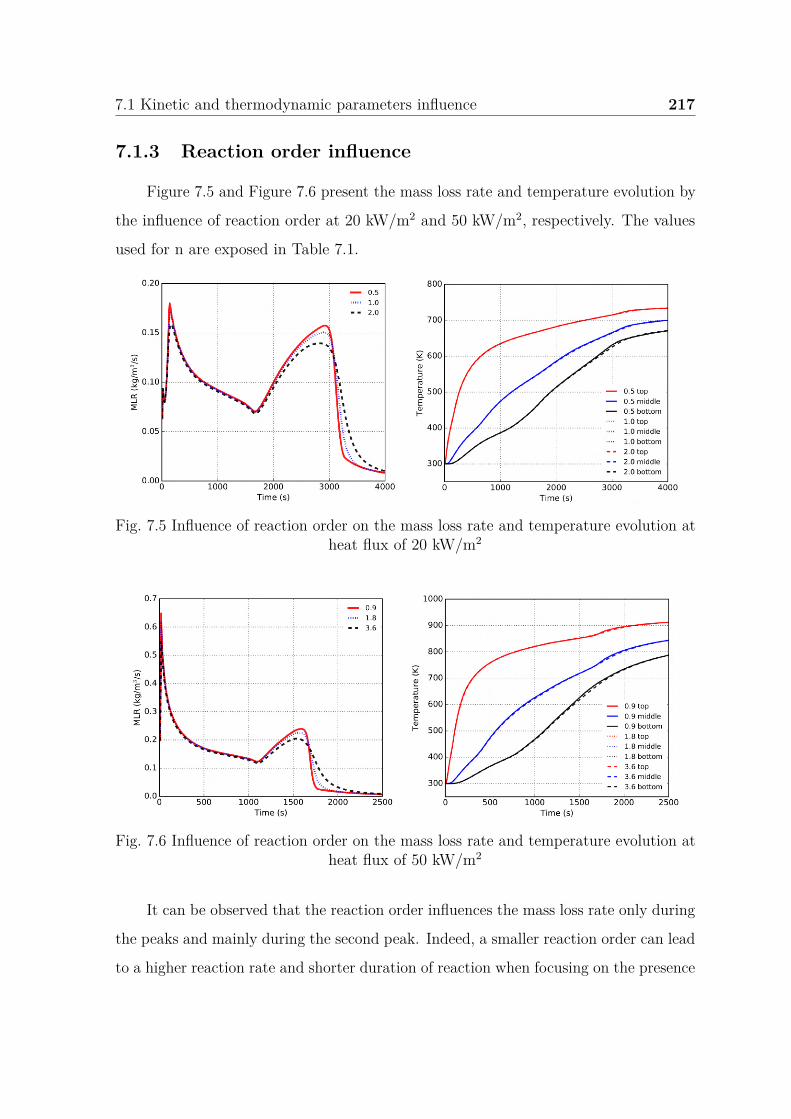
7.1 Kinetic and thermodynamic parameters influence 217
7.1.3 Reaction order influence
Figure 7.5 and Figure 7.6 present the mass loss rate and temperature evolution by
the influence of reaction order at 20 kW/m2 and 50 kW/m2, respectively. The values
used for n are exposed in Table 7.1.
Fig. 7.5 Influence of reaction order on the mass loss rate and temperature evolution atheat flux of 20 kW/m2
Fig. 7.6 Influence of reaction order on the mass loss rate and temperature evolution atheat flux of 50 kW/m2
It can be observed that the reaction order influences the mass loss rate only during
the peaks and mainly during the second peak. Indeed, a smaller reaction order can lead
to a higher reaction rate and shorter duration of reaction when focusing on the presence
218 Sensitivity analysis
of steeper evolution trend for the second peak. While for temperature evolution, no
apparent difference is observed under different heat flux. All these observations are
coherent to those found in earlier activation energy and pre-exponential factor influence
analysis. Indeed, for different heat fluxes, these three kinetic parameters play an
important role in the pyrolysis reaction rate whereas they have a limited effect on the
temperature in the condensed phase. Neglecting the effect of the range, it seems in
this preliminary study, that the activation energy can have the most important effect
on the pyrolysis reaction. Correspondingly, the pre-exponential factor’s influence is
lower than the activation energy and the least importance can be given by the reaction
order.
To conclude concerning the kinetics parameters (A, E, n) influence, they should
be responsible to involve chemical reaction part in the pyrolysis process. Then, if the
kinetic is highly influential, these three parameters should be predicted precisely and
correctly. For example, we have demonstrated that the heating rate can influence the
kinetics with a “non-linear” form even during the relatively small different heating
process at the TGA scale. At a larger scale with a high heating process, the kinetics
difference is believed to be higher and the correct chemical kinetics can’t be obtained.
This is still a challenge and more focus should be paid in the future. However, if our
studies rely on the fire pyrolysis engineering field to predict the temperature profile
inside the condensed phase, then the kinetic parameters can be neglected. This last
conclusion should be paid attention. Indeed in this study, the pyrolysis process is linked
to the heat transfer process in the model used through the enthalpy of decomposition
and then the convection and diffusion process of gas released through the pores of
the solid. Here the sensitivity analysis has been made with a quite low “endothermic”
enthalpy of decomposition. For reactions with a higher “endothermic’ enthalpy of
decomposition, the change of chemistry (through kinetic parameters) could have more
influence on temperatures.
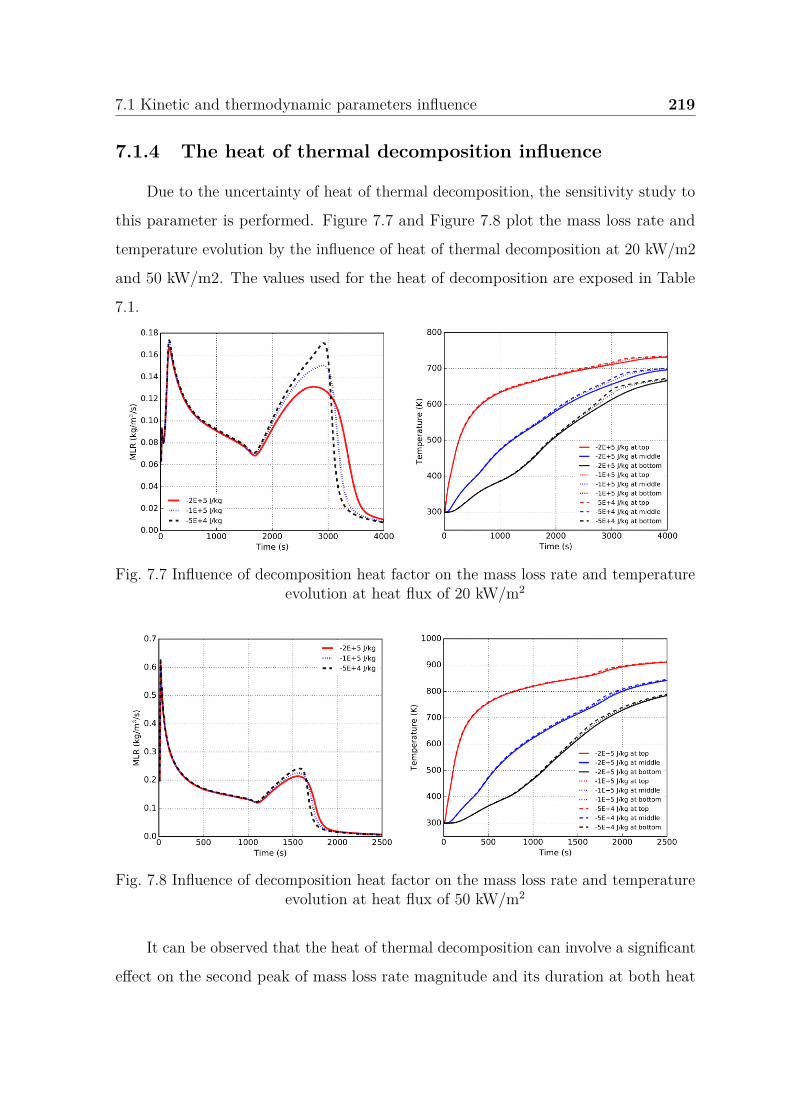
7.1 Kinetic and thermodynamic parameters influence 219
7.1.4 The heat of thermal decomposition influence
Due to the uncertainty of heat of thermal decomposition, the sensitivity study to
this parameter is performed. Figure 7.7 and Figure 7.8 plot the mass loss rate and
temperature evolution by the influence of heat of thermal decomposition at 20 kW/m2
and 50 kW/m2. The values used for the heat of decomposition are exposed in Table
7.1.
Fig. 7.7 Influence of decomposition heat factor on the mass loss rate and temperatureevolution at heat flux of 20 kW/m2
Fig. 7.8 Influence of decomposition heat factor on the mass loss rate and temperatureevolution at heat flux of 50 kW/m2
It can be observed that the heat of thermal decomposition can involve a significant
effect on the second peak of mass loss rate magnitude and its duration at both heat
220 Sensitivity analysis
fluxes. Higher intensity of mass loss rate and shorter duration of the second peak can
present with lower energy absorption. The first peak of mass loss rate presents quite
good similarities under different values of decomposition heat. This phenomenon can
be explained by infinitely fast reactions occurring with a high heating rate and high
temperature at the wood surface. This can also explain that more apparent influence
can be found for the second peak of the reaction rate at 20 kW/m2 compared with the
one at 50 kW/m2, due to higher temperature distribution at higher heat flux to start
the chemical reaction easily.
Again, no significant difference occurs by different heat of thermal decomposition.
This can also be testified by a very good superposition for the first reaction peak
at a high heat flux of 50 kW/m2. Indeed, at the initial stage, the chemical reaction
only occurs at the material surface. The pyrolysis process is limited by the heating
process due to the fact that small heat is accumulated in a deep location and then,
the heat is not sufficient to permit the pyrolysis reaction which means that the heat
of decomposition has no influence. Conversely, in this study compared with a lower
heat flux of 20 kW/m2, the higher heat flux of 50 kW/m2 could lead to pyrolysis
reaction of short time length. Thus, the effect of the heat of thermal decomposition
on the initial pyrolysis stage can be neglected in this study. This can also explain the
different evolution trends of temperature evolution at different in-depth locations. On
the contrary, during the second peak of mass loss rate, the heating rate is smaller while
a large amount of heat is accumulated by heat conduction along with the heat feedback
of silicate thermal insulation. Strong pyrolysis reaction occurs due to a large mass
fraction of remaining virgin material. Indeed, at this stage, the remaining mass can be a
leading factor to contribute to the large second reaction peak. Therefore, the pyrolysis
process is limited by chemical reaction and different heats of decomposition can give
many serious differences at this location (near the material bottom surface) on the mass
loss rate evolution and the corresponding temperature evolution. When comparing
the different levels of influence on the reaction rate at different heat fluxes, similar
observations can be obtained with a more serious impact on the temperature evolution
7.2 Thermal and physical parameters influence 221
at lower heat flux. Indeed, the heat of decomposition represents the correlation of
reaction and heat, more serious reaction means more heat is absorbed as a heat sink.
Thus, the temperature is lower, this can be seen at approximately 3000 s concerning
temperature evolution especially at 20 kW/m2 in Figure 7.7.
To conclude this part, the pyrolysis stage at the second peak of the mass loss rate
is highly sensitive to the heat of thermal decomposition. However, the pyrolysis stage
prior to the second peak is insensitive to the heat of decomposition. Temperature
evolution is slightly sensitive to the heat of decomposition only at the duration of the
second peak, where strong reactions take place. The influence on the bottom location
is more serious compared with the location of the top and middle. The pyrolysis case
at lower heat flux is more sensitive to the heat of decomposition, while at higher heat
flux, the influence is moderate. It can demonstrate that when conducting relevant
pyrolysis studies, much more attention should be paid if they involve low-temperature
environment.
7.2 Thermal and physical parameters influence
Thermal and physical parameters can reflect the heat and mass transfer behavior
during the pyrolysis process. These parameters are mainly including virgin thermal
conductivity (virgin k), char thermal conductivity (char k), virgin specific heat capacity
(virgin cp), char specific heat capacity (char cp), virgin permeability (virgin K), char
permeability (char K), emissivity (ε), and absorptivity (α). The emissivity and
absorptivity are assumed to be identical in this study.
The variation range of thermophysical parameters is mainly selected by the common
practice used in the literature. For example, it is reported that some thermophysical
parameters could vary by approximately 10% such as thermal conductivity and specific
heat capacity [32, 74]. This variation value can also be found in [128, 126] due to
the different uncertainty levels of related parameters and the variation range of 10%
is commonly used for these studies. Thus, for specific heat capacity and thermal
222 Sensitivity analysis
conductivity, their values will be changed approximately in this study by minus or
plus 10% of average nominal values to conduct the sensitivity analysis. Indeed, the
thermophysical parameters are highly dependent on temperature, they can involve
large differences concerning thermal conductivity and specific heat capacity [101].
The emissivity is the material surface properties representing the capacity of
surface heat radiation to the ambient atmosphere. During the pyrolysis experiment,
it is observed that the material surface can be relatively slow or fast to form a char
layer. Indeed, at a low heating rate, the char formation process is quite slow. Thus,
the virgin emissivity can have some influence due to it needs some time to convert to
char. However, when under a high heating rate, the surface instantaneously presents a
char layer, thus, the virgin emissivity can be reasonably neglected. For the two heat
flux employed in this study, it is observed that even at the location of 4mm beneath
the top surface of the material, the heating rate can attain more than approximately
150 K/min for both heat flux. Thus, the virgin emissivity can only have little influence
just during the very short onset time. Furthermore, after this stage, all the emissivity
is determined totally by char properties through the rest pyrolysis process in case of
no in-depth radiation absorption reaching the virgin layer under the char layer. In this
study, only the char properties are used. For the char emissivity, some reported values
concern 0.88 [98] and 0.9 [55]. However, due to the uncertain properties, as discussed
in the literature review [80, 81], a larger variation range is given, from 0.8 to 1.0.
For wood permeability, the reported values are 7.5×10⁻¹³ m2 [98] and 1.0×10⁻¹⁴
m2 [55]. Consequently, the variation range in this study is changing from 1.0×10⁻¹³
m2 to 1.0×10⁻¹⁵ m2 to increase a little more or less. For char permeability, the
corresponding literature values are approximately with 1.0×10⁻¹¹ m2 [98, 55]. Similar
with wood permeability, they are changed from 1.0×10⁻¹² m2 to 1.0×10⁻¹⁰ m2.
The corresponding thermal and physical parameters are collected in Table 7.2.
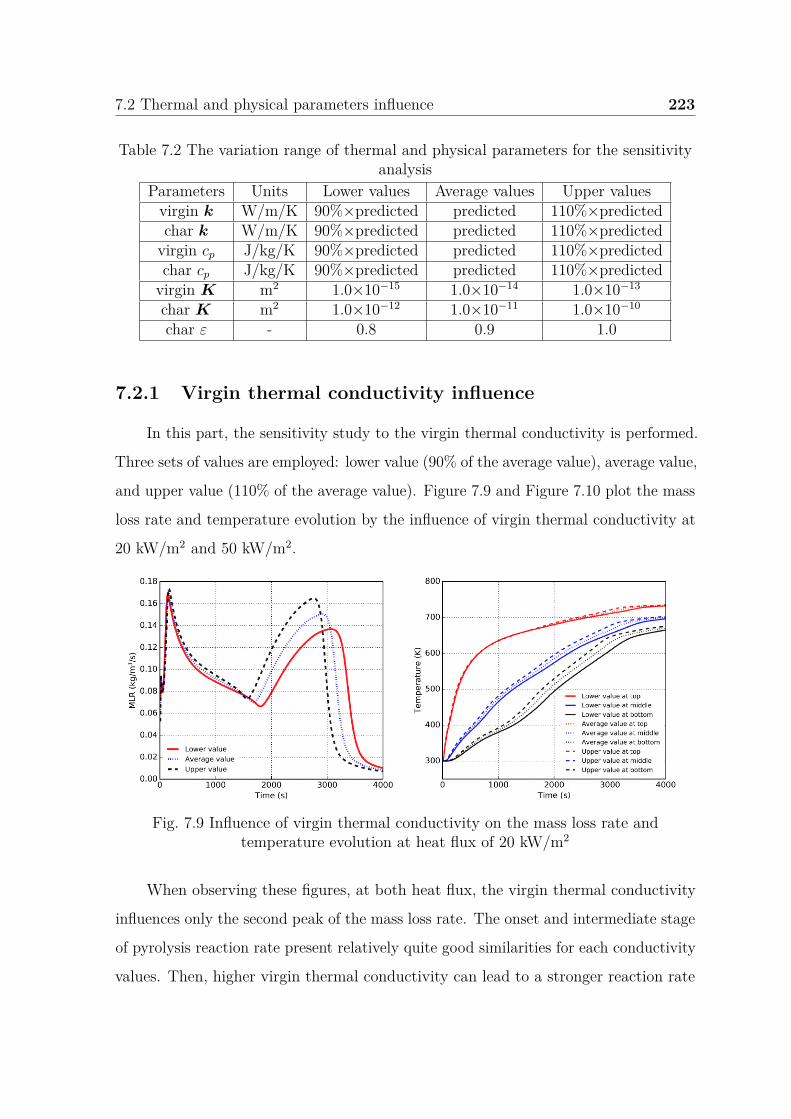
7.2 Thermal and physical parameters influence 223
Table 7.2 The variation range of thermal and physical parameters for the sensitivityanalysis
Parameters Units Lower values Average values Upper valuesvirgin k W/m/K 90%×predicted predicted 110%×predictedchar k W/m/K 90%×predicted predicted 110%×predicted
virgin cp J/kg/K 90%×predicted predicted 110%×predictedchar cp J/kg/K 90%×predicted predicted 110%×predicted
virgin K m2 1.0×10⁻¹⁵ 1.0×10⁻¹⁴ 1.0×10⁻¹³
char K m2 1.0×10⁻¹² 1.0×10⁻¹¹ 1.0×10⁻¹⁰
char ε - 0.8 0.9 1.0
7.2.1 Virgin thermal conductivity influence
In this part, the sensitivity study to the virgin thermal conductivity is performed.
Three sets of values are employed: lower value (90% of the average value), average value,
and upper value (110% of the average value). Figure 7.9 and Figure 7.10 plot the mass
loss rate and temperature evolution by the influence of virgin thermal conductivity at
20 kW/m2 and 50 kW/m2.
Fig. 7.9 Influence of virgin thermal conductivity on the mass loss rate andtemperature evolution at heat flux of 20 kW/m2
When observing these figures, at both heat flux, the virgin thermal conductivity
influences only the second peak of the mass loss rate. The onset and intermediate stage
of pyrolysis reaction rate present relatively quite good similarities for each conductivity
values. Then, higher virgin thermal conductivity can lead to a stronger reaction rate
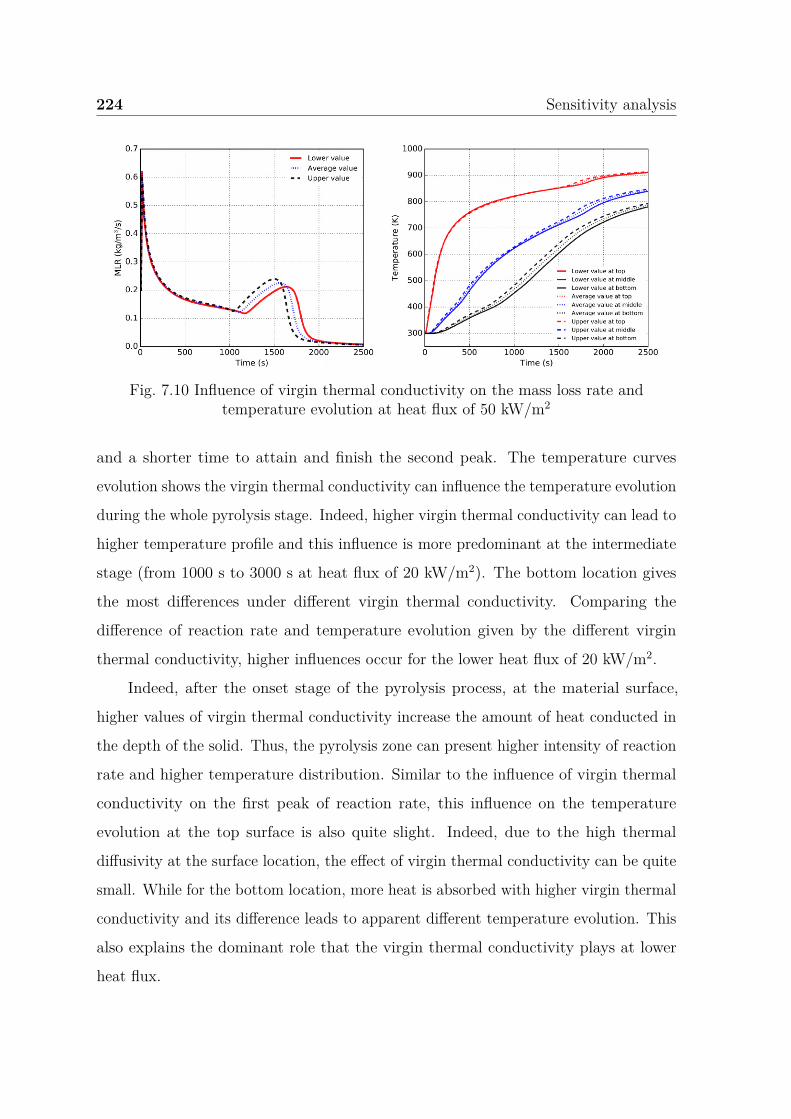
224 Sensitivity analysis
Fig. 7.10 Influence of virgin thermal conductivity on the mass loss rate andtemperature evolution at heat flux of 50 kW/m2
and a shorter time to attain and finish the second peak. The temperature curves
evolution shows the virgin thermal conductivity can influence the temperature evolution
during the whole pyrolysis stage. Indeed, higher virgin thermal conductivity can lead to
higher temperature profile and this influence is more predominant at the intermediate
stage (from 1000 s to 3000 s at heat flux of 20 kW/m2). The bottom location gives
the most differences under different virgin thermal conductivity. Comparing the
difference of reaction rate and temperature evolution given by the different virgin
thermal conductivity, higher influences occur for the lower heat flux of 20 kW/m2.
Indeed, after the onset stage of the pyrolysis process, at the material surface,
higher values of virgin thermal conductivity increase the amount of heat conducted in
the depth of the solid. Thus, the pyrolysis zone can present higher intensity of reaction
rate and higher temperature distribution. Similar to the influence of virgin thermal
conductivity on the first peak of reaction rate, this influence on the temperature
evolution at the top surface is also quite slight. Indeed, due to the high thermal
diffusivity at the surface location, the effect of virgin thermal conductivity can be quite
small. While for the bottom location, more heat is absorbed with higher virgin thermal
conductivity and its difference leads to apparent different temperature evolution. This
also explains the dominant role that the virgin thermal conductivity plays at lower
heat flux.
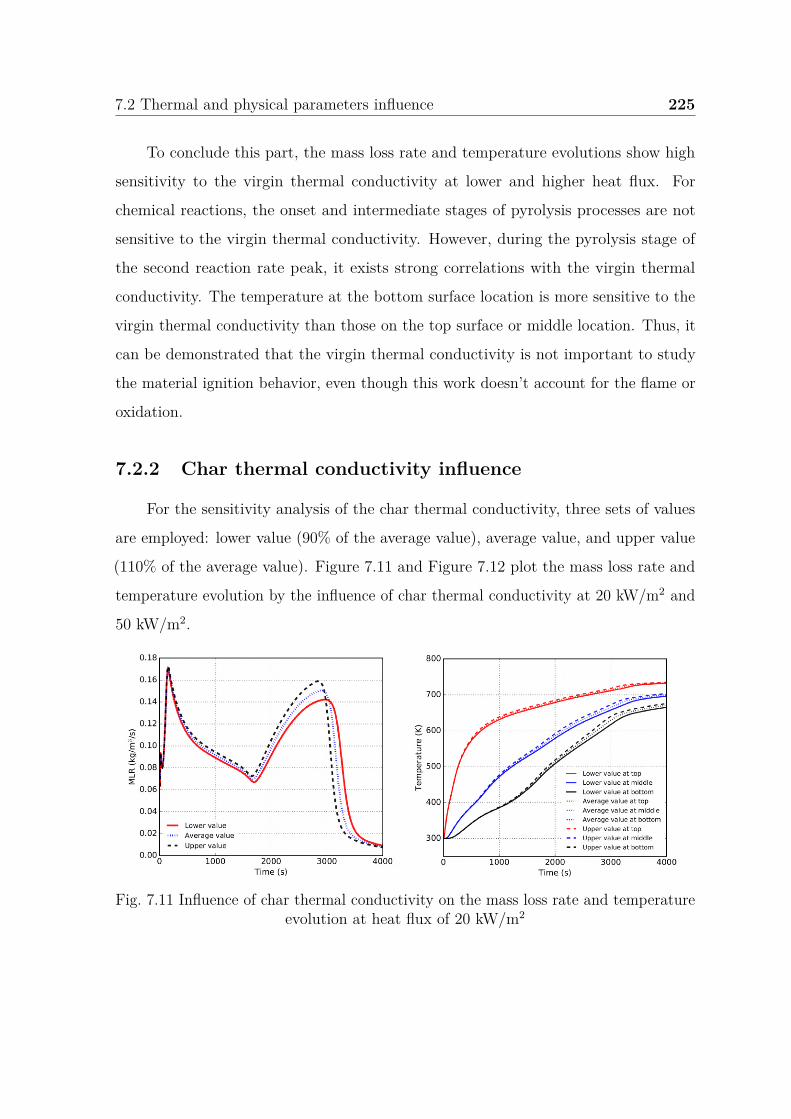
7.2 Thermal and physical parameters influence 225
To conclude this part, the mass loss rate and temperature evolutions show high
sensitivity to the virgin thermal conductivity at lower and higher heat flux. For
chemical reactions, the onset and intermediate stages of pyrolysis processes are not
sensitive to the virgin thermal conductivity. However, during the pyrolysis stage of
the second reaction rate peak, it exists strong correlations with the virgin thermal
conductivity. The temperature at the bottom surface location is more sensitive to the
virgin thermal conductivity than those on the top surface or middle location. Thus, it
can be demonstrated that the virgin thermal conductivity is not important to study
the material ignition behavior, even though this work doesn’t account for the flame or
oxidation.
7.2.2 Char thermal conductivity influence
For the sensitivity analysis of the char thermal conductivity, three sets of values
are employed: lower value (90% of the average value), average value, and upper value
(110% of the average value). Figure 7.11 and Figure 7.12 plot the mass loss rate and
temperature evolution by the influence of char thermal conductivity at 20 kW/m2 and
50 kW/m2.
Fig. 7.11 Influence of char thermal conductivity on the mass loss rate and temperatureevolution at heat flux of 20 kW/m2
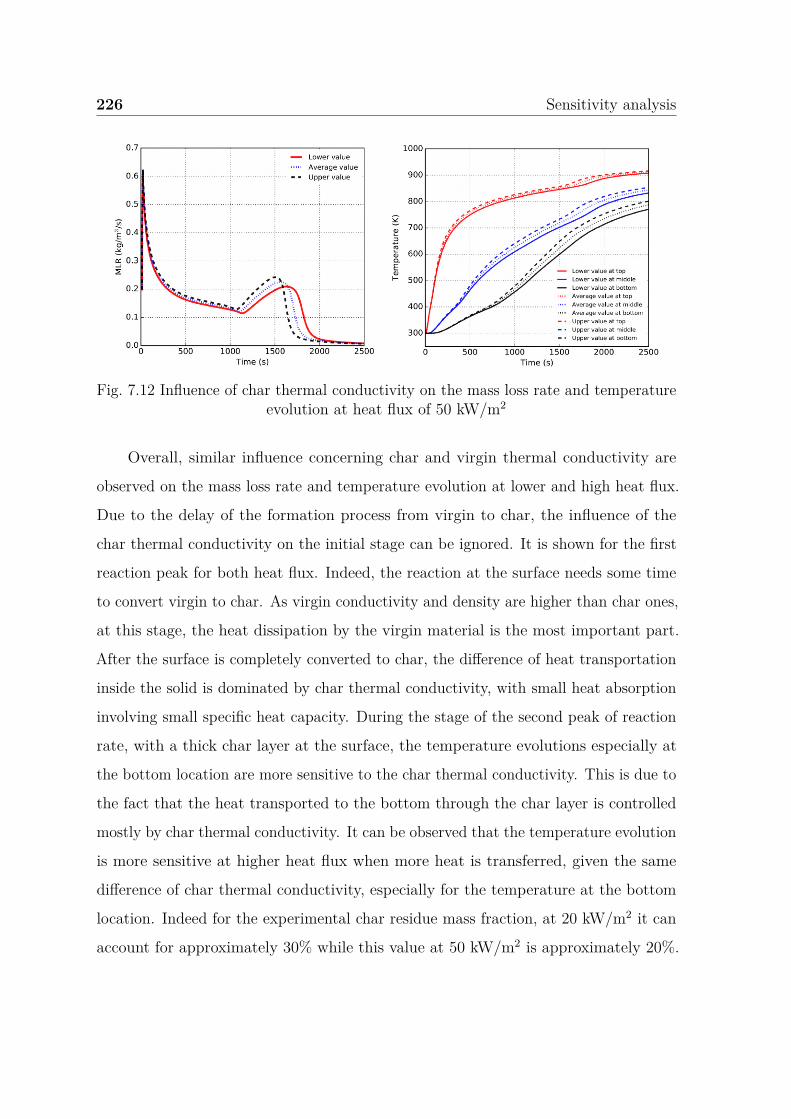
226 Sensitivity analysis
Fig. 7.12 Influence of char thermal conductivity on the mass loss rate and temperatureevolution at heat flux of 50 kW/m2
Overall, similar influence concerning char and virgin thermal conductivity are
observed on the mass loss rate and temperature evolution at lower and high heat flux.
Due to the delay of the formation process from virgin to char, the influence of the
char thermal conductivity on the initial stage can be ignored. It is shown for the first
reaction peak for both heat flux. Indeed, the reaction at the surface needs some time
to convert virgin to char. As virgin conductivity and density are higher than char ones,
at this stage, the heat dissipation by the virgin material is the most important part.
After the surface is completely converted to char, the difference of heat transportation
inside the solid is dominated by char thermal conductivity, with small heat absorption
involving small specific heat capacity. During the stage of the second peak of reaction
rate, with a thick char layer at the surface, the temperature evolutions especially at
the bottom location are more sensitive to the char thermal conductivity. This is due to
the fact that the heat transported to the bottom through the char layer is controlled
mostly by char thermal conductivity. It can be observed that the temperature evolution
is more sensitive at higher heat flux when more heat is transferred, given the same
difference of char thermal conductivity, especially for the temperature at the bottom
location. Indeed for the experimental char residue mass fraction, at 20 kW/m2 it can
account for approximately 30% while this value at 50 kW/m2 is approximately 20%.
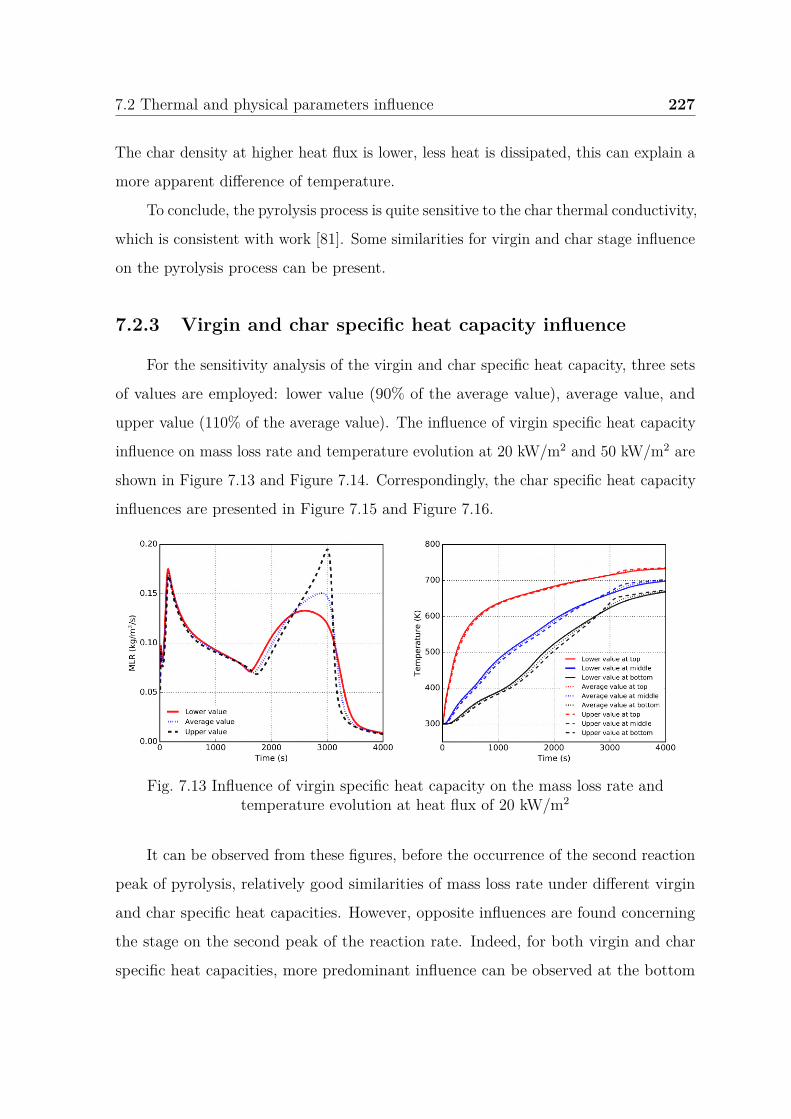
7.2 Thermal and physical parameters influence 227
The char density at higher heat flux is lower, less heat is dissipated, this can explain a
more apparent difference of temperature.
To conclude, the pyrolysis process is quite sensitive to the char thermal conductivity,
which is consistent with work [81]. Some similarities for virgin and char stage influence
on the pyrolysis process can be present.
7.2.3 Virgin and char specific heat capacity influence
For the sensitivity analysis of the virgin and char specific heat capacity, three sets
of values are employed: lower value (90% of the average value), average value, and
upper value (110% of the average value). The influence of virgin specific heat capacity
influence on mass loss rate and temperature evolution at 20 kW/m2 and 50 kW/m2 are
shown in Figure 7.13 and Figure 7.14. Correspondingly, the char specific heat capacity
influences are presented in Figure 7.15 and Figure 7.16.
Fig. 7.13 Influence of virgin specific heat capacity on the mass loss rate andtemperature evolution at heat flux of 20 kW/m2
It can be observed from these figures, before the occurrence of the second reaction
peak of pyrolysis, relatively good similarities of mass loss rate under different virgin
and char specific heat capacities. However, opposite influences are found concerning
the stage on the second peak of the reaction rate. Indeed, for both virgin and char
specific heat capacities, more predominant influence can be observed at the bottom
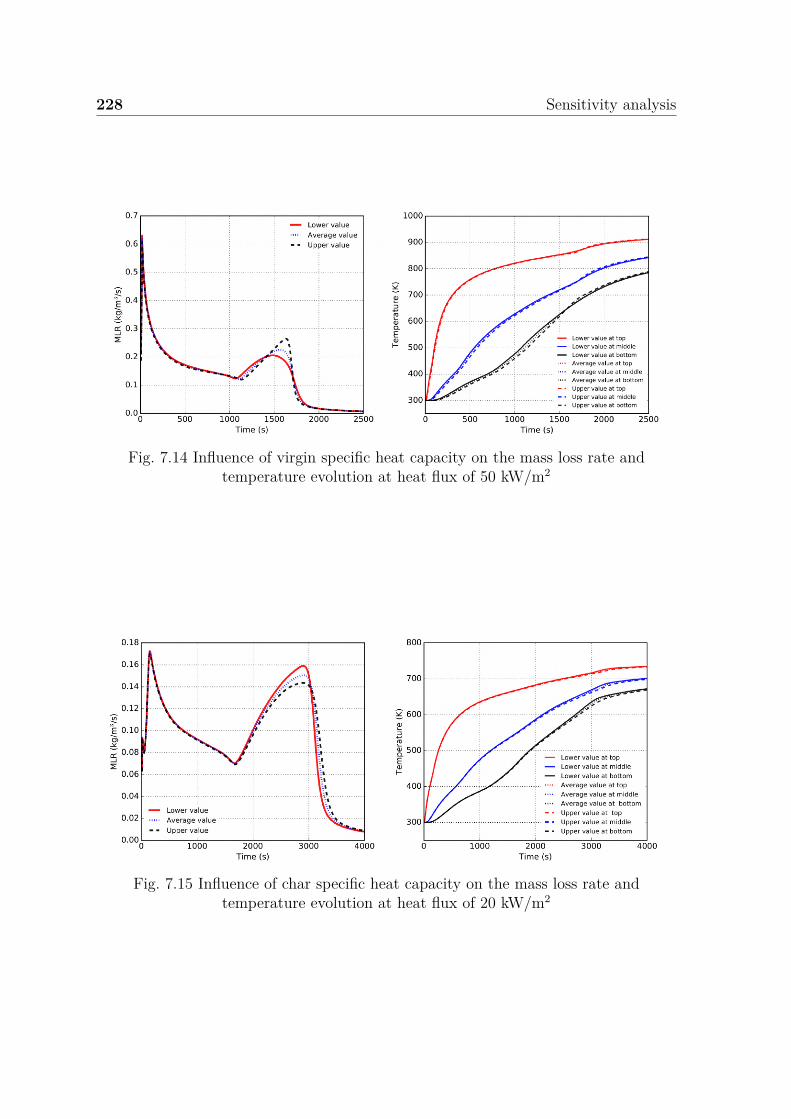
228 Sensitivity analysis
Fig. 7.14 Influence of virgin specific heat capacity on the mass loss rate andtemperature evolution at heat flux of 50 kW/m2
Fig. 7.15 Influence of char specific heat capacity on the mass loss rate andtemperature evolution at heat flux of 20 kW/m2
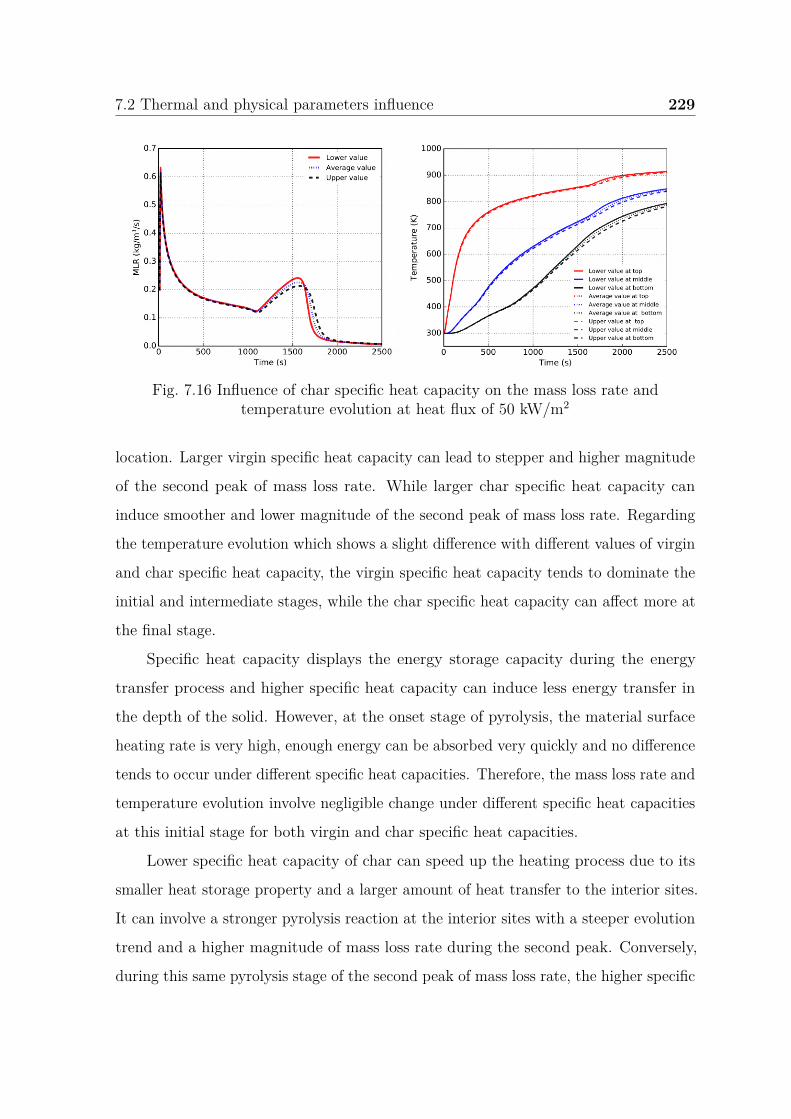
7.2 Thermal and physical parameters influence 229
Fig. 7.16 Influence of char specific heat capacity on the mass loss rate andtemperature evolution at heat flux of 50 kW/m2
location. Larger virgin specific heat capacity can lead to stepper and higher magnitude
of the second peak of mass loss rate. While larger char specific heat capacity can
induce smoother and lower magnitude of the second peak of mass loss rate. Regarding
the temperature evolution which shows a slight difference with different values of virgin
and char specific heat capacity, the virgin specific heat capacity tends to dominate the
initial and intermediate stages, while the char specific heat capacity can affect more at
the final stage.
Specific heat capacity displays the energy storage capacity during the energy
transfer process and higher specific heat capacity can induce less energy transfer in
the depth of the solid. However, at the onset stage of pyrolysis, the material surface
heating rate is very high, enough energy can be absorbed very quickly and no difference
tends to occur under different specific heat capacities. Therefore, the mass loss rate and
temperature evolution involve negligible change under different specific heat capacities
at this initial stage for both virgin and char specific heat capacities.
Lower specific heat capacity of char can speed up the heating process due to its
smaller heat storage property and a larger amount of heat transfer to the interior sites.
It can involve a stronger pyrolysis reaction at the interior sites with a steeper evolution
trend and a higher magnitude of mass loss rate during the second peak. Conversely,
during this same pyrolysis stage of the second peak of mass loss rate, the higher specific
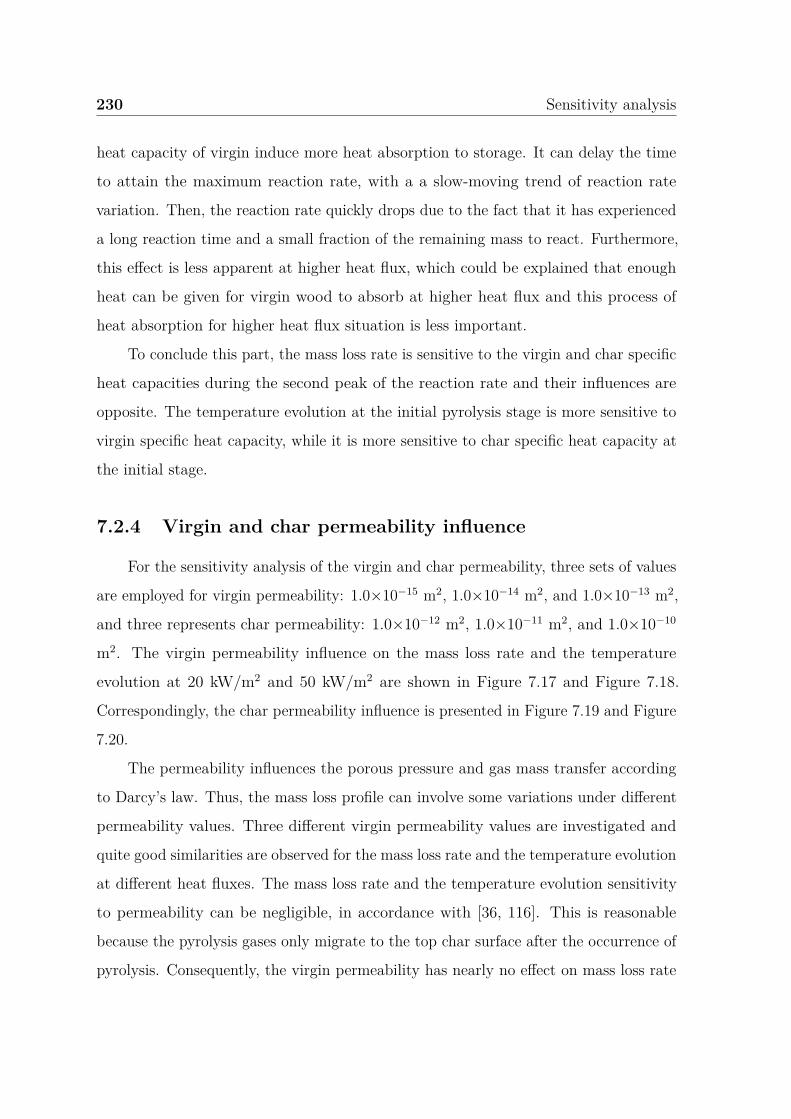
230 Sensitivity analysis
heat capacity of virgin induce more heat absorption to storage. It can delay the time
to attain the maximum reaction rate, with a a slow-moving trend of reaction rate
variation. Then, the reaction rate quickly drops due to the fact that it has experienced
a long reaction time and a small fraction of the remaining mass to react. Furthermore,
this effect is less apparent at higher heat flux, which could be explained that enough
heat can be given for virgin wood to absorb at higher heat flux and this process of
heat absorption for higher heat flux situation is less important.
To conclude this part, the mass loss rate is sensitive to the virgin and char specific
heat capacities during the second peak of the reaction rate and their influences are
opposite. The temperature evolution at the initial pyrolysis stage is more sensitive to
virgin specific heat capacity, while it is more sensitive to char specific heat capacity at
the initial stage.
7.2.4 Virgin and char permeability influence
For the sensitivity analysis of the virgin and char permeability, three sets of values
are employed for virgin permeability: 1.0×10⁻¹⁵ m2, 1.0×10⁻¹⁴ m2, and 1.0×10⁻¹³ m2,
and three represents char permeability: 1.0×10⁻¹² m2, 1.0×10⁻¹¹ m2, and 1.0×10⁻¹⁰
m2. The virgin permeability influence on the mass loss rate and the temperature
evolution at 20 kW/m2 and 50 kW/m2 are shown in Figure 7.17 and Figure 7.18.
Correspondingly, the char permeability influence is presented in Figure 7.19 and Figure
7.20.
The permeability influences the porous pressure and gas mass transfer according
to Darcy’s law. Thus, the mass loss profile can involve some variations under different
permeability values. Three different virgin permeability values are investigated and
quite good similarities are observed for the mass loss rate and the temperature evolution
at different heat fluxes. The mass loss rate and the temperature evolution sensitivity
to permeability can be negligible, in accordance with [36, 116]. This is reasonable
because the pyrolysis gases only migrate to the top char surface after the occurrence of
pyrolysis. Consequently, the virgin permeability has nearly no effect on mass loss rate
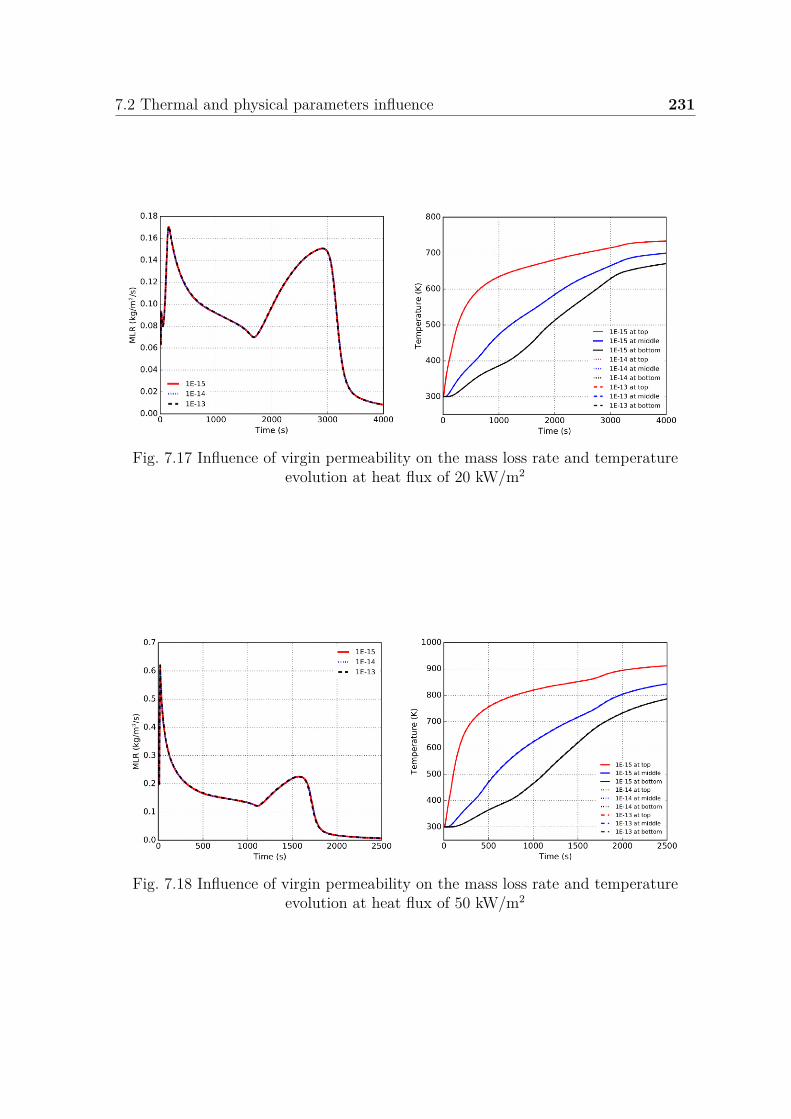
7.2 Thermal and physical parameters influence 231
Fig. 7.17 Influence of virgin permeability on the mass loss rate and temperatureevolution at heat flux of 20 kW/m2
Fig. 7.18 Influence of virgin permeability on the mass loss rate and temperatureevolution at heat flux of 50 kW/m2
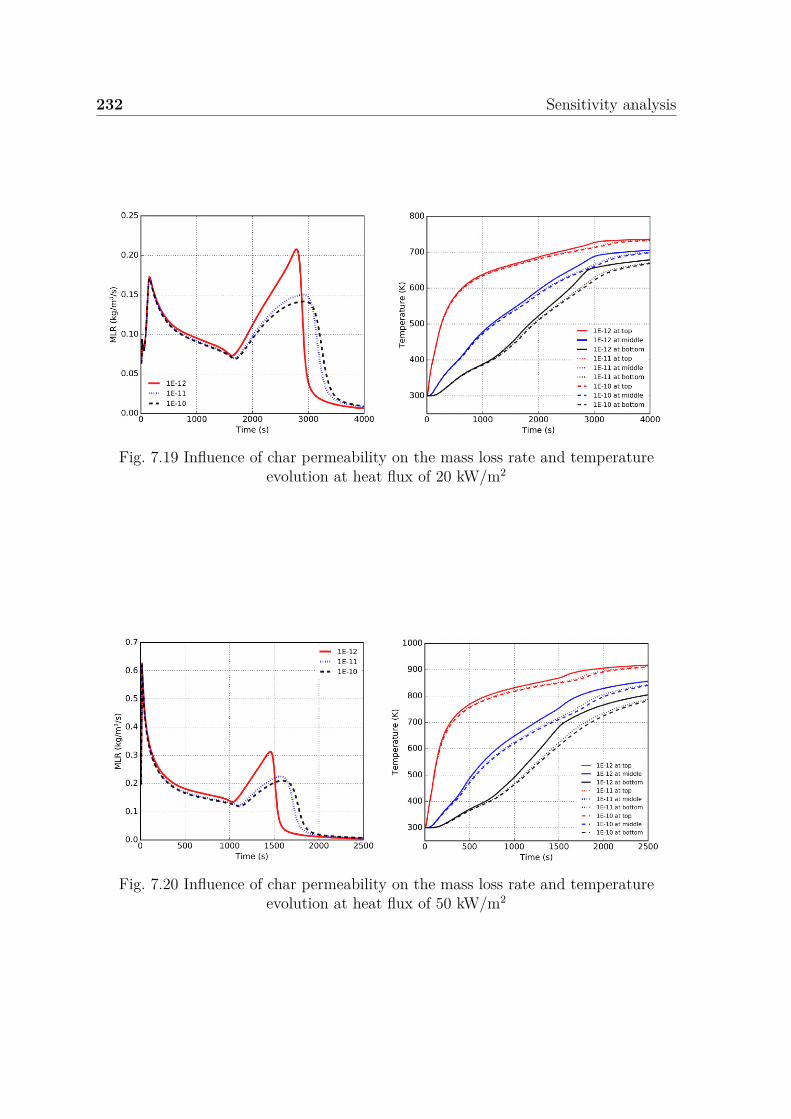
232 Sensitivity analysis
Fig. 7.19 Influence of char permeability on the mass loss rate and temperatureevolution at heat flux of 20 kW/m2
Fig. 7.20 Influence of char permeability on the mass loss rate and temperatureevolution at heat flux of 50 kW/m2
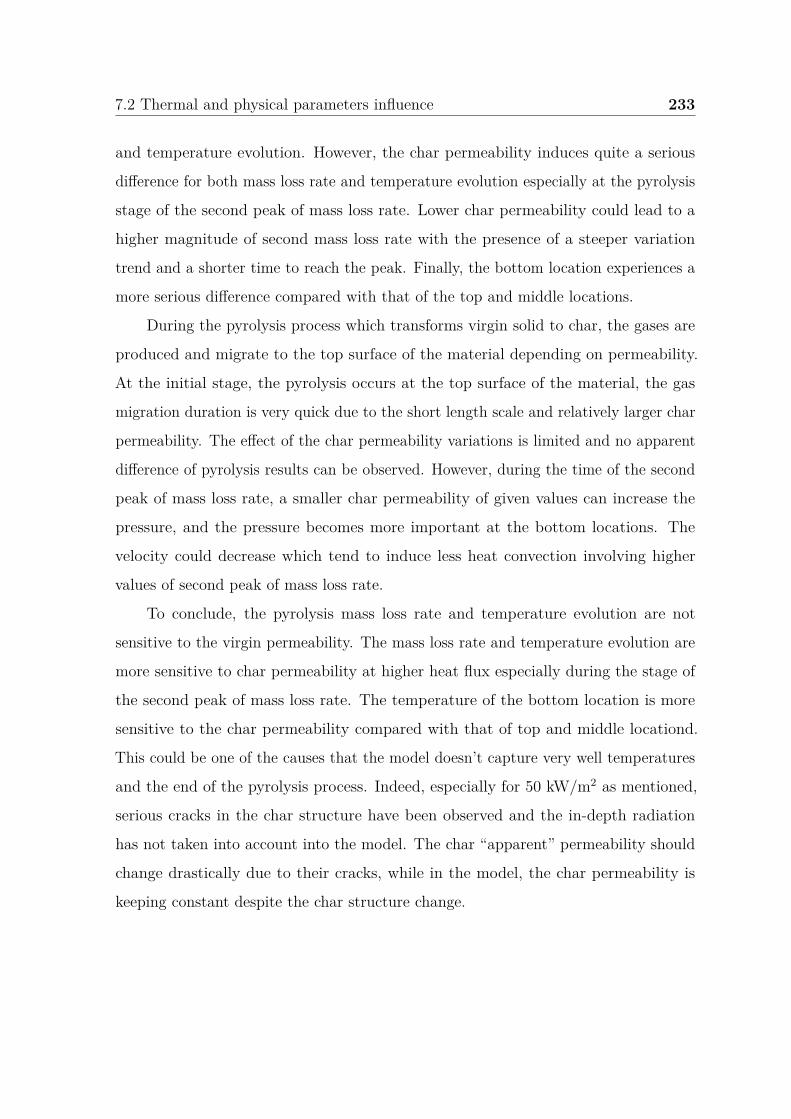
7.2 Thermal and physical parameters influence 233
and temperature evolution. However, the char permeability induces quite a serious
difference for both mass loss rate and temperature evolution especially at the pyrolysis
stage of the second peak of mass loss rate. Lower char permeability could lead to a
higher magnitude of second mass loss rate with the presence of a steeper variation
trend and a shorter time to reach the peak. Finally, the bottom location experiences a
more serious difference compared with that of the top and middle locations.
During the pyrolysis process which transforms virgin solid to char, the gases are
produced and migrate to the top surface of the material depending on permeability.
At the initial stage, the pyrolysis occurs at the top surface of the material, the gas
migration duration is very quick due to the short length scale and relatively larger char
permeability. The effect of the char permeability variations is limited and no apparent
difference of pyrolysis results can be observed. However, during the time of the second
peak of mass loss rate, a smaller char permeability of given values can increase the
pressure, and the pressure becomes more important at the bottom locations. The
velocity could decrease which tend to induce less heat convection involving higher
values of second peak of mass loss rate.
To conclude, the pyrolysis mass loss rate and temperature evolution are not
sensitive to the virgin permeability. The mass loss rate and temperature evolution are
more sensitive to char permeability at higher heat flux especially during the stage of
the second peak of mass loss rate. The temperature of the bottom location is more
sensitive to the char permeability compared with that of top and middle locationd.
This could be one of the causes that the model doesn’t capture very well temperatures
and the end of the pyrolysis process. Indeed, especially for 50 kW/m2 as mentioned,
serious cracks in the char structure have been observed and the in-depth radiation
has not taken into account into the model. The char “apparent” permeability should
change drastically due to their cracks, while in the model, the char permeability is
keeping constant despite the char structure change.
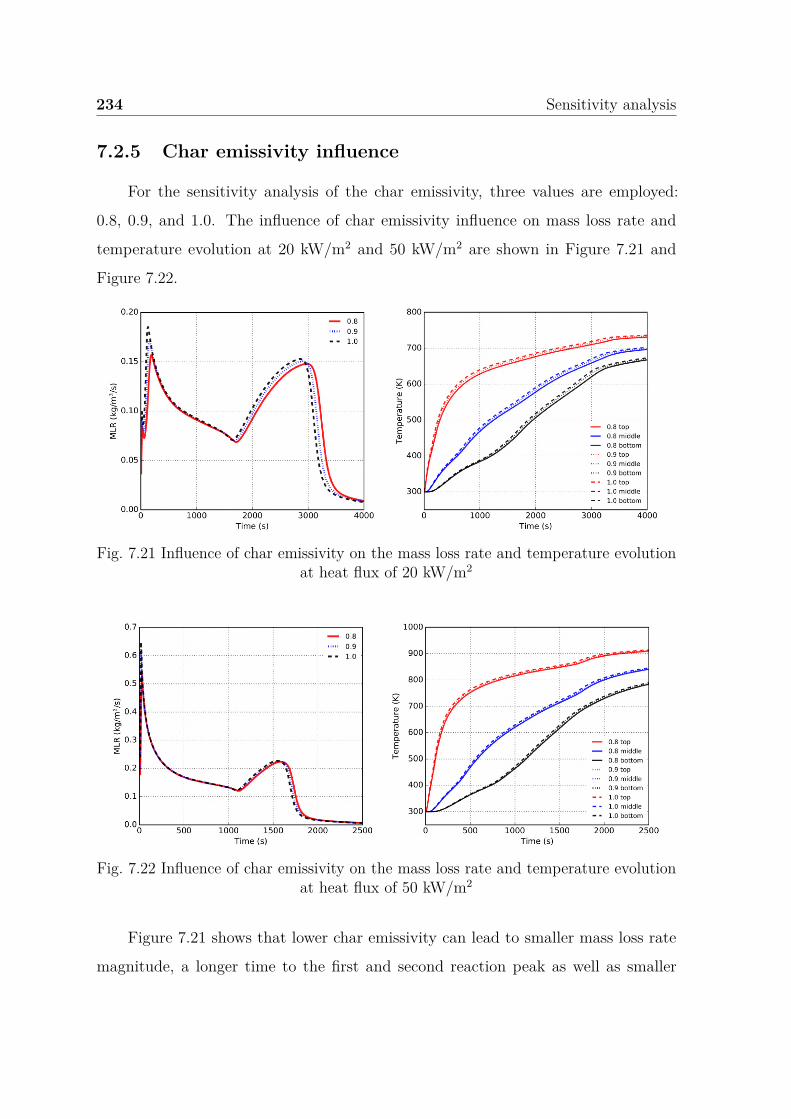
234 Sensitivity analysis
7.2.5 Char emissivity influence
For the sensitivity analysis of the char emissivity, three values are employed:
0.8, 0.9, and 1.0. The influence of char emissivity influence on mass loss rate and
temperature evolution at 20 kW/m2 and 50 kW/m2 are shown in Figure 7.21 and
Figure 7.22.
Fig. 7.21 Influence of char emissivity on the mass loss rate and temperature evolutionat heat flux of 20 kW/m2
Fig. 7.22 Influence of char emissivity on the mass loss rate and temperature evolutionat heat flux of 50 kW/m2
Figure 7.21 shows that lower char emissivity can lead to smaller mass loss rate
magnitude, a longer time to the first and second reaction peak as well as smaller
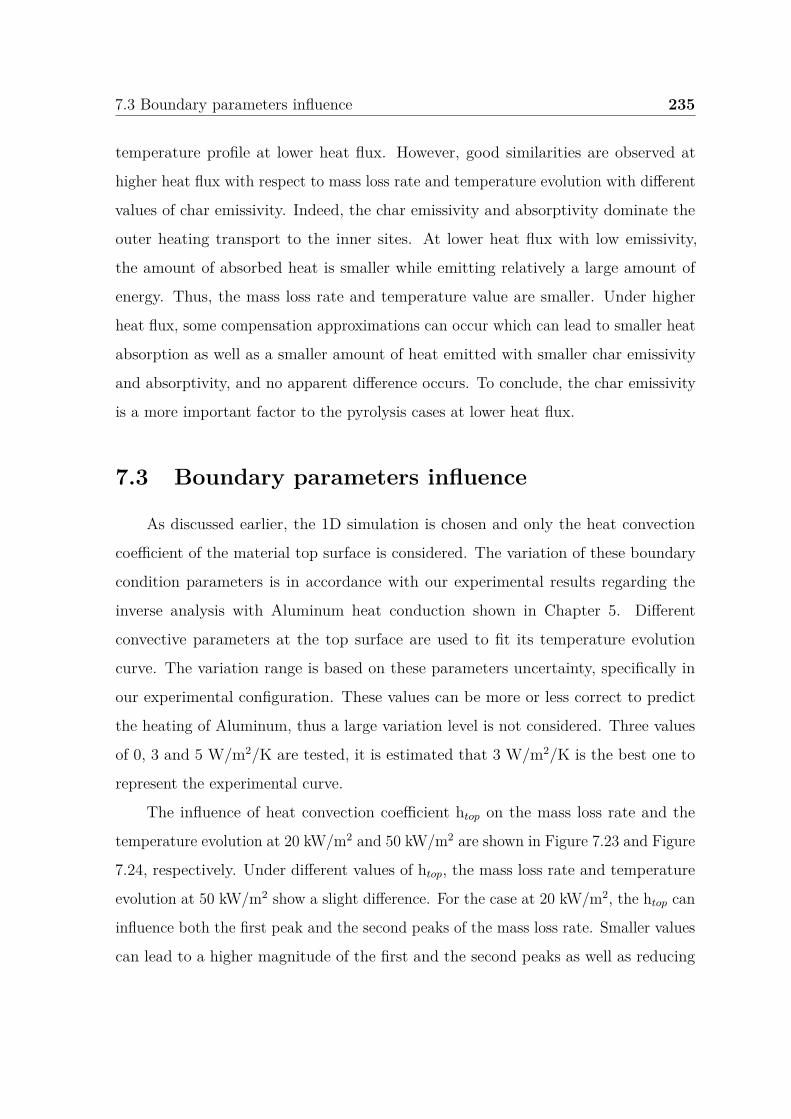
7.3 Boundary parameters influence 235
temperature profile at lower heat flux. However, good similarities are observed at
higher heat flux with respect to mass loss rate and temperature evolution with different
values of char emissivity. Indeed, the char emissivity and absorptivity dominate the
outer heating transport to the inner sites. At lower heat flux with low emissivity,
the amount of absorbed heat is smaller while emitting relatively a large amount of
energy. Thus, the mass loss rate and temperature value are smaller. Under higher
heat flux, some compensation approximations can occur which can lead to smaller heat
absorption as well as a smaller amount of heat emitted with smaller char emissivity
and absorptivity, and no apparent difference occurs. To conclude, the char emissivity
is a more important factor to the pyrolysis cases at lower heat flux.
7.3 Boundary parameters influence
As discussed earlier, the 1D simulation is chosen and only the heat convection
coefficient of the material top surface is considered. The variation of these boundary
condition parameters is in accordance with our experimental results regarding the
inverse analysis with Aluminum heat conduction shown in Chapter 5. Different
convective parameters at the top surface are used to fit its temperature evolution
curve. The variation range is based on these parameters uncertainty, specifically in
our experimental configuration. These values can be more or less correct to predict
the heating of Aluminum, thus a large variation level is not considered. Three values
of 0, 3 and 5 W/m2/K are tested, it is estimated that 3 W/m2/K is the best one to
represent the experimental curve.
The influence of heat convection coefficient htop on the mass loss rate and the
temperature evolution at 20 kW/m2 and 50 kW/m2 are shown in Figure 7.23 and Figure
7.24, respectively. Under different values of htop, the mass loss rate and temperature
evolution at 50 kW/m2 show a slight difference. For the case at 20 kW/m2, the htop can
influence both the first peak and the second peaks of the mass loss rate. Smaller values
can lead to a higher magnitude of the first and the second peaks as well as reducing
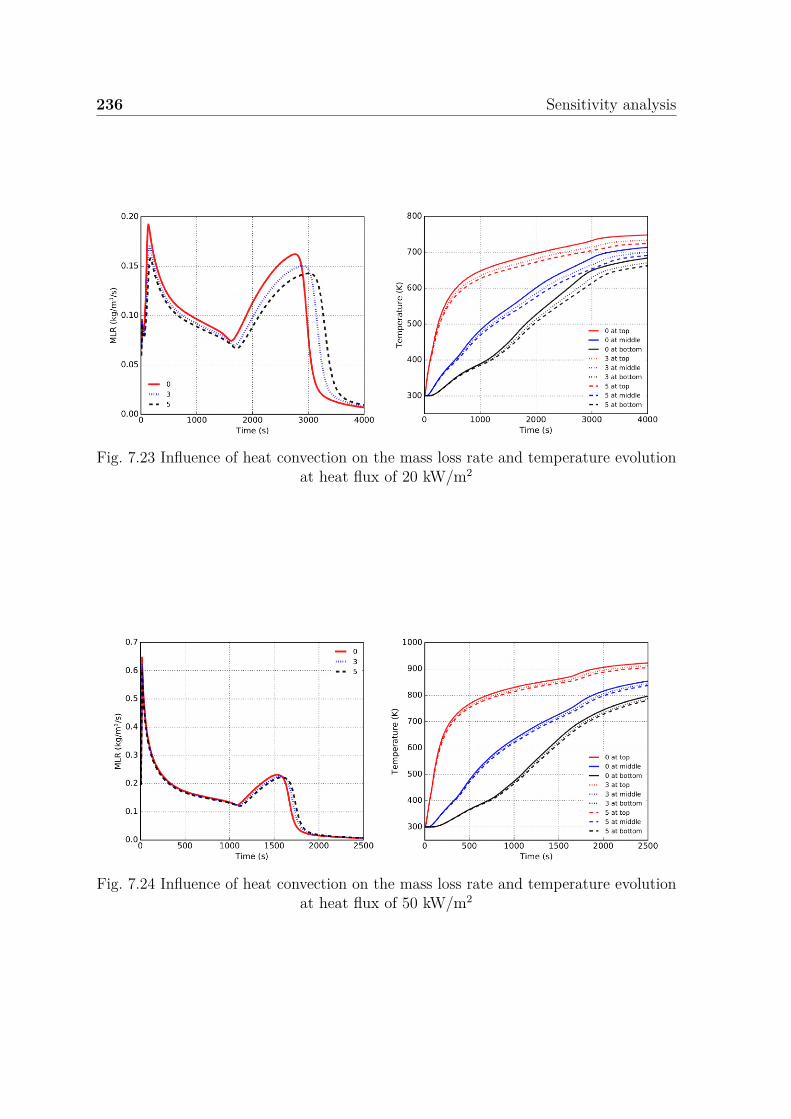
236 Sensitivity analysis
Fig. 7.23 Influence of heat convection on the mass loss rate and temperature evolutionat heat flux of 20 kW/m2
Fig. 7.24 Influence of heat convection on the mass loss rate and temperature evolutionat heat flux of 50 kW/m2
7.4 Water content influence 237
the time to the second peak. The temperature at the start in different locations shows
good similarities under different values of htop, while at the next pyrolysis stages, the
temperature at different locations presents some differences. These differences seem to
be homogeneous for the three locations.
Indeed, with a lower ambient temperature, the convective heat loss at the top
surface can influence a part of the heat that is not conducted inside the condensed
phase. At higher heat flux, the top surface absorbs more heat, thus the convective heat
loss under different convection coefficients are small compared with those absorbed
largely under high heat flux. However, for lower heat flux, this portion of convective
heat loss can account for a large amount of heat absorbed at this lower heat flux. It
can show more serious influence on the lower heat flux, while it has slight influence
on higher heat flux. To conclude, the mass loss rate and temperature evolution are
sensitive to the htop at lower heat flux while they are insensitive at higher heat flux.
In real fire when flame occurs, the heat convection at the surface of the solid still
a challenge for modeling. Indeed, to capture such phenomenon correctly very fine
mesh is needed or a specific well-defined model applicable with a coarse mesh. The
sensitivity of convection on pyrolysis process point out in this study demonstrate that
we should make effort to develop an appropriate model to capture the convection
process especially at ignition or extinction time where this process should be dominant
as demonstrate here because of strong impact when heat fluxes involves are low.
7.4 Water content influence
This part is focused on the moisture content uncertainty. The reason why we study
unreliable water content in wood is that water plays an important role in pyrolysis,
as we have already discussed concerning the pyrolysis of wet wood and dry wood
in Chapter 6. However, the way the water content influence under different heating
scenarios is not clear. The following part will study the wood pyrolysis behavior
containing different water content.
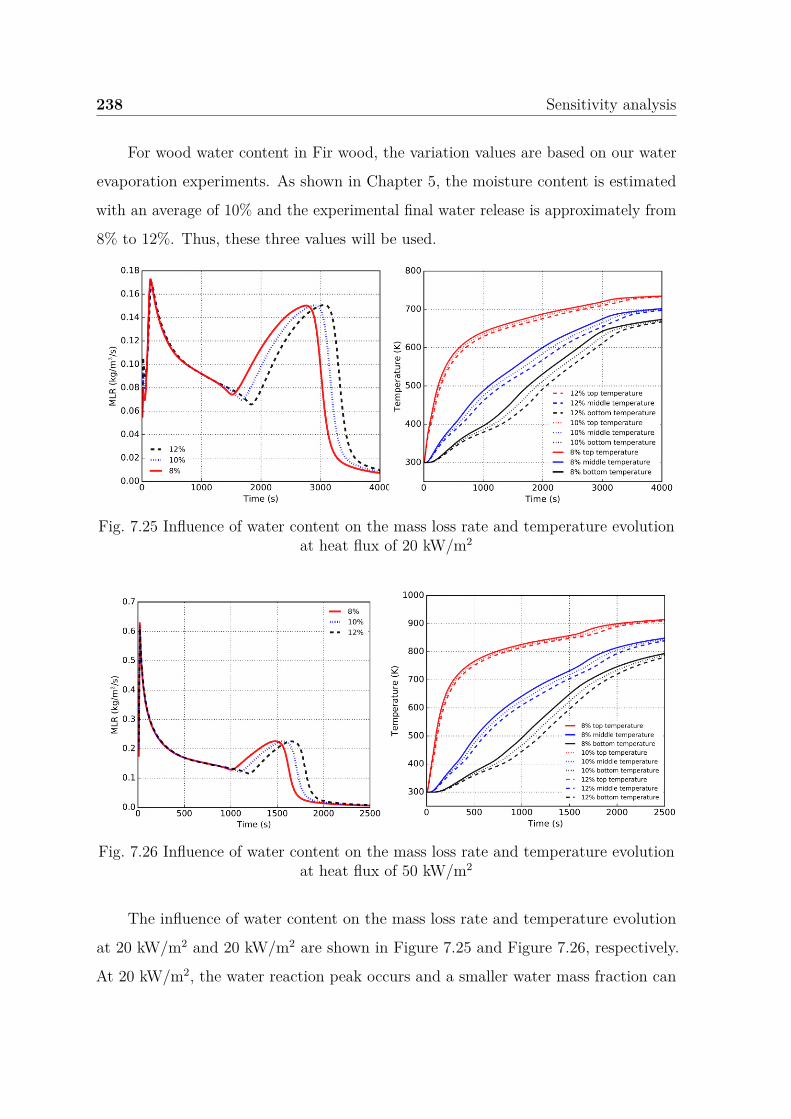
238 Sensitivity analysis
For wood water content in Fir wood, the variation values are based on our water
evaporation experiments. As shown in Chapter 5, the moisture content is estimated
with an average of 10% and the experimental final water release is approximately from
8% to 12%. Thus, these three values will be used.
Fig. 7.25 Influence of water content on the mass loss rate and temperature evolutionat heat flux of 20 kW/m2
Fig. 7.26 Influence of water content on the mass loss rate and temperature evolutionat heat flux of 50 kW/m2
The influence of water content on the mass loss rate and temperature evolution
at 20 kW/m2 and 20 kW/m2 are shown in Figure 7.25 and Figure 7.26, respectively.
At 20 kW/m2, the water reaction peak occurs and a smaller water mass fraction can
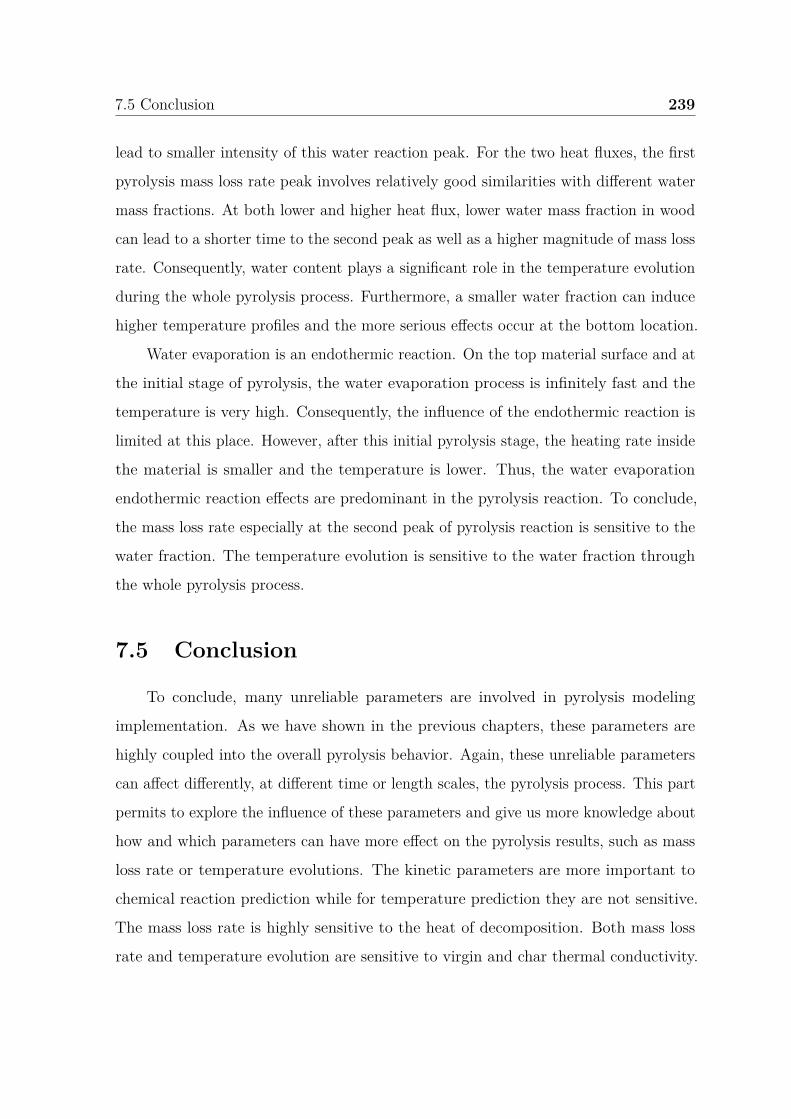
7.5 Conclusion 239
lead to smaller intensity of this water reaction peak. For the two heat fluxes, the first
pyrolysis mass loss rate peak involves relatively good similarities with different water
mass fractions. At both lower and higher heat flux, lower water mass fraction in wood
can lead to a shorter time to the second peak as well as a higher magnitude of mass loss
rate. Consequently, water content plays a significant role in the temperature evolution
during the whole pyrolysis process. Furthermore, a smaller water fraction can induce
higher temperature profiles and the more serious effects occur at the bottom location.
Water evaporation is an endothermic reaction. On the top material surface and at
the initial stage of pyrolysis, the water evaporation process is infinitely fast and the
temperature is very high. Consequently, the influence of the endothermic reaction is
limited at this place. However, after this initial pyrolysis stage, the heating rate inside
the material is smaller and the temperature is lower. Thus, the water evaporation
endothermic reaction effects are predominant in the pyrolysis reaction. To conclude,
the mass loss rate especially at the second peak of pyrolysis reaction is sensitive to the
water fraction. The temperature evolution is sensitive to the water fraction through
the whole pyrolysis process.
7.5 Conclusion
To conclude, many unreliable parameters are involved in pyrolysis modeling
implementation. As we have shown in the previous chapters, these parameters are
highly coupled into the overall pyrolysis behavior. Again, these unreliable parameters
can affect differently, at different time or length scales, the pyrolysis process. This part
permits to explore the influence of these parameters and give us more knowledge about
how and which parameters can have more effect on the pyrolysis results, such as mass
loss rate or temperature evolutions. The kinetic parameters are more important to
chemical reaction prediction while for temperature prediction they are not sensitive.
The mass loss rate is highly sensitive to the heat of decomposition. Both mass loss
rate and temperature evolution are sensitive to virgin and char thermal conductivity.
240 Sensitivity analysis
For virgin and char specific heat capacity, they are more important at lower heat flux.
The mass loss rate and temperature evolution are sensitive to char permeability and
insensitive to virgin permeability. The water content can be more important to the
material surface at the initial time thus for the material ignition study, this water effect
should be noticed. Again, the water content can influence the temperature evolution
through the whole pyrolysis process for different heat flux, but this influence on the
top surface at high heat flux can be negligible.
In the future, this water content should be put much emphasis, especially when
conducting some experiments at low heating environment. Similar to water content, the
char emissivity is more important in a lower heating environment and much attention
should be paid to determine this value. Char thermal conductivity is more important
than char specific heat capacity, but the char is quite uncertain and fragile with a
highly changing properties evolution. This is still a challenge to capture this aspect and
future studies should be given. Boundary heat convective coefficient is more important
in the low heating environment, however, these values are usually estimated dependent
on experimental conditions. In the future, this part should be highly experimentally
or numerically solved in order to know the correct heating loss circumstance at the
ambient environment.
Chapter 8
Conclusion and perspective
8.1 Conclusion
Natural or synthetic composite materials are used widely in different applications.
However, they are involved with high fire risks. Then, one actual large challenge is to
improve their fire safety properties, consisting of fire resistance and reaction to fire.
When considering the action of these materials during a fire, the thermal decomposition
step is very important and has to be understood and described with specific attention.
Indeed, a solid has a huge influence on the ignition, fire growth, flame characteristics
and propagation, extinction, etc. In this sense, many studies are conducted in past
years in the fire safety research community in order to develop performant models
of pyrolysis. These studies associate experimental and numerical investigations at
different scales.
In this context, the present thesis aims to study the pyrolysis of two different
composite materials in order to better understand the thermal decomposition process
and to give data required for the PATO model development and validation. The first
material is wood while the second one is carbon fiber/epoxy resin composite. Wood
is chosen because it is a kind of isotropic composite material while carbon/epoxy is
chosen because it is a kind of non-isotropic material. To study the whole pyrolysis
process, the up-scaling method is used to first study the aspects separately in a detailed
242 Conclusion and perspective
scale (kinetic, heat and mass transfer, porosity, etc.), and secondly, these aspects are
coupled on a larger scale to study the interactions. Then, during this work, two scales
are used: the particle scale TGA (thermally thin) and bench-scale cone calorimeter
scale (thermally thick). Furthermore, to validate the model more accurately in a first
approach and to avoid the uncertainties due to poorly controlled boundary conditions
(formed by flame or oxidation), the experimental manipulations are conducted under
an inert atmosphere for both scales.
The comprehensive pyrolysis model PATO is dealing with heat and mass transfers
into porous media and involves chemical reactions. It contains different solid phases
and one single gas phase. The different components within composite materials are
separated which involve their own intrinsic chemical and physical properties. The local
thermal equilibrium is considered between the gas volatiles and solid phase, and they
are implemented based on the volume averaging method. Different numbers of parallel
reactions are defined for each component and they are finally integrated to implement
the overall material pyrolysis behavior. This developed 3D model describes the gas
transport within the pores of materials at the Darcy scale. Thermal conductivity is
formulated in a tensor form allowing the definition of heat transfer in three directions
of the domain. The radiation boundary conditions concerning fire scenarios are added
to the model, and it is expected to be an alternative applicable comprehensive pyrolysis
model to provide potential prediction accuracy when evaluating the current pyrolysis
models in the fire safety community.
The thermal decomposition of wood has been studied using a TGA apparatus.
From the evolution of the mass loss and the mass loss rate curves, two mechanisms (one-
step and multi-step parallel reactions) of thermal decomposition have been proposed
to assess their predictability. The kinetic parameters are predicted to implement the
chemical reactions by modeling fitting method with TGA experiment which is described
with the Arrhenius-type equation through different time scales. The multi-step parallel
reaction scheme fits quite well the mass loss and the MLR, while the one-step global
reaction scheme doesn’t capture well the MLR peak value and the temperature range
8.1 Conclusion 243
at which the pyrolysis reaction occurs. It seems to approve that the kinetics are not
predicted qualitatively well with the one-step global reaction scheme compared with the
parallel one. However, from a macroscopic view, targeting experimental and numerical
mass loss profile, the one-step global mechanism succeeds to represent the overall
pyrolysis trend, such mechanism could be applicable to describe the pyrolysis process
when a fire is fully developed.
To analyze the assumption of no presence of heat and mass gradient in the
sample during the TGA experiment, a 0D (zero-gradient model) and 2D axis-symmetry
(gradient model) simulations have been compared. For both simulations, no significant
difference has been identified. The influence of the heating rate on the pyrolysis process
has been analyzed. It is demonstrated that only the peak of reaction rate shifts to a
higher temperature range when the heating rate increases. We conclude that for a mass
fraction of the virgin wood material more than 50 wt%, the kinetic process is governed
by the heating process. When it comes to less than 50 wt% of virgin mass fraction,
the remaining mass becomes the limited parameter on the overall reaction process.
The heating process can interact with the global pyrolysis process and each reaction
is not affected in the same way by the heating process. Only the cellulose thermal
decomposition reaction seems to be affected by the heating rate, while the reactions
of hemicellulose and lignin are not affected. Moreover, the lignin decomposition can
produce the largest mass fraction of char residue at the end of the pyrolysis process,
and this char residue doesn’t change with heating rate. However, the heating process
changes the mass fraction of char residue given by the cellulose and hemicellulose
reactions. As the heating process plays an important role in the thermal decomposition,
2D simulations have been conducted to analyze the possible thermal gradients into
the solid in TGA configuration at 50 K/min. It is demonstrated that heat and mass
transfer interact with pyrolysis reactions in TGA when the global heating rate is high.
These interactions need to be correctly captured by the model to describe correctly
the overall pyrolysis process.
244 Conclusion and perspective
In order to explore the pyrolysis behavior at different thermal conditions, a bench-
scale cone calorimeter under a controlled atmosphere with nitrogen has been introduced
accompanied by a silicate sample holder for thermal insulation. The numerical models
are implemented to study the pyrolysis processes at different time and length scales
under 1D and 2D. The sensitivity of mesh size and time steps on numerical results are
verified, it has been demonstrated that the heat transfer process is far less sensitive to
mesh size and time steps compared with the chemistry process. The convective heat
coefficients are extracted by inverse analysis with pure heat conduction of Aluminum
and a set of heat convection coefficients are assigned for model prediction. The thermal
parameters of wood are obtained based on dry wood pure heat conduction experiments.
The thermophysical properties, i.e., specific heat capacity and thermal conductivity of
wood, are estimated similarly by inverse analysis. To verify if the char matrix and the
associated thermal parameters are or not highly dependent on heat flux conducted, an
inverse analysis to obtain char thermal parameters is conducted with the char pure
heat conduction. The experiments for temperature evolution are found to be predicted
with accuracy under 20 kW/m2. When subjected to the high heat flux of 50 kW/m2,
the experiments can involve serious scatter compared with prediction and they are
quite unreliable compared with reality, and they are not appropriate to predict the
pyrolysis process under 50 kW/m2. It is demonstrated that in-depth radiation is a
key process under 50 kW/m2, and the char conductivity extracted is an “apparent”
value. We conclude that the char data from the inverse analysis under lower heat flux
is preferable.
The 1D and 2D models are matching up quite well for the top locations and the
difference is increased for the bottom temperature. It is pointed out that the role of
insulating silicate material is very important which can give a better prediction of mass
loss and temperature profile by the 2D model, and this “side effect” tends to be increased
in the slow heating process. It is demonstrated that water evaporation involves a
relatively slow rate for the bottom location and the water could prolong the pyrolysis
severely. It is found that the final char yield fraction and temperature concerning wet
8.1 Conclusion 245
wood and dry wood pyrolysis behave similarly and no apparent differences are involved.
Then, the water only tends to delay the pyrolysis process and the corresponding reaction
peak or temperature rise is then influenced. It is demonstrated that the difference of
MLR between dry and wet cases is enhanced at low heat flux and the temperature
difference between dry and wet wood increases with the thickness. For low heat
flux, the reaction rate and the pyrolysis advancement are slow with a thick pyrolysis
layer accompanied by a smaller temperature gradient. While for high heat flux, it is
involved with a thin pyrolysis layer with a high-temperature gradient. Globally, the
predicted char depth matches reasonably well the experiment at 20 kW/m2 while it is
over-predicted at 50 kW/m2 except for the initial stage of pyrolysis
Similar to wood experimental manipulation, the modeling of thermal decomposition
of the carbon/epoxy composite is conducted firstly at the TGA scale and secondly at
the cone calorimeter scale. A parallel mechanism of thermal decomposition has been
employed and the associated kinetic parameters have been validated at the TGA scale
by comparison with the experimental data. The experimental char yield mass fraction
in this work contributes to the general observation which involves less char residue at a
high heating rate. The kinetic parameters extracted could reflect the pyrolysis reaction
behavior for the different heating processes. The evaluation of the model to represent
the thermal decomposition of the carbon/epoxy composite is conducted addressing
the mass loss, the mass loss rate, and the temperature profiles at different locations.
The occurrence and the termination of the pyrolysis process are captured well by the
model, but the magnitude of the mass loss rate peak is over-predicted compared with
the experiment for both heat fluxes. The prediction at lower heat flux seems to be
better when targeting the temperature evolution and the delamination and cracking
are responsible for these discrepancies. It is demonstrated that serious delamination
occurs at different locations through the thickness of the composite under different
heat fluxes. In order to explore the non-isotropic thermal conductivity of carbon/epoxy
composite, the values are tackled by tensor changing along with different directions
under 3D. 1D and 3D modeling are compared, the mass loss and temperature account
246 Conclusion and perspective
for nearly the same variation trend which concludes that the isotropic assumption can
be appropriate regarding the simulation of thermal decomposition of carbon/epoxy
composite.
Many input parameters are involved during this modeling study. The more input
parameters are used in the model, the higher uncertainties can be observed. Thus,
a sensitivity analysis is conducted to explore how these parameters are linked to
the pyrolysis behavior and which ones are more uncertain. The OAT method is
employed to analyze the sensitivity of relevant pyrolysis model parameters, they are
including kinetics, the heat of decomposition, thermal, and physical parameters. To
point out the different key parameters involved and to investigate their role in these
interactions, sensitivity analysis of the mass loss rate and temperature evolution at
different locations is conducted. It is found that the mass loss rate is quite sensitive to
the kinetic parameters (activation energy, pre-exponential factor, and reaction order),
and this influence is stronger at lower heat flux, while the temperature evolution is
slightly sensitive to the activation energy. A similar influence is observed with the heat
of thermal decomposition compared with those kinetic parameters, and the bottom
location is more influenced. Similar influences are found concerning virgin and char
thermal conductivity, and their influence on the bottom location is more serious. Virgin
and char specific heat capacity has some influence on different pyrolysis stages. It is
found that the char emissivity is more important in a lower heating environment and
much attention should be paid to determine this value. The virgin permeability has no
influence can be concluded, while char permeability could pose some effect especially at
high heat flux environment and bottom location. Heat convection coefficient is found
more important at lower heat flux. The temperature evolution is quite sensitive to the
water content through the whole pyrolysis process, and it can be more important to
the material surface at the initial time, thus, for the material ignition study, this water
effect should be noticed.
Finally, the results obtained show that the PATO model involves good capabilities
to provide a relatively accurate prediction for the pyrolysis behavior of different
8.2 Perspective 247
composite materials under different heating environment. The present work gives new
insights when manipulating numerical studies for pyrolysis especially coupling the
complexity of physical phenomenon in fire scenarios.
8.2 Perspective
In this work, the released gas during the pyrolysis process is tabulated with
Nitrogen, the volatile gas reactions concerned are neglected, and the energy is mainly
from heat conduction and pyrolysis in the condensed phase. Thus in the future, more
complicated options should be adopted such as equilibrium elemental conservation
and finite species conservation to capture the evolution of the specific pyrolysis gases
composition and corresponding element/species transfer. Moreover, this study focused
on an anaerobic environment concerning the chemical and thermophysical process,
thus the kinetics and thermophysical process under a realistic air environment should
be continuously described, which needs to consider oxidation and flame. And the
capability of the model prediction needs to be evaluated under more detailed boundary
conditions. In such case, based on a bench-scale in this study, a larger scale experiment
and corresponding modeling study should be performed.
Due to the fact that the thermal conductivity of carbon/epoxy composite along
the fibers is much higher than in other directions, thus, it is reasonably correct to
suppose that the temperature distribution is uniform for the horizontal cross-section
direction. In this study, the top surface is parallel to the cone heater which is assumed
as a 1D experimental configuration, However, when the sample is subjected to irradiant
heat flux at different directions in a real fire scenario, it is expected to behave quite
differently regarding the non-isotropic thermal conductivity. This behavior influence on
relevant modeling studies concerning different boundary configurations can be explored.
As demonstrated, the char thermal conductivity is more important than char
specific heat capacity, but the char is quite uncertain and fragile with highly changing
properties during pyrolysis reaction. This is still a challenge to capture this aspect and
248 Conclusion and perspective
future studies should be given more concentration. As shown, at high heat fluxes, the
char heat conduction is dominated by in-depth radiation due to large cracks presence,
thus the in-depth radiation factor should be included in the modeling study. The
boundary heat convective coefficient is more important in the low heating environment,
however, these values are usually estimated with less accuracy. In the future, this part
should be highly experimentally or numerically solved to know the accurate heating
loss circumstance in the ambient environment.
The local thermal equilibrium between the solid and gas phase is assumed in the
present work with no heat exchange between gas in the pore and the solid. For example,
the water evaporation process which involves a highly endothermic reaction, and local
thermal equilibrium cannot be correct and this assumption could be developed to be
more realistic for a non-local thermal equilibrium case in the future.
This work doesn’t take into account the shrinkage, swelling, cracks, and delamina-
tion during the pyrolysis process. The physical structure change could lead to serious
influences on the pyrolysis results. Thus, the modeling of the physical structure change
implementation is still challenging work. One of the most complicated numerical
manipulations concerning shrinkage and swelling to account for the physical structure
change would be inherited to the model and some validation work is expected to be
conducted.
In this work, the parallel reaction scheme is employed. As found in this study, one
of the most important drawbacks of a parallel reaction mechanism is that it doesn’t take
into account the heating rate into the chemical reaction when the heating condition
is a key parameter on the pyrolysis process, and it fails to predict the final residual
mass fraction making this mechanism inconsistent in terms of mass conservation. It
has been shown that it is especially applicable for conditions when the reaction is
slow compared to the heat transfer process because slow reactions are very sensitive
to kinetic parameters. The highest heating rates are involved at the beginning of
the pyrolysis process as well as the highest gradient of heating rates. During this
beginning stage, the pyrolysis gases are released governing the ignition process when
8.2 Perspective 249
the thermal decomposition is involved in air. Then, to capture correctly ignition
process, the pyrolysis model should describe correctly those first stages when heating
and gradients are high. As a perspective of this study, the heating process should
be taken into account carefully in the chemical mechanism, with competitive and
consecutive reactions. Such mechanisms would allow defining some prior reactions
pathway in function of the heating process.
Finally, the condensed phase pyrolysis model is expected to be coupled with the
gas phase flame model to predict the real fire behaviors in the air atmosphere.

References
[1] Chittaranjan Deo and SK Acharya. Effect of moisture absorption on mechanicalproperties of chopped natural fiber reinforced epoxy composite. Journal ofreinforced plastics and composites, 29(16):2513–2521, 2010.
[2] Shurong Wang, Gongxin Dai, Haiping Yang, and Zhongyang Luo. Lignocellulosicbiomass pyrolysis mechanism: a state-of-the-art review. Progress in Energy andCombustion Science, 62:33–86, 2017.
[3] Yanming Ding, Ofodike A Ezekoye, Shouxiang Lu, and Changjian Wang. Thermaldegradation of beech wood with thermogravimetry/fourier transform infraredanalysis. Energy Conversion and Management, 120:370–377, 2016.
[4] Izabella Vermesi, Matthew J DiDomizio, Franz Richter, Elizabeth J Weckman,and Guillermo Rein. Pyrolysis and spontaneous ignition of wood under transientirradiation: Experiments and a-priori predictions. Fire safety journal, 91:218–225,2017.
[5] N Grange, K Chetehouna, N Gascoin, A Coppalle, I Reynaud, and S Senave.One-dimensional pyrolysis of carbon based composite materials using firefoam.Fire Safety Journal, 97:66–75, 2018.
[6] Robert Clive Easby. Fire behaviour of pultruded composites. PhD thesis, NewcastleUniversity, 2007.
[7] Maxime Villière, Damien Lecointe, Vincent Sobotka, Nicolas Boyard, and DidierDelaunay. Experimental determination and modeling of thermal conductivitytensor of carbon/epoxy composite. Composites Part A: Applied Science andManufacturing, 46:60–68, 2013.
[8] Matthew T McGurn. Numerical Modeling and Simulation of Flame Spread OverCharring Materials. PhD thesis, State University of New York at Buffalo, 2013.
[9] Matthew T McGurn, Paul E DesJardin, and Amanda B Dodd. Numerical simu-lation of expansion and charring of carbon-epoxy laminates in fire environments.International Journal of Heat and Mass Transfer, 55(1-3):272–281, 2012.
[10] Mark McKinnon. A generalized methodology to characterize composite materialsfor pyrolysis models. PhD thesis, 2016.
[11] Anna Matala et al. Methods and applications of pyrolysis modelling for polymericmaterials. VTT Technical Research Centre of Finland, 2013.
252 References
[12] Isaac T Leventon, Kevin T Korver, and Stanislav I Stoliarov. A generalizedmodel of flame to surface heat feedback for laminar wall flames. Combustion andFlame, 179:338–353, 2017.
[13] Deborah DL Chung and Deborah Chung. Carbon fiber composites. Elsevier,2012.
[14] N Burger, A Laachachi, M Ferriol, M Lutz, V Toniazzo, and D Ruch. Reviewof thermal conductivity in composites: mechanisms, parameters and theory.Progress in Polymer Science, 61:1–28, 2016.
[15] Kai Dong, Kui Liu, Qian Zhang, Bohong Gu, and Baozhong Sun. Experimentaland numerical analyses on the thermal conductive behaviors of carbon fiber/epoxyplain woven composites. International Journal of Heat and Mass Transfer,102:501–517, 2016.
[16] Yue Liu, Bernd Zwingmann, and Mike Schlaich. Carbon fiber reinforced polymerfor cable structures—a review. Polymers, 7(10):2078–2099, 2015.
[17] Duy Quang Dao, Thomas Rogaume, Jocelyn Luche, Frank Richard, LucasBustamante Valencia, and Sindonie Ruban. Thermal degradation of epoxyresin/carbon fiber composites: Influence of carbon fiber fraction on the firereaction properties and on the gaseous species release. Fire and Materials,40(1):27–47, 2016.
[18] Ziqing Yu. Thermal and mechanical responses of fiber reinforced polymer com-posites under one-sided fire exposure. PhD thesis, 2012.
[19] Tian Tian and Kevin D Cole. Anisotropic thermal conductivity measurementof carbon-fiber/epoxy composite materials. International Journal of Heat andMass Transfer, 55(23-24):6530–6537, 2012.
[20] Pauline Tranchard, Fabienne Samyn, Sophie Duquesne, Matthieu Thomas, BrunoEstèbe, Jean-Luc Montès, and Serge Bourbigot. Fire behaviour of carbon fibreepoxy composite for aircraft: Novel test bench and experimental study. Journalof Fire Sciences, 33(3):247–266, 2015.
[21] Mark B McKinnon, Yan Ding, Stanislav I Stoliarov, Sean Crowley, and Richard ELyon. Pyrolysis model for a carbon fiber/epoxy structural aerospace composite.Journal of Fire Sciences, 35(1):36–61, 2017.
[22] Talal Fateh, Jianping Zhang, Michael Delichatsios, and T Rogaume. Experimentalinvestigation and numerical modelling of the fire performance for epoxy resincarbon fibre composites of variable thicknesses. Fire and Materials, 41(4):307–322,2017.
[23] Zhi Zhang, Changjian Wang, Gai Huang, Haoran Liu, Shenlin Yang, and AifengZhang. Thermal degradation behaviors and reaction mechanism of carbon fibre-epoxy composite from hydrogen tank by tg-ftir. Journal of hazardous materials,357:73–80, 2018.
References 253
[24] Huichang Niu and Naian Liu. Thermal decomposition of pine branch: Unifiedkinetic model on pyrolytic reactions in pyrolysis and combustion. Fuel, 160:339–345, 2015.
[25] Talal Fateh, Franck Richard, Thomas Rogaume, and Paul Joseph. Experimentaland modelling studies on the kinetics and mechanisms of thermal degradation ofpolymethyl methacrylate in nitrogen and air. Journal of Analytical and AppliedPyrolysis, 120:423–433, 2016.
[26] Andrea Frangi and MARIO Fontana. Fire performance of timber structuresunder natural fire conditions. Fire Safety Science, 8:279–290, 2005.
[27] K Grigoriou and AP Mouritz. Comparative assessment of the fire structuralperformance of carbon-epoxy composite and aluminium alloy used in aerospacestructures. Materials & Design, 108:699–706, 2016.
[28] Serge Bourbigot and Sophie Duquesne. Fire retardant polymers: recent devel-opments and opportunities. Journal of Materials Chemistry, 17(22):2283–2300,2007.
[29] AP Mouritz, S Feih, E Kandare, Z Mathys, AG Gibson, PE Des Jardin, SW Case,and BY Lattimer. Review of fire structural modelling of polymer composites.Composites Part A: Applied Science and Manufacturing, 40(12):1800–1814, 2009.
[30] MA Maaroufi, Y Carpier, Benoît Vieille, L Gilles, A Coppalle, and FabriceBarbe. Post-fire compressive behaviour of carbon fibers woven-ply polyphenylenesulfide laminates for aeronautical applications. Composites Part B: Engineering,119:101–113, 2017.
[31] Long Shi, Michael Yit Lin Chew, Xuanya Liu, Xudong Cheng, Bo Wang, andGuomin Zhang. An experimental and numerical study on fire behaviors of charringmaterials frequently used in buildings. Energy and Buildings, 138:140–153, 2017.
[32] Chris Lautenberger. A Generalized Pyrolysis Model for Combustible Solids. PhDthesis, 2007.
[33] Jing Li, Junhui Gong, and Stanislav I Stoliarov. Development of pyrolysis modelsfor charring polymers. Polymer Degradation and Stability, 115:138–152, 2015.
[34] Jose Manuel Sañes Iborra. Pyrolysis modelling. new test cases for fds firesimulator. B.S. thesis, Universitat Politècnica de Catalunya, 2015.
[35] Kathrin Grewolls. Probabilistic Modelling of Sensitivity in Fire Simulations. PhDthesis, University of Central Lancashire, 2013.
[36] Stanislav I Stoliarov, Sean Crowley, Richard N Walters, and Richard E Lyon.Prediction of the burning rates of charring polymers. Combustion and Flame,157(11):2024–2034, 2010.
[37] Andrés Anca-Couce. Reaction mechanisms and multi-scale modelling of lignocel-lulosic biomass pyrolysis. Progress in Energy and Combustion Science, 53:41–79,2016.
254 References
[38] Michele Corbetta, Alessio Frassoldati, Hayat Bennadji, Krystle Smith, Michelle JSerapiglia, Guillaume Gauthier, Thierry Melkior, Eliseo Ranzi, and Elizabeth MFisher. Pyrolysis of centimeter-scale woody biomass particles: kinetic modelingand experimental validation. Energy & fuels, 28(6):3884–3898, 2014.
[39] K Kwiatkowski, PJ Zuk, K Bajer, and M Dudyński. Biomass gasification solverbased on openfoam. Computer Physics Communications, pages 1–29, 2013.
[40] Xiao-Min Wang, Li-Song Zhang, Chi Yang, Na Liu, and Wen-Long Cheng.Estimation of temperature-dependent thermal conductivity and specific heatcapacity for charring ablators. International Journal of Heat and Mass Transfer,129:894–902, 2019.
[41] Jun Koyanagi, Kenta Shinba, Yasuhiro Fukuda, Kenichi Hirai, Akiko Nakazato,Akinori Yoshimura, Takuya Aoki, and Yasuo Kogo. A numerical simulation ofdelamination caused by internal gas pressure for mid-density cfrp. CompositesPart A: Applied Science and Manufacturing, 115:255–263, 2018.
[42] Chris Lautenberger and Carlos Fernandez-Pello. Generalized pyrolysis model forcombustible solids. Fire Safety Journal, 44(6):819–839, 2009.
[43] Stanislav I Stoliarov, Isaac T Leventon, and Richard E Lyon. Two-dimensionalmodel of burning for pyrolyzable solids. Fire and Materials, 38(3):391–408, 2014.
[44] K McGrattan, R McDermott, S Hostikka, J Floyd, and M Vanella. Fire Dynam-ics Simulator Technical Reference Guide Volume 1: Mathematical Model. USDepartment of Commerce, National Institute of Standards and Technology, 2019.
[45] Valentin Biasi. Modélisation thermique de la dégradation d’un matériau compositesoumis au feu. PhD thesis, 2014.
[46] Pauline Tranchard, Fabienne Samyn, Sophie Duquesne, Bruno Estèbe, and SergeBourbigot. Modelling behaviour of a carbon epoxy composite exposed to fire:Part i—characterisation of thermophysical properties. Materials, 10(5):494, 2017.
[47] George M Lloyd, A Razani, and Kwang J Kim. Formulation and numericalsolution of non-local thermal equilibrium equations for multiple gas/solid porousmetal hydride reactors. Journal of Heat Transfer, 123(3):520–526, 2001.
[48] CT Sun and Rajesh S Vaidya. Prediction of composite properties from a repre-sentative volume element. Composites science and Technology, 56(2):171–179,1996.
[49] Toufik Kanit, Samuel Forest, Isabelle Galliet, Valérie Mounoury, and DominiqueJeulin. Determination of the size of the representative volume element for randomcomposites: statistical and numerical approach. International Journal of solidsand structures, 40(13-14):3647–3679, 2003.
[50] Swantje Bargmann, Benjamin Klusemann, Jürgen Markmann, Jan Eike Schn-abel, Konrad Schneider, Celal Soyarslan, and Jana Wilmers. Generation of 3drepresentative volume elements for heterogeneous materials: A review. Progressin Materials Science, 96:322–384, 2018.
References 255
[51] Kai-Yuan Li, Xinyan Huang, Charles Fleischmann, Guillermo Rein, and Jie Ji.Pyrolysis of medium-density fiberboard: optimized search for kinetics schemeand parameters via a genetic algorithm driven by kissinger’s method. Energy &fuels, 28(9):6130–6139, 2014.
[52] Haoran Liu, Changjian Wang, Bing Chen, and Zhi Zhang. A further study of py-rolysis of carbon fibre-epoxy composite from hydrogen tank: Search optimizationfor kinetic parameters via a shuffled complex evolution. Journal of hazardousmaterials, 374:20–25, 2019.
[53] Chris Lautenberger, Guillermo Rein, and Carlos Fernandez-Pello. The applicationof a genetic algorithm to estimate material properties for fire modeling frombench-scale fire test data. Fire safety journal, 41(3):204–214, 2006.
[54] R Carvel, T Steinhaus, G Rein, and JL Torero. Determination of the flammabilityproperties of polymeric materials: A novel method. Polymer Degradation andStability, 96(3):314–319, 2011.
[55] Morten G Grønli and Morten C Melaaen. Mathematical model for wood pyrolysiscomparison of experimental measurements with model predictions. Energy &Fuels, 14(4):791–800, 2000.
[56] Andrés Anca-Couce, Nico Zobel, Anka Berger, and Frank Behrendt. Smoulderingof pine wood: Kinetics and reaction heats. Combustion and Flame, 159(4):1708–1719, 2012.
[57] Mehran Jalili, Andres Anca-Couce, and Nico Zobel. On the uncertainty of amathematical model for drying of a wood particle. Energy & fuels, 27(11):6705–6717, 2013.
[58] Inge Haberle, Øyvind Skreiberg, Joanna Łazar, and Nils Erland L Haugen.Numerical models for thermochemical degradation of thermally thick woodybiomass, and their application in domestic wood heating appliances and gratefurnaces. Progress in Energy and Combustion Science, 63:204–252, 2017.
[59] Murlidhar Gupta, Jin Yang, and Christian Roy. Specific heat and thermalconductivity of softwood bark and softwood char particles. Fuel, 82(8):919–927,2003.
[60] Franz Richter, Arvind Atreya, Panagiotis Kotsovinos, and Guillermo Rein. Theeffect of chemical composition on the charring of wood across scales. Proceedingsof the Combustion Institute, 37(3):4053–4061, 2019.
[61] Colomba Di Blasi. Modeling chemical and physical processes of wood and biomasspyrolysis. Progress in energy and combustion science, 34(1):47–90, 2008.
[62] Morten Gunnar Grønli. A theoretical and experimental study of the thermal degra-dation of biomass. PhD thesis, Norwegian University of Science and TechnologyTrondheim, Norway, 1996.
[63] Martin Kaltschmitt and Wolfgang Streicher. Energie aus biomasse. In Regenera-tive Energien in Österreich, pages 339–532. Springer, 2009.
256 References
[64] J Ratte, Frederic Marias, Jean Vaxelaire, and Philippe Bernada. Mathematicalmodelling of slow pyrolysis of a particle of treated wood waste. Journal ofhazardous materials, 170(2-3):1023–1040, 2009.
[65] Won Chan Park, Arvind Atreya, and Howard R Baum. Experimental andtheoretical investigation of heat and mass transfer processes during wood pyrolysis.Combustion and Flame, 157(3):481–494, 2010.
[66] Won Chan Park. A Study of Pyrolysis of Charring Materials and its Applicationto Fire Safety and Biomass Utilization. PhD thesis, 2008.
[67] Michel Bellais. Modelling of the pyrolysis of large wood particles. PhD thesis,KTH-Royal Institute of Technology, 2007.
[68] Long Shi and Michael Yit Lin Chew. A review of fire processes modeling ofcombustible materials under external heat flux. Fuel, 106:30–50, 2013.
[69] Richard Chippendale. Modelling of the thermal chemical damage caused to carbonfibre composites. PhD thesis, University of Southampton, 2013.
[70] Laurent Pouliot Laforte and Louis Laberge Lebel. Thermal analysis and degrada-tion of properties in carbon fiber/epoxy laminate riveting at high temperatures.Polymer Testing, 67:205–212, 2018.
[71] D Quang Dao, J Luche, F Richard, T Rogaume, C Bourhy-Weber, and S Ruban.Determination of characteristic parameters for the thermal decomposition ofepoxy resin/carbon fibre composites in cone calorimeter. International journalof hydrogen energy, 38(19):8167–8178, 2013.
[72] Tian Tian. Anisotropic thermal property measurement of carbon-fiber/epoxycomposite materials. PhD thesis, The University of Nebraska-Lincoln, 2011.
[73] Kamila Salasinska, Mateusz Barczewski, Monika Borucka, Rafał L Górny, PawełKozikowski, Maciej Celiński, and Agnieszka Gajek. Thermal stability, fire andsmoke behaviour of epoxy composites modified with plant waste fillers. Polymers,11(8):1234, 2019.
[74] SHI LONG. Pyrolysis and Combustion Processes of Combustible Materials underExternal Heat Flux. PhD thesis, 2014.
[75] Won Chan Park, Arvind Atreya, and Howard R Baum. Determination ofpyrolysis temperature for charring materials. Proceedings of the combustionInstitute, 32(2):2471–2479, 2009.
[76] Mark B McKinnon, Stanislav I Stoliarov, and Artur Witkowski. Development of apyrolysis model for corrugated cardboard. Combustion and Flame, 160(11):2595–2607, 2013.
[77] Ashish Davinderkumar Vinayak. Mathematical modeling & simulation of pyrolysis& flame spread in openfoam. Master’s thesis, Bergische Universität Wuppertal,2017.
References 257
[78] N Grange, P Tadini, K Chetehouna, N Gascoin, I Reynaud, and S Senave.Determination of thermophysical properties for carbon-reinforced polymer-basedcomposites up to 1000° c. Thermochimica Acta, 659:157–165, 2018.
[79] John R Howell, M Pinar Menguc, and Robert Siegel. Thermal Radiation HeatTransfer. CRC Press, 2015.
[80] Adrian P Mouritz and Arthur Geoff Gibson. Fire properties of polymer compositematerials, volume 143. Springer Science & Business Media, 2007.
[81] Himanshu Goyal and Perrine Pepiot. On the validation of a one-dimensionalbiomass pyrolysis model using uncertainty quantification. ACS SustainableChemistry & Engineering, 6(9):12153–12165, 2018.
[82] Joshua D Swann, Yan Ding, and Stanislav I Stoliarov. Characterization ofpyrolysis and combustion of rigid poly (vinyl chloride) using two-dimensionalmodeling. International Journal of Heat and Mass Transfer, 132:347–361, 2019.
[83] Mathew John Hagge. A numerical model for biomass pyrolysis. PhD thesis, IowaState University, 2005.
[84] Damien M Marquis and Eric Guillaume. Modelling reaction-to-fire of polymer-based composite laminate. In Nanocomposites with Unique Properties and Appli-cations in Medicine and Industry. IntechOpen, 2011.
[85] Daniel Neves, Henrik Thunman, Arlindo Matos, Luís Tarelho, and AlbertoGómez-Barea. Characterization and prediction of biomass pyrolysis products.Progress in Energy and Combustion Science, 37(5):611–630, 2011.
[86] Giancarlo Gentile, Paulo Eduardo Amaral Debiagi, Alberto Cuoci, Alessio Fras-soldati, Eliseo Ranzi, and Tiziano Faravelli. A computational framework forthe pyrolysis of anisotropic biomass particles. Chemical Engineering Journal,321:458–473, 2017.
[87] A Yu Snegirev, VA Talalov, VV Stepanov, and JN Harris. A new model topredict pyrolysis, ignition and burning of flammable materials in fire tests. Firesafety journal, 59:132–150, 2013.
[88] NK Kim, S Dutta, and D Bhattacharyya. A review of flammability of natural fibrereinforced polymeric composites. Composites Science and Technology, 162:64–78,2018.
[89] Gillian Leplat, Cédric Huchette, and Valentin Biasi. Thermal and damageanalysis of laser-induced decomposition within carbon/epoxy composite laminates.Journal of Fire Sciences, 34(5):361–384, 2016.
[90] K Grigoriou and AP Mouritz. Influence of ply stacking pattern on the structuralproperties of quasi-isotropic carbon-epoxy laminates in fire. Composites Part A:Applied Science and Manufacturing, 99:113–120, 2017.
258 References
[91] Zohreh Ghorbani, Robert Webster, Mariano Lázaro, and Arnaud Trouvé. Lim-itations in the predictive capability of pyrolysis models based on a calibratedsemi-empirical approach. Fire safety journal, 61:274–288, 2013.
[92] Behdad Moghtaderi. The state-of-the-art in pyrolysis modelling of lignocellulosicsolid fuels. Fire and Materials: An International Journal, 30(1):1–34, 2006.
[93] MJ Spearpoint and JG Quintiere. Predicting the burning of wood using anintegral model. Combustion and Flame, 123(3):308–325, 2000.
[94] Nicolas Bal. Uncertainty and complexity in pyrolysis modelling. PhD thesis, TheUniversity of Edinburgh, 2012.
[95] Abhishek Bhargava, Patrick Van Hees, and Berit Andersson. Pyrolysis modelingof pvc and pmma using a distributed reactivity model. Polymer Degradation andStability, 129:199–211, 2016.
[96] Yan Ding, Joshua D Swann, Qi Sun, Stanislav I Stoliarov, and Roland H Kraemer.Development of a pyrolysis model for glass fiber reinforced polyamide 66 blendedwith red phosphorus: Relationship between flammability behavior and materialcomposition. Composites Part B: Engineering, 176:107263, 2019.
[97] Franz Richter and Guillermo Rein. Pyrolysis kinetics and multi-objective inversemodelling of cellulose at the microscale. Fire Safety Journal, 91:191–199, 2017.
[98] Victor Pozzobon, Sylvain Salvador, Jean Jacques Bézian, Mouna El-Hafi, Yan-nick Le Maoult, and Gilles Flamant. Radiative pyrolysis of wet wood underintermediate heat flux: Experiments and modelling. Fuel Processing Technology,128:319–330, 2014.
[99] CHRIS Lautenberger and AC Fernandez-Pello. Optimization algorithms formaterial pyrolysis property estimation. Fire Safety Science, 10:751–764, 2011.
[100] Nicolas Bal and Guillermo Rein. On the effect of inverse modelling and compen-sation effects in computational pyrolysis for fire scenarios. Fire safety journal,72:68–76, 2015.
[101] JP Hidalgo, P Pironi, RM Hadden, and S Welch. A framework for evaluatingthe thermal behaviour of carbon fibre composite materials. In Proceedings of the2nd IAFSS European symposium of fire safety science, pages 195–200, 2015.
[102] Ariza Sharikin Abu Bakar. Characterization of fire properties for coupled pyrol-ysis and combustion simulation and their optimised use. PhD thesis, VictoriaUniversity, 2015.
[103] Ramin Mehrabian, Robert Scharler, and Ingwald Obernberger. Effects of pyrolysisconditions on the heating rate in biomass particles and applicability of tga kineticparameters in particle thermal conversion modelling. Fuel, 93:567–575, 2012.
[104] E Kim and N Dembsey. Parameter estimation for comprehensive pyrolysismodeling: guidance and critical observations. Fire Technology, 51(2):443–477,2015.
References 259
[105] Imtiaz Ali, Salman Raza Naqvi, and Ali Bahadar. Kinetic analysis of botryococcusbraunii pyrolysis using model-free and model fitting methods. Fuel, 214:369–380,2018.
[106] Quang-Vu Bach and Wei-Hsin Chen. Pyrolysis characteristics and kineticsof microalgae via thermogravimetric analysis (tga): A state-of-the-art review.Bioresource technology, 246:88–100, 2017.
[107] Michael Ewart Brown. Introduction to thermal analysis: techniques and applica-tions, volume 1. Springer Science & Business Media, 2001.
[108] Pauline Tranchard, Sophie Duquesne, Fabienne Samyn, Bruno Estebe, and SergeBourbigot. Kinetic analysis of the thermal decomposition of a carbon fibre-reinforced epoxy resin laminate. Journal of Analytical and Applied Pyrolysis,126:14–21, 2017.
[109] Ariza Sharikin Abu Bakar. Characterization of fire properties for coupled pyrol-ysis and combustion simulation and their optimised use. PhD thesis, VictoriaUniversity, 2015.
[110] Yousef Haseli. Modeling combustion of single biomass particle. PhD thesis, 2012.
[111] Yanming Ding, Ofodike A Ezekoye, Jiaqing Zhang, Changjian Wang, and Shoux-iang Lu. The effect of chemical reaction kinetic parameters on the bench-scalepyrolysis of lignocellulosic biomass. Fuel, 232:147–153, 2018.
[112] James G Quintiere, Richard N Walters, and Sean Crowley. Flammability proper-ties of aircraft carbon-fiber structural composite. Technical report, 2007.
[113] Hsiang-Cheng Kung. A mathematical model of wood pyrolysis. Combustion andflame, 18(2):185–195, 1972.
[114] Henderson. A model for the thermal response of polymer composite materialswith experimental verification. Journal of composite materials, 19(6):579–595,1985.
[115] Naadia Nawaz. Modelling and experimental analysis of aerospace composites infire. Master’s thesis, 2011.
[116] Chris Lautenberger and Carlos Fernandez-Pello. A model for the oxidativepyrolysis of wood. Combustion and Flame, 156(8):1503–1513, 2009.
[117] Marcos Chaos, Mohammed M Khan, Niveditha Krishnamoorthy, John L de Ris,and Sergey B Dorofeev. Evaluation of optimization schemes and determinationof solid fuel properties for cfd fire models using bench-scale pyrolysis tests.Proceedings of the Combustion Institute, 33(2):2599–2606, 2011.
[118] Marcos Chaos. Application of sensitivity analyses to condensed-phase pyrolysismodeling. Fire safety journal, 61:254–264, 2013.
[119] Junhui Gong, Yixuan Chen, Juncheng Jiang, Lizhong Yang, and Jing Li. Anumerical study of thermal degradation of polymers: Surface and in-depthabsorption. Applied Thermal Engineering, 106:1366–1379, 2016.
260 References
[120] Zoubir Acem, Damien Brissinger, Anthony Collin, Gilles Parent, Pascal Boulet,Thi Hay Yen Quach, Benjamin Batiot, Franck Richard, and Thomas Rogaume.Surface temperature of carbon composite samples during thermal degradation.International Journal of Thermal Sciences, 112:427–438, 2017.
[121] Talal Fateh, T Rogaume, and F Richard. Multi-scale modeling of the thermaldecomposition of fire retardant plywood. Fire safety journal, 64:36–47, 2014.
[122] S Stoliarov and R Lyon. Thermo-kinetic model of burning for pyrolyzing materials.Fire Safety Science, 9:1141–1152, 2008.
[123] https://code.google.com/archive/p/firefoam-dev/. Firefoam.
[124] Yan Ding, Kyungok Kwon, Stanislav I Stoliarov, and Roland H Kraemer. De-velopment of a semi-global reaction mechanism for thermal decomposition ofa polymer containing reactive flame retardant. Proceedings of the CombustionInstitute, 37(3):4247–4255, 2019.
[125] Yan Ding, Stanislav I Stoliarov, and Roland H Kraemer. Pyrolysis modeldevelopment for a polymeric material containing multiple flame retardants:Relationship between heat release rate and material composition. Combustionand Flame, 202:43–57, 2019.
[126] Stanislav I Stoliarov, Sean Crowley, Richard E Lyon, and Gregory T Linteris.Prediction of the burning rates of non-charring polymers. Combustion and Flame,156(5):1068–1083, 2009.
[127] Chris Lautenberger. Gpyro3d: A three dimensional generalized pyrolysis model.Fire Safety Science, 11:193–207, 2014.
[128] Florian Kempel, Bernhard Schartel, Gregory T Linteris, Stanislav I Stoliarov,Richard E Lyon, Richard N Walters, and Anja Hofmann. Prediction of the massloss rate of polymer materials: Impact of residue formation. Combustion andFlame, 159(9):2974–2984, 2012.
[129] Artur Witkowski, Bertrand Girardin, Michael Försth, Fiona Hewitt, GaëlleFontaine, Sophie Duquesne, Serge Bourbigot, and T Richard Hull. Developmentof an anaerobic pyrolysis model for fire retardant cable sheathing materials.Polymer degradation and stability, 113:208–217, 2015.
[130] Jing Li. A MULTISCALE APPROACH TO PARAMETERIZATION OF BURN-ING MODELS FOR POLYMERIC MATERIALS. PhD thesis, 2014.
[131] Bernhard Peters and Christian Bruch. Drying and pyrolysis of wood particles:experiments and simulation. Journal of analytical and applied pyrolysis, 70(2):233–250, 2003.
[132] Jing Li and Stanislav I Stoliarov. Measurement of kinetics and thermodynamicsof the thermal degradation for charring polymers. Polymer degradation andstability, 106:2–15, 2014.
References 261
[133] KY Li, DSW Pau, YN Hou, and J Ji. Modeling pyrolysis of charring materials:determining kinetic properties and heat of pyrolysis of medium density fiberboard.Industrial & Engineering Chemistry Research, 53(1):141–149, 2014.
[134] Stanislav I Stoliarov and Jing Li. Parameterization and validation of pyrolysismodels for polymeric materials. Fire Technology, 52(1):79–91, 2016.
[135] Jing Li and Stanislav I Stoliarov. Measurement of kinetics and thermodynamicsof the thermal degradation for non-charring polymers. Combustion and Flame,160(7):1287–1297, 2013.
[136] Özge Çepelioğullar, Hanzade Haykırı-Açma, and Serdar Yaman. Kinetic mod-elling of rdf pyrolysis: Model-fitting and model-free approaches. Waste manage-ment, 48:275–284, 2016.
[137] Ruiyu Chen, Xiaokang Xu, Yang Zhang, Siuming Lo, and Shouxiang Lu. Kineticstudy on pyrolysis of waste phenolic fibre-reinforced plastic. Applied ThermalEngineering, 136:484–491, 2018.
[138] ISO 5660-1: 2002. Reaction-to-fire tests—heat release, smoke production andmass loss rate—part 1: Heat release rate (cone calorimeter method), 2002.
[139] 2058 ASTM, E. Standard test methods for measurement of synthetic polymermaterial flammability using a fire propagation apparatus (fpa). astm international,west conshohocken, pa, 2013, doi: 10.1520/e2058-13.
[140] Qingfeng Xu, Lingzhu Chen, Kent A Harries, Fuwen Zhang, Qiong Liu, andJinghui Feng. Combustion and charring properties of five common constructionalwood species from cone calorimeter tests. Construction and Building Materials,96:416–427, 2015.
[141] Romain Meinier, Rodolphe Sonnier, Pascal Zavaleta, Sylvain Suard, and LaurentFerry. Fire behavior of halogen-free flame retardant electrical cables with thecone calorimeter. Journal of hazardous materials, 342:306–316, 2018.
[142] Pietro Di Modica. Modelling fire behaviour of composite materials. PhD thesis,Newcastle University, 2016.
[143] Xuan Liu. Design and analysis of new gasification apparatus based on thestandard cone calorimeter. Master’s thesis, 2012.
[144] JEJ Staggs. Convection heat transfer in the cone calorimeter. Fire Safety Journal,44(4):469–474, 2009.
[145] Yeqing Wang, Timothy K Risch, and Joseph H Koo. Assessment of a one-dimensional finite element charring ablation material response model for phenolic-impregnated carbon ablator. Aerospace Science and Technology, 91:301–309,2019.
[146] Vincent Blay and Luis F Bobadilla. Numerical study of the accuracy of tempera-ture measurement by thermocouples in small-scale reactors. Chemical EngineeringResearch and Design, 131:545–556, 2018.
262 References
[147] Zhengping Zou, Weiping Yang, Weihao Zhang, Xiaokui Wang, and Jian Zhao.Numerical modeling of steady state errors for shielded thermocouples basedon conjugate heat transfer analysis. International Journal of Heat and MassTransfer, 119:624–639, 2018.
[148] Xue Chen, Xin-Lin Xia, Chuang Sun, and Yang Li. Numerical analysis on thetransient measurement of gas temperature in porous material using thermocouplesat high temperatures. International Journal of Heat and Mass Transfer, 91:1060–1068, 2015.
[149] Chenghang Zheng, Leming Cheng, Alexei Saveliev, Zhongyang Luo, and KefaCen. Gas and solid phase temperature measurements of porous media combustion.Proceedings of the Combustion Institute, 33(2):3301–3308, 2011.
[150] Thomas Steinhaus. Determination of intrinsic material flammability propertiesfrom material tests assisted by numerical modelling. PhD thesis, The Universityof Edinburgh, 2010.
[151] Pedro Reszka. In-depth temperature profiles in pyrolyzing wood. PhD thesis, TheUniversity of Edinburgh, 2008.
[152] Lucie Hasalová, Jiří Ira, and Milan Jahoda. Practical observations on the use ofshuffled complex evolution (sce) algorithm for kinetic parameters estimation inpyrolysis modeling. Fire safety journal, 80:71–82, 2016.
[153] Jing Li, Junhui Gong, and Stanislav I Stoliarov. Gasification experiments forpyrolysis model parameterization and validation. International Journal of Heatand Mass Transfer, 77:738–744, 2014.
[154] J Lachaud, JB Scoggins, TE Magin, MG Meyer, and NN Mansour. A genericlocal thermal equilibrium model for porous reactive materials submitted to hightemperatures. International Journal of Heat and Mass Transfer, 108:1406–1417,2017.
[155] James B Scoggins, Vincent Leroy, Georgios Bellas-Chatzigeorgis, Bruno Dias, andThierry E Magin. Mutation++: Multicomponent thermodynamic and transportproperties for ionized gases in c++. arXiv preprint arXiv:2002.01783, 2020.
[156] Stephen Whitaker. The method of volume averaging, volume 13. Springer Science& Business Media, 1999.
[157] Jie Chen, Shuyu Sun, and Xiaoping Wang. Homogenization of two-phase fluidflow in porous media via volume averaging. Journal of Computational and AppliedMathematics, 353:265–282, 2019.
[158] John M Dinwoodie. Timber: its nature and behaviour. CRC Press, 2000.
[159] Benoit Gentilleau. Modélisation et validation expérimentale du comporte-ment thermomécanique de multicouches polymère-composite bobine. PhD thesis,Chasseneuil-du-Poitou, Ecole nationale supérieure de mécanique et d . . . , 2012.
References 263
[160] Jean Lachaud, Tom van Eekelen, James B Scoggins, Thierry E Magin, and Nagi NMansour. Detailed chemical equilibrium model for porous ablative materials.International Journal of Heat and Mass Transfer, 90:1034–1045, 2015.
[161] Jeremie BE Meurisse, Jean Lachaud, Francesco Panerai, Chun Tang, and Nagi NMansour. Multidimensional material response simulations of a full-scale tiledablative heatshield. Aerospace Science and Technology, 76:497–511, 2018.
[162] TALAL Fateh, FRANCK Richard, and THOMAS Rogaume. Modeling of thepyrolysis of plywood exposed to heat fluxes under cone calorimeter. Fire SafetyScience, 11:208–221, 2014.
[163] James Quintiere. Fundamentals of Fire Phenomena. Wiley, 2006.
[164] Brian M Adams, Mohamed S Ebeida, Michael S Eldred, Gianluca Geraci, John DJakeman, Kathryn A Maupin, Jason A Monschke, J Adam Stephens, Laura PSwiler, Dena M Vigil, et al. Dakota, a multilevel parallel object-oriented frame-work for design optimization, parameter estimation, uncertainty quantification,and sensitivity analysis: Version 6.7 user’s manual. 2014.
[165] Esther Kim, N Dembsey, and S Shivkumar. Evaluating effects of applyingdifferent kinetic models to pyrolysis modeling of fiberglass-reinforced polymercomposites. Fire and Materials, 39(2):153–173, 2015.
[166] R Lyon, NATALLIA Safronava, and EZGI Oztekin. A simple method fordetermining kinetic parameters for materials in fire models. Fire Safety Science,10:765–777, 2011.
[167] Marcin Wojdyr. Fityk: a general-purpose peak fitting program. Journal ofApplied Crystallography, 43(5-1):1126–1128, 2010.
[168] David E Goldenberg. Genetic algorithms in search, optimization and machinelearning. Addison Wesley, Reading: MA, 1989.
[169] Zbigniew Michalewicz. Genetic algorithms+ data structures= evolution programs.Springer Science & Business Media, 2013.
[170] Kaiyuan Li, Dennis SW Pau, Jinhui Wang, and Jie Ji. Modelling pyrolysis ofcharring materials: determining flame heat flux using bench-scale experimentsof medium density fibreboard (mdf). Chemical engineering science, 123:39–48,2015.
[171] ASM International Handbook Committee et al. ASM Handbook, Volume 15-Casting. ASM International., 2008.
[172] Joshua D Swann, Yan Ding, Mark B McKinnon, and Stanislav I Stoliarov.Controlled atmosphere pyrolysis apparatus ii (capa ii): A new tool for analysis ofpyrolysis of charring and intumescent polymers. Fire Safety Journal, 91:130–139,2017.
264 References
[173] U Sand, J Sandberg, J Larfeldt, and R Bel Fdhila. Numerical prediction of thetransport and pyrolysis in the interior and surrounding of dry and wet wood log.Applied Energy, 85(12):1208–1224, 2008.
[174] VILLE Hankalin, TUUKKA Ahonen, and RISTO Raiko. On thermal propertiesof a pyrolysing wood particle. Finnish-Swedish Flame Days, 16, 2009.
[175] Richard S Miller and J Bellan. A generalized biomass pyrolysis model basedon superimposed cellulose, hemicelluloseand liqnin kinetics. Combustion scienceand technology, 126(1-6):97–137, 1997.
[176] Hong Lu, Elvin Ip, Justin Scott, Paul Foster, Mark Vickers, and Larry L Baxter.Effects of particle shape and size on devolatilization of biomass particle. Fuel,89(5):1156–1168, 2010.
[177] Andrés Anca-Couce and Robert Scharler. Modelling heat of reaction in biomasspyrolysis with detailed reaction schemes. Fuel, 206:572–579, 2017.
[178] CA Koufopanos, N Papayannakos, G Maschio, and A Lucchesi. Modelling ofthe pyrolysis of biomass particles. studies on kinetics, thermal and heat transfereffects. The Canadian journal of chemical engineering, 69(4):907–915, 1991.
[179] Toshiro Harada, Toshimitsu Hata, and Shigehisa Ishihara. Thermal constants ofwood during the heating process measured with the laser flash method. Journalof Wood Science, 44(6):425–431, 1998.
[180] BV Babu and AS Chaurasia. Pyrolysis of biomass: improved models for simulta-neous kinetics and transport of heat, mass and momentum. Energy conversionand Management, 45(9-10):1297–1327, 2004.
[181] Julien Blondeau and Hervé Jeanmart. Biomass pyrolysis at high temperatures:Prediction of gaseous species yields from an anisotropic particle. Biomass andbioenergy, 41:107–121, 2012.
[182] Lee J Curtis and Dennis J Miller. Transport model with radiative heat transfer forrapid cellulose pyrolysis. Industrial & engineering chemistry research, 27(10):1775–1783, 1988.
[183] Forest Products Laboratory (US). Wood handbook: Wood as an engineeringmaterial. The Laboratory, 1999.
[184] DL Pyle and CA Zaror. Heat transfer and kinetics in the low temperaturepyrolysis of solids. Chemical engineering science, 39(1):147–158, 1983.
[185] Bertil Fredlund. A model for heat and mass transfer in timber structures duringfire. PhD thesis, 1988.
[186] KW Ragland, DJ Aerts, and AJ Baker. Properties of wood for combustionanalysis. Bioresource technology, 37(2):161–168, 1991.
[187] RKK Yuen, GH Yeoh, G de Vahl Davis, and E Leonardi. Modelling the pyrolysisof wet wood–i. three-dimensional formulation and analysis. International journalof heat and mass transfer, 50(21-22):4371–4386, 2007.
References 265
[188] Amit Kumar Biswas and Kentaro Umeki. Simplification of devolatilizationmodels for thermally-thick particles: Differences between wood logs and pellets.Chemical Engineering Journal, 274:181–191, 2015.
[189] Christian Bruch, Bernhard Peters, and Thomas Nussbaumer. Modelling woodcombustion under fixed bed conditions. Fuel, 82(6):729–738, 2003.
[190] Molllie Rose Semmes. A Model for Non-Oxidative and Oxidative Pyrolysis ofCorrugated Cardboard. PhD thesis, 2013.
[191] Yanming Ding, Changjian Wang, and Shouxiang Lu. Modeling the pyrolysis ofwet wood using firefoam. Energy conversion and management, 98:500–506, 2015.
[192] Johannes Rath, MG Wolfinger, Gerhard Steiner, Gernot Krammer, FedericaBarontini, and Valerio Cozzani. Heat of wood pyrolysis. Fuel, 82(1):81–91, 2003.
[193] Abhishek Sharma, Vishnu Pareek, and Dongke Zhang. Biomass pyrolysis—areview of modelling, process parameters and catalytic studies. Renewable andSustainable Energy Reviews, 50:1081–1096, 2015.
[194] http://www.firecomp.info/. Firecomp project.
[195] Aixi Zhou. Stiffness and strength of fiber reinforced polymer composite bridgedeck systems. PhD thesis, Virginia Tech, 2002.
[196] Pauline Tranchard. High temperature-dependent thermal properties of a carbon-fiber epoxy composite. 2018.
[197] Georgios Kalogiannakis, Danny Van Hemelrijck, and Guy Van Assche. Measure-ments of thermal properties of carbon/epoxy and glass/epoxy using modulatedtemperature differential scanning calorimetry. Journal of composite materials,38(2):163–175, 2004.
[198] Ning Tian. A general thermal thickness model and a heating rate related ignitioncriterion for combustible solids. PhD thesis, The University of North Carolina atCharlotte, 2013.
[199] Jiri Nossent, Pieter Elsen, and Willy Bauwens. Sobol’sensitivity analysis of acomplex environmental model. Environmental Modelling & Software, 26(12):1515–1525, 2011.
[200] Meng Xu, Jin Yang, and Ziyou Gao. Using one-at-a-time sensitivity analysisdesigns for genetic algorithm solving continuous network design problems. In 2009International Joint Conference on Computational Sciences and Optimization,volume 2, pages 114–118. IEEE, 2009.
[201] Andrea Saltelli, Stefano Tarantola, Francesca Campolongo, and Marco Ratto.Sensitivity analysis in practice: a guide to assessing scientific models, volume 1.Wiley Online Library, 2004.

Appendix A
Summary in French for each
chapter/Résumé en français pour
chaque chapitre
A.1 Chapitre 1: Introduction
Il existe deux grands ensembles de matériaux composites, à savoir les fibres
naturelles et les fibres artificielles. Le bois, qui est une sorte de matériau de la
biomasse, représente les composites de fibres naturelles les plus couramment utilisés,
qui comprennent principalement de l’hémicellulose, de la cellulose et de la lignine.
Les matériaux composites synthétiques, qui sont une combinaison de certains sous-
composants dans différents processus de manipulation, ont le potentiel d’être l’un des
matériaux les plus influents utilisés en raison de leur champ d’application différent à
grande échelle dans l’industrie. Les composites en fibre de carbone représentent l’un
des composites en fibres artificielles largement utilisés.
Cependant, les matériaux composites naturels ou synthétiques possèdent un
potentiel relativement élevé de provoquer un incendie qui pourrait produire une grande
quantité de gaz et de fumée toxiques. Dans l’industrie à haute pression, les composites
carbone/époxy sont largement utilisés pour les réservoirs de stockage d’hydrogène et
268 Summary in French for each chapter/Résumé en français pour chaque chapitre
peuvent provoquer des incendies et des explosions catastrophiques lorsque le composite
carbone/époxy est endommagé par la chaleur externe ou des sources mécaniques. Des
études de pyrolyse du bois et de sécurité incendie devraient également être menées
en permanence dans les feux de forêt ainsi que dans les domaines connexes tels que
le traitement thermique du bois et les incendies de bâtiments en bois. En bref,
tous ces matériaux composites présentent un risque d’incendie élevé et les processus
thermo-physiques et chimiques fondamentaux doivent être largement étudiés.
Il existe deux principaux domaines de recherche concernant le feu composite, l’un
implique une étude expérimentale ou théorique fondamentale pour la prédiction et la
prévention des tendances d’inflammabilité des matériaux telles que la recherche sur
les produits ignifuges. Cela concerne la réaction au feu. L’autre se concentre sur la
résistance au feu et concerne l’étude de l’intégrité de la structure du feu comme dans
les infrastructures ou l’industrie du transport. En effet, du fait de l’influence du feu sur
la structure composite ainsi que des accidents graves, les études de la structure incendie
sont en partie menées en ce qui concerne la réponse du matériau à l’échauffement
du feu et le temps d’exposition. Pour conclure, de nombreux événements d’incendies
catastrophiques et tendances aux risques impliquent le composite carbone/époxy et le
bois dans notre vie quotidienne ou dans des domaines industriels connexes.
Le phénomène fondamental de l’incendie est la pyrolyse, alors sa modélisation est
un moyen efficace d’évaluer les comportements. L’étude de modélisation de la pyrolyse
est une partie importante en tant qu’approche supplémentaire du travail expérimental
et de la mise en œuvre détaillée du phénomène de pyrolyse pour prédire la croissance
du feu. Le modèle de pyrolyse a été largement utilisé pour obtenir et optimiser le
comportement au feu des matériaux, en particulier pour les nouveaux matériaux qui
sont assez compliqués et avancés. En outre, pour les essais de pyrolyse sont complexes
et coûteux, une étude de modélisation de la pyrolyse a été largement réalisée pour
prédire la réponse thermique et chimique des matériaux tels que le profil de perte
de masse et l’évolution de la température pour prédire progressivement le processus
d’allumage.
A.1 Chapitre 1: Introduction 269
Pour de nombreux modèles de pyrolyse, le matériau composite est généralement
considéré comme une nouvelle structure homogène, qui implique des propriétés ther-
miques et physiques individuelles constituées de différents composants. La conductivité
thermique du matériau vierge et du charbon, qui sont des propriétés cruciales pen-
dant le processus de pyrolyse, est normalement traitée comme des valeurs constantes
dans différentes directions, bien qu’elle se comporte bien différemment en réalité. Le
changement de structure de la matrice pendant le processus de pyrolyse est toujours
un défi dans la modélisation. En effet, cela pourrait affecter de manière significative le
paramètre apparent calculé. Les milieux poreux sont également traités la plupart du
temps à «l’échelle de Darcy» en utilisant le concept de «volume équivalent représentatif»
(REV) pour définir les propriétés apparentes à partir des propriétés locales en utilisant
des techniques de mise à l’échelle. Mais, lorsque la structure du milieu poreux change
dans le temps et dans l’espace pendant le processus de pyrolyse, les techniques de mise
à l’échelle peuvent être difficiles à obtenir. En plus des paramètres thermo-physiques,
les paramètres cinétiques sont généralement traités comme des valeurs généralisées
sous différentes vitesses de chauffage TGA, ce qui est acceptable en raison de la plage
relativement petite de vitesses de chauffage, compte tenu de l’influence du retard
thermique sous des vitesses de chauffage élevées. Cependant, il pourrait se comporter
différemment sous différentes vitesses de chauffage en raison de la complexité de la
cinétique multiple et de chevauchement des différents composants. De nombreuses
études ont été réalisées pour explorer le comportement de pyrolyse des matériaux
composites, telles que les expériences TGA pour la détermination de mécanismes
cinétiques et le calorimètre à cône utilisé pour capturer le processus de transfert de
chaleur et de masse 1D. Cependant, de nombreuses expériences de calorimètre à cône
sont menées sous atmosphère ambiante pour étudier le comportement de combustion et
des études limitées sont trouvées dans des conditions anaérobies. C’est souvent le bon
choix lors de l’examen du scénario d’incendie pratique, mais cela pourrait entraîner
beaucoup d’incertitude lors de la validation du modèle de pyrolyse en raison de la
perturbation de la flamme et de l’oxydation du charbon. Ainsi, il est crucial d’éliminer
270 Summary in French for each chapter/Résumé en français pour chaque chapitre
ces incertitudes connexes pour maximiser la précision de la prédiction pour la validation
du modèle de pyrolyse. De plus, très peu d’études de modélisation prennent en compte
la condition aux limites de la surface latérale et inférieure, une hypothèse d’adiabatique
ou impénétrable est généralement effectuée.
Le but de recherche du présent travail est de développer un modèle de pyrolyse
complet traitant des transferts de chaleur et de masse dans des milieux poreux ainsi que
des réactions chimiques impliquées en même temps. Le bois et le matériau composite
carbone/époxy sont choisis pour développer un modèle 3D incluant des paramètres
physiques non isotropes. Les paramètres de prévision d’incendie les plus importants
sont concentrés, y compris le front de pyrolyse, le profil de perte de masse et la
distribution de la température à différents endroits en profondeur. Les trois processus,
y compris la chaleur, le transfert de masse et les réactions chimiques, sont mis en œuvre
sur différentes échelles de temps et de longueur, qui comprennent principalement des
essais au calorimètre à cône à atmosphère contrôlée et à l’échelle du milligramme. Les
différentes vitesses de chauffage utilisées dans le test TGA sont extraites des expériences
de calorimètre à cône correspondant pour approcher le comportement de chauffage réel.
Les paramètres thermiques et aux limites sont assez incertains concernant les différentes
configurations de test. Par conséquent, la concentration est effectuée pour obtenir les
propriétés du matériau exactement utilisées dans cette étude. Dans différents scénarios
d’incendie, ces processus pourraient interagir plus ou moins fortement ensemble. Un
accent est mis sur cela pour mettre en évidence les différents paramètres clés impliqués
et étudier leur rôle dans ces interactions.
Ce travail se concentre sur la validation du modèle de pyrolyse et les travaux
connexes tels que l’estimation des propriétés et des paramètres. Un nouveau modèle
complet de pyrolyse traitant des transferts de chaleur et de masse à travers un milieu
poreux ainsi que des réactions chimiques est développé et proposé. Comme mentionné ci-
dessus, le processus de transfert de chaleur, de transfert de masse et de décomposition
thermique chimique pourrait interagir sur de nombreuses échelles de temps et de
longueur. La modélisation de la pyrolyse dans cette étude n’implique pas la combustion
A.2 Chapitre 2: Revue de la littérature 271
en phase gazeuse et l’oxydation du charbon qui contient beaucoup de perturbations
dans la limite. Les processus thermo-physiques et chimiques sont concentrés dans la
phase condensée. Pour caractériser correctement chaque processus et les valider avec
soin, ils sont étudiés un par un à des échelles différentes dans le temps et dans l’espace.
Après avoir capturé correctement chacun d’eux par le modèle numérique, le travail
se concentre sur les interactions entre eux. Certains régimes sont identifiés lorsque
l’un des processus régit toute la partie pyrolyse. Dans un tel cas, les paramètres clés
régissant la pyrolyse globale sont identifiés et analysés par des techniques de sensibilité.
En ce qui concerne la théorie thermiquement mince, l’expérience TGA à l’échelle du
milligramme et la méthode d’ajustement du modèle utilisées pour obtenir les paramètres
cinétiques exactes (c’est-à-dire l’énergie d’activation, le facteur pré-exponentiel, l’ordre
de réaction) et la fraction massique finale du charbon sous différentes vitesses de
chauffage. Des expériences de calorimètre à cône à atmosphère contrôlée (CACC)
sont menées pour obtenir le taux de perte de masse et l’évolution du gradient de
température à différents endroits. Les propriétés thermo-physiques inconnues telles
que la capacité thermique spécifique, la conductivité thermique et les coefficients de
convection thermique aux limites sont prédites à l’aide d’une méthode de modélisation
inverse. Enfin, les différentes analyses de sensibilité des paramètres sont effectuées pour
caractériser l’incertitude du modèle. Différentes conditions de chauffage sont étudiées
pour faire varier l’intensité et les interactions entre ces processus afin d’étudier le rôle
de chaque processus. Des modélisations ont été menées sur les deux matériaux en 1D
et 2D.
A.2 Chapitre 2: Revue de la littérature
Ce chapitre fournit un contexte complet pour l’étude de modélisation de la
pyrolyse. Premièrement, les matériaux de carbonisation poreux cibles sont axés sur
le bois et le composite carbone/époxy dans cette étude. Leurs propriétés chimiques
et physiques fondamentales sont évaluées, en particulier les différents composants à
272 Summary in French for each chapter/Résumé en français pour chaque chapitre
l’intérieur des matériaux. Les similitudes et les différences sont discutées, le bois peut
être considéré comme isotrope tandis que le composite carbone/époxy implique des
propriétés anisotropes compte tenu des différences de conductivité thermique dans
différentes directions.
Les processus de pyrolyse de ces deux matériaux dans le scénario d’incendie sont
décrits sous les aspects chimiques, de chaleur et de transfert de masse ainsi que sous
les aspects de changement de structure physique. Les similitudes de la formation
de la couche de charbon ont un effet important sur le processus de pyrolyse, tandis
que le retrait du bois et la délamination des composites carbone/époxy font que ces
deux matériaux se pyrolyse avec une grande différence. Différents types de modèles de
pyrolyse sont évalués, des modèles de pyrolyse simples aux modèles complets. L’accent
est mis sur le modèle complet de pyrolyse, qui se couple principalement aux réactions
chimiques, à la chaleur et au transfert de masse. Les modèles élémentaires concernant
ces trois parties sont formulés mathématiquement et utilisent principalement l’équation
d’Arrhenius et la loi de Darcy. Ensuite, les modèles de pyrolyse développés dans la
communauté des incendies sont décrits brièvement, leurs avantages et leurs inefficacités
sont évalués.
Le processus de validation du modèle de pyrolyse implique la comparaison de
la prédiction du modèle avec les données expérimentales. Des tests TGA à l’échelle
du milligramme et des tests de calorimètre à cône expérimental à l’échelle du banc
sont introduits et décrits lors de l’examen de différentes échelles de longueur carac-
téristique sous la théorie thermiquement mince et thermiquement épaisse. Différents
paramètres d’entrée pour mettre en œuvre le modèle de pyrolyse sont discutés, et ils
sont principalement collectés avec des paramètres chimiques et thermo-physiques. Les
propriétés cinétiques sont spécifiées pour contrôler la réaction de pyrolyse tandis que
les propriétés thermo-physiques déterminent le processus de transfert de chaleur et de
masse. Les paramètres cinétiques sont principalement estimés par des expériences TGA
en s’ajustant aux profils de perte de masse correspondants basés sur la modélisation
de la pyrolyse. La méthode d’analyse inverse d’ajustement de courbe est généralement
A.3 Chapitre 3: Description du solveur PATO 273
utilisée pour caractériser les propriétés thermo-physiques en complément de la méthode
expérimentale.
Sur la base de la description du processus de modélisation de la pyrolyse susmen-
tionnée avec différents aspects, le chapitre suivant présentera un nouveau modèle de
pyrolyse PATO pour surmonter certaines inefficacités des modèles de pyrolyse actuels
dans la communauté des incendies. Ce modèle implique l’hypothèse de la théorie de
la moyenne des volumes, et les équations de conservation pertinentes contenant la
conductivité thermique et le tenseur de perméabilité sont décrites. Il peut être mis en
œuvre avec des conditions aux limites de convection flexibles sur différentes surfaces.
En utilisant ce modèle, les paramètres cinétiques, les paramètres thermo-physiques
et les paramètres des conditions aux limites sont également collectés avec un certain
niveau de précision. Ils sont estimés avec différentes options de simulation à hériter
comme paramètres d’entrée pour enfin valider ce modèle de pyrolyse.
A.3 Chapitre 3: Description du solveur PATO
Le présent chapitre a permis de présenter le modèle PATO utilisé dans cette étude,
la théorie détaillée de la moyenne volumique est décrite et les équations de conservation
correspondantes sont fournies ainsi que les expressions des propriétés des matériaux
connexes. Différents mécanismes de réaction cinétique concernant la pyrolyse du bois
et des composites carbone/époxy sont expliqués. Les méthodes numériques et les
conditions aux limites à différentes surfaces de matériaux utilisées dans cette étude
sont présentées pour mettre en œuvre les simulations qui incluent principalement des
simulations de TGA, de conduction thermique pure et de calorimètre à cône. Enfin,
certaines hypothèses du modèle et les options de simulation correspondantes sont
données.
La boîte à outils d’analyse des matériaux poreux (PATO) basée sur OpenFOAM
est un solveur numérique open-source (GNU GPL) publié par la NASA pour analyser
le processus de transfert de chaleur et de masse des matériaux poreux réactifs, par
274 Summary in French for each chapter/Résumé en français pour chaque chapitre
exemple, le comportement de pyrolyse des matériaux carbonisés. Ce solveur résout
les équations aux dérivées partielles par la méthode des volumes finis. PATO intègre
également Mutation++ en tant que bibliothèque tierce qui est développée par Von
Karman Institute. Le Mutation++ est utilisé pour calculer les réactions chimiques à
l’équilibre qui incluent la base de données pour les compositions chimiques des gaz, la
thermodynamique et le transport. PATO est développé initialement pour l’ablateur de
carbonisation, qui est utilisé dans le système de protection thermique pour la rentrée des
véhicules aérospatiaux impliquant des conditions de chauffage aux limites rigoureuses.
Cette limite explique le flux de gaz à haute enthalpie. Le gaz sous l’environnement
aérothermique à haute pression et la température est contrôlée par le flux de chaleur
de convection tandis que le flux de chaleur de rayonnement est moins prédominant. La
couche limite est traitée comme un équilibre thermique pour la réaction chimique, le
transfert de chaleur et le transfert de masse, qui traitent de l’interaction entre le gaz
ambiant, le gaz de pyrolyse et la couche de charbon de surface.
Ce modèle de pyrolyse complet a été développé pour traiter les transferts de chaleur
et de masse dans des milieux poreux ainsi que les réactions chimiques impliquées en
même temps. Ce modèle implique différentes phases solides et une phase gazeuse
unique. Différents composants des matériaux composites sont séparés et impliquent
leurs propres propriétés chimiques et physiques intrinsèques. L’équilibre thermique
local est considéré entre les gaz volatils et la phase solide, et ils sont mis en œuvre sur la
base de la méthode de moyenne volumique. Différents nombres de schémas de réaction
parallèles sont définis pour chaque composant et ils sont finalement intégrés pour mettre
en œuvre l’ensemble du comportement de pyrolyse du matériau. Les simulations de
différents cas de décomposition thermique permettent d’étudier les interactions entre
les processus de transfert de chaleur et de masse ainsi que les réactions chimiques
au sein du solide. Le modèle 3D développé décrit le transport du gaz dans les pores
des matériaux à l’échelle de Darcy. La conductivité thermique est formulée sous une
forme tenseur permettant la définition du transfert de chaleur dans trois directions
du domaine. Les conditions aux limites de rayonnement concernant les scénarios
A.4 Chapitre 4: Modélisation à l’échelle des particules de la pyrolyse du bois 275
d’incendie sont ajoutées au modèle. Et on s’attend à ce qu’il s’agisse d’un autre modèle
de pyrolyse complet applicable pour fournir une précision de prédiction potentielle
lors de l’évaluation des modèles de pyrolyse actuels dans la communauté de la sécurité
incendie.
Dans ce travail, le bois est traité comme un matériau composite isotrope, c’est-à-
dire que le tenseur de conductivité thermique et de perméabilité est négligé, tandis que
pour le composite carbone/époxy, ces valeurs ne sont pas uniformes pour différentes
directions. Lorsqu’on s’attaque à des schémas de réaction parallèles indépendants pour
le bois qui implique quatre composants, à savoir l’eau, l’hémicellulose, la cellulose, la
lignine. Ainsi, l’eau, l’hémicellulose, la cellulose et la lignine impliquent les quatre
phases solides. Pour le composite carbone/époxy, seule la résine époxy représente la
réaction avec deux schémas de réaction parallèles, la réaction de la fibre de carbone et
de l’eau à l’intérieur sont négligeables. Dans ce travail, on suppose que la production
de pyrolyse est de l’azote pour tous les gaz libérés.
A.4 Chapitre 4: Modélisation à l’échelle des par-
ticules de la pyrolyse du bois
Ce chapitre est dédié à la modélisation de la décomposition thermique du bois à
l’échelle des particules, c’est-à-dire à l’échelle TGA (Analyse Thermogravimétrique).
Des expériences ont été réalisées en utilisant l’appareil TGA sous atmosphère inerte,
pour deux vitesses de chauffage: 10 K/min et 50 K/min. À partir des évolutions de
la perte de masse et du taux de perte de masse, deux schémas de réaction ont été
proposés: un global et un multi-parallèles. Les paramètres cinétiques inconnus ont
été déterminés par le modèle DAKOTA en PATO. Les évolutions de modélisation de
la perte de masse et des taux de perte de masse ont été comparées aux évolutions
expérimentales afin d’analyser l’influence du schéma réactionnel. L’influence de la
vitesse de chauffe sur les paramètres cinétiques est analysée. Ainsi, les paramètres
cinétiques optimisés par une vitesse de chauffage sont comparés par les paramètres
276 Summary in French for each chapter/Résumé en français pour chaque chapitre
cinétiques extraits d’autres vitesses de chauffage. Enfin, la modélisation 2D avec le
modèle PATO permet d’explorer l’interaction des transferts de chaleur et de masse à
cette échelle de particules spécifique.
Afin d’explorer l’influence de la vitesse de chauffage sur la réaction de pyrolyse,
il est choisi d’extraire un ensemble de données cinétiques pour chaque condition de
chauffage. Les paramètres cinétiques sont obtenus tout d’abord par une vitesse de
chauffage et après leur analyse pour simuler un autre cas de vitesse de chauffage.
L’influence de la vitesse de chauffage sur le processus de pyrolyse est analysée, il est
démontré que la fraction de résidu massique finale semble être indépendante de la vitesse
de chauffage, et le pic de vitesse de réaction se déplace vers une plage de température
plus élevée lorsque la vitesse de chauffage augmente. Nous avons constaté que pour une
fraction massique de matière vierge supérieure à 50% en poids, le processus cinétique
est régi par l’élévation de température de l’échantillon. Lorsqu’il s’agit de moins de
50% en poids de fraction massique vierge, la masse restante devient le paramètre limité
du processus de réaction global. Il est démontré que le processus de chauffage peut
interagir avec le processus de pyrolyse global, et chaque réaction de décomposition
thermique n’est pas affectée de la même manière par le processus de chauffage. Seule la
réaction vis-à-vis de la décomposition thermique de la cellulose semble être affectée par
la vitesse de chauffage en termes de plage de température de début. De plus, la vitesse
de chauffage n’affecte pas la température de début de la réaction hémicellulosique. Il
peut être démontré qu’une vitesse de chauffage plus élevée tend à favoriser l’intensité
et la durée de la réaction hémicellulosique. Une vitesse de chauffage plus élevée semble
affaiblir le processus de décomposition thermique de la cellulose avec une plus grande
plage de températures de réaction lorsque la vitesse de chauffage augmente. La vitesse
de chauffage affecte la cinétique de chaque réaction de différentes manières, la vitesse
de chauffage n’a pratiquement aucun impact sur la décomposition thermique de la
lignine. Cependant, les réactions de décomposition thermique de l’hémicellulose et de
la cellulose sont affectées par le processus de chauffage.
A.4 Chapitre 4: Modélisation à l’échelle des particules de la pyrolyse du bois 277
Afin d’évaluer la prévisibilité pour différents schémas de réaction, un simple
schéma de réaction global en une étape et un schéma de réaction parallèle indépendant
complexe avec un modèle de réaction de nième ordre sont proposés pour décrire le
comportement de décomposition thermique du matériau. On constate que pour les deux
vitesses de chauffage, les deux schémas conviennent bien au processus d’évaporation
de l’eau, de sorte que l’évaporation de l’eau est indépendante des schémas de réaction
de pyrolyse. Pour les deux vitesses de chauffage, le schéma de réaction parallèle
indépendant convient assez bien. Le schéma de réaction global en une étape ne capture
pas bien la valeur de pic de MLR et la plage de température à laquelle la réaction de
pyrolyse se produit. Cependant, d’un point de vue macroscopique, ciblant le profil de
perte de masse expérimental et numérique, le mécanisme global en une étape réussit à
représenter la tendance globale de la pyrolyse, de sorte qu’un tel mécanisme pourrait
être applicable pour décrire le processus de pyrolyse lorsqu’un incendie est pleinement
développé.
Des simulations 2D ont été menées pour analyser les gradients thermiques possibles
dans le solide en configuration TGA à 50 K/min. Différents temps caractéristiques sont
concentrés pour explorer le comportement de réaction concernant la vitesse de réaction
de l’hémicellulose, de la cellulose et de la lignine. Les trois temps caractéristiques
concernant: le temps de pic de vitesse de réaction, le temps avant et après ce pic,
respectivement. Il est démontré que l’avancement des réactions est assez constant sur
toute l’épaisseur du solide. Une plus grande différence est observée pour la réaction
hémicellulosique au moment où la vitesse de réaction est maximale. On montre que
la vitesse de réaction maximale globale est observée lorsque l’avancement d’une telle
réaction globale est d’environ 0.5 en 0D. Cependant, pour le modèle 2D, concernant
l’avancement de la réaction de chaque composant qui se comporte en fonction de
l’épaisseur. Les principales différences concernent l’hémicellulose et une progression
d’environ 0.41 est observée en surface et de 0.38 au centre au temps caractéristique
de 349.3 s. Au temps caractéristique précédant la vitesse de réaction maximale, les
réactions d’hémicellulose et de cellulose présentent des gradients de vitesse de réaction
278 Summary in French for each chapter/Résumé en français pour chaque chapitre
plus élevés avec une différence d’environ 15% de la vitesse de réaction entre la surface
et le centre de l’échantillon. La lignine est moins influencée par une différence de
vitesse de réaction inférieure à 10%. On constate une évolution de vitesse de chauffage
plus élevée qui atteint 54 K/min en comparant la réaction d’hémicellulose où les
vitesses de chauffage sont encore proches de 50 K/min. Au moment où les vitesses
de réaction sont maximales, nous avons observé moins de gradient de vitesse de
réaction pour l’hémicellulose et la lignine. Leur vitesse de réaction à la surface et
aux emplacements intermédiaires (impliquent une vitesse de réaction maximale) de
l’échantillon est d’environ 5%. Cependant, cette différence de vitesse de réaction est
d’environ 15% pour la cellulose accompagnée d’une différence de 2K entre la surface et
le milieu de l’échantillon, et d’une vitesse de chauffage supérieure à 50 K/min (environ
56 K/min). On peut noter qu’à ces instants caractéristiques, lorsque les vitesses de
réaction sont maximales, la valeur maximale de la vitesse de réaction est située au
milieu de l’échantillon et différentes valeurs plus petites sont observées à la surface,
démontrant que les fronts de réaction se déplacent de la surface vers le milieu de
l’épaisseur de l’échantillon. Pour le temps caractéristique après le pic de vitesse de
réaction (courbes vertes), on observe une tendance similaire pour les réactions de
lignine et de cellulose. Alors que des gradients de vitesse de réaction plus élevés pour la
réaction de cellulose, une tendance opposée pour la vitesse de réaction d’hémicellulose
Cela démontre qu’un gradient d’avancement de réaction est formé à travers l’épaisseur
du solide. Avec un tel comportement discuté ci-dessus, nous pouvons conclure que les
transferts de chaleur et de masse interagissent avec les réactions de pyrolyse lorsque la
vitesse de chauffage globale est supérieure à 50 K/min. Ces interactions doivent être
correctement capturées par le modèle pour décrire correctement le processus global de
pyrolyse.
A.5 Chapitre 5: Expériences au cône calorimètre et validation du modèle de pyrolysedu bois 279
A.5 Chapitre 5: Expériences au cône calorimètre
et validation du modèle de pyrolyse du bois
En raison du lien étroit entre les processus chimiques et thermo-physiques au cours
du scénario de pyrolyse par incendie réel, ce chapitre se concentre sur la pyrolyse du
bois à une plus grande échelle de laboratoire, avec l’appareil calorimétrique à cône. Des
expériences sont menées afin de caractériser la décomposition thermique du bois, avec
à la fois des transferts de chaleur et de masse. Les paramètres convectifs aux limites
et thermo-physiques sont prédits spécifiquement dans les conditions expérimentales
concernant le calorimètre à cône. L’évaporation de l’humidité est ciblée, la pyrolyse du
bois humide et du bois sec est étudiée numériquement à différentes échelles de temps
et de longueur.
Des analyses numériques pertinentes sont menées à différentes échelles de temps et
de longueur pour différents scénarios de pyrolyse. Avec un porte-échantillon en silicate
épais à isolation thermique, le coefficient de convection thermique sur les côtés et sur
la surface inférieure n’est pas considéré comme important. Le coefficient de convection
thermique de la surface supérieure est bien prédit par analyse inverse pour passer de 3
à 5 W/m2/K pour le modèle 2D, alors qu’il est estimé à 0 à 3 W/m2/K pour le modèle
1D avec moins précision. La conductivité thermique et la capacité thermique spécifique
du bois et du charbon sont prédites par analyse inverse des conditions expérimentales,
et leur signification physique est vérifiée. Le processus d’évaporation de l’humidité du
bois humide sous une exposition à un flux de chaleur de 5 kW/m2 est analysé. Une
bonne adaptation est obtenue en ce qui concerne la perte de masse, le taux de perte de
masse et les évolutions de température à trois endroits dans l’épaisseur de l’échantillon.
Le front d’évaporation est courbé avec différents niveaux, avec une augmentation de
l’évolution dans le temps et dans l’espace qui est influencée par l’effet secondaire imposé
par la conduction thermique du silicate dans le modèle 2D. Le front d’évaporation
est mince aux emplacements supérieurs et devient épais lorsqu’il se déplace vers le
bas, ce qui est influencé par la réaction endothermique de l’eau et la diminution de la
280 Summary in French for each chapter/Résumé en français pour chaque chapitre
vitesse de chauffage. Sur la base de l’analyse de l’évolution de la température du bois
humide et sec, l’eau peut retarder l’évolution de la température à travers l’épaisseur,
et l’emplacement du fond est le plus influencé. Cependant, les températures finales des
différents endroits ne sont pas influencées par l’eau.
Sur la base de l’observation de l’influence de l’eau, les procédés de pyrolyse du bois
humide et sec sont analysés par modélisation 1D et 2D à un flux thermique incident
de 20 kW/m2et 50 kW/m2. La vitesse de chauffage est spécifiée à 10 K/min pour la
pyrolyse humide du bois à 20 kW/m2, et une vitesse de chauffage d’environ 50 K/min
est estimée à 50 kW/m2. Comparé à la pyrolyse humide du bois, le bois sec subit un
processus de chauffage rapide avec une vitesse de réaction intensifiée et une évolution
de température plus élevée. L’évolution de la température implique différents niveaux
du plateau, en particulier pour les emplacements inférieurs à faible flux thermique.
Concernant la validation du modèle, le modèle 2D permet de mieux prédire la perte
de masse, le taux de perte de masse et l’évolution de la température par rapport au
modèle 1D. Le modèle peut être validé avec plus de précision à un flux thermique plus
faible (20 kW/m2) par rapport aux cas à flux thermique plus élevé (50 kW/m2). De
même, le front de charbon expérimental est validé pour la pyrolyse humide du bois à 20
kW/m2 et 50 kW/m2 aux différents temps caractéristiques et une meilleure prédiction
peut être observée à un flux thermique plus faible.
Une analyse numérique est menée avec des détails concernant l’influence de l’eau
et du processus de chauffage sur les scalaires globaux et locaux. L’eau peut retarder le
processus de perte de masse, mais une fraction massique fixe de résidus de charbon
est présente pour le bois humide et sec. La vitesse de réaction d’évaporation de l’eau
est globalement plus élevée au départ que celles des autres réactions (hémicellulose,
cellulose et lignine) à 20 kW/m2, tandis que pour le cas de 50 kW/m2, la vitesse de
réaction de l’eau est inférieure aux vitesses de réaction de autres composants. La
différence concernant le taux de perte de masse entre les cas de pyrolyse du bois sec
et humide est plus prédominante à un flux thermique plus faible. L’eau peut fournir
une évolution de température plus faible pour le bois humide, mais la température
A.6 Chapitre 6: Modélisation de multi-échelle à la pyrolyse du compositecarbone/époxy 281
finale reste constante par rapport au cas de la pyrolyse du bois sec. Des différences
de température plus importantes entre la pyrolyse du bois humide et sec peuvent être
trouvées pour l’emplacement inférieur par rapport à celui des emplacements supérieurs
ou intermédiaires. On étudie la propagation du front d’évaporation et de pyrolyse
aux différents temps caractéristiques. Le front d’évaporation est relativement mince
tout au long du processus et il peut interagir de manière physique avec le processus de
pyrolyse. Cependant, ce front d’évaporation peut changer pour devenir très épais en
descendant vers l’espace inférieur plus frais, et il est loin du front de pyrolyse et ne
pourrait pas interagir avec ce processus de pyrolyse à un flux thermique plus faible.
A.6 Chapitre 6: Modélisation de multi-échelle à la
pyrolyse du composite carbone/époxy
Ce chapitre a été dédié à la modélisation de la décomposition thermique d’un
composite résine époxy/fibres de carbone, d’une part à l’échelle TGA et d’autre part à
l’échelle d’un calorimètre conique. Un mécanisme à deux parallèles de décomposition
thermique a été utilisé et les paramètres cinétiques associés ont été validés à l’échelle
TGA par comparaison avec les données expérimentales. Les propriétés physiques et
thermiques requises pour la modélisation de la décomposition thermique à l’échelle du
calorimètre à cône ont été déterminées à partir de différentes sources de la littérature.
L’évaluation du modèle pour représenter la décomposition thermique du composite
carbone/époxy a été effectuée en tenant compte de la perte de masse, du taux de perte
de masse et des profils de température dans l’épaisseur des échantillons composites.
Le procédé de pyrolyse composite carbone/époxy à l’échelle TGA et à l’échelle
du calorimètre à cône est étudié. Selon les courbes expérimentales, il se produit un
plateau après la fin de la décomposition thermique qui implique que la fraction de
perte de masse totale représente respectivement environ 25% et 30% pour les deux
vitesses de chauffage. La fraction massique expérimentale du rendement en charbon
dans ce travail est également conforme à l’observation générale qui implique moins de
282 Summary in French for each chapter/Résumé en français pour chaque chapitre
résidus de charbon à une vitesse de chauffage élevée. Les paramètres cinétiques extraits
ont bien prédit les courbes expérimentales, une bonne remise en forme est obtenue
notamment à 20 K/min, à l’exception de certains niveaux de déviation pour la partie
queue. La vitesse de chauffage de 50 K/min implique un écart modéré par rapport à
celle de 20 K/min, qui est décalée vers une température plus basse. il est démontré
que les paramètres cinétiques pourraient refléter le comportement de la réaction de
pyrolyse pour différents processus de chauffage. Ces vitesses de chauffage sont liées à
l’expérience du cône calorimètre avec un flux de chaleur de 20 kW/m2 et 50 kW/m2.
Afin d’explorer les propriétés thermo-physiques non isotropes telles que la conduc-
tivité thermique, les valeurs sont abordées par changement de tenseur avec différentes
directions sous 3D pour la pyrolyse composite carbone/époxy. Le composite car-
bone/époxy implique une conductivité thermique plus grande pour la direction dans
le plan que celle pour la direction de l’épaisseur. Ainsi, 5 fois la différence est prise
cette étude. Un travail de modélisation 1D est d’abord effectué pour témoigner de
l’hypothèse que le composite de carbone époxy vierge est homogène en tenant compte
des propriétés isotropes. Afin de montrer l’influence des propriétés anisotropes sur
le comportement de la pyrolyse qui impliquent différentes valeurs dans différentes
directions du composite carbone/époxy, des travaux de modélisation 3D sont également
réalisés à titre de comparaison. En observant les données expérimentales, la pyrolyse
du composite carbone/époxy à l’échelle du calorimètre à cône n’apparaît pas comme le
deuxième pic du taux de perte de masse dans cette étude, On peut observer que le
taux de perte de masse et la prédiction de température sous 1D et 3D impliquent des
tendances de variation qui démontrent que l’hypothèse isotrope peut être applicable
en ce qui concerne la simulation de la décomposition thermique du composite car-
bone/époxy. En fin de test en cône calorimètre, la fraction massique moyenne du résidu
du composite carbone/époxy représente environ 75% en poids, On observe qu’un accord
raisonnable est obtenu pour la perte de masse normalisée et le taux de perte de masse
correspondant, en particulier en ce qui concerne la fraction massique finale du résidu de
charbon et la plage de durée du pic du taux de perte de masse. L’occurrence et la fin du
A.7 Chapitre 7: Analyse de sensibilité 283
processus de pyrolyse sont capturées avec précision. Cependant, l’amplitude prévue du
pic de taux de perte de masse est déviée avec une erreur relativement importante par
rapport aux données de l’expérience. Pour un flux de chaleur de 20 K/min. Lorsque
l’on compare la perte de masse et le taux de perte de masse entre les valeurs mesurées
et les prédites, il montre une concordance parfaite du début jusqu’à 300 s. Il démontre
la validité et la précision de ce modèle au stade initial de la pyrolyse. Il est observé que
du début à environ 500 s, le modèle sous-prédit la surface supérieure et les températures
moyennes d’environ 20 K, tandis que la température de la surface arrière implique
une bonne adaptation avec les données expérimentales. La température de la surface
inférieure est en bon accord avec celle expérimentale. on pense qu’un degré raisonnable
de précision est obtenu en particulier pour la prédiction de température à 20 kW/m2 à
l’exception de l’amplitude de crête du taux de perte de masse. On peut conclure qu’un
délaminage grave se produit à différents endroits à travers l’épaisseur dans les cas de
20 kW/m2 et 50 kW/m2. Concernant cette étude, le délaminage grave se produit entre
les emplacements supérieurs et intermédiaires à 20 kW/m2. Alors que pour 50 kW/m2,
cette délamination grave se produit entre les emplacements du milieu et du bas. Pour
conclure cette partie, un niveau de prédiction similaire est observé à 20 kW/m2 et 50
kW/m2. À l’exception des écarts plus importants de la prédiction de l’amplitude du
pic du taux de perte de masse, la prédiction à un flux thermique plus faible semble
être plus précise lorsque l’on cible l’évolution de la température.
A.7 Chapitre 7: Analyse de sensibilité
Plus la quantité des paramètres d’entrée du modèle est importante, plus les incer-
titudes sont élevées. Afin de tester comment ces paramètres sont liés au comportement
de pyrolyse et lesquels sont les plus incertains, le chapitre 7 est consacré à une analyse
de sensibilité afin d’explorer leurs effets. L’analyse de sensibilité pourrait donner
des informations sur la manière dont les paramètres influencent les résultats. Par
exemple, pendant le processus de pyrolyse, différents paramètres peuvent jouer des
284 Summary in French for each chapter/Résumé en français pour chaque chapitre
rôles différents sur les résultats. Ainsi, à l’avenir, nous pourrons nous concentrer sur les
paramètres qui doivent être déterminés correctement par des moyens numériques ou
expérimentaux de manière à permettre de diminuer les incertitudes du modèle causées
par les paramètres d’entrée et d’améliorer l’efficacité de la prédiction du modèle.
Pour conclure, de nombreux paramètres non fiables sont impliqués pour la mise
en œuvre de la modélisation de la pyrolyse. Les paramètres cinétiques sont plus
importants pour la prédiction des réactions chimiques alors que pour la prédiction de la
température, ils ne sont pas sensibles. Le taux de perte de masse est très sensible à la
chaleur de décomposition. Le taux de perte de masse et l’évolution de la température
sont sensibles à la conductivité thermique vierge et carbonisée. Pour la capacité
thermique spécifique de la vierge et du charbon, elles sont plus importantes à un flux
thermique plus faible. Le taux de perte de masse et l’évolution de la température sont
sensibles à la perméabilité au charbon et insensibles à la perméabilité vierge. La teneur
en eau peut être plus importante pour la surface du matériau au moment initial, donc
pour l’étude d’inflammation du matériau, cet effet de l’eau doit être remarqué. Là
encore, la teneur en eau peut influencer l’évolution de la température tout au long du
processus de pyrolyse pour différents flux de chaleur, mais cette influence sur la surface
supérieure à un flux de chaleur élevé peut être négligeable.
À l’avenir, cette teneur en eau devrait être mise beaucoup l’accent, en particulier
lors de la réalisation d’une expérience dans un environnement à faible chauffage. De
même avec la teneur en eau, l’émissivité du charbon est plus importante dans un
environnement de chauffage inférieur et une grande attention doit être accordée pour
déterminer cette valeur. La conductivité thermique du charbon est plus importante
que la capacité thermique spécifique du charbon, mais le charbon est assez incertain
et fragile avec une évolution des propriétés très changeante. Il est toujours difficile
de saisir cet aspect et des études futures devraient être données. Le coefficient de
convection de la chaleur limite est plus important dans un environnement à faible
chauffage, cependant, ces valeurs sont généralement estimées en fonction des conditions
expérimentales. À l’avenir, cette partie du travail devrait être résolue de manière
A.8 Chapitre 8: Conclusion et perspective 285
hautement expérimentale ou numérique afin de connaître les circonstances correctes de
perte de chaleur dans l’environnement ambiant.
A.8 Chapitre 8: Conclusion et perspective
Dans ce contexte, la présente thèse vise à étudier la pyrolyse de deux matériaux
composites différents afin de mieux comprendre le processus de décomposition thermique
et de fournir les données nécessaires au développement et à la validation du modèle
PATO. Le premier matériau est le bois tandis que le second est un composite fibre de
carbone/résine époxy. Le bois est choisi car il s’agit d’une sorte de matériau composite
isotrope tandis que le carbone/époxy est choisi car il s’agit d’une sorte de matériau non
isotrope. Pour étudier l’ensemble du processus de pyrolyse, la méthode multi-échelle a
été choisie qui consiste à étudier les aspects séparément à une échelle détaillée (cinétique,
transfert de chaleur et de masse, porosité, etc.), et deuxièmement, ces aspects sont
couplés à plus grande échelle pour étudier les interactions. Ensuite, au cours de ce
travail, deux échelles sont utilisées: l’échelle de la matière TGA (thermiquement mince)
et l’échelle du cône calorimètre (thermiquement épaisse). De plus, pour valider plus
précisément le modèle dans une première approche et éviter les incertitudes dues
à des conditions aux limites mal contrôlées (formées par flamme ou oxydation), les
manipulations expérimentales sont conduites sous atmosphère inerte pour les deux
échelles.
La décomposition thermique du bois a été étudiée à l’aide d’un appareil TGA. A
partir de l’évolution des courbes de perte de masse et de taux de perte de masse, deux
mécanismes (réactions parallèles à une étape et à plusieurs étapes) de décomposition
thermique ont été proposés. Les paramètres cinétiques devraient mettre en œuvre les
réactions chimiques en modélisant la méthode d’ajustement avec l’expérience TGA qui
est décrite avec l’équation de type Arrhenius à travers différentes échelles de temps. Le
schéma de réaction parallèle en plusieurs étapes modélise bien la perte de masse et la
vitesse de perte de masse MLR, tandis que le schéma de réaction global en une étape
286 Summary in French for each chapter/Résumé en français pour chaque chapitre
ne capture pas bien la valeur du pic du MLR et la plage de températures à laquelle
la réaction de pyrolyse se produit. Pour analyser l’hypothèse d’absence de chaleur et
de gradient de masse dans l’échantillon lors de l’expérience TGA, des simulations 0D
(modèle à gradient nul) et 2D à symétrie d’axe (modèle à gradient) ont été comparées.
Pour les deux simulations, aucune différence significative n’a été identifiée. L’influence
de la vitesse de chauffage sur le processus de pyrolyse a été analysée. Il est démontré
que seul le pic de vitesse de réaction passe dans une plage de températures plus élevée
lorsque la vitesse de chauffage augmente. Le processus de chauffage peut interagir avec
le processus de pyrolyse global et chaque réaction n’est pas affectée de la même manière
par le processus de chauffage. Le processus de chauffage jouant un rôle important
dans la décomposition thermique, des simulations 2D ont été menées pour analyser les
gradients thermiques possibles dans le solide en configuration TGA à 50 K/min. Il est
démontré que le transfert de chaleur et de masse interagit avec les réactions de pyrolyse
dans TGA lorsque la vitesse de chauffage globale est élevée. Ces interactions doivent
être correctement capturées par le modèle pour décrire correctement le processus global
de pyrolyse.
Afin d’explorer le comportement de la pyrolyse dans différentes conditions ther-
miques, des tests en cône calorimètre sous atmosphère contrôlée sous l’azote ont été
réalisés avec un porte-échantillon en silicate pour l’isolation thermique. Les modèles
numériques sont mis en œuvre pour étudier les processus de pyrolyse à différentes
échelles de temps et de longueur sous 1D et 2D. Les coefficients de chaleur convective
sont extraits par analyse inverse avec conduction thermique pure de l’aluminium et un
ensemble de coefficients de convection thermique est attribué pour la prédiction du
modèle. Les paramètres thermiques du bois et du charbon sont obtenus sur la base
d’expériences de conduction thermique pure. Les modèles 1D et 2D correspondent
assez bien pour les emplacements supérieurs et la différence est augmentée pour la
température inférieure. On précise que le rôle du matériau silicate isolant est très
important ce qui peut donner une meilleure prédiction de la perte de masse et du profil
de température par le modèle 2D, et cet «effet secondaire» a tendance à être augmenté
A.8 Chapitre 8: Conclusion et perspective 287
dans le processus de chauffage lent. On constate que la fraction et la température
de rendement final du charbon concernant le bois humide et la pyrolyse du bois sec
se comportent de la même manière et aucune différence apparente n’est impliquée.
Ensuite, l’eau a seulement tendance à retarder le processus de pyrolyse et le pic de
réaction ou l’élévation de température correspondant est alors influencé. Il est démontré
que la différence de MLR entre les caisses sèches et humides est augmentée à faible flux
thermique et que la différence de température entre le bois sec et humide augmente
avec l’épaisseur. Pour un faible flux thermique, la vitesse de réaction et l’avancement de
la pyrolyse sont lents avec une couche de pyrolyse épaisse accompagnée d’un gradient
de température plus petit. Alors que pour un flux thermique élevé, il s’agit d’une
fine couche de pyrolyse à gradient de température élevée. Pour la modélisation de
la décomposition thermique du composite carbone/époxy est réalisée d’une part à
l’échelle TGA et d’autre part à l’échelle du cône calorimètre. Un mécanisme parallèle
de décomposition thermique a été utilisé et les paramètres cinétiques associés ont
été validés à l’échelle TGA par comparaison avec les données expérimentales. La
fraction massique expérimentale du rendement en charbon dans ce travail contribue
à l’observation générale qui implique moins de résidus de charbon à une vitesse de
chauffage élevée. Les paramètres cinétiques extraits pourraient refléter le comportement
de la réaction de pyrolyse pour les différents processus de chauffage. L’évaluation
du modèle pour représenter la décomposition thermique du composite carbone/époxy
est menée en tenant compte de la perte de masse, du taux de perte de masse et des
profils de température à différents endroits. L’occurrence et la fin du processus de
pyrolyse sont bien capturées par le modèle, mais l’ampleur du pic du taux de perte
de masse est surestimée par rapport à l’expérience pour les deux flux de chaleur. Il
est démontré qu’une délamination grave se produit à différents endroits à travers
l’épaisseur du composite sous différents flux de chaleur. Afin d’explorer la conductivité
thermique non isotrope du composite carbone/époxy, les valeurs sont abordées par
changement de tenseur avec différentes directions sous 3D. Les modélisations 1D et 3D
sont comparées, la perte de masse et la température expliquent à peu près la même
288 Summary in French for each chapter/Résumé en français pour chaque chapitre
tendance de variation qui conclut que l’hypothèse isotrope peut être appropriée en ce
qui concerne la simulation de la décomposition thermique du composite carbone/époxy.
Pour l’étude de sensibilité, on constate que le taux de perte de masse est assez
sensible aux paramètres cinétiques (énergie d’activation, facteur pré-exponentiel et
ordre de réaction), et cette influence est plus forte à flux thermique plus faible, alors
que l’évolution de la température est légèrement sensible à l’énergie d’activation. Une
influence similaire est observée avec la chaleur de décomposition thermique par rapport
à ces paramètres cinétiques, et l’emplacement du fond est plus influencé. Des influences
similaires sont trouvées concernant la conductivité thermique vierge et carbonisée,
et leur influence sur l’emplacement du fond est plus grave. La capacité thermique
spécifique de la vierge et du charbon a une certaine influence sur les différentes étapes
de pyrolyse. On constate que l’émissivité du charbon est plus importante dans un
environnement de chauffage plus faible et qu’une grande attention doit être accordée
pour déterminer cette valeur. La perméabilité vierge n’a aucune influence peut être
conclue, tandis que la perméabilité au charbon pourrait avoir un certain effet, en
particulier dans un environnement à flux thermique élevé et à l’emplacement du fond.
Le coefficient de convection thermique est plus important lorsque le flux thermique est
plus faible. L’évolution de la température est assez sensible à la teneur en eau tout
au long du processus de pyrolyse, et elle peut être plus importante pour la surface du
matériau au moment initial, ainsi, pour l’étude d’inflammation du matériau, cet effet
de l’eau doit être remarqué.
Enfin, les résultats obtenus montrent que le modèle PATO implique de bonnes
capacités pour fournir une prédiction relativement précise du comportement de pyrol-
yse de différents matériaux composites sous différents environnements de chauffage.
Le présent travail donne de nouvelles perspectives lors de la manipulation d’études
numériques pour la pyrolyse couplant en particulier la complexité des phénomènes
physiques dans les scénarios d’incendie.