Embed Size (px)
Citation preview
Application of various strategies to enhance the
solubility and bioavailability of Rosuvastatin calcium
A dissertation submitted in partial
fulfillment of the requirements for the degree of
Doctor of Philosophy (Pharmaceutics)
by
Rai Muhammad Sarfraz Pharm. D., M.Phil.
Department of Pharmacy
Faculty of Pharmacy and Alternative Medicine,
The Islamia University of Bahawalpur,
Pakistan
2013-2016

i
In the name of Allah, Most Gracious, Most Merciful
ii
Dedicated to,
My Dearest Parents
For their endless support, appreciation, encouragement and ever sincere prayers
My Dearest Brothers, Sisters & Wife
For their love, care, confidence and giving me strength to chase my dreams
IV
I, Rai Muhammad Sarfraz, Ph.D. Scholar of Department of Pharmacy, The Islamia
University of Bahawalpur, hereby declare that the research work entitled “Application
of Various Strategies to Enhance the Solubility and Bioavailability of Rosuvastatin
Calcium” is done by me. I also certify that nothing has been incorporated in this
research work without acknowledgement and that to the best of my knowledge and
belief it does not contain any material previously published or written by any other
person or any material previously submitted for a degree in any university where due
reference is not made in the text.
Rai Muhammad Sarfraz
V
It is hereby certified that this dissertation entitled “Application of Various Strategies to
Enhance the Solubility and Bioavailability of Rosuvastatin Calcium” is based upon
the results of experiments carried out by Mr. Rai Muhammad Sarfraz under my
supervision. No portion of this work has previously been presented for higher degree in
this university or any other institute of learning and to the best of the knowledge, no
material has been used in this dissertation which is not her own work except where due
acknowledgement has been made. He has fulfilled all the requirements and is qualified to
submit this dissertation for the Degree of Doctor of Philosophy in Pharmaceutics.
Prof. Dr. Mahmood Ahmad
Supervisor,
Dean Faculty of Pharmacy and Alternative medicine,
The Islamia University of Bahawalpur

V
All praises to Allah Almighty who created the universe and knows whatever is in it,
hidden or evident, and who bestowed upon me the intellectual ability and wisdom to
search for its secrets.
All respects, blessings and love to the last Holy Prophet MUHAMMAD, (Sal-
Allaho-alaihe-wa-aalehee-wasallam), who enabled me to recognize Creator and His
creations and changed me from man to Muslim by teaching, “Seek knowledge from
cradle to grave.”
I feel ample pleasure in expressing my heartiest gratitude to my ever affectionate
supervisor Prof. Dr. Mahmood Ahmad for his supervision and constant support. His
precious assistance of constructive comments and suggestions throughout the
experimental and thesis works have contributed to the success of this research.
I would like to encompass my deep felt gratitude and appreciations to Dr. Naveed Akhtar,
Chairman Department of Pharmacy for his support to the completion of this milestone.
I record my sincere thanks and appreciation for my seniors, particularly Assistant
Professor Dr. Muhammad Usman Minhas for his valuable guidance and support.
I would like to thanks Asif Mahmood, who as a good friend was always willing to help
and give his best suggestions. It would have been a lonely lab without his. It would like
to acknowledge cooperation and support of my seniors Mrs. Ayesha Yaqoob and Mr.
Muhammad Rouf Akram.
Also I would like to acknowledge Hafiz Muhammad Saleem, peon Dean Office and
Muhammad Binyamin, Lab attendant, M.Phil/Ph.D. Research Lab. 25 for their services
and cooperation during my research work.
I express my heartfelt gratitude to my mother, father, sisters, brothers and all other
family members. Their unlimited love and affection served me a beacon of light. It is
through their benevolent help and wholehearted prayers that enabled me to complete my
studies. I am also indebted to all those people who prayed for my success.
At the last, but not the least, I am grateful to Higher Education Commission of
Pakistan for financial support in the form of Indigenous Scholarship.
RAI MUHAMMAD SARFRAZ
VI
VII
RST Rosuvastatin Calcium
HMG-CoA 3-hydroxy-3-methyl glutaryl CoA
CoA Co enzyme A
BCS Biopharmaceutics classification system
β-CD β- cyclodextrin
MAA Methacrylic acid
HPMC Hydroxypropyl methylcellulose
NCEs New Chemical Entities
PVP Polyvinyl pyrrolidone
PEG Polyethylene glycols
Log P Partition coefficient
SCF Supercritical fluid
Tc Critical temperature
Tp Critical pressure
CMC Critical micelle concentration
USP United State Pharmacopoeia
BP British Pharmacopoeia
FDA Food and Drug Agency
CEFIC European Chemical Industry Council
ApoB Apolipoprotein B
CK Creatine kinase
VIII
APS Ammonium per sulphate
MBA N, N/ methylene-bis-acrylamide
TEM Transmission electron microscopy
FTIR Fourier transforms infrared spectroscopy
PXRD Powder X-ray diffraction
SEM Scanning electron microscopy
TGA Thermal gravimetric analysis
DSC Differential scanning calorimetry
FDT’s Fast disintegrating tablets
ODT’s Oro dispersible tablets
LDL Low-density lipoprotein
HDL High-density lipoprotein
Hrs Hours
UV Ultraviolet
AUC0-∞ Area Under the Curve from zero to infinity
AUMC0-∞ Area Under the First Moment Curve from
zero to infinity
Cmax Maximum Plasma Concentration
HPLC High Performance Liquid Chromatography
GIT Gastro-intestinal Tract
MRT Mean Residence Time
Tmax Time for Maximum Plasma Concentration
t1/2 Half life
IX
b.w Body weight
ALT Alanine transaminase
AST Aspartate transaminase
MCH Mean corpuscular hemoglobin
MCV Mean corpuscular volume
MCHC Mean corpuscular hemoglobin concentration
Hb Hemoglobin
ANOVA Analysis of variance
X
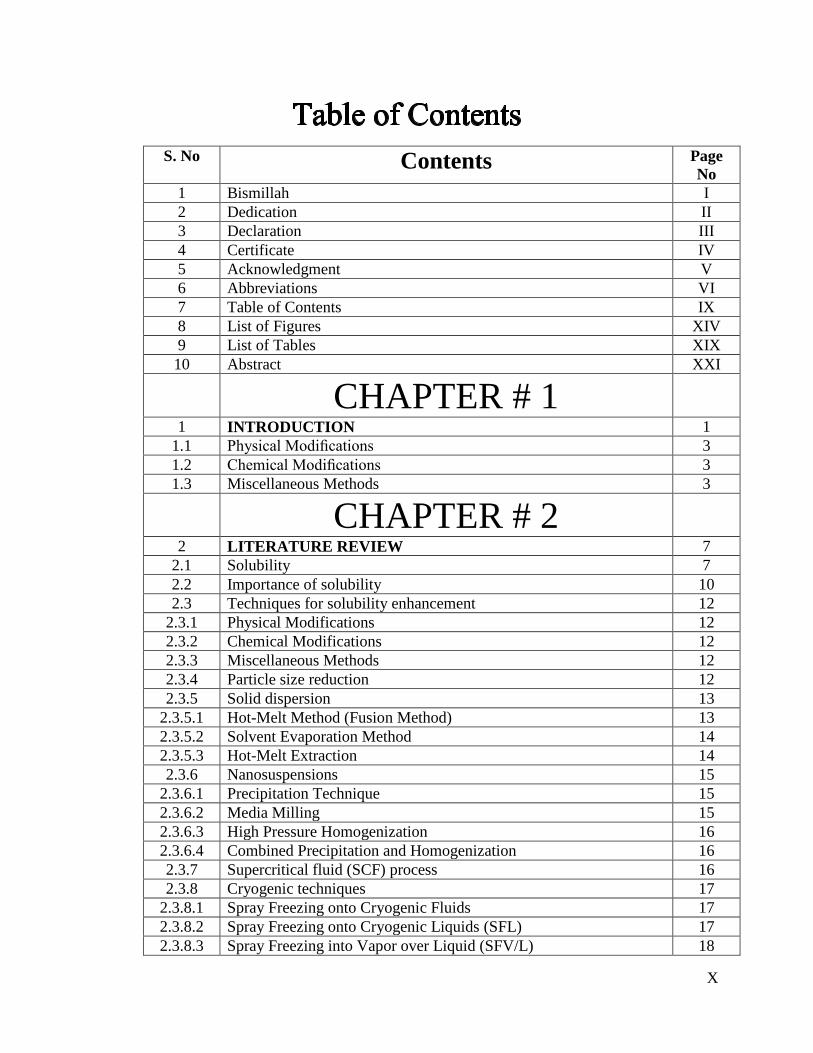
S. No Contents Page
No
1 Bismillah I
2 Dedication II
3 Declaration III
4 Certificate IV
5 Acknowledgment V
6 Abbreviations VI
7 Table of Contents IX
8 List of Figures XIV
9 List of Tables XIX
10 Abstract XXI
CHAPTER # 1
1 INTRODUCTION 1
1.1 Physical Modifications 3
1.2 Chemical Modifications 3
1.3 Miscellaneous Methods 3
CHAPTER # 2
2 LITERATURE REVIEW 7
2.1 Solubility 7
2.2 Importance of solubility 10
2.3 Techniques for solubility enhancement 12
2.3.1 Physical Modifications 12
2.3.2 Chemical Modifications 12
2.3.3 Miscellaneous Methods 12
2.3.4 Particle size reduction 12
2.3.5 Solid dispersion 13
2.3.5.1 Hot-Melt Method (Fusion Method) 13
2.3.5.2 Solvent Evaporation Method 14
2.3.5.3 Hot-Melt Extraction 14
2.3.6 Nanosuspensions 15
2.3.6.1 Precipitation Technique 15
2.3.6.2 Media Milling 15
2.3.6.3 High Pressure Homogenization 16
2.3.6.4 Combined Precipitation and Homogenization 16
2.3.7 Supercritical fluid (SCF) process 16
2.3.8 Cryogenic techniques 17
2.3.8.1 Spray Freezing onto Cryogenic Fluids 17
2.3.8.2 Spray Freezing onto Cryogenic Liquids (SFL) 17
2.3.8.3 Spray Freezing into Vapor over Liquid (SFV/L) 18
XI
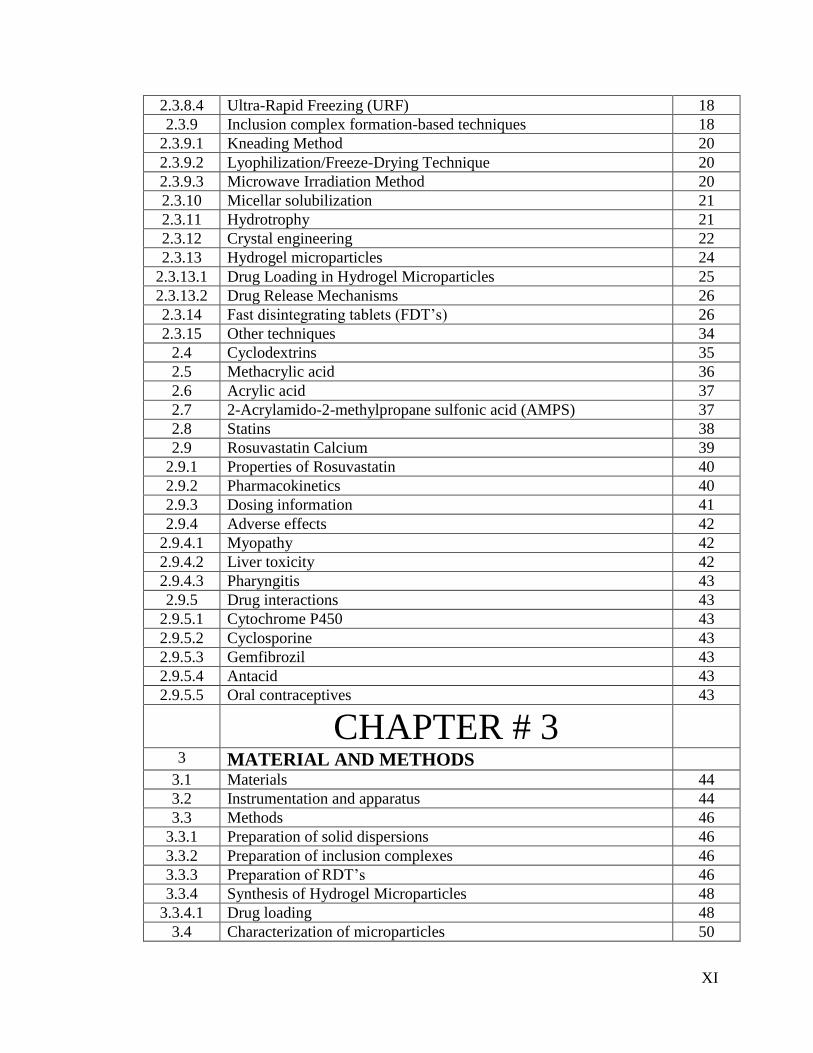
2.3.8.4 Ultra-Rapid Freezing (URF) 18
2.3.9 Inclusion complex formation-based techniques 18
2.3.9.1 Kneading Method 20
2.3.9.2 Lyophilization/Freeze-Drying Technique 20
2.3.9.3 Microwave Irradiation Method 20
2.3.10 Micellar solubilization 21
2.3.11 Hydrotrophy 21
2.3.12 Crystal engineering 22
2.3.13 Hydrogel microparticles 24
2.3.13.1 Drug Loading in Hydrogel Microparticles 25
2.3.13.2 Drug Release Mechanisms 26
2.3.14 Fast disintegrating tablets (FDT’s) 26
2.3.15 Other techniques 34
2.4 Cyclodextrins 35
2.5 Methacrylic acid 36
2.6 Acrylic acid 37
2.7 2-Acrylamido-2-methylpropane sulfonic acid (AMPS) 37
2.8 Statins 38
2.9 Rosuvastatin Calcium 39
2.9.1 Properties of Rosuvastatin 40
2.9.2 Pharmacokinetics 40
2.9.3 Dosing information 41
2.9.4 Adverse effects 42
2.9.4.1 Myopathy 42
2.9.4.2 Liver toxicity 42
2.9.4.3 Pharyngitis 43
2.9.5 Drug interactions 43
2.9.5.1 Cytochrome P450 43
2.9.5.2 Cyclosporine 43
2.9.5.3 Gemfibrozil 43
2.9.5.4 Antacid 43
2.9.5.5 Oral contraceptives 43
CHAPTER # 3
3 MATERIAL AND METHODS
3.1 Materials 44
3.2 Instrumentation and apparatus 44
3.3 Methods 46
3.3.1 Preparation of solid dispersions 46
3.3.2 Preparation of inclusion complexes 46
3.3.3 Preparation of RDT’s 46
3.3.4 Synthesis of Hydrogel Microparticles 48
3.3.4.1 Drug loading 48
3.4 Characterization of microparticles 50
XII
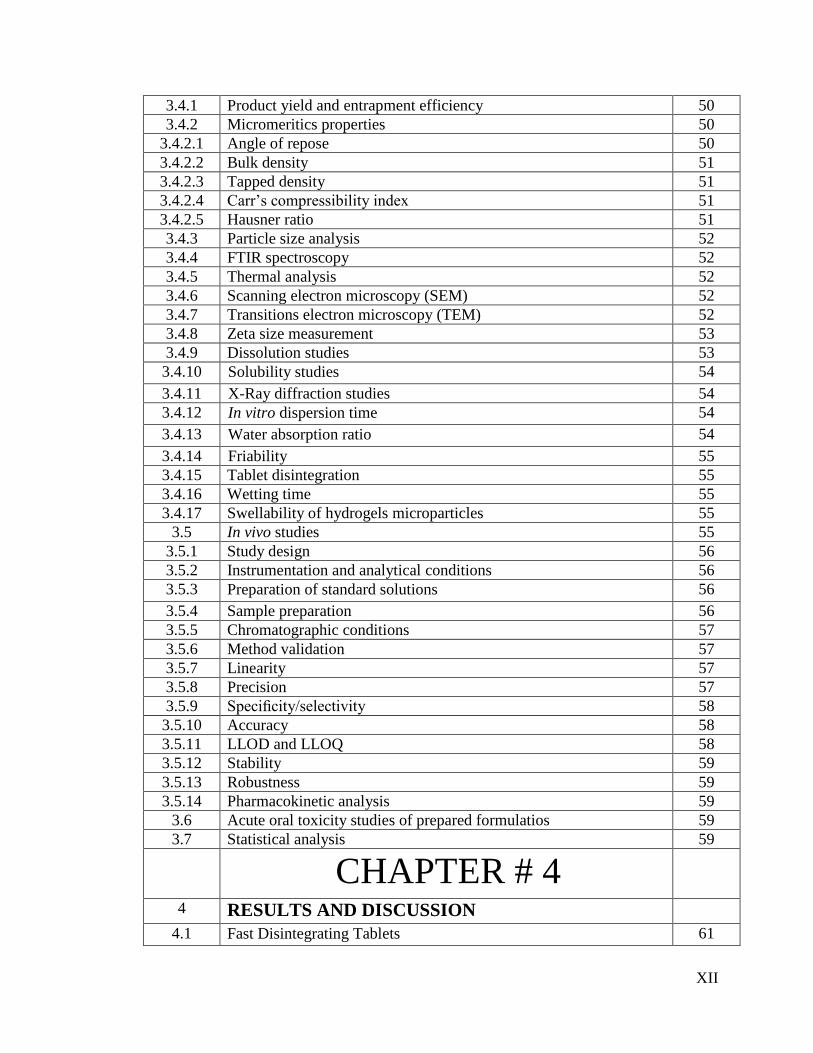
3.4.1 Product yield and entrapment efficiency 50
3.4.2 Micromeritics properties 50
3.4.2.1 Angle of repose 50
3.4.2.2 Bulk density 51
3.4.2.3 Tapped density 51
3.4.2.4 Carr’s compressibility index 51
3.4.2.5 Hausner ratio 51
3.4.3 Particle size analysis 52
3.4.4 FTIR spectroscopy 52
3.4.5 Thermal analysis 52
3.4.6 Scanning electron microscopy (SEM) 52
3.4.7 Transitions electron microscopy (TEM) 52
3.4.8 Zeta size measurement 53
3.4.9 Dissolution studies 53
3.4.10 Solubility studies 54
3.4.11 X-Ray diffraction studies 54
3.4.12 In vitro dispersion time 54
3.4.13 Water absorption ratio 54
3.4.14 Friability 55
3.4.15 Tablet disintegration 55
3.4.16 Wetting time 55
3.4.17 Swellability of hydrogels microparticles 55
3.5 In vivo studies 55
3.5.1 Study design 56
3.5.2 Instrumentation and analytical conditions 56
3.5.3 Preparation of standard solutions 56
3.5.4 Sample preparation 56
3.5.5 Chromatographic conditions 57
3.5.6 Method validation 57
3.5.7 Linearity 57
3.5.8 Precision 57
3.5.9 Specificity/selectivity 58
3.5.10 Accuracy 58
3.5.11 LLOD and LLOQ 58
3.5.12 Stability 59
3.5.13 Robustness 59
3.5.14 Pharmacokinetic analysis 59
3.6 Acute oral toxicity studies of prepared formulatios 59
3.7 Statistical analysis 59
CHAPTER # 4
4 RESULTS AND DISCUSSION
4.1 Fast Disintegrating Tablets 61
XIII
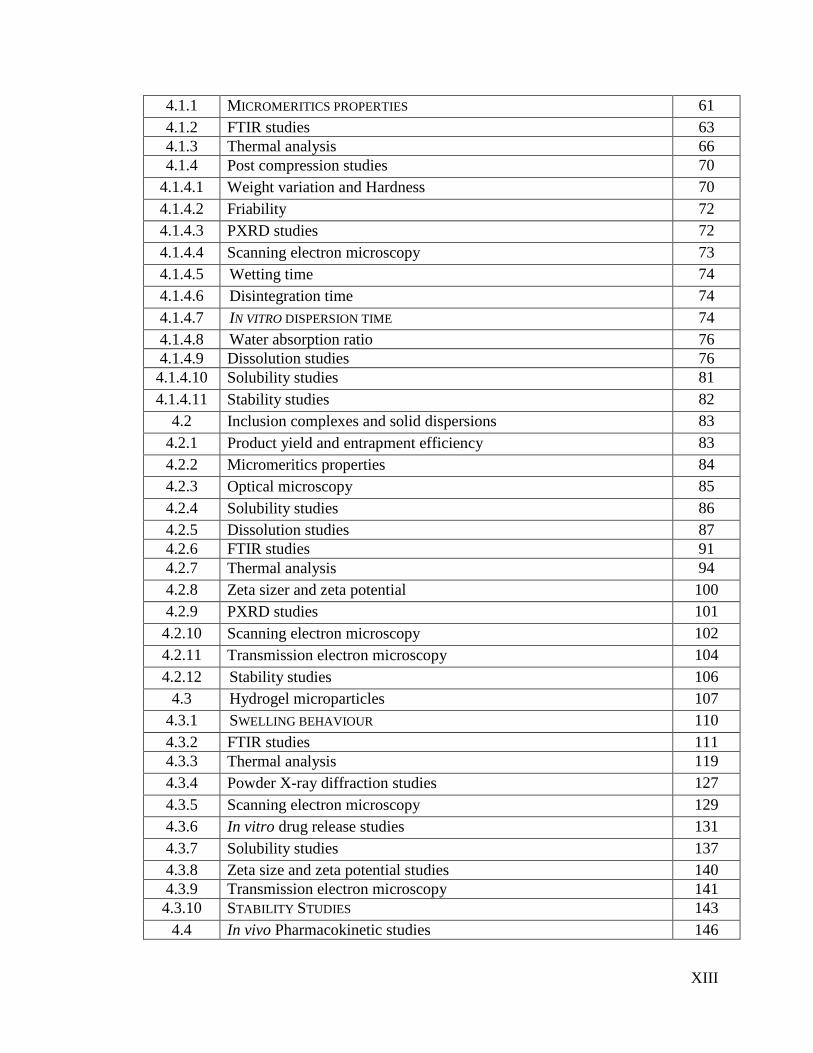
4.1.1 MICROMERITICS PROPERTIES 61
4.1.2 FTIR studies 63
4.1.3 Thermal analysis 66
4.1.4 Post compression studies 70
4.1.4.1 Weight variation and Hardness 70
4.1.4.2 Friability 72
4.1.4.3 PXRD studies 72
4.1.4.4 Scanning electron microscopy 73
4.1.4.5 Wetting time 74
4.1.4.6 Disintegration time 74
4.1.4.7 IN VITRO DISPERSION TIME 74
4.1.4.8 Water absorption ratio 76
4.1.4.9 Dissolution studies 76
4.1.4.10 Solubility studies 81
4.1.4.11 Stability studies 82
4.2 Inclusion complexes and solid dispersions 83
4.2.1 Product yield and entrapment efficiency 83
4.2.2 Micromeritics properties 84
4.2.3 Optical microscopy 85
4.2.4 Solubility studies 86
4.2.5 Dissolution studies 87
4.2.6 FTIR studies 91
4.2.7 Thermal analysis 94
4.2.8 Zeta sizer and zeta potential 100
4.2.9 PXRD studies 101
4.2.10 Scanning electron microscopy 102
4.2.11 Transmission electron microscopy 104
4.2.12 Stability studies 106
4.3 Hydrogel microparticles 107
4.3.1 SWELLING BEHAVIOUR 110
4.3.2 FTIR studies 111
4.3.3 Thermal analysis 119
4.3.4 Powder X-ray diffraction studies 127
4.3.5 Scanning electron microscopy 129
4.3.6 In vitro drug release studies 131
4.3.7 Solubility studies 137
4.3.8 Zeta size and zeta potential studies 140
4.3.9 Transmission electron microscopy 141
4.3.10 STABILITY STUDIES 143
4.4 In vivo Pharmacokinetic studies 146
XIV
4.4.1 Standard curve 146
4.4.2 HPLC method development 146
4.4.3 Pharmacokinetic evaluation of Rosuvastatin calcium 151
4.5 Acute oral toxicity study of prepared formulations 167
4.5.1 Biochemical blood analysis 167
4.5.2 Histopathological study 169
4.5.3 Acute oral toxicity study of prepared formulations 170
4.5.4 Clinical Observations 170
4.5.5 Biochemical blood analysis 171
4.5.6 Histopathological Study 171
CHAPTER # 5
5 CONCLUSION 175
CHAPTER # 6
6 REFERENCES 177
XV
Fig. No. Contents Page No.
2.1 Biopharmaceutics Classification System 9
2.2 Representations of hydrophobic cavity and hydrophilic outer
surface of cyclodextrin 19
2.3 1:1 drug cyclodextrin complexes 19
2.4 1:2 drug cyclodextrin complexes 19
2.5 Structure of β-Cyclodextrin 36
2.6 Structure of Methacrylic acid 37
2.7 Structure of acrylic acid 37
2.8 Structure of 2-Acrylamido-2-methylpropane sulfonic acid
(AMPS) 38
2.9 Mechanism of action of statins 39
2.10 Structure of Rosuvastatin calcium 40
4.1(a) FTIR spectra of rosuvastatin calcium 63
4.1(b) FTIR spectra of β-cyclodextrin 64
4.1(c) FTIR spectra of Kyron T134 64
4.1(d) FTIR spectra of sodium starch glycolate 65
4.1(e) FTIR spectra of FDT’s 65
4.2(a) TGA curves of Rosuvastatin calcium 66
4.2(b) DSC curves of Rosuvastatin calcium 67
4.2(c) TGA curves of β-cyclodextrin 67
4.2(d) DSC curves of β-cyclodextrin 68
4.2(e) TGA curves of FDT’s 69
4.2(f) DSC curves of FDT’s 69
4.3 SEM image of FDT 70
4.4 X-Ray diffraction patterns of (A) Rosuvastatin calcium, (B) β-
cyclodextrin and (C) FDT’s 73
4.5(b) Standard Curve of Rosuvastatin calcium at pH 1.2 78
4.5(c) Cumulative % drug release from different formulations of FDT’s
and RST tablets at 6.8 pH 78
4.6 Solubility studies of pure drug and FDT’s 82
4.7 Optical microscope images of microparticles 85
4.8 Solubility studies of pure drug and microparticles 87
4.9(a) Cumulative % drug release from different formulations and RST
tablet at pH 6.8 88
4.9(b) Cumulative % drug release from different formulations and RST
tablet at pH 1.2 89
4.10(a) FTIR spectra of rosuvastatin calcium 91
4.10(b) FTIR spectra of β-cyclodextrin 92
4.10(c) FTIR spectra of Physical mixture of rosuvastatin and β-
cyclodextrin 92
XVI
4.10(d) FTIR spectra of solid dispersions 93
4.10(e) FTIR spectra of inclusion complexes 94
4.11(a) DSC curves of Rosuvastatin calcium 95
4.11(b) TGA curves of Rosuvastatin calcium 95
4.11(c) TGA curves of β-cyclodextrin 96
4.11(d) DSC curves of β-cyclodextrin 96
4.11(e) DSC curves of inclusion complexes 98
4.11(f) TGA curves of inclusion complexes 98
4.11(g) TGA curves of solid dispersions 99
4.11(h) DSC curves of solid dispersions 99
4.12(a) Zeta size measurement of microparticles (µm) 100
4.12(b) Zeta potential measurement of microparticles 101
4.13 X-Ray diffraction patterns of (A) Rosuvastatin calcium, (B) β-
cyclodextrin and (C) solid dispersions (D) inclusion complexes 102
4.14 SEM images of lyophilized microparticles at various
magnifications 103
4.15 TEM images of lyophilized microparticles at various
magnifications 105
4.16(a) FTIR spectra of Rosuvastatin calcium 112
4.16(b) FTIR spectra of β-cyclodextrin 112
4.16(c) FTIR spectra of methacrylic acid 113
4.16(d) FTIR spectra of MBA 113
4.16(e) FTIR spectra of Acrylamido-2-methyl propane sulphonic acid 114
4.16(f) FTIR spectra of Ammonium per sulphate 114
4.16(g) FTIR spectra of Physical mixture of cyclodextrin and
Acrylamido-2-methyl propane sulphonic acid 115
4.16(h) FTIR spectra of Physical mixture of β-cyclodextrin and
Rosuvastatin calcium 116
4.16(i)
FTIR spectra of Physical mixture of rosuvastatin, ammonium
persulfate, Acrylamido-2-methyl propane sulphonic acid and
methylene bisacrylamide
116
4.16(j) FTIR spectra of Hydrogel microparticles containing methacrylic
acid 118
4.16(k) FTIR spectra of Hydrogel microparticles containing Acrylamido-
2-methyl propane sulphonic acid 118
4.17(a) DSC curve of rosuvastatin calcium 120
4.17(b) TGA curve of rosuvastatin calcium 120
4.17(c) TGA curve of β-cyclodextrin 121
4.17(d) DSC curve of β-cyclodextrin 121
4.17(e) TGA curve of AMPS 122
4.17(f) DSC curve of AMPS 122
4.17(g) TGA curve of MBA 123
4.17(h) DSC curve of MBA 123
4.17(i) TGA of hydrogel microparticles containing methacrylic acid 125
4.17(j) TGA of hydrogel microparticles containing AMPS 126
XVII
4.17(k) DSC of hydrogel microparticles containing methacrylic acid 126
4.17(l) DSC of hydrogel microparticles containing AMPS 127
4.18
Powder X-Ray diffraction pattern of (A) Rosuvastatin calcium,
(B) β-cyclodextrin, (C) hydrogel microparticles of methacrylic
acid, (D) hydrogel microparticles of AMPS
128
4.19 SEM images of lyophilized hydrogels microparticles at various
Magnifications 130
4.20(a) Cumulative % drug release from hydrogel microparticles
containing MAA and from RST tablets at pH 6.8 132
4.20(b) Cumulative % drug release from hydrogel microparticles
containing MAA and from RST tablets at pH 1.2 133
4.20(c) Cumulative % drug release from hydrogel microparticles
containing AMPS and from RST tablets at pH 6.8 134
4.20(d) Cumulative % drug release from hydrogel microparticles
containing AMPS and from RST tablets at pH 1.2 135
4.21(a) Solubility studies of pure drug and hydrogel microparticles
containing MAA 138
4.21(b) Solubility studies of pure drug and hydrogel microparticles
containing AMPS 139
4.22(a) Zeta size measurement of hydrogel microparticles (µm) 140
4.22(b) Zeta potential measurement of hydrogel microparticles 141
4.23 TEM images of lyophilized hydrogel microparticles at various
magnifications 142
4.24 Proposed reaction of β-cyclodextrin-g-MMA hydrogel
microparticles 144
4.25 Proposed reaction of β-cyclodextrin-g-AMPS hydrogel
microparticles 145
4.26 Standard curve of Rosuvastatin calcium in rabbit plasma 146
4.27 HPLC chromatogram of blanked Plasma 148
4.28 HPLC chromatogram of Rosuvastatin calcium in mobile phase 149
4.29 HPLC chromatogram of spiked Plasma 149
4.30 HPLC chromatogram of rabbit’s samples taken after
administration of drug 150
4.31 Plasma profile of Rosuvastatin calcium after administration of
FDT’s formulation 153
4.32 Plasma profile of Rosuvastatin calcium after administration of
hydrogel microparticles formulation 154
4.33 Plasma profile of Rosuvastatin calcium after administration of
commercially available tablets 155
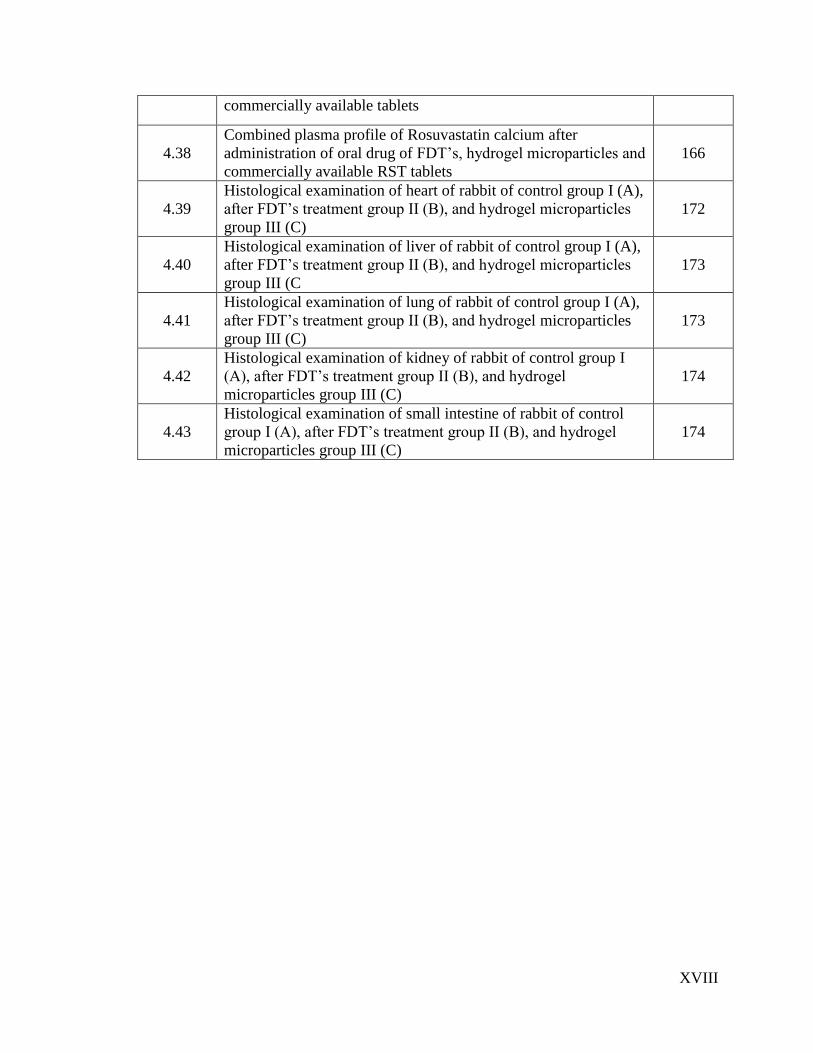
4.34
Combined plasma profile of Rosuvastatin calcium after
administration of oral drug of FDT’s, hydrogel microparticles and
commercially available RST tablets
159
4.35 Plasma profile of Rosuvastatin calcium after administration of
FDT’s formulation 160
4.37 Plasma profile of Rosuvastatin calcium after administration of 162
XVIII
commercially available tablets
4.38
Combined plasma profile of Rosuvastatin calcium after
administration of oral drug of FDT’s, hydrogel microparticles and
commercially available RST tablets
166
4.39
Histological examination of heart of rabbit of control group I (A),
after FDT’s treatment group II (B), and hydrogel microparticles
group III (C)
172
4.40
Histological examination of liver of rabbit of control group I (A),
after FDT’s treatment group II (B), and hydrogel microparticles
group III (C
173
4.41
Histological examination of lung of rabbit of control group I (A),
after FDT’s treatment group II (B), and hydrogel microparticles
group III (C)
173
4.42
Histological examination of kidney of rabbit of control group I
(A), after FDT’s treatment group II (B), and hydrogel
microparticles group III (C)
174
4.43
Histological examination of small intestine of rabbit of control
group I (A), after FDT’s treatment group II (B), and hydrogel
microparticles group III (C)
174
XIX
Table
No. Page
No.
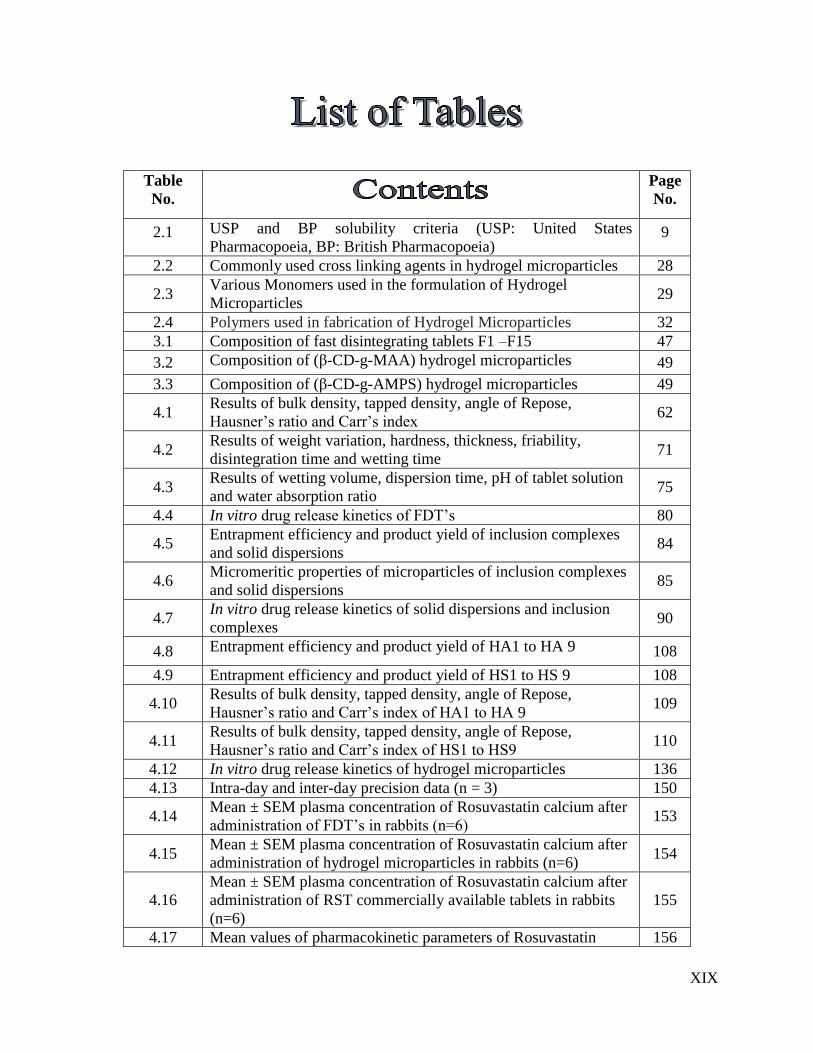
2.1 USP and BP solubility criteria (USP: United States
Pharmacopoeia, BP: British Pharmacopoeia) 9
2.2 Commonly used cross linking agents in hydrogel microparticles 28
2.3 Various Monomers used in the formulation of Hydrogel
Microparticles 29
2.4 Polymers used in fabrication of Hydrogel Microparticles 32
3.1 Composition of fast disintegrating tablets F1 –F15 47
3.2 Composition of (β-CD-g-MAA) hydrogel microparticles 49
3.3 Composition of (β-CD-g-AMPS) hydrogel microparticles 49
4.1 Results of bulk density, tapped density, angle of Repose,
Hausner’s ratio and Carr’s index 62
4.2 Results of weight variation, hardness, thickness, friability,
disintegration time and wetting time 71
4.3 Results of wetting volume, dispersion time, pH of tablet solution
and water absorption ratio 75
4.4 In vitro drug release kinetics of FDT’s 80
4.5 Entrapment efficiency and product yield of inclusion complexes
and solid dispersions 84
4.6 Micromeritic properties of microparticles of inclusion complexes
and solid dispersions 85
4.7 In vitro drug release kinetics of solid dispersions and inclusion
complexes 90
4.8 Entrapment efficiency and product yield of HA1 to HA 9 108
4.9 Entrapment efficiency and product yield of HS1 to HS 9 108
4.10 Results of bulk density, tapped density, angle of Repose,
Hausner’s ratio and Carr’s index of HA1 to HA 9 109
4.11 Results of bulk density, tapped density, angle of Repose,
Hausner’s ratio and Carr’s index of HS1 to HS9 110
4.12 In vitro drug release kinetics of hydrogel microparticles 136
4.13 Intra-day and inter-day precision data (n = 3) 150
4.14 Mean ± SEM plasma concentration of Rosuvastatin calcium after
administration of FDT’s in rabbits (n=6) 153
4.15 Mean ± SEM plasma concentration of Rosuvastatin calcium after
administration of hydrogel microparticles in rabbits (n=6) 154
4.16
Mean ± SEM plasma concentration of Rosuvastatin calcium after
administration of RST commercially available tablets in rabbits
(n=6)
155
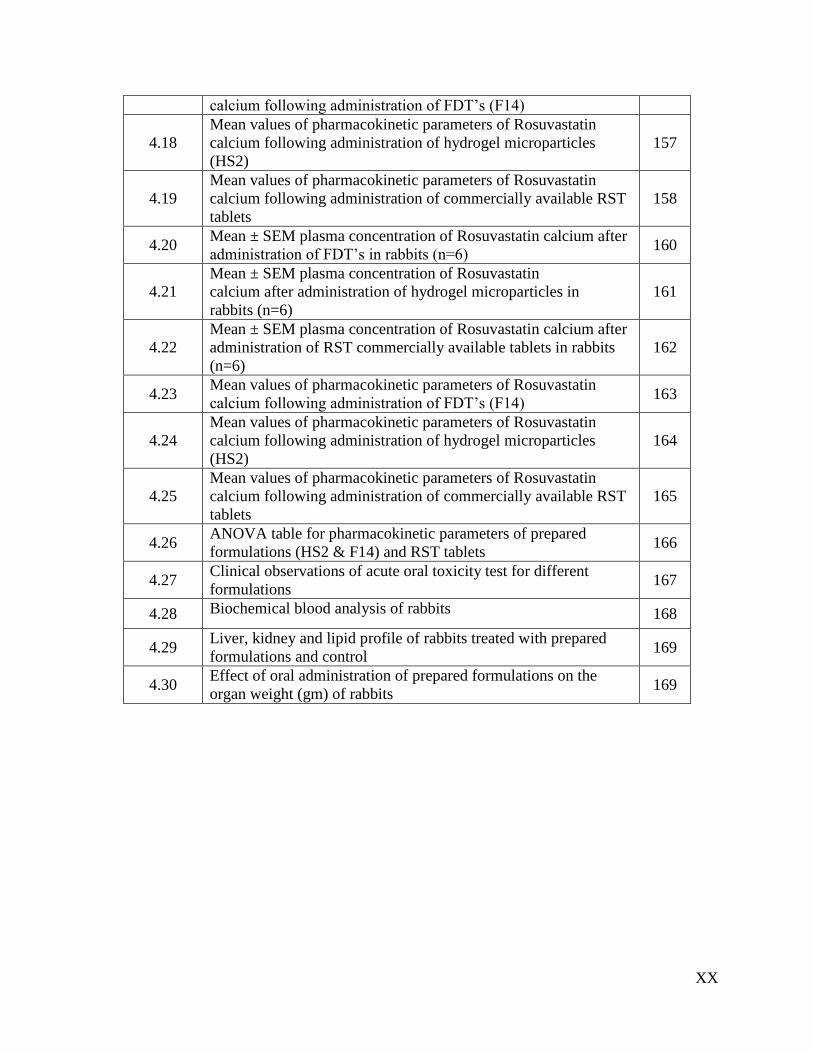
4.17 Mean values of pharmacokinetic parameters of Rosuvastatin 156
XX
calcium following administration of FDT’s (F14)
4.18
Mean values of pharmacokinetic parameters of Rosuvastatin
calcium following administration of hydrogel microparticles
(HS2)
157
4.19
Mean values of pharmacokinetic parameters of Rosuvastatin
calcium following administration of commercially available RST
tablets
158
4.20 Mean ± SEM plasma concentration of Rosuvastatin calcium after
administration of FDT’s in rabbits (n=6) 160
4.21
Mean ± SEM plasma concentration of Rosuvastatin
calcium after administration of hydrogel microparticles in
rabbits (n=6)
161
4.22
Mean ± SEM plasma concentration of Rosuvastatin calcium after
administration of RST commercially available tablets in rabbits
(n=6)
162
4.23 Mean values of pharmacokinetic parameters of Rosuvastatin
calcium following administration of FDT’s (F14) 163
4.24
Mean values of pharmacokinetic parameters of Rosuvastatin
calcium following administration of hydrogel microparticles
(HS2)
164
4.25
Mean values of pharmacokinetic parameters of Rosuvastatin
calcium following administration of commercially available RST
tablets
165
4.26 ANOVA table for pharmacokinetic parameters of prepared
formulations (HS2 & F14) and RST tablets 166
4.27 Clinical observations of acute oral toxicity test for different
formulations 167
4.28 Biochemical blood analysis of rabbits 168
4.29 Liver, kidney and lipid profile of rabbits treated with prepared
formulations and control 169
4.30 Effect of oral administration of prepared formulations on the
organ weight (gm) of rabbits 169
XXI
ABSTRACT
The term ‘solubility’ is defined as an excess amount of solute that can be
incorporated in a given amount of solvent. Solubility of poorly water-soluble drugs is
one of the most emerging issue associated with these drugs to form a suitable dosage
form that will provide desired pharmacological response. Their low solubility causes
elimination of most of the drug from body as such, and desired therapeutic levels are not
achieved. In recent years, a large number of drugs have been developed, but nearly 70%
of new drugs have poor water solubility. Major part of the human body is made up of
water. Therefore, drugs must be having a certain aqueous solubility. The solubility of
drugs ultimately has strong impact on their bioavailability. Rosuvastatin calcium (RST)
belongs to the Biopharmaceutics Classification System class II having low solubility and
high permeability. It is a poorly water-soluble 3-hydroxy-3-methyl glutaryl CoA (HMG-
CoA) reductase inhibitor.
Efforts have been made to enhance solubility of these drugs. Different techniques
have been used to enhance solubility of these poorly water soluble drugs such as
reduction in particle size to increase surface area, thus increasing the dissolution rate of
drug, solubilization in surfactant systems, formation of water-soluble complexes, drug
derivatization such as strong electrolyte salt forms that usually have higher dissolution
rate, producing liquisolid formulations, manipulation of the solid state of a drug
substance to enhance drug dissolution i.e. by decreasing crystallinity of the drug
substance through formation of solid solutions, solid dispersion formulations.
Polymers are major players in these formulations to enhance solubility e.g.,
chitosan, polyvinyl pyrolidone, polyvinyl alcohol, β-cyclodextrin, etc. β-Cyclodextrin is
one of the most efficient polymer among all of these to work as a carrier for these drugs
to enhance solubility.
In present work, fast disintegrating tablets (FDT’s) of rosuvastatin calcium were
prepared by using β-cyclodextrin as polymer along with different super disintegrants such
as kyron T134 and sodium starch glycolate and microparticles were prepared by using β-
cyclodextrin as polymer to enhance solubility. Microparticles were prepared by using
solvent evaporation (solid dispersions), kneeding technique (inclusion complexes) and
XXII
free radical polymerization to prepare hydrogel microparticles. Prepared formulations
were evaluated by Fourier Transform Infrared Spectroscopy (FTIR), Differential
Scanning Calorimetry (DSC), Thermo Gravimetric Analysis (TGA), dissolution studies,
powder X-ray diffraction (PXRD), scanning electron microscopy (SEM), zeta size and
zeta potential, transmission electron microscopy (TEM), and stability studies to confirm
enhancement in solubility. FDT’s were further characterized by wetting time, wetting
volume, disintegration time, dispersion time etc. Different in vitro kinetic models such as
zero order, first order, Higuchi, and Korsmeyer–Peppas were applied to determine the
release behavior of drug from prepared formulations. Results were also statistically
analyzed by mean, one-way analysis of variance (ANOVA), and p value was determined
to check significant results.
Results of FTIR and DSC of prepared formulations had revealed that stable
complex was formed between drug and polymer. SEM study of formulations had shown
that small openings were present on their surfaces. These openings facilitated the
penetration of water and rapid release of drug. From PXRD study it was observed that
drug had changed from crystalline to amorphous form. Internal morphology of TEM
images had shown that drug was present inside of FDT’s and microparticles. Zeta size
and zeta potential studies confirmed that microparticles had micron size and net charge
was neutral. Wetting time, wetting volume, disintegration time, dispersion time, water
absorption ratio of FDT’s were 43±1.15-96±1.5 seconds, 80±0.5-22±1.50 seconds,
3±1.50-77±1.50 seconds, 29±0.58-57±0.58 seconds and 1.10±0.01-2.00±0.02,
respectively.
FDT’s and microparticles dissolution studies had shown that FDT’s released 91-
97% (p=0.025) of drug while inclusion complexes and solid dispersions released 71-92%
(p=0.15) of drug and hydrogel microparticles released upto 92% of drug (p=0.02). In
contrast to prepared formulations, drug released from commercially available tablets of
Rosuvastatin calcium was very less (43%). Due to acidic nature of Rosuvastatin calcium
drug was more soluble at higher pH value i.e., at 6.8 as compared to 1.2 pH. Hydrogel
microparticles containing Acrylamido-2-methyl propane sulphonic acid (AMPS) as
monomer had shown pH independent swelling and shown better release than methacrylic
XXIII
acid (MAA) containing hydrogel microparticles. AMPS containing hydrogel
microparticles released drug at both pH values but it was better at 6.8 than 1.2.
Solubility studies revealed that prepared formulations had greater solubility at 6.8
pH phosphate buffer, 1.2 pH HCl buffer and in pure water than alone drug. All three
types of formulations had enhanced solubility of Rosuvastatin calcium but it was highest
at 6.8 pH phosphate buffer. FDT’s enhanced solubility of Rosuvastatin calcium 7.42
folds in HCl buffer of 1.2 pH, while in phosphate buffer of 6.8 pH 11.71 folds and in pure
water 9.05 folds solubility was enhanced. Microparticles prepared by solvent evaporation
had enhanced solubility 3.32 folds, 8.54 folds and 5.86 folds at 1.2 pH, 6.8 pH and in
pure water, respectively. Hydrogel microparticles prepared by AMPS had enhanced
solubility 7.53 folds, 10.66 folds and 7.30 folds at 1.2 pH, 6.8 pH and in pure water,
respectively. In case of hydrogel microparticles containing MAA had no greater impact
on solubility of Rosuvastatin calcium (RST) at 1.2 pH, while these enhanced solubility
upto 9.59 folds and 6.9 folds at pH 6.8 and in pure water. From findings it was observed
that solubility of Rosuvastatin calcium was enhanced by using these techniques.
Pharmacokinetic data had also depicted that Cmax and AUC0-24 were also greater
for prepared formulations in contrast to RST commercially available tablets. Elimination
half-life of drug was reduced upto 4 hours in our formulations. Toxicology data also
shown that no toxic effects were observed from hematological, biochemical and
histological studies.
From findings of this study it was concluded that solubility of Rosuvastatin
calcium was successfully enhanced by using techniques. Prepared formulations were
found stable during stability studies of 6 month period. Thus, we can conclude that
solubility of BCS class drugs can be enhanced by using these techniques with improved
bioavailability.
1
1. INTRODUCTION
A number of new active compounds show a very low solubility in
biological media due to lipophilic nature. Most of the pharmaceutical industries are
facing a major challenge to increase solubility of drugs by using different
formulation techniques to reach an acceptable bioavailability. More than one-third
of available drugs are poorly water soluble which are listed in USP and 41% of failures
in new drug development have been attributed due to poor biopharmaceutical properties
including poor solubility. This limits their dissolution in gastrointestinal tract and leads
to low levels of oral absorption and bioavailability [1].
Present era belongs to the development of those chemical entities that have low
dose to produce desired effects within body [2]. For this purpose main problem
originated with these chemicals is that of their low water solubility and ultimately low
bioavailability [3]. Poorly water soluble drugs are eliminated from gastrointestinal tract
before their dissolution that results in low bioavailability and reduced clinical effects
[4]. Most part of human body is composed of water and drug should have to be water
soluble to produce desired effects at low dose [3]. For this purpose work is going to be
done to improve the solubility of poorly water soluble drugs and ultimately
bioavailability [5].
The group of medications referred to as statins, 3-hydroxy-3-methylglutaryl-
coenzyme A (HMG-CoA) reductase inhibitors, has been the most popular and widely
prescribed for treating hypercholesteremia and atherosclerosis. Statins are used to lower
cholesterol levels by inhibiting the enzyme HMG-CoA reductase that catalyzes the
conversion of HMG-CoA to mevolanate, which plays a major role in the production of
cholesterol in liver [6–7].
Rosuvastatin calcium (RST) is one of the newest member of drugs that belongs
to statin group, and was approved in the United States in 2003 for the treatment of
dyslipidemia. RST also reduces the level of low-density lipoprotein (LDL) in plasma,
modestly increases level of HDL cholesterol in blood and is satisfactorily tolerated by
patients [8].
Rosuvastatin calcium, a widely prescribed antihyperlipidemic HMG-CoA
reductase inhibitor drug belongs to Class II under biopharmaceutics classification
2
system (BCS) and exhibit low and variable oral bioavailability due to its poor aqueous
solubility. It is crystalline in nature having only 20% bioavailability. Peak plasma level
is achieved within 3-5 hours and plasma protein binding is 90%. Its oral absorption is
dissolution rate limited and it requires enhancement in solubility and dissolution rate
for increasing its oral bioavailability. Several techniques such as micronization,
cyclodextrin-complexation, use of surfactants and solubilizers, solid dispersion in water
soluble and dispersible carriers, use of salts, prodrugs and polymorphs which exhibit
high solubility, microemulsions and self-emulsifying micro and nano disperse systems
have been used to enhance the solubility, dissolution rate and bioavailability of poorly
soluble drugs [9].
Different technologies can be used to enhance dissolution rate of highly
lipophilic drugs there by improving their bioavailability [10–13]. Usually, two-
component systems consisting of a hydrophilic carrier in which drug is incorporated.
The drug incorporated in hydrophilic carrier may be molecularly dispersed or may
occur as nanocrystals or amorphous nanoparticles. The improved dissolution rate of
drug can be ascribed to (i) an increased solubility of drug because of its amorphous
state or small particle size (Kelvin’s law) [14–17] (ii) an increasing surface area
available for drug dissolution because of small size of drug particles [18, 19] and (iii)
an improved wetting of drug caused by the hydrophilic carrier [20, 21].
There are number of methods for enhancing dissolution rate of poorly water-
soluble drugs including reducing particle size to increase surface area, thus increasing
the dissolution rate of drug [22], solubilization in surfactant systems [23,24], formation
of water-soluble complexes [25], drug derivatization such as strong electrolyte salt
forms that usually have higher dissolution rate [26], producing liquisolid formulations
[27], manipulation of the solid state of a drug substance to enhance drug dissolution i.e.
by decreasing crystallinity of drug substance through formation of solid solutions and
solid dispersion formulations [28].
Variety of carriers have been used in previously discussed technologies to
promote solubility enhancement of poorly water soluble drugs [29]. These includes
polyethylene glycols (PEG), polyvinyl pyrrolidone (PVP), lactose, Chitosan, β-
cyclodextrin (β-CD), and hydroxypropyl methylcellulose (HPMC) are most commonly
used enhancers [30, 31]. Now a day’s poloxamers, a group of block copolymer
3
nonionic surfactants have also been used for this purpose in various techniques [32].
These carriers have strong effect on major parameters of drugs to enhance solubility,
dissolution and bioavailability of many hydropobic drugs making them suitable
chemical moieties with improved solubility [33].
Hydrotropes have also been employed to increase aqueous solubility of poorly
soluble drugs. In many cases, the aqueous solubility of poorly soluble drugs has been
increased by 2-4 folds of magnitude, simply by mixing hydrotropes in water [34].
Despite this advantage, application of low molecular weight hydrotropes in drug
delivery has not been practical, because it may result in absorption of a significant
amount of hydrotropes themselves into the body along with drug. One approach to
prevent absorption of hydrotropes along with drug from the gastrointestinal tract after
oral administration, is to make polymeric hydrotropic agents (hydrotropic polymers).
Hydrotropic polymers are expected to provide an alternative approach for increasing
aqueous solubility of poorly soluble drugs [35, 36].
Different solubility enhancement techniques are used that can be categorized
into physical modifications, chemical modifications of the drug substance and other
miscellaneous techniques.
1.1 Physical Modifications
Particle size reduction like micronization and nanosuspension, drug dispersion
in carriers like eutectic mixtures, solid dispersions, solid solutions and cryogenic
techniques.
1.2 Chemical Modifications
Change of pH, use of buffer, derivatization, complexation and salt formation.
1.3 Miscellaneous Methods
Supercritical fluid process, use of adjuvant like surfactant, solubilizes,
cosolvency and hydrotrophy.
In kneading method, drug and polymers are triturated in pestle and mortar by
the addition of liquid drop wise which may be water or hydro alcoholic mixture
resulting in formation of slurry and reduction of particle size resulting in enhanced
4
bioavailability due to kneading. Then kneaded mixture is dried and passed through
mesh if required to bring uniformity in contents [37].
In solvent evaporation method drug and carrier are dissolved in separate
miscible solvents and then evaporation is done under vacuum to yield a solid solution.
Many researchers have studied solid dispersion of meloxicam, naproxen and
nimesulide using solvent evaporation technique. Dissolution study revealed that the
modified solvent evaporation is the most convenient and effective method for solubility
enhancement of poorly water soluble drugs, among various methods of preparation of
solid dispersions [38].
Hydrogels are three dimensional particles having capability of absorbing large
amount of water maintaining insolubility behavior due to crosslinking agents. Cross-
linked hydrophilic polymer gels, or “hydrogels,” have become an important class of
formulations in nanotechnology, biotechnology, and in pharmaceuticals due to their
distinctive material properties. When hydrogels are in the form of macroscopic links or
confined to smaller dimensions, they are termed as microgels or hydrogel
microparticles, also called as cross-linked polymeric particles. When the size of
microgels is reduced up to the range of submicrmeters, they are known as nanogels.
Microparticles are suitable for delivery of drugs because of their large surface area and
ability to modify their size and hydrophobicity. Hydrogel microparticles are employed
in solid dosage forms, i.e. tablets as superdisintegrants, e.g., polyacrylic acid (AA)
super porous hydrogel microparticles. Microgels/nanogels/hydrogel microparticles are
used in diagnostic imaging and as semiconductor nanocrystals. Hydrogel microparticles
and hydrophilic polymers are used in patterning surfaces, immobilizing cells, and
proteins within the microenvironment of hydrogels.
Cell-laden hydrogels are used as scaffolding materials in tissue engineering and
as immune isolation barriers in microencapsulation technology. Hydrogel
microparticles have been used in fabrication of tunable micro lenses that respond to pH
and temperature changes, for example, N-isopropyl acrylamide hydrogel microparticles
prepared by aqueous polymerization. Hydrogel microparticles are employed in
enhancement of hydrophobic and poorly water-soluble drugs like acyclovir whose
solubility has been enhanced by the formation of chitosan hydrogel microparticles.
5
Efforts are being continuously made to utilizing these emerging tools in solubility
enhancement of hydrophobic drugs [39].
Another interesting method to improve the dissolution of poorly water soluble
drugs is fast disintegrating tablets with a high drug load might be the incorporation of
superdisintegrants. Superdisintegrants do not irritate the gastrointestinal tract and can
be used at low amounts in the formulations. We speculate that by the incorporation of
superdisintegrants, the tablets will rapidly disintegrate which prevents crystallization of
the drug. Superdisintegrants added in the formulation increase the drug release, thus
increasing the bioavailability of drug. Mouth disintegrating tablets when placed in the
mouth, disintegrate instantaneously, releasing the drug, which dissolves or disperses in
the saliva [40].
6
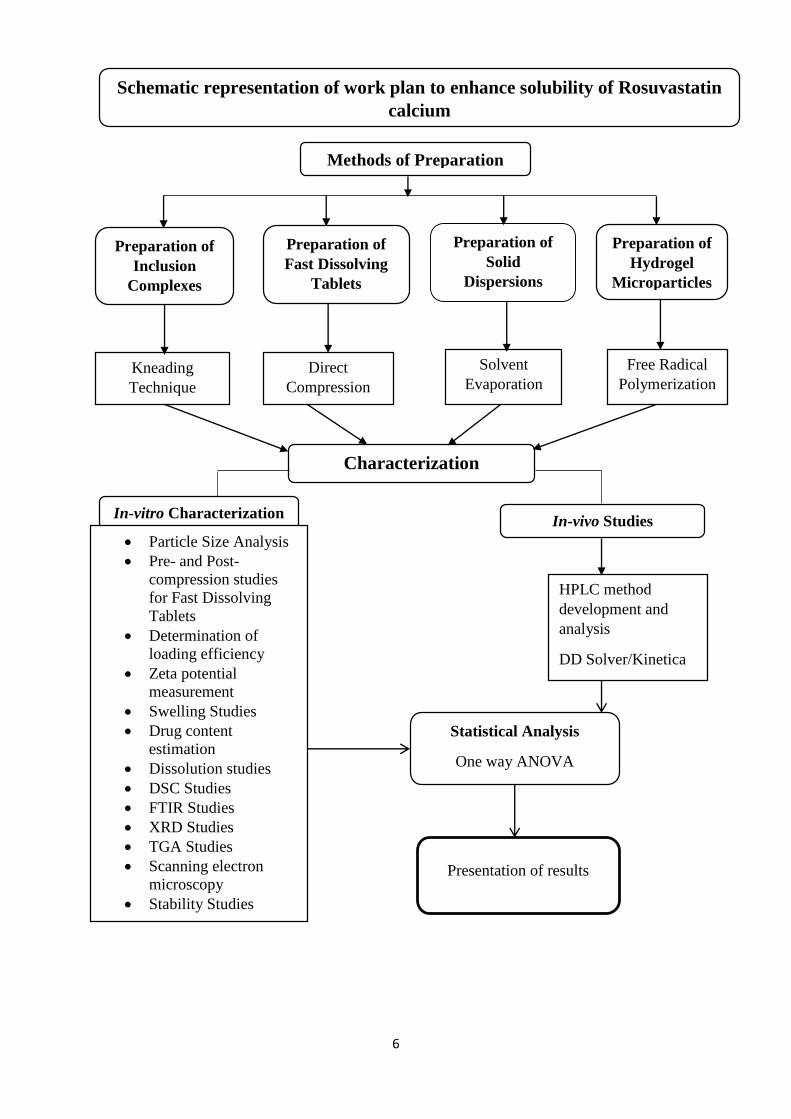
Schematic representation of work plan to enhance solubility of Rosuvastatin
calcium
Methods of Preparation
Preparation of
Inclusion
Complexes
Preparation of
Hydrogel
Microparticles
Solvent
Evaporation Kneading
Technique
Free Radical
Polymerization
In-vitro Characterization
Particle Size Analysis
Pre- and Post-
compression studies
for Fast Dissolving
Tablets
Determination of
loading efficiency
Zeta potential
measurement
Swelling Studies
Drug content
estimation
Dissolution studies
DSC Studies
FTIR Studies
XRD Studies
TGA Studies
Scanning electron
microscopy
Stability Studies
Characterization
In-vivo Studies
HPLC method
development and
analysis
DD Solver/Kinetica
Statistical Analysis
One way ANOVA
Microsoft Excel
Preparation of
Solid
Dispersions
Preparation of
Fast Dissolving
Tablets
Direct
Compression
Presentation of results
7
2. LITERATURE REVIEW
2.1 Solubility
The term solubility is defined as an excess amount of solute that can be
dissolved in a certain volume of solvent. It can also be defined both quantitatively and
qualitatively. Quantitatively it is solute concentration in a saturated solution at a certain
temperature. In qualitative terms, solubility is spontaneous interaction of two or more
substances to form a homogeneous molecular dispersion. Solubility has a number of
expressions of concentration as parts, percentage, molarity, molality, volume fraction
and mole fraction [41-43].
Solubility is the property of a solid, liquid, or gaseous chemical material
called solute to dissolve in a solid, liquid, or gaseous solvent to form a uniform solution
of solute in solvent. The solubility of a substance mostly determined by solvent used as
well as on temperature and pressure. The degree of solubility of a substance in a
particular solvent is calculated as saturation concentration where adding more solute
does not increase its concentration in the solution [44].
The degree of solubility varies extensively, from infinitely soluble (fully
miscible) such as ethanol in water, to poorly soluble, such as silver chloride in water.
The term insoluble is frequently related with poorly or very poorly soluble compounds
[45]. Solubility occurs under dynamic equilibrium, which means that solubility results
from the parallel and disparate methods of dissolution and phase joining (e.g.,
precipitation of solids). Solubility equilibrium occurs when the two processes proceed
at a constant rate. Under certain conditions equilibrium in solubility may be exceeded
to give a so-called supersaturated solution, which is metastable [46].
Solubility does not to be mixed up with the capability to dissolve or liquefy a
substance, since these procedures may occur not only because of dissolution but also
because of a chemical reaction. For example, zinc is not soluble in hydrochloric acid,
but it can be desolved by chemically reacting zinc chloride and hydrogen, where zinc
chloride is soluble in hydrochloric acid. Solubility does also be governed by particle
size or other kinetic factors; given enough time, even large particles will eventually
dissolve [47].
8
Saturated solutions of ionic complexes of comparatively less solubility are
sometimes defined by solubility constants. It is a case of equilibrium procedure. It
defines balance between dissolved ions from salt and undissolved salt. Similar to other
equilibrium constants, temperature would affect the numerical value of solubility
constant. The value of this constant is usually independent of the existence of additional
species in solvent.
The Flory-Huggins solution theory is a theoretical model elaborating solubility
of polymers. The Hansen solubility factors and the Hildebrand solubility factors are
empirical approaches for the forecast of solubility. It is also probable to guess solubility
from other physical constants such as enthalpy of fusion. The partition coefficient (Log
P) is an amount of differential solubility of a compound in a hydrophobic solvent and
a hydrophilic solvent. The logarithm of these two values allows compounds to be
classified in terms of hydrophilicity (or hydrophobicity).
The Biopharmaceutics Classification System (BCS) is a guide for forecasting
the intestinal drug absorption provided by the U.S. Food and Drug Administration. This
system confines the forecasting using solubility and intestinal permeability factors.
Solubility is constructed on the highest-dose strength of fast release product. A drug is
judged extremely soluble when the maximum dose strength is soluble in 250 mL or less
of aqueous media at pH range of 1 to 7.5. The volume assessment of 250 mL is
derivative from typical bioequivalence study procedures that recommend
administration of a drug product to fasting human volunteers with a glass of water [48].
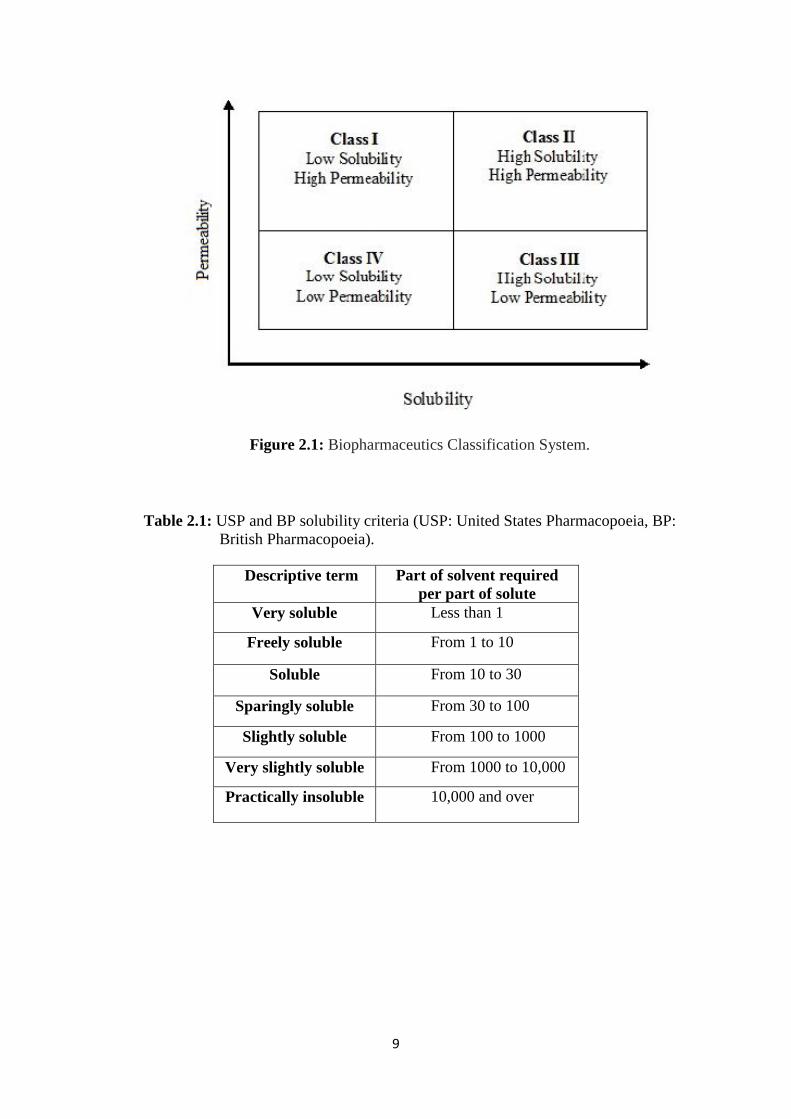
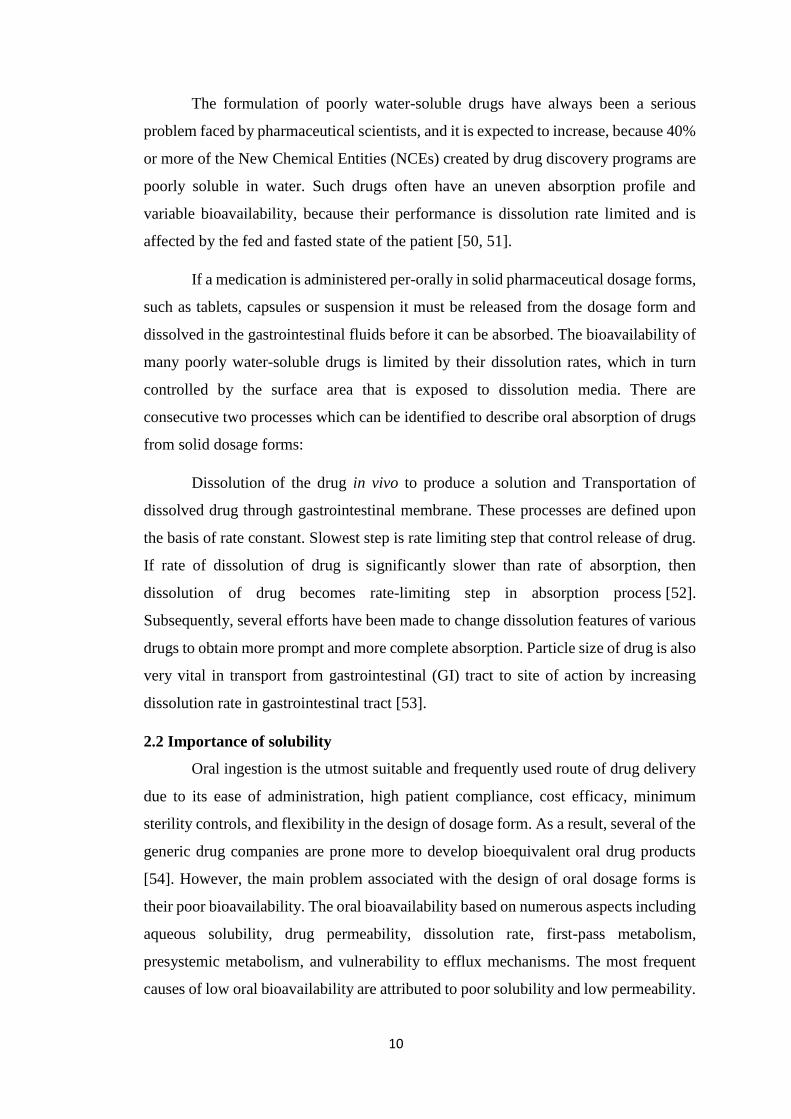
The intestinal permeability classification is based on a comparison to
intravenous injection. All those factors are extremely vital, since 85% of mostly sold
drugs in USA and Europe are orally administered. According to Biopharmaceutics
Classification System (BCS), all the drugs have been divided into four classes: class I
- high soluble and high permeable, class II - low soluble and high permeable, class III
- high soluble and low permeable and class IV - low soluble and low permeable. Drugs
belonging to Class II under BCS have low and variable oral bioavailability due to their
poor aqueous solubility as shown in Figure 2.1 [49]. United State Pharmacopoeia (USP)
and British Pharmacopoeia (BP) has also established solubility criteria as shown in
Table 2.1.
9
Figure 2.1: Biopharmaceutics Classification System.
Table 2.1: USP and BP solubility criteria (USP: United States Pharmacopoeia, BP:
British Pharmacopoeia).
Descriptive term Part of solvent required
per part of solute
Very soluble Less than 1
Freely soluble From 1 to 10
Soluble From 10 to 30
Sparingly soluble From 30 to 100
Slightly soluble From 100 to 1000
Very slightly soluble From 1000 to 10,000
Practically insoluble 10,000 and over
10
The formulation of poorly water-soluble drugs have always been a serious
problem faced by pharmaceutical scientists, and it is expected to increase, because 40%
or more of the New Chemical Entities (NCEs) created by drug discovery programs are
poorly soluble in water. Such drugs often have an uneven absorption profile and
variable bioavailability, because their performance is dissolution rate limited and is
affected by the fed and fasted state of the patient [50, 51].
If a medication is administered per-orally in solid pharmaceutical dosage forms,
such as tablets, capsules or suspension it must be released from the dosage form and
dissolved in the gastrointestinal fluids before it can be absorbed. The bioavailability of
many poorly water-soluble drugs is limited by their dissolution rates, which in turn
controlled by the surface area that is exposed to dissolution media. There are
consecutive two processes which can be identified to describe oral absorption of drugs
from solid dosage forms:
Dissolution of the drug in vivo to produce a solution and Transportation of
dissolved drug through gastrointestinal membrane. These processes are defined upon
the basis of rate constant. Slowest step is rate limiting step that control release of drug.
If rate of dissolution of drug is significantly slower than rate of absorption, then
dissolution of drug becomes rate-limiting step in absorption process [52].
Subsequently, several efforts have been made to change dissolution features of various
drugs to obtain more prompt and more complete absorption. Particle size of drug is also
very vital in transport from gastrointestinal (GI) tract to site of action by increasing
dissolution rate in gastrointestinal tract [53].
2.2 Importance of solubility
Oral ingestion is the utmost suitable and frequently used route of drug delivery
due to its ease of administration, high patient compliance, cost efficacy, minimum
sterility controls, and flexibility in the design of dosage form. As a result, several of the
generic drug companies are prone more to develop bioequivalent oral drug products
[54]. However, the main problem associated with the design of oral dosage forms is
their poor bioavailability. The oral bioavailability based on numerous aspects including
aqueous solubility, drug permeability, dissolution rate, first-pass metabolism,
presystemic metabolism, and vulnerability to efflux mechanisms. The most frequent
causes of low oral bioavailability are attributed to poor solubility and low permeability.
11
Solubility also plays a vital role for other dosage forms like parenteral
formulations [55]. Solubility is one of the significant factor to obtain desired
concentration of drug in systemic circulation for attaining necessary pharmacological
response [56]. Poorly water soluble drugs frequently require high doses in order to
reach therapeutic plasma concentrations after oral administration. Low aqueous
solubility is the main problem with formulation development of new chemical entities
as well as generic development. Any drug to be absorbed must be present in the form
of an aqueous solution at site of absorption. Water is the solvent of choice for liquid
pharmaceutical formulations. Most of the drugs are either weakly acidic or weakly basic
having poor aqueous solubility.
More than 40% NCEs (new chemical entities) developed in pharmaceutical
industry are practically insoluble in water. These poorly water soluble drugs having
slow drug absorption leads to insufficient and variable bioavailability and
gastrointestinal mucosal toxicity. For orally administered drugs solubility is the most
important rate limiting parameter to achieve their desired concentration in systemic
circulation for pharmacological response. Problem of solubility is a major challenge for
formulation scientists [57].
The improvement of drug solubility and thereby its oral bio-availability remains
one of the most challenging aspects of drug development process especially for oral-
drug delivery system. There are numerous approaches available and reported in
literature to enhance solubility of poorly water-soluble drugs. These techniques are
chosen on the basis of certain aspects such as properties of drug under consideration,
nature of excipients to be selected, and nature of intended dosage form.
The poor solubility and low dissolution rate of poorly water soluble drugs in the
aqueous gastrointestinal fluids often cause insufficient bioavailability. Especially for
class II (low solubility and high permeability) substances according to BCS, the
bioavailability may be enhanced by increasing solubility and dissolution rate of drug in
the gastro-intestinal fluids. As for BCS class II drugs, rate limiting step is drug release
from dosage form and solubility in gastric fluid and not absorption, so increasing the
solubility in turn increases bioavailability for BCS class II drugs [54, 57, 58].
The negative effect of compounds with low solubility include poor absorption
and bioavailability, insufficient solubility for intravenous (IV) dosing, development
12
challenges leading to increasing the development cost and time, burden shifted to
patient (frequent high-dose administration) [55].
2.3 Techniques for solubility enhancement
Solubility enhancement methods can be classified into physical modification,
chemical modifications of drug substance, and other techniques.
2.3.1 Physical Modifications
Decrease in particle size e.g., micronization and nanosuspension, change in
crystal form like polymorphs, amorphous form and cocrystallization, distribution of
drug in carrier system like eutectic mixtures, solid dispersions, solid solutions and
cryogenic techniques.
2.3.2 Chemical Modifications
This method involve alteration in pH, use of buffer derivatization, complexation, and
salt formation.
2.3.3 Miscellaneous Methods
Supercritical fluid method, use of adjuvants like surfactants, solubilizing agents,
cosolvency, hydrotrophy, and unique excipients.
2.3.4 Particle size reduction
The solubility of drug is frequently associated with particle size of drug. When
size of particles is reduced then surface area of particles has been increased as a result
there is increase in surface to volume ratio. This increase in surface area causes more
contact of particles with solvent that ultimately enhances its solubility.
Normally several methods are used to reduce particle size. These include
comminution and spray drying that based upon the mechanical stress to separate
aggregates of active compound. This reduction in particle size enhances solubility. This
method of solubility enhancement is very economic, cost effective and efficient.
Grinding and milling are two basic mechanical forces that are associated with
comminution. These forces apply desired level of physical stress on drug product to
separate aggregates of drug particles. In comminution and spray drying, thermal stress
is also generated that must be kept in mind while dealing with thermosensitive drugs.
13
Using conventional methodologies for practically insoluble drugs may not be able to
improve the solubility up to anticipated level.
Micronization is an alternative traditional practice for reduction in particle size.
Micronization enhances dissolution rate of drugs by increasing surface area, it does not
improves equilibrium solubility. Reduction in particle size of these drugs causes
increase in surface area, as a result rate of dissolution has increased. Micronization of
drugs is carried out by milling methods by means of jet mill, rotor stator colloid mills.
This technique cannot be used for drugs which have high dose [59].
These methods were applied to griseofulvin, progesterone, spironolactone and
fenofibrate. For these drugs, micronization enhances digestive absorption, and
subsequently their bioavailability and clinical effectiveness. Micronized fenofibrate
shown greater than 10-fold (1.3% to 20%) rise in dissolution within 30 minutes in bio
relevant media [60, 61].
2.3.5 Solid dispersion
The theory of solid dispersions was initially suggested by Sekiguchi and Obi,
who examined generation and dissolution enactment of eutectic melts of a sulfonamide
drug and a water-soluble carrier in the start of 1960s [62]. Solid dispersions exemplify
a beneficial pharmaceutical system for improving dissolution, absorption, and
therapeutic effectiveness of drugs in dosage forms. The term solid dispersion represent
to a group of solid products involving at least two dissimilar constituents, usually a
hydrophilic medium and a hydrophobic drug. The most frequently applied hydrophilic
carriers for solid dispersions comprise of polyvinylpyrrolidone (Povidone, PVP),
polyethylene glycols (PEGs), Plasdone-S630. Surfactants like Tween-80, Docusate
sodium, Pluronic-F68, and Sodium lauryl sulphate (SLS) also find a place in the
formulation of solid dispersion.
The solubility of celecoxib, halofantrine, and ritonavir has been enhanced by
solid dispersion using appropriate hydrophilic carriers like celecoxib with povidone
(PVP) and ritonavir with gelucire. Numerous methods to formulate solid dispersion of
poorly water soluble drugs with an objective to increase their aqueous solubility are
listed below [63-65].
2.3.5.1 Hot-Melt Method (Fusion Method)
14
The major benefits of direct melting process is its easiness and inexpensive. The
melting or fusion technique was first suggested by Sekiguchi and Obi to formulate rapid
release solid dispersion dosage forms. In this technique, physical blend of a drug and a
water-soluble carrier is heated directly till both of these will melts. The melted blend is
then cooled and frozen quickly in an ice bath with continuous stirring. Obtained solid
mass is then crumpled, ground, and passed through sieve which can be compacted into
tablets by using other ingredients required for tablets. The melting point of this two
phase system is reliant on its composition, i.e. the nature of chosen carrier system and
quantity of drug used [66].
The most important requirement for the development of solid dispersion by hot-
melt process is miscibility of drug and carrier in melted state. Drug and carrier should
be thermostable when using this technique for preparation of solid disperssions.
2.3.5.2 Solvent Evaporation Method
Tachibana and Nakamura [67] first time prepare solid disperssions by
dissolving carrier and drug in same solvent and then evaporated solvent under vacuum
to yield a solid solution. This allowed them to prepare a solid solution of extremely
lipophilic β-carotene in hydrophilic carrier povidone. Various researchers studied solid
dispersion of meloxicam, naproxen, and nimesulide by means of solvent evaporation
method. These outcomes recommend that said approaches can be used effectively for
enhancement of solubility and stability of solid dispersions of hydrophobic drugs [68,
69].
The major benefit of solvent evaporation technique is that thermal breakdown
of drugs or carriers can be prohibited because less temperature is needed for evaporation
of organic solvents. The basic disadvantage associated with this technique is much
greater cost required for preparation and it’s very difficult to remove organic solvents.
The probable adverse effect of apparently insignificant quantity of solvent on chemical
stability of drug, the choice of a common volatile solvent, and problem in reproducing
crystal forms [70, 71].
2.3.5.3 Hot-Melt Extrusion
Hot-melt extrusion is basically same as fusion method excluding powerful
blending of different ingredients carried out by extruder. Similar to conventional fusion
method, miscibility of drug and matrix could be difficult [72, 73]. High-shear forces
15
increases temperature of extruder that is problematic for thermosensitive compounds.
This method has advantage over conventional fusion method because it can be used for
large scale production due to continuity of this approach. Moreover, handling of
product is very convenient because at the end of extruder, shape of final product can be
adjusted for further processing without grinding [74].
2.3.6 Nanosuspension
Nanosuspension is also a favorable approach that has been developed for
effective delivery of poorly water soluble drugs. This technique is equally helpful for
both water insoluble drugs as well as oil insoluble [75-77]. A pharmaceutical
nanosuspension is a two phase system comprising of nano sized drug units stabilized
by surfactants for oral and topical use or parenteral and pulmonary application. In
nanosuspensions, generally the size of solid ingredients is kept below than one micron
with an average size of 200-600 nm [78- 80].
Several approaches applied for preparation of nanosuspensions comprise of
precipitation method, media milling, high-pressure homogenization in water, high
pressure homogenization in non-aqueous media and combination of precipitation and
high-pressure homogenization [81, 82].
2.3.6.1 Precipitation Technique
In precipitation method drug is dissolved in a solvent, which is then added to
antisolvent to precipitate crystals. This technique is advantageous because it involve
cost effective equipment’s but there is challenge of preventing microparticles formation
during growth of crystals. The selection of solvents is also critical because drug have
to be soluble at least in one solvent and this solvent should have been miscible with
antisolvent. This approach of solubility enhancement cannot be applied for those drugs
that are insoluble in aqueous and non-aqueous media [83]. Nanosuspension of Danazol
and Naproxen have been formulated by precipitation method to enhance their
dissolution rate and oral bioavailability. Decrease in particle size of naproxen was also
linked with increase in the rate of absorption nearly 4-times [84, 85].
2.3.6.2 Media Milling
The nanosuspensions can also be formulated by the application of high-shear
media mills. The milling chamber filled with milling media, water, drug, and stabilizer
16
is rotated at a very high-shear rate under controlled temperatures for some days (at least
2–7 days). The milling medium is composed of glass, Zirconium oxide, or highly cross-
linked polystyrene resin. High energy shear forces are produced as a consequence of
the impaction of milling media with drug that convert microparticles of drug into nano
sized particles [82].
2.3.6.3 High Pressure Homogenization
Nanosuspension of many hydrophobic drugs can be prepared by using High-
pressure homogenization. In this technique, suspension of drug and surfactant has been
passed through a high pressure homogenizer having nano size aperture. The principle
of this process is constructed on cavitation in aqueous phase. The cavitations forces
within particles are suitably high to change drug microparticles into nanoparticles. The
issue with this technique is the necessity of small sample particles before loading and
the fact that many cycles of homogenization are needed [86].
Dissolution rate and bioavailability of poorly soluble drugs such as
spironolactone, budesonide, and omeprazole have been enhanced by decreasing their
particle size by high pressure homogenization [87-89].
2.3.6.4 Combined Precipitation and Homogenization
The precipitated drug nanoparticles have an ability to carry on crystal
development of micron size. These crystals required to be treated with high-energy
forces (homogenization). Problem occur in stability and bioavailability due to totally
amorphous, moderately amorphous or crystalline nature. To avoid this problem
suspension of particles is ultimately homogenized which stabilize particle size achieved
after the process of precipitation.
2.3.7 Supercritical fluid (SCF) process
A new technique for production of nano size particle and solubilization whose
use has increased in past few years is supercritical fluid (SCF) technique. Supercritical
fluids have temperature and pressure above than there critical temperature (Tc) and
critical pressure (Tp), simultaneously having characteristics of liquid and gas. SCFs
close to their critical temperatures, can easily be compressed and permitting slight
variations in pressure to significantly modify density and mass carriage properties of
fluid that mainly govern its solvent ability. As soon as drug constituents are solubilized
17
inside the SCF (generally carbon dioxide), their particle size usually decreased and may
be recrystallized. Particles produced by this method usually have particle size that is
very close to each other mostly in the range of submicrons. Presently SCF methods
have confirmed the ability to produce nanoparticulate suspensions having particles
diameter 5–2,000 nm. A number of pharmaceutical industries including Nektar
Therapeutics and Lavipharm, are focusing in nano size particle manufacturing by using
SCF approach for solubility improvement.
Different approaches of SCF handling have been established to overcome
specific limitations, such as precipitation by using compressed antisolvent method
(PCA), gas antisolvent recrystallization (GAS), solution enhanced dispersion by SCF
(SEDS), fast expansion of supercritical solutions (FESS), supercritical antisolvent
methods (SAS), and aerosol supercritical extraction system (ASES) [90, 91].
2.3.8 Cryogenic techniques
Cryogenic approach has been established to improve dissolution rate of drugs
by producing nanosized amorphous drug particles with large number of pores at low-
temperature. Cryogenic techniques are defined by type of injection means (capillary,
rotary, pneumatic, and ultrasonic nozzle), site of nozzle (above or below liquid level),
and composition of cryogenic liquid (hydrofluoroalkanes, Ar, O2, N2, and organic
solvents). After cryogenic processing, dry powder can be gained by several drying
procedures such as vacuum freeze drying, atmospheric freeze drying, spray freeze
drying, and lyophilization [92-94].
2.3.8.1 Spray Freezing onto Cryogenic Fluids
Briggs and Maxvell developed method of spray freezing using cryogenic fluids.
In this method, drug and carrier (lactose, mannitol, inositol, maltose, or dextran) were
dissolved in water and atomized on surface of boiling agitated fluorocarbon refrigerant.
Sonication probe can be retained in stirred refrigerant to improve dispersion of aqueous
solution [95].
2.3.8.2 Spray Freezing into Cryogenic Liquids (SFL)
Amorphous nano sized particles of drug having greater surface area with
enhanced wetting ability can be produced by using SLF particle technique. This
technique provides direct incorporation of liquid into liquid between automatized feed
18
solution and cryogenic liquid to attain strong atomization into micro droplets and then
ultimately quicker freezing rates. Then dry and free-flowing powder is obtained by
lyophilizing frozen particles [96].
2.3.8.3 Spray Freezing into Vapor over Liquid (SFV/L)
In this technique drug solution is frozen in cryogenic fluid and ultimately
elimination of frozen solvent results in production of drug particles having greater
wetting ability. In SFV/L atomized tiny particles normally initiate to freeze in vapor
form before they interact cryogenic liquid. When solvent freezes then drug become
supersaturated in unfrozen area of atomized particles so small droplets become nucleate
and grow [97, 98].
2.3.8.4 Ultra-Rapid Freezing (URF)
Ultra-rapid freezing is an innovative cryogenic technique that produces nano
sized drug particulate with significantly improved surface area and desired surface
morphology. Presentation of drugs solution to solid surface of cryogenic moiety takes
towards immediate freezing and following lyophilization (for exclusion of solvent)
result into micronized drug having more solubility. Such rapid freezing hampers phase
parting and crystallization of pharmaceutical constituents takes towards complete
mixing of amorphous drug-carrier solid dispersions and solid solutions [99].
2.3.9 Inclusion complex formation-based techniques
Amongst all the solubility improvement methods, inclusion complex
development approach has been used more accurately to enhance aqueous solubility,
bioavailability and dissolution rate of hydrophobic drugs.
Inclusion complexes are made by the addition of nonpolar fragment or nonpolar
part of one moiety (known as guest) into the hole of second moiety or group of
molecules (known as host). The most frequently implied host molecules are
cyclodextrins. The breakdown of starch by using enzyme such as cyclodextrin-
glycosyltransferase (CGT) yields cyclic oligomers, Cyclodextrins (CDs). Basically
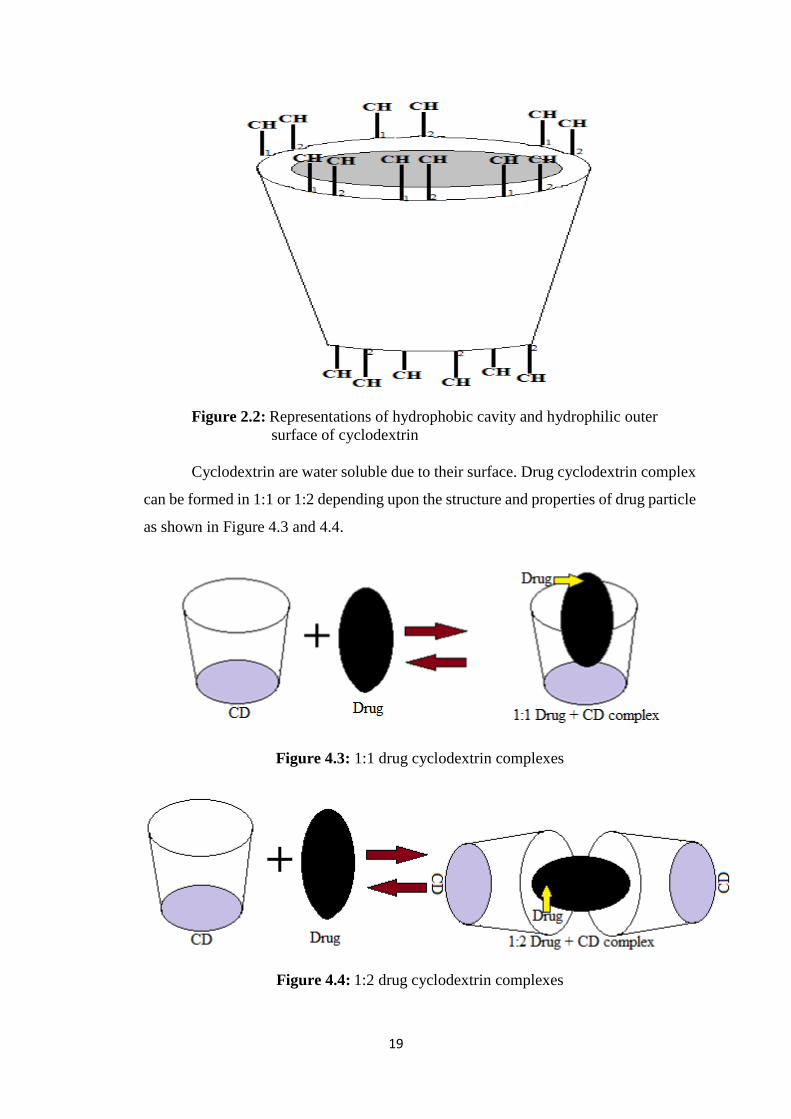
these are monomers of glucose linked in a donut like ring containing hydrophobic inner
cavity and hydrophilic outer surface as shown in Figure 2.2. These are crystalline, water
soluble, nonreducing, cyclic oligosaccharides. Three naturally present CDs are α-
Cyclodextrin, β-Cyclodextrin, and γ-Cyclodextrin [100].
19
Figure 2.2: Representations of hydrophobic cavity and hydrophilic outer
surface of cyclodextrin
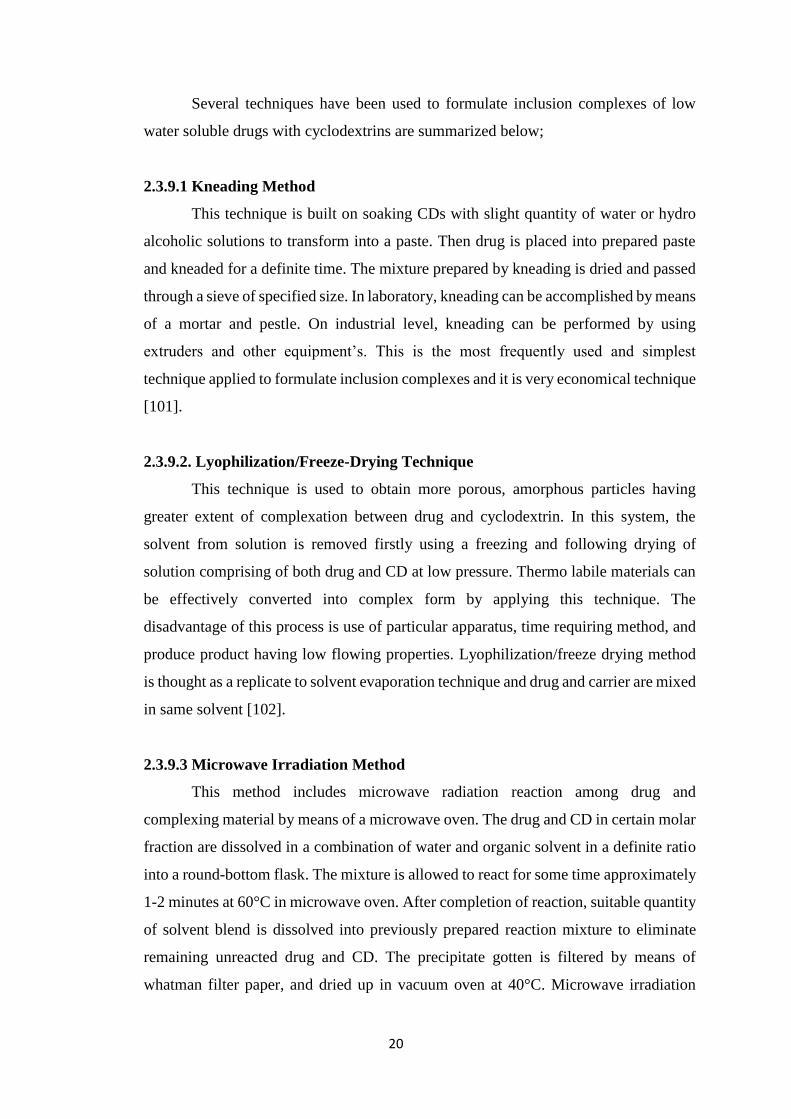
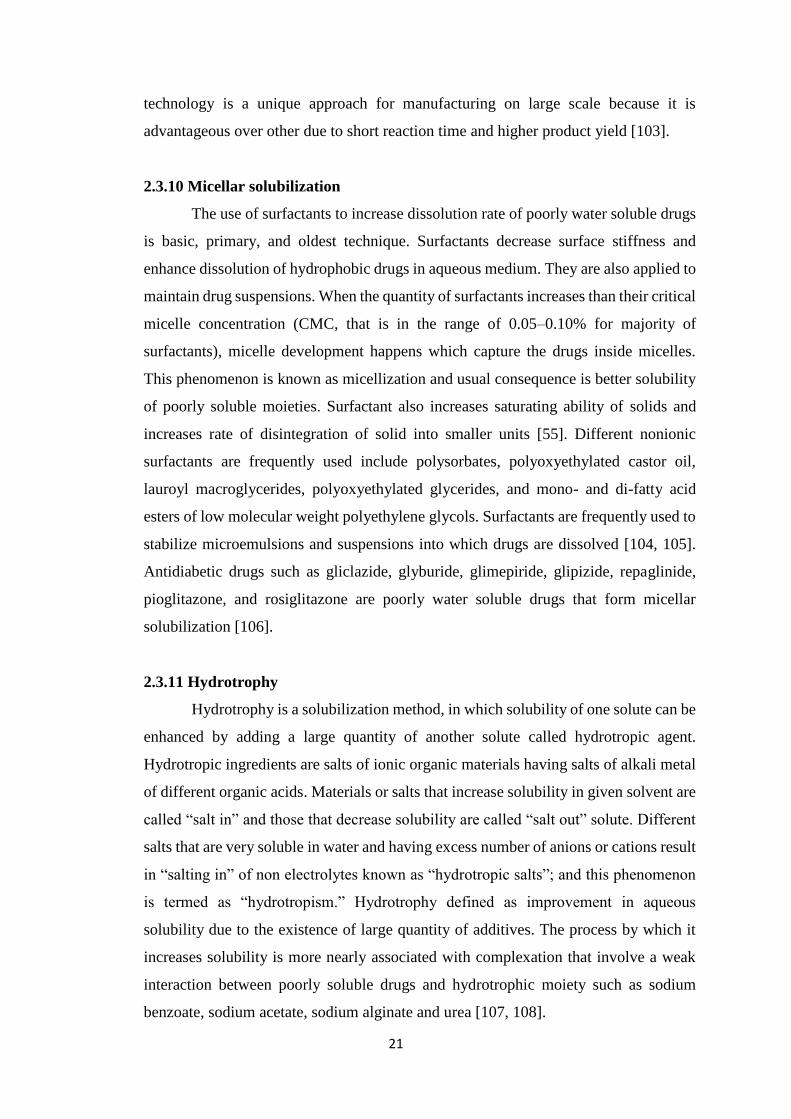
Cyclodextrin are water soluble due to their surface. Drug cyclodextrin complex
can be formed in 1:1 or 1:2 depending upon the structure and properties of drug particle
as shown in Figure 4.3 and 4.4.
Figure 4.3: 1:1 drug cyclodextrin complexes
Figure 4.4: 1:2 drug cyclodextrin complexes
20
Several techniques have been used to formulate inclusion complexes of low
water soluble drugs with cyclodextrins are summarized below;
2.3.9.1 Kneading Method
This technique is built on soaking CDs with slight quantity of water or hydro
alcoholic solutions to transform into a paste. Then drug is placed into prepared paste
and kneaded for a definite time. The mixture prepared by kneading is dried and passed
through a sieve of specified size. In laboratory, kneading can be accomplished by means
of a mortar and pestle. On industrial level, kneading can be performed by using
extruders and other equipment’s. This is the most frequently used and simplest
technique applied to formulate inclusion complexes and it is very economical technique
[101].
2.3.9.2. Lyophilization/Freeze-Drying Technique
This technique is used to obtain more porous, amorphous particles having
greater extent of complexation between drug and cyclodextrin. In this system, the
solvent from solution is removed firstly using a freezing and following drying of
solution comprising of both drug and CD at low pressure. Thermo labile materials can
be effectively converted into complex form by applying this technique. The
disadvantage of this process is use of particular apparatus, time requiring method, and
produce product having low flowing properties. Lyophilization/freeze drying method
is thought as a replicate to solvent evaporation technique and drug and carrier are mixed
in same solvent [102].
2.3.9.3 Microwave Irradiation Method
This method includes microwave radiation reaction among drug and
complexing material by means of a microwave oven. The drug and CD in certain molar
fraction are dissolved in a combination of water and organic solvent in a definite ratio
into a round-bottom flask. The mixture is allowed to react for some time approximately
1-2 minutes at 60°C in microwave oven. After completion of reaction, suitable quantity
of solvent blend is dissolved into previously prepared reaction mixture to eliminate
remaining unreacted drug and CD. The precipitate gotten is filtered by means of
whatman filter paper, and dried up in vacuum oven at 40°C. Microwave irradiation
21
technology is a unique approach for manufacturing on large scale because it is
advantageous over other due to short reaction time and higher product yield [103].
2.3.10 Micellar solubilization
The use of surfactants to increase dissolution rate of poorly water soluble drugs
is basic, primary, and oldest technique. Surfactants decrease surface stiffness and
enhance dissolution of hydrophobic drugs in aqueous medium. They are also applied to
maintain drug suspensions. When the quantity of surfactants increases than their critical
micelle concentration (CMC, that is in the range of 0.05–0.10% for majority of
surfactants), micelle development happens which capture the drugs inside micelles.
This phenomenon is known as micellization and usual consequence is better solubility
of poorly soluble moieties. Surfactant also increases saturating ability of solids and
increases rate of disintegration of solid into smaller units [55]. Different nonionic
surfactants are frequently used include polysorbates, polyoxyethylated castor oil,
lauroyl macroglycerides, polyoxyethylated glycerides, and mono- and di-fatty acid
esters of low molecular weight polyethylene glycols. Surfactants are frequently used to
stabilize microemulsions and suspensions into which drugs are dissolved [104, 105].
Antidiabetic drugs such as gliclazide, glyburide, glimepiride, glipizide, repaglinide,
pioglitazone, and rosiglitazone are poorly water soluble drugs that form micellar
solubilization [106].
2.3.11 Hydrotrophy
Hydrotrophy is a solubilization method, in which solubility of one solute can be
enhanced by adding a large quantity of another solute called hydrotropic agent.
Hydrotropic ingredients are salts of ionic organic materials having salts of alkali metal
of different organic acids. Materials or salts that increase solubility in given solvent are
called “salt in” and those that decrease solubility are called “salt out” solute. Different
salts that are very soluble in water and having excess number of anions or cations result
in “salting in” of non electrolytes known as “hydrotropic salts”; and this phenomenon
is termed as “hydrotropism.” Hydrotrophy defined as improvement in aqueous
solubility due to the existence of large quantity of additives. The process by which it
increases solubility is more nearly associated with complexation that involve a weak
interaction between poorly soluble drugs and hydrotrophic moiety such as sodium
benzoate, sodium acetate, sodium alginate and urea [107, 108].
22
The hydrotropes are recognized as automatically accumulate in solution. The
grouping of hydrotropes on the basis of molecular structure is challenging, thus large
number of moieties have been described to show hydrotropic properties. Particularly,
ethanol, aromatic alcohols such as resorcinol, pyrogallol, catechol, α and β-naphthols,
alkaloids and salicylates e.g., caffeine and nicotine, ionic surfactants like SDS (sodium
dodecyl sulphate), diacids, and dodecylated oxidibenzene. The aromatic hydrotropes
having anionic head groups are frequently studied compounds. These are high in
number due to isomerism and their active hydrotrope action that may be because of
presence of interactive pi (π) orbital [109].
Hydrotropes having cationic hydrophilic moiety are non abundant like salts of
aromatic amines, such as procaine hydrochloride. In addition to improving aqueous
solubility of compounds, they also improve accumulation of surfactants that results in
micelle formation [110].
2.3.12 Crystal engineering
Particle size is the most important parameter that decide how much surface area
of drug is exposed to dissolution. Thus particle size is very important for drug
dissolution and is based upon various conditions used for crystallization or on
techniques used for comminution such as impact milling and fluid energy milling.
By using comminution method we can yield particles which are very dissimilar
having charge and cohesive, with likely to cause difficulties in downstream processing
and product performance. Hence, crystal engineering methods are established for
precise manifestation of drugs to yield pure powders having clear particle size range,
crystal habit, crystal form (crystalline or amorphous), surface nature and surface energy
[111]. By manipulating the crystallization conditions (use of different solvents or
change in the stirring or adding other components to crystallizing drug solution), it is
possible to prepare crystals with different packing arrangement; such crystals are called
polymorphs.
Due to this reason, polymorphs of same drug differ in their various
characteristics like melting point, dissolution rate, solubility and stability etc. Majority
of drugs have different polymorphs and efforts have been made to formulate multiple
polymorphs of drugs that are more stable under different conditions with improved
solubility. A typical example of the significance of polymorphism on bioavailability is
that of chloramphenicol palmitate suspension. Polymorphs of chloramphenicol
23
palmitate have been made that have low serum concentration as compared to same dose
of metastable polymorph [112]. Another research was carried out on oxytetracycline
and it was observed that polymorph A (have 55% dissolution at 30 min) was dissolved
more slowly than polymorph B (have 95% dissolution at 30 min) [113].
Crystal engineering technique also includes the formation of hydrates and
solvates for improving dissolution rate. Throughout crystallization method, it is likely
to entrap molecules of solvent inside lattice. If water is used as solvent, the subsequent
crystal is a hydrate; if solvent used is other than water then it is termed as solvate. Every
solvate has its own dissolution rate and solubility. Dissolution rate and solubility of a
drug differ significantly for different solvates. For example, toluene and pentanol
solvates of glibenclamide have more solubility as compared to different non solvated
polymorphs [114]. Hydrates may have rapid or slow dissolution rate than anhydrous
form. Most favorable condition for anhydrous form is that it should have fast
dissolution rate rather than hydrate. For example, dissolution rate of anhydrous form of
theophylline was rapid than its hydrate form [115]. In some cases, anhydrous forms of
drug are less soluble than hydrous form and have slow dissolution rate. It was observed
that dihydrate form of erythromycin was more soluble than monohydrate and anhydrate
forms [116]. Normally solvates are not preferably used because organic solvents are
present that can be toxic. Organic solvents are used in formulations upto specified limits
because in human, use of greater concentrations in daily dose are not recommended.
Crystal engineering suggest large number of methods to enhance solubility and
dissolution rate, which can be implemented by having complete understanding of
crystallization procedures and the specific characteristics of active pharmaceutical
moieties. The method comprises of dissolving drug in solvent and precipitation
occurred in a precise mode to yield nanoparticles by addition of an antisolvent generally
it is water [111].
Formation of cocrystals opened new ways in pharmaceutical field to solve the
issues of poorly water soluble drugs. In this technique two or more molecules are linked
together to form new crystals having superior characteristics than alone. Molecular or
ionic drug combined with cocrystal former which is in solid form at specific conditions
to form pharmaceutical cocrystals [117]. Generally these are formed by slowly
evaporating cocrystal former from solution however, sublimation, growth from the
melt, or crushing different solid cocrystal formers in a ball mill are also appropriate
approaches [118].
24
Carbamazepine: saccharin cocrystal was more stable, enhanced dissolution rate
and more rapid absorption in dogs when compared with alone crystals of
carbamazepine [119]. In another study by Childs et al., fluoxetine HCl and succinic
acid cocrystal exhibited approximately two fold enhancement in aqueous solubility
after only 5 min [120]. It was detected that itraconazole L-malic acid cocrystal shown
a related dissolution profile to that of the marketed preparation [121].
Generally, crystallization techniques consist of sublimation, crystallization
from solutions, evaporation, thermal handling, desolvation, or grinding/milling. These
are being substituted with innovative approaches of crystal engineering like SCF
techniques [122, 123] to prepare pharmaceutical solids with preferred dissolution rate
and stability. Melt sonocrystallization is an alternative emerging tool that uses
ultrasonic energy to yield spongy rapid dissolving particles for poorly water soluble
drug moieties [124]. Depending upon recently available literature, it look like that
crystal engineering techniques need to be exploited more for enhancing the dissolution
rate of hydrophobic drugs.
2.3.13 Hydrogel microparticles
A hydrogel is made from a macromolecular hydrophilic polymers that assemble
themselves in a cross-linked complex. These have ability of engrossing a great quantity
of water fluctuating from 10% to many folds of their own weight and eventually
showing swelling activities [125]. When hydrogels are of microscopic size and
arranged in smaller dimensions, they are designated as microgels or hydrogel
microparticles or called as cross-linked polymeric microparticles. When size of
microgels is decreased up to the level of submicrmeters, they are recognized as
nanogels. [126]. Microgels/nanogels have exceptional benefits for polymer-based drug
delivery systems (DDS) over polymer protein conjugates, [127] polymer–drug
conjugates, [128] micelles, [129] and vesicles [130] depending upon amphiphilic and
doubly hydrophilic block copolymers, dendrimers, [131] and submicrometer-sized
particles [132]. Microgels/nanogels’ size range from nanometers to several
micrometers with an enormous surface area for conjugation with drugs [133].
Hydrogel microparticles consist of a hydrophilic mixture, which has the
characteristics of both solid and liquid [134]. The hydrogel structure contains networks
that are formed by random cross-linking of macromolecules [135]. It has three phases:
polymeric-network matrix solid phase, interstitial fluid phase, and ionic phase. The
25
solid phase consists of a network of cross-linked polymeric chains. The cross-linked
polymeric network can be made physicochemically, for example, by Vander Waals
interactions, hydrogen bonding, electrostatic interactions, and physical entanglements
as well as by covalent bonding. The fluid phase imbibes into polymeric network pores
and give wet and elastic properties to hydrogel microparticles. Owing to these
properties, the structure of hydrogels resembles to a living tissue. The ionic phase
consists of ionizable groups that are bounded to polymeric chains and mobile ions
(counter ions and coions). This phase exists due to the presence of an electrolytic
solvent. Hydrogel microparticles can be formed from both natural and synthetic
polymers [136].
Hydrogel microparticles are used for improvement of solubility of hydrophobic
and poorly water soluble drugs [137]. Hydrogel microparticles are employed in solid
dosage forms, i.e. tablets as superdisintegrants, e.g., polyacrylic acid (AA) super porous
hydrogel microparticles [138]. Microgels/nanogels/hydrogel microparticles are used in
diagnostic Imaging [139] and as semiconductor nanocrystals [140]. Hydrogel
microparticles and hydrophilic polymers are used in patterning surfaces, immobilizing
cells, and proteins within the microenvironment of hydrogels [141]. Cell-laden
hydrogels are used as scaffolding materials in tissue engineering [142] and as immune
isolation barriers in microencapsulation technology [143]. Hydrogel microparticles
have been used in fabrication of tunable micro lenses that respond to pH and
temperature changes, for example, N-isopropyl acrylamide hydrogel microparticles
prepared by aqueous polymerization.
2.3.13.1 Drug Loading in Hydrogel Microparticles
In hydrogel microparticles, drug can be loaded by two methods [144];
1. Post loading and
2. In situ loading.
In post loading of drug, first the particles matrix is formed and then drug is
absorbed. The diffusion method drags drug molecules inside the particles. Release of
drugs from these particles is also carried out by diffusion and swelling of hydrogel
microparticles. In in situ loading of drug, the polymer solution is mixed with drug and
drug–polymer conjugates are formed.
In this method, matrix formation and encapsulation of drug molecules is carried
out side by side. Drug release can be determined by diffusion, hydrogel swelling,
26
reversible drug–polymer interactions, or degradation of labile covalent bonds [145,
146].
2.3.13.2 Drug Release Mechanisms
Release of drug from matrix of hydrogel microparticles is based upon
composition of the formulation (type of polymer, drug, monomer, initiator, cross-
linker, etc.), size and shape of particles, method of preparation, and environmental
conditions.
In addition to these factors, the following factors also affect the release of drug
from swollen particles:
Penetration of water into the particles through pores,
In contact or wetting of the particles matrix with release media,
Creation of pores by the entrapped water,
Drug and polymer degradation,
Change in the pH of particles matrix due to degradation of polymers,
Swelling ability of particles,
Presence of acidic or basic environment due to degradation of products,
Amount of drug present in the matrix of hydrogel microparticles,
Diffusion of drug in the fluid,
Absorption and desorption processes,
Hydrostatic pressure created in drug delivery devices, and
Changes occurred in the sizes of pores due to swelling of polymers [146, 147]
By these mechanisms, drug release follows the following phenomenon:
Exterior diffusion,
Interior diffusion,
Desorption, and
Chemical reactions
2.3.14 Fast disintegrating tablets (FDT’s)
According to FDA, a FDT is ‘‘a solid dosage form having active moieties that
disintegrates quickly, mostly within seconds, when employed upon tongue.’’
Commonly dissolution and absorption happens concurrently with disintegration of
27
drug. It can be given with or without water and thus eliminating use of water for oral
drug administration. Food and Drug Agency (FDA) enlisted strategies for development
of FDT’s in pharmaceutical industry to come across quality standard. Preferably, FDT’s
weight should be below than 500 mg to sustain ease of administration and it should
disintegrate in less than 30 seconds in United States Pharmacopeia (USP) using
disintegration test method or some other techniques [148].
About 50% of peoples having chronic illness do not comply with medication
[149]. Patient compliance is most important issue for attainment of all pharmacological
treatment but serious in chronic conditions. Approximately one third of hospitalized
patients in United States are because of noncompliance to medication [150].
Noncompliance in use of medication can lead towards more death rates, and ultimately
increase in the price of health care facilities all over the world. Elements accountable
for noncompliance are physician, patients, health system [151], and formulation
parameters [152]. Taste of formulation is one of the most important parameter to be
considered when discussing patient noncompliance towards medication. Unpleasant
taste of medication is especially considered in case of pediatric and geriatric patients.
Bitter taste can be reduced or even eliminated by using various formulation techniques
used for manufacturing of FDT’s.
Latest advancements in technology have shown new dosage forms for
paediatric, geriatric or non-compliant peoples, those who have problems in chewing or
swallowing solid dosage forms and are reluctant to use solid dosage forms due to
anxiety of choking [150]. Hence, MDT’s tablets are a perfect fit for them.
Superdisintegrants used in these dosage forms increase drug release, thus improvement
in bioavailability of drug [151]. When these tablets are placed in mouth, disintegrate
immediately and drug releases, which dissolves in saliva and become liquid in oral
cavity, without using water [152]. FDT’s have an advantage over convenient dosage
forms especially in case of travelling patients where there is no availability of water
[153].
Furthermore, this dosage form have characteristics of both liquid and solid
formulation. Some drugs have been absorbed from mouth, pharynx and esophagus
when they pass through these parts along with saliva. In these cases, bioavailability of
such drugs have been greatly enhanced as compared to those seen in conventional
tablets. FDT’s permits children, elderly, and as well as to general patients to take their
medications separately wherever required, much eradicating the aspect of patient non-
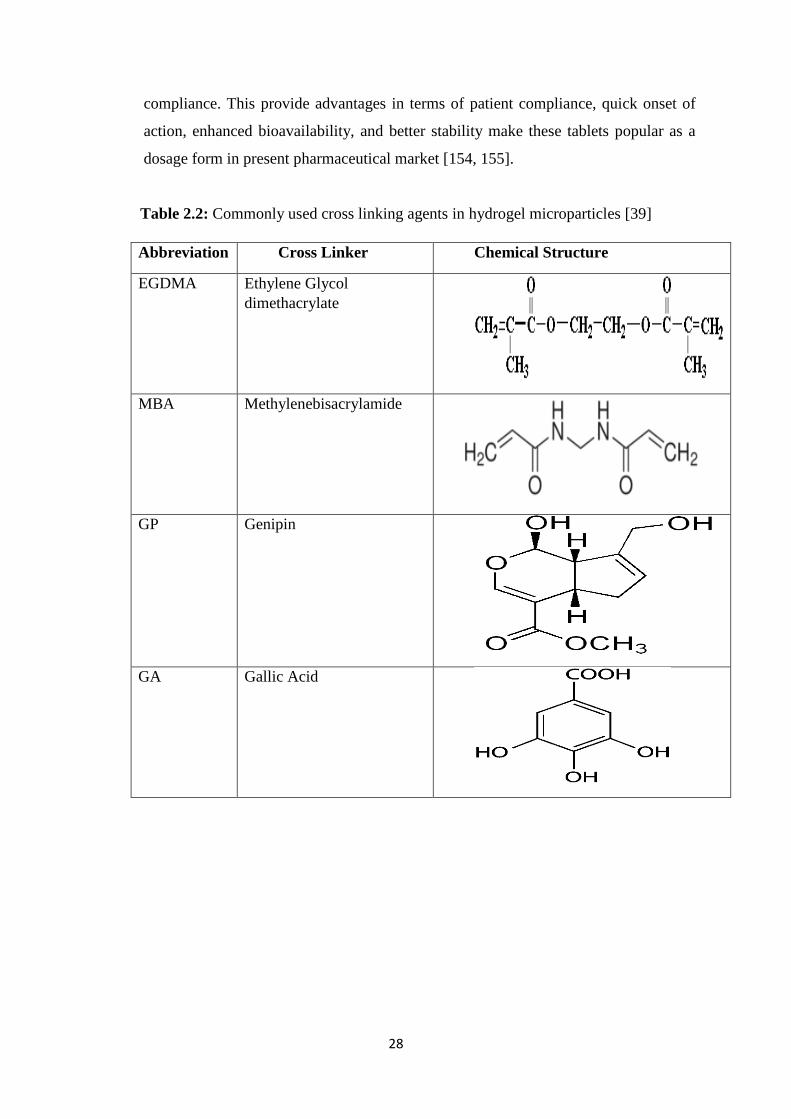
28
compliance. This provide advantages in terms of patient compliance, quick onset of
action, enhanced bioavailability, and better stability make these tablets popular as a
dosage form in present pharmaceutical market [154, 155].
Table 2.2: Commonly used cross linking agents in hydrogel microparticles [39]
Abbreviation Cross Linker Chemical Structure
EGDMA Ethylene Glycol
dimethacrylate
MBA Methylenebisacrylamide
GP Genipin
GA Gallic Acid
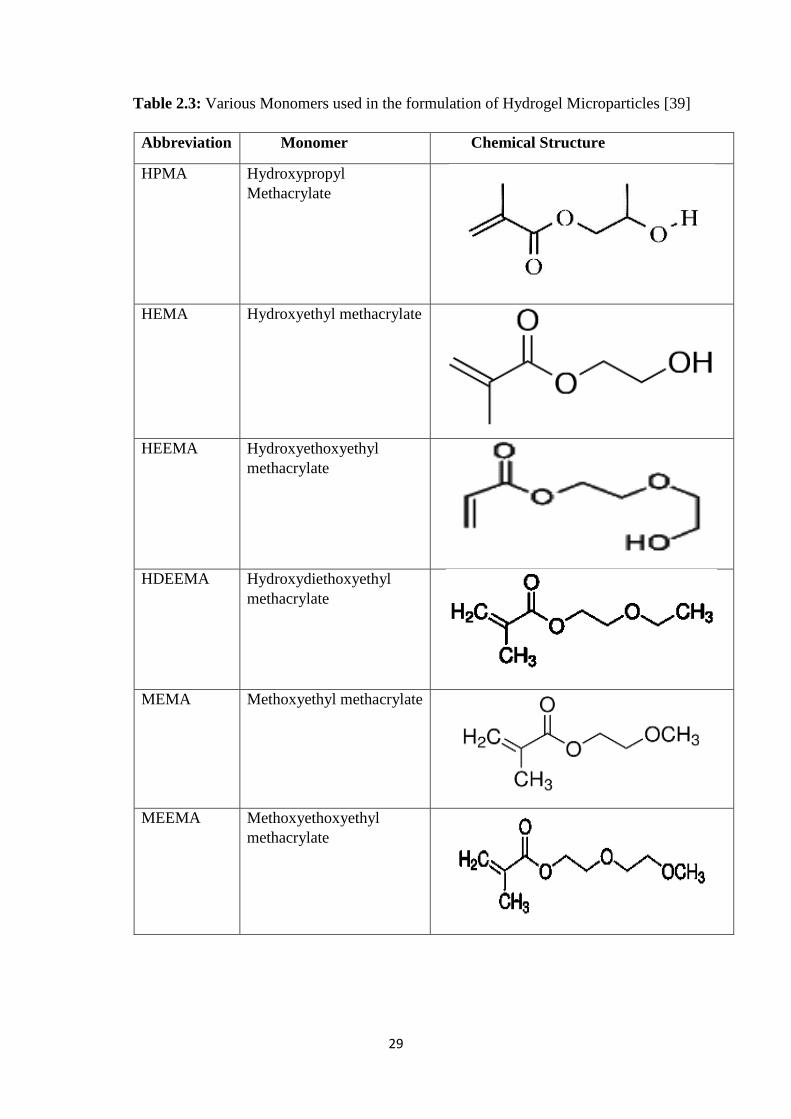
29
Table 2.3: Various Monomers used in the formulation of Hydrogel Microparticles [39]
Abbreviation Monomer Chemical Structure
HPMA Hydroxypropyl
Methacrylate
HEMA Hydroxyethyl methacrylate
HEEMA Hydroxyethoxyethyl
methacrylate
HDEEMA Hydroxydiethoxyethyl
methacrylate
MEMA Methoxyethyl methacrylate
MEEMA Methoxyethoxyethyl
methacrylate
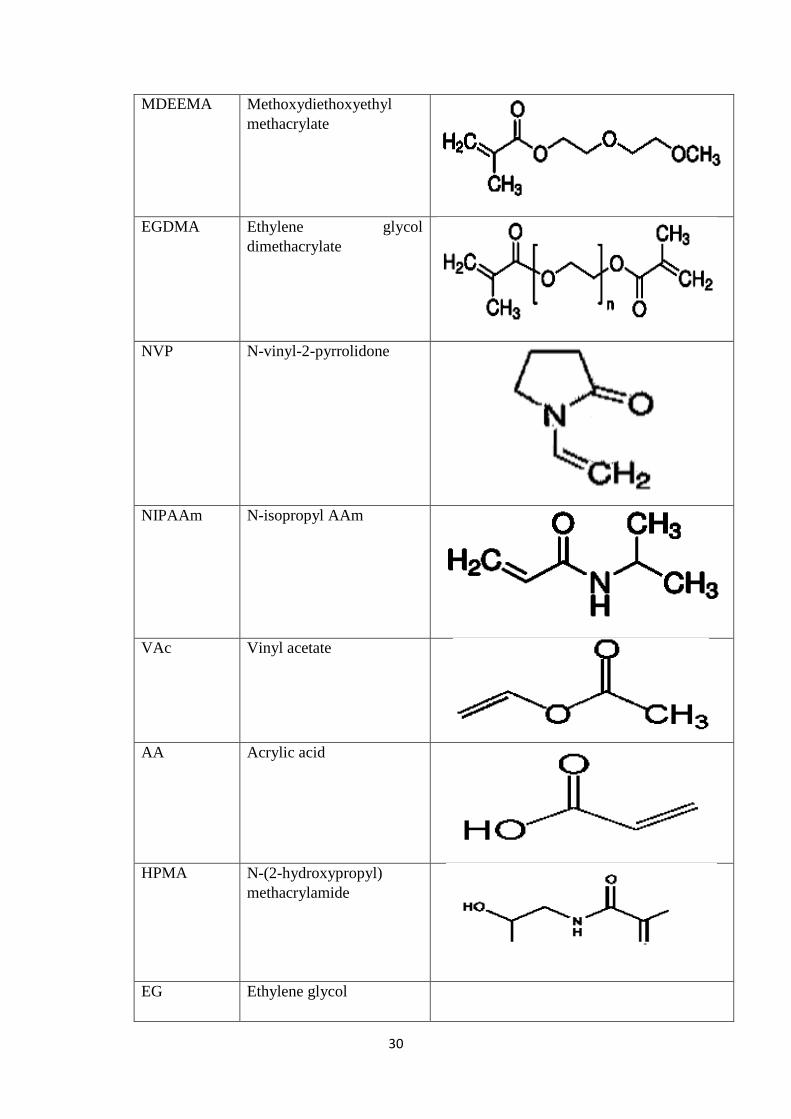
30
MDEEMA Methoxydiethoxyethyl
methacrylate
EGDMA Ethylene glycol
dimethacrylate
NVP N-vinyl-2-pyrrolidone
NIPAAm N-isopropyl AAm
VAc Vinyl acetate
AA Acrylic acid
HPMA N-(2-hydroxypropyl)
methacrylamide
EG Ethylene glycol
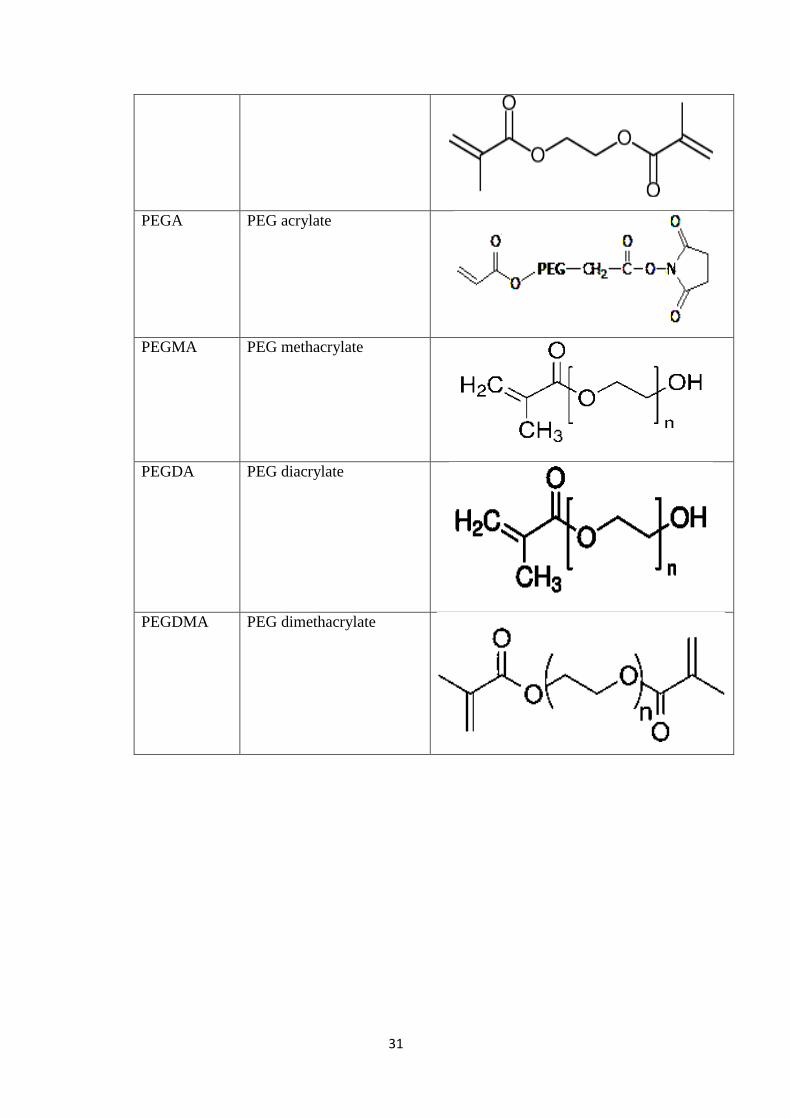
31
PEGA PEG acrylate
PEGMA PEG methacrylate
PEGDA PEG diacrylate
PEGDMA PEG dimethacrylate
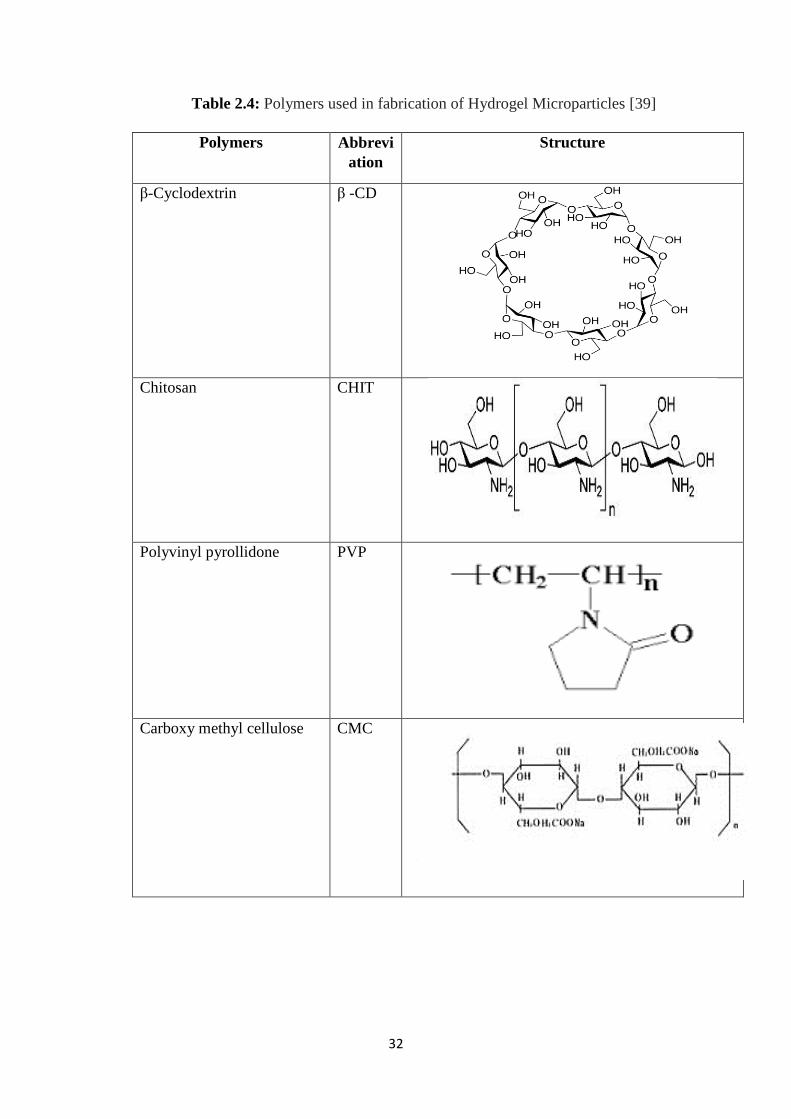
32
Table 2.4: Polymers used in fabrication of Hydrogel Microparticles [39]
Polymers Abbrevi
ation
Structure
β-Cyclodextrin β -CD
Chitosan CHIT
Polyvinyl pyrollidone PVP
Carboxy methyl cellulose CMC
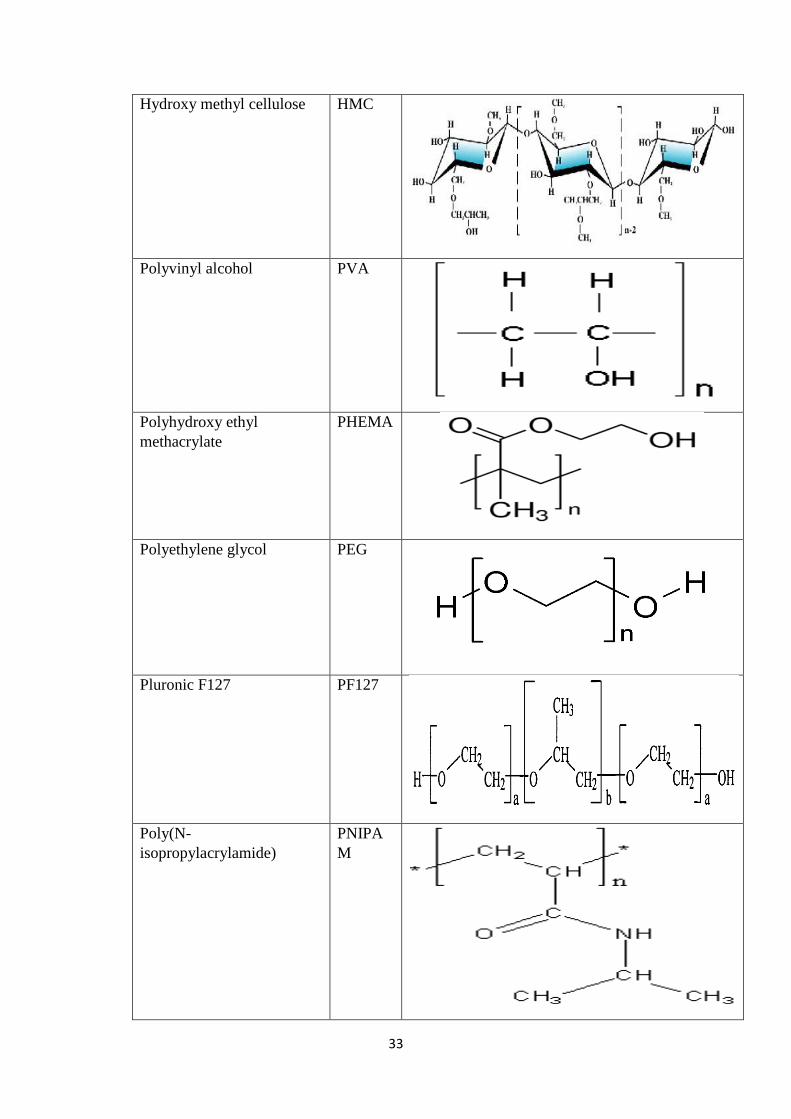
33
Hydroxy methyl cellulose HMC
Polyvinyl alcohol PVA
Polyhydroxy ethyl
methacrylate
PHEMA
Polyethylene glycol PEG
Pluronic F127 PF127
Poly(N-
isopropylacrylamide)
PNIPA
M
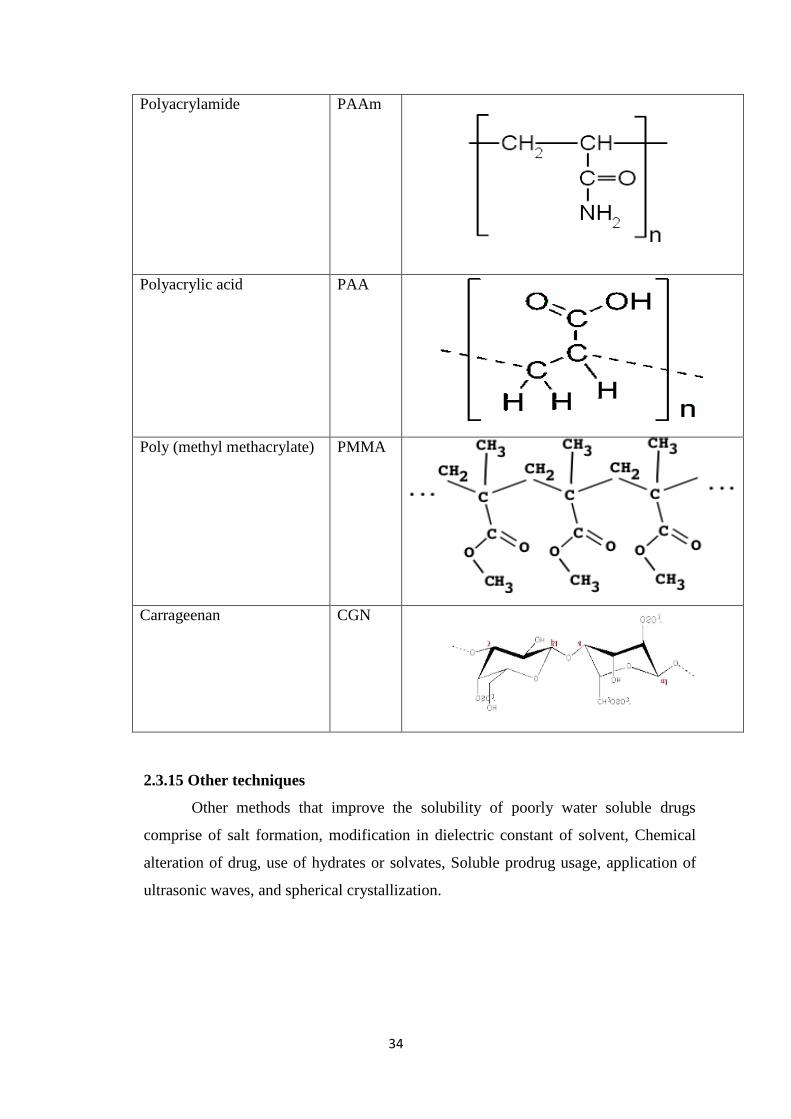
34
Polyacrylamide
PAAm
Polyacrylic acid
PAA
Poly (methyl methacrylate) PMMA
Carrageenan CGN
2.3.15 Other techniques
Other methods that improve the solubility of poorly water soluble drugs
comprise of salt formation, modification in dielectric constant of solvent, Chemical
alteration of drug, use of hydrates or solvates, Soluble prodrug usage, application of
ultrasonic waves, and spherical crystallization.
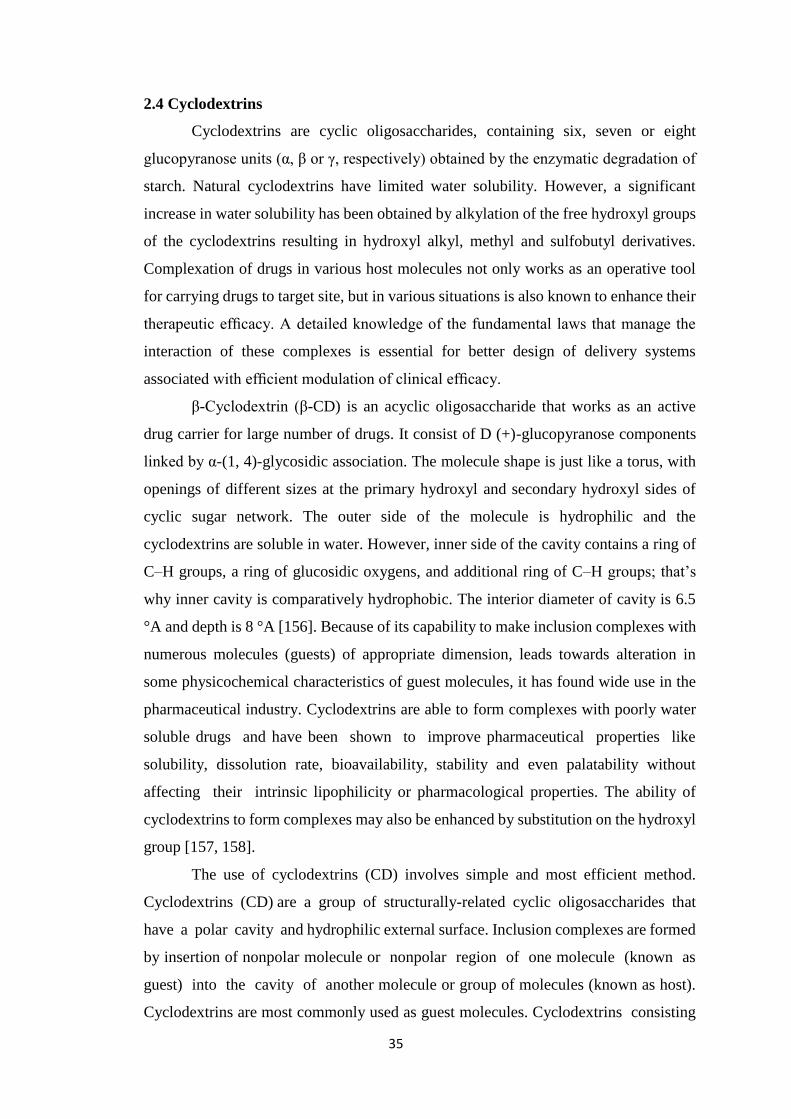
35
2.4 Cyclodextrins
Cyclodextrins are cyclic oligosaccharides, containing six, seven or eight
glucopyranose units (α, β or γ, respectively) obtained by the enzymatic degradation of
starch. Natural cyclodextrins have limited water solubility. However, a significant
increase in water solubility has been obtained by alkylation of the free hydroxyl groups
of the cyclodextrins resulting in hydroxyl alkyl, methyl and sulfobutyl derivatives.
Complexation of drugs in various host molecules not only works as an operative tool
for carrying drugs to target site, but in various situations is also known to enhance their
therapeutic efficacy. A detailed knowledge of the fundamental laws that manage the
interaction of these complexes is essential for better design of delivery systems
associated with efficient modulation of clinical efficacy.
β-Cyclodextrin (β-CD) is an acyclic oligosaccharide that works as an active
drug carrier for large number of drugs. It consist of D (+)-glucopyranose components
linked by α-(1, 4)-glycosidic association. The molecule shape is just like a torus, with
openings of different sizes at the primary hydroxyl and secondary hydroxyl sides of
cyclic sugar network. The outer side of the molecule is hydrophilic and the
cyclodextrins are soluble in water. However, inner side of the cavity contains a ring of
C–H groups, a ring of glucosidic oxygens, and additional ring of C–H groups; that’s
why inner cavity is comparatively hydrophobic. The interior diameter of cavity is 6.5
°A and depth is 8 °A [156]. Because of its capability to make inclusion complexes with
numerous molecules (guests) of appropriate dimension, leads towards alteration in
some physicochemical characteristics of guest molecules, it has found wide use in the
pharmaceutical industry. Cyclodextrins are able to form complexes with poorly water
soluble drugs and have been shown to improve pharmaceutical properties like
solubility, dissolution rate, bioavailability, stability and even palatability without
affecting their intrinsic lipophilicity or pharmacological properties. The ability of
cyclodextrins to form complexes may also be enhanced by substitution on the hydroxyl
group [157, 158].
The use of cyclodextrins (CD) involves simple and most efficient method.
Cyclodextrins (CD) are a group of structurally-related cyclic oligosaccharides that
have a polar cavity and hydrophilic external surface. Inclusion complexes are formed
by insertion of nonpolar molecule or nonpolar region of one molecule (known as
guest) into the cavity of another molecule or group of molecules (known as host).
Cyclodextrins are most commonly used as guest molecules. Cyclodextrins consisting
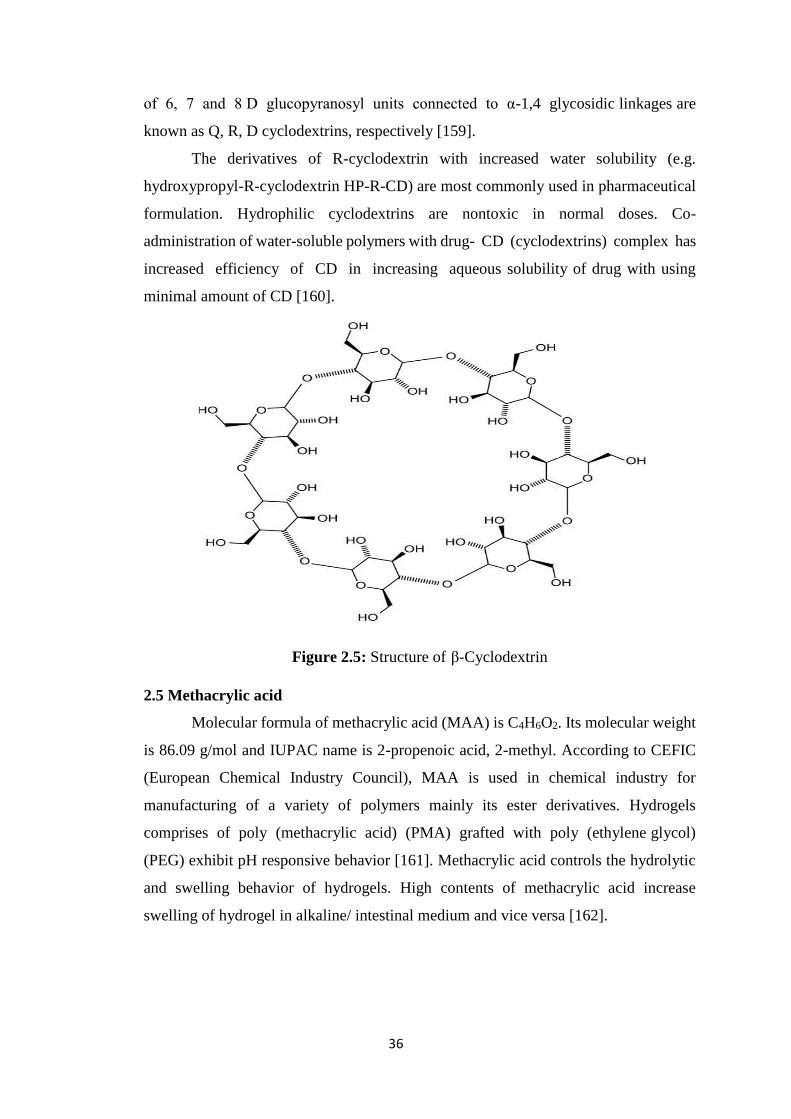
36
of 6, 7 and 8 D glucopyranosyl units connected to α-1,4 glycosidic linkages are
known as Q, R, D cyclodextrins, respectively [159].
The derivatives of R-cyclodextrin with increased water solubility (e.g.
hydroxypropyl-R-cyclodextrin HP-R-CD) are most commonly used in pharmaceutical
formulation. Hydrophilic cyclodextrins are nontoxic in normal doses. Co-
administration of water-soluble polymers with drug- CD (cyclodextrins) complex has
increased efficiency of CD in increasing aqueous solubility of drug with using
minimal amount of CD [160].
Figure 2.5: Structure of β-Cyclodextrin
2.5 Methacrylic acid
Molecular formula of methacrylic acid (MAA) is C4H6O2. Its molecular weight
is 86.09 g/mol and IUPAC name is 2-propenoic acid, 2-methyl. According to CEFIC
(European Chemical Industry Council), MAA is used in chemical industry for
manufacturing of a variety of polymers mainly its ester derivatives. Hydrogels
comprises of poly (methacrylic acid) (PMA) grafted with poly (ethylene glycol)
(PEG) exhibit pH responsive behavior [161]. Methacrylic acid controls the hydrolytic
and swelling behavior of hydrogels. High contents of methacrylic acid increase
swelling of hydrogel in alkaline/ intestinal medium and vice versa [162].
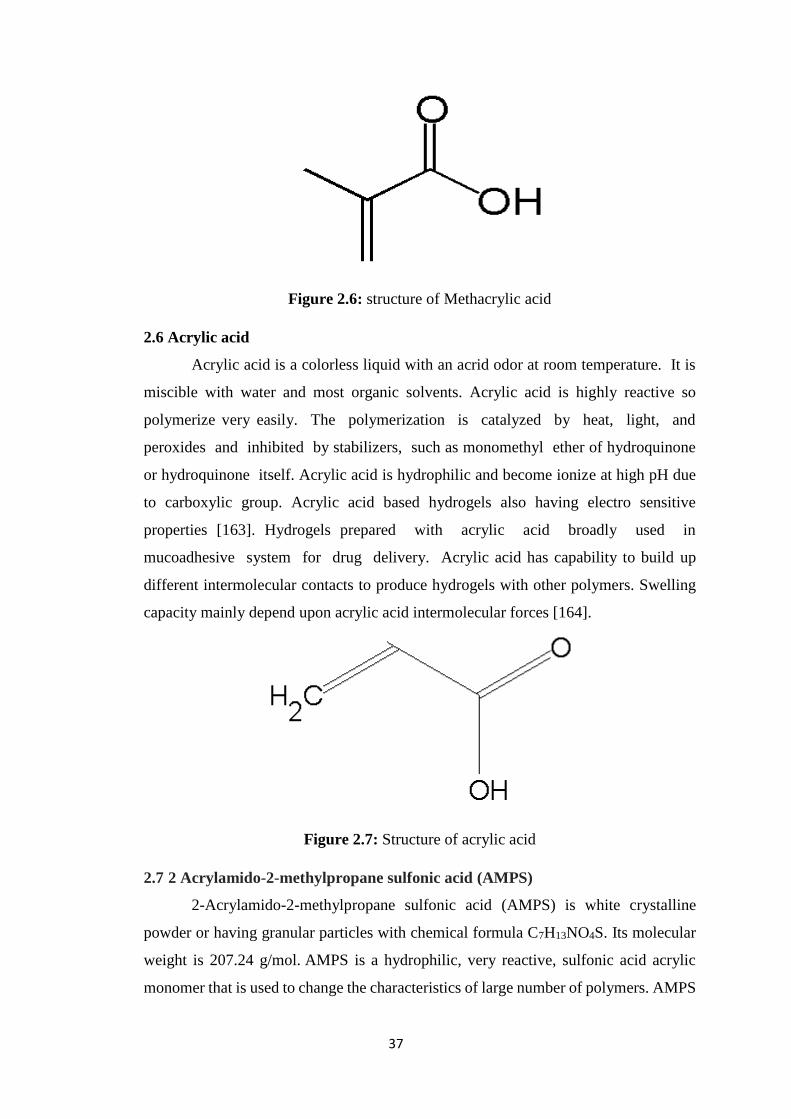
37
Figure 2.6: structure of Methacrylic acid
2.6 Acrylic acid
Acrylic acid is a colorless liquid with an acrid odor at room temperature. It is
miscible with water and most organic solvents. Acrylic acid is highly reactive so
polymerize very easily. The polymerization is catalyzed by heat, light, and
peroxides and inhibited by stabilizers, such as monomethyl ether of hydroquinone
or hydroquinone itself. Acrylic acid is hydrophilic and become ionize at high pH due
to carboxylic group. Acrylic acid based hydrogels also having electro sensitive
properties [163]. Hydrogels prepared with acrylic acid broadly used in
mucoadhesive system for drug delivery. Acrylic acid has capability to build up
different intermolecular contacts to produce hydrogels with other polymers. Swelling
capacity mainly depend upon acrylic acid intermolecular forces [164].
Figure 2.7: Structure of acrylic acid
2.7 2 Acrylamido-2-methylpropane sulfonic acid (AMPS)
2-Acrylamido-2-methylpropane sulfonic acid (AMPS) is white crystalline
powder or having granular particles with chemical formula C7H13NO4S. Its molecular
weight is 207.24 g/mol. AMPS is a hydrophilic, very reactive, sulfonic acid acrylic
monomer that is used to change the characteristics of large number of polymers. AMPS
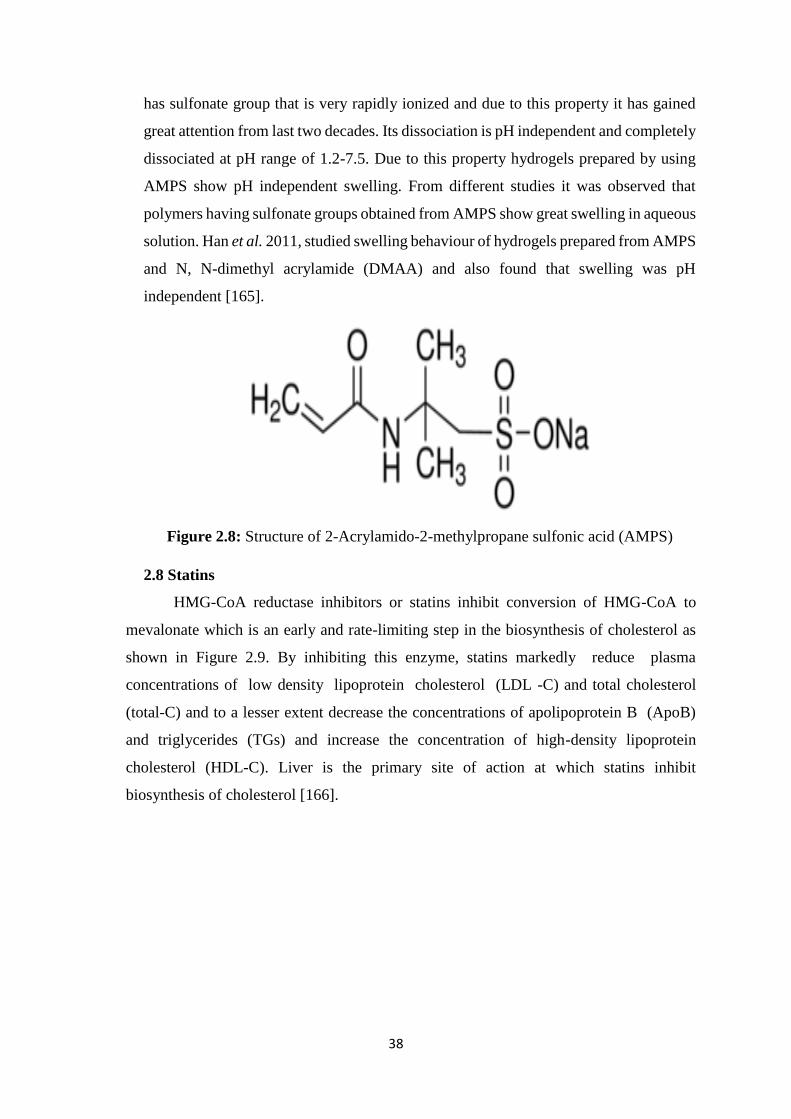
38
has sulfonate group that is very rapidly ionized and due to this property it has gained
great attention from last two decades. Its dissociation is pH independent and completely
dissociated at pH range of 1.2-7.5. Due to this property hydrogels prepared by using
AMPS show pH independent swelling. From different studies it was observed that
polymers having sulfonate groups obtained from AMPS show great swelling in aqueous
solution. Han et al. 2011, studied swelling behaviour of hydrogels prepared from AMPS
and N, N-dimethyl acrylamide (DMAA) and also found that swelling was pH
independent [165].
Figure 2.8: Structure of 2-Acrylamido-2-methylpropane sulfonic acid (AMPS)
2.8 Statins
HMG-CoA reductase inhibitors or statins inhibit conversion of HMG-CoA to
mevalonate which is an early and rate-limiting step in the biosynthesis of cholesterol as
shown in Figure 2.9. By inhibiting this enzyme, statins markedly reduce plasma
concentrations of low density lipoprotein cholesterol (LDL -C) and total cholesterol
(total-C) and to a lesser extent decrease the concentrations of apolipoprotein B (ApoB)
and triglycerides (TGs) and increase the concentration of high-density lipoprotein
cholesterol (HDL-C). Liver is the primary site of action at which statins inhibit
biosynthesis of cholesterol [166].
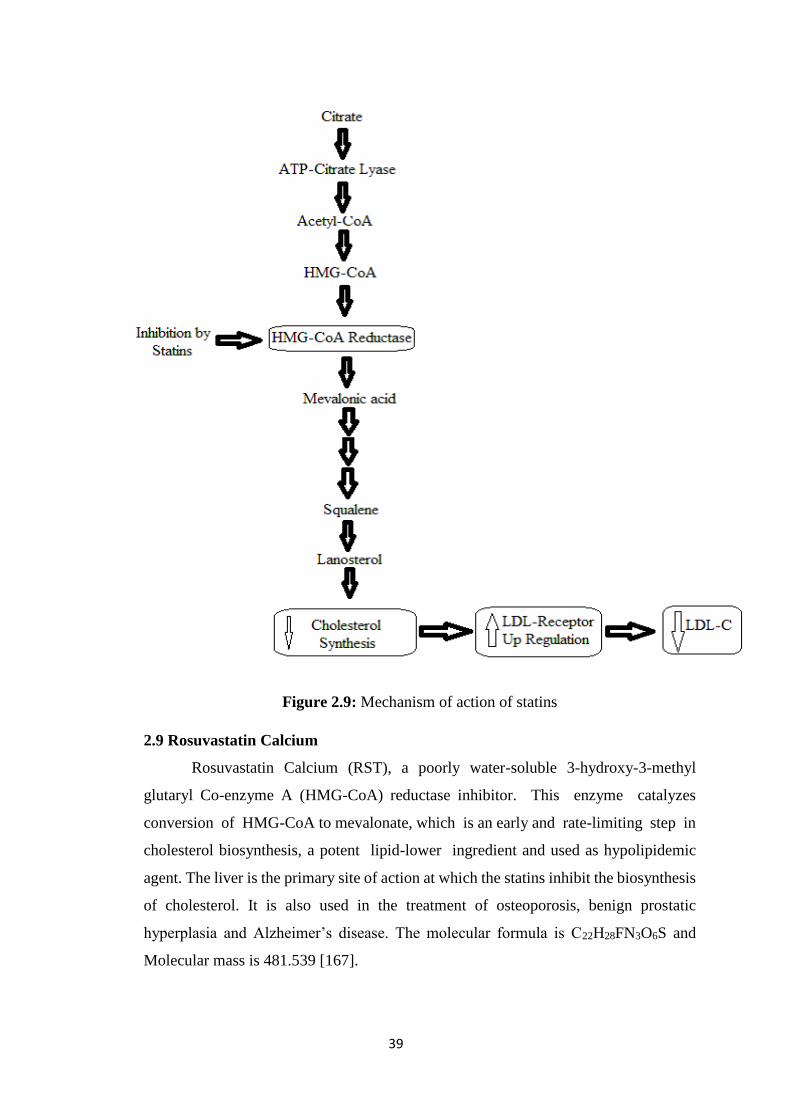
39
Figure 2.9: Mechanism of action of statins
2.9 Rosuvastatin Calcium
Rosuvastatin Calcium (RST), a poorly water-soluble 3-hydroxy-3-methyl
glutaryl Co-enzyme A (HMG-CoA) reductase inhibitor. This enzyme catalyzes
conversion of HMG-CoA to mevalonate, which is an early and rate-limiting step in
cholesterol biosynthesis, a potent lipid-lower ingredient and used as hypolipidemic
agent. The liver is the primary site of action at which the statins inhibit the biosynthesis
of cholesterol. It is also used in the treatment of osteoporosis, benign prostatic
hyperplasia and Alzheimer’s disease. The molecular formula is C22H28FN3O6S and
Molecular mass is 481.539 [167].
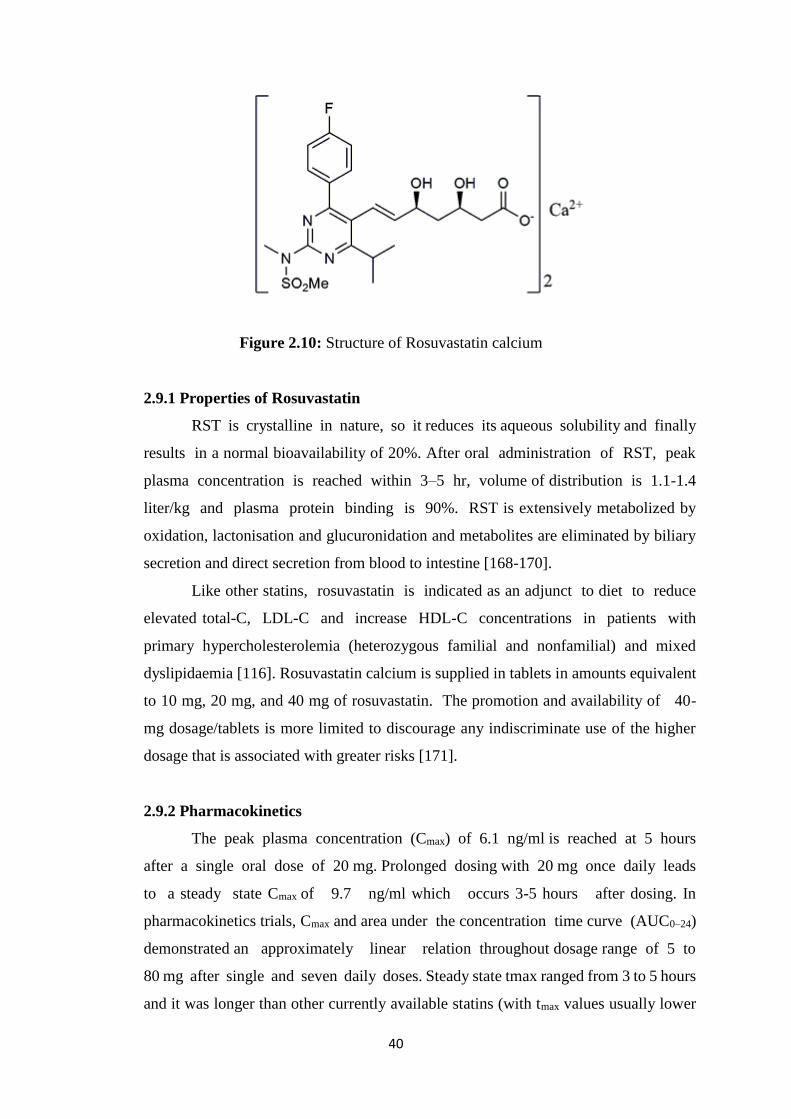
40
Figure 2.10: Structure of Rosuvastatin calcium
2.9.1 Properties of Rosuvastatin
RST is crystalline in nature, so it reduces its aqueous solubility and finally
results in a normal bioavailability of 20%. After oral administration of RST, peak
plasma concentration is reached within 3–5 hr, volume of distribution is 1.1-1.4
liter/kg and plasma protein binding is 90%. RST is extensively metabolized by
oxidation, lactonisation and glucuronidation and metabolites are eliminated by biliary
secretion and direct secretion from blood to intestine [168-170].
Like other statins, rosuvastatin is indicated as an adjunct to diet to reduce
elevated total-C, LDL-C and increase HDL-C concentrations in patients with
primary hypercholesterolemia (heterozygous familial and nonfamilial) and mixed
dyslipidaemia [116]. Rosuvastatin calcium is supplied in tablets in amounts equivalent
to 10 mg, 20 mg, and 40 mg of rosuvastatin. The promotion and availability of 40-
mg dosage/tablets is more limited to discourage any indiscriminate use of the higher
dosage that is associated with greater risks [171].
2.9.2 Pharmacokinetics
The peak plasma concentration (Cmax) of 6.1 ng/ml is reached at 5 hours
after a single oral dose of 20 mg. Prolonged dosing with 20 mg once daily leads
to a steady state Cmax of 9.7 ng/ml which occurs 3-5 hours after dosing. In
pharmacokinetics trials, Cmax and area under the concentration time curve (AUC0–24)
demonstrated an approximately linear relation throughout dosage range of 5 to
80 mg after single and seven daily doses. Steady state tmax ranged from 3 to 5 hours
and it was longer than other currently available statins (with tmax values usually lower
41
than 3 hours) [172, 173]. The elimination half-life (t1/2) is about 19 hours in healthy
volunteers [174].
2.9.3 Dosing information
Rosuvastatin calcium is available in tablets in quantities equivalent to 5 mg, 10
mg, 20 mg, and 40 mg of rosuvastatin. The promotion and availability of 40-mg
dosage/tablets is more restricted and discourage because higher dosages are linked with
greater risks.
In the management of hypercholesterolemia, traditionally recommended initial
dose is 10 mg once a day.
A primary dosage of 5 mg once a day should be recommended for patients who
do not have much higher values of LDL-C. Higher doses of satins are also prone
towards greater chances of development of myopathy.
For patients with marked hypercholesterolemia and aggressive lipid targets, a
starting dosage of 20 mg once a day may be considered.
A dosage of 40 mg once a day should be reserved for those patients who have
not achieved the LDL-C goal at a dosage of 20 mg.
Concomitant drug use - the dosage of rosuvastatin should not exceed 5 mg once
a day in patients who are also being treated with cyclosporine, or 10 mg once a
day in patients also treated with gemfibrozil as these drugs can increase the
levels of rosuvastatin and increase the risk of myopathy.
Kidney failure - Dosage adjustment is not necessary in patients with mild or
moderate renal insufficiency. However, in patients with severe renal
impairment (creatinine clearance less than 30 mL/minute) who are not on
hemodialysis, the initial dosage should be 5 mg once a day, and should not
exceed 10 mg once a day.
Food – doses can be taken without regard to meals.
Time of day – like atorvastatin, doses of rosuvastatin can be taken at any time
of the day. Other statins are taken at night to maximize the action of the statin
by inhibiting the synthesis of cholesterol which takes place during the night
[166, 175].
42
2.9.4 Adverse effects
2.9.4.1 Myopathy
In one trial, 5.5% of patients taking rosuvastatin group had myalgia. Creatine
kinase (CK) levels in almost half of these patients were 10 times the upper limit
of normal (ULN). All patients were taking 8-0mg rosuvastatin daily except for
one patient who was taking 5mg. Another 1% of patients had raised CK levels
but had no symptoms of myopathy. The incidence of these effects was similar
to atorvastatin [176].
In another trial using lower doses of rosuvastatin (5-10mg daily), no cases of
myopathy (defined as CK elevation >10 times the ULN accompanied by muscle
symptoms) were observed [177]. Three patients out of 239 studied had single
transient elevations in CK that were >10 times the ULN without overt muscle
symptoms.
Rare cases of rhabdomyolysis have been reported in clinical trials where doses
>80mg have been used [166].
The Food and Drug Agency (FDA) in the United States has issued a warning
regarding rosuvastatin advising physicians to start doses as low as possible and
that maintenance doses of drug should be based on individual cholesterol goals.
All patients should be informed that statins can cause muscle injury, which in
rare, severe cases, can cause kidney damage and other organ failure and is
potentially life-threatening. Patients should be told to promptly report to their
physician signs or symptoms of muscle pain and weakness, malaise, fever, dark
urine, nausea, or vomiting [178].
2.9.4.2 Liver toxicity
In one trial, 4% of patients taking rosuvastatin had liver enzymes (ALT)
measured at three times the upper limit of normal level. Most of these patients
were taking 80 mg of rosuvastatin. Another trial using lower doses of
rosuvastatin (5-10 mg) recorded that 0.8 % of patients studied had ALT levels
at three times the upper limit of normal level [177].
No cases of liver failure or irreversible liver disease has been reported in clinical
trial [172].
43
2.9.4.3 Pharyngitis
Pharyngitis has been reported as occurring in approximately 9% of patients
taking rosuvastatin. It is not clear why this occurs with rosuvastatin doses. However,
other gastrointestinal reactions have been reported – diarrhea, constipation, stomach
upset and nausea which occur in approximately 3% of patients studied [177].
2.9.5 Drug interactions
2.9.5.1 Cytochrome P450
Rosuvastatin clearance is not dependent on metabolism by CYP 3A4 to a
clinically significant extent, thus rosuvastatin is unlikely to have blood levels increased
by drugs which inhibit CYP 3A4 enzyme system.
2.9.5.2 Cyclosporine
Co administration of cyclosporine with rosuvastatin can elevate rosuvastatin
blood levels 11 times that when rosuvastatin is administered alone. This combination
can lead to the possibility of rhabdomyolysis with such high levels of rosuvastatin.
2.9.5.3 Gemfibrozil
Co administration of gemfibrozil with rosuvastatin can elevate rosuvastatin
blood levels 2 times that when rosuvastatin is administered alone. This combination can
lead to the possibility of rhabdomyolysis with such high levels of rosuvastatin.
2.9.5.4 Antacid
Co administration of cyclosporine with antacids can reduce rosuvastatin blood
levels by 50 per cent. However, when the antacid was administered 2 hours after the
rosuvastatin dose, there were no clinically significant changes in blood levels.
2.9.5.5 Oral contraceptives
Co administration of oral contraceptives with rosuvastatin can elevate
ethinyloestradiol levels by 26% and norgestrel levels by 34%, increasing the possibility
of adverse effects of these hormones [166, 179].
44
3. MATERIAL AND METHODS
3.1 Materials
Rosuvastatin Calcium was obtained as gift sample from Getz pharmaceuticals
Karachi, Pakistan. β-cyclodextrin, methacrylic acid, 2-Acrylamido-2-methylpropane
sulfonic acid (AMPS), Ammonium persulfate, methylene bisacrylamide and methanol
were purchased from Sigma Aldrich Chemie GmbH, Steinheim, Germany. Kyron T134,
sodium starch glycolate, magnesium stearate, lactose and saccharine were obtained
from Warrick pharmaceuticals Islamabad, Pakistan. Acetonitrile, diethyl ether, absolute
ethanol, dichloromethane, chloroform, diethyl acetate were purchased from Sigma–
Aldrich (Oslov, Norway). 0.45 μm sized membrane filters were purchased from
Sartorius, Germany. HPLC grade ultrapure water was prepared by Milli-Q® system
(Millipore, Milford, MA, USA). All the chemicals were used of high purity grade.
3.2 Instrumentation and apparatus
High Performance Liquid Chromatographic1, UV/Visible Spectrophotometer2,
Sonicator3, Dissolution Test Apparatus4, Centrifuge Machine5, pH Meter6,
Ultrasonic Bath7, Electric Balance8, Membrane Filter9, Magnetic Stirrer10, B.P.
Apparatus11, Vacuum Pump12, Distillation Plant13, Ultra-low Freezer14,
Micropipettes15, Filtration Assembly16, Measuring Cylinder17, Beakers18 50, 100, 250,
500 & 1000 mL, Measuring Flasks19 50, 100, 250, 500 & 1000 mL, Centrifuge
Tubes20, Sample Test Tubes21, Disposable Syringes22, Vortex Mixer23, Incubator24,
Centrifuge25, Fourier Transform Infrared Spectroscopy(FTIR) 26, Scanning Electron
Microscopy (SEM) 27, Differential Scanning Calorimeter and Thermo Gravimetric
Analyzer (DSC &TGA) 28, XRD29.
1. Agilent 1100 Series U.S.A
2. UV-1600 Shimadzu. Germany
3. Elma, Germany
4. PTCF II Pharma Test, Germany
5. Model 4000-China 35
6. WTW pH 300-Germany
45
7. Fisher Scientific FS 28 H-Germany
8. PerciaXB120A
9. Sartorius (0.45 μm filters)-Germany
10. Gallen Kamp-England
11. Model No 500-China
12. Rotary Vane Pump ILMVAC-Germany
13. WDA/4 R & M-England
14. Sanyo-Japan
15. Softpet- Finland
16-21. Pyrex-France
22. BD-Pakistan
23. Seouline Bio Scirnce-Korea
24. Velp Scientifica-Italy
25. Hettich-Germany
26. Bruker, Tenser 27-Germany
27. Quanta 250, FEI
28. SDT Q-600 (TA New Castle, DE)
29. Expert pro Panalytical-Germany
46
3.3 Methods
3.3.1 Preparation of solid dispersions
Solid dispersions were prepared by using solvent evaporation technique. In
solvent evaporation technique, drug was dissolved in solubilizing additives at 25 °C.
Then required quantity of β-cyclodextrin was dissolved in hot distilled water. Then it
was added drop wise into drug solution, with continuous stirring for one hour. The
complexes formed were filtered and dried under vacuum. Prepared solid mass was
stored in a desiccator under vacuum. The dried products were removed, pulverized and
passed through sieve No. 60 and finally stored in a closed air tight container for further
analysis [170]. Four formulation S1, S2, S3 and S4 were prepared by this method
containing drug and β-cyclodextrin in 1:1, 1:2, 1:3 and 1:4, respectively.
3.3.2 Preparation of inclusion complexes
Inclusion complexes were prepared by using kneeding technique. In kneeding
technique required quantities of drug and β-cyclodextrin were weighed accurately on
electronic weighing balance (Shimadzu, AUW 220D, Japan) in different ratios. A
homogenous paste of cyclodextrin was prepared in a mortar by adding water: methanol
mixture (1:3) in small quantities. Drug powder added to this paste in portions, with
continuous kneading for three hour. An appropriate quantity of water: methanol mixture
(1:3) was added further to maintain suitable consistency of paste. This paste, then dried
in a hot air oven at 45°C–50°C for 24 hour. The dried complexes were powdered and
passed through sieve No. 60 and stored in air tight containers [171]. Four formulation
K1, K2, K3 and K4 were prepared by this method containing drug and β-cyclodextrin
in 1:1, 1:2, 1:3 and 1:4, respectively.
3.3.3 Preparation of FDT’s
Fast disintegrating tablets were prepared by using direct compression
method. All ingredients required for preparation of mouth disintegrating tablets were
passed through mesh No 60 separately. Then all ingredients were weighed and mixed
in geometrical order and compressed by using 8mm round flat punches on 10 station
rotary tablet machine. Total 15 formulations were prepared by using various
concentrations of two superdisintegrants and β-cyclodextrin, to study enhancement in
solubility of rosuvastatin calcium [172] as shown in Table 1.
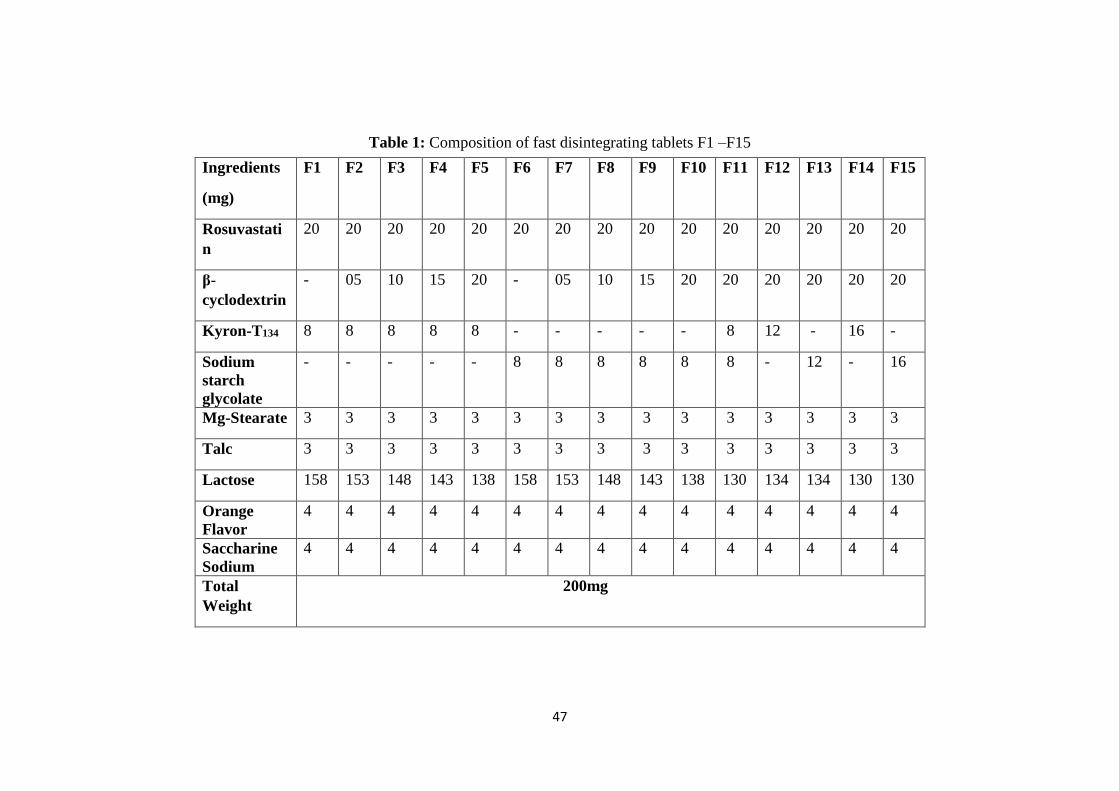
47
Table 1: Composition of fast disintegrating tablets F1 –F15
Ingredients
(mg)
F1 F2 F3 F4 F5 F6 F7 F8 F9 F10 F11 F12 F13 F14 F15
Rosuvastati
n
20 20 20 20 20 20 20 20 20 20 20 20 20 20 20
β-
cyclodextrin
- 05 10 15 20 - 05 10 15 20 20 20 20 20 20
Kyron-T134 8 8 8 8 8 - - - - - 8 12 - 16 -
Sodium
starch
glycolate
- - - - - 8 8 8 8 8 8 - 12 - 16
Mg-Stearate 3 3 3 3 3 3 3 3 3 3 3 3 3 3 3
Talc 3 3 3 3 3 3 3 3 3 3 3 3 3 3 3
Lactose 158 153 148 143 138 158 153 148 143 138 130 134 134 130 130
Orange
Flavor
4 4 4 4 4 4 4 4 4 4 4 4 4 4 4
Saccharine
Sodium
4 4 4 4 4 4 4 4 4 4 4 4 4 4 4
Total
Weight
200mg
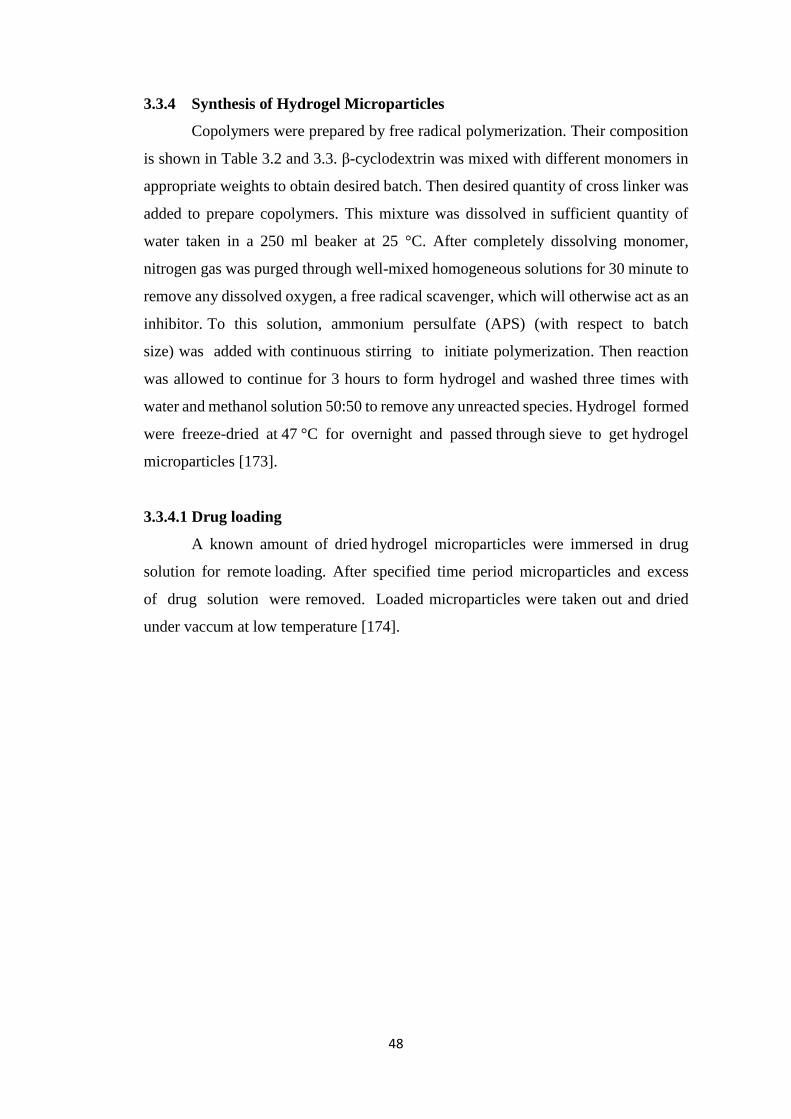
48
3.3.4 Synthesis of Hydrogel Microparticles
Copolymers were prepared by free radical polymerization. Their composition
is shown in Table 3.2 and 3.3. β-cyclodextrin was mixed with different monomers in
appropriate weights to obtain desired batch. Then desired quantity of cross linker was
added to prepare copolymers. This mixture was dissolved in sufficient quantity of
water taken in a 250 ml beaker at 25 °C. After completely dissolving monomer,
nitrogen gas was purged through well-mixed homogeneous solutions for 30 minute to
remove any dissolved oxygen, a free radical scavenger, which will otherwise act as an
inhibitor. To this solution, ammonium persulfate (APS) (with respect to batch
size) was added with continuous stirring to initiate polymerization. Then reaction
was allowed to continue for 3 hours to form hydrogel and washed three times with
water and methanol solution 50:50 to remove any unreacted species. Hydrogel formed
were freeze-dried at 47 °C for overnight and passed through sieve to get hydrogel
microparticles [173].
3.3.4.1 Drug loading
A known amount of dried hydrogel microparticles were immersed in drug
solution for remote loading. After specified time period microparticles and excess
of drug solution were removed. Loaded microparticles were taken out and dried
under vaccum at low temperature [174].
49
Table 3.2: Composition of (β-CD-g-MAA) hydrogel microparticles
Code β-Cyclodextrin
(g/100g)
Methacrylic acid
(g/100g)
Cross linker
(g/100g)
Initiator
(g/100g)
HM1 2 30 0.4 0.4
HM2 4 30 0.4 0.4
HM3 6 30 0.4 0.4
HM4 4 10 0.4 0.4
HM5 4 20 0.4 0.4
HM6 4 40 0.4 0.4
HM7 4 30
0.6 0.4
HM8 4 30
0.8 0.4
HM9 4 30
01 0.4
Table 3.3: Composition of (β-CD-g-AMPS) hydrogel microparticles
Code β-Cyclodextrin
(g/100g)
AMPS
(g/100g)
Cross linker
(g/100g)
Initiator
(g/100g)
HS1 0.5 2 0.3 0.1
HS2 1 2 0.3 0.1
HS3 2 2 0.3 0.1
HS4 1 4 0.3 0.1
HS5 1 5 0.3 0.1
HS6 1 6 0.3 0.1
HS7 1 4 0.4 0.1
HS8 1 4 0.5 0.1
HS9 1 4 0.6 0.1
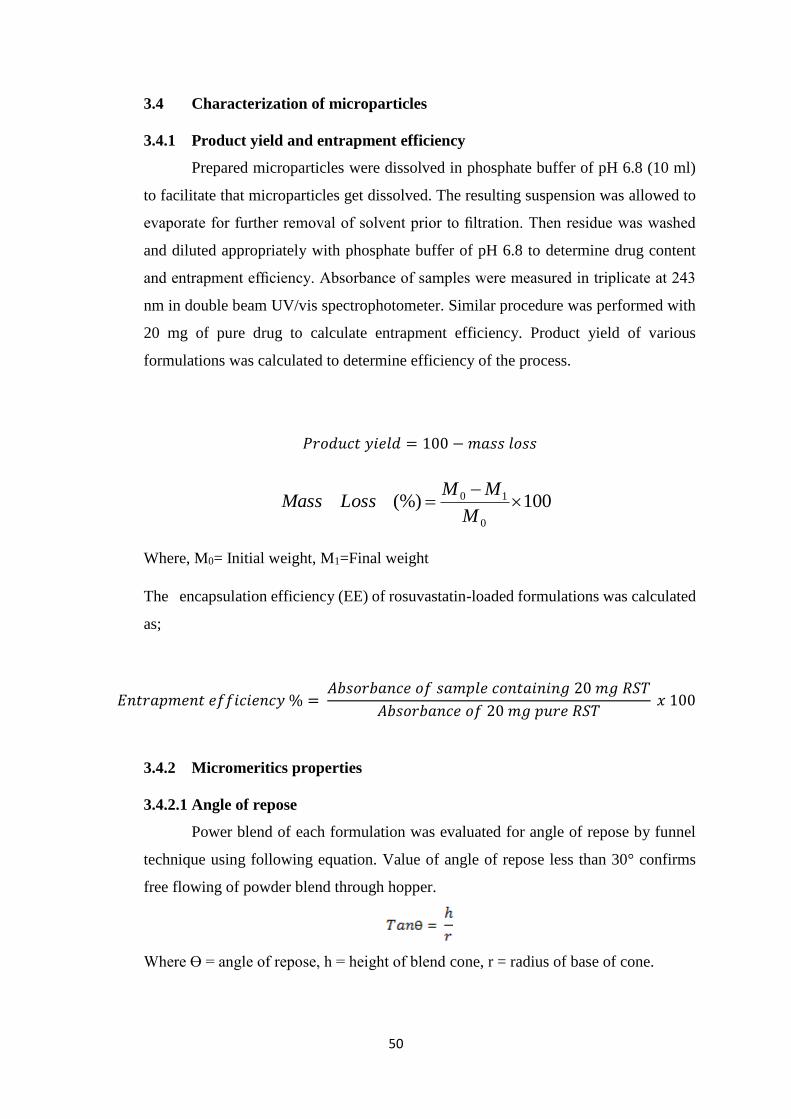
50
3.4 Characterization of microparticles
3.4.1 Product yield and entrapment efficiency
Prepared microparticles were dissolved in phosphate buffer of pH 6.8 (10 ml)
to facilitate that microparticles get dissolved. The resulting suspension was allowed to
evaporate for further removal of solvent prior to filtration. Then residue was washed
and diluted appropriately with phosphate buffer of pH 6.8 to determine drug content
and entrapment efficiency. Absorbance of samples were measured in triplicate at 243
nm in double beam UV/vis spectrophotometer. Similar procedure was performed with
20 mg of pure drug to calculate entrapment efficiency. Product yield of various
formulations was calculated to determine efficiency of the process.
𝑃𝑟𝑜𝑑𝑢𝑐𝑡 𝑦𝑖𝑒𝑙𝑑 = 100 − 𝑚𝑎𝑠𝑠 𝑙𝑜𝑠𝑠
Where, M0= Initial weight, M1=Final weight
The encapsulation efficiency (EE) of rosuvastatin-loaded formulations was calculated
as;
𝐸𝑛𝑡𝑟𝑎𝑝𝑚𝑒𝑛𝑡 𝑒𝑓𝑓𝑖𝑐𝑖𝑒𝑛𝑐𝑦 % = 𝐴𝑏𝑠𝑜𝑟𝑏𝑎𝑛𝑐𝑒 𝑜𝑓 𝑠𝑎𝑚𝑝𝑙𝑒 𝑐𝑜𝑛𝑡𝑎𝑖𝑛𝑖𝑛𝑔 20 𝑚𝑔 𝑅𝑆𝑇
𝐴𝑏𝑠𝑜𝑟𝑏𝑎𝑛𝑐𝑒 𝑜𝑓 20 𝑚𝑔 𝑝𝑢𝑟𝑒 𝑅𝑆𝑇 𝑥 100
3.4.2 Micromeritics properties
3.4.2.1 Angle of repose
Power blend of each formulation was evaluated for angle of repose by funnel
technique using following equation. Value of angle of repose less than 30° confirms
free flowing of powder blend through hopper.
Where Ɵ = angle of repose, h = height of blend cone, r = radius of base of cone.
100(%)0
10
M
MMLossMass
51
3.4.2.2 Bulk density
Powder mixture was poured in graduated volume measuring cylinder (Pyrex®)
and bulk volume (Vb) was visually noted. After this powder mass (M) was measured
on electronic weighing balance (Shimadzu, AUW220D Japan). Bulk density (ρb) was
determind by using following equation.
3.4.2.3 Tapped density
Measuring cylinder containing known mass (M) of powder material was tapped
for definite number of tapings. Tapped volume (Vt) was noted. Tapped density was
calculated by using following equation.
3.4.2.4 Carr’s compressibility index
Free flowing property of powder was confirmed from compressibility index (I).
It was calculated by using following formula. Carr’s index between 13 -19 % confirms
good flow and if it is more than 21 % it presents poor flow of microparticles.
Where Vb and Vt are bulk and tapped volume, respectively.
3.4.2.5 Hausner ratio
It is another parameter of micromeritics properties determination. It is a ratio
between two densities i.e. tapped (ρt) and bulk (ρb). Value less than 1.25 indicates that
powder particles have good flow while more than 1.25 suggest poor flow.
3.4.3 Particle size analysis
The mean size (volume average particle diameter) and size distribution of
drug loaded microparticles was obtained by using light optical microscopy (Nikon
E200, Tokyo, Japan) equipped with (DCM-35 USB 2.0 and MINISEE IMAGE
software, Scopetek Electric, Hangzhou, China). Size detrmination was made in
52
triplicate by subsequent suspension of microparticles in redistilled water at 25 ºC. To
make the samples for analysis, approximately 2 mg prepared microparticles were
suspended in 5 ml of deionized water and then visualized under optical microscope
[175].
3.4.4 FTIR spectroscopy
FTIR spectra were obtained between 400 and 4000 cm-1 by using IR
spectrophotometer (Tensor 27, OPUS software) to confirm the formation of copolymer.
FTIR spectra of individual ingredients and prepared formulations were taken. Samples
were prepared by finely grinding prepared formulations and exposing to infrared
radiation [172].
3.4.5 Thermal analysis
DSC and TGA analysis of prepared formulations and all ingredients were taken
to determine stability of ingredients in prepared formulations. DSC (Q600 TA USA)
was done by heating the samples from ambient to 400 ºC at heating rate of 10 ºC/min
in a nitrogen atmosphere at flow rate of 10 ml/min. Thermal stability of copolymer was
studied by TGA (Q600 TA USA) in temperature range of 0 ºC to 800 ºC under inert
nitrogen atmosphere [172].
3.4.6 Scanning electron microscopy (SEM)
Scanning electron microscopy was performed to describe shape and
morphology as well as to check particle size. For SEM measurement’s, rosustatin
based prepared formulations were attached on metal stubs using double-sided
adhesive tape. Then it was dried in a vacuum chamber and sputter-coated with a
gold layer of 10 nm thick and viewed under high resolution SEM (JSM-840, Joel
Instruments, Tokyo, Japan) [174].
3.4.7 Transitions electron microscopy (TEM)
Transitions electron microscopy was used to determine internal morphology of
prepared microparticles. For TEM measurement’s JEM-2800 Transmission Electron
Microscope was used. For TEM analysis, rosuvastatin based prepared formulations
were attached on metal stubs using double-sided adhesive tape. Then it was dried
53
in a vacuum chamber and sputter-coated with a gold layer of 10 nm thick and viewed
under high resolution TEM at 120 kV using high magnification [176].
3.4.8 Zeta size measurement
The average particle size of prepared microparticles was measured by using
particle size analyzer (Zetasizer Ver System; Malvern Instruments Ltd., Malvern, UK).
To analyze particle size, microparticles were suspended with filtered (0.22 μm)
ultrapure water [177].
3.4.9 Dissolution studies
Dissolution studies of prepared microparticles and tablets were performed in a
calibrated 6 station dissolution test apparatus equipped with paddles USP type-2
apparatus (Pharma Test Germany) using 900 ml of 6.8 pH phosphate buffer as a
medium. The paddles were operated at 50 rpm and temperature was kept at 37 ± 0.2 ºC
throughout the experiment. 5 ml samples were taken after pre decided time interval and
replaced with equal volume of same dissolution medium to keep volume constant
during experiment. The amount of the drug dissolved was estimated by UV/Vis
spectrophotometer (Pharma Spec 1700 Shimadzu Japan) at 243 nm. The dissolution
studies on each formulation were carried out in triplicate.
Dissolution data was evaluated by means of several model-dependent methods
like zero order, first order, Higuchi, and Korsmeyer–Peppas to evaluate the kinetics of
drug release. Time required for 25% and 50% release of drug (T25% and T50%,
respectively) was also calculated from regression equation of zero-order model. The
zero-order model illustrates system where rate of drug release is independent of initial
concentration of drug:
Mt = ko𝑡
Where ko is zero-order rate constant and Mt is the amount of drug released at
time t. The release of drug from an insoluble matrix is a function of square root of time
as shown in Higuchi equation:
𝑀𝑡 = 𝐾𝐻𝑡1/2
Where KH is Higuchi rate constant, which represents design variables of system.
To determine mode of drug release, the initial 60% drug release values were fitted to
Korsmeyer–Peppas model:
54
Mt/M∞ = 𝐾𝑡𝑛
Where Mt/M∞ is fraction of drug released at time t, K is drug release rate
constant, and n is release exponent. The n value is employed for characterization of
different release modes for cylindrical-shaped solid formulations. Drug release
exponent (n) and drug release mode are related as: n = 0.45, Fickian diffusion; 0.45 <
n < 0.89, Anomalous (non-Fickian) diffusion; n = 0.89, Case-II transport; and n > 0.89,
Super case-II transport. Dissolution data was evaluated using DD Solver [178].
3.4.10 Solubility studies
The solubilities of rosuvastatin calcium and RST- β-CD complex were
determined at pH 1.2 and 6.8 and in distilled water by shake-flask method. Excess
amount of RST and RST- β-CD prepared formulations were placed in 10 ml vials to
which 1.0 ml of two different solutions (pH 1.2, 6.8) and distilled water was added.
These mixtures were shaken in a water bath (MSC-100 China) at 37±0.5 °C at 150 rpm
for 72 hour. All samples were filtered through 0.45 µm membrane filters, diluted with
buffer and analyzed for RST on UV/Vis spectrophotometer at 243 nm [179].
3.4.11 X-Ray diffraction studies
Samples were subjected for powder XRD studies to compare with physical
mixture and pure drug. Powder X-ray diffractograms were taken at 5 to 50 ºC at 2Ɵ to
study crystalline and amorphous nature of rosuvastatin calcium.
3.4.12 In vitro dispersion time
Time needed for complete dispersion of tablet was measured in this test. Six ml
of phosphate buffer having pH 6.80 was taken in a beaker having 10 ml volume. Tablet
was placed in that beaker and dispersion time was observed. The experiment was
repeated thrice for each formulation.
3.4.13 Water absorption ratio
It is the amount of water absorbed by tablet in a unit time. Six ml of water was
taken in a Petri dish of internal diameter 6.50 cm. A piece of tissue paper folded twice
was placed in petri dish. A tablet was weighed before keeping onto tissue paper in petri
dish and time taken by tablet for complete wetting was measured. Wetted tablet was
reweighed and water absorption ratio was calculated [172].
55
3.4.14 Friability
Friability of tablets was determined by using Roche Friabilator (Pharma Test,
Germany). Twenty tablets were weighed and placed in the drum of friabilator and speed
was kept at 25 rpm. Tablets were allowed to revolve, fall freely from height of six
inches for 4 min. Then tablets were de-dusted using muslin cloth and re-weighed [180].
3.4.15 Tablet disintegration
Tablet disintegration apparatus was used. Six tablets were taken and placed
individually in each tube and cover them properly. The temperature of medium was
maintained at 37±2°C. Time taken by the tablet to disintegrate completely was noted
[181].
3.4.16 Wetting time
10 ml solution of phosphate buffer of pH 6.8 as saliva was taken in petri dish.
A circular tissue paper having diameter 8 cm folded twice was placed in petri dish.
Single fast disintegrating tablet was placed on tissue paper and time for complete
wetting was noted [180].
3.4.17 Swellability of hydrogels microparticles
The swelling ability of prepared hydrogel microparticles were determined at
37 °C by introducing known amount of hydrogel microparticles in 100 ml 0.5 M
buffer solutions of pH 1.2 and 7.4. The samples were taken at predefined time
intervals to calculate dynamic swelling, weighed after removing excess of water
by blotting with tissue paper. The swelling studies were continued until equilibrium
weight was achieved. The degree of swelling and equilibrium water content were
determined using following equations [183].
Q=𝑀𝑠
𝑀𝑑
𝐸𝑊𝐶% =𝑀𝑠 − 𝑀𝑑
𝑀𝑑× 100
3.5 In vivo studies
In vivo studies were performed using Agilent 1100 series HPLC system to
calculate different pharmacokinetic parameters in rabbit’s plasma.
56
3.5.1 Study design
18 male albino rabbits of average weight 2.5 ± 0.010 kg were used for this
study. Rabbits were divided into 3 groups of 6 rabbits each (n=6). All the rabbits were
fasted overnight with ad libitum access to water during experiment and animals were
fed 4 for hour after oral dose. Two group of animals had received a single dose of FDT’s
and hydrogel microparticles containing 20 mg of rosuvastatin calcium while 3rd group
had given a 20 mg of commercially available tablet of rosuvastatin. Samples were
drawn at 0, 0.5, 1, 1.5, 2, 4, 6 and 12 hour.
3.5.2 Instrumentation and analytical conditions
Agilent 1100 series HPLC system consisted of LC-10 AT VP pump, DGU-14
AM on-line degasser, Rheodyne manual injector fitted with a 20 µL loop, and SPD-10
AVP UV–VIS detector and a Hypersil BDS C 8 (250 X 4.6 mm) column was utilized
for separation. Chromatographic system was integrated via Shimadzu model CBM- 102
Communication Bus Module to P-IV computer loaded with CLASS-GC software
(Version 5.03) for data acquisition and mathematical calculations. Centrifuge Machine
(Model 4000-China), Vortex Mixer (Seouline Bio Scirnce-Korea), pH Meter (WTW
pH 300-Germany), Ultrasonic Bath (Fisher Scientific FS 28 H-Germany), Electric
Balance, (Percia XB 120A), Membrane Filter (Sartorius, 0.45 µm filters-Germany),
Distillation Plant, Micropipettes (Softpet- Finland), Filtration Assembly (Pyrex-
France), Distillation Plant (WDA/4 R & M England).
3.5.3 Preparation of standard solutions
The stock solutions of rosuvastatin calcium were prepared by dissolving
appropriate amount corresponding to 1.0 mg/ml concentration of working standards in
methanol. All stock solutions were stored at 2–8 °C. The stock solutions were further
diluted with the mobile phase acetonitrile–water (50:50, v/v; pH adjusted to 3.0 with
orthophosphoric acid) to give a series of standard mixtures having a final concentration
in the range of 2.0–500 ng/ml [184].
3.5.4 Sample preparation
A simple, one step liquid–liquid extraction (LLE) procedure was carried out for
the extraction of rosuvastatin from serum samples. A volume (50µl) of working
solution (to give a final concentration of 500 ng/ml) was added to 200µl of serum and
57
mixed for approximately 10 seconds. Then absolute ethanol (600µl) was added and
vortex-mixed for 2 minute for deproteination. Next 1.0 ml of diethyl ether (extraction
solvent) was added, vortex-mixed for 5 minute and centrifuged at 3500 rpm at 0 °C for
5 min. The organic layer was separated, collected in same tube and evaporated to
complete dryness under gentle stream of nitrogen on a heating block maintained at 40
°C. After drying, residue was reconstituted in 500 µl of mobile phase, vortex-mixed for
2 minute and 20 µl sample was injected onto HPLC system [185].
3.5.5 Chromatographic conditions
Chromatographic separation was performed with different proportions of
acetonitrile–water and methanol–water as a mobile phase with different flow rates in
the range of 0.8–1.6 ml/min in an isocratic mode. Injection volume was kept in the
range of 10–50µl. Column oven temperature was varied in the range of 25–35 °C and
eluate was monitored using UV detection at various wavelengths in the range of 220–
280 nm. Various experimental parameters were optimized for determination of
rosuvastatin calcium.
3.5.6 Method validation
The suggested analytical method was validated according to international
guidelines with respect to certain parameters such as specificity/selectivity, linearity,
LLOQ, LLOD, precision, accuracy, sensitivity, recovery and robustness/ruggedness.
3.5.7 Linearity
The linearity of the method was established by spiking a series of standard
mixtures of rosuvastatin (2.0–500 ng/ml), extracting and analyzing in triplicate.
Calibration curves for standard solutions and spiked serum samples were then acquired
by plotting their response ratios (ratios of the peak area of the analytes to internal
standard) against their respective concentrations. Linear regression was applied and
slope (a), intercept (b), correlation coefficient (r) and standard error (Es) were
determined [184].
3.5.8 Precision
Method precision was determined both in terms of repeatability (injection and
analysis) and intermediate precision (intra-day and inter-days reproducibility). Inorder
58
to determine injection repeatability, serum samples spiked with 500 ng/ml of
rosuvastatin were injected 10 times into HPLC system and repeatability of retention
time and peak area was determined and expressed as mean and %RSD calculated from
the data obtained. Similarly, analysis repeatability was verified by analyzing eight
serum samples spiked with 500 ng/ml of rosuvastatin prepared individually, determined
as amount recovered and expressed as mean and %RSD calculated from the data
obtained. For the intermediate precision (intra-day and inter-days reproducibility),
serum samples spiked at three different concentration levels were analyzed three times
a day in triplicate injections over three consecutive days and expressed as mean ± SD
and % RSD calculated from data obtained [185].
3.5.9 Specificity/selectivity
The specificity/selectivity of the analytical method was investigated by
confirming the complete separation and resolution of all the desired peaks of the
analytes in mobile phase and spiked rabbit’s serum.
3.5.10 Accuracy
Accuracy was determined in terms of percent recovery. Blank rabbit’s serum
was spiked with the analytes at five different concentration levels (2.0, 64, 145, 250,
500 ng/ml of rosuvastatin. Another set of standard mixtures at the same concentration
levels was also prepared in the mobile phase (acetonitrile–water, 50:50, v/v; pH
adjusted to 3.0 with orthophosphoric acid). The serum was extracted with the procedure
noted above and injected onto the HPLC system in triplicate. Percent recoveries for
rosuvastatin was calculated using the following formula [185]:
%Recovery =𝐴
𝐵× 100
Where A is the response ratio of the analyte in serum sample, B is the response
ratio of the analyte in standard mixture.
3.5.11 LLOD and LLOQ
Detection and quantification limits were determined through dilution method
using S/N approach by injecting a 20 µl sample. LLOD was considered as the minimum
concentration with a signal to noise ratio of at least three (S/N≈3), while LLOQ was
taken as a minimum concentration with a signal to noise ratio of at least ten (S/N≈10).
59
3.5.12 Stability
The stability studies of rosuvastatin spiked serum samples were carried out over
a period of 48 h at 25 °C (room temperature under laboratory light), 2–8 °C
(refrigerator) and−80 °C (frozen) and standard solutions for one month at 2–8 °C.
3.5.13 Robustness
The robustness of the developed method was investigated by evaluating the
influence of small deliberate variations in procedure variables like column oven
temperature (±1 °C), flow rate (±5%) and pH of the mobile phase (±0.2 units) [186].
3.5.14 Pharmacokinetic analysis
Noncompartmental analysis was used to study pharmacokinetic of Rosuvastatin
calcium in rabbit’s plasma by using the software package kinetic v 4.4. Peak plasma
concentration (Cmax) and time to reach peak plasma concentration (Tmax) were
calculated by visual inspection of plasma concentration-time curves. The area under the
plasma concentration curve (AUC0-t) was measured using trapezoidal rule.
3.6 Acute oral toxicity studies of prepared formulatios
Prepared formulations were administered to different groups of rabbits to
determine toxicity caused by these formulations. For this purpose hematological,
biochemical and histopathological parameters were evaluated. Slides were prepared to
see any histological changes in normal structure of such as heart, liver, lungs, kidney,
spleen, intestine and stomach.
3.7 Statistical analysis
SPSS 18® software was used to analyze the data. All results were expressed as
mean ± standard deviation (SD). The data for various formulations were compared by
one-way analysis of variance (ANOVA). P < 0.05 was considered to be statistically
significant.
60
4. RESULTS AND DISCUSSION
For proper pharmacological response of drug, it’s necessary for drug molecules
to properly dissolve and become soluble in available media to produce desired effect at
targeted area. For this purpose, efforts have been made to prepare Fast Disintegrating
Tablets (FDT’s) and microparticles. FDT’s were prepared by using direct compression
method containing rosuvastatin calcium with β-cyclodextrin and superdisintegrants in
various ratios. Microparticles were prepared by using various techniques such as
kneeding and solvent evaporation techniques to prepare inclusion complexes and solid
dispersions and copolymerization to formulate hydrogel microparticles. All these
formulations were prepared to enhance solubility as well as dissolution profile of
rosuvastatin to achieve desired therapeutic efficacy. This study was divided into three
groups: first was preparation and characterization of FDT’s, in second group
microparticles were prepared through kneeding and solvent evaporation technique
while in third group hydrogel microparticles were prepared by using different
concentrations of polymer along with various monomers. All prepared formulations
were characterized through various parameters and compared with each other as well
as with commercially available conventional formulations. From this characterization
we have determined difference in solubility of prepared formulations with marketed
dosage form. Results of these three groups of formulations are presented under
following broader headings.
1) Fast disintegrating tablets
2) Inclusion Complexes and Solid Dispersions
3) Hydrogel Microparticles
4) In vivo pharmacokinetic studies
5) Acute oral toxicity study of prepared formulations
All of above results are discussed in detail one by one.
61
4.1 Fast Disintegrating Tablets
4.1.1 Micromeritics properties
Fifteen formulations of FDT’s were prepared by varying concentration of β-
cyclodextrin and superdisintegrants. FDT’s were first evaluated for micromeritics
parameters to study flow properties of powder material to be compressed into tablets.
Flow properties are very important for powder or particulate material to compress into
tablets. Materials that do not have good flow properties are difficult to compress into
tablets and ultimately leads towards improper mixing of drug with excipients. To avoid
such issues powder was first evaluated for flow properties such as angle of repose, bulk
density, tapped density, Carr’s index and Hausner’s ratio. Results of these rheological
parameters are present in Table 4.1. Bulk density and tapped density were 0.728 to
0.774 g/ml and 0.860 to 0.891 g/ml, respectively. These values were further used to
calculate Carr’s index and Hausner’s ratio. Calculated values of angle of repose for
various formulations were evaluated as 23.10Ɵ to 26.60Ɵ. These values were lying
within the range given in different pharmacopeia’s i.e. angle of repose should be less
than 30° for powder material to be compressed into tablets. Carr’s index is also another
important parameter to judge flow of powder material. Normally powder material is
considered good for compression into tablets if its Carr’s index value is between 13-
19%. If it exceeds 21% then powder has poor flow. Results of our formulations for
Carr’s index were 14.70% to 16.75%. Similar to angle of repose and Carr’s index
calculated values of Hausner’s ratio were also within acceptable limits of better flow
that were 1.15 to 1.19. These results had favored that our material was suitable for
compression into FDT’s and all ingredients were mixed properly before compression.
These results are similar to another study conducted by Hafeez et al. (2014) [187]. They
also prepared FDT’s by using kyron T134 and evaluated for different rheological
properties. Their results of rheological parameters are in agreement to our findings.
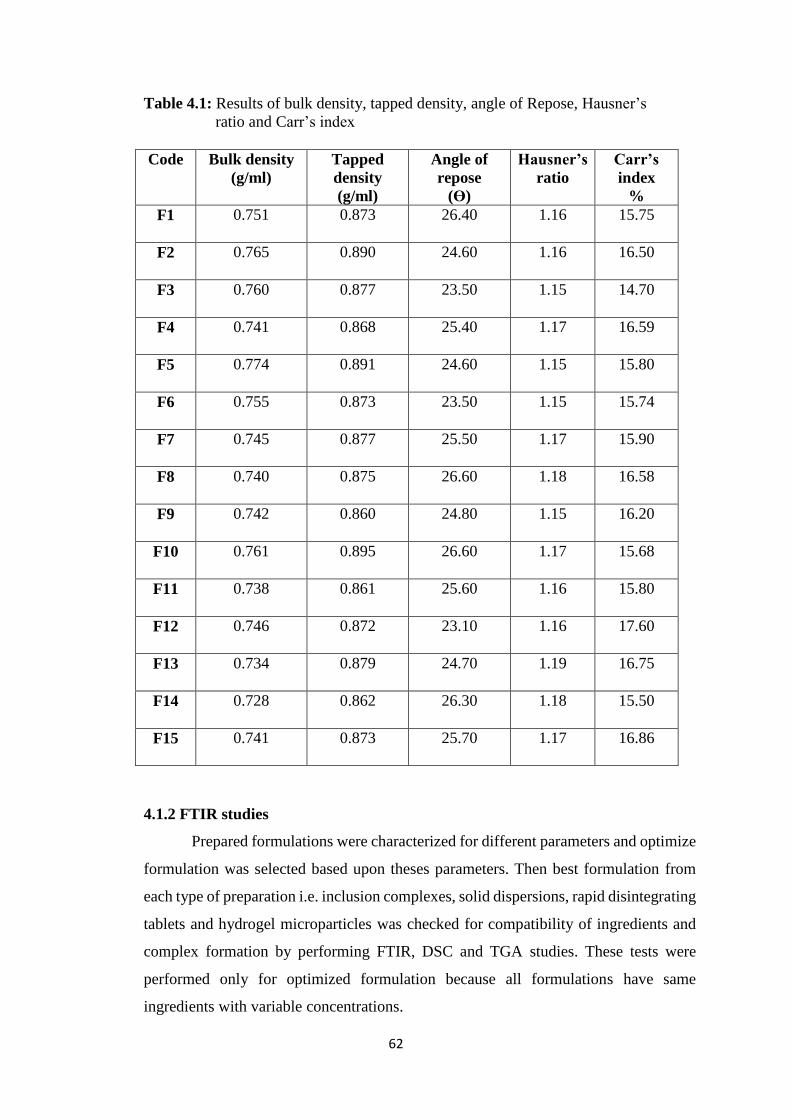
62
Table 4.1: Results of bulk density, tapped density, angle of Repose, Hausner’s
ratio and Carr’s index
Code Bulk density
(g/ml)
Tapped
density
(g/ml)
Angle of
repose
(ϴ)
Hausner’s
ratio
Carr’s
index
%
F1 0.751 0.873 26.40 1.16 15.75
F2 0.765 0.890 24.60 1.16 16.50
F3 0.760 0.877 23.50 1.15 14.70
F4 0.741 0.868 25.40 1.17 16.59
F5 0.774 0.891 24.60 1.15 15.80
F6 0.755 0.873 23.50 1.15 15.74
F7 0.745 0.877 25.50 1.17 15.90
F8 0.740 0.875 26.60 1.18 16.58
F9 0.742 0.860 24.80 1.15 16.20
F10 0.761 0.895 26.60 1.17 15.68
F11 0.738 0.861 25.60 1.16 15.80
F12 0.746 0.872 23.10 1.16 17.60
F13 0.734 0.879 24.70 1.19 16.75
F14 0.728 0.862 26.30 1.18 15.50
F15 0.741 0.873 25.70 1.17 16.86
4.1.2 FTIR studies
Prepared formulations were characterized for different parameters and optimize
formulation was selected based upon theses parameters. Then best formulation from
each type of preparation i.e. inclusion complexes, solid dispersions, rapid disintegrating
tablets and hydrogel microparticles was checked for compatibility of ingredients and
complex formation by performing FTIR, DSC and TGA studies. These tests were
performed only for optimized formulation because all formulations have same
ingredients with variable concentrations.
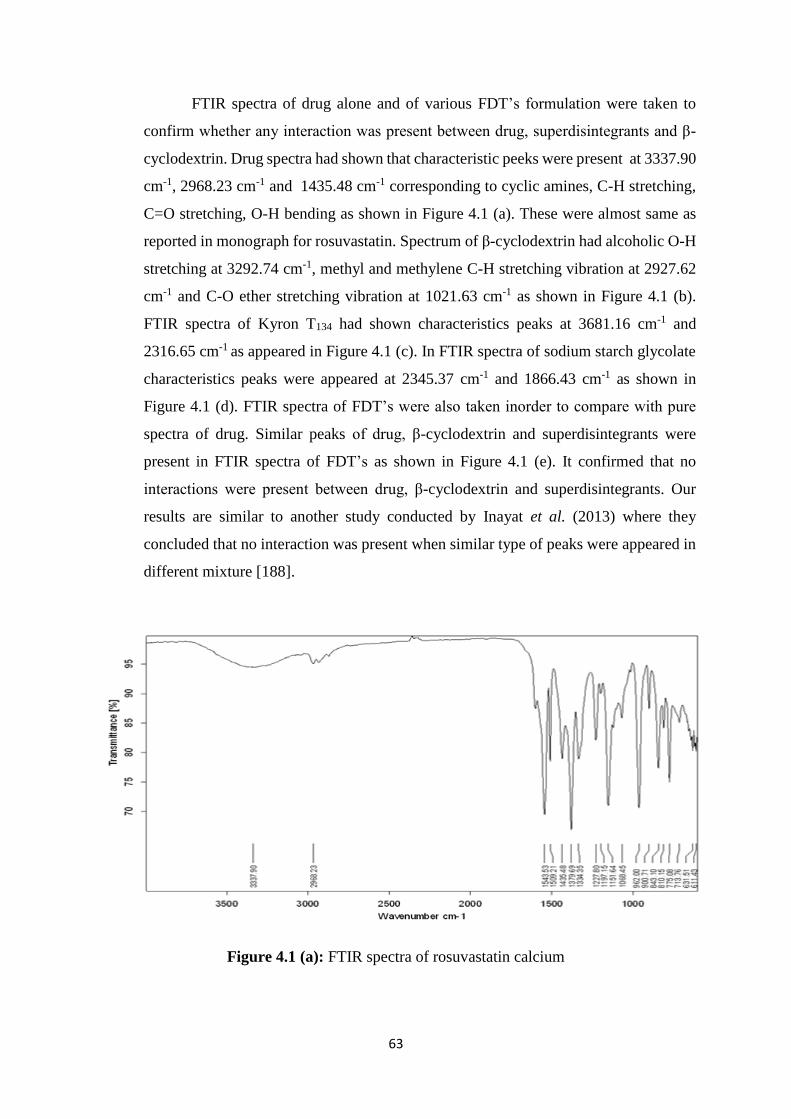
63
FTIR spectra of drug alone and of various FDT’s formulation were taken to
confirm whether any interaction was present between drug, superdisintegrants and β-
cyclodextrin. Drug spectra had shown that characteristic peeks were present at 3337.90
cm-1, 2968.23 cm-1 and 1435.48 cm-1 corresponding to cyclic amines, C-H stretching,
C=O stretching, O-H bending as shown in Figure 4.1 (a). These were almost same as
reported in monograph for rosuvastatin. Spectrum of β-cyclodextrin had alcoholic O-H
stretching at 3292.74 cm-1, methyl and methylene C-H stretching vibration at 2927.62
cm-1 and C-O ether stretching vibration at 1021.63 cm-1 as shown in Figure 4.1 (b).
FTIR spectra of Kyron T134 had shown characteristics peaks at 3681.16 cm-1 and
2316.65 cm-1 as appeared in Figure 4.1 (c). In FTIR spectra of sodium starch glycolate
characteristics peaks were appeared at 2345.37 cm-1 and 1866.43 cm-1 as shown in
Figure 4.1 (d). FTIR spectra of FDT’s were also taken inorder to compare with pure
spectra of drug. Similar peaks of drug, β-cyclodextrin and superdisintegrants were
present in FTIR spectra of FDT’s as shown in Figure 4.1 (e). It confirmed that no
interactions were present between drug, β-cyclodextrin and superdisintegrants. Our
results are similar to another study conducted by Inayat et al. (2013) where they
concluded that no interaction was present when similar type of peaks were appeared in
different mixture [188].
Figure 4.1 (a): FTIR spectra of rosuvastatin calcium
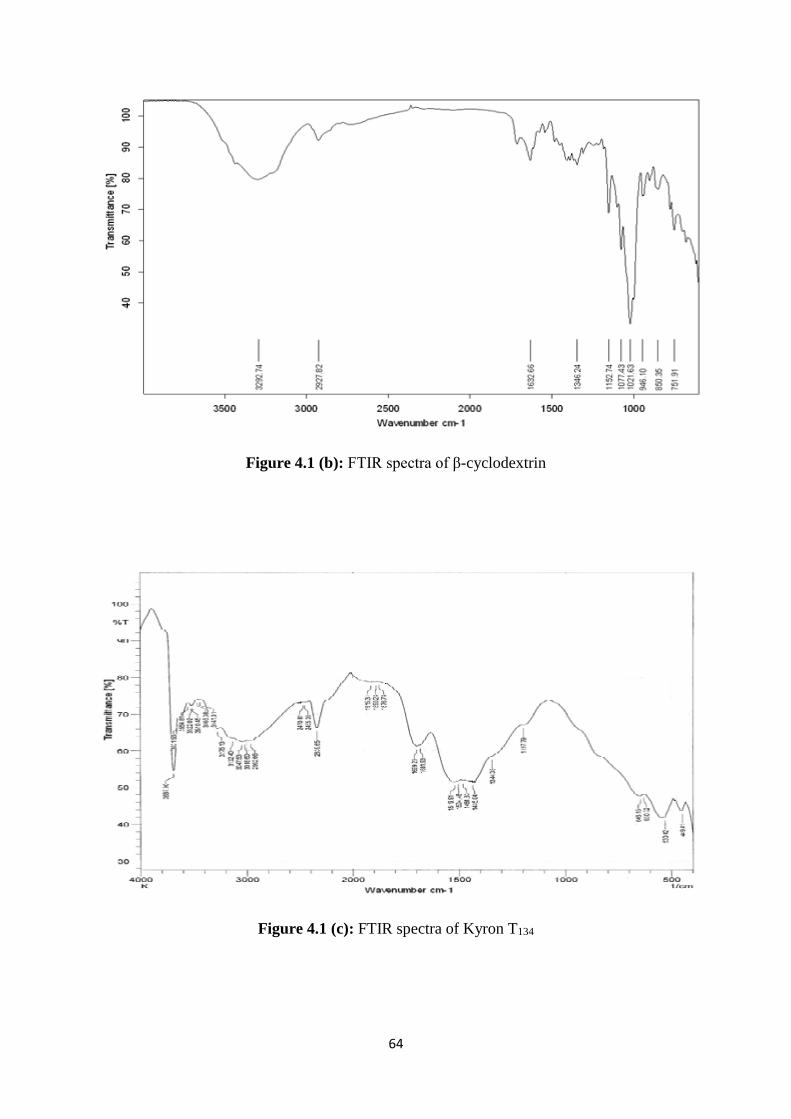
64
Figure 4.1 (b): FTIR spectra of β-cyclodextrin
Figure 4.1 (c): FTIR spectra of Kyron T134
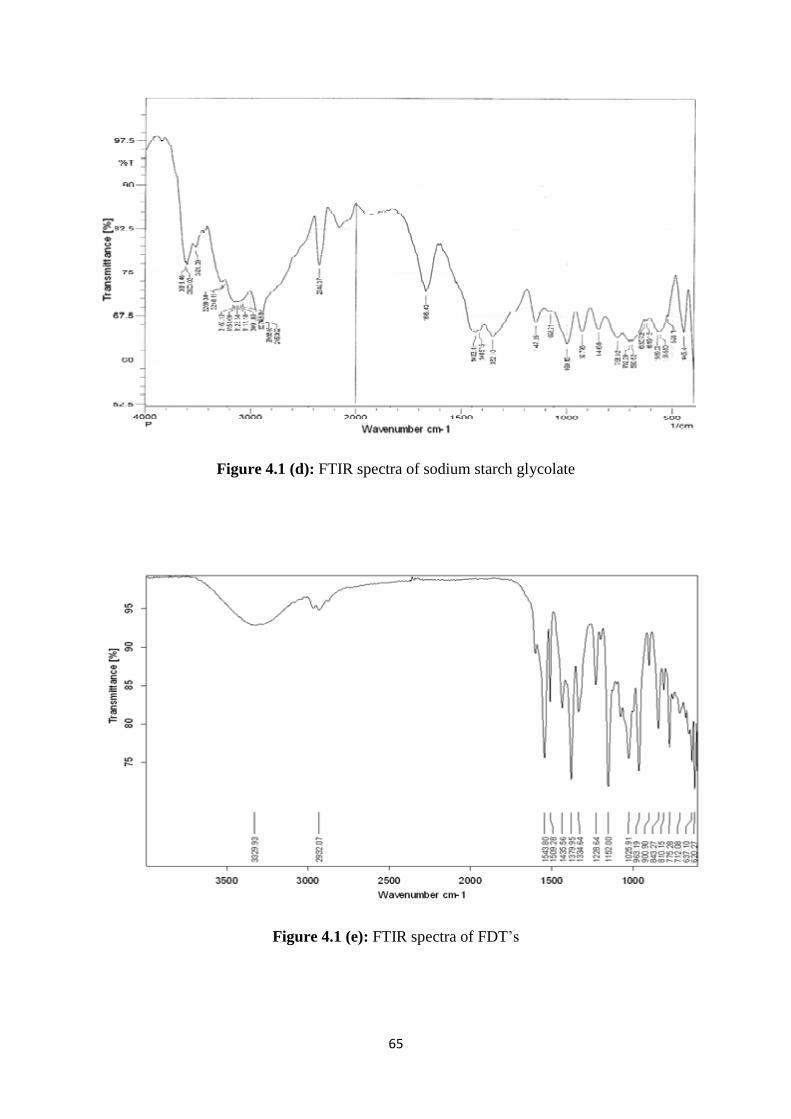
65
Figure 4.1 (d): FTIR spectra of sodium starch glycolate
Figure 4.1 (e): FTIR spectra of FDT’s
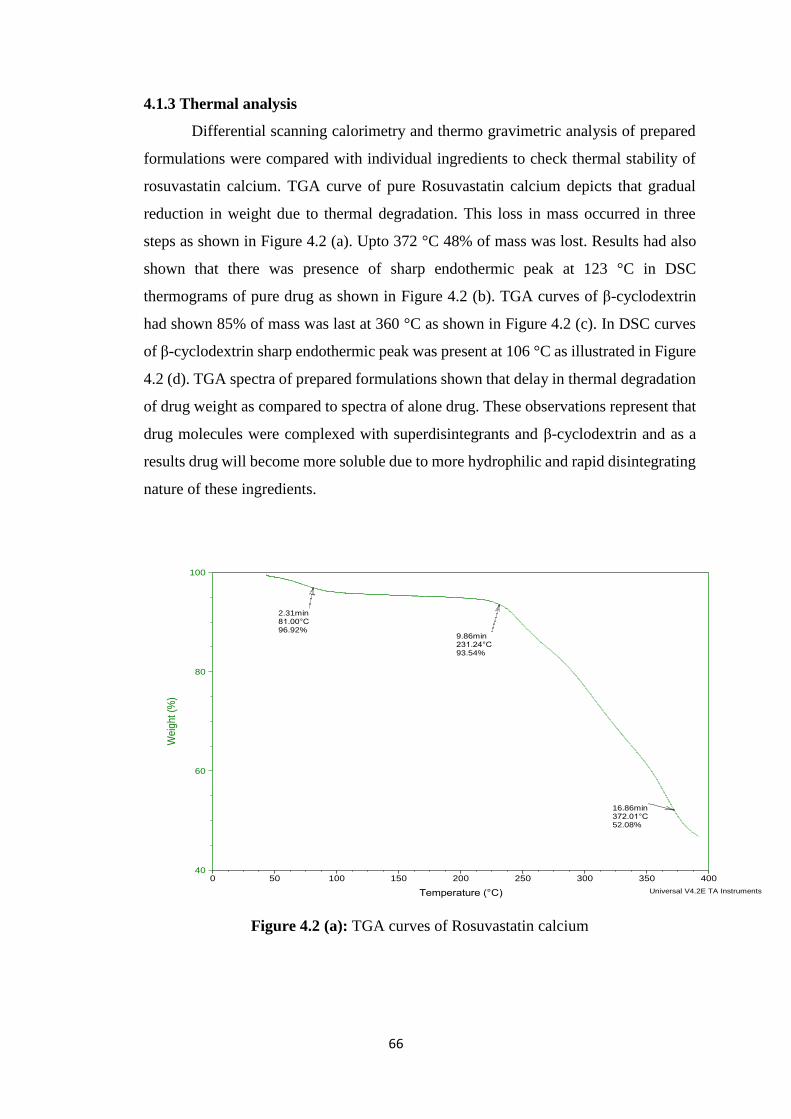
66
4.1.3 Thermal analysis
Differential scanning calorimetry and thermo gravimetric analysis of prepared
formulations were compared with individual ingredients to check thermal stability of
rosuvastatin calcium. TGA curve of pure Rosuvastatin calcium depicts that gradual
reduction in weight due to thermal degradation. This loss in mass occurred in three
steps as shown in Figure 4.2 (a). Upto 372 °C 48% of mass was lost. Results had also
shown that there was presence of sharp endothermic peak at 123 °C in DSC
thermograms of pure drug as shown in Figure 4.2 (b). TGA curves of β-cyclodextrin
had shown 85% of mass was last at 360 °C as shown in Figure 4.2 (c). In DSC curves
of β-cyclodextrin sharp endothermic peak was present at 106 °C as illustrated in Figure
4.2 (d). TGA spectra of prepared formulations shown that delay in thermal degradation
of drug weight as compared to spectra of alone drug. These observations represent that
drug molecules were complexed with superdisintegrants and β-cyclodextrin and as a
results drug will become more soluble due to more hydrophilic and rapid disintegrating
nature of these ingredients.
Figure 4.2 (a): TGA curves of Rosuvastatin calcium
2.31min81.00°C96.92%
9.86min231.24°C93.54%
16.86min372.01°C52.08%
40
60
80
100
Weig
ht (%
)
0 50 100 150 200 250 300 350 400
Temperature (°C)
Sample: TSize: 2.3280 mg
Comment: T
DSC-TGAFile: D:\TGA\RAY\T.001
Run Date: 15-Apr-2015 11:16Instrument: SDT Q600 V8.2 Build 100
Universal V4.2E TA Instruments
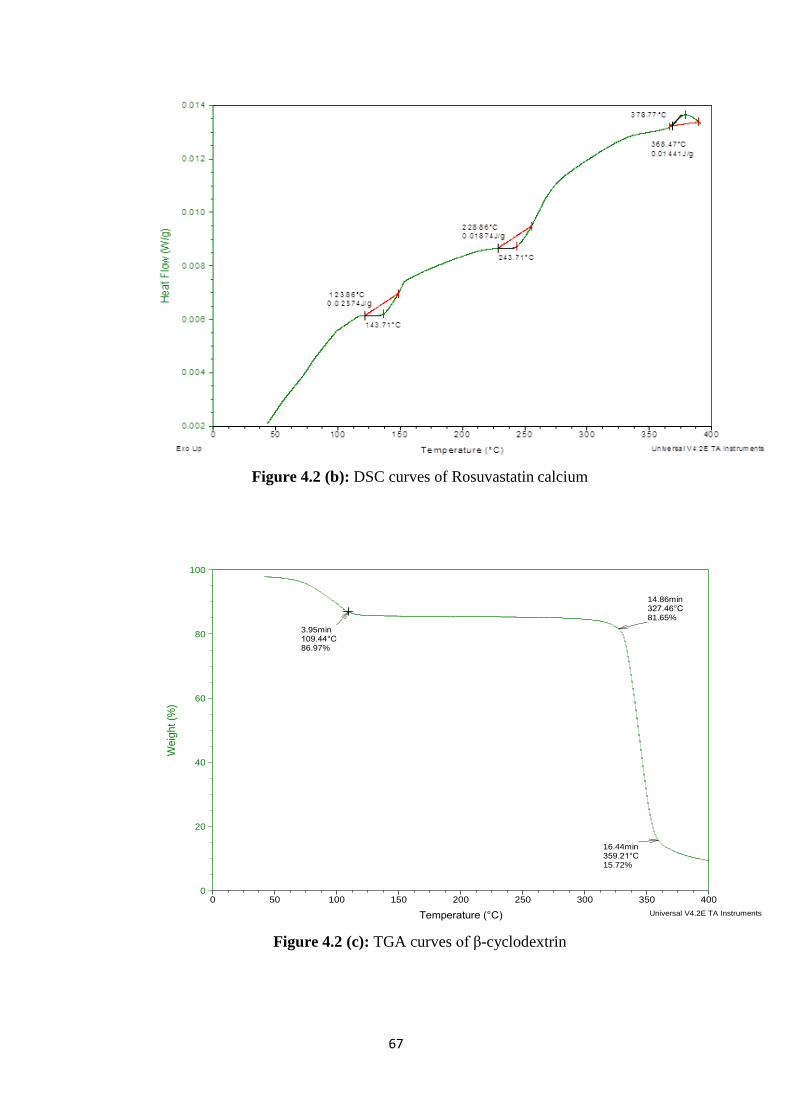
67
Figure 4.2 (b): DSC curves of Rosuvastatin calcium
Figure 4.2 (c): TGA curves of β-cyclodextrin
3.95min109.44°C86.97%
14.86min327.46°C81.65%
16.44min359.21°C15.72%
0
20
40
60
80
100
We
igh
t (%
)
0 50 100 150 200 250 300 350 400
Temperature (°C)
Sample: BSize: 2.3400 mg
Comment: B
DSC-TGAFile: D:\TGA\RAY\B.001
Run Date: 14-Apr-2015 12:26Instrument: SDT Q600 V8.2 Build 100
Universal V4.2E TA Instruments
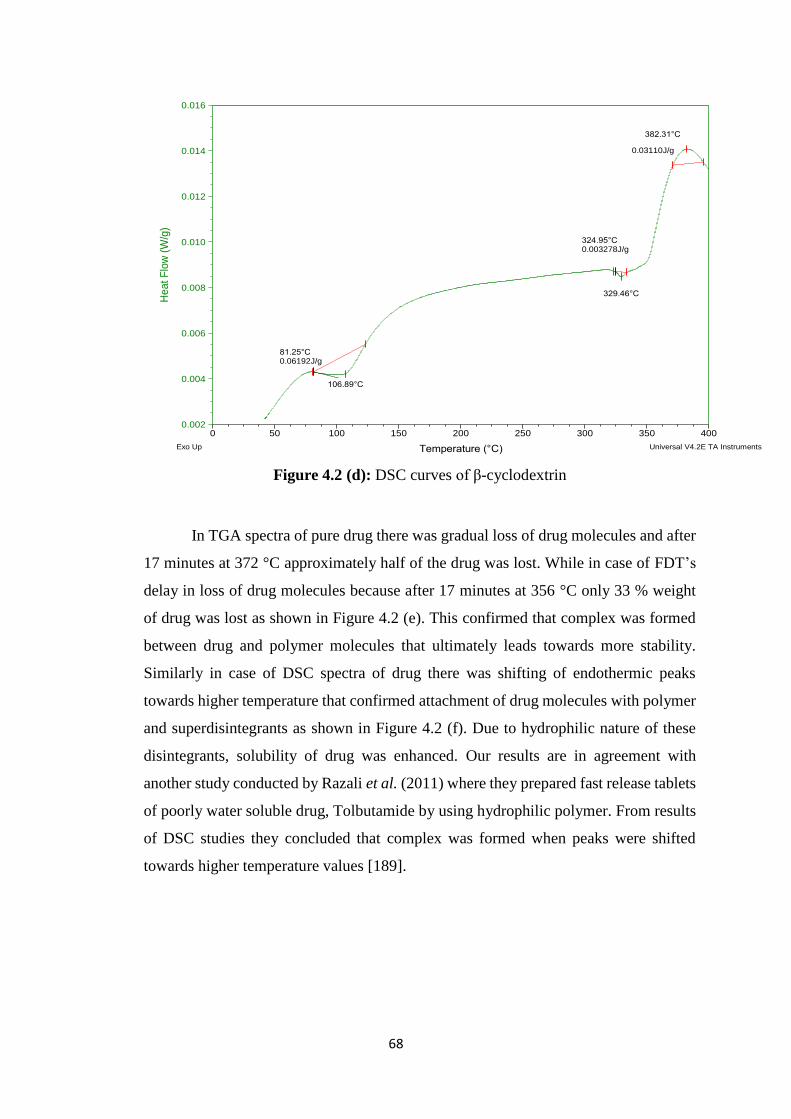
68
Figure 4.2 (d): DSC curves of β-cyclodextrin
In TGA spectra of pure drug there was gradual loss of drug molecules and after
17 minutes at 372 °C approximately half of the drug was lost. While in case of FDT’s
delay in loss of drug molecules because after 17 minutes at 356 °C only 33 % weight
of drug was lost as shown in Figure 4.2 (e). This confirmed that complex was formed
between drug and polymer molecules that ultimately leads towards more stability.
Similarly in case of DSC spectra of drug there was shifting of endothermic peaks
towards higher temperature that confirmed attachment of drug molecules with polymer
and superdisintegrants as shown in Figure 4.2 (f). Due to hydrophilic nature of these
disintegrants, solubility of drug was enhanced. Our results are in agreement with
another study conducted by Razali et al. (2011) where they prepared fast release tablets
of poorly water soluble drug, Tolbutamide by using hydrophilic polymer. From results
of DSC studies they concluded that complex was formed when peaks were shifted
towards higher temperature values [189].
106.89°C
81.25°C0.06192J/g
329.46°C
324.95°C0.003278J/g
382.31°C
0.03110J/g
0.002
0.004
0.006
0.008
0.010
0.012
0.014
0.016
Heat F
low
(W
/g)
0 50 100 150 200 250 300 350 400
Temperature (°C)
Sample: BSize: 2.3400 mg
Comment: B
DSC-TGAFile: D:\TGA\RAY\B.001
Run Date: 14-Apr-2015 12:26Instrument: SDT Q600 V8.2 Build 100
Exo Up Universal V4.2E TA Instruments
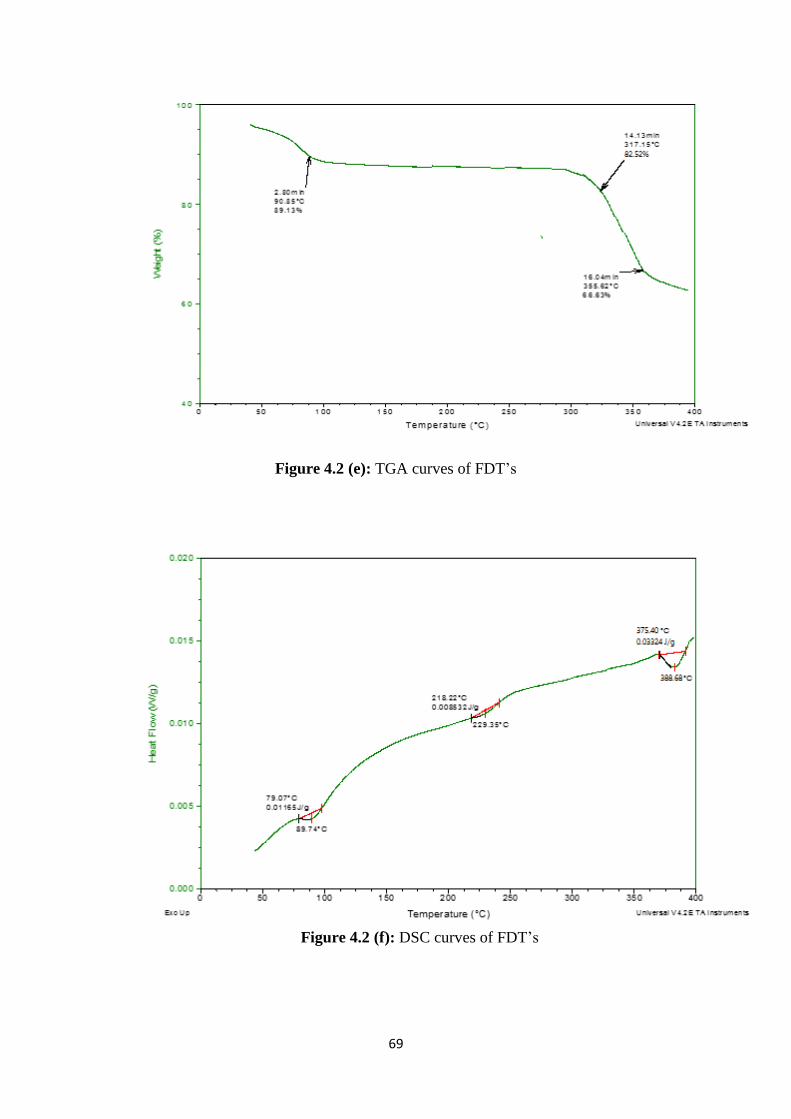
69
Figure 4.2 (e): TGA curves of FDT’s
Figure 4.2 (f): DSC curves of FDT’s
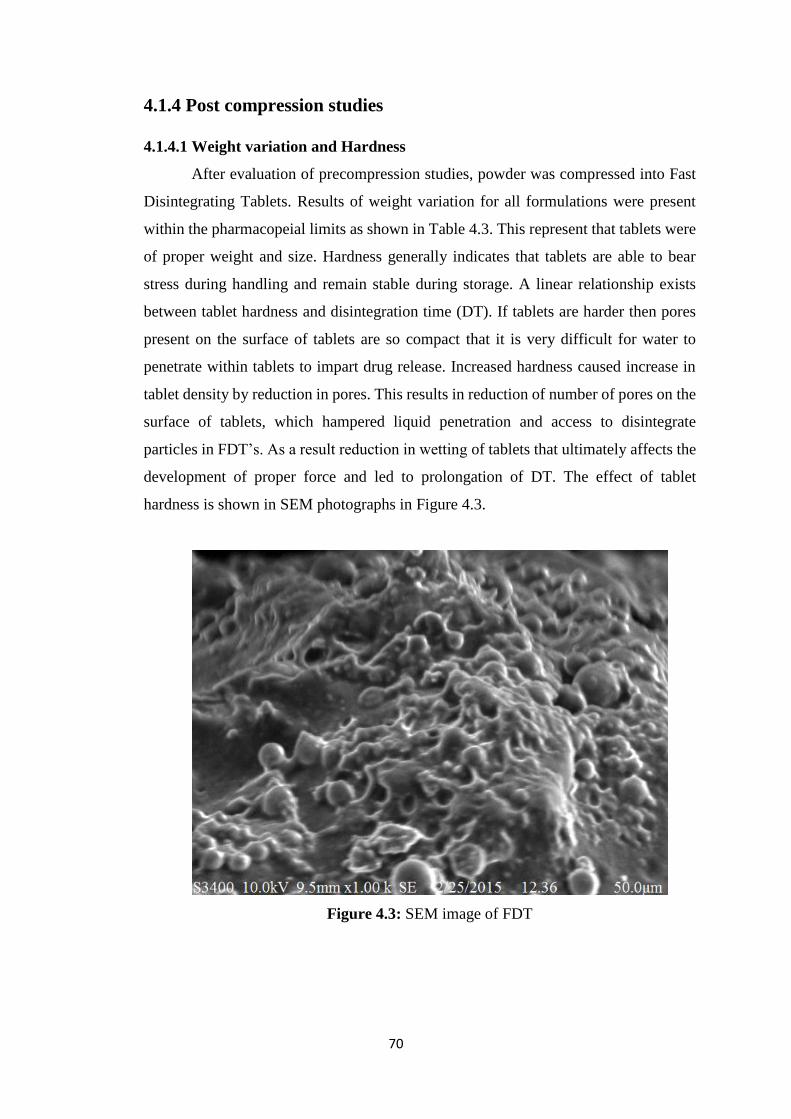
70
4.1.4 Post compression studies
4.1.4.1 Weight variation and Hardness
After evaluation of precompression studies, powder was compressed into Fast
Disintegrating Tablets. Results of weight variation for all formulations were present
within the pharmacopeial limits as shown in Table 4.3. This represent that tablets were
of proper weight and size. Hardness generally indicates that tablets are able to bear
stress during handling and remain stable during storage. A linear relationship exists
between tablet hardness and disintegration time (DT). If tablets are harder then pores
present on the surface of tablets are so compact that it is very difficult for water to
penetrate within tablets to impart drug release. Increased hardness caused increase in
tablet density by reduction in pores. This results in reduction of number of pores on the
surface of tablets, which hampered liquid penetration and access to disintegrate
particles in FDT’s. As a result reduction in wetting of tablets that ultimately affects the
development of proper force and led to prolongation of DT. The effect of tablet
hardness is shown in SEM photographs in Figure 4.3.
Figure 4.3: SEM image of FDT
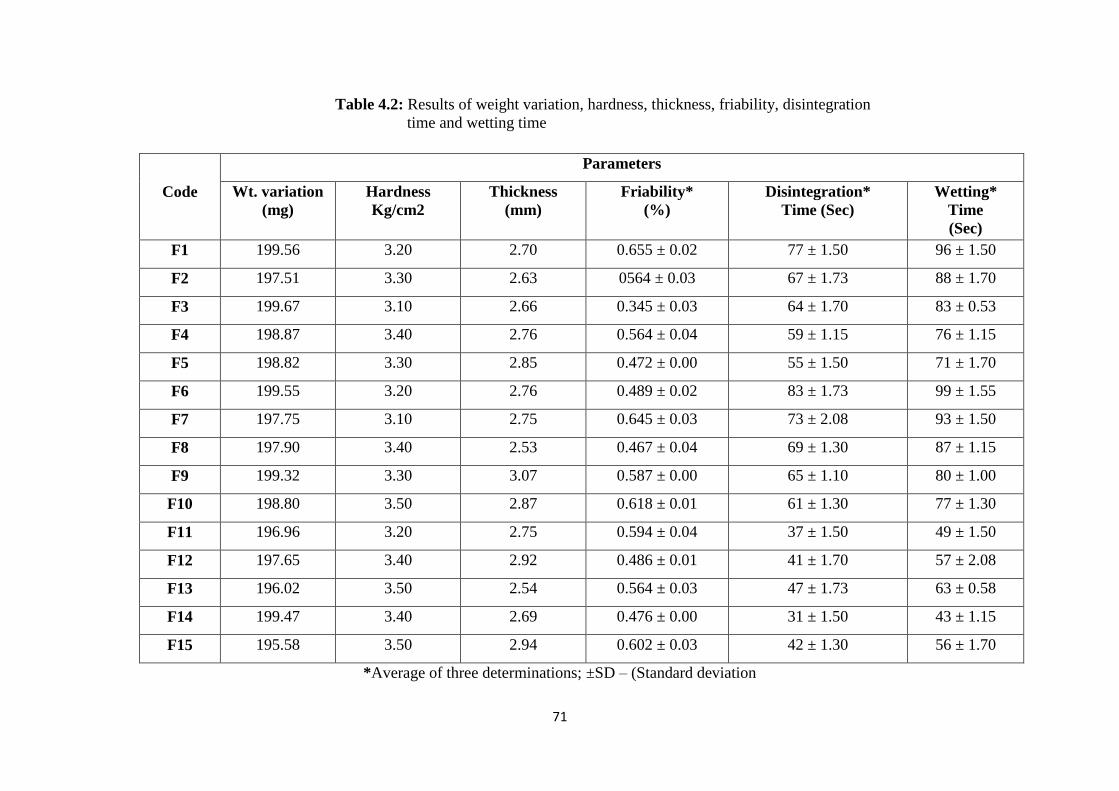
71
Table 4.2: Results of weight variation, hardness, thickness, friability, disintegration
time and wetting time
*Average of three determinations; ±SD – (Standard deviation
Parameters
Code Wt. variation
(mg)
Hardness
Kg/cm2
Thickness
(mm)
Friability*
(%)
Disintegration*
Time (Sec)
Wetting*
Time
(Sec)
F1 199.56 3.20 2.70 0.655 ± 0.02 77 ± 1.50 96 ± 1.50
F2 197.51 3.30 2.63 0564 ± 0.03 67 ± 1.73 88 ± 1.70
F3 199.67 3.10 2.66 0.345 ± 0.03 64 ± 1.70 83 ± 0.53
F4 198.87 3.40 2.76 0.564 ± 0.04 59 ± 1.15 76 ± 1.15
F5 198.82 3.30 2.85 0.472 ± 0.00 55 ± 1.50 71 ± 1.70
F6 199.55 3.20 2.76 0.489 ± 0.02 83 ± 1.73 99 ± 1.55
F7 197.75 3.10 2.75 0.645 ± 0.03 73 ± 2.08 93 ± 1.50
F8 197.90 3.40 2.53 0.467 ± 0.04 69 ± 1.30 87 ± 1.15
F9 199.32 3.30 3.07 0.587 ± 0.00 65 ± 1.10 80 ± 1.00
F10 198.80 3.50 2.87 0.618 ± 0.01 61 ± 1.30 77 ± 1.30
F11 196.96 3.20 2.75 0.594 ± 0.04 37 ± 1.50 49 ± 1.50
F12 197.65 3.40 2.92 0.486 ± 0.01 41 ± 1.70 57 ± 2.08
F13 196.02 3.50 2.54 0.564 ± 0.03 47 ± 1.73 63 ± 0.58
F14 199.47 3.40 2.69 0.476 ± 0.00 31 ± 1.50 43 ± 1.15
F15 195.58 3.50 2.94 0.602 ± 0.03 42 ± 1.30 56 ± 1.70
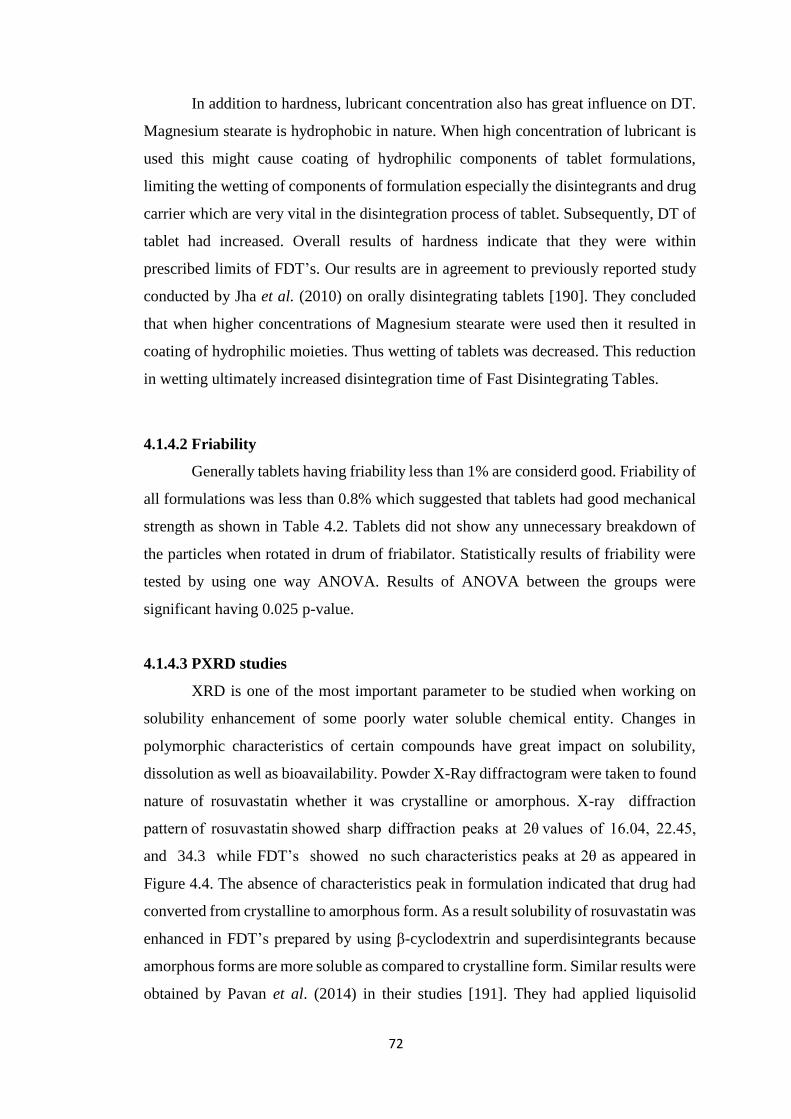
72
In addition to hardness, lubricant concentration also has great influence on DT.
Magnesium stearate is hydrophobic in nature. When high concentration of lubricant is
used this might cause coating of hydrophilic components of tablet formulations,
limiting the wetting of components of formulation especially the disintegrants and drug
carrier which are very vital in the disintegration process of tablet. Subsequently, DT of
tablet had increased. Overall results of hardness indicate that they were within
prescribed limits of FDT’s. Our results are in agreement to previously reported study
conducted by Jha et al. (2010) on orally disintegrating tablets [190]. They concluded
that when higher concentrations of Magnesium stearate were used then it resulted in
coating of hydrophilic moieties. Thus wetting of tablets was decreased. This reduction
in wetting ultimately increased disintegration time of Fast Disintegrating Tables.
4.1.4.2 Friability
Generally tablets having friability less than 1% are considerd good. Friability of
all formulations was less than 0.8% which suggested that tablets had good mechanical
strength as shown in Table 4.2. Tablets did not show any unnecessary breakdown of
the particles when rotated in drum of friabilator. Statistically results of friability were
tested by using one way ANOVA. Results of ANOVA between the groups were
significant having 0.025 p-value.
4.1.4.3 PXRD studies
XRD is one of the most important parameter to be studied when working on
solubility enhancement of some poorly water soluble chemical entity. Changes in
polymorphic characteristics of certain compounds have great impact on solubility,
dissolution as well as bioavailability. Powder X-Ray diffractogram were taken to found
nature of rosuvastatin whether it was crystalline or amorphous. X-ray diffraction
pattern of rosuvastatin showed sharp diffraction peaks at 2θ values of 16.04, 22.45,
and 34.3 while FDT’s showed no such characteristics peaks at 2θ as appeared in
Figure 4.4. The absence of characteristics peak in formulation indicated that drug had
converted from crystalline to amorphous form. As a result solubility of rosuvastatin was
enhanced in FDT’s prepared by using β-cyclodextrin and superdisintegrants because
amorphous forms are more soluble as compared to crystalline form. Similar results were
obtained by Pavan et al. (2014) in their studies [191]. They had applied liquisolid
73
technology for solubility and dissolution profile enhancement of Rosuvastatin calcium
and concluded that characteristics peaks in X-ray diffraction pattern of formulations
were disappeared that were present in X-ray diffraction pattern of pure Rosuvastatin
calcium. Thus drug was converted into amorphous form in liquisolid complex and
crystallinity was lost. Due to this amorphous nature, its solubility was enhanced.
Figure 4.4: X-Ray diffraction patterns of (A) Rosuvastatin calcium, (B) β-
cyclodextrin and (C) FDT’s
4.1.4.4 Scanning electron microscopy
Morphology of FDT’s was determined by using scanning electron microscopy.
SEM images of FDT’s were taken to see the upper surface as well as inner structure.
SEM images had shown that pores were present on surface of tablets as shown in Figure
4.3. These pores had favored in the penetration of water inside of tablets. This
penetrated water helped to fasten the release of drug from tablets and ultimately
solubility was enhanced.
74
4.1.4.5 Wetting time
Wetting time is the indication of hydrophobicity of the ingredients. Lower the
wetting time faster will be the disintegration. Wetting time for all 15 formulations was
less than 2 minute lying between 43 to 96 seconds as shown in Table 4.2. It was lowest
for F14 formulation containing drug and β-cyclodextrin in 1:1 and kyron T134 8% as
superdisintegrant. The results of one way ANOVA had shown that p-value for wetting
time was 0.036. It indicates that results were significant and wetting of tablets was
affected by the nature and concentration of β-cyclodextrin and superdisintegrants.
Akbari et al. (2011) had also prepared fast disintegrating tablets of Rosuvastatin by
using β-cyclodextrin and sodium starch glycolate as superdisintegrant. They concluded
similar results that maximum amount of Rosuvastatin was released when β-
cyclodextrin and drug were used in 1:1 and it had wetting time less than 1 minute [192].
4.1.4.6 Disintegration time
Disintegration time for FDT’s is generally less than 1 minute. Rapid uptake of
water from surrounding media can cause swelling of tablets and ultimately quick
disintegration to produce bursting effect. This results in fast release of drug from its
medium into surrounding environment and hence solubility of loaded drug was
enhanced. Similar to wetting time it was also lowest for F14 as mentioned in Table 4.2.
Similar results were obtained by Madgulkar et al. (2009) in their study where they
prepared mouth disintegrating tablets of Tramadol by using superdisintegrants and
concluded that solubility of drug was enhanced when rapid disintegration of tablets had
taken place [193].
4.1.4.7 In vitro dispersion time
In vitro dispersion test was performed for all of the formulations. This test was
used to find dispersion time for tablets by using petri dish method. Dispersion of tablets
was affected by swelling which was due to disintegrants. Formulation F14 had lowest
dispersion time among all formulations as shown in Table 4.3. These results had shown
that kyron T134 was better choice as superdisintegrant than sodium starch glycolate
because dispersion time was lowest for formulations containing kyron T134.
Comparable results were obtained by Gupta et al. (2010) where they concluded that
rapid disintegrating tablets containing kyron T134 as superdisintegrant shown less in
vitro dispersion time when compared with rapid disintegrating tablets containing
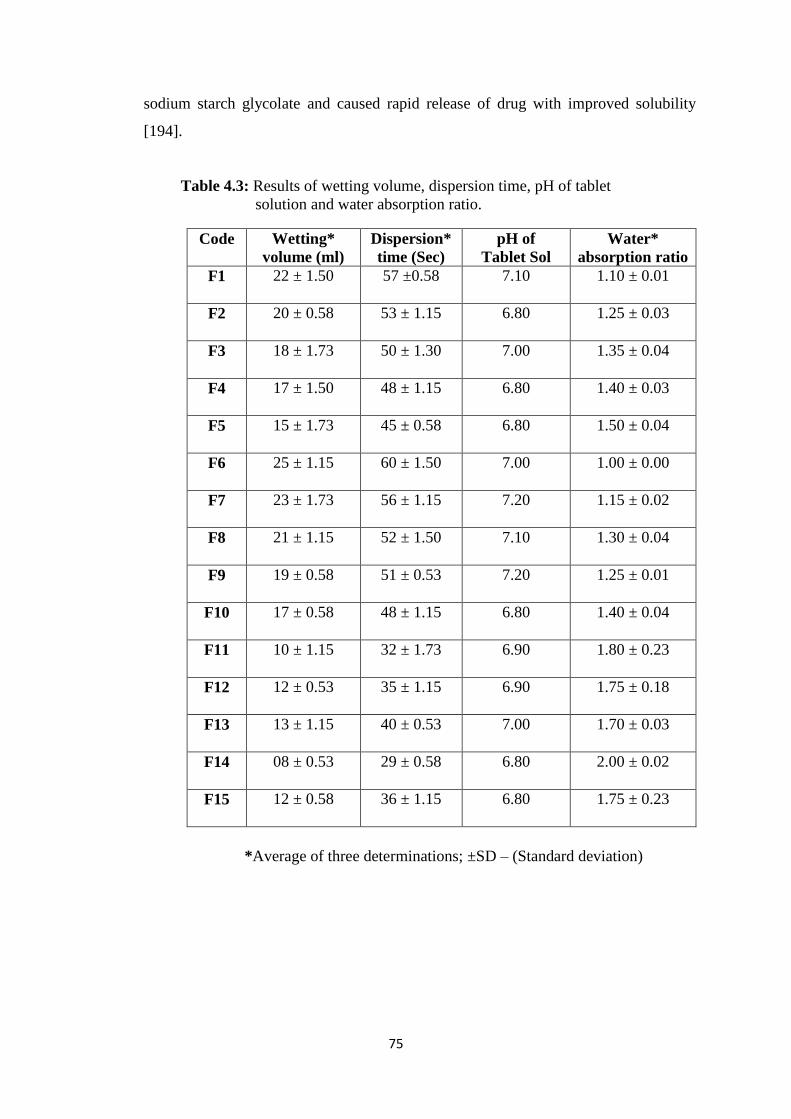
75
sodium starch glycolate and caused rapid release of drug with improved solubility
[194].
Table 4.3: Results of wetting volume, dispersion time, pH of tablet
solution and water absorption ratio.
*Average of three determinations; ±SD – (Standard deviation)
Code Wetting*
volume (ml)
Dispersion*
time (Sec)
pH of
Tablet Sol
Water*
absorption ratio
F1 22 ± 1.50 57 ±0.58 7.10 1.10 ± 0.01
F2 20 ± 0.58 53 ± 1.15 6.80 1.25 ± 0.03
F3 18 ± 1.73 50 ± 1.30 7.00 1.35 ± 0.04
F4 17 ± 1.50 48 ± 1.15 6.80 1.40 ± 0.03
F5 15 ± 1.73 45 ± 0.58 6.80 1.50 ± 0.04
F6 25 ± 1.15 60 ± 1.50 7.00 1.00 ± 0.00
F7 23 ± 1.73 56 ± 1.15 7.20 1.15 ± 0.02
F8 21 ± 1.15 52 ± 1.50 7.10 1.30 ± 0.04
F9 19 ± 0.58 51 ± 0.53 7.20 1.25 ± 0.01
F10 17 ± 0.58 48 ± 1.15 6.80 1.40 ± 0.04
F11 10 ± 1.15 32 ± 1.73 6.90 1.80 ± 0.23
F12 12 ± 0.53 35 ± 1.15 6.90 1.75 ± 0.18
F13 13 ± 1.15 40 ± 0.53 7.00 1.70 ± 0.03
F14 08 ± 0.53 29 ± 0.58 6.80 2.00 ± 0.02
F15 12 ± 0.58 36 ± 1.15 6.80 1.75 ± 0.23
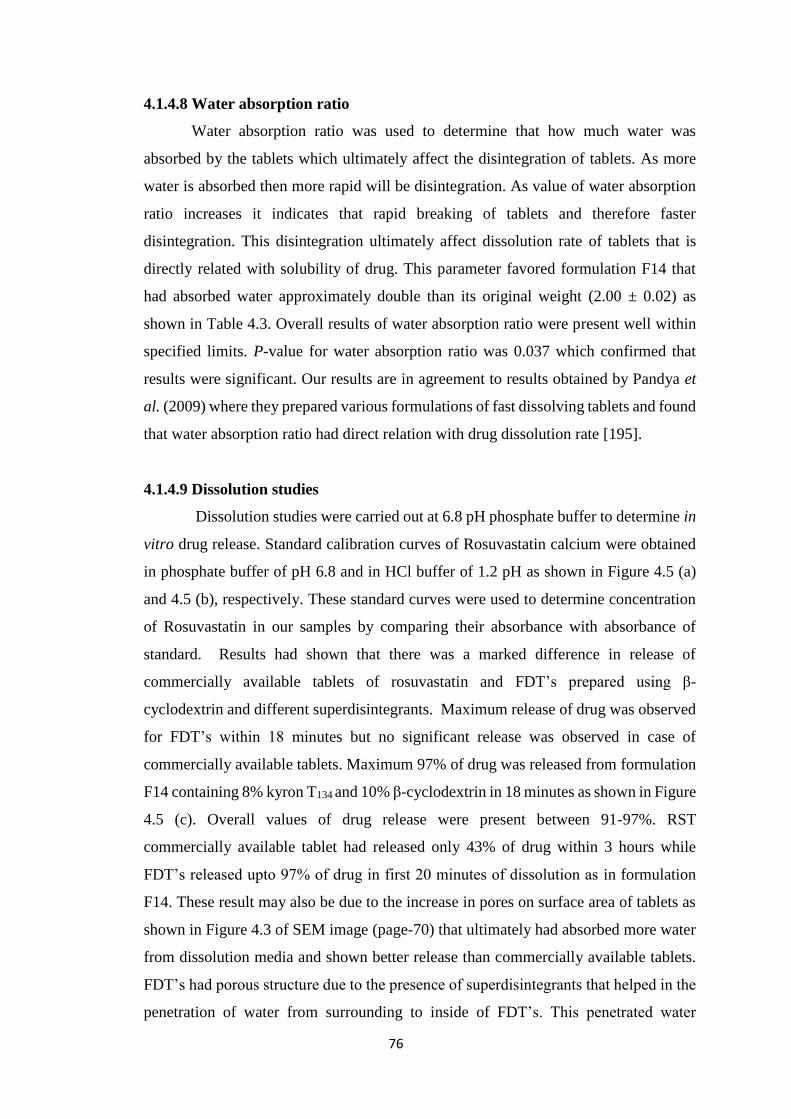
76
4.1.4.8 Water absorption ratio
Water absorption ratio was used to determine that how much water was
absorbed by the tablets which ultimately affect the disintegration of tablets. As more
water is absorbed then more rapid will be disintegration. As value of water absorption
ratio increases it indicates that rapid breaking of tablets and therefore faster
disintegration. This disintegration ultimately affect dissolution rate of tablets that is
directly related with solubility of drug. This parameter favored formulation F14 that
had absorbed water approximately double than its original weight (2.00 ± 0.02) as
shown in Table 4.3. Overall results of water absorption ratio were present well within
specified limits. P-value for water absorption ratio was 0.037 which confirmed that
results were significant. Our results are in agreement to results obtained by Pandya et
al. (2009) where they prepared various formulations of fast dissolving tablets and found
that water absorption ratio had direct relation with drug dissolution rate [195].
4.1.4.9 Dissolution studies
Dissolution studies were carried out at 6.8 pH phosphate buffer to determine in
vitro drug release. Standard calibration curves of Rosuvastatin calcium were obtained
in phosphate buffer of pH 6.8 and in HCl buffer of 1.2 pH as shown in Figure 4.5 (a)
and 4.5 (b), respectively. These standard curves were used to determine concentration
of Rosuvastatin in our samples by comparing their absorbance with absorbance of
standard. Results had shown that there was a marked difference in release of
commercially available tablets of rosuvastatin and FDT’s prepared using β-
cyclodextrin and different superdisintegrants. Maximum release of drug was observed
for FDT’s within 18 minutes but no significant release was observed in case of
commercially available tablets. Maximum 97% of drug was released from formulation
F14 containing 8% kyron T134 and 10% β-cyclodextrin in 18 minutes as shown in Figure
4.5 (c). Overall values of drug release were present between 91-97%. RST
commercially available tablet had released only 43% of drug within 3 hours while
FDT’s released upto 97% of drug in first 20 minutes of dissolution as in formulation
F14. These result may also be due to the increase in pores on surface area of tablets as
shown in Figure 4.3 of SEM image (page-70) that ultimately had absorbed more water
from dissolution media and shown better release than commercially available tablets.
FDT’s had porous structure due to the presence of superdisintegrants that helped in the
penetration of water from surrounding to inside of FDT’s. This penetrated water
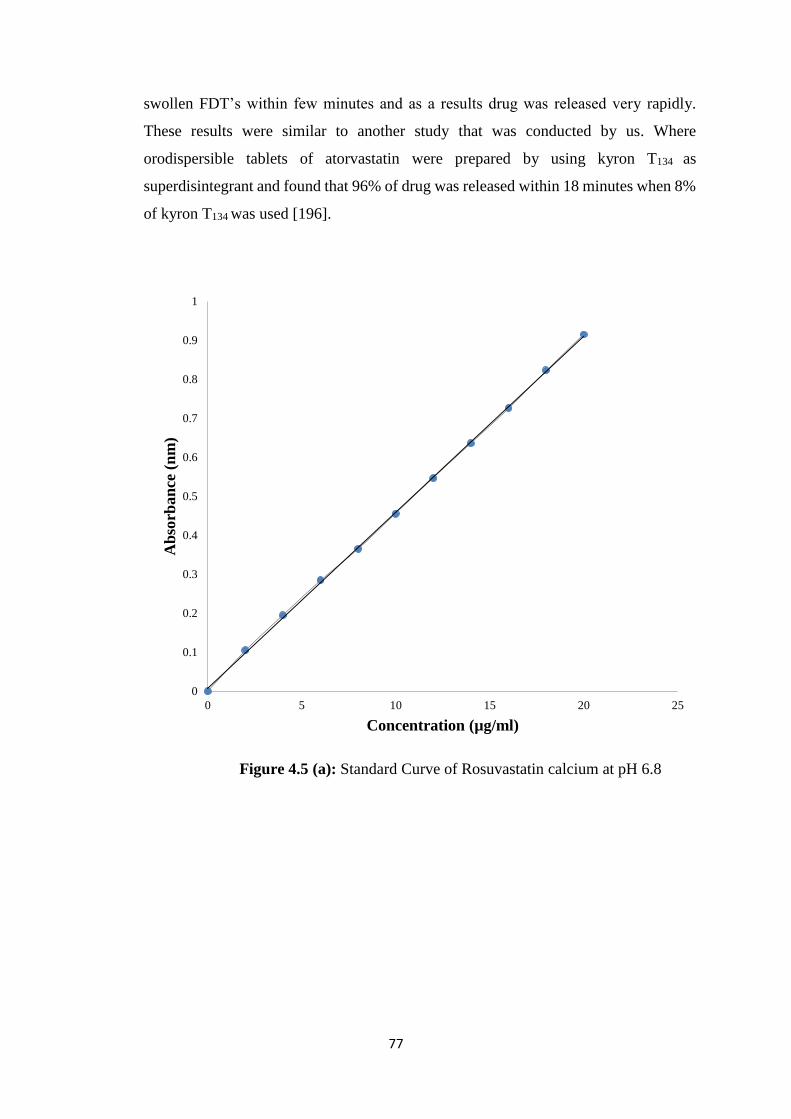
77
swollen FDT’s within few minutes and as a results drug was released very rapidly.
These results were similar to another study that was conducted by us. Where
orodispersible tablets of atorvastatin were prepared by using kyron T134 as
superdisintegrant and found that 96% of drug was released within 18 minutes when 8%
of kyron T134 was used [196].
Figure 4.5 (a): Standard Curve of Rosuvastatin calcium at pH 6.8
0
0.1
0.2
0.3
0.4
0.5
0.6
0.7
0.8
0.9
1
0 5 10 15 20 25
Ab
sorb
an
ce (
nm
)
Concentration (µg/ml)
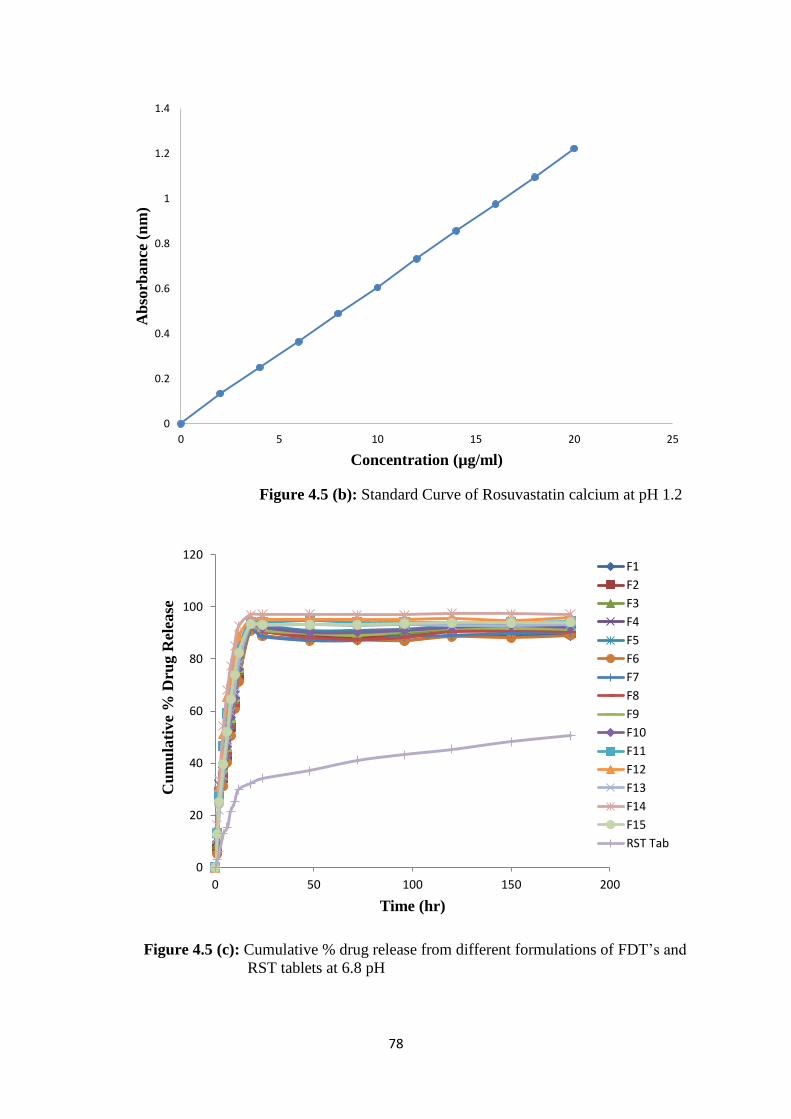
78
Figure 4.5 (b): Standard Curve of Rosuvastatin calcium at pH 1.2
Figure 4.5 (c): Cumulative % drug release from different formulations of FDT’s and
RST tablets at 6.8 pH
0
0.2
0.4
0.6
0.8
1
1.2
1.4
0 5 10 15 20 25
Ab
sorb
an
ce (
nm
)
Concentration (µg/ml)
0
20
40
60
80
100
120
0 50 100 150 200
Cu
mu
lati
ve
% D
rug R
elea
se
Time (hr)
F1
F2
F3
F4
F5
F6
F7
F8
F9
F10
F11
F12
F13
F14
F15
RST Tab
79
Different kinetic models, i.e. zero order, first order, Higuchi and Korsmeyer-
Peppas were applied on in vitro release data by using DD Solver® excel based Add in
program. Final model selection was made on best fit observations. Higher values of
correlation coefficient i.e. R2 of model proved best fit of that model for explanation of
drug release from formulations. From R2 values of F12 (0.9980) and F14 (0.9990) it
was observed that release pattern followed first order release kinetics as shown in Table
4.4. The results of T25, T50 and T75 had shown that there was rapid release of drug from
FDT’s due to bursting effect because T25 was approximately double than T50. These
results had shown that an increase in concentration of superdisintegrant and β-
cyclodextrin had increased the release of drug from FDT’s significantly (p < 0.05),
which is in accordance with our previously reported study in which FDT’s of Acyclovir
were prepared by using β-cyclodextrin and kyron T134 and concluded that drug release
followed first order drug release kinetic model that was diffusion and erosion controlled
[197].
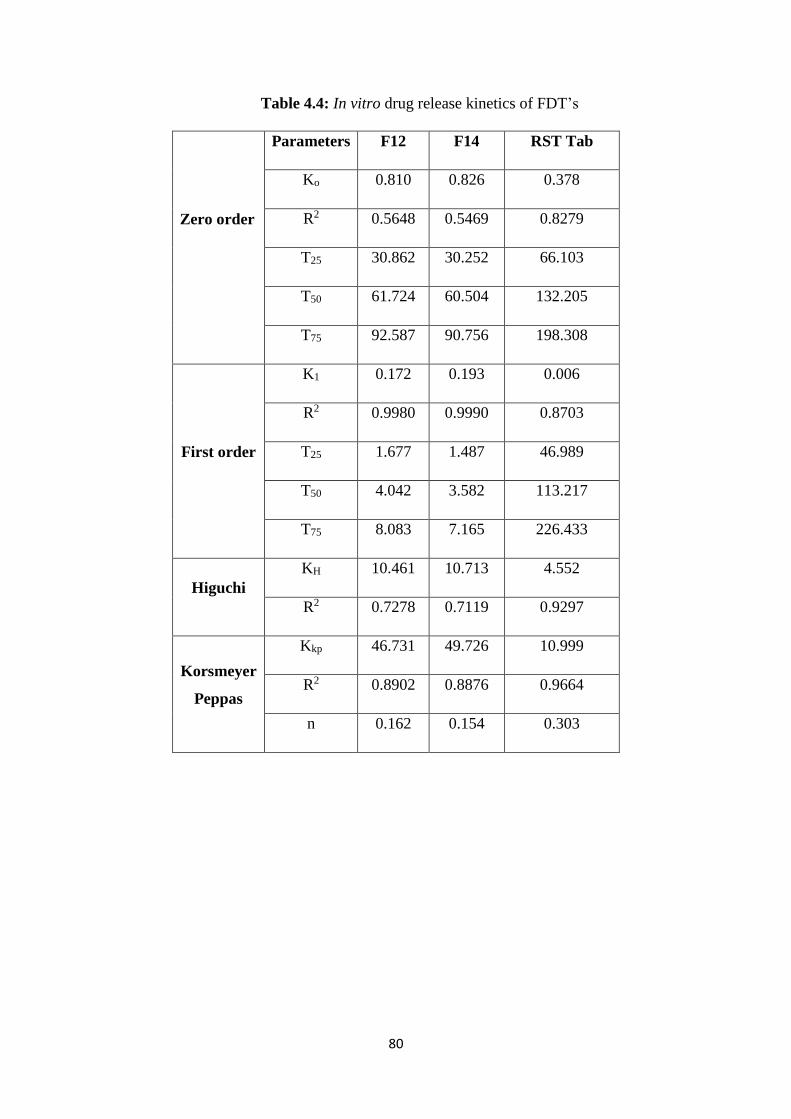
80
Table 4.4: In vitro drug release kinetics of FDT’s
Zero order
Parameters F12 F14 RST Tab
Ko 0.810 0.826 0.378
R2 0.5648 0.5469 0.8279
T25 30.862 30.252 66.103
T50 61.724 60.504 132.205
T75 92.587 90.756 198.308
First order
K1 0.172 0.193 0.006
R2 0.9980 0.9990 0.8703
T25 1.677 1.487 46.989
T50 4.042 3.582 113.217
T75 8.083 7.165 226.433
Higuchi
KH 10.461 10.713 4.552
R2 0.7278 0.7119 0.9297
Korsmeyer
Peppas
Kkp 46.731 49.726 10.999
R2 0.8902 0.8876 0.9664
n 0.162 0.154 0.303
81
4.1.4.10 Solubility studies
Rosuvastatin calcium is a weak acid. Due to its acidic nature it had more
solubility in basic media as compared to acidic pH. So it become ionized in basic
medium and is therefore soluble in high pH solutions. Solubility studies of pure drug
and prepared FDT’s were conducted both basic as well as in acidic media. Results had
shown that highest solubility of FDT’s were present at pH 6.8 in phosphate buffer when
compared with HCl buffer of low pH (1.2). However, highest solubility was observed
in water in ionic form as shown in Figure 4.6. From solubility studies of rosuvastatin
calcium it was observed that pure drug had very low solubility in acidic media at 1.2
pH buffer while had slightly better solubility in phosphate buffer of basic pH 6.8. In
water pure drug had greater solubility as compared to 1.2 and 6.8 pH buffers.
When solubility studies of FDT’s were performed, it was observed that same
amount of drug loaded in FDT’s had several folds more solubility than pure drug. From
Figure 4.6, it is clear that there was increase in solubility of rosuvastatin calcium in
FDT’s upto 7.42 folds at pH 1.2 while at 6.8 pH solubility was enhanced upto 11.71
folds. In distilled water there was 9 folds increase in solubility of drug occurred loaded
in FDT’s as compared to solubility of pure drug. These results clearly depict that FDT’s
had enhanced solubility of rosuvastatin calcium in different pH media but it varied
based upon the pH of used media. Pure drug had more solubility in distilled water as
compared to HCl buffer of 1.2 pH and phosphate buffer of pH 6.8. The order in which
pure drug had more solubility was distilled water > phosphate buffer of pH 6.8 > HCl
buffer of 1.2 pH. While in case of FDT’s rosuvastatin calcium solubility was increased
in all three media used for solubility studies but it was 11.71 folds increase in phosphate
buffer of pH 6.8 and 9 folds in distilled water. Our results are in agreement to Shilpi et
al. (2015), they prepared different complexes of poorly water soluble drug with β-
cyclodextrin and concluded that solubility of complex was enhanced upto 5.32 folds as
compared to solubility of pure drug [198].
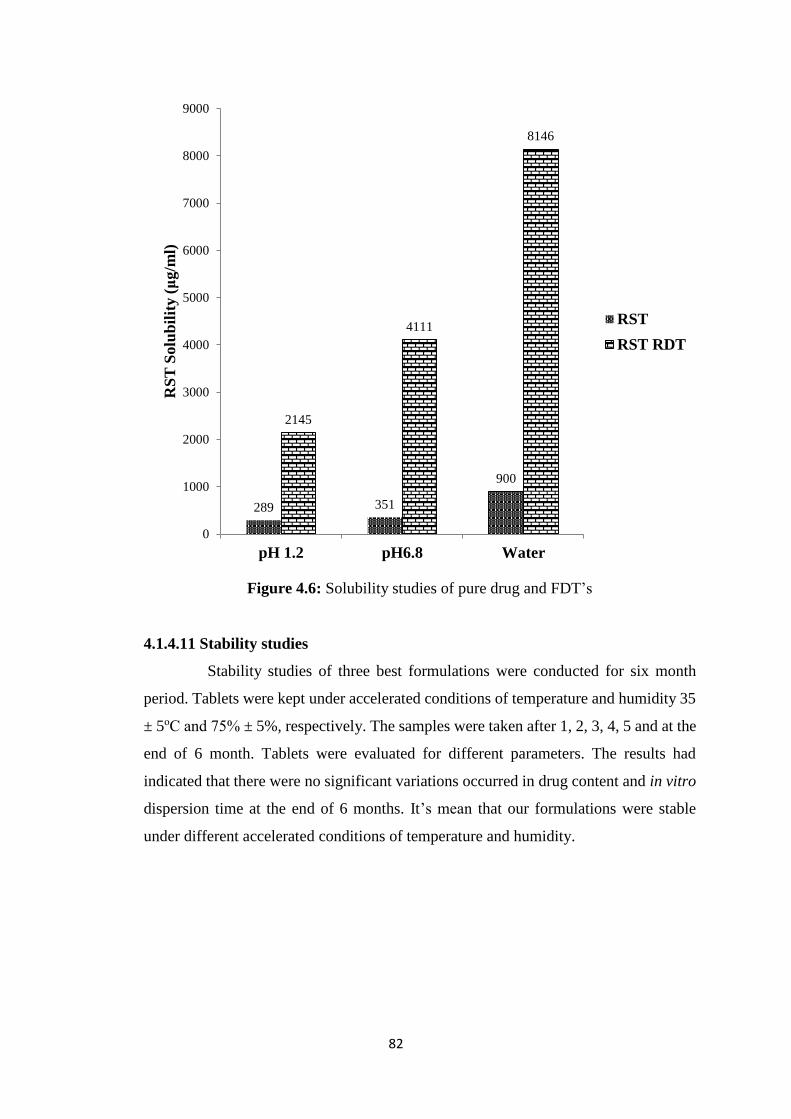
82
Figure 4.6: Solubility studies of pure drug and FDT’s
4.1.4.11 Stability studies
Stability studies of three best formulations were conducted for six month
period. Tablets were kept under accelerated conditions of temperature and humidity 35
± 5оС and 75% ± 5%, respectively. The samples were taken after 1, 2, 3, 4, 5 and at the
end of 6 month. Tablets were evaluated for different parameters. The results had
indicated that there were no significant variations occurred in drug content and in vitro
dispersion time at the end of 6 months. It’s mean that our formulations were stable
under different accelerated conditions of temperature and humidity.
289 351
900
2145
4111
8146
0
1000
2000
3000
4000
5000
6000
7000
8000
9000
pH 1.2 pH6.8 Water
RS
T S
olu
bil
ity (
μg/m
l)
RST
RST RDT
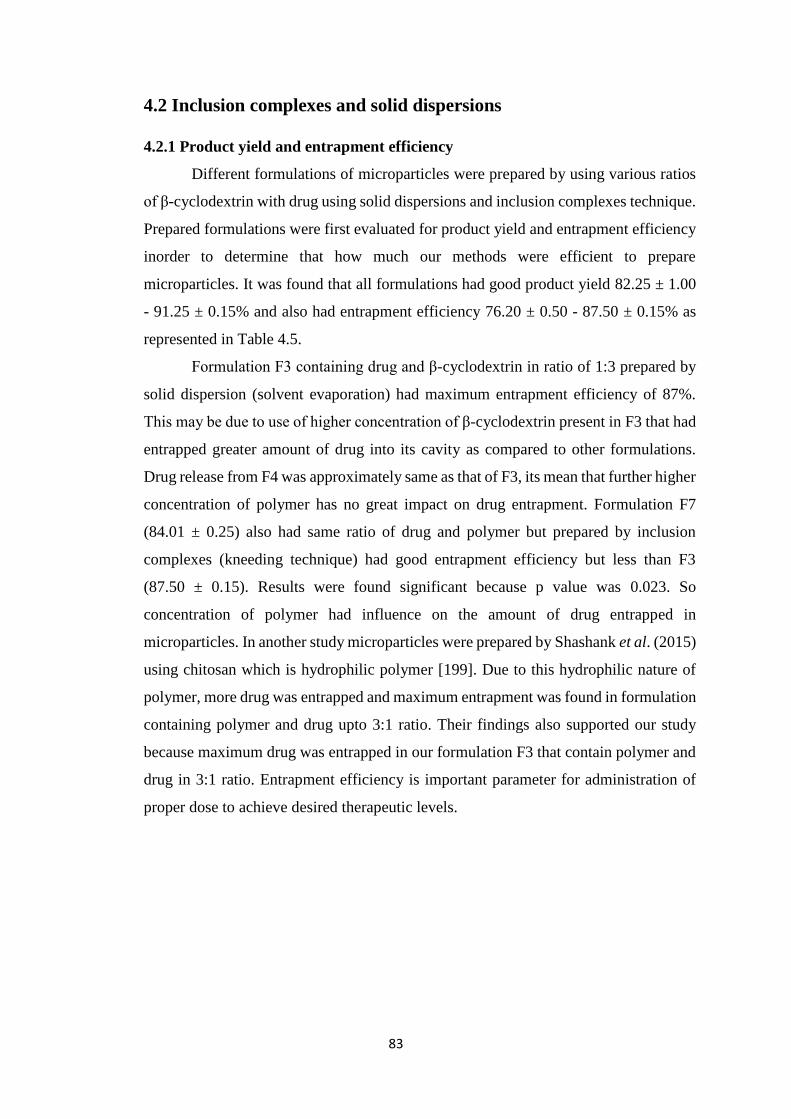
83
4.2 Inclusion complexes and solid dispersions
4.2.1 Product yield and entrapment efficiency
Different formulations of microparticles were prepared by using various ratios
of β-cyclodextrin with drug using solid dispersions and inclusion complexes technique.
Prepared formulations were first evaluated for product yield and entrapment efficiency
inorder to determine that how much our methods were efficient to prepare
microparticles. It was found that all formulations had good product yield 82.25 ± 1.00
- 91.25 ± 0.15% and also had entrapment efficiency 76.20 ± 0.50 - 87.50 ± 0.15% as
represented in Table 4.5.
Formulation F3 containing drug and β-cyclodextrin in ratio of 1:3 prepared by
solid dispersion (solvent evaporation) had maximum entrapment efficiency of 87%.
This may be due to use of higher concentration of β-cyclodextrin present in F3 that had
entrapped greater amount of drug into its cavity as compared to other formulations.
Drug release from F4 was approximately same as that of F3, its mean that further higher
concentration of polymer has no great impact on drug entrapment. Formulation F7
(84.01 ± 0.25) also had same ratio of drug and polymer but prepared by inclusion
complexes (kneeding technique) had good entrapment efficiency but less than F3
(87.50 ± 0.15). Results were found significant because p value was 0.023. So
concentration of polymer had influence on the amount of drug entrapped in
microparticles. In another study microparticles were prepared by Shashank et al. (2015)
using chitosan which is hydrophilic polymer [199]. Due to this hydrophilic nature of
polymer, more drug was entrapped and maximum entrapment was found in formulation
containing polymer and drug upto 3:1 ratio. Their findings also supported our study
because maximum drug was entrapped in our formulation F3 that contain polymer and
drug in 3:1 ratio. Entrapment efficiency is important parameter for administration of
proper dose to achieve desired therapeutic levels.
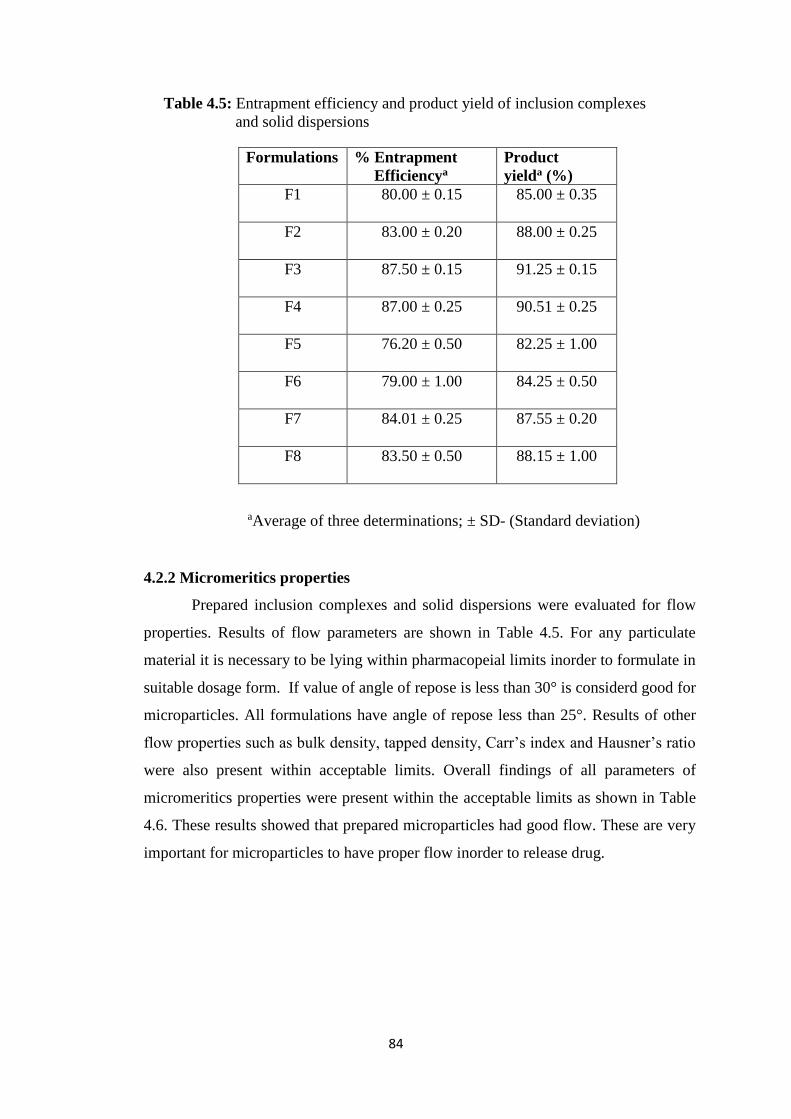
84
Table 4.5: Entrapment efficiency and product yield of inclusion complexes
and solid dispersions
aAverage of three determinations; ± SD- (Standard deviation)
4.2.2 Micromeritics properties
Prepared inclusion complexes and solid dispersions were evaluated for flow
properties. Results of flow parameters are shown in Table 4.5. For any particulate
material it is necessary to be lying within pharmacopeial limits inorder to formulate in
suitable dosage form. If value of angle of repose is less than 30° is considerd good for
microparticles. All formulations have angle of repose less than 25°. Results of other
flow properties such as bulk density, tapped density, Carr’s index and Hausner’s ratio
were also present within acceptable limits. Overall findings of all parameters of
micromeritics properties were present within the acceptable limits as shown in Table
4.6. These results showed that prepared microparticles had good flow. These are very
important for microparticles to have proper flow inorder to release drug.
Formulations % Entrapment
Efficiencya
Product
yielda (%)
F1 80.00 ± 0.15 85.00 ± 0.35
F2 83.00 ± 0.20 88.00 ± 0.25
F3 87.50 ± 0.15 91.25 ± 0.15
F4 87.00 ± 0.25 90.51 ± 0.25
F5 76.20 ± 0.50 82.25 ± 1.00
F6 79.00 ± 1.00 84.25 ± 0.50
F7 84.01 ± 0.25 87.55 ± 0.20
F8 83.50 ± 0.50 88.15 ± 1.00
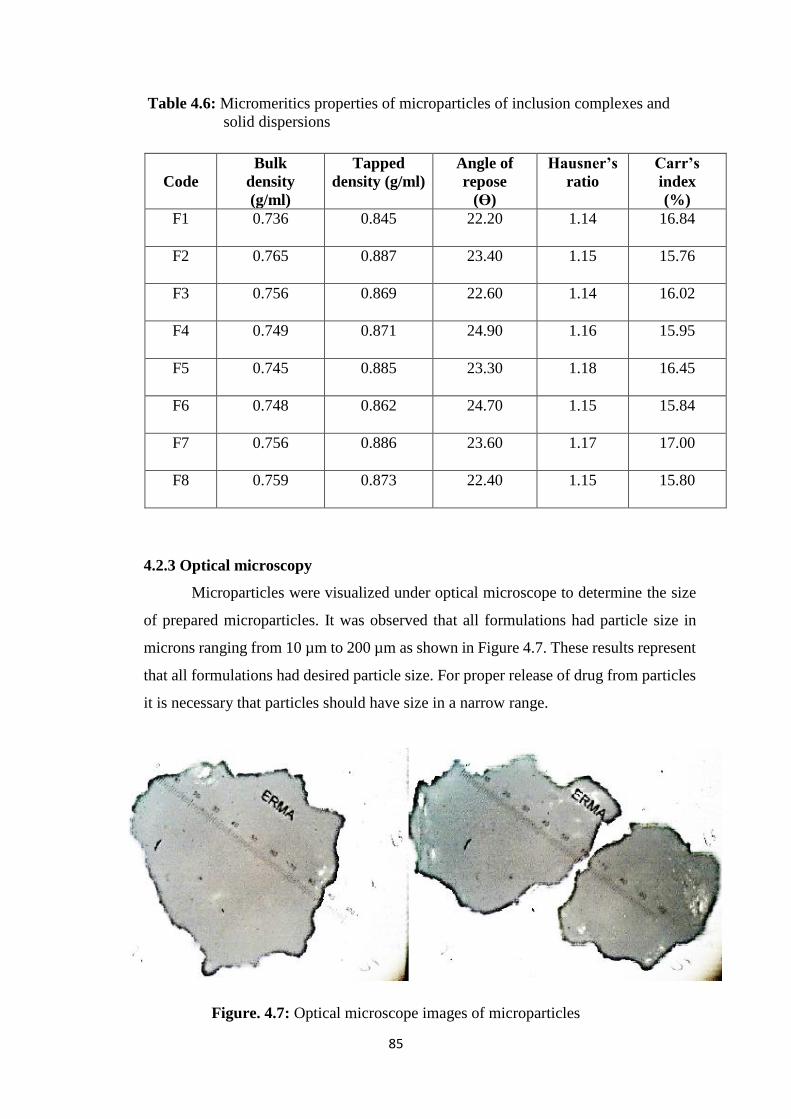
85
Table 4.6: Micromeritics properties of microparticles of inclusion complexes and
solid dispersions
4.2.3 Optical microscopy
Microparticles were visualized under optical microscope to determine the size
of prepared microparticles. It was observed that all formulations had particle size in
microns ranging from 10 µm to 200 µm as shown in Figure 4.7. These results represent
that all formulations had desired particle size. For proper release of drug from particles
it is necessary that particles should have size in a narrow range.
Figure. 4.7: Optical microscope images of microparticles
Code
Bulk
density
(g/ml)
Tapped
density (g/ml)
Angle of
repose
(ϴ)
Hausner’s
ratio
Carr’s
index
(%)
F1 0.736 0.845 22.20 1.14 16.84
F2 0.765 0.887 23.40 1.15 15.76
F3 0.756 0.869 22.60 1.14 16.02
F4 0.749 0.871 24.90 1.16 15.95
F5 0.745 0.885 23.30 1.18 16.45
F6 0.748 0.862 24.70 1.15 15.84
F7 0.756 0.886 23.60 1.17 17.00
F8 0.759 0.873 22.40 1.15 15.80
86
4.2.4 Solubility studies
Rosuvastatin calcium is a weak acid in nature so it shows ionization in basic
medium and is therefore soluble in high pH solutions. Our results had also shown
highest solubility at pH 6.8 when compared with other buffers of low pH (1.2).
However, highest solubility was observed in water in ionic form. From the solubility
study of both drug as well as prepared microparticles, it was observed that there had
been significant increase in the solubility of drug in water (5.86 fold), pH 1.2
(3.32 fold) and pH 6.8 (8.54 fold) as seen in Figure 4.8. This increase in solubility of
drug in microparticles was due to the complex formation of drug with β-cyclodextrin.
β-cyclodextrin is hydrophilic in nature, when it forms complex with other poorly water
soluble moieties then these water insoluble drug molecules becomes water soluble.
Solubility of prepared microparticles was enhanced several folds as compared to pure
drug in different pH medias. But highest solubility was observed at 6.8 pH. Shilpi et al.
(2015) [198] worked on solubility enhancement of Nelfinavir by preparing complex of
drug with β-cyclodextrin in different ratios and concluded that solubility was enhanced
upto 5.32 folds at 1.2 pH while 3.64 folds at 4.5 pH. Our results had shown more
solubility at higher pH (6.8) as compared to 1.2 pH. This difference in results was due
to the nature of drug. Nelfinavir is basic in nature therefor, it is more soluble in acidic
media as compared to higher pH. While Rosuvastatin calcium is weak acid in nature.
Due to this acidic nature it become more soluble at higher pH (6.8) values as compared
to lower pH (1.2). Rosuvastatin is available in its calcium salt, therefore, it is more
soluble in water as compared to different buffer media. But when Rosuvastatin calcium
complexed with hydrophilic polymers then it became more soluble in buffer media of
higher pH rather than in pure water as shown Figure 4.8.
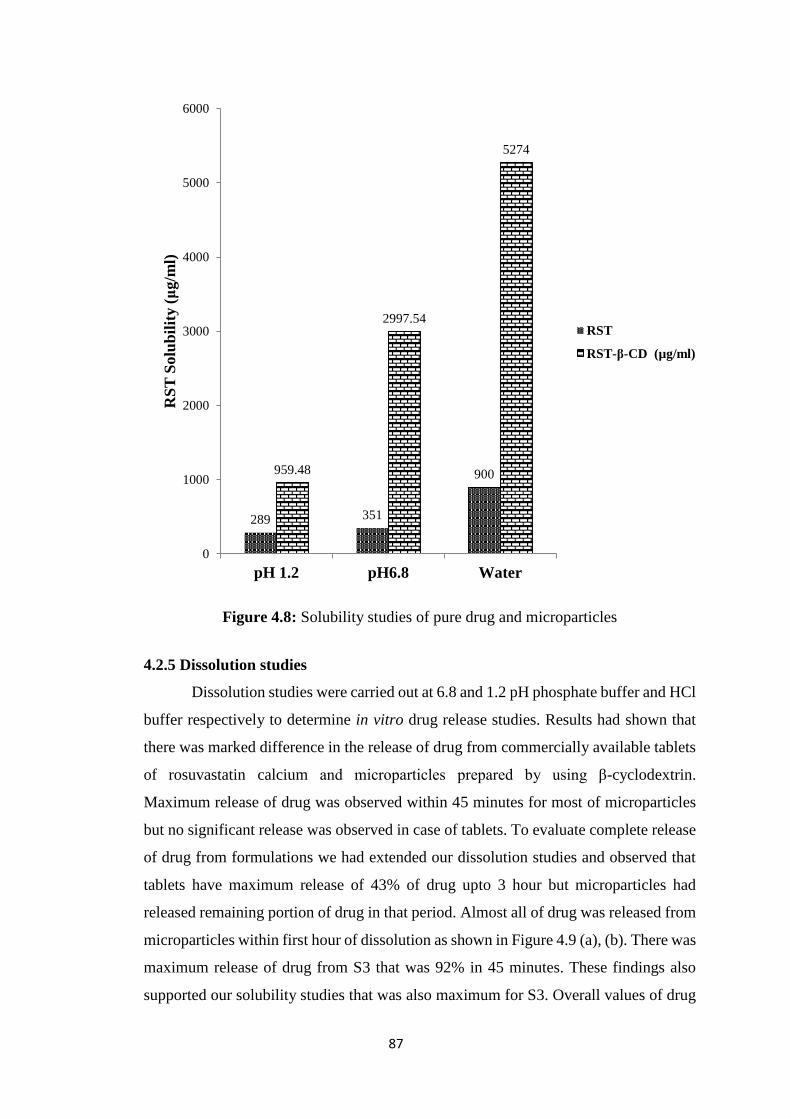
87
Figure 4.8: Solubility studies of pure drug and microparticles
4.2.5 Dissolution studies
Dissolution studies were carried out at 6.8 and 1.2 pH phosphate buffer and HCl
buffer respectively to determine in vitro drug release studies. Results had shown that
there was marked difference in the release of drug from commercially available tablets
of rosuvastatin calcium and microparticles prepared by using β-cyclodextrin.
Maximum release of drug was observed within 45 minutes for most of microparticles
but no significant release was observed in case of tablets. To evaluate complete release
of drug from formulations we had extended our dissolution studies and observed that
tablets have maximum release of 43% of drug upto 3 hour but microparticles had
released remaining portion of drug in that period. Almost all of drug was released from
microparticles within first hour of dissolution as shown in Figure 4.9 (a), (b). There was
maximum release of drug from S3 that was 92% in 45 minutes. These findings also
supported our solubility studies that was also maximum for S3. Overall values of drug
289 351
900959.48
2997.54
5274
0
1000
2000
3000
4000
5000
6000
pH 1.2 pH6.8 Water
RS
T S
olu
bil
ity (
μg/m
l)
RST
RST-β-CD (µg/ml)
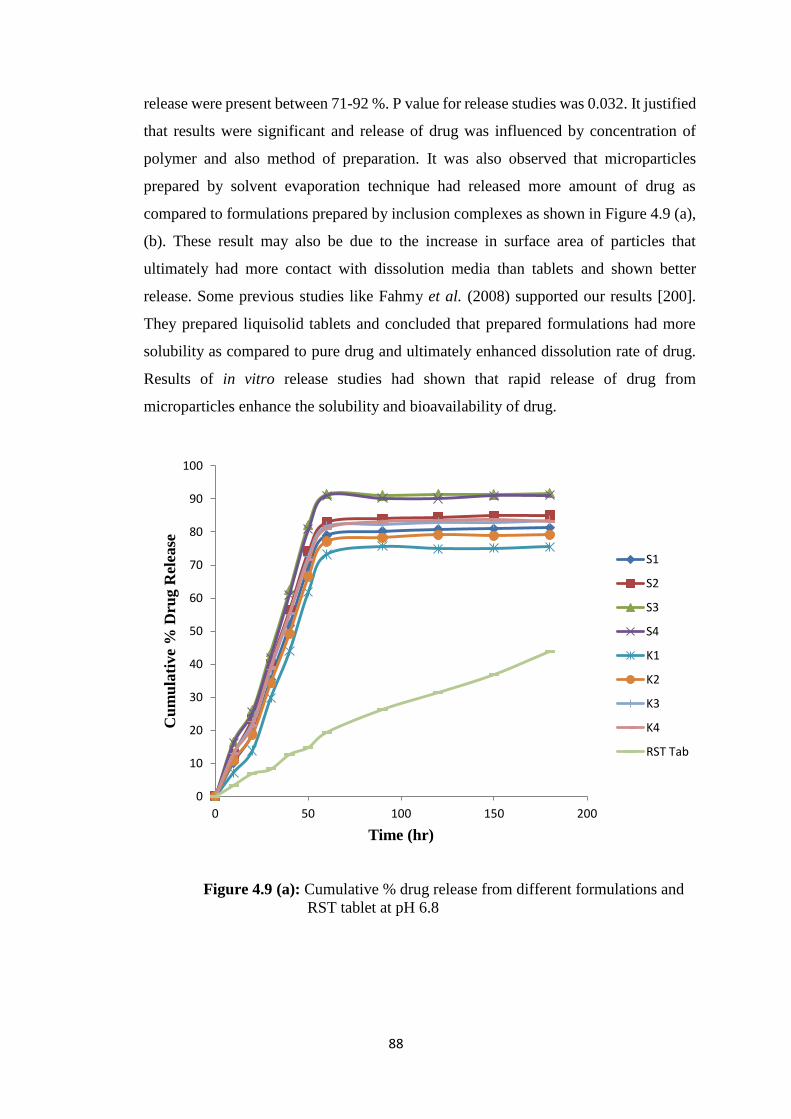
88
release were present between 71-92 %. P value for release studies was 0.032. It justified
that results were significant and release of drug was influenced by concentration of
polymer and also method of preparation. It was also observed that microparticles
prepared by solvent evaporation technique had released more amount of drug as
compared to formulations prepared by inclusion complexes as shown in Figure 4.9 (a),
(b). These result may also be due to the increase in surface area of particles that
ultimately had more contact with dissolution media than tablets and shown better
release. Some previous studies like Fahmy et al. (2008) supported our results [200].
They prepared liquisolid tablets and concluded that prepared formulations had more
solubility as compared to pure drug and ultimately enhanced dissolution rate of drug.
Results of in vitro release studies had shown that rapid release of drug from
microparticles enhance the solubility and bioavailability of drug.
Figure 4.9 (a): Cumulative % drug release from different formulations and
RST tablet at pH 6.8
0
10
20
30
40
50
60
70
80
90
100
0 50 100 150 200
Cu
mu
lati
ve
% D
rug R
elea
se
Time (hr)
S1
S2
S3
S4
K1
K2
K3
K4
RST Tab
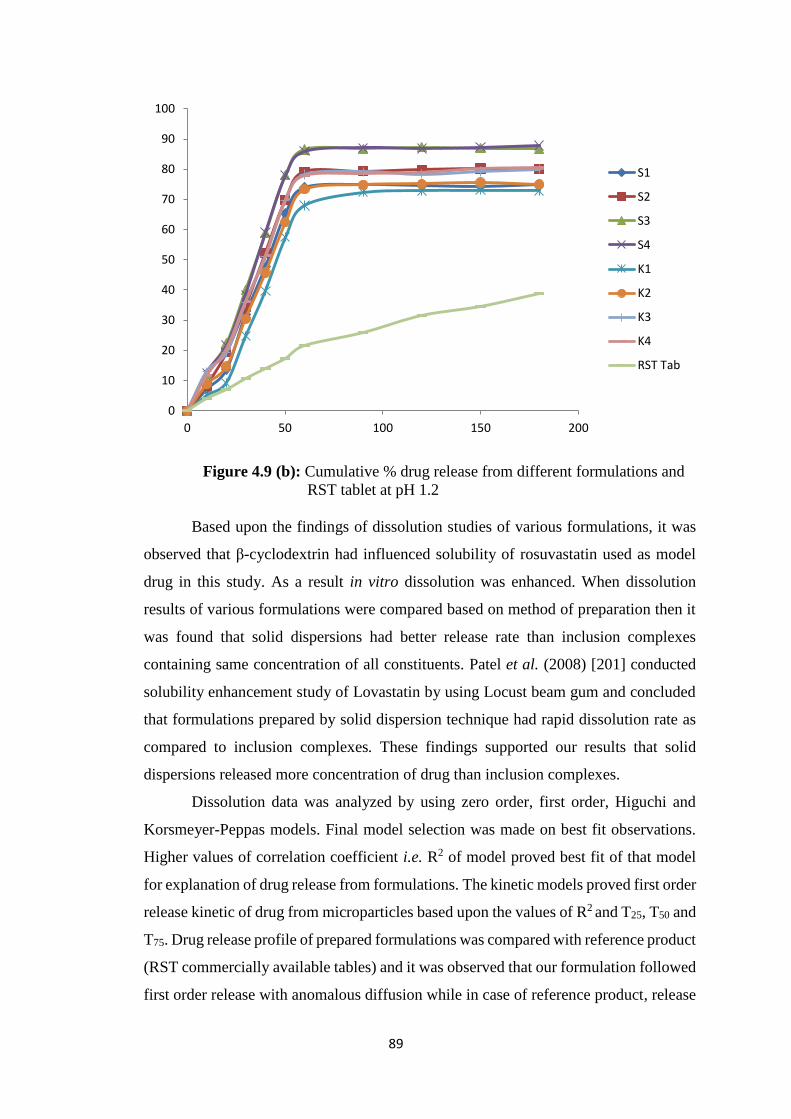
89
Figure 4.9 (b): Cumulative % drug release from different formulations and
RST tablet at pH 1.2
Based upon the findings of dissolution studies of various formulations, it was
observed that β-cyclodextrin had influenced solubility of rosuvastatin used as model
drug in this study. As a result in vitro dissolution was enhanced. When dissolution
results of various formulations were compared based on method of preparation then it
was found that solid dispersions had better release rate than inclusion complexes
containing same concentration of all constituents. Patel et al. (2008) [201] conducted
solubility enhancement study of Lovastatin by using Locust beam gum and concluded
that formulations prepared by solid dispersion technique had rapid dissolution rate as
compared to inclusion complexes. These findings supported our results that solid
dispersions released more concentration of drug than inclusion complexes.
Dissolution data was analyzed by using zero order, first order, Higuchi and
Korsmeyer-Peppas models. Final model selection was made on best fit observations.
Higher values of correlation coefficient i.e. R2 of model proved best fit of that model
for explanation of drug release from formulations. The kinetic models proved first order
release kinetic of drug from microparticles based upon the values of R2 and T25, T50 and
T75. Drug release profile of prepared formulations was compared with reference product
(RST commercially available tables) and it was observed that our formulation followed
first order release with anomalous diffusion while in case of reference product, release
0
10
20
30
40
50
60
70
80
90
100
0 50 100 150 200
S1
S2
S3
S4
K1
K2
K3
K4
RST Tab
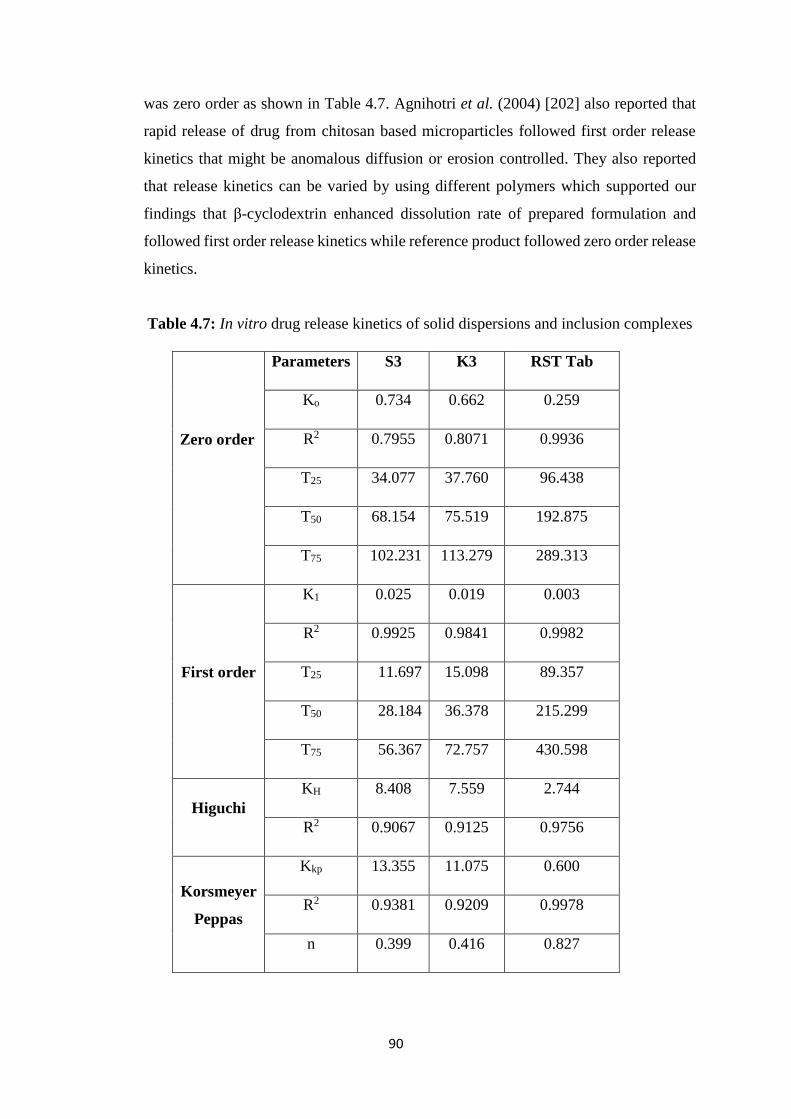
90
was zero order as shown in Table 4.7. Agnihotri et al. (2004) [202] also reported that
rapid release of drug from chitosan based microparticles followed first order release
kinetics that might be anomalous diffusion or erosion controlled. They also reported
that release kinetics can be varied by using different polymers which supported our
findings that β-cyclodextrin enhanced dissolution rate of prepared formulation and
followed first order release kinetics while reference product followed zero order release
kinetics.
Table 4.7: In vitro drug release kinetics of solid dispersions and inclusion complexes
Zero order
Parameters S3 K3 RST Tab
Ko 0.734 0.662 0.259
R2 0.7955 0.8071 0.9936
T25 34.077 37.760 96.438
T50 68.154 75.519 192.875
T75 102.231 113.279 289.313
First order
K1 0.025 0.019 0.003
R2 0.9925 0.9841 0.9982
T25 11.697 15.098 89.357
T50 28.184 36.378 215.299
T75 56.367 72.757 430.598
Higuchi
KH 8.408 7.559 2.744
R2 0.9067 0.9125 0.9756
Korsmeyer
Peppas
Kkp 13.355 11.075 0.600
R2 0.9381 0.9209 0.9978
n 0.399 0.416 0.827
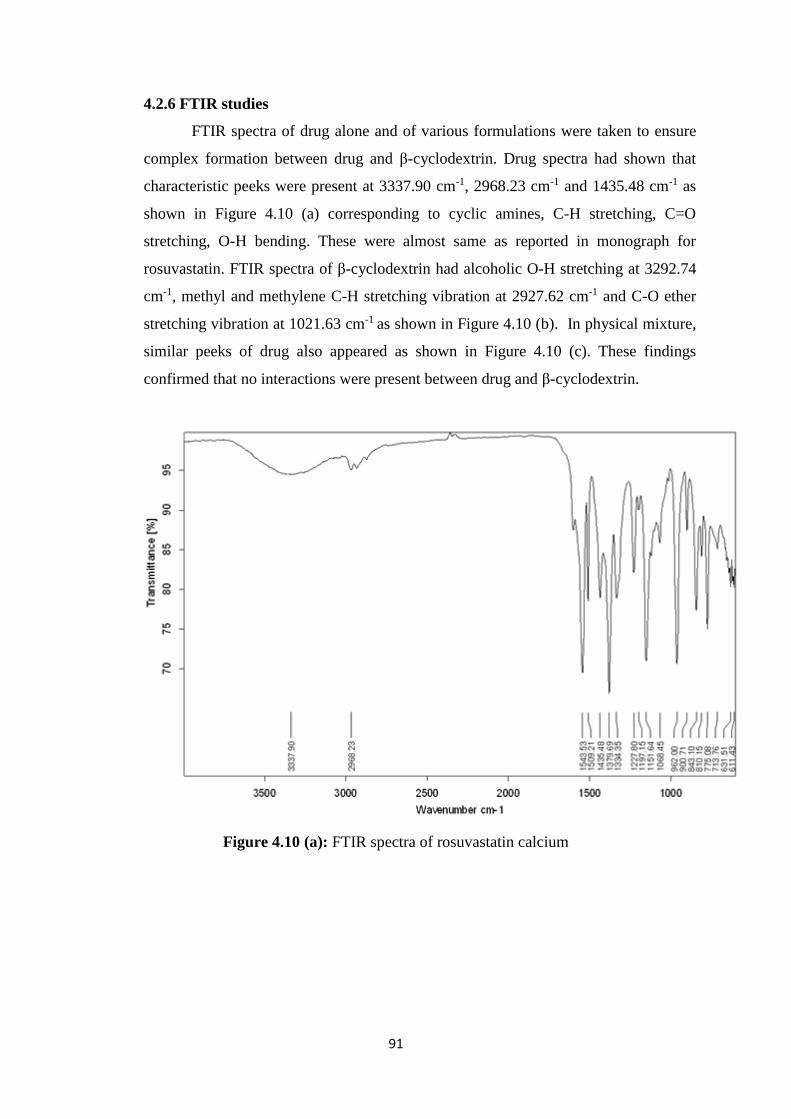
91
4.2.6 FTIR studies
FTIR spectra of drug alone and of various formulations were taken to ensure
complex formation between drug and β-cyclodextrin. Drug spectra had shown that
characteristic peeks were present at 3337.90 cm-1, 2968.23 cm-1 and 1435.48 cm-1 as
shown in Figure 4.10 (a) corresponding to cyclic amines, C-H stretching, C=O
stretching, O-H bending. These were almost same as reported in monograph for
rosuvastatin. FTIR spectra of β-cyclodextrin had alcoholic O-H stretching at 3292.74
cm-1, methyl and methylene C-H stretching vibration at 2927.62 cm-1 and C-O ether
stretching vibration at 1021.63 cm-1 as shown in Figure 4.10 (b). In physical mixture,
similar peeks of drug also appeared as shown in Figure 4.10 (c). These findings
confirmed that no interactions were present between drug and β-cyclodextrin.
Figure 4.10 (a): FTIR spectra of rosuvastatin calcium
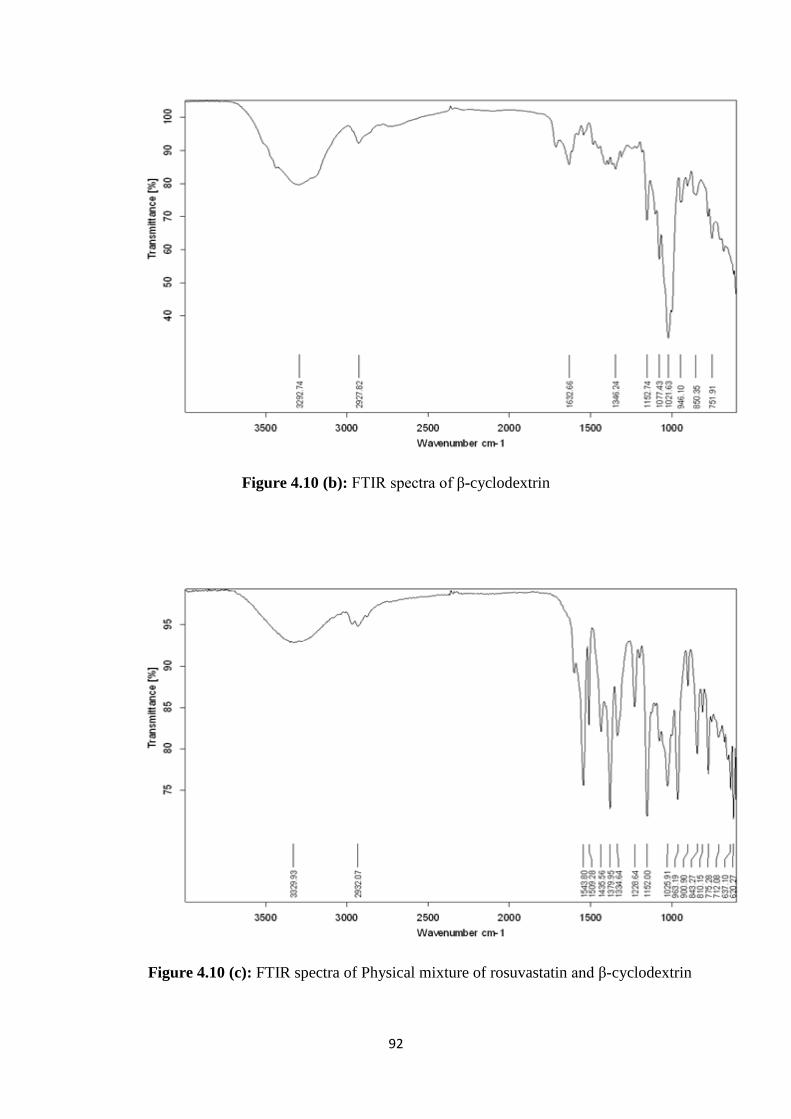
92
Figure 4.10 (b): FTIR spectra of β-cyclodextrin
Figure 4.10 (c): FTIR spectra of Physical mixture of rosuvastatin and β-cyclodextrin
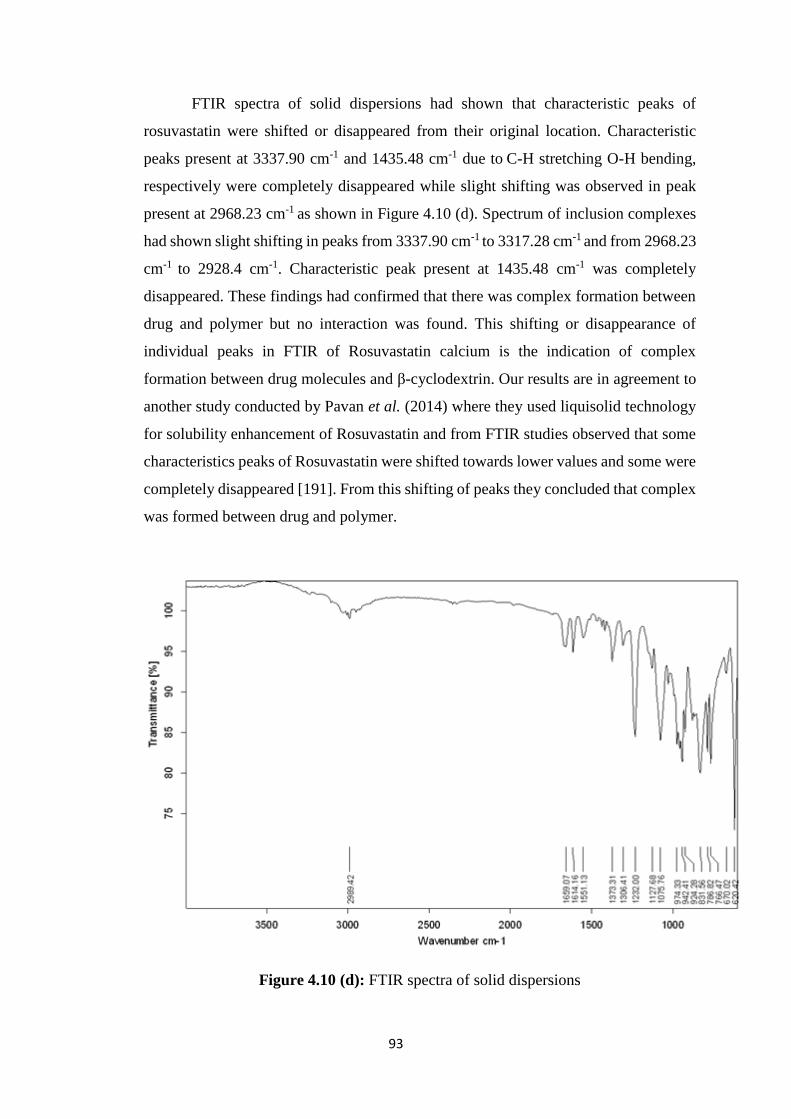
93
FTIR spectra of solid dispersions had shown that characteristic peaks of
rosuvastatin were shifted or disappeared from their original location. Characteristic
peaks present at 3337.90 cm-1 and 1435.48 cm-1 due to C-H stretching O-H bending,
respectively were completely disappeared while slight shifting was observed in peak
present at 2968.23 cm-1 as shown in Figure 4.10 (d). Spectrum of inclusion complexes
had shown slight shifting in peaks from 3337.90 cm-1 to 3317.28 cm-1 and from 2968.23
cm-1 to 2928.4 cm-1. Characteristic peak present at 1435.48 cm-1 was completely
disappeared. These findings had confirmed that there was complex formation between
drug and polymer but no interaction was found. This shifting or disappearance of
individual peaks in FTIR of Rosuvastatin calcium is the indication of complex
formation between drug molecules and β-cyclodextrin. Our results are in agreement to
another study conducted by Pavan et al. (2014) where they used liquisolid technology
for solubility enhancement of Rosuvastatin and from FTIR studies observed that some
characteristics peaks of Rosuvastatin were shifted towards lower values and some were
completely disappeared [191]. From this shifting of peaks they concluded that complex
was formed between drug and polymer.
Figure 4.10 (d): FTIR spectra of solid dispersions
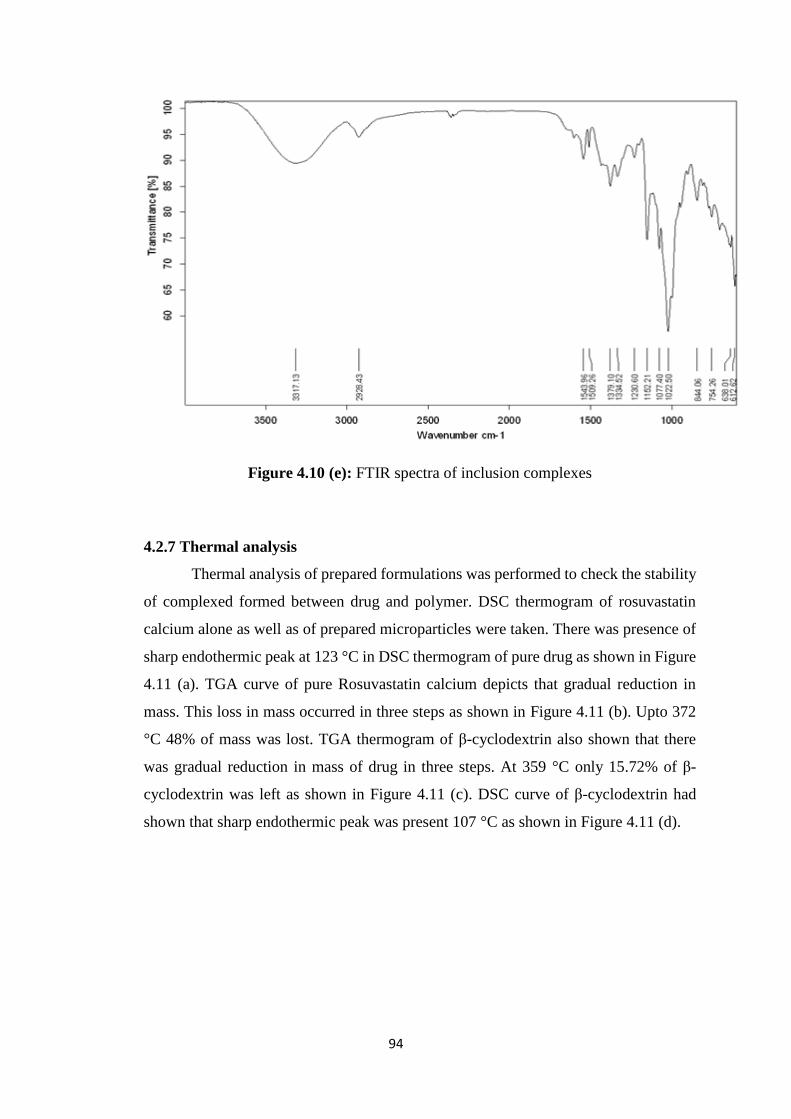
94
Figure 4.10 (e): FTIR spectra of inclusion complexes
4.2.7 Thermal analysis
Thermal analysis of prepared formulations was performed to check the stability
of complexed formed between drug and polymer. DSC thermogram of rosuvastatin
calcium alone as well as of prepared microparticles were taken. There was presence of
sharp endothermic peak at 123 °C in DSC thermogram of pure drug as shown in Figure
4.11 (a). TGA curve of pure Rosuvastatin calcium depicts that gradual reduction in
mass. This loss in mass occurred in three steps as shown in Figure 4.11 (b). Upto 372
°C 48% of mass was lost. TGA thermogram of β-cyclodextrin also shown that there
was gradual reduction in mass of drug in three steps. At 359 °C only 15.72% of β-
cyclodextrin was left as shown in Figure 4.11 (c). DSC curve of β-cyclodextrin had
shown that sharp endothermic peak was present 107 °C as shown in Figure 4.11 (d).
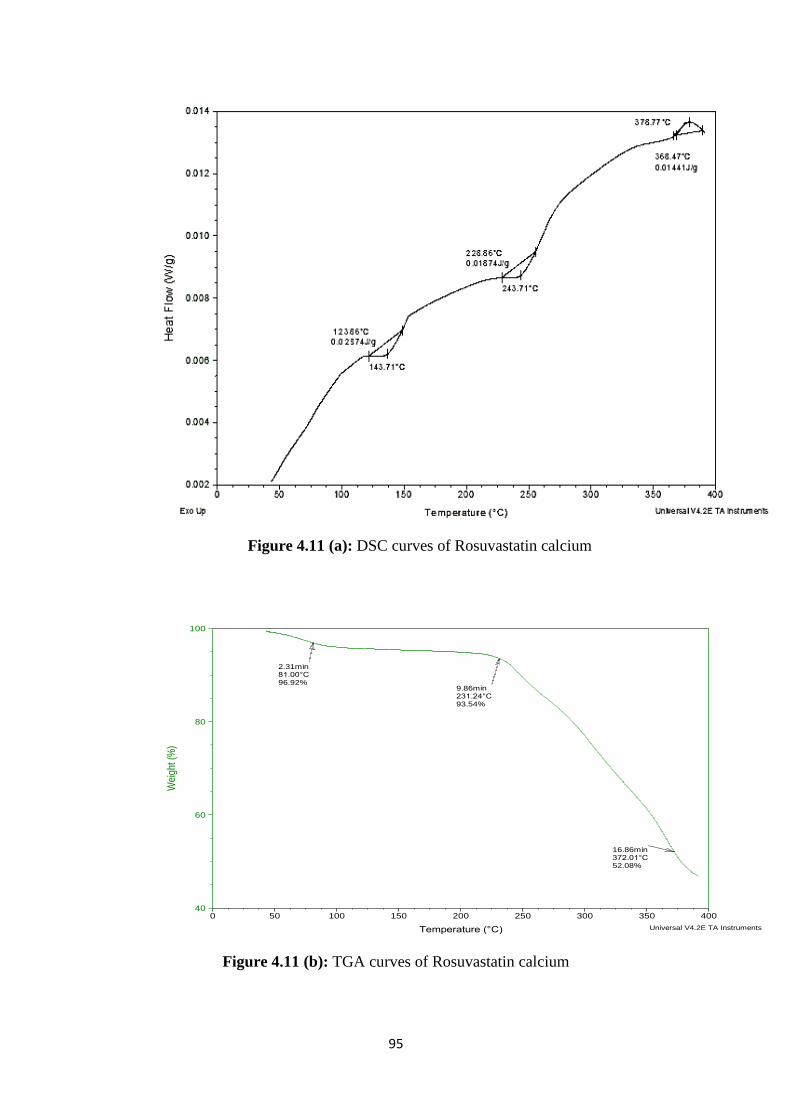
95
Figure 4.11 (a): DSC curves of Rosuvastatin calcium
Figure 4.11 (b): TGA curves of Rosuvastatin calcium
2.31min81.00°C96.92%
9.86min231.24°C93.54%
16.86min372.01°C52.08%
40
60
80
100
Wei
ght (
%)
0 50 100 150 200 250 300 350 400
Temperature (°C)
Sample: TSize: 2.3280 mg
Comment: T
DSC-TGAFile: D:\TGA\RAY\T.001
Run Date: 15-Apr-2015 11:16Instrument: SDT Q600 V8.2 Build 100
Universal V4.2E TA Instruments
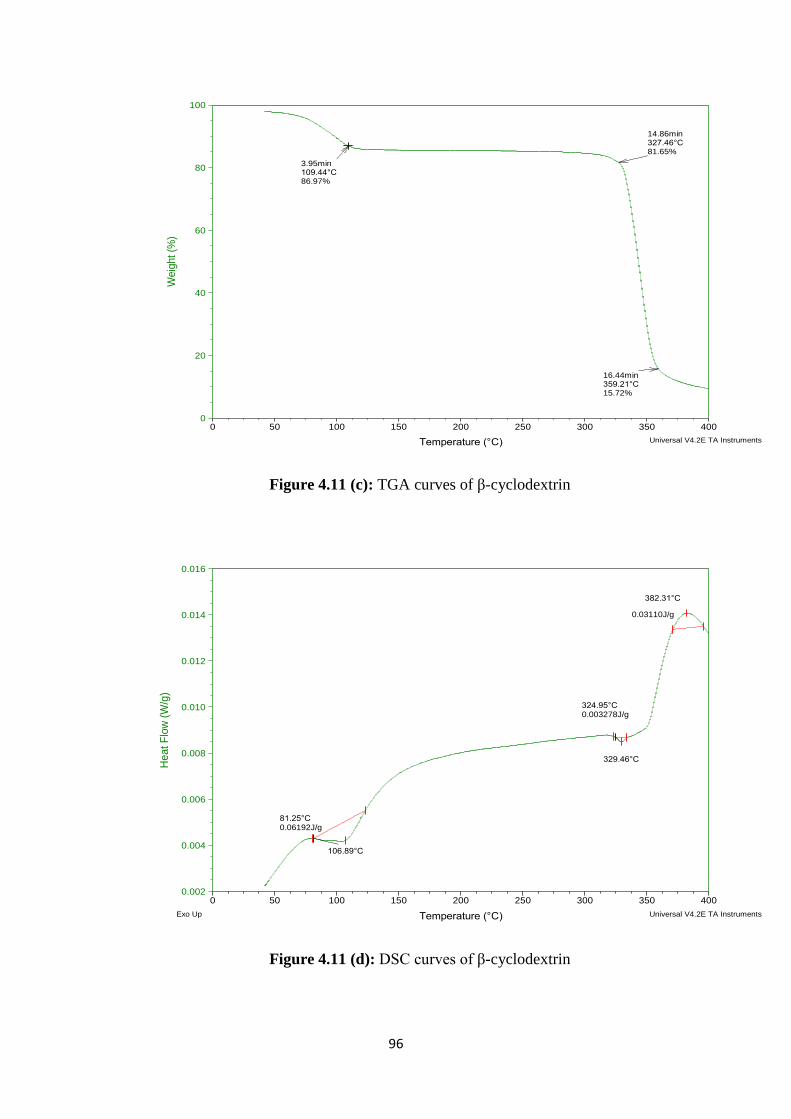
96
Figure 4.11 (c): TGA curves of β-cyclodextrin
Figure 4.11 (d): DSC curves of β-cyclodextrin
3.95min109.44°C86.97%
14.86min327.46°C81.65%
16.44min359.21°C15.72%
0
20
40
60
80
100
We
igh
t (%
)
0 50 100 150 200 250 300 350 400
Temperature (°C)
Sample: BSize: 2.3400 mg
Comment: B
DSC-TGAFile: D:\TGA\RAY\B.001
Run Date: 14-Apr-2015 12:26Instrument: SDT Q600 V8.2 Build 100
Universal V4.2E TA Instruments
106.89°C
81.25°C0.06192J/g
329.46°C
324.95°C0.003278J/g
382.31°C
0.03110J/g
0.002
0.004
0.006
0.008
0.010
0.012
0.014
0.016
Heat F
low
(W
/g)
0 50 100 150 200 250 300 350 400
Temperature (°C)
Sample: BSize: 2.3400 mg
Comment: B
DSC-TGAFile: D:\TGA\RAY\B.001
Run Date: 14-Apr-2015 12:26Instrument: SDT Q600 V8.2 Build 100
Exo Up Universal V4.2E TA Instruments
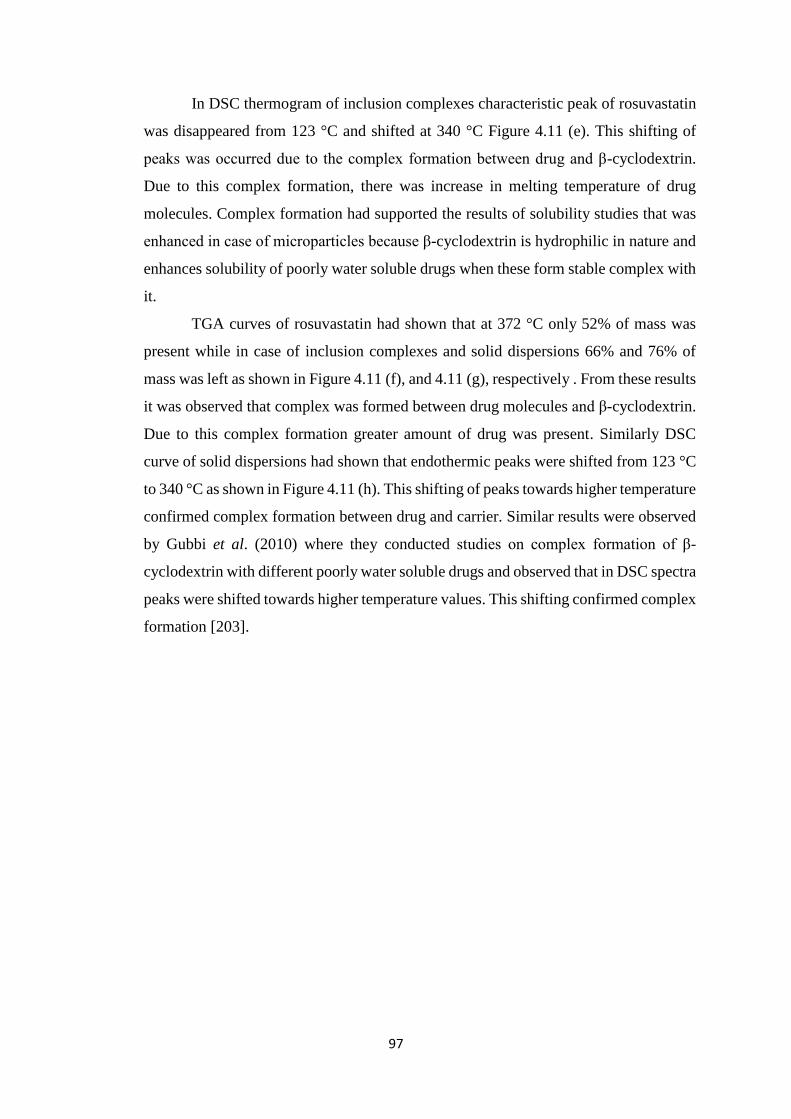
97
In DSC thermogram of inclusion complexes characteristic peak of rosuvastatin
was disappeared from 123 °C and shifted at 340 °C Figure 4.11 (e). This shifting of
peaks was occurred due to the complex formation between drug and β-cyclodextrin.
Due to this complex formation, there was increase in melting temperature of drug
molecules. Complex formation had supported the results of solubility studies that was
enhanced in case of microparticles because β-cyclodextrin is hydrophilic in nature and
enhances solubility of poorly water soluble drugs when these form stable complex with
it.
TGA curves of rosuvastatin had shown that at 372 °C only 52% of mass was
present while in case of inclusion complexes and solid dispersions 66% and 76% of
mass was left as shown in Figure 4.11 (f), and 4.11 (g), respectively . From these results
it was observed that complex was formed between drug molecules and β-cyclodextrin.
Due to this complex formation greater amount of drug was present. Similarly DSC
curve of solid dispersions had shown that endothermic peaks were shifted from 123 °C
to 340 °C as shown in Figure 4.11 (h). This shifting of peaks towards higher temperature
confirmed complex formation between drug and carrier. Similar results were observed
by Gubbi et al. (2010) where they conducted studies on complex formation of β-
cyclodextrin with different poorly water soluble drugs and observed that in DSC spectra
peaks were shifted towards higher temperature values. This shifting confirmed complex
formation [203].
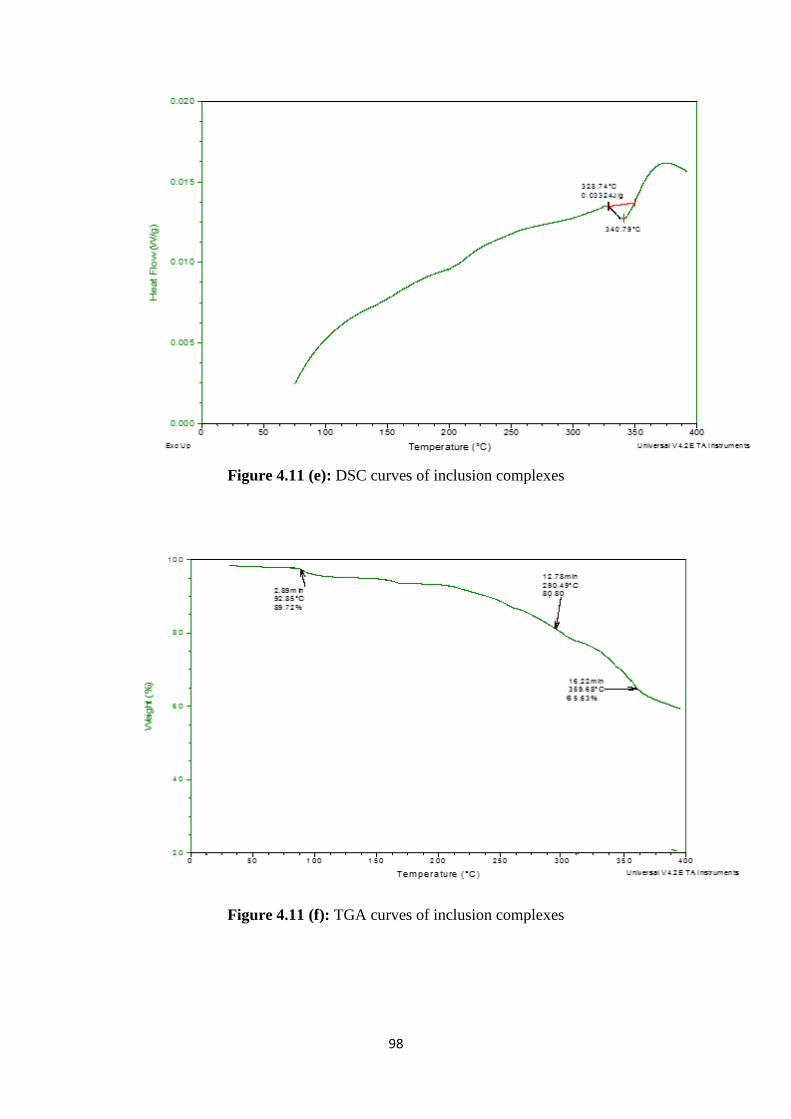
98
Figure 4.11 (e): DSC curves of inclusion complexes
Figure 4.11 (f): TGA curves of inclusion complexes
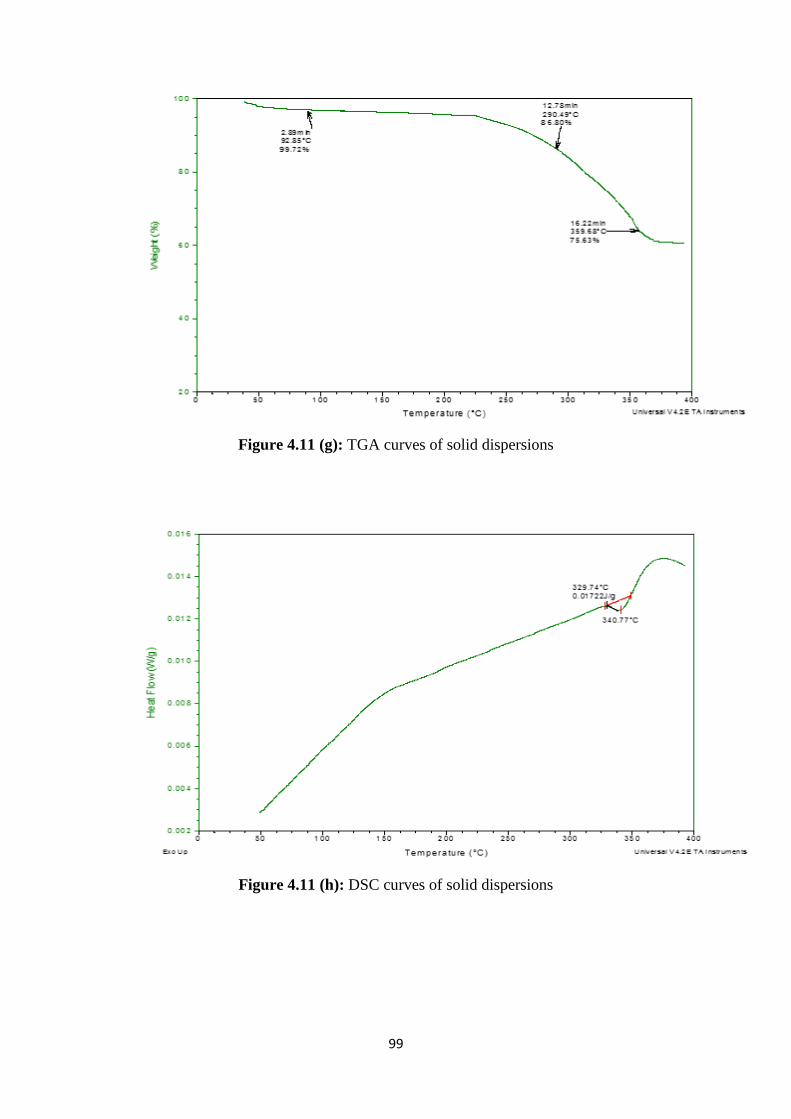
99
Figure 4.11 (g): TGA curves of solid dispersions
Figure 4.11 (h): DSC curves of solid dispersions
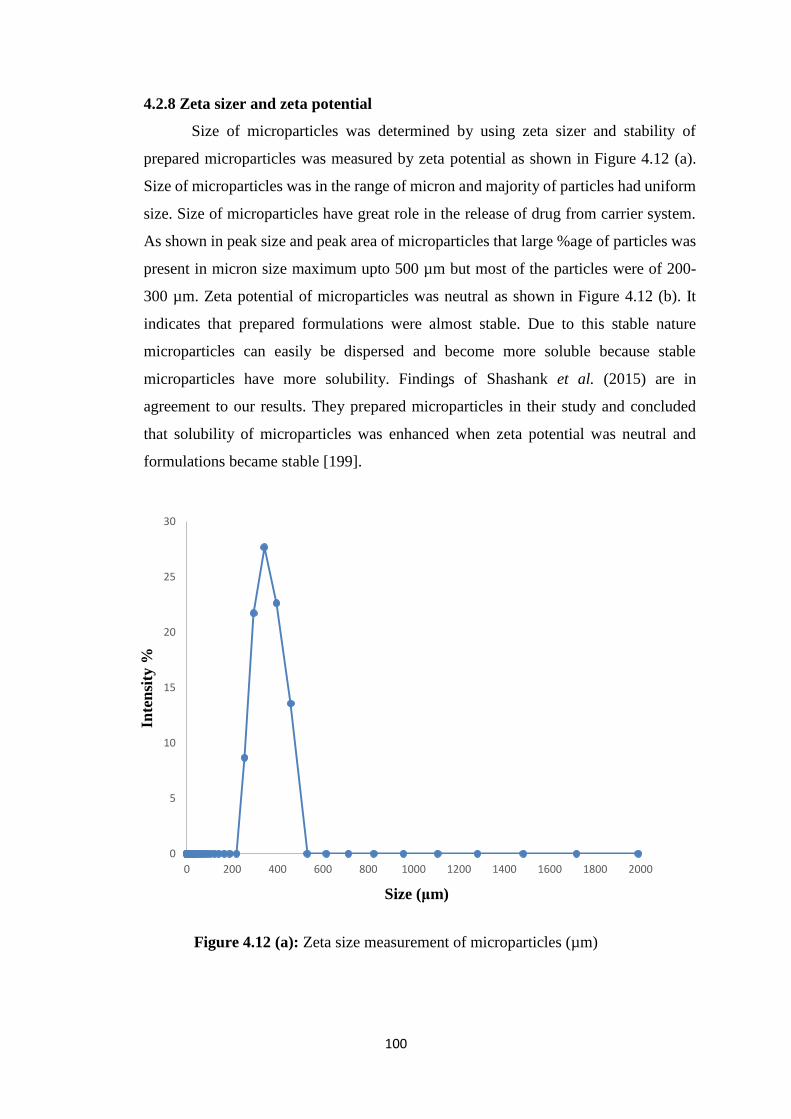
100
4.2.8 Zeta sizer and zeta potential
Size of microparticles was determined by using zeta sizer and stability of
prepared microparticles was measured by zeta potential as shown in Figure 4.12 (a).
Size of microparticles was in the range of micron and majority of particles had uniform
size. Size of microparticles have great role in the release of drug from carrier system.
As shown in peak size and peak area of microparticles that large %age of particles was
present in micron size maximum upto 500 µm but most of the particles were of 200-
300 µm. Zeta potential of microparticles was neutral as shown in Figure 4.12 (b). It
indicates that prepared formulations were almost stable. Due to this stable nature
microparticles can easily be dispersed and become more soluble because stable
microparticles have more solubility. Findings of Shashank et al. (2015) are in
agreement to our results. They prepared microparticles in their study and concluded
that solubility of microparticles was enhanced when zeta potential was neutral and
formulations became stable [199].
Figure 4.12 (a): Zeta size measurement of microparticles (µm)
0
5
10
15
20
25
30
0 200 400 600 800 1000 1200 1400 1600 1800 2000
Inte
nsi
ty %
Size (μm)
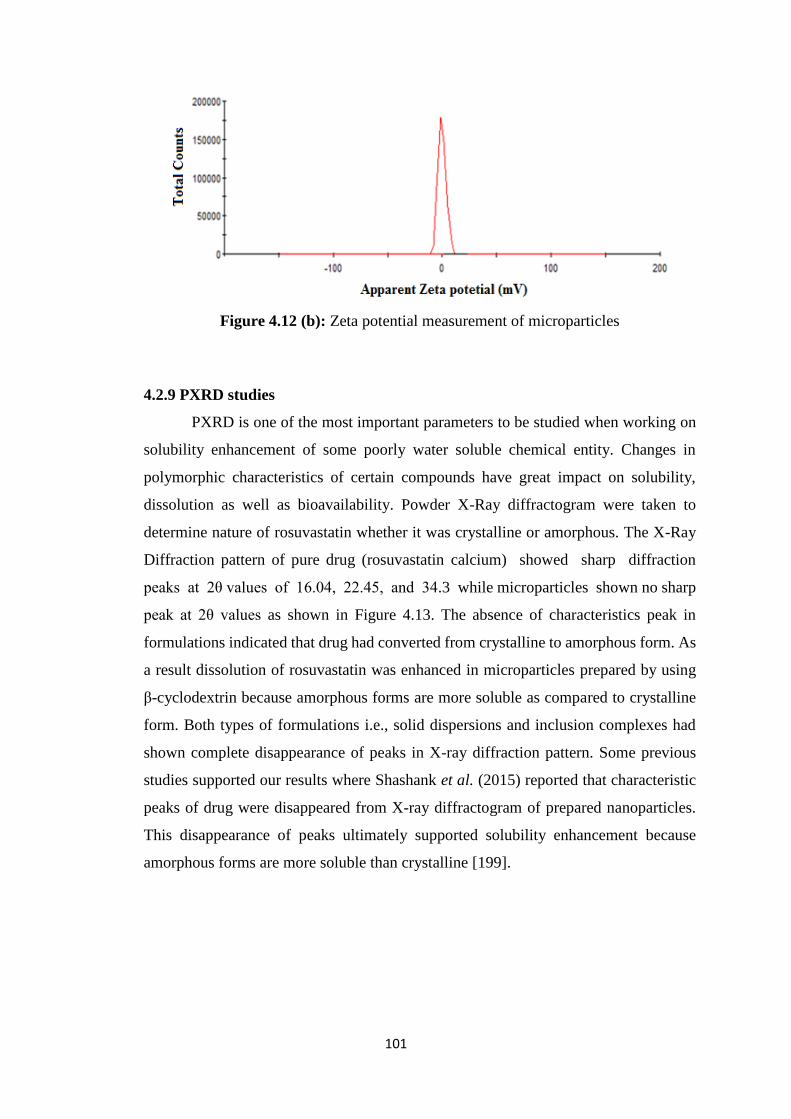
101
Figure 4.12 (b): Zeta potential measurement of microparticles
4.2.9 PXRD studies
PXRD is one of the most important parameters to be studied when working on
solubility enhancement of some poorly water soluble chemical entity. Changes in
polymorphic characteristics of certain compounds have great impact on solubility,
dissolution as well as bioavailability. Powder X-Ray diffractogram were taken to
determine nature of rosuvastatin whether it was crystalline or amorphous. The X-Ray
Diffraction pattern of pure drug (rosuvastatin calcium) showed sharp diffraction
peaks at 2θ values of 16.04, 22.45, and 34.3 while microparticles shown no sharp
peak at 2θ values as shown in Figure 4.13. The absence of characteristics peak in
formulations indicated that drug had converted from crystalline to amorphous form. As
a result dissolution of rosuvastatin was enhanced in microparticles prepared by using
β-cyclodextrin because amorphous forms are more soluble as compared to crystalline
form. Both types of formulations i.e., solid dispersions and inclusion complexes had
shown complete disappearance of peaks in X-ray diffraction pattern. Some previous
studies supported our results where Shashank et al. (2015) reported that characteristic
peaks of drug were disappeared from X-ray diffractogram of prepared nanoparticles.
This disappearance of peaks ultimately supported solubility enhancement because
amorphous forms are more soluble than crystalline [199].
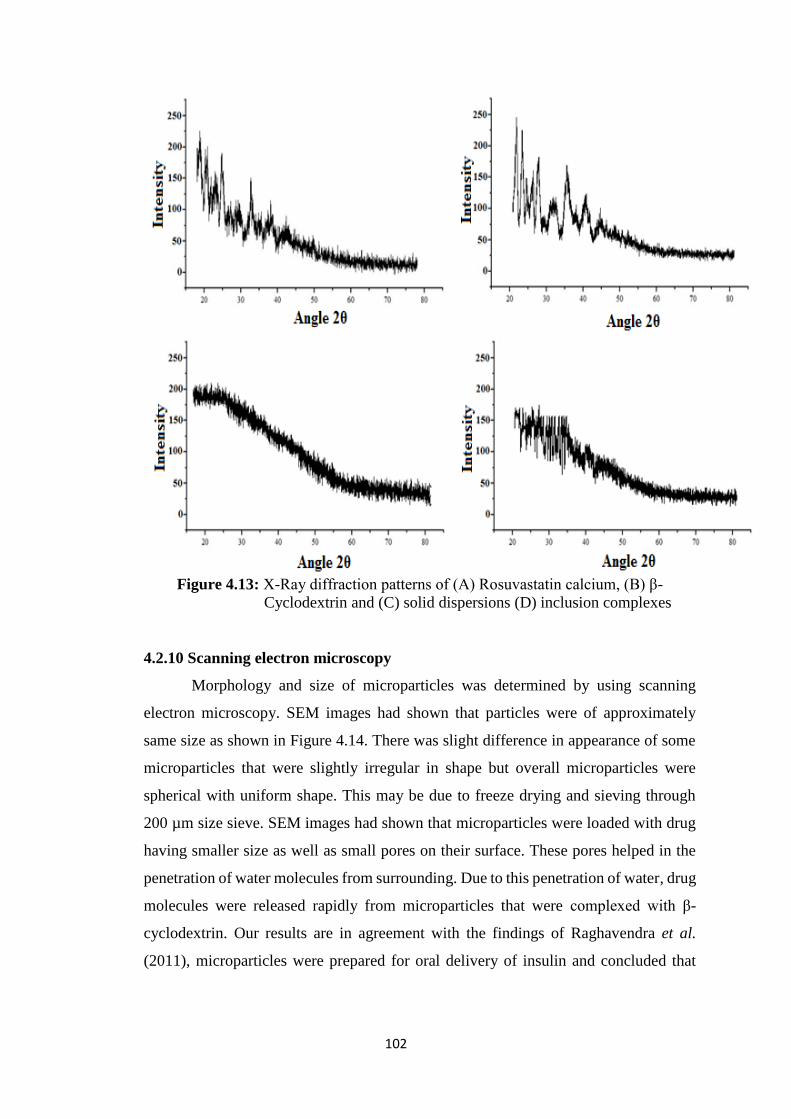
102
Figure 4.13: X-Ray diffraction patterns of (A) Rosuvastatin calcium, (B) β-
Cyclodextrin and (C) solid dispersions (D) inclusion complexes
4.2.10 Scanning electron microscopy
Morphology and size of microparticles was determined by using scanning
electron microscopy. SEM images had shown that particles were of approximately
same size as shown in Figure 4.14. There was slight difference in appearance of some
microparticles that were slightly irregular in shape but overall microparticles were
spherical with uniform shape. This may be due to freeze drying and sieving through
200 µm size sieve. SEM images had shown that microparticles were loaded with drug
having smaller size as well as small pores on their surface. These pores helped in the
penetration of water molecules from surrounding. Due to this penetration of water, drug
molecules were released rapidly from microparticles that were complexed with β-
cyclodextrin. Our results are in agreement with the findings of Raghavendra et al.
(2011), microparticles were prepared for oral delivery of insulin and concluded that
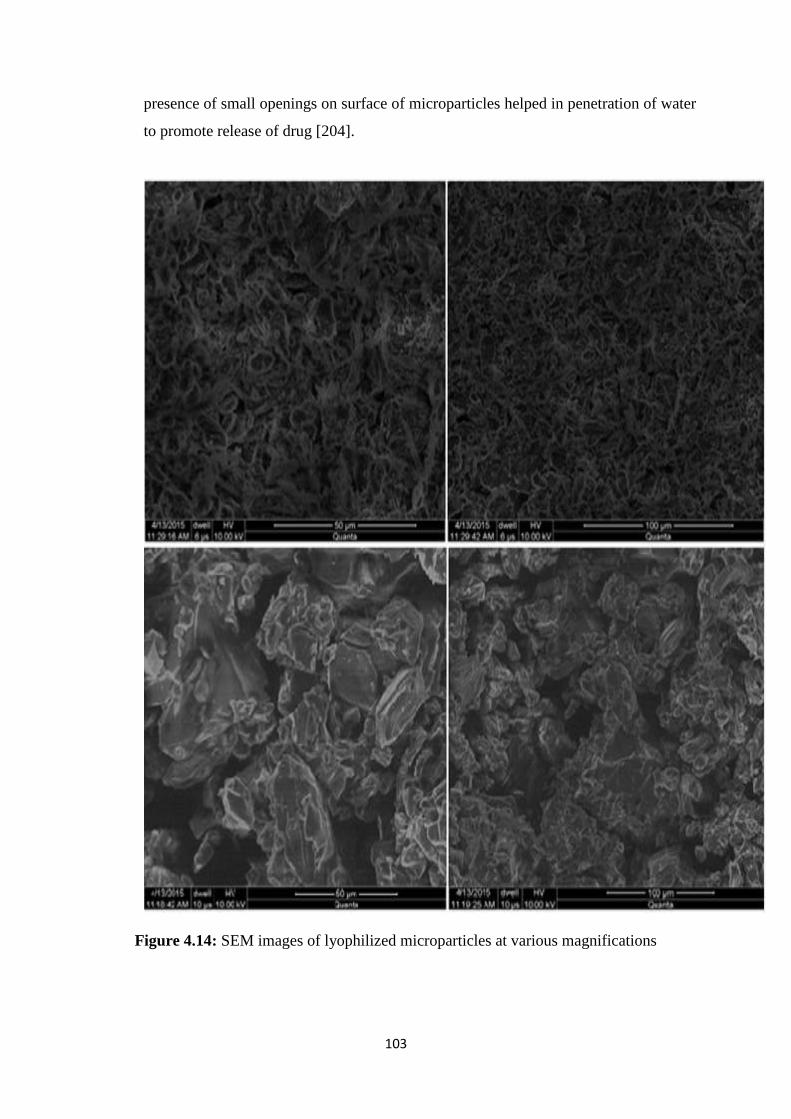
103
presence of small openings on surface of microparticles helped in penetration of water
to promote release of drug [204].
Figure 4.14: SEM images of lyophilized microparticles at various magnifications
104
4.2.11 Transmission electron microscopy
In order to determine shape and size of prepared microparticles, TEM analysis
was performed. TEM analysis was performed to see the internal morphology of
microparticles. Images had shown that microparticles had small uniform size upto the
range of 500-600 um. Drug loaded in microparticles either present in dispersed
molecules or in the form of nano dispersions. Images had clearly shown that drug was
loaded in microparticles both in molecular form as well as in the form of nano
dispersions as shown in Figure 4.15. Due to this fine distribution of drug within
microparticles results in increase in solubility of drug molecules that ultimately
enhanced its bioavailability.
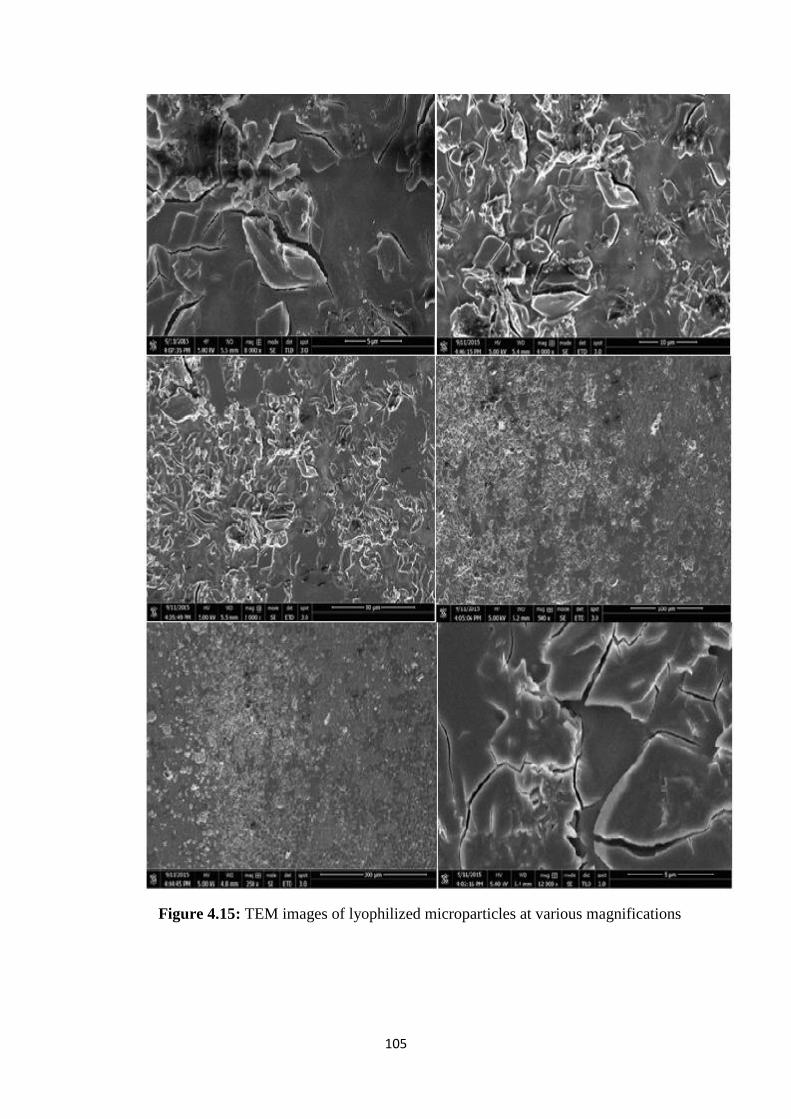
105
Figure 4.15: TEM images of lyophilized microparticles at various magnifications
106
4.2.12 Stability studies
Stability studies of two best formulations were conducted for six month period.
Microparticles were kept under accelerated conditions of temperature and humidity 35
± 5оС and 75% ± 5%, respectively. The samples were taken after 1, 2, 3, and 6 month
time period. These samples were evaluated for different parameters like solubility
studies, dissolution studies, FTIR, thermal analysis etc. The results had indicated that
there were no significant variations occurred in drug content at the end of 6 months.
Approximately similar amount of drug was released even in samples taken after 6
month period. Its means that our formulations were stable under different accelerated
conditions of temperature and humidity. Physical appearance of prepared formulation
was also compared to check any change but no difference was observed in freshly
prepared formulations and for that kept under accelerated conditions for stability
studies.
107
4.3 Hydrogel microparticles
Two different types of hydrogel microparticles were prepared containing
methacrylic acid and Acrylamido-2-methyl propane sulphonic acid in various
concentrations along with β-cyclodextrin, MBA and APS. Total eighteen formulations
of hydrogel microparticles were prepared, out of which nine had methacrylic acid and
other nine had Acrylamido-2-methyl propane sulphonic acid. Prepared formulations
varied from each other by concentration of β-cyclodextrin which is used as polymer,
MBA used as cross linker and methacrylic acid and Acrylamido-2-methyl propane
sulphonic acid which were used as monomers. Prepared hydrogel microparticles were
evaluated for various parameters and studied the effect of polymer, monomer and cross
linker on swelling, release and solubility of rosuvastatin calcium that was used as model
drug. Hydrogel microparticles were first evaluated for micromeritics parameters.
Results of product yield and entrapment efficiency are listed in Table 4.8 and
4.9. Results of these parameters are in acceptable limits. All prepared formulations of
hydrogel microparticles had product yield of 86.50 ± 0.30 to 91 ± 0.50%. Findings of
entrapment efficiency had shown that 82.30 ± 0.25 to 89.00 ± 0.15% of drug was loaded
in various formulations. Entrapment efficiency is vital parameter to determine
efficiency of prepared carrier system to evaluate proper dosage regimen. Our results
had justified that prepared carrier system was suitable for loading of rosuvastatin
calcium to deliver desired quantity of drug at targeted sites.
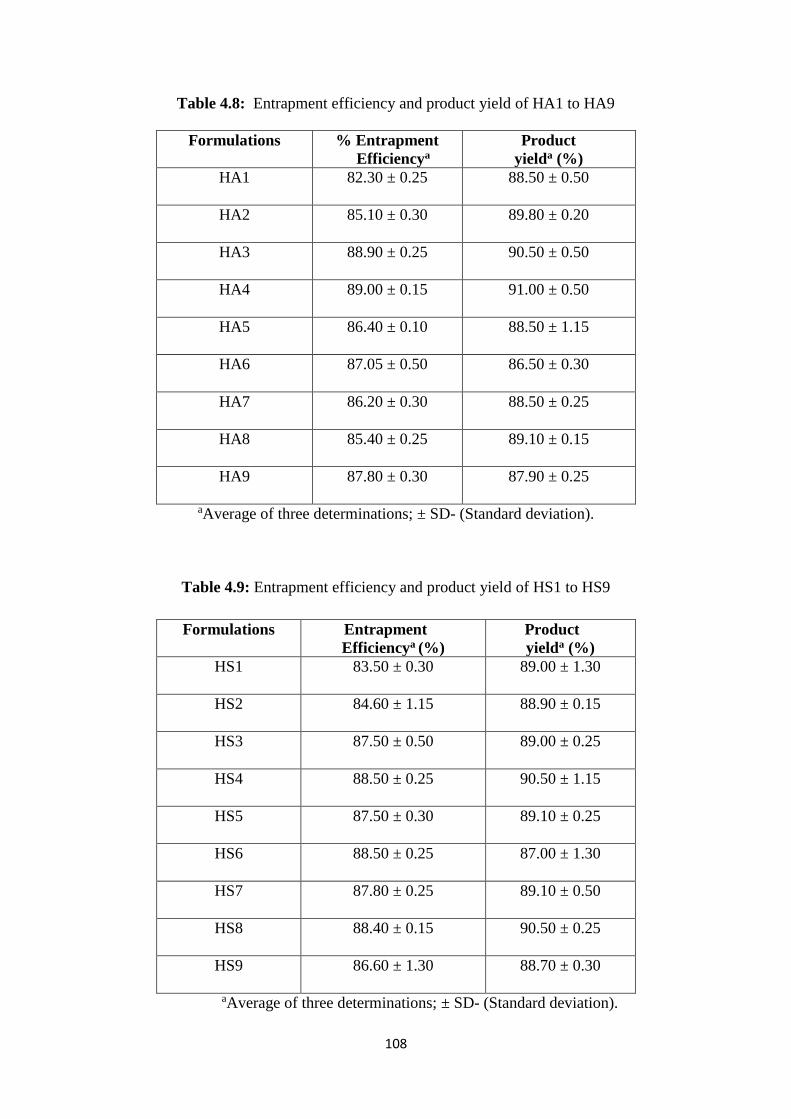
108
Table 4.8: Entrapment efficiency and product yield of HA1 to HA9
aAverage of three determinations; ± SD- (Standard deviation).
Table 4.9: Entrapment efficiency and product yield of HS1 to HS9
aAverage of three determinations; ± SD- (Standard deviation).
Formulations % Entrapment
Efficiencya
Product
yielda (%)
HA1 82.30 ± 0.25 88.50 ± 0.50
HA2 85.10 ± 0.30 89.80 ± 0.20
HA3 88.90 ± 0.25 90.50 ± 0.50
HA4 89.00 ± 0.15 91.00 ± 0.50
HA5 86.40 ± 0.10 88.50 ± 1.15
HA6 87.05 ± 0.50 86.50 ± 0.30
HA7 86.20 ± 0.30 88.50 ± 0.25
HA8 85.40 ± 0.25 89.10 ± 0.15
HA9 87.80 ± 0.30 87.90 ± 0.25
Formulations Entrapment
Efficiencya (%)
Product
yielda (%)
HS1 83.50 ± 0.30 89.00 ± 1.30
HS2 84.60 ± 1.15 88.90 ± 0.15
HS3 87.50 ± 0.50 89.00 ± 0.25
HS4 88.50 ± 0.25 90.50 ± 1.15
HS5 87.50 ± 0.30 89.10 ± 0.25
HS6 88.50 ± 0.25 87.00 ± 1.30
HS7 87.80 ± 0.25 89.10 ± 0.50
HS8 88.40 ± 0.15 90.50 ± 0.25
HS9 86.60 ± 1.30 88.70 ± 0.30
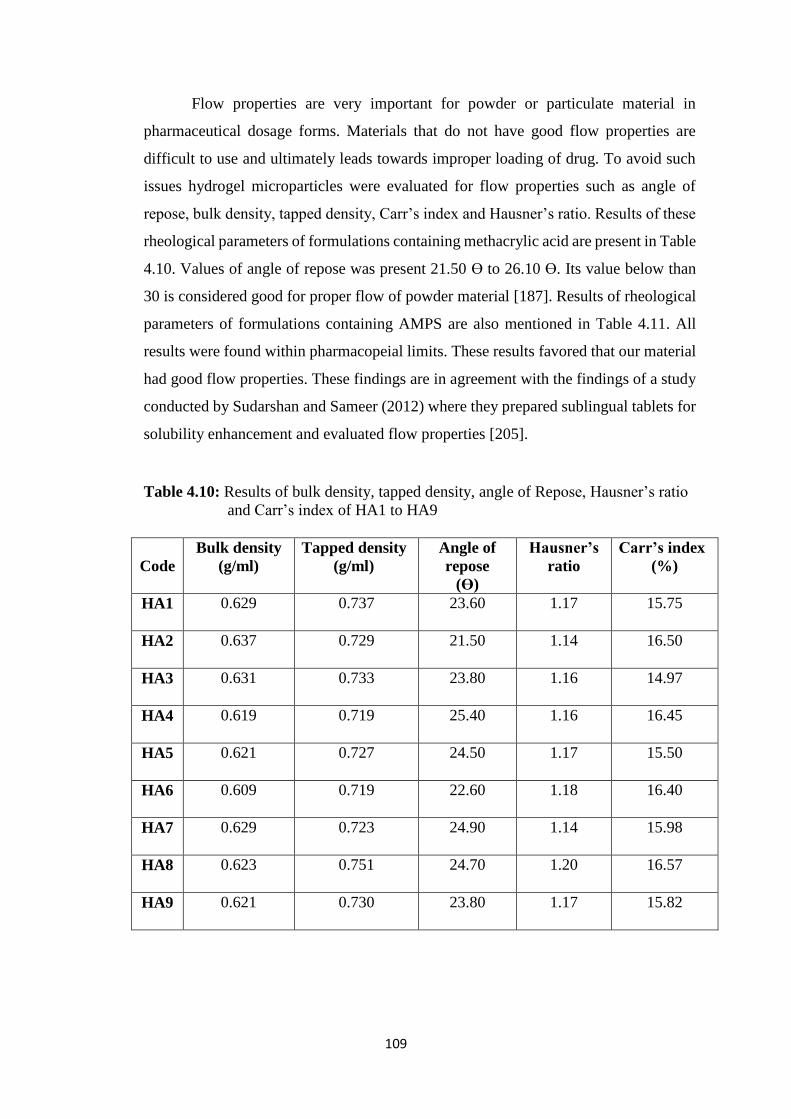
109
Flow properties are very important for powder or particulate material in
pharmaceutical dosage forms. Materials that do not have good flow properties are
difficult to use and ultimately leads towards improper loading of drug. To avoid such
issues hydrogel microparticles were evaluated for flow properties such as angle of
repose, bulk density, tapped density, Carr’s index and Hausner’s ratio. Results of these
rheological parameters of formulations containing methacrylic acid are present in Table
4.10. Values of angle of repose was present 21.50 Ɵ to 26.10 Ɵ. Its value below than
30 is considered good for proper flow of powder material [187]. Results of rheological
parameters of formulations containing AMPS are also mentioned in Table 4.11. All
results were found within pharmacopeial limits. These results favored that our material
had good flow properties. These findings are in agreement with the findings of a study
conducted by Sudarshan and Sameer (2012) where they prepared sublingual tablets for
solubility enhancement and evaluated flow properties [205].
Table 4.10: Results of bulk density, tapped density, angle of Repose, Hausner’s ratio
and Carr’s index of HA1 to HA9
Code
Bulk density
(g/ml)
Tapped density
(g/ml)
Angle of
repose
(ϴ)
Hausner’s
ratio
Carr’s index
(%)
HA1 0.629 0.737 23.60 1.17 15.75
HA2 0.637 0.729 21.50 1.14 16.50
HA3 0.631 0.733 23.80 1.16 14.97
HA4 0.619 0.719 25.40 1.16 16.45
HA5 0.621 0.727 24.50 1.17 15.50
HA6 0.609 0.719 22.60 1.18 16.40
HA7 0.629 0.723 24.90 1.14 15.98
HA8 0.623 0.751 24.70 1.20 16.57
HA9 0.621 0.730 23.80 1.17 15.82
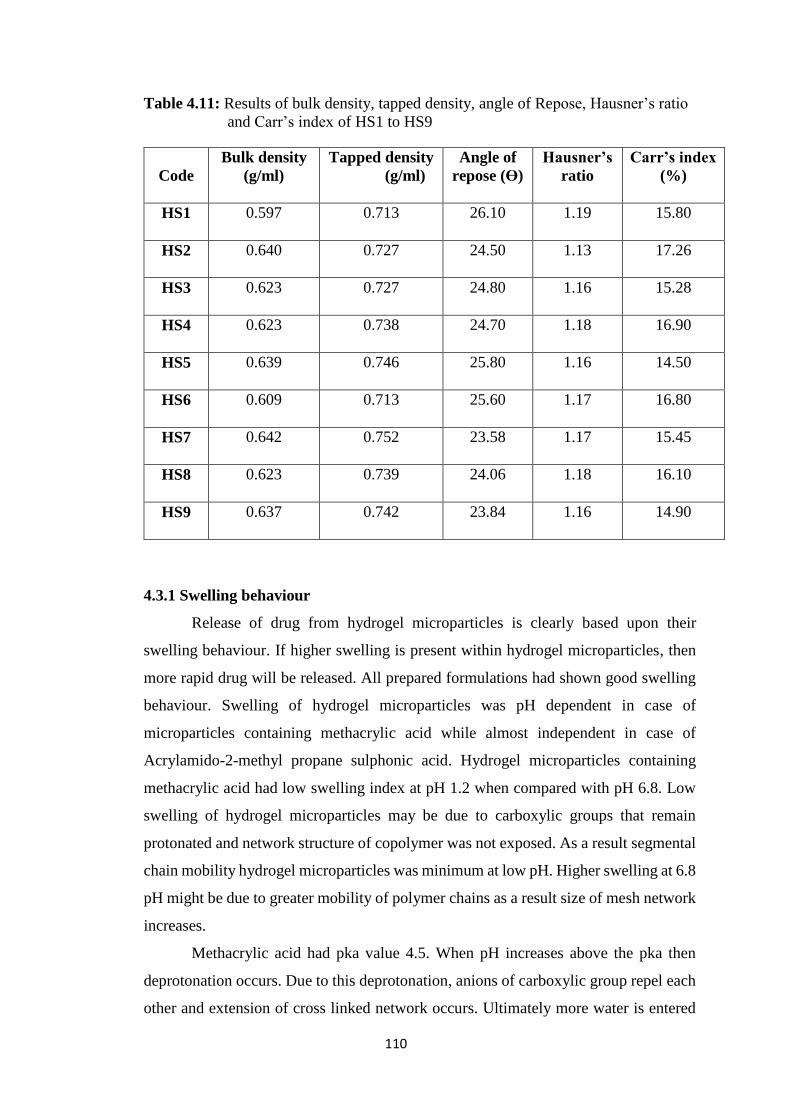
110
Table 4.11: Results of bulk density, tapped density, angle of Repose, Hausner’s ratio
and Carr’s index of HS1 to HS9
4.3.1 Swelling behaviour
Release of drug from hydrogel microparticles is clearly based upon their
swelling behaviour. If higher swelling is present within hydrogel microparticles, then
more rapid drug will be released. All prepared formulations had shown good swelling
behaviour. Swelling of hydrogel microparticles was pH dependent in case of
microparticles containing methacrylic acid while almost independent in case of
Acrylamido-2-methyl propane sulphonic acid. Hydrogel microparticles containing
methacrylic acid had low swelling index at pH 1.2 when compared with pH 6.8. Low
swelling of hydrogel microparticles may be due to carboxylic groups that remain
protonated and network structure of copolymer was not exposed. As a result segmental
chain mobility hydrogel microparticles was minimum at low pH. Higher swelling at 6.8
pH might be due to greater mobility of polymer chains as a result size of mesh network
increases.
Methacrylic acid had pka value 4.5. When pH increases above the pka then
deprotonation occurs. Due to this deprotonation, anions of carboxylic group repel each
other and extension of cross linked network occurs. Ultimately more water is entered
Code
Bulk density
(g/ml)
Tapped density
(g/ml)
Angle of
repose (ϴ)
Hausner’s
ratio
Carr’s index
(%)
HS1 0.597 0.713 26.10 1.19 15.80
HS2 0.640 0.727 24.50 1.13 17.26
HS3 0.623 0.727 24.80 1.16 15.28
HS4 0.623 0.738 24.70 1.18 16.90
HS5 0.639 0.746 25.80 1.16 14.50
HS6 0.609 0.713 25.60 1.17 16.80
HS7 0.642 0.752 23.58 1.17 15.45
HS8 0.623 0.739 24.06 1.18 16.10
HS9 0.637 0.742 23.84 1.16 14.90
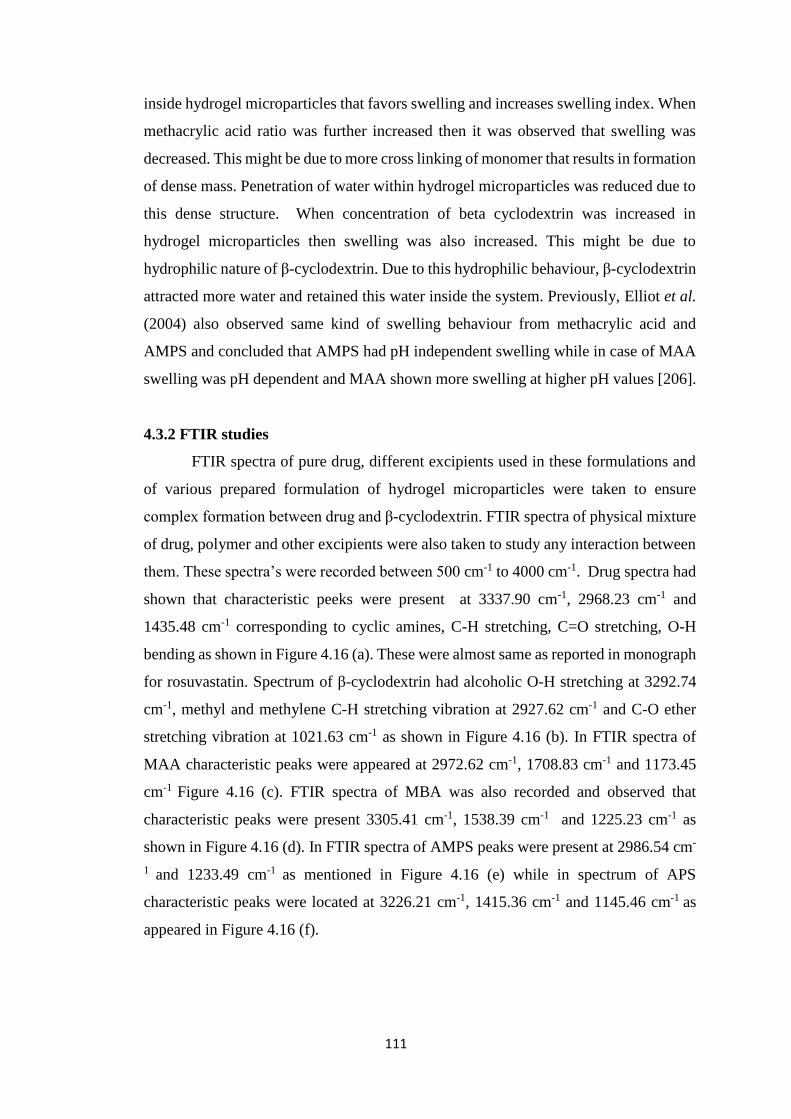
111
inside hydrogel microparticles that favors swelling and increases swelling index. When
methacrylic acid ratio was further increased then it was observed that swelling was
decreased. This might be due to more cross linking of monomer that results in formation
of dense mass. Penetration of water within hydrogel microparticles was reduced due to
this dense structure. When concentration of beta cyclodextrin was increased in
hydrogel microparticles then swelling was also increased. This might be due to
hydrophilic nature of β-cyclodextrin. Due to this hydrophilic behaviour, β-cyclodextrin
attracted more water and retained this water inside the system. Previously, Elliot et al.
(2004) also observed same kind of swelling behaviour from methacrylic acid and
AMPS and concluded that AMPS had pH independent swelling while in case of MAA
swelling was pH dependent and MAA shown more swelling at higher pH values [206].
4.3.2 FTIR studies
FTIR spectra of pure drug, different excipients used in these formulations and
of various prepared formulation of hydrogel microparticles were taken to ensure
complex formation between drug and β-cyclodextrin. FTIR spectra of physical mixture
of drug, polymer and other excipients were also taken to study any interaction between
them. These spectra’s were recorded between 500 cm-1 to 4000 cm-1. Drug spectra had
shown that characteristic peeks were present at 3337.90 cm-1, 2968.23 cm-1 and
1435.48 cm-1 corresponding to cyclic amines, C-H stretching, C=O stretching, O-H
bending as shown in Figure 4.16 (a). These were almost same as reported in monograph
for rosuvastatin. Spectrum of β-cyclodextrin had alcoholic O-H stretching at 3292.74
cm-1, methyl and methylene C-H stretching vibration at 2927.62 cm-1 and C-O ether
stretching vibration at 1021.63 cm-1 as shown in Figure 4.16 (b). In FTIR spectra of
MAA characteristic peaks were appeared at 2972.62 cm-1, 1708.83 cm-1 and 1173.45
cm-1 Figure 4.16 (c). FTIR spectra of MBA was also recorded and observed that
characteristic peaks were present 3305.41 cm-1, 1538.39 cm-1 and 1225.23 cm-1 as
shown in Figure 4.16 (d). In FTIR spectra of AMPS peaks were present at 2986.54 cm-
1 and 1233.49 cm-1 as mentioned in Figure 4.16 (e) while in spectrum of APS
characteristic peaks were located at 3226.21 cm-1, 1415.36 cm-1 and 1145.46 cm-1 as
appeared in Figure 4.16 (f).
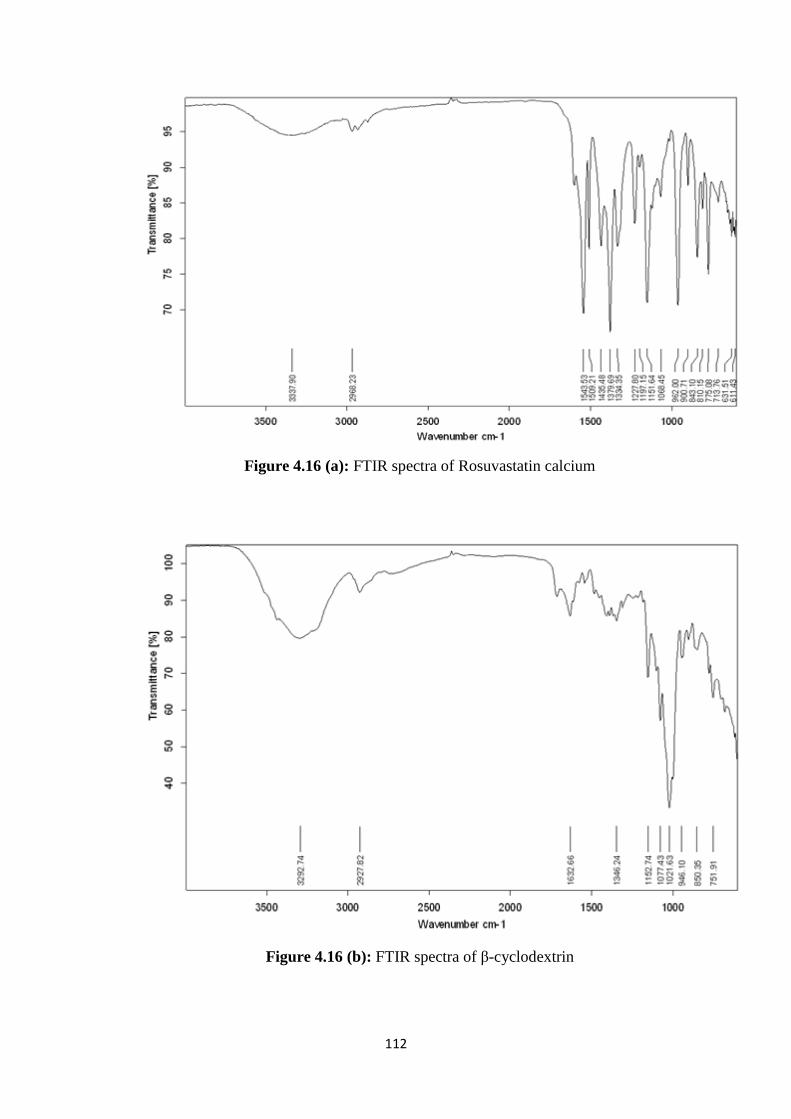
112
Figure 4.16 (a): FTIR spectra of Rosuvastatin calcium
Figure 4.16 (b): FTIR spectra of β-cyclodextrin
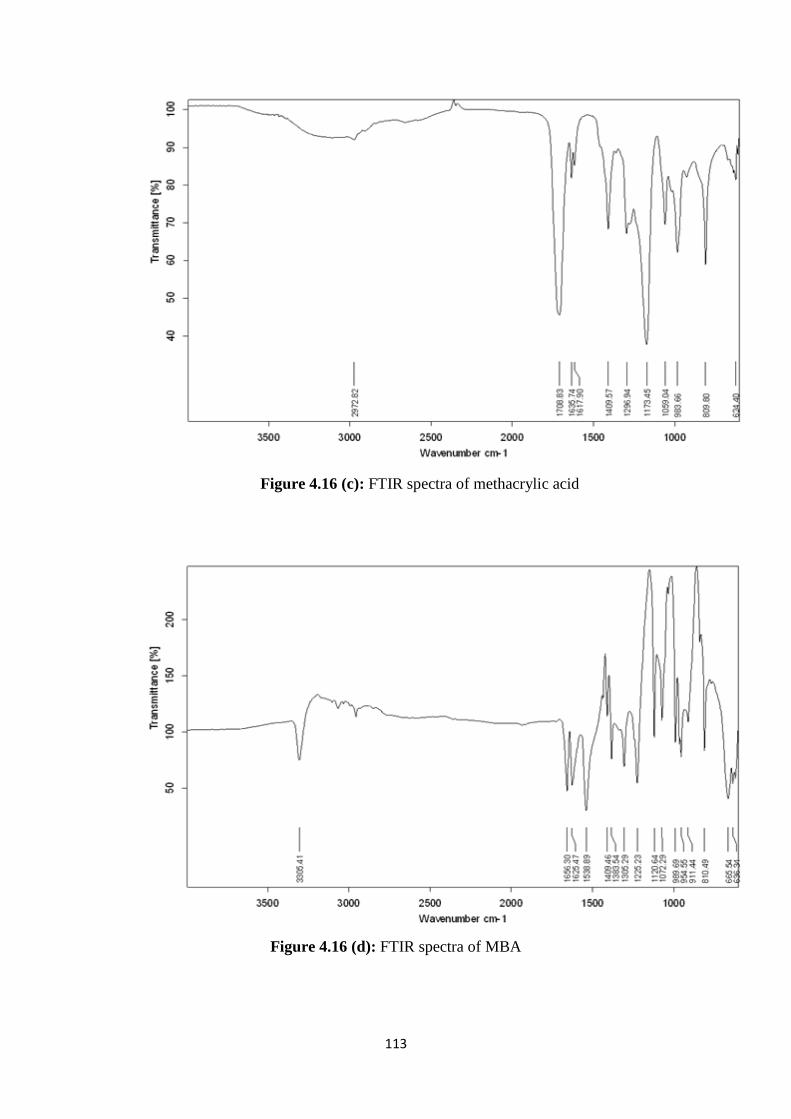
113
Figure 4.16 (c): FTIR spectra of methacrylic acid
Figure 4.16 (d): FTIR spectra of MBA
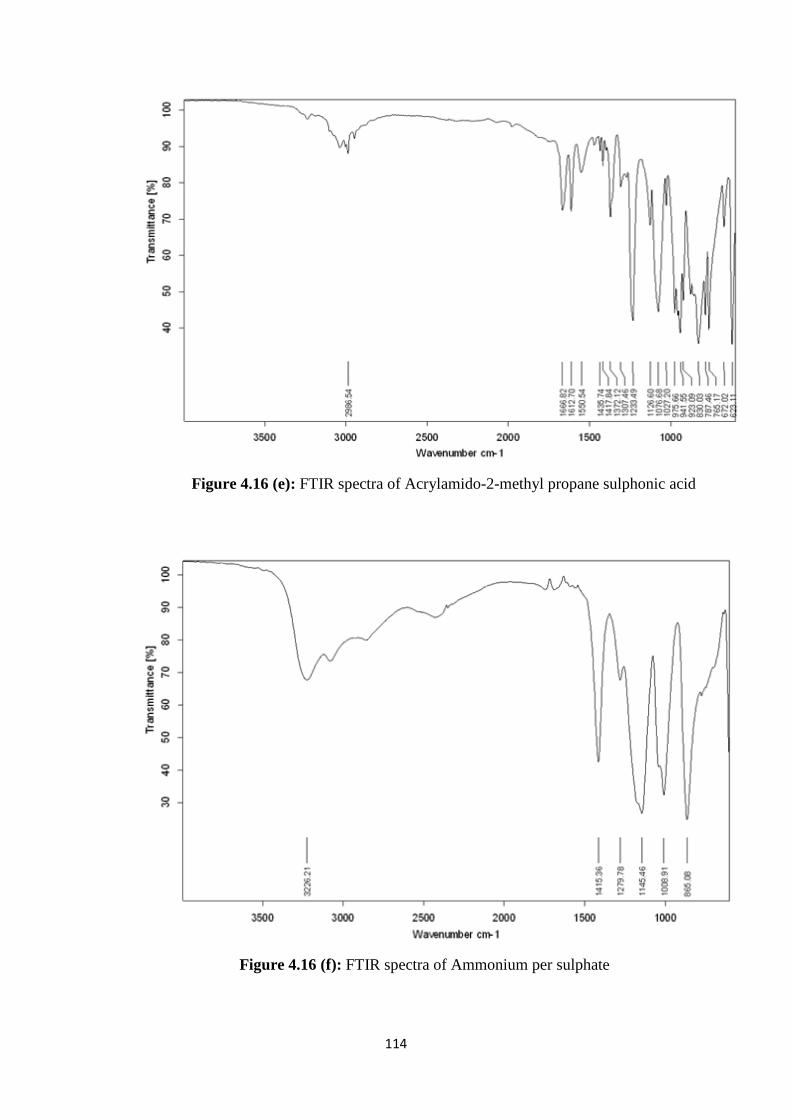
114
Figure 4.16 (e): FTIR spectra of Acrylamido-2-methyl propane sulphonic acid
Figure 4.16 (f): FTIR spectra of Ammonium per sulphate
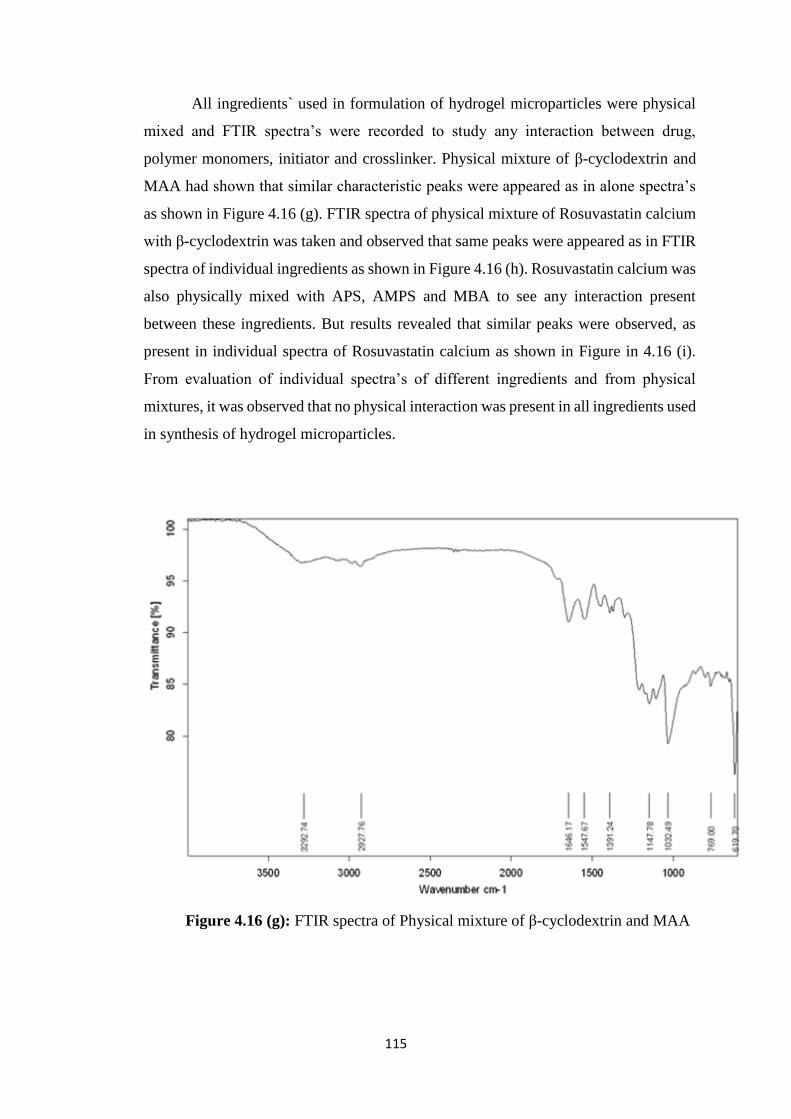
115
All ingredients` used in formulation of hydrogel microparticles were physical
mixed and FTIR spectra’s were recorded to study any interaction between drug,
polymer monomers, initiator and crosslinker. Physical mixture of β-cyclodextrin and
MAA had shown that similar characteristic peaks were appeared as in alone spectra’s
as shown in Figure 4.16 (g). FTIR spectra of physical mixture of Rosuvastatin calcium
with β-cyclodextrin was taken and observed that same peaks were appeared as in FTIR
spectra of individual ingredients as shown in Figure 4.16 (h). Rosuvastatin calcium was
also physically mixed with APS, AMPS and MBA to see any interaction present
between these ingredients. But results revealed that similar peaks were observed, as
present in individual spectra of Rosuvastatin calcium as shown in Figure in 4.16 (i).
From evaluation of individual spectra’s of different ingredients and from physical
mixtures, it was observed that no physical interaction was present in all ingredients used
in synthesis of hydrogel microparticles.
Figure 4.16 (g): FTIR spectra of Physical mixture of β-cyclodextrin and MAA
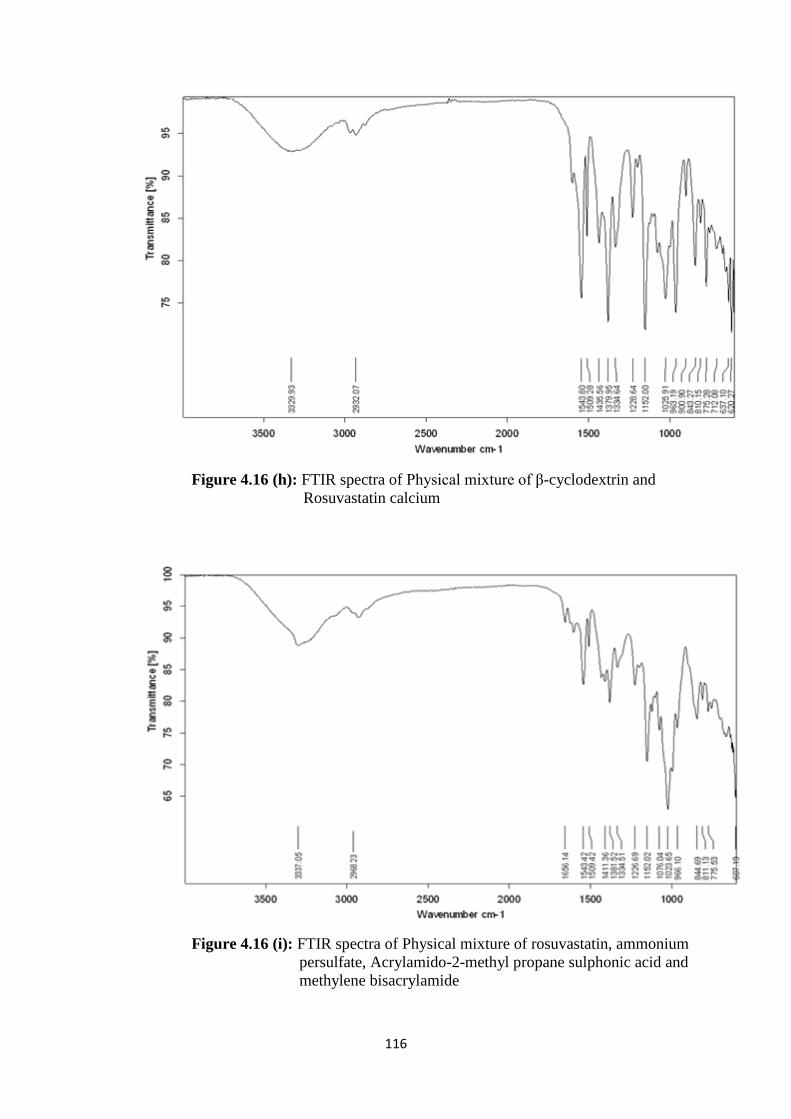
116
Figure 4.16 (h): FTIR spectra of Physical mixture of β-cyclodextrin and
Rosuvastatin calcium
Figure 4.16 (i): FTIR spectra of Physical mixture of rosuvastatin, ammonium
persulfate, Acrylamido-2-methyl propane sulphonic acid and
methylene bisacrylamide
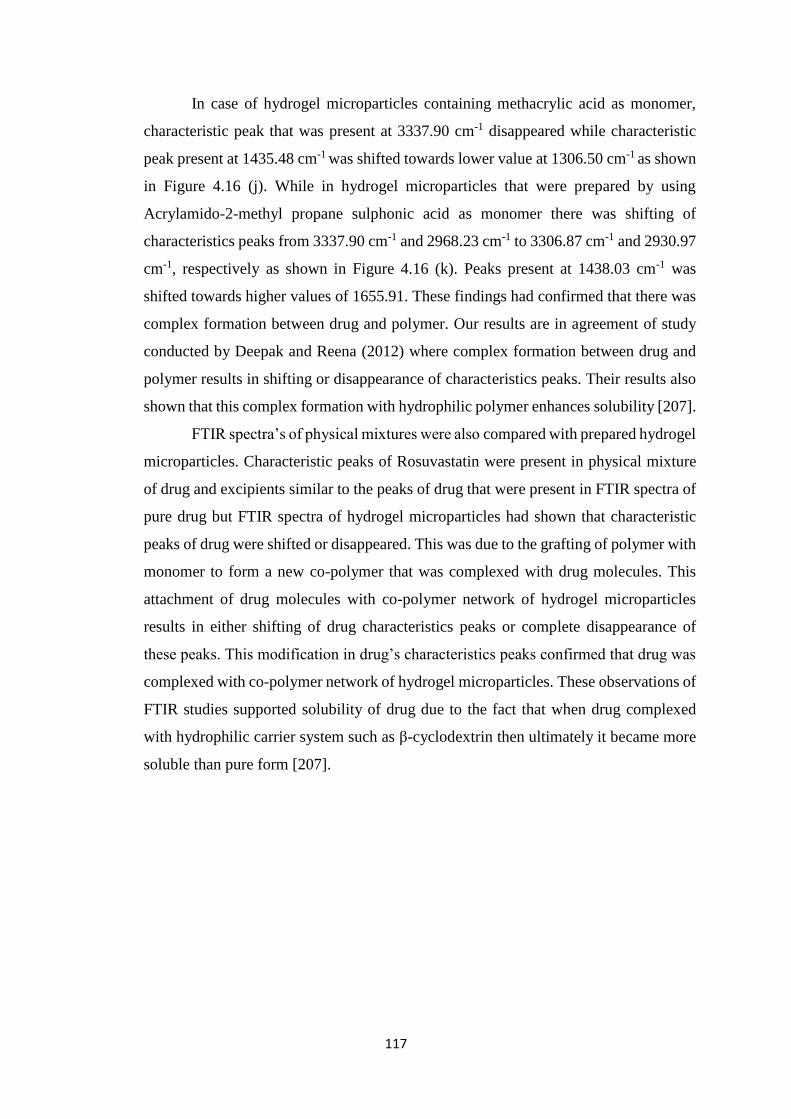
117
In case of hydrogel microparticles containing methacrylic acid as monomer,
characteristic peak that was present at 3337.90 cm-1 disappeared while characteristic
peak present at 1435.48 cm-1 was shifted towards lower value at 1306.50 cm-1 as shown
in Figure 4.16 (j). While in hydrogel microparticles that were prepared by using
Acrylamido-2-methyl propane sulphonic acid as monomer there was shifting of
characteristics peaks from 3337.90 cm-1 and 2968.23 cm-1 to 3306.87 cm-1 and 2930.97
cm-1, respectively as shown in Figure 4.16 (k). Peaks present at 1438.03 cm-1 was
shifted towards higher values of 1655.91. These findings had confirmed that there was
complex formation between drug and polymer. Our results are in agreement of study
conducted by Deepak and Reena (2012) where complex formation between drug and
polymer results in shifting or disappearance of characteristics peaks. Their results also
shown that this complex formation with hydrophilic polymer enhances solubility [207].
FTIR spectra’s of physical mixtures were also compared with prepared hydrogel
microparticles. Characteristic peaks of Rosuvastatin were present in physical mixture
of drug and excipients similar to the peaks of drug that were present in FTIR spectra of
pure drug but FTIR spectra of hydrogel microparticles had shown that characteristic
peaks of drug were shifted or disappeared. This was due to the grafting of polymer with
monomer to form a new co-polymer that was complexed with drug molecules. This
attachment of drug molecules with co-polymer network of hydrogel microparticles
results in either shifting of drug characteristics peaks or complete disappearance of
these peaks. This modification in drug’s characteristics peaks confirmed that drug was
complexed with co-polymer network of hydrogel microparticles. These observations of
FTIR studies supported solubility of drug due to the fact that when drug complexed
with hydrophilic carrier system such as β-cyclodextrin then ultimately it became more
soluble than pure form [207].
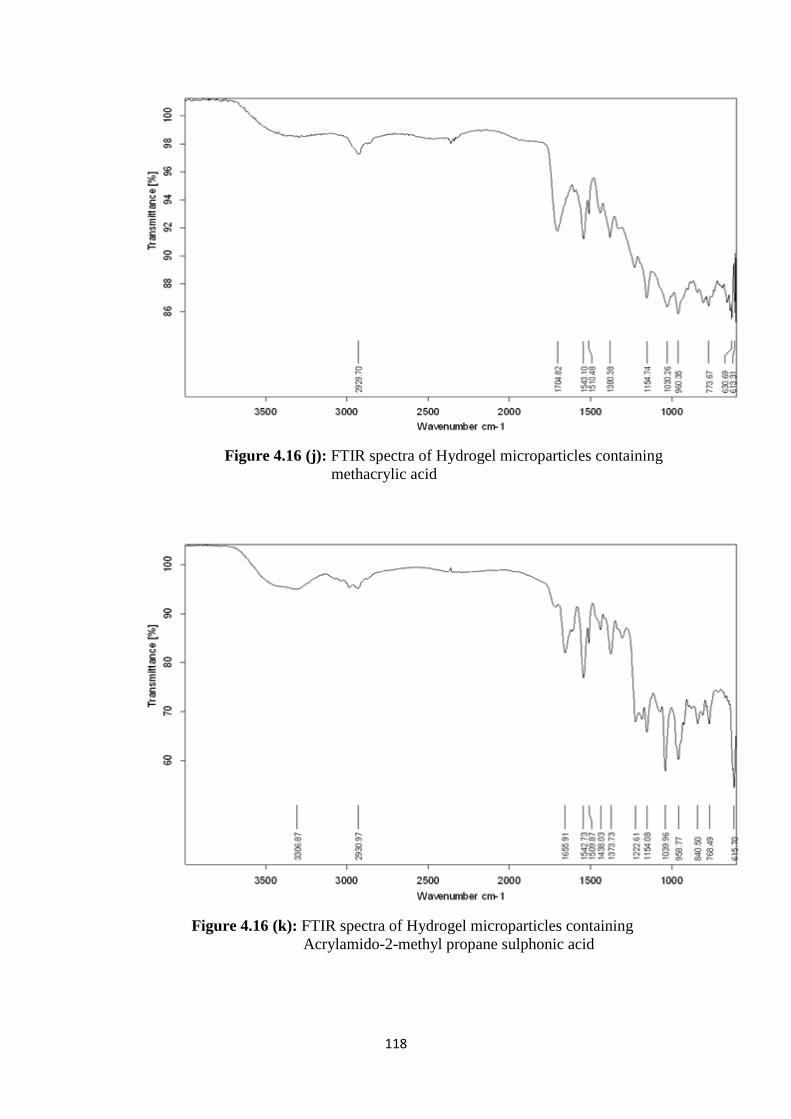
118
Figure 4.16 (j): FTIR spectra of Hydrogel microparticles containing
methacrylic acid
Figure 4.16 (k): FTIR spectra of Hydrogel microparticles containing
Acrylamido-2-methyl propane sulphonic acid
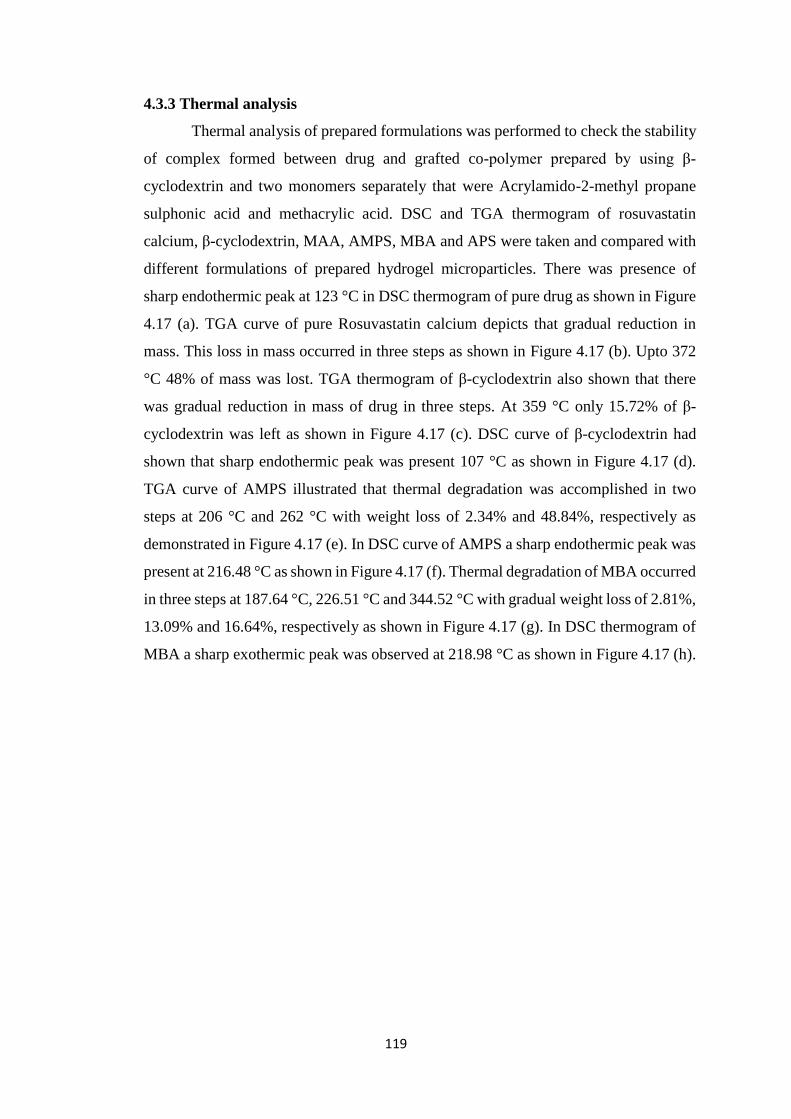
119
4.3.3 Thermal analysis
Thermal analysis of prepared formulations was performed to check the stability
of complex formed between drug and grafted co-polymer prepared by using β-
cyclodextrin and two monomers separately that were Acrylamido-2-methyl propane
sulphonic acid and methacrylic acid. DSC and TGA thermogram of rosuvastatin
calcium, β-cyclodextrin, MAA, AMPS, MBA and APS were taken and compared with
different formulations of prepared hydrogel microparticles. There was presence of
sharp endothermic peak at 123 °C in DSC thermogram of pure drug as shown in Figure
4.17 (a). TGA curve of pure Rosuvastatin calcium depicts that gradual reduction in
mass. This loss in mass occurred in three steps as shown in Figure 4.17 (b). Upto 372
°C 48% of mass was lost. TGA thermogram of β-cyclodextrin also shown that there
was gradual reduction in mass of drug in three steps. At 359 °C only 15.72% of β-
cyclodextrin was left as shown in Figure 4.17 (c). DSC curve of β-cyclodextrin had
shown that sharp endothermic peak was present 107 °C as shown in Figure 4.17 (d).
TGA curve of AMPS illustrated that thermal degradation was accomplished in two
steps at 206 °C and 262 °C with weight loss of 2.34% and 48.84%, respectively as
demonstrated in Figure 4.17 (e). In DSC curve of AMPS a sharp endothermic peak was
present at 216.48 °C as shown in Figure 4.17 (f). Thermal degradation of MBA occurred
in three steps at 187.64 °C, 226.51 °C and 344.52 °C with gradual weight loss of 2.81%,
13.09% and 16.64%, respectively as shown in Figure 4.17 (g). In DSC thermogram of
MBA a sharp exothermic peak was observed at 218.98 °C as shown in Figure 4.17 (h).
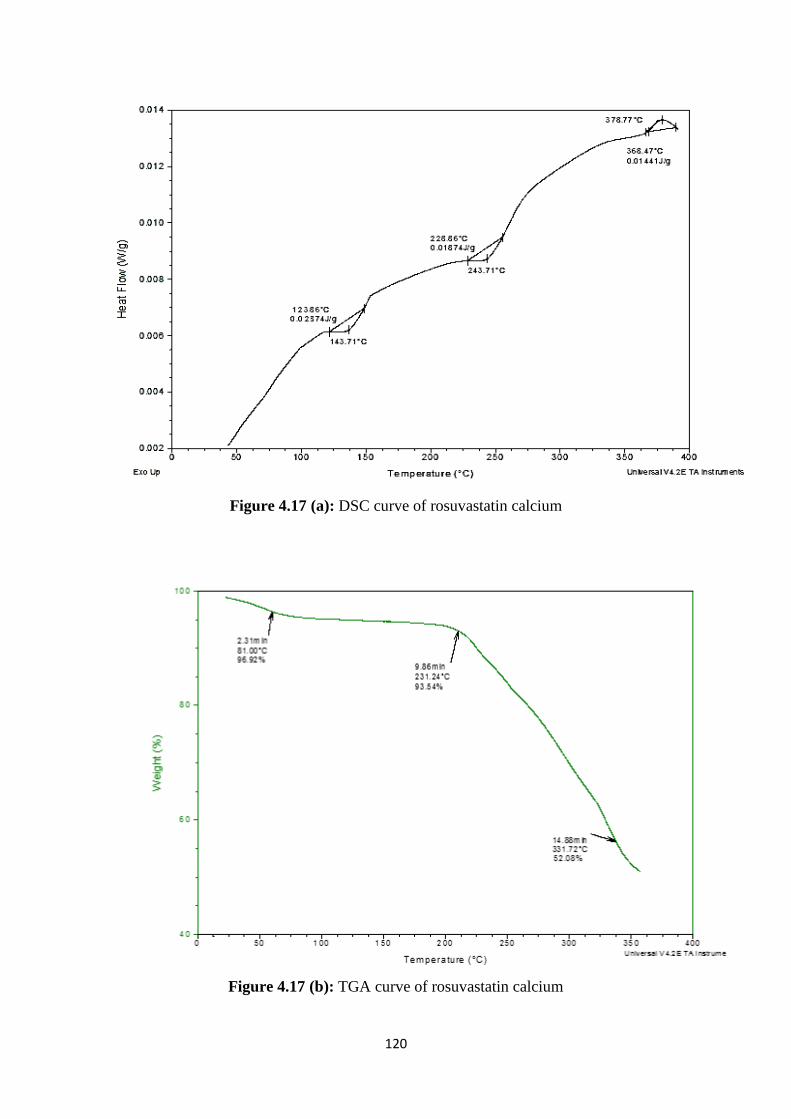
120
Figure 4.17 (a): DSC curve of rosuvastatin calcium
Figure 4.17 (b): TGA curve of rosuvastatin calcium
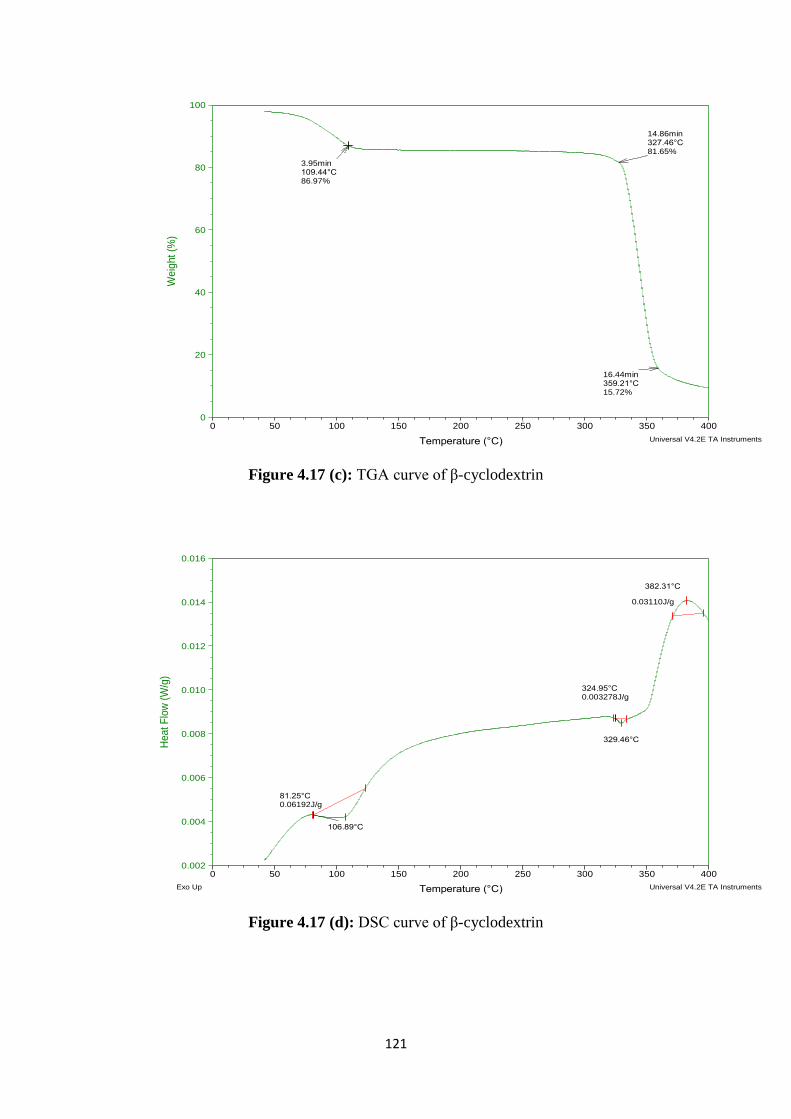
121
Figure 4.17 (c): TGA curve of β-cyclodextrin
Figure 4.17 (d): DSC curve of β-cyclodextrin
3.95min109.44°C86.97%
14.86min327.46°C81.65%
16.44min359.21°C15.72%
0
20
40
60
80
100
We
igh
t (%
)
0 50 100 150 200 250 300 350 400
Temperature (°C)
Sample: BSize: 2.3400 mg
Comment: B
DSC-TGAFile: D:\TGA\RAY\B.001
Run Date: 14-Apr-2015 12:26Instrument: SDT Q600 V8.2 Build 100
Universal V4.2E TA Instruments
106.89°C
81.25°C0.06192J/g
329.46°C
324.95°C0.003278J/g
382.31°C
0.03110J/g
0.002
0.004
0.006
0.008
0.010
0.012
0.014
0.016
Heat F
low
(W
/g)
0 50 100 150 200 250 300 350 400
Temperature (°C)
Sample: BSize: 2.3400 mg
Comment: B
DSC-TGAFile: D:\TGA\RAY\B.001
Run Date: 14-Apr-2015 12:26Instrument: SDT Q600 V8.2 Build 100
Exo Up Universal V4.2E TA Instruments
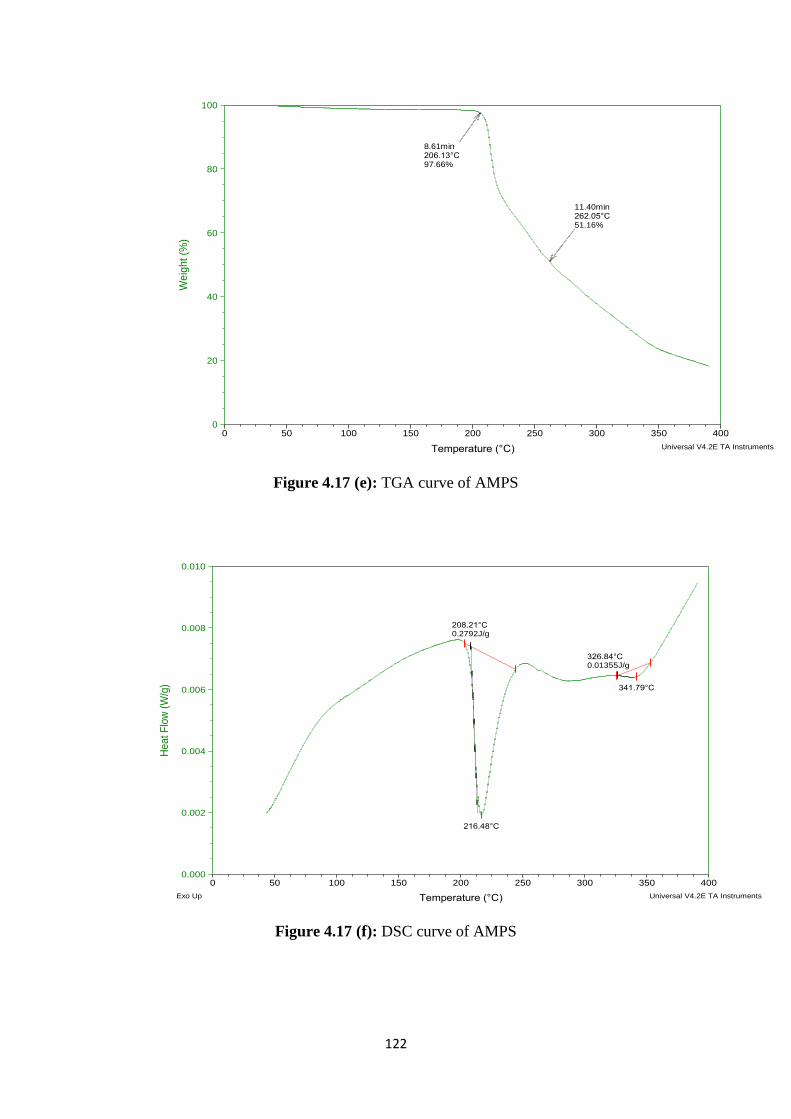
122
Figure 4.17 (e): TGA curve of AMPS
Figure 4.17 (f): DSC curve of AMPS
8.61min206.13°C97.66%
11.40min262.05°C51.16%
0
20
40
60
80
100
Weig
ht (%
)
0 50 100 150 200 250 300 350 400
Temperature (°C)
Sample: MSize: 2.5450 mg
Comment: M
DSC-TGAFile: D:\TGA\RAY\M.001
Run Date: 15-Apr-2015 13:08Instrument: SDT Q600 V8.2 Build 100
Universal V4.2E TA Instruments
216.48°C
208.21°C0.2792J/g
341.79°C
326.84°C0.01355J/g
0.000
0.002
0.004
0.006
0.008
0.010
He
at
Flo
w (
W/g
)
0 50 100 150 200 250 300 350 400
Temperature (°C)
Sample: MSize: 2.5450 mg
Comment: M
DSC-TGAFile: D:\TGA\RAY\M.001
Run Date: 15-Apr-2015 13:08Instrument: SDT Q600 V8.2 Build 100
Exo Up Universal V4.2E TA Instruments
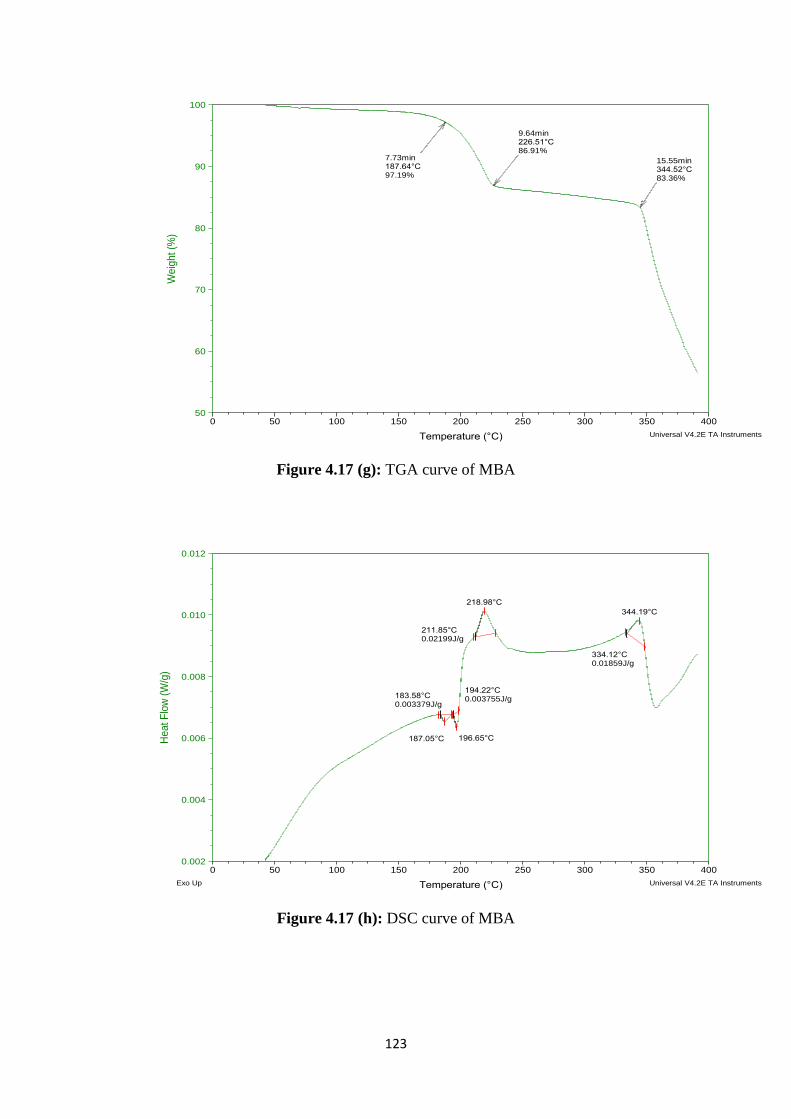
123
Figure 4.17 (g): TGA curve of MBA
Figure 4.17 (h): DSC curve of MBA
7.73min187.64°C97.19%
9.64min226.51°C86.91%
15.55min344.52°C83.36%
50
60
70
80
90
100
We
ight (%
)
0 50 100 150 200 250 300 350 400
Temperature (°C)
Sample: OSize: 2.7410 mg
Comment: O
DSC-TGAFile: D:\TGA\RAY\O.001
Run Date: 15-Apr-2015 09:50Instrument: SDT Q600 V8.2 Build 100
Universal V4.2E TA Instruments
218.98°C
211.85°C0.02199J/g
344.19°C
334.12°C0.01859J/g
187.05°C
183.58°C0.003379J/g
196.65°C
194.22°C0.003755J/g
0.002
0.004
0.006
0.008
0.010
0.012
He
at
Flo
w (
W/g
)
0 50 100 150 200 250 300 350 400
Temperature (°C)
Sample: OSize: 2.7410 mg
Comment: O
DSC-TGAFile: D:\TGA\RAY\O.001
Run Date: 15-Apr-2015 09:50Instrument: SDT Q600 V8.2 Build 100
Exo Up Universal V4.2E TA Instruments
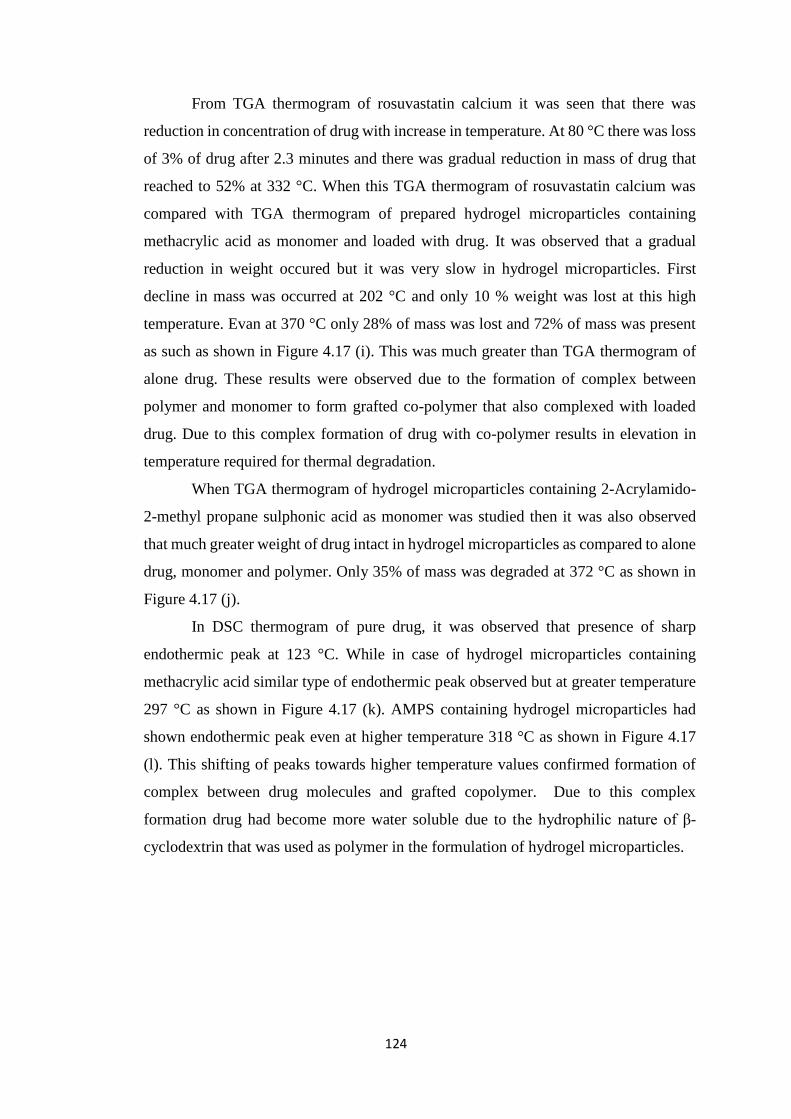
124
From TGA thermogram of rosuvastatin calcium it was seen that there was
reduction in concentration of drug with increase in temperature. At 80 °C there was loss
of 3% of drug after 2.3 minutes and there was gradual reduction in mass of drug that
reached to 52% at 332 °C. When this TGA thermogram of rosuvastatin calcium was
compared with TGA thermogram of prepared hydrogel microparticles containing
methacrylic acid as monomer and loaded with drug. It was observed that a gradual
reduction in weight occured but it was very slow in hydrogel microparticles. First
decline in mass was occurred at 202 °C and only 10 % weight was lost at this high
temperature. Evan at 370 °C only 28% of mass was lost and 72% of mass was present
as such as shown in Figure 4.17 (i). This was much greater than TGA thermogram of
alone drug. These results were observed due to the formation of complex between
polymer and monomer to form grafted co-polymer that also complexed with loaded
drug. Due to this complex formation of drug with co-polymer results in elevation in
temperature required for thermal degradation.
When TGA thermogram of hydrogel microparticles containing 2-Acrylamido-
2-methyl propane sulphonic acid as monomer was studied then it was also observed
that much greater weight of drug intact in hydrogel microparticles as compared to alone
drug, monomer and polymer. Only 35% of mass was degraded at 372 °C as shown in
Figure 4.17 (j).
In DSC thermogram of pure drug, it was observed that presence of sharp
endothermic peak at 123 °C. While in case of hydrogel microparticles containing
methacrylic acid similar type of endothermic peak observed but at greater temperature
297 °C as shown in Figure 4.17 (k). AMPS containing hydrogel microparticles had
shown endothermic peak even at higher temperature 318 °C as shown in Figure 4.17
(l). This shifting of peaks towards higher temperature values confirmed formation of
complex between drug molecules and grafted copolymer. Due to this complex
formation drug had become more water soluble due to the hydrophilic nature of β-
cyclodextrin that was used as polymer in the formulation of hydrogel microparticles.
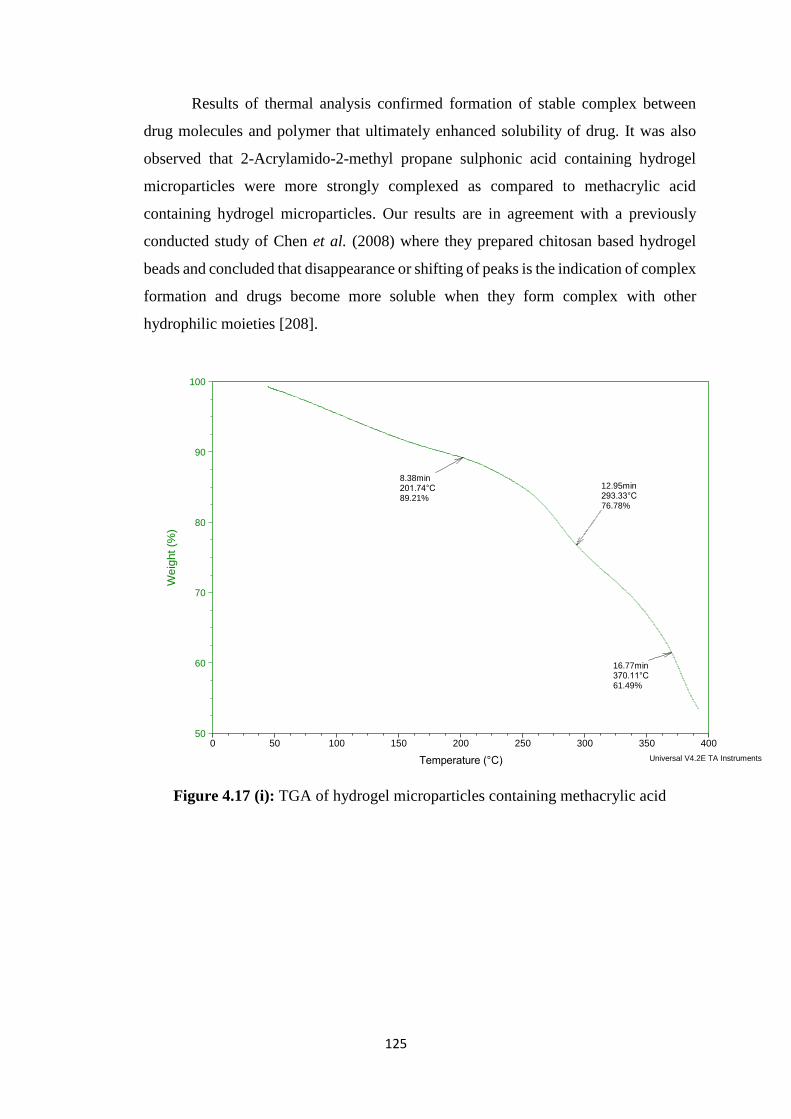
125
Results of thermal analysis confirmed formation of stable complex between
drug molecules and polymer that ultimately enhanced solubility of drug. It was also
observed that 2-Acrylamido-2-methyl propane sulphonic acid containing hydrogel
microparticles were more strongly complexed as compared to methacrylic acid
containing hydrogel microparticles. Our results are in agreement with a previously
conducted study of Chen et al. (2008) where they prepared chitosan based hydrogel
beads and concluded that disappearance or shifting of peaks is the indication of complex
formation and drugs become more soluble when they form complex with other
hydrophilic moieties [208].
Figure 4.17 (i): TGA of hydrogel microparticles containing methacrylic acid
8.38min201.74°C89.21%
12.95min293.33°C76.78%
16.77min370.11°C61.49%
50
60
70
80
90
100
Weig
ht (%
)
0 50 100 150 200 250 300 350 400
Temperature (°C)
Sample: H S 1Size: 2.0950 mg
Comment: H S 1
DSC-TGAFile: D:\TGA\RAY\H S 1.001
Run Date: 17-Apr-2015 11:34Instrument: SDT Q600 V8.2 Build 100
Universal V4.2E TA Instruments
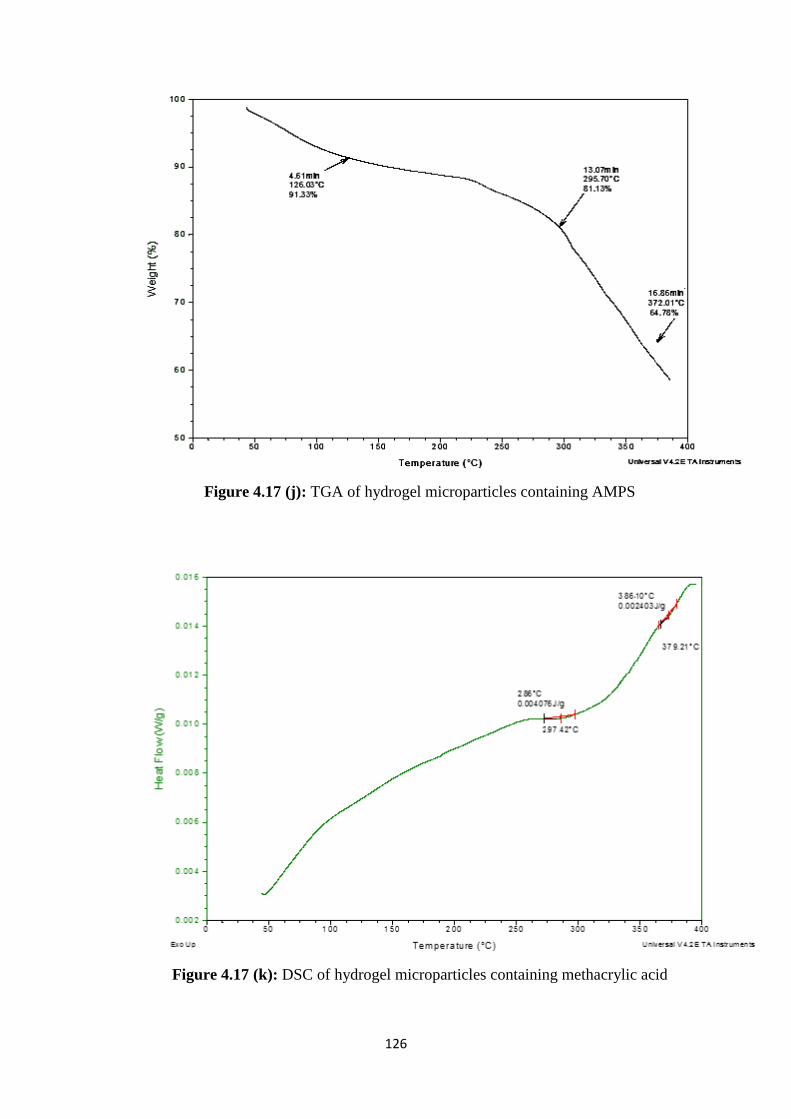
126
Figure 4.17 (j): TGA of hydrogel microparticles containing AMPS
Figure 4.17 (k): DSC of hydrogel microparticles containing methacrylic acid
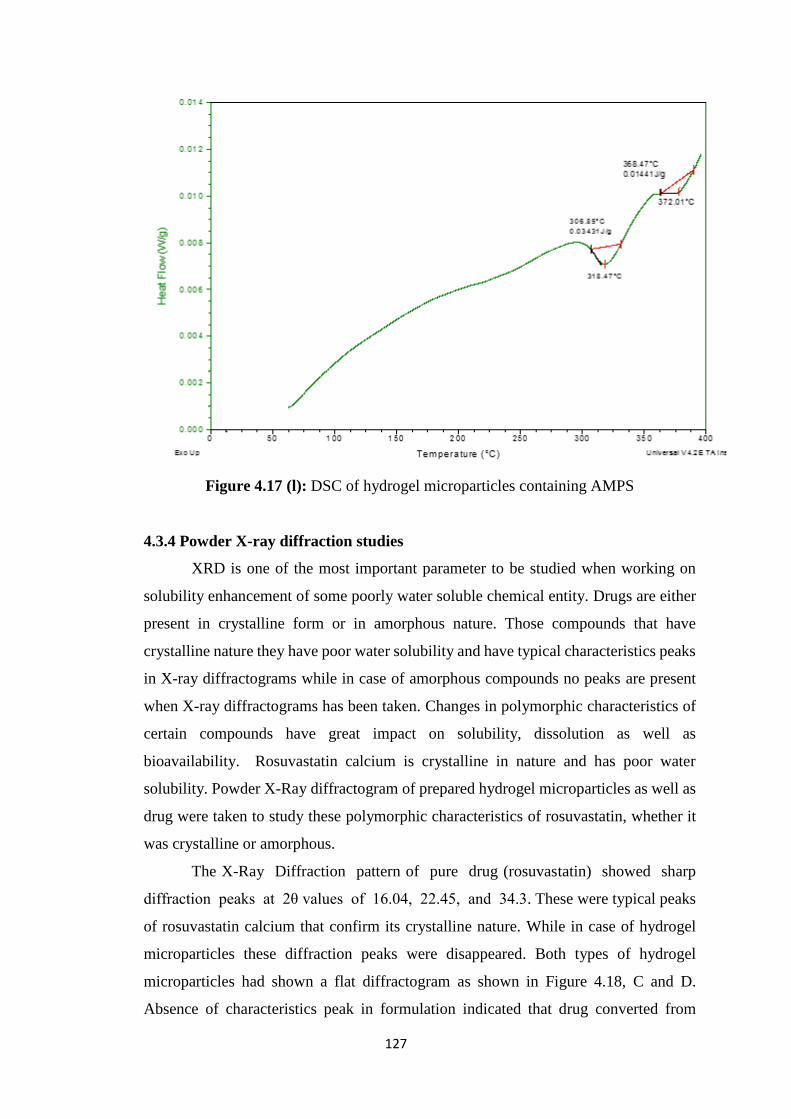
127
Figure 4.17 (l): DSC of hydrogel microparticles containing AMPS
4.3.4 Powder X-ray diffraction studies
XRD is one of the most important parameter to be studied when working on
solubility enhancement of some poorly water soluble chemical entity. Drugs are either
present in crystalline form or in amorphous nature. Those compounds that have
crystalline nature they have poor water solubility and have typical characteristics peaks
in X-ray diffractograms while in case of amorphous compounds no peaks are present
when X-ray diffractograms has been taken. Changes in polymorphic characteristics of
certain compounds have great impact on solubility, dissolution as well as
bioavailability. Rosuvastatin calcium is crystalline in nature and has poor water
solubility. Powder X-Ray diffractogram of prepared hydrogel microparticles as well as
drug were taken to study these polymorphic characteristics of rosuvastatin, whether it
was crystalline or amorphous.
The X-Ray Diffraction pattern of pure drug (rosuvastatin) showed sharp
diffraction peaks at 2θ values of 16.04, 22.45, and 34.3. These were typical peaks
of rosuvastatin calcium that confirm its crystalline nature. While in case of hydrogel
microparticles these diffraction peaks were disappeared. Both types of hydrogel
microparticles had shown a flat diffractogram as shown in Figure 4.18, C and D.
Absence of characteristics peak in formulation indicated that drug converted from
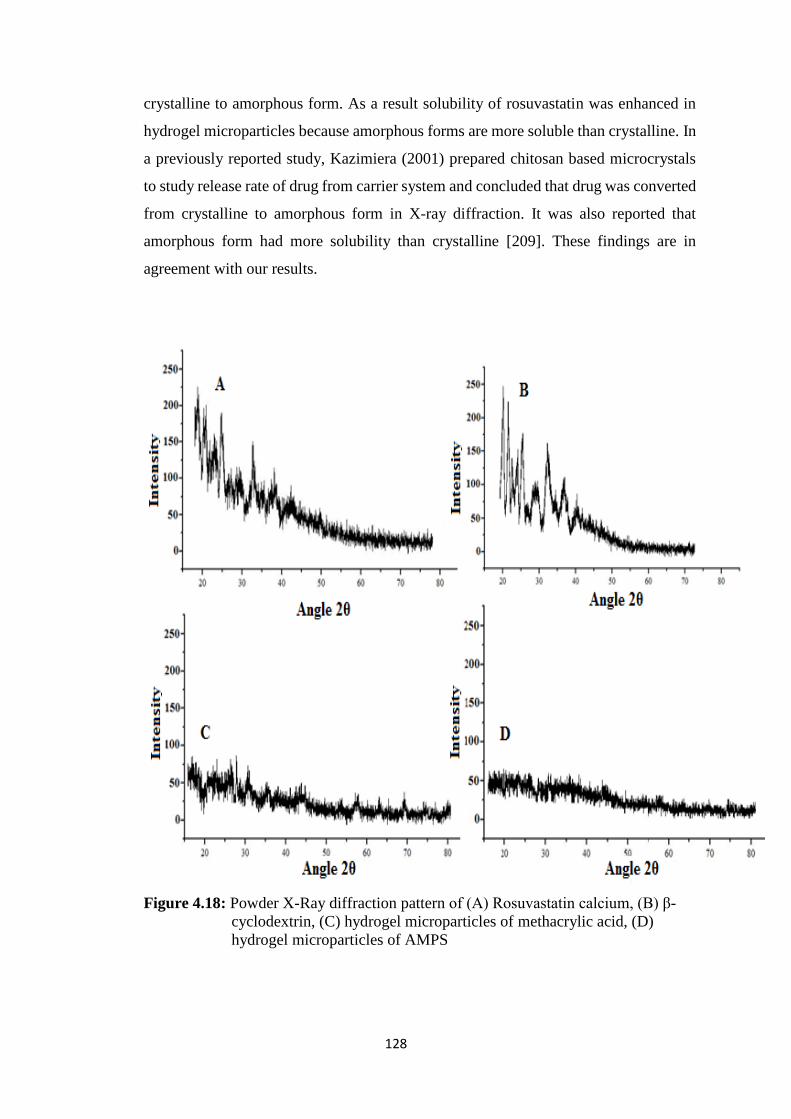
128
crystalline to amorphous form. As a result solubility of rosuvastatin was enhanced in
hydrogel microparticles because amorphous forms are more soluble than crystalline. In
a previously reported study, Kazimiera (2001) prepared chitosan based microcrystals
to study release rate of drug from carrier system and concluded that drug was converted
from crystalline to amorphous form in X-ray diffraction. It was also reported that
amorphous form had more solubility than crystalline [209]. These findings are in
agreement with our results.
Figure 4.18: Powder X-Ray diffraction pattern of (A) Rosuvastatin calcium, (B) β-
cyclodextrin, (C) hydrogel microparticles of methacrylic acid, (D)
hydrogel microparticles of AMPS
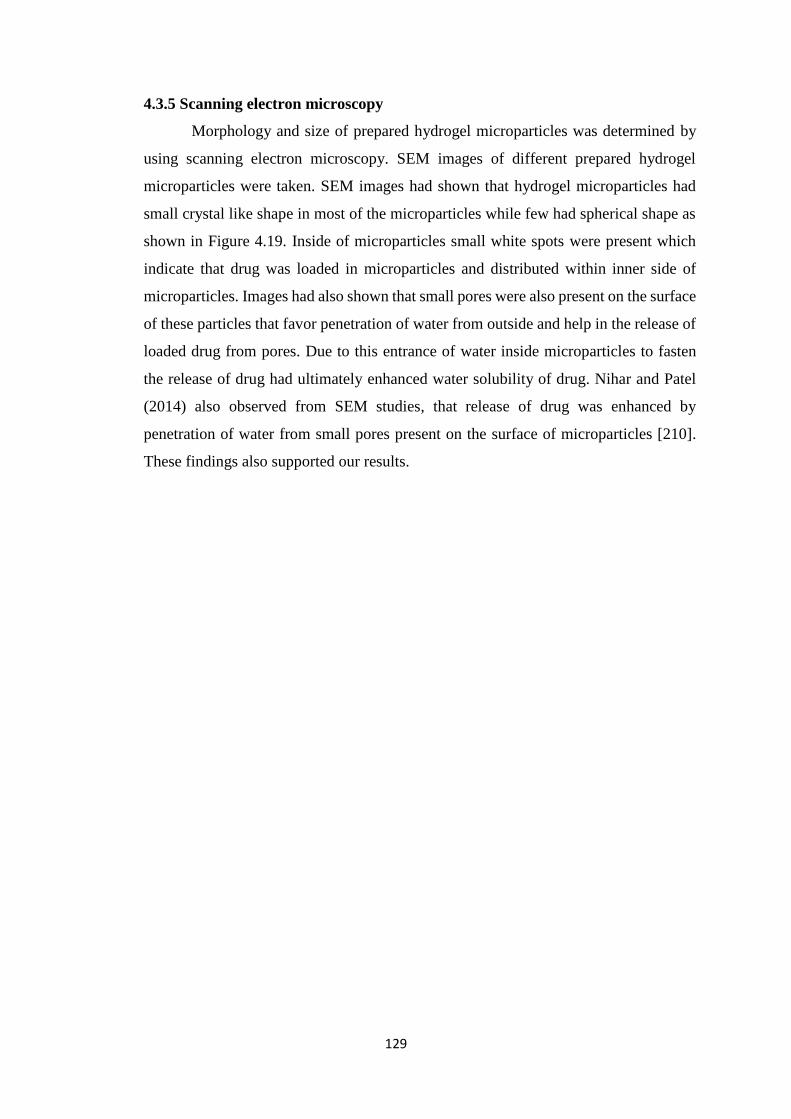
129
4.3.5 Scanning electron microscopy
Morphology and size of prepared hydrogel microparticles was determined by
using scanning electron microscopy. SEM images of different prepared hydrogel
microparticles were taken. SEM images had shown that hydrogel microparticles had
small crystal like shape in most of the microparticles while few had spherical shape as
shown in Figure 4.19. Inside of microparticles small white spots were present which
indicate that drug was loaded in microparticles and distributed within inner side of
microparticles. Images had also shown that small pores were also present on the surface
of these particles that favor penetration of water from outside and help in the release of
loaded drug from pores. Due to this entrance of water inside microparticles to fasten
the release of drug had ultimately enhanced water solubility of drug. Nihar and Patel
(2014) also observed from SEM studies, that release of drug was enhanced by
penetration of water from small pores present on the surface of microparticles [210].
These findings also supported our results.
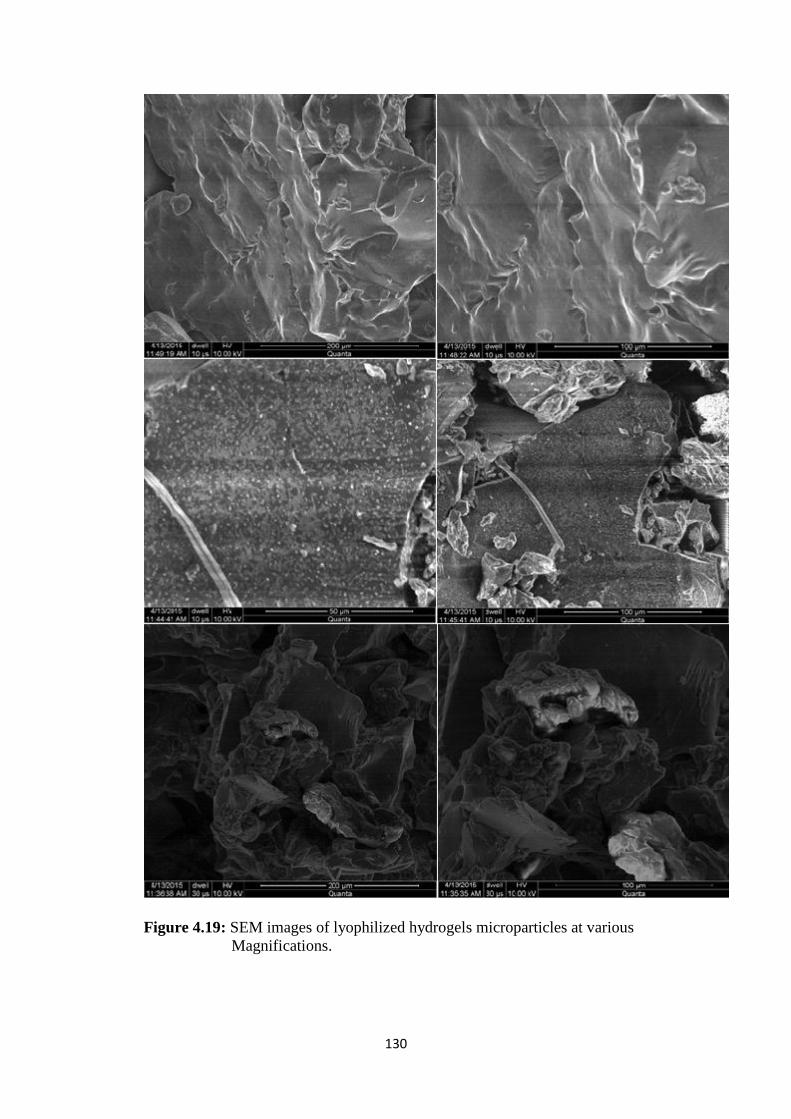
130
Figure 4.19: SEM images of lyophilized hydrogels microparticles at various
Magnifications.
131
4.3.6 In vitro drug release studies
Dissolution studies were carried out at 6.8 and 1.2 pH phosphate buffer and
HCl, respectively to determine in vitro drug release. Dissolution studies were performed
for various prepared hydrogel microparticles formulations and for commercially
available tablets in order to compare release of drug. Results had shown that there was
a marked difference in release of commercially available tablets of rosuvastatin and
hydrogel microparticles prepared by using β-cyclodextrin and monomers. It was
observed that there was more release of drug in basic media as compared to acidic pH.
This was due to the acidic nature of rosuvastatin calcium. It is weak acid and become
more ionized in basic environment thus soluble in basic environment. As already
discussed in swelling studies of hydrogel microparticles that methacrylic acid (MAA)
containing microparticles had pH dependent swelling while Acrylamido-2-methyl
propane sulphonic acid (AMPS) containing hydrogel microparticles had pH
independent swelling behaviour. For release of drug from hydrogel microparticles, it is
necessary to become swollen first and then release of drug occurred.
In dissolution studies of methacrylic acid containing hydrogel microparticles it
was observed that rapid release of drug had been taken place at 6.8 pH while very slow
release at acidic (1.2) pH as shown in Figures 4.20 (a) and 4.20 (b). At 6.8 pH maximum
amount of drug was released (85.74%) from formulation HM2 containing 4g/100g of
β-cyclodextrin with in 1 hour of dissolution studies. This formulation had MAA
30g/100g and MBA 0.4 g/100g. Approximately same concentration of drug was
released from formulation HM3. This formulation had slight greater amount of β-
cyclodextrin 6g/100g. So from dissolution studies it was observed that maximum
amount of drug was released when 4 g/100g of β-cyclodextrin was used in hydrogel
microparticles. From results of dissolution studies at pH 6.8 of formulation containing
MAA as monomer, it was found that β-cyclodextrin concentration that favored
maximum release of drug from hydrogel microparticles was 4 g/100g.
In different formulations, concentrations of monomer and crosslinker were also
varied and it was found that maximum amount of drug was released when MAA
(monomer) concentration was 30g/100g and MBA (crosslinker) was 0.4g/100g. When
higher concentrations of MBA were used these resulted in formation of more compact
structure that retorted release of drug from polymeric network. When even less
concentration was used then such type of crosslinking was not occurred that can hold
sufficient amount of drug. Thus 0.4g/100g of MBA concentration was considered
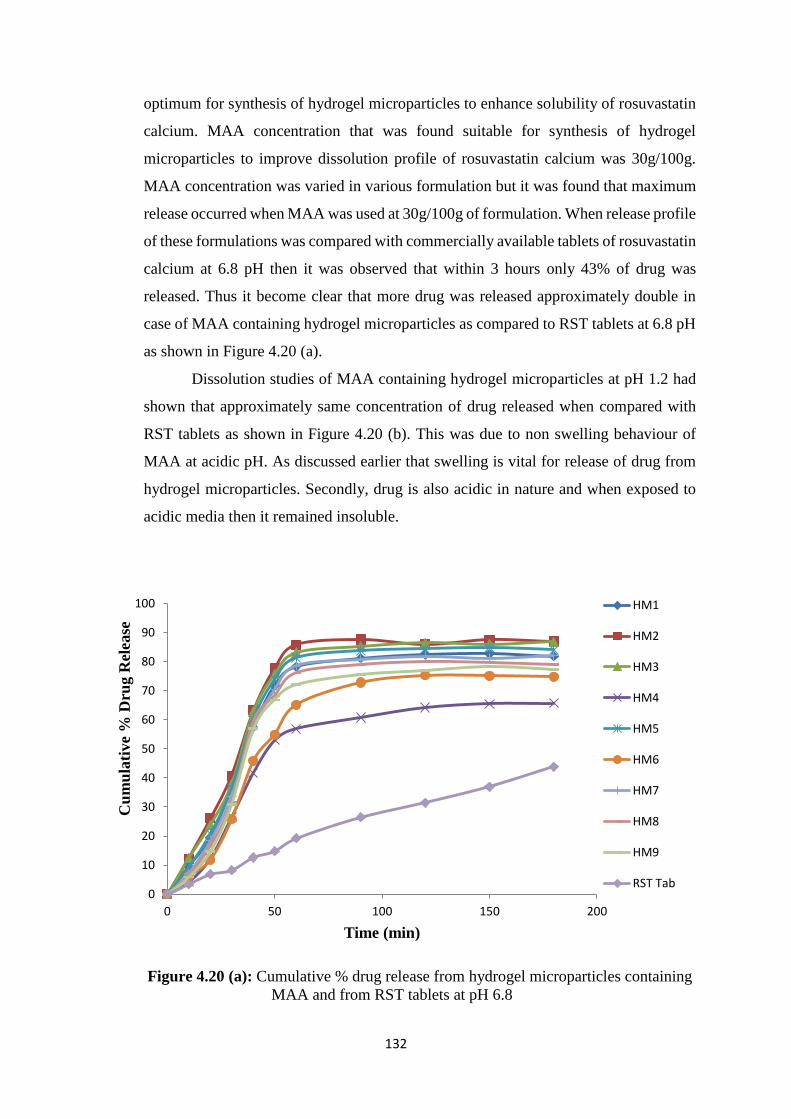
132
optimum for synthesis of hydrogel microparticles to enhance solubility of rosuvastatin
calcium. MAA concentration that was found suitable for synthesis of hydrogel
microparticles to improve dissolution profile of rosuvastatin calcium was 30g/100g.
MAA concentration was varied in various formulation but it was found that maximum
release occurred when MAA was used at 30g/100g of formulation. When release profile
of these formulations was compared with commercially available tablets of rosuvastatin
calcium at 6.8 pH then it was observed that within 3 hours only 43% of drug was
released. Thus it become clear that more drug was released approximately double in
case of MAA containing hydrogel microparticles as compared to RST tablets at 6.8 pH
as shown in Figure 4.20 (a).
Dissolution studies of MAA containing hydrogel microparticles at pH 1.2 had
shown that approximately same concentration of drug released when compared with
RST tablets as shown in Figure 4.20 (b). This was due to non swelling behaviour of
MAA at acidic pH. As discussed earlier that swelling is vital for release of drug from
hydrogel microparticles. Secondly, drug is also acidic in nature and when exposed to
acidic media then it remained insoluble.
Figure 4.20 (a): Cumulative % drug release from hydrogel microparticles containing
MAA and from RST tablets at pH 6.8
0
10
20
30
40
50
60
70
80
90
100
0 50 100 150 200
Cu
mu
lati
ve
% D
rug R
elea
se
Time (min)
HM1
HM2
HM3
HM4
HM5
HM6
HM7
HM8
HM9
RST Tab
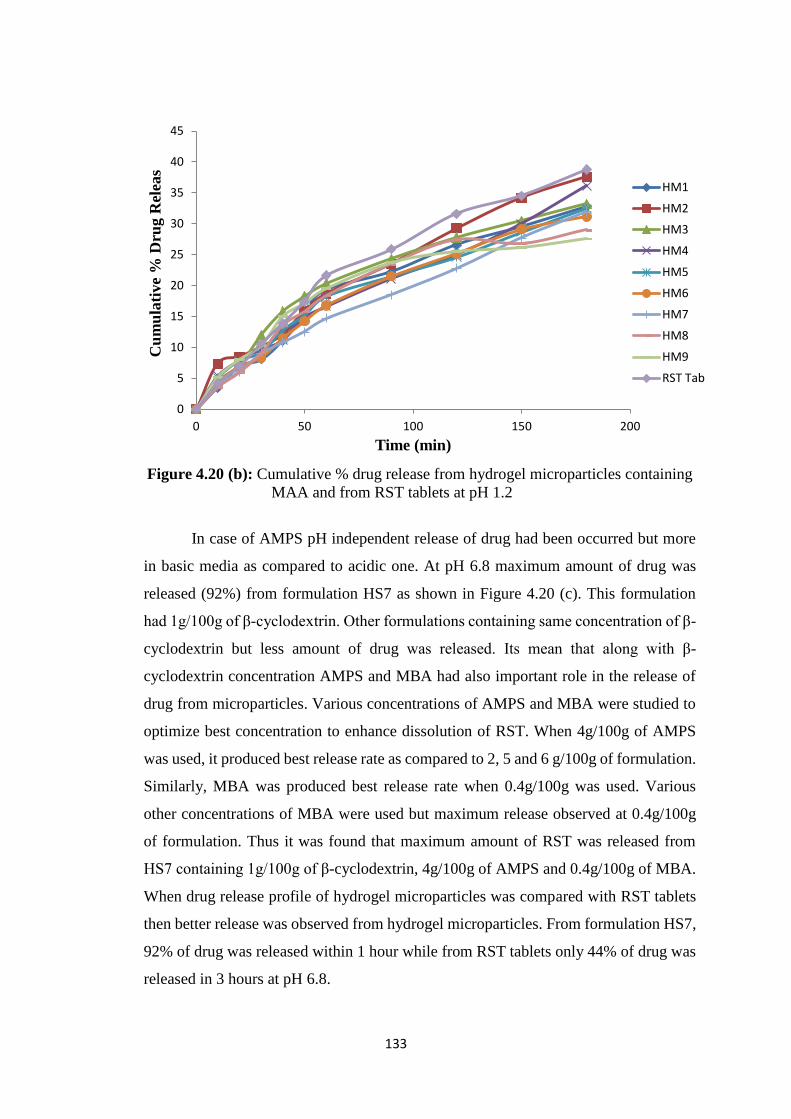
133
Figure 4.20 (b): Cumulative % drug release from hydrogel microparticles containing
MAA and from RST tablets at pH 1.2
In case of AMPS pH independent release of drug had been occurred but more
in basic media as compared to acidic one. At pH 6.8 maximum amount of drug was
released (92%) from formulation HS7 as shown in Figure 4.20 (c). This formulation
had 1g/100g of β-cyclodextrin. Other formulations containing same concentration of β-
cyclodextrin but less amount of drug was released. Its mean that along with β-
cyclodextrin concentration AMPS and MBA had also important role in the release of
drug from microparticles. Various concentrations of AMPS and MBA were studied to
optimize best concentration to enhance dissolution of RST. When 4g/100g of AMPS
was used, it produced best release rate as compared to 2, 5 and 6 g/100g of formulation.
Similarly, MBA was produced best release rate when 0.4g/100g was used. Various
other concentrations of MBA were used but maximum release observed at 0.4g/100g
of formulation. Thus it was found that maximum amount of RST was released from
HS7 containing 1g/100g of β-cyclodextrin, 4g/100g of AMPS and 0.4g/100g of MBA.
When drug release profile of hydrogel microparticles was compared with RST tablets
then better release was observed from hydrogel microparticles. From formulation HS7,
92% of drug was released within 1 hour while from RST tablets only 44% of drug was
released in 3 hours at pH 6.8.
0
5
10
15
20
25
30
35
40
45
0 50 100 150 200
Cu
mu
lati
ve
% D
rug
Rel
eas
Time (min)
HM1
HM2
HM3
HM4
HM5
HM6
HM7
HM8
HM9
RST Tab
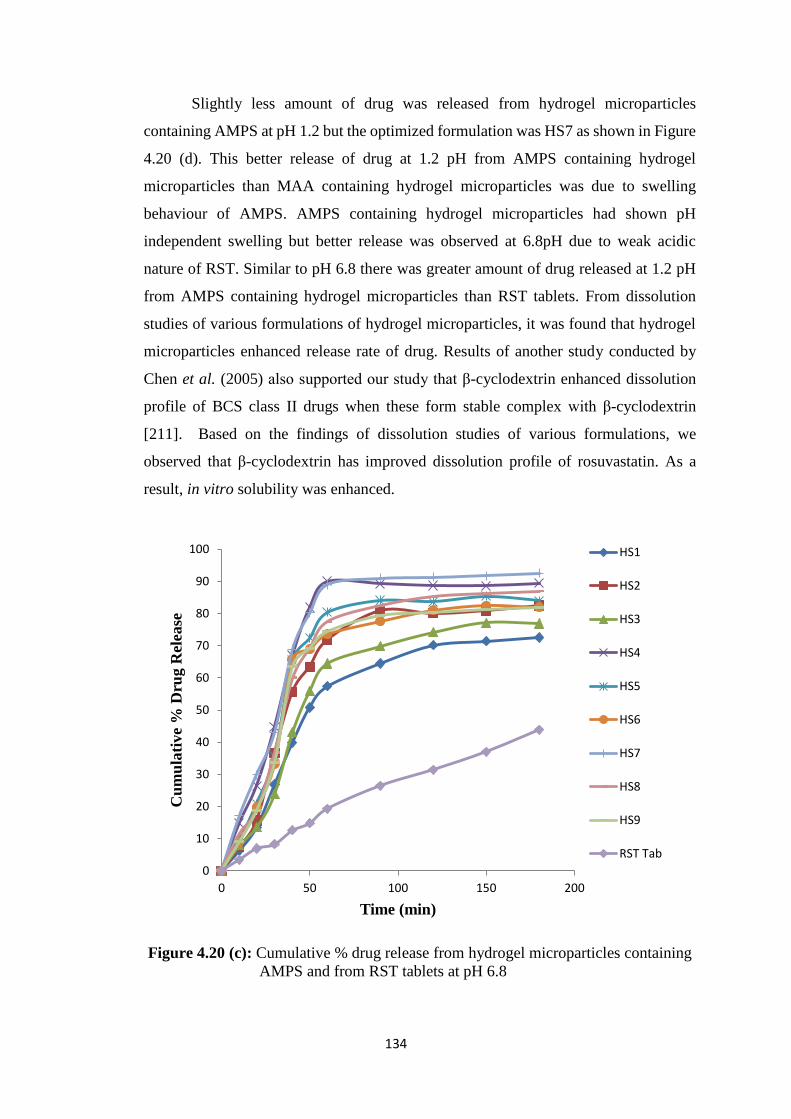
134
Slightly less amount of drug was released from hydrogel microparticles
containing AMPS at pH 1.2 but the optimized formulation was HS7 as shown in Figure
4.20 (d). This better release of drug at 1.2 pH from AMPS containing hydrogel
microparticles than MAA containing hydrogel microparticles was due to swelling
behaviour of AMPS. AMPS containing hydrogel microparticles had shown pH
independent swelling but better release was observed at 6.8pH due to weak acidic
nature of RST. Similar to pH 6.8 there was greater amount of drug released at 1.2 pH
from AMPS containing hydrogel microparticles than RST tablets. From dissolution
studies of various formulations of hydrogel microparticles, it was found that hydrogel
microparticles enhanced release rate of drug. Results of another study conducted by
Chen et al. (2005) also supported our study that β-cyclodextrin enhanced dissolution
profile of BCS class II drugs when these form stable complex with β-cyclodextrin
[211]. Based on the findings of dissolution studies of various formulations, we
observed that β-cyclodextrin has improved dissolution profile of rosuvastatin. As a
result, in vitro solubility was enhanced.
Figure 4.20 (c): Cumulative % drug release from hydrogel microparticles containing
AMPS and from RST tablets at pH 6.8
0
10
20
30
40
50
60
70
80
90
100
0 50 100 150 200
Cu
mu
lati
ve
% D
rug R
elea
se
Time (min)
HS1
HS2
HS3
HS4
HS5
HS6
HS7
HS8
HS9
RST Tab
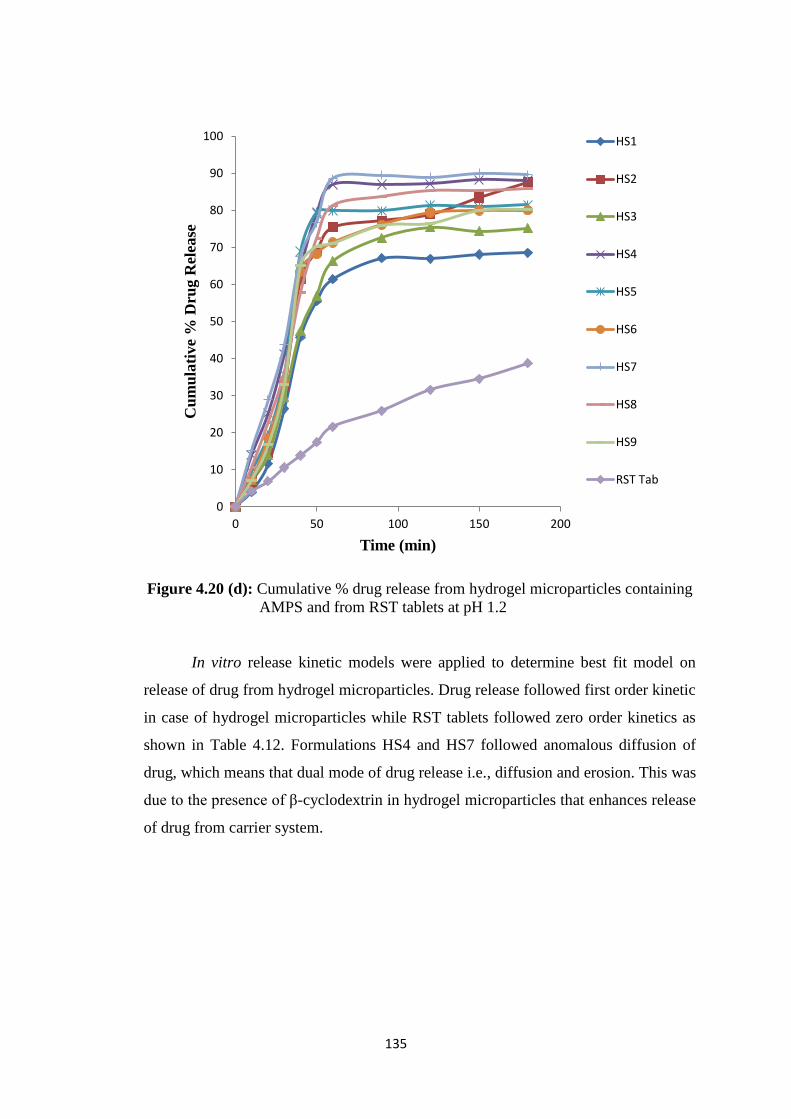
135
Figure 4.20 (d): Cumulative % drug release from hydrogel microparticles containing
AMPS and from RST tablets at pH 1.2
In vitro release kinetic models were applied to determine best fit model on
release of drug from hydrogel microparticles. Drug release followed first order kinetic
in case of hydrogel microparticles while RST tablets followed zero order kinetics as
shown in Table 4.12. Formulations HS4 and HS7 followed anomalous diffusion of
drug, which means that dual mode of drug release i.e., diffusion and erosion. This was
due to the presence of β-cyclodextrin in hydrogel microparticles that enhances release
of drug from carrier system.
0
10
20
30
40
50
60
70
80
90
100
0 50 100 150 200
Cu
mu
lati
ve
% D
rug
Rel
ease
Time (min)
HS1
HS2
HS3
HS4
HS5
HS6
HS7
HS8
HS9
RST Tab
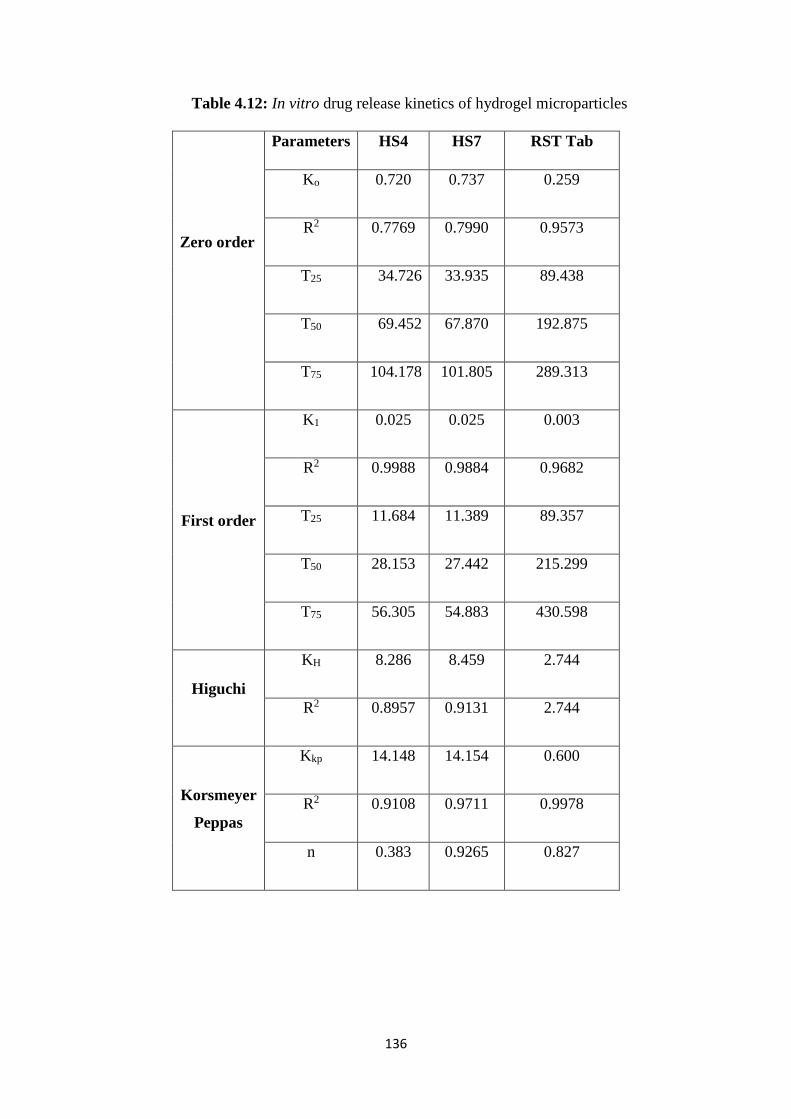
136
Table 4.12: In vitro drug release kinetics of hydrogel microparticles
Zero order
Parameters HS4 HS7 RST Tab
Ko 0.720 0.737 0.259
R2 0.7769 0.7990 0.9573
T25 34.726 33.935 89.438
T50 69.452 67.870 192.875
T75 104.178 101.805 289.313
First order
K1 0.025 0.025 0.003
R2 0.9988 0.9884 0.9682
T25 11.684 11.389 89.357
T50 28.153 27.442 215.299
T75 56.305 54.883 430.598
Higuchi
KH 8.286 8.459 2.744
R2 0.8957 0.9131 2.744
Korsmeyer
Peppas
Kkp 14.148 14.154 0.600
R2 0.9108 0.9711 0.9978
n 0.383 0.9265 0.827
137
4.3.7 Solubility studies
Rosuvastatin calcium is a weak acid. Due to its acidic nature it has more
solubility in basic media as compared to acidic pH. So it become ionized at higher pH
values and therefore soluble in high pH solutions. Solubility studies of pure drug and
prepared hydrogel microparticles were conducted at 6.8 pH phosphate buffer solution
as well as in HCl buffer solution of 1.2 pH. Results had shown that highest solubility
of MAA containing hydrogel microparticles was present at 6.8 pH phosphate buffer
when compared with buffer solution of low pH (1.2). However, highest solubility was
observed in water in ionic form as shown in Figure 4.21 (a). From solubility studies of
rosuvastatin calcium it was observed that pure drug had very low solubility in acidic
media at 1.2 pH buffer while slight better solubility in phosphate buffer of basic pH 6.8.
In water, pure drug had greater solubility as compared to 1.2 and 6.8 pH buffers. When
solubility studies of hydrogel microparticles were performed, it was observed that same
amount of drug loaded in hydrogel microparticles had several folds more solubility than
pure drug. Increase in solubility of drug from MAA containing hydrogel microparticles
was upto 9.59 folds at 6.8 pH while at 1.2 pH, solubility was remained unchanged. This
was due to non swelling behaviour of MAA at acidic pH. In distilled water, solubility
was increased upto 6.9 folds as compared to solubility of pure drug as shown in Figure
4.21 (a).
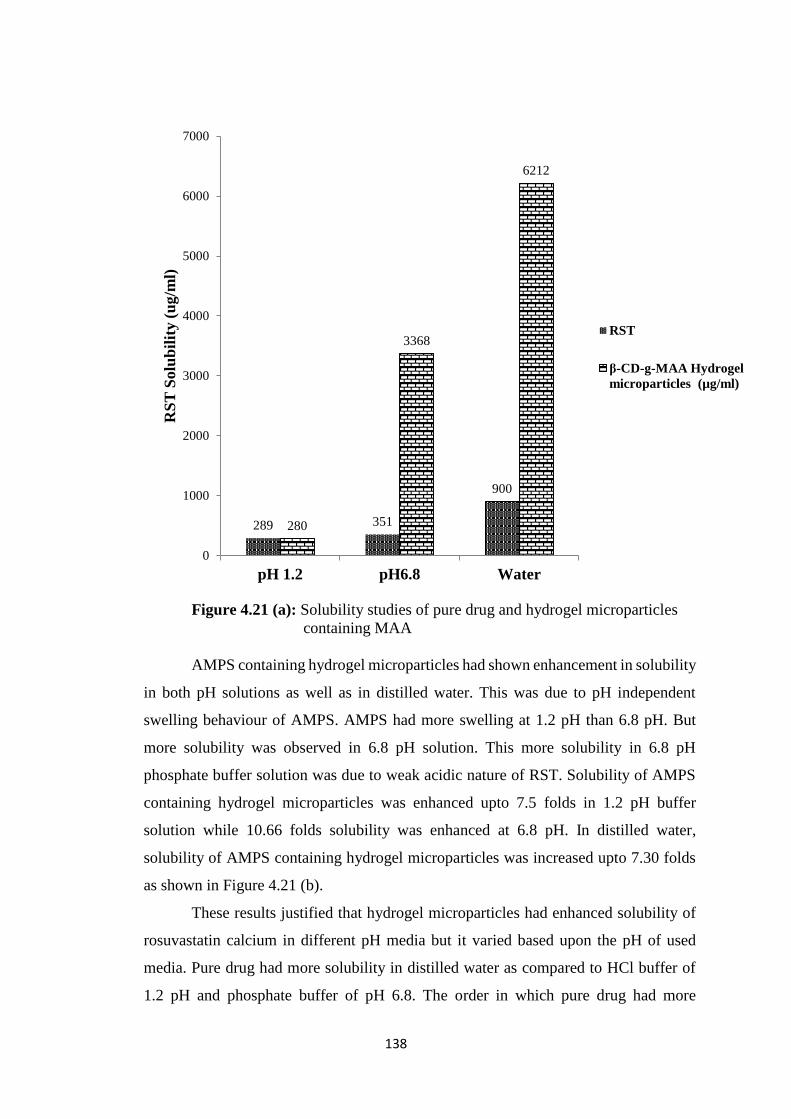
138
Figure 4.21 (a): Solubility studies of pure drug and hydrogel microparticles
containing MAA
AMPS containing hydrogel microparticles had shown enhancement in solubility
in both pH solutions as well as in distilled water. This was due to pH independent
swelling behaviour of AMPS. AMPS had more swelling at 1.2 pH than 6.8 pH. But
more solubility was observed in 6.8 pH solution. This more solubility in 6.8 pH
phosphate buffer solution was due to weak acidic nature of RST. Solubility of AMPS
containing hydrogel microparticles was enhanced upto 7.5 folds in 1.2 pH buffer
solution while 10.66 folds solubility was enhanced at 6.8 pH. In distilled water,
solubility of AMPS containing hydrogel microparticles was increased upto 7.30 folds
as shown in Figure 4.21 (b).
These results justified that hydrogel microparticles had enhanced solubility of
rosuvastatin calcium in different pH media but it varied based upon the pH of used
media. Pure drug had more solubility in distilled water as compared to HCl buffer of
1.2 pH and phosphate buffer of pH 6.8. The order in which pure drug had more
289 351
900
280
3368
6212
0
1000
2000
3000
4000
5000
6000
7000
pH 1.2 pH6.8 Water
RS
T S
olu
bil
ity (
ug/m
l)
RST
β-CD-g-MAA Hydrogel
microparticles (µg/ml)
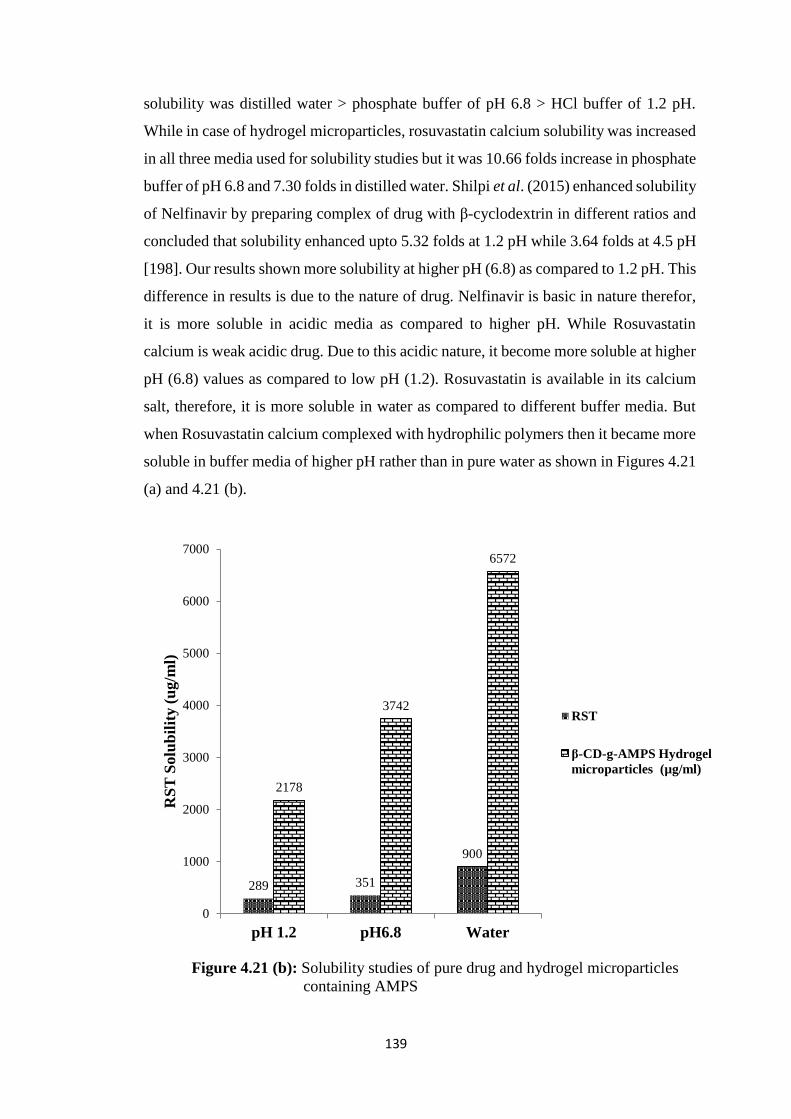
139
solubility was distilled water > phosphate buffer of pH 6.8 > HCl buffer of 1.2 pH.
While in case of hydrogel microparticles, rosuvastatin calcium solubility was increased
in all three media used for solubility studies but it was 10.66 folds increase in phosphate
buffer of pH 6.8 and 7.30 folds in distilled water. Shilpi et al. (2015) enhanced solubility
of Nelfinavir by preparing complex of drug with β-cyclodextrin in different ratios and
concluded that solubility enhanced upto 5.32 folds at 1.2 pH while 3.64 folds at 4.5 pH
[198]. Our results shown more solubility at higher pH (6.8) as compared to 1.2 pH. This
difference in results is due to the nature of drug. Nelfinavir is basic in nature therefor,
it is more soluble in acidic media as compared to higher pH. While Rosuvastatin
calcium is weak acidic drug. Due to this acidic nature, it become more soluble at higher
pH (6.8) values as compared to low pH (1.2). Rosuvastatin is available in its calcium
salt, therefore, it is more soluble in water as compared to different buffer media. But
when Rosuvastatin calcium complexed with hydrophilic polymers then it became more
soluble in buffer media of higher pH rather than in pure water as shown in Figures 4.21
(a) and 4.21 (b).
Figure 4.21 (b): Solubility studies of pure drug and hydrogel microparticles
containing AMPS
289 351
900
2178
3742
6572
0
1000
2000
3000
4000
5000
6000
7000
pH 1.2 pH6.8 Water
RS
T S
olu
bil
ity (
ug/m
l)
RST
β-CD-g-AMPS Hydrogel
microparticles (µg/ml)
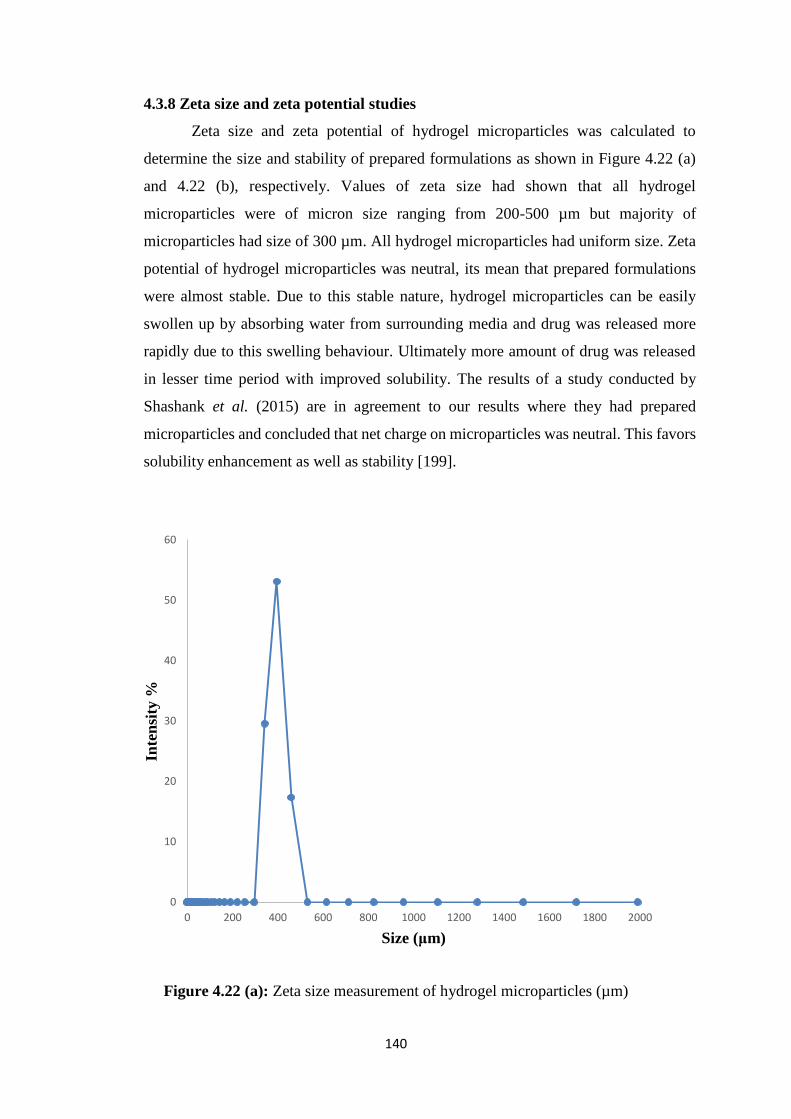
140
4.3.8 Zeta size and zeta potential studies
Zeta size and zeta potential of hydrogel microparticles was calculated to
determine the size and stability of prepared formulations as shown in Figure 4.22 (a)
and 4.22 (b), respectively. Values of zeta size had shown that all hydrogel
microparticles were of micron size ranging from 200-500 µm but majority of
microparticles had size of 300 µm. All hydrogel microparticles had uniform size. Zeta
potential of hydrogel microparticles was neutral, its mean that prepared formulations
were almost stable. Due to this stable nature, hydrogel microparticles can be easily
swollen up by absorbing water from surrounding media and drug was released more
rapidly due to this swelling behaviour. Ultimately more amount of drug was released
in lesser time period with improved solubility. The results of a study conducted by
Shashank et al. (2015) are in agreement to our results where they had prepared
microparticles and concluded that net charge on microparticles was neutral. This favors
solubility enhancement as well as stability [199].
Figure 4.22 (a): Zeta size measurement of hydrogel microparticles (µm)
0
10
20
30
40
50
60
0 200 400 600 800 1000 1200 1400 1600 1800 2000
Inte
nsi
ty %
Size (μm)
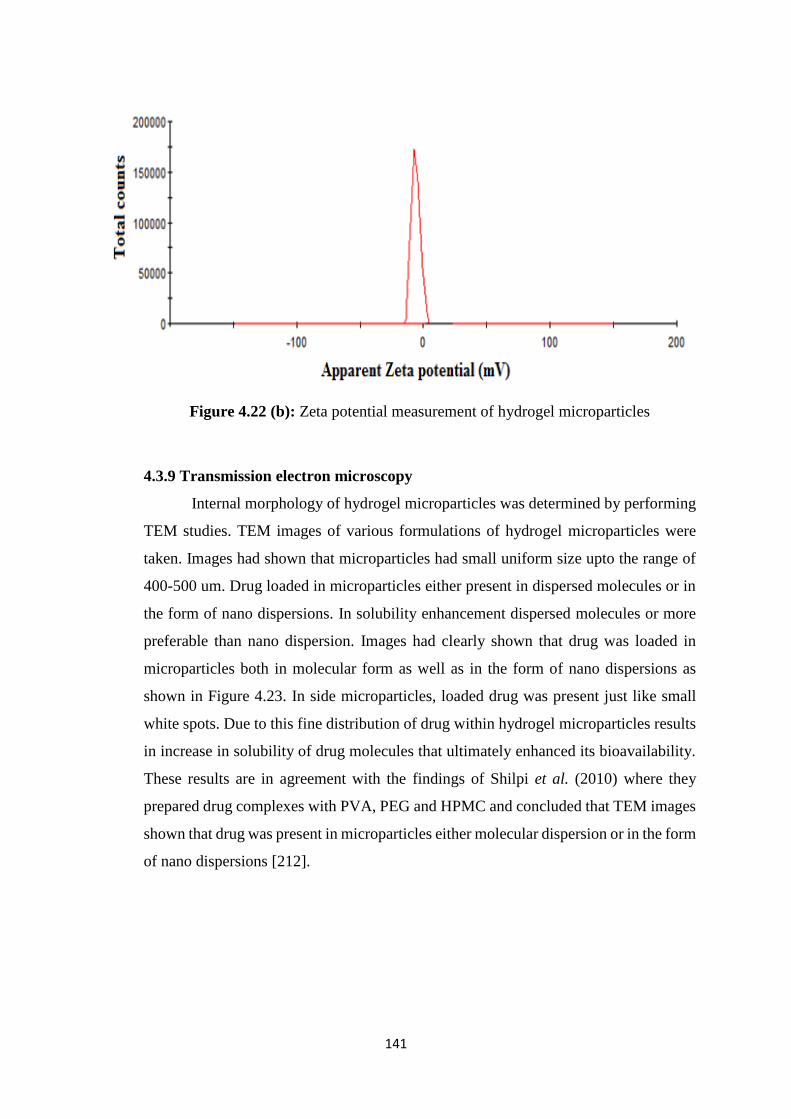
141
Figure 4.22 (b): Zeta potential measurement of hydrogel microparticles
4.3.9 Transmission electron microscopy
Internal morphology of hydrogel microparticles was determined by performing
TEM studies. TEM images of various formulations of hydrogel microparticles were
taken. Images had shown that microparticles had small uniform size upto the range of
400-500 um. Drug loaded in microparticles either present in dispersed molecules or in
the form of nano dispersions. In solubility enhancement dispersed molecules or more
preferable than nano dispersion. Images had clearly shown that drug was loaded in
microparticles both in molecular form as well as in the form of nano dispersions as
shown in Figure 4.23. In side microparticles, loaded drug was present just like small
white spots. Due to this fine distribution of drug within hydrogel microparticles results
in increase in solubility of drug molecules that ultimately enhanced its bioavailability.
These results are in agreement with the findings of Shilpi et al. (2010) where they
prepared drug complexes with PVA, PEG and HPMC and concluded that TEM images
shown that drug was present in microparticles either molecular dispersion or in the form
of nano dispersions [212].
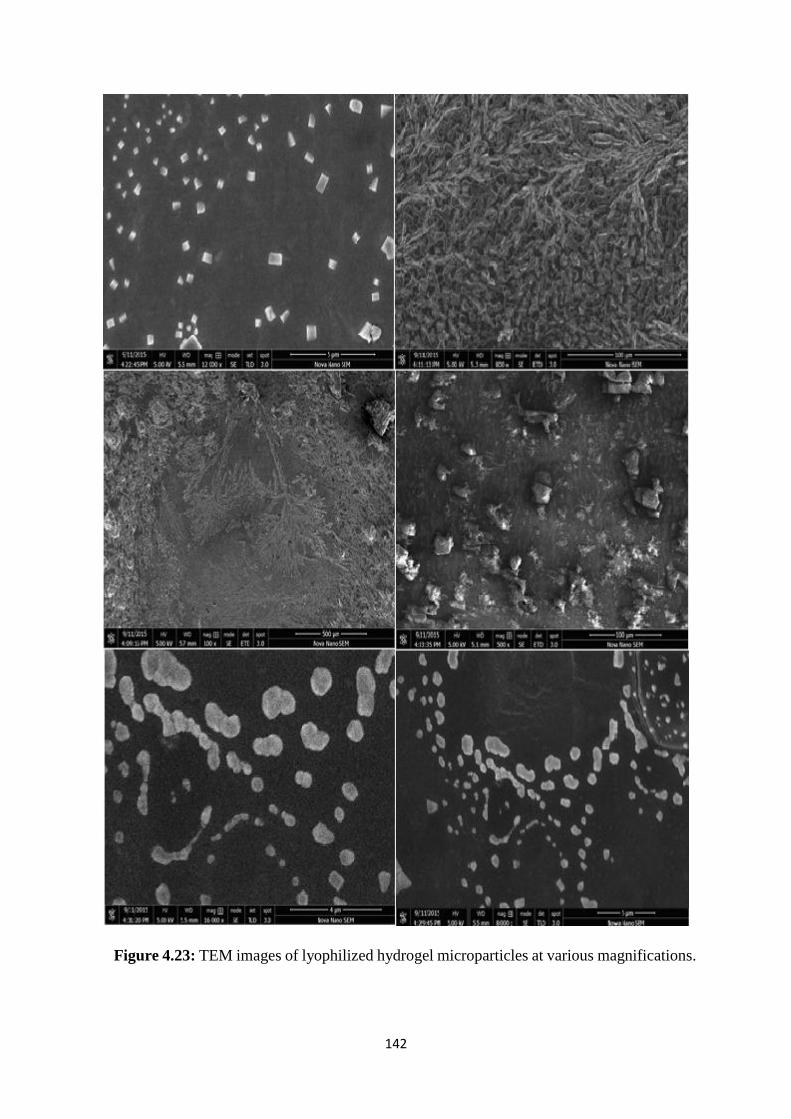
142
Figure 4.23: TEM images of lyophilized hydrogel microparticles at various magnifications.
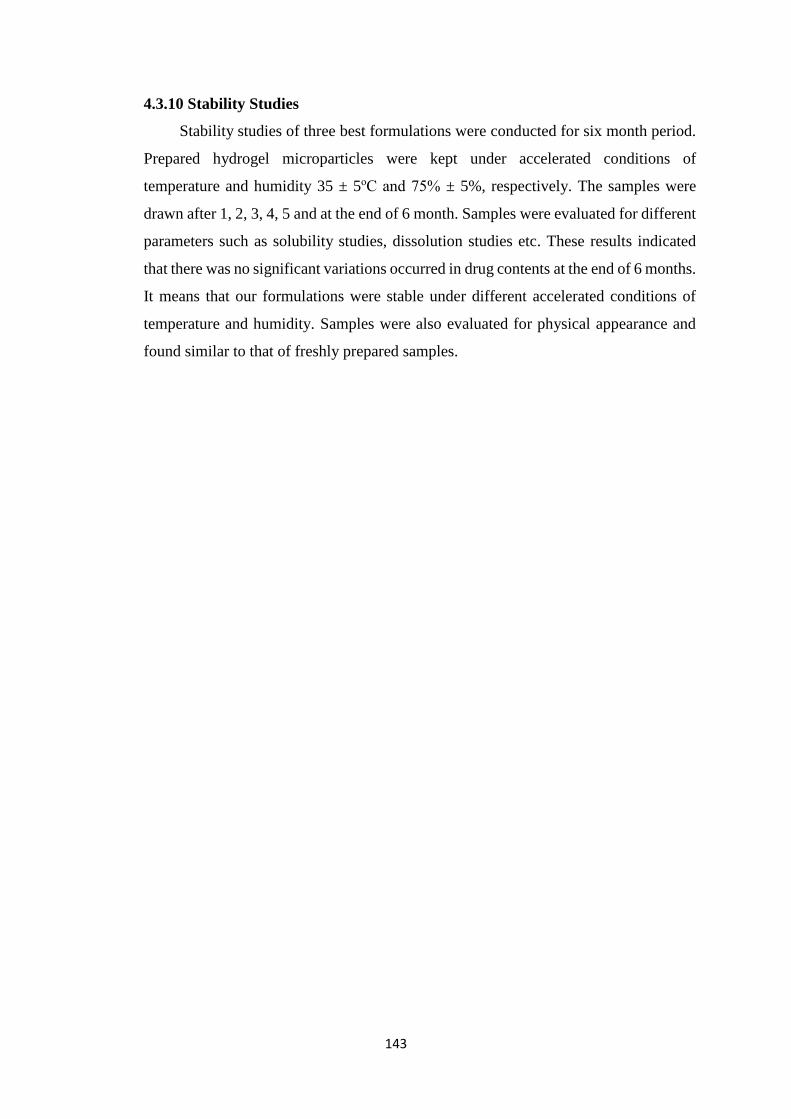
143
4.3.10 Stability Studies
Stability studies of three best formulations were conducted for six month period.
Prepared hydrogel microparticles were kept under accelerated conditions of
temperature and humidity 35 ± 5оС and 75% ± 5%, respectively. The samples were
drawn after 1, 2, 3, 4, 5 and at the end of 6 month. Samples were evaluated for different
parameters such as solubility studies, dissolution studies etc. These results indicated
that there was no significant variations occurred in drug contents at the end of 6 months.
It means that our formulations were stable under different accelerated conditions of
temperature and humidity. Samples were also evaluated for physical appearance and
found similar to that of freshly prepared samples.
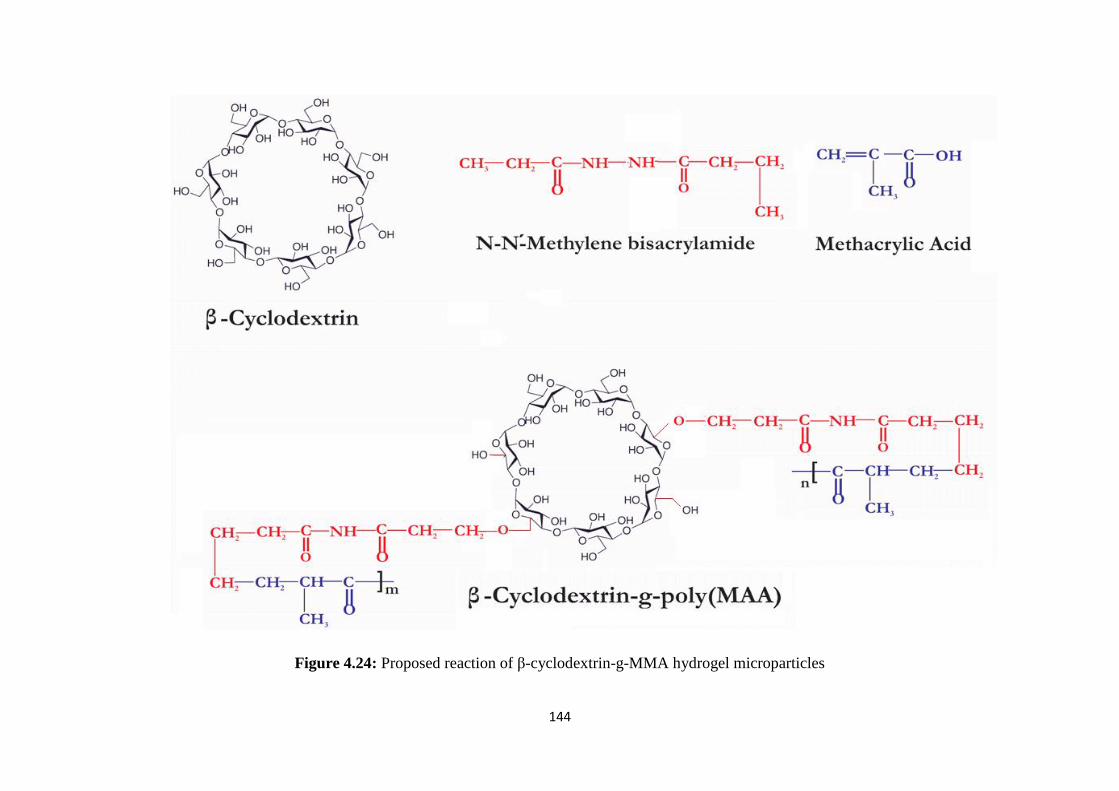
144
Figure 4.24: Proposed reaction of β-cyclodextrin-g-MMA hydrogel microparticles
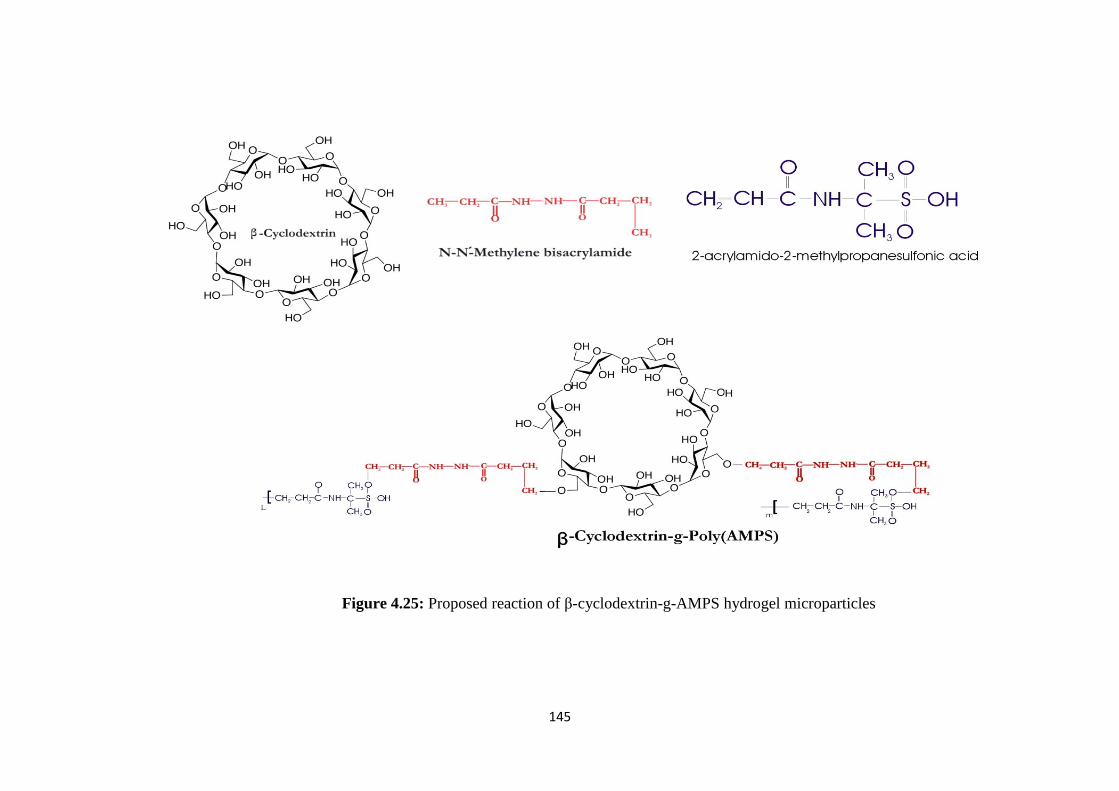
145
Figure 4.25: Proposed reaction of β-cyclodextrin-g-AMPS hydrogel microparticles
146
4.4 In vivo Pharmacokinetic studies
4.4.1 Standard curve
Standard curve of Rosuvastatin calcium was constructed by using
known plasma drug concentrations within ranges of 25 ng/mL to 2000 ng/mL and linear
regression was applied to fit straight line. Mean R2 values 0.9996 was also determined
as shown in Figure 4.26.
Figure 4.26: Standard curve of Rosuvastatin calcium in rabbit plasma
4.4.2 HPLC method development
Several organic solvents were tried for the preparation of stock solutions of all
analytes. Methanol was selected due to greater solubility of analytes in it. The
corresponding working solutions of Rosuvastatin calcium were prepared by diluting
their stock solutions with acetonitrile–water (50:50, v/v; pH adjusted to 3.0 with
orthophosphoric acid). Acetonitrile, methanol and methanol–ethanol in different ratios
were tried for protein precipitation but complete protein precipitation was achieved with
y = 0.1935x + 1.677R² = 0.9996
0
50
100
150
200
250
300
350
400
450
0 500 1000 1500 2000 2500
Pea
k a
rea
Concentration (ng/ml)
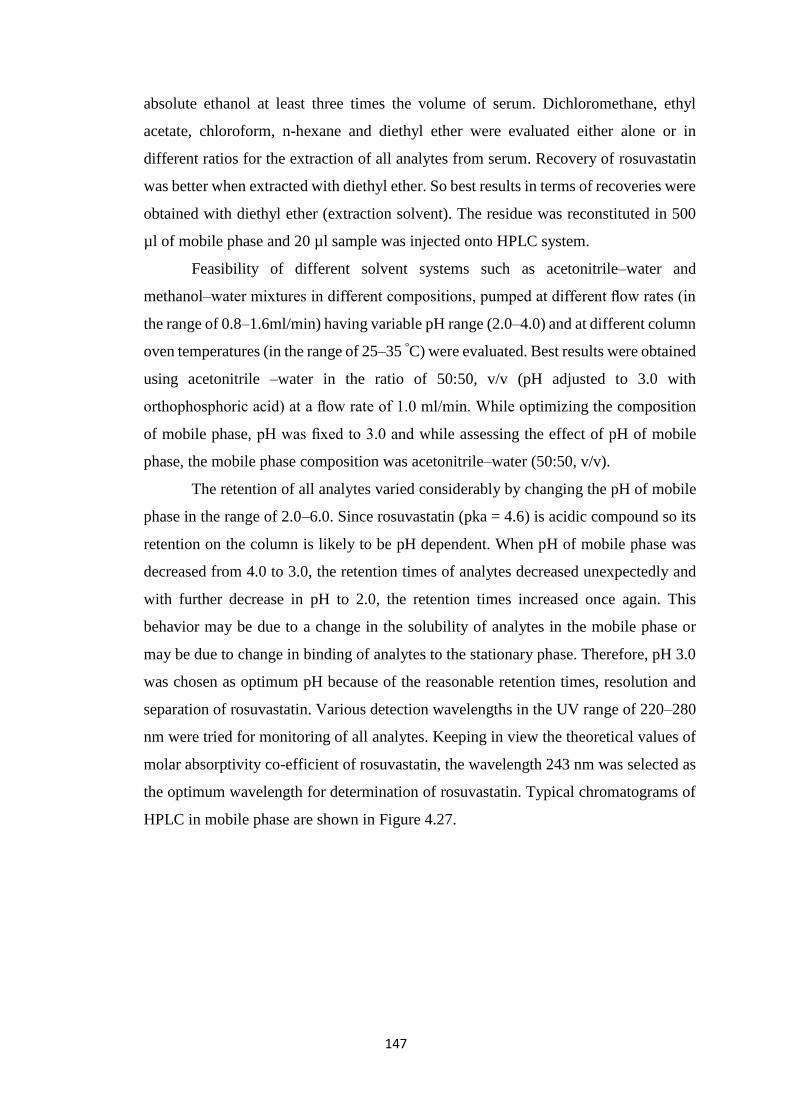
147
absolute ethanol at least three times the volume of serum. Dichloromethane, ethyl
acetate, chloroform, n-hexane and diethyl ether were evaluated either alone or in
different ratios for the extraction of all analytes from serum. Recovery of rosuvastatin
was better when extracted with diethyl ether. So best results in terms of recoveries were
obtained with diethyl ether (extraction solvent). The residue was reconstituted in 500
µl of mobile phase and 20 µl sample was injected onto HPLC system.
Feasibility of different solvent systems such as acetonitrile–water and
methanol–water mixtures in different compositions, pumped at different flow rates (in
the range of 0.8–1.6ml/min) having variable pH range (2.0–4.0) and at different column
oven temperatures (in the range of 25–35 °C) were evaluated. Best results were obtained
using acetonitrile –water in the ratio of 50:50, v/v (pH adjusted to 3.0 with
orthophosphoric acid) at a flow rate of 1.0 ml/min. While optimizing the composition
of mobile phase, pH was fixed to 3.0 and while assessing the effect of pH of mobile
phase, the mobile phase composition was acetonitrile–water (50:50, v/v).
The retention of all analytes varied considerably by changing the pH of mobile
phase in the range of 2.0–6.0. Since rosuvastatin (pka = 4.6) is acidic compound so its
retention on the column is likely to be pH dependent. When pH of mobile phase was
decreased from 4.0 to 3.0, the retention times of analytes decreased unexpectedly and
with further decrease in pH to 2.0, the retention times increased once again. This
behavior may be due to a change in the solubility of analytes in the mobile phase or
may be due to change in binding of analytes to the stationary phase. Therefore, pH 3.0
was chosen as optimum pH because of the reasonable retention times, resolution and
separation of rosuvastatin. Various detection wavelengths in the UV range of 220–280
nm were tried for monitoring of all analytes. Keeping in view the theoretical values of
molar absorptivity co-efficient of rosuvastatin, the wavelength 243 nm was selected as
the optimum wavelength for determination of rosuvastatin. Typical chromatograms of
HPLC in mobile phase are shown in Figure 4.27.
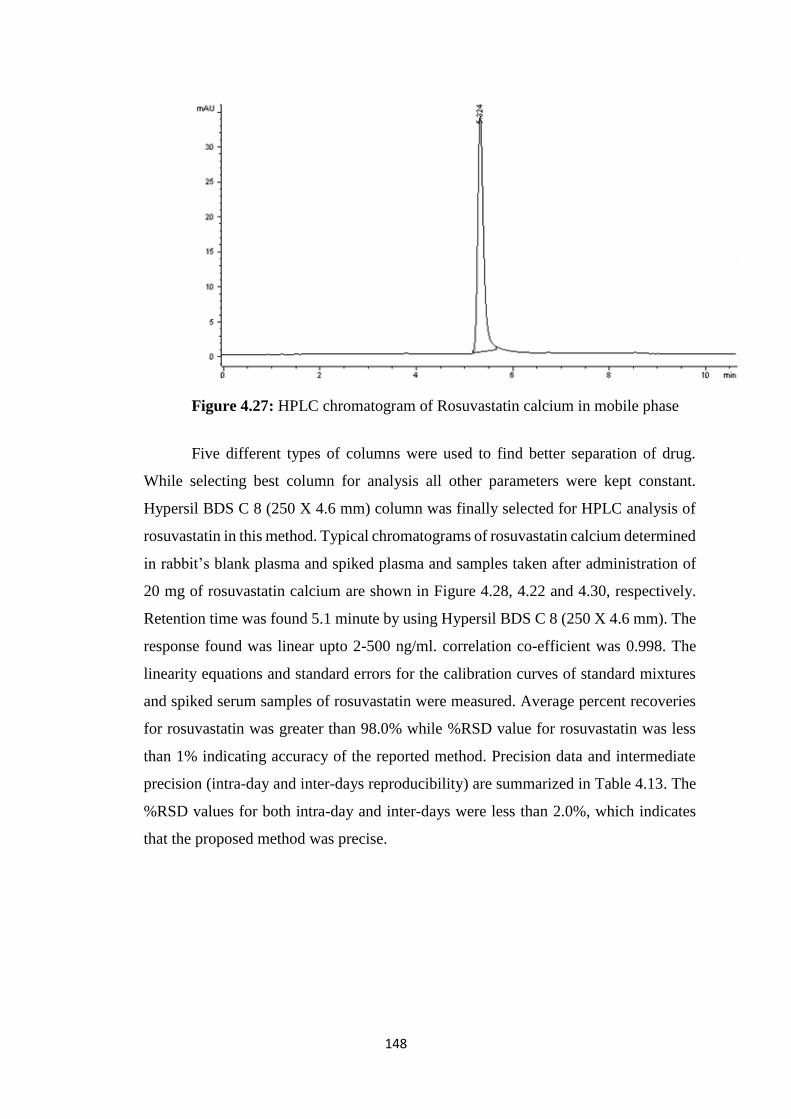
148
Figure 4.27: HPLC chromatogram of Rosuvastatin calcium in mobile phase
Five different types of columns were used to find better separation of drug.
While selecting best column for analysis all other parameters were kept constant.
Hypersil BDS C 8 (250 X 4.6 mm) column was finally selected for HPLC analysis of
rosuvastatin in this method. Typical chromatograms of rosuvastatin calcium determined
in rabbit’s blank plasma and spiked plasma and samples taken after administration of
20 mg of rosuvastatin calcium are shown in Figure 4.28, 4.22 and 4.30, respectively.
Retention time was found 5.1 minute by using Hypersil BDS C 8 (250 X 4.6 mm). The
response found was linear upto 2-500 ng/ml. correlation co-efficient was 0.998. The
linearity equations and standard errors for the calibration curves of standard mixtures
and spiked serum samples of rosuvastatin were measured. Average percent recoveries
for rosuvastatin was greater than 98.0% while %RSD value for rosuvastatin was less
than 1% indicating accuracy of the reported method. Precision data and intermediate
precision (intra-day and inter-days reproducibility) are summarized in Table 4.13. The
%RSD values for both intra-day and inter-days were less than 2.0%, which indicates
that the proposed method was precise.
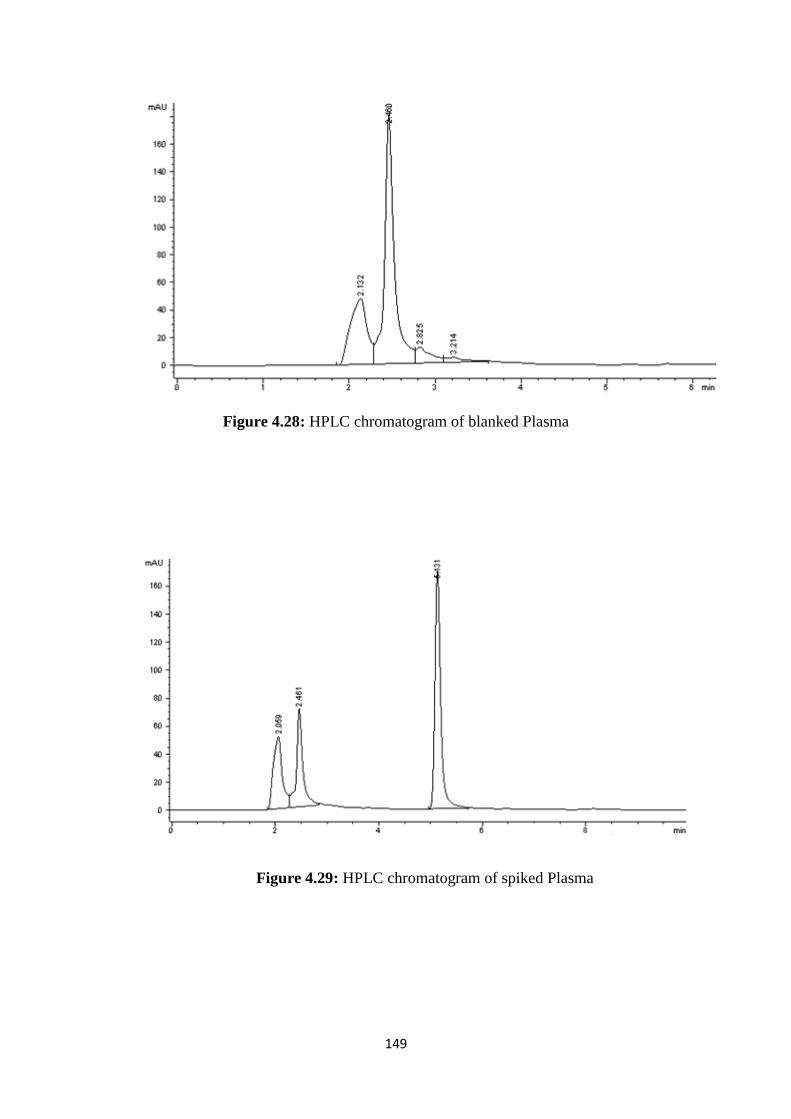
149
Figure 4.28: HPLC chromatogram of blanked Plasma
Figure 4.29: HPLC chromatogram of spiked Plasma
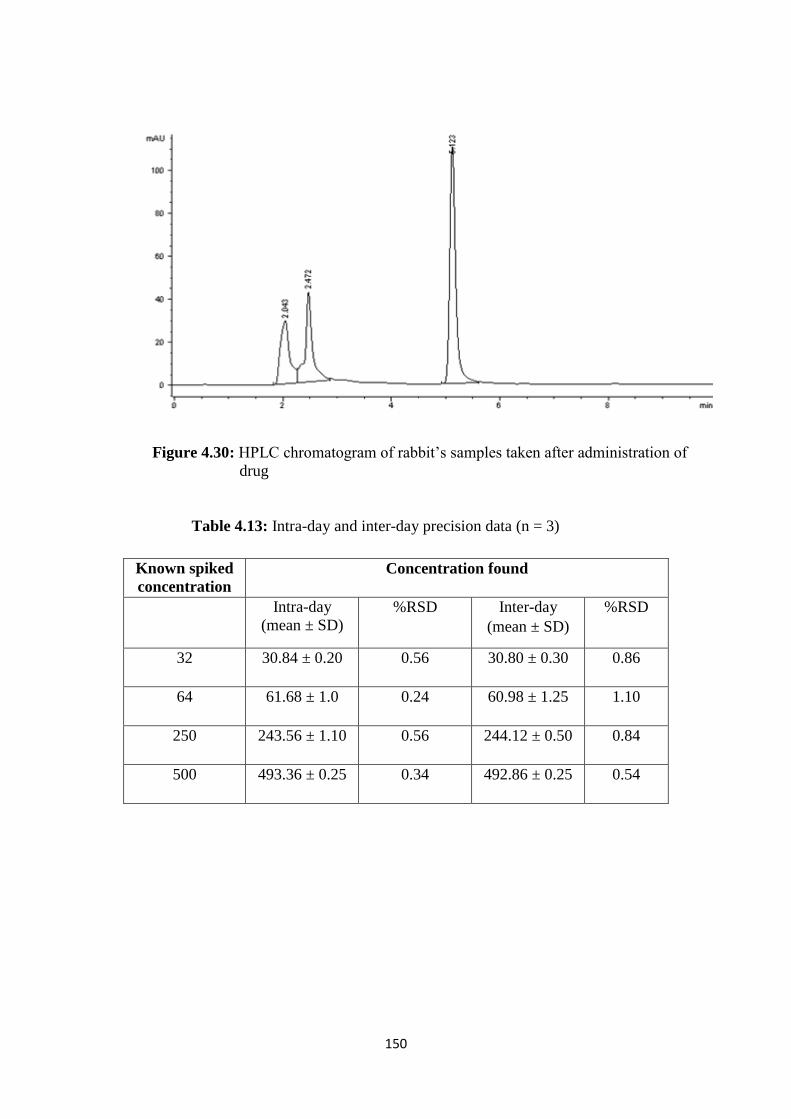
150
Figure 4.30: HPLC chromatogram of rabbit’s samples taken after administration of
drug
Table 4.13: Intra-day and inter-day precision data (n = 3)
Known spiked
concentration
Concentration found
Intra-day
(mean ± SD)
%RSD Inter-day
(mean ± SD)
%RSD
32 30.84 ± 0.20 0.56 30.80 ± 0.30 0.86
64 61.68 ± 1.0 0.24 60.98 ± 1.25 1.10
250 243.56 ± 1.10 0.56 244.12 ± 0.50 0.84
500 493.36 ± 0.25 0.34 492.86 ± 0.25 0.54
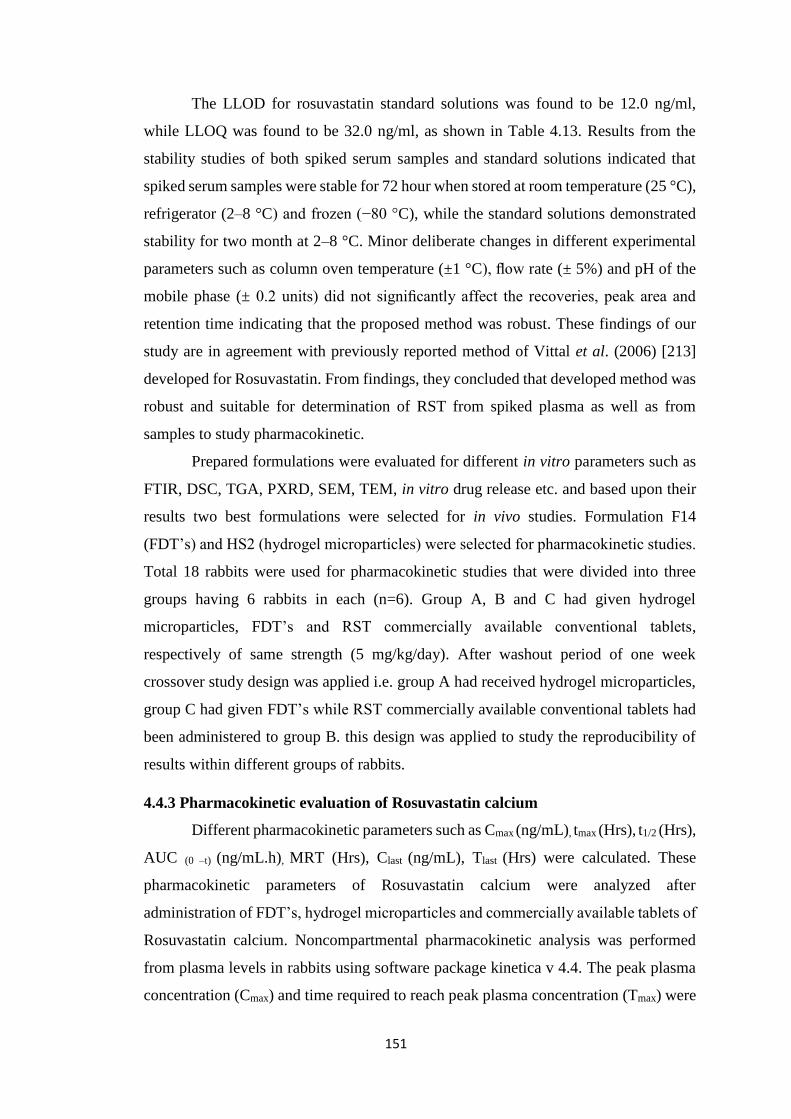
151
The LLOD for rosuvastatin standard solutions was found to be 12.0 ng/ml,
while LLOQ was found to be 32.0 ng/ml, as shown in Table 4.13. Results from the
stability studies of both spiked serum samples and standard solutions indicated that
spiked serum samples were stable for 72 hour when stored at room temperature (25 °C),
refrigerator (2–8 °C) and frozen (−80 °C), while the standard solutions demonstrated
stability for two month at 2–8 °C. Minor deliberate changes in different experimental
parameters such as column oven temperature (±1 °C), flow rate (± 5%) and pH of the
mobile phase (± 0.2 units) did not significantly affect the recoveries, peak area and
retention time indicating that the proposed method was robust. These findings of our
study are in agreement with previously reported method of Vittal et al. (2006) [213]
developed for Rosuvastatin. From findings, they concluded that developed method was
robust and suitable for determination of RST from spiked plasma as well as from
samples to study pharmacokinetic.
Prepared formulations were evaluated for different in vitro parameters such as
FTIR, DSC, TGA, PXRD, SEM, TEM, in vitro drug release etc. and based upon their
results two best formulations were selected for in vivo studies. Formulation F14
(FDT’s) and HS2 (hydrogel microparticles) were selected for pharmacokinetic studies.
Total 18 rabbits were used for pharmacokinetic studies that were divided into three
groups having 6 rabbits in each (n=6). Group A, B and C had given hydrogel
microparticles, FDT’s and RST commercially available conventional tablets,
respectively of same strength (5 mg/kg/day). After washout period of one week
crossover study design was applied i.e. group A had received hydrogel microparticles,
group C had given FDT’s while RST commercially available conventional tablets had
been administered to group B. this design was applied to study the reproducibility of
results within different groups of rabbits.
4.4.3 Pharmacokinetic evaluation of Rosuvastatin calcium
Different pharmacokinetic parameters such as Cmax (ng/mL), tmax (Hrs), t1/2 (Hrs),
AUC (0 –t) (ng/mL.h), MRT (Hrs), Clast (ng/mL), Tlast (Hrs) were calculated. These
pharmacokinetic parameters of Rosuvastatin calcium were analyzed after
administration of FDT’s, hydrogel microparticles and commercially available tablets of
Rosuvastatin calcium. Noncompartmental pharmacokinetic analysis was performed
from plasma levels in rabbits using software package kinetica v 4.4. The peak plasma
concentration (Cmax) and time required to reach peak plasma concentration (Tmax) were
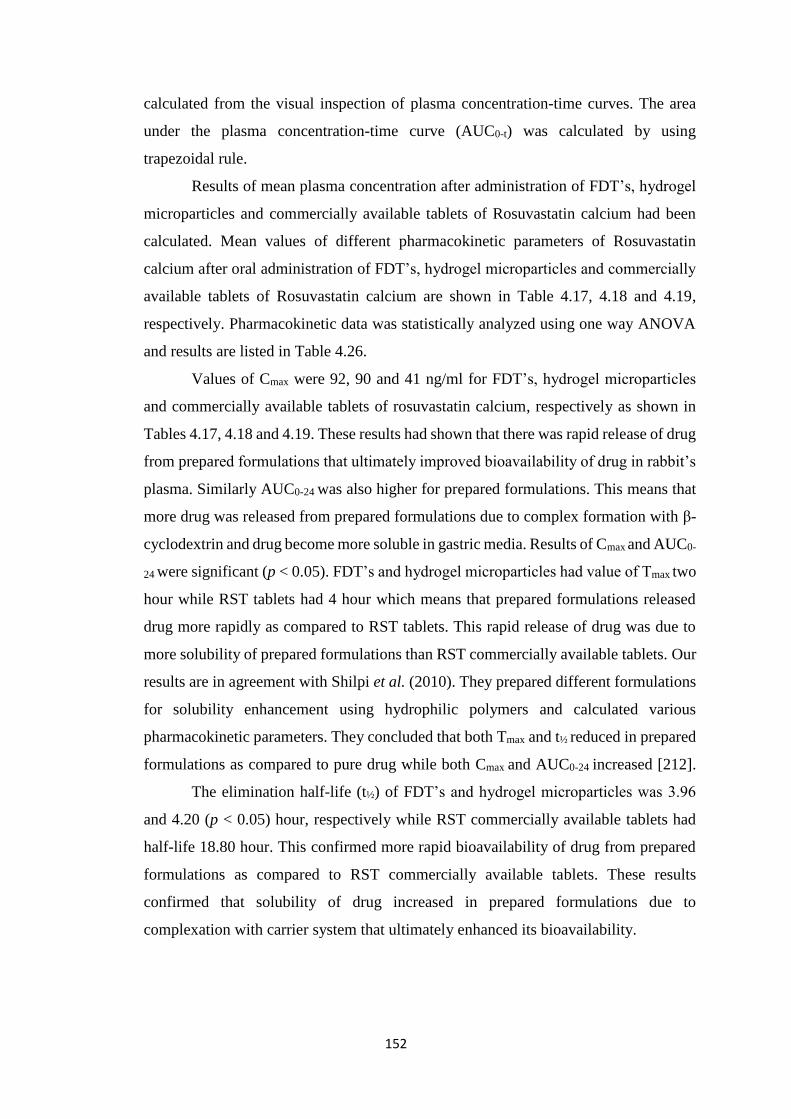
152
calculated from the visual inspection of plasma concentration-time curves. The area
under the plasma concentration-time curve (AUC0-t) was calculated by using
trapezoidal rule.
Results of mean plasma concentration after administration of FDT’s, hydrogel
microparticles and commercially available tablets of Rosuvastatin calcium had been
calculated. Mean values of different pharmacokinetic parameters of Rosuvastatin
calcium after oral administration of FDT’s, hydrogel microparticles and commercially
available tablets of Rosuvastatin calcium are shown in Table 4.17, 4.18 and 4.19,
respectively. Pharmacokinetic data was statistically analyzed using one way ANOVA
and results are listed in Table 4.26.
Values of Cmax were 92, 90 and 41 ng/ml for FDT’s, hydrogel microparticles
and commercially available tablets of rosuvastatin calcium, respectively as shown in
Tables 4.17, 4.18 and 4.19. These results had shown that there was rapid release of drug
from prepared formulations that ultimately improved bioavailability of drug in rabbit’s
plasma. Similarly AUC0-24 was also higher for prepared formulations. This means that
more drug was released from prepared formulations due to complex formation with β-
cyclodextrin and drug become more soluble in gastric media. Results of Cmax and AUC0-
24 were significant (p < 0.05). FDT’s and hydrogel microparticles had value of Tmax two
hour while RST tablets had 4 hour which means that prepared formulations released
drug more rapidly as compared to RST tablets. This rapid release of drug was due to
more solubility of prepared formulations than RST commercially available tablets. Our
results are in agreement with Shilpi et al. (2010). They prepared different formulations
for solubility enhancement using hydrophilic polymers and calculated various
pharmacokinetic parameters. They concluded that both Tmax and t½ reduced in prepared
formulations as compared to pure drug while both Cmax and AUC0-24 increased [212].
The elimination half-life (t½) of FDT’s and hydrogel microparticles was 3.96
and 4.20 (p < 0.05) hour, respectively while RST commercially available tablets had
half-life 18.80 hour. This confirmed more rapid bioavailability of drug from prepared
formulations as compared to RST commercially available tablets. These results
confirmed that solubility of drug increased in prepared formulations due to
complexation with carrier system that ultimately enhanced its bioavailability.
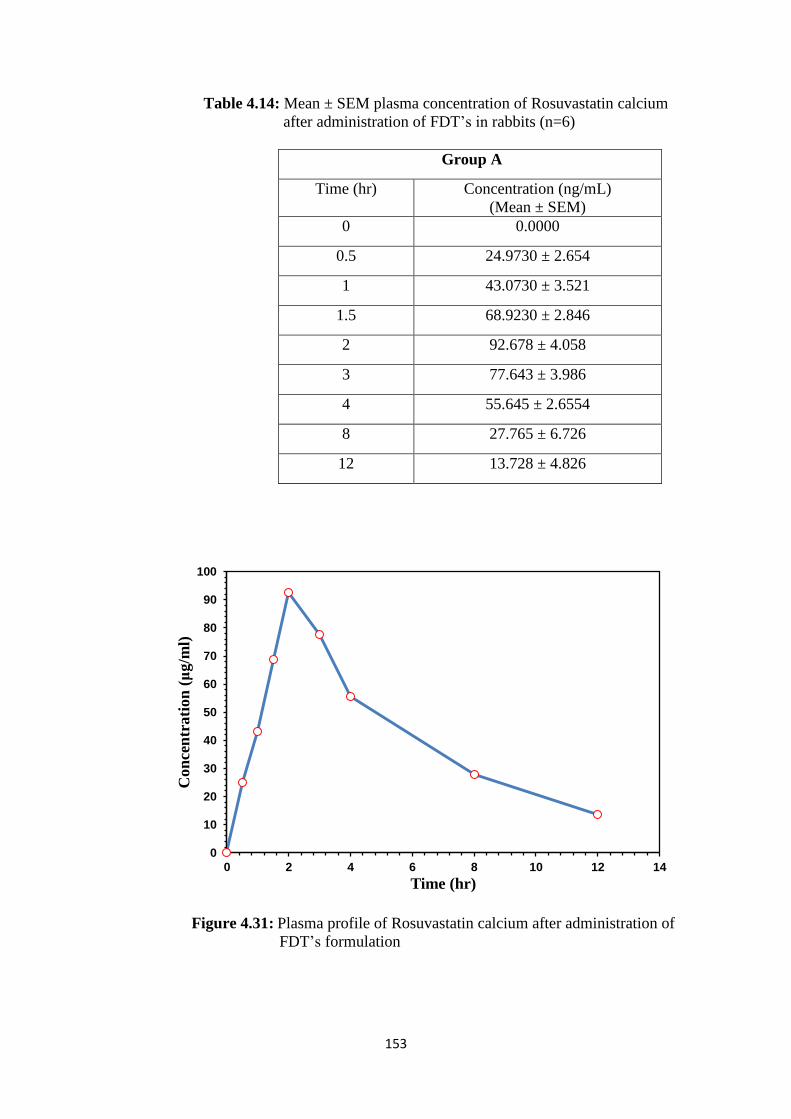
153
Table 4.14: Mean ± SEM plasma concentration of Rosuvastatin calcium
after administration of FDT’s in rabbits (n=6)
Group A
Time (hr) Concentration (ng/mL)
(Mean ± SEM)
0 0.0000
0.5 24.9730 ± 2.654
1 43.0730 ± 3.521
1.5 68.9230 ± 2.846
2 92.678 ± 4.058
3 77.643 ± 3.986
4 55.645 ± 2.6554
8 27.765 ± 6.726
12 13.728 ± 4.826
Figure 4.31: Plasma profile of Rosuvastatin calcium after administration of
FDT’s formulation
0
10
20
30
40
50
60
70
80
90
100
0 2 4 6 8 10 12 14
Con
cen
trati
on
(μ
g/m
l)
Time (hr)
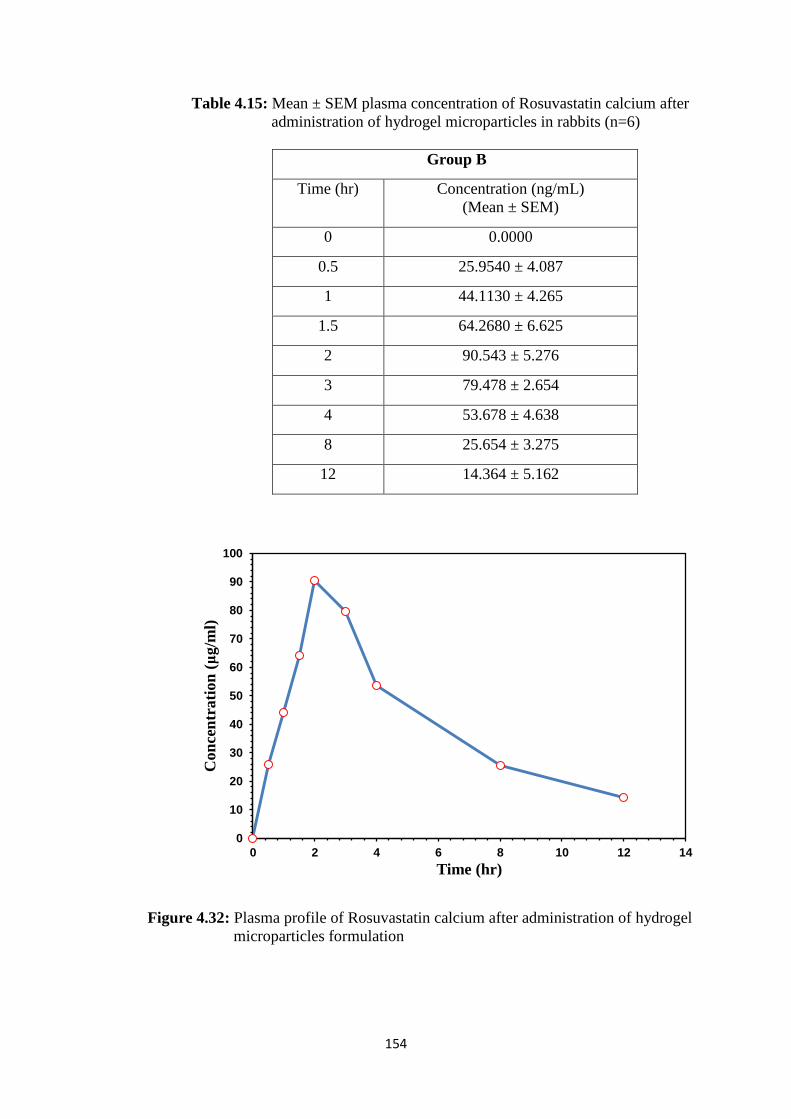
154
Table 4.15: Mean ± SEM plasma concentration of Rosuvastatin calcium after
administration of hydrogel microparticles in rabbits (n=6)
Group B
Time (hr) Concentration (ng/mL)
(Mean ± SEM)
0 0.0000
0.5 25.9540 ± 4.087
1 44.1130 ± 4.265
1.5 64.2680 ± 6.625
2 90.543 ± 5.276
3 79.478 ± 2.654
4 53.678 ± 4.638
8 25.654 ± 3.275
12 14.364 ± 5.162
Figure 4.32: Plasma profile of Rosuvastatin calcium after administration of hydrogel
microparticles formulation
0
10
20
30
40
50
60
70
80
90
100
0 2 4 6 8 10 12 14
Con
cen
trati
on
(μ
g/m
l)
Time (hr)
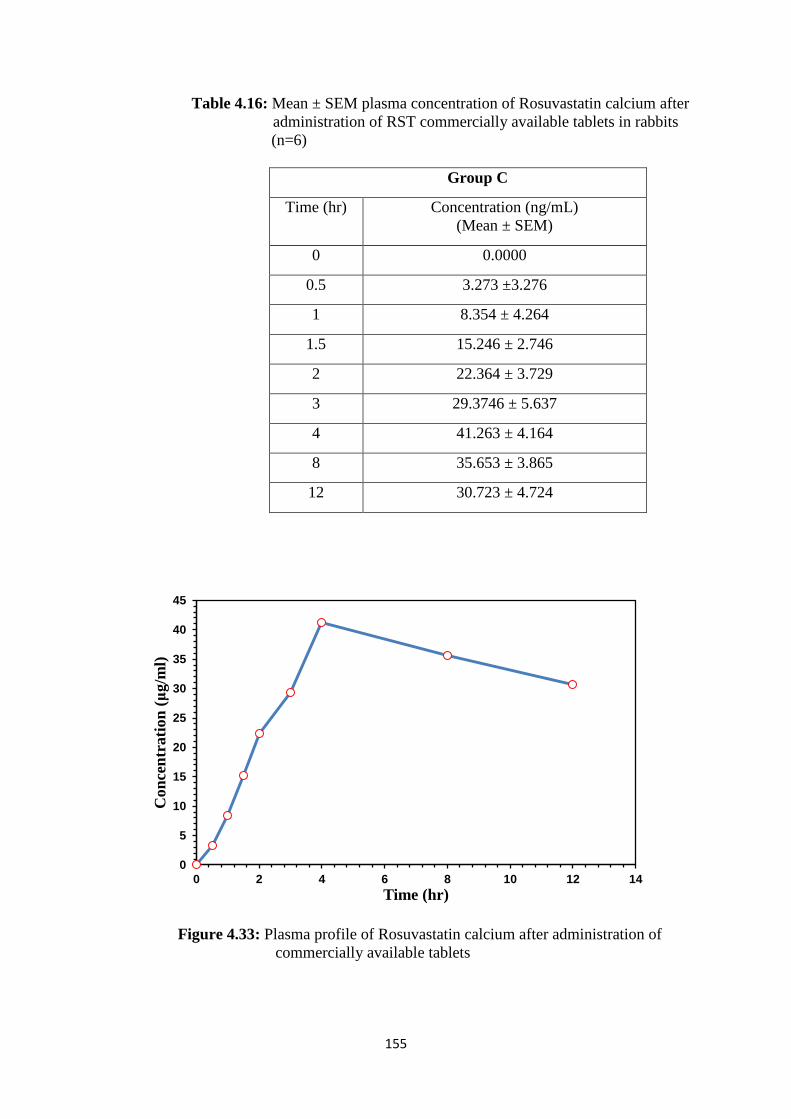
155
Table 4.16: Mean ± SEM plasma concentration of Rosuvastatin calcium after
administration of RST commercially available tablets in rabbits
(n=6)
Group C
Time (hr) Concentration (ng/mL)
(Mean ± SEM)
0 0.0000
0.5 3.273 ±3.276
1 8.354 ± 4.264
1.5 15.246 ± 2.746
2 22.364 ± 3.729
3 29.3746 ± 5.637
4 41.263 ± 4.164
8 35.653 ± 3.865
12 30.723 ± 4.724
Figure 4.33: Plasma profile of Rosuvastatin calcium after administration of
commercially available tablets
0
5
10
15
20
25
30
35
40
45
0 2 4 6 8 10 12 14
Con
cen
trati
on
(μ
g/m
l)
Time (hr)
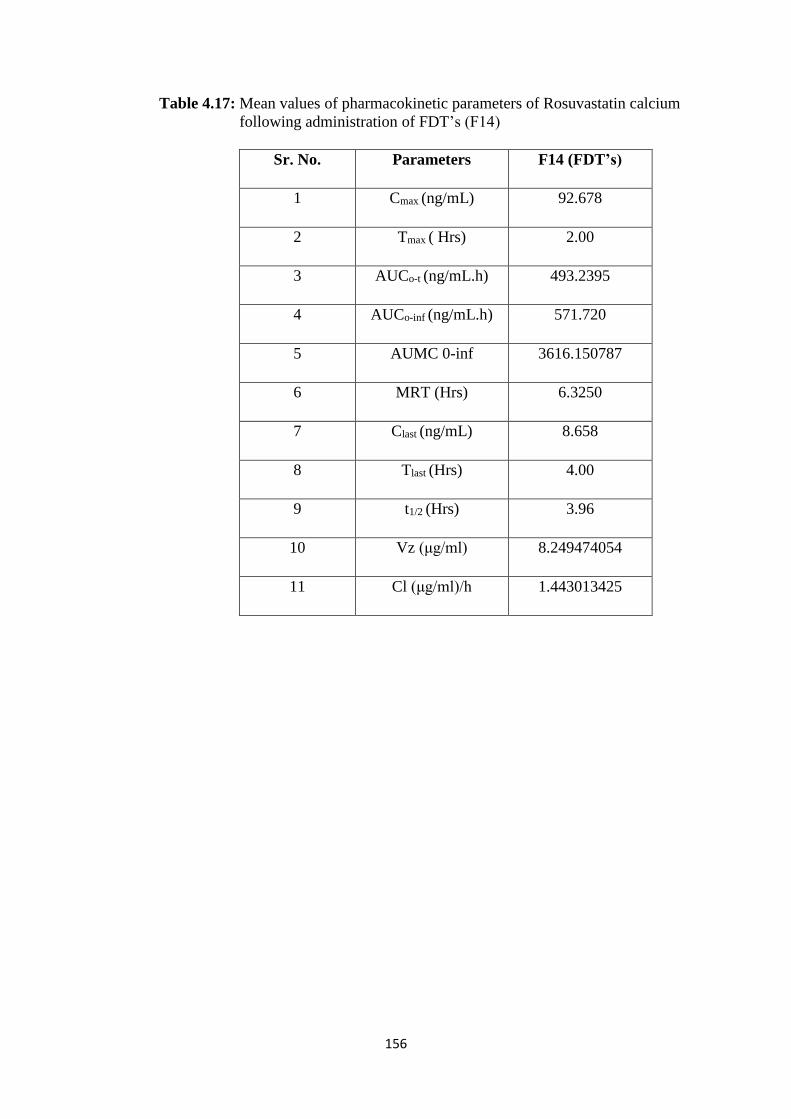
156
Table 4.17: Mean values of pharmacokinetic parameters of Rosuvastatin calcium
following administration of FDT’s (F14)
Sr. No. Parameters F14 (FDT’s)
1 Cmax (ng/mL) 92.678
2 Tmax ( Hrs) 2.00
3 AUCo-t (ng/mL.h) 493.2395
4 AUCo-inf (ng/mL.h) 571.720
5 AUMC 0-inf 3616.150787
6 MRT (Hrs) 6.3250
7 Clast (ng/mL) 8.658
8 Tlast (Hrs) 4.00
9 t1/2 (Hrs) 3.96
10 Vz (μg/ml) 8.249474054
11 Cl (μg/ml)/h 1.443013425
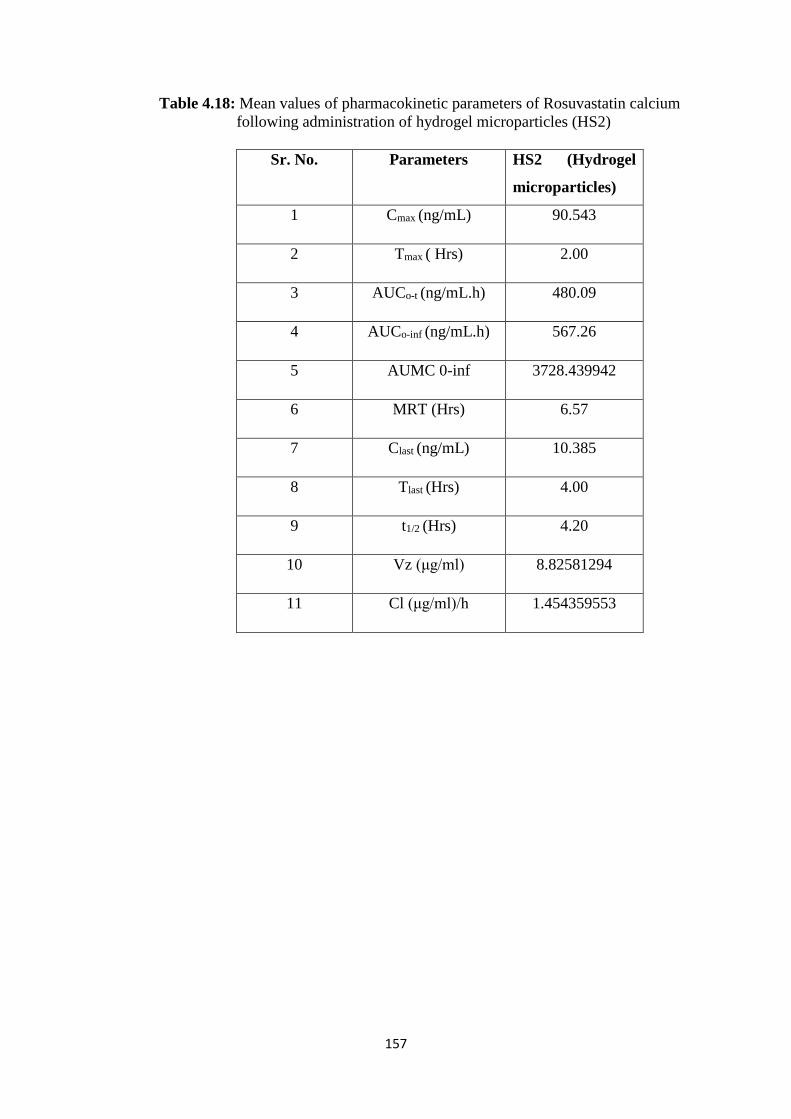
157
Table 4.18: Mean values of pharmacokinetic parameters of Rosuvastatin calcium
following administration of hydrogel microparticles (HS2)
Sr. No. Parameters HS2 (Hydrogel
microparticles)
1 Cmax (ng/mL) 90.543
2 Tmax ( Hrs) 2.00
3 AUCo-t (ng/mL.h) 480.09
4 AUCo-inf (ng/mL.h) 567.26
5 AUMC 0-inf 3728.439942
6 MRT (Hrs) 6.57
7 Clast (ng/mL) 10.385
8 Tlast (Hrs) 4.00
9 t1/2 (Hrs) 4.20
10 Vz (μg/ml) 8.82581294
11 Cl (μg/ml)/h 1.454359553
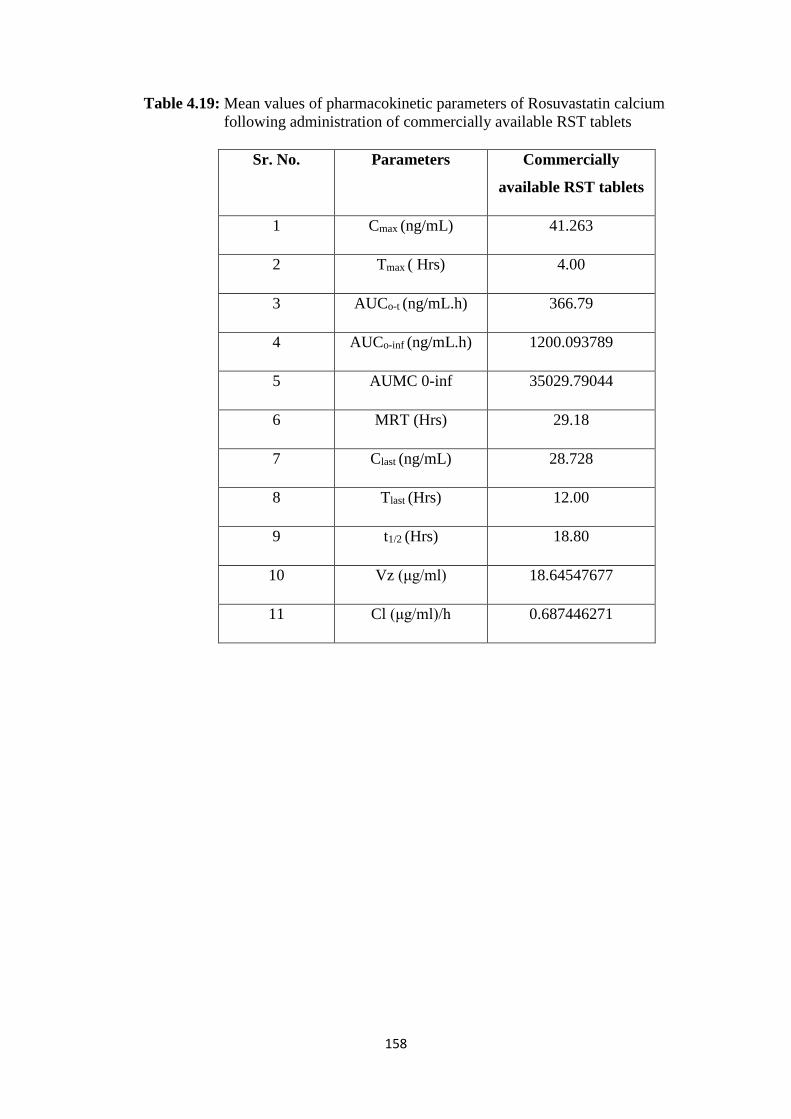
158
Table 4.19: Mean values of pharmacokinetic parameters of Rosuvastatin calcium
following administration of commercially available RST tablets
Sr. No. Parameters Commercially
available RST tablets
1 Cmax (ng/mL) 41.263
2 Tmax ( Hrs) 4.00
3 AUCo-t (ng/mL.h) 366.79
4 AUCo-inf (ng/mL.h) 1200.093789
5 AUMC 0-inf 35029.79044
6 MRT (Hrs) 29.18
7 Clast (ng/mL) 28.728
8 Tlast (Hrs) 12.00
9 t1/2 (Hrs) 18.80
10 Vz (μg/ml) 18.64547677
11 Cl (μg/ml)/h 0.687446271
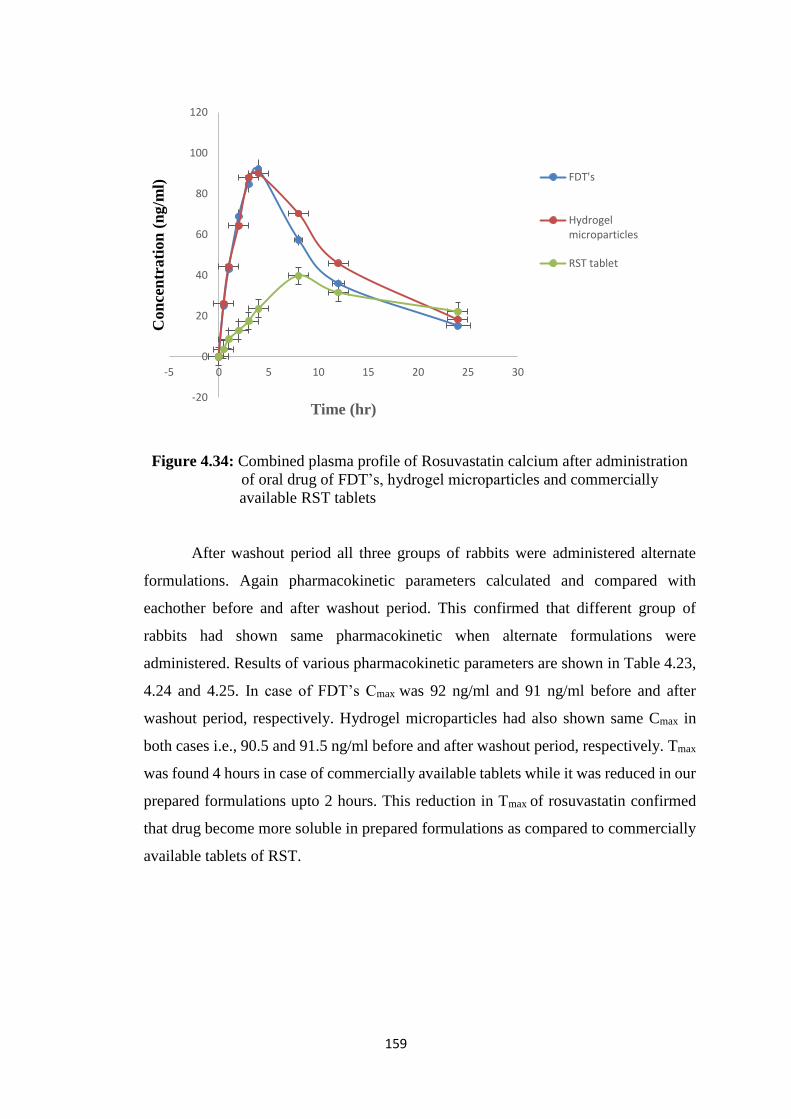
159
Figure 4.34: Combined plasma profile of Rosuvastatin calcium after administration
of oral drug of FDT’s, hydrogel microparticles and commercially
available RST tablets
After washout period all three groups of rabbits were administered alternate
formulations. Again pharmacokinetic parameters calculated and compared with
eachother before and after washout period. This confirmed that different group of
rabbits had shown same pharmacokinetic when alternate formulations were
administered. Results of various pharmacokinetic parameters are shown in Table 4.23,
4.24 and 4.25. In case of FDT’s Cmax was 92 ng/ml and 91 ng/ml before and after
washout period, respectively. Hydrogel microparticles had also shown same Cmax in
both cases i.e., 90.5 and 91.5 ng/ml before and after washout period, respectively. Tmax
was found 4 hours in case of commercially available tablets while it was reduced in our
prepared formulations upto 2 hours. This reduction in Tmax of rosuvastatin confirmed
that drug become more soluble in prepared formulations as compared to commercially
available tablets of RST.
-20
0
20
40
60
80
100
120
-5 0 5 10 15 20 25 30
Con
cen
trati
on
(n
g/m
l)
Time (hr)
FDT's
Hydrogelmicroparticles
RST tablet
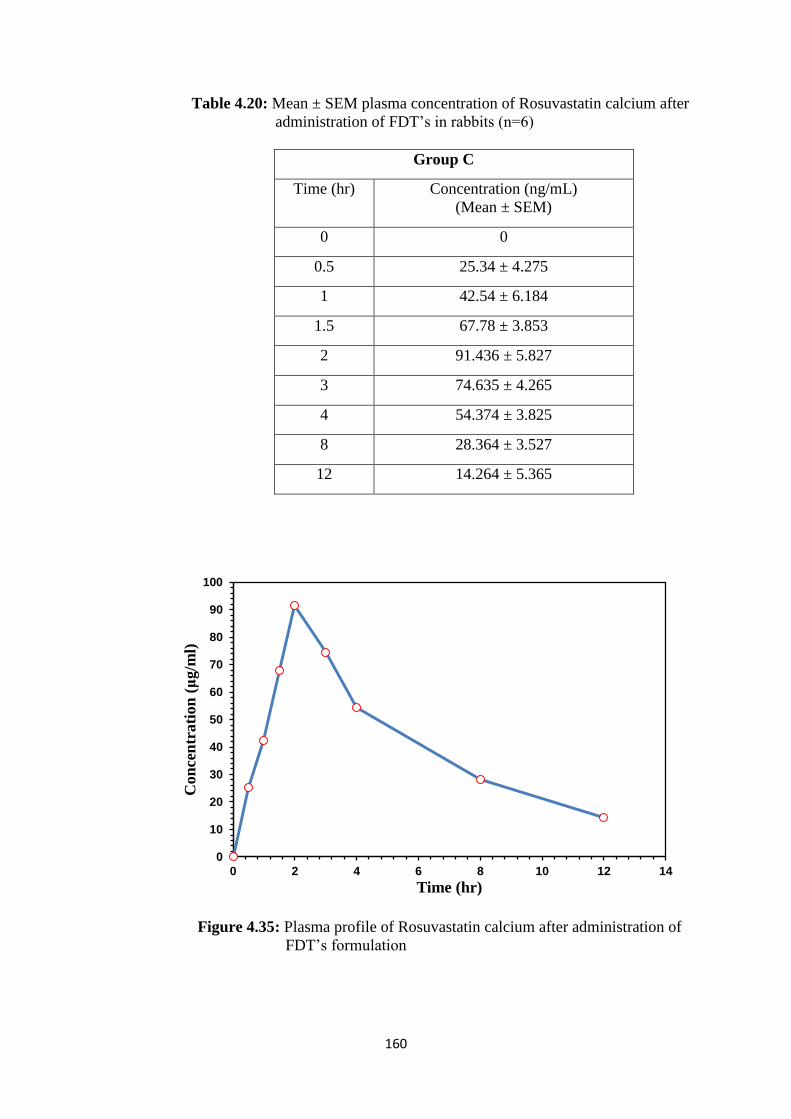
160
Table 4.20: Mean ± SEM plasma concentration of Rosuvastatin calcium after
administration of FDT’s in rabbits (n=6)
Group C
Time (hr) Concentration (ng/mL)
(Mean ± SEM)
0 0
0.5 25.34 ± 4.275
1 42.54 ± 6.184
1.5 67.78 ± 3.853
2 91.436 ± 5.827
3 74.635 ± 4.265
4 54.374 ± 3.825
8 28.364 ± 3.527
12 14.264 ± 5.365
Figure 4.35: Plasma profile of Rosuvastatin calcium after administration of
FDT’s formulation
0
10
20
30
40
50
60
70
80
90
100
0 2 4 6 8 10 12 14
Co
nce
ntr
ati
on
(μ
g/m
l)
Time (hr)
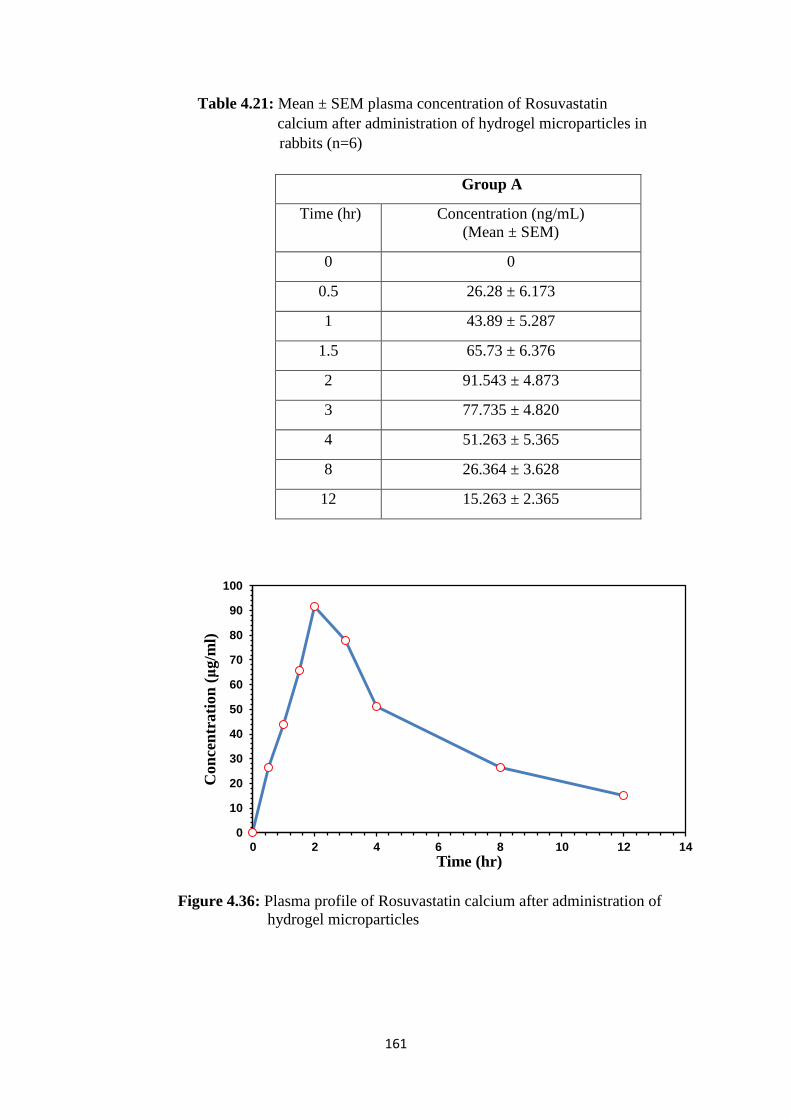
161
Table 4.21: Mean ± SEM plasma concentration of Rosuvastatin
calcium after administration of hydrogel microparticles in
rabbits (n=6)
Figure 4.36: Plasma profile of Rosuvastatin calcium after administration of
hydrogel microparticles
0
10
20
30
40
50
60
70
80
90
100
0 2 4 6 8 10 12 14
Con
cen
trati
on
(μ
g/m
l)
Time (hr)
Group A
Time (hr) Concentration (ng/mL)
(Mean ± SEM)
0 0
0.5 26.28 ± 6.173
1 43.89 ± 5.287
1.5 65.73 ± 6.376
2 91.543 ± 4.873
3 77.735 ± 4.820
4 51.263 ± 5.365
8 26.364 ± 3.628
12 15.263 ± 2.365
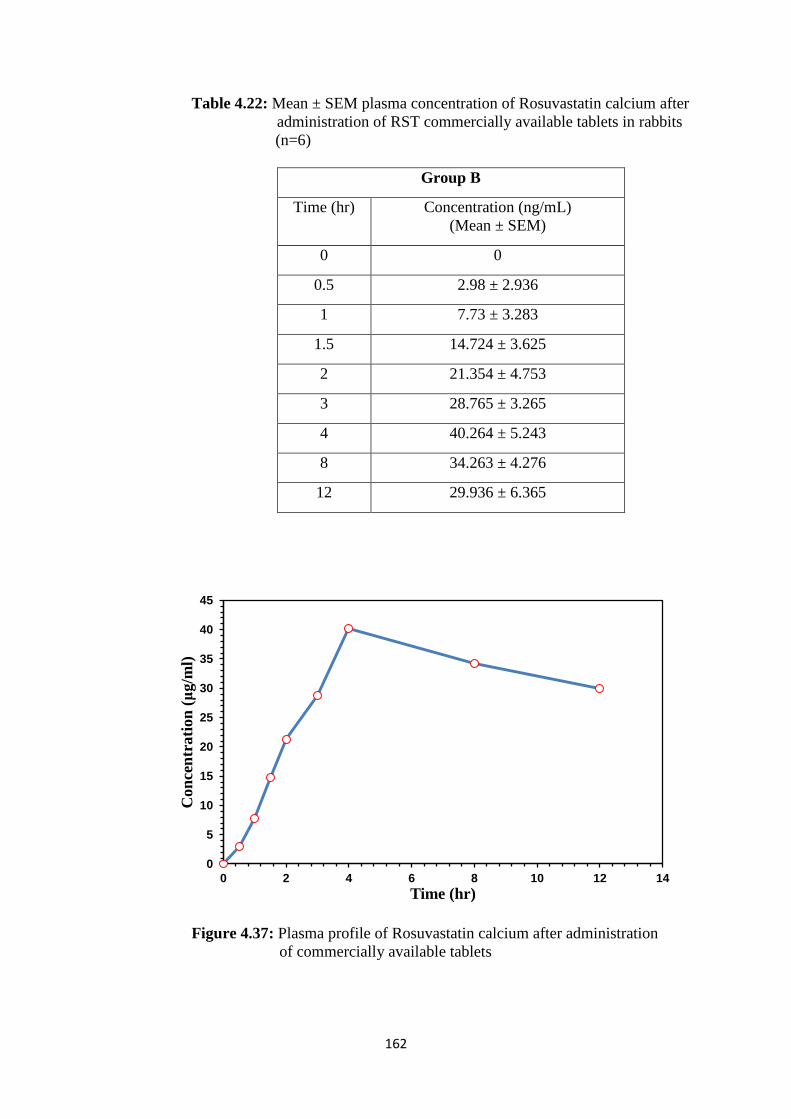
162
Table 4.22: Mean ± SEM plasma concentration of Rosuvastatin calcium after
administration of RST commercially available tablets in rabbits
(n=6)
Group B
Time (hr) Concentration (ng/mL)
(Mean ± SEM)
0 0
0.5 2.98 ± 2.936
1 7.73 ± 3.283
1.5 14.724 ± 3.625
2 21.354 ± 4.753
3 28.765 ± 3.265
4 40.264 ± 5.243
8 34.263 ± 4.276
12 29.936 ± 6.365
Figure 4.37: Plasma profile of Rosuvastatin calcium after administration
of commercially available tablets
0
5
10
15
20
25
30
35
40
45
0 2 4 6 8 10 12 14
Con
cen
trati
on
(μ
g/m
l)
Time (hr)
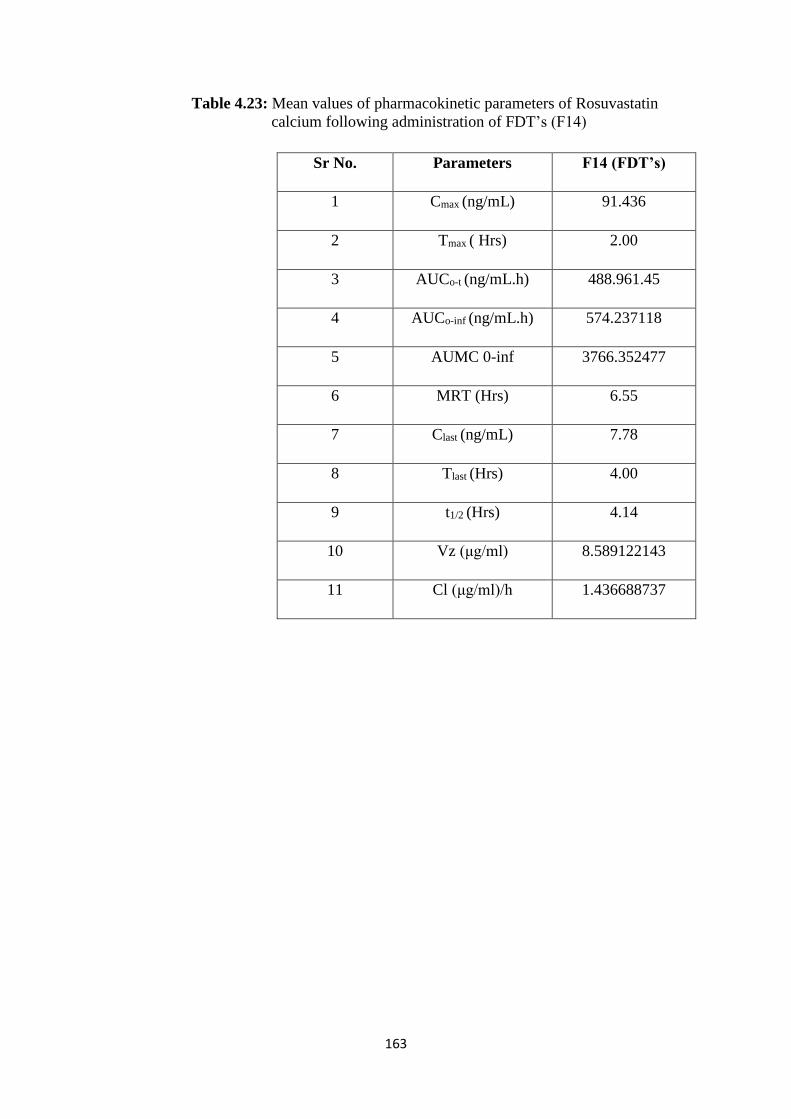
163
Table 4.23: Mean values of pharmacokinetic parameters of Rosuvastatin
calcium following administration of FDT’s (F14)
Sr No. Parameters F14 (FDT’s)
1 Cmax (ng/mL) 91.436
2 Tmax ( Hrs) 2.00
3 AUCo-t (ng/mL.h) 488.961.45
4 AUCo-inf (ng/mL.h) 574.237118
5 AUMC 0-inf 3766.352477
6 MRT (Hrs) 6.55
7 Clast (ng/mL) 7.78
8 Tlast (Hrs) 4.00
9 t1/2 (Hrs) 4.14
10 Vz (μg/ml) 8.589122143
11 Cl (μg/ml)/h 1.436688737
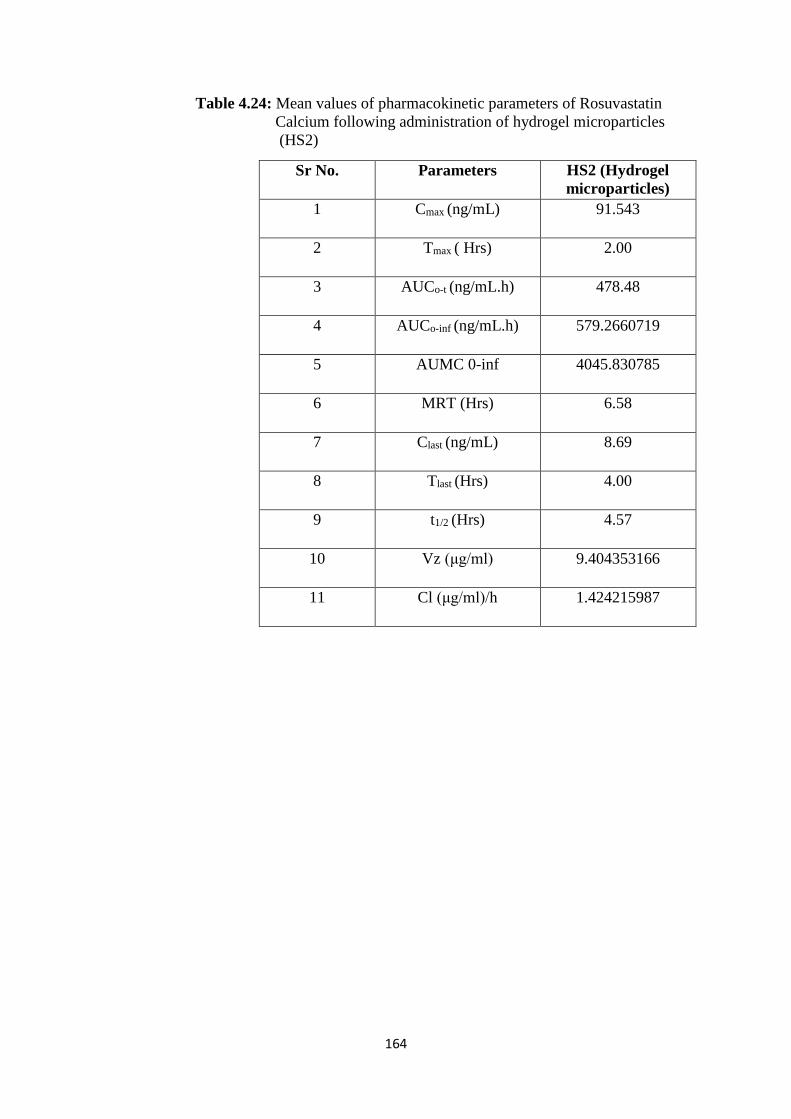
164
Table 4.24: Mean values of pharmacokinetic parameters of Rosuvastatin
Calcium following administration of hydrogel microparticles
(HS2)
Sr No. Parameters HS2 (Hydrogel
microparticles)
1 Cmax (ng/mL) 91.543
2 Tmax ( Hrs) 2.00
3 AUCo-t (ng/mL.h) 478.48
4 AUCo-inf (ng/mL.h) 579.2660719
5 AUMC 0-inf 4045.830785
6 MRT (Hrs) 6.58
7 Clast (ng/mL) 8.69
8 Tlast (Hrs) 4.00
9 t1/2 (Hrs) 4.57
10 Vz (μg/ml) 9.404353166
11 Cl (μg/ml)/h 1.424215987
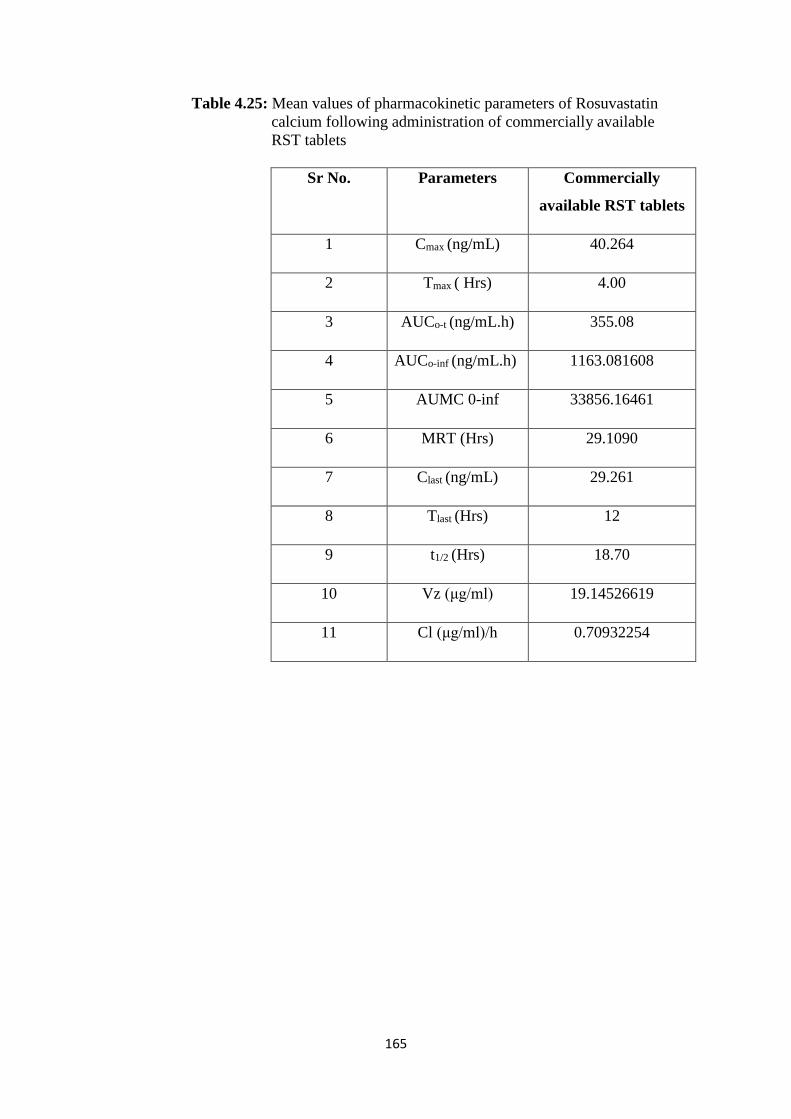
165
Table 4.25: Mean values of pharmacokinetic parameters of Rosuvastatin
calcium following administration of commercially available
RST tablets
Sr No. Parameters Commercially
available RST tablets
1 Cmax (ng/mL) 40.264
2 Tmax ( Hrs) 4.00
3 AUCo-t (ng/mL.h) 355.08
4 AUCo-inf (ng/mL.h) 1163.081608
5 AUMC 0-inf 33856.16461
6 MRT (Hrs) 29.1090
7 Clast (ng/mL) 29.261
8 Tlast (Hrs) 12
9 t1/2 (Hrs) 18.70
10 Vz (μg/ml) 19.14526619
11 Cl (μg/ml)/h 0.70932254
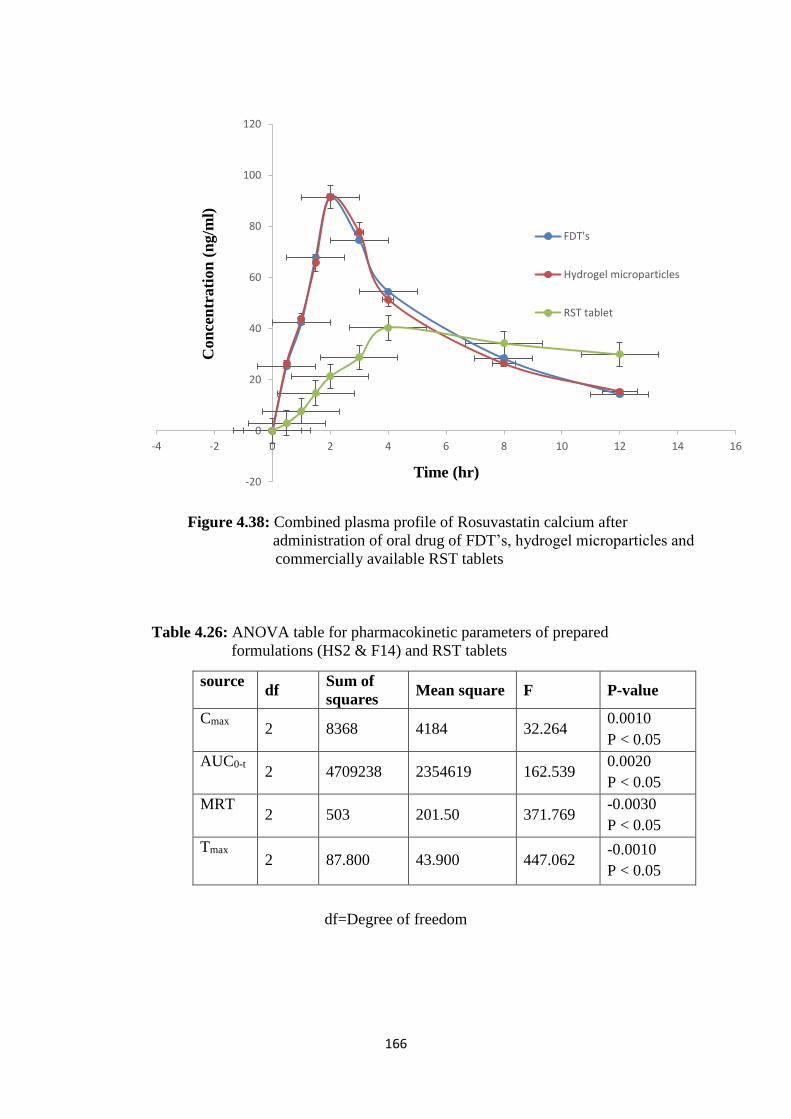
166
Figure 4.38: Combined plasma profile of Rosuvastatin calcium after
administration of oral drug of FDT’s, hydrogel microparticles and
commercially available RST tablets
Table 4.26: ANOVA table for pharmacokinetic parameters of prepared
formulations (HS2 & F14) and RST tablets
df=Degree of freedom
-20
0
20
40
60
80
100
120
-4 -2 0 2 4 6 8 10 12 14 16
Con
cen
trati
on
(n
g/m
l)
Time (hr)
FDT's
Hydrogel microparticles
RST tablet
source df
Sum of
squares Mean square F P-value
Cmax 2 8368 4184 32.264
0.0010
P < 0.05
AUC0-t 2 4709238 2354619 162.539
0.0020
P < 0.05
MRT 2 503 201.50 371.769
-0.0030
P < 0.05
Tmax 2 87.800 43.900 447.062
-0.0010
P < 0.05
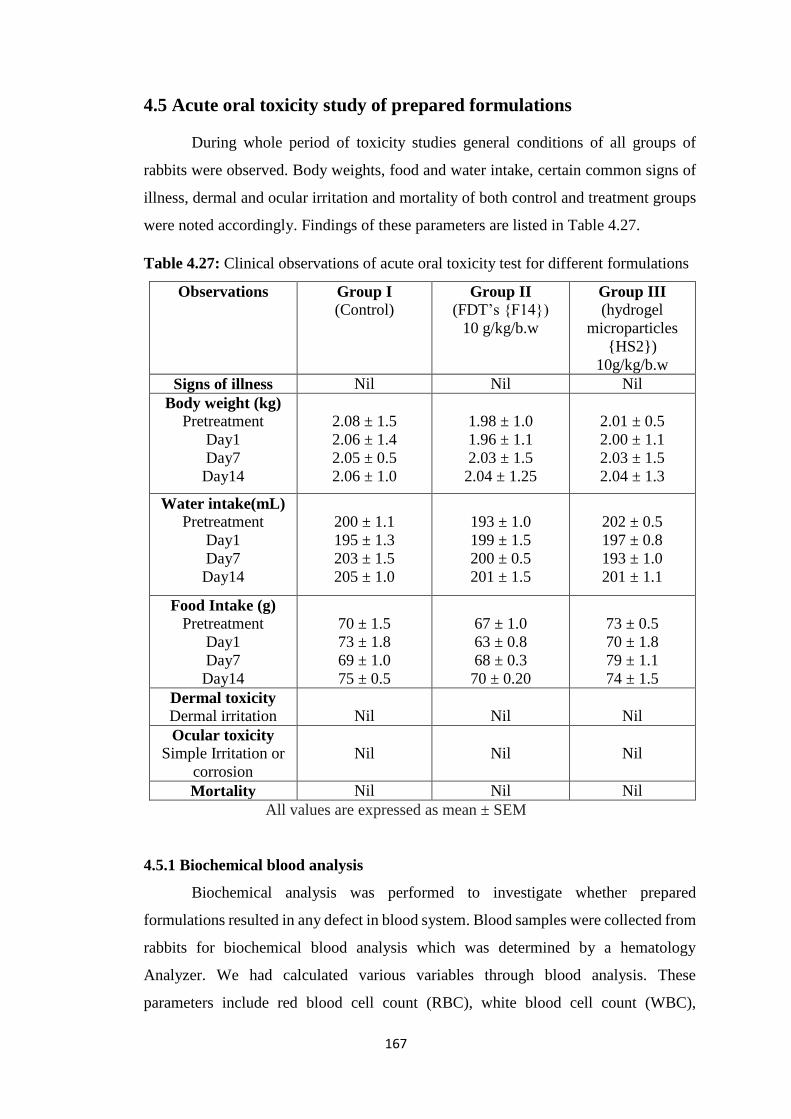
167
4.5 Acute oral toxicity study of prepared formulations
During whole period of toxicity studies general conditions of all groups of
rabbits were observed. Body weights, food and water intake, certain common signs of
illness, dermal and ocular irritation and mortality of both control and treatment groups
were noted accordingly. Findings of these parameters are listed in Table 4.27.
Table 4.27: Clinical observations of acute oral toxicity test for different formulations
Observations Group I
(Control) Group II
(FDT’s {F14})
10 g/kg/b.w
Group III
(hydrogel
microparticles
{HS2})
10g/kg/b.w
Signs of illness Nil Nil Nil
Body weight (kg)
Pretreatment
Day1
Day7
Day14
2.08 ± 1.5
2.06 ± 1.4
2.05 ± 0.5
2.06 ± 1.0
1.98 ± 1.0
1.96 ± 1.1
2.03 ± 1.5
2.04 ± 1.25
2.01 ± 0.5
2.00 ± 1.1
2.03 ± 1.5
2.04 ± 1.3
Water intake(mL)
Pretreatment
Day1
Day7
Day14
200 ± 1.1
195 ± 1.3
203 ± 1.5
205 ± 1.0
193 ± 1.0
199 ± 1.5
200 ± 0.5
201 ± 1.5
202 ± 0.5
197 ± 0.8
193 ± 1.0
201 ± 1.1
Food Intake (g)
Pretreatment
Day1
Day7
Day14
70 ± 1.5
73 ± 1.8
69 ± 1.0
75 ± 0.5
67 ± 1.0
63 ± 0.8
68 ± 0.3
70 ± 0.20
73 ± 0.5
70 ± 1.8
79 ± 1.1
74 ± 1.5
Dermal toxicity
Dermal irritation
Nil
Nil
Nil
Ocular toxicity
Simple Irritation or
corrosion
Nil
Nil
Nil
Mortality Nil Nil Nil
All values are expressed as mean ± SEM
4.5.1 Biochemical blood analysis
Biochemical analysis was performed to investigate whether prepared
formulations resulted in any defect in blood system. Blood samples were collected from
rabbits for biochemical blood analysis which was determined by a hematology
Analyzer. We had calculated various variables through blood analysis. These
parameters include red blood cell count (RBC), white blood cell count (WBC),
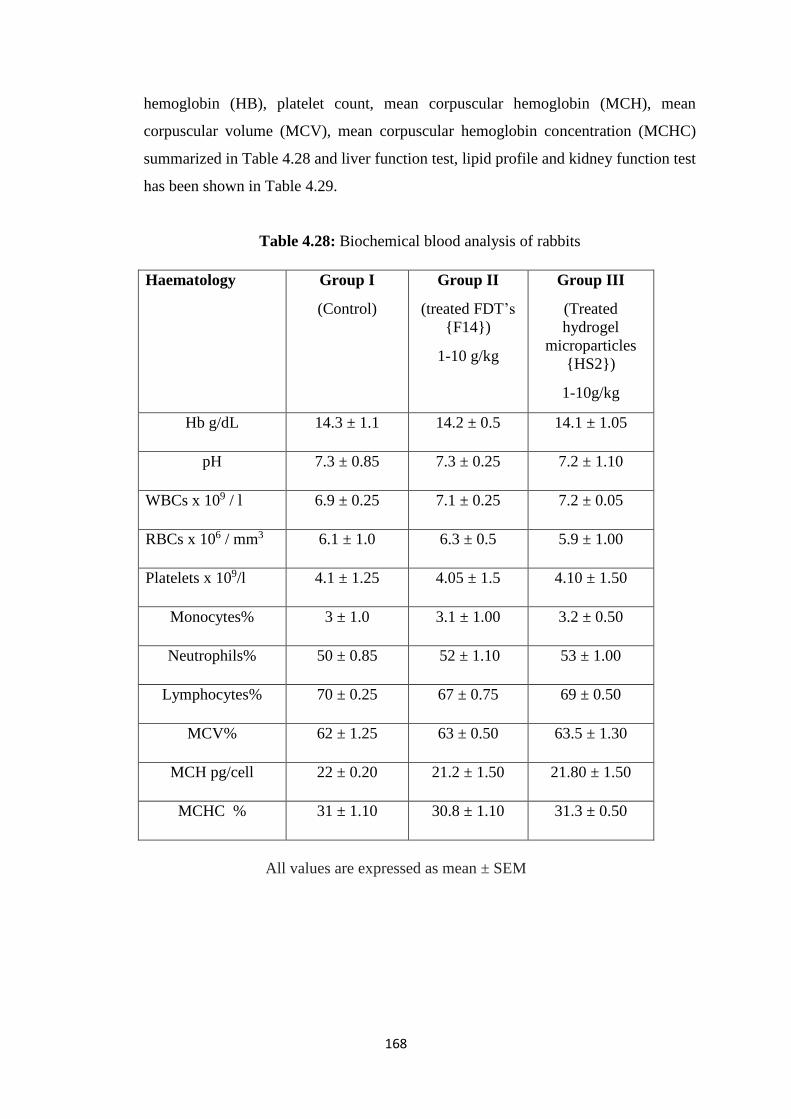
168
hemoglobin (HB), platelet count, mean corpuscular hemoglobin (MCH), mean
corpuscular volume (MCV), mean corpuscular hemoglobin concentration (MCHC)
summarized in Table 4.28 and liver function test, lipid profile and kidney function test
has been shown in Table 4.29.
Table 4.28: Biochemical blood analysis of rabbits
All values are expressed as mean ± SEM
Haematology
Group I
(Control)
Group II
(treated FDT’s
{F14})
1-10 g/kg
Group III
(Treated
hydrogel
microparticles
{HS2})
1-10g/kg
Hb g/dL 14.3 ± 1.1 14.2 ± 0.5 14.1 ± 1.05
pH 7.3 ± 0.85 7.3 ± 0.25 7.2 ± 1.10
WBCs x 109 / l 6.9 ± 0.25 7.1 ± 0.25 7.2 ± 0.05
RBCs x 106 / mm3 6.1 ± 1.0 6.3 ± 0.5 5.9 ± 1.00
Platelets x 109/l 4.1 ± 1.25 4.05 ± 1.5 4.10 ± 1.50
Monocytes% 3 ± 1.0 3.1 ± 1.00 3.2 ± 0.50
Neutrophils% 50 ± 0.85 52 ± 1.10 53 ± 1.00
Lymphocytes% 70 ± 0.25 67 ± 0.75 69 ± 0.50
MCV% 62 ± 1.25 63 ± 0.50 63.5 ± 1.30
MCH pg/cell 22 ± 0.20 21.2 ± 1.50 21.80 ± 1.50
MCHC % 31 ± 1.10 30.8 ± 1.10 31.3 ± 0.50
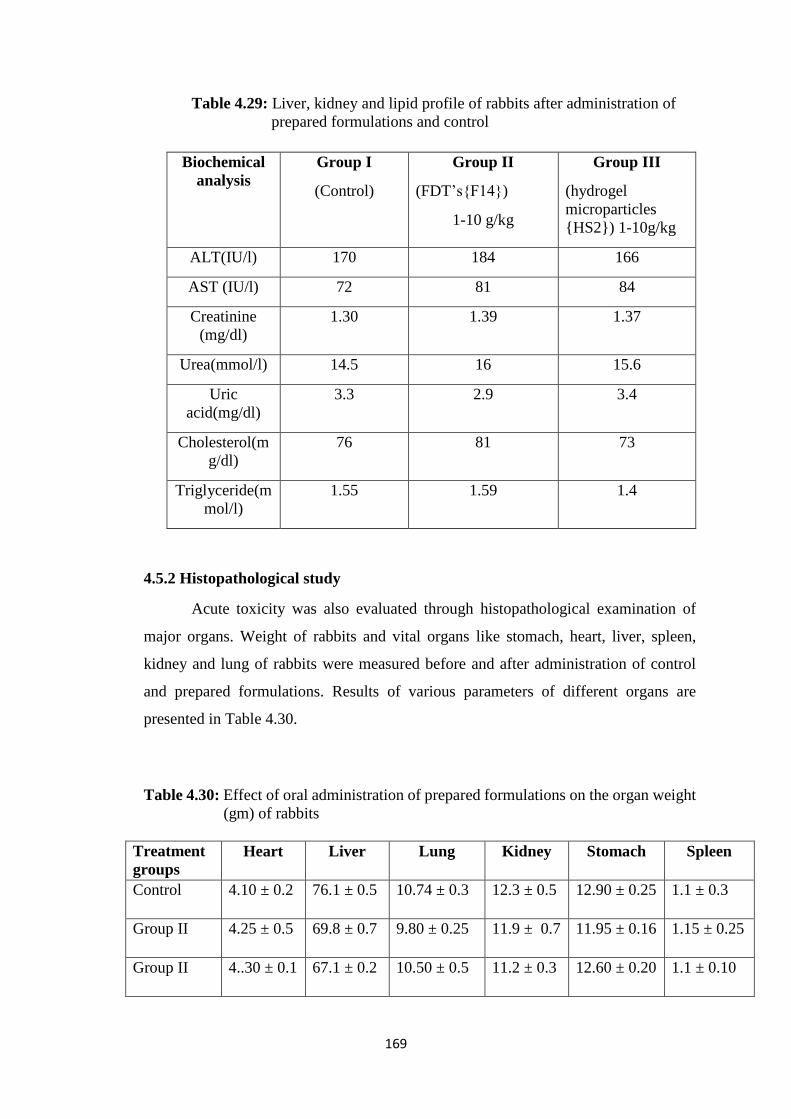
169
Table 4.29: Liver, kidney and lipid profile of rabbits after administration of
prepared formulations and control
4.5.2 Histopathological study
Acute toxicity was also evaluated through histopathological examination of
major organs. Weight of rabbits and vital organs like stomach, heart, liver, spleen,
kidney and lung of rabbits were measured before and after administration of control
and prepared formulations. Results of various parameters of different organs are
presented in Table 4.30.
Table 4.30: Effect of oral administration of prepared formulations on the organ weight
(gm) of rabbits
Treatment
groups
Heart Liver Lung Kidney Stomach Spleen
Control 4.10 ± 0.2 76.1 ± 0.5 10.74 ± 0.3 12.3 ± 0.5 12.90 ± 0.25 1.1 ± 0.3
Group II 4.25 ± 0.5 69.8 ± 0.7 9.80 ± 0.25 11.9 ± 0.7 11.95 ± 0.16 1.15 ± 0.25
Group II 4..30 ± 0.1 67.1 ± 0.2 10.50 ± 0.5 11.2 ± 0.3 12.60 ± 0.20 1.1 ± 0.10
Biochemical
analysis
Group I
(Control)
Group II
(FDT’s{F14})
1-10 g/kg
Group III
(hydrogel
microparticles
{HS2}) 1-10g/kg
ALT(IU/l) 170 184 166
AST (IU/l) 72 81 84
Creatinine
(mg/dl)
1.30 1.39 1.37
Urea(mmol/l) 14.5 16 15.6
Uric
acid(mg/dl)
3.3 2.9 3.4
Cholesterol(m
g/dl)
76 81 73
Triglyceride(m
mol/l)
1.55 1.59 1.4
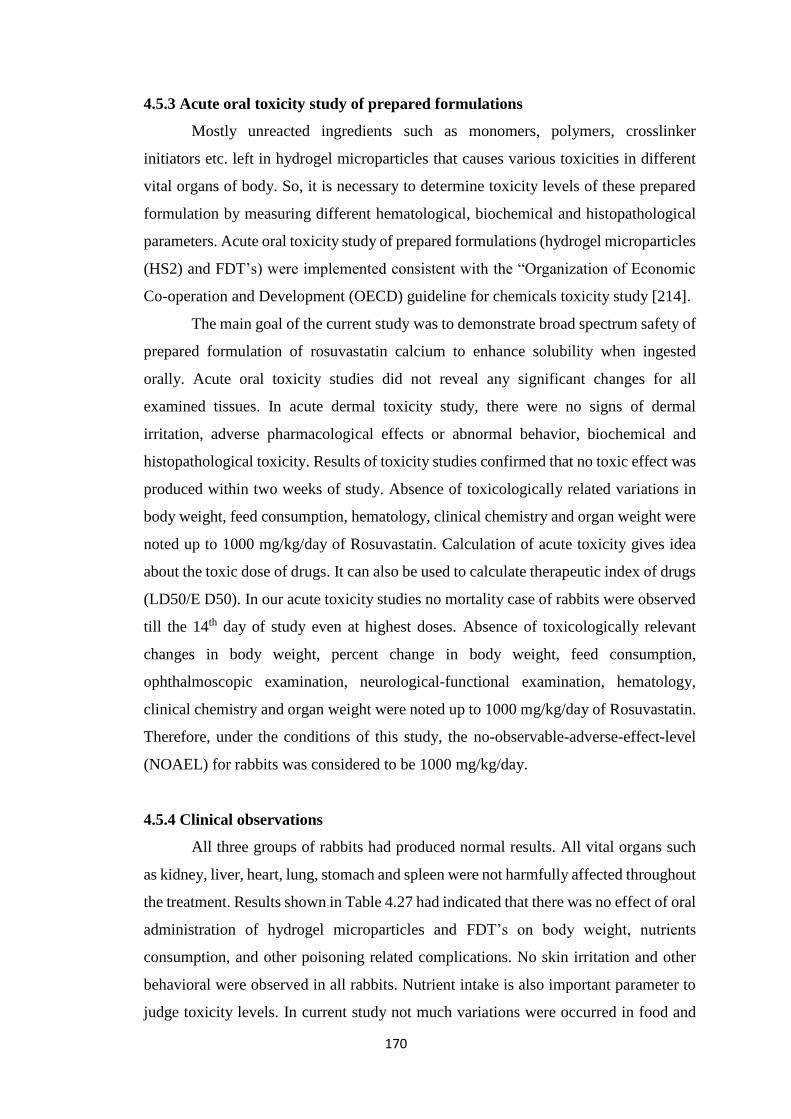
170
4.5.3 Acute oral toxicity study of prepared formulations
Mostly unreacted ingredients such as monomers, polymers, crosslinker
initiators etc. left in hydrogel microparticles that causes various toxicities in different
vital organs of body. So, it is necessary to determine toxicity levels of these prepared
formulation by measuring different hematological, biochemical and histopathological
parameters. Acute oral toxicity study of prepared formulations (hydrogel microparticles
(HS2) and FDT’s) were implemented consistent with the “Organization of Economic
Co-operation and Development (OECD) guideline for chemicals toxicity study [214].
The main goal of the current study was to demonstrate broad spectrum safety of
prepared formulation of rosuvastatin calcium to enhance solubility when ingested
orally. Acute oral toxicity studies did not reveal any significant changes for all
examined tissues. In acute dermal toxicity study, there were no signs of dermal
irritation, adverse pharmacological effects or abnormal behavior, biochemical and
histopathological toxicity. Results of toxicity studies confirmed that no toxic effect was
produced within two weeks of study. Absence of toxicologically related variations in
body weight, feed consumption, hematology, clinical chemistry and organ weight were
noted up to 1000 mg/kg/day of Rosuvastatin. Calculation of acute toxicity gives idea
about the toxic dose of drugs. It can also be used to calculate therapeutic index of drugs
(LD50/E D50). In our acute toxicity studies no mortality case of rabbits were observed
till the 14th day of study even at highest doses. Absence of toxicologically relevant
changes in body weight, percent change in body weight, feed consumption,
ophthalmoscopic examination, neurological-functional examination, hematology,
clinical chemistry and organ weight were noted up to 1000 mg/kg/day of Rosuvastatin.
Therefore, under the conditions of this study, the no-observable-adverse-effect-level
(NOAEL) for rabbits was considered to be 1000 mg/kg/day.
4.5.4 Clinical observations
All three groups of rabbits had produced normal results. All vital organs such
as kidney, liver, heart, lung, stomach and spleen were not harmfully affected throughout
the treatment. Results shown in Table 4.27 had indicated that there was no effect of oral
administration of hydrogel microparticles and FDT’s on body weight, nutrients
consumption, and other poisoning related complications. No skin irritation and other
behavioral were observed in all rabbits. Nutrient intake is also important parameter to
judge toxicity levels. In current study not much variations were occurred in food and
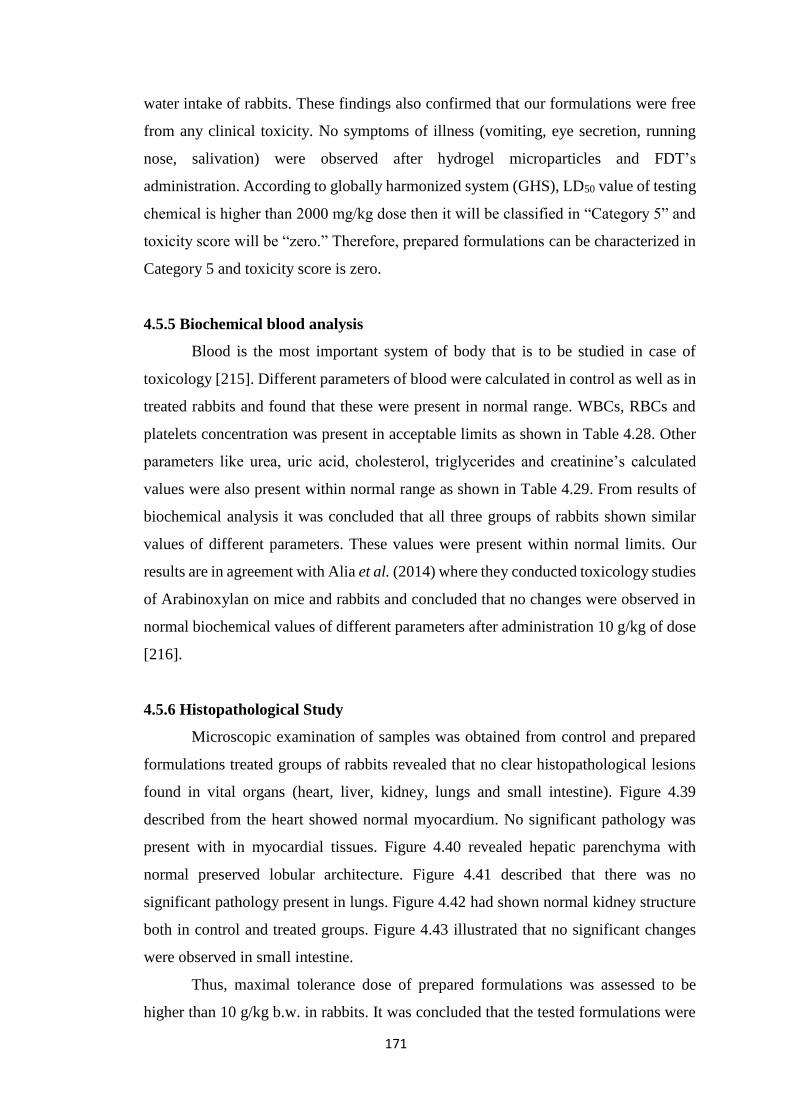
171
water intake of rabbits. These findings also confirmed that our formulations were free
from any clinical toxicity. No symptoms of illness (vomiting, eye secretion, running
nose, salivation) were observed after hydrogel microparticles and FDT’s
administration. According to globally harmonized system (GHS), LD50 value of testing
chemical is higher than 2000 mg/kg dose then it will be classified in “Category 5” and
toxicity score will be “zero.” Therefore, prepared formulations can be characterized in
Category 5 and toxicity score is zero.
4.5.5 Biochemical blood analysis
Blood is the most important system of body that is to be studied in case of
toxicology [215]. Different parameters of blood were calculated in control as well as in
treated rabbits and found that these were present in normal range. WBCs, RBCs and
platelets concentration was present in acceptable limits as shown in Table 4.28. Other
parameters like urea, uric acid, cholesterol, triglycerides and creatinine’s calculated
values were also present within normal range as shown in Table 4.29. From results of
biochemical analysis it was concluded that all three groups of rabbits shown similar
values of different parameters. These values were present within normal limits. Our
results are in agreement with Alia et al. (2014) where they conducted toxicology studies
of Arabinoxylan on mice and rabbits and concluded that no changes were observed in
normal biochemical values of different parameters after administration 10 g/kg of dose
[216].
4.5.6 Histopathological Study
Microscopic examination of samples was obtained from control and prepared
formulations treated groups of rabbits revealed that no clear histopathological lesions
found in vital organs (heart, liver, kidney, lungs and small intestine). Figure 4.39
described from the heart showed normal myocardium. No significant pathology was
present with in myocardial tissues. Figure 4.40 revealed hepatic parenchyma with
normal preserved lobular architecture. Figure 4.41 described that there was no
significant pathology present in lungs. Figure 4.42 had shown normal kidney structure
both in control and treated groups. Figure 4.43 illustrated that no significant changes
were observed in small intestine.
Thus, maximal tolerance dose of prepared formulations was assessed to be
higher than 10 g/kg b.w. in rabbits. It was concluded that the tested formulations were
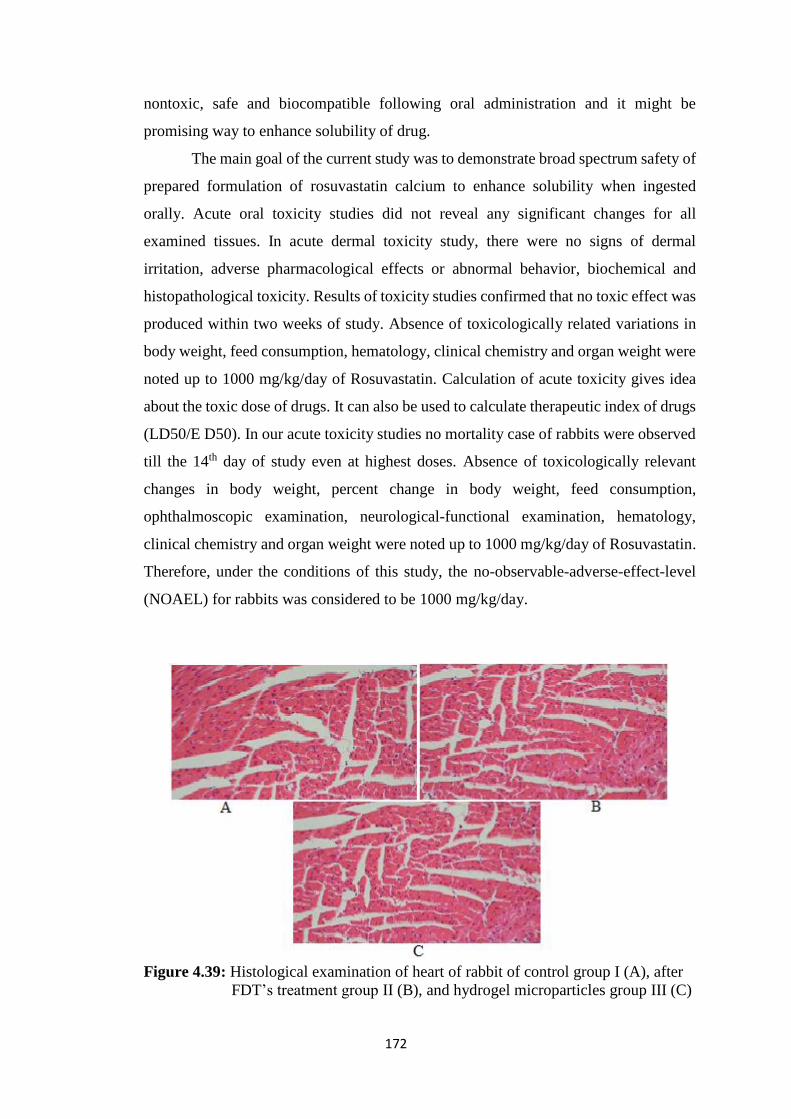
172
nontoxic, safe and biocompatible following oral administration and it might be
promising way to enhance solubility of drug.
The main goal of the current study was to demonstrate broad spectrum safety of
prepared formulation of rosuvastatin calcium to enhance solubility when ingested
orally. Acute oral toxicity studies did not reveal any significant changes for all
examined tissues. In acute dermal toxicity study, there were no signs of dermal
irritation, adverse pharmacological effects or abnormal behavior, biochemical and
histopathological toxicity. Results of toxicity studies confirmed that no toxic effect was
produced within two weeks of study. Absence of toxicologically related variations in
body weight, feed consumption, hematology, clinical chemistry and organ weight were
noted up to 1000 mg/kg/day of Rosuvastatin. Calculation of acute toxicity gives idea
about the toxic dose of drugs. It can also be used to calculate therapeutic index of drugs
(LD50/E D50). In our acute toxicity studies no mortality case of rabbits were observed
till the 14th day of study even at highest doses. Absence of toxicologically relevant
changes in body weight, percent change in body weight, feed consumption,
ophthalmoscopic examination, neurological-functional examination, hematology,
clinical chemistry and organ weight were noted up to 1000 mg/kg/day of Rosuvastatin.
Therefore, under the conditions of this study, the no-observable-adverse-effect-level
(NOAEL) for rabbits was considered to be 1000 mg/kg/day.
Figure 4.39: Histological examination of heart of rabbit of control group I (A), after
FDT’s treatment group II (B), and hydrogel microparticles group III (C)
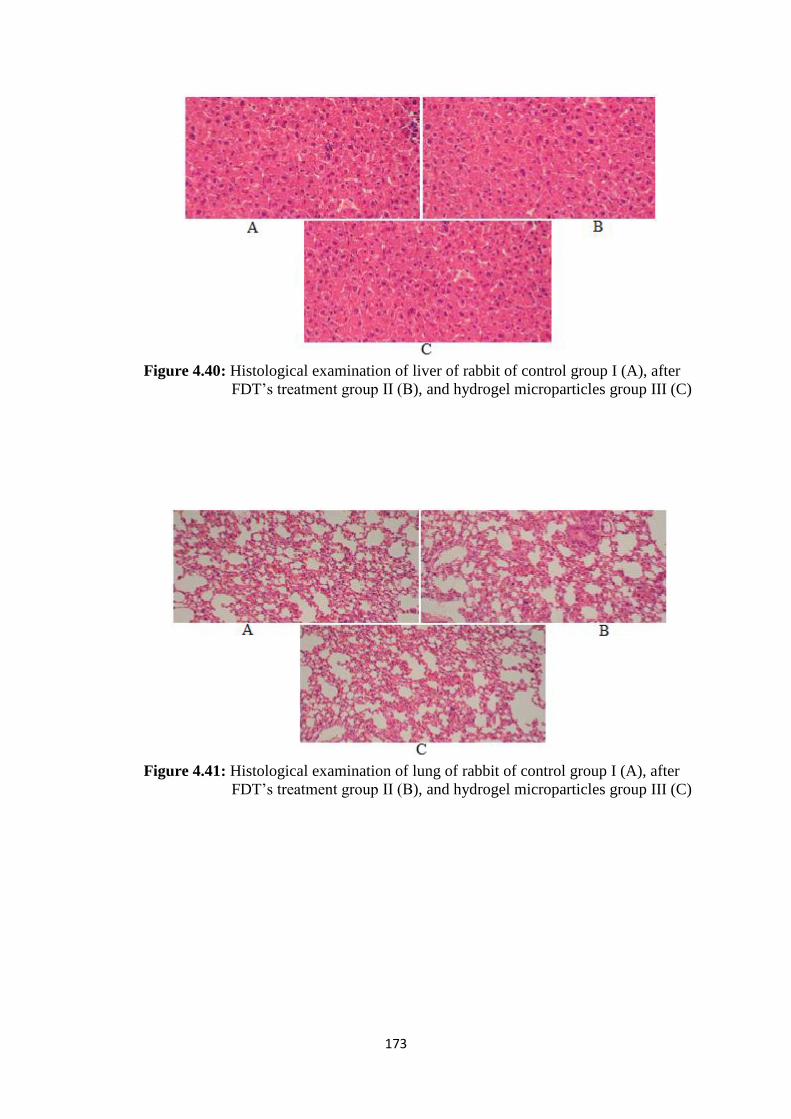
173
Figure 4.40: Histological examination of liver of rabbit of control group I (A), after
FDT’s treatment group II (B), and hydrogel microparticles group III (C)
Figure 4.41: Histological examination of lung of rabbit of control group I (A), after
FDT’s treatment group II (B), and hydrogel microparticles group III (C)
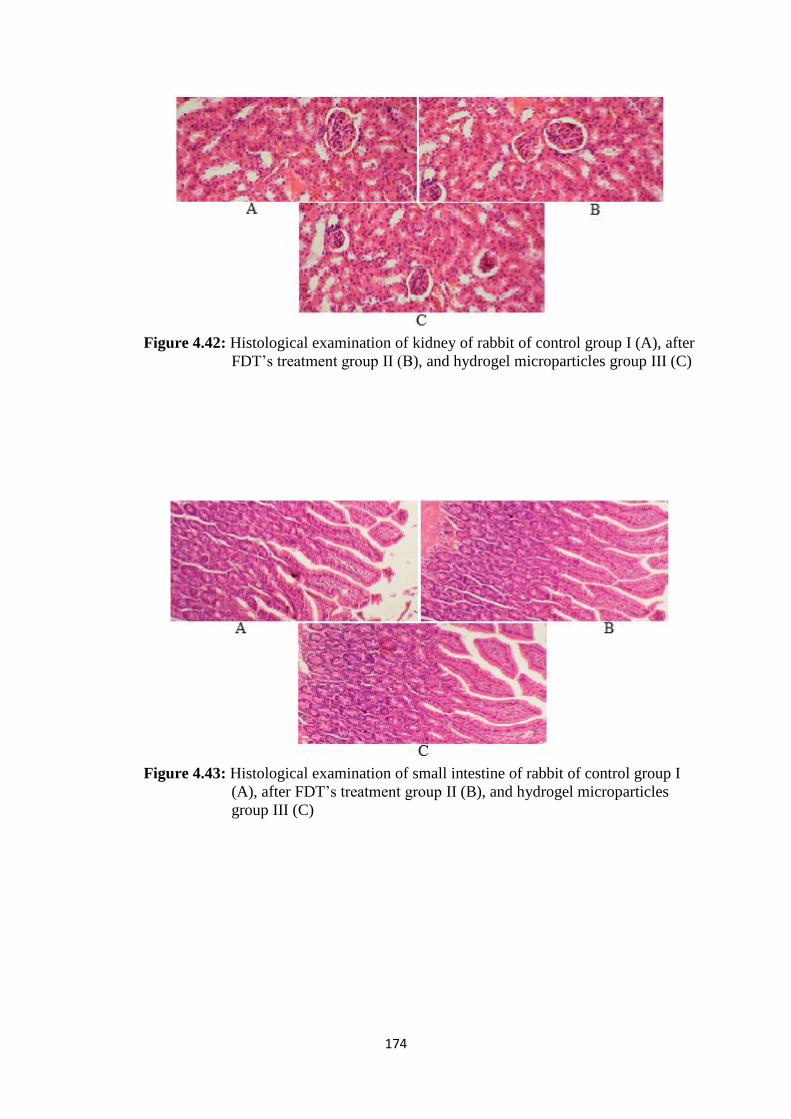
174
Figure 4.42: Histological examination of kidney of rabbit of control group I (A), after
FDT’s treatment group II (B), and hydrogel microparticles group III (C)
Figure 4.43: Histological examination of small intestine of rabbit of control group I
(A), after FDT’s treatment group II (B), and hydrogel microparticles
group III (C)
175
5. CONCLUSION
In present work three different types of formulations were prepared to enhance
solubility of Rosuvastatin calcium. These three groups include FDT’s, microparticles
prepared by inclusion complexes and solid dispersions and hydrogel microparticles by
free radical polymerization. From results of these prepared formulations it was
concluded that solubility of Rosuvastatin was enhanced to various degrees by using
these techniques.
FDT’s were prepared by using different ratios of superdisintegrants and β-
cyclodextrin had shown that solubility was enhanced upto 11 folds in phosphate buffer
of 6.8 pH. This enhancement of solubility was present in formulation F14 that had 20
mg (10%) of β-cyclodextrin and kyron T134 16 mg (8%). This study also revealed that
kyron T134 was better choice to impart rapid release of drug with enhanced solubility
than sodium starch glycolate. From findings of these solubility enhancement results by
preparing FDT’s, it was concluded that FDT’s are very useful in solubility enhancement
of poorly water soluble drugs.
Inclusion complexes and solid dispersions had also enhanced solubility of
Rosuvastatin calcium several folds. By using these two techniques eight formulations
were prepared and evaluated for various solubility enhancement parameters. From these
results it was concluded that both methods enhanced solubility but solid dispersion
enhanced greater solubility of Rosuvastatin calcium. Similar concentrations of β-
cyclodextrin were used in both techniques and found that there was more solubility
enhancement from solid dispersions as compared to inclusion complexes. Optimized
concentration of β-cyclodextrin was also determined that enhanced maximum
solubility. It was found that drug- β-cyclodextrin (1:3) had enhanced maximum
solubility. Further increase in concentration had no greater impact on solubility. Thus
from such findings we concluded that both techniques are useful tool to enhance
solubility of Rosuvastatin calcium but solid dispersions are better choice than inclusion
complexes and β-cyclodextrin produces best results when used in 3:1 with drug.
Hydrogel microparticles also enhanced solubility of Rosuvastatin calcium upto
9.5 folds in phosphate buffer of pH 6.8. Overall findings of hydrogel microparticles had
shown that MAA containing microparticles enhanced solubility but lesser than AMPS
containing microparticles. Thus from such findings it was concluded that all the
176
techniques used for solubility enhancement in this study had successfully enhanced
solubility.
Pharmacokinetic studies were conducted to study enhancement in solubility of
Rosuvastatin calcium in vivo. These studies had shown that there was rapid response of
drug release in rabbits as compared to RST commercially available tablets. From
pharmacokinetic studies, it was also concluded that solubility was enhanced because
more AUC0-t was observed. Tmax was also reduced in case of prepared formulations
as compared to RST commercially available tablets. Toxicology studies, it was also
observed that no changes occurred in hematological and biochemical values. No
histopathological changes were observed in vital organs such as liver, kidney, heart,
lungs, stomach and spleen.
Thus, from all of these findings it was concluded that FDT’s, microparticles
prepared by inclusion complexes and solid dispersions and hydrogel microparticles
prepared by free radical polymerization provided an efficient and effective tool for
solubility enhancement of BCS class II drugs. Solubility of Rosuvastatin was
successfully enhanced several folds in this study both in vitro and in vivo without any
toxicity as compared to RST commercially available tablets.
177
6. REFERENCES
[1] Perrut M, Jung J, Leboeuf F. Enhancement of dissolution rate of poorly-soluble
active ingredients by supercritical fluid processes Part 1: Micronization of neat
particles. International Journal of Pharmaceutics, 2005; 288: 3-10.
[2] Martinez MN, Amidon GL. A mechanistic approach to understanding the
factors affecting drug absorption: a review of fundamentals. Journal of Clinical
Pharmacology, 2002; 42: 620-643.
[3] Ku MS, Dulin W. A biopharmaceutical classification-based Right-First-Time
formulation approach to reduce human pharmacokinetic variability and project cycle
time from First-In-Human to clinical Proof-Of-Concept. Pharmaceutical Development
and Technology, 2012; 17: 285-302.
[4] Yalkowsky S. Techniques of solubilization of Drugs. (Ed.). Marcel Dekker
publisher, New York, 1981; Vol. 2, p. 118-134.
[5] Lipinski CA, Lombardo F, Dominy BW, Feenay PJ. Experimental and
computational approaches to estimate solubility and permeability in drug discovery and
development settings. Advances in Drug Delivery Reviews, 2001; 46: 3-26.
[6] Williams KJ, Tabas I. The response-to-retention hypothesis of early
atherogenesis. Atherosclerosis Thrombosis Vascular Biology, (1995); 15: 551-561.
[7] Lewington S, Whitlock G, Clarke R. Blood cholesterol and vascular mortality
by age, sex, and blood pressure: A meta-analysis of individual data from 61 prospective
studies with 55,000 vascular deaths. Lancet, 2008; 370: 1829–39.
[8] Martin PD, Mitchell PD, Schneck DW. Pharmacodynamic effects and
pharmacokinetics of a new HMG-CoA reductase inhibitor, rosuvastatin, after morning
or evening administration in healthy volunteers. Journal of Clinical Pharmacology,
(2002); 54: 472–477.
[9] Carswell C, Plosker L, Jarvis B. Rosuvastatin. Drugs, (2002); 62: 2075–2085.
[10] Arias MJ, Gines JM, Moyano JR, Rabasco AM. The application of solid
dispersion technique with D-mannitol to the improvement in oral absorption of
triamterene. Journal of Drug Target, 1994; 2: 45–51.
[11] Zerrouk N, Chemtob C, Arnaud P, Toscani S, Dugue J. In vitro and in vivo
evaluation of carbamazepine-PEG 6000 solid dispersions. International Journal of
Pharmaceutics, 2001; 225: 49–62.
[12] Palmieri GF, Cantalamessa F, Di Martino P, Nasuti C, Martelli S. Lonidamine
solid dispersions: in vitro and in vivo evaluation. Drug Development and Industrial
Pharmacy, 2002; 28: 1241–1250.
178
[13] Lee S, Nam K, Kim MS, Jun SW, Park JS, Woo JS, Hwang SJ. Preparation and
characterization of solid dispersions of itraconazole by using aerosol solvent extraction
system for improvement in drug solubility and bioavailability. Archives of Pharmacal
Research, 2005; 28: 866–874.
[14] Yonemochi E, Ueno Y, Ohmae T, Oguchi T, Nakajima S, Yamamoto K.
Evaluation of amorphous ursodeoxycholic acid by thermal methods. Pharmaceutical
Research, 1997; 14: 798–803.
[15] Yonemochi E, Kitahara S, Maeda S, Yamamura S, Oguchi T, Yamamoto K.
Physicochemical properties of amorphous clarithromycin obtained by grinding and
spray drying. European Journal of Pharmaceutical Sciences, 1999; 7: 331–338.
[16] Mura P, Cirri M, Faucci MT, Gines-Dorado JM, Bettinetti GP. Investigation of
the effects of grinding and co-grinding on physicochemical properties of glisentide.
Journal of Pharmaceutical and Biomedical Analysis, 2002; 30: 227–237.
[17] Dai WG, Dong LC, Song YQ. Nanosizing of a drug/carrageenan complex to
increase solubility and dissolution rate. International Journal of Pharmaceutics, 2007;
342: 201–207.
[18] Kubo H, Mizobe M. Improvement of dissolution rate and oral bioavailability of
a sparingly water-soluble drug, (+/-)-5-[[2-(2-naphthalenylmethyl)-5-benzoxazolyl]-
methyl] - 2, 4-thiazolidinedione, in co-ground mixture with D-mannitol. Biological and
Pharmaceutical Bulletin, 1997; 20: 460–463.
[19] Purvis T, Vaughn JM, Rogers TL, Chen X, Overhoff KA, Sinswat P, Hu J,
McConville JT, Johnston KP, Williams RO. 3rd, Cryogenic liquids, nanoparticles, and
microencapsulation. International Journal of Pharmaceutics, 2006; 324: 43–50.
[20] Kawashima Y, Saito M, Takenaka H. Improvement of solubility and dissolution
rate of poorly water-soluble salicylic acid by a spray-drying technique. Journal of
Pharmacy and Pharmacology, 1975; 27: 1–5.
[21] Chow AHL, Hsia CK, Gordon JD, Young JWM, Vargha-Butler EI. Assessment
of wettability and its relationship to the intrinsic dissolution rate of doped phenytoin
crystals. International Journal of Pharmaceutics, 1995; 126: 21–28.
[22] Kubo H, Osawa T, Takashima K. Enhancement of oral bioavailability and
pharmacological effect of 1-(3, 4-dimethoxyphenyl)-2, 3-bis (methoxycarbonyl)-4-
hydroxy-6, 7, 8-trimethoxynapthalene (TA-7552), a new hypocholesterolemic agent by
micronization in coground mixture with D-mannitol. Biological and Pharmaceutical
Bulletin, 1996; 19: 741-747.
[23] Martis L, Hall NA, Thakkar AL. Micelle formation and testerone solubilization
by sodium glycocholate. Journal of pharmaceutical Sciences, 1972; 61: 1757-1761.
[24] Rees JA, Collett JH. The dissolution of salicylic acid in micellar solutions of
polysorbate-20. Journal of Pharmacy and Pharmacology, 1974; 26: 956-960.
179
[25] Casella R, Williams DA, Jambhekar SS. Solid state cyclodextrin complexes
containing indomethacin, ammonia and water. II. Solubility studies. International
Journal of Pharmaceutics, 1998; 165: 1-14.
[26] Trapani G, Latrofa A, Franco M. Water-soluble salts of amino acid esters of the
anaesthetic agent propofol. International Journal of Pharmaceutics, 1998; 175: 195-
204.
[27] Nokhodchi A, Javadzadeh Y, Siahi MR. The effect of type and concentration of
vehicles on the dissolution rate of a poorly soluble drug (indomethacin) from liquisolid
compacts. Journal of pharmaceutical Sciences, 2005; 8: 18-25.
[28] Nokhodchi A, Talari R, Valizadeh H. An investigation on the solid dispersions
of Chlordiazepoxide. International Journal of Biomedical Sciences, 2007; 3: 211-217.
[29] Neelam S, Mamta K. Micellar Solubilization of some poorly soluble Anti
diabetic Drugs: A Technical Note. American Association of Pharmaceutical Scientists
Pharmaceutical Science and Technology, 2008; 9: 431-436.
[30]
Patil MP, Naresh GJ. Preparation and characterization of Gliclazide polyethyle
ne glycol 4000 solid dispersions. Acta Pharmaceutica, 2009; 59: 57-65.
[31] Biswal S, Sahoo J, Murthy PN. Enhancement of dissolution rate of Gliclazide
using solid dispersions with Polyethylene Glycol 6000. AAPS Pharmaceutical Science
and Technology, 2008; 8: E1-E8.
[32] Tejal JS, Avani FA, Jolly RP. Process Optimization and Characterization of
Poloxamer Solid Dispersions of a Poorly Water soluble Drug. American Association
of Pharmaceutical Scientists Pharmaceutical Science and Technology, 2007; 8: E1-
E7.
[33] Chen Y, Zhang G, Neilly J. Enhancing the bioavailability of ABT963 using
dispersion containing Pluronic F68. International Journal of Pharmaceutics, 2004; 286:
69-80.
[34] Coffman RE, Kildsig DO. Effect of Nicotinamide and Urea on the Solubility of
Riboflavin in Various solvents. Journal of Pharmaceutical Sciences, 1996; 85: 951-954.
[35] Allen C, Maysinger D, Eisenberg A. Nano-engineering block copolymer
aggregates for drug Delivery. Colloids Surface B, 1999; 99: 3-27.
[36] Kataoka K, Harada A, Nagasaki Y. Block co-polymer micelles for drug
delivery: design, characterization and biological significance. Advances in Drug
Delivery Reviews, 2001; 47: 113-131.
180
[37] Baboota S, Bhaliwal M, Kohli K. Physicochemical Characterization, in-vitro
Dissolution Behaviour, and Pharmacodynamic Studies of Reficoxib- Cyclodextrin
Inclusion Compounds. Preparation and Properties of Reficoxib hydroxypropyl R-
Cyclodextrin Inclusion Complex: a technical note. American Association of
Pharmaceutical Scientists Pharmaceutical Science and Technology, 2005; 6: E83-E9.
[38] Patel M, Tekade A, Gattani S. Solubility Enhancement of Lovastatin by
Modified Locust Bean Gum Using Solid Dispersion Techniques. American Association
of Pharmaceutical Scientists Pharmaceutical Science and Technology, 2008; 9: 1262-
1269.
[39] Mahmood A, Sarfraz MR, Asif M. Hydrogel Microparticles as an Emerging
Tool in Pharmaceutical Field: A Review; Advances in polymer Technology, DOI
10.1002/adv.21535.
[40] Sudarshan S, Dhaval S. Development and Characterization of Mouth
Dissolving Tablet of Zolmitriptan. Asian Pacific Journal of Tropical Disease, 2012; 5:
S457-S464.
[41] Martin A. Physical Pharmacy. Wavely publisher: New Delhi, India, 1994; p.
223.
[42] Neuberg C. Hydrotrophy. Biochemical Journal Pharmacology, 1989; 75: 577-
583.
[43] Osol A. Remington’s Pharmaceutical sciences. Mack Publishing Company:
Eastern Pennsylvania, 1990; p. 200-203.
[44] Lachman L, Lieberman H, Kanig JL. The Theory and practice of Industrial
Pharmacy. Lea & Febiger: Philadelphia, 1986; p. 293-345.
[45] Clugston M, Fleming R. Advanced Chemistry. Oxford Publishing: Oxford, UK,
2000; p. 417-423.
[46] Myrdal PB, Yalkowsky SH. Solubilization of drugs in aqueous media.
Encyclopedia of Pharmaceutical Technology. Informa Health Care: New York, USA,
2007; p. 3311.
[47] Ketan TS, Anuradha KG, Jignasa KS. Drug Solubility: Importance and
Enhancement Techniques. International scholarly research notices pharmaceutics,
2012; 8: 1-10.
[48] Amidon GL, Lennernas H, Shah VP, Crison JR. A theoretical basis for a
biopharmaceutic drug classification: the correlation of in vitro drug product dissolution
and in vivo bioavailability. Pharmaceutical Research, 1995; 12: 413–420.
[49] Chi-Yuan W, Leslie ZB. Predicting Drug Disposition via Application of BCS:
Transport/Absorption/ Elimination Interplay and Development of a Biopharmaceutics
Drug Disposition Classification System. Pharmaceutical Research, 2005; 22: 11-23.
181
[50] Okonogi S, Yonemochi E, Oguchi T, Puttipipatkhachorn S, Yamamoto, K.
Enhanced dissolution of ursodeoxycholic acid from the solid dispersion. Drug
Development and Industrial Pharmacy, 1997; 23: 1115-1121.
[51] Patravale VB, Date AA, Kulkarni RM. Nanosuspension: a promising drug
delivery strategy. Journal of Pharmacy and Pharmacology, 2004; 56: 827-840.
[52] Habib MJ. Pharmaceutical solid dispersion Technology. Techonomic
Publishing Company: Inc. Lancaster, Pennsylvania (USA), 2001; p. 1-36.
[53] Martin MT, Margarit MV, Salcedo GE. Characterization and solubility study of
solid dispersions of flunarizine and plyvinyl pyrrolidone. Farmaco, 2002; 57: 723-727.
[54] Yellela SRK. Pharmaceutical technologies for enhancing oral bioavailability of
poorly soluble drugs. Journal of Bioequivalence & Bioavailability, 2010; 2: 28–36.
[55] Edward KH, Li D. Drug like properties: Concept, Structure, Design and
Methods, from ADME to Toxicity Optimization. Elsevier publisher: UK, 2008; p. 56.
[56] Vemula VR, Lagishetty V, Lingala S. Solubility enhancement
techniques. International Journal of Pharmaceutical Sciences Review and
Research, 2010; 5:41–51.
[57] Sharma D, Soni M, Kumar S, Gupta GD. Solubility enhancement, eminent role
in poorly soluble drugs. Research Journal of Pharmacy and Technology, 2009; 2: 220–
224.
[58] Kumar A, Sahoo SK, Padhee K, Kochar PS, Sathapathy A, Pathak N. Review
on solubility enhancement techniques for hydrophobic drugs. Pharmacie
Globale, 2011; 3: 1–7.
[59] Blagden N, De-Matas M, Gavan PT, York P. Crystal engineering of active
pharmaceutical ingredients to improve solubility and dissolution rates. Advanced Drug
Delivery Reviews, 2007; 59: 617–630.
[60] Vogt M, Kunath K, Dressman JB. Dissolution enhancement of fenofibrate by
micronization, cogrinding and spray-drying: comparison with commercial
preparations. European Journal of Pharmaceutics and Biopharmaceutics, 2008; 68:
283–288.
[61] Chaumeil JC. Micronization: a method of improving the bioavailability of
poorly soluble drugs. Methods and Findings in Experimental and Clinical
Pharmacology, 1998; 20: 211–215.
[62] Sekiguchi K, Obi N. Studies on absorption of eutectic mixtures. I.A. comparison
of the behaviour of eutectic mixtures of sulphathiazole and that of ordinary
sulphathiazole in man. Chemical and Pharmaceutical Bulletin, 1961; 9: 866–872.
182
[63] Gupta P, Kakumanu VK, Bansal AK. Stability and solubility of celecoxib-PVP
amorphous dispersions: a molecular perspective. Pharmaceutical Research, 2004; 21:
1762–1769.
[64] Abdul-Fattah AM, Bhargava HN. Preparation and in vitro evaluation of solid
dispersions of halofantrine. International Journal of Pharmaceutics, 2002; 235: 17–33.
[65] Sinha S, Ali M, Baboota S, Ahuja A, Kumar A, Ali J. Solid dispersion as an
approach for bioavailability enhancement of poorly water-soluble drug ritonavir. AAPS
Pharma Science Technology, 2010; 11: 518–527.
[66] Chiou WL, Riegelman S. Pharmaceutical applications of solid dispersion
systems. Journal of Pharmaceutical Sciences, 1971; 60: 1281–1302.
[67] Tachibana T, Nakamura A. A method for preparing an aqueous colloidal
dispersion of organic materials by using water-soluble polymers: dispersion of β-
carotene by polyvinylpyrrolidone. Colloid and Polymer Science, 1965; 203: 130–133.
[68] Nanosuspension drug delivery technology and application—nanotech—express
pharma pulse. http://www.expresspharmapulse.com.
[69] Muller RH, Jacobs C, Kayer O. Nanosuspensions for the formulation of poorly
soluble drugs. In: Nielloud F, Marti-Mestres G, editors. Pharmaceutical Emulsion and
Suspension. Marcel Dekker publisher: New York, USA, 2000; p. 383–407.
[70] Nash RA. Suspensions. In: Swarbrick J, Boylan JC, editors. Encyclopedia of
Pharmaceutical Technology. Marcel Dekker publisher: New York, USA, 2002; p.
2045–3032.
[71] Chowdary KPR, Madhavi BLR. Novel drug delivery technologies for insoluble
drugs. Indian Drug, 2005; 42: 557–564.
[72] Patravale VB, Date AA, Kulkarni RM. Nanosuspensions: a promising drug
delivery strategy. Journal of Pharmacy and Pharmacology, 2004; 56: 827–840.
[73] Muller RH, Bohm BHL, Grau J. Nanosuspensions: a formulation approach for
poorly soluble and poorly bioavailable drugs. In: Wise D, editor. Handbook of
Pharmaceutical Controlled Release Technology. CRC press: Boca Raton, USA, 2000;
p. 345–357.
[74] Merisko-Liversidge E, Liversidge GG, Cooper ER. Nanosizing: a formulation
approach for poorly-water-soluble compounds. European Journal of Pharmaceutical
Sciences, 2003; 18: 113–120.
[75] Liversidge GG, Conzentino P. Drug particle size reduction for decreasing
gastric irritancy and enhancing absorption of naproxen in rats. International Journal of
Pharmaceutics, 1995; 125: 309–313.
183
[76] Keck CM, Müller RH. Drug nanocrystals of poorly soluble drugs produced by
high pressure homogenization. European Journal of Pharmaceutics and
Biopharmaceutics, 2006; 62: 3–16.
[77] Langguth P, Hanafy A, Frenzel D. Nanosuspension formulations for low-
soluble drugs: pharmacokinetic evaluation using spironolactone as model
compound. Drug Development and Industrial Pharmacy, 2005; 31: 319–329.
[78] Jacobs C, Müller RH. Production and characterization of a budesonide
nanosuspension for pulmonary administration. Pharmaceutical Research, 2002; 19:
189–194.
[79] Moschwitzer J, Achleitner G, Pomper H, Müller RH. Development of an
intravenously injectable chemically stable aqueous omeprazole formulation using
nanosuspension technology. European Journal of Pharmaceutics and
Biopharmaceutics, 2004; 58: 615–619.
[80] Sunkara G, Kompella UB. Drug delivery applications of supercritical fluid
technology. Drug Delivery Technology, 2002; 2: 44–50.
[81] Manna L, Banchero M, Sola D, Ferri A, Ronchetti S, Sicardi S. Impregnation
of PVP microparticles with ketoprofen in the presence of supercritical CO2. Journal of
Supercritical Fluids, 2007; 42: 378–384.
[82] Leuenberger H. Spray freeze-drying—the process of choice for low water
soluble drugs? Journal of Nanoparticle Research, 2002; 4: 111–119.
[83] Mumenthaler M, Leuenberger H. Atmospheric spray-freeze drying: a suitable
alternative in freeze-drying technology. International Journal of Pharmaceutics, 1991;
72: 97–110.
[84] Williams RQ. Process for production of nanoparticles and microparticles by
spray freezing into liquid. US Patent no. 20030041602, 2003.
[85] Briggs AR, Maxvell TJ. Process for preparing powder blends. US Patent no.
3721725, 1973.
[86] Rogers TL, Hu J, Yu Z, Johnston KP, Williams RO. A novel particle
engineering technology: spray-freezing into liquid. International Journal of
Pharmaceutics, 2002; 242: 93–100.
[87] Buxton IR, Peach JM. Process and apparatus for freezing a liquid medium. US
Patent no. 4470202, 1984.
[88] Cyclodextrins in pharmaceuticals: an overview. http://www.pharmainfo.net/
pharma -student-magazine/cyclodextrins-pharmaceuticals-overview-0.
[89] Purvis T, Mattucci ME, Crisp MT, Johnston KP, Williams RO. Rapidly
dissolving repaglinide powders producers by the ultra-rapid freezing process. AAPS
PharmSciTech, 2007; 8: 58-65.
184
[90] Uekama K, Hirayama F, Irie T. Cyclodextrin drug carrier systems. Chemical
Reviews, 1998; 98: 2045–2076.
[91] Parikh RK, Mansuri NS, Gohel MC, Soniwala MM. Dissolution enhancement
of nimesulide using complexation and salt formation techniques. Indian Drugs, 2005;
42: 149–154.
[92] Cao F, Guo J, Ping Q. The physicochemical characteristics of freeze-dried
scutellarin- cyclodextrin tetra-component complexes. Drug Development and
Industrial Pharmacy, 2005; 31: 747–756.
[93] Wen X, Tan F, Jing Z, Liu Z. Preparation and study the 1:2 inclusion complex
of carvedilol with β-cyclodextrin. Journal of Pharmaceutical and Biomedical
Analysis, 2004; 34: 517–523.
[94] Martin A. Physical Pharmacy. Willaims and Wilkins: Baltimore Md, USA,
1993; p. 561-583.
[95] Rangel-Yagui CD, Pessoa A, Tavares LC. Micellar solubilization of
drugs. Journal of Pharmacy and Pharmaceutical Sciences, 2005; 8: 147–163.
[96] Hsu CH, Cui Z, Mumper RJ, Jay M. Micellar solubilization of some poorly
soluble antidiabetic drugs. AAPS PharmSciTech, 2008; 9: 939–943.
[97] Rasool AA, Hussain AA, Dittert LW. Solubility enhancement of some water-
insoluble drugs in the presence of nicotinamide and related compounds. Journal of
Pharmaceutical Sciences, 1991; 80: 387–393.
[98] Badwan AA, Khordagui LK, Saleh AM, Khalil SA. The solubility of
benzodiazepines in sodium salicylate solution and a proposed mechanism for
hydrotropic solubilization. International Journal of Pharmaceutics, 1983; 13: 67–74.
[99] Roy BK, Moulik SP. Functions of hydrotropes (sodium salicylate, proline,
pyrogallol, resorcinol and urea) in solution with special reference to amphiphile
behaviors. Colloids and Surfaces, 2002; 203: 155–166.
[100] Patil SV, Sahoo SK. Pharmaceutical overview of spherical crystallization. Der
Pharmacia Lettre, 2010; 2: 421–426.
[101] Blagden N, De-Matas M, Gavan PT, York P. Crystal engineering of active
pharmaceutical ingredients to improve solubility and dissolution rates. Advanced Drug
Delivery Reviews, 2007; 59: 617–630.
[102] Aguiar AJ, Krc J, Kinkel AW, Samyn JC. Effect of polymorphism on the
absorption of chloramphenicol from chloramphenicol palmitate. Journal of
Pharmaceutical Sciences, 1967; 56: 847–853.
185
[103] Liebenberg W, De-Villiers MM, Wurster DE, Swanepoel E, Dekker TG, Lotter
AP. The effect of polymorphism on powder compaction and dissolution properties of
chemically equivalent oxytetracycline hydrochloride powders. Drug Development and
Industrial Pharmacy, 1999; 25: 1027–1033.
[104] Suleiman MS, Najib NM. Isolation and physicochemical characterization of
solid forms of glibenclamide. International Journal of Pharmaceutics, 1989; 50: 103–
109.
[105] Shefter E, Higuchi T. Dissolution behavior of crystalline solvated and
nonsolvated forms of some pharmaceuticals. Journal of Pharmaceutical
Sciences, 1963; 52: 781–791.
[106] Allen PV, Rahn PD, Sarapu AC, Vanderwielen AJ. Physical characterization of
erythromycin: anhydrate, monohydrate, and dihydrate crystalline solids. Journal of
Pharmaceutical Sciences, 1978; 67: 1087–1093.
[107] Vishweshwar P, McMahon JA, Bis JA, Zaworotko MJ. Pharmaceutical co-
crystals. Journal of Pharmaceutical Sciences, 2006; 95: 499–516.
[108] Shan N, Zaworotko MJ. The role of cocrystals in pharmaceutical science. Drug
Discovery Today, 2008; 13: 440–446.
[109] Hickey MB, Peterson ML, Scoppettuolo LA. Performance comparison of a co-
crystal of carbamazepine with marketed product. European Journal of Pharmaceutics
and Biopharmaceutics, 2007; 67: 112–119.
[110] Childs SL, Chyall LJ, Dunlap JT, Smolenskaya VN, Stahly BC, Stahly GP.
Crystal engineering approach to forming cocrystals of amine hydrochlorides with
organic acids. Molecular complexes of fluoxetine hydrochloride with benzoic, succinic,
and fumaric acids. Journal of the American Chemical Society, 2004; 126: 13335–
13342.
[111] Remenar JF, Morissette SL, Peterson ML. Crystal engineering of novel
cocrystals of a triazole drug with 1, 4-dicarboxylic acids. Journal of the American
Chemical Society, 2003; 125: 8456–8457.
[112] Moribe K, Tozuka Y, Yamamoto K. Supercritical carbon dioxide processing of
active pharmaceutical ingredients for polymorphic control and for complex
formation. Advanced Drug Delivery Reviews, 2008; 60: 328–338.
[113] Pasquali I, Bettini R, Giordano F. Supercritical fluid technologies: an innovative
approach for manipulating the solid-state of pharmaceuticals. Advanced Drug Delivery
Review, 2008; 60: 399–410.
[114] Paradkar A, Maheshwari M, Kamble R, Grimsey I, York P. Design and
evaluation of celecoxib porous particles using melt sonocrystallization. Pharmaceutical
Research, 2006; 23: 1395–1400.
186
[115] Han X, Liu HC, Wang D, Su FE, Wu X. Effects of injectable chitosan
thermosensitive hydrogel on dog bone marrow stromal cells in vitro. Shanghai Journal
of Stomatology, 2011: 20; 113-118.
[116] Diana C, Artur JMV, Miguel MG, Joao Q. Plasmid DNA hydrogels for
biomedical applications. Advances in Colloidal and Interface Sciences, 2014; 205: 257-
264.
[117] Harris JM, Chess RB. Effect of pegylation on pharmaceuticals. Nature Reviews
Drug Discovery, 2003; 2: 214-221.
[118] Khandare J, Minko T. Polymer–drug conjugates: Progress in polymeric
prodrugs. Progress in Polymer Sciences, 2006; 31: 359-397.
[119] Bae Y, Fukushima S, Harada A, Kataoka K. Design of Environment-Sensitive
Supramolecular Assemblies for Intracellular Drug Delivery: Polymeric Micelles that
are Responsive to Intracellular pH Change. Angewandte Chemie International Edition,
2003; 42: 4640-4643.
[120] Buetuen V, Liu S, Weaver JVM, Bories-Azeau X, Cai Y, Armes SP. A brief
review of ‘schizophrenic’ block copolymers. Reactive and Functional Polymers, 2006;
66: 157-165.
[121] Tomalia DA. Birth of a new macromolecular architecture: dendrimers as
quantized building blocks for nanoscale synthetic polymer chemistry. Progress in
Polymer Sciences, 2005; 30: 294-324.
[122] Kim SH, Jeong JH, Chun KW, Park TG. Target-Specific Cellular Uptake of
PLGA Nanoparticles Coated with Poly (L-lysine)−Poly (ethylene glycol)−Folate
Conjugate. Langmuir, 2005; 21: 8852-8857.
[123] Jung T, Kamm W, Breitenbach A, Kaiserling E, Xiao JX, Kissel T.
Biodegradable nanoparticles for oral delivery of peptides: is there a role for polymers
to affect mucosal uptake. European Journal of Pharmaceutics and Biopharmaceutics,
2000; 50: 147-160.
[124] Sophie R, Tomme V, Storm G, Hennink WE. In situ gelling hydrogels for
pharmaceutical and biomedical applications. International Journal of Pharmaceutics,
2008; 355: 1-16.
[125] Barbucci R. Hydrogels. Biological properties and applications. Springer-
Verlag: Italia, Milan, Italy, 2009; p. 79.
[126] Klouda L, Mikos AG. Thermoresponsive hydrogels in biomedical applications.
European Journal of Pharmaceutics and Biopharmaceutics, 2008; 68: 34-45.
[127] Stulzer HK, Tagliari MP, Parize AL, Silva MAS, Laranjeira MCM. Evaluation
of cross-linked chitosan microparticles containing acyclovir obtained by spray-drying.
Material Sciences and Engineering: C, 2009; 29: 387-392.
187
[128] Yang S, Fu Y, Jeong SH, Park K. Application of poly(acrylic acid) superporous
hydrogel microparticles as a super-disintegrant in fast-disintegrating tablets. Journal of
Pharmacy and Pharmacology, 2004; 56: 429-436.
[129] Hasegawa U, Nomura SIM, Kaul SC, Hirano T, Akiyoshi K. Nanogel-quantum
dot hybrid nanoparticles for live cell imaging. Biochemical and Biophysical Research
and Communications, 2005; 331: 917-921.
[130] Kuang M, Wang D, Bao H, Gao M, Mohwald H, Jiang M. Fabrication of
Multicolor-Encoded Microspheres by Tagging Semiconductor Nanocrystals to
Hydrogel Spheres. Advanced Materials, 2005; 17: 267-270.
[131] Oh JK, Drumright R, Siegwart DJ, Matyjaszewski K. The development of
microgels/nanogels for drug delivery applications. Progress in Polymer Sciences, 2008;
33: 448-477.
[132] Peppas NA, Hilt JZ. Khademhosseini A, Langer R. Hydrogels in Biology and
Medicine: From Molecular Principles to Bionanotechnology. Advanced Materials,
2006; 18: 1345-1360.
[133] Sefton MV, May MH, Lahooti S, Babensee JE. Making microencapsulation
work: conformal coating, immobilization gels and in vivo performance. Journal of
Controlled Release, 2000; 65: 173-186.
[134] Li H, Luo R, Lam KY. Modeling of environmentally sensitive hydrogels for
drug delivery: An overview and recent developments, Frontiers in Drug Design
Discovery, 2006; 2: 295-331.
[135] Silvia M, Yue Q, Lynne JW, Christopher DE, Veronica G, Trevor JL, Keith
MM,
John SF, Patrick GH. Self-assembly of ciprofloxacin and a tripeptide into an
antimicrobial nanostructured hydrogel. Biomaterials, 2013; 34: 3678-3687.
[136] Roman Z, Zofia M, Katarzyna N. Drug release from hydrogel matrices.
Ecological Chemistry and Engineering S, 2010; 17: 117-244.
[137] Moura MJ, Gil MH, Figueiredo MM. Delivery of cisplatin from thermosensitive
co-cross-linked chitosan hydrogels. European Polymer Journal, 2013; 49: 2504-2510.
[138] Rahman Z, Siddiqui A, Mansoor AK. Orally disintegrating tablet of novel salt
of antiepileptic drug: Formulation strategy and evaluation. European Journal of
Pharmaceutics and Biopharmaceutics, 2013; 85: 1300–1309.
[139] Lee JK, Grace KA, Taylor AJ. Effect of a pharmacy care program on medication
adherence and persistence, blood pressure, and low-density lipoprotein cholesterol: a
randomized controlled trial. Journal of the American Medical Association, 2006; 296:
2563–2571.
[140] Osterberg L, Blaschke T. Adherence to medication. New England Journal of
Medicine, 2005; 353: 487–497.
188
[141] Brown MT, Bussell JK. Medication adherence: WHO cares?. Mayo Clinic
Proceedings, 2011; 86: 304–314.
[142] Jin J, Sklar GE, Oh VMS, Li SC. Factors affecting therapeutic compliance: a
review from the patient’s perspective. Journal of Therapeutics and Clinical Risk
Management, 2008; 4: 269–286.
[143] Sarfraz RM. Mahmood A, Asif M, Hafeez UK, Sajid B, Usman MM, Sher M.
Comparative Study of Various Polymeric Superdisintegrants on the Design and
Evaluation of Novel Antihypertensive Orodispersible Tablets. Adv poly technol. DOI:
10. 1002/adv. 21562.
[144] Sarfraz RM, Ahmad M, Mahmood A, Khan HU, Sher M, Maheen S, Bashir I,
Iqbal A, Ahsan H. Formulation and in-vitro evaluation of novel atorvastatin-amlodipine
orodispersible tablets. International Journal of Biology Pharmacy and Allied Sciences,
2014, 3: 941-951.
[145] Sarfraz RM, Khan HU, Mahmood A, Ahmad M, Maheen S, Sher M.
Formulation and Evaluation of Mouth Disintegrating Tablets of Atenolol and
Atorvastatin. Indian journal of pharmaceutical sciences, 2015:77; 83-90.
[146] Rona B, Hirak C, Munna S. Host–Guest Complexation of Oxicam NSAIDs with
β-Cyclodextrin. Biopolymers, 2004; 75: 355–365.
[147] Dominique D. Cyclodextrins and Carrier Systems. Journal of Controlled
Release, 1999; 62: 263–268.
[148] Rajeswari C. Cyclodextrins in Drug Delivery: An Updated Review. AAPS
Pharmaceutical Science and Technology, 2005; 6: 329–357.
[149] Amit C, Upendra N, Neha G, Sharma VK, Khosa RL. Enhancement of
solubilization and bioavailability of poorly soluble drugs by physical and chemical
modifications: A recent review. Journal of Advanced Pharmacy Education &
Research, 2012; 2: 32-67.
[150] Aiman AO, Nadia MA. Improvement of Glibenclamide Bioavailability Using
Cyclodextrin Inclusion Complex Dispersed in Polyethylene Glycol. Jordan Journal of
Pharmaceutical Sciences, 2009; 2: 119-130.
[151] Peppas NA, Klier J. Controlled release by using poly (methacrylic acid-g-
ethylene glycol) hydrogels. Journal of Controlled Release, 1991; 16: 203-214.
[152] Davaran S, Rashidi MR, Hashemi M. Synthesis and Characterization of
Methacrylic Derivatives of 5-Amino salicylic Acid with pH-Sensitive Swelling
Properties. AAPS Pharmaceutical Science and Technology. 2001; 2: 1-6.
[153] Tanaka T, Nishio I, Sun ST, Ueno-Nishio S. Collapse of gels in an electric field.
Science, 1982; 218: 467-469.
189
[154] Bromberg L, Temchenko M, Alakhov V, Hatton TA. Bioadhesive properties
and rheology of polyether-modified poly (acrylic acid) hydrogels. International journal
of pharmaceutics, 2004; 282: 45-60.
[155] Durmaza S, Okay O. Acrylamide/2-acrylamido-2-methylpropane sulfonic acid
sodium salt-based hydrogels: synthesis and characterization. Polymer, 2000; 41: 3693–
3704.
[156] Crestor Product Information. Astra-Zeneca Pharmaceuticals LP. Wilmington,
August 2003.
[157] Michael S. Chemical pharmacokinetic and pharmacodynamic properties of
statins: an update. Fundamentals of Clinical Pharmacology, 2004; 19:117–25.
[158] Fritz B. Crystalline forms of Rosuvastatin calcium salt, US Patent No.
20080194604A1. Aug-2008.
[159] Shlomit W. Crystalline Rosuvastatin calcium, US Patent No. 20080176878A1.
Jul-2008.
[160] Valerie NH. Crystalline Rosuvastatin calcium intermediate, US Patent No.
20070123550A1. May-2007.
[161] Hussar DA. New Drug of 2003. Journal of the American Pharmaceutical
Association, 2004; 44: 168-210.
[162] White CM. A review of the pharmacologic and pharmacokinetic aspects of
rosuvastatin. Journal of Clinical Pharmacology, 2002; 42: 963–970.
[163] Warwick MJ, Dane AL, Raza A, Scheneck DW. Single and multiple dose
pharmacokinetics and safety of the new HMG-CoA reductase inhibitor ZD 4522.
Atherosclerosis. 2000; 151: 39-47.
[164] Aggarwal RK, Showkathali R. Rosuvastatin calcium in acute coronary
syndromes. Expert Opinion on Pharmacotherapy, 2013; 14: 1215–1227.
[165] Hussar DA. New Drug of 2003. Journal of American Pharmaceutical
Association, 2004; 44: 168-210
[166] Schwartz GS, Bolognese MA, Tremblay BP et al. Efficacy and Safety of
Rosuvastatin and Atorvastatin in Patients with Hypercholesterolemia and a High Risk
of Coronary Heart Disease: A Randomized, Controlled Trial. American Heart Journal,
2004; 148: 4-11.
[167] Brown WV, MD, Bays HE, MD, Hassman DR. Rosuvastatin Study Group.
Efficacy and Safety of Rosuvastatin Compared With Pravastatin and Simvastatin in
Patients With Hypercholesterolemia: A Randomized, Double-Blind, 52-Week Trial.
American Heart Journal, 2002; 144: 1036-1043.
190
[168] McKenney JM, Jones PH, Adamczyk A, Cain VA, Bryzinski BS, Blasetto JW.
Comparison of the Efficacy of Rosuvastatin versus Atorvastatin, Simvastatin, and
Pravastatin in Achieving Lipid Goals: Results from the STELLAR Trial. Current
Medicine Research Opinion, 2003; 19: 689-698.
[169] Chan KY, Boucher ES, Gandhi PJ, Silva MA. HMG-CoA Reductase Inhibitors
for Lowering Elevated Levels of C - reactive protein. American Journal of Health-
System in Pharmaceuticals, 2004; 61: 1676-1681.
[170] Patel M, Tekade A, Gattani S, Surana S. Solubility Enhancement of Lovastatin
by Modified Locust Bean Gum Using Solid Dispersion Techniques. AAPS
Pharmaceutical Science and Technology, 2008; 9: 1262-1269.
[171] Nikhil KS, Seema P, Solanki SS, Bhatere DS. Enhancement of solubility of
acyclovir by solid dispersions and inclusion complexation method. World Applied
Science Journal, 2010; 11: 857-864.
[172] Sarfraz RM, Khan HU, Mahmood A, Ahmad M, Maheen S, Sher M. Indian
Journal of Pharmaceutical sciences, 2015; 77: 83-90.
[173] Raghavendra CM, Vidhya R, Tejraj MA. Poly (N-vinylcaprolactam-co-
methacrylic acid) hydrogel microparticles for oral insulin delivery. Journal of
Microencapsulation, 2011; 28: 384–394.
[174] Sajeesh S. Sharma CP. Interpolymer Complex Microparticles Based on
Polymethacrylic Acid-Chitosan for Oral Insulin Delivery. Journal of applied polymer
science, 2006; 99: 506-512.
[175] Ying L, Sturekb M, Park K. Microparticles produced by the hydrogel template
method for sustained drug delivery. International Journal of Pharmaceutics, 2014; 461:
258-269.
[176] Wang ZL. Transmission Electron Microscopy of Shape-Controlled
Nanocrystals and Their Assemblies. Journal of Physical Chemistry B, 2000; 104: 1153-
1175.
[177] Hellen KS, Tagliari MP, Parize AL, Silva MAS, Laranjeira MCM. Evaluation
of cross-linked chitosan microparticles containing acyclovir obtained by spray-drying.
Material Sciences and Engineering: C, 2008; 29: 387-392.
[178] Khan SA, Ahmad M, Murtaza G, Aamir MN, Rehman NU, Kousar R, Rasool
F, Akhtar M. Formulation of Nimesulide Floating Microparticles Using Low-viscosity
Hydroxypropyl Methylcellulose. Tropical Journal Pharmaceutical Research, 2010; 9:
293-299.
[179] Shilpi, K.; Ganesh, T. B.; Prashant, B. M.; Shaila, L. Enhancement of aqueous
solubility and oral bioavailability of nelfinavir by complexation with ß-cyclodextrin.
Tropical Journal Pharmaceutical Research, 2015, 14, 1333-1340.
191
[180] Jagadale SK, Patil PS. Navale R. Formulation Development and Evaluation of
Orally Disintegrating Tablets of Losartan Potassium by Direct Compression Method.
Research Journal of Pharmaceutical, Biological and Chemical Sciences, 2013; 4: 127-
135.
[181] Bi YH, Sunada Y, Yonezawa Y, Danjo K, Otsuka A, Iida K. Preparation and
Evaluation of a Compressed Tablet Rapidly Disintegrating in the Oral Cavity. Chemical
and Pharmaceutical Bulletin, 1996; 44: 2121-2127.
[182] Yin L, Fei L, Cui F, Tang C, Yin C. Superporous hydrogels containing
poly(acrylic acid-co-acrylamide)/O-carboxymethyl chitosan interpenetrating polymer
networks. Biomaterials, 2007; 28: 1258-1266.
[183] Peppas NA, Barr H. In: Hydrogels in medicine and pharmacy. Pappas NA,
Editor. Fundamentals. CRC Press: Boca Raton, Florida, 1986; p 27-57.
[184] Fazli N, Zafar I, Abad K, Lateef A, Yasar S, Amir ZK, Jamshaid AK,
Salimullah K. Simultaneous determination of timolol maleate, rosuvastatin calcium
and diclofenac sodium in pharmaceuticals and physiological fluids using HPLC-UV.
Journal of Chromatography B, 2011; 879: 3434–3443.
[185] Yasar S, Zafar I, Lateef Ahmad, Abad K, Muhammad IK, Shabnam N, Fazli N.
Simultaneous determination of rosuvastatin and atorvastatin in human serum using RP-
HPLC/UV detection: Method development, validation and optimization of various
experimental parameters. Journal of Chromatography B, 2011; 879: 557–563.
[186] Sena C, Sidika T. Determination of Rosuvastatin at Picogram Level in Serum
by Fluorimetric Derivatization with 9-Anthryldiazomethane using HPLC. Journal of
Chromatographic Science, 2013; 51: 53–58.
[187] Hafeezullah K, Asif M, Safirah M, Sarfraz RM, Alamgeer Y, Ayesha S, Akhtar
M, Haseeb A, Muhammad TK, Khalil M, Tahir MR. Formulation and In vitro
Evaluation of Novel Antidiabetic Orodispersible Tablets Using Kyron-T134 and
Crosscaramellose Sodium as Superdisintegrants. Latin American Journal of Pharmacy,
2014; 33: 631-639.
[188] Inayat BP, Prakash RS, Pritish K. Formulation design and optimization of novel
mouth dissolving tablets for venlafaxine hydrochloride using sublimation technique.
Journal of Pharmaceutical Research, 2013; 6: 593-598.
[189] Razali S, Wong TW. Design of superdisintegrant- and effervescent agent-less
dispersible fast-release melt pellets. Powder Technol, 2013; 235: 289-298.
[190] Jha SK, Geethalakshmi A, Bhatia V, Shukla T. Orally disintegrating tablets -
technology for mankind. Journal of global pharmaceutical technology, 2010; 2: 11-17.
[191] Pavan RK, Karimunnisa SS, Pravin DC. Application of Liquisolid Technology
for Enhancing Solubility and Dissolution of Rosuvastatin. Advanced Pharmaceutical
Bulletin, 2014; 4: 197-204.
192
[192] Akbari B, Valaki B, Maradiya V, Akbari A, Vidyasagar G. Optimization of
Super Disintegrants and Subliming Agent on Dissolution Rate of Rosuvastatin
Orodispersible Tablets by Using A 32 Factorial Design. International Journal of
Comprehensive Pharmacy, 2011; 2: 1-6.
[193] Madgulkar A, Bhalekar M, Padalkar R. Formulation Design and Optimization
of Novel Taste Masked Mouth-Dissolving Tablets of Tramadol Having Adequate
Mechanical Strength. AAPS Pharmaceutical Science and Technology, 2009; 2: 574-
581.
[194] Gupta A, Mishra A, Gupta V, Bansal P, Singh R, Singh A. Recent Trends of
Fast Dissolving Tablet - An Overview of Formulation Technology. International
Journal of Pharmaceutical and Biological Archives, 2010; 1: 1-10.
[195] Pandya V, Patel D, Patel J, Patel R. Formulation, Characterization, and
Optimization of Fast-Dissolve Tablets Containing Celecoxib Solid Dispersion.
Dissolution Technologies, 2009: 16: 22-27.
[196] Sarfraz RM, Ahmad M, Mahmood A, Khan HU, Sher M, Maheen S, Bashir I,
Iqbal A, Ahsan H. Formulation and in-vitro evaluation of novel atorvastatin -
amlodipine orodispersible tablets. International Journal of Biology Pharmacy and
Sciences, 2014, 3: 941-951.
[197] Asif M, Mahmood A, Sarfraz RM, Usman MM and Ayesha Y. Development
and In Vitro Evaluation of Acyclovir Rapid Dissolving Tablets: a Solubility and
Bioavailability Enhancement Study. Latin American Journal of Pharmacy, 2015;
34:1701-1709.
[198] Shilpi K, Ganesh TB, Prashant BM, Shaila L. Enhancement of aqueous
solubility and oral bioavailability of nelfinavir by complexation with ß-cyclodextrin.
Tropical Journal Pharmaceutical Research, 2015; 14: 1333-1340.
[199] Shashank T, Satish KMN, Ashwati P. Formulation and characterization of 5-
Fluorouracil enteric coated nanoparticles for sustained and localized release in treating
colorectal cancer. Saudi pharmaceutical Journal, 2015; 23: 308-314.
[200] Fahmy RH, Kassem MA. Enhancement of Loratidine dissolution rate through
liquisolid tablets formulation: in vitro and in vivo evaluation. European Journal of
Pharmaceutics and Biopharmaceutics, 2008; 69:993-1003.
[201] Patel M, Tekade A, Gattani S, Surana S. Solubility enhancement of lovastatin
by modified locust bean gum using solid dispersion techniques. AAPS Pharma Science
Technology, 2008; 9:1262–1269.
[202] Agnihotri SA, Mallikarjuna NN, Aminabhavi TM. Recent advances on
chitosan-based micro- and nanoparticles in drug delivery. Journal of Controlled
Release, 2004; 100: 5–28.
[203] Gubbi SR, Jarag R. Formulation and characterization of atorvastatin calcium
liquisolid compacts. Asian Journal of Pharmaceutical Sciences, 2010; 5: 50-60.
193
[204] Raghavendra C, Mundargi V, Rangaswamy TM. Poly (N-vinylcaprolactam-co-
methacrylic acid) hydrogel microparticles for oral insulin delivery. Journal of
Microencapsulation, 2011; 28: 384-394.
[205] Sudarshan KS, Sameer AA. Development and characterization of sublingual
tablet of Lisinopril. Asian Pacific Journal of Tropical Biomedicine, 2012; 4: S1711-
S1719.
[206] Elliott JE, Macdonald M, Nie J, Bowman CN. Structure and swelling of poly
(acrylic acid) hydrogels: effect of pH, ionic strength, and dilution on the cross linked
polymer structure. Polymer, 2004; 45: 1503-1510.
[207] Deepak P, Reena S. Synthesis and characterization of graft copolymers of
methacrylic acid onto gelatinized potato starch using chromic acid initiator in presence
of air. Advance Materials Letters, 2012; 3: 136-142.
[208] Chen S, Liu M, Jin S, Wang B. Preparation of ionic crosslinked chitosan-based
gel beads and effect of reaction conditions on drug release behaviors.
International Journal of Pharmacy, 2008; 349: 180–187.
[209] Kazimiera HB. Evaluation of microcrystalline chitosan properties as a drug
carrier. Part II. The influence of microcrystalline chitosan on release rate of ketoprofen.
Acta Poloniae Pharmaceutica, 2001; 58: 185-194.
[210] Nihar S, Patel KR. Formulation and Development of Hydrogel for Poly
Acrylamide-Co-acrylic acid. Journal of pharmaceutical science and bioscientific
research, 2014; 4: 114-120.
[211] Chen KS, Ku YA, Lin HR, Yan TR, Sheu DC, Chen TM, Lin FH. Preparation
and characterization of pH sensitive poly (N-vinyl-2-pyrrolidone/itaconic acid)
copolymer hydrogels. Materials Chemistry and Physics, 2005; 91: 484-489.
[212] Shilpi S, Mushir A, Sanjula Baboota, Alka A, Anil K, Javed A. Solid Dispersion
as an Approach for Bioavailability Enhancement of Poorly Water-Soluble Drug
Ritonavir. AAPS Pharma Science Technology, 2010; 11: 518-527.
[213] Vittal S, Shitut NR, Kumar TR, Vinu MCA, Mullangi R, Srinivas NR.
Simultaneous quantitation of rosuvastatin and gemfibrozil in human plasma by high-
performance liquid chromatography and its application to a pharmacokinetic study.
Biomedical Chromatography, 2006; 20: 1252–1259.
[214] Organization for Economic Cooperation and Development (OECD) Guidelines
for Testing of Chemicals. Acute Oral Toxicity- Fixed Dose Procedure Annexure, 2001;
420.
[215] Piyasi M, Kishor S, Sourav B, Aditi B, Roshnara M, Kundua PP. pH
sensitive N-succinyl chitosan grafted polyacrylamide hydrogel for oral insulin
delivery. Carbohydrate Polymers, 2014; 112: 627–637.
194
[216] Alia E, Sajid B, Shazia S, Ume RT1, Uzma S, Muhammad N, Farina K, Nasir
HM. Acute toxicity studies of a novel excipient arabinoxylan isolated from Ispaghula
(Plantago ovata) husk. Drug and Chemical Toxicology,
10.3109/01480545.2014.956219.