Embed Size (px)
Citation preview
L U L E A I U N I V E R S I T Y
OF T E C H N O L O G Y
2003:36
DOCTORAL THESIS
Fine Particulate By-products from
Mineral and Metallurgical Industries
as Filler in Cement-based Materials
Helena Moosberg-Bustnes
Department of Chemical and Metallurgical Engineering Division of Mineral Processing
2003:36 • ISSN: 1402 - 1544 • ISRN: LTU - DT - - 03/36 - - SE
L U L E Å • T E K N I S K A * * * * *
U N I V E R S I T E T
Fine particulate by-products from mineral and metallurgical industries as filler in cement-based materials
Som med vederbörligt tillstånd av tekniska fakultetsnämnden vid Luleå tekniska universitet för avläggande av teknologie doktorsexamen, kommer att offentligt forsvaras i universitetets sal nr. C937, onsdagen den 17 december 2003, kl. 10:00.
Fakultetsopponent: Tekn. Dr. Annika Ekvall, SP Sveriges Provnings- och forskningsinstitut
Helena Moosberg-Bustnes Avdelningen för Mineralteknik
Institutionen för Kemi och Metallurgi Luleå tekniska universitet
Akademisk avhandling
Doctoral Thesis 2003:36 ISSN 1402-1544 ISRN: LTU-DT—03/36-SE
Fine particulate by-products from mineral and metallurgical industries as filler in cement-based
materials.
Helena Moosberg-Bustnes
Division of Mineral Processing Department of Chemical and Metallurgical Engineering
Luleå University of Technology S-971 87 Luleå
Luleå 2003
Acknowledgements
This doctoral thesis has been prepared at the Swedish Cement and Concrete Institute (CBI) in Stockholm and at the Division of Mineral Processing, Department of Chemical and Metallurgical Engineering at Luleå University of Technology (LTU). This project is a part of MiMeR's (Minerals and Metals Recycling Research Centre at Luleå University of Technology) research programme "New Materials".
The financial support for this thesis was provided by MiMeR, MinFo (Swedish Mineral Processing Research Association), MinBaS (Minerals Aggregates Stone), Cementa AB, CBI, and Forskarskolan i Bergs och Mineralteknik.
I would like to thank my supervisors Fil. Dr. Lotta Lind at SSAB Merox AB and Professor Eric Forssberg at LTU for valuable advises and discussions, Fil. Dr. Bo-Erik Eriksson and Tekn. Dr. Hans-Erik Gram at Cementa AB, MSc Marianne Thomaeus at MinFo and Professor Johan Silfwerbrand and Fil. Dr. Björn Lagerblad at CBI for taking time to read and discuss my work.
I would also like to thank all member industries of MiMeR, Nordkalk AB, SM A and Tinfos Jernverk A/S who have contributed to this thesis by providing the materials I have used in the experiments, and CBI's personal for the valuable work with sample preparations and analysis, as well as friends and colleagues for help and support.
Last but not least: Thank you, to John and my mother and father, for always being there.
Stockholm in November 2003
Helena Moosberg-Bustnes
...when you can measure what you are speaking about, and express it in numbers,
you know something about it; but when you cannot measure it, when you cannot
express it in numbers, your knowledge is of a meagre and unsatisfactory kind: it may
be the beginning of knowledge, but you have scarcely, in your thoughts, advanced to
the state of SCIENCE, whatever the matter may be. (Lord Kelvin, as Sir William
Thomson, Speaking on "Electrical Units of Measurements" at the Institution of Civil
Engineers, London, 3 May 1883.)
Abstract
In cement-based products, such as concrete and mortars, a balance between the particle sizes of the components must be kept in order to obtain the required material properties, such as workability and strength. Sometimes aggregates lack the necessary amount of fines, or the aggregates may even have been washed at the quarry or gravel pit - in order to remove fine material that may cause problems with dusting, or humus that will cause durability problems in concrete. In order to optimise the quality of the concrete, fine particles usually have to be added. Large quantities of filler material are needed in the production of modern concrete types. One example is self-compacting concrete (SCC) where one principle is to use large amounts of fine material to reduce the friction between the larger aggregates.
The influence of fine particulate materials on concrete properties was investigated. The results show that filler, even i f inert, interacts with the cement paste, i.e. the filler effect leads to a denser more homogenous cement paste, and thus a stronger concrete. This proves that filler addition is beneficial for the concrete.
Use of by-products such as slag, dust or sludge from the metallurgical industries as filler materials in concrete may be beneficial for concrete properties, such as strength and homogeneity, it may also help to conserve natural resources and at the same time be an economically viable option. However, to be able to successfully use the available materials they must be suitable for the planned purpose - to be mixed with cement.
A test procedure consisting of easy to use, reliable experimental methods was therefore developed. The most important properties were considered to be heat development in fresh concrete, strength development, shrinkage, expansion and workability. Test methods were chosen according to these criteria as well as for simplicity of use and evaluation. Scanning electron microscopy was used both to evaluate the shape of the particles and to verily some results.
A selection of available by-products was tested for their impact on concrete properties. Some of the by-products affected the cement hydration. This phenomenon was deemed to have its origin in the chemistry of the by-products, i.e., their content of metal compounds. Cement pastes were therefore combined with metal oxides and the effect on cement hydration and strength investigated. FTIR-analyses were used to evaluate some metal oxides effect on cement hydration. The result shows that addition of materials that contain ZnO or PbO wil l result in retardation of the cement reactions.
Zeta-potential measurements of by-products in electrolyte has been made followed by rheological measurements of by-product containing cement pastes and mortars. The investigations show that the by-products affect the rheological properties, this is due to their particle shapes, particle size distributions, specific surface areas and surface chemistry. To obtain more knowledge about the physical properties of the particles, limestone fillers with varying particle size distributions and origins, i.e., surface texture was investigated. It was found that both particle size distributions and surface textures affect rheological properties.
A study concerning modification of steel-slags was made in order to confirm that it is possible to affect the durability and activity problems of the steel-slags. The results were positive from the modification experiments, sieving and collection of the fines of disintegrating slag, wet fine grinding, and remelting followed by granulation.
To facilitate the use and evaluation of by-products as filler material a quality control method was tested. PaRMAC is a method that uses the relationship between three fractions of a materials particle size distribution. The quotas between the fractions give the coordinates in a xy-diagram. The changes in position in the diagram give an indication of how the particle distribution and packing of a system changes.
In order to verify the validity ofthe test methods concerning strength, rate of reaction and heat development one fine particulate material was first examined in laboratory scale where it was considered to be a potential filler material. Thereafter the dust was mixed into concrete and a full scale casting of a culvert was made. The operators' opinions of the experimental material were noted.
The conclusions are that it is possible to use by-products as filler material in cement based products, and that by-products should be used since they represent an economical, and environmental alternative that also may improve concrete properties.
Feinkörnige Nebenprodukte aus Bergbau und Metallurgie als Füller in Zementgebundenen Baustoffen
Zusammenfassung
In Zementgebundenen Baustoffen wie Beton und Mörtel muss ein Gleichgewicht zwischen den Korngrößen der Inhaltsstoffe gewahrt bleiben, um die geforderten Materialeigenschaften, z.B. Verarbeitbarkeit und Festigkeit, zu erhalten. In manchen Fällen enthalten die Zuschläge nicht den benötigten Anteil an Feinkorn oder aber die Zuschläge wurden in der Kiesgrube oder im Steinbruch gewaschen - um Feinmaterial zu entfernen, dass zu Staubbelastung führen könnte, oder um Humusstoffe zu entfernen die zu Problemen der Dauerhaftigkeit des Betons fuhren könnten. In diesen Fällen ist in der Regel die Zugabe von feinkörnigen Stoffen zur Optimierung der Betonqualität notwendig. Große Füllermengen sind zur Herstellung der modernen Betontypen notwendig. Ein Beispiel hierfür ist der Selbstverdichtende Beton, in dem eine Herstellungsgrundlage die Anwendung großer Mengen an Feinmaterial zur Verringerung der Reibung zwischen den größeren Zuschlagkörnern darstellt.
In dieser Arbeit wurde der Einfluss feinkörniger Materialen auf die Betoneigenschaften untersucht. Die Ergebnisse belegen, dass selbst inerte Füller mit dem Zementstein interagieren. So kommt es z.B. durch den Füllereffekt zur Ausbildung eines dichteren und homogeneren Zementsteins und als Folge dessen zu erhöhter Betonfestigkeit. Das beweist eine Verbesserung des Betons durch Füllerzugabe.
Die Verwendung von Restprodukten wie Schlacke, Staub oder Schlamm aus der metallurgischen Industrie als Füllstoffe in Betonen kann die Festigkeit und Homogenität des Betons positiv beeinflussen. Gleichzeitig führt dies zur Schonung natürlicher Ressourcen und kann ökonomisch sinnvoll sein. Um die vorhandenen Materialien für den gewünschten Zweck - das Vermischen mit Zement - sinnvoll einzusetzen zu können ist jedoch ihre Eignung zu überprüfen.
Aus diesem Grund wurde ein Versuchsplan, bestehend aus einfach anzuwendenden und verlässlichen Testmethoden, entwickelt. Wärmeentwicklung im Frischbeton, Festigkeitsentwicklung, Schwinden, Expansion und Verarbeitbarkeit wurden als wichtigste Kriterien betrachtet. Die Untersuchungsmethoden wurden passend zu diesen Kriterien gewählt, aber auch aufgrund Durchführbarkeit und Beurteilbarkeit der Ergebnisse. Elektronenmikroskopische Untersuchungen wurden sowohl zur Beurteilung der Kornform der Füllstoffe als auch zur Überprüfung einiger Ergebnisse eingesetzt.
Eine Auswahl an verfügbaren Restprodukten wurde auf ihren Einfluss auf die Betoneigenschaften untersucht. Einige dieser Stoffe beeinflussten die Zementhydratation. Dieses Phänomen hat seine Ursache in der chemischen Zusammensetzung der Restprodukte, vor allem dem Gehalt an metallischen Verbindungen. Aus diesem Grund wurde Zementleim mit verschiedenen Metalloxiden gemischt und die Auswirkungen auf Hydratation und Festigkeit untersucht. FTIR-Untersuchungen wurden zur Beurteilung des Einflusses einiger Metalloxide auf die Zementhydratation verwendet. Die Ergebnisse zeigen eine
Verlangsamung der Zementhydratation bei Zugabe von Zink- und Bleioxidhaltigen Stoffen.
Messungen der Zetapotentiale der Restprodukte in Elektrolytlösungen, gefolgt von rheologischen Untersuchungen restprodukthaltiger Zementleime und Mörtel, wurden durchgeführt. Die Untersuchungen belegen einen Einfluss der Restprodukte auf die rheologischen Eigenschaften als Folge von Kornform, Korngrößenverteilung, spezifischen Oberflächen und Oberflächenchemie. Um die Erkenntnisse über die physikalischen Eigenschaften der Partikel zu vertiefen, wurden Untersuchungen an Kalksteinfüllern mit variierender Korngrößenverteilung und Herkunft durchgeführt. Sowohl Oberflächentextur als auch Korngrößenverteilung konnten als relevante Einflussfaktoren auf die rheologischen Eigenschaften bestimmt werden.
Eine Studie, betreffend die Modifikation von Stahlschlacken, wurde durchgeführt, um nachzuweisen, dass es möglich ist, die Dauerhaftigkeits- und Aktivitätsprobleme von Stahlschlacken zu beeinflussen. Als Modifikationen wurden Absieben des Feinanteils von gemahlener Schlacke, Nassmahlung sowie Einschmelzen mit nachfolgender Granulierung mit positiven Ergebnissen durchgeführt.
Eine Methode zur Qualitätskontrolle wurde untersucht, um die Anwendung und Beurteilung von Restprodukten als Füllstoffe zu etablieren. Beim Einsatz von PaRMAC werden die Verhältnisse zwischen drei Fraktionen der Korngrößenverteilung eines Materials beurteilt. Die Verhältnisse zwischen den einzelnen Fraktionen ergeben Koordinaten in einem xy-Diagramm. Veränderungen der Lage im Diagramm indizieren Veränderungen der Korngrößenverteilung und Packungsdichte eines Partikelsystems.
Um die Verlässlichkeit der Testmethoden für Festigkeitsentwicklung, Reaktionsrate und Wärmeentwicklung zu verifizieren wurde ein feinkörniges Material zunächst im Labor untersucht und als potentieller Füllstoff klassifiziert. Danach wurde dieses Material im Großversuch zur Herstellung von Tunnelelementen als Zusatzstoff im Beton eingesetzt und die Erkenntnisse des Ausführenden über das getestete Material bewertet.
Zusammenfassend kann die Nutzung von Restprodukten in Form von Füllstoffen in Zementgebundenen Baustoffen als ökonomisch und ökologisch sinnvolle Alternative betrachtet werden, die gegebenenfalls sogar zur Verbesserung der Betoneigenschaften fuhren kann.
Contents
ACKNOWLEDGEMENTS ABSTRACT ZUSAMMENFASSUNG CONTENTS L I S T OF PAPERS
1. INTRODUCTION 1 1.1 Statistics - by-products from mineral and metallurgical industries 3
2. O B J E C T I V E S 6
2.1 Limitations 7
3. PROJECT DESCRIPTION 7
4. T H E O R E T I C A L BACKGROUND 11
4.1 Heat of hydration 11 4.1.1 Cement hydration 12 4.1.2 Hydration kinetics 14 4.1.3 The influence on cement hydration of metal compounds 15
4.2 The effect of filler on the microstructure of cement paste 15 4.3 The effect of partly substituting cement by mineral fdlers 16 4.4 Interparticle forces 17
4.4.1 Brownian motion 17 4.4.2 Van der Waals forces 17 4.4.3 Forces due to adsorbed liquid layers 17 4.4.4 Forces due to liquid bridges 18 4.4.5 Viscous forces 19
4.5 Interfacial transition zone 19 4.6 Particle packing 20 4.7 Rheology of cement based products 22
4.7.1 Water requirement and specific surface area vs. filling of voids 23 4.7.2 Rheology of particle suspensions 24 4.7.3 Particle shapes effect on rheology 25 4.7.4 Specific surface areas effect on rheology 25 4.7.5 Yield stress and viscosity 26
4.8 Superplasticizers 27 4.9 Surface charge of particles - zeta-potential 29
4.9.1 Zeta-potential in particle-water system 29 4.9.2 Zeta-potential in the cement, water and admixture system 30
4.10 Modification of by-products 32
5 METHODS 33 33 34 34 34
5.1 Mixing and casting 5.1.1 Sources of error
5.2 Measurement of air content in mortar 5.2.1 Sources of error
5.3 Beta-p 35 5.3.1 Sources of error 36
5.4 Rheological measurements, cement paste viscosity and yield stress 37 5.4.1 Sources of error 39
5.5 Rheological measurements, mortar viscosity and yield stress 39 5.5.1 Sources of error 40
5.6 Compressive strength and flexural strength 40 5.6.1 Sources of error 41
5.7 Shrinkage and expansion 41 5.7.1 Sources of error 42
5.8 X-ray diffraction 42 5.8.1 Sources of error 42
5.9 Calorimetry 43 5.9.1 Sources of error 43
5.10 FTIR-spectroscopy 43 5.10.1 Sources of error 44 5.11 Scanning electron microscopy 44
5.11.1 EDS/SEM analysis 44 5.11.2 Scanning electron micrographs 44 5.11.3 Particle shape analysis 45 5.11.4 Samples preparation for SEM analyses 45 5.11.5 Sources of error 46
5.12 Particle size analyses 46 5.12.1 Sources of error 46
5.13 Specific surface analyses and density 46 5.13.1 Sources of error 46
5.14 ICP-Particle packing 47 5.14.1 Sources of error 47
5.15 Zeta potential measurements 47 5.15.1 Sources of error 48
5.16 Remelting and granulation of slag 48 5.16.1 Sources of error 49
5.17 Wet grinding 49 5.17.1 Sources of error 49
5.18 Correlation analysis 50
6 M A T E R I A L S 51 6.1 Cement and filler materials in Papers 1-3 and 17 51 6.2 Cement types and filler materials in Paper 6-16 54
6.2.1 Cement 54 6.2.2 By-products 54 6.2.3 Metal oxides 56 6.2.4 Limestone fillers 56 6.2.5 Steel slags 58 6.2.6 Filter dust 58
7 R E S U L T S AND DISCUSSION 60 7.1 The function of fillers in cement-based materials 60 7.2 Natural minerals as fillers in cement-based materials 61 7.3 The effect of increasing amounts of fine/coarse particles on plastic 63
Viscosity and yield stress
7.3.1 Microscopic studies of cement paste containing inert filler materials 65 7.4 Effect of by-products on cement paste/concrete properties; hydration, 67
strength and volume stability - ground materials 7.4.1 The use of by-products from metallurgical and mineral industries as 70 filler in cement based materials - ground materials
7.5 Metallurgical dusts and sludges effect on cement hydration, reaction rate and 70 strength development when they are used as filler material in cement paste - fine particulate materials
7.5.1 Particle characterisation of by-products 72 7.5.2 Dispersion of by-products and homogeneity when mixed into 72
cement-based materials 7.6 Dust versus slag 73 7.7 Modification of steel slags 73 7.8 Metal oxides effect on hydration and compressive strength 74
7.8.1 XRD-analysis of cement pastes containing metal oxides 77 7.8.2 The effect of iron, chromium-, and zinc oxide mixtures 77
7.9 FTIR measurements of metal oxide containing cement pastes 78 7.10 Water demand - beta-p 79
7.10.1 Limestone fdler 79 7.10.2 By-products 80
7.11 Zeta-potential measurements of by-products in electrolyte 80 7.12 Particle packing and rheology of by-products 81
7.12.1 Particle packing 81 7.12.2 Rheology of cement pastes containing by-products 82 7.12.3 Rheology of mortars containing by-products 82
7.13 Rheology versus beta-p measurements 83 7.13.1 Limestone fdlers 83 7.13.2 By-products 83
7.14 Surface texture and particle size distributions effect on cement paste 83 7.15 Rheology versus zeta-potential 84 7.16 Evaluation of PaRMAC - a method to make it easier for the industries 84
to investigate by-products 7.16.1 Connecting PaRMAC diagram with rheology 85
7.17 From laboratory to full scale experiments 87 7.18 Other benefits from the use of by-products - aesthetical properties 87
7.18.1 Colouring 87 7.18.2 Architectural 89
8 CONCLUSIONS 89
9 FURTHER R E S E A R C H AND DEVELOPMENT 91
10 R E F E R E N C E S 93
11 PAPERS 1-17 98
List of papers
The thesis includes the following papers, which wi l l be referred to with their corresponding numbers.
1 Moosberg-Bustnes H., Lagerblad B. and Forssberg E. The use of by-products from metallurgical and mineral industries as filler in cement based materials, Waste Management and Research, 2003, Vol. 21, pp. 29-37.
2 Moosberg-Bustnes FL, Lagerblad B. and Forssberg E. Natural minerals as fillers in cement based materials (as manuscript), p. 23.
3 Moosberg-Bustnes H., Lagerblad B. and Forssberg E. The function of fillers in concrete. Accepted for publication 2003 Materials and structures (Proofs).
4 Moosberg-Bustnes H. The effect of metal oxides on cement hydration - State of the art report, MiMer-report no: 2002-2-07 pp.37.
5 Moosberg-Bustnes H. Steel slags - a state of the art report, MiMer-report no: 2002-2-07 p. 17.
6 Moosberg-Bustnes FL, Lind L. and Forssberg E. Fine Particulate Metallurgical Byproducts Influence on Cement Hydration and Strength Development - an Initial Study, Accepted for publication 2003 Scandinavian Journal of Metallurgy, (parti)
7 Moosberg-Bustnes H., Lind L. and Forssberg E. The effect of metal oxides on cement hydration" MiMeR-report no 2003-02-02, Submitted to: Advances in cement research, 2003
8 Moosberg-Bustnes H., Lind L. and Forssberg E. FTIR analyses of cement paste containing metal oxide" MiMeR-report no 2003-02-02
9 Moosberg-Bustnes H. and Fagerholm M. Evaluation ofthe PaRMAC method with regard to limestone fillers' PSD and its effect on cement paste rheology" MinFo-report no. A2000-3:2 (In Swedish), Submitted to: Powder Technology, 2003
10 Moosberg-Bustnes H., Lind L. and Forssberg E. Zeta-potential measurements of by-products in electrolyte, Submitted to Scandinavian Journal of Metallurgy, 2003 (partll)
11 Moosberg-Bustnes H., Lind L. and Forssberg E. Particle packing and rheological experiments on by-products" Submitted to: Scandinavian Journal of Metallurgy, 2003 (partlll)
12 Moosberg-Bustnes H. The influence of limestone fillers' origin, surface texture and particle size distribution on cement paste properties, MinBas-report, 2003.
13 Moosberg-Bustnes H. By-products from mineral and metallurgical industries in concrete" Proceedings of the international conference on sustainable concrete construction, Dundee, Scotland, 2002 pp. 281-290.
14 Moosberg-Bustnes H. Characterisation of filler", Proceedings from the 3rd International Symposium on self-compacting concrete, Reykjavik Iceland 2003, pp. 540-550.
15 Moosberg-Bustnes H. Steel-slags as filler material in concrete" (To be presented) Proceedings from 7th international conference on molten slags fluxes and salts, Cape Town, South Africa, January 2004 (Reviewed)
16 Moosberg-Bustnes H. and Hunsbeth L. Filter dust as filler in concrete - from laboratory to full scale (To be presented) Proceedings from the international SCANMET conference, Luleå, Sweden, 2004 (Reviewed)
17 Lagerblad B, Vogt C. And Moosberg-Bustnes H. Fine ground slag as cement replacement and pozzolana, Proceedings from the 15th International Conference on Building Materials (15 Internationale Baustofftagung), Weimar, Germany, 2003, Vol. l,pp.543-552.
1 Introduction
Concrete is the most common construction material today. It has many positive qualities, among others: it is easy to produce, it can be made in all kinds of climates, it has high durability and can be used to make both simple and complicated structures, and the manufacturing cost is relatively low. Concretes main advantage as building material is that it can be tailor-made according to the customer's specifications.
Traditionally, mineral admixtures have been used to reduce the cost of concrete. Due to the development in chemical admixture technology, i.e., the development of new more effective superplasticizers, fine particulate mineral admixtures are being used to improve concrete properties. For example: Self-compacting concrete needs supplementing filler material to increase the volume of its fluid phase and to bind excess water due to the large degree of particle dispersion. Sometimes the available aggregates lack the necessary amount of fines and thus filler material has to be added. The use of crushed aggregates instead of natural sand and gravel gives a workability change of the concrete, which can be remedied by adding filler materials.
There are different types of by-products and it is important to distinguish between them since their usefulness for further use in the society varies. The two "basic" groups are organic and inorganic materials. The first will not be included in this work. The inorganic compounds can be further divided into different classes. There are materials from the heavy industry, for example: mineral- and metallurgical industry, which contains inorganic elements such as (metal oxides) lead, zinc, copper, mercury, chromium, cadmium and others. There are also radioactive materials and materials containing toxic, hazardous or polluting organic compounds. Of these three groups, only the first one is suited for civil engineering purposes.
The manufacturing processes used by the mineral and metallurgical industries are complex, and in addition to the primary products, minerals and metals, a wealth of by-products are produced. Some of these materials have excellent properties for road construction purposes, granulated blast furnace slag function as a latent hydraulic binder, and there are even some materials that successfully have been used as filler in concrete, for example silica fume. However, the major parts of the by-products have not been investigated with the aim of using them as fillers or aggregates in cement-based materials.
Use of by-products as a substitute for natural raw materials in the construction industry may also help to conserve natural resources, and at the same time reduce the environmental hazards arising from the disposal of some waste materials. Nonetheless, to be able to successfully utilise a by-product it must be an economically competitive substitute for the natural raw material that is commonly used. This includes the costs of processing and transportation. The material must also be suitable for the planned purpose, i.e., its stability and durability over the expected life span must be ensured in the context of the particular building application. Unfortunately, the use of supplementary cementing materials is associated with a few problems. The properties of these minerals are variable, and often little care is given to their control during production since they are only by-products. The quality control of concrete becomes more acute when these types of materials are used as
1
mineral admixtures. There are not many countries that have established standards for the use of by-products in concrete production.
In order to find a solution to the industries problem with waste products, there are several ways to go: waste minimisation, recycling to the process, recycling to another process, modification for use in other application, or store it while research is conducted to find a solution to the recycling problem.
In the concrete industries most of the researchers terminology, instruments and test methods are unknown. It is therefore imperative that the use of filler from metallurgical industries is facilitated by the use of test methods that are easy to use and gives reliable results concerning their effect on concrete properties.
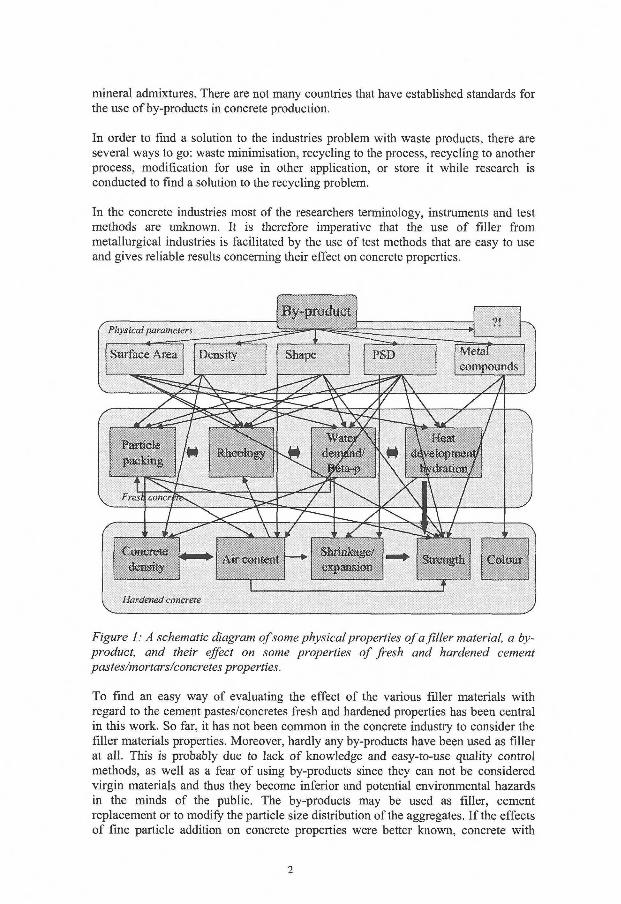
Figure 1: A schematic diagram of some physical properties of a filler material, a byproduct, and their effect on some properties of fresh and hardened cement pastes/mortars/concretes properties.
To find an easy way of evaluating the effect of the various filler materials with regard to the cement pastes/concretes fresh and hardened properties has been central in this work. So far, it has not been common in the concrete industry to consider the filler materials properties. Moreover, hardly any by-products have been used as filler at all. This is probably due to lack of knowledge and easy-to-use quality control methods, as well as a fear of using by-products since they can not be considered virgin materials and thus they become inferior and potential environmental hazards in the minds of the public. The by-products may be used as filler, cement replacement or to modify the particle size distribution of the aggregates. I f the effects of fine particle addition on concrete properties were better known, concrete with
2
improved and/or desirable properties could be custom-made to fulf i l specified requirements, for instance self-compacting concrete or high-strength concrete. Certain environmental and economic benefits may also accrue from the use of fine particles
It is very important to characterise the physical parameters of a by-product i f it is to be used as a filler material in cement-based products, and to find the key-properties, i.e., the properties that has the largest impact on the cement pastes behaviour. Figure 1 is a schematic picture of some physical properties of a by-product and its effect on cement paste properties in fresh and hardened state. I f one physical parameter is changed a "chain reaction" wil l take place that affects several of the properties of fresh and hardened cement paste. In order to use by-products as filler in cement-based materials more knowledge about the by-products has to be obtained, as well as more knowledge about how the cement paste properties are affected by the various physical properties.
Waste, per definition, is "material which the holder discards, or intends to or is required to discard and which may be sent for final disposal, reuse or recovery" (from European committee for standardisation - Characterisation of waste, CEN/TC 292 N677). In the case of reuse or recovery the author of this thesis dislikes the word waste - waste implies something negative and useless, the designations by-product or secondary raw material are a more positive way of naming something that is not the main product from a process, but a secondary product (bonus product?) that can be utilised in another process and have its own value and place in our society. Henceforth, in this thesis the designation by-products will be used.
1.1 Statistics - by-products from mineral and metallurgical industries.
According to EEA, European Environment Agency, five major waste streams make up the bulk of total waste generation in the EU: manufacturing waste (26 % ) , mining and quarrying waste (29 % ) , construction and demolition waste (22 %) , municipal solid waste (14 %) and agricultural and forestry waste (ca 9 %, estimation of exact amounts is difficult). 2 percent of the waste is hazardous waste, i.e., 27 million tonnes.v
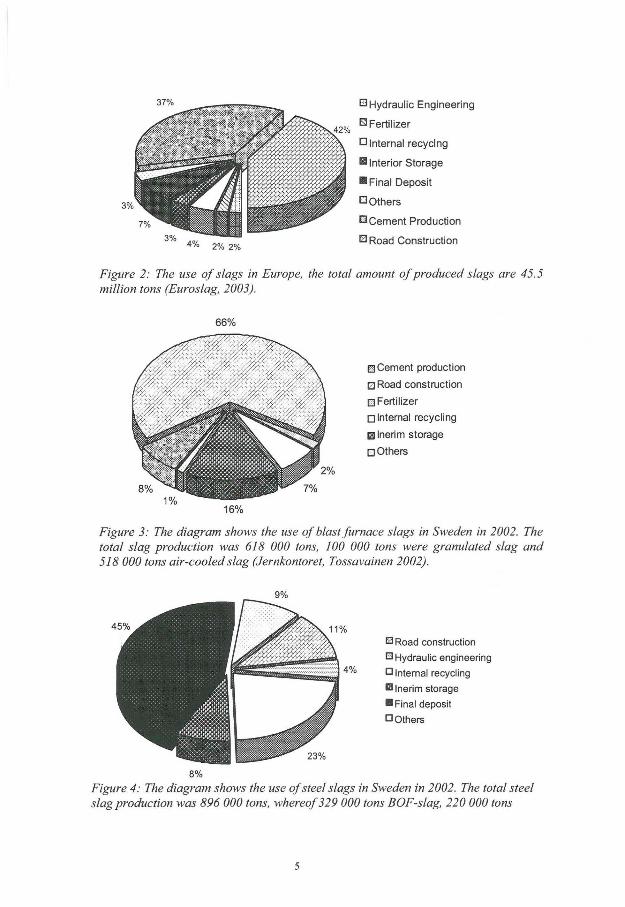
The total production of slags in Europe 2002 was 45.5 million tons. The areas where slags are used can be found in Figure 2, the two major areas of use are in cement production and road construction. Table 1 show the areas of use in percentage of the production in Sweden and the total figure for the production in Europe. NB! The interim storage in Sweden has decreased, stored material has been used. Comparison show that the cement and concrete industries in Sweden use less slags in their production than the rest of Europe, and the rate of final deposit is much higher. However, the internal recycling is much higher and the percentage of use in other areas, such as production of glass, insulation material, etc., is higher.
v from "Waste generated in Europe, data 1985-1997, Eurostat, 2000, p. 37"
3
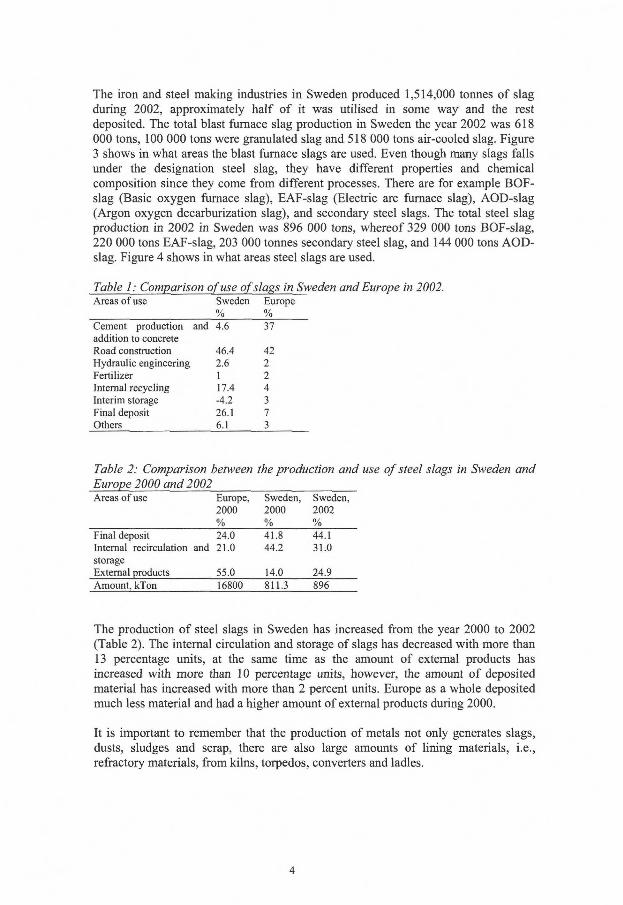
The iron and steel making industries in Sweden produced 1,514,000 tonnes of slag during 2002, approximately half of it was utilised in some way and the rest deposited. The total blast furnace slag production in Sweden the year 2002 was 618 000 tons, 100 000 tons were granulated slag and 518 000 tons air-cooled slag. Figure 3 shows in what areas the blast furnace slags are used. Even though many slags falls under the designation steel slag, they have different properties and chemical composition since they come from different processes. There are for example BOF-slag (Basic oxygen furnace slag), EAF-slag (Electric arc furnace slag), AOD-slag (Argon oxygen decarburization slag), and secondary steel slags. The total steel slag production in 2002 in Sweden was 896 000 tons, whereof 329 000 tons BOF-slag, 220 000 tons EAF-slag, 203 000 tonnes secondary steel slag, and 144 000 tons AOD-slag. Figure 4 shows in what areas steel slags are used.
Table 1: Comparison of use of slags in Sweden and Europe in 2002. Areas of use Sweden Europe
% % Cement production and 4.6 37 addition to concrete Road construction 46.4 42 Hydraulic engineering 2.6 2 Fertilizer 1 2 Internal recycling 17.4 4 Interim storage -4.2 3 Final deposit 26.1 7 Others 6.1 3
Table 2: Comparison between the production and use of steel slags in Sweden and
Areas of use Europe, Sweden, Sweden, 2000 2000 2002 % % %
Final deposit 24.0 41.8 44.1 Internal recirculation and 21.0 44.2 31.0 storage External products 55.0 14.0 24.9 Amount, kTon 16800 811.3 896
The production of steel slags in Sweden has increased from the year 2000 to 2002 (Table 2). The internal circulation and storage of slags has decreased with more than 13 percentage units, at the same time as the amount of external products has increased with more than 10 percentage units, however, the amount of deposited material has increased with more than 2 percent units. Europe as a whole deposited much less material and had a higher amount of external products during 2000.
It is important to remember that the production of metals not only generates slags, dusts, sludges and scrap, there are also large amounts of lining materials, i.e., refractory materials, from kilns, torpedos, converters and ladles.
4
37%
4% 2% 2%
• Hydraulic Engineering
• Fertilizer
• Internal recyclng
B Interior Storage
H Final Deposit
• others
• Cement Production
• Road Construction
Figure 2: The use of slags in Europe, the total amount of produced slags are 45.5 million tons (Euroslag, 2003).
66%
S3 Cement production
• Road construction
• Fertilizer
• Internal recycling
E Inerim storage
• Others
16%
Figure 3: The diagram shows the use of blast furnace slags in Sweden in 2002. The total slag production was 618 000 tons, 100 000 tons were granulated slag and 518 000 tons air-cooled slag (Jernkontoret, Tossavainen 2002).
9%
• Road construction S Hydraulic engineering
• Internal recycling
B Inerim storage • Final deposit
• Others
Figure 4: The diagram shows the use of steel slags in Sweden in 2002. The total steel slag production was 896 000 tons, whereof329 000 tons BOF-slag, 220 000 tons
5
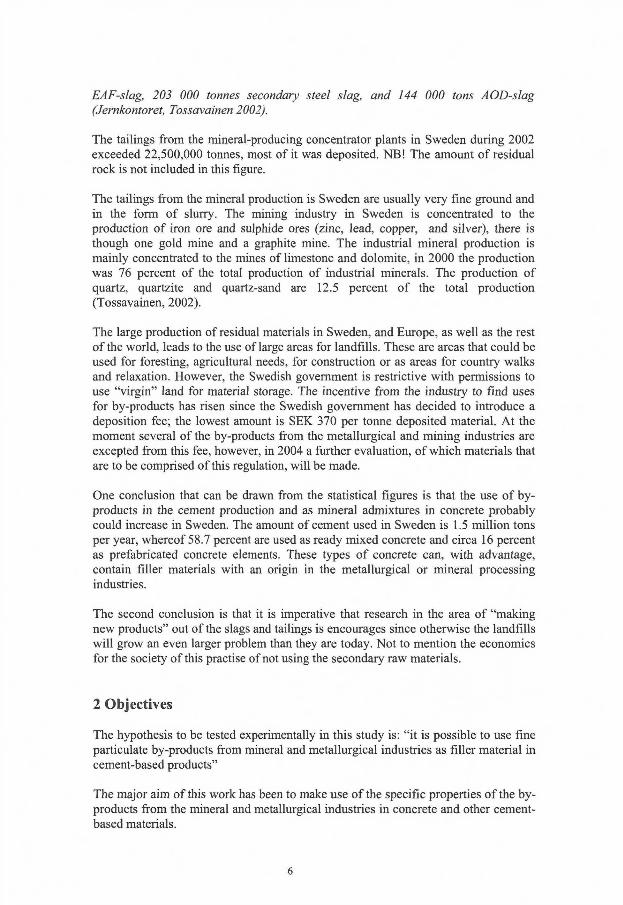
EAF-slag, 203 000 tonnes secondary steel slag, and 144 000 tons AOD-slag (Jernkontoret, Tossavainen 2002).
The tailings from the mineral-producing concentrator plants in Sweden during 2002 exceeded 22,500,000 tonnes, most of it was deposited. NB! The amount of residual rock is not included in this figure.
The tailings from the mineral production is Sweden are usually very fine ground and in the form of slurry. The mining industry in Sweden is concentrated to the production of iron ore and sulphide ores (zinc, lead, copper, and silver), there is though one gold mine and a graphite mine. The industrial mineral production is mainly concentrated to the mines of limestone and dolomite, in 2000 the production was 76 percent of the total production of industrial minerals. The production of quartz, quartzite and quartz-sand are 12.5 percent of the total production (Tossavainen, 2002).
The large production of residual materials in Sweden, and Europe, as well as the rest of the world, leads to the use of large areas for landfills. These are areas that could be used for foresting, agricultural needs, for construction or as areas for country walks and relaxation. However, the Swedish government is restrictive with permissions to use "virgin" land for material storage. The incentive from the industry to find uses for by-products has risen since the Swedish government has decided to introduce a deposition fee; the lowest amount is SEK 370 per tonne deposited material. At the moment several of the by-products from the metallurgical and mining industries are excepted from this fee, however, in 2004 a further evaluation, of which materials that are to be comprised of this regulation, wil l be made.
One conclusion that can be drawn from the statistical figures is that the use of byproducts in the cement production and as mineral admixtures in concrete probably could increase in Sweden. The amount of cement used in Sweden is 1.5 million tons per year, whereof 58.7 percent are used as ready mixed concrete and circa 16 percent as prefabricated concrete elements. These types of concrete can, with advantage, contain filler materials with an origin in the metallurgical or mineral processing industries.
The second conclusion is that it is imperative that research in the area of "making new products" out of the slags and tailings is encourages since otherwise the landfills wil l grow an even larger problem than they are today. Not to mention the economics for the society of this practise of not using the secondary raw materials.
2 Objectives
The hypothesis to be tested experimentally in this study is: "it is possible to use fine particulate by-products from mineral and metallurgical industries as filler material in cement-based products"
The major aim of this work has been to make use of the specific properties of the byproducts from the mineral and metallurgical industries in concrete and other cement-based materials.
6
To be able to use the by-products properly is it important to find ways to test their influence on concrete properties; a test procedure had to be developed.
It is important to investigate the influence of fine particles on concrete properties and thus attain a base knowledge that can be used on other types of materials, i.e., byproducts. This knowledge is also needed to explain the phenomena that occur when fillers are used.
2.1 Limitations
The results in this study are only valid for the tested materials, which in most cases are only collected at one time. The by-products may vary in composition over production time and therefore have to be controlled before use.
The investigated by-products were chosen with regard to their availability, produced amounts and knowledge about their chemical compounds. There are many, not yet investigated mineral and metallurgical by-products or mixes thereof, which possibly may function as filler material in cement-based materials.
This investigation has concentrated on cement paste and concrete properties such as heat development, strength development, shrinkage/expansion and rheological measurements, as well as particle characterisation. It is important to remember that there are several further investigations that has to be performed before these materials can be considered commercial products suitable for addition to concrete, i.e., resistance against chemical attacks, chloride diffusion and chloride binding capacity (Seawater resistance), effect on rebar corrosion, freeze-thaw resistance, sulphate resistance etc.
3 Project description
The project is described in a schematic figure to facilitate the understanding of the project layout (Figure 5).
The first part of the initial study was to find and examine reliable methods of evaluating the effect of specific products on the properties of concrete within a reasonable timeframe. It is important, since a by-product's reaction in the cement system cannot be predicted by chemical analysis. Materials can have the same chemical components but still react in different ways, due to their mineralogy, and it is therefore imperative that materials with desirable properties can be separated from materials with undesirable ones.
A selection of available by-products was tested for their impact on concrete properties. A test-procedure was developed and the ground by-products replaced part of the cement in respective mixtures (Paper 1). Some materials demonstrated properties that made them unsuitable for use, while others can be used as inert or reactive fillers. In order to see i f the test method works for other materials a series of
7
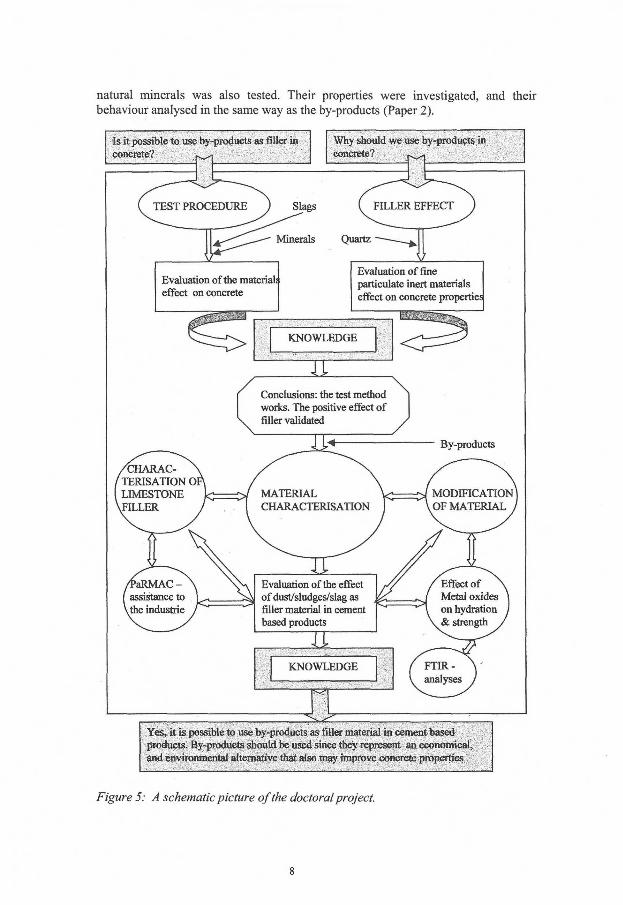
natural minerals was also tested. Their properties were investigated, and their behaviour analysed in the same way as the by-products (Paper 2).
Is it possible to use by-products as filler in concrete?
Why should we use by-products in
concrete?
T E S T P R O C E D U R E J51ags
Minerals Quartz
Evaluation ofthe material? effect on concrete
Evaluation of fine particulate inert materials effect on concrete propertied
K N O W L E D G E
Conclusions: the test method works. The positive effect of filler validated
By-products
MODIFICATION ] O F M A T E R I A L
Evaluation of the effect of dust/sludges/slag as filler material in cement based products
f . u "
Evaluation of the effect of dust/sludges/slag as filler material in cement based products
^
Effect of Metal oxides on hydration & strength
K N O W L E D G E F T I R -analyses
Yes, it is possible to use by-products as filler material in cement based products. By-products should be used since they represent an economical, and environmental alternative that also may improve concrete properties
Figure 5: A schematic picture of the doctoral project.
8
The second part of the initial study was to investigate the influence of fine particulate filler on concrete properties. Quartz was chosen as filler, since it can be considered to be inert. Fillers interact with the cement in several ways. They may be chemically inert but can still indirectly influence the chemical structure of the cement paste and concrete in a positive way. Fillers can also replace cement and be used to improve rheological properties, which in tum will influence the properties of the hardened concrete (Paper 3).
The quartz fillers used in the experiments had different particle sizes and were added to the concrete in different amounts. The obtained knowledge of how quartz fillers behave may be applicable to other types of filler of different origins, i.e., byproducts. The largest potential use for the materials are as filler for self-compacting concrete or to minimise the use of cement in ordinary concrete.
The results from the initial study lead to the conclusions: that the chosen methods can be used as a screening method that will separate materials with desirable properties from materials with undesirable ones; the positive effect of filler addition may be due to physical and/or chemical effects, however, the physical effect leads to a denser more homogenous cement paste, and thus a stronger concrete. The results from the initial study was verified in Paper 17.
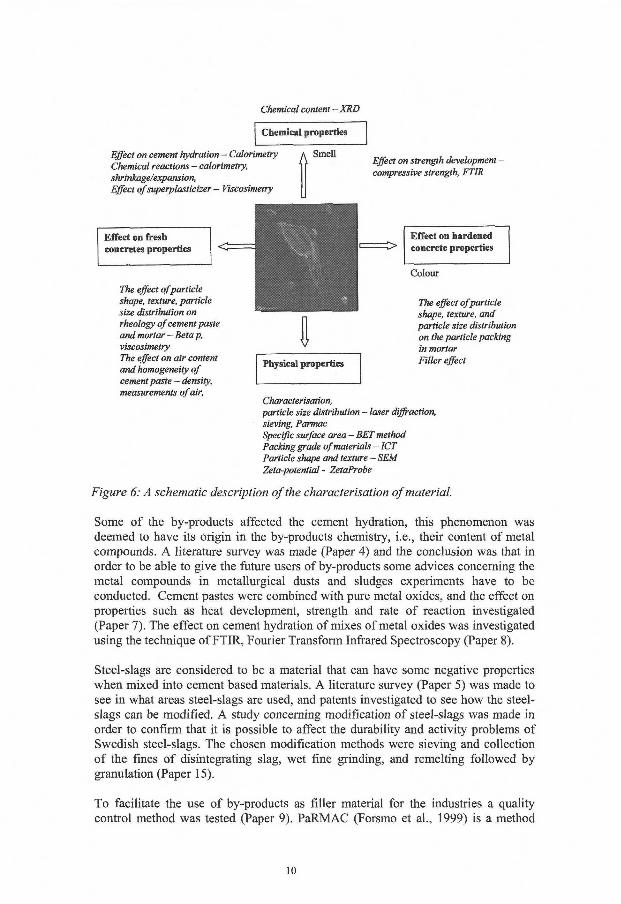
The initial study was conducted on ground by-products, which may not always be an practical approach. It was thus decided that the continued work of finding acceptance for by-products should be continued on fine particulate by-products, such as dust and sludges. These types of materials differ greatly from slags in many aspects, their particle shape, chemical content and origin. Material characterisation was performed and some new characterisation methods evaluated (Papers 6 and 14) in order to further develop the test method. The result showed that physical properties such as particle shape, porosity, and particle size distribution are important. A comparison between the two groups of by-products was made in Paper 13. A schematic description of the characterisation of a material can be found in Figure 6. The chemical and physical properties are analysed with regard to the fresh and hardened concrete properties.
When evaluating the suitability of by-products it is important to collect more knowledge of the effects of certain physical properties. In order to evaluate the importance of the physical properties, limestone fillers of varying particle size distribution and origin (surface texture) where characterised (Paper 12).
In order to further develop the test method, rheological measurements were conducted instead of the previously used workability tests. The experiments started with an evaluation of the by-products surface properties. The zeta-potential of the by-products in a synthetic pore solution was measured (Paper 10). Thereafter viscosity and yield stress measurements were performed on cement pastes with byproduct addition (Paper 11). The particle packing of the systems was also investigated to see i f the by-products affected the packing. As comparison the limestone fillers used for the experiments in Paper 12, were also tested with regard to their effect on rheology.
9
Chemical content - XRD
Chemical properties
Effect on cement hydration - Calorimetry Chemical reactions - calorimetry, shrinkage/expansion, Effect of superplasticizer - Viscosimetry
A Smell
Effect on strength development -compressive strength, FTIR
Effect on fresh concretes properties <=
The effect of particle shape, texture, particle size distribution on rheology of cement paste and mortar - Beta p, viscosimetry The effect on air content and homogeneity of cement paste - density, measurements of air,
m
1 Physical properties
Effect on hardened concrete properties
Colour
The effect of particle shape, texture, and particle size distribution on the particle packing in mortar Filler effect
Characterisation, particle size distribution - laser diffraction, sieving, Parmac Specific surface area - BET method Packing grade of materials - ICT Particle shape and texture - SEM Zeta-potential - ZetaProbe
Figure 6: A schematic description of the characterisation of material.
Some of the by-products affected the cement hydration, this phenomenon was deemed to have its origin in the by-products chemistry, i.e., their content of metal compounds. A literature survey was made (Paper 4) and the conclusion was that in order to be able to give the future users of by-products some advices concerning the metal compounds in metallurgical dusts and sludges experiments have to be conducted. Cement pastes were combined with pure metal oxides, and the effect on properties such as heat development, strength and rate of reaction investigated (Paper 7). The effect on cement hydration of mixes of metal oxides was investigated using the technique of FTIR, Fourier Transform Infrared Spectroscopy (Paper 8).
Steel-slags are considered to be a material that can have some negative properties when mixed into cement based materials. A literature survey (Paper 5) was made to see in what areas steel-slags are used, and patents investigated to see how the steel-slags can be modified. A study concerning modification of steel-slags was made in order to confirm that it is possible to affect the durability and activity problems of Swedish steel-slags. The chosen modification methods were sieving and collection of the fines of disintegrating slag, wet fine grinding, and remelting followed by granulation (Paper 15).
To facilitate the use of by-products as filler material for the industries a quality control method was tested (Paper 9). PaRMAC (Forsmo et al., 1999) is a method
10
that uses the relationship between three fractions of a materials particle size distribution. The quotas between the fractions give the coordinates in a xy-diagram. The changes in position in the diagram gives an indication of how the particle distribution and packing of a system changes.
In order to verify the test method's validity concerning strength, rate of reaction and heat development one fine particulate material was first examined in laboratory scale where it was considered to be a potential filler material. Thereafter the dust was mixed into concrete and a full scale casting of a conduit was made. The operators opinions of the experimental material was noted (Paper 16).
4 Theoretical background
4.1 Heat of hydration
Knowledge of kinetics is important for understanding the chemical mechanisms of any reaction. This is also true for the hydration of Portland cement. The reactions are exothermic; therefore, the kinetics can be followed using isothermal calorimetry. The reactions are also reflected in changes in the properties of the hardened concrete. Depending on temperature, water/cement ratio, particle size and composition, the intensity of heat liberated varies with time. Measurements of the heat development provide information on the rate of hydration, and also how added materials influence it.
The liberated heat, during the cement hydration, is in the given moment formed by the sums of heats of different physical and chemical parallel ongoing reactions. These reactions can not easily be differentiated and only the total sum of heats measured. These heats are for example: wetting heat of cement, solution heat of clinker minerals, exothermic heat of hydro silicates and aluminates, crystallisation and recrystallisation heat, adsorption heat of water on hydration products (Hela et al., 2003).
Addition of by-products/fillers may change the cement hydration in different ways, either positively or negatively. The added materials may cause the hydration to accelerate or retard, to increase or decrease the individual peaks, and even affect the total heat development (Jiang et al., 1993).
Although the general form of the reaction rate is consistent, there are many hydration variables that can change the details. The reactivity is material- dependent, but reaction conditions (variables) influence the reaction rate. For example:
• Water/cement ratio (w/c-ratio) has only a small effect on the early kinetics of ordinary concretes. The latter stages can though be slowed by a shortage of water caused by the consumption during the early reaction.
• Particle size (or specific surface area) strongly influences the reaction rate. Decreasing the particle size decreases the length of stage I I (see Figure 7), and increases the height of the second heat peak. Throughout the entire reaction, larger particles influence the hydration less.
11
• Temperature has a strong effect on the kinetics. Increasing temperature decreases the length of stage I I and increases the peak height and shortens the length of stages I I I and IV (see Figure 7). Higher temperatures result in increased reaction until approximately the end of stage IV, at which point there appears to be little difference in the degree of reaction at various temperatures between 0 and 50°C. (Copeland and Kantro, 1969, Kantro et al., 1962, Bentur et al., 1979).
• Soluble metal salts and metal oxides change the dormant period, i.e., the time between the first and second peaks of hydration, and the intensity of initial peaks. The metal content has an influence on the early hydration, but not on the long-term properties, as long as the added amount of the heavy metal compounds is not too high (Bhatty et al., 1999).
• I f free lime is present in the samples, it will cause an early heat development when it reacts with water in the cement paste. The result is that cement hydration wil l be disturbed and thus affect the concrete properties.
• Soluble sulphates influence the early hydration reactions by prolonging the dormant period (Mehta, 1986, Taylor, 1997).
• Addition of admixtures: accelerators, retarders, water reducers, superplastisizers, antifreeze admixtures, and air-entraining agents, etc., influences the hydration. The hydration can be accelerated or retarded due to addition of admixtures
4.1.1 Cement hydration
Portland cement is made by heating a mixture of limestone and clay, or other materials of similar bulk composition and sufficient reactivity, ultimately to a temperature of about 1450 ° C. Partial fusion occurs, and nodules of clinker are produced. The clinker is mixed with a few percent of calcium sulphate (gypsum) and finely ground, to make the cement. The clinker typically has a composition in the region of 67% CaO, 22% Si0 2 , 5% A1 20 3 , 3% Fe 20 3 and 3% other components, and normally contains four major phases, called alite, belite, aluminate and ferrite. Several other phases, such as alkali sulphates and calcium oxide, are normally present in minor amounts. Alite is the most important constituent of all normal Portland cement clinkers, of which it constitutes 50-70%. It is tricalcium silicate, CasSiOs (C3S), modified in composition and crystal structure by ionic substitutions. Belite is dicalcium silicate, Ca 2Si0 4 (C2S) modified by ionic substitutions and normally present, wholly or largely, as the ß-polymorph. It constitutes 15-30% of normal Portland cement. Aluminate constitutes 5-10% of most normal cement clinker. It is tricalcium aluminate, Ca3Al20ö (C3A), substantially modified in composition and sometimes also in structure by ionic substitutions. Ferrite makes up 5-15% of normal Portland cement clinkers. It is tetracalcium aluminoferrite, Ca4AlFe05 (C 4AF), substantially modified in composition by variation in Al/Fe ratio and ionic substitutions (Taylor 1997).
The cement hydration process starts when cement is mixed with water. The hydration process consists of several overlapping chemical reactions between the clinker components, calcium sulphate and water. The alkali ions influence the early hydration rate of particularly C 3A. Figure 7 shows a schematic heat development curve for the hydration of Portland cement. As the hydration of cement is an exothermic reaction, the rate of evolution of heat is an indication of the rate of hydration.
12
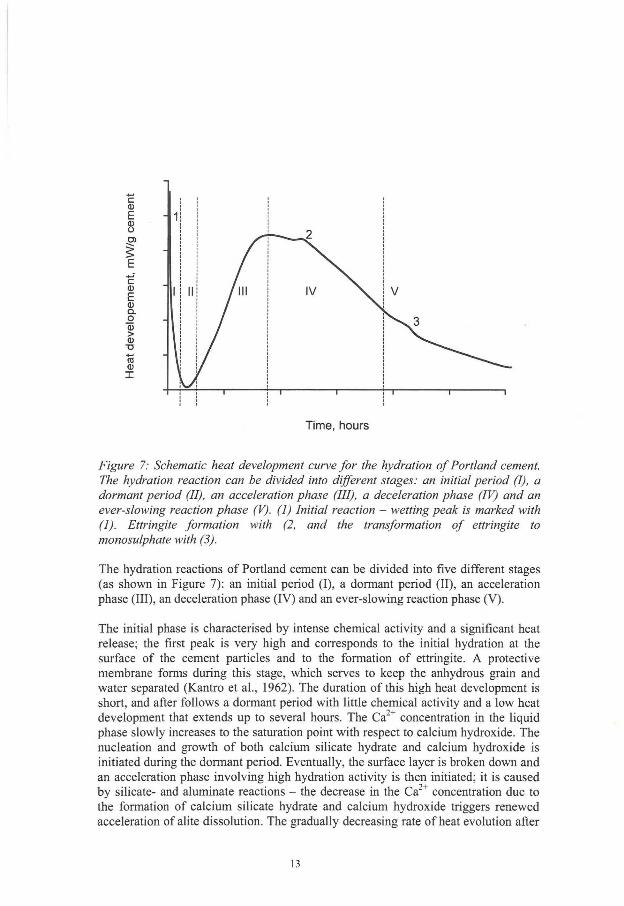
Figure 7: Schematic heat development curve for the hydration of Portland cement. The hydration reaction can be divided into different stages: an initial period (I), a dormant period (II), an acceleration phase (III), a deceleration phase (IV) and an ever-slowing reaction phase (V). (1) Initial reaction - wetting peak is marked with (1). Ettringite formation with (2, and the transformation of ettringite to monosulphate with (3).
The hydration reactions of Portland cement can be divided into five different stages (as shown in Figure 7): an initial period (I), a dormant period (II), an acceleration phase (III), an deceleration phase (IV) and an ever-slowing reaction phase (V).
The initial phase is characterised by intense chemical activity and a significant heat release; the first peak is very high and corresponds to the initial hydration at the surface of the cement particles and to the formation of ettringite. A protective membrane forms during this stage, which serves to keep the anhydrous grain and water separated (Kantro et al., 1962). The duration of this high heat development is short, and after follows a dormant period with little chemical activity and a low heat development that extends up to several hours. The Ca 2 + concentration in the liquid phase slowly increases to the saturation point with respect to calcium hydroxide. The nucleation and growth of both calcium silicate hydrate and calcium hydroxide is initiated during the dormant period. Eventually, the surface layer is broken down and an acceleration phase involving high hydration activity is then initiated; it is caused by silicate- and aluminate reactions - the decrease in the Ca 2 + concentration due to the formation of calcium silicate hydrate and calcium hydroxide triggers renewed acceleration of alite dissolution. The gradually decreasing rate of heat evolution after
13
24 hours corresponds to the continuing slow reactions of the late stage, the diffusion through the pores in the products of hydration becomes the controlling factor. Often, a third peak occurs , which is explained by the renewed formation of ettringite. A further, less distinct peak is associated with the transformation of ettringite to monosulphate, when the sulphates are consumed, and ferrite reactions (Kantro et al., 1962, Jennings, 1982, Neville, 1995, Taylor, 1997).
4.1.2 Hydration kinetics
The heat of hydration can be determined by using isothermal conduction calorimetry. By measuring the heat development an understanding of the materials setting and strength development is obtained.
Cement hydration is a function of its fineness. Commonly, cement has a broad particle size distribution, which wil l have different kinetics than i f it was a monosized material.
Detailed information about reaction kinetics is prohibited by the broad particle size distribution but Knudsen (1980) showed that the hydration degree-time curve for Portland cement is closely related to the form of the particle size distribution of the material.
Knudsen (1980) used earlier work by Taplin (1968) and proposed that kinetics of cement hydration may be followed by Equation 1. It shows that a change of fineness and a change of temperature have the same effect on the curve.
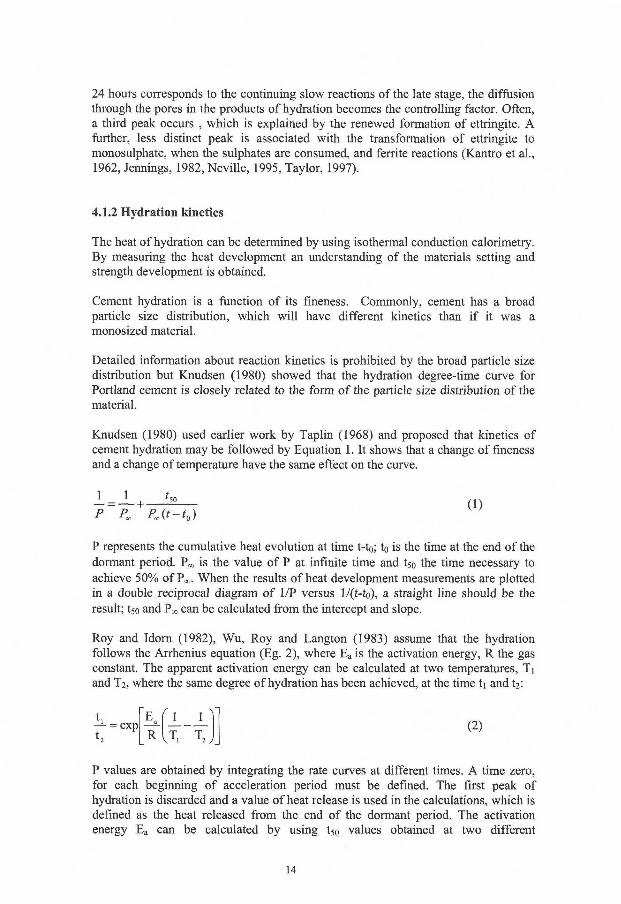
I = J - + - ^ _ (1)
P represents the cumulative heat evolution at time t-to; to is the time at the end of the dormant period. P«, is the value of P at infinite time and t 5 0 the time necessary to achieve 50% of Pæ. When the results of heat development measurements are plotted in a double reciprocal diagram of 1/P versus l/(t-to), a straight line should be the result; 150 and PM can be calculated from the intercept and slope.
Roy and Idorn (1982), Wu, Roy and Langton (1983) assume that the hydration follows the Arrhenius equation (Eg. 2), where E a is the activation energy, R the gas constant. The apparent activation energy can be calculated at two temperatures, Ti and T2, where the same degree of hydration has been achieved, at the time ti and 12:
t. - = exp|
E, { 1 1 ^
R l T , T 2 y
(2)
P values are obtained by integrating the rate curves at different times. A time zero, for each beginning of acceleration period must be defined. The first peak of hydration is discarded and a value of heat release is used in the calculations, which is defined as the heat released from the end of the dormant period. The activation energy E a can be calculated by using t 5 0 values obtained at two different
14
temperatures. Since tgo is the time necessary to achieve 50 percent degree of reaction, the magnitude of tso is an inverse function of hydration rate. For example (Roy and Idorn, 1982); the values of tso of slag cement are 34.57 and 9.86 hr at 38 and 60 C, respectively. According to Eq. (7) the calculated apparent activation energies for hydration is 49.1 KJ/mole. The calculated E a of the Portland cement is 44.31 KJ/mole. The higher (apparent) activation energies calculated for slag cements relative to Portland cements establish why slag cements could benefit from thermal activation.
Unfortunately, there are no hydration models that take mineral admixtures effect on cement hydration into consideration.
4.1.3 The influence on cement hydration of metal compounds
Analytical methods used in the industry to define the chemical content of a byproduct are usually designed to determine metal as an element. The anions are seldom determined, with the exception of phosphate, fluoride and cyanide, which are considered to be environmental hazardous. When they are analysed, it is as the anion alone, not as the associated metal (or other) compound (Conner 1990). The reason for these "half made" analysis of by-products are mostly due to cost since the determination of speciation may require several analyses with equipment that are both expensive and not always easily accessible, for example scanning electron microscopy, Fourier transform infrared spectroscopy, nuclear magnetic resonance. Less expensive methods like titration, thermal analysis and chemical analyses are not as accurate as the above mentioned but can be used to get some information of the tested material. To be able to facilitate the use of by-products, in the society as whole, the "waste" materials have to be thoroughly analysed so that they can be classified after their qualities and be used in the most effective way in the proper processes.
The industrial materials can be of two types, soluble or insoluble. Water-soluble compounds are usually salts, such as nitrates, borates and phosphates (for example: lead(II)nitrate, cadmium chloride hydrate, mercury(II)chloride). Insoluble compounds are often metal oxides, for example: lead(II)oxide, cadmium oxide, chromium(III)oxide.
A literature review on the subject of metal compounds effect on cement hydration is presented in Paper 4.
4.2 The effect of filler on the microstructure of cement paste
The microstructure of the cement paste is not only dependent on the cement hydration and the water/cement ratio, but also on:
• The particle size distribution of the materials used; • The initial particle packing of the system; • The filler's effect on rheological characteristics such as the water demand,
superplasticizer efficiency, segregation, bleeding, etc.; this wi l l determine the
15
yield stress and viscosity of the system, which in turn wil l affect the flow characteristics, the final pacing ofthe system and its homogeneity;
• The filler's effect on the kinetics of the hydration reactions; • The reactivity of the filler, i.e., i f it is puzzolanic, latent hydraulic or otherwise;
and its effect on the resulting products of the hydration reactions.
For example: Silica fume, i.e., condensed silica is a by-product from the smelting process used to produce silicon metal and ferrosilicon alloys, is a material that first acts as filler and then has a puzzolanic reaction when mixed with Portland cement. It contributes to the progress of the cement hydration in the fresh concrete by providing nucleation sites for calcium hydroxide. This contribution is possible because of the fineness of the particles. The silica fume makes the paste more homogenous by decreasing pore sizes and filling up interparticle voids between cement particles and aggregates. Later, it reacts with the calcium hydroxide and forms calcium silicate hydrate (C-S-H), which is a puzzolanic reaction. The C-S-H has a larger volume, so it wi l l also contribute to the homogenisation and reduction of pore sizes in the cement paste.
4.3 The effect of partly substituting cement by mineral fillers
Keeping the w/c-ratio constant while substituting a volume portion of the cement in a "base mix" by an equal volume portion of filler means that the total water content of the granular mass is reduced. This may or may not cause the mix to appear drier, as this would depend on the amount of cement being replaced and on the particle size of the filler replacing cement.
I f cement is replaced with coarser particles the total specific surface area will be reduced and there wil l also be a reduced number of contact points between the solids. The relative amount of admixtures wil l increase, i.e. amount of plasticizer per unit surface area.
Filler ofthe same size distribution as cement wil l not affect the specific surface area, although the particles may have different properties and demand more or less admixtures to give the same rheological values.
The effect of a filler material with a finer particle size distribution than cement should be that the voids between the cement grains are filled, i.e. the filler effect. The cement paste will be more dense and homogenous. I f more of the fine particles are added the result will be that the coarser particles are separated. The number of contact points between solid particles wil l increase as well as the total surface area.
The particle size of the cement substituting filler is of importance because it affects the amount of admixtures available per unit area of solids. This, in turn, has an influence on, for example, the dispersive effect of a superplasticizer, and therefore on workability. The number of contact points between particles influences on the rheology of the mix and is affected by the particle size of the filler. A finer filler will have more of a "filling in voids effect" than a coarser filler, provided that the effect of surface forces has been eliminated so as to avoid clustering of fines.
16
4.4 Interparticle forces
There are several kinds of forces that coexist in a cement suspension, this section describes some of them.
4.4.1 Brownian movement
The Brownian randomising force influences the spatial orientation and arrangement of particles. This force is strongly size dependent and has an influence on particles with a size below 1 pm.
4.4.2 Van der Waals forces
Molecularly based attractive forces exist between all solids. The energy of these, so called van der Waals forces, is in the order of 0.1 electron volt. These intermolecular forces, which become significant at molecular separation of about 1 nm or less, are much weaker than the forces associated with covalent chemical bonds or electrostatic interactions of charged particles. They are important, however, since they are responsible for many of the physical properties of solids and liquids. The viscosity, surface tension and diffusion of liquids are examples of physical properties that are a consequence of intermolecular forces (McGraw-Hill 1984, Rhodes 1999). When the van der Waals attraction between cement grains and the electrostatic attraction between unlike charges on the surface of particles are dominant, the net result is an attraction and the particles tend to flocculate. Although in the presence of polymeric or surfactant materials on the surface of cement grains, the net result may be a repulsion and the particles remain separate.
I f a filler material is introduced into the cement water suspension, it may influence the electrostatic forces, depending on its mineralogical nature and the particles surface charges. The addition of fine particles between the cement particles can thus affect the electrostatic attraction and the flocculated structure. I f the filler is partly soluble in alkaline water, they may also modify the electrolyte and thus influence the electrostatic forces even more.
4.4.3 Forces due to adsorbed liquid layers
A surface layer of adsorbed vapour will form on particles in the presence of condensable vapour. I f these particles are in contact, bonding forces result from the overlapping of the adsorbed layers. The strength of the bond is dependent on the area of contact and the tensile strength of the adsorbed layers. The thickness and strength of the layers increase with increasing partial pressure of the vapour in the surrounding atmosphere. There is a critical pressure at which the adsorbed layer bonding gives way to liquid bridge bonding.
17
4.4.4 Forces due to liquid bridges
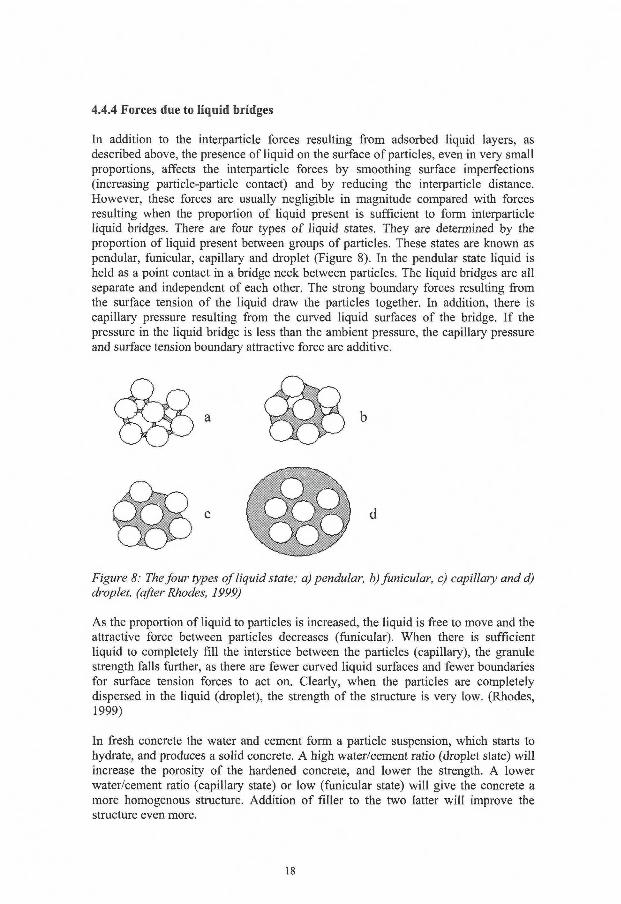
In addition to the interpartiele forces resulting from adsorbed liquid layers, as described above, the presence of liquid on the surface of particles, even in very small proportions, affects the interpartiele forces by smoothing surface imperfections (increasing particle-particle contact) and by reducing the interpartiele distance. However, these forces are usually negligible in magnitude compared with forces resulting when the proportion of liquid present is sufficient to form interpartiele liquid bridges. There are four types of liquid states. They are determined by the proportion of liquid present between groups of particles. These states are known as pendular, funicular, capillary and droplet (Figure 8). In the pendular state liquid is held as a point contact in a bridge neck between particles. The liquid bridges are all separate and independent of each other. The strong boundary forces resulting from the surface tension of the liquid draw the particles together. In addition, there is capillary pressure resulting from the curved liquid surfaces of the bridge. I f the pressure in the liquid bridge is less than the ambient pressure, the capillary pressure and surface tension boundary attractive force are additive.
Figure 8: The four types of liquid state; a) pendular, b) funicular, c) capillary and d) droplet, (after Rhodes, 1999)
As the proportion of liquid to particles is increased, the liquid is free to move and the attractive force between particles decreases (funicular). When there is sufficient liquid to completely f i l l the interstice between the particles (capillary), the granule strength falls further, as there are fewer curved liquid surfaces and fewer boundaries for surface tension forces to act on. Clearly, when the particles are completely dispersed in the liquid (droplet), the strength of the structure is very low. (Rhodes, 1999)
In fresh concrete the water and cement form a particle suspension, which starts to hydrate, and produces a solid concrete. A high water/cement ratio (droplet state) wil l increase the porosity of the hardened concrete, and lower the strength. A lower water/cement ratio (capillary state) or low (funicular state) wil l give the concrete a more homogenous structure. Addition of filler to the two latter will improve the structure even more.
b
d
18
4.4.5 Viscous forces
There are viscous forces that are proportional to the local velocity differences between a cement particle and the surrounding water, as well as between an aggregate and the surrounding cement paste. Cement paste falls into the range of dense suspensions, which means that particles have to move out of the way of each other, especially when agglomerates are formed. These forces affect the suspension in rest since the Brownian motion or electrostatic forces make particles move through the suspension. The same forces exist when the suspension is stirred.
4.5 Interfacial transition zone
The microstructure of the hydrated cement paste close to coarse aggregates differs from that of the bulk of the cement paste. The main reason for this is that the cement particles are unable to become closely packed against large aggregates. Therefore, there is less cement present to hydrate and fill the original voids. The consequence is that the interface zone has a much higher porosity than the hydrated cement paste further away from the coarse aggregate (Scrivener and Pratt 1996). The strength of the zone is lower than in the rest of the cement paste, since porosity influences the cement paste strength negatively.
The paste structure in the interfacial zone differs markedly from that of the bulk paste and constitutes the weakest part of concrete, both chemically and structurally. Location of the weakest part around the strongest part, namely the aggregate, limits transfer of stress to the aggregate and severely curbs its ability to strengthen the concrete.
The inhomogeneous structure of the paste develops initially in the plastic state, when excess water collects around the aggregate particles. This is thought to result from looser packing of cement particles at the interface, the so-called wall effect, and internal bleeding which favours porosity beneath aggregate particles. (Mehta, 1986)
Bleeding arises because the aggregates/particles in suspension in fresh concrete tend to settle, since they have a higher density than the fluid paste. In practice, bleed water is trapped at the undersides of the larger aggregate particles, and thus increases the local water/cement ratio.
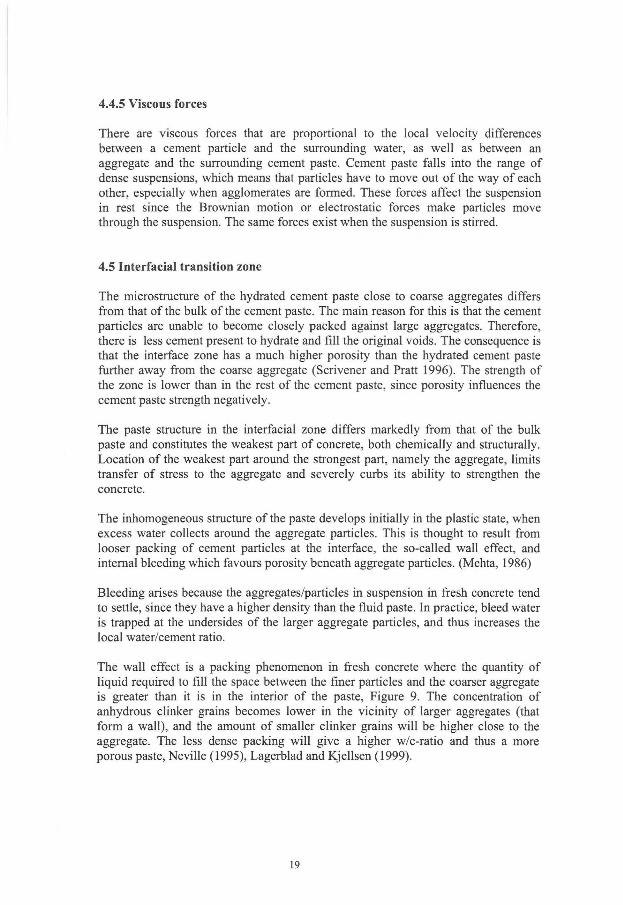
The wall effect is a packing phenomenon in fresh concrete where the quantity of liquid required to fill the space between the finer particles and the coarser aggregate is greater than it is in the interior of the paste, Figure 9. The concentration of anhydrous clinker grains becomes lower in the vicinity of larger aggregates (that form a wall), and the amount of smaller clinker grains will be higher close to the aggregate. The less dense packing wil l give a higher w/c-ratio and thus a more porous paste, Neville (1995), Lagerblad and Kjellsen (1999).
19
Cement/filler
Figure 9: The wall effect. The enlargement shows the coarser cement particles in suspension of water andfine filler particles.
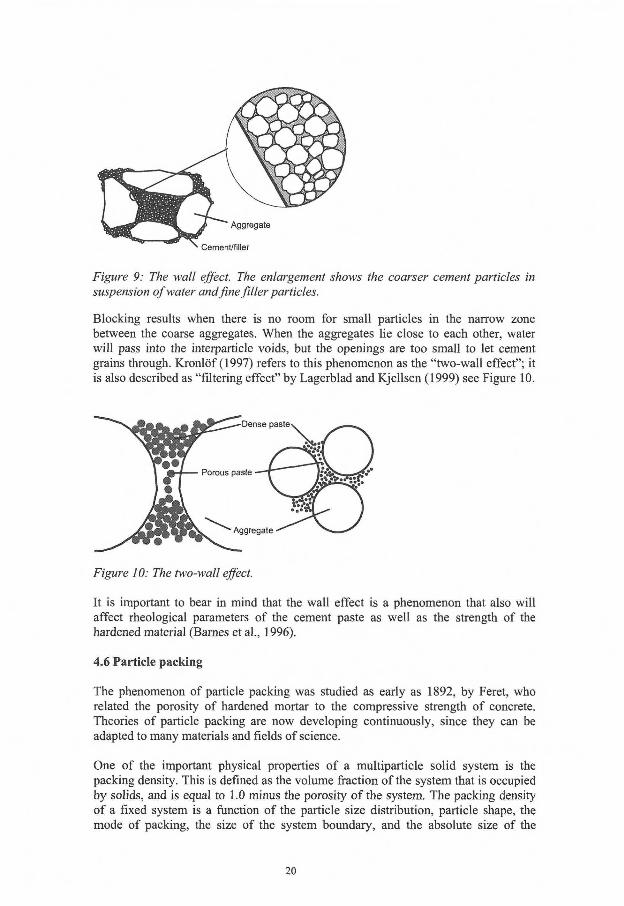
Blocking results when there is no room for small particles in the narrow zone between the coarse aggregates. When the aggregates lie close to each other, water will pass into the interpartiele voids, but the openings are too small to let cement grains through. Kronlöf (1997) refers to this phenomenon as the "two-wall effect"; it is also described as "filtering effect" by Lagerblad and Kjellsen (1999) see Figure 10.
Figure 10: The two-wall effect.
It is important to bear in mind that the wall effect is a phenomenon that also will affect rheological parameters of the cement paste as well as the strength of the hardened material (Barnes et al., 1996).
4.6 Particle packing
The phenomenon of particle packing was studied as early as 1892, by Feret, who related the porosity of hardened mortar to the compressive strength of concrete. Theories of particle packing are now developing continuously, since they can be adapted to many materials and fields of science.
One of the important physical properties of a multiparticle solid system is the packing density. This is defined as the volume fraction of the system that is occupied by solids, and is equal to 1.0 minus the porosity of the system. The packing density of a fixed system is a function of the particle size distribution, particle shape, the mode of packing, the size of the system boundary, and the absolute size of the
20
particles and the interpartiele fluid. The more angular, oblong and rougher the particles are, the lower the packing density wil l be.
Packing of mono-sized spherical particles is the basis of all later work. The packing patterns can be characterised by the voidage (void ratio is defined as the ratio of the volume of the voids to the volume of the particles), or by the packing symmetry and co-ordination number, i.e., points of contact per sphere. The packing density wil l vary between 0.52 for cubic packing and 0.74 for rhombohedral, with orthorombic and thetragonal-sphenoidal packing occurring in between these two values (Cumberland and Crawford, 1987).
Binary packing of spherical particles, with various size ratios, shows that the volume fraction of the solids increases from about 0.63 for packing of each of the individual fractions to 0.70 for a mixture of larger and finer particles with a size ratio of only 3.5:1, and to 0.84 for a larger size ratio of 16:1. The practical densities are lower than the theoretical densities, since each component disturbs the order of the other. The extent of this disturbance depends on the size ratio of the particles. The disturbance is slight at the size ratios exceeding 7:1, which is close to the critical diameter ratio of 6.5 at which the smaller spheres wil l just pass through the triangular pore formed by three closely-packed larger spheres. The densest packing in binary mixes is obtained with a high size ratio between large and small particles. (McGeary, 1961)
Packing density is greater when more particle fractions are mixed together. McGeary made a quartenary mixture of spheres with size ratios 1:7:38:316 and volume composition 6, 10, 23, and 61 percent, with a fraction solids content of 0.951. The theoretical value is 0.975. This result implies that by the addition of more particle fractions it should be possible to obtain higher packing densities.
The packing density of spherical particles can be estimated by a number of models described in the literature reviews of particle packing models and concrete properties. Among others, for example the ones that have been made by Johansen and Andersen (1989), and Larsen (1991).
The first basic research on particle packing was started by Fumas in 1931. His theory was that the best (ideal) packing of spherical particles is obtained i f the fine particles fill the voids between the larger ones without expanding the total volume. According to Powers (1968), the production of satisfactory concrete nevertheless requires aggregates with a low content of voids, even i f they are not the lowest possible, and this requires the proper combination of sizes within the allowable size range. Powers' work resulted in empirical analytical relationships for the estimation of the void ratio of concrete aggregates.
It is theoretically possible to achieve almost 100 percent dense packing, by filling voids between larger particles (stones) with successive finer particles - especially i f consideration to their geometry is taken. This maximum density theory results in the so-called Fuller-grading curve. In practice this is impossible to obtain due to wall effects, i.e. particles are packed more loosely in the vicinity of a surface than in the bulk. However, when several materials with different particle fractions are combined the voids-content decreases. In concrete, however, one cannot have the densest
21
particle packing, as the concrete wi l l become too rigid to be of practical use. Thus, a modified approach must be taken that takes into account the mobility of the particles.
The latest research investigates packing of particles with different size distributions. Among others; Stovall et al presented a Linear Packing Density Model for compact systems comprising particles of different sizes and shapes in 1986. The model includes the loosening effect, i.e., smaller particles "loosen" the packing of the larger ones, and the wall effect. The small particles wil l also reduce the friction between the larger aggregates. The packing density of each size class is given as a monosized packing density. The basis of the model is that, in a compact system, at least one size class is fully packed, i.e., at least one size class occupies the maximum volume permitted by the presence of other size classes in the mix. Self-compacting concrete follows the same concept; fluidity is maintained by keeping the aggregates apart with a fluid mass of smaller particles, which are in turn separated by even smaller particles, and so on. To keep the water/cement-ratio (w/c-ratio) low and still maintain a proper homogenisation of the cement and filler, the use of superplasticizer is imperative.
4.7 Rheology of cement based products
Fresh cement paste and concrete are materials that can be seen as suspensions of particles in a viscous liquid. The paste or concrete can be elastic, plastic or viscous or something in-between depending on composition and stress.
The flow behaviour of fresh paste influences the workability of both mortars and concretes. Cement suspensions show a very complex rheological behaviour. They have yield stress, they show shear-thinning and sometimes shear-thickening behaviour, and they have time dependent rheological properties, for instance, thixotropy and rheopexyv. Test conditions can complicate the measurements and sometimes lead to false conclusions. Segregation phenomena, a sliding process at the walls of the rheometer, or the occurrence of a plug in the gap may all influence the results obtained (Barnes et al., 1996).
Yield stress increases with increasing specific surface area at constant solids concentration and it increases with increasing solids concentration at constant specific surface. The plastic viscosity show similar behaviour (vom Berg, 1979).
It is known that the rheology changes when: • The w/c ratio changes, • The amount or type of chemical admixtures are changed, • When the amount or type of filler material in a mixture changes, • The cement type changes, • One type of aggregate is replaced with another,
v Shear-thinning - the reduction of viscosity with increasing rate of shear in a steady shear flow, shear-thickening - the increase of viscosity with increasing rate of shear in a steady shear flow, Thixotropy - a decrease of the apparent viscosity under constant shear stress or shear rate, followed by a gradual recovery when the stress or shear rate is removed - the effect it time-dependent, Rheopexy -the synonym of anti-thixotropy, an increase of the apparent viscosity under constant shear stress/rate followed by a gradual recovery when the stress or shear rate is removed, the effect is time-dependent.
22
• Natural aggregates, stone and sand, are replaced with a crushed material, I.e., when the properties of one of the constituent change, the properties of the concrete changes.
A main factor affecting the water retention ability, and thus rheological properties, is the packing ability of the particles. This property is in tum affected by particle size, size distribution particle shape, shape distribution, and colloidal/electrostatic forces
For small particles, roughly below 10 microns, both repulsive and attractive electrostatic forces are large in comparison to gravitational effects.
4.7.1 Water requirement and specific surface area vs. filling of voids
Because specific surface area gives a misleading picture of the workability of concrete, Murdock (1960) suggested an empirical surface index, which can be described as a weighted average size with an added constant, proposing that the water requirement to obtain a certain workability is proportional to the relative surface area only down to and including particle size fraction 2.4 - 4.76 mm. Below this particle size, the water requirement is less than the proportional increase in surface area. The effects of the surface area becomes less important with decreasing particle size due to other effects becoming more dominant. For particles < 150 pm the increase in water requirement is negligible. In literature on concrete and within the concrete industry, it is frequently stated that the water requirement of a granular substance to obtain a certain workability is primarily dependent on the specific surface area of the solids. The reasoning is that more water is required to cover the larger surface area. The statement does not lead to false conclusions for ordinary, fresh concrete without surface active agents, where a finer cement actually does require more water, although not due to the size of the areas to be covered with water - but due to the fact that the internal resistance (cohesion) has a greater effect on a fine particle system than on a coarse system (Bache, 1981).
Powers (1968) has calculated the amount of water required to moisten the surface of particles on the basis of a presumed thickness of the water film (18 Å) covering the surface. This amount of water proved to be extremely small compared to the amount of water needed to fill the voids between the particles of the mass.
Clearly, the specific surface area of concrete aggregate is largely determined by the amount of finer particles in the mass. Even though particles < 125 pm normally only are present in minor amounts, their influence on the total specific surface area of the aggregate is significant.
Bache (1973) asserts that, particularly in connection with superplastisized particle systems, it is meaningless to claim that the water requirement becomes greater with increasing specific surface area. On the contrary, dispersed silica particles for instance, reduce the volume of void space available for water by filling in the voids between cement grains. Thereby, more water becomes available for lubrication between coarser particles.
23
4.7.2 Rheology of particle suspensions
With reference to the general behaviour of aqueous dispersions of mineral particles, the rheological characteristics of cement pastes are related to the nature of attractive and repulsive forces, which exist between cement and cement hydration product particles. These are categorised in section 4.4.
In concentrated dispersions of solid in liquid, like cement systems, the proximity of particles gives rise to strong interactions, the strength of which depend on the shape of the particles, their size distribution, their concentration, their surface properties and the composition of the liquid. Commonly there is a net attraction which causes flocculation - the consequence of randomly moving particles coming together and sticking. The size and architecture of the floes play a major role in the rheology of the dispersion, with vigorous shearing reducing the floes to the primary particles accompanied by a reduced resistance to flow, often followed by reflocculation and thickening when the dispersion comes to rest, structural breakdown and build-up. (Banfill, 2003, Tattersall and Banfi.il, 1983)
Factors influencing the rheology of particle suspensions are primarily of a physical nature. The flow behaviour of a suspension depends primarily on the concentration of particles (volume of particles vs. total suspension volume), particle size distribution (packing properties and particle fineness) and the particles geometrical shape, as well as the extent to which the particles are flocculated. The best description of relationships between particle concentration and suspension viscosity in cement paste is the Krieger-Dougherty equation (Eq. 3) (Struble and Sun, 1995).
I L Tic
. vfok, i - A (3)
where q is the suspension viscosity, q c is the apparent viscosity of the continuous phase (liquid phase or suspending media viscosity), <j) is the concentration of solids by volume (solid volume fraction), <|>m is maximum solids concentration by volume (maximum volume fraction), and [q] is the intrinsic viscosity of the suspension.
According to equation 3, suspension viscosity depends on the suspending media viscosity q c , the volume fraction of particles <j)m and finally, particle shape as expressed by the intrinsic viscosity [q]. Intrinsic viscosity is a measure of the effect of individual particles on viscosity. Maximum volume fraction, <|>m, depends on particle size distribution and particle shape. For monosized spherical particles, values of (|>m often fall between 0.60 and 0.70 (Struble and Sun, 1995). (j)m is approximately 0.64 for random close packing and roughly 0.71 for the closest possible arrangement of spheres, i.e., face-centred cubic packing or hexagonal close packing (Hiemenz and Rajagopalan, 1997) When the particle shape deviates from the spherical, (])m wil l decrease, Barnes et al. (1996) found that it can be as low as 0.23 (glass fibres).
It is understood from eq. 3 that the suspension viscosity increases as solid volume fraction increases. When the solid volume fraction increases towards the maximum solid volume fraction the viscosity tends to infinity. At the maximum packing fraction, (|)m, a constant contact between particles makes flow impossible. A material
24
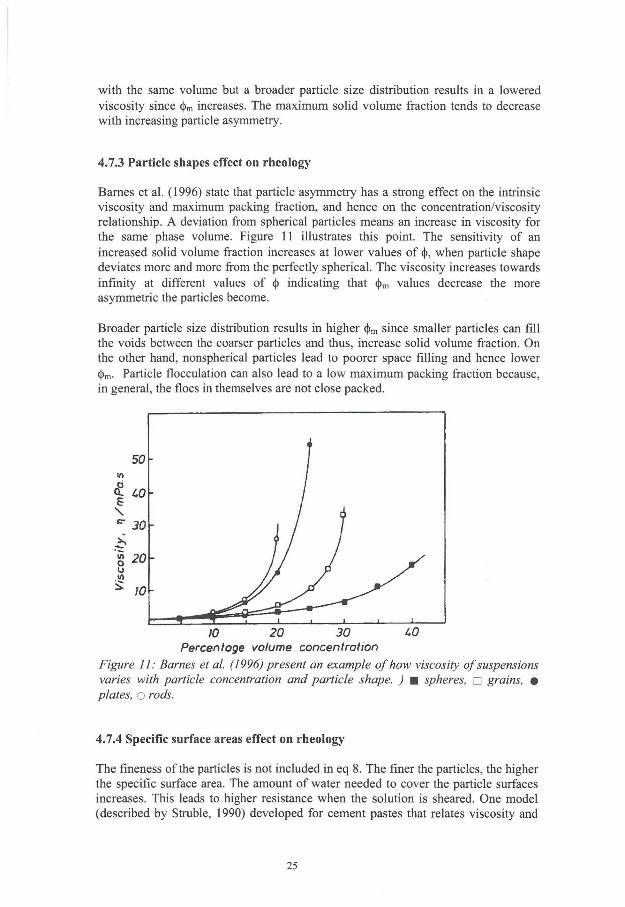
with the same volume but a broader particle size distribution results in a lowered viscosity since <|>m increases. The maximum solid volume fraction tends to decrease with increasing particle asymmetry.
4.7.3 Particle shapes effect on rheology
Barnes et al. (1996) state that particle asymmetry has a strong effect on the intrinsic viscosity and maximum packing fraction, and hence on the concentration/viscosity relationship. A deviation from spherical particles means an increase in viscosity for the same phase volume. Figure 11 illustrates this point. The sensitivity of an increased solid volume fraction increases at lower values of (j), when particle shape deviates more and more from the perfectly spherical. The viscosity increases towards infinity at different values of <j) indicating that <j)m values decrease the more asymmetric the particles become.
Broader particle size distribution results in higher § m since smaller particles can fdl the voids between the coarser particles and thus, increase solid volume fraction. On the other hand, nonspherical particles lead to poorer space filling and hence lower <))m. Particle flocculation can also lead to a low maximum packing fraction because, in general, the floes in themselves are not close packed.
/0 20 30 CO Percentage volume concentration
Figure 11: Barnes et al. (1996) present an example of how viscosity of suspensions varies with particle concentration and particle shape. ) • spheres, • grains, • plates, O rods.
4.7'.4 Specific surface areas effect on rheology
The fineness of the particles is not included in eq 8. The finer the particles, the higher the specific surface area. The amount of water needed to cover the particle surfaces increases. This leads to higher resistance when the solution is sheared. One model (described by Struble, 1990) developed for cement pastes that relates viscosity and
25
particle packing is based on the film thickness of water separating adjacent particles in the paste. The film thickness may be approximated using the hydraulic radius, the volume of water divided by the specific surface area of cement. The model predicts an inverse relationship between viscosity and the water film thickness. Thus, the viscosity increases as the particle system becomes finer. It should be noted that the film thickness is not consistent with the Krieger-Dougherty relationship. In the Krieger-Dougherty relationship there is an effect of particle size distribution, but not of particle size, so suspensions of monosized particles wil l have the same <|)m and the same viscosity even i f their particle sizes are different. The water film thickness model gives that suspensions of monosized particles will have different water film thicknesses and therefore different viscosities i f their particle sizes are different.
4.7.5 Yield stress and viscosity
Viscosity and yield stress are properties/variables needed to describe the rheology of particle suspensions such as cement paste, mortar or concrete. The yield stress can in a simplified way be described as follows: Cement grains spontaneously flocculate when mixed with water. As their concentration increases this flocculated particle system forms a continuous three-dimensional network. Below the yield stress level, the suspension behaves elastically. To break the network and enable flow the stress must rise about this level. In conventional concrete this is why vibration is needed to make the concrete flow into all comers of the formwork. A way of reducing the yield stress is to add a dispersing agent or a superplasticizer, breaking up the flocks, releasing the network. The weaker the flocculated particle network, the less superplasticizer is needed to lower the yield stress (or reduce it to near zero).
The Bingham model (Figure 12) is used to describe flow behaviour of fine mortars. The equation (Eq. 4) states that when material shear stress exceeds the materials yield stress the material starts to flow. The relationship between the shear rate and the shear stress is thereafter linear and the slope defines the plastic viscosity. The plastic viscosity is a material property that provides a measure of the resistance to changes in the shape or arrangements of its constituents.
The Bingham equation:
T = T 0 + q y (4)
where t is shear stress, x 0is yield stress, q is viscosity andy is shear rate.
26
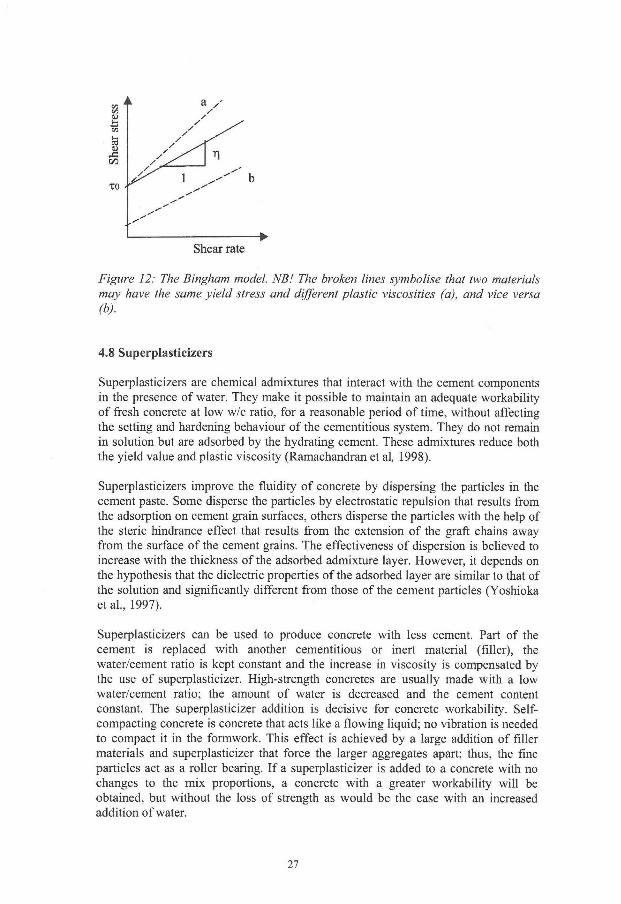
I • Shear rate
Figure 12: The Bingham model. NB! The broken lines symbolise that two materials may have the same yield stress and different plastic viscosities (a), and vice versa (b).
4.8 Superplasticizers
Superplasticizers are chemical admixtures that interact with the cement components in the presence of water. They make it possible to maintain an adequate workability of fresh concrete at low w/c ratio, for a reasonable period of time, without affecting the setting and hardening behaviour of the cementitious system. They do not remain in solution but are adsorbed by the hydrating cement. These admixtures reduce both the yield value and plastic viscosity (Ramachandran et al, 1998).
Superplasticizers improve the fluidity of concrete by dispersing the particles in the cement paste. Some disperse the particles by electrostatic repulsion that results from the adsorption on cement grain surfaces, others disperse the particles with the help of the steric hindrance effect that results from the extension of the graft chains away from the surface of the cement grains. The effectiveness of dispersion is believed to increase with the thickness of the adsorbed admixture layer. However, it depends on the hypothesis that the dielectric properties of the adsorbed layer are similar to that of the solution and significantly different from those of the cement particles (Yoshioka etal., 1997).
Superplasticizers can be used to produce concrete with less cement. Part of the cement is replaced with another cementitious or inert material (filler), the water/cement ratio is kept constant and the increase in viscosity is compensated by the use of superplasticizer. High-strength concretes are usually made with a low water/cement ratio; the amount of water is decreased and the cement content constant. The superplasticizer addition is decisive for concrete workability. Self-compacting concrete is concrete that acts like a flowing liquid; no vibration is needed to compact it in the formwork. This effect is achieved by a large addition of filler materials and superplasticizer that force the larger aggregates apart; thus, the fine particles act as a roller bearing. I f a superplasticizer is added to a concrete with no changes to the mix proportions, a concrete with a greater workability will be obtained, but without the loss of strength as would be the case with an increased addition of water.
27
First-generation superplasticizers are primarily anionic materials. They create negative charges on the cement particles, causing them to repel each other, thereby reducing surface friction. They have little or no effect on the hydration products, but they function as strong retarders on the hydration process. Second-generation superplasticizers are more adsorbed on the cement particles, they are derivative of melamine or naphthalene. This action not only produces plasticity in the cement paste, while allowing a low water/cement ratio, but also controls the hydration process and enables them to be used at a lower concrete temperatures than the first-generation materials. Third-generation superplasticizers have steric effects, because of their long-molecular chains with side chains. They are less adsorbed onto the cement particles, but the effects they produce are due more to a steric-hindrance mechanism than to electrostatic repulsion. They can maintain initial setting characteristics similar to normal concrete while producing a highly plastic mix at an extremely low water/cement ratio (Rixiom and Mailvaganam 1999).
Zhang et al. (2001) write that in cement paste, molecules of the superplasticizer may occur in four possible states, namely as:
• free molecule/ion • adsorbed molecule/ion • micelle in solution • adsorbed micelle
Flatt and Houst (2001) proposed that there are three categories of interaction behaviour needed to describe the interaction and state of the superplasticizers with the cement suspension.
The first part of the superplasticizer is consumed by intercalation, coprecipitation or micellisationv within the hydrating cement minerals, forming an organo-mineral phase. These chemical reactions during the formation of ettringite and calcium silicate hydrate, mean that the admixture is no longer available for dispersing floes and are most important in the first minutes after addition, when the precipitation rate of ettringite is highest, governed by the availability of sulphate. As a consequence, at the same addition level, a cement with a high degree of admixture consumption wil l have less favourable rheology than an otherwise identical cement but with a lower degree of consumption. Delayed addition can reduce this consumption, especially for long chain polyelectrolyte polymers, which are trapped in the organo-mineral phase, but has less effect on polymers with side chains extending through the surface hydration layers into the solution.
The second part is available for adsorption at the surface of cement particles and is effective in dispersing the floes, but the adsorbed amount is not easily measured since analytical methods are based on the amount removed from the solution and this can not distinguish between admixture consumed in the first part (above) and adsorbed on the surfaces.
v Intercalation - incorporation of molecules of one substance into the crystal lattice of another as it precipitates from solution. Coprecipitation - precipitation of one substance from solution, encouraged by the tiny solid nuclei that form during precipitation of another, both substances precipitate together. Micellisation - Polymer molecules with hydrophobic and hydrophilic parts group together in aqueous solution such that the hydrophobic parts associate to form regions from which water is excluded.
28
The third part consists of the superplasticizer that remains dissolved in the aqueous phase once enough polymers have been added to satisfy the polymer consumption, and thus plays a part in the dispersing the cement particles.
4.9 Surface charge of particles - zeta-potential
One particle surface property that influences suspension rheology is the surface potential. Furthermore, particle surface chemistry indirectly influences the rheology, in that the surfaces attract surface-active agents such as superplasticizers differently.
Surface charge can originate from dissociation of surface groups, specific adsorption of ions or ionic polymers. The distribution of ionic species as a function of distance from a charged surface is calculated by assuming that the suspension is at equilibrium. This means that for each species, the electrochemical potential will be the same, whatever its distance from the charged surface. Hydrating cement suspensions are not at full chemical equilibrium and the ionic composition evolves with time. However, locally an equilibrium condition can be reached in which ions have the same chemical potential in the bulk as close to the reacting surfaces. Over time, the nature of the exposed surfaces changes, so that the potential changes, and that other ionic compositions will match this equilibrium requirement. These changes in the aqueous phase composition is linked with the hydration reaction (Flatt and Bowen, 2003).
Yoshioka et al. (2002) investigated pure clinker minerals and found that without superplasticizer addition the zeta-potentials of C3S and C2S were negative, -5 mV, and those of C3A and C3AF positive, from 5 to 10 mV. Due to these opposite potentials flocculation of particles may occur in the cement paste. After addition of superplasticizer, zeta-potential for C3S was approximately -10 mV, and -15 mV for the other clinker minerals. Larger amount of superplasticizers were adsorbed on C 3A and C 3AF particles.
Wu and Roy (1982) reported that blast furnace slag has a high negative zeta-potential, which results in better particle dispersion and higher paste fluidity compared to normal Portland cement. Zeta-potential measurements show that the slag particles have a significant negative charge, which is further enhanced by the adsorption of superplasticizer molecules. The slag cements have an increased negative charge compared to those of Portland cements, generating better dispersion without superplasticizer or with minimal amounts. This may be correlated to the observed increased workability obtained when using slag cements. The zeta-potential in the suspension decreases with time for both types of cement.
4.9.1 Zeta-potential in a particle-water system
The zeta-potential provides information about the surface charge of particles in suspension.
29
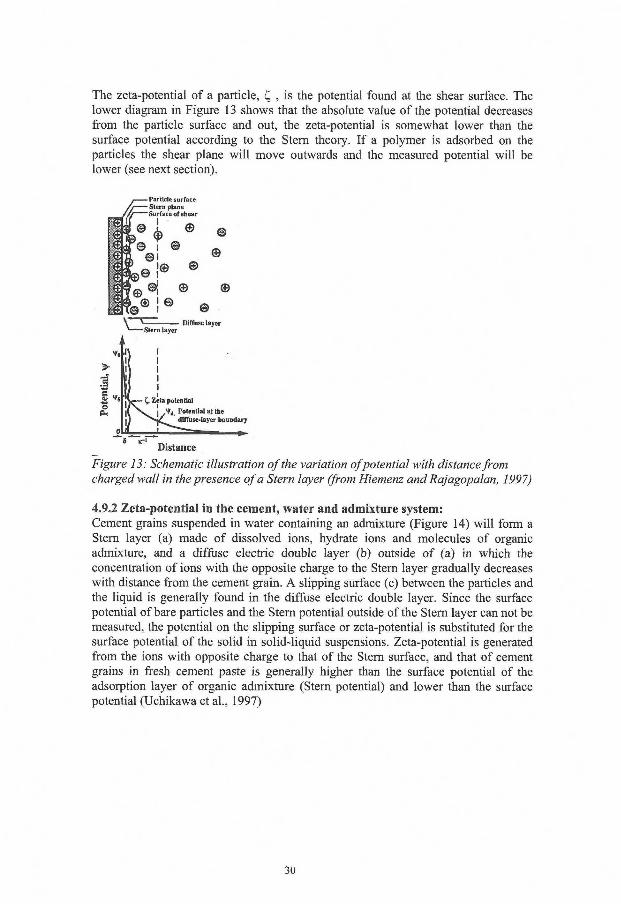
The zeta-potential of a particle, C, , is the potential found at the shear surface. The lower diagram in Figure 13 shows that the absolute value of the potential decreases from the particle surface and out, the zeta-potential is somewhat lower than the surface potential according to the Stem theory. I f a polymer is adsorbed on the particles the shear plane wil l move outwards and the measured potential will be lower (see next section).
Distance
Figure 13: Schematic illustration of the variation of potential with distance from charged wall in the presence of a Stern layer (from Hiemenz and Rajagopalan, 1997)
4.9.2 Zeta-potential in the cement, water and admixture system: Cement grains suspended in water containing an admixture (Figure 14) wil l form a Stern layer (a) made of dissolved ions, hydrate ions and molecules of organic admixture, and a diffuse electric double layer (b) outside of (a) in which the concentration of ions with the opposite charge to the Stern layer gradually decreases with distance from the cement grain. A slipping surface (c) between the particles and the liquid is generally found in the diffuse electric double layer. Since the surface potential of bare particles and the Stern potential outside of the Stern layer can not be measured, the potential on the slipping surface or zeta-potential is substituted for the surface potential of the solid in solid-liquid suspensions. Zeta-potential is generated from the ions with opposite charge to that of the Stem surface, and that of cement grains in fresh cement paste is generally higher than the surface potential of the adsorption layer of organic admixture (Stern potential) and lower than the surface potential (Uchikawa et al., 1997)
30
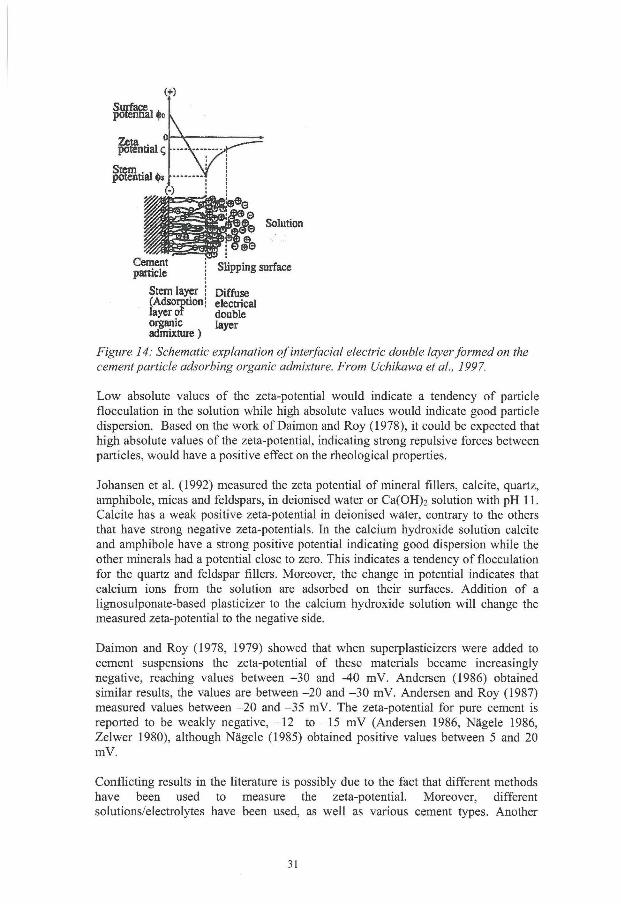
(f)
Stem layer • Diffuse (Adsorption; electrical layer of double organic layer admixture)
Figure 14: Schematic explanation of interfacial electric double layer formed on the cement particle adsorbing organic admixture. From Uchikawa et al, 1997.
Low absolute values of the zeta-potential would indicate a tendency of particle flocculation in the solution while high absolute values would indicate good particle dispersion. Based on the work of Daimon and Roy (1978), it could be expected that high absolute values of the zeta-potential, indicating strong repulsive forces between particles, would have a positive effect on the rheological properties.
Johansen et al. (1992) measured the zeta potential of mineral fillers, calcite, quartz, amphibole, micas and feldspars, in deionised water or Ca(OH)2 solution with pH 11. Calcite has a weak positive zeta-potential in deionised water, contrary to the others that have strong negative zeta-potentials. In the calcium hydroxide solution calcite and amphibole have a strong positive potential indicating good dispersion while the other minerals had a potential close to zero. This indicates a tendency of flocculation for the quartz and feldspar fillers. Moreover, the change in potential indicates that calcium ions from the solution are adsorbed on their surfaces. Addition of a lignosulponate-based plasticizer to the calcium hydroxide solution will change the measured zeta-potential to the negative side.
Daimon and Roy (1978, 1979) showed that when superplasticizers were added to cement suspensions the zeta-potential of these materials became increasingly negative, reaching values between -30 and -40 mV. Andersen (1986) obtained similar results, the values are between -20 and -30 mV. Andersen and Roy (1987) measured values between -20 and -35 mV. The zeta-potential for pure cement is reported to be weakly negative, -12 to -15 mV (Andersen 1986, Nägele 1986, Zelwer 1980), although Nägele (1985) obtained positive values between 5 and 20 mV.
Conflicting results in the literature is possibly due to the fact that different methods have been used to measure the zeta-potential. Moreover, different solutions/electrolytes have been used, as well as various cement types. Another
31
reason can be that the zeta-potential values have not been compensated for the background levels of ions, i.e. the background may not have been measured and deducted from the results.
4.10 Modification of by-products
There are many mineral processing techniques and metallurgical processes, but they all have one thing in common - they generate residual materials. Some of these materials can be used in other processes directly, others need to be crushed or ground before they can be used. Sometimes, the only possibility of making the by-products into raw material for further use in a process is to modify its chemical and/or physical properties.
The concept of modification comprises several physical and chemical methods, i.e., mineral processing and metallurgical processes. For example; different ways of cooling molten slags, changing the chemical composition of the slag, different ways of crushing or grinding the material with subsequent concentration of certain fractions with desired properties, flotation, gravimetric or electromagnetic separation of the desired fractions, etcetera.
A literature review about steel slag, different ways to utilise it, and different modification process can be found in Paper 5.
32
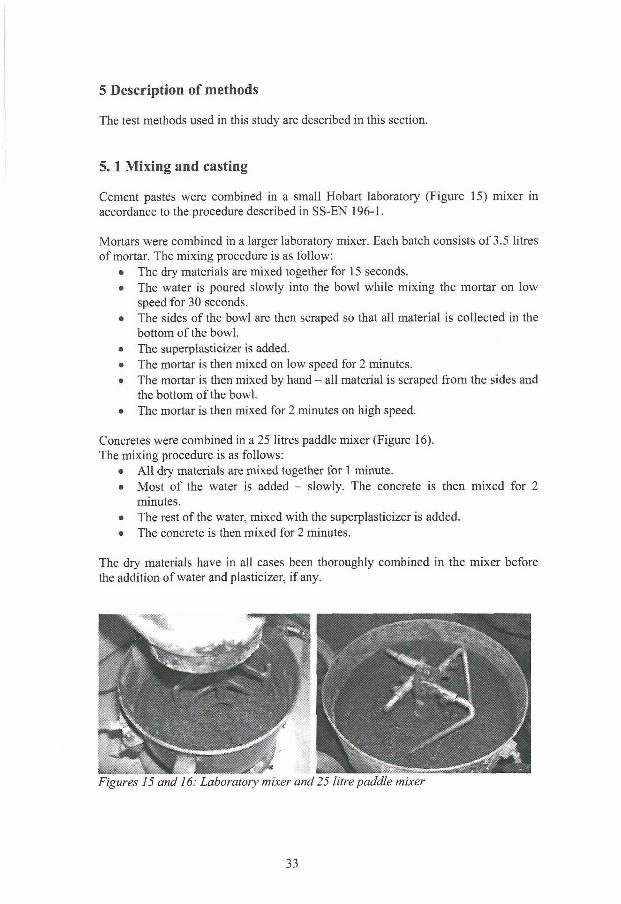
5 Description of methods
The test methods used in this study are described in this section.
5.1 Mixing and casting
Cement pastes were combined in a small Hobart laboratory (Figure 15) mixer in accordance to the procedure described in SS-EN 196-1.
Mortars were combined in a larger laboratory mixer. Each batch consists of 3.5 litres of mortar. The mixing procedure is as follow:
• The dry materials are mixed together for 15 seconds. • The water is poured slowly into the bowl while mixing the mortar on low
speed for 30 seconds. • The sides of the bowl are then scraped so that all material is collected in the
bottom of the bowl. • The superplasticizer is added. • The mortar is then mixed on low speed for 2 minutes. • The mortar is then mixed by hand - all material is scraped from the sides and
the bottom of the bowl. • The mortar is then mixed for 2 minutes on high speed.
Concretes were combined in a 25 litres paddle mixer (Figure 16). The mixing procedure is as follows:
• Al l dry materials are mixed together for 1 minute. • Most of the water is added - slowly. The concrete is then mixed for 2
minutes. • The rest of the water, mixed with the superplasticizer is added. • The concrete is then mixed for 2 minutes.
The dry materials have in all cases been thoroughly combined in the mixer before the addition of water and plasticizer, i f any.
Figures 15 and 16: Laboratory mixer and 25 litre paddle mixer
33
Prisms of cement paste or mortar was cast in 4x4x16 cm3 moulds. Cubes of mortar or concrete was cast in 10x10x10 cm3 or 15x15x15 cm 3 steel moulds.
Demoulding took place after 24 hours and the specimens were cured and stored in 100 percent RH (relative humidity) and 20 °C.
5.1.1 Sources of error
• The proper mixing procedure has to be followed, and the mixing time has to be the same for all samples to make comparison possible.
5.2 Measurement of air content in mortar
The air content in the fresh mortars was measured with the so-called pressure method, it is in accordance with SS-EN 12350-7. The method is based on the relation between the volume of air and the applied pressure (at a constant temperature) given by Boyle's law (Eq. 5).
Boyle's law (Gaskell, 1981) states that the pressure-volume relationship of a gas at constant temperature, T, is
The mix proportions or the properties of the material need not be known and when commercial air meters are used, no calculations are required as direct graduations in percentage of air is provided.
The pressure type air meter used in the experiments is shown in Figure 17a. A schematic picture is shown in Figure 17b (Neville, 1995). The procedure consists essentially of observing the decrease in the volume of a sample of compacted mortar or concrete, when subjected to a known pressure.
The measurement sequence is as follows: • The container is filled with mortar and the surface levelled to the rim. • The rim is wiped with a clean cloth and then the container is closed. • The water container is filled. • The pressure is increased with a hand pump. • The percent air in the mortar is then read.
5.2.1 Sources of error
• At high altitudes, the pressure meter must be re-calibrated. • The method is not suitable for use with porous aggregates or with lightweight
concrete.
34
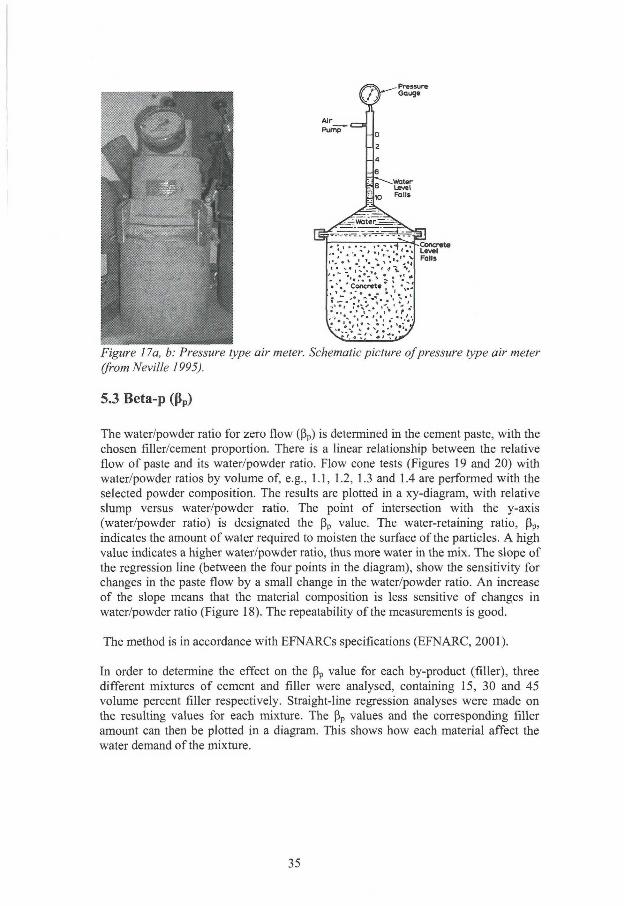
Figure 17a, b: Pressure type air meter. Schematic picture of pressure type air meter (from Neville 1995).
5.3 Beta-p (ßp)
The water/powder ratio for zero flow (ß p) is determined in the cement paste, with the chosen filler/cement proportion. There is a linear relationship between the relative flow of paste and its water/powder ratio. Flow cone tests (Figures 19 and 20) with water/powder ratios by volume of, e.g., 1.1, 1.2, 1.3 and 1.4 are performed with the selected powder composition. The results are plotted in a xy-diagram, with relative slump versus water/powder ratio. The point of intersection with the y-axis (water/powder ratio) is designated the ß p value. The water-retaining ratio, ß p , indicates the amount of water required to moisten the surface of the particles. A high value indicates a higher water/powder ratio, thus more water in the mix. The slope of the regression line (between the four points in the diagram), show the sensitivity for changes in the paste flow by a small change in the water/powder ratio. An increase of the slope means that the material composition is less sensitive of changes in water/powder ratio (Figure 18). The repeatability of the measurements is good.
The method is in accordance with EFNARCs specifications (EFNARC, 2001).
In order to determine the effect on the ß p value for each by-product (filler), three different mixtures of cement and filler were analysed, containing 15, 30 and 45 volume percent filler respectively. Straight-line regression analyses were made on the resulting values for each mixture. The ß p values and the corresponding filler amount can then be plotted in a diagram. This shows how each material affect the water demand of the mixture.
35
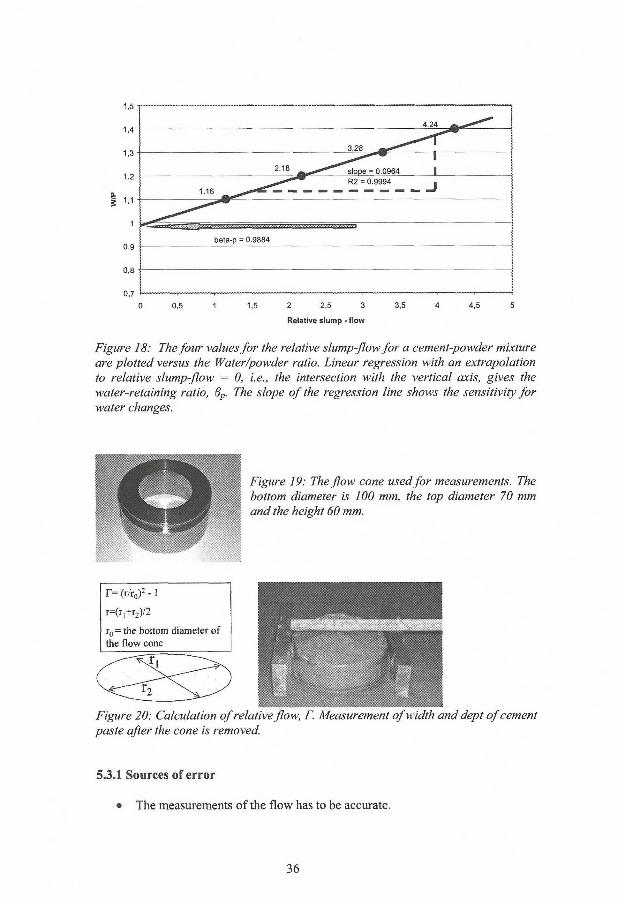
O 0,5 1 1,5 2 2,5 3 3,5 4 4,5 5
Relative slump - flow
Figure 18: The four values for the relative slump-flow for a cement-powder mixture are plotted versus the Water/powder ratio. Linear regression with an extrapolation to relative slump-flow = 0, i.e., the intersection with the vertical axis, gives the water-retaining ratio, 8P. The slope of the regression line shows the sensitivity for water changes.
Figure 19: The flow cone used for measurements. The bottom diameter is 100 mm, the top diameter 70 mm and the height 60 mm.
r = ( r / r „ ) 2 - l
r-(r : tr :)/2
r 0 = the bottom diameter of the flow cone
j
Figure 20: Calculation of relative flow, F. Measurement of width and dept of cement paste after the cone is removed.
5.3.1 Sources of error
• The measurements of the flow has to be accurate.
36
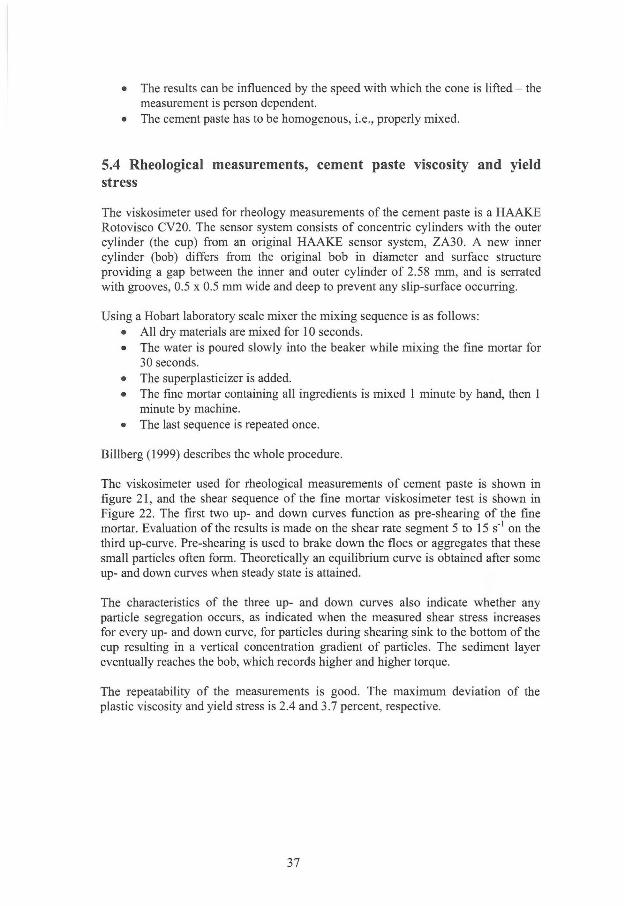
• The results can be influenced by the speed with which the cone is lifted - the measurement is person dependent.
• The cement paste has to be homogenous, i.e., properly mixed.
5.4 Rheological measurements, cement paste viscosity and yield stress
The viskosimeter used for rheology measurements of the cement paste is a HAAKE Rotovisco CV20. The sensor system consists of concentric cylinders with the outer cylinder (the cup) from an original HAAKE sensor system, ZA30. A new inner cylinder (bob) differs from the original bob in diameter and surface structure providing a gap between the inner and outer cylinder of 2.58 mm, and is serrated with grooves, 0.5 x 0.5 mm wide and deep to prevent any slip-surface occurring.
Using a Hobart laboratory scale mixer the mixing sequence is as follows: • All dry materials are mixed for 10 seconds. • The water is poured slowly into the beaker while mixing the fine mortar for
30 seconds. • The superplasticizer is added. • The fine mortar containing all ingredients is mixed 1 minute by hand, then 1
minute by machine. • The last sequence is repeated once.
Billberg (1999) describes the whole procedure.
The viskosimeter used for rheological measurements of cement paste is shown in figure 21, and the shear sequence of the fine mortar viskosimeter test is shown in Figure 22. The first two up- and down curves function as pre-shearing of the fine mortar. Evaluation of the results is made on the shear rate segment 5 to 15 s"1 on the third up-curve. Pre-shearing is used to brake down the floes or aggregates that these small particles often form. Theoretically an equilibrium curve is obtained after some up- and down curves when steady state is attained.
The characteristics of the three up- and down curves also indicate whether any particle segregation occurs, as indicated when the measured shear stress increases for every up- and down curve, for particles during shearing sink to the bottom of the cup resulting in a vertical concentration gradient of particles. The sediment layer eventually reaches the bob, which records higher and higher torque.
The repeatability of the measurements is good. The maximum deviation of the plastic viscosity and yield stress is 2.4 and 3.7 percent, respective.
37
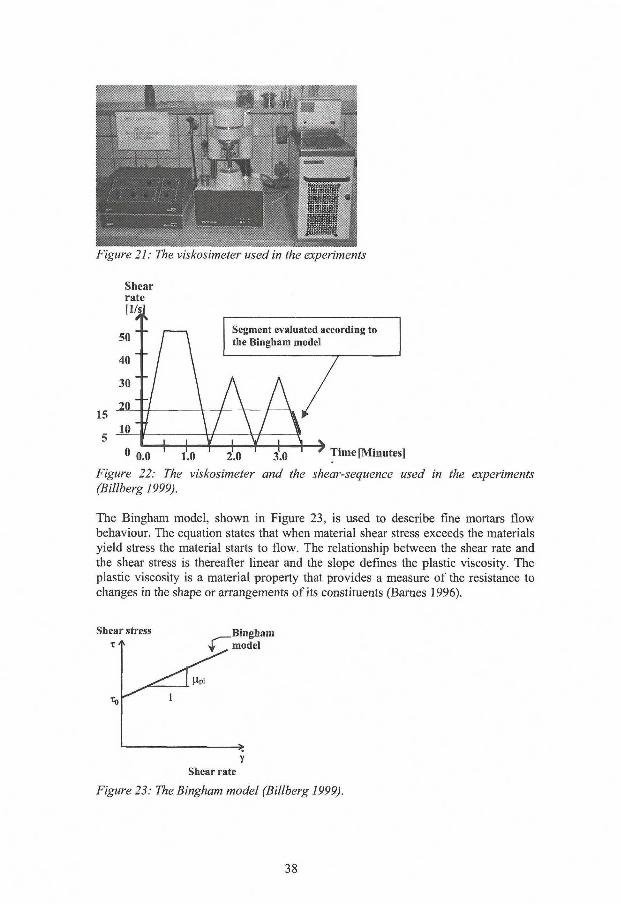
Figure 22: The viskosimeter and the shear-sequence used in the experiments (Billberg 1999).
The Bingham model, shown in Figure 23, is used to describe fine mortars flow behaviour. The equation states that when material shear stress exceeds the materials yield stress the material starts to flow. The relationship between the shear rate and the shear stress is thereafter linear and the slope defines the plastic viscosity. The plastic viscosity is a material property that provides a measure of the resistance to changes in the shape or arrangements of its constituents (Barnes 1996).
Shear stress Bingham ^ model
Upl
I > Y
Shear rate
Figure 23: The Bingham model (Billberg 1999).
38
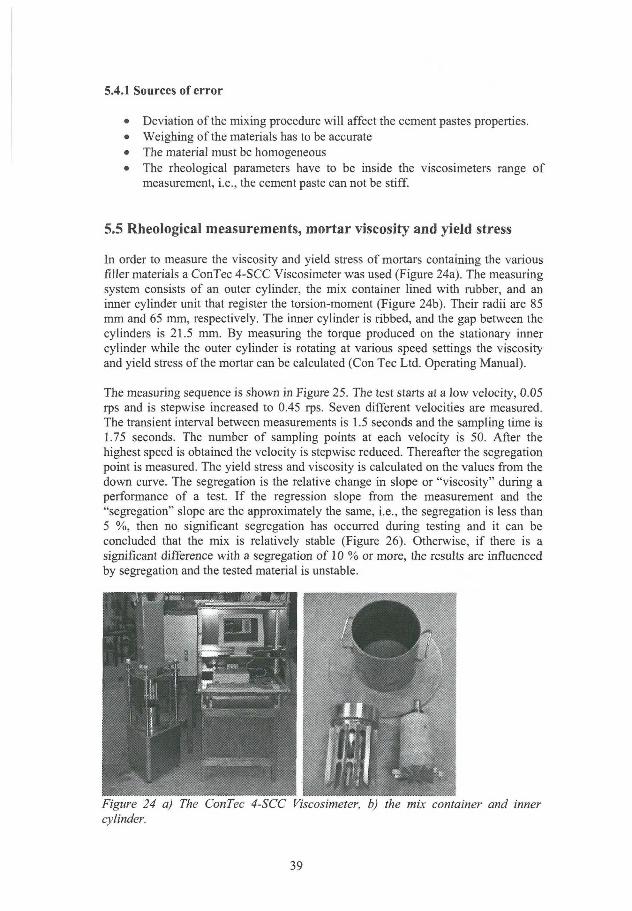
5.4.1 Sources of error
• Deviation of the mixing procedure will affect the cement pastes properties. • Weighing of the materials has to be accurate • The material must be homogeneous • The rheological parameters have to be inside the viscosimeters range of
measurement, i.e., the cement paste can not be stiff.
5.5 Rheological measurements, mortar viscosity and yield stress
In order to measure the viscosity and yield stress of mortars containing the various filler materials a ConTec 4-SCC Viscosimeter was used (Figure 24a). The measuring system consists of an outer cylinder, the mix container lined with rubber, and an inner cylinder unit that register the torsion-moment (Figure 24b). Their radii are 85 mm and 65 mm, respectively. The inner cylinder is ribbed, and the gap between the cylinders is 21.5 mm. By measuring the torque produced on the stationary inner cylinder while the outer cylinder is rotating at various speed settings the viscosity and yield stress of the mortar can be calculated (Con Tec Ltd. Operating Manual).
The measuring sequence is shown in Figure 25. The test starts at a low velocity, 0.05 rps and is stepwise increased to 0.45 rps. Seven different velocities are measured. The transient interval between measurements is 1.5 seconds and the sampling time is 1.75 seconds. The number of sampling points at each velocity is 50. After the highest speed is obtained the velocity is stepwise reduced. Thereafter the segregation point is measured. The yield stress and viscosity is calculated on the values from the down curve. The segregation is the relative change in slope or "viscosity" during a performance of a test. I f the regression slope from the measurement and the "segregation" slope are the approximately the same, i.e., the segregation is less than 5 %, then no significant segregation has occurred during testing and it can be concluded that the mix is relatively stable (Figure 26). Otherwise, i f there is a significant difference with a segregation of 10 % or more, the results are influenced by segregation and the tested material is unstable.
Figure 24 a) The ConTec 4-SCC Viscosimeter, b) the mix container and inner cylinder.
39
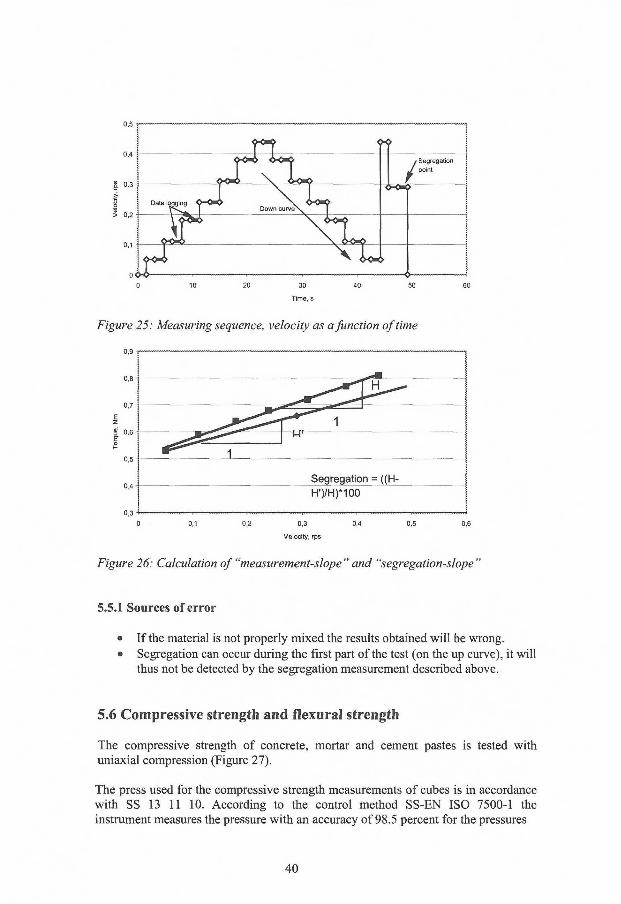
Figure 25: Measuring sequence, velocity as a function of time
•
^ ^ r * ^ 1
i — ^
; Segregation = ((H-
H')/H)*100
J , . , , , 0 0,1 0,2 0,3 0,4 0,5 0,6
Velocity, rps
Figure 26: Calculation of "measurement-slope" and "segregation-slope"
5.5.1 Sources of error
• I f the material is not properly mixed the results obtained wil l be wrong. • Segregation can occur during the first part of the test (on the up curve), it wil l
thus not be detected by the segregation measurement described above.
5.6 Compressive strength and flexural strength
The compressive strength of concrete, mortar and cement pastes is tested with uniaxial compression (Figure 27).
The press used for the compressive strength measurements of cubes is in accordance with SS 13 11 10. According to the control method SS-EN ISO 7500-1 the instrument measures the pressure with an accuracy of 98.5 percent for the pressures
40
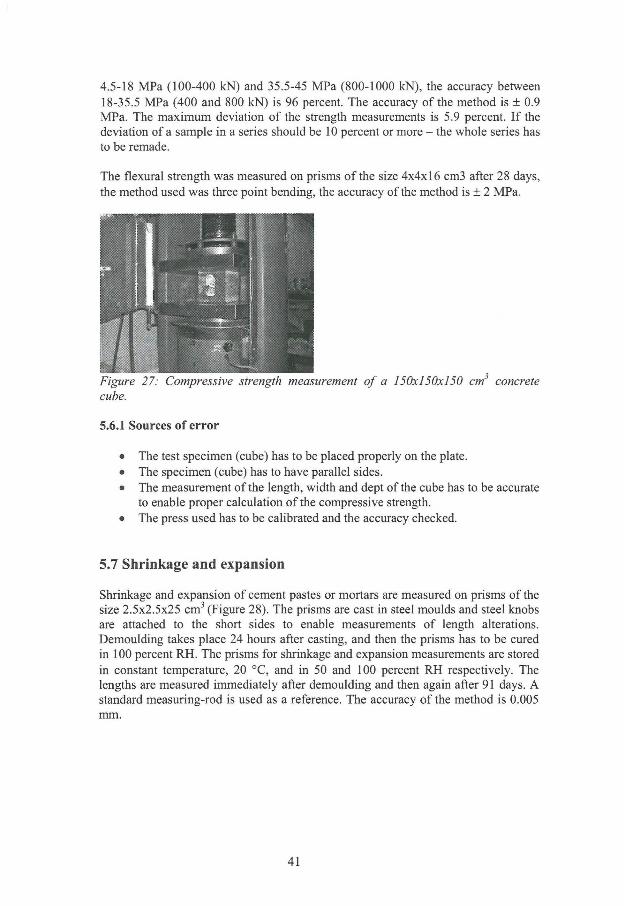
4.5-18 MPa (100-400 kN) and 35.5-45 MPa (800-1000 kN), the accuracy between 18-35.5 MPa (400 and 800 kN) is 96 percent. The accuracy ofthe method is + 0.9 MPa. The maximum deviation of the strength measurements is 5.9 percent. I f the deviation of a sample in a series should be 10 percent or more - the whole series has to be remade.
The flexural strength was measured on prisms of the size 4x4x16 cm3 after 28 days, the method used was three point bending, the accuracy of the method is + 2 MPa.
Figure 27: Compressive strength measurement of a 150x150x150 cm3 concrete cube.
5.6.1 Sources of error
• The test specimen (cube) has to be placed properly on the plate. • The specimen (cube) has to have parallel sides. • The measurement of the length, width and dept of the cube has to be accurate
to enable proper calculation of the compressive strength. • The press used has to be calibrated and the accuracy checked.
5.7 Shrinkage and expansion
Shrinkage and expansion of cement pastes or mortars are measured on prisms of the size 2.5x2.5x25 cm 3 (Figure 28). The prisms are cast in steel moulds and steel knobs are attached to the short sides to enable measurements of length alterations. Demoulding takes place 24 hours after casting, and then the prisms has to be cured in 100 percent RH. The prisms for shrinkage and expansion measurements are stored in constant temperature, 20 °C, and in 50 and 100 percent RH respectively. The lengths are measured immediately after demoulding and then again after 91 days. A standard measuring-rod is used as a reference. The accuracy of the method is 0.005 mm.
41
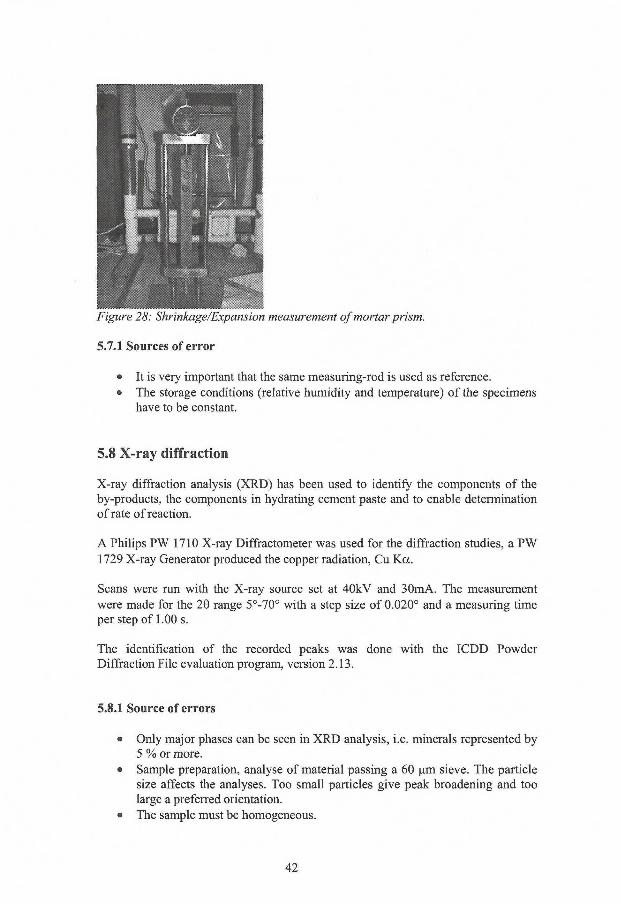
Figure 28: Shrinkage/Expansion measurement of mortar prism.
5.1 A Sources of error
• It is very important that the same measuring-rod is used as reference. • The storage conditions (relative humidity and temperature) of the specimens
have to be constant.
5.8 X-ray diffraction
X-ray diffraction analysis (XRD) has been used to identify the components of the by-products, the components in hydrating cement paste and to enable determination of rate of reaction.
A Philips PW 1710 X-ray Diffractometer was used for the diffraction studies, a PW 1729 X-ray Generator produced the copper radiation, Cu Ka.
Scans were run with the X-ray source set at 40kV and 30mA. The measurement were made for the 29 range 5°-70° with a step size of 0.020° and a measuring time per step of 1.00 s.
The identification of the recorded peaks was done with the ICDD Powder Diffraction File evaluation program, version 2.13.
5.8.1 Source of errors
• Only major phases can be seen in XRD analysis, i.e. minerals represented by 5 % or more.
• Sample preparation, analyse of material passing a 60 pm sieve. The particle size affects the analyses. Too small particles give peak broadening and too large a preferred orientation.
• The sample must be homogeneous.
42
5.9 Calorimetry
The experiments in this thesis have been conducted with an isothermal calorimeter in order to examine the heat development of cement pastes with or without admixtures. The heat produced in the sample of cement paste is measured as it is conducted away from the sample, i.e. the sample is kept at constant temperature. The instrument used for the experiments has an accuracy of ± 5 percent.
The measurement procedure is simple; the weighted cement and water is mixed and then a sample weighted into a disposable plastic beaker. The beaker is placed into the measurement chamber in the calorimeter, the chamber is then sealed and the measurement started. The time between measurements has been the same in all experiments, 600 s, the length of the analysis has varied depending on the chemical reactions of the sample, i.e., i f retardation of hydration reaction occurred. The output is the heat development rate.
5.9.1 Sources of errors
• The weighing has to be accurate since the heat developed is dependent on the amount of cement in the cement paste.
5.10 FTIR-spectroscopy
A Perkin Elmer System 2000 FT-IR was used for the analyses of cement pastes containing metal oxides. Diffuse reflectance technique was used, and the mean value of 100 scans calculated.
Diffuse reflectance means that the reflected light leaves the sample in any and all directions, i.e., the angle of incidence is fixed, but angles of reflection vary from 0 to 360 degrees. Diffusely reflected radiation is made up of light that is scattered, absorbed, transmitted, and reflected by the sample (Smith 1996).
When FTIR analyses are made all frequencies are measured simultaneously in an interferometer and a complete spectrum can be obtained very rapidly. The frequency scale of an interferometer is derived from a helium neon laser that acts as an internal reference for each scan.
The essential component of an interferometer is a system for splitting a beam of radiation into two and then recombining the two beams after introducing a path difference. This combined beam passes through the sample to the detector. Division of the beam is achieved with a beamsplitter that transmits about 50% and reflects about 50% of the radiation. One part of the beam goes to a fixed mirror and the other to a mirror that can be moved to introduce a varying path difference. When the beams are recombined an interference pattern is obtained as the path difference is varied. On recombination, interference between the two beams causes the energy reaching the detector to vary as the path difference changes. For a source with a
43
single optical frequency this interference variation (or interferogram) is sinusoidal, with maxima when the two beams are exactly in phase and minima when the two are 180 degrees out of phase. The spacing between the maxima corresponds to a change in path difference equal to the wavelength. For a broad band source, the interference pattern is the sum of the cosine waves for all the frequencies present. This interferogram consists of a strong signal at the point where path difference is zero, falling away rapidly on either side. The customary spectrum showing energy as a function of frequency, can be obtained from the interferogram by the mathematical process of Fourier Transformation. When no sample is present this gives a single beam spectrum, the overall shape of which is largely determined by the characteristics of the beamsplitter and source. Normally, interferometers operate by first recording this background and then rationing the sample spectrum against it.The most commonly used beamsplitter is a plate of KBr with a germanium coating (Perkin Elmer, 1992).
5.10.1 Sources of error:
• The sample and the KBr have to be thoroughly mixed. • Particle size affects the analysis. • Adsorption of atmospheric water and C02 during sample preparation. • Changes of atmospheric water and C02, in the room where the FTIR is
situated, during analyses will result in extraneous bands in the final ratioed spectrum.
5.11 Scanning electron microscopy
A Philips 515 Scanning electron microscopy (SEM) has been used to investigate the chemical content of by-products and cement pastes, to determinate the f-shape of particles, and to obtain pictures (micrographs) of the by-product particles surfaces.
5.11.1 EDS/SEM analysis
Chemical analyses were made using scanning electron microscope (SEM) equipped with energy dispersive spectrometer (EDS).
A l l results are presented as oxides of the analysed metals and normalised to 100 %.
5.11.2 Scanning electron micrographs
BSE image - backscattered electron image made with backscattered electron detector.
SE image - secondary electron image made with secondary electron detector.
44
5.11.3 Particle shape analysis
Calculation (Eq. 6) of "f-shape"
f-shape = Area / n * (LP / 2) 2 (6)
where LP is the particles longest projection.
Area - The particle area is evaluated by summing all the graphic pixels within the particle and using the pixel size in X and Y directions to convert the number of pixels to microns.
F-shapes have been obtained using "Particle Analysis"-soft ware ("Genesis" soft ware package) developed by ED AX Inc.
Shape analyses were made on BSE images in most cases. Where the major content of particles was light elements (carbon) and the atomic number contrast between the particle and sample holder (graphite) was not satisfactory, SE images were used for shape analysis.
5.11.4 Sample preparation for SEM analyses
4.11.4.1 Cut samples Samples of the particles were mixed with epoxy resin and the hardened test specimen polished. This wil l give cut surfaces of randomly oriented particles. The surface was thereafter covered with a thin carbon layer (Figure 29).
In order to see the dispersion of the filler material in cement paste, samples of cement/by-product pastes were cut and their top surfaces polished. The surface was thereafter covered with a thin carbon layer.
4.11.4.2 Whole particles Samples of the particles were dusted onto a carbon plate covered with glue, the sample was thereafter covered with a thin carbon layer.
^ ^ ^ ^ illlllllüi
Wr? -nita. : '
Figure 29: Specimens prepared for SEM analyses.
45
5.11.5 Sources of error
• Indistinct boundaries between particle and epoxy resin make it more difficult to properly analyse the particles.
• There may be shadowing effects from the three-dimensional particles since the electron beam is angled, i.e., not vertical to the plane of the carbon plate. This type of error may cause slightly lower f-shape values i f not corrected.
• I f the deagglomeration of the particles has failed, agglomerates wil l be interpreted as single particles.
• Dust may be interpreted as particles and has to be removed prior to image analysis.
5.12 Particle size analyses
The particle size distributions of the by-products have been determined with laser diffraction analysis at Cementa Research in Slite, Sweden. The instrument used is an CILAS granulometer Alcatel 850. The instrument uses the Mie theory to calculate the scattering matrix, the refractive indices of particulate and medium, or their ratio, are used in the calculations of the model matrix. The model assumes that the particles are spherical (ISO 13320-1:1999(E)), the largest cross-section of the particle defines the diameter of the sphere.
5.12.1 Sources of errors
• A measured particles size wil l appear larger than it really is since the largest cross-section is used to define the volume of particle.
• The proper refractive indices have to be used. • The material has to be properly deagglomerated.
5.13 Specific surface area analyses and density
The specific surface area analyses and the density of the by-products and cements have been performed at Cementa Research in Slite, Sweden. The BET-method (Braunauer et a. 1938) has been used for all surface analyses, and the density was determined with helium pycknometer.
5.13.1 Sources of errors
• The specific surface area, analysed with the BET-method, will be a measure of the total surface area of the particles. Pores and other surface irregularities will be part of the total area. It is important that the weighing of the samples are accurate and that the instrument is properly calibrated.
• The weighing is important for the density measurements.
46
5.14 ICP - Particle packing
The particle packing of the by-products, cement and standard sand (DIN 196-1) was determined on dry materials with an Intensive Compaction Tester at Cementa research in Slite, Sweden.
The IC-tester applies a static pressure to the sample before a shear action is initiated. This initial pressure is then maintained throughout the kneading process.
The sample is normally compressed between the top and bottom plates in the work cylinder. Due to the fine particulate nature of the fillers less material is needed for the test and a liner is inserted, and a circular plate with small holes in it is put on top to allow airflow out of the material. Filter papers are used at the top and bottom of the sample to avoid material loss. The top and bottom plates remain parallel to each other throughout the compaction process, while the angle between the work cylinder and the plates changes continuously during the circular work motion. This results in a kneading action under pressure. As this compaction proceeds, the distance between top and bottom plates will normally decrease. On the basis of this distance, and the amount of mass initially filled into the cylinder the apparatus computes the density of the sample throughout the compaction process.
The compaction is carried out according to the shear compaction principle - shear planes develop in the sample as a result of the kneading action. Due to this and the compression force applied, the particles relocate relative to each other into more favourable positions and the air is expelled, which leads to compaction and higher density.
The pressure setting has been 3.6 bar for all compaction runs and the number of kneading cycles 80. The initial volume of all samples was 0.4 litres.
5.14.1 Sources of error
• To obtain the right density the sample weight has to be accurate. I f the pressure is to high the result will be interpartiele crushing or deformation of the particles, and thus an increased density.
5.15. Z-potential measurements
The z-potential analysis of the by-products were performed at the Institute for Surface Chemistry, YKI in Stockholm, Sweden. The instrument used is ZetaProbe which is an electroacoustic instrument from Colloidal Dynamics Inc.
The zeta-potential, C\, is the voltage difference between the surface of a suspended particle and the surrounding electrolyte solution, see section 4.9.
In the ZetaProbe a very high frequency (MHz) electric field is applied to the suspension and this causes the (charged) particles to oscillate backwards and forwards at the same frequency as the field. I f the particles have a density different
47
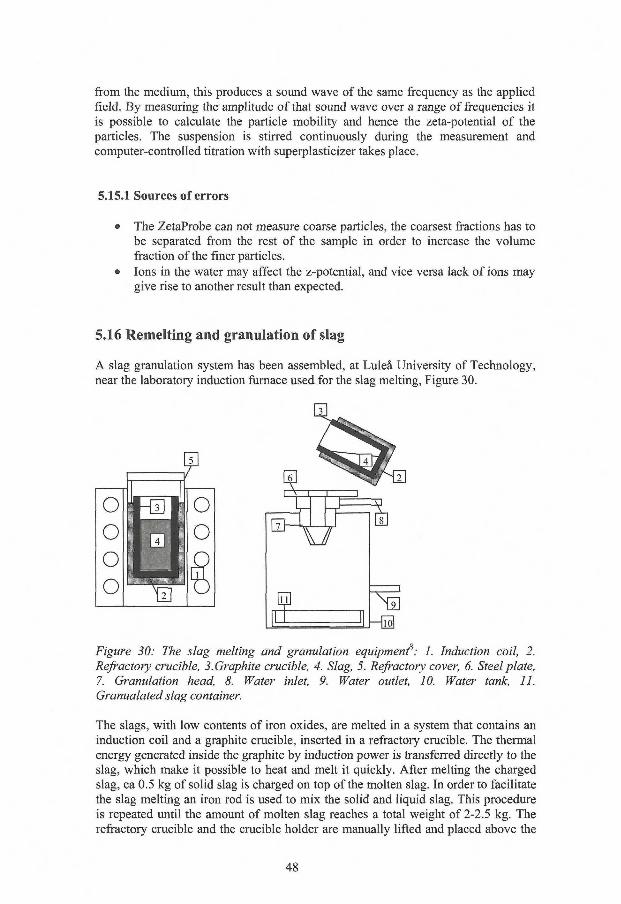
from the medium, this produces a sound wave of the same frequency as the applied field. By measuring the amplitude of that sound wave over a range of frequencies it is possible to calculate the particle mobility and hence the zeta-potential of the particles. The suspension is stirred continuously during the measurement and computer-controlled titration with superplasticizer takes place.
5.15.1 Sources of errors
• The ZetaProbe can not measure coarse particles, the coarsest fractions has to be separated from the rest of the sample in order to increase the volume fraction of the finer particles.
• Ions in the water may affect the z-potential, and vice versa lack of ions may give rise to another result than expected.
5.16 Remelting and granulation of slag
A slag granulation system has been assembled, at Luleå University of Technology, near the laboratory induction furnace used for the slag melting, Figure 30.
Figure 30: Tne slag melting and granulation equipment : 1. Induction coil, 2. Refractory crucible, 3. Graphite crucible, 4. Slag, 5. Refractory cover, 6. Steel plate, 7. Granulation head, 8. Water inlet, 9. Water outlet, 10. Water tank, 11. Granualated slag container.
The slags, with low contents of iron oxides, are melted in a system that contains an induction coil and a graphite crucible, inserted in a refractory crucible. The thermal energy generated inside the graphite by induction power is transferred directly to the slag, which make it possible to heat and melt it quickly. After melting the charged slag, ca 0.5 kg of solid slag is charged on top of the molten slag. In order to facilitate the slag melting an iron rod is used to mix the solid and liquid slag. This procedure is repeated until the amount of molten slag reaches a total weight of 2-2.5 kg. The refractory crucible and the crucible holder are manually lifted and placed above the
48
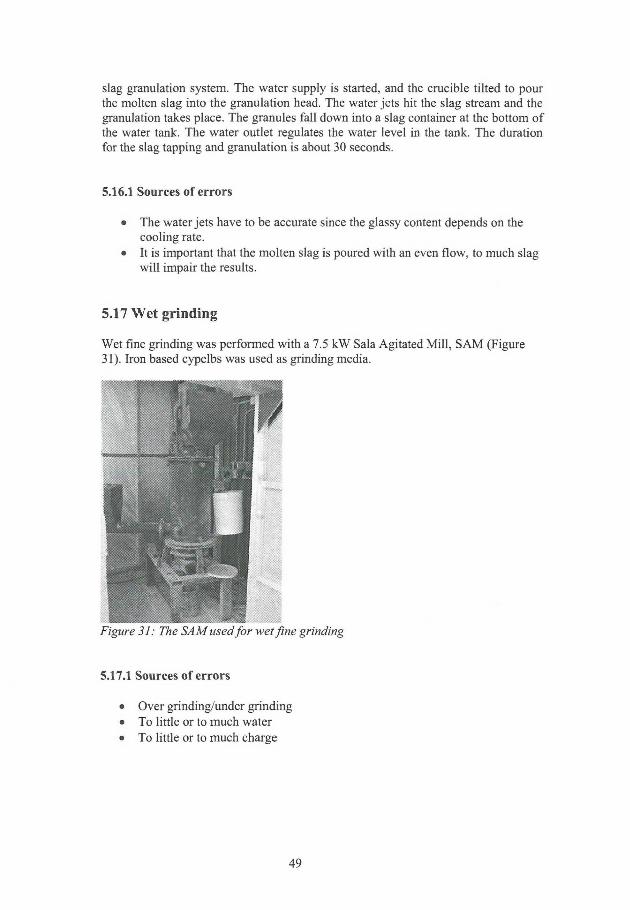
slag granulation system. The water supply is started, and the crucible tilted to pour the molten slag into the granulation head. The water jets hit the slag stream and the granulation takes place. The granules fall down into a slag container at the bottom of the water tank. The water outlet regulates the water level in the tank. The duration for the slag tapping and granulation is about 30 seconds.
5.16.1 Sources of errors
• The water jets have to be accurate since the glassy content depends on the cooling rate.
• It is important that the molten slag is poured with an even flow, to much slag wil l impair the results.
5.17 Wet grinding
Wet fine grinding was performed with a 7.5 kW Sala Agitated Mil l , SAM (Figure 31). Iron based cypelbs was used as grinding media.
Figure 31: The SAM used for wet fine grinding
5.17.1 Sources of errors
• Over grinding/under grinding • To little or to much water • To little or to much charge
49
5.18 Correlation analysis
Correlation analyses, of the experimental results, were performed with an optional software tool in Microsoft EXCEL that gives the correlation coefficient, r, from the Pearson product moment correlation (eq. 7). The coefficient r is a value between -1.0 and 1.0 that corresponds to the linear relationship between two sets of data. X and Y are the variables and n the number of pairs that are to be compared. A correlation of 1.0 indicates a perfect relationship such that i f the individual has the highest score on one variable, it has the highest score on the other. With a negative correlation, they track one another inversely, i.e., one of the variables decreases as the other increases. A correlation of less than one, either positive or negative, indicates that each member of a pair of scores attracts the other less than perfectly so that the highest score on one variable in a positive correlation may be accompanied by a medium high score on the other variable. The extent of relationship is indicated more accurately by the square of the correlation coefficient. Because the connection between the amount of relationship and the size of correlation coefficient is not constant from 0 to 1, a large change is needed at the low-end of the correlation scale to achieve the same amount of increase in a relationship as a small change attains at the top of the scale. The square of the correlation indicates the proportion of the variance that is accounted for by the relationship. For example, with a correlation of 1, 100 percent of the variance of the variables is accounted for by the relationship. With the correlation of 0.9, the accounted variance is 81 percent, and the correlation of 0.8 and 0.7 corresponds to 64 and 49 percent, respectively.
n ( l X Y ) - ( l x X l Y ) ( ? )
V [ n l X 2 - ( l X ) 2 | n Z Y 2 - ( l Y ) 2 j
50
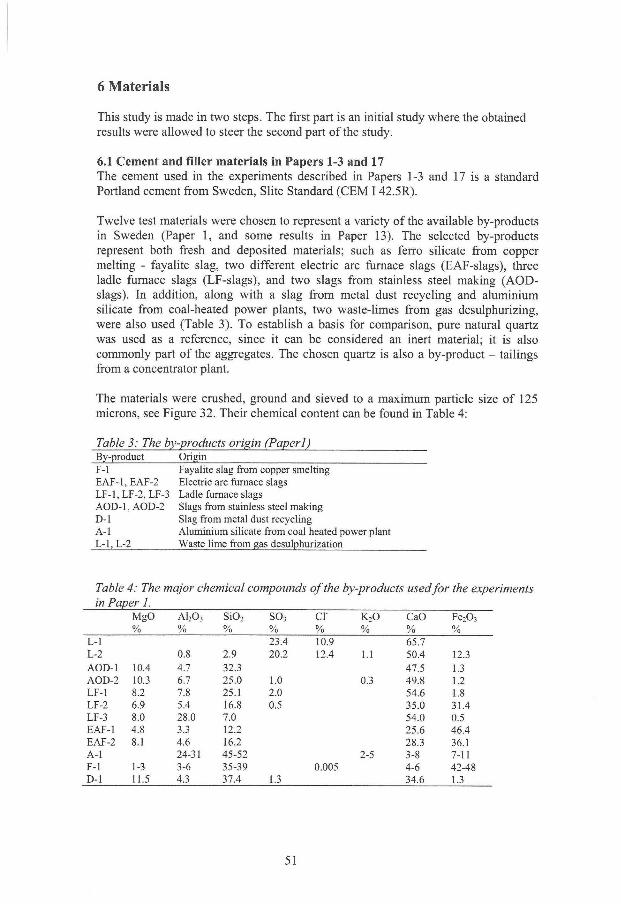
6 Materials
This study is made in two steps. The first part is an initial study where the obtained results were allowed to steer the second part of the study.
6.1 Cement and filler materials in Papers 1-3 and 17 The cement used in the experiments described in Papers 1-3 and 17 is a standard Portland cement from Sweden, Slite Standard (CEM I 42.5R).
Twelve test materials were chosen to represent a variety of the available by-products in Sweden (Paper 1, and some results in Paper 13). The selected by-products represent both fresh and deposited materials; such as ferro silicate from copper melting - fayalite slag, two different electric arc furnace slags (EAF-slags), three ladle furnace slags (LF-slags), and two slags from stainless steel making (AOD-slags). In addition, along with a slag from metal dust recycling and aluminium silicate from coal-heated power plants, two waste-limes from gas desulphurizing, were also used (Table 3). To establish a basis for comparison, pure natural quartz was used as a reference, since it can be considered an inert material; it is also commonly part of the aggregates. The chosen quartz is also a by-product - tailings from a concentrator plant.
The materials were crushed, ground and sieved to a maximum particle size of 125 microns, see Figure 32. Their chemical content can be found in Table 4:
Table 3: The by-products origin (Paper 1) By-product Origin F - l Fayalite slag from copper smelting E A F - l , E A F - 2 Electric arc furnace slags LF-1, LF-2, LF-3 Ladle furnace slags AOD-1, AOD-2 Slags from stainless steel making D-l Slag from metal dust recycling A - l Aluminium silicate from coal heated power plant L - l , L-2 Waste lime from gas desulphurization
Table 4: The major chemical compounds of the by-products usedfor the experiments in Paper 1.
MgO A1 2 0 3 S i 0 2 s o 3 C f K 2 0 CaO F e 2 0 3
% % % % % % % % L - l 23.4 10.9 65.7 L-2 0.8 2.9 20.2 12.4 1.1 50.4 12.3 AOD-1 10.4 4.7 32.3 47.5 1.3 AOD-2 10.3 6.7 25.0 1.0 0.3 49.8 1.2 LF-1 8.2 7.8 25.1 2.0 54.6 1.8 LF-2 6.9 5.4 16.8 0.5 35.0 31.4 LF-3 8.0 28.0 7.0 54.0 0.5 EAF-1 4.8 3.3 12.2 25.6 46.4 EAF-2 8.! 4.6 16.2 28.3 36.1 A - l 24-31 45-52 2-5 3-8 7-11 F - l 1-3 3-6 35-39 0.005 4-6 42-48 D-l 11.5 4.3 37.4 1.3 34.6 1.3
51
The minerals used in the investigation described in Paper 2 are all natural minerals and not by-products. Eight minerals were chosen: bauxite, andalusite, kyanite, periclase, hornblende, epidote, olivine and wollastonite. Quartz was used as reference material. The minerals were crushed, ground and sieved to a maximum particle size of 125 microns.
XRD-analysis of the minerals show that: • The bauxite (a rock type) sample is a mixture of hydrated aluminium oxides,
including gibbsite Al(OH)3, boehmite AIO(OH) and diaspore HAIO2. Boehmite and diaspore belong to the orthorhombic crystal system and gibbsite to the monoclinic.
• The andalusite sample is an aluminium silicate, AI2S1O5, which belongs to the orthorhombic crystal system. It is trimorphous with kyanite and sillimanite. It is formed at medium temperatures and low pressures, in metamorphosed argillaceous rock types.
• The kyanite sample is a triclinic aluminium silicate, AbSiOs . It is trimorphous with andalusite and sillimanite. It is formed at medium temperatures and high pressures in metamorphosed argillaceous rock types.
• The periclase sample is a crystalline magnesium oxide (isometric mineral) MgO. It belongs to the cubic crystal system. It is normally an industrially manufactured mineral and is rare in nature, as it easily reacts with water and forms brucite, Mg02.
• The quartz sample is crystalline silica, Si02, and belongs to the hexagonal crystal system. It is a common rock-forming mineral in the earth crust, in igneous, metamorphic, and sedimentary rocks.
• The epidote sample consists manly of epidote and clinozoisite (epidote group), with small amounts of clinochlore (chlorite group) and nepheline (feldspathoid).
• The olivine sample consists of magnesium-rich forsterite together with some clinochlore (chlorite group) and talc.
• The wollastonite samples consists mainly of calcium silicate with small amounts of quartz and calcium carbonate;
• The hornblende sample consists of hornblende together with tremolite and actinolite, and also small amounts of muscovite, quartz and calcium carbonate.
The quartz fillers used in the investigation in Paper 3 are both commercial products and by-products. The particle size distributions of the commercial products, M300, M500 and M6000, from SIBELCO S.A., and the by-product that comes from the mineral processing industry, are shown in Figure 33.
52
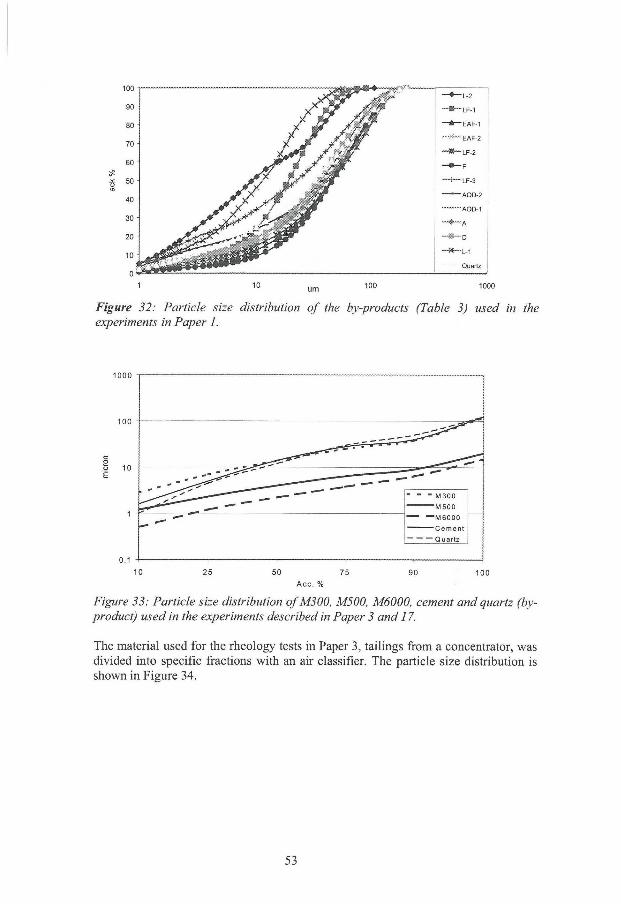
1 10 u m 100 1000
Figure 32: Particle size distribution of the by-products (Table 3) used in the experiments in Paper 1.
1000
100
o o 10 E
i i ^ ^ ^ ^ - - ^ ^ ^ ~~~~ - - - M300
M500
—M6000
Cement
Quartz
- - - M300
M500
—M6000
Cement
Quartz
10 25 50 75 90 100
A c c . %
Figure 33: Particle size distribution of M300, M500, M6000, cement and quartz (by
product) used in the experiments described in Paper 3 and 17.
The material used for the rheology tests in Paper 3, tailings from a concentrator, was divided into specific fractions with an air classifier. The particle size distribution is shown in Figure 34.
53
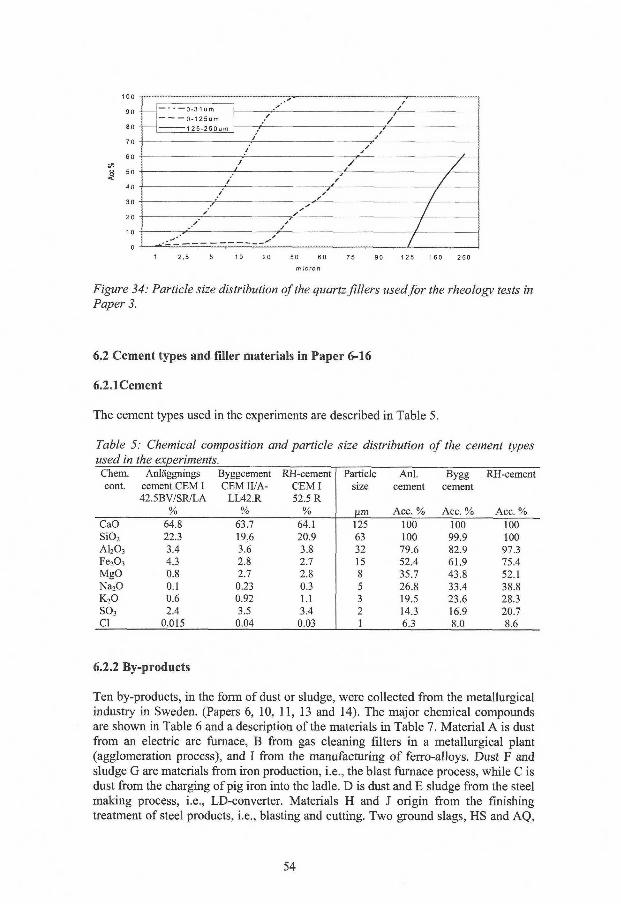
Figure 34: Particle size distribution of the quartz fillers usedfor the rheology tests in Paper 3.
6.2 Cement types and filler materials in Paper 6-16
6.2.1Cement
The cement types used in the experiments are described in Table 5.
Table 5: Chemical composition and particle size distribution of the cement types used in the experiments.
Chem. Anläggnings Byggcement RH-cement Particle Anl. Bygg RH-cement cont. cement C E M I C E M II/A- C E M I size cement cement
42.5BV/SR/LA LL42.R 52.5 R % % % um Acc. % Acc. % Acc. %
CaO 64.8 63.7 64.1 125 100 100 100 S i 0 2 22.3 19,6 20.9 63 100 99.9 100 A1 2 0 3 3.4 3.6 3.8 32 79.6 82.9 97.3 F e 2 0 3 4.3 2.8 2.7 15 52.4 61.9 75.4 MgO 0.8 2.7 2.8 8 35.7 43.8 52.1 Na 2 0 0.1 0.23 0.3 5 26.8 33.4 38.8 K , 0 0.6 0.92 1.1 3 19.5 23.6 28.3 S 0 3 2.4 3.5 3.4 2 14.3 16.9 20.7 CI 0.015 0.04 0.03 1 6.3 8.0 8.6
6.2.2 By-products
Ten by-products, in the form of dust or sludge, were collected from the metallurgical industry in Sweden. (Papers 6, 10, 11, 13 and 14). The major chemical compounds are shown in Table 6 and a description of the materials in Table 7. Material A is dust from an electric arc furnace, B from gas cleaning filters in a metallurgical plant (agglomeration process), and I from the manufacturing of ferro-alloys. Dust F and sludge G are materials from iron production, i.e., the blast furnace process, while C is dust from the charging of pig iron into the ladle. D is dust and E sludge from the steel making process, i.e., LD-converter. Materials H and J origin from the finishing treatment of steel products, i.e., blasting and cutting. Two ground slags, HS and AQ,
54
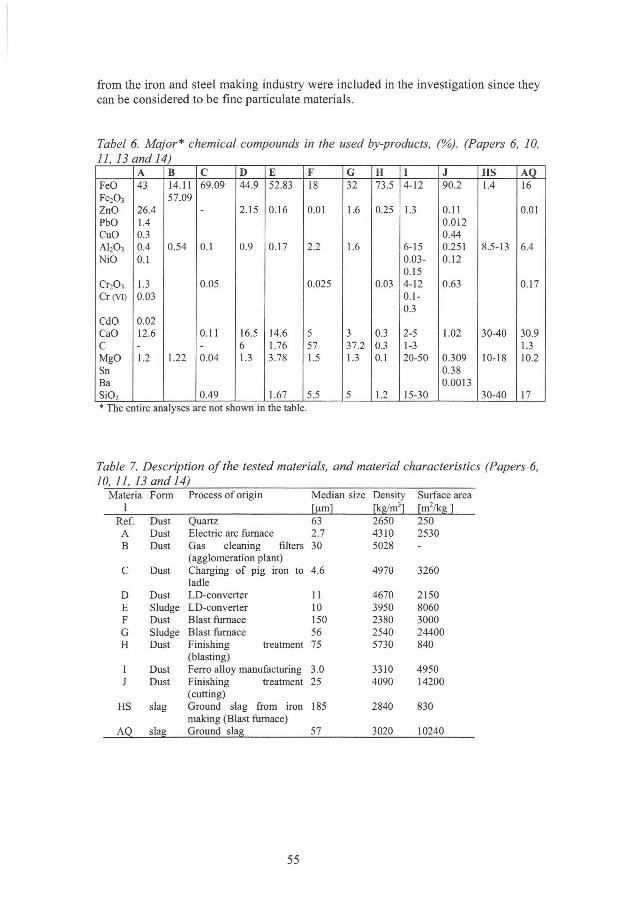
from the iron and steel making industry were included in the investigation since they can be considered to be fine particulate materials.
Tabel 6. Major* chemical compounds in the used by-products, (%). (Papers 6, 10, 11, 13 and 14)
A B C D E F G H I J HS AQ FeO 43 14.11 69.09 44.9 52.83 18 32 73.5 4-12 90.2 1.4 16 F e 2 0 3 57.09 ZnO 26.4 - 2.15 0.16 0.01 1.6 0.25 1.3 0.11 0.01 PbO 1.4 0.012 CuO 0.3 0.44 A1 20 3
0.4 0.54 0.1 0.9 0.17 2.2 1.6 6-15 0.251 8.5-13 6.4 NiO 0.1 0.03-
0.15 0.12
C r 2 0 3 1.3 0.05 0.025 0.03 4-12 0.63 0.17 Cr (VI) 0.03 0.1-
0.3 CdO 0.02 CaO 12.6 0.11 16.5 14.6 5 3 0.3 2-5 1.02 30-40 30.9 C - - 6 1.76 57 37.2 0.3 1-3 1.3 MgO 1.2 1.22 0.04 1.3 3.78 1.5 1.3 0.1 20-50 0.309 10-18 10.2 Sn 0.38 Ba 0.0013 SiO, 0.49 1.67 5.5 5 1.2 15-30 30-40 17 * The entire analyses are not shown in the table.
Table 7. Description of the tested materials, and material characteristics (Papers 6, 10, 11, 13 and 14)
Materia Form Process of origin Median size Density Surface area 1 [urn] fkg/m3l fm2/kg ]
Ref. Dust Quartz 63 2650 250 A Dust Electric arc furnace 2.7 4310 2530 B Dust Gas cleaning filters 30 5028 -
(agglomeration plant) C Dust Charging of pig iron to 4.6 4970 3260
ladle D Dust LD-converter 11 4670 2150 E Sludge LD-converter 10 3950 8060 F Dust Blast furnace 150 2380 3000 G Sludge Blast furnace 56 2540 24400 H Dust Finishing treatment 75 5730 840
(blasting) I Dust Ferro alloy manufacturing 3.0 3310 4950 J Dust Finishing treatment 25 4090 14200
(cutting) IIS slag Ground slag from iron 185 2840 830
making (Blast furnace) AO slag Ground slag 57 3020 10240
55
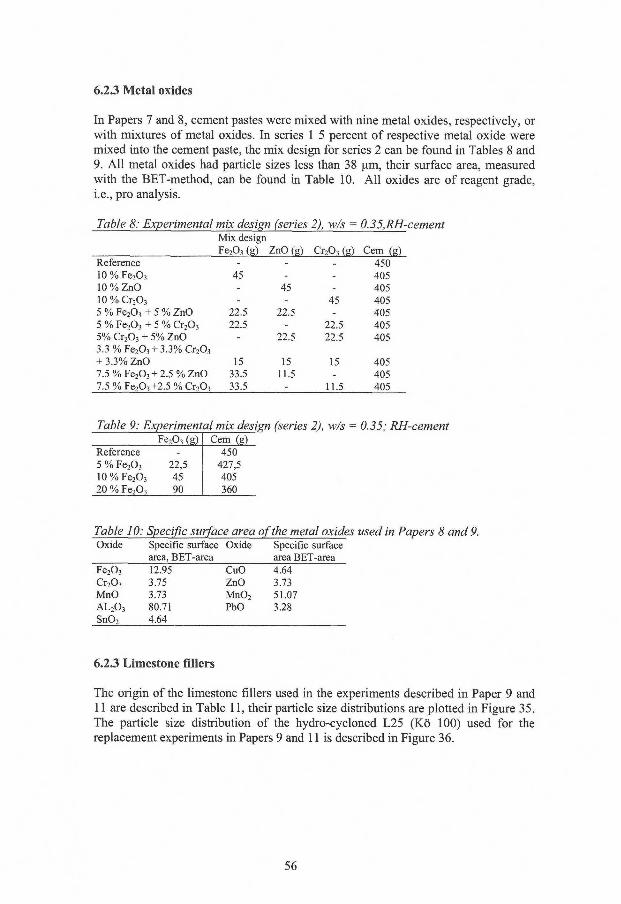
6.2.3 Metal oxides
In Papers 7 and 8, cement pastes were mixed with nine metal oxides, respectively, or with mixtures of metal oxides. In series 1 5 percent of respective metal oxide were mixed into the cement paste, the mix design for series 2 can be found in Tables 8 and 9. Al l metal oxides had particle sizes less than 38 pm, their surface area, measured with the BET-method, can be found in Table 10. Al l oxides are of reagent grade, i.e., pro analysis.
Table 8: Experimental mix design (series 2), w/s = 0.35,RH-cement Mix design Fe 2 Q 3 fa) ZnO (g) Cr 2 Q 3 (g) Cem fa)
Reference - - - 450 10 % F e 2 0 3 45 - - 405 10 % ZnO - 45 - 405 10 % C r 2 0 3
- - 45 405 5 % F e 2 0 3 + 5 % ZnO 22.5 22.5 - 405 5 % F e 2 0 3 + 5 % C r 2 0 3 22.5 - 22.5 405 5% C r 2 0 3 + 5% ZnO - 22.5 22.5 405 3.3 % F e 2 0 3 + 3 .3%Cr 2 0 3
+ 3.3% ZnO 15 15 15 405 7 .5%Fe 2 0 3 + 2.5 %ZnO 33.5 11.5 - 405 7 .5%Fe,0 3 +2.5%Cr,0 3 33.5 - 11.5 405
Table 9: Experimental mix design (series 2), w/s = 0.35; RH-cement Fe,0 , fa) Cem (g)
Reference - 450 5 % F e 2 0 3 22,5 427,5 10%Fe 2 O 3 45 405 20 % F e 2 0 3 90 360
Table 10: Specific surface area of the metal oxides used in Papers 8 and 9. Oxide Specific surface Oxide Specific surface
area, BET-area area BET-area F e 2 0 3 12.95 CuO 4.64 C r 2 0 3 3.75 ZnO 3.73 MnO 3.73 Mn0 2 51.07 A L 2 0 3 80.71 PbO 3.28 Sn0 2 4.64
6.2.3 Limestone fillers
The origin of the limestone fillers used in the experiments described in Paper 9 and 11 are described in Table 11, their particle size distributions are plotted in Figure 35. The particle size distribution of the hydro-cycloned L25 (Kö 100) used for the replacement experiments in Papers 9 and 11 is described in Figure 36.
56
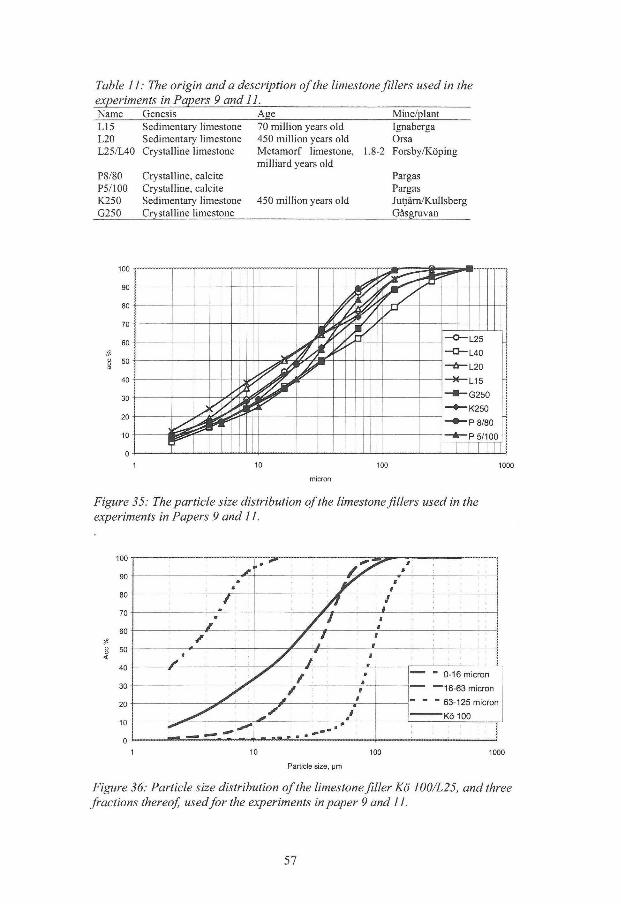
Table 11: The origin and a description of the limestone fülers used in the
Name Genesis Age Mine/plant L15 Sedimentary limestone 70 million years old Ignaberga L20 Sedimentary limestone 450 million years old Orsa L25/L40 Crystalline limestone Metamorf limestone, 1 .8-2 Forsby/Köping
milliard years old P8/80 Crystalline, calcite Pargas P5/100 Crystalline, calcite Pargas K250 Sedimentary limestone 450 million years old Jutjärn/Kullsberg G250 Crystalline limestone Gåsgruvan
Figure 35: The particle size distribution of the limestone fdlers used in the experiments in Papers 9 and 11.
57
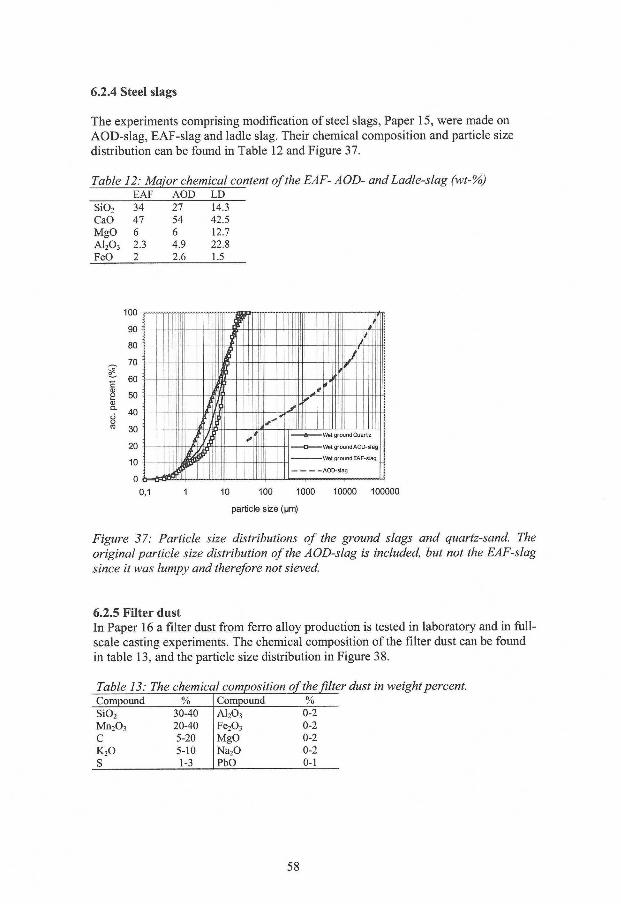
6.2.4 Steel slags
The experiments comprising modification of steel slags, Paper 15, were made on AOD-slag, EAF-slag and ladle slag. Their chemical composition and particle size distribution can be found in Table 12 and Figure 37.
Table 12: Major chemical content of the EAF- AOD- and Ladle-slag (wt-%) E A F AOD L D
S i 0 2 34 27 14.3 CaO 47 54 42.5 MgO 6 6 12.7 A1 2 0 3 2.3 4.9 22.8 FeO 2 2.6 1.5
Figure 37: Particle size distributions of the ground slags and quartz-sand. The original particle size distribution of the AOD-slag is included, but not the EAF-slag since it was lumpy and therefore not sieved.
6.2.5 Filter dust In Paper 16 a filter dust from ferro alloy production is tested in laboratory and in full-scale casting experiments. The chemical composition of the filter dust can be found in table 13, and the particle size distribution in Figure 38.
Table 13: The chemical composition of the filter dust in weight percent. Compound % Compound % S i 0 2
30-40 A1 2 0 3 0-2 M n 2 0 3 20-40 F e 2 0 3
0-2 C 5-20 MgO 0-2 K 2 0 5-10 Na 2 0 0-2 S 1-3 PbO 0-1
58
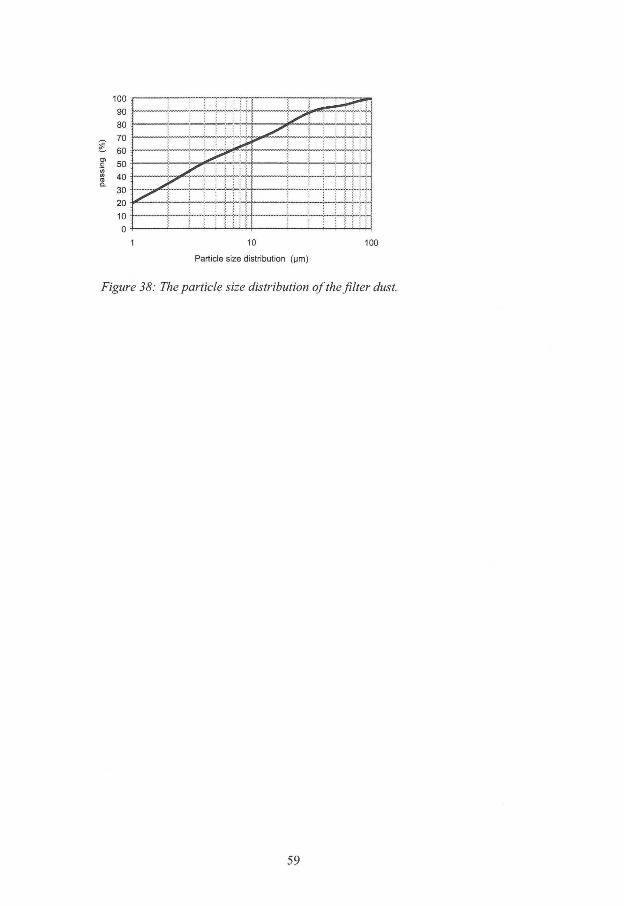
10 100
Particle size distribution (urn)
Figure 38: The particle size distribution of the filter dust.
59
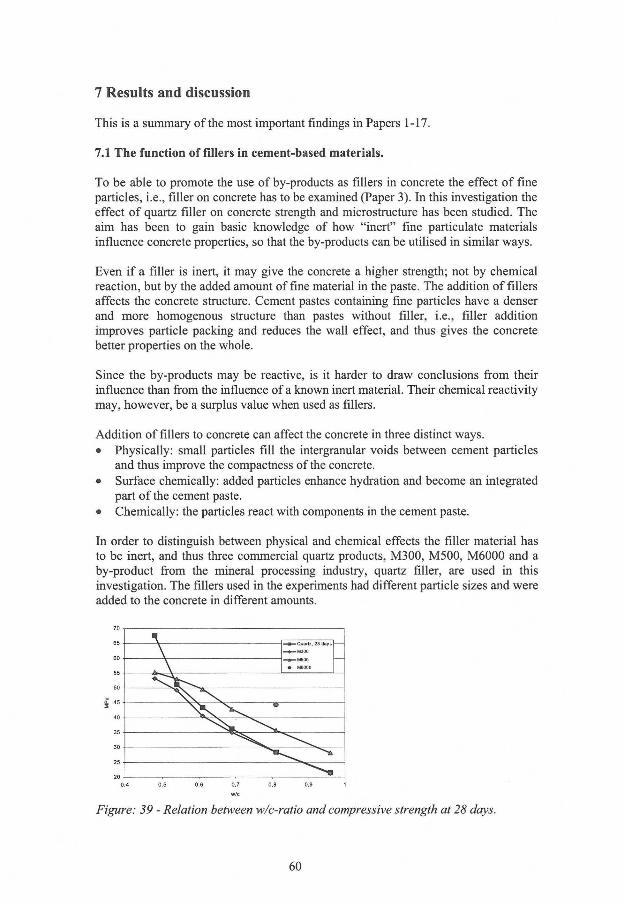
7 Results and discussion
This is a summary of the most important findings in Papers 1-17.
7.1 The function of fillers in cement-based materials.
To be able to promote the use of by-products as fillers in concrete the effect of fine particles, i.e., filler on concrete has to be examined (Paper 3). In this investigation the effect of quartz filler on concrete strength and microstructure has been studied. The aim has been to gain basic knowledge of how "inert" fine particulate materials influence concrete properties, so that the by-products can be utilised in similar ways.
Even i f a filler is inert, it may give the concrete a higher strength; not by chemical reaction, but by the added amount of fine material in the paste. The addition of fillers affects the concrete structure. Cement pastes containing fine particles have a denser and more homogenous structure than pastes without filler, i.e., filler addition improves particle packing and reduces the wall effect, and thus gives the concrete better properties on the whole.
Since the by-products may be reactive, is it harder to draw conclusions from their influence than from the influence of a known inert material. Their chemical reactivity may, however, be a surplus value when used as fillers.
Addition of fillers to concrete can affect the concrete in three distinct ways. • Physically: small particles fill the intergranular voids between cement particles
and thus improve the compactness of the concrete. • Surface chemically: added particles enhance hydration and become an integrated
part ofthe cement paste. • Chemically: the particles react with components in the cement paste.
In order to distinguish between physical and chemical effects the filler material has to be inert, and thus three commercial quartz products, M300, M500, M6000 and a by-product from the mineral processing industry, quartz filler, are used in this investigation. The fillers used in the experiments had different particle sizes and were added to the concrete in different amounts.
0.4 0,5 0,6 0,7 0,8 0.9 1
Figure: 39 - Relation between w/c-ratio and compressive strength at 28 days.
60
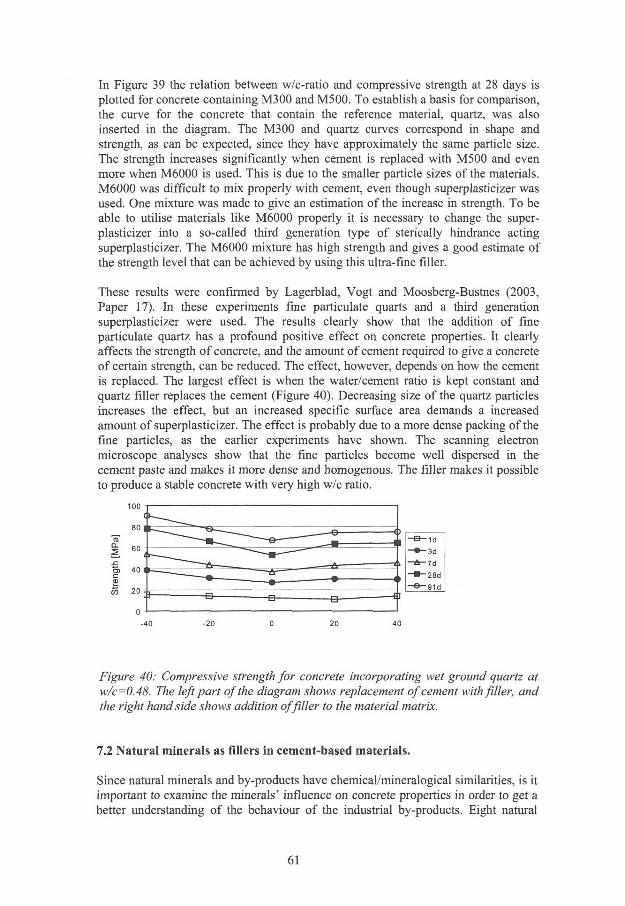
In Figure 39 the relation between w/c-ratio and compressive strength at 28 days is plotted for concrete containing M300 and M500. To establish a basis for comparison, the curve for the concrete that contain the reference material, quartz, was also inserted in the diagram. The M300 and quartz curves correspond in shape and strength, as can be expected, since they have approximately the same particle size. The strength increases significantly when cement is replaced with M500 and even more when M6000 is used. This is due to the smaller particle sizes of the materials. M6000 was difficult to mix properly with cement, even though superplasticizer was used. One mixture was made to give an estimation of the increase in strength. To be able to utilise materials like M6000 properly it is necessary to change the superplasticizer into a so-called third generation type of sterically hindrance acting superplasticizer. The M6000 mixture has high strength and gives a good estimate of the strength level that can be achieved by using this ultra-fine filler.
These results were confirmed by Lagerblad, Vogt and Moosberg-Bustnes (2003, Paper 17). In these experiments fine particulate quarts and a third generation superplasticizer were used. The results clearly show that the addition of fine particulate quartz has a profound positive effect on concrete properties. It clearly affects the strength of concrete, and the amount of cement required to give a concrete of certain strength, can be reduced. The effect, however, depends on how the cement is replaced. The largest effect is when the water/cement ratio is kept constant and quartz filler replaces the cement (Figure 40). Decreasing size of the quartz particles increases the effect, but an increased specific surface area demands a increased amount of superplasticizer. The effect is probably due to a more dense packing of the fine particles, as the earlier experiments have shown. The scanning electron microscope analyses show that the fine particles become well dispersed in the cement paste and makes it more dense and homogenous. The filler makes it possible to produce a stable concrete with very high w/c ratio.
100
-40 -20 0 20 40
Figure 40: Compressive strength for concrete incorporating wet ground quartz at w/c=0.48. The left part of the diagram shows replacement of cement with filler, and the right hand side shows addition of filler to the material matrix.
7.2 Natural minerals as fillers in cement-based materials.
Since natural minerals and by-products have chemical/mineralogical similarities, is it important to examine the minerals' influence on concrete properties in order to get a better understanding of the behaviour of the industrial by-products. Eight natural
61
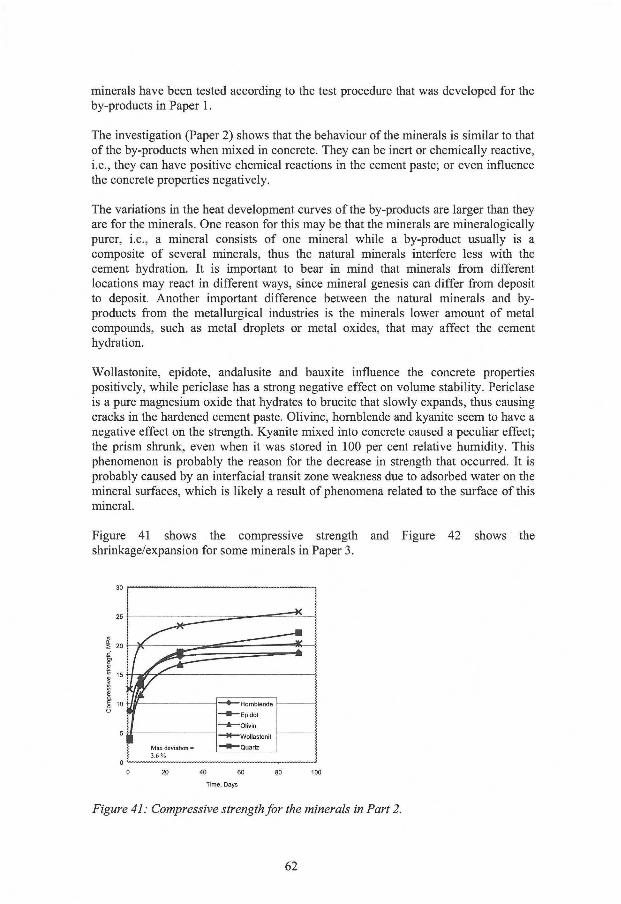
minerals have been tested according to the test procedure that was developed for the by-products in Paper 1.
The investigation (Paper 2) shows that the behaviour of the minerals is similar to that of the by-products when mixed in concrete. They can be inert or chemically reactive, i.e., they can have positive chemical reactions in the cement paste; or even influence the concrete properties negatively.
The variations in the heat development curves of the by-products are larger than they are for the minerals. One reason for this may be that the minerals are mineralogically purer, i.e., a mineral consists of one mineral while a by-product usually is a composite of several minerals, thus the natural minerals interfere less with the cement hydration. It is important to bear in mind that minerals from different locations may react in different ways, since mineral genesis can differ from deposit to deposit. Another important difference between the natural minerals and byproducts from the metallurgical industries is the minerals lower amount of metal compounds, such as metal droplets or metal oxides, that may affect the cement hydration.
Wollastonite, epidote, andalusite and bauxite influence the concrete properties positively, while periclase has a strong negative effect on volume stability. Periclase is a pure magnesium oxide that hydrates to brucite that slowly expands, thus causing cracks in the hardened cement paste. Olivine, hornblende and kyanite seem to have a negative effect on the strength. Kyanite mixed into concrete caused a peculiar effect; the prism shrunk, even when it was stored in 100 per cent relative humidity. This phenomenon is probably the reason for the decrease in strength that occurred. It is probably caused by an interfacial transit zone weakness due to adsorbed water on the mineral surfaces, which is likely a result of phenomena related to the surface of this mineral.
Figure 41 shows the compressive strength and Figure 42 shows the shrinkage/expansion for some minerals in Paper 3.
30
25
5
• Hornblende
B Epidot
A Olivin
—K—Wollastonit
—X—Quartz Max deviation = 3.6 %
• Hornblende
B Epidot
A Olivin
—K—Wollastonit
—X—Quartz
0 20 40 60 80 100
Time, Days
Figure 41: Compressive strength for the minerals in Part 2.
62
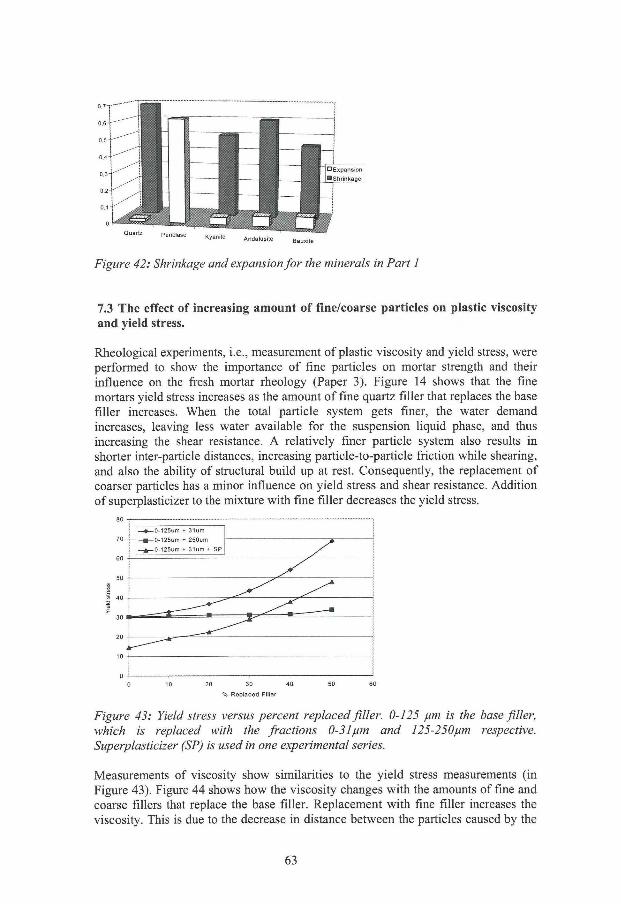
Figure 42: Shrinkage and expansion for the minerals in Part 1
7.3 The effect of increasing amount of fine/coarse particles on plastic viscosity and yield stress.
Rheological experiments, i.e., measurement of plastic viscosity and yield stress, were performed to show the importance of fine particles on mortar strength and their influence on the fresh mortar rheology (Paper 3). Figure 14 shows that the fine mortars yield stress increases as the amount of fine quartz filler that replaces the base filler increases. When the total particle system gets finer, the water demand increases, leaving less water available for the suspension liquid phase, and thus increasing the shear resistance. A relatively finer particle system also results in shorter inter-particle distances, increasing particle-to-particle friction while shearing, and also the ability of structural build up at rest. Consequently, the replacement of coarser particles has a minor influence on yield stress and shear resistance. Addition of superplasticizer to the mixture with fine filler decreases the yield stress.
80
0 <, , 1
0 10 20 30 40 50 60
% Replaced Filler
Figure 43: Yield stress versus percent replaced filler. 0-125 pm is the base filler, which is replaced with the fractions 0-3lpm and 125-250pm respective. Superplasticizer (SP) is used in one experimental series.
Measurements of viscosity show similarities to the yield stress measurements (in Figure 43). Figure 44 shows how the viscosity changes with the amounts of fine and coarse fillers that replace the base filler. Replacement with fine filler increases the viscosity. This is due to the decrease in distance between the particles caused by the
63
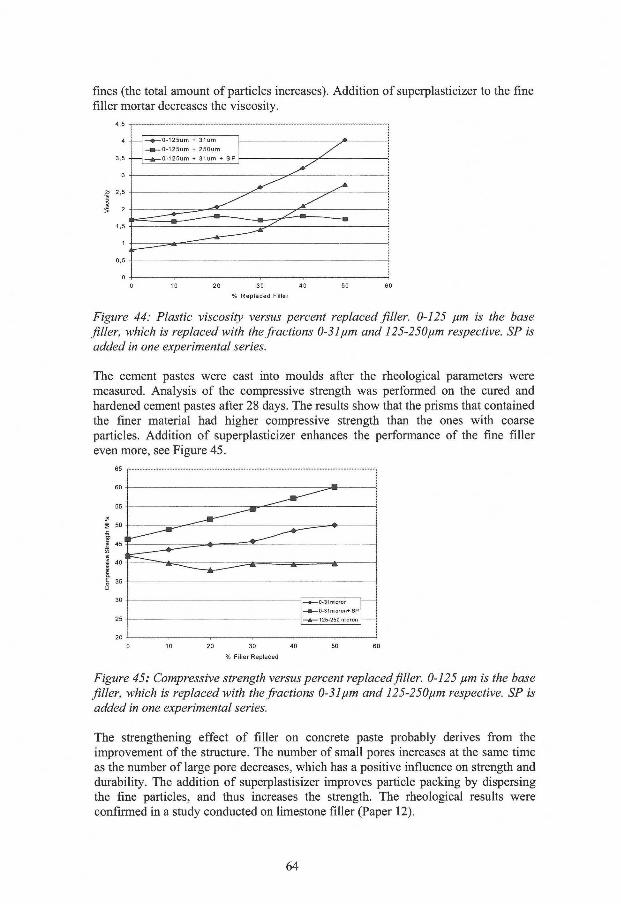
fines (the total amount of particles increases). Addition of superplasticizer to the fine filler mortar decreases the viscosity.
4,5
0_5 ______ _ _ _ _ _ I
0 -I , , i j , i 0 10 20 30 40 50 60
% Replaced Filler
Figure 44: Plastic viscosity versus percent replaced filler. 0-125 pm is the base filler, which is replaced with the fractions 0-31pm and 125-250pm respective. SP is added in one experimental series.
The cement pastes were cast into moulds after the rheological parameters were measured. Analysis of the compressive strength was performed on the cured and hardened cement pastes after 28 days. The results show that the prisms that contained the finer material had higher compressive strength than the ones with coarse particles. Addition of superplasticizer enhances the performance of the fine filler even more, see Figure 45.
% Filler Replaced
Figure 45: Compressive strength versus percent replaced filler. 0-125 pm is the base filler, which is replaced with the fractions 0-31 pm and 125-250pm respective. SP is added in one experimental series.
The strengthening effect of filler on concrete paste probably derives from the improvement of the structure. The number of small pores increases at the same time as the number of large pore decreases, which has a positive influence on strength and durability. The addition of superplastisizer improves particle packing by dispersing the fine particles, and thus increases the strength. The rheological results were confirmed in a study conducted on limestone filler (Paper 12).
64
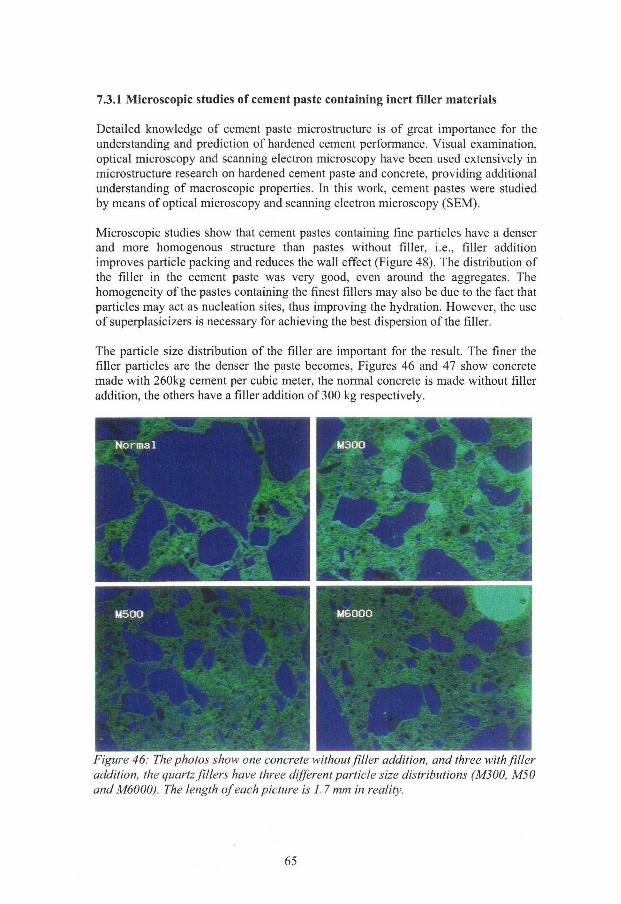
7.3.1 Microscopic studies of cement paste containing inert filler materials
Detailed knowledge of cement paste microstructure is of great importance for the understanding and prediction of hardened cement performance. Visual examination, optical microscopy and scanning electron microscopy have been used extensively in microstructure research on hardened cement paste and concrete, providing additional understanding of macroscopic properties. In this work, cement pastes were studied by means of optical microscopy and scanning electron microscopy (SEM).
Microscopic studies show that cement pastes containing fine particles have a denser and more homogenous structure than pastes without filler, i.e., filler addition improves particle packing and reduces the wall effect (Figure 48). The distribution of the filler in the cement paste was very good, even around the aggregates. The homogeneity of the pastes containing the finest fillers may also be due to the fact that particles may act as nucleation sites, thus improving the hydration. However, the use of superplasicizers is necessary for achieving the best dispersion of the filler.
The particle size distribution of the filler are important for the result. The finer the filler particles are the denser the paste becomes, Figures 46 and 47 show concrete made with 260kg cement per cubic meter, the normal concrete is made without filler addition, the others have a filler addition of 300 kg respectively.
Figure 46: The photos show one concrete without filler addition, and three with filler addition, the quartz fillers have three different particle size distributions (M300, M50 and M6000). The length of each picture is 1.7 mm in reality.
65
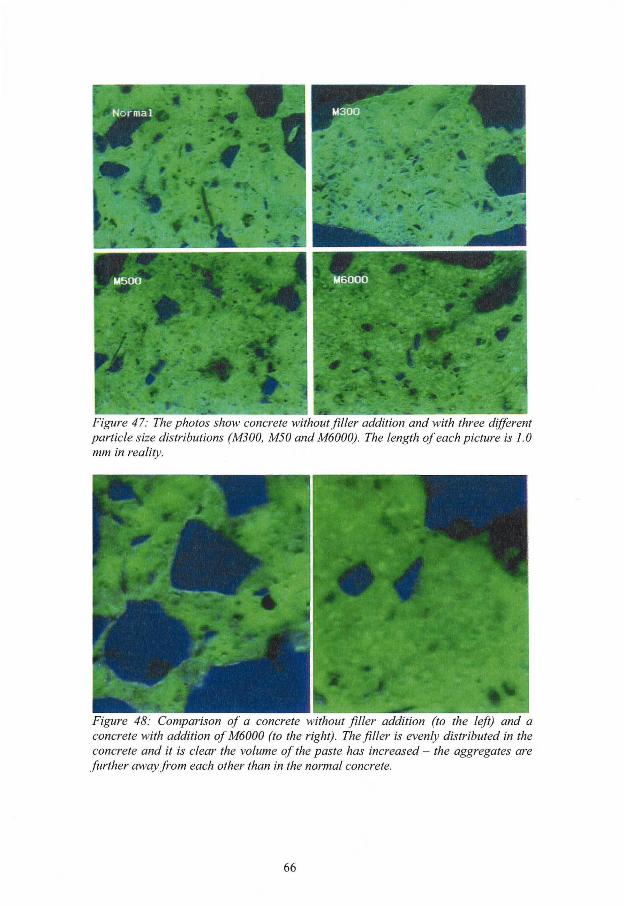
i % * •
Figure 47: The photos show concrete without filler addition and with three different particle size distributions (M300, M50 and M6000). The length of each picture is 1.0 mm in reality.
Figure 48: Comparison of a concrete without filler addition (to the left) and a concrete with addition of M6000 (to the right). The filler is evenly distributed in the concrete and it is clear the volume of the paste has increased - the aggregates are further away from each other than in the normal concrete.
66
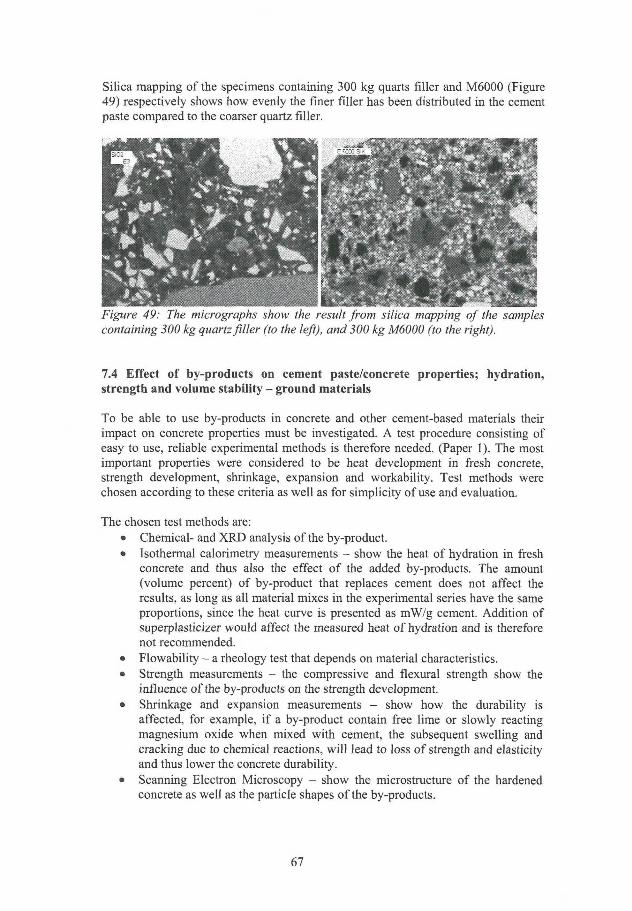
Silica mapping of the specimens containing 300 kg quarts filler and M6000 (Figure 49) respectively shows how evenly the finer filler has been distributed in the cement paste compared to the coarser quartz filler.
|_3i-PHB __»_l_
Figure 49: The micrographs show the result from silica mapping of the samples containing 300 kg quartz filler (to the left), and 300 kg M6000 (to the right).
7.4 Effect of by-products on cement paste/concrete properties; hydration, strength and volume stability - ground materials
To be able to use by-products in concrete and other cement-based materials their impact on concrete properties must be investigated. A test procedure consisting of easy to use, reliable experimental methods is therefore needed. (Paper 1). The most important properties were considered to be heat development in fresh concrete, strength development, shrinkage, expansion and workability. Test methods were chosen according to these criteria as well as for simplicity of use and evaluation.
The chosen test methods are: • Chemical- and XRD analysis of the by-product. • Isothermal calorimetry measurements - show the heat of hydration in fresh
concrete and thus also the effect of the added by-products. The amount (volume percent) of by-product that replaces cement does not affect the results, as long as all material mixes in the experimental series have the same proportions, since the heat curve is presented as mW/g cement. Addition of superplasticizer would affect the measured heat of hydration and is therefore not recommended.
• Flowability - a rheology test that depends on material characteristics. • Strength measurements - the compressive and flexural strength show the
influence of the by-products on the strength development. • Shrinkage and expansion measurements - show how the durability is
affected, for example, i f a by-product contain free lime or slowly reacting magnesium oxide when mixed with cement, the subsequent swelling and cracking due to chemical reactions, wil l lead to loss of strength and elasticity and thus lower the concrete durability.
• Scanning Electron Microscopy - show the microstructure of the hardened concrete as well as the particle shapes of the by-products.
67
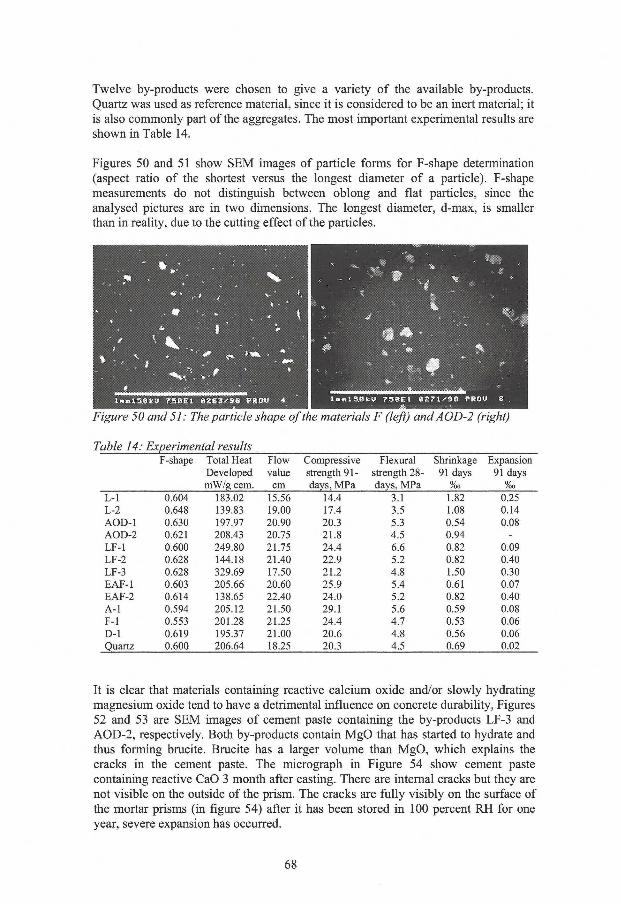
Twelve by-products were chosen to give a variety of the available by-products. Quartz was used as reference material, since it is considered to be an inert material; it is also commonly part of the aggregates. The most important experimental results are shown in Table 14.
Figures 50 and 51 show SEM images of particle forms for F-shape determination (aspect ratio of the shortest versus the longest diameter of a particle). F-shape measurements do not distinguish between oblong and flat particles, since the analysed pictures are in two dimensions. The longest diameter, d-max, is smaller than in reality, due to the cutting effect of the particles.
Figure 50 and 51: The particle shape of the materials F (left) and AOD-2 (right)
Table 14: Experimental results F-shape Total Heat Flow Compressive Flexural Shrinkage Expansion
Developed value strength 91- strength 28- 91 days 91 days mW/g cem. cm days, MPa days, MPa %0 %0
L - l 0.604 183.02 15.56 14.4 3.1 1.82 0.25 L-2 0.648 139.83 19.00 17.4 3.5 1.08 0.14 AOD-1 0.630 197.97 20.90 20.3 5.3 0.54 0.08 AOD-2 0.621 208.43 20.75 21.8 4.5 0.94 -LF-1 0.600 249.80 21.75 24.4 6.6 0.82 0.09 LF-2 0.628 144.18 21.40 22.9 5.2 0.82 0.40 LF-3 0.628 329.69 17.50 21.2 4.8 1.50 0.30 EAF-1 0.603 205.66 20.60 25.9 5.4 0.61 0.07 EAF-2 0.614 138.65 22.40 24.0 5.2 0.82 0.40 A - l 0.594 205.12 21.50 29.1 5.6 0.59 0.08 F - l 0.553 201.28 21.25 24.4 4.7 0.53 0.06 D - l 0.619 195.37 21.00 20.6 4.8 0.56 0.06 Quartz 0.600 206.64 18.25 20.3 4.5 0.69 0.02
It is clear that materials containing reactive calcium oxide and/or slowly hydrating magnesium oxide tend to have a detrimental influence on concrete durability, Figures 52 and 53 are SEM images of cement paste containing the by-products LF-3 and AOD-2, respectively. Both by-products contain MgO that has started to hydrate and thus forming brucite. Brucite has a larger volume than MgO, which explains the cracks in the cement paste. The micrograph in Figure 54 show cement paste containing reactive CaO 3 month after casting. There are internal cracks but they are not visible on the outside of the prism. The cracks are fully visibly on the surface of the mortar prisms (in figure 54) after it has been stored in 100 percent RH for one year, severe expansion has occurred.
68
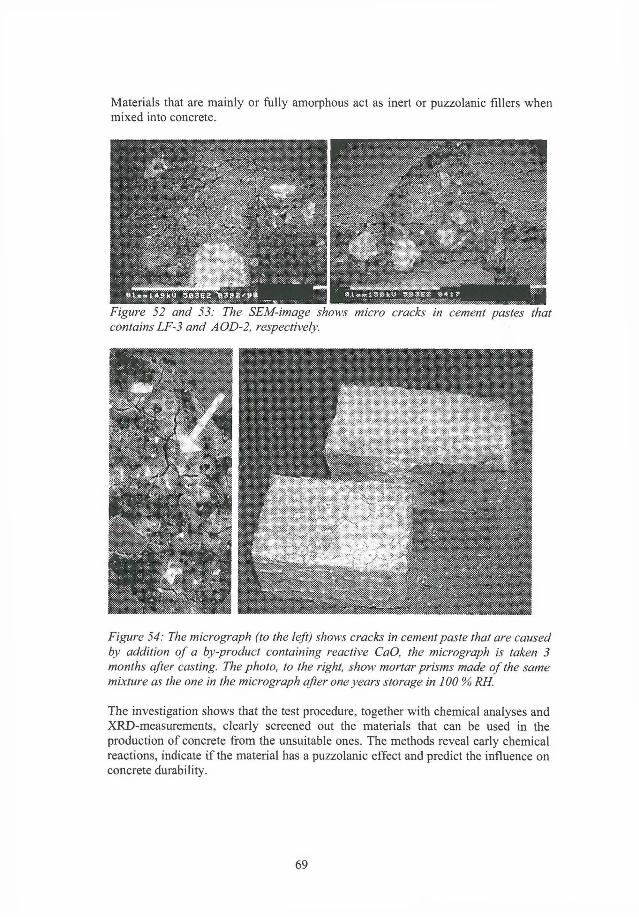
Materials that are mainly or fully amorphous act as inert or puzzolanic fillers when mixed into concrete.
Figure 52 and 53: The SEM-image shows micro cracks in cement pastes that contains LF-3 and AOD-2, respectively.
Figure 54: The micrograph (to the left) shows cracks in cement paste that are caused by addition of a by-product containing reactive CaO, the micrograph is taken 3 months after casting. The photo, to the right, show mortar prisms made of the same mixture as the one in the micrograph after one years storage in 100% RH.
The investigation shows that the test procedure, together with chemical analyses and XRD-measurements, clearly screened out the materials that can be used in the production of concrete from the unsuitable ones. The methods reveal early chemical reactions, indicate i f the material has a puzzolanic effect and predict the influence on concrete durability.
69
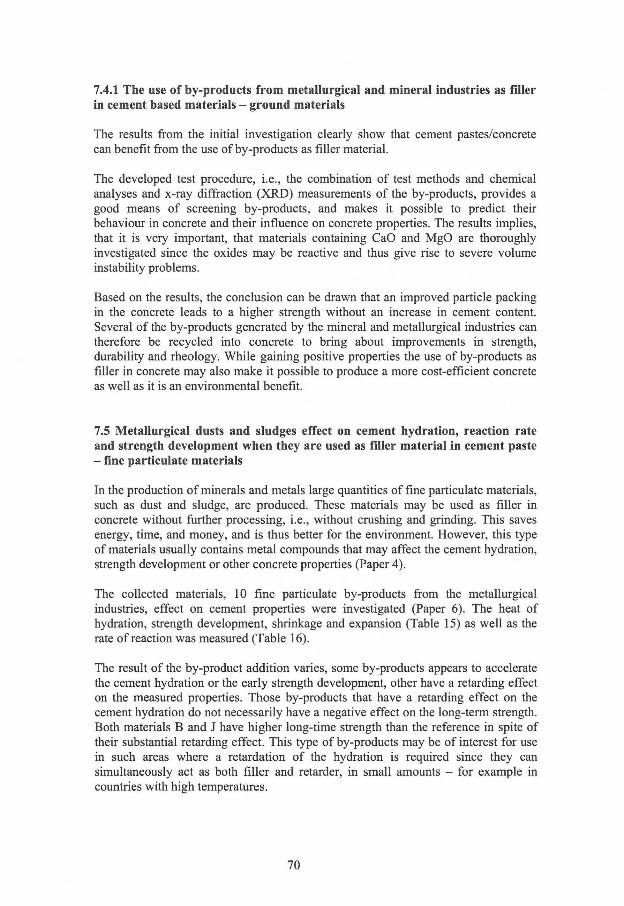
7.4.1 The use of by-products from metallurgical and mineral industries as filler in cement based materials - ground materials
The results from the initial investigation clearly show that cement pastes/concrete can benefit from the use of by-products as filler material.
The developed test procedure, i.e., the combination of test methods and chemical analyses and x-ray diffraction (XRD) measurements of the by-products, provides a good means of screening by-products, and makes it possible to predict their behaviour in concrete and their influence on concrete properties. The results implies, that it is very important, that materials containing CaO and MgO are thoroughly investigated since the oxides may be reactive and thus give rise to severe volume instability problems.
Based on the results, the conclusion can be drawn that an improved particle packing in the concrete leads to a higher strength without an increase in cement content. Several of the by-products generated by the mineral and metallurgical industries can therefore be recycled into concrete to bring about improvements in strength, durability and rheology. While gaining positive properties the use of by-products as filler in concrete may also make it possible to produce a more cost-efficient concrete as well as it is an environmental benefit.
7.5 Metallurgical dusts and sludges effect on cement hydration, reaction rate and strength development when they are used as filier material in cement paste - fine particulate materials
In the production of minerals and metals large quantities of fine particulate materials, such as dust and sludge, are produced. These materials may be used as filler in concrete without further processing, i.e., without crushing and grinding. This saves energy, time, and money, and is thus better for the environment. However, this type of materials usually contains metal compounds that may affect the cement hydration, strength development or other concrete properties (Paper 4).
The collected materials, 10 fine particulate by-products from the metallurgical industries, effect on cement properties were investigated (Paper 6). The heat of hydration, strength development, shrinkage and expansion (Table 15) as well as the rate of reaction was measured (Table 16).
The result of the by-product addition varies, some by-products appears to accelerate the cement hydration or the early strength development, other have a retarding effect on the measured properties. Those by-products that have a retarding effect on the cement hydration do not necessarily have a negative effect on the long-term strength. Both materials B and J have higher long-time strength than the reference in spite of their substantial retarding effect. This type of by-products may be of interest for use in such areas where a retardation of the hydration is required since they can simultaneously act as both filler and retarder, in small amounts - for example in countries with high temperatures.
70
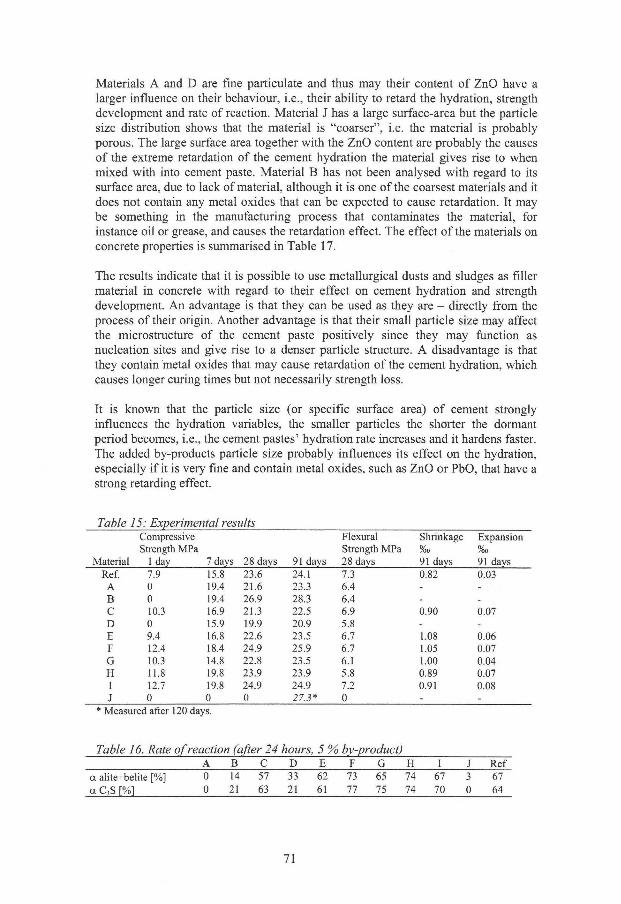
Materials A and D are fine particulate and thus may their content of ZnO have a larger influence on their behaviour, i.e., their ability to retard the hydration, strength development and rate of reaction. Material J has a large surface-area but the particle size distribution shows that the material is "coarser", i.e. the material is probably porous. The large surface area together with the ZnO content are probably the causes of the extreme retardation of the cement hydration the material gives rise to when mixed with into cement paste. Material B has not been analysed with regard to its surface area, due to lack of material, although it is one of the coarsest materials and it does not contain any metal oxides that can be expected to cause retardation. It may be something in the manufacturing process that contaminates the material, for instance oil or grease, and causes the retardation effect. The effect of the materials on concrete properties is summarised in Table 17.
The results indicate that it is possible to use metallurgical dusts and sludges as filler material in concrete with regard to their effect on cement hydration and strength development. An advantage is that they can be used as they are - directly from the process of their origin. Another advantage is that their small particle size may affect the microstructure of the cement paste positively since they may function as nucleation sites and give rise to a denser particle structure. A disadvantage is that they contain metal oxides that may cause retardation of the cement hydration, which causes longer curing times but not necessarily strength loss.
It is known that the particle size (or specific surface area) of cement strongly influences the hydration variables, the smaller particles the shorter the dormant period becomes, i.e., the cement pastes' hydration rate increases and it hardens faster. The added by-products particle size probably influences its effect on the hydration, especially i f it is very fine and contain metal oxides, such as ZnO or PbO, that have a strong retarding effect.
Table 15: Experimental results Compressive Strength MPa
Flexural Strength MPa
Shrinkage %0
Expansion °/oo
Material 1 day 7 days 28 days 91 days 28 days 91 days 91 days Ref. 7.9 15.8 23.6 24.1 7.3 0.82 0.03
A 0 19.4 21.6 23.3 6.4 - -B 0 19.4 26.9 28.3 6.4 - -C 10.3 16.9 21.3 22.5 6.9 0.90 0.07 D 0 15.9 19.9 20.9 5.8 - -E 9.4 16.8 22.6 23.5 6.7 1.08 0.06 F 12.4 18.4 24.9 25.9 6.7 1.05 0.07 G 10.3 14.8 22.8 23.5 6.1 1.00 0.04 H 11.8 19.8 23.9 23.9 5.8 0.89 0.07 I 12.7 19.8 24.9 24.9 7.2 0.91 0.08 J 0 0 0 27.3* 0 - -
* Measured after 120 days.
Table 16. Rate of reaction (after 24 hours, 5 % by-product) A B C D E F G H I J Ref
a alite+belite [%] 0 14 57 33 62 73 65 74 67 3 67
a C 3 S r%l 0 21 63 21 61 77 75 74 70 0 64
71
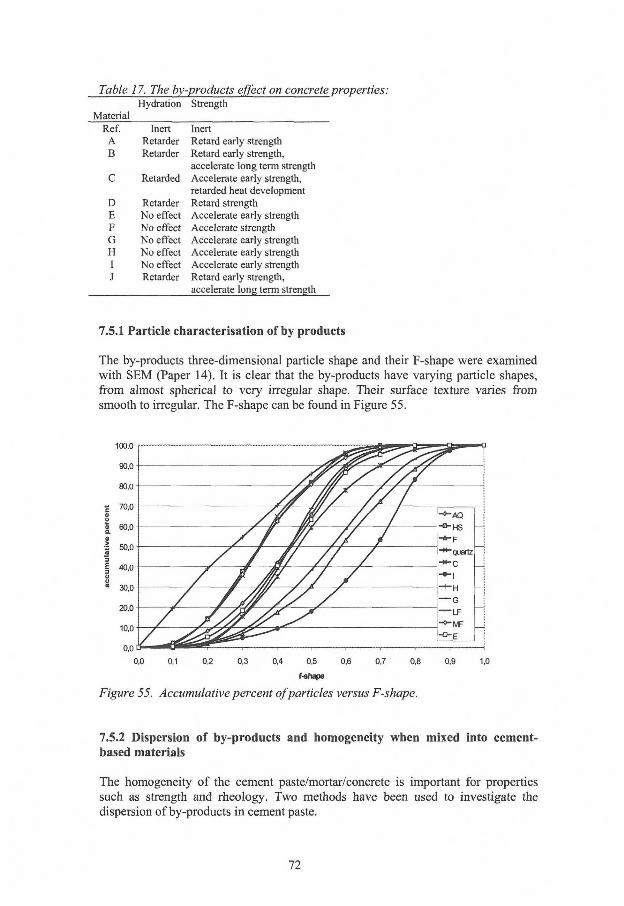
Table 17. The by-,
Material Hydration Strength
Ref. Inert Inert A Retarder Retard early strength B Retarder Retard early strength,
accelerate long term strength C Retarded Accelerate early strength,
retarded heat development D Retarder Retard strength E No effect Accelerate early strength F No effect Accelerate strength G No effect Accelerate early strength H No effect Accelerate early strength I No effect Accelerate early strength J Retarder Retard early strength,
accelerate long term strength
7.5.1 Particle characterisation of by products
The by-products three-dimensional particle shape and their F-shape were examined with SEM (Paper 14). It is clear that the by-products have varying particle shapes, from almost spherical to very irregular shape. Their surface texture varies from smooth to irregular. The F-shape can be found in Figure 55.
7.5.2 Dispersion of by-products and homogeneity when mixed into cement-based materials
The homogeneity of the cement paste/mortar/concrete is important for properties such as strength and rheology. Two methods have been used to investigate the dispersion of by-products in cement paste.
72
SEM investigations of the by-products has been made with regard to their dispersion in cement paste (Paper 14). The micrographs showed that all by-products were well dispersed in the cement paste. The homogeneity of fresh mortar with by-product addition was investigated, the air content and the measured mortar density as well as the theoretical mortar density was used to calculate the difference between the normalised measured density and the theoretical density. The resulting values proved that the mortars containing by-products were homogenous. The air content varied and can be connected to the particle shape of the by-products.
7.6 Dust versus slag
Earlier research about the compatibility of metallurgical by-products and cement has mostly been concentrated in the area of slags, with the exception of fly ashes and silica fume. Usually, the dusts and sludges have similar chemical composition as the slags. The materials have the same process of origin, but they have different behaviour when they are mixed with cement into concrete.
The slags in this investigation appears to have high levels of free calcium oxide (f-CaO) that reacts with the mixing water and causes a rise of the heat development, whereas the investigated dusts and sludges seem to be free from f-CaO. The dusts and sludges here investigated also appears to have low levels of reactive MgO, in contrast to the slags that may contain MgO that hydrates to brucite and causes swelling of the hardened concrete, and thus an decrease of the strength. The slags needed to be crushed and ground before used. Some of them contained metal droplets that caused problems during the grinding as opposed to the fine particulate dusts and sludges that could be used with their natural particle size distribution and surface area.
Both slags and fine particulate materials can be modified, however, the processes differs. Slag can be remelted and other materials added, thus will change its chemistry, it may be granulated in order to obtain higher glass content or another mineralogy. Dusts may be changed by using for example the oxy-fmes process, which can reduce or oxidize the material at the same time as it melts and agglomerates.
7.7 Modification of steel slags
Earlier investigations of slag, dusts and sludges have shown that some materials give rise to durability problem due to their content of reactive (free) calcium oxide (f-CaO) or magnesium oxide (MgO). When f-CaO comes in contact with water it starts to hydrate and a large amount of heat is released. The heat may cause the cement paste to crack and thus reduce the strength of the concrete. MgO decreases the concrete's long-term durability, since the formation of brucite causes an expansion, and subsequent cracks in the cement paste. Other materials have shown a low reactivity together with cement, resulting in decreased strength and durability (Paper 5).
73
The three different studies (Paper 15) that were conducted examined the effect of the fines of disintegrating AOD-slag on concrete strength. The effect of wet ground EAF- and AOD-slags on cement pastes heat development, concrete strength and shrinkage/expansion were examined. Remelting and granulation of AOD-, EAF- and ladle-slags, their effects on cement hydration were examined, in order to see i f it is possible to solve the durability and activity problems of the tested steel slags.
The compressive strength for mortar containing fines (-45 pm fraction) of disintegrating AOD slag obtains a slightly increased strength compared with the reference samples containing quartz. This effect may be due to the filler effect or that a positive chemical effect takes place.
Wet grinding of AOD and EAF slags appears to be a feasible way of increase the slags activity. The durability problem, expansion caused by reactive MgO and CaO, seems to be overcome by the finely ground slags, they have the same volume changes as the cement reference. The ground material must, however, be used in slurry form since drying destroys the obtained surface activation of the particles.
Remelting and granulation of slags had a positive effect on the examined ladle- and EAF-slag. The granulated AOD-slag on the other hand, had decreased activity and retarded the cement reactions. The granulated slags effects on cement hydration are positively affected when the glassy phase is increased and vice versa.
The results from the three investigations show that steel-slags can be used as filler in cement based products since the problems of activation (effect on cement hydration) and durability i.e., expansion problem, can be overcome.
7.8 Metal oxides effect on cement hydration and compressive strength
Since the effect of the dusts and sludges on cement hydration and strength were noticeable (Paper 6), and the probable cause was deemed to be the materials content of metal compounds, it was considered important to investigate the effect of pure metal oxides on cement paste properties. Especially, as a literature survey (Paper 4) showed that even though much research had been done in that specific area, the results were often conflicting.
When by-products containing metal compounds are mixed with cement the cement chemistry wil l become more complex. Metal ions can exchange with the ions in the clinker or they can precipitate with the anions that are part of the clinker minerals. They can become a part of the calcium silicate hydrate or chemisorb at the surfaces. They can also form surface compounds on specific clinker minerals or inclusions as well as they may become an inert part of the system. Zinc and lead oxides are known as retarders of the hydration, others are considered to be accelerators, for example aluminium oxide. Some metal oxides, such as chromium oxide, have non or low effect (Paper 4).
It is known that the particle size (or specific surface area) of cement strongly influences the hydration variables, the smaller particles the shorter the dormant period, i.e., the cement pastes' hydration rate increases and it hardens faster. The
74
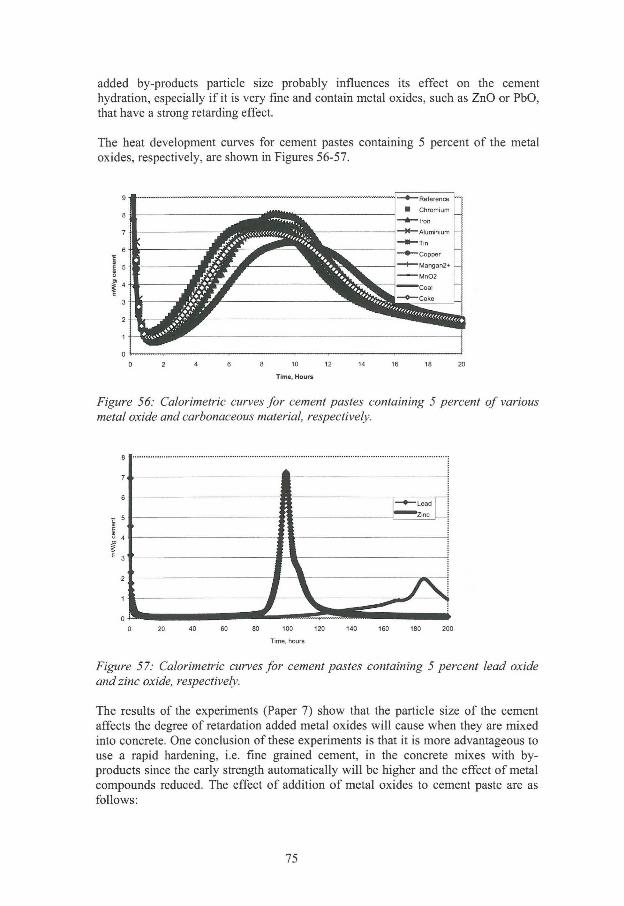
added by-products particle size probably influences its effect on the cement hydration, especially i f it is very fine and contain metal oxides, such as ZnO or PbO, that have a strong retarding effect.
The heat development curves for cement pastes containing 5 percent of the metal oxides, respectively, are shown in Figures 56-57.
1
I • Lead
t 4 4 ; I \ / \
Figure 57: Calorimetric curves for cement pastes containing 5 percent lead oxide and zinc oxide, respectively.
The results of the experiments (Paper 7) show that the particle size of the cement affects the degree of retardation added metal oxides will cause when they are mixed into concrete. One conclusion of these experiments is that it is more advantageous to use a rapid hardening, i.e. fine grained cement, in the concrete mixes with byproducts since the early strength automatically wi l l be higher and the effect of metal compounds reduced. The effect of addition of metal oxides to cement paste are as follows:
75
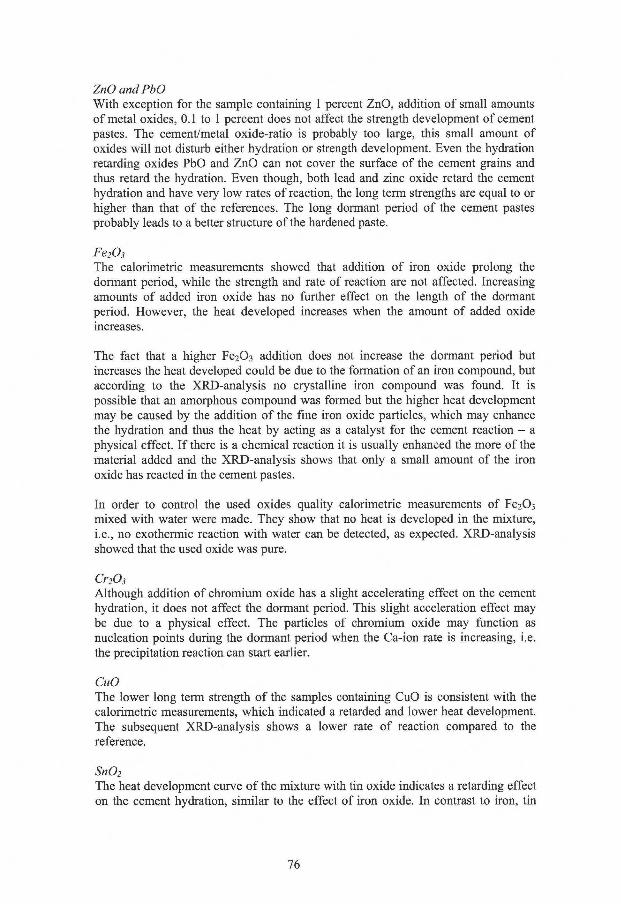
ZnO and PbO With exception for the sample containing 1 percent ZnO, addition of small amounts of metal oxides, 0.1 to 1 percent does not affect the strength development of cement pastes. The cement/metal oxide-ratio is probably too large, this small amount of oxides will not disturb either hydration or strength development. Even the hydration retarding oxides PbO and ZnO can not cover the surface of the cement grains and thus retard the hydration. Even though, both lead and zinc oxide retard the cement hydration and have very low rates of reaction, the long term strengths are equal to or higher than that of the references. The long dormant period of the cement pastes probably leads to a better structure of the hardened paste.
Fe203
The calorimetric measurements showed that addition of iron oxide prolong the dormant period, while the strength and rate of reaction are not affected. Increasing amounts of added iron oxide has no further effect on the length of the dormant period. However, the heat developed increases when the amount of added oxide increases.
The fact that a higher Fe203 addition does not increase the dormant period but increases the heat developed could be due to the formation of an iron compound, but according to the XRD-analysis no crystalline iron compound was found. It is possible that an amorphous compound was formed but the higher heat development may be caused by the addition of the fine iron oxide particles, which may enhance the hydration and thus the heat by acting as a catalyst for the cement reaction - a physical effect. I f there is a chemical reaction it is usually enhanced the more of the material added and the XRD-analysis shows that only a small amount of the iron oxide has reacted in the cement pastes.
In order to control the used oxides quality calorimetric measurements of Fe203 mixed with water were made. They show that no heat is developed in the mixture, i.e., no exothermic reaction with water can be detected, as expected. XRD-analysis showed that the used oxide was pure.
Cr203
Although addition of chromium oxide has a slight accelerating effect on the cement hydration, it does not affect the dormant period. This slight acceleration effect may be due to a physical effect. The particles of chromium oxide may function as nucleation points during the dormant period when the Ca-ion rate is increasing, i.e. the precipitation reaction can start earlier.
CuO The lower long term strength of the samples containing CuO is consistent with the calorimetric measurements, which indicated a retarded and lower heat development. The subsequent XRD-analysis shows a lower rate of reaction compared to the reference.
Sn02
The heat development curve of the mixture with tin oxide indicates a retarding effect on the cement hydration, similar to the effect of iron oxide. In contrast to iron, tin
76
oxide had a slightly negative effect on the long term strength, but the rate of reaction was in the same region as the reference.
Al203
Addition of AI2O3 appears to have very little effect on the heat development and strength development of cement pastes. This may be due to the fact that AI2O3 is a component in the cement clinker. The aluminium is also a part of the hydration product ettringite.
Coal and coke Coal and coke addition to cement paste causes a decrease in strength although the rates of reaction is equal to the references.
It is possible that small amounts of Fe and Cr ions are dissolved and bound into the C-S-H and in the ettringite. Al-ions can be substituted with Fe or Cr (Taylor 1997), but this could not be proven with the XRD-analysis since the peaks of these compounds will be small compared to the ordinary ettringite, due to the small amounts of the metal oxides that have reacted, and overlapped by the Al-ion containing ettringite since they will have similar crystal lattices.
The difference between samples stored in 100 percent relative humidity (RH) and 50 percent RH is fundamental. The rate of reaction of the samples stored in 50 percent RH is almost zero - they can not hydrate since the reactions demand water and due to the ambient low RH the cement paste wil l be dehydrated in a few days time. It is therefore imperative to have the right curing and storing conditions i f by-products containing retarding metal oxides are used as fdler material. I f these conditions are met, the end result will be positive with regard to the cement pastes' strength and reaction rate.
7.8.1 XRD-analyses of the cement pastes containing metal oxides
XRD-analyses of cement pastes (Paper 7) containing ZnO and PbO show that the rate of reaction is low after 24 hours of curing, however it reaches the same levels as the rate of reaction of the reference after 28 days. This is consistent with their effect on heat of hydration and strength. The cement pastes that contain CuO a lower rate of reaction compared to the reference. The other metal oxides had little effect on the reaction rate. The XRD-analysis could not distinguish formation of any new crystalline compounds in the cement pastes.
7.8.2 The effect of iron-, chromium-, and zinc oxide mixtures The effect of combinations of metal oxides on cement hydration was investigated (Paper 7), the heat development curves for the mixture containing iron oxide and chromium oxide are schematically described in Table 18, to is the time at which the transition between the dormant period and the acceleration period occurs and t m a x is the time when the maximum heat dQ/dt is obtained.
A l l mixtures containing zinc oxide were retarded. A combined effect of the retarding ability of zinc oxides and the less amount of clinker in the mixtures in this series may
77
explain why these mixes of oxides retard the hydration equally much or more than the previous examined cement paste that contained 5 percent ZnO. The more zinc oxide the mixtures contain the longer the sample stays retarded.
Table 18: Nucleation and growth rates for cement pastes containing iron and chromium oxides, the formulas are explained in Paper 15 Material to tmax Nucleation
v„=l/to Growth
v e=l/(W-to) 5%Fe 100 550 9.999 E-3 2.222 E-3 10%Fe 110 560 9.091 E-3 2.222 E-3 20%Fe 120 570 8.333 E-3 2.222 E-3 5%Fe5%Cr 110 490 9.091 E-3 2.632 E-3 7,5%Fe 2,5%Cr 100 480 9.999 E-3 2.632 E-3 10% Cr 100 490 9.999 E-3 2.564 E-3 Cement 100 510 9.999 E-3 2.439 E-3
Comparison of the nucleation and growth rates for the samples implies that the nucleation rate decreases with increasing amounts of iron oxide, although the growth rate stays constant. This is due to the prolonged dormant period, the time between to and tmax is the same for the three cement pastes containing iron oxides. When iron oxide is mixed with chromium oxide the t m a x is accelerated. The heat development is measured every 10 th minute, this defines the maximum inaccuracy of the calculations.
7.9 F T I R measurements of metal oxide containing cement pastes
Since XRD-analyses (Paper 7) could not prove formation of an iron compound in the cement pastes that contained iron oxide, a thermodynamic database (HSC-chemistry, version 2.03) was searched in order to see i f there were any chemical compounds containing iron that possibly could be formed. The cement chemistry with addition of iron oxide and water were used as entry data. The search resulted in ca 200 chemical compounds. It was considered impossible to deduct which of the compounds that were realistic to investigate. Thus, another approach to the problem would be to analyse the cement paste with another method. Fourier Transform Infrared Spectroscopy was chosen (Paper 8) as analyse method.
In paper 7, it was noted that addition of Fe2Ü3 seems to increase the height of the heat development curve with increasing amounts of addition. Since by-products are complex materials they usually contain more than one metal compound. Some experiments were thus performed on metal oxide mixes to further evaluate the effect of ZnO, Cr203, Fe203 on cement hydration. The method used is Fourier Transform Infrared Spectroscopy analyses (FTIR).
It is clear that zinc oxide, pure and as a mixture severely retards the cement hydration. The FTIR analyses of cement paste containing iron oxide and/or chromium oxide could not pinpoint formation of any new metal containing compounds. However, these analyses do not prove that reactions and formation of metal oxide bearing compounds have not taken place, the formed amount may be so
78
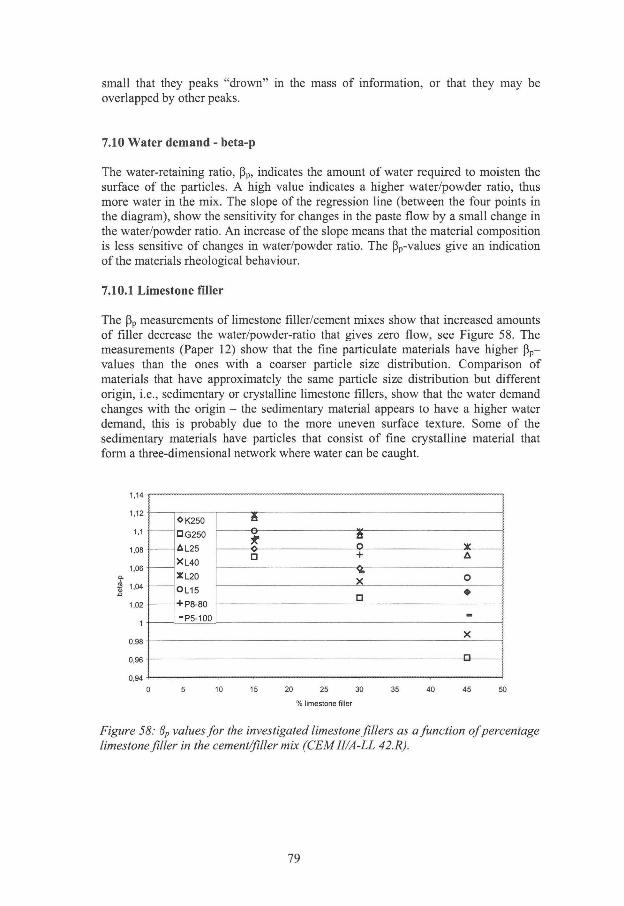
small that they peaks "drown" in the mass of information, or that they may be overlapped by other peaks.
7.10 Water demand - beta-p
The water-retaining ratio, ß p , indicates the amount of water required to moisten the surface of the particles. A high value indicates a higher water/powder ratio, thus more water in the mix. The slope of the regression line (between the four points in the diagram), show the sensitivity for changes in the paste flow by a small change in the water/powder ratio. An increase of the slope means that the material composition is less sensitive of changes in water/powder ratio. The ßp-values give an indication of the materials rheological behaviour.
7.10.1 Limestone filler
The ß p measurements of limestone fdler/cement mixes show that increased amounts of filler decrease the water/powder-ratio that gives zero flow, see Figure 58. The measurements (Paper 12) show that the fine particulate materials have higher ßp-values than the ones with a coarser particle size distribution. Comparison of materials that have approximately the same particle size distribution but different origin, i.e., sedimentary or crystalline limestone fillers, show that the water demand changes with the origin - the sedimentary material appears to have a higher water demand, this is probably due to the more uneven surface texture. Some of the sedimentary materials have particles that consist of fine crystalline material that form a three-dimensional network where water can be caught.
1,14
1,12
1,1
1,08
1,06 Q.
i 1.04 -O
1.02
1
0,98
0,96
0,94
«K250
• G250
-L25
Xl_40
XL20
OL15
+ P8-80
-P5-100
2 «K250
• G250
-L25
Xl_40
XL20
OL15
+ P8-80
-P5-100
* * o o *
«K250
• G250
-L25
Xl_40
XL20
OL15
+ P8-80
-P5-100
• + _
«K250
• G250
-L25
Xl_40
XL20
OL15
+ P8-80
-P5-100
_ X °
«K250
• G250
-L25
Xl_40
XL20
OL15
+ P8-80
-P5-100
• •
«K250
• G250
-L25
Xl_40
XL20
OL15
+ P8-80
-P5-100 -X
•
20 25 30
% limestone filler
Figure 58: 8P values for the investigated limestone fillers as a function of percentage limestone filler in the cement/filler mix (CEMII/A-LL 42. R).
79
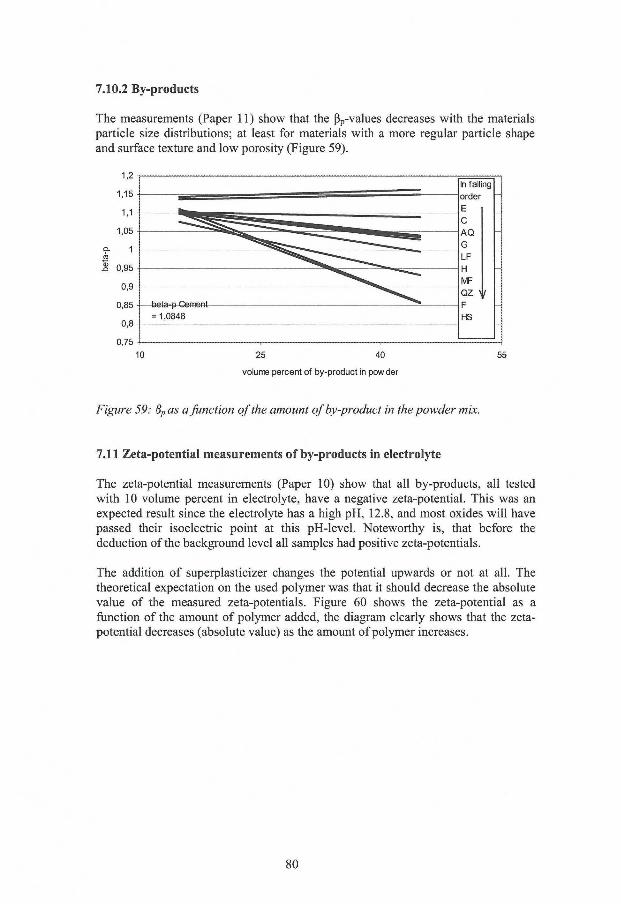
7.10.2 By-products
The measurements (Paper 11) show that the ßp-values decreases with the materials particle size distributions; at least for materials with a more regular particle shape and surface texture and low porosity (Figure 59).
Figure 59: Bp as a function of the amount of by-product in the powder mix.
7.11 Zeta-potential measurements of by-products in electrolyte
The zeta-potential measurements (Paper 10) show that all by-products, all tested with 10 volume percent in electrolyte, have a negative zeta-potential. This was an expected result since the electrolyte has a high pH, 12.8, and most oxides wil l have passed their isoelectric point at this pH-level. Noteworthy is, that before the deduction of the background level all samples had positive zeta-potentials.
The addition of superplasticizer changes the potential upwards or not at all. The theoretical expectation on the used polymer was that it should decrease the absolute value of the measured zeta-potentials. Figure 60 shows the zeta-potential as a function of the amount of polymer added, the diagram clearly shows that the zeta-potential decreases (absolute value) as the amount of polymer increases.
80
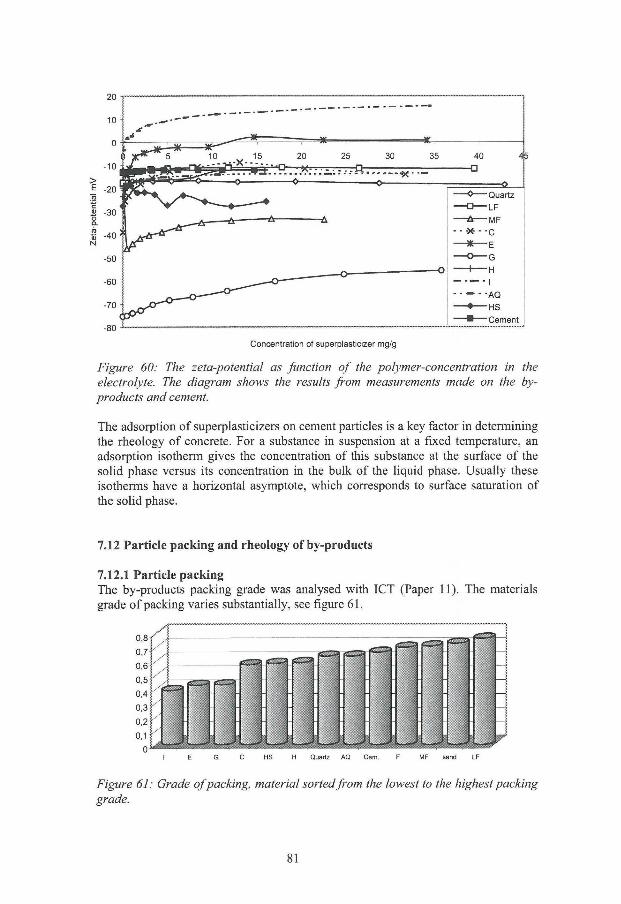
20 i
Concentration of superplasticizer mg/g
Figure 60: The zeta-potential as function of the polymer-concentration in the electrolyte. The diagram shows the results from measurements made on the byproducts and cement.
The adsorption of superplasticizers on cement particles is a key factor in determining the rheology of concrete. For a substance in suspension at a fixed temperature, an adsorption isotherm gives the concentration of this substance at the surface of the solid phase versus its concentration in the bulk of the liquid phase. Usually these isotherms have a horizontal asymptote, which corresponds to surface saturation of the solid phase.
7.12 Particle packing and rheology of by-products
7.12.1 Particle packing
The by-products packing grade was analysed with ICT (Paper 11). The materials grade of packing varies substantially, see figure 61.
Figure 61: Grade ofpacking, material sorted from the lowest to the highest packing grade.
81
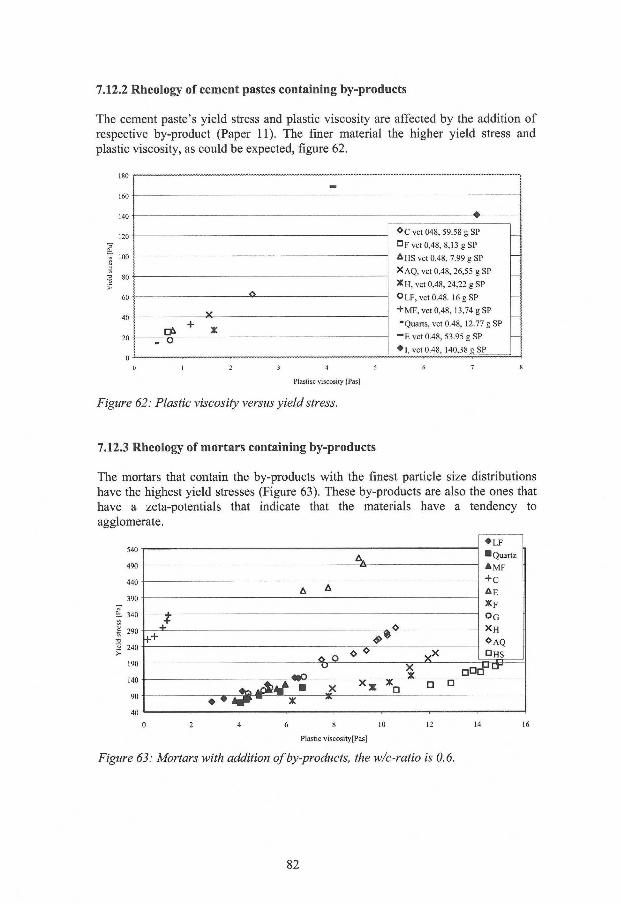
7.12.2 Rheology of cement pastes containing by-products
The cement paste's yield stress and plastic viscosity are affected by the addition of respective by-product (Paper 11). The finer material the higher yield stress and plastic viscosity, as could be expected, figure 62.
-—.
* C vet 048, 59.58 g SP
DF vet 0,48, 8,13 g SP
A HS vet 0.48, 7.99 g SP
XAQ, vet 0,48,26,55 g SP
X H , vet 0,48, 24,22 g SP
OLF.vct 0.48. 16gSP
+ MF, vet 0,48, 13,74 g SP
-Quarts, vet 0.48, 12.77 g SP
- E vet 0.48, 53.95 g SP
• i , vet 0.48, 140,38 g SP
-
* C vet 048, 59.58 g SP
DF vet 0,48, 8,13 g SP
A HS vet 0.48, 7.99 g SP
XAQ, vet 0,48,26,55 g SP
X H , vet 0,48, 24,22 g SP
OLF.vct 0.48. 16gSP
+ MF, vet 0,48, 13,74 g SP
-Quarts, vet 0.48, 12.77 g SP
- E vet 0.48, 53.95 g SP
• i , vet 0.48, 140,38 g SP
-
* C vet 048, 59.58 g SP
DF vet 0,48, 8,13 g SP
A HS vet 0.48, 7.99 g SP
XAQ, vet 0,48,26,55 g SP
X H , vet 0,48, 24,22 g SP
OLF.vct 0.48. 16gSP
+ MF, vet 0,48, 13,74 g SP
-Quarts, vet 0.48, 12.77 g SP
- E vet 0.48, 53.95 g SP
• i , vet 0.48, 140,38 g SP
-
<>
* C vet 048, 59.58 g SP
DF vet 0,48, 8,13 g SP
A HS vet 0.48, 7.99 g SP
XAQ, vet 0,48,26,55 g SP
X H , vet 0,48, 24,22 g SP
OLF.vct 0.48. 16gSP
+ MF, vet 0,48, 13,74 g SP
-Quarts, vet 0.48, 12.77 g SP
- E vet 0.48, 53.95 g SP
• i , vet 0.48, 140,38 g SP
-
X
* C vet 048, 59.58 g SP
DF vet 0,48, 8,13 g SP
A HS vet 0.48, 7.99 g SP
XAQ, vet 0,48,26,55 g SP
X H , vet 0,48, 24,22 g SP
OLF.vct 0.48. 16gSP
+ MF, vet 0,48, 13,74 g SP
-Quarts, vet 0.48, 12.77 g SP
- E vet 0.48, 53.95 g SP
• i , vet 0.48, 140,38 g SP
-
CA + *
* C vet 048, 59.58 g SP
DF vet 0,48, 8,13 g SP
A HS vet 0.48, 7.99 g SP
XAQ, vet 0,48,26,55 g SP
X H , vet 0,48, 24,22 g SP
OLF.vct 0.48. 16gSP
+ MF, vet 0,48, 13,74 g SP
-Quarts, vet 0.48, 12.77 g SP
- E vet 0.48, 53.95 g SP
• i , vet 0.48, 140,38 g SP
-
. O
* C vet 048, 59.58 g SP
DF vet 0,48, 8,13 g SP
A HS vet 0.48, 7.99 g SP
XAQ, vet 0,48,26,55 g SP
X H , vet 0,48, 24,22 g SP
OLF.vct 0.48. 16gSP
+ MF, vet 0,48, 13,74 g SP
-Quarts, vet 0.48, 12.77 g SP
- E vet 0.48, 53.95 g SP
• i , vet 0.48, 140,38 g SP
-
0 1 2 3 4 5 6 7 8
Plastisc viscosity [Pas]
Figure 62: Plastic viscosity versus yield stress.
7.12.3 Rheology of mortars containing by-products
The mortars that contain the by-products with the finest particle size distributions have the highest yield stresses (Figure 63). These by-products are also the ones that have a zeta-potentials that indicate that the materials have a tendency to agglomerate.
540
400
440
390
L 340
1 290
2 240
190
140
90
40
• L F
• Quartz
A M F
+ C
A E
X F
O G
X H
* A Q
° H S
• L F
• Quartz
A M F
+ C
A E
X F
O G
X H
* A Q
° H S
• L F
• Quartz
A M F
+ C
A E
X F
O G
X H
* A Q
° H S
A A
• L F
• Quartz
A M F
+ C
A E
X F
O G
X H
* A Q
° H S
• L F
• Quartz
A M F
+ C
A E
X F
O G
X H
* A Q
° H S
t + •
• L F
• Quartz
A M F
+ C
A E
X F
O G
X H
* A Q
° H S
4-+
• L F
• Quartz
A M F
+ C
A E
X F
O G
X H
* A Q
° H S
• L F
• Quartz
A M F
+ C
A E
X F
O G
X H
* A Q
° H S
x • • • - r f W ^ x x * *• * ° D
6 8 10
Plastic viscosity[Pas]
Figure 63: Mortars with addition of by-products, the w/c-ratio is 0.6.
82
7.13 Rheology versus beta-p measurements
The values from the ß p measurements indicate that the water demand of the material compositions appear to correlate to the rheological parameters of cement pastes, i.e., yield stress and plastic viscosity. This means that it is a better method to use than the workability test from the initial test method.
7.13.1 Limestone fillers
The rheological measurements show that crystalline limestone fillers effect on rheological parameters differs from the sedimentary limestone fillers, even though they have the same particle size distribution. Fillers that have the same origin but different particle size distributions will , when mixed into cement paste, affect the rheology in different ways. The finer the material is the more it wil l increase the yield stress and plastic viscosity.
The ß p measurements show that i f materials with the same origin but different particle size distributions are compared, the filler that contains the highest amounts of fine particles wil l have the highest water demand and also higher yield stress and viscosity. The material with the coarser particle size distribution have lower ß p
values for all amounts of filler, this means that the material is more sensitive for water changes - coarser material need less water to moisten the surfaces. The result from the ß p measurements appears to correlate well with the viscosity and yield stress values.
7.13.2 By-products
The ß p measurements of cement paste with by-product addition correlates fairly well to the rheological measurements in those cases where the materials have a regular particle shape, smooth surfaces and are non porous. The irregular and porous materials behave more unpredictable.
7.14 Surface texture and particle size distributions effect on cement paste
The surface texture of crystalline and sedimentary limestone fillers influences the materials behaviour. Comparison of two lime stone fillers with the same particle size distribution but different origins, show that the smoother surface of the crystalline limestone give rise to a lower water demand than the more uneven surface of the sedimentary limestone filler (Paper 12).
Rheological measurements show that the yield stress and plastic viscosity increases with increasing amounts of fines. The particle packing increases at the same time, and the strength show a positive trend. Increasing amounts of coarse particles on the other hand appears to have a negative effect on the rheology, little effect on particle packing and strength. A fine particulate crystalline limestone mixed into cement paste has a higher total heat development than a coarser material.
83
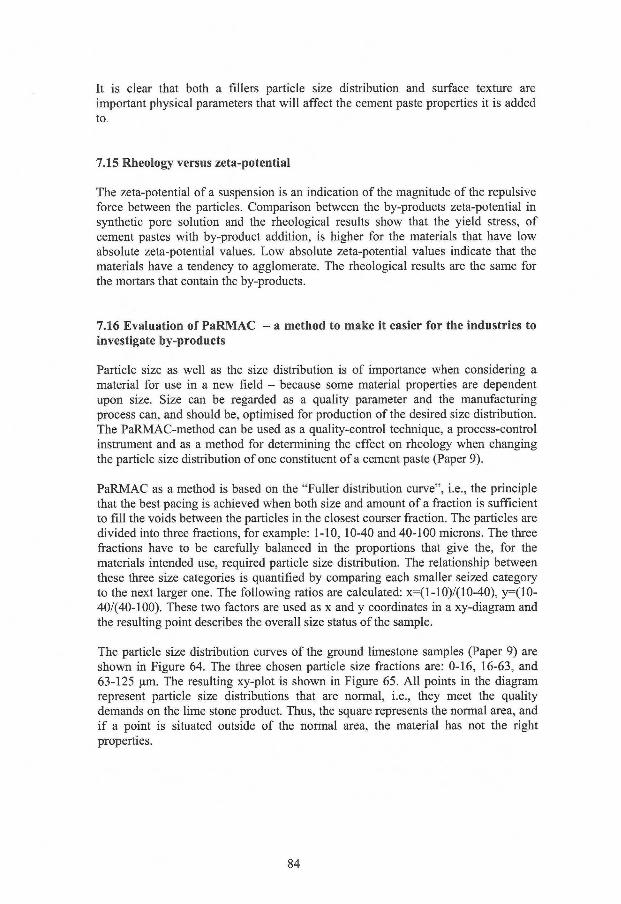
It is clear that both a fillers particle size distribution and surface texture are important physical parameters that wil l affect the cement paste properties it is added to.
7.15 Rheology versus zeta-potential
The zeta-potential of a suspension is an indication of the magnitude of the repulsive force between the particles. Comparison between the by-products zeta-potential in synthetic pore solution and the rheological results show that the yield stress, of cement pastes with by-product addition, is higher for the materials that have low absolute zeta-potential values. Low absolute zeta-potential values indicate that the materials have a tendency to agglomerate. The rheological results are the same for the mortars that contain the by-products.
7.16 Evaluation of PaRMAC - a method to make it easier for the industries to investigate by-products
Particle size as well as the size distribution is of importance when considering a material for use in a new field - because some material properties are dependent upon size. Size can be regarded as a quality parameter and the manufacturing process can, and should be, optimised for production of the desired size distribution. The PaRMAC-method can be used as a quality-control technique, a process-control instrument and as a method for determining the effect on rheology when changing the particle size distribution of one constituent of a cement paste (Paper 9).
PaRMAC as a method is based on the "Fuller distribution curve", i.e., the principle that the best pacing is achieved when both size and amount of a fraction is sufficient to fill the voids between the particles in the closest courser fraction. The particles are divided into three fractions, for example: 1-10, 10-40 and 40-100 microns. The three fractions have to be carefully balanced in the proportions that give the, for the materials intended use, required particle size distribution. The relationship between these three size categories is quantified by comparing each smaller seized category to the next larger one. The following ratios are calculated: x=(l-10)/(10-40), y=(10-40/(40-100). These two factors are used as x and y coordinates in a xy-diagram and the resulting point describes the overall size status ofthe sample.
The particle size distribution curves of the ground limestone samples (Paper 9) are shown in Figure 64. The three chosen particle size fractions are: 0-16, 16-63, and 63-125 pm. The resulting xy-plot is shown in Figure 65. A l l points in the diagram represent particle size distributions that are normal, i.e., they meet the quality demands on the lime stone product. Thus, the square represents the normal area, and i f a point is situated outside of the normal area, the material has not the right properties.
84
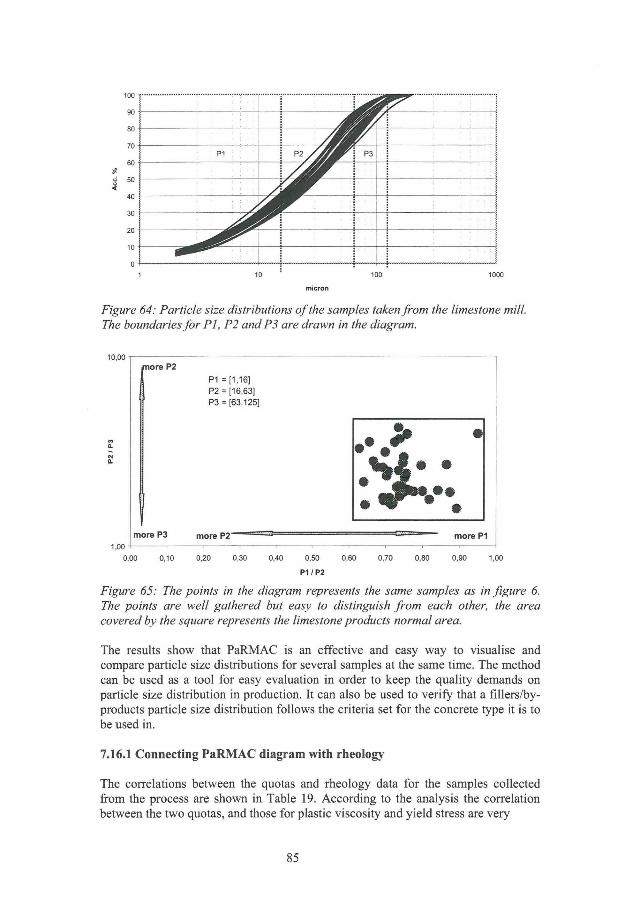
10 1000
Figure 64: Particle size distributions of the samples taken from the limestone mill. The boundaries for PI, P2 and P3 are drawn in the diagram.
more P2 P1 = [1,16] P2 = [16,63] P3 = [63,125]
• $
more r j more P2 — more P1
0,00 0,10 0,20 0,30 0,40 0,50 0,60 0,70 0,80 0,90 1,00
P1 /P2
Figure 65: The points in the diagram represents the same samples as in figure 6. The points are well gathered but easy to distinguish from each other, the area covered by the square represents the limestone products normal area.
The results show that PaRMAC is an effective and easy way to visualise and compare particle size distributions for several samples at the same time. The method can be used as a tool for easy evaluation in order to keep the quality demands on particle size distribution in production. It can also be used to verify that a fillers/byproducts particle size distribution follows the criteria set for the concrete type it is to be used in.
7.16.1 Connecting PaRMAC diagram with rheology
The correlations between the quotas and rheology data for the samples collected from the process are shown in Table 19. According to the analysis the correlation between the two quotas, and those for plastic viscosity and yield stress are very
85
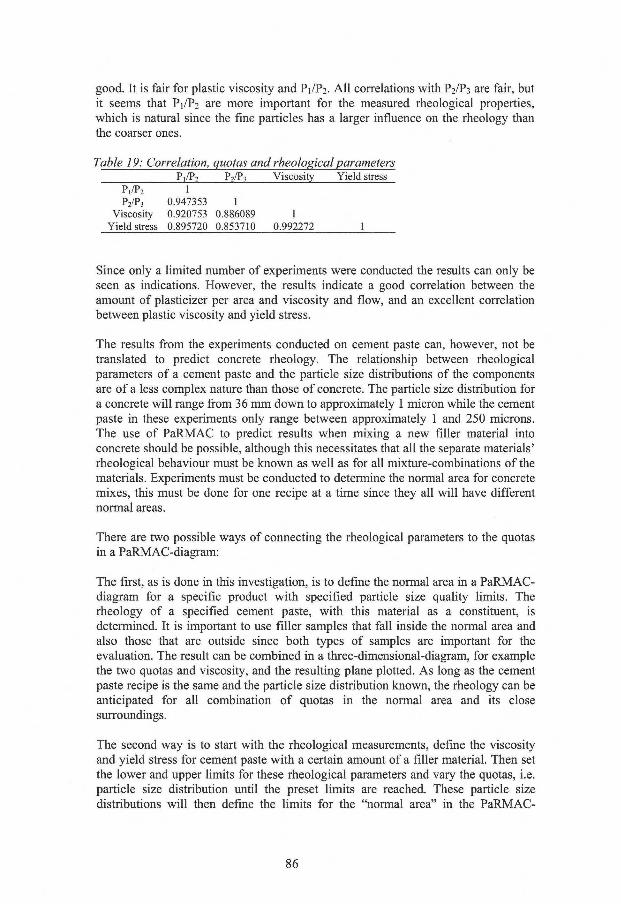
good. It is fair for plastic viscosity and P1/P2. A l l correlations with P2/P3 are fair, but it seems that P1/P2 are more important for the measured rheological properties, which is natural since the fine particles has a larger influence on the rheology than the coarser ones.
Table 19: Correlation, quotas and rheological parameters P1/P2 P2/P3 Viscosity Yield stress
P1/P2 1
P2/P3 0.947353 1 Viscosity 0.920753 0.886089 1
Yield stress 0.895720 0.853710 0.992272 1
Since only a limited number of experiments were conducted the results can only be seen as indications. However, the results indicate a good correlation between the amount of plasticizer per area and viscosity and flow, and an excellent correlation between plastic viscosity and yield stress.
The results from the experiments conducted on cement paste can, however, not be translated to predict concrete rheology. The relationship between rheological parameters of a cement paste and the particle size distributions of the components are of a less complex nature than those of concrete. The particle size distribution for a concrete will range from 36 mm down to approximately 1 micron while the cement paste in these experiments only range between approximately 1 and 250 microns. The use of PaRMAC to predict results when mixing a new filler material into concrete should be possible, although this necessitates that all the separate materials' rheological behaviour must be known as well as for all mixture-combinations of the materials. Experiments must be conducted to determine the normal area for concrete mixes, this must be done for one recipe at a time since they all will have different normal areas.
There are two possible ways of connecting the rheological parameters to the quotas in a PaRMAC-diagram:
The first, as is done in this investigation, is to define the normal area in a PaRMAC-diagram for a specific product with specified particle size quality limits. The rheology of a specified cement paste, with this material as a constituent, is determined. It is important to use filler samples that fall inside the normal area and also those that are outside since both types of samples are important for the evaluation. The result can be combined in a three-dimensional-diagram, for example the two quotas and viscosity, and the resulting plane plotted. As long as the cement paste recipe is the same and the particle size distribution known, the rheology can be anticipated for all combination of quotas in the normal area and its close surroundings.
The second way is to start with the rheological measurements, define the viscosity and yield stress for cement paste with a certain amount of a filler material. Then set the lower and upper limits for these rheological parameters and vary the quotas, i.e. particle size distribution until the preset limits are reached. These particle size distributions wil l then define the limits for the "normal area" in the PaRMAC-
86
diagram and make it possible to steer the process so that the particle size distribution always correlates to the wanted rheological properties.
7.17 From laboratory to full-scale experiments
In order to verify the validity of the developed test method concerning strength, rate of reaction and heat development one fine particulate material, a fdter dust, was first examined in laboratory scale. The result from the laboratory investigation showed that it was possible to use the filter dust as filler in concrete. It has a retarding effect on cement hydration and strength i f added in large amounts (>10-15 percent), however, the long terms strength is high. Thereafter, the dust was mixed into concrete and a full scale casting of a culvert foundation was made.
The results from the laboratory investigation correlate well with the results from the full-scale experiment. The operators were positive in their evaluation of the concrete mixture. However, their opinion were that the material needs to be handled in some sort of dispenser system, since it is fine particulate and very dark, to avoid being blackened by the material (Paper 16).
7.18 Other benefits from the use of by-products - aesthetical properties
Addition of industrial by-products to concrete may not only affect its technical properties, but also aesthetical ones, for example the colour of the cement paste or the texture or concrete surfaces
7.18.1 Colouring
The colouring of concrete is not only a technique it is also an art form. There are many grey concrete walls that have been covered by layers of paint in order to brighten the view for the people that work in/live in/passes by the buildings. Thus, the walls become more "friendly" for a while - until the colour start to flake of. I f the whole mass of concrete is coloured instead, any peace of the concrete surface that flakes off will only create a new surface and not destroy the overall impression of the coloured wall.
It has become more common, during the last decade, to colour concrete constructions either by integral methods or by the application of colour after the concrete has set and hardened. There are for example, several bridges in Sweden that are integrally coloured with red iron oxide (Fe2Ü3). Instead of using ground iron ore, it is possible to utilise fine particulate by-products from the metallurgical industries that mainly consist of iron oxides. These materials may give the concrete reddish yellow, red, brown or dark grey to black colours. By using them, it is also possible to obtain several shades of grey, from a light grey to a dark anthracite colour, which gives the architects new means to express the beauty of concrete structures.
Cr203 is a metal oxide used as green pigment in concrete, there are by-products that could be used instead.
87
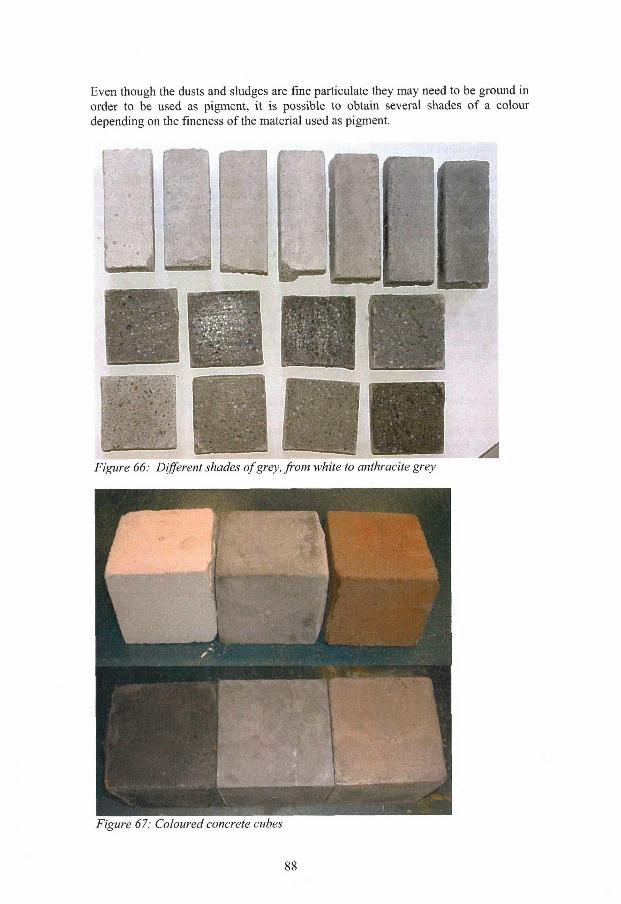
Even though the dusts and sludges are fine particulate they may need to be ground in order to be used as pigment, it is possible to obtain several shades of a colour depending on the fineness of the material used as pigment.
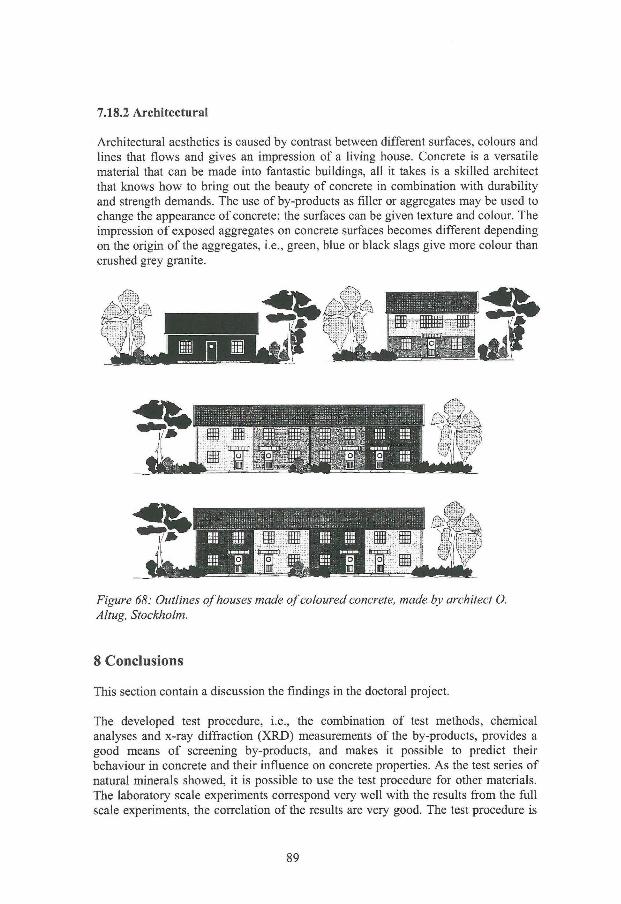
7.18.2 Architectural
Architectural aesthetics is caused by contrast between different surfaces, colours and lines that flows and gives an impression of a living house. Concrete is a versatile material that can be made into fantastic buildings, all it takes is a skilled architect that knows how to bring out the beauty of concrete in combination with durability and strength demands. The use of by-products as filler or aggregates may be used to change the appearance of concrete; the surfaces can be given texture and colour. The impression of exposed aggregates on concrete surfaces becomes different depending on the origin of the aggregates, i.e., green, blue or black slags give more colour than crushed grey granite.
Figure 68: Outlines of houses made of coloured concrete, made by architect O. Altug, Stockholm.
8 Conclusions
This section contain a discussion the findings in the doctoral project.
The developed test procedure, i.e., the combination of test methods, chemical analyses and x-ray diffraction (XRD) measurements of the by-products, provides a good means of screening by-products, and makes it possible to predict their behaviour in concrete and their influence on concrete properties. As the test series of natural minerals showed, it is possible to use the test procedure for other materials. The laboratory scale experiments correspond very well with the results from the full scale experiments, the correlation of the results are very good. The test procedure is
89
now adopted by the Swedish Cement and Concrete Research Institute, and is considered to be a valuable and timesaving tool in the process of screening possible filler materials. It is also used in industrial research projects conducted by: MiMeR (Minerals and Metals Resycling Research Centre), MinFo (Swedish Mineral Processing Research Association) and MinBaS (Mineral, Aggregates Stone).
Addition of by-products to concrete improve certain concrete properties at the same time as it is a viable means of using materials that would otherwise be deposited. Even i f a fdler is inert, it may give the concrete a higher strength; not by chemical reaction, but by the added amount of fine material in the paste. The addition of fillers affects the concrete structure and cement pastes containing fine particles have a denser and more homogenous structure than pastes without filler, i.e., filler addition improves particle packing and reduces the wall effect. When the homogeneity increases, the concrete wi l l obtain better properties on the whole. The use of superplasicizers is necessary for achieving the best dispersion of the filler. The homogeneity of the pastes that contain the finest fillers may also be a result of the particles acting as nucleation sites, and thus improving hydration. In an environmental context, this phenomenon may be turned to advantage and it may also make it possible to use less cement without loss of material strength.
Based on the results, the conclusion can be drawn that an improved particle packing in the concrete leads to a higher strength without an increase in cement content. Several of the by-products generated by the mineral and metallurgical industries can therefore be recycled into concrete to bring about improvements in strength, durability and rheology.
This study show that the PaRMAC method can become an important tool for the users and producers of by-products as a quality-control technique, as a process-control instrument or as a method for determining the effect of a certain property, for example: the rheology when changing the particle size distribution of one constituent of a cement paste.
Evaluation and characterisation of physical properties of the filler materials show that they have varying particle shapes and particle size distributions etcetera. This means that it should always be possible to find a by-product whose physical properties wil l correlate to the production specifications of cement-based products, i.e., quality demands and properties in fresh and hardened state.
It is clear that almost all by-products from the mineral and metallurgical industries can be used in cement-based products, with the exception of materials that contain reactive calcium oxide and/or reactive magnesium oxide. Otherwise it is a matter of deciding what properties that are desirable of the concrete - addition of a by-product may change the dormant period of the cement hydration so that it becomes several days or even weeks long, the initial rate of reaction and strength of the concrete may also be low. Addition of by-products to mortars and concretes change their water demand and rheological behaviour. However, the end results are similar concerning long-term reaction rate and strength. It is important to remember that it is not possible to take an old concrete recipe and substitute a filler material directly with a fine particulate by-product. The recipe has to be recalculated and allowance made for the by-products physical properties, for example the amount of superplasticizer may
90
have to be increased, the amount of cement or aggregates changed in order to obtain the same workability as in the old recipe.
It is very important to have proper curing and hardening conditions i f by-products that contains retarding metal oxides, such as zinc and/or lead oxides, are used as filler. The oxides wil l affect the early cement reactions and i f the cement paste/concrete is left without curing water it will be dehydrated in a few days time, the consequence is that the cement can not hydrate and the material will not obtain any strength. However, i f the conditions are proper the result wil l be positive regarding the cements reaction rate and long-term strength.
The results from the modification experiments on some steel-slags clearly show that it is possible to change their properties, so that they become compatible with cement in concrete. This can be done either by physical modification (i.e., sieving or grinding) or by remelting followed by granulation.
It is proven that the test method is valid and that there are suitable materials available, however, there are other obstacles to overcome before by-products are commonly used in cement-based products. For instance, laws and regulations that states what type of materials that are allowed to be used in concrete. Usually these regulations and laws demand that materials are "certified", i.e., registered as products. This is a process that takes time and is expensive, especially with regard to the fact that even i f a by-product is certified, it may prove almost impossible to sell it on the market since no one has tried it in concrete constructions before. The reason that no one tries to use these materials is that the regulations states that the builder has to be responsible for the new materials, thus everyone prefers to use "old" known materials. This "catch 22-sequence" has to be broken and the use of by-products encouraged by laws and governmental decrees.
Industrial by-products should be considered as a potentially valuable resource merely awaiting appropriate treatment and application.
9 Further research and development
The by-products that have positive properties, with regard to cement pastes/concretes strength, heat development and volume stability have to be further evaluated before they can be put forward as products, i.e. filler material.
Properties that have to be investigated: • Carbonisation depth - as the influence of the relative humidity. • Resistance against chemical attacks, • Chloride diffusion and chloride binding capacity (Seawater resistance), • Effect on rebar corrosion, • Freeze-thaw resistance, • Sulphate resistance etc.
Environmental concern makes it important to compare leaching between ordinary concrete, concrete containing inert filler (quartz) and concrete containing byproducts. Wil l the leaching mechanisms change with by-product addition?
91
We know that the particle surfaces are important for a materials rheological behaviour, but we do not know to what extent the surfaces affects certain cement paste properties. Investigation of polymer adsorption on limestone particles with different surface textures wil l give more information on how the texture affects the needed amount of surfactant
Further investigations of the effect of metal oxides on cement hydration: • Their effect on the hydration mechanisms • The position of metal ions in the cement matrix • The bindings formed between metal ions and cement gel • Are the metal ions bound in the cement pastes or wil l they leach • Can the retardation of zinc and lead oxides be countered? I f possible, what is
the mechanism and can by-products that have a retarding effect be treated the same way?
Optimisation of by-product mixes used as raw material in briquettes, which are to be recirculated to a metal producing process. How shall one compose an optimal recipe, that ensures that enough of the metal bearing by-products are used at the same time, as the strength is high and the curing/hardening time short?
Investigate the effect of monosized fdler, fdler consisting of two monofractions, three... etcetera, on cement pastes/concretes particle packing, compressive strength and rheological properties.
92
10 References
Andersen P.J. The effect of superplasticizers and air-entraining agents on the zeta potential of cement particles. Cement and Concrete Research, Vol. 16, 1986, pp. 931-940.
Bache H.H.The processing of fresh concrete. BFL Report no 313. Concrete research laboratory, Karistrup, Denmark 1973.
Bache H.H. Densified cement ultrafine particle based materials. Cement och betong laboratoriet. Report No. 40 Aalborg, Denmark 1981.
Banfill P.F.G. The rheology of fresh concrete - a review, Prodeedings of the 11th international congress on the chemistry of cement, Durban, South Africa, 2003 pp. 50-62.
Barnes H.A., Hutton J.F. and Walters K. An Introduction to rheology, Elsevier Science, Amsterdam, Netherlands, 1996, p. 199.
Bentur, A., Berger, R.L., Kung, J.H., Milestone, B. and Young, J.F. Structural properties of calcium silicate pastes: I I , Effect of curing temperature. Journal of the American Ceramic Society. Vol 62, 7-8, 1979, p 362-366.
vom Berg W., Influence of specific surface and concentration of solids upon the flow behaviour of cement pastes. Magasine of concrete research vol. 31,No 109, 1979, pp. 211-216.
Billberg, P., Self-compacting concrete for civil engineering structure - the Swedish experience, CBI-report 2:99. Swedish Cement and Concrete Research Institute, Stockholm, Sweden, 1999.
Braunauer S., Emmett P.H. and Teller E. Absorption of gases in multimolecular layers, Journal ojAm. Chem. Soc. Vol. 60, 1938, p. 309.
Bhatty, J.I., MacGregor Miller, F., West, P.B. and Öst, B.W. Stabilization of heavy metals in Portland cement, silica fiime/Portland cement and masonry cement matrices: effects of salts and oxides on paste properties and acetic acid leachability. Portland Cement Association Research & Development, PCA R&D Serial No 2067, RP348. 1999, p 7-17.
Colloidal Dynamics 2002 - Introducing the ZetaProbe (www.colloidal-dynamics.com)
Conner J. R. (1990) Chemical fixation and solidification of hazardous wastes, Van Nostrand Reinhold. New York, USA. Pp.692.
Copeland, L.E. and Kantro, D.L. Hydration of Portland cement. Proceedings of the 5th international ISCC symposium on the chemistry of cement 1968, vol I I . 1969, p 387-420.
93
Cumberland, DJ . and Crawford, RJ. Handbook of powder technology: The packing of particles. Elsevier. Amsterdam, The Netherlands, 1987.
Daimon M . and Roy D.M. Rheological properties of cement mixes: I Methods, preliminary experiments, and adsorption studies. Cement and Concrete Research, Vol. 8, 1978, pp. 753-764.
Daimon M. and Roy D.M. Rheological properties of cement mixes: I I Zeta potential and potential and preliminary viscosity studies. Cement and concrete research, Vol 9, No 1, 1979, pp. 103-110.
EFNARC, Specification and guidelines for self-compacting concrete. EFNARC Association House, Hampshire, UK, 2001.
Euroslag, statistics from www.euroslag.com
Feret, R. Sur la compacité des mortiers hydraliques. Annales des Ponts et Chaussées, 2 n d Semester, 1892, p 5-161.
Flatt RJ. and Bowen P. Electrostatic repulsion between particles in cement suspensions: Domain of validity of linearized Poisson-Boltzmann equation for nonideal electrolytes, Cement and concrete research, Vol 33, 2003, pp. 781-791.
Flatt RJ. and Houst Y.F. A simplified view on chemical effects pertubing the action of superplasticizers, Cement and concrete research, Vol 31, 2001, pp. 1169-1176.
Forsmo S.P.E., Forsmo S-E. and Samskog P-O. Characterization of changes in particle size distribution by the PaRMAC evaluation method, KONA Powder and Particle No. 17,1999, pp.106-113.
Furnas, C.C. Grading the aggregates I - Mathematical relations for beds of broken solids of maximum density. Ind. Eng. Chem. 23 (9) 1931, p 1052-1058.
Gaskell D.R. Introduction to metallurgical thermodynamics, second edition, Taylor and Francis, 1981, p. 611.
Hela R., Stastnik S. and Zach J. Rheology and reactive testing methods for properties of cement mortars and their utilization for concrete design, Proceedings from 2nd
international RILEMworkshop on life prediction and aging management of concrete structures, Edt. Naus D.T., 2003, pp. 173-184.
Hiemenz P.C. and Rajagopalan R. Principles of colloid and surface chemistry, Marcel Dekker, Inc, NY, USA, 1997, p.650
Jennings, H.M. The developing microstructure in Portland cement. Advances in cement technology. Edt. Ghosh, S.N. 1982, p 350-385.
94
Jiang, S.P, Mutin, J.C & Nonat. A. Effect of Fillers (Fine Particles) on the Kinetics of Cement Hydration. Proceedings Of the 3rd Bejing International Symposium on Cement and Concrete. Bejing, China, vol. 3, 1993, 126-131.
Johansen, V. and Andersen, P.J. Particle packing and concrete properties. Materials Science of Concrete I I , Skalny, J and Mindess, S. Eds., American Ceramic Society, 1989, p 111-147.
Johansen K., Meland, I . , Lindgård J., Wallevik O., Skjeggerud, K , Lundevall G. And Hauck C. Effekt av ulike filler-typer i sementbaserte materialer. Report no. STF70 A92035, SINTEF Structures and concrete, Trondheim, 1992. (in Norwegian)
Kantro, D.L., Brunauer, S. And Weise, CH. Development of surface in the hydration of calcium silicates. I I . Extension of investigations to earlier and later stages of hydration. Journal of Physical Chemistry. 66, 1962, p 1804-1809.
Knudsen, T. On particle size distribution in cement hydration Proceedings from the 7th International Congress on the Chemistry of Cement. Vol I I , 1980, pp. 1-170-175.
Kronlöf, A. Filler effect of inert mineral powder in concrete, PhD Thesis, VTT publications 322, 1997.
Lagerblad, B. and Kjellsen, K.O. Normal and high strength concretes with conventional aggregates. Engineering and Transport Properties of the Interfacial Transition Zone in Cementitious Composites RILEM Report 20, 1999, 53-70.
Larsén, A. Partikelpackning- proportionering av betong, (Particle packing- concrete mix design) in Swedish, 1991, CBI-report 6:91.
McGeary, R.K. Mechanical Packing of Sperical Particles. Journal of American Ceramic Society, 44 (10), 1961, p 513-522
McGraw-Hill concise encyclopedia of science and technology. 1984, McGraw-Hill, Inc
Mehta, P.K., Concrete Structure, Properties, and Materials New Jersy, USA. Prentice-Hall, 1986, p 17-41.
Murdock L.J., The workability of concrete, Magazine: Concrete Research Vol. 2, No. 36, 1960, pp. 35-44.
Neville, A.M. Properties of Concrete. Essex, UK. Longman Group Ltd, 1995.
Nägele E. The zeta-potential of cement. Cement and Concrete Research, Vol. 15, 1985, pp. 453-462.
Nägele E. The zeta-potential of cement Part I I : Effect of pH-value. Cement and Concrete Research,Vo\. 16, 1986, pp. 853-863.
Perkin Elmer User Manual 1992 - "Perkin Elmer System 2000 FT-IR
95
Powers, T.C. The properties of fresh concrete. John Wiley & Sons, Inc. New York, USA. 1968, 664 p.
Ramachandran. V.S., Malhotra, V.M., Jolicoeur, C. and Spiratos, N . Superplasticizers: Properties and applications in concrete. CANMET, Ottawa, Canada. 1998,404 p.
Rhodes, M . Introduction to Particle Technology. John Wiley & sons, Brisbane, Australia, 1999.
Rixiom, R. and Mailvaganam, N. Chemical admixtures for concrete. 3 r d edition. E & F Spoon Ltd. London, UK. 1999, 437 p.
Roy, D.M. and Idorn, G.M. Hydration, structure, and properties of blast furnace slag cements, mortars, and concrete ACUournal No.6, 1982, pp. 444-457.
Scrivener, K.L. and Pratt, P.L. Characterisation of interfacial microstructure. RILEM TC 108-ICC: Interfacial Transition zone in Concrete, ed. Mass J. C, E & F Spoon Ltd. London, UK. 1996, p. 3-16.
Smith B.C. Fundamentals of fourier transform infrared spectroscopy, CR Press LLC, FL, USA, 1996. p.202
Stovall, T., de Larrard, F. And Buil, M . (1986) Linear packing density model of grain mixtures. Powder Technology 48, 1986, pp. 1-12.
Struble L. and Sun G.K. Viscosity of portland cement paste as a function of concentration, Advanced cement based materials, 1995, 2, 62-69.
Struble L.J. The rheology of fresh cement paste, Advances in cementitious materials, Ceramic Transactions, edt. S. Mindess, Vol. 16, 1990, pp. 7-26
Taplin J.H. Proceedings from the 5 t h International Symposium on the Chemistry of cement, Cement Association of Japan, 1969, Vol. 2, pp.337-348.
Tattersall G.H. and Banfill P.F.G. The rheology of fresh concrete. Pitman Books Ltd. London 1983.
Taylor, H.F.W. Cement Chemistry. Academic Press Limited. London, UK, 1997.
Tossavainen M . Statistik över restproducter från mineralindustrin (in Swedish) MiMeR report 2002-X-06, p. 8.
Uchikawa H., Hanehara S.and Sawaki D. The role of steric repulsive force in the dispersion of cement particles in fresh paste prepared with organic admixture. Cement and Concrete Research, Vol. 27, 1997, pp. 37-50.
Wu X. and Roy D.M. Zeta potential investigation during hydration of slag cement. Proceedings, Materials research society symposium 1982, ed. by Jan Skalny.
96
Wu, X., Roy, D.M and Langton, C.A."Early stage hydration of slag-cement" Cement and Concrete Research Vol. 13, 1983, pp. 277-286.
Yoshioka K., Sakai E., Daimon M . and Kitahara A. Role of steric hindrance in the performance of superplasticizers for concrete. Journal of American Ceramic Society, Vol. 80, No. 10, 1997, pp. 2667-2671.
Youshioka K., Tazawa E-L, Kawai K. and Enohata T. Adsorption characteristics of superplasticizers on cement component minerals, Cement and Concrete Research Vol. 32, 2002, pp. 1507-1513.
Zelwer A. Propriétés électrocinétiques å la surface des minéraux du ciment Portland (Electrokineti surface properties of Portland cement minerals) Proceedings from the 7th International Congress on the Chemistry of Cement 2, I I , 1980, pp. 147-152. (in French)
Zhang T., Shang S., Yin F., Aishah A., Salmiah A. and Ooi T.L. Adsorptive behaviour of surfactants on surface of Portland cement, Cement and Concrete Research Vol. 31, 2001, pp. 1009-1015.
97

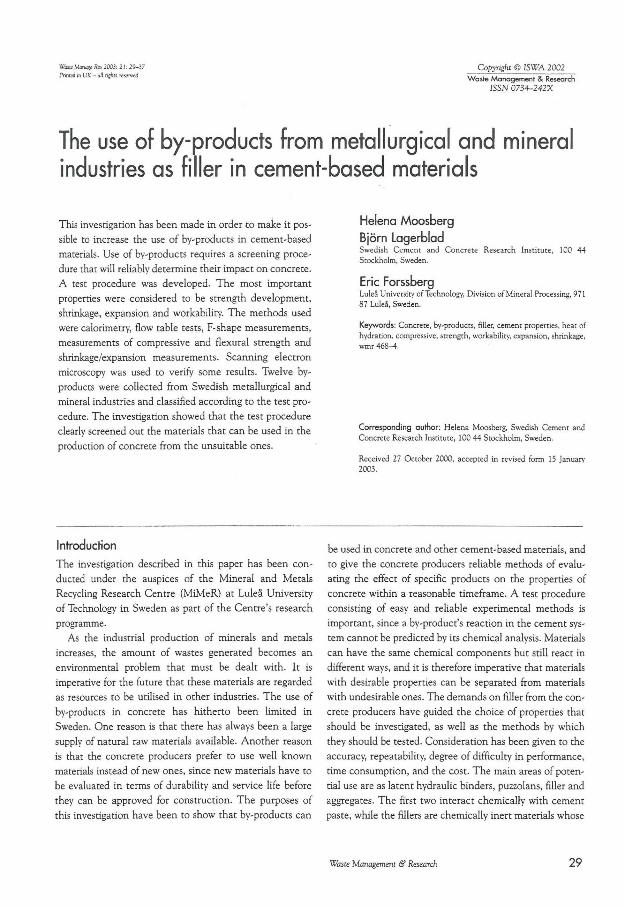
Wate Manage Ses 2003: 21. 29-37
Primed in UK - all rights reserved Copyright © ISWA 2002
Waste Management & Research ISSN 0734-242%
The use of by-products from metallurgical and mineral industries as filler in cement-based materials
This investigation has been made in order to make it pos
sible to increase the use of by-products in cement-based
materials. Use of by-products requires a screening proce
dure that will reliably determine their impact on concrete.
A test procedure was developed. The most important
properties were considered to be strength development,
shrinkage, expansion and workability. The methods used
were calorimetry, flow table tests, F-shape measurements,
measurements of compressive and flexural strength and
shrinkage/expansion measurements. Scanning electron
microscopy was used to verify some results. Twelve by
products were collected from Swedish metallurgical and
mineral industries and classified according to the test pro
cedure. The investigation showed that the test procedure
clearly screened out the materials that can be used in the
production of concrete from the unsuitable ones.
Helena Moosberg
Björn Lagerblad Swedish Cement and Concrete Research Institute, 100 44 Stockholm, Sweden.
Eric Forssberg Luleå University of Technology, Division of Mineral Processing, 971 87 Luleå, Sweden.
Keywords: Concrere, by-products, filler, cement properties, heat of hydration, compressive, strength, workability, expansion, shrinkage, wmr 468-4.
Corresponding author: Helena Moosberg, Swedish Cement and Concrete Research Institute, 100 44 Stockholm, Sweden.
Received 27 October 2000, accepted in revised form 15 January 2003.
Introduction
The investigation described in this paper has been con
ducted under the auspices of the Mineral and Metals
Recycling Research Centre (MiMeR) at Luleå University
of Technology in Sweden as part of the Centre's research
programme.
As the industrial production of minerals and metals
increases, the amount of wastes generated becomes an
environmental problem that must be dealt with. It is
imperative for the future that these materials are regarded
as resources to be utilised in other industries. The use of
by-products in concrete has hitherto been limited in
Sweden. One reason is that there has always been a large
supply of natural raw materials available. Another reason
is that the concrete producers prefer to use well known
materials instead of new ones, since new materials have to
be evaluated in terms of durability and service life before
they can be approved for construction. The purposes of
this investigation have been to show that by-products can
be used in concrete and other cement-based materials, and
to give the concrete producers reliable methods of evalu
ating the effect of specific products on the properties of
concrete within a reasonable timeframe. A test procedure
consisting of easy and reliable experimental methods is
important, since a by-product's reaction in the cement sys
tem cannot be predicted by its chemical analysis. Materials
can have the same chemical components but still react in
different ways, and it is therefore imperative that materials
with desirable properties can be separated from materials
with undesirable ones. The demands on filler from the con
crete producers have guided the choice of properties that
should be investigated, as well as the methods by which
they should be tested. Consideration has been given to the
accuracy, repeatability, degree of difficulty in performance,
time consumption, and the cost. The main areas of poten
tial use are as latent hydraulic binders, puzzolans, filler and
aggregates. The first two interact chemically with cement
paste, while the fillers are chemically inert materials whose
Waste Management & Research 29
Helena Moosberg, Björn Lagerblad, Eric Forssberg
function in concrete is based on surface properties, size and
shape.
When not only the technical and economical attrac
tiveness of the by-products is considered but also the eco
logical and energy-conserving implication of their use, the
importance of finding a wide field of application increases.
Concrete is the most frequently used construction mate
rial today. It is commonly made by mixing Portland cement
with sand, rock/gravel and water. Concrete can be consid
ered a composite material, consisting of aggregates, with a
varying size distribution, in a matrix of binding medium.
The main component of the binder is a calcium silicate
hydrate gel formed from the mixture of hydraulic cement
and water. Hydraulic cement hardens by reacting with
water and thus forms a water-resistant product. Fillers and
fines are products that are part of the aggregate, but they
can also be added to strengthen the paste.
A number of different waste products (by-products) are
generated during mining and production of minerals and
metals. Some of these are recycled back to the process and
some are used in other applications. When slag formers are
added to a metal extraction/refining process in order to
remove impurities the slag cannot, in most cases, be recy
cled to the process. In this case the only alternative may be
to find uses for the slag in other applications, i.e. replacing
virgin materials.
Research study
To be able to persuade concrete producers to use by
products, it is important to prove that they are harmless
and that they may even improve the concrete. The most
vital properties are considered to be strength, durability,
i.e. shrinkage and expansion and the rheology/workability
of the cement paste. Test methods were chosen according
to these criteria as well as for simplicity of use and evalua
tion. Standard equipment and methods have been chosen
to make it possible to conduct these tests in a normal con
crete laboratory without further investments in equipment.
Earlier investigations on natural minerals (Kjellsen &
Lagerblad 1995), and on slags (Wu 1983) have also served
as a guideline.
The choice of properties and methods is based on the
knowledge (Taylor 1990, Neville 1995, Betonghandbok:
Material 1994) of how a concrete should be designed to
suit the concrete producers and users. Concrete strength,
which is a very important property, depends on the homo
geneity of the paste phase and the amount of internal
cracks. Homogeneity in a paste depends on how it is mixed
and how well the cement and filler blend together. The
filler addition may lower the workability of the paste if the
material reacts chemically, or due to a particle shape that
increases the water demand, and thus the paste will be
more difficult to mix properly. It is not possible to increase
the amount of added water, since there is a correlation
between the amount of water and cement, i.e. w/c-ratio,
which is pre-set for different concrete types. The w/c-ratio
is also important for strength since it determines the poros
ity of the paste - higher water content leads to higher
porosity and thus lower strength. Another disadvantage
with high viscosity is that it is more difficult to cast con
crete of high viscosity than concrete that has a better
workability. When concrete is exposed to high shrinkage
cracking will occur, which will give lower strength and also
lower durability. Expansion will also cause cracking and
thus strength loss in the hardened paste. The addition of a
by-product may positively influence the concrete's perfor
mance but can at the same time make it brittle, i.e.
decrease the flexural strength, or vice versa.
Twelve by-products were collected from MiMeR's mem
ber companies and their chemical and mineralogical prop
erties characterised. A test procedure was developed to
examine the impact of the by-products on concrete rheol
ogy, strength, chemical impact and durability. In the con
crete mixtures the different by-products replaced 45% by
weight of the cement. The early hydration was studied by
isothermal calorimetry, and the fresh properties by flow
table. The particle shape was analysed using a scanning
electron microscope, and the parameter F-shape defined.
Compressive and flexural strength were measured on con
crete prisms of 4 x 4 x 16 cm 3 . The durability, i.e. shrink
age and expansion of concrete prisms of 2.5 x 2.5 x 25 cm 3
were measured. The cement used in this investigation is a
standard Portland cement from Sweden, Slite Standard
(CEMI42.5R) .
Materials
The test materials were chosen to give a variety of the
available by-products, such as ferro silicate from copper
melting, fayalite slag ( F - l ) , two different electric arch fur
nace slags, EAF-slags (EAF-1, E A F - 2 ) , three ladle fur
nace slags, LF-slags (LF-1, L F - 2 , L F - 3 ) , two slags from
stainless steel making, AOD-slags (AOD-1, A O D - 2 ) .
Along with a slag from metal dust recycling ( D - l ) , alu
minium silicate from coal-heated power plants, ( A - l ) , and
two waste-limes from gas desulphurising ( L - l , L -2 ) . To
establish a basis for comparison, pure natural quartz was
used as a reference, since it can be considered to be an
inert material; it is also commonly part of the aggregates.
The quartz-cement mixture was treated and tested in the
30 Waste Management & Research
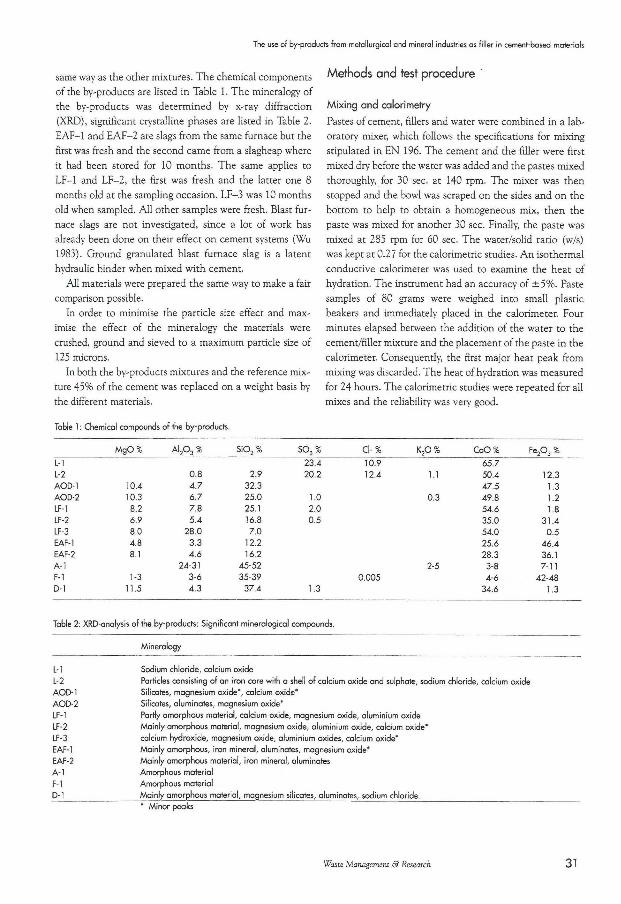
The use of by-products from metallurgical and mineral industries as filler in cement-based materials
same way as the other mixtures. The chemical components
of the by-products are listed in Table 1. The mineralogy of
the by-products was determined by x-ray diffraction
(XRD), significant crystalline phases are listed in Table 2.
EAF-1 and E A F - 2 are slags from the same furnace but the
first was fresh and the second came from a slagheap where
it had been stored for 10 months. The same applies to
LF-1 and L F - 2 , the first was fresh and the latter one 8
months old at the sampling occasion. LF-3 was 10 months
old when sampled. All other samples were fresh. Blast fur
nace slags are not investigated, since a lot of work has
already been done on their effect on cement systems (Wu
1983). Ground granulated blast furnace slag is a latent
hydraulic binder when mixed with cement.
All materials were prepared the same way to make a fair
comparison possible.
In order to minimise the particle size effect and max
imise the effect of the mineralogy the materials were
crushed, ground and sieved to a maximum particle size of
125 microns.
In both the by-products mixtures and the reference mix
ture 45% of the cement was replaced on a weight basis by
the different materials.
Table 1: Chemical compounds of the by-products.
Methods and test procedure
Mixing and calorimetry
Pastes of cement, fillers and water were combined in a lab
oratory mixer, which follows the specifications for mixing
stipulated in E N 196. The cement and the filler were first
mixed dry before the water was added and the pastes mixed
thoroughly, for 30 sec. at 140 rpm. The mixer was then
stopped and the bowl was scraped on the sides and on the
bottom to help to obtain a homogeneous mix, then the
paste was mixed for another 30 sec. Finally, the paste was
mixed at 285 rpm for 60 sec. The water/solid ratio (w/s)
was kept at 0.27 for the calorimetric studies. A n isothermal
conductive calorimeter was used to examine the heat of
hydration. The instrument had an accuracy of ± 5 % . Paste
samples of 80 grams were weighed into small plastic
beakers and immediately placed in the calorimeter. Four
minutes elapsed between the addition of the water to the
cement/filler mixture and the placement of the paste in the
calorimeter. Consequently, the first major heat peak from
mixing was discarded. The heat of hydration was measured
for 24 hours. The calorimetric studies were repeated for all
mixes and the reliability was very good.
MgO% A l 2 0 3 % S i0 2 % SO,% 0-% K 2 0 % CaO% F e 2 0 3 %
L-l 23.4 10.9 65.7 L-2 0.8 2.9 20.2 12.4 1.1 50.4 12.3 AOD-1 10.4 4.7 32.3 47.5 1.3 AOD-2 10.3 6.7 25.0 1.0 0.3 49.8 1.2 LF-1 8.2 7.8 25.1 2.0 54.6 1.8 LF-2 6.9 5.4 16.8 0.5 35.0 31.4 LF-3 8.0 28.0 7.0 54.0 0.5 EAF-1 4.8 3.3 12.2 25.6 46.4 EAF-2 8.1 4.6 16.2 28.3 36.1 A-l 24-31 45-52 2-5 3-8 7-11 F-l 1-3 3-6 35-39 0.005 4-6 42-48 D-l 11.5 4.3 37.4 1.3 34.6 1.3
Table 2: XRD-analysis of the by-products: Significant mineralogical compounds.
Mineralogy
L-l Sodium chloride, calcium oxide
L-2 Particles consisting of an iron core with a shell of calcium oxide and sulphate, sodium chloride, calcium oxide AOD-1 Silicates, magnesium oxide*, calcium oxide*
AOD-2 Silicates, aluminates, magnesium oxide*
LF-1 Partly amorphous material, calcium oxide, magnesium oxide, aluminium oxide
LF-2 Mainly amorphous material, magnesium oxide, aluminium oxide, calcium oxide*
LF-3 calcium hydroxide, magnesium oxide, aluminium oxides, calcium oxide*
EAF-1 Mainly amorphous, iron mineral, aluminates, magnesium oxide*
EAF-2 Mainly amorphous material, iron mineral, aluminates
A-l Amorphous material
F-l Amorphous material
D-l Mainly amorphous material, magnesium silicates, aluminates, sodium chloride. " Minor peaks
Waste Management & Research 31
Helena Moosberg, Björn Lagerblad, Eric Forssberg
F-shape
Samples of the ground particles were mixed with epoxy
resin and the resulting test specimens polished. This will
give cut surfaces of randomly oriented particles. Persson
(1996) describes the method and the parameter defini
tions. Images of the ground by-products particle shapes
were taken with a scanning electron microscope. Image
analysis (computer analysis of digital images) was used to
define the parameter F-shape, which is an aspect ratio of
the shortest versus the longest diameter of a particle. At
least 400 particles in each sample were measured.
Spherical particles have an F-shape value of 1, and cubical
particles 0.71. The image analysis study makes it possible
to describe the particle shapes and surface textures of the
fine materials, hence providing a means of determining the
water demand and workability. F-shape together with the
flow table tests of the mixed mortars gives a good concep
tion of how the particles behave. In this investigation F-
shape is measured to verify the results of the flow test.
Flowability
For the flow table tests and the casting of concrete prisms
the w/s ratio was increased to 0.50. 1,350 grams of a stan
dard sand, D I N - E n 196-1 with a maximum particle size of
2 mm, was added to the paste and mixed according to the
EN 196 procedure. The flow tests of the mortar were done
according to the S S - E N 1015-3 procedure.
Strength
The strength of the concrete is a very important property.
Both compressive and flexural strength were tested in this
investigation.
To test the compressive and flexural strength, concrete
prisms of 4 x 4 x 16 cm 3 were cast in steel moulds.
Demoulding took place after 24 hours and the prisms were
cured and stored in 100% relative humidity (RH).
The concrete prisms were tested in three-point bending
(flexural strength) after 28 days. The compressive strength
of the prisms was tested with uniaxial compression at 1, 7,
28 and 91 days. The press used for the tests is in accor
dance with the SS 13 11 10.
Shrinkage and expansion
To test the effect of by-products on shrinkage and expan
sion, concrete prisms of 2.5 x 2.5 x 25 cm 3 were cast in
steel moulds. Steel knobs were attached to the short sides
to enable measurements of length alterations. Demoulding
took place 24 hours after casting, and the prisms were
cured in 100% relative humidity (RH). The prisms for
shrinkage and expansion measurements were stored in
constant temperature, 20°C, and in 50 and 100% R H
respectively. The lengths were measured immediately after
demoulding and then again after 91days. A standard rod
was used as a reference. The accuracy of the length mea
surements is ± 0.005 mm.
Scanning Electron Microscopy Analysis
After 91 days six test prisms were chosen in order to verify
the experimental results, namely: L - l , L - 2 , LF-1 , L F - 2 ,
L F - 3 and A O D - 2 . The samples were cut, polished and
analysed with a scanning electron microscope in order to
investigate the chemical components and structure in the
cement phase.
The prisms were chosen because L - l , L -2 and L F - 3
had the lowest compressive strengths. LF-1 and L F - 2
since it is interesting to compare a fresh slag with a
matured one. The LF-slags had higher compressive
strength than the EAF-slags right up to the 28-day
strength, but this decreases with time, which implies that a
negative reaction takes place. A O D - 2 was included since
the obtained information was not complete, the shrinkage
was high but the expansion measurements were impossible
to perform since the prism crumbled to pieces when han
dled. All prisms have been stored in 100% RH.
Results and discussion
Calorimetry
The effects of the different by-products on the heat of
hydration are shown in Figs, la and lb. The results are pre
sented as the rate of heat evolved per gram cement. The
first thermal peak that occurs immediately after water is
added is not shown, but is included in the presentation of
total evolved heat, see Table 3. The shapes of the curves
are similar to the one for the cement, but with a different
amount of heat developed and displacement of the peaks
in time. The curves for L - l , L - 2 and L F - 3 deviate from
the others, since they have only one peak and an extreme
ly high initial heat development, their total heat develop
ment is however low. This implies that a chemical reaction
takes place initially. X R D analysis shows that free lime is
present in the samples, which will cause an early heat
development when it reacts in the cement paste. The
result is that cement hydration will be disturbed and thus
affect the concrete properties. A latent hydraulic/puz-
zolanic material shows a low initial heat development, but
should also have a high total. E A F - 1 and LF-1 fulfil those
conditions; LF-3 has the highest total heat development;
L - l , L - 2 and L F - 2 the lowest. The other materials are
assembled around the total heat development curve of the
reference.
32 Waste Management & Research
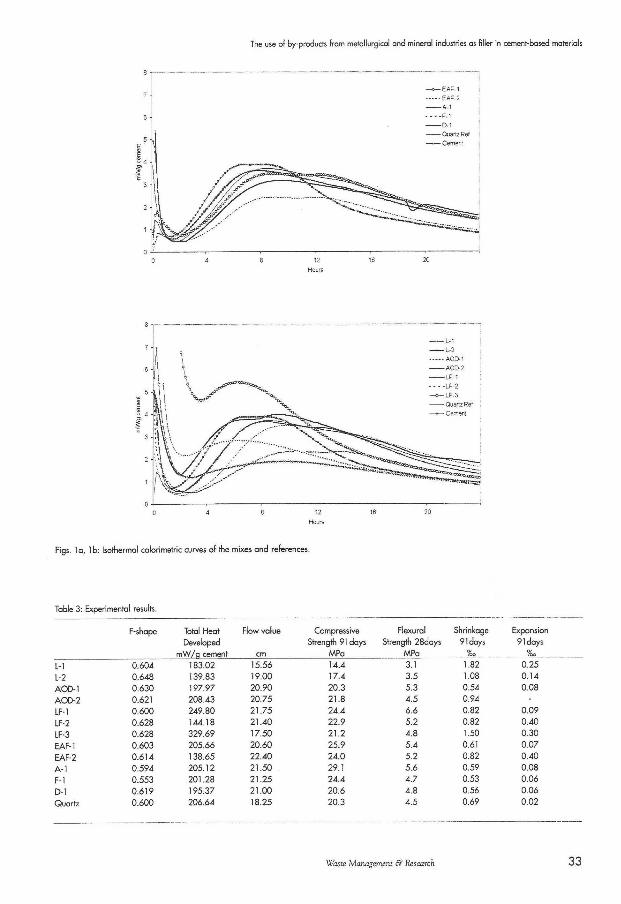
The use of by-products from metallurgical and mineral industries as filler in cement-based materials
Pigs, la, lb: Isothermal calorimetric curves of the mixes and references.
Table 3: Experimental results.
F-shape Total Heat Flow value Compressive Flexural Shrinkage Expansion
Developed Strength 91 days Strength 28days 91 days 91 days
mW/q cement cm MPa MPa %o %o
L-l 0.604 183.02 15.56 14.4 3.1 1.82 0.25
L-2 0.648 139.83 19.00 17.4 3.5 1.08 0.14
AOD-1 0.630 197.97 20.90 20.3 5.3 0.54 0.08
AOD-2 0.621 208.43 20.75 21.8 4.5 0.94
LF-1 0.600 249.80 21.75 24.4 6.6 0.82 0.09
LF-2 0.628 144.18 21.40 22.9 5.2 0.82 0.40
LF-3 0.628 329.69 17.50 21.2 4.8 1.50 0.30
EAF-1 0.603 205.66 20.60 25.9 5.4 0.61 0.07
EAF-2 0.614 138.65 22.40 24.0 5.2 0.82 0.40
A-l 0.594 205.12 21.50 29.1 5.6 0.59 0.08
F-l 0.553 201.28 21.25 24.4 4.7 0.53 0.06
D-l 0.619 195.37 21.00 20.6 4.8 0.56 0.06
Quartz 0.600 206.64 18.25 20.3 4.5 0.69 0.02
Waste Management & Research 33
Helena Moosberg, Björn Lagerblad, Eric Forssberg
Hydration can be considered to have accelerated when
the second peak occurs earlier and similarly retarded when
it appears later (Jiang e t <d- 1993). From the heat develop
ment curves is it possible to conclude that E A F - 2 , L F - 2 ,
L - l and L-2 have a slightly retarding effect.
No consideration has been given to the influence of
heavy metal content in the slags on the heat development.
According to Bhatty et al. (1999), soluble metal salts and
metal oxides change the induction time (the time between
the first and second peaks of hydration) and the intensity
of initial peaks. There is a heavy metal content in the test
ed slags, but since their possible influence will be apparent
in the results, evaluating their specific effect is of no inter
est: either the slag is suitable to mix with concrete or it is
not. The metal content is probably the reason for the dis
placement of the peaks that can be seen in the results.
The metal content has an influence on the early hydra
tion but not on the long-term properties, as long as the
added amount of the heavy metal compounds is not too
high. Noteworthy is the fact that cement affords chemical
as well as physical immobilisation potential of by-products.
This implies that a product, containing heavy metals or
other non-attractive compounds, may not only contribute
to the strength of the concrete but may also be rendered
harmless for the environment by matrix forming with cal
cium silicate (Tashiro 1977, Glasser 1992 &Glasser 1994).
F-shape
Particle asymmetry has a strong effect on the viscosity and
maximum packing fraction, and hence on the concentra
tion/viscosity relationship (Barnes et al. 1996). Deviation
from spherical shape means an increase in viscosity for the
same phase volume. Asymmetric particles, especially flat
ones, resist rotation in a paste to a greater degree than
spherical ones, as well as having a higher water demand
and changed particle packing properties. F-shape mea
surements do not distinguish between oblong and flat par
ticles, since the analysed pictures are in two dimensions.
All the by-products have F-shape values below 0.71 (see
Table 3) which indicates a more or less oblong particle
shape. The values range from 0.553 to 0.648. The quartz
used as reference material had an F-shape of 0.600. This
means that all of the by-products have suitable particle
shapes and there will be no negative influence on the water
demand and thus the flowability.
Workability
Material characteristics, such as the particle size distribu
tion, particle shape, surface texture and the nature of the
material influence the properties of fresh concrete mix
tures more than hardened concrete. Compared to smooth
and rounded particles, rough textured, angular, and elon
gated particles require more cement paste to produce
workable concrete mixtures. Flaky particles, for example
mica, have a larger water demand than spherical particles.
Calcium oxide hydrates, and will thus use some of the
water, which lowers the amount of free water, thus lower
ing the flowability. Chemical reactions between the parti
cles and the cement paste may also cause the particles to
dissolve, thereby creating a rougher surface.
The influence of the different by-products on the flowa
bility of the cement-filler mortars is shown in Table 3. Four
determinations were made with the flow table and the
mean values are used. Two of the materials had lower
flowability than the quartz reference, LF-3 and L - l . All
the others have a higher value, but not so much that it can
be considered a positive characteristic. The measured flow
values show the effects of chemical reactions, not the influ
ence of particle shape, since the F-shape values indicate
that all materials have an acceptable particle shape. The
low values obtained from the mixtures of the above men
tioned materials probably derive from hydration of calcium
oxide which takes place during the early cement hydration.
XRD-analysis of the materials shows that they contain cal
cium oxide, and the calorimetric measurements confirm
that reactions take place. They can be seen as strong ini
tial peaks.
Previously reported results on the effect of filler on con
crete workability have been contradictory, since, for exam
ple, Bonavetti & Irassar (1994) reported negative effects,
Krstulovic et al. (1994) a positive effect and Malhotra &
Caretta (1985) no particular effect at all. The different
results reflect the influence of various experimental factors
and material characteristics, such as surface area and the
nature of fillers, i.e. mineralogy, additives, etc.
Strength
Compressive strength
Strength development of concrete is dependent on the
water/cement ratio and the characteristics of the cement,
such as particle size distribution and clinker composition,
as well as the amount of admixtures and fillers. The curing
conditions, time, temperature and R H are also important.
The effect of additives may vary and can influence the
strength in different ways. If the strength of a mixture is
higher than the reference after one day, the added materi
al is accelerating the hydration; if the strength is lower, the
material is acting as a retarding agent. When the material
affects the seven-day strength, it functions as a binder. If
there is a prominent increase in the long-term strength,
the material can be considered a puzzolan or latent
34 Waste Management & Research
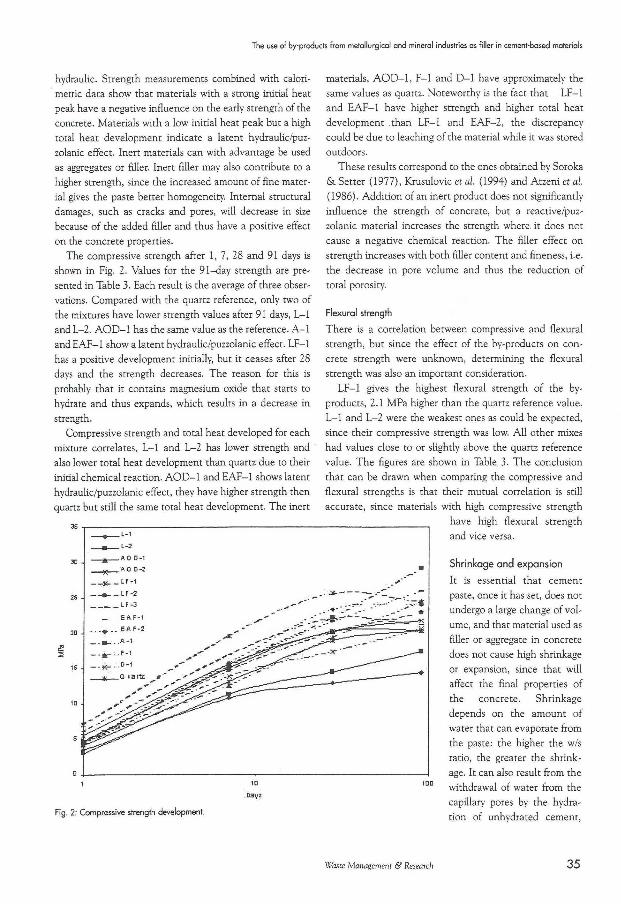
The use of by-products from metallurgical and mineral industries as filler in cement-based materials
hydraulic. Strength measurements combined with calori
metric data show that materials with a strong initial heat
peak have a negative influence on the early strength of the
concrete. Materials with a low initial heat peak but a high
total heat development indicate a latent hydraulic/puz-
zolanic effect. Inert materials can with advantage be used
as aggregates or filler. Inert filler may also contribute to a
higher strength, since the increased amount of fine mater
ial gives the paste better homogeneity. Internal structural
damages, such as cracks and pores, will decrease in size
because of the added filler and thus have a positive effect
on the concrete properties.
The compressive strength after 1, 7, 28 and 91 days is
shown in Fig. 2. Values for the 91-day strength are pre
sented in Table 3. Each result is the average of three obser
vations. Compared with the quartz reference, only two of
the mixtures have lower strength values after 91 days, L - l
and L - 2 . A O D - 1 has the same value as the reference. A - l
and E A F - 1 show a latent hydraulic/puzzolanic effect. LF-1
has a positive development initially, but it ceases after 28
days and the strength decreases. The reason for this is
probably that it contains magnesium oxide that starts to
hydrate and thus expands, which results in a decrease in
strength.
Compressive strength and total heat developed for each
mixture correlates, L - l and L-2 has lower strength and
also lower total heat development than quartz due to their
initial chemical reaction. A O D - 1 and E A F - 1 shows latent
hydraulic/puzzolanic effect, they have higher strength then
quartz but still the same total heat development. The inert
ID
D a y '
Fig. 2: Compressive strength development.
materials, A O D - 1 , F - l and D - l have approximately the
same values as quartz. Noteworthy is the fact that LF-1
and E A F - 1 have higher strength and higher total heat
development than LF-1 and E A F - 2 , the discrepancy
could be due to leaching of the material while it was stored
outdoors.
These results correspond to the ones obtained by Soroka
& Setter (1977), Krusulovic et al. (1994) and Atzeni et al.
(1986). Addition of an inert product does not significantly
influence the strength of concrete, but a reactive/puz-
zolanic material increases the strength where, it does not
cause a negative chemical reaction. The filler effect on
strength increases with both filler content and fineness, i.e.
the decrease in pore volume and thus the reduction of
total porosity.
Flexural strength
There is a correlation between compressive and flexural
strength, but since the effect of the by-products on con
crete strength were unknown, determining the flexural
strength was also an important consideration.
LF-1 gives the highest flexural strength of the by
products, 2.1 MPa higher than the quartz reference value.
L—1 and L—2 were the weakest ones as could be expected,
since their compressive strength was low. All other mixes
had values close to or slightly above the quartz reference
value. The figures are shown in Table 3. The conclusion
that can be drawn when comparing the compressive and
flexural strengths is that their mutual correlation is still
accurate, since materials with high compressive strength
have high flexural strength
and vice versa.
Shrinkage and expansion
It is essential that cement
paste, once it has set, does not
undergo a large change of vol
ume, and that material used as
filler or aggregate in concrete
does not cause high shrinkage
or expansion, since that will
affect the final properties of
the concrete. Shrinkage
depends on the amount of
water that can evaporate from
the paste: the higher the w/s
ratio, the greater the shrink
age. It can also result from the
withdrawal of water from the
capillary pores by the hydra
tion of unhydrated cement,
Waste Management & Research 35
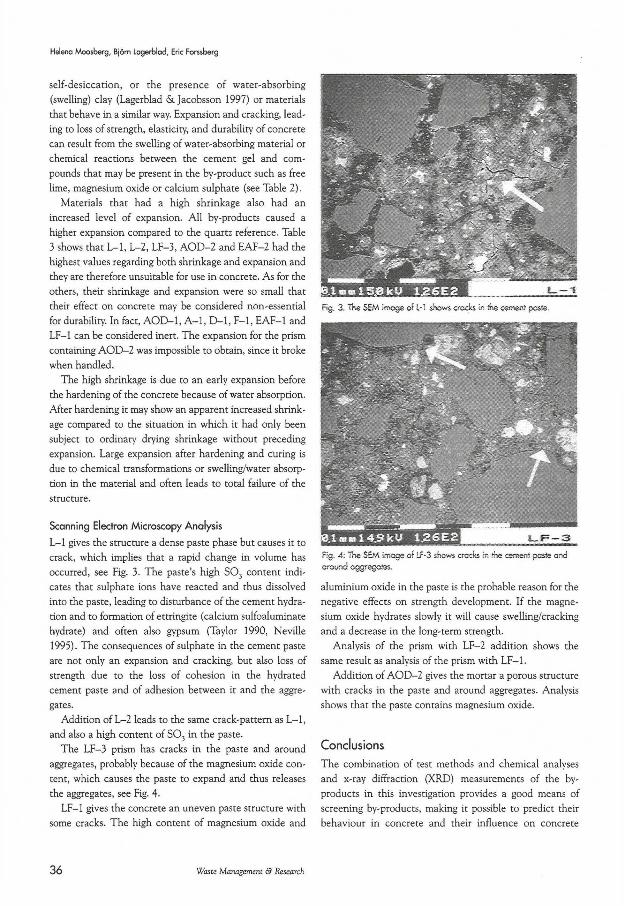
Helena Moosberg, Björn Lagerblad, Eric Forssberg
self-desiccation, or the presence of water-absorbing
(swelling) clay (Lagerblad & Jacobsson 1997) or materials
that behave in a similar way. Expansion and cracking, lead
ing to loss of strength, elasticity, and durability of concrete
can result from the swelling of water-absorbing material or
chemical reactions between the cement gel and com
pounds that may be present in the by-product such as free
lime, magnesium oxide or calcium sulphate (see Table 2).
Materials that had a high shrinkage also had an
increased level of expansion. All by-products caused a
higher expansion compared to the quartz reference. Table
3 shows that L - l , L -2 , L F - 3 , A O D - 2 and E A F - 2 had the
highest values regarding both shrinkage and expansion and
they are therefore unsuitable for use in concrete. As for the
others, their shrinkage and expansion were so small that
their effect on concrete may be considered non-essential
for durability. In fact, A O D - 1 , A - l , D - l , F - l , E A F - 1 and
LF-1 can be considered inert. The expansion for the prism
containing A O D - 2 was impossible to obtain, since it broke
when handled.
The high shrinkage is due to an early expansion before
the hardening of the concrete because of water absorption.
After hardening it may show an apparent increased shrink
age compared to the situation in which it had only been
subject to ordinary drying shrinkage without preceding
expansion. Large expansion after hardening and curing is
due to chemical transformations or swelling/water absorp
tion in the material and often leads to total failure of the
structure.
Scanning Electron Microscopy Analysis
L - l gives the structure a dense paste phase but causes it to
crack, which implies that a rapid change in volume has
occurred, see Fig. 3. The paste's high S 0 3 content indi
cates that sulphate ions have reacted and thus dissolved
into the paste, leading to disturbance of the cement hydra
tion and to formation of ettringite (calcium sulfoaluminate
hydrate) and often also gypsum (Taylor 1990, Neville
1995). The consequences of sulphate in the cement paste
are not only an expansion and cracking, but also loss of
strength due to the loss of cohesion in the hydrated
cement paste and of adhesion between it and the aggre
gates.
Addition of L-2 leads to the same crack-pattern as L - l ,
and also a high content of S 0 3 in the paste.
The L F - 3 prism has cracks in the paste and around
aggregates, probably because of the magnesium oxide con
tent, which causes the paste to expand and thus releases
the aggregates, see Fig. 4.
LF-1 gives the concrete an uneven paste structure with
some cracks. The high content of magnesium oxide and
Fig. 3. The SEM image of shows cracks in rhe cement paste.
rig. 4: The SEM image ot Lr-3 shows crocks in the cement paste and
cround aggregates.
aluminium oxide in the paste is the probable reason for the
negative effects on strength development. If the magne
sium oxide hydrates slowly it will cause swelling/cracking
and a decrease in the long-term strength.
Analysis of the prism with L F - 2 addition shows the
same result as analysis of the prism with L F - 1 .
Addition of A O D - 2 gives the mortar a porous structure
with cracks in the paste and around aggregates. Analysis
shows that the paste contains magnesium oxide.
Conclusions
The combination of test methods and chemical analyses
and x-ray diffraction (XRD) measurements of the by
products in this investigation provides a good means of
screening by-products, making it possible to predict their
behaviour in concrete and their influence on concrete
36 Waste Management & Research
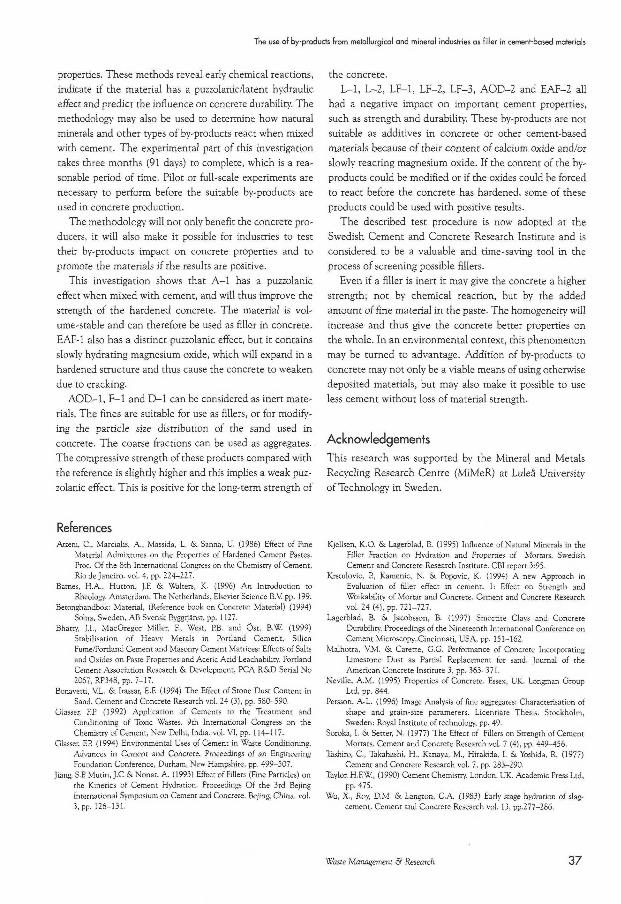
The use of by-products from metallurgical and minera! industries as filier in cement-based materials
properties. These methods reveal early chemical reactions,
indicate if the material has a puzzolanic/latent hydraulic
effect and predict the influence on concrete durability. The
methodology may also be used to determine how natural
minerals and other types of by-products react when mixed
with cement. The experimental part of this investigation
takes three months (91 days) to complete, which is a rea
sonable period of time. Pilot or full-scale experiments are
necessary to perform before the suitable by-products are
used in concrete production.
The methodology will not only benefit the concrete pro
ducers, it will also make it possible for industries to test
their by-products impact on concrete properties and to
promote the materials if the results are positive.
This investigation shows that A - l has a puzzolanic
effect when mixed with cement, and will thus improve the
strength of the hardened concrete. The material is vol
ume-stable and can therefore be used as filler in concrete.
EAF-1 also has a distinct puzzolanic effect, but it contains
slowly hydra ting magnesium oxide, which will expand in a
hardened structure and thus cause the concrete to weaken
due to cracking.
AOD-1, F - l and D - l can be considered as inert mate
rials. The fines are suitable for use as fillers, or for modify
ing the particle size distribution of the sand used in
concrete. The coarse fractions can be used as aggregates.
The compressive strength of these products compared with
the reference is slightly higher and this implies a weak puz
zolanic effect. This is positive for the long-term strength of
References Atzeni, C, Marcialis, A., Massida, L. & Sanna, U. (1986) Effect of Fine
Material Admixtures on the Properties of Hardened Cement Pastes. Proc. Of the 8th International Congress on the Chemistry of Cement, Rio de Janeiro, vol. 4, pp. 224-227.
Barnes, H.A., Hutton, J.F. & Walters, K. (1996) An Introduction to Rheology. Amsterdam, The Netherlands, Elsevier Science B.Vi pp. 199.
Betonghandbok: Material, (Reference book on Concrete: Material) (1994) Solna, Sweden, AB Svensk Byggtjänst, pp. 1127.
Bhatty, J.I., MacGregor Miller, E, West, PB. and Ost, B.W. (1999) Stabilisation of Heavy Metals in Portland Cement, Silica Fume/Portland Cement and Masonry Cement Matrices: Effects of Salts and Oxides on Paste Properties and Acetic Acid Leachability. Portland Cement Association Research 6k Development, PCA R&D Serial No 2067, RP348, pp. 7-17.
Bonavetti, VL. & Irassar, E.F. (1994) The Effect of Stone Dust Content in Sand. Cement and Concrete Research vol. 24 (3), pp. 580-590.
Glasser, F.P (1992) Application of Cements to the Treatment and Conditioning of Toxic Wastes. 9th International Congress on the Chemistry of Cement, New Delhi, India, vol. VI, pp. 114-117.
Glasser, ER (1994) Environmental Uses of Cement in Waste Conditioning. Advances in Cement and Concrere, Proceedings of an Engineering Foundation Conference, Durham, New Hampshire, pp. 499-507.
Jiang, S.E Mutin, J.C &. Nonat. A. (1993) Effect of Fillers (Fine Particles) on the Kinetics of Cement Hydration. Proceedings Of the 3rd Bejing International Symposium on Cement and Concrete. Bejing, China, vol. 3, pp. 126-131.
the concrete.
L - l , L - 2 , L F - 1 , L F - 2 , L F - 3 , A O D - 2 and E A F - 2 all
had a negative impact on important cement properties,
such as strength and durability. These by-products are not
suitable as additives in concrete or other cement-based
materials because of their content of calcium oxide and/or
slowly reacting magnesium oxide. If the content of the by
products could be modified or if the oxides could be forced
to react before the concrete has hardened, some of these
products could be used with positive results.
The described test procedure is now adopted at the
Swedish Cement and Concrete Research Institute and is
considered to be a valuable and time-saving tool in the
process of screening possible fillers.
Even if a filler is inert it may give the concrete a higher
strength; not by chemical reaction, but by the added
amount of fine material in the paste. The homogeneity will
increase and thus give the concrete better properties on
the whole. In an environmental context, this phenomenon
may be turned to advantage. Addition of by-products to
concrete may not only be a viable means of using otherwise
deposited materials, but may also make it possible to use
less cement without loss of material strength.
Acknowledgements
This research was supported by the Mineral and Metals
Recycling Research Centre (MiMeR) at Luleå University
of Technology in Sweden.
Kjellsen, K.O. & Lagerblad, B. (1995) Influence of Natural Minerals in the Filler Fraction on Hydration and Properties of Mortars. Swedish Cement and Concrete Research Institute. CBI report 3:95.
Krstulovic, R, Kamenic, N. & Popovic, K. (1994) A new Approach in Evaluation of filler effect in cement. 1: Effect on Strength and Workability' of Mortar and Concrete. Cement and Concrete Research vol. 24 (4), pp. 721-727.
Lagerblad, B. & Jacobsson, B. (1997) Smectite Clays and Concrete Durability. Proceedings of the Nineteenth Intetnational Conference on Cement Microscopy-Cincinnati, USA, pp. 151-162.
Malhotra, V.M. &. Carette, G.G. Performance of Concrete Incorporating Limestone Dust as Partial Replacement for sand. Journal of the American Concrete Institute 3, pp. 363-371.
Neville, A.M. (1995) Properties of Concrete. Essex, UK. Longman Group Ltd, pp. 844.
Persson, A-L. (1996) Image Analysis of fine aggregates: Characterisation of shape and grain-size parameters. Licentiate Thesis. Stockholm, Sweden: Royal Institute of technology, pp. 49.
Soroka, 1. &. Setter, N. (1977) The Effect of Fillers on Sttength of Cement Mortars. Cement and Concrete Research vol. 7 (4), pp. 449-456.
Tashiro, C , Takahashi, H., Kanaya, M., Hirakida, I . & Yoshida, R. (1977) Cement and Concrete Research vol. 7, pp. 283-290.
Taylor, H.F.W., (1990) Cement Chemistry, London, UK. Academic Press Ltd, pp. 475.
Wu, X-, Roy, D.M. & Langton, CA. (1983) Early stage hydration of slag-cement. Cemenr and Concrete Reseatch vol. 13, pp.277-286.
Waste Management & Research 37


1
Natural minerals as fillers in cement based materials.
Helena Moosberg Björn Lagerblad Eric Forssberg*
Swedish Cement and Concrete Research Institute 100 44 Stockholm, Sweden
* Luleå University of Technology Division of Mineral Processing 971 87 Luleå, Sweden
2
Natural minerals as fillers in cement based materials.
Abstract
Concrete aggregates are made up of rocks and minerals. The fines, and filler products consist mainly of individual minerals. Often, and for different purposes, mineral fillers are added to the concrete. The aim of this investigation has been to gain a better understanding of how different minerals affect the properties of fresh, hardening and hardened concrete. Eight different minerals were chosen and their effects on heat development, strength, shrinkage and expansion were measured. Scanning electron microscopy (SEM) was used to determine the effect on the texture of the cement paste. The results show that the different minerals influence the concrete properties in several ways, both positively and negatively.
1 Introduction
Concrete is a composite material that consists of approximately 70 percent aggregates, i.e., stone/gravel and sand in a matrix of binding medium. Cement together with water forms the binding phase, i.e., the cement paste. Due to their small size, the fillers can be regarded as both part of the aggregate and the paste.
Binders/hydraulic cement are materials that harden upon reaction with water, thus forming a water resistant phase. Fillers consist of very small chemically inert particles whose function in concrete is based on size and shape. Puzzolanic materials react chemically with components of the cement paste and nonnally have a positive influence on concrete properties.
In this investigation natural minerals have been tested according to the same methods as the by-products in a previous paper by Moosberg et al (2000). The aim of this investigation has been to reveal the impact of different minerals on concrete in order to gain a better understanding of how industrial by-products wil l act. The comparison is interesting, due to the chemical similarity of by-products and some natural minerals. Quartz has been used as a reference in all conducted experiments.
This report presents two similar investigations of four materials each. The series were not conducted at the same time; therefore, the results are biased and are thus presented separately. Both natural minerals and by-products can be used in concrete to improve its properties.
2 Experimental procedure
The purpose of the experimental work has been to observe the effect of minerals mixed with cement in concrete, to investigate the reactions that occur and how these affect the properties of concrete. Earlier investigations on natural minerals (Kjellsen & Lagerblad 1995), and on slags (Wu 1983, Moosberg et al 2000) have served as a guideline. The experimental methods used in this investigation are more completely described in the previous study, "The use of by-products from metallurgical and mineral industries as filler in cement-based materials".
3
To ensure constant experimental conditions, all variables except the minerals were kept constant. Due to the differences in density, the amounts of the added minerals were calculated by volume percent rather than by weight. The water/solid ratio (w/s-ratio) was kept at 0.27 for the calorimetric measurements, and 0.5 for the flow tests and casting of prisms for the strength tests. The cement used in this investigation is a standard Portland cement from Sweden, Slite Standard (CEM I 42.5R).
3 Materials
In order to minimise the particle size effect and maximise the effect of the mineralogy, the minerals were crushed, ground and sieved to a maximum particle size of 125 microns to make fair comparison possible.
A mineral can have different compositions, depending on what site it is taken from. It is important to remember that, even i f the same mineral is used, the results may differ i f it originates from different mines.
4 Methods
4.1 Mixing procedure
Pastes of cement, fillers and water were combined in a laboratory mixer according to the specifications for mixing stipulated in EN 196. The cement and the filler were first mixed dry before the water was added and the pastes mixed thoroughly for 30 sec. at 140 rpm. The mixer was then stopped and the bowl was scraped on the sides and on the bottom to help to obtain a homogenous mix, then the paste was mixed for another 30 sec. Finally, the paste was mixed at 285 rpm. for 60 sec. The water/solid ratio (w/s) was kept at 0.27 for the calorimetric studies.
In both the cement-mineral mixtures and the reference mixture 45 percent of the cement was replaced on a volume basis by the different materials, and the water/cement ratio kept constant. Due to the differences in material density, the density of the mortars varies.
4.2 Calorimetric measurements
Isothermal conductive calorimetry was applied to examine the added minerals' influence on the heat of hydration. The instrument has an accuracy of ± 5 percent. Paste samples of 80 grams were weighed into small plastic beakers and immediately placed in the calorimeter. Four minutes elapsed between the addition of the water to the cement/filler mixture and the placement of the paste in the calorimeter. Consequently, the first major heat peak from mixing was discarded. The heat of hydration was measured for 24 hours. The calorimetric studies were repeated for all mixes and the repeatability was very good.
4
4.3 Flowability
For the flow table tests and the casting of concrete prisms the w/s ratio was increased to 0.50. A standard sand, DIN-196, was added to the paste and mixed according to the EN 196 procedure. The mortar flow tests were done according to the SS-EN 1015-3 procedure.
4.4 Strength
The strength of the concrete is a very important property. Both compressive and flexural strength were tested in this investigation.
To test the compressive and flexural strengths, concrete prisms of 4 x 4 x 16 cm 3
were cast in steel moulds. Demoulding took place after 24 hours and the prisms were cured and stored under 100 percent relative humidity (RH).
The concrete prisms were tested in three-point bending (flexural strength) after 28 days. The compressive strength of the prisms was tested with uniaxial compression at 1, 7,28 and 91 days. The press used for the tests is in accordance with SS 13 11 10.
4.5 Shrinkage and Expansion
To test the effect of by-products on shrinkage and expansion, concrete prisms of 2.5 x 2.5 x 25 cm3 were cast in steel moulds. Steel knobs were attached to the short sides to enable measurements of length alterations. Demoulding took place 24 hours after casting, and the prisms were cured in 100 percent relative humidity (RH). The prisms for shrinkage and expansion measurements were stored under constant temperature, 20°C, and 50 and 100 percent RH respectively. The lengths were measured immediately after demoulding and then again after 91 days. A standard rod was used as a reference. The accuracy of the length measurements is ± 0.005 mm.
4.6 Scanning Electron Microscopy
A sample of each mixture was impregnated with epoxy, cut, polished and analysed with a scanning electron microscope to investigate chemical content and structure. The concrete samples, with a w/c-ratio of 0.5, displayed a porous and uneven cement paste upon examination. Therefore, new specimens, made of cement and filler only, were cast with a w/c-ratio of 0.4. They were cured and stored in 100 percent RH for eight weeks before sample preparation started.
5
5 PART 1
5.1 Materials
The investigated materials are:
• Bauxite • Andalusite • Periclase • Kyanite • Quartz (as reference material)
Quartz is a common mineral in concrete (as aggregates) and it is considered an inert material and therefore chosen as reference.
Chemical analyses of the materials used in the test are presented in Table 1.
Table 1: Chemical compounds
Bauxite Andalusite Periclase Kyanite % % % %
A1 20 3 85 59 1.5 54-60
SiC-2 7.5 39 3.5 43.7-37.6
Fe 20 3 1.39 0.95 0.9 1
MgO 0.22 0.15 90.25 0.01
CaO 0.23 0.2 1.8 0.03
X-ray diffraction analysis (XRD-analysis) ofthe minerals shows that:
• the bauxite sample mainly consists of aluminium oxide, together with some corundum, mullite, sillimanite and small amounts of minerals from amphibole and analcim groups;
• the andalusite sample also contains small amounts of quartz, mica and minerals from the kaolinite-serpentine group;
• the kyanite sample also contain small amounts of quartz, topaz and mica.
5.1.1 Mineralogy
Bauxite (a rock type) is a mixture of hydrated aluminium oxides, including gibbsite Al(OH) 3 , boehmite AIO(OH) and diaspore HAIO2. Boehmite and diaspore belong to the orthorhombic crystal system and gibbsite to the monoclinic.
Andalusite is an aluminium silicate, AI2S1O5, which belongs to the orthorhombic crystal system. It is trimorphous with kyanite and sillimanite. It is formed at medium temperatures and low pressures, in metamorphosed argillaceous rock types.
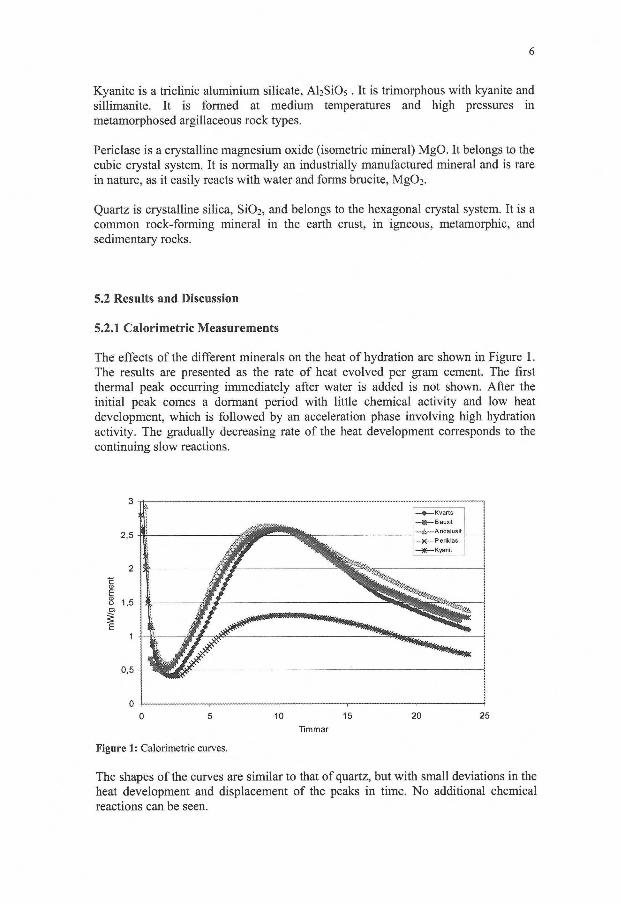
6
Kyanite is a triclinic aluminium silicate, A^SiOs. It is trimorphous with kyanite and sillimanite. It is formed at medium temperatures and high pressures in metamorphosed argillaceous rock types.
Periclase is a crystalline magnesium oxide (isometric mineral) MgO. It belongs to the cubic crystal system. It is normally an industrially manufactured mineral and is rare in nature, as it easily reacts with water and forms brucite, MgÜ2.
Quartz is crystalline silica, Si02, and belongs to the hexagonal crystal system. It is a common rock-forming mineral in the earth crust, in igneous, metamorphic, and sedimentary rocks.
5.2 Results and Discussion
5.2.1 Calorimetric Measurements
The effects of the different minerals on the heat of hydration are shown in Figure 1. The results are presented as the rate of heat evolved per gram cement. The first thermal peak occurring immediately after water is added is not shown. After the initial peak comes a dormant period with little chemical activity and low heat development, which is followed by an acceleration phase involving high hydration activity. The gradually decreasing rate of the heat development corresponds to the continuing slow reactions.
1 • Kvarts : —fö— Bauxit
J —£x—Andalusit I .„.^.__.perjklas —j£— Kyanit
0 -I , , i 0 5 10 15 20 25
Timmar
Figure 1: Calorimetric curves.
The shapes of the curves are similar to that of quartz, but with small deviations in the heat development and displacement of the peaks in time. No additional chemical reactions can be seen.
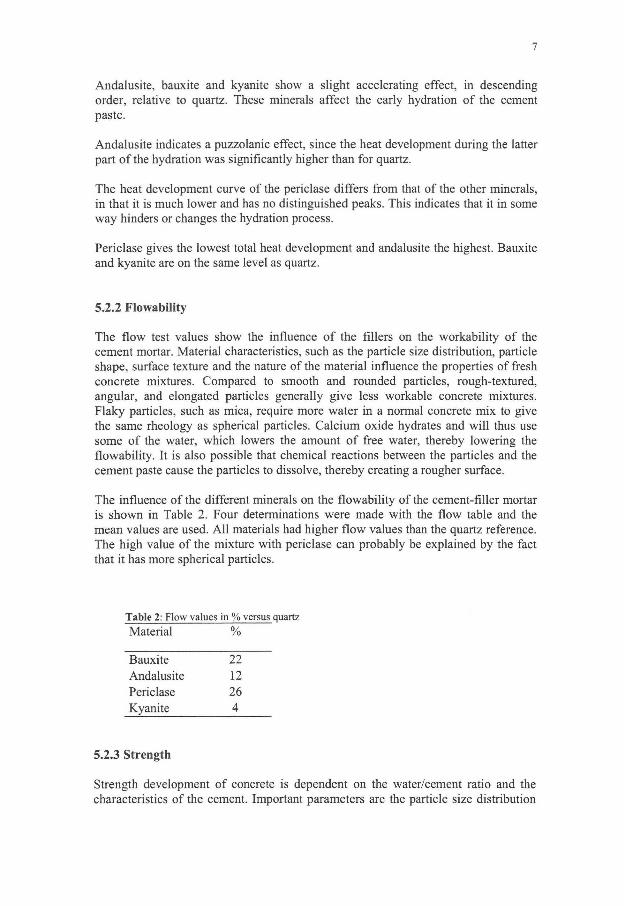
7
Andalusite, bauxite and kyanite show a slight accelerating effect, in descending order, relative to quartz. These minerals affect the early hydration of the cement paste.
Andalusite indicates a puzzolanic effect, since the heat development during the latter part of the hydration was significantly higher than for quartz.
The heat development curve of the periclase differs from that of the other minerals, in that it is much lower and has no distinguished peaks. This indicates that it in some way hinders or changes the hydration process.
Periclase gives the lowest total heat development and andalusite the highest. Bauxite and kyanite are on the same level as quartz.
5.2.2 Flowability
The flow test values show the influence of the fillers on the workability of the cement mortar. Material characteristics, such as the particle size distribution, particle shape, surface texture and the nature of the material influence the properties of fresh concrete mixtures. Compared to smooth and rounded particles, rough-textured, angular, and elongated particles generally give less workable concrete mixtures. Flaky particles, such as mica, require more water in a normal concrete mix to give the same rheology as spherical particles. Calcium oxide hydrates and will thus use some of the water, which lowers the amount of free water, thereby lowering the flowability. It is also possible that chemical reactions between the particles and the cement paste cause the particles to dissolve, thereby creating a rougher surface.
The influence of the different minerals on the flowability of the cement-filler mortar is shown in Table 2. Four determinations were made with the flow table and the mean values are used. Al l materials had higher flow values than the quartz reference. The high value of the mixture with periclase can probably be explained by the fact that it has more spherical particles.
Table 2: Flow values in % versus quartz
Material %
Bauxite 22 Andalusite 12 Periclase 26 Kyanite 4
5.2.3 Strength
Strength development of concrete is dependent on the water/cement ratio and the characteristics of the cement. Important parameters are the particle size distribution
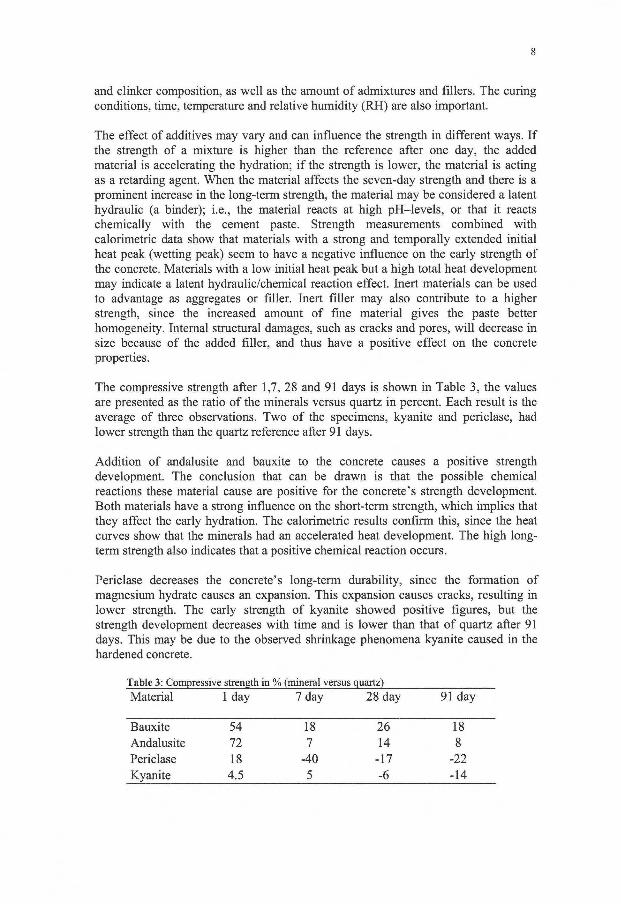
8
and clinker composition, as well as the amount of admixtures and fillers. The curing conditions, time, temperature and relative humidity (RH) are also important.
The effect of additives may vary and can influence the strength in different ways. I f the strength of a mixture is higher than the reference after one day, the added material is accelerating the hydration; i f the strength is lower, the material is acting as a retarding agent. When the material affects the seven-day strength and there is a prominent increase in the long-term strength, the material may be considered a latent hydraulic (a binder); i.e., the material reacts at high pH-levels, or that it reacts chemically with the cement paste. Strength measurements combined with calorimetric data show that materials with a strong and temporally extended initial heat peak (wetting peak) seem to have a negative influence on the early strength of the concrete. Materials with a low initial heat peak but a high total heat development may indicate a latent hydraulic/chemical reaction effect. Inert materials can be used to advantage as aggregates or filler. Inert filler may also contribute to a higher strength, since the increased amount of fine material gives the paste better homogeneity. Internal structural damages, such as cracks and pores, wil l decrease in size because of the added filler, and thus have a positive effect on the concrete properties.
The compressive strength after 1,7, 28 and 91 days is shown in Table 3, the values are presented as the ratio of the minerals versus quartz in percent. Each result is the average of three observations. Two of the specimens, kyanite and periclase, had lower strength than the quartz reference after 91 days.
Addition of andalusite and bauxite to the concrete causes a positive strength development. The conclusion that can be drawn is that the possible chemical reactions these material cause are positive for the concrete's strength development. Both materials have a strong influence on the short-term strength, which implies that they affect the early hydration. The calorimetric results confirm this, since the heat curves show that the minerals had an accelerated heat development. The high long-term strength also indicates that a positive chemical reaction occurs.
Periclase decreases the concrete's long-term durability, since the formation of magnesium hydrate causes an expansion. This expansion causes cracks, resulting in lower strength. The early strength of kyanite showed positive figures, but the strength development decreases with time and is lower than that of quartz after 91 days. This may be due to the observed shrinkage phenomena kyanite caused in the hardened concrete.
Table 3: Compressive strength in % (mineral versus quartz)
Material 1 day 7 day 28 day 91 day
Bauxite 54 18 26 18 Andalusite 72 7 14 8 Periclase 18 -40 -17 -22 Kyanite 4.5 5 -6 -14
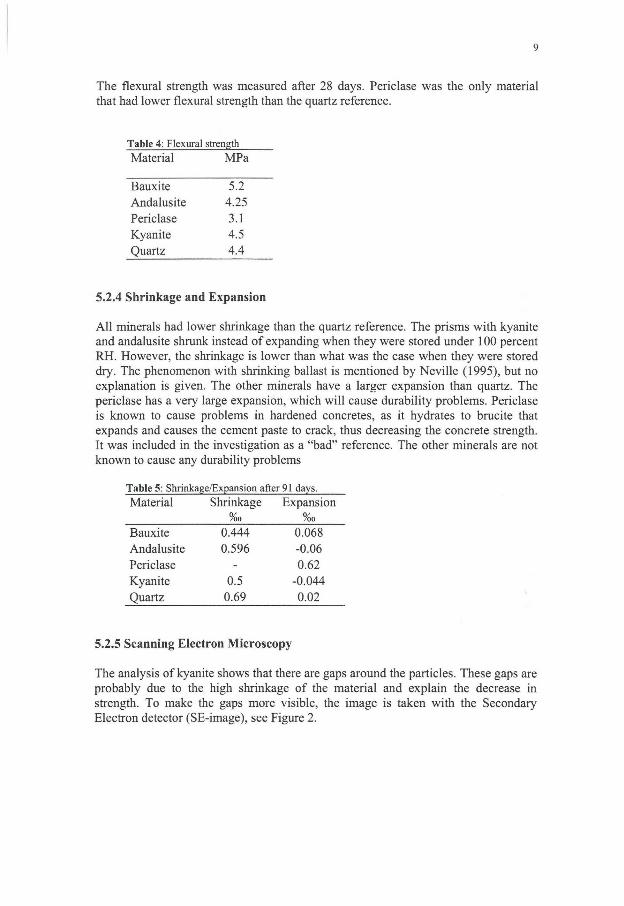
9
The flexural strength was measured after 28 days. Periclase was the only material that had lower flexural strength than the quartz reference.
Table 4: Flexural strength
Material MPa
Bauxite 5.2 Andalusite 4.25 Periclase 3.1 Kyanite 4.5 Quartz 4.4
5.2.4 Shrinkage and Expansion
All minerals had lower shrinkage than the quartz reference. The prisms with kyanite and andalusite shrunk instead of expanding when they were stored under 100 percent RH. However, the shrinkage is lower than what was the case when they were stored dry. The phenomenon with shrinking ballast is mentioned by Neville (1995), but no explanation is given. The other minerals have a larger expansion than quartz. The periclase has a very large expansion, which will cause durability problems. Periclase is known to cause problems in hardened concretes, as it hydrates to brucite that expands and causes the cement paste to crack, thus decreasing the concrete strength. It was included in the investigation as a "bad" reference. The other minerals are not known to cause any durability problems
Material Shrinkage Expansion % 0
Bauxite 0.444 0.068 Andalusite 0.596 -0.06 Periclase - 0.62 Kyanite 0.5 -0.044 Quartz 0.69 0.02
5.2.5 Scanning Electron Microscopy
The analysis of kyanite shows that there are gaps around the particles. These gaps are probably due to the high shrinkage of the material and explain the decrease in strength. To make the gaps more visible, the image is taken with the Secondary Electron detector (SE-image), see Figure 2.
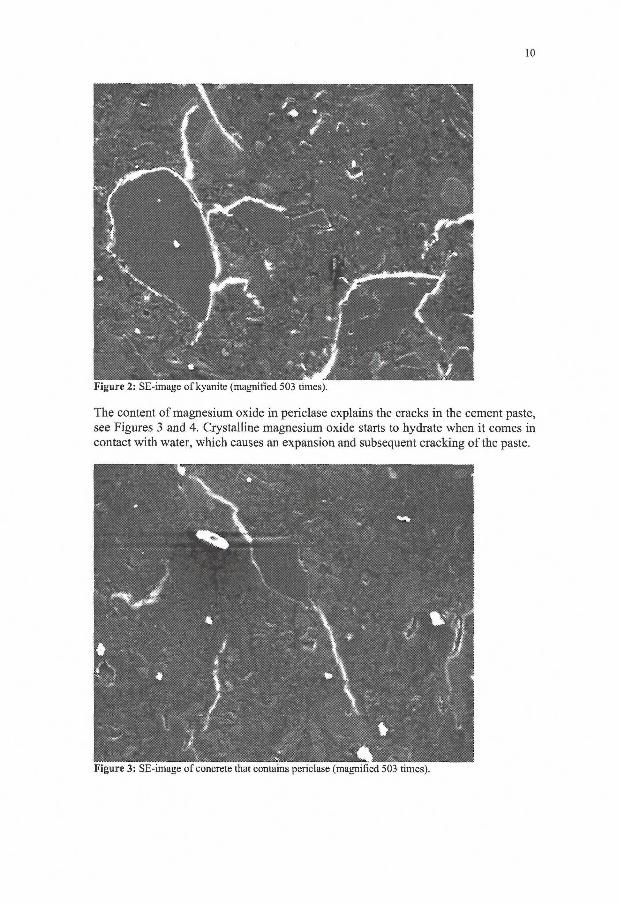
10
Figure 2: SE-image of kyanite (magnified 503 times).
The content of magnesium oxide in periclase explains the cracks in the cement paste, see Figures 3 and 4. Crystalline magnesium oxide starts to hydrate when it comes in contact with water, which causes an expansion and subsequent cracking of the paste.
Figure 3: SE-image of concrete that contains periclase (magnified 503 times).
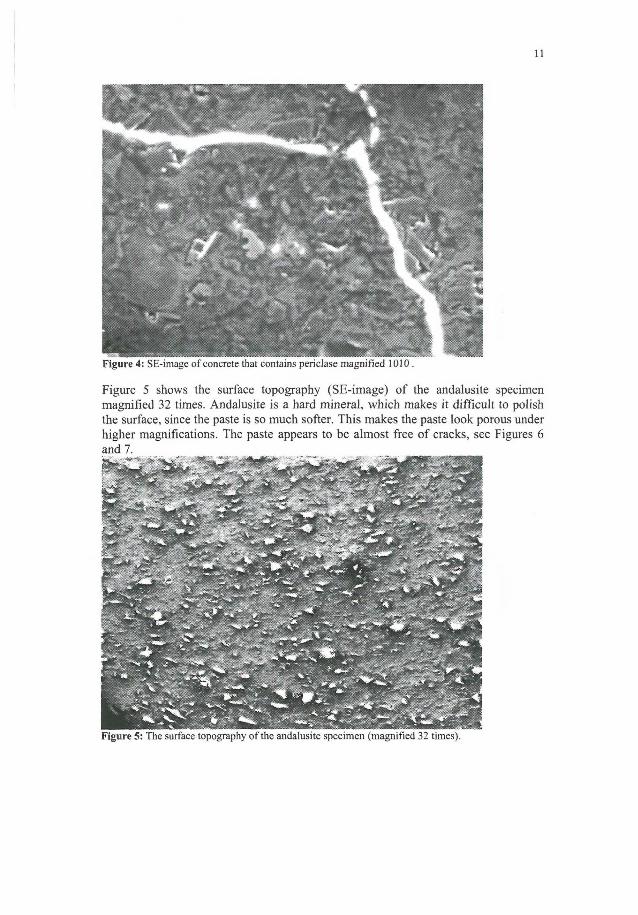
11
Figure 4: SE-image of concrete that contains periclase magnified 1010 .
Figure 5 shows the surface topography (SE-image) of the andalusite specimen magnified 32 times. Andalusite is a hard mineral, which makes it difficult to polish the surface, since the paste is so much softer. This makes the paste look porous under higher magnifications. The paste appears to be almost free of cracks, see Figures 6 and 7.
Figure 5: The surface topography of the andalusite specimen (magnified 32 times).
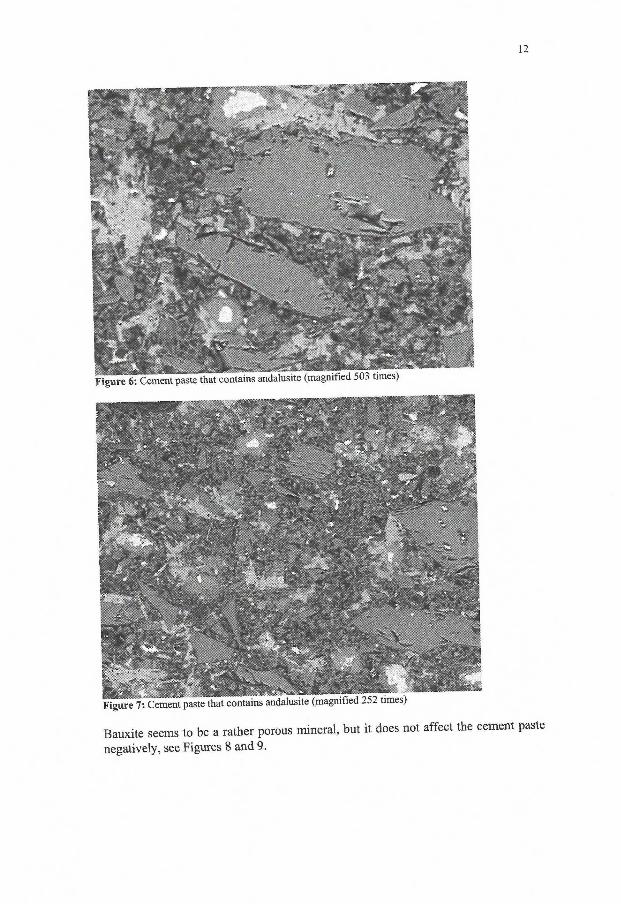
12
S K Figure 6: Cement paste that contains andalusite (magnified 503 times)
Figure 7: Cement paste that contains andalusite (magnified 252 times;
Bauxite seems to be a rather porous mineral, but it does not affect the cement paste
negatively, see Figures 8 and 9.
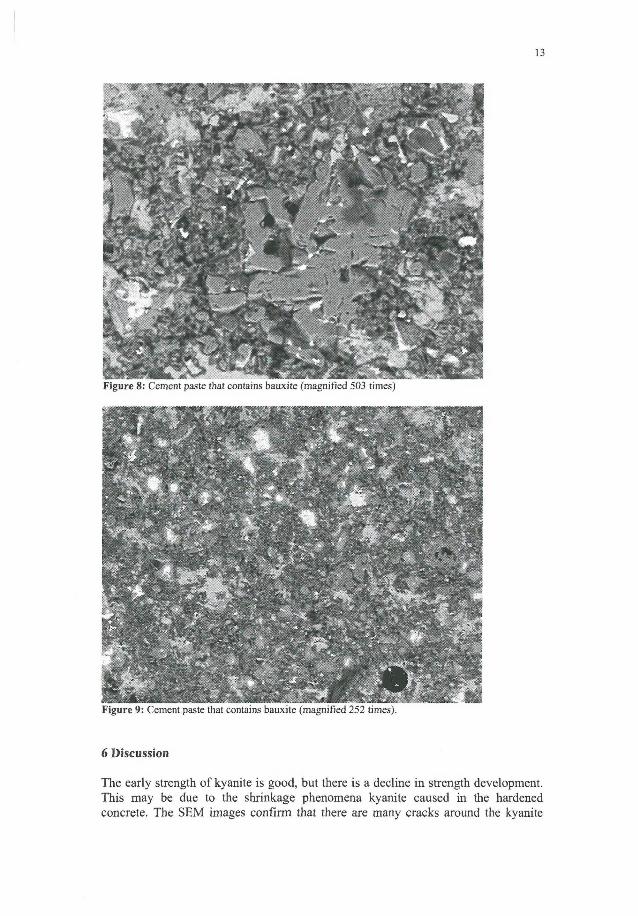
13
Figure 9: Cement paste that contains bauxite (magnified 252 times).
6 Discussion
The early strength of kyanite is good, but there is a decline in strength development. This may be due to the shrinkage phenomena kyanite caused in the hardened concrete. The SEM images confirm that there are many cracks around the kyanite
14
particles. The kyanite itself wi l l not shrink; the phenomenon is probably caused by an interfacial transit zone weakness due to adsorbed water on the mineral surfaces.
Andalusite and bauxite have a positive influence on concrete strength and strength development. Their influence on the short-term strength is positive, compared with the quartz reference, they do achieve more than double strength.
The heat development and also long-term strength of andalusite implies that the mineral reacts chemically with the cement paste, thus causing the positive effect. Bauxite does not develop as high total heat as the andalusite, but it has the highest strength of the tested minerals, which indicates that it has a positive chemical effect on the cement paste. The aluminium oxide in bauxite probably reacts chemically, while the one in andalusite reacts at the surface.
Periclase addition affects the concrete negatively, since it causes so much expansion that the durability deteriorates strongly. It is unsuitable for use in concrete or other cement-based material, as expected. When examined under a scanning electron microscope, the paste does show a lot of cracks, which are a result of the expansion of the slowly hydrating magnesium oxide.
15
7 PART 2
7.1 Material
The investigated minerals are:
• Epidote
• Wollastonite • Olivine • Hornblende • Quartz (as reference material)
Quartz is a common mineral in concrete (as aggregates). It is considered an inert material and therefore chosen as reference.
X-ray diffraction analysis (XRD-analysis) of the minerals shows that:
• the epidote sample consists manly of epidote and clinozoisite (epidote group), with small amounts of clinochlore (chlorite group) and nepheline (feldspathoid);
• the olivine sample consists of magnesium-rich forsterite together with some clinochlore (chlorite group) and talc;
• the wollastonite samples consists mainly of calcium silicate with small amounts of quartz and calcium carbonate;
• the hornblende sample consists of hornblende together with tremolite and actinolite, and also small amounts of muscovite, quartz and calcium carbonate.
7.1.1 Mineralogy
Epidote is calcium aluminium iron silicate. Epidote, Ca2(Al,Fe)3Si30i2(OH), and clinozoisite, Ca2Al3Si30i2(OH), belongs to the monoclinic crystal system. It occurs in low-grade metamorphic rocks or as a rare accessory constituent in igneous rocks.
Olivine is a magnesium iron silicate (Mg,Fe)2Si04, with varying magnesium and iron content with the end members: forsterite Mg2Si04, and fayalite FeSi04. Olivine is a common rock-forming mineral in low silica igneous rocks, basic and ultrabasic rocks. It belongs to the orthorhombic crystal system.
Wollastonite is a calcium silicate, CaSi03.The mineral belongs to the triclinic crystal system and it is generally fibrous. Wollastonite is a metamorphic mineral formed under high temperature. It is found in contact-metamorphosed limestones.
Hornblende, (Ca,Na,K)2.3(Mg,Fe2+,Fe3+,Al)5(Si,Al)8022(OH)2 is a complex silicate, and the most common mineral of the amphibole group. It belongs to the monoclinic crystal system. The mineral is a primary constituent in many intermediate igneous and acid rocks. It is a common metamorphic mineral.
Quartz is crystalline silica, Si02, and belongs to the hexagonal crystal system. It is a common rock-forming mineral in the earth crust, in igneous, metamorphic, and sedimentary rocks.
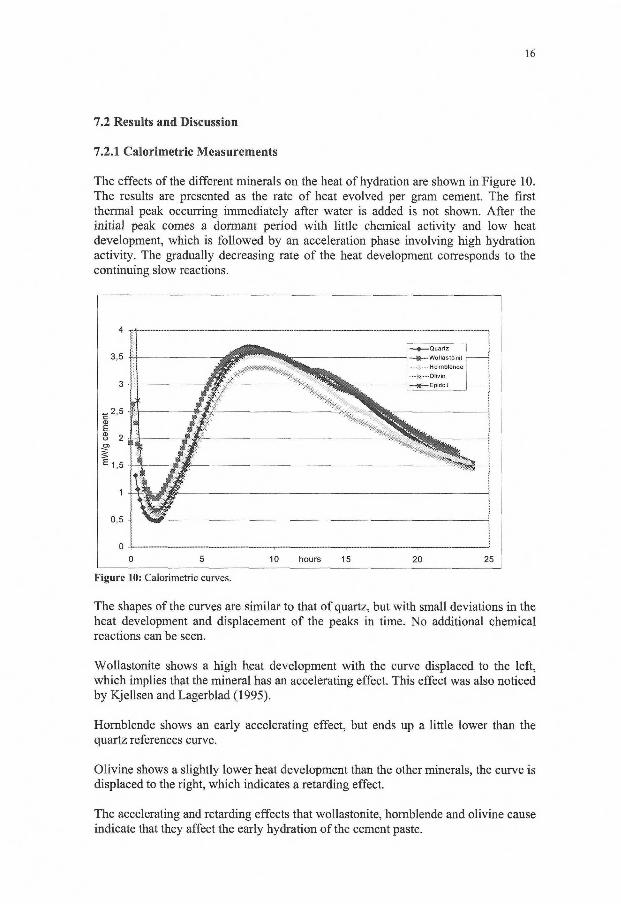
16
7.2 Results and Discussion
7.2.1 Calorimetric Measurements
The effects of the different minerals on the heat of hydration are shown in Figure 10. The results are presented as the rate of heat evolved per gram cement. The first thermal peak occurring immediately after water is added is not shown. After the initial peak comes a dormant period with little chemical activity and low heat development, which is followed by an acceleration phase involving high hydration activity. The gradually decreasing rate of the heat development corresponds to the continuing slow reactions.
4 T -
0 5 10 hours 15 20 25
Figure 10: Calorimetric curves.
The shapes of the curves are similar to that of quartz, but with small deviations in the heat development and displacement of the peaks in time. No additional chemical reactions can be seen.
Wollastonite shows a high heat development with the curve displaced to the left, which implies that the mineral has an accelerating effect. This effect was also noticed by Kjellsen and Lagerblad (1995).
Hornblende shows an early accelerating effect, but ends up a little lower than the quartz references curve.
Olivine shows a slightly lower heat development than the other minerals, the curve is displaced to the right, which indicates a retarding effect.
The accelerating and retarding effects that wollastonite, hornblende and olivine cause indicate that they affect the early hydration of the cement paste.
17
Epidote follows the quartz curve initially, but the heat development increases to a slightly higher level than the reference. This implies that the material has a positive chemical reaction when mixed with cement.
7.2.2 Flowability
Hornblende and epidote have lower flow values than the quartz reference, while olivine and wollastonite have higher values. The results indicate that both hornblende and epidote increase the water demand of the cement paste. According to Johansen et al. (1992), amphibole caused an increased water demand when mixed with cement, although they expected it to be a water-reducing mineral. The difference in water demand may be due to the fact that hornblende can have variations in its cleavage angles; i.e., the form of the particles may vary.
Table 6: Flow values in % versus quartz
Material %
Hornblende -8 Epidote -17 Olivine 7 Wollastonite 3
7.2.3 Strength
The high initial strength, one-day values, of hornblende and wollastonite indicate a positive influence on the early hydration of the cement paste. Hornblende's long-term strength decreases and is lower than the reference after 91 days. Wollastonite has higher strength than the other minerals, which means that it has a strong positive influence on both short- and long-term strength. This may be due to the fibrous character of the mineral.
Epidote follows the quartz curve for 28 days, after which the strength increases more quickly. This behaviour indicates that epidote has a puzzolanic effect when mixed with cement. Olivine seems to have a retarding effect on the early strength. After 91 days the value is still lower than that of the quartz reference, but at the same level as hornblende.
The concrete made with olivine as filler had lower strength than the quartz reference; according to other investigations (Lindgård and Johansen, 1996), olivine can be used as aggregates without any decrease in concrete strength. It may be that the size of olivine, i.e., its surface area, is important for how it affects concrete. According to Danielsen (1979), who did experiments with mixtures of olivine and quartz, the combination of coarse quartz and fine olivine had a lower strength than the quartz reference, while the combination coarse olivine and fine quartz did not affect the strength level.
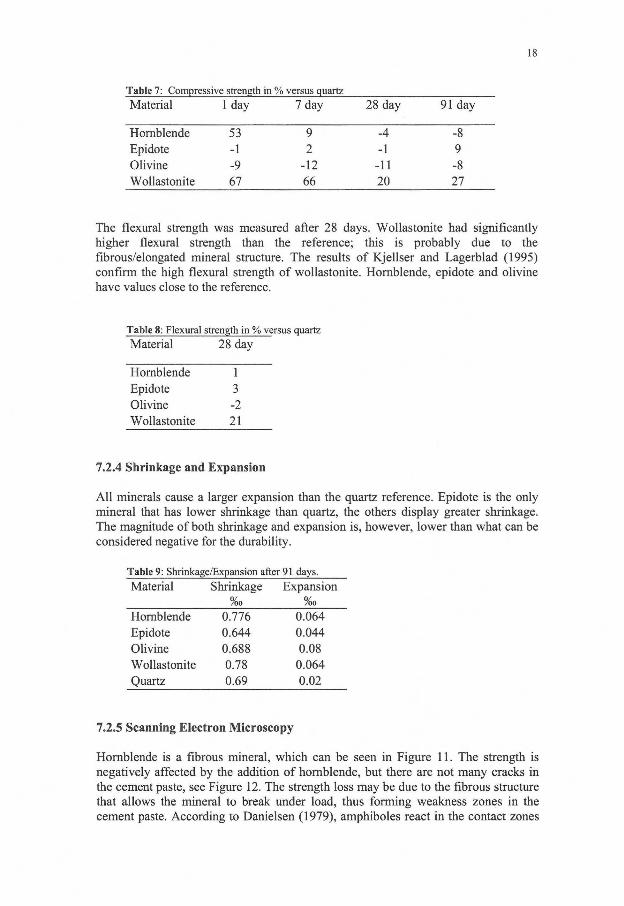
18
Table 7: Compressive strength in % versus quartz
Material 1 day 7 day 28 day 91 day
Hornblende 53 9 -4 -8 Epidote -1 2 -1 9 Olivine -9 -12 -11 -8 Wollastonite 67 66 20 27
The flexural strength was measured after 28 days. Wollastonite had significantly higher flexural strength than the reference; this is probably due to the fibrous/elongated mineral structure. The results of Kjellser and Lagerblad (1995) confirm the high flexural strength of wollastonite. Hornblende, epidote and olivine have values close to the reference.
Material 28 day
Hornblende 1 Epidote 3 Olivine -2 Wollastonite 21
7.2.4 Shrinkage and Expansion
All minerals cause a larger expansion than the quartz reference. Epidote is the only mineral that has lower shrinkage than quartz, the others display greater shrinkage. The magnitude of both shrinkage and expansion is, however, lower than what can be considered negative for the durability.
Table 9: Shrinkage/Expansion after 91 days.
Material Shrinkage Expansion %0 %0
Hornblende 0.776 0.064 Epidote 0.644 0.044 Olivine 0.688 0.08 Wollastonite 0.78 0.064 Quartz 0.69 0.02
7.2.5 Scanning Electron Microscopy
Hornblende is a fibrous mineral, which can be seen in Figure 11. The strength is negatively affected by the addition of hornblende, but there are not many cracks in the cement paste, see Figure 12. The strength loss may be due to the fibrous structure that allows the mineral to break under load, thus forming weakness zones in the cement paste. According to Danielsen (1979), amphiboles react in the contact zones
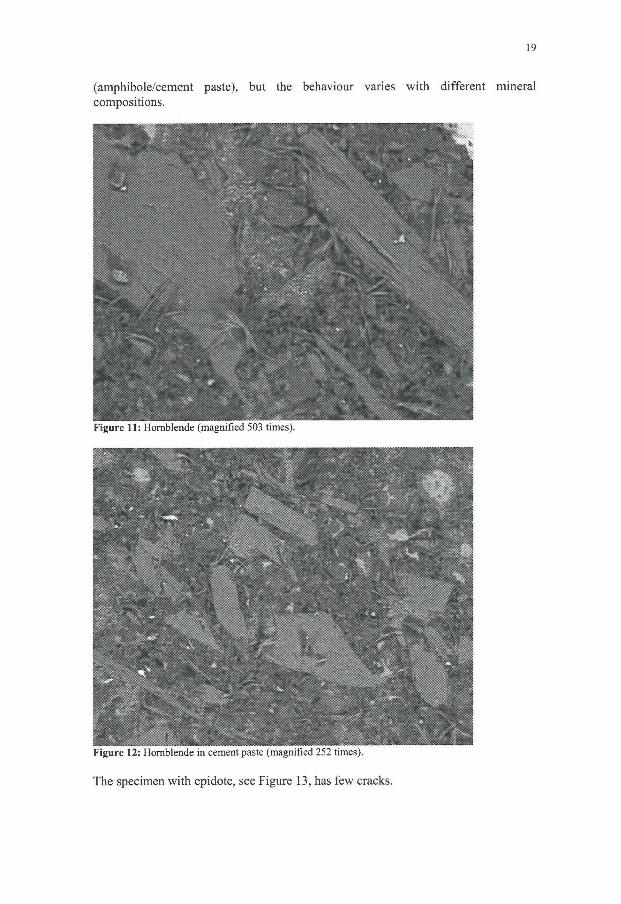
19
(amphibole/cement paste), but the behaviour varies with different mineral compositions.
Figure 12: Hornblende in cement paste (magnified 252 times).
The specimen with epidote, see Figure 13, has few cracks.
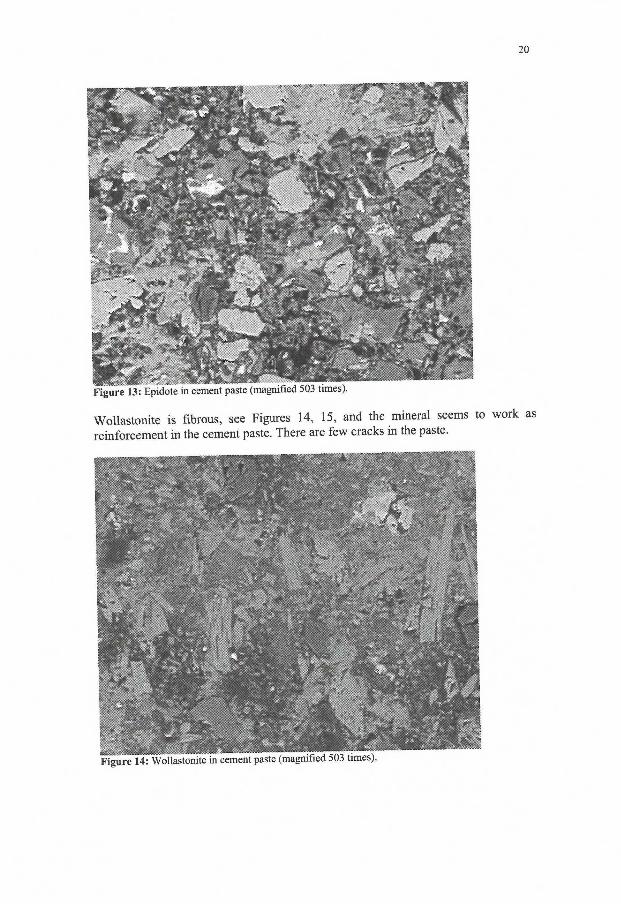
Wollastonite is fibrous, see Figures 14, 15, and the mineral seems to reinforcement in the cement paste. There are few cracks in the paste.
Figure 14: Wollastonite in cement paste (magnified 503 times).
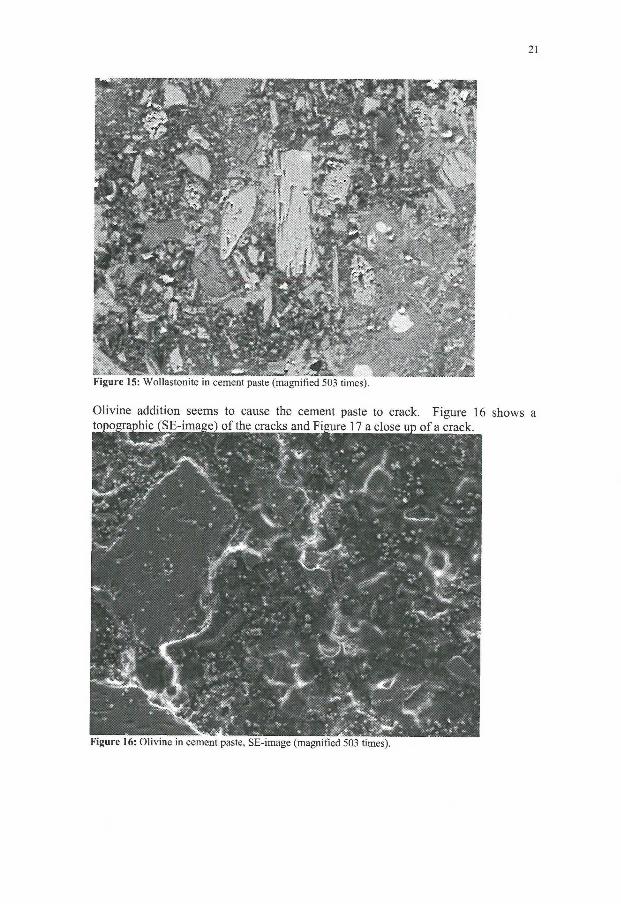
Figure 15: Wollastonite in cement paste (magnified 503 times).
Olivine addition seems to cause the cement paste to crack. Figure 16 shows a
Figure 16: Olivine in cement paste, SE-image (magnified 503 times).
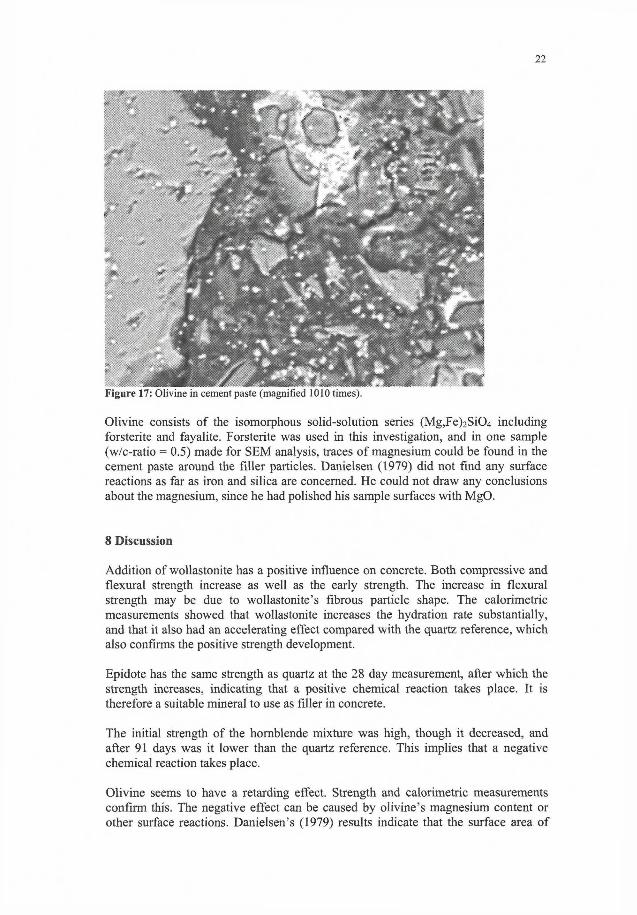
22
Figure 17: Olivine in cement paste (magnified 1010 times).
Olivine consists of the isomorphous solid-solution series (Mg,Fe) 2Si04 including forsterite and fayalite. Forsterite was used in this investigation, and in one sample (w/c-ratio = 0.5) made for SEM analysis, traces of magnesium could be found in the cement paste around the filler particles. Danielsen (1979) did not find any surface reactions as far as iron and silica are concerned. He could not draw any conclusions about the magnesium, since he had polished his sample surfaces with MgO.
8 Discussion
Addition of wollastonite has a positive influence on concrete. Both compressive and flexural strength increase as well as the early strength. The increase in flexural strength may be due to wollastonite's fibrous particle shape. The calorimetric measurements showed that wollastonite increases the hydration rate substantially, and that it also had an accelerating effect compared with the quartz reference, which also confirms the positive strength development.
Epidote has the same strength as quartz at the 28 day measurement, after which the strength increases, indicating that a positive chemical reaction takes place. It is therefore a suitable mineral to use as filler in concrete.
The initial strength of the hornblende mixture was high, though it decreased, and after 91 days was it lower than the quartz reference. This implies that a negative chemical reaction takes place.
Olivine seems to have a retarding effect. Strength and calorimetric measurements confirm this. The negative effect can be caused by olivine's magnesium content or other surface reactions. Danielsen's (1979) results indicate that the surface area of
23
the olivine affects the strength of the concrete. The tested olivine is unsuitable for use in concrete and other cement-based materials.
9 Comparison of by-products and minerals.
Compared to the by-products in the previous investigation (Moosberg et al, 2000), the minerals in Part 1 and Part 2 do not deviate much from the results of the quartz reference, with the exception of periclase. The variations in the heat development curves of the by-products are larger than they are for the minerals. One reason for this may be that the minerals are chemically purer; therefore, there is less interference with the cement hydration. It is important to remember that minerals from different locations may react in different ways, since the mineral genesis can differ from deposit to deposit.
10 Acknowledgements
This research was supported by the Mineral and Metals Recycling Research Centre (MiMeR) at Luleå University of Technology in Sweden. The CBI part of the research has been financed by the Foundation for Swedish Concrete Research.
11 References
Danielsen, S.W. (1979?) Betongtillslag/mineraloverflater - en studie av tillslagsmineralogiens betydning for betongens egenskaper, (in Norwegian) PhD-thesis in two parts. Trondheims Universty.
Johansen, K., Meland, I . , Lindegård, J., Wallevik, O., Skjeggerud, K., Lundevall, G. And Hauck, C, (1992) Effekt av ulike fillertyper i sementbaserte materialer. Delrapport 3.7, STF70 A92035 (in Norweigan)
Kjellsen, K.O. & Lagerblad, B. (1995) Influence of Natural Minerals in the Filler Fraction on Hydration and Properties of Mortars. Swedish Cement and Concrete Research Institute. CBI report 3:95.
Lindgård, Jan. and Johansen, K., (1996) Crushed olivine as concrete aggregate. Proceedings from Nordic Concrete Research Meeting, Espoo, Finland
Moosberg, H., Lagerblad, B. and Forssberg, E. The use of by-products from metallurgical and mineral industries as filler in cement based materials. Submitted to Waste Management & Research, September 2000.
Neville, A.M. (1995) Properties of Concrete. Essex, UK. Longman Group Ltd.
Wu, X., Roy, D.M. & Langton, CA. (1983) Early stage hydration of slag-cement. Cement and Concrete Research vol. 13, 277-286.

1
The function of fillers in concrete
1 1 2
H . Moosberg-Bustnes , B . Lagerblad , E. Forssberg (1) Swedish Cement and Concrete Research Institute, Stockholm, Sweden (2) Luleå University of Technology, Division of Mineral Processing, Luleå, Sweden
ABSTRACT The purpose ot this investigation has been to evaluate the effect of quartz filler on concrete strength and microstructure, and to see if it is possible to replace cement with filler without loss of strength. Fillers are materials whose function in concrete is based mainly on size and shape. They can interact with cement in several ways; to improve particle packing and give the fresh concrete other properties, and even to reduce the amount of cement in concrete without loss of strength. Quartz was chosen as filler material, since it is inert and is available both as a by-product and a natural raw material. Different amounts of filler were used in the various experiments, as well as different particle size distributions. The results are positive: fillers can partially replace cement and at the same time improve the properties and the microstructure of the concrete. This research is part of a larger project that aims to find uses for byproducts in concrete.
RESUME L 'objectij de cette recherche a été d évaluer I ejjet de la charge au quartz sur la résistance et la microstructure du béton, et de voir s 'il est possible de remplacer le ciment par une charge, sans perdre de résistance. Les charges sont des matiéres dont la fonction au sein du béton dépend essentiellement de la taille et de la forme. Elles peuvent interagir avec le ciment de plusieurs maniéres ; pour augmenter le compactage des particules et donner d'autres propriétés au béton frais, et méme pour réduire la quantité de ciment dans le béton sans perdre de résistance. Le quartz a été choisi comme matériau de charge, car inerte et disponible aussi bien en tant que sous-produit qu'en tant que matiére premiere naturelle. Différentes quantités de charge ont été utilisées lors des différentes expériences, ainsi que différentes répartitions entre les tallies des particules. Les résultats sont positifs: les charges peuvent remplacer le ciment et en méme temps améliorer les propriétés et la microstructure du béton. Cette recherche fait partie d'un projet majeur dont le but est de trouver des utilisations pour les sous-produits contenus dans le béton.
1. INTRODUCTION The purpose with this investigation is to test and describe the influence on concrete of quartz filler with different particle sizes and in different amounts. This basic knowledge can then be used on other types of filler of different origin. This investigation is a part of a larger project that aims to find uses for by-products in concrete. From experience we know that fillers have a profound effect on concrete in both the fresh and hardened state. Especially as the development of more effective superplasticizers has made it possible to increase the amount of filler, which opens new opportunities and fields of application. The particles may be used to reduce the amount of cement and/or give the fresh concrete other
properties, e.g., self-compactability. Fillers can be made, but large quantities are also available as byproducts from different industries. Use of these products will benefit the environment, since it will reduce the need for deposition. At the same time, the use of by-products can reduce cement consumption, which is also positive for the environment. The fillers interact with the cement in several ways. They may be chemically inert but can still indirectly influence the chemical structure of the cement paste and concrete in a positive way. The large surface of the small particles may foster nucleation, density and homogenise the paste. Moreover, it will influence the concrete by giving it other rheological properties, which in turn will influence also the properties of the hardened concrete.
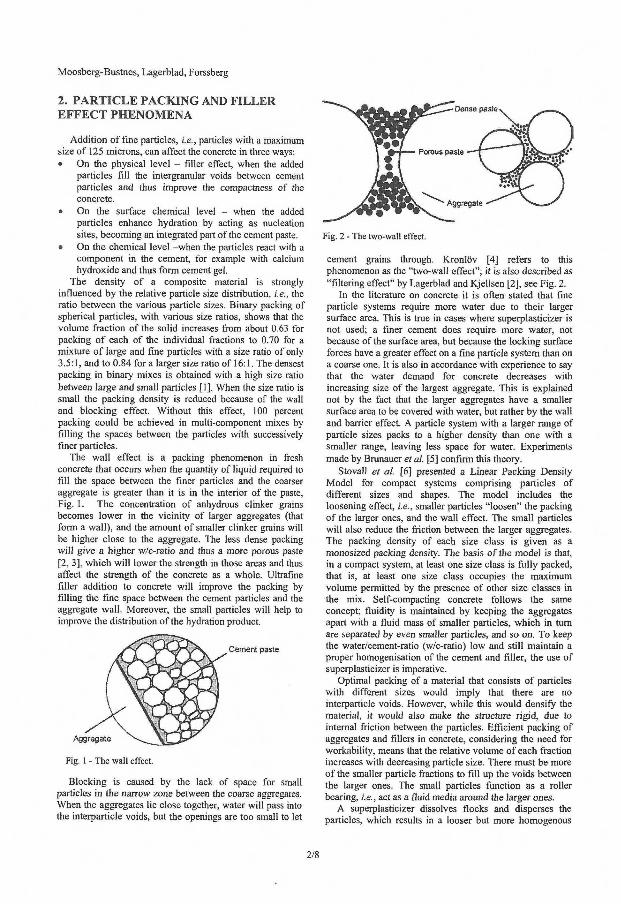
Moosberg-Bustnes, Lagerblad, Forssberg
2. PARTICLE PACKING AND F I L L E R E F F E C T PHENOMENA
Addition of fine particles, i.e., particles with a maximum size of 125 microns, can affect the concrete in three ways: • On the physical level - filler effect, when the added
particles fill the intergranular voids between cement particles and thus improve the compactness of the concrete.
• On the surface chemical level - when the added particles enhance hydration by acting as nucleation sites, becoming an integrated part of the cement paste.
• On the chemical level —when the particles react with a component in the cement, for example with calcium hydroxide and thus form cement gel.
The density of a composite material is strongly influenced by the relative particle size distribution, i.e., the ratio between the various particle sizes. Binary packing of spherical particles, with various size ratios, shows that the volume fraction of the solid increases from about 0.63 for packing of each of the individual fractions to 0.70 for a mixture of large and fine particles with a size ratio of only 3.5:1, and to 0.84 for a larger size ratio of 16:1. The densest packing in binary mixes is obtained with a high size ratio between large and small particles [1]. When the size ratio is small the packing density is reduced because of the wall and blocking effect. Without this effect, 100 percent packing could be achieved in multi-component mixes by filling the spaces between the particles with successively finer particles.
The wall effect is a packing phenomenon in fresh concrete that occurs when the quantity of liquid required to fill the space between the finer particles and the coarser aggregate is greater than it is in the interior of the paste, Fig. 1. The concentration of anhydrous clinker grains becomes lower in the vicinity of larger aggregates (that form a wall), and the amount of smaller clinker grains will be higher close to the aggregate. The less dense packing will give a higher w/c-ratio and thus a more porous paste [2, 3], which will lower the strength in those areas and thus affect the strength of the concrete as a whole. Ultrafine filler addition to concrete will improve the packing by filling the fine space between the cement particles and the aggregate wall. Moreover, the small particles will help to improve the distribution of the hydration product.
Cemsnt paste
Fig. 1 - The wall effect.
Blocking is caused by the lack of space for small particles in the narrow zone between the coarse aggregates. When the aggregates lie close together, water will pass into the interpartiele voids, but the openings are too small to let
Fig. 2 - The two-wall effect.
cement grains through. Kronlöv [4] refers to this phenomenon as the "two-wali effect"; it is also described as "filtering effect" by Lagerblad and Kjellsen [2], see Fig. 2.
In the literature on concrete it is often stated that fine particle systems require more water due to their larger surface area. This is true in cases where superplasticizer is not used; a finer cement does require more water, not because of the surface area, but because the locking surface forces have a greater effect on a fine particle system than on a coarse one. It is also in accordance with experience to say that the water demand for concrete decreases with increasing size of the largest aggregate. This is explained not by the fact that the larger aggregates have a smaller surface area to be covered with water, but rather by the wall and barrier effect. A particle system with a larger range of particle sizes packs to a higher density than one with a smaller range, leaving less space for water. Experiments made by Brunauer et al. [5] confirm this theory.
Stovall et al. [6] presented a Linear Packing Density Model for compact systems comprising particles of different sizes and shapes. The model includes the loosening effect, i.e., smaller particles "loosen" the packing of the larger ones, and the wall effect. The small particles will also reduce the friction between the larger aggregates. The packing density of each size class is given as a monosized packing density. The basis of the model is that, in a compact system, at least one size class is fully packed, that is, at least one size class occupies the maximum volume permitted by the presence of other size classes in the mix. Self-compacting concrete follows the same concept; fluidity is maintained by keeping the aggregates apart with a fluid mass of smaller particles, which in rum are separated by even smaller particles, and so on. To keep the water/cement-ratio (w/c-ratio) low and still maintain a proper homogenisation of the cement and filler, the use of superplasticizer is imperative.
Optimal packing of a material that consists of particles with different sizes would imply that there are no interpartiele voids. However, while this would densify the material, it would also make the structure rigid, due to internal friction between the particles. Efficient packing of aggregates and fillers in concrete, considering the need for workability, means that the relative volume of each fraction increases with decreasing particle size. There must be more of the smaller particle fractions to fill up the voids between the larger ones. The small particles function as a roller bearing, i.e., act as a fluid media around the larger ones.
A superplasticizer dissolves flocks and disperses the particles, which results in a looser but more homogenous
2/8
Materials and Structures I Maténaux et Constructions, Vol. 36, Month 2003
particle packing. Particles of ultrafine powder, which form an electric double layer after adsorbing superplasticizer, will be more effective in filling in the spaces between the cement particles and dispersing these particles. As a result, the fluidity of the cement paste increases. According to Nehdi [7], the workability is obtained with the densest particle packing, since the adsorbed water will not only fill voids, it will increase the thickness of the water layer around particles, which in turn decreases viscosity and improves flow properties. In a cement-filler system, the amount of free water is decreased, and most of the water is adsorbed on the surface of grains or entrapped inside flocks of particles. Through its action on the surface charges a superplasticizer can partially liberate the water adsorbed as a surface layer, but not decrease the amount of free water. Thus, a superplasticizer is more efficient in a dense particulate system with high surface area, and has only limited effect in a porous low-density system.
At the initial stage of hydration the physical and surface chemical effects are important for the fresh and young concrete, while eventual pozzolanic reactions start later and affect the hardened concrete. Silica, in principle, is unstable in the high pH in concrete. Amorphous silica, disordered quartz and meta-stable cristobalite are classical pozzolans. Normally, quartz is considered an inert material, but finegrained ordered quartz will also react if it has a very high surface area, i.e., very fine particles. According to Benezet and Benhassaine [8], it is the size of the quartz particles that determines the occurrence of a pozzolanic reaction, i.e., the surface area is the important factor. Quartz particles have to be a lot smaller than 5 microns to contribute to a pozzolanic reaction. As a comparison, silica fume has a particle size of 0.1 microns and shows a distinct pozzolanic reaction as early as one to three days after mixing with Portland cement or up to one year after mixing when slag-cement is used [9], Knauss and Wolery [10] reports that the dissolution rate of quartz is approximately 2-3 times higher at pH 12 compared to pH 7.
3. EXPERIMENTAL S T U D Y
3.1 Materials
Quartz was chosen as test material, since it can be considered an inert material and is available as both byproducts and virgin materials. Three commercial quartz products, M300, M500, M6000 from SIBELCO S.A. and a by-product (pure quartz) from the mineral processing industry are used in this investigation. M6000 is a cristobalite, which is a polymorph of quartz, i.e., the same chemistry but a different structure. It can also be considered a chemically inert material at short terms, but it will have a pozzolanic effect in concrete after a long period of time. This reaction will not affect the short-term strength; only the physical influence of the particles will be seen in the results. The by-product was sieved to a maximum particle size of 125 microns, the same as the cement used. M300, M500 and M6000 have the same particle size as cement, finer than cement and significantly finer than cement, d50 are 14,4 and 2.2 microns respectively.
The by-product was used for the rheology tests. The material was classified by SINTEF in Norway. The classification was done using an INPROSYS air classifier, type IAC 200. The quartz was divided into six different size fractions, three of them were used in the experiments. The 0-125 micron fraction was used as base-filler and 0-31 and 125-250 micron fractions were used for replacement.
3.2 Methods
3.2.1 Mixing
The concrete was mixed in a paddle mixer, in accordance with the SS-ENV 206, in batches of 25 litres. First, cement and filler were mixed dry, then the aggregates were added. The water and superplasticizer were mixed and then added to the dry components.
3.2.2 Slump test
The concrete flowability was measured according to the SS 13 71 23 procedure.
3.2.3 Compressive strength
In order to test the compressive strength, concrete cubes of 0.15 x 0.15 x 0.15 m3 were cast in steel moulds according to the procedure in SS 13 11 12. Demoulding took place after 24 hours and the cubes were cured and stored under 100 percent relative humidity (RH). The cubes were measured and weighted before the compressive strength was tested with uniaxial compression at 7 and 28 days, according to the procedure in SS 13 72 1 0. The press used for the tests is in accordance with SS 13 11 10.
3.2.4 Microscopy analyses
After 91 days 14 samples were chosen for scanning electron microscopy (SEM) analysis in order to verify the experimental results. The samples were impregnated with epoxy resin, cut, polished and then analysed with a SEM in order to investigate the structure. Silica mapping was also done on the samples to determine the distribution of the filler particles in the cement paste. Thin sections were also made of the above-mentioned samples and they were analysed with an optical microscope.
3.2.5 Rheology tests
The viscosimeter used for rheology measurements was a HAAKE Rotovisco CV20. The sensor system consists of concentric cylinders with the outer cylinder (the cup) from an original HAAKE sensor system, ZA30. A new inner cylinder (bob) differs from the original bob in diameter and surface structure providing a gap between the inner and outer cylinder of 2.58 mm, and is serrated with grooves, 0.5 x 0.5 mm wide and deep to prevent any slip-surface occurring. Using a Hobart laboratory scale mixer the mixing sequence is as follows: AH dry materials are mixed for 10 seconds. The water is poured slowly into the beaker while mixing the fine mortar for 30 seconds. The superplasticizer is added. The fine mortar containing all ingredients is mixed 1 minute by hand, then 1 minute by machine. The last sequence is repeated once. Billberg [11] describes the whole procedure. The linear Bingham model is used to describe the flow [12].
To test the compressive strength of the mortar prisms of 0.04 x 0.04 x 0.16 m3 were cast in steel moulds. Demoulding
3/8
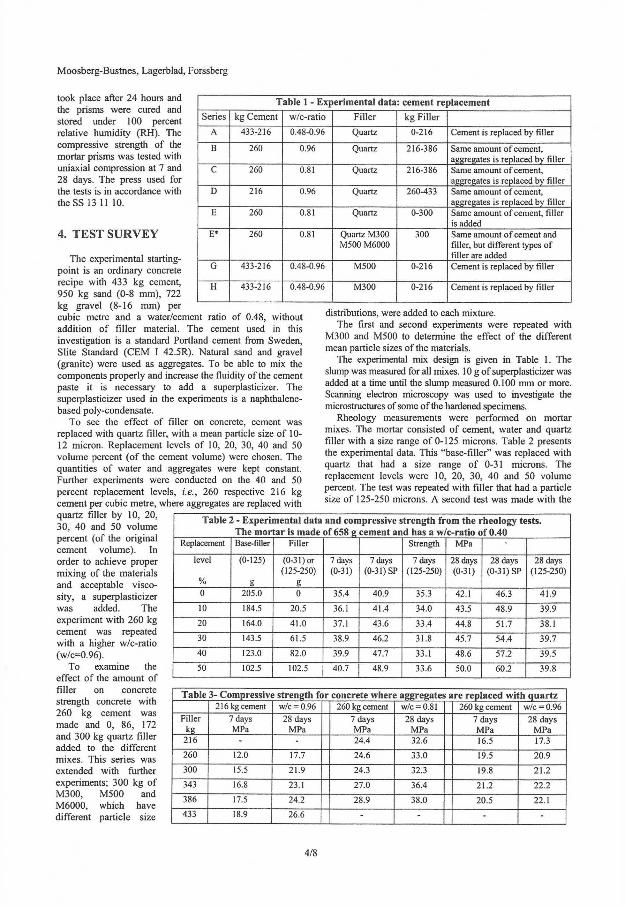
Moosberg-Bustnes, Lagerblad, Forssberg
took place after 24 hours and the prisms were cured and stored under 100 percent relative humidity (RH). The compressive strength of the mortar prisms was tested with uniaxial compression at 7 and 28 days. The press used for the tests is in accordance with theSS 13 11 10.
4. TEST SURVEY
The experimental starting-point is an ordinary concrete recipe with 433 kg cement, 950 kg sand (0-8 mm), 722 kg gravel (8-16 mm) per cubic metre and a water/cement ratio of 0.48, without addition of filler material. The cement used in this investigation is a standard Portland cement from Sweden, Slite Standard (CEM I 42.5R). Natural sand and gravel (granite) were used as aggregates. To be able to mix the components properly and increase the fluidity of the cement paste it is necessary to add a superplasticizer. The superplasticizer used in the experiments is a naphthalene-based poly-condensate.
To see the effect of filler on concrete, cement was replaced with quartz filler, with a mean particle size of 10-12 micron. Replacement levels of 10, 20, 30, 40 and 50 volume percent (of the cement volume) were chosen. The quantities of water and aggregates were kept constant. Further experiments were conducted on the 40 and 50 percent replacement levels, i.e., 260 respective 216 kg cement per cubic metre, where aggregates are replaced with quartz filler by 10, 20, 30, 40 and 50 volume percent (of the original cement volume). In order to achieve proper mixing of the materials and acceptable viscosity, a superplasticizer was added. The experiment with 260 kg cement was repeated with a higher w/c-ratio (w/c=0.96).
To examine the effect of the amount of filler on concrete strength concrete with 260 kg cement was made and 0, 86, 172 and 300 kg quartz filler added to the different mixes. This series was extended with further experiments; 300 kg of M300, M500 and M6000, which have different particle size
Table 1 - Experimental data: cement replacement Series kg Cement w/c-ratio Filler kg Filler
A 433-216 0.48-0.96 Quartz 0-216 Cement is replaced by filler
B 260 0.96 Quartz 216-386 Same amount of cement, aggregates is replaced by filler
C 260 0.81 Quartz 216-386 Same amount of cement, aggregates is replaced by filler
D 216 0.96 Quartz 260-433 Same amount of cement, aggregates is replaced by filler
E 260 0.81 Quartz 0-300 Same amount of cement, filler is added
E* 260 0.81 Quartz M300 M500 M6000
300 Same amount of cement and filler, but different types of filler are added
G 433-216 0.48-0.96 M500 0-216 Cement is replaced by filler
H 433-216 0.48-0.96 M300 0-216 Cement is replaced by filler
distributions, were added to each mixture. The first and second experiments were repeated with
M300 and M500 to determine the effect of the different mean particle sizes of the materials.
The experimental mix design is given in Table 1. The slump was measured for all mixes. 10 g of superplasticizer was added at a time until the slump measured 0.100 mm or more. Scanning electron microscopy was used to investigate the microstructures of some of the hardened specimens.
Rheology measurements were performed on mortar mixes. The mortar consisted of cement, water and quartz filler with a size range of 0-125 microns. Table 2 presents the experimental data. This "base-filler" was replaced with quartz that had a size range of 0-31 microns. The replacement levels were 10, 20, 30, 40 and 50 volume percent. The test was repeated with filler that had a particle size of 125-250 microns. A second test was made with the
Table 2 - Experimental data and compressive strength from the rheology tests. The mortar is made of 658 g cement and has a w/c-ratio of 0.40
Replacement Base-filler Filler Strength MPa
level
%
(0-125)
g
(0-31) or (125-250)
g
7 days (0-31)
7 days (0-31) SP
7 days (125-250)
28 days (0-31)
28 days (0-31) SP
28 days (125-250)
0 205.0 0 35.4 40.9 35.3 42.1 46.3 41.9
10 184.5 20.5 36.1 41.4 34.0 43.5 48.9 39.9
20 164.0 41.0 37.1 43.6 33.4 44.8 51.7 38.1
30 143.5 61.5 38.9 46.2 31.8 45.7 54.4 39.7
40 123.0 82.0 39.9 47.7 33.1 48.6 57.2 39.5
50 102.5 102.5 40.7 48.9 33.6 50.0 60.2 39.8
Table 3- Compressive strength for concrete where aggregates are replaced with quartz 216 kg cement w/c = 0.96 260 kg cement w/c = 0.81 260 kg cement w/c = 0.96
Filler kg
7 days MPa
28 days MPa
7 days MPa
28 days MPa
7 days MPa
28 days MPa
216 - - 24.4 32.6 16.5 17.3
260 12.0 17.7 24.6 33.0 19.5 20.9
300 15.5 21.9 24.3 32.3 19.8 21.2
343 16.8 23.1 27.0 36.4 21.2 22.2
386 17.5 24.2 28.9 38.0 20.5 22.1
433 18.9 26.6 - - - -
4/8
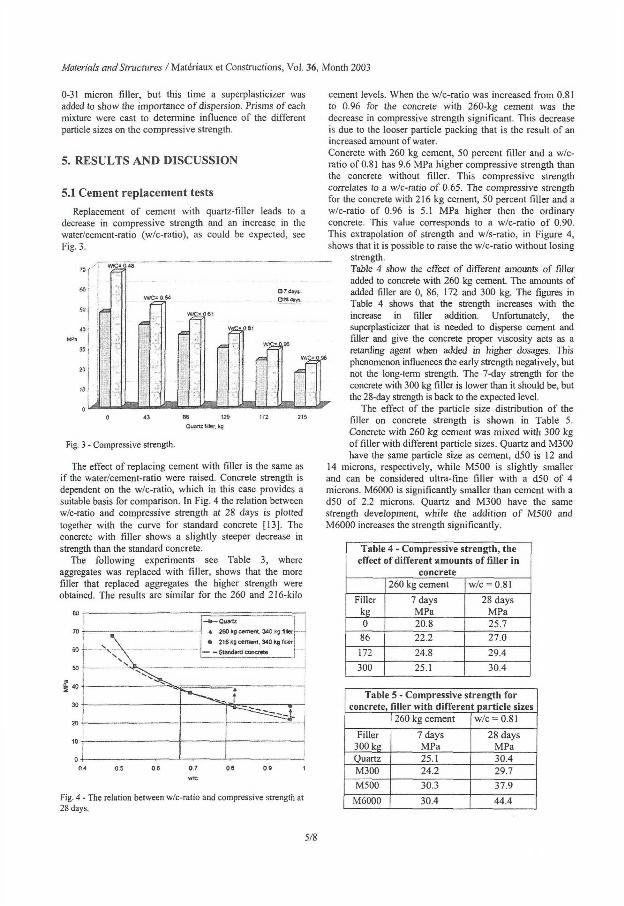
Materials and Structures IMatériaux et Constmctions, Vol. 36, Month 2003
0-31 micron filler, but this time a superplasticizer was added to show the importance of dispersion. Prisms of each mixture were cast to determine influence of the different particle sizes on the compressive strength.
5. RESULTS AND DISCUSSION
5.1 Cement replacement tests
Replacement of cement with quartz-filler leads to a decrease in compressive strength and an increase in the water/cement-ratio (w/c-ratio), as could be expected, see Fig. 3.
O 7 day* Cm day*
SS5f
Iff - V '&f
Fig. 3 - Compressive strength.
The effect of replacing cement with filler is the same as if the water/cement-ratio were raised. Concrete strength is dependent on the w/c-ratio, which in this case provides a suitable basis for comparison. In Fig. 4 the relation between w/c-ratio and compressive strength at 28 days is plotted together with the curve for standard concrete [13]. The concrete with filler shows a slightly steeper decrease in strength than the standard concrete.
The following experiments see Table 3, where aggregates was replaced with filler, shows that the more filler that replaced aggregates the higher strength were obtained. The results are similar for the 260 and 216-kilo
cement levels. When the w/c-ratio was increased from 0.81 to 0.96 for the concrete with 260-kg cement was the decrease in compressive strength significant. This decrease is due to the looser particle packing that is the result of an increased amount of water. Concrete with 260 kg cement, 50 percent filler and a w/c-ratio of 0.81 has 9.6 MPa higher compressive strength than the concrete without filler. This compressive strength correlates to a w/c-ratio of 0.65. The compressive strength for the concrete with 216 kg cement, 50 percent filler and a w/c-ratio of 0.96 is 5.1 MPa higher then the ordinary concrete. This value corresponds to a w/c-ratio of 0.90. This extrapolation of strength and w/s-ratio, in Figure 4, shows that it is possible to raise the w/c-ratio without losing
strength. Table 4 show the effect of different amounts of filler added to concrete with 260 kg cement. The amounts of added filler are 0, 86, 172 and 300 kg. The figures in Table 4 shows that the strength increases with the increase in filler addition. Unfortunately, the superplasticizer that is needed to disperse cement and filler and give the concrete proper viscosity acts as a retarding agent when added in higher dosages. This phenomenon influences the early strength negatively, but not the long-term strength. The 7-day strength for the concrete with 300 kg filler is lower than it should be, but the 28-day strength is back to the expected level.
The effect of the particle size distribution of the filler on concrete strength is shown in Table 5. Concrete with 260 kg cement was mixed with 300 kg of filler with different particle sizes. Quartz and M300 have the same particle size as cement, d50 is 12 and
14 microns, respectively, while M500 is slightly smaller and can be considered ultra-fine filler with a d50 of 4 microns. M6000 is significantly smaller than cement with a d50 of 2.2 microns. Quartz and M300 have the same strength development, while the addition of M500 and M6000 increases the strength significantly.
80
60
50
n 2 40
30
20
10
0
Quartz
a 260 kg cement, 340 kg finer
* 216 kg cement, 340 kg filter
— - Standard concrete
. . . .
i \ v \ - -
Quartz
a 260 kg cement, 340 kg finer
* 216 kg cement, 340 kg filter
— - Standard concrete
. . . .
Ni \
I
0.7
w/c
Fig. 4 - The relation between w/c-ratio and compressive strength at 28 days.
Table 4 - Compressive strength, the effect of different amounts of filler in
concrete 260 kg cement w/c = 0.81
Filler kg
7 days MPa
28 days MPa
0 20.8 25.7 86 22.2 27.0
172 24.8 29.4
300 25.1 30.4
Table 5 - Compressive strength for concrete, filler with different particle sizes
260 kg cement w/c = 0.81
Filler 300 kg
7 days MPa
28 days MPa
Quartz 25.1 30.4 M300 24.2 29.7
M500 30.3 37.9
M6000 30.4 44.4
5/8
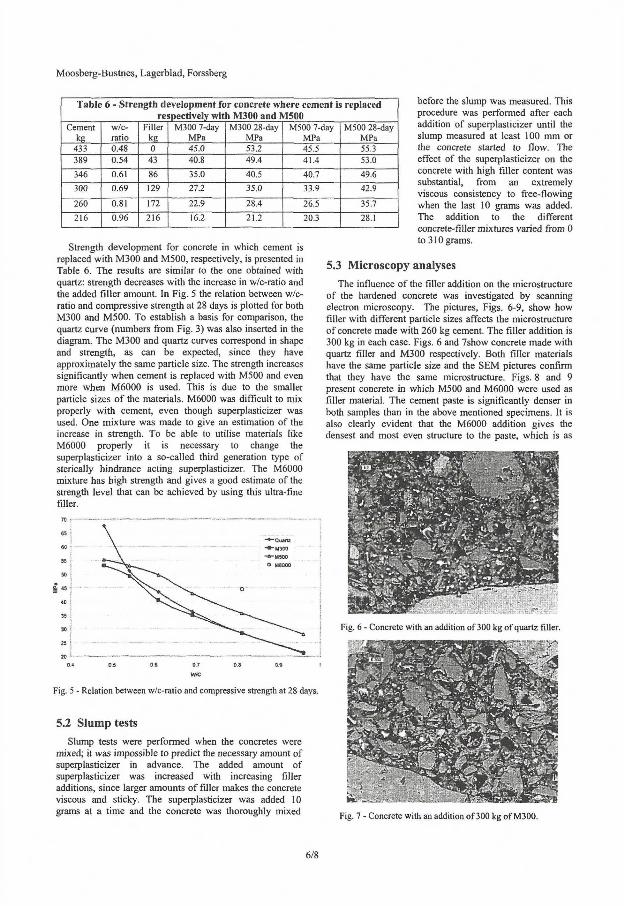
Moosberg-Bustnes, Lagerblad, Forssberg
Table 6 - Strength development for concrete where cement is replaced respectively with M300 and MSOO
Cement kg
w/c-ratio
Filler kg
M300 7-day MPa
M300 28-day MPa
M500 7-day MPa
M500 28-day MPa
433 0.48 0 45.0 53.2 45.5 55.3 389 0.54 43 40.8 49.4 41.4 53.0
346 0.61 86 35.0 40.5 40.7 49.6
300 0.69 129 27.2 35.0 33.9 42.9
260 0.81 172 22.9 28.4 26.5 35.7
216 0.96 216 16.2 21.2 20.3 28.1
Strength development for concrete in which cement is replaced with M300 and M500, respectively, is presented in Table 6. The results are similar to the one obtained with quartz: strength decreases with the increase in w/c-ratio and the added fdler amount. In Fig. 5 the relation between w/c-ratio and compressive strength at 28 days is plotted for both M300 and M500. To establish a basis for comparison, the quartz curve (numbers from Fig. 3) was also inserted in the diagram. The M300 and quartz curves correspond in shape and strength, as can be expected, since they have approximately the same particle size. The strength increases significantly when cement is replaced with M500 and even more when M6000 is used. This is due to the smaller particle sizes of the materials. M6000 was difficult to mix properly with cement, even though superplasticizer was used. One mixture was made to give an estimation of the increase in strength. To be able to utilise materials like M6000 properly it is necessary to change the superplasticizer into a so-called third generation type of sterically hindrance acting superplasticizer. The M6000 mixture has high strength and gives a good estimate of the strength level that can be achieved by using this ultra-fine filler.
before the slump was measured. This procedure was performed after each addition of superplasticizer until the slump measured at least 100 mm or the concrete started to flow. The effect of the superplasticizer on the concrete with high filler content was substantial, from an extremely viscous consistency to free-flowing when the last 10 grams was added. The addition to the different concrete-filler mixtures varied from 0 to 310 grams.
5.3 Microscopy analyses
The influence of the filler addition on the microstructure of the hardened concrete was investigated by scanning electron microscopy. The pictures, Figs. 6-9, show how filler with different particle sizes affects the microstructure of concrete made with 260 kg cement. The filler addition is 300 kg in each case. Figs. 6 and 7show concrete made with quartz filler and M300 respectively. Both filler materials have the same particle size and the SEM pictures confirm that they have the same microstructure. Figs. 8 and 9 present concrete in which M500 and M6000 were used as filler material. The cement paste is significantly denser in both samples than in the above mentioned specimens. It is also clearly evident that the M6000 addition gives the densest and most even structure to the paste, which is as
*"M3C0
O M6G00
Fig. 6 - Concrete with an addition of 300 kg of quartz filler.
Fig. 5 - Relation between w/c-ratio and compressive strength at 28 days.
5.2 Slump tests
Slump tests were performed when the concretes were mixed; it was impossible to predict the necessary amount of superplasticizer in advance. The added amount of superplasticizer was increased with increasing filler additions, since larger amounts of filler makes the concrete viscous and sticky. The superplasticizer was added 10 grams at a time and the concrete was thoroughly mixed Fig. 7 - Concrete with an addition of 300 kg of M300.
6/8
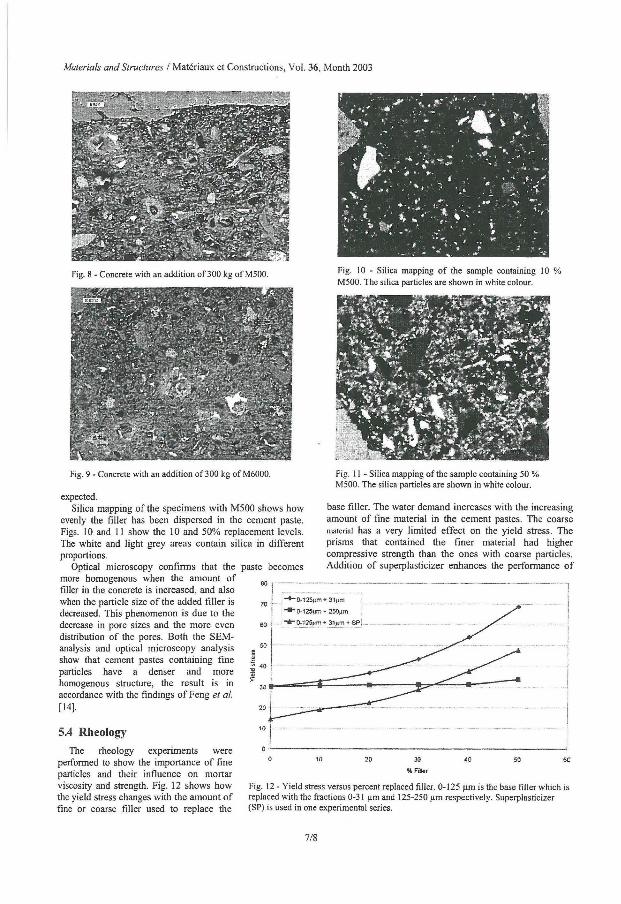
Materials and Structures I Matériaux et Constmctions, Vol. 36, Month 2003
Fig. 9 - Concrete with an addition of 300 kg of M6000.
expected.
Silica mapping ofthe specimens with M500 shows how evenly the filler has been dispersed in the cement paste. Figs. 10 and 11 show the 10 and 50% replacement levels. The white and light grey areas contain silica in different proportions.
Optical microscopy confirms that the paste becomes more homogenous when the amount of filler in the concrete is increased, and also when the particle size of the added filler is decreased. This phenomenon is due to the decrease in pore sizes and the more even distribution of the pores. Both the SEM-analysis and optical microscopy analysis show that cement pastes containing fine particles have a denser and more homogenous structure, the result is in accordance with the findings of Feng et al. [14].
5.4 Rheology
The rheology experiments were performed to show the importance of fine particles and their influence on mortar viscosity and strength. Fig. 12 shows how the yield stress changes with the amount of fine or coarse filler used to replace the
Fig. 11 - Silica mapping of the sample containing 50 % M500. The silica particles are shown in white colour.
base filler. The water demand increases with the increasing amount of fine material in the cement pastes. The coarse material has a very limited effect on the yield stress. The prisms that contained the finer material had higher compressive strength than the ones with coarse particles. Addition of superplasticizer enhances the performance of
Fig. 12 - Yield stress versus percent replaced filler. 0-125 urn is the base filler which is replaced with the fractions 0-31 um and 125-250 urn respectively. Superplasticizer (SP) is used in one experimental series.
7/8
Moosberg-Bustnes, Lagerblad, Forssberg
the fine filler even more, see Table 2 for figures. Each result is the average of three observations. The variations in compressive strength in the samples of both series with fine particles were low. Maximum deviation was 0.46 percent, while the samples with coarse particles displayed greater deviation, maximum 2.53 percent. One reason for this may be that the samples with coarser particles are not as homogeneous as the ones with finer particles. The disparity between the different test series is due to the improvement in particle packing caused by the addition of fine particles, and the fact that the superplasticizer disperses the particles.
6. CONCLUSION
The addition of fillers can affect the concrete in three ways: on the physical, surface chemical, and the chemical levels. In this investigation the physical and surface chemical effects can be seen in the results. The pure chemical effect, i.e., pozzolanic effect, can only be detected if the long-term strength is measured. The strengthening effect of filler on concrete paste derives from the improvement of the pore structure. The amount of small pores increases at the same time as the number of large pore decreases, which has a positive influence on strength and durability. The filler effect is emphasised by the addition of superplasticizer to the concrete. The superplasticizer improves the particle packing by dispersing the fine particles, thereby increasing the strength. Microscopic studies demonstrate that cement pastes containing fine particles have a denser and more homogenous structure than pastes without filler. They also showed that the distribution of the filler in the cement paste was very good, even around the aggregates, which proves that filler addition improves particle packing and reduces the wall effect. The homogeneity of the pastes containing the finest fillers may be a possible result of the particles acting as nucleation sites, thus improving the hydration. Based on the results, it seems that concrete strength can be increased not necessarily through excessive cement contents, but via improved particle packing. Several of the by-products generated by the mineral and metallurgical industry can therefore be recycled into concrete to bring about improvements in strength, durability and rheology.
ACKNOWLEDGEMENTS
This research was supported by the Mineral and Metals Recycling Research Centre (MiMeR) at Luleå University of Technology in Sweden. The CBI part of the research has been financed by the Foundation for Swedish Concrete Research.
REFERENCES
[ I ] McGeary, R.K, 'Mechanical Packing of Sperical Particles' Journal of American Ceramic Society, 44 (10) (1961) 513-522.
[2] Lagerblad, B. and Kjellsen, K.O., 'Normal and high strength concretes with conventional aggregates', 'Engineering and Transport Properties of the Interfacial Transition Zone in Cementitious Composites', R1LEM Report 20, (1999) 53-70.
[3] Neville, A.M., 'Properties of Concrete' (Longman Group Ltd., Essex, 1995).
[4] Kronlöf, A., 'Filler effect of inert mineral powder in concrete', PhD Thesis, VTT publications 322 (1997)
[5] Brunauer, S. and coworkers, 'Hardened Portland cement pastes of low porosity I , I I , III', Cem. Concr. Res. 2 (1972) 313-330, 331-348,463-480.
[6] Stovall, T., de Larrard, F. And Buil, M., 'Linear packing density model of grain mixtures', Powder Technology 48 (1986) 1-12.
[7] Nehdi, M., 'Microfiller effect on rheology, microstructure, and mechanical properties of high-performance concrete' Ph.D. thesis, University of British Columbia (1998).
[8] Benezet, J-C. and Benhassaine, A., 'Influence de la taille des particules sur la réactivité pouzzolanique de poudres de quartz', Bulletin des Laboratoires des Ponts et Chaussées 219(1999) 17-28.
[9] Khatri, R.P. and Sirivivatnanon, V., 'Effect of different supplementary cementitious materials on mechanical properties of high performance concrete', Vem. Concr. Res. 25(1995)209-220.,
[10] Knauss, K.G. and Wolery, T.J., 'The dissolution kinetics of quartz as a function of pH and time at 70°C Geochimica et Cosmochimica Acta 52 (1988) 43-53.
[ I I ] Billberg, P., 'Self-compacting concrete for civil engineering structure - the Swedish experience', CBI-report 2:99, Stockholm, Sweden, (1999).
[12] Barnes, H.A., Hutton, J..F. and Walters, K., 'An Introduction to Rheology', (Elsevier Science B.V., Amsterdam, 1996).
[13] Concrete Handbook: Material, (only available in Swedish) (Svensksk Byggtjänst, Solna, 1994).
[14] Feng, N.Q., Shi, Y.X. and Hao, T.Y., influence of ultrafine powder on the fluidity and strength of cement paste', Advances in Cement Research 12 (2000) 89-95.
Paper received: August 23, 2002: Paper accepted: October 1, 2002

1
The effect of metal oxides on cement hydration - State of the art report
Helena Moosberg-Bustnes Swedish Cement and Concrete Research Institute
Abstract
There are different types of "wastes" and it is important to distinguish between them since their usefulness for further use in the society varies. The two "basic" groups are organic and inorganic materials. The first wil l not be included in this work. The inorganic compounds can be further divided into different classes. There are materials from the heavy industry, for example: mineral- and metallurgical industry, which contains inorganic elements such as (metal oxides) lead, zinc, copper, mercury, chrome, cadmium and others. There are also radioactive materials and materials containing toxic, hazardous or polluting organic compounds. Of these three groups, only the first one is suited for civil engineering purposes.
The industrial materials can be of two types, soluble or insoluble. Water-soluble compounds are usually salts, such as nitrates, borates and phosphates (for example: lead(II)nitrate, cadmium chloride hydrate, mercury(II)chloride) . Insoluble compounds are often metal oxides, for example: lead(II)oxide, cadmium oxide, chromium(III)oxide.
This review attempts to present a mixture of knowledge obtained during the last decades, and "old" truths about the interaction between metal containing materials and cement. Hopefully this review will lead to a better understanding of how various metal ions behave when mixed into concrete.
1 Portland cement and its major hydration reactions
Portland cement is made by heating a mixture of limestone and clay, or other materials of similar bulk composition and sufficient reactivity, ultimately to a temperature of about 1450 ° C. Partial fusion occurs, and nodules of clinker are produced. The clinker is mixed with a few percent of calcium sulphate (gypsum) and finely ground, to make the cement. The clinker typically has a composition in the region of 67% CaO, 22% Si0 2 , 5% A1 20 3 , 3% Fe 20 3 and 3% other components, and normally contains four major phases, called alite, belite, aluminate and ferrite. Several other phases, such as alkali sulphates and calcium oxide, are normally present in minor amounts. Alite is the most important constituent of all normal Portland cement clinkers, of which it constitutes 50-70%. It is tricalcium silicate, Ca3SiOs, modified in composition and crystal structure by ionic substitutions. Belite is dicalcium silicate, Ca 2Si0 4
modified by ionic substitutions and normally present, wholly or largely, as the ß-polymorph. It constitutes 15-30% of normal Portland cement. Aluminate constitutes 5-10% of most normal cement clinker. It is tricalcium aluminate,
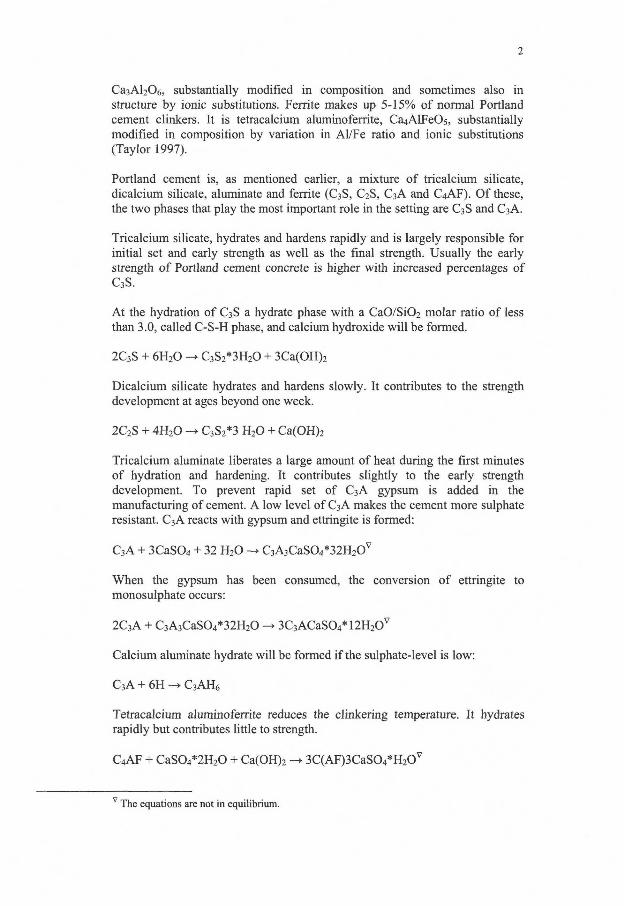
2
Ca 3 Al 2 06, substantially modified in composition and sometimes also in structure by ionic substitutions. Ferrite makes up 5-15% of normal Portland cement clinkers. It is tetracalcium aluminoferrite, Ca^lFeOs, substantially modified in composition by variation in Al/Fe ratio and ionic substitutions (Taylor 1997).
Portland cement is, as mentioned earlier, a mixture of tricalcium silicate, dicalcium silicate, aluminate and ferrite (C3S, C2S, C3A and C4AF). Of these, the two phases that play the most important role in the setting are C3S and C3A.
Tricalcium silicate, hydrates and hardens rapidly and is largely responsible for initial set and early strength as well as the final strength. Usually the early strength of Portland cement concrete is higher with increased percentages of C3S.
At the hydration of C3S a hydrate phase with a CaO/Si02 molar ratio of less than 3.0, called C-S-H phase, and calcium hydroxide wil l be formed.
2C3S + 6H 2 0 -> C 3S 2*3H 20 + 3Ca(OH)2
Dicalcium silicate hydrates and hardens slowly. It contributes to the strength development at ages beyond one week.
2C2S + 4H 2 0 -> C3S2*3 H 2 0 + Ca(OH)2
Tricalcium aluminate liberates a large amount of heat during the first minutes of hydration and hardening. It contributes slightly to the early strength development. To prevent rapid set of C3A gypsum is added in the manufacturing of cement. A low level of C3 A makes the cement more sulphate resistant. C 3A reacts with gypsum and ettringite is formed:
C 3A + 3CaS04 + 32 H 2 0 —• C 3A 3CaS0 4*32H 2Ov
When the gypsum has been consumed, the conversion of ettringite to monosulphate occurs:
2C 3A + C 3A 3CaS0 4*32H 20 -» 3C 3ACaS0 4*12H 2Ov
Calcium aluminate hydrate will be formed i f the sulphate-level is low:
C 3A + 6H -> C 3 AH 6
Tetracalcium aluminoferrite reduces the clinkering temperature. It hydrates rapidly but contributes little to strength.
C 4AF + CaS0 4*2H 20 + Ca(OH)2 ->• 3C(AF)3CaS04*H2Ov
v The equations are not in equilibrium.
Compounds that affect the C3S hydration as retarders usually increases the length of the dormant period and delay Ca(OH)2 precipitation. The mechanism by which this effect occurs is, according to many authors, related to the formation of a coating of insoluble, amorphous gels around the C3S grains that inhibits the grains access to the pore solution. The retardation effect can also result from interference with the development of C 3A hydration, the presence of sodium and potassium ions in the internal pore solution will produce a basic environment and will thus function as a retarder for C 3A because of the formation of an amorphous precipitate of Ca(OH)2.
Calcium sulphate is added to the clinker in the cement manufacturing in order to control the rate of set and the hydration of the aluminate phase. C3A mixed with water wi l l instantly develop a large amount of heat and becomes hard in a very short time. The hardening and heat development rises from the crystallisation of a dense, hydrated calcium aluminate from the supersaturated solution. In order to control the C3A hydration calcium sulphate, in the form of gypsum, is added. The addition of sulphate will lead to the formation of ettringite instead of hydrated calcium aluminates. However, while gypsum is a retarder, the hemihydrate and anhydrite forms are accelerators of the set (Taylor 1997, Lea 1971, Neville 1995, Betonghandbok 1994).
2 Solidification and stabilisation
In the area of solidification and stabilisation (S/S) of industrial waste materials cement has several advantages: it can be used as a matrix material as well as container. The wastes are evenly dispersed in the hardened concrete, breakage or cracking does not result in discharge of the contents but only increases the accessible surface area for leachants. Cement based materials have also an ability to chemically immobilise added waste materials.
Chemical stabilisation is the alteration of the added materials form so that leachability is eliminated or reduced. The mechanism may be chemical bonding or specific interactions, e.g. adsorption, between the waste and the binding agent. Solidification refers to bringing the waste into a solid state that will allow it to be handled; it does not imply chemical interaction between the waste and the binding agent. Solidification can also be described as a process of eliminating free water by hydration of cement ( if cement is the chosen matrix material).
Cements differ from chemically passive matrixes, such as polymer, by providing a significant chemical immobilisation potential for many inorganic waste species. It is important to remember that both physical and chemical aspects of cement behaviour are important and, moreover, that physical and chemical mechanisms of immobilisation will normally interact; hence, the microstructure, porosity, permeability, and mineralogy of cement materials are also of concern. Portland cement has a number of chemical features that are responsible for its widespread use in waste immobilisation processes. It is tolerant of wet material - water is required for set to occur. It is not flammable and is durable in the natural environment. It can also be used as an activator for
4
other potentially cementitious materials, i.e. glassy slag or fly ash. These materials become an integral part of the cementitious matrix with the result that they provide a matrix which utilises one "waste" (fly ash, slag etc.) to immobilise others. Moreover, Portland cement is widely available to a reasonable cost.
Stabilisation procedure is relatively simple which represent one advantage of such way of waste management. I f the waste is mixed with anhydrous cement and water, there is the possibility of ions incorporation in the cement structure during the hydrolysis process. Heavy metal ions could bind with the cement by the process of chemisorption, precipitation, surface adsorption, entrapment inside the matrix, chemical incorporation or with the combination of these possibilities (Conner 1990, Cocke andMollah 1993, Glasser 1993)
Miyake et al. (1988) investigated the uptake of Pb2 +, Cd 2 + , Sr2 + and Ba 2 + ions from concentrated aqueous solutions by calcite and aragonite (both are forms of CaC03). Calcite is a constituent of cement and concrete and those materials wil l be useful for low temperature immobilisation of waste ions. The reactions of Pb 2 +, Cd 2 + and Ba 2 + ions with strontianite (SrC03), and of Pb2 +, Cd 2 + and Sr2 + ions with witherite (BaC0 3) where also examined. The selectivity in the uptake of the metal ions for the different carbonate compounds were; for calcite: Pb 2 + > Sr 2 + > Ba 2 + > Cd 2 +, for aragonite (: Pb 2 + > Cd 2 + > Sr2+ > Ba 2 +, for strontianite: Cd 2 + > Pb 2 + > Ba 2 + and for witherite: Pb 2 + > Cd 2 + > Sr2 +. The immobilisation of the metal ions using carbonate compounds seems to proceed by dissolution and recrystallisation mechanisms rather than by a topoactic reaction.
Bishop (1988) found, surprisingly, that metal leaching rates decreased with decreases in particle size of the waste material, the opposite of what was expected. One possible explanation for the result is that the metals were bound to the particles by sorption mechanisms. Increased surface areas occurring in the smaller particles would cause greater sorption and thus lower leachate metal concentrations.
The proposed S/S mechanisms of heavy metals using Portland cement is shown by Conner (1990) in Figure 1. Pb can be precipitated on the surface of hydrates, and Cr incorporated in hydrates, especially C-S-H. Cd ions participated and incorporated into the forming portlandite, Ca(OH)2, resulting in substituting for Ca and creating the double compound CdCa(OH)4. The effects of S/S of heavy metals are dependent on the amounts of hydrates created.
In general, cement pastes are suitable matrixes for stabilising metals, while some significant retardation or acceleration mat occur at early ages, sufficient hydration does usually occur at later ages to form strong pastes.
An advantage of using cement to stabilise/solidify wastes is that the resulting material (concrete) contains a large amount of free alkalinity because of the cement used in the process. This is fortunate since it wi l l help to buffer the material against acid leaching.
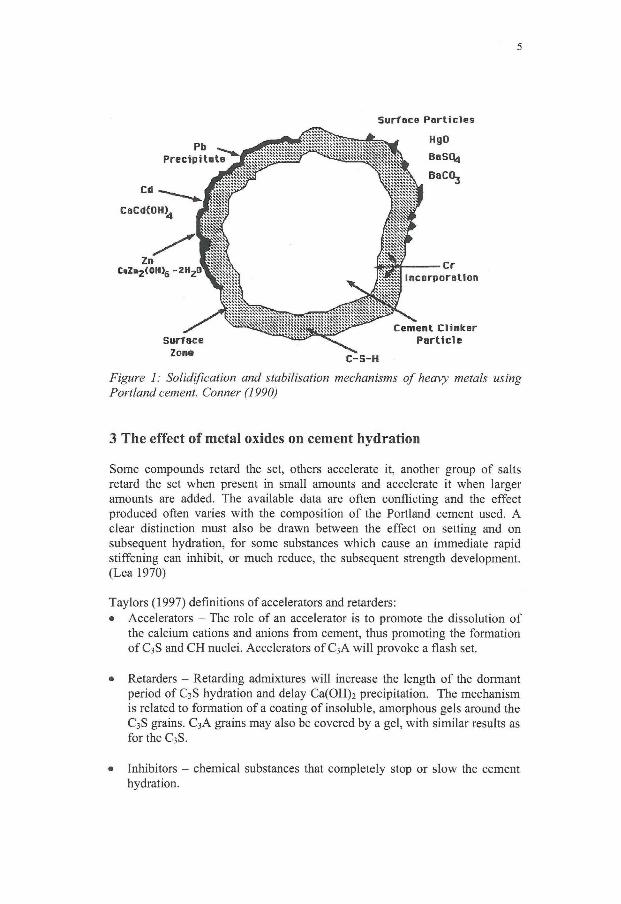
5
Surface Particles
Figure 1: Solidification and stabilisation mechanisms of heavy metals using Portland cement. Conner (1990)
3 The effect of metal oxides on cement hydration
Some compounds retard the set, others accelerate it, another group of salts retard the set when present in small amounts and accelerate it when larger amounts are added. The available data are often conflicting and the effect produced often varies with the composition of the Portland cement used. A clear distinction must also be drawn between the effect on setting and on subsequent hydration, for some substances which cause an immediate rapid stiffening can inhibit, or much reduce, the subsequent strength development. (Lea 1970)
Taylors (1997) definitions of accelerators and retarders: • Accelerators - The role of an accelerator is to promote the dissolution of
the calcium cations and anions from cement, thus promoting the formation of C3S and CH nuclei. Accelerators of C3A wil l provoke a flash set.
• Retarders - Retarding admixtures will increase the length of the dormant period of C3S hydration and delay Ca(OH)2 precipitation. The mechanism is related to formation of a coating of insoluble, amorphous gels around the C3S grains. C 3A grains may also be covered by a gel, with similar results as for the C3S.
• Inhibitors - chemical substances that completely stop or slow the cement hydration.
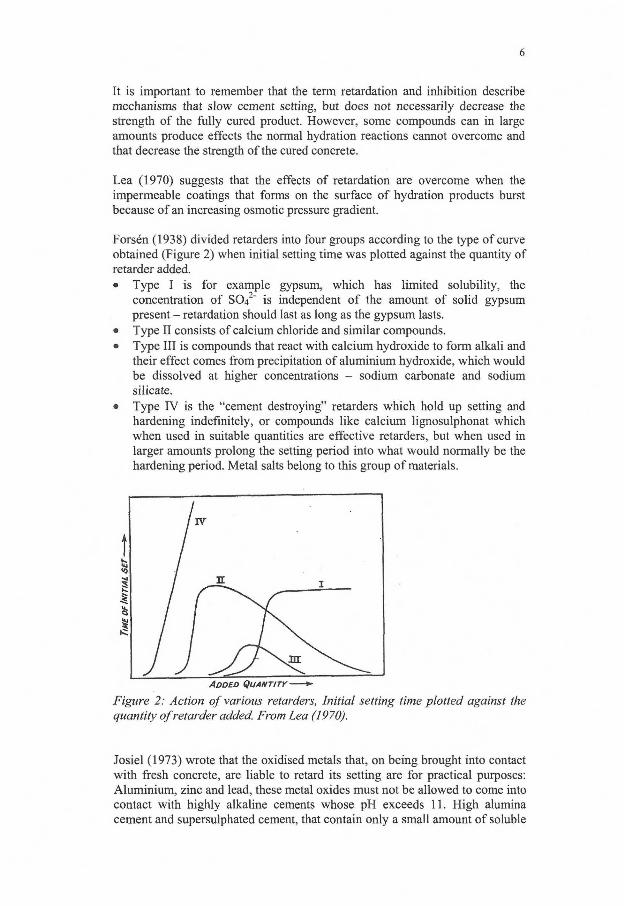
6
It is important to remember that the term retardation and inhibition describe mechanisms that slow cement setting, but does not necessarily decrease the strength of the fully cured product. However, some compounds can in large amounts produce effects the normal hydration reactions cannot overcome and that decrease the strength of the cured concrete.
Lea (1970) suggests that the effects of retardation are overcome when the impermeable coatings that forms on the surface of hydration products burst because of an increasing osmotic pressure gradient.
Forsen (1938) divided retarders into four groups according to the type of curve obtained (Figure 2) when initial setting time was plotted against the quantity of retarder added. • Type I is for example gypsum, which has limited solubility, the
concentration of SO42" is independent of the amount of solid gypsum present - retardation should last as long as the gypsum lasts.
• Type I I consists of calcium chloride and similar compounds. • Type I I I is compounds that react with calcium hydroxide to form alkali and
their effect comes from precipitation of aluminium hydroxide, which would be dissolved at higher concentrations - sodium carbonate and sodium silicate.
• Type IV is the "cement destroying" retarders which hold up setting and hardening indefinitely, or compounds like calcium lignosulphonat which when used in suitable quantities are effective retarders, but when used in larger amounts prolong the setting period into what would normally be the hardening period. Metal salts belong to this group of materials.
/ w
/ 31 I
JJ ADDED QUANTITY—*•
Figure 2: Action of various retarders, Initial setting time plotted against the quantity of retarder added. From Lea (1970).
Josiel (1973) wrote that the oxidised metals that, on being brought into contact with fresh concrete, are liable to retard its setting are for practical purposes: Aluminium, zinc and lead, these metal oxides must not be allowed to come into contact with highly alkaline cements whose pH exceeds 11. High alumina cement and supersulphated cement, that contain only a small amount of soluble
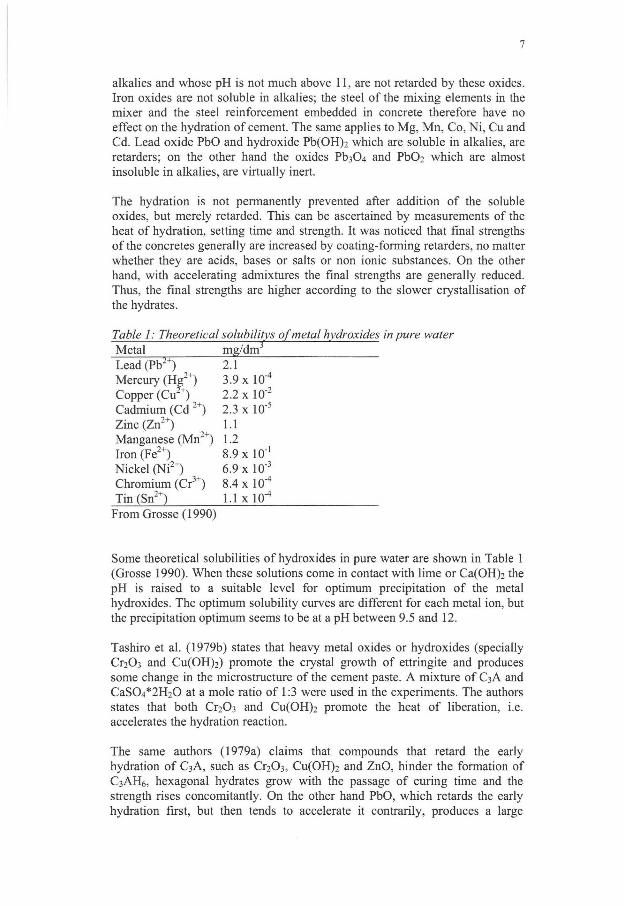
7
alkalies and whose pH is not much above 11, are not retarded by these oxides. Iron oxides are not soluble in alkalies; the steel of the mixing elements in the mixer and the steel reinforcement embedded in concrete therefore have no effect on the hydration of cement. The same applies to Mg, Mn, Co, Ni, Cu and Cd. Lead oxide PbO and hydroxide Pb(OH)2 which are soluble in alkalies, are retarders; on the other hand the oxides Pb3Ü4 and PbÜ2 which are almost insoluble in alkalies, are virtually inert.
The hydration is not permanently prevented after addition of the soluble oxides, but merely retarded. This can be ascertained by measurements of the heat of hydration, setting time and strength. It was noticed that final strengths of the concretes generally are increased by coating-forming retarders, no matter whether they are acids, bases or salts or non ionic substances. On the other hand, with accelerating admixtures the final strengths are generally reduced. Thus, the final strengths are higher according to the slower crystallisation of the hydrates.
Table 1: Theoretical solubilitys of metal hydroxides in pure water Metal mg/dm'3
Lead (Pb2 +) 2.1 Mercury (Hg 2 +) 3.9 x 10"4
Copper (Cu 2 +) 2.2 x 10"2
Cadmium (Cd 2 + ) 2.3 x 10"5
Zinc (Zn 2 +) 1.1 Manganese (Mn 2 + ) 1.2 Iron (Fe2 +) 8.9 x 10"' Nickel (Ni 2 + ) 6.9 x 10'3
Chromium (Cr 3 +) 8.4 x IO"4
Tin (Sn2 +) 1.1 x 10 -4
From Grosse (1990)
Some theoretical solubilities of hydroxides in pure water are shown in Table 1 (Grosse 1990). When these solutions come in contact with lime or Ca(OH)2 the pH is raised to a suitable level for optimum precipitation of the metal hydroxides. The optimum solubility curves are different for each metal ion, but the precipitation optimum seems to be at a pH between 9.5 and 12.
Tashiro et al. (1979b) states that heavy metal oxides or hydroxides (specially Cr203 and Cu(OH)2) promote the crystal growth of ettringite and produces some change in the microstructure of the cement paste. A mixture of C3A and CaS04*2H~20 at a mole ratio of 1:3 were used in the experiments. The authors states that both Cr203 and Cu(OH)2 promote the heat of liberation, i.e. accelerates the hydration reaction.
The same authors (1979a) claims that compounds that retard the early hydration of C 3A, such as Cr203, Cu(OH)2 and ZnO, hinder the formation of C3AF1S, hexagonal hydrates grow with the passage of curing time and the strength rises concomitantly. On the other hand PbO, which retards the early hydration first, but then tends to accelerate it contrarily, produces a large
amount of C3AH-6. The hardened paste will actually be mostly composed of C3AH.6 and the resulting effect will be low compressive strength.
The formation of coatings around the cement grains is typical of precipitation processes that occur within a narrow zone between two solutions at high degrees of supersaturation (Birchall 1980). The implication is that those metal cations giving highly insoluble hydroxy-compounds in alkaline solution, for instance Pb, Zn, Cu, Cd, Sn, have a retarding effect on cement hydration. Seeing that the solubility of these hydroxy-compounds is low, the conclusion is that it requires low concentrations of the metal salts to cause a retardation effect, as long as the cement grains are completely coated by the metal hydroxide. The size of the cement particles, i.e. the surface area, affects the amounts of metal salt that is needed to produce enough metal-hydroxide to completely cover the grains (Lieber 1968).
Thomas et al. (1981) write that any changes that occur in the colloidal structure of the coating (chemical conversion or crystal conversion) could render it less effective after the initial retardation. The conversion of zinc hydroxide to crystalline calcium zincate in cement noted by Lieber (1968) is a possible example of this effect, providing a contrast with lead hydroxide which does not convert so readily. Copper oxide/hydroxide does not share the same amphoteric character and it is perhaps significant that, according to Tashiros work (1980), CuO is a more effective long-term retarder than either ZnO or PbO.
Lieber (1973) classified the retarding effectiveness of metal cations in the order Zn(II) > Pb(II) > Cu(II) > Sn(II) > Cd(II), but also states that it is important to remember that both the cation and anion of the metal salt may be active participants in the retardation or acceleration of the cement hydration.
However, there are a number of cations that cause a retarding effect but no known cation that accelerate setting and hardening. A number of anions have an accelerating effect, for example the water-soluble halogenides. Soluble phosphates, arsenates, borates and fluosilicates are active to varying degrees as retarders (Lieber, 1973). Soluble borates are also strong retarders of Portland cement. They can even prevent the setting from occurring indefinitely; this property is taken advantage of in the oil well drilling industry to retard the set of various "muds".
Chromate, sulphate and carbonate salts affect the set of cement. Chromate salts wil l act similarly to sulphate by forming chromoaluminate crystals (C3A*CaCr04*nH20) which can cover C 3A grains as well (Regourd 1982).
Stephanov et al. (1981) found that metal chloride additives of Mn, Co, Ni, Cu and Zn interact with silicate and aluminate components of cement to form complexes whose stability makes a substantial contribution to the final compressive strength of cement. It is claimed that this influence on strength development is related to the stability constant and enthalpy of formation of the complexes. It is also considered that the differences in strength are due principally to changes in the hydration to the silicate components of cement.
9
Mortars containing heavy metal oxides have significantly lower resistance against NaCl than plain mortar. The resistance of mortars exposed to repeated action of chloride solution decreases in the order of PbO, &2O3 and Zr0 2 . The reason for the mortar degradation seems to be the induced leaching type of chloride corrosion, which causes the hydrolytic decomposition of hydration products in hardened cement paste of the composite and the degradation of its engineering properties (Zivica 1996).
Conduction calorimetric measurements of the hydration of Portland cement mixed with Pb, Zn and Cd respectively were done by Asavapisit et al. (1997). They showed that the paste with Pb was severely retarded with a high rate of heat evolution between 150 and 200 hours. The sample with zinc showed no heat maximum at all, implying inhibition of cement hydration. Addition of Cd caused an increased heat development, but at the approximately same time as Portland cement. The retardation of cement hydration implies lead complexes are initially precipitated onto the surfaces of cement clinker particles. The behaviour of zinc is similar to lead except it is rapidly resolubilised, hydrolysed and adsorbed onto solid surfaces. The main effect of cadmium were that it functioned as accelerator, i.e. increased the heat of hydration during the first 24 hours
Even i f metal oxide addition diminishes the rate of hardening at ordinary temperature, considerable strength can be developed by autoclave treatment of the concrete. I f the moulding and pre-curing methods are selected to suit the autoclave treatment, an even better effect can be expected (Tashiro et al. 1977).
4 Mechanisms
When a metallurgical by-product product is mixed with cement the cement chemistry becomes more complex. Metal ions can exchange with the ions in the clinker or they can precipitate with the anions that are part of the clinker (or gypsum). They can become a part of the calcium silicate hydrate or chemisorb at the surfaces. They can also form surface compounds on specific clinker minerals or inclusions as well as they also may be an inert part of the system.
Komarniemi et al. (1988) investigated the reactions of metal cations with calcium silicate. They found that Pb2+, Cd 2 +, Mn 2 + , Zn 2 + and Cu 2 + appear to be able to replace Ca 2 + at the surfaces of the silicates.
The complexation rate between a metal ion and a ligand is partly dependent on the rate at which water leaves and enters the coordination sphere of the ion, the water exchange. For anions and most ligands, this rate is invariably fast, on the order of 109-1010 per second. For cations this rate decreases from this limit for H + , Na + and K + , down via the large divalent and trivalent ions, Ca2 +, La 3 + , to the smaller divalent ions, Mg 2 + , to the smaller highly charged ions A l 3 + . Table 2 show the water exchange rate constants for some metal ions.
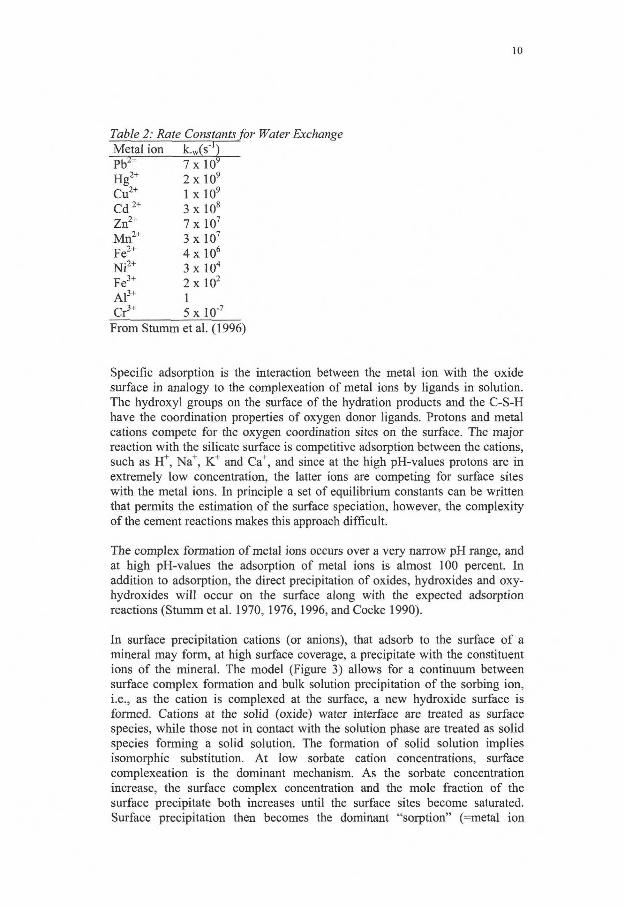
10
Table 2: Rate Constants for Water Exchange Metal ion Pb 2 + 7 x l O 9
H g 2 + 2 x l 0 9
Cu 2 + 1 x 10⁹
C d 2 + 3 x 10s
Zn 2 + 7x 10⁷
M n 2 + 3 x IO7
Fe 2 + 4 x 10⁶
N i 2 + 3x 10⁴
Fe 3 + 2 x 10²
A l 3 + 1 Cr 3 + 5 x IO"7
From Stumm etal. (1996)
Specific adsorption is the interaction between the metal ion with the oxide surface in analogy to the complexeation of metal ions by ligands in solution. The hydroxyl groups on the surface of the hydration products and the C-S-H have the coordination properties of oxygen donor ligands. Protons and metal cations compete for the oxygen coordination sites on the surface. The major reaction with the silicate surface is competitive adsorption between the cations, such as H + , Na +, K + and Ca+, and since at the high pH-values protons are in extremely low concentration, the latter ions are competing for surface sites with the metal ions. In principle a set of equilibrium constants can be written that permits the estimation of the surface speciation, however, the complexity of the cement reactions makes this approach difficult.
The complex formation of metal ions occurs over a very narrow pH range, and at high pH-values the adsorption of metal ions is almost 100 percent. In addition to adsorption, the direct precipitation of oxides, hydroxides and oxy-hydroxides wi l l occur on the surface along with the expected adsorption reactions (Stumm et al. 1970,1976,1996, and Cocke 1990).
In surface precipitation cations (or anions), that adsorb to the surface of a mineral may form, at high surface coverage, a precipitate with the constituent ions of the mineral. The model (Figure 3) allows for a continuum between surface complex formation and bulk solution precipitation of the sorbing ion, i.e., as the cation is complexed at the surface, a new hydroxide surface is formed. Cations at the solid (oxide) water interface are treated as surface species, while those not in contact with the solution phase are treated as solid species forming a solid solution. The formation of solid solution implies isomorphic substitution. At low sorbate cation concentrations, surface complexeation is the dominant mechanism. As the sorbate concentration increase, the surface complex concentration and the mole fraction of the surface precipitate both increases until the surface sites become saturated. Surface precipitation then becomes the dominant "sorption" (=metal ion
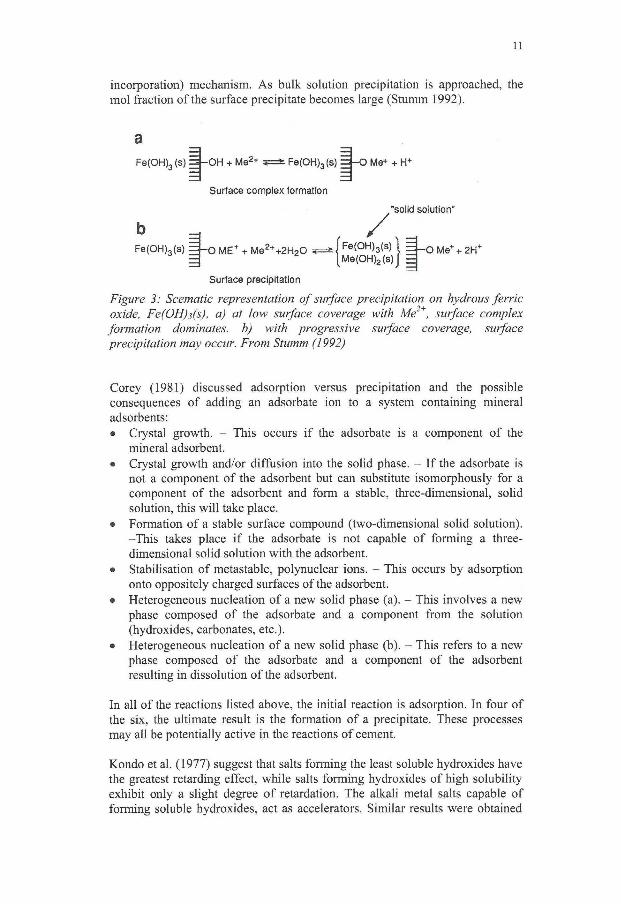
11
incorporation) mechanism. As bulk solution precipitation is approached, the mol fraction of the surface precipitate becomes large (Stumm 1992).
a
Fe(OH) 3 (s) ^ - O H + M e 2 + a=fc Fe(OH)3(s) = | - 0 Me+ + H +
Surface complex formation
Fe(OH) 3(s) 3 - o M E + + M e 2 + + 2 H 2 0 j F e ( O H ) 3 ( s ) I
\Me(OH) 2 (s)J
"solid solution"
-O Me+ + 2H +
Surface precipitation
Figure 3: Scematic representation of surface precipitation on hydrous ferric oxide, Fe(OH)}(s), a) at low surface coverage with Me2+, surface complex formation dominates, b) with progressive surface coverage, surface precipitation may occur. From Stumm (1992)
Corey (1981) discussed adsorption versus precipitation and the possible consequences of adding an adsorbate ion to a system containing mineral adsorbents: • Crystal growth. - This occurs i f the adsorbate is a component of the
mineral adsorbent. • Crystal growth and/or diffusion into the solid phase. - I f the adsorbate is
not a component of the adsorbent but can substitute isomorphously for a component of the adsorbent and form a stable, three-dimensional, solid solution, this will take place.
• Formation of a stable surface compound (two-dimensional solid solution). -This takes place i f the adsorbate is not capable of forming a three-dimensional solid solution with the adsorbent.
• Stabilisation of metastable, polynuclear ions. - This occurs by adsorption onto oppositely charged surfaces of the adsorbent.
• Heterogeneous nucleation of a new solid phase (a). - This involves a new phase composed of the adsorbate and a component from the solution (hydroxides, carbonates, etc.).
• Heterogeneous nucleation of a new solid phase (b). - This refers to a new phase composed of the adsorbate and a component of the adsorbent resulting in dissolution of the adsorbent.
In all of the reactions listed above, the initial reaction is adsorption. In four of the six, the ultimate result is the formation of a precipitate. These processes may all be potentially active in the reactions of cement.
Kondo et al. (1977) suggest that salts forming the least soluble hydroxides have the greatest retarding effect, while salts forming hydroxides of high solubility exhibit only a slight degree of retardation. The alkali metal salts capable of forming soluble hydroxides, act as accelerators. Similar results were obtained
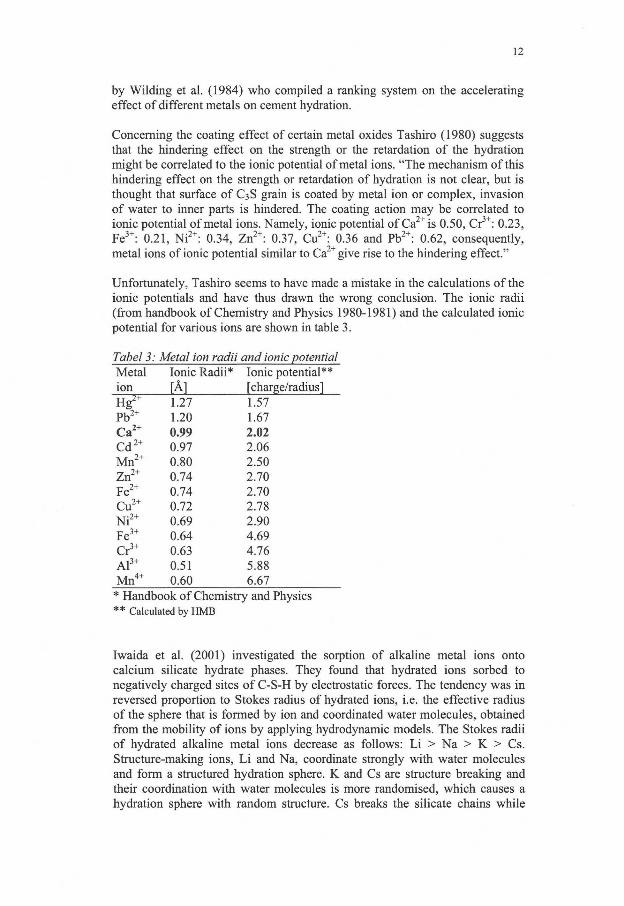
12
by Wilding et al. (1984) who compiled a ranking system on the accelerating effect of different metals on cement hydration.
Concerning the coating effect of certain metal oxides Tashiro (1980) suggests that the hindering effect on the strength or the retardation of the hydration might be correlated to the ionic potential of metal ions. "The mechanism of this hindering effect on the strength or retardation of hydration is not clear, but is thought that surface of C3S grain is coated by metal ion or complex, invasion of water to inner parts is hindered. The coating action may be correlated to ionic potential of metal ions. Namely, ionic potential of Ca 2 +is 0.50, Cr3": 0.23, Fe 3 +: 0.21, N i 2 + : 0.34, Zn 2 + : 0.37, Cu 2 +: 0.36 and Pb2 +: 0.62, consequently, metal ions of ionic potential similar to Ca2+ give rise to the hindering effect."
Unfortunately, Tashiro seems to have made a mistake in the calculations of the ionic potentials and have thus drawn the wrong conclusion. The ionic radii (from handbook of Chemistry and Physics 1980-1981) and the calculated ionic potential for various ions are shown in table 3.
Tabel 3: Metal ion radii and ionic potential Metal Ionic Radii* Ionic potential** ion [Å] [charge/radius] Hg 2 + 1.27 1.57 Pb 2 + 1.20 1.67 C a 2 + 0.99 2.02 C d 2 + 0.97 2.06 M n 2 + 0.80 2.50 Zn 2 + 0.74 2.70 Fe 2 + 0.74 2.70 Cu 2 + 0.72 2.78 N i 2 + 0.69 2.90 Fe 3 + 0.64 4.69 Cr 3 + 0.63 4.76 A l 3 + 0.51 5.88 M n 4 + 0.60 6.67
* Handbook of Chemistry and Physics * * Calculated by HMB
Iwaida et al. (2001) investigated the sorption of alkaline metal ions onto calcium silicate hydrate phases. They found that hydrated ions sorbed to negatively charged sites of C-S-H by electrostatic forces. The tendency was in reversed proportion to Stokes radius of hydrated ions, i.e. the effective radius of the sphere that is formed by ion and coordinated water molecules, obtained from the mobility of ions by applying hydrodynamic models. The Stokes radii of hydrated alkaline metal ions decrease as follows: L i > Na > K > Cs. Structure-making ions, L i and Na, coordinate strongly with water molecules and form a structured hydration sphere. K and Cs are structure breaking and their coordination with water molecules is more randomised, which causes a hydration sphere with random structure. Cs breaks the silicate chains while
13
sorbed onto C-S-H, and the OH ions have an important role in breaking the silicate chain.
5 Metal oxides effect on reinforcement corrosion
Noteworthy is the influence of metal oxides in the cement paste on reinforcement corrosion. According to Tashiro (1986) and Tashiro et al. (1985) ZnO, CuO and PbO inhibit chloride-induced corrosion of the steel reinforcement. Zivica and Vargova (1995) confirm the inhibition effect of PbO. Zivica (1994) found Zr0 2 to be an effective corrosion inhibitor. Even more surprising is the fact that & 2 O 3 and MnO may act as corrosion stimulating compounds. In their paper Tashiro et al. (1985) presume that when Pb and Zn respectively, are added to cement the cathode part is coated with compact hydrates, which serve to prevent oxygen intrusion. In the case of Mn or Cu, the passivation occurs due to the formation of a film on the anode, which promotes the dissolution of the anode. The corrosion is accelerated as a result of the increased current density. When Cr is added, dissolution of iron is accelerated with decreasing calcium concentration, caused by the progress of the hydration. In the case of Fe, the activity of the concentration of Fe 2 + rises and the electrode potential (Zivica 1994) becomes more positive and shifts into the passive area.
Zivica and Vargova (1995) and Zivica and Janotka (1996) found & 2 O 3 , Fe203, V2O5, CdO, TiO and M o 0 3 to be corrosion stimulating substances. Addition of W03-ions resulted in an exceptional acceleration of the corrosion and total dissolution of the steel-reinforcement.
6 Literature on specific metals
6.1 Lead
Lead belongs to group IVA of the periodic table and it has two valence states, 2+ and 4+. Lead is amphoteric.
Bhatty and West (1993) found that PbO significantly retard the cement hydration, the induction time is prolonged and the early strength reduced. The long-term strength is though higher than in the samples without PbO addition. They suggest that the results may be explained in terms of interference caused by Pb compounds around hydrating cement particles, or by the formation of a complex lead doped silicate hydrate. The results were the same for Portland cement of both Type I (high C3S, high C 3A) and Type V (low C3S, low C 3A).
The long setting times and prolonged induction periods for pastes that contains PbO may be explained by the possible formation of complex hydration products or the interference of product growth at the rim of clinker particles by surface adsorption. The following interactions have been proposed: • The formation of a complex lead-doped calcium-silicate-hydrate, which
retards further hydration via a diffusion controlled mechanism.
14
• The formation of stable metal hydroxides with calcium hydroxide or the formation of lead doped calcium hydroxides.
• The coating of insoluble lead oxide around the hydrating cement particles, to inhibit the normal course of hydration
• A metal fixation mechanism, in the C3S pastes, by substitution or addition with the calcium-silicate-hydrate, thereby interrupting its growth. The proposed reactions are: C-S-H + Me -> Me-C-S-H (addition reaction) C-S-H + Me -> Me-S-H + Ca (substitution reaction)
Bishop (1988) made sequential leaching tests and found that lead seemed to be bound into the silica matrix, which implies that it should not start to leach until the silica matrix is broken down. I f lead were adsorbed on pore surfaces or bound into the solid in the pores it should be released along with the alkalinity. The results showed that the lead did not leach until the alkalinity was leached and then the dissolution of lead paralleled the leaching of silicon. The result indicates that lead hydroxide is not encapsulated in the cement gel matrix but has reacted and formed some type of complex silicate.
Lieber (1968) consider Pb0 2 to be practically inert and Pb 3 0 4 to have a rather insignificant retarding effect while PbO and Pb(OH)2 retard the setting and hardening of Portland cements significantly. The retardation effect of definite amounts of PbO depends on the surface area and of the C3S content of the cement. PbO has an influence on the C3S only, which wil l be retarded. The strength will though be increased after 28 days by the addition. Zhao et al. (1992) examined different Pb-compounds and found that Pb 3 0 4 and the water soluble salts, lead nitrate and lead acetate did not inhibit cement hydration to the contrary of PbO and the water insoluble salts, PbC0 3 and PbS04, which greatly inhibited the cement hydration. They also write that the retardation is due to the formation of an amorphous Pb(OH)2 phase at the surface of the unhydrated cement particles which inhibits hydration. It is also likely that the amorphous phase also blocks pores and inhibits the diffusion of water to unreacted cement leaving some unhydrated cement particles in the paste. Thomas et al. (1981) suggest that insoluble lead salts form a gelatinous lead hydroxide coating around the cement grains and act as a diffusional barrier to water. This slows the rate of hydration and results in reduced setting rates. This is the reason that even low concentrations (0.15 weight percent) of lead retard the setting of cement (Lieber 1968). The high surface energies of the cement components are lowered by the deposition of the lead and assures their general coating (Cocke et al. 1989). X-ray diffraction studies reveal that Portland cements do not hydrate and that no Ca(OH)2 is formed during the retardation period, while the initial reaction of the aluminate and ferrite phases with the gypsum takes place as usual (Lieber 1968).
Culliane et al. (1987) found no weakening of the Portland cement paste at lead concentrations as high as 8 weight percent and showed that it may even enhance the strength of the final product. Cement/fly-ash and lime/fly ash mixtures showed a sharp decline in strength at lead levels as low as 2 weight percent.
15
Ortego et al. (1989) made thermogravimetric and Fourier-transform infrared analyses (FTIR) of Portland cement samples containing lead nitrate. They found that the inhibition is primarily a physical one, through formation of insoluble compounds that prevent water from reacting with the calcium silicates. Ortego (1990) concludes that it appears to be a kinetic effect that is overcome with additional setting time. Leaching results indicate that lead stabilisation is enhanced by phosphate additives. He suggests that lead is present as sulphate or hydrosulphate species; this fact can be related to the absence of ettringite reported in 1979(b) by Tashiro et al.
Nuclear magnetic resonance (NMR) analysis indicates that the retardation applies to the aluminate phases as well as the silicate phases. Reasonable normal hydration reactions occur after the retardation period, but there are significant differences in the mature cement pastes due to the presence of lead components. NMR relaxation times indicate that at 28 days there is a higher proportion of exchangeable water and a lower proportion of both C-S-H and calcium hydroxide, compared to cement alone (Cartledge et al. 1990).
A lead ion in basic solution forms Pb(OH)2 in a dilute hydroxide solution and the plumbite ion, Pb02~ in a concentrated hydroxide solution. The anionic nature of plumbite makes it unlikely to adsorb to the negative oxygen sites on the silicate. This is supported by the observation that anions adsorb best at low pH while cations adsorb best at high pH. It can be argued that the lead may be deposited as a precipitate. The simultaneous presence of sulphate and lead ions is expected to produce lead sulphate, which is similar to barium sulphate but because of its greater density it is deposited more readily. The mechanism by which a precipitate can quickly cover the hydrating clinker particles with a membrane precipitate is not clear. When adsorption is considered again, there has to be cationic species that are generated in the process that can be adsorbed on the negative surface. At high pH values may Pb(II) form cluster ions containing up to six Pb atoms such as [Pb60(OH) 6]
4 +. In the cement environment, these hydroxy-cations may be adsorbed on the silicate surface and/or precipitate as sulphates forming a membrane that slows the hydration process. (Barium is expected to produce barium sulphate in cement.) Cocke (1990)
According to Cocke and Mollah (1993) cement grains that are coated with insoluble lead species are in contact with the supersaturated pore solution longer than they would be in the absence of lead; consequently, this increased contact time leads to enhanced silicate polymerisation on the surface of the cement. Interior silicates, deprived of access to the hydrating solution, are less polymerised.
The immobilisation of lead by hydraulic binders probably occurs by one or a combination of the following mechanisms: (1) Addition: C-S-H + Pb —* Pb-C-S-H, (2) Substitution: C-S-H + Pb -> Pb-S-H + calcium, (3) Precipitation of new compound: Pb + OH + Ca + S0 4 —> mixed salts (Thevenin and Pera 1999).
16
The presence of surface lead in mature paste samples suggests that the dissolution and reprecipitation of lead salts occur throughout the cement hydration process, probably because the pH in the cement pore waters undergoes fluctuations during the progress of hydration. This process leaves leachable lead on surfaces that are accessible to water. Even though the complex lead salts are not highly water soluble, they are sufficient soluble to result in undesirably high lead levels in the leachates (Cartledge et al. 1990).
Ilic et al. (2000) write that the early flexural strength is lower for samples with added lead than for the references without. The difference diminishes with time. Successful stabilisation of lead with the concentration 10 000 mg/1 of Pb 2 + in the cement matrix was achieved. The leaching tests showed that the heavy metal containing waste was immobilised and could safely be used as building material. The immobilisation was not satisfactory for lead concentrations of 30 000 mg/1, i.e. it can not be used in civil engineering (roads, embankments, foundations etc.), but it can be safely deposited (landfilled). Lead dissolution at low pH values corresponded closely with the loss of aluminium, suggesting an ettringite or ferrite stabilisation mechanism.
6.2 Chromium
Chromium belongs to group V I of the periodic table. It has three possible valence states, 2+, 3+ and 6+.
Bhatty and West (1993) found that Cr 2 0 3 addition had almost no effect on the hydration, the accelerating effect was slight and did not affect the initial setting, the early strength development was not affected and the long term strength was slightly lower than the reference. The results were the same for Portland cement of both Type I (high C3S, high C3A) and Type V (low C3S, low C 3A).
Tashiro et al. (1979b) showed that chromium is an accelerator for the aluminate phase. Chromium addition increases the total porosity as well as the average pore diameter at the early stages when ettringite is formed. The addition improves crystal growth of the ettringite, but it reduces the strength of the hardened ettringite. According to Tashiro and Oba (1979a) C 3A paste with Cr203 addition reaches its strength maximum after seven days of curing. The strength wil l though decrease thereafter and stay at a lower level. Pastes containing 1 to 5 mol percent Cr203 showed similar formation of C3AH~6 as pastes without additions of metal oxides; at higher chromium oxide additions the hydrate appears distinctly after 28 days of curing (XRD-analysis). Chromium oxide retards the early hydration of C 3A, but to a smaller extent than other metal oxides such as zinc and copper oxides. Ortego (1990) suggests that this may be due to the fact that chromium is incorporated throughout the cement matrix.
Bishop (1988) showed that chromium has a similar behaviour to lead in cement pastes, i.e. it is incorporated in the C-S-H gel. This implies that chromium is hard to leach from the cement paste.
17
Ortego et al. (1989) found that chrome is incorporated throughout the cement matrix. Brown and Bishop (1990) and Mollah et al. (1992) came to the same conclusion, chromium was bound in the silicate matrix of the cement paste. Mollah et al. studied the incorporation of chromium nitrate in Portland cement type V and IP. Scanning electron microscope (equipped with energy dispersive x-ray spectroscopy, EDS) and FTIR investigations indicate that chromium compounds are not formed on the surface of hardened cement; these compounds are dispersed below the surface of the cement matrix. Chromium ions can substitute the silicon in the C-S-H.
X-ray photoelectron spectroscope (XPS) shows that chromium is present in its original oxidation state Cr(III), and that it is evenly distributed throughout the paste. The binding energies are consistent with silicate, carbonate or hydroxide compounds and not with its oxides (Cocke et al. 1989).
Cocke (1990) writes that the most stable aqueous solutions of cromium are the Cr(III) and Cr(IV) systems. The oxide, being amphoteric, forms chromites in concentrated alkaline solutions. The Cr(OH)3 which forms at intermediate pH values dissolves at high pH to form Cr(OH)4" like ions which are unlikely to adsorb to the silicate surface (see lead). Precipitation or the formation of solid solutions may need to be considered here.
6.3 Zinc
Zinc is one of the transition elements and belongs to the group IIB of the periodic table. Its valence state is 2+ and it is amphoteric.
Several authors have studied the effect of zinc. Lieber and Gebauer (1969) found that calcium hydroxozincate causes a slight retardation of the setting of Portland cement or C3S, but that the strength reaches a higher level already after one day compared with references without zincate. They used X-ray diffraction (XRD) to show that crystalline calcium zincate is formed during the retardation period, but also that it is dissolved during the course of the hydration reaction and is not detectable, by X-ray diffraction methods, after a few days. Micro-probe analysis showed that zinc had migrated into the silicate hydrate phase. Poon et al. (1985a) investigated the Zn release from a cementitious matrix an their conclusion was that Ca(OH)2 was the major phase involved in the fixation reaction and that the calcium silicate hydrate gel was unlikely to be involved in the fixation process. The same authors (1986b) used extended x-ray absorption fine structure technique and identified Zn in a cementitious matrix as co-ordinated by a first shell of four oxygens and a second shell consisting of a mixture of OH and Si atoms. The authors interpret the results as proof that the model of calcium zincate surface precipitation is correct.
The retardation effect of definite amounts of ZnO depends on the surface area and ofthe C3S content of the cement since experiments made with pure clinker phases showed that zinc has a specific retarding influence only on C3S. The
18
strength will though be increased after 28 days by the addition. During the retardation period neither hydration nor hydrolysis of the C3S takes place. The reaction of sulphate with aluminates and ferrites which takes place during the first minutes after mixing the cement with water is not delayed by addition of ZnO, which only acts on the subsequent binding of the sulphate (Lieber 1968).
Arliguie and Grandet (1982, 1990a, 1990b) report that an amorphous layer of Zn(OH)2 is formed during the hydration of C3S phase in the presence of zinc, thus retarding the hydration. The effect of this layer depends on its permeability. I f the concentration of Ca 2 + and OH" ions in the pore solution is high enough the hydration wil l start again since the zinc hydroxide wil l react into crystalline calcium zinc hydroxide.
Arliguie and Grandet (1990b) added 5 weight percent zinc to Portland cement and found that the concentration of sulphate in the cement affects the hydration of C3A. A concentration up to 2.5 percent sulphate has an accelerating effect upon the C3A hydration. However, the C3A hydration wil l be retarded when the concentration of sulphate exceeds 2.5 percent, a concentration of 5.5 percent wil l obstruct the hydration or even completely inhibit the set. The C3S hydration is retarded by the presence of zinc at all sulphate concentrations, due to the formation of a layer of amorphous zinc hydroxide, Zn(OH)2. Setting wil l be completely inhibited when the concentration of sulphate is above 4 percent.
According to Tashiro and Oba (1979a) hydration of the C3A phase is partially hindered in the presence of zinc oxide; when the substitution is 20 mol percent ZnO only a small amount of hydrate will be formed, even after 28 days of curing. Conclusions concerning the physical inhibition of calcium silicate by zinc have been confirmed in other studies (among others Ortego et al. 1989 and Cocke 1990).
Mollah et al. (1993) used FTIR and XPS to analyse the effect of zinc oxide, they suggest a formation of a surface layer of CaZn2(OH)6*2H20, that wil l inhibit the transport of water to the C3S phase.
Zinc has been found to increase the permeability of cement, probably by promoting ettringite formation (Poon et al. 1985b and 1986a). Increased permeability does not lead to a corresponding increase in zinc concentration in leachates. This implies that zinc is retained in the matrix by a primarily chemical mechanism.
Cocke (1990) write: Zinc hydroxide is an ampholyte, i.e. it can function both as a base and an acid. The equilibrium can be written:
Zn 2 + + 20H" -» Zn(OH) 2 -> 2H + + Zn0 2
2" pH3to5 pH 11 to 12
Z n ( O H ) 2 ^ ZnO + H 2 0
Considering water in the equilibrium, Zn(H 20) 2(OH) a2' , the hydroxy complex, is present in strongly basic solution. Its anionic properties preclude its
19
adsorption in basic solution. From these solutions, the crystalline zincates can be formed.
Cullinane et al. (1987) and Ortego et al. (1989) studied the effect of zinc nitrate, Zn(NÜ3)2, on the cement properties. Cullinane et al. write that additions of zinc nitrate below 2 weight percent to concrete does not change the compressive strength values compared to the reference; higher contents, 5 and 8 weight percent, do though reduce the compressive strength significantly. Similar observations have been reported earlier by Tashiro et al. (1979b) who used zinc oxide instead of zinc nitrate.
Olmo et al. (2001) found that the retardation effect of ZnO was enhanced by the presence of other metal oxides.
6.4 Aluminium
Aluminium belongs to group IIIA of the periodic system. It is amphoteric and has a valence state of 3+.
Soluble aluminium acts as an accelerator for cement setting (Lea 1970) and can result in unwanted flash set. Aluminium in alkaline, aqueous solution is usually in the form of the aluminate anion, AIO2", and will accelerate the set of cement, especially when blast furnace slag or fly ash is present, since they are activated by this anion. Metallic aluminium wil l cause hydrogen gas formation in alkaline cement, this phenomenon can be used to form porous cement with low density.
6.5 Copper
Copper is one of the transition elements and belongs to the group IB of the periodic table. Its valence states are 1+ and 2+.
According to Tashiro and Oba (1979a) Cu(OH)2 retard the early hydration of calcium aluminate (C3A). The strength reaches a maximum after 14 days and remains at that level thereafter, in contrast to the pure aluminate, which after it reached the maximum strength after 14 days suffers a significant drop in long term strength due to phase transition.
Tashiro (1980) found that Cu(OH)2 retard the degree of hydration of C3S, the compressive strength and that the addition also changed the structure of the hardened hydrates. The differential calorimetric measurements he made showed an acceleration of the C3S hydration. X-ray analysis after 28 days showed very low levels of Ca(OH)2 and higher levels of tobermorite gel compared with the reference. The addition produced changes in the pore size distribution and increased the total pore volume.
20
Copper oxide/hydroxide does not share the same amphoteric character as ZnO and PbO and it is perhaps an explanation to why CuO is a more effective long-term retarder than both ZnO and PbO (Thomas et al. 1981).
Cullinane et al. (1987) found that the 28-day compressive strength was increased by addition of copper nitrate to Portland cement, at all concentrations (up to 8 wt. %) .
6.6 Iron
Iron is a transition element belonging to group VII I of the periodic table. The valence states are 2+, 3+ and 6+.
Fe 3 + ions present in the C3S crystal lattice lead to low early strength with recovery at later ages.
When 5 weight % of Fe 20 3 is mixed with C 3 A and CaS0 4*2H 20 (with the mole ratio of 1:3) an increase in the amount of pores in the paste can be seen, as well as crystal growth of ettringite (Tashiro et al. 1979b).
According to Freeman (1989) iron is both a matrix disruptor and an accelerator, the ratio of Fe 2 + to Fe 3 + is though important.
Olmo et al. (2001) found that Fe 20 3 addition to Portland cement did not affect the setting and compressive strength at early ages, however, the long term compressive strength is decreased to a greater extent compared to samples containing ZnO.
6.7 Tin
Tin belongs to group IVA of the periodic table. Its valence states are 2+ and 4+. SnO is soluble in acids and strong alkalies contrary to Sn02.
According to Freeman (1989) tin is both a matrix disruptor and a retarder. Hill and Sharp (2003) found that addition of tin-ions retards the cement hydration and leads to the formation of Fridel's salt and calcium hydroxo-stannate.
6.8 Barium
Barium belongs to the alkaline earth metals (group IIA of the periodic table) and its valence state is 2+. Bariums behaviour resembles calcium, which belongs to the same group.
Fourier transform infrared analysis indicates that barium form the insoluble sulphate BaS04. This is a significant result since gypsum (CaS04) is added to cement to prevent "flash set" by retarding the hydration of tricalcium aluminate. Rapid hydration of this aluminate results in precipitates that have
21
low strength and weaken the hardened concrete. Metal ions that react with sulphate would therefore negate the beneficial reactions of the added gypsum (Ortego 1990).
6.9 Mercury
Mercury belongs to group IIB of the periodic table and it has two valence states, 1+ and 2+.
Mercury, Hg 2 + , precipitates as red or yellow (depending on the particle size) HgO in alkalihydroxide solutions and is expected to be present in the cement environment. Hg(OH)2 is not known to exist in cement (Cocke 1990).
McWhinney et al. (1990) studied the mechanism of mercury fixation in Portland cement. They mixed aqueous mercury nitrate (10 wt. %) into Portland cement (type I) and saw an instantaneous precipitate of mercury oxide (HgO) when the solution touched the cement. Mercury (II) reacts in the basic cement environment to form nearly linear polymeric HgO, which is relatively soluble and volatile (forms Hg and oxygen at elevated temperatures). This precipitate is retained in the matrix by physical, not chemical, sorption. The used techniques did not give any evidence of chemical bonding between the cement and the mercury. However, the authors did notice that the HgO has the potential to retard the set by coating the calcium silicate and thus inhibit the hydration.
Poon et al. (1985a) stated that the retaining potential of mercury in the cement matrix is related to the amount of calcium content in the solidified waste. The inability of mercury to form an insoluble hydroxide or silicate with the solidifying material means that the metal remains in pore solution or at most, is only loosely bound to the hydrated products through sorption. The metal is therefore physically encapsulated within the cement structure and is not chemically stabilised. The stabilisation seems to occur through physical sorbtion processes.
Mercury oxide is fairly soluble at 10"3 - 10"4 M , and is either sorbed on the surface of the cement matrix or dissolved in the pore solution (Ortego et al. 1989 and Poon etal. 1985b).
In a later paper Poon, (1986a) identified a mechanism which consists of a combination of chemical and physical isolation processes responsible for the containment of mercury.
Poon et al. (1986b) used extended x-ray absorption fine structure technique to investigate the mechanism of immobilisation of mercury. Their result indicates that the Hg-atoms are situated in a highly disordered local environment in the cementitious matrix (probably a mixture of sites). A combination of alkaline oxide precipitation and cation exchange is thought to be responsible for the retention of Hg in the cement matrix.
22
Ortego et al. (1989) reached the same conclusions about HgO.
Addition of HgO gives a marginally reduced setting time for Type I cement. The early strength is lower than for the references, but the long term strength is not affected (Bhatty and West 1993).
6.10 Cadmium
Cadmium is a group IIB element with the valence state 2+.
Bishop (1988) found that cadmium seems to be adsorbed on pore surfaces or bound into the solid in the pores since it is released along with the alkalinity during leaching tests. The cumulative alkalinity leached as a function of total acid passed through one set of leaching columns correspond to the cumulative cadmium percentage leached.
Ortego (1990) found that cadmium stabilisation is enhanced by sulphide, which form an insoluble CdS precipitate.
Cadmium may exist in insoluble form as cadmium hydroxide. Cadmium hydroxide and nitrate have both the effect of shortening the dormant period by up to an hour. The acceleration phase that follows is associated with rapid growth of Ca(OH)2 and C-S-H, and the early start for the acceleration phase may be the result of the presence of the solid Cd(OH)2, which provides nucleation sites for the precipitation of Ca(OH)2 (Cartledge et al. 1990).
Apart from the rather minor acceleration of silicate hydration, the cadmium salts have little effect on the cement matrix. There are minor differences in the matrix at 28 days, specifically a higher degree of polymerisation and an increase in the proportion of the C-S-H gel phase. Calcium and cadmium ions have the same charge and almost the same ionic radius. Hence, in certain situations there is the possibility for substitution of one for the other in crystal lattices. Solid Cd(OH)2 is believed to exist encapsulated in C-S-H and/or calcium hydroxide in the matrix. This mean that the cadmium cannot be leached easily since it is neither very accessible to water nor in a very soluble chemical form (Cartledge et al. 1990).
Bhatty and West (1993) found that the setting time becomes longer, and that the hydration is retarded by CdO addition for both Type I and Type V cements. The early strength is low for both cement types but the long term strength are comparable to the references for Type I paste, though not for the type V paste which remains lower than the reference.
Tumidaj ski and Thomson (1995) investigated the influence of CdO on the early hydration of C3A. They found that CdO had a small effect on the thermal characteristics of the hydration - slightly less heat was liberated. The presence of CdO increased the formation of the cubic hydrated phase, and was retained ion the matrix as Cd(OH)2.
23
Asavapisit et al. (1997) confirms the work of Cartledge et al. (1990) They found that Cd addition caused an significant increase in Q m a x (maximum rate of heat evolution), which occurred at approximately the same time as for Portland cement, and an increased initial rate of Ca(OH)2 formation. Cd 2 + and Ca 2 + are similar in size, and therefore the Cd(OH)2 probably acts as a nuclei for Ca(OH)2. The Cd(OH)2 therefore appears to accelerate hydration during the first 24 hours, although Ca(OH)2 levels in samples hydrated for longer periods are similar to those found in control samples. The interactions of Cd with hydrating cement are very different from those of Zn, despite the reported formation of similar CaCd2(OH)4 and CaCZn2(OH)é*H20 species on the surface of hydration products.
6.11 Manganese
Manganese is a transition element belonging to the VIIB group of the periodic table. It may have valence states of 1+ up to 7+.
The introduction of M n 3 + ions into the crystal lattice of C3S does not affect the early strength but slows strength development at later ages (Lea 1970).
Mn 2 can substitute Ca 2 + into the crystalline structure of CasA^Cv In presence of CaO and AI2O3, Mn forms a Ca2AlMnOs phase, reducing appreciably tricalcium aluminate content (Puertas et al. 1988).
Uchikawa et al. (1997) found that Mn was evenly distributed through the cement hydrates, although with a slight emphasis for the calcium silicate hydrate (C-S-H) compared to the mono sulphate hydrate. The Ca(OH)2 hardly contained any Mn at all. Their theory is that M n 2 + and M n 3 + are substituted for Ca2 +, and A l 3 + or Fe 3 + respectively. Those ions can be found in the C-S-H and the mono sulphate hydrate. Electron probe microanalysis showed that most of the ions existed in the hydrate on the surfaces ofthe alite particles.
6.12 Nickel
Nickel is a transition element belonging to group VI I I of the periodic table. The valence states are 1+, 3+ and 4+.
Tashiro (1980) found that addition of NiO to C3S paste did not have any significant influence on the strength development, he noted though, that the 3 day strength was slightly promoted compared with the reference. The powder x-ray analysis did not show any specific changes compared with the reference.
7 Carbonaceous materials
By-products from the industry may also be contaminated with other materials, for examples oil or grease from machinery, or coal and coke from the process. These materials may also affect the cement hydration and strength dvelopment,
24
7.1 Coal and coke
There is a limited amount of research reported about the effect of coal and cokes on cement hydration. Dutta et al. (1995) write that "the setting time, hardening time, flow properties, etc., of cement are greatly influenced by the presence of various materials, and the effect is likely to be more pronounced when these materials are hydrophobic in nature like coal or coke. The surface activity of these materials changes with their structure, thermal history, ash content and other characteristics." Coke increase the water demand slightly compared with coal, this is probably due to the fact that coke is porous. Carbonaceous materials act as set retarders, where of coke affects the setting time more than coal does. The setting time increases with an increased amount of addition of these materials.
Roszczynialski (1992) found that coal retards the heat development. The hydrophobic grains of coal disturb the wetting of the cement, and as a consequence, hinder the hydration. Gray et al. (1991) found that oxidised coal resulted in a more hydrophilic surface, which was indicated by more negative zeta potentials, higher induction times, and lower contact angles.
Incorporation of high-carbon-fly ash in the cement manufacturing of Portland cement was observed to reduce the clinkering temperature and decrease the alkali content of the resulting cement (Bhatty et al. 2001).
7.2 Oil and grease
Relatively low levels of oil and grease (the types are not specified in the report) may affect both cement hydration and strength development, 8 percent can result in a 44 percent reduction in the 28-day compressive strength of Portland cement (Cullinane et al. 1987).
Oily compounds in large concentrations can completely inhibit cement set by covering the grains with a hydrophobic coating that prevents hydration. Emulsification of oily products may prevent oily coating and allow cement hydration to proceed naturally.
According to Freeman (1989) oil can totally destroy the cement reactions.
8 Conclusion
It is difficult to draw adequate conclusions from the literature about how metal oxide additions affect the cement hydration, even i f it is rather extensive. A great variety of materials and techniques have been applied with varying, sometimes even contradictory, results. However, it is clear that during the cement hydration metal ions even in very small amounts will interact with the various existing phases in the hydrated cement leading to modifications of the
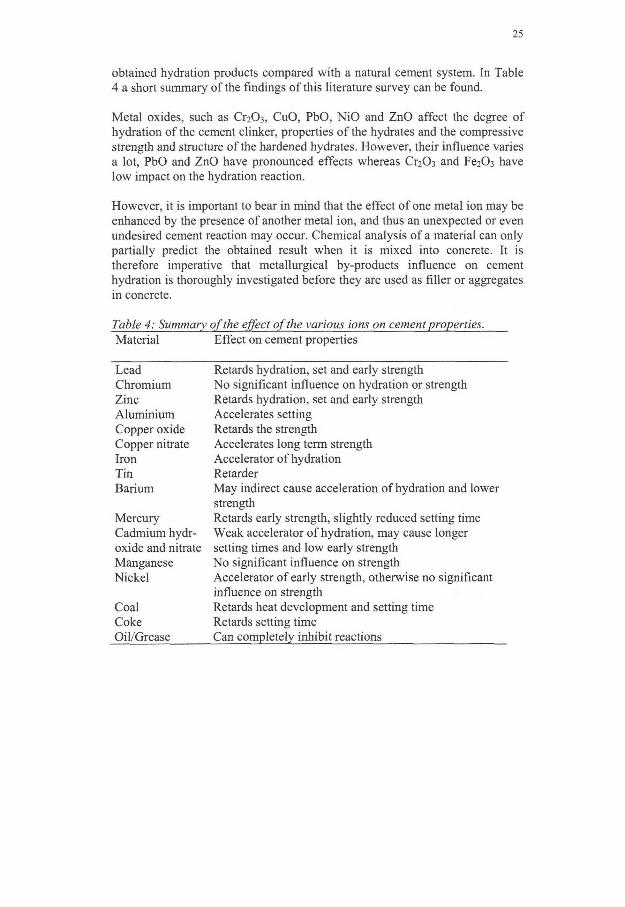
25
obtained hydration products compared with a natural cement system. In Table 4 a short summary of the findings of this literature survey can be found.
Metal oxides, such as C^Ch, CuO, PbO, NiO and ZnO affect the degree of hydration of the cement clinker, properties of the hydrates and the compressive strength and structure of the hardened hydrates. However, their influence varies a lot, PbO and ZnO have pronounced effects whereas CriOj and Fe203 have low impact on the hydration reaction.
However, it is important to bear in mind that the effect of one metal ion may be enhanced by the presence of another metal ion, and thus an unexpected or even undesired cement reaction may occur. Chemical analysis of a material can only partially predict the obtained result when it is mixed into concrete. It is therefore imperative that metallurgical by-products influence on cement hydration is thoroughly investigated before they are used as filler or aggregates in concrete.
Table 4: Summary of the effect ofthe various ions on cement properties. Material Effect on cement properties
Lead Retards hydration, set and early strength Chromium No significant influence on hydration or strength Zinc Retards hydration, set and early strength Aluminium Accelerates setting Copper oxide Retards the strength Copper nitrate Accelerates long term strength Iron Accelerator of hydration Tin Retarder Barium May indirect cause acceleration of hydration and lower
strength Mercury Retards early strength, slightly reduced setting time Cadmium hydr Weak accelerator of hydration, may cause longer oxide and nitrate setting times and low early strength Manganese No significant influence on strength Nickel Accelerator of early strength, otherwise no significant
influence on strength Coal Retards heat development and setting time Coke Retards setting time Oil/Grease Can completely inhibit reactions
26
9 Cited References
Arliguie G., Ollivier J.P. & Grandet J. (1982) "Etude de l'effet retardateur du zinc sur l'hydratation de la pate de ciment Portland" Cement and Concrete Research, Vol. 12, pp. 79-86.
Arliguie G. & Grandet J. (1990a) "Influence de la composition d'un ciment Portland sur son hydratation en presence de zinc" Cement and Concrete Research, Vol. 20, pp. 517-524.
Arliguie G. & Grandet J. (1990b) "Etude de l'hydratation du ciment en presence de zinc influence de la teneur en gypse" Cement and Concrete Research, Vol. 20, pp. 346-354.
Asavapisit S, Fowler G. & Cheeseman C.R. (1997) "Solution chemisty during cement hydration in the presence of metal hydroxide wastes" Cement and Concrete Research, Vol. 27, pp. 1249-1260.
Betonghandbok: Material (1994) (Reference book on Concrete: Material) Solna, Sweden, AB Svensk Byggtjänst, 1097 pp.
Bhatty J.I. & West P.B. (1993) "Interaction of heavy metals in portland cement stabilized waste systems: effects on paste hydration" Emerging Technologies Symposium on Cement and Concrete in the Global Environment, Chicago, 111. Portland Cement Association; 114.
Bhatty J. I . , Gajda & Miller F.M. (2001) "Use of high-carbon fly ash in cement-manufacture" Cement Americas, May/June, pp. 32-34.
Birchall J.D., Howard A.J., & Double D.D. (1980) "Some general considerations of a membrane/osmosis model for portland cement hydration" Cement and Concrete Research, Vol. 10, pp. 145-155.
Bishop P.L. (1988) "Leaching of inorganic hazardous constituents from stabilized/solified hazardous wastes" Hazardous Waste & Hazardous Materials, Vol. 5, No.2, pp. 129-143.
Cartledge F.K, Butler L.G., Chalasani D., Eaton H.C., Frey F.P., Herrera E., Tittlebaum M.E. & Yang S-L (1990) "Immobilization mechanisms in solidification/stabilization of Cd and Pb salts using Portland cement fixing agents" Environ. Sei. Technol., Vol. 24, No. 6, pp. 867-873.
Cocke D., Ortego J.D., McWhinney H , Lee K. and Shukla S. (1989) "A model for lead retardation of cement setting" Cement and Concrete Research, Vol. 19, No. l ,pp. 156-158.
27
Cocke D.L., McWhinney H.G., Dufner CD., Horrel B. & Ortego J.D. (1989) "An XPS and EDS investigation of Portland cement doped with Pb 2 + and Cr 3 +
cations" Hazardous Waste & Hazardous Materials, Vol. 6, No. 3, pp. 251-267.
Cocke D.L. (1990) "The binding chemistry and leaching mechanisms of hazardous substances in cementitious solidification/stabilization systems" Journal of Hazardous Materials, No. 24, pp. 231-253.
Cocke D.L & Mollah M. Y.A. (1993) "The chemistry and leaching mechanisms of hazardous substances in cementitious solidification/stabilization systems" Edt. R.D. Spence. Lewis Publishers, Boca Raton, Florida USA. pp.107-242.
Conner J. R. (1990) "Chemical fixation and solidification of hazardous wastes" Van Nostrand Reinhold. New York, USA. Pp.692.
Corey R.B., (1981) "Adsorption VS Precipitation" Adsorption of Inorganics at Solid-Liquid Interfaces Edt. Anderson M.A., Rubin A.J. Ann Arbor Science, pp. 161-182.
Cullinane M.J. Bricka Jr. R. M. & Francingues Jr. N. R. (1987) "An assessment of materials that interfere with stabilisation/solidification processes" Report EPA/600/9-87/1005, Environmental Protection Agency, WA
Dutta D.K., Bordoloi D. & Borthakur P.C. (1995) "Hydration of Portland cement clinker in the presence of carbonaceous material" Cement and Concrete Research, Vol. 25, pp. 1095-1102.
Forsén L. (1938) "The chemistry of retarders and accelerators" Proceedings of the symposium on the chemistry of cements, Stockholm, Sweden, pp. 298-333.
Freeman H.M. (1989) "Standard handbook of hazardous waste treatment and disposal" New York: McGraw-Hill, p 7.94.
Glasser F.P (1993) "Chemistry of cement-solidified waste forms" Edt. R.D. Spence. Lewis Publishers, Boca Raton, Florida USA. pp. 1-39.
Gray L.M., Lai R.W., Wells A.W. (1991) "Surface modification of oxidized coal by methanol vapor" pp. 804-813.
Grosse D.W. (1990) "Review of treatment for hazardous waste streams" Encyclopedia of environmental control technology, vol 4. Edt. Cheremisinoff P.N. , Gulf publishing Company, Houston, Texas, USA. pp. 541-611.
Handbook of Chemistry and Physics (1980-1981) 61 s ' edition, CRC Press Inc., Bocka Raton, Florida USA. p. F-216-217.
Hil l J. & Sharp J.H. (2003) "The hydration products of Portland cement in the presence of tin(II) chloride" Cement and Concrete Research, Vol. 33, pp. 121-124.
28
Ilic M. , Miletic S., Mil i 'c D. & Brceski I . (2000) "Solidification of lead ions in portland cement matrix" Waste materials in construction Editors: Woolley G.R., Goumans J.J.J.M. & Wainwright. Elsevier, Amsterdam, pp. 87-97.
Iwaida T., Nagasaki S., Tanaka S. & Yaita T. (2001) "Sorption of alkaline metal ions onto C-S-H (calcium silicate hydrated phases,)" Cement Science and Concrete Technology, No.55, pp.21-25.
Josiel A. (1973) "Admixtures for Cement, Physico-chemistry of Concrete and its Reinforcement" Published by the author.
Komarnieni S., Breval E., Roy D.M. and Roy R. (1988) "Reactions of some calcium silicates with metal cations" Cement and Concrete Research, Vol. 18, pp. 204-220.
Kondo R., Daimon M. , Sakai E. & Ushiyama H. (1977) "Influence of inorganic salts on the hydration of tricalcium silicate" J. Appl. Chem. Biotechnol., Vol 27, pp. 191-197.
Lea F.M. (1970) "The chemistry of cement and concrete" Edward Arnold (Publishers) Ltd. pp. 698.
Lieber W. (1968) "The influence of lead and zinc compounds on the hydration of Portland cement" Proceedings of The Fifth International Symposium on the Chemistry of Cement, Tokyo. Part I I , Vol. I I . pp. 444-454.
Lieber von W. & Gebauer J. (1969) "Einbau von zink in calciumsilicathydrate" Zement-Kalk-Gips, Nr4. Pp. 161-164.
Lieber von W. (1973) "Wirkung anorganicher Zusätze auf das Erstarren und Erhärten von Portlandzement" Zement-Kalk-Gips, Nr 2. Pp. 75-79.
McWhinney H.G., Cocke D.L., Balke K. & Ortego D. (1990) "An investigation of mercury solidification and stabilization in portland cement using X-ray photoelectron spectroscopy and energy dispersive spectroscopy" Cement and Concrete Research, Vol. 20, pp. 79-91.
Miyake M., Komarneni S. & Roy R. (1988) "Immobilization of Pb2+, Cd2+, Sr2+ and Ba2+ ions using calcite and aragonite" Cement and Concrete Research, Vol. 18, pp. 485-490.
Mollah M.Y.A., Tsai Y-N., Hess T.R. & Cocke D.L. (1992) "An FTIR, SEM, and EDS investigation of solidification/stabilization of chromium using portland cement Type V and Type IP" Journal of Hazardous Materials, No. 30, pp. 273-283.
Mollah M.Y.A., Hess T.R. Tsai Y-N, & Cocke D.L. (1993) "An FTIR and XPS investigations of the effects of carbonation on the solidification/stabilization of
29
cement based systems-portland type V with zinc" Cement and Concrete Research, Vol. 23, pp. 773-784.
Neville, A.M., (1995) "Properties of Concrete", Fourth edition. Essex, UK. Longman Group Ltd. 771 pp.
Olmo I . F, Chacon E. & Irabien A. (2001) "Influence of lead, zinc, iron (III) and chromium (III) oxides on the setting time and strength development of Portland Cement" Cement and Concrete Research, Vol. 31 pp. 1213-1219.
Ortego J.D. Jackson S., Yu G-S., McWhinney H. & Cocke D.L. (1989) Solidification of hazardous substances - a TGA and FTIR Study of Portland cement containing metal nitrates"" Environ. Sei. Health, Vol. 24, No. 6, pp. 589-602.
Ortego J.D. (1990) "Spectroscopic and leaching studies of solidified toxic metals" Journal of Hazardous Materials, 24, pp 137-144.
Poon C.S., Clark A.L, Peters C.J. & Perry R. (1985a) "Mechanisms of metal fixation and leaching by cement based fixation processes" Waste Management & Research, Vol. 3, pp. 127-142.
Poon C.S., Peters C.J. & Perry R. (1985b) " Mechanisms of metal stabilization by cement based fixation processes" The Science of the Total Environment, vol 41 pp. 55-71.
Poon C.S., Clark A.L, Perry R., Barker A.P. & Barnes P. (1986a) "Permeability study on the cement based solidification process for the disposal of hazardous wastes" Cement and Concrete Research, Vol. 16, pp. 161-172.
Poon C, Clark A.L & Perry R. (1986b) "Atomic structure analysis of stabilized toxic wastes" Environmental Technology Letters, Vol. 7, pp.461-468.
Puertas F., Soria J. Blanco-Varela M.T. and Våzques T. (1988) "Modification on the tricalcium aluminate phase in cements by manganese substitution" Cement and Concrete Research, Vol. 18, pp. 837-842.
Regourd M (1982) "L'Hydratation du Ciment Portland" Le Beton Hydralique, Paris, Presses de L'Ecole Nationale des Ponts et Chaussees. pp. 193-221.
Roszcynialski W. (1992) "The influence of some fly ashes and blast-furnace slags on blended cement hydration and properties " Proceedings from the 9th
International Congress on the Chemistry of Cement, New Delhi, India. Vol IV, pp. 698-704.
Stepanova, I.N., Lukina L.G., Svatovskaya L.B. & Sychev M.M. (1981) "Hardening of cement pastes in presence of chlorides of 3d elements " Journal of applied chemistry ofthe USSR, Vol. 54, pp. 885-888.
30
Stumm W., Huang CP. and Jenkins S.R. (1970) "Specific Chemical Interaction Affecting the Stability of Dispersed System" Croatica Chemica Acta, Vol. 42, pp. 223-244.
Stumm W., Hohl H. And Dalang F. (1976) "Interaction of metal ions with hydrous oxide surfaces" Croatica Chemica Acta, Vol. 48, pp. 491-504.
Stumm W. (1992) "Chemistry of the solid-water interface" Wiley-Interscience Publication, USA, 397 pp.
Stumm W & Morgan J. J. (1996) "Aquatic Chemistry" Third edition, Wiley-Interscience Publication, USA, pp. 934.
Tashiro C. (1977) "Hardening property of cement mortar adding heavy metal compound and solubility of heavy metal from hardened mortar" Cement and Concrete Research, Vol. 7, pp. 283-290.
Tashiro C. & Oba J. (1979a) "The effects of Cr203, Cu(OH)2, ZnO and PbO on the compressive strength and the hydrates of the hardened C3A paste" Cement and Concrete Research, Vol. 9, pp. 253-258.
Tashiro C, Oba J. & Akama K. (1979b) "The effects of several heavy metal oxides on the formation of ettringite and the microstructure of hardened ettringite" Cement and Concrete Research, Vol. 9, pp. 303-308.
Tashiro C. (1980) "The effects of several heavy metal oxides on the hydration and the microstructure of hardened mortar of C3S" 7th International Congress on the Chemistry of Cement, Vol I I , pp. 37-42.
Tashiro C, Ueoka K. & Tachibana S. (1985) "Effect of heavy-metal oxides on the corrosion of steel in cement mortar" Proceedings SILICONF Budapest (Hungary: Hungary Academy of Sciens) pp. 281-292.
Tashiro C (1986) "Effect of zinc oxide admixtures on corrosion inhibition of iron in cement mortar containing sea water" Proceedings from the 8th
International Congress on the Chemistry of cement. Rio de Janeiro, Brazil, Vol. V, pp. 226-230.
Taylor H. F. W. (1997) "Cement Chemistry 2 n d edition" Thomas Telford Publishing, UK. 459 pp.
Thevenin Gior of. Pera J. (1999) "Interactions between lead and different binders" Cement and Concrete Research, Vol. 29, pp. 1605-1610.
Thomas N. L., Jameson & Double D.D. (1981) "The effect of lead nitrate on the early hydration of Portland cement" Cement and Concrete Research, Vol. 11 pp. 143-153.
31
Tumidajski P.J. and Thomson M.L. (1995) " Influence of CdO on the early hydration of 3CaOAi203" Cement and Concrete Research, Vol. 25, No. 8, pp. 1679-1690.
Uchikawa H., Hanehara S. & Hirao H. (1997) "Behaviour of heavy metal elements in the hardening of cement paste" Proceedings of the 10th
international congress on the chemistry of cement, Gothenburg, Sweden, Vol. 2 Cement hydration, 7 pp.
Wilding C.R, Walter A. & Double D.D. (1984) "A classification of inorganic and organic admixtures by conduction calorimetry" Cement and Concrete Research, Vol. 14, pp. 185-194.
Zhao B., Daugherty K.E., Zhang L., Ingram K.D and Hil l R. (1992) "Portland cement doped with lead compounds" Canadian Portland Association, Cement industry solutions to waste management, Proceedings of the first international symposium, Calgary, Alberta, October 7-9. pp. 359-372.
ZivicaV. (1994) "Zirconium dioxide admixture as an inhibitor of corrosion of concrete reinforcement" Building Research Journal, Vol 42, No 6, pp. 367-373.
Zivica V. (1996) "Resistance of cement mortars containing heavy metal oxides exposed to long-term repeated action of chloride solution" Construction and Building Materials, Vol. 10, No. 7, pp. 515-519.
Zivica I & Janotka I (1996) "Influence of heavy metal oxides upon hardening and electrochemical properties of cement based materials" Proceedings from the 7th International Conference on Durability of Building Materials and Components, Vol. I , pp. 259-267.
Zivica V & Vargova M . (1994) "Functionality of PbO corrosion inhibitor under conditions of chloride diffusion" Building Research Journal, Vol 43, pp. 115-123.
9 Other references
Ahluwalia S.C. & Mathur V.K. (1986) "Thermal studies on the effect of some transition metal oxides on the kinetics of formation and stabilization of ß-dicalcium silicate" Proceedings from the 8th International Congress on the Chemistry of cement. Rio de Janeiro, Brazil, Vol I I , pp. 40-50.
Arnold M . & Rosenberg M. (1964) "Study of the mechanism through which calcium cloride accelerates the set of Portland cement" Journal of the American Concrete Institute, Vol. 61 No. 10 pp. 1261-1268.
Asavapisit S, Fowler G. & Cheeseman C.R. (1997) "Solution chemisty during cement hydration in the presence of metal hydroxide wastes" Cement and Concrete Research, Vol. 27, pp. 1249-1260.
32
Atzeni C, Massidda L. & Sanna U. (1996) "Use of granulated slag from lead and zinc processing in concrete technology" Cement and Concrete Research, Vol. 26, pp. 1381-1388.
Batchelor B. (1989) "Modeling chemical and physical processes in leaching solidified wastes" Third international conference on new frontiers for hazardous waste management Pittsburg, Pennsylvania, USA, pp. 123-130.
Bhatty J. I . , Miller F. McG., West P.B. & Öst B.W. (1999) "Stabilization of heavy metals in Portland cement, silica fume/Portland cement and masonry cement matrices" Portland Cement Association R &D report No. RP348, pp. 7-17.
Bhatty M.S.Y. (1987) "Fixation of metallic ions in Portland cement" Proceedings of the National conference on hazardous wastes and hazardous materials 1987, pp. 140-145
Bobrowski A., Gawlicki M . & Malolepszy J. (1997) "Analytical evaluation of immobilisation of heavy metals in cement matrices" Environmental Science & Technology, Vol. 31, No 3, pp. 745-749.
Brown T.M. & Bishop P.L., (1985) "The effect of particle size on the leaching of heavy metals from stabilized/solidified wastes" Proceedings from the International Conference on New Frontiers for Hazardous Waste Management Pittsburgh, Pennsylvania, USA, pp. 356-363.
Chan W.W.J. & Wu C.M.L. (2000) "Durability of concrete with high cement replacement" Cement and Concrete Research, Vol. 30, pp. 865-879.
Conner J.R. (1993) "Chemistry of cementitious solified/stabilized waste forms" Edt. R.D. Spence. Lewis Publishers, Boca Raton, Florida USA. pp. 41-82.
Copeland L.E. & Kantro D.L. (1964) "Chemistry of hydration of Portland cement at ordinary temperature" The Chemistry of Cements vol. I, Academic Press, London, pp 313-370.
Cullinane M.J. Bricka Jr. R. M. & Francingues Jr. N . R. (1987) "An assessment of materials that interfere with stabilisation/solidification processes" Report EPA/600/9-87/1005, Environmental Protection Agency, WA
Edwards G.C. &Angstadt R.L. (1966) "The effect of some soluble inorganic admixtures on the early hydration of Portland cement" Journal of applied Chemistry, Vol. 16, May.
Eijk van R.J. & Brouwers H.J.H (1997) "Simulation of cement-hardening in the presence of carbon using HYDRA2D" Proceedings of the 10th
international congress on the chemistry of cement Gothenburg, Sweden. Cement hydration. Vol. 2, 2Ü052, 7 pp.
33
Ezirim H.C. & McCarter WJ. (1998) "Monitoring hydration of alkali-activated slag and fly ash" Proceedings Sixth CANMET/ACIInternational Conference Bangkok, Thailand, pp. 821-835.
Felix F., Fraaij A.L.A & Hendriks CF. (2001) "Comparison of Stabilisation/Solidification- treatments of hazardous waste materials" HERON, ISSN 0046-7316, Vol. 46, No 2, pp. 119-133.
Fernandez Olmo I . , Chacon E. & Irabien A. (2001) "Influence of lead, zinc, iron (III) and chromium (III) oxides on the setting time and strength development of Portland Cement" Cement and Concrete Research, Vol. 31 pp. 1213-1219.
Gier S. & Johns W.D (2000) "Heavy metal-adsorption on micas and clay minerals studied by X-ray photoelectron spectroscopy" Applied Clay Science, Vol. 16, pp. 289-299.
Glasser F. P. (1992) "Application of cements to the treatment and conditioning of toxic wastes" 9th International congress on the Chemistry of Cement New Delhi, India. Vol. V I . Pp. 114-118.
Glasser F. P. (1994) "Environmental uses of cement in waste conditioning" Emerging Technologies Symposium on Cement and Concrete in the Global Environment, Chicago, 111. Portland Cement Association; 114.
Grube W.E. Jr (1989) "Evaluation of the soliditech solidification/stabilization technology" Third international conference on new frontiers for hazardous waste management Pittsburg, Pennsylvania, USA, pp. 176-188.
Hansen W.C. (1952) "Oil well cements" Proceedings of the thirdh International Symposium on the Chemistry of Cement, London, UK. pp 598-632.
Ionescu D. Meadowcroft T.R. & Barr P.V. (2001) "Early-age hydration kinetics of steel slags" Advances in Cement Research, Vol. 13, No. 1, pp. 21-30.
Iwai T., Mori T., Yoda A. & Oshima M. (1968) "A Method of utilizing blastfurnace slag as a strengt-improving agent for concrete" Proceedings of The Fifth International Symposium on the Chemistry of Cement, Tokyo. Part I I , Vol. I I . pp. 208-214.
Jawed I . , Goto S. & Kondo R. (1976) " Hydration of tetracalcium Aluminoferrite in presence of lime and sulfates" Cement and Concrete Research, Vol. 6 pp. 441-454.
Josiel A. (1968) "Some principles in cement hydration" Proceedings of The Fifth International Symposium on the Chemistry of Cement, Tokyo. Part I I , vol. I I . pp. 268-287
34
Kondo R., Satake M . & Ushiyama H. (1974) "Diffusion of varius ions in hardened Portland cement" The cement association ofJapan: Review of the twenty-eighth general meeting - Technical session, Tokyo. pp. 41-43.
Lieber von W. (1967)"Einfluss von Zinkoxyd auf das Erstarren und Erhärten von Portlandzementen" Zement-Kalk-Gips, No 3. Pp. 91-101.
Lorenzo M . P., Goni S. &Sagrera J.L. (1991) "Chemical changes in the poresolution of cement pastes with slag addition of copper " Blended cements in construction, Elsevier science publishers Ltd. Essex England pp. 125-137.
McCarthy G.J. & Solem-Tishmack J.K. (1994) "Hydration mineralogy of cementitious coal combustion by-products" Advances in Cement and Concrete ISBN 0-7844-0034-2, pp. 103-121.
Moulin I . , Stone W.E.E., Sanz J., Bottero J-Y., Mosnier F. & Haehnel C. (2000) "Retention of zinc and chromium ions by different phases of hydrated calcium aluminate: a solid state 2 7 A1 NMR study" Journal of Phys. and Chem., Vol. 104, pp. 9230-9238.
Murakami K. & Tanaka H. (1968) "Contribution of calcium thiosulphate to the acceleration of the hydration of Portland cement and comparison with other soluble inorganic salts" Proceedings of The Fifth International Symposium on the Chemistry of Cement, Tokyo. Part I I , vol. I I . pp. 422-436.
Nagataki S., Yu Q & Hisada M. (2002) "Effect of leaching conditions and curing time on the leaching of heavy metals in fly ash cement mortars" Advances in Cement Research, Vol. 14, No. 2, pp. 71-83.
Niel E. M . M. G. (1968) "The Influence of alkali-carbonate on the hydration of cement" Proceedings of The Fifth International Symposium on the Chemistry of Cement, Tokyo. Part I I , vol. I I . pp. 472-486.
Nocun-Wczelik W & Malolepszy J (1997) "Studies on immobilization of heavy metals in cement paste - C-S-H leaching behaviour" Proceedings of the 10th international congress on the chemistry of cement, Gothenburg, Sweden. Vol. 4, 8 pp.
Ol^insky A. "Formation of hydration on mineral suport" Proceedings of the 10' international congress on the chemistry of cement Gothenburg, Sweden. Cement hydration. Vol. 2, 2Ü015, 4 pp.
Ortego J.D. & Barroeta Y. (1991) "Leaching Effects on Silicate Polymerization. An FTIR and 29Si NMR study of lead and zinc in Portland cement" Environ. Sei. Technol., Vol. 25, No. 6, pp. 1171-1174.
Park C-K. (2000) "Hydration and solidification of hazardous wastes containing hevy metals using modified cementitious materials" Cement and Concrete Research, Vol. 30, pp. 429-435.
35
Poon CS., Peters CJ. & Perry R. (1983) "Use of stabilization processes in the control of toxic wastes" Effluent and Water Treatment Journal, Vol. 23, pp. 451-459.
Poon C.S., Clark A.I . & Perry R. (1985) "Investigation of the physical properties of cement based fixation processes for the disposal of toxic wastes" The Public Health Engineer, Vol 13, pp. 108-110.
Puertas F. & Glasser F.P. (1987) "Modification of the ferrite phase in cements by manganese substitution" Advances in Cement Research, Vol 1, No 1, pp. 31-34.
Puntke S. & Schneider M. (2001) "Das Verhalten von Schwermetallen in Zement und Beton" ZKG International, Vol. 54 No. 2. Pp. 106-113.
Sha W. & Pereira G.B. (2001) "Differential scanning calorimetry study of hydrated ground granulated blast-furnace slag" Cement and Concrete Research, Vol. 31, pp. 327-329.
Thevenin G. Pera J. (1999) "Interactions between lead and different binders" Cement and Concrete Research, Vol. 29, pp. 1605-1610.
Trussell S. & Spence R.D. (1994) "A review of solidification/stabilization inteferences" Waste Management, Vol. 14, No 6, pp. 507-519.
Tsimas S., Delagrammatikas G., Papageorgiou A.J. & Tzouvalas G.N. (2001) "Evaluation of industrial by-products for the control of setting time of cements" Cemento ve Beton Dunyasi, Vol. 6, No 34, pp. 54-62.
Turriziani R. (1964) "Aspects of the Chemistry of Puzzolanas" The Chemistry of Cements vol. II, Academic Press, London, pp 69-86.
Vivian E.H. (1960) "Some chemical additions and admixtures in cement paste and concrete" Proceedings of the Fourth International Symposium on the Chemistry of Cement, Washington, USA pp. 909-926.
Weng C.H., Huang CP., Allen H.E., Leavens P.B. & Sanders P.F. (1996) "Chemical interaction between Cr(VI) and hydrous concrete particles" Environmental Science & Technology, Vol. 30, No 2, pp. 371-376.
Wilk C M . (1997) "Stabilization of heavy metals with Portland cement: research synopsis" Waste Management Information, Portland Cement Association. IS007.01W, 5 pp.
Ziegler F & Johnson CA. (2001) "The solubility of calcium zincate (CaZn2(OH)6*2H20)" Cement and Concrete Research, Vol. 31, pp. 1327-1332.

36
Zivica V. (1997) "Hardening and properties of cement-based materials incorporating heavy metal oxides" Bulletin of material science, Vol. 20, No5, pp 677-683.

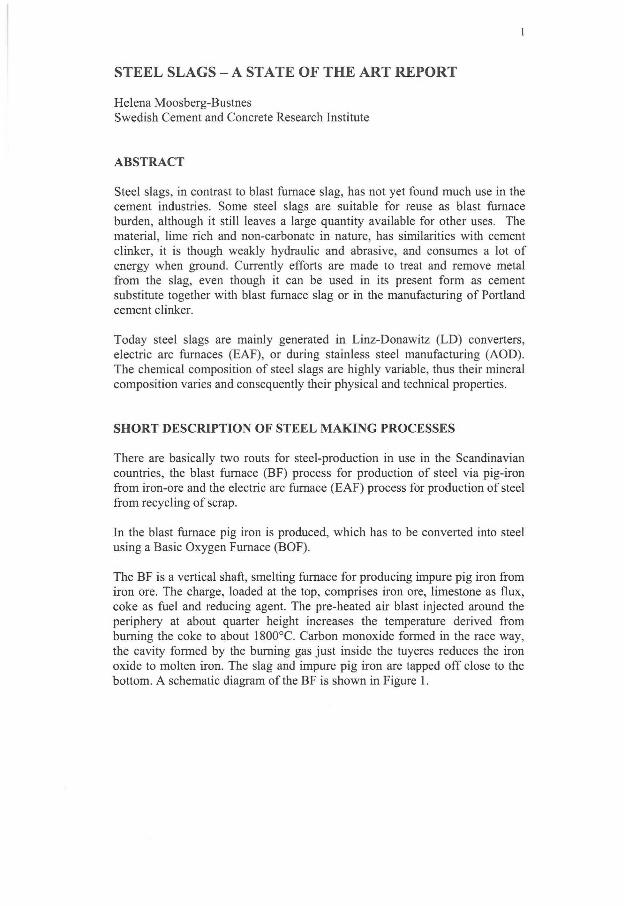
1
S T E E L SLAGS - A STATE OF THE ART REPORT
Helena Moosberg-Bustnes Swedish Cement and Concrete Research Institute
ABSTRACT
Steel slags, in contrast to blast furnace slag, has not yet found much use in the cement industries. Some steel slags are suitable for reuse as blast furnace burden, although it still leaves a large quantity available for other uses. The material, lime rich and non-carbonate in nature, has similarities with cement clinker, it is though weakly hydraulic and abrasive, and consumes a lot of energy when ground. Currently efforts are made to treat and remove metal from the slag, even though it can be used in its present form as cement substitute together with blast furnace slag or in the manufacturing of Portland cement clinker.
Today steel slags are mainly generated in Linz-Donawitz (LD) converters, electric arc furnaces (EAF), or during stainless steel manufacturing (AOD). The chemical composition of steel slags are highly variable, thus their mineral composition varies and consequently their physical and technical properties.
SHORT DESCRIPTION OF S T E E L MAKING PROCESSES
There are basically two routs for steel-production in use in the Scandinavian countries, the blast furnace (BF) process for production of steel via pig-iron from iron-ore and the electric arc furnace (EAF) process for production of steel from recycling of scrap.
In the blast furnace pig iron is produced, which has to be converted into steel using a Basic Oxygen Furnace (BOF).
The BF is a vertical shaft, smelting furnace for producing impure pig iron from iron ore. The charge, loaded at the top, comprises iron ore, limestone as flux, coke as fuel and reducing agent. The pre-heated air blast injected around the periphery at about quarter height increases the temperature derived from burning the coke to about 1800°C. Carbon monoxide formed in the race way, the cavity formed by the burning gas just inside the tuyeres reduces the iron oxide to molten iron. The slag and impure pig iron are tapped off close to the bottom. A schematic diagram of the BF is shown in Figure 1.
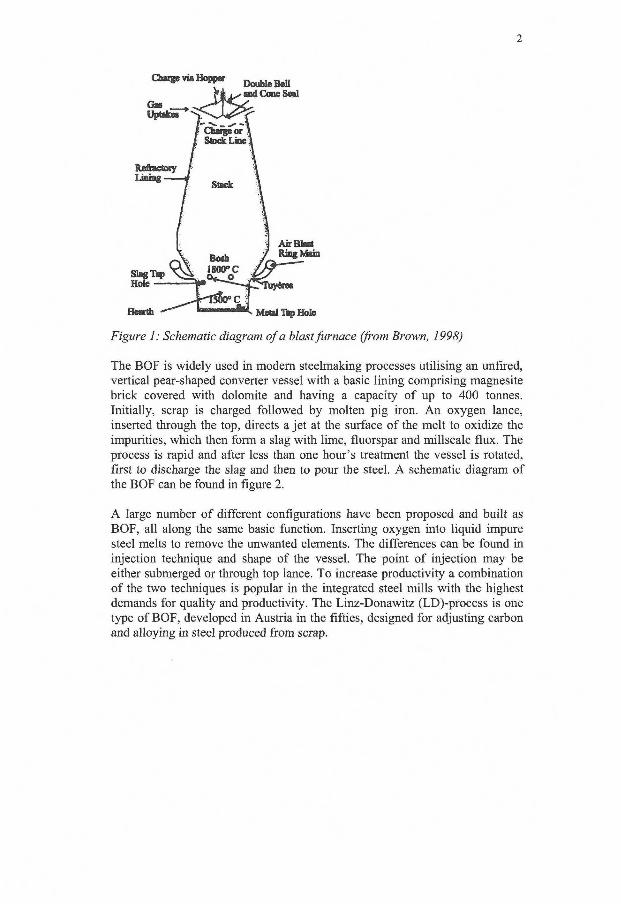
2
Figure 1: Schematic diagram of a blastfurnace (from Brown, 1998)
The BOF is widely used in modern steelmaking processes utilising an unfired, vertical pear-shaped converter vessel with a basic lining comprising magnesite brick covered with dolomite and having a capacity of up to 400 tonnes. Initially, scrap is charged followed by molten pig iron. An oxygen lance, inserted through the top, directs a jet at the surface of the melt to oxidize the impurities, which then form a slag with lime, fluorspar and millscale flux. The process is rapid and after less than one hour's treatment the vessel is rotated, first to discharge the slag and then to pour the steel. A schematic diagram of the BOF can be found in figure 2.
A large number of different configurations have been proposed and built as BOF, all along the same basic function. Inserting oxygen into liquid impure steel melts to remove the unwanted elements. The differences can be found in injection technique and shape of the vessel. The point of injection may be either submerged or through top lance. To increase productivity a combination of the two techniques is popular in the integrated steel mills with the highest demands for quality and productivity. The Linz-Donawitz (LD)-process is one type of BOF, developed in Austria in the fifties, designed for adjusting carbon and alloying in steel produced from scrap.
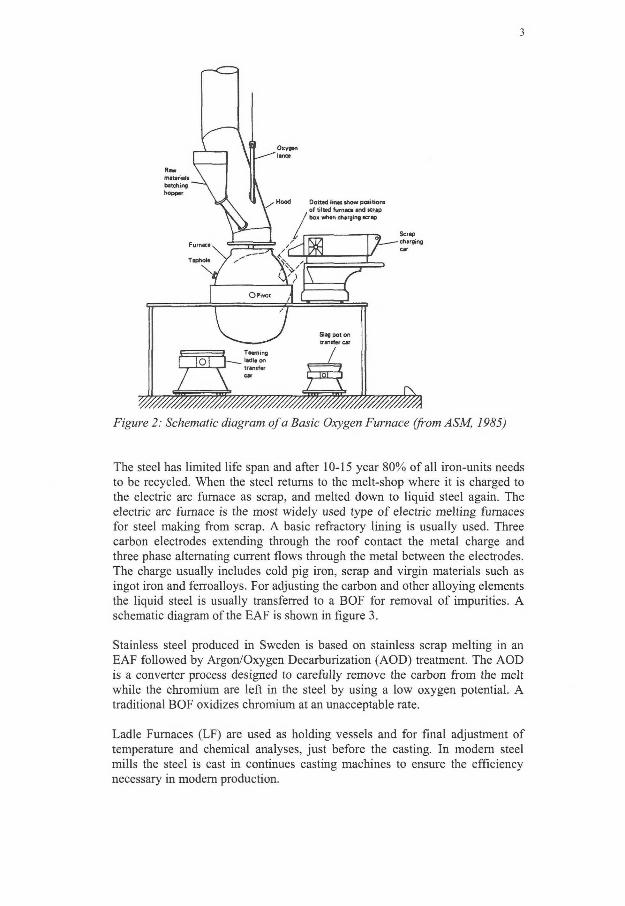
3
Figure 2: Schematic diagram of a Basic Oxygen Furnace (from ASM, 1985)
The steel has limited life span and after 10-15 year 80% of all iron-units needs to be recycled. When the steel returns to the melt-shop where it is charged to the electric arc furnace as scrap, and melted down to liquid steel again. The electric arc furnace is the most widely used type of electric melting furnaces for steel making from scrap. A basic refractory lining is usually used. Three carbon electrodes extending through the roof contact the metal charge and three phase alternating current flows through the metal between the electrodes. The charge usually includes cold pig iron, scrap and virgin materials such as ingot iron and ferroalloys. For adjusting the carbon and other alloying elements the liquid steel is usually transferred to a BOF for removal of impurities. A schematic diagram of the EAF is shown in figure 3.
Stainless steel produced in Sweden is based on stainless scrap melting in an EAF followed by Argon/Oxygen Decarburization (AOD) treatment. The AOD is a converter process designed to carefully remove the carbon from the melt while the chromium are left in the steel by using a low oxygen potential. A traditional BOF oxidizes chromium at an unacceptable rate.
Ladle Furnaces (LF) are used as holding vessels and for final adjustment of temperature and chemical analyses, just before the casting. In modern steel mills the steel is cast in continues casting machines to ensure the efficiency necessary in modern production.
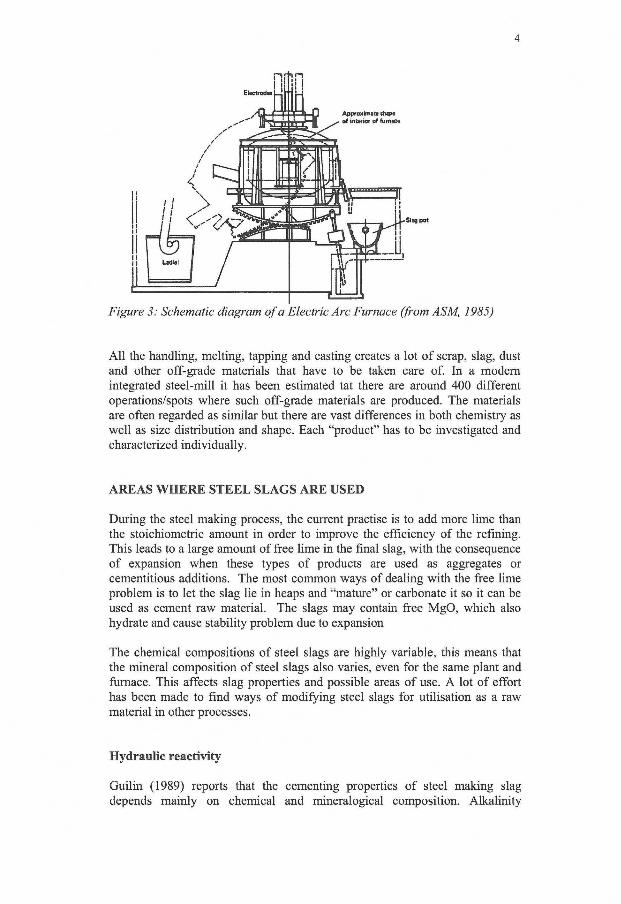
4
Un
S l q j p a t
Figure 3: Schematic diagram of a Electric Arc Furnace (from ASM, 1985)
A l l the handling, melting, tapping and casting creates a lot of scrap, slag, dust and other off-grade materials that have to be taken care of. In a modern integrated steel-mill it has been estimated tat there are around 400 different operations/spots where such off-grade materials are produced. The materials are often regarded as similar but there are vast differences in both chemistry as well as size distribution and shape. Each "product" has to be investigated and characterized individually.
AREAS W H E R E S T E E L SLAGS A R E USED
During the steel making process, the current practise is to add more lime than the stoichiometric amount in order to improve the efficiency of the refining. This leads to a large amount of free lime in the final slag, with the consequence of expansion when these types of products are used as aggregates or cementitious additions. The most common ways of dealing with the free lime problem is to let the slag lie in heaps and "mature" or carbonate it so it can be used as cement raw material. The slags may contain free MgO, which also hydrate and cause stability problem due to expansion
The chemical compositions of steel slags are highly variable, this means that the mineral composition of steel slags also varies, even for the same plant and furnace. This affects slag properties and possible areas of use. A lot of effort has been made to find ways of modifying steel slags for utilisation as a raw material in other processes.
Hydraulic reactivity
Guilin (1989) reports that the cementing properties of steel making slag depends mainly on chemical and mineralogical composition. Alkalinity
5
(CaO/Si02+P205) " correlates well with cementing property of steel slag and cement strength, which may be used to evaluate the slag activity. Steel slag with high alkalinity has high activity and vice versa. Despite different treatment and appearance do naturally cooled lumpy steel slag, granulated slag and pan sprinkled slag have the same major components - cementing properties is not affected. Water pulverised or naturally cooled pulverised slags have lower activity than lump or granulated slag.
The chemical composition of Chinese steel slags may vary in its composition, se Table 1.
Table 1: The composition of 21 Chinese steel slag (%): Si0 2 9.08-22.50 A1 2 0 3 1.50-12.17 MnO 0.23-4.94 Fe 2 0 3 2.41-14.50 CaO 28.31-55.14 P 2 0 5 0.28-1.99 FeO 22.63-4.76 MgO 2.29-13.54 f-CaO 0.63-7.96
The alkalinity for the steel slag in Table 1 varies between 1.24 and 4.24.
It is possible to test the activity and obtain an activity index. There has not yet been established a standard test method for the measurement of the hydraulic reactivity of LD-slags but the following procedure is used in China: A mixture of 90 percent slag and 10 percent gypsum is ground to a fineness of 3800 cm2/g. The 7 and 28 day compressive strength of mortar measured according to GBl77-85 "Test method for cement mortar strength".
For lumpy slag, granulated slag and pan sprinkled slag, at alkalinity levels over 3.0, the ratio of the 28 day compressive strength of blast furnace slag cement to the activity index of steel slag is 3.0-3.2, while at alkalinity levels of 3.0-2.11, the ratio is 3.3-3.5. These values are treated as the "activity index" to compare the relative hydraulic potential of different slag types. The relation of alkalinity of slag, their activity indices and actual compressive strength of cement mixes, confirm the validity of the slag alkalinity as a fairly reliable indicator of their hydraulic reactivity.
Shi (2001) examined the characteristics and cementitious properties of EAF slags. The major mineral in the slags was y-C2S regardless of their fineness. The other identified minerals include C3S, ß-C 2S, 54CaO*MgO*AL203*16 Si0 2 , HCaO*7Al 20 3*CaF 2, 3CaO*MgO*3Si02, CaMg(C0 3) 2, CaF2 and Ca(OH)2. Since the quantity of cementitious minerals is limited, the cementitious property of the slag is weak under normal hydration conditions. However, in the presence of a chemical activator (in these experiments; Na 2Si0 3) has the slag significant cementitious property. The potential cementitious property of the slags increases with their fineness regardless of some differences in their mineral composition.
* The metallurgical term for basicity (B 4) is usually expressed as (CaO+MgO)/(Si02+A1203).
6
Alkali activated steel slag
In China LD-slag has been used in combination with blast furnace slag in a special type of slag-cement. The use of a suitable activator is imperative to ensure good results with stabile cement properties. Qinghan et al. (1989, 1982) showed that LD-slag could substitute up to 20 percent blast furnace slag to make high strength, alkali activated slag binder that would have strength properties similar to or higher than the same binder without LD-slag. The optimum level seems to be around 20 percent, since a higher substitution noticeably decreases the strength. A binder containing 20 percent LD-slag and 80 percent blast furnace slag developed a compressive strength of 119.4 MPa after 180 days. Waterglass of 1.5-1.7 modulus was used as the activator with an alkali dosage of 4-5 percent. The presence of calcium silicate hydrate as an essential phase in the hydrated specimens was established, but there were also hydrogarnet and zeolite-type hydrates. Another sample containing 10 percent LD-slag and 5 percent Na?0 showed that the amount of larger pores was reduced and the smaller ones increased during the hydration. The total porosity after 90 days was as low as 4.14 percent and about 22 percent of the pores had radii of 18.40 Å. The densified microstructure makes it posses high strength and durability.
Parameswaran et al. (1986) found that alkali activation is a distinct possibility for the utilisation of steel slag. A multicomponent activator consisting of sodium hydroxide, sodium sulphate and hydraulic lime was developed for alkali activation of blast furnace slag as well as of slag and fly ash mixtures. An attempt was made to activate a steel slag mix by a similar multicomponent activator with the aim to incorporate higher proportions of steel slag with the basicity of 2.25 percent and virtually no free CaO (0.30 percent). The strength development of mortar made of a mixture of 55 percent steel slag, 30 percent blast furnace slag, 10 percent gypsum and 5 percent activator was positive. The 3 day strength was 12.1 MPa, 7 and 28 day strength 34.0 and 40.0 MPa respectively. The reduction in pore size with age was measurable.
Steel slag mixed into cement
Sersale (1986) found that: The examined steel slag (Italian) could partially substitute blast furnace slag, at a rate of 10 percent, in slag cements. The substitution results in a slight water reduction for mixtures with maintained consistency, in a slight acceleration of the initial set and delay of the final, and a slight lowering of the compressive strength, quit acceptable at long ages.
The same slag, as a partial substitute of limestone in the raw mix of Portland clinker, likewise at a rate of 10 percent, could be used without affecting the technical behaviour of the resultant cements, and with a decrease of the heat consumption for the clinker burning.
Another possible use of the steel slag is as aggregate for the manufacture of concrete endowed with high abrasion resistance. Comparison with other
7
concretes containing aggregates of basalt and limestone respectively, show that the abrasion resistance of concrete mixed with steel slag is twice as high.
The study also revealed the lack of heat resistance of the steel slag concrete -hence use of slag in fire resistant concretes must be disregarded.
Wang (1986) found that steam treatment could be used to facilitate quick and complete hydration of the free CaO content in converter steel slag. This wi l l eliminate material instability due to expansion. When steel slag is soaked in water, free lime will hydrate and form Ca(OH) within interstices. This will reduce porosity and thus be disadvantageous to further hydration of free CaO. The hydration of silicates will be accelerated with the duration of water immersion. When steel slag is exposed to steam, the solution of CaO and the movement of Ca2 + will be hindered, the hydration reaction takes place directly on the surface of the CaO grains. The expansion stress enabled the slag to crack to pieces, which is advantageous for further hydration of free CaO.
The optimum conditions for steam treatment of steel slag were found to be saturated steam with a pressure of 1-3 atmospheres for less than 3 hours, most of the free CaO will be hydrated at the same time as the degree of hydration of the silicates will be low. Stem treated slag together with blast furnace slag, Portland cement clinker and gypsum was mixed in the ratio of 30:30:35:5, and then ground to a specific surface of 3200-3500 cm2/g, the resulting cement displayed satisfactory properties. Wang states that blended cement made with steam treated steel slag will have a lower initial hydration rate as a result of the different quantity and morphology of the obtained hydrates. The strength will though increase at middle and later ages as the hydration continues and thus promotes the compactness of the hardened cement paste.
Duda (1987) found that simultaneous addition of LD-slag and granulated blast furnace slag to Portland cement causes a distinct improvement in pore structure, sulphate resistance and acceptable final strength values. Therefore, for all practical purposes, LD-slag is well suited to combine with granulated blast furnace slag as substitute for Portland cement. Duda made an extension of the study (1989) where five LD-slags were ground and permitted to react with water and NaOH. This investigation demonstrated that NaOH accelerates the hydration but with certain changes in the hydrate phase composition and morphology. The study established that blended mortars made with LD-slag that contained 11.6 percent free lime did not have any problems or unsoundness due to the LD-slag content.
Altun A.L and Yilmaz I . (2002) examined LD-slag with high content of MgO as additive in Portland cement. The slag origins from Turkey and it was ground and mixed into concrete in rates of 15, 30 and 45 percent. The 2- and 7-day compressive strengths decreases with increasing amounts of Mn, however the 28-day strengths are not as low as expected. The resulting concrete were acceptable according to Turkish standards in regards to volume stability, strength and setting time.
Slag as raw material for clinker
Sersale (1986) made two kinds of raw mixes - one without steel slag and one with 7.3 percent steel slag. Both mixes were fired, in a 3.6 0 *130 m rotary kiln, under similar conditions. The mix containing steel slag had a 6 percent reduction in the specific heat consumption for clinker burning compared to the normal mix.
Ordinary mix Limestone 71% Clay 27.5% Pyrite ash 1.5% Steel slag mix Limestone 66% Clay 26.7% Steel slag 7.3 %
Both the standard mix and the steel slag containing mix supplied clinker with chemical, physical and mechanical properties corresponding to the normal industrial production. The performance of concrete made of the slag containing clinker is within the specified values (Italian standard?) The time to the initial and final set is longer though, and it increases with the steel slag content.
Steel slag as soil stabilising agent
Pousette, Jacobsson and Masik (1995, 1996) have examined the possibility of using LD-slag for soil stabilisation. Their investigations show that it is possible to stabilise a clayey silt soil (sulphide rich clay) with cement so that strength and deformation properties are enhanced. The strength raise will be almost five times the original strength i f only cement is used. When 6.5 % LD-slag (plus cement) is added the soils strength raise will be six times the original strength. The settlement of a thus stabilised soil can be reduced up to 90 percent, i.e. a soil that is estimated to have an settlement of 1 meter will after a complete stabilisation have a settlement of only 10 centimetres.
Stabilisation of converter slag by incineration and subsequent immersion in alkaline solution
Umemura Y and Tsuyuki (2002) found that stable qualities could be obtained by incinerating converter slag at low temperature, and thereafter immerse it in an alkaline solution followed by pulverisation.
The converter slag used in the study was pulverised to a particle size between 0.15 and 5 mm. It was then incinerated in an electric furnace at 450 °C for two hours and thereafter immersed in saturated Ca(OH)2 solution. The slag was ground to a maximum particle size of 75 urn.
The amount of free lime in the converter slag was reduced to approximately 1 percent. The measured expansion of concrete with addition of modified converter slag was low. These findings indicates that it is possible to use converter slag as a cementitious material.
9
Stabilisation of steel slag with S i0 2
Kuehn et al. (2000) describes a method of treating liquid LD-slag with co-injection of quartz sand and oxygen in order to make it volume stable. The addition of quartz sand to the liquid slag can solve the problem of free lime in BOF slag and hence the problem of insufficient volume stability.
After tapping of slag the slag pot is transferred to a separate injection stand. The treatment starts with the blowing of oxygen to open the slag lid followed by co-injection of quartz sand plus oxygen. By injection of oxygen the exothermal oxidation of metallic and divalent iron of the slag delivers energy. This energy is sufficient to heat up and dissolve higher amounts of quartz sand in the slag without loss of temperature. In fact, practical operation has shown that the temperature is increased. With increasing amounts of dissolved quartz the slag leaves the heterogeneous area of the system. Furthermore, increasing concentrations of trivalent iron shift the saturation border of tricalciumsilicate, dicalciumsilikate and calcium oxide into the lime rich corner of the system and enlarges the homogenous liquid area of this system. Once the described reactions have started the viscosity of the slag is lowered markedly and further mixing of slag and quartz sand is enhanced by the oxygen jet. Thus the dissolution of free lime is supported by the improved kinetic conditions.
Other materials, rich in Si02, wil l act in the same way. Glass cullets, which consist mainly of Si02, have been tested successfully but cause problems owing to the high viscosity of the molten glass.
The treated BOF slag has excellent volume stability and physical properties that are comparable to or even better than those of natural stones.
Steel slags as road building materials
A review by Höbeda (1992) concludes that: LD-slag is a material that varies in composition, the quality has to be monitored constantly i f it is to be used as a road building material. The amount of free calcium oxide has to be low, especially i f the slag should be mixed into asphalt. Slag properties are dependent of the porosity - dense slags may have properties that are equally good as the best natural materials. LD-slags are used in asphalt (surfaces) due to the slags excellent durability and its capacity to adhere to bitumen. Asphalt mixed with slag has good stability and the road surface maintain a high friction coefficient. Fine material (LD-slag) can be used as reinforcement in road foundations. LD-slag mixed with blast furnace slag is a material well suited for use in roadbeds and reinforcement layers since it becomes an chemically active material with a binding effect, that gives a higher strength.
10
Mineral wool made of steel slag
The term mineral wool encompasses three distinct products that have common applications and similar manufacturing processes, but originates from different raw materials: rock or stone wool glass wool, and slag wool.
The molten material is poured in a stream onto rapidly spinning wheels. Droplets of melt are flung from the wheel and in doing so, cool into fibres. Binders such as mineral oil secure the wool into a blanket, which is cured before being cut and packaged. Water repellent coatings are also added (Crossley 2001).
Steel slag in clay brick production
Bonazza et al. (2002) evaluates the feasibility recykling steel slags in clay brick industry. The tested slags are rich in CaO, FeO, MnO and Cr2Ü3. Coarsegrained slags, 1-10 cm were ground and combined with clay. Up to 2-3 wt percent slag can be mixed into the clay without technological drawbacks. The chromium and manganese can be considered inert in this case. Addition of 5-6 wt percent slag increases the porosity and decreases mechanical properties; larger amounts induced intolerable changes of important material properties.
SUMMARY
Although most researchers acknowledge the importance of the glassy phase of the slags, most of the research has been aimed at blast furnace slags which are low in iron oxide and not the steel slags with their higher content of iron and other metals. Almost no consideration has been given the role of the slags glassy phase in combination with the hydration process of Portland cement.
This short review show that there are several ways to modify or utilise steel slags today. It seems to be a material, witch not only has a large production but also a great potential for future use.
The problems with steel slags are that they contain free calcium oxide, which can cause swelling or crumbling, and also heavy metals.
Unfortunately, the use of LD-slag as cement raw material is low, even i f it has good properties, due to the fact that it among other metals contain vanadium. The slag is otherwise a suitable material for the cement making process and would supply Fe to the clinker.
Steel slags can be seen to offer some advantages over natural materials but further research is necessary to improve the volume stability and in some cases control or take advantage of the disintegration due to dikalciumsilicate-transformation.
11
PATENTED METHODS - S T E E L SLAG
> NKK corp., a Japanese company has patented a method of regenerating molten slag in a furnace or converter after the steel tapping, by addition of solid carbon and flux to the slag (US P. 4,102,675 Jul. 1978).
"The Japanese Patent Showa No. 49-83693 describes an earlier method that comprise the following steps: 1. Molten slag from a steel making process (BOF) is transferred into an
electrical smelting furnace, where sufficient hot metal already has been charged.
2. The slag is heated through the charged hot metal to which electric thermal energy is applied.
3. The composition of the slag is varied by chemical reaction between the slag and the hot metal or other flux - the slag is subjected to the final regeneration
4. Such regenerated slag may be used as cement materials.
This method has a lot of disadvantages, such as heat loss from the slag transfer, hot metal is required as heating media, the agitation and gas blowing, and the control of the composition of the hot metal so that the slag "regenerates" in the desired way."
The US Patent 4,102,675 has been developed to overcome the above mentioned problems, the main feature lie in the blowing of oxygen into molten slag, directly in the furnace/converter after the addition of solid carbon and flux. This regeneration method can be used in the steel making process without any additional equipment. Oxygen is blown into the slag, the temperature raised to more than 1500 °C and the slag is agitated. The generated slag can be controlled in composition so that it will be suitable for uses such as lime or cement, etc.
The patent description:
1. A process of changing the composition of molten slag, comprising the steps of
• tapping molten steel from a converter to separate the molten steel from the molten slag and thereby substantially leaving the molten slag remaining in the converter, said slag comprising CaO, Si0 2, MgO, MnO, FeO and P2O5;
• adding solid carbon and flux to the molten slag that remain in the converter;
• blowing oxygen onto the carbon and flux on the surface of the molten slag to generate a exothermic reaction and compensate for heat loss caused by the addition of carbon and flux, without addition of any external heat, whereby the molten slag is regenerated to increase the amount of CaO, Si0 2, MgO, MnO, FeO and P 2 0 5 ; and
• removing the regenerated slag from the converter and thereby prepare it for another steel making charge.
12
2. The molten slag should prior to generation comprise of 45-50 %CaO; about 15 % Si0 2 , about 15 % total Fe of FeO; 3-8 % MgO; 3-4 % MnO; and 2-4 % P2O5.
3. The solid carbon used is coke and of a size less than 30 mm, but of more than 10 mm.
4. A controlling agent comprising AI2O3 or SiÜ2, can be added after regeneration.
NKK corp has patented (US P. 4,124,404 Nov. 1978) a method for utilisation of a steel slag discharged in a large quantity from steel making furnaces such as a converter, an open-heart furnace or an electric arc furnace. The steel slag wil l be manufactured by reducing the original steel slag and then oxidising it. The patent also comprises a method for manufacturing steel slag cement.
A principal object of the invention is to provide conditions for the reduction, conditions for the oxidation, conditions for chemical composition adjustments of the steel slag cement. "In accordance with one of the features of the present invention, there is provided a steel slag cement, manufactured by reducing a steel slag discharged from a steel making furnace such as a converter, an open heart furnace or an electric arc furnace, and then oxidising the steel slag thus reduced, which consists of, in weight percentage:
A method patented (US Patent 4,174,961) by a Dutch company, ENCI, "for recovering elemental iron and manganese present in oxide form in waste slag obtained from oxygen steel production. The metal oxides are reduced in the presence of carbon or carbon combined with a coal mine waste material and an AI2O3 containing additive present in the form of a silicate."
"The purpose of the invention is to provide a method for working-up LD-slag, said method allowing 1. extraction of metal from the slag by reduction at relatively low temperature
and not necessarily in the liquid phase, whereby advantageously an already cooled LD-slag (dumped material) can be used as starting material;
2. the use as a flux additive of a material having a lower AI2O3 content than bauxite, preferably a waste material;
3. the separation of slag and metal at relatively low temperature and preferably in a technologically simple way; while
4. the remaining slag is an industrially useful product which preferably can be simple converted into a normal Portland- or blast furnace cement"
>
CaO: 68-72 %, Si0 2: 22-26 %, Fe 20 3: 0.2-1.0 %, P 2 0 5 : 0.1-0.6 %, MnO: trace to 0.4 %, MgO: 0.3-3.0 %, and the balance incidental impurities."
A1 2 0 3 : 1-3 %, T i 0 2 : 0.4-0.9 % CaF2: 0.3-2.0 %,
The above mentioned purposes are reached if:
13
• the LD-slag is mixed beforehand with an additive (additives) at containing the Al and Si oxides. The ratio of the additive(s) should be 45-2/4 parts of additive to 55-9/4 parts of LD-slag.
• carbon is used as a reducing agent, the reduction takes place (mainly) in the solid phase. Whereafter
• preferably a temperature between 1350 and 1450 °C is used to heat the composition. The iron and manganese is separated from the newly formed slag and is subsequently removed.
• After adding lime (or materials high in CaO or CaC03- content) the newly formed slag can be converted into Portland cement clinker.
> US Patent 4,882,303 (Nippon Chemical Industries Co Ltd) is about a method to modify steel slag by incorporating 0.3 to 1.5 % B2O3 to make it resistant to degradation in the cooling down process.
The obtained modified steel slag is prevented against degradation phenomena and yellowish turbid water. It can be used as aggregates or artificial stones for a variety of civil engineering purposes. Fine powder of the modified slag can be used as a cement material due to its hydraulicity and fire resistance.
> A process and apparatus by which steel slag can be added to the feedstock materials into a rotary cement kiln to form cement clinker was patented by an American company (US Patent 5,421,880). The steel slag is crushed and screened to provide steel slag particles having a maximum diameter of 2".
The slag is fed into the input end of the kiln together with feedstock materials, thereby obtaining all of the advantages of the use of steel slag without the disadvantage of the requirement to provide fine grinding, pulverisation or comminution of the slag.
> D Krofchak has patented (US Patent 5,439,505) a treatment of steel mill waste for recycling.
"Steel mill waste containing iron, iron oxides and polluting compounds are treated with a strong alkali to raise the pH to 14 to allow more alkali to solubilize silica. The mixture of materials and silica gels is then reacted with alkaline silicic compounds and allowed to cure and form hard sedimentary rock-like materials, solidified into a non-polluting solid which can be recycled in a steel-making furnace to produce iron and non-polluting slag.
> US Patent 5,478,392 relates to the preparation of a porous granulated steel slag with a loose bulk density of less than 1 kg/dm3, and 0.99 kg/dm3 in the
14
compacted dumped state, and a free calcium oxide content a 1/10 of the content in the non-granulated slag.
The porous steel slag is obtained by spraying a molten stream of steel slag with a sprayed, pressurised, atomised stream of water as a result of which the slag is broken apart. The same effect can be obtained by means of a rotating drum where from water is squirted to the outside.
Granulation of blast furnace slag is known and the density falls from 1,650 to 1,000 kg/m3, whereas in the case of steel slag the density can fall from 2,100 to as low as 770 kg/m3. It is therefor possible to use this material as embankment material since it has lower density than water. The porous granulated steel slag is also very suitable as road building material and as binder for partial or complete replacement of cement.
> US Patent 5,944,870 from 1999 is a process in which a number of slags (LD-slag etc) can be converted into valuable hydraulic binders and binder additives at the similar times as the simultaneous production of pig iron or steel.
The process substantially consists in that iron oxide containing liquid slag, such as steel slag, is mixed with iron oxide carriers, such as iron ores, basic lean ores, rolling mill cinder or metallurgical dusts and lime, to form a Fe2Ü3 containing ferrite slag. The ferrite slag is introduced into a reduction reactor over, and in contact with, an iron bath containing carbon sufficient to reduce the Fe2C"3 content of the slag to form a sinter phase and pig iron or steel; and discharging the sinter phase from the reactor as a clinker.
The appropriate cristallographic marginal conditions for the formation of synthetic binder or synthetic binder additives or hydraulic binders have been substantially changed due to the process and it has become feasible to produce cement clinkers having high early strength values. The clinker is resintered in an oxidising atmosphere that serves to remove iron droplets, thereby oxidising dispersed iron and binding the same into the clinker phase in the Fe 3 + form.
> US Patent 5,496,392 from 1996 relates to a process for the production of metal alloys, metal oxides and slag based products, such as mineral wool, from industrial waste materials.
The invention provides a process for recycling industrial waste materials comprising the following steps: • Blending of one or more metal-containing industrial waste materials, at
least one carbonaceous reducing agent and at least one primary fluxing agent into a homogenous semi-solid mass.
• Forming the mass to particles whereafter they are cured and dried to moisture content of less than 10%.
15
• Heating and melting of the particles, a molten slag comprising nonreducible metal oxides is formed which may be used to form mineral wool.
By the process, pure metals and metal alloys, metal oxides and man made vitrous fiber as well as exhaust products such as carbon dioxide is produced from the industrial wastes.
REFERENCES
Altun A.I . and Yilmaz I . (2002) "Study on steel furnace slags with high MgO as additive in Portland cement" Cement and Concrete Research, vol. 32, pp. 1247-1249.
ASM - American Society for Metals (1985) "Metals Handbook" ASM, Ohio, USA.
Brown CD. (1998) "Dictionary of Metallurgy" John Wiley & Sons, Inc, NY, USA. p.308.
Bonazza A., Cunico L., Dircetti G., Dondi M., Guarini G. and Ruffini A. (2002) "Recycling of steel slag in clay brick production" Key Engineering Materials, vols.206-213, pp. 835-838.
Crossley P. (2001) "Leader of the Flock - Mineral Wool Production and Markets" Industrial Minerals, No. 409, pp. 54-67.
Duda A. (1987) "Aspects of the sulphate resistance of steelwork slag cements" Cement and Concrete Research, vol. 17, pp. 373-384.
Duda A. (1989) "Hydraulic reactions of LD steelwork slags" Cement and Concrete Research, vol. 19, pp. 793-801.
Guilin Z., et al. (1989) "Quality of steelmaking slag and assessing methid for its cementing property" Proc. of the 2 n d International Symposium on Cement and Concrete, vol. 2, Beijing, pp. 295-302.
Höbeda P. (1992) "Stålslagg från LD-processen som vägmaterial - en "state of the art" rapport", Väg och transportforskningsinstitutet, Nr V193.
Kuehn M., Drissen P. & Screy H. (2000) "Treatment of liquid steel slags" Engineering of Slags A scientific and Technological Challenge, Proceedings from the 2 n d European Slag Conference. Düsseldorf, Germany. Euroslag Publication No. 1.
Pousette K , Jacobsson A. and Masik J. (1995) "Stabilisering av sulfidjord" Forskningsrapport TULEA 1995:34 Avdelningen för geoteknik.
Pousette K., Jacobsson A. and Masik J. (1996) "Stabilisering av sulfidjord etapp 2" Forskningsrapport TULEA 1996:15 Avdelningen för geoteknik.
16
Quinghan B., (1989)"Investigation on a new type steel-iron slag cement" Proc. of the 2 n d International Symposium on Cement and Concrete, Beijing, pp. 288-294.
Quinghan B., (1992) "High strength alkali steel iron slag binder" Proc. of the 9 t h ICCC, vol. 3, New Delhi, pp. 291-297.
Sersale R., et al. (1986) "A study on the utilisation of an Italian steel slag" Proc. ofthe 8 t h ICCC, vol. 2, Rio de Janeiro, pp. 194-198.
Shi C, (2001) "Characteristics and cementitious properties of ladle slag fines from steel production", Cement and Concrete Research, vol. 32, pp. 459-462.
Wang Y., (1986) "The effect of hydration products in steam treated steel slag (OCS) on the hydration of steel slag - Portland blended cement" Proc. of the 8 t h ICCC, vol. 2, Rio de Janeiro, pp. 36-40.
Umemura Y and Tsuyuki N (2002) "Utilization of converter slag as a concrete admixture" Proceedings from the International Conferense: Challaenges of concrete construction in Dundee, Scottland, UK. September 2002. pp. 151-160.
US Patent 4,102,675 "Method of Treating Molten Slags in Steel Making Process" Nippon Kokan Kabushiki Kaisha, July 1978.
US Patent 4,124,404 "Steel Slag Cement and Method for Manufacturing the Same" Nippon Kokan Kabushiki Kaisha, November 1978.
US Patent 4,174,961 "Method for Working-up Waste Slag from the Oxygene Steel Production" Eerste Nederlandse Cement Industrie (ENCI), November 1979.
US Patent 4,882,303 "Modified steel slag and Method for Manufacturing the Same" Nippon Chemical Industrial Co. Ltd., November 1989.
US Patent 5,421,880 "Method and Apparatus for Using Steel Slag in Cement Clinker Production" Texas Industries Inc., June 1995.
US Patent 5,478,392 "Porous Granulated Steel Slag Composition and Use of Such as Aggregate or Cement Replacement in Building Materials, Road Building and Embankment" Pelt & Hooykaas B.V., December 1995.
US Patent 5,496,392 "Method of Recycling Industrial Waste" Sims et al. Enviroscience, March 1996.
US Patent 5,944,870 "Method of Manufacturing Pig Iron or Steel and Cement Clinker from Slags" Holderbank Financiere Glarus AG., August 1999.

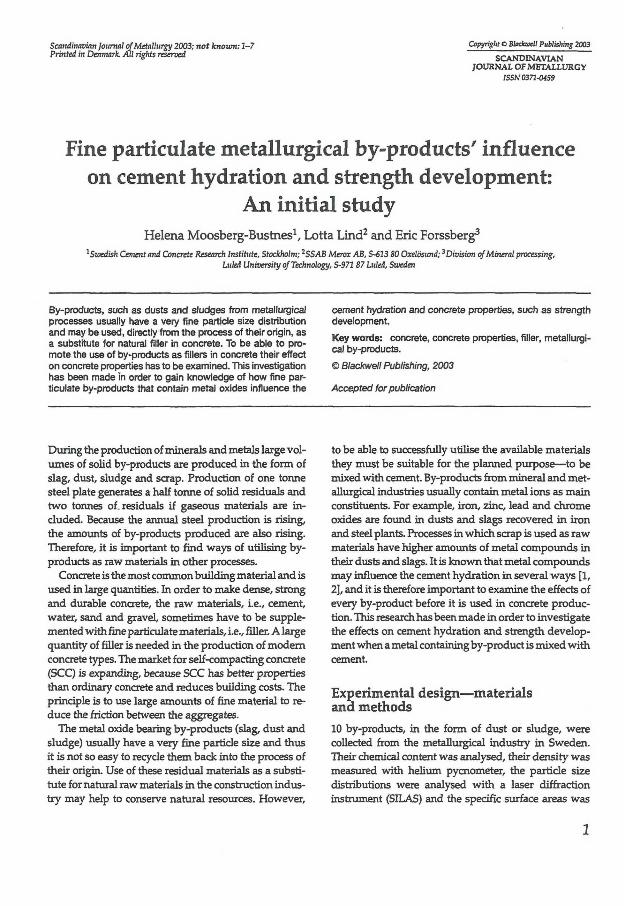
Scandinavian journal of Metallurgy 2003; not known: 1-7 Printed in Denmark. Ali rights reserved
Copyright O Bladaøell Publislting 2003
SCANDINAVIAN JOURNAL OF METALLURGY
ISSN 03714459
Fine particulate metallurgical by-products' influence on cement hydration and strength development:
An initial study Helena Moosberg-Bustnes1, Lotta Lind 2 and Eric Forssberg3
1 Swedish Cenant and Concrete Research Institute, Stockholm; 2SSAB Merox AB, S-613 SO Oxelösund; ^Division of Mineral processing, Luled University of Technology, S-971 87 Lulei, Sweden
By-products, such as dusts and sludges from metallurgical processes usually have a very fine particle size distribution and may be used, directly from the process of their origin, as a substitute for natural filler in concrete. To be able to promote the use of by-products as fillers in concrete their effect on concrete properties has to be examined. This investigation has been made in order to gain knowledge of how fine particulate by-products that contain metal oxides influence the
cement hydration and concrete properties, such as strength development.
Key words: concrete, concrete properties, filler, metallurgical by-products.
© Blackwell Publishing, 2003
Accepted for publication
During the production of minerals and metals large volumes of solid by-products are produced in the form of slag, dust, sludge and scrap. Production of one tonne steel plate generates a half tonne of solid residuals and two tonnes of. residuals if gaseous materials are included. Because the annual steel production is rising, the amounts of by-products produced are also rising. Therefore, it is important to find ways of utilising byproducts as raw materials in other processes.
Concrete is the most common building material and is used in large quantities. In order to make dense, strong and durable concrete, the raw materials, i.e., cement, water, sand and gravel, sometimes have to be supplemented with fine particulate materials, i.e., filler. A large quantity of filler is needed in the production of modern concrete types. The market for self-compacting concrete (SCC) is expanding, because SCC has better properties than ordinary concrete and reduces building costs. The principle is to use large amounts of fine material to reduce the friction between the aggregates.
The metal oxide bearing by-products (slag, dust and sludge) usually have a very fine particle size and thus it is not so easy to recycle them back into the process of their origin. Use of these residual materials as a substitute for natural raw materials in the construction industry may help to conserve natural resources. However,
to be able to successfully utilise the available materials they must be suitable for the planned purpose—to be mixed with cement. By-products from mineral and metallurgical industries usually contain metal ions as main constituents. For example, iron, zinc, lead and chrome oxides are found in dusts and slags recovered in iron and steel plants. Processes in which scrap is used as raw materials have higher amounts of metal compounds in their dusts and slags. It is known that metal compounds may influence the cement hydration in several ways [1, 21 and it is therefore important to examine the effects of every by-product before it is used in concrete production. This research has been made in order to investigate the effects on cement hydration and strength development when a metal containing by-product is mixed with cement.
Experimental design—materials and methods 10 by-products, in the form of dust or sludge, were collected from the metallurgical industry in Sweden. Their chemical content was analysed, their density was measured with helium pycnometer, the particle size distributions were analysed with a laser diffraction instrument (SILAS) and the specific surface areas was
1
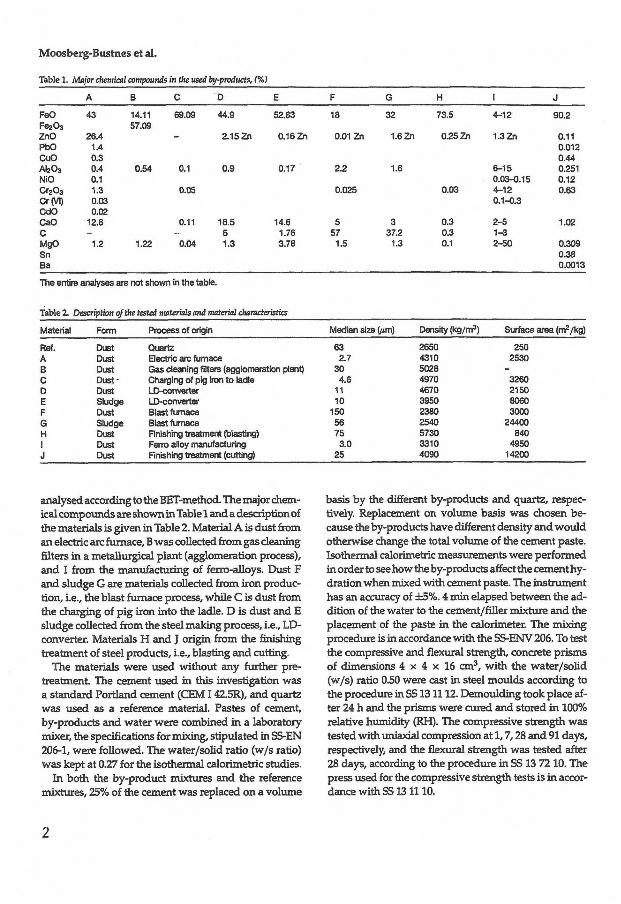
Moosberg-Bustnes et al.
Table 1. Major chemical compounds in the used by-products, (%)
A B C D E F G H I J
FeO 43 14.11 69.09 44.9 52.83 18 32 73.5 4- 12 90.2 FB203 57.09 ZnO 26.4 2.15 Zn 0.16 Zn 0.01 Zn 1.6 Zn 0.25 Zn 1.3 Zn 0.11 PbO 1.4 0.012 CuO 0.3 0.44 Al 2 0 3
0.4 0.54 0.1 0.9 0.17 2.2 1.6 6-15 0.251 NiO 0.1 0.03-0.15 0.12 CT2O3 1.3 0.05 0.025 0.03 4-12 0.63 Cr(v1) 0.03 0.1-0.3 CdO 0.02 CaO 12.6 0.11 16.5 14.6 5 3 0.3 2-5 1.02 C - 6 1.76 57 37.2 0.3 1-3 MgO 1.2 1.22 0.04 1.3 3.78 1.5 1.3 0.1 2-50 0.309 Sn 0.38 Ba 0.0013
The entire analyses are not shown in the table.
Table 2. Description ofthe tested materials and material characteristics
Material Form Process of origin Median size tjtm) Density (kg/m3) Surface area (rr /kg)
Ref. Dust Quartz 63 2650 250 A Oust Electric arc furnace 2.7 4310 2530 B Dust Gas cleaning filters (agglomeration plant) 30 5028 -C Dust- Charging of pig iron to ladle 4.6 4970 3260 D Dust LD-converter 11 4670 2150 E Sludge LD-converter 10 3950 8060 F Dust Blastfurnace 150 2380 3000 G Sludge Blast furnace 5S 2540 24400 H Dust Finishing treatment (blasting) 75 5730 840 1 Dust Ferro alloy manufacturing 3.0 3310 4950 J Dust Finishing treatment (cutting) 25 4090 14200
analysed according to the BET-method. The major chemical compounds are shown in Table 1 and a description of the materials is given in Table 2. Material A is dust from an electric arc furnace, B was collected from gas cleaning filters in a metallurgical plant (agglomeration process), and I from the manufacturing of ferro-alloys. Dust F and sludge G are materials collected from iron production, i.e., the blast furnace process, while C is dust from the charging of pig iron into the ladle. D is dust and E sludge collected from the steel making process, i.e., LD-converter. Materials H and J origin from the finishing treatment of steel products, i.e., blasting and cutting.
The materials were used without any further pre-treatment. The cement used in this investigation was a standard Portland cement (CEM 142.5R), and quartz was used as a reference material. Pastes of cement, by-products and water were combined in a laboratory mixer, the specifications for mixing, stipulated in SS-EN 206-1, were followed. The water/solid ratio (w/s ratio) was kept at 0.27 for the isothermal calorimetric studies.
In both the by-product mixtures and the reference mixtures, 25% of the cement was replaced on a volume
basis by the different by-products and quartz, respectively. Replacement on volume basis was chosen because the by-products have different density and would otherwise change the total volume of the cement paste. Isothermal calorimetric measurements were performed in order to see how the by-products affect the cement hydration when mixed with cement paste. The instrument has an accuracy of ±5%. 4 min elapsed between the addition of the water to the cement/filler mixture and the placement of the paste in the calorimeter. The mixing procedure is in accordance with the SS-ENV 206. To test the compressive and flexural strength, concrete prisms of dimensions 4 x 4 x 16 cm3, with the water/solid (w/s) ratio 0.50 were cast in steel moulds according to the procedure in SS 131112. Demoulding took place after 24 h and the prisms were cured and stored in 100% relative humidity (RH). The compressive strength was tested with uniaxial compression at 1,7,28 and 91 days, respectively, and the flexural strength was tested after 28 days, according to the procedure in SS 13 72 10. The press used for the compressive strength tests is in accordance with SS 131110.
2
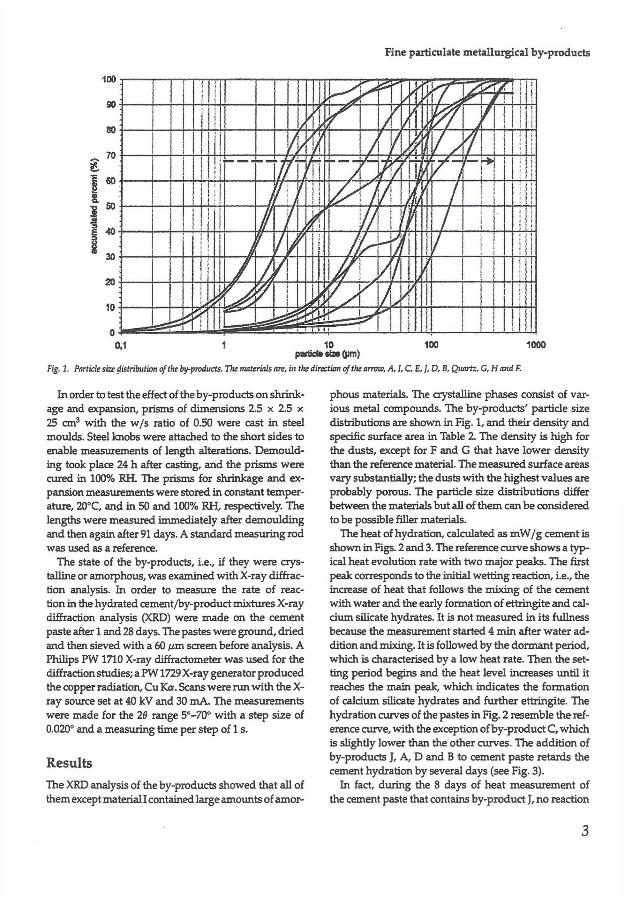
Fine particulate metallurgical by-products
10 partieta size (urn)
Fig. 1. Particle size distribution ofthe by-products. The materials are, in the direction of the arrow, A, 1, C, E,j, D, B, Quartz, G, Hand F.
1000
In order to test the effect of the by-products on shrinkage and expansion, prisms of dimensions 2.5 x 2.5 x 25 cm3 with the w/s ratio of 0.50 were cast in steel moulds. Steel knobs were attached to the short sides to enable measurements of length alterations. Demoulding took place 24 h after casting, and the prisms were cured in 100% RH. The prisms for shrinkage and expansion measurements were stored in constant temperature, 20°C, and in 50 and 100% RH, respectively. The lengths were measured immediately after demoulding and then again after 91 days. A standard measuring rod was used as a reference.
The state of the by-products, i.e., if they were crystalline or amorphous, was examined with X-ray diffraction analysis. In order to measure the rate of reaction in the hydrated cement/by-product mixtures X-ray diffraction analysis (XRD) were made on the cement paste after 1 and 28 days. The pastes were ground, dried and then sieved with a 60 ßm screen before analysis. A Philips PW 1710 X-ray diffractometer was used for the diffraction studies; a PW 1729 X-ray generator produced the copper radiation, Cu Ka. Scans were run with the X-ray source set at 40 kV and 30 mA. The measurements were made for the 26 range 5°-70° with a step size of 0.020° and a measuring time per step of 1 s.
Results The XRD analysis of the by-products showed that all of them except material I contained large amounts of amor
phous materials. The crystalline phases consist of various metal compounds. The by-products' particle size distributions are shown in Fig. 1, and their density and specific surface area in Table 2. The density is high for the dusts, except for F and G that have lower density than the reference material. The measured surface areas vary substantially; the dusts with the highest values are probably porous. The particle size distributions differ between the materials but all of them can be considered to be possible filler materials.
The heat of hydration, calculated as mW/g cement is shown in Figs. 2 and 3. The reference curve shows a typical heat evolution rate with two major peaks. The first peak corresponds to the initial wetting reaction, i.e., the increase of heat that follows the mixing of the cement with water and the early formation of ettringite and calcium silicate hydrates. It is not measured in its fullness because the measurement started 4 min after water addition and inixing. It is followed by the dormant period, which is characterised by a low heat rate. Then the setting period begins and the heat level increases until it reaches the main peak, which indicates the formation of calcium silicate hydrates and further ettringite. The hydration curves of the pastes in Fig. 2 resemble the reference curve, with the exception of by-product C, which is slightly lower than the other curves. The addition of by-products J, A, D and B to cement paste retards the cement hydration by several days (see Fig. 3).
In fact, during the 8 days of heat measurement of the cement paste that contains by-product J, no reaction
3
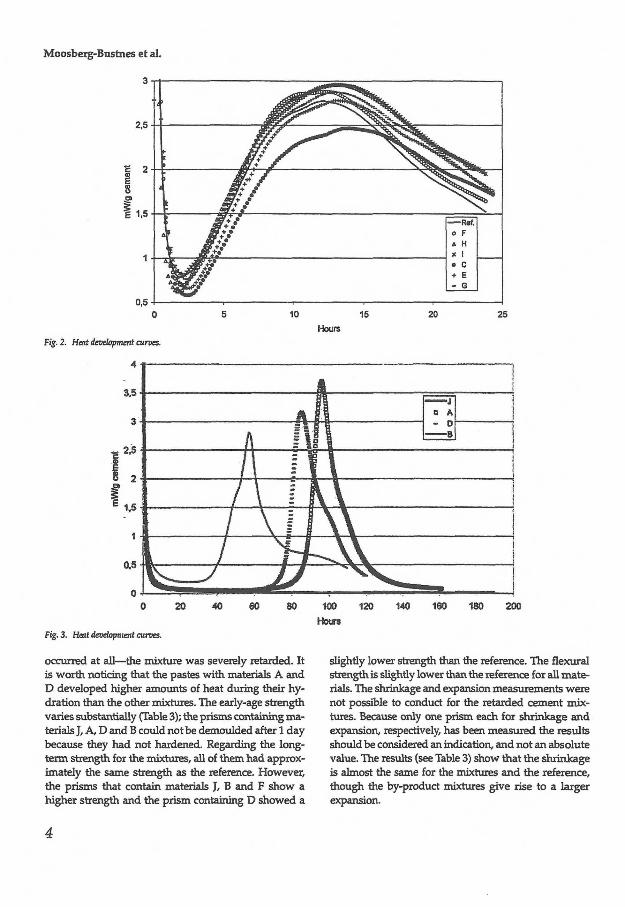
Moosberg-Bustnes et al.
3
Hours Fig. 2. Heat development curves.
0.5
I
A H H I A fll 1 —8
11 z so a MIH
I
• •it
u
' / \ \ ' ^ — .
0 20
Fig. 3. Heat development curves.
AO 60 80 100 120 Hours
140 160 180 200
occurred at all—the mixture was severely retarded. It is worth noticing that the pastes with materials A and D developed higher amounts of heat during their hydration than the other mixtures. The early-age strength varies substantially (Table 3); the prisms containing materials J, A, D and B could not be demoulded after 1 day because they had not hardened. Regarding the long-term strength for the rnixtures, all of them had approximately the same strength as the reference. However, the prisms that contain materials J, B and F show a higher strength and the prism containing D showed a
slightly lower strength than the reference. The flexural strength is slightly lower than the reference for all materials. The shrinkage and expansion measurements were not possible to conduct for the retarded cement mixtures. Because only one prism each for shrinkage and expansion, respectively, has been measured the results should be considered an indication, and not an absolute value. The results (see Table 3) show that the shrinkage is almost the same for the mixtures and the reference, though the by-product mixtures give rise to a larger expansion.
4
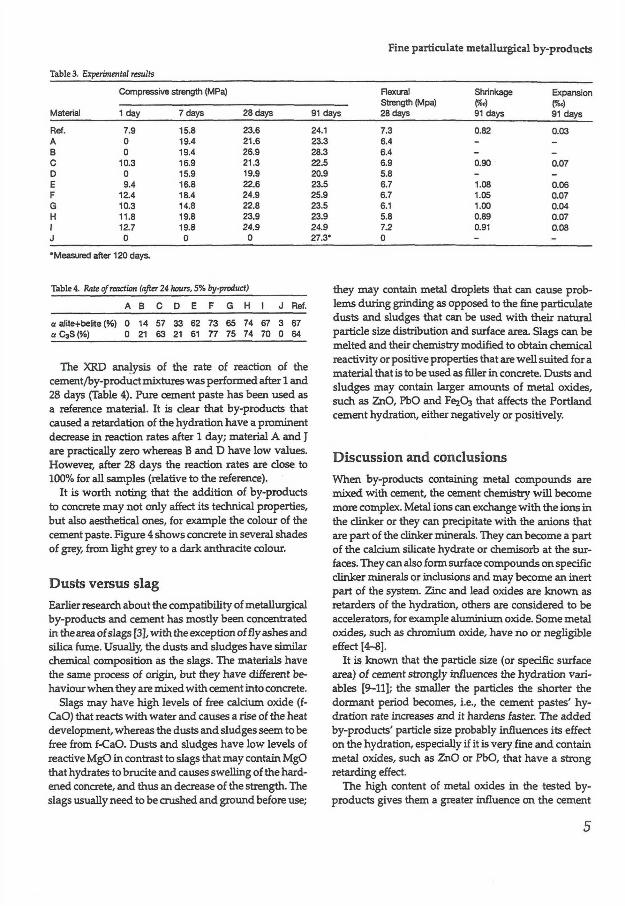
Fine particulate metallurgical by-products
Table 3. Experimental results
Compressive strength (MPa) Flexural Shrinkage Expansion Strength (Mpa) PM (%o)
Material 1 day 7 days 28 days 91 days 28 days 91 days 91 days
Ref. 7.9 15.8 23.6 24.1 7.3 0.82 0.03 A 0 19.4 21.6 23.3 6.4 - -B 0 19.4 26.9 28.3 6.4 - -C 10.3 16.9 21.3 22.5 6.9 0.90 0.07 D 0 15.9 19.9 20.9 5.8 - -E 9.4 16.8 22.6 23.5 6.7 1.08 0.06 F 12.4 18.4 24.9 25.9 6.7 1.05 0.07 G 10.3 14.8 22.8 23.5 6.1 1.00 0.04 H 11.8 19.8 23.9 23.9 5.8 0.89 0.07 1 12.7 19.8 24.9 24.9 7.2 0.91 0.08 J 0 0 0 27.3' 0 - -'Measured after 120 days.
Table 4. Rate of reaction (after 24 hours, 5% by-product)
A B C D E F G H I J Ref.
a alite+belrte (%) 0 14 57 33 62 73 65 74 67 3 67 a QjS (%) 0 21 63 21 61 77 75 74 70 0 64
The XRD analysis of the rate of reaction of the cement/by-product mixtures was performed after 1 and 28 days (Table 4). Pure cement paste has been used as a reference material. It is clear that by-products that caused a retardation of the hydration have a prominent decrease in reaction rates after 1 day; material A and J are practically zero whereas B and D have low values. However, after 28 days the reaction rates are close to 100% for all samples (relative to the reference).
It is worth noting that the addition of by-products to concrete may not only affect its technical properties, but also aesthetical ones, for example the colour of the cement paste. Figure 4 shows concrete in several shades of grey, from light grey to a dark anthracite colour.
Dusts versus slag Earlier research about the compatibility of metallurgical by-products and cement has mostly been concentrated in the area of slags [3], with the exception of fly ashes and silica fume. Usually, the dusts and sludges have similar chemical composition as the slags. The materials have the same process of origin, but they have different behaviour when they are mixed with cement into concrete.
Slags may have high levels of free calcium oxide (f-CaO) that reacts with water and causes a rise of the heat development, whereas the dusts and sludges seem to be free from f-CaO. Dusts and sludges have low levels of reactive MgO in contrast to slags that may contain MgO that hydrates to brucite and causes swelling of the hardened concrete, and thus an decrease of the strength. The slags usually need to be crushed and ground before use;
they may contain metal droplets that can cause problems during grinding as opposed to the fine particulate dusts and sludges that can be used with their natural particle size distribution and surface area. Slags can be melted and their chemistry modified to obtain chemical reactivity or positive properties that are well suited for a material that is to be used as filler in concrete. Dusts and sludges may contain larger amounts of metal oxides, such as ZnO, PbO and F e ^ that affects the Portland cement hydration, either negatively or positively.
Discussion and conclusions When by-products containing metal compounds are mixed with cement, the cement chemistry will become more complex. Metal ions can exchange with the ions in the clinker or they can precipitate with the anions that are part of the clinker minerals. They can become a part of the calcium silicate hydrate or chemisorb at the surfaces. They can also form surface compounds on specific clinker minerals or inclusions and may become an inert part of the system. Zinc and lead oxides are known as retarders of the hydration, others are considered to be accelerators, for example aluminium oxide. Some metal oxides, such as chromium oxide, have no or negligible effect [4-8].
It is known that the particle size (or specific surface area) of cement strongly influences the hydration variables [9-11]; the smaller the particles the shorter the dormant period becomes, i.e., the cement pastes' hydration rate increases and it hardens faster. The added by-products' particle size probably influences its effect on the hydration, especially if it is very fine and contain metal oxides, such as ZnO or PbO, that have a strong retarding effect.
The high content of metal oxides in the tested byproducts gives them a greater influence on the cement
5
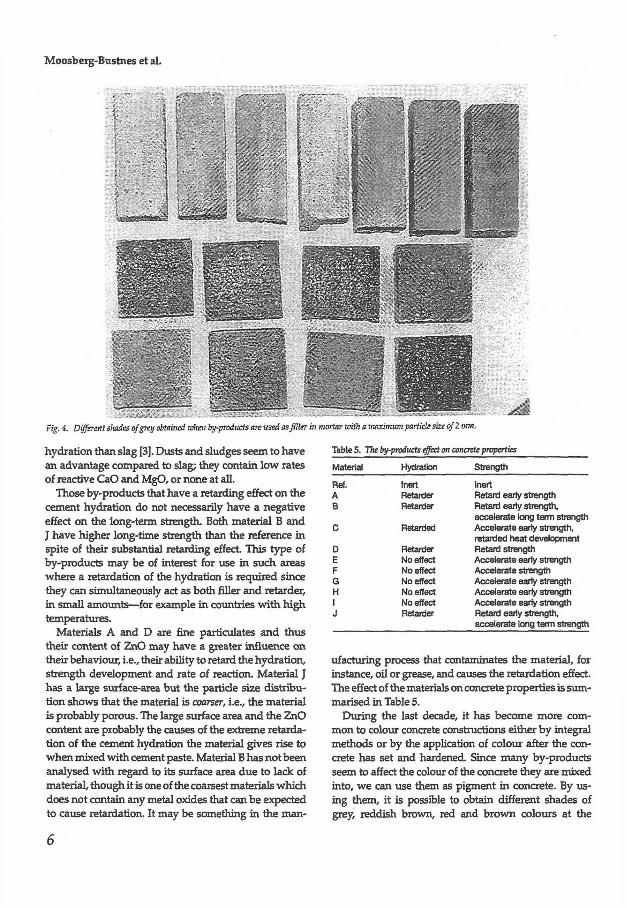
Moosberg-Bustnes et al.
Fig, i. Different shades of grey obtained what by-products are used as filer m mortar with a maximum particle size of 2 trim.
Table5. The by-products effect on concrete properties hydration than slag [3]. Dusts and sludges seem to have an advantage compared to slag; they contain low rates of reactive CaO and MgO, or none at all.
Those by-products that have a retarding effect on the cement hydration do not necessarily have a negative effect on the long-term strength. Both material B and J have higher long-time strength than the reference in spite of their substantial retarding effect This type of by-products may be of interest for use in such areas where a retardation of the hydration is required since they can simultaneously act as both filler and retarder, in small amounts—for example in countries with high temperatures.
Materials A and D are fine particulates and thus their content of ZnO may have a greater influence on their behaviour, i.e., their ability to retard the hydration, strength development and rate of reaction. Material J has a large surface-area but the particle size distribution shows that the material is coarser, i.e., the material is probably porous. The large surface area and the ZnO content are probably the causes of the extreme retardation of the cement hydration the material gives rise to when mixed with cement paste. Material B has not been analysed with regard to its surface area due to lack of material, though it is one of the coarsest materials which does not contain any metal oxides that can be expected to cause retardation. It may be something in the man-
Material Hydration Strength
Ref. Inert Inert A Retarder Retard early strength B Retarder Retard early strength.
accelerate long term strength C Retarded Accelerate early strength,
retarded heat development D Retarder Retard strength E No effect Accelerate early strength F No effect Accelerate strength G No effect Accelerate early strength H No effect Accelerate early strength 1 No effect Accelerate early strength J Retarder Retard early strength,
accelerate long term strength
ufacturing process that contaminates the material, for instance, oil or grease, and causes the retardation effect. The effect of the materials on concrete properties is summarised in Table 5.
During the last decade, it has become more common to colour concrete constructions either by integral methods or by the application of colour after the concrete has set and hardened. Since many by-products seem to affect the colour of the concrete they are mixed into, we can use them as pigment in concrete. By using them, it is possible to obtain different shades of grey, reddish brown, red and brown colours at the
6
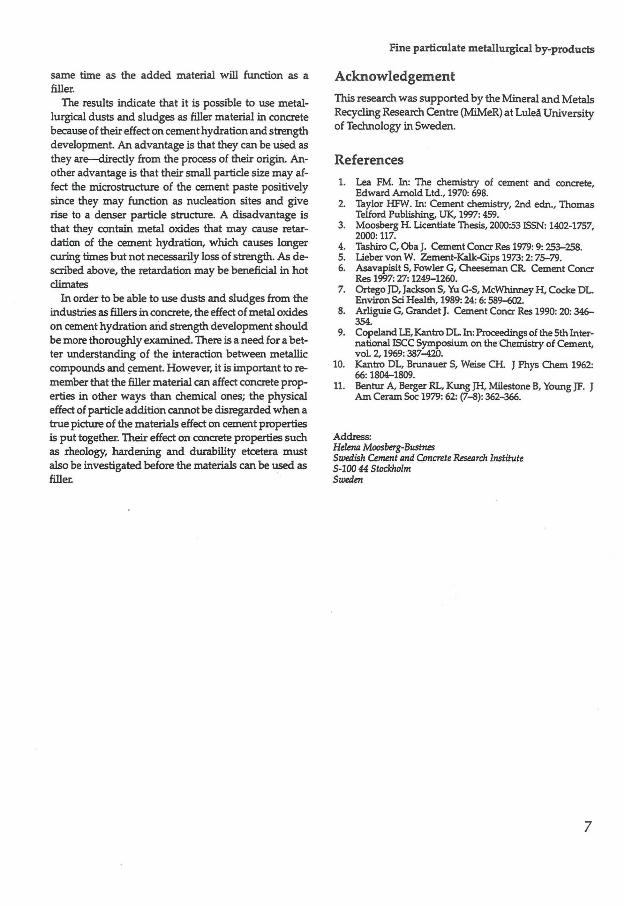
Fine particulate metallurgical by-products
same time as the added material will function as a filler.
The results indicate that it is possible to use metallurgical dusts and sludges as filler material in concrete because of their effect on cement hydration and strength development. An advantage is that they can be used as they are—directly from the process of their origin. Another advantage is that their small particle size may affect the microstructure of the cement paste positively since they may function as nucleation sites and give rise to a denser particle structure. A disadvantage is that they contain metal oxides that may cause retardation of the cement hydration, which causes longer curing times but not necessarily loss of strength. As described above, the retardation may be beneficial in hot climates
In order to be able to use dusts and sludges from the industries as fillers in concrete, the effect of metal oxides on cement hydration and strength development should be more thoroughly examined. There is a need for a better understanding of the interaction between metallic compounds and cement. However, it is important to remember that the filler material can affect concrete properties in other ways than chemical ones; the physical effect of particle addition cannot be disregarded when a true picture of the materials effect on cement properties is put together. Their effect on concrete properties such as rheology, hardening and durability etcetera must also be investigated before the materials can be used as filler.
Acknowledgement This research was supported by the Mineral and Metals Recycling Research Centre (MiMeR) at Luleå University of Technology in Sweden.
References
1. Lea FM. In: The chemistry of cement and concrete, Edward Arnold Ltd., 1970: 698.
2. Taylor HFW. In: Cement chemistry, 2nd edn., Thomas Telford Publishing, UK, 1997:459.
3. Moosberg H. Licentiate Thesis, 2000:53 ISSN: 1402-1757, 2000:117.
4. Tashiro C, Oba J. Cement Concr Res 1979:9:253-258. 5. Lieber von W. Zement-Kalk-Gips 1973:2:75-79. 6. Asavapisit S, Fowler G, Cheeseman CR. Cement Concr
Res 1997:27:1249-1260. 7. Ortego TD, lackson S, Yu G-S, McWhinney H, Cocke DL.
Environ Sei Health, 1989:24:6:589-602. 8. Arliguie G, Grandet J. Cement Concr Res 1990:20: 346-
354. 9. Copeland LE, Kantro DL. In: Proceedings of the 5th Inter
national ISCC Symposium on the Chemistry of Cement, voL 2,1969:387-420.
10. Kantro DL, Brunauer S, Weise CH. I Phys Chem 1962: 66:1804-1809.
11. Bentur A, Berger RL, Kung JH, Milestone B, Young JF. J Am Ceram Soc 1979:62: (7-8): 362-366.
Address: Helena Moosberg-Bustnes Swedish Cement and Concrete Research Institute S-100 44 Stockholm Sweden
7

1
An calorimetric and XRD study of the effect of some metal oxides on cement hydration
H. Moosberg-Bustnes, Swedish Cement and Concrete Research Institute L. Lind, SSAB Merox AB E. Forssberg, Luleå University of Technology
ABSTRACT
During the production of minerals and metals a number of metal ion bearing products are generated, such as slag, dust and sludge. To be able to promote the use of these by-products as fillers in concrete the effect of metal oxides on concrete properties has to be examined. The main objective of this study was to investigate the effect on cement hydration and strength of cement paste to which various metal oxides had been added. The cement pastes were analysed with isothermal calorimetry and X-ray diffraction analysis. ZnO and PbO was found to severely retard the cement hydration, while the others had less effect or non on the investigated properties.
1 BACKGROUND
For many years, research in the field of by-products has been concentrated in finding ways to make better deposit products, and not to utilise these products as raw materials in other processes. Materials from thermal processes, i.e. slags, dusts and sludges, usually contain metal compounds as main constituents. Many of these materials are treated before disposal by means of solidification/stabilisation techniques, using cement as matrix material. Earlier investigations by Moosberg (2000, 2003) show that it is possible to use these materials as filler in concrete but that there is a need to know more about their effect on the cement system. Researchers have used a variety of different methods to characterise the effect of metal oxide addition to cement, some have examined the physical process of setting, others the hydration. The degree of retardation or acceleration has been defined by different parameters, and comparison between results made difficult since different amounts of metal oxide have been added to the cement pastes. The researchers do however agree about the fact that metal oxides affect the cement hydration, and that especially zinc oxide and lead oxide cause a pronounced retardation.
The main objective of this study was to investigate the effect on cement hydration and strength of cement paste to which various metal oxides had been added. As an extension of the experimental design, the effect of carbonaceous materials in the form of coal and coke were also examined since they may be present as an "pollutant" in many of the by-products that come from the iron and steel making industries.
2 L I T E R A T U R E R E V I E W
It is known that some chemical compounds retard the set of cement and that others accelerate it. There are even compounds that completely inhibit the hydration. The available data are often conflicting and the effect produced often varies with the composition of the Portland cement used.
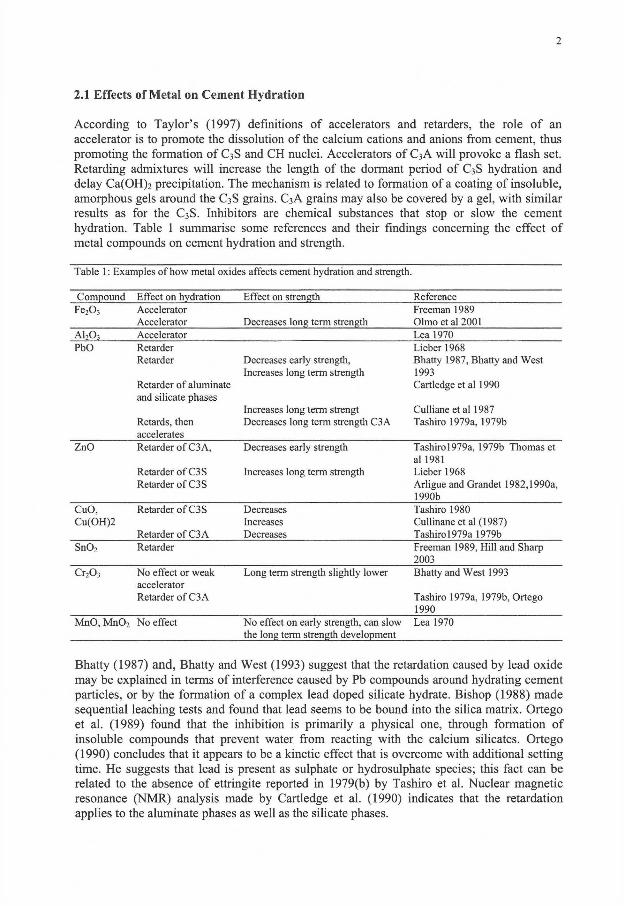
2
2.1 Effects of Metal on Cement Hydration
According to Taylor's (1997) definitions of accelerators and retarders, the role of an accelerator is to promote the dissolution of the calcium cations and anions from cement, thus promoting the formation of C3S and CH nuclei. Accelerators of C3A will provoke a flash set. Retarding admixtures wil l increase the length of the dormant period of C3S hydration and delay Ca(OH)2 precipitation. The mechanism is related to formation of a coating of insoluble, amorphous gels around the C3S grains. C3A grains may also be covered by a gel, with similar results as for the C3S. Inhibitors are chemical substances that stop or slow the cement hydration. Table 1 summarise some references and their findings concerning the effect of metal compounds on cement hydration and strength.
Table 1: Examples of how metal oxides affects cement hydration and strength.
Compound Effect on hydration Effect on strength Reference F e 2 0 3 Accelerator Freeman 1989
Accelerator Decreases long term strength Olmo etal 2001 AI2O3 Accelerator Lea 1970 PbO Retarder Lieber 1968
Retarder Decreases early strength, Increases long term strength
Bhatty 1987, Bhatty and West 1993
Retarder of aluminate Cartledge et al 1990 and silicate phases
Increases long term strengt Cullianeetal 1987 Retards, then Decreases long term strength C3A Tashiro 1979a, 1979b accelerates
ZnO Retarder of C3A, Decreases early strength Tashiro 1979a, 1979b Thomas et al 1981
Retarder of C3 S Increases long term strength Lieber 1968 Retarder ofC3S Arligue and Grandet 1982,1990a,
1990b CuO, Retarder of C3S Decreases Tashiro 1980 Cu(OH)2 Increases Cullinane et al (1987)
Retarder of C3A Decreases Tashiro 1979a 1979b Sn0 2
Retarder Freeman 1989, Hill and Sharp 2003
C r 2 0 3 No effect or weak accelerator Retarder of C3 A
Long term strength slightly lower Bhatty and West 1993
Tashiro 1979a, 1979b, Ortego 1990
MnO, M n 0 2 No effect No effect on early strength, can slow
the long term strength development Lea 1970
Bhatty (1987) and, Bhatty and West (1993) suggest that the retardation caused by lead oxide may be explained in terms of interference caused by Pb compounds around hydrating cement particles, or by the formation of a complex lead doped silicate hydrate. Bishop (1988) made sequential leaching tests and found that lead seems to be bound into the silica matrix. Ortego et al. (1989) found that the inhibition is primarily a physical one, through formation of insoluble compounds that prevent water from reacting with the calcium silicates. Ortego (1990) concludes that it appears to be a kinetic effect that is overcome with additional setting time. He suggests that lead is present as sulphate or hydrosulphate species; this fact can be related to the absence of ettringite reported in 1979(b) by Tashiro et al. Nuclear magnetic resonance (NMR) analysis made by Cartledge et al. (1990) indicates that the retardation applies to the aluminate phases as well as the silicate phases.
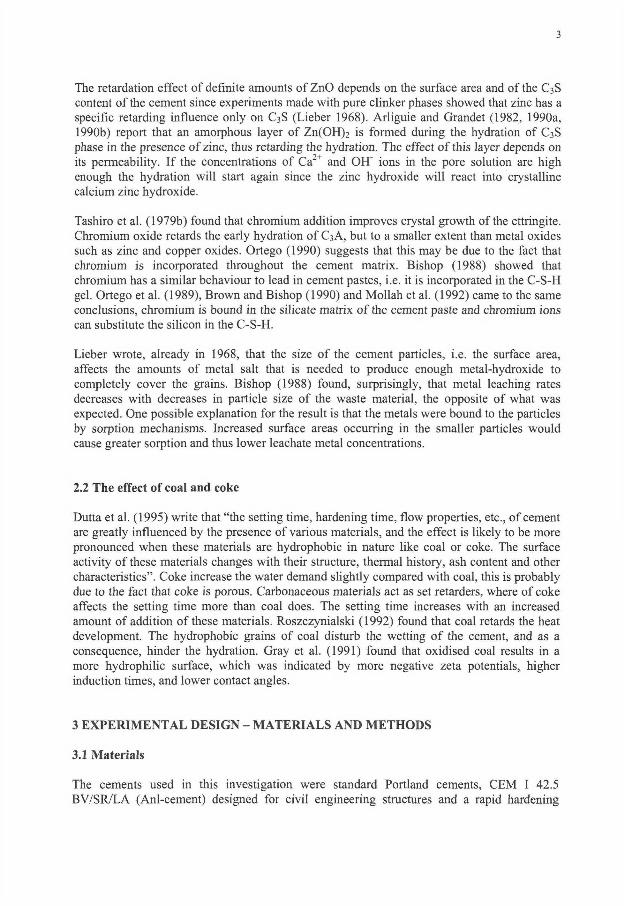
3
The retardation effect of definite amounts of ZnO depends on the surface area and of the C3S content of the cement since experiments made with pure clinker phases showed that zinc has a specific retarding influence only on C3S (Lieber 1968). Arliguie and Grandet (1982, 1990a, 1990b) report that an amorphous layer of Zn(OH)2 is formed during the hydration of C3S phase in the presence of zinc, thus retarding the hydration. The effect of this layer depends on its permeability. I f the concentrations of Ca + and OH" ions in the pore solution are high enough the hydration will start again since the zinc hydroxide wil l react into crystalline calcium zinc hydroxide.
Tashiro et al. (1979b) found that chromium addition improves crystal growth of the ettringite. Chromium oxide retards the early hydration of C3A, but to a smaller extent than metal oxides such as zinc and copper oxides. Ortego (1990) suggests that this may be due to the fact that chromium is incorporated throughout the cement matrix. Bishop (1988) showed that chromium has a similar behaviour to lead in cement pastes, i.e. it is incorporated in the C-S-H gel. Ortego et al. (1989), Brown and Bishop (1990) and Mollah et al. (1992) came to the same conclusions, chromium is bound in the silicate matrix of the cement paste and chromium ions can substitute the silicon in the C-S-H.
Lieber wrote, already in 1968, that the size of the cement particles, i.e. the surface area, affects the amounts of metal salt that is needed to produce enough metal-hydroxide to completely cover the grains. Bishop (1988) found, surprisingly, that metal leaching rates decreases with decreases in particle size of the waste material, the opposite of what was expected. One possible explanation for the result is that the metals were bound to the particles by sorption mechanisms. Increased surface areas occurring in the smaller particles would cause greater sorption and thus lower leachate metal concentrations.
2.2 The effect of coal and coke
Dutta et al. (1995) write that "the setting time, hardening time, flow properties, etc., of cement are greatly influenced by the presence of various materials, and the effect is likely to be more pronounced when these materials are hydrophobic in nature like coal or coke. The surface activity of these materials changes with their structure, thermal history, ash content and other characteristics". Coke increase the water demand slightly compared with coal, this is probably due to the fact that coke is porous. Carbonaceous materials act as set retarders, where of coke affects the setting time more than coal does. The setting time increases with an increased amount of addition of these materials. Roszczynialski (1992) found that coal retards the heat development. The hydrophobic grains of coal disturb the wetting of the cement, and as a consequence, hinder the hydration. Gray et al. (1991) found that oxidised coal results in a more hydrophilic surface, which was indicated by more negative zeta potentials, higher induction times, and lower contact angles.
3 E X P E R I M E N T A L DESIGN - MATERIALS AND METHODS
3.1 Materials
The cements used in this investigation were standard Portland cements, CEM I 42.5 BV/SR/LA (Anl-cement) designed for civil engineering structures and a rapid hardening
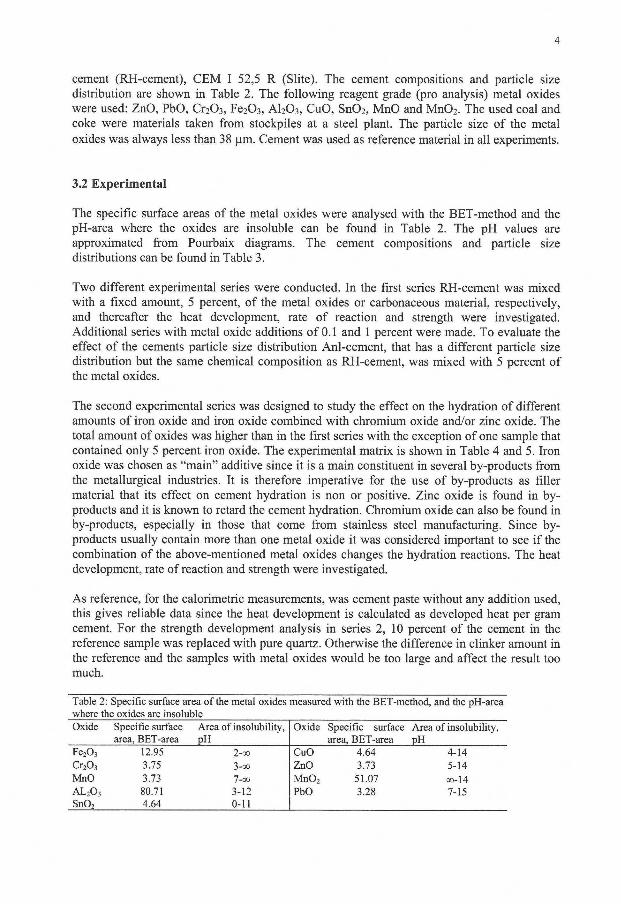
4
cement (RH-cement), CEM I 52,5 R (Slite). The cement compositions and particle size distribution are shown in Table 2. The following reagent grade (pro analysis) metal oxides were used: ZnO, PbO, Cr 2 0 3 , Fe 20 3 , A1 20 3 , CuO, Sn0 2, MnO and Mn0 2 . The used coal and coke were materials taken from stockpiles at a steel plant. The particle size of the metal oxides was always less than 38 um. Cement was used as reference material in all experiments.
3.2 Experimental
The specific surface areas of the metal oxides were analysed with the BET-method and the pH-area where the oxides are insoluble can be found in Table 2. The pH values are approximated from Pourbaix diagrams. The cement compositions and particle size distributions can be found in Table 3.
Two different experimental series were conducted. In the first series RH-cement was mixed with a fixed amount, 5 percent, of the metal oxides or carbonaceous material, respectively, and thereafter the heat development, rate of reaction and strength were investigated. Additional series with metal oxide additions of 0.1 and 1 percent were made. To evaluate the effect of the cements particle size distribution Anl-cement, that has a different particle size distribution but the same chemical composition as RH-cement, was mixed with 5 percent of the metal oxides.
The second experimental series was designed to study the effect on the hydration of different amounts of iron oxide and iron oxide combined with chromium oxide and/or zinc oxide. The total amount of oxides was higher than in the first series with the exception of one sample that contained only 5 percent iron oxide. The experimental matrix is shown in Table 4 and 5. Iron oxide was chosen as "main" additive since it is a main constituent in several by-products from the metallurgical industries. It is therefore imperative for the use of by-products as filler material that its effect on cement hydration is non or positive. Zinc oxide is found in byproducts and it is known to retard the cement hydration. Chromium oxide can also be found in by-products, especially in those that come from stainless steel manufacturing. Since byproducts usually contain more than one metal oxide it was considered important to see i f the combination of the above-mentioned metal oxides changes the hydration reactions. The heat development, rate of reaction and strength were investigated.
As reference, for the calorimetric measurements, was cement paste without any addition used, this gives reliable data since the heat development is calculated as developed heat per gram cement. For the strength development analysis in series 2, 10 percent of the cement in the reference sample was replaced with pure quartz. Otherwise the difference in clinker amount in the reference and the samples with metal oxides would be too large and affect the result too much.
Table 2: Specific surface area of the metal oxides measured with the BET-method, and the pH-area where the oxides are insoluble Oxide Specific surface
area, BET-area Area of insolubility, PH
Oxide Specific surface area, BET-area
Area of insolubility, pH
F e 2 0 3 12.95 2-00 CuO 4.64 4-14 C r 2 0 3 3.75 3-00 ZnO 3.73 5-14 MnO 3.73 7-00 M n 0 2 51.07 00-14
A L 2 0 3 80.71 3-12 PbO 3.28 7-15 Sn0 2 4.64 0-11
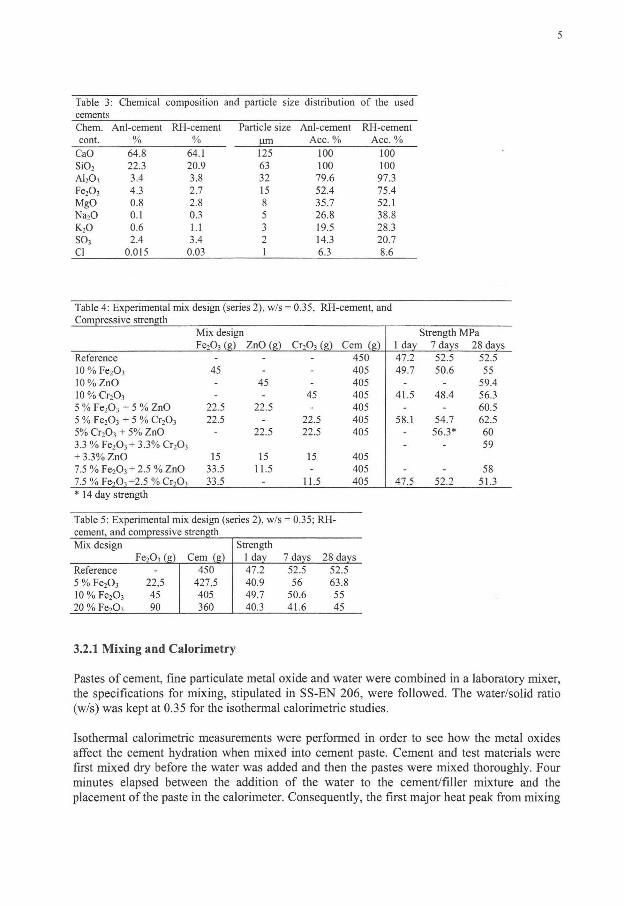
5
Table 3 : Chemical composition and particle size distribution of the used cements Chem. Anl-cement RH-cement Particle size Anl-cement RH-cement cont. % % um Acc. % Acc. %
CaO 64.8 64.1 125 100 100 Si0 2 22.3 20.9 63 100 100 A1 20 3
3.4 3.8 32 79.6 97.3 Fe 2 0 3
4.3 2.7 15 52.4 75.4 MgO 0.8 2.8 8 35.7 52.1 Na 20 0.1 0.3 5 26.8 38.8 K 2 0 0.6 1.1 3 19.5 28.3 SÖ3 2.4 3.4 2 14.3 20.7 CI 0.015 0.03 1 6.3 8.6
Table 4: Experimental mix design (series 2), w/s = 0.35, RH-cement, and Compressive strength
Mix desig n Strength MPa F e 2 0 3 (g) ZnO (g) C r 2 0 3 (g) Cem (g) 1 day 7 days 28 days
Reference - - - 450 47.2 52.5 52.5 10 % F e 2 0 3 45 - - 405 49.7 50.6 55 10% ZnO - 45 - 405 - - 59.4 10 % C r 2 0 3
- - 45 405 41.5 48.4 56.3 5 % F e 2 0 3 + 5 % ZnO 22.5 22.5 - 405 - - 60.5 5 % F e 2 0 3 + 5 % Cr 2 Oj 22.5 - 22.5 405 58.1 54.7 62.5 5% C r 2 0 3 + 5% ZnO - 22.5 22.5 405 - 56.3* 60 3 .3%Fe 2 0 3 + 3 .3%Cr 2 0 3
- - 59 + 3.3% ZnO 15 15 15 405 7 .5%Fe 2 0 3 + 2.5 %ZnO 33.5 11.5 - 405 - - 58 7.5%Fe 20 3+2.5 % C r 2 0 , 33.5 - 11.5 405 47.5 52.2 51.3 * 14 day strength
Table 5: Experimental mix design (series 2), w/s = 0.35; R H -cement, and compressive strength Mix design Strength
Fe 2 O s (g) Cem (g) 1 dav 7 days 28 days Reference 450 47.2 52.5 52.5 5 % F e 2 0 3 22,5 427,5 40.9 56 63.8 10%Fe 2 O 3 45 405 49.7 50.6 55 20 % F e 2 0 3 90 360 40.3 41.6 45
3.2.1 Mixing and Calorimetry
Pastes of cement, fine particulate metal oxide and water were combined in a laboratory mixer, the specifications for mixing, stipulated in SS-EN 206, were followed. The water/solid ratio (w/s) was kept at 0.35 for the isothermal calorimetric studies.
Isothermal calorimetric measurements were performed in order to see how the metal oxides affect the cement hydration when mixed into cement paste. Cement and test materials were first mixed dry before the water was added and then the pastes were mixed thoroughly. Four minutes elapsed between the addition of the water to the cement/filler mixture and the placement of the paste in the calorimeter. Consequently, the first major heat peak from mixing
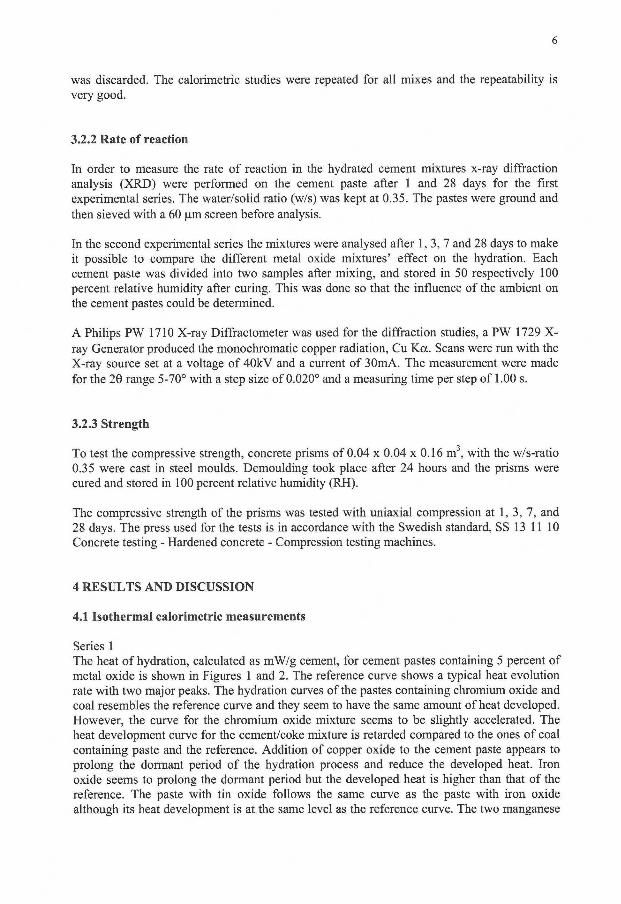
6
was discarded. The calorimetric studies were repeated for all mixes and the repeatability is very good.
3.2.2 Rate of reaction
In order to measure the rate of reaction in the hydrated cement mixtures x-ray diffraction analysis (XRD) were performed on the cement paste after 1 and 28 days for the first experimental series. The water/solid ratio (w/s) was kept at 0.35. The pastes were ground and then sieved with a 60 pm screen before analysis.
In the second experimental series the mixtures were analysed after 1,3,7 and 28 days to make it possible to compare the different metal oxide mixtures' effect on the hydration. Each cement paste was divided into two samples after mixing, and stored in 50 respectively 100 percent relative humidity after curing. This was done so that the influence of the ambient on the cement pastes could be determined.
A Philips PW 1710 X-ray Diffractometer was used for the diffraction studies, a PW 1729 X-ray Generator produced the monochromatic copper radiation, Cu Kcc. Scans were run with the X-ray source set at a voltage of 40kV and a current of 30mA. The measurement were made for the 29 range 5-70° with a step size of 0.020° and a measuring time per step of 1.00 s.
3.2.3 Strength
To test the compressive strength, concrete prisms of 0.04 x 0.04 x 0.16 m 3 , with the w/s-ratio 0.35 were cast in steel moulds. Demoulding took place after 24 hours and the prisms were cured and stored in 100 percent relative humidity (RH).
The compressive strength of the prisms was tested with uniaxial compression at 1, 3, 7, and 28 days. The press used for the tests is in accordance with the Swedish standard, SS 13 11 10 Concrete testing - Hardened concrete - Compression testing machines.
4 RESULTS AND DISCUSSION
4.1 Isothermal calorimetric measurements
Series 1 The heat of hydration, calculated as mW/g cement, for cement pastes containing 5 percent of metal oxide is shown in Figures 1 and 2. The reference curve shows a typical heat evolution rate with two major peaks. The hydration curves ofthe pastes containing chromium oxide and coal resembles the reference curve and they seem to have the same amount of heat developed. However, the curve for the chromium oxide mixture seems to be slightly accelerated. The heat development curve for the cement/coke mixture is retarded compared to the ones of coal containing paste and the reference. Addition of copper oxide to the cement paste appears to prolong the dormant period of the hydration process and reduce the developed heat. Iron oxide seems to prolong the dormant period but the developed heat is higher than that of the reference. The paste with tin oxide follows the same curve as the paste with iron oxide although its heat development is at the same level as the reference curve. The two manganese
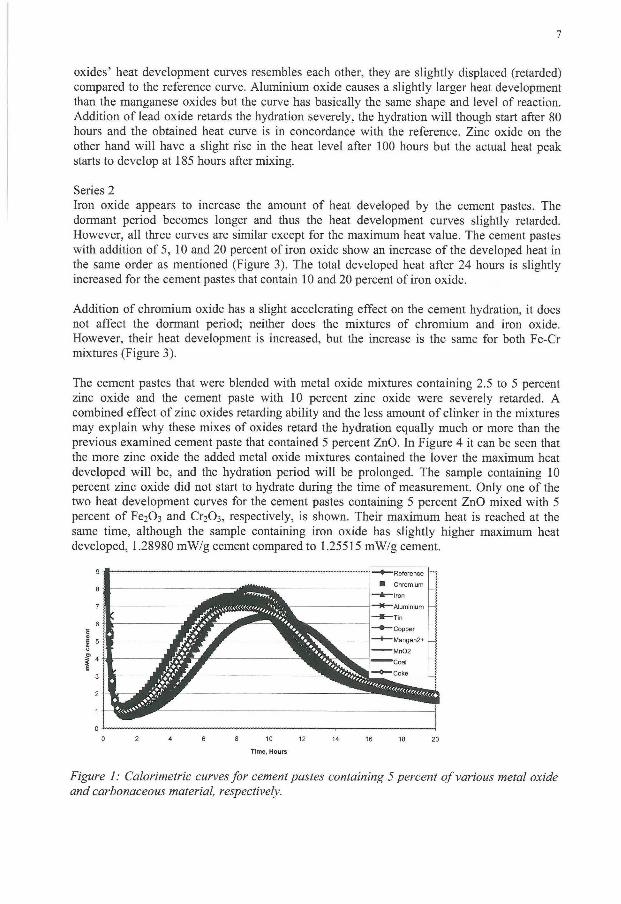
7
oxides' heat development curves resembles each other, they are slightly displaced (retarded) compared to the reference curve. Aluminium oxide causes a slightly larger heat development than the manganese oxides but the curve has basically the same shape and level of reaction. Addition of lead oxide retards the hydration severely, the hydration wil l though start after 80 hours and the obtained heat curve is in concordance with the reference. Zinc oxide on the other hand wil l have a slight rise in the heat level after 100 hours but the actual heat peak starts to develop at 185 hours after mixing.
Series 2 Iron oxide appears to increase the amount of heat developed by the cement pastes. The dormant period becomes longer and thus the heat development curves slightly retarded. However, all three curves are similar except for the maximum heat value. The cement pastes with addition of 5, 10 and 20 percent of iron oxide show an increase of the developed heat in the same order as mentioned (Figure 3). The total developed heat after 24 hours is slightly increased for the cement pastes that contain 10 and 20 percent of iron oxide.
Addition of chromium oxide has a slight accelerating effect on the cement hydration, it does not affect the dormant period; neither does the mixtures of chromium and iron oxide. However, their heat development is increased, but the increase is the same for both Fe-Cr mixtures (Figure 3).
The cement pastes that were blended with metal oxide mixtures containing 2.5 to 5 percent zinc oxide and the cement paste with 10 percent zinc oxide were severely retarded. A combined effect of zinc oxides retarding ability and the less amount of clinker in the mixtures may explain why these mixes of oxides retard the hydration equally much or more than the previous examined cement paste that contained 5 percent ZnO. In Figure 4 it can be seen that the more zinc oxide the added metal oxide mixtures contained the lover the maximum heat developed wil l be, and the hydration period wil l be prolonged. The sample containing 10 percent zinc oxide did not start to hydrate during the time of measurement. Only one of the two heat development curves for the cement pastes containing 5 percent ZnO mixed with 5 percent of Fe203 and Cr203, respectively, is shown. Their maximum heat is reached at the same time, although the sample containing iron oxide has slightly higher maximum heat developed, 1.28980 mW/g cement compared to 1.25515 mW/g cement.
0 J , , , , , , , \
0 2 4 6 8 10 12 14 16 18 20
Time, Hours
Figure 1: Calorimetric curves for cement pastes containing 5 percent of various metal oxide and carbonaceous material, respectively.
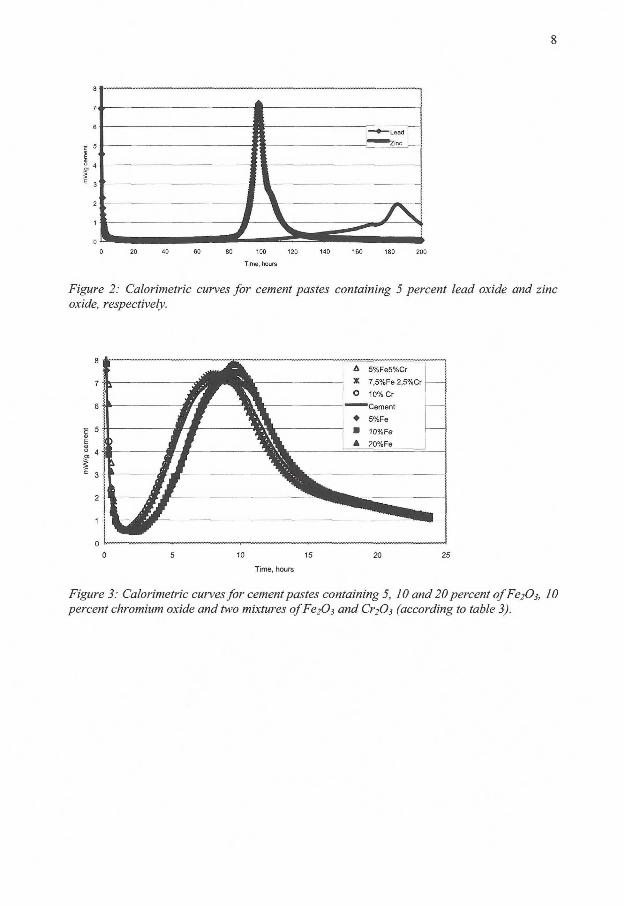
8
Time, hours
Figure 2: Calorimetric curves for cement pastes containing 5 percent lead oxide and zinc oxide, respectively.
Figure 3: Calorimetric curves for cement pastes containing 5, 10 and 20 percent of FezOj, 10 percent chromium oxide and two mixtures ofFeiOj and Cr20s (according to table 3).
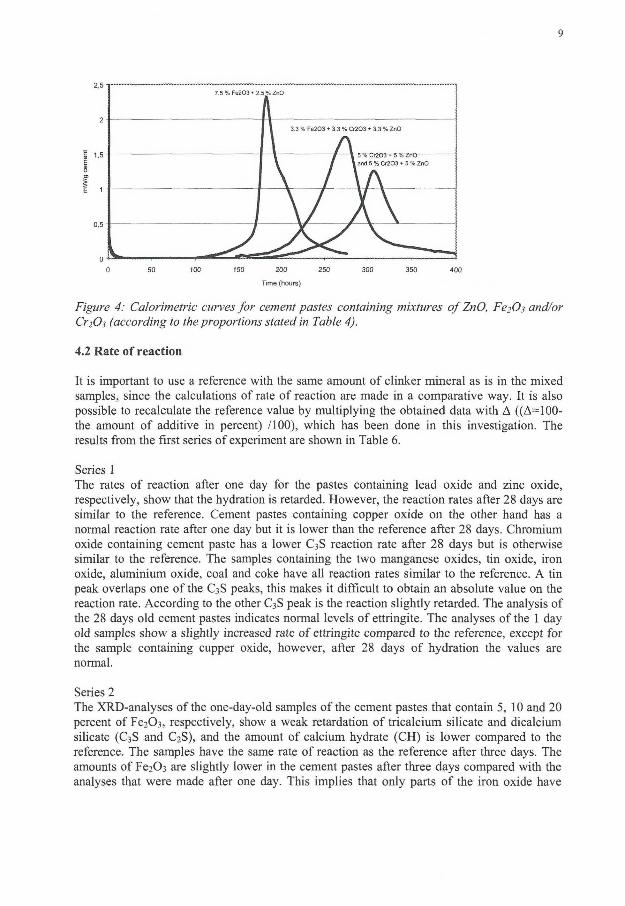
9
Figure 4: Calorimetric cun>es for cement pastes containing mixtures of ZnO, Fe?03 and/or CriO} (according to the proportions stated in Table 4).
4.2 Rate of reaction
It is important to use a reference with the same amount of clinker mineral as is in the mixed samples, since the calculations of rate of reaction are made in a comparative way. It is also possible to recalculate the reference value by multiplying the obtained data with A ((A=100-the amount of additive in percent) /100), which has been done in this investigation. The results from the first series of experiment are shown in Table 6.
Series 1 The rates of reaction after one day for the pastes containing lead oxide and zinc oxide, respectively, show that the hydration is retarded. However, the reaction rates after 28 days are similar to the reference. Cement pastes containing copper oxide on the other hand has a normal reaction rate after one day but it is lower than the reference after 28 days. Chromium oxide containing cement paste has a lower C3S reaction rate after 28 days but is otherwise similar to the reference. The samples containing the two manganese oxides, tin oxide, iron oxide, aluminium oxide, coal and coke have all reaction rates similar to the reference. A tin peak overlaps one of the C3S peaks, this makes it difficult to obtain an absolute value on the reaction rate. According to the other C3S peak is the reaction slightly retarded. The analysis of the 28 days old cement pastes indicates normal levels of ettringite. The analyses of the 1 day old samples show a slightly increased rate of ettringite compared to the reference, except for the sample containing cupper oxide, however, after 28 days of hydration the values are normal.
Series 2 The XRD-analyses of the one-day-old samples of the cement pastes that contain 5, 10 and 20 percent of Fe203, respectively, show a weak retardation of tricalcium silicate and dicalcium silicate (C3S and C2S), and the amount of calcium hydrate (CH) is lower compared to the reference. The samples have the same rate of reaction as the reference after three days. The amounts of Fe2Ü3 are slightly lower in the cement pastes after three days compared with the analyses that were made after one day. This implies that only parts of the iron oxide have
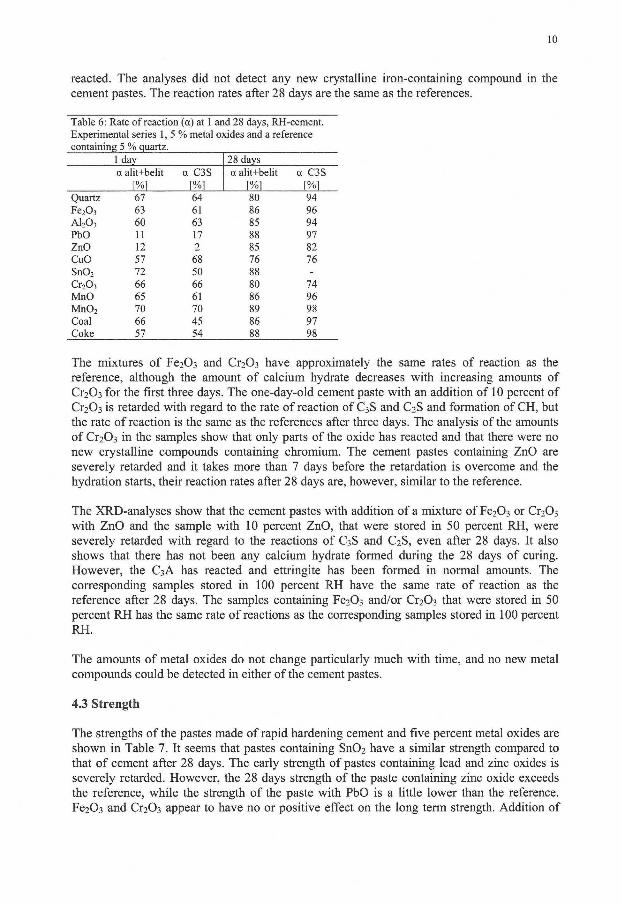
10
reacted. The analyses did not detect any new crystalline iron-containing compound in the cement pastes. The reaction rates after 28 days are the same as the references.
Table 6: Rate of reaction (a) at 1 and 28 days, RH-cement. Experimental series 1,5% metal oxides and a reference containin g 5 % quartz.
1 day 28 days a alit+belit a C3S a alit+belit a C3S
r%i [%] \%] [%] Quartz 67 64 80 94 F e 2 0 3 63 61 86 96 A1 2 0 3 60 63 85 94 PbO 11 17 88 97 ZnO 12 2 85 82 CuO 57 68 76 76 Sn0 2 72 50 88 -C r 2 0 3 66 66 80 74 MnO 65 61 86 96 Mn0 2
70 70 89 98 Coal 66 45 86 97 Coke 57 54 88 98
The mixtures of Fe203 and C^Ch have approximately the same rates of reaction as the reference, although the amount of calcium hydrate decreases with increasing amounts of Cr2Ü3 for the first three days. The one-day-old cement paste with an addition of 10 percent of Cr203 is retarded with regard to the rate of reaction of C3S and C2S and formation of CH, but the rate of reaction is the same as the references after three days. The analysis of the amounts of Cr2Ü3 in the samples show that only parts of the oxide has reacted and that there were no new crystalline compounds containing chromium. The cement pastes containing ZnO are severely retarded and it takes more than 7 days before the retardation is overcome and the hydration starts, their reaction rates after 28 days are, however, similar to the reference.
The XRD-analyses show that the cement pastes with addition of a mixture of Fe203 or Q2O3 with ZnO and the sample with 10 percent ZnO, that were stored in 50 percent RH, were severely retarded with regard to the reactions of C3S and C2S, even after 28 days. It also shows that there has not been any calcium hydrate formed during the 28 days of curing. However, the C 3A has reacted and ettringite has been formed in normal amounts. The corresponding samples stored in 100 percent RH have the same rate of reaction as the reference after 28 days. The samples containing Fe203 and/or Cr 2 0 3 that were stored in 50 percent RH has the same rate of reactions as the corresponding samples stored in 100 percent RH.
The amounts of metal oxides do not change particularly much with time, and no new metal compounds could be detected in either ofthe cement pastes.
4.3 Strength
The strengths of the pastes made of rapid hardening cement and five percent metal oxides are shown in Table 7. It seems that pastes containing Sn02 have a similar strength compared to that of cement after 28 days. The early strength of pastes containing lead and zinc oxides is severely retarded. However, the 28 days strength of the paste containing zinc oxide exceeds the reference, while the strength of the paste with PbO is a little lower than the reference. Fe203 and Cr203 appear to have no or positive effect on the long term strength. Addition of
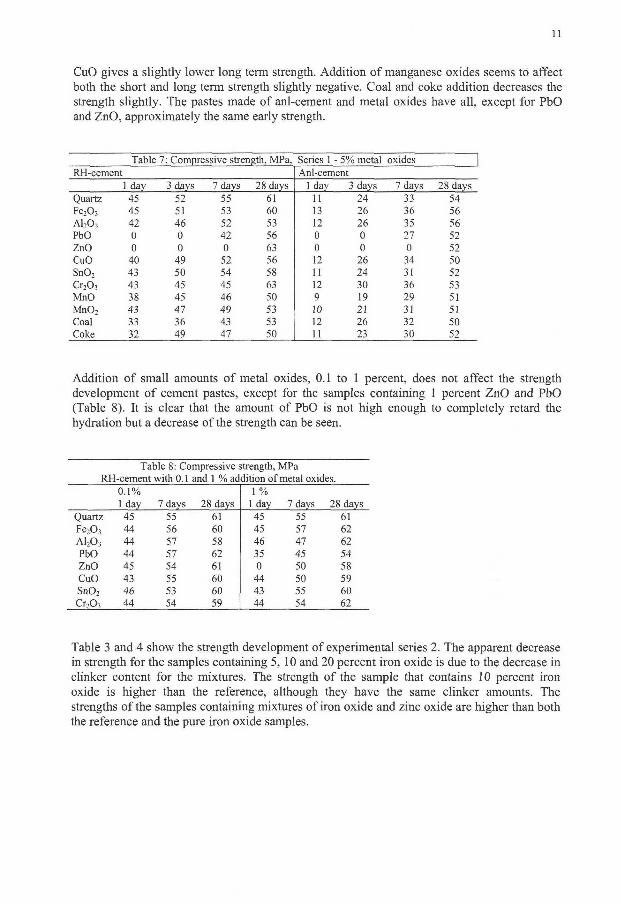
11
CuO gives a slightly lower long term strength. Addition of manganese oxides seems to affect both the short and long term strength slightly negative. Coal and coke addition decreases the strength slightly. The pastes made of anl-cement and metal oxides have all, except for PbO and ZnO, approximately the same early strength.
Table 7: Compressive strength, MPa, Series 1 - 5% metal oxides RH-cement Anl-cement
1 day 3 days 7 days 28 days 1 day 3 days 7 days 28 days Quartz 45 52 55 61 11 24 33 54 F e 2 0 3 45 51 53 60 13 26 36 56 A1 20 3
42 46 52 53 12 26 35 56 PbO 0 0 42 56 0 0 27 52 ZnO 0 0 0 63 0 0 0 52 CuO 40 49 52 56 12 26 34 50 Sn0 2 43 50 54 58 11 24 31 52 C r 2 0 3
43 45 45 63 12 30 36 53 MnO 38 45 46 50 9 19 29 51 Mn0 2 43 47 49 53 10 21 31 51 Coal 33 36 43 53 12 26 32 50 Coke 32 49 47 50 11 23 30 52
Addition of small amounts of metal oxides, 0.1 to 1 percent, does not affect the strength development of cement pastes, except for the samples containing 1 percent ZnO and PbO (Table 8). It is clear that the amount of PbO is not high enough to completely retard the hydration but a decrease of the strength can be seen.
Table 8: Compressive strength, MPa RH-cement with 0.1 and 1 % addition of metal oxides.
0.1% 1 day 7 days 28 days
1 % 1 day 7 days 28 days
Quartz 45 55 61 45 55 61 F e 2 0 3 44 56 60 45 57 62 A1 2 0 3 44 57 58 46 47 62 PbO 44 57 62 35 45 54 ZnO 45 54 61 0 50 58 CuO 43 55 60 44 50 59 Sn0 2 46 53 60 43 55 60 C r 2 0 3 44 54 59 44 54 62
Table 3 and 4 show the strength development of experimental series 2. The apparent decrease in strength for the samples containing 5, 10 and 20 percent iron oxide is due to the decrease in clinker content for the mixtures. The strength of the sample that contains 10 percent iron oxide is higher than the reference, although they have the same clinker amounts. The strengths of the samples containing mixtures of iron oxide and zinc oxide are higher than both the reference and the pure iron oxide samples.
12
5 DISCUSSION
The particle size of the cement affects the degree of retardation added metal oxides will cause when they are mixed into concrete. One conclusion of these experiments is that it is more advantageous to use a rapid hardening, i.e. fine grained cement, in the concrete mixes with by-products since the early strength automatically wi l l be higher and the effect of metal compounds reduced.
With exception for the sample containing 1 percent ZnO, addition of small amounts of metal oxides, 0.1 to 1 percent does not affect the strength development of cement pastes. The cement/metal oxide-ratio is probably too large, this small amount of oxides wil l not disturb either hydration or strength development. Even the hydration retarding oxides PbO and ZnO can not cover the surface of the cement grains and thus retard the hydration.
The high early strength that the anl- cement paste mixtures obtained may be due to a physical phenomenon, i.e. the filler effect. Addition of small particles fills the voids between the cement grains and makes the paste more dense and homogenous, which leads to a higher strength.
Calorimetric measurements showed that addition of iron oxide prolong the dormant period, while the strength and rate of reaction are not affected. The second experimental series confirms this result but it also demonstrates that increased amount of added iron oxide has no further effect on the length of the dormant period. However, the heat developed increases when the amount of added oxide increases.
The fact that a higher Fe?03 addition does not increase the dormant period but increases the heat developed could be due to the formation of an iron compound, but according to the XRD-analysis no crystalline iron compound was found. It is possible that an amorphous compound was formed but the higher heat development may be caused by the addition of the fine iron oxide particles, which may enhance the hydration and thus the heat by acting as a catalyst for the cement reaction - a physical effect. I f there is a chemical reaction it is usually enhanced the more of the material added and the XRD-analysis shows that only a small amount of the iron oxide has reacted in the cement pastes. Calorimetric measurements of Fe203 mixed with water show that no heat is developed in the mixture, i.e., no exothermic reaction with water can be detected.
The strength of the sample that contains 10 percent iron oxide is higher than that of the reference, although they have the same clinker amounts. This may be due to the fact that the added iron oxide had much smaller particles than the quarts, and thus may affect the particle packing of the cement paste positively. The quartz had approximately the same particle size distribution as the anl-cement, The particle size distribution was chosen in accordance with the findings in Moosberg (2000) with the objective of avoiding the filler effect.
It is possible that small amounts of Fe and Cr ions are dissolved and bound into the C-S-H and in the ettringite. Al-ions can be substituted with Fe or Cr (Taylor 1997), but this could not be proven with the XRD-analysis since the peaks of these compounds will be small compared to the ordinary ettringite, due to the small amounts of the metal oxides that have reacted, and overlapped by the Al-ion containing ettringite since they wi l l have similar crystal lattices.
13
The lower long term strength of the samples containing CuO is consistent with the calorimetric measurements, which indicated a retarded and lower heat development. The subsequent XRD-analysis shows a lower rate of reaction compared to the reference.
The heat development curve of the mixture with tin oxide indicates a retarding effect on the cement hydration, similar to the effect of iron oxide. In contrast to iron, tin oxide had a slightly negative effect on the long term strength, but the rate of reaction was in the same region as the reference.
Even though, both lead and zinc oxide retard the cement hydration and have very low rates of reaction, the long term strengths are equal to or higher than that of the references. The long dormant period of the cement pastes probably leads to a better structure of the hardened paste.
Although addition of chromium oxide has a slight accelerating effect on the cement hydration, it does not affect the dormant period. This slight acceleration effect may be due to a physical effect. The particles of chromium oxide may function as nucleation points during the dormant period when the Ca-ion rate is increasing, i.e. the precipitation reaction can start earlier.
Coal and coke addition to cement paste causes a decrease in strength although the rates of reaction is equal to the references.
A combined effect of the retarding ability of zinc oxides and the less amount of clinker in the mixtures in series 2 may explain why these mixes of oxides retard the hydration equally much or more than the previous examined cement paste that contained 5 percent ZnO. The cement paste containing a mixture of 7.5 percent iron oxide and 2.5 percent zinc oxide and the sample containing 5 percent zinc oxide reaches their heat maxima 183 and 185 hours after mixing, respectively.
Iron oxide, aluminium oxide and manganese dioxide have large surface areas. The surface areas of the used lead oxide and zinc oxide are of the same magnitude as chromium oxide, cupper oxide, tin oxide and manganese oxide. Al l the metal oxides are practically insoluble at the pH-level obtained in a cement paste, thus there is not a connection between the solubility and surface area that can explain the retardation of lead and zinc oxide, i,e., fine particulate materials with high solubility reacts fast.
The difference between samples stored in 100 percent relative humidity (RH) and 50 percent RH is fundamental. The rate of reaction of the samples stored in 50 percent RH is almost zero - they can not hydrate since the reactions demand water and due to the ambient low RH the cement paste will be dehydrated in a few days time. It is therefore imperative to have the right curing and storing conditions i f by-products that contain ZnO are used as filler material. I f these conditions are met, the end result wil l be positive with regard to the cement pastes' strength and reaction rate.
It is important to remember that the terms retardation and inhibition describe mechanisms that slow cement setting, but do not necessarily decrease the strength of the fully cured product. However, some compounds can in large amounts produce effects the normal hydration reactions cannot overcome. On the other hand, a metal oxide that, when added in different amounts to the cement paste, does not affect the hydration mechanism may affect the microstructure of the cement pastes. The small particles can f i l l interpartiele voids in the cement paste and make it more dense and homogenous and thus stronger.
14
6 CONCLUSIONS
Small amounts of metal oxides appear to have no or an insignificant effect on cement hydration, the particle size distribution of the cement has a more prominent effect on hydration and strength development. However, larger amount of metal oxides, especially retarding agents such as zinc oxide and lead oxide affects the short term strength significantly although the long term strength is not negatively affected. Copper oxide on the other hand, has a slight effect on the short term strength but addition wil l decrease the long term strength noticeably. Coal and coke decreases the strength while Fe203 and Cr 2 0 3 appear to have a slightly positive effect on the long term strength. Manganese, aluminium, and tin oxide appears to have no effect on the long term strength.
The experimental results implies that curing conditions and storing procedures has to be altered for cement based products containing zinc oxide bearing by-products in order to obtain the highest possible strength.
It is a fact that many by-products from mineral and metallurgical industries contain metal compounds that affects the cement hydration, this may not necessarily prevent the use of them in cement based products since their effects may be overcome with time.
7 A C K N O W L E D G E M E N T
The authors gratefully acknowledge the support by MiMeR, Minerals and Metals Recycling Research Centre at The Technical University in Luleå (LTU).
8 R E F E R E N C E S
1. Arliguie G , Ollivier J.P. & Grandet J., Etude de l'effet retardateur du zinc sur l'hydratation de la pate de ciment Portland, Cement and Concrete Research vol. 12, 1982, pp. 79-86.
2. Arliguie G. & Grandet J. (1990) "Influence de la composition d'un ciment Portland sur son hydratation en presence de zinc" Cement and Concrete Research vol. 20, pp. 517-524.
3. Arliguie G. & Grandet J. (1990) "Etude de l'hydratation du ciment en presence de zinc influence de la teneur en gypse" Cement and Concrete Research vol. 20, pp. 346-354.
4. Bhatty J.I. & West P.B., Interaction of heavy metals in portland cement stabilized waste systems: effects on paste hydration Emerging Technologies Symposium on Cement and Concrete in the Global Environment, Chicago, 111. Portland Cement Association; 114. 1993.
5. Bhatty M.S.Y. (1987) "Fixation of Metallic Ions in Portland Cement" Proceedings of the national conference on hazardous wastes and hazardous materials 1987, pp. 140-145
15
6. Bishop P.L. (1988) "Leaching of Inorganic Hazardous Constituents from Stabilized/Solified Hazardous Wastes" Hazardous Waste & Hazardous Materials Vol. 5, No.2, pp. 129-143.
7. Cartledge F.K, Butler L.G., Chalasani D., Eaton H C , Frey F.P., Herrera E., Tittlebaum M.E. & Yang S-L (1990) "Immobilization Mechanisms in Solidification/Stabilization of Cd and Pb Salts Using Portland Cement Fixing Agents" Environ. Sei. Technol. Vol. 24, No. 6, pp. 867-873.
8. Cullinane M.J. Bricka Jr. R. M . & Francingues Jr. N . R. (1987) "An assessment of materials that interfere with stabilisation/solidification processes" Report EPA/600/9-87/1005, Environmental Protection Agency, WA
9. Dutta D.K., Bordoloi D. & Borthakur P.C. (1995) "Hydration of Portland cement clinker in the presence of carbonaceous material" Cement and Concrete Research, vol. 25, pp. 1095-1102.
10. Freeman H.M (1989) "Standard handbook of hazardous waste treatment and disposal" New York: McGraw-Hill, p 7.94.
11. Gray L.M., Lai R.W., Wells A.W. (1991) "Surface modification of oxidized coal by methanol vapor", pp. 804-813.
12. Hi l l J. & Sharp J.H. (2003) "The hydration products of Portland cement in the presence of tin(II) chloride" Cement and Concrete Research, Vol. 33, pp. 121-124.
13. Lea F.M. (1970) "The chemistry of cement and concrete" Edward Arnold (Publishers) Ltd. pp. 698.
14. Lieber W., "The Influence of Lead and Zinc Compounds on the Hydration of Portland Cement" Proceedings of The Fifth International Symposium on the Chemistry of Cement, Tokyo. Part I I , vol. I I . 1968, pp. 444-454.
15. Mollah M.Y.A., Tsai Y - N , Hess T.R. & Cocke D.L. (1992) "An FTIR, SEM, and EDS investigation of solidification/stabilization of chromium using portland cement Type V and Type IP" Journal of Hazardous Materials, No. 30, pp. 273-283.
16. Moosberg H (2000) "Utilisation of Chemically Inert or Puzzolanic Particles to Modify Concrete Properties and Save Cement". Licentiate Thesis 2000:53, ISSN: 1402-1757, Luleå University of Technology, pp. 117.
17. Moosberg H, Lagerblad B. and Forssberg E. (2003) "The use of by-products from metallurgical and mineral industries as filler in cement-based materials" Waste management and research, No. 21, pp. 29-37.
18. Olmo I . F, Chacon E. & Irabien A. (2001) "Influence of lead, zinc, iron (III) and chromium (III) oxides on the setting time and strength development of Portland Cement" Cement and Concrete Research, Vol. 31, pp. 1213-1219.
16
19. Ortego J.D. Jackson S., Yu G-S, McWhinney H. & Cocke D.L. (1989) Solidification of hazardous substances - a TGA and FTIR Study of Portland cement containing metal nitrates" Environ. Sei. Health, Vol. 24, No. 6, pp. 589-602.
20. Ortego J.D. (1990) "Spectroscopic and leaching studies of solidified toxic metals" Journal of Hazardous Materials 24, pp 137-144.
21. Roszcynialski W. (1992) "The influence of some fly ashes and blast-furnace slags on blended cement hydration and properties" Proceedings from the 9th International Congress on the Chemistry of Cement, New Delhi, India. Vol IV, pp. 698-704.
22. Tashiro C. & Oba J. (1979) "The effects of Cr203, Cu(OH)2, ZnO and PbO on the compressive strength and the hydrates of the hardened C3A paste" Cement and Concrete Research, vol. 9, pp. 253-258.
23. Tashiro C, Oba J. & Akama K. (1979) "The effects of several heavy metal oxides on the formation of ettringite and the microstructure of hardened ettringite" Cement and Concrete Research, vol. 9, pp. 303-308.
24. Tashiro C. (1980) "The effects of several heavy metal oxides on the hydration and the microstructure of hardened mortar of C3S" 7th International Congress on the Chemistry of Cement, Vol I I , pp. 37-42.
25. Taylor H. F. W. (1997) "Cement Chemistry" 2 n d edition Thomas Telford Publishing, UK. 459 pp.
26. Thomas N. L , Jameson & Double D.D. (1981) "The effect of lead nitrate on the early hydration of Portland cement" Cement and Concrete Research, vol. 11, pp. 143-153.

I
Fourier Transform Infrared spectrometer analysis of cement pastes containing metal oxides
H. Moosberg-Bustnes, Swedish Cement and Concrete Research Institute L. Lind, SSAB Merox AB E. Forssberg, Luleå University of Technology
Abstract
This investigation has been made in order to evaluate the effect of ZnO, Cr203, Fe203, and mixes thereof on cement hydration. The method used is Fourier Transform Infrared Spectroscopy (FTIR). The analysis illustrates the hydration of the cement pastes well although no new reactions or compounds have been found.
1 Background
The enhanced environmental awareness of the heavy industries has made recycling and use of industrial by-products into an attractive alternative to landfills. However in order to be able to use these materials in other processes their properties' have to be thoroughly characterised. In a previous article by Moosberg-Bustnes et al. (2003) the effects of metal oxide addition to cement pastes' heat development and strength have been investigated. It was noted that addition of Fe203 seems to increase the height of the heat development curve with increasing amounts of addition. Since by-products are complex materials they usually contain more than one metal compound. Some experiments were thus performed on metal oxide mixes. This investigation has been made in order to further evaluate the effect of ZnO, Cr 2 0 3 , Fe 20 3, and mixes thereof on cement hydration. The method used is Fourier Transform Infrared Spectroscopy (FTIR).
1.1 Theory - IR
Infrared spectroscopy is used in the area of determination of molecular structure and identification of chemical species.
I f a molecule is placed in an electromagnetic field (e.g, light) a transfer of energy from the field to the molecule will occure. The more atoms there are in a molecule the more complicated the situation becomes since all the nuclei perform their own harmonic oscillation. For any given molecule, however, only those vibrations which are permitted by the selection rules for that molecule appears in the infrared spectra. The selection rules are determined by the symmetry of the molecule. The fundamental modes of vibration which lead to absorption bands in the region 400-4000 cm"1 are, in general, the stretching and bending modes. The vibrational frequencies of these modes for the species under study vary considerably, depending on parameters such as molecule structure, chemical bonds, crystal forms impurities in solid solution etcetera. The presence of several phases of nearly similar absorption characteristics makes the analyses more complex (Ghosh, 2001).
2
1.2 FTIR
When FTIR analyses are made all frequencies are measured simultaneously in an interferometer and a complete spectrum is obtained rapidly. The frequency scale of an interferometer is derived from a helium neon laser that acts as an internal reference for each scan.
The essential component of an interferometer is a system for splitting a beam of radiation into two and then recombining the two beams after introducing a path difference. This combined beam passes through the sample to the detector. Division of the beam is achieved with a beamsplitter that transmits about 50% and reflects about 50% of the radiation. One part of the beam goes to a fixed mirror and the other to a mirror that can be moved to introduce a varying path difference. When the beams are recombined an interference pattern is obtained as the path difference is varied. On recombination, interference between the two beams causes the energy reaching the detector to vary as the path difference changes. For a source with a single optical frequency this interference variation (or interferogram) is sinusoidal, with maxima when the two beams are exactly in phase and minima when the two are 180 degrees out of phase. The spacing between the maxima corresponds to a change in path difference equal to the wavelength. For a broad band source, the interference pattern is the sum of the cosine waves for all the frequencies present. This interferogram consists of a strong signal at the point where path difference is zero, falling away rapidly on either side. The customary spectrum showing energy as a function of frequency, can be obtained from the interferogram by the mathematical process of Fourier Transformation. When no sample is present this gives a single beam spectrum, the overall shape of which is largely determined by the characteristics of the beamsplitter and source. Normally, interferometers operate by first recording this background and then rationing the sample spectrum against it. The most commonly used beamsplitter is a plate of KBr with a germanium coating (Parkin Elmer, 1992).
One major problem during sample preparation and analysis is the water and CO2 absorption from the atmosphere. Adequate stability can be achieved, but the presence of atmospheric absorption is a major inconvenience. Any change in water or carbon dioxide concentration results in extraneous bands in the final ratioed spectrum (Ghosh, 2001 and Parking Elmer, 1992).
2 Experiments
The Fourier Transform Infrared Spectroscopy analyses was performed with an Parkin Elmer System 2000 FTIR. Diffuse reflectance technique was used, and the mean value of 100 scans calculated.
Diffuse reflectance means that the reflected light leaves the sample in any and all directions, i.e., the angle of incidence is fixed, but angles of reflection vary from 0 to 360 degrees. Diffusely reflected radiation is made up of light that is scattered, absorbed, transmitted, and reflected by the sample (Smith 1996).
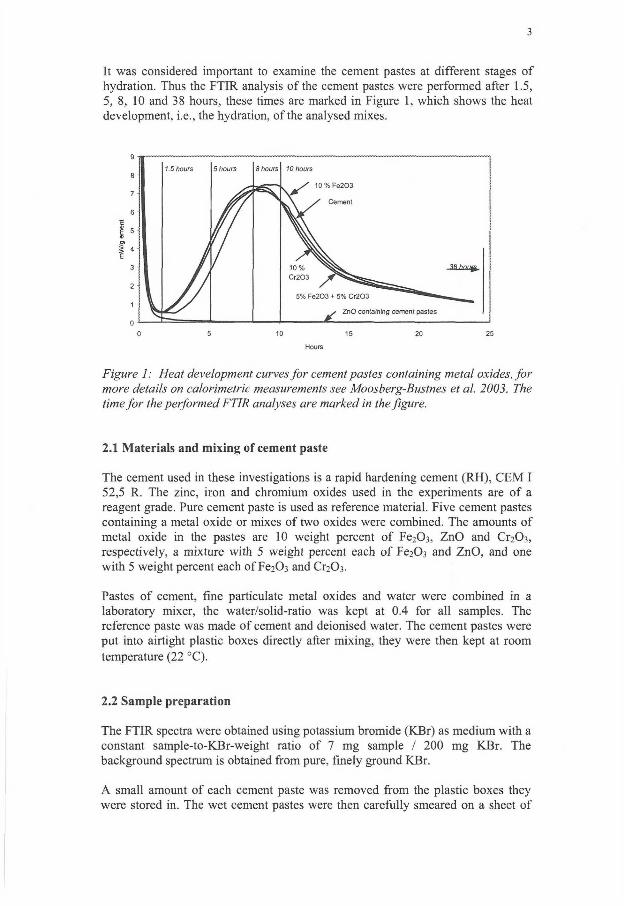
3
It was considered important to examine the cement pastes at different stages of hydration. Thus the FTIR analysis of the cement pastes were performed after 1.5, 5, 8, 10 and 38 hours, these times are marked in Figure 1, which shows the heat development, i.e., the hydration, of the analysed mixes.
q 4 1— i ii i it r , i
0 5 10 15 20 25
Hours
Figure 1: Heat development curves for cement pastes containing metal oxides, for more details on calorimetric measurements see Moosberg-Bustnes et al. 2003. The time for the performed FTIR analyses are marked in the figure.
2.1 Materials and mixing of cement paste
The cement used in these investigations is a rapid hardening cement (RH), CEM I 52,5 R. The zinc, iron and chromium oxides used in the experiments are of a reagent grade. Pure cement paste is used as reference material. Five cement pastes containing a metal oxide or mixes of two oxides were combined. The amounts of metal oxide in the pastes are 10 weight percent of Fe203, ZnO and Cr 203, respectively, a mixture with 5 weight percent each of Fe203 and ZnO, and one with 5 weight percent each of Fe203 and Cr 203.
Pastes of cement, fine particulate metal oxides and water were combined in a laboratory mixer, the water/solid-ratio was kept at 0.4 for all samples. The reference paste was made of cement and deionised water. The cement pastes were put into airtight plastic boxes directly after mixing, they were then kept at room temperature (22 °C).
2.2 Sample preparation
The FTIR spectra were obtained using potassium bromide (KBr) as medium with a constant sample-to-KBr-weight ratio of 7 mg sample / 200 mg KBr. The background spectrum is obtained from pure, finely ground KBr.
A small amount of each cement paste was removed from the plastic boxes they were stored in. The wet cement pastes were then carefully smeared on a sheet of
4
blotting-paper, scraped thereof and smeared on another blotting paper to remove as much water as possible before grinding. The hardened cement pastes were treated in the opposite way; first ground then smeared onto blotting paper. They were then deaglomerated with the same mortar and pestle as used for grinding. The samples were then spread on a blotting paper and left for five minuets before weighing.
The cement pastes and the KBr were ground separately with an agate mortar and pestle. The ground cement pastes were then diluted in the ground KBr. The mixture was thoroughly mixed with a spatula and thereafter spooned into a sample cup. Excess material was removed with the spatula edge. It is important that the cup is filled in the same manner every time since the intensity of diffusely reflected light is dependent on the packing density of the particles in the sample. The intensity also depends on the samples' particle size, i.e. the cup should not be tapped or the sample surface tampered with since that may cause larger particles to rise to the surface.
3 Results and discussion
The examined absorption region reaches from 400 to 4000 cm"' with a resolution of 2 cm"1. Ponchert (1985) and Socrates (1980) were used to identify the compounds in the analysed cement pastes.
3.1 Portland cement
Unhydrated Portland cement typically shows strong bands at 525 and 925 cm"1 due to silicates. The bands in the -1650 and 3500 cm"1 regions are due to water and OH. The peak at 2360 cm"1 is due to carbon dioxide, (kolla upp of det är fler toppar) Water bound to gypsum gives rise to peaks at 1623, 1688 and 3550 cm"1. Peaks at 1120 and 1145 cm"1 are from S-0 stretching vibrations from the sulphates present (Figure 2).
The vibrational spectrum changes with time when hydrating cement is investigated, Figure 2. The formation of ettringite in the first stages of hydration changes the sulphate absorption, two peaks at 1120 and 1145 cm"1, to a single peak centred at 1120 cm'1. The silicate phases that have a broad Si-0 absorption band at 935 cm"1 shifts to 965 cm"1, due to the polymerisation, i.e., formation of calcium silicate hydrates (C-S-H) that occurs, the silicate peak at 525 cm"1 broadens and can not be distinguished after 38 hours. Calcium hydroxide gives a peak at 3645 cm"1 that becomes stronger with time. The carbonate peaks at 1420-1480 cm"1 exist in both the unhydrated and hydrated cement, they are, however, slightly increased in the hydrating cement samples. The water bound gypsum peak at 3550 cm"1 can not be distinguished in the sample analysed after 8 hours of hydration. The two water bound gypsum peaks at 1623 and 1688 becomes one peak centred at 1650 cm"1 sometime between 5 and 8 hours after the water addition, this peak is due to bending of the water molecules, whereas the region between 3100 to 3800 cm"1 is due to stretching of the water molecule. This region broadens with time due to the ability of water to form many different bindings (ref. see section 6.1).
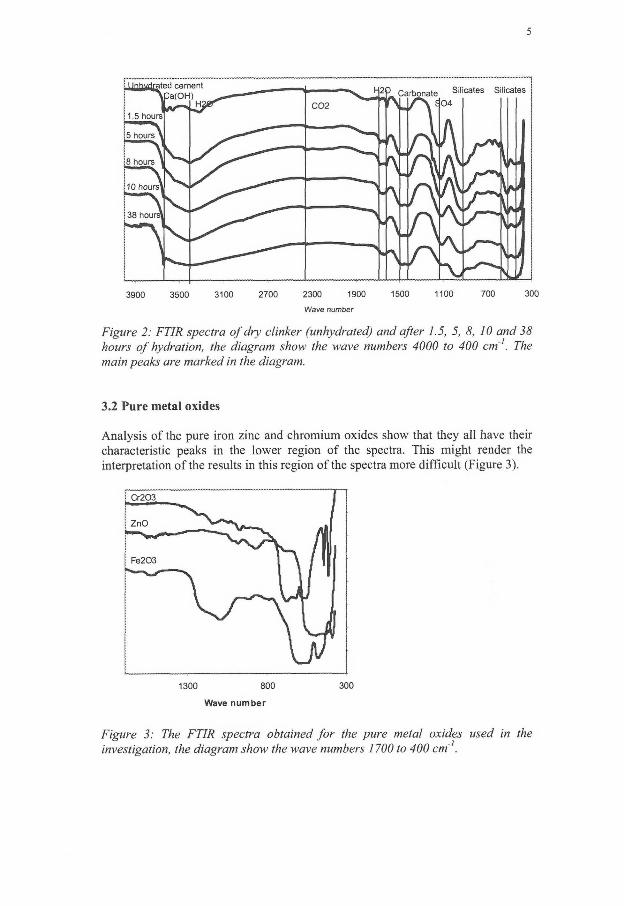
5
3900 3500 3100 2700 2300 1900 1500 1100 700 300
Wave number
Figure 2: FTIR spectra of dry clinker (unhydrated) and after 1.5, 5, 8, 10 and 38 hours of hydration, the diagram show the wave numbers 4000 to 400 cm'1. The main peaks are marked in the diagram.
3.2 Pure metal oxides
Analysis of the pure iron zinc and chromium oxides show that they all have their characteristic peaks in the lower region of the spectra. This might render the interpretation of the results in this region of the spectra more difficult (Figure 3).
1300 800 300
Wave number
Figure 3: The FTIR spectra obtained for the pure metal oxides used in the investigation, the diagram show the wave numbers 1700 to 400 cm'1.
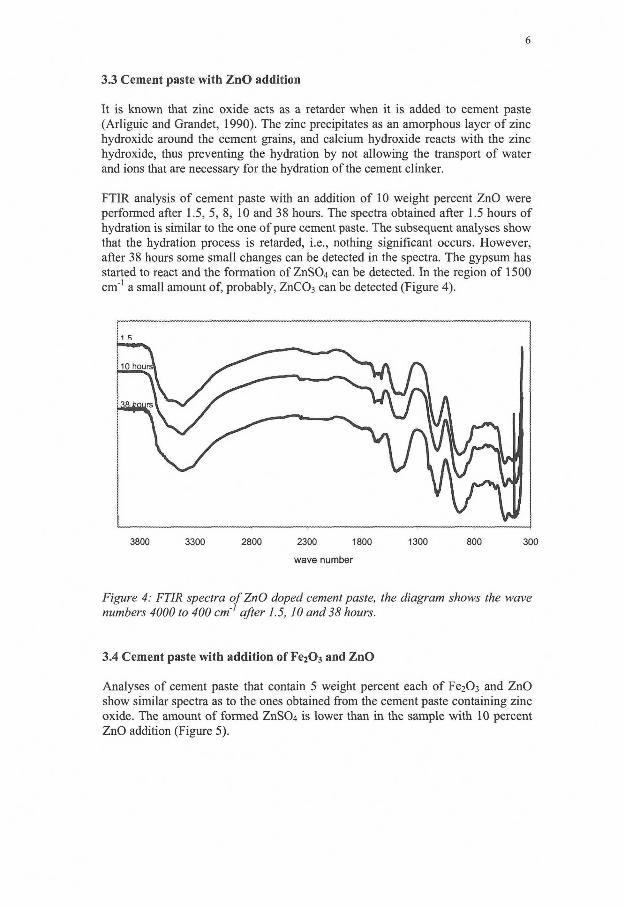
6
3 . 3 Cement paste with ZnO addition
It is known that zinc oxide acts as a retarder when it is added to cement paste (Arliguie and Grandet, 1990). The zinc precipitates as an amorphous layer of zinc hydroxide around the cement grains, and calcium hydroxide reacts with the zinc hydroxide, thus preventing the hydration by not allowing the transport of water and ions that are necessary for the hydration of the cement clinker.
FTIR analysis of cement paste with an addition of 10 weight percent ZnO were performed after 1.5, 5, 8, 10 and 38 hours. The spectra obtained after 1.5 hours of hydration is similar to the one of pure cement paste. The subsequent analyses show that the hydration process is retarded, i.e, nothing significant occurs. However, after 38 hours some small changes can be detected in the spectra. The gypsum has started to react and the formation of ZnS04 can be detected. In the region of 1500 cm"1 a small amount of, probably, ZnC03 can be detected (Figure 4).
i s
3800 3300 2800 2300 1800 1300 800 300
wave number
Figure 4: FTIR spectra of ZnO doped cement paste, the diagram shows the wave numbers 4000 to 400 cm'1 after 1.5, 10 and 38 hours.
3 .4 Cement paste with addition of F e 2 0 3 and ZnO
Analyses of cement paste that contain 5 weight percent each of Fe2Ü3 and ZnO show similar spectra as to the ones obtained from the cement paste containing zinc oxide. The amount of formed ZnS04 is lower than in the sample with 10 percent ZnO addition (Figure 5).
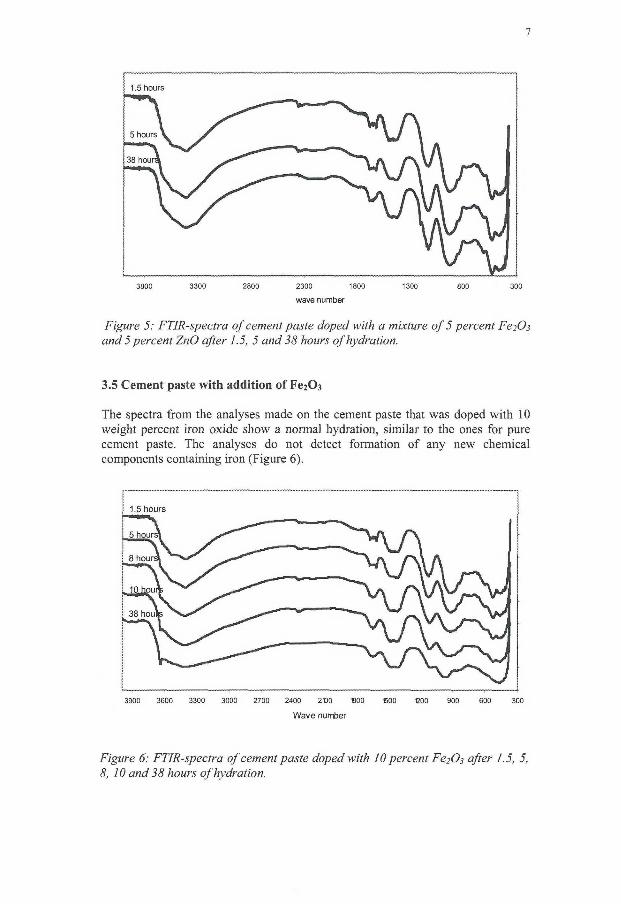
7
1.5 hours
3800 3300 2800 2300 1800 1300 800 300
wave number
Figure 5: FTIR-spectra of cement paste doped with a mixture of 5 percent FeiOi and 5 percent ZnO after 1.5, 5 and 38 hours of hydration.
3.5 Cement paste with addition of Fe2C>3
The spectra from the analyses made on the cement paste that was doped with 10 weight percent iron oxide show a normal hydration, similar to the ones for pure cement paste. The analyses do not detect formation of any new chemical components containing iron (Figure 6).
1.5 hours
3900 3600 3300 3000 2700 2400 2t)0 -B00 1500 1200 900 600 300
Wave number
Figure 6: FTIR-spectra of cement paste doped with 10 percent FejO} after 1.5, 5, 8, 10 and 38 hours of hydration.
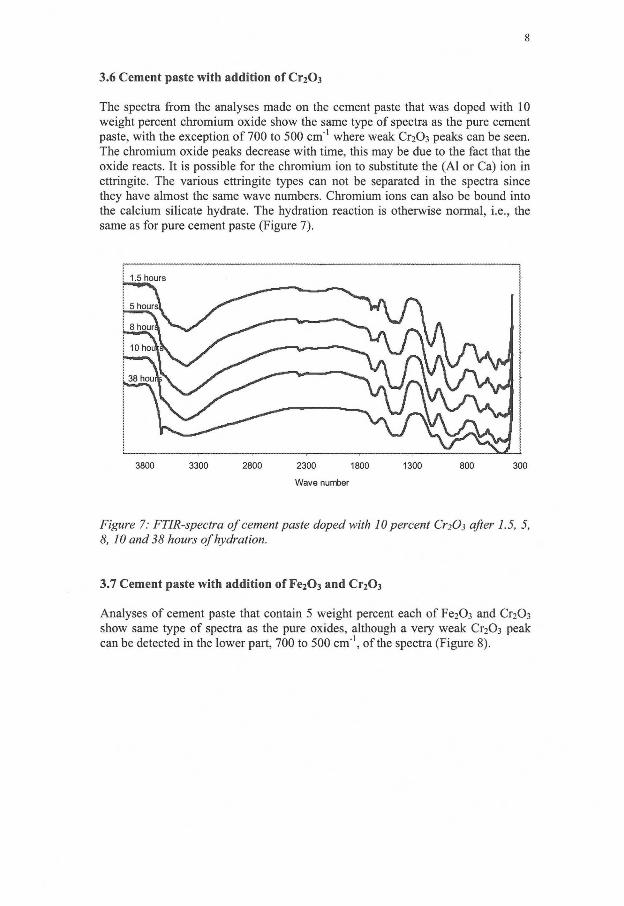
8
3.6 Cement paste with addition of Cr20 3
The spectra from the analyses made on the cement paste that was doped with 10 weight percent chromium oxide show the same type of spectra as the pure cement paste, with the exception of 700 to 500 cm"1 where weak Cr203 peaks can be seen. The chromium oxide peaks decrease with time, this may be due to the fact that the oxide reacts. It is possible for the chromium ion to substitute the (Al or Ca) ion in ettringite. The various ettringite types can not be separated in the spectra since they have almost the same wave numbers. Chromium ions can also be bound into the calcium silicate hydrate. The hydration reaction is otherwise normal, i.e., the same as for pure cement paste (Figure 7).
1.5 hours
3800 3300 2800 2300 1800 1300 800 300
Wave number
Figure 7: FTIR-spectra of cement paste doped with 10 percent CrzOi after 1.5, 5, 8, 10 and 38 hours of hydration.
3.7 Cement paste with addition of F e 2 0 3 and C r 2 0 3
Analyses of cement paste that contain 5 weight percent each of Fe 2 0 3 and Cr 2 0 3
show same type of spectra as the pure oxides, although a very weak Cr 2 0 3 peak can be detected in the lower part, 700 to 500 cm"1, of the spectra (Figure 8).
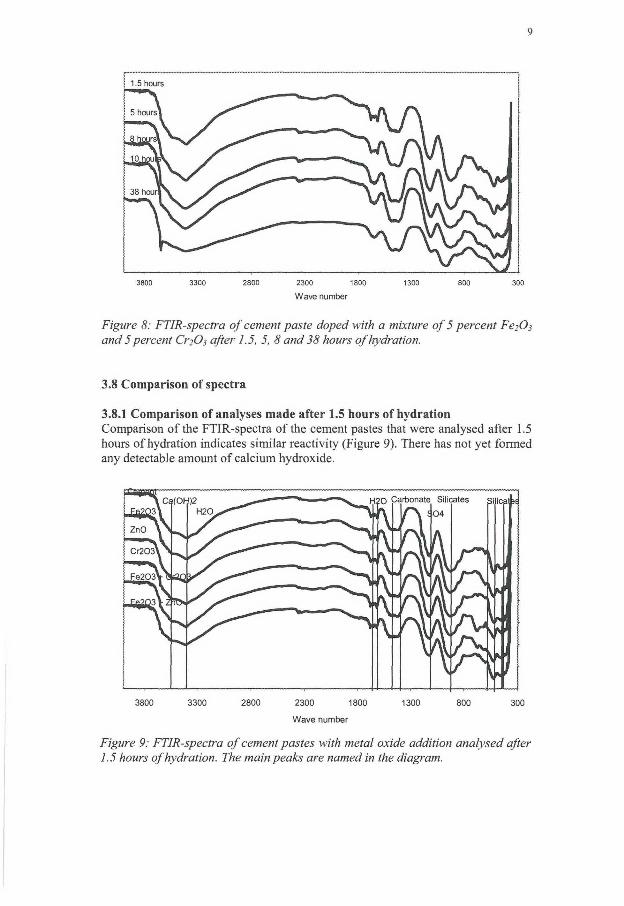
9
1.5 hours
3800 3300 2800 2300 1800 1300 800 300
Wave number
Figure 8: FTIR-spectra of cement paste doped with a mixture of 5 percent FejO^ and 5 percent CnOj after 1.5, 5, 8 and 38 hours of hydration.
3.8 Comparison of spectra
3.8.1 Comparison of analyses made after 1.5 hours of hydration Comparison of the FTIR-spectra of the cement pastes that were analysed after 1.5 hours of hydration indicates similar reactivity (Figure 9). There has not yet formed any detectable amount of calcium hydroxide.
3800 3300 2800 2300 1800 1300 800 300
Wave number
Figure 9: FTIR-spectra of cement pastes with metal oxide addition analysed after 1.5 hours of hydration. The main peaks are named in the diagram.
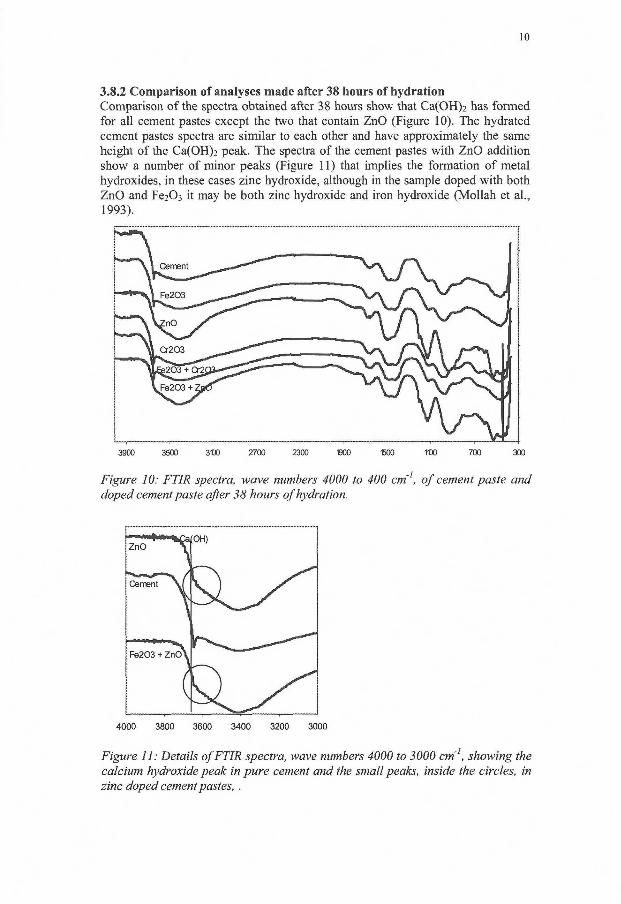
10
3.8.2 Comparison of analyses made after 38 hours of hydration Comparison of the spectra obtained after 38 hours show that Ca(OH)2 has formed for all cement pastes except the two that contain ZnO (Figure 10). The hydrated cement pastes spectra are similar to each other and have approximately the same height of the Ca(OH)2 peak. The spectra of the cement pastes with ZnO addition show a number of minor peaks (Figure 11) that implies the formation of metal hydroxides, in these cases zinc hydroxide, although in the sample doped with both ZnO and Fe203 it may be both zinc hydroxide and iron hydroxide (Mollah et a l , 1993).
3900 3500 3TJ0 2700 2300 1300 -BOO TCO 700 300
Figure 10: FTIR spectra, wave numbers 4000 to 400 cm', of cement paste and doped cement paste after 38 hours of hydration.
4000 3800 3600 3400 3200 3000
Figure 11: Details of FTIR spectra, wave numbers 4000 to 3000 cm'1, showing the calcium hydroxide peak in pure cement and the small peaks, inside the circles, in zinc doped cement pastes, .
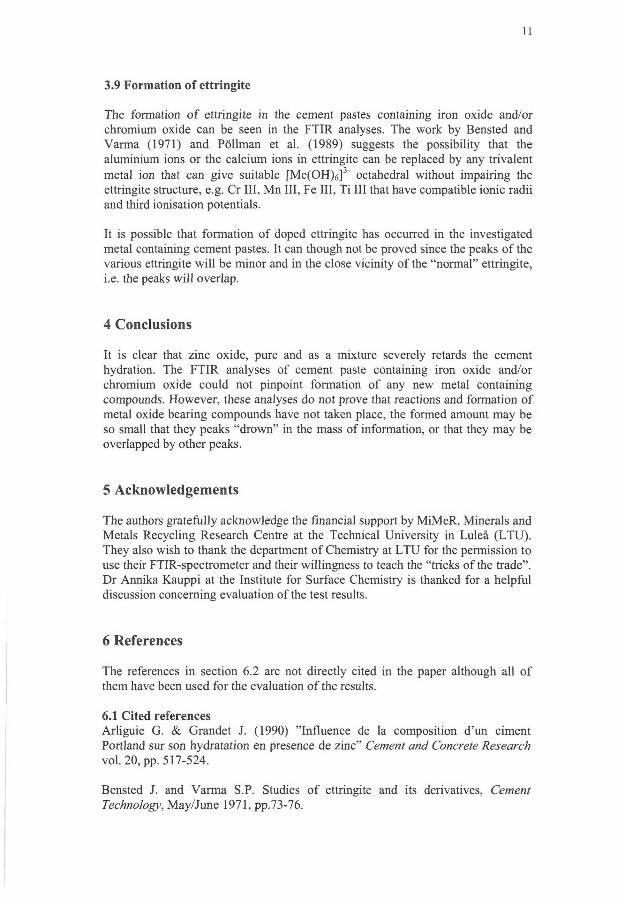
11
3.9 Formation of ettringite
The formation of ettringite in the cement pastes containing iron oxide and/or chromium oxide can be seen in the FTIR analyses. The work by Bensted and Varma (1971) and Pöllman et al. (1989) suggests the possibility that the aluminium ions or the calcium ions in ettringite can be replaced by any trivalent metal ion that can give suitable [Me(OH)6j3~ octahedral without impairing the ettringite structure, e.g. Cr I I I , Mn I I I , Fe I I I , Ti I I I that have compatible ionic radii and third ionisation potentials.
It is possible that formation of doped ettringite has occurred in the investigated metal containing cement pastes. It can though not be proved since the peaks of the various ettringite wi l l be minor and in the close vicinity of the "normal" ettringite, i.e. the peaks will overlap.
4 Conclusions
It is clear that zinc oxide, pure and as a mixture severely retards the cement hydration. The FTIR analyses of cement paste containing iron oxide and/or chromium oxide could not pinpoint formation of any new metal containing compounds. However, these analyses do not prove that reactions and formation of metal oxide bearing compounds have not taken place, the formed amount may be so small that they peaks "drown" in the mass of information, or that they may be overlapped by other peaks.
5 Acknowledgements
The authors gratefully acknowledge the financial support by MiMeR, Minerals and Metals Recycling Research Centre at the Technical University in Luleå (LTU). They also wish to thank the department of Chemistry at LTU for the permission to use their FTIR-spectrometer and their willingness to teach the "tricks of the trade". Dr Annika Kauppi at the Institute for Surface Chemistry is thanked for a helpful discussion concerning evaluation of the test results.
6 References
The references in section 6.2 are not directly cited in the paper although all of them have been used for the evaluation of the results.
6.1 Cited references Arliguie G. & Grandet J. (1990) "Influence de la composition d'un ciment Portland sur son hydratation en presence de zinc" Cement and Concrete Research vol. 20, pp. 517-524.
Bensted J. and Varma S.P. Studies of ettringite and its derivatives, Cement Technology, May/June 1971, pp. 73-76.
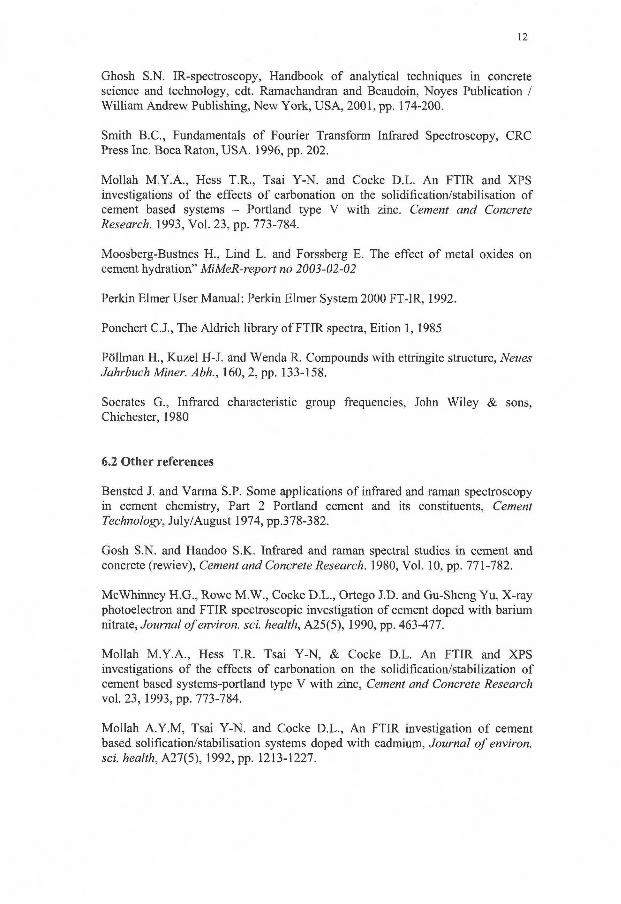
12
Ghosh S.N. IR-spectroscopy, Handbook of analytical techniques in concrete science and technology, edt. Ramachandran and Beaudoin, Noyes Publication / William Andrew Publishing, New York, USA, 2001, pp. 174-200.
Smith B.C., Fundamentals of Fourier Transform Infrared Spectroscopy, CRC Press Inc. Boca Raton, USA. 1996, pp. 202.
Mollah M . Y . A , Hess T.R, Tsai Y-N. and Cocke D.L. An FTIR and XPS investigations of the effects of carbonation on the solidification/stabilisation of cement based systems - Portland type V with zinc. Cement and Concrete Research. 1993, Vol. 23, pp. 773-784.
Moosberg-Bustnes H , Lind L. and Forssberg E. The effect of metal oxides on cement hydration" MiMeR-report no 2003-02-02
Perkin Elmer User Manual: Perkin Elmer System 2000 FT-IR, 1992.
Ponchert C J , The Aldrich library of FTIR spectra, Eition 1, 1985
Pöllman H , Kuzel H-J. and Wenda R. Compounds with ettringite structure, Neues Jahrbuch Miner. Abh., 160, 2, pp. 133-158.
Socrates G , Infrared characteristic group frequencies, John Wiley & sons, Chichester, 1980
6.2 Other references
Bensted J. and Varma S.P. Some applications of infrared and raman spectroscopy in cement chemistry, Part 2 Portland cement and its constituents, Cement Technology, July/August 1974, pp.378-382.
Gosh S.N. and Handoo S.K. Infrared and raman spectral studies in cement and concrete (rewiev), Cement and Concrete Research. 1980, Vol. 10, pp. 771-782.
McWhinney H.G, Rowe M . W , Cocke D . L , Ortego J.D. and Gu-Sheng Yu, X-ray photoelectron and FTIR spectroscopic investigation of cement doped with barium nitrate, Journal of environ, sei. health, A25(5), 1990, pp. 463-477.
Mollah M.Y.A, Hess T.R. Tsai Y-N, & Cocke D.L. An FTIR and XPS investigations of the effects of carbonation on the solidification/stabilization of cement based systems-portland type V with zinc, Cement and Concrete Research vol. 23,1993, pp. 773-784.
Mollah A.Y.M, Tsai Y-N. and Cocke D . L , An FTIR investigation of cement based solification/stabilisation systems doped with cadmium, Journal of environ, sei. health, A27(5), 1992, pp. 1213-1227.
13
Mollah M.Y.A, Tsai Y - N , Hess T.R. & Cocke D.L. An FTIR, SEM, and EDS investigation of solidification/stabilization of chromium using portland cement Type V and Type IP Journal of Hazardous Materials, No. 30, 1992, pp. 273-283.
Mollah A.Y.M, Parga J.R. and Cocke D.L. An infrared spectroscopic Examination of Cement-basted solification/stabilisation systems - Portland types V and IP with zinc, Journal of environ, sei. health, A27(6), 1992, pp. 1503-1519.
Mollah A.Y.M, Yu W , Schennach R. and Cocke D.L. A fourier transform infrared spectroscopic investigation of the early hydration of Portland cement and the influence of sodium lignosuphonate, Cement and Concrete Research. 2000, Vol. 30, pp. 267-273.
Ortego J.D. & Barroeta Y. Leaching Effects on Silicate Polymerization. An FTIR and 29Si NMR Study of Lead and Zinc in Portland Cement, Environ. Sei. Techno!., Vol. 25, No. 6, 1991, pp. 1171-1174.
Ortego J.D, Jackson S, Yu G-S, McWhinney H. & Cocke D.L. Solidification of hazardous substances - a TGA and FTIR Study of Portland cement containing metal nitrates"" Environ. Sei. Health, Vol. 24, No. 6, 1989, pp. 589-602.

1
Evaluation of the PaRMAC method with regard to limestone fillers' PSD and its effect on cement paste rheology
H. Moosberg-Bustnes, Swedish Cement and Concrete Research Institute M. Fagerholm, Nordkalk AB
Abstract
There are many by-products from the mineral and metallurgical industries that can be used as filler material in concrete. However, the by-product must meet the same quality demands as virgin materials do concerning particle size distribution and other critical parameters. The aim of the present work is to evaluate the use of the PaRMAC method in order to see i f it is possible to use it as a control method for filler material, i.e. characterisation of fine particles, and to predict the effect of the fillers particle size distribution on the viscosity of a cement paste. The results show that it is possible to use the method to evaluate the effect of a filler materials particle size distribution on cement paste rheology.
1 Introduction
One of the main concerns of the metallurgical industry currently is to find new and improved means to minimize the amount of by-products going to landfills. Every stream of material originating in the process should find a user, internally or externally. An example of internal use can be recirculation to the process of origin for utilisation of the metallic value in materials. External uses have been much harder to find, but a large variety of by-products have been proven to be excellent as filler and/or aggregate in concrete, such as silica fume and ground granulated blast-furnace slag. Before a material can be used for these purposes it has to pass a number of tests, and it must meet certain quality demands.
Characterisation of by-products from mineral and metallurgical industries is essential to ensure optimal utilisation of the resources. I f a by-product shall be used with high efficiency it has to meet the same quality demands as those set for virgin material today. This means that the by-product must be produced under strict quality control and that the chemical, mechanical and physical properties of the material are kept constant. I f the variations within a certain amount of product are known, mixing with another product may be a solution to achieve constancy in some of the quality parameters considered important for a specific use.
Particle size as well as the size distribution is of importance when a material is considered for use in a new field. Size can be regarded as a quality parameter and the manufacturing process can be optimised for the production of a certain size fraction.
There are several methods for measuring particle size and size distribution, sieving, sedimentation, laser diffraction and microscopic investigation are among them. Al l means of measuring have "pros and cons" and it is imperative to have
2
good knowledge about the method behind the presented results. Change of method wil l change the results, as a consequence a translation of the results from the previously used method is important otherwise information will be lost.
PaRMAC is a method for describing particle size distributions, and the method has been optimised for characterisation of the fine end in iron ore pellet feed by LKAB. Present work has been conducted with the aim to use the PaRMAC method for characterisation of fine particles, filler material, and connect the result with their effect on viscosity of cement paste. Fillers are an important part of the aggregates in concrete and concrete properties are affected both in wet and hardened states. In this investigation a limestone filler from Nordkalk AB has been used as an example.
1.1 The PaRMAC method
PaRMAC (Particle Ratios Method for Agglomeration Characterisation) has been developed by the Swedish iron ore mining company LKAB to provide a method to evaluate and demonstrate the effect of varying particle size distribution in iron ore pellet feed on the final properties of the product. Normal sieve analyses give particle size distributions described in weight percent, down to approximately 38 microns. A limitation to 38 microns gives more information about the courser part of the feed than the fine end. PaRMAC as a method is based on the "Fuller distribution curve", i.e. the principle that the best packing is achieved when both size and the amount of a fraction is sufficient to f i l l the voids between the particles in the closest courser fraction. LKAB uses the method to optimise the agglomeration properties of the pellet feed with respect to the required pellet properties. An instrument from Lasentech is used to measure the number of particles in each fraction of the pellet feed. The particles are divided into three fractions, 1-10, 10-40 and 40-100 microns. These size classes are chosen empirically to describe the different behaviour of the particles. In order to obtain the optimal agglomeration properties, and thereby optimum pellet quality, the three fractions have to be carefully balanced in the proportions that give the required particle size distribution (Forsmo et al. 1997,1999).
The slope of a material's particle size distribution curve can also be interpreted from the PaRMAC-diagram, the steeper the curve the further up and to the left the point moves. The particle size distribution moves towards a more monosized state, with regard to the chosen fractions, which will affect the particle packing and thus the rheology and strength of the hardened cement paste (the better the packing the better the strength)
In this investigation the three fractions wil l be designated Pi, P2 and P3 relating to the finest, medium and coarsest particle fraction, respectively.
The relationship between theses three size categories is quantified by comparing each smaller size category to the next larger category. The following ratios are calculated P1/P2 and P2/P3 that wil l be used as the x- and y-coordinate in a PaRMAC-diagram. The resulting (x,y) point describes the overall size status of the
3
sample. Changes in the position of this point describe changes in the particle size distribution.
1.2 Aim of the study
The overall aim of this study is to examine the possibility of using the PaRMAC method as a quality control instrument for the manufacturers and users of filler materials, regardless of the fillers origin.
This aim can be divided into three parts: • To investigate i f it is possible to use a particle size distribution analysis
instrument that measures the volume distribution and not the number of particles in each fraction, and still be able to get reliable results with the PaRMAC method.
• To see i f it is possible to find the best limits for the three fractions Pi, P2
and P3 for the limestone filler used in this study. • I f the first parts of the study are positive, the next step is to see i f it is
possible to connect the particle size distribution of the filler via the PaRMAC diagram to the rheology obtained when the filler is mixed into cement paste.
2 Experimental
2.1 Particle size distribution analysis
In the work done by Forsmo et al. (1997, 1999) an instrument that measures the number of particles in each fraction has been used. In the present work a Malvern Mastersizer has been used, it is an instrument that measures the volume of the particles in each size fraction. The instrument uses the Mie theory to calculate the scattering matrix, the refractive indices of particulate and medium, or their ratio, are used in the calculations of the model matrix. The model assumes that the particles are spherical (ISO 13320-1:1999(E)), the largest cross-section of the particle defines the diameter of the sphere. One reason for the choice of this type of instrument is that it is commonly available at production sites. It must always be considered an advantage i f existing instrumentation can be used, and it is easier for the personal that perform the analysis once the method is developed. It also ensures that the development costs are kept on a reasonable level. Some comparative measurements were made with a Fritsch laser instrument in order to assess the effect of different instruments using the same measuring model on the grouping of data points in the PaRMAC-diagrams.
The laser diffraction measurements of the limestone filler, with the Malvern-instrument, were made at the Nordkalk production site in Köping. The analyses made with the Fritsch-instrument were made at the Nordkalk chemical laboratory in Pargas, Finland.
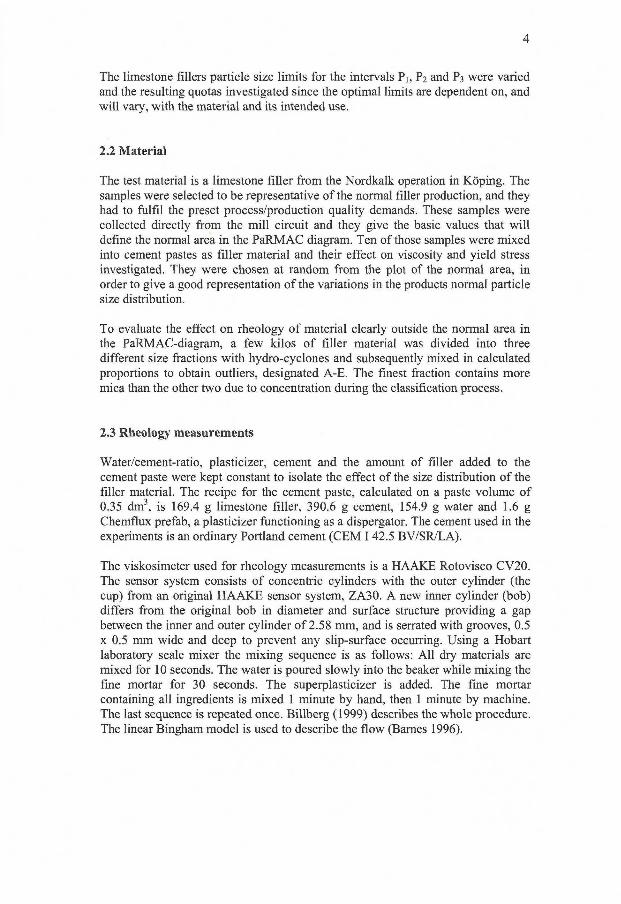
4
The limestone fillers particle size limits for the intervals Pi, P2 and P3 were varied and the resulting quotas investigated since the optimal limits are dependent on, and wil l vary, with the material and its intended use.
2.2 Material
The test material is a limestone filler from the Nordkalk operation in Köping. The samples were selected to be representative of the normal filler production, and they had to fulf i l the preset process/production quality demands. These samples were collected directly from the mill circuit and they give the basic values that wi l l define the normal area in the PaRMAC diagram. Ten of those samples were mixed into cement pastes as filler material and their effect on viscosity and yield stress investigated. They were chosen at random from the plot of the normal area, in order to give a good representation of the variations in the products normal particle size distribution.
To evaluate the effect on rheology of material clearly outside the normal area in the PaRMAC-diagram, a few kilos of filler material was divided into three different size fractions with hydro-cyclones and subsequently mixed in calculated proportions to obtain outliers, designated A-E. The finest fraction contains more mica than the other two due to concentration during the classification process.
2.3 Rheology measurements
Water/cement-ratio, plasticizer, cement and the amount of filler added to the cement paste were kept constant to isolate the effect of the size distribution of the filler material. The recipe for the cement paste, calculated on a paste volume of 0.35 dm3, is 169.4 g limestone filler, 390.6 g cement, 154.9 g water and 1.6 g Chemflux prefab, a plasticizer functioning as a dispergator. The cement used in the experiments is an ordinary Portland cement (CEM 142.5 BV/SR/LA).
The viskosimeter used for rheology measurements is a HAAKE Rotovisco CV20. The sensor system consists of concentric cylinders with the outer cylinder (the cup) from an original HAAKE sensor system, ZA30. A new inner cylinder (bob) differs from the original bob in diameter and surface structure providing a gap between the inner and outer cylinder of 2.58 mm, and is serrated with grooves, 0.5 x 0.5 mm wide and deep to prevent any slip-surface occurring. Using a Hobart laboratory scale mixer the mixing sequence is as follows: Al l dry materials are mixed for 10 seconds. The water is poured slowly into the beaker while mixing the fine mortar for 30 seconds. The superplasticizer is added. The fine mortar containing all ingredients is mixed 1 minute by hand, then 1 minute by machine. The last sequence is repeated once. Billberg (1999) describes the whole procedure. The linear Bingham model is used to describe the flow (Barnes 1996).
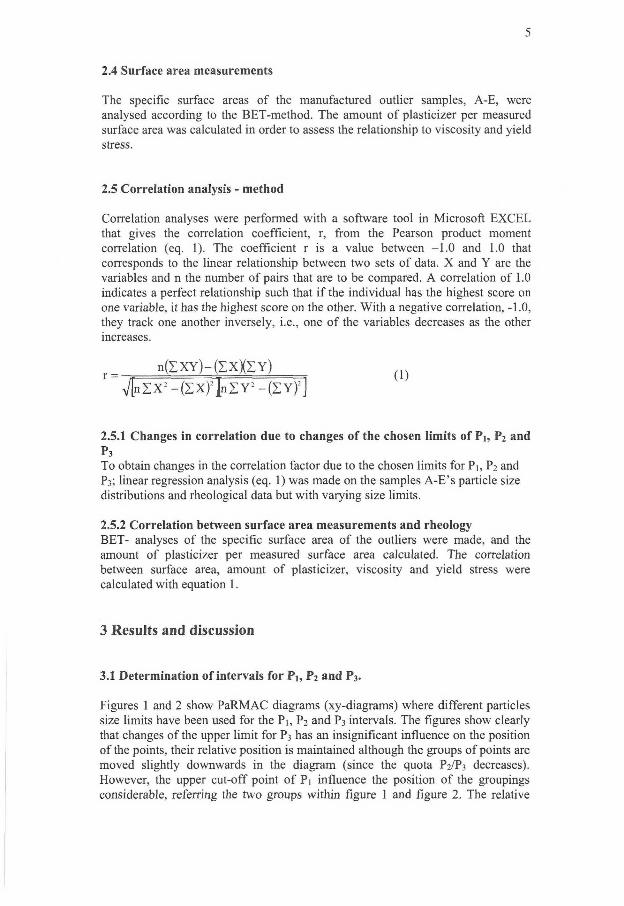
5
2.4 Surface area measurements
The specific surface areas of the manufactured outlier samples, A-E, were analysed according to the BET-method. The amount of plasticizer per measured surface area was calculated in order to assess the relationship to viscosity and yield stress.
2.5 Correlation analysis - method
Correlation analyses were performed with a software tool in Microsoft EXCEL that gives the correlation coefficient, r, from the Pearson product moment correlation (eq. 1). The coefficient r is a value between —1.0 and 1.0 that corresponds to the linear relationship between two sets of data. X and Y are the variables and n the number of pairs that are to be compared. A correlation of 1.0 indicates a perfect relationship such that i f the individual has the highest score on one variable, it has the highest score on the other. With a negative correlation, -1.0, they track one another inversely, i.e., one of the variables decreases as the other increases.
n ( l X Y ) - ( l x X l Y ) ( 1 )
V l n S X ; - ( Z X ) 2 j n 2 : Y 2 - ( 2 : Y ) 2 j
2.5.1 Changes in correlation due to changes of the chosen limits of Pi, P 2 and P 3
To obtain changes in the correlation factor due to the chosen limits for Pi, P2 and P3; linear regression analysis (eq. 1) was made on the samples A-E's particle size distributions and rheological data but with varying size limits.
2.5.2 Correlation between surface area measurements and rheology BET- analyses of the specific surface area of the outliers were made, and the amount of plasticizer per measured surface area calculated. The correlation between surface area, amount of plasticizer, viscosity and yield stress were calculated with equation 1.
3 Results and discussion
3.1 Determination of intervals for Pi, P 2 and P 3.
Figures 1 and 2 show PaRMAC diagrams (xy-diagrams) where different particles size limits have been used for the Pi, P 2 and P3 intervals. The figures show clearly that changes of the upper limit for P3 has an insignificant influence on the position of the points, their relative position is maintained although the groups of points are moved slightly downwards in the diagram (since the quota P2/P3 decreases). However, the upper cut-off point of Pi influence the position of the groupings considerable, referring the two groups within figure 1 and figure 2. The relative
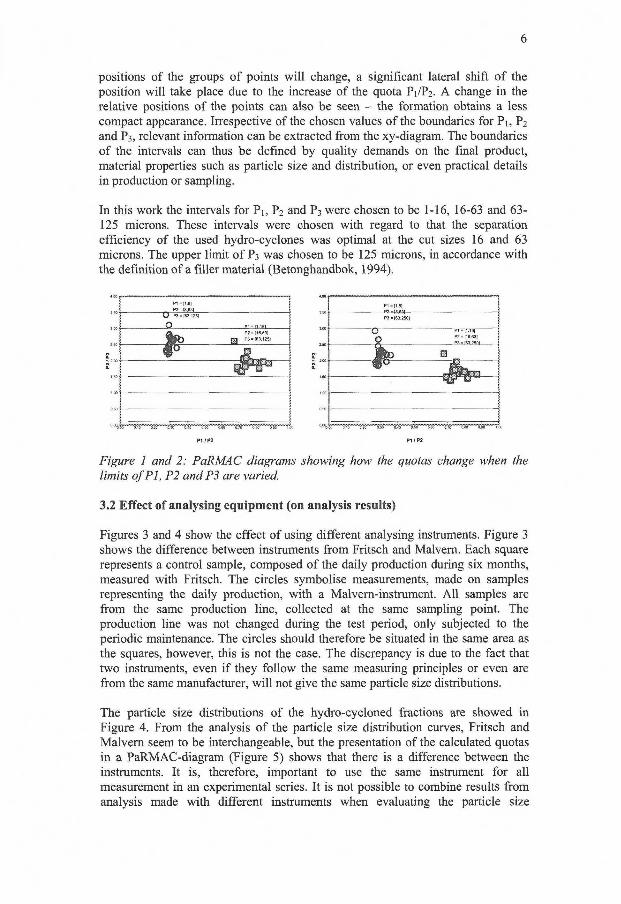
6
positions of the groups of points wil l change, a significant lateral shift of the position will take place due to the increase of the quota P1/P2. A change in the relative positions of the points can also be seen - the formation obtains a less compact appearance. Irrespective of the chosen values of the boundaries for Pi, P2 and P3, relevant information can be extracted from the xy-diagram. The boundaries of the intervals can thus be defined by quality demands on the final product, material properties such as particle size and distribution, or even practical details in production or sampling.
In this work the intervals for Pi, P2 and P3 were chosen to be 1-16, 16-63 and 63-125 microns. These intervals were chosen with regard to that the separation efficiency of the used hydro-cyclones was optimal at the cut sizes 16 and 63 microns. The upper limit of P3 was chosen to be 125 microns, in accordance with the definition of a filler material (Betonghandbok, 1994).
P2 = [16,63] P3 = [63.125}
Figure 1 and 2: PaRMAC diagrams showing how the quotas change when the limits of PI, P2 and P3 are varied.
3.2 Effect of analysing equipment (on analysis results)
Figures 3 and 4 show the effect of using different analysing instruments. Figure 3 shows the difference between instruments from Fritsch and Malvern. Each square represents a control sample, composed of the daily production during six months, measured with Fritsch. The circles symbolise measurements, made on samples representing the daily production, with a Malvem-instrument. Al l samples are from the same production line, collected at the same sampling point. The production line was not changed during the test period, only subjected to the periodic maintenance. The circles should therefore be situated in the same area as the squares, however, this is not the case. The discrepancy is due to the fact that two instruments, even i f they follow the same measuring principles or even are from the same manufacturer, wil l not give the same particle size distributions.
The particle size distributions of the hydro-cycloned fractions are showed in Figure 4. From the analysis of the particle size distribution curves, Fritsch and Malvern seem to be interchangeable, but the presentation of the calculated quotas in a PaRMAC-diagram (Figure 5) shows that there is a difference between the instruments. It is, therefore, important to use the same instrument for all measurement in an experimental series. It is not possible to combine results from analysis made with different instruments when evaluating the particle size
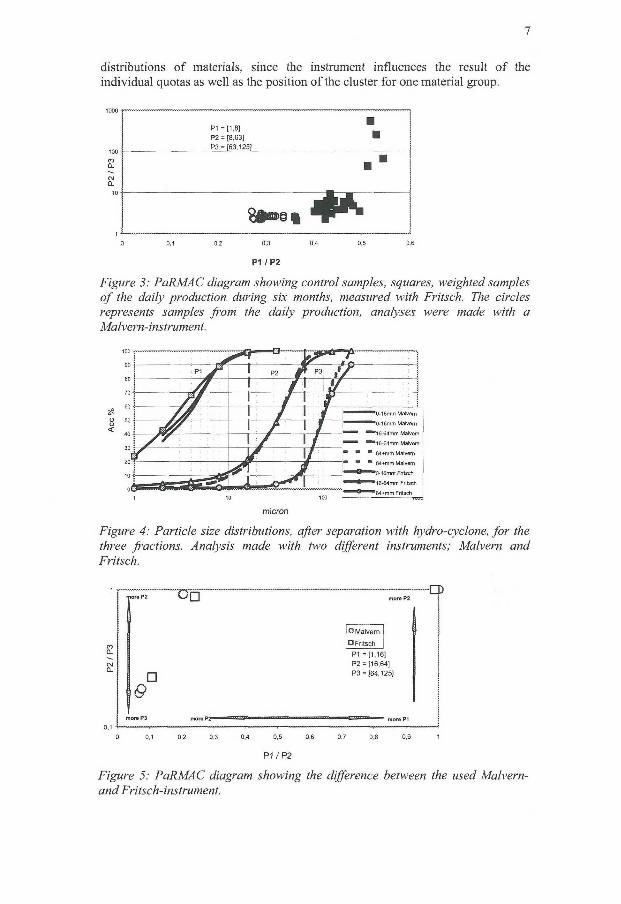
7
distributions of materials, since the instrument influences the result of the individual quotas as well as the position of the cluster for one material group.
Figure 3: PaRMAC diagram showing control samples, squares, weighted samples of the daily production during six months, measured with Fritsch. The circles represents samples from the daily production, analyses were made with a Malvern-instrument.
t rt P1 P2 § ' P3
j u
^ ™™ *Q-16mm Malvem
^ m *0-16mm Malvem l *16-64rrtm Malven "*16-64mm Malven
• *" ™ 64-i-mm Malvern
/ ^ m *0-16mm Malvem
l *16-64rrtm Malven "*16-64mm Malven
• *" ™ 64-i-mm Malvern
^ m *0-16mm Malvem l *16-64rrtm Malven "*16-64mm Malven
• *" ™ 64-i-mm Malvern
j • m m 64+mm Malvem ™" ^ ^ ™0-16mrn Fritsch • ^^^"l6-64mm Fritsch
1 10 1 10 «""« ^ »64+mm Fritsch
micron
Figure 4: Particle size distributions, after separation with hydro-cyclone, for the three fractions. Analysis made with two different instruments; Malvern and Fritsch.
P1 IP2
Figure 5: PaRMAC diagram showing the difference between the used Malvern-and Fritsch-instrument.
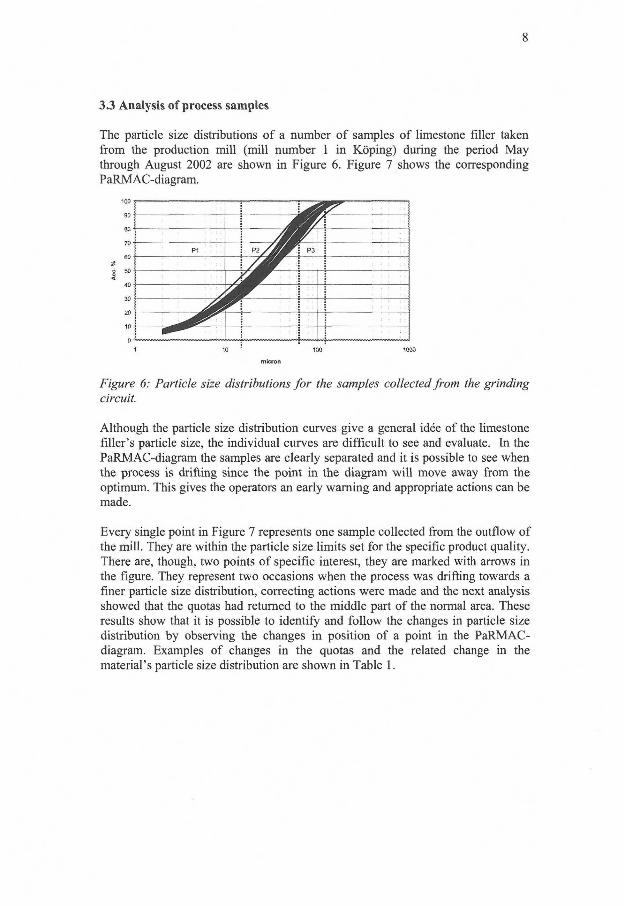
8
3.3 Analysis of process samples
The particle size distributions of a number of samples of limestone filler taken from the production mill (mill number 1 in Köping) during the period May through August 2002 are shown in Figure 6. Figure 7 shows the corresponding PaRMAC-diagram.
Figure 6: Particle size distributions for the samples collected from the grinding circuit.
Although the particle size distribution curves give a general idée of the limestone filler's particle size, the individual curves are difficult to see and evaluate. In the PaRMAC-diagram the samples are clearly separated and it is possible to see when the process is drifting since the point in the diagram wil l move away from the optimum. This gives the operators an early warning and appropriate actions can be made.
Every single point in Figure 7 represents one sample collected from the outflow of the mill. They are within the particle size limits set for the specific product quality. There are, though, two points of specific interest, they are marked with arrows in the figure. They represent two occasions when the process was drifting towards a finer particle size distribution, correcting actions were made and the next analysis showed that the quotas had returned to the middle part of the normal area. These results show that it is possible to identify and follow the changes in particle size distribution by observing the changes in position of a point in the PaRMAC-diagram. Examples of changes in the quotas and the related change in the material's particle size distribution are shown in Table 1.
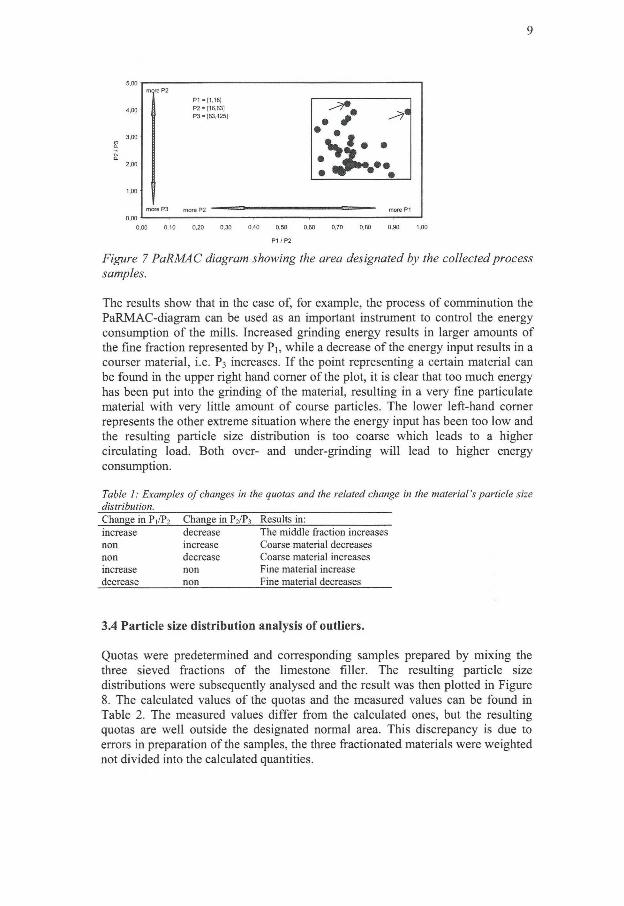
9
P1 = [1,16] 92 = [16.63] 93 = [63,125] • #
• • more 93 m o r e P2
0.00 0,10 0,20 0,30 0,40 0.50 0,60 0,70 0,8
P1 /P2
0,90 1,00
Figure 7 PaRMAC diagram showing the area designated by the collected process samples.
The results show that in the case of, for example, the process of comminution the PaRMAC-diagram can be used as an important instrument to control the energy consumption of the mills. Increased grinding energy results in larger amounts of the fine fraction represented by Pi, while a decrease of the energy input results in a courser material, i.e. P3 increases. I f the point representing a certain material can be found in the upper right hand corner of the plot, it is clear that too much energy has been put into the grinding of the material, resulting in a very fine particulate material with very little amount of course particles. The lower left-hand corner represents the other extreme situation where the energy input has been too low and the resulting particle size distribution is too coarse which leads to a higher circulating load. Both over- and under-grinding wil l lead to higher energy consumption.
Table I: Examples of changes in the quotas and the related change in the material's particle size distribution. Change in P,/P : Change in P 2/P, Results in: increase decrease The middle fraction increases non increase Coarse material decreases non decrease Coarse material increases increase non Fine material increase decrease non Fine material decreases
3.4 Particle size distribution analysis of outliers.
Quotas were predetermined and corresponding samples prepared by mixing the three sieved fractions of the limestone filler. The resulting particle size distributions were subsequently analysed and the result was then plotted in Figure 8. The calculated values of the quotas and the measured values can be found in Table 2. The measured values differ from the calculated ones, but the resulting quotas are well outside the designated normal area. This discrepancy is due to errors in preparation of the samples, the three fractionated materials were weighted not divided into the calculated quantities.
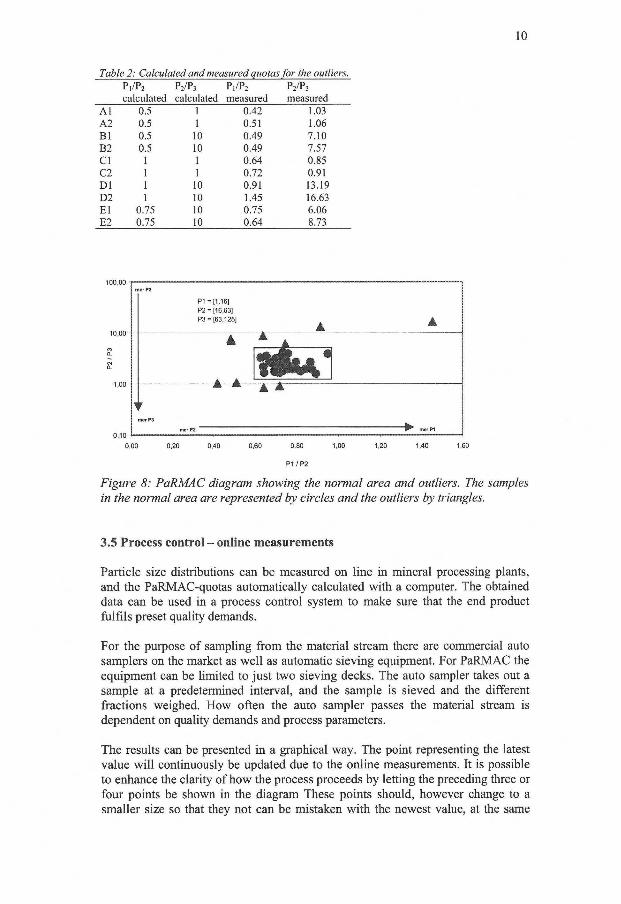
10
Table 2: Calculated and measured quotas for the outliers. P,/P 2 P2/P3 Pl/P2 P2/P3 calculated calculated measured measured
A l 0.5 1 0.42 1.03 A2 0.5 1 0.51 1.06 BI 0.5 10 0.49 7.10 B2 0.5 10 0.49 7.57 CI 1 1 0.64 0.85 C2 1 1 0.72 0.91 D l 1 10 0.91 13.19 D2 1 10 1.45 16.63 E l 0.75 10 0.75 6.06 E2 0.75 10 0.64 8.73
10,00
1,00
erP2
P1 = [1,16] P2 = [16,63] P3 = [63,125]
A 4 * A
r merPS
merP2 W merP1
0,00 0,20 0,40 0,60 0,80 1,00 1,20 1,40 1,60
P1 /P2
Figure 8: PaRMAC diagram showing the normal area and outliers. The samples in the normal area are represented by circles and the outliers by triangles.
3 . 5 Process control - online measurements
Particle size distributions can be measured on line in mineral processing plants, and the PaRMAC-quotas automatically calculated with a computer. The obtained data can be used in a process control system to make sure that the end product fulfils preset quality demands.
For the purpose of sampling from the material stream there are commercial auto samplers on the market as well as automatic sieving equipment. For PaRMAC the equipment can be limited to just two sieving decks. The auto sampler takes out a sample at a predetermined interval, and the sample is sieved and the different fractions weighed. How often the auto sampler passes the material stream is dependent on quality demands and process parameters.
The results can be presented in a graphical way. The point representing the latest value wil l continuously be updated due to the online measurements. It is possible to enhance the clarity of how the process proceeds by letting the preceding three or four points be shown in the diagram These points should, however change to a smaller size so that they not can be mistaken with the newest value, at the same
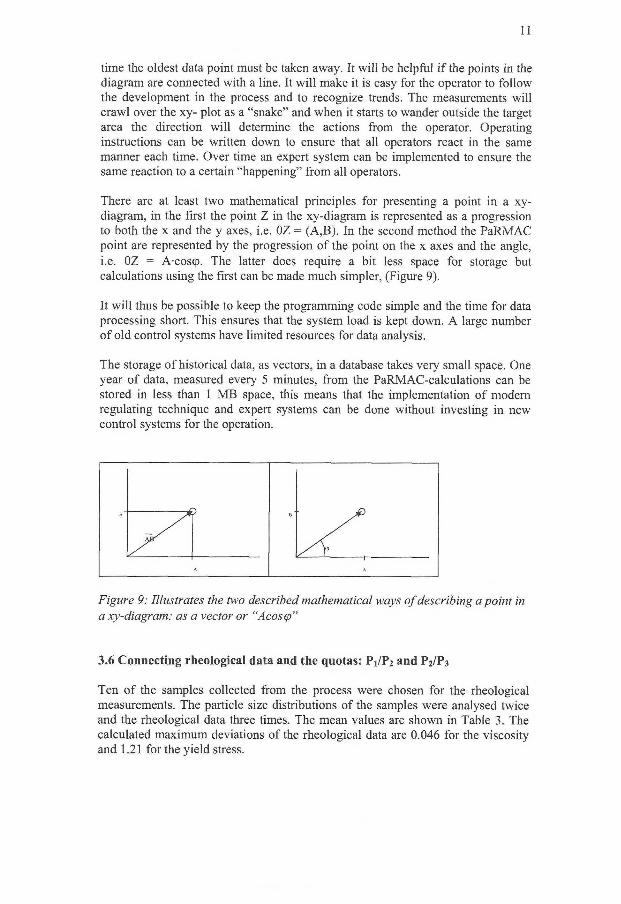
11
time the oldest data point must be taken away. It will be helpful i f the points in the diagram are connected with a line. It wil l make it is easy for the operator to follow the development in the process and to recognize trends. The measurements will crawl over the xy- plot as a "snake" and when it starts to wander outside the target area the direction wil l determine the actions from the operator. Operating instructions can be written down to ensure that all operators react in the same manner each time. Over time an expert system can be implemented to ensure the same reaction to a certain "happening" from all operators.
There are at least two mathematical principles for presenting a point in a xy-diagram, in the first the point Z in the xy-diagram is represented as a progression to both the x and the y axes, i.e. OZ = (A,B). In the second method the PaRMAC point are represented by the progression of the point on the x axes and the angle, i.e. OZ = A coscp. The latter does require a bit less space for storage but calculations using the first can be made much simpler, (Figure 9).
It wil l thus be possible to keep the programming code simple and the time for data processing short. This ensures that the system load is kept down. A large number of old control systems have limited resources for data analysis.
The storage of historical data, as vectors, in a database takes very small space. One year of data, measured every 5 minutes, from the PaRMAC-calculations can be stored in less than 1 MB space, this means that the implementation of modern regulating technique and expert systems can be done without investing in new control systems for the operation.
Figure 9: Illustrates the two described mathematical ways of describing a point in a xy-diagram: as a vector or "Acostp"
3.6 Connecting rheological data and the quotas: P1/P2 and P2/P3
Ten of the samples collected from the process were chosen for the rheological measurements. The particle size distributions of the samples were analysed twice and the rheological data three times. The mean values are shown in Table 3. The calculated maximum deviations of the rheological data are 0.046 for the viscosity and 1.21 for the yield stress.
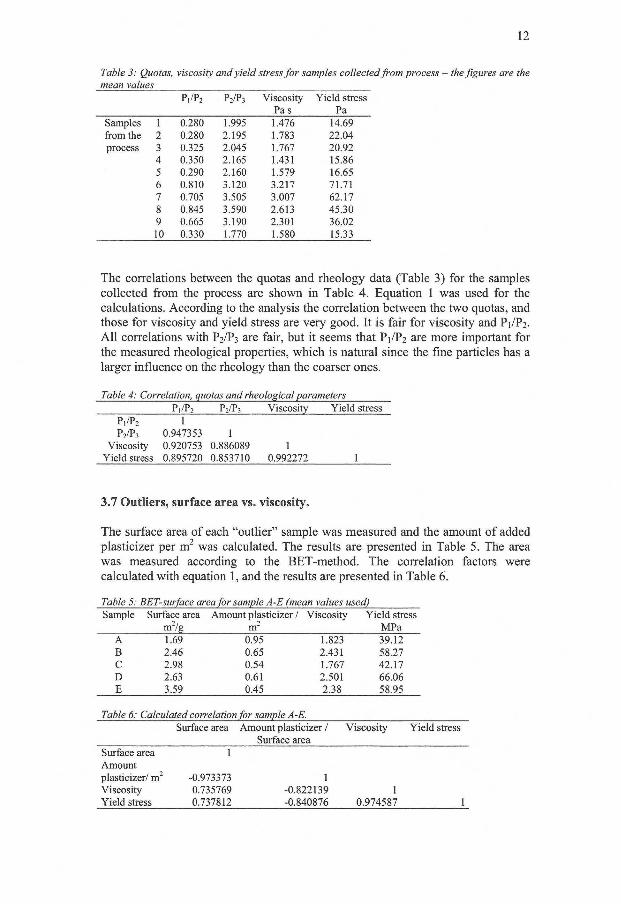
12
Table 3: Quotas, viscosity and yield stress for samples collected from process — the figures are the mean values
P,/P 2 P2/P3 Viscosity Pas
Yield stress Pa
Samples 1 0.280 1.995 1.476 14.69 from the 2 0.280 2.195 1.783 22.04 process 3 0.325 2.045 1.767 20.92
4 0.350 2.165 1.431 15.86 5 0.290 2.160 1.579 16.65 6 0.810 3.120 3.217 71.71 7 0.705 3.505 3.007 62.17 8 0.845 3.590 2.613 45.30 9 0.665 3.190 2.301 36.02 10 0.330 1.770 1.580 15.33
The correlations between the quotas and rheology data (Table 3) for the samples collected from the process are shown in Table 4. Equation 1 was used for the calculations. According to the analysis the correlation between the two quotas, and those for viscosity and yield stress are very good. It is fair for viscosity and P1/P2. All correlations with P2/P3 are fair, but it seems that P1/P2 are more important for the measured rheological properties, which is natural since the fine particles has a larger influence on the rheology than the coarser ones.
Table 4: Correlation, quotas and rheological parameters
P1/P2 P2/P3 Viscosity Yield stress
P1/P2 1
P2/P3 0.947353 1 Viscosity 0.920753 0.886089 1
Yield stress 0.895720 0.853710 0.992272 1
3.7 Outliers, surface area vs. viscosity.
The surface area of each "outlier" sample was measured and the amount of added plasticizer per m 2 was calculated. The results are presented in Table 5. The area was measured according to the BET-method. The correlation factors were calculated with equation 1, and the results are presented in Table 6.
Table 5: BET-surface area for sample A-E (mean values used) Sample Surface area Amount plasticizer / Viscosity Yield stress
m2/g nrj MPa A 1.69 0.95 1.823 39.12 B 2.46 0.65 2.431 58.27 C 2.98 0.54 1.767 42.17 D 2.63 0.61 2.501 66.06 E 3.59 0.45 2.38 58.95
Table 6: Calculated correlation for sample A-E. Surface area Amount plasticizer / Viscosity Yield stress
Surface area Surface area 1 Amount plasticizer/ m' -0.973373 1 Viscosity 0.735769 -0.822139 1 Yield stress 0.737812 -0.840876 0.974587 1
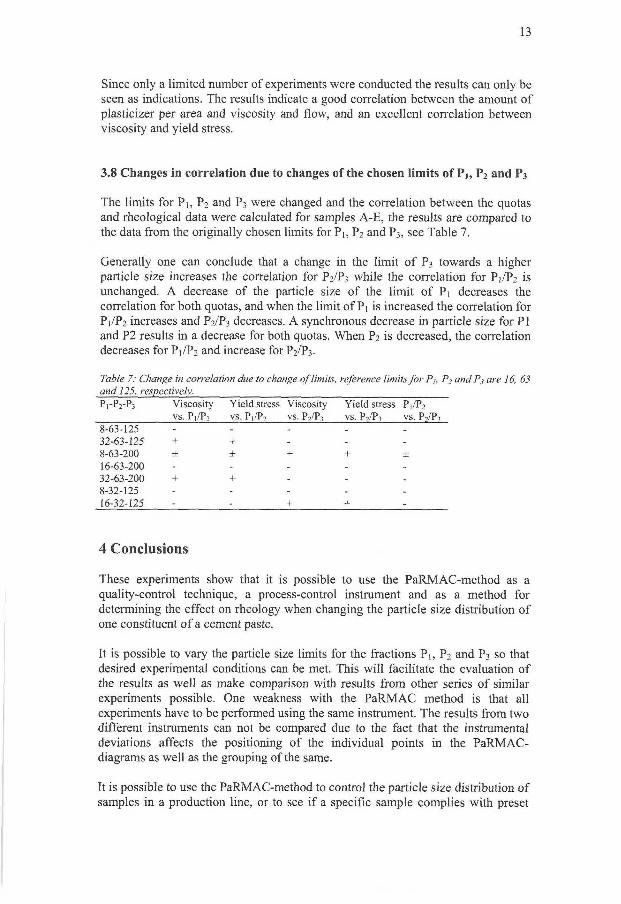
13
Since only a limited number of experiments were conducted the results can only be seen as indications. The results indicate a good correlation between the amount of plasticizer per area and viscosity and flow, and an excellent correlation between viscosity and yield stress.
3.8 Changes in correlation due to changes ofthe chosen limits of Pj, P 2 and P 3
The limits for Pj, P 2 and P3 were changed and the correlation between the quotas and rheological data were calculated for samples A-E, the results are compared to the data from the originally chosen limits for Pi, P 2 and P3 , see Table 7.
Generally one can conclude that a change in the limit of P3 towards a higher particle size increases the correlation for P2/P3 while the correlation for P]/P2 is unchanged. A decrease of the particle size of the limit of Pi decreases the correlation for both quotas, and when the limit of Pi is increased the correlation for P1/P2 increases and P2/p3 decreases. A synchronous decrease in particle size for PI and P2 results in a decrease for both quotas. When P2 is decreased, the correlation decreases for Pi/P2 and increase for P2/P3.
Table 7: Change in correlation due to change of limits, reference limits for P,, P2 andPj are 16, 63 and 125, respectively. P1-P2-P3 Viscosity Yield stress Viscosity Yield stress Pi./P2
vs. P]/P 2 vs. P|/P 2 vs. P 2/P 3 vs. P 2 /P 3 vs. P 2 /P 3
8-63-125 32-63-125 + + 8-63-200 ± ± 16-63-200 32-63-200 + + 8-32-125 16-32-125
4 Conclusions
These experiments show that it is possible to use the PaRMAC-method as a quality-control technique, a process-control instrument and as a method for determining the effect on rheology when changing the particle size distribution of one constituent of a cement paste.
It is possible to vary the particle size limits for the fractions Pi, P2 and P3 so that desired experimental conditions can be met. This wil l facilitate the evaluation of the results as well as make comparison with results from other series of similar experiments possible. One weakness with the PaRMAC method is that all experiments have to be performed using the same instrument. The results from two different instruments can not be compared due to the fact that the instrumental deviations affects the positioning of the individual points in the PaRMAC-diagrams as well as the grouping of the same.
It is possible to use the PaRMAC-method to control the particle size distribution of samples in a production line, or to see i f a specific sample complies with preset
+ + ±
+ +
1 4
quality demands, i.e. i f the point is situated in the "normal area". The method is both fast and easy to use and it can therefore become a valuable tool for particle size distribution control in a production line.
Depending on where the "point" ends up in the PaRMAC-diagram corrective measures can be made to the process in order to get it back to the normal conditions. PaRMAC may therefore be considered an important tool in process control and quality assurance.
This investigation proves that it is possible to set the limits of the normal area for a filler material in a PaRMAC-diagram, with regard to the required viscosity and yield stress of cement paste of a certain composition. The materials calculated quotas and thereof resulting PaRMAC-diagram clearly correlates with the viscosity and yield stress of cement pastes.
The results from the experiments conducted on cement paste can, however, not be translated to predict concrete rheology. The relationship between rheological parameters of a cement paste and the particle size distributions of the components are of a less complex nature than those of concrete. The particle size distribution for a concrete will range from 36 mm down to approximately 1 micron while the cement paste in these experiments only range between approximately 1 and 250 microns. The use of PaRMAC to predict results when mixing a new fdler material into concrete should be possible, although this necessitates that all the separate materials' rheological behaviour must be known as well as for all mixture-combinations of the materials. Experiments must be conducted to determine the normal area for concrete mixes, this must be done for one recipe at a time since they all wil l have different normal areas.
There are two possible ways of connecting the rheological parameters to the quotas in a PaRMAC-diagram. The first, as is done in this investigation, is to define the normal area in a PaRMAC-diagram for a specific product with specified particle size quality limits. The rheology of a specified cement paste, with this material as a constituent, is determined. It is important to use filler samples that fall inside the normal area and also those that are outside since both types of samples are important for the evaluation. The result can be combined in a three-dimensional-diagram, for example the two quotas and viscosity, and the resulting plane plotted. As long as the cement paste recipe is the same and the particle size distribution known, the rheology can be anticipated for all combination of quotas in the normal area and its close surroundings. The second way is to start with the rheological measurements, define the viscosity and yield stress for cement paste with a certain amount of a filler material. Then set the lower and upper limits for these rheological parameters and vary the quotas, i.e. particle size distribution until the preset limits are reached. These particle size distributions wi l l then define the limits for the "normal area" in the PaRMAC-diagram and make it possible to steer the process so that the particle size distribution always correlates to the wanted rheological properties.
1 5
5 Acknowledgements
The authors gratefully acknowledge the financial support from the Swedish Mineral Processing Research Association and Nordkalk AB. Seija Forsmo at LKAB is thanked for her valuable advises and for sharing her expertise.
6 References
Barnes, H A , Hutton, J..F. and Walters, K , A n Introduction to Rheology', Elsevier Science B . V , Amsterdam, 1996.
Betonghandbok: Material, (Reference book on Concrete: Material), Solna Sweden, AB Svensk Byggtjänst, 1994
Billberg, P, 'Self-compacting concrete for civil engineering structure - the Swedish experience' CBI-report 2:99. Swedish Cement and Concrete Research Institute , Stockholm, Sweden, 1999.
Forsmo S.P.E, Forsmo S-E "PaRMAC - A New Method of Evaluating the Particle Size Distribution for Agglomeration" Proceedings from the XXIMPC - Aachen. 1997, Pp. 347-353.
Forsmo S.P.E, Forsmo S-E. and Samskog P-O. "Characterization of Changes in Particle Size Distribution by the PaRMAC evaluation Method" Kona Powder and Particle,No 17, 1999, pp. 106-113.

1
Measurements of metallurgical by-products zeta-potential in electrolyte.
H. Moosberg-Bustnes, Swedish Cement and Concrete Research Institute L. Lind, SSAB Merox AB E. Forssberg, Luleå University of Technology
Abstract
The use of by-products, dust and sludges, from the mineral and metallurgical industry as fdler materials in concrete demands that a thorough characterisation of the materials is made. The purpose of this investigation is to measure the zeta-potential as function of added polymer for 11 by-products intended as filler materials and a Portland cement. A synthetic pore solution was used as electrolyte. The results show that most of the materials had a strong negative potential. There is no indication that particle flocculation is of such a magnitude that it would influence rheological properties.
1 Background
The rheological properties of cement pastes, mortars and concretes vary largely due to the components, the recipe and the preparation. One variable that may affect the rheological properties is the surface chemistry of the particles.
Cement particles in suspension are agglomerated and form a three-dimension network. The water trapped between particles has no more lubricating action. Superplasticizers, which disperse agglomerates, release the entrapped water and thus improve the fluidity. The total interaction force, allowing agglomeration of cement particles, takes into consideration the sum of dispersion, electrostatic and steric forces. Dispersion of agglomerated particles is a key point to improve the workability of concrete or to reduce the amount of mixing water.
The use of by-products, dust and sludges, from the mineral and metallurgical industry as fdler materials in concrete demands that a thorough characterisation of the materials is made. Surface properties are important in particle systems. In concrete, where particles of different kinds are put together, the zeta-potential may affect flocculation and dispersion. The risk for flocculation is high when particles with negative and positive charges are mixed. The pH is high in cement paste and this will affect the zeta-potential, most materials wi l l become negatively charged. Moreover, the materials are fine particulate and wil l , when mixed into cement paste, need superplasticizer addition to obtain a reasonable rheology.
Measurement of a material's zeta-potential in a high pH, synthetic cementitious environment may give information of the amount of plasticizer needed to cover the particles and also of the zeta-potential in the system. The use of deionised water had been easier, but zeta-potential in pure water was considered unimportant since it would not contribute substantially to this investigation as the materials investigated are intended to be used together with cement.
2
1.1 Superplasticizers The fluidity of concrete is strongly affected by the cement paste, which correlates with the repulsive forces between the cement grains. The force acting between the cement grains comprises van der Waal's force and the electrostatic repulsive force generated by the electric charge on the surface of particles. Addition of admixtures will increase the electrostatic repulsive force since molecules will be adsorbed on the surface of the cement grains. A steric repulsive force will also be generated. The total interpartiele potential energy is the sum of these forces (Uchikawa et a l , 1997, and Yoshioka et a l , 1997).
Chemical admixtures can improve the properties of concrete. High performance concrete with high strength, fluidity and self-compactability can be realised mainly thanks to chemical admixtures. Rheological properties of fresh concrete can be strongly affected by the combination of cement and admixtures. Problems, such as stiffening, large slump loss or retardation of setting are phenomena generally caused by incompatibilities between cement and admixtures. The interaction problems can be roughly classified in two groups: (a) problems caused by the effect of the admixture's addition on the hydration reaction of cement, and (b) problems caused by the adsorption of the admixture to the cement particles. The system becomes even more complicated when filler materials are added, since they may affect the cement reactions and the admixtures can also affect them.
Hanehara and Yamada (1999) studied this problem (for cement) and found that polycarboxylate type of plasticizer had the best compatibility with different kinds of cement, although it is affected by large amounts of alkaline sulphates. Kato et al. (1997) explain this phenomenon: The polyethylene oxide chains shrink when mixing water containing sulphate ions is used, thereby decreasing the steric repulsion. Polycarboxylic acid-based admixture is a non-ionic surface-active agent with zero potential. The side chains of polyethylene oxide extending on the surface of cement particles in the form of a brush of a comb migrate in the water and the cement particles are dispersed by the steric hindrance ofthe side chains (Hanehara and Yamada, 1999) and not by changing the surface potential. The interaction problem of the polycarboxylic acid-based admixture is a phenomenon in that the amount of the admixture added to the cement varies largely according to the cement type. When used in low w/c-ratio concrete a small difference in the dispersibility of the admixture changes the fluidity noticeably (Yamaguchi et a l , 1995)
Comparisons of adsorption measurements of admixtures and the zeta-potential show that approximately the same amount of polymer is needed to reach a constant zeta-potential as to reach an adsorption-plateau (Flatt et a l , 1997, Kauppi et a l , 2003). The adsorption-plateau represents the maximum adsorption of the polymer on the particle surfaces of the analysed material.
1.2 Surface charge and zeta-potential Surface charge can originate from dissociation of surface groups, specific adsorption of ions or ionic polymers. The distribution of ionic species as a function of distance from a charged surface is calculated by assuming that the suspension is at equilibrium. This means that for each species, the electrochemical potential wi l l be the same, whatever its distance from the charged surface. Hydrating cement suspensions are not at full
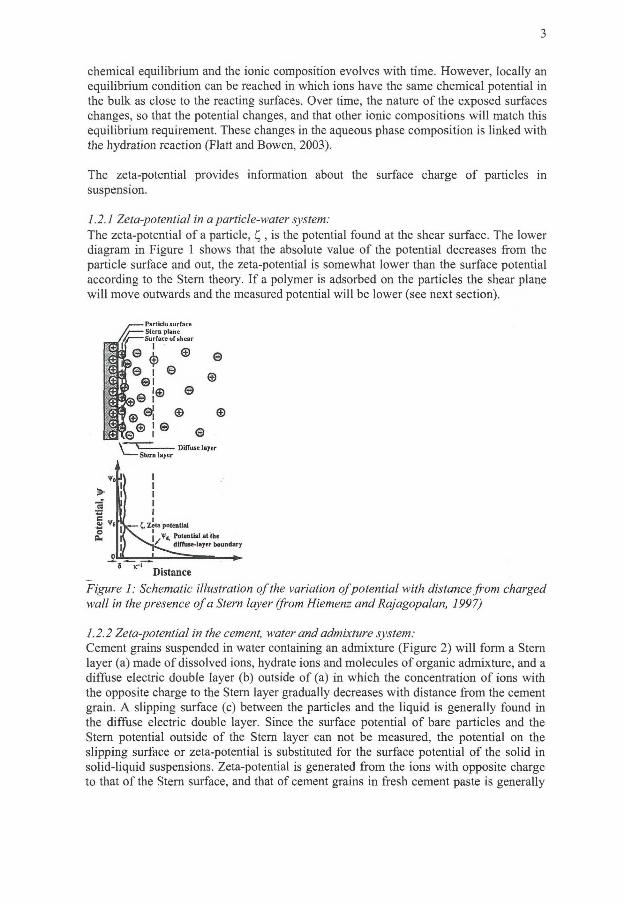
3
chemical equilibrium and the ionic composition evolves with time. However, locally an equilibrium condition can be reached in which ions have the same chemical potential in the bulk as close to the reacting surfaces. Over time, the nature of the exposed surfaces changes, so that the potential changes, and that other ionic compositions wil l match this equilibrium requirement. These changes in the aqueous phase composition is linked with the hydration reaction (Flatt and Bowen, 2003).
The zeta-potential provides information about the surface charge of particles in suspension.
1.2.1 Zeta-potential in a particle-water system: The zeta-potential of a particle, C\, is the potential found at the shear surface. The lower diagram in Figure 1 shows that the absolute value of the potential decreases from the particle surface and out, the zeta-potential is somewhat lower than the surface potential according to the Stern theory. I f a polymer is adsorbed on the particles the shear plane wil l move outwards and the measured potential wil l be lower (see next section).
/ — — Particle surface / i Stern plane
_f/i Surface of shear
afjj _ i
Distance
Figure 1: Schematic illustration of the variation ofpotential with distance from charged wall in the presence of a Stern layer (from Hiemenz and Rajagopalan, 1997)
1.2.2 Zeta-potential in the cement, water and admixture system: Cement grains suspended in water containing an admixture (Figure 2) wi l l form a Stern layer (a) made of dissolved ions, hydrate ions and molecules of organic admixture, and a diffuse electric double layer (b) outside of (a) in which the concentration of ions with the opposite charge to the Stern layer gradually decreases with distance from the cement grain. A slipping surface (c) between the particles and the liquid is generally found in the diffuse electric double layer. Since the surface potential of bare particles and the Stern potential outside of the Stern layer can not be measured, the potential on the slipping surface or zeta-potential is substituted for the surface potential of the solid in solid-liquid suspensions. Zeta-potential is generated from the ions with opposite charge to that of the Stern surface, and that of cement grains in fresh cement paste is generally

4
higher than the surface potential of the adsorption layer of organic admixture (Stern potential) and lower than the surface potential (Uchikawa et a l , 1997)
Surface, potential
Cement particle
Stem layer (Adsorption! layer or organic admixture)
g>Q Solution
Slipping surface
Diffuse electrical double layer
Figure 2: Schematic explanation of interfacial electric double layer formed on the cement particle adsorbing organic admixture. From Uchikawa et al, 1997.
Low absolute values of zeta-potential would indicate a tendency of particle flocculation in the solution while high absolute values would indicate good particle dispersion. Based on the work of Daimon and Roy (1978), it could be expected that high absolute values of zeta-potential, indicating strong repulsive forces between particles, would have a positive effect on the rheological properties.
Johansen et al. (1992) measured the zeta potential of mineral fillers, calcite, quartz, amphibole, micas and feldspars, in deionised water or Ca(OH)2 solution with pH 11. Calcite has a positive (low) zeta-potential in deionised water, contrary to the others that have strong negative zeta-potentials. In the calcium hydroxide solution calcite and amphibole have a strong positive potential indicating good dispersion while the other minerals had a potential close to zero. This indicates a tendency of flocculation for the quartz and feldspar fillers. Moreover, the change in potential indicates that calcium ions from the solution are adsorbed on their surfaces. Addition of a lignosulponate-based plasticizer to the calcium hydroxide solution wil l change the measured zeta-potential to the negative side.
Daimon and Roy (1978, 1979) showed that when superplasticizers were added to cement suspensions the zeta-potential of these materials became increasingly negative, reaching values between -30 and -40 mV. Andersen (1986) obtained similar results, the values are between -20 and -30 mV. Andersen and Roy (1987) measured values between -20 and -35 mV. The zeta-potential for pure cement is reported to be weakly negative, -12 to -15 mV (Andersen 1986, Nägele 1986, Zelwer 1980), although Nägele (1985) obtained positive values between 5 and 20 mV.
5
Conflicting results in the literature is possibly due to the fact that different methods have been used to measure the zeta-potential. Moreover, different solutions/electrolytes have been used, as well as various cement types. Another reason can be that the zeta-potential values have not been compensated for the background levels of ions, i.e. the background may not have been measured and deducted from the results.
2 Experiments
2.1 Materials
The investigated materials, designated quarts, LF, MF, C, E, F, G, H, I , AQ and HS are more thoroughly described in Moosberg-Bustnes (2003) and Moosberg-bustnes et al. (2003). A short description of the materials can be found in Table l.The cement used is a Portland cement, CEM I I / A-L 42.5R.
Table I. Description of the tested materials, and material characteristics Material Process of origin Median Density Surface area
particle size BET-method [urn] [kg/m3l [mJ/kg 1
QZ Quartz 63 2650 250 L F Limestone filler 23 2850 1080 MF Ground glass 44 2520 410
C Charging of pig iron to ladle 4.6 4970 3260 F. LD-converter, sludge 10 3950 8060 F Blast furnace 150 2380 3000 G Blast furnace, sludge 56 2540 24400 II Finishing treatment of steel 75 5730 840
products (blasting) I Ferro alloy manufacturing 3.0 3310 4950
AQ Ground slag 57 3020 10240 HS Ground slag 185** 2840 830
** Material is sieved at 125 urn before use.
The interaction between by-products, cement, and the plasticizer has to be evaluated in order to see i f there are any agglomeration or dispersion effects. A polycarboxylate-based superplasticizer has been used in this experimental set-up. It is based on a polycarboxylate backbone with polyoxyethylene based side chains. This polymer has only a weak potential in the polycarboxylate chain, and according to the theories about polymer adsorption on mineral particles (Yoshioka et al. 1997) the neutral polyoxyethylene chains will stretch into the solution (electrolyte in this case). This leads to a small additional potential at the same time as the shear plane is displaced from the particle.
2.2 Zeta-potential measurements The zeta-potential has been measured at YKJ (Institute for Surface Chemistry, in Stockholm, Sweden) with an electroacoustic instrument: ZetaProbe from Colloidal Dynamics. In the ZetaProbe a very high frequency (MHz) electric field is applied to the suspension and this causes the (charged) particles to oscillate backwards and forwards at the same frequency as the field. I f the particles have a density different from the medium, this produces a sound wave of the same frequency as the applied field. By measuring the amplitude of that sound wave over a range of frequencies it is possible to
6
calculate the particle mobility and hence the zeta-potential of the particles. The suspension is stirred continuously during the measurement and computer-controlled titration with superplasticizer is possible to perform.
A synthetic pore-solution has been used as electrolyte. The electrolyte was made of 2.0658g CaS0 4x2H 20, 12.496g Na 2S0 4 and 3,999g NaOH diluted to one litre with deionised, degased water. This gives an ionic strength of ca 12 mM Ca2 +, 100 mM SO42" and 276 mM Na +, with a pH of 12.8. The reasons for the choice to use a synthetic pore solution instead of "real" pore solution are: a) it is time consuming to filtrate the mix of cement and water since membrane filters have to be used, b) there is a risk of residual fine particles in the solution, which would change the zeta-potential, and c) each batch of a synthetic pore solution wil l always have the same ionic strength, while the real one may vary. The recipe of the synthetic pore solution was chosen after discussions with Y K I (Kauppi, 2003).
In order to see the effect of the superplasticizer on the by-products, the zeta-potential was studied as a function of added amount of superplasticizer to a suspension of byproduct particles and electrolyte. Adsorption of the superplasticizer on the particle surfaces changes the zeta-potential. It is known that approximately the same amount of polymer is needed to reach a constant zeta-potential as to reach an adsorption-plateau. This will provide information about the material's tendency to flocculate or disperse, which are parameters that wi l l affect the rheology of cement pastes containing byproducts. It wi l l also make it possible to estimate the need of superplasticizer when the by-product are mixed into cement paste. The zeta-potential measurements were made twice.
The by-products and the cement were sieved, and the -75 urn fraction of the materials was used for the measurements. The ZetaProbe can not detect large particles and they wil l only dilute the sample. The result, i f large particles, is that the absolute values of the zeta-potential wil l become lower. It will, however, not affect the trends of the measurements.
The measurements were performed on samples containing 10 volume percent of respective by-product. The method requires that the density and the dielectric constant of the tested material, s, are known, the values that are used in these experiments can be found in Table 1. The dielectric constants are calculated from the by-products' chemical composition, the values are taken from the Dielectric Constant Reference Guide (ASI) . Al l materials have low constants, which means that small variations (± 5) of the values wil l not affect the results.
Since the analyses have been made with an electrolyte, and not deionised water, the measured zeta-potential wil l be severely affected. The zeta-potential becomes positive due to the ions in the solution. Therefore background measurements on pure electrolyte have been made to establish a base line.
4 Results and discussion
The zeta-potential measurements show that all by-products, all tested with 10 volume percent in electrolyte, have a negative zeta-potential. This was an expected result since
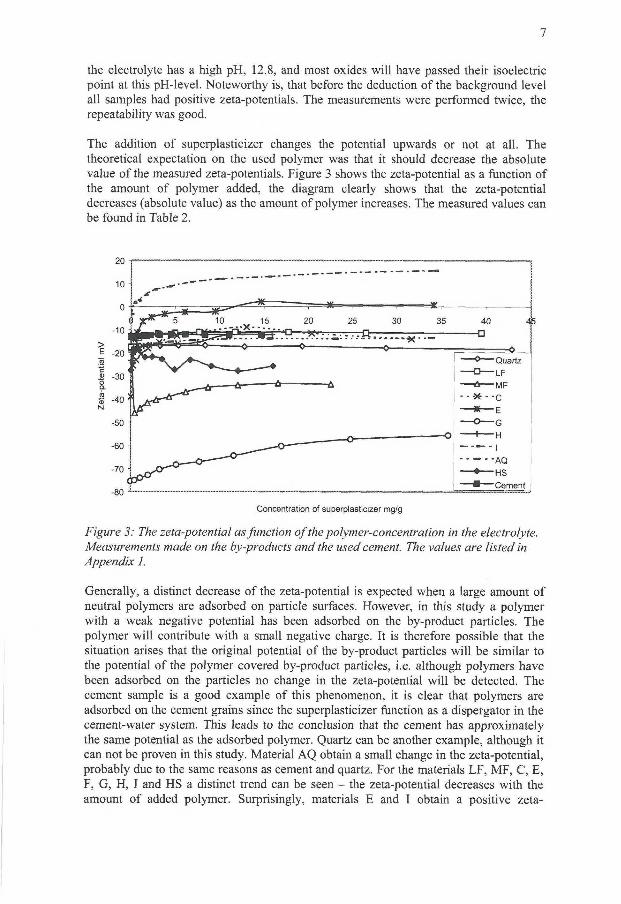
7
the electrolyte has a high pH, 12.8, and most oxides will have passed their isoelectric point at this pH-level. Noteworthy is, that before the deduction of the background level all samples had positive zeta-potentials. The measurements were performed twice, the repeatability was good.
The addition of superplasticizer changes the potential upwards or not at all. The theoretical expectation on the used polymer was that it should decrease the absolute value of the measured zeta-potentials. Figure 3 shows the zeta-potential as a function of the amount of polymer added, the diagram clearly shows that the zeta-potential decreases (absolute value) as the amount of polymer increases. The measured values can be found in Table 2.
20
Concentration of superplasticizer mg/g
Figure 3: The zeta-potential as function of the polymer-concentration in the electrolyte. Measurements made on the by-products and the used cement. The values are listed in Appendix 1.
Generally, a distinct decrease of the zeta-potential is expected when a large amount of neutral polymers are adsorbed on particle surfaces. However, in this study a polymer with a weak negative potential has been adsorbed on the by-product particles. The polymer will contribute with a small negative charge. It is therefore possible that the situation arises that the original potential of the by-product particles wil l be similar to the potential of the polymer covered by-product particles, i.e. although polymers have been adsorbed on the particles no change in the zeta-potential wil l be detected. The cement sample is a good example of this phenomenon, it is clear that polymers are adsorbed on the cement grains since the superplasticizer function as a dispergator in the cement-water system. This leads to the conclusion that the cement has approximately the same potential as the adsorbed polymer. Quartz can be another example, although it can not be proven in this study. Material AQ obtain a small change in the zeta-potential, probably due to the same reasons as cement and quartz. For the materials LF, MF, C, E, F, G, H, I and HS a distinct trend can be seen - the zeta-potential decreases with the amount of added polymer. Surprisingly, materials E and I obtain a positive zeta-
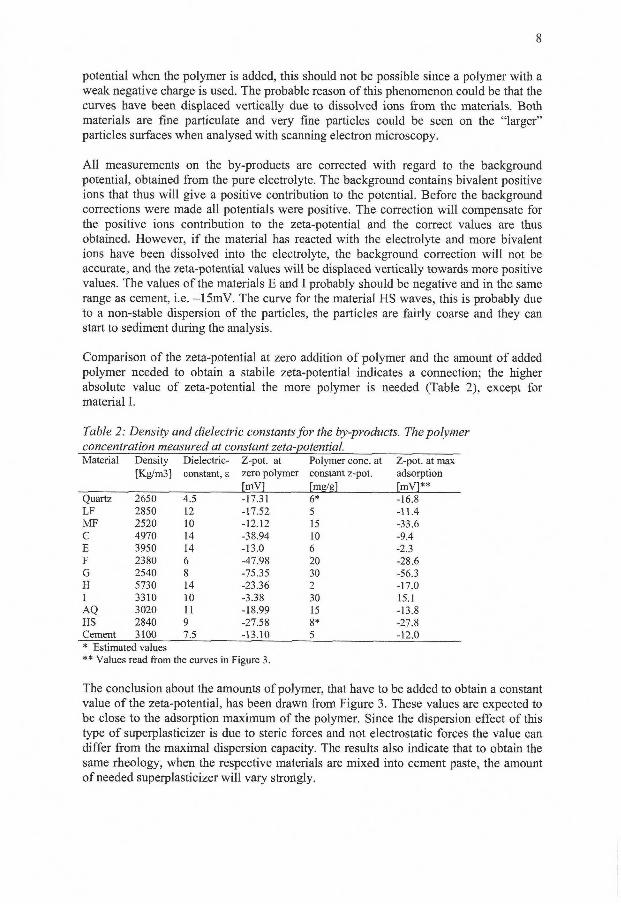
8
potential when the polymer is added, this should not be possible since a polymer with a weak negative charge is used. The probable reason of this phenomenon could be that the curves have been displaced vertically due to dissolved ions from the materials. Both materials are fine particulate and very fine particles could be seen on the "larger" particles surfaces when analysed with scanning electron microscopy.
Al l measurements on the by-products are corrected with regard to the background potential, obtained from the pure electrolyte. The background contains bivalent positive ions that thus will give a positive contribution to the potential. Before the background corrections were made all potentials were positive. The correction wil l compensate for the positive ions contribution to the zeta-potential and the correct values are thus obtained. However, i f the material has reacted with the electrolyte and more bivalent ions have been dissolved into the electrolyte, the background correction wil l not be accurate, and the zeta-potential values wil l be displaced vertically towards more positive values. The values of the materials E and I probably should be negative and in the same range as cement, i.e. -15mV. The curve for the material HS waves, this is probably due to a non-stable dispersion of the particles, the particles are fairly coarse and they can start to sediment during the analysis.
Comparison of the zeta-potential at zero addition of polymer and the amount of added polymer needed to obtain a stabile zeta-potential indicates a connection; the higher absolute value of zeta-potential the more polymer is needed (Table 2), except for material I .
Table 2: Density and dielectric constants for the by-products. The polymer concentration measured at constant zeta-potential. Material Density Dielectric- Z-pot. at Polymer cone, at Z-pot. at max
[Kg/m3] constant, s zero polymer constant z-pot. adsorption rmvi [mg/gl fmVl**
Quartz 2650 4.5 -17.31 6* -16.8 L F 2850 12 -17.52 5 -11.4 MF 2520 10 -12.12 15 -33.6 C 4970 14 -38.94 10 -9.4 E 3950 14 -13.0 6 -2.3 F 2380 6 -47.98 20 -28.6 G 2540 8 -75.35 30 -56.3 H 5730 14 -23.36 2 -17.0 1 3310 10 -3.38 30 15.1 AQ 3020 11 -18.99 15 -13.8 HS 2840 9 -27.58 8* -27.8 Cement 3100 7.5 -13.10 5 -12.0 * Estimated values ** Values read from the curves in Figure 3.
The conclusion about the amounts of polymer, that have to be added to obtain a constant value of the zeta-potential, has been drawn from Figure 3. These values are expected to be close to the adsorption maximum of the polymer. Since the dispersion effect of this type of superplasticizer is due to steric forces and not electrostatic forces the value can differ from the maximal dispersion capacity. The results also indicate that to obtain the same rheology, when the respective materials are mixed into cement paste, the amount of needed superplasticizer will vary strongly.
9
It is important to bear in mind that other factors can affect the result of these zeta-potential measurements. For example some of the by-products are porous and this can render it more difficult to evaluate the adsorbed amounts of polymer on particle surfaces.
5 Conclusions
In cement pastes the concentration of particles gives rise to strong interactions, depending on the shape of the particles, their size distribution and their surface properties. Commonly there is a net attraction that causes agglomeration of particles. The size and three-dimensional structure of these floes influences the cement paste rheology severely. I f chemical admixtures are used and / or by-products added, the system will become even more complex. This result from this study indicate that to obtain the same rheology, when the by-products are mixed into cement paste, the amount of needed superplasticizer wil l vary strongly.
The zeta-potential measurement of materials I and E illustrate one problem that can arise - dissolved ions in the solution, this leads to a positive zeta potential and it is difficult to evaluate the materials properly. However, the rheology of cement pastes containing these materials will probably be affected due to the dissolved ions and the low potential.
With reservations for experimental limitations, the results of the zeta-potential measurements of the by-products do not indicate that particle agglomeration is of that magnitude that it would influence rheological properties. A study of the by-products effect on cement paste rheology is planned. This study provides information that will be helpful for the evaluation and interpretation of rheological data.
6 Acknowledgements
The support from MiMer, Minerals and Metals Recycling Research Centre at the Technical University in Luleå is gratefully acknowledged.
7 References
Andersen P.J. The effect of superplasticizers and air-entraining agents on the zeta potential of cement particles. Cement and Concrete Research, Vol. 16, 1986, pp. 931-940.
Andersen P.J. and Roy D.M. The effects of adsorption of superplasticizers on the surface of cement. Cement and Concrete Research, Vol. 17, 1987, pp. 805-813.
ASI inc., Dielectric Constanct Reference Guide, http://www.asiinstr.com/dcl.html
Daimon M . and Roy D.M. Rheological properties of cement mixes: I Methods, preliminary experiments, and adsorption studies. Cement and Concrete Research, Vol. 8, 1978, pp. 753-764.
10
Daimon M . and Roy D.M. Rheological properties of cement mixes: I I . Zeta potential and preliminary viscosity studies. Cement and Concrete Research, Vol. 9, 1979, pp. 103-110.
Flatt R.J. and Bowen P. Electrostatic repulsion between particles in cement suspensions: Domain of validity of linearized Poisson-Boltzmann equation for nonideal electrolytes. Cement and Concrete Research, Vol. 33, 2003 pp. 781-791.
RJ Flatt, Y.F. Houst,, P. Bowen, H. Hofmann, J. Widmer, U. Sulser, U. Maeder, T.A. Bürge, Interaction of superplasticizers with model powders in a highly alkaline medium, in: V.M. Malhotra, (Ed.) Fifth CANMET/ACI international conference on Superplasticizers and other chemical admixtures in concrete (SP-173), ACI, Farmington Hill , M i , USA, 1997, pp. 743-762.
Johansen K , Meland I , Lindgård J, Wallevik O , Skjeggerud K , Lundevall G. and Hauk C. Effekt av ulike fillertyper i cementbaserte materialer (Effect of different filler materials in cement based materials), Report no. STF70 A92035, SINTEF Structures and concrete, Trondheim, 1992. (in Norwegian)
Kato H , Yoshioka K. and Ushiyama H. Influence of sulphate ion on steric hindrance in the performance of superplasticizers. JCA Proceedings of Cement and Concrete No. 51, 1997, pp. 264-269.
Kauppi A , Banfill P.F.G, Bowen P, Galmiche L , Houst Y .F , Laufma F , Mäder U , Perche F , Petersen B.G, Reknes K , Schober I , Siebold A. and Swift D. Improved superplasticizers for high performance concrete. Proceedings of the 11 t h International Congress on the Chemistry of Cement in Durban, South Africa: Cements contribution to the Development in the 21 s t Century, Edt. Grieve G. and Owens G , 2003, pp. 528-536.
Kauppi A , Institute for Surface Chemistry, in Stockholm, Sweden, Personal communication, 2003
Hanehara S. and Yamada K. Interaction between cement and chemical admixture from the point of cement hydration, absorption behaviour of admixture, and paste rheology. Cement and Concrete Research, Vol. 29, 1999 pp. 1159-1165.
Hiemenz P.C. and Rajagopalan R. Principles of colloid and surface chemistry, third edition. Marcel Deccer, Inc. New York, USA, 1997 p. 528.
Moosberg-Bustnes H. Characterisation of filler, Proceedings from the 3 r d International Symposium on Aself-compacting Concrete, Reykjavik, Island, August 2003
Moosberg-Bustnes H , Lind L. and Forssberg E. Fine Particulate Metallurgical Byproducts Influence on Cement Hydration and Strength Development - an Initial Study, Scandinavian Journal of Metallurgy, (accepted, to be published) 2003.
Muhua T. and Roy D.M. An investigation of the effect of organic solvent on the rheological properties and hydration of cement paste Cement and Concrete Research, Vol. 17, 1987, pp. 983-994.
1 1
Nägele E. The zeta-potential of cement. Cement and Concrete Research, Vol. 15, 1985, pp. 453-462.
Nägele E. The zeta-potential of cement Part I I : Effect of pH-value. Cement and Concrete Research, Vol. 16, 1986, pp. 853-863.
Uchikawa H , Hanehara S.and Sawaki D. The role of steric repulsive force in the dispersion of cement particles in fresh paste prepared with organic admixture. Cement and Concrete Research, Vol. 27, 1997, pp. 37-50.
Yamada K , Takahashi T , Hanahara S. and Matsuhisa M. Effects of the chemical structure on the properties of polycarboxylate-type superplasticizer. Cement and Concrete Research, Vol. 30, 2000, pp. 197-207.
Yamaguchi O , Nakajima H. and Takahshi M. The effect of paste and mortar containing various types of water-reducing agents, JCA Proceedings of Cement and Concrete No. 49, 1995, pp. 216-221.
Yoshioka K , Sakai E , Daimon M . and Kitahara A. Role of steric hindrance in the performance of superplasticizers for concrete. Journal of American Ceramic Society, Vol. 80, No. 10, 1997, pp. 2667-2671.
Zelwer A. Propriétés électrocinétiques å la surface des minéraux du ciment Portland (Electrokineti surface properties of Portland cement minerals) Proceedings from the 7 t h
International Congress on the Chemistry of Cement 2, I I , 1980, pp. 147-152. (in French)
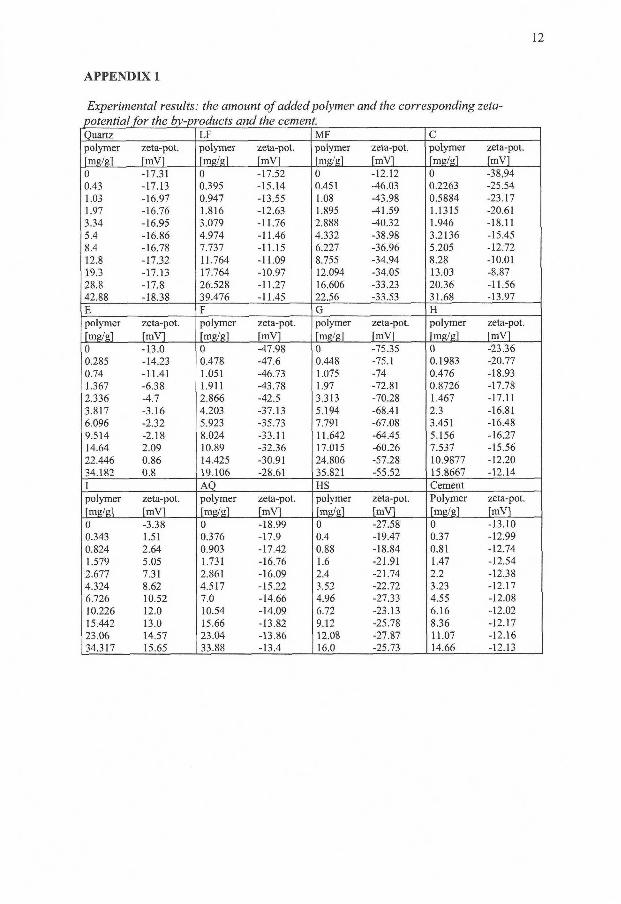
12
APPENDIX 1
Experimental results: the amount of added polymer and the corresponding zeta-potential for the by-products and the cement. Quartz L F MF C polymer zeta-pot. polymer zeta-pot. polymer zeta-pot. polymeT zeta-pot.
[mg/g] [mV] rmg/gl [mVl [mg/g] [mV] [mg/gl [mVl 0 -17.31 0 -17.52 0 -12.12 0 -38,94 0.43 -17.13 0.395 -15.14 0.451 -46.03 0.2263 -25.54 1.03 -16.97 0.947 -13.55 1.08 -43.98 0.5884 -23.17 1.97 -16.76 1.816 -12.63 1.895 -41.59 1.1315 -20.61 3.34 -16.95 3.079 -11.76 2.888 -40.32 1.946 -18.11 5.4 -16.86 4.974 -11.46 4.332 -38.98 3.2136 -15.45 8.4 -16.78 7.737 -11.15 6.227 -36.96 5.205 -12.72 12.8 -17.32 11.764 -11.09 8.755 -34.94 8.28 -10.01 19.3 -17.13 17.764 -10.97 12.094 -34.05 13.03 -8.87 28.8 -17.8 26.528 -11.27 16.606 -33.23 20.36 -11.56 42.88 -18.38 39.476 -11.45 22.56 -33.53 31.68 -13.97 E F G H polymer zeta-pot. polymer zeta-pot. polymer zeta-pot. polymer zeta-pot.
[mg/g] rmvi [mg/g] [mVl [mg/g] [mvq [mg/g] [mVl
0 -13.0 0 -47.98 0 -75.35 0 -23.36 0.285 -14.23 0.478 -47.6 0.448 -75.1 0.1983 -20.77 0.74 -11.41 1.051 -46.73 1.075 -74 0.476 -18.93 1.367 -6.38 1.911 -43.78 1.97 -72.81 0.8726 -17.78 2.336 -4.7 2.866 -42.5 3.313 -70.28 1.467 -17.11 3.817 -3.16 4.203 -37.13 5.194 -68.41 2.3 -16.81 6.096 -2.32 5.923 -35.73 7.791 -67.08 3.451 -16.48 9.514 -2.18 8.024 -33.11 11.642 -64.45 5.156 -16.27 14.64 2.09 10.89 -32.36 17.015 -60.26 7.537 -15.56 22.446 0.86 14.425 -30.91 24.806 -57.28 10.9877 -12.20 34.182 0.8 19.106 -28.61 35.821 -55.52 15.8667 -12.14
I A Q _ HS Cement
polymer zeta-pot. polymer zeta-pot. polymer zeta-pot. Polymer zeta-pot.
[mg/g] [mVl [mg/g] [mVl [mg/g] [mV] [mg/g] fmVl
0 -3.38 0 -18.99 0 -27.58 0 -13.10 0.343 1.51 0.376 -17.9 0.4 -19.47 0.37 -12.99 0.824 2.64 0.903 -17.42 0.88 -18.84 0.81 -12.74 1.579 5.05 1.731 -16.76 1.6 -21.91 1.47 -12.54 2.677 7.31 2.861 -16.09 2.4 -21.74 2.2 -12.38 4.324 8.62 4.517 -15.22 3.52 -22.72 3.23 -12.17 6.726 10.52 7.0 -14.66 4.96 -27.33 4.55 -12.08 10.226 12.0 10.54 -14.09 6.72 -23.13 6.16 -12.02 15.442 13.0 15.66 -13.82 9.12 -25.78 8.36 -12.17 23.06 14.57 23.04 -13.86 12.08 -27.87 11.07 -12.16 34.317 15.65 33.88 -13.4 16.0 -25.73 14.66 -12.13

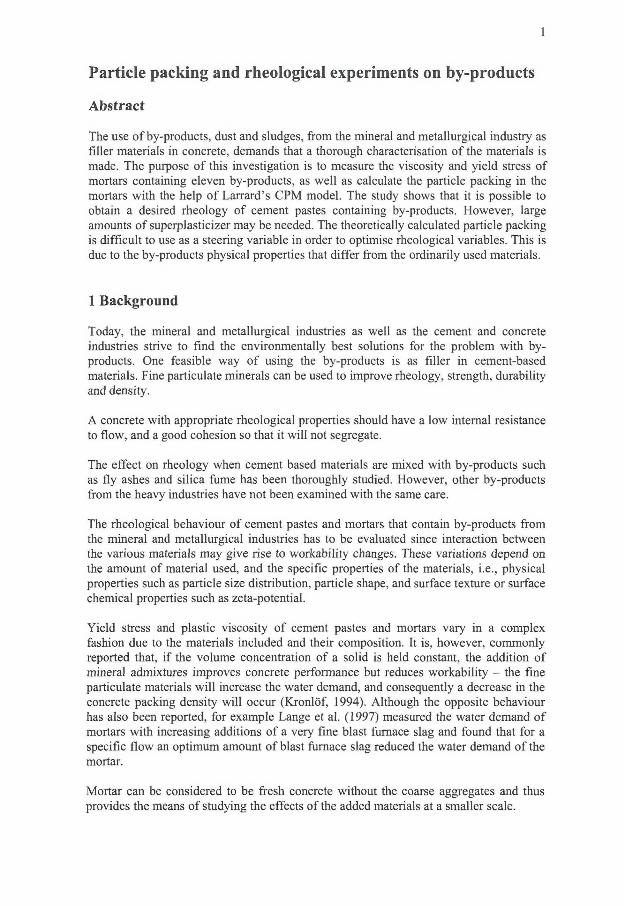
1
Particle packing and rheological experiments on by-products
Abstract
The use of by-products, dust and sludges, from the mineral and metallurgical industry as filler materials in concrete, demands that a thorough characterisation of the materials is made. The purpose of this mvestigation is to measure the viscosity and yield stress of mortars containing eleven by-products, as well as calculate the particle packing in the mortars with the help of Larrard's CPM model. The study shows that it is possible to obtain a desired rheology of cement pastes containing by-products. However, large amounts of superplasticizer may be needed. The theoretically calculated particle packing is difficult to use as a steering variable in order to optimise rheological variables. This is due to the by-products physical properties that differ from the ordinarily used materials.
1 Background
Today, the mineral and metallurgical industries as well as the cement and concrete industries strive to find the environmentally best solutions for the problem with byproducts. One feasible way of using the by-products is as filler in cement-based materials. Fine particulate minerals can be used to improve rheology, strength, durability and density.
A concrete with appropriate rheological properties should have a low internal resistance to flow, and a good cohesion so that it will not segregate.
The effect on rheology when cement based materials are mixed with by-products such as fly ashes and silica fume has been thoroughly studied. However, other by-products from the heavy industries have not been examined with the same care.
The rheological behaviour of cement pastes and mortars that contain by-products from the mineral and metallurgical industries has to be evaluated since interaction between the various materials may give rise to workability changes. These variations depend on the amount of material used, and the specific properties of the materials, i.e., physical properties such as particle size distribution, particle shape, and surface texture or surface chemical properties such as zeta-potential.
Yield stress and plastic viscosity of cement pastes and mortars vary in a complex fashion due to the materials included and their composition. It is, however, commonly reported that, i f the volume concentration of a solid is held constant, the addition of mineral admixtures improves concrete performance but reduces workability - the fine particulate materials will increase the water demand, and consequently a decrease in the concrete packing density will occur (Kronlöf, 1994). Although the opposite behaviour has also been reported, for example Lange et al. (1997) measured the water demand of mortars with increasing additions of a very fine blast furnace slag and found that for a specific flow an optimum amount of blast furnace slag reduced the water demand of the mortar.
Mortar can be considered to be fresh concrete without the coarse aggregates and thus provides the means of studying the effects of the added materials at a smaller scale.
2
2 Material
The investigated materials, designated quarts, LF, MF, C, E, F, G, H, I , AQ and HS are more thoroughly described in Moosberg-Bustnes (2003) and Moosberg-Bustnes et al. (2003). The cement used is a Portland cement, CEM I I / A-L 42.5R.
Material I is a dust from the manufacturing of ferro-alloys. Dust F and sludge G are materials from iron production, i.e., the blast furnace process, while C is dust from the charging of pig iron into the ladle. E is sludge from the steel making process, i.e., LD-converter. Material H origins from the finishing treatment of steel products, i.e., blasting. AQ and HS are ground slags from iron and steel making. Quartz, limestone and fine ground glass have been added to the experimental matrix as reference materials.
The interaction between by-products, cement, and the plasticizer has to be evaluated in order to see i f there are any undesired effects on the mortar rheology. A polycarboxylate-based superplasticizer has been used in this experimental set-up. It is based on a polycarboxylate backbone with polyoxyethylene based side chains.
A standard sand, DIN 196-1, was used in the mortars.
3 Methods
3.1 ICT - Intensive compaction test
The particle packing was determined with an Intensive Compaction (IC) Tester at Cementa research in Slite, Sweden.
The IC-tester applies a static pressure to the sample before a shear action is initiated. This initial pressure is then maintained throughout the kneading process.
The sample is normally compressed between the top and bottom plates in the work cylinder. Due to the fine particulate nature of the fillers less material is needed for the test and a liner is inserted, and a circular plate with small holes in it is put on top to allow airflow out of the material. Filter papers are used at the top and bottom of the sample to avoid material loss. The top and bottom plates remain parallel to each other throughout the compaction process, while the angle between the work cylinder and the plates changes continuously during the circular work motion. This results in a kneading action under pressure. As this compaction proceeds, the distance between top and bottom plates wil l normally decrease. On the basis of this distance, and the amount of mass initially filled into the cylinder the apparatus computes the density of the sample throughout the compaction process.
The compaction is carried out according to the shear compaction principle - shear planes develop in the sample as a result of the kneading action. Due to this and the compression force applied, the particles relocate relative to each other into more favourable positions and the air is expelled, which leads to compaction and higher density.
3
The pressure setting has been 3.6 bars for all compaction runs and the number of kneading cycles 80. The initial volume of all samples was 0.4 litres. The compaction was made twice and the density measured, with the same results.
3.2 Beta-p measurements
There is a linear relationship between the relative flow of paste and its water/powder ratio. Flow cone tests with water/powder ratios by volume of, e.g, 1.1, 1.2, 1.3 and 1.4 were performed with the selected powder composition. The results are plotted in a xy-diagram, with relative slump versus water/powder ratio. The point of intersection with the y-axis (water/powder ratio) is designated the ß p value. The water-retaining ratio, ß p , indicates the amount of water required to moisten the surface of the particles. A high value indicates a higher water/powder ratio, thus more water in the mix. The slope ofthe regression line (between the four points in the diagram), show the sensitivity for changes in the paste flow by a small change in the water/powder ratio. An increase of the slope means that the material composition is less sensitive to changes in water/powder ratio (EFNARC, 2001).
In order to determine the effect on the ß p value for each by-product (fdler), three different mixtures of cement and filler were analysed, containing 15, 30 and 45 volume percent filler, respectively. Straight-line regression analyses were made on the resulting values for each mixture. The ß p values and the corresponding filler amount can then be plotted in a diagram. This shows how each material affect the water demand of the mixture.
3.3 Rheological measurements
The first step of the rheological study was to start with measurements on cement paste and then to continue with mortar.
Admixtures mainly affect the flow behaviour of the cement paste without altering the composition or behaviour of the aggregates. Therefore, it seems reasonable to try to select admixtures, chemical and mineral, by only testing the cement paste (Ferraris et a l , 2003)
3.3.1 Cement paste
The first purpose of these experiments on cement paste was to see i f it was possible to obtain a low yield stress (without sedimentation) for all materials, regardless of amount of SP used, i.e., without concerns for cost or unrealistic amount of superplasticizer in the receipt.
Secondly, to be able to compare the effect on rheology of different by-products', some of the parameters have to be fixed. This means that the volumes of cement, by-product and water were kept constant for all mixes. A polycarboxylate-based superplasticizer was used to disperse the particles in the cement paste. A normal cement paste recipe, calculated on a paste volume of 0.35 dm 3, was used as a base for these experiments, it
4
contained 390.6 g cement, 169.4 g limestone filler, 143.4 g water and 16 g superplasticizer. The addition of super plasticizer was calculated per square meter surface area of limestone filler, this value was then multiplied with the surface area of the by-products. The surface area used for theses calculations can be found in Table 1.
The viscosimeter used for rheology measurements is a HAAKE Rotovisco CV20. The sensor system consists of concentric cylinders with the outer cylinder (the cup) from an original HAAKE sensor system, ZA30. A new inner cylinder (bob) differs from the original bob in diameter and surface structure providing a gap between the inner and outer cylinder of 2.58 mm, and is serrated with grooves, 0.5 x 0.5 mm wide and deep to prevent any slip-surface occurring.
Using a Hobart laboratory scale mixer the mixing sequence is as follows: Al l dry materials are mixed for 10 seconds, the water is then slowly poured into the bowl while mixing the fine mortar for 30 seconds. Then the superplasticizer is added. The fine mortar containing all ingredients is mixed 1 minute by hand, then 1 minute by machine. The last sequence is repeated once. Billberg (1999) describes the whole procedure in detail.
3.3.2 Mortar
In order to measure the viscosity and yield stress of mortars containing the various filler materials a ConTec 4-SCC Viscosimeter was used. The measuring system consists of an outer cylinder, the mix container lined with rubber, and an inner cylinder unit that register the torsion-moment. Their radii are 85 mm and 65 mm, respectively. The inner cylinder is ribbed, and the gap between the cylinders is 21.5 mm. By measuring the torque produced on the stationary inner cylinder while the outer cylinder is rotating at various speed settings, the viscosity and yield stress of the mortar can be calculated (Con Tec Ltd. Operating Manual).
The mortar receipt, used for the measurements, was calculated from a concrete receipt containing 300 kg cement (CEM II/A-LL 42,5R), 125 kg limestone filler, 180 kg water 583.7 kg gravel and 1084.1 kg sand per cubic meter. The volume proportions of the mortar are the same as in the concrete. The filler volume was kept constant for all mixes, DIN-196-1 standard sand with maximum particle size of 2 mm was used as aggregates. The amount of superplasticizer (polycarboxylate-based) was kept constant, i.e. 1.5 gram per litre of mortar. The yield stress and plastic viscosity were measured 5, 15, 30, 45 and 60 minutes after mixing. Three compressive strength test cubes, 10 x 10 xlO cm 3, were cast of each mortar, the strength was measured after 49 days.
Using a laboratory scale mixer the mixing sequence is as follows: the dry material are mixed together for 15 seconds. The water is poured slowly into the bowl while mixing the mortar on low speed for 30 seconds. The sides of the bowl are then scraped so that all material is collected in the bottom of the bowl. The superplasticizer is added, and the mortar is then mixed on low speed for 2 minutes. The mortar is then mixed by hand and all material is scraped from the sides and the bottom of the bowl, the mortar is then mixed on high speed for two minutes. The mortar is thereafter transferred from the mixing bowl to the viscosimeter.
5
The measuring sequence is as follows: the test starts at a low velocity, 0.05 rps and is stepwise increased to 0.45 rps. The rheological data are measured at seven different velocities. The transient interval between measurements is 1.5 seconds and the sampling time is 1.75 seconds. The number of sampling points at each velocity is 50. After the highest speed is obtained, the velocity is stepwise reduced. Thereafter, the segregation point is measured. The yield stress and viscosity are calculated on the values from the down curve. The segregation is the relative change in slope or "viscosity" during a test. I f the regression slope from the measurement and the "segregation" slope are approximately same, i.e., the segregation is less than 5 %, then no significant segregation has occurred during testing and it can be concluded that the mix is relatively stable. Otherwise, i f there is a significant difference with a segregation of 10 % or more, the results are influenced by segregation and the tested material is unstable. The segregation point has only been used to confirm i f the mortars are homogenous throughout the measurements.
A comparison of quartz, MF, LF and H at the water/cement-ratios 0.6 and 0.65 were made in order to evaluate the influence of the water/cement-ratio.
3.3.2.1 Mini-slump
As a comparative method to the viscosimetry test, a mini-slump test, as described by Kantro (1980), of the mortars workability was made 5 and 60 minutes after mixing.
3.4 Calculation of particle packing
The computer program used to calculate the particle packing is software developed by the Nordic project "Concrete mix design" (Gram, 2003).
The model, CPM (Compressible packing model), used in the computer software to calculate the particle packing is developed by Larrard (1999), and the program calculates the packing according to LPDM, Linear Packing Density Model (Stoval, Larrard and Buil, 1986) for compact systems of particles of different sizes. Calculation of LPDM demands calculation of loosening effect and wall effect. The material density and the packing density of each material have to be experimentally deduced. The k-value, i.e., compaction index is kept constant while the grade of packing is optimised. Two calculation models have been used in this study: 1) calculation of the particle packing of a specific recipe (material combination), 2) optimisation of the particle packing from a selection of materials, with some limitations on parameters such as minimum amount of cement and w/c-ratio.
3.4.1 Mortars with optimum particle packing
In order to investigate the rheological properties of mortars with "optimum" particle packing, the software program was allowed to choose among the by-products and optimise the recipe to achieve this aim. The rheological properties of the mortars were subsequently analysed with the ConTec 4-SCC Viscosimeter. Three compressive strength test cubes, 10 x 10 xlO cm 3, were cast of each mortar, the strength was measured after 49 days.
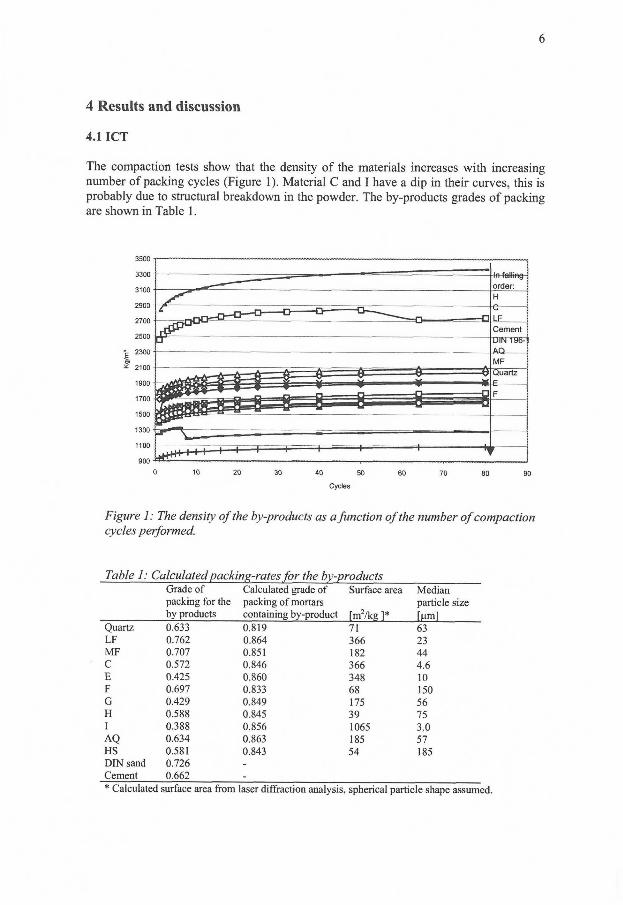
6
4 Results and discussion
4.1 I C T
The compaction tests show that the density of the materials increases with increasing number of packing cycles (Figure 1). Material C and I have a dip in their curves, this is probably due to structural breakdown in the powder. The by-products grades of packing are shown in Table 1.
In falling
-
order: H « LF Cement
• DIN 196-
&o MF
—* i Quartz e F
p ^ ^ ^ - ^ — 0
a " \ . — • j j + H + + + H 1 1 1 ^ 1 1 1 f
0 10 20 30 40 50 60 70 80 90
C y c l e s
Figure 1: The density of the by-products as a function of the number of compaction cycles performed.
Table 1: Calculated packing-rates for the by-products Grade of Calculated grade of Surface area Median packing for the packing of mortars particle size by products containing by-product fm2/kg 1* fuml
Quartz 0.633 0.819 71 63 L F 0.762 0.864 366 23 MF 0.707 0.851 182 44 C 0.572 0.846 366 4.6 E 0.425 0.860 348 10 F 0.697 0.833 68 150 G 0.429 0.849 175 56 H 0.588 0.845 39 75 I 0.388 0.856 1065 3.0 AQ 0.634 0.863 185 57 HS 0.581 0.843 54 185 DIN sand 0.726 -Cement 0.662 -* Calculated surface area from laser diffraction analysis, spherical particle shape assumed.
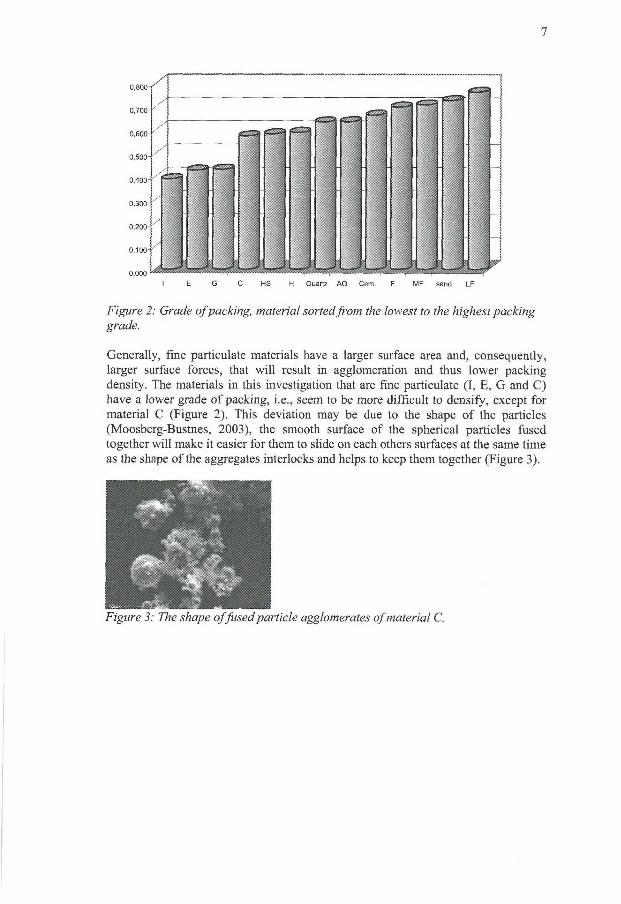
7
E G C HS H Quartz AQ Cem. F MF sand LF
Figure 2: Grade of packing, material sorted from the lowest to the highest packing grade.
Generally, fine particulate materials have a larger surface area and, consequently, larger surface forces, that wil l result in agglomeration and thus lower packing density. The materials in this investigation that are fine particulate ( I , E, G and C) have a lower grade of packing, i.e., seem to be more difficult to densify, except for material C (Figure 2). This deviation may be due to the shape of the particles (Moosberg-Bustnes, 2003), the smooth surface of the spherical particles fused together will make it easier for them to slide on each others surfaces at the same time as the shape ofthe aggregates interlocks and helps to keep them together (Figure 3).
Figure 3: The shape offused particle agglomerates of material C.
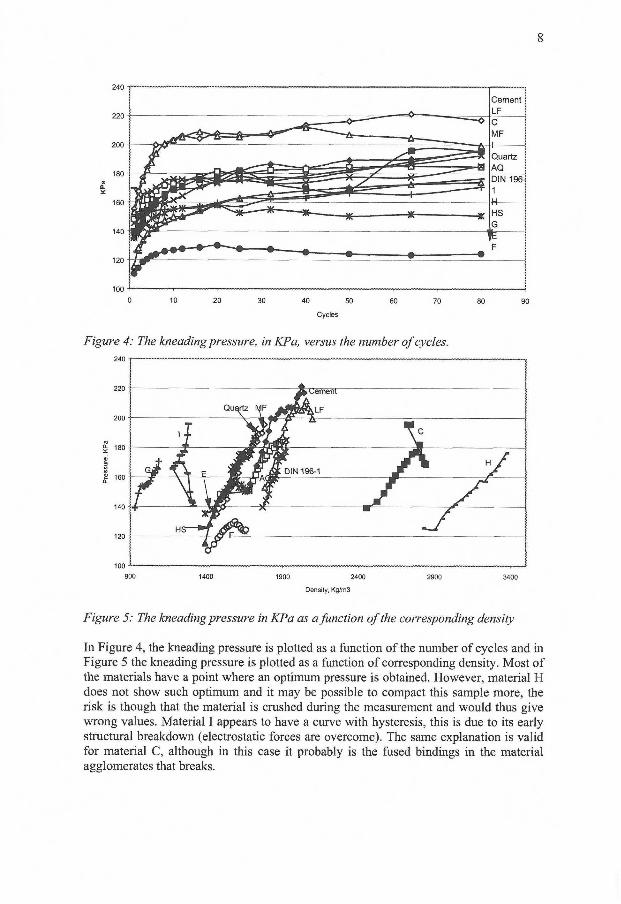
8
10 20
Figure 4: The kneading pressure, in KPa, versus the number of cycles. 240 1
S 160
1900 2400
Density, Kg/m3
Figure 5: The kneading pressure in KPa as a function of the corresponding density
In Figure 4, the kneading pressure is plotted as a function of the number of cycles and in Figure 5 the kneading pressure is plotted as a function of corresponding density. Most of the materials have a point where an optimum pressure is obtained. However, material H does not show such optimum and it may be possible to compact this sample more, the risk is though that the material is crushed during the measurement and would thus give wrong values. Material I appears to have a curve with hysteresis, this is due to its early structural breakdown (electrostatic forces are overcome). The same explanation is valid for material C, although in this case it probably is the fused bindings in the material agglomerates that breaks.
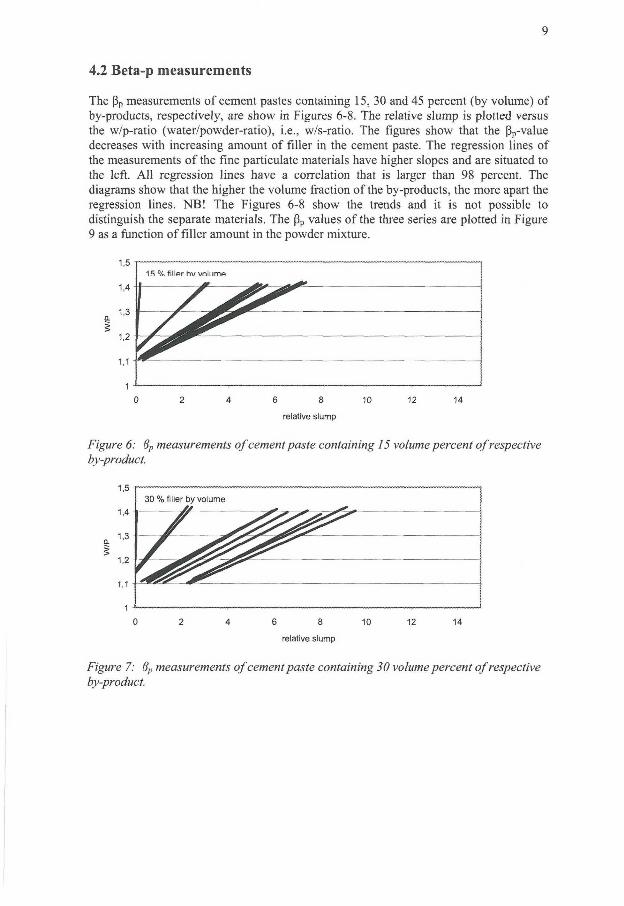
9
4.2 Beta-p measurements
The ß p measurements of cement pastes containing 15, 30 and 45 percent (by volume) of by-products, respectively, are show in Figures 6-8. The relative slump is plotted versus the w/p-ratio (water/powder-ratio), i.e., w/s-ratio. The figures show that the ßp-value decreases with increasing amount of filler in the cement paste. The regression lines of the measurements of the fine particulate materials have higher slopes and are situated to the left. A l l regression lines have a correlation that is larger than 98 percent. The diagrams show that the higher the volume fraction of the by-products, the more apart the regression lines. NB! The Figures 6-8 show the trends and it is not possible to distinguish the separate materials. The ß p values of the three series are plotted in Figure 9 as a function of filler amount in the powder mixture.
6 8 10
relative slump
Figure 6: 8P measurements of cement paste containing 15 volume percent of respective by-product.
10 12
relative slump
Figure 7: 8P measurements of cement paste containing 30 volume percent of respective by-product.
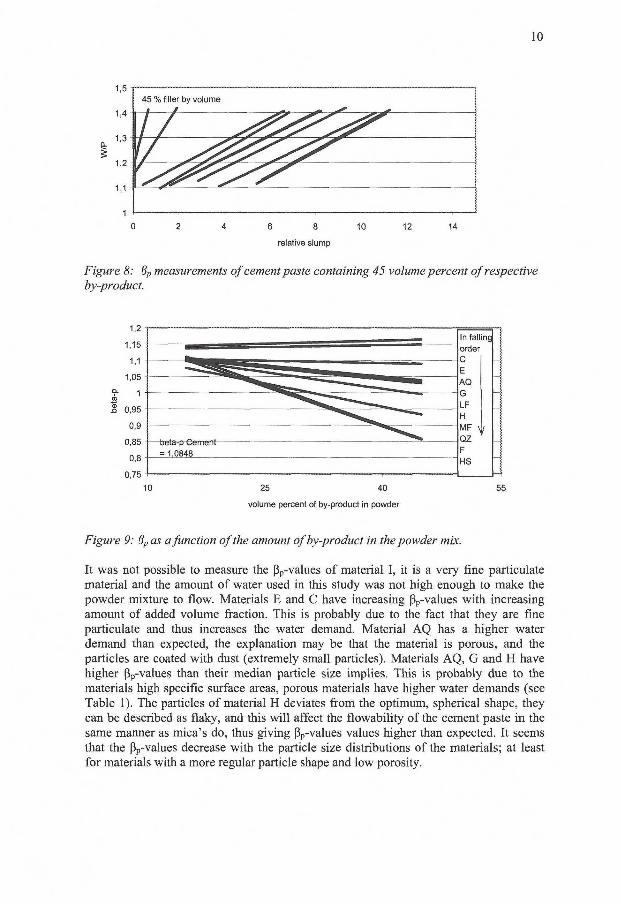
1 0
45 % filler by volume
1 j/ ^^^^^^ 1 1
0 2 4 6 8 10 12 14
relative slump
Figure 8: 6P measurements of cement paste containing 45 volume percent of respective by-product.
1,2 -f
0,75-1 1 1 H
10 25 40 55
volume percent of by-product in powder
Figure 9: 8P as a function of the amount of by-product in the powder mix.
It was not possible to measure the ßp-values of material I , it is a very fine particulate material and the amount of water used in this study was not high enough to make the powder mixture to flow. Materials E and C have increasing ßp-values with increasing amount of added volume fraction. This is probably due to the fact that they are fine particulate and thus increases the water demand. Material AQ has a higher water demand than expected, the explanation may be that the material is porous, and the particles are coated with dust (extremely small particles). Materials AQ, G and H have higher ßp-values than their median particle size implies. This is probably due to the materials high specific surface areas, porous materials have higher water demands (see Table 1). The particles of material H deviates from the optimum, spherical shape, they can be described as flaky, and this will affect the flowability of the cement paste in the same manner as mica's do, thus giving ßp-values values higher than expected. It seems that the ßp-values decrease with the particle size distributions of the materials; at least for materials with a more regular particle shape and low porosity.
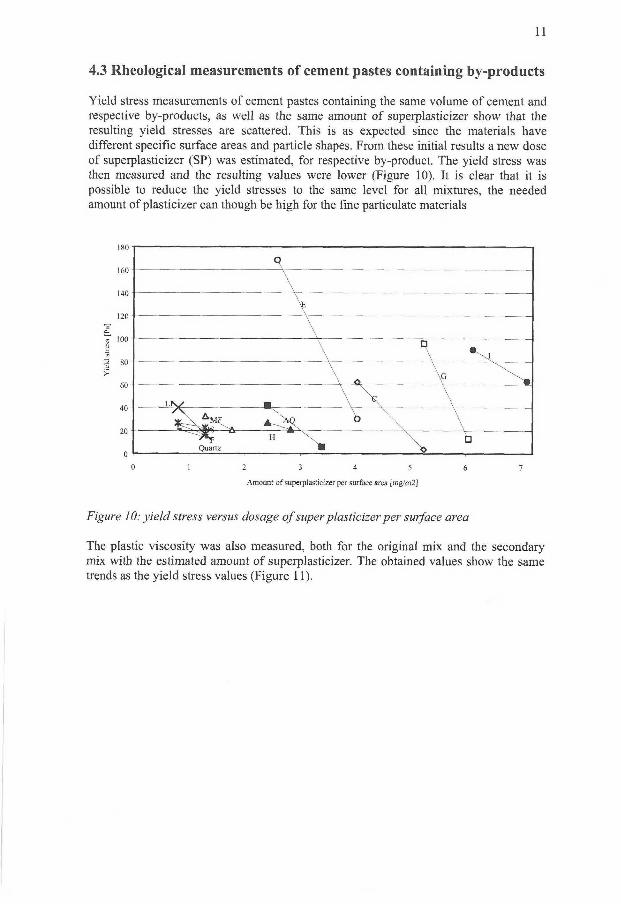
11
4.3 Rheological measurements of cement pastes containing by-products
Yield stress measurements of cement pastes containing the same volume of cement and respective by-products, as well as the same amount of superplasticizer show that the resulting yield stresses are scattered. This is as expected since the materials have different specific surface areas and particle shapes. From these initial results a new dose of superplasticizer (SP) was estimated, for respective by-product. The yield stress was then measured and the resulting values were lower (Figure 10). It is clear that it is possible to reduce the yield stresses to the same level for all mixtures, the needed amount of plasticizer can though be high for the fine particulate materials
sf 1 0 0
a so
0 1 2 3 4 5 6 7
Amount of superplasticizer per surface area [mg/m2]
Figure 10: yield stress versus dosage of super plasticizer per surface area
The plastic viscosity was also measured, both for the original mix and the secondary mix with the estimated amount of superplasticizer. The obtained values show the same trends as the yield stress values (Figure 11).
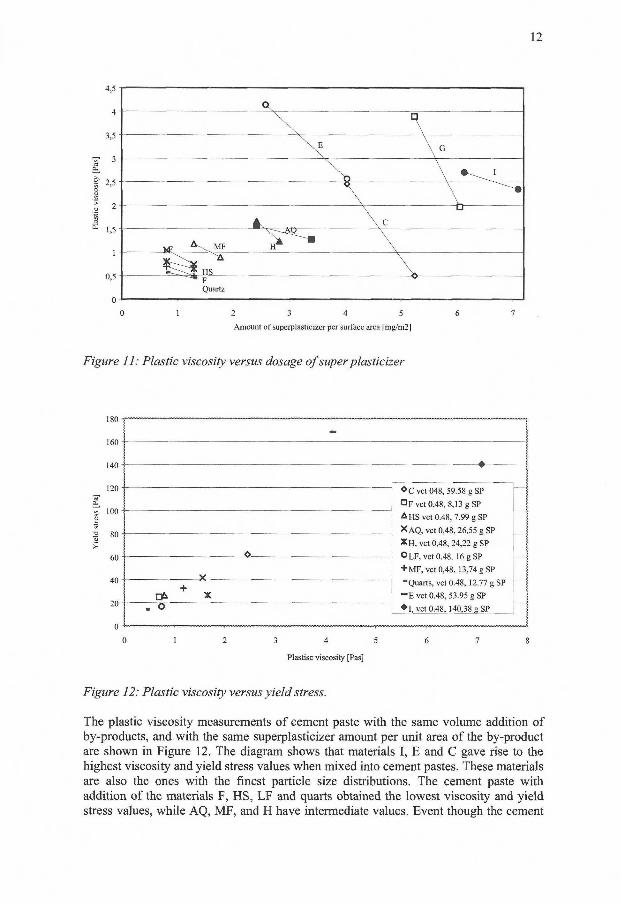
1 2
4,5
4
3,5
S 3
I 2.5 O
* 2
= 1,5
1
0,5
0
M F
2 3 4 5
Amount of superplasticizer per surface area [mg/m2]
Figure 11: Plastic viscosity versus dosage of super plasticizer
160
140
120
2 80
>
60
40
20
-
—
* C vet 048, 59.58 g SP
C F vet 0,48, 8,13 g SP
A HS vet 0.48, 7.99 g SP
XAQ, vet 0,48, 26,55 g SP
* H , vet 0,48, 24,22 g SP
° L F , vet 0.48. 16 g SP
+ M F , vet 0,48, 13,74 g SP
-Quarts, vet 0.48, 12.77 g SP
- E vet 0.48, 53.95 g SP
—
* C vet 048, 59.58 g SP
C F vet 0,48, 8,13 g SP
A HS vet 0.48, 7.99 g SP
XAQ, vet 0,48, 26,55 g SP
* H , vet 0,48, 24,22 g SP
° L F , vet 0.48. 16 g SP
+ M F , vet 0,48, 13,74 g SP
-Quarts, vet 0.48, 12.77 g SP
- E vet 0.48, 53.95 g SP
— o
* C vet 048, 59.58 g SP
C F vet 0,48, 8,13 g SP
A HS vet 0.48, 7.99 g SP
XAQ, vet 0,48, 26,55 g SP
* H , vet 0,48, 24,22 g SP
° L F , vet 0.48. 16 g SP
+ M F , vet 0,48, 13,74 g SP
-Quarts, vet 0.48, 12.77 g SP
- E vet 0.48, 53.95 g SP
—
* C vet 048, 59.58 g SP
C F vet 0,48, 8,13 g SP
A HS vet 0.48, 7.99 g SP
XAQ, vet 0,48, 26,55 g SP
* H , vet 0,48, 24,22 g SP
° L F , vet 0.48. 16 g SP
+ M F , vet 0,48, 13,74 g SP
-Quarts, vet 0.48, 12.77 g SP
- E vet 0.48, 53.95 g SP
—
+ O k X
* C vet 048, 59.58 g SP
C F vet 0,48, 8,13 g SP
A HS vet 0.48, 7.99 g SP
XAQ, vet 0,48, 26,55 g SP
* H , vet 0,48, 24,22 g SP
° L F , vet 0.48. 16 g SP
+ M F , vet 0,48, 13,74 g SP
-Quarts, vet 0.48, 12.77 g SP
- E vet 0.48, 53.95 g SP
—
. o • i , vet 0.48, 140,38 g SP
3 4 5
Plastisc viscosity [Pas]
Figure 12: Plastic viscosity versus yield stress.
The plastic viscosity measurements of cement paste with the same volume addition of by-products, and with the same superplasticizer amount per unit area of the by-product are shown in Figure 12. The diagram shows that materials I , E and C gave rise to the highest viscosity and yield stress values when mixed into cement pastes. These materials are also the ones with the finest particle size distributions. The cement paste with addition of the materials F, HS, LF and quarts obtained the lowest viscosity and yield stress values, while AQ, MF, and H have intermediate values. Event though the cement
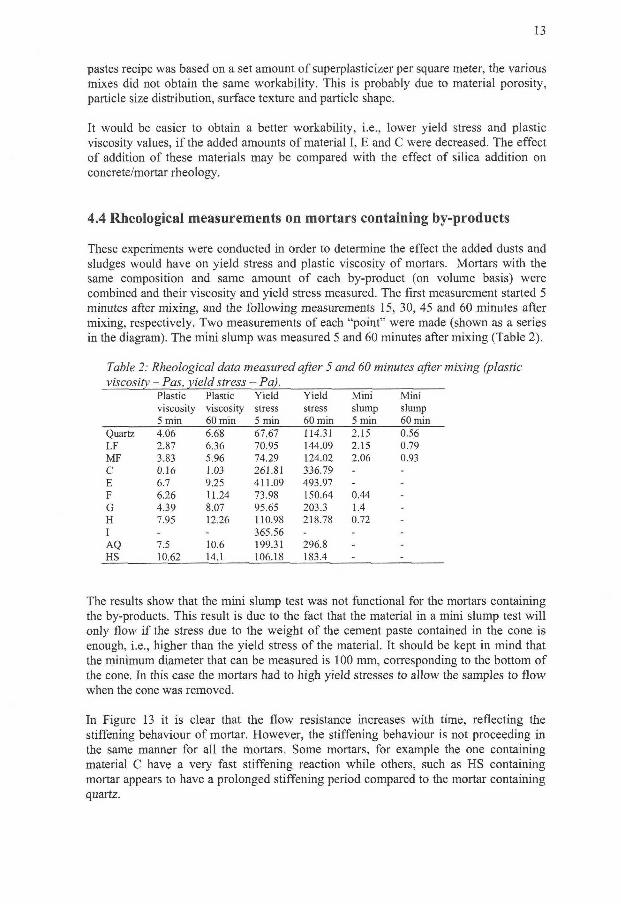
13
pastes recipe was based on a set amount of superplasticizer per square meter, the various mixes did not obtain the same workability. This is probably due to material porosity, particle size distribution, surface texture and particle shape.
It would be easier to obtain a better workability, i.e., lower yield stress and plastic viscosity values, i f the added amounts of material I , E and C were decreased. The effect of addition of these materials may be compared with the effect of silica addition on concrete/mortar rheology.
4.4 Rheological measurements on mortars containing by-products
These experiments were conducted in order to determine the effect the added dusts and sludges would have on yield stress and plastic viscosity of mortars. Mortars with the same composition and same amount of each by-product (on volume basis) were combined and their viscosity and yield stress measured. The first measurement started 5 minutes after mixing, and the following measurements 15, 30, 45 and 60 minutes after mixing, respectively. Two measurements of each "point" were made (shown as a series in the diagram). The mini slump was measured 5 and 60 minutes after mixing (Table 2).
Table 2: Rheological data measured after 5 and 60 minutes after mixing (plastic viscosity - Pas, yield stress -Pa).
Plastic Plastic Yield Yield Mini Mini viscosity viscosity stress stress slump slump 5 min 60 min 5 min 60 min 5 min 60 min
Quartz 4.06 6.68 67.67 114.31 2.15 0.56 L F 2.87 6.36 70.95 144.09 2.15 0.79 MF 3.83 5.96 74.29 124.02 2.06 0.93 C 0.16 1.03 261.81 336.79 - -E 6.7 9.25 411.09 493.97 - -F 6.26 11.24 73.98 150.64 0.44 -G 4.39 8.07 95.65 203.3 1.4 -H 7.95 12.26 110.98 218.78 0.72 -I - - 365.56 - - -
AQ 7.5 10.6 199.31 296.8 - -HS 10.62 14.1 106.18 183.4 - -
The results show that the mini slump test was not functional for the mortars containing the by-products. This result is due to the fact that the material in a mini slump test wi l l only flow i f the stress due to the weight of the cement paste contained in the cone is enough, i.e., higher than the yield stress of the material. It should be kept in mind that the minimum diameter that can be measured is 100 mm, corresponding to the bottom of the cone. In this case the mortars had to high yield stresses to allow the samples to flow when the cone was removed.
In Figure 13 it is clear that the flow resistance increases with time, reflecting the stiffening behaviour of mortar. However, the stiffening behaviour is not proceeding in the same manner for all the mortars. Some mortars, for example the one containing material C have a very fast stiffening reaction while others, such as HS containing mortar appears to have a prolonged stiffening period compared to the mortar containing quartz.
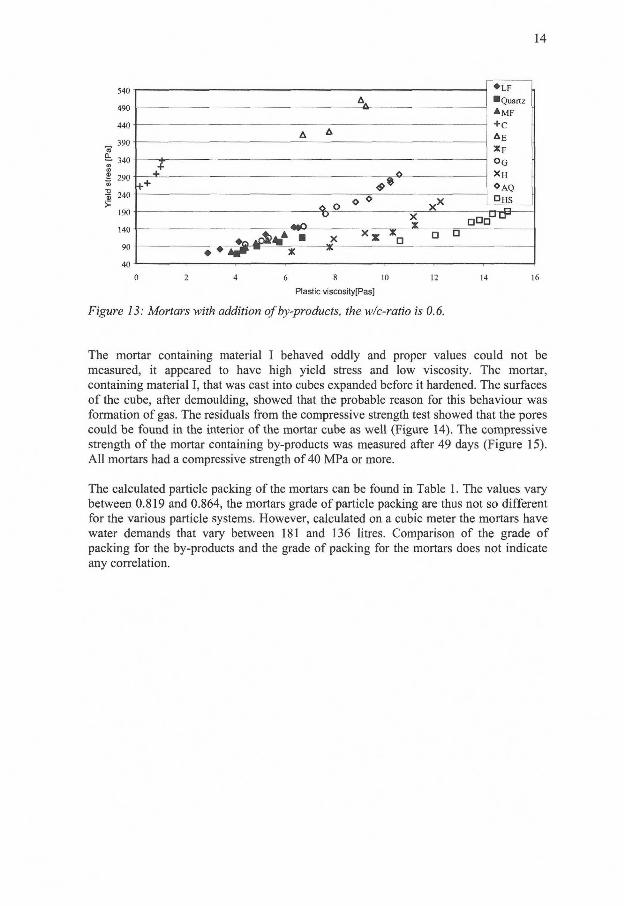
14
I 240 >-
190
140
• L F
•Quartz
A M F
+ C
A E
X F
O Q
X H
• A Q
• L F
•Quartz
A M F
+ C
A E
X F
O Q
X H
• A Q
• L F
•Quartz
A M F
+ C
A E
X F
O Q
X H
• A Q
A *
• L F
•Quartz
A M F
+ C
A E
X F
O Q
X H
• A Q
• L F
•Quartz
A M F
+ C
A E
X F
O Q
X H
• A Q
t + O
• L F
•Quartz
A M F
+ C
A E
X F
O Q
X H
• A Q
• L F
•Quartz
A M F
+ C
A E
X F
O Q
X H
• A Q
• L F
•Quartz
A M F
+ C
A E
X F
O Q
X H
• A Q
0 2 4 6 8 10 12 14 16
Plastic viscosityfPas]
Figure 13: Mortars with addition of by-products, the w/c-ratio is 0.6.
The mortar containing material I behaved oddly and proper values could not be measured, it appeared to have high yield stress and low viscosity. The mortar, containing material I , that was cast into cubes expanded before it hardened. The surfaces of the cube, after demoulding, showed that the probable reason for this behaviour was formation of gas. The residuals from the compressive strength test showed that the pores could be found in the interior of the mortar cube as well (Figure 14). The compressive strength of the mortar containing by-products was measured after 49 days (Figure 15). A l l mortars had a compressive strength of 40 MPa or more.
The calculated particle packing of the mortars can be found in Table 1. The values vary between 0.819 and 0.864, the mortars grade of particle packing are thus not so different for the various particle systems. However, calculated on a cubic meter the mortars have water demands that vary between 181 and 136 litres. Comparison of the grade of packing for the by-products and the grade of packing for the mortars does not indicate any correlation.
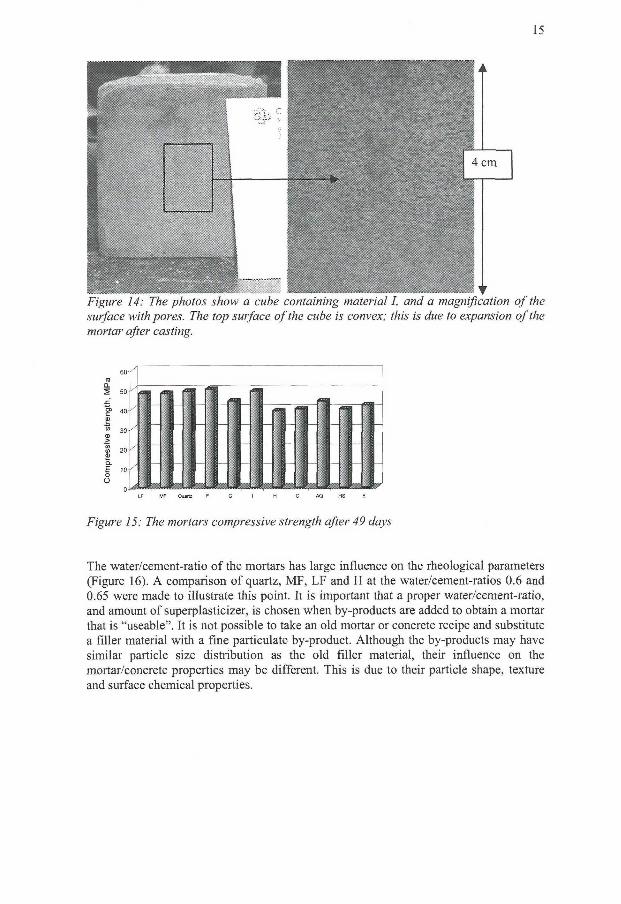
1 5
Figure 14: The photos show a cube containing material I, and a magnification of the surface with pores. The top surface of the cube is convex; this is due to expansion ofthe mortar after casting.
Figure 15: The mortars compressive strength after 49 days
The water/cement-ratio of the mortars has large influence on the rheological parameters (Figure 16). A comparison of quartz, MF, LF and H at the water/cement-ratios 0.6 and 0.65 were made to illustrate this point. It is important that a proper water/cement-ratio, and amount of superplasticizer, is chosen when by-products are added to obtain a mortar that is "useable". It is not possible to take an old mortar or concrete recipe and substitute a filler material with a fine particulate by-product. Although the by-products may have similar particle size distribution as the old filler material, their influence on the mortar/concrete properties may be different. This is due to their particle shape, texture and surface chemical properties.
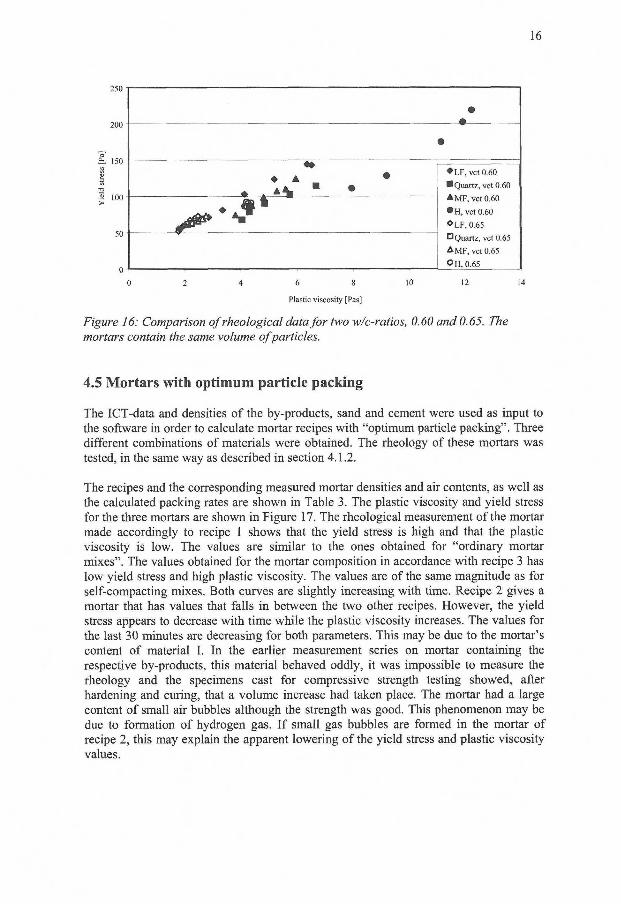
16
• •
4 »
• A • L F , vet 0.60
•Quartz, vet 0.60
A M F , vet 0.60
• H , vet 0.60
* L F , 0.65
O Quartz, vet 0.65
A M F , vet 0.65
OH, 0.65
• L F , vet 0.60
•Quartz, vet 0.60
A M F , vet 0.60
• H , vet 0.60
* L F , 0.65
O Quartz, vet 0.65
A M F , vet 0.65
OH, 0.65
• L F , vet 0.60
•Quartz, vet 0.60
A M F , vet 0.60
• H , vet 0.60
* L F , 0.65
O Quartz, vet 0.65
A M F , vet 0.65
OH, 0.65 0 ' i 1 ! '
0 2 4 6 8 10 12 14
Plastic viscosity [Pas]
Figure 16: Comparison of rheological data for two w/c-ratios, 0.60 and 0.65. The mortars contain the same volume of particles.
4.5 Mortars with optimum particle packing
The ICT-data and densities of the by-products, sand and cement were used as input to the software in order to calculate mortar recipes with "optimum particle packing". Three different combinations of materials were obtained. The rheology of these mortars was tested, in the same way as described in section 4.1.2.
The recipes and the corresponding measured mortar densities and air contents, as well as the calculated packing rates are shown in Table 3. The plastic viscosity and yield stress for the three mortars are shown in Figure 17. The rheological measurement of the mortar made accordingly to recipe 1 shows that the yield stress is high and that the plastic viscosity is low. The values are similar to the ones obtained for "ordinary mortar mixes". The values obtained for the mortar composition in accordance with recipe 3 has low yield stress and high plastic viscosity. The values are of the same magnitude as for self-compacting mixes. Both curves are slightly increasing with time. Recipe 2 gives a mortar that has values that falls in between the two other recipes. However, the yield stress appears to decrease with time while the plastic viscosity increases. The values for the last 30 minutes are decreasing for both parameters. This may be due to the mortar's content of material I . In the earlier measurement series on mortar containing the respective by-products, this material behaved oddly, it was impossible to measure the rheology and the specimens cast for compressive strength testing showed, after hardening and curing, that a volume increase had taken place. The mortar had a large content of small air bubbles although the strength was good. This phenomenon may be due to formation of hydrogen gas. I f small gas bubbles are formed in the mortar of recipe 2, this may explain the apparent lowering of the yield stress and plastic viscosity values.
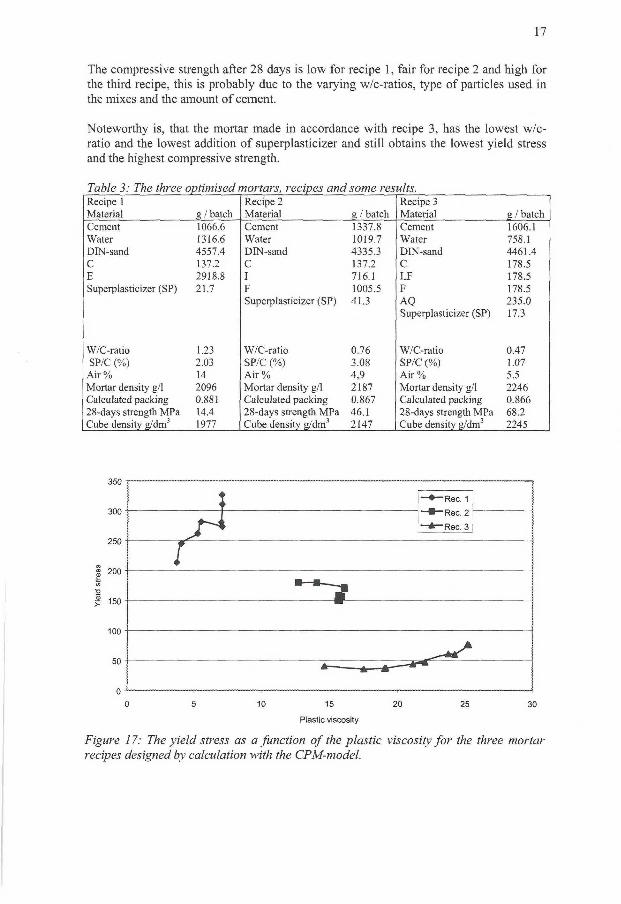
17
The compressive strength after 28 days is low for recipe 1, fair for recipe 2 and high for the third recipe, this is probably due to the varying w/c-ratios, type of particles used in the mixes and the amount of cement.
Noteworthy is, that the mortar made in accordance with recipe 3, has the lowest w/c-ratio and the lowest addition of superplasticizer and still obtains the lowest yield stress and the highest compressive strength.
Table 3: The three optimised mortars, recipes and some results. Recipe 1 Recipe 2 Recipe 3 Material g / batch Material g / batch Material g / batch Cement 1066.6 Cement 1337.8 Cement 1606.1 Water 1316.6 Water 1019.7 Water 758.1 DIN-sand 4557.4 DIN-sand 4335.3 DIN-sand 4461.4 C 137.2 C 137.2 C 178.5 E 2918.8 I 716.1 L F 178.5 Superplasticizer (SP) 21.7 F 1005.5 F 178.5
Superplasticizer (SP) 41.3 AQ 235.0 Superplasticizer (SP) 17.3
W/C-ratio 1.23 W/C-ratio 0.76 W/C-ratio 0.47 SP/C (%) 2.03 SP/C (%) 3.08 SP/C (%) 1.07
Air% 14 Air % 4,9 Air % 5.5 Mortar density g/1 2096 Mortar density g/1 2187 Mortar density g/1 2246 Calculated packing 0.881 Calculated packing 0.867 Calculated packing 0.866 28-days strength MPa 14.4 28-days strength MPa 46.1 28-days strength MPa 68.2 Cube density g/dm3 1977 Cube density g/dm3 2147 Cube density g/dm3 2245
350 I
0 ' 1 1 f
0 5 10 15 20 25 30
Plastic viscosity
Figure 17: The yield stress as a function of the plastic viscosity for the three mortar recipes designed by calculation with the CPM-model.
1 8
4.6 Effect of the by-products zeta-potential on rheology
The zeta-potential of a suspension is an indication of the magnitude of the repulsive force between the particles. The higher the zeta potential with the identical polarity, the more predominant the electrostatic repulsion between particles. Comparison between the by-products' zeta-potential in synthetic pore solution (Moosberg-Bustnes et al. 2003) and the rheological results show that the yield stress, of cement pastes with by-product addition, is higher for materials I and E, which have low absolute zeta-potential values. Low absolute zeta-potential values indicate that the materials have a tendency to flocculate. The rheological results are the same for the mortars that contain the byproducts. However, although addition of material C gives rise to a high yield stress, the zeta-potential is "normal". The effect of material C may be due to its irregular particle shape - the particles can hook on to each other and thus movement is obstructed.
5 Conclusions
In cement pastes the concentration of particles gives rise to strong interactions, depending on the shape of the particles, their size distribution and their surface properties. I f chemical admixtures are used and / or by-products added the system wil l become even more complex.
The study proves that it is possible to obtain a desired yield stress and plastic viscosity of cement pastes containing by-products, it may though change the perception of what is a "normal dosage" of superplasticizer. Some materials need high amounts of admixture, while others are similar to the normally used filler materials. The zeta-potential of the by-products appears to be important, the cement pastes and mortars containing byproducts with low absolute values have higher yield stresses than the others. Low absolute zeta-potential values indicate materials that have a tendency to flocculate.
There is not a good correlation between the beta-p measurements and the plastic viscosity and the yield stress, this may be due to the materials porosity and particle shapes. However, the fine particulate materials have higher beta-p values, higher water demand and thus higher plastic viscosity and yield stress.
The mini slump test was not functional for the mortars containing the by-products. This result is due to the fact that the material in a mini slump test wil l only flow i f the stress due to the weight of the cement paste contained in the cone is enough, i.e., higher than the yield stress of the material. It should be kept in mind that the minimum diameter that can be measured is 100 mm, corresponding to the bottom of the cone. In this case the mortars had to high yield stresses to allow the samples to flow when the cone was removed.
The three mortars with optimised particle packing have noticeably different plastic viscosities and yield stresses. Recipe 1 with the highest calculated packing, 0.881, had a high yield stress and low viscosity, while the mortar recipe 3, with a grade of packing of 0.866, resulted in low yield stress. It is possible that when the grade of packing increases the yield wil l be affected by the added particles shape, the particle may even interlock and thus increase the resistance against movement. However, the particle systems are probably not properly dispersed and thus the structure consist of particles flocks. It is
1 9
possible to change the rheological values significantly by adding more superplasticizer. The conclusion must be that it is difficult to use theoretically calculated particle packing as a steering variable in order to optimise rheological variables, especially when using complicated, previously not investigated materials, such as by-products.
It is not possible to take an old mortar or concrete recipe and substitute a filler material with a fine particulate by-product. Although the by-products may have similar particle size distribution as the old filler material, their influence on the mortar/concrete properties may be different. This is due to their particle shape, texture and surface chemical properties.
6 Acknowledgement
The authors gratefully acknowledge the financial support from MiMeR (Minerals and Metals Recycling Research Centre at Luleå University of Technology) and Cementa AB.
7 References
Billberg, P., Self-compacting concrete for civil engineering structure - the Swedish experience CBI-report 2:99. Swedish Cement and Concrete Research Institute, Stockholm, Sweden, 1999.
EFNARC, Specification and guidelines for self-compacting concrete EFNARC Association House, Hampshire, UK, 2001
Ferraris CF. Obla K.H- and Hil l R. The influence of mineral admixtures on the rheology of cement paste and concrete, Cement and Concrete Research, Vol. 31, 2001, pp. 245-255.
Gram H-E, Personal communication 2003, Cement AB, Sweden
ICT-manual, Invelop Oy, 1991, p. 27.
Kantro D.L. Influence of water-reducing admixtures on properties of cement paste - a miniature slump test, Cement, Concrete and Aggregates, Vol. 2, No. 2, 1980, pp. 95-102.
Kronlöf A. Effect of very fine aggregate on concrete strength, Materials and structures, 1994, Vol. 27, No. 165, pp. 15-25.
Lange F., Mörtel N . and Rudert V. Dense packing of cement pastes and resulting consequences on mortar properties, Cement and Concrete Research, Vol. 27, No. 10, 1997, pp. 1481-1488.
de Larrard F. Concrete mixture proportioning, a scientific approach, Modern concrete technology 9, E & FN Spoon, London GB, 1999, p. 418.

20
Moosberg-Bustnes H, Lind L. and Forssberg E. Measurements of metallurgical byproducts zeta-potential in electrolyte, (submitted to) Scandinavian journal of metallurgy, 2003
Stoval T., de Larrard F. and Buil M . Linear packing density model of grain mixtures, Powder Technology 48, pp.1-12.

1
The influence of limestone fillers' origin, surface texture and particle size distribution on cement paste properties.
H. Moosberg-Bustnes, Swedish Cement and Concrete Research Institute
Abstract
It is known that particle size distribution, particle shape and surface texture are the main important physical parameters describing the effects of the filler material on the cement paste properties. In order to facilitate the use of mineral and metallurgical by-products as filler in concrete it is important to know which of the mentioned properties is the most important one for the filler materials function. To obtain base knowledge, 8 limestone fillers with different origin (genesis and metamorphose grade) and particle size distribution have been added to cement paste. Particle characterisation has been performed on the limestone particles with scanning electron microscopy, and the various limestone fillers effect on cement pastes' water demand, rheology, heat of hydration and strength have been investigated. It is clear that the particle size distribution plays a major roll, although the origin/surface texture affects water demand and rheology. The limestone fillers, particle size distribution and origins have a minor effect on the cement pastes' compressive strength.
1 Background
The use of by-products as filler in concrete opens a whole new range of possibilities, at the same time as it raises a lot of questions. However, their behaviour in, and influence on cement paste has to be thoroughly evaluated before they can be put in to regular use.
It is known that particle size distribution, particle shape and surface texture are important physical parameters for how the filler affect cement paste. But it is not known which one of the parameters that is the most important one, or i f they are equally important. To be able to choose the right type of by-products as filler material it is imperative it is known i f the shape, texture or size distribution is the most important parameter. This study is made in order to obtain more knowledge in this area. Limestone fillers have been chosen as experimental materials since they are commonly used and they excist in different size ranges and have different origins.
2 Literature
2.1 The influence ofthe particle size distribution on rheology
Generally, the problems with segregation and sedimentation set the restriction on the maximum particle size of the filler materials that can be used in cement paste. High amounts of fines may increase the viscosity.
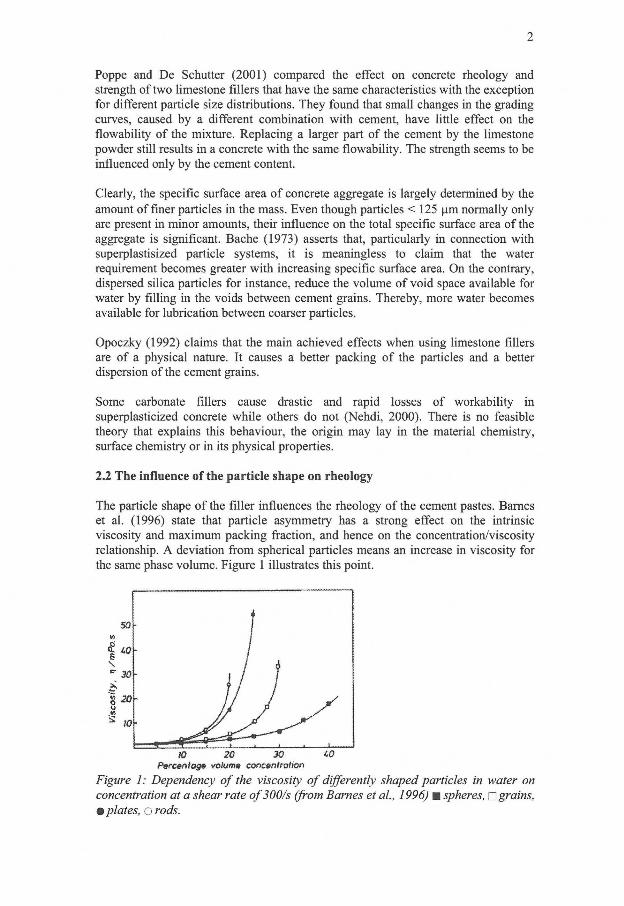
2
Poppe and De Schutter (2001) compared the effect on concrete rheology and strength of two limestone fillers that have the same characteristics with the exception for different particle size distributions. They found that small changes in the grading curves, caused by a different combination with cement, have little effect on the flowability of the mixture. Replacing a larger part of the cement by the limestone powder still results in a concrete with the same flowability. The strength seems to be influenced only by the cement content.
Clearly, the specific surface area of concrete aggregate is largely determined by the amount of finer particles in the mass. Even though particles < 125 pm normally only are present in minor amounts, their influence on the total specific surface area of the aggregate is significant. Bache (1973) asserts that, particularly in connection with superplastisized particle systems, it is meaningless to claim that the water requirement becomes greater with increasing specific surface area. On the contrary, dispersed silica particles for instance, reduce the volume of void space available for water by filling in the voids between cement grains. Thereby, more water becomes available for lubrication between coarser particles.
Opoczky (1992) claims that the main achieved effects when using limestone fillers are of a physical nature. It causes a better packing of the particles and a better dispersion of the cement grains.
Some carbonate fillers cause drastic and rapid losses of workability in superplasticized concrete while others do not (Nehdi, 2000). There is no feasible theory that explains this behaviour, the origin may lay in the material chemistry, surface chemistry or in its physical properties.
2.2 The influence of the particle shape on rheology
The particle shape of the filler influences the rheology of the cement pastes. Barnes et al. (1996) state that particle asymmetry has a strong effect on the intrinsic viscosity and maximum packing fraction, and hence on the concentration/viscosity relationship. A deviation from spherical particles means an increase in viscosity for the same phase volume. Figure 1 illustrates this point.
10 20 30 iO Percentage volume concentration
Figure 1: Dependency of the viscosity of differently shaped particles in water on concentration at a shear rate of300/s (from Barnes et al, 1996) • spheres, • grains, • plates, o rods.
3
Bergström (1996) found that deviation from a spherical shape always lead to higher viscosity, it can also result in other effects, for example: rod shaped particles can cause shear-thickening.
2.3 Limestone's effect on cement hydration
From a chemical point of view, limestone filler does not have pozzolanic properties, but it reacts with the aluminate phases of cement to form an calcium monocarboaluminate hydrate with no significant changes on the strength of blended cement (Bonavetti 1992, 2003)
Nehdi (2000) asked the question: Although there is abundant literature suggesting the nucleation mechanism as the primary cause for the microfilier acceleration of the early age hydration, there is a certain confusion as to what is nucleating: C-S-H or portlandite (calcium hydroxide, CH) or both, and in what sequence?
Soroka and Stern (1977) state that limestone filler act as the crystallisation nucleus for the precipitation of calcium hydrate (CH). Bonavetti et al. (2003) also hold that view, i.e., that the main effects of limestone filler are of physical nature, it causes a better packing of the cement paste, disperses the cement grains and acts as the crystallisation nucleus for the precipitation of CH.
Ramachandran and Zhang (1986) suggested that calcite not only accelerates the hydration of C3S, but that a certain percentage of calcite is consumed before the first 24 hours in this process. They explained the increased hydration rate by the nucleation of C-S-H around calcite particles, which would incorporate a part of the calcite in some kind of composite. They supported this idea by 24 hours SEM micrographs illustrating the growth of C-S-H around calcite grains.
Kjellsen and Lagerblad (1995) argued that the acceleration of the hydration is initiated during the induction period, before any notable long-range nucleation of C-S-H can be expected. The acceleratory effect of limestone fillers may be due to precipitation of hydrates on the particles. The surface of calcite may provide beneficial substrates for CH precipitation implying that CH probably will precipitate on theses minerals, which in turn wil l lower the Ca 2 + ion concentration in the pore solution. This can lead to the observed increased hydration rate, therefore they questioned the above mentioned explanation.
Nehdi and Mindess ( ) argued that in the presence of calcite removal of calcium ions from the cement-water solution the hydration would start earlier, and would enhance further dissolution of calcium ions. They thought that calcite particles would partially dissolve in the limestone cement water system, providing extra Ca 2 + ions and thus modifying the kinetics of the hydration reactions. Because of the low solubility of calcite in alkaline systems this theory does not seem to be thermodynamically plausible. They investigated this aspect by comparing he effect of limestone filler and hydrated lime powder, the hydrated lime is much more soluble in water than limestone powder and would provide many more Ca 2 + ions in the solution, thus further increasing the hydration rate. No severe losses of workability were observed. Therefore, the effect of dissolution of Ca 2 + ions may not
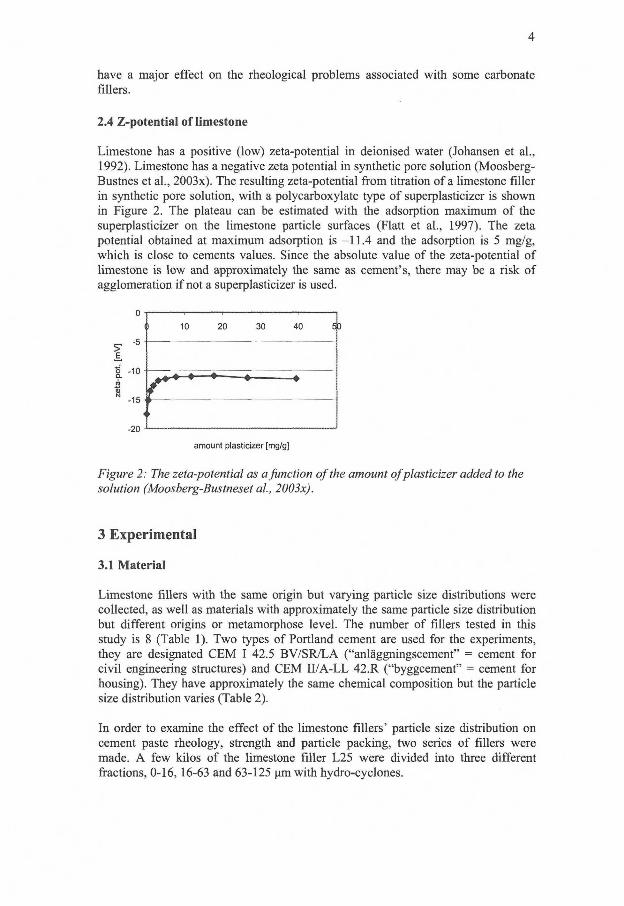
4
have a major effect on the rheological problems associated with some carbonate fillers.
2.4 Z-potential of limestone
Limestone has a positive (low) zeta-potential in deionised water (Johansen et al., 1992). Limestone has a negative zeta potential in synthetic pore solution (Moosberg-Bustnes et al., 2003x). The resulting zeta-potential from titration of a limestone filler in synthetic pore solution, with a polycarboxylate type of superplasticizer is shown in Figure 2. The plateau can be estimated with the adsorption maximum of the superplasticizer on the limestone particle surfaces (Flatt et al., 1997). The zeta potential obtained at maximum adsorption is -11.4 and the adsorption is 5 mg/g, which is close to cements values. Since the absolute value of the zeta-potential of limestone is low and approximately the same as cement's, there may be a risk of agglomeration i f not a superplasticizer is used.
10 2 0 3 0 4 0
> E
2 -10 •
- 1 5
-20
amount plasticizer [mg/g]
Figure 2: The zeta-potential as a function of the amount ofplasticizer added to the solution (Moosberg-Bustneset al, 2003x).
3 Experimental
3.1 Material
Limestone fillers with the same origin but varying particle size distributions were collected, as well as materials with approximately the same particle size distribution but different origins or metamorphose level. The number of fillers tested in this study is 8 (Table 1). Two types of Portland cement are used for the experiments, they are designated CEM I 42.5 BV/SR/LA ("anläggningscement" = cement for civil engineering structures) and CEM II/A-LL 42.R ("byggcement" = cement for housing). They have approximately the same chemical composition but the particle size distribution varies (Table 2).
In order to examine the effect of the limestone fillers' particle size distribution on cement paste rheology, strength and particle packing, two series of fillers were made. A few kilos of the limestone filler L25 were divided into three different fractions, 0-16, 16-63 and 63-125 pm with hydro-cyclones.
5
Base filler, the limestone filler L25, was gradually replaced with 0-16 and 16-63 um fraction, respectively, and the desired properties of the resulting cement pastes were examined. The replacement levels were 10, 30, 50 and 70 percent.
Table 1: Limestone fillers used in the study Name Genesis Age Mine/plant L15 Sedimentary limestone 70 million years old Ignaberga L20 Sedimentary limestone 450 million years old Orsa L25/L40 Crystalline limestone Metamorf limestone, 1 .8-2 Forsby/Köping
milliard years old P8/80 Crystalline, calcite Pargas P5/100 Crystalline, calcite Pargas K250 Sedimentary limestone 400 million years old Boda/Kullsberg G250 Crystalline limestone 1900 million years old Gåsgruvan
Table 2: Chemical composition, weight percent, and particle size distribution of the used cements (Cementa, 2003}
Chem. cont.
Anläggningscement CEMI 42.5BV/SR/LA
%
Byggcement CEMII/A-LL42.R
%
Particle size
urn
Anl. cement
Acc. %
Byggcement
Acc. %
CaO 64.8 63.7 125 100 100 S i 0 2 22.3 19,6 63 100 99.9 A1 2 0 3
3.4 3.6 32 79.6 82.9 F e 2 0 3
4.3 2.8 15 52.4 61.9 MgO 0.8 2.7 8 35.7 43.8 Na 2 0 0.1 0.23 5 26.8 33.4 K 2 0 0.6 0.92 3 19.5 23.6 S 0 3
2.4 3.5 2 14.3 16.9 CI 0.015 0.04 1 6.3 8.0
3.2 Scanning electron microscopy analyses
A Philips 515 Scanning electron microscopy (SEM) has been used to investigate the limestone fillers particle shape, their f-shape, and to obtain pictures (micrographs) of the by-product particles surfaces.
3.2.1 Particle shape
Micrographs of the limestone filler particles were taken with scanning electron microscopy to enable evaluation of the three-dimensional particle shape, particle surface textures and pores, i f any.
3.2.2 F-shape
Image analysis (computer analysis of digital SEM images) was used to define the parameter F-shape of the limestone fillers, which is an aspect ratio of the shortest versus the longest diameter of a particle. At least 400 particles in each sample were measured. Persson (1996) describes the procedure. Spherical particles have an F-shape value of 1, and cubical particles 0.71. The image analysis study makes it possible to describe the particle shapes ofthe filler materials.
6
3.3 Particle size distribution and specific surface area
The particle size distributions of the materials were determined by laser diffraction analysis (SILAS) and the specific surface areas were analysed by the producers. The BET-method was used, although some limestone fillers also were analysed with the Blaine-method.
3.4 Calorimetry
Isothermal calorimetric measurements were performed on cement/limestone filler mixtures in order to see how the limestone fillers particle size distributions and different origins affect the cement hydration. The cement used for the calorimetric experiments was a Portland cement (CEM I 42.5 BV/SR/LA) and the w/s-rate kept at 0.40. The limestone filler was mixed into the cement pastes by 20 weight percent. The heat development was measured for 24 hours, four minutes elapsed between the addition of the water to the cement/filler mixture and the placement of the paste in the calorimeter. The first heat peak, the wetting peak, was thus discarded. The calorimeter has an accuracy of ± 5 percent. The analyses were performed twice, with excellent repeatability.
3.5 Determination of water/powder ratio for zero flow - pp
Determination of the fdler/cement mixtures water demand, i.e., the influence of addition of filler materials on the flowability of the cement paste was investigated. Two different cement types were used in the experiments to evaluate the effect of the cement type on the filler materials.
The water/powder ratio for zero flow (ß p) is determined in the paste, with the chosen filler/cement proportions of 15, 30 and 45 volume percent filler. Flow cone tests with water/powder ratios by volume of, e.g., 1.1, 1.2, 1.3 and 1.4 were performed with the selected powder compositions. The measurements were performed three times for each powder mixture. The results are plotted in xy-diagram, with relative slump versus water/powder ratio. The point of intersection with the y-axis (water/powder ratio) is designated the ß p value. The method is in accordance with EFNARC's specifications (EFNARC). The slope of the regression line represents the materials sensitivity of increased water content. Lower values indicate greater sensitivity to increasing water content.
In order to determine the ß p value for each limestone filler and mixture, straight-line regression analyses were made on the resulting values for each mixture. The ß p
values and the corresponding filler amount could then be plotted in a diagram.
3.6 Rheological measurements
Water/cement-ratio, plasticizer, cement and the amount of filler added to the cement paste were kept constant to isolate the effect of the size distribution of the filler material. The recipe for the cement paste, calculated on a paste volume of 0.35 dm3, is 169.4 g limestone filler, 390.6 g cement, 154.9 g water and 1.6 g Chemfiux prefab, a plasticizer functioning as a dispergator. The measurements were performed
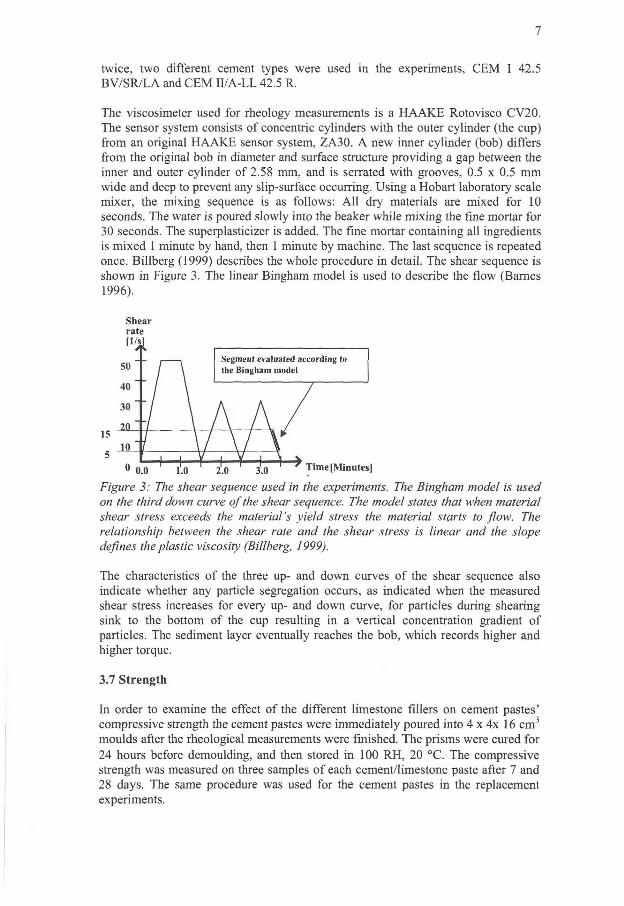
7
twice, two different cement types were used in the experiments, CEM I 42.5 BV/SR/LA and CEM II/A-LL 42.5 R.
The viscosimeter used for rheology measurements is a HAAKE Rotovisco CV20. The sensor system consists of concentric cylinders with the outer cylinder (the cup) from an original HAAKE sensor system, ZA30. A new inner cylinder (bob) differs from the original bob in diameter and surface structure providing a gap between the inner and outer cylinder of 2.58 mm, and is serrated with grooves, 0.5 x 0.5 mm wide and deep to prevent any slip-surface occurring. Using a Hobart laboratory scale mixer, the mixing sequence is as follows: Al l dry materials are mixed for 10 seconds. The water is poured slowly into the beaker while mixing the fine mortar for 30 seconds. The superplasticizer is added. The fine mortar containing all ingredients is mixed 1 minute by hand, then 1 minute by machine. The last sequence is repeated once. Billberg (1999) describes the whole procedure in detail. The shear sequence is shown in Figure 3. The linear Bingham model is used to describe the flow (Barnes 1996).
Shear rate
Figure 3: The shear sequence used in the experiments. The Bingham model is used on the third down curve of the shear sequence. The model states that when material shear stress exceeds the material's yield stress the material starts to flow. The relationship between the shear rate and the shear stress is linear and the slope defines the plastic viscosity (Billberg, 1999).
The characteristics of the three up- and down curves of the shear sequence also indicate whether any particle segregation occurs, as indicated when the measured shear stress increases for every up- and down curve, for particles during shearing sink to the bottom of the cup resulting in a vertical concentration gradient of particles. The sediment layer eventually reaches the bob, which records higher and higher torque.
3.7 Strength
In order to examine the effect of the different limestone fillers on cement pastes' compressive strength the cement pastes were immediately poured into 4 x 4x 16 cm 3
moulds after the rheological measurements were finished. The prisms were cured for 24 hours before demoulding, and then stored in 100 RH, 20 °C. The compressive strength was measured on three samples of each cement/limestone paste after 7 and 28 days. The same procedure was used for the cement pastes in the replacement experiments.
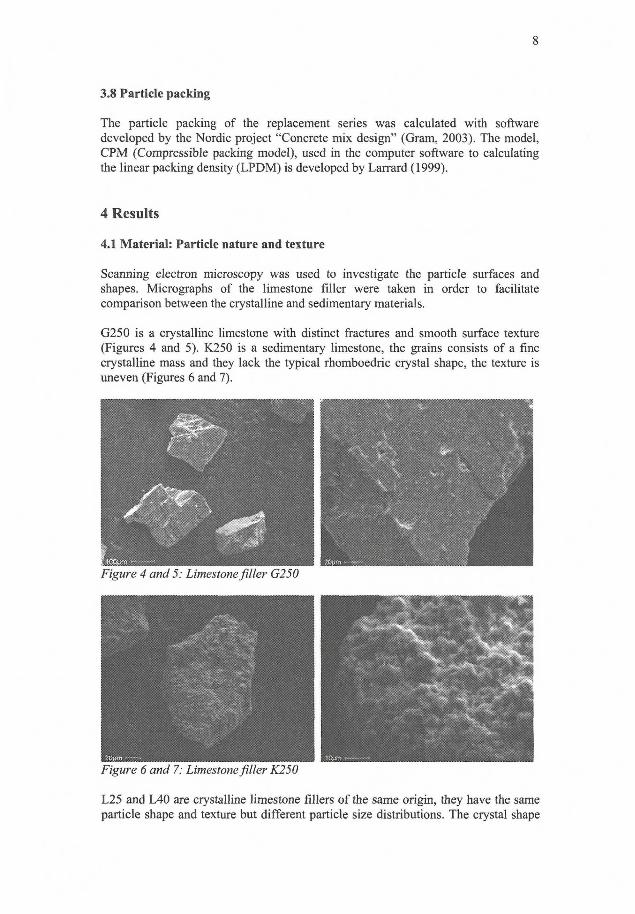
8
3.8 Particle packing
The particle packing of the replacement series was calculated with software developed by the Nordic project "Concrete mix design" (Gram, 2003). The model, CPM (Compressible packing model), used in the computer software to calculating the linear packing density (LPDM) is developed by Larrard (1999).
4 Results
4.1 Material: Particle nature and texture
Scanning electron microscopy was used to investigate the particle surfaces and shapes. Micrographs of the limestone fdler were taken in order to facilitate comparison between the crystalline and sedimentary materials.
G250 is a crystalline limestone with distinct fractures and smooth surface texture (Figures 4 and 5). K250 is a sedimentary limestone, the grains consists of a fine crystalline mass and they lack the typical rhomboedric crystal shape, the texture is uneven (Figures 6 and 7).
Figure 4 and 5: Limestone filler G250
Figure 6 and 7: Limestone filler K250
L25 and L40 are crystalline limestone fillers of the same origin, they have the same particle shape and texture but different particle size distributions. The crystal shape
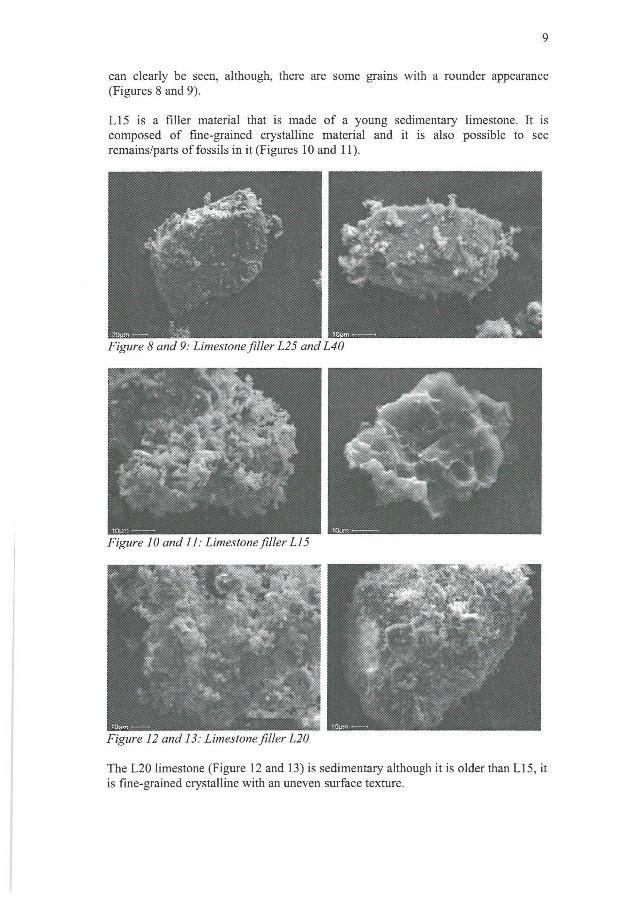
9
can clearly be seen, although, there are some grains with a rounder appearance (Figures 8 and 9).
LI5 is a filler material that is made of a young sedimentary limestone. It is composed of fine-grained crystalline material and it is also possible to see remains/parts of fossils in it (Figures 10 and 11).
Figure 8 and 9: Limestone filler L25 and L40
Figure 10 and 11: Limestone filler LI 5
Figure 12 and 13: Limestone filler L20
The L20 limestone (Figure 12 and 13) is sedimentary although it is older than L15, it is fine-grained crystalline with an uneven surface texture.
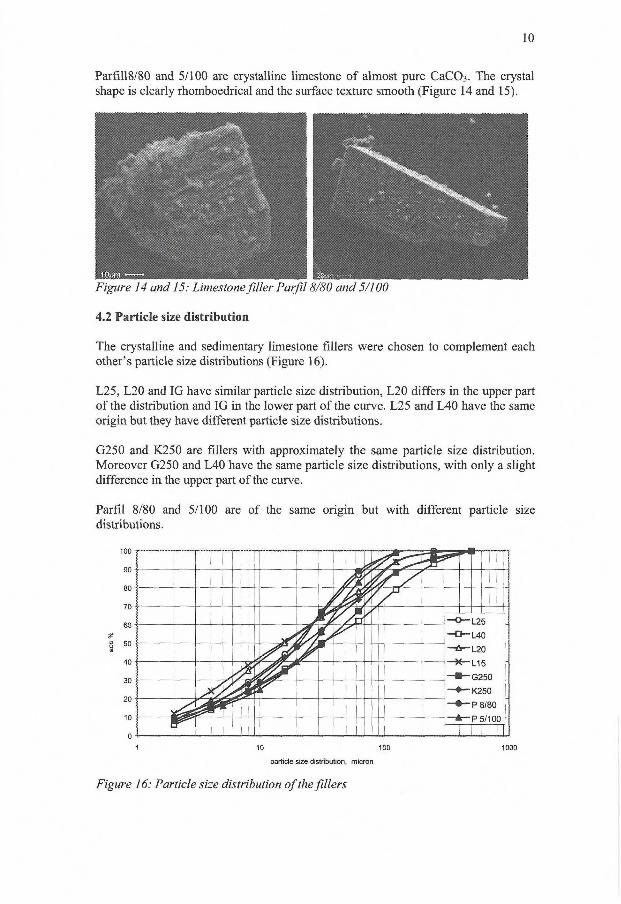
10
Parfill8/80 and 5/100 are crystalline limestone of almost pure CaCOj. The crystal shape is clearly rhomboedrical and the surface texture smooth (Figure 14 and 15).
Figure 14 and 15: Limestone fdler Parfil 8/80 and 5/100
4.2 Particle size distribution
The crystalline and sedimentary limestone fillers were chosen to complement each other's particle size distributions (Figure 16).
L25, L20 and IG have similar particle size distribution, L20 differs in the upper part of the distribution and IG in the lower part of the curve. L25 and L40 have the same origin but they have different particle size distributions.
G250 and K250 are fillers with approximately the same particle size distribution. Moreover G250 and L40 have the same particle size distributions, with only a slight difference in the upper part ofthe curve.
Parfil 8/80 and 5/100 are of the same origin but with different particle size distributions.
—O— L25
- O - L 4 0
—O— L25
- O - L 4 0
L20
L15
oom
L20
L15
oom
— • — K250
P8/80
P 5/100
I wt—
1
P8/80
P 5/100
I 1 10 100 1000
particle size distribution, micron
Figure 16: Particle size distribution of the fillers
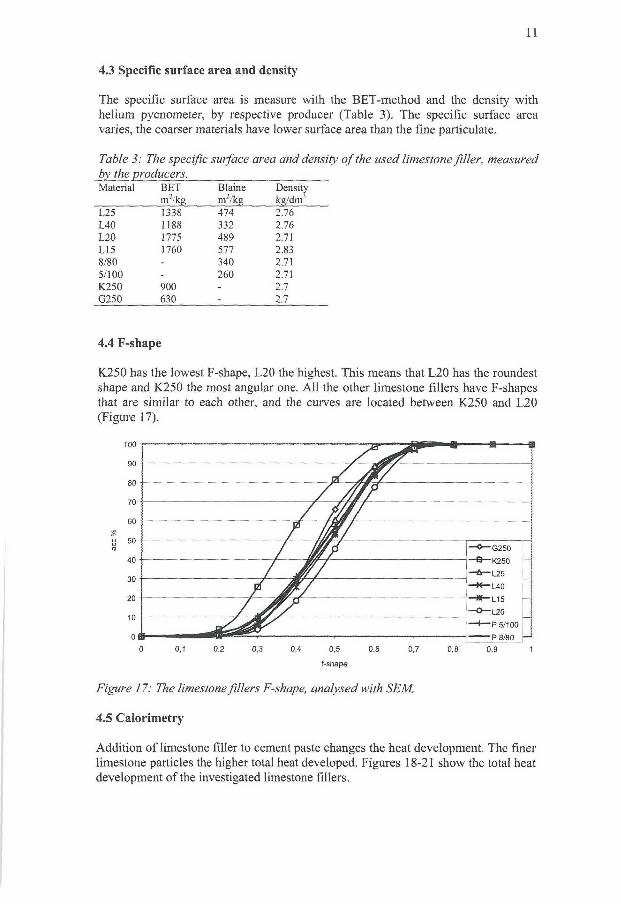
11
4.3 Specific surface area and density
The specific surface area is measure with the BET-method and the density with helium pycnometer, by respective producer (Table 3). The specific surface area varies, the coarser materials have lower surface area than the fine particulate.
Table 3: The specific surface area and density of the used limestone filler, measured by the producers. Material B E T Blaine Density
m2/kg m2/kg kg/dm3
L25 1338 474 2.76 L40 1188 332 2.76 L20 1775 489 2.71 L15 1760 577 2.83 8/80 - 340 2.71 5/100 - 260 2.71 K250 900 - 2.7 G250 630 - 2.7
4.4 F-shape
K250 has the lowest F-shape, L20 the highest. This means that L20 has the roundest shape and K250 the most angular one. Al l the other limestone fillers have F-shapes that are similar to each other, and the curves are located between K250 and L20 (Figure 17).
Figure 17: The limestone fillers F-shape, analysed with SEM.
4.5 Calorimetry
Addition of limestone filler to cement paste changes the heat development. The finer limestone particles the higher total heat developed. Figures 18-21 show the total heat development ofthe investigated limestone fillers.
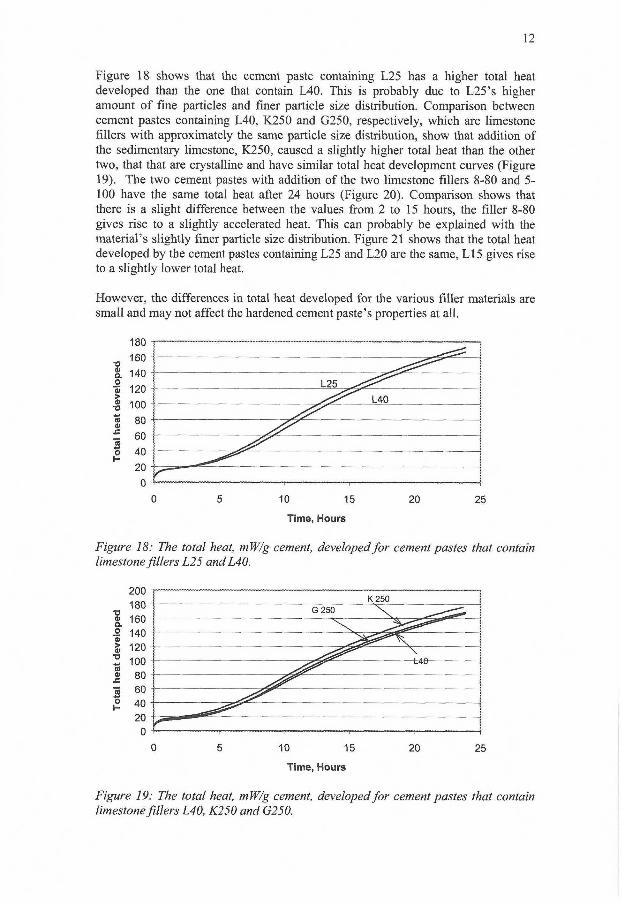
1 2
Figure 18 shows that the cement paste containing L25 has a higher total heat developed than the one that contain L40. This is probably due to L25's higher amount of fine particles and finer particle size distribution. Comparison between cement pastes containing L40, K250 and G250, respectively, which are limestone fillers with approximately the same particle size distribution, show that addition of the sedimentary limestone, K250, caused a slightly higher total heat than the other two, that that are crystalline and have similar total heat development curves (Figure 19). The two cement pastes with addition of the two limestone fillers 8-80 and 5-100 have the same total heat after 24 hours (Figure 20). Comparison shows that there is a slight difference between the values from 2 to 15 hours, the fdler 8-80 gives rise to a slightly accelerated heat. This can probably be explained with the material's slightly finer particle size distribution. Figure 21 shows that the total heat developed by the cement pastes containing L25 and L20 are the same, LI5 gives rise to a slightly lower total heat.
However, the differences in total heat developed for the various filler materials are small and may not affect the hardened cement paste's properties at all.
0 5 10 15 20 25
Time, Hours
Figure 18: The total heat, mW/g cement, developed for cement pastes that contain limestone fillers L25 and L40.
Time, Hours
Figure 19: The total heat, mW/g cement, developed for cement pastes that contain limestone fillers L40, K250 and G250.
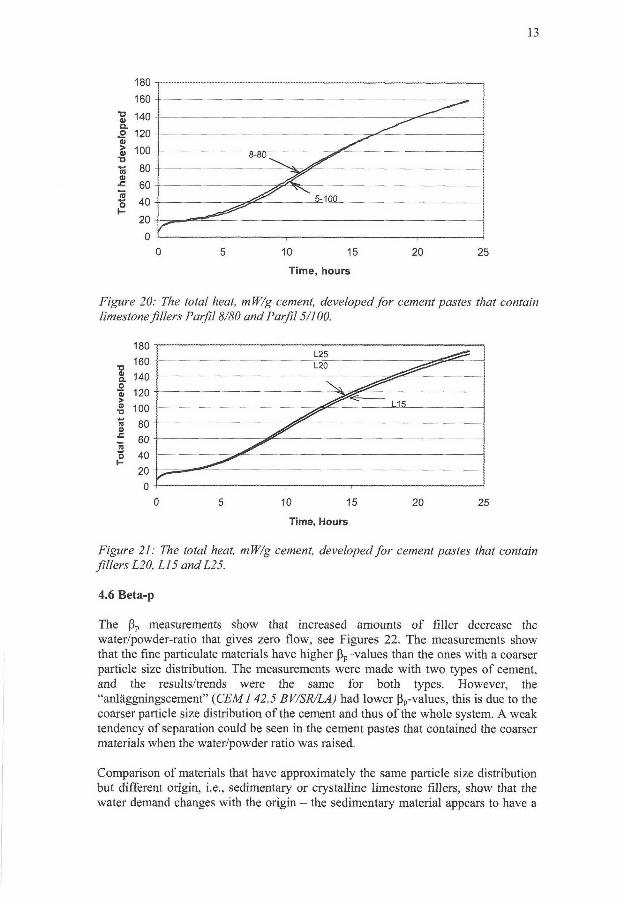
13
Time, hours
Figure 20: The total heat, m W/g cement, developed for cement pastes that contain limestone fillers Parfil 8/80 and Parfil 5/100.
180 i
Time, Hours
Figure 21: The total heat, mW/g cement, developed for cement pastes that contain fillers L20, LI5 andL25.
4.6 Beta-p
The ß p measurements show that increased amounts of filler decrease the water/powder-ratio that gives zero flow, see Figures 22. The measurements show that the fine particulate materials have higher ßp-values than the ones with a coarser particle size distribution. The measurements were made with two types of cement, and the results/trends were the same for both types. However, the "anläggningscement" (CEM142.5 BV/SR/LA) had lower ßp-values, this is due to the coarser particle size distribution of the cement and thus of the whole system. A weak tendency of separation could be seen in the cement pastes that contained the coarser materials when the water/powder ratio was raised.
Comparison of materials that have approximately the same particle size distribution but different origin, i.e., sedimentary or crystalline limestone fillers, show that the water demand changes with the origin - the sedimentary material appears to have a
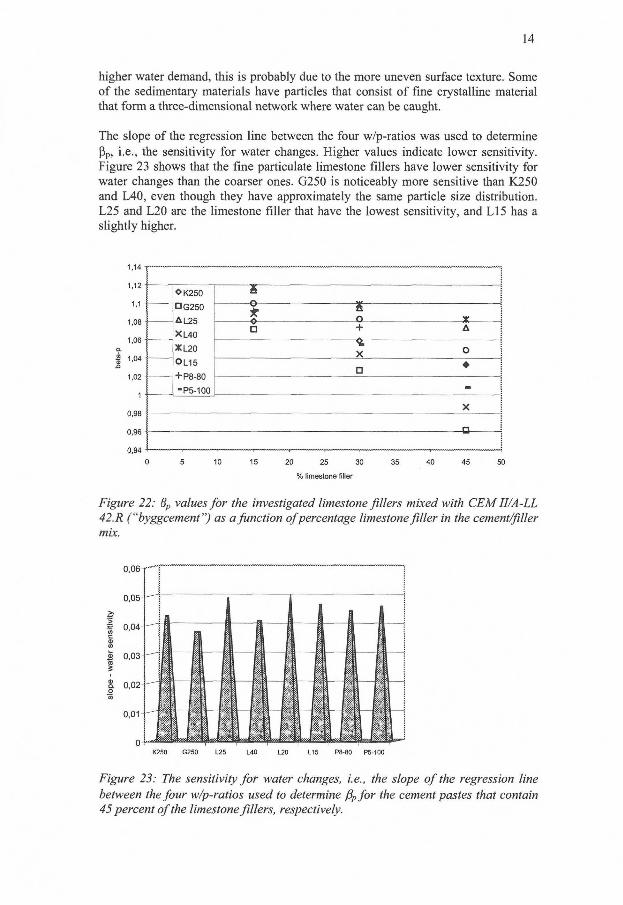
14
higher water demand, this is probably due to the more uneven surface texture. Some of the sedimentary materials have particles that consist of fine crystalline material that form a three-dimensional network where water can be caught.
The slope of the regression line between the four w/p-ratios was used to determine ß p , i.e., the sensitivity for water changes. Higher values indicate lower sensitivity. Figure 23 shows that the fine particulate limestone fillers have lower sensitivity for water changes than the coarser ones. G250 is noticeably more sensitive than K250 and L40, even though they have approximately the same particle size distribution. L25 and L20 are the limestone filler that have the lowest sensitivity, and L15 has a slightly higher.
OK250 a
• G250
A|_25
XL40
* L 2 0
OL15
+ P8-80
-P5-100
o S 0 O X
• G250
A|_25
XL40
* L 2 0
OL15
+ P8-80
-P5-100
• + A
• G250
A|_25
XL40
* L 2 0
OL15
+ P8-80
-P5-100
X °
• G250
A|_25
XL40
* L 2 0
OL15
+ P8-80
-P5-100
• •
• G250
A|_25
XL40
* L 2 0
OL15
+ P8-80
-P5-100 -X
•
0 5 10 15 20 25 30 35 40 45 50
Figure 22: 6p values for the investigated limestone fillers mixed with CEM II/A-LL 42. R ("byggcement") as a function of percentage limestone filler in the cement/filler mix.
Figure 23: The sensitivity for water changes, i.e., the slope of the regression line between the four w/p-ratios used to determine ßpfor the cement pastes that contain 45 percent of the limestone fillers, respectively.
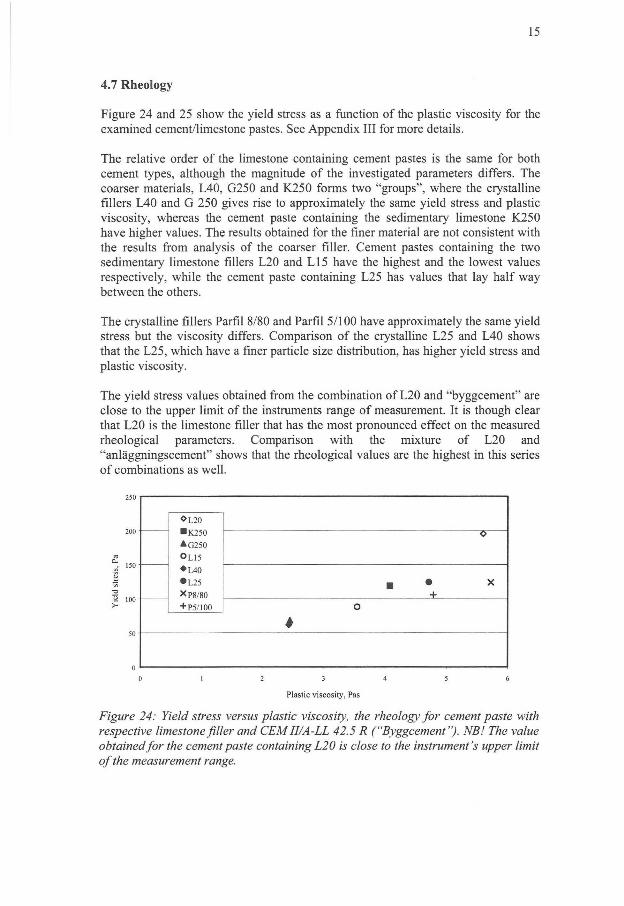
15
4.7 Rheology
Figure 24 and 25 show the yield stress as a function of the plastic viscosity for the examined cement/limestone pastes. See Appendix I I I for more details.
The relative order of the limestone containing cement pastes is the same for both cement types, although the magnitude of the investigated parameters differs. The coarser materials, L40, G250 and K250 forms two "groups", where the crystalline fillers L40 and G 250 gives rise to approximately the same yield stress and plastic viscosity, whereas the cement paste containing the sedimentary limestone K250 have higher values. The results obtained for the finer material are not consistent with the results from analysis of the coarser filler. Cement pastes containing the two sedimentary limestone fillers L20 and LI5 have the highest and the lowest values respectively, while the cement paste containing L25 has values that lay half way between the others.
The crystalline fillers Parfil 8/80 and Parfil 5/100 have approximately the same yield stress but the viscosity differs. Comparison of the crystalline L25 and L40 shows that the L25, which have a finer particle size distribution, has higher yield stress and plastic viscosity.
The yield stress values obtained from the combination of L20 and "byggcement" are close to the upper limit of the instruments range of measurement. It is though clear that L20 is the limestone filler that has the most pronounced effect on the measured rheological parameters. Comparison with the mixture of L20 and "anläggningscement" shows that the rheological values are the highest in this series of combinations as well.
£ 100
*L20
• K250
*G250
OL15
• L 4 0
• L 2 5
XP8/80
+P5/100
*L20
• K250
*G250
OL15
• L 4 0
• L 2 5
XP8/80
+P5/100
O
*L20
• K250
*G250
OL15
• L 4 0
• L 2 5
XP8/80
+P5/100
• • x +
*L20
• K250
*G250
OL15
• L 4 0
• L 2 5
XP8/80
+P5/100 o *
0 1 2 3 4 5 6
Plastic viscosity. Pas
Figure 24: Yield stress versus plastic viscosity, the rheology for cement paste with respective limestone filler and CEM II/A-LL 42.5 R ("Byggcement"). NB! The value obtained for the cement paste containing L20 is close to the instrument's upper limit of the measurement range.
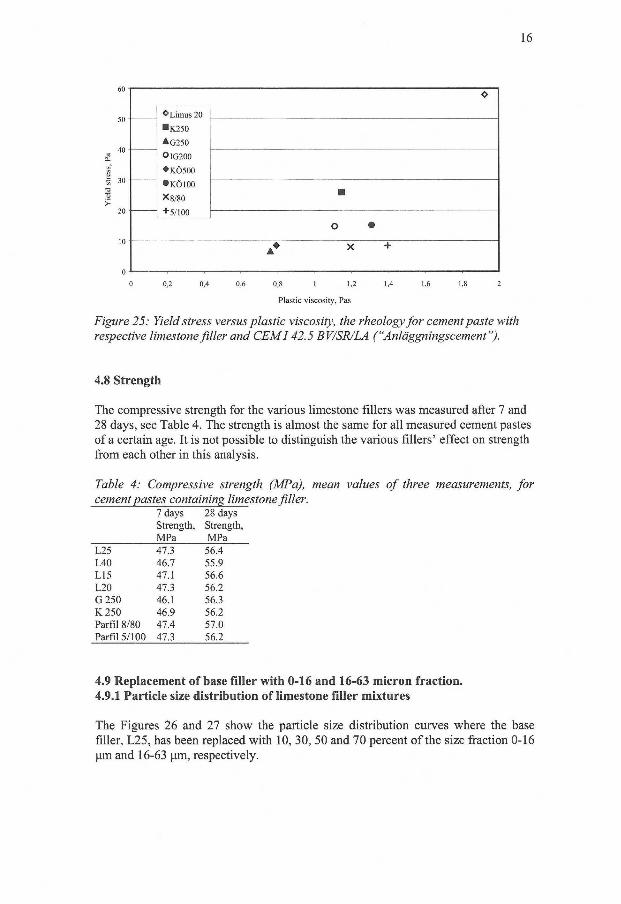
16
* L i m u s 20
• K 2 5 0
AG250
OIG200
• KÖ500
• K Ö I O O
*8/80
+ 5/100
• * L i m u s 20
• K 2 5 0
AG250
OIG200
• KÖ500
• K Ö I O O
*8/80
+ 5/100
* L i m u s 20
• K 2 5 0
AG250
OIG200
• KÖ500
• K Ö I O O
*8/80
+ 5/100
* L i m u s 20
• K 2 5 0
AG250
OIG200
• KÖ500
• K Ö I O O
*8/80
+ 5/100
•
* L i m u s 20
• K 2 5 0
AG250
OIG200
• KÖ500
• K Ö I O O
*8/80
+ 5/100
O •
A * X +
0 0,2 0,4 0,6 0,8 1 1,2 1,4 1,6 1,8 2
Plastic viscosity, Pas
Figure 25: Yield stress versus plastic viscosity, the rheology for cement paste with respective limestone filler and CEM 142.5 BV/SR/LA ("Anläggningscement").
4.8 Strength
The compressive strength for the various limestone fillers was measured after 7 and 28 days, see Table 4. The strength is almost the same for all measured cement pastes of a certain age. It is not possible to distinguish the various fillers' effect on strength from each other in this analysis.
Table 4: Compressive strength (MPa), mean values of three measurements, for cement pastes containing limestone filler.
7 days 28 days Strength, Strength, MPa MPa
L25 47.3 56.4 L40 46.7 55.9 L15 47.1 56.6 L20 47.3 56.2 G 250 46.1 56.3 K 250 46.9 56.2 Parfil 8/80 47.4 57.0 Parfil 5/100 47.3 56.2
4.9 Replacement of base filler with 0-16 and 16-63 micron fraction. 4.9.1 Particle size distribution of limestone filler mixtures
The Figures 26 and 27 show the particle size distribution curves where the base filler, L25, has been replaced with 10, 30, 50 and 70 percent ofthe size fraction 0-16 um and 16-63 pm, respectively.
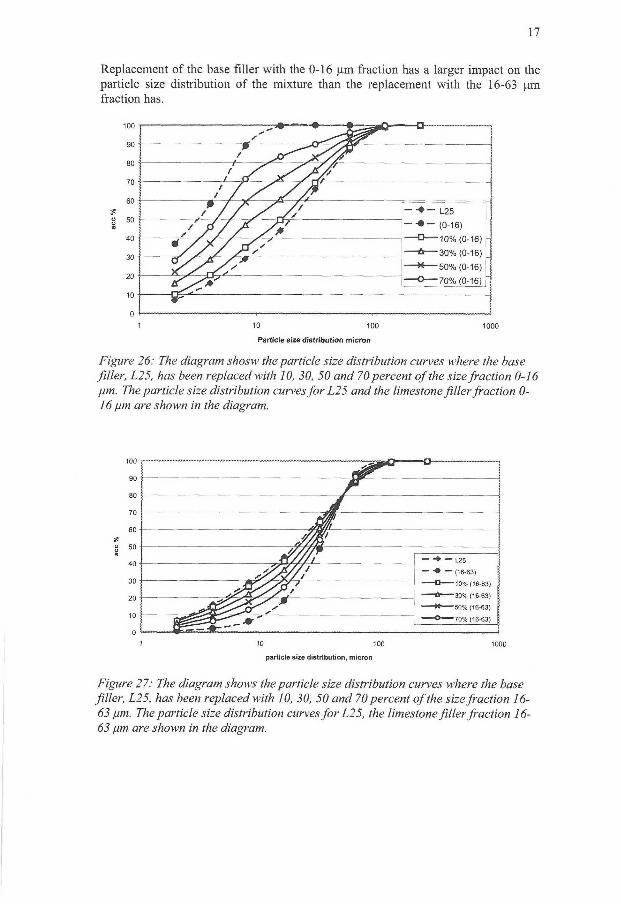
17
Replacement of the base filler with the 0-16 pm fraction has a larger impact on the particle size distribution of the mixture than the replacement with the 16-63 pm fraction has.
100
90
80
70
60
u u 50
40
30
20
10
0
T———-— o
/ ry— jxS/y
t / / / M > / . / y / ,
- • • — L25 — • • — (0-16)
•10% (0-16)
30% (0-16)
50% (0-16)
4 / / / i f '
(0-16)
•10% (0-16)
30% (0-16)
50% (0-16) O/ A / *
(0-16)
•10% (0-16)
30% (0-16)
50% (0-16) v / S / / * rr y
(0-16)
•10% (0-16)
30% (0-16)
50% (0-16)
•70% (0-16)
10 100
Particle size distribution micron
Figure 26: The diagram shosw the particle size distribution curves where the base filler, L25, has been replaced with 10, 30, 50 and 70 percent of the size fraction 0-16 pm. The particle size distribution curves for L25 and the limestone filler fraction 0-16 pm are shown in the diagram.
Figure 27: The diagram shows the particle size distribution curves where the base filler, L25, has been replaced with 10, 30, 50 and 70 percent of the size fraction 16-63 pm. The particle size distribution curves forL25, the limestone filler fraction 16-63 pm are shown in the diagram.
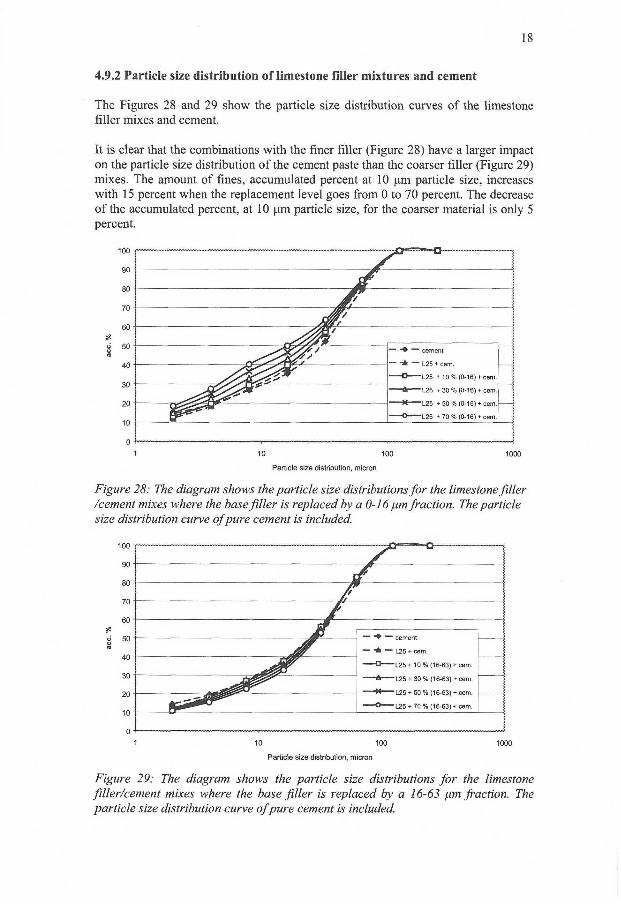
18
4.9.2 Particle size distribution of limestone filler mixtures and cement
The Figures 28 and 29 show the particle size distribution curves of the limestone filler mixes and cement.
It is clear that the combinations with the finer filler (Figure 28) have a larger impact on the particle size distribution of the cement paste than the coarser filler (Figure 29) mixes. The amount of fines, accumulated percent at 10 urn particle size, increases with 15 percent when the replacement level goes from 0 to 70 percent. The decrease of the accumulated percent, at 10 pm particle size, for the coarser material is only 5 percent.
-™~JJ~—™—VI
JHP/ v
^sr\/yr / r f ^ ' T T ' ' '
— — cement
— • * — L25 + cem.
D — L 2 5 + 10 % (0-16) + cem.
— — cement
— • * — L25 + cem.
D — L 2 5 + 10 % (0-16) + cem.
A L25 + 30 % (0-16) * cem.
't L25 + 50 % (0-16) + cem.
— O — L25 * 70 % (0-16) * cem.
10 100
Particle size distribution, micron
Figure 28: The diagram shows the particle size distributions for the limestone filler /cement mixes where the base filler is replaced by a 0-16 pm fraction. The particle size distribution curve of pure cement is included.
100
90
80
70
60
50
40
30
20
10
™ ~~ • ^ r y ^ ^ y . — . —
/ / j j
Mr
~ ™~ cement
— "* — L25 + cem.
Q L25 + 10 % (16-63) + cem.
~ ™~ cement
— "* — L25 + cem.
Q L25 + 10 % (16-63) + cem.
~ ™~ cement
— "* — L25 + cem.
Q L25 + 10 % (16-63) + cem.
A L25 +. 30 % (16-63) + cem.
O ^ L 2 5 + 70 % (16-63) + cem.
10 100
Particle size distribution, micron
Figure 29: The diagram shows the particle size distributions for the limestone filler/cement mixes where the base filler is replaced by a 16-63 pm fraction. The particle size distribution curve of pure cement is included.
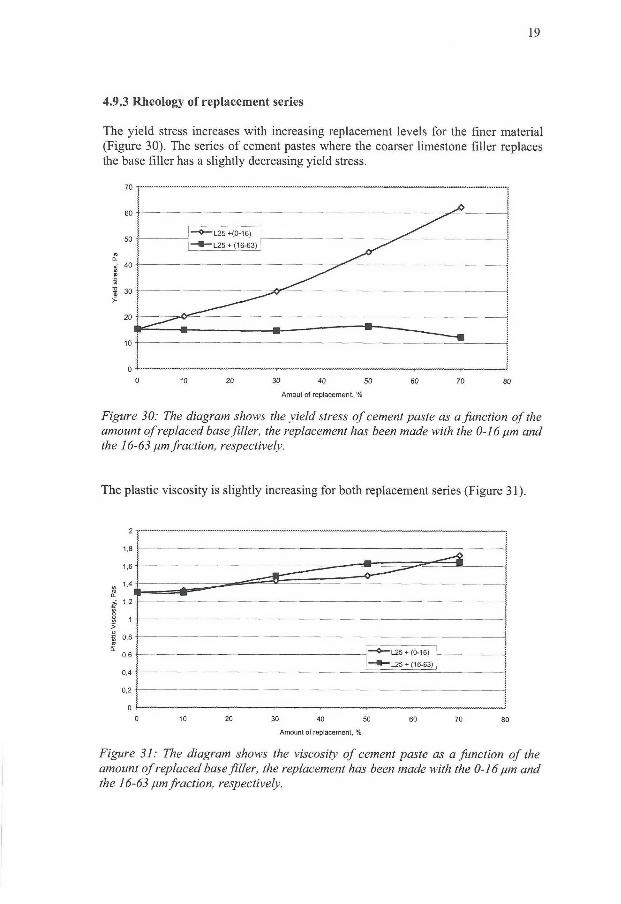
19
4.9.3 Rheology of replacement series
The yield stress increases with increasing replacement levels for the finer material (Figure 30). The series of cement pastes where the coarser limestone filler replaces the base filler has a slightly decreasing yield stress.
0 10 20 30 40 SO 60 70
Amout of replacement, %
Figure 30: The diagram shows the yield stress of cement paste as a function of the amount of replaced base fdler, the replacement has been made with the 0-16 pm and the 16-63 pm fraction, respectively.
The plastic viscosity is slightly increasing for both replacement series (Figure 31).
0 10 20 30 40 50 60 70 80
Amount of replacement, %
Figure 31: The diagram shows the viscosity of cement paste as a function of the amount of replaced base filler, the replacement has been made with the 0-16 pm and the 16-63 pm fraction, respectively.
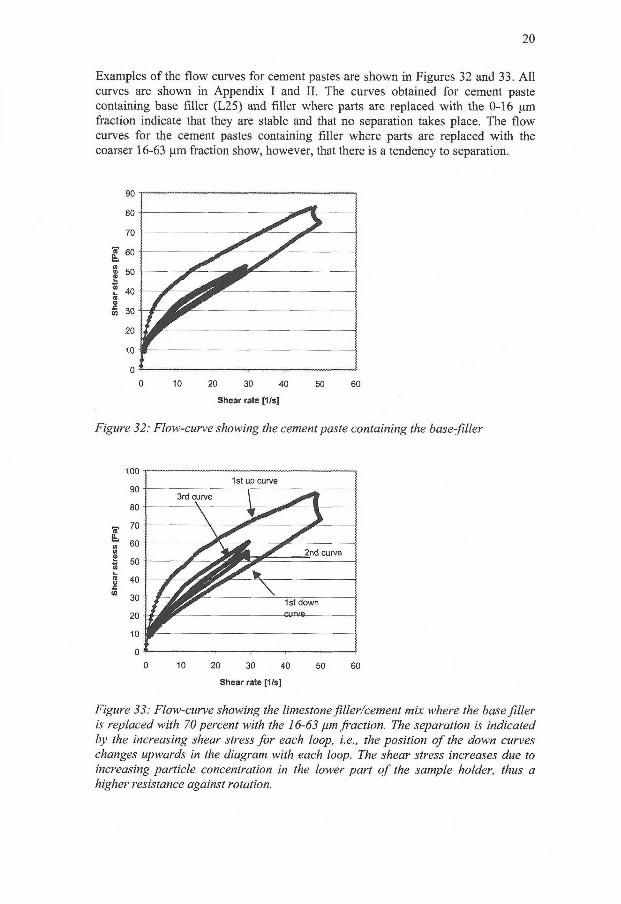
20
Examples of the flow curves for cement pastes are shown in Figures 32 and 33. Al l curves are shown in Appendix I and I I . The curves obtained for cement paste containing base filler (L25) and filler where parts are replaced with the 0-16 pm fraction indicate that they are stable and that no separation takes place. The flow curves for the cement pastes containing filler where parts are replaced with the coarser 16-63 pm fraction show, however, that there is a tendency to separation.
20 30 40
Shear rate [1/s]
50 60
Figure 32: Flow-curve showing the cement paste containing the base-filler
1st up curve
2nd curve
1st down
0 10 20 30 40 50 60
Shear rate [1/s]
Figure 33: Flow-curve showing the limestone filler/cement mix where the base filler is replaced with 70 percent with the 16-63 pm fraction. The separation is indicated by the increasing shear stress for each loop, i.e., the position of the down curves changes upwards in the diagram with each loop. The shear stress increases due to increasing particle concentration in the lower part of the sample holder, thus a higher resistance against rotation.
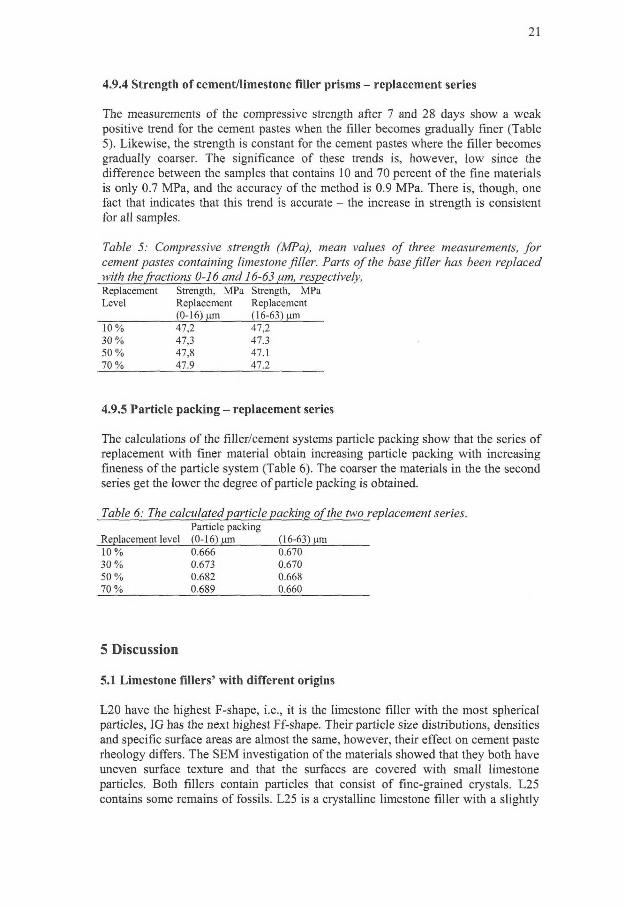
2 1
4.9.4 Strength of cement/limestone filler prisms - replacement series
The measurements of the compressive strength after 7 and 28 days show a weak positive trend for the cement pastes when the fdler becomes gradually finer (Table 5). Likewise, the strength is constant for the cement pastes where the filler becomes gradually coarser. The significance of these trends is, however, low since the difference between the samples that contains 10 and 70 percent of the fine materials is only 0.7 MPa, and the accuracy of the method is 0.9 MPa. There is, though, one fact that indicates that this trend is accurate - the increase in strength is consistent for all samples.
Table 5: Compressive strength (MPa), mean values of three measurements, for cement pastes containing limestone filler. Parts of the base filler has been replaced with the fractions 0-16 and 16-63 pm, respectively, Replacement Strength, MPa Strength, MPa Level Replacement Replacement
(0-16) um (16-63) nm 10% 47,2 47,2 30% 47,3 47.3 50% 47.8 47.1 70% 47.9 47.2
4.9.5 Particle packing - replacement series
The calculations of the filler/cement systems particle packing show that the series of replacement with finer material obtain increasing particle packing with increasing fineness of the particle system (Table 6). The coarser the materials in the the second series get the lower the degree of particle packing is obtained.
Table 6: The calculated particle packing of the two replacement series. Particle packing
Replacement level (0-16) u.m (16-63) nm 10% 0.666 0.670 30% 0.673 0.670 50% 0.682 0.668 70% 0.689 0.660
5 Discussion
5.1 Limestone fillers' with different origins
L20 have the highest F-shape, i.e., it is the limestone filler with the most spherical particles, IG has the next highest Ff-shape. Their particle size distributions, densities and specific surface areas are almost the same, however, their effect on cement paste rheology differs. The SEM investigation of the materials showed that they both have uneven surface texture and that the surfaces are covered with small limestone particles. Both fillers contain particles that consist of fine-grained crystals. L25 contains some remains of fossils. L25 is a crystalline limestone filler with a slightly
22
lower F-shape than L20 and LI5, the crystal shape can be seen and the surfaces of the grains are fairly smooth and clean. The particle shape is slightly larger, which is consistent with the smaller specific surface area.
L40 and G250 are crystalline limestone fillers with similar particle size distributions, the difference is in the coarser part of the distribution curve - L40 contain a bit more of coarse particles. Both have smooth surface textures and lower specific surface areas than the finer filler materials. K 250 has the same particle size distribution but it is a sedimentary limestone filler, there is no typical calcite crystals and the surface texture is uneven. The yield stress and the plastic viscosity of cement paste containing K250 is higher than for cement pastes containing the crystalline materials. The cement pastes that contain L40 and G250 obtain the same rheological results.
The crystalline fdler Parfd 8/80 contain more fine particles than Parfil 5/100, which correlates to their specific surface areas. The fillers have smooth surfaces and all the particles are crystalline. They have approximately the same yield stress but the viscosity differs when they are mixed into cement paste.
The measurement of total developed heat from the cement pastes containing the various limestone fillers indicates that the particle size distribution affects the amount of heat evolved. Coarser material in cement paste give rise to a lower total heat than the finer material of the same origin. Addition of the the younger, 70 miljon years old, of the two fine particulate sedimentary limestone fillers to cement paste, give rise to a lower total heat than the other, which is 450 miljon years old. L20 and the crystalline L25 have almost the same total heat developed after 25 hours. The cement paste containing the two coarse crystalline fillers show approximately the same heat development, however, the cement paste containing the sedimentary coarse filler has a higher total heat.
The rheological measurements show that crystalline limestone fillers effect on rheological parameters differs from the sedimentary limestone fillers, even though they have the same particle size distribution. Fillers that have the same origin but different particle size distributions will , when mixed into cement paste, affect the rheology in different ways. The finer the material is the more it wil l increase the yield stress and plastic viscosity.
The ß p measurements show that i f materials with the same origin but different particle size distributions are compared, the filler that contains the highest amounts of fine particles will have the highest water demand and also higher yield stress and viscosity. The material with the coarser particle size distribution have lower ß p
values for all amounts of filler, this means that the material is more sensitive for water changes - coarser material need less water to moisten the surfaces. The result from the ß p measurements appears to correlate well with the viscosity and yield stress values.
Comparison of materials that have approximately the same particle size distribution but different origin, i.e., sedimentary or crystalline limestone fillers, show that the water demand changes with the origin - the sedimentary material appears to have a higher water demand, this is probably due to the more uneven surface texture. Some
23
of the sedimentary materials have particles that consist of fine crystalline material that form a three-dimensional network where water can be caught.
Addition of the various limestone fillers to cement pastes appears to have a minor effect on the compressive strength after 7 and 28 days.
The F-shape of the particles in this investigation appears to have no effect on ß p , strength or rheology. L20 is the material with roundest particles, but also the one that gives rise to the highest plastic viscosity and yield stress.
5.2 Replacement series
Comparison of the two replacement series show that the changes in the particle size distributions are more pronounced for the filler consisting of a finer material. This leads to the conclusion that this material must show more pronounced trends in the examined properties when the replacement levels 0 to 70 percent are examined. Likewise, the coarser material must have weaker trends due to the smaller difference between the particle size distributions for the respective replacement level.
The yield stress increases with increasing amounts of fines, this can be expected since the volume of the particles are the same but the actual number of particles increases. Increasing amounts of fine material will reduce the free water in the paste. The added amount of super plasticizer is the same for all cement pastes, due to the increasing amounts of fine material in these experiments there will be less and less free admixture in the water. This wil l lead to a higher yield stress. The measurement of the plastic viscosity shows a slightly increasing trend, this can be explained by the same theory as for the yield stress.
The yield stress measured for the cement pastes that contained filler material that gradually become coarser shows a slightly negative trend. This can be explained by the fact that the total particle system becomes coarser and thus more water and admixture are free in the matrix. The slightly positive trend of the plastic viscosity is not consistent with the theory. However, the flow curves give an indication of the reason for this anomaly, the material seems to segregate. Segregation (sedimentaion) of the material, wil l according to Barnes et al. (1996), result in an increase in the measured viscosity.
The calculations of the filler/cement systems' particle packing show that the series of replacement with finer material obtain increasing particle packing with increasing fineness of the particle system. The coarser the second series get the lower the degree of particle packing is obtained. The compressive strength of the cement pastes containing the limestone filler mixes appears to show a correlation to the particle packing, the better packing grade the better strength.
6 Conclusions
• The ß p measurements show clearly that increased amounts of filler decreases the water/powder ratio that gives zero flow, and that the filler with finer
24
particle size have higher values than the coarser ones, i.e., they are less sensitive for water changes.
• The ß p measurements appear to correlate well with the rheological measurements.
• The F-shape of the particles in this investigation appears to have no effect on ß p, strength or rheology.
• The particle size distribution of the added limestone filler affects the cement pastes total developed heat. The sedimentary (younger materials with less metamorphose grade) appears to affect the heat development, although this investigation did not answer the question of how they affect the cement hydration.
• Increasing amount of fines in the filler material wil l increase the grade of particle packing, as well as it appears to increase the compressive strength and the viscosity and yield stress of the cement paste. However, when the amount of coarse particles is increased in a particle system the strength, viscosity and yield stress decrease.
7 Acknowledgement
The financial support from the Swedish Mineral Processing Association (MinFo) is gratefully acknowledged, as well as the support from the MinFo members Nordkalk and SMA Karbonates, who supplied the investigated filler materials, analyses and discussions.
8 References
Bache H.H. The processing of fresh concrete. BFL Report no 313. Concrete research laboratory, Karlstrup, Denmark 1973.
Barnes, H.A., Hutton, J..F. and Walters, K , A n Introduction to Rheology', Elsevier Science B.V., Amsterdam, 1996.
Billberg, P. Self-compacting concrete for civil engineering structure - the Swedish experience CBI-report 2:99. Swedish Cement and Concrete Research Institute, Stockholm, Sweden, 1999.
Bergström L. Rheological properties of ALC^-SiC whisker composite suspensions, Journal of Material Science, 31, 1996, pp. 52-57.
Bonavetti V., Donza H., Menéndez G., Cabrera O. and Irassar E.F., Limestone filler cement in low w/c concrete: A rational use of energy, Cement and Concrete Research, Vol. 33, 2003, pp. 865-871.
Cementa AB, Product declarations for "anläggningscement" and "byggcement", (can also be found on www.cementa.se), 2003.
Flatt R.J., Houst Y.F., Bowen P., Hofmann H , Widmer J., Sulser U., Maeder U., Bürge T.A., Interaction of superplasticizers with model powders in a highly alkaline
25
medium, in: V.M. Malhotra, (Ed.) Fifth CANMET/ACI international conference on Superplasticizers and other chemical admixtures in concrete (SP-173), ACI, Farmington Hill , Mi , USA, 1997, pp. 743-762.
Gram H-E, Personal communication 2003, Cement AB, Sweden
Kjellsen K.O. and Lagerblad B. Influence of natural minerals in the filler fraction on hydration and properties of mortars, Swedish Cement and Concrete Research Institute, CBI-report no 3, 1995, 41p.
Larrard F. de. Concrete mixture proportioning - a scientific approach, Modern concrete technology 9, edt. E & FN Spoon, 1999, p.418.
Nehdi M. Why some carbonate fillers cause rapid increases of viscosity in dispersed cement-based materials, Cement and Concrete Research, Vol. 30, 2000, pp. 1663-1669.
Nehdi M. and Mindess S., Microfilier partial substitution for cement, chapter in Materials science of concrete V I , in: Y. Skalny, S. Mindess (eds.), American Ceramic Society. 49p
Opoczky L. Progress of the particle size distribution during the intergrinding of a clinker-limstone mixture, Zement Kalk Gips, Vol. 45, No. 12, 1992, pp. 648-651.
Persson, A-L. Image Analysis of fine aggregates: Characterisation of shape and grain-size parameters. Licentiate Thesis. Stockholm, Sweden: Royal Institute of technology, 1996.
Poppe A-M. and De Schutter G. Influence of the nature and grading curve of the powder on the rheology of self compacting concrete, Proceedings from the 5th
CANMET/ACI International Conference on Recent Advances in Concrete Technology, ed. Malhotra V.M. , 2001, pp. 399-414.
Ramachandran V.S. and Zhang C-M. Dependence of fineness of calcium carbonate on the hydration behaviour of tricalcium silicate, Durability Build. Mater. 4, 1986, pp. 45-66.
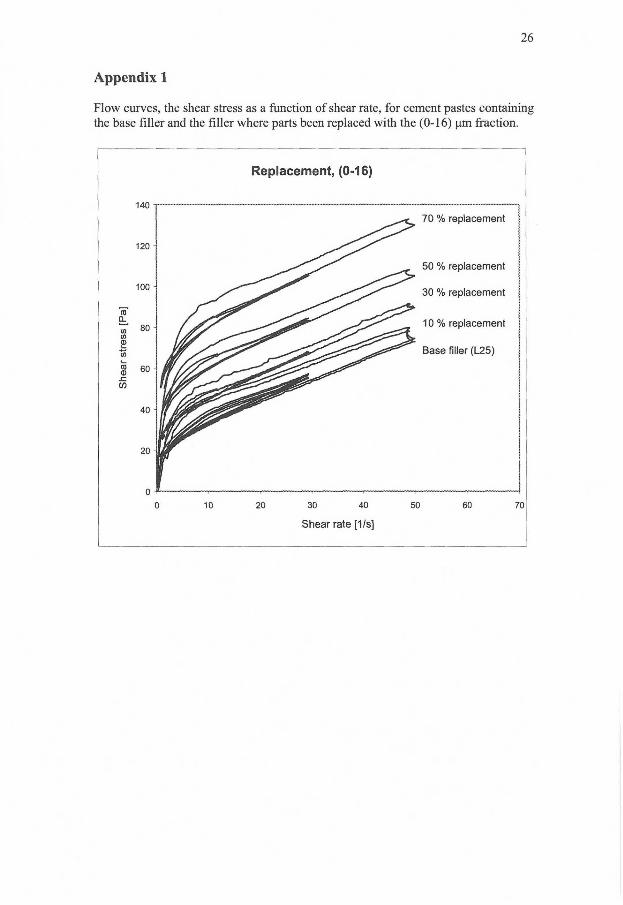
26
Appendix 1
Flow curves, the shear stress as a function of shear rate, for cement pastes containing the base filler and the fdler where parts been replaced with the (0-16) pm fraction.
Replacement, (0-16)
140
Shear rate [1/s]
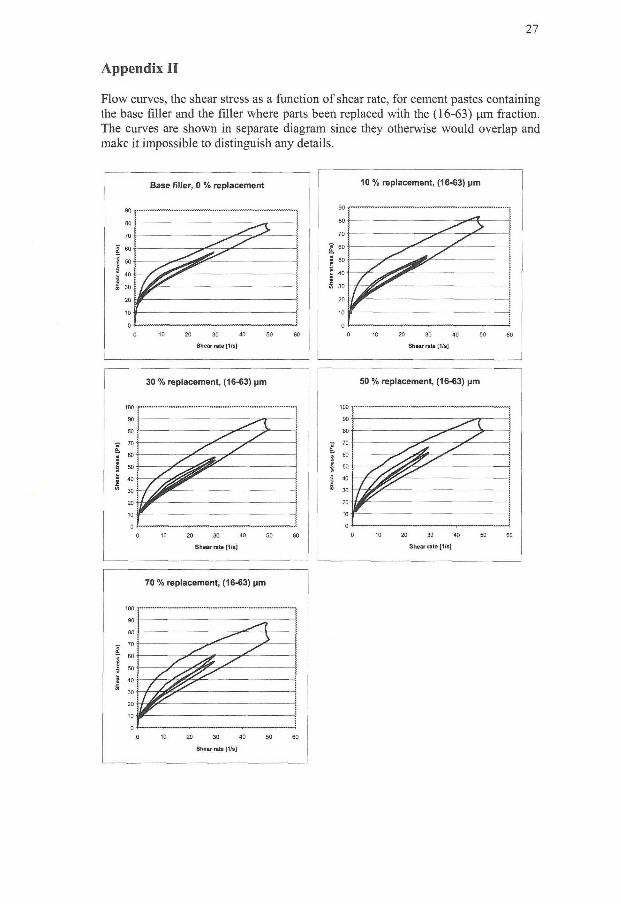
27
Appendix II
Flow curves, the shear stress as a function of shear rate, for cement pastes containing the base filler and the filler where parts been replaced with the (16-63) pm fraction. The curves are shown in separate diagram since they otherwise would overlap and make it impossible to distinguish any details.
filler, 0 % replacement 10 % replacement, (16-63) pm
30 % replacement, (16-63) pm
70 % replacement, (16-63) pm
50 % replacement, (16-63) pm
0 10 20 30 40 50 60
Shear rate [1/s]
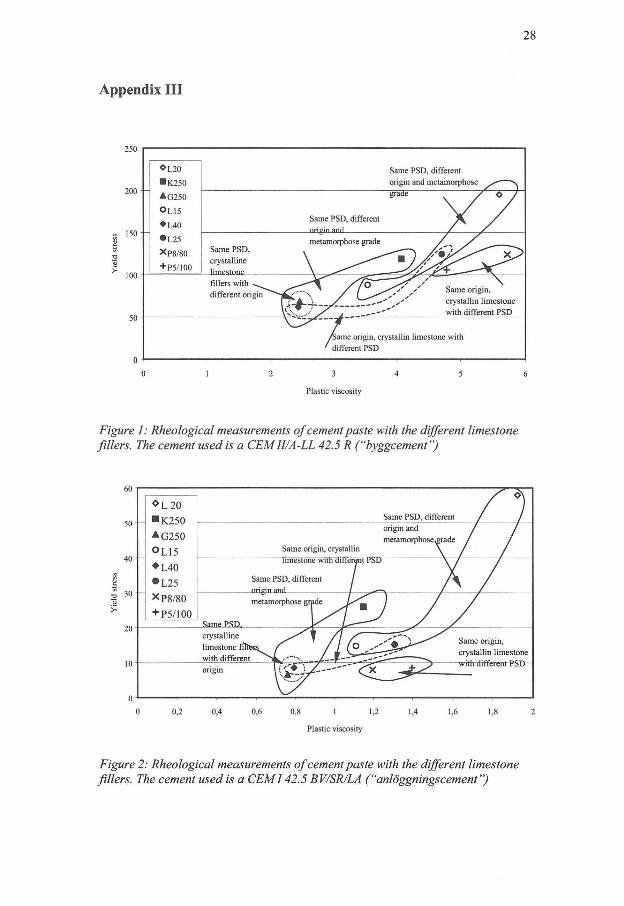
28
Appendix III
250
50
^ L 2 0
• K 2 5 0
AG250
O L 1 5
• L 4 0
• L , 2 5
X P 8 / 8 0
+P5/100
Same P S D , different
origin and metamorphose ^
^ L 2 0
• K 2 5 0
AG250
O L 1 5
• L 4 0
• L , 2 5
X P 8 / 8 0
+P5/100
grade s ^ J
Same PSD, different J \ /
nrigtn anrl / /
^ L 2 0
• K 2 5 0
AG250
O L 1 5
• L 4 0
• L , 2 5
X P 8 / 8 0
+P5/100
metamorphose grade / jr
Same P S D , . >. X i T " / / ^**" TT^i \ j i > - — H 1 / > X
crystalline \ ^ ^ " ^ • / y f 7 ^ / f , ^ v - *"**^ limestone \ .—^"""^ ^ v ^ ^ S ^ ^ T ' -—• T \ fillers with
different origin ^ | ^ " " " ' \ > / / / / ' • Same origin,
~S j with different P S D _ /Same origin, crystallin limestone with
' different PSD
0 1 2 3 4 5 6
Plastic viscosity
Figure 1: Rheological measurements of cement paste with the different limestone fillers. The cement used is a CEM II/A-LL 42.5 R ("byggcement")
60
20
10
0
OL 20 •K250
±G250
° L 1 5
• L 4 0
•L25
XP8/80
+ P5/100
/ n Same P S D , different / /
OL 20 •K250
±G250
° L 1 5
• L 4 0
•L25
XP8/80
+ P5/100
origin and / /
metamorphose^rade / /
Same origin, crystallin \ / /
OL 20 •K250
±G250
° L 1 5
• L 4 0
•L25
XP8/80
+ P5/100
limestone with different PSD \ / J
Same P S D , different / / * /
origin and / -—v / /
OL 20 •K250
±G250
° L 1 5
• L 4 0
•L25
XP8/80
+ P5/100 metamorphose grade J^*^ j / /
Same P S D . \ r L—— S /
crystalline / I ~—-, „ . . A / — " / / / _ m \ ^ — Same origin,
limestone fillets f / 1 t O . ,,- ,-^ \ / / m v • - - - — ; T ^ ~ crystallin limestone
with different s / — f — ^ .,. ,.„ , „„„ ~ / — ' v — I ? w i t h Ulffeieilt P S D
origin XÜr-lr' " C? j '
0 0,2 0,4 0,6 0,8 1 1,2 1,4 1,6 1,8 2
Plastic viscosity
Figure 2: Rheological measurements of cement paste with the different limestone fillers. The cement used is a CEM 142.5 BV/SR/LA ("anlöggningscement")

BY-PRODUCTS FROM MINERAL AND METALLURGICAL INDUSTRIES AS F I L L E R IN CONCRETE
H Moosberg-Bustnes Swedish Cement and Concrete Research Institute, Sweden
and Luleå University of Technology, Sweden
ABSTRACT. A large quantity of filler is needed in the production of modern concrete types. Fillers can be made, but there is an abundance of by-products available from different industries. The use of by-products, from mineral and metallurgical industries, as filler in concrete requires a screening procedure that with high reliability can determine their impact on some important concrete properties, such as heat of hydration and strength development. A test procedure has been developed and evaluated. This paper is a summary of this procedure, and some of the findings are presented.
Keywords: By-products, Filler, Heat of hydration, Compressive strength, Testprocedure.
H Moosberg-Bustnes is a mineral-processing engineer, MSc, from Luleå University of Technology, Luleå, Sweden. She is currently working as a researcher at the Swedish Cement and Concrete Research Institute in Stockholm, Sweden. Her research focuses mainly on the use of by-products from mineral and metallurgical industries as filler in concrete. She obtained a Licentiate degree from Luleå University of Technology in 2000. She is also a PhD student at the Division of Mineral Processing at Luleå University of Technology.
282
INTRODUCTION
Some people say that waste materials are an avoidable problem; that new or improved manufacturing processes together with recycling will stop the waste piles and deposits from rising, they also argue that we wil l find new uses for old deposited waste materials. Undoubtedly, they are right in some aspects because new technologies wil l be developed, recycling will rise and some old waste materials may be used in new processes. However, it is not likely that all deposited materials can be recycled into manufacturing processes, and it is extremely unlikely that the new technology will be completely free from pollution or waste. It is therefore important to continue to search for better ways to utilise waste products. It is also important to stop seeing these products as wastes - they are potential new raw materials, and hence they should be thoroughly examined and evaluated, so that they can be reused in the proper way in the industrial processes which would benefit most from their use. Henceforward, in this paper the word waste material will be replaced with the more positive designation: by-product.
Most of the research about by-products from metallurgical industries in combination with cement, is in the area of immobilisation or stabilisation of industrial residuals. Usually the end product will be considered more or less harmless and deposited. It would be better i f we would be able to use these products for purposes that benefit the society instead of just making a better "deposit-product".
Use of by-products as a substitute for natural raw materials in the construction industry may help to conserve natural resources, and at the same time reduce the environmental hazards arising from the disposal of some materials. However, to be able to successfully utilise a byproduct it must be an economically competitive substitute for the natural raw material that is commonly used. This includes the costs of processing and transportation. The material must also be suitable for the planned purpose, i.e., its stability and durability over the expected life span must be ensured in the context of the particular building application.
A large quantity of filler is needed in the production of modern concrete types. The market for self-compacting concrete (SCC) is expanding, since SCC has better properties than ordinary concrete and reduces building costs. The principle is to use large amounts of fine material to reduce the friction between the aggregates.
Fillers are usually inexpensive, especially i f they are by-products; consequently, they can be used to manufacture cost efficient concrete. However, cost reduction is no longer the only, or even the most important, consideration for using fillers in concrete. Fillers can be used to increase or to decrease the density; to change the concrete properties; for example, strength and rheology, and to add colour to concrete.
To be able to utilise by-products as filler materials the effect of specific products on the properties of concrete has to be evaluated. It is thus important to find reliable evaluation methods that both can be used and also produces results within a reasonable timeframe, since a by-products reaction in the cement system can not be predicted by its chemical analysis only. Materials can have the same chemical components but still react in different ways, and it is therefore imperative that materials with desirable properties can be separated from materials with undesirable ones.
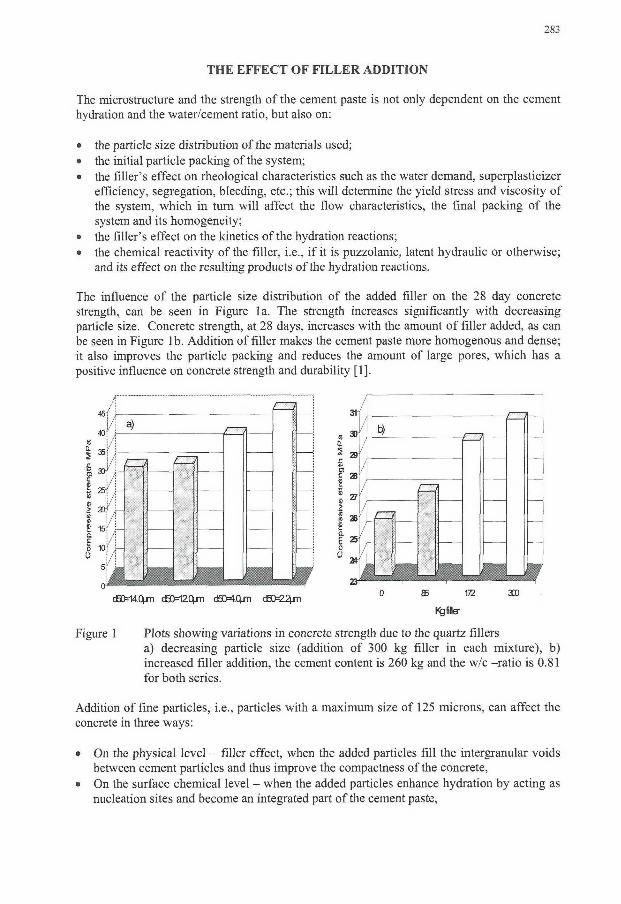
283
THE E F F E C T OF F I L L E R ADDITION
The microstructure and the strength of the cement paste is not only dependent on the cement hydration and the water/cement ratio, but also on:
• the particle size distribution of the materials used; • the initial particle packing of the system; • the fdler's effect on rheological characteristics such as the water demand, superplasticizer
efficiency, segregation, bleeding, etc.; this wil l determine the yield stress and viscosity of the system, which in turn wil l affect the flow characteristics, the final packing of the system and its homogeneity;
• the filler's effect on the kinetics of the hydration reactions; • the chemical reactivity of the filler, i.e., i f it is puzzolanic, latent hydraulic or otherwise;
and its effect on the resulting products of the hydration reactions.
The influence of the particle size distribution of the added filler on the 28 day concrete strength, can be seen in Figure la. The strength increases significantly with decreasing particle size. Concrete strength, at 28 days, increases with the amount of filler added, as can be seen in Figure lb. Addition of filler makes the cement paste more homogenous and dense; it also improves the particle packing and reduces the amount of large pores, which has a positive influence on concrete strength and durability [1].
Kgfiller
Figure 1 Plots showing variations in concrete strength due to the quartz fillers a) decreasing particle size (addition of 300 kg filler in each mixture), b) increased filler addition, the cement content is 260 kg and the w/c -ratio is 0.81 for both series.
Addition of fine particles, i.e., particles with a maximum size of 125 microns, can affect the concrete in three ways:
• On the physical level - filler effect, when the added particles fill the intergranular voids between cement particles and thus improve the compactness of the concrete,
• On the surface chemical level - when the added particles enhance hydration by acting as nucleation sites and become an integrated part of the cement paste,
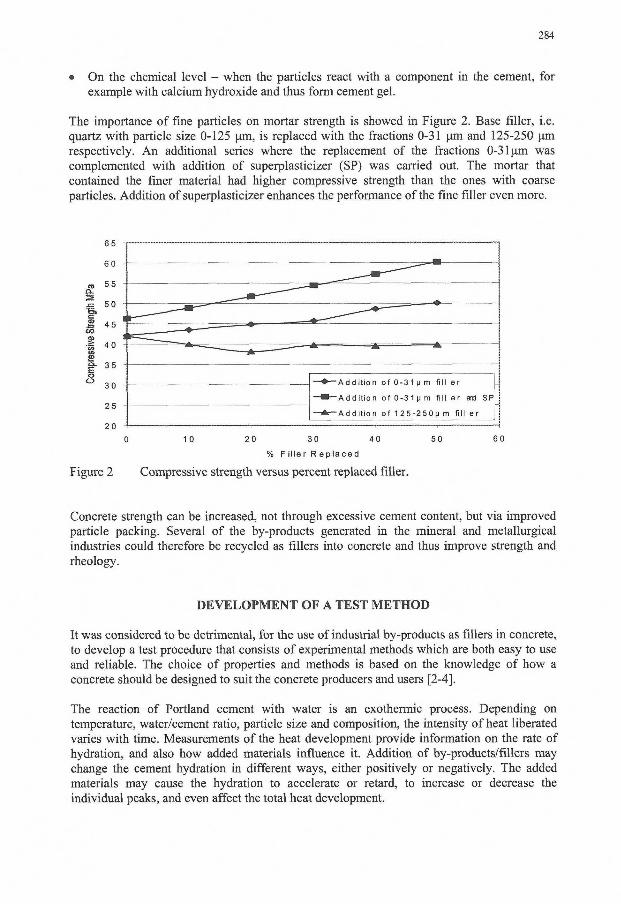
284
• On the chemical level - when the particles react with a component in the cement, for example with calcium hydroxide and thus form cement gel.
The importance of fine particles on mortar strength is showed in Figure 2. Base filler, i.e. quartz with particle size 0-125 pm, is replaced with the fractions 0-31 pm and 125-250 pm respectively. An additional series where the replacement of the fractions 0-3 lpm was complemented with addition of superplasticizer (SP) was carried out. The mortar that contained the finer material had higher compressive strength than the ones with coarse particles. Addition of superplasticizer enhances the performance of the fine filler even more.
65
20 4 1 1 . 1
0 10 20 30 40 50 60
% F ille r R e p l a c e d
Figure 2 Compressive strength versus percent replaced filler.
Concrete strength can be increased, not through excessive cement content, but via improved particle packing. Several of the by-products generated in the mineral and metallurgical industries could therefore be recycled as fillers into concrete and thus improve strength and rheology.
DEVELOPMENT OF A TEST METHOD
It was considered to be detrimental, for the use of industrial by-products as fillers in concrete, to develop a test procedure that consists of experimental methods which are both easy to use and reliable. The choice of properties and methods is based on the knowledge of how a concrete should be designed to suit the concrete producers and users [2-4].
The reaction of Portland cement with water is an exothermic process. Depending on temperature, water/cement ratio, particle size and composition, the intensity of heat liberated varies with time. Measurements of the heat development provide information on the rate of hydration, and also how added materials influence it. Addition of by-products/fillers may change the cement hydration in different ways, either positively or negatively. The added materials may cause the hydration to accelerate or retard, to increase or decrease the individual peaks, and even affect the total heat development.
285
Material characteristics, such as the particle size distribution, particle shape, surface texture and the nature of the material influence the properties of fresh concrete mixtures more than hardened concrete. Compared to smooth and rounded particles, rough textured, angular, and elongated particles require more cement paste to produce workable concrete mixtures. Flaky particles, for example mica, have a larger water demand than spherical particles. Calcium oxide reacts with water and wil l thus lower the amount of free water in the mixture, thus lowering the flowability. Chemical reactions between the particle surfaces and the cement paste may cause the particles to start to dissolve, thereby creating a rougher surface.
Strength development of concrete is dependent on the water/cement ratio and the characteristics of the cement, such as particle size distribution and clinker composition, as well as the amount of admixtures and fillers. The curing conditions, time, temperature and relative humidity (RH) are also important.
The effect of additives may vary and can influence the strength in different ways. I f the strength of a mixture is higher than the reference after one day, the added material is accelerating the hydration; i f the strength is lower, the material is acting as a retarding agent. When the material affects the long-term strength positively, it may be a puzzolanic or latent hydraulic material. A failed hydration or a negative influence on the long-term strength signals that the material gives rise to reactions that are not favourable for the development of the desirable concrete properties. Strength measurements combined with calorimetric data show that materials with a strong initial heat peak have a negative influence on the early strength of the concrete. Materials with a low initial heat peak but a high total heat development indicate that some sort of chemical reaction takes place. Inert materials can with advantage be used as aggregates or filler. Inert filler may also contribute to a higher strength, since the increased amount of fine material gives the paste better homogeneity. Internal structural damages, such as cracks and pores, will decrease in size because of the added filler and thus have a positive effect on the concrete properties. There is a correlation between compressive and flexural strength, but since the effect of the by-products on concrete strength was unknown, determining the flexural strength was also an important consideration.
It is essential that cement paste, once it has set, does not undergo a large change of volume, and that material used as filler or aggregate in concrete does not cause high shrinkage or expansion, since that wil l affect the final properties of the concrete. Shrinkage depends on the amount of water that can evaporate from the paste: the higher the w/s ratio, the greater the shrinkage. It can also result from the withdrawal of water from the capillary pores by the hydration of unhydrated cement, self-desiccation, or the presence of water-absorbing (swelling) clay or materials that behave in a similar way. Expansion and cracking, leading to loss of strength, elasticity, and durability of concrete can result from the swelling of water-absorbing material or chemical reactions between the cement gel and compounds that may be present in the by-product, such as free lime, magnesium oxide or calcium sulphate.
Scanning electron microscopy can be used both to evaluate the shape of the particles and to verify results.
286
The chosen test methods are:
• Chemical- and XRD analysis of the by-product. • Isothermal calorimetry measurements - show the heat of hydration in fresh concrete and
thus also the effect of the added by-products. The amount (volume percent) of by-product that replaces cement does not affect the results, as long as all material mixes in the experimental series have the same proportions, since the heat curve is presented as mW/g cement. Addition of superplasticizer would affect the measured heat of hydration and is therefore not recommended.
• Flowability - a rheology test that depends on material characteristics. • Strength measurements - the compressive and flexural strength show the influence of the
by-products on the strength development. • Shrinkage and expansion measurements - show how the durability is affected, for
example, i f a by-product contain free lime or slowly reacting magnesium oxide when mixed with cement, the subsequent swelling and cracking due to chemical reactions, wi l l lead to loss of strength and elasticity and thus lower the concrete durability.
• Scanning Electron Microscopy - show the microstructure of the hardened concrete.
EVALUATION OF SOME TEST RESULTS
Slag from Metallurgical Industries
Mineral and metallurgical industries produce large amounts of waste materials during their production, solely the iron and steelmaking industries in Sweden produced 1,170,000 tonnes of slag during 1999, approximately half of it was utilised in some way and the rest deposited. The tailings from the mineral-producing concentrator plant exceeded 20,000,000 tonnes, most of it was deposited, during the same period. The incitement to find uses for slag and other by-products increases concurrently, year by year, with the rising production of minerals and metals.
The previously described test procedure were used to investigate the effect of some industrial by-products on concrete properties. To exemplify the results, a selection of four materials with different chemical components and reactions were chosen. K is a waste-lime from gas desulphurizing, L is a ladle furnace slag, M is a slag from metal dust recycling, N is a ash (aluminium silicate) from coal-heated power plants.
The heat development curve (Figure 2) of materials containing calcium oxide (free lime) show one peak and an extremely high initial heat development, the total heat development is however low. This is due to the hydration of the free lime, which wil l cause an early heat development when it reacts in the cement paste. The result is that cement hydration wil l be disturbed and thus affect the concrete properties, both the early and long term strength are affected.
Magnesium oxide does not affect the heat development or the short term strength, it wi l l though affect the long term strength. Chemically reactive materials compared to inert materials have a higher, or similar heat development curve. Chemically reactive materials usually affect the long term strength and can not be pinpointed only by their heat development. Details of the experiments and the results can be found in [1].
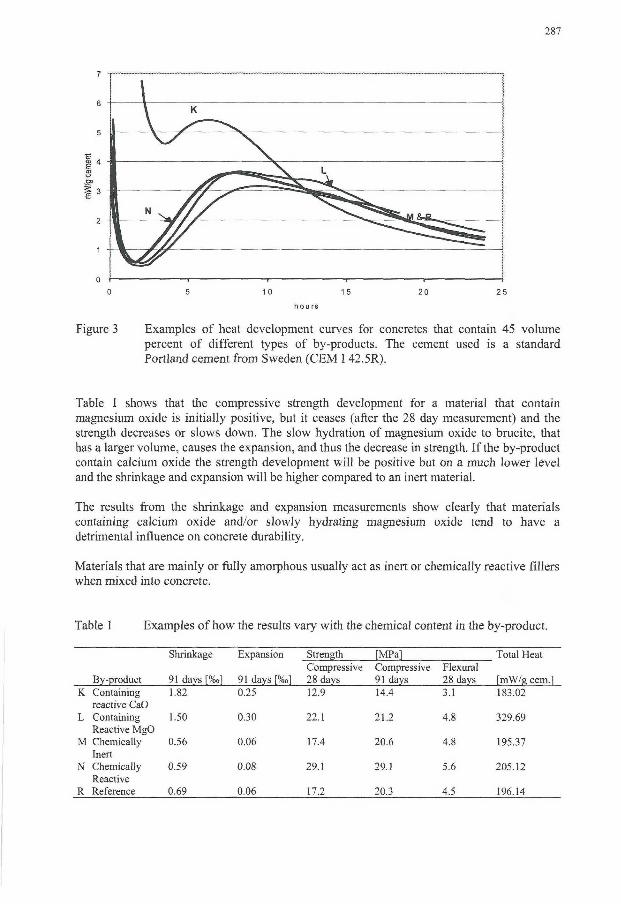
287
.OJ
2
\
\ K
, L
V ^ ^ ^ ^ ^
0 5 10 15 20 25
hours
Figure 3 Examples of heat development curves for concretes that contain 45 volume percent of different types of by-products. The cement used is a standard Portland cement from Sweden (CEM I 42.5R).
Table 1 shows that the compressive strength development for a material that contain magnesium oxide is initially positive, but it ceases (after the 28 day measurement) and the strength decreases or slows down. The slow hydration of magnesium oxide to brucite, that has a larger volume, causes the expansion, and thus the decrease in strength. I f the by-product contain calcium oxide the strength development will be positive but on a much lower level and the shrinkage and expansion wil l be higher compared to an inert material.
The results from the shrinkage and expansion measurements show clearly that materials containing calcium oxide and/or slowly hydrating magnesium oxide tend to have a detrimental influence on concrete durability.
Materials that are mainly or fully amorphous usually act as inert or chemically reactive fillers when mixed into concrete.
Table 1 Examples of how the results vary with the chemical content in the by-product.
Shrinkage Expansion Strength [MPa] Total Heat
By-product 91 days [%o] 91 days f%»l Compressive 28 days
Compressive 91 days
Flexural 28 days [mW/g cem.]
K Containing 1.82 0.25 12.9 14.4 3.1 183.02 reactive CaO
L Containing 1.50 0.30 22.1 21.2 4.8 329.69 Reactive MgO
M Chemically 0.56 0.06 17.4 20.6 4.8 195.37 Inert
N Chemically Reactive
0.59 0.08 29.1 29.1 5.6 205.12
R Reference 0.69 0.06 17.2 20.3 4.5 196.14
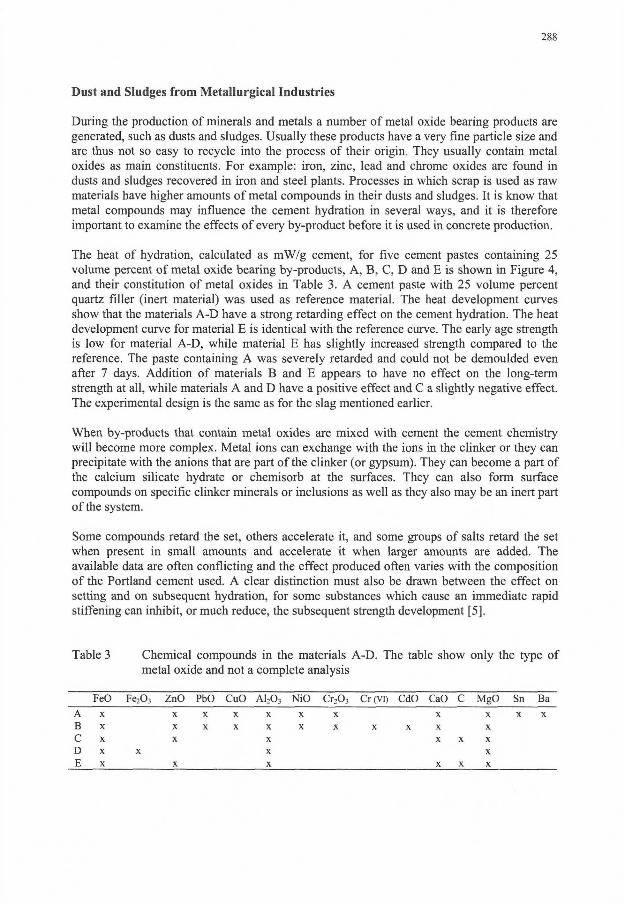
288
Dust and Sludges from Metallurgical Industries
During the production of minerals and metals a number of metal oxide bearing products are generated, such as dusts and sludges. Usually these products have a very fine particle size and are thus not so easy to recycle into the process of their origin. They usually contain metal oxides as main constituents. For example: iron, zinc, lead and chrome oxides are found in dusts and sludges recovered in iron and steel plants. Processes in which scrap is used as raw materials have higher amounts of metal compounds in their dusts and sludges. It is know that metal compounds may influence the cement hydration in several ways, and it is therefore important to examine the effects of every by-product before it is used in concrete production.
The heat of hydration, calculated as mW/g cement, for five cement pastes containing 25 volume percent of metal oxide bearing by-products, A, B, C, D and E is shown in Figure 4, and their constitution of metal oxides in Table 3. A cement paste with 25 volume percent quartz filler (inert material) was used as reference material. The heat development curves show that the materials A-D have a strong retarding effect on the cement hydration. The heat development curve for material E is identical with the reference curve. The early age strength is low for material A-D, while material E has slightly increased strength compared to the reference. The paste containing A was severely retarded and could not be demoulded even after 7 days. Addition of materials B and E appears to have no effect on the long-term strength at all, while materials A and D have a positive effect and C a slightly negative effect. The experimental design is the same as for the slag mentioned earlier.
When by-products that contain metal oxides are mixed with cement the cement chemistry wil l become more complex. Metal ions can exchange with the ions in the clinker or they can precipitate with the anions that are part of the clinker (or gypsum). They can become a part of the calcium silicate hydrate or chemisorb at the surfaces. They can also form surface compounds on specific clinker minerals or inclusions as well as they also may be an inert part of the system.
Some compounds retard the set, others accelerate it, and some groups of salts retard the set when present in small amounts and accelerate it when larger amounts are added. The available data are often conflicting and the effect produced often varies with the composition of the Portland cement used. A clear distinction must also be drawn between the effect on setting and on subsequent hydration, for some substances which cause an immediate rapid stiffening can inhibit, or much reduce, the subsequent strength development [5].
Table 3 Chemical compounds in the materials A-D. The table show only the type of metal oxide and not a complete analysis
FeO F e 2 0 3 ZnO PbO CuO A1 20 3 NiO C r 2 0 3 Cr (VI) CdO CaO C MgO Sn Ba
A X X X X X X X X X X X B X X X X X X X x x x X C X X X X X X D X X X X E X X X X X X
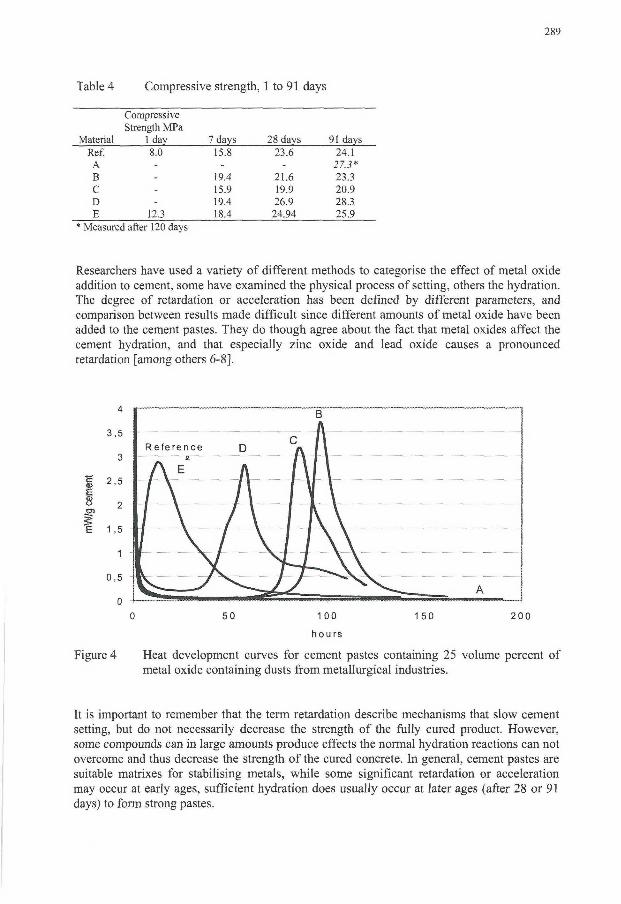
289
Table 4 Compressive strength, 1 to 91 days
Compressive Strength MPa
Material 1 day 7 days 28 days 91 days Ref. 8.0 15.8 23.6 24.1
A - - - 27.3* B - 19.4 21.6 23.3 C - 15.9 19.9 20.9 D - 19.4 26.9 28.3 E 12.3 18.4 24.94 25.9
* Measured after 120 days
Researchers have used a variety of different methods to categorise the effect of metal oxide addition to cement, some have examined the physical process of setting, others the hydration. The degree of retardation or acceleration has been defined by different parameters, and comparison between results made difficult since different amounts of metal oxide have been added to the cement pastes. They do though agree about the fact that metal oxides affect the cement hydration, and that especially zinc oxide and lead oxide causes a pronounced retardation [among others 6-8].
It is important to remember that the term retardation describe mechanisms that slow cement setting, but do not necessarily decrease the strength of the fully cured product. However, some compounds can in large amounts produce effects the normal hydration reactions can not overcome and thus decrease the strength of the cured concrete. In general, cement pastes are suitable matrixes for stabilising metals, while some significant retardation or acceleration may occur at early ages, sufficient hydration does usually occur at later ages (after 28 or 91 days) to form strong pastes.
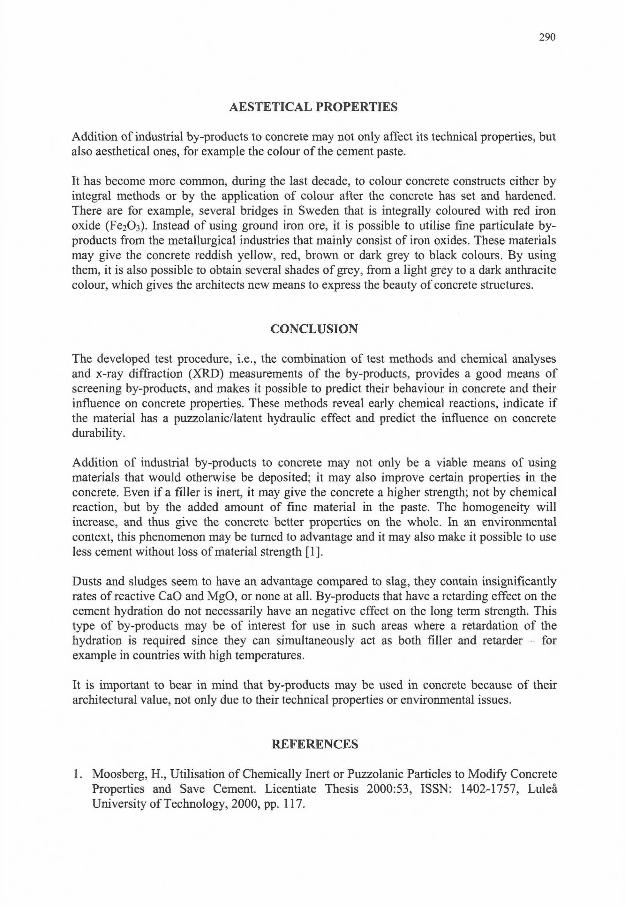
290
A E S T E T I C A L PROPERTIES
Addition of industrial by-products to concrete may not only affect its technical properties, but also aesthetical ones, for example the colour of the cement paste.
It has become more common, during the last decade, to colour concrete constructs either by integral methods or by the application of colour after the concrete has set and hardened. There are for example, several bridges in Sweden that is integrally coloured with red iron oxide (Fe203). Instead of using ground iron ore, it is possible to utilise fine particulate byproducts from the metallurgical industries that mainly consist of iron oxides. These materials may give the concrete reddish yellow, red, brown or dark grey to black colours. By using them, it is also possible to obtain several shades of grey, from a light grey to a dark anthracite colour, which gives the architects new means to express the beauty of concrete structures.
CONCLUSION
The developed test procedure, i.e., the combination of test methods and chemical analyses and x-ray diffraction (XRD) measurements of the by-products, provides a good means of screening by-products, and makes it possible to predict their behaviour in concrete and their influence on concrete properties. These methods reveal early chemical reactions, indicate i f the material has a puzzolanic/latent hydraulic effect and predict the influence on concrete durability.
Addition of industrial by-products to concrete may not only be a viable means of using materials that would otherwise be deposited; it may also improve certain properties in the concrete. Even i f a filler is inert, it may give the concrete a higher strength; not by chemical reaction, but by the added amount of fine material in the paste. The homogeneity will increase, and thus give the concrete better properties on the whole. In an environmental context, this phenomenon may be turned to advantage and it may also make it possible to use less cement without loss of material strength [1].
Dusts and sludges seem to have an advantage compared to slag, they contain insignificantly rates of reactive CaO and MgO, or none at all. By-products that have a retarding effect on the cement hydration do not necessarily have an negative effect on the long term strength. This type of by-products may be of interest for use in such areas where a retardation of the hydration is required since they can simultaneously act as both filler and retarder - for example in countries with high temperatures.
It is important to bear in mind that by-products may be used in concrete because of their architectural value, not only due to their technical properties or environmental issues.
R E F E R E N C E S
1. Moosberg, H., Utilisation of Chemically Inert or Puzzolanic Particles to Modify Concrete Properties and Save Cement. Licentiate Thesis 2000:53, ISSN: 1402-1757, Luleå University of Technology, 2000, pp. 117.
291
2. Mehta, P.K., Concrete Structure, Properties, and Materials New Jersy, USA. Prentice-Hall. 1986 pp. 17-41.
3. Neville, A.M., Properties of Concrete, Fourth edition. Essex, UK. Longman Group Ltd. 1995, pp.771.
4. Betonghandbok: Material, (Reference book on Concrete: Material) Solna, Sweden, AB Svensk Byggtjänst, 1994, pp. 1097.
5. Lea F.M., The chemistry of cement and concrete Edward Arnold (Publishers) Ltd. 1970 pp. 698.
6. Arliguie G., Ollivier J.P. & Grandet J., Etude de l'effet retardateur du zinc sur l'hydratation de la pate de ciment Portland, Cement and Concrete Research vol. 12, 1982, pp. 79-86.
7. Bhatty J.I. & West P.B., Interaction of heavy metals in portland cement stabilized waste systems: effects on paste hydration Emerging Technologies Symposium on Cement and Concrete in the Global Environment, Chicago, 111. Portland Cement Association; 114. 1993.
8. Lieber W., The Influence of Lead and Zinc Compounds on the Hydration of Portland Cement, Proceedings of The Fifth International Symposium on the Chemistry of Cement, Tokyo. Part I I , vol. I I . 1968, pp. 444-454.

3rd International Symposium on Self-compacting Concrete, 17-20 August 2003, Reykjavik, Iceland
CHARACTERISATION OF F I L L E R
Helena Moosberg-Bustnes Swedish Cement and Concrete Research Institute
ABSTRACT: A large quantity offiller is needed in the production of self-compacting concrete. Fillers can be made, but there is an abundance of by-products available from different industries. The use of by-products, from mineral and metallurgical industries, as filler in concrete requires a thoroughly characterisation of the materials.
Material characteristics, such as the particle size distribution, particle shape, surface texture and the nature of the material influence the properties of fresh concrete mixtures more than they affect the hardened concrete.
By-products/filler materials in the form of dust or sludge were collected from the metallurgical industry in Sweden. The materials were evaluated with different methods: the particle size distribution, surface area, particle shape and water demand (6P) were determined and evaluated. In order to facilitate the use of by-products as fillers, a method of characterising changes in particle size distributions, PaRMAC was studied.
The study shows that fine-grained materials from the metallurgical industries can be characterised, systemised and optimised in order to be used as fillers.
KEYWORDS: Filler, by-products, characterisation, cement paste
1. BACKGROUND
Concrete is the most common building material and is used in large quantities. In order to make dense, strong and durable concrete the raw materials, i.e., cement, water, sand and gravel, sometimes have to be supplemented with fine particulate materials, i.e., filler. A large quantity of filler is needed in the production of modern concrete types. One principle of self-compacting concrete is to use large amounts of fine material to reduce the friction between the aggregates.
By-products from metallurgical industries, slag, dust and sludge, usually have a very fine particle size and are thus not so easy to recycle back into the process of their origin. Use of these residual materials as a substitute for natural raw materials in the construction industry may help to conserve natural resources. However, for a successful use, the available materials must be suitable for the planned purpose - to be mixed with cement and the other concrete constituents.
Material characteristics, such as the particle size distribution, particle shape, surface texture and specific surface area of the material influence the properties of fresh concrete mixtures more than they affect the hardened concrete. Compared to smooth and rounded particles, rough textured, angular, and elongated particles require more cement paste to produce workable concrete mixtures. Flaky particles have a larger water demand than spherical particles.
This study has been made in order to characterise and systemise by-products and to investigate their effect on water demand, ß p > in cement pastes. The study is a part of MiMeR's
540
3rd International Symposium on Self-compacting Concrete, 17-20 August 2003, Reykjavik, Iceland
research program (Minerals and Metals recycling Research Centre at Luleå Technical University)
2. MATERIALS AND E X P E R I M E N T A L DESIGN
By-products, in the form of dust or sludge, from the metallurgical industries were collected and analysed in an earlier study (Moosberg-Bustnes et al.); their effect on cement hydration and strength were examined. In the present study materials that were found to have non or positive effect on cement hydration and strength were further investigated. Material I is a dust from the manufacturing of ferro-alloys. Dust F and sludge G are materials from iron production, i.e., the blast furnace process, while C is dust from the charging of pig iron into the ladle. E is sludge from the steel making process, i.e., LD-converter. Material H origins from the finishing treatment of steel products, i.e., blasting. AQ and HS are ground slags from iron and steel making. Quartz, limestone and fine ground glass have been added to the experimental matrix.
The cement used in this investigation was a Swedish Portland cement (CEM II/A-LL 42.5R) with median particle size of 10 pm and a specific surface area of 485 m2/kg.
2.1 Mixing
Pastes of cement, filler material and water were combined in a laboratory mixer. The specifications for mixing, stipulated in SS-EN 206, was followed. The water/solid ratio (w/s) was kept according to the experimental matrix for the ßp- and rheology measurements.
2.2 Particle size distribution, specific surface area, density and air content
The particle size distributions of the materials were determined by laser diffraction analysis (SILAS) and the specific surface areas were analysed according to the BET-method. The densities of the filler materials were measured with helium pycnometer.
Density and air content were measured on the fresh concrete after mixing according to SS 13 71 15. The theoretical density of the concrete mixtures was calculated from the known material densities as a comparison. The measured densities were normalised to 100 percent mortar. The density of the hardened concrete was calculated from weight and measures after 49 days.
2.3 Scanning electron microscopy analyses
2.3.1 Particle shape
Micrographs of typical filler particles were taken with scanning electron microscopy to enable evaluation ofthe three-dimensional particle shape, particle surface textures and pores, i f any.
2.3.2 F-shape
Samples of the fillers were mixed with epoxy resin and the resulting test specimens were polished. This will give cut surfaces of randomly oriented particles. Persson (1996) describes the method and the parameter definitions. Backscatter electron (BSE) images of the ground by-products' particle shapes were taken with a scanning electron microscope (SEM). Image analysis (computer analysis of digital images) was used to define the parameter F-shape, which is an aspect ratio of the shortest versus the longest diameter of a particle. At least 400 particles in each sample were measured. Spherical particles have an F-shape value of 1, and cubical particles 0.71. The image analysis study makes it possible to describe the particle
541
3rd International Symposium on Self-compacting Concrete, 17-20 August 2003, Reykjavik, Iceland
shapes of the fine materials, hence, providing a means of determining the water demand and workability. F-shape together with the measurements of water demand - ß p of the mixed mortars give a good conception of how the particles behave.
2.3.3 Dispersion of filler in concrete
In order to see how well the various filler material was dispersed in cement paste, scanning electron microscopy was used. Cement pastes containing 20 weight percent of the various filler materials were prepared. The w/p-ratio was kept at 0.37, and the same superplasticizer, "chemflux prefab", was used as in the other experiments. The hardened cement pastes were cut and polished and then analysed with SEM. Element mapping of the samples were made with energy dispersive spectroscopy (EDS).
2.4 Determination of water/powder ratio for zero flow - ß p
Determination of the filler/cement mixtures water demand, i.e., the influence of addition of filler materials on the flowability of the cement paste was investigated.
The water/powder ratio for zero flow (ß p) is determined in the paste, with the chosen filler/cement proportions of 15, 30 and 45 volume percent filler. Flow cone tests with water/powder ratios by volume of, e.g., 1.1, 1.2, 1.3 and 1.4 were performed with the selected powder compositions. The results are plotted in a xy-diagram, with relative slump versus water/powder ratio. The point of intersection with the y-axis (water/powder ratio) is designated the ß p value. The method is in accordance with EFNARCs specifications (EFNARC).
In order to determine the ß p value for each material and mixture straight-line regression analyses were made on the resulting values for each mixture. The ß p values and the corresponding filler amount can then be plotted in a diagram.
2.5 Compressive strength
The mortar receipt, used for the strength measurements, was calculated from a concrete receipt that contained 300 kg cement (CEM II/A-LL 42,5R), 125 kg limestone filler, 180 kg water 583.7 kg gravel and 1084.1 kg sand per cubic meter. The volume proportions of the mortar are the same as in the concrete. The filler volume was kept constant for all mixes, a DIN-196-1 standard sand with maximum particle size of 2 mm was used as aggregates. The added amount of plasticizer, Chemflux Prefab, was kept constant at 1.5 gram per litre of mortar.
The mortars mixed for the rheological experiments were cast into cubes of 10x10x10 cm3. The compressive strength of the mortar cubes was measured after 49 days. The test procedure was in accordance with SS-EN 12390-3.
2.6 PaRMAC-method
2.6.1 Method description
Particle size distribution and particle shape are two of the factors affecting the rheology of cement pastes. Traditionally, the particle size distribution is analysed by sieving or laser diffraction methods. One problem is that normal sieve analyses gives a particle size distribution described in weight percent, down to approximately 38 microns. 38 microns tells more about the courser part of the feed than the fine end. Another difficulty is to evaluate
542
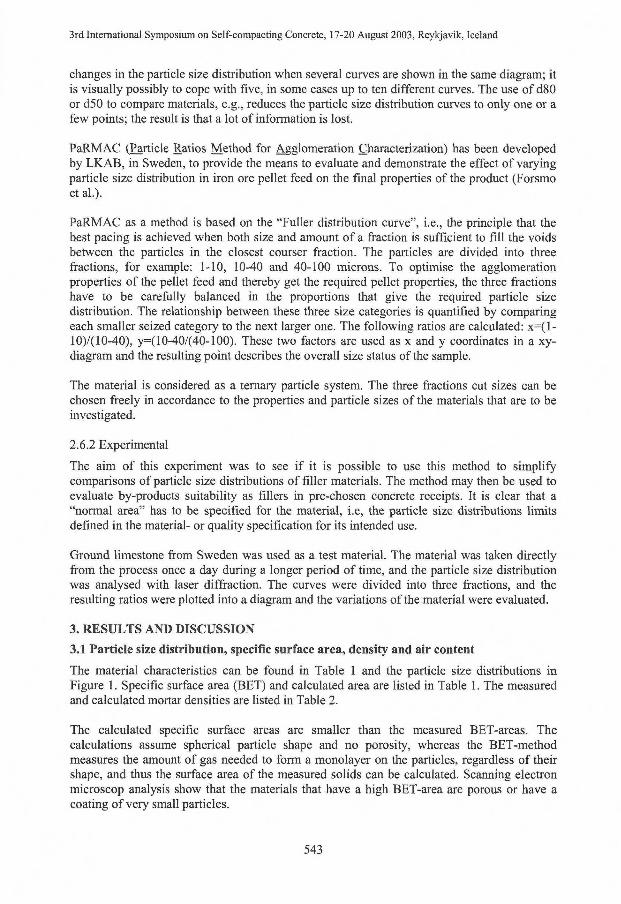
3rd International Symposium on Self-compacting Concrete, 17-20 August 2003, Reykjavik, Iceland
changes in the particle size distribution when several curves are shown in the same diagram; it is visually possibly to cope with five, in some cases up to ten different curves. The use of d80 or d50 to compare materials, e.g., reduces the particle size distribution curves to only one or a few points; the result is that a lot of information is lost.
PaRMAC (Particle Ratios Method for Agglomeration Characterization) has been developed by LKAB, in Sweden, to provide the means to evaluate and demonstrate the effect of varying particle size distribution in iron ore pellet feed on the final properties of the product (Forsmo et al.).
PaRMAC as a method is based on the "Fuller distribution curve", i.e., the principle that the best pacing is achieved when both size and amount of a fraction is sufficient to fill the voids between the particles in the closest courser fraction. The particles are divided into three fractions, for example: 1-10, 10-40 and 40-100 microns. To optimise the agglomeration properties of the pellet feed and thereby get the required pellet properties, the three fractions have to be carefully balanced in the proportions that give the required particle size distribution. The relationship between these three size categories is quantified by comparing each smaller seized category to the next larger one. The following ratios are calculated: x=( l -10)/(10-40), y=( 10-40/(40-100). These two factors are used as x and y coordinates in a xy-diagram and the resulting point describes the overall size status of the sample.
The material is considered as a ternary particle system. The three fractions cut sizes can be chosen freely in accordance to the properties and particle sizes of the materials that are to be investigated.
2.6.2 Experimental
The aim of this experiment was to see i f it is possible to use this method to simplify comparisons of particle size distributions of filler materials. The method may then be used to evaluate by-products suitability as fillers in pre-chosen concrete receipts. It is clear that a "normal area" has to be specified for the material, i.e, the particle size distributions limits defined in the material- or quality specification for its intended use.
Ground limestone from Sweden was used as a test material. The material was taken directly from the process once a day during a longer period of time, and the particle size distribution was analysed with laser diffraction. The curves were divided into three fractions, and the resulting ratios were plotted into a diagram and the variations of the material were evaluated.
3. R E S U L T S AND DISCUSSION
3.1 Particle size distribution, specific surface area, density and air content
The material characteristics can be found in Table 1 and the particle size distributions in Figure 1. Specific surface area (BET) and calculated area are listed in Table 1. The measured and calculated mortar densities are listed in Table 2.
The calculated specific surface areas are smaller than the measured BET-areas. The calculations assume spherical particle shape and no porosity, whereas the BET-method measures the amount of gas needed to form a monolayer on the particles, regardless of their shape, and thus the surface area of the measured solids can be calculated. Scanning electron microscop analysis show that the materials that have a high BET-area are porous or have a coating of very small particles.
543
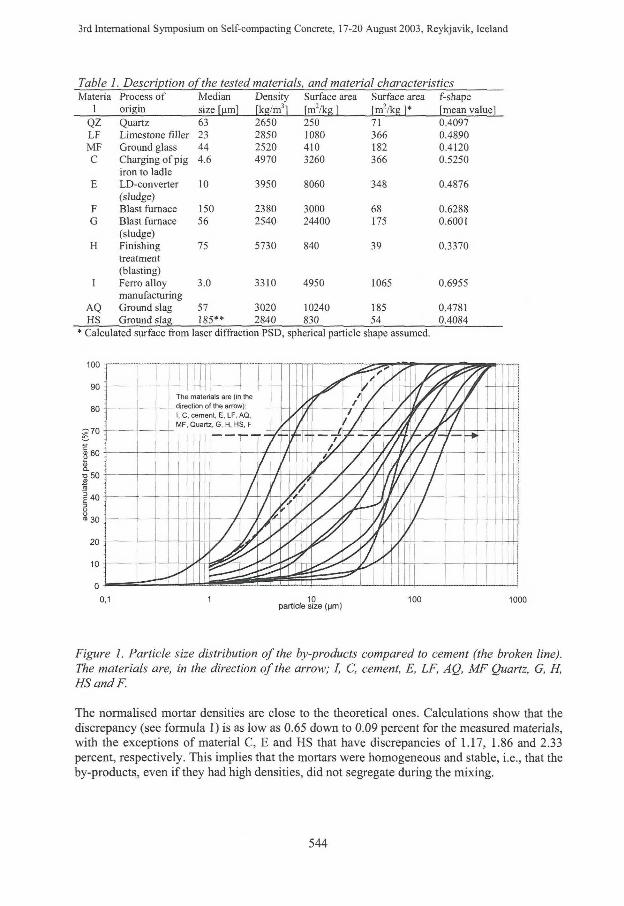
3rd International Symposium on Self-compacting Concrete, 17-20 August 2003, Reykjavik, Iceland
Table 1. Description ofthe tested materials, and material characteristics Materia Process of Median Density Surface area Surface area f-shape
1 origin size [um] [kg/m3] [m 2/kgl [nr/kg ]* [mean value] QZ Quartz 63 2650 250 71 0.4097 L F Limestone filler 23 2850 1080 366 0.4890
MF Ground glass 44 2520 410 182 0.4120 C Charging of pig 4.6 4970 3260 366 0.5250
iron to ladle E LD-converter 10 3950 8060 348 0.4876
(sludge) F Blast furnace 150 2380 3000 68 0.6288 G Blast furnace 56 2540 24400 175 0.6001
(sludge) H Finishing 75 5730 840 39 0.3370
treatment (blasting)
I Ferro alloy 3.0 3310 4950 1065 0.6955 manufacturing
AQ Ground slag 57 3020 10240 185 0.4781 HS Ground slag 185** 2840 830 54 0.4084
* Calculated surface from laser diffraction PSD, spherical particle shape assumed.
Figure 1. Particle size distribution of the by-products compared to cement (the broken line). The materials are, in the direction of the arrow; I, C, cement, E, LF, AQ, MF Quartz, G, H, HSandF.
The normalised mortar densities are close to the theoretical ones. Calculations show that the discrepancy (see formula 1) is as low as 0.65 down to 0.09 percent for the measured materials, with the exceptions of material C, E and HS that have discrepancies of 1.17, 1.86 and 2.33 percent, respectively. This implies that the mortars were homogeneous and stable, i.e., that the by-products, even i f they had high densities, did not segregate during the mixing.
544
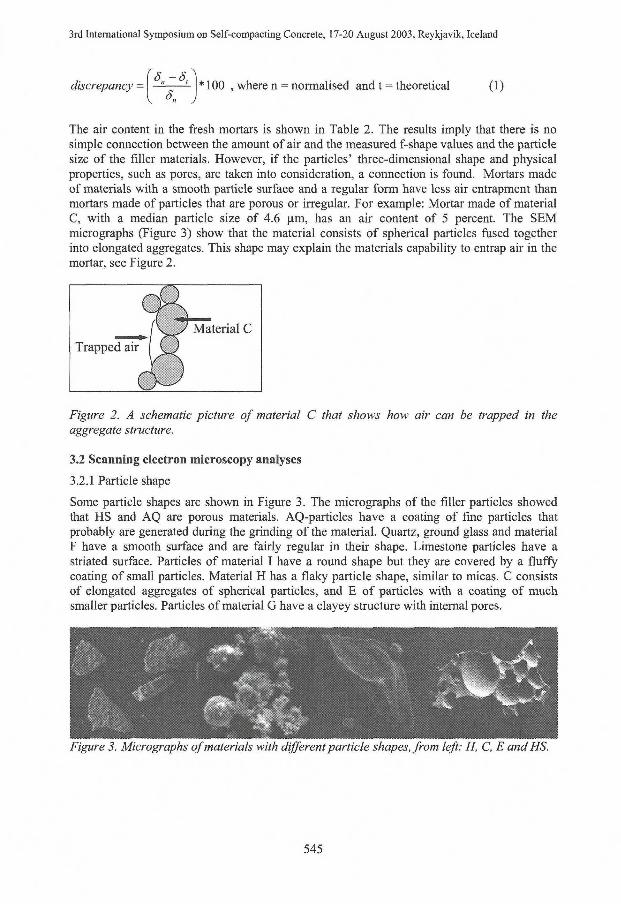
3rd International Symposium on Self-compacting Concrete, 17-20 August 2003, Reykjavik, Iceland
discrepancy = ! 100 , where n = normalised and t = theoretical (1)
The air content in the fresh mortars is shown in Table 2. The results imply that there is no simple connection between the amount of air and the measured f-shape values and the particle size of the filler materials. However, i f the particles' three-dimensional shape and physical properties, such as pores, are taken into consideration, a connection is found. Mortars made of materials with a smooth particle surface and a regular form have less air entrapment than mortars made of particles that are porous or irregular. For example: Mortar made of material C, with a median particle size of 4.6 pm, has an air content of 5 percent. The SEM micrographs (Figure 3) show that the material consists of spherical particles fused together into elongated aggregates. This shape may explain the materials capability to entrap air in the mortar, see Figure 2.
Trapped air
Figure 2. A schematic picture of material C that shows how air can be trapped in the aggregate structure.
3.2 Scanning electron microscopy analyses
3.2.1 Particle shape
Some particle shapes are shown in Figure 3. The micrographs of the filler particles showed that HS and AQ are porous materials. AQ-particles have a coating of fine particles that probably are generated during the grinding of the material. Quartz, ground glass and material F have a smooth surface and are fairly regular in their shape. Limestone particles have a striated surface. Particles of material I have a round shape but they are covered by a f luffy coating of small particles. Material H has a flaky particle shape, similar to micas. C consists of elongated aggregates of spherical particles, and E of particles with a coating of much smaller particles. Particles of material G have a clayey structure with internal pores.
Figure 3. Micrographs of materials with different particle shapes, from left: H C, E and HS.
545
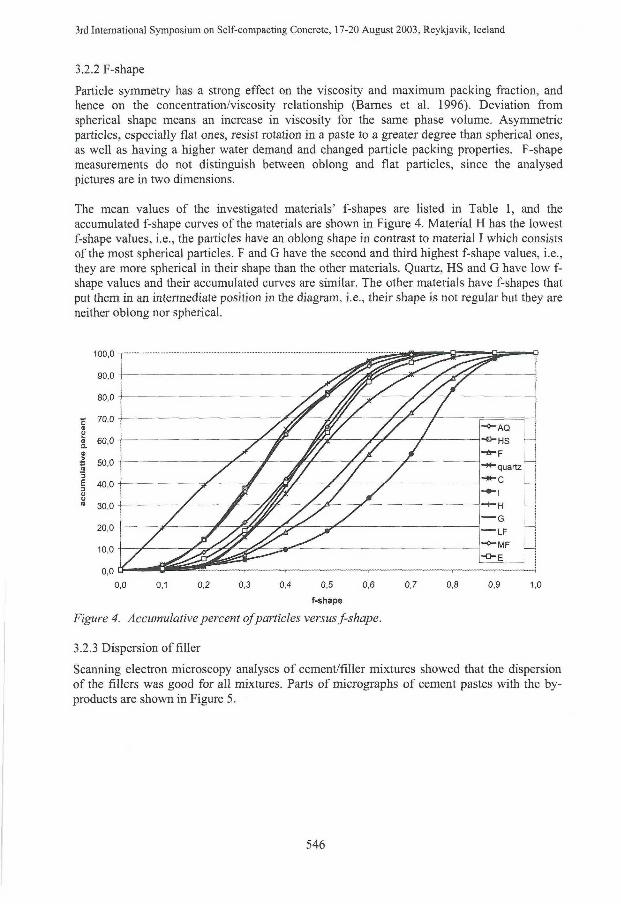
3rd International Symposium on Self-compacting Concrete, 17-20 August 2003, Reykjavik, Iceland
3.2.2 F-shape
Particle symmetry has a strong effect on the viscosity and maximum packing fraction, and hence on the concentration/viscosity relationship (Barnes et al. 1996). Deviation from spherical shape means an increase in viscosity for the same phase volume. Asymmetric particles, especially flat ones, resist rotation in a paste to a greater degree than spherical ones, as well as having a higher water demand and changed particle packing properties. F-shape measurements do not distinguish between oblong and flat particles, since the analysed pictures are in two dimensions.
The mean values of the investigated materials' f-shapes are listed in Table 1, and the accumulated f-shape curves of the materials are shown in Figure 4. Material H has the lowest f-shape values, i.e., the particles have an oblong shape in contrast to material I which consists of the most spherical particles. F and G have the second and third highest f-shape values, i.e., they are more spherical in their shape than the other materials. Quartz, HS and G have low f-shape values and their accumulated curves are similar. The other materials have f-shapes that put them in an intermediate position in the diagram, i.e., their shape is not regular but they are neither oblong nor spherical.
100,0 -
90,0
80,0
per
cen
t 70,0 -
60,0 -
> m 50,0 -
:um
ut
40,0 -
u 30,0 -
20,0 -
10,0 -
0,0 C
0,0 0,1 0,2 0,3 0,5
f-shape
0,6 0,7
-9-AQ
- ° - H S
-*~quartz
-*-c
-H -G - L F
-MF
"E
0,9 1,0
Figure 4. Accumulative percent of particles versus f-shape.
3.2.3 Dispersion of filler
Scanning electron microscopy analyses of cement/filler mixtures showed that the dispersion of the fillers was good for all mixtures. Parts of micrographs of cement pastes with the byproducts are shown in Figure 5.
546
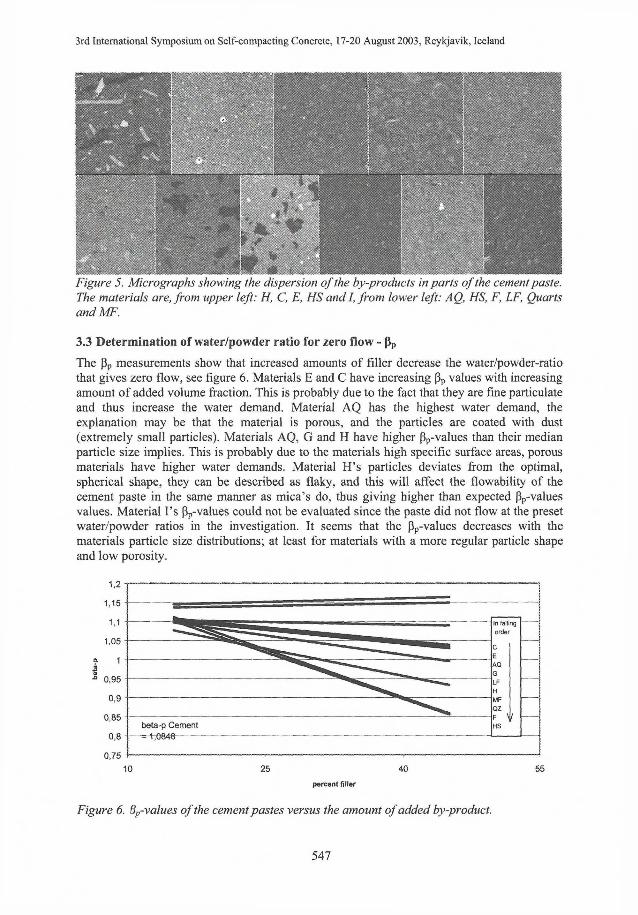
3rd International Symposium on Self-compacting Concrete, 17-20 August 2003, Reykjavik, Iceland
Figure 5. Micrographs showing the dispersion of the by-products in parts ofthe cement paste. The materials are, from upper left: H, C, E, HS and I, from lower left: AQ, HS, F, LF, Quarts and MF.
3.3 Determination of water/powder ratio for zero flow - ß p
The ß p measurements show that increased amounts of filler decrease the water/powder-ratio that gives zero flow, see figure 6. Materials E and C have increasing ß p values with increasing amount of added volume fraction. This is probably due to the fact that they are fine particulate and thus increase the water demand. Material AQ has the highest water demand, the explanation may be that the material is porous, and the particles are coated with dust (extremely small particles). Materials AQ, G and H have higher ßp-values than their median particle size implies. This is probably due to the materials high specific surface areas, porous materials have higher water demands. Material H's particles deviates from the optimal, spherical shape, they can be described as flaky, and this will affect the flowability of the cement paste in the same manner as mica's do, thus giving higher than expected ßp-values values. Material Ts ßp-values could not be evaluated since the paste did not flow at the preset water/powder ratios in the investigation. It seems that the ßp-values decreases with the materials particle size distributions; at least for materials with a more regular particle shape and low porosity.
percent filler
Figure 6. 3p-values of the cement pastes versus the amount of added by-product.
547
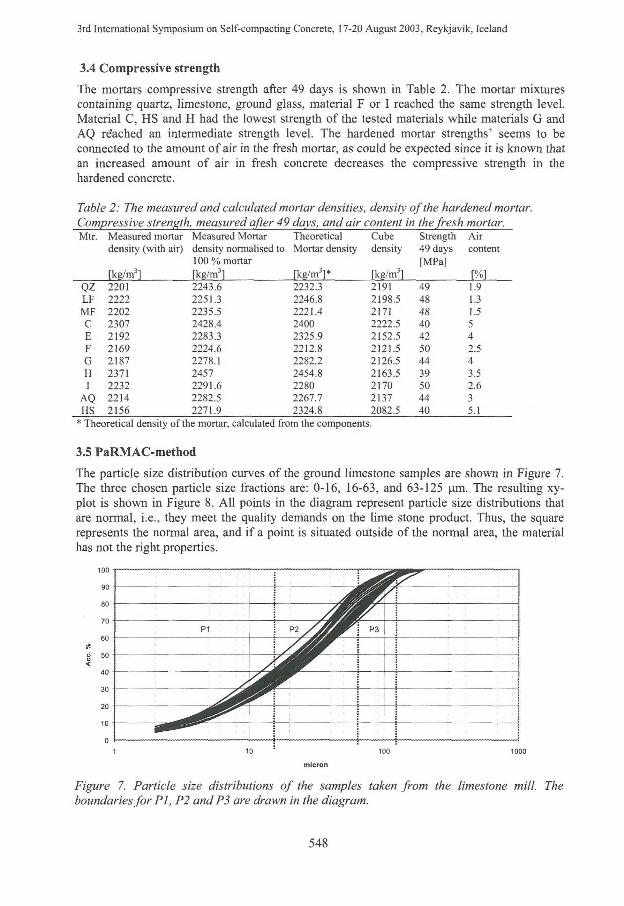
3rd International Symposium on Self-compacting Concrete, 17-20 August 2003, Reykjavik, Iceland
3.4 Compressive strength
The mortars compressive strength after 49 days is shown in Table 2. The mortar mixtures containing quartz, limestone, ground glass, material F or I reached the same strength level. Material C, HS and H had the lowest strength of the tested materials while materials G and AQ re'ached an intermediate strength level. The hardened mortar strengths' seems to be connected to the amount of air in the fresh mortar, as could be expected since it is known that an increased amount of air in fresh concrete decreases the compressive strength in the hardened concrete.
Table 2: The measured and calculated mortar densities, density of the hardened mortar. Compressive strength, measured after 49 days, and air content in the fresh mortar. Mtr. Measured mortar Measured Mortar Theoretical Cube Strength Air
density (with air) density normalised to Mortar density density 49 days content
[kg/m3]
100% mortar
rkg/m3l ikg/m3l* rkg/m'l [MPa]
r%i QZ 2201 2243.6 2232.3 2191 49 1.9 L F 2222 2251.3 2246.8 2198.5 48 1.3 MF 2202 2235.5 2221.4 2171 48 1.5
C 2307 2428.4 2400 2222.5 40 5 E 2192 2283.3 2325.9 2152.5 42 4 F 2169 2224.6 2212.8 2121.5 50 2.5 G 2187 2278.1 2282.2 2126.5 44 4 H 2371 2457 2454.8 2163.5 39 3.5 I 2232 2291.6 2280 2170 50 2.6
AO 2214 2282.5 2267.7 2137 44 3 HS 2156 2271.9 2324.8 2082.5 40 5.1
* Theoretical density of the mortar, calculated from the components.
3.5 PaRMAC-method
The particle size distribution curves of the ground limestone samples are shown in Figure 7. The three chosen particle size fractions are: 0-16, 16-63, and 63-125 pm. The resulting xy-plot is shown in Figure 8. Al l points in the diagram represent particle size distributions that are normal, i.e., they meet the quality demands on the lime stone product. Thus, the square represents the normal area, and i f a point is situated outside of the normal area, the material has not the right properties.
P1 P3
^ ^ ^ ^
1 10 : 100 1000
micron
Figure 7. Particle size distributions of the samples taken from the limestone mill. The boundaries for PI, P2 and P3 are drawn in the diagram.
548
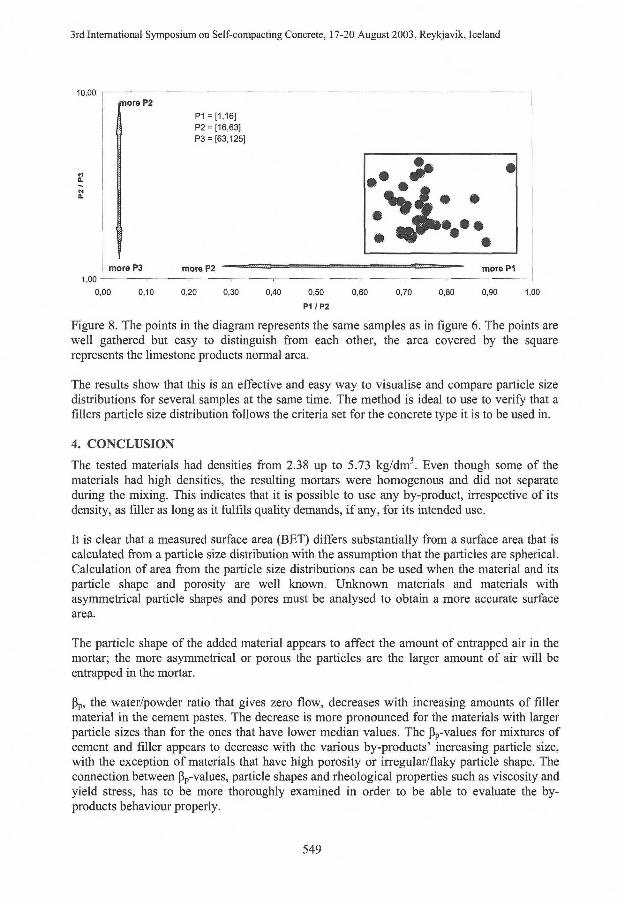
3rd International Symposium on Self-compacting Concrete, 17-20 August 2003, Reykjavik, Iceland
10,00 more P2
more P3
P1 =[1,16] P2 = [16,63] P3 = [63,125]
more P2 more P1
0,40 0,50
P1 /P2
0,60 0,70 0,80 0,90
Figure 8. The points in the diagram represents the same samples as in figure 6. The points are well gathered but easy to distinguish from each other, the area covered by the square represents the limestone products normal area.
The results show that this is an effective and easy way to visualise and compare particle size distributions for several samples at the same time. The method is ideal to use to verify that a fillers particle size distribution follows the criteria set for the concrete type it is to be used in.
4. CONCLUSION
The tested materials had densities from 2.38 up to 5.73 kg/dm3. Even though some of the materials had high densities, the resulting mortars were homogenous and did not separate during the mixing. This indicates that it is possible to use any by-product, irrespective of its density, as filler as long as it fulfils quality demands, i f any, for its intended use.
It is clear that a measured surface area (BET) differs substantially from a surface area that is calculated from a particle size distribution with the assumption that the particles are spherical. Calculation of area from the particle size distributions can be used when the material and its particle shape and porosity are well known. Unknown materials and materials with asymmetrical particle shapes and pores must be analysed to obtain a more accurate surface area.
The particle shape of the added material appears to affect the amount of entrapped air in the mortar; the more asymmetrical or porous the particles are the larger amount of air will be entrapped in the mortar.
ß p, the water/powder ratio that gives zero flow, decreases with increasing amounts of filler material in the cement pastes. The decrease is more pronounced for the materials with larger particle sizes than for the ones that have lower median values. The ßp-values for mixtures of cement and filler appears to decrease with the various by-products' increasing particle size, with the exception of materials that have high porosity or irregular/flaky particle shape. The connection between ßp-values, particle shapes and rheological properties such as viscosity and yield stress, has to be more thoroughly examined in order to be able to evaluate the byproducts behaviour properly.
549
3rd International Symposium on Self-compacting Concrete, 17-20 August 2003, Reykjavik, Iceland
Particle size as well as the size distribution is of importance when considering a material for use in a new field - because some material properties are dependent upon size. Size can be regarded as a quality parameter and the manufacturing process can, and should be, optimised for production of the desired size distribution. The results show that PaRMAC is an effective and easy way to visualise and compare particle size distributions for several samples at the same time. The method can be used as a tool for easy evaluation in order to keep the quality demands on particle size distribution in production. It can also be used to verify that a fillers/by-products particle size distribution follows the criteria set for the concrete type it is to be used in.
Characterizing the by-products form the mineralogical and metallurgical industries are important to ensure optimum utilization of the available recourses. I f a by-product shall be used effectively it has to meet the same quality demands as are put on virgin materials today. This means that by-products must be produced under strict quality control and that the chemical, mechanical and physical properties of the material are kept constant. I f the variations within a certain amount of product are known, mixing with another may be a solution to achieve constancy in some of the quality parameters considered important for a specific use.
5. R E F E R E N C E S
Bames, H.A., Hutton, J..F. and Walters, K. (1996). An Introduction to Rheology, Elsevier Science B.V., Amsterdam.
EFNARC (2001) Specification and guidelines for self-compacting concrete. EFNARC Association House, Hampshire, UK
Forsmo S.P.E, Forsmo S-E. and Samskog P-O. (1999). Characterization of Changes in Particle Size Distribution by the PaRMAC evaluation Method. Kona Powder and Particle, No 17, 1999, pp. 106-113.
Moosberg-Bustnes H., Lind L. and Forssberg E. (2003) Fine particulate metallurgical byproducts influence on cement hydration and strength development - an initial study, Scandinavian Journal of Metallurgy (accepted for publication).
Persson, A-L. (1996). Image Analysis of fine aggregates: Characterisation of shape and grain-size parameters. Licentiate Thesis. Stockholm, Sweden: Royal Institute of technology.
550

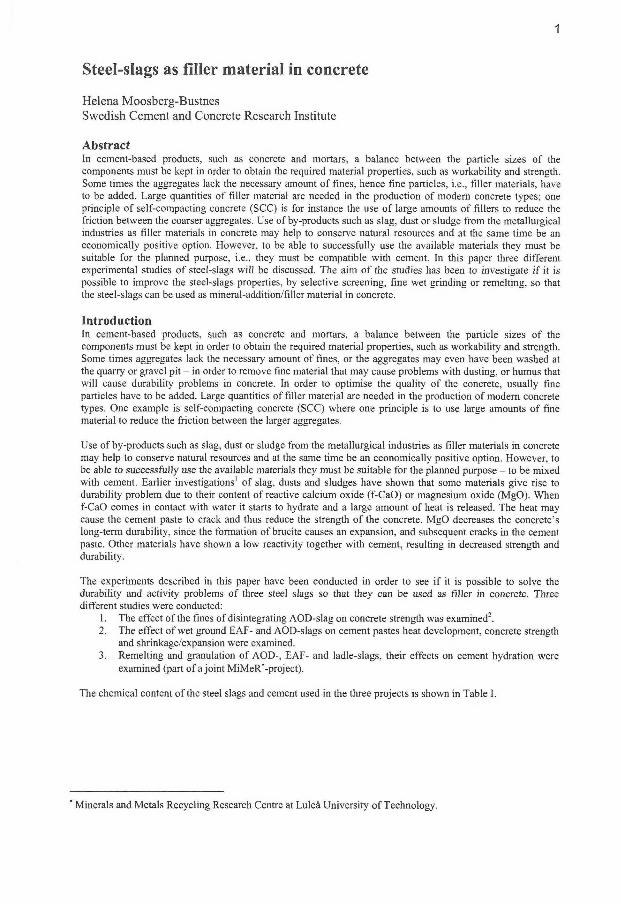
1
Steel-slags as filler material in concrete
Helena Moosberg-Bustnes Swedish Cement and Concrete Research Institute
Abstract In cement-based products, such as concrete and mortars, a balance between the particle sizes of the components must be kept in order to obtain the required material properties, such as workability and strength. Some times the aggregates lack the necessary amount of fines, hence fine particles, i.e., filler materials, have to be added. Large quantities of filler material are needed in the production of modern concrete types; one principle of self-compacting concrete (SCC) is for instance the use of large amounts of fillers to reduce the friction between the coarser aggregates. Use of by-products such as slag, dust or sludge from the metallurgical industries as filler materials in concrete may help to conserve natural resources and at the same time be an economically positive option. However, to be able to successfully use the available materials they must be suitable for the planned purpose, i.e., they must be compatible with cement. In this paper three different experimental studies of steel-slags will be discussed. The aim of the studies has been to investigate if it is possible to improve the steel-slags properties, by selective screening, fine wet grinding or remelting, so that the steel-slags can be used as mineral-addition/filler material in concrete.
Introduction In cement-based products, such as concrete and mortars, a balance between the particle sizes of the components must be kept in order to obtain the required material properties, such as workability and strength. Some times aggregates lack the necessary amount of fines, or the aggregates may even have been washed at the quarry or gravel pit - in order to remove fine material that may cause problems with dusting, or humus that will cause durability problems in concrete. In order to optimise the quality of the concrete, usually fine particles have to be added. Large quantities of filler material are needed in the production of modern concrete types. One example is self-compacting concrete (SCC) where one principle is to use large amounts of fine material to reduce the friction between the larger aggregates.
Use of by-products such as slag, dust or sludge from the metallurgical industries as filler materials in concrete may help to conserve natural resources and at the same time be an economically positive option. However, to be able to successfully use the available materials they must be suitable for the planned purpose - to be mixed with cement. Earlier investigations1 of slag, dusts and sludges have shown that some materials give rise to durability problem due to their content of reactive calcium oxide (f-CaO) or magnesium oxide (MgO). When f-CaO comes in contact with water it starts to hydrate and a large amount of heat is released. The heat may cause the cement paste to crack and thus reduce the strength of the concrete. MgO decreases the concrete's long-term durability, since the formation of brucite causes an expansion, and subsequent cracks in the cement paste. Other materials have shown a low reactivity together with cement, resulting in decreased strength and durability.
The experiments described in this paper have been conducted in order to see if it is possible to solve the durability and activity problems of three steel slags so that they can be used as filler in concrete. Three different studies were conducted:
1. The effect of the fines of disintegrating AOD-slag on concrete strength was examined2. 2. The effect of wet ground E A F - and AOD-slags on cement pastes heat development, concrete strength
and shrinkage/expansion were examined. 3. Remelting and granulation of AOD-, E A F - and ladle-slags, their effects on cement hydration were
examined (part of a joint MiMeR'-project).
The chemical content of the steel slags and cement used in the three projects is shown in Table I.
* Minerals and Metals Recycling Research Centre at Luleå University of Technology.
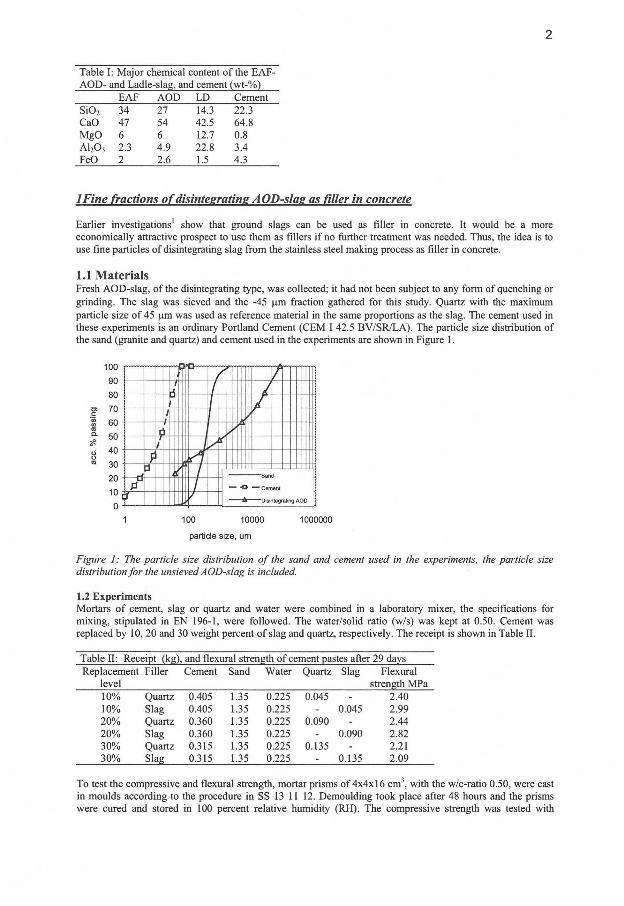
2
Table I: Major chemical content of the E A F -AOD- and Ladle-slag, and cement (wt-%)
E A F AOD L D Cement S i 0 2 34 27 14.3 22.3 CaO 47 54 42.5 64.8 MgO 6 6 12.7 0.8 A1 2 0 3
2.3 4.9 22.8 3.4 FeO 2 2.6 1.5 4.3
lFine fractions of disintegrating AOD-slae as filler in concrete
Earlier investigations' show that ground slags can be used as filler in concrete. It would be a more economically attractive prospect to use them as fillers if no further treatment was needed. Thus, the idea is to use fine particles of disintegrating slag from the stainless steel making process as filler in concrete.
1.1 Materials Fresh AOD-slag, of the disintegrating type, was collected; it had not been subject to any form of quenching or grinding. The slag was sieved and the -45 urn fraction gathered for this study. Quartz with the maximum particle size of 45 um was used as reference material in the same proportions as the slag. The cement used in these experiments is an ordinary Portland Cement (CEM I 42.5 BV/SR/LA) . The particle size distribution of the sand (granite and quartz) and cement used in the experiments are shown in Figure 1.
Figure 1: The particle size distribution of the sand and cement used in the experiments, the particle size distribution for the unsieved AOD-slag is included.
1.2 Experiments Mortars of cement, slag or quartz and water were combined in a laboratory mixer, the specifications for mixing, stipulated in E N 196-1, were followed. The water/solid ratio (w/s) was kept at 0.50. Cement was replaced by 10, 20 and 30 weight percent of slag and quartz, respectively. The receipt is shown in Table II.
Table II: Receipt (kg), and flexural strength of cement pastes after 29 days Replacement Filler Cement Sand Water Quartz Slag Flexural
level strength MPa 10% Quartz 0.405 1.35 0.225 0.045 - 2.40 10% Slag 0.405 1.35 0.225 - 0.045 2.99 20% Quartz 0.360 1.35 0.225 0.090 - 2.44 20% Slag 0.360 1.35 0.225 - 0.090 2.82 30% Quartz 0.315 1.35 0.225 0.135 - 2.21 30% Slag 0.315 1.35 0.225 - 0.135 2.09
To test the compressive and flexural strength, mortar prisms of 4x4x16 cm3, with the w/c-ratio 0.50, were cast in moulds according to the procedure in SS 13 11 12. Demoulding took place after 48 hours and the prisms were cured and stored in 100 percent relative humidity (RH). The compressive strength was tested with
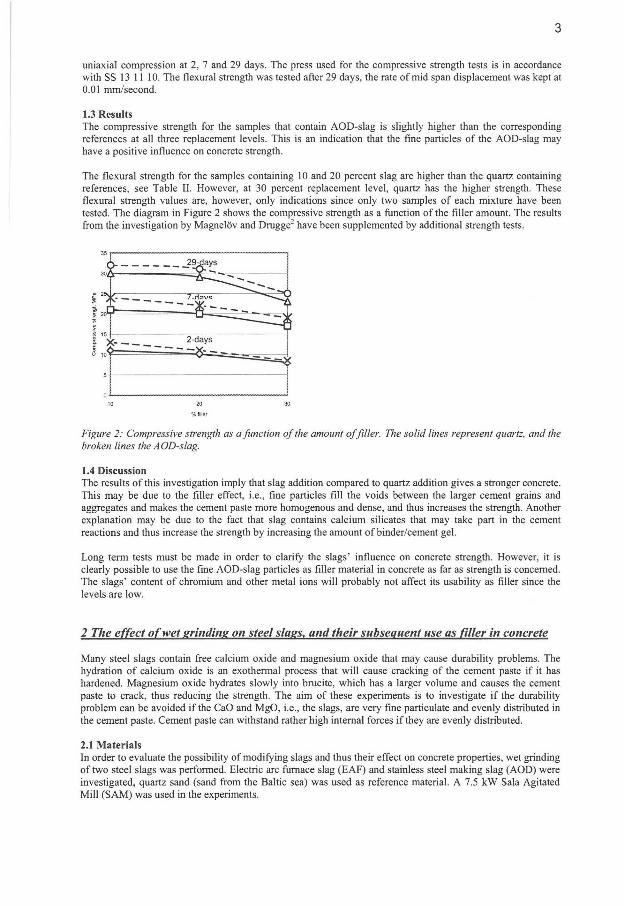
3
uniaxial compression at 2, 7 and 29 days. The press used for the compressive strength tests is in accordance with SS 13 11 10. The flexural strength was tested after 29 days, the rate of mid span displacement was kept at 0.01 mm/second.
1.3 Results The compressive strength for the samples that contain AOD-slag is slightly higher than the corresponding references at all three replacement levels. This is an indication that the fine particles of the AOD-slag may have a positive influence on concrete strength.
The flexural strength for the samples containing 10 and 20 percent slag are higher than the quartz containing references, see Table II. However, at 30 percent replacement level, quartz has the higher strength. These flexural strength values are, however, only indications since only two samples of each mixture have been tested. The diagram in Figure 2 shows the compressive strength as a function of the filler amount. The results from the investigation by Magnelöv and Drugge2 have been supplemented by additional strength tests.
0 j ! 10 20 30
% filler
Figure 2: Compressive strength as a function of the amount offiller. The solid lines represent quartz, and the broken lines the A OD-slag.
1.4 Discussion The results of this investigation imply that slag addition compared to quartz addition gives a stronger concrete. This may be due to the filler effect, i.e., fine particles fill the voids between the larger cement grains and aggregates and makes the cement paste more homogenous and dense, and thus increases the strength. Another explanation may be due to the fact that slag contains calcium silicates that may take part in the cement reactions and thus increase the strength by increasing the amount of binder/cement gel.
Long term tests must be made in order to clarify the slags' influence on concrete strength. However, it is clearly possible to use the fine AOD-slag particles as filler material in concrete as far as strength is concerned. The slags' content of chromium and other metal ions will probably not affect its usability as filler since the levels are low.
2 The effect of wet grinding on steel slags, and their subsequent use as filler in concrete
Many steel slags contain free calcium oxide and magnesium oxide that may cause durability problems. The hydration of calcium oxide is an exothermal process that will cause cracking of the cement paste if it has hardened. Magnesium oxide hydrates slowly into brucite, which has a larger volume and causes the cement paste to crack, thus reducing the strength. The aim of these experiments is to investigate if the durability problem can be avoided if the CaO and MgO, i.e., the slags, are very fine particulate and evenly distributed in the cement paste. Cement paste can withstand rather high internal forces if they are evenly distributed.
2.1 Materials In order to evaluate the possibility of modifying slags and thus their effect on concrete properties, wet grinding of two steel slags was performed. Electric arc furnace slag (EAF) and stainless steel making slag (AOD) were investigated, quartz sand (sand from the Baltic sea) was used as reference material. A 7.5 kW Sala Agitated Mill (SAM) was used in the experiments.
4
2.2 Experimental Each material was fed into the mill together with water. They were ground for 20 minutes and then the slurry was poured into plastic buckets, and left for quenching. One hour later, the slurries were homogenised and their water/solid-content analysed. The ground materials' particle size distributions are shown in Figure 4.
2.2.1 Isothermal calorimetric measurements Isothermal calorimetric measurements were performed in order to see how the materials affect the cement hydration when mixed into cement paste. Twenty weight-percent of the cement was replaced by the various slags (dry weight). The instrument has an accuracy of ± 5 percent. Four minutes elapsed between the addition of the water to the cement/filler mixture and the placement of the paste in the calorimeter. The mixing procedure is in accordance with the SS-ENV 206. The water/solid-ratio was kept at 0.40 for all samples. Mortar and pestle were used to (dry) grind samples of the original slags so that their heat development curves could be determined as well as the wet ground slags. The material was sieved and the -45 um fraction used. A sample each of the wet ground materials were dried, deagglomerated and thereafter mixed into cement paste and analysed with the calorimeter. The water content in the slurries was analysed and the amount of mixing water adjusted to obtain the correct water/solid-ratio.
According to Murat and Sadok3, hydration kinetics, i.e., the nucleation rate V„, and the growth rate V g , can be approximated by the following formulas:
Where: to is the time at which the transition between the dormant period and the accelerating period occurs, and tmax is the time when the maximum heat, dQ/dt is obtained (the second peak).
The hydration is accelerated when the peak occurs earlier and likewise retarded when it occurs later.
2.2.2 Compressive strength The concrete was based on a receipt containing 433 kg cement and 1672 kg aggregates per cubic meter. Mixtures of concrete where 20 and 40 percent cement were replaced with AOD-slag, EAF-slag and quartz, respectively, were mixed in accordance to SS EN-206-1, the references without filler were made in the same way. Concrete cubes, 0.10 x 0.10 x 0.10 m 3 were cast to determine the filler materials' influence on the concrete strength. To facilitate calculations of efficiency factors, concrete with three different water/cement-ratios (w/c-ratio) was mixed. The samples with w/c-ratios of 0.61 and 0.81 correspond to the clinker content in the mixtures with 20 and 40 percent slags.
2.2.3 Shrinkage and expansion In order to test the effect of the ground slags on shrinkage and expansion, prisms of 2.5x2.5x25 cm 3 with the w/s-ratio of 0.40 were cast in steel moulds. Steel knobs were attached to the short sides to enable measurements of length alterations. Demoulding took place 24 hours after casting, and the prisms were cured in 100 percent RH. The prisms for shrinkage and expansion measurements were stored in constant temperature, 20 °C, and in 50 and 100 percent RH respectively. The lengths were measured immediately after demoulding and then again after 91 days. A standard measuring-rod was used as a reference.
2.2.4 Efficiency factor In order to be able to measure the relative effect of filler material compared to cement an efficiency-factor (k-factor) can be calculated4 , 5. This factor represents the amount of filler that can be considered equal to the cement, in regard to the compressive strength.
K = — 'o
[1]
('max h) [2]
[3]
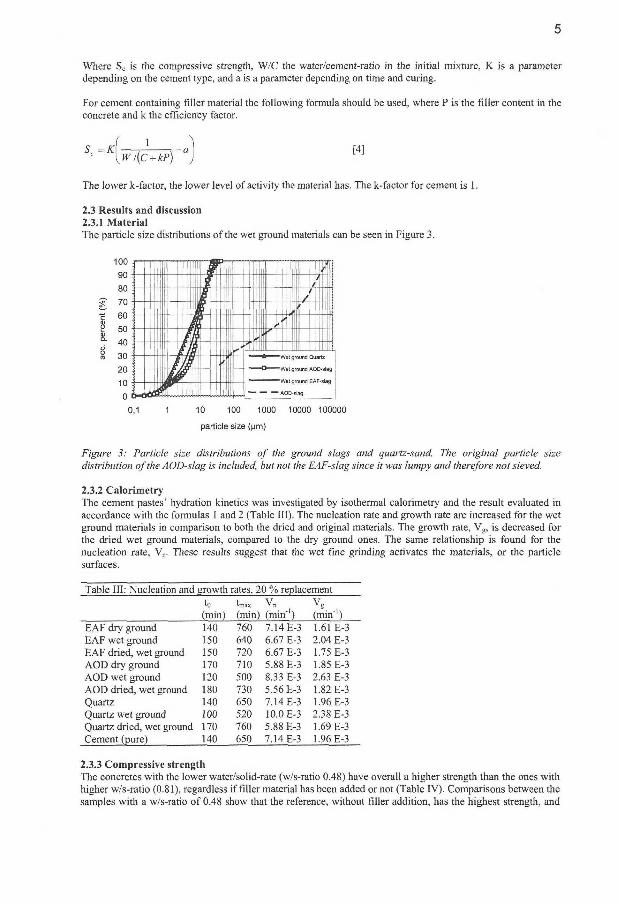
5
Where S c is the compressive strength, W/C the water/cement-ratio in the initial mixture, K is a parameter depending on the cement type, and a is a parameter depending on time and curing.
For cement containing filler material the following formula should be used, where P is the filler content in the concrete and k the efficiency factor.
S, =K\ [4] Wl{C + kP)
The lower k-factor, the lower level of activity the material has. The k-factor for cement is 1.
2.3 Results and discussion 2.3.1 Material The particle size distributions of the wet ground materials can be seen in Figure 3.
Wet ground Quartz
Wet ground AOD-slag
Wet ground EAF-slag
AOD-slag
10 100 1000
particle size (urn)
10000 100000
Figure 3: Particle size distributions of the ground slags and quartz-sand. The original particle size distribution of the AOD-slag is included, but not the EAF-slag since it was lumpy and therefore not sieved.
2.3.2 Calorimetry The cement pastes' hydration kinetics was investigated by isothermal calorimetry and the result evaluated in accordance with the formulas 1 and 2 (Table III). The nucleation rate and growth rate are increased for the wet ground materials in comparison to both the dried and original materials. The growth rate, V g , is decreased for the dried wet ground materials, compared to the dry ground ones. The same relationship is found for the nucleation rate, V„. These results suggest that the wet fine grinding activates the materials, or the particle surfaces.
Table III: Nucleation and growth rates, 20 % replacement
to tmax v„ v 8
(min) (min) (min" ) (min •') E A F dry ground 140 760 7.14 E-3 1.61 E-3 E A F wet ground 150 640 6.67 E-3 2.04 E-3 E A F dried, wet ground 150 720 6.67 E-3 1.75 E-3 AOD dry ground 170 710 5.88 E-3 1.85 E-3 AOD wet ground 120 500 8.33 E-3 2.63 E-3 AOD dried, wet ground 180 730 5.56 E-3 1.82 E-3 Quartz 140 650 7.14 E-3 1.96 E-3 Quartz wet ground 100 520 10.0 E-3 2.38 E-3 Quartz dried, wet ground 170 760 5.88 E-3 1.69 E-3 Cement (pure) 140 650 7.14 E-3 1.96 E-3
2.3.3 Compressive strength The concretes with the lower water/solid-rate (w/s-ratio 0.48) have overall a higher strength than the ones with higher w/s-ratio (0.81), regardless if filler material has been added or not (Table IV). Comparisons between the samples with a w/s-ratio of 0.48 show that the reference, without filler addition, has the highest strength, and
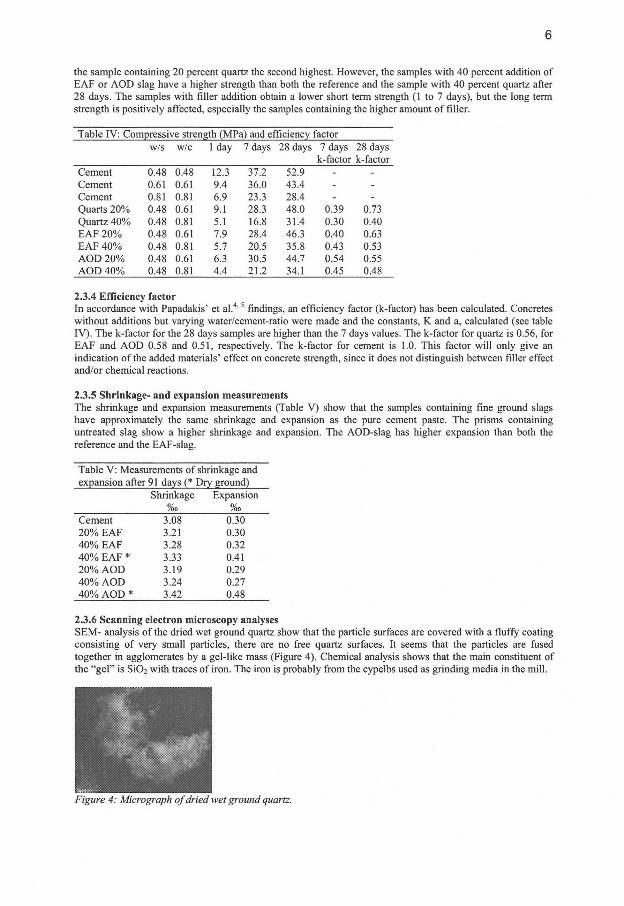
6
the sample containing 20 percent quartz the second highest. However, the samples with 40 percent addition of E A F or AOD slag have a higher strength than both the reference and the sample with 40 percent quartz after 28 days. The samples with filler addition obtain a lower short term strength (1 to 7 days), but the long term strength is positively affected, especially the samples containing the higher amount of filler.
Table IV: Compressive strength (MPa) and efficiency factor w/s w/c 1 day 7 days 28 days 7 days 28 days
k-factor k-factor Cement 0.48 0.48 12.3 37.2 52.9 - -Cement 0.61 0.61 9.4 36.0 43.4 - -Cement 0.81 0.81 6.9 23.3 28.4 - -Quarts 20% 0.48 0.61 9.1 28.3 48.0 0.39 0.73 Quartz 40% 0.48 0.81 5.1 16.8 31.4 0.30 0.40 E A F 20% 0.48 0.61 7.9 28.4 46.3 0.40 0.63 E A F 40% 0.48 0.81 5.7 20.5 35.8 0.43 0.53 AOD 20% 0.48 0.61 6.3 30.5 44.7 0.54 0.55 AOD 40% 0.48 0.81 4.4 21.2 34.1 0.45 0.48
2.3.4 Efficiency factor In accordance with Papadakis' et a l . 4 ' 5 findings, an efficiency factor (k-factor) has been calculated. Concretes without additions but varying water/cement-ratio were made and the constants, K and a, calculated (see table IV). The k-factor for the 28 days samples are higher than the 7 days values. The k-factor for quartz is 0.56, for E A F and AOD 0.58 and 0.51, respectively. The k-factor for cement is 1.0. This factor will only give an indication of the added materials' effect on concrete strength, since it does not distinguish between filler effect and/or chemical reactions.
2.3.5 Shrinkage- and expansion measurements The shrinkage and expansion measurements (Table V) show that the samples containing fine ground slags have approximately the same shrinkage and expansion as the pure cement paste. The prisms containing untreated slag show a higher shrinkage and expansion. The AOD-slag has higher expansion than both the reference and the EAF-slag.
Table V: Measurements of shrinkage and expansion after 91 days (* Dry ground)
Shrinkage Expansion %o °/oo
Cement 3.08 0.30 20% E A F 3.21 0.30 40% E A F 3.28 0.32 40% E A F * 3.33 0.41 20% AOD 3.19 0.29 40% AOD 3.24 0.27 40% AOD * 3.42 0.48
2.3.6 Scanning electron microscopy analyses S E M - analysis of the dried wet ground quartz show that the particle surfaces are covered with a fluffy coating consisting of very small particles, there are no free quartz surfaces. It seems that the particles are fused together in agglomerates by a gel-like mass (Figure 4). Chemical analysis shows that the main constituent of the "gel" is S i0 2 with traces of iron. The iron is probably from the cypelbs used as grinding media in the mill.
Figure 4: Micrograph of dried wet ground quartz.
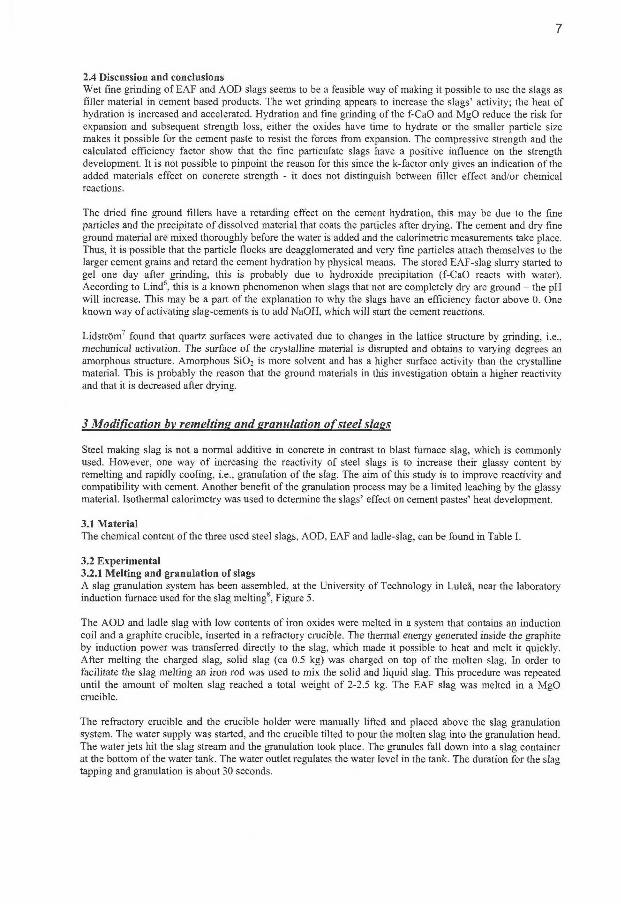
7
2.4 Discussion and conclusions Wet fine grinding of E A F and AOD slags seems to be a feasible way of making it possible to use the slags as filler material in cement based products. The wet grinding appears to increase the slags' activity; the heat of hydration is increased and accelerated. Hydration and fine grinding of the f-CaO and MgO reduce the risk for expansion and subsequent strength loss, either the oxides have time to hydrate or the smaller particle size makes it possible for the cement paste to resist the forces from expansion. The compressive strength and the calculated efficiency factor show that the fine particulate slags have a positive influence on the strength development. It is not possible to pinpoint the reason for this since the k-factor only gives an indication of the added materials effect on concrete strength - it does not distinguish between filler effect and/or chemical reactions.
The dried fine ground fillers have a retarding effect on the cement hydration, this may be due to the fine particles and the precipitate of dissolved material that coats the particles after drying. The cement and dry fine ground material are mixed thoroughly before the water is added and the calorimetric measurements take place. Thus, it is possible that the particle flocks are deagglomerated and very fine particles attach themselves to the larger cement grains and retard the cement hydration by physical means. The stored EAF-slag slurry started to gel one day after grinding, this is probably due to hydroxide precipitation (f-CaO reacts with water). According to Lind 6 , this is a known phenomenon when slags that not are completely dry are ground - the pH will increase. This may be a part of the explanation to why the slags have an efficiency factor above 0. One known way of activating slag-cements is to add NaOH, which will start the cement reactions.
Lidström7 found that quartz surfaces were activated due to changes in the lattice structure by grinding, i.e., mechanical activation. The surface of the crystalline material is disrupted and obtains to varying degrees an amorphous structure. Amorphous S i 0 2 is more solvent and has a higher surface activity than the crystalline material. This is probably the reason that the ground materials in this investigation obtain a higher reactivity and that it is decreased after drying.
3 Modification by remelting and granulation of steel slags
Steel making slag is not a normal additive in concrete in contrast to blast furnace slag, which is commonly used. However, one way of increasing the reactivity of steel slags is to increase their glassy content by remelting and rapidly cooling, i.e., granulation of the slag. The aim of this study is to improve reactivity and compatibility with cement. Another benefit ofthe granulation process may be a limited leaching by the glassy material. Isothermal calorimetry was used to determine the slags' effect on cement pastes' heat development.
3.1 Material The chemical content of the three used steel slags, AOD, E A F and ladle-slag, can be found in Table I.
3.2 Experimental 3.2.1 Melting and granulation of slags A slag granulation system has been assembled, at the University of Technology in Luleå, near the laboratory induction furnace used for the slag melting8, Figure 5.
The AOD and ladle slag with low contents of iron oxides were melted in a system that contains an induction coil and a graphite crucible, inserted in a refractory crucible. The thermal energy generated inside the graphite by induction power was transferred directly to the slag, which made it possible to heat and melt it quickly. After melting the charged slag, solid slag (ca 0.5 kg) was charged on top of the molten slag. In order to facilitate the slag melting an iron rod was used to mix the solid and liquid slag. This procedure was repeated until the amount of molten slag reached a total weight of 2-2.5 kg. The E A F slag was melted in a MgO crucible.
The refractory crucible and the crucible holder were manually lifted and placed above the slag granulation system. The water supply was started, and the crucible tilted to pour the molten slag into the granulation head. The water jets hit the slag stream and the granulation took place. The granules fall down into a slag container at the bottom of the water tank. The water outlet regulates the water level in the tank. The duration for the slag tapping and granulation is about 30 seconds.
8
Figure 5: The slag melting and granulation equipment*: 1. Induction coil, 2. Refractory crucible, 3. Graphite crucible, 4. Slag, 5. Refractory cover, 6. Steel plate, 7. Granulation head, 8. Water inlet, 9. Water outlet, 10. Water tank, 11. Granualated slag container.
3.2.2 X-ray diffraction analysis The states of the original and the granulated slags, i.e. if they were crystalline or amorphous, were examined with x-ray diffraction analysis. The slags were ground, and then sieved with a 60 pm screen before analysis. A Philips PW1710 X-ray Diffractometer was used for the diffraction studies, a PW1729 X-ray Generator produced the copper radiation, Cu K a . Scans were run with the X-ray source set at 40kV and 30mA. The measurement were made for the 29 range 5°-70° with a step size of 0.020° and a measuring time per step of 1.00 s.
3.2.3 Calorimetric measurements The heat development curves were determined with an isothermal calorimeter (see subsection 2.2.1 for technical details). Cement pastes where 20 weight-percent of the cement was replaced, with the respective slags were analysed. Pure cement was used as reference material.
3.4 Results 3.4.1 X-Ray diffraction analysis The X R D analysis shows that the original ladle slag is crystalline and that the granulated ladle slag is almost wholly amorphous, it contains a small amount of crystalline magnesium oxide. The granulated E A F slag contains the same compounds as the original slag, the peaks are, however, slightly lower. The granulated AOD slag has fewer peaks than the original slag, its structure has clearly changed towards a more glassy state. The crystalline compounds consist mainly of calcium oxides and calcium silicates and a small amount of magnesium oxide.
3.4.2 Calorimetric measurements The calorimetric measurements of the ladle slag show that the untreated slag retards the heat development severely. However, the granulated slag has clearly become reactive, the nucleation and growth rates are significantly higher, in fact they are almost the same as the pure cements. The maximum heat developed is though slightly lower. The heat development for granulated AOD slag is lower and retarded in comparison to both the reference and the original slag. The granulated E A F slag is slightly accelerated compared to the untreated slag, the amount of developed heat has not changed (Figure 6 and Table VI).
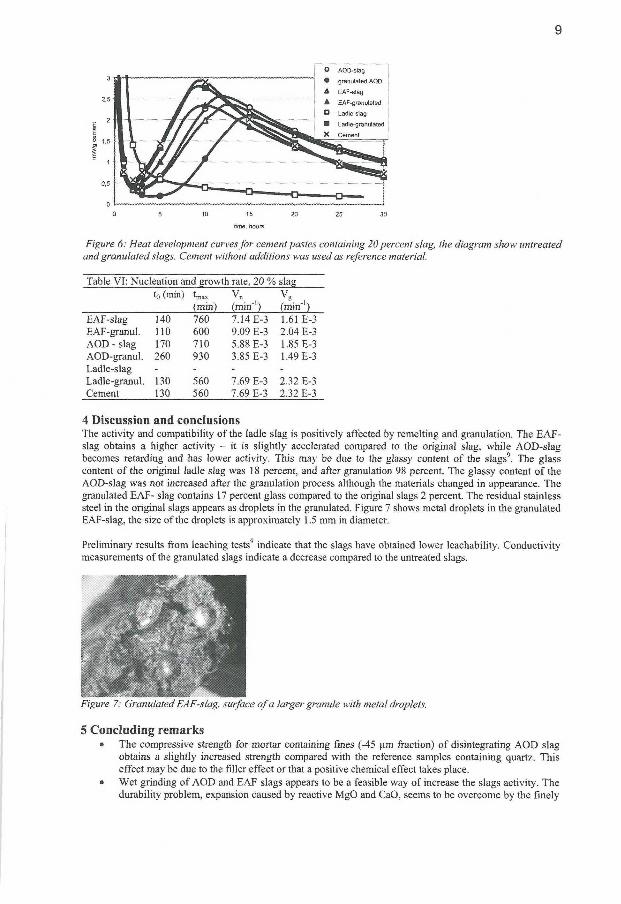
9
Q 5 10 15 20 25 30
time, hours
Figure 6: Heat development curves for cement pastes containing 20 percent slag, the diagram show untreated and granulated slags. Cement without additions was used as reference material.
Table VI: Nucleation and growth rate, 20 % slag t0 (min) tmax v„
(min) (min"1) (min'1) EAF-slag 140 760 7.14 E-3 1.61 E-3 EAF-granul. 110 600 9,09 E-3 2.04 E-3 AOD - slag 170 710 5.88 E-3 1.85 E-3 AOD-granul. 260 930 3.85 E-3 1.49 E-3 Ladle-slag - - - -Ladle-granul. 130 560 7.69 E-3 2.32 E-3 Cement 130 560 7.69 E-3 2.32 E-3
4 Discussion and conclusions The activity and compatibility of the ladle slag is positively affected by remelting and granulation. The E A F -slag obtains a higher activity - it is slightly accelerated compared to the original slag, while AOD-slag becomes retarding and has lower activity. This may be due to the glassy content of the slags9. The glass content of the original ladle slag was 18 percent, and after granulation 98 percent. The glassy content of the AOD-slag was not increased after the granulation process although the materials changed in appearance. The granulated E A F - slag contains 17 percent glass compared to the original slags 2 percent. The residual stainless steel in the original slags appears as droplets in the granulated. Figure 7 shows metal droplets in the granulated EAF-slag, the size of the droplets is approximately 1.5 mm in diameter.
Preliminary results from leaching tests'1 indicate that the slags have obtained lower leachability. Conductivity measurements of the granulated slags indicate a decrease compared to the untreated slags.
Figure 7: Granulated EAF-slag, surface of a larger granule with metal droplets.
5 Concluding remarks • The compressive strength for mortar containing fines (-45 urn fraction) of disintegrating AOD slag
obtains a slightly increased strength compared with the reference samples containing quartz. This effect may be due to the filler effect or that a positive chemical effect takes place.
• Wet grinding of AOD and E A F slags appears to be a feasible way of increase the slags activity. The durability problem, expansion caused by reactive MgO and CaO, seems to be overcome by the finely

10
ground slags, they have the same volume changes as the cement reference. The ground material must, however, be used in slurry form since drying destroys the obtained surface activation of the particles.
• Remelting and granulation of slags had a positive effect on the examined ladle- and EAF-slag. The granulated AOD-slag on the other hand, had decreased activity and retarded the cement reactions. The granulated slags effects on cement hydration are positively affected when the glassy phase is increased and vice versa.
The results from the three investigations show that steel-slags can be used as filler in cement based products since the problems of activation (effect on cement hydration) and durability can be overcome.
6 Acknowledgements This research is part ofthe research programme at Mineral and Metals Recycling Research Centre (MiMeR) at Luleå University of Technology in Sweden. The author gratefully thanks Cementa AB in Slite for the use of their SAM-mill, and Carsten Vogt at CBI for his help with grinding of the materials.
6 References 1. Moosberg, H., Utilisation of Chemically Inert or Puzzolanic Particles to Modify Concrete Properties and
Save Cement. Licentiate Thesis 2000:53, Luleå University of Technology, 2000, pp. 117. 2. Magnelöv, M. & Drugge R., (2001) Användning av slagg som filler i betong, Student-project at Luleå
University of Technology, department of process metallurgy. (Supervisors: Helena Moosberg-Bustnes, CBI and Johan Eriksson, department of process metallurgy at L T U )
3. Murat M. and Sadok E l . H. Role of foreign cations in solution in the hydration kinetics of high alumina cement, Calcium Aluminate Cements, ed. Mangabhai R.J. E.&F.N. Spoon. 1990, pp. 155-166.
4. Papadakis V .G. and Tsimas S. Supplementary cementing materials in concrete, Part I: efficiency and design Cement and Concrete Research, 2002, Vol 32, pp 1525-1532.
5. Papadakis V.G. , Antiohos S. and Tsimas S. Supplementary cementing materials in concrete, Part II:a fundamental estimation of the efficiency factor, Cement and Concrete Research, 2002, Vol 32, pp 1533-1538.
6. Lind L . , SSAB Merox AB, Oxelösund, personal communication. 7. Lidström L . Surface and bond-forming properties of quartz and silicate minerals and their application in
mineral processing techniques Acta Polytechnica Scandinavica, 1968, p. 149. 8. QiXing Y and Eriksson J. , Luleå University of Technology, Division of Process Metallurgy, personal
communication 9. Tossavainen M, Luleå University of Technology, Division of Mineral Processing, personal
communication.

I
Filter dust as filler in concrete - from laboratory to full scale
H. Moosberg-Bustnes, Swedish Cement and Concrete Research Institute L. Hunsbeth, Tinfos Jernverk A/S
Abstract
Environmental considerations have become important for the metallurgical industries worldwide. Recycling and use of industrial "waste-products" is an attractive alternative to landfills. This practice reduces or eliminates potential pollution problems, conserves natural resources, saves energy and is also economically beneficial. However in order to be able to use these materials in other processes their properties has to be thoroughly characterised so that they are suitable for their planned purpose.
Modern concrete, such as self-compacting concrete, needs supplementing filler material to increase the volume of its fluid phase and to bind excess water due to the large degree of particle dispersion. Sometimes the aggregates lack the necessary amount of fines and thus filler material has to be added. The use of crushed aggregates instead of natural sand and gravel gives a workability change of the concrete, which can be remedied by adding filler materials.
This investigation has been made on a flue dust, collected in the smoke hood covering the tapping area at Tinfos Jemverk A/S site in Kvinesdal, Norway, with the intention of using the material as filler in concrete. The materials effect on cement hydration, rate of reaction, shrinkage/expansion and concrete strength development has been investigated.
The results show that the material has a slight retarding effect on the cement hydration. The rate of reaction and the strength development after 28 days of curing is normal. The shrinkage and expansion measurements after 91 days of curing are also normal. The conclusion of the investigation is that it is possible to use the filter dust as filler in concrete.
Due to the positive results of the experiments conducted in laboratory scale, full scale mixing and casting of construction concrete containing filter dust was performed at Tinfos Jernverk A/S site in Kvinesdal.
1 Introduction
As the environmental concerns have become more important for the industries and the industrial production of minerals and metals still continue to increases, the problem with landfills, both economically and environmentally, has become imperative to solve.
In order to find a solution to the metallurgical industries problem with waste products, there are several ways to go: waste minimisation, recycling to the process, recycling to another process, modification for use in other application, or deposit it while research is conducted to find a solution to the recycling problem.
Concrete is the most frequently used construction material today. Use of waste materials as a substitute for natural raw materials in the construction industry may help to
2
conserve natural resources. Nonetheless, to be able to successfully utilise a waste material it must be an economically competitive substitute for the natural raw material that is commonly used. This includes the costs of processing and transportation. The material must also be suitable for the planned purpose, i.e., its stability and durability over the expected life span must be ensured in the context of the particular building application (Moosberg-Bustnes et al., 2003).
Traditionally, mineral admixtures have been used to reduce the cost of concrete. Due to the development in chemical admixture technology, i.e., the development of more effective superplasticizers, fine particulate mineral admixtures are being used to improve concrete properties. For example: Self-compacting concrete needs supplementing filler material to increase the volume of its fluid phase and to bind excess water due to the large degree of particle dispersion. Sometimes the available aggregates lack the necessary amount of fines and thus filler material has to be added. The use of crushed aggregates instead of natural sand and gravel gives a workability change of the concrete, which can be remedied by adding fdler materials.
There are not many countries that have established standards for the use of by-products in concrete production.
2 Experimental study - laboratory scale
The aim of this study was to investigate the effect on concrete properties of a filter dust from the production line of Tinfos Jemverk A/S. The dust is collected from the smoke hood covering the tapping area using a textile bag house filter. The amount of dust collected is between 150 and 200 ton per year. The cement used in this investigation is a CEM I 42.5 BV/SR/LA - cement for civil engineering structures. The quarts used as reference material is designated M300, and comes from SIBELCO S.A. This material has approximately the same particle size distribution as the cement.
2.1 Characterisation of the filter dust The recipes are based on volume percent and not weight percent, this means that the material density has to be analysed. Determination of the particle size distribution and specific surface area (by the BET-method) wil l provide additional information of the material. Scanning electron microscopy was used to determine the three-dimensional shape of the dust particles.
2.2 Mixing and Calorimetry Isothermal calorimetric measurements were performed in order to see how the filter dust affects the cement hydration when mixed into cement paste. Pastes of cement, dust and water were combmed in a laboratory mixer, the specifications for mixing, stipulated in SS-EN 196-1, was followed. The water/solid ratio (w/s) was kept at 0.37 for the isothermal calorimetric studies. A series of experiment were conducted where the amount of dust added to the cement paste was 5, 10 and 15 volume percent, respectively. Quartz filler was used as reference material, and added in the same volumes as the dust to cement paste.
Cement and test materials were first mixed dry, with a Hobart laboratory mixer, before the water was added and then the pastes were mixed thoroughly. Four minutes elapsed
3
between the addition of the water to the cement/filler mixture and the placement of 50 gram of the paste in the calorimeter. Consequently, the first major heat peak from mixing was discarded. The calorimetric studies were repeated for all mixes and the repeatability is very good.
2.3 Rate of reaction In order to measure the rate of reaction in the hydrated cement/filter dust mixtures x-ray diffraction analysis (XRD) were performed on the cement paste after 1 and 28 days for the first experimental series. The water/solid ratio (w/s) was kept at 0.37. The pastes were ground and then sieved with a 60 pm screen before analysis.
A Philips PW 1710 X-ray Diffractometer was used for the diffraction studies, a PW 1729 X-ray Generator produced the monochromatic copper radiation, Cu Ka. Scans were run with the X-ray source set at a voltage of 40kV and a current of 30mA. The measurements were made for the 29 range 5-70° with a step size of 0.020° and a measuring time per step of 1.00 s.
2.4 Compressive strength 2.4.1 Mortar Mortar was made in accordance to the recipes in Table 1. The mixing procedure follows the standard SS-EN 196. A standard sand, DIN 196-1, was used in the experiments. To test the compressive strength, mortar prisms of 0.04 x 0.04 x 0.16 m 3 , were cast in steel moulds. Demoulding took place after 24 hours and the prisms were cured and stored in 100 percent relative humidity (RH).
The compressive strength of the prisms was tested with uniaxial compression at 1, 7, 28 and 91 days. The press used for the tests is in accordance with the Swedish standard, SS 13 11 10 Concrete testing - Hardened concrete - Compression testing machines.
Tabell 1: Mortar recipe. Filler Cement Water
g 5 % Quartz 19.2 427.5 225 10 % Quarts 38.5 405 225 15 % Quarts 57.7 382.5 225 5 % TAS 20 427.5 225 10 % TAS 40 405 225 15 % TAS 60 382.5 225
2.4.2 Concrete Since there are two ways to use filler materials, as cement replacement or to modify the aggregates particle size distribution curve, two test series and two corresponding test series have been investigated with regard to compressive strength.
The first series is based on a standard concrete recipe where 5, 10 and 15 volume percent of the cement is replaced by the filter dust (Table 2), superplasticizer is added to achieve proper dispersion of the materials. A reference series, where quartz replaces the cement in the same amounts as in the test series, is made and treated in the same way as the test series. The compressive strength is tested after 7 and 28 days.
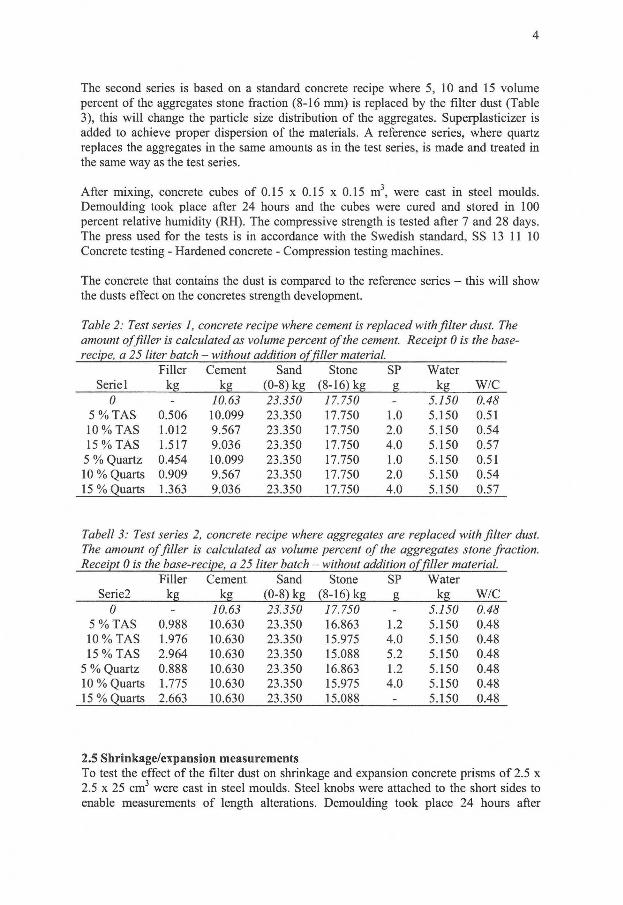
4
The second series is based on a standard concrete recipe where 5, 10 and 15 volume percent of the aggregates stone fraction (8-16 mm) is replaced by the filter dust (Table 3), this wil l change the particle size distribution of the aggregates. Superplasticizer is added to achieve proper dispersion of the materials. A reference series, where quartz replaces the aggregates in the same amounts as in the test series, is made and treated in the same way as the test series.
After mixing, concrete cubes of 0.15 x 0.15 x 0.15 m 3, were cast in steel moulds. Demoulding took place after 24 hours and the cubes were cured and stored in 100 percent relative humidity (RH). The compressive strength is tested after 7 and 28 days. The press used for the tests is in accordance with the Swedish standard, SS 13 11 10 Concrete testing - Hardened concrete - Compression testing machines.
The concrete that contains the dust is compared to the reference series - this wil l show the dusts effect on the concretes strength development.
Table 2: Test series 1, concrete recipe where cement is replaced with filter dust. The amount offiller is calculated as volume percent of the cement. Receipt 0 is the base-recipe, a 25 liter batch - without addition of fdler material.
Filler Cement Sand Stone SP Water Seriel kg kg (0-8) kg (8-16) kg g kg W/C
0 10.63 23.350 17.750 5.150 0.48 5 % TAS 0.506 10.099 23.350 17.750 1.0 5.150 0.51 10% TAS 1.012 9.567 23.350 17.750 2.0 5.150 0.54 15% TAS 1.517 9.036 23.350 17.750 4.0 5.150 0.57 5 % Quartz 0.454 10.099 23.350 17.750 1.0 5.150 0.51 10 % Quarts 0.909 9.567 23.350 17.750 2.0 5.150 0.54 15 % Quarts 1.363 9.036 23.350 17.750 4.0 5.150 0.57
Tabell 3: Test series 2, concrete recipe where aggregates are replaced with filter dust. The amount of filler is calculated as volume percent of the aggregates stone fraction. Receipt 0 is the base-recipe, a 25 liter batch - without addition of filler material.
Filler Cement Sand Stone SP Water Serie2 kg kg (0-8) kg (8-16) kg g kg W/C
0 10.63 23.350 17.750 5.150 0.48 5 % TAS 0.988 10.630 23.350 16.863 1.2 5.150 0.48 10 % TAS 1.976 10.630 23.350 15.975 4.0 5.150 0.48 15% TAS 2.964 10.630 23.350 15.088 5.2 5.150 0.48
5 % Quartz 0.888 10.630 23.350 16.863 1.2 5.150 0.48 10 % Quarts 1.775 10.630 23.350 15.975 4.0 5.150 0.48 15 % Quarts 2.663 10.630 23.350 15.088 - 5.150 0.48
2.5 Shrinkage/expansion measurements To test the effect of the fdter dust on shrinkage and expansion concrete prisms of 2.5 x 2.5 x 25 cm3 were cast in steel moulds. Steel knobs were attached to the short sides to enable measurements of length alterations. Demoulding took place 24 hours after
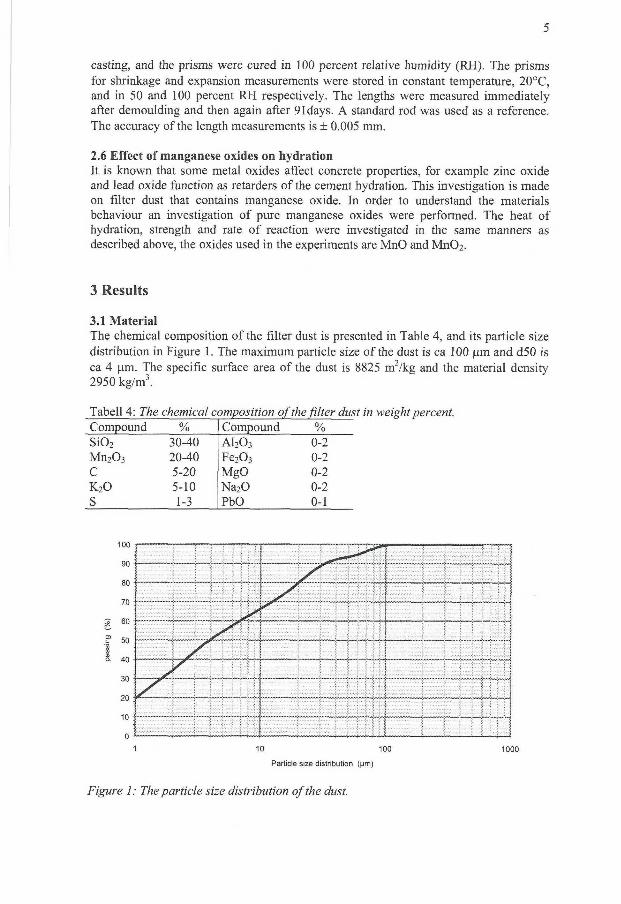
5
casting, and the prisms were cured in 100 percent relative humidity (RH). The prisms for shrinkage and expansion measurements were stored in constant temperature, 20°C, and in 50 and 100 percent RH respectively. The lengths were measured immediately after demoulding and then again after 91days. A standard rod was used as a reference. The accuracy of the length measurements is ± 0.005 mm.
2.6 Effect of manganese oxides on hydration It is known that some metal oxides affect concrete properties, for example zinc oxide and lead oxide function as retarders of the cement hydration. This investigation is made on filter dust that contains manganese oxide. In order to understand the materials behaviour an mvestigation of pure manganese oxides were performed. The heat of hydration, strength and rate of reaction were investigated in the same manners as described above, the oxides used in the experiments are MnO and Mn02.
3 Results
3.1 Material The chemical composition of the filter dust is presented in Table 4, and its particle size distribution in Figure 1. The maximum particle size of the dust is ca 100 pm and d50 is ca 4 pm. The specific surface area of the dust is 8825 m2/kg and the material density 2950 kg/m3.
Tabell 4: The chemical composition of the filter dust in weight percent. Compound % Compound % Si0 2 30-40 A1 2 0 3 0-2 Mn203 20-40 Fe 20 3 0-2 C 5-20 MgO 0-2 K 2 0 5-10 Na 20 0-2 S 1-3 PbO 0-1
10 100 Particle size distribution (urn)
Figure 1: The particle size distribution of the dust.
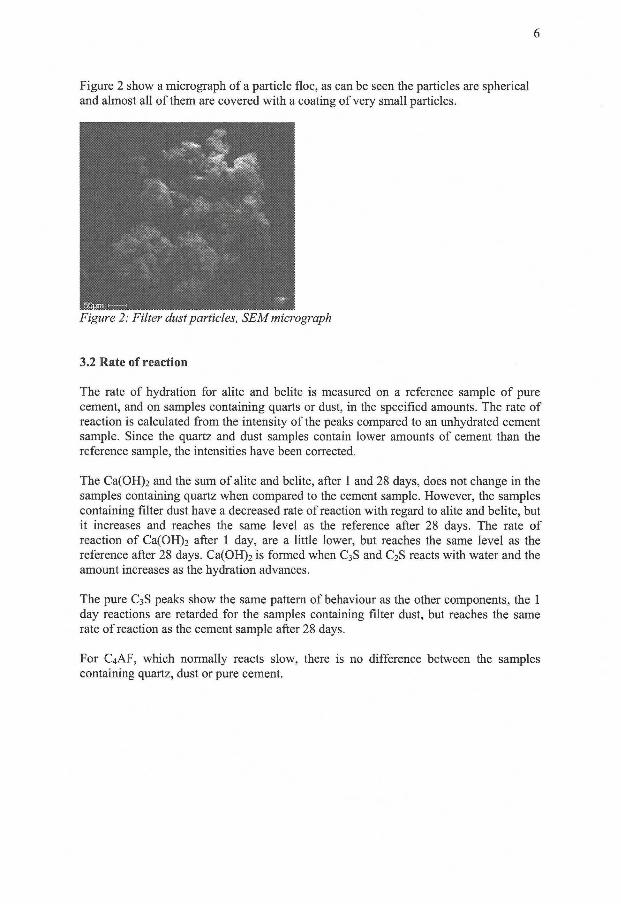
6
Figure 2 show a micrograph of a particle floe, as can be seen the particles are spherical and almost all of them are covered with a coating of very small particles.
Figure 2: Filter dust particles, SEM micrograph
3.2 Rate of reaction
The rate of hydration for alite and belite is measured on a reference sample of pure cement, and on samples containing quarts or dust, in the specified amounts. The rate of reaction is calculated from the intensity of the peaks compared to an unhydrated cement sample. Since the quartz and dust samples contain lower amounts of cement than the reference sample, the intensities have been corrected.
The Ca(OH)2 and the sum of alite and belite, after 1 and 28 days, does not change in the samples containing quartz when compared to the cement sample. However, the samples containing filter dust have a decreased rate of reaction with regard to alite and belite, but it increases and reaches the same level as the reference after 28 days. The rate of reaction of CafOHh after 1 day, are a little lower, but reaches the same level as the reference after 28 days. Ca(OH)2 is formed when C3S and C2S reacts with water and the amount increases as the hydration advances.
The pure C3S peaks show the same pattern of behaviour as the other components, the 1 day reactions are retarded for the samples containing filter dust, but reaches the same rate of reaction as the cement sample after 28 days.
For C4AF, which normally reacts slow, there is no difference between the samples containing quartz, dust or pure cement.
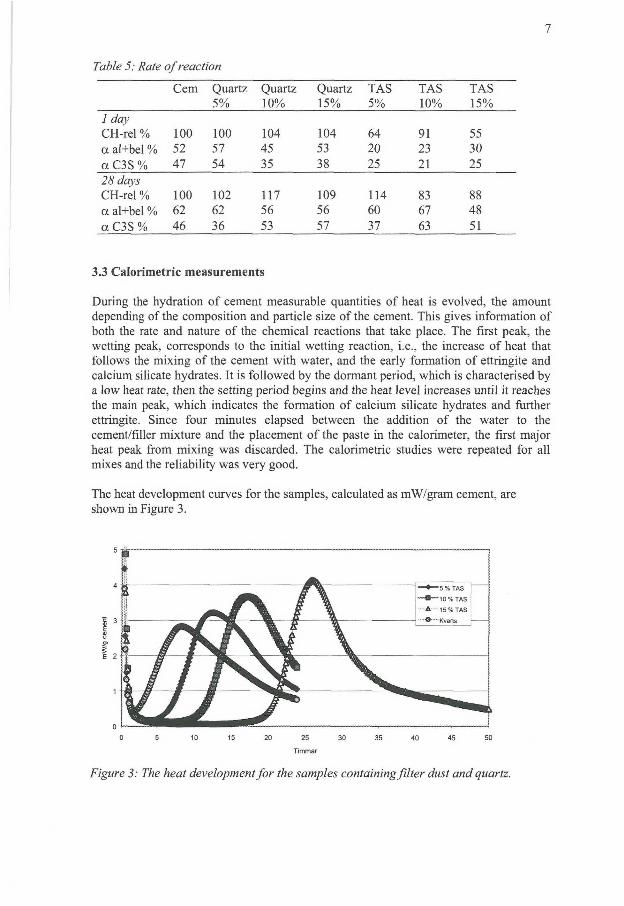
7
Table 5: Rate of reaction
Cem Quartz Quartz Quartz TAS TAS TAS 5% 10% 15% 5% 10% 15%
1 day CH-rel % 100 100 104 104 64 91 55 a al+bel % 52 57 45 53 20 23 30
a C3S % 47 54 35 38 25 21 25
CH-rel % 100 102 117 109 114 83 88 a al+bel % 62 62 56 56 60 67 48
a C3S % 46 36 53 57 37 63 51
3.3 Calorimetric measurements
During the hydration of cement measurable quantities of heat is evolved, the amount depending of the composition and particle size of the cement. This gives information of both the rate and nature of the chemical reactions that take place. The first peak, the wetting peak, corresponds to the initial wetting reaction, i.e., the increase of heat that follows the mixing of the cement with water, and the early formation of ettringite and calcium silicate hydrates. It is followed by the dormant period, which is characterised by a low heat rate, then the setting period begins and the heat level increases until it reaches the main peak, which indicates the formation of calcium silicate hydrates and further ettringite. Since four minutes elapsed between the addition of the water to the cement/filler mixture and the placement of the paste in the calorimeter, the first major heat peak from mixing was discarded. The calorimetric studies were repeated for all mixes and the reliability was very good.
The heat development curves for the samples, calculated as mW/gram cement, are shown in Figure 3.
20 25 30
Timmar
Figure 3: The heat development for the samples containing filter dust and quartz.
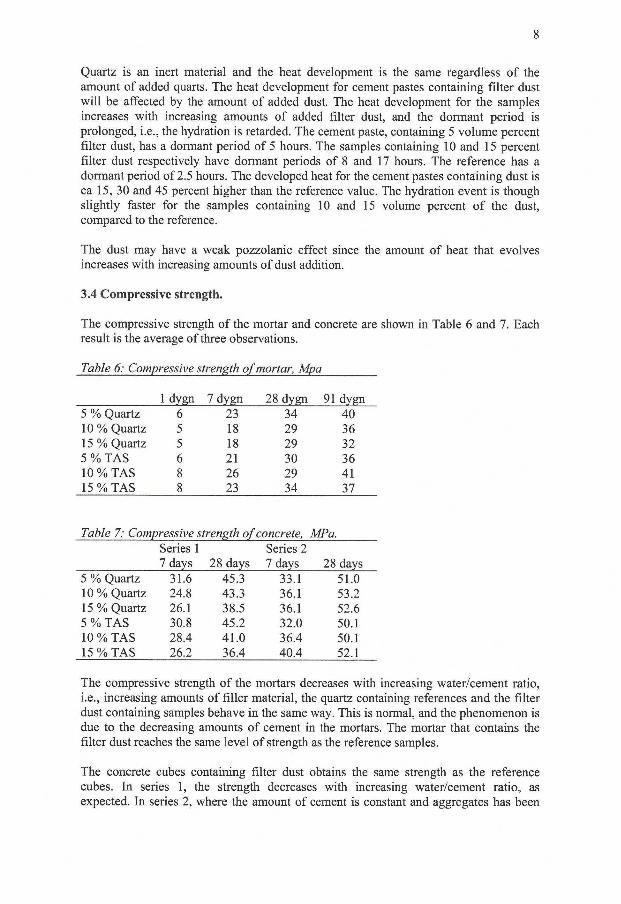
8
Quartz is an inert material and the heat development is the same regardless of the amount of added quarts. The heat development for cement pastes containing filter dust wil l be affected by the amount of added dust. The heat development for the samples increases with increasing amounts of added fdter dust, and the dormant period is prolonged, i.e., the hydration is retarded. The cement paste, containing 5 volume percent fdter dust, has a dormant period of 5 hours. The samples containing 10 and 15 percent filter dust respectively have dormant periods of 8 and 17 hours. The reference has a dormant period of 2.5 hours. The developed heat for the cement pastes containing dust is ca 15, 30 and 45 percent higher than the reference value. The hydration event is though slightly faster for the samples containing 10 and 15 volume percent of the dust, compared to the reference.
The dust may have a weak pozzolanic effect since the amount of heat that evolves increases with increasing amounts of dust addition.
3.4 Compressive strength.
The compressive strength of the mortar and concrete are shown in Table 6 and 7. Each result is the average of three observations.
Table 6: Compressive strength of mortar, Mpa
1 dygn 7 dygn 28 dygn 91 dygn 5 % Quartz 6 23 34 40 10 % Quartz 5 18 29 36 15% Quartz 5 18 29 32 5 % TAS 6 21 30 36 10 % TAS 8 26 29 41 15% TAS 8 23 34 37
Table 7: Compressive strength of concrete, MPa. Series 1 Series 2 7 days 28 days 7 days 28 days
5 % Quartz 31.6 45.3 33.1 51.0 10 % Quartz 24.8 43.3 36.1 53.2 15% Quartz 26.1 38.5 36.1 52.6 5 % TAS 30.8 45.2 32.0 50.1 10 % TAS 28.4 41.0 36.4 50.1 15% TAS 26.2 36.4 40.4 52.1
The compressive strength of the mortars decreases with increasing water/cement ratio, i.e., increasing amounts of filler material, the quartz containing references and the filter dust containing samples behave in the same way. This is normal, and the phenomenon is due to the decreasing amounts of cement in the mortars. The mortar that contains the filter dust reaches the same level of strength as the reference samples.
The concrete cubes containing filter dust obtains the same strength as the reference cubes. In series 1, the strength decreases with increasing water/cement ratio, as expected. In series 2, where the amount of cement is constant and aggregates has been
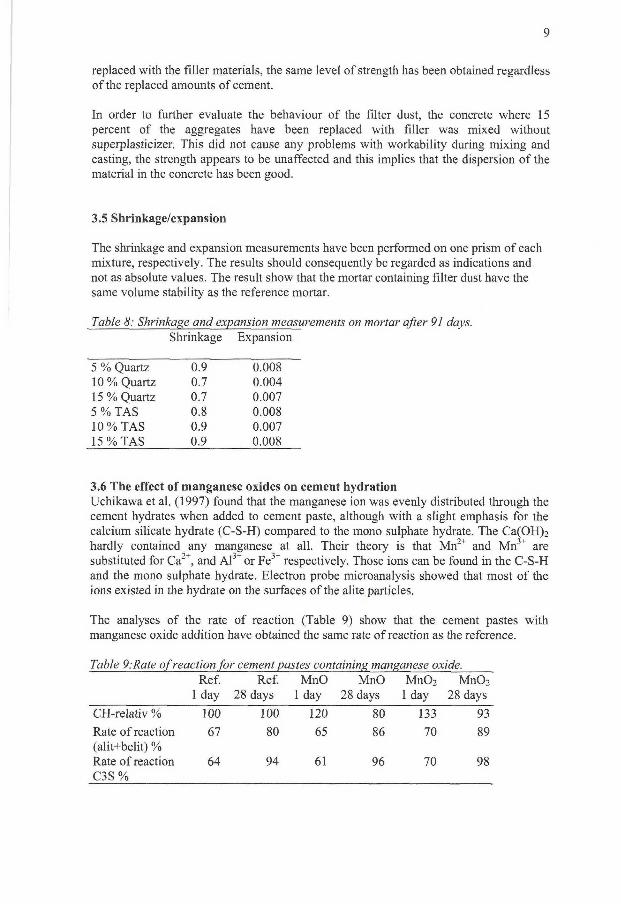
9
replaced with the filler materials, the same level of strength has been obtained regardless of the replaced amounts of cement.
In order to further evaluate the behaviour of the fdter dust, the concrete where 15 percent of the aggregates have been replaced with filler was mixed without superplasticizer. This did not cause any problems with workability during mixing and casting, the strength appears to be unaffected and this implies that the dispersion of the material in the concrete has been good.
3.5 Shrinkage/expansion
The shrinkage and expansion measurements have been performed on one prism of each mixture, respectively. The results should consequently be regarded as indications and not as absolute values. The result show that the mortar containing fdter dust have the same volume stability as the reference mortar.
Table 8: Shrinkage and expansion measurements on mortar after 91 days. Shrinkage Expansion
5 % Quartz 0.9 0.008 10% Quartz 0.7 0.004 15 % Quartz 0.7 0.007 5 % TAS 0.8 0.008 10% TAS 0.9 0.007 15% TAS 0.9 0.008
3.6 The effect of manganese oxides on cement hydration Uchikawa et al. (1997) found that the manganese ion was evenly distributed through the cement hydrates when added to cement paste, although with a slight emphasis for the calcium silicate hydrate (C-S-H) compared to the mono sulphate hydrate. The Ca(OH)2
hardly contained any manganese at all. Their theory is that M n 2 + and M n 3 + are substituted for Ca2 +, and A l 3 + or Fe 3 + respectively. Those ions can be found in the C-S-H and the mono sulphate hydrate. Electron probe microanalysis showed that most of the ions existed in the hydrate on the surfaces of the alite particles.
The analyses of the rate of reaction (Table 9) show that the cement pastes with manganese oxide addition have obtained the same rate of reaction as the reference.
Table 9:Rate of reaction for cement pastes containing manganese oxide. Ref. Ref. MnO MnO Mn0 2 Mn0 2
1 day 28 days 1 day 28 days 1 day 28 days
CH-relativ % 100 100 120 80 133 93
Rate of reaction 67 80 65 86 70 89 (alit+belit) % Rate of reaction 64 94 61 96 70 98 C3S %
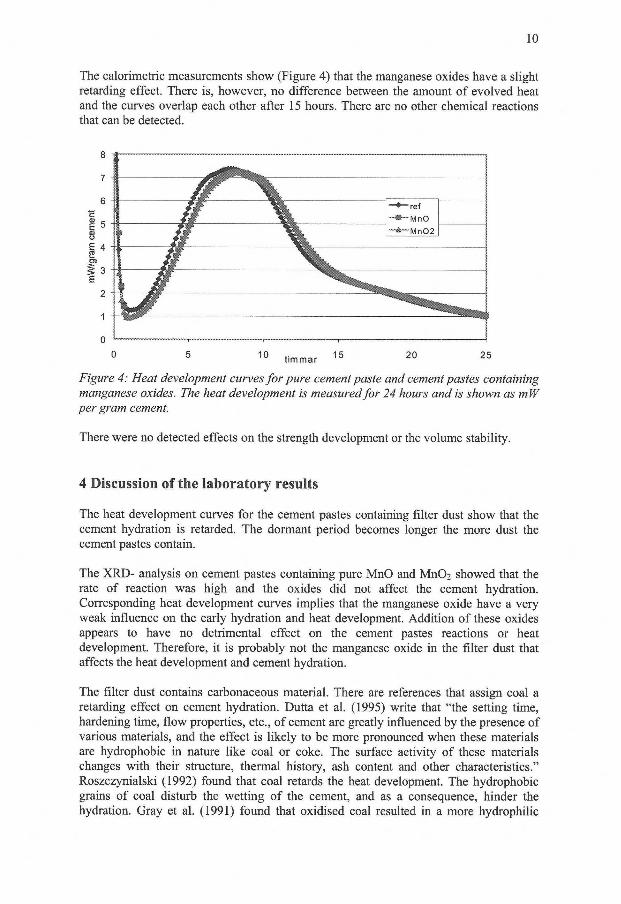
1 0
The calorimetric measurements show (Figure 4) that the manganese oxides have a slight retarding effect. There is, however, no difference between the amount of evolved heat and the curves overlap each other after 15 hours. There are no other chemical reactions that can be detected.
g -g - ,
6
I 5
I 4
g 3 E
~«~MnO Mn02
Figure 4: Heat development curves for pure cement paste and cement pastes containing manganese oxides. The heat development is measured for 24 hours and is shown as mW per gram cement.
There were no detected effects on the strength development or the volume stability.
4 Discussion of the laboratory results
The heat development curves for the cement pastes containing filter dust show that the cement hydration is retarded. The dormant period becomes longer the more dust the cement pastes contain.
The XRD- analysis on cement pastes containing pure MnO and M n 0 2 showed that the rate of reaction was high and the oxides did not affect the cement hydration. Corresponding heat development curves implies that the manganese oxide have a very weak influence on the early hydration and heat development. Addition of these oxides appears to have no detrimental effect on the cement pastes reactions or heat development. Therefore, it is probably not the manganese oxide in the filter dust that affects the heat development and cement hydration.
The filter dust contains carbonaceous material. There are references that assign coal a retarding effect on cement hydration. Dutta et al. (1995) write that "the setting time, hardening time, flow properties, etc., of cement are greatly influenced by the presence of various materials, and the effect is likely to be more pronounced when these materials are hydrophobic in nature like coal or coke. The surface activity of these materials changes with their structure, thermal history, ash content and other characteristics." Roszczynialski (1992) found that coal retards the heat development. The hydrophobic grains of coal disturb the wetting of the cement, and as a consequence, hinder the hydration. Gray et al. (1991) found that oxidised coal resulted in a more hydrophilic
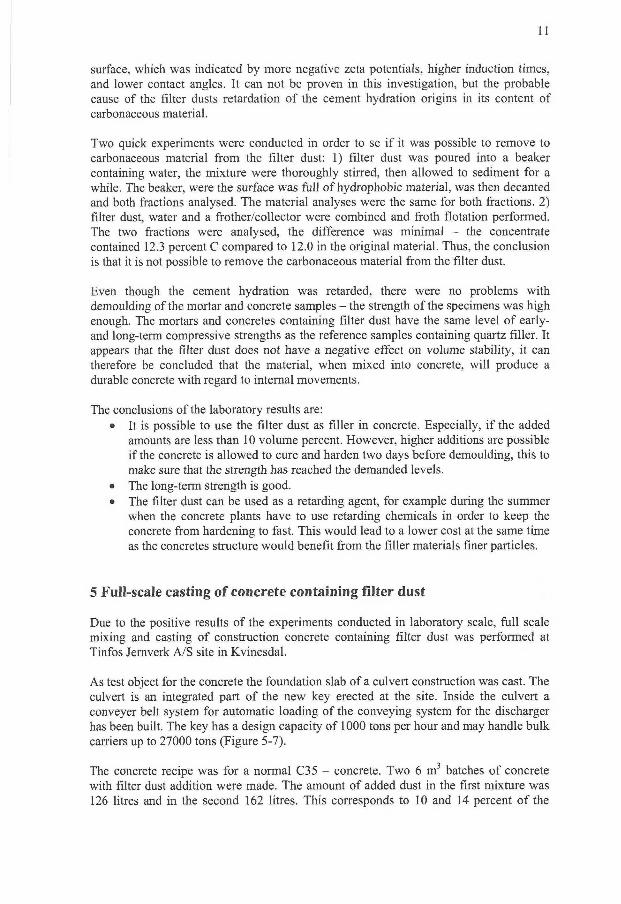
1 1
surface, which was indicated by more negative zeta potentials, higher induction times, and lower contact angles. It can not be proven in this investigation, but the probable cause of the filter dusts retardation of the cement hydration origins in its content of carbonaceous material.
Two quick experiments were conducted in order to se i f it was possible to remove to carbonaceous material from the filter dust: 1) fdter dust was poured into a beaker containing water, the mixture were thoroughly stirred, then allowed to sediment for a while. The beaker, were the surface was full of hydrophobic material, was then decanted and both fractions analysed. The material analyses were the same for both fractions. 2) fdter dust, water and a frother/collector were combined and froth flotation performed. The two fractions were analysed, the difference was minimal - the concentrate contained 12.3 percent C compared to 12.0 in the original material. Thus, the conclusion is that it is not possible to remove the carbonaceous material from the fdter dust.
Even though the cement hydration was retarded, there were no problems with demoulding of the mortar and concrete samples - the strength ofthe specimens was high enough. The mortars and concretes containing filter dust have the same level of early-and long-term compressive strengths as the reference samples containing quartz fdler. It appears that the filter dust does not have a negative effect on volume stability, it can therefore be concluded that the material, when mixed into concrete, will produce a durable concrete with regard to internal movements.
The conclusions of the laboratory results are: • It is possible to use the fdter dust as fdler in concrete. Especially, i f the added
amounts are less than 10 volume percent. However, higher additions are possible i f the concrete is allowed to cure and harden two days before demoulding, this to make sure that the strength has reached the demanded levels.
• The long-term strength is good. • The filter dust can be used as a retarding agent, for example during the summer
when the concrete plants have to use retarding chemicals in order to keep the concrete from hardening to fast. This would lead to a lower cost at the same time as the concretes structure would benefit from the filler materials finer particles.
5 Full-scale casting of concrete containing filter dust
Due to the positive results of the experiments conducted in laboratory scale, ful l scale mixing and casting of construction concrete containing filter dust was performed at Tinfos Jemverk A/S site in Kvinesdal.
As test object for the concrete the foundation slab of a culvert construction was cast. The culvert is an integrated part of the new key erected at the site. Inside the culvert a conveyer belt system for automatic loading of the conveying system for the discharger has been built. The key has a design capacity of 1000 tons per hour and may handle bulk carriers up to 27000 tons (Figure 5-7).
The concrete recipe was for a normal C35 - concrete. Two 6 m 3 batches of concrete with filter dust addition were made. The amount of added dust in the first mixture was 126 litres and in the second 162 litres. This corresponds to 10 and 14 percent of the
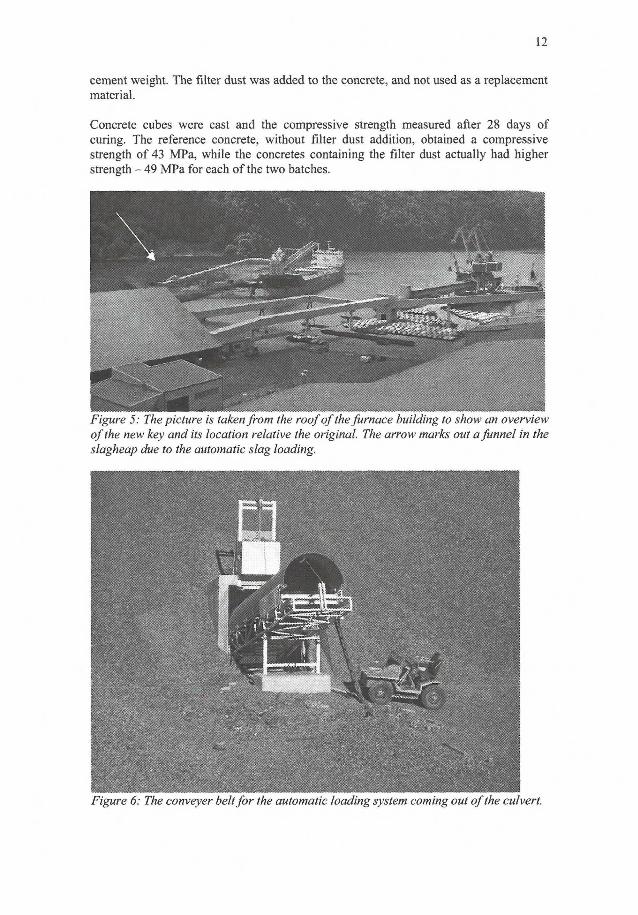
12
cement weight. The filter dust was added to the concrete, and not used as a replacement material.
Concrete cubes were cast and the compressive strength measured after 28 days of curing. The reference concrete, without filter dust addition, obtained a compressive strength of 43 MPa, while the concretes containing the filter dust actually had higher strength - 49 MPa for each of the two batches.
Figure 5: The picture is taken from the roof of the furnace building to show an overview of the new key and its location relative the original. The arrow marks out a funnel in the slagheap due to the automatic slag loading.
Figure 6: The conveyer belt for the automatic loading system coming out of the culvert.
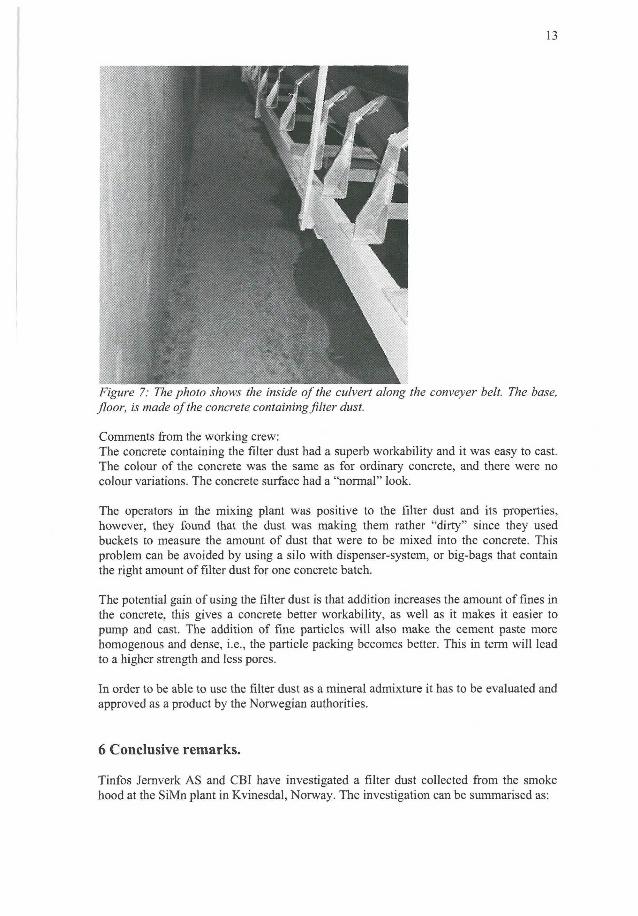
13
Figure 7: The photo shows the inside of the culvert along the conveyer belt. The base, floor, is made of the concrete containing fdter dust.
Comments from the working crew: The concrete containing the filter dust had a superb workability and it was easy to cast. The colour of the concrete was the same as for ordinary concrete, and there were no colour variations. The concrete surface had a "normal" look.
The operators in the mixing plant was positive to the filter dust and its properties, however, they found that the dust was making them rather "dirty" since they used buckets to measure the amount of dust that were to be mixed into the concrete. This problem can be avoided by using a silo with dispenser-system, or big-bags that contain the right amount of filter dust for one concrete batch.
The potential gain of using the filter dust is that addition increases the amount of fines in the concrete, this gives a concrete better workability, as well as it makes it easier to pump and cast. The addition of fine particles wi l l also make the cement paste more homogenous and dense, i.e., the particle packing becomes better. This in term will lead to a higher strength and less pores.
In order to be able to use the filter dust as a mineral admixture it has to be evaluated and approved as a product by the Norwegian authorities.
6 Conclusive remarks.
Tinfos Jemverk AS and CBI have investigated a filter dust collected from the smoke hood at the SiMn plant in Kvinesdal, Norway. The investigation can be summarised as:
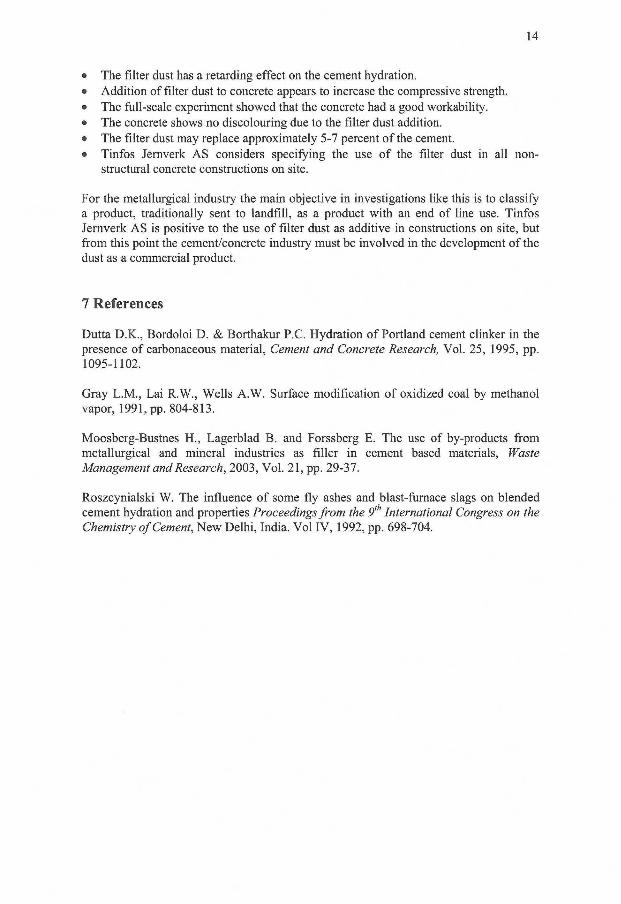
14
• The filter dust has a retarding effect on the cement hydration. • Addition of fdter dust to concrete appears to increase the compressive strength. • The full-scale experiment showed that the concrete had a good workability. • The concrete shows no discolouring due to the filter dust addition. • The fdter dust may replace approximately 5-7 percent of the cement. • Tinfos Jemverk AS considers specifying the use of the fdter dust in all non
structural concrete constmctions on site.
For the metallurgical industry the main objective in investigations like this is to classify a product, traditionally sent to landfill, as a product with an end of line use. Tinfos Jemverk AS is positive to the use of filter dust as additive in constmctions on site, but from this point the cement/concrete industry must be involved in the development of the dust as a commercial product.
7 References
Dutta D.K., Bordoloi D. & Borthakur P.C. Hydration of Portland cement clinker in the presence of carbonaceous material, Cement and Concrete Research, Vol. 25, 1995, pp. 1095-1102.
Gray L.M., Lai R.W., Wells A.W. Surface modification of oxidized coal by methanol vapor, 1991, pp. 804-813.
Moosberg-Bustnes H , Lagerblad B. and Forssberg E. The use of by-products from metallurgical and mineral industries as filler in cement based materials, Waste Management and Research, 2003, Vol. 21, pp. 29-37.
Roszcynialski W. The influence of some fly ashes and blast-fumace slags on blended cement hydration and properties Proceedings from the 9th International Congress on the Chemistry of Cement, New Delhi, India. Vol IV, 1992, pp. 698-704.

Lagerblad, B.; Vogt, C; Moosberg-Bustnes, H.
Fine ground quartz as cement replacement and pozzolana
Abstract
The access of effective superplasticizer has opened the possibility to use fillers much more efficently. To find out the effect of fillers we have made several series of experiments with quartz fillers in different amounts and with different fineness. For the experiments quartz was chosen as this mineral is easy to access and may act pozzolanic. Quartz in the size of cement, quartz finer than cement and ultrafine cristobalite quartz has been tested. As quartz dust may give silicosis, wet ground quartz, used in the concrete as slurry, has been tested.
Quartz grains finer than cement give a pronounced increase in concrete strength. It is possible to replace up to 40 % of the cement and still obtain similar strength. This seems to be due to that the small quartz grains become an integrated part of the hydrated cement paste instead of discrete particles. Moreover, fine quartz acts as slow pozzolana. Thus, the paste becomes more homogenous with thinner interfacial transition zones. Combination with silica fume improves these effects even more. The presence of small particles in the paste accalerates the cement hydration. The results indicate that it is possible to reduce the amount of cement dramatically by the use of fine-ground quartz.
1 Introduction
The use of fillers in concrete in combination with Portland cement can be used to achieve different aims. One can improve the properties of both the fresh and hardened concrete. We know that fillers wil l increase the performance of concrete III. We also know that the fineness of the filler influences the hydration 111, and strength of concrete ßl. In the fresh paste, the small particles wil l improve the workability of the concrete by dispersing the bigger aggregate grains. Bleeding and segregation can be reduced and higher packing density of the fine aggregates can be achieved. These changes of the rheological properties will in tum affect the properties of the hardened concrete. Fillers are one of the basic concepts in producing self-compacting concrete.
The aim of this study was to make a careful examination of the effect of quartz filler on concrete properties and how it can be used to reduce the cement content in concrete. Quartz was chosen as it is readily available and as fine ground quartz presumably reacts pozzolanicly.
To find this we have substituted cement and aggregate of a reference mix with different amounts of fine ground quartz of different fineness and type. We have tested quartz in the size of cement, quartz finer than cement and ultra fine cristobalite quartz. As fine quartz dust may give silicosis, we have also investigated the effect of fresh wet ground quartz used as a slurry.
1-0543
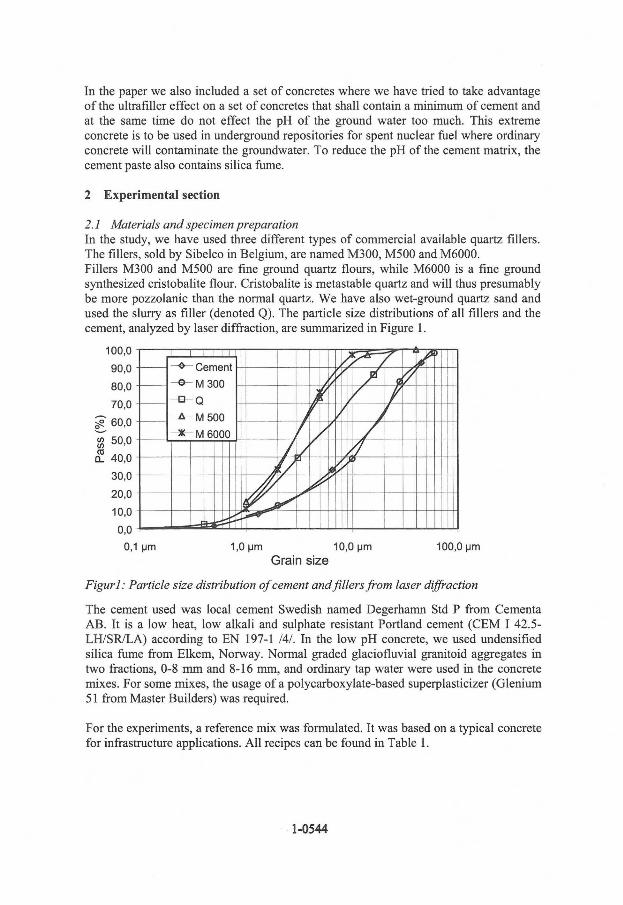
In the paper we also included a set of concretes where we have tried to take advantage of the ultrafilier effect on a set of concretes that shall contain a minimum of cement and at the same time do not effect the pH of the ground water too much. This extreme concrete is to be used in underground repositories for spent nuclear fuel where ordinary concrete will contaminate the groundwater. To reduce the pH of the cement matrix, the cement paste also contains silica fume.
2 Experimental section
2.1 Materials and specimen preparation In the study, we have used three different types of commercial available quartz fillers. The fdlers, sold by Sibelco in Belgium, are named M300, M500 and M6000. Fillers M300 and M500 are fine ground quartz flours, while M6000 is a fine ground synthesized cristobalite flour. Cristobalite is metastable quartz and will thus presumably be more pozzolanic than the normal quartz. We have also wet-ground quartz sand and used the slurry as filler (denoted Q). The particle size distributions of all fillers and the cement, analyzed by laser diffraction, are summarized in Figure 1.
100,0
90,0
80,0
70,0
ST 60,0
50,0
rx 40,0
30,0
20,0
10,0
0,0
0,1 [jm 1,0 |jm 10,0 pm 100,0 |jm Grain size
Figur 1: Particle size distribution of cement andfillers from laser diffraction
The cement used was local cement Swedish named Degerhamn Std P from Cementa AB. It is a low heat, low alkali and sulphate resistant Portland cement (CEM I 42.5-LH/SR/LA) according to EN 197-1 141. In the low pH concrete, we used undensified silica fume from Elkem, Norway. Normal graded glaciofluvial granitoid aggregates in two fractions, 0-8 mm and 8-16 mm, and ordinary tap water were used in the concrete mixes. For some mixes, the usage of a polycarboxylate-based superplasticizer (Glenium 51 from Master Builders) was required.
For the experiments, a reference mix was formulated. It was based on a typical concrete for infrastructure applications. Al l recipes can be found in Table 1.
1-0544
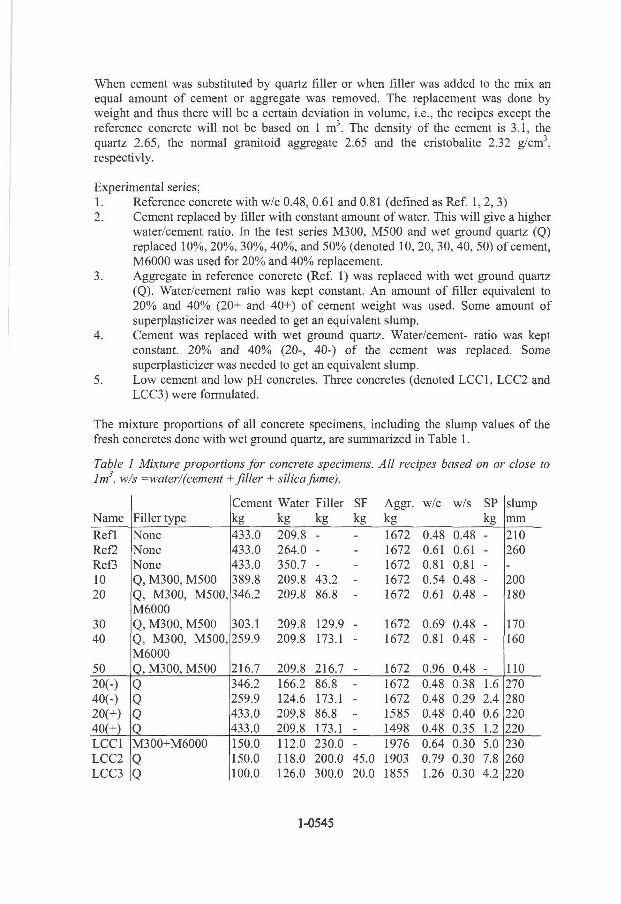
When cement was substituted by quartz filler or when filler was added to the mix an equal amount of cement or aggregate was removed. The replacement was done by weight and thus there wil l be a certain deviation in volume, i.e., the recipes except the reference concrete will not be based on 1 m 3 . The density of the cement is 3.1, the quartz 2.65, the normal granitoid aggregate 2.65 and the cristobalite 2.32 g/cm3, respectivly.
Experimental series; 1. Reference concrete with w/c 0.48, 0.61 and 0.81 (defined as Ref. 1, 2, 3) 2. Cement replaced by filler with constant amount of water. This will give a higher
water/cement ratio. In the test series M300, M500 and wet ground quartz (Q) replaced 10%, 20%, 30%, 40%, and 50% (denoted 10, 20, 30, 40, 50) of cement, M6000 was used for 20% and 40% replacement.
3. Aggregate in reference concrete (Ref. 1) was replaced with wet ground quartz (Q). Water/cement ratio was kept constant. An amount of filler equivalent to 20% and 40% (20+ and 40+) of cement weight was used. Some amount of superplasticizer was needed to get an equivalent slump.
4. Cement was replaced with wet ground quartz. Water/cement- ratio was kept constant. 20% and 40% (20-, 40-) of the cement was replaced. Some superplasticizer was needed to get an equivalent slump.
5. Low cement and low pH concretes. Three concretes (denoted LCC1, LCC2 and LCC3) were formulated.
The mixture proportions of all concrete specimens, including the slump values of the fresh concretes done with wet ground quartz, are summarized in Table 1.
Table 1 Mixture proportions for concrete specimens. All recipes based on or close to Jm3. w/s =water/(cement + filler + silica fume).
Cement Water Filler SF Aggr. w/c w/s SP slump Name Filler type kg kg kg kg kg kg mm
Refl None 433.0 209.8 - - 1672 0.48 0.48 - 210 Ref2 None 433.0 264.0 - - 1672 0.61 0.61 - 260 Ref3 None 433.0 350.7 - - 1672 0.81 0.81 - -10 Q, M300, M500 389.8 209.8 43.2 - 1672 0.54 0.48 - 200 20 Q, M300, M500,
M6000 346.2 209.8 86.8 - 1672 0.61 0.48 - 180
30 Q, M300, M500 303.1 209.8 129.9 1672 0.69 0.48 - 170 40 Q, M300, M500,
M6000 259.9 209.8 173.1 - 1672 0.81 0.48 - 160
50 Q, M300, M500 216.7 209.8 216.7 - 1672 0.96 0.48 - 110 20(-) Q 346.2 166.2 86.8 - 1672 0.48 0.38 1.6 270 40(-) Q 259.9 124.6 173.1 - 1672 0.48 0.29 2.4 280 20(+) Q 433.0 209.8 86.8 - 1585 0.48 0.40 0.6 220 40(+) 0 433.0 209.8 173.1 - 1498 0.48 0.35 1.2 220 LCC1 M300+M6000 150.0 112.0 230.0 - 1976 0.64 0.30 5.0 230 LCC2 Q 150.0 118.0 200.0 45.0 1903 0.79 0.30 7.8 260 LCC3 Q 100.0 126.0 300.0 20.0 1855 1.26 0.30 4.2 220
1-0545
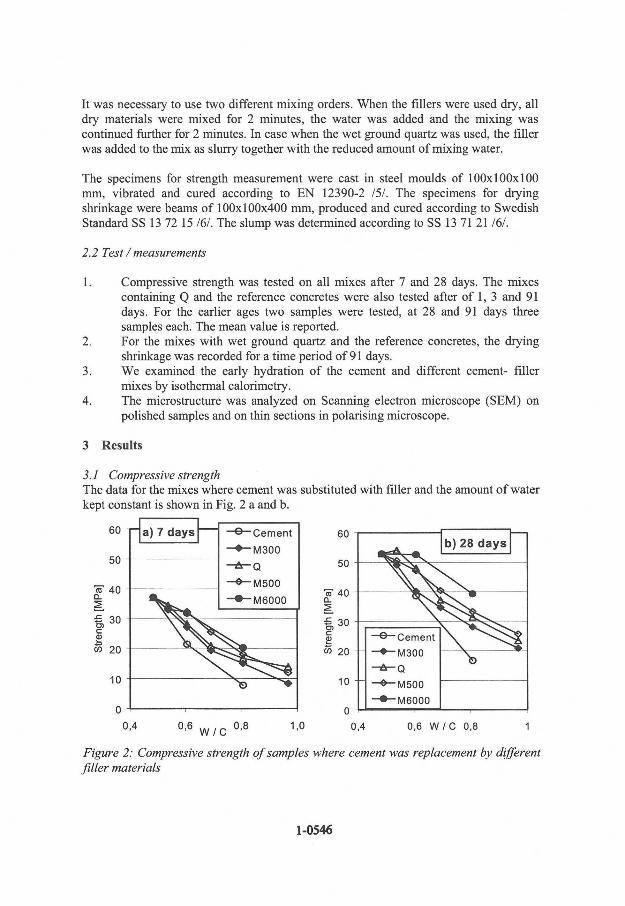
It was necessary to use two different mixing orders. When the fillers were used dry, all dry materials were mixed for 2 minutes, the water was added and the mixing was continued further for 2 minutes. In case when the wet ground quartz was used, the filler was added to the mix as slurry together with the reduced amount of mixing water.
The specimens for strength measurement were cast in steel moulds of 100x100x100 mm, vibrated and cured according to EN 12390-2 151. The specimens for drying shrinkage were beams of 100x100x400 mm, produced and cured according to Swedish Standard SS 13 72 15 161. The slump was determined according to SS 13 71 21161.
2.2 Test / measurements
1. Compressive strength was tested on all mixes after 7 and 28 days. The mixes containing Q and the reference concretes were also tested after of 1, 3 and 91 days. For the earlier ages two samples were tested, at 28 and 91 days three samples each. The mean value is reported.
2. For the mixes with wet ground quartz and the reference concretes, the drying shrinkage was recorded for a time period of 91 days.
3. We examined the early hydration of the cement and different cement- filler mixes by isothermal calorimetry.
4. The microstructure was analyzed on Scanning electron microscope (SEM) on polished samples and on thin sections in polarising microscope.
3 Results
3.1 Compressive strength The data for the mixes where cement was substituted with fdler and the amount of water kept constant is shown in Fig. 2 a and b.
0,4 ° ' 6 W / C ° ' 8 1,0 0,4 0,6 W / C 0,8
Figure 2: Compressive strength of samples where cement was replacement by different filler materials
1-0546
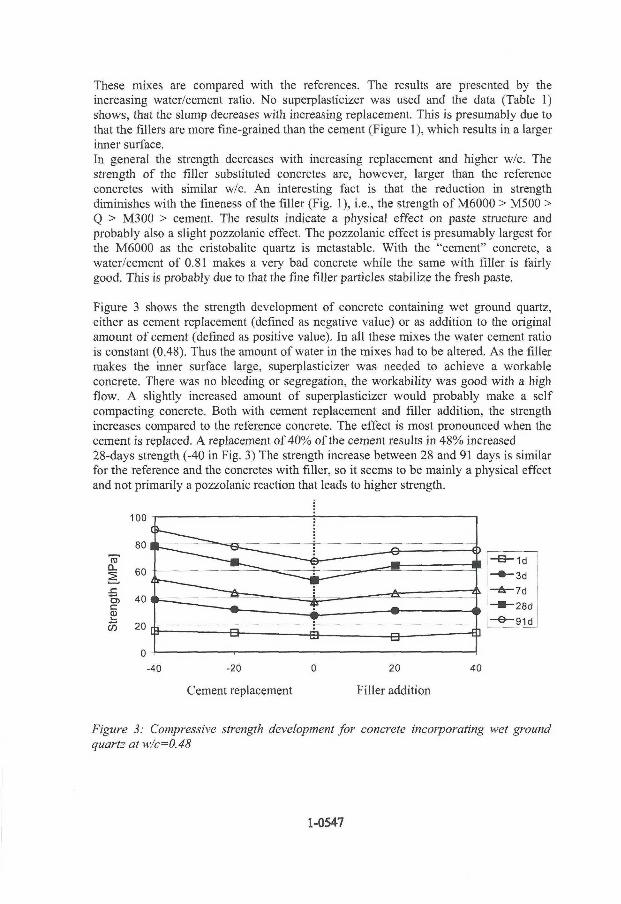
These mixes are compared with the references. The results are presented by the increasing water/cement ratio. No superplasticizer was used and the data (Table 1) shows, that the slump decreases with increasing replacement. This is presumably due to that the fdlers are more fine-grained than the cement (Figure 1), which results in a larger inner surface. In general the strength decreases with increasing replacement and higher w/c. The strength of the filler substituted concretes are, however, larger than the reference concretes with similar w/c. An interesting fact is that the reduction in strength diminishes with the fineness of the filler (Fig. 1), i.e., the strength of M6000 > M500 > Q > M300 > cement. The results indicate a physical effect on paste structure and probably also a slight pozzolanic effect. The pozzolanic effect is presumably largest for the M6000 as the cristobalite quartz is metastable. With the "cement" concrete, a water/cement of 0.81 makes a very bad concrete while the same with filler is fairly good. This is probably due to that the fine filler particles stabilize the fresh paste.
Figure 3 shows the strength development of concrete containing wet ground quartz, either as cement replacement (defined as negative value) or as addition to the original amount of cement (defined as positive value). In all these mixes the water cement ratio is constant (0.48). Thus the amount of water in the mixes had to be altered. As the filler makes the inner surface large, superplasticizer was needed to achieve a workable concrete. There was no bleeding or segregation, the workability was good with a high flow. A slightly increased amount of superplasticizer would probably make a self compacting concrete. Both with cement replacement and filler addition, the strength increases compared to the reference concrete. The effect is most pronounced when the cement is replaced. A replacement of 40% of the cement results in 48% increased 28-days strength (-40 in Fig. 3) The strength increase between 28 and 91 days is similar for the reference and the concretes with filler, so it seems to be mainly a physical effect and not primarily a pozzolanic reaction that leads to higher strength.
100 i
-40 -20 0 20 40
Cement replacement Filler addition
Figure 3: Compressive strength development for concrete incorporating wet ground quartz at w/c=0.48
1-0547
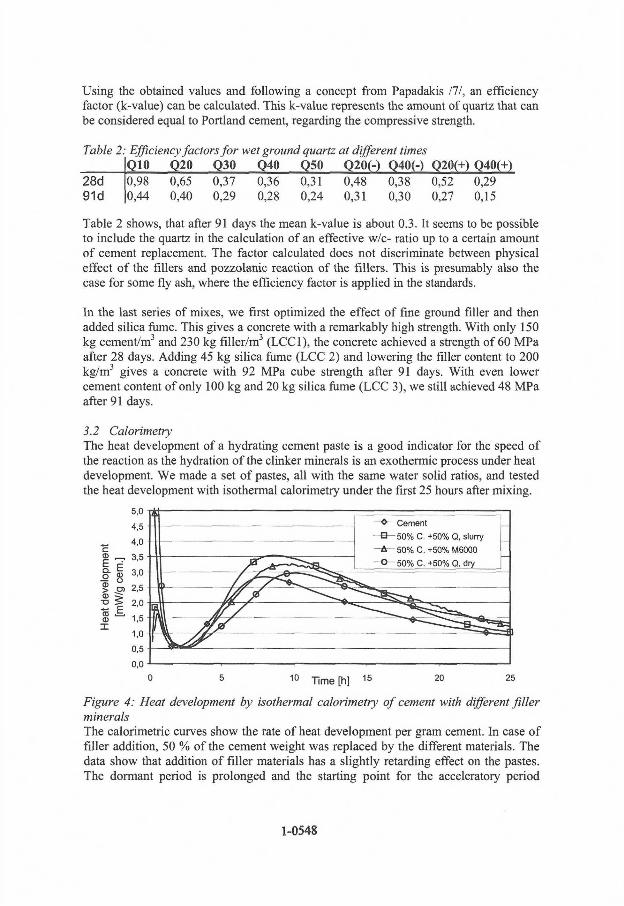
Using the obtained values and following a concept from Papadakis 111, an efficiency factor (k-value) can be calculated. This k-value represents the amount of quartz that can be considered equal to Portland cement, regarding the compressive strength.
Table 2: Efficiency factors for wet ground quartz at different times Q10 Q20 Q30 Q40 Q50 Q20(-) Q40(-) Q20(+) Q40(+)
28d 0,98 0,65 0,37 0,36 0,31 0,48 0,38 0,52 0,29 91d 0,44 0,40 0,29 0,28 0,24 0,31 0,30 0,27 0,15
Table 2 shows, that after 91 days the mean k-value is about 0.3. It seems to be possible to include the quartz in the calculation of an effective w/c- ratio up to a certain amount of cement replacement. The factor calculated does not discriminate between physical effect of the fillers and pozzolanic reaction of the fillers. This is presumably also the case for some fly ash, where the efficiency factor is applied in the standards.
In the last series of mixes, we first optimized the effect of fine ground filler and then added silica fiime. This gives a concrete with a remarkably high strength. With only 150 kg cement/m3 and 230 kg filler/m3 (LCC1), the concrete achieved a strength of 60 MPa after 28 days. Adding 45 kg silica fume (LCC 2) and lowering the filler content to 200 kg/m 3 gives a concrete with 92 MPa cube strength after 91 days. With even lower cement content of only 100 kg and 20 kg silica fume (LCC 3), we still achieved 48 MPa after 91 days.
3.2 Calorimetry The heat development of a hydrating cement paste is a good indicator for the speed of the reaction as the hydration of the clinker minerals is an exothermic process under heat development. We made a set of pastes, all with the same water solid ratios, and tested the heat development with isothermal calorimetry under the first 25 hours after mixing.
5,0 i
0,0 J 1 f-
0 5 10 T i m e [ h ] 15 20
Figure 4: Heat development by isothermal calorimetry of cement with different fdler minerals The calorimetric curves show the rate of heat development per gram cement. In case of filler addition, 50 % of the cement weight was replaced by the different materials. The data show that addition of filler materials has a slightly retarding effect on the pastes. The dormant period is prolonged and the starting point for the acceleratory period
1-0548
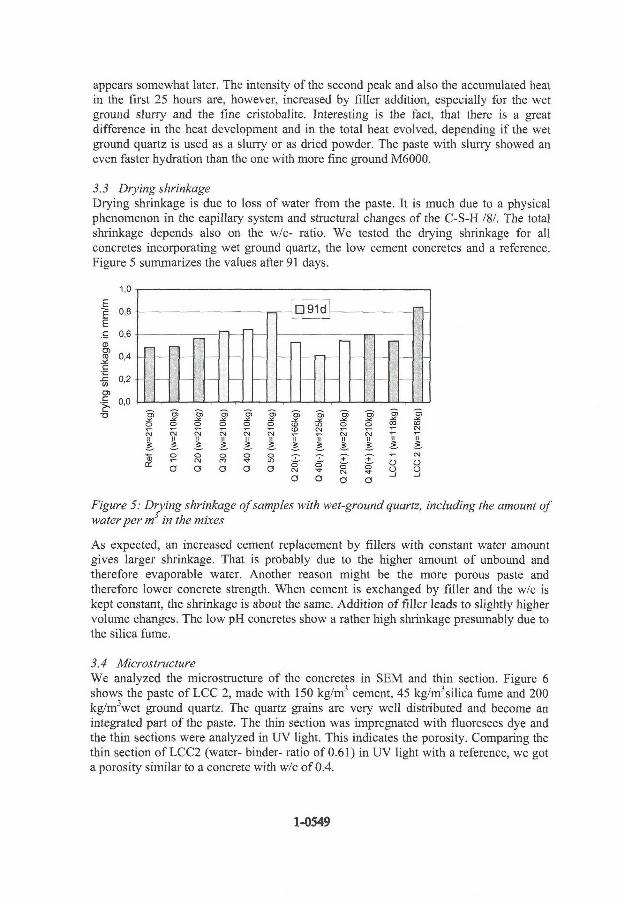
appears somewhat later. The intensity of the second peak and also the accumulated heat in the first 25 hours are, however, increased by filler addition, especially for the wet ground slurry and the fine cristobalite. Interesting is the fact, that there is a great difference in the heat development and in the total heat evolved, depending i f the wet ground quartz is used as a slurry or as dried powder. The paste with slurry showed an even faster hydration than the one with more fine ground M6000.
3.3 Drying shrinkage Drying shrinkage is due to loss of water from the paste. It is much due to a physical phenomenon in the capillary system and structural changes of the C-S-H /8/. The total shrinkage depends also on the w/c- ratio. We tested the drying shrinkage for all concretes incorporating wet ground quartz, the low cement concretes and a reference. Figure 5 summarizes the values after 91 days.
•o
1,0
0,8
0,6
0,4
0,2
0,0
-
--
-
—
-
å 1 2. -E
o u o
Figure 5: Drying shrinkage of samples with wet-ground quartz, including the amount of water per m3 in the mixes
As expected, an increased cement replacement by fillers with constant water amount gives larger shrinkage. That is probably due to the higher amount of unbound and therefore evaporable water. Another reason might be the more porous paste and therefore lower concrete strength. When cement is exchanged by filler and the w/c is kept constant, the shrinkage is about the same. Addition of filler leads to slightly higher volume changes. The low pH concretes show a rather high shrinkage presumably due to the silica fume.
3.4 Microstructure We analyzed the microstructure of the concretes in SEM and thin section. Figure 6 shows the paste of LCC 2, made with 150 kg/m3 cement, 45 kg/m3silica fume and 200 kg/m3wet ground quartz. The quartz grains are very well distributed and become an integrated part of the paste. The thin section was impregnated with fluoresces dye and the thin sections were analyzed in UV light. This indicates the porosity. Comparing the thin section of LCC2 (water- binder- ratio of 0.61) in UV light with a reference, we got a porosity similar to a concrete with w/c of 0.4.
1-0549
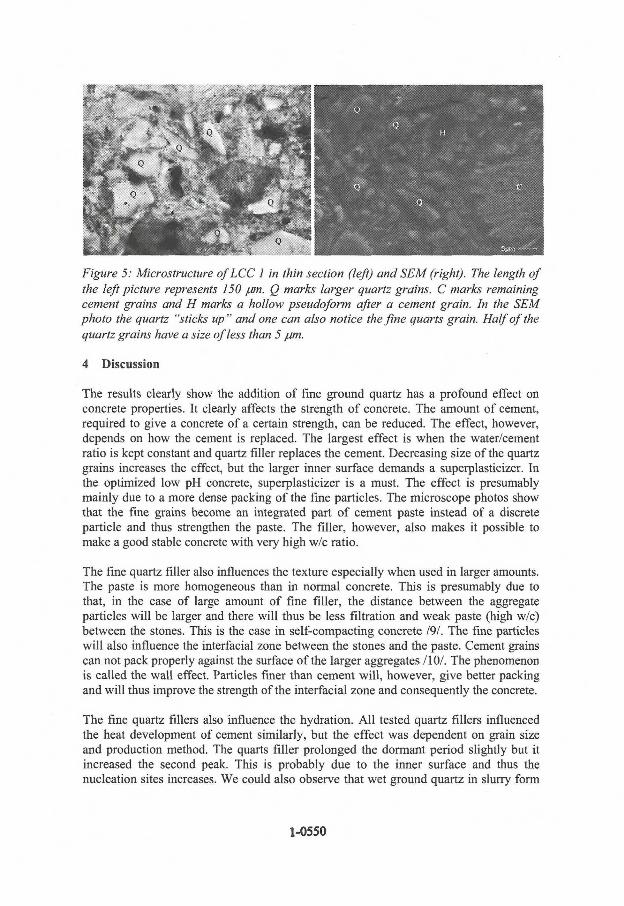
Figure 5: Microstructure of LCC 1 in thin section (left) and SEM (right). The length of the left picture represents 150 pm. Q marks larger quartz grains. C marks remaining cement grains and H marks a hollow pseudoform after a cement grain. In the SEM photo the quartz "sticks up " and one can also notice the fine quarts grain. Half of the quartz grains have a size of less than 5 pm.
4 Discussion
The results clearly show the addition of fine ground quartz has a profound effect on concrete properties. It clearly affects the strength of concrete. The amount of cement, required to give a concrete of a certain strength, can be reduced. The effect, however, depends on how the cement is replaced. The largest effect is when the water/cement ratio is kept constant and quartz filler replaces the cement. Decreasing size of the quartz grains increases the effect, but the larger inner surface demands a superplasticizer. In the optimized low pH concrete, superplasticizer is a must. The effect is presumably mainly due to a more dense packing of the fine particles. The microscope photos show that the fine grains become an integrated part of cement paste instead of a discrete particle and thus strengthen the paste. The filler, however, also makes it possible to make a good stable concrete with very high w/c ratio.
The fine quartz filler also influences the texture especially when used in larger amounts. The paste is more homogeneous than in normal concrete. This is presumably due to that, in the case of large amount of fine filler, the distance between the aggregate particles will be larger and there will thus be less filtration and weak paste (high w/c) between the stones. This is the case in self-compacting concrete 191. The fine particles wil l also influence the interfacial zone between the stones and the paste. Cement grains can not pack properly against the surface of the larger aggregates /10/. The phenomenon is called the wall effect. Particles finer than cement wil l , however, give better packing and will thus improve the strength of the interfacial zone and consequently the concrete.
The fine quartz fillers also influence the hydration. A l l tested quartz fillers influenced the heat development of cement similarly, but the effect was dependent on grain size and production method. The quarts filler prolonged the dormant period slightly but it increased the second peak. This is probably due to the inner surface and thus the nucleation sites increases. We could also observe that wet ground quartz in slurry form
1-0550
acted differently to dry ground or dried formerly wet ground quartz. This is presumably due to the properties of the quartz surface. The surface properties of both dry and wet ground quartz were studied by Lidström / l l / . The grinding process creates a disrupted lattice zone around the grains. In this layer the quartz loses its crystalline properties. Aging was found to rebuild the crystal stmctures in the disrupted lattice zone. Stressed quarts will react pozzolanicly and thus one can presume both a chemical reaction and a good bonding between the cement paste and quartz filler, which wi l l strengthen the paste. Presumably, the fresh wet ground quartz is more reactive than the dry quartz fillers. The higher heat development at least during the first 25 hours means that the cement is used better or that the energy built into the deformed quartz is released. In any case, the physical properties of the cement paste improves.
Presumably, some of the quartz has reacted. We know that it in saturated Ca(OH)2 solution consume Calcium which must be due to a pozzolanic reaction. The pozzolanic reaction (apart from the surface reaction) is presumably rather slow and thus we must wait for the one-year results before any final conclusions can be drawn.
Conclusions Fine ground quartz can improve the properties of concrete and save cement. The best effect in concrete is achieved when cement is replaced with filler and the w/c- ratio is kept constant, but the mixes require superplasticizer due to the reduced water content. In an optimized recipe and a given strength more than 40% of the cement can be replaced with quartz filler. Dry quartz filler may cause silicosis. The results from this work shows that wet ground quartz used as slurry is as good or better.
Acknowledgement
We would like to thank the Swedish Energy Agency for supporting the work on grinding and the Swedish Nuclear Fuel and Waste Management Co. for supporting the work on the optimized low pH concrete.
References
III Moosberg-Bustness, H.: Utilisation of chemically inert or pozzolanic particles to modify concrete and save cement, Licentiate Thesis, 2000, Luleå University of Technology
111 Kjellsen, K. O.; Lagerblad, B.: Influence of natural minerals in the filler fraction on hydration and properties of mortars, CBI report 3:95; 1995, Cbl Stockholm, Sweden
ßl Kronlöf, A.: Effect of very fine aggregate on concrete strength, RILEM, 1994, Materials and Structures 27
IAI European Committee for Standardization, European Standard EN 197-1, 2000,CEN Brussels,
1-0551
151 European Committee for Standardization, European Standard EN 12390-2, 2000.CEN Brussels,
161 BST handbok 12, Betongprovning med svensk standard, 1991, Grunditz & Forsberg, Linköping, Sweden
111 Papadakis,V. G.; Tsimas, S.: Supplementary cementing materials in concrete, Part 1 & 2. Cement and Concrete Research Vol. 32, 2002, Pergamon
/8/ Taylor, H. W. F.: Cement chemistry, 2 n d edit., Thomas Telford, 1997, London 191 Lagerblad, B.; Kjellsen, K. O.: Normal and high strength concretes with
conventional aggregates, Engeneering and transport properties of the Interfacial Transition Zone in cementitious materials, RILEM report 20
110/ Mehta, P. K : Concrete structure, properties an materials, Prentice- Hall, 1986, New Jersey, USA
/ I I / Lidström, L.: Surface and bond forming properties of quartz and silicate minerals and their application in mineral processing techniques, Acta Polytecnica Scandinavia No. 75, Stockholm, 1968
Authors:
Björn Lagerblad PhD, Assoc. Prof. CBI Stockholm 10044 Stockholm
Carsten Vogt cand. Ing. Bauhaus-Univ. Weimar 99423 Weimar
Helena Moosberg-Bustnes Tekn. Lie CBI Stockholm 10044 Stockholm
1-0552
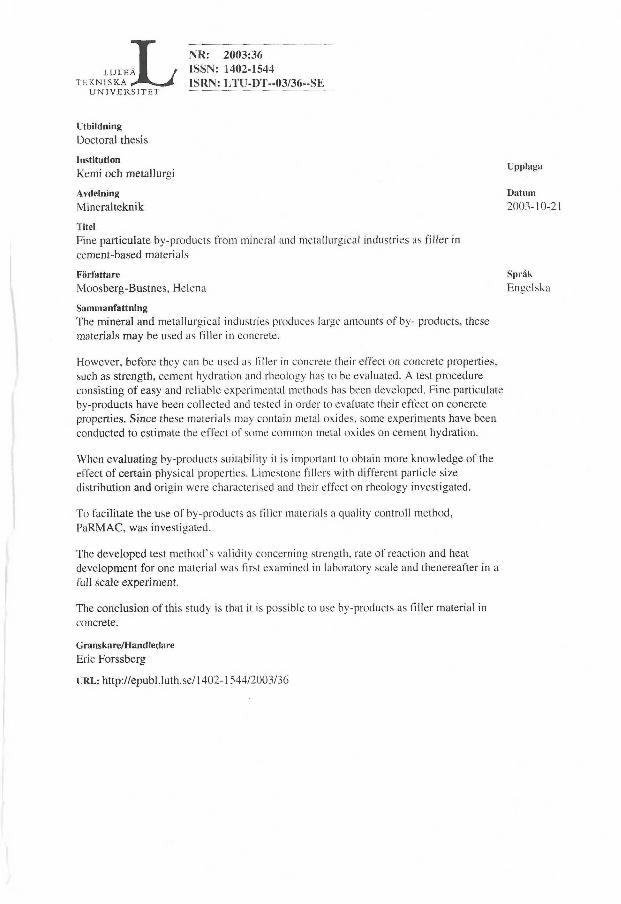
L U L E A • T E K N I S K A
U N I V E R S I T E T
NR: 2003:36 ISSN: 1402-1544 1SRN: LTTJ-DT-03/36--SE
Utbildning
Doctoral thesis
Institution
Kemi och metallurgi Upplaga
Avdelning
Mineral teknik
Datum
2003-10-21
Titel
Fine particulate by-products from mineral and metallurgical industries as filler in
cement-based materials
Sammanfattning
The mineral and metallurgical industries produces large amounts of by- products, these
materials may be used as filler in concrete.
However, before they can be used as filler in concrete their effect on concrete properties,
such as strength, cement hydration and rheology has to be evaluated. A test procedure
consisting of easy and reliable experimental methods has been developed. Fine particulate
by-products have been collected and tested in order to evaluate their effect on concrete
properties. Since these materials may contain metal oxides, some experiments have been
conducted to estimate the effect of some common metal oxides on cement hydration.
When evaluating by-products suitability it is important to obtain more knowledge of the
effect of certain physical properties. Limestone fillers with different particle size
distribution and origin were characterised and their effect on rheology investigated.
To facilitate the use of by-products as filler materials a quality controll method,
P a R M A C , was investigated.
The developed test method's validity concerning strength, rate of reaction and heat
development for one material was first examined in laboratory scale and thenereafter in a
full scale experiment.
The conclusion of this study is that it is possible to use by-products as filler material in
concrete.
Granskare/Handledare
Eric Forssberg
URL: http://epubl.luth.se/1402-1544/2003/36
Författare
Moosberg-Bustnes, Helena
Språk
Engelska