Embed Size (px)
Citation preview
Does Aid Decrease Tax Revenue
in Developing Countries?
A Study by
Ludovica Gambaro, Jonna Meyer-Spasche, and Ashikur Rahman
March 2007
This report was prepared as a Capstone Project for the United Kingdom’s
Department for International Development (DFID); supervised by Carlos Santiso
(DFID), Joachim Wehner (LSE) and Daniel Sturm (LSE). The Capstone Project is
part of the Master of Public Administration (MPA) programme at the London
School of Economics and Political Science (LSE).
Abstract
This paper studies the relationship between development aid inflows and tax revenue in
recipient countries1. For a sample of 65 countries over the period of 1990 to 2004, our
results do not support the hypothesis that aid substitutes for domestic tax revenue. On the
contrary, we find evidence that there is a positive association between aid inflows and tax
revenue, which is primarily driven by the positive relationship between grants and tax
revenue. We neither find any evidence for the hypothesis that the marginal impact of aid
on tax revenue is different in countries with low corruption compared to more strongly
corrupted countries. When we look at a more disaggregate picture, we identify a
heterogeneous association of aid with different components of tax revenue. We also
explore the possible two-way relationship between tax revenue and institutions.
Contact the authors:
Ludovica Gambaro: [email protected]
Jonna Meyer-Spasche: [email protected]
Ashikur Rahman: [email protected]
MPA Public and Economic Policy, London School of Economics, V815 Tower Two,
Houghton Street, London, WC2A 2AE
1 Original idea: Carlos Santiso (DFID).
Table of Content
Executive Summary iii
1. Introduction: The Debate over a Substitution Effect of Aid 1
2. Literature Review: Previous Evidence is Ambiguous 3
3. Empirical Model and Data 7
a. Empirical Model 7
b. Data Description 10
4. Results 12
a. Baseline Results: No General Substitution Effect 13
b. Role of Corruption: No Differential Impact of Aid 16
c. Disaggregating Tax Revenue: Heterogeneous Picture 19
d. Tax Revenue and Institutions: A Two-Way Relationship? 25
5. Conclusion and Implications: A Role for Development Policy 29
References 32
Appendix
a. Construction of the Dataset 36
b. List of Countries in the Sample 37
Tables and Figures:
Table 1: Descriptive Statistics of Sample Data 11
Table 2: Baseline Results: Aid on Tax Revenue 12
Table 3: Robustness Checks 14
Table 4: Aid on Revenue in Two Different Time Periods 15
Table 5: Interaction of Aid and Corruption 19
Table 6: Descriptive Statistics of Tax Structure in Sample 21
Table 7: Aid on Different Types of Tax Revenue 22
Table 8: Tax Revenue on Governance Indicators 27
Figure 1: Tax Revenue and Governance Indicators 26
iii
Executive Summary
In the context of donor governments’ commitment to scale up development aid in order
to achieve the Millennium Development Goals (MDGs), one important question is how
the domestic revenue recipient governments collect responds to an inflow of aid. There is
the theoretical concern that aid might partly substitute for domestic tax revenue, for
example if the recipient government chooses to grant certain constituencies a tax relief
instead of using the aid for development oriented investments. On the other hand, the
recipient government might also invest part of the aid money into the enhancement of
their institutional capacity, thereby strengthening also their tax administration, which
might increase the collected tax revenue.
Hence, the relationship between aid and tax revenue is essentially an empirical question.
The results of previous analyses, mostly country case studies, are ambiguous. One
comprehensive study was conducted by Gupta et al. (2003), which points out a negative
relationship between aid, and more particularly grants, with domestic revenue and a
positive relationship between net loans and domestic revenue.
This study aims at identifying whether there is a systematic relationship between aid and
tax revenue in developing countries by examining the available data in a panel-data
regression analysis. For a sample of 65 countries over the period from 1990 to 2004, we
examine whether different components of aid, grants and loans, differ in their association
with tax revenue. Furthermore, we disaggregate tax revenue into income and capital
taxes, goods and services taxes, and trade taxes, and try to identify whether there is a
heterogeneous association of aid with different components of tax revenue. The dual
relationship between taxes and the quality of governance institutions is also explored.
The results provide a background for more in-depth micro-level explorations, as well as
some broad implications for policy-makers.
Key Results
• There is systematic evidence for a positive correlation between aid and tax
revenue. The coefficient on aid in the form of grants is positive and significant
across different specifications and several robustness checks, whereas the
coefficient on aid in the form of net loans is negative but insignificant. Concerns
over a general substitution effect of aid are thus not supported.
iv
• A re-estimation of Gupta et al.’s specification on their dataset shows that the
negative correlation they find for net aid and grants with revenue over the period
1970-2000 turns into a positive correlation for the period 1990-2000.
• Our results are stable in magnitude and significance to the inclusion of an
interaction between aid and corruption, which itself does not seem to be
significant. Hence, there is no evidence for a differential impact of aid on tax
revenue in more vs. less corrupt countries.
• Disaggregating tax revenue into three major types of taxes shows a heterogeneous
picture: net aid and grants are negatively correlated with income and capital tax
revenue and positively correlated with revenue from taxes on goods and services
and on trade. The structure and effectiveness of the taxation system and
administrative institutions may be an omitted variable influencing both aid and
tax revenue.
• The results of the correlation of tax revenue and governance institutions hint at a
possible two-way relationship: revenue from taxes overall, income and capital,
and goods and services is positively associated with all six World Bank
Governance Indicators, but trade taxes show a negative correlation with three of
the indicators. This suggests that countries that have on average higher trade taxes
also tend to have weaker administrative institutions. These factors can reinforce
each other over time.
Implications
• Our results suggest that the role of development policy post 1990, with its
stronger focus on institutions, is a possible underlying factor of the positive
association between aid and tax revenue. Therefore, both donors and recipient
countries should try to identify the pivotal set of policies that influenced the
response of tax revenue to the inflow of aid after 1990.
• The effectiveness of administrative institutions seems to be a crucial factor
influencing the structure and collection of tax revenue. Our findings imply that
before a tax policy reform can effectively be implemented, crucial constraints on
the effectiveness of tax administration may have to be targeted. The easier tax

v
evasion is the more difficult it will be to shift the main revenue source from
“easy” but unsustainable taxes like trade taxes to more sustainable tax types like
income and capital taxes.
• Further micro-level analysis of this issue will be useful in order to determine the
underlying dynamics that affect the relationship between aid and tax revenue.
Does Aid Decrease Tax Revenue in Developing Countries?
1
1. Introduction: The Debate Over a Substitution Effect of Aid
In order to provide public services and to enhance human and economic development in
their country, governments use taxation as the central source of state revenue. Developing
countries are not able to finance all desirable public expenditures and investments
through the tax revenue they collect, which is why bilateral and multilateral donors
provide development assistance and thereby alleviate budget constraints. The question,
however, is whether foreign aid is simply added to the domestic budget or whether it has
partially a substitution effect. Recipient governments can choose to increase expenditure
and investment by the full amount of aid, or they can choose to lower their tax effort or
borrowing and keep the planned expenditures constant.
To what extent aid influences expenditure decisions has been extensively examined in the
literature under the term of “fungibility” (cf. Devarajan et al. 1999): per definition, aid is
fungible if “recipients reallocate resources that would have been spent for purposes now
financed by foreign aid” (Gupta et al. 2003: 6, footnote 9), thus aid could, in effect,
finance unproductive public expenditures or be used for tax relief. However, the
fungibility literature has focused primarily on the expenditure side and has largely
neglected the analysis of impacts on the revenue side.
Yet if development assistance is intended to help countries help themselves so that sooner
or later they no longer need foreign aid then it matters whether aid actually increases the
budget and domestic revenue available for public services and other government tasks.
Several responses of recipient governments to an inflow of aid are imaginable: they could
use it to enhance institutional capacity and strengthen the fiscal administration so that tax
revenue might even increase, or they could use aid as a substitute for tax revenue by for
example using it to alleviate the tax burden of powerful lobby groups. In theory, a
reduction in tax effort could also free resources for the private sector and increase
investment if distortively high taxes are reduced. However, since developing countries
typically have very low tax revenue in general, the primary concern is over a potential
further reduction.
The broader context of this issue is the planned increase of development aid resources
and the question of aid effectiveness (cf. Gupta et al. 2006; Kenny 2006; World Bank
Does Aid Decrease Tax Revenue in Developing Countries?
2
1998). In order to achieve the Millennium Development Goals (MDGs), agreed at the
United Nations Millennium Summit in 2000, most donors of development assistance –
including the United Kingdom - have pledged to substantively scale up their development
budgets. Given the often low administrative capacity of recipient countries to effectively
employ these inflows, the OECD’s Development Assistance Committee (DAC) members
agreed in their “Paris Declaration on Aid Effectiveness” of 2005 to concentrate on
strengthening partner countries’ capacities and national development strategies (OECD
2006: 8). DFID elaborates in its most recent White Paper how it plans to focus on
governance and building capable and accountable states by committing half of its
bilateral aid budget to public services for the poor (DFID 2006). Against this backdrop it
is important to know what impact aid has on the tax effort in recipient countries, whether
this impact is influenced by the quality of administrational institutions, and whether this
process even has repercussions on the quality of institutions.
This study does not intend to solve the question of a substitution effect of aid, or to
discover which types and levels of taxes are most conducive to development; its more
humble intention is to try to find whether there is a systematic relationship between aid
and tax revenue in developing countries by examining the available data in a panel-data
regression analysis. We will explore whether different components of aid, grants and
loans, differ in their association with tax revenue. Furthermore we will disaggregate tax
revenue into income and capital taxes, goods and services taxes, and trade taxes, and try
to identify whether the different types of taxes are differently correlated to an inflow of
aid. The dual relationship between taxes and the quality of governance institutions will
also be looked into, as far as the data permit. The value of such a cross-country approach
lies in the general background it provides for more in-depth micro-level explorations.
Results of aggregate analyses can also be used to draw broad guidelines for policy-
makers.
The next section will give an overview over the previous literature on the relationship
between aid and taxation. This is followed in section 3 by a description of our empirical
model and the data used in the analysis. Section 4 will present the regressions, results,
and interpretations of the results. The concluding section 5 will highlight some potential
policy implications and questions for further research.
Does Aid Decrease Tax Revenue in Developing Countries?
3
2. Literature Review: Previous Evidence is Ambiguous
The literature on fiscal impacts of development assistance in aid recipient countries does
not offer a conclusive picture. Furthermore, it is largely dominated by studies focusing on
government expenditure behaviour and aid fungibility. The impact of aid on
governments’ taxation behaviour has mostly been dealt with in country case studies, with
ambiguous results, while cross-country analyses are few. This is why it is still very
difficult to draw generalisable conclusions about this relationship. McGillivray and
Morrissey (2001) survey the - mostly post-1990 – theoretical and empirical literature on
this topic and thus provide a good overview over a range of findings: out of eight
studies1, of which six are case studies and two are cross-sectional analyses of small
samples, four studies find negative effects of aid on tax revenue, while two find a positive
effect, and two find no significant effect. We will now first look at the existing cross-
country analyses in this field and then at several country case studies, each step including
both the studies also covered in McGillivray and Morrissey (2001) and additional ones.
The first important study in the field of aid and taxation was Heller’s cross-section time-
series in which he assessed how aid affects public fiscal behaviour in an econometric
model for eleven African countries (Heller 1975). Heller’s results suggest that aid
increases investment and facilitates a reduction in domestic tax levels and borrowing,
with the magnitude of the effects and the response of public consumption to aid varying
according to the type of aid: he finds that grants tend to be used more for consumption
whereas loans tend to facilitate investment more strongly. Thus while he does not deal
with impacts on taxation in detail, Heller already identifies different effects different aid
components might have. Other cross-country analyses arrive at different results: Khan
and Hoshino (1992), in their cross-sectional analysis of five developing countries in
South and Southeast Asia, find an overall increase in tax effort, which is apparently
driven by the impact of loans, whereas grants tend to reduce the tax effort. However,
Otim (1996), in a government expenditure behaviour study of three South Asian
countries, finds that both loans and grants increase tax effort.
1 The studies they review are Heller 1975, Gang/Khan 1991, Khan/Hoshino 1992, Rubino 1997, Iqbal 1997,
Franco-Rodriguez et al. 1998, McGillivray/Ahmed 1999, and Franco-Rodriguez 2000.
Does Aid Decrease Tax Revenue in Developing Countries?
4
The most comprehensive cross-sectional time-series analysis is conducted by Gupta et al.
(2003) who separately examine the impact of grants and loans on government revenue in
a large sample of developing countries between 1970 and 2000. Their results suggest that
net aid has a negative impact on government revenue, which seems to be driven by a
negative impact of grants on revenue, whereas loans are associated with increased
domestic revenue mobilisation. One potential explanation they offer for why this might
be the case is that loans may imply the need of a repayment, which serves as an incentive
to increase the domestic tax effort. Because of the comprehensiveness and careful study
design of Gupta et al. (2003)’s analysis, throughout the next steps in our analysis we will
use their paper as a reference point.
Turning to country case studies of individual developing countries over the last 15 years,
we see that those have produced similarly mixed results: Gang and Khan (1991), using
time-series data for India, find no significant relationship between aid and tax revenue.
Iqbal (1997) produces a similar result for Pakistan, whereas Franco-Rodriguez et al.
(1998) suggest a negative correlation between aid and taxation in Pakistan. A negative
impact of aid on tax revenue is also suggested by the results of Rubino (1997) and
McGillivray and Ahmed (1999) in their analyses of fiscal response to aid in Indonesia
and the Philippines, respectively. Moreover, the latter study finds that in the Philippines
between 1962 and 1990, aid seems to be associated with public sector fiscal behaviour
that is in general believed to be detrimental to economic development, such as a decrease
of public investment and saving and an increase of public sector borrowing. The findings
of case studies of African countries are mixed as well: While Osei et al. (2003) discover a
positive relationship between aid and tax effort in Ghana, McGillivray and Outtara
(2003)’s results suggest a negative impact of aid on tax revenue in Cote d’Ivoire.
Fagernäs and Roberts (2004), reporting the results of three individual country studies,
find a moderate positive relationship of aid on tax revenue for Malawi and Uganda but a
negative one for Zambia. However, they warn that the causality may be indirect and
spurious due to imperfectly consolidated budgets.
Concerning the analytical frameworks used in previous fiscal response studies, the model
introduced by Heller (1975) has long dominated and for example been employed and
further refined by Mosley et al. (1987), Gang and Khan (1991) and Franco-Rodriguez et
Does Aid Decrease Tax Revenue in Developing Countries?
5
al. (1998). This framework models budget choice and assumes that governments
maximise their utility subject to the budget constraint by attaining various expenditure
and revenue targets they have set, which can be expressed in a quadratic loss function. It
is further assumed that in maximising their utility, decision-makers take into account
alternative uses of public resources and alternative modes of domestic or external
financing. However, these utility functions provide no representation of actual budgetary
processes (Fagernäs/Roberts 2004: 11): no generally accepted rationales for and estimates
of the target fiscal variables have been identified, and real life budget choices are made
by function or objective rather than economic category (investment, consumption) and
are based on changing macroeconomic circumstances and political objectives. The
analytical framework employed for example by Gupta et al. (2003), on the other hand,
refrains from a specific theoretic model and instead treats the research question as an
empirical one which is best examined through an inductive strategy. This study follows
the latter approach.
A preliminary conclusion drawn from these cross-sectional and country case studies
could be that while there is evidence for an effect of aid on taxation, it is ambiguous in
which direction the effect works. A comparison of the different analyses is made difficult
by the fact that all of the above mentioned studies use different models and regression
specifications, but most importantly by the lacking availability of comprehensive data.
Nevertheless, there are some possible, more systematic explanations for the ambiguous
findings: omitted variable bias is one possibility. It may be that strong country-specific
aspects influence the impact aid can have on tax revenue, such as tax policies, the
development orientation of the government, the quality and design of institutions such as
the tax system, overall bureaucracy, political stability, the level of corruption, or many
other possible characteristics yet to be determined.
Since one objective of this study for DFID was to also to look into the relationship
between tax revenue and institutions, the literature on possible links between these
variables shall now briefly be reviewed. The relationship between aid and the quality of
institutions has been much studied since the 1990s under the heading of “good
Does Aid Decrease Tax Revenue in Developing Countries?
6
governance”2, but it has not often been embedded in analyses of aid and tax revenue.
Ghura (1998) finds that the tax revenue of 39 Sub-Saharan African countries between
1985 and 1996 was not only influenced by the economic structure and level of income
but also by the institutional aspects of corruption and the provision of public services in
sectors like education. Gupta et al.’s results, when controlling for corruption, indicate that
the negative effect of grants on tax revenue is larger in countries with higher corruption,
while loans seem to have some offsetting effect against a negative impact of corruption
on tax revenue (2003: 12). In a paper concerned with the relationship between aid
dependence and the quality of governance institutions, Bräutigam (2000) briefly looks at
the impact of aid dependence on tax effort and finds that it can reduce the tax base and
the tax effort, at the same time implying that institutions are weaker. Moreover, the
reduction of the tax base can in the long run result in a further weakening of the
institutional capacity. Thus the quality of institutions has a dual role: it may be an
important determinant of tax revenue in developing countries, and at the same time there
may also be a reverse effect. The latter aspect, though, has not been dealt with much in
the literature.
Another stream of literature relevant for this study deals with taxation issues in
developing countries. The relationship between aid and tax revenue disaggregated into
different types of taxes would have been of particular interest to us but we could not find
any literature explicitly dealing with this. The literature on developing country tax policy
issues in general is informative to a certain extent: when thinking about the possible
reasons aid recipient governments might have for reducing or increasing tax effort it is
important to bear in mind the context in which they operate. Adam and O’Connell (1998)
and Tanzi and Zee (2000) both find that Sub-Saharan African countries have higher tax
revenue to GDP ratios than other developing country regions; in particular the average
tax rates on trade exceed those in other regions by ca. 50%, and the tax burden on
agricultural exports is unusually high as well. At the same time, given the persistently
lower level of GDP, these taxes do not seem to indicate a sustainable movement into the
2 Cf. Crawford (2000), Moore/Robinson (1994), World Bank (1998) for discussions on good governance as
an objective and a condition of development aid, or Bräutigam/Knack (2004) on the relationship between aid dependence and institutional quality, finding evidence for an association of higher aid levels with a deterioration of the quality of governance.
Does Aid Decrease Tax Revenue in Developing Countries?
7
direction of the much higher tax ratios of developed countries but rather that trade taxes
are more economically distortive.
Tanzi and Zee claim that this taxation pattern can partially be explained by the
observation that “in developing countries, tax policy is often the art of the possible rather
than the pursuit of the optimal” (2000: 4). The structure of developing country economies
and constraints in the capacity of the tax administration make it difficult to impose for
example income or value-added taxes and lead to a frequent reliance on many small tax
sources and trade taxes (ibid.). Another factor leading to relatively higher trade taxes is
that in many developing countries, the domestic groups adversely affected by these taxes
are rarely concentrated lobby groups, but usually dispersed individual stakeholders like
consumers and farmers (the latter particularly in developing countries with a high share
of agriculture in GDP and a high share of agricultural products in the country’s exports).
Thus, even though relatively more distortive, trade taxes are often used to finance
transfers to politically powerful or favoured groups like the domestic manufacturing
industries (Adam/O’Connell 1998), especially when those groups lobby for tax
exemptions in the tax types that affect them, which are usually income and corporate
taxes. These considerations indicate that it may be highly insightful to examine in more
detail the impact of aid – overall or grants and loans separately - on different components
of tax revenue.
3. Empirical Model and Data
3.1 Empirical Model
The relationship between aid and revenues from taxation is essentially an empirical
question. The evidence emerging from studies on individual countries and small groups
of countries does not seem to add up consistently in a broader cross-country picture. Such
broader aggregate evidence would be useful as it could provide the necessary background
to ascertain the evidence emerging from more micro-econometric studies. Moreover,
despite not offering the kind of specific knowledge which is applicable in policy settings,
an aggregate analysis can well function as a signpost in the still almost uncharted territory
of the relation between aid and tax revenue.
Does Aid Decrease Tax Revenue in Developing Countries?
8
One of the main obstacles to this type of study is the lack of data. As outlined in the
literature review, the systematic evidence on a large sample is scant, with the remarkable
exception of the study by Gupta et al. (2003). Our approach is in line with theirs and
models variations in tax ratios across countries and time as a function of income from aid
and other main determinants of tax revenue. We are interested in the following regression
model:
ittiititit XAIDREV εθλγβα +++++= (1)
Where itREV represents the tax revenue in percent of GDP of country i in year t , itAID
indicates the inflow of net aid in percent of GDP of country i in year t . itX is a vector of
control variables, whereas iλ controls for country specific time invariant effects, and tθ
are year dummies, controlling for year specific economic and policy shocks common to
all countries. itε is a random error term.
The advantage of this approach is that it is not dependent on a specific macroeconomic
model. Yet it depends crucially on how reasonable its assumptions are, and therefore on
what controls are included in vector itX . Specifically we propose to use, first of all, the
logarithm of GDP per capita. However crude, GDP per capita is a reasonable proxy of the
level of economic development. Economic development is, in turn, a key determinant of
tax revenue since as countries develop their tax bases expand more than proportionately
to the growth in their level of income (Tanzi 1992). Moreover, it is suggested that an
increase in income not only reflects a higher capacity of the citizens to pay taxes, but also
a greater capacity of policy makers to levy and collect taxes (Chelliah 1971). Second we
decide to include the percentage share of agricultural and industrial value added over
GDP. These variables allow controlling for the structure of the economy, which is an
important determinant of tax revenue (Tanzi 1992). We expect a large agricultural sector
to be detrimental for tax revenue since farmers are difficult to tax directly3 and a large
share of agricultural activity is normally for subsistence. On the other hand, having a
strong industrial sector is likely to be conducive to domestic tax revenue since it is easier
3 Implicit forms of taxing agriculture, while common in many developing countries, shall not be dealt with
here because they do not directly affect tax revenue.
Does Aid Decrease Tax Revenue in Developing Countries?
9
for policy makers to tax industrial activities, due to the greater availability of information
on their income and profit. Finally, we want to include a measure of openness because, as
argued in the literature review, certain characteristics of trade which passes the borders of
a country make it an important source of tax revenue for some countries. This is partly
due to the fact that in developing countries it is often the most monetized sector of the
economy. Moreover, the administrative ease with which trade taxes can be collected
makes them an attractive source of domestic tax revenue when administrative capacity to
collect taxes from other sources is weak and inefficient (Linn/Weitzel 1990; Lotz/Morss
1970). We measure openness as the sum of imports and exports in percent of GDP.
Clearly this estimation strategy can highlight only a correlation between our variables of
interest and cannot explain the mechanisms underlying their relation. Indeed aid and
revenue are likely to be influenced by common factors. The institutional setting and the
quality of the institutions of a country, for example, are likely to be reflected both in the
aid inflow and in the tax capacity of a country. We will turn to this point in more detail in
section 4. Yet our primary interest is focused on the direction and the strength of the
correlation between aid and tax revenue, which has to be established before any
underlying mechanism is ascertained.
Another important advantage of our econometric model is that is it flexible enough to
allow including further variables and moving consistently towards more disaggregated
specifications. In particular, we argue that interesting results can emerge when looking
more specifically at the composition of tax revenue and at the composition of aid. Our
first step in this direction is to consider the composition of aid, looking separately at
grants and loans. This distinction is well established in the literature that has investigated
the different impacts of these aid channels on development (cf. Cordella/Ulku 2004,
Morrissey et al. 2006). Hence, across all regressions, we first use net aid as the key
explanatory variable and second grants and net loans.
Finally, to estimate our baseline specification we use ordinary least squares (OLS).
Having a panel dataset allows us to control for country fixed effects.
Does Aid Decrease Tax Revenue in Developing Countries?
10
3.2 Data Description
Data on tax revenue is drawn from the IMF’s “Government Finance Statistics” referring
to “consolidated central government”4. We checked the data for inconsistencies and drop
the few countries displaying implausible figures (see Appendix). We have also checked
for changes in countries’ budgeting procedures and revenues registration. For example
some countries have switched to an accrual budgeting system from a cash system, thus
undermining the coherence of the time series. We have dealt with this particular issue by
comparing the figures, tracing the changes and controlling the stability of our results to
changes in the budgeting system.
In order to calculate the share of tax revenue as a percentage of GDP we use data on GDP
available from the IMF’s “International Financial Statistics”. Using the same source as
for tax revenue – and having both variables expressed in nominal local currency - has
enhanced the coherence of our dataset. Yet the limited availability of data on both
revenue and GDP was largely responsible for constraints in terms of which countries we
were able to use in the regressions.
Data on the key independent variable, net aid and its components grants and net loans,
are taken from the OECD’s “International Development Statistics”. This dataset is
composed of two datasets, according to the classification of the recipient country which
was used up until 2004. Net aid is the sum of total Official Development Assistance
(ODA) and Official Assistance (OA) from all members in the DAC and it includes
grants, concessional loans with a grant element of at least 25 percent, and technical
cooperation. “Net” means that principal and interest repayments or forgiveness on
previous loans have been accounted for. Furthermore the OECD collects data on aid that
distinguish between aid commitments by purpose, one “purpose” being programme
assistance. These data are of particular interest as their different design could hint to
some of the institutional factors behind our correlation of interest. However, the data are
too scant to allow any cross-country regression.
4 Although “consolidated general government” would be the ideal variable here, due to the unavailability of
comprehensive data on this series we chose to use consolidated central government. We do not assume this to be very problematic since most external assistance is routed through the central government budget.
Does Aid Decrease Tax Revenue in Developing Countries?
11
Data on control variables are drawn from the World Bank’s “World Development
Indicators”. These include GDP per capita in constant US dollars, agriculture and
industry value-added in percent of GDP, and the sum of imports and exports of goods and
services in percent of GDP. Additionally, we later control for corruption, which has been
found to have a significant impact on tax revenue by Gupta et al. (2003), Ghura (1998),
and others.
We aggregate these datasets to construct an annual panel of 624 observations, which
include 65 countries and the years from 1990 to 2004. The availability of the respective
variables used accounts for the variation in the number of observations across
regressions. The full list of countries and a full description of how the dataset has been
constructed is provided in the Appendix.
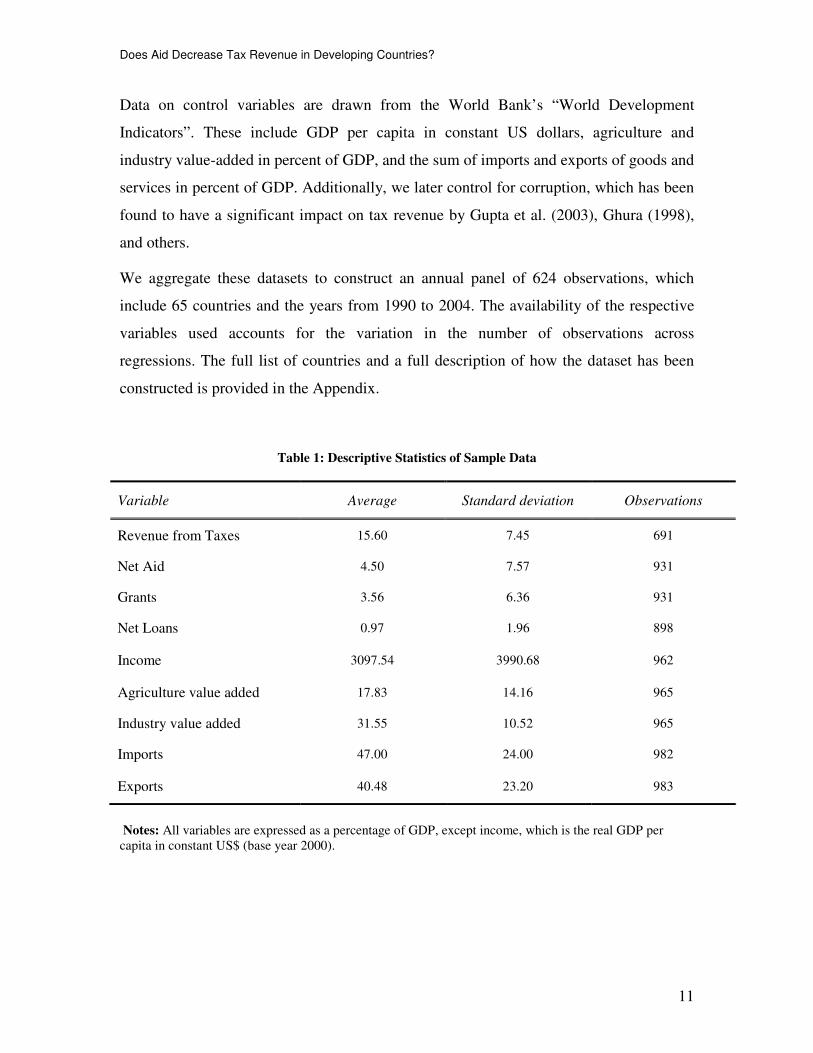
Table 1: Descriptive Statistics of Sample Data
Notes: All variables are expressed as a percentage of GDP, except income, which is the real GDP per capita in constant US$ (base year 2000).
Variable Average Standard deviation Observations
Revenue from Taxes 15.60 7.45 691
Net Aid 4.50 7.57 931
Grants 3.56 6.36 931
Net Loans 0.97 1.96 898
Income 3097.54 3990.68 962
Agriculture value added 17.83 14.16 965
Industry value added 31.55 10.52 965
Imports 47.00 24.00 982
Exports 40.48 23.20 983
Does Aid Decrease Tax Revenue in Developing Countries?
12
4. Results
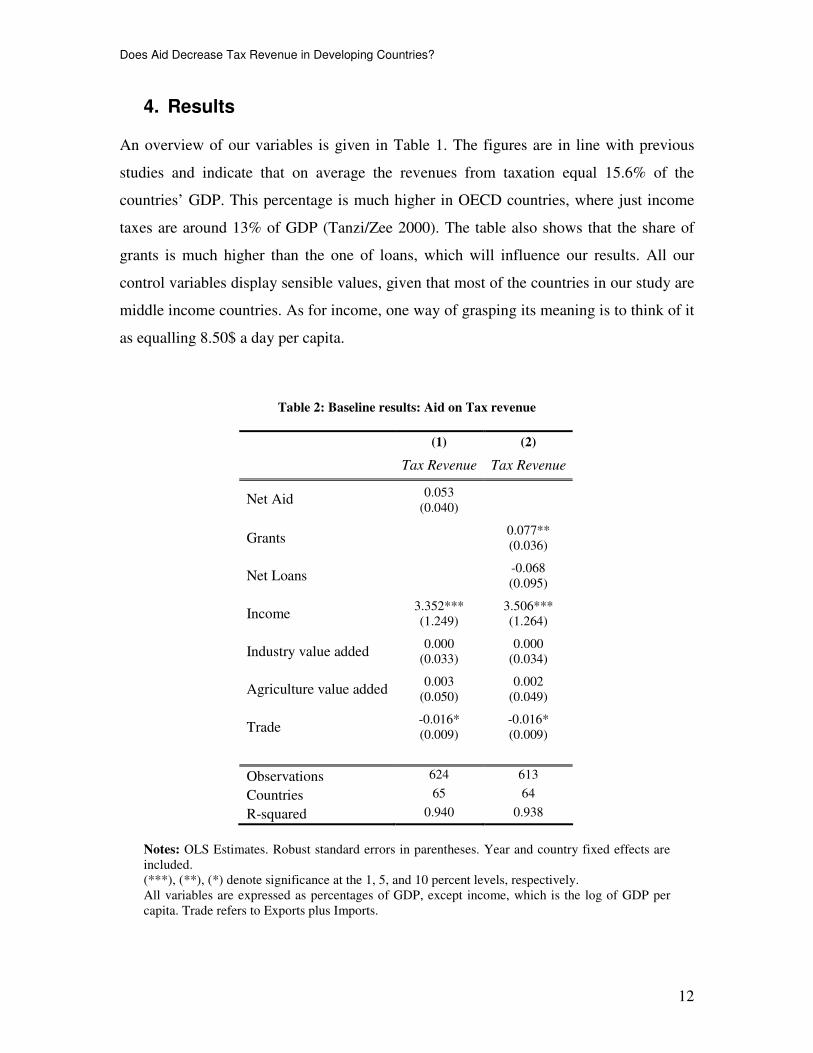
An overview of our variables is given in Table 1. The figures are in line with previous
studies and indicate that on average the revenues from taxation equal 15.6% of the
countries’ GDP. This percentage is much higher in OECD countries, where just income
taxes are around 13% of GDP (Tanzi/Zee 2000). The table also shows that the share of
grants is much higher than the one of loans, which will influence our results. All our
control variables display sensible values, given that most of the countries in our study are
middle income countries. As for income, one way of grasping its meaning is to think of it
as equalling 8.50$ a day per capita.
Table 2: Baseline results: Aid on Tax revenue
(1) (2)
Tax Revenue Tax Revenue
0.053 Net Aid
(0.040)
0.077** Grants
(0.036)
-0.068 Net Loans
(0.095)
3.352*** 3.506*** Income
(1.249) (1.264)
0.000 0.000 Industry value added
(0.033) (0.034)
0.003 0.002 Agriculture value added
(0.050) (0.049)
-0.016* -0.016* Trade
(0.009) (0.009)
Observations 624 613
Countries 65 64
R-squared 0.940 0.938
Notes: OLS Estimates. Robust standard errors in parentheses. Year and country fixed effects are included. (***), (**), (*) denote significance at the 1, 5, and 10 percent levels, respectively. All variables are expressed as percentages of GDP, except income, which is the log of GDP per capita. Trade refers to Exports plus Imports.
Does Aid Decrease Tax Revenue in Developing Countries?
13
4.1 Baseline Results: No General Substitution Effect
We now turn to estimating our baseline regression, the results of which are shown in
Table 2. Column 1 shows that net aid has a positive correlation with tax revenue,
although not statistically significant. The results in column 2 indicate how this positive
correlation stems from the significant and positive relation between grants and tax
revenue. The magnitude of the coefficient is very small, indicating that an increase of one
percentage point in the share of grants over GDP is correlated with only a 0.077
percentage point change in tax revenue. Turning to loans, they have a negative
coefficient, which however is not statistically significant.
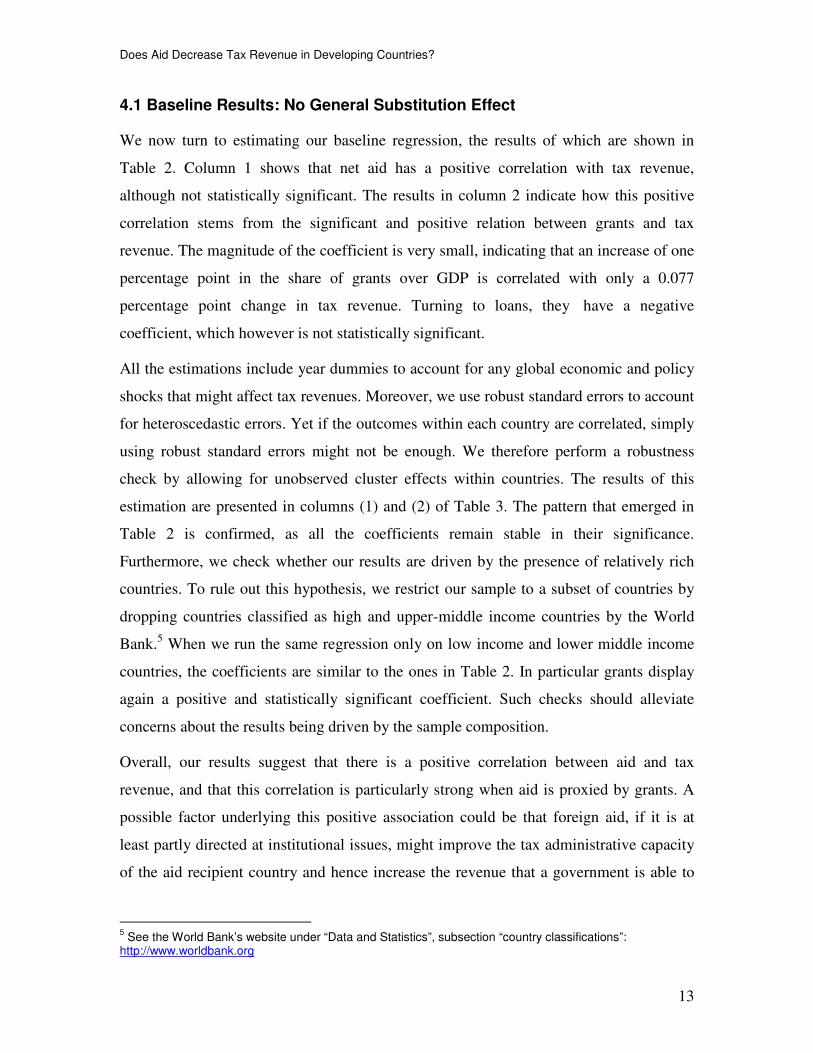
All the estimations include year dummies to account for any global economic and policy
shocks that might affect tax revenues. Moreover, we use robust standard errors to account
for heteroscedastic errors. Yet if the outcomes within each country are correlated, simply
using robust standard errors might not be enough. We therefore perform a robustness
check by allowing for unobserved cluster effects within countries. The results of this
estimation are presented in columns (1) and (2) of Table 3. The pattern that emerged in
Table 2 is confirmed, as all the coefficients remain stable in their significance.
Furthermore, we check whether our results are driven by the presence of relatively rich
countries. To rule out this hypothesis, we restrict our sample to a subset of countries by
dropping countries classified as high and upper-middle income countries by the World
Bank.5 When we run the same regression only on low income and lower middle income
countries, the coefficients are similar to the ones in Table 2. In particular grants display
again a positive and statistically significant coefficient. Such checks should alleviate
concerns about the results being driven by the sample composition.
Overall, our results suggest that there is a positive correlation between aid and tax
revenue, and that this correlation is particularly strong when aid is proxied by grants. A
possible factor underlying this positive association could be that foreign aid, if it is at
least partly directed at institutional issues, might improve the tax administrative capacity
of the aid recipient country and hence increase the revenue that a government is able to
5 See the World Bank’s website under “Data and Statistics”, subsection “country classifications”:
http://www.worldbank.org
Does Aid Decrease Tax Revenue in Developing Countries?
14
Table 3: Robustness Checks
Notes: OLS Estimates. Year and country fixed effects included. Columns (1) and (2): clustered standard errors in parenthesis. Columns (3) and (4): robust standard errors in parenthesis. (***), (**), (*) denote significance at the 1, 5, and 10 percent levels, respectively. All variables are expressed as percentages of GDP, except income, which is the log of GDP per capita. Trade refers to Exports plus Imports. Country classification according to income is taken from the World Bank’s list of economies (July 2006).
generate from taxes. Grants might have a stronger influence on this association since they
may be targeted more towards improving institutions and capacity, whereas loans are
often given for infrastructure projects and other capital investments.
These results are opposite to the evidence offered by Gupta et al. (2003). The discrepancy
can be due to different factors. First of all the time period we consider is more recent, but
also shorter. Hence, we are mirroring a more medium-term correlation, whereas Gupta et
al.’s panel dates back to 1970, but ends in 2000. Our results are thus more likely to
capture the most recent changes in development policies of both donors and recipients,
(1) (2) (3) (4)
Tax Revenue Tax Revenue Tax Revenue Tax Revenue
All Countries All Countries Low Income and
Lower Middle Income Countries
Low Income and Lower Middle
Income Countries
0.053 0.052 Net aid
(0.038) (0.034)
0.077** 0.071** Grants
(0.038) (0.036)
-0.068 -0.060 Net Loans
(0.088) (0.076)
3.352* 3.506* 6.117*** 6.537*** Income
(2.000) (2.002) (1.386) (1.391)
0.000 0.000 -0.064** -0.069** Industry value added
(0.049) (0.050) (0.032) (0.032)
0.003 0.002 0.019 0.018 Agriculture value added
(0.082) (0.076) (0.042) (0.042)
-0.016 -0.016 0.006 0.006 Trade
(0.013) (0.013) (0.011) (0.011)
Observations 624 613 383 380
Countries 65 64 41 41
R-squared 0.940 0.938 0.947 0.948
Does Aid Decrease Tax Revenue in Developing Countries?
15
which, during the 1990s, have moved towards new strategies and approaches. The debate
on aid effectiveness has resulted in a stronger focus on governance institutions, which
also touches upon administrative effectiveness and thus concerns the collection of taxes.
Therefore, the positive coefficient of grants might reflect such a recent change in
Table 4: Aid on Revenue in Two Different Time Periods
(1) (3) (2) (4)
Log Revenue Log Revenue Log Revenue Log Revenue
1975-2000 1975-2000 1990-2000 1990-2000
-0.010*** 0.006* Net Aid
(0.003) (0.004)
0.000*** -0.000 Net Aid
(0.000) (0.000)
-0.016*** 0.000 Grants
(0.003) (0.005)
0.000*** 0.000 (Grants)2
(0.000) (0.000)
0.011*** 0.014*** Net Loans
(0.004) (0.004)
-0.000 -0.000* (Net Loans)2
(0.000) (0.000)
-0.000*** -0.000*** 0.000*** 0.000*** Income
(0.000) (0.000) (0.000) (0.000)
-0.011*** -0.012*** -0.008*** -0.008*** Industry value added
(0.001) (0.001) (0.003) (0.003)
0.008*** 0.008*** 0.003* 0.003* Agriculture value added (0.001) (0.001) (0.002) (0.002)
0.003*** 0.003*** 0.002*** 0.002*** Trade
(0.000) (0.000) (0.001) (0.001)
Observations 1943 1943 708 708
Countries 107 107 92 92
R-squared 0.882 0.882 0.921 0.922
Notes: OLS estimates. Country fixed effects included. Standard errors in parentheses. Estimates obtained based on the dataset used by Gupta et al. (2003). (***), (**), (*) denote significance at the 1, 5, and 10 percent levels, respectively. All variables are expressed as percentages of GDP, except income, which is the log of GDP per capita. Trade refers to Exports plus Imports.
Does Aid Decrease Tax Revenue in Developing Countries?
16
development policies. Secondly, our specification is slightly different from the one used
by Gupta et al., as we use tax revenue as dependent variable rather than total government
revenue. Total revenue is a more aggregate variable, as it also includes income from, for
example, state assets and rents from mineral resources. It is therefore less apt to capture
the factors directly linked to the tax system, which is essentially what we are interested
in.
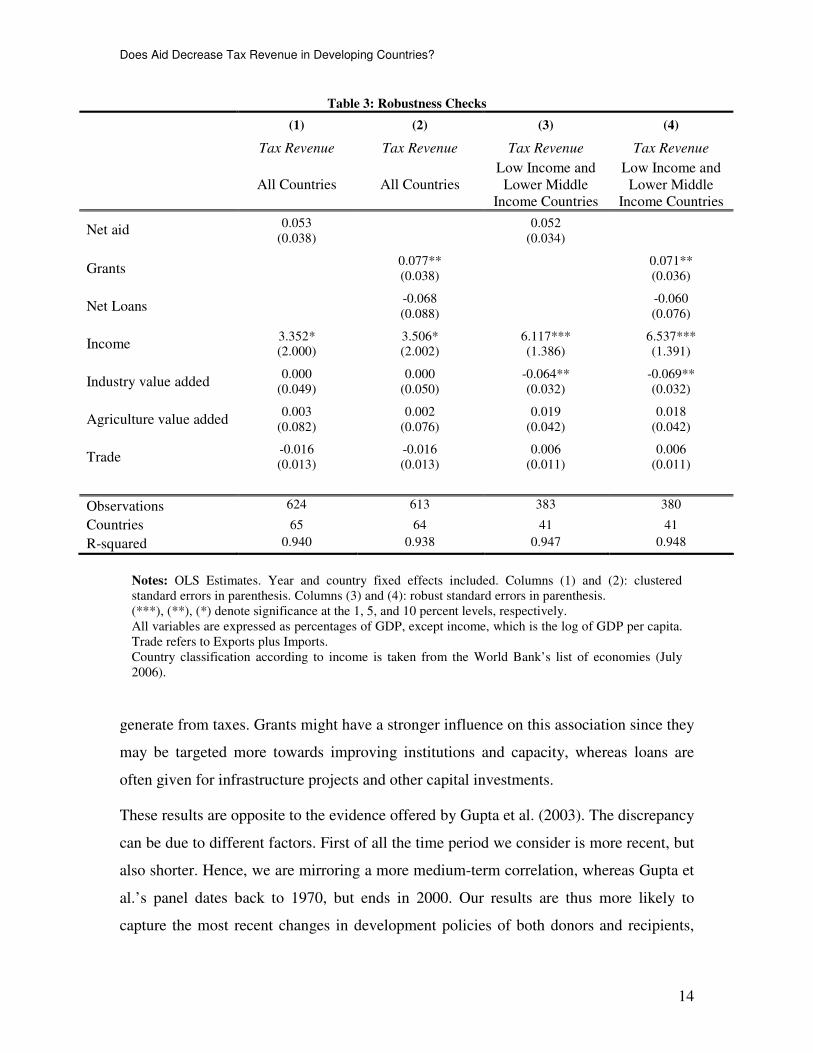
In order to further strengthen our findings we re-estimated Gupta et al.’s (2003)
regressions on a more recent time period but on their original dataset, which we received
from the authors upon request. Columns (1) and (2) of Table 4 show Gupta et al.’s
baseline results as published in their paper, which we were able to exactly replicate. Their
baseline results show an overall negative relationship between aid and domestic revenue,
which seems to be driven by the negative correlation of grants with revenue, whereas net
loans have a positive coefficient. However, when we use their specification on their data
from 1990 to 2000, which is the time period overlapping with our own dataset, we see
that the coefficient of aid has switched its sign. From column (3) we can see that aid has a
positive association with domestic revenue, which is significant at 10%. The
decomposition of aid in column (4) shows that this positive association is driven by the
positive relationship between net loans and domestic revenue while grants have an
insignificant association with domestic revenue which is no longer negative. The
coefficients maintain these signs and even increase in magnitude when we slightly
change the specification by including year dummies and redefining the dependent
variable to domestic revenue as a share of GDP instead of the logarithm of domestic
revenue as a share of GDP. In sum, this analysis lends support to our results that, post
1990, the aggregate relationship between aid and tax revenue is positive.
4.2 Role of Corruption: No Differential Impact of Aid
One possible direction to expand our analysis is to include some measure of governance
quality in order to see whether any specific pattern linked to governance quality emerges.
This type of exercise is relevant in light of the emphasis that the debate on aid policy has
put on institutional dynamics in aid recipient countries. One possible indicator of
Does Aid Decrease Tax Revenue in Developing Countries?
17
governance quality is the level of corruption. More specifically, corruption is important
for our discussion because corruption is detrimental for revenue performance. Corruption
can indeed be used as a proxy for fiscal corruption, and the literature has described how
the specific features of the tax system favour the diffusion of corruption by complicated
tax laws, weak legal and judicial systems, excessive discretionary power vested in tax
administrators, lack of accountability and transparency in the tax administration, the
necessity for frequent communication between tax payers and tax officials, and low
salaries in the public sector (Tanzi 1998).
The existing literature has looked at the role of corruption by focusing on the individual
explanatory power of a corruption variable in explaining the cross country variation of
revenue from taxes (Ghura 1998; Gupta et al. 2003). Our approach is slightly different
because we attempt to see whether net aid and, more interestingly, grants and net loans
have a different relation with revenues due specifically to the presence of corruption.
That is to say that, instead of controlling for the correlation between corruption and
revenue, we look at the interaction of aid and corruption. One would expect that aid,
whether in the form of grants or net loans, has a marginally higher impact on revenue
collection in countries with low corruption than in countries with high corruption.
In order to test this hypothesis we use a comprehensive index on corruption that has been
collected by the World Bank since 1996 in its publication “Governance Indicators 1996-
2005” together with five other governance indicators (Kaufmann et al. 2006). There is
therefore only a partial overlap with the years covered by our dataset. Nonetheless we
chose this index because it is constructed from multiple indices and surveys assembled by
various institutions, which strengthens its validity compared to single survey indices.6
Since we are mostly interested in the cross-country variation of corruption we have
exploited the variation of the mean of the index for each country to construct two
dummies: low corruption and high corruption. We have used the median of the
distribution of the mean (of the corruption index for each country) to identify countries
with lower corruption. This approach allows us to have an equal number of countries in
6 The indicator is constructed in order to have a standardised normal distribution across countries. Hence it
lies between -2.5 and 2.5 for almost all countries, with highly corrupted countries scoring towards -2.5. The methodology and the sources used are described in detail in Kaufmann et al. (2003) and Kaufmann et al. (2006).
Does Aid Decrease Tax Revenue in Developing Countries?
18
both groups, and, more importantly, prevents our results from being driven by any
particular subset of countries. Our procedure is simple and the key advantage of this is
that a binary variable, constructed in this way, can be more easily used to cover the entire
time period we are interested in. However, this strategy depends on the assumption that a
country’s governance institutions do not change substantially over the time period we are
looking at. This assumption may not hold for every country in the sample, but it is
generally buttressed by the low variations in the World Bank governance indicators per
country between 1996 and 2004 (ibid.).
Our estimation strategy considers an alternative specification of equation (1) to account
for the different correlation aid might have with revenue in highly corrupted countries.
We do so by introducing an interaction term capturing the interaction between corruption
and net aid, grants and net loans, respectively.
Therefore, the baseline equation is augmented to:
ittiitititit XLowCorrAIDAIDREV εθλβββα ++++++= )())(()( 321
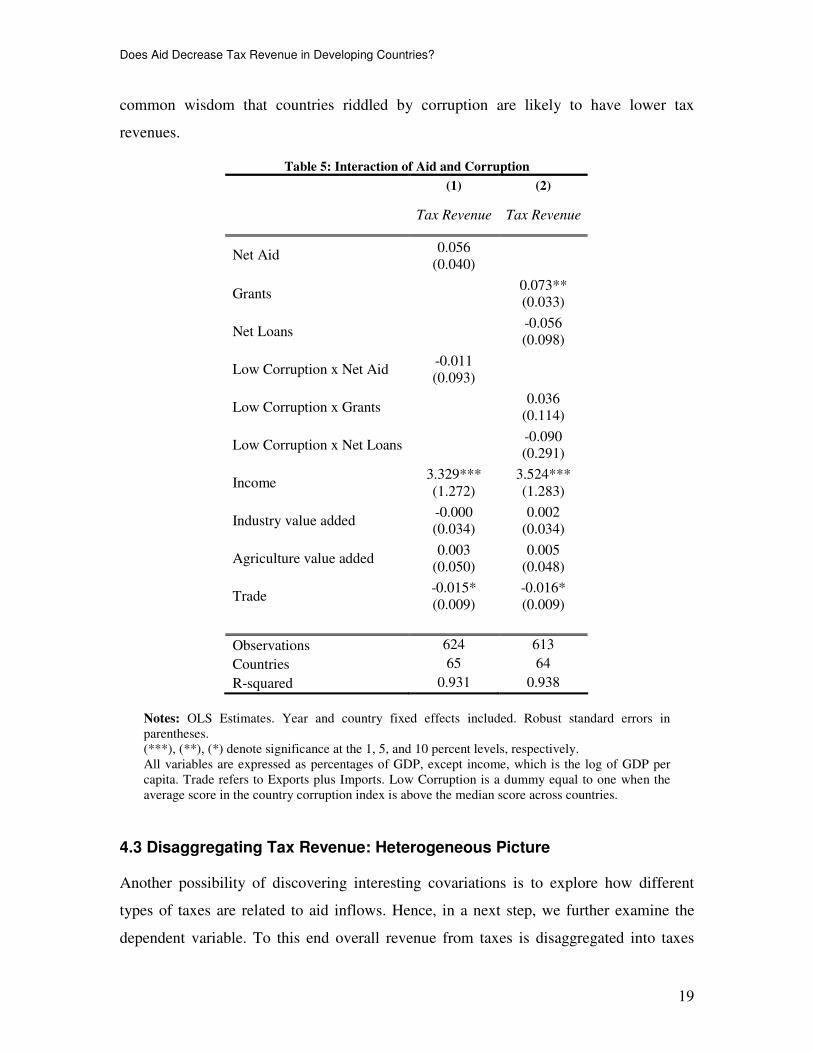
The results are shown in Table 5. All three coefficients for net aid, grants and net loans
remain stable in sign, magnitude and significance. In particular, the coefficient for grants
is still positive and significant at 5%, indicating a positive association with tax revenue.
Yet the key parameter of interest is 2β . If this coefficient is significantly different from
zero, then the relation between aid and tax revenue is different in countries with low
corruption in comparison to countries with high corruption. However, from column (1) in
Table 5 we can see that the coefficient of the interaction term is far from being
statistically significant. In column (2) we decompose aid into grants and net loans and
interact both components with the dummy low corruption. The coefficients for both
interactions turn out statistically insignificant. We therefore do not find any solid
evidence for a differential relation between aid and tax revenue when the recipient
country is highly corrupt as opposed to less corrupt. One has to keep in mind that this
result does not say anything about the direct relation between corruption and tax revenue,
which is bundled in the country specific effect. So the result does not question the
Does Aid Decrease Tax Revenue in Developing Countries?
19
common wisdom that countries riddled by corruption are likely to have lower tax
revenues.
Table 5: Interaction of Aid and Corruption
(1) (2)
Tax Revenue Tax Revenue
0.056 Net Aid
(0.040)
0.073** Grants
(0.033)
-0.056 Net Loans
(0.098)
-0.011 Low Corruption x Net Aid
(0.093)
0.036 Low Corruption x Grants
(0.114)
-0.090 Low Corruption x Net Loans
(0.291)
3.329*** 3.524*** Income
(1.272) (1.283)
-0.000 0.002 Industry value added
(0.034) (0.034)
0.003 0.005 Agriculture value added
(0.050) (0.048)
-0.015* -0.016* Trade
(0.009) (0.009)
Observations 624 613
Countries 65 64
R-squared 0.931 0.938
Notes: OLS Estimates. Year and country fixed effects included. Robust standard errors in parentheses. (***), (**), (*) denote significance at the 1, 5, and 10 percent levels, respectively. All variables are expressed as percentages of GDP, except income, which is the log of GDP per capita. Trade refers to Exports plus Imports. Low Corruption is a dummy equal to one when the average score in the country corruption index is above the median score across countries.
4.3 Disaggregating Tax Revenue: Heterogeneous Picture
Another possibility of discovering interesting covariations is to explore how different
types of taxes are related to aid inflows. Hence, in a next step, we further examine the
dependent variable. To this end overall revenue from taxes is disaggregated into taxes
Does Aid Decrease Tax Revenue in Developing Countries?
20
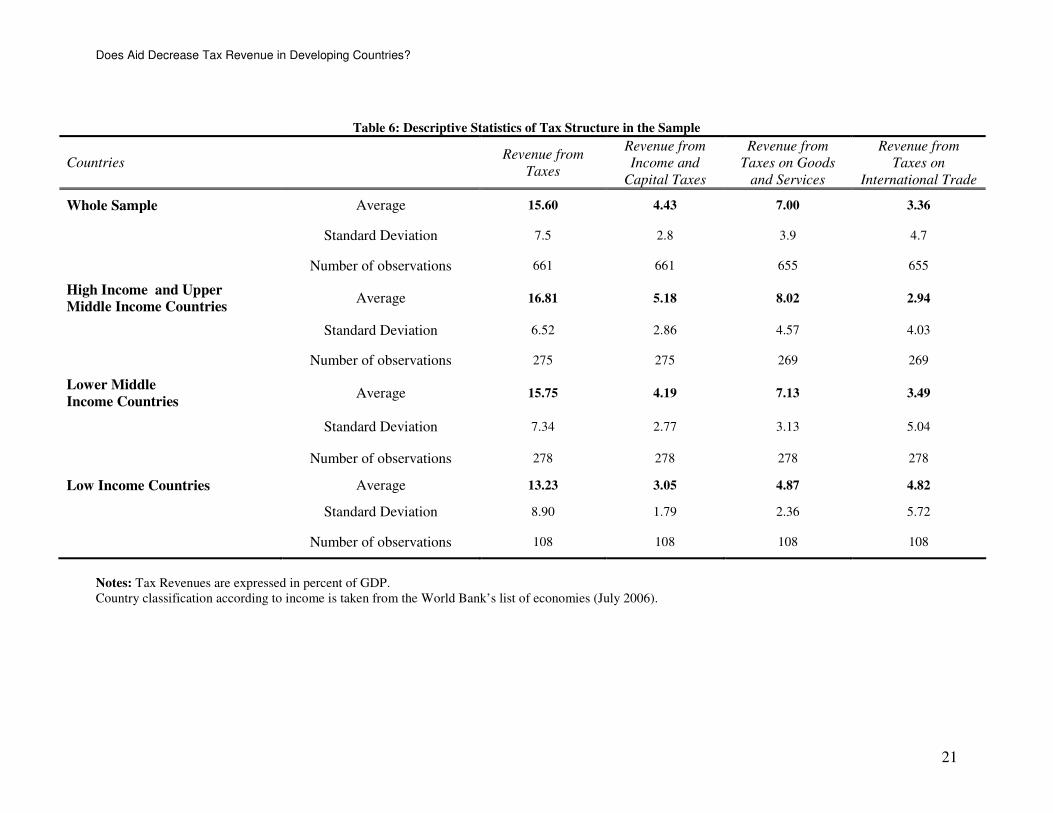
from a) income, profits and capital gains, b) goods and services, and c) international
trade. Table 6 shows how they are distributed in our sample. The figures in Table 6
confirm that the overall positive relationship of aid and tax revenue can not be entirely
driven by endogeneity: with rising national income overall tax revenue increases as well,
whereas net aid is negatively correlated with income (not shown). We shall return to
aspects of this table during the interpretation of the regression results.
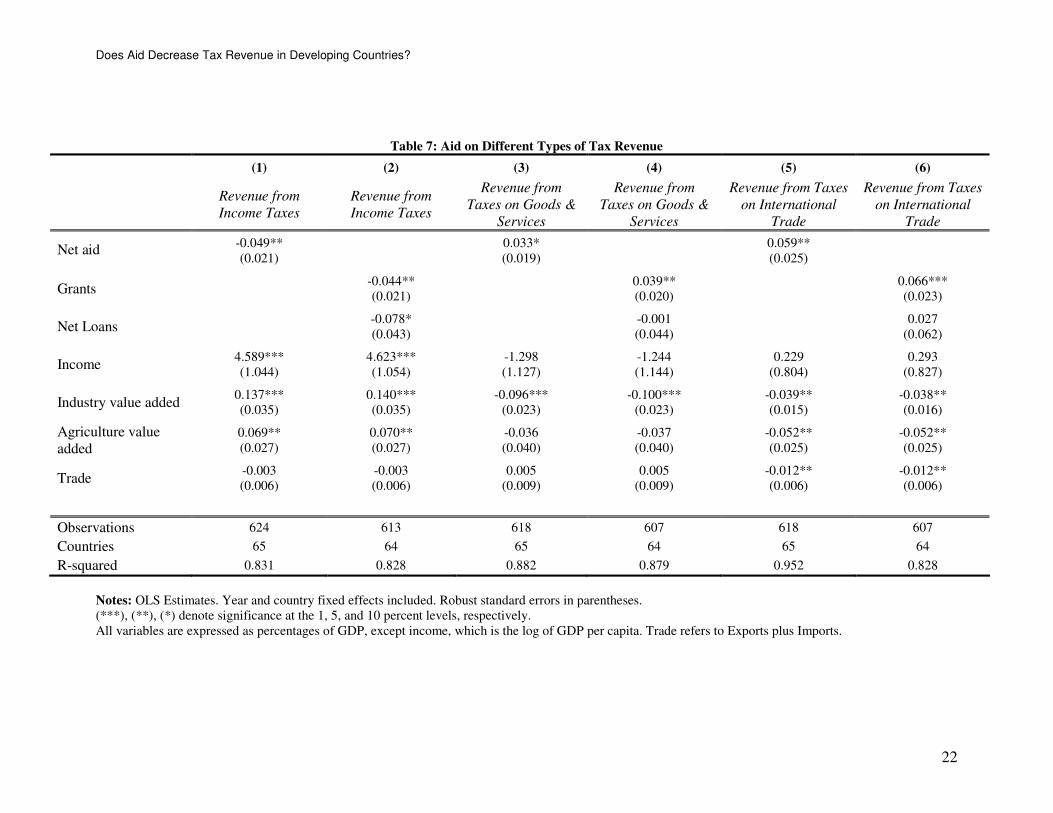
By re-estimating the baseline regression on each of the three tax types respectively, we
see that the correlation with aid is heterogeneous across the different types of taxes; the
results are presented in Table 7.
Starting with income and capital taxes, column (1) shows that net aid has a negative and
significant association with revenues from these taxes, which is confirmed in column (2)
for both grants and loans. Such a response might be driven by policy makers’ decision to
use aid as a substitute for domestic taxes and thus to try to free resources for the private
sector by lowering income and capital taxes. The developmental reasoning behind such a
policy would be that since capital taxes may inhibit private sector investments and
individual labour supply, a lowering of such taxes could be conducive to economic
growth. However, as we can see in Table 6, average revenue from income taxes is only
4.4% of GDP in our sample countries, which is very low compared to an average income
and capital tax revenue of around 12.5-13% of GDP in OECD countries between 1990
and 20047. Hence, the observable substitution effect is probably less developmentally
oriented and rather to the benefit of powerful lobby groups whose tax burden might have
been lowered as a response to aid inflows. This is precisely the kind of substitution effect
donors are concerned about.
Among the control variables, GDP per capita (Income) is worth mentioning. Its strong
positive association with revenues from income and corporate taxes is not surprising as
one can expect countries with higher income to have a generally better administrative
capacity, which allows them to adequately impose and collect direct taxes, and also that
they have a greater share of formal economic activity than less developed countries,
which enables them to tax the monetary gains from such activity in the first place.
7 Figures drawn from the OECD’s annual Revenue Statistics publication.
Does Aid Decrease Tax Revenue in Developing Countries?
21
Table 6: Descriptive Statistics of Tax Structure in the Sample
Notes: Tax Revenues are expressed in percent of GDP. Country classification according to income is taken from the World Bank’s list of economies (July 2006).
Countries
Revenue from
Taxes
Revenue from
Income and
Capital Taxes
Revenue from
Taxes on Goods
and Services
Revenue from
Taxes on
International Trade
Whole Sample Average 15.60 4.43 7.00 3.36
Standard Deviation 7.5 2.8 3.9 4.7
Number of observations 661 661 655 655
High Income and Upper
Middle Income Countries Average 16.81 5.18 8.02 2.94
Standard Deviation 6.52 2.86 4.57 4.03
Number of observations 275 275 269 269
Lower Middle
Income Countries Average 15.75 4.19 7.13 3.49
Standard Deviation 7.34 2.77 3.13 5.04
Number of observations 278 278 278 278
Low Income Countries Average 13.23 3.05 4.87 4.82
Standard Deviation 8.90 1.79 2.36 5.72
Number of observations 108 108 108 108
Does Aid Decrease Tax Revenue in Developing Countries?
22
Table 7: Aid on Different Types of Tax Revenue
Notes: OLS Estimates. Year and country fixed effects included. Robust standard errors in parentheses. (***), (**), (*) denote significance at the 1, 5, and 10 percent levels, respectively. All variables are expressed as percentages of GDP, except income, which is the log of GDP per capita. Trade refers to Exports plus Imports.
(1) (2) (3) (4) (5) (6)
Revenue from
Income Taxes
Revenue from
Income Taxes
Revenue from
Taxes on Goods &
Services
Revenue from
Taxes on Goods &
Services
Revenue from Taxes
on International
Trade
Revenue from Taxes
on International
Trade
-0.049** 0.033* 0.059** Net aid
(0.021) (0.019) (0.025)
-0.044** 0.039** 0.066*** Grants
(0.021) (0.020) (0.023)
-0.078* -0.001 0.027 Net Loans
(0.043) (0.044) (0.062)
4.589*** 4.623*** -1.298 -1.244 0.229 0.293 Income
(1.044) (1.054) (1.127) (1.144) (0.804) (0.827)
0.137*** 0.140*** -0.096*** -0.100*** -0.039** -0.038** Industry value added
(0.035) (0.035) (0.023) (0.023) (0.015) (0.016)
0.069** 0.070** -0.036 -0.037 -0.052** -0.052** Agriculture value added (0.027) (0.027) (0.040) (0.040) (0.025) (0.025)
-0.003 -0.003 0.005 0.005 -0.012** -0.012** Trade
(0.006) (0.006) (0.009) (0.009) (0.006) (0.006)
Observations 624 613 618 607 618 607
Countries 65 64 65 64 65 64
R-squared 0.831 0.828 0.882 0.879 0.952 0.828
Does Aid Decrease Tax Revenue in Developing Countries?
23
Columns (3) and (4) report the association between revenues from goods and services
taxes and net aid, grants and net loans. The coefficients indicate that net aid and grants
have a positive association with taxes from goods and services, whereas the coefficient
for net loans is no longer significant. The expansion of goods and services taxes, for
example by introducing a value-added tax, is often favoured in donor strategies because
this might broaden the tax base and thus sustainably increase tax revenue. Hence grants
are sometimes tied to a tax policy reform targeted at goods and services taxes - a policy
that was increasingly pursued since the 1990s (Gloppen/Rakner 2002). Although not
always successfully implemented, such tax reforms may be reflected in the aid
coefficients in columns (3) and (4).
Lastly, the results in columns (5) and (6) suggest that while net aid and grants have a
strong positive and significant correlation with trade taxes, the association of net loans
with trade taxes seems to be positive as well, but insignificant. These coefficients might
be explained by considering the ones in relation with income taxes: as income taxes are
lowered, there is a need for increasing revenue from other sources, for example trade
taxes. This might especially occur when donors demand an overall stable or increased tax
ratio. From a developmental perspective, an increase in trade tax rates is not desirable
considering the distortions trade taxes create in an economy through increased prices for
consumers of imports or lowered competitiveness of domestic producers of exports
(depending on the respective shares of taxes on imports and exports). However, an
increase in revenue from trade taxes might also be caused not by increased tax rates but
by an increased effectiveness in tax collection in general, which may be an objective of
aid. Another possible explanation is endogeneity: countries that have comparatively high
trade taxes also tend to be poorer, as can be seen in Table 6, and it may be the latter
aspect that results in a higher inflow of aid. Concerning the control variables, the trade
coefficient is of particular interest. It is negative and significant, which could again be
due to a stronger reliance on trade taxes in weaker economies: a weak economy can have
a higher share of revenue from trade taxes than a stronger economy and at the same time
a lower trade-to-GDP ratio.
Looking at the overall results – a correlation of aid with lower income tax revenue and
higher goods and services as well as trade tax revenue – it is difficult to argue for a direct
Does Aid Decrease Tax Revenue in Developing Countries?
24
link between aid and tax revenue that would affect different types of taxes in a different
way, but consistently across countries. The pattern of coefficients in Table 7 hints more
towards being driven by omitted variable bias. There may not be a direct impact of aid on
different types of taxes but it may be intervening factors that are related to both aid and
tax revenue that drive the observed relationships. Potentially important omitted factors
may be a combination of the economic structure and the quality (in terms of
effectiveness) of administrative institutions as measured by the World Bank’s governance
indicators like corruption, government effectiveness, or the rule of law8, which could
influence both aid and tax revenue.
First, on their potential influence on aid: the economic structure of a country in terms of
the size of its formal economic sector or the diversification of production is a key
determinant of aid insofar as a weak economic structure is generally correlated with low
GDP per capita. However, controlling for level of income and the size of the agricultural
and industrial sectors and trade, as done in our regressions, may not fully capture a
country’s economic structure: a large agricultural sector does not say much about how
export-oriented this sector is and hence how formalised and thus taxable. The influence
of institutional quality on aid is theoretically ambiguous: aid disbursements may either be
higher for countries with better institutions because aid effectiveness is expected to be
higher in these countries, or they may be higher for weaker countries in order to try to
strengthen their administrative effectiveness.
The potential influence of institutions on tax revenue is more determinate: countries with
weak administrative capacity may not be able to collect much revenue from taxes which
can be evaded more easily, such as taxes on income and profits, and may thus have to
rely more strongly on taxes which are relatively easy to collect, such as taxes on trade
which has to pass official customs. In addition to this, the economic structure of a country
further constrains the options of taxation, that is to what extent there is formal economic
activity that can be taxed. Hence, the interplay between economic structure and
administrative capacity in a country may influence both the overall amount of tax
8 On the construction of these indicators see above section 4.2, and (Kaufmann et al. 2006).
Does Aid Decrease Tax Revenue in Developing Countries?
25
revenue that it is able to collect, given certain tax rates, but also the choice of which types
of taxes it aims to collect.
Even if a poor country aims at reforming its tax policy, maybe assisted by a donor
project, its success may be severely constrained by the given administrative capacity and
economic structure. For example, an attempt towards broadening the tax base by
extending income and corporate taxes may not lead to an increase in tax revenue if tax
collection capacity is not enhanced at the same time and enforcement of these taxes is
low. Furthermore, an increase of income taxes may not be a viable option if there is little
formal income. Gloppen and Rakner (2002) report these and other weaknesses in the
implementation of recent donor-supported tax reforms in several Sub-Saharan African
countries.
Our data, as presented in Table 6, provide some support for such an interpretation of the
relationship between tax revenue structure, economic structure, and administrative
effectiveness, assuming that the income level of a country can be seen as a rough proxy
for both economic structure and administrative capacity: high and upper medium income
countries have a higher overall share of tax revenue in GDP than lower medium income
countries, which in turn have a higher tax revenue than low income countries. Richer
countries also rely more strongly on taxes on income and capital as well as on goods and
services, whereas poorer countries derive relatively more revenue from trade taxes. We
will now examine the relationship between tax revenue and institutions in a little more
detail.
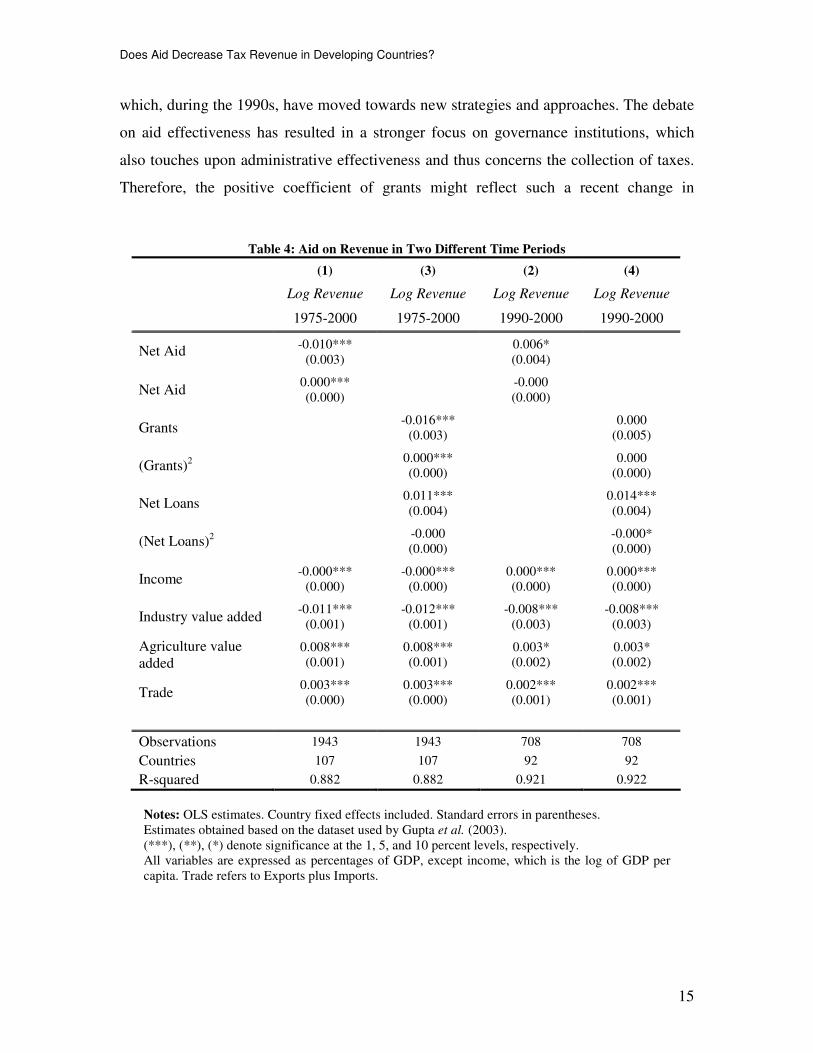
4.4 Tax Revenue and Institutions: A Two-Way Relationship?
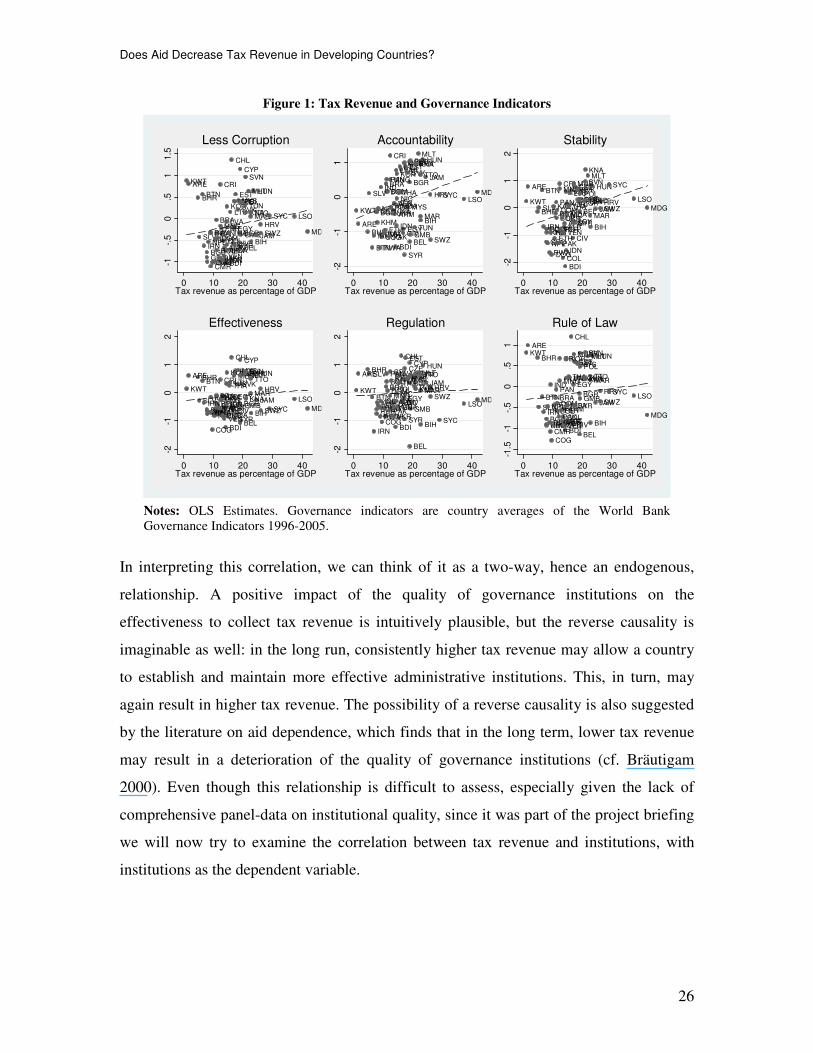
Overall, tax revenue as a share of GDP is positively correlated with all six World Bank
Governance Indicators, as shown in Figure 1. The association is strongest and statistically
significant for the indicators less corruption (at 10%), voice and accountability, and
political stability (both at 1%)9.
9 Table not shown.
Does Aid Decrease Tax Revenue in Developing Countries?
26
Figure 1: Tax Revenue and Governance Indicators
Notes: OLS Estimates. Governance indicators are country averages of the World Bank Governance Indicators 1996-2005.
In interpreting this correlation, we can think of it as a two-way, hence an endogenous,
relationship. A positive impact of the quality of governance institutions on the
effectiveness to collect tax revenue is intuitively plausible, but the reverse causality is
imaginable as well: in the long run, consistently higher tax revenue may allow a country
to establish and maintain more effective administrative institutions. This, in turn, may
again result in higher tax revenue. The possibility of a reverse causality is also suggested
by the literature on aid dependence, which finds that in the long term, lower tax revenue
may result in a deterioration of the quality of governance institutions (cf. Bräutigam
2000). Even though this relationship is difficult to assess, especially given the lack of
comprehensive panel-data on institutional quality, since it was part of the project briefing
we will now try to examine the correlation between tax revenue and institutions, with
institutions as the dependent variable.
ALBARM
BHR
BGDBEL
BTN
BOL
BIH
BRA
BGR
BDIKHMCMR
CHL
COL
COG
CRI
CIV
HRV
CYP
CZE
DOM
EGYSLV
EST
ETHGMB
GEO
HUN
IND
IDN
IRN
JAM
KAZ
KOR
KWT
LVALSO
LTU
MDG
MYS
MLT
MUS
MDA
MNG
MAR
NPL NIC
PAK
PANPER
POL
RWA
SYCSVK
SVN
KNA
SWZ
SYR
THA
TTOTUN
UKR
ARE
VEN
-1-.
50
.51
1.5
0 10 20 30 40Tax revenue as percentage of GDP
Less Corruption
ALB
ARM
BHR
BGD
BELBTN
BOL
BIH
BRA BGR
BDI
KHM
CMR
CHL
COL
COG
CRI
CIV
HRV
CYPCZE
DOM
EGY
SLV
EST
ETHGMB
GEO
HUN
IND
IDN
IRN
JAM
KAZ
KOR
KWT
LVA
LSO
LTU
MDG
MYS
MLT
MUS
MDA
MNG
MARNPL
NIC
PAK
PAN
PER
POL
RWA
SYC
SVK
SVNKNA
SWZ
SYR
THA
TTO
TUN
UKR
ARE
VEN
-2-1
01
0 10 20 30 40Tax revenue as percentage of GDP
Accountability
ALBARM
BHR
BGD
BEL
BTN
BOL
BIH
BRA
BGR
BDI
KHMCMR
CHL
COLCOG
CRI
CIV
HRVCYP
CZE
DOM
EGY
SLV
EST
ETH
GMB
GEO
HUN
IND
IDN
IRN
JAMKAZKORKWT
LVALSO
LTU
MDGMYS
MLTMUS
MDA
MNG
MAR
NPL
NIC
PAK
PAN
PER
POL
RWA
SYCSVK
SVN
KNA
SWZ
SYR
THATTOTUN
UKR
ARE
VEN
-2-1
01
2
0 10 20 30 40Tax revenue as percentage of GDP
Stability
ALBARM
BHR
BGD
BEL
BTN
BOL
BIH
BRABGR
BDI
KHMCMR
CHL
COL
COG
CRI
CIV
HRV
CYP
CZE
DOM
EGYSLV
EST
ETH GMBGEO
HUN
INDIDNIRN JAM
KAZ
KOR
KWTLVA
LSO
LTU
MDG
MYSMLTMUS
MDA
MNGMAR
NPL NICPAK
PANPER
POL
RWASYC
SVK
SVN
KNA
SWZ
SYR
THATTO
TUN
UKR
ARE
VEN
-2-1
01
2
0 10 20 30 40Tax revenue as percentage of GDP
Effectiveness
ALBARM
BHR
BGD
BEL
BTN
BOL
BIH
BRABGR
BDI
KHMCMR
CHL
COL
COG
CRI
CIV
HRV
CYPCZE
DOMEGY
SLV
EST
ETHGMB
GEO
HUN
IND IDN
IRN
JAM
KAZ
KOR
KWT
LVA
LSO
LTU
MDG
MYSMLT
MUS
MDA
MNGMAR
NPL
NIC
PAK
PANPER
POL
RWA SYC
SVKSVN
KNASWZ
SYR
THA
TTO
TUN
UKR
ARE
VEN
-2-1
01
2
0 10 20 30 40Tax revenue as percentage of GDP
Regulation
ALB
ARM
BHR
BGD
BEL
BTN
BOL
BIH
BRABGR
BDIKHMCMR
CHL
COL
COG
CRI
CIV
HRV
CYPCZE
DOM
EGY
SLV
EST
ETHGMB
GEO
HUN
IND
IDN
IRN
JAM
KAZ
KORKWT
LVA
LSO
LTU
MDG
MYSMLTMUS
MDA
MNG MAR
NPL
NICPAK
PAN
PER
POL
RWA
SYC
SVK
SVN
KNA
SWZSYR
THA TTOTUN
UKR
ARE
VEN
-1.5
-1-.
50
.51
0 10 20 30 40Tax revenue as percentage of GDP
Rule of Law
Does Aid Decrease Tax Revenue in Developing Countries?
27
Table 8: Tax Revenue on Governance Indicators
Notes: OLS Estimates. Robust standard errors in parentheses. (***), (**), (*) denote significance at the 1, 5, and 10 percent levels, respectively. All variables are expressed as percentages of GDP, except income, which is the log of GDP per capita. Governance indicators are country averages of the World Bank Governance Indicators 1996-2005.
(1) (2) (3) (4) (5) (6)
Less Corruption Voice &
Accountability Political Stability
Government
Effectiveness
Regulatory
Quality Rule of Law
0.028 0.022 0.012 0.057** 0.048 0.031 Revenue from taxes on income and capital (0.027) (0.037) (0.033) (0.028) (0.031) (0.028)
0.005 0.081*** 0.052** 0.009 0.018 0.004 Revenue from taxes on goods and services (0.017) (0.023) (0.021) (0.018) (0.019) (0.017)
0.007 0.008 0.040** -0.021 -0.027* -0.003 Revenue from taxes on international trade (0.014) (0.019) (0.017) (0.014) (0.016) (0.014)
0.030** -0.008 0.024* 0.018 0.013 0.016 Net Aid
(0.012) (0.016) (0.014) (0.012) (0.013) (0.012)
0.480*** 0.285*** 0.523*** 0.391*** 0.377*** 0.430*** Income
(0.063) (0.086) (0.077) (0.065) (0.071) (0.065)
Observations 66 66 66 66 66 66
R-squared 0.559 0.429 0.556 0.538 0.508 0.546
F test 15.21*** 9.01*** 15.02*** 14.00*** 12.38*** 14.42***
Does Aid Decrease Tax Revenue in Developing Countries?
28
A picture of the overall correlation of tax revenue and governance indicators is given in
Figure 1. Moving beyond the aggregate correlation, we now want to identify differences
in how the three tax types are correlated with the quality of institutions. Based on the
same assumptions concerning the governance indicators as described above in section 4.2
for corruption, we compute average values for the three types of tax revenue and the six
governance indicators for each country and perform a cross-sectional regression. The
cross-sectional perspective is sufficient to provide a broad impression of the average
correlation of these two variables across the past 15 years. As control variables, we
include net aid and the log of GDP per capita as two other main potential determinants of
institutional quality.
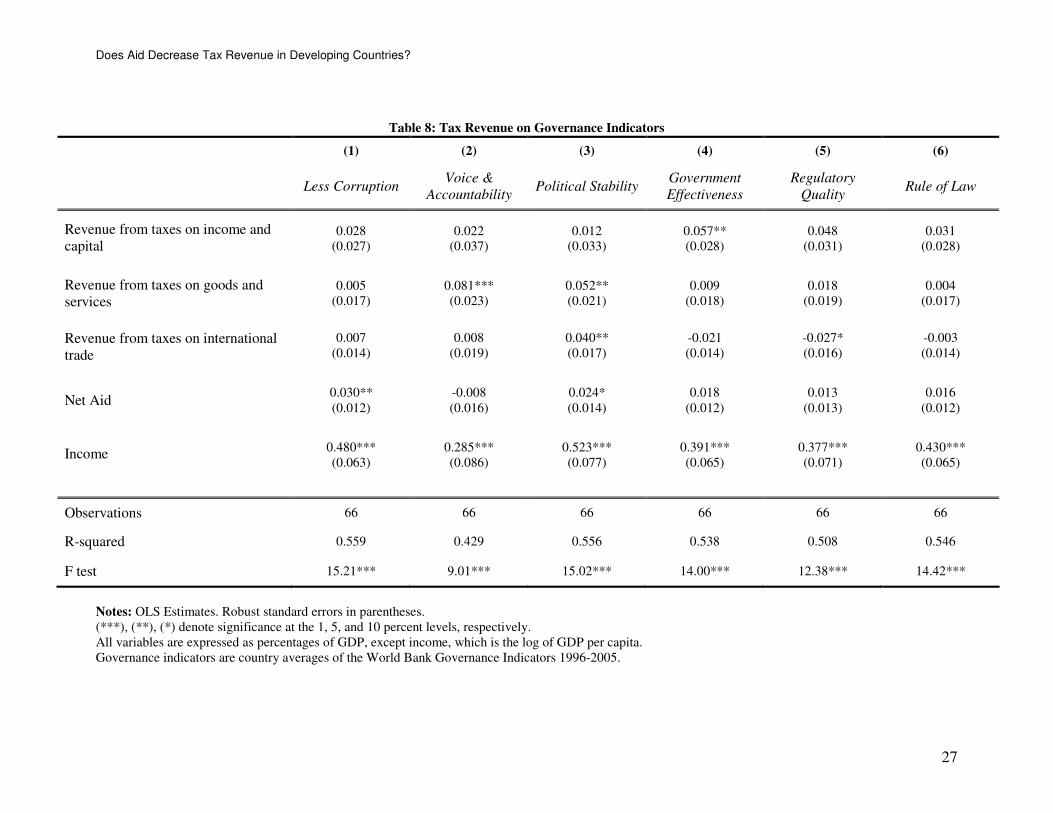
The results, shown in Table 8, indicate a heterogeneous relationship between the different
tax types and institutional capacity. The income tax coefficients are all positive and have
on average the highest positive values, with a significant coefficient in the correlation
with government effectiveness. The goods and sales tax coefficients are all positive as
well, with significant coefficients in association with accountability and political stability.
Trade taxes show a positive and significant association with political stability as well,
which is not surprising because one can assume that in instable political environments the
tax administrative capacity is weakened overall. More interesting are the negative trade
tax coefficients in association with government effectiveness, regulatory quality, and the
rule of law, of which the coefficient on government effectiveness is significant. This
suggests that countries with higher average revenue from trade taxes are systematically
weaker in several aspects of administrative effectiveness, while higher average revenue
from the other two tax types is positively correlated with it. These characteristics may
reinforce each other over time
These results are thus in line with the interpretation provided above for the potential two-
way relationship between tax revenue and institutions and the particular role of trade
taxes. However, since the data does not allow a deeper analysis of the direction of
causality, we need to be cautious in interpreting the correlations shown in Table 8. For
example, the positive and significant coefficient of taxes on goods and services in
association with the governance indicator of voice and accountability does not
necessarily imply that the increase of such taxes results in an enhanced democratic
Does Aid Decrease Tax Revenue in Developing Countries?
29
quality within a country; it could also be that the reverse effect is dominant in this
relationship (institutions influence tax revenue). We can thus cautiously conclude that the
results shown in Table 8 at least do not neglect the possibility of a two-way relationship
between tax revenue and the quality of governance institutions.
5. Conclusion and Implications: A Role for Development
Policy
The aim of this analysis was to identify whether there is a systematic relationship
between aid and tax revenue in aid recipient countries. The key result of our panel-data
regressions is that there is systematic evidence for a positive correlation between aid and
tax revenue. This result is particularly solid when we focus on aid in the form of grants,
as opposed to loans. Indeed the coefficient on grants is positive and significant across
different specifications and several robustness checks. The results are also stable to the
inclusion of an interaction between aid and corruption, which itself does not seem to be
significant. Hence, there is no evidence for a differential impact of aid on tax revenue in
more vs. less corrupt countries. Moreover, a re-estimation of Gupta et al.’s (2003)
baseline regression on their own dataset shows that the negative correlation they find for
aid and grants with revenue over the period 1970-2000 turns into a positive correlation
for the period 1990-2000. Our results might thus capture changes in development policies
since the end of the Cold War. Concerns over a general substitution effect of aid are thus
not supported by our results.
These results are indicative evidence that countries that receive more grants are also able
to collect higher revenues from taxation. This is to some extent counter intuitive, as we
would expect grants to target the poorest countries, which have the smallest tax base and
weakest tax administration systems. However, the decomposition of taxes suggests a
possible explanation. When we look at the correlation between aid and different types of
taxes we find a heterogeneous picture: grants are negatively correlated with income tax
revenue and positively correlated with revenue from taxes on goods and services and on
trade. This result points to the role of the determinants of the tax structure in aid recipient
countries: the poorest countries tend to rely more strongly on taxes on imports and
Does Aid Decrease Tax Revenue in Developing Countries?
30
exports and at the same time they attract grants. Since the level of income is controlled
for, another potential explanatory variable is the interplay between economic structure
and institutional capacity: a government can only levy taxes on sectors and activities that
are part of the formal (as opposed to subsistence) economy, and it can only collect taxes
if its administrative capacity is sufficiently effective. Therefore the positive correlation
between grants and tax revenue lends some support to the interpretation that development
aid since the 1990s, through its stronger focus on institutions, may have led to an
improvement in the tax administration and revenue collection in recipient countries.
Looking at the relationship between tax revenue and institutions more closely, we find
positive correlations of all six World Bank Governance Indicators with revenue from
taxes overall, income and capital, and goods and services, but negative correlations of
trade taxes with three of the indicators. This suggests that countries that have on average
higher trade taxes also tend to have weaker administrative institutions. These results are
consistent with the intuitive interpretation that more effective institutions will allow a
government to collect higher revenue from taxes, but they may also hint at the possibility
of a two-way relationship that in the long term, persistently higher tax revenue may have
a positive impact on the strength of administrative institutions. However, this study’s
results do not permit strong inferences on the exact causal mechanisms at play in this
relationship.
Constraints on the identification of the causal mechanisms underlying the correlations are
a limitation of our study. Addressing causality will require us to deal with endogeneity,
which primarily stems from two sources: omitted variable bias and reverse causality. Our
empirical finding that grants have a positive relationship with tax revenue is opposite to
the findings of several previous studies, however most of which are country case studies.
Therefore, it is crucial that we understand what is driving the positive association we find
between grants and tax revenue. As one way of addressing this concern we have
estimated our empirical model using country fixed effects. This procedure controls for
any country specific time invariant characteristic which has the potential to affect our
result. However, what remains to be controlled for are country specific time varying
characteristics. Hence, future research on this issue should focus more on micro analyses,
which will help to identify causality. In particular, this kind of studies could focus on
Does Aid Decrease Tax Revenue in Developing Countries?
31
detailed institutional arrangements and their evolution over time, as they have the
capacity to influence fiscal behaviour in response to foreign development assistance.
A deeper exploration of the role of taxation reforms, especially in relation with donor
policies, may also prove insightful. A cautious implication to draw from the results of this
study would be that before a tax reform can effectively be implemented, crucial
constraints on the effectiveness of tax administration need to be targeted. The easier tax
evasion is the more difficult it will be to shift the main revenue source from “easy” but
unsustainable taxes like trade taxes to more sustainable tax types like income and capital
taxes. One note of caution is in order with respect to taxes on income, capital and
corporate profits: net aid, grants and net loans all exhibit a negative association with this
type of taxes. This may indicate a partial substitution effect of aid, for example as a
favour to powerful lobby groups. Further investigation of this issue may shed more light
on this relationship.
To sum our results up, his study finds a positive overall relationship between aid,
especially grants, and tax revenue in recipient countries. Moreover, the overall picture
suggests that the role of development policy post 1990 is a possible underlying factor of
the positive association between aid and tax revenue. Therefore, both donors and
recipient countries should try to identify the pivotal set of policies that influenced the
response of domestic tax revenue to the inflow of foreign aid after 1990. The relationship
between development aid and tax revenue in recipient countries may be a long way from
being precisely identified, but in the context of the debate of scaling up aid and the
question of aid effectiveness it will be highly worthwhile to further examine it. This study
is another small step in this direction.
Does Aid Decrease Tax Revenue in Developing Countries?
32
References
Adam, Christopher S./O’Connell, Stephen A. 1998: Aid, taxation, and development:
Analytical perspectives on aid effectiveness in Sub-Saharan Africa, World Bank
Policy Research Working Paper 1885.
Bräutigam, Deborah 2000: Aid dependence and governance, Expert Group on
Development Issues (EGDI), 2000: 1.
Bräutigam, Deborah/Knack, Steven 2004: Foreign aid, institutions, and governance in
Sub-Saharan-Africa, in: Economic Development and Cultural Change, 52 (2), pp.
255-285.
Catterson, Julie/Lindahl, Claes 1999: The sustainability enigma: Aid dependency and the
phasing out of projects – the case of Swedish aid to Tanzania, Expert Group on
Development Issues (EDGI), 1999:1.
Chelliah, Raja J. 1971: Trends in taxation in developing countries, IMF Staff Papers, 18
(2), pp. 254-325.
Cordella, Tito/Ulku, Hulya 2004: Grants versus Loans, IMF Working Paper 04/161.
Crawford, Gordon 2000: Promoting democratic governance in the South, in: European
Journal of Development Research, 12 (1), pp. 23-57.
Devarajan, Shantayanan/Rajkumar, Andrew Sunil/Swaroop, Vinaya 1999: What does aid
to Africa finance?, World Bank Policy Research Working Paper 2092.
DFID 2006: White Paper: Making governance work for the poor – eliminating world
poverty.
Fagernäs, Sonja/Roberts, John 2004: Fiscal impact of aid: A survey of issues and
synthesis of country studies of Malawi, Uganda and Zambia, ESAU Working
Paper 11, Overseas Development Institute.
Franco-Rodriguez, Susana/McGillivary, Mark/Morrisey, Oliver 1998: Aid and the public
sector in Pakistan: Evidence with endogenous aid, in: World Development, 26, pp.
1241-1250.
Does Aid Decrease Tax Revenue in Developing Countries?
33
Gang, Ira N./Khan, Haider A. 1991: Foreign aid, taxes and public investment, in: Journal
of Development Economics, 34 (1), pp. 355-69.
Ghura, Dhaneshwar 1998: Tax revenue in Sub-Saharan Africa: Effects of economic
policies and corruption, IMF Working Paper No. 98/135.
Gloppen, Siri/Rakner, Lise 2002: Accountability through tax reform? Reflections from
Sub-Sahara Africa, in: IDS Bulletin, 33(3), pp. 30-40.
Gupta, Sanjeev/Clements, Benedict/Pivovarsky, Alexander/Tiongson, Erwin R. 2003:
Foreign aid and revenue response: does the composition of aid matter?, IMF
Working Paper No. 03/176.
Gupta, Sanjeev/Powell, Robert/Yang, Yongzheng 2006: Macroeconomic challenges of
scaling up aid to Africa: A checklist for practitioners, Washington, D.C.: IMF.
Heller, Peter S. 1975: A model of public fiscal behavior in developing countries: Aid,
investment, and taxation, in: American Economic Review, 65 (3), pp.429-45.
Iqbal, Zafar 1997: Foreign aid and the public sector: A model of fiscal behavior in
Pakistan, in: Pakistan Development Review, 36, pp. 115-129.
Linn, FJ/Weitzel, D. 1990: Public finance, trade and development: What have we
learned?, in: Tanzi, Vito (ed.): Fiscal policy in open developing economies,
International Monetary Fund: Washington, pp. 9-28.
Kaufmann, Daniel/Kraay, Aart/Mastruzzi, Massimo 2003: Governance Matters III:
Governance indicators for 1996- 2002, The World Bank.
Kaufmann, Daniel/Kraay, Aart/Mastruzzi, Massimo 2006: Governance Matters V:
Aggregate and individual governance indicators for 1996- 2005, The World Bank.
Kenny, Charles 2006: What is effective aid? How would donors allocate it?, World Bank
Policy Research Working Paper 4005.
Khan, Haider A./Hoshino, Eiichi 1992: Impact of foreign aid on the fiscal behavior of
LDC Governments, in: World Development, 20 (10), pp. 1481-88.
Does Aid Decrease Tax Revenue in Developing Countries?
34
McGillivray, Mark/Ahmed, Akhter 1999: Aid, adjustment and public sector fiscal
behavior in the Philippines, in: Journal of Asia-Pacific Economy, 4 (2), pp. 381-
391.
McGillivray, Mark/Morrissey, Oliver 2001: A review of evidence on the fiscal effects of
aid, CREDIT Research Paper 01/13, University of Nottingham.
McGillivray, Mark/Ouattara, Bazoumana 2003: Aid, debt burden and government fiscal
behavior in Cote d’Ivoire, in: Journal of African Economies, 14 (2), pp. 247-269.
Moore, Mick/Robinson, Mark 1994: Can foreign aid be used to promote good
government in developing countries?, in: Ethics and International Affairs, 8 (1),
pp. 141-158.
Morrissey, Oliver/Islei, Oliver/M’Amanja, Daniel 2006: Aid loans versus aid grants: Are
the effects different?, CREDIT Research Paper 06/07, University of Nottingham.
OECD 2005: Evaluation of General Budget Support, Inception Report.
OECD 2006: Harmonising donor practices for effective aid delivery, Vol. 2: Budget
support, sector wide approaches and capacity development in public financial
management, DAC Guidelines and Reference Series, Paris.
Osei, Robert/Morrissey, Oliver/Lloyd, Tim 2003: Modeling the fiscal effects of aid: An
impulse response analysis for Ghana, CREDIT Research Paper 03/10, University
of Nottingham.
Otim, Samuel, 1996: Foreign aid and government fiscal behavior in low-income South
Asian countries, in: Applied Economics, 28, pp.927-33.
Rubino, Ciara 1997: Aid, the public sector and the real exchange rate: The case studies of
Indonesia, unpublished PhD thesis, Department of Economics, University of
Warwick.
Tanzi, Vito 1992: Structural factors and tax revenue in developing countries: A decade of
evidence, in: Goldin, I./Winters, A.L. (eds.): Open economies: Structural
adjustment and agriculture, Cambridge: Cambridge University Press, pp. 267-281.
Does Aid Decrease Tax Revenue in Developing Countries?
35
Tanzi, Vito 1998: Corruption Around the World: Causes, Consequences, Scope and
Cures, IMF Working Paper 98/63.
Tanzi, Vito 2000: Taxation and economic structure, in: Perry, G./Whalley, J/McMahon,
G. (eds.): Fiscal reform and structural change in developing countries,
Basingstoke: Macmillan, pp. 215-227.
Tanzi, Vito/Zee, Howell H. 2000: Tax policy for emerging markets: Developing
countries, IMF Working Paper WP/00/35.
White, Howard 1999: Dollars, Dialogue and Development: An Evaluation of Swedish
Programme Aid, Institute of Social Studies.
World Bank 1998: Assessing aid: What works, what doesn’t, and why. Vol. 1, World
Bank Policy Research Report 18295.
Does Aid Decrease Tax Revenue in Developing Countries?
36
Appendix
a) Construction of the Dataset
This appendix describes the construction of the dataset and a few additional controls that
we have performed on our results. All data are drawn from the online data service of
ESDS International, University of Manchester.
The data on tax revenue are drawn from the IMF’s “Government Finance Statistics”, and
in particular we choose data referring to “consolidated central government”. Data are
organised according to the accounting method used by the government: whether cash or
accrual. This second method has supplanted the cash accounting system in a small group
of countries (Bolivia, Cambodia, Chile, Colombia, Czech Republic, El Salvador,
Hungary, Lithuania, and Poland) since 2000. For this group we have drawn data from
both series and constructed one complete series, after checking for its consistency.
Switching to an accrual accounting system does not seem to create a break in the series
on tax revenue. This is expected as the accrual system mainly differs from the cash
system in the way governments’ expenditures are recorded, whereas tax revenues are
measured in an almost identical way. Further checks on our estimates have included a
dummy indicating whether a country has changed its accounting system, but it did not
turn out to be significant or to affect our results.
Data on tax revenue are expressed in current local currency units. We have therefore
drawn the data on GDP from the IMF’s “International Financial Statistics” since it is also
expressed in current local currency. We have then constructed our dependent variable as
the share of tax revenues over GDP in percentage points. We have dropped countries that
had revenue figures of over 100% for consecutive years (Azerbaijan, Democratic
Republic of Congo, Romania, Turkey and Zimbabwe). We have controlled whether there
was only a problem in the GDP figures of these outliers in the IMF data base, but using
GDP data from the World Bank did not solve the problem.
Data on net aid, grants and net loans are drawn from the OECD’s “International
Development Statistics”. This dataset is composed of two datasets, according to the
classification of the recipient country as it was used up until 2004. The classification is
made according to the recipient income status. Few countries have switched from one
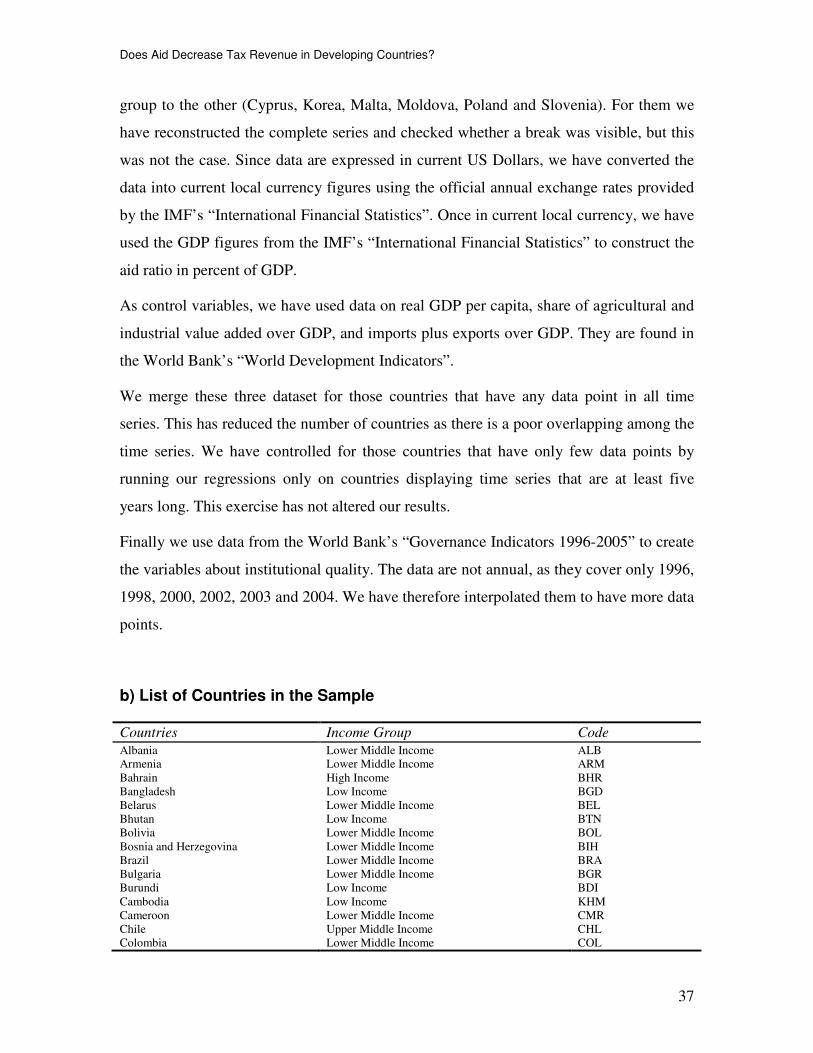
Does Aid Decrease Tax Revenue in Developing Countries?
37
group to the other (Cyprus, Korea, Malta, Moldova, Poland and Slovenia). For them we
have reconstructed the complete series and checked whether a break was visible, but this
was not the case. Since data are expressed in current US Dollars, we have converted the
data into current local currency figures using the official annual exchange rates provided
by the IMF’s “International Financial Statistics”. Once in current local currency, we have
used the GDP figures from the IMF’s “International Financial Statistics” to construct the
aid ratio in percent of GDP.
As control variables, we have used data on real GDP per capita, share of agricultural and
industrial value added over GDP, and imports plus exports over GDP. They are found in
the World Bank’s “World Development Indicators”.
We merge these three dataset for those countries that have any data point in all time
series. This has reduced the number of countries as there is a poor overlapping among the
time series. We have controlled for those countries that have only few data points by
running our regressions only on countries displaying time series that are at least five
years long. This exercise has not altered our results.
Finally we use data from the World Bank’s “Governance Indicators 1996-2005” to create
the variables about institutional quality. The data are not annual, as they cover only 1996,
1998, 2000, 2002, 2003 and 2004. We have therefore interpolated them to have more data
points.
b) List of Countries in the Sample
Countries Income Group Code
Albania Lower Middle Income ALB Armenia Lower Middle Income ARM Bahrain High Income BHR Bangladesh Low Income BGD Belarus Lower Middle Income BEL Bhutan Low Income BTN Bolivia Lower Middle Income BOL Bosnia and Herzegovina Lower Middle Income BIH Brazil Lower Middle Income BRA Bulgaria Lower Middle Income BGR Burundi Low Income BDI Cambodia Low Income KHM Cameroon Lower Middle Income CMR Chile Upper Middle Income CHL Colombia Lower Middle Income COL
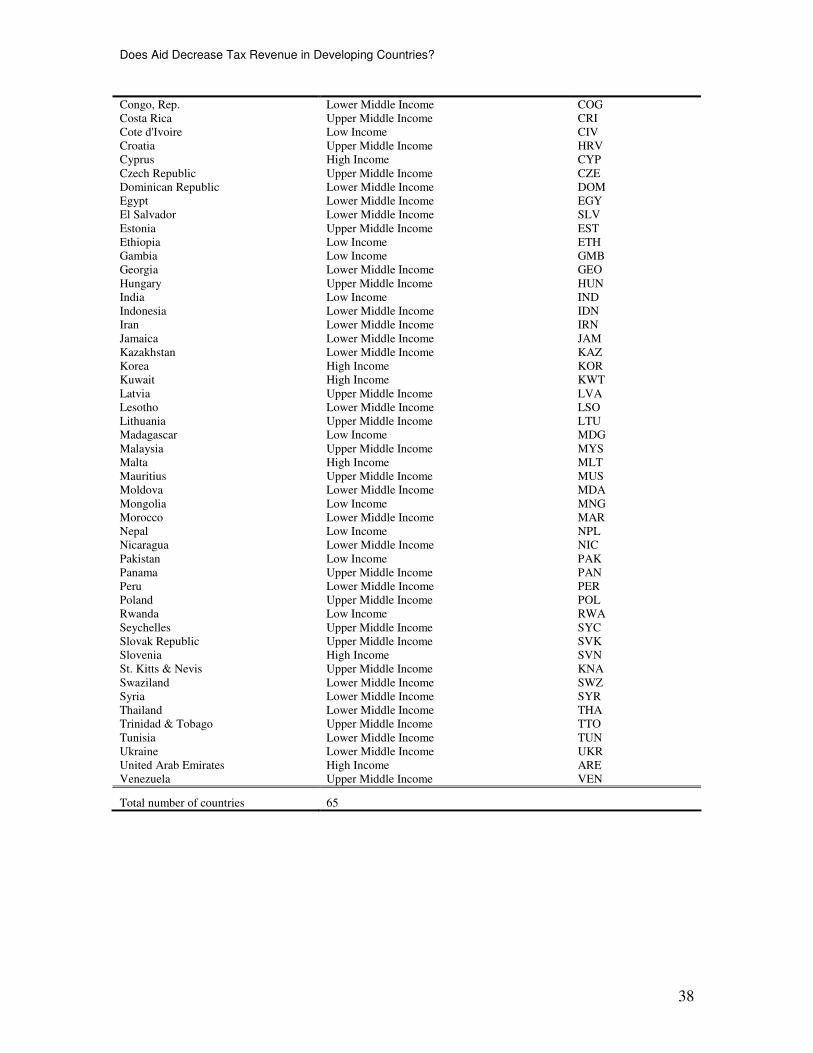
Does Aid Decrease Tax Revenue in Developing Countries?
38
Congo, Rep. Lower Middle Income COG Costa Rica Upper Middle Income CRI Cote d'Ivoire Low Income CIV Croatia Upper Middle Income HRV Cyprus High Income CYP Czech Republic Upper Middle Income CZE Dominican Republic Lower Middle Income DOM Egypt Lower Middle Income EGY El Salvador Lower Middle Income SLV Estonia Upper Middle Income EST Ethiopia Low Income ETH Gambia Low Income GMB Georgia Lower Middle Income GEO Hungary Upper Middle Income HUN India Low Income IND Indonesia Lower Middle Income IDN Iran Lower Middle Income IRN Jamaica Lower Middle Income JAM Kazakhstan Lower Middle Income KAZ Korea High Income KOR Kuwait High Income KWT Latvia Upper Middle Income LVA Lesotho Lower Middle Income LSO Lithuania Upper Middle Income LTU Madagascar Low Income MDG Malaysia Upper Middle Income MYS Malta High Income MLT Mauritius Upper Middle Income MUS Moldova Lower Middle Income MDA Mongolia Low Income MNG Morocco Lower Middle Income MAR Nepal Low Income NPL Nicaragua Lower Middle Income NIC Pakistan Low Income PAK Panama Upper Middle Income PAN Peru Lower Middle Income PER Poland Upper Middle Income POL Rwanda Low Income RWA Seychelles Upper Middle Income SYC Slovak Republic Upper Middle Income SVK Slovenia High Income SVN St. Kitts & Nevis Upper Middle Income KNA Swaziland Lower Middle Income SWZ Syria Lower Middle Income SYR Thailand Lower Middle Income THA Trinidad & Tobago Upper Middle Income TTO Tunisia Lower Middle Income TUN Ukraine Lower Middle Income UKR United Arab Emirates High Income ARE Venezuela Upper Middle Income VEN
Total number of countries 65


