Embed Size (px)
Citation preview
Does Ownership Structure Affect Corporations’ Responses to Lower Dividend Tax Rates? An Analysis of Public and Private Banks
C. Bryan Cloyd Virginia Tech
(540) 231-3181 [email protected]
John R. Robinson The University of Texas at Austin
(512) 471-5315 [email protected]
and
Connie D. Weaver
The University of Texas at Austin (512) 471-5318
May 25, 2005
_______________ Robinson and Weaver gratefully acknowledge the support of the Red McCombs School of Business. Weaver also appreciates support from the Deloitte & Touche Centennial Faculty Fellowship. The authors also appreciate the constructive comments of Gary Twite and finance workshop participants at the University of Texas at Austin and ATAX/University of New South Wales.
Does Ownership Structure Affect Corporations’ Responses to Lower Dividend Tax Rates? An Analysis of Public and Private Banks
ABSTRACT
The Jobs and Growth Tax Relief Reconciliation Act of 2003 (JGTRRA) significantly
reduces the maximum tax rate imposed on dividend income received in 2003 through
2008 by individual shareholders. Using data from call reports filed with the Federal
Reserve Board, we investigate whether federally regulated bank holding companies
(BHCs) increased dividend distributions after JGTRRA. By focusing on BHCs, we are
able to compare the responses to this important but temporary change in tax policy across
publicly-traded and privately-held corporations, while controlling for industry-related
factors. Examining private firms’ dividend payouts and reactions to JGTRRA allows us to
estimate the effect of differential taxation on dividend policy in a setting that is relatively
free of the information asymmetry and agency problems that may dominate the payout
decisions of public firms. We find that dividend yield (i.e. dividend distributions deflated
by assets) increased after the reduction of the dividend tax rate for both private and public
BHCs. However, private BHCs increased dividend payouts to a greater extent than most
public BHCs. Our findings have implications for tax policy and for understanding
differences between public and private firms.
Keywords: Dividend policy; Dividend taxes; Closely-held corporations, and Bank
holding companies.
Data Availability: Data are available from public sources identified in the paper.
Does Ownership Structure Affect Corporations’ Responses to Lower Dividend Tax Rates? An Analysis of Public and Private Banks
I. INTRODUCTION
The relation between dividend policy and taxation has puzzled financial economists for
decades (Stiglitz 1973; Black 1976). For much of the history of income taxation in the U.S.,
individuals have faced higher tax rates on dividend income than on long-term capital gains.
Hence, a policy of making dividend distributions to individual shareholders is sub-optimal
compared to a policy of repurchasing shares or reinvesting profits. Yet, despite the tax
disadvantages of paying dividends, many firms make regular dividend distributions in the
apparent belief that retail investors prefer dividend paying stocks (Brav et al. 2004). We
investigate the relation between dividend policy and taxation by comparing changes in dividend
payouts for a sample of public (publicly-traded) firms to those for a sample of private (privately-
held) corporations around the 2003 reduction in dividend taxes. Private firms have stronger tax
incentives to avoid dividends because their shareholders are more likely to be individuals.
Moreover, private firms have fewer non-tax reasons to pay dividends (e.g. agency costs) because
their shareholders are likely to be more directly involved in managing the firm. A comparison of
the dividend response for private versus public firms around a reduction in dividend taxes
provides a unique opportunity to test the extent to which (1) individual taxation discourages
corporations from paying dividends and (2) dividend policy is influenced by nontax
considerations.
A battered stock market set the stage for proposals to reduce dividend taxation, beginning
with President George W. Bush’s economic summit in August 2002 (Esenwein and Gravelle
2003). In late May 2003, Congress passed and President Bush signed the Jobs and Growth Tax
Page 1
Relief Reconciliation Act of 2003 (JGTRRA), which significantly lowered the maximum
individual tax rate on dividend income (from 38.1 percent) and equalized it with the maximum
tax rate on capital gains at 15 percent.1 Among the rationales offered in support of dividend tax
relief were that it would (1) reduce the cost of capital for publicly-traded firms, leading to
“economic growth and the creation of jobs” (H.R. Rep. No. 108-94, ¶10,110), (2) increase the
value of the stock market by increasing the after-tax return on equity, and (3) mitigate corporate
governance problems by encouraging firms to pay out more dividends.2 It is noteworthy that all
of these objectives are particular to publicly-traded firms.3
Several concurrent studies investigate the effect of JGTRRA’s dividend tax rate cut on
dividend initiations and payouts by publicly-traded firms. Using a sample of non-utility, non-
financial firms traded on the three major stock exchanges, Chetty and Saez (2004) find that the
probabilities of dividend initiations and dividend increases during the first four quarters
following the tax cut (through 2004 Q2) are greater for firms with low-growth forecasts and for
firms whose major shareholders and/or managers also had incentives to increase dividends.
Using a sample of publicly-traded firms that declared dividends during the first six months
following passage of JGTRRA, Blouin, Ready and Shackelford (2004) find that quarterly
dividends per share increased after the tax rate cut. Although they do not find a significant
1 This legislation (P.L. 108-27) decoupled the tax rate for dividends from that on other ordinary income, such as interest and wages, by reducing the tax rate for dividends paid by a domestic or qualified foreign corporation to individuals. The maximum 15 percent rate is temporary, applying to qualified dividends received in 2003 through 2008. For lower-income individuals, a five-percent rate applies to dividend income through 2007, and in 2008 dividend income is tax-free. The Joint Committee on Taxation estimates that this legislation will increase the federal deficit by $350 billion over a ten year period. 2 Paraphrasing a report by Prudential Securities economist Ed Yardeni, Bartlett (2002) argues that, because “dividends are a better indicator of profitability than easily-manipulated earnings statements,” reducing dividend taxation would solve “a lot of corporate-governance problems” by increasing dividend payments. 3 Growth and job creation by non-publicly-held ventures should be relatively unconstrained by dividend taxation as such businesses can organize as limited liability companies or S corporations.
Page 2

relation between responses to the tax cut and the extent to which shares are owned by individual
investors, they do find some evidence that dividend increases were greater for firms with high
levels of insider ownership (i.e. shares owned by officers and directors). Similarly, Brown, Liang
and Weisbenner (2005) find that the probability of a dividend increase by publicly-traded firms
following enactment of JGTRRA is increasing in direct stock ownership by firms’ top five
executives, and decreasing in the number of stock options held by these individuals.4
Collectively, these studies suggest that public firms’ responses to the dividend tax cut depend on
the extent to which their top managers’ economic interests are aligned with those of
shareholders. On the other hand, Julio and Ikenberry (2004) suggest that the upward trend in
dividend payouts by public firms began at least two years before the tax cut and may have been
driven by changing economic conditions and a desire to restore investor confidence in the
aftermath of corporate accounting scandals.5
We contribute to this literature by comparing the pre- and post-JGTRRA dividend payouts
of publicly-traded versus privately-held corporations. To facilitate this comparison, we use data
from call reports filed with the Federal Reserve Board to construct a six and three-quarter year
panel of quarterly observations, from 1998 Q1 to 2004 Q3, for 333 publicly-traded and 220
privately-held bank holding companies (BHCs).6 Our research design holds industry effects
constant and takes advantage of several important differences between publicly-traded and
privately-held BHCs. First, ownership of privately-held BHCs is more likely to be concentrated 4 Because dividends do not accrue to option holders and they reduce the retained value of firm assets, managers who hold stock options have a disincentive to pay dividends (Lambert, Lanen and Larcker 1989). 5 Blouin et al. acknowledge that they cannot rule out the possibility that dividend increases reflect improving economic conditions, which occurred during the same period as the tax cut, or a shift in investor focus toward valuing firms based on dividends rather than earnings. 6 The Federal Reserve Board requires both private and public bank holding companies to report financial data and distribution information each calendar quarter, which provides comparable data across firm ownership type while holding industry constant.
Page 3
among high-tax rate individuals who share tax incentives to avoid dividend payouts prior to
JGTRRA. Second, because owners of privately-held BHCs are more likely to be involved in
managing the firm, non-tax explanations for paying dividends despite their tax disadvantages
(e.g. signaling and limited overinvestment by managers) are less applicable to these firms. In
sum, privately-held BHCs have more tax reasons to retain earnings and few non-tax reasons to
distribute earnings than their publicly-traded counterparts. Third, private BHCs are less able to
use tax-advantaged share repurchases because of tax rules that treat share redemptions as
dividends unless the transaction causes a significant reduction in the shareholder’s proportionate
interest in the firm. If maintaining control within a relatively small group of shareholders is
important or if shares of privately-held BHCs lack a ready market, then shareholders of these
firms are likely to have pent-up demand for liquidity that might be unleashed by a temporary cut
in the dividend tax rate. Consequently, relative to publicly-traded BHCs, we expect privately-
held BHCs to have lower dividend payouts before JGTRRA and to increase dividend payouts to a
greater extent as a result of JGTRRA. Moreover, any differential effect of JGTRRA across these
two groups could not be attributed to changing economic conditions, which are held constant
across groups. Nor could a greater response to JGTRRA by private firms be attributed to market-
driven increases in investors’ preferences for dividends because such market preferences are
irrelevant to privately-held firms.
Our initial analysis reveals that the magnitude and frequency of dividends over our
sample period is seasonal across calendar quarters and generally increasing across years for both
public and private firms. To control for these trends as well as financial and regulatory
considerations, we estimate random effects regressions of annual dividend yield on tax regime
(an indicator variable identifying periods after the structural shift in tax rates enacted in
Page 4
JGTRRA) and firm-level financial characteristics (e.g., profitability, liquidity, capital adequacy,
and maturity).7 Our regression results indicate that both private and public BHCs significantly
increased dividend distributions after the enactment of JGTRRA. We estimate that the average
private BHC in our sample increased dividends by roughly $680,000 during the first four
quarters following enactment (i.e. 2003 Q3 through 2004 Q2). Additionally, the average public
BHC in our sample increased dividends by $3.8 million. However, the increase in the public
BHC dividends is dominated by the 45 largest public BHCs with assets greater than $10 billion.
Excluding these 45 largest BHCs, “small” public BHCs increased dividend distributions by
approximately $577,000 during the first four quarters following enactment of JGTRRA. These
estimates suggest that from a policy perspective, the dividend tax cut has thus far benefited
shareholders of private BHCs more than those of all but the largest publicly-traded BHCs.
Additionally, in quarter-by-quarter analyses we find that public and private BHCs
significantly increased dividend distributions in the quarter immediately after the enactment of
JGTRRA. We estimate that the average private (small public) BHC in our sample immediately
increased dividends by $203,300 ($73,500) in the quarter following the dividend tax cut (i.e.
2003 Q3). Public (both large and small) BHCs delayed further increases until the 2004 Q1;
whereas private BHCs show significant increases in each quarter until the 2004 Q2. These results
are consistent with our expectation that private BHCs exhibit higher tax sensitivity and respond
more readily to their shareholders’ personal tax incentives.
The remainder of this study is organized as follows. The next section summarizes the
related literature and develops the hypotheses. The third section presents the research method
7 Because our sample includes private BHCs that are not publicly-traded, we calculate dividend yield by deflating distributions by gross assets.
Page 5
including a description of the sample. The fourth and fifth sections report our results and
supplemental analyses, respectively. The final section concludes.
II. PRIOR LITERATURE AND HYPOTHESES DEVELOPMENT
A substantial body of prior research seeks to identify factors that explain cross-sectional
differences in firms’ dividend policies. Allen and Michaely (2003) provide an extensive review
of this literature, concluding that the accumulated evidence, based on data from publicly-traded
firms, suggests that both dividends and repurchases are paid to reduce potential overinvestment
by managers. DeAngelo, DeAngelo, and Stulz (2004) draw a similar conclusion based on their
finding that the likelihood of paying dividends is positively related to the ratio of earned equity
to total assets. Others argue that managers use dividends to convey private information about
firm value to the market (Kalay and Loewenstein 1986; Michaely, Thaler and Womack 1995;
Ofer and Siegel 1987; Nissim and Ziv 2001). Fama and French (2001) examine an extended time
period (1926-1999) to identify the characteristics of dividend payers. They find that the
likelihood of dividend distributions for industrial firms is related to size, profitability, and
growth.
DeAngelo and DeAngelo (2004) argue that firm value requires a genuine prospect of
substantial payouts because rational investors will not pay more for shares than the expected net
present value of future distributions.8 However, if dividends are taxed more harshly than long-
8 DeAngelo and DeAngelo’s (2004) primary purpose is to correct misinterpretations of Miller and Modigliani’s (1961) dividend irrelevance theorem. Miller and Modigliani (1961) analytically demonstrate that, in a perfect capital market with no tax rate differential between dividends and capital gains, and with fixed investment, financing, and operating policies, a firm’s dividend policy is irrelevant to firm value. The assumptions of this model are, however, very restrictive. For example, DeAngelo and DeAngelo point out that, by holding investment policy constant, the firm’s choice set is restricted to dividend policies that pay out 100 percent or more of free cash flow in every period, where distributions in excess of free cash flow are financed by fairly priced sales of additional stock. Furthermore, they show that, if the firm reinvests free cash flow on a value-neutral basis, indifference holds only if the present value of expected distributions is equal to that of the full stream of free cash flows.
Page 6
term capital gains, then tax sensitive investors will not be indifferent to the form of payout.
Consequently, much of the payout research focuses on the effect of individual taxes on corporate
dividend policy, in large part because of the belief that the high tax cost of dividends relative to
capital gains serves as an impediment to distributing earnings via dividends versus alternative
payout mechanisms. For example, publicly-traded corporations can reduce shareholder taxes on
distributions by substituting stock repurchases for dividends.9 Repurchases generally result in
lower-taxed capital gains and allow investors to control the timing of income recognition.
Although Feldstein and Green (1983) argue that this form of tax avoidance is limited, the extent
to which taxes motivate corporations to substitute share repurchases for dividend distributions
remains an open question.
An alternative to analyzing the influence of taxes by comparing dividends and share
repurchases is to examine the effect of changes in the relative tax rates between dividends and
capital gains. Evidence of a change in dividend distributions associated with change in the
relative level of taxes on dividends would suggest the importance of tax considerations on
dividend policy for several reasons. First, managers should be reluctant to modify dividend
distributions in response to a tax rate change because dividends impose immediate taxes on all
individual shareholders whereas capital gains taxes are only imposed on shareholders who sell
shares. Second, a shift in dividend policy is likely to be viewed by investors as a permanent
commitment to making distributions. Hence, an increase in distributions in response to a
(presumably) temporary reduction in taxes might be mistaken by investors as a permanent shift
in dividend policy. Finally, taxes would seem to be secondary to financial considerations, such as
liquidity and profitability, as well as regulatory concerns. 9 Grullon and Michaely (2002) examine the substitutability of repurchases and dividends and find that dividend-paying firms use repurchases as a substitute but that the rate of substitution is less than one.
Page 7
Several concurrent studies (Blouin, Ready, and Shackelford 2004; Chetty and Saez 2004;
Julio and Ikenberry 2004; and Brown, Liang and Weisbenner 2005) use this approach to
investigate the extent to which publicly-held corporations increased dividend distributions after
JGTRRA. Taken as a group, the results of these studies suggest that publicly-traded firms
responded to the dividend tax cut by initiating or increasing dividends, although Julio and
Ikenberry (2004) report that dividend distributions for industrial firms were trending upward well
before the dividend tax cut in 2003. These studies also suggest that cross-sectional variation in
firms’ responses to the dividend tax cut is at least partially explained by their economic
consequences to top executives. Brav et al.’s (2004) survey of financial executives indicates that
payout decisions typically originate with the CFO or Treasurer, and are approved by the CEO
before being considered by the Board of Directors. Hence, it is not surprising that managers’
personal outcomes affect payout decisions.
We conjecture that, ceteris paribus, dividend taxes operate analogous to transaction costs,
thereby reducing the number and magnitude of distributions during periods of high dividend tax
rates. If our expectations hold, we anticipate that the likelihood and amount of dividend
distributions will increase after the tax rate reduction enacted in JGTRRA. We expect that nontax
factors (e.g., reductions in liquidity, profitability, or capital) may preclude dividend distributions
for certain BHCs. Hence, we employ a multivariate regression to control for these nontax
considerations.
In addition, we expect that the dividend tax effect will be greater for privately-held BHCs
than for BHCs whose stock is publicly-traded on stock exchanges. First, information asymmetry
between managers and stockholders and agency problems are likely to be smaller for private
BHCs than for public BHCs (Beatty and Harris 1999; Niswander and Swanson 2000; Brav,
Page 8
Graham, Harvey and Michaely 2004). Our public versus private comparison is analogous to the
comparison of public firms across countries with differing levels of legal protection for minority
shareholders. La Porta, Lopez-de-Silanes and Shleifer (1999) find that firms organized in
countries with poor legal protection of shareholder rights tend to have controlling shareholders
who either manage the firms directly, or are well positioned to monitor hired managers. In
contrast, firms in countries with good shareholder protection (e.g. the United States) tend to have
widely dispersed ownership and professional management. In a subsequent study, La Porta,
Lopez-de-Silanes, Shleifer and Vishny (2000) find that dividend policy is related to cross-
country differences in shareholder protection. Firms organized in countries with poor shareholder
protection distribute less, presumably because there is little information asymmetry between
controlling shareholders and management. In contrast, firms organized in countries with good
shareholder protection tend to distribute more as dividends, consistent with shareholders using
their legal rights to limit professional managers.
Second, shareholders of private BHCs are more likely to be individuals, who are directly
affected by the decrease in the dividend tax rate. Because managers of private BHCs are likely to
be shareholders, we expect their dividend payout decisions to be much more aligned with
shareholders’ personal tax incentives (Ke 2001). Therefore, we predict shareholder dividend tax
status to have a larger influence on the payout decision of private BHCs.10
We extend the investigation of the effect of dividend taxation by examining whether
dividend distributions increased after the enactment of JGTRRA for a large sample of BHCs that
includes both public and private firms. In general, prior research has excluded financial
10 It is possible that dividend distributions will not increase after the tax rate reduction. Owners of privately-held BHCs likely have alternative mechanisms for receiving their returns (e.g., deductible salaries). Compared with these alternative mechanisms, dividends may still prove to be a prohibitively costly way to distribute returns even after JGTRRA thereby precluding any detectable increase in dividend distributions.
Page 9
institutions from study. However, BHCs represent a large dividend-paying sector of the economy
and, to the extent that we find BHCs responding to a change in the dividend tax rate in light of
potentially severe regulatory restrictions on distributions, our setting provides a strong test of the
effect of dividend taxation. Moreover, by examining privately-held firms, we are able to estimate
the tax effect for payout decisions that are more likely to reflect the incentives to owners rather
than managers.
III. RESEARCH METHOD
We investigate the dividend tax effect by first examining the trend of quarterly BHC
dividend distributions from 1998 Q1 through the 2004 Q3 for sample firms classified by
ownership structure (private and public BHCs). In order to control for size and because our
sample consists of both public and private firms, we estimate dividend yield by deflating
dividends by total assets. We then develop a regression model to test the association between
dividend yield and the structural shift in dividend tax rates enacted in JGTRRA while controlling
for financial and regulatory considerations as well as time and firm fixed effects.
Sample Selection
We construct our sample by identifying all BHCs filing call reports with the Federal
Reserve Board in 2003 Q3. We limit sample BHCs to firms that were not subsidiaries or
Subchapter S electing corporations. We further restrict our sample to those BHCs that filed call
reports for each of 27 consecutive quarters beginning with 1998 Q1 and ending with 2004 Q3.
We also eliminate BHCs that could not be clearly identified as either privately-held or publicly-
Page 10
traded.11 Finally, we eliminate firms without valid observations for dividends or firm financial
attributes (i.e., assets, liquidity, income, retained earnings, risk-adjusted capital, and growth rate)
used in our regression analyses. This procedure results in a sample consisting of 533 BHCs. Our
final sample is a panel of 220 private BHCs and 333 public BHCs with complete regression data
for each quarter from 1998 Q1 through 2004 Q3.12
Descriptive Statistics and Univariate Results
Table 1 provides descriptive statistics for the sample BHCs partitioned by ownership
status. Variables are measured on an annual basis and averaged across calendar years within
ownership group. Public BHCs are larger (total assets), faster growing (growth in assets), and
more profitable (income and return on assets) than their private counterparts.13 In contrast,
private BHCs are more liquid (liquidity ratio)14 and better capitalized (measured by either the
retained earnings to assets ratio, RE/TA, or the tier 1 risk ratio) 15 than public BHCs. To control
for variations in size, we measure relative distributions (dividend yield) as the amount of
dividends deflated by various measures of size including total assets (DIV/TA), income 11 Initially, we classify sample BHCs as private or publicly traded according to the public ownership field obtained from SNL datasource. SNL classifies public firms in two categories, Major Exchange and Other Public. Major Exchange firms are those trading on the NYSE, AMEX or NASDAQ, whereas Other Public firms include any firm for which SNL can obtain a CUSIP. We include firms as public if we can identify both a ticker symbol and a CUSIP number. Private firms are those without CUSIP numbers or ticker symbols. 12 As we add new quarters of data to the sample, we lose firms from the panel that lack data for those quarters. For example, 13 private (one public) firms were dropped due to missing data in 2004 Q3. 13 Tests were conducted using both parametric (t tests) and nonparametric (Wilcoxon tests) statistics (p < 0.05, two-tailed). 14 The liquidity ratio is liquid assets divided by total liabilities at the end of the period. Liquid assets are defined as the sum of cash and balances due, securities, federal funds sold, and trading account assets less pledged securities. 15 The tier 1 risk ratio is the core capital (tier 1 capital) divided by risk-weighted assets. Core capital is total equity less net unrealized gains and unrealized losses less accumulated net gains (losses) on cash flow hedges less nonqualifying perpetual preferred stock and qualifying minority interests in consolidated subsidiaries less disallowed goodwill and other intangible assets and other miscellaneous adjustments. Risk- weighted assets are defined per the regulatory capital requirements, which classifies assets into four risk categories (e.g., category 1 includes cash and equivalents; category 4 includes commercial and consumer loans) and assigns a risk weight to each category (e.g., category 1 assets are assigned a weight of zero; category 4 assets are 100 percent risk-weighted). In general, the tier 1 capital should equal or exceed 4 percent of risk-weighted assets.
Page 11
(DIV/INC), and tier 1 capital (DIV/T1C). When averaged across the six full calendar years in our
sample, public BHCs pay higher dividends and have a higher dividend yield (regardless of yield
measure) than private BHCs.
------------------------- Insert Table 1 here
-------------------------
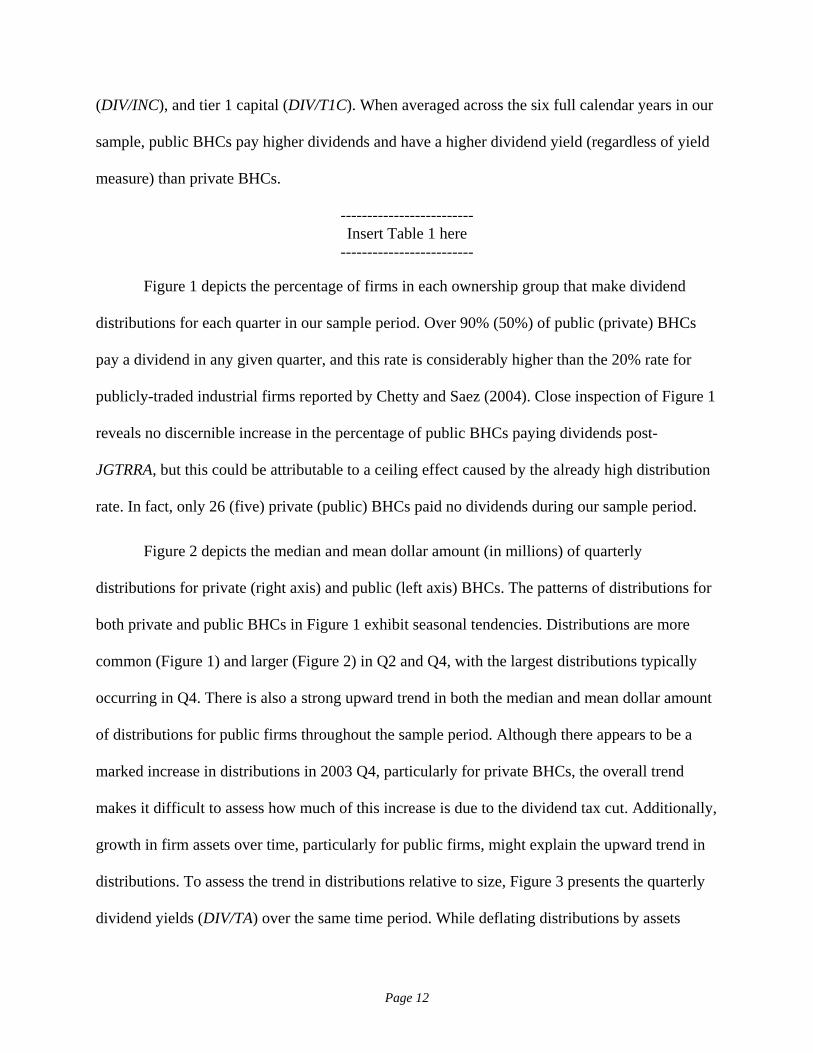
Figure 1 depicts the percentage of firms in each ownership group that make dividend
distributions for each quarter in our sample period. Over 90% (50%) of public (private) BHCs
pay a dividend in any given quarter, and this rate is considerably higher than the 20% rate for
publicly-traded industrial firms reported by Chetty and Saez (2004). Close inspection of Figure 1
reveals no discernible increase in the percentage of public BHCs paying dividends post-
JGTRRA, but this could be attributable to a ceiling effect caused by the already high distribution
rate. In fact, only 26 (five) private (public) BHCs paid no dividends during our sample period.
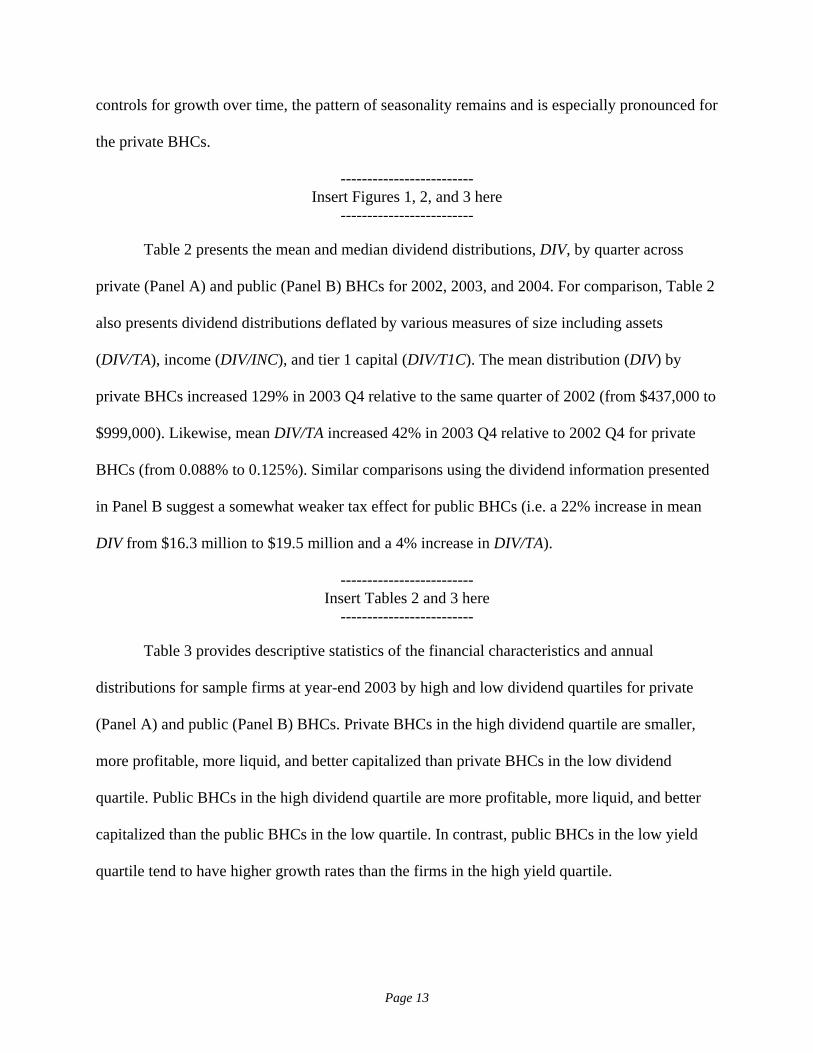
Figure 2 depicts the median and mean dollar amount (in millions) of quarterly
distributions for private (right axis) and public (left axis) BHCs. The patterns of distributions for
both private and public BHCs in Figure 1 exhibit seasonal tendencies. Distributions are more
common (Figure 1) and larger (Figure 2) in Q2 and Q4, with the largest distributions typically
occurring in Q4. There is also a strong upward trend in both the median and mean dollar amount
of distributions for public firms throughout the sample period. Although there appears to be a
marked increase in distributions in 2003 Q4, particularly for private BHCs, the overall trend
makes it difficult to assess how much of this increase is due to the dividend tax cut. Additionally,
growth in firm assets over time, particularly for public firms, might explain the upward trend in
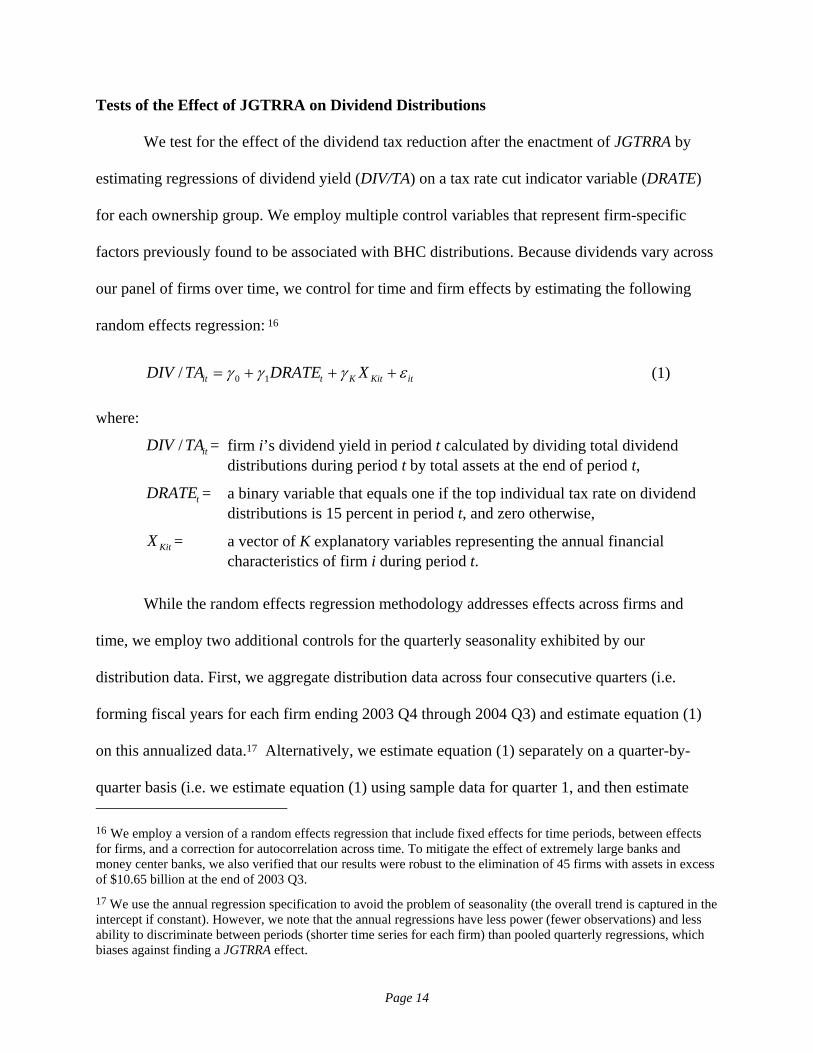
distributions. To assess the trend in distributions relative to size, Figure 3 presents the quarterly
dividend yields (DIV/TA) over the same time period. While deflating distributions by assets
Page 12
controls for growth over time, the pattern of seasonality remains and is especially pronounced for
the private BHCs.
------------------------- Insert Figures 1, 2, and 3 here
-------------------------
Table 2 presents the mean and median dividend distributions, DIV, by quarter across
private (Panel A) and public (Panel B) BHCs for 2002, 2003, and 2004. For comparison, Table 2
also presents dividend distributions deflated by various measures of size including assets
(DIV/TA), income (DIV/INC), and tier 1 capital (DIV/T1C). The mean distribution (DIV) by
private BHCs increased 129% in 2003 Q4 relative to the same quarter of 2002 (from $437,000 to
$999,000). Likewise, mean DIV/TA increased 42% in 2003 Q4 relative to 2002 Q4 for private
BHCs (from 0.088% to 0.125%). Similar comparisons using the dividend information presented
in Panel B suggest a somewhat weaker tax effect for public BHCs (i.e. a 22% increase in mean
DIV from $16.3 million to $19.5 million and a 4% increase in DIV/TA).
------------------------- Insert Tables 2 and 3 here
-------------------------
Table 3 provides descriptive statistics of the financial characteristics and annual
distributions for sample firms at year-end 2003 by high and low dividend quartiles for private
(Panel A) and public (Panel B) BHCs. Private BHCs in the high dividend quartile are smaller,
more profitable, more liquid, and better capitalized than private BHCs in the low dividend
quartile. Public BHCs in the high dividend quartile are more profitable, more liquid, and better
capitalized than the public BHCs in the low quartile. In contrast, public BHCs in the low yield
quartile tend to have higher growth rates than the firms in the high yield quartile.
Page 13
Tests of the Effect of JGTRRA on Dividend Distributions
We test for the effect of the dividend tax reduction after the enactment of JGTRRA by
estimating regressions of dividend yield (DIV/TA) on a tax rate cut indicator variable (DRATE)
for each ownership group. We employ multiple control variables that represent firm-specific
factors previously found to be associated with BHC distributions. Because dividends vary across
our panel of firms over time, we control for time and firm effects by estimating the following
random effects regression: 16
itKitKtit XDRATETADIV εγγγ +++= 10/ (1)
where:
itTADIV / = firm i’s dividend yield in period t calculated by dividing total dividend distributions during period t by total assets at the end of period t,
tDRATE = a binary variable that equals one if the top individual tax rate on dividend distributions is 15 percent in period t, and zero otherwise,
KitX = a vector of K explanatory variables representing the annual financial characteristics of firm i during period t.
While the random effects regression methodology addresses effects across firms and
time, we employ two additional controls for the quarterly seasonality exhibited by our
distribution data. First, we aggregate distribution data across four consecutive quarters (i.e.
forming fiscal years for each firm ending 2003 Q4 through 2004 Q3) and estimate equation (1)
on this annualized data.17 Alternatively, we estimate equation (1) separately on a quarter-by-
quarter basis (i.e. we estimate equation (1) using sample data for quarter 1, and then estimate 16 We employ a version of a random effects regression that include fixed effects for time periods, between effects for firms, and a correction for autocorrelation across time. To mitigate the effect of extremely large banks and money center banks, we also verified that our results were robust to the elimination of 45 firms with assets in excess of $10.65 billion at the end of 2003 Q3. 17 We use the annual regression specification to avoid the problem of seasonality (the overall trend is captured in the intercept if constant). However, we note that the annual regressions have less power (fewer observations) and less ability to discriminate between periods (shorter time series for each firm) than pooled quarterly regressions, which biases against finding a JGTRRA effect.
Page 14
equation (1) using sample data for quarter 2, and so forth). To allow for the possibility that
estimated coefficients on the various explanatory variables might differ by ownership structure,
we perform all these regressions separately within each ownership group.
Consistent with the prior literature, we include variables to control for profitability,
liquidity, and regulatory constraints based on minimum capital requirements. In his classic paper
examining dividend policy, Lintner (1956) finds a positive relation between dividend payments
and firm profitability.18 Specifically, we control for firm profitability by including ROA
measured as income for the period divided by total assets at the end of the period.19 Our liquidity
measure, LIQ, is the ratio of liquid assets to total liabilities at the end of the period. BHCs are
subject to regulatory capital requirements not imposed on industrial firms. Therefore, to control
for risk and capital adequacy, we include the Tier 1 risk-adjusted capital ratio, T1 Ratio. Finally,
following DeAngelo, DeAngelo, and Stulz (2004), we include the ratio of retained earnings to
total assets, RE/TA, to control for public firms’ incentive to pay dividends to mitigate agency
problems that might become more severe as profits accumulate.
IV. REGRESSION RESULTS
Table 4 reports the results of estimating equation (1) regressions on an annualized basis.
Each analysis includes six annual observations for each firm, five pre-JGTRRA years (1998
through 2002) and one post-JGTRRA year (2003). In column (1), the annual period is a calendar
year (Q4 is the year-end) and 2003 is treated as a post-JGTRRA year because we lack 18 Subsequent studies reevaluated the Lintner (1956) model and find the positive relation between profitability and dividends to be robust (Fama and Babiak 1968; Bernartzi, Michaely, and Thaler 1997; Brav, Graham, Harvey and Michaely 2004). 19 In annual regressions, ROA is measured by summing income for four consecutive quarters within period t and dividing by total assets at the end of period t. In quarterly regressions, ROA is income for that quarter divided by total assets at the end of the same quarter.
Page 15
observations for Q4 2004. In columns (2) through (4), the annual periods are hypothetical fiscal
years ending in Q1, Q2 and Q3, respectively. For example, in the column (3) analysis, the post-
JGTRRA period is a Q2 fiscal year running from 2003 Q3 to 2004 Q2.20
------------------------- Insert Table 4 here
-------------------------
Panel A (Panel B) of Table 4 presents the results of estimating equation (1) on an annual
basis for private (public) BHCs. The estimated coefficient for DRATE is significantly positive
across all the annual models for private firms and in three of the four fiscal year models for
public firms. Because the calendar year model treats 2003 as a post-JGTRRA period, we expect
the weakest results for DRATE in column (1), particularly for public firms. We find that only the
private firm DRATE results for the quarter 3 fiscal year model are weaker than those of the
calendar year.
The control variables included in the regressions are largely consistent with expectations.
Profitability (ROA) exerts a powerful positive influence on distributions for all ownership
structures; whereas, liquidity (LIQ) is not statistically significant in a consistent manner for either
private or public BHCs. In contrast, Growth is significantly negative for both public and private
firms, which is consistent with growing firms re-investing free cash flow rather than paying
dividends. Finally, our results are consistent with the maturity/agency conjecture of DeAngelo,
20 Although JGTRRA was approved by the House by a comfortable margin, approval by the Senate on May 23, 2003 required the tie-breaking vote of Vice President Cheney (51-50). Therefore, ultimate approval by President Bush was assured. The dividend tax provision of JGTRRA was effective retroactively for taxable years beginning after December 31, 2002. However, because the legislation passed the Senate by such a narrow margin, firms were unlikely to change their dividend policy until after May 23, 2003. Therefore, we use the second calendar quarter to define the pre- and post-enactment periods for purposes of our tests. For our third quarter model (column (4)), we use only the third quarter of 2004 as a post-enactment period in the table 4 results. To the extent that firms increased dividends in response to the tax rate reduction in the third quarter of 2003, our classification biases against finding an increase in dividend distributions. We report the results including the first through third quarters of 2003 as qualifying for the dividend tax reduction in sensitivity tests later in the paper.
Page 16
DeAngelo, and Stulz (2004) in that higher retained earnings (RE/TA) is positively associated
with dividend yield for public BHCs. Importantly, RE/TA is not statistically significant for
private BHCs. The positive coefficient on RE/TA for public firms is consistent with these firms
paying dividends to limit overinvestment by managers.
To estimate the magnitude of the tax effect for the year following the enactment, we
multiply the DRATE coefficient for each annual model reported in table 4 by the average
(median) assets in each group as of year end. These estimates are reported in table 5. We
estimate that the average (median) private BHC increased dividends by roughly $680,000
($409,000) during the four quarters beginning with 2003 Q3 (i.e. the first quarter following the
enactment of JGTRRA). For the average (median) public BHC, we estimate the increase to be
approximately $3,836,000 ($301,000) over the same four quarters. However, further analyses
reveals that the large increase in the public BHC dividend distributions is driven by the 45 largest
public BHCs with assets greater than $10 billion. Excluding these 45 largest BHCs, public BHCs
increased mean (median) dividend distributions by approximately $577,000 ($270,000) during
the first four quarters following enactment of JGTRRA. These estimates suggest that from a
policy perspective the dividend tax cut was more likely to benefit shareholders of private BHCs
than those of all but the largest publicly-traded BHCs. This is consistent with our expectation
that private BHCs respond more readily to their shareholders’ personal tax incentives than do
public BHCs, possibly because agency problems are more prevalent in public firms. Using a
Chow test of equality of coefficients across regressions, we find that the DRATE coefficients for
private BHCs are significantly greater than those of the public BHCs in all but the Quarter 3
fiscal year regressions (χ’s ≥ 5.52; p’s ≤ 0.02).
Page 17
------------------------- Insert Table 5 here
-------------------------
Tests of the Timing of the Effect of JGTRRA on Dividend Distributions
Table 6 presents the results of estimating equation (1) on a quarter-by-quarter basis to
provide evidence of the timing of the effect of JGTRRA on distributions for each ownership
structure. In each model there are five pre-JGTRRA quarters and one post-JGTRRA quarter
(either 2003 Q3, 2003 Q4, 2004 Q1, or 2004 Q2) for each firm. A significantly positive
coefficient on DRATE for a particular quarter indicates that dividend yields were higher after
JGTRRA for that quarter relative to the same quarter in pre-JGTRRA years. Columns (1) through
(4) of Table 6 contain the results from estimating quarterly random effects regressions for
quarters 3, 4, 1, and 2, respectively, corresponding to the four successive quarters since the
enactment of JGTRRA.
------------------------- Insert Table 6 here
-------------------------
The results from estimating regressions for each quarter suggest that private BHCs
significantly increased dividend payout immediately after enactment of JGTRRA. The
coefficients on DRATE are significantly positive for each quarter except 2004 Q2 following
enactment, but the magnitude of the coefficient is decreasing across time (i.e., 0.029, 0.014,
0.016, and 0.005 in quarters 3, 4, 1, and 2, respectively). One interpretation of this pattern is that,
after quickly satisfying shareholders’ pent-up demand for liquidity by increasing dividends
immediately after the tax cut, private BHCs returned to their prior payout levels. In contrast,
similar regressions for the public BHCs (Table 6, Panel B) provide evidence of a weaker
response to the enactment of JGTRRA. Specifically, the quarter-by-quarter regression results
show a significant response immediately following the dividend tax cut by the public BHCs
Page 18
albeit smaller in magnitude than the private BHCs (0.004 vs. 0.029). Public BHCs show no
reaction for 2003 Q4, followed by increasingly positive responses in the first and second quarters
of 2004 (i.e., -0.004, 0.009, 0.010 for quarters 4, 1, and 2, respectively).
V. SUPPLEMENTAL ANALYSIS
We investigate the robustness of the random effect regression results by conducting a
series of additional analyses. First, we estimate equation (1) using pooled quarterly observations
to make use of the variations between periods to discern a shift associated with a tax rate
decrease. These regressions are based on observations for 7,928 (8,502) firm-quarters for private
(public) BHCs. The pooled quarterly model is estimated using annual and quarter fixed effects,
and firm between-effects in addition to a correction for autocorrelation, and thus, it provides a
powerful test that uses all available information. Untabulated results indicate that these
regressions are statistically significant (F-tests < 0.01) but have less explanatory power than the
annual regressions reported in Table 4 (R2 is 0.022 for private and 0.084 for public BHCs).
Nevertheless, the estimated coefficient on DRATE is significantly positive for both private and
public BHCs, consistent with our annual regressions. The estimated coefficients on the control
variables are also consistent with those reported previously.
Second, we test the sensitivity of our coding scheme for the enactment of the dividend tax
rate reduction. In our primary tests, we classified 2003 as a post-enactment period only for the
calendar year specification of equation (1). In the fiscal year end models, we classified Q1
through Q3 of 2003 as pre-enactment periods. To test the sensitivity of our results to this
classification, we re-estimate our regression models after re-classifying 2003 Q1 through Q3 as
qualifying for the dividend tax rate reduction. Using this reclassification, the estimated
coefficient on DRATE is significantly positive for private BHCs for each model with fiscal years
Page 19
ending Q1, Q2, and Q3, consistent with our table 4 results. For public BHCs, however, the
estimated coefficient on DRATE for models with fiscal years ending Q1 and Q2 is insignificant.
The coefficient on DRATE for the fiscal year ending Q3 model is significantly positive (p =
0.05). These weaker results for the public BHCs are consistent with our timing results (table 6).
Because public BHCs did not significantly increase distributions until Q1 of 2004, including Q1
and Q2 of 2003 as post-enactment periods dampens results for this group.
Our third supplemental analysis uses annual tobit regressions to consider the effect of
firm-quarter observations where the firm did not make a dividend distribution (i.e. dividend
payouts are naturally censored at zero). Nevertheless, untabulated results of these tobit
regressions are qualitatively similar to those reported in Table 4, which suggests that including
firm-quarter observations without dividend distributions does not bias our results.
The regression results presented in Tables 4 and 6 are consistent with the contention that
the tax rate reduction enacted by JGTRRA served to increase dividend distributions. A related
issue is whether this legislation also made dividend distributions more likely for firms that had
not previously paid dividends. Figure 1 suggests a very high proportion of BHCs pay regular
dividends. Indeed, only 26 (5) private (public) firms did not make at least one quarterly dividend
payment sometime during the period 1998 through 2004 Q3. To further examine the tendency of
BHCs to make distributions Table 7 presents the number of firms that did not make any dividend
distribution during a calendar year. Excluding 2004, the proportion of private firms forgoing a
dividend varies from 14.5 percent (32 firms) to 18.2 percent (40 firms) of our sample of 220
private BHCs. In contrast, the proportion (and number) of public firms not making at least one
dividend is smaller (from 3.6 percent to 4.5 percent of our sample).
Page 20
------------------------- Insert Table 7 here
-------------------------
If a dividend tax rate reduction stimulates the non-paying private BHCs to initiate
dividend distributions, this effect might be evidenced by a higher proportion of non-paying firms
initiating dividend distributions after JGTRRA.21 Table 7 also presents the number and
proportion of non-paying BHCs that make a dividend payment in the calendar year following a
calendar year without a dividend. While these numbers are small, there is a slight increase in the
proportion of non-paying firms that initiate dividends after enactment of JGTRRA in 2003 (19.4
percent for private firms and 30.8 percent of public firms). Because of the high proportion of
public BHCs that regularly pay dividends, it seems unlikely that the reduction in the dividend tax
rate would have a discernable effect on the few public BHCs that do not pay dividends. Hence,
we explore the potential effect of JGTRRA on the likelihood of dividend payments by BHCs by
focusing our attention of private BHCs.
To formally test whether private firms are more likely to pay a dividend after JGTRRA,
we estimate a self-selection model that integrates the decision to pay a dividend into dividend
yield estimation. We are unaware of previous work to model the dividend payout decision for
private firms; therefore, we view this analysis as exploratory. The self-selection model is
specified as follows:
itKitKtit uXDRATEPAY 110 +++= δδδ (2)
21 It is also possible that firms substituted dividend distributions for stock repurchases after JGTRRA. Because stock repurchases for closely-held companies are typically taxed as dividend distributions, we expect that any substitution between dividends and stock repurchases due to the dividend tax cut would be limited to public firms. The use of stock repurchases by private firms is likely to be driven by nontax considerations (e.g. buying out dissenting or retiring shareholders)..Using a sample of firms with calendar year information for stock repurchases, we re-estimated our random effects regression with stock repurchases (the amount of stock repurchases deflated by total assets) as the dependent measure. Consistent with our expectation, the regression results (untabulated) indicate that the level of stock repurchases declined for public firms after JGTRRA.
Page 21
itKitKtit uXDRATETADIV 210/ +++= γγγ (3)
where:
PAY it = one if firm pays a dividend during the year, and zero otherwise,
itTADIV / = firm i’s dividend yield in period t calculated by dividing total dividend distributions during period t by total assets at the end of period t,
tDRATE = a binary variable that equals one if the top individual tax rate on dividend distributions is 15 percent in period t, and zero otherwise,
KitX = a vector of K explanatory variables used in equation (1) representing the annual financial characteristics of firm i during period t.
Table 8 reports the results of the distribution choice (Panel A) and distribution amount
(Panel B) equations.22 Overall, the results from the distribution choice model show no evidence
that the likelihood of paying dividends changes after the enactment of JGTRRA. ROA is
significantly positively related to the likelihood of a private BHC making a dividend distribution
indicating that more profitable firms are more likely to pay dividends. Growth is significantly
negatively related to the likelihood of paying dividends suggesting that higher growth firms are
less likely to make dividend distributions. None of the other control variables are significant.
------------------------- Insert Table 8 here
-------------------------
The results from the dividend amount model are consistent with our previous results for
private BHCs: dividend yield increased after the enactment of JGTRRA. Interestingly, only ROA
is significant in the distribution amount equation once the self-selection issue is addressed.
Growth is not significant suggesting that although growth is an important factor in the decision
to pay a dividend, once the decision is made to pay a dividend, growth does not influence the
amount of the distribution. Similar to our results in table 4, LIQ, T1 Risk, and RE/TA are not 22 Table 8 does not present the results from estimating the Quarter 2 fiscal year because the low incidence of dividend payments prevented the convergence of the estimation procedure.
Page 22
statistically significant for private firms. The χ2 tests of independent equations are not significant
in any of the models indicating that the distribution choice and the distribution amount are not
correlated for this sample. In essence, this means that we may estimate the dividend amount
equation using OLS without concern of any selection bias.
VI. CONCLUSION
We analyze the dividend policy for privately-held and publicly-held bank holding
companies with the expectation that private firms are more likely to be influenced by individual
tax considerations while public firms are more likely to consider nontax factors. We compare the
level of dividend distributions before and after enactment of JGTRRA for both public BHCs and
private BHCs to assess the extent to which differential taxation of dividend income versus capital
gains for individual shareholders influences corporate dividend payouts.
So far as we are aware, this is the first study to compare the dividend policies of publicly-
traded firms to those of privately-held firms. Relative to publicly-traded BHCs, privately-held
BHCs have more tax reasons to avoid dividends because their shareholders are more likely to be
individuals and have fewer non-tax reasons to pay dividends (e.g. agency costs) because their
shareholders are likely to be more directly involved in managing the firm. Therefore, comparing
payouts of private versus public firms, in combination with the dividend tax cut that was a
central part of JGTRRA, provides a very powerful test of the hypothesis that the tax
disadvantages of dividends for individual shareholders discourage corporations from paying
dividends. Our analysis of distributions by bank holding companies also fills a void in the
financial literature, most of which features tests based exclusively on industrial firms.
Page 23
We find that BHCs’ distributions are seasonal across quarters and trending upward over
time throughout our sample period. Unlike industrial firms, the vast majority of BHCs paid some
dividends prior to JGTRRA regardless of ownership structure. Consequently, we do not find a
significant increase in the percentage of BHCs paying dividends after JGTRRA. However, we do
find that the amount of dividends paid by BHCs (as a percentage of assets) is sensitive to the
differential tax rates on dividend income versus capital gains for individuals, particularly for
privately-held BHCs. In the periods prior to JGTRRA, when the maximum tax rate on dividend
income exceeded the maximum tax rate on capital gains for individuals, we find that privately-
held BHCs have significantly lower dividend yields than the publicly-traded counterparts. This
result suggests that private BHCs retain earnings consistent with tax incentives for individual
shareholders and/or that public BHCs distribute earnings to mitigate potential agency problems.
In the first four quarters after enactment of the dividend tax cut, we find that private BHCs
increased dividend payouts to a greater extent than publicly-traded BHCs exclusive of the very
largest public BHCs. This result is consistent with the notion that reducing the tax disadvantage
of dividends relative to capital gains enabled private firms to satisfy pent-up liquidity demands of
their individual shareholders at minimal tax costs. However, it also appears that after having
initially satisfied this demand, dividend distributions by private firms may be returning to their
pre-JGTRRA levels. In contrast, the tax effect on dividend payouts by publicly-traded firms
appears to have started more slowly and to be increasing after 2003.
We conclude that the dividend tax cut of JGTRRA differentially influenced both the
timing and magnitude of dividend distributions by public versus private BHCs. We estimate that,
over the first four quarters following enactment, the average private BHC increased dividend
distributions by $680,000 and that the average public BHC, excluding the 45 largest BHCs,
Page 24
increased distributions by $577,000. Much of the political rhetoric preceding JGTRRA focused
on the intended benefits to shareholders of public firms (e.g. increasing the value of the stock
market and mitigating corporate governance problems). Indeed, we estimate that the 45 largest
public BHCs increased dividend distributions by roughly $26 million during the first four
quarters following the enactment of JGTRRA. However, despite these stated objectives, our
analyses indicate that for our sample of bank holding companies JGTRRA bestows greater
benefits on the shareholders of privately-held corporations than all but the very largest public
BHCs.
Page 25
REFERENCES
Allen, F., and R. Michaely, 2003, “Payout Policy,” in Constantinides, G., M. Harris and R. Stulz (eds.) Handbook of the Economics of Finance (Amsterdam: North-Holland).
Barlett, B. 2002. My conference call. National Review Online (August 21).
Beatty, A., and D. Harris. 1999. The effects of taxes, agency costs and information asymmetry on earnings management: A comparison of public and private firms. Review of Accounting Studies 3: 299-326.
Bernartzi, R. Michaely, and Thaler, 1997, Do changes in dividends signal the future or the past? Journal of Finance 52 (3), 1007-1034.
Black, F. 1976. The dividend puzzle. Journal of Portfolio Management 2: 5-8.
Blouin, J. L., J. S. Ready, and D. A. Shackelford, 2004, Did dividends increase after the 2003 reduction in dividend tax rates? Working paper, University of North Carolina.
Brav, A., J. R. Graham, C. R. Harvey, and R. Michaely, 2004, Payout policy in the 21st century. NBER working paper 9657.
Brown, J.R., N. Liang, and S. Weisbenner. 2005. Executive financial incentives and payout policy: Firm responses to the 2003 dividend tax cut. Working paper, University of Illinois.
Chetty, R. and E. Saez, 2004, Do dividend payments respond to taxes? Preliminary evidence from the 2003 dividend tax cut. NBER working paper 10572.
DeAngelo, H., and L. DeAngelo, 2004, Payout policy irrelevance and the dividend puzzle. Working paper, University of Southern California.
DeAngelo, H., L. DeAngelo, and R. M. Stulz, 2004, Dividend policy, agency costs, and earned equity. Working paper, University of Southern California.
Esenwein, G.A., and J.G. Gravelle. 2003. The taxation of dividend income: An overview and economic analysis of the issues. Congressional Research Service report, updated May 15, 2003.
Fama, E. and H. Babiak, 1968, Dividend policy: an empirical analysis. Journal of the American Statistical Association, 63 (324), 1132-1161.
Fama, E. and K. French, 2001, Disappearing dividends: Changing firm characteristics or lower propensity to pay? Journal of Financial Economics 60, 3-43.
Feldstein, M. and J. Green, 1983, Why do companies pay dividends? American Economic Review 73, 17-30.
Grullon, G. and R. Michaely, 2002, Dividends, share repurchases and the substitution hypothesis. Journal of Finance 57 (4), 1649-1684.
Page 26
Grullon, G., R. Michaely, and B, Swaminathan, 2002, Are dividend changes a sign of firm maturity? Journal of Business 75 (3), 387-424.
Julio, B. and D. L. Ikenberry, 2004, Reappearing dividends. Journal of Applied Corporate Finance 16 (4, Fall): 89-100.
Kalay, A. and U. Loewenstein, 1986, The information content of the timing of dividend announcements. Journal of Financial Economics 16, 373-388.
Ke, B. 2001. Taxes as a determinant of managerial compensation in privately held insurance companies. The Accounting Review 76 (4, October): 655-674.
Lambert, R., W. Lanen, and D. Larcker. 1989. Executive stock option plans and corporate dividend policy. Journal of Financial and Quantitative Analysis 24 (4): 409-425.
La Porta, R., F. Lopez-de-Silanes, and A. Shleifer. 1999. Corporate ownership around the world. The Journal of Finance 54 (2, April): 471-517.
La Porta, R., F. Lopez-de-Silanes, A. Shleifer, and R. Vishny. 2000. Agency problems and dividend policies around the world. The Journal of Finance 55 (1, February): 1-33.
Lintner, J. 1956, Distribution of incomes of corporations among dividends, retained earnings, and taxes. American Economic Review 46 (2), 97-113.
Michaely, R., R. Thaler, and K. Womack, 1995, Price reactions to dividend initiations and omissions: overreaction or drift? Journal of Finance 50 (2), 573-608.
Miller, M. and F. Modiglianni. 1961. Dividend policy, growth, and the valuation of shares. Journal of Business 34, 411-433.
Nissim, D. and A. Ziv, 2001, Dividend changes and future profitability. Journal of Finance 56 (6), 2111-2133.
Niswander, F. and E. Swanson, 2000, Loan, security, and dividend choices by individual (unconsolidated) public and private commerce BHCs. Journal of Accounting and Public Policy 19, 201-235.
Ofer, A. R. and D. R. Siegel, 1987, Corporate financial policy, information, and market expectations: An empirical investigation of dividends. Journal of Finance 42 (4), 889-911.
Stiglitz, J. 1973. Taxation, corporate financial policy, and the cost of capital. Journal of Public Economics 2, 1-34.
Page 27
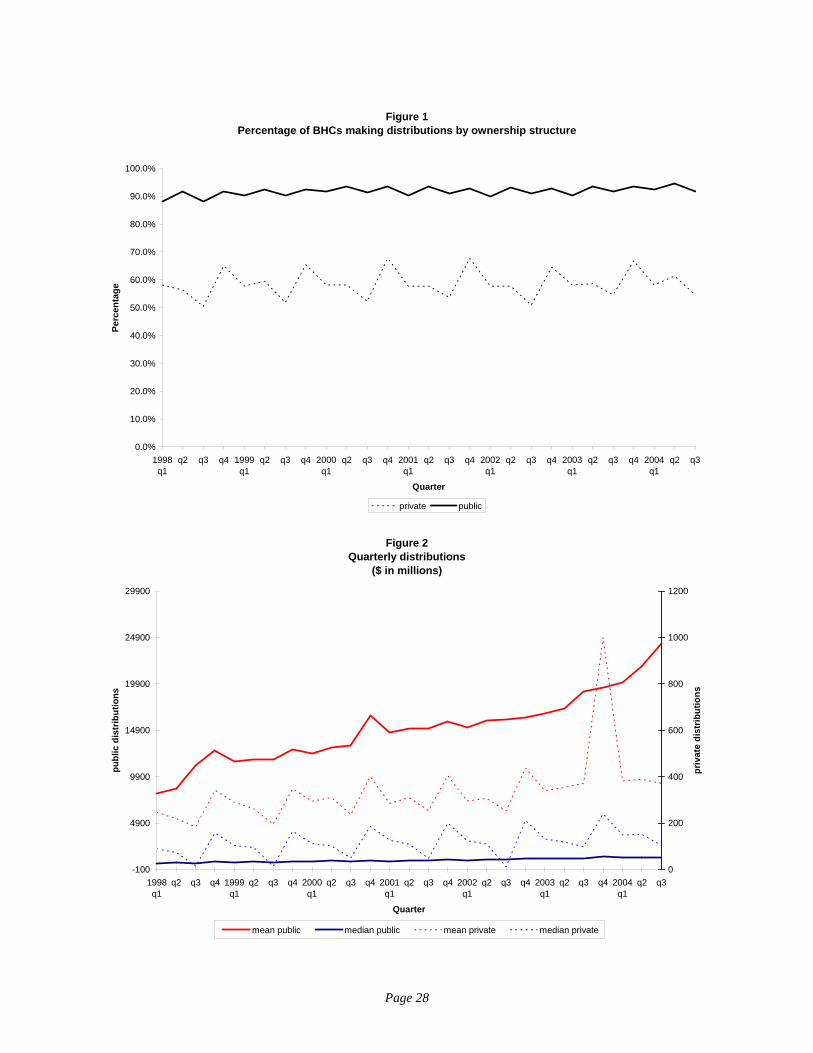
Figure 1Percentage of BHCs making distributions by ownership structure
0.0%
10.0%
20.0%
30.0%
40.0%
50.0%
60.0%
70.0%
80.0%
90.0%
100.0%
1998q1
q2 q3 q4 1999q1
q2 q3 q4 2000q1
q2 q3 q4 2001q1
q2 q3 q4 2002q1
q2 q3 q4 2003q1
q2 q3 q4 2004q1
q2 q3
Quarter
Perc
enta
ge
private public
Figure 2Quarterly distributions
($ in millions)
-100
4900
9900
14900
19900
24900
29900
1998q1
q2 q3 q4 1999q1
q2 q3 q4 2000q1
q2 q3 q4 2001q1
q2 q3 q4 2002q1
q2 q3 q4 2003q1
q2 q3 q4 2004q1
q2 q3
Quarter
publ
ic d
istr
ibut
ions
0
200
400
600
800
1000
1200
priv
ate
dist
ribut
ions
mean public median public mean private median private
Page 28
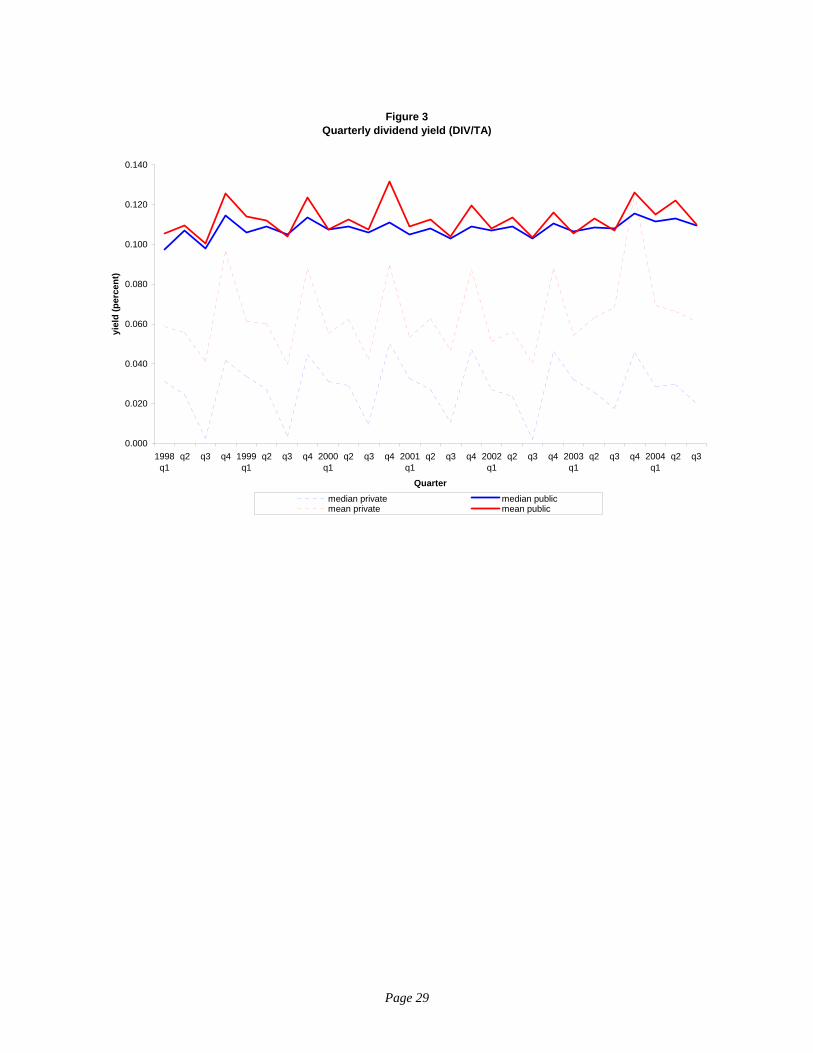
Figure 3Quarterly dividend yield (DIV/TA)
0.000
0.020
0.040
0.060
0.080
0.100
0.120
0.140
1998q1
q2 q3 q4 1999q1
q2 q3 q4 2000q1
q2 q3 q4 2001q1
q2 q3 q4 2002q1
q2 q3 q4 2003q1
q2 q3 q4 2004q1
q2 q3
Quarter
yiel
d (p
erce
nt)
median private median publicmean private mean public
Page 29
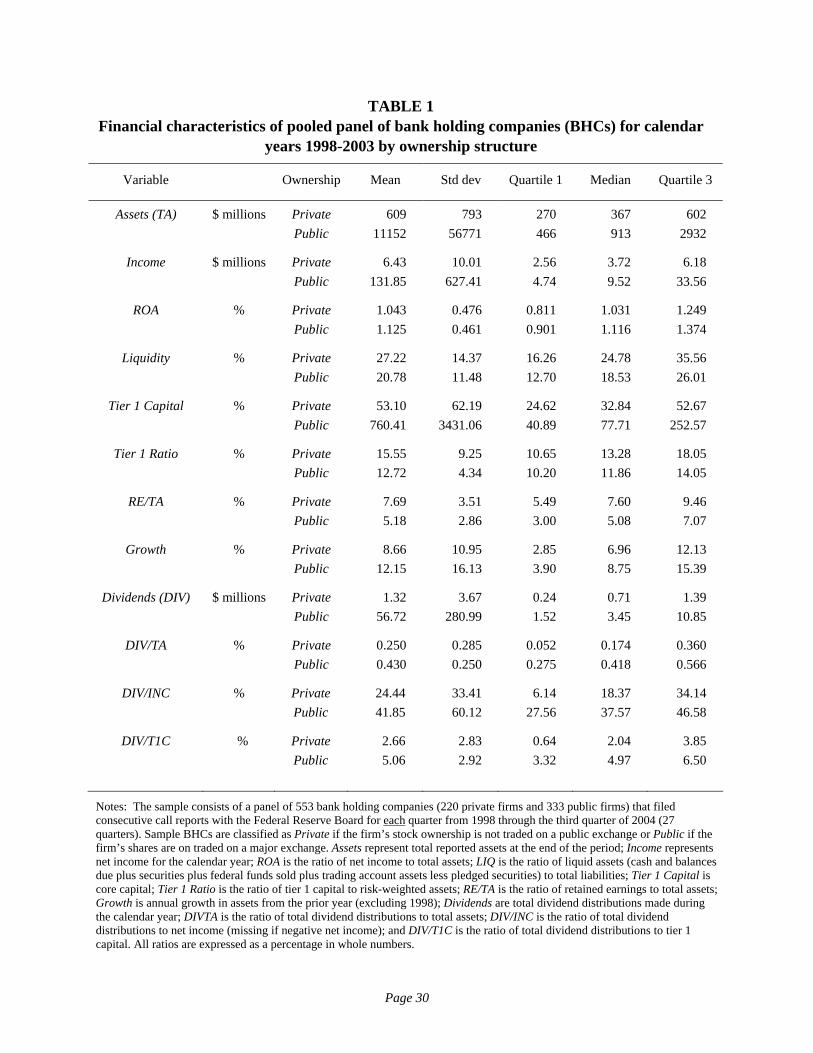
TABLE 1 Financial characteristics of pooled panel of bank holding companies (BHCs) for calendar
years 1998-2003 by ownership structure
Variable Ownership Mean Std dev Quartile 1 Median Quartile 3
Assets (TA) $ millions Private 609 793 270 367 602 Public 11152 56771 466 913 2932
Income $ millions Private 6.43 10.01 2.56 3.72 6.18 Public 131.85 627.41 4.74 9.52 33.56
ROA % Private 1.043 0.476 0.811 1.031 1.249 Public 1.125 0.461 0.901 1.116 1.374
Liquidity % Private 27.22 14.37 16.26 24.78 35.56 Public 20.78 11.48 12.70 18.53 26.01
Tier 1 Capital % Private 53.10 62.19 24.62 32.84 52.67 Public 760.41 3431.06 40.89 77.71 252.57
Tier 1 Ratio % Private 15.55 9.25 10.65 13.28 18.05 Public 12.72 4.34 10.20 11.86 14.05
RE/TA % Private 7.69 3.51 5.49 7.60 9.46 Public 5.18 2.86 3.00 5.08 7.07
Growth % Private 8.66 10.95 2.85 6.96 12.13 Public 12.15 16.13 3.90 8.75 15.39
Dividends (DIV) $ millions Private 1.32 3.67 0.24 0.71 1.39 Public 56.72 280.99 1.52 3.45 10.85
DIV/TA % Private 0.250 0.285 0.052 0.174 0.360 Public 0.430 0.250 0.275 0.418 0.566
DIV/INC % Private 24.44 33.41 6.14 18.37 34.14 Public 41.85 60.12 27.56 37.57 46.58
DIV/T1C % Private 2.66 2.83 0.64 2.04 3.85 Public 5.06 2.92 3.32 4.97 6.50
Notes: The sample consists of a panel of 553 bank holding companies (220 private firms and 333 public firms) that filed consecutive call reports with the Federal Reserve Board for each quarter from 1998 through the third quarter of 2004 (27 quarters). Sample BHCs are classified as Private if the firm’s stock ownership is not traded on a public exchange or Public if the firm’s shares are on traded on a major exchange. Assets represent total reported assets at the end of the period; Income represents net income for the calendar year; ROA is the ratio of net income to total assets; LIQ is the ratio of liquid assets (cash and balances due plus securities plus federal funds sold plus trading account assets less pledged securities) to total liabilities; Tier 1 Capital is core capital; Tier 1 Ratio is the ratio of tier 1 capital to risk-weighted assets; RE/TA is the ratio of retained earnings to total assets; Growth is annual growth in assets from the prior year (excluding 1998); Dividends are total dividend distributions made during the calendar year; DIVTA is the ratio of total dividend distributions to total assets; DIV/INC is the ratio of total dividend distributions to net income (missing if negative net income); and DIV/T1C is the ratio of total dividend distributions to tier 1 capital. All ratios are expressed as a percentage in whole numbers.
Page 30
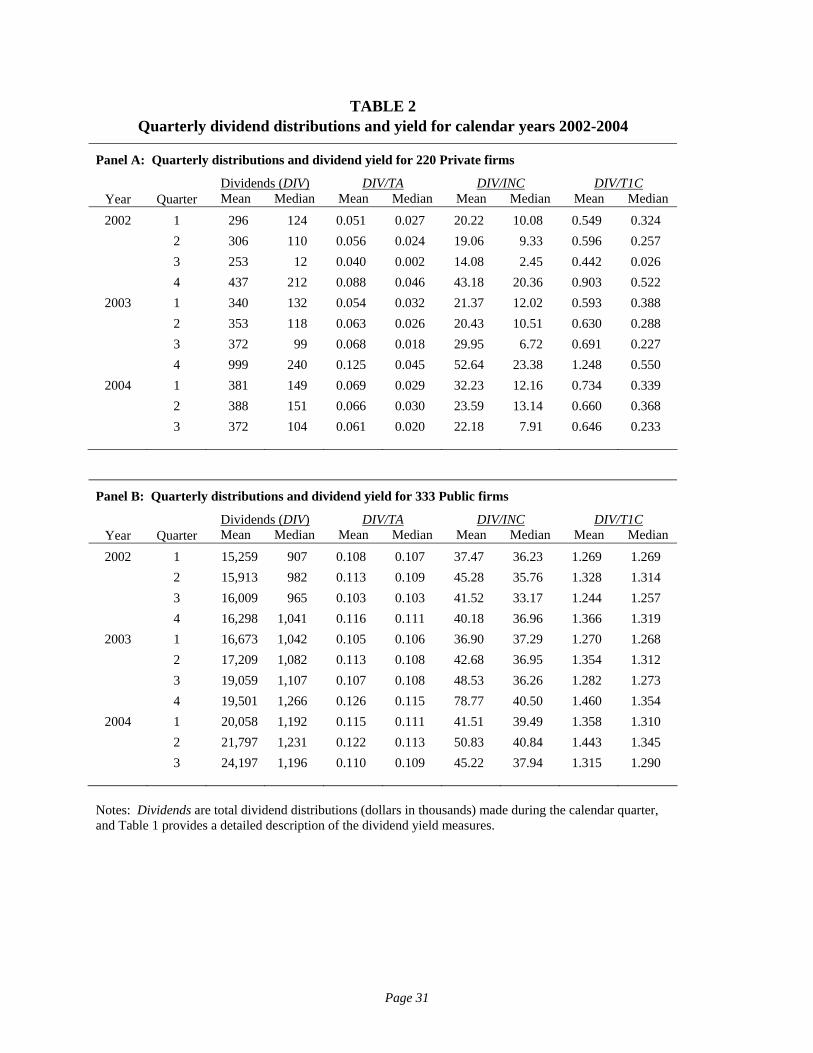
TABLE 2 Quarterly dividend distributions and yield for calendar years 2002-2004
Panel A: Quarterly distributions and dividend yield for 220 Private firms
Dividends (DIV) DIV/TA DIV/INC DIV/T1C Year Quarter Mean Median Mean Median Mean Median Mean Median
2002 1 296 124 0.051 0.027 20.22 10.08 0.549 0.324 2 306 110 0.056 0.024 19.06 9.33 0.596 0.257 3 253 12 0.040 0.002 14.08 2.45 0.442 0.026 4 437 212 0.088 0.046 43.18 20.36 0.903 0.522
2003 1 340 132 0.054 0.032 21.37 12.02 0.593 0.388 2 353 118 0.063 0.026 20.43 10.51 0.630 0.288 3 372 99 0.068 0.018 29.95 6.72 0.691 0.227 4 999 240 0.125 0.045 52.64 23.38 1.248 0.550
2004 1 381 149 0.069 0.029 32.23 12.16 0.734 0.339 2 388 151 0.066 0.030 23.59 13.14 0.660 0.368 3 372 104 0.061 0.020 22.18 7.91 0.646 0.233
Panel B: Quarterly distributions and dividend yield for 333 Public firms
Dividends (DIV) DIV/TA DIV/INC DIV/T1C Year Quarter Mean Median Mean Median Mean Median Mean Median
2002 1 15,259 907 0.108 0.107 37.47 36.23 1.269 1.269 2 15,913 982 0.113 0.109 45.28 35.76 1.328 1.314 3 16,009 965 0.103 0.103 41.52 33.17 1.244 1.257 4 16,298 1,041 0.116 0.111 40.18 36.96 1.366 1.319
2003 1 16,673 1,042 0.105 0.106 36.90 37.29 1.270 1.268 2 17,209 1,082 0.113 0.108 42.68 36.95 1.354 1.312 3 19,059 1,107 0.107 0.108 48.53 36.26 1.282 1.273 4 19,501 1,266 0.126 0.115 78.77 40.50 1.460 1.354
2004 1 20,058 1,192 0.115 0.111 41.51 39.49 1.358 1.310 2 21,797 1,231 0.122 0.113 50.83 40.84 1.443 1.345 3 24,197 1,196 0.110 0.109 45.22 37.94 1.315 1.290
Notes: Dividends are total dividend distributions (dollars in thousands) made during the calendar quarter, and Table 1 provides a detailed description of the dividend yield measures.
Page 31
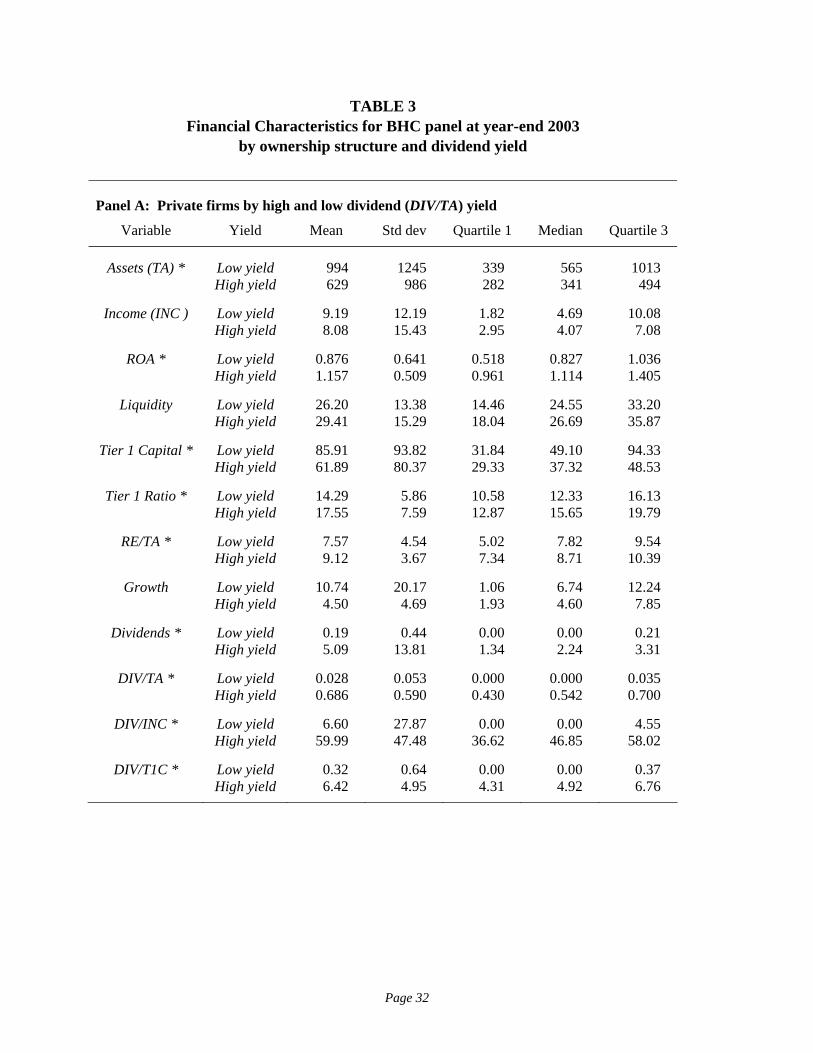
TABLE 3 Financial Characteristics for BHC panel at year-end 2003
by ownership structure and dividend yield
Panel A: Private firms by high and low dividend (DIV/TA) yield
Variable Yield Mean Std dev Quartile 1 Median Quartile 3
Assets (TA) * Low yield 994 1245 339 565 1013 High yield 629 986 282 341 494
Income (INC ) Low yield 9.19 12.19 1.82 4.69 10.08 High yield 8.08 15.43 2.95 4.07 7.08
ROA * Low yield 0.876 0.641 0.518 0.827 1.036 High yield 1.157 0.509 0.961 1.114 1.405
Liquidity Low yield 26.20 13.38 14.46 24.55 33.20 High yield 29.41 15.29 18.04 26.69 35.87
Tier 1 Capital * Low yield 85.91 93.82 31.84 49.10 94.33 High yield 61.89 80.37 29.33 37.32 48.53
Tier 1 Ratio * Low yield 14.29 5.86 10.58 12.33 16.13 High yield 17.55 7.59 12.87 15.65 19.79
RE/TA * Low yield 7.57 4.54 5.02 7.82 9.54 High yield 9.12 3.67 7.34 8.71 10.39
Growth Low yield 10.74 20.17 1.06 6.74 12.24 High yield 4.50 4.69 1.93 4.60 7.85
Dividends * Low yield 0.19 0.44 0.00 0.00 0.21 High yield 5.09 13.81 1.34 2.24 3.31
DIV/TA * Low yield 0.028 0.053 0.000 0.000 0.035 High yield 0.686 0.590 0.430 0.542 0.700
DIV/INC * Low yield 6.60 27.87 0.00 0.00 4.55 High yield 59.99 47.48 36.62 46.85 58.02
DIV/T1C * Low yield 0.32 0.64 0.00 0.00 0.37 High yield 6.42 4.95 4.31 4.92 6.76
Page 32
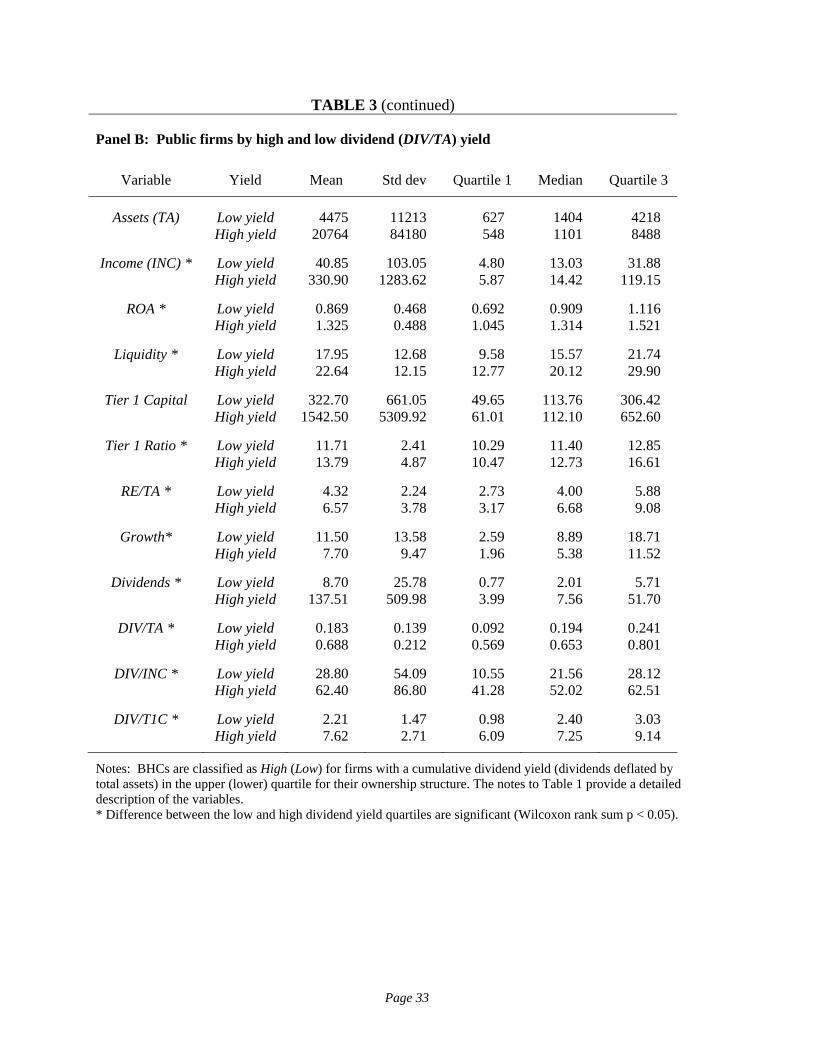
TABLE 3 (continued)
Panel B: Public firms by high and low dividend (DIV/TA) yield
Variable Yield Mean Std dev Quartile 1 Median Quartile 3
Assets (TA) Low yield 4475 11213 627 1404 4218 High yield 20764 84180 548 1101 8488
Income (INC) * Low yield 40.85 103.05 4.80 13.03 31.88 High yield 330.90 1283.62 5.87 14.42 119.15
ROA * Low yield 0.869 0.468 0.692 0.909 1.116 High yield 1.325 0.488 1.045 1.314 1.521
Liquidity * Low yield 17.95 12.68 9.58 15.57 21.74 High yield 22.64 12.15 12.77 20.12 29.90
Tier 1 Capital Low yield 322.70 661.05 49.65 113.76 306.42 High yield 1542.50 5309.92 61.01 112.10 652.60
Tier 1 Ratio * Low yield 11.71 2.41 10.29 11.40 12.85 High yield 13.79 4.87 10.47 12.73 16.61
RE/TA * Low yield 4.32 2.24 2.73 4.00 5.88 High yield 6.57 3.78 3.17 6.68 9.08
Growth* Low yield 11.50 13.58 2.59 8.89 18.71 High yield 7.70 9.47 1.96 5.38 11.52
Dividends * Low yield 8.70 25.78 0.77 2.01 5.71 High yield 137.51 509.98 3.99 7.56 51.70
DIV/TA * Low yield 0.183 0.139 0.092 0.194 0.241 High yield 0.688 0.212 0.569 0.653 0.801
DIV/INC * Low yield 28.80 54.09 10.55 21.56 28.12 High yield 62.40 86.80 41.28 52.02 62.51
DIV/T1C * Low yield 2.21 1.47 0.98 2.40 3.03 High yield 7.62 2.71 6.09 7.25 9.14
Notes: BHCs are classified as High (Low) for firms with a cumulative dividend yield (dividends deflated by total assets) in the upper (lower) quartile for their ownership structure. The notes to Table 1 provide a detailed description of the variables. * Difference between the low and high dividend yield quartiles are significant (Wilcoxon rank sum p < 0.05).
Page 33
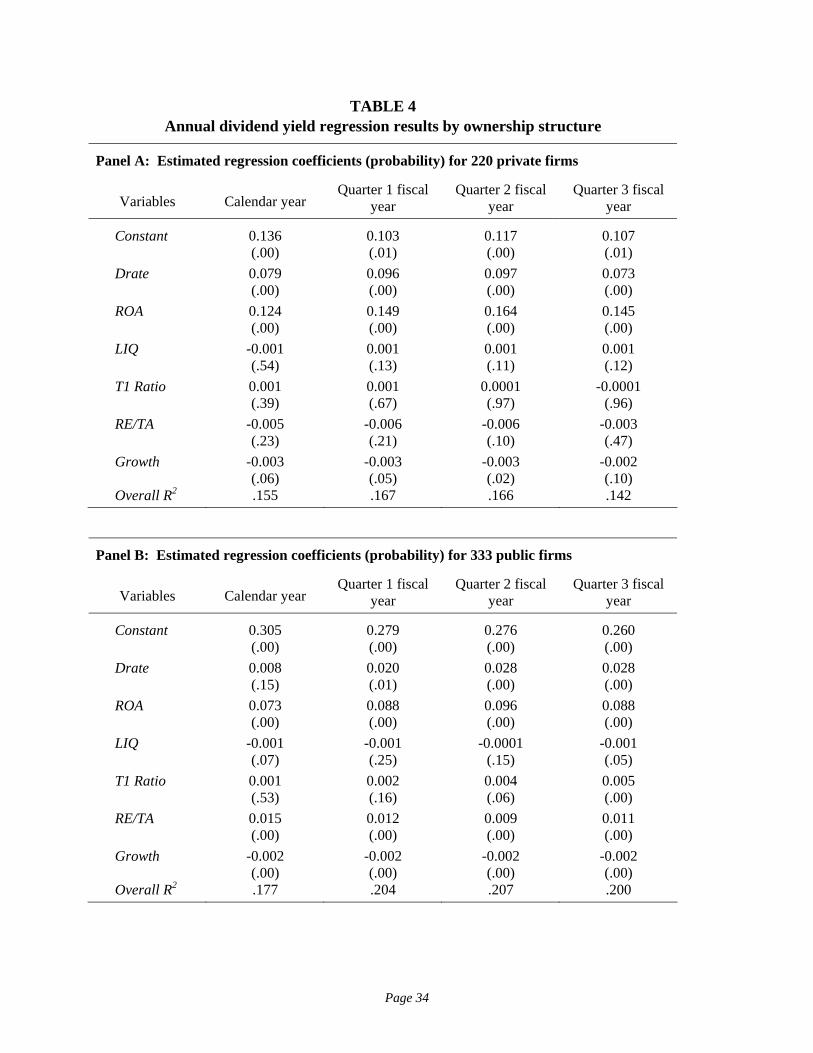
TABLE 4 Annual dividend yield regression results by ownership structure
Panel A: Estimated regression coefficients (probability) for 220 private firms
Variables Calendar year Quarter 1 fiscal
year Quarter 2 fiscal
year Quarter 3 fiscal
year
Constant 0.136 (.00)
0.103 (.01)
0.117 (.00)
0.107 (.01)
Drate 0.079 (.00)
0.096 (.00)
0.097 (.00)
0.073 (.00)
ROA 0.124 (.00)
0.149 (.00)
0.164 (.00)
0.145 (.00)
LIQ -0.001 (.54)
0.001 (.13)
0.001 (.11)
0.001 (.12)
T1 Ratio 0.001 (.39)
0.001 (.67)
0.0001 (.97)
-0.0001 (.96)
RE/TA -0.005 (.23)
-0.006 (.21)
-0.006 (.10)
-0.003 (.47)
Growth -0.003 (.06)
-0.003 (.05)
-0.003 (.02)
-0.002 (.10)
Overall R2 .155 .167 .166 .142
Panel B: Estimated regression coefficients (probability) for 333 public firms
Variables Calendar year Quarter 1 fiscal
year Quarter 2 fiscal
year Quarter 3 fiscal
year
Constant 0.305 (.00)
0.279 (.00)
0.276 (.00)
0.260 (.00)
Drate 0.008 (.15)
0.020 (.01)
0.028 (.00)
0.028 (.00)
ROA 0.073 (.00)
0.088 (.00)
0.096 (.00)
0.088 (.00)
LIQ -0.001 (.07)
-0.001 (.25)
-0.0001 (.15)
-0.001 (.05)
T1 Ratio 0.001 (.53)
0.002 (.16)
0.004 (.06)
0.005 (.00)
RE/TA 0.015 (.00)
0.012 (.00)
0.009 (.00)
0.011 (.00)
Growth -0.002 (.00)
-0.002 (.00)
-0.002 (.00)
-0.002 (.00)
Overall R2 .177 .204 .207 .200
Page 34
TABLE 4 (continued)
Notes: Regression equation (1) was estimated including fixed effects for firm (bank holding company) and time (year). Significance levels are corrected for first-order autoregressive disturbances, and all probabilities are two-tailed except for Drate, which is tested using one-tailed probabilities. The regression sample is estimated with a panel of 1,320 firm-years for 220 private BHCs and 1,998 firm-years for 333 public BHCs. The calendar year regression is estimated with observations accumulated over the four consecutive quarters ending with calendar year Q4. The quarter one fiscal year regression is estimated with observations accumulated over the four consecutive quarters ending with Q1; the quarter two fiscal year regression is estimated with observations accumulated over the four consecutive quarters ending with Q2 and the quarter three fiscal year regression is estimated with observations accumulated over the four consecutive quarters ending with Q3. The dependent variable, dividend yield (DIV/TA), is the percent (in whole numbers) calculated by dividing dividend distributions aggregated over the four quarters in each period by total assets at the end of the quarter. Drate is a binary variable that equals one for each year ending after the enactment of the JGTRRA, and zero otherwise. Public is a binary variable that equals one for public firms and zero for private firms. The notes to Table 1 provide a detailed description of the remaining regression variables.
Page 35
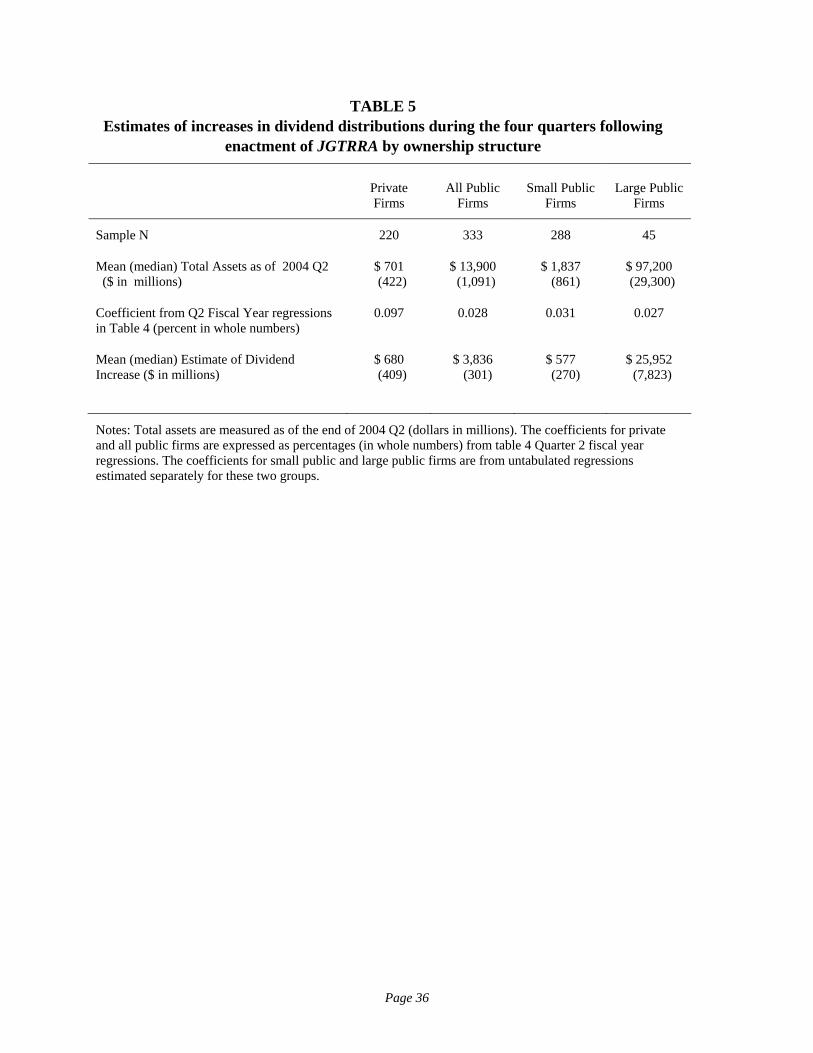
TABLE 5 Estimates of increases in dividend distributions during the four quarters following
enactment of JGTRRA by ownership structure
Private Firms
All Public Firms
Small Public Firms
Large Public Firms
Sample N 220 333 288 45
Mean (median) Total Assets as of 2004 Q2 ($ in millions)
$ 701 (422)
$ 13,900 (1,091)
$ 1,837 (861)
$ 97,200 (29,300)
Coefficient from Q2 Fiscal Year regressions in Table 4 (percent in whole numbers)
0.097 0.028 0.031 0.027
Mean (median) Estimate of Dividend Increase ($ in millions)
$ 680 (409)
$ 3,836 (301)
$ 577 (270)
$ 25,952 (7,823)
Notes: Total assets are measured as of the end of 2004 Q2 (dollars in millions). The coefficients for private and all public firms are expressed as percentages (in whole numbers) from table 4 Quarter 2 fiscal year regressions. The coefficients for small public and large public firms are from untabulated regressions estimated separately for these two groups.
Page 36
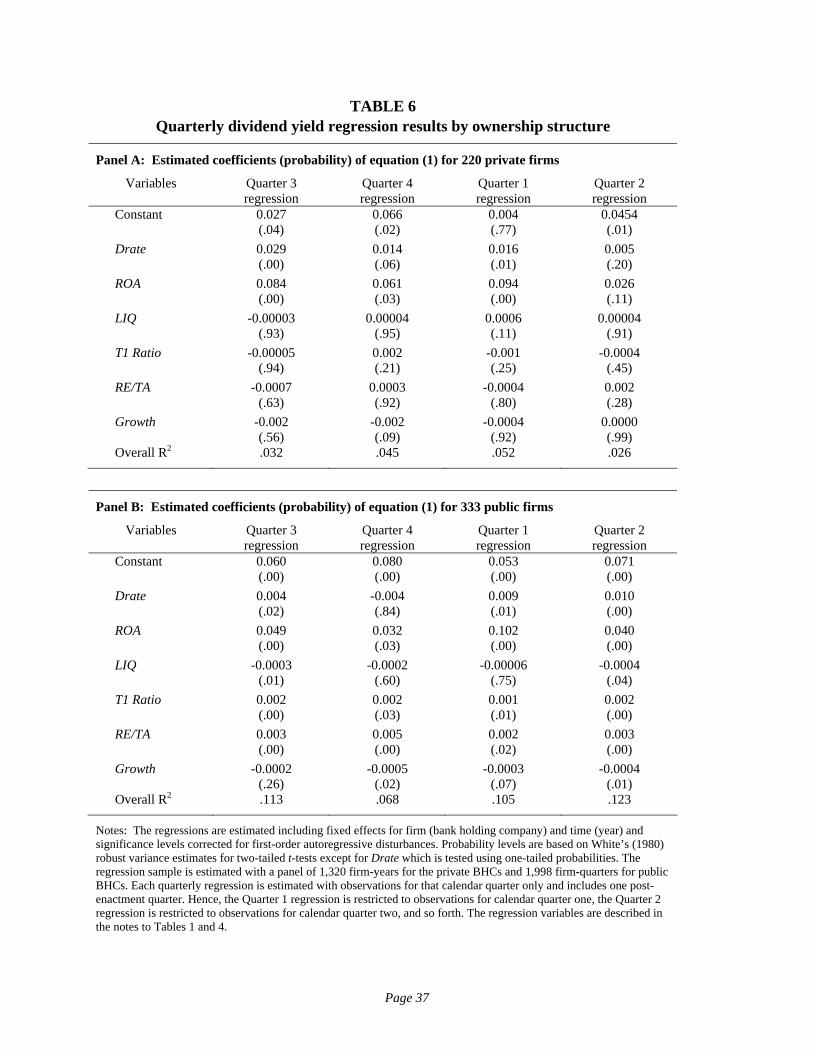
TABLE 6 Quarterly dividend yield regression results by ownership structure
Panel A: Estimated coefficients (probability) of equation (1) for 220 private firms
Variables Quarter 3 regression
Quarter 4 regression
Quarter 1 regression
Quarter 2 regression
Constant 0.027 (.04)
0.066 (.02)
0.004 (.77)
0.0454 (.01)
Drate 0.029 (.00)
0.014 (.06)
0.016 (.01)
0.005 (.20)
ROA 0.084 (.00)
0.061 (.03)
0.094 (.00)
0.026 (.11)
LIQ -0.00003 (.93)
0.00004 (.95)
0.0006 (.11)
0.00004 (.91)
T1 Ratio -0.00005 (.94)
0.002 (.21)
-0.001 (.25)
-0.0004 (.45)
RE/TA -0.0007 (.63)
0.0003 (.92)
-0.0004 (.80)
0.002 (.28)
Growth -0.002 (.56)
-0.002 (.09)
-0.0004 (.92)
0.0000 (.99)
Overall R2 .032 .045 .052 .026
Panel B: Estimated coefficients (probability) of equation (1) for 333 public firms
Variables Quarter 3 regression
Quarter 4 regression
Quarter 1 regression
Quarter 2 regression
Constant 0.060 (.00)
0.080 (.00)
0.053 (.00)
0.071 (.00)
Drate 0.004 (.02)
-0.004 (.84)
0.009 (.01)
0.010 (.00)
ROA 0.049 (.00)
0.032 (.03)
0.102 (.00)
0.040 (.00)
LIQ -0.0003 (.01)
-0.0002 (.60)
-0.00006 (.75)
-0.0004 (.04)
T1 Ratio 0.002 (.00)
0.002 (.03)
0.001 (.01)
0.002 (.00)
RE/TA 0.003 (.00)
0.005 (.00)
0.002 (.02)
0.003 (.00)
Growth -0.0002 (.26)
-0.0005 (.02)
-0.0003 (.07)
-0.0004 (.01)
Overall R2 .113 .068 .105 .123
Notes: The regressions are estimated including fixed effects for firm (bank holding company) and time (year) and significance levels corrected for first-order autoregressive disturbances. Probability levels are based on White’s (1980) robust variance estimates for two-tailed t-tests except for Drate which is tested using one-tailed probabilities. The regression sample is estimated with a panel of 1,320 firm-years for the private BHCs and 1,998 firm-quarters for public BHCs. Each quarterly regression is estimated with observations for that calendar quarter only and includes one post-enactment quarter. Hence, the Quarter 1 regression is restricted to observations for calendar quarter one, the Quarter 2 regression is restricted to observations for calendar quarter two, and so forth. The regression variables are described in the notes to Tables 1 and 4.
Page 37
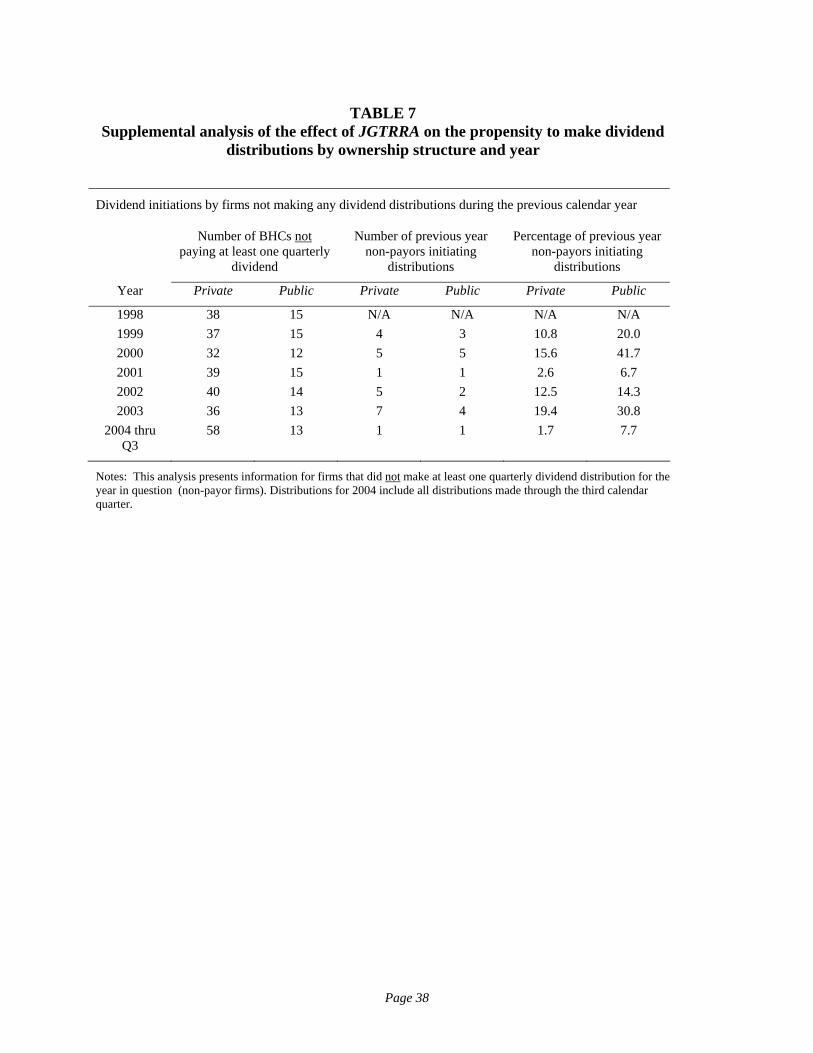
TABLE 7 Supplemental analysis of the effect of JGTRRA on the propensity to make dividend
distributions by ownership structure and year
Dividend initiations by firms not making any dividend distributions during the previous calendar year
Number of BHCs not paying at least one quarterly
dividend
Number of previous year non-payors initiating
distributions
Percentage of previous year non-payors initiating
distributions
Year Private Public Private Public Private Public
1998 38 15 N/A N/A N/A N/A 1999 37 15 4 3 10.8 20.0 2000 32 12 5 5 15.6 41.7 2001 39 15 1 1 2.6 6.7 2002 40 14 5 2 12.5 14.3 2003 36 13 7 4 19.4 30.8
2004 thru Q3
58 13 1 1 1.7 7.7
Notes: This analysis presents information for firms that did not make at least one quarterly dividend distribution for the year in question (non-payor firms). Distributions for 2004 include all distributions made through the third calendar quarter.
Page 38
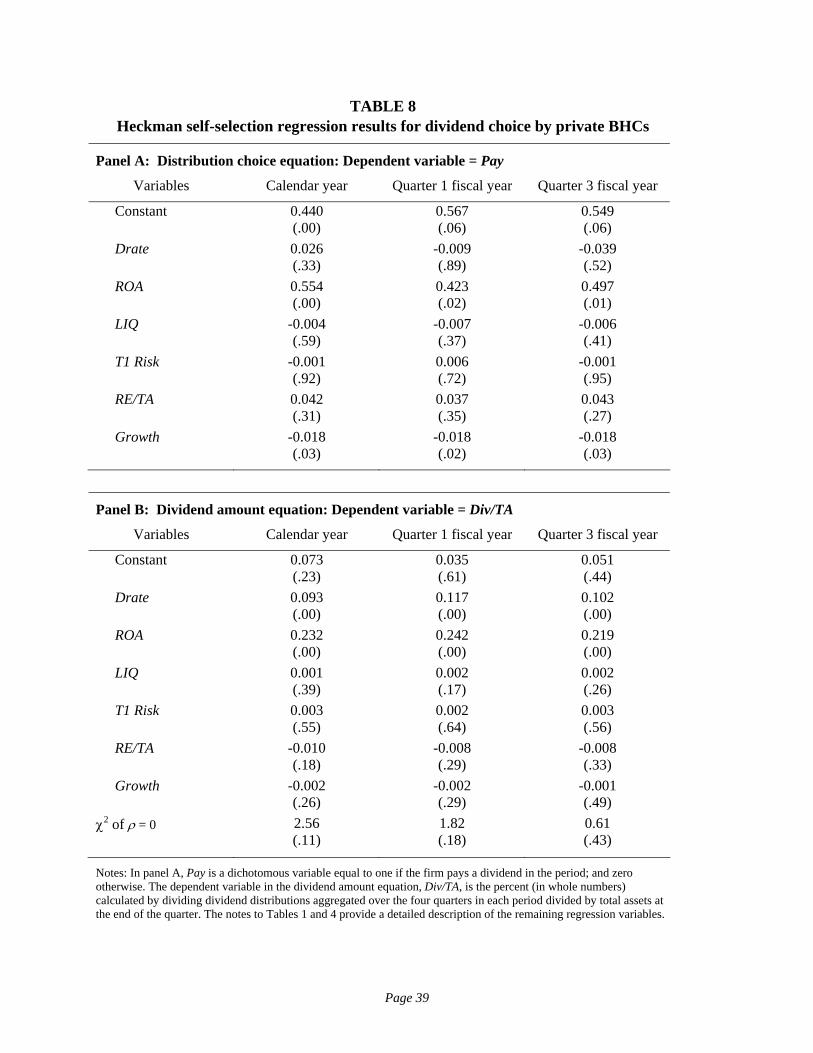
TABLE 8 Heckman self-selection regression results for dividend choice by private BHCs
Panel A: Distribution choice equation: Dependent variable = Pay
Variables Calendar year Quarter 1 fiscal year Quarter 3 fiscal year
Constant 0.440 (.00)
0.567 (.06)
0.549 (.06)
Drate 0.026 (.33)
-0.009 (.89)
-0.039 (.52)
ROA 0.554 (.00)
0.423 (.02)
0.497 (.01)
LIQ -0.004 (.59)
-0.007 (.37)
-0.006 (.41)
T1 Risk -0.001 (.92)
0.006 (.72)
-0.001 (.95)
RE/TA 0.042 (.31)
0.037 (.35)
0.043 (.27)
Growth -0.018 (.03)
-0.018 (.02)
-0.018 (.03)
Panel B: Dividend amount equation: Dependent variable = Div/TA
Variables Calendar year Quarter 1 fiscal year Quarter 3 fiscal year
Constant 0.073 (.23)
0.035 (.61)
0.051 (.44)
Drate 0.093 (.00)
0.117 (.00)
0.102 (.00)
ROA 0.232 (.00)
0.242 (.00)
0.219 (.00)
LIQ 0.001 (.39)
0.002 (.17)
0.002 (.26)
T1 Risk 0.003 (.55)
0.002 (.64)
0.003 (.56)
RE/TA -0.010 (.18)
-0.008 (.29)
-0.008 (.33)
Growth -0.002 (.26)
-0.002 (.29)
-0.001 (.49)
χ2 of ρ = 0
2.56 (.11)
1.82 (.18)
0.61 (.43)
Notes: In panel A, Pay is a dichotomous variable equal to one if the firm pays a dividend in the period; and zero otherwise. The dependent variable in the dividend amount equation, Div/TA, is the percent (in whole numbers) calculated by dividing dividend distributions aggregated over the four quarters in each period divided by total assets at the end of the quarter. The notes to Tables 1 and 4 provide a detailed description of the remaining regression variables.
Page 39


