Embed Size (px)
Citation preview

Tools for fun and fruitful meetings.
“Don’t let meetings make you go bananas!”
Erwin Elling


Tools for fun and fruitful meetings.
“Don’t let meetings make you go bananas!”
Graduate thesis for the doctoral Business Information Technology and
the Master of Science Human Media Interaction, University of Twente, Enschede, the Netherlands
Erwin Elling
3 August 2007
Graduation committee:
Dr. E.M.A.G. van Dijk (University of Twente, Enschede, the Netherlands)
Dr. Ir. R.J. Rienks (University of Twente, Enschede, the Netherlands)
Ir. F.M.J.W. van den Berg (University of Twente, Enschede, the Netherlands)
Dr. W.M. Post (TNO Human Factors, Soesterberg, the Netherlands)

2 / 90

3 / 90
Voorwoord (Preface in Dutch)
Ik heb wel eens gedacht: “Waar ben ik aan begonnen?!”Inmiddels ben ik er wel achter dat ik
aan heel veel dingen ben begonnen, maar eigenlijk doet dat er nu niet zoveel toe. Ik sta
namelijk op het punt om iets af te maken!
Ruim anderhalf jaar geleden besloot ik dat ik maar ergens anders dan in Enschede moest
gaan wonen, stage lopen en afstuderen. Als ik nu terugkijk is alles vanaf dat moment best
snel gegaan. Ik had ineens een kamer in Utrecht (bedankt Gijs en Bas), het contact met TNO
was plots gelegd (bedankt Betsy) en al heel snel zat ik voor het eerst (en voor het laatst in
pak) in Soesterberg om mijn opdracht te bespreken (bedankt Wilfried). Nog iets later moest
ik toch ook nog even met het afdelingshoofd spreken, maar dat is gelukkig helemaal goed
gekomen (bedankt Hajee). Nu zijn stage en afstuderen ineens achter de rug en sluit ik beide
studies waaraan ik ooit ben begonnen in één klap af.
Eigenlijk heeft mijn hele stage- en afstudeertraject best veel overeenkomsten met het
onderzoek in deze scriptie. Een groot deel van mijn onderzoek gaat over samenwerken en de
bijbehorende efficiëntie, effectiviteit en tevredenheid. Het combineren van twee
afstudeeropdrachten heeft ook alles te maken met efficiëntie. Als je daarbij ook nog veel kunt
samenwerken, heeft dat gevolgen voor de effectiviteit. Door iedereen waarmee ik samen heb
mogen werken, ben ik inderdaad erg effectief geweest. Ik heb op allerlei plekken, zelfs in het
buitenland, samengewerkt met mensen met diverse achtergronden en heb daardoor veel
over al die achtergronden geleerd. Ik heb gezien dat die mensen er allemaal verschillende
manieren van samenwerken op nahouden, met hun eigen soorten technische ondersteuning
en heel verschillende uitkomsten. Ook heb ik bevestigd gekregen dat ik juist die verschillen
en dat multidisciplinaire aspect heel prettig vind. Een spin in het web, in de breedte bezig.
Daarbij heb ik precies genoeg vrijheid en verantwoordelijkheid gekregen om overal rond te
kunnen kijken en mijn eigen richting te bepalen, zonder het spoor helemaal bijster te raken.
Ten eerste wil ik daarvoor Wilfried, mijn begeleider bij TNO, bedanken. Voor alle
professionele én persoonlijke aandacht. Ik heb het enorm prettig en leerzaam gevonden om
met hem te mogen werken en heb vooral genoten van de vliegwielwerking van onze
discussies. Ten tweede bedank ik mijn begeleiders van Universiteit Twente, Betsy, Rutger en
Frank. De manier waarop ze mij feedback hebben gegeven, voornamelijk in de vorm van
vragen en niet in kritiek, heeft me erg geholpen om zoveel mogelijk uit dit project te halen.
Daarbij hebben ze heel goed ingeschat wat ik graag wilde bereiken. De tip om mijn
afstudeerdatum uit te stellen en tussendoor mijn hoofd even leeg te maken met een vakantie
is wel het meest waardevol geweest. Ten derde bedank ik mijn ouders voor de onbegrensde
interesse in mijn werk en alles wat dat met mij persoonlijk heeft gedaan. Het was frappant
om te merken dat de overgangen tussen levensfases bij hen en bij mij zoveel op elkaar lijken.
Het was altijd fijn om in de spaarzame momenten dat ik bij ze was even te kunnen luchten.
Stiekem ben ik in mijn verhaal nu al richting tevredenheid gegaan. Ik hoop dat de
tevredenheid van mijn verhaal afstraalt, want ik ben enorm tevreden. Zonder alle mensen
waar ik mee heb mogen samenwerken, al mijn collega’s van TNO, collega’s binnen het AMI
4 / 90
project, vrienden, familie en huisgenoten was dit niet gelukt. Ik wil het opnemen van een al
te lange waslijst van namen graag vermijden, dus ik ga er vanuit dat de juiste mensen zich
wel aangesproken voelen door dit woordje van dank. Speciaal wil ik nog Achiel bedanken
voor het doornemen van mijn hele verslag op raar gebruik van Engels. Daarnaast verdient
Maaike speciale aandacht voor haar inspiratie op het gebied van bananen.
Dit laatste brengt mij nog bij iets wat ik moet opbiechten. Voordat ik daadwerkelijk de
allerlaatste letters typ en deze scriptie echt afmaak, moet me nog iets van het hart voor wat
betreft de titel en voorpagina: Eerlijk gezegd houd ik niet eens zoveel van bananen…
Erwin Elling
Utrecht, 3 augustus 2007

5 / 90
Contents
Summary................................................................................................................................................7
1 Introduction...........................................................................................................................................9
1.1 The AMI Project.....................................................................................................................................9
1.2 Multimodal meeting browsers ..........................................................................................................10
1.3 Motivation and research question ....................................................................................................11
1.4 Outline of research ..............................................................................................................................12
2 Literature study...................................................................................................................................15
2.1 How can we define teams? ................................................................................................................15
2.2 How can we measure and compare the performance of teams?..................................................16
2.3 How can technology improve the performance of teams?............................................................19
2.4 Research question revisited, hypotheses and research framework .............................................24
3 Experimental method ........................................................................................................................29
3.1 Participants...........................................................................................................................................29
3.2 Apparatus.............................................................................................................................................30
3.3 Measures...............................................................................................................................................34
3.4 Experimental conditions ....................................................................................................................36
3.5 Procedure..............................................................................................................................................41
4 Results ..................................................................................................................................................45
4.1 Mental effort.........................................................................................................................................45
4.2 Tool usability .......................................................................................................................................46
4.3 Team factors .........................................................................................................................................48
4.4 Project experiences ..............................................................................................................................49
4.5 Information transfer and outcome....................................................................................................50
4.6 Mapping of results to the research framework...............................................................................51
5 Conclusion and discussion...............................................................................................................53
5.1 Discussion and future research .........................................................................................................55
References............................................................................................................................................59
A Welcome letter, used at TNO, Soesterberg....................................................................................63
B Examples of e-mails with instructions ...........................................................................................65
C Procedure checklist for experimenter.............................................................................................69
D Questionnaires....................................................................................................................................73

6 / 90

7 / 90
Summary
Do you enjoy meetings? Most professionals work in teams and join, but not enjoy, at least
one meeting a day. Time spent in meetings is often perceived as hardly productive. We
should change meetings into effective, efficient, and satisfying events!
Can technology help? A possible way to increase team performance is the use of a
multimodal meeting browser; a system that provides access to information about meetings
that have taken place in the past. These systems are a combination of underlying
technologies based on, for example, speech recognition and automatic annotation of meeting
videos. We have learned from the literature that the support these browsers give and the
way the information in the browser is structured should fit the task that is carried out by the
team. To know how we can use technology to support teams best, we need to find out what
the most ideal combination is.
An experimental comparison. We have created an experimental setup in which teams
prepare and carry out a meeting in a realistic project context. Thirty teams were assigned to
different conditions; a standard present-day office environment, and three kinds of
multimodal meeting browsers that offer different combinations of support and different
types of information structure.
Promising results. Results show an increase in perceived effectiveness, efficiency and
satisfaction of the support, when teams can use a multimodal meeting browser. These effects
differ for the different kinds of browsers. Similar results have been found for the team
process and the outcomes of their teamwork.
3
3,5
4
4,5
5
1 2 3 4Condition
Score (
min
=1
, m
ax=
7)
Effectiveness
Efficiency
Satisfaction
Mean effectiveness, efficiency and satisfaction for conditions with no browser (1), a time-oriented browser (2), a meeting-
oriented browser (3) and a project-oriented browser (4).
Hooray for meetings! The performance of teams in meetings can indeed be increased by
offering technological support, such as multimodal meeting browsers. We have found that
the strength of this effect strongly depends on the way different kinds of support are
combined. The best results are achieved with a maximum task/technology fit and an
information structure that suits the task of the team. With our indications, we can develop
systems that will make the meetings of the future fun and fruitful!

8 / 90

9 / 90
1 Introduction
Most professionals participate in at least one meeting a day. The amount of time spent in
meetings has increased over the past few decades and it is anticipated that this amount will
only rise. It is evident that meetings are an important tool for organisations and employees
for achieving their goals. Many people however, have negative feelings about meetings and
feel that their time spent in meetings is hardly productive and interrupting with more
important tasks (Rogelberg, Leach, Warr, and Burnfield, 2006).
Our research is aimed at finding whether and how technology can help to turn meetings into
more effective, efficient, and satisfying events. The research is part of the Augmented Multi-
party Interaction (AMI) project, which aims at developing new technologies for supporting
human interaction in the context of meetings. In this chapter we discuss the AMI project,
describe the specific type of technology we are concerned with (multimodal meeting
browsers), and further specify the backgrounds of our research.
1.1 The AMI Project
Our research has been carried out within the context of the AMI Project. AMI is a multi-
disciplinary research project, with 15 members that cooperate in researching and developing
the possibilities of augmented group interaction, mainly aiming at business meetings. Both
TNO and the University of Twente are members of AMI.
Research is conducted in several areas such as advanced signal processing, machine learning
models and social interaction dynamics. All of this is focused on gaining knowledge and
creating technologies that will enhance the experience of meetings and enrich corporate
knowledge management systems, enabling enterprise assets to include searchable and
intelligent meeting archives (AMI project, 2007a). “The project aims to enhance the value of
multimodal meeting recordings and to make human interaction more effective in real time. These goals
will be achieved by developing new tools for computer-supported cooperative work and by designing
new ways to search and browse meetings as part of an integrated multimodal group communication,
captured from a wide range of devices.” (AMI project, 2003, p. 1)
AMI’s vision is that employee productivity can be raised to a higher level when changes in
technologies are accompanied by changes in business processes for people to take advantage
of their new tools.
Integrated systems for meeting
interactivity using AMI Corpus
Treatment of audio/video (multimodal) at the meeting level
Standards and tools Audio/speech processingStill and moving image
(video) processing
Figure 1.1 Hierarchy of demonstrators in the AMI project (based on AMI project, 2007b).

10 / 90
The main share of the research within AMI is aimed at the basic technologies that are needed
to automatically augment the meeting experience. “AMI research core building blocks reside in
one of three areas: Audio/Speech Processing, Still and Moving Image Processing and the development
of Standards and Tools for research and development. Based on these components, some
demonstrations illustrate the research underway which spans multimodal inputs and treats the
meeting as an integrated source of knowledge and information. In order to interact and use the
meeting data and metadata, several computer-human interface paradigms are being explored. These
are grouped together as demonstrations of integrated systems for meeting interactivity.” (AMI
project, 2007a). This approach leads to several levels of technology that can be demonstrated,
as can be seen in the hierarchy in Figure 1.1.
1.2 Multimodal meeting browsers
Since the class of integrated systems for meeting interactivity is rather broad, we will now
specify an instance on which we will focus. Of the different types of systems that belong to
this category, we are mainly concerned with the systems that provide access to information
about meetings that have taken place in the past. These systems are generally called meeting
browsers, since they make it possible to glance through a body of meeting information.
Multimodal meeting browsers form the interface for the disclosure of different forms,
different modalities, of meeting information. These browsers offer ways to browse through
multiple modalities, such as audio- and videorecordings, slideshows and handwritten notes.
“[Multimodal meeting browsers enable] a user to navigate around an archive of meetings, efficiently
viewing and accessing the full multimodal content, based on automatic annotation, structuring and
indexing of those information streams. For example, navigation may be enabled using automatic
annotations such as speech transcription, identification of participants, and identification of their
focus of attention at a particular time.” (McCowan et al., 2005)
Tucker and Whittaker (2005) give an overview of current problems and possibilities of
meeting browsers. They distinguish different types of meeting browsers according to the
focus of their presentation and navigation. Specifically, they segregate browsers into those
that are focused on audio or video (perceptual) and those that are focused on non audio-
visual artefacts or elements derived from this raw data (semantic). They further discuss that
a big difference between browsers is found in the elements they use for indexing the
information (e.g. speaker turns, presented slides, key frames, and automatic speech
recognition transcripts).
The most promising form of meeting browsers seems to be the range of browsers that works
with derived data forms (Rienks, 2007). One example of a multimodal meeting browser of
this type is shown in Figure 1.2. It is easily seen that this browser is an integrated system that
is composed of different building blocks that stem from “lower level” research. From left to
right, top to bottom, the browser consists of a kaleidoscopic visualization of who is speaking
about what, the document in focus, the structured speech transcription, an overview of
related documents, video signals, and the audio signal (Lalanne, Sire, Inghold, et al. 2003).
This meeting browser offers synchronous browsing through the different modalities of the
recordings.

11 / 90
Figure 1.2 An example of a multimodal meeting browser (Lalanne, Sire, Inghold, et al., 2003).
1.3 Motivation and research question
As stated before, the majority of research within AMI is aimed at the underlying technology
for integrated systems and mainly has a bottom up approach. From the top down we find
research that is concerned with the user-needs for and the design of integrated systems, such
as multimodal meeting browsers. For example, Whittaker, Laban, and Tucker (2005) have
investigated the current habits and needs of people in meetings by looking at how people
record different types of meeting information and how this affects their individual and
collaborative work in a later stadium. Based on this kind of information, it can be evaluated
in which scenarios technology could be helpful, how well current technology addresses these
needs and what is required to enhance the technological support available to meetings.
According to Tucker and Whittaker (2005) the area of research that is concerned with the
evaluation of the quality of integrated systems has not been addressed sufficiently. One of
the reasons for this is the fact that these systems have mostly been designed to examine the
success of underlying technologies. This makes evaluation of the integrated systems a
secondary concern. Tucker and Whittaker argue that now the technology has reached a
sufficient level of maturity, more attention should go out to evaluations of integrated
systems. An example of work in this area is the Browser Evaluation Test, a method for the
objective, comparable and repeatable assessment of performance of meeting browsers,
developed in the AMI project (Wellner, Flynn, Tucker, & Whittaker, 2005).
Most of the evaluations that have been carried out within AMI aimed at determining the
success of underlying technologies. Post, Cremers, and Blanson Henkemans (2004) point out
that the success of a meeting is better determined from a series of meetings, such as in a
project with a clear goal. As reflected in AMI’s aforementioned vision, in order to raise
employee productivity to another level, changes in technology should be accompanied by
changes in business processes for people to take advantage of their new tools. For these

12 / 90
reasons, it is not enough to evaluate technology by providing individual participants with
tasks without a context. Now that a sufficient level of maturity for the integrated systems has
been reached, we can investigate the use of technology within the processes that belong to a
realistic project context.
Our research focuses on multimodal meeting browsers as an instance of integrated systems
for meeting interactivity. We will determine what the effects of the use of different kinds of
meeting browsers are in project meetings. Since meetings are an effort of multiple
individuals who work together, we wish to study the performance of teams. Our research
question is:
Does the use of multimodal meeting browsers improve team performance in project meetings?
1.4 Outline of research
In order to answer our research question we will present both a literature study and a study
in an experimental setting.
We will present our literature study in Chapter 2, in which we answer three questions by
which we can specify our research question:
• How can we define teams?
• How can we measure and compare the performance of teams?
• How can technology improve the performance of teams?
To do so, we will examine literature in the areas of teams, team performance measurement
and technological support for teams. The insights in how to measure and compare team
performance will lead to a framework for our experimental research. Furthermore, we will
present the different aspects of how technology can support team performance. Based on
this, we can hypothesise about what kind of multimodal meeting browsers will offer the best
team support.
Based on the lessons learned in our literature research chapter we will present three different
multimodal meeting browsers. To research the use of these browsers for meetings within a
realistic project context and thereby check the validity of our hypotheses, we have executed
an experiment. We will describe the different meeting browsers and the further experimental
design in Chapter 3. The results of our experiment will be presented in Chapter 4.
Finally,we will answer our research question and discuss the implications of what we have
found in Chapter 5. In this chapter we will further give recommendations for future work.
A schematic overview of this research approach is given in Figure 1.3.

13 / 90
Hypotheses
(2.5)
Research framework
(2.4)
Experiment
(3 and 4)
Influence of integrated systems
for meeting activity on team
performance in project meetings
(5)
Theory of teams
(2.1)
Theory of team
performance
measurement
(2.2)
Theory of
technological support
for teams
(2.3) Figure 1.3 A schematic overview of our research approach (with corresponding chapter and section numbers).

14 / 90

15 / 90
2 Literature study
In this chapter we will describe the theoretical body for our research. We will discuss
previous research into teams, team performance measurement and technological support for
teams. We will learn about how technology can support teams and how we can measure the
extent to which this affects team performance. Together this will lead to a specification of our
research question and a research framework for experimental research into the effects of
multimodal meeting browsers on team performance. Further, we will present several
hypotheses through which our experimental data can be viewed and interpreted.
2.1 How can we define teams?
An elaborate definition of teams is given by Salas, Dickinson, Converse and Tannenbaum
(1992, pp. 126-127): “A distinguishable set of two or more people who interact dynamically,
interdependently, and adaptively toward a common and valued goal/object/mission, who have each
been assigned specific roles or functions to perform, and who have a limited life span of membership.”
This definition does not only state that a set of people works together with a common goal,
but also in which way they do this.
Groups and teams
The concept of teams is easily confused with the concept of groups. Whereas the
performance of groups is equal to the sum of all individual contributions, teams coordinate
their efforts in order to achieve positive synergy. The main difference is thus found in the
way people work together. Daft (2000, p. 599) states: “Although a team is a group of people, the
two terms are not interchangeable. An employer, a teacher, or a coach can put together a group of
people and never build a team. The team concept implies a sense of shared mission and collective
responsibility.” The goal of groups is mainly to exchange information, while teams aim at a
collective effort. Furthermore, mutual responsibility and a complementary set of skills
distinguish teams from groups (Robbins, 1997). Robbins (1997) states that knowledge of
group processes can be used to contribute to creating teams that perform better or more
effective. In our research we will use knowledge from both areas of research. We will not go
into depths about the differences between groups and teams and regard teams as a special
form of groups.
Individuals, groups and teams
Members of teams do not merely try to achieve their own individual goals; they have shared
goals. The division of labour enables teams to achieve goals that are too complex for any
individual (Cooke, Salas, Cannon-Bowers, Stout, 2000). Though individual decisions do not
suffer from internal power struggles and tend to be faster and less ambiguous with respect to
accountability, there are a lot of situations in which it is more fruitful to work together.
According to Robbins (1997) the information and knowledge generated by groups is
generally more complete and groups have more power to take different perspectives and
assess multiple alternatives. Group decisions are therefore of better quality and final
solutions find a higher rate of acceptance. In general groups are superior in terms of
effectiveness; they produce more alternatives, and make better decisions than individuals.
Groupwork however tends to be less efficient, as the process of taking a decision costs more

16 / 90
time and resources. The decision for working together thus depends on the trade-off
between increases in effectiveness and losses in efficiency (Post, Huis in ‘t Veld, & Van den
Boogaard, 2007).
A team is thus a special kind of group, a set of two or more persons working together. Other
than in a group, members of a team have shared goals, and shared responsibilities. A team
tries to achieve a collective goal, through a collective effort. Working in a group or a team,
compared to individual work, tends to be more effective but less efficient.
2.2 How can we measure and compare the performance of teams?
A lot of research into the performance of teams has already been done. Different models exist
that provide a starting point for developing an understanding of the various factors that may
play a role in team performance (Rasker, 2002). Team research is particularly complex due to
the number of factors that must be considered (Salas, Dickinson, Converse, & Tannenbaum,
1992). This complexity is worsened by heterogeneity in the labelling of similar factors and
the fact that every model seems to identify a new set of factors (Rasker, 2002). A large
amount of the models is based on a division between input factors, process factors and
outcome factors.
Group interaction process
Performance outcomes
Performance quality
Speed of solutions
Numbers of errors
Other outcomes
Member satisfaction
Group cohesiveness
Attitude change
Sociometric structure
Individual level factors
Pattern of members’skills
Members’attitude
Member personality characteristics
Group level factors
Group structure
Level of cohesiveness
Group size
Environment level factors
Group task characteristics
Reward structure
Level of environmental stress
Figure 2.1 Summary of McGrath’s Input-Process-Outcome framework for analyzing group behaviour and performance
(based on Hackman, 1987).
Input-Process-Outcome frameworks
The Input-Process-Outcome framework of McGrath (1984) shows how the input influences
the group interaction process and what outcomes can be expected. Figure 2.1 shows a
summary of McGrath’s framework. McGrath argues that individual-level factors, group-
level factors and environmental-level factors influence the group interaction process, which
in turn influences the outcomes. McGrath and Hollingshead (1994) extend this framework in
their conceptual framework for studying the impact of technology on groups, as found in
Figure 2.2. In this framework they add several variables, such as the input variable of
technology and the variables that constitute the group interaction process. Furthermore, they
introduce the panel of organisational concepts. “These organising concepts and the sets of
variables they subsume, function as a basis for interpretation of how combinations of input factors lead
to changes in process and outcome variables” (McGrath and Hollingshead, 1994, p. 96). The

17 / 90
introduction of this panel makes us aware that particular combinations of input factors lead
to particular types of groups, which in turn have an effect on process and outcome.
Group attributes
Task/ Projects/
Purposes
Technology
Member attributes
Context factors
Groups as
consensus generating
systems
Groups as
information processing
systems
Groups as
vehicles for motivating
& regulating behaviour
User reactions
Task performance
effectiveness
Member relations
Information processing
Participation
Consensus generating
Normative regulation
Input factors Organising concepts Process variables Outcome factors
Figure 2.2 A conceptual framework for studying the impact of technology on groups (based on McGrath & Hollingshead,
1994; Blanson Henkemans, 2004).
In line with the aformentioned work several other frameworks have been developed with
different points of focus. Nunamaker, Dennis, Valacich, Vogel and George (1991), for
example, introduce a model in which the input factors have been divided into group factors,
task factors, context factors and the factor “Electronic Meeting System”. They state that the
input commonalities found in several frameworks generally comprise of group
characteristics, task characteristics, contextual or situational factors and technological factors.
Post, Cremers and Blanson Henkemans (2004) present a “meeting paradigm” that can be
used to generate and measure meeting behaviour, a specific type of teamwork. They state
that meetings should not be considered as isolated events and present a meeting cycle, with
various input variables that largely correspond with the aforementioned input factors, which
influence process and outcome. The previously introduced factor of technology can be found
in their framework as “means”. A model of this framework is shown in Figure 2.3.
Meeting cycle
Distribute
resultsPrepare
Execute
actions
Meet
Process measures
Outcome measures
Methods
Individual
Team
Task
Organisation
Environment
Means
Figure 2.3 Conceptualization of Post, Cremers, and Blanson Henkemans’ “meeting paradigm” (2004). The process and the
outcome of series of meetings depend on several input factors.
18 / 90
We have seen that in general the factors of team performance are divided into input factors,
process factors and outcome factors. Since we want to investigate the effects of multimodal
meeting browsers on team performance, we are mainly interested in the influence of the
input factor of technology on the process and outcome factors.
Factors for measuring process and outcome
Smith-Jentsch, Johnston and Payne (1998) distinguish two types of measures: They state that
both process measures and outcome measures should be taken into account when evaluating
teamwork, in their case for the assessment of training needs. They argue that outcome
measures alone do not specify what aspects of human performance have lead to these
outcomes; outcomes are affected by more than human performance. They reason that it is
possible to stumble upon the right outcome, which makes it possible to reinforce flawed
processes, when feedback to a team is only based on outcome measures. Contrary, it can be
discussed whether the right process does necessarily lead to the right outcome. Nunamaker
et al. (1991) put forward that meeting outcomes such as efficiency, effectiveness and
satisfaction depend upon the interaction of the different input factors that influence the
meeting process. Therefore they state: “[I]t is inappropriate to say that EMS [Electronic Meeting
Systems] use ‘improves group task performance’ or ‘reduces member satisfaction’; all statements must
be qualified by the situation” (Nunamaker et al., 1991, p. 45). It appears that the assessment of
the processes and the outcomes of teamwork can be done separately, but not without taking
the influences of the other factors into account.
Performance measurement scheme
Individual Team
Process Cognitive processes Position specific taskwork skills
Information exchange Communication
Supporting behaviour Team leadership
Outcome
Accuracy Latency
Mission effectiveness
Aggregate latency & accuracy
Figure 2.4 Performance measurement scheme with examples of factors for individual outcomes, individual processes, team
outcomes and team processes (based on Smith-Jentsch et al., 1998).
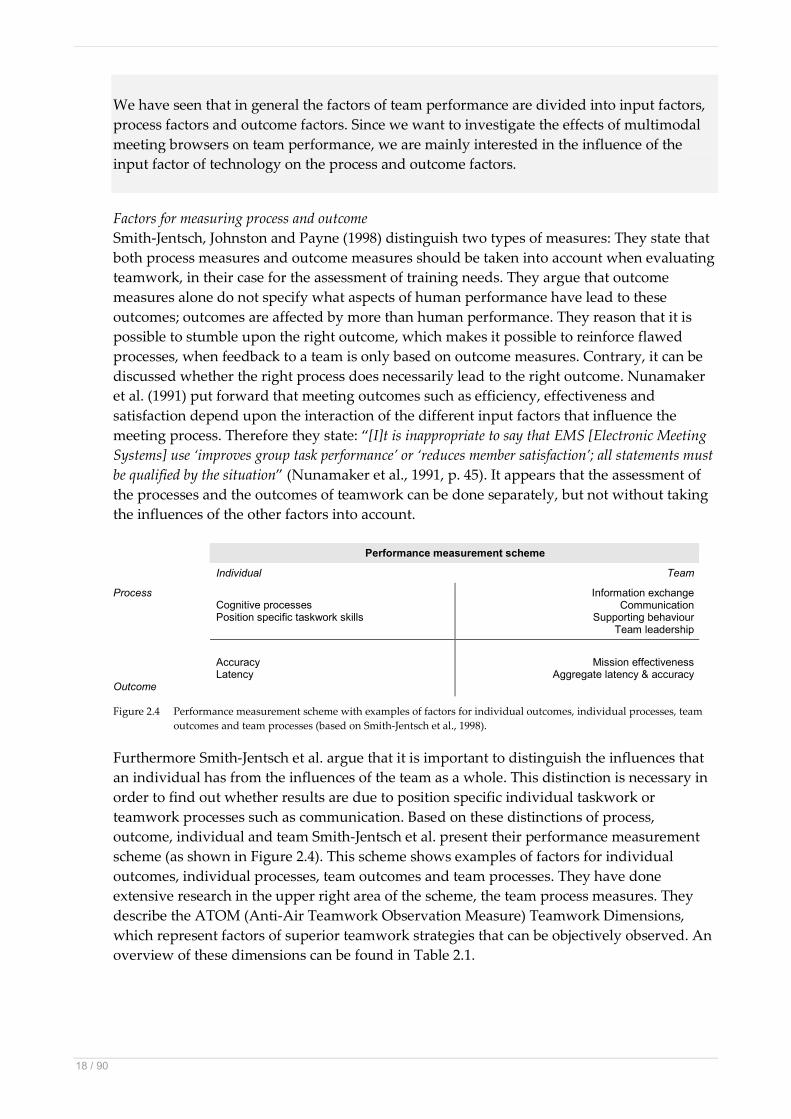
Furthermore Smith-Jentsch et al. argue that it is important to distinguish the influences that
an individual has from the influences of the team as a whole. This distinction is necessary in
order to find out whether results are due to position specific individual taskwork or
teamwork processes such as communication. Based on these distinctions of process,
outcome, individual and team Smith-Jentsch et al. present their performance measurement
scheme (as shown in Figure 2.4). This scheme shows examples of factors for individual
outcomes, individual processes, team outcomes and team processes. They have done
extensive research in the upper right area of the scheme, the team process measures. They
describe the ATOM (Anti-Air Teamwork Observation Measure) Teamwork Dimensions,
which represent factors of superior teamwork strategies that can be objectively observed. An
overview of these dimensions can be found in Table 2.1.

19 / 90
Table 2.1 The four ATOM Teamwork Dimensions (Smith-Jentsch et al., 1998)
Teamwork dimension Definition
Information exchange
Seeking information from all available sources; Passing information to the appropriate persons before being asked; Providing “big picture” situation updates.
Communication
Using proper phraseology; Providing complete internal and external reports; Avoiding excess chatter; Ensuring communication is audible and ungarbled.
Supporting behaviour
Correcting team errors; Providing and requesting backup or assistance when needed.
Team initiative/ leadership
Providing guidance or suggestions to team members; Stating clear team and individual priorities.
As we have seen in this section, team performance can be and has been measured in different
ways by different researchers. In a meta study Dennis, Wixom and Vandenberg (2001) define
the construct of effectiveness, efficiency and satisfaction, which has been proven to be a
reasonable set of outcome factors for team performance in several other studies and is a
widely used combination of factors in, for example, usability research.
Working in groups, as mentioned before, depends on the trade-off between increases in
effectiveness and losses in efficiency. Daft (2000) mentions that besides the productive output
of a team (the quality and quantity of task outputs as defined by team goals), team
effectiveness is related to personal satisfaction, i.e. “the team’s ability to meet the personal needs
of its members and hence maintain their membership and commitment” (Daft, 2000, p. 599).
Rogelberg, Leach, Warr and Burnfield (2006) study the effect of meetings on job attitudes and
well-being. They show that meeting effectiveness has a positive effect on job-related comfort,
job-related enthusiasm, job satisfaction and perceptions of productivity. Satisfaction is a
legitimate objective of an organisation and organisations have a responsibility towards their
employees to provide them with intrinsically rewarding jobs. Therefore, besides
effectiveness and efficiency, participants should be satisfied with the process and the
outcomes of a meeting (Post, Huis in ‘t Veld, and Van den Boogaard, 2007).
We have seen that besides the factor of technology there are a lot of other input factors that
influence the factors of process and outcome. When evaluating teamwork, both process and
outcome measures should be taken into account. Additionaly, we should distinguish
between the influence of the individual and the influences of the team as a whole. In order to
properly draw conclusions in this area of research, all statements about the performance of a
team must be qualified by their situation. Finally, team performance is often split up into the
construct of effectiveness, efficiency and satisfaction in order to make this abstract concept
somewhat more tangible and measurable.
2.3 How can technology improve the performance of teams?
Technological support for teams can be found in many flavours and under a multitude of
labels. People speak of groupware, meeting means, computer supported cooperative work,
electronical meeting systems, group support systems and so forth. To avoid confusion, we
will use “technological support for teams” as an overlapping term. We will first achieve a
better understanding of the potential influence of general technological support on team

20 / 90
performance and apply this knowledge to the specific example of multimodal meeting
browsers later.
Different situations and different kinds of support
One way of classifying the types of technological support for teams is a classification by
synchrony of communication (time) and geographical distribution (space). Johansen (1998)
has introduced the much used time-space matrix. This matrix helps classification of
technological support from a user’s perspective. A time-space matrix filled with some
examples can be found in Table 2.2.
Table 2.2 A time-space matrix for classification of computer-supported meeting systems, filled with several examples
(McCowan et al 2005; Johansen, 1988).
Time-space matrix
Co-located (same place) Remote (different places)
Synchronous communication (same time)
Face to Face Interactions e.g., smart meeting rooms
Remote Interactions
e.g., chat, teleconferencing’
Asynchronous communication (different times)
Ongoing tasks e.g., message boards, team rooms
Communication and Coordination
e.g., e-mail, news groups
Besides this classification from a user’s perspective, it is important to distinguish between the
types of support the system should offer. To answer this question, Nunamaker et al. (1991)
start off with a look at the gains and losses of a group process. A non-exhaustive overview of
possible group process gains and losses is given in Table 2.3.
Table 2.3 Some important group process gains and losses (derived from Nunamaker et al., 1991)
Common Process Gains
More information A group as a whole has more information than any one member.
Synergy A member uses information in a way that the original holder did not, because that member has different information or skills.
More objective evaluation Groups are better at catching errors than are the individuals who proposed ideas.
Common Process Losses
Failure to remember Members lack focus on communication, missing or forgetting the contributions of others.
Cognitive inertia Discussion moves along one train of thought without deviating because group members refrain from contributing comments that are not directly related to the current discussion.
Information overload Information is presented faster than it can be processed.
Coordination problems Difficulty integrating members’ contributions because the group does not have an appropriate strategy, which can lead to dysfunctional cycling or incomplete discussions resulting in premature decisions.
Incomplete use of information Incomplete access to and use of information necessary for successful task completion.
Incomplete task analysis Members lack focus on communication, missing or forgetting the contributions of others.
They then go on to identify four theoretical mechanisms by which technological support for
teams can affect the balance between these gains and losses (as can be found in Table 2.4).
These four mechanisms are the fundamental means by which technological support for
teams affect meetings. A multitude of similar labellings and classification schemes exists.
McGrath and Hollingshead (1994), for example, distinguish Group (Internal)
Communication Support Systems (GCSS), Group External Communication Support Systems
(GXSS), Group Information Support Systems (GISS) and Group Performance Support
21 / 90
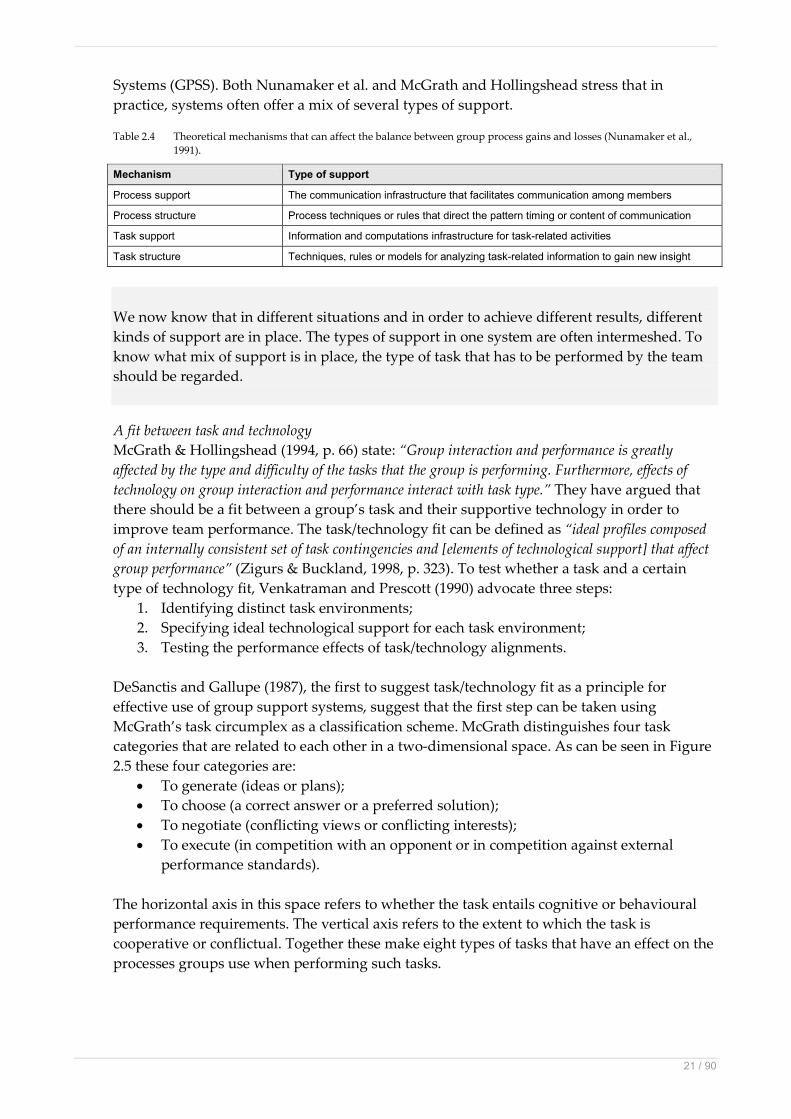
Systems (GPSS). Both Nunamaker et al. and McGrath and Hollingshead stress that in
practice, systems often offer a mix of several types of support.
Table 2.4 Theoretical mechanisms that can affect the balance between group process gains and losses (Nunamaker et al.,
1991).
Mechanism Type of support
Process support The communication infrastructure that facilitates communication among members
Process structure Process techniques or rules that direct the pattern timing or content of communication
Task support Information and computations infrastructure for task-related activities
Task structure Techniques, rules or models for analyzing task-related information to gain new insight
We now know that in different situations and in order to achieve different results, different
kinds of support are in place. The types of support in one system are often intermeshed. To
know what mix of support is in place, the type of task that has to be performed by the team
should be regarded.
A fit between task and technology
McGrath & Hollingshead (1994, p. 66) state: “Group interaction and performance is greatly
affected by the type and difficulty of the tasks that the group is performing. Furthermore, effects of
technology on group interaction and performance interact with task type.” They have argued that
there should be a fit between a group’s task and their supportive technology in order to
improve team performance. The task/technology fit can be defined as “ideal profiles composed
of an internally consistent set of task contingencies and [elements of technological support] that affect
group performance” (Zigurs & Buckland, 1998, p. 323). To test whether a task and a certain
type of technology fit, Venkatraman and Prescott (1990) advocate three steps:
1. Identifying distinct task environments;
2. Specifying ideal technological support for each task environment;
3. Testing the performance effects of task/technology alignments.
DeSanctis and Gallupe (1987), the first to suggest task/technology fit as a principle for
effective use of group support systems, suggest that the first step can be taken using
McGrath’s task circumplex as a classification scheme. McGrath distinguishes four task
categories that are related to each other in a two-dimensional space. As can be seen in Figure
2.5 these four categories are:
• To generate (ideas or plans);
• To choose (a correct answer or a preferred solution);
• To negotiate (conflicting views or conflicting interests);
• To execute (in competition with an opponent or in competition against external
performance standards).
The horizontal axis in this space refers to whether the task entails cognitive or behavioural
performance requirements. The vertical axis refers to the extent to which the task is
cooperative or conflictual. Together these make eight types of tasks that have an effect on the
processes groups use when performing such tasks.

22 / 90
Negotiate
Generate
Choose Execute
I I
IIII
III III
IVIV
Creativity
tasks
Intellective
tasks
Judgment
tasks
Cognitive
conflict
tasks
Planning
tasks
Psychomotor
tasks
Contests/
battles
Mixed-
motive
tasks
Cognitive Behavioral
Collaborate
Coordinate
Conflict-Resolution
Figure 2.5 Group task circumplex (based on McGrath, 1984).
Though the task circumplex has been used extensively, Zigurs and Buckland (1998) identify
that research in this area is subject to more than one interpretation and that outcomes are
often conflicting. This might be due to the fact that tasks can often be classified in multiple
categories. They furthermore argue that prescriptions based on the circumplex have not been
tested in a systematic way across different types of technologies. Also, theories of
task/technology fit that are based on the circumplex address concepts that are too broad to
formulate specific fit prescriptions.
Since a consistent theoretical model of fit is missing, Zigurs and Buckland present their own
theory for task/technology fit, based on attributes of task complexity. In section 2.1 we
already found that it is not only important what a team does, but also how they do this.
Zigurs and Buckland (1998, p. 316), in line with Campbell (1988) define a group task as “the
behaviour requirement for accomplishing stated goals, via some process, using given information [in a
group]” Besides focusing on characteristics of the task (the task qua task approach) they
acknowledge that the characteristics define what is to be accomplished and how this should
be accomplished (the task behaviour requirements approach). They focus on the central
importance of complexity of both process and outcomes of task performance. According to
Campbell this is directly related “[…] to the task attributes that increase information load,
diversity, or rate of change” (Zigurs & Buckland, 1998, p. 317). The levels of load, diversity and
rate of change indicate the level of cognitive demands, which in turn indicates the level of
complexity.
To determine the complexity of a task Zigurs and Buckland define four basic attributes that
make up the complexity level of a task: outcome multiplicity, solution scheme multiplicity,
conflicting interdependence, and solution scheme/outcome uncertainty. The dimension of
outcome multiplicity refers to tasks which have more than one desired outcome. As each
outcome requires a separate information processing stream and as the solution should be
evaluated against the criterions of every outcome, this increases information load and
information diversity. One can speak of solution scheme multiplicity when there is more
than one possible course of action to attain a goal. The existence of alternative ways to reach
a goal increases information load, because one must consider multiple elements and their
best configuration (e.g. a game of chess). The dimension of conflicting interdependence refers
to situations in which the adoption of one solution scheme conflicts with adopting another

23 / 90
solution scheme, when outcomes are in conflict (e.g. quality vs. quantity) and when
information is in conflict. The final dimension, solution scheme/outcome uncertainty, defines
the amount of certainty about whether a given solution scheme will lead to a desired
outcome. Different combinations of these dimensions have been aggregated into five
categories of tasks, as can be found in Table 2.5.
Table 2.5 Aggregated task categories (adapted from Campbell, 1988: in Zigurs and Buckland, 1998).
Simple Tasks Problem Tasks Decision Tasks Judgment Tasks Fuzzy Tasks
Outcome Multiplicity No No Yes No Yes
Solution Scheme Multiplicity
No Yes No No Yes
Conflicting Interdependence
No Yes or no Yes or no Yes or no Yes or no
Solution Scheme/ Outcome Uncertainty
Not applicable Low to high Low to high Low to high Low to high
Primary characteristics
Single outcome and solution scheme
Solution scheme multiplicity
Outcome multiplicity
Conflicting interdependence or uncertainty
Joint presence of outcome multiplicity and solution scheme multiplicity
As stated before, technology can be (and has been) characterised from many different
perspectives. In their theory, Zigurs and Buckland identify three particularly important types
of support: communication support, process structuring and information processing.
Examples of elements of these dimensions can be found in Table 2.6. According to Dennis,
Wixom and Vandenberg (2001) these dimensions have evolved from three of the four
mechanisms of Nunamaker et al. (as already shown in Table 2.4) and have been named
differently due to our evolving understanding of each. They point out that communication
support has evolved from process support, information processing support has evolved from
task structure and that process structure still goes under the same label. Although they do
not comment on Nunamakers’ mechanism of task support, we find the elements of this
mechanism in the dimension of information processing support.
Table 2.6 Examples of elements for the dimensions of technological support for teams that are commonly provided in
exisiting systems that offer technological support for teams (based on Zigurs & Buckland, 1998; Zigurs, Buckland,
Connolly, & Wilson, 1999).
Dimension Examples of elements
Communication Support Simultaneous input; Anonymous input; Input feedback; Group display.
Process Structuring Agenda setting; Agenda enforcement; Complete record of group interaction.
Information Processing Gather information; Share information; Aggregate information; Evaluate information; Structure information (e.g. allocation, stakeholder analysis, multi attribute utility analysis, cross-impact analysis).
Zigurs and Buckland state that an appropriate task/technology fit should result in higher
performing groups, in terms of i.e. efficiency, outcome quality and process quality. The final
step of their theory can be found in Table 2.7 in which several fit profiles are presented.
According to Zigurs and Buckland, several of the individual elements of the task categories,

24 / 90
as seen in Table 2.5 imply particular types of support. For example, outcome multiplicity
implies a need for processing support and conflicting interdependence implies
communication support. Combinations of these elements imply a specific combination of
support as is suggested in Table 2.7. This table summarised the prescriptions for the
task/technology fit theory, however the authors realise that the terms “low, medium and
high” are an approximation. Although Zigurs and Buckland provide every fit profile with
examples from existing research, they discuss that some of the propositions are based on
very little prior research. More recent studies (such as Zigurs, Buckland, Connolly, and
Wilson, 1999) provide more support for their theory.
Table 2.7 Fit profiles: Task categories and the level of support they require of each dimension of technological support (based
on Zigurs & Buckland, 1998).
Simple Task Problem Task Decision Task Judgment Task Fuzzy Task
Communication support High Low Low High High
Process structuring Low Low High Low Medium
Information processing Low High High High High
We have found a way to determine what kind of cooperation and task we are dealing with,
what kind of support is suitable for this kind of task and of what elements each of the
dimensions of support can comprise. Furthermore, we can now hypothesise about what
process gains and losses will be affected by a certain mix of support, whether there is a
task/technology fit and if an increase in team performance is probable.
2.4 Research question revisited, hypotheses and research framework
In Chapter 1 we formulated the following research question:
Does the use of multimodal meeting browsers improve team performance in project meetings?
In the previous sections we have learned that in order to correctly draw conclusions in this
area of research, all statements must be qualified by their situation, such as the type of team,
and the type of task they perform. Within AMI we focus on small teams in design projects,
which somewhat further specifies our scope. With respect to the time/space matrix, in line
with the focus of AMI and the practice of everyday business, our research concentrates on
the use of meeting browsers in co-located, real-time meetings and the remote, individual
preparation of these meetings. Furthermore we have learned that team performance can be
split up into the construct of effectiveness, efficiency and satisfaction in order to make this
abstract concept somewhat more tangible and measurable. Based on these new insights we
can now concretise our research question:
Does the use of multimodal meeting browsers, in co-located, real-time design project meetings and the
remote individual preparation of these, improve team performance of small teams in terms of
effectiveness, efficiency and satisfaction?

25 / 90
To answer this question however, the literature study alone does not suffice. Based on the
information we have gathered from literature, we can generate hypotheses and construct a
research framework. The framework can be used to setup and examine the results of an
experiment in which our hypotheses can be validated. Together with the answers that we
have found in the literature study, this might give a satisfying answer to the research
question. To do so, we will follow the steps of Venkatraman et al. as presented in section
2.3.We will first determine what kind of task we are dealing with and then specify the type
of support that is needed. This will lead to hypotheses that will be verified by carrying out
the third step; testing the team performance in an experiment.
The task environment
When trying to determine the task type of design according to the Task Circumplex of
McGrath, it becomes clear it can be classified in multiple categories, as Zigur and Bucklands’
remarks suggest. In this case, it turns out that the task of design is essentially a combination
of tasks and should therefore indeed be classified in multiple categories. For example, due to
its creative aspects, design fits the Generate quadrant. Since the product under design is
probably subject to requirements that might conflict (e.g. cost vs. quality) it also fits the
Negotiate quadrant. This makes it hard to formulate specific fit prescriptions.
When looking at the four attributes for task complexity and the task categories of Zigurs and
Buckland, as presented in Table 2.5, design can be classified as a fuzzy task. The primary
characteristic of joint presence of outcome multiplicity and solution scheme multiplicity can
be recognised. Design is subject to outcome multiplicity as the outcome of design is mostly
subject to evaluation by different stakeholders with different criteria. Solution scheme
multiplicity can be found as there are multiple ways to explore the problem space and find a
solution. Furthermore, in many cases there will be conflicting interdependence and solution
scheme/outcome uncertainty.
The technological support
Looking at the fit profiles in Table 2.7 and having classified design as a fuzzy task, the
technology to support this task should incorporate a high level of communication support, a
medium level of process structuring and a high level of support in information processing.
That is, these amounts of support would yield the best fit between task and technology and
would therefore aid the team that carries out this task best.
As we have presented, meeting browsers are aimed at giving insight into the information
that stems from meetings that have taken place in the past. Therefore, meeting browsers
mainly give support for information processing. They make it easier to, for example, gather
and aggregate information, by providing a structured overview (elements of support as
already shown in Table 2.6). Referring to the general process gains and losses in Table 2.3,
this could, for example, increase the amount of information that is found by the group, make
it easier to remember forgotten pieces of information and decrease chances of information
overload.
Especially the stucture of information is important here, since it can have many forms and as
with task/technology fit in general, it depends on the type of task what structure is in place.
Earlier work within AMI already shows several attempts to design browsers that offer task-
oriented support (Cremers & Hilhorst, 2005; Cremers, Groenewegen, Kuijper, & Post, 2007)
and the necessary underlying data structures (Elling, 2007).User research has pointed out

26 / 90
what meeting-related information is found most important. A meeting browser that
structures information based on this knowledge, i.e. structuring in line with the most
important concepts from the meeting context, could provide better assistance with respect to
information processing. Whittaker, Laban, and Tucker (2005) argue that current meeting
browsers are highly focused on single meetings and are, therefore, poorly placed to support
the collection of data from a long-term series of meetings. They conclude that future meeting
browsers should supply more possibilities to perform a higher level analysis on a series of
meetings, for example, tracking the progress of a task assigned in one meeting over a series
of meetings. In other words, a meeting browser that structures information in line with the
most important concepts from the project context could provide even better assistance. Punte
and Hamel (2004) state that designers move through the so called problem space of design
activities in order to find a solution to a certain problem. They argue that it is impossible for
a designer to have the whole problem space in his or her active memory due to the
complexity of design and that parts of the problem space can be stored in external memory.
Meeting browsers could fulfull this function of external memory. Apart from the concepts
from the meeting or the project context, knowledge of the way a designer thinks and works
might lead to even better task-oriented assistance.
Meeting browsers can offer some process structuring by giving an overview of what steps in
the process have already been carried out and what steps should still be taken. Just as
support for information processing, this can be implemented in a task-oriented manner. A
simple example of this is a list of actions that have been performed in one meeting and still
have to be performed later (to-do’s), or in the case of a more project-oriented meeting
browser, an overview of project phases and the current status of the project. These could be
used to determine important items for the agenda of a new meeting. The most saillant
example of process structuring as given in Table 2.6, in multimodal meeting browsers is the
availability of complete records of group interaction. These records form the basis for the
multimodal meeting browsers. Again, referring to Table 2.3 this could lead to less failure to
remember and a more complete task analysis, as every part of past group interaction can be
reviewed at any time.
The form of multimodal meeting browsers we focus on does not directly offer
communication support. Interestingly however, a meeting browser can bring a certain
amount of asynchronity into a real-time meeting, by giving direct access to information from
the past. If we want to achieve a real fit, further means for communication support such as a
group display that can be offered by every member of the group should be offered in
addition to the meeting browser. The use of a meeting browser on such a group display
might make it easier to ensure that every group member is talking about the same pieces of
information and not deviating too much, which deminishes changes of cognitive intertia. A
meeting browser used as a group, instead of individually, in combination with other means,
might lead to a greater amount of support for communication.

27 / 90
Hypotheses
Based on the previously discussed matters, we present the following hypotheses:
Hypothesis 1:
The use of a multimodal meeting browser that reaches low task/technology fit will yield a
higher increase in effectiveness, efficiency and satisfaction of teamwork than a situation
without the use of such a browser.
Hypothesis 2:
The use of a multimodal meeting browser that reaches high task/technology fit will yield a
higher increase in effectiveness, efficiency and satisfaction of teamwork than the use of a
multimodal meeting browser that reaches low task/technology fit.
Hypothesis 3:
The use of a multimodal meeting browser that reaches high task/technology fit and offers a
suitable task-oriented information structure will yield a higher increase in effectiveness,
efficiency and satisfaction of teamwork than the use of a meeting browser that reaches low
task/technology fit and than a meeting browser that does not offer suitable task-oriented
information structure.
Research framework
We will validate our hypotheses in an experimental setting in line with Post, Cremers and
Blanson Henkemans (2004) who have defined a research environment for generating and
measuring meeting behaviour. Post, Cremers and Blanson Henkemans have suggested that
this experimental setting can be used to compare different meeting means, by providing
similar teams with the same task, but different technological support. We use an instrument
to evaluate meeting support tools in this environment by Post, Huis in ‘t Veld and Van den
Boogaard (2007). This instrument includes a framework based on the previously introduced
Input-Process-Outcome model as shown in Figure 2.6 and makes it possible to measure the
different factors.
Figure 2.6 Framework for studying meeting behaviour (Post, Huis in ‘t Veld, & Van den Boogaard, 2007)

28 / 90
We have learned that we need to regard both the process and the outcomes in order to make
a rightful assessment of the team performance. Since we are mainly interested in team
performance, we will only use the factors aimed at determining effectiveness, efficiency and
satisfaction. Although effectiveness, efficiency and satisfaction are mostly regarded as
outcome factors, we will use input variables, as well as process and outcome variables to
assess the differences in effectiveness, efficiency and satisfaction. As input measures we have
added the factors of tool effectiveness, efficiency and satisfaction, by which we measure the
perceived usability of the technological support in every situation. The rest of the factors are
more focused on the effects of this technological support in the rest of the team process and
on the outcomes of this process.
In section 2.2 we have found that it is best to distinguish individual influences from the
influences from the team as a whole. Our experiment will be split up in a part that is carried
out individually, the individual preparation and in a part that requires a team effort, the
actual meeting. For both of these parts we will collect individual measures, which we can
aggregate to measures of the team as a whole by combining the data from all team members.
Our research framework is shown in Table 2.8.
Table 2.8 Research framework
Input Process Outcome
Tool effectiveness Information transfer Information processing
Information outcome Team effectiveness Effectiveness
Tool efficiency Mental effort Work pace
Team efficiency
Efficiency
Tool satisfaction Process satisfaction
Outcome satisfaction Team satisfaction Satisfaction
As stated before, the meeting browsers form an interface for the disclosure of meeting
information. We are interested in how well the right information can be gathered,
transferred, combined and used by the teams with the different meeting browsers.
Consequently, we will mainly focus on the dimensions of information exchange as
distinguished by Smit-Jentsch et al. (1998), or the information processing dimension as
distinguished by Zigurs and Buckland (1998). In our experiments we can control the
information that can be found in the browsers and thus track and trace what parts of the
information have been found and used. In our research framework, as depicted in Table 2.8,
this can be found as the variable of information transfer in the process column and the
variable of information outcome in the outcome column. Together with the outcome variable
team effectiveness this will form our effectiveness measures.
We have shown that the complexity of a task is related to the information load, diversity and
rate of change. We are interested in the amount of mental effort that is needed for a task with
different kinds of technological support. The mental effort will therefore be one of the
variables for our efficiency measure. Additionally, we will use tool efficiency, work pace and
team efficiency as measures for efficiency.
Finally, our satisfaction measures comprise the variables of tool satisfaction, process
satisfaction, outcome satisfaction and team satisfaction.

29 / 90
3 Experimental method
An experiment was set up to compare meetings with and without multimodal meeting
browser support. For a better understanding of what form of support might work best four
conditions were examined; three variants of a multimodal meeting browser and a condition
without a browser were part of the comparison. We manipulated the input variables by
providing different teams with different meeting browsers or no meeting browser at all and
measured whether and to what extent the process and the outcome variables differed. The
experiments took place at TNO in Soesterberg, The Netherlands and at the University of
Edinburgh, Scotland.
In this chapter we will take a look at our participants, apparatus, measures, experimental
conditions and the procedure. Parts of this chapter can also be found in Post, Elling, Cremers
and Kraaij (2007), Cremers, Post, Elling et al. (2007), and Post and Elling (2007) in which we
have shortly described the experiment and some preliminary results of our analysis.
3.1 Participants
A total of 152 participants (38 teams of four) were recruited by TNO and the University of
Edinburgh. Our final sample consisted of 120 participants (30 teams of four). The data from
24 participants (six complete teams) was dropped, as the runs in which they participated
were used as pilots. The data from eight participants (two complete teams) who suffered too
many technical or personal problems to deliver any meaningful data was dropped as well.
The teams in our final sample were assigned to the four conditions (which we will discuss in
section 3.4) and divided over the two locations as shown in Table 3.1.
Table 3.1 Divisions of teams (and participants) over conditions and locations.
Condition 1 Condition 2 Condition 3 Condition 4
TNO, Soesterberg 3 (12) 2 (8) 2 (8) 4 (16)
University of Edinburgh 5 (20) 5 (20) 5 (20) 4 (16)
Total 8 (32) 7 (28) 7 (28) 8 (32)
Most of the recruited participants in Soesterberg were undergraduate students of the
University of Utrecht, who participated in the experiment as a part of a course into computer
supported work. The group in Soesterberg was totalled by students with varying
backgrounds. All participants in Soesterberg were native Dutch speakers. The participants in
Edinburgh were recruited mainly from the university’s graduate students and staff. Two
third (66%) of the participants in Edinburgh were native English speakers, mainly from the
United Kingdom (47%) and the United States (12%). The rest were of varying mother tongue.
The mean age of our 120 participants was 23 years old (with a standard deviation of six
years), 57% were male and 43% female. Almost all participants were students (97%), the rest
was staff of the Universtiy of Edinburgh. Most of the participants were students of computer
science, information science or informatics (50%), 15% were students of psychology, 7% of
philosophy and the rest of varying or unspecified studies.

30 / 90
Nearly all (99%) of our participants use the computer and the internet (both for browsing the
internet and for email) on a daily basis, all of them on at least a weekly basis. Most of our
participants (62%) chats daily and 48% uses their computer to search for multi-media content
daily.
Almost half (47%) of our participants stated that they participate in meetings on a weekly
basis or more, the rest on a monthly basis (37%), or never (14%). Being offered a choice
between no, hardly any, average, and a lot of experience, 37% stated they have hardly any
experience with working in project teams and 46% has average experience. The rest has
either no (11%) experience or a lot (7%) of experience. The majority of the participants has no
(42%) or hardly any (31%) experience in product or service development. The rest has
average (22%) or a lot of (5%) experience.
All of them were paid €45.- for about 4 hours of work.
3.2 Apparatus
As mentioned before, we wish to do research into the use of meeting browsers within a
realistic project context. In the previous chapter we have seen that the success of a meeting is
better determined from a series of meetings, such as in a project with a clear goal.
Furthermore, we have learned that the success of a meeting, or a project, depends not only
on the means used (e.g. a meeting browser), but also on, for example, project or meeting
method, individual factors, team factors, type of task, organisational culture, environment.
These factors have been specified and are controlled in the following experimental scenario,
based on the research environment as presented by Post et al. (2004).
Table 3.2 Role descriptions of the design team (based on Van den Boogaard, 2004).
Role descriptions:
Project manager (PM) Coordinates the project and is overall responsible; Should guarantee the project is carried out with limits of time and budget; Act as chair of the project, makes and distributes minutes and a final report.
Industrial designer (ID) Responsible for the working, components and look-and-feel design.
User interface designer (UID) Responsible for the technical functions, user interface and look-and-feel design.
Marketing expert (ME) Responsible for user requirements, trend watching and product evaluation.
Four participants take part in a small design team, playing a specific role (see Table 3.2).
They are invited by the management of their company “Real Reaction” to take over a design
project from a team of which the progress was dissatisfying. A realistic context is provided
by simulated input from their organisation and from the market (Figure 3.1). The simulated
project itself is divided into four phases of which the first three have been carried out in three
meetings by the substituted team (Project Kick-off, Functional Design Phase, and Conceptual
Design Phase). The new team has to prepare and carry out a real time co-located meeting in
which they have to finish the final project phase (Detailed Design Phase) and come up with
the design of a television remote control. (An overview of these project phases in our
experimental procedure can be found in Figure 3.2.) The participants are provided with
information about the previous team and the materials this team had produced. The team is
forced to reconsider decisions that have been made by the substituted team and backtrack on
how these decisions were reached. In every condition this information can be accessed with a
different form of technological support; as mentioned before, we tested three kinds of
multimodal meeting browsers and a situation without such a browser.

31 / 90
Market
(simulated)
Innovation Trends
Target groups User requirements
Organisation
(simulated)
Account manager Personal coach
Head of department Training Services
Design team
(real life)
PM ME
ID UID
Figure 3.1 Realistic context of the design project (based on Post, Blanson Henkemans, Van den Boogaard, and Van Verseveld,
2005).
Both preparation and execution of the meeting is carried out in meeting rooms at TNO in
Soesterberg (Figure 3.3) and at the University of Edinburgh. These well instrumented
research environments for four participants provide the participants with individual
workplaces (including a private computer), a shared workplace (including electronic
presentation boards), and, depending on the experimental condition, a particular kind of
technological support.
The materials from the substituted team stem from previous research within AMI (Post, Huis
in ‘t Veld and Van den Boogaard, 2007; Van den Boogaard, 2004). Teams in this research had
to carry out all of the aforementioned project phases. We picked the materials of the team
that acted most natural and of which all of the materials was available. Furthermore, video
and audio recordings and corresponding annotations of this team’s interactions were
suitable for use in all of our conditions.
The participants of our experiment and their (computer) interactions are observed and
recorded by means of video cameras, microphones, and registrations of their computer
screens. Participants receive e-mails about the tasks to carry out (sent by a virtual head of the
department) and some hints (sent by a virtual coach). Examples of these e-mails can be found
in Appendix B. Additionaly, they receive a series of questionnaires and rating scales on
which we will comment in the next section. The experimenter controls the scenario by
manually sending these e-mails. The e-mails are sent on pre-planned points in time,
according to the scheme in Appendix C, in order to have the same time constraints in all
experiments, all conditions and on both locations. The observers and the experimenter are
able to observe the team remotely and to give guidance in case of technical problems (Figure
3.4). Because of being remotely stationed and having standardised e-mails that are sent
according to the aforementioned scheme, experimenter-bias is reduced to a minimum.
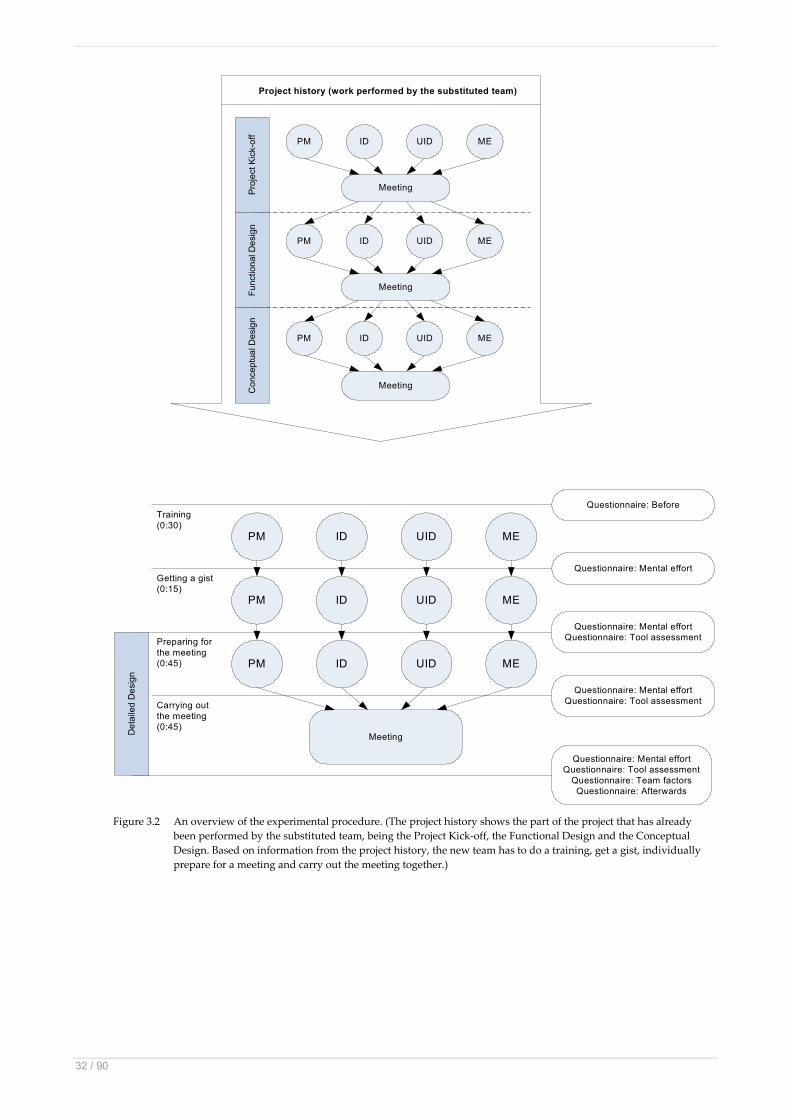
32 / 90
Meeting
PM ID UID ME
PM ID UID ME
PM ID UID ME
Getting a gist
(0:15)
Training
(0:30)
Preparing for
the meeting
(0:45)
Carrying out
the meeting
(0:45)
Questionnaire: Mental effort
Questionnaire: Mental effort
Questionnaire: Tool assessment
Questionnaire: Mental effort
Questionnaire: Tool assessment
Questionnaire: Mental effort
Questionnaire: Tool assessment
Questionnaire: Team factors
Questionnaire: Afterwards
Meeting
PM ID UID ME
Meeting
PM ID UID ME
Meeting
PM ID UID ME
Project history (work performed by the substituted team)
Questionnaire: Before
De
taile
d D
esig
n
Pro
ject K
ick-o
ffF
unction
al D
esig
nC
onceptu
al D
esig
n
Figure 3.2 An overview of the experimental procedure. (The project history shows the part of the project that has already
been performed by the substituted team, being the Project Kick-off, the Functional Design and the Conceptual
Design. Based on information from the project history, the new team has to do a training, get a gist, individually
prepare for a meeting and carry out the meeting together.)

33 / 90
Figure 3.3 Research environment called “Team Cockpit”. On the left, not shown, is a large shared presentation screen. The
participants are discussing a clay prototype remote control.
Figure 3.4 The observers’ and experimenters’ view of the research environment. The large display shows the four
participants’ computer interactions. The display on the left shows a video stream of the team, not recognizable on
this picture.

34 / 90
3.3 Measures
Parts of the evaluation instrument that we use for measuring the project input, process and
outcome variables are based on Post, Huis in ‘t Veld and Van den Boogaard (2007) and Van
den Boogaard (2004).That way we make sure that our evaluation instrument is composed of
questionnaires that have all been used in a comparable experiment, and moreover that they
have been validated. The instrument addresses more factors than we will use in our research.
These additional measures will be taken, in order to collect data for future research.
Most of the factors from our framework in Table 2.8 are measured through questionnaires.
Figure 3.2 shows the moments in time these questionnaires are taken. All questionnaires are
taken once, except for the questionnaire mental effort and the tool assessment which are
repeated measures of respectively four and three times. All questionnaires are filled out
individually by all participants. An overview of the measurements per questionnaire is
provided in Table 3.3. This table also shows several examples of the questions that were
asked.
In order to measure how much effort it took to finish every part of the experiment, the Rating
Scale Mental Effort (RSME) is used in the questionnaires for mental effort. The RSME is a
translation of the Dutch “Beoordelings Schaal Mentale Inspanning” (BSMI) (De Waard, 1996;
Van den Boogaard, 2004). The scale ranges from “absolutely no effort” (0) to “extreme effort”
(150). The participants are asked to indicate how much effort it took to complete every task,
by filling out a number between 0 and 150 just after finishing it. The rating scale is shown in
Table 3.3. Most other factors are measured by combining the result of several items with 7
point rating scales, ranging from “not applicable at alll” (1) to “very much applicable” (7).
For example, tool effectiveness is measured in the tool assessment questionnaire with four
items as can be seen in Table 3.3. Besides the elements from our framework, we have
gathered some general information about our participants and their backgrounds and
experience (Questionnaire before). This way we can, for example, determine the homogeinity
of our participant group. Furthermore we are able to get an idea of how close our experiment
is to a real life situation. Also, some questions were posed to get an impression about how
the team experienced the project (Questionnaire afterwards). These were used as an extra
measure for overall perceived effectiveness, efficiency and satisfaction and can be found in
Table 3.3.
Apart from the subjective measures mentioned above, two objective measures were added.
We have created an instrument to do an analysis of the information transfer and information
outcome. To do so, 16 information items have been distilled from the stimulus material. All
of these items are important pieces of the “puzzle” the teams had to solve; seven
requirements for the final design of the remote control (criteria) and nine ways to fulfil these
requirements (solutions) as can be found in Table 3.4.
The information transfer is measured by scoring the products (slideshows) of all participants
after their individual preparations for the meeting. The information outcome is measured by
scoring the final report of every team to the same scheme. Hereby we can determine the
amount of important information items that was found, transferred and used. Information
transfer and outcome are objective measures to parallel the subjective measure of
information processing. A plausible outcome that combines most of these information items
is shown in Figure 3.5.

35 / 90
Table 3.3 An overview of the questionnaires and measures with several examples. A full overview of the questions per
questionnaire can be found in Appendix D.
Questionnaire: Before (taken one time)
Subject background information 3 questions
Technology experience 6 questions
Meeting experience 13 questions
(Design) project experience 2 questions
Questionnaire: Mental effort (taken four times)
Mental effort 150 point scale
Please indicate, by filling in a number between 0 and 150, how much effort it took for you to complete the task you have just finished.
…
Questionnaire: Tool assessment (taken three times)
Tool effectiveness 4 items
It is always possible to find the information needed. All necessary information can be found. Looking for information leads to the right results. I think that no useful information was left unfound.
Not applicable at alll 1 ○
2 ○
3 ○
4 ○
5 ○
6 ○
7 ○
Very much applicable
Tool efficiency 4 items
Tool satisfaction 4 items
Questionnaire: Team factors (taken one time)
Information processing 4 items
Team effectiveness 4 items
Work pace 4 items
Team efficiency 7 items
Process satisfaction 3 items
Team satisfaction 2 items
Outcome satisfaction 5 items
Questionnaire: Afterwards (taken one time)
Overall project experiences 3 questions
Do you feel that the objectives for today’s project were generally attained? Do you feel that the time for today’s project was generally well-spent? Did you generally like to participate in today’s project?
○ Never ○ Hardly ever ○ Sometimes ○ Most of the times ○ Always

36 / 90
Table 3.4 Information items for analysis of information transfer (Where these criteria and solutions shared?) and information
outcome (Where these criteria and solutions applied correctly?).
Criteria
The product should be fashionable and trendy The product should include innovative technology The design should focus on simplicity (easy to use and easy to learn) The product should be easy to find The product should prevent RSI (comfortable and ergonomic) The company should be recognizable in the product (in logo, colour or slogan) The cost should be below € 12.50
Solutions
The use of an LCD screen The use of speech recognition The use of solar cells The use of a kinetic battery The use of a scroll wheel The use of soft material (latex or rubber) The use of fruity colours or fruity shapes A curved design A correct calculation of the product costs
Figure 3.5 A plausible outcome that incorporates most of the criteria. Most apparent is the fact that this clay model is
fashionable in terms of our experimental context, hence its fruity colours and curved, banana-like shape.
3.4 Experimental conditions
In every of our four experimental conditions the teams have access to a particular kind of
technological support through which information from the substituted team can be
retrieved. The available information in every condition is identical, the main difference is
how the information is structured and through which source it is offered. When information
is not offered through a multimodal meeting browser, it is accessible through standard office
tools. These standard office tools comprise a word processor, a spreadsheet program, a
slideshow editor, an email client, an internet browser, and the file system browser (i.e.

37 / 90
Microsoft Office Word, Excel, PowerPoint, Outlook, Internet Explorer, and Windows
Explorer).
Table 3.5 depicts the different amount of support in all conditions. The first condition, which
is comparable to a standard present-day office environment, does not offer much support.
The second condition, with a “time-oriented meeting” browser, based on the current state-of-
the-art, offers little more support. The technological support in this condition reaches little
task/technology support. As seen in our hypotheses in section 2.4, we expect a moderate
increase in effectiveness, efficiency and satisfaction, compared to the first condition. The
other two conditions offer respectively a meeting-oriented meeting browser and a project-
oriented meeting browser. These last two are examples of browsers that might be available
when technology that is under research in the AMI project at the moment becomes available.
A comparable amount of support is offered, however task-orientation is based on different
concepts; the browser in the third condition focuses on meeting-oriented aspects, where the
browser in the fourth condition is based on concepts related to projects.
In all conditions every member of the team has an individual workplace with a private
computer and a shared workplace on which files can be stored and shared. A large shared
presentation screen can be accessed on all computers. This way a standard amount (rated as
“low”) of communication support is offered in every condition.
Table 3.5 Overview of levels of support for every dimension in all conditions (inspired from Zigurs, Buckland et al., 1999).
Condition 1 Condition 2 Condition 3 Condition 4
“No browser” “Time-oriented” “Meeting-oriented” “Project-oriented”
Communication Support LOW LOW LOW LOW
Simultaneous input; X X X X
Anonymous input;
Input feedback;
Group display. X X X X
Process Structuring LOW LOW MEDIUM MEDIUM
Agenda setting; X X
Agenda enforcement;
Complete record of group interaction. X X X X
Information Processing LOW MEDIUM HIGH HIGH
Gather information; X X X X
Share information; X X X X
Aggregate information; X X
Evaluate information;
Structure information X X X

38 / 90
Condition 1 (“No browser”)
In the basic condition, no meeting browser is provided. This condition can be regarded as a
standard present-day office environment and offers a folder structure in the file system,
organised by project phase. In these folders, users can find documents, minutes, slideshows
and audio/video recordings of the three previous meetings. Also, an email client with the
collection of emails sent and received by the substituted team, and an internet browser with
several bookmarks to inspiring websites are available, both organised per role. Information
is not structured task-oriented and users will have to find parallels within the set of
information themselves. Consequently, support for information processing and process
structuring is limited. Examples of elements of the basic technological support in this
condition can be found in Figure 3.6.
Figure 3.6 Screenshots of the standard desktop environment in condition 1, i.e. the e-mail client (top) and the file system
browser (bottom).

39 / 90
Condition 2 (“Time-oriented”)
In the second condition, all basic support of the first condition is still available. For making
use of the meeting registrations, however, a meeting browser is provided, which offers
synchronization of the multimodal meeting recordings (i.e., synchronous browsing through
slideshows, automatic speech transcripts and audio/video material). This meeting browser
can be regarded as state-of-the-art; comparable systems are currently available. A screenshot
of this meeting browser can be found in Figure 3.7. This browser offers “time-oriented
integration” per meeting, by which we mean that the structuring of information is in
chronological order. This browser provides an easier way to consult the record of group
interaction, based on chronolgy, and therefore mainly adds support for information
processing. Slideshows, audio/video registrations, a “speaker activity log” of each
participant and transcripts of the dialogs (from left to right, top to bottom) can be browsed
synchronously. The transcripts can be searched for keywords.
Figure 3.7 Screenshot of the multimodal meeting browser used in condition 2.

40 / 90
Condition 3 (“Meeting-oriented”)
The meeting browser in the third condition is almost similar to the meeting browser in the
second one. The only difference is the availability of automatically generated abstracts in the
browser. Figure 3.8 shows a screenshot of this meeting browser. In the upper right, the
abstracts are found. These abstracts are divided in a full text abstract and lists of actions,
decisions and problems. Sentences in the full text abstract and items in the lists provide links
to parts of the previous meetings. It is easier for the user to find the right information and to
see what parts of the project have already been finished this way. The most important
information for every meeting is aggregated and it is made easy to see what actions,
decisions and problems from meetings in the past should still be attended. This browser is an
example of what can be achieved with new technology that is currently under research
within AMI and will be available in the near future. We call the structure of information in
this browser “meeting-oriented” as the abstracts do not focus merely on chronology, but
based on concepts on the meeting level.
Figure 3.8 Screenshot of the multimodal meeting browser used in condition 3.

41 / 90
Condition 4 (“Project-oriented”)
In the fourth and final condition, all material, including documents, is integrated from the
perspective of a user in a project setting, i.e., carrying out role-specific work in a design
project (Cremers, Groenewegen, Kuijper, & Post, 2007). The Task Based Project Browser, as it
is called, provides direct access to three different information sources via the tabs Meetings,
Documents and Messages. In addition, it is possible to access these sources indirectly via
three task-oriented tabs: Project (project details, people involved, and different design
phases), Todo’s (see Figure 3.9) and Decisions. All information items are linked to the
original sources. This makes it possible to, for instance, immediately view a meeting clip in
which a specific information item, such as an action item, is being discussed. The information
provided in the Meetings tab is identical to the information in the meeting browser of the
third condition. The Task Based Project Browser aggregates information from all meetings in
a project. Furthermore, the structuring of information based on higher level concepts should
offer more support for information processing. This browser is an example of what might be
achieved with new technology on the longer term.
Figure 3.9 Screenshot of the “Todo’s” tab of the multimodal meeting browser used in condition 4 (Task Based Project
Browser).
3.5 Procedure
Two locations are used, to simplify the recruitment of participants and to allow for different
collaborating parties in AMI to do observations focused on their specific interests. We aimed
at a similar division of experiments between both locations. Since it was easier to find
participant for our experiment however, per condition three of the experiments were done in
Soesterberg and five in Edinburgh.

42 / 90
After doing five pilots in Soesterberg to fine-tune the experimental procedure, we went to
Edinburgh to help setup the experimental environment, provide some guidance to their
experimenters and run one pilot over there. This way we could be sure that we would
actually run a similar experiment at the two locations. Based on the outcomes of these pilots
the exact timing of the procedure (Appendix C) were changed to allow for more time to
practice and create more time pressure in the preparation and the meeting. Furthermore, we
added the explanation of some difficult words to our instructions, since we could not easily
change this in our material at that time. The only known differences between the materials
used at the two locations were these instructions.
The participants were divided among the teams at random in order to mix people with
different backgrounds and, for example, language and computer skills and prevent the bias
that would occur otherwise. E.g. the people that were relatively computer illiterate or had a
lot of experience in meetings appeared to be spread over different teams. We have noticed
that the definition of meeting and project experience was not clear to all participants. In
conversation it appeared that most of the students did have such experience. They however
underrated this, because of it being study-related instead of work-related. Most of the
participants did have at least some meeting and project experience.
We would have preferred to randomise our conditions as well. We did not succeed in this,
because not all of the meeting browser demonstrators were fully ready at the time we
needed to start our experiments. Especially the project-oriented meeting browser for
condition 4 took much longer to develop than we had initially planned. Since the differences
between the various pilots were much bigger than the differences that could be observed
between the four conditions, we believe that the differences between conditions, due to these
causes are negligible. Furthermore, due to gaining experience in the pilots, using a
standardised procedure and being remotely stationed, experiment bias was reduced to a
minimum.
The experimental procedure, of which a visual overview is given in Figure 3.2, was as
follows:
After the participants are welcomed, the experiment is explained in a welcome letter
(Appendix A). They are told about their upcoming tasks, are divided among the four team
roles and seated in the research environment accordingly. All team members have to open
their e-mail client and from that point on, they have to follow the instructions sent to them
by the experimenter.
The participants are instructed to start off with reading a general explanation of the
functionalities of the kind of technological support they are assigned to. After doing so, they
receive a series of specific questions for which they have to exercise with various parts of the
supporting tools. This training session prevents bias caused by lack of familiarity or skills.
Participants in all conditions gain an equal amount of experience and get a similar feeling for
what kind of information can be found where. For every kind of technological support the
same skills are trained by asking questions that guide the user through particular parts of the
tools. For example, the use of the internet browser and the bookmarks is trained with the
following exercise: “Open the website of the company Real Reaction and describe the company logo
and colour.” The training lasts about 30 minutes; inclarities were explained afterwards.

43 / 90
The experimental part of the procedure consists of three phases. The first two phases are
carried out individually. First, the participants have 15 minutes to familiarise themselves
with the project, the substituted team and their personal roles, which will be further referred
to as “getting a gist”. Second, they have 45 minutes to individually prepare the upcoming
meeting. Finally, they have to group up and carry out the meeting, which also lasts 45
minutes. Before, in between and after the three phases, the participants receive e-mails that
either contain links to electronic questionnaires or task related instructions. Several examples
of such e-mails can be found in Appendix B, a full overview is given in Post & Elling (2007).
In the second and third phase, the participants are warned five minutes before the phase
ends to finish their work in the allocated time.

44 / 90

45 / 90
4 Results
In this chapter we will take a look at the data that was derived from our experiments and get
a first idea of what can be derived from our analysis. We will describe the results per
questionnaire and we will map these results to our research framework (i.e. divide them into
results for input, process and outcome and effectiveness, efficiency and satisfaction) and
compare our results with our hypotheses. To verify the reliability of our combined
questionnaire items, we used Cronbach’s alpha (hereinafter α). Furthermore we used one-
way analyses of variance (ANOVAs) and repeated measures ANOVAs. A significance level
of .05 was used for all statistical tests.
4.1 Mental effort
Mental effort was determined four times during the experiment. A repeated measures
ANOVA between the four condition showed no significant differences between any of the
conditions (F(3,26)=1.852; n.s.). Different conditions do thus not yield a significantly different
mental effort (see Table 4.1 and Figure 4.1).
Table 4.1 Mean mental effort over four measurements for conditions with no browser (1), the time-oriented browser (2), the
meeting-oriented browser (3) and the project-oriented browser (4), rated on the 0-150 mental effort scale.
Condition 1 Condition 2 Condition 3 Condition 4
Mental effort 56.77 48.95 58.85 51.37
0
10
20
30
40
50
60
70
80
90
100
110
120
130
140
150
1 2 3 4
Condition
Mental effort
Mental effort
Figure 4.1 Mean mental effort over four measurements for conditions with no browser (1), the time-oriented browser (2), the
meeting-oriented browser (3) and the project-oriented browser (4), plotted on the 0-150 mental effort scale.

46 / 90
Analysis with a repeated measures ANOVA within the four measurements shows a
significant difference between the first measurement and the other three (F(3,78)=48.474;
p<.001). The mean mental effort, gradually increases along the process; getting a gist,
preparing the meeting and carrying out the meeting takes significantly more mental effort
than the training session. There is no significant difference between the three tasks after the
training (see Table 4.2 and Figure 4.2).
Table 4.2 Mean mental effort over four conditions after the training (1), getting a gist (2), preparing the meeting (3), and
carrying out the meeting (4), rated on the 0-150 mental effort scale (* differs significantly from measurement 1).
Measurement 1 Measurement 2 Measurement 3 Measurement 4
Mental effort 35.48 56.68* 61.44* 62.34*
0
10
20
30
40
50
60
70
80
90
100
110
120
130
140
150
1 2 3 4
Measurement
Mental effort
Mental effort
Figure 4.2 Mean mental effort over four conditions after the training (1), getting a gist (2), preparing the meeting (3), and
carrying out the meeting (4), plotted on the 0-150 mental effort scale.
No interaction effects were found, which means that this trend does not differ significantly
between the conditions.
4.2 Tool usability
At three points in the scenario participants were asked to fill out the questionnaire for tool
assessment with questions about their opinion on usability of the technological support that
was available to them. Questions were asked referring to the usability aspects effectiveness
(α=0.822), efficiency (α=0.739) and satisfaction (α=0.758). For every aspect four items were
added to the questionnaire, in a random order. Mean total scores per assessment and per
condition were calculated.
For all three aspects a repeated measures ANOVA showed a significant effect of condition
between condition 1 and 3 and between condition 1 and 4. For effectiveness, condition 1

47 / 90
differed significantly from condition 3 (F(3,26)=8.222; p<.01) and from condition 4
(F(3,26)=8.222; p<.001). For efficiency, condition 1 differed significantly from condition 3
(F(3,26)=5.495; p<.05) and condition 4 (F(3, 263)=5.495; p<.01). For satisfaction, condition 1
differed significantly from condition 3 (F(3,26)=8.272; p<.01) and condition 4 (F(3,26)=8.272;
p<.001). Condition 2 showed no differences on any of these factors. As can be seen in Table
4.3 and Figure 4.3 the mean scores of the three measurements increase over the four
conditions, for all three aspects. The technological support of the conditions with the
meeting-oriented browser and the project-oriented browsers is rated significantly higher on
effectivess, efficiency and satisfaction than the condition with no browser support.
Table 4.3 Mean effectiveness, efficiency and satisfaction over three measurements for conditions with no browser (1), the
time-oriented browser (2), the meeting-oriented browser (3), and the project-oriented browser (4), rated on a 1-7
scale (* differs significantly from condition 1).
Condition 1 Condition 2 Condition 3 Condition 4
Effectiveness 3.45 4.26 4.62* 4.78*
Efficiency 3.67 4.07 4.40* 4.53*
Satisfaction 3.74 4.18 4.67* 4.80*
3
3,5
4
4,5
5
1 2 3 4Condition
Score (
min
=1
, m
ax=
7)
Effectiveness
Efficiency
Satisfaction
Figure 4.3 Mean effectiveness, efficiency and satisfaction over three measurements for conditions with no browser (1), the
time-oriented browser (2), the meeting-oriented browser (3) and the project-oriented browser (4), plotted on a 1-7
scale
For all three aspects a significant difference between measurements was found. For
effectiveness, measurement 1 differed significantly from measurement 3 (F(2,52)=4.187;
p<.05). For efficiency, measurement 1 differed significantly from measurement 3
(F(2,52)=6.067; p<0.01). For satisfaction, measurement 1 differed significantly from both
measurement 2 (F(2,52)=12.514; p<.05) and measurement 3 (F(2,52)=12.514; p<.001). As can be
seen in Table 4.4 and Figure 4.4, mean scores of the three conditions increase for all three
aspects. A significant difference can be found between the moment after getting a gist and
after carrying out the meeting. All three toolsets are thus being rated better after some time
of use.

48 / 90
Table 4.4 Mean effectiveness, efficiency and satisfaction over four conditions after getting a gist (1), preparing the meeting
(2), and carrying out the meeting, rated on a 1-7 scale (* differs significantly from measurement 1).
Measurement 1 Measurement 2 Measurement 3
Effectiveness 4.11 4.28 4.41*
Efficiency 3.98 4.19 4.32*
Satisfaction 4.12 4.35* 4.56*
3
3,5
4
4,5
5
1 2 3
Measurement
Score (
min
=1
, m
ax=
7)
Effectiveness
Efficiency
Satisfaction
Figure 4.4 Mean effectiveness, efficiency and satisfaction over four conditions after getting a gist (1), preparing the meeting
(2), and carrying out the meeting, plotted on a 1-7 scale.
No interactions effects were found, which means that the trends were similar in all
conditions.
4.3 Team factors
The one way ANOVAs for team satisfaction (α=0.820), team efficiency (α=0.767), team
effectiveness (α=0.686), and work pace (α=0.838) did not show any significant differences
between conditions. For the other team factors Levene’s test for homogeneity of variances
was significant, which means that not all premises for ANOVA were fulfilled. However,
since the F-test is quite robust, we decided to go with the outcome of our ANOVA.
For outcome satisfaction (α=0.893) the one way ANOVA showed a significant difference
between conditions 1 and 3 (F(3,26)=3.896; p<.05) and between conditions 1 and 4
(F(3,26)=3.896; p<.05). Outcome satisfaction was thus rated significantly higher in conditions
with support of a meeting-oriented meeting browser and support of a project-oriented
meeting browser, than in the condition without a meeting browser.
For process satisfaction (α=0.893) the one way ANOVA showed a significant difference
between condition 1 and 3 (F(3,26)=4.463; p<.05). Process satisfaction was thus rated
significantly higher in the condition with a meeting-oriented meeting browser than in the
condition without a meeting browser.
For information processing (α=0.748) the one way ANOVA showed a significant difference
between conditions 1 and 3 (F(3,26)=3.544; p<.05). Information processing was thus rated

49 / 90
significantly higher in the condition with a meeting-oriented meeting browser than in the
condition without a meeting browser.
Even in the cases where no significant differences between conditions have been found, we
think we may see a trend in our results. For all aspects values increase from condition 1 to 3
and then drop a little at condition 4. The participants rated the support of a meeting-oriented
meeting browser best, followed by support of a project-oriented meeting browser and
support of a time-oriented meeting browser. The condition without a browser is rated
lowest. The differences between the conditions can be found in Table 4.5 and is shown in
Figure 4.5.
Table 4.5 Team factor means for conditions with no browser (1), the time-oriented browser (2), the meeting-oriented browser
(3) and the project-oriented browser (4), rated on a 1-7 scale (* differs significantly from condition 1).
Condition 1 Condition 2 Condition 3 Condition 4
Outcome satisfaction 4.29 5.01 5.36* 5.31*
Team satisfaction 5.09 5.38 6.02 5.77
Team efficiency 4.13 4.32 5.03 4.58
Team effectiveness 4.62 5.03 5.31 5.06
Work pace 4.32 4.19 4.55 4.20
Process satisfaction 4.77 5.11 5.81* 5.58
Information processing 4.88 5.13 5.71* 5.41
Total Mean 4.59 4.88 5.40 5.13
3,5
4
4,5
5
5,5
6
6,5
1 2 3 4
Condition
Score (
min
=1
, m
ax=
7)
Outcome satisfaction
Team satisfaction
Team efficiency
Team effectiveness
Work pace
Process satisfaction
Information processing
Figure 4.5 Team factor means for conditions with no browser (1), the time-oriented browser (2), the meeting-oriented browser
(3) and the project-oriented browser (4), plotted on a 1-7 scale.
4.4 Project experiences
Afterwards, the participants were asked three questions on their experiences working in the
project, related to respectively perceived effectiveness, perceived efficiency and satisfaction.
They were given five possible answers: “never”, “hardly ever”, “sometimes”, “most of the
times”, and “always”. Answers were generally positive and can be found in Table 4.6 and
Figure 4.6.
The mean score over all conditions on the question “Do you feel that the objectives for
today’s project were generally attained?” was 3.85 (“most of the times”). There were no

50 / 90
significant differences between the conditions. People do not feel a significant difference in
the extent to which the objectives of the project have been attained.
The mean score over all conditions on the question “Do you feel that the time for today’s
project was generally well spent?” was 3.78 (“most of the times”). A one way ANOVA
showed a significant difference between condition 1 and 3 (F(3,26)=3.834; p<.05). People feel
that their time was significantly better spent in the condition with the meeting-oriented
meeting browser than in the condition without the support of a browser.
The mean score over all conditions on the question “Did you generally like to participate in
today’s project?” was 4.00. A one way ANOVA showed a significant difference between
condition 2 and 3 (F(3,23)=6.680; p<.05) and between condition 2 and 4 (F(3,23)=6.680; p<.05).
People most disliked participating in the condition with the time-oriented meeting browser.
Compared to this, they significantly preferred participating in a project with the meeting-
oriented meeting browser and the project-oriented meeting browser, which was rated
highest.
Table 4.6 Mean results on experiences working in the project for conditions with no browser (1), the time-oriented browser
(2), the meeting-oriented browser (3), and the project-oriented browser (4), rated on a 1-7 scale (* differs
significantly from condition 1; ** differs significantly from condition 2).
Condition 1 Condition 2 Condition 3 Condition 4
Objectives attained 3.59 3.93 4.00 3.91
Time well spent 3.41 3.61 4.14* 4.00
Liked to participate 3.81 3.68 4.21** 4.28**
3
3,5
4
4,5
5
1 2 3 4
Condition
Score (
min
=1
, m
ax=
7)
Objectives attained
Time well spent
Liked to participate
Figure 4.6 Mean results on experiences working in the project for conditions with no browser (1), the time-oriented browser
(2), the meeting-oriented browser (3), and the project-oriented browser (4), plotted on a 1-7 scale.
4.5 Information transfer and outcome
To determine the information transfer, we scored the slideshows the participants created
during their individual preparation for the meeting. For both the criteria and the solutions
(as we showed in Table 3.4) we determined the absolute and the net proportion of
information items that were represented in their slideshows. The difference between the
absolute and net proportion can be illustrated with Table 4.7 in which the seven criteria have
been scored for the slideshows of one particular team. Of the seven criteria every member

51 / 90
could find (7*4=28), the project manager (PM) and the industrial designer (ID) only found
one, the user interface designer (UID) found two and the marketing expert (ME) found four
(1+1+2+4=8). This would mean an absolute proportion of 8/28=0.29. However, as a whole, the
team let only one criterion (criterion #2) unfound. The net proportion would therefore be
6/7=0.86. This shows that information was distributed across the team, as we have also
observed during the experiments.
Table 4.7 Example of the scoring schema for information transfer and information outcome.
Criterion #1
Criterion #2
Criterion#3
Criterion #4
Criterion #5
Criterion #6
Criterion #7
Solu
tion #
1
Solu
tion #
2
…
Slideshow PM X
Slideshow ID x
Slideshow UID x x
Slideshow ME x x x x
Final Report x
One way ANOVAs for the combinations of absolute and net proportion of criteria did not
show any significant differences between conditions. One way ANOVAs for absolute and
net proportion of solutions did not either. Also, multivariate ANOVAs (Wilk’s Lambda) for
the absolute proportion of criteria and solutions and for the net proportion of criteria and
solutions did not show any significant differences between conditions. This means that no
significant differences were found between the conditions for the amount of absolute or net
criteria, or absolute or net solutions, or for any combination of these.
To determine the information outcome, the final report was scored to the same criteria. In
Table 4.7 we can see that whereas this particular team as a whole just left one criterion
unfound, they only mentioned criteria #3 in their final report. Whereas information transfer
was not really bad, information outcome was thus quite disappointing. This could, for
example, indicate problems with the integration of distributed information, which is
something we have also observed during our experiments.
One way ANOVAs for the proportion of criteria and the proportion of solutions and a
multivariate MANOVA (a multivariate ANOVA) for both did not show any significant
differences between the conditions. Again, this means that no significant differences were
found between conditions for any combinations of the information items that were found.
4.6 Mapping of results to the research framework
We will shortly repeat our results, mapped to the input, process and outcome, as in the
research framework in Table 2.8.
Input measures
In the conditions of the meeting-oriented meeting browser and the project-oriented meeting
browser, effectiveness, efficiency and satisfaction of the technological support is rated
significantly higher than in the condition with no browser support. In all conditions
usability was rated significantly lower when being exposed to the (new kinds of)
technological support for the first time. After some time of use, the usability rating rises and

52 / 90
normalises. No interaction effects were found, which means that in all conditions a similar
trend between measurements was found. This effect is thus similar for all conditions.
Process measures
Information processing was perceived significantly higher in the condition with a meeting-
oriented meeting browser than in the condition without a meeting browser. Participants
found that they shared information better and put individual contributions together better.
We have not been able to back this up by our objective assessment of information transfer.
No significant differences between conditions in process efficiency have been found in terms
of mental effort or workpace. Process satisfaction was perceived significantly higher in the
condition with a meeting-oriented meeting browser than in the condition without a meeting
browser.
Outcome measures
We have not found significant differences in the perception of team effectiveness or team
efficiency. Nor was a difference in effectiveness in terms of information outcome found.
Outcome satisfaction however was rated significantly higher in conditions with support of a
meeting-oriented meeting browser and support of a project-oriented meeting browser, than
in the condition without a meeting browser. No significant differences between conditions
have been found in team satisfaction. The afterward questions about project experiences
show no significant differences between conditions in overall project effectiveness. The
meeting-oriented meeting browser scored significantly higher on overall project efficiency
than no browser support. For overall project satisfaction the conditions with the project-
oriented and the meeting-oriented meeting browsers stand out, whereas the time-oriented
meeting browser scores worst.

53 / 90
5 Conclusion and discussion
We have started our research with the observation that although meetings are an important
tool for organisations for achieving their goals, they are at the same time perceived as hardly
productive and not enjoyable. Therefore, we have set off on a journey to find out if we can
change this with the help of technology; we wanted to find out whether the use of
multimodal meeting browsers can improve team performance in project meetings.
In our literature study we found out that shared goals and responsibilities are what makes
teams different from groups. Also, the collective effort of a group or team, might be less
efficient, but is more effective than individual work. We have learned that we can quantify
team performance in terms of input, process and output, and effectiveness, efficiency and
satisfaction. Additionaly, we have found that a specific task needs a specific type of
technological support, depending on the task’s complexity. This support can be aimed at the
dimensions of communication support, process structuring and information processing. All
of this has lead to a specification of our research question as follows:
Does the use of multimodal meeting browsers, in co-located, real-time design project meetings and the
remote individual preparation of these, improve team performance of small teams in terms of
effectiveness, efficiency and satisfaction?
In the experimental part of our studies, we have clearly shown that team performance can
indeed be improved by offering technological support, such as multimodal meeting
browsers. Our findings in both our literature study and our experimental research suggest
that the extent to which this improves, is however highly dependent on what support is
provided by the browser and in what way the information is structured.
Hypothesis 1: The use of a multimodal meeting browser that reaches low task/technology fit
will yield a higher increase in effectiveness, efficiency and satisfaction of teamwork than a
situation without the use of such a browser.
The results of our experiment do not support our first hypothesis. In the condition with the
time-oriented meeting browser (condition 2) only a low level of communication support, a
low level of process structuring support and a medium level of information processing
support are available. This means only a low task/technology fit is reached. None of the
factors we have measured in this condition show significant improvements when compared
to the condition without a browser (condition 1). The fact that no significant improvements
can be found is not totally unexpected. The theory of task/technology fit already suggested
that these amounts of support would not achieve a fit and would therefore not offer optimal
support for the complex, fuzzy task of design. It turns out that not even a moderate increase
can be significantly shown.
54 / 90
Hypothesis 2: The use of a multimodal meeting browser that reaches high task/technology fit
will yield a higher increase in effectiveness, efficiency and satisfaction of teamwork than the
use of a multimodal meeting browser that reaches low task/technology fit.
Our results support the second hypothesis. Both in the condition with the meeting-oriented
browser (condition 3) and the condition with the project-oriented meeting browser
(condition 4) a high task/technology fit is reached. In these conditions a low level of
communication support, a high level of information processing support and a medium level
of process structuring support are found. In these conditions significant differences with the
condition without a browser (condition 1) have been found, whereas in the condition with
the time-oriented browser that reaches low task/technology fit, this is not the case.
The meeting-oriented browser stands out. Input measures show a significant better rating for
effectiveness, efficiency and satisfaction in this condition, compared to the situation without
support of a browser. For the process, information processing in this condition is perceived
significantly better than in the condition without a browser. Although we have not been able
to support this with an objective measurement, the subjective measure of perceived
information transfer shows a significant improvement compared to the condition without a
browser. This is an improvement in effectiveness. We have not found significant differences
in efficiency of the process, in work pace or in mental effort. The perceived team efficiency
according to the question about whether participants found their time well spent however
shows a significant improvement. Additionally, process satisfaction and outcome satisfaction
were rated significantly higher than when there was no support of a browser. The
satisfaction of the whole project experience shows a significant difference when compared to
the time-oriented browser.
The project-oriented browser does not show these clear results. Input measures show a
significant better rating for effectiveness, efficiency and satisfaction in this condition,
compared to the situation without support of a browser. Further, only outcome satisfaction
showed a significant improvement compared to the first condition. The satisfaction of the
overall project experience was significantly better than in the condition with the time-
oriented browser. The project browser shows an improvement to no browser support and in
some cases to the time-oriented browser.
Hypothesis 3: The use of a multimodal meeting browser that reaches high task/technology fit
and offers a suitable task-oriented information structure will yield a higher increase in
effectiveness, efficiency and satisfaction of teamwork than the use of a meeting browser that
reaches low task/technology fit and than a meeting browser that does not offer suitable task-
oriented information structure.
Our results partly support the third hypothesis. Both the meeting-oriented browser
(condition 3) and the project-oriented browser (condition 4) incorporate a task-oriented
structure. As shown at the previous hypothesis, especially the meeting-oriented browser had
outstanding results. However, we would have suspected differently, the meeting-oriented
structure of information apparently had more effect than the project-oriented structure. The
only difference between the time-oriented browsers and the meeting-oriented browser is the
availability of automatically generated abstracts (Figure 5.1). Integration of an abstract,
action, decisions and problems (all concepts from the meeting concepts) provide important
new ways to browse the information from the previous meetings. We have not been able to

55 / 90
determine a similar strong effect for structuring based on project-oriented concepts, however
this browser is still rated better than the browser without this kind of structuring.
Figure 5.1 The only difference between the time-oriented browser and the meeting-oriented browser is the availability of
these automatically generated abstracts.
5.1 Discussion and future research
All in all, we found that with the right task/technology fit, technological support can help to
improve meetings. Additionally, we have found an effect of task-oriented information
structure. The project-oriented browser showed important improvements with respect to the
condition without a browser, however the effects were not as clear as the meeting-oriented
browser. The project-oriented browser is a far more complex tool than the other browsers
and the implementation had not progressed as far as we had planned. Due to time and
budget constraints, it contains less functionality, more bugs and is less integrated than we
had originally planned. Especially the overview of the different meetings in the project had
to suffer from this. In hindsight, this might have been the most crucial part of this particular
browser. Interestingly, several suggestions for improvement of the tools were given by our
participants. Important ones being the organisation of information in one well-structured
tool, the inclusion of action points and decisions per team members and global search
possibilities. Most of these ideas for improvement were mentioned in the concept of the
project-oriented browser. We have however not been able to implement all of these ideas in
the final demonstrator (Cremers, Groenewegen, Kuijper and Post, 2007). When comparing
the differences between the concept of this browser (Figure 5.2) and the final implementation
of the demonstrator (Figure 3.9) the differences are quite apparent.

56 / 90
Figure 5.2 The concept of the project-oriented browser.
The fact that none of our browsers showed a real task/technology fit, since we have not
offered a high level of communication support, leads to believe that even more succesfull
results can be achieved. We have focused on a very complex task in this case; the complexity
of design makes it difficult to find the right balance in support and to achieve fit, because a
lot of different types of tasks should be supported Also our task-orientation was quite
generic. We have done some previous theoretical research into the technical possibilities of
task based structuring of information (Elling, 2007). We have observed that more task-
oriented support, based on concepts like, for example, in the case of design projects,
materials, techniques and requirements, might offer even better support. Furthermore, we
have collected more data about how the current browsers were used and what parts of the
browsers were liked best. Based on these findings and this data we propose additional
research into what elements best support people in meetings and the practical possibilities of
more task-oriented browsers.
Interestingly, and outside the scope of our original research framework, the teams that were
provided with the meeting based browser, also rated their leadership as the strongest. From
our observations it seemed that these groups were far more goal-oriented. As the groups
have been randomised, this could be due to the way the browser has influenced the leader of
the group. For example, the overview of open action points provides useful input for agenda
setting. As we have seen in the team performance of Smith-Jentsch et al. (Figure 5.3), team
leadership is one of the factors that leads to better teamperformance; evenso strong
leadership is a prerequisite for a good meeting. We would therefore suggest more research
into the support of leaders as the right technological support, might turn a weak leader into a
stronger one.
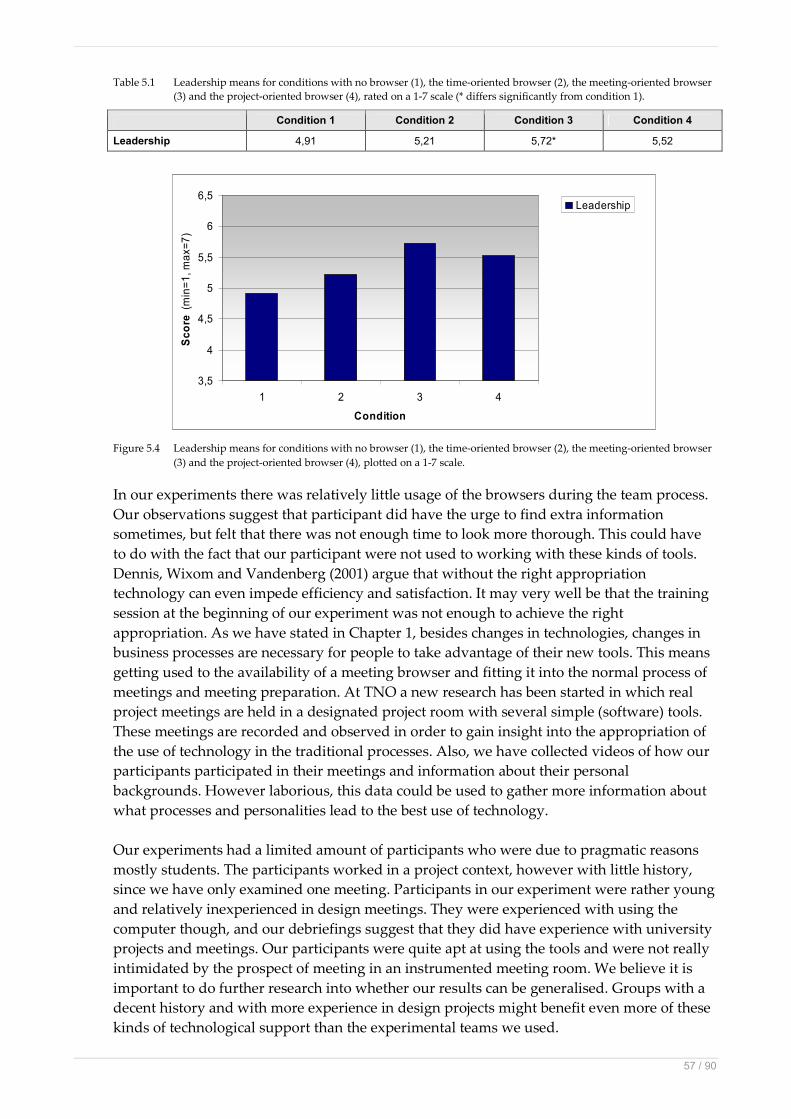
57 / 90
Table 5.1 Leadership means for conditions with no browser (1), the time-oriented browser (2), the meeting-oriented browser
(3) and the project-oriented browser (4), rated on a 1-7 scale (* differs significantly from condition 1).
Condition 1 Condition 2 Condition 3 Condition 4
Leadership 4,91 5,21 5,72* 5,52
3,5
4
4,5
5
5,5
6
6,5
1 2 3 4
Condition
Score (
min
=1
, m
ax=
7)
Leadership
Figure 5.4 Leadership means for conditions with no browser (1), the time-oriented browser (2), the meeting-oriented browser
(3) and the project-oriented browser (4), plotted on a 1-7 scale.
In our experiments there was relatively little usage of the browsers during the team process.
Our observations suggest that participant did have the urge to find extra information
sometimes, but felt that there was not enough time to look more thorough. This could have
to do with the fact that our participant were not used to working with these kinds of tools.
Dennis, Wixom and Vandenberg (2001) argue that without the right appropriation
technology can even impede efficiency and satisfaction. It may very well be that the training
session at the beginning of our experiment was not enough to achieve the right
appropriation. As we have stated in Chapter 1, besides changes in technologies, changes in
business processes are necessary for people to take advantage of their new tools. This means
getting used to the availability of a meeting browser and fitting it into the normal process of
meetings and meeting preparation. At TNO a new research has been started in which real
project meetings are held in a designated project room with several simple (software) tools.
These meetings are recorded and observed in order to gain insight into the appropriation of
the use of technology in the traditional processes. Also, we have collected videos of how our
participants participated in their meetings and information about their personal
backgrounds. However laborious, this data could be used to gather more information about
what processes and personalities lead to the best use of technology.
Our experiments had a limited amount of participants who were due to pragmatic reasons
mostly students. The participants worked in a project context, however with little history,
since we have only examined one meeting. Participants in our experiment were rather young
and relatively inexperienced in design meetings. They were experienced with using the
computer though, and our debriefings suggest that they did have experience with university
projects and meetings. Our participants were quite apt at using the tools and were not really
intimidated by the prospect of meeting in an instrumented meeting room. We believe it is
important to do further research into whether our results can be generalised. Groups with a
decent history and with more experience in design projects might benefit even more of these
kinds of technological support than the experimental teams we used.
58 / 90
Concluding, although these systems are not available yet, we believe in the power of the
task-oriented multimodal meeting browser. There is still a lot of work to be done on, for
example, the automatic annotation of the meeting videos. Until this can be done
automatically, more experience on the business processes that go along with these systems
can be built up by manually annotating meetings, such as in the aforementioned new
research at TNO’s project room and other additional research. The implications of our work
can guide this future research in the right directions.
We have found that it ís possible to support the complex tasks of design meetings and with
some more work, the effect of the meeting browsers can probably be improved. Our ultimate
aim is more effective, efficient and satisfactory project meetings. We are on our way to have
meetings that no longer make us go bananas. The meetings of the future will be fun and
fruitful!

59 / 90
References
Ackerman, M.S., & Mandel, E. (1999). Memory in the Small, Combining Collective Memory
and Task Support for a Scientific Community. In: Journal of Organisational Computing
and Electronic Commerce, 1999, 9(2-3), pp. 105-127.
Alblas, G. (1992). Groepsprestaties. In: R. W. Meertens & J. von Grumbkow (Eds.), Sociale
Psychologie, pp. 317-336, Wolters-Noordhoff, Groningen.
AMI project (2003). Integrated project Annex 1 – “Description of Work”, Augmented Multi-party
Interaction (AMI). Sixth Framework Programme, Priority 2, Information Society
Technologies.
AMI project (2007a). Welcome to AMI: Augmented Multi-party Interaction. Retrieved April 2007,
from http://www.amiproject.org/
AMI project (2007b). D6.2. Use Cases and User Requirements. Revision 2. Augmented Multi-
party Interaction (AMI).
Blanson Henkemans, O. (2004). A Research Environment for Embedded Meeting Behavior.
Graduation thesis, Tilburg University, the Netherlands.
Brodbeck, F. C. (1996). Criteria for the study of work group functioning. In: M. A. West (Ed.),
Handbook of Work Group Psychology, pp. 285-315, Chichester: John Wiley & Sons.
Campbell, D.J. (1988). Task Complexity: A Review and Analysis. In: Academy of Management
Review (13:1), 1988, pp. 40-52.
Cremers, A., & Hilhorst, B. (2005). What was discussed by whom, how, when and where?
Personalized browsing of annotated ultimedia meeting recordings. In: Proceedings of
HCII 2005, LasVegas, Nevada, USA.
Cremers, A., Post, W., Elling, E., Dijk, B. van, Van der Wal, B., Carletta, J., Flynn, M., Wellner,
P., & Tucker, S. (2007). D6.4.Meeting Browser Eval Report. Augmented Multi-party
Interaction (AMI).
Cremers, A.H.M., Groenewegen, P., Kuijper, I., & Post, W.M. (2007). The Project Browser:
supporting information access for a project team. Accepted for presentation at HCII 2007,
Beijing, July 22-27.
Carletta, J., Ashby, S., Bourban, S., Flynn, M., Guillemot, M., Hain, T., Kadlec, J., Karaiskos,
V. Kraaij, W., Kronenthal, M. Lathoud, G., Lincoln, M., Lisowska, A., McCowan, I.,
Post, W., Reidsma, D., & Wellner, P. (2005). The AMI Meeting Corpus: A pre-
announcement. In: Proceedings of MLMI 2005, Edinburgh, UK, June 2005.
Cooke, N. J., Salas, E., Cannon-Bowers, J. A., & Stout, R. (2000). Measuring team knowledge.
In: Human Factors, 42, 151-173.
Dennis, A. R., Wixom, B. H., & Vandenberg, R. J. (2001). Understanding Fit and
Appropriation Effects in Group Support Systems via Meta-Analysis. In: MIS
Quarterly, June 2001, 25:2, 167-192
DeSanctis, G., & Gallupe, R.B. (1987). A Foundation for the Study of Group Decision Support
Systems. In: Management Science (33:5), 1987, pp. 589-609.
Daft, R.L. (2000). Management. Fifth Edition. The Dryden Press, Orlando, Florida.
Elling, E. (2007). A pragmatic project ontology. Internship report, University of Twente, the
Netherlands.
Hackman, J.R. (1983). The design of work teams. In: J.W. Lorsch (Ed.), Handbook of
organisational behavior. Englewood Cliffs, NJ: Prentice–Hall.

60 / 90
Johansen, R. (1988). GroupWare: Computer Support for Business Teams. The Free Press, New
York.
Lalanne, D., Sire, S., Ingold, R., Behera, A., Mekhaldi, D., & Rotz, D. (2003). A Research
Agenda For Assessing The Utility Of Document Annotations. In Multimedia
Databases Of Meeting Recordings, In: Proceedings of 3rd International Workshop on
Multimedia Data And Document Engineering, Berlin, Germany, September 8th.
McCowan, I., Carletta, J., Kraaij, W., Ashby, S., Bourban, S., Flynn, M., Guillemot, M., Hain,
T., Kadlec, J., Karaiskos, V., Kronenthal, M., Lathoud, G., Lincoln, M., Lisowska, A.,
Post, W., Reidsma, D., & Wellner, P. (2005). The AMI Meeting Corpus. In: Noldus,
L.P.J.J., Grieco, F., Loijens, L.W.S., & Zimmerman, P.H. (Eds.) Proceedings Measuring
Behavior 2005, 5th International Conference on Methods and Techniques in
Behavioral Research. Wageningen: Noldus Information Technology, pp. 137-140.
McGrath, J.E. (1984). Groups: Interaction and performance. Englewood Cliffs, NJ: Prentice-Hall.
McGrath, J.E., & Hollingshead, A.B. (1994). Groups Interacting with Technology: Ideas,
Evidence, Issues, and an Agenda. Sage Publications, Thousand Oaks, CA.
Nunamaker, J.F., Dennis, A.R., Valacich, J.S., Vogel, D.R., & George, J. (1991). Electronic
Meeting Systems to Support Group Work. In: Communcations of the ACM (34:7), 1991,
pp. 40-61.
Post, W.M., Cremers, A,H.M. and Blanson Henkemans, O. (2004). A research environment
for meeting behavior. In: A. Nijholt & T. Nishida (Eds.). Proceedings of Social
Intelligence Design 2004, pp. 159-165.
Post, W.M. & Elling, E. (2007). D1.3. Enhanced Scenario Definition. Augmented Multi-party
Interaction (AMI).
Post, W.M., Elling, E., Cremers, A., & Kraaij, W. (2007). Experimental comparison of multimodal
meeting browsers. Proceedings of HCI International 2007, Beijing.
Post, W.M., Huis In’t Veld, M.A.A. and Van den Boogaard, S.A.A. (2007). Evaluating meeting
support tools. In: Personal and Ubiquitous Computing. Accepted for publication.
Post, W.M., Blanson Henkemans, O., Van den Boogaard, S.A.A, Van Verseveld, O.H., (2005).
Scenario Definition. AMI Project Deliverable 1.2.
Punte, P.A.J., & Hamel, R. (2004). De probleemruimte van het ontwerpen. TNO Technische
Menskunde, Soesterberg, The Netherlands. TNO-report TM-04-D018.
Rasker, P.C (2002). Communication and performance in teams. Ponsen & Looijen, Amsterdam.
Rienks, R. (2007). Meetings in Smart Environments: Implications of Progressing Technologies. PhD
Thesis, University of Twente, The Netherlands.
Robbins, S.P. (1997). Essentials of Organisational behavior. Fifth Edition. Prentice-Hall, New
Jersey.
Rogelberg, S. G., Leach, D. J., Warr, P. B. & Burnfield, J. L. (2006). “Not another meeting!”
Are meeting time demands related to employee well-being? In: Journal of Applied
Psychology. 91(1), January 2006, pp. 83-96.
Salas, E., Dickinson, T. L., Converse, S. A., & Tannenbaum, S. I. (1992). Toward an
understanding of team performance and training. In W. Swezey & E. Salas (Eds.),
Teams: Their training and performance, pp. 3-29, Norwood, NJ: Ablex.
Smith-Jentsch, K.A., Johnston, J.H., & Paynes, S.C. (1998). Measuring team-related expertise
in complex environments. In: Cannon-Bowers, J.A., Salas, E. (Eds) Making decisions
under stress: Implications for individual and team training. APA, Washington, DC.
Straus, S.G. (1999) Testing a Typology of Tasks: An Empirical Validation of McGrath’s Group
Task Circumplex. In: Small Group Research, 30:2, pp. 166-187.

61 / 90
Tucker, S., & Whittaker, S. (2005). Accessing Multimodal Meeting Data: Systems, Problems
and Possibilities, In: Bengio, S., Bourlard, H. (Eds.) Lecture Notes In Computer Science,
3361, 1-11.
Van den Boogaard, S.A.A. (2004). Meeting behavior: Exploring factors of success. Graduation
thesis, Leiden University, the Netherlands.
Venkatraman, N., & Prescott, J.E. (1990). Environment-strategy Coalignment: An Empirical
Test of Its Performance Implications. Strategic Management Journal, 11-1, 1990, pp. 1-
23.
Waard, D. (1996). The measurement of drivers’ mental workload. PhD thesis, University of
Groningen, Traffic Research Center.
Whittaker, S., Laban, R., & Tucker, S. (2005). Analysing Meeting Records: An Ethnographic
Study and Technological Implications. In: 2nd Joint Workshop on Multimodal Interaction
and Machine Learning Algorithms, 2005.
Wellner, P., Flynn, M., Tucker, S., Whittaker, S. (2005). A meeting browser evaluation test. In:
CHI ’05 extended abstracts on Human factors in computing systems, pp. 2021–2024,
NewYork, NY, USA. ACM Press.
Zigurs, I., & Buckland, B. K. (1998). A theory of task/technology fit and group support
systems effectiveness. MISQ. 22: 3, September 1998, pp. 313-334.
Zigurs, I., Buckland, B. K., Connolly, J. R., & Wilson, E. V. (1999). A test of task-technology fit
theory for group support systems. SIGMIS Databas,e 30, 3-4, September 1999, pp. 34-
50.

62 / 90
63 / 90
A Welcome letter, used at TNO, Soesterberg
Welcome to TNO Human Factors. Thank you for participating in our experiment!
TNO is a collection of research institutes that generates knowledge and aims at applying this
knowledge in practice. This particular institute works with knowledge about the functioning
of people in technical environments. TNO participates in a European consortium that
cooperates in researching the possibilities of more efficient and pleasant meetings. To reach
this, advanced meeting environments are used. Furthermore software is being developed to
store video and audio automatically in the form of meeting minutes. In order to evaluate
this, you are asked to participate in this experiment.
The experiment
The management of the company where you work, Real Reaction, is dissatisfied with the
progress of their development team. Therefore you are asked to participate in a new
development team to finish the design project of the previous team. During the project, you
will have a specific assigned role (project manager, industrial designer, user interface
designer or marketing expert). The role tasks will become clear in the course of the project.
We ask you to follow the task instructions and to take your role seriously. We emphasise that
we are not judging you personally, but only the situation.
• The official language will be English.
• Knowledge of design or your particular role is not necessary.
• The process will be captured by audio, video and other loggings to review it afterwards.
• For your participation you will get a financial compensation of €45.- which will be
transferred to your bank account.
Programme
We will start with a training so you can get familiar with the project environment and the
software. During this time it is possible to ask the experimenter questions. After the training,
the actual experiment starts. The experiment consists of different tasks: first you have to form
a broad picture of the project, then you have to prepare for a meeting and at last you will
participate in a meeting. Precise instructions about these different tasks will follow by Email.
• In case of a technical problem it is possible to get help from the experimenter.
• Please, do not delete any files that you create.
• Please, do not use Email or internet for anything else than the experiment and do not
email each other.
• Please, whenever you’re instructed to stop working on something, stop immediately and
only proceed when you’re instructed to do so (i.e. during questionnaire breaks).
• Please, turn off your telephone.
The experiment will take about 3 to 4 hours. There will be a coffee break half-way. During
this break, please do not talk about the experiment. After the experiment, please do not tell
any future subjects (i.e. your study mates) about the experiment, this will influence the
results.
Again, thank you for your participation!

64 / 90

65 / 90
B Examples of e-mails with instructions
This appendix shows three examples of e-mails with instructions. The first example is a role
specific instruction for the User Interface Designer at the start of the meeting preparation.
The second example was sent to all participants to denote the end of this phase. The third
example shows how the participants were asked to fill out several questionnaires, between
preparation for the meeting and carrying out the meeting. A full overview of the e-mails in
our experimental setup is given in Post and Elling (2007).

66 / 90
Time: 1:41 (at the start of preparing for the meeting)
Role: User Interface Designer
From: Personal Coach
Subject: [UID] Meeting preparation
Body Text:
Below, you find information for the task you have to perform in the detailed design meeting.
Use the available information of the previous team to prepare for the meeting. Feel free to
use the attached file for your presentation.
Your personal coach
Detailed Design
How to design the user interface: In this third and final design phase, the detailed design,
you, as user-interface designer, have to come up with the user-interface design: how can the
user operate the apparatus. You are asked to specify the interface elements (button, scroll
wheel, etc.), including:
1. Function
2. Position
3. Form
4. Material
5. Color
Prepare your presentation for the next and final meeting.
Attachment:

67 / 90
Time: 2:23 (at the end of preparing for the meeting)
Role: All
From: Account Manager
Subject: Training
Body Text:
Dear colleagues,
If you have not sent them yet, reply to this message and attach your presentations
immediately (for the project manager, also the product specification document so far). Also,
save these files in the shared project folder and wait for further instructions. When you are
not finished, you can continue your work during the meeting.
You will meet up with your team soon.
Regards,
Your account manager
Attachment: n.a.
Time: 2:25 (between preparing for the meeting and carrying out the meeting)
Role: All
From: Experimenter
Subject: Questionnaires 4
Body Text:
Please fill out all of the following questionnaires:
AMI mental effort 3:
http://tmquest.tm.tno.nl/nq.cfm?q=1897932e-f1f6-4485-ebd7-3a0f1835de88
AMI tool assessment 2:
http://tmquest.tm.tno.nl/nq.cfm?q=317edfe7-f1f6-4485-e767-902c75e1c2a5
Thanks,
Your Experimenter
Attachment: n.a.

68 / 90

69 / 90
C Procedure checklist for experimenter
time todo ( ">" = by experimenter) duration
morning Setup meeting room
> List of subjects at reception desk
> Create 4 subject packages (Welcome, AMI informed consent, TNO subject form and Instruction)
> Check if there are pens for all the subjects and the experimenters
> Check for paper to take notes
> Check Quindi tool (camera's, sound, auto capture)
> Check microphones, replace batteries
> Check beamer(s)
> Check subject computers: (Shortcuts in place, mails and documents available?, Delete emails and documents of the previous group!)
> Check mice, keyboards, headsets, batteries…
> Check lights
> Check meeting browser
> Check drinks in refrigerator
> Check emails on experimenters computer (import Outbox TBE experimenter FINAL.pst into drafts) and set Sent and Reveive columns to only show time (not date)
> Place modelling clay on table
14:00 Welcome subjects 0:15
> Do not disturb light in Experium
> Offer coffee/tea/…
> Check names
> Divide subject packages
> Intro talk/ Welcome/ Explanation of experiment
Fill out informed consent AMI subject statement, TNO subject form
> Divide roles
If necessary, switch seats.
14:15 Introduction 0:45
>Instruct the subjects to open their Inbox in Outlook and to read the first Email very carefully!
> Send Email "Questionnaires 1" from Experimenter (Pretest, memory test?, spatial orientation test? Leadership test? Occupational personality test?)
Memory test 1
Pretest
Memory test 2
Spatial orientation test
Memory test 3
> Send Email "Training" from Experimenter
Carry out Training/Instruction
Email Training outcome to Experimenter
> If necessary, provide help.
> Send Email "Questionnaires 2" from Experimenter (Mental effort)

70 / 90
15:00 Familiarize with project, team and roles (a ‘gist’) 0:15
> Send Email "New project team" from Account Manager
Read instructions received by email
> Observe first reactions according to observation scheme
> Log use of browser
Make notes on relevant findings
> Send Email "Send your impressions now!" from Account Manager
Email notes to Account Manager
15:15 Questionnaires 0:10
> Send Email "Questionnaires 3" from Experimenter (Mental effort, Tool assessment)
Fill out questionnaires
15:25 Break 0:15
> Offer coffee/tea/…
> Do not allow to talk about the experiment
15:40 Individual work, role-specific preparation of the meeting (‘specific information’) 0:45
> Log use of browser
> Send Email "Remarks on previous team" from Account Manager
> Send Email "[UID] Meeting preparation" from Personal Coach
> Send Email "[ID] Meeting preparation" from Personal Coach
> Send Email "[ME] Meeting preparation" from Personal Coach
> Send Email "[PM] Meeting preparation" from Personal Coach
Read instructions received by email
Prepare role-specific presentation
> Send Email "Send your presentations now!" from Account Manager
Email presentation to Account Manager and save in shared folder
16:25 Questionnaires 0:15
> Send Email "Questionnaires 4" from Experimenter (Mental effort, Tool assessment)
Mental effort questionnaire
Tool assessment quesionnaire
> Very quick coffee?
16:40 Team work, performing the meeting 0:45
> Observe group behaviour according to observation scheme
> Log use of browser
> Start recording video/ audio
> Send Email "Start your meeting now!" from Account Manager
Meeting agenda, presented by PM
Presentations on findings.
Marketing Expert presentation
Prototype development
Finance
Prototype evaluation
Product specification
> Send Email "5 minutes left for your meeting"
> Send Email "End your meeting now!"
17:25 Questionnaires 0:20
> Send Email "Questionnaires 5" (Mental effort, Tool assessment, Dominance, Team)

71 / 90
> Stop recording video/ audio
17:45 End of experiment 0:30
Fill out payment form
Fill out/take home TNO subject form
> Remind not to talk about the experiment with fellow students
> Send home subjects
> Save audio and video recordings Quindi
> Save shared folder contents
> Export Emails Outlook (inbox and sent items)
> Copy/Paste Email information Outlook to Excel (inbox and sent items)
> Gather log files
> Mice in docking stations
> Turn off all systems
end of day > Clean up

72 / 90

73 / 90
D Questionnaires
Questionnaire: Before
Background information
2 What is your gender?
○ Male
○ Female
3 What is your age?
…
4 What is your current profession/ study?
…
Technology experience
5 How often do you use a computer?
○ Never
○ Monthly
○ Weekly
○ Daily
6 How often do you use the Internet for browsing web pages?
○ Never
○ Monthly
○ Weekly
○ Daily – less than 1 hour
○ Daily – 1 – 3 hours
○ Daily – more than 3 hours
7 How often do you use the Internet for email?
○ Never
○ Monthly
○ Weekly
○ Daily – less than 1 hour
○ Daily – 1 – 3 hours
○ Daily – more than 3 hours
8 How often do you use the Internet for chatting?
○ Never
○ Monthly
○ Weekly
○ Daily – less than 1 hour
○ Daily – 1 – 3 hours
○ Daily – more than 3 hours

74 / 90
9 How often do you search for multi-media content (audio (e.g. music) or video (e.g., movies)) on the computer?
○ Never
○ Monthly
○ Weekly
○ Daily – less than 1 hour
○ Daily – 1 – 3 hours
○ Daily – more than 3 hours
10 Which of the following devices do you own or use regularly?
□ Laptop
□ GSM
□ PDA
□ MP3-player
Meeting experience
11 How often do you participate in meetings?
○ Never
○ Monthly
○ Weekly
○ Daily – once
○ Daily – more than once
12 What is the typical size of your meetings (number of participants)?
…
13 What is the typical length of your meetings (in minutes)?
…
14 How would you characterize your typical meetings (e.g. subject matter, objective, and atmosphere)?
…
15 What role(s) do you typically perform in meetings?
□ Chairman
□ Draw up the minutes
□ Participant
□ Other: …
16 Do you feel that the objectives for your meetings are generally attained?
○ Never
○ Hardly ever
○ Sometimes
○ Most of the times
○ Always
17 Do you feel that the time for your meetings are generally well-spent?
○ Never
○ Hardly ever

75 / 90
○ Sometimes
○ Most of the times
○ Always
18 Do you generally like to participate in your meetings?
○ Never
○ Hardly ever
○ Sometimes
○ Most of the times
○ Always
19 Which of the following means do you use BEFORE a meeting (to prepare for the meeting)?
□ Minutes of the previous meeting(s)
□ Related documents
□ Agenda
□ Personal recollection
□ Contact other participants
□ Personal notes of the previous meeting(s)
□ Means to prepare a presentation
□ Pictures of previous meeting(s)
□ Audio recording of previous meeting(s)
□ Video recording of previous meeting(s)
□ Consult external information sources (e.g. internet)
□ Contact external people (face-to-face, e-mail, telephone)
□ Other: …
20 Which of the following means do you use DURING a typical meeting?
□ Minutes of the previous meeting(s)
□ Use and annotate related documents
□ Agenda
□ Personal recollection
□ Make personal notes
□ Make discuss shared notes (e.g., on blackboard, whiteboard, flip-over)
□ Give/discuss a presentation
□ Make pictures
□ Make Audio recording
□ Make Video recording
□ Consult external information sources (e.g. internet)
□ Contact external people (face-to-face, e-mail, telephone)
□ Audio conferencing tools
□ Video conferencing tools
□ Other: …
21 Which of the following means do you typically use AFTER a meeting (to process the results)?
□ Minutes of the previous meeting(s)
□ Related documents
□ Agenda
□ Personal recollection

76 / 90
□ Contact other participants
□ Personal notes of the previous meeting(s)
□ Means to prepare a presentation
□ Pictures of previous meeting(s)
□ Audio recording of previous meeting(s)
□ Video recording of previous meeting(s)
□ Consult external information sources (e.g. internet)
□ Contact external people (face-to-face, e-mail, telephone)
□ Other: …
22 What types of information do you typically include in your personal notes?
□ Decisions taken
□ Things to do
□ Things you want to tell others
□ Reminders
□ Reference materials (names, phone number, webpages)
□ “Doodles” (absent-minded scribbles)
□ Other: …
23 When you have missed a meeting, how do you catch up?
□ Read meeting minutes
□ Ask other participants
□ Consult notes of other participants
□ Consult audio recording
□ Consult video recording
□ Other: …
Design projects
24 Do you have experience with working in project teams?
○ No
○ Hardly any
○ Average
○ A lot
25 Do you have knowledge of or experience in product or service development?
○ No
○ Hardly any
○ Average
○ A lot

77 / 90
Questionnaire: Mental effort
Please indicate, by filling in a number between 0 and 150, how much effort it took for you to complete the task you have just finished.
…

78 / 90
Questionnaire: Tool assessment
2 It is possible to quickly find the information.
Not applicable at all 1 ○
2 ○
3 ○
4 ○
5 ○
6 ○
7 ○
Very much applicable
3 The result of finding information is worth the effort.
Not applicable at all 1 ○
2 ○
3 ○
4 ○
5 ○
6 ○
7 ○
Very much applicable
4 Looking for information leads to the right results.
Not applicable at all 1 ○
2 ○
3 ○
4 ○
5 ○
6 ○
7 ○
Very much applicable
5 There are no better ways of finding the information.
Not applicable at all 1 ○
2 ○
3 ○
4 ○
5 ○
6 ○
7 ○
Very much applicable
6 It is enjoyable to look for information.
Not applicable at all 1 ○
2 ○
3 ○
4 ○
5 ○
6 ○
7 ○
Very much applicable
7 I prefer this way over other ways of looking for information.
Not applicable at all 1 ○
2 ○
3 ○
4 ○
5 ○
6 ○
7 ○
Very much applicable
8 All necessary information can be found.
Not applicable at all 1 ○
2 ○
3 ○
4 ○
5 ○
6 ○
7 ○
Very much applicable
9 I think that no useful information was left unfound.
Not applicable at all 1 ○
2 ○
3 ○
4 ○
5 ○
6 ○
7 ○
Very much applicable
10 It is easy to find the information.
Not applicable at all 1 ○
2 ○
3 ○
4 ○
5 ○
6 ○
7 ○
Very much applicable
11 It is always possible to find the information needed.
Not applicable at all 1 ○
2 ○
3 ○
4 ○
5 ○
6 ○
7 ○
Very much applicable
12 All in all, looking for information is satisfactory.
Not applicable at all 1 ○
2 ○
3 ○
4 ○
5 ○
6 ○
7 ○
Very much applicable
13 It doesn’t take many steps to find the information.
Not applicable at all 1 ○
2 ○
3 ○
4 ○
5 ○
6 ○
7 ○
Very much applicable
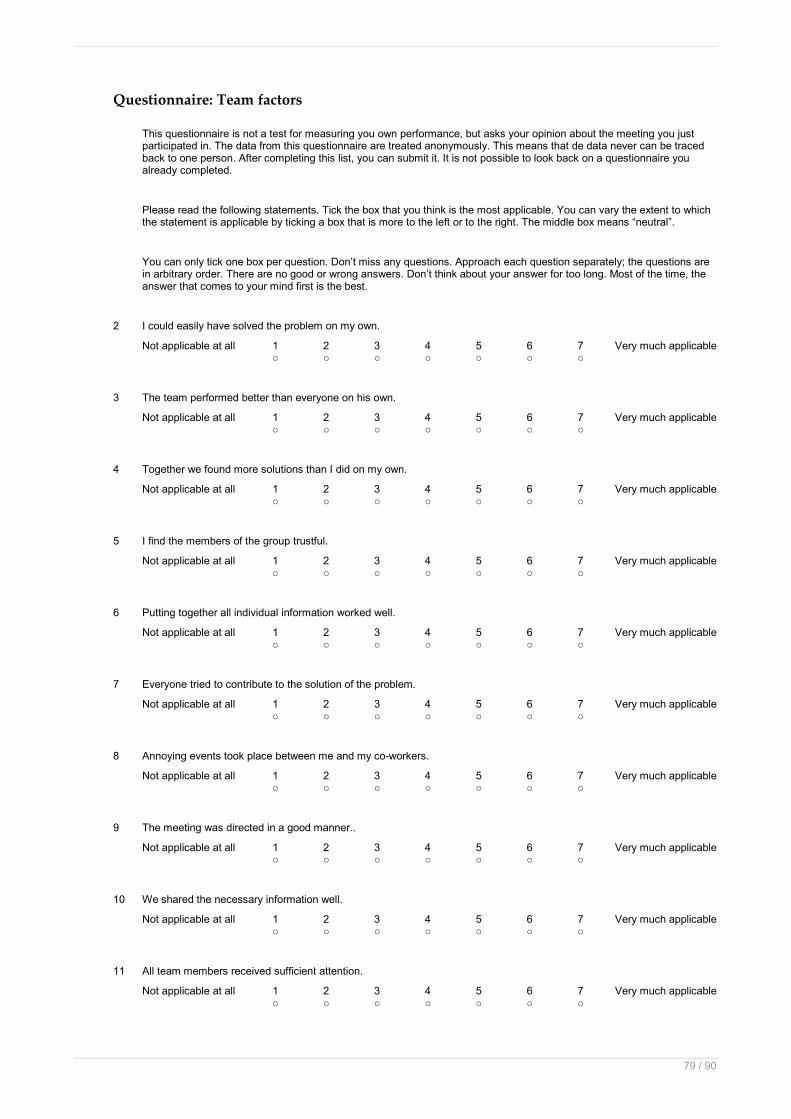
79 / 90
Questionnaire: Team factors
This questionnaire is not a test for measuring you own performance, but asks your opinion about the meeting you just participated in. The data from this questionnaire are treated anonymously. This means that de data never can be traced back to one person. After completing this list, you can submit it. It is not possible to look back on a questionnaire you already completed.
Please read the following statements. Tick the box that you think is the most applicable. You can vary the extent to which the statement is applicable by ticking a box that is more to the left or to the right. The middle box means “neutral”.
You can only tick one box per question. Don’t miss any questions. Approach each question separately; the questions are in arbitrary order. There are no good or wrong answers. Don’t think about your answer for too long. Most of the time, the answer that comes to your mind first is the best.
2 I could easily have solved the problem on my own.
Not applicable at all 1 ○
2 ○
3 ○
4 ○
5 ○
6 ○
7 ○
Very much applicable
3 The team performed better than everyone on his own.
Not applicable at all 1 ○
2 ○
3 ○
4 ○
5 ○
6 ○
7 ○
Very much applicable
4 Together we found more solutions than I did on my own.
Not applicable at all 1 ○
2 ○
3 ○
4 ○
5 ○
6 ○
7 ○
Very much applicable
5 I find the members of the group trustful.
Not applicable at all 1 ○
2 ○
3 ○
4 ○
5 ○
6 ○
7 ○
Very much applicable
6 Putting together all individual information worked well.
Not applicable at all 1 ○
2 ○
3 ○
4 ○
5 ○
6 ○
7 ○
Very much applicable
7 Everyone tried to contribute to the solution of the problem.
Not applicable at all 1 ○
2 ○
3 ○
4 ○
5 ○
6 ○
7 ○
Very much applicable
8 Annoying events took place between me and my co-workers.
Not applicable at all 1 ○
2 ○
3 ○
4 ○
5 ○
6 ○
7 ○
Very much applicable
9 The meeting was directed in a good manner..
Not applicable at all 1 ○
2 ○
3 ○
4 ○
5 ○
6 ○
7 ○
Very much applicable
10 We shared the necessary information well.
Not applicable at all 1 ○
2 ○
3 ○
4 ○
5 ○
6 ○
7 ○
Very much applicable
11 All team members received sufficient attention.
Not applicable at all 1 ○
2 ○
3 ○
4 ○
5 ○
6 ○
7 ○
Very much applicable

80 / 90
12 Whenever I needed help I could ask my co-workers.
Not applicable at all 1 ○
2 ○
3 ○
4 ○
5 ○
6 ○
7 ○
Very much applicable
13 The job could have been done in less time.
Not applicable at all 1 ○
2 ○
3 ○
4 ○
5 ○
6 ○
7 ○
Very much applicable
14 I made use of every moment.
Not applicable at all 1 ○
2 ○
3 ○
4 ○
5 ○
6 ○
7 ○
Very much applicable
15 I find my work of good quality.
Not applicable at all 1 ○
2 ○
3 ○
4 ○
5 ○
6 ○
7 ○
Very much applicable
16 I had to work extra hard to finish a task.
Not applicable at all 1 ○
2 ○
3 ○
4 ○
5 ○
6 ○
7 ○
Very much applicable
17 I find the members of the group helpful.
Not applicable at all 1 ○
2 ○
3 ○
4 ○
5 ○
6 ○
7 ○
Very much applicable
18 Had I been working just by myself, I would have solved the problem better.
Not applicable at all 1 ○
2 ○
3 ○
4 ○
5 ○
6 ○
7 ○
Very much applicable
19 The job could have been done with fewer people.
Not applicable at all 1 ○
2 ○
3 ○
4 ○
5 ○
6 ○
7 ○
Very much applicable
20 I am satisfied with the process by which the group made its decision.
Not applicable at all 1 ○
2 ○
3 ○
4 ○
5 ○
6 ○
7 ○
Very much applicable
21 I find the members of the group kind.
Not applicable at all 1 ○
2 ○
3 ○
4 ○
5 ○
6 ○
7 ○
Very much applicable
22 Every team member had sufficient opportunity to make his contribution.
Not applicable at all 1 ○
2 ○
3 ○
4 ○
5 ○
6 ○
7 ○
Very much applicable
23 All individual contributions affected the design process.
Not applicable at all 1 ○
2 ○
3 ○
4 ○
5 ○
6 ○
7 ○
Very much applicable
24 I am satisfied with the prize of the design solution.
Not applicable at all 1 ○
2 ○
3 ○
4 ○
5 ○
6 ○
7 ○
Very much applicable

81 / 90
25 I am satisfied with the result of the effort we put in as a team.
Not applicable at all 1 ○
2 ○
3 ○
4 ○
5 ○
6 ○
7 ○
Very much applicable
26 I had difficulty with expressing myself.
Not applicable at all 1 ○
2 ○
3 ○
4 ○
5 ○
6 ○
7 ○
Very much applicable
27 I felt appreciated by my co-workers.
Not applicable at all 1 ○
2 ○
3 ○
4 ○
5 ○
6 ○
7 ○
Very much applicable
28 We spent the available time efficiently.
Not applicable at all 1 ○
2 ○
3 ○
4 ○
5 ○
6 ○
7 ○
Very much applicable
29 I had too much work to do.
Not applicable at all 1 ○
2 ○
3 ○
4 ○
5 ○
6 ○
7 ○
Very much applicable
30 I am satisfied with the group’s discussion.
Not applicable at all 1 ○
2 ○
3 ○
4 ○
5 ○
6 ○
7 ○
Very much applicable
31 I am satisfied with completeness of the design solution.
Not applicable at all 1 ○
2 ○
3 ○
4 ○
5 ○
6 ○
7 ○
Very much applicable
32 I am satisfied with the precision of the design solution.
Not applicable at all 1 ○
2 ○
3 ○
4 ○
5 ○
6 ○
7 ○
Very much applicable
33 We helped each other with tool problems.
Not applicable at all 1 ○
2 ○
3 ○
4 ○
5 ○
6 ○
7 ○
Very much applicable
34 I had to work under time pressure.
Not applicable at all 1 ○
2 ○
3 ○
4 ○
5 ○
6 ○
7 ○
Very much applicable
35 Had I been working just by myself, I would have solved the problem faster.
Not applicable at all 1 ○
2 ○
3 ○
4 ○
5 ○
6 ○
7 ○
Very much applicable
36 I find the members of the group pleasant to be with.
Not applicable at all 1 ○
2 ○
3 ○
4 ○
5 ○
6 ○
7 ○
Very much applicable
37 On my own I had never been able to find such a good solution.
Not applicable at all 1 ○
2 ○
3 ○
4 ○
5 ○
6 ○
7 ○
Very much applicable

82 / 90
38 I was on good terms with my co-workers.
Not applicable at all 1 ○
2 ○
3 ○
4 ○
5 ○
6 ○
7 ○
Very much applicable
39 There is a good atmosphere among me and my co-workers.
Not applicable at all 1 ○
2 ○
3 ○
4 ○
5 ○
6 ○
7 ○
Very much applicable
40 I had to work very fast.
Not applicable at all 1 ○
2 ○
3 ○
4 ○
5 ○
6 ○
7 ○
Very much applicable
41 I am satisfied with correctness of the design solution.
Not applicable at all 1 ○
2 ○
3 ○
4 ○
5 ○
6 ○
7 ○
Very much applicable
42 I had difficulty with understanding my co-workers.
Not applicable at all 1 ○
2 ○
3 ○
4 ○
5 ○
6 ○
7 ○
Very much applicable
43 In all, I am satisfied with the solution for the design.
Not applicable at all 1 ○
2 ○
3 ○
4 ○
5 ○
6 ○
7 ○
Very much applicable
44 We corrected each others mistakes.
Not applicable at all 1 ○
2 ○
3 ○
4 ○
5 ○
6 ○
7 ○
Very much applicable
45 All in all, I am very satisfied.
Not applicable at all 1 ○
2 ○
3 ○
4 ○
5 ○
6 ○
7 ○
Very much applicable
46 Decisions were made in a democratic way.
Not applicable at all 1 ○
2 ○
3 ○
4 ○
5 ○
6 ○
7 ○
Very much applicable
47 Because each participant provided a part of the puzzle, we could do the job.
Not applicable at all 1 ○
2 ○
3 ○
4 ○
5 ○
6 ○
7 ○
Very much applicable
48 The presentations of my co-workers were understandable.
Not applicable at all 1 ○
2 ○
3 ○
4 ○
5 ○
6 ○
7 ○
Very much applicable
49 I am satisfied with the way we worked together.
Not applicable at all 1 ○
2 ○
3 ○
4 ○
5 ○
6 ○
7 ○
Very much applicable
50 The presentations of my co-workers were complete.
Not applicable at all 1 ○
2 ○
3 ○
4 ○
5 ○
6 ○
7 ○
Very much applicable

83 / 90
51 I find the members of the group irritating.
Not applicable at all 1 ○
2 ○
3 ○
4 ○
5 ○
6 ○
7 ○
Very much applicable

84 / 90
Questionnaire: Afterwards
Condition 1
1 Check the cells to indicate which information sources you used during the project and the means you used for this.
Min
ute
s
Pre
senta
tions
Em
ails
/messages
Inte
rnet
Room
vie
w v
ideos
Clo
se u
p v
ideos
File system (Explorer) □ □ □ □ □ □
Email (Outlook) □ □ □ □ □ □
Internet □ □ □ □ □ □
2 How useful did you find the minutes?
Not useful at all 1 ○
2 ○
3 ○
4 ○
5 ○
6 ○
7 ○
Very much useful
3 How useful did you find the presentations?
Not useful at all 1 ○
2 ○
3 ○
4 ○
5 ○
6 ○
7 ○
Very much useful
4 How useful did you find the e-mail / messages?
Not useful at all 1 ○
2 ○
3 ○
4 ○
5 ○
6 ○
7 ○
Very much useful
5 How useful did you find the internet?
Not useful at all 1 ○
2 ○
3 ○
4 ○
5 ○
6 ○
7 ○
Very much useful
6 How useful did you find the room view videos?
Not useful at all 1 ○
2 ○
3 ○
4 ○
5 ○
6 ○
7 ○
Very much useful
7 How useful did you find the close-up videos?
Not useful at all 1 ○
2 ○
3 ○
4 ○
5 ○
6 ○
7 ○
Very much useful
8 How usable did you find the file system (Explorer) to search for information?
Not usable at all 1 ○
2 ○
3 ○
4 ○
5 ○
6 ○
7 ○
Very much usable
9 How usable did you find e-mail (Outlook) to search for information?
Not usable at all 1 ○
2 ○
3 ○
4 ○
5 ○
6 ○
7 ○
Very much usable
10 How usable did you find Internet to search for information?
Not usable at all 1 ○
2 ○
3 ○
4 ○
5 ○
6 ○
7 ○
Very much usable
Condition 2
1 Check the cells to indicate which information sources you used during the project and the means you used for this.

85 / 90
Min
ute
s
Pre
senta
tions
Em
ails
/messages
Inte
rnet
Room
vie
w v
ideos
Clo
se u
p v
ideos
Speaker
activity log
Meeting tra
nscripts
File system (Explorer) □ □ □ □ □ □ □ □
Email (Outlook) □ □ □ □ □ □ □ □
Internet □ □ □ □ □ □ □ □
Meeting browser □ □ □ □ □ □ □ □
2 How useful did you find the minutes?
Not useful at all 1 ○
2 ○
3 ○
4 ○
5 ○
6 ○
7 ○
Very much useful
3 How useful did you find the presentations?
Not useful at all 1 ○
2 ○
3 ○
4 ○
5 ○
6 ○
7 ○
Very much useful
4 How useful did you find the e-mail / messages?
Not useful at all 1 ○
2 ○
3 ○
4 ○
5 ○
6 ○
7 ○
Very much useful
5 How useful did you find the internet?
Not useful at all 1 ○
2 ○
3 ○
4 ○
5 ○
6 ○
7 ○
Very much useful
6 How useful did you find the room view videos?
Not useful at all 1 ○
2 ○
3 ○
4 ○
5 ○
6 ○
7 ○
Very much useful
7 How useful did you find the close-up videos?
Not useful at all 1 ○
2 ○
3 ○
4 ○
5 ○
6 ○
7 ○
Very much useful
8 How useful did you find the speaker activity log?
Not useful at all 1 ○
2 ○
3 ○
4 ○
5 ○
6 ○
7 ○
Very much useful
9 How useful did you find the meeting transcripts?
Not useful at all 1 ○
2 ○
3 ○
4 ○
5 ○
6 ○
7 ○
Very much useful
10 How usable did you find the file system (Explorer) to search for information?
Not usable at all 1 ○
2 ○
3 ○
4 ○
5 ○
6 ○
7 ○
Very much usable
11 How usable did you find e-mail (Outlook) to search for information?
Not usable at all 1 ○
2 ○
3 ○
4 ○
5 ○
6 ○
7 ○
Very much usable

86 / 90
12 How usable did you find Internet to search for information?
Not usable at all 1 ○
2 ○
3 ○
4 ○
5 ○
6 ○
7 ○
Very much usable
13 How usable did you find the meeting browser to search for information?
Not usable at all 1 ○
2 ○
3 ○
4 ○
5 ○
6 ○
7 ○
Very much usable
Condition 3
1 Check the cells to indicate which information sources you used during the project and the means you used for this.
Pre
senta
tions
Em
ails
/messages
Inte
rnet
Room
vie
w v
ideos
Clo
se u
p v
ideos
Speaker
activity log
Meeting tra
nscripts
Abstr
acts
Actions
Decio
ns
Pro
ble
ms
File system (Explorer) □ □ □ □ □ □ □ □ □ □ □
Email (Outlook) □ □ □ □ □ □ □ □ □ □ □
Internet □ □ □ □ □ □ □ □ □ □ □
Meeting browser □ □ □ □ □ □ □ □ □ □ □
2 How useful did you find the presentations?
Not useful at all 1 ○
2 ○
3 ○
4 ○
5 ○
6 ○
7 ○
Very much useful
3 How useful did you find the e-mail / messages?
Not useful at all 1 ○
2 ○
3 ○
4 ○
5 ○
6 ○
7 ○
Very much useful
4 How useful did you find the internet?
Not useful at all 1 ○
2 ○
3 ○
4 ○
5 ○
6 ○
7 ○
Very much useful
5 How useful did you find the room view videos?
Not useful at all 1 ○
2 ○
3 ○
4 ○
5 ○
6 ○
7 ○
Very much useful
6 How useful did you find the close-up videos?
Not useful at all 1 ○
2 ○
3 ○
4 ○
5 ○
6 ○
7 ○
Very much useful
7 How useful did you find the speaker activity log?
Not useful at all 1 ○
2 ○
3 ○
4 ○
5 ○
6 ○
7 ○
Very much useful
8 How useful did you find the meeting transcripts?
Not useful at all 1 ○
2 ○
3 ○
4 ○
5 ○
6 ○
7 ○
Very much useful
9 How useful did you find the Abstracts?
Not useful at all 1 2 3 4 5 6 7 Very much useful

87 / 90
○ ○ ○ ○ ○ ○ ○
10 How useful did you find the Actions?
Not useful at all 1 ○
2 ○
3 ○
4 ○
5 ○
6 ○
7 ○
Very much useful
11 How useful did you find the Decisions?
Not useful at all 1 ○
2 ○
3 ○
4 ○
5 ○
6 ○
7 ○
Very much useful
12 How useful did you find the Problems?
Not useful at all 1 ○
2 ○
3 ○
4 ○
5 ○
6 ○
7 ○
Very much useful
13 How usable did you find the file system (Explorer) to search for information?
Not usable at all 1 ○
2 ○
3 ○
4 ○
5 ○
6 ○
7 ○
Very much usable
14 How usable did you find e-mail (Outlook) to search for information?
Not usable at all 1 ○
2 ○
3 ○
4 ○
5 ○
6 ○
7 ○
Very much usable
15 How usable did you find Internet to search for information?
Not usable at all 1 ○
2 ○
3 ○
4 ○
5 ○
6 ○
7 ○
Very much usable
16 How usable did you find the meeting browser to search for information?
Not usable at all 1 ○
2 ○
3 ○
4 ○
5 ○
6 ○
7 ○
Very much usable
Condition 4
1 Check the cells to indicate which information sources you used during the project and the means you used for this.
Min
ute
s
Pre
senta
tions
Em
ails
/messages
Inte
rnet
Room
vie
w v
vid
eos
Clo
se u
p v
ideos
Speaker
activity log
Meeting tra
nscripts
To d
o’s
Decis
ions
Project □ □ □ □ □ □ □ □ □ □
To do’s □ □ □ □ □ □ □ □ □ □
Decisions □ □ □ □ □ □ □ □ □ □
Documents □ □ □ □ □ □ □ □ □ □
Messages □ □ □ □ □ □ □ □ □ □
Meetings □ □ □ □ □ □ □ □ □ □
2 How useful did you find the minutes?
Not useful at all 1 ○
2 ○
3 ○
4 ○
5 ○
6 ○
7 ○
Very much useful
3 How useful did you find the presentations?

88 / 90
Not useful at all 1 ○
2 ○
3 ○
4 ○
5 ○
6 ○
7 ○
Very much useful
4 How useful did you find the e-mail / messages?
Not useful at all 1 ○
2 ○
3 ○
4 ○
5 ○
6 ○
7 ○
Very much useful
5 How useful did you find the internet?
Not useful at all 1 ○
2 ○
3 ○
4 ○
5 ○
6 ○
7 ○
Very much useful
6 How useful did you find the room view videos?
Not useful at all 1 ○
2 ○
3 ○
4 ○
5 ○
6 ○
7 ○
Very much useful
7 How useful did you find the close-up videos?
Not useful at all 1 ○
2 ○
3 ○
4 ○
5 ○
6 ○
7 ○
Very much useful
8 How useful did you find the speaker activity log?
Not useful at all 1 ○
2 ○
3 ○
4 ○
5 ○
6 ○
7 ○
Very much useful
9 How useful did you find the meeting transcripts?
Not useful at all 1 ○
2 ○
3 ○
4 ○
5 ○
6 ○
7 ○
Very much useful
10 How useful did you find the To do's?
Not useful at all 1 ○
2 ○
3 ○
4 ○
5 ○
6 ○
7 ○
Very much useful
11 How useful did you find the Decisions?
Not useful at all 1 ○
2 ○
3 ○
4 ○
5 ○
6 ○
7 ○
Very much useful
12 How usable did you find the Project tab to search for information?
Not usable at all 1 ○
2 ○
3 ○
4 ○
5 ○
6 ○
7 ○
Very much usable
13 How usable did you find the To do's tab to search for information?
Not usable at all 1 ○
2 ○
3 ○
4 ○
5 ○
6 ○
7 ○
Very much usable
14 How usable did you find the Decisions tab to search for information?
Not usable at all 1 ○
2 ○
3 ○
4 ○
5 ○
6 ○
7 ○
Very much usable
15 How usable did you find the Documents tab to search for information?
Not usable at all 1 ○
2 ○
3 ○
4 ○
5 ○
6 ○
7 ○
Very much usable
16 How usable did you find the Messages tab to search for information?
Not usable at all 1 ○
2 ○
3 ○
4 ○
5 ○
6 ○
7 ○
Very much usable

89 / 90
17 How usable did you find the Meetings tab to search for information?
Not usable at all 1 ○
2 ○
3 ○
4 ○
5 ○
6 ○
7 ○
Very much usable
Condition 1, 2, 3, 4
2 Do you feel that the objectives for today’s project were generally attained?
○ never
○ hardly ever
○ sometimes
○ most of the times
○ always
3 Do you feel that the time for today’s project was generally well-spent?
○ never
○ hardly ever
○ sometimes
○ most of the times
○ always
4 Did you generally like to participate in today’s project?
○ never
○ hardly ever
○ sometimes
○ most of the times
○ always
5 What type of information did you miss in the information on the computer?
…
6 What types of search options did you miss in the information on the computer?
…
7 Do you trust the information on the computer to provide an accurate and adequate representation of the project?
Yes, because …
Yes, but …
No, because …
8 Would you like to participate in meetings that take place in a ‘smart meeting room’ in which all communication is logged (in real life)?
Yes, because …
Yes, but …
No, because …
9 Would meeting in a ‘smart meeting room’ affect your behaviour during meetings?
Yes, because …
Yes, but …
No, because …

90 / 90


