Embed Size (px)
Citation preview
Doppler Myocardial Imaging toEvaluate the Effectiveness of PacingSites in Patients Receiving Biventricular PacingGerardo Ansalone, MD,* Paride Giannantoni, MD,* Renato Ricci, MD,* Paolo Trambaiolo, MD,†Francesco Fedele, MD,‡ Massimo Santini, MD, FACC, FESCRome, Italy
OBJECTIVES The goal of this study was to compare the efficacy of biventricular pacing (BIV) at the mostdelayed wall of the left ventricle (LV) and at other LV walls.
BACKGROUND Biventricular pacing could provide additional benefit when it is applied at the most delayedsite.
METHODS In 31 patients with advanced nonischemic heart failure, the activation delay was defined, inblind before BIV, by regional noninvasive Tissue Doppler Imaging as the time intervalbetween the end of the A-wave (C point) and the beginning of the E-wave (O point) fromthe basal level of each wall. The left pacing site was considered concordant with the mostdelayed site when the lead was inserted at the wall with the greatest regional interval betweenC and O points (COR). After BIV, patients were divided into group A (13/31) (i.e., pacedat the most delayed site) and group B (18/31) (i.e., paced at any other site).
RESULTS After BIV, in all patients LV end-diastolic (LVEDV) and end-systolic (LVESV) volumesdecreased (p � 0.025 and 0.001), LV ejection fraction (LVEF) increased (p � 0.002), QRSnarrowed (p � 0.000), New York Heart Association class decreased (p � 0.006), 6-minwalked distance (WD) increased (p � 0.046), the interval between closure and opening ofmitral valve (CO) and isovolumic contraction time (ICT) decreased (p � 0.001 and 0.000),diastolic time (EA) and Q-P2 interval increased (p � 0.003 and 0.000), while Q-A2 intervaland mean performance index (MPI) did not change. Group A showed greater improvementover group B in LVESV (p � 0.04), LVEF (p � 0.04), bicycle stress testing work (p � 0.03)and time (p � 0.08) capacity, CO (p � 0.04) and ICT (p � 0.02).
CONCLUSIONS After BIV, LV performance improved significantly in all patients; however, the greatestimprovement was found in patients paced at the most delayed site. (J Am Coll Cardiol2002;39:489–99) © 2002 by the American College of Cardiology
In patients receiving biventricular pacing (BIV), the site ofthe left ventricle (LV) lead varies randomly for severalanatomical and technical reasons so that LV pacing cannotbe applied at the most delayed wall in all patients. Since therationale of BIV is to stimulate the most delayed LV wall(1–5), the left pacing site could provide additional benefitwhen it is concordant with the most delayed site. Ourobservational study aimed to define the most delayed wall bytissue Doppler imaging (TDI) (6–9) and to verify whetherLV performance showed a greater improvement in patientspaced at the most delayed site compared with patients pacedat any other site.
METHODS
Inclusion criteria. We studied 31 patients with nonisch-emic heart failure (HF) and left bundle branch block(LBBB) who were referred to our institution from January1999 to January 2001. The inclusion criteria were: patientswith severe HF, still symptomatic (New York Heart Asso-
ciation [NYHA] class III or IV) after optimal drug treat-ment involving diuretics, converting enzyme inhibitors atthe maximum tolerated dose and beta-adrenergic blockingagents with: LV systolic dysfunction defined by ejectionfraction �40%, permanent LBBB, normal sinus rhythm, atleast one hospitalization for HF in the year before inclusion,drug-induced stability for at least three months beforeinclusion and successful BIV implantation. All patientsunderwent coronary angiography. For reference, 18 of these31 patients were included in an earlier study to analyzequalitative patterns of LV activation.Standard echocardiography. All the studies were per-formed with a commercially available ultrasonographic sys-tem (Acuson, Sequoia, Mountain View, California). Theechocardiographic study was performed in baseline condi-tion, the day before and the day after pacemaker implanta-tion, that is, respectively, in sinus rhythm (SR) and BIV.Detailed two-dimensional and M-mode echocardiographywas obtained under American Society of Echocardiographyguidelines to measure the following parameters: 1) LVend-diastolic volume (LVEDV); 2) LVEDV index(LVEDVI) (i.e., LVEDV/body surface area); 3) LV end-systolic volume (LVESV); 4) LVESV index (LVESVI)(i.e., LVESV/body surface area); 5) LV ejection fraction
From the *Department of Heart Diseases, San Filippo Neri Hospital, Rome, Italy;†Department of Cardiology, Sandro Pertini Hospital, Rome, Italy; and the ‡Depart-ment of Cardiac and Respiratory Sciences of University “La Sapienza,” Rome, Italy.
Manuscript received April 4, 2001; revised manuscript received October 10, 2001,accepted October 31, 2001.
Journal of the American College of Cardiology Vol. 39, No. 3, 2002© 2002 by the American College of Cardiology ISSN 0735-1097/02/$22.00Published by Elsevier Science Inc. PII S0735-1097(01)01772-7
(LVEF) assessed using the modified biplane Simpson rule(10). The LV volumes and LVEF were calculated as theaverage of three different blind measurements by twoechocardiographists. The standard echo-Doppler approachwas applied to measure transmitral, aortic and pulmonaryflow velocities with a 2.5 MHz to 5.0 MHz pulsed-wave(PW) Doppler in the four-chamber apical and parasternalviews. The following systolic and diastolic time intervalswere measured before and after BIV: 1) LV electromechan-ical systole (Q-A2); 2) RV electromechanical systole (Q-P2);3) LV pre-ejection period; 4) RV pre-ejection period; 5) LVelectromechanical interval from Q-wave to mitral closure; 6)LV isovolumic contraction time (ICT) from mitral closureto beginning of the aortic flow; 7) RV ejection time; 8) LVejection time (LVET); 9) isovolumic LV relaxation time(IRT) from A2 closure to mitral opening; 10) time betweenclosure and re-opening of mitral valve (CO); 11) diastolictime (EA); 12) mean performance index (MPI) measured bythe difference between CO and LVET normalized for LVET[(CO � LVET)/LVET]. All intervals were expressed incorrected units (c.u. � measured interval/�R-R interval).Tissue Doppler Imaging (TDI). Tissue Doppler imagingwas performed in M-mode color Doppler (M-mode) andPW Doppler modalities from the apical view to assesslongitudinal myocardial regional function analyzing, respec-tively, interventricular septum (IVS), inferior, posterior,
lateral and anterior walls. In PW, the velocity profiles wererecorded with a sample volume placed in the middle of thebasal segment of each wall. Gain and filters were adjusted asneeded to eliminate background noise and allow for a cleartissue signal. Tissue Doppler imaging velocities (from �30to 30 cm/s) were recorded at a sweep speed of 100 mm/s andstored digitally on a magneto-optical disk. In M-mode, thescanned sector was acquired with two-dimensional andM-mode gray scale imaging set at zero level, with thecolor-coded scale set at the highest level.Regional time intervals. The following systolic and dia-stolic time intervals were detected regionally at each wallusing PW and M-mode modalities: 1) CO interval (COR),lengthening from the end of the A-PW to the beginning ofthe E-PW or from the end of the last blue component of thepreceding cycle to the beginning of the first homogeneousblue diastolic M-mode component; 2) EA interval (EAR),detected from the beginning of the E-PW to the end of theA-PW, or from the end of the third red systolic M-modecomponent to the end of the blue diastolic M-modecomponent; 3) isovolumic contraction time (ICTR) length-ening from the beginning of the S1-PW to the beginning ofthe S2-PW, or from the beginning of the first red systolicM-mode component to the beginning of the second redsystolic M-mode component; 4) isovolumic relaxation time(IRTR) lengthening from the end of the S2-PW to thebeginning of the E-PW or from the end of the second redsystolic M-mode component to the end of the third red systolicM-mode component; 5) LVETR resulting from the differencebetween the COR and the sum of ICTR � IRTR [i.e., COR �(ICTR � IRTR)]; 6) mean performance index (MPIR) esti-mated using the rule (COR � LVETR)/LVETR. All intervalswere measured in PW modality and expressed in c.u.Assessment of regional delay. The COR was selected toassess the regional mechanical delay in LV activation; it wascalculated at each wall in M-mode and PW modalities, inc.u. for at least three beats. The most delayed site wasidentified from the maximum COR in each patient beforeBIV, in blind to avoid any bias in the choice of pacing site.Concordance between the delayed site and the pacingsite. We identified the pacing site by analyzing the frontal,lateral, right and left oblique X-ray views. The lead positionwas classified as lateral, posterior, inferior or anterior ac-cording to the anatomy of the branches of the coronarysinus (11). Then, a correlation between the site of pacing(X-ray defined) and the site of delay (TDI defined) wasassessed in blind by two observers with 100% concordance.On the basis of such a correlation, when the catheter wasplaced at the wall where the COR achieved maximum value,the pacing site was considered coincident with the mostdelayed wall. The only exception was the IVS because leftpacing is not feasible at this site for anatomic reasons. Thus,when the maximum COR was detected at the IVS and theinferior wall paced, the latter was considered concordantwith the site of the delay, provided that it showed thelongest COR after that of the IVS. On the basis of the
Abbreviations and AcronymsBIV � biventricular pacingCO � time between closure and re-opening of
mitral valveCOR � time between the end of regional A-PW
and the beginning of E-PWEA � left ventricular diastolic timeHF � heart failureICT � left ventricular isovolumetric contraction
timeIRT � left ventricular isovolumetric relaxation timeIVS � interventricular septumLBBB � left bundle branch blockLV � left ventricleLVEDV � left ventricular end-diastolic volumeLVEDVI � left ventricular end-diastolic volume indexLVEF � left ventricular ejection fractionLVESV � left ventricular end-systolic volumeLVESVI � left ventricular end-systolic volume indexLVET � left ventricular ejection timeM-mode � M-mode color DopplerMPI � left ventricular mean performance indexMUGA � multigated equilibrium blood pool
scintigraphyNYHA � New York Heart AssociationPW � pulsed-waveQ-A2 � left ventricular electromechanical systoleQ-P2 � right ventricular electromechanical systoleRV � right ventricleSR � sinus rhythmTDI � tissue Doppler imagingWD � 6-min walked distance
490 Ansalone et al. JACC Vol. 39, No. 3, 2002Effectiveness of Pacing Sites in BIV February 6, 2002:489–99
concordance or discordance between the pacing site and thedelayed site, patients were divided into group A: patientspaced at the site of the greatest delay, and group B: patientspaced at any other site. Two-dimensional and TDI param-eters, NYHA class, exercise tolerance and QRS narrowingwere compared in the two groups before and after BIV.
Exercise tolerance. All patients underwent maximaland/or symptom-limited bicycle stress testing using anincremental protocol of 10 W/min until the maximumtolerated workload was reached. The test was performed theday before implantation during spontaneous SR and oneweek later during BIV. The 6-min walking test was alsoperformed before and after BIV.Clinical evaluation. A skilled HF physician evaluatedNYHA class before (�1 week) and after (�1 week �1month) implantation.Statistical analysis. Data are presented as mean � SD forcontinuous variables. The differences in all patients and ineach subgroup were validated using a two-way repeatedmeasures analysis of variance.
RESULTS
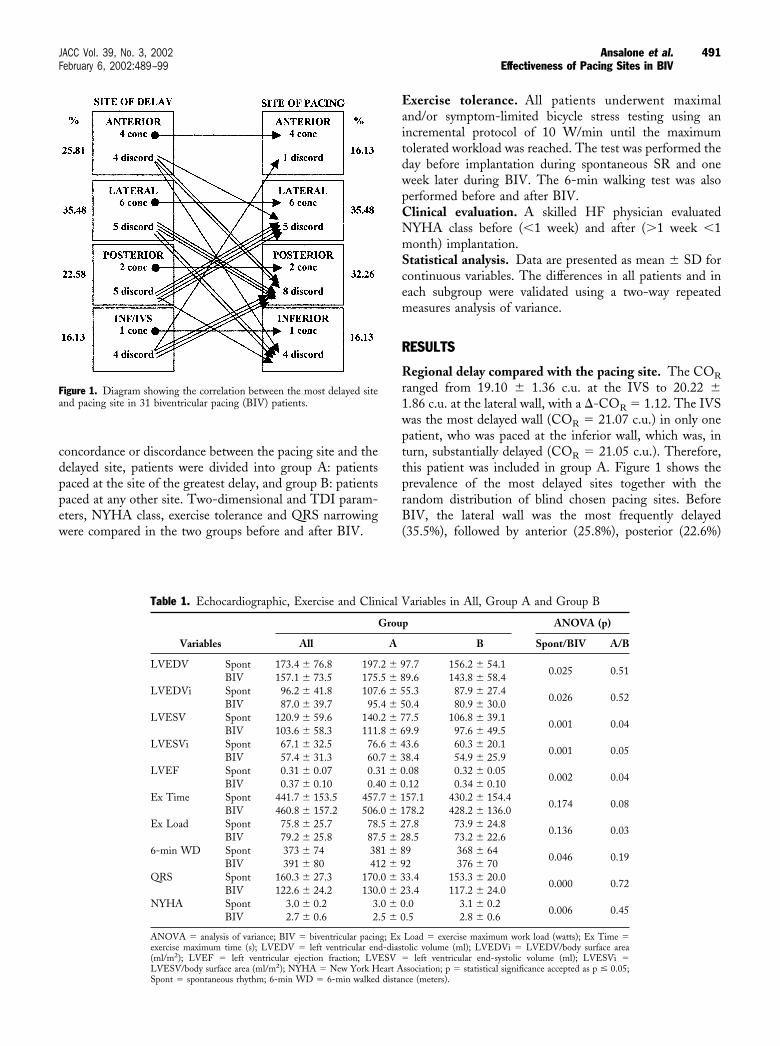
Regional delay compared with the pacing site. The CORranged from 19.10 � 1.36 c.u. at the IVS to 20.22 �1.86 c.u. at the lateral wall, with a �-COR � 1.12. The IVSwas the most delayed wall (COR � 21.07 c.u.) in only onepatient, who was paced at the inferior wall, which was, inturn, substantially delayed (COR � 21.05 c.u.). Therefore,this patient was included in group A. Figure 1 shows theprevalence of the most delayed sites together with therandom distribution of blind chosen pacing sites. BeforeBIV, the lateral wall was the most frequently delayed(35.5%), followed by anterior (25.8%), posterior (22.6%)
Figure 1. Diagram showing the correlation between the most delayed siteand pacing site in 31 biventricular pacing (BIV) patients.
Table 1. Echocardiographic, Exercise and Clinical Variables in All, Group A and Group B
Variables
Group ANOVA (p)
All A B Spont/BIV A/B
LVEDV Spont 173.4 � 76.8 197.2 � 97.7 156.2 � 54.10.025 0.51
BIV 157.1 � 73.5 175.5 � 89.6 143.8 � 58.4LVEDVi Spont 96.2 � 41.8 107.6 � 55.3 87.9 � 27.4
0.026 0.52BIV 87.0 � 39.7 95.4 � 50.4 80.9 � 30.0
LVESV Spont 120.9 � 59.6 140.2 � 77.5 106.8 � 39.10.001 0.04
BIV 103.6 � 58.3 111.8 � 69.9 97.6 � 49.5LVESVi Spont 67.1 � 32.5 76.6 � 43.6 60.3 � 20.1
0.001 0.05BIV 57.4 � 31.3 60.7 � 38.4 54.9 � 25.9
LVEF Spont 0.31 � 0.07 0.31 � 0.08 0.32 � 0.050.002 0.04
BIV 0.37 � 0.10 0.40 � 0.12 0.34 � 0.10Ex Time Spont 441.7 � 153.5 457.7 � 157.1 430.2 � 154.4
0.174 0.08BIV 460.8 � 157.2 506.0 � 178.2 428.2 � 136.0
Ex Load Spont 75.8 � 25.7 78.5 � 27.8 73.9 � 24.80.136 0.03
BIV 79.2 � 25.8 87.5 � 28.5 73.2 � 22.66-min WD Spont 373 � 74 381 � 89 368 � 64
0.046 0.19BIV 391 � 80 412 � 92 376 � 70
QRS Spont 160.3 � 27.3 170.0 � 33.4 153.3 � 20.00.000 0.72
BIV 122.6 � 24.2 130.0 � 23.4 117.2 � 24.0NYHA Spont 3.0 � 0.2 3.0 � 0.0 3.1 � 0.2
0.006 0.45BIV 2.7 � 0.6 2.5 � 0.5 2.8 � 0.6
ANOVA � analysis of variance; BIV � biventricular pacing; Ex Load � exercise maximum work load (watts); Ex Time �exercise maximum time (s); LVEDV � left ventricular end-diastolic volume (ml); LVEDVi � LVEDV/body surface area(ml/m2); LVEF � left ventricular ejection fraction; LVESV � left ventricular end-systolic volume (ml); LVESVi �LVESV/body surface area (ml/m2); NYHA � New York Heart Association; p � statistical significance accepted as p � 0.05;Spont � spontaneous rhythm; 6-min WD � 6-min walked distance (meters).
491JACC Vol. 39, No. 3, 2002 Ansalone et al.February 6, 2002:489–99 Effectiveness of Pacing Sites in BIV
and IVS and/or inferior walls (16.13%). A total of 13/31patients (41.9%) were paced at the most delayed site, while18/31 patients (58.1%) were paced at a discordant site. Themost widely paced site was the lateral wall (35.5%), followedby posterior (32.3%) and anterior (16.1%) or inferior wall(16.1%).
QRS duration. QRS narrowed significantly in all (p �0.000), with no significant decrease in groups A or B (Table 1).Echocardiographic data. After BIV, in all LVEDV,LVEDVi, LVESV and LVESVi decreased significantly(p � 0.025, 0.026, 0.001 and 0.001, respectively), whileLVEF increased significantly (p � 0.002) (Table 1). How-
Table 2. Global Time Intervals in All, Group A and Group B
Variable
Group ANOVA (p)
All A B Spont/BIV A/B
CO Spont 16.72 � 1.73 16.99 � 1.81 16.53 � 1.690.001 0.04
BIV 15.43 � 2.24 14.79 � 2.08 15.89 � 2.29EA Spont 13.52 � 2.39 12.91 � 1.88 13.97 � 2.67
0.003 0.25BIV 14.81 � 2.35 14.75 � 2.39 14.85 � 2.38
QA2 Spont 13.80 � 1.29 14.38 � 0.98 13.38 � 1.350.130 0.08
BIV 14.15 � 0.95 14.26 � 1.09 14.07 � 0.86QP2 Spont 12.77 � 0.98 12.86 � 0.67 12.71 � 1.18
0.000 0.70BIV 14.10 � 1.03 14.04 � 1.19 14.15 � 0.92
ICT Spont 3.67 � 1.14 4.12 � 1.17 3.34 � 1.020.000 0.02
BIV 2.19 � 1.05 2.17 � 1.09 2.20 � 1.06IRT Spont 3.52 � 1.19 3.42 � 0.86 3.60 � 1.40
0.519 0.74BIV 3.33 � 1.35 3.34 � 1.30 3.32 � 1.42
MPI Spont 0.77 � 0.26 0.75 � 0.28 0.78 � 0.250.109 0.22
BIV 0.68 � 0.36 0.59 � 0.36 0.75 � 0.35
All intervals were measured in corrected units (c.u. � measured interval/√ preceding RR).ANOVA � analysis of variance; BIV � biventricular pacing; CO � interval between the mitral valve closing and re-opening;
EA � diastolic lengthening of the LV; ICT � isovolumic contraction time; IRT � isovolumic relaxation time; MPI � meanperformance index; QA2 � interval between Q-wave and aortic valve closing; QP2 � interval between Q-wave and pulmonaryvalve closing; Spont � spontaneous rhythm.
Table 3. Regional Time Intervals in All, Group A, and Group B
Variable
Group ANOVA (p)
All A B Spont/BIV A/B
CO Ivs Spont 19.22 � 1.36 19.85 � 1.05 18.77 � 1.390.000 0.03
BIV 17.42 � 1.11 17.40 � 1.06 17.43 � 1.17CO Inf Spont 19.61 � 1.19 19.90 � 0.81 19.40 � 1.39
0.000 0.33BIV 18.03 � 1.01 18.08 � 0.98 17.99 � 1.06
CO Lat Spont 19.91 � 1.86 20.58 � 1.29 19.43 � 2.090.000 0.31
BIV 18.11 � 1.73 18.52 � 1.48 17.82 � 1.88CO Pos Spont 19.86 � 1.78 20.36 � 1.30 19.45 � 2.04
0.000 0.35BIV 17.96 � 1.69 18.01 � 1.59 17.92 � 1.80
CO Ant Spont 19.71 � 1.63 20.22 � 1.08 19.35 � 1.880.000 0.30
BIV 17.86 � 1.70 18.01 � 1.69 17.76 � 1.75EA Ivs Spont 11.05 � 2.48 9.77 � 1.88 11.98 � 2.48
0.001 0.04BIV 12.45 � 2.01 12.09 � 2.06 12.71 � 1.99
EA Inf Spont 10.73 � 2.74 9.97 � 2.32 11.29 � 2.940.003 0.37
BIV 11.96 � 2.11 11.60 � 2.27 12.23 � 2.00EA Lat Spont 10.40 � 2.93 9.04 � 1.51 11.38 � 3.33
0.001 0.08BIV 11.91 � 2.64 11.38 � 2.19 12.30 � 2.92
EA Pos Spont 10.46 � 3.07 9.39 � 1.91 11.33 � 3.580.004 0.25
BIV 12.13 � 2.76 11.79 � 2.71 12.38 � 2.84EA Ant Spont 10.61 � 2.85 9.40 � 1.33 11.48 � 3.34
0.003 0.21BIV 12.22 � 2.43 11.75 � 1.93 12.55 � 2.75
IRT Lat Spont 6.13 � 1.68 6.32 � 1.11 5.99 � 2.010.210 0.05
BIV 5.71 � 1.58 5.17 � 1.30 6.11 � 1.68MPI Lat Spont 1.27 � 0.49 1.24 � 0.42 1.30 � 0.55
0.087 0.02BIV 1.46 � 0.63 1.11 � 0.36 1.72 � 0.66
All intervals were measured in corrected units (c.u. � measured interval/√ preceding RR).ANOVA � analysis of variance; BIV � biventricular pacing; COANT � COR at anterior wall; COINF � COR at inferior
wall; COIVS � COR at interventricular septum; COLAT � COR at lateral wall; COPOS � COR at posterior wall; EAANT �EAR at anterior wall; EAINF � EAR at inferior wall; EAIVS � EAR at interventricular septum; EALAT � EAR at lateral wall;EAPOS � EAR at posterior wall; IRTLAT � isovolumic relaxation time at lateral wall; MPILat � mean performance index atlateral wall; Spont � spontaneous rhythm.
492 Ansalone et al. JACC Vol. 39, No. 3, 2002Effectiveness of Pacing Sites in BIV February 6, 2002:489–99
ever, group A showed greater improvement over group B inLVESV (p � 0.04), LVESVi (p � 0.05) and LVEF (p �0.04), while LVEDV and LVEDVi showed no significantdifference between the two groups (Table 1).Exercise tolerance. After BIV, in all, NYHA class de-creased (p � 0.006), 6-min walked distance (WD) increased(p � 0.046), while bicycle stress testing work and timecapacity showed no significant changes (Table 1). Con-versely, group A showed greater improvement over group Bin exercise work (p � 0.03) and time (p � 0.08) capacity,while NYHA class and WD showed no further improve-ment (Table 1).
Global time intervals. After BIV, in all, CO and ICTdecreased (p � 0.001 and 0.000), EA and Q-P2 increased(p � 0.003 and 0.000), while no significant change wasobserved in IRT, MPI or Q-A2 (Table 2). However, groupA showed greater improvement over group B in CO (p �0.04) and ICT (p � 0.02) decrease (Table 2).Regional time intervals. After BIV, in all, COR and EARimproved at every wall (p � 0.000 and at least 0.004), butimprovement was greater in group A at the IVS (p � 0.03and 0.04) (Table 3). At the lateral wall, IRTR and MPIRdecreased in group A, while they increased in group B (p �0.05 and 0.02) (Table 3).
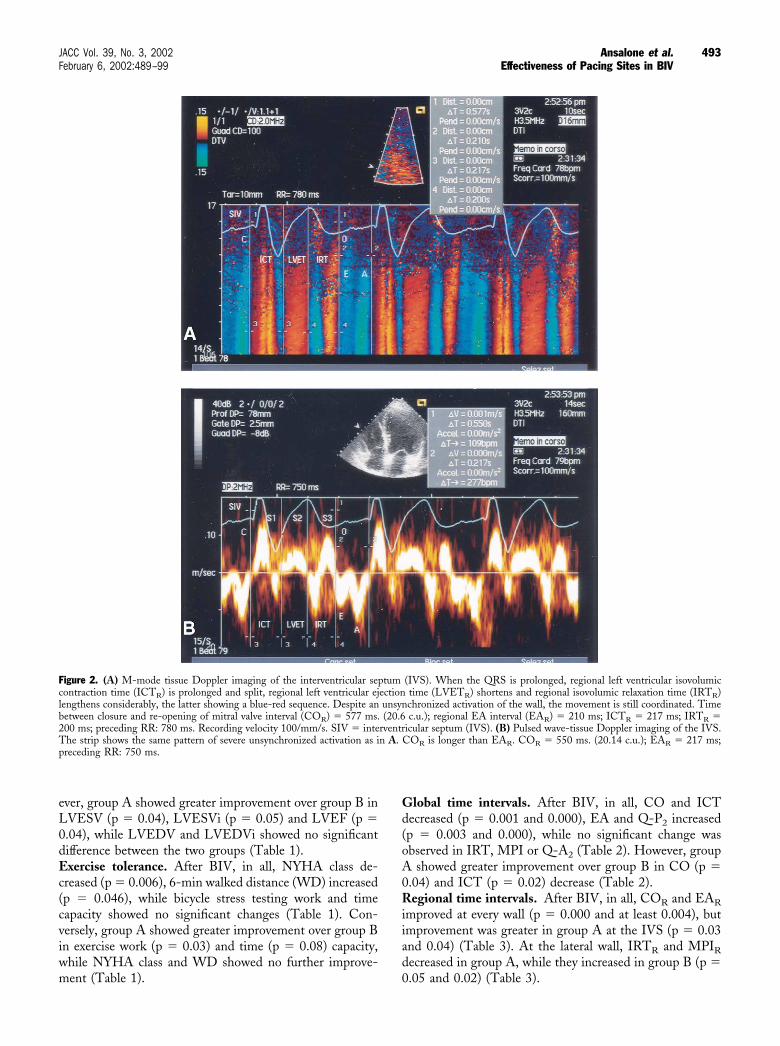
Figure 2. (A) M-mode tissue Doppler imaging of the interventricular septum (IVS). When the QRS is prolonged, regional left ventricular isovolumiccontraction time (ICTR) is prolonged and split, regional left ventricular ejection time (LVETR) shortens and regional isovolumic relaxation time (IRTR)lengthens considerably, the latter showing a blue-red sequence. Despite an unsynchronized activation of the wall, the movement is still coordinated. Timebetween closure and re-opening of mitral valve interval (COR) � 577 ms. (20.6 c.u.); regional EA interval (EAR) � 210 ms; ICTR � 217 ms; IRTR �200 ms; preceding RR: 780 ms. Recording velocity 100/mm/s. SIV � interventricular septum (IVS). (B) Pulsed wave-tissue Doppler imaging of the IVS.The strip shows the same pattern of severe unsynchronized activation as in A. COR is longer than EAR. COR � 550 ms. (20.14 c.u.); EAR � 217 ms;preceding RR: 750 ms.
493JACC Vol. 39, No. 3, 2002 Ansalone et al.February 6, 2002:489–99 Effectiveness of Pacing Sites in BIV
Regional myocardial velocities. After BIV, there were nosignificant changes in myocardial velocity values in all,group A or group B.
DISCUSSION
In our previous series, we assessed the regional qualitativeTDI patterns due to LBBB and/or HF as well as theirchanges after BIV (12). These patterns were graduated in ascale reflecting the progression from asynchronous (i.e.,delayed) to dyskinetic wall motion of the LV. Such a scaleenabled us to compare LV asynchrony before BIV with LVresynchronization after BIV. However, the highest degree
of dyskinetic wall motion does not always correspond to thehighest degree of regional delay per se. Since TDI in thisfield may identify the most delayed site to guide BIVimplantation, in this study, first we defined the most delayedsite in blind with implantation; second, we evaluated thedegree of concordance of the pacing sites (randomly as-signed) with the most delayed sites (TDI pre-defined);third, we compared LV performance in patients paced at aconcordant site with that in patients paced at a discordantsite. Because there was no substantial data on the clinicalrelevance of such a discordance and TDI had not yet beenvalidated as a reliable method to choose the pacing site, weapplied an observational protocol aimed at avoiding any bias
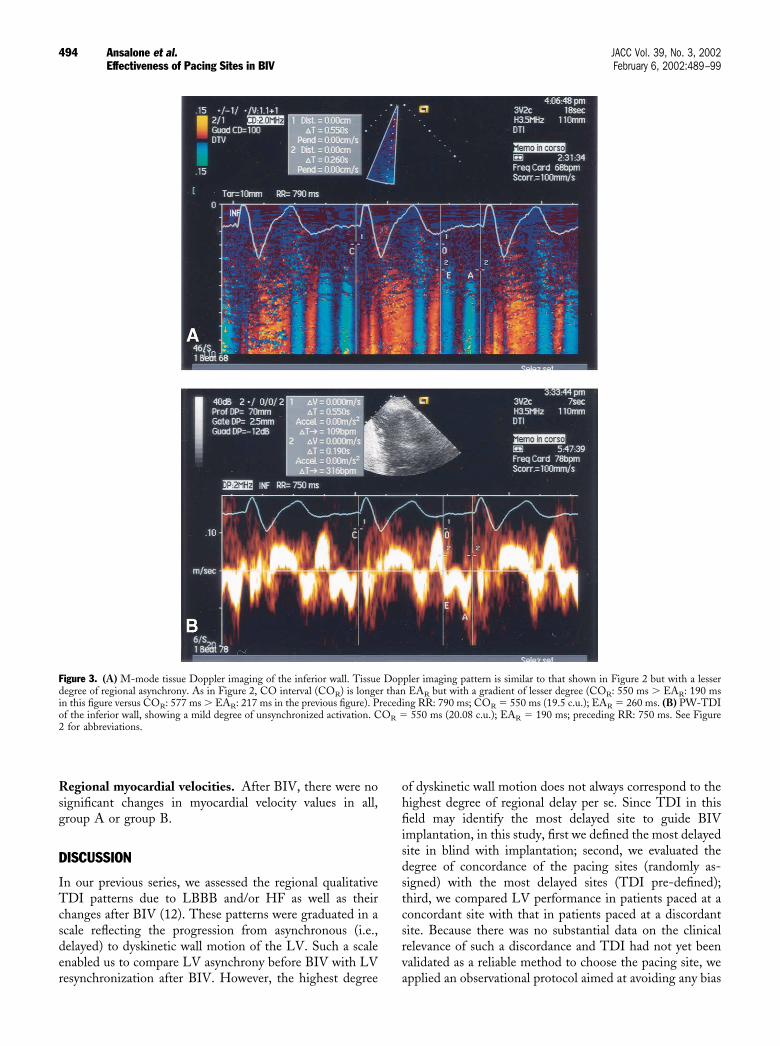
Figure 3. (A) M-mode tissue Doppler imaging of the inferior wall. Tissue Doppler imaging pattern is similar to that shown in Figure 2 but with a lesserdegree of regional asynchrony. As in Figure 2, CO interval (COR) is longer than EAR but with a gradient of lesser degree (COR: 550 ms � EAR: 190 msin this figure versus COR: 577 ms � EAR: 217 ms in the previous figure). Preceding RR: 790 ms; COR � 550 ms (19.5 c.u.); EAR � 260 ms. (B) PW-TDIof the inferior wall, showing a mild degree of unsynchronized activation. COR � 550 ms (20.08 c.u.); EAR � 190 ms; preceding RR: 750 ms. See Figure2 for abbreviations.
494 Ansalone et al. JACC Vol. 39, No. 3, 2002Effectiveness of Pacing Sites in BIV February 6, 2002:489–99
in the selection of pacing site, the latter having already beensubjected to several technical and anatomic restrictions dueto the complexity of implantation.Assessment of regional delay. To identify the most de-layed site we chose the COR, which reflects the delaybetween two mechanical events (i.e., the beginning of theE-PW and the end of the A-PW); consequently, thisinterval is strictly related to the regional duration of themechanical phases of active systole (pre-ejective and ejectivecontraction) and diastole (post-ejective early relaxation)(13). This parameter is consistent with the time frame
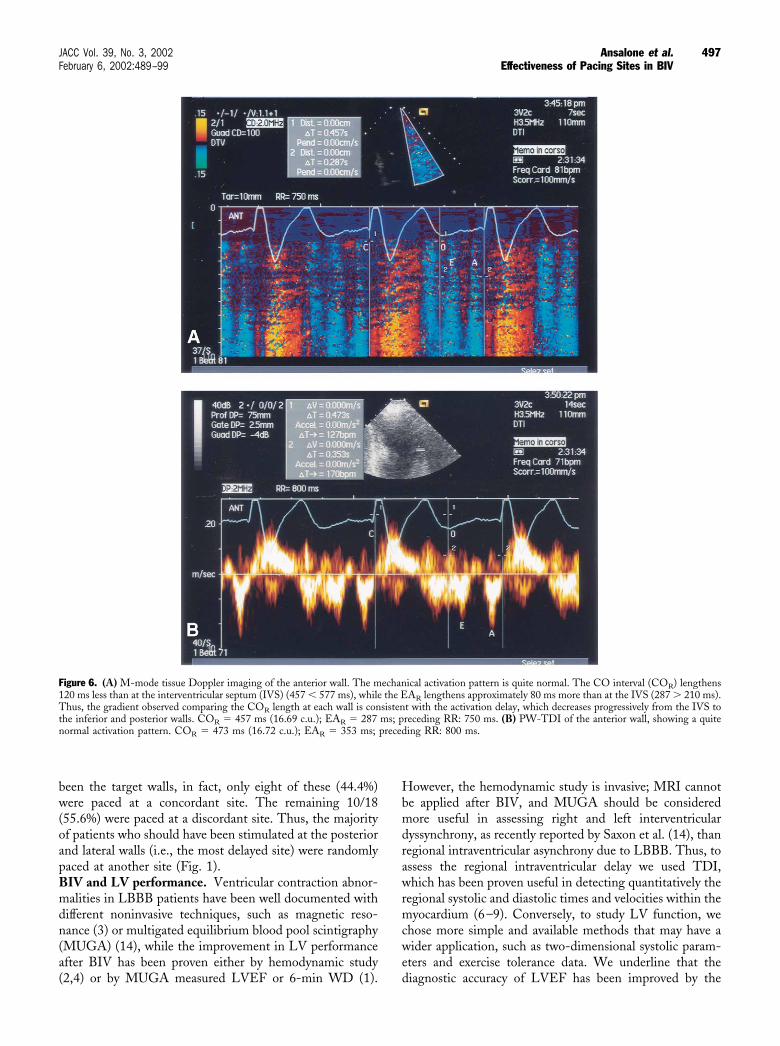
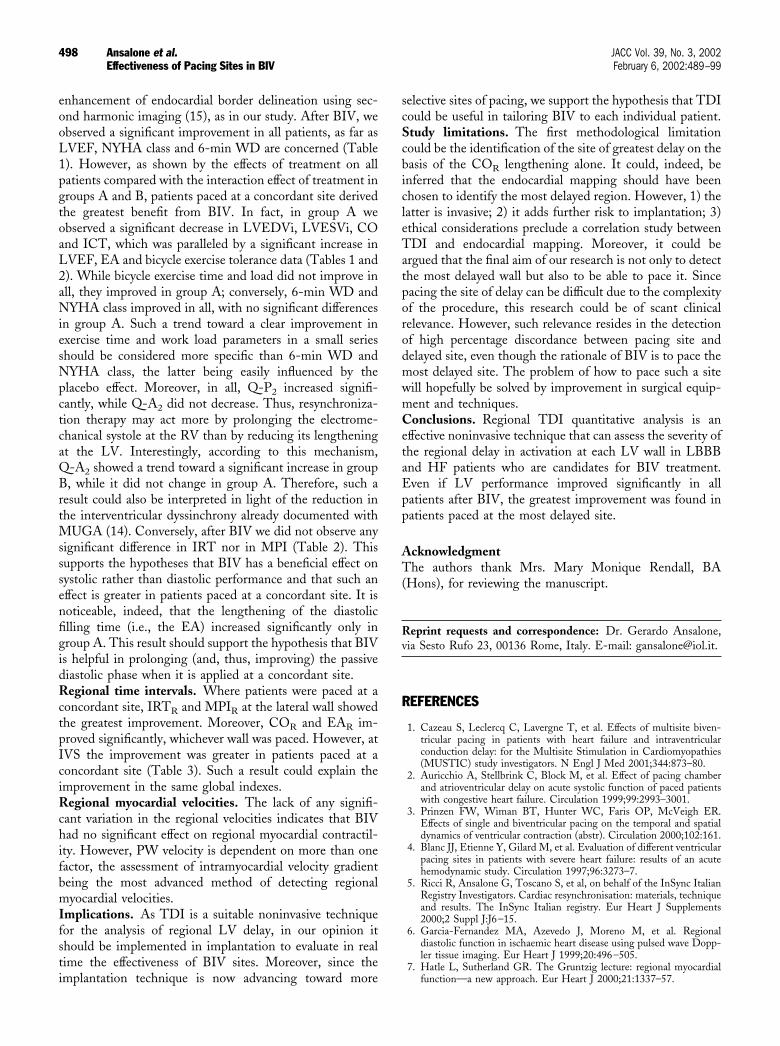
required at each wall to complete the electrical conduction,together with the mechanical activation and active relax-ation phases. Thus, the time-frame between the maximumand minimum COR, assessed individually at the basal levelof each wall, in itself reflects the regional electromechanicaldelay in each patient. As shown in Figures 2A to 6A, the�-COR between the IVS and the lateral wall was approxi-mately 100 ms, the COR in M-mode color ranging from aminimum of 450 ms (16.69 c.u.) at the anterior walland 470 ms (16.61 c.u.) at the lateral wall to a maximum of577 ms (20.6 c.u.) at the IVS. Furthermore, the M-mode
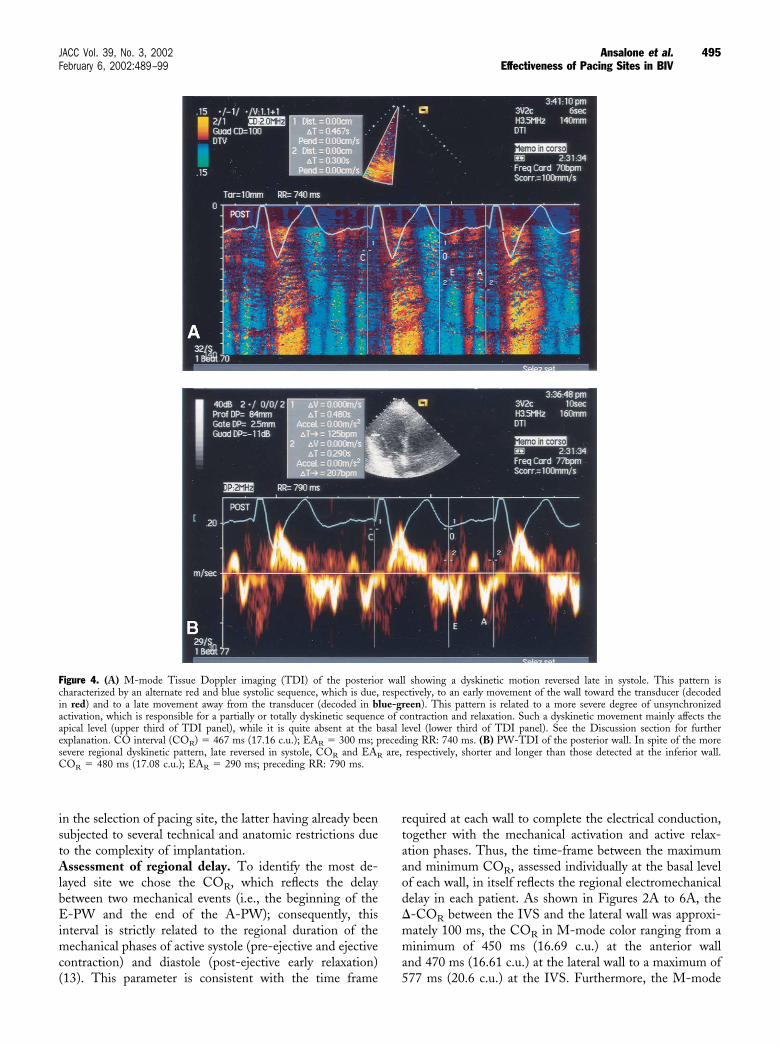
Figure 4. (A) M-mode Tissue Doppler imaging (TDI) of the posterior wall showing a dyskinetic motion reversed late in systole. This pattern ischaracterized by an alternate red and blue systolic sequence, which is due, respectively, to an early movement of the wall toward the transducer (decodedin red) and to a late movement away from the transducer (decoded in blue-green). This pattern is related to a more severe degree of unsynchronizedactivation, which is responsible for a partially or totally dyskinetic sequence of contraction and relaxation. Such a dyskinetic movement mainly affects theapical level (upper third of TDI panel), while it is quite absent at the basal level (lower third of TDI panel). See the Discussion section for furtherexplanation. CO interval (COR) � 467 ms (17.16 c.u.); EAR � 300 ms; preceding RR: 740 ms. (B) PW-TDI of the posterior wall. In spite of the moresevere regional dyskinetic pattern, late reversed in systole, COR and EAR are, respectively, shorter and longer than those detected at the inferior wall.COR � 480 ms (17.08 c.u.); EAR � 290 ms; preceding RR: 790 ms.
495JACC Vol. 39, No. 3, 2002 Ansalone et al.February 6, 2002:489–99 Effectiveness of Pacing Sites in BIV
TDI pattern at the IVS and inferior wall was characterizedby the splitting of the COR into three major red compo-nents (i.e., the ICTR, the LVETR and the IRTR), while thedirection of the wall movement was always toward thetransducer (and, thus, decoded in red). Conversely, thepattern at the lateral and posterior walls was consistent withthe splitting of the COR into two main components,indicating a dyskinetic movement directed early toward andlate away from the transducer. Such a dyskinetic movementof the lateral wall was related to the shortest COR, whereasthe unsynchronized motion of the IVS was associated withthe longest COR observed in this patient. The same patternswith more clearly defined signals can be observed in PWmodality (Figs. 2B to 6B). By applying this method, we
found that the lateral and posterior were the most frequentlydelayed walls, together attaining a prevalence of 58.1% ofpatients, while in the remaining 41.9% of patients the delaywas anterior, inferior or at the IVS (Fig. 1). Thus, in spiteof the relative prevalence of the delay at the lateral andposterior walls, in more than one-third of cases, a substan-tial minority of patients, the delay is located at another sitefrom that considered as target wall for left pacing.Regional delay compared with the pacing site. The lackof concordance between the site of delay and the site ofpacing is likely to reduce the real benefit in improvement inLV performance due to BIV. In our series, we found 18/31patients (58.1%) with the delay at the lateral and posteriorwalls. Even though the lateral and posterior should have
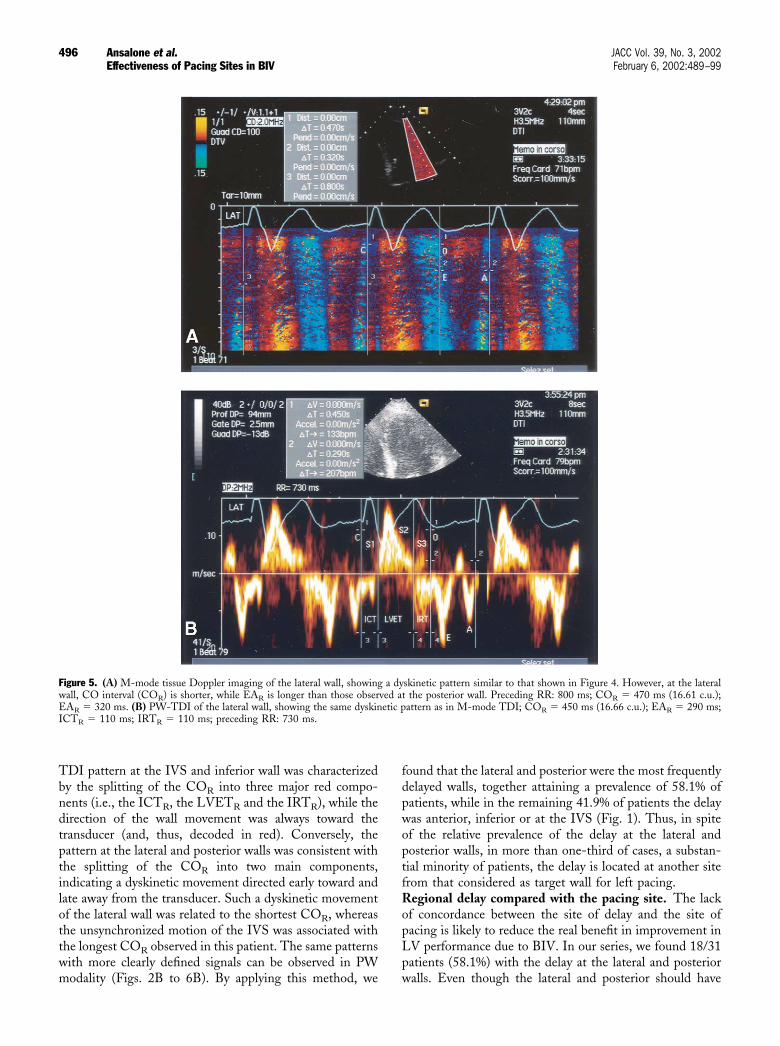
Figure 5. (A) M-mode tissue Doppler imaging of the lateral wall, showing a dyskinetic pattern similar to that shown in Figure 4. However, at the lateralwall, CO interval (COR) is shorter, while EAR is longer than those observed at the posterior wall. Preceding RR: 800 ms; COR � 470 ms (16.61 c.u.);EAR � 320 ms. (B) PW-TDI of the lateral wall, showing the same dyskinetic pattern as in M-mode TDI; COR � 450 ms (16.66 c.u.); EAR � 290 ms;ICTR � 110 ms; IRTR � 110 ms; preceding RR: 730 ms.
496 Ansalone et al. JACC Vol. 39, No. 3, 2002Effectiveness of Pacing Sites in BIV February 6, 2002:489–99
been the target walls, in fact, only eight of these (44.4%)were paced at a concordant site. The remaining 10/18(55.6%) were paced at a discordant site. Thus, the majorityof patients who should have been stimulated at the posteriorand lateral walls (i.e., the most delayed site) were randomlypaced at another site (Fig. 1).BIV and LV performance. Ventricular contraction abnor-malities in LBBB patients have been well documented withdifferent noninvasive techniques, such as magnetic reso-nance (3) or multigated equilibrium blood pool scintigraphy(MUGA) (14), while the improvement in LV performanceafter BIV has been proven either by hemodynamic study(2,4) or by MUGA measured LVEF or 6-min WD (1).
However, the hemodynamic study is invasive; MRI cannotbe applied after BIV, and MUGA should be consideredmore useful in assessing right and left interventriculardyssynchrony, as recently reported by Saxon et al. (14), thanregional intraventricular asynchrony due to LBBB. Thus, toassess the regional intraventricular delay we used TDI,which has been proven useful in detecting quantitatively theregional systolic and diastolic times and velocities within themyocardium (6–9). Conversely, to study LV function, wechose more simple and available methods that may have awider application, such as two-dimensional systolic param-eters and exercise tolerance data. We underline that thediagnostic accuracy of LVEF has been improved by the
Figure 6. (A) M-mode tissue Doppler imaging of the anterior wall. The mechanical activation pattern is quite normal. The CO interval (COR) lengthens120 ms less than at the interventricular septum (IVS) (457 � 577 ms), while the EAR lengthens approximately 80 ms more than at the IVS (287 � 210 ms).Thus, the gradient observed comparing the COR length at each wall is consistent with the activation delay, which decreases progressively from the IVS tothe inferior and posterior walls. COR � 457 ms (16.69 c.u.); EAR � 287 ms; preceding RR: 750 ms. (B) PW-TDI of the anterior wall, showing a quitenormal activation pattern. COR � 473 ms (16.72 c.u.); EAR � 353 ms; preceding RR: 800 ms.
497JACC Vol. 39, No. 3, 2002 Ansalone et al.February 6, 2002:489–99 Effectiveness of Pacing Sites in BIV
enhancement of endocardial border delineation using sec-ond harmonic imaging (15), as in our study. After BIV, weobserved a significant improvement in all patients, as far asLVEF, NYHA class and 6-min WD are concerned (Table1). However, as shown by the effects of treatment on allpatients compared with the interaction effect of treatment ingroups A and B, patients paced at a concordant site derivedthe greatest benefit from BIV. In fact, in group A weobserved a significant decrease in LVEDVi, LVESVi, COand ICT, which was paralleled by a significant increase inLVEF, EA and bicycle exercise tolerance data (Tables 1 and2). While bicycle exercise time and load did not improve inall, they improved in group A; conversely, 6-min WD andNYHA class improved in all, with no significant differencesin group A. Such a trend toward a clear improvement inexercise time and work load parameters in a small seriesshould be considered more specific than 6-min WD andNYHA class, the latter being easily influenced by theplacebo effect. Moreover, in all, Q-P2 increased signifi-cantly, while Q-A2 did not decrease. Thus, resynchroniza-tion therapy may act more by prolonging the electrome-chanical systole at the RV than by reducing its lengtheningat the LV. Interestingly, according to this mechanism,Q-A2 showed a trend toward a significant increase in groupB, while it did not change in group A. Therefore, such aresult could also be interpreted in light of the reduction inthe interventricular dyssinchrony already documented withMUGA (14). Conversely, after BIV we did not observe anysignificant difference in IRT nor in MPI (Table 2). Thissupports the hypotheses that BIV has a beneficial effect onsystolic rather than diastolic performance and that such aneffect is greater in patients paced at a concordant site. It isnoticeable, indeed, that the lengthening of the diastolicfilling time (i.e., the EA) increased significantly only ingroup A. This result should support the hypothesis that BIVis helpful in prolonging (and, thus, improving) the passivediastolic phase when it is applied at a concordant site.Regional time intervals. Where patients were paced at aconcordant site, IRTR and MPIR at the lateral wall showedthe greatest improvement. Moreover, COR and EAR im-proved significantly, whichever wall was paced. However, atIVS the improvement was greater in patients paced at aconcordant site (Table 3). Such a result could explain theimprovement in the same global indexes.Regional myocardial velocities. The lack of any signifi-cant variation in the regional velocities indicates that BIVhad no significant effect on regional myocardial contractil-ity. However, PW velocity is dependent on more than onefactor, the assessment of intramyocardial velocity gradientbeing the most advanced method of detecting regionalmyocardial velocities.Implications. As TDI is a suitable noninvasive techniquefor the analysis of regional LV delay, in our opinion itshould be implemented in implantation to evaluate in realtime the effectiveness of BIV sites. Moreover, since theimplantation technique is now advancing toward more
selective sites of pacing, we support the hypothesis that TDIcould be useful in tailoring BIV to each individual patient.Study limitations. The first methodological limitationcould be the identification of the site of greatest delay on thebasis of the COR lengthening alone. It could, indeed, beinferred that the endocardial mapping should have beenchosen to identify the most delayed region. However, 1) thelatter is invasive; 2) it adds further risk to implantation; 3)ethical considerations preclude a correlation study betweenTDI and endocardial mapping. Moreover, it could beargued that the final aim of our research is not only to detectthe most delayed wall but also to be able to pace it. Sincepacing the site of delay can be difficult due to the complexityof the procedure, this research could be of scant clinicalrelevance. However, such relevance resides in the detectionof high percentage discordance between pacing site anddelayed site, even though the rationale of BIV is to pace themost delayed site. The problem of how to pace such a sitewill hopefully be solved by improvement in surgical equip-ment and techniques.Conclusions. Regional TDI quantitative analysis is aneffective noninvasive technique that can assess the severity ofthe regional delay in activation at each LV wall in LBBBand HF patients who are candidates for BIV treatment.Even if LV performance improved significantly in allpatients after BIV, the greatest improvement was found inpatients paced at the most delayed site.
AcknowledgmentThe authors thank Mrs. Mary Monique Rendall, BA(Hons), for reviewing the manuscript.
Reprint requests and correspondence: Dr. Gerardo Ansalone,via Sesto Rufo 23, 00136 Rome, Italy. E-mail: [email protected].
REFERENCES
1. Cazeau S, Leclercq C, Lavergne T, et al. Effects of multisite biven-tricular pacing in patients with heart failure and intraventricularconduction delay: for the Multisite Stimulation in Cardiomyopathies(MUSTIC) study investigators. N Engl J Med 2001;344:873–80.
2. Auricchio A, Stellbrink C, Block M, et al. Effect of pacing chamberand atrioventricular delay on acute systolic function of paced patientswith congestive heart failure. Circulation 1999;99:2993–3001.
3. Prinzen FW, Wiman BT, Hunter WC, Faris OP, McVeigh ER.Effects of single and biventricular pacing on the temporal and spatialdynamics of ventricular contraction (abstr). Circulation 2000;102:161.
4. Blanc JJ, Etienne Y, Gilard M, et al. Evaluation of different ventricularpacing sites in patients with severe heart failure: results of an acutehemodynamic study. Circulation 1997;96:3273–7.
5. Ricci R, Ansalone G, Toscano S, et al, on behalf of the InSync ItalianRegistry Investigators. Cardiac resynchronisation: materials, techniqueand results. The InSync Italian registry. Eur Heart J Supplements2000;2 Suppl J:J6–15.
6. Garcia-Fernandez MA, Azevedo J, Moreno M, et al. Regionaldiastolic function in ischaemic heart disease using pulsed wave Dopp-ler tissue imaging. Eur Heart J 1999;20:496–505.
7. Hatle L, Sutherland GR. The Gruntzig lecture: regional myocardialfunction—a new approach. Eur Heart J 2000;21:1337–57.
498 Ansalone et al. JACC Vol. 39, No. 3, 2002Effectiveness of Pacing Sites in BIV February 6, 2002:489–99

8. Sohn DW, Chai IH, Lee DJ, et al. Assessment of mitral annulusvelocity by Doppler Tissue Imaging in the evaluation of left ventriculardiastolic function. J Am Coll Cardiol 1997;30:474–80.
9. Shan K, Bick RJ, Poindexter BJ, et al. Relation of tissue Dopplerderived myocardial velocities to myocardial structure and beta-adrenergic receptor density in humans. J Am Coll Cardiol 2000;36:891–6.
10. Schiller NB, Shah PM, Crawford M, et al. Recommendations forquantification of the left ventricle by two-dimensional echocardiogra-phy. J Am Soc Echocardiogr 1989;2:358–67.
11. Daubert JC, Ritter P, Le Breton H, et al. Permanent left ventricularpacing with transvenous leads inserted into the coronary veins. PacingClin Electrophysiol 1998;21:239–45.
12. Ansalone G, Giannantoni P, Ricci R, Trambaiolo P, Fedele F, SantiniM. Doppler myocardial imaging in patients with heart failure receivingbiventricular pacing treament. Am Heart J 2001;142:881–96.
13. Henein MY, Gibson DG. Long axis function in disease. Heart1999;81:229–31.
14. Kerwin WF, Botvinick EH, O’Connell JW, et al. Ventricular con-traction abnormalities in dilated cardiomyopathy: effect of biventricu-lar pacing to correct interventricular dyssynchrony. J Am Coll Cardiol2000;35:1221–7.
15. Tsujita-Kuroda Y, Zhang G, Sumita Y, et al. Validity and reproduc-ibility of echocardiographic measurement of left ventricular ejectionfraction by acoustic quantification with tissue harmonic imagingtechnique. J Am Soc Echocardiogr 2000;13:300–5.
499JACC Vol. 39, No. 3, 2002 Ansalone et al.February 6, 2002:489–99 Effectiveness of Pacing Sites in BIV


