Embed Size (px)
Citation preview
rpsgroup.com/ireland Nov 2018
Draft Wind Energy Guidelines Wind Turbine Noise Analysis
Draft Wind Energy Guidelines- Wind Turbine Noise Analysis
MGE0713RP0001F01 i
TABLE OF CONTENTS
GLOSSARY .................................................................................................................................. III
EXECUTIVE SUMMARY ................................................................................................................ IV
1 INTRODUCTION ................................................................................................................ 1
2 CONVERTING NOISE INDICATORS ..................................................................................... 2
2.1 LDEN INDICATOR ............................................................................................................................... 2
2.2 WORLD HEALTH ORGANISATION INDICATOR ....................................................................................... 2
2.3 WIND TURBINE NOISE INDICATOR ..................................................................................................... 2
2.4 DRAFT WIND ENERGY GUIDELINE INDICATOR ...................................................................................... 3
2.5 CONVERTING THE INDICATORS .......................................................................................................... 3
3 WEATHER CONDITIONS .................................................................................................... 4
3.1 MET ÉIREANN WIND DATA .............................................................................................................. 4
3.2 DATA RESOLUTION.......................................................................................................................... 4
3.3 WIND SPEED CONVERSION ............................................................................................................... 4
3.4 SELECTION OF WEATHER STATIONS ................................................................................................... 4
3.5 FILTERING OF WIND DATA ................................................................................................................ 5
3.5.1 Wind Rose.......................................................................................................................... 5
4 CALCULATION OF NOISE LEVELS ...................................................................................... 10
4.1 WIND SHEAR ............................................................................................................................... 10
4.2 WIND SPEED CORRECTION ............................................................................................................. 10
4.3 WIND DIRECTION CORRECTION ....................................................................................................... 13
4.4 GRID CONSTRAINT AND CURTAILMENT CORRECTION .......................................................................... 13
4.4.1 Installed Wind and Capacity Factor ................................................................................. 13
4.4.2 Constraint ........................................................................................................................ 13
4.4.3 Curtailment ...................................................................................................................... 14
5 RESULTS ......................................................................................................................... 15
5.1 CALCULATIONS ............................................................................................................................. 15
5.2 MODIFICATION OF RRNL ............................................................................................................... 17
6 CONCLUSION ................................................................................................................. 18
7 REFERENCES ................................................................................................................... 19

Draft Wind Energy Guidelines- Wind Turbine Noise Analysis
MGE0713RP0001F01 ii
LIST OF TABLES
Table 3-1 Sample Conversion of Wind Speed from Knots to m/s........................................................... 4 Table 3-2 Sample filtered data ................................................................................................................ 5 Table 3-3 All stations wind speed (m/s) 01/01/1988 00:00 to 01/01/2018 00:00 ................................. 6 Table 4-1 Wind turbine sound power (dB(A)) including wind shear correction ................................... 12 Table 4-2 Noise Level correction (dB) based on wind direction ........................................................... 13 Table 5-1 Turbine noise reduction due to wind speed (dB(A)) ............................................................. 15 Table 5-2 Reduction to Lden due to low wind speeds in evening and night periods ............................. 16 Table 5-3 Reduction to Lden due to constraints and curtailment in evening and night periods ........... 16 Table 5-4 Cumulative noise corrections ............................................................................................... 16
Draft Wind Energy Guidelines- Wind Turbine Noise Analysis
MGE0713RP0001F01 iii
GLOSSARY
A-Weighting A frequency-dependent correction that is applied to a measured or calculated sound of moderate intensity to mimic the varying sensitivity of the ear to sound for different frequencies.
IoA GPG Institute of Acoustics Good Practice Guide to the Application of ETSU-R-97 for the Assessment and Rating of Wind Turbine Noise.
LAeq,T A-weighted, equivalent continuous sound pressure level during a stated time interval starting at t1 and ending at t2, expressed in decibels (dB), at a given point in space.
Lday Equivalent continuous sound pressure level when the reference time interval is the day.
Lden Day-evening-night-weighted sound pressure level.
Levening Equivalent continuous sound pressure level when the reference time interval is the evening.
Lnight Equivalent continuous sound pressure level when the reference time interval is the night.
RRNL Relative Rated Noise Limit.
WEDG Wind Energy Development Guidelines.
WHO World Health Organisation.
Draft Wind Energy Guidelines- Wind Turbine Noise Analysis
MGE0713RP0001F01 iv
EXECUTIVE SUMMARY
The Draft Wind Energy Development Guidelines are based on a rated noise exposure level of 43 dB(A) on an LA90 measurement basis. The World Health Organisation (WHO) Environmental Noise Guidelines for the European Region (WHO, 2018) set a Conditional Recommendation for wind turbine noise of 45 dB on an Lden basis.
The difference between these levels is comprised of the following elements:
A correction of +2 dB(A) to convert the RRNL which is measured in accordance with the IoA Good Practice Guide (2013) on a LA90 basis to a LAeq basis.
A correction of + 6.4 dB(A) to include the evening and night time noise penalties built into the Lden.
Wind turbine noise modelling at planning stage is carried out using worst case (maximum) noise output from the turbines . Due to weather conditions wind turbines do not operate at full power all the time, the anticipated noise emission will therefore always be less than the worst case scenario.
RPS was requested by the Department of Communications, Climate Action and Environment to carry out an analysis of long term wind speed data with typical large turbine noise data to compare the average sound output to the worst case condition under long term average conditions.
RPS collated 30-year wind data for Malin Head, Valentia and Mullingar. The three sites show an expected range of differences in wind speed; Malin Head being the most exposed coastal site, Mullingar being the most sheltered inland site and Valentia being somewhere in between. Using sound power level data from three wind turbine manufacturers, the long term average sound power output over the relevant range of wind speeds was calculated.
The correction required is in two parts, one to convert between the noise indicators and the other to incorporate the penalties included in the Lden indicator. A correction of +2 dB(A) is required to convert the RRNL which is measured in accordance with the IoA GPG on an LA90 basis to an LAeq basis.
Calculating out the Lden with the appropriate penalties for the evening and night periods adds a further 6.4 dB(A) to the noise level when measured as LA90. This means that the ‘correction’ between the measured wind turbine noise level and the WHO Conditional Recommendation is a total of -8.4 dB(A), i.e. the average measured noise level must be significantly lower than the worst case noise prediction.
Corrections required to adjust for wind speed, wind direction, time of day wind variations and grid curtailments and constraints were examined. The corrections were calculated to range from -7.1 dB(A) for locations close to the turbines and -9.1 dB(A) for locations remote from the turbines.
It is reasonable to conclude from both these calculations that the annual average noise output from wind turbines in Ireland will be sufficiently lower than the maximum rated sound power to be consistent with the WHO guidelines.
Draft Wind Energy Guidelines- Wind Turbine Noise Analysis
MGE0713RP0001F01 1
1 INTRODUCTION
The Draft Wind Energy Development Guidelines (WEDG, 2018) are developed from the prefered draft approach noise exposure level of 43 dB(A) which is based on an L90, 10 min measurement basis. The World Health Organisation Environmental Noise Guidelines for the European Region (WHO, 2018) set a Conditional Recommendation of 45 dB on an Lden basis. The WHO Environmental Noise Guidelines do not provide a transformation to compare the two noise indicators.
The WEDG modelling approach uses ISO 9613-2 calculations. The limit is set at planning decision stage based on a noise modelling calculation using ‘worst case’ conditions:
ISO 9613-2 predictions are based on ‘meteorological conditions favourable to propagation’;
WEDG noise limit is set at the maximum noise output from the wind turbine(s); and
The turbine(s) are assumed to be running under these conditions all the time.
In practice, these three conditions are never realised. Therefore, it is necessary to consider the most likely scenario in terms of establishing what noise levels could be expected from wind turbines under normal operating conditions. This report outlines the influence of long term weather conditions and operational constraints on the long term noise emissions from wind turbines.
The purpose of this anlaysis is to investigate the likely variation in noise output of wind turbines over an extended period and compare this to the potential maximum noise output for the same turbines.
Draft Wind Energy Guidelines- Wind Turbine Noise Analysis
MGE0713RP0001F01 2
2 CONVERTING NOISE INDICATORS
2.1 Lden INDICATOR
Lden includes a 10 dB penalty added to the average noise level in the night period (23:00 hrs to 07:00 hrs) and a 5 dB penalty added to the evening period (19:00 hrs to 23:00 hrs).
The END and ISO 1996-1:2016 Acoustics — Description, measurement and assessment of environmental noise - Part 1: Basic quantities and assessment procedures (ISO 1996) include formulae defining Lden in the following way:
𝐿𝑑𝑒𝑛 = 10𝑙𝑜𝑔1
24[12 ∗ 10
𝐿𝑑𝑎𝑦
10 + 4 ∗ 105+𝐿𝑒𝑣𝑒
10 + 8 ∗ 1010+𝐿𝑛𝑖𝑔ℎ𝑡
10 ]
In steady state weather and propagation conditions, noise levels from wind turbines will be the same regardless of day, evening or night periods, say 40 dB(A) in all three periods. Applying the penalties to the evening and night noise levels, the Lden is calculated at 46.395 dB(A) or 6.4 dB greater than the steady state noise level.
This temporal conversion remains the same regardless of the steady state noise level.
2.2 WORLD HEALTH ORGANISATION INDICATOR
Lden is a long term energy-based noise exposure metric chosen by the WHO because ‘most health outcomes considered in these guidelines are expected to occur as a result of long-term exposure’ (WHO, 2018, p.9) and to be compatible with the European Union (EU) Directive 2002/49/EC, relating to the assessment and management of environmental noise (the END). Lden is an acoustic energy-based indicator which can be correlated using a “rule of thumb” transformation ‘as long as the conversion accounts for the long-term average of populations rather than individual exposure situations’ (WHO, 2018, pp.9-10).
2.3 WIND TURBINE NOISE INDICATOR
The Institute of Acoustics Good Practice Guide to the Application of ETSU-R-97 for the Assessment and Rating of Wind Turbine Noise (IoA, 2013) and ETSU-R-97 use the LA90 10 min indicator for both background noise and wind turbine noise as it ‘allows reliable measurements to be made without corruption from relatively loud, transitory noise events from other sources’ (EPA, 2011 , p.21).
The IoA (2013) provides a correction from an energy-based indicator for wind turbines of
LAeq = LA90 + 2 dB.
Draft Wind Energy Guidelines- Wind Turbine Noise Analysis
MGE0713RP0001F01 3
2.4 DRAFT WIND ENERGY GUIDELINE INDICATOR
The draft Wind Energy Development Guidelines (WEDG), (DHPLG, 2018) wind turbine noise indicator is LA90 10 min for the same reasons as set out in ETSU-R-97 and the IoA GPG.
2.5 CONVERTING THE INDICATORS
Wind turbine noise is not a continuous noise source. At any specific location it depends on the source (wind turbine) noise level and the propagation from source to receiver. Wind turbines do not operate at low wind speeds and are subject to operating constraints from the grid. Wind turbine noise output and noise propagation to the receiver are both highly dependent on wind speed and direction.
In order to compare the draft WEDG indicator of 43 dB(A) LA90, 10 min to the WHO Conditional Recommendation of 45 dB Lden the following factors need to be considered:
Wind turbine noise output over a range of wind speeds;
Noise propagation over a range of wind directions;
Wind turbine operational constraints in the evening and night periods.
Draft Wind Energy Guidelines- Wind Turbine Noise Analysis
MGE0713RP0001F01 4
3 WEATHER CONDITIONS
The weather conditions influencing wind turbine noise output and propagation are wind speed and direction. Wind data used in this analysis are from Met Éireann’s online data archive. A dataset for the period 1988 to 2018 (30 years) was used in order to provide a long term analysis.
3.1 MET ÉIREANN WIND DATA
Met Éireann keeps an archive of climate data listed under individual weather stations across the country. To achieve a geographically-sensible spread of data, three stations in different parts of the country were selected: Malin Head, Valentia Observatory and Mullingar. This geographical spread considers the potential difference in wind speed across the country, as the dataset is collected in the north, south and the midlands respectively.
3.2 DATA RESOLUTION
The data used in this analysis are available at different resolutions, depending on user requirements. For this analysis, hourly data was selected for each of the three stations. Sample lengths are also consistent at 30 years.
3.3 WIND SPEED CONVERSION
Met Éireann measure and archive their wind data in knots. To get the data in a more usable format of metres per second (m/s) a conversion factor of 0.514444 is applied to each recording over the 30-year period. A sample conversion is included in Table 3-1.
Table 3-1 Sample Conversion of Wind Speed from Knots to m/s
Malin Head Wind speed (knots) Conversion Factor Wind speed (m/s)
01/01/1988 00:00 29 0.514444 14.92
01/01/1988 01:00 27 0.514444 13.89
3.4 SELECTION OF WEATHER STATIONS
The selection of weather stations for use in this analysis was done on a geographical basis. Wind is a climatological variable that is susceptible to distinct variation, often because of topography, buildings and oceanic influence. Malin Head, in the extreme north of the country, represents a location that is dominated by Atlantic weather systems, hence the highest average wind speeds and gales are recorded in this location. Valentia Observatory, in the southwest of the country, is similarly positioned on the Atlantic coastline. However, its position on the mainland is sheltered by Valentia Island to the west, resulting in reduced wind speeds compared to Malin Head. Mullingar weather station represents a good example of an inland weather station in Ireland due to its central location. There is no oceanic influence on wind speeds observed at Mullingar, therefore average wind speeds are expectedly lower. This pattern is also seen regarding gales (gusts > 17.5 m/s). Inland stations experience gales on average two days per year, and coastal stations such as Malin Head can
Draft Wind Energy Guidelines- Wind Turbine Noise Analysis
MGE0713RP0001F01 5
experience gales 50 days per year. The selection of weather stations was limited to stations with 30-years’ worth of data between the same dates (1988 – 2018), this ruled out stations such as Birr from the analysis.
3.5 FILTERING OF WIND DATA
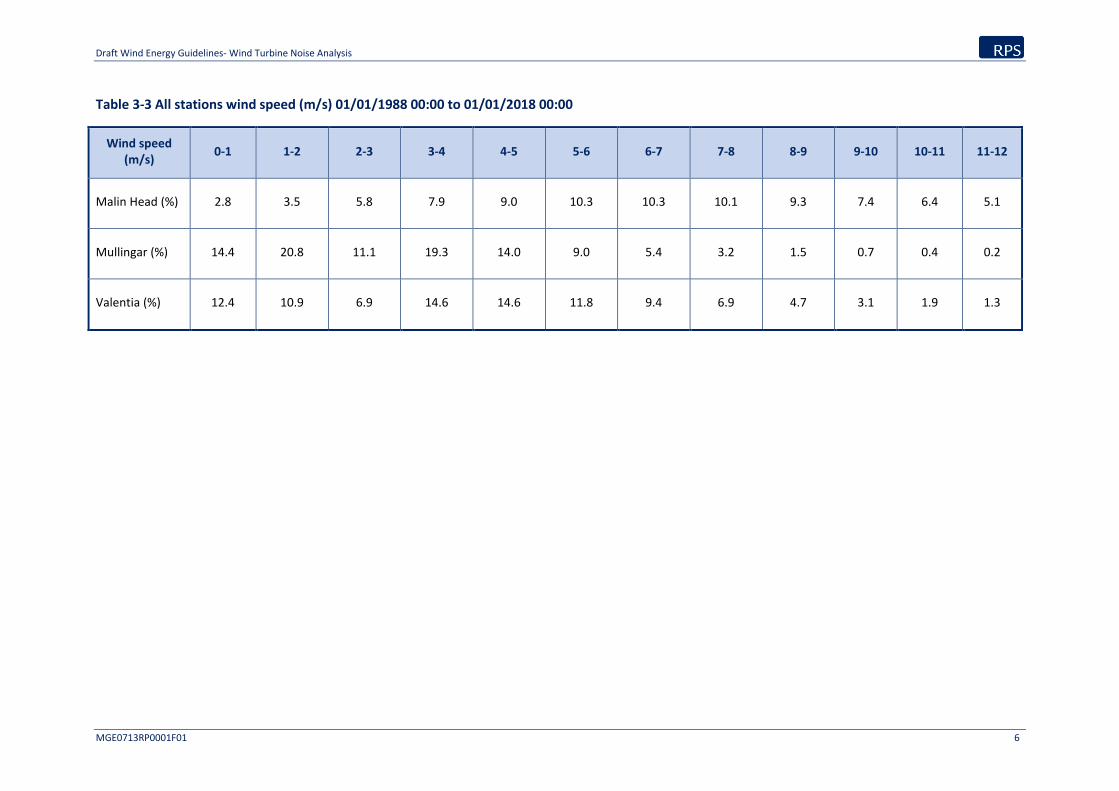
The 30-years’ worth of hourly data for each of the three stations were filtered into bins of 1 m/s. The day period includes hours from 07:00-19:00, the evening from 19:00-23:00 and the night from 23:00-07:00. This enables the visualisation of wind speed frequency in the day, evening and night periods (Table 3-2) as well as an hourly analysis of noise output from the three turbine types chosen.
Table 3-2 Sample filtered data
Station 0 - 1 (m/s) 1 - 2 (m/s) 2 - 3 (m/s) 3 - 4 (m/s)
Malin Head (hours) 7418 9139 15284 20615
Malin Head (%) 2.8 3.5 5.8 7.9
Data from Malin Head is used for illustrative purposes. This sample accounts for the total period (24 hours each day). Each bin represents the number of hours where wind speed was recorded at a certain level. For example, there were 7,418 hours in the 30-year period where wind speed was measured between 0 and 1 m/s. This figure is displayed as a percentage of total number of observations (2.8%). Ultimately, this figure tells us that 2.8% of all observations at Malin Head fell within the range of 0-1 m/s. Table 3-3 presents the filtered date for all three sites.
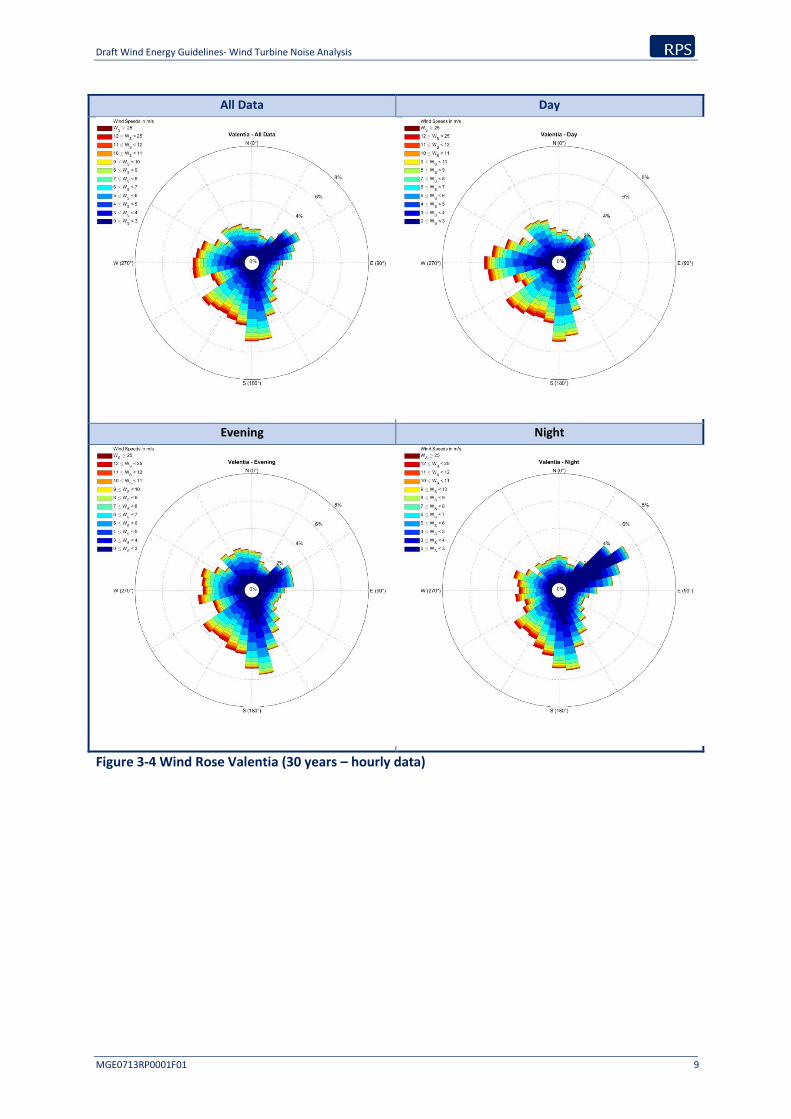
3.5.1 Wind Rose
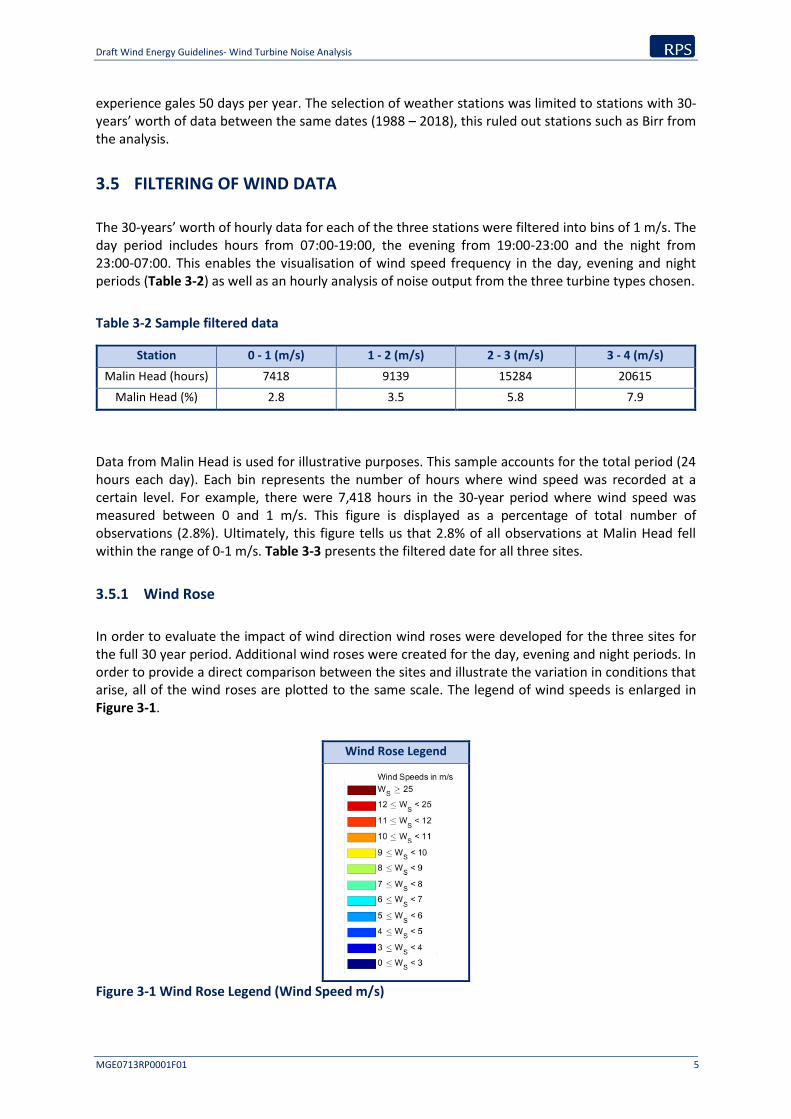
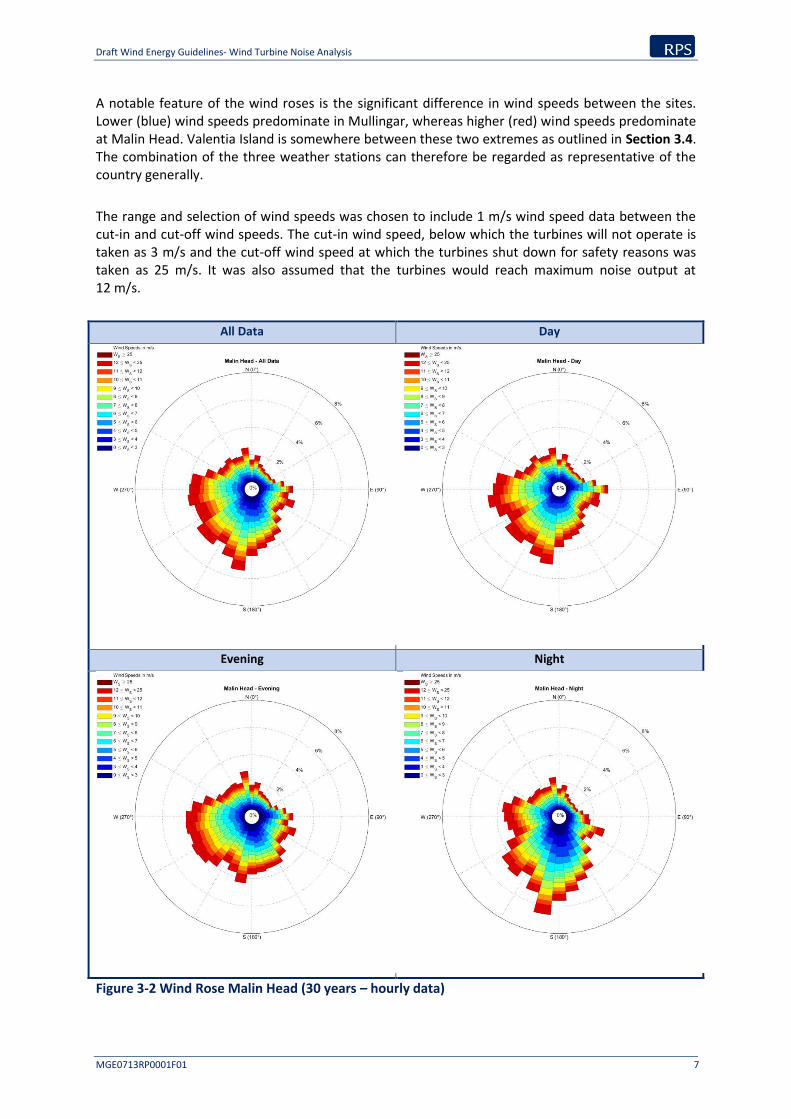
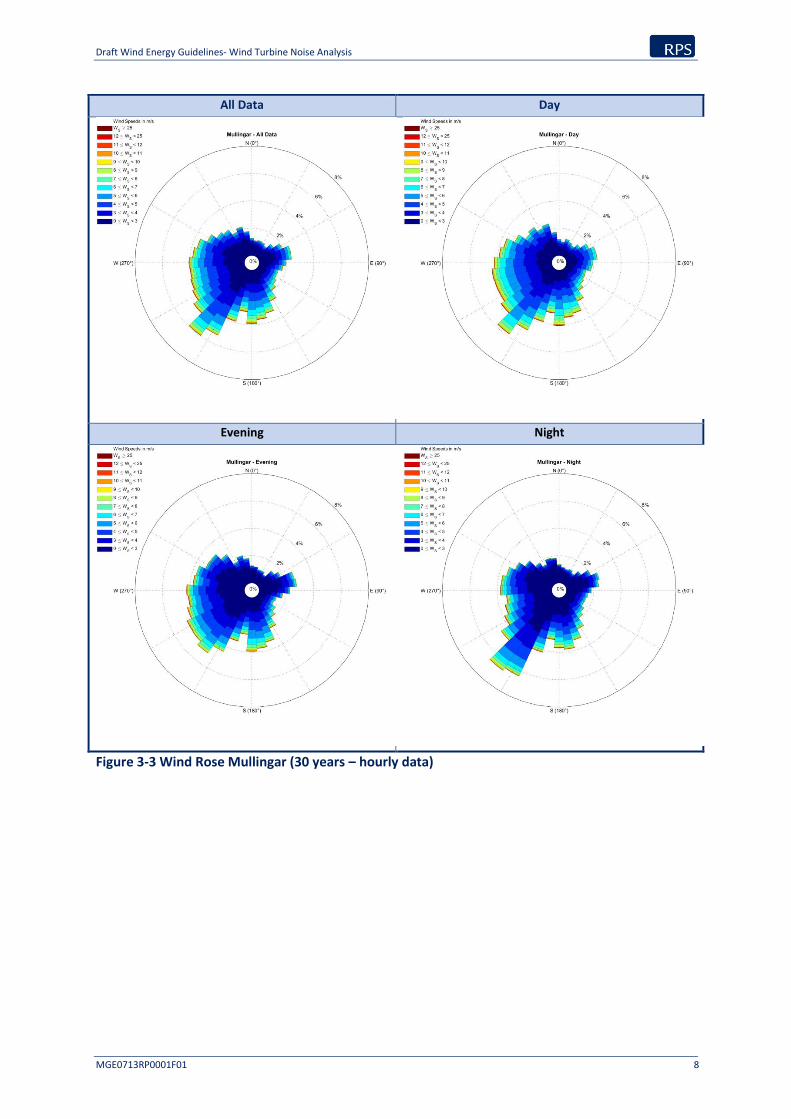
In order to evaluate the impact of wind direction wind roses were developed for the three sites for the full 30 year period. Additional wind roses were created for the day, evening and night periods. In order to provide a direct comparison between the sites and illustrate the variation in conditions that arise, all of the wind roses are plotted to the same scale. The legend of wind speeds is enlarged in Figure 3-1.
Wind Rose Legend
Figure 3-1 Wind Rose Legend (Wind Speed m/s)
Draft Wind Energy Guidelines- Wind Turbine Noise Analysis
MGE0713RP0001F01 6
Table 3-3 All stations wind speed (m/s) 01/01/1988 00:00 to 01/01/2018 00:00
Wind speed (m/s)
0-1 1-2 2-3 3-4 4-5 5-6 6-7 7-8 8-9 9-10 10-11 11-12
Malin Head (%) 2.8 3.5 5.8 7.9 9.0 10.3 10.3 10.1 9.3 7.4 6.4 5.1
Mullingar (%) 14.4 20.8 11.1 19.3 14.0 9.0 5.4 3.2 1.5 0.7 0.4 0.2
Valentia (%) 12.4 10.9 6.9 14.6 14.6 11.8 9.4 6.9 4.7 3.1 1.9 1.3
Draft Wind Energy Guidelines- Wind Turbine Noise Analysis
MGE0713RP0001F01 7
A notable feature of the wind roses is the significant difference in wind speeds between the sites. Lower (blue) wind speeds predominate in Mullingar, whereas higher (red) wind speeds predominate at Malin Head. Valentia Island is somewhere between these two extremes as outlined in Section 3.4. The combination of the three weather stations can therefore be regarded as representative of the country generally.
The range and selection of wind speeds was chosen to include 1 m/s wind speed data between the cut-in and cut-off wind speeds. The cut-in wind speed, below which the turbines will not operate is taken as 3 m/s and the cut-off wind speed at which the turbines shut down for safety reasons was taken as 25 m/s. It was also assumed that the turbines would reach maximum noise output at 12 m/s.
All Data Day
Evening Night
Figure 3-2 Wind Rose Malin Head (30 years – hourly data)
Draft Wind Energy Guidelines- Wind Turbine Noise Analysis
MGE0713RP0001F01 8
All Data Day
Evening Night
Figure 3-3 Wind Rose Mullingar (30 years – hourly data)
Draft Wind Energy Guidelines- Wind Turbine Noise Analysis
MGE0713RP0001F01 9
All Data Day
Evening Night
Figure 3-4 Wind Rose Valentia (30 years – hourly data)

Draft Wind Energy Guidelines- Wind Turbine Noise Analysis
MGE0713RP0001F01 10
4 CALCULATION OF NOISE LEVELS
4.1 WIND SHEAR
The 30 year Met Éireann wind data series was collected at 10m height. The IoA Good Practice Guide (2013) requires that where a 10 metre mast is used corrections must be made to allow for wind shear characteristics. This usually takes the form of a site specific wind shear factor or wind shear exponent. On a national scale it is necessary to use the wind shear correction set out in Section 4.5.4 of the IoA Good Practice Guide (2013). A fixed correction of 2 m/s has been applied to data from Figure 4-1 in Table 5-2 to accommodate the low cut in wind speed of 3 m/s and allow for some periods where turbines shut down due to lack of wind.
4.2 WIND SPEED CORRECTION
The capacity factor is the amount of energy produced (MW output) relative to the theoretical maximum that could have been produced if the wind generation operated at full capacity. Therefore, it represents the average output of the wind generation. It is related to the wind speed.
For 2017, the capacity factor of wind farms was 26% which was the same as in 2016. In 2015 it was 31%. The noise level from wind turbines will reduce in a similar manner depending on power output.
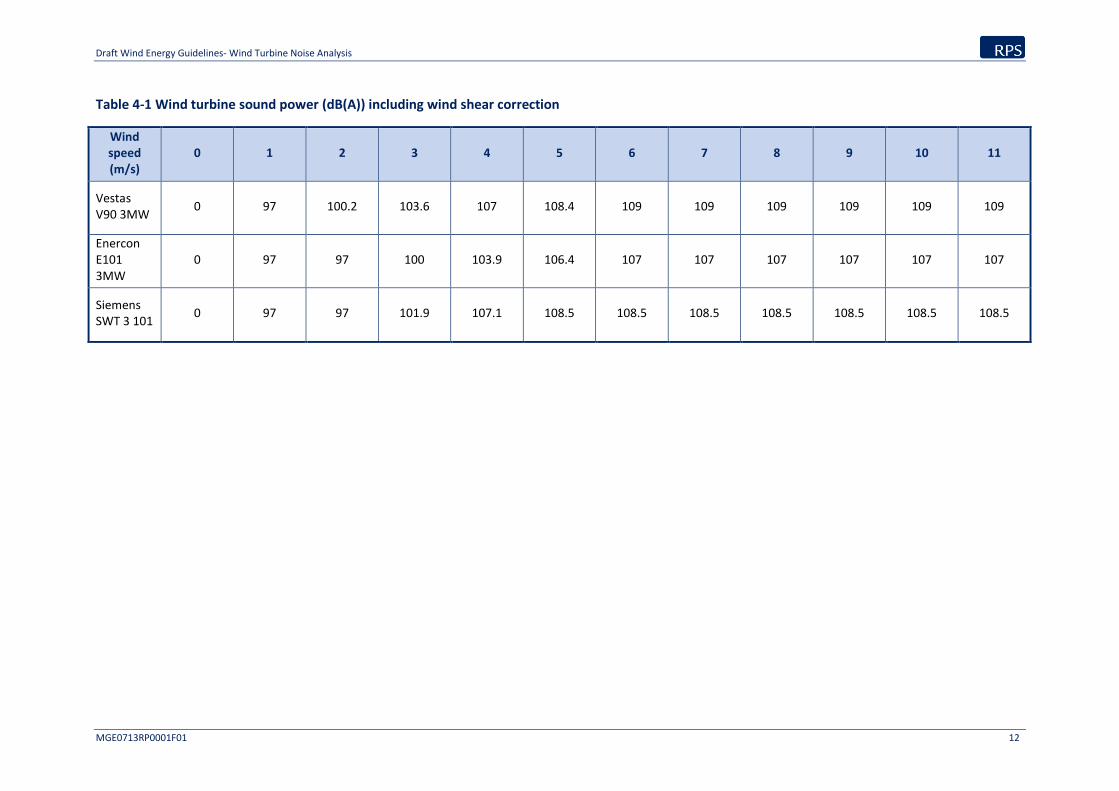
Noise output from Vestas V90 3MW, Enercon E101 3MW and Siemens SWT 3 101 turbines at 10 m standardised wind speeds were examined. Sound power level data for each turbine was obtained and where necessary extrapolated to a uniform cut in wind speed of 3 m/s. The critical data in this instance is the change in noise output for each 1 m/s change in wind speed. The maximum sound power level in each case is based on published data for the turbine.
A calculation using the relative noise output for each wind speed bin was used to calculate an annual average noise output compared to maximum noise output at rated wind speed as follows:
𝐴𝑣𝑒𝑟𝑎𝑔𝑒 𝑁𝑜𝑖𝑠𝑒 𝑂𝑢𝑡𝑝𝑢𝑡 = 10 × log10 [[∑ 10
𝐿𝑝
10 × 𝑁𝑜. 𝑜𝑓 𝑜𝑐𝑐𝑢𝑟𝑟𝑒𝑛𝑐𝑒 ℎ𝑜𝑢𝑟𝑠𝐸𝑎𝑐ℎ 𝑊𝑖𝑛𝑑 𝑆𝑝𝑒𝑒𝑑1 ]
𝑇𝑜𝑡𝑎𝑙 𝑁𝑢𝑚𝑏𝑒𝑟 𝑜𝑓 𝐻𝑜𝑢𝑟𝑠]
Where Lp = wind turbine sound power at selected wind speed as stated in Table 4-1.
The difference between this and the maximum noise level is reported in Table 5-1.
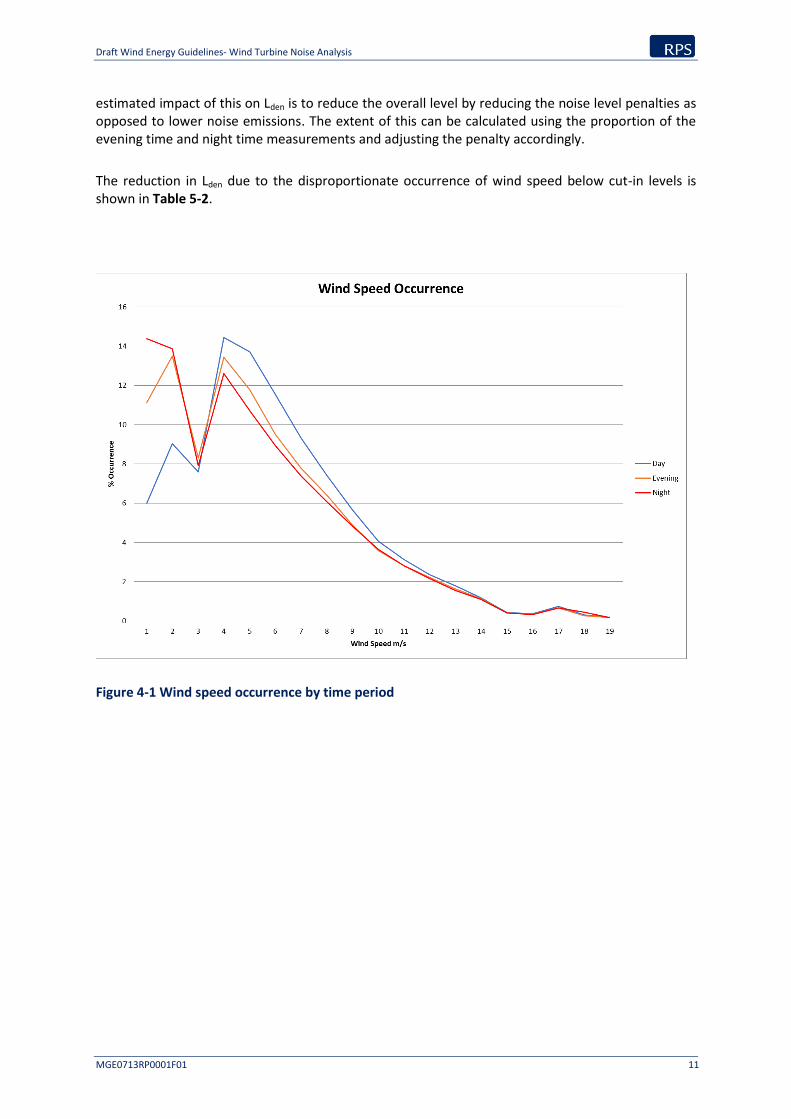
A separate factor arises by the fact that average wind speed varies throughout the day. Figure 4-1 shows the average variation in wind speed (for the three sites combined) over the 30-year period analysed. Wind speeds below cut-in wind speed occur more frequently in the evening and night periods than during the day period. The cumulative impact of this pattern is that wind turbines will be less likely to be operating at full power during the evening and night periods.
With reduced operation during the evening and night periods wind turbine noise levels attracting a penalty will be less than those arising during the day period when no penalty is applied. The
Draft Wind Energy Guidelines- Wind Turbine Noise Analysis
MGE0713RP0001F01 11
estimated impact of this on Lden is to reduce the overall level by reducing the noise level penalties as opposed to lower noise emissions. The extent of this can be calculated using the proportion of the evening time and night time measurements and adjusting the penalty accordingly.
The reduction in Lden due to the disproportionate occurrence of wind speed below cut-in levels is shown in Table 5-2.
Figure 4-1 Wind speed occurrence by time period
Draft Wind Energy Guidelines- Wind Turbine Noise Analysis
MGE0713RP0001F01 12
Table 4-1 Wind turbine sound power (dB(A)) including wind shear correction
Wind speed (m/s)
0 1 2 3 4 5 6 7 8 9 10 11
Vestas V90 3MW
0 97 100.2 103.6 107 108.4 109 109 109 109 109 109
Enercon E101 3MW
0 97 97 100 103.9 106.4 107 107 107 107 107 107
Siemens SWT 3 101
0 97 97 101.9 107.1 108.5 108.5 108.5 108.5 108.5 108.5 108.5
Draft Wind Energy Guidelines- Wind Turbine Noise Analysis
MGE0713RP0001F01 13
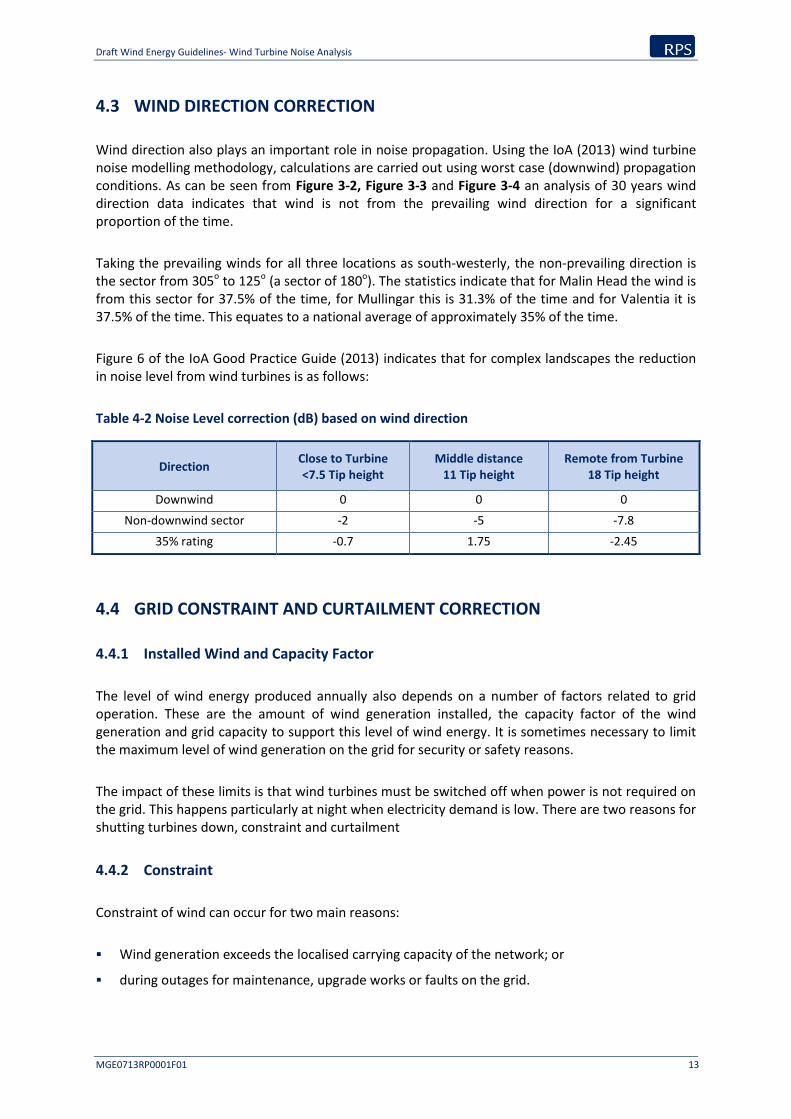
4.3 WIND DIRECTION CORRECTION
Wind direction also plays an important role in noise propagation. Using the IoA (2013) wind turbine noise modelling methodology, calculations are carried out using worst case (downwind) propagation conditions. As can be seen from Figure 3-2, Figure 3-3 and Figure 3-4 an analysis of 30 years wind direction data indicates that wind is not from the prevailing wind direction for a significant proportion of the time.
Taking the prevailing winds for all three locations as south-westerly, the non-prevailing direction is the sector from 305o to 125o (a sector of 180o). The statistics indicate that for Malin Head the wind is from this sector for 37.5% of the time, for Mullingar this is 31.3% of the time and for Valentia it is 37.5% of the time. This equates to a national average of approximately 35% of the time.
Figure 6 of the IoA Good Practice Guide (2013) indicates that for complex landscapes the reduction in noise level from wind turbines is as follows:
Table 4-2 Noise Level correction (dB) based on wind direction
Direction Close to Turbine <7.5 Tip height
Middle distance 11 Tip height
Remote from Turbine 18 Tip height
Downwind 0 0 0
Non-downwind sector -2 -5 -7.8
35% rating -0.7 1.75 -2.45
4.4 GRID CONSTRAINT AND CURTAILMENT CORRECTION
4.4.1 Installed Wind and Capacity Factor
The level of wind energy produced annually also depends on a number of factors related to grid operation. These are the amount of wind generation installed, the capacity factor of the wind generation and grid capacity to support this level of wind energy. It is sometimes necessary to limit the maximum level of wind generation on the grid for security or safety reasons.
The impact of these limits is that wind turbines must be switched off when power is not required on the grid. This happens particularly at night when electricity demand is low. There are two reasons for shutting turbines down, constraint and curtailment
4.4.2 Constraint
Constraint of wind can occur for two main reasons:
Wind generation exceeds the localised carrying capacity of the network; or
during outages for maintenance, upgrade works or faults on the grid.
Draft Wind Energy Guidelines- Wind Turbine Noise Analysis
MGE0713RP0001F01 14
4.4.3 Curtailment
Curtailment is a technically different reason for shutdown due to:
System stability requirements (synchronous inertia, dynamic and transient stability);
Operating reserve requirements, including negative reserve;
Voltage control requirements; or
System Non-Synchronous Penetration (SNSP10) limit.
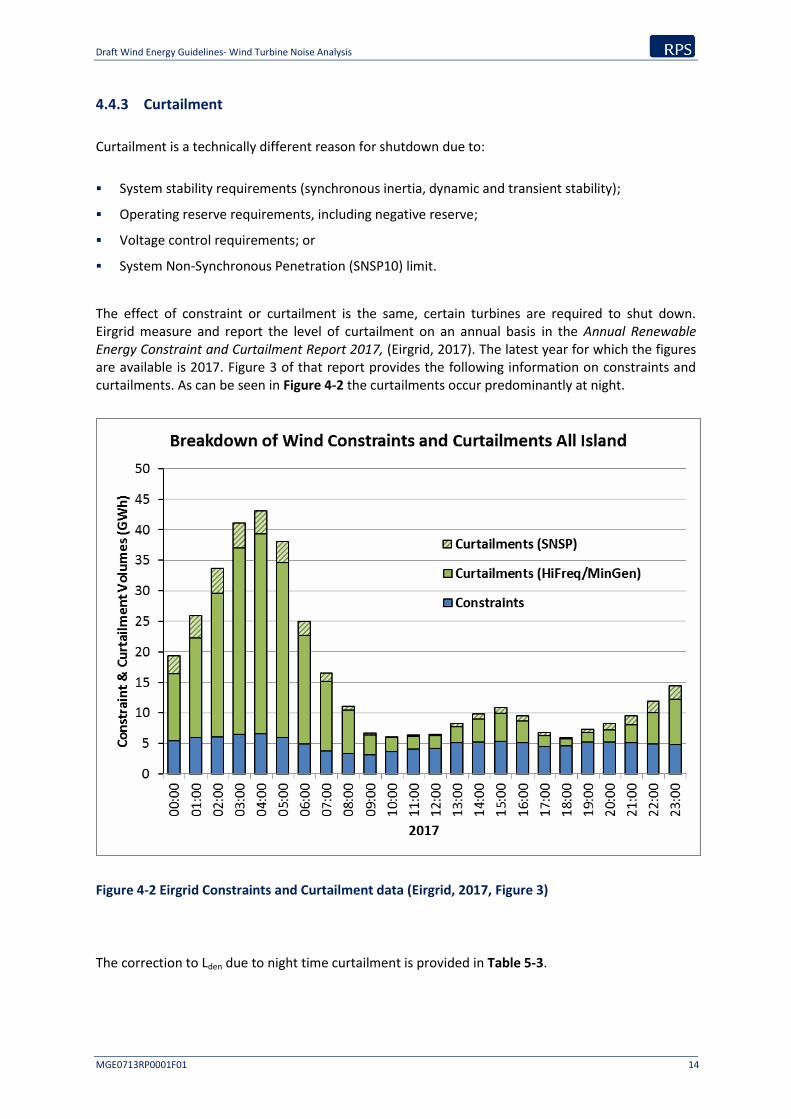
The effect of constraint or curtailment is the same, certain turbines are required to shut down. Eirgrid measure and report the level of curtailment on an annual basis in the Annual Renewable Energy Constraint and Curtailment Report 2017, (Eirgrid, 2017). The latest year for which the figures are available is 2017. Figure 3 of that report provides the following information on constraints and curtailments. As can be seen in Figure 4-2 the curtailments occur predominantly at night.
Figure 4-2 Eirgrid Constraints and Curtailment data (Eirgrid, 2017, Figure 3)
The correction to Lden due to night time curtailment is provided in Table 5-3.
Draft Wind Energy Guidelines- Wind Turbine Noise Analysis
MGE0713RP0001F01 15
5 RESULTS
5.1 CALCULATIONS
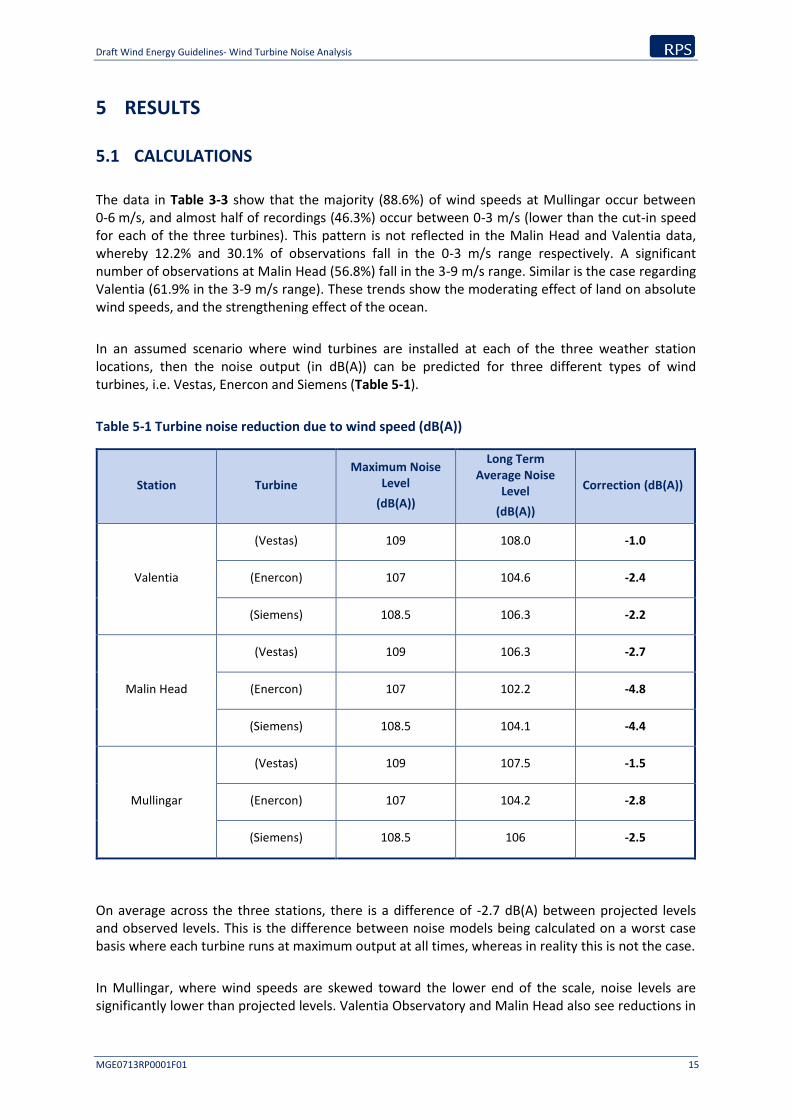
The data in Table 3-3 show that the majority (88.6%) of wind speeds at Mullingar occur between 0-6 m/s, and almost half of recordings (46.3%) occur between 0-3 m/s (lower than the cut-in speed for each of the three turbines). This pattern is not reflected in the Malin Head and Valentia data, whereby 12.2% and 30.1% of observations fall in the 0-3 m/s range respectively. A significant number of observations at Malin Head (56.8%) fall in the 3-9 m/s range. Similar is the case regarding Valentia (61.9% in the 3-9 m/s range). These trends show the moderating effect of land on absolute wind speeds, and the strengthening effect of the ocean.
In an assumed scenario where wind turbines are installed at each of the three weather station locations, then the noise output (in dB(A)) can be predicted for three different types of wind turbines, i.e. Vestas, Enercon and Siemens (Table 5-1).
Table 5-1 Turbine noise reduction due to wind speed (dB(A))
Station Turbine
Maximum Noise Level
(dB(A))
Long Term Average Noise
Level
(dB(A))
Correction (dB(A))
Valentia
(Vestas) 109 108.0 -1.0
(Enercon) 107 104.6 -2.4
(Siemens) 108.5 106.3 -2.2
Malin Head
(Vestas) 109 106.3 -2.7
(Enercon) 107 102.2 -4.8
(Siemens) 108.5 104.1 -4.4
Mullingar
(Vestas) 109 107.5 -1.5
(Enercon) 107 104.2 -2.8
(Siemens) 108.5 106 -2.5
On average across the three stations, there is a difference of -2.7 dB(A) between projected levels and observed levels. This is the difference between noise models being calculated on a worst case basis where each turbine runs at maximum output at all times, whereas in reality this is not the case.
In Mullingar, where wind speeds are skewed toward the lower end of the scale, noise levels are significantly lower than projected levels. Valentia Observatory and Malin Head also see reductions in
Draft Wind Energy Guidelines- Wind Turbine Noise Analysis
MGE0713RP0001F01 16
observed noise compared to projected noise. Wind speed at Malin Head is on average the highest of the three locations, therefore the reduction in noise output is not as great when compared to Mullingar and Valentia. Valentia’s lesser noise reduction compared to Malin Head can be attributed to its comparatively sheltered location. Wind speeds are reduced due to local topography; therefore, turbines do not run at maximum output for the extended periods of time that are observed at Malin Head. Results from Valentia offer a representative medium between the low reductions in Malin Head and the high reductions in Mullingar.
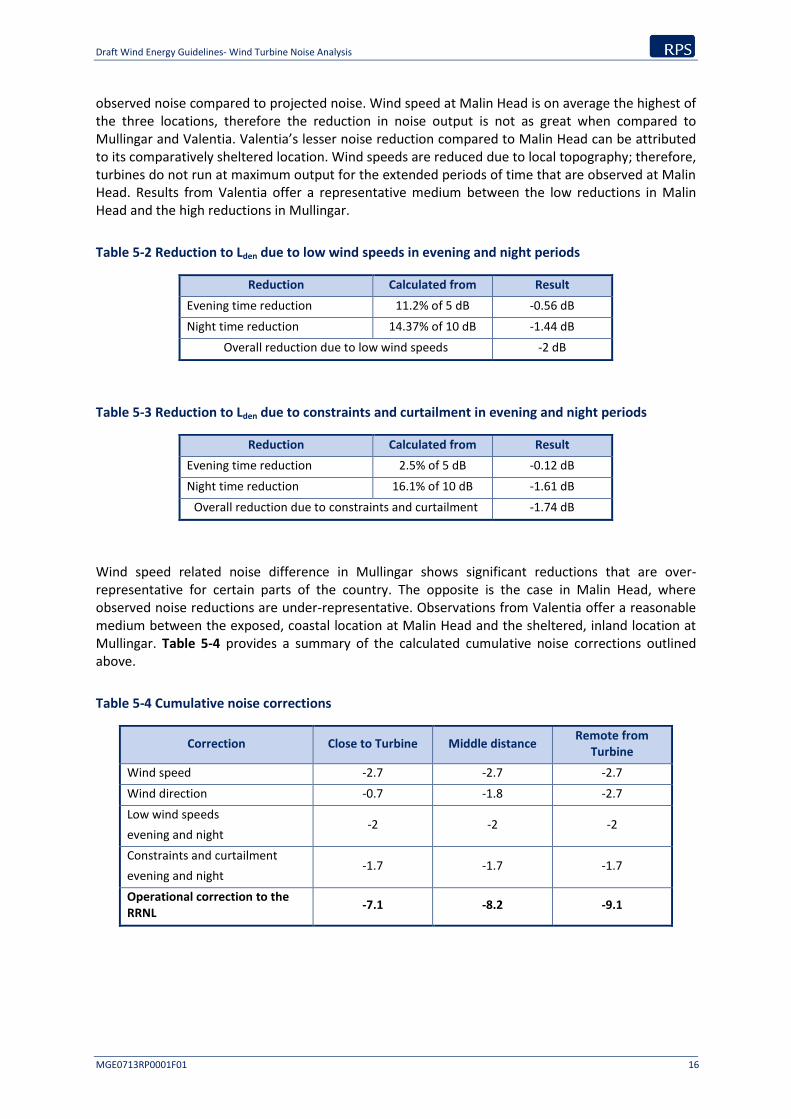
Table 5-2 Reduction to Lden due to low wind speeds in evening and night periods
Reduction Calculated from Result
Evening time reduction 11.2% of 5 dB -0.56 dB
Night time reduction 14.37% of 10 dB -1.44 dB
Overall reduction due to low wind speeds -2 dB
Table 5-3 Reduction to Lden due to constraints and curtailment in evening and night periods
Reduction Calculated from Result
Evening time reduction 2.5% of 5 dB -0.12 dB
Night time reduction 16.1% of 10 dB -1.61 dB
Overall reduction due to constraints and curtailment -1.74 dB
Wind speed related noise difference in Mullingar shows significant reductions that are over-representative for certain parts of the country. The opposite is the case in Malin Head, where observed noise reductions are under-representative. Observations from Valentia offer a reasonable medium between the exposed, coastal location at Malin Head and the sheltered, inland location at Mullingar. Table 5-4 provides a summary of the calculated cumulative noise corrections outlined above.
Table 5-4 Cumulative noise corrections
Correction Close to Turbine Middle distance Remote from
Turbine
Wind speed -2.7 -2.7 -2.7
Wind direction -0.7 -1.8 -2.7
Low wind speeds
evening and night -2 -2 -2
Constraints and curtailment
evening and night -1.7 -1.7 -1.7
Operational correction to the RRNL
-7.1 -8.2 -9.1
Draft Wind Energy Guidelines- Wind Turbine Noise Analysis
MGE0713RP0001F01 17
5.2 MODIFICATION OF RRNL
Due to the differences in noise indicators used in the Draft WEDG and WHO 2018 there is a differential between the indicators. The Draft WEDG limit is based on a ‘worst case’ predicted noise level whereas the WHO Conditional Recommendation is based on long term average noise measurements.
As outlined in Section 2.3, in the IoA Good Practice Guide (2013) the standard correction for wind turbine noise measured as LA90 is 2 dB(A). This is based on experience dating back to the publication of ETSU-R-97 and revalidated during the drafting of the IoA guide. In Section 2.1 the impact of imposing a 5 dB(A) penalty on evening period measurements and 10 dB(A) on night time measurements was set out. The cumulative effect of these two corrections is that an 8.4 dB(A) differential needs to be justified.
Examining the long term wind speed and direction measurements at three weather stations spread across the country provides an estimated reduction in noise levels due to variations in wind speed [2.7 dB(A)) and wind direction (0.7 to 2.7 dB(A)]. These corrections are calculated in Section 3 based on long term averages. The lower figure for wind direction arises for turbines within 5.25 times the tip height of the nearest turbine. This is a very small percentage of the properties surrounding a wind farm. The average property is more likely to experience reductions at the middle or higher end of the range.
Further analysis of the wind speed characteristics indicate that lighter winds tend to occur during the evening and night periods, both of which are penalised in the Lden calculation. Due to the frequency of occurrence of the lighter winds the reduction in the penalties are likely to result in a correction of 2 dB(A) on overall rated noise levels.
The calculation of noise levels is based on wind turbines operating 100% of the time. This does not happen due to constraints and curtailment on the grid. An analysis of 2017 data indicates that this is equivalent to a correction of 1.7 dB(A) in noise level on an annual basis. A greater reduction would arise due to shutdowns for maintenance, but this has not been included in this figure.
The aggregated difference between the worst case predicted noise level and the likely long term average measured noise level is in the range 7.1 to 9.1 dB(A). As outlined above the lower end of this range applies to properties within 5.25 times the tip height. The typical average correction is more likely to be over 8 dB(A) and consistent with the WHO 2018 Conditional Recommendation.

Draft Wind Energy Guidelines- Wind Turbine Noise Analysis
MGE0713RP0001F01 18
6 CONCLUSION
The corrections between worst case predicted and calculated annual average noise levels are based on 30 year weather data on a geographical spread of sites across Ireland applied to data on large turbine designs from three different manufacturers.
The corrections are sufficient to confirm that the RRNL level is consistent with the WHO guidelines.
Draft Wind Energy Guidelines- Wind Turbine Noise Analysis
MGE0713RP0001F01 19
7 REFERENCES
Department of Communications, Climate Action and the Environment (DCCAE), Ireland, (2018) Draft Wind Energy Development Guidelines;
Eirgrid, (2017), Annual Renewable Energy Constraint and Curtailment Report 2017;
Environmental Protection Agency (EPA), (2011), Guidance Note on Noise Assessment of Wind Turbine Operations at EPA Licenced Sites (NG3)
Institute of Acoustics, (2013), A Good Practice Guide to the Application of ETSU-R-97 for the Assessment and Rating of Wind Turbine Noise.
World Health Organisation (WHO), (2018), Environmental Noise Guidelines for the European Region