Embed Size (px)
Citation preview
© Siemens AG 2010. All rights reserved
Dr. Heinrich HiesingerMember of the Managing Board of Siemens AGCEO Industry Sector
Capital Market Days 'Industry'Munich, March 26, 2010
Driving performance… now and for the future
Capital Market Days 'Industry' © Siemens AG 2010. All rights reservedMarch 26, 2010Page 2
Safe Harbour Statement
This document contains forward-looking statements and information – that is, statements related to future, not past, events. These statements may be identified by words such as "expects," "looks forward to", "anticipates", "intends", "plans", "believes", "seeks", "estimates", "will", "project" or words of similar meaning. Such statements are based on the current expectations and certain assumptions of Siemens' management, and are, therefore, subject to certain risks and uncertainties. A variety of factors, many of which are beyond Siemens' control, affect Siemens' operations, performance, business strategy and results and could cause the actual results, performance or achievements of Siemens to be materially different from any future results, performance or achievements that may be expressed or implied by such forward-looking statements. For Siemens, particular uncertainties arise, among others, from changes in general economic and business conditions (including margin developments in major business areas and recessionary trends); the possibility that customers may delay the conversion of booked orders into revenue or that prices will decline as a result of continued adverse market conditions to a greater extent than currently anticipated by Siemens' management; developments in the financial markets, including fluctuations in interest and exchange rates, commodity and equity prices, debt prices (credit spreads) and financial assets generally; continued volatility and a further deterioration of the capital markets; a worsening in the conditions of the credit business and, in particular, additional uncertainties arising out of the subprime, financial market and liquidity crises; future financial performance of major industries that Siemens serves, including, without limitation, the Sectors Industry, Energy and Healthcare; the challenges of integrating major acquisitions and implementing joint ventures and other significant portfolio measures; the introduction of competing products or technologies by other companies; a lack of acceptance of new products or services by customers targeted by Siemens; changes in business strategy; the outcome of pending investigations and legal proceedings and actions resulting from the findings of these investigations; the potential impact of such investigations and proceedings on Siemens' ongoing business including its relationships with governments and other customers; the potential impact of such matters on Siemens' financial statements; as well as various other factors. More detailed information about certain of the risk factors affecting Siemens is contained throughout this report and in Siemens' other filings with the SEC, which are available on the Siemens website, www.siemens.com, and on the SEC’s website, www.sec.gov. Should one or more of these risks or uncertainties materialize, or should underlying assumptions prove incorrect, actual results may vary materially from those described in the relevant forward-looking statement as expected, anticipated, intended, planned, believed, sought, estimated or projected. Siemens does not intend or assume any obligation to update or revise these forward-looking statements in light of developments which differ from those anticipated.
New orders and backlog; adjusted or organic growth rates of Revenue and new orders; book-to-bill ratio; return on equity, or ROE; return on capital employed, or ROCE; Free cash flow; cash conversion rate, or CCR; EBITDA (adjusted); EBIT (adjusted); earnings effect from purchase price allocation (PPA effects) and integration costs; net debt and adjusted industrial net debt are or may be non-GAAP financial measures. These supplemental financial measures should not be viewed in isolation as alternatives to measures of Siemens’ financial condition, results of operations or cash flows as presented in accordance with IFRS in its Consolidated Financial Statements. A definition of these supplemental financial measures, a reconciliation to the most directly comparable IFRS financial measures and information regarding the usefulness and limitations of these supplemental financial measures can be found on Siemens' Investor Relations website at www.siemens.com/nonGAAP.
Capital Market Days 'Industry' © Siemens AG 2010. All rights reservedMarch 26, 2010Page 3
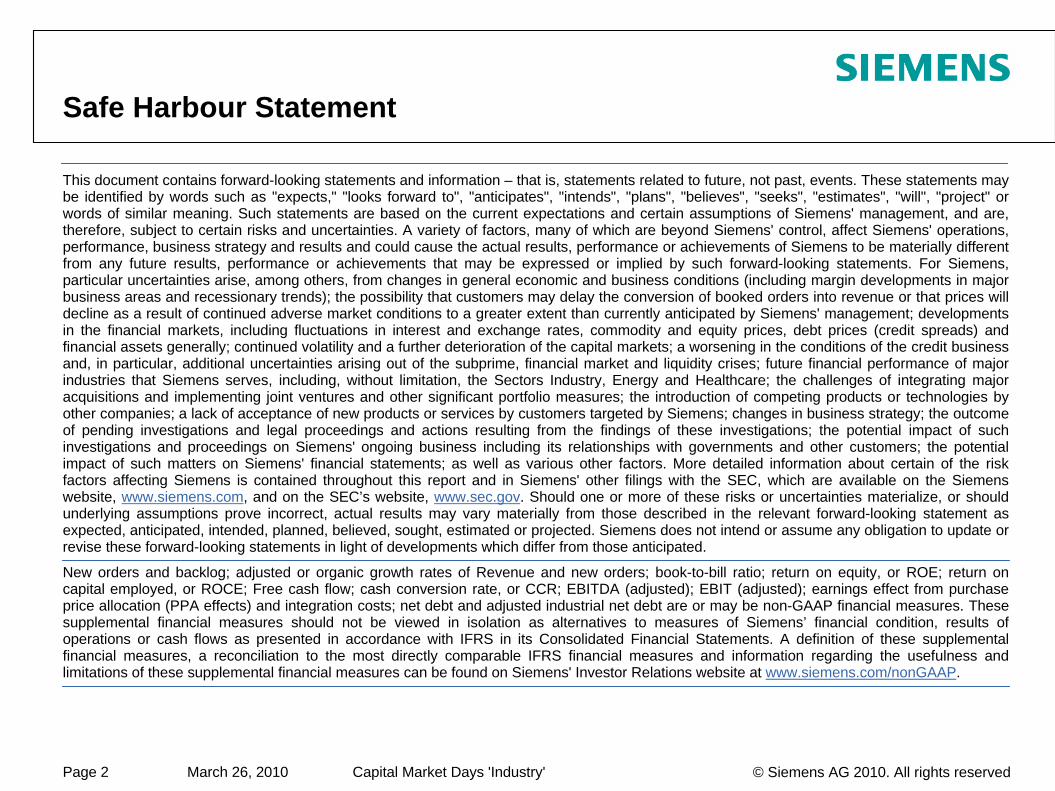
Industry Sector: #1 in our markets
Top competitors by business fields
11%* 18%* 7%*
18%*
8%*
SMS
8%*
Industry SectorDrive
TechnologiesBuilding
Technologies Osram Industry Solutions MobilityIndustry
Automation
Source: market research institutes / own calculations* Market share in our target market based on revenue 2009
Capital Market Days 'Industry' © Siemens AG 2010. All rights reservedMarch 26, 2010Page 4
-10
-8
-6
-4
-2
0
2
4
6
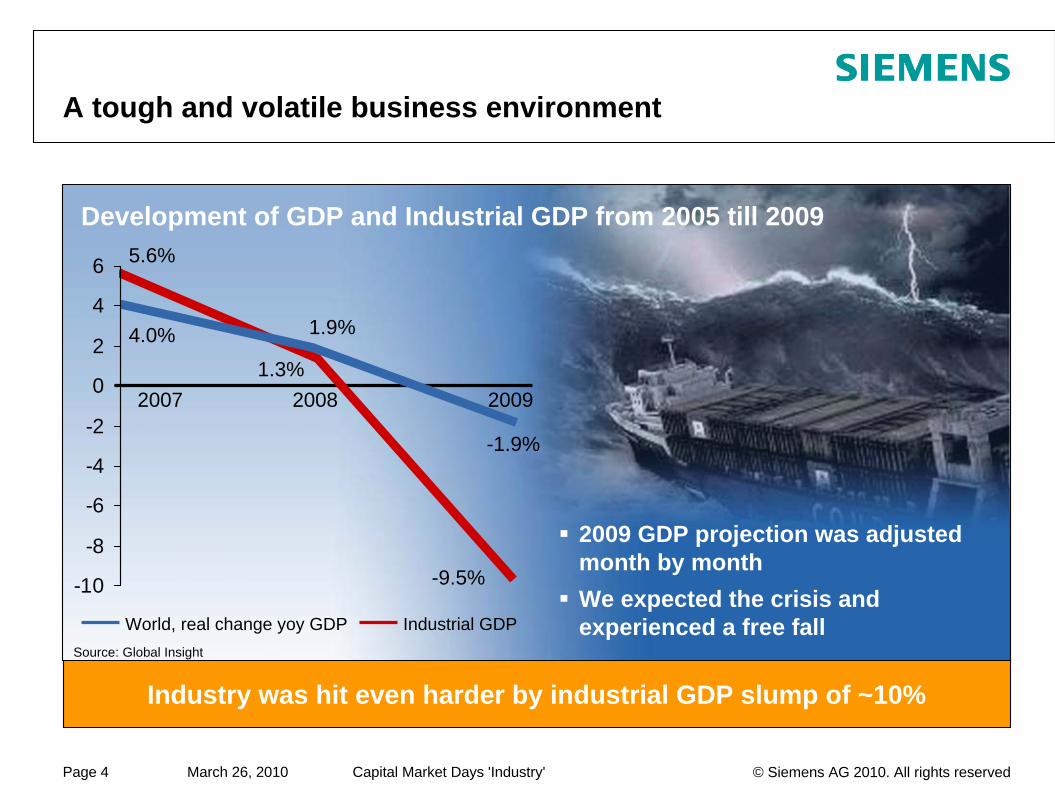
A tough and volatile business environment
2009 GDP projection was adjusted month by monthWe expected the crisis and experienced a free fall
Development of GDP and Industrial GDP from 2005 till 2009
Source: Global Insight
Industry was hit even harder by industrial GDP slump of ~10%
-9.5%
-1.9%
5.6%
Industrial GDPWorld, real change yoy GDP
20091.3%
2007 2008
1.9%4.0%
Capital Market Days 'Industry' © Siemens AG 2010. All rights reservedMarch 26, 2010Page 5
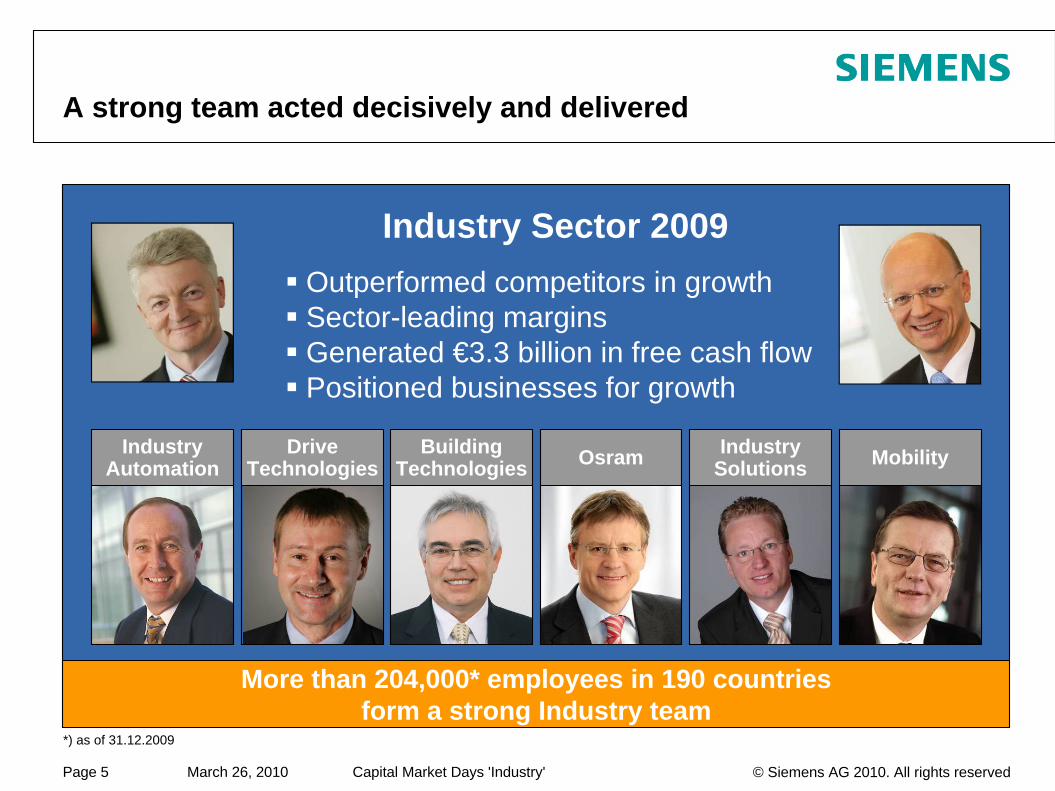
A strong team acted decisively and delivered
Industry Automation Osram Industry
Solutions Mobility
Industry Sector 2009Outperformed competitors in growthSector-leading marginsGenerated €3.3 billion in free cash flowPositioned businesses for growth
Building Technologies
Drive Technologies
More than 204,000* employees in 190 countries form a strong Industry team
*) as of 31.12.2009
Capital Market Days 'Industry' © Siemens AG 2010. All rights reservedMarch 26, 2010Page 6
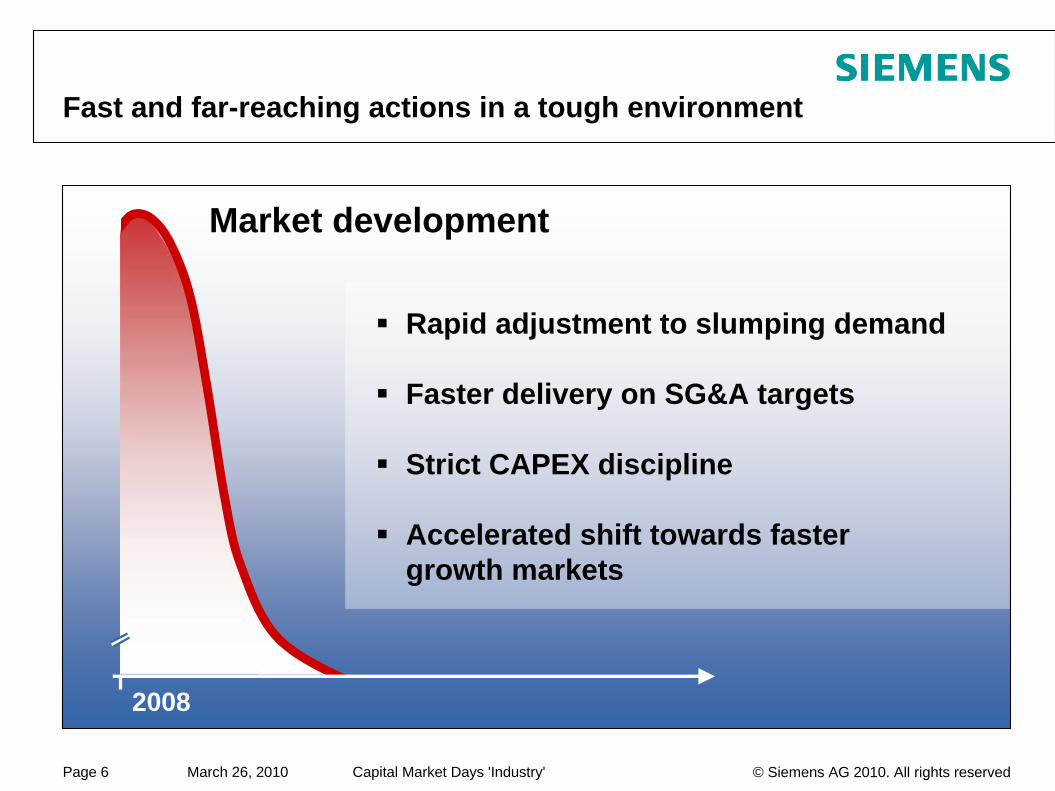
Fast and far-reaching actions in a tough environment
Market development
2008
Rapid adjustment to slumping demand
Faster delivery on SG&A targets
Strict CAPEX discipline
Accelerated shift towards fastergrowth markets
Capital Market Days 'Industry' © Siemens AG 2010. All rights reservedMarch 26, 2010Page 7
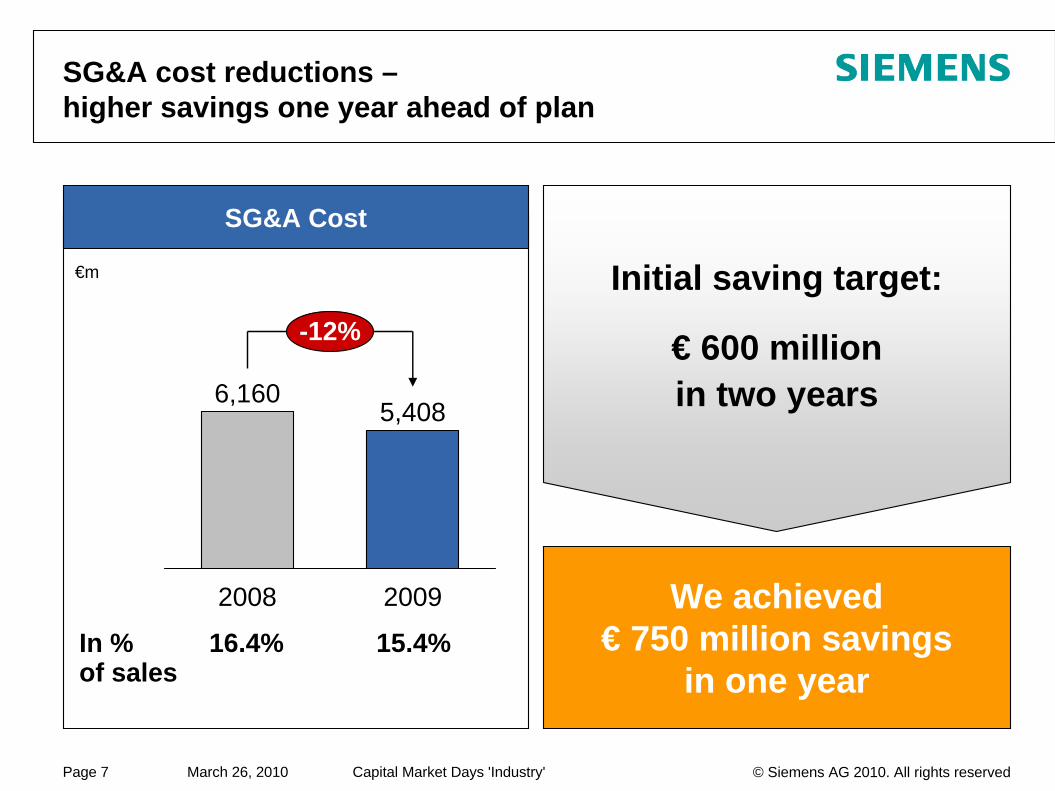
SG&A cost reductions – higher savings one year ahead of plan
-12%
20092008
5,4086,160
In % of sales
16.4% 15.4%
SG&A Cost
We achieved€ 750 million savings
in one year
€m Initial saving target:
€ 600 millionin two years
Capital Market Days 'Industry' © Siemens AG 2010. All rights reservedMarch 26, 2010Page 8
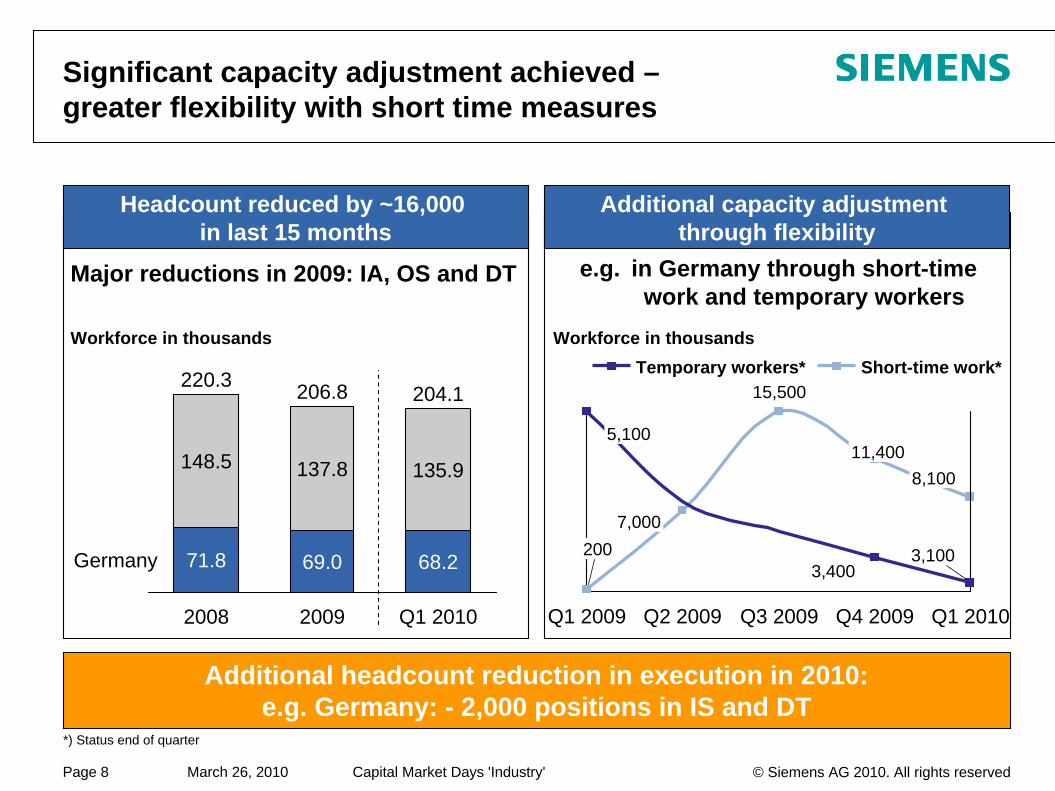
Headcount reduced by ~16,000 in last 15 months
Additional capacity adjustment through flexibility
Significant capacity adjustment achieved – greater flexibility with short time measures
Additional headcount reduction in execution in 2010: e.g. Germany: - 2,000 positions in IS and DT
Workforce in thousands
Major reductions in 2009: IA, OS and DT
Germany
Q1 2010
204.1
68.2
135.9
2009
206.8
69.0
137.8
2008
220.3
71.8
148.5
e.g. in Germany through short-time work and temporary workers
Q1 2010
8,100
3,100
Q4 2009
11,400
3,400
Q3 2009
15,500
Q2 2009
7,000
Q1 2009
200
5,100
Short-time work*Temporary workers*Workforce in thousands
*) Status end of quarter
Capital Market Days 'Industry' © Siemens AG 2010. All rights reservedMarch 26, 2010Page 9
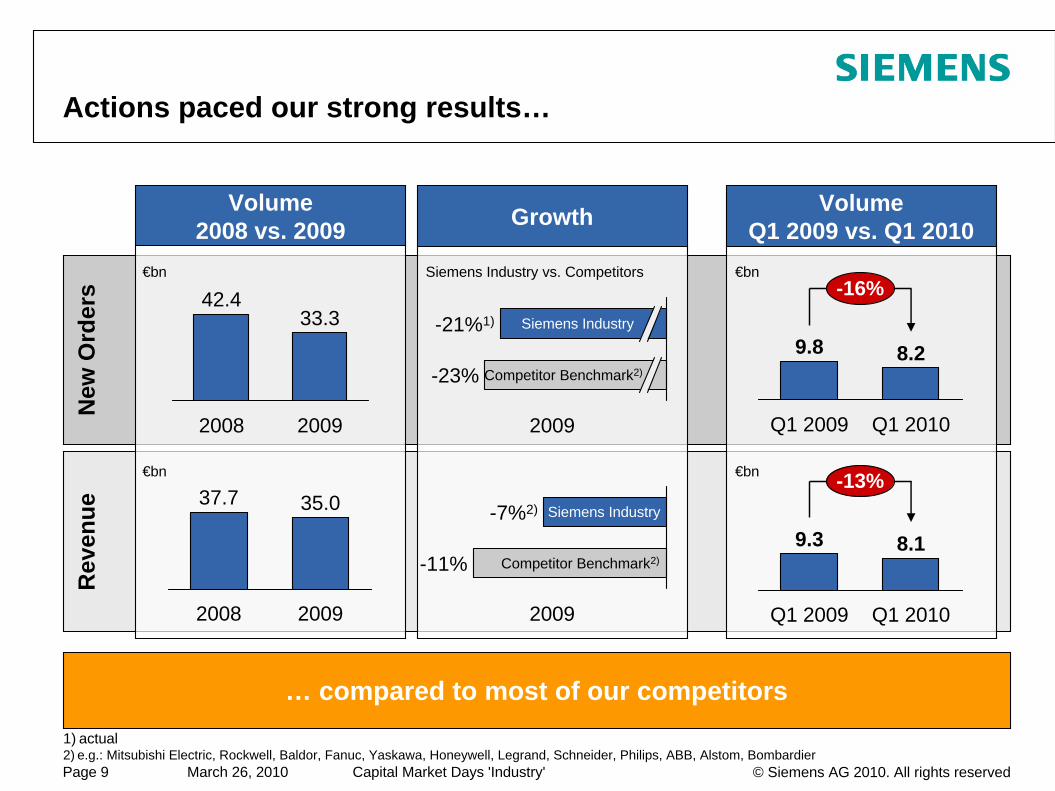
Actions paced our strong results…N
ew O
rder
s
Volume2008 vs. 2009
VolumeQ1 2009 vs. Q1 2010
Rev
enue
Growth
… compared to most of our competitors
€bn €bnSiemens Industry vs. Competitors
37.7
2009
35.0
2008
2009
33.3
2008
42.4
Q1 2009 Q1 2010
-16%
9.8 8.2
-13%
Q1 2010
8.1
Q1 2009
9.3
-23%
-21%1)
2009
Siemens Industry
Competitor Benchmark2)
-11%
-7%2)
2009
Siemens Industry
Competitor Benchmark2)
2) e.g.: Mitsubishi Electric, Rockwell, Baldor, Fanuc, Yaskawa, Honeywell, Legrand, Schneider, Philips, ABB, Alstom, Bombardier1) actual
€bn €bn
Capital Market Days 'Industry' © Siemens AG 2010. All rights reservedMarch 26, 2010Page 10
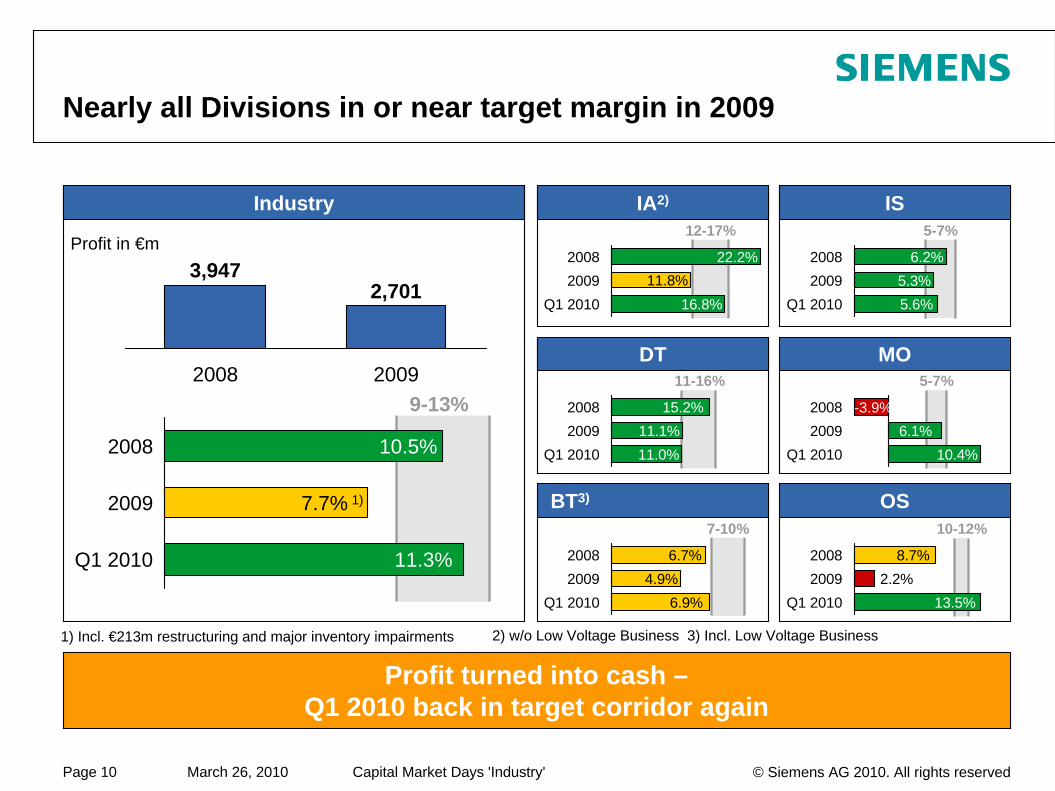
OS
IS
MO
10-12%
5-7%
BT3)
11-16%
5-7%
9-13%
2008
Q1 2010
2009
Nearly all Divisions in or near target margin in 2009
Profit turned into cash –Q1 2010 back in target corridor again
Industry IA2)
DT
Profit in €m
2009
2,701
2008
3,947
11.3%
7.7% 1)
10.5%
12-17%
Q1 201020092008
11.8%22.2%
16.8% Q1 201020092008
Q1 201020092008
Q1 201020092008
7-10%
Q1 201020092008
Q1 201020092008
5.6%5.3%
6.2%
11.0%11.1%
15.2% -3.9%
6.9%4.9%
6.7%2.2%
8.7%
13.5%
6.1%10.4%
1) Incl. €213m restructuring and major inventory impairments 2) w/o Low Voltage Business 3) Incl. Low Voltage Business
Capital Market Days 'Industry' © Siemens AG 2010. All rights reservedMarch 26, 2010Page 11
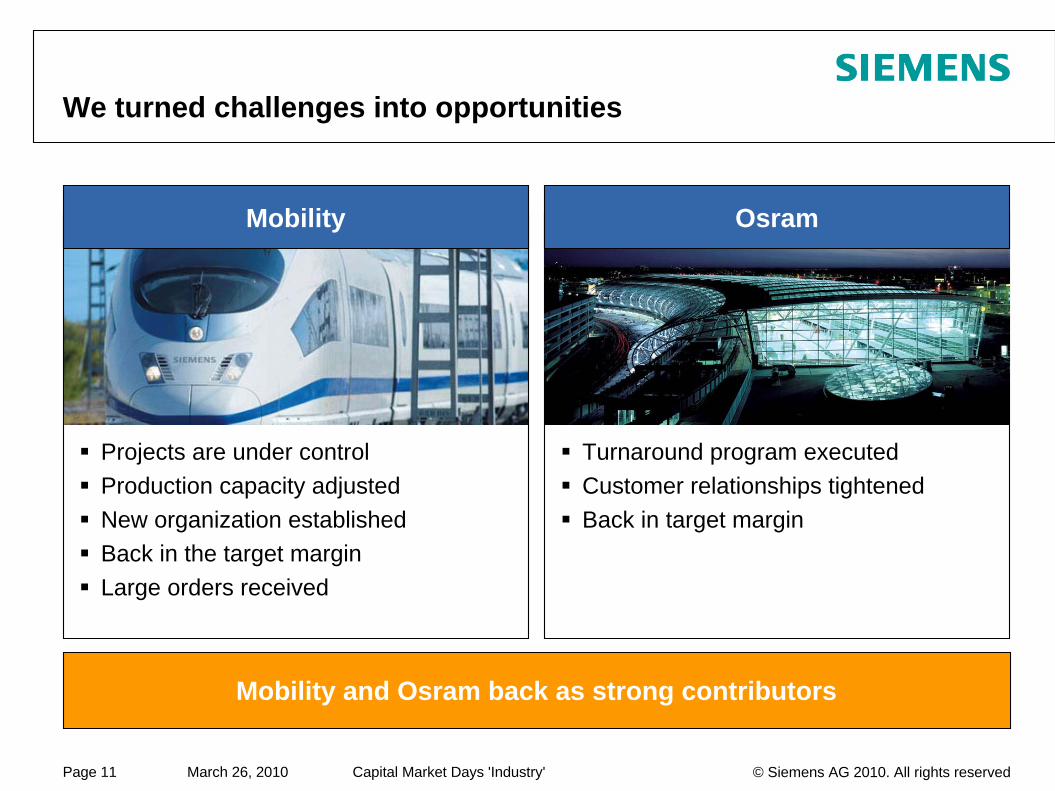
We turned challenges into opportunities
Projects are under controlProduction capacity adjustedNew organization establishedBack in the target marginLarge orders received
Turnaround program executedCustomer relationships tightenedBack in target margin
Mobility Osram
Mobility and Osram back as strong contributors
Capital Market Days 'Industry' © Siemens AG 2010. All rights reservedMarch 26, 2010Page 12
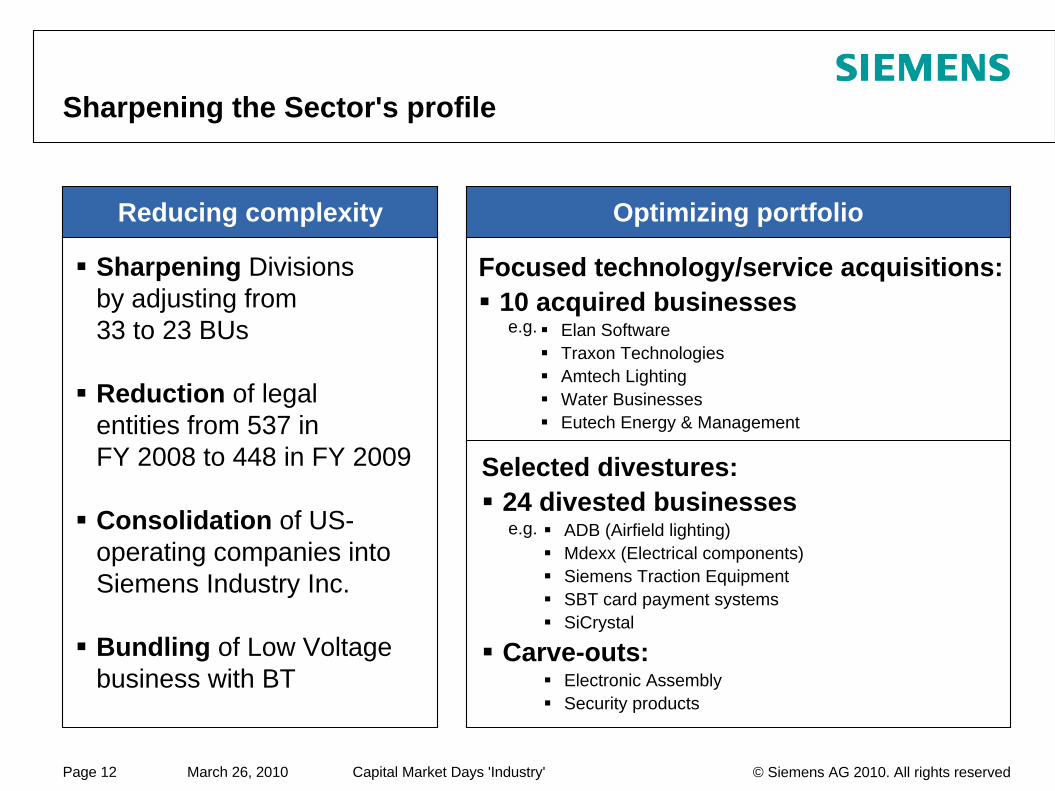
Reducing complexity
Sharpening the Sector's profile
Sharpening Divisions by adjusting from 33 to 23 BUs
Reduction of legal entities from 537 in FY 2008 to 448 in FY 2009
Consolidation of US-operating companies into Siemens Industry Inc.
Bundling of Low Voltage business with BT
Selected divestures:24 divested businesses
ADB (Airfield lighting)Mdexx (Electrical components)Siemens Traction EquipmentSBT card payment systemsSiCrystal
Carve-outs:Electronic AssemblySecurity products
Focused technology/service acquisitions:10 acquired businesses
Elan SoftwareTraxon TechnologiesAmtech Lighting Water BusinessesEutech Energy & Management
Optimizing portfolio
e.g.
e.g.
Capital Market Days 'Industry' © Siemens AG 2010. All rights reservedMarch 26, 2010Page 13
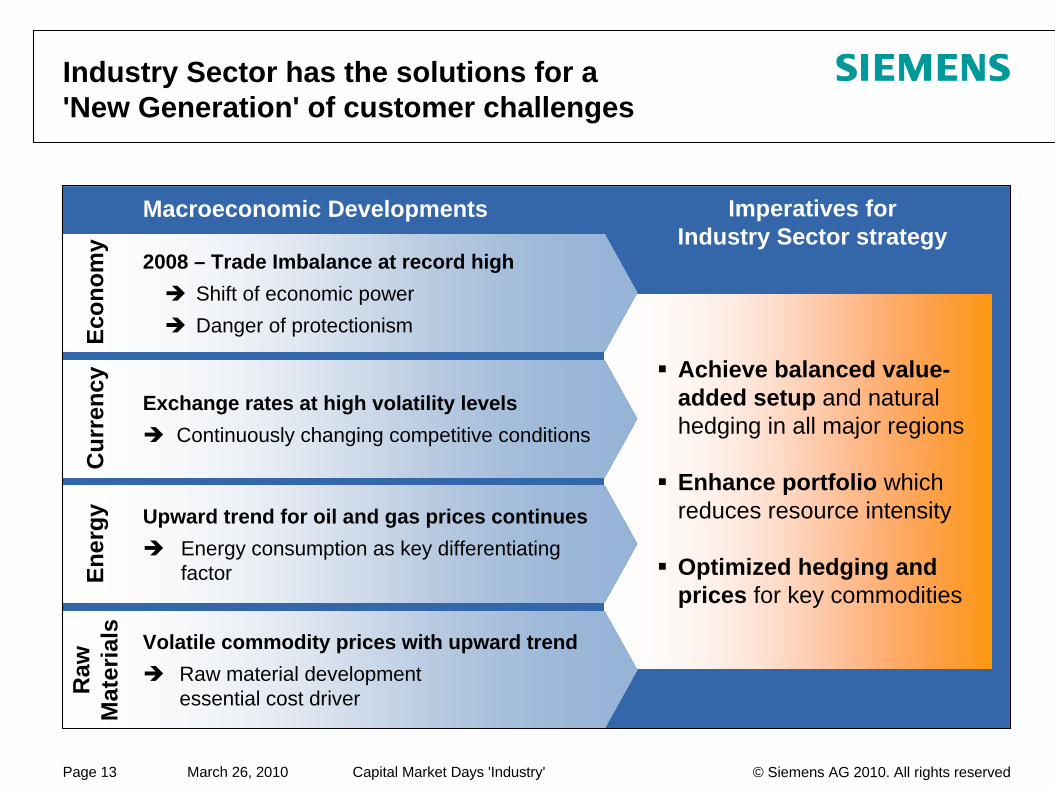
Achieve balanced value-added setup and natural hedging in all major regions
Enhance portfolio which reduces resource intensity
Optimized hedging and prices for key commodities
Volatile commodity prices with upward trend Raw material development essential cost driver
2008 – Trade Imbalance at record high Shift of economic powerDanger of protectionism
Exchange rates at high volatility levels Continuously changing competitive conditions
Upward trend for oil and gas prices continuesEnergy consumption as key differentiating factor
Econ
omy
Cur
renc
yEn
ergy
Raw
Mat
eria
ls
Macroeconomic Developments Imperatives for Industry Sector strategy
Industry Sector has the solutions for a 'New Generation' of customer challenges
Capital Market Days 'Industry' © Siemens AG 2010. All rights reservedMarch 26, 2010Page 14
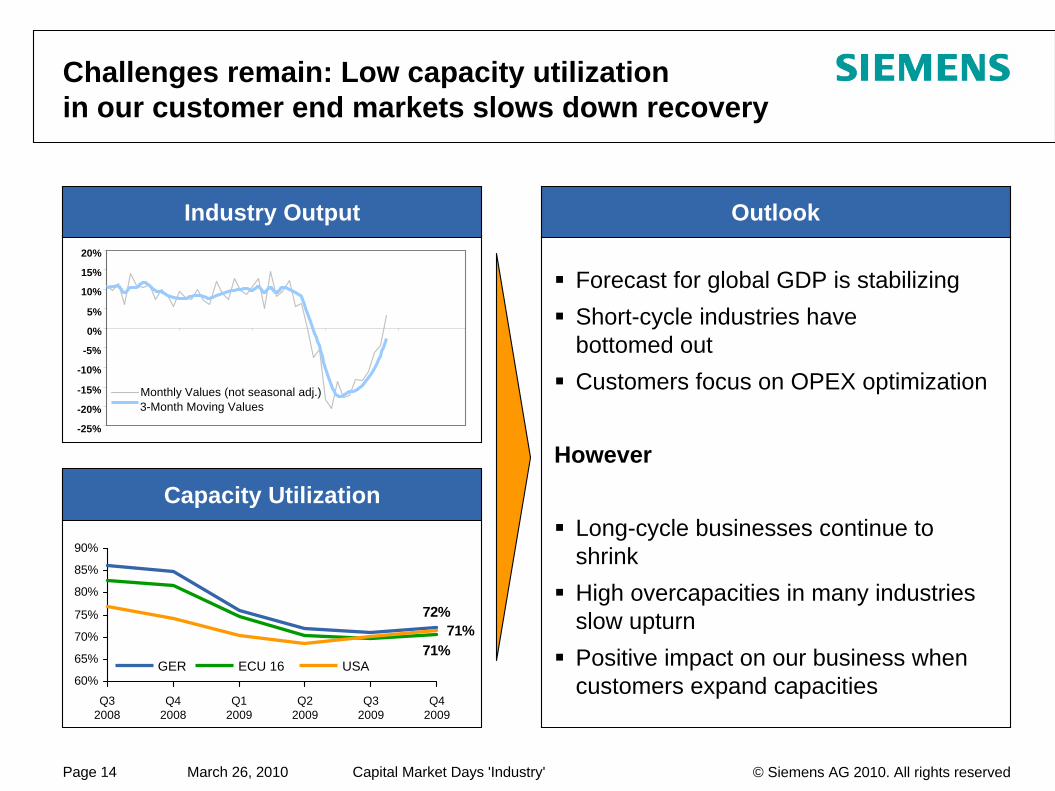
Challenges remain: Low capacity utilization in our customer end markets slows down recovery
Forecast for global GDP is stabilizingShort-cycle industries havebottomed outCustomers focus on OPEX optimization
However
Long-cycle businesses continue to shrinkHigh overcapacities in many industries slow upturnPositive impact on our business when customers expand capacities
OutlookIndustry Output
Capacity Utilization
72%
71%71%
60%
65%
70%
75%
80%
85%
90%
Q42009
Q32009
Q22009
Q12009
Q42008
Q32008
USAECU 16GER
-25%
-20%
-15%
-10%
-5%
0%
5%
10%
15%
20%
Monthly Values (not seasonal adj.)3-Month Moving Values
Capital Market Days 'Industry' © Siemens AG 2010. All rights reservedMarch 26, 2010Page 15
2008
421
85
117
119
100
2010
364
74
77
108
105
2009
371
77
82
114
98
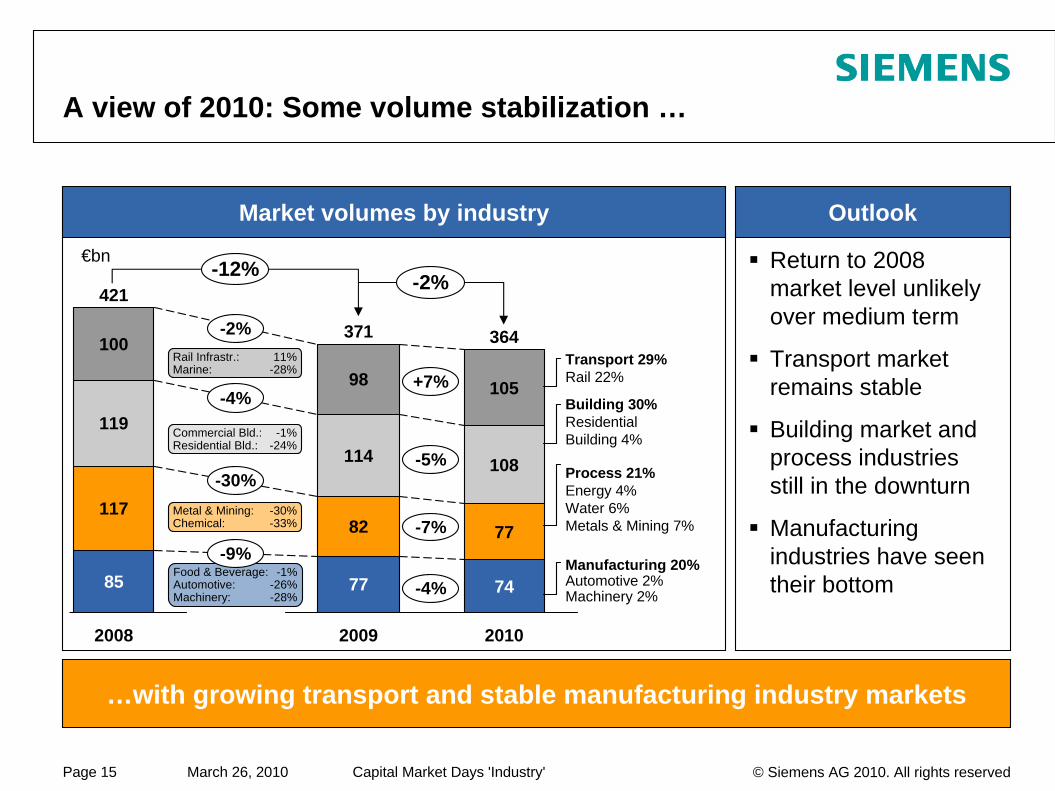
A view of 2010: Some volume stabilization …
Return to 2008 market level unlikely over medium term
Transport market remains stable
Building market and process industries still in the downturn
Manufacturing industries have seen their bottom
Outlook
…with growing transport and stable manufacturing industry markets
Market volumes by industry
€bn
Manufacturing 20% Automotive 2%Machinery 2%
Process 21%Energy 4%Water 6%Metals & Mining 7%
Building 30% Residential Building 4%
Transport 29%Rail 22%+7%
-5%
-7%
-4%
-12%
Food & Beverage: -1%Automotive: -26%Machinery: -28%
Metal & Mining: -30%Chemical: -33%
Commercial Bld.: -1%Residential Bld.: -24%
Rail Infrastr.: 11%Marine: -28%
-30%
-4%
-2%
-9%
-2%
Capital Market Days 'Industry' © Siemens AG 2010. All rights reservedMarch 26, 2010Page 16
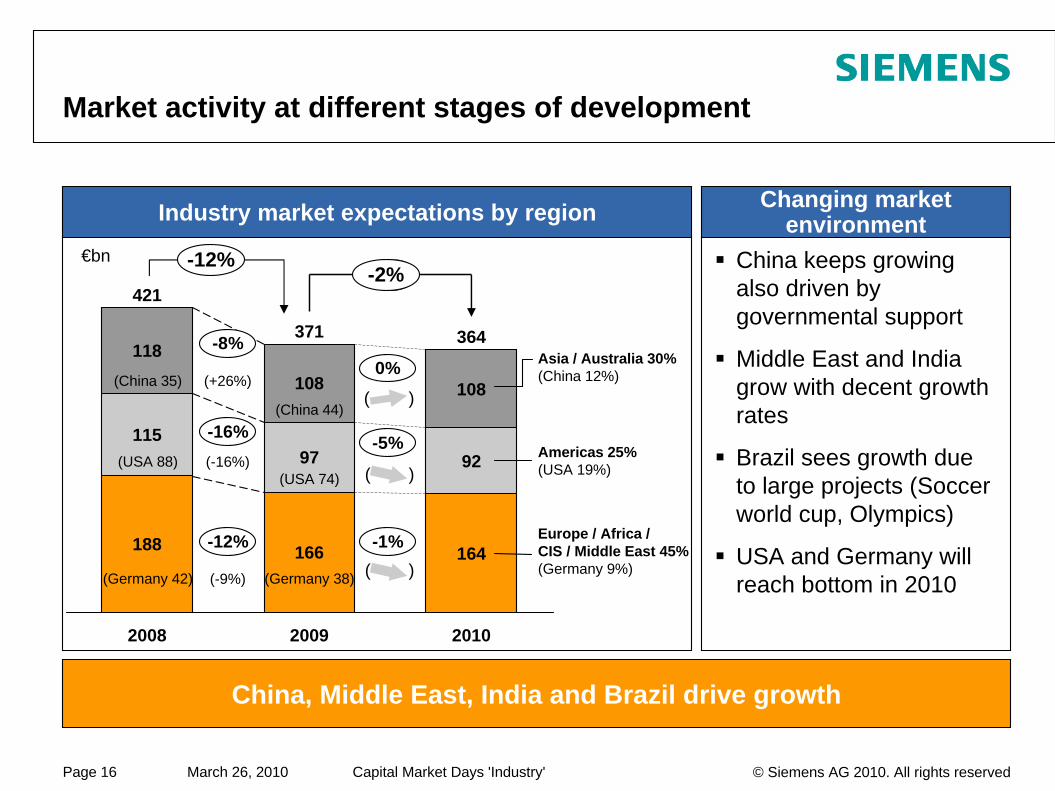
Market activity at different stages of development
China keeps growing also driven by governmental support
Middle East and India grow with decent growth rates
Brazil sees growth due to large projects (Soccer world cup, Olympics)
USA and Germany will reach bottom in 2010
Changing market environment
China, Middle East, India and Brazil drive growth
Industry market expectations by region
-2%
2010
364
164
92
108
2009
371
166
97
108
2008
421
188
115
118 -8%
-16%
-12% Europe / Africa /CIS / Middle East 45%(Germany 9%)
Americas 25%(USA 19%)
Asia / Australia 30%(China 12%)0%
-5%
-1%
€bn -12%-2%
(China 35)
(USA 88)
(Germany 42)
(China 44)
(USA 74)
(Germany 38)
(+26%)
(-16%)
(-9%)
(
(
)
)
( )
Capital Market Days 'Industry' © Siemens AG 2010. All rights reservedMarch 26, 2010Page 17
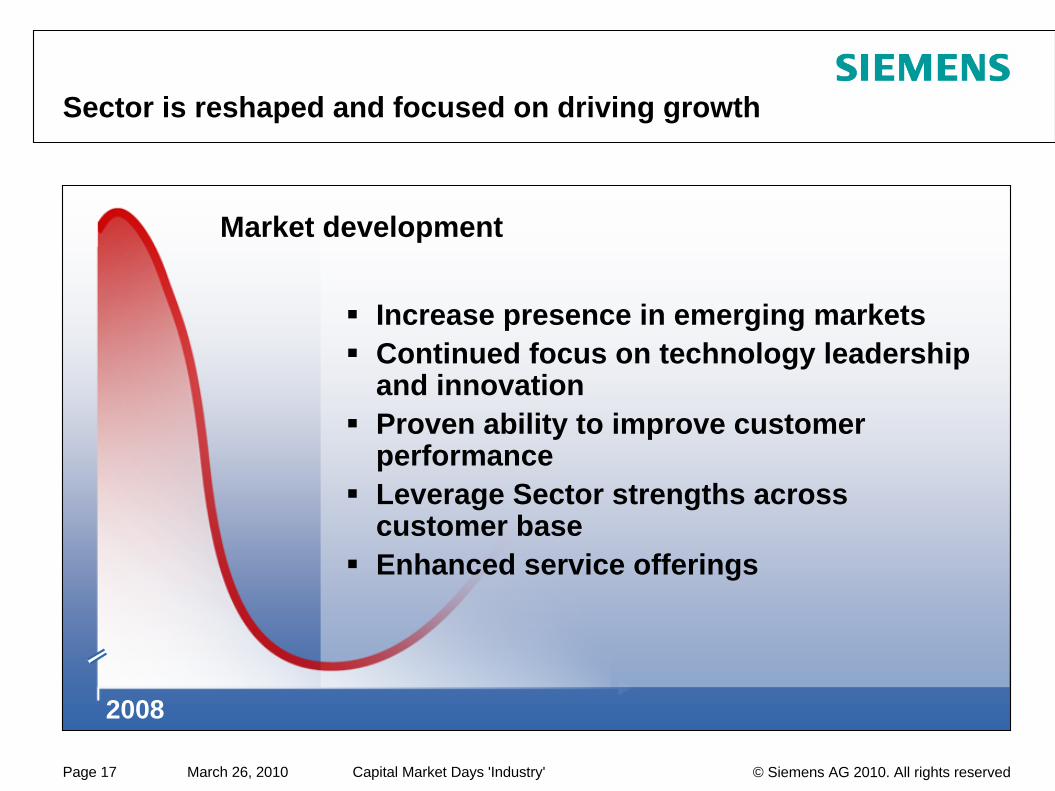
Sector is reshaped and focused on driving growth
Market development
2008
Increase presence in emerging marketsContinued focus on technology leadership and innovationProven ability to improve customer performanceLeverage Sector strengths acrosscustomer baseEnhanced service offerings
Capital Market Days 'Industry' © Siemens AG 2010. All rights reservedMarch 26, 2010Page 18
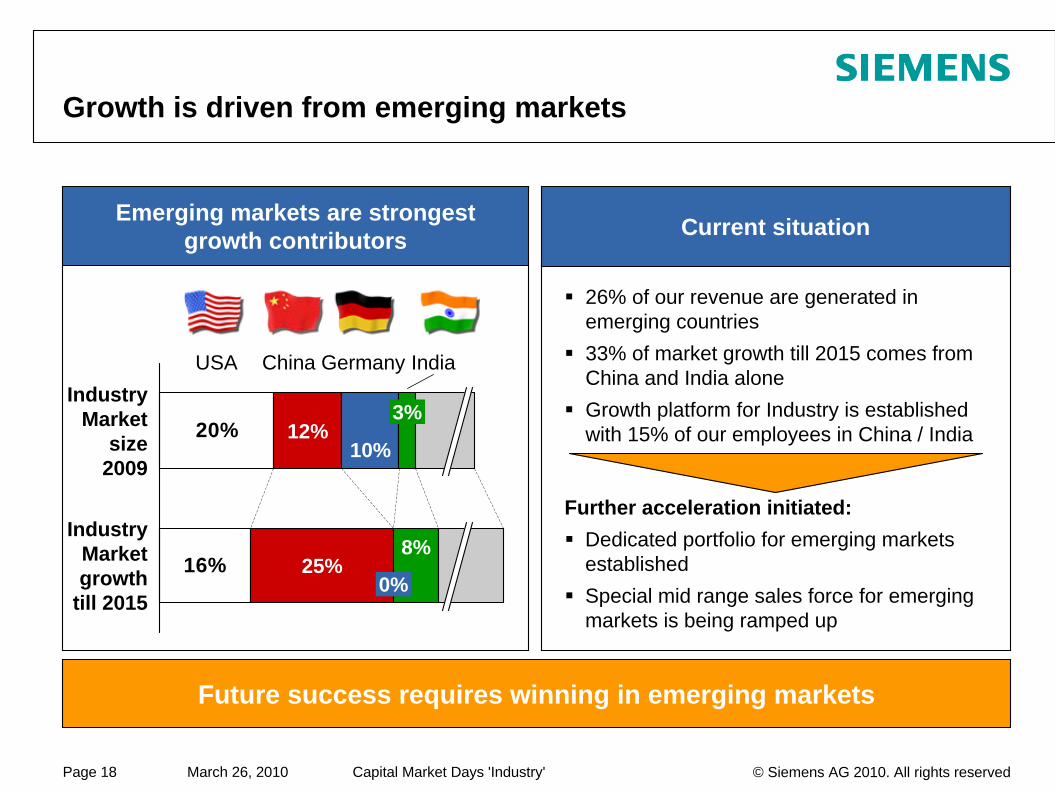
Growth is driven from emerging markets
Current situation
Future success requires winning in emerging markets
Emerging markets are strongest growth contributors
26% of our revenue are generated in emerging countries33% of market growth till 2015 comes from China and India aloneGrowth platform for Industry is established with 15% of our employees in China / India
Further acceleration initiated:Dedicated portfolio for emerging markets established Special mid range sales force for emerging markets is being ramped up
20%
16%Industry
Market growth
till 2015
IndiaGermanyChinaUSA
25%0%
8%
IndustryMarket
size2009
12%10%
3%
Capital Market Days 'Industry' © Siemens AG 2010. All rights reservedMarch 26, 2010Page 19
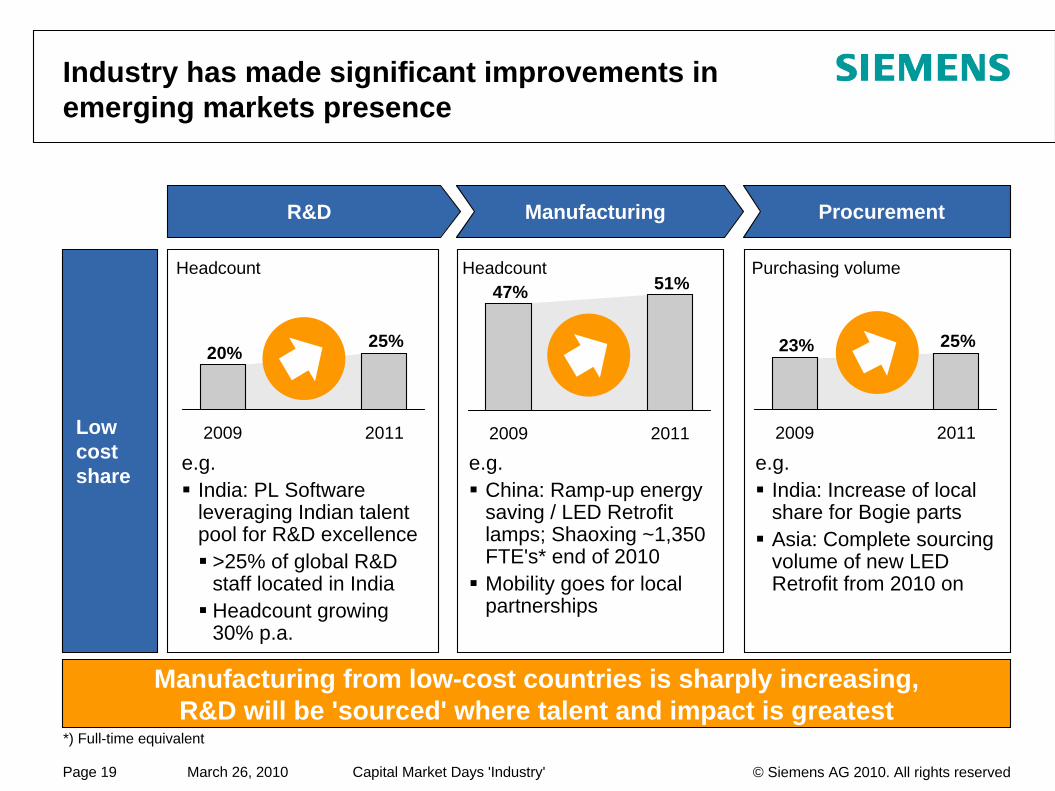
Procurement
Low cost share
ManufacturingR&D
Industry has made significant improvements in emerging markets presence
e.g. India: PL Software leveraging Indian talent pool for R&D excellence
>25% of global R&D staff located in IndiaHeadcount growing30% p.a.
e.g.India: Increase of local share for Bogie partsAsia: Complete sourcing volume of new LED Retrofit from 2010 on
e.g.China: Ramp-up energy saving / LED Retrofit lamps; Shaoxing ~1,350 FTE's* end of 2010Mobility goes for local partnerships
Manufacturing from low-cost countries is sharply increasing, R&D will be 'sourced' where talent and impact is greatest
25%23%
2009 2011
25%20%
20112009
51%47%
2009 2011
Headcount Headcount Purchasing volume
*) Full-time equivalent
Capital Market Days 'Industry' © Siemens AG 2010. All rights reservedMarch 26, 2010Page 20
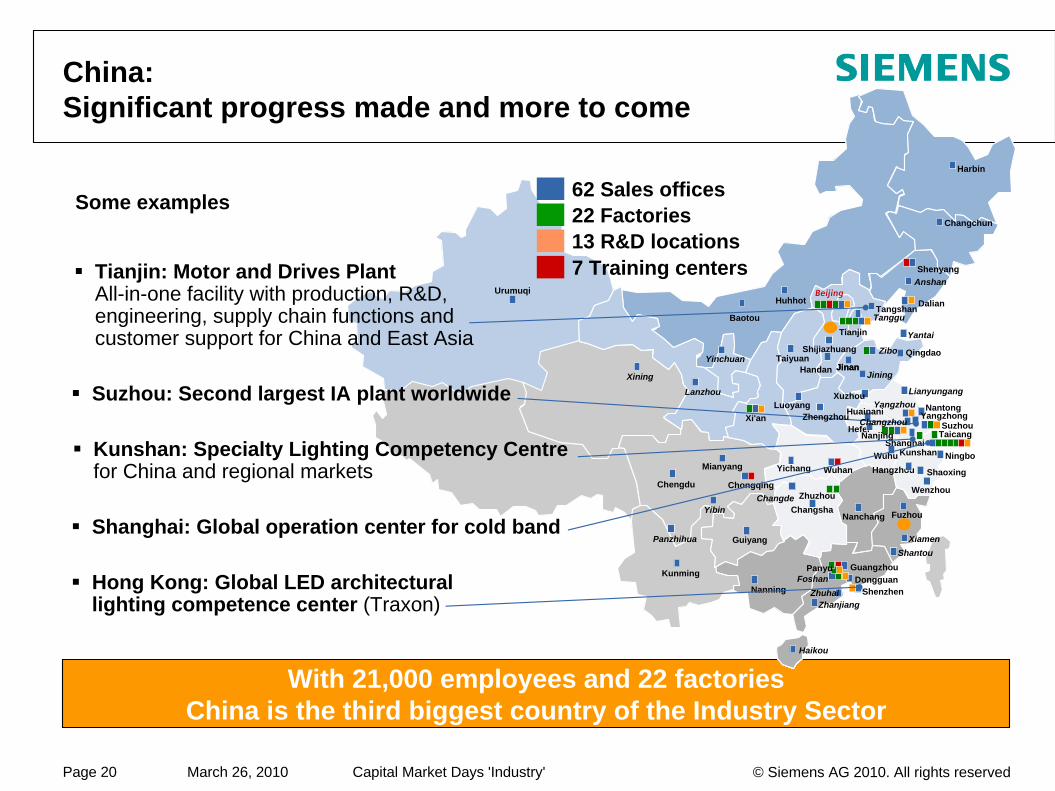
China: Significant progress made and more to come
With 21,000 employees and 22 factories China is the third biggest country of the Industry Sector
Some examples
Anshan
Ningbo
Changchun
Nanning
Wuhan
Panzhihua
Chongqing
Yichang
Huhhot
Taiyuan
Xi'an
JiningJinan
Chengdu
Zibo
Hangzhou
Kunming
Harbin
Changsha
Suzhou
Nantong
Zhanjiang
Changde
Wuhu
Huainani
Shenyang
Fuzhou
Foshan
Nanchang
Guiyang
Mianyang
Yinchuan
Lanzhou
Tangshan
Beijing
Jinan
Hefei
Yangzhou
Shaoxing
Qingdao
Tanggu
YantaiTianjin
Dalian
Xuzhou Lianyungang
Wenzhou
XiamenShantou
DongguanShenzhen
Guangzhou
Zhuhai
Luoyang
Yibin
Shijiazhuang
Haikou
ShanghaiTaicang
Kunshan
Zhuzhou
Urumuqi
Baotou
HandanXining
Yangzhong
Hong Kong: Global LED architecturallighting competence center (Traxon)
Tianjin: Motor and Drives PlantAll-in-one facility with production, R&D, engineering, supply chain functions and customer support for China and East Asia
Suzhou: Second largest IA plant worldwide
Kunshan: Specialty Lighting Competency Centrefor China and regional markets
Shanghai: Global operation center for cold band
13 R&D locations22 Factories62 Sales offices
7 Training centers
NanjingChangzhouZhengzhou
Panyu
Capital Market Days 'Industry' © Siemens AG 2010. All rights reservedMarch 26, 2010Page 21
Anshan
Ningbo
Changchun
Nanning
Wuhan
Panzhihua
Chongqing
Yichang
Huhhot
Zhengzhou
Taiyuan
Xi'an
JiningJinan
Chengdu
Zibo
Hangzhou
Kunming
Harbin
Changsha
NanjingSuzhou
Nantong
Zhanjiang
Changde
Wuhu
Huainani
Shenyang
Fuzhou
Foshan
Nanchang
Guiyang
Mianyang
Yinchuan
Lanzhou
Tangshan
Beijing
Jinan
Hefei
Yizheng
Shaoxing
Qingdao
Tanggu
YantaiTianjin
Dalian
Xuzhou Lianyungang
Wenzhou
Xiamen
Shantou
DongguanShenzhen
Guangzhou
Zhuhai
Luoyang
Yibin
Shijiazhuang
Haikou
WuxiTaicang
Kunshan
Zhuzhou
Panyu
Urumuqi
Baotou
Changzhou
HandanXining
Yangzhong
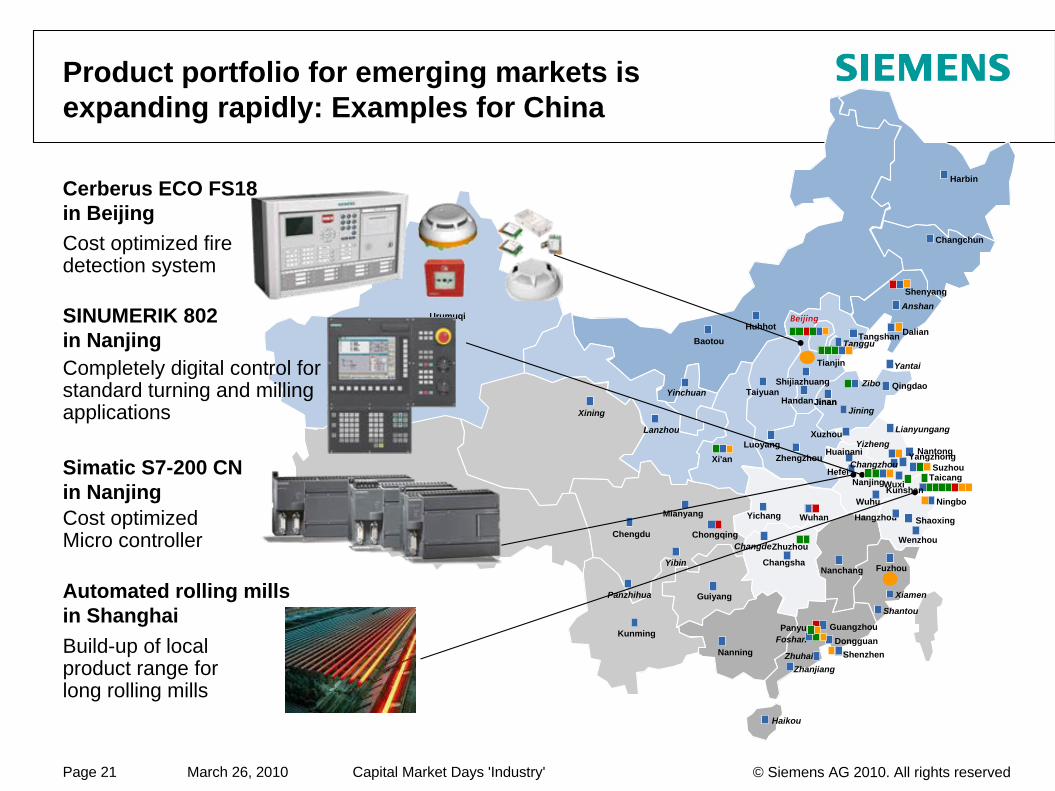
Product portfolio for emerging markets is expanding rapidly: Examples for China
Build-up of local product range for long rolling mills
Cost optimized Micro controller
Completely digital control for standard turning and milling applications
Cost optimized fire detection system
Automated rolling millsin Shanghai
Cerberus ECO FS18in Beijing
SINUMERIK 802 in Nanjing
Simatic S7-200 CNin Nanjing
Capital Market Days 'Industry' © Siemens AG 2010. All rights reservedMarch 26, 2010Page 22
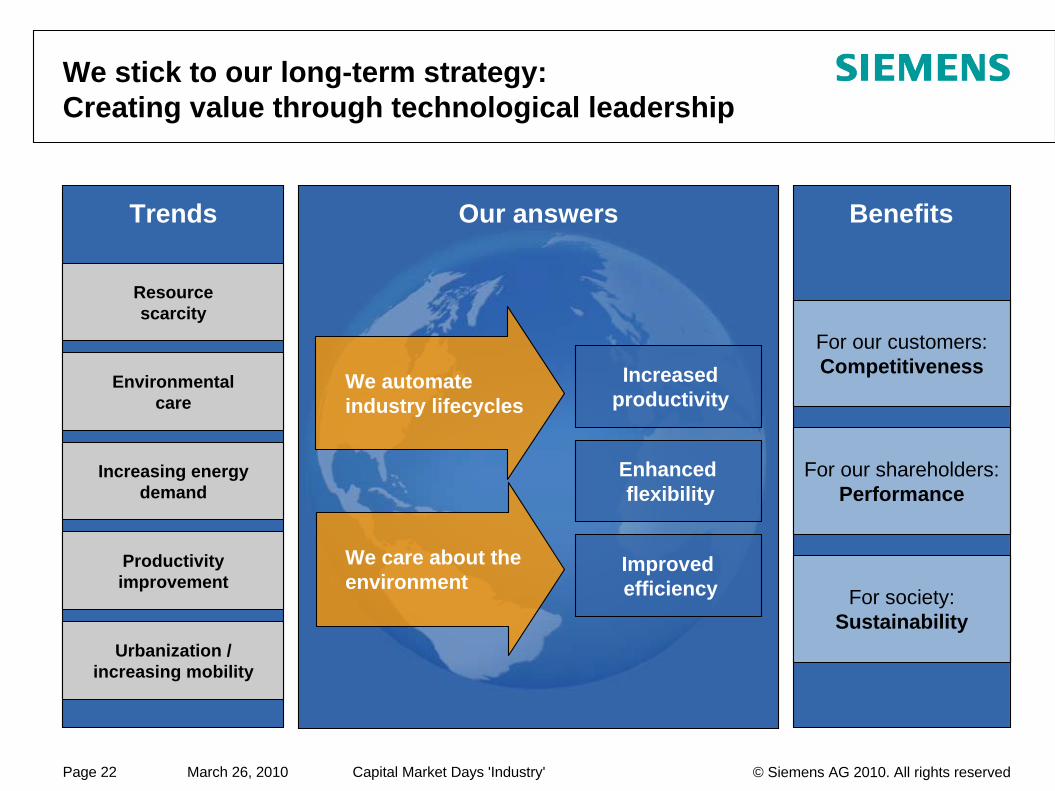
We stick to our long-term strategy: Creating value through technological leadership
Trends
Resource scarcity
Productivity improvement
Increasing energy demand
Environmental care
Urbanization / increasing mobility
Benefits
For our customers: Competitiveness
For our shareholders: Performance
For society: Sustainability
Our answers
Increased productivity
Enhanced flexibility
Improved efficiency
We care about the environment
We automate industry lifecycles
Capital Market Days 'Industry' © Siemens AG 2010. All rights reservedMarch 26, 2010Page 23
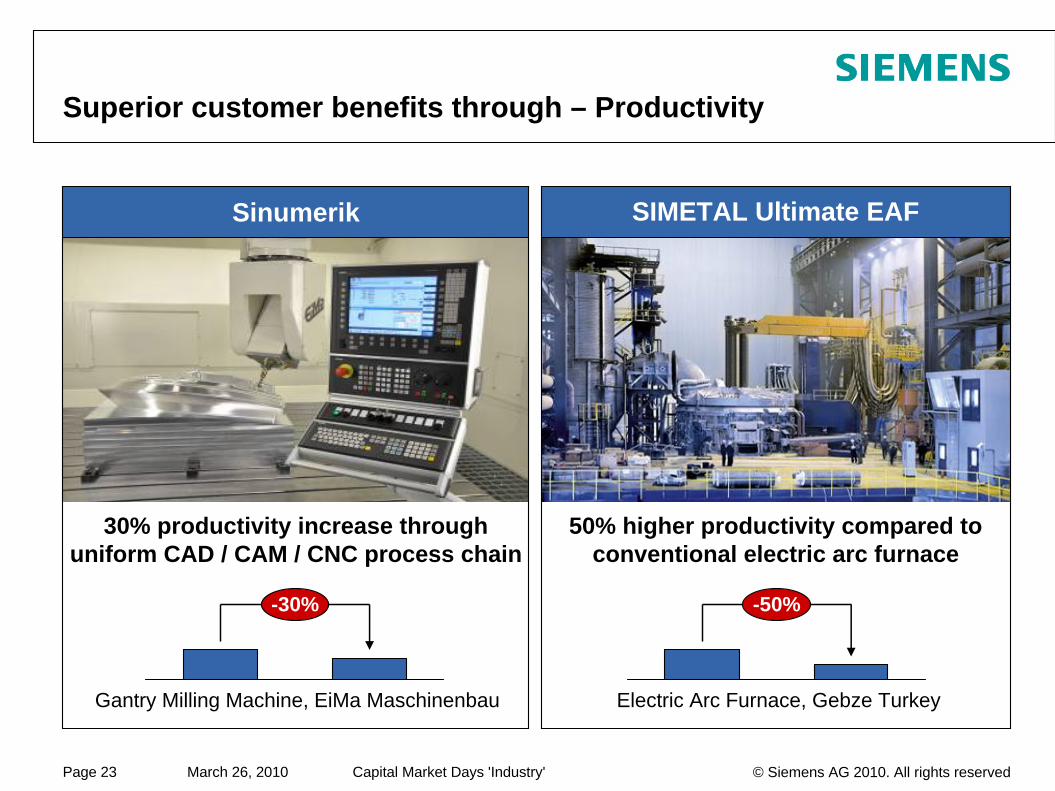
Superior customer benefits through – Productivity
30% productivity increase through uniform CAD / CAM / CNC process chain
-30%
Gantry Milling Machine, EiMa Maschinenbau
50% higher productivity compared to conventional electric arc furnace
-50%
Electric Arc Furnace, Gebze Turkey
SIMETAL Ultimate EAFSinumerik
Capital Market Days 'Industry' © Siemens AG 2010. All rights reservedMarch 26, 2010Page 24
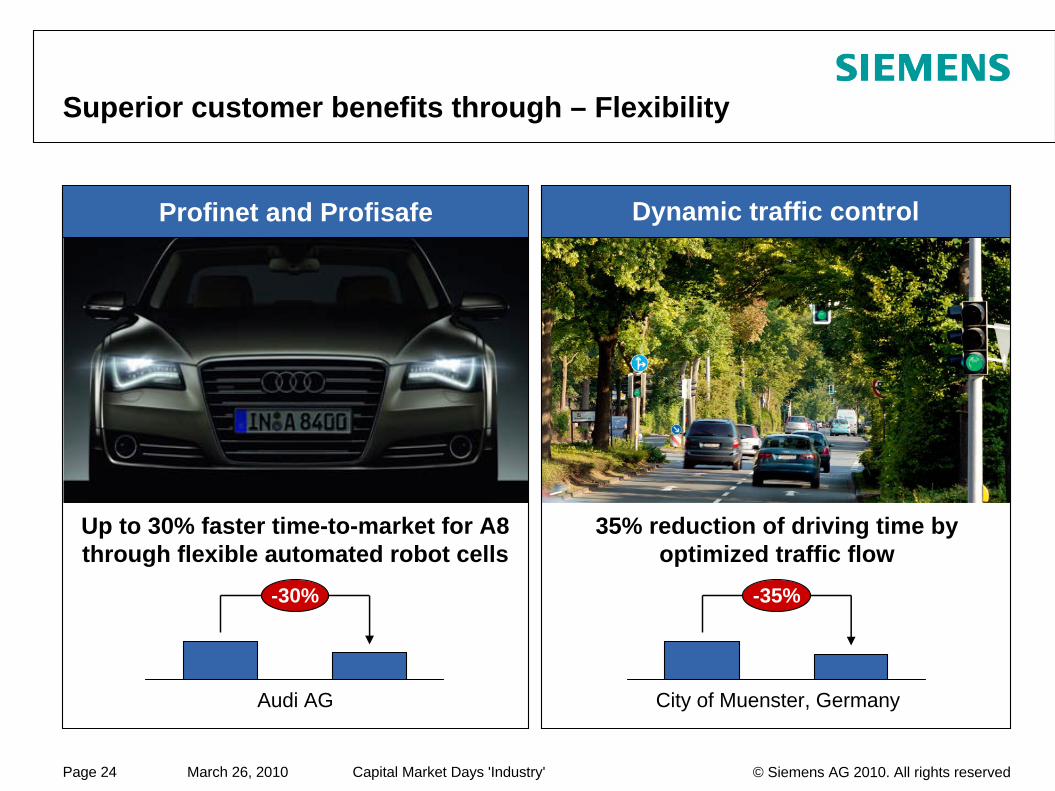
Superior customer benefits through – Flexibility
Up to 30% faster time-to-market for A8 through flexible automated robot cells
-30%
Audi AG
35% reduction of driving time by optimized traffic flow
-35%
City of Muenster, Germany
Dynamic traffic controlProfinet and Profisafe
Capital Market Days 'Industry' © Siemens AG 2010. All rights reservedMarch 26, 2010Page 25
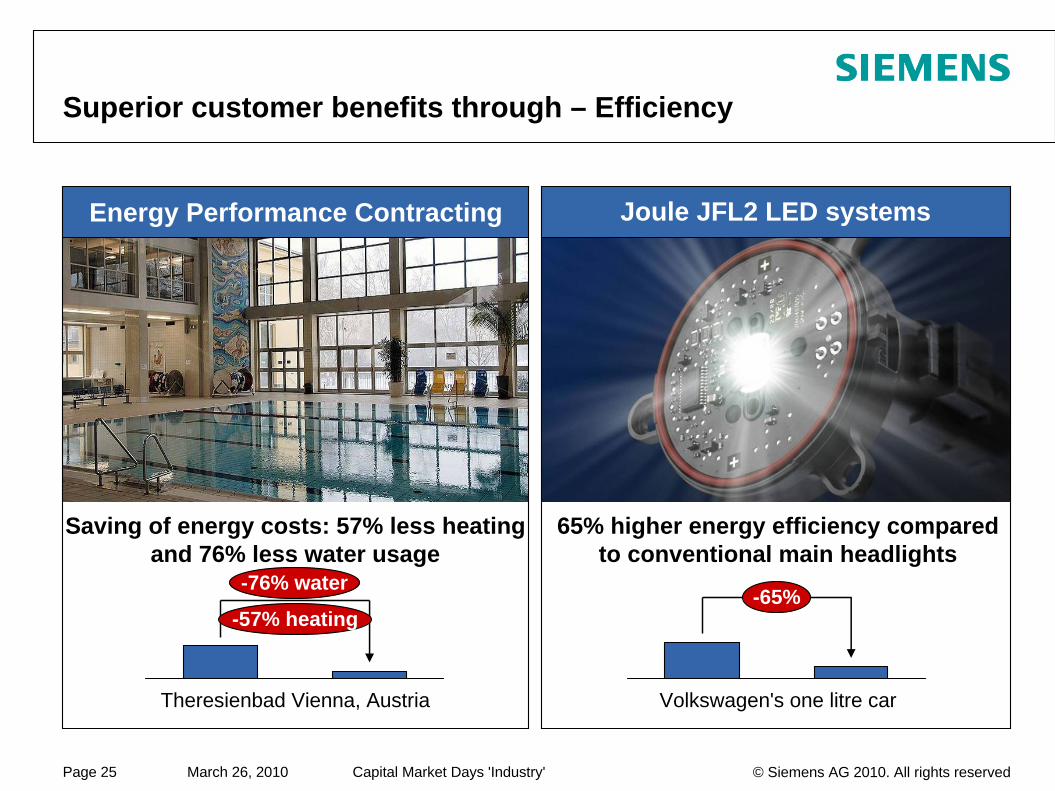
Superior customer benefits through – Efficiency
Saving of energy costs: 57% less heating and 76% less water usage
-76% water
Theresienbad Vienna, Austria
65% higher energy efficiency compared to conventional main headlights
-65%
Volkswagen's one litre car
Joule JFL2 LED systems Energy Performance Contracting
-57% heating
Capital Market Days 'Industry' © Siemens AG 2010. All rights reservedMarch 26, 2010Page 26
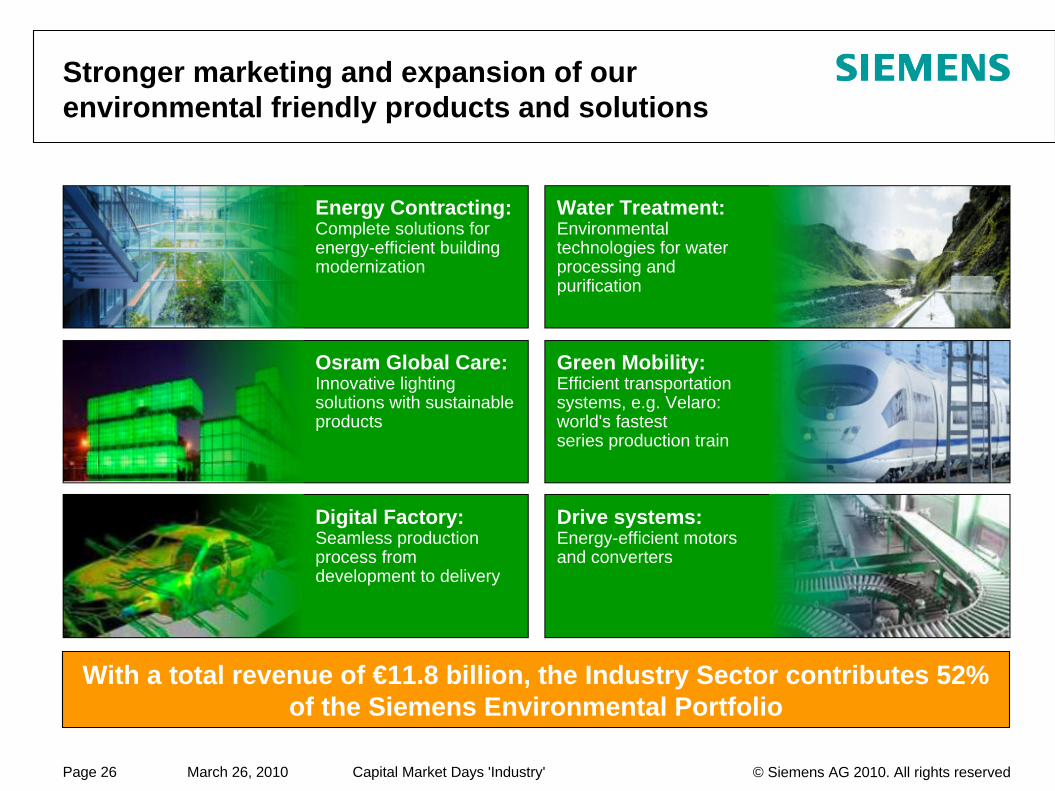
Stronger marketing and expansion of our environmental friendly products and solutions
With a total revenue of €11.8 billion, the Industry Sector contributes 52% of the Siemens Environmental Portfolio
Osram Global Care: Innovative lighting solutions with sustainable products
Digital Factory: Seamless production process from development to delivery
Energy Contracting: Complete solutions for energy-efficient building modernization
Drive systems: Energy-efficient motors and converters
Water Treatment: Environmental technologies for water processing and purification
Green Mobility: Efficient transportation systems, e.g. Velaro: world's fastestseries production train
Capital Market Days 'Industry' © Siemens AG 2010. All rights reservedMarch 26, 2010Page 27
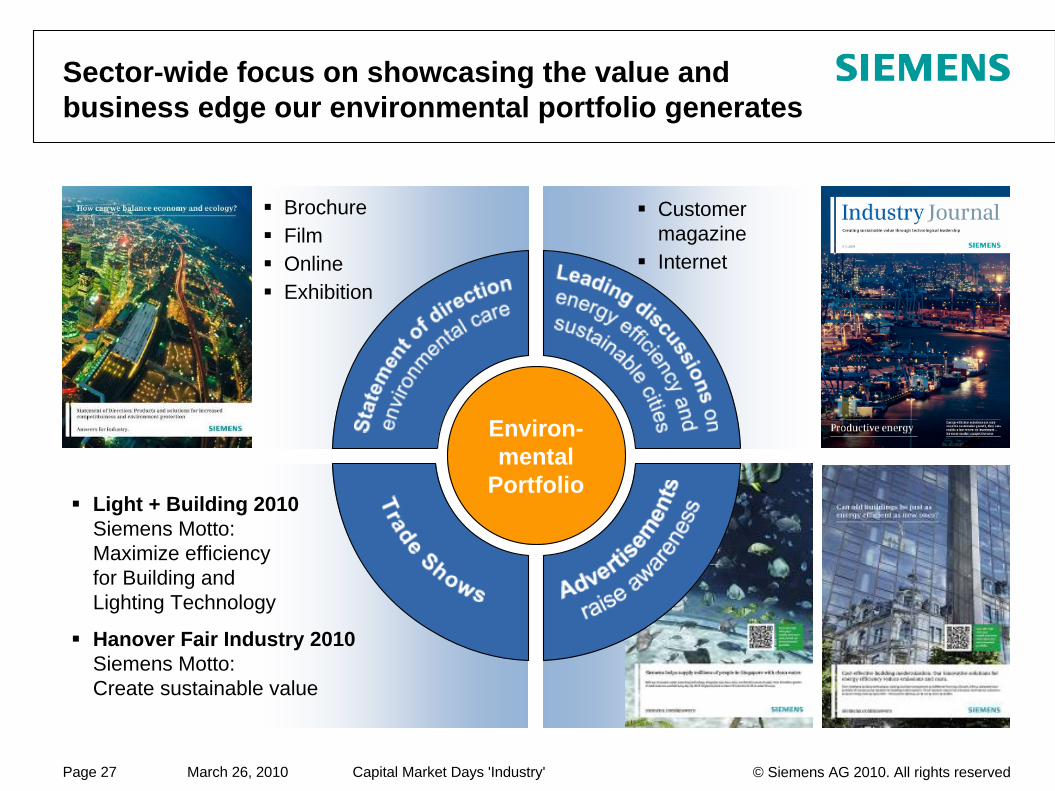
Light + Building 2010Siemens Motto: Maximize efficiency for Building andLighting Technology
Hanover Fair Industry 2010Siemens Motto:Create sustainable value
BrochureFilmOnlineExhibition
Environ- mental
Portfolio
Customer magazineInternet
Sector-wide focus on showcasing the value and business edge our environmental portfolio generates
Capital Market Days 'Industry' © Siemens AG 2010. All rights reservedMarch 26, 2010Page 28
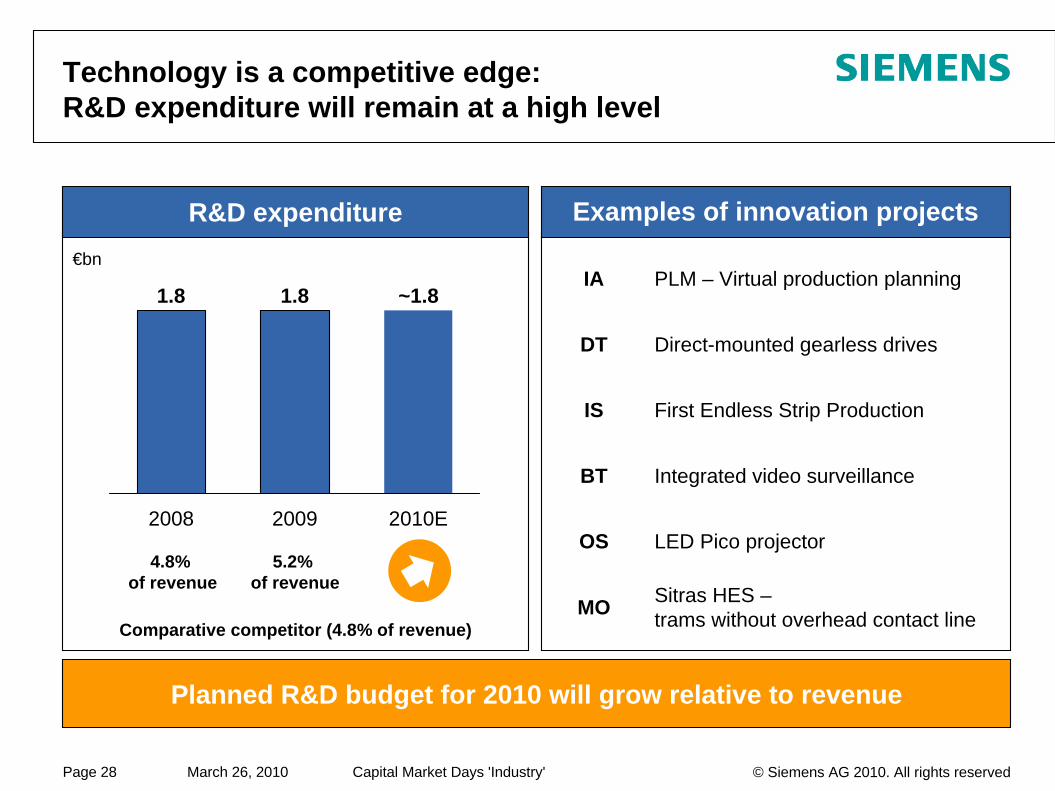
Examples of innovation projects
Technology is a competitive edge: R&D expenditure will remain at a high level
Planned R&D budget for 2010 will grow relative to revenue
R&D expenditure
Comparative competitor (4.8% of revenue)
5.2% of revenue
PLM – Virtual production planning
Direct-mounted gearless drives
First Endless Strip Production
Integrated video surveillance
LED Pico projector
Sitras HES – trams without overhead contact line
IA
DT
IS
BT
OS
MO
€bn
4.8% of revenue
2010E
~1.8
2009
1.8
2008
1.8
Capital Market Days 'Industry' © Siemens AG 2010. All rights reservedMarch 26, 2010Page 29
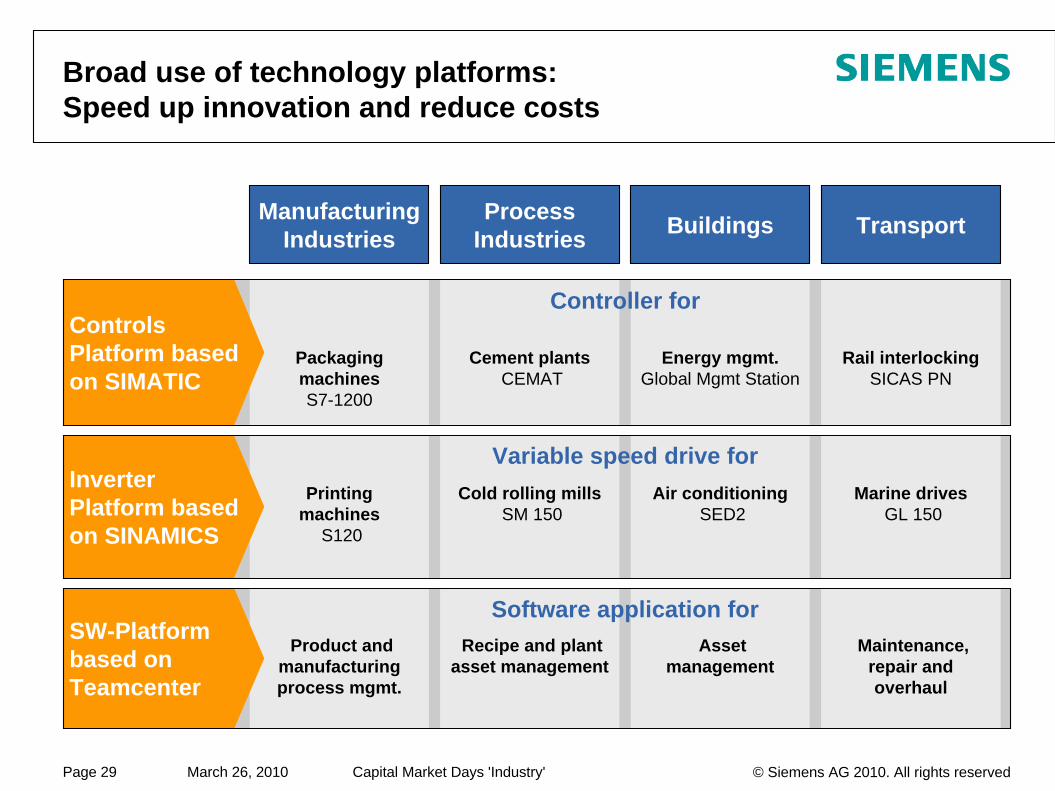
Broad use of technology platforms: Speed up innovation and reduce costs
Manufacturing Industries Buildings TransportProcess
Industries
SW-Platform based on Teamcenter
Controls Platform based on SIMATIC
Inverter Platform based on SINAMICS
Packaging machines S7-1200
Energy mgmt. Global Mgmt Station
Rail interlocking SICAS PN
Cement plants CEMAT
Printing machines
S120
Air conditioning SED2
Marine drives GL 150
Cold rolling mills SM 150
Product and manufacturing process mgmt.
Asset management
Maintenance, repair and overhaul
Recipe and plant asset management
Controller for
Variable speed drive for
Software application for
Capital Market Days 'Industry' © Siemens AG 2010. All rights reservedMarch 26, 2010Page 30
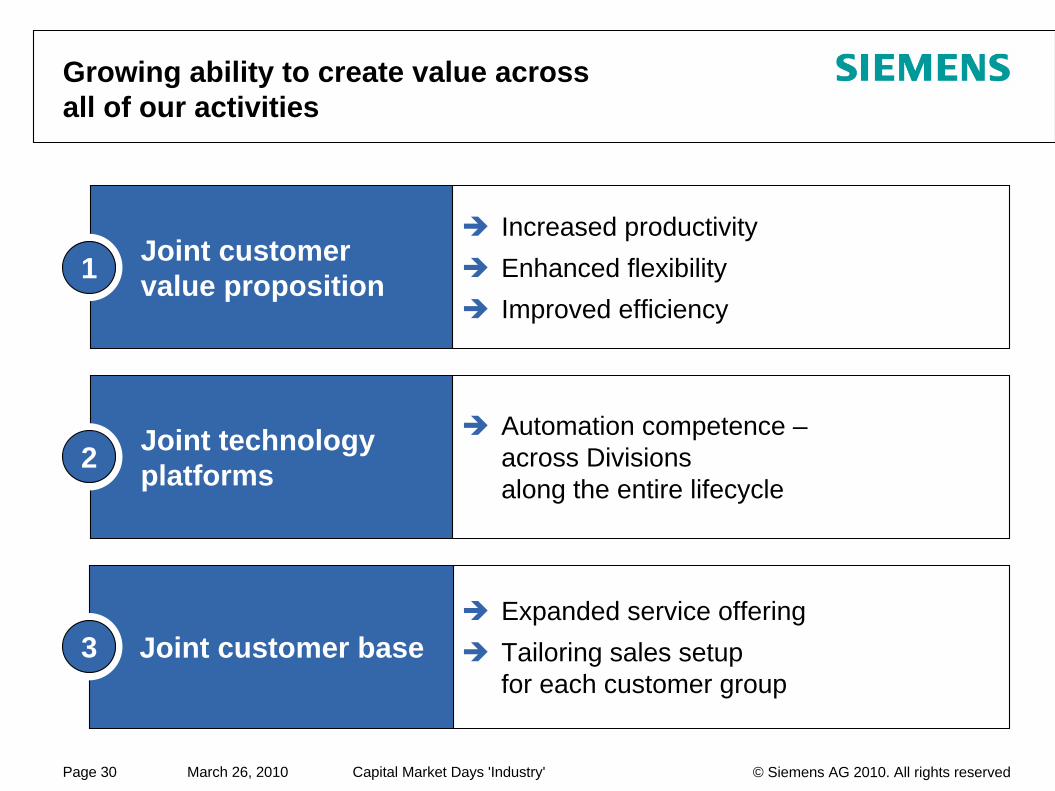
Joint customer value proposition
Growing ability to create value across all of our activities
1
Joint technology platforms
Automation competence –across Divisionsalong the entire lifecycle
2
Increased productivityEnhanced flexibilityImproved efficiency
Expanded service offeringTailoring sales setup for each customer group
Joint customer base3
Capital Market Days 'Industry' © Siemens AG 2010. All rights reservedMarch 26, 2010Page 31
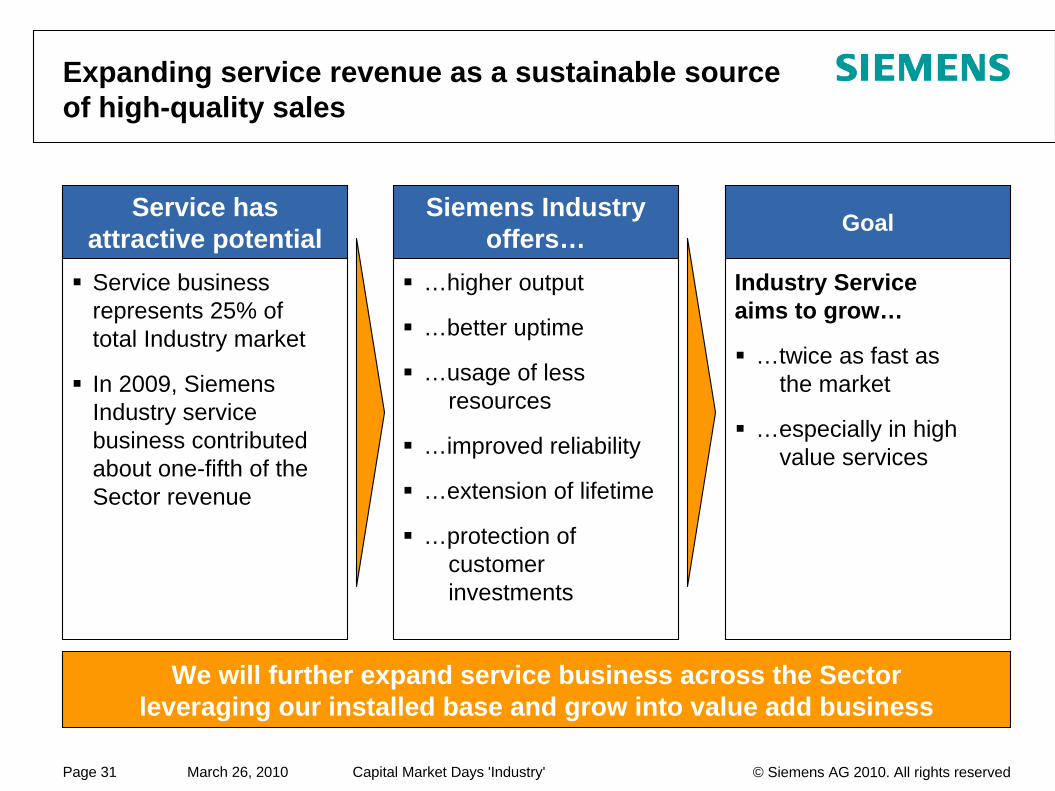
Expanding service revenue as a sustainable source of high-quality sales
We will further expand service business across the Sectorleveraging our installed base and grow into value add business
…higher output
…better uptime
…usage of less resources
…improved reliability
…extension of lifetime
…protection of customer investments
Siemens Industry offers…
Service business represents 25% oftotal Industry market
In 2009, Siemens Industry service business contributed about one-fifth of the Sector revenue
Service has attractive potential
Industry Serviceaims to grow…
…twice as fast asthe market
…especially in high value services
Goal
Capital Market Days 'Industry' © Siemens AG 2010. All rights reservedMarch 26, 2010Page 32
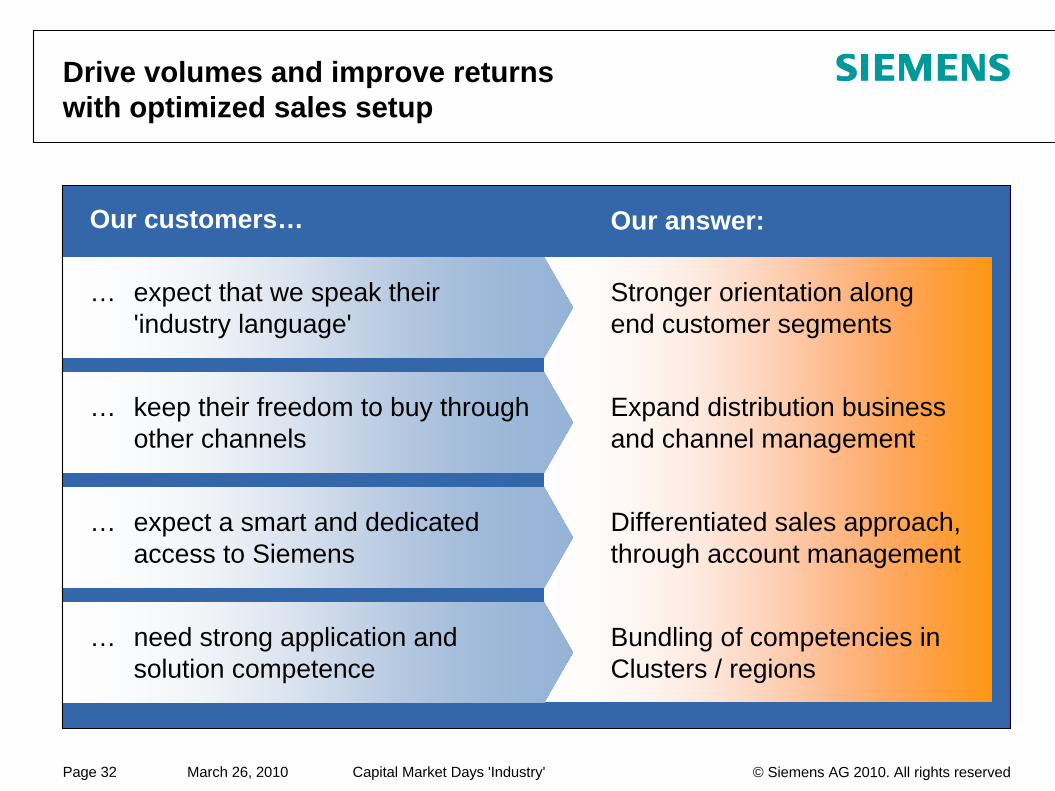
Our customers… Our answer:
Drive volumes and improve returns with optimized sales setup
Stronger orientation along end customer segments
Bundling of competencies in Clusters / regions
Differentiated sales approach, through account management
Expand distribution business and channel management
… need strong application and solution competence
… expect a smart and dedicated access to Siemens
… keep their freedom to buy through other channels
… expect that we speak their 'industry language'
Capital Market Days 'Industry' © Siemens AG 2010. All rights reservedMarch 26, 2010Page 33
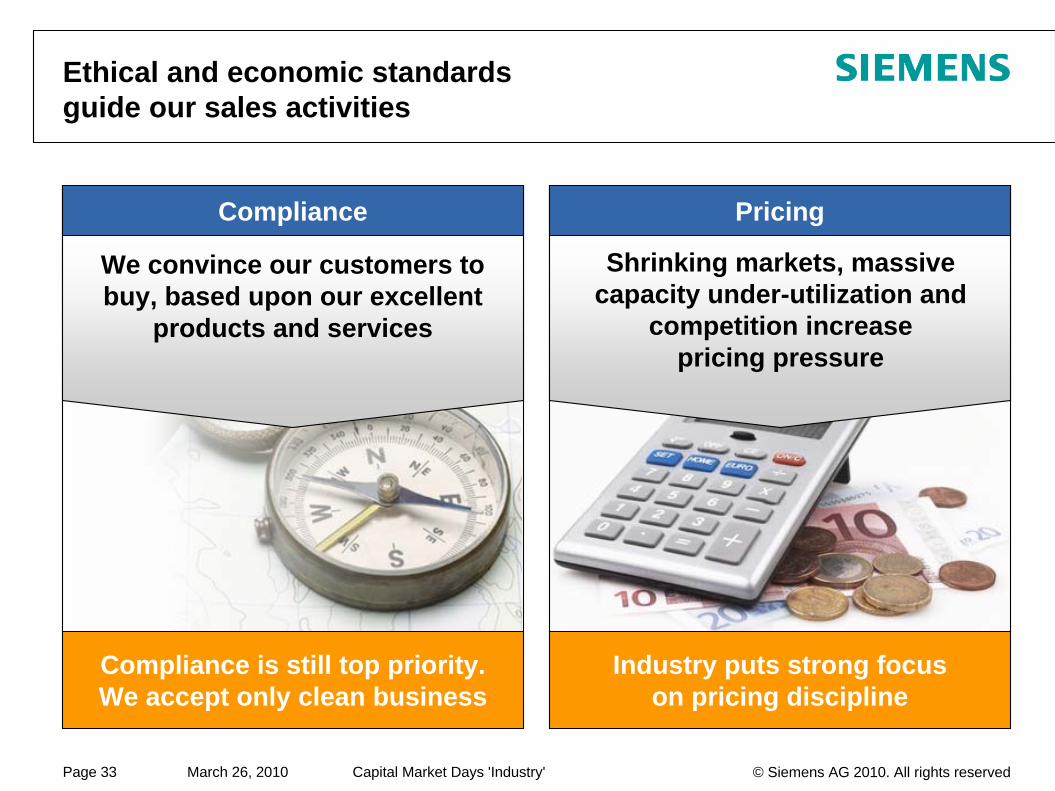
Ethical and economic standards guide our sales activities
Compliance is still top priority.We accept only clean business
Industry puts strong focus on pricing discipline
We convince our customers to buy, based upon our excellent
products and services
Shrinking markets, massive capacity under-utilization and
competition increase pricing pressure
Compliance Pricing
Capital Market Days 'Industry' © Siemens AG 2010. All rights reservedMarch 26, 2010Page 34
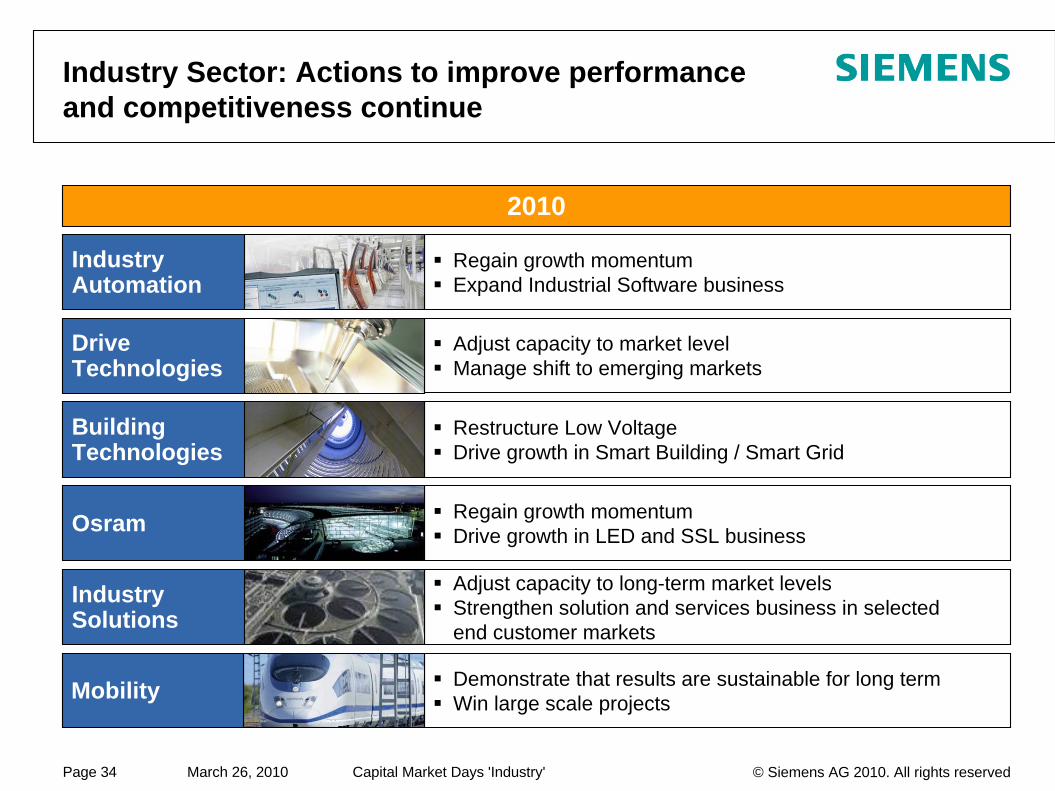
Industry Sector: Actions to improve performance and competitiveness continue
Regain growth momentumExpand Industrial Software business
Adjust capacity to market levelManage shift to emerging markets
Restructure Low VoltageDrive growth in Smart Building / Smart Grid
Regain growth momentumDrive growth in LED and SSL business
Adjust capacity to long-term market levelsStrengthen solution and services business in selectedend customer markets
Demonstrate that results are sustainable for long termWin large scale projects
2010
Industry Automation
Drive Technologies
Building Technologies
Osram
Industry Solutions
Mobility
Capital Market Days 'Industry' © Siemens AG 2010. All rights reservedMarch 26, 2010Page 35
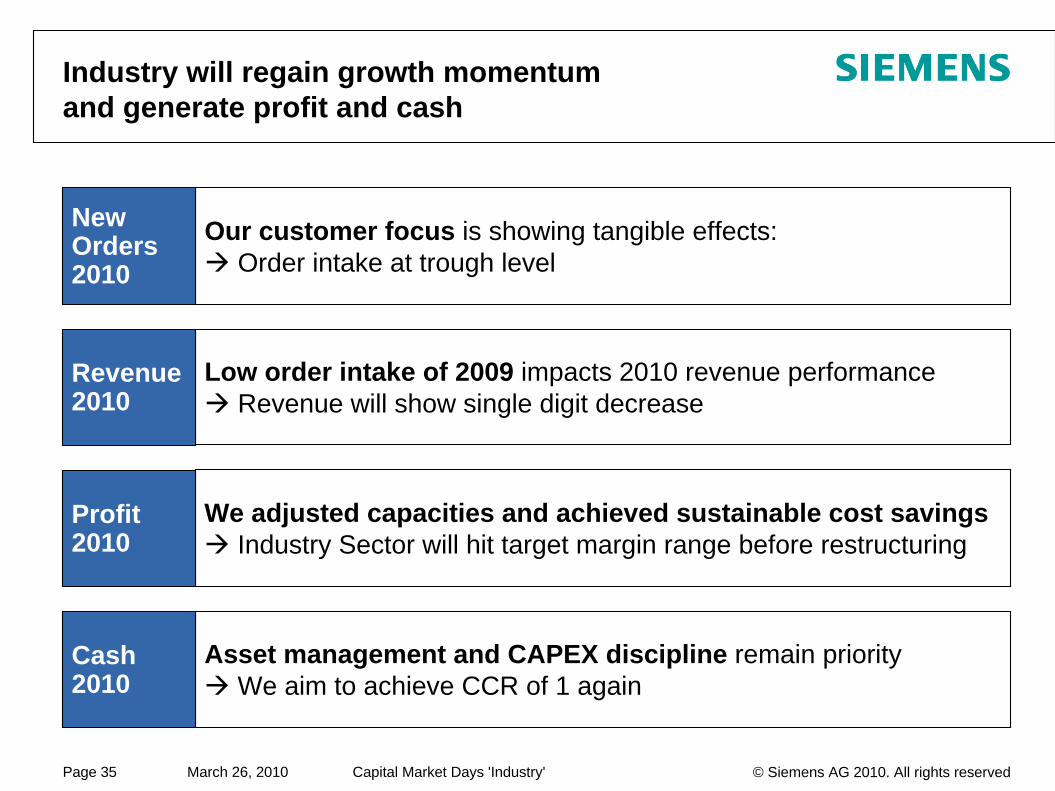
Industry will regain growth momentum and generate profit and cash
Our customer focus is showing tangible effects:Order intake at trough level
Low order intake of 2009 impacts 2010 revenue performanceRevenue will show single digit decrease
We adjusted capacities and achieved sustainable cost savingsIndustry Sector will hit target margin range before restructuring
Asset management and CAPEX discipline remain priorityWe aim to achieve CCR of 1 again
NewOrders2010
Revenue2010
Profit2010
Cash2010
Capital Market Days 'Industry' © Siemens AG 2010. All rights reservedMarch 26, 2010Page 36
Reconciliation and Definitions for Non-GAAP Measures (I)
To supplement Siemens’ Consolidated Financial Statements presented in accordance with International Financial Reporting Standards, or IFRS, Siemens presents the following supplemental financial measures:
New orders and order backlogAdjusted or organic growth rates of Revenue and new orders;Book-to-bill ratio;Return on equity, or ROE;Return on capital employed, or ROCE;Free cash flow and cash conversion rate, or CCR;EBITDA (adjusted) and EBIT (adjusted);Earnings effect from purchase price allocation (PPA effects) and integration costsNet debt; andAdjusted industrial net debt.
These supplemental financial measures are or may be “non-GAAP financial measures,” as defined in the rules of the U.S. Securities and Exchange Commission (SEC). They exclude or include amounts that are included or excluded, as applicable, in the calculation of the most directly comparable financial measures calculated in accordance with IFRS, and their usefulness is therefore subject to limitations, which are described below under “Limitations on Usefulness of Non-GAAP Financial Measures.” Accordingly, they should not be viewed in isolation as alternatives to the most directly comparable financial measures calculated in accordance with IFRS, as identified in the following discussion, and they should be considered in conjunction with Siemens’ Consolidated Financial Statements presented in accordance with IFRS and the Notes thereto. Siemens’ most recent Consolidated Financial Statements at any given time (the “Annual Financial Statements”) can be found in the most recent Annual Report of Siemens (the “Annual Report”), which can be accessed at www.siemens.com/annual-report. Siemens’ most recent interim Consolidated Financial Statements (the “Interim Financial Statements”) at any given time can be found at www.siemens.com/investors under the heading “Publications” – “Financial Publications” – “Financial Statements” or in the most recent Quarterly Report of Siemens (the “Quarterly Reports”), which can be accessed at www.siemens.com/quarterly-reports.
In addition, in considering these supplemental financial measures, investors should bear in mind that other companies that report or describe similarly titled financial measures may calculate them differently. Accordingly, investors should exercise appropriate caution in comparing these supplemental financial measures to similarly titled financial measures reported by other companies.
Definitions, most directly comparable IFRS financial measures and usefulness of Siemens’ supplemental financial measuresSiemens’ supplemental financial measures are designed to measure growth, capital efficiency, cash generation and optimization of Siemens’ capital structure and therefore are used to formulate targets for Siemens. The following discussion provides definitions of these supplemental financial measures, the most directly comparable IFRS financial measures and information regarding the usefulness of these supplemental financial measures.
New orders and order backlogUnder its policy for the recognition of new orders, Siemens generally recognizes a new order when we enter into a contract that we consider “legally effective and binding” based on a number of different criteria. In general, if a contract is considered legally effective and binding, Siemens recognizes the total contract value. The contract value is the agreed price or fee for that portion of the contract for which the delivery of goods and/or the provision of services is irrevocably agreed. Future revenues from service, maintenance and outsourcing contracts are recognized as new orders in the amount of the total contract value only if there is adequate assurance that the contract will remain in effect for its entire duration (e.g., due to high exit barriers for the customer).
Capital Market Days 'Industry' © Siemens AG 2010. All rights reservedMarch 26, 2010Page 37
Reconciliation and Definitions for Non-GAAP Measures (II)
New orders and order backlog (continued)New orders are generally recognized immediately when the relevant contract becomes legally effective and binding. The only exception are orders with short overall contract terms. In this case, a separate reporting of new orders would provide no significant additional information regarding our performance. For orders of this type the recognition of new orders thus occurs when the underlying revenue is recognized.Order backlog represents the future revenues of our Company resulting from already recognized new orders. Order backlog is calculated by adding the new orders of the current fiscal year to the balance of the order backlog from the prior fiscal year and subtracting the revenue recognized in the current fiscal year. If an order from the current fiscal year is cancelled or its amount is modified, Siemens adjusts its new order total for the current quarter accordingly, but do not retroactively adjust previously published new order totals. However, if an order from a previous fiscal year is cancelled, new orders of the current quarter and accordingly the current fiscal year are generally not adjusted, instead, if the adjustment exceeds a certain threshold, the existing order backlog is revised. Aside from cancellations, the order backlog is also subject to changes in the consolidation group and to currency translation effects.There is no standard system for compiling and calculating new orders and order backlog information that applies across companies. Accordingly, its new orders and order backlog may not be comparable with new orders and order backlog reported by other companies. Siemens does subject its new orders and its order backlog to internal documentation and review requirements. Siemens may change its policies for recognizing new orders and order backlog in the future without previous notice.
Adjusted or organic growth rates of Revenue and new ordersIn its financial reports, Siemens presents, on a worldwide basis and for each Sector and Cross-Sector Business, the percentage change from period to period in Revenue and new orders as adjusted for currency translation effects and portfolio effects. The adjusted percentage changes are called adjusted or organic rates of growth. The IFRS financial measure most directly comparable to adjusted or organic growth rate of Revenue is the unadjusted growth rate calculated based on the actual Revenue figures presented in the Consolidated Income Statement. There is no comparable IFRS financial measure for the adjusted or organic growth rate of new orders because, as discussed above, new orders is not an IFRS financial measure.Siemens presents its Consolidated Financial Statements in Euros; however, a significant proportion of its operations takes place in a functional currency other than the Euro, particularly the U.S. dollar and the British pound. Converting figures from these currencies into Euros affects the comparability of Siemens’ results and financial position when the exchange rates for these currencies fluctuate. Some Divisions are significantly affected due to the large proportion of international operations, particularly in the U.S.All Sectors and Divisions as well as Cross-Sector Businesses are subject to foreign currency translation effects; however, some Divisions are particularly affected since they generate a significant portion of their operations through subsidiaries whose results are subject to foreign currency translation effects. The effect of acquisitions and dispositions on Siemens’ consolidated revenues and expenses affects the comparability of the Consolidated Financial Statements between different periods.The adjusted or organic growth rates of Revenue and new orders are calculated by subtracting currency translation effects and portfolio effects from the relevant actual growth rates. The currency translation effect is calculated as (1) (a) Revenues or new orders, as the case may be, for the current period, based on the currency exchange rate of the current period minus (b) Revenues or new orders for the current period, based on the currency exchange rate of the previous period, divided by (2) Revenues or new orders for the previous period, based on the currency exchange rate of the previous period. The portfolio effect is calculated, in the case of acquisitions, as the percentage change in Revenues or new orders, as the case may be, attributable to the acquired business and, in the case of dispositions, as the percentage change in Revenues or new orders on the assumption that the disposed business had not been part of Siemens in the previous period. Adjusted growth rates of Revenue and new orders are always calculated for a period of twelve months.Siemens is making portfolio adjustments for certain transactions, including the carve-outs of Siemens Home and Office Communication Devices GmbH & Co. KG and the Wireless Modules business, as well as for other minor transactions in the Sectors, Cross-Sector Businesses and Other Operations. For further information regarding major acquisitions and dispositions, see “Notes to Consolidated Financial Statements.”Siemens believes that the presentation of an adjusted or organic growth rate of Revenue and new orders provides useful information to investors because a meaningful analysis of trends in Revenue and new orders from one period to the next requires an understanding of the developments in the operational business, net of the impact of currency translation and portfolio effects. Siemens’ management considers adjusted or organic rates of growth in its management of Siemens’ business. For this reason, Siemens believes that investors’ ability to assess Siemens’ overall performance may be improved by disclosure of this information.
Book-to-bill ratioThe book-to-bill ratio measures the relationship between orders received and the amount of products and services shipped and billed. A book-to-bill ratio of above 1 indicates that more orders were received than billed, indicating stronger demand, whereas a book-to-bill ratio of below 1 points to weaker demand. The book-to-bill ratio is not required or defined by IFRS.
Capital Market Days 'Industry' © Siemens AG 2010. All rights reservedMarch 26, 2010Page 38
Reconciliation and Definitions for Non-GAAP Measures (III)
Return on equity, or ROEIn line with common practice in the financial services industry, Siemens Financial Services (SFS) uses return on equity, or ROE, as one of its key profitability measures. Siemens defines ROE as annualized Income before income taxes of SFS divided by the average allocated equity for SFS. The allocated equity for SFS is determined and influenced by the size and quality of its portfolio of commercial finance assets (primarily leases) and equity investments. This allocation is designed to cover the risks of the underlying business and is in line with common credit risk management standards in banking. The actual risk portfolio of the SFS portfolio is evaluated and controlled monthly and is reflected in the quarterly (commercial finance) and annual (equity investments) adjustments of allocated equity.Return on equity is reported only for the SFS segment. Siemens believes that the presentation of ROE and average allocated equity provides useful information to investors because management uses ROE as a supplement to Siemens’ Consolidated Financial Statements in evaluating the business performance of SFS, and therefore the measure assists investors in assessing Siemens’ overall performance.Return on capital employed, or ROCEReturn on capital employed, or ROCE, is Siemens’ measure of capital efficiency. Siemens uses this financial performance ratio in order to assess its income generation from the point of view of its shareholders and creditors, who provide Siemens with equity and debt. The different methods of calculation are detailed below. Siemens believes that the presentation of ROCE and the various non-GAAP financial measures involved in its calculation provides useful information to investors because ROCE can be used to determine whether capital invested in the Company and the Sectors yields competitive returns. In addition, achievement of predetermined targets relating to ROCE is one of the factors Siemens takes into account in determining the amount of performance-based or variable compensation received by its management.ROCE at the Siemens group levelSiemens defines group ROCE as net income (before interest) divided by average capital employed, or CE.Net income (before interest), the numerator in the ROCE calculation, is defined as Net income excluding Other interest income (expense), net and taxes thereon. Taxes on Other interest (expense), net are calculated in a simplified form by applying the current tax rate, which can be derived from the Consolidated Statements of Income, to Other interest income (expense), net.Capital employed, or CE, the denominator in the ROCE calculation, is defined as Total equity plus Long-term debt plus Short-term debt and current maturities of long-term debt minus Cash and cash equivalents. Each of the components of capital employed appears on the face of the Consolidated Balance Sheet.ROCE at the Siemens group level, on a continuing operations basisSiemens also presents group ROCE on a continuing operations basis. For this purpose, the numerator is Income from continuing operations and the denominator is CE, less Assets classified as held for disposal presented as discontinued operations, net of Liabilities associated with assets held for disposal presented as discontinued operations.ROCE at the Sector levelFor the Sectors, ROCE is defined as Profit divided by average Assets. Profit for each Sector is defined as earnings before financing interest, certain pension costs and income taxes; certain items not considered performance-indicative by management may be excluded. Assets for each Sector are defined as Total assets less intragroup financing receivables and investments, less income tax assets, less non-interest-bearing liabilities/provisions other than tax liabilities.Free cash flow and cash conversion rateSiemens defines Free cash flow as Net cash provided by (used in) operating activities less Additions to intangible assets and property, plant and equipment. The IFRS financial measure most directly comparable to Free cash flow is Net cash provided by (used in) operating activities.Siemens believes that the presentation of Free cash flow provides useful information to investors because it is a measure of cash generated by our operations after deducting cash outflows for Additions to intangible assets and property, plant and equipment. Therefore the measure gives an indication of the long-term cash generating ability of our business. In addition, because Free cash flow is not impacted by portfolio activities, it is less volatile than the total of Net cash provided by (used in) operating activities and Net cash provided by (used in) investing activities. For this reason, Free cash flow is reported on a regular basis to Siemens’ management, who uses it to assess and manage cash generation among the various reportable segments of Siemens and for the worldwide Siemens group. Achievement of predetermined targets relating to Free cash flow generation is one of the factors Siemens takes into account in determining the amount of performance-based or variable compensation received by its management, both at the level of the worldwide Siemens group and at the level of individual reportable segments. Cash conversion rate, or CCR, is defined as Free cash flow divided by Net income. Siemens believes that the presentation of the CCR provides useful information to investors because it is an operational performance measure that shows how much of its income Siemens converts to Free cash flow. CCR is reported on a regular basis to Siemens’ management.
Capital Market Days 'Industry' © Siemens AG 2010. All rights reservedMarch 26, 2010Page 39
Reconciliation and Definitions for Non-GAAP Measures (IV)
EBITDA (adjusted) and EBIT (adjusted)Siemens defines EBITDA (adjusted) as EBIT (adjusted) before amortization (which in turn is defined as Amortization and impairments of intangible assets other than goodwill) and Depreciation and impairment of property, plant and equipment and goodwill. Siemens defines EBIT (adjusted) as Income from continuing operations before income taxes less Financial income (expense), net and Income (loss) from investments accounted for using the equity method, net. Each of the components of EBIT (adjusted) appears on the face of the Consolidated Financial Statements, and each of the additional components of EBITDA (adjusted) appears in the Consolidated Financial Statements or the MD&A thereto, which may be found in the relevant annual or quarterly report filed with the SEC. The IFRS financial measure most directly comparable to EBIT (adjusted) and EBITDA (adjusted) is Income from continuing operations before income taxes.Siemens believes that the presentation of EBITDA (adjusted) and EBIT (adjusted) as a cash earnings measure provides useful information to investors. Therefore EBITDA (adjusted) and EBIT (adjusted) are also broadly used by analysts, rating agencies and investors to assess the performance of a company.
Earnings effect from purchase price allocation (PPA effects) and integration costsProfit margins may be adjusted for PPA effects and integration costs effects. The purchase price paid for an acquired business is allocated to the assets, liabilities and contingent liabilities acquired based on their fair values. The fair value step-ups result in an earnings effect over time, e.g. additional amortization of fair value step-ups of intangible assets, which is defined as a PPA effect. Integration costs are internal or external costs that arise after the signing of an acquisition in connection with the integration of the acquired business, e.g. costs in connection with the adoption of Siemens’ guidelines and policies.Siemens believes that the presentation of PPA effects and integration costs effects provides useful information to investors as it allows investors to consider earnings impacts related to business combination accounting and integration in the performance analysis.
Net debtSiemens defines net debt as total debt less total liquidity. Total debt is defined as Short-term debt and current maturities of long-term debt plus Long-term debt. Total liquidity is defined as Cash and cash equivalents plus current Available-for-sale financial assets. Each of these components appears in the Consolidated Balance Sheets. The IFRS financial measure most directly comparable to net debt is total debt as reported in the Notes to Consolidated Financial Statements.Siemens believes that the presentation of net debt provides useful information to investors because its management reviews net debt as part of its management of Siemens’ overall liquidity, financial flexibility, capital structure and leverage. In particular, net debt is an important component of adjusted industrial net debt. Furthermore, certain debt rating agencies, creditors and credit analysts monitor Siemens’ net debt as part of their assessments of Siemens’ business.
Adjusted industrial net debtSiemens defines adjusted industrial net debt as net debt less (1) SFS debt excluding SFS internally purchased receivables; less (2) 50% of the nominal amount of our hybrid bond; plus (3) the funded status of pension plans; plus (4) the funded status of other post-employment benefits; plus (5) credit guarantees; and (6) fair value hedge accounting adjustments. The fair value hedge accounting adjustment has been included in fiscal 2009 in our definition of adjusted industrial net debt. The fair value hedge accounting adjustment is representing risks being hedged. We believe that deducting the fair value hedge accounting adjustment from net debt in addition to the adjustments presented above provides investors more meaningful information to our scheduled debt service obligations. Further information concerning adjusted industrial net debt can be found in the Annual Report under the heading “Management’s discussion and analysis – Liquidity and capital resources – Capital structure.”Siemens manages adjusted industrial net debt as one component of its capital. As part of our “Fit42010” program, we decided to optimize our capital structure. A key consideration is to maintain ready access to capital markets through various debt products and to preserve our ability to repay and service our debt obligations over time. Siemens therefore has set a capital structure goal that is measured by adjusted industrial net debt divided by Earnings before interest taxes depreciation and amortization (EBITDA) as adjusted. Adjusted EBITDA is calculated as earnings before income taxes (EBIT) (adjusted) before amortization (defined as amortization and impairments of intangible assets other than goodwill) and depreciation and impairments of property, plant and equipment and goodwill. Adjusted EBIT is Income from continuing operations before income taxes less Financial income (expense), net and Income (loss) from investments accounted for using the equity method, net.Siemens believes that using the ratio of “adjusted industrial net debt” to “EBITDA (adjusted)” as a measure of its capital structure provides useful information to investors because management uses it to manage our debt-equity ratio while ensuring both unrestricted access to debt financing instruments in the capital markets and our ability to meet scheduled debt service obligations.
Capital Market Days 'Industry' © Siemens AG 2010. All rights reservedMarch 26, 2010Page 40
Reconciliation and Definitions for Non-GAAP Measures (V)
Limitations Associated with Siemens’ Supplemental Financial MeasuresThe supplemental financial measures reported by Siemens may be subject to limitations as analytical tools. In particular:
With respect to adjusted or organic growth rates of Revenue and new orders: These measures are not adjusted for other effects, such as increases or decreases in prices or quantity/volume.With respect to book-to-bill ratio: The use of this measure is inherently limited by the fact that it is a ratio and thus does not provide information as to the absolute number of orders received by Siemens or the absolute amount of products and services shipped and billed by it.With respect to return on equity, or ROE: This measure is not adjusted for special items, such as the disposition of equity investments (allocated to SFS) or impairments, and therefore it has been volatile over prior year periods. In addition, the use of this measure is inherently limited by the fact that it is a ratio and thus does not provide information as to the absolute amount of Siemens’ income.With respect to return on capital employed, or ROCE: The use of this measure is inherently limited by the fact that it is a ratio and thus does not provide information as to the absolute amount of Siemens’ income.With respect to Free cash flow and cash conversion rate: Free cash flow is not a measure of cash generated by operations that is available exclusively for discretionary expenditures. This is, because in addition to capital expenditures needed to maintain or grow its business, Siemens requires cash for a wide variety of non-discretionary expenditures, such as interest and principal payments on outstanding debt, dividend payments or other operating expenses. In addition, the use of cash conversion rate is inherently limited by the fact that it is a ratio and thus does not provide information about the amount of Siemens’ Free cash flow.With respect to EBITDA (adjusted) and EBIT (adjusted): EBITDA (adjusted) excludes non-cash items such as depreciation, amortization and impairment, it does not reflect the expense associated with, and accordingly the full economic effect of, the loss in value of Siemens’ assets over time. Similarly, neither EBITDA (adjusted) nor EBIT (adjusted) reflect the impact of financial income and taxes, which are significant cash expenses that may reduce the amount of cash available for distribution to shareholders or reinvestment in the business.With respect to earnings effects from purchase price allocation (PPA effects) and integration costs: The fact that the profit margin is adjusted for these effects does not mean that they do not impact profit of the relevant segment in the Consolidated Financial Statements.With respect to net debt and the ratio adjusted industrial net debt to EBITDA (adjusted): Siemens typically uses a considerable portion of its cash, cash equivalents and available-for-sale financial assets at any given time for purposes other than debt reduction. Therefore, the fact that these items are excluded from net debt does not mean that they are used exclusively for debt repayment. The use of the ratio adjusted industrial net debt to EBITDA (adjusted) is inherently limited by the fact that it is a ratio.
Compensation for Limitations Associated with Siemens’ Supplemental Financial MeasureSiemens provides a quantitative reconciliation of each supplemental financial measure to the most directly comparable IFRS financial measure below, in the Notes to Consolidated Financial Statements or in the Annual Reports and Quarterly Reports under the heading “Management’s discussion and analysis,” and Siemens encourages investors to review those reconciliations carefully.


![A Sustainable Future for Transport [Now!]](https://img.pdfslide.net/doc/110x75/632142a9537c10e8380292ad/a-sustainable-future-for-transport-now.jpg)