Embed Size (px)
Citation preview
DRUIDSFDetection of Regions With UnexpectedInternal Deviation From Stationarity
OLIVIER FEDRIGO,1n DEAN C. ADAMS,2 and GAVIN J.P. NAYLOR3
1Department of Biology, Duke University, Durham, North Carolina 277082Department of Ecology, Evolution and Organismal Biology, Iowa StateUniversity, Ames, Iowa 500113School of Computational Science and Information Technology 150-A DiracScience Library, Florida State University, Tallahassee, Florida 32306
ABSTRACT Most methods for inferring phylogenies from sequence data assume that patternsof substitution have been stationary over time. Changes in evolutionary constraint can result innonstationary substitution patterns that are phylogenetically misleading unless modeled appro-priately. Here we present a multiple-alignment-based method to identify regions that are likely tocontain misleading phylogenetic signals due to changes in evolutionary constraints. The method usesa moving window approach to identify regions with a statistically significant deviation fromstationarity in the physicochemical properties of amino acids among taxa. The protocol has beenimplemented in the software package DRUIDS (Detecting Regions of Unexpected Internal Deviationfrom Stationarity), available from the first author upon request. J. Exp. Zool. 304B:119–128, 2005.r 2005 Wiley-Liss, Inc.
Phylogenetic trees are useful for understandingboth evolutionary patterns and processes and areintegral to many genomic and bioinformaticapplications. They have been used to understandpatterns of gene duplication (Page and Cotton,2002), to estimate the function of unidentifiedgenes using orthology (Storm and Sonnhammer,2003), to identify residues responsible for func-tional divergence (Yokoyama and Radlwimmer,’98; Naylor and Gerstein, 2001; Gu and VanderVelden, 2002), and to identify subsets of aminoacids under selection (Yang et al., 2000). As thenumber of disciplines embracing phylogeneticapproaches continues to grow, it becomes evermore important to ensure that estimated trees areaccurate. Empirical studies suggest there is con-siderable room for improvement as differentmarkers frequently yield different trees whensubjected to phylogenetic analysis.The lack of agreement among phylogenetic
estimates from different markers suggests thatmodels of molecular evolution do not have a goodfit to the data to which they are applied (horizontaltransfer, lineage sorting, gene duplication, andsampling error notwithstanding). One of the morecommon shortcomings of models is their failure toaccommodate deviations in process stationarityFchanges in patterns of substitution associated with
changes in constraint over the course of evolution.Such changes in substitution patterns often showup as a lack of fit between the assumed model andthe input data.
DETECTING REGIONS OFINCONSISTENCY BETWEEN MODEL AND
DATA
Tree-based approaches
Grassly and Rambaut (’97) presented an ap-proach (implemented in the software programPLATO: Partial Likelihood Analysis ThroughOptimization) to detect gene regions whose pat-terns of substitution had poor fits to a given treefor a specified model. Their motivation was todetect recombination events in gene sequences,but their method can be used to detect any regionof relatively poor fit between data and model,whether it be due to a recombination event or to achange in constraint. PLATO receives a tree, asubstitution model, and a DNA sequence align-
nCorrespondence to: Olivier Fedrigo, Duke University, Departmentof Biology, 139 Biological Science Building, Science Drive, Durham,NC 27708-0338. E-mail: [email protected]
Received 24 August 2004; Accepted 15 November 2004Published online 31 January 2005 in Wiley InterScience (www.
interscience.wiley.com). DOI: 10.1002/jez.b.21032
r 2005 WILEY-LISS, INC.
JOURNAL OF EXPERIMENTAL ZOOLOGY (MOL DEV EVOL) 304B:119–128 (2005)
ment and outputs the likelihood scores associatedwith specific regions of the molecule.While it is effective for identifying regions that
have a poor fit to a model for a particular tree, itrequires a tree. As such, it can only be used todetect misleading signals when the tree is given.To avoid the obvious circularity (requiring the
tree to identify regions best suited to estimatingthe tree), a method is needed that identifiesphylogenetically misleading regions without refer-ence to a tree. If regions of nonstationarity couldbe so recognized, they could be deleted prior toanalysis, or steps could be taken to developappropriate models to better estimate trees.
Alignment-based (tree-independent)approaches
Among closely related taxa, it is common to findvariation at the nucleotide level but not at theamino acid level. At higher levels of divergence, webegin to see variation in amino acids but not in thechemical properties of those same amino acids. Atextreme levels of divergence, variability in chemi-cal properties may exist among homologousregions of sequences as their functions begin todiverge. In general, when sequences show varia-tion at the nucleotide or amino acid level but notat the level of chemical properties, we assume thatfunctional constraints have been constant over thecourse of evolution. However, when homologousregions exhibit differences in chemical propertiesamong taxa, we must entertain the possibility thatthere have been changes in functional constraintsover the time scale being examined. Such changesin constraint can result in patterns of nucleotideand amino acid substitution that are nonstation-ary and potentially phylogenetically misleadingunless modeled appropriately. We present anapproach to identify such potentially misleadingregions directly from the alignment. Because thereis always some degree of ‘‘background variation’’in natural systems, we identify regions whosevariation in amino acid properties across taxa ishigher than would be expected by chance. Thisallows us to distinguish variation due to deviationfrom stationarity from that due to poor taxonsampling and high rates of evolution that can alsoresult in patterns of variation that are super-ficially similar to those resulting from a shift inconstraint. We call the approach ‘‘DetectingRegions with Unexpected Internal Deviation fromStationarity,’’ or DRUIDS.
METHODS
Mapping higher-order features onto DNAsequences
In order to identify differences in higher orderproperties, we first assign mappings from the DNAto the corresponding amino acid sequence usingthe appropriate genetic code, and from the aminoacid to the property associated with the amino acid(e.g., hydrophobic, acidic, basic, amide etc). Eachamino acid is assigned a numerical score forhydropathy, polarity, volume, mass, and chargeusing standard measures from the literature [e.g.,the Kyte–Doolittle hydropathy scale (K-D) (Kyteand Doolittle, ’82) and residue volume (Zamyatin,’72)]. For example, if an adenine is encountered ata particular site for a particular taxon and thisadenine occupies the second codon position of a‘‘CAT’’ codon, coding for the hydrophilic residuehistidine, we would assign the nucleotide thehydropathy score of !3.2 (following the Kyte–Doolittle scoring system).
Assessing deviation from stationarity
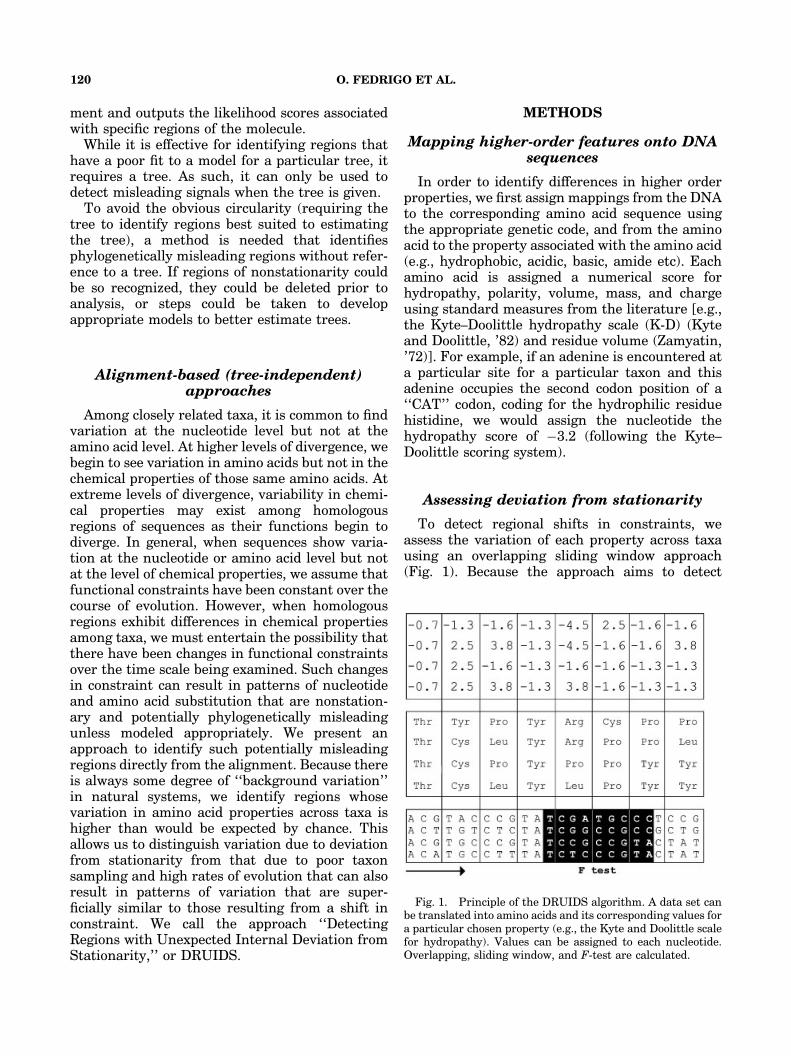
To detect regional shifts in constraints, weassess the variation of each property across taxausing an overlapping sliding window approach(Fig. 1). Because the approach aims to detect
Fig. 1. Principle of the DRUIDS algorithm. A data set canbe translated into amino acids and its corresponding values fora particular chosen property (e.g., the Kyte and Doolittle scalefor hydropathy). Values can be assigned to each nucleotide.Overlapping, sliding window, and F-test are calculated.
O. FEDRIGO ET AL.120
amino acid property patterns, the codon levelseems to be the obvious level of analysis.However, we chose a nucleotide-by-nucleotide
overlapping sliding window approach to facilitatea direct comparison with other analysis such asG+C content and nucleotide substitution ratepatterns. Comparative tests between the twolevels showed a small difference at the edges ofthe detected region (data not shown) that isnegligible relative to the effects of other approx-imations such as choice of a threshold of signifi-cance and window sizes. For each window, the nullhypothesis is that there is no deviation fromstationarity or ‘‘DFS’’ across taxa. This is achievedby contrasting the observed variation within awindow across taxa, against a null distributiongenerated by resampling character states. Theresampling procedure is based on 10,000 iterationsand samples codons rather than nucleotides toconserve biological relevance and to be consistentwith the property mapping. In all windows, thevariance among taxa is used to calculate an Fratio.The idea is to measure the variation among
(MSb) and within (MSw) taxa. If the variationbetween taxa is significantly larger than thevariation within taxa, we assume there is adeviation from stationary inside the window.
F " MSb=MSw
with
MSb "Xk
i"1
!mmi ! !!mm!mm# $2= k! 1# $;
which is the mean square between k taxa and with
MSw "Xk
i"1
Xn
j"1
mij ! !mmi! "2
= N ! k# $;
which is the mean square within taxa for a windowof n nucleotides and N"kn; mij denotes the valuemapped on the jth nucleotide of the window forthe ith taxon, !mmi is the average of all nucleotides inthe window for the ith taxon, and !!mm!mm is the mean ofall nucleotides for all taxa (N).Those F ratios that fall in the highest 5% or 10%
of the distribution are taken as the subset mostlikely to exhibit a DFS. Using most extreme 5% ofthe F values ensures that our procedure has anexperimental error rate of 5%.
Implementation
Software has been implemented for theWindows operating system and is in development
for Mac OSX. It is available by request fromthe first author or at http://www.acpub.duke.edu/Bofedrigo/Druids.html. The DRUIDSsoftware has a Graphical User Interface thatallows one to explore up to three parameterssimultaneously. A help file explaining thefeatures and options is included. The user canselect the properties to be investigated fromthe following: residue hydrophobicity, residuevolume, residue mass, residue charge, and residuesolubility. Additional properties can be added byplacing a design file into the appropriate directory.Local deviation from stationarity for G+C
content can also be evaluated. Deviationfrom stationarity can be explored for multiplephysical-chemical parameters (e.g., hydrophobi-city and volume), but the alignment is scannedfor DFS for each property separately. The unionor intersection of the solutions for each para-meter can then be explored depending on thegoal of the study. The default value for windowsize is 12 nucleotides, corresponding to four aminoacids, the approximate length associated withone turn of an alpha helix (3.6 residues long).The maximum is set at 21 nucleotides, whichcorresponds to seven amino acids or approximatelytwo turns of an alpha helix. This setting may beuseful to capture changes in constraint associatedwith a pair of residues located on one face of ahelix (e.g., exposed to solvent). The smallestallowable window size is set at six nucleotides(two codons). When a range of window sizes isinput, the program will return all the sitesexhibiting a statistically significant deviationfrom stationarity in the final output. However,detection of patterns is done independently foreach window size and/or property. There is noestimation of a global statistical significance.Other aspects of the alignment can also beexplored, such as base composition, G+C content,and codon usage bias (Wright, ’90; Long andGillespie, ’91).
Tests of the method
We evaluated the effectiveness of DRUIDS inthree ways. We asked: (1) Can DRUIDS identifyconstraint change using simulated data? (2) CanDRUIDS identify regions of nonstationarity inreal data sets? (3) Can DRUIDS be used toimprove phylogenetic accuracy?
DRUIDS 121
(1) Can DRUIDS identify constraintchanges in simulated data?
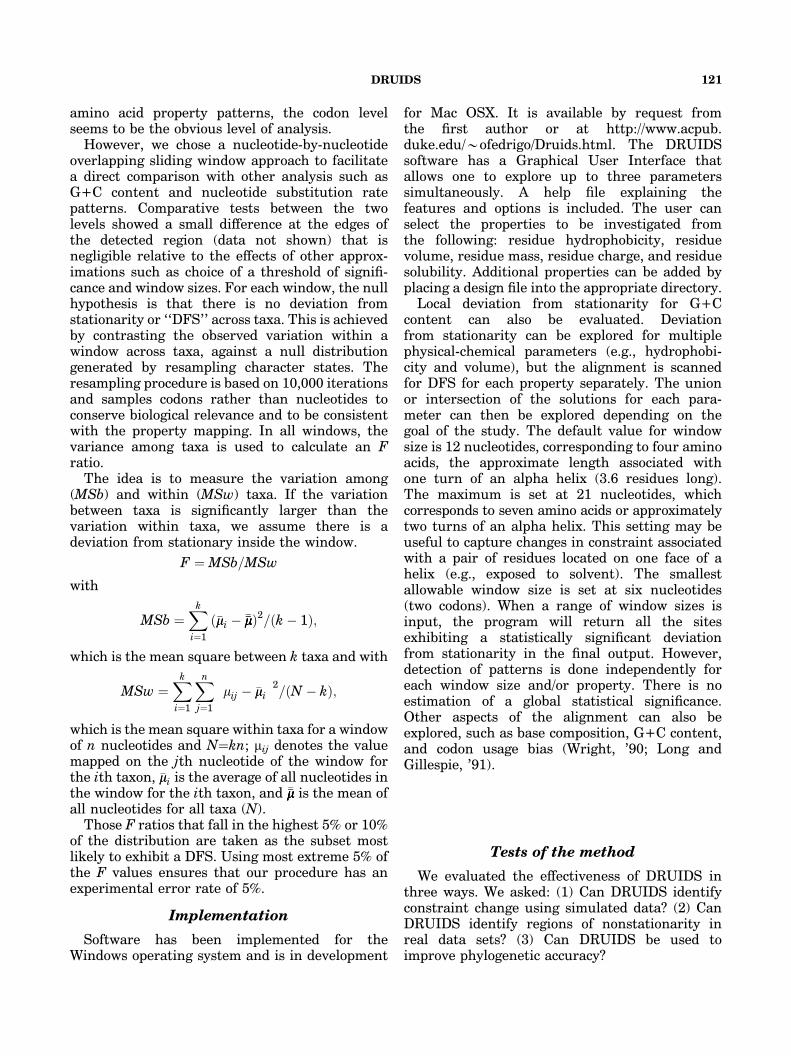
We tested the efficacy of DRUIDS with simu-lated protein coding sequence data. Sequenceswere simulated over a known phylogeny (Fig. 2)using a codon model (Goldman and Yang, ’94;Muse and Gaut, ’94) in which each codon wasallowed to mutate to one of its nine possible one-step neighbors (sequence size"1200 nucleotidesand equal branch length"0.25 substitution persite). The freedom to vary of each codon wasrestricted according to the physical-chemical prop-erties of the constraint class to which it belonged(i.e., codons constrained to be hydrophobic wereallowed to mutate to other codons whose aminoacids were also hydrophobic). The ancestral start-ing sequence included a patch at the 50 end (patchI) constrained to be hydrophobic (node 1, Fig. 2).After two bifurcation events (node 2, Fig. 2), thehydrophobic constraint in patch I was changed toa hydrophilic constraint (subsequently allowingonly hydrophilic residues to be substituted). At thesame time, a new hydrophobic constraint wasintroduced at a patch toward the 30 end of thesequence (patch II) for the clade (((D,E),(F,-G)),((H,I),(J,K))). The swapping of the hydropho-
bicity constraint for a hydrophilic constraint withthe simultaneous establishment of a new hydro-phobicity constraint was chosen to mimic theshifts in constraint associated with moving from atransmembrane to an extramembrane environ-ment. Finally, the original hydrophobic constrainton patch I, at the 50 end of the sequence, isrestored at the base of the clade containing taxa Dand E (node 3, Fig. 2). The sequences that weresimulated under this constraint were subjected toparsimony analysis and maximum likelihood withGTR model (Lanave et al., ’84) using PAUPn
4.0b10 (Swofford, ’99), and the phylogenetic signalwas characterized with split decomposition (Hu-son, ’98). Sequence regions showing deviationfrom stationarity were identified and filtered outusing DRUIDS with a window size of 12 and 5%significance level. The filtered data set was thenreanalyzed using parsimony, maximum likelihood,and split decomposition.
(2) Can DRUIDS identify regions ofnonstationarity in real data sets?
We subjected four different vertebrate cyto-chrome b data sets, each with similar numbers oftaxa and comparable divergence times, to analyseswith DRUIDS. The four data sets were (i) birds,(ii) carnivores, (iii) primates, and (iv) teleostfishes. Patterns of nonstationarity were comparedamong the data sets. These were then plotted ontothe three-dimensional crystal structure of cyto-chrome b (Xia et al., ’97) using the softwarepackage MolMol (Koradi et al., ’96).
(3) Can DRUIDS be used to improvephylogenetic accuracy?
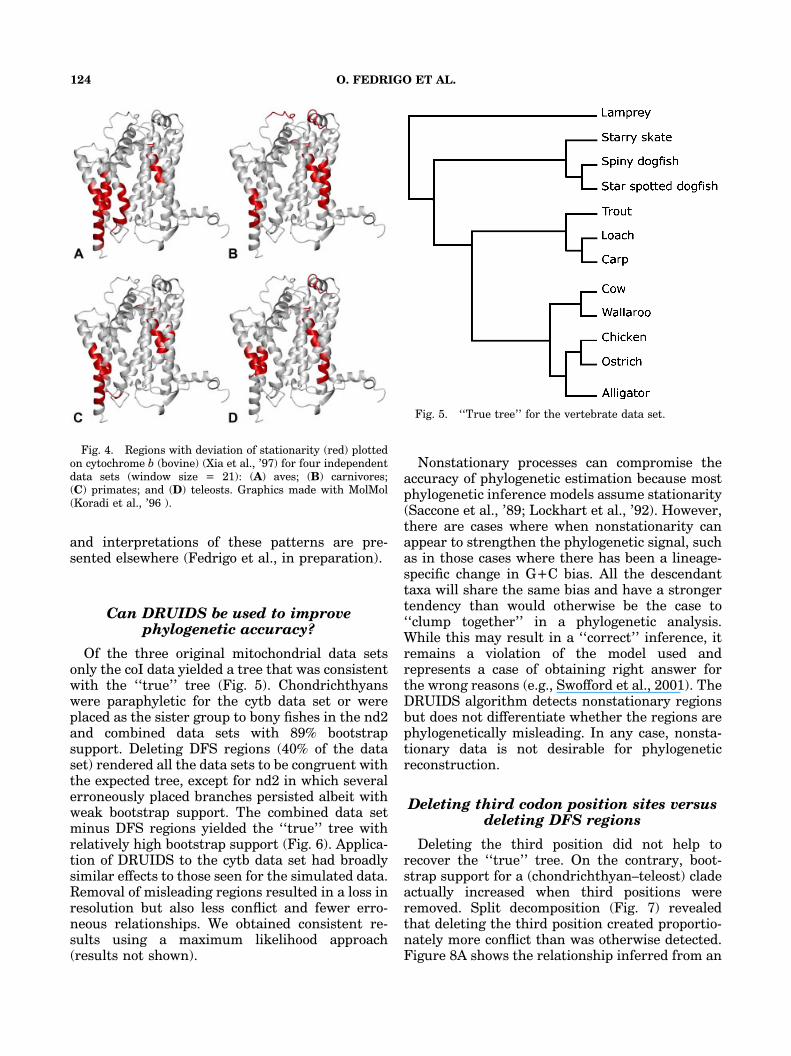
If regions of nonstationarity are responsible forsome of the phylogenetically misleading signal inmolecular data sets, then identifying and deletingthem should improve phylogenetic estimation. Wetested this idea using a data set composed ofdeeply divergent mitochondrial sequences fromvertebrate groups whose evolutionary inter-rela-tionships are well established (Fig. 5) but that areknown to yield anomalous trees for mitochondrialsequence data (Rasmussen and Arnasson, ’99;Takezaki and Gobojori, ’99). This ‘‘known phylo-geny’’ provided a benchmark against whichphylogenetic estimates could be contrasted. Weexplored the effects of deleting nonstationaryregions for three genes: cytochrome oxydase I(coI), cytochrome b (cytb), and NADH2 (nd2)(Table 1).
Fig. 2. Simulation design. Filled circles represent ahydrophobic constraint at the NH3
+ end of the protein(corresponding to the 50 end of the gene). The squarerepresents a hydrophobic patch at the COO! end of theprotein (corresponding to the 30 end of the gene). These twoconstraints alternate at nodes 1, 2, and 3 and are illustrated intheir respective panels. This series of evolutionary changes inconstraint were chosen to mimic the alternating movements oftwo helices from a transmembrane to an extramembraneenvironment.
O. FEDRIGO ET AL.122
Phylogenetic trees were estimated using parsi-mony and maximum likelihood with the GTRmodel for each gene individually and in combina-tion. Each data set was then subjected to analysisusing DRUIDS. Regions showing nonstationarityfor both hydrophobicity and volume (union of thetwo properties for 21-nucleotide-long windowswith 10% for the F-test significance) were removedby filtering. The ‘‘filtered’’ data sets were thensubjected to parsimony and maximum likelihoodanalyses. The effects of these exclusion strategieswere contrasted with the effects of removing thirdposition sites, an alternative commonly usedstrategy to ‘‘improve’’ phylogenetic signal (Swof-ford et al., ’96).
RESULTS AND DISCUSSION
Can DRUIDS identify constraint changesin simulated data?
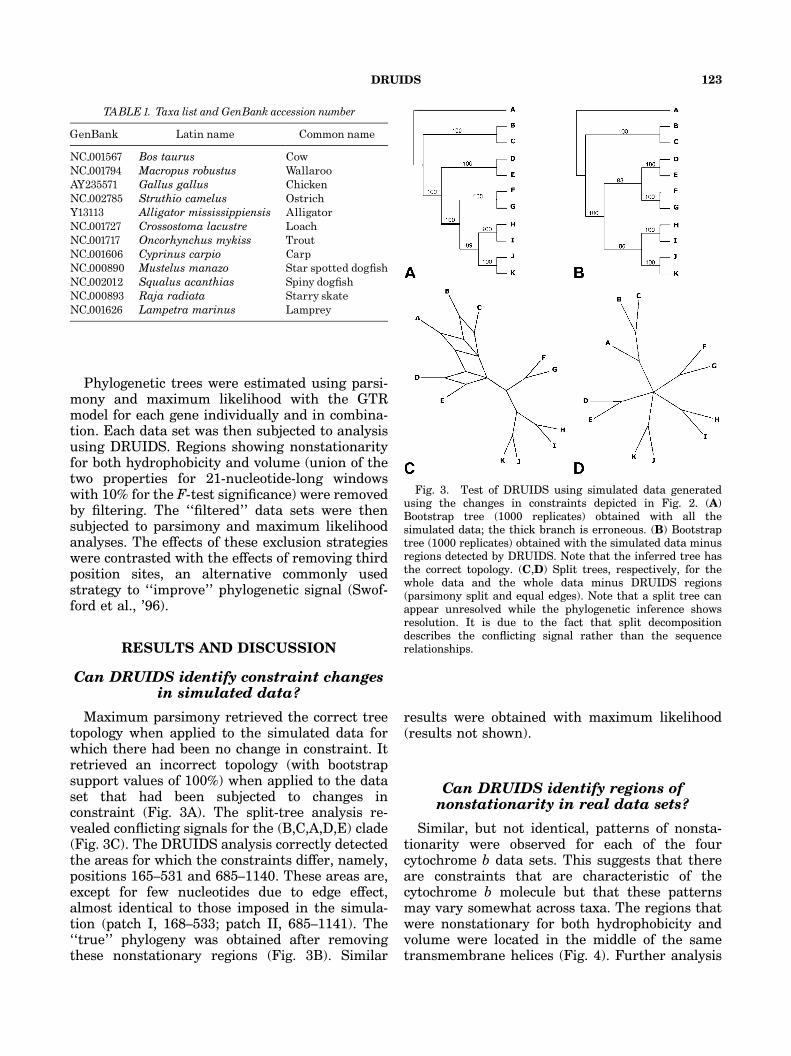
Maximum parsimony retrieved the correct treetopology when applied to the simulated data forwhich there had been no change in constraint. Itretrieved an incorrect topology (with bootstrapsupport values of 100%) when applied to the dataset that had been subjected to changes inconstraint (Fig. 3A). The split-tree analysis re-vealed conflicting signals for the (B,C,A,D,E) clade(Fig. 3C). The DRUIDS analysis correctly detectedthe areas for which the constraints differ, namely,positions 165–531 and 685–1140. These areas are,except for few nucleotides due to edge effect,almost identical to those imposed in the simula-tion (patch I, 168–533; patch II, 685–1141). The‘‘true’’ phylogeny was obtained after removingthese nonstationary regions (Fig. 3B). Similar
results were obtained with maximum likelihood(results not shown).
Can DRUIDS identify regions ofnonstationarity in real data sets?
Similar, but not identical, patterns of nonsta-tionarity were observed for each of the fourcytochrome b data sets. This suggests that thereare constraints that are characteristic of thecytochrome b molecule but that these patternsmay vary somewhat across taxa. The regions thatwere nonstationary for both hydrophobicity andvolume were located in the middle of the sametransmembrane helices (Fig. 4). Further analysis
TABLE1. Taxa list and GenBank accession number
GenBank Latin name Common name
NC__001567 Bos taurus CowNC__001794 Macropus robustus WallarooAY235571 Gallus gallus ChickenNC__002785 Struthio camelus OstrichY13113 Alligator mississippiensis AlligatorNC__001727 Crossostoma lacustre LoachNC__001717 Oncorhynchus mykiss TroutNC__001606 Cyprinus carpio CarpNC__000890 Mustelus manazo Star spotted dog¢shNC__002012 Squalus acanthias Spiny dog¢shNC__000893 Raja radiata Starry skateNC__001626 Lampetra marinus Lamprey
Fig. 3. Test of DRUIDS using simulated data generatedusing the changes in constraints depicted in Fig. 2. (A)Bootstrap tree (1000 replicates) obtained with all thesimulated data; the thick branch is erroneous. (B) Bootstraptree (1000 replicates) obtained with the simulated data minusregions detected by DRUIDS. Note that the inferred tree hasthe correct topology. (C,D) Split trees, respectively, for thewhole data and the whole data minus DRUIDS regions(parsimony split and equal edges). Note that a split tree canappear unresolved while the phylogenetic inference showsresolution. It is due to the fact that split decompositiondescribes the conflicting signal rather than the sequencerelationships.
DRUIDS 123
and interpretations of these patterns are pre-sented elsewhere (Fedrigo et al., in preparation).
Can DRUIDS be used to improvephylogenetic accuracy?
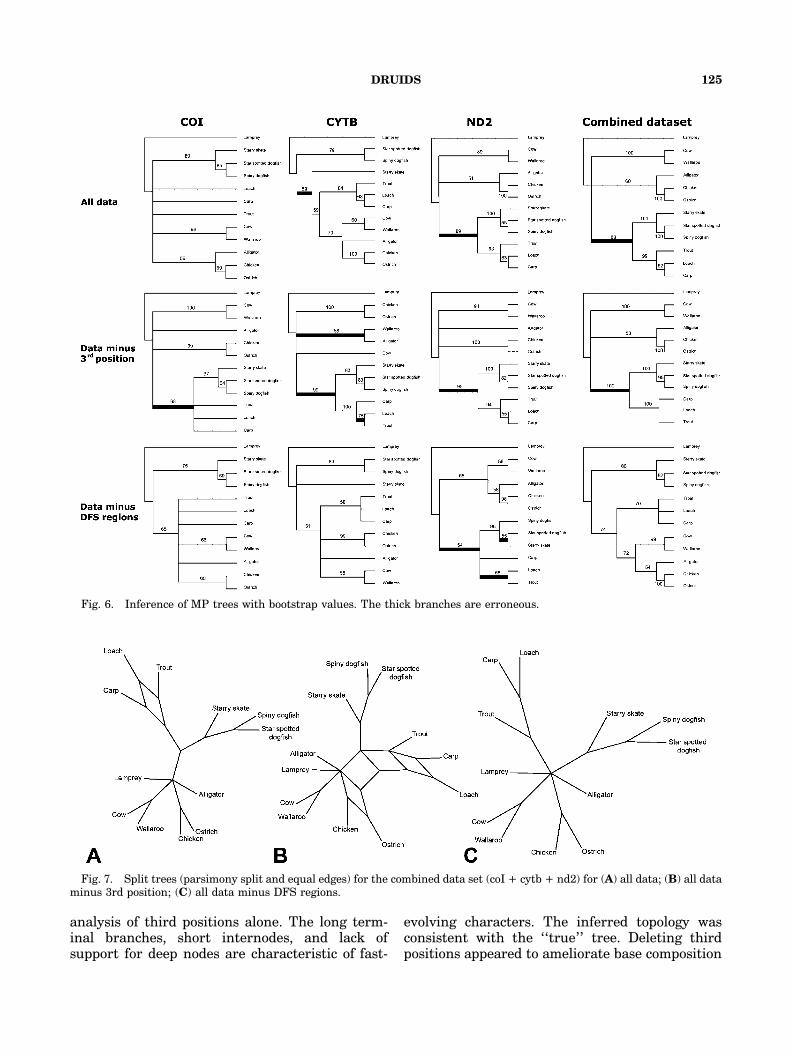
Of the three original mitochondrial data setsonly the coI data yielded a tree that was consistentwith the ‘‘true’’ tree (Fig. 5). Chondrichthyanswere paraphyletic for the cytb data set or wereplaced as the sister group to bony fishes in the nd2and combined data sets with 89% bootstrapsupport. Deleting DFS regions (40% of the dataset) rendered all the data sets to be congruent withthe expected tree, except for nd2 in which severalerroneously placed branches persisted albeit withweak bootstrap support. The combined data setminus DFS regions yielded the ‘‘true’’ tree withrelatively high bootstrap support (Fig. 6). Applica-tion of DRUIDS to the cytb data set had broadlysimilar effects to those seen for the simulated data.Removal of misleading regions resulted in a loss inresolution but also less conflict and fewer erro-neous relationships. We obtained consistent re-sults using a maximum likelihood approach(results not shown).
Nonstationary processes can compromise theaccuracy of phylogenetic estimation because mostphylogenetic inference models assume stationarity(Saccone et al., ’89; Lockhart et al., ’92). However,there are cases where when nonstationarity canappear to strengthen the phylogenetic signal, suchas in those cases where there has been a lineage-specific change in G+C bias. All the descendanttaxa will share the same bias and have a strongertendency than would otherwise be the case to‘‘clump together’’ in a phylogenetic analysis.While this may result in a ‘‘correct’’ inference, itremains a violation of the model used andrepresents a case of obtaining right answer forthe wrong reasons (e.g., Swofford et al., 2001). TheDRUIDS algorithm detects nonstationary regionsbut does not differentiate whether the regions arephylogenetically misleading. In any case, nonsta-tionary data is not desirable for phylogeneticreconstruction.
Deleting third codon position sites versusdeleting DFS regions
Deleting the third position did not help torecover the ‘‘true’’ tree. On the contrary, boot-strap support for a (chondrichthyan–teleost) cladeactually increased when third positions wereremoved. Split decomposition (Fig. 7) revealedthat deleting the third position created proportio-nately more conflict than was otherwise detected.Figure 8A shows the relationship inferred from an
Fig. 4. Regions with deviation of stationarity (red) plottedon cytochrome b (bovine) (Xia et al., ’97) for four independentdata sets (window size = 21): (A) aves; (B) carnivores;(C) primates; and (D) teleosts. Graphics made with MolMol(Koradi et al., ’96 ).
Fig. 5. ‘‘True tree’’ for the vertebrate data set.
O. FEDRIGO ET AL.124
analysis of third positions alone. The long term-inal branches, short internodes, and lack ofsupport for deep nodes are characteristic of fast-
evolving characters. The inferred topology wasconsistent with the ‘‘true’’ tree. Deleting thirdpositions appeared to ameliorate base composition
Fig. 6. Inference of MP trees with bootstrap values. The thick branches are erroneous.
Fig. 7. Split trees (parsimony split and equal edges) for the combined data set (coI + cytb + nd2) for (A) all data; (B) all dataminus 3rd position; (C) all data minus DFS regions.
DRUIDS 125
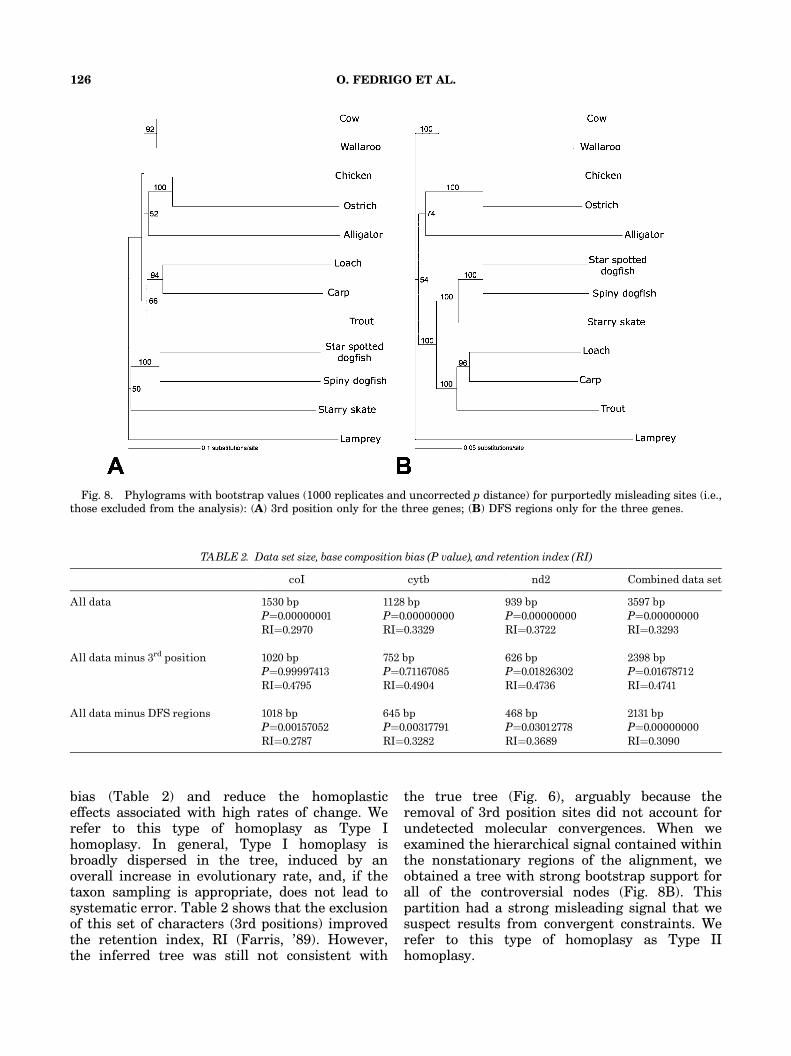
bias (Table 2) and reduce the homoplasticeffects associated with high rates of change. Werefer to this type of homoplasy as Type Ihomoplasy. In general, Type I homoplasy isbroadly dispersed in the tree, induced by anoverall increase in evolutionary rate, and, if thetaxon sampling is appropriate, does not lead tosystematic error. Table 2 shows that the exclusionof this set of characters (3rd positions) improvedthe retention index, RI (Farris, ’89). However,the inferred tree was still not consistent with
the true tree (Fig. 6), arguably because theremoval of 3rd position sites did not account forundetected molecular convergences. When weexamined the hierarchical signal contained withinthe nonstationary regions of the alignment, weobtained a tree with strong bootstrap support forall of the controversial nodes (Fig. 8B). Thispartition had a strong misleading signal that wesuspect results from convergent constraints. Werefer to this type of homoplasy as Type IIhomoplasy.
Fig. 8. Phylograms with bootstrap values (1000 replicates and uncorrected p distance) for purportedly misleading sites (i.e.,those excluded from the analysis): (A) 3rd position only for the three genes; (B) DFS regions only for the three genes.
TABLE 2. Data set size, base composition bias (P value), and retention index (RI)
coI cytb nd2 Combined data set
All data 1530 bp 1128 bp 939 bp 3597 bpP"0.00000001 P"0.00000000 P"0.00000000 P"0.00000000RI"0.2970 RI"0.3329 RI"0.3722 RI"0.3293
All data minus 3rd position 1020 bp 752 bp 626 bp 2398 bpP"0.99997413 P"0.71167085 P"0.01826302 P"0.01678712RI"0.4795 RI"0.4904 RI"0.4736 RI"0.4741
All data minus DFS regions 1018 bp 645 bp 468 bp 2131 bpP"0.00157052 P"0.00317791 P"0.03012778 P"0.00000000RI"0.2787 RI"0.3282 RI"0.3689 RI"0.3090
O. FEDRIGO ET AL.126
Type I homoplasy emphasizes chance conver-gences associated with overall fast rates of evolu-tion or long time spans and can be thought of aswhite noise. If the ‘‘true’’ phylogenetic signal isstrong enough, it will rise above this noise aschampioned by the ‘‘total evidence’’ school. Thesecond type of conflicting signal, Type II homo-plasy, is more problematic because it involvesconvergence due to independent changes of struc-tural or functional constraint and is less readilyidentified as it need not be associated with highrates of change. Type II homoplasy is rarelyrandomly distributed over a tree and should beviewed as a directional homoplastic force with atendency to attract unrelated lineages together. Ifit is stronger than the background noise and the‘‘true’’ phylogenetic signal, it can be misleading.Long branch attraction (Felsenstein, ’78), due tothe independent accumulation of similar characterstates on two unrelated branches, can arise as aconsequence of convergent constraints (causingtype II homoplasy). The effect is exacerbated whenchanges in constraint are associated with elevatedsubstitution rates. At its most fundamental, TypeII homoplasy arises as a consequence of modelmisspecification. However, because it arises fromnonstationarity of the substitution process, itgenerally cannot be fixed with a more parameter-rich stationary model. Rather, its appropriateamelioration requires that different models beassigned to different sequence regions in differentparts of a tree. Deciding which models should beapplied when and where is generally not immedi-ately obvious from the aligned input data. How-ever, we believe this will be a fruitful avenue forfuture research.
Are there alternatives to characterdeletion?
Some sites can be homoplastic for certain cladesand synapomorphic for others. Deleting characterscan be a risky strategy because, in removinghomoplasy associated with one part of a tree, onemight unwittingly be removing phylogenetic in-formation in different part of the tree. Thesimulation study (Figs. 2 and 3) revealed thatsome support is lost after removal of the areasdetected by DRUIDS. Patch II contains numeroussynapomorphies for the clade ((H, I), (J, K)), eventhough it contains homoplastic character statesfor the taxa F and G. The effect of deleting regionscan be even worse if the deleted regions do notrepresent the major source of bias in the data set
[e.g., when a data set is plagued with several longbranches (Felsenstein, ’78), or a complex distribu-tion of among site rate variation]. In suchsituations, the decrease in synapomorphic supportcan pave the way for other biases to misleadphylogenetic reconstruction. What is needed is amethod that down weights the phylogeneticallymisleading influences of a character in one part ofa tree while leaving its phylogenetically informa-tiveness intact in the remainder of the tree. This isbest achieved through an explicit model of mole-cular evolutionary dynamics under a likelihoodframework. This is an area of on going research.
Caveats
Sliding windows approaches are useful fordetecting patterns of nonstationarity over multi-ple alignments of DNA sequences. In this paper,we show that the approach can be extended toidentify shifts in biochemical constraints by con-sidering nonstationarity at levels above that ofnucleotide variation. The most appropriate win-dow size is that commensurate with the scale ofthe biological constraint. Unfortunately, this israrely apparent at the outset of any study. Thuswe recommend setting a lower bound on windowsize equivalent to one turn of an alpha helix (fouramino acids or 12 nucleotides) and an upper boundof two turns of an alpha helix (seven amino acidsor 21 nucleotides). While we believe the approachrepresents an improvement over prior approaches,we caution that moving-window approaches areprone to ‘‘dilute’’ patterns of nonstationarity thatare not distributed contiguously along a sequence.For example, if one face of a helix is exposed tosolvent while the other is buried, the amino acidson the exposed surface would be constrained in adifferent way than those that are buried. Con-straints associated with such a scenario would notbe distributed contiguously along a sequence butwould be distributed with a periodicity consistentwith the turns of the helix. The averagingapproaches intrinsic to moving-window analysesmight cause such patterns to be missed. However,it is possible to detect these patterns by comparingthe outcome of various window sizes. Indeed, largewindow sizes tend to smooth out variations instationarity, whereas small window sizes will showmore fine-grained and patchy distributions. Thus,a noncontiguously distributed constraint will becharacterized by a marked difference in F-testscore profiles between analysis of various windowsizes.
DRUIDS 127
We plan to develop approaches that considerwindows that are composed not only of sequentialneighbors but also of residues that are spatiallyadjacent on the protein structure. This wouldbetter accommodate patterns of constraint changethat are spatially localized on the protein struc-ture but sequentially distant in the sequence.While the DRUIDS approach to multiple align-ment exploration is free from any ad hoc phyloge-netic hypothesis, it does not identify all signalsthat are phylogenetically misleading. For example,DRUIDS does not account for problems associatedwith taxon sampling (Kim, ’96; Graybeal, ’98;Hillis, ’98; Poe, ’98). However, we believe that itdoes offer new opportunities for exploring theeffects of constraint change, codon usage, andG+C bias on the phylogenetic signal.
ACKNOWLEDGMENTS
We thank Gunter Wagner and two anonymousreviewers for helpful comments on the manu-script. We thank Andres Lopez for his inputconcerning the codon bias features of the software,all the people who tested different versions ofDRUIDS, and Anna Keyte for editing variousversions of the manuscript.
LITERATURE CITED
Farris JS. 1989. The retention index and the rescaledconsistency index. Cladistics 5:417–419.
Felsenstein J. 1978. Cases in which parsimony or compat-ibility methods will be positively misleading. Syst Zool27:783–791.
Goldman N, Yang Z. 1994. A codon-based model of nucleotidesubstitution for protein-coding DNA sequences. Mol BiolEvol 11:725–736.
Grassly NC, Rambaut A. 1997. A likelihood method for thedetection of selection and recombination using sequencedata. Mol Biol Evol 14:239–247.
Graybeal A. 1998. Is it better to add taxa or characters to adifficult phylogenetic problem? Syst Biol 47:9–17.
Gu X, Vander Velden K. 2002. DIVERGE: phylogeny-basedanalysis for functional–structural divergence of a proteinfamily. Bioinformatics 18:500–501.
Hillis DM. 1998. Taxonomic sampling, phylogenetic accuracy,and investigator bias. Syst Biol 47:3–8.
Huson DH. 1998. SplitsTree: analyzing and visualizingevolutionary data. Bioinformatics 14:68–73.
Kim J. 1996. General inconsistencies conditions for maximumparsimony: effects of branch lengths and increasing num-bers of taxa. Syst Biol 45:363–374.
Koradi R, Billeter M, Wuthrich K. 1996. MolMol: a programfor display and analysis of macromolecular structures. J MolGraph 14:51–55.
Kyte J, Doolittle RF. 1982. A simple method for displayingthe hydropathic character of a protein. J Mol Biol 157:105–132.
Lanave C, Preparata G, Saccone C, Serio G. 1984. A newmethod for calculating evolutionary substitution rates.J Mol Evol 20:86–93.
Lockhart PJ, Howe CJ, Bryant DA, Beanland TJ, Larkum AW.1992. Substitutional bias confounds inference of cyanelleorigins from sequence data. J Mol Evol 34:153–162.
Long M, Gillespie JH. 1991. Codon usage divergence ofhomologous vertebrate genes and codon usage clock. J MolEvol 32:6–15.
Muse SV, Gaut BS. 1994. A likelihood approach for comparingsynonymous and nonsynonymous nucleotide substitutionrates, with application to the chloroplast genome. Mol BiolEvol 11:715–724.
Naylor GJP, Gerstein, M. 2000. Measuring shifts in functionand evolutionary opportunity using variability profiles: acase study of the globins. J Mol Evol 51:223–233.
Page RDM, Cotton J. 2002. Vertebrate phylogenomics:reconciled trees and gene duplications. Pac Symp Biocomp536–547.
Poe S. 1998. Sensitivity of phylogeny estimation to taxonomicsampling. Syst Biol 47:18–31.
Rasmussen A-S, Arnason U. 1999. Molecular studies suggestthat cartilaginous fishes have a terminal position in thepiscine tree. Proc Natl Acad Sci USA 96:2177–2182.
Saccone C, Pesole G, Preparata G. 1989. DNA microenviron-ments and the molecular clock. Mol Evol 29:407–411.
Storm CE, Sonnhammer EL. 2003. Comprehensive analysis oforthologous protein domains using the HOPS database.Genome Res 13:2353–2362.
Swofford DL. 1999. PAUPn: phylogenetic analysisusing parsimony, ver. 4.02ba. Sunderland, MA: SinauerAssociates.
Swofford DL, Olsen GL, Waddell PJ, Hillis DM. 1996.Phylogenetic inference. In: Hillis DM, Morowitz C, MableBK, editors. Molecular systematics, 2nd edition. Sunder-land, MA: Sinauer Associates. p 407–514.
Swofford DL, Waddell PJ, Huelsenbeck JP, Foster PG, LewisPO, Rogers JS. 2001. Bias in phylogenetic estimation and itsrelevance to the choice between parsimony and likelihoodmethods. Syst Biol 50:526–539.
Takezaki N, Gobojori T. 1999. Correct and incorrect verte-brate phylogenies obtained by the entire mitochondrialDNA sequences. Mol Biol Evol 16:590–601.
Wright F. 1990. The ‘effective number of codons’ used in agene. Gene 87:23–29.
Xia D, Yu C-A, Kim H, Xia J-Z, Kachurin AM, Zhang L, Yu L,Deisenhofer J. 1997. Crystal structure of the cytochromebc1 complex from bovine heart mitochondria. Science277:60–66.
Yang Z, Nielsen R, Goldman N, Pedersen AM. 2000. Codon-substitution models for heterogenous selection pressure atamino acid sites. Genetics 155:431–449.
Yokoyama S, Radlwimmer FB. 1998. The ‘‘five-sites’’ rule andthe evolution of red and green color vision of mammals. MolBiol Evol 15:560–567.
Zamyatin AA. 1972. Protein volume in solution. Prog BiophysMol Biol 24:107–123.
O. FEDRIGO ET AL.128


