Embed Size (px)
Citation preview
Journal of the Meteorological Society of Japan, Vol. 84, No. 2, pp. 277--294, 2006 277
Dry Intrusions Following Eastward-Propagating Synoptic-Scale
Cloud Systems over Sumatera Island
Fumie MURATA
Research Institute for Humanity and Nature, Kyoto, Japan
Manabu D. YAMANAKA
Graduate School of Science and Technology, Kobe University, Kobe, JapanInstitute of Observational Research for Global Change, Japan Agency for Marine-Earth Science and
Technology, Yokosuka, Japan
Hiroyuki HASHIGUCHI
Research Institute for Sustainable Humanosphere, Kyoto University, Kyoto, Japan
Shuichi MORI
Institute of Observational Research for Global Change, Japan Agency for Marine-Earth Science andTechnology, Yokosuka, Japan
Mahally KUDSY, Tien SRIBIMAWATI
Agency for the Assessment and Application of Technology, Jakarta Pusat, Indonesia
Budi SUHARDI and EMRIZAL
Indonesian Meteorological and Geophysical Agency, Jakarta Pusat, Indonesia
(Manuscript received 20 April 2005, in final form 16 November 2005)
Abstract
We observed four dry intrusions that occurred over Sumatera Island (Sumatra) during the intensiverawinsonde observation periods in 1998–2004. The events were accompanied by westerly winds, and in-cluded the passage of a single organized synoptic-scale cloud system, with a structure similar to a squallline. The cloud systems had the properties of a Kelvin wave. Eastward propagation speed was around13 m/s, and the horizontal scale was several thousand kilometers. Severe rain occurred as the cloud sys-tems passed, and dry intrusion suppressed convections in the rear part.
1. Introduction
Some of the most active convection in theworld occurs around Indonesia (e.g., Ramage1968; Webster and Lucas 1992). Warm sea sur-face temperatures provide sufficient water va-por throughout the year. The complex land-sea
Corresponding author: Fumie Murata, ResearchInstitute for Humanity and Nature 457-1, Ka-migamo Motoyama, Kita-ku, Kyoto 603-8047,Japan.E-mail: [email protected]( 2006, Meteorological Society of Japan
distribution over Indonesia supports local land-sea breeze circulations (Hadi et al. 2000, 2002).Complex topography supports mountain-valleywinds. Convergence occurs over mountains,between islands, or with background winds(Houze et al. 1980). Many studies have re-marked on the dominance of the diurnal varia-tion in convection (e.g., Murakami 1983; Hen-don and Woodberry 1993; Nitta and Sekine1994; Yang and Slingo 2001). Sui and Lau(1992) analyzed satellite data and noted thatconvection on diurnal cycle diminished duringthe active phase of the Madden-Julian Oscilla-tion (MJO; Madden and Julian 1971, 1972,1994). However, detailed analyses using in situobservations have not been conducted. In thispaper, we focus on the suppression of convec-tion on intraseasonal timescales, using in situobservations.
Dry intrusions can suppress convection (e.g.,Numaguti et al. 1995; Brown and Zhang 1997;DeMott and Rutledge 1998). Dry intrusionswere first recognized and investigated in ob-servations from the Tropical-Ocean Global-Atmosphere Coupled Ocean-Atmosphere Re-sponse Experiment (TOGA COARE; Websterand Lucas 1992). Dry intrusions are character-ized by very dry air in the lower or middle tro-posphere (e.g., Parsons et al. 1994). Vertical airparcel displacement cannot explain the drynessof air; instead, lateral advection is responsible(Numaguti et al. 1995; Mapes and Zuidema1996). Horizontal distributions of precipitablewater (PW) derived from satellite data confirmthe dry air advection that forces the remark-able decrease in humidity in the humid lowertroposphere (e.g., Sheu and Liu 1995). Back-trajectory analyses using objective analysisdata also show the dry air advection fromthe subtropics or mid-latitudes (e.g., Yoneyamaand Fujitani 1995; Yoneyama and Parsons1999). Two factors facilitate convective sup-pression in dry intrusions: entrainment of dryair, and the suppression of vertical motion by astable layer at the base of the dry layer (Numa-guti et al. 1995; Mapes and Zuidema 1996).
Dry intrusions in the western Pacific havebeen observed and analyzed since TOGACOARE (Yoneyama 2003), but few studieshave detailed dry intrusions in the IndianOcean or over Indonesia. Yatagai and Sumi(1997) used only satellite data, and reported
dry intrusions over the Indian and PacificOceans. Zachariasse et al. (2001) reported verydry air in the middle troposphere over the In-dian Ocean.
Several studies (e.g., Parsons et al. 2000;Johnson et al. 2001; Redelsperger et al. 2002)suggested that convective suppression, andsubsequent remoistening in the boundary layerand free atmosphere, may regulate MJO. How-ever, few studies related dry intrusions to cloudsystems. The dry intrusions described in thisstudy were related to eastward-propagatingsynoptic-scale cloud systems.
Eastward-propagating synoptic-scale cloudsystems were described by Nakazawa (1986,1988), Takayabu and Murakami (1991), andDunkerton and Crum (1995). These cloud sys-tems have been also studied as convectivelycoupled Kelvin waves using spectral analysis(e.g., Takayabu 1994; Wheeler and Kiladis1999; Wheeler et al. 2000). Nakazawa (1986,1988) described how the cloud systems wererelated to the MJO, and called them super-clusters. But, such disturbances have been ob-served independent of the MJO (Takayabu andMurakami 1991; Dunkerton and Crum 1995).
Here, we describe dry intrusions that wereobserved over the province of West Sumatera,located near the Equator on the west coast ofSumatera Island (Fig. 1). Data were providedby several intensive rawinsonde observationperiods that were conducted over Sumatera(Murata et al. 2002; Mori et al. 2004; Sakuraiet al. 2005). We investigated four dry eventsthat occurred during the intensive rawinsondeobservation periods. In this paper, we describecommon features of the four observed dryevents. Section 2 describes the data used. Ob-servations for each case are discussed in Sec-tion 3. Composite analyses are examined inSection 4, including background conditions(Section 4.1) and observational results (Section4.2). Analyses are compared with past studiesand discussed in Section 5. Section 6 containsthe conclusion.
2. Data
1) Observation sites and periods:Rawinsonde data, and surface meteorological
data were observed at two stations (Fig. 1) inthe province of West Sumatera, Sumatera Is-land, Indonesia. Coordinated universal time
278 Journal of the Meteorological Society of Japan Vol. 84, No. 2
(UTC), and mean sea level (MSL) are used todepict time and height, respectively, in thisstudy. Local standard time (LST) at bothsites is UTC þ 7 hours. ‘Kototabang’ (100.32�E,0.20�S, 865 m MSL) is in the mountains, about50 km from the west coast of Sumatera. ‘Pa-dang’ (100.35�E, 0.88�S, 2 m MSL) is a porttown on the Indian Ocean. Three intensiverawinsonde observation periods (4–7 October1998, 27–31 May 2001, and 6–12 June 2001)at Kototabang, and one intensive rawinsondeobservation period (5–9 May 2004) at Padangwere analyzed.
2) Rawinsondes:Rawinsondes were launched four times daily
(00, 06, 12, and 18 UTC) at Kototabang, andtwice daily (00 and 12 UTC) at Padang. AIRcompany rawinsondes were used for soundingsin 1998. Vaisala rawinsondes were used in
2001 and 2004. The Vaisala rawinsondes in-cluded new RS80-15GH, and old RS80-15Gmodels. The old RS80-15G models recordedsoundings in 2004. Past studies (e.g., Fujiwaraet al. 2003; Nakamura et al. 2004) have noteda dry bias at lower altitudes in data fromRS80-15G models. Therefore, a humidity cor-rection was applied as described in the Appen-dix. TA1000 and TX1000 1000-g meteorologicalballoons from the TOTEX Company were used.TX1000 balloons were used at night (12, 18UTC or 19, 01 LST) to minimize balloon burstnear the tropopause. Analyzed data includedtemperature, relative humidity, pressure, andzonal winds; all were averaged every 100 m.
3) Surface data:Hourly pressure, temperature, and relative
humidity in 1998 and 2004 were providedby standard operational surface observations(barograph and thermohygrograph) at stationsof the Indonesian Meteorological and Geophysi-cal Agency (BMG), where the intensive rawin-sonde observations were conducted. Rainfalldata in 1998 were observed by a standardtipping-bucket-type rain gauge (OgasawaraCompany) with resolutions of 0.5 mm and1 min. An accumulation-type rain gauge mea-sured 3-hourly rainfall data in 2004. The latterwas a routine observation that was providedby BMG. A Vaisala automatic weather station(MAWS201) measured surface data in 2001.MAWS201 comprised a PMT16A pressure sen-sor, QMH101 temperature and humidity sen-sors, and a QMR101 precipitation sensor. Theoriginal time resolution of MAWS201 is 1 minfor hourly averaged surface pressure, tempera-ture and relative humidity, and 6-hourly (00,06, 12, 18 UTC) accumulated rainfall data. The6-hourly rainfall values were accumulationsfrom the previous six hours.
4) Black body temperature from satellite:The black body temperature ðTBBÞ data used
were observed by Geostationary MeteorologicalSatellite in 1998 and 2001, and by GOES-9 in2004. All data were provided by Kochi Univer-sity. Hourly data were used with horizontalresolution of 0.5� in longitude and latitude.
5) Precipitable water by satellite:A precipitable water (PW) dataset from
SSM/I(F14) was provided by Remote Sensing
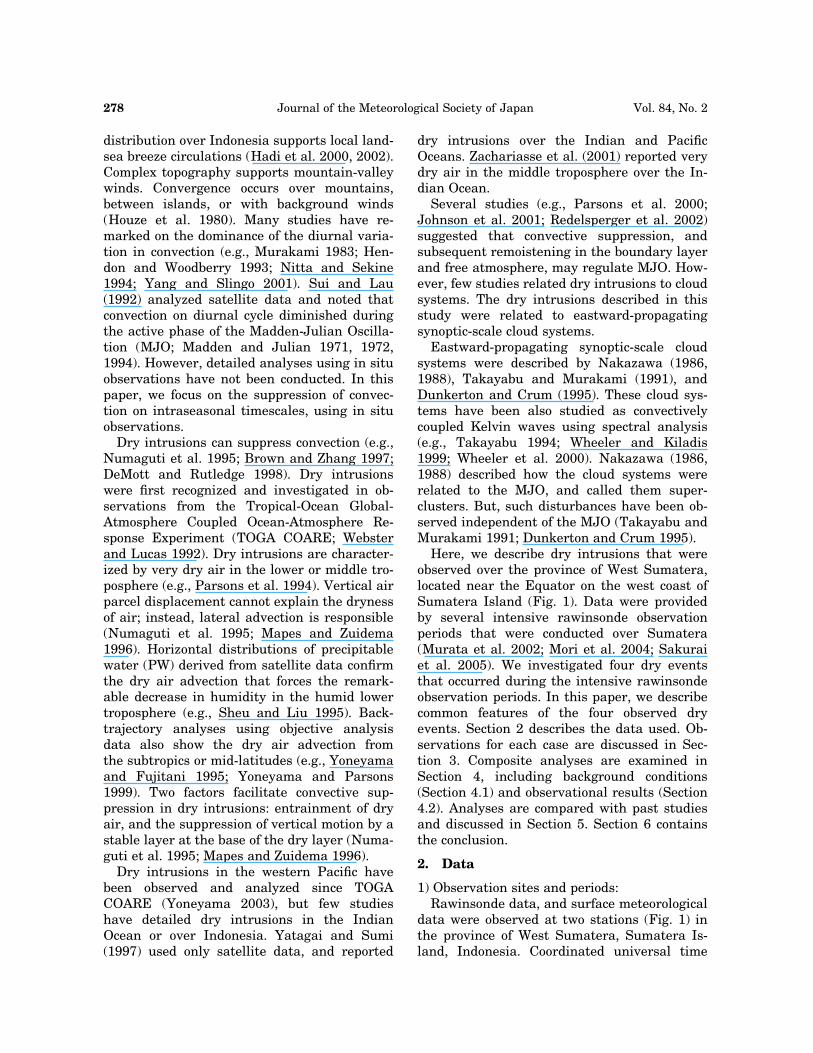
Fig. 1. Location of observation sites: Ko-totabang and Padang. Light shadingshows land region. Dark shading in theupper and lower figures shows altitudesmore than 500 m, and that more than1500 m, respectively. Contours in thelower figure are drawn every 250 m upto 1500 m.
April 2006 F. MURATA et al. 279
Systems1. The dataset was a 3-day average ofthe previous day, the present day, and the nextday, with a horizontal resolution of 0.5� in lon-gitude and latitude.
6) Objective analysis data:Data used were from the NCEP/NCAR re-
analysis (Kalnay et al. 1996) and includedzonal wind, meridional wind, and omega. Datawere 6-hourly values, with a horizontal resolu-tion of 2.5� in longitude and latitude.
3. Case study
Each of four dry events, and the accompany-ing background conditions are described in thissection. These events had relative humidities ofless than 50% in the lower troposphere up to6 km; the dryness persisted for more than halfa day. MJO active phases noted were definedby negative periods of 20–70-days filtered TBB
for 80–100�E, and 10�N–10�S averaged data.Figure 2a is a time-longitude section of TBB,
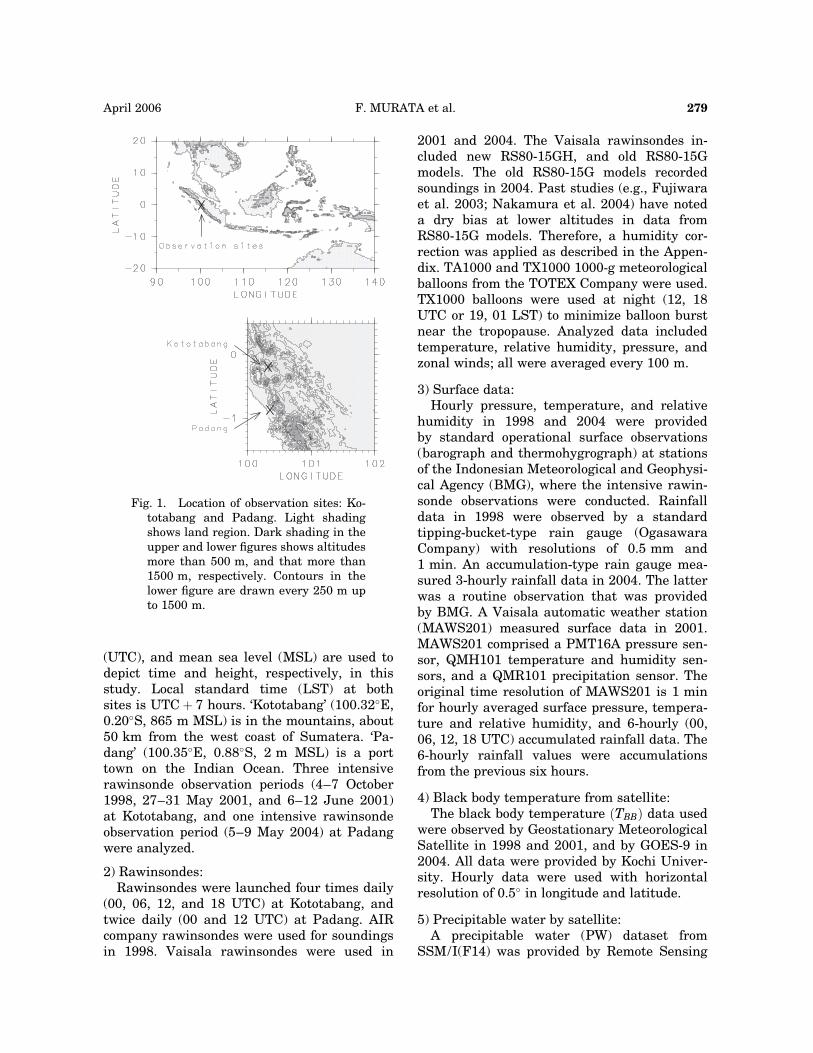
averaged between 0 and 1�S during 4–7 Octo-ber 1998. The days shown in the figure were af-ter the end of an active MJO phase, but highcloud developed in the eastern Indian Ocean.Convection was active in the Indian Ocean dur-ing the first 2 days. The dotted line denotesan eastward propagating speed of 10�/day or13 m/s. TBB colder than 220 K appeared at87�E at 06 UTC, and at 93�E at 18 UTC 4 Octo-ber, and subsequently propagated eastward atabout 13 m/s. After the cloud system passedacross 100�E, the cloud tops became lower, orthe region of high cloud tops became smallerthan the west. Eastward propagation was dis-crete in 100–107�E, and became indistinctnear 110�E. Rains fell during 00–18 UTC (07–01 LST of the following day) on 4 October, and06–24 UTC (13–07 LST of the following day) on5 October (Fig. 2b). Figure 2c shows a time-height section of 6-hourly zonal winds up to6 km. Strong westerly winds exceeding 10 m/sbegan at 12 UTC on 5 October, correspondingto the passage of an eastward-propagatingcloud system. The top of the layer of westerlywinds exceeding 10 m/s rose from 3 km to5 km between 5 and 7 October. Figure 2dshows a time-height section of 6-hourly relativehumidity up to 10 km. Humidity exceeding 80%
extended up to 10 km between 12 and 18 UTC(19 and 01 LST of the following day) on 5 Octo-ber as the cloud system passed. A region of highhumidity between 5 and 8 km persisted until
Fig. 2. (a) Time-longitude section ofhourly TBB averaged between 0 and1�S during 4–7 October 1998. Dark andlight shading indicates TBB colder than240 K, 260 K, respectively. The contourinterval is 10 K. A solid line of 100.3�Eshows the observation site. A dottedline represents a reference speed of10�/day or 13 m/s. (b) Timeseries of6-hourly rainfall amount. The rainfallamounts represent accumulation dur-ing the previous 6 hours. (c) Time-height section of 6-hourly zonal wind.Dark and light shading indicates zonalwinds more than 10 m/s and 5 m/s, re-spectively. A contour interval is 5 m/s.(d) Time-height section of 6-hourly rela-tive humidity. Dark and light shadingindicates relative humidity exceeding80%, and less than 50%, respectively. Acontour interval is 10%.
1 www.remss.com
280 Journal of the Meteorological Society of Japan Vol. 84, No. 2
the end of the sounding period. From 6 October,the bottom of the humid layer correspondedto the upper boundary of strong westerlywinds. Dry air with relative humidity less than50%, appeared at around 2 km at 00 UTC on6 October, and persisted during 18 UTC on6 October–06 UTC on 7 October at 2–3 kmin the layer with westerly winds.
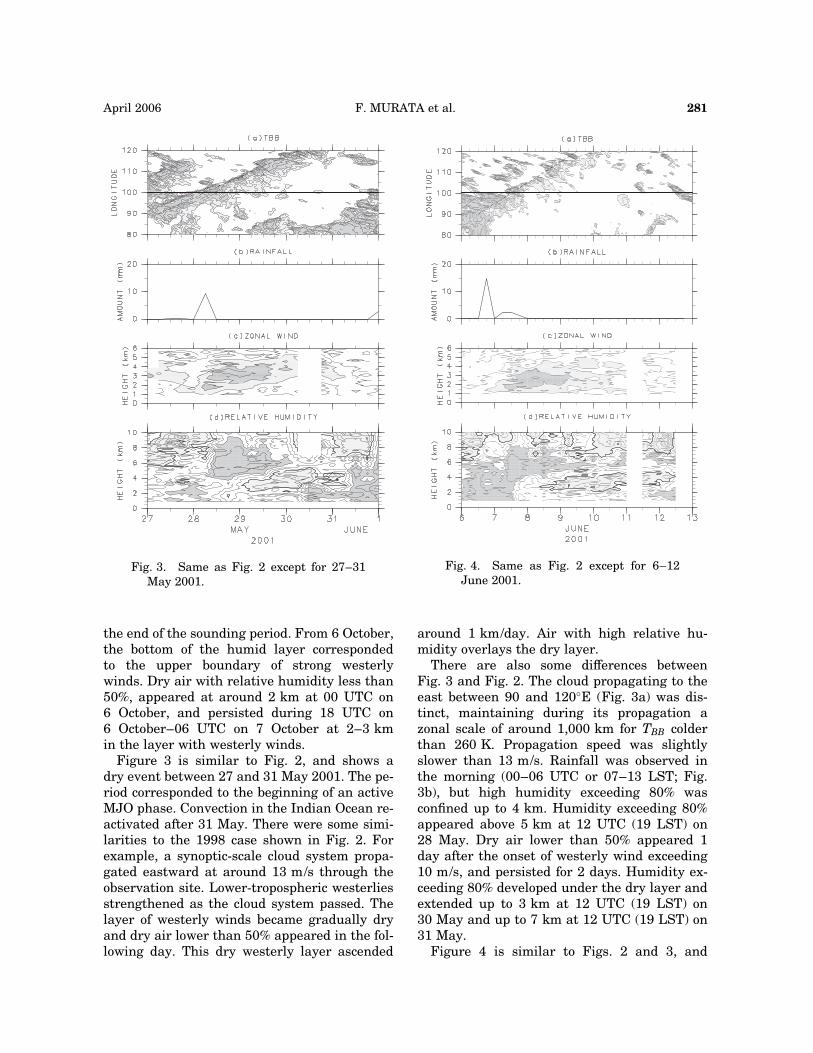
Figure 3 is similar to Fig. 2, and shows adry event between 27 and 31 May 2001. The pe-riod corresponded to the beginning of an activeMJO phase. Convection in the Indian Ocean re-activated after 31 May. There were some simi-larities to the 1998 case shown in Fig. 2. Forexample, a synoptic-scale cloud system propa-gated eastward at around 13 m/s through theobservation site. Lower-tropospheric westerliesstrengthened as the cloud system passed. Thelayer of westerly winds became gradually dryand dry air lower than 50% appeared in the fol-lowing day. This dry westerly layer ascended
around 1 km/day. Air with high relative hu-midity overlays the dry layer.
There are also some differences betweenFig. 3 and Fig. 2. The cloud propagating to theeast between 90 and 120�E (Fig. 3a) was dis-tinct, maintaining during its propagation azonal scale of around 1,000 km for TBB colderthan 260 K. Propagation speed was slightlyslower than 13 m/s. Rainfall was observed inthe morning (00–06 UTC or 07–13 LST; Fig.3b), but high humidity exceeding 80% wasconfined up to 4 km. Humidity exceeding 80%appeared above 5 km at 12 UTC (19 LST) on28 May. Dry air lower than 50% appeared 1day after the onset of westerly wind exceeding10 m/s, and persisted for 2 days. Humidity ex-ceeding 80% developed under the dry layer andextended up to 3 km at 12 UTC (19 LST) on30 May and up to 7 km at 12 UTC (19 LST) on31 May.
Figure 4 is similar to Figs. 2 and 3, and
Fig. 3. Same as Fig. 2 except for 27–31May 2001.
Fig. 4. Same as Fig. 2 except for 6–12June 2001.
April 2006 F. MURATA et al. 281
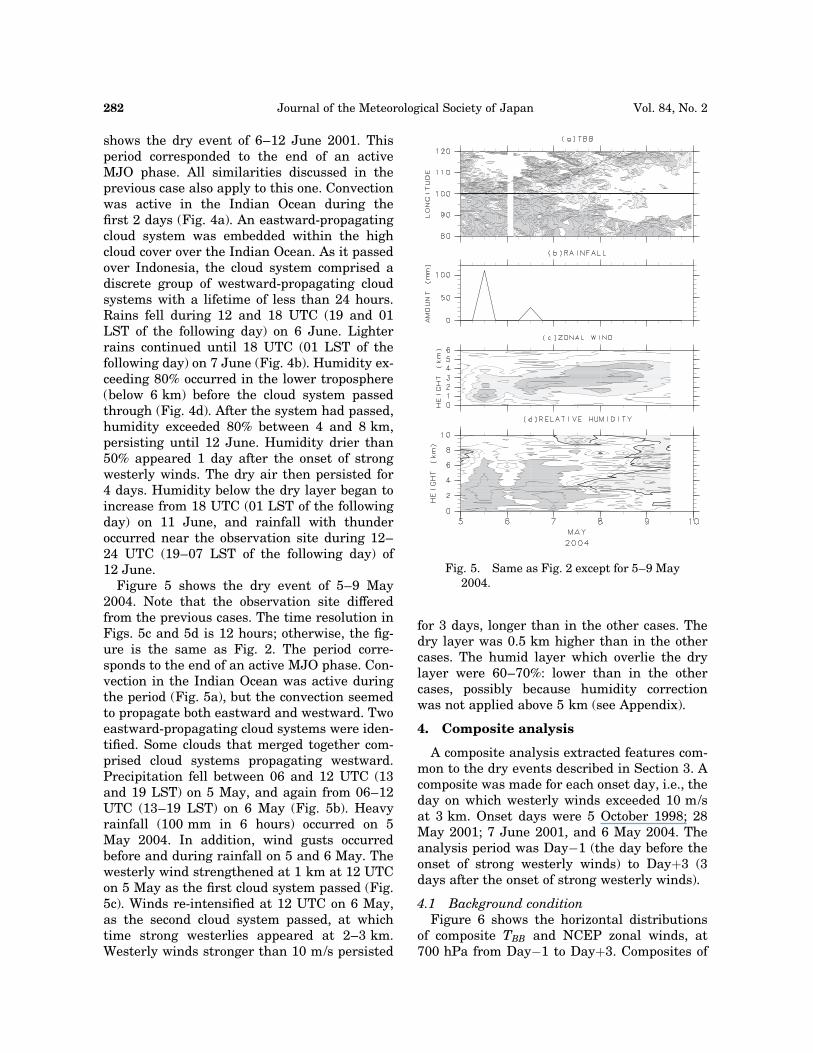
shows the dry event of 6–12 June 2001. Thisperiod corresponded to the end of an activeMJO phase. All similarities discussed in theprevious case also apply to this one. Convectionwas active in the Indian Ocean during thefirst 2 days (Fig. 4a). An eastward-propagatingcloud system was embedded within the highcloud cover over the Indian Ocean. As it passedover Indonesia, the cloud system comprised adiscrete group of westward-propagating cloudsystems with a lifetime of less than 24 hours.Rains fell during 12 and 18 UTC (19 and 01LST of the following day) on 6 June. Lighterrains continued until 18 UTC (01 LST of thefollowing day) on 7 June (Fig. 4b). Humidity ex-ceeding 80% occurred in the lower troposphere(below 6 km) before the cloud system passedthrough (Fig. 4d). After the system had passed,humidity exceeded 80% between 4 and 8 km,persisting until 12 June. Humidity drier than50% appeared 1 day after the onset of strongwesterly winds. The dry air then persisted for4 days. Humidity below the dry layer began toincrease from 18 UTC (01 LST of the followingday) on 11 June, and rainfall with thunderoccurred near the observation site during 12–24 UTC (19–07 LST of the following day) of12 June.
Figure 5 shows the dry event of 5–9 May2004. Note that the observation site differedfrom the previous cases. The time resolution inFigs. 5c and 5d is 12 hours; otherwise, the fig-ure is the same as Fig. 2. The period corre-sponds to the end of an active MJO phase. Con-vection in the Indian Ocean was active duringthe period (Fig. 5a), but the convection seemedto propagate both eastward and westward. Twoeastward-propagating cloud systems were iden-tified. Some clouds that merged together com-prised cloud systems propagating westward.Precipitation fell between 06 and 12 UTC (13and 19 LST) on 5 May, and again from 06–12UTC (13–19 LST) on 6 May (Fig. 5b). Heavyrainfall (100 mm in 6 hours) occurred on 5May 2004. In addition, wind gusts occurredbefore and during rainfall on 5 and 6 May. Thewesterly wind strengthened at 1 km at 12 UTCon 5 May as the first cloud system passed (Fig.5c). Winds re-intensified at 12 UTC on 6 May,as the second cloud system passed, at whichtime strong westerlies appeared at 2–3 km.Westerly winds stronger than 10 m/s persisted
for 3 days, longer than in the other cases. Thedry layer was 0.5 km higher than in the othercases. The humid layer which overlie the drylayer were 60–70%: lower than in the othercases, possibly because humidity correctionwas not applied above 5 km (see Appendix).
4. Composite analysis
A composite analysis extracted features com-mon to the dry events described in Section 3. Acomposite was made for each onset day, i.e., theday on which westerly winds exceeded 10 m/sat 3 km. Onset days were 5 October 1998; 28May 2001; 7 June 2001, and 6 May 2004. Theanalysis period was Day�1 (the day before theonset of strong westerly winds) to Dayþ3 (3days after the onset of strong westerly winds).
4.1 Background conditionFigure 6 shows the horizontal distributions
of composite TBB and NCEP zonal winds, at700 hPa from Day�1 to Dayþ3. Composites of
Fig. 5. Same as Fig. 2 except for 5–9 May2004.
282 Journal of the Meteorological Society of Japan Vol. 84, No. 2
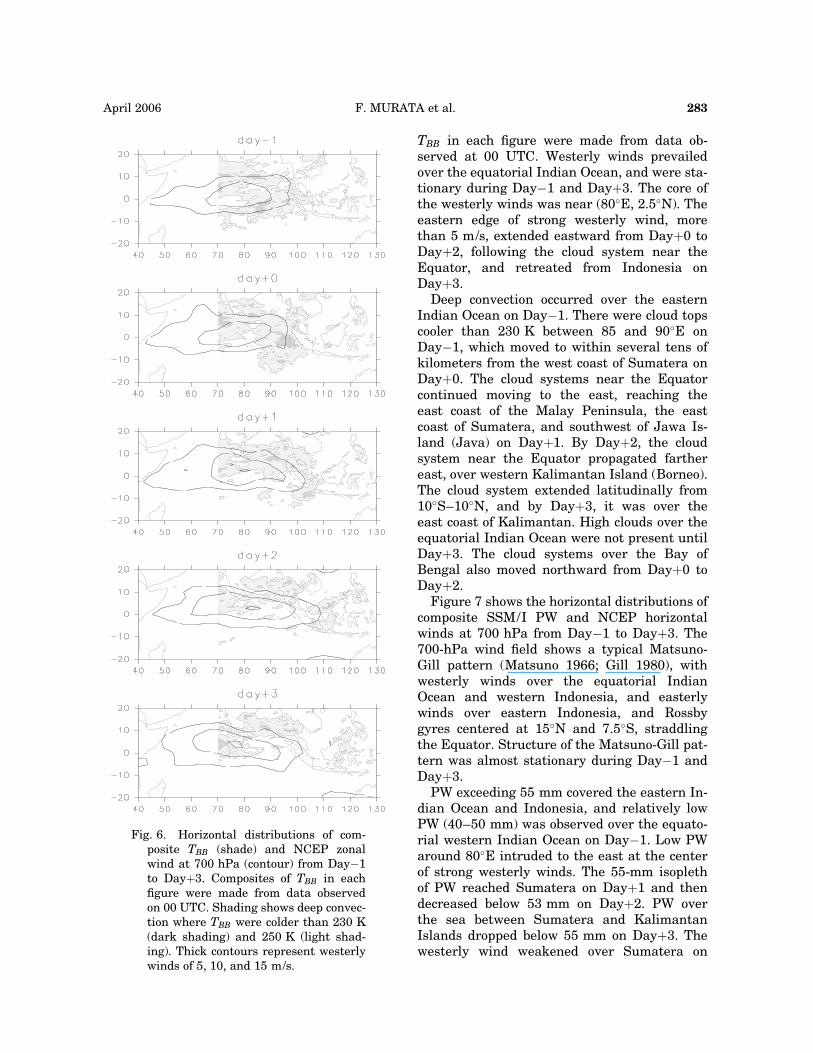
TBB in each figure were made from data ob-served at 00 UTC. Westerly winds prevailedover the equatorial Indian Ocean, and were sta-tionary during Day�1 and Dayþ3. The core ofthe westerly winds was near (80�E, 2.5�N). Theeastern edge of strong westerly wind, morethan 5 m/s, extended eastward from Dayþ0 toDayþ2, following the cloud system near theEquator, and retreated from Indonesia onDayþ3.
Deep convection occurred over the easternIndian Ocean on Day�1. There were cloud topscooler than 230 K between 85 and 90�E onDay�1, which moved to within several tens ofkilometers from the west coast of Sumatera onDayþ0. The cloud systems near the Equatorcontinued moving to the east, reaching theeast coast of the Malay Peninsula, the eastcoast of Sumatera, and southwest of Jawa Is-land (Java) on Dayþ1. By Dayþ2, the cloudsystem near the Equator propagated farthereast, over western Kalimantan Island (Borneo).The cloud system extended latitudinally from10�S–10�N, and by Dayþ3, it was over theeast coast of Kalimantan. High clouds over theequatorial Indian Ocean were not present untilDayþ3. The cloud systems over the Bay ofBengal also moved northward from Dayþ0 toDayþ2.
Figure 7 shows the horizontal distributions ofcomposite SSM/I PW and NCEP horizontalwinds at 700 hPa from Day�1 to Dayþ3. The700-hPa wind field shows a typical Matsuno-Gill pattern (Matsuno 1966; Gill 1980), withwesterly winds over the equatorial IndianOcean and western Indonesia, and easterlywinds over eastern Indonesia, and Rossbygyres centered at 15�N and 7.5�S, straddlingthe Equator. Structure of the Matsuno-Gill pat-tern was almost stationary during Day�1 andDayþ3.
PW exceeding 55 mm covered the eastern In-dian Ocean and Indonesia, and relatively lowPW (40–50 mm) was observed over the equato-rial western Indian Ocean on Day�1. Low PWaround 80�E intruded to the east at the centerof strong westerly winds. The 55-mm isoplethof PW reached Sumatera on Dayþ1 and thendecreased below 53 mm on Dayþ2. PW overthe sea between Sumatera and KalimantanIslands dropped below 55 mm on Dayþ3. Thewesterly wind weakened over Sumatera on
Fig. 6. Horizontal distributions of com-posite TBB (shade) and NCEP zonalwind at 700 hPa (contour) from Day�1to Dayþ3. Composites of TBB in eachfigure were made from data observedon 00 UTC. Shading shows deep convec-tion where TBB were colder than 230 K(dark shading) and 250 K (light shad-ing). Thick contours represent westerlywinds of 5, 10, and 15 m/s.
April 2006 F. MURATA et al. 283
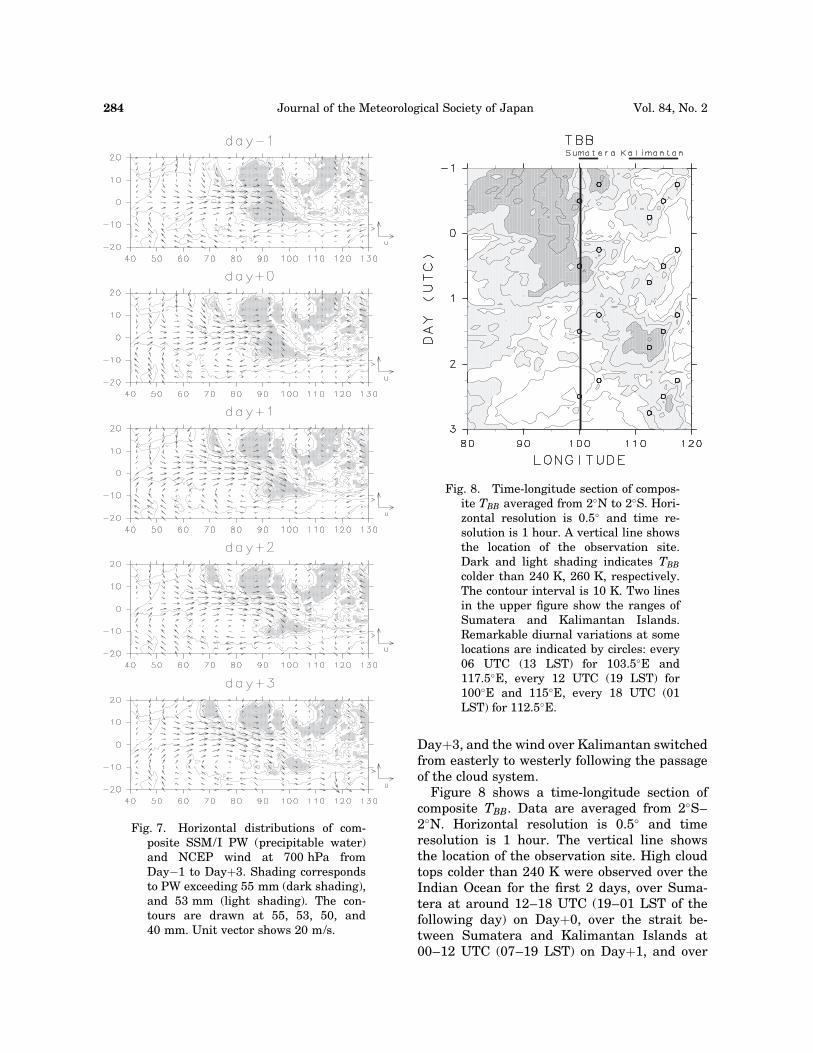
Dayþ3, and the wind over Kalimantan switchedfrom easterly to westerly following the passageof the cloud system.
Figure 8 shows a time-longitude section ofcomposite TBB. Data are averaged from 2�S–2�N. Horizontal resolution is 0.5� and timeresolution is 1 hour. The vertical line showsthe location of the observation site. High cloudtops colder than 240 K were observed over theIndian Ocean for the first 2 days, over Suma-tera at around 12–18 UTC (19–01 LST of thefollowing day) on Dayþ0, over the strait be-tween Sumatera and Kalimantan Islands at00–12 UTC (07–19 LST) on Dayþ1, and over
Fig. 7. Horizontal distributions of com-posite SSM/I PW (precipitable water)and NCEP wind at 700 hPa fromDay�1 to Dayþ3. Shading correspondsto PW exceeding 55 mm (dark shading),and 53 mm (light shading). The con-tours are drawn at 55, 53, 50, and40 mm. Unit vector shows 20 m/s.
Fig. 8. Time-longitude section of compos-ite TBB averaged from 2�N to 2�S. Hori-zontal resolution is 0.5� and time re-solution is 1 hour. A vertical line showsthe location of the observation site.Dark and light shading indicates TBB
colder than 240 K, 260 K, respectively.The contour interval is 10 K. Two linesin the upper figure show the ranges ofSumatera and Kalimantan Islands.Remarkable diurnal variations at somelocations are indicated by circles: every06 UTC (13 LST) for 103.5�E and117.5�E, every 12 UTC (19 LST) for100�E and 115�E, every 18 UTC (01LST) for 112.5�E.
284 Journal of the Meteorological Society of Japan Vol. 84, No. 2
Kalimantan by 18 UTC (01 LST of the followingday) on Dayþ1. Propagation speed was 8–10�/day (10–13 m/s). TBB colder than 260 K, whichcorresponded to heights around 7 km, disap-peared 1 day after the passage of the cloud sys-tem. Figure 8 also shows the local time depen-dence of cloud development. Remarkablediurnal variations are indicated by circles inFig. 8. A clear diurnal signal in the westwardpropagation appeared over Kalimantan. High(cold) cloud tops appeared near 118�E at 06UTC (13 LST), and dissipated near 112�E at18 UTC (01 LST). A diurnal signal also ap-peared over Sumatera. High cloud tops ap-peared near 103�E at 06 UTC (13 LST), andnear 100�E at 12 UTC (19 LST). Diurnal sig-nals could be identified even in the eastwardpropagating cloud system. An influence of diur-nal circulations was implied in this area.
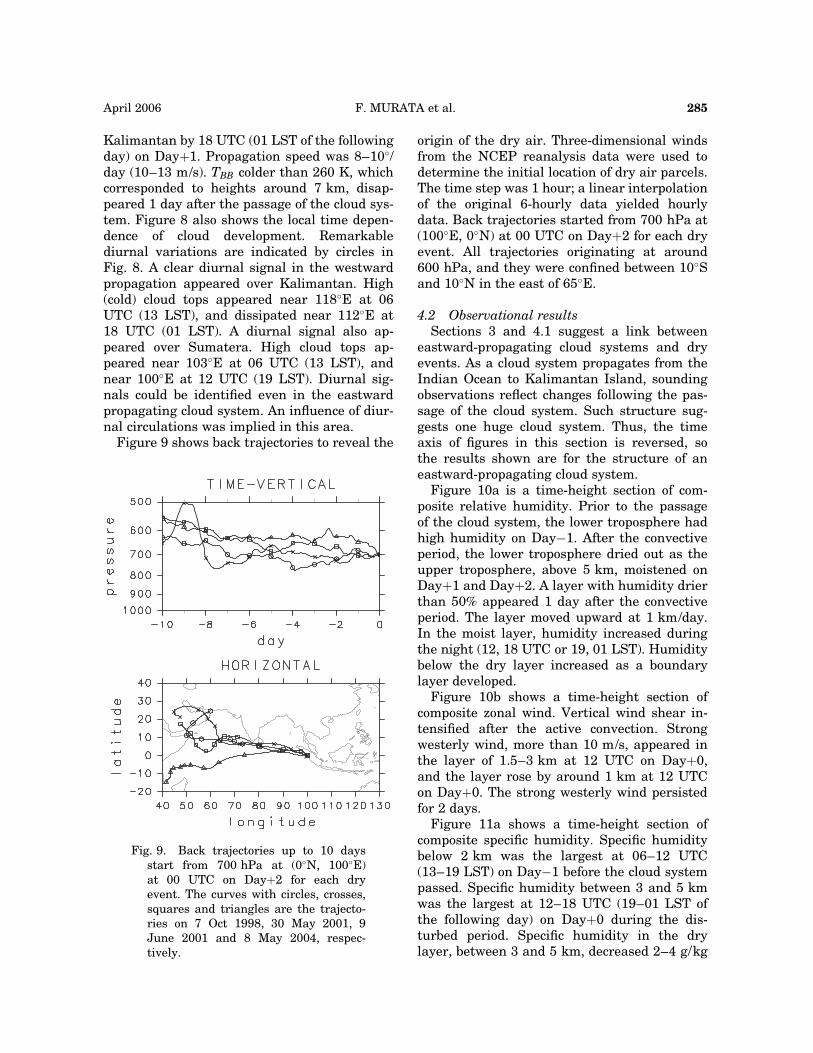
Figure 9 shows back trajectories to reveal the
origin of the dry air. Three-dimensional windsfrom the NCEP reanalysis data were used todetermine the initial location of dry air parcels.The time step was 1 hour; a linear interpolationof the original 6-hourly data yielded hourlydata. Back trajectories started from 700 hPa at(100�E, 0�N) at 00 UTC on Dayþ2 for each dryevent. All trajectories originating at around600 hPa, and they were confined between 10�Sand 10�N in the east of 65�E.
4.2 Observational resultsSections 3 and 4.1 suggest a link between
eastward-propagating cloud systems and dryevents. As a cloud system propagates from theIndian Ocean to Kalimantan Island, soundingobservations reflect changes following the pas-sage of the cloud system. Such structure sug-gests one huge cloud system. Thus, the timeaxis of figures in this section is reversed, sothe results shown are for the structure of aneastward-propagating cloud system.
Figure 10a is a time-height section of com-posite relative humidity. Prior to the passageof the cloud system, the lower troposphere hadhigh humidity on Day�1. After the convectiveperiod, the lower troposphere dried out as theupper troposphere, above 5 km, moistened onDayþ1 and Dayþ2. A layer with humidity drierthan 50% appeared 1 day after the convectiveperiod. The layer moved upward at 1 km/day.In the moist layer, humidity increased duringthe night (12, 18 UTC or 19, 01 LST). Humiditybelow the dry layer increased as a boundarylayer developed.
Figure 10b shows a time-height section ofcomposite zonal wind. Vertical wind shear in-tensified after the active convection. Strongwesterly wind, more than 10 m/s, appeared inthe layer of 1.5–3 km at 12 UTC on Dayþ0,and the layer rose by around 1 km at 12 UTCon Dayþ0. The strong westerly wind persistedfor 2 days.
Figure 11a shows a time-height section ofcomposite specific humidity. Specific humiditybelow 2 km was the largest at 06–12 UTC(13–19 LST) on Day�1 before the cloud systempassed. Specific humidity between 3 and 5 kmwas the largest at 12–18 UTC (19–01 LST ofthe following day) on Dayþ0 during the dis-turbed period. Specific humidity in the drylayer, between 3 and 5 km, decreased 2–4 g/kg
Fig. 9. Back trajectories up to 10 daysstart from 700 hPa at (0�N, 100�E)at 00 UTC on Dayþ2 for each dryevent. The curves with circles, crosses,squares and triangles are the trajecto-ries on 7 Oct 1998, 30 May 2001, 9June 2001 and 8 May 2004, respec-tively.
April 2006 F. MURATA et al. 285
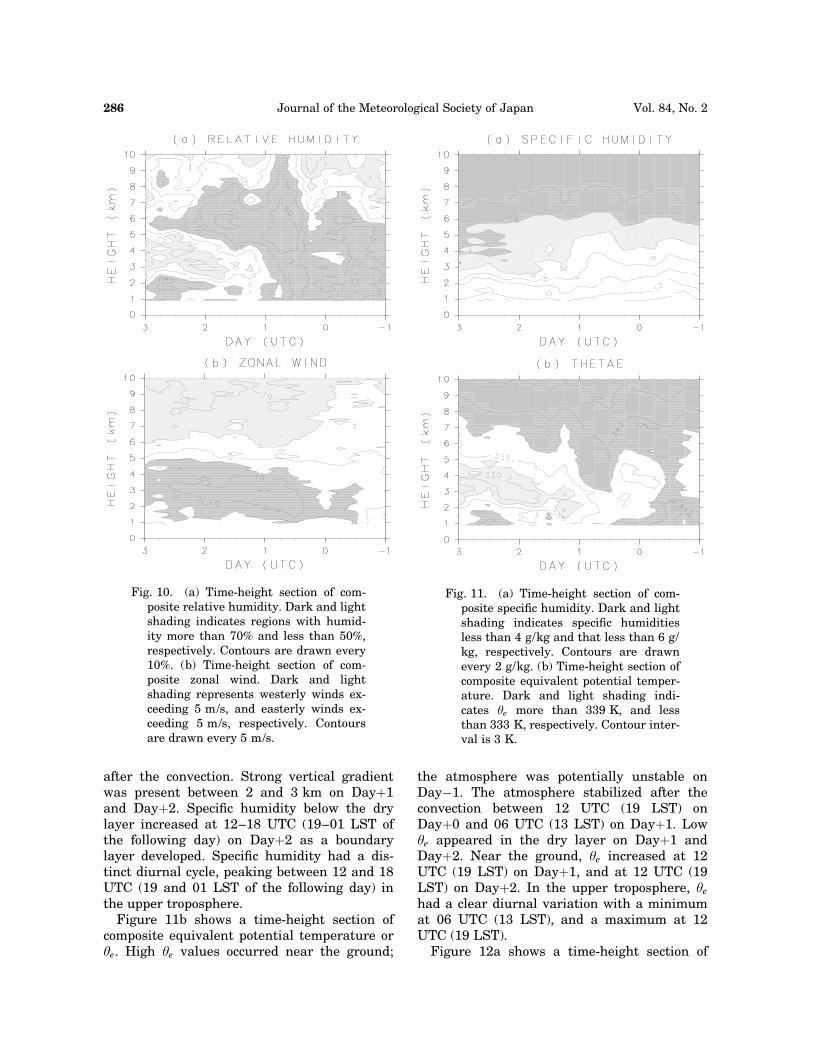
after the convection. Strong vertical gradientwas present between 2 and 3 km on Dayþ1and Dayþ2. Specific humidity below the drylayer increased at 12–18 UTC (19–01 LST ofthe following day) on Dayþ2 as a boundarylayer developed. Specific humidity had a dis-tinct diurnal cycle, peaking between 12 and 18UTC (19 and 01 LST of the following day) inthe upper troposphere.
Figure 11b shows a time-height section ofcomposite equivalent potential temperature orye. High ye values occurred near the ground;
the atmosphere was potentially unstable onDay�1. The atmosphere stabilized after theconvection between 12 UTC (19 LST) onDayþ0 and 06 UTC (13 LST) on Dayþ1. Lowye appeared in the dry layer on Dayþ1 andDayþ2. Near the ground, ye increased at 12UTC (19 LST) on Dayþ1, and at 12 UTC (19LST) on Dayþ2. In the upper troposphere, ye
had a clear diurnal variation with a minimumat 06 UTC (13 LST), and a maximum at 12UTC (19 LST).
Figure 12a shows a time-height section of
Fig. 10. (a) Time-height section of com-posite relative humidity. Dark and lightshading indicates regions with humid-ity more than 70% and less than 50%,respectively. Contours are drawn every10%. (b) Time-height section of com-posite zonal wind. Dark and lightshading represents westerly winds ex-ceeding 5 m/s, and easterly winds ex-ceeding 5 m/s, respectively. Contoursare drawn every 5 m/s.
Fig. 11. (a) Time-height section of com-posite specific humidity. Dark and lightshading indicates specific humiditiesless than 4 g/kg and that less than 6 g/kg, respectively. Contours are drawnevery 2 g/kg. (b) Time-height section ofcomposite equivalent potential temper-ature. Dark and light shading indi-cates ye more than 339 K, and lessthan 333 K, respectively. Contour inter-val is 3 K.
286 Journal of the Meteorological Society of Japan Vol. 84, No. 2
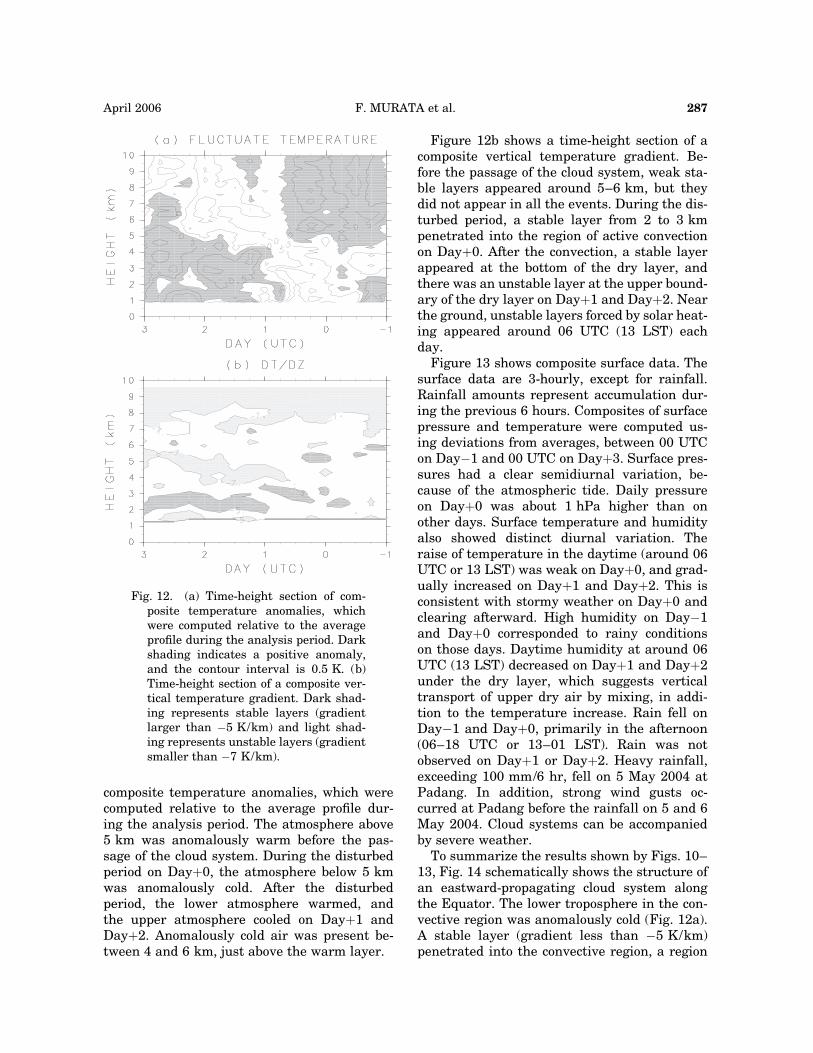
composite temperature anomalies, which werecomputed relative to the average profile dur-ing the analysis period. The atmosphere above5 km was anomalously warm before the pas-sage of the cloud system. During the disturbedperiod on Dayþ0, the atmosphere below 5 kmwas anomalously cold. After the disturbedperiod, the lower atmosphere warmed, andthe upper atmosphere cooled on Dayþ1 andDayþ2. Anomalously cold air was present be-tween 4 and 6 km, just above the warm layer.
Figure 12b shows a time-height section of acomposite vertical temperature gradient. Be-fore the passage of the cloud system, weak sta-ble layers appeared around 5–6 km, but theydid not appear in all the events. During the dis-turbed period, a stable layer from 2 to 3 kmpenetrated into the region of active convectionon Dayþ0. After the convection, a stable layerappeared at the bottom of the dry layer, andthere was an unstable layer at the upper bound-ary of the dry layer on Dayþ1 and Dayþ2. Nearthe ground, unstable layers forced by solar heat-ing appeared around 06 UTC (13 LST) eachday.
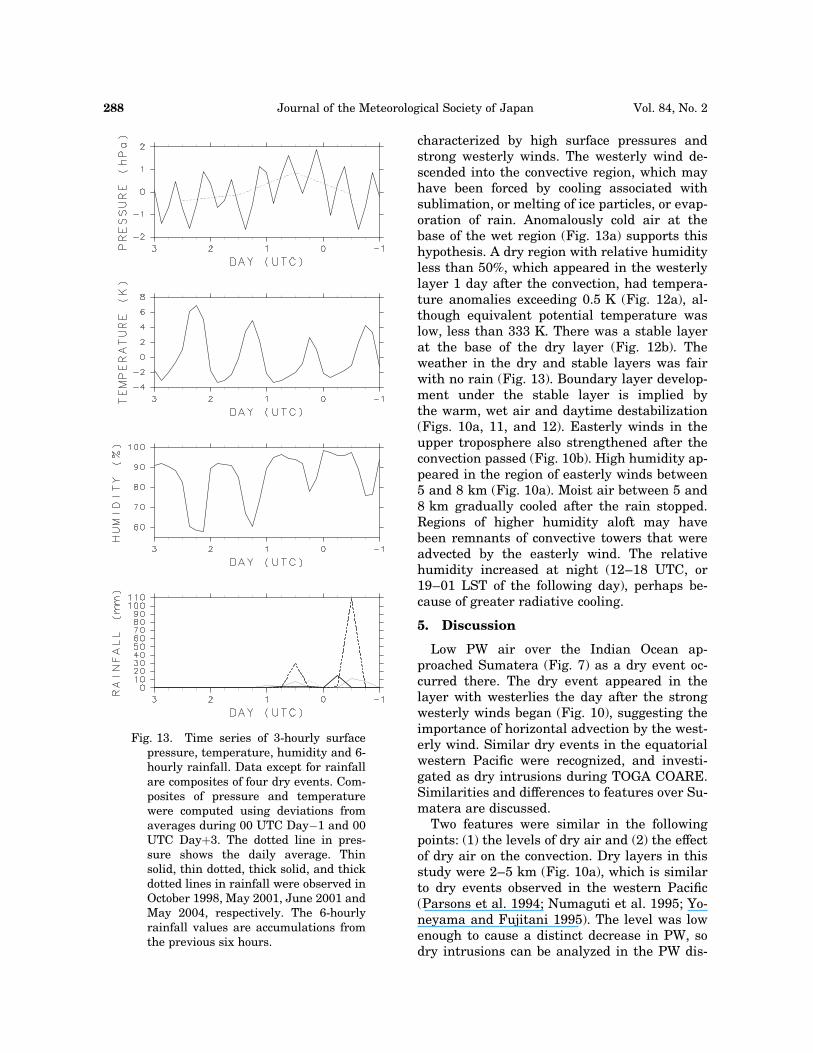
Figure 13 shows composite surface data. Thesurface data are 3-hourly, except for rainfall.Rainfall amounts represent accumulation dur-ing the previous 6 hours. Composites of surfacepressure and temperature were computed us-ing deviations from averages, between 00 UTCon Day�1 and 00 UTC on Dayþ3. Surface pres-sures had a clear semidiurnal variation, be-cause of the atmospheric tide. Daily pressureon Dayþ0 was about 1 hPa higher than onother days. Surface temperature and humidityalso showed distinct diurnal variation. Theraise of temperature in the daytime (around 06UTC or 13 LST) was weak on Dayþ0, and grad-ually increased on Dayþ1 and Dayþ2. This isconsistent with stormy weather on Dayþ0 andclearing afterward. High humidity on Day�1and Dayþ0 corresponded to rainy conditionson those days. Daytime humidity at around 06UTC (13 LST) decreased on Dayþ1 and Dayþ2under the dry layer, which suggests verticaltransport of upper dry air by mixing, in addi-tion to the temperature increase. Rain fell onDay�1 and Dayþ0, primarily in the afternoon(06–18 UTC or 13–01 LST). Rain was notobserved on Dayþ1 or Dayþ2. Heavy rainfall,exceeding 100 mm/6 hr, fell on 5 May 2004 atPadang. In addition, strong wind gusts oc-curred at Padang before the rainfall on 5 and 6May 2004. Cloud systems can be accompaniedby severe weather.
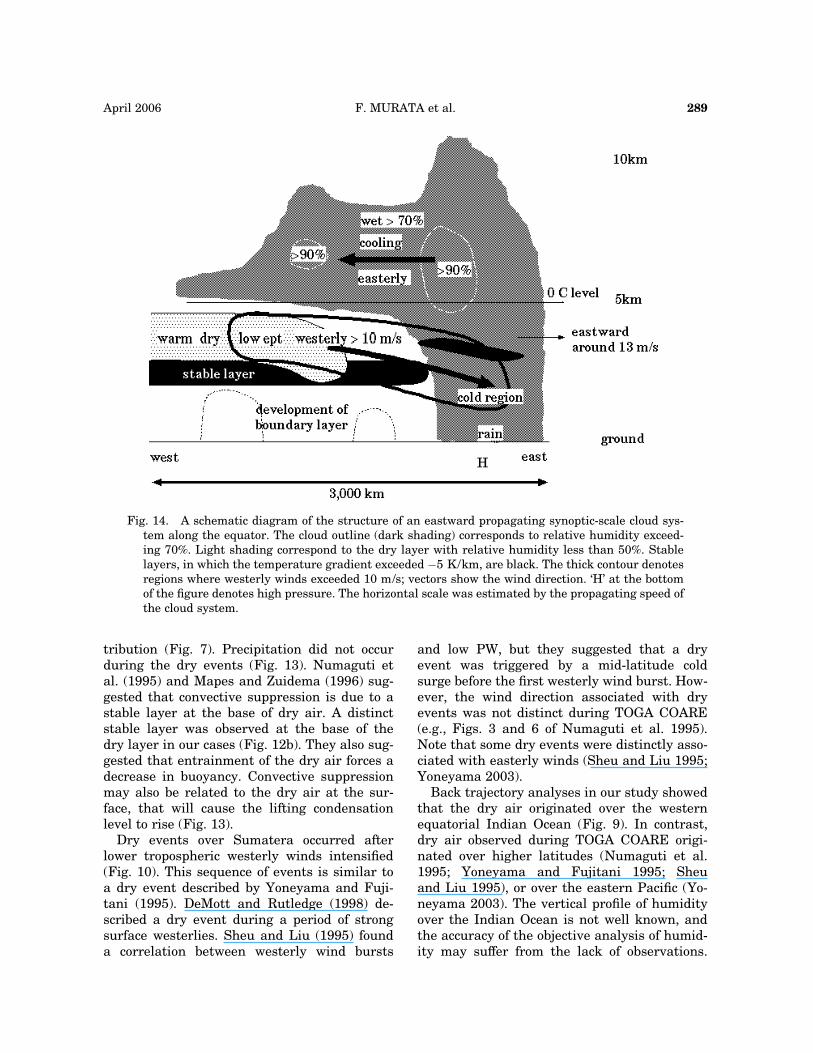
To summarize the results shown by Figs. 10–13, Fig. 14 schematically shows the structure ofan eastward-propagating cloud system alongthe Equator. The lower troposphere in the con-vective region was anomalously cold (Fig. 12a).A stable layer (gradient less than �5 K/km)penetrated into the convective region, a region
Fig. 12. (a) Time-height section of com-posite temperature anomalies, whichwere computed relative to the averageprofile during the analysis period. Darkshading indicates a positive anomaly,and the contour interval is 0.5 K. (b)Time-height section of a composite ver-tical temperature gradient. Dark shad-ing represents stable layers (gradientlarger than �5 K/km) and light shad-ing represents unstable layers (gradientsmaller than �7 K/km).
April 2006 F. MURATA et al. 287
characterized by high surface pressures andstrong westerly winds. The westerly wind de-scended into the convective region, which mayhave been forced by cooling associated withsublimation, or melting of ice particles, or evap-oration of rain. Anomalously cold air at thebase of the wet region (Fig. 13a) supports thishypothesis. A dry region with relative humidityless than 50%, which appeared in the westerlylayer 1 day after the convection, had tempera-ture anomalies exceeding 0.5 K (Fig. 12a), al-though equivalent potential temperature waslow, less than 333 K. There was a stable layerat the base of the dry layer (Fig. 12b). Theweather in the dry and stable layers was fairwith no rain (Fig. 13). Boundary layer develop-ment under the stable layer is implied bythe warm, wet air and daytime destabilization(Figs. 10a, 11, and 12). Easterly winds in theupper troposphere also strengthened after theconvection passed (Fig. 10b). High humidity ap-peared in the region of easterly winds between5 and 8 km (Fig. 10a). Moist air between 5 and8 km gradually cooled after the rain stopped.Regions of higher humidity aloft may havebeen remnants of convective towers that wereadvected by the easterly wind. The relativehumidity increased at night (12–18 UTC, or19–01 LST of the following day), perhaps be-cause of greater radiative cooling.
5. Discussion
Low PW air over the Indian Ocean ap-proached Sumatera (Fig. 7) as a dry event oc-curred there. The dry event appeared in thelayer with westerlies the day after the strongwesterly winds began (Fig. 10), suggesting theimportance of horizontal advection by the west-erly wind. Similar dry events in the equatorialwestern Pacific were recognized, and investi-gated as dry intrusions during TOGA COARE.Similarities and differences to features over Su-matera are discussed.
Two features were similar in the followingpoints: (1) the levels of dry air and (2) the effectof dry air on the convection. Dry layers in thisstudy were 2–5 km (Fig. 10a), which is similarto dry events observed in the western Pacific(Parsons et al. 1994; Numaguti et al. 1995; Yo-neyama and Fujitani 1995). The level was lowenough to cause a distinct decrease in PW, sodry intrusions can be analyzed in the PW dis-
Fig. 13. Time series of 3-hourly surfacepressure, temperature, humidity and 6-hourly rainfall. Data except for rainfallare composites of four dry events. Com-posites of pressure and temperaturewere computed using deviations fromaverages during 00 UTC Day�1 and 00UTC Dayþ3. The dotted line in pres-sure shows the daily average. Thinsolid, thin dotted, thick solid, and thickdotted lines in rainfall were observed inOctober 1998, May 2001, June 2001 andMay 2004, respectively. The 6-hourlyrainfall values are accumulations fromthe previous six hours.
288 Journal of the Meteorological Society of Japan Vol. 84, No. 2
tribution (Fig. 7). Precipitation did not occurduring the dry events (Fig. 13). Numaguti etal. (1995) and Mapes and Zuidema (1996) sug-gested that convective suppression is due to astable layer at the base of dry air. A distinctstable layer was observed at the base of thedry layer in our cases (Fig. 12b). They also sug-gested that entrainment of the dry air forces adecrease in buoyancy. Convective suppressionmay also be related to the dry air at the sur-face, that will cause the lifting condensationlevel to rise (Fig. 13).
Dry events over Sumatera occurred afterlower tropospheric westerly winds intensified(Fig. 10). This sequence of events is similar toa dry event described by Yoneyama and Fuji-tani (1995). DeMott and Rutledge (1998) de-scribed a dry event during a period of strongsurface westerlies. Sheu and Liu (1995) founda correlation between westerly wind bursts
and low PW, but they suggested that a dryevent was triggered by a mid-latitude coldsurge before the first westerly wind burst. How-ever, the wind direction associated with dryevents was not distinct during TOGA COARE(e.g., Figs. 3 and 6 of Numaguti et al. 1995).Note that some dry events were distinctly asso-ciated with easterly winds (Sheu and Liu 1995;Yoneyama 2003).
Back trajectory analyses in our study showedthat the dry air originated over the westernequatorial Indian Ocean (Fig. 9). In contrast,dry air observed during TOGA COARE origi-nated over higher latitudes (Numaguti et al.1995; Yoneyama and Fujitani 1995; Sheuand Liu 1995), or over the eastern Pacific (Yo-neyama 2003). The vertical profile of humidityover the Indian Ocean is not well known, andthe accuracy of the objective analysis of humid-ity may suffer from the lack of observations.
Fig. 14. A schematic diagram of the structure of an eastward propagating synoptic-scale cloud sys-tem along the equator. The cloud outline (dark shading) corresponds to relative humidity exceed-ing 70%. Light shading correspond to the dry layer with relative humidity less than 50%. Stablelayers, in which the temperature gradient exceeded �5 K/km, are black. The thick contour denotesregions where westerly winds exceeded 10 m/s; vectors show the wind direction. ‘H’ at the bottomof the figure denotes high pressure. The horizontal scale was estimated by the propagating speed ofthe cloud system.
April 2006 F. MURATA et al. 289
However, mid-levels of the atmosphere over thewestern equatorial Indian Ocean are drier thanover the eastern equatorial Indian Ocean. Thewestern part of the Indian Ocean is in the sub-sidence region of the Walker circulation and isgenerally convectively inactive. Moistening ofmid-levels by convection is therefore consideredto be rare. The horizontal gradient of PW alongthe equatorial Indian Ocean (Fig. 7) is consis-tent with this notion. In contrast, the TOGACOARE region is located east of the warm poolregion, so the atmosphere is generally moisterto the west. Back-trajectory results (Fig. 9),the sloping layer of westerly winds (Fig. 10b),and the warm anomaly in the dry layer (Fig.12a), all suggest that gradual sinking motionof middle level air also contributes to lower spe-cific humidity. The subsidence of 100 hPa per10 days (Fig. 9), and ye decrease of around 6 Kper day in the dry layer (Fig. 11b) can be ex-plained by longwave radiative cooling.
Eastward-propagating synoptic-scale cloudsystems (Fig. 8) were associated with the dryevents, and precipitation fell before the dryevents (Fig. 13). Numaguti et al. (1995) notedthat rainfall occurred several days before thedry events, but no studies using data duringTOGA COARE have related dry events to cloudsystems. Recently, Roca et al. (2005) indicateda relation between dry intrusions and rainfallin West Africa.
The observed cloud systems have some fea-tures of Kelvin waves. The high surface pres-sure, and near-surface westerly winds, werenearly in phase (Fig. 14). The latitudinalextent of 10�N–10�S (Fig. 6) was similar tothe deduced equatorial radius of deformation(Takayabu 1994). The observed phase speed(around 13 m/s) was also similar to paststudies. Wheeler et al. (2000) and Straub andKiladis (2002) described zonal-height sectionsof convectively-coupled Kelvin waves, from com-posites of reanalysis dataset, and rawinsondesobserved in the eastern Pacific, respectively.The lower atmosphere cooled during the dis-turbed period, and the upper atmosphere cooledafter the disturbed period, similar to Fig. 12a.The descending westerly wind anomalies to-ward the convective region, dry anomalies inthe westerly anomalies, and wet anomaly re-gion above the dry anomaly region in their fig-ures are also similar to the structure of our
study (Figs. 10a, b).Other eastward-propagating cloud systems
independent of dry intrusions yet with similarphase speeds and horizontal scales were ob-served at the observation sites (not shown).Such systems do not always follow dry intru-sions, or even strong westerly winds, so dry in-trusions or strong westerly winds are not neces-sary for the steady eastward propagation. Theobserved cloud system is one kind of eastwardpropagating synoptic-scale cloud systems.
The observed cloud system (Fig. 14) resem-bles a squall line (e.g., Houze 2004) in appear-ance, though squall lines have smaller scales(typically up to several hundred kilometers)than the cloud systems described in our study,which scale to more than 1000 km. For exam-ple, there were two similar airflows in therear part: a descending rear inflow (westerlywind) below the 0�C layer, and front-to-rearflow (easterly wind) above the 0�C layer. Thedescending westerly winds were characterizedby low equivalent potential temperature, andthe easterly wind advected humid air. Highsurface pressure occurred during the period ofactive convection.
Composite analysis in the 700 hPa wind field(Figs. 7 and 8) revealed a stationary Matsuno-Gill pattern over the Indian Ocean and Indone-sia. The eastward-propagating cloud systemsnear the Equator seem to overlay the standingwave. There is a hypothesis to consider station-ary heating as a forcing source of MJO (e.g.,Zhang and Hendon 1997), but the dry eventsin our study appeared in the various phases ofMJOs (see, Section 3). The relationship be-tween dry events and MJOs is beyond the aimof this study.
Observed rainfall occurred mostly in the af-ternoon (06–18 UTC or 13–01 LST of thefollowing day; Fig. 13), timing that is similarto rainfall produced by diurnal disturbances.Cloud development over Sumatera and Kali-mantan Islands also showed local time depen-dence (e.g., Mori et al. 2004; Sakurai et al.2005, for Sumatera Island) even in thesynoptic-scale disturbances (Fig. 8). They implythat diurnal-scale systems have an influenceon synoptic-scale cloud systems. Figures 8 and13 also represent that even local convectionson diurnal timescales were suppressed duringthe dry events.
290 Journal of the Meteorological Society of Japan Vol. 84, No. 2
6. Conclusion
Dry events that sometimes appear over Su-matera manifest as a dry layer, between 2 and5 km. Four dry events occurred in the westerlywind field after the westerly wind intensified tomore than 10 m/s in the lower troposphere.Strong westerlies appeared as an eastward-propagating synoptic-scale cloud system passedthrough.
Common features of the dry events werehighlighted by a composite analysis. The large-scale wind field showed a stationary Matsuno-Gill pattern over the Indian Ocean and Indone-sia. A cloud system overlaying the stationarywave propagated eastward, with the latitudinalscale of 10�S–10�N; 700-hPa westerly windsfollowed the cloud system. The longitudinalscale of the cloud system, measured as the areawhere TBB was colder than 260 K, was 1000 km.Propagation speed was around 13 m/s. Lowvalues of PW over the Indian Ocean extendedeastward, following the westerly wind. Dryevents were caused by dry intrusions of west-erly wind. The dry air originated over the equa-torial western Indian Ocean.
The structure of the eastward propagatingsynoptic-scale cloud system was estimated bysoundings. The structure of the cloud systemwas similar to the structure of squall lines inappearance. The cloud systems also displayedproperties of a Kelvin wave: they propagatedeastward along the Equator and showed an in-phase relation between the high surface pres-sure and lower tropospheric westerly wind.
The observed eastward-propagating synoptic-scale cloud system produced rain as it passedthe observation site, and suppressed convectionin the rear part of the cloud system. A system-atic weather transition occurred in equatorialregions as the cloud system moved. Tropicalweather forecasts may be improved in the fu-ture studies by considering these cloud systemsand how they relate to the MJO.
Acknowledgement
The first author thanks Drs. Shinjiro Kanaeat the Research Institute for Humanity andNature, and Taiichi Hayashi at Kyoto Univer-sity (Kyoto-U) for providing a good environ-ment in which to continue this study. Drs.Kunio Yoneyama at the Japan Agency for
Marine-Earth Science and Technology (JAM-STEC), Tetsuo Nakazawa at the MeteorologicalResearch Institute, and Atusi Numaguti atHokkaido University (Hokkaido-U) providedvaluable comments. We appreciate good discus-sions with Drs. Hisayuki Kubota and QoosakuMoteki at JAMSTEC, Tetsuya Takemi at TokyoInstitute of Technology, and Mr. Satoru Yokoiat Kyoto-U. Drs. Masatomo Fujiwara atHokkaido-U and Shin-Ya Ogino at JAMSTECparticipated in valuable discussions in theearly stage of this study. We also thank the Ed-itor (Dr. Jun Matsumoto) and two anonymousreviewers for their help to improve this paper.The observation site, ‘Kototabang’, was con-structed and maintained through the effortsof Drs. Susumu Kato and Shoichiro Fukao atKyoto-U, and members of the Research Insti-tute for Sustainable Humanosphere (RISH),Kyoto-U. Rawinsonde observations were con-ducted in cooperation with the Agency forthe Assessment and Application of Technology(BPPT), Indonesia, the Indonesian Meteorolog-ical and Geophysical Agency, the Institute ofObservational Research for Global ChangeJAMSTEC, RISH Kyoto-U, and Kobe Univer-sity. Rawinsonde observations in April–May2004 were conducted as part of the joint projectbetween Kyoto-U Active Geosphere Investiga-tions for the 21st Century COE and BPPT In-donesia, and the joint project between Japanand the National Institute of Aeronautics andSpace, Indonesia, called Coupling Processesin the Equatorial Atmosphere (CPEA). CPEAis supported by a Grant-in-Aid for ScientificResearch on Priority Area-764 from the Minis-try of Education, Culture, Sports, Science, andTechnology (MEXT) of Japan. The figuresin this paper were drawn using the GFD-DENNOU Library.
Appendix
Two types of Vaisala rawinsonde were usedto produce soundings in 2004. The total sound-ing period were during 00 UTC 10 April–12UTC 09 May 2004. Older RS80-15G modelswere used in the latter half of the period (12UTC 26 April–12 UTC 09 May). Some studies(e.g., Fujiwara et al. 2003; Nakamura et al.2004) have noted a dry bias at lower altitudesby old RS80-15G models using A-Humicaphumidity sensors. A humidity correction was
April 2006 F. MURATA et al. 291
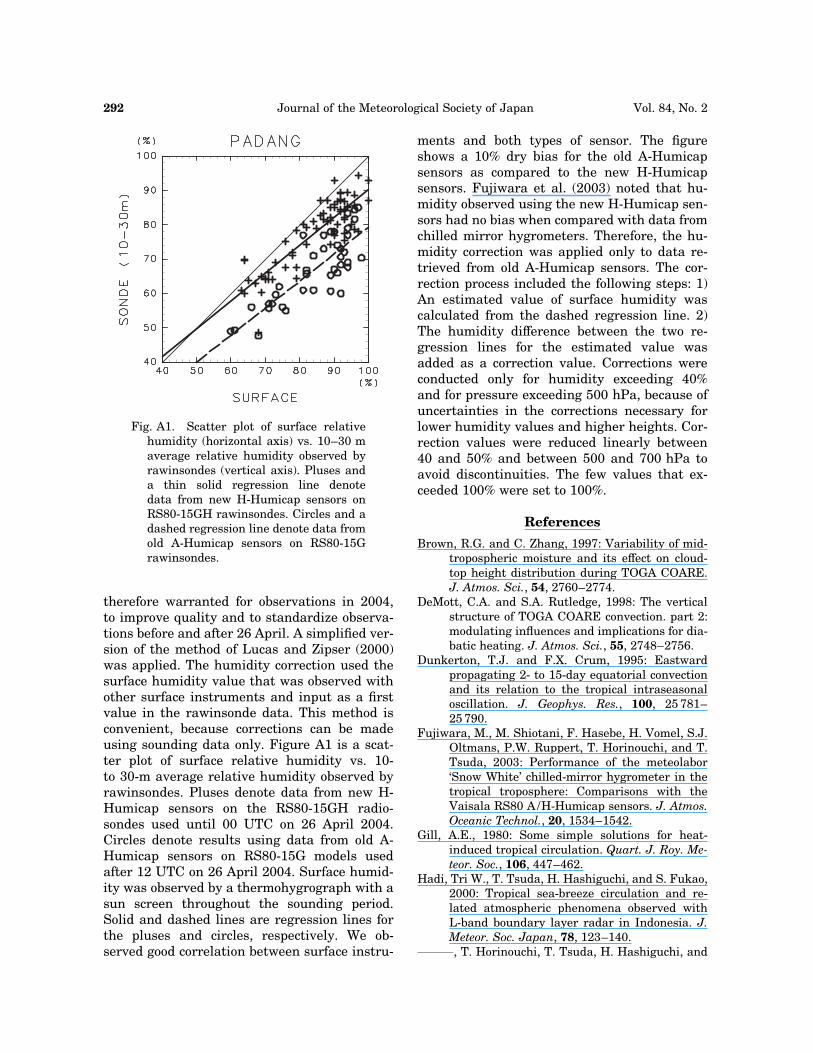
therefore warranted for observations in 2004,to improve quality and to standardize observa-tions before and after 26 April. A simplified ver-sion of the method of Lucas and Zipser (2000)was applied. The humidity correction used thesurface humidity value that was observed withother surface instruments and input as a firstvalue in the rawinsonde data. This method isconvenient, because corrections can be madeusing sounding data only. Figure A1 is a scat-ter plot of surface relative humidity vs. 10-to 30-m average relative humidity observed byrawinsondes. Pluses denote data from new H-Humicap sensors on the RS80-15GH radio-sondes used until 00 UTC on 26 April 2004.Circles denote results using data from old A-Humicap sensors on RS80-15G models usedafter 12 UTC on 26 April 2004. Surface humid-ity was observed by a thermohygrograph with asun screen throughout the sounding period.Solid and dashed lines are regression lines forthe pluses and circles, respectively. We ob-served good correlation between surface instru-
ments and both types of sensor. The figureshows a 10% dry bias for the old A-Humicapsensors as compared to the new H-Humicapsensors. Fujiwara et al. (2003) noted that hu-midity observed using the new H-Humicap sen-sors had no bias when compared with data fromchilled mirror hygrometers. Therefore, the hu-midity correction was applied only to data re-trieved from old A-Humicap sensors. The cor-rection process included the following steps: 1)An estimated value of surface humidity wascalculated from the dashed regression line. 2)The humidity difference between the two re-gression lines for the estimated value wasadded as a correction value. Corrections wereconducted only for humidity exceeding 40%and for pressure exceeding 500 hPa, because ofuncertainties in the corrections necessary forlower humidity values and higher heights. Cor-rection values were reduced linearly between40 and 50% and between 500 and 700 hPa toavoid discontinuities. The few values that ex-ceeded 100% were set to 100%.
References
Brown, R.G. and C. Zhang, 1997: Variability of mid-tropospheric moisture and its effect on cloud-top height distribution during TOGA COARE.J. Atmos. Sci., 54, 2760–2774.
DeMott, C.A. and S.A. Rutledge, 1998: The verticalstructure of TOGA COARE convection. part 2:modulating influences and implications for dia-batic heating. J. Atmos. Sci., 55, 2748–2756.
Dunkerton, T.J. and F.X. Crum, 1995: Eastwardpropagating 2- to 15-day equatorial convectionand its relation to the tropical intraseasonaloscillation. J. Geophys. Res., 100, 25 781–25 790.
Fujiwara, M., M. Shiotani, F. Hasebe, H. Vomel, S.J.Oltmans, P.W. Ruppert, T. Horinouchi, and T.Tsuda, 2003: Performance of the meteolabor‘Snow White’ chilled-mirror hygrometer in thetropical troposphere: Comparisons with theVaisala RS80 A/H-Humicap sensors. J. Atmos.Oceanic Technol., 20, 1534–1542.
Gill, A.E., 1980: Some simple solutions for heat-induced tropical circulation. Quart. J. Roy. Me-teor. Soc., 106, 447–462.
Hadi, Tri W., T. Tsuda, H. Hashiguchi, and S. Fukao,2000: Tropical sea-breeze circulation and re-lated atmospheric phenomena observed withL-band boundary layer radar in Indonesia. J.Meteor. Soc. Japan, 78, 123–140.
———, T. Horinouchi, T. Tsuda, H. Hashiguchi, and
Fig. A1. Scatter plot of surface relativehumidity (horizontal axis) vs. 10–30 maverage relative humidity observed byrawinsondes (vertical axis). Pluses anda thin solid regression line denotedata from new H-Humicap sensors onRS80-15GH rawinsondes. Circles and adashed regression line denote data fromold A-Humicap sensors on RS80-15Grawinsondes.
292 Journal of the Meteorological Society of Japan Vol. 84, No. 2
S. Fukao, 2002: Sea-breeze circulation overJakarta, Indonesia: A climatology based onboundary layer radar observations. Mon. Wea.Rev., 130, 2153–2166.
Hendon, H.H. and K. Woodberry, 1993: The diurnalcycle of tropical convection. J. Geophys. Res.,98, 16 623–16 637.
Houze, R.A., S.G. Geotis, F.D. Marks, and A.K. West,1980: Winter monsoon convection in the vicin-ity of north Borneo. part 1: structure and timevariation of the clouds and precipitation. Mon.Wea. Rev., 109, 1595–1614.
———, 2004: Mesoscale convective systems. Rev.Geophys., 42, RG4003.
Johnson, R.H., P.E. Ciesieleski, and J.A. Cotturone,2001: Multiscale variability of the atmosphericmixed layer over the western Pacific warmpool. J. Atmos. Sci., 58, 2729–2750.
Kalnay, E. and Coauthors, 1996: The NCEP-NCAR40-year reanalysis project. Bull. Amer. Meteor.Soc., 78, 437–471.
Lucas, C. and E.J. Zipser, 2000: Environmental vari-ability during TOGA COARE. J. Atmos. Sci.,57, 2333–2350.
Madden, R.A. and P.R. Julian, 1971: Detection ofa 40–50 day oscillation in the zonal wind inthe tropical Pacific. J. Atmos. Sci., 28, 702–708.
——— and ———, 1972: Description of global scalecirculation cells in the tropics with a 40–50day period. J. Atmos. Sci., 29, 1109–1123.
——— and ———, 1994: Observations of the 40–50-day tropical oscillation—a review. Mon. Wea.Rev., 122, 814–837.
Mapes, B.E. and P. Zuidema, 1996: Radiative-dynamical consequences of dry tongues in thetropical troposphere. J. Atmos. Sci., 53, 620–638.
Matsuno, T., 1966: Quasi-geostrophic motions in theequatorial area. J. Meteor. Soc. Japan, 44, 25–42.
Mori, S., J.-I. Hamada, Y.I. Tauhid, M.D. Yamanaka,N. Okamoto, F. Murata, N. Sakurai, H. Hashi-guchi, and T. Sribimawati, 2004: Diurnal land-sea rainfall peak migration over Sumatera Is-land, Indonesian maritime continent observedby TRMM satellite and intensive rawinsondesoundings. Mon. Wea. Rev., 132, 2021–2039.
Murakami, M., 1983: Analysis of the deep convectiveactivity over the western Pacific and southeastAsia. J. Meteor. Soc. Japan, 61, 60–76.
Murata, F., M.D. Yamanaka, F. Fujiwara, S. Ogino,H. Hashiguchi, S. Fukao, M. Kudsy, T. Sribi-mawati, S.W.B. Harijono, and E. Kelana,2002: Relationship between wind and precipi-tation observed with a UHF radar, GPS raw-insondes and surface meteorological instru-
ments at Kototabang, West Sumatera duringSeptember–October 1998. J. Meteor. Soc.Japan, 80, 347–360.
Nakamura, H., H. Seko, Y. Shoji, Aerological obser-vatory, and Meteorological instruments center,2004: Dry biases of humidity measurementsfrom the Vaisala RS80-A and Meisei RS2-91radiosondes and from ground-based GPS. J.Meteor. Soc. Japan, 82(1B), 277–299.
Nakazawa, 1986: Mean features of 30–60 day varia-tions as inferred from 8-year OLR data. J. Me-teor. Soc. Japan, 64, 777–786.
———, 1988: Tropical super clousters within intra-seasonal variations over the western Pacific. J.Meteor. Soc. Japan, 66, 823–839.
Nitta, T. and S. Sekine, 1994: Diurnal variation ofconvective activity over the tropical westernPacific. J. Meteor. Soc. Japan, 72, 627–641.
Numaguti, A., R. Oki, K. Nakamura, K. Tsuboki, N.Misawa, T. Asai, and Y.-M. Kodama, 1995: 4–5-day-period variation and low-level dry air ob-served in the equatorial western Pacific duringthe TOGA-COARE IOP. J. Meteor. Soc. Japan,73(2B), 267–290.
Parsons, D., W. Dabberdt, H. Cole, T. Hock, C. Mar-tin, A.-L. Barrett, E. Miller, M. Spowart, M.Howard, W. Ecklund, D. Carter, K. Gage, andJ. Wilson, 1994: The integrated sounding sys-tem: description and preliminary observationsfrom TOGA COARE. Bull. Amer. Meteor. Soc.,75, 553–567.
———, K. Yoneyama, and J.-L. Redelsperger, 2000:The evolution of the tropical western Pacificatmosphere–ocean system following the ar-rival of a dry intrusion. Quart. J. Roy. Meteor.Soc., 126, 517–548.
Ramage, C.S., 1968: Role of a tropical ‘maritime con-tinent’ in the atmospheric circulation. Mon.Wea. Rev., 96, 365–369.
Redelsperger, J.-L., D.B. Parsons, and F. Guichard,2002: Recovery processes and factors limitingcloud-top height following the arrival of a dryintrusion observed during TOGA COARE. J.Atmos. Sci., 59, 2438–2457.
Roca, R., J.-L. Lafore, C. Piriou, and J.-L. Redel-sperger, 2005: Extratropical dry-air intrusionsinto the West African monsoon midtropo-sphere: an important factor for the convectiveactivity over the Sahel. J. Atmos. Sci., 62,390–407.
Renggono, F., H. Hashiguchi, S. Fukao, M.D. Yama-naka, S.-Y. Ogino, N. Okamoto, F. Murata,B.P. Sitorus, M. Kudsy, M. Kartasasmita, andG. Ibrahim, 2001: Precipitating clouds ob-served by 1.3-GHz boundary layer radars inequatorial Indonesia. Ann. Geophysicae, 19,889–897.
April 2006 F. MURATA et al. 293
Sakurai, N., F. Murata, M.D. Yamanaka, S. Mori,J.-I. Hamada, H. Hashiguchi, Y.I. Tauhid, T.Sribimawati, and B. Suhardi, 2005: Diurnal cy-cle of migration of convective cloud systemsover Sumatera Island. J. Meteor. Soc. Japan,83, 835–850.
Sheu, R.-S. and G. Liu, 1995: Atmospheric humid-ity variations associated with westerly windbursts during Tropical Ocean Global Atmo-sphere (TOGA) Coupled Ocean AtmosphereResponse Experiment. J. Geophys. Res., 100,25759–25768.
Straub, K.H. and G.N. Kiladis, 2002: Observations ofa convectively coupled Kelvin wave in the east-ern Pacific ITCZ. J. Atmos. Sci., 59, 30–53.
Sui, C.-H. and K.-M. Lau, 1992: Multiple phenomenain the tropical atmosphere over the westernPacific. Mon. Wea. Rev., 120, 407–430.
Takayabu, Y.N. and M. Murakami, 1991: The struc-ture of super cloud clusters observed on 1–20June 1986 and their relationship to easterlywaves. J. Meteor. Soc. Japan, 69, 105–125.
———, 1994: Large-scale cloud disturbances associ-ated with equatorial waves. Part I: Spectralfeatures of the cloud disturbances. J. Meteor.Soc. Japan, 72, 433–448.
Webster, P.J. and R. Lucas, 1992: TOGA COARE:The coupled ocean-atmosphere response exper-iment. Bull. Amer. Meteor. Soc., 73, 1377–1416.
Wheeler, M. and G.N. Kiladis, 1999: Convectivelycoupled equatorial waves: analysis of clouds
and temperature in the wave-number-frequency domain. J. Atmos. Sci., 56, 374–399.
———, ———, and P.J. Webster, 2000: Large-scaledynamical fields associated with convectivelycoupled waves. J. Atmos. Sci., 57, 613–640.
Yang, G.-Y. and J. Slingo, 2001: The diurnal cycle inthe tropics. Mon. Wea. Rev., 129, 784–801.
Yatagai, Y. and A. Sumi, 1997: Statistical features ofdry air intrusions into the equatorial ocean.Proceedings of COARE97 conference, 161–162.
Yoneyama, K. and T. Fujitani, 1995: The behaviorof dry westerly air associated with convectionobserved during the TOGA-COARE R/V Nat-sushima cruise. J. Meteor. Soc. Japan, 73(2B),291–304.
——— and D.B. Parsons, 1999: A proposed mecha-nism for the intrusion of dry air into the tropi-cal western Pacific region. J. Atmos. Sci., 56,1524–1546.
———, 2003: Moisture variability over the tropicalwestern Pacific ocean. J. Meteor. Soc. Japan,81(2), 317–337.
Zachariasse, M., H.G. Smit, P.F.J. van Velthoven,and H. Kelder, 2001: Cross-tropopause and in-terhemispheric transports into the tropical freetroposphere over the Indian Ocean. J. Geophys.Res., 106, 28 441–28 452.
Zhang, C. and H.H. Hendon, 1997: Propagating andstanding components of the intraseasonal oscil-lation in tropical convection. J. Atmos. Sci., 54,741–752.
294 Journal of the Meteorological Society of Japan Vol. 84, No. 2


