Embed Size (px)
Citation preview

Perception amp Psychophysics2003 65 (5) 801-816
When people are presented with multiple tasks at thesame time each involving a rapid choice of actions sub-stantial interference usually occurs In the laboratory this in-terference between tasks is often measured using the psy-chological refractory period (PRP) design where twodifferent stimuli requiring speeded responses are sepa-rated in time by a variable stimulus onset asynchrony(SOA) As the SOA becomes shorter responses to the sec-ond stimulus are slowed dramatically even with seeminglyvery easy tasks (eg choice response time [RT] tasks in-volving trivial perceptual discriminations) This slowingknown as the PRP effect is very robust it has been foundin numerous experiments using various combinations oftasks input modalities and output modalities (see Welford1952)
Several different converging measures point toward theconclusion that the PRP effect is due largely to a centralbottleneck that is as shown in Figure 1 only one centraloperation takes place at a time (for recent reviews seeLien amp Proctor 2002 and Pashler amp Johnston 1998 fora contrary view see Meyer et al 1995) Central operations
include response selection and perhaps also memory re-trieval (Carrier amp Pashler 1995) memory consolidation(Jolicœur amp DellrsquoAcqua 1998) mental rotation (RuthruffMiller amp Lachmann 1995) and lexical processing (Mc-Cann Remington amp Van Selst 2000) but generally do notinclude inputoutput operations such as stimulus identifi-cation and response execution
Although the evidence for a central bottleneck appearsto be strong it has primarily come from PRP experimentsthat emphasized Task 1 over Task 2 There are two ways inwhich PRP studies emphasize Task 1 First the Task 1stimulus is almost always presented before the Task 2stimulus (hence the labels Task 1 and Task 2) Subjectsmight therefore infer that Task 1 is more important thanTask 2 Second PRP instructions often place explicit em-phasis on the speed of Task 1 For example subjects mightbe told to ldquorespond to Task 1 as fast as possiblerdquo These in-structions are intended to encourage subjects to emit theirTask 1 response as soon as it has been selected Absent theseinstructions subjects often withhold their Task 1 responseuntil their Task 2 response is also ready This response-grouping strategy (Borger 1963) is undesirable from theexperimenterrsquos point of view because it makes it difficultto determine when the critical Task 1 operations actuallyfinished
The emphasis on Task 1 raises the question of whetherthe central bottleneck revealed by PRP studies is obliga-tory (ie due to some structural limitation) or merely vol-untary Subjects might have the latent ability to overlap
801 Copyright 2003 Psychonomic Society Inc
This research was supported by grants from the National ResearchCouncil and the National Aeronautics and Space Administration Theresearch was also supported by Grant MH45584 from the National In-stitute of Mental Health to HEP We thank James Johnston DavidMeyer Mei-Ching Lien and Roger Remington for helpful commentsCorrespondence should be addressed to E Ruthruff NASA Ames Re-search Center Moffett Field CA 94035 (e-mail eruthruffmailarcnasagov)
Dual-task interference with equal task emphasisGraded capacity sharing or central postponement
ERIC RUTHRUFFNASA Ames Research Center Moffett Field California
HAROLD E PASHLERUniversity of California San Diego La Jolla California
and
ELIOT HAZELTINENASA Ames Research Center Moffett Field California
Most studies using the psychological refractory period (PRP) design suggest that dual-task perfor-mance is limited by a central bottleneck Because subjects are usually told to emphasize Task 1 how-ever the bottleneck might reflect a strategic choice rather than a structural limitation To evaluate thepossibility that central operations can proceed in parallel albeit with capacity limitations we con-ducted two dual-task experiments with equal task emphasis In both experiments subjects tended toeither group responses together or respond to one task well before the other In addition stimulusndashresponse compatibility effects were roughly constant across stimulus onset asynchronies (SOAs) Atthe short SOA compatibility effects also carried over onto response times for the other task This pat-tern of results is difficult to reconcile with the possibility that subjects share capacity roughly equallybetween simultaneous central operations However this pattern is consistent with the existence of astructural central bottleneck
802 RUTHRUFF PASHLER AND HAZELTINE
central operations but instead choose a bottleneck strat-egy because it is the easiest way to satisfy the Task 1 em-phasis instructions (see McLeod 1977 Meyer amp Kieras1997a 1997b Meyer et al 1995 Pashler 1994a Ruthruffet al 1995) There is in fact some reason to believe thatpeople have the latent potential to overlap central opera-tions Several recent studies have shown that Task 2 pro-cessing can influence RT to Task 1 (RT1) which is some-times called a backward compatibility effect Of particularinterest are cases in which backward compatibility effectson RT1 appear to stem from Task 2 stages at or beyondthe central stage (Hommel 1998 Lien amp Proctor 2000Logan amp Schulkind 2000 for a review see Lien amp Proc-tor 2002) Although the evidence is indirect such effectsare consistent with the hypothesis that Task 2 centralstages can be carried out (although not necessarily to com-pletion or with adequate accuracy levels) in parallel withTask 1 central stages
In addition a few recent studies have provided evidencefor parallel central processing in dual-task paradigms afterconsiderable practice (ie over 1000 trials per taskHazeltine Teague amp Ivry 2002 Schumacher SeymourGlass Kieras amp Meyer 2001 but see also Levy amp Pash-ler 2001 Ruthruff Johnston amp Van Selst 2001 RuthruffJohnston Van Selst Whitsell amp Remington 2003 VanSelst Ruthruff amp Johnston 1999) Schumacher et al forinstance found very small dual-task costs (10 msec)after subjects had performed five sessions of an auditoryndashvocal task (saying ldquo1rdquo ldquo2rdquo or ldquo3rdquo to low- medium- andhigh-pitched tones respectively) and a visualndashmanual task(making a compatible keypress to the spatial position of acircle) A limitation of these studies however is that prac-tice tends to dramatically reduce single-task RT conse-quently little dual-task interference would be expected evenif a bottleneck were still present (for a thorough discussionof ldquolatentrdquo bottlenecks see Ruthruff et al 2003) Fur-thermore even if the central bottleneck were eliminated inthese studies it might reflect the automatization of one orboth tasks with prolonged practice For instance peoplemight develop ldquojumper-cablerdquo paths directly betweenstimulus- and response-related areas (Johnston amp Del-gado 1993) This explanation seems particularly plausiblegiven the simplicity of the tasks typically used in these stud-iesmdashonly a few stimuli mapped directly to a few responses(often with high stimulusndashresponse [SndashR] compatibility)
The purpose of the present paper is to determine whetherparallel processing of central stages is possible even with-out thousands of practice trials when the instructions en-courage it There have been a few previous attempts to ad-dress this issue empirically In particular Ruthruff Pashlerand Klaassen (2001) found substantial central interferencebetween tasks even when subjects were asked to group re-sponses together which provided an incentive to carry outthe tasks concurrently These results argue strongly againstthe possibility that subjects performed both tasks togetherwith no central interference However the existence ofcentral interference does not necessarily imply that therewas a central bottleneck A viable alternative possibility is
that central operations proceeded in parallel but relativelyslowly due to capacity limitations (eg Kahneman 1973McLeod 1977) The present paper addresses this possi-bility which we call graded capacity sharing
GRADED CAPACITY SHARING
According to the graded capacity-sharing model con-sidered in this paper all stages on the two tasks (includingcentral stages such as response selection) can proceed inparallel Due to capacity limitations however some ofthese stages might proceed more slowly under dual-taskconditions than under single-task conditions In this paperwe focus on a version of this model in which capacitysharing occurs only in central stages (see McLeod 1977)with the input and output stages generally free from ca-pacity limitations This model can easily explain the greatbulk of PRP experiments simply by assuming that most ofthe available capacity is allocated initially to Task 1 Thisassumption is certainly plausible given the typical PRP in-structions to emphasize Task 1 Two recent papers (Navonamp Miller 2002 Tombu amp Jolicœur 2003) appraised themerits of capacity-sharing models and reached very sim-ilar conclusions
Unfortunately few existing data speak to the question ofwhether graded capacity sharing is or is not possible Oneexception however is a study by Pashler (1994a) in whichsubjects were instructed to place equal emphasis on eachof two tasks (a tone classification task and a letter classi-fication task) In that study the SOA between the tone andthe letter was 21000 2500 0 500 or 1000 msec sothat each task was equally likely to come first Thus un-like in the PRP paradigm there was no implicit or explicitencouragement for subjects to strategically impose a vol-untary processing bottleneck
To determine whether central operations were per-formed in series (as predicted by the central bottleneckmodel) or in parallel (as predicted by capacity-sharingmodels) Pashler (1994a) examined the time between theresponses to the tone and letter tasks also known as the inter-response interval (IRI) If central operations are per-formed serially then the response to Task A should gen-erally be emitted well before the response to Task B orvice versa That is the IRIs should be relatively large Inaddition there might be a modest proportion of trialswhere subjects group responses together producing anIRI close to zero Thus there should be three distinct pat-terns of response On the other hand if central operationsare performed in parallel with roughly equal capacity al-location then one might expect a broad unimodal distri-bution of IRIs centered roughly near zero The data showedthe response patterns predicted by the central bottleneckmodel rather than that predicted by roughly equal capacitysharing
The data from Pashler (1994a) indicate that a bottle-neck can arise even when the two tasks are given equalemphasis However an important limitation of this studyis that both tasks required manual responses (left hand for
DUAL-TASK INTERFERENCE WITH EQUAL TASK EMPHASIS 803
the tone task right hand for the letter task) Therefore itis possible that the bottleneck was not in central process-ing but rather in response initiation or execution (DeJong 1993 Keele 1973 but see also Sommer Leutholdamp Schubert 2001)
THE PRESENT STUDY
The present study was designed to determine whethergraded central capacity sharing is possible when subjectsare encouraged to overlap performance of the two tasksand when each task uses distinct input and output modal-ities We chose to study tasks with novel (ie not highlypracticed) SndashR mappings which clearly require centralprocessing and should produce relatively long RTs (en-suring that a central bottleneck if present could be easilydetected) Experiment 1 used the basic design of Pashler(1994a) with both positive and negative SOAs and equaltask emphasis However in the present Experiment 1 weused a tone task with a vocal response and an alpha-numeric character-identification task with a manual re-sponse (see below for details) The use of different responsemodalities on the two tasks greatly reduces the likelihoodof a response initiationexecution bottleneck Thus if westill find evidence for a bottleneck we can more confi-dently conclude that the locus of the bottleneck is in cen-tral processing
We used two different approaches to test between thecentral bottleneck model and the graded central capacity-sharing model The first approach was to examine the dis-tribution of IRIs across trials Experiment 1 tests the bot-tleneck model predictions outlined by Pashler (1994a)Experiment 2 tests these predictions as well as a novel pre-diction from the bottleneck model (discussed later) re-garding the effects of a slight SOA manipulation (250 or 150 msec) on the IRIs Specifically SOA should in-fluence which taskrsquos central operations are performedfirst but should not affect the shape of the underlying IRIdistribution
The second approach to testing these models (used onlyin Experiment 1) involved manipulating the duration ofcentral processing on the character task using a SndashR com-patibility manipulation As discussed below the centralbottleneck model makes very specific predictions regard-ing (1) how this compatibility manipulation will affect thecharacter task itself and (2) how these effects will carryover onto the tone task The capacity-sharing model makesmuch less specific predictions for each of these effectsbecause the outcome depends critically on how capacity isdivided between the two tasks However it does make spe-cific predictions for the joint values of these two effects
Central Bottleneck Model PredictionsIn this section we develop the logic underlying the pre-
dictions of the central bottleneck model We first discusspredictions regarding IRI distributions and then discuss pre-dictions regarding the effects of SndashR compatibility
Interresponse intervals To be consistent with our de-finition of SOA (character onset time minus tone onset
time) we define the IRI as the time of the character-taskresponse minus the time of the tone-task response Thuspositive numbers indicate that the tone-task response wasemitted first and negative values indicate that the character-task response was emitted first
As noted by Pashler (1994a) the central bottleneckmodel implies that on each trial subjects can perform cen-tral operations on the tasks in one of two possible orders(ie tone-before-character or character-before-tone) Ifsubjects select a response to the tone task first and promptlyexecute that response (ie without delays due to responsegrouping) then the tone-task response will be emittedwell before the character-task response producing a largepositive IRI The left panel of Figure 1 shows processingtime diagrams for this central processing order the toppanel corresponds to the compatible condition and thebottom panel corresponds to the incompatible conditionUnder the simplifying assumptions that a bottleneck is al-ways encountered at the 0-msec SOA and that the outputstages on the two tasks are roughly equal in duration theIRI on such trials should simply be equal to the durationof central processing on the character task (plus any task-switching time see Lien Schweickert amp Proctor 2003)On the basis of previous studies (eg Pashler 1994b) wecan roughly estimate that this stage will take 300ndash400 msec on average of course this stage time shouldvary considerably from trial to trial as does the overall RT
When subjects select responses in the other ordermdashcharacter before tonemdashand promptly execute responses(ie without response grouping) the character-task re-sponse will be emitted well before the tone-task response(see the right panel of Figure 1) Given our IRI definitionthese trials produce negative IRI values If we ignore thenegative sign (which merely indicates that the characterresponse came first) we see that these IRIs should beroughly equal to the duration of central processing on thetone task (again 300ndash400 msec on average)
A third possibility (not shown in Figure 1) is that sub-jects will perform central operations in one of the two pos-sible orders but then emit responses in close temporalsynchrony (ldquoresponse groupingrdquo Borger 1963) that isthey will withhold the response selected first until they areready to make the response selected second In this casethe IRI should be relatively small (perhaps between 2150and 1150 msec) There should still be some variability inIRIs but this variability should be far smaller than that ob-served when responses are not grouped (Pashler amp John-ston 1989)
Together these predictions suggest that the distributionof IRIs aggregated across subjects should have three dis-tinct and identifiable components1 One component (cor-responding to the case where tone-task central operationsare performed before character-task central operationswithout response grouping) should have a mode in the300ndash400 msec range and should depend strongly on character-task SndashR compatibility Another component(corresponding to the case where character-task centraloperations are performed before tone-task central opera-tions without response grouping) should have a mode in
804 RUTHRUFF PASHLER AND HAZELTINE
the 2300 to 2400 msec range and should not depend oncharacter-task SndashR compatibility The third component(corresponding to response grouping) should have a meannear zero with an especially low variance and should notdepend on SndashR compatibility
Compatibility effects on the character task For thecharacter task letters were mapped compatibly onto re-sponses but digits were not (for half the subjects) or viceversa (for the other half of the subjects) Because SndashRcompatibility was manipulated within blocks subjects didnot know in advance of each trial whether the charactertask would be compatible or incompatible According tothe central bottleneck model the effects of character-taskSndashR compatibility on the character task itself should beroughly additive with the effects of SOA (see McCann ampJohnston 1992 Pashler 1984 Pashler amp Johnston 1989Schweickert 1978 Schweickert amp Townsend 1989) Inbrief the reason is that the start of the central stage maybe delayed at short SOAs (due to the bottleneck) but afterthis delay it proceeds at full speed Because this stage pro-ceeds at the same speed in all conditions (and is on theldquocritical pathrdquo) the effect of SndashR compatibility should re-main unchanged
Carryover of compatibility effects onto tone-taskRT The central bottleneck model also makes specificpredictions regarding the effects of the character-task SndashRcompatibility manipulation on the tone task at the shortSOA (0 msec) If tone-task central operations are per-formed before character-task central operations and theresponses are not grouped (see the left panel of Figure 1)then tone-task RT should not be influenced by the SndashRcompatibility manipulation on the character task that isno carryover should occur A different result is expectedhowever when character-task central operations are per-formed before tone-task central operations (see the right
panel of Figure 1) In this case prolongation of centraloperations in the character task (due to the incompatibleSndashR mapping) should delay the start of central operationson the tone task and thus increase tone-task RT as well Infact it should increase by roughly the same amount as thecharacter task RT increases that is there should be fullcarryover of the compatibility effect onto tone-task RTCarryover should also occur when responses are groupedtogether regardless of the central processing order
These carryover predictions can also be expressed interms of the effects on the IRI distributions Full carry-over (predicted when character-task central operations areperformed first or when responses are grouped together)implies that the IRIs should not be influenced by the com-patibility manipulation However zero carryover (predictedwhen tone-task central operations are performed first with-out response grouping) implies that the IRIs should bestrongly influenced by character-task SndashR compatibility
Summary of central bottleneck model predictionsIn summary the central bottleneck model makes severalclear predictions First the distribution of IRIs shouldhave three distinct and identifiable components tone be-fore character character before tone and response group-ing Second character-task compatibility effects on thecharacter task itself should not depend on the SOA Thirdat the 0-msec SOA these character-task compatibility ef-fects should not carry over onto tone-task RT when the tone-task response is emitted well before the character-task response but should carry over fully when the character-task response is emitted well before the tone-task response
Capacity-Sharing Model Predictions To derive useful predictions from this class of models
it is necessary to first specify in more detail what is meantby ldquocapacity sharingrdquo As a starting point we adopt the
Figure 1 Example processing time diagrams for a central bottleneck model of the 0-msec SOA condition of Experiment 1 The leftpanel corresponds to trials where tone-task central operations are performed first the right panel corresponds to trials where character-task central operations are performed first The top panel corresponds to the compatible stimulusndashresponse mapping onthe character task the bottom panel corresponds to the incompatible mapping
Tone Before Character Character Before Tone
Compatible Character Task Compatible Character Task
Incompatible Character Task Incompatible Character Task
Tone
Character
Tone
Character
Tone
Character
Tone
Character
PerceptualProcessing
PerceptualProcessing
PerceptualProcessing
PerceptualProcessing
PerceptualProcessing
PerceptualProcessing
PerceptualProcessing
PerceptualProcessing
ResponseExecution
ResponseExecution
ResponseExecution
ResponseExecution
ResponseExecution
ResponseExecution
ResponseExecution
ResponseExecution
ResponseSelection
ResponseSelection
ResponseSelection
ResponseSelection
ResponseSelection
ResponseSelection
ResponseSelection
ResponseSelection
DUAL-TASK INTERFERENCE WITH EQUAL TASK EMPHASIS 805
model proposed by McLeod (1977 see also Tombu ampJolicœur 2003) which is reasonably well specified andplausible and which can account for most previous PRPfindings
As in the central bottleneck model processing is de-composed into three stages perceptual processing cen-tral processing and response execution The perceptualand response execution stages are assumed to operate inparallel with any other stages with no capacity limitations(provided there are no conflicts for a particular input oroutput modality) The central stages can also operate inparallel with other stages as shown in Figure 2A but re-quire a share of a fixed limited pool of resources Capac-ity can be allocated to each of two tasks (Y Z) in any ar-bitrary combination in order to meet the current taskdemands provided that the values are positive and sum to 1(ie there is no unused capacity while a central stage isunder way) Capacity can be dynamically reallocated assoon as a new task needs central processing or an old taskcompletes central processing2 Figure 2B shows a possibleallocation of capacity to central operations on Tasks Y andZ over time in this case central operations on Task Y fin-ish first at which point Task Z instantaneously receivesthe entire capacity3 McLeod (1977) did not specify ex-actly how the rate of central processing depends on ca-pacity but here we make the most straightforward as-sumption which is that processing rate is proportional tocapacity (see also Pashler 1984)
This capacity-sharing model is similar in many respectsto the central bottleneck model except for the critical as-sumption that central operations can proceed in parallelIn fact this model includes the central bottleneck model
as a special case where capacity allocation is always all-or-none (ie [01] or [10] where the two numbers inbrackets correspond to the proportion of capacity allo-cated to Tasks Y and Z respectively) Thus this capacity-sharing model can explain existing PRP data (which ap-pear to support the central bottleneck model) simply byasserting that PRP experiments encourage all-or-none ca-pacity allocation The key issue is whether under instruc-tions that encourage task sharing we will continue to seeall-or-none allocation (ie a bottleneck) or instead see ev-idence of actual capacity sharing (eg allocations such as[55])
Interresponse intervals The present experiments un-like most PRP experiments did not emphasize one taskover the other Subjects were encouraged to respond toboth tasks quickly and accurately In addition each taskwas equally likely to appear first Thus if capacity shar-ing is possible these instructions would appear to en-courage a roughly even split of capacity between the twotasks (later we will consider more complicated possibili-ties) If so one should expect a unimodal distribution ofIRIs This distribution should be fairly broad due to vari-ation in the completion times of the two tasks Given sim-ilar mean single-task RTs to the character and tone tasksone might expect the center of this distribution to be lo-cated somewhere near zero (though it could be shiftedaway from zero if one task generally receives more ca-pacity than the other)
Response grouping might also occur on some trials Ifthe decision to group responses is random (in the GeneralDiscussion we consider more exotic possibilities) thengrouping should simply increase the height of the IRI dis-tribution near 0 msec As noted by Pashler (1994a) on tri-als where grouping occurs it is difficult to discriminate ca-pacity sharing from central postponement thus whereverpossible our analyses focus on subsets of the data not in-fluenced by response grouping
Compatibility effects At long SOAs (21000 and11000 msec) where the first task can generally be com-pleted prior to the arrival of the stimulus for the secondtask each task should receive the entire capacity At the 0-msec SOA however capacity is likely to be shared Thereduced capacity should slow the central stages and thusmagnify the compatibility effects relative to the 21000-and 11000-msec SOAs (see Pashler 1984)
The exact size of the increase in compatibility effects atthe 0-msec SOA depends on the amount of time duringwhich tone-task central operations overlap with character-task operations If there is no temporal overlap then noincrease should occur If there is temporal overlap whichseems likely given that the mean RTs to the tone and char-acter tasks were similar then an increase in compatibilityeffects should occur In this case the size of the increasedepends on the allocation of capacity Let Ctone and Ccharrepresent the proportions of capacity allocated to the tonetask and character task respectively As shown in the Ap-pendix the maximum possible increase in the character-task compatibility effect at the short SOA is CtoneCchartimes the baseline (long SOA) compatibility effect For
A
B
Task Y
Task Z
CA
PAC
ITY
TIME
PerceptualProcessing
PerceptualProcessing
CentralProcessing
CentralProcessing
ResponseExecution
ResponseExecution
Task Y
Task Z
Figure 2 (A) Example processing time diagram for the capacity-sharing model (B) Central operations on Tasks Y and Z share alimited pool of capacity over time
806 RUTHRUFF PASHLER AND HAZELTINE
example with equal capacity sharing [0505] and maxi-mum temporal overlap the compatibility effect at the 0-msec SOA would be twice the size of the baseline com-patibility effect at long SOAs
Carryover of compatibility effects onto tone-taskRT The predicted carryover of character-task compati-bility effects onto tone-task RT depends on the amount ofoverlap between the central operations of the two tasksand on the capacity allocation If there is no overlap thenno carryover should occur If there is complete temporaloverlap then there should also be complete carryover thatis the carryover should be equal to the baseline (longSOA) compatibility effect on character-task RT (see theAppendix for details)
Because the amount of temporal overlap and the exactcapacity allocation are unknown the capacity-sharingmodel considered here does not make specific predictionsabout the effects of compatibility on the character task it-self and the carryover onto the tone task when consideredindividually However the model does make specifictestable predictions about these effects when consideredjointly As discussed in the Appendix these effects shouldbe linearly related The reason is that both effects dependon the exact same set of variables (temporal overlap andcapacity allocation) Figure 3 shows the predicted carry-over effect plotted against the predicted increase in the ef-fect of compatibility on the character task at the shortSOA expressed as a proportion of the baseline (longSOA) compatibility effect Predictions are shown for sev-eral different allocations of capacity to the two tasks Thepredictions for each allocation are represented by a line Theexact location along this line depends on the degree of
temporal overlap Points on the lower left (indicating noincrease in compatibility effects and no carryover) corre-spond to the case where there is no temporal overlap andpoints on the right correspond to cases where there is sub-stantial temporal overlap Also shown in Figure 3 on thefar left are two points corresponding to cases in which thecentral operations are processed strictly serially ([01] and[10]) as predicted by the central bottleneck model Thedashed line connecting these two points represents possi-ble mixtures (across trials) of the two strictly serial pro-cessing orders Note that each possible capacity allocationis consistent with only a limited range of combinations ofcompatibility and carryover effects Thus by examiningthe values for these two effects from an experiment we canestimate the capacity allocations used in that experiment4
Summary of capacity-sharing predictions If ca-pacity is shared roughly equally between tasks then onewould expect a broad unimodal distribution of IRIs Inaddition the effects of character-task SndashR compatibilityon the character task itself should be larger at the 0-msecSOA than at the long SOAs Furthermore these compati-bility effects should partially carry over onto tone-task RTJointly the effects of character-task SndashR compatibility onthe character task itself and on the tone task (ie carryover)can be used to estimate how capacity was allocated to thetwo tasks (Figure 3) If this estimate indicates extreme ca-pacity allocations ([01] or [10]) then there is no evidencefor graded capacity sharing
EXPERIMENT 1
The goal of Experiment 1 was to test the predictions ofthe central bottleneck and the capacity-sharing model Toensure that subjects were familiar with the tasks before webegan collecting data the first four blocks (a total of 152trials) were considered practice
MethodSubjects Thirty-two undergraduates at the University of Cali-
fornia San Diego participated in exchange for partial course creditStimuli Tone stimuli were presented at 100 800 or 3000 Hz and
lasted for 150 msec Character stimuli (A B C 1 2 3) subtending14ordm horizontally 3 19ordm vertically were white against a black back-ground
Procedure Subjects responded to the 100- 800- and 3000-Hztones by saying ldquolowrdquo ldquomediumrdquo and ldquohighrdquo respectively The ex-perimenter taped the session and later verified with a spot check thattone-task accuracy was greater than 90 for each subject Subjectsresponded to character stimuli (A B C 1 2 3) by pressing the ldquojrdquoldquokrdquo or ldquolrdquo key For half the subjects the letters A B and C weremapped in alphabetic order onto the three response keys from left toright (ie compatibly) but the numbers were mapped in a scrambledorder (3 1 2) onto the same three response keys producing an in-compatible mapping For the remaining subjects numbers weremapped compatibly (1 2 3) but letters were mapped incompatibly(C A B)
Subjects completed 12 blocks of 38 trials each (2 warmup trialsplus 36 test trials) Each trial began with the presentation of a fixa-tion cross for 1000 msec followed by a blank field for 500 msecfollowed by the tone andor character stimuli Three different SOAsbetween the tone and character were used 21000 0 and 1000 msecPositive SOAs indicate that the tone sounded before the character
Figure 3 Capacity-sharing model predictions Shown are thepredicted increases in the effects of the compatibility manipula-tion on RT to the character task itself at the short SOA relativeto the long SOA and the predicted carryover of compatibility ef-fects onto tone-task RT at the short SOA Predictions are shownfor several possible allocations of capacity to the two tasks [01][73] [55] [37] and [10] where the first and second num-bers in brackets indicate the capacity initially allocated to thecharacter and tone tasks respectively The asterisk representsthe results from Experiment 1 (with standard error bars)
DUAL-TASK INTERFERENCE WITH EQUAL TASK EMPHASIS 807
appeared whereas negative SOAs indicate that the character ap-peared before the tone sounded If an error was detected an errormessage was displayed for 1 sec The next trial began 1 sec later At theend of each block of trials subjects received performance feedback(RT and percent correct) and were allowed to take a short break
Subjects were asked to respond to both tasks as quickly and ac-curately as possible Both tasks were given equal emphasis The in-structions neither encouraged nor discouraged any particular re-sponse pattern
ResultsSubjects with character-task error rates greater than
15 in either the compatible or the incompatible condi-tion were eliminated from the analyses (n 5 3) as weresubjects who tended to group responses even at the 21000and 1000 msec SOAs (n = 3) In addition trials with anerror an RT less than 200 msec (1 of all trials) or anRT greater than 3 sec (1 of all trials) were excludedfrom the analyses
Main effects Mean tone-task and character-task RTsas well as character-task error rates are shown in Table 1as a function of SOA and character-task response com-patibility There was a significant main effect of SOA onboth the character task [F(250) 5 841 p 001] and thetone task [F(250) 5 1169 p 001] reflecting substan-tial dual-task slowing at the 0-msec SOA There was alsoa significant main effect of compatibility on the charactertask [F(125) 5 632 p 001] RTs were 174 mseclonger on average in the incompatible condition than inthe compatible condition Error data on the character taskshowed a small but significant main effect of SOA[F(250) 5 37 p 05] In addition errors were muchless frequent in the compatible condition (04) than inthe incompatible condition (49) [F(125) 5 724 p 001]
IRI distributions Figure 4A shows the distribution ofIRIs for the 0-msec SOA condition Plotted are the pro-portion of responses averaged across subjects in each 60-msec bin the open squares represent the compatible con-dition and the filled circles represent the incompatiblecondition Qualitatively the aggregate IRI distributionsappear to match the predictions of the central bottleneckmodel That model predicts that there will be one high-
variance component with a mode between 2300 and2400 msec (where tone-task central operations are per-formed first) that should depend on character-task com-patibility and another high-variance component with amode between 300 and 400 msec (where character-taskcentral operations are performed first) that should not de-pend on character-task compatibility There is also appar-ent evidence for the third predicted component (corre-sponding to grouped responses) with relatively low varianceand a mean near zero
Although the aggregate data show three componentsindividual subjects often show evidence for only one ortwo of the predicted components (eg some do not groupresponses others prefer one response order over the other)This point is evident in Figure 4B which shows the his-togram of IRIs (averaged across the compatible and in-compatible conditions) for two subgroups one with ex-tensive response grouping and one with relatively littleresponse grouping To make this classification we countedthe number of responses for each subject in the bin ex-tending from 230 to 130 msec (which according to thebottleneck model should consist primarily of trials whereresponse grouping occurred) The subjects suspected ofextensive grouping (n 5 8) all had 10 or more responsesin this bin whereas the remaining subjects (n 5 18) allhad 7 or fewer responses in this bin The 18 ldquonongroupersrdquo(diamond symbols connected by a solid line) clearly showbimodality and the two modes fall just where the bottle-neck model predicts they would fall (plus or minus300ndash400 msec) The 8 subjects suspected of grouping(plus symbols connected by a dotted line) also show evi-dence for these same two components in the same placesHowever these subjects also produced a narrow spike ofIRIs near 0 msec The narrowness of this spike suggestsresponse grouping (ie an effort to synchronize re-sponses) Thus the data are consistent with a bottleneckmodel combined with the reasonable proviso that a mi-nority of subjects frequently grouped responses
The most straightforward prediction from the capacity-sharing model with roughly equal sharing is a unimodaldistribution of IRIs This prediction was not confirmedThe dip in response proportion in the bins between 90 and
Table 1Response Time (RT in Milliseconds) and Error Rate (ER) for Each Task
as a Function of Stimulus Onset Asynchrony (SOA) and Character-Task StimulusndashResponse Mapping (Compatible vs Incompatible) in Experiment 1
SOA
21000 0 11000 (Char Then Tone) (Simultaneous) (Tone Then Char)
Task RT ER RT ER RT ER
Tone Compatible 759 1051 891Incompatible 793 1118 869
Character Compatible 740 02 996 07 668 01Incompatible 900 43 1157 39 869 66
808 RUTHRUFF PASHLER AND HAZELTINE
210 msec was not predicted by this model nor was thehigh proportion of responses in extreme positive or nega-tive IRI bins (eg beyond 2450 or 1450 msec)
Compatibility effects 3 SOA Consistent with thecentral bottleneck model the data showed no significantinteraction between compatibility and SOA on character-task RT [F(250) 5 147 p 2] the effect of compati-bility was 160 msec at the 21000-msec SOA 161 msecat the 0-msec SOA and 201 msec at the 1000-msec SOAThe capacity-sharing model however incorrectly pre-dicted an increase in compatibility effects at the 0-msecSOA
Neither model provides an obvious explanation for thesomewhat larger compatibility effects at the 1000-msecSOA (where the letter task was performed second) relativeto the 21000-msec SOA (where the letter task was per-formed first) However this difference was not significant[F(125) 5 227 p 1] and might simply be due to sam-pling error
Carryover of response compatibility effects ontotone-task RT At the short SOA (0 msec) we observedsignificant effects of character-task compatibility on thetone task Overall this carryover effect was 67 msec Thecentral bottleneck model predicts no carryover when thetone-task response is emitted well before the character-task response but predicts full carryover (ie roughlyequal in size to the compatibility effects on the charactertask itself) onto tone-task RT when the character-task re-sponse is emitted well before the tone-task responseThus the 67-msec average carryover effect would reflecta mixture of two states one producing no carryover andone producing full carryover (as noted response group-ing also produces full carryover) To evaluate this predic-tion trials with an IRI more negative than 2210 msec wereassigned to the tone-before-character category whereas tri-als with an IRI greater than 1210 were assigned to thecharacter-before-tone category Because not all subjectsproduced adequate numbers of responses in each category
Figure 4 Experiment 1 Proportion of interresponse intervals (IRIs) in each 60-msec bin Positive IRIs indicate that the subject responded to the tone task before thecharacter task negative IRIs indicate that the subject responded to the character taskbefore the tone task (A) Compatible (open squares) versus incompatible (filled circles)mapping (B) Nongroupers (diamonds) versus groupers (plus signs)
DUAL-TASK INTERFERENCE WITH EQUAL TASK EMPHASIS 809
to permit a meaningful estimate of carryover each esti-mate was based only on data from subjects with at least 5trials in both the compatible and incompatible conditionsWith this approach the carryover of compatibility effectsonto tone-task RT in the tone-before-character categorywas 221 msec (based on 17 subjects with an average of116 compatible trials and 131 incompatible trials) butcarryover in the character-before-tone category was170 msec (based on 18 subjects with an average of 132compatible trials and 116 incompatible trials) The lattercarryover effect (170 msec) on the tone task is roughlyequal to the 161-msec compatibility effect observed forthe character task itself at this SOA indicating full carry-over Thus we observed no carryover in the tone-before-character category and full carryover in the character-before-tone category just as predicted by the central bottleneck model
The lack of an increase in compatibility effects on thecharacter task at the short SOA combined with the sub-stantial carryover onto the tone task argues against equalor approximately equal capacity sharing Figure 3 showsthe predicted combinations of values for these two effectsas a function of the capacity allocation the asterisk showsthe values observed in Experiment 1 along with standarderror bars5 This data point fell within the range predictedfrom all-or-none capacity allocations ([01] and [10])hence the data are consistent with a mixture of the twopossible orders of sequential central processing predictedby the central bottleneck model (tone-before-characterand character-before-tone) Meanwhile the data are in-consistent with the predictions based on a roughly equalallocation of capacity to the central operations on the twotasks
Near-Zero IRIs Grouping or Capacity SharingAlthough the data suggest that subjects often chose ex-
treme allocations of capacity to the central stages consis-tent with the bottleneck model it is nevertheless conceiv-able that capacity sharing occurred on a subset of trials Inparticular there were a substantial number of trials withIRIs close to zero (at least for a small subset of subjects)that might have resulted from roughly equal capacity shar-ing According to the bottleneck model however thesetrials resulted from response grouping (ie intentional de-ferment of one response until the other response has alsobeen selected)
There are two findings that support this response-grouping interpretation First these trials show a very tallnarrow peak (see Figure 4B) just as one would expect ifresponses were occasionally produced as a couplet (Pash-ler amp Johnston 1989) Second if there is a central bottle-neck and responses are grouped then the character-taskcompatibility effect should carry over fully onto tone-taskRT (regardless of the order of the central operations) In-deed for IRIs between 1150 and 2150 msec the meaneffect of compatibility on the character task was 123 msecand the mean carryover onto the tone task was 116 msecBecause the data with IRIs near 0 closely follow the pre-
dictions from the central bottleneck model plus responsegrouping they do not constitute evidence for capacitysharing Nevertheless a primary goal of Experiment 2will be to replicate these IRI results in a design that pro-duces less response grouping yielding cleaner data
DiscussionThe results were generally consistent with the central
bottleneck model First the distribution of IRIs was con-sistent the predicted three-component pattern The centralmode (with a peak near 0-msec IRI) is assumed to corre-spond to trials in which subjects grouped responses Thetwo extreme modes (with peaks near 1350 and 2350 msec)correspond to the two possible orders in which centralprocesses can be executed (without response grouping)A second finding supporting the central bottleneck modelconcerns the effects of the character-task SndashR compati-bility manipulation The effects of this manipulation oncharacter-task RT were roughly constant across SOAs Inaddition these effects did not carry over onto tone-taskRT when the tone-task response came first but carriedover fully when the character-task response came first
The results however did not match the predictions ofthe capacity-sharing model outlined in the introductionAccording to this model central operations operate in par-allel but must share a limited pool of resources First thismodel predicts a unimodal distribution of IRIs contrary toour observations (Figure 4) There was a tendency for sub-jects to respond to one task well before the other (eg by300ndash400 msec) or nearly simultaneously Meanwhilethere were relatively few responses in intermediate IRIbins (eg the IRI bins centered at 60 and 120 msec) Thecapacity-sharing model also has difficulty accounting forthe observed effects of character-task SndashR compatibilityAs can be seen in Figure 3 the lack of an increase in com-patibility effects on the character task at the short SOAcombined with the substantial carryover onto the tone taskis inconsistent with roughly equal capacity sharing be-tween simultaneous central operations Instead it sug-gests the use of the extreme capacity allocations predictedby the central bottleneck model ([01] and [10])
EXPERIMENT 2
Experiment 2 had two main purposes One purpose wasto replicate Experiment 1 in a design that produces less re-sponse grouping and another purpose was to test a novel pre-diction regarding the IRI distributions We adopted a de-sign that has recently been used by several investigators todetermine whether dual-task interference can be eliminatedafter practice (Hazeltine Ruthruff amp Remington 2001Hazeltine et al 2002 Levy amp Pashler 2001 Schumacheret al 2001) In this design there are three conditions onedual-task condition and two single-task conditions (one foreach task) The single- and dual-task conditions are mixedtogether randomly within a block so subjects cannotknow which combination of tasks will be presented on theupcoming trial The particular tasks we chose were the
810 RUTHRUFF PASHLER AND HAZELTINE
ones used by Hazeltine et al (2001) One task (auditoryndashvocal) required a tone classification (as in Experiment 1)and the other task (visualndashmanual) required the classifi-cation of a word as a ldquobugrdquo ldquofoodrdquo or ldquotreerdquo
We had two reasons for adopting this particular designFirst there have been several recent reports that after sev-eral sessions of practice in this paradigm subjects cansometimes learn to perform two tasks together with verylittle interference and no sign of a bottleneck In factHazeltine et al (2001) found such a result after practiceusing essentially the same tasks and design as the presentExperiment 2 Thus there is reason to believe that thisparadigm is conducive to the overlap of central process-ing Second the use of single-task conditions seems es-pecially likely to discourage the response-grouping strat-egy (indeed grouping is not even possible on the single-task trials) By deterring response grouping we should beable to determine the true central processing modes (ser-ial vs parallel) adopted by a greater proportion of the sub-jects
Because there was no compatibility manipulation inthis experiment we will focus only on the distribution ofIRIs The central bottleneck model again predicts that thisdistribution will have three specific components We alsotested a new prediction of the bottleneck model regardingthe effects of SOA in the dual-task condition We used aslight SOA manipulation (the tone was presented either50 msec before or 50 msec after the word) because it wasgenerally not noticed by the subjects (the stimuli appear tobe simultaneous) and therefore was unlikely to influenceany strategic choices made by the subjects According tothe bottleneck model the task presented first should havea slight head start and therefore should tend to engage thecentral bottleneck first The processing order would prob-ably not be strictly first-come-first-served because sub-jects faced with variable task orders from trial to trial havea bias toward using the same central processing order usedon the previous trial (eg De Jong 1995) Neverthelessthe slight difference in SOAs should still cause a notice-able shift in the proportions of the two processing ordersAlthough the overall frequency of each of the three com-ponents of the IRI distribution will change the basicshape of each component should stay the same Conse-quently the SOA manipulation should primarily cause avertical shift in the two components corresponding to non-grouping trials (ie the proportion of responses in eachbin should be shifted up or down by a constant factor)
The predictions of the capacity-sharing model for theeffects of the small SOA manipulation are less clear How-ever the most straightforward prediction is that the taskpresented first will receive the total pool of capacity for50 msec before roughly equal sharing begins The effectwould be to shift the IRI distributions 50 msec to the leftor the right (depending on whether the SOA was positiveor negative) Thus the IRI distributions in the 250 and150 msec SOAs might differ primarily by a combinedhorizontal shift (rather than the vertical shift predicted bythe central bottleneck model) of about 100 msec
MethodSubjects Twelve students from community colleges in the Moun-
tain View California area participated in exchange for money orpartial course credit None had participated in Experiment 1
Stimuli Tone stimuli were presented at 220 880 and 3520 Hzand lasted for 300 msec Word stimuli subtending 14ordm horizontally 319ordm vertically were white against a black background There werefour bug words (ANT FLEA APHID BEETLE) four food words (EGGSOUP CANDY COOKIE) and four tree words (OAK PINE CEDARSPRUCE) The words remained visible until a response was made
Procedure Subjects responded to the 220- 880- and 3520-Hztones by saying ldquoonerdquo ldquotwordquo or ldquothreerdquo respectively Subjects re-sponded to bug food and tree words by pressing the ldquojrdquo ldquokrdquo and ldquolrdquokeys respectively Subjects were first allowed to study the words foreach category They then completed 15 blocks of 63 trials each (in-cluding three warmup trials) The first five blocks were consideredpractice Each block contained a mixture of 36 dual-task trials (18 trials at each of the two SOAs) 12 single-task tone trials and 12single-task word trials Because subjects did not know which task(s)would appear they presumably prepared for both of them Subjectswere asked to respond quickly and accurately to both tasks Bothtasks were given equal emphasis
Each trial began with the presentation of a f ixation cross for500 msec then a blank f ield for 300 msec followed by the toneandor words If an error was made an error message was displayedfor 2000 msec The next trial began 500 msec later At the end ofeach block of trials subjects received performance feedback (RTand percent correct) and were allowed to take a short break
ResultsTrials with an error an RT less than 200 msec (1 of
all trials) or an RT greater than 3 sec (1 of all trials)were excluded from the analyses
Main effects Mean tone-task and word-task RTs aswell as error rates are shown in Table 2 as a function oftrial type (single vs dual) and SOA Dual-task RTs weresignificantly slower than single-task RTs for both theword task [F(111) 5 585 p 001] and the tone task[F(111) 5 284 p 001] Thus we again found evi-dence of dual-task interference
IRI distributions Figure 5A shows the IRI distribu-tion averaged across subjects Plotted are the proportionof responses in each 60-msec bin the open circles repre-sent the 250-msec SOA condition and the filled squaresrepresent the 150-msec SOA condition These data clearlyshow the trimodal pattern predicted by the central bottle-neck model These results replicate those of Experiment 1but with far fewer responses near zero Thus the data con-firmed our expectations that this design which includes asubstantial of number of single-task trials would reducethe incidence of response grouping
Table 2Response Time (RT in Milliseconds) and Error Rate (ER)
for Each Task as a Function of the Number of Tasks (SingleDual) and SOA (250 msec 150 msec) in Experiment 2
Dual
WordndashTone TonendashWordSingle (250 msec) (150 msec)
Task RT ER RT ER RT ER
Tone 722 55 905 68 871 74Word 755 48 1013 65 1042 63
DUAL-TASK INTERFERENCE WITH EQUAL TASK EMPHASIS 811
One of the most striking features of the IRI distribu-tions relates to the effect of SOA Changing the SOA ap-pears to primarily influence the proportion of trials in thetwo extreme components of the IRI distribution withoutnoticeably changing the shapes of those distributions Theshift was in the predicted directionmdashsubjects tended to re-spond to the tasks in the order in which they were pre-sented Note that the vertical shift was not as large as onewould expect from a strict first-come-first-served policyfor central processing De Jong (1995) presented evidencethat central processing order is partially determined in ad-vance of the trial specifically subjects are biased towardrepeating the central processing order used on the previ-ous trial This bias was also apparent in the present exper-iment When subjects responded in one order (withoutgrouping) on a trial they usually (70 of the time) re-sponded in the same order on the next trial as well
To facilitate comparisons between the shape of the pos-itive and negative components of the IRI distribution be-tween SOAs Figure 5B shows the same IRI data condi-tionalized on response order for each SOA This procedureserves to equalize the average height of each componentfor each SOA so that their shapes can be compared moredirectly First we removed data from bins near zero (2210to 1210 msec) where response grouping was likely tohave occurred Then we divided the proportion of IRIs ineach positive IRI bin at the 50-msec SOA by the total pro-portion of positive IRIs at that SOA and we divided theproportion of IRIs in each negative bin by the total pro-portion of negative IRIs at that SOA This procedure wasthen repeated for the 250-msec SOA as well Condition-alizing the data on response order clarified that the shapesand locations of the IRI distributions are very similar foreach SOA (see Figure 5B) This finding supports the cen-
Figure 5 Experiment 2 Proportion of interresponse intervals (IRIs) in 60-msecbins as a function of SOA (250 vs 150 msec) Positive SOAs indicate that the tonesounded before the character appeared and negative SOAs indicate that the charac-ter appeared before the tone sounded Likewise positive IRIs indicate that the sub-ject responded to the tone task before the character task negative IRIs indicate thatthe subject responded to the character task before the tone task (A) Actual data(B) Data conditionalized on response order
812 RUTHRUFF PASHLER AND HAZELTINE
tral bottleneck model which assumes that SOA partiallydetermines which central processing order is used butdoes not influence the IRI distribution produced by thatprocessing order
On the other hand the IRI histogram is inconsistentwith the capacity-sharing model in which central opera-tions on the two tasks share capacity roughly equally Inparticular note the sharp dip in response proportion in thebins close to zero and the large number of responses in ex-treme IRI bins (beyond 2450 or 1450 msec) Also asdiscussed earlier the most straightforward prediction forthe effect of SOA on the IRI distributions is a horizontalshift of roughly 100 msec Figure 5 however shows a ver-tical shift not a horizontal one
Quantitative test The arguments just presented forthe central bottleneck over the capacity-sharing modelwere based primarily on a qualitative analysis of the IRIhistograms To provide a quantitative test between thesemodels we compared the number of trials with IRIs nearzero with the number of trials with extreme IRIs Specif-ically we compared the number of responses in the 90ndash210 msec IRI bins (both positive and negative) to the num-ber of responses in the 270ndash390 msec bins (positive andnegative) According to the capacity-sharing model thefrequency of responses should be highest in IRI bins nearzero and decline at more extreme IRIs Thus bins near zeroclearly should have more responses than the bins fur-ther from zero According to the bottleneck model how-ever there should be relatively few responses in the 90ndash210 msec range because such IRIs are longer than onewould expect on trials with response grouping and some-what shorter than one would expect on trials without re-sponse grouping meanwhile the bottleneck model pre-dicts that there should be many responses in the 270ndash390 msec range which is close to the mode that one wouldexpect from serial central processing (without grouping)
In Experiment 2 the extreme IRI bins had roughly twiceas many responses as the bins near 0 msec (18 vs 09)this difference was statistically significant [F(111) 5 50p 05] Eleven of the 12 subjects showed this patternthe remaining subject appeared to have grouped responsestogether in close temporal synchrony (54 of responsesfell between 2150 and 1150 msec) Thus this quantita-tive analysis confirmed the predictions of the centralbottleneck model but not those of the capacity-sharingmodel
DiscussionThe IRI distributions obtained in Experiment 2 provide
clear evidence for the three components predicted by thecentral bottleneck model rather than the unimodal distri-bution predicted by the capacity-sharing model withroughly equal sharing between tasks In addition the ef-fect of SOA was mainly to shift the proportion of trialswithin each of the three components of the IRI distribu-tion (ie a vertical shift) without any apparent change tothe position or shape of these components This findingconfirms the predictions of the central bottleneck model
but is contrary to the straightforward prediction of the capacity-sharing model (a horizontal shift in the distribu-tions of IRIs)
GENERAL DISCUSSION
In this article we considered the possibility that there isgraded capacity sharing between central stages ratherthan a strict (all-or-none) central bottleneck Specificallywe evaluated the possibility that subjects can perform cen-tral operations in parallel albeit more slowly than whenthey perform each central operation in isolation Our basicapproach (unlike that of traditional PRP experiments) wasto emphasize each task equally and to encourage subjectsto overlap the two tasks as much as possible
Despite conditions that encouraged the overlap of cen-tral operations subjects appeared to perform central op-erations sequentially First the IRI distributions appearedto consist of three distinct components this trimodal pat-tern was evident most clearly in Experiment 2 (Figure 5)Thus we replicated the basic findings of Pashler (1994a)using a different pair of tasks (an auditoryndashvocal task anda visualndashmanual task) that minimized the possibility of re-sponse conflicts This finding is consistent with the cen-tral bottleneck model which asserts that subjects mustchoose one of two possible orders for sequentially per-forming central operations The pattern is not consistenthowever with the model outlined in the introduction inwhich subjects divide a limited pool of resources roughlyequally between central operations on the two tasks Ac-cording to the most straightforward version of that modelthe IRIs should have a broad unimodal distribution
The effects of character-task SndashR compatibility (Ex-periment 1) also indicated that central operations wereperformed sequentially According to the central bottle-neck model the effects of compatibility on the charactertask itself should be constant across SOAs In addition atthe 0-msec SOA character-task compatibility effectsshould carry over fully onto tone-task RT when character-task central operations are performed first but not whenthey are performed second These predictions were veri-fied in Experiment 1 According to the capacity-sharingmodel however the effects of character-task SndashR com-patibility on the character task itself should be larger at the0-msec SOA than at the long SOAs The reason is that thetasks must share capacity at the 0-msec SOA The reducedcapacity allocation should prolong central operationsmagnifying the effects of the compatibility manipulationon the character task (see Pashler 1984) Contrary to thisprediction compatibility effects were roughly additivewith SOA (Table 1)
One could attempt to reconcile the capacity-sharingmodel with the observed compatibility effects by arguingthat tone-task central operations generally finished wellbefore character-task central operations so that there waslittle temporal overlap between these central operationsHowever this explanation is unsatisfactory for two rea-sons First the tone-task response was often emitted after
DUAL-TASK INTERFERENCE WITH EQUAL TASK EMPHASIS 813
the character-task response (and vice versa) Second ifthere was no temporal overlap then there should also havebeen no carryover of compatibility effects onto tone-taskRT (see the Appendix) Thus the substantial carryover ef-fects combined with no increase in compatibility effectson the character task itself at the short SOA is incompati-ble with roughly equal capacity sharing between centraloperations Figure 3 shows the predictions of the capacity-sharing model under various allocations of capacity alongwith the observed results (indicated by the asterisk) Theobserved data are consistent only with very extreme ca-pacity allocations such as the [01] and [10] allocationspredicted by the central bottleneck model
Revised Capacity-Sharing ModelHow might the capacity-sharing model described in this
paper be revised in order to account for the present dataTo account for the compatibility effects described hereone could postulate that more capacity is allocated to thecharacter task on incompatible trials than on compatibletrials For example a subject assigned to the compatible map-ping of digits onto the three response keys (1 2 3) andthe incompatible mapping of letters onto the three re-sponse keys (C A B) might allocate more capacity to thecharacter task when a letter is presented than when a digitis presented Relative to the original capacity-sharingmodel this revised model would predict a smaller in-crease in compatibility effects at the short SOA and wouldpredict more carryover of compatibility effects on to thetone task In other words the predicted results would bemore in line with the observed results
Even if capacity allocation is adjusted dynamically de-pending on the category of the present stimulus this re-vised capacity-sharing model still cannot easily accountfor the IRI distributions (Figure 5) which appear to con-sist of three distinct components Capacity sharing plusrandom response grouping could create a spike in the cen-ter of the IRI distribution but would not produce the dipin the proportion of responses at IRIs near 200 msec Toexplain the dip one could further propose that responsegrouping is not random but occurs primarily on trials thatwould have produced an IRI of about plus or minus200 msec This selective response grouping would take tri-als away from bins near 200 msec and redistribute them tobins near 0 msec Although this revised capacity-sharingmodel might appear to explain the aggregate data fromExperiment 1 it incorrectly predicts that the dip shouldbe the smallest for the subjects with the smallest numberof grouped responses In fact Figure 4B shows that thesubset of participants (n = 18) who rarely grouped re-sponses actually showed a much more pronounced dipthan did those (n = 8) who appeared to frequently groupresponses Likewise Experiment 2 produced very little re-sponse grouping overall yet the drop in the frequency ofIRIs was near 2200 msec and 1200 msec (see Figure 5)
To explain the IRI data a capacity-sharing model wouldneed to add some further provisionmdashfor example thatsubjects tend to use extreme capacity allocations (eg
[28] and [82]) while rarely adopting intermediate al-locations It is not clear however why subjects capable ofgraded capacity sharing would primarily utilize extremeallocations (see Tombu amp Jolicœur 2003 for one possibleexplanation) In contrast the central bottleneck modelprovides a clear rationale for the appearance of two dis-tinct allocations because it states that those two allocations([01] and [10]) are the only feasible choices
It is conceivable of course that subjects did share ca-pacity between simultaneous central operations on a smallproportion of trials The present data cannot rule out thishypothesis At the same time there appears to be little ev-idence in favor of it either The central bottleneck modelwith occasional response grouping can explain the presentfindings extremely well without the additional assumptionthat there was a subset of trials where capacity was sharedTherefore parsimony would seem to favor the straight-forward bottleneck model
Of course we cannot rule out the possibility that ca-pacity sharing can occur under conditions not investigatedin the present experiments For example central capacitysharing might occur after extensive practice with greaterincentives or with much easier tasks Further work per-haps using the same techniques as those employed in thepresent study is needed to evaluate these possibilities
Structural Versus Voluntary BottlenecksIt has been noted that the central bottleneck observed in
the PRP paradigm might occur as a result of the Task 1 em-phasis instructions (eg Meyer amp Kieras 1997a 1997b)that is subjects might have the latent ability to performcentral operations in parallel with no interference but in-stead voluntarily adopt a bottleneck strategy (to satisfy theTask 1 emphasis instructions) If so one might expect thecentral bottleneck to be eliminated when both tasks aregiven equal emphasis There are now several studies in-cluding the present one that contradict this prediction (Car-rier amp Pashler 1995 Levy amp Pashler 2001 Pashler1994a Ruthruff et al 1995 Experiment 3 Ruthruff Pash-ler amp Klaassen 2001 Tombu amp Jolicœur 2000) It re-mains to be seen whether the central bottleneck can beeliminated under even more extreme pressure to overlapcentral processing In any case it seems clear that the cen-tral bottleneck cannot be attributed to PRP instructionsOur results instead support the hypothesis that the centralbottleneck is due to the cognitive architecture The bottle-neck might occur because humans have insufficient capac-ity to carry out more than one central operation at a timeAlternatively the bottleneck might be imposed by execu-tive control mechanisms to maintain a coherent course ofaction (eg to avoid selecting two conflicting responses)
Although the central bottleneck cannot easily be elim-inated at relatively low practice levels there is recent evi-dence suggesting that it can sometimes be eliminated afterconsiderable practice (Hazeltine et al 2001 Hazeltineet al 2002 Levy amp Pashler 2001 Schumacher et al2001) It remains to be seen whether the apparent elimi-nation of the central bottleneck occurs because central op-
814 RUTHRUFF PASHLER AND HAZELTINE
erations are performed in parallel or because practice insome cases eliminates the need for central operations Forinstance it is possible that there are two processing routesto activate a response code (see Lien amp Proctor 2002)one of which (response selection) comprises the centralbottleneck and one of which (automatic response activa-tion) does not Perhaps early in practice subjects must relyon the route that does comprise the central bottleneck butwith practice they learn to rely on the processing route thatdoes not comprise the central bottleneck (see RuthruffJohnston amp Van Selst 2001)
Summary Previous dual-task studies have generally indicated
that at relatively low levels of practice subjects performcentral operations in series rather than in parallel How-ever these studies might have discouraged parallel centralprocessing (eg because of instructions emphasizing onetask over the other) The purpose of the present study wasto see whether subjects can perform central operations ontwo novel tasks in parallel under more favorable condi-tions These conditions include the use of relatively sim-ple tasks equal task emphasis and explicit encourage-ment to perform the tasks in parallel
Substantial dual-task interference was obtained whicha priori could be due to a central bottleneck (serial per-formance of central stages) or to central capacity sharing(parallel performance of central stages albeit with inter-ference) The observed IRI distributions and SndashR com-patibility effects however suggest that subjects generallydid not share capacity roughly equally between tasks In-stead it appears that subjects first devoted all (or at leastthe vast majority) of their capacity to the central opera-tions of one task and then devoted their entire capacity tothe central operations of the other task Thus the only waya capacity-sharing model can fit our data is to mimic thesequential processing assumed by the central bottleneckmodel Given the evidence that central bottlenecks occureven under favorable conditions for parallel central pro-cessing it appears that central bottlenecks might be wide-spread in the real world
REFERENCES
Borger R (1963) The refractory period and serial choice-reactionsQuarterly Journal of Experimental Psychology 15 1-12
Carrier M amp Pashler H (1995) Attentional limitations in memoryretrieval Journal of Experimental Psychology Learning Memory ampCognition 21 1339-1348
De Jong R (1993) Multiple bottlenecks in overlapping task perfor-mance Journal of Experimental Psychology Human Perception ampPerformance 19 965-989
De Jong R (1995) The role of preparation in overlapping-task perfor-mance Quarterly Journal of Experimental Psychology 48A 2-25
Hazeltine E Ruthruff E amp Remington R W (2001 Novem-ber) Dual-task costs depend on the pairings of stimulus and responsemodalities Paper presented at the annual meeting of the PsychonomicSociety Orlando FL
Hazeltine E Teague D amp Ivry R B (2002) Simultaneous dual-task performance reveals parallel response selection after practiceJournal of Experimental Psychology Human Perception amp Perfor-mance 28 527-545
Hommel B (1998) Automatic stimulusndashresponse translation in dual-task performance Journal of Experimental Psychology Human Per-ception amp Performance 24 1368-1384
Johnston J C amp Delgado D F (1993 November) Bypassing thesingle-channel bottleneck in dual-task performance Paper presentedat the annual meeting of the Psychonomic Society Washington DC
Jolicœur P amp DellrsquoAcqua R (1998) The demonstration of short-term consolidation Cognitive Psychology 36 138-202
Kahneman D (1973) Attention and effort Englewood Cliffs NJPrentice-Hall
Keele S W (1973) Attention and human performance Pacific Pal-isades CA Goodyear
Levy J amp Pashler H (2001) Is dual-task slowing instruction depen-dent Journal of Experimental Psychology Human Perception amp Per-formance 27 862-869
Lien M-C amp Proctor R W (2000) Multiple spatial correspondenceeffects on dual-task performance Journal of Experimental Psychol-ogy Human Perception amp Performance 26 1260-1280
Lien M-C amp Proctor R W (2002) Stimulusndashresponse compatibil-ity and psychological refractory period effects Implications for re-sponse selection Psychonomic Bulletin amp Review 9 212-238
Lien M-C Schweickert R amp Proctor R W (2003) Task switch-ing and response correspondence in the psychological refractory pe-riod paradigm Journal of Experimental Psychology Human Percep-tion amp Performance 29 692-712
Logan G D amp Schulkind M D (2000) Parallel memory retrievalin dual-task situations I Semantic memory Journal of ExperimentalPsychology Human Perception amp Performance 26 1260-1280
McCann R S amp Johnston J C (1992) Locus of the single-channelbottleneck in dual-task interference Journal of Experimental Psy-chology Human Perception amp Performance 18 471-484
McCann R S Remington R W amp Van Selst M (2000) Auto-maticity in visual word processing A dual-task investigation Journalof Experimental Psychology Human Perception amp Performance 261352-1370
McLeod P (1977) Parallel processing and the psychological refractoryperiod Acta Psychologica 41 381-396
Meyer D E amp Kieras D E (1997a) A computational theory of ex-ecutive cognitive processes and multiple-task performance Part 1Basic mechanisms Psychological Review 104 3-65
Meyer D E amp Kieras D E (1997b) A computational theory of ex-ecutive cognitive processes and multiple-task performance Part 2Accounts of psychological refractory-period phenomena Psycholog-ical Review 104 749-791
Meyer D E Kieras D E Lauber E Schumacher E H Glass JZurbriggen E Gmeindl L amp Apfelblat D (1995) Adaptiveexecutive control Flexible multiple-task performance without perva-sive immutable response-selection bottlenecks Acta Psychologica90 163-190
Navon D amp Miller J O (2002) Queuing or sharing A critical eval-uation of the single-bottleneck notion Cognitive Psychology 44 193-251
Pashler H (1984) Processing stages in overlapping tasks Evidencefor a central bottleneck Journal of Experimental Psychology HumanPerception amp Performance 10 358-377
Pashler H (1994a) Graded capacity-sharing in dual-task interfer-ence Journal of Experimental Psychology Human Perception ampPerformance 20 330-342
Pashler H (1994b) Overlapping mental operations in serial perfor-mance with preview Quarterly Journal of Experimental Psychology47A 161-191
Pashler H amp Johnston J C (1989) Chronometric evidence for cen-tral postponement in temporally overlapping tasks Quarterly Journalof Experimental Psychology 41A 19-45
Pashler H amp Johnston J C (1998) Attentional limitations in dual-task performance In H Pashler (Ed) Attention (pp 155-189) HoveUK Psychology Press
Ruthruff E Johnston J C amp Van Selst M (2001) Why practicereduces dual-task interference Journal of Experimental PsychologyHuman Perception amp Performance 27 3-21
Ruthruff E Johnston J C Van Selst M Whitsell S amp Rem-
DUAL-TASK INTERFERENCE WITH EQUAL TASK EMPHASIS 815
ington R (2003) Vanishing dual-task interference after practiceHas the bottleneck been eliminated or is it merely latent Journal ofExperimental Psychology Human Perception amp Performance 29280-289
Ruthruff E Miller J O amp Lachmann T (1995) Does mental ro-tation require central mechanisms Journal of Experimental Psychol-ogy Human Perception amp Performance 21 552-570
Ruthruff E Pashler H E amp Klaassen A (2001) Processing bot-tlenecks in dual-task performance Structural limitation or voluntarypostponement Psychonomic Bulletin amp Review 8 73-80
Schumacher E H Seymour T L Glass J M Kieras D E ampMeyer D E (2001) Virtually perfect time sharing in dual-task per-formance Uncorking the central attentional bottleneck Psychologi-cal Science 121 101-108
Schweickert R (1978) A critical path generalization of the additivefactor method Analysis of a Stroop task Journal of MathematicalPsychology 18 105-139
Schweickert R amp Townsend J T (1989) A trichotomy Inter-actions of factors prolonging sequential and concurrent mentalprocesses in stochastic discrete mental (PERT) networks Journal ofMathematical Psychology 33 328-347
Sommer W Leuthold H amp Schubert T (2001) Multiple bottle-necks in information processing An electrophysiological examina-tion Psychonomic Bulletin amp Review 8 81-88
Tombu M amp Jolicœur P (2000 November) Is the PRP effect due toa strategic or structural bottleneck Poster presented at the annualmeeting of the Psychonomic Society New Orleans
Tombu M amp Jolicœur P (2003) A central capacity sharing model ofdual-task performance Journal of Experimental Psychology HumanPerception amp Performance 29 3-18
Van Selst M Ruthruff E amp Johnston J C (1999) Can practiceeliminate the psychological refractory period effect Journal of Ex-
perimental Psychology Human Perception amp Performance 25 1268-1285
Welford A T (1952) The ldquopsychological refractory periodrdquo and thetiming of high-speed performancemdashA review and a theory BritishJournal of Psychology 43 2-19
NOTES
1 Depending on individual differences some subjects might showonly one or two of the three predicted components
2 The reallocation assumption is needed to adequately explain ob-served PRP effects If capacity were not reallocated then Task 2 RTwould be slow at all SOAs not just the short ones
3 Rather than assume capacity shifts are instantaneous one couldallow for a switch cost The inclusion of a modest switch time would notmaterially alter the predictions discussed below
4 A complication arises if capacity allocation varies considerablyfrom trial to trial Nevertheless each point on Figure 3 is consistent onlywith certain combinations of capacity allocations For instance a find-ing of zero increase in compatibility effects combined with substantialcarryover (as we found in Experiment 1) suggests that intermediate ca-pacity allocations rarely if ever occurred
5 The predictions shown in Figure 3 are expressed as a ratio of thebaseline (long SOA) compatibility effect so that they will be independentof the effect size observed in a particular experiment To place the resultsof Experiment 1 on this plot it was necessary to rescale the values re-ported earlier The mean character-task compatibility effect was 161 msecat the short SOA and 1805msec at long SOAs (21000 and 11000 msec)Thus the compatibility effect at short SOAs was 089 times that foundat the long SOAs producing an ldquoincreaserdquo of 2011 The carryover ofSndashR compatibility onto tone-task RT was 67 msec which is 037 timesthe baseline (long SOA) compatibility effect on the character task itself
APPENDIXCapacity-Sharing Model Predictions for the Effect of SndashR Compatibility
In this Appendix we determine how manipulations of the duration of central processing shouldaffect dual-task RTs according to the capacity-sharing model outlined in the introduction (wherecentral stages share capacity but input and output stages do not) Specifically the goal is to de-termine what effect a manipulation of the Task Y central stage will have on RT to Task Y itselfand how much of this effect will carry over onto RT to Task Z For the sake of concreteness wefocus on the central stage manipulation used in the present Experiment1 character-task SndashR com-patibility
It is convenient to model the effect of incompatibility as simply adding a central stage(Stage ldquoIrdquo) beyond that required in the compatible condition The compatibility effect on the char-acter task itself therefore is simply the average time to complete Stage I Let CY and CZ representthe proportion of capacity (assumed to be constant across trials) allocated to Task Y and Task Zwhen their central operations are both pending at the same time where CY 1 CZ 5 1 Let W be arandom variable representing the total amount of work required on a particular central stage on aparticular trial defined as the time (in milliseconds) it would take to complete that stage under fullcapacity Under reduced capacity the actual time T required to complete the work depends on theproportion of capacity allocated to that task that is W 5 T C
Compatibility Effects on Task Y The compatibility effect on Task Y at the long SOA (CE long_SOA) where Task Y is assumed to
operate at full capacity is simply the average time required to complete Stage I Thus it is equalto the expected value of WI
CE long _SOA 5 E (WI)
At short SOAs however Stage I will sometimes share capacity with Task Z the reduced ca-pacity will prolong Stage I and hence increase CEshort_SOA relative to CE long _SOA Let Toverlap be arandom variable representing the amount of time during which Stage I of Task Y overlaps withcentral operations on Task Z (ie the amount of time Stage I operates with reduced capacity) LetWoverlapY represent the amount of work accomplished on Task Y during Toverlap
WoverlapY = Toverlap CY (A1)
816 RUTHRUFF PASHLER AND HAZELTINE
APPENDIX (Continued)
CEshort_SOA the average time to complete Stage I at the short SOA is equal to the expected valueof Toverlap plus the expected value of the time to complete the remaining work (WI 2 WoverlapY) atfull capacity Therefore CE short_SOA 5 E (Toverlap) 1 E (WI) 2 E (WoverlapY) Substituting the valueof WoverlapY from Equation 1 and noting that CZ 5 1 2 CY it follows that
CE short_SOA 5 E (WI) 1 E (Toverlap) CZ
The average increase in the compatibility effect at the short SOA relative to the long SOA (de-noted by DCE) is equal to CE short_SOA minus CE long _SOA Thus
DCE 5 E (WI) 1 E (Toverlap) CZ 2 E (WI)
DCE 5 E (Toverlap) CZ (A2)
As an informal explanation of Equation 2 note that Toverlap CZ is the amount of work com-pleted on Task Z while it overlaps with Stage I of Task Y This work completed on Task Z meanslost work on Task Y which must be made up later at a cost of 1 msec per unit of lost work
The maximum possible DCE is obtained with maximum Toverlap which occurs when all the workon Stage I of Task Y is performed under reduced capacity Thus max (Toverlap) 5 WI CY Under thiscondition DCE will be equal to CE long_SOA (CZCY) With equal capacity sharing ([0505]) forexample DCE would be equal to CE long _SOA thus CE short_SOA would be twice as large as CE long_SOA
Carryover of Compatibility Effects onto Task ZThe carryover of the Task Y compatibility effect onto RT to Task Z is simply the lengthening
of Task Z central operations during the overlap with Stage I of Task Y Let Woverlap Z represent theamount of work accomplished on Task Z during Toverlap at reduced capacity CZ on a given trial
Woverlap Z 5 Toverlap CZ (A3)
The time cost of the overlap on Task Z is the time required to complete Woverlap Z under reducedcapacity (ie Toverlap) minus the time it would have taken to complete the same amount of workunder full capacity Thus the time cost is equal to Toverlap 2 Woverlap Z Using Equation A3 this timecost can also be expressed as Toverlap 2 Toverlap CZ which reduces to Toverlap CY Thus the av-erage carryover effect is given by
Carryover 5 E (Toverlap) CY (A4)
As an intuitive explanation note that Toverlap CY is the amount of Task Z work lost to Task Y dur-ing the overlap to be made up later at a cost of 1 msec per unit of lost work
The maximum carryover effect (obtained with maximum Toverlap) is equal to E(WI) which issimply the baseline (long SOA) compatibilityeffect on Task Y (ie CElong _SOA) Thus the base-line compatibility effect can carry over fully onto Task Z but no more
Carryover Versus DCE Note that DCE (see Equation A2) and carryover (see Equation A4) are linearly related to each
other DCE 5 Carryover (CZCY) Also note that the maximum possible carryover and maxi-mum possible DCE are both proportional to the baseline compatibility effect (CE long _SOA) There-fore it is convenient to divide each term by CE long _SOA so that their maximum values do not de-pend on CE long _SOA
(A5)
This linear relationship is shown in Figure 3 for several different values of CY and CZ It shouldnot be surprising that these two measures are tightly coupled Informally speaking the effects ofcompatibility on Task Y itself and the carryover onto Task Z both depend on the amount of worklost to the other task while their central operations overlap
(Manuscript received October 17 2001revision accepted for publication December 17 2002)
DCECE
Carryover CE long_SOA long_SOA
Z
Y
= C
C
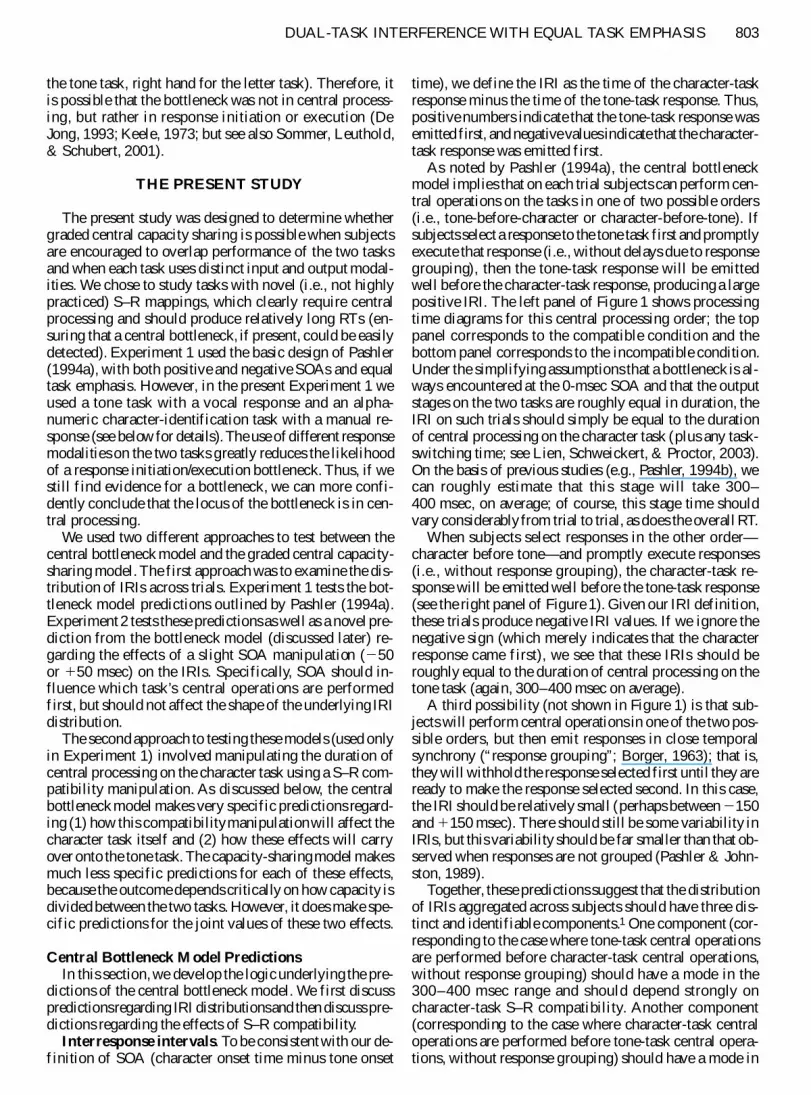
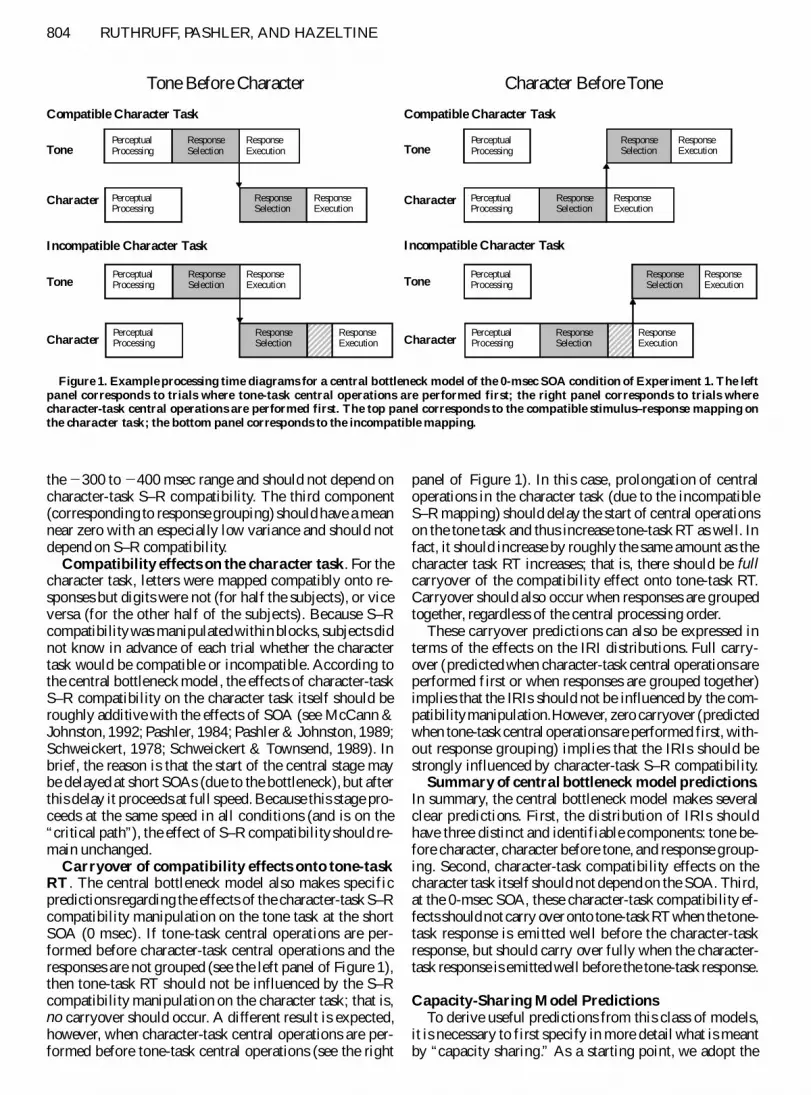
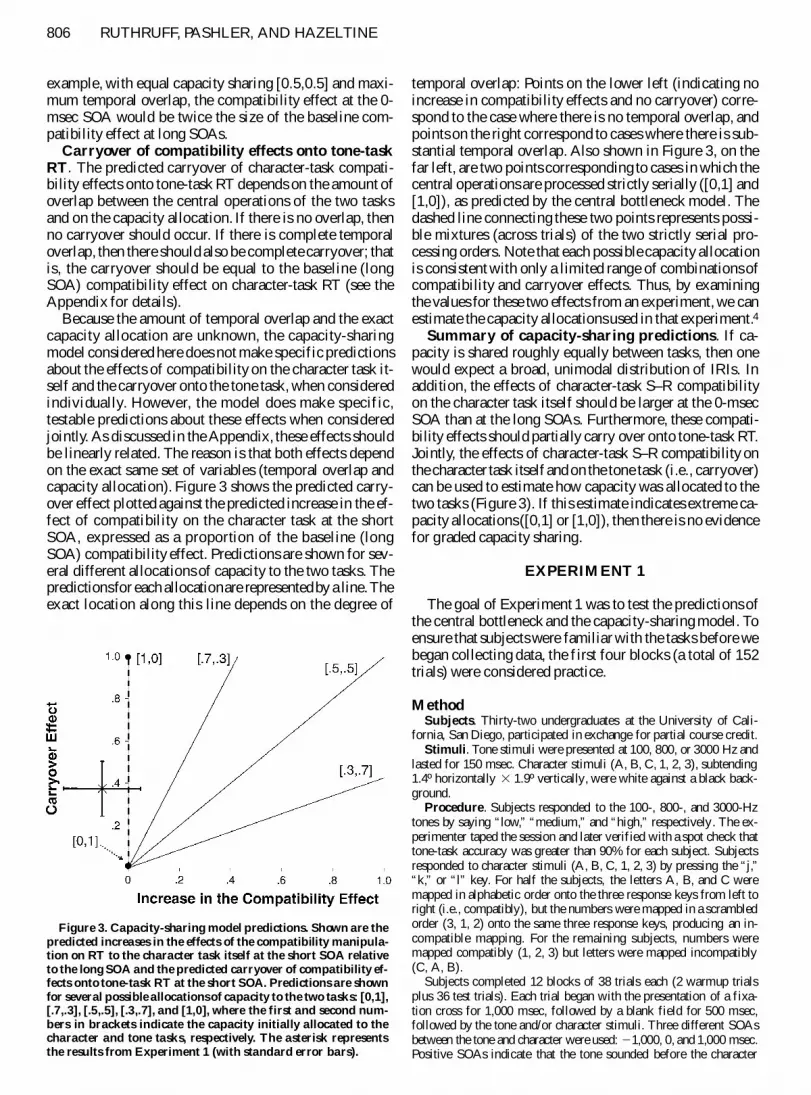