Embed Size (px)
Citation preview
http://www.jstor.org
Dynamics of Representation: The Case of US Spending on DefenceAuthor(s): Christopher WlezienSource: British Journal of Political Science, Vol. 26, No. 1, (Jan., 1996), pp. 81-103Published by: Cambridge University PressStable URL: http://www.jstor.org/stable/194014Accessed: 05/06/2008 10:43
Your use of the JSTOR archive indicates your acceptance of JSTOR's Terms and Conditions of Use, available at
http://www.jstor.org/page/info/about/policies/terms.jsp. JSTOR's Terms and Conditions of Use provides, in part, that unless
you have obtained prior permission, you may not download an entire issue of a journal or multiple copies of articles, and you
may use content in the JSTOR archive only for your personal, non-commercial use.
Please contact the publisher regarding any further use of this work. Publisher contact information may be obtained at
http://www.jstor.org/action/showPublisher?publisherCode=cup.
Each copy of any part of a JSTOR transmission must contain the same copyright notice that appears on the screen or printed
page of such transmission.
JSTOR is a not-for-profit organization founded in 1995 to build trusted digital archives for scholarship. We enable the
scholarly community to preserve their work and the materials they rely upon, and to build a common research platform that
promotes the discovery and use of these resources. For more information about JSTOR, please contact [email protected].
B.J.Pol.S. 26, 81-103 Copyright ? 1996 Cambridge University Press
Printed in Great Britain
Dynamics of Representation: The Case of US Spending on Defence CHRISTOPHER WLEZIEN*
The representation of public preferences in public policy is fundamental to most conceptions of
democracy. If representation is effectively undertaken, we would expect to find a correspondence between public preferences for policy and policy itself. If representation is dynamic, policy makers should respond to changes in preferences over time. The integrity of the representational connection, however, rests fundamentally on the expectation that the public actually notices and
responds to policy decisions. Such a public would adjust its preferences for 'more' or 'less' policy in response to what policy makers actually do, much like a thermostat. Despite its apparent importance, there is little research that systematically addresses this feedback of policy on
preferences over time. Quite simply, we do not know whether the public adjusts its preferences for policy in response to what policy makers do. By implication, we do not fully understand the
dynamics of representation. This research begins to address these issues and focuses on the
relationships between public preferences and policy in a single, salient domain.
The representation of public preferences in public policy is fundamental to most conceptions of democracy. In its simplest form, elected officials are expected to be sensitive to public opinion and to attempt to represent that opinion in policy because of the threat of electoral sanction. This expectation is evident throughout the literature on democratic polities, and there is a growing body of research that generally corroborates a linkage between public preferences and policy.' If there is representation, we should find a correspondence between
* Department of Political Science , University of Houston. Earlier versions of this article were
presented at the 1992 Meetings of the Midwest Political Science Association and the American Political Science Association, both held in Chicago, and at George Washington University, Georgetown University, and as part of the Political Economy Workshop at the University of Houston. Many people provided critical comments on aspects of this research. I would like to thank especially Mark Franklin, and also Andrew Austin, Richard Brody, Steve Craig, Robert Erikson, James Granato, Thomas Hartley, William Jacoby, Kathleen Knight, David Papell, Ken Rasinski, David Sanders, Tom Smith, James Stimson, Nat Wilcox and John Williams. The project has been supported by grants from the National Science Foundation (SBR-9310056) and the Center for Public Policy at the University of Houston.
See, e.g., Robert Weissberg, Public Opinion and Popular Government (Englewood Cliffs, NJ: Prentice Hall, 1976); Alan Monroe, 'Consistency Between Constituency Preferences and National Policy Decisions', American Politics Quarterly, 12 (1979), 3-19; Benjamin I. Page and Robert Y. Shapiro, 'Effects of Public Opinion on Policy', American Political Science Review, 76 (1983), 175-90; Benjamin I. Page and Robert Y. Shapiro, The Rational Public (Chicago: University of Chicago Press, 1991); Robert S. Erikson, Gerald C. Wright Jr and John P. McIver, Statehouse Democracy: Public Opinion and Policy in the American States (New York: Cambridge University Press, 1993); Thomas R. Marshall, Public Opinion and the Supreme Court (Boston, Mass.: Unwin Hyman, 1988); Thomas Hartley and Bruce Russett, 'Public Opinion and the Common Defense: Who
82 WLEZIEN 82 WLEZIEN
expressed public preferences for policy and policy itself across space or time. If representation is dynamic, changes in public preferences for policy should lead to changes in policy over time: when the public becomes more supportive of policy activity, governments will presumably provide more policy.
Unfortunately, we usually do not have measures of what the public wants. With rare exceptions, such as over the abortion issue, survey organizations do not ask people how much policy they want. (Imagine asking people how much defence spending is appropriate.) Instead, survey organizations usually ask about relative preferences - whether we are spending 'too little', whether spending should 'be increased', or whether we should 'do more'. In effect, people are asked to compare their preferred levels of policy to policy itself and express whether they want 'more' or 'less'.
Thus, if the public's preferred level of policy is greater than the actual level, the public favours more policy activity (say, spending on defence) than is currently in place. It follows that if policy makers respond to the signal for more spending, and provide more (but not too much) spending, then the new policy position would more closely correspond to the preferred level, ceteris paribus. In practice, this responsiveness to the public's preference for 'more' (or 'less') policy constitutes 'representation'. In the event of representation of this sort, the public should be more satisfied with current policy than with previous policy, because current policy would be closer to the preferred level. If the public is reasonably well-informed about what policy makers do, then it would not be so much in favour of 'more' spending on defence as it was before. The public still might favour more spending, but not as much as it did in the prior period. If policy makers were to provide more spending than the public prefers, the public would actually prefer to see spending reduced. If policy makers were closely attuned and solely responsive to the public preference for more spending, that preference would tend to equilibrate rather quickly over time. In effect, the public would behave like a thermostat, so that when policy differed from the favoured policy temperature (which could itself change) the public would send a signal to adjust policy accordingly and, once sufficiently adjusted, the signal would stop.2
This conception of the public contrasts quite clearly with the traditional
(F'note continued)
Governs Military Spending in the United States?' American Political Science Review, 86 (1992), 905-15.
2 Note that this conceptualization of the opinion-policy connection effectively integrates the 'covariation' and 'satisfying' models of congruence offered by Weissberg, Public Opinion and
Popular Government. The conceptualization actually has deep roots in political science, including Karl W. Deutsch, The Nerves of Government (New York: The Free Press, 1964) and David Easton, A Framework for Political Analysis (Englewood Cliffs, NJ: Prentice-Hall, 1965). For a more
complete development of the thermostatic model, see Christopher Wlezien, 'The Public as Thermostat: Dynamics of Preferences for Spending', American Journal of Political Science, 39
(1995), forthcoming.
Dynamics of Representation 83 Dynamics of Representation 83
conception of public opinion, for it presumes that the public is reasonably well-informed about policy.3 Note, however, that the integrity of the representational connection rests fundamentally on the expectation that the public notices and responds to what policy makers actually do. Otherwise, politicians would lack an obvious incentive to represent what the public wants. Indeed, without such public responsiveness to policy, expressed public preferences would contain little meaningful information and, thus, would be of little use to politicians motivated to represent the public.4
Despite its apparent importance, very little research systematically addresses such public responsiveness to policy. Indeed, only a handful of studies even focus on public opinion about policy over time.5 Perhaps this lack of attention is understandable, given the traditional conception of public preferences. It is noteworthy, however, that those studies that do focus on public opinion about policy suggest that the public is responsive to policy.6 This said, we still do not know whether the public actually adjusts its preferences for 'more' or 'less' policy activity in response to what policy makers do. By implication, we do not fully understand the dynamics of representation.
This article focuses on the interrelationships between public preferences and policy in a single domain, namely, defence spending in the United States. This policy domain is particularly appropriate for such a study, for two reasons. First, defence spending decisions in the United States are clearly defined and made annually. Also, a reliable time series of public preferences for spending is available. Secondly, defence spending is a fairly salient policy domain - one that is quite important to the American public.7 Thus, the research conducted here represents a case study of the connections between opinion and
3 See, e.g., Philip E. Converse, 'The Nature of Belief Systems in Mass Publics', in Fred I. Greenstein and Nelson W. Polsby, eds, Handbook of Social Science, vol. 4 (Reading, Mass.: Addison-Wesley, 1964); Donald E. Kinder, 'Diversity and Complexity in American Public Opinion', in Ada W. Finifter, ed., Political Science: The State of the Discipline (Washington, DC: American Political Science Association, 1983).
4 Also see Paul Sniderman, 'The New Look in Public Opinion Research', in Ada W. Finifter, ed., Political Science: The State of the Discipline II (Washington, DC: American Political Science Association, 1993).
5 Page and Shapiro, The Rational Public; James Stimson, Public Opinion in America: Moods, Cycles, and Swings (Boulder, Colo.: Westview Press, 1991); Richard Stoll, US National Security Policy and the Soviet Union: Persistent Regularities and Extreme Contingencies (Columbia: University of South Carolina Press, 1990); Robert H. Durr, 'What Moves Policy Sentiment?' American Political Science Review, 87 (1993), 158-70; Christopher Wlezien and Malcolm Goggin, 'The Courts, Interest Groups, and Public Opinion about Abortion', Political Behavior, 15 (1993), 381-405.
6 In particular, see Durr, 'What Moves Policy Sentiment?' but also see Stoll, US National Security Policy, and Wlezien and Goggin, 'The Courts, Interest Groups, and Public Opinion about Abortion'.
7 See, e.g., Alan I. Abramowitz, 'Issue Evolution Reconsidered: Racial Attitudes and Partisanship in the US Electorate', American Journal of Political Science, 38 (1994), 1-24; William G. Jacoby, 'Public Attitudes toward Government Spending', American Journal of Political Science, 38 (1994), 336-61.
84 WLEZIEN 84 WLEZIEN
policy over time, where both representation and public responsiveness seem likely to occur.
A MODEL OF PUBLIC PREFERENCES AND POLICY
Following Downs, the public can be conceived of as a collection of individuals distributed along a dimension of preference for spending on defence.8 Of course, this characterization is not meant to imply that individuals have specific preferred levels of spending in mind; rather, it is intended to reflect the fact that some individuals want more spending than others. Let the public preference (P*) be represented by the median along this dimension, which implies a certain 'ideal' level of defence spending.
Now, if the level of policy (P) differs from the level the public prefers, the public favours a corresponding change in policy - basically, either more or less. In effect, the public's relative preference, R, represents the difference between its preferred level of policy and policy itself. Thus, if there is representation, changes in P would be positively associated with levels of R, i.e., when the public wants more (less) spending they would get more (less). This expectation can be summarized as follows:
APt = ao + Bi Rt- i + B2 Zt- + e, (1)
where Z refers to the set of other determinants of policy and ao and et represent the intercept and the error term, respectively. Note that policy makers are hypothesized to be responsive to the public preference registered in year t - 1, when spending decisions for fiscal year t are made. Of course, it may be that policy makers' responsiveness to preferences is slightly more delayed, which can be determined empirically.
Public preferences can influence spending decisions either through presiden- tial requests or through congressional action on requests. The structure of presidential and congressional responsiveness may differ somewhat, since presidential requests for regular appropriations are formulated between six and twelve months prior to congressional appropriations decisions. For instance, requests for fiscal year 1994 were formulated during 1992 and presented to the Congress in early 1993. Since requests were presented at the beginning of 1993, they may reflect opinion in 1992 but cannot fully incorporate public preferences in 1993. The Congress, however, may adjust those requests on the basis of the more current information about public opinion that is available in 1993. In more formal terms, requests for fiscal year t may reflect Net Support in year t - 2 and appropriations may reflect Net Support in year t - 1.
It should be made clear that the hypothetical responsiveness of Congress reflects the net effect of its members' responsiveness to preferences in their districts. To the extent that shifts in preferences occur uniformly across districts,
8 Anthony Downs, An Economic Theory of Democracy (New York: Harper, 1957). 8 Anthony Downs, An Economic Theory of Democracy (New York: Harper, 1957).
Dynamics of Representation 85 Dynamics of Representation 85
national preferences effectively summarize those shifts. Page and Shapiro document a general pattern of parallelism in public opinion change across a wide range of issues and subcategories of the American public.9 This pattern of parallelism implies that district opinion follows national opinion or, put differently, national opinion summarizes opinion across districts.'0 And, if members of Congress follow changes in district opinion, the median congressional preference follows changes in the national preference over time.
As was noted above, the public's relative preference, R, is conceived to represent the difference between the public's preferred level of policy (P*) and policy (P) itself. This characterization implies that R is (first-order) integrated, whereby the influences on R in year t become incorporated into R in year t + 1. Thus, the model of public preferences can be written as follows:
ARt = AP*t - AP, (2)
where R can change because either P* or P changes; an increase in P* positively influences R and an increase in P negatively influences R.
Turning specifically to the budgetary context, this general model implies that:
ARt = B3 AP*t +B4 AP +ft, (3)
where f is the error term. Since, in theory, R represents the difference between P* and P, one might expect B3 to equal ' 1' and B4 to be' - 1'. These expectations reflect the assumption that R, P* and P share a common metric, which they do not. Indeed, we do not even observe P*, making it necessary to rely on instruments. Thus, all that can be expected is that B3 will be positive and B4 will be negative. These theoretical expectations can be assessed empirically."
A MEASURE OF PUBLIC PREFERENCES FOR SPENDING
In order to determine whether policy makers actually respond to public preferences for spending and whether the public responds to what policy makers do, it is important that the public preference for spending (using the same question wording) is measured at roughly the same point in time in each year. If the public responds to what policy makers do, analysis that either combines similar data collected over the course of each year or combines data collected at different points in time in different years may distort the public's
9 Page and Shapiro, The Rational Public. 10 Also see Larry Bartels, 'Constituency Opinion and Congressional Policy Making: The Reagan
Defense Buildup,' American Political Science Review, 85 (1991), 429-56. ' The model of preferences and policy developed here implies equilibration in both preferences
and policy, i.e., that when the two variables are out of equilibrium they adjust to each other over time. In effect, the model implies a 'cointegrating' relationship between preferences and policy, which is explicitly considered below.
86 WLEZIEN 86 WLEZIEN
responsiveness to policy as well as policy makers' responsiveness to preferences. Effects of this sort can be quite disruptive for analysis, particularly if the public responds very quickly to policy makers' behaviour by acquiring information during the course of the policy-making process itself. Put simply, combining public opinion data, say, collected at different points during each year, may mask public responsiveness to policy (and exaggerate representation). Perhaps it is not surprising that one recent study of the interrelationships between defence opinion and policy, in which all data about public preferences for spending in each year were averaged, indicated that the public does not adjust its preferences in response to policy.12
The General Social Survey (GSS) has asked the same question about defence spending at the same point in time (February-April) in virtually every year since 1973. The survey asks: 'Are we spending too much, too little, or about the right amount on the military, armaments and defense?' The GSS asked the question in every year except 1979, 1981 and 1992; fortunately, Gallup asked the same question in surveys that were conducted during 1979 and 1981.13 From these data, time series of public preference marginals about defence spending can be constructed that cover 1973 to 1991. The simplest, most useful way to reflect the public preference is to create a measure of 'Net Support for Spending' by subtracting the percentage of people who think we are spending too much from the percentage of people who think we are spending too little. While imperfect, the measure does serve to indicate the degree to which the public wants 'more' spending on defence over time.14
THE REPRESENTATION OF PUBLIC PREFERENCES
Although the question used to construct the measure of Net Support asks specifically about spending, political actors have little direct control over spending per se. They do, however, have considerable influence over spending indirectly through appropriations decisions. Appropriations bills specify an amount of budget authority that is available to an agency or department for
obligation, that is, for making commitments to spend money. When money is
actually spent, an expenditure or outlay occurs, which often lags far behind appropriations decisions and obligations, as in the case of defence procurement. Accordingly, the budgetary commitment to programs is primarily evident in the budget authority specified in appropriations, not the actual outlays that result
12 Hartley and Russett, 'Public Opinion and the Common Defense'.
13 Roper also asked the same question in the December of every year since 1973 and this data
is used in analysis that follows to explore public responsiveness to policy. 14 Note that the percentage of people who think spending is 'about right' varies within a fairly
narrow range over time and the percentages of people who think we are spending 'too little' and 'too much' over time are virtual mirror images of each other. Not surprisingly, analyses using the
percentage of the public that responds 'too little' or 'too much' separately produce results that differ
only marginally from those using the measure of Net Support.
Dynamics of Representation Dynamics of Representation
60
40
60
40
1976 1980 1984 1988 Year
1976 1980 1984 1988 Year
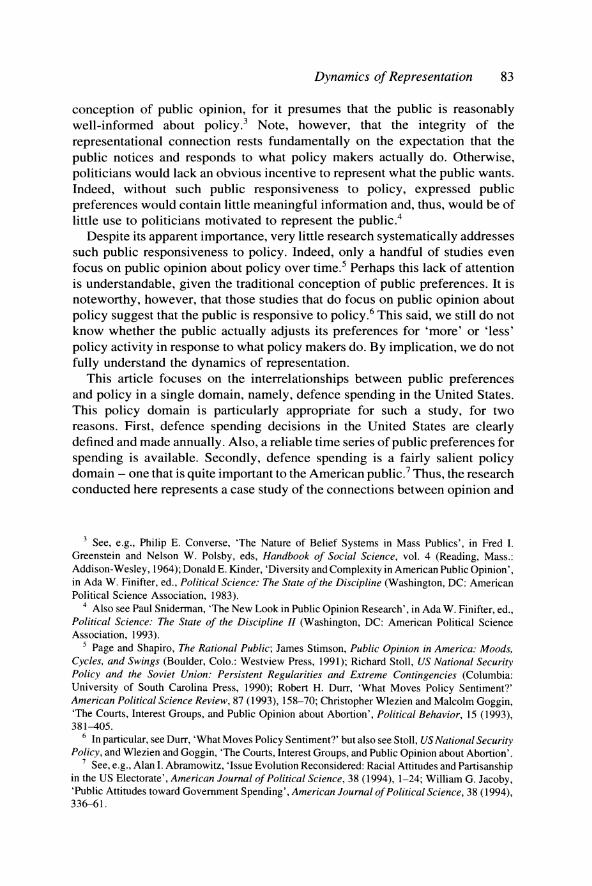
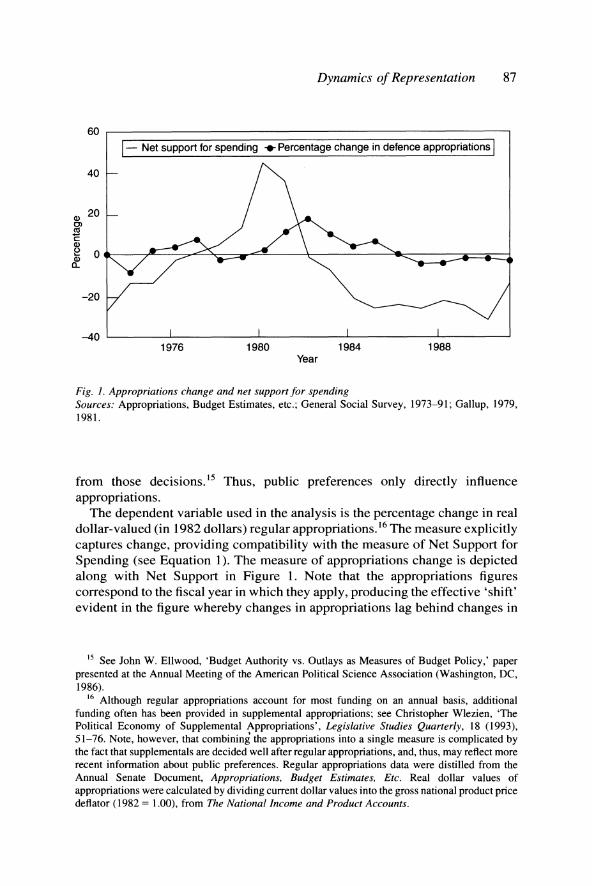
Fig. 1. Appropriations change and net support for spending Sources: Appropriations, Budget Estimates, etc.; General Social Survey, 1973-91; Gallup, 1979, 1981.
from those decisions.15 Thus, public preferences only directly influence
appropriations. The dependent variable used in the analysis is the percentage change in real
dollar-valued (in 1982 dollars) regular appropriations. 16 The measure explicitly captures change, providing compatibility with the measure of Net Support for
Spending (see Equation 1). The measure of appropriations change is depicted along with Net Support in Figure 1. Note that the appropriations figures correspond to the fiscal year in which they apply, producing the effective 'shift' evident in the figure whereby changes in appropriations lag behind changes in
15 See John W. Ellwood, 'Budget Authority vs. Outlays as Measures of Budget Policy,' paper presented at the Annual Meeting of the American Political Science Association (Washington, DC, 1986).
16 Although regular appropriations account for most funding on an annual basis, additional funding often has been provided in supplemental appropriations; see Christopher Wlezien, 'The Political Economy of Supplemental Appropriations', Legislative Studies Quarterly, 18 (1993), 51-76. Note, however, that combining the appropriations into a single measure is complicated by the fact that supplementals are decided well after regular appropriations, and, thus, may reflect more recent information about public preferences. Regular appropriations data were distilled from the Annual Senate Document, Appropriations, Budget Estimates, Etc. Real dollar values of appropriations were calculated by dividing current dollar values into the gross national product price deflator (1982 = 1.00), from The National Income and Product Accounts.
20 20
0 0
0) (1
a) a)
a) nL
0) (1
a) a)
a) nL
-20
-40
-20
-40
87 87
88 WLEZIEN 88 WLEZIEN
preferences. Indeed, the figure suggests that appropriations do follow prefer- ences, tending to increase slowly as the public becomes more supportive of defence spending through the 1970s, dropping off temporarily under Carter, and then increasing sharply in the wake of the very large jump in support for spending in 1980. The large increases in defence appropriations during the early 1980s were followed by a decline in Net Support and an ensuing decline in appropriations. By the mid 1980s the public, on balance, was strongly opposed to more defence spending and actual cuts in defence appropriations were under way.
In order rigorously to assess the influence of preferences on appropriations, it is necessary to control for confounding influences by specifying a complete model of appropriations behaviour. Explanations used to account for budgetary behaviour can be conceptualized as relating to either baseline budgetary components or the politics of the budgetary process. Baseline variables typically include various economic indicators, such as unemployment and inflation. The standard political variables are elections and the partisan affiliation of both the
president and Congress. Models of defence budgetary policy also commonly include measures of Soviet spending. All of these 'control' variables were
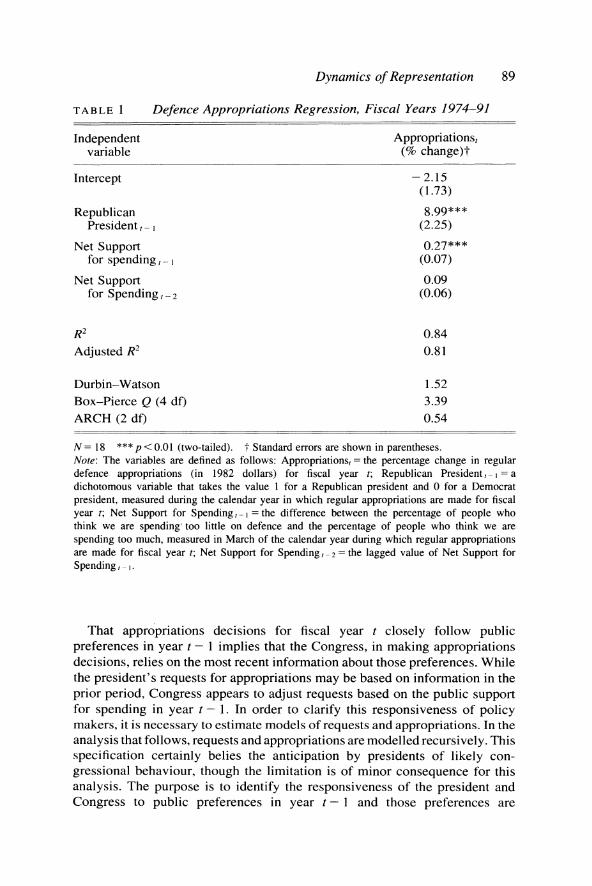
incorporated into the analyses, but only the reduced forms of the estimated models of appropriations behaviour are presented here.17 The estimated model of appropriations change is described in Table 1.18
The analysis shows that defence appropriations tend to follow public preferences for more spending. Perhaps most importantly, policy makers appear to respond solely to the most recent information about public preferences when appropriations decisions are made, in year t - 1: the influence of Net Support in year t - I on appropriations change overwhelms the influence of previous information about preferences registered in year t - 2. This result is important, for it shows that policy makers respond to the level of public preferences for spending, which is quite satisfying; after all, the measure of Net Support captures the public's preference for 'more' spending. So, when the public wants more (less) spending, policy makers provide more (less) appropriations.19
17 The economic and political measures are based on D. Roderick Kiewiet and Mathew D. McCubbins, 'Presidential Influence on Congressional Appropriations Decisions', American Journal of Political Science, 32 (1988), 713-36; Soviet spending measures were drawn from Hartley and Russett, 'Public Opinion and the Common Defense'.
18 In order to preserve a precious degree of freedom, the value of Net Support in 1971 (from Roper) was used as the measure of Net Supportt- 2 for fiscal year 1974, i.e., as the measure of Net Support in 1972. This coding decision poses only negligible consequences for the estimated parameters. Note also that when a variable that captures the change in the federal deficit is included in the model, following Hartley and Russett, 'Public Opinion and the Common Defense', its estimated effect is negative, implying that as the deficit increases defence appropriations also increase. This finding contrasts with Hartley and Russett's result, but the coefficient is far too unreliable to credit.
19 Of course, as the results in Table 1 make clear, policy makers do respond to the change in Net Support t- , but the pattern is not distinguishable from the responsiveness to the level of Net Support -2 (recall that the level of Net Support, - represents the sum of the change in Net Support, - I and the level of Net Support - 2).
preferences. Indeed, the figure suggests that appropriations do follow prefer- ences, tending to increase slowly as the public becomes more supportive of defence spending through the 1970s, dropping off temporarily under Carter, and then increasing sharply in the wake of the very large jump in support for spending in 1980. The large increases in defence appropriations during the early 1980s were followed by a decline in Net Support and an ensuing decline in appropriations. By the mid 1980s the public, on balance, was strongly opposed to more defence spending and actual cuts in defence appropriations were under way.
In order rigorously to assess the influence of preferences on appropriations, it is necessary to control for confounding influences by specifying a complete model of appropriations behaviour. Explanations used to account for budgetary behaviour can be conceptualized as relating to either baseline budgetary components or the politics of the budgetary process. Baseline variables typically include various economic indicators, such as unemployment and inflation. The standard political variables are elections and the partisan affiliation of both the
president and Congress. Models of defence budgetary policy also commonly include measures of Soviet spending. All of these 'control' variables were
incorporated into the analyses, but only the reduced forms of the estimated models of appropriations behaviour are presented here.17 The estimated model of appropriations change is described in Table 1.18
The analysis shows that defence appropriations tend to follow public preferences for more spending. Perhaps most importantly, policy makers appear to respond solely to the most recent information about public preferences when appropriations decisions are made, in year t - 1: the influence of Net Support in year t - I on appropriations change overwhelms the influence of previous information about preferences registered in year t - 2. This result is important, for it shows that policy makers respond to the level of public preferences for spending, which is quite satisfying; after all, the measure of Net Support captures the public's preference for 'more' spending. So, when the public wants more (less) spending, policy makers provide more (less) appropriations.19
17 The economic and political measures are based on D. Roderick Kiewiet and Mathew D. McCubbins, 'Presidential Influence on Congressional Appropriations Decisions', American Journal of Political Science, 32 (1988), 713-36; Soviet spending measures were drawn from Hartley and Russett, 'Public Opinion and the Common Defense'.
18 In order to preserve a precious degree of freedom, the value of Net Support in 1971 (from Roper) was used as the measure of Net Supportt- 2 for fiscal year 1974, i.e., as the measure of Net Support in 1972. This coding decision poses only negligible consequences for the estimated parameters. Note also that when a variable that captures the change in the federal deficit is included in the model, following Hartley and Russett, 'Public Opinion and the Common Defense', its estimated effect is negative, implying that as the deficit increases defence appropriations also increase. This finding contrasts with Hartley and Russett's result, but the coefficient is far too unreliable to credit.
19 Of course, as the results in Table 1 make clear, policy makers do respond to the change in Net Support t- , but the pattern is not distinguishable from the responsiveness to the level of Net Support -2 (recall that the level of Net Support, - represents the sum of the change in Net Support, - I and the level of Net Support - 2).
Dynamics of Representation 89 Dynamics of Representation 89
TABLE 1 Defence Appropriations Regression, Fiscal Years 1974-91
Independent Appropriations, variable (% change)t
Intercept -2.15 (1.73)
Republican 8.99*** President,- (2.25)
Net Support 0.27*** for spending,_- (0.07)
Net Support 0.09 for Spending, 2 (0.06)
R2 0.84
Adjusted R2 0.81
Durbin-Watson 1.52 Box-Pierce Q (4 df) 3.39 ARCH (2 df) 0.54
N = 18 *** p< 0.01 (two-tailed). t Standard errors are shown in parentheses. Note: The variables are defined as follows: Appropriations, = the percentage change in regular defence appropriations (in 1982 dollars) for fiscal year t; Republican President ,-= a dichotomous variable that takes the value 1 for a Republican president and 0 for a Democrat president, measured during the calendar year in which regular appropriations are made for fiscal year t; Net Support for Spending,- = the difference between the percentage of people who think we are spending too little on defence and the percentage of people who think we are spending too much, measured in March of the calendar year during which regular appropriations are made for fiscal year t; Net Support for Spending ,2 = the lagged value of Net Support for Spending,_ .
That appropriations decisions for fiscal year t closely follow public preferences in year t- 1 implies that the Congress, in making appropriations decisions, relies on the most recent information about those preferences. While the president's requests for appropriations may be based on information in the prior period, Congress appears to adjust requests based on the public support for spending in year t- 1. In order to clarify this responsiveness of policy makers, it is necessary to estimate models of requests and appropriations. In the analysis that follows, requests and appropriations are modelled recursively. This specification certainly belies the anticipation by presidents of likely con- gressional behaviour, though the limitation is of minor consequence for this analysis. The purpose is to identify the responsiveness of the president and Congress to public preferences in year t - 1 and those preferences are
90 WLEZIEN 90 WLEZIEN
TABLE 2 Defence Appropriations Behaviour Regressions, Fiscal Years 1974-91
Independent Requests, Appropriations, variable (% change)t (% change)t
Intercept 0.22 - 0.73 (2.72) (0.86)
Requests, 0.64*** (0.09)
Republican 10.48*** President, l (3.53)
Net Support 0.12 0.14*** for Spending, 1 (0.11) (0.04)
Net Support 0.18** -0.01 for Spending ,- 2 (0.09) (0.05)
R2 0.69 0.93 Adjusted R2 0.61 0.91
Durbin-Watson 1.17 1.01 Box-Pierce Q (4 df) 3.96 3.42 ARCH (2 df) 0.54 4.20
N = 18 *** p < 0.01. **p <0.05 (two-tailed). t Standard errors are shown in parentheses. Note: The variable that is unique to this analysis is defined as follows: Requests, = the percentage change in presidential requests for regular defence appropriations (in 1982 dollars) for fiscal year t.
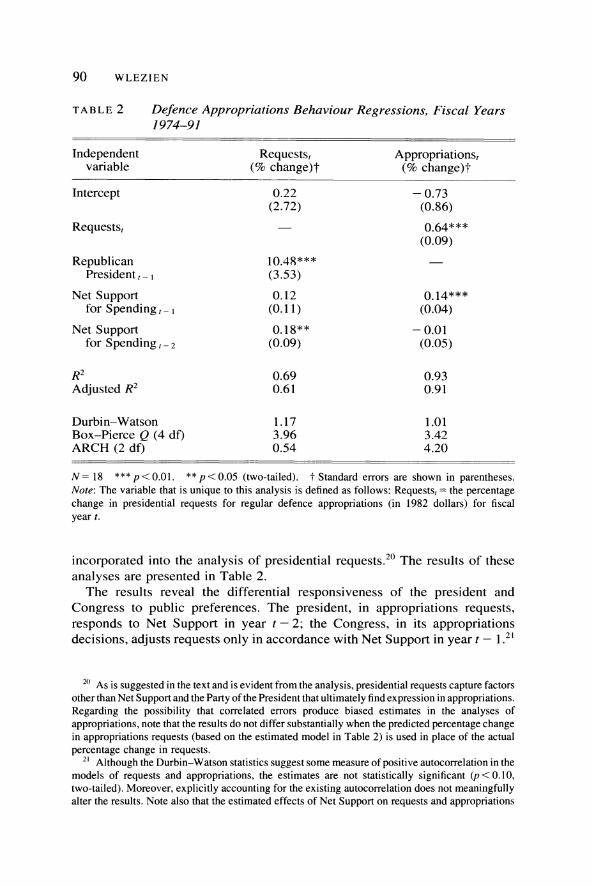
incorporated into the analysis of presidential requests.20 The results of these
analyses are presented in Table 2. The results reveal the differential responsiveness of the president and
Congress to public preferences. The president, in appropriations requests, responds to Net Support in year t - 2; the Congress, in its appropriations decisions, adjusts requests only in accordance with Net Support in year t - 1.21
20 As is suggested in the text and is evident from the analysis, presidential requests capture factors other than Net Support and the Party of the President that ultimately find expression in appropriations. Regarding the possibility that correlated errors produce biased estimates in the analyses of
appropriations, note that the results do not differ substantially when the predicted percentage change in appropriations requests (based on the estimated model in Table 2) is used in place of the actual percentage change in requests.
21 Although the Durbin-Watson statistics suggest some measure of positive autocorrelation in the models of requests and appropriations, the estimates are not statistically significant (p <0.10, two-tailed). Moreover, explicitly accounting for the existing autocorrelation does not meaningfully alter the results. Note also that the estimated effects of Net Support on requests and appropriations
TABLE 2 Defence Appropriations Behaviour Regressions, Fiscal Years 1974-91
Independent Requests, Appropriations, variable (% change)t (% change)t
Intercept 0.22 - 0.73 (2.72) (0.86)
Requests, 0.64*** (0.09)
Republican 10.48*** President, l (3.53)
Net Support 0.12 0.14*** for Spending, 1 (0.11) (0.04)
Net Support 0.18** -0.01 for Spending ,- 2 (0.09) (0.05)
R2 0.69 0.93 Adjusted R2 0.61 0.91
Durbin-Watson 1.17 1.01 Box-Pierce Q (4 df) 3.96 3.42 ARCH (2 df) 0.54 4.20
N = 18 *** p < 0.01. **p <0.05 (two-tailed). t Standard errors are shown in parentheses. Note: The variable that is unique to this analysis is defined as follows: Requests, = the percentage change in presidential requests for regular defence appropriations (in 1982 dollars) for fiscal year t.
incorporated into the analysis of presidential requests.20 The results of these
analyses are presented in Table 2. The results reveal the differential responsiveness of the president and
Congress to public preferences. The president, in appropriations requests, responds to Net Support in year t - 2; the Congress, in its appropriations decisions, adjusts requests only in accordance with Net Support in year t - 1.21
20 As is suggested in the text and is evident from the analysis, presidential requests capture factors other than Net Support and the Party of the President that ultimately find expression in appropriations. Regarding the possibility that correlated errors produce biased estimates in the analyses of
appropriations, note that the results do not differ substantially when the predicted percentage change in appropriations requests (based on the estimated model in Table 2) is used in place of the actual percentage change in requests.
21 Although the Durbin-Watson statistics suggest some measure of positive autocorrelation in the models of requests and appropriations, the estimates are not statistically significant (p <0.10, two-tailed). Moreover, explicitly accounting for the existing autocorrelation does not meaningfully alter the results. Note also that the estimated effects of Net Support on requests and appropriations
Dynamics of Representation 91 Dynamics of Representation 91
Put simply, congressional action on requests reflects the most recent information about public preferences, which includes the innovations that occur between year t - 2 and year t - 1 (also see fn. 19). When increases (decreases) in requests are not supported by public preferences at the time Congress makes appropriations, the Congress cuts (adds to) those requests in their appropriations decisions. Ultimately, therefore, appropriations change in fiscal year t solely reflects the public preference in year t- 1, as shown in Table 1.
When controlling for public preferences, a strong partisan difference is evident in presidential requests and, to a lesser extent, actual appropriations. Based on the coefficient in Table 1, the percentage change in real dollar-valued defence appropriations is about 9 per cent higher among Republican presidents than among Democrats (in this analysis, Carter), given public preferences.22 However, the actual appropriations change does not differ by party as dramatically as the coefficient implies, because the public is less supportive of more spending under Republican presidents. This fact suggests that Republican presidents, in advancing and accomplishing relatively higher appropriations than Democrats, effectively drive down public support for more spending. In order to address this possibility, it is necessary explicitly to model public preferences themselves. Such a model, once estimated, also can be used to assess more definitively the representation of preferences in policy - to ascertain whether policy makers respond to public preferences or primarily to certain components of those preferences, e.g., the perceived Soviet threat, instead. It is to the model of public preferences that the discussion turs next.
THE FEEDBACK OF POLICY ON PUBLIC PREFERENCES
The theoretical model outlined earlier implies that the public responds to what policy makers actually do, that policy 'feeds back' on preferences. However, the focus of public responsiveness is not entirely clear. The public may respond to appropriations decisions as mediated by news reporting, perhaps in the same way that the public acquires information about the economy.23 Alternatively, the
(F'note continued)
are slightly larger when the years 1981-83 are excluded from the analysis, apparently reflecting some level of non-linearity in the responsiveness of both the president and Congress. In effect, institutional actors become slightly less responsive to Net Support as the measure tends toward its upper (or lower) bounds - technically, the measure is bounded by - 100 and 100. Since the estimated non-linearity in institutional responsiveness is minor, the results based on linear specification are reported here.
22 The effect may seem counterintuitive, for it implies that defence appropriations increase in each year under Republican presidents. Note, however, that the effect of the party of the president on defence appropriations is not isolated to transitions in administrations; see Christopher Wlezien, 'The President, Congress, and Appropriations, 1951-1985,' American Politics Quarterly, 24 (1996), forthcoming. Moreover, the effect holds only when the level of Net Support, - is included in the model, which is exactly what one might expect if appropriations feed back on Net Support.
23 See, e.g., Richard A. Brody, Assessing the President: The Media, Elite Opinion, and Public Support (Stanford, Calif.: Stanford University Press, 1991); Michael B. MacKuen, Robert S. Erikson
92 WLEZIEN 92 WLEZIEN
public may not acquire and process information about policy makers' behaviour, but may instead respond to spending, as money makes its way into localities and people's pockets. This distinction in the focus of public responsiveness is not trivial - it relates directly to a substantial body of research on public opinion, indeed, decision theory more generally.24 Of course, it is possible to settle this issue empirically. In the analysis that follows the feedback of appropriations on preferences is considered first.
If there is negative feedback of appropriations decisions on public preferences for spending, then changes in Net Support will be negatively related to changes in appropriations. When appropriations increase (decrease), Net Support will decrease (increase). Such an estimated connection between appropriations and public preferences cannot be the result of simultaneity. After all, any positive feedback of appropriations on Net Support only serves to bias the analysis against finding such a pattern.25 Percentage change measures of real dollar- valued appropriations are used here.
The general model of public preferences described in Equation (3) implies that public preferences for more spending reflect both the public's preferred level of spending and policy itself. Of course, it may be that shifts in public support for more defence spending primarily reflect shifts in policy. The preferred level of spending may remain unchanged while spending itself changes, producing ebbs and flows in the support for more spending. However, public support for more defence spending also may reflect shifts in the preferred level of spending over time, and there is reason to think it does. Indeed, there is reason to expect the public to respond to changes in the Soviet threat.26 Since we do not directly observe the preferred level of defence spending, however, it is necessary to rely on instruments.
An indication of the Soviet threat over time is provided by responses to a like/dislike item in the GSS and surveys conducted by the American Institute for Public Opinion (AIPO).27 The item registers the like/dislike of 'Russia' on
(F'note continued)
and James A. Stimson, 'Peasants or Bankers? The American Electorate and the US Economy', American Political Science Review, 86 (1992), 597-611. But also see David Sanders, David Marsh and Hugh Ward, 'The Electoral Impact of Press Coverage of the British Economy', British Journal
of Political Science, 23 (1993), 175-210, for a different formulation. 24 See Richard Nisbett and Lee Ross, Human Inference: Strategies and Shortcomings of Social
Judgment (Englewood Cliffs, NJ: Prentice-Hall, 1980). 25 Thus, accounting for any positive simultaneity between changes in appropriations and Net
Support, which is not straightforward, can only strengthen the negative, feedback relationship between them.
26 See Farid Abolfathi, 'Threat, Public Opinion, and Military Spending in the United States, 1930-1990', in Patrick McGowan and Charles W. Kegley Jr, eds., Threats, Weapons, and Foreign Policy (Beverly Hills, Calif.: Sage, 1980). Also see Mark S. Kamlet and David C. Mowery, 'Influences on Executive and Congressional Budgetary Priorities', American Political Science Review, 81 (1987), 155-78.
27 Richard G. Niemi, John Mueller and Tom Smith, Trends in Public Opinion: A Compendium of Survey Data (Westport, Conn.: Greenwood Press, 1989).
Dynamics of Representation 93 Dynamics of Representation 93
a ten-point scale ranging from - 5 to 5. A measure of Net Dislike can be created by subtracting the percentage of people that likes Russia from the percentage that dislikes the nation.28 The measure follows standard interpretations of US-Soviet relations over time, marking low relative dislike in the mid-1970s and then tending to erode before reaching a peak of dislike in 1980. The measure levels off during the mid 1980s and drops sharply thereafter. While imperfect, in that it does not incorporate information about national security in general, the measure does capture the apparent threat from the Soviet Union, the primary reliable source of threat to the United States over the period.29 As Net Dislike increases (decreases), the public is expected to become more (less) supportive of defence spending.
Recall that the public's relative preference for defence spending is captured by the measure of Net Support. A differenced measure is used as the dependent variable because there is a theoretical expectation outlined above (and borne out in separate analyses) that the current influences on public preferences become integrated into future values. In effect, Net Support remains essentially unchanged unless something (such as a shift in Net Dislike) happens to change it, which is an important and intuitively satisfying result. Note that the functional form relating Net Dislike to Net Support is based on empirical analysis. The results from estimating the model of Net Support (differenced) are presented in the first column of Table 3.
These results indicate that the model of public preferences for defence spending performs quite well. Changes in Net Support follow changes in the relations between the United States and the Soviet Union, as captured by the measures of Net Dislike. As relations worsen (improve), the public supports higher (lower) defence spending. The public adjusts its preferences immedi- ately, in year t, in response to shifts in the Soviet threat during the same period. Although the public does update its preferences based on the most current information, that information is not fully incorporated until the following year - the coefficient for the lagged change in Net Dislike is positive and easily meets standard levels of statistical significance. This result suggests that a certain inertia characterizes the public's adjustment of preferences for defence spending in response to shifts in the US-Soviet relationship.
Perhaps most importantly, the analysis reveals substantial negative feedback
28 Neither the GSS nor AIPO asked the question in 1978, so the value in that year represents the average of the values in 1977 and 1979. Excluding the year from the analysis that follows makes virtually no difference to the estimated parameters.
29 Charles W. Kegley Jr and Eugene R. Wittkopf, American Foreign Policy: Pattern and Process (New York: St Martin's Press, 1989). The potential limitation of the measure is most notable in 1991, when Net Support increased in apparent correspondence with American involvement in Desert Storm. Note, however, that the measure of Net Dislike outperforms the more common spending-based indicators of need for defence spending (see fn. 17) in the models of Net Support. Thus, it appears that the measure captures much more information that is relevant to the public demand for spending, such as relates to important real world events that have no basis in spending, e.g., the Soviet invasion of Afghanistan.
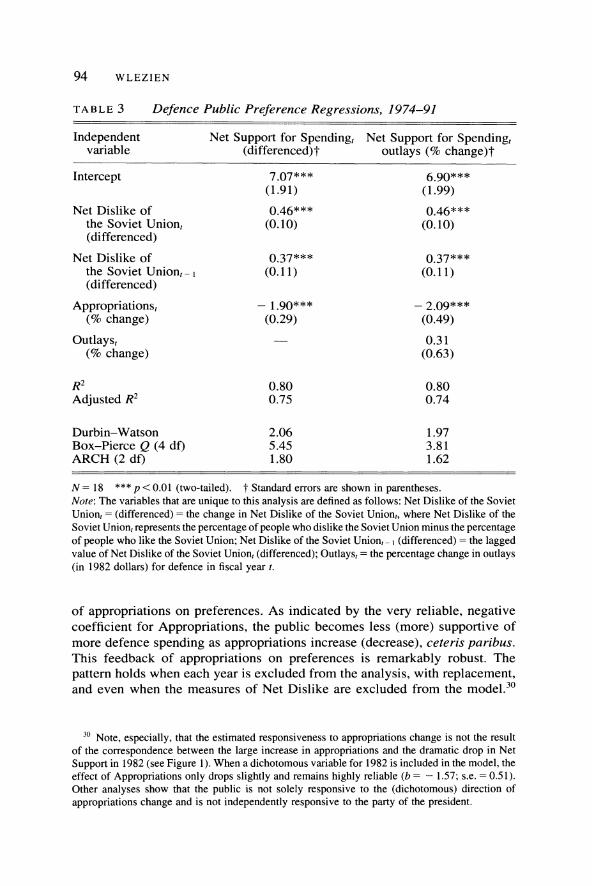
94 WLEZIEN 94 WLEZIEN
TABLE 3 Defence Public Preference Regressions, 1974-91
Independent Net Support for Spending, Net Support for Spending, variable (differenced)t outlays (% change)t
Intercept 7.07*** 6.90*** (1.91) (1.99)
Net Dislike of 0.46*** 0.46*** the Soviet Union, (0.10) (0.10) (differenced)
Net Dislike of 0.37*** 0.37*** the Soviet Union,- 1 (0.11) (0.11) (differenced)
Appropriations, -1.90*** -2.09*** (% change) (0.29) (0.49)
Outlays, 0.31 (% change) (0.63)
R2 0.80 0.80 Adjusted R2 0.75 0.74
Durbin-Watson 2.06 1.97 Box-Pierce Q (4 df) 5.45 3.81 ARCH (2 df) 1.80 1.62
N = 18 ***p < 0.01 (two-tailed). t Standard errors are shown in parentheses. Note: The variables that are unique to this analysis are defined as follows: Net Dislike of the Soviet Union, = (differenced) = the change in Net Dislike of the Soviet Union,, where Net Dislike of the Soviet Union, represents the percentage of people who dislike the Soviet Union minus the percentage of people who like the Soviet Union; Net Dislike of the Soviet Union,-1 (differenced) = the lagged value of Net Dislike of the Soviet Union, (differenced); Outlays, = the percentage change in outlays (in 1982 dollars) for defence in fiscal year t.
of appropriations on preferences. As indicated by the very reliable, negative coefficient for Appropriations, the public becomes less (more) supportive of more defence spending as appropriations increase (decrease), ceteris paribus. This feedback of appropriations on preferences is remarkably robust. The
pattern holds when each year is excluded from the analysis, with replacement, and even when the measures of Net Dislike are excluded from the model.30
30 Note, especially, that the estimated responsiveness to appropriations change is not the result of the correspondence between the large increase in appropriations and the dramatic drop in Net Support in 1982 (see Figure 1). When a dichotomous variable for 1982 is included in the model, the effect of Appropriations only drops slightly and remains highly reliable (b = - 1.57; s.e. = 0.51). Other analyses show that the public is not solely responsive to the (dichotomous) direction of appropriations change and is not independently responsive to the party of the president.
Dynamics of Representation 95 Dynamics of Representation 95
Moreover, it appears that the public updates its preferences based on only the most recent information about policy, namely, those appropriations for the current fiscal years. Separate analyses reveal that the public is not independently responsive to presidential requests. The public also is not responsive to appropriations for previous fiscal years.31
Before accepting this conclusion, it is necessary to determine whether the public responds to appropriations or outlays. The most straightforward way to assess the focus of public responsiveness is to include a measure of the percentage change in outlays together with the measure of appropriations change in the model of Net Support.32 The results from estimating the model (in the second column of Table 3) show that the public does not respond to Outlays independently of Appropriations - the coefficient for the measure of outlays is incorrectly (positively) signed and is not statistically significant. It is fairly clear, therefore, that the public responds directly to the most recently available information about policy, namely, appropriations decisions, not the actual outcomes of those decisions.33 Although the finding may be surprising, given the traditional conception of public opinion, it appears that the public is quite well-informed about what policy makers do over time, at least in the defence spending domain. Otherwise, the public could not be responsive to actual appropriations change.34
EXPLORING PUBLIC RESPONSIVENESS
That the public responds so powerfully to decisions about appropriations is quite startling. But, what is equally, if not more, astonishing is that the public responds
31 The positive, statistically significant intercept in Table 3 suggests that the public's preferred level of defence spending tends to increase over time, ceteris paribus. The intercept (7.07), taken together with the coefficient for Appropriations, (1.90), implies that the amount of appropriations the public wants increases by about 3.72 per cent (in real dollars) on an annual basis. In other words, assuming Net Dislike remains unchanged, Net Support will tend to drift upward unless appropriations increase by just less than 4 per cent, which exceeds the average annual growth in the real gross national product. Although the tendency may largely be due to 'income effects', the possibility is not considered here; for a straightforward discussion of income effects, see David Kreps, A Course in Microeconomic Theory (Princeton, NJ: Princeton University Press, 1990).
32 Outlays data were drawn from the Budget of the United States Government, Fiscal Year 1993
(Supplement, February 1992). 33 Moreover, separate analyses show that the pattern holds across subcategories of education and
party identification, implying that the evident responsiveness to appropriations is not driven by a particular segment of the American public.
34 Analysis using cointegration methodology produces results that do not differ meaningfully from
those presented herein - see the Appendix. Such public responsiveness must reflect information communicated by the mass media (see fn. 23) or in other ways. For a basic discussion of two-stage information flows, see James A. Stimson, 'The Paradox of Ignorant Voters, but Competent Electorate', in Donald S. Lutz and Kent L. Tedin, eds, Perspectives on American and Texas Politics (Dubuque, Iowa: Kendall/Hunt, 1989). For an interesting assessment of the mediating role of political elites, see Brody, Assessing the President, especially the discussion of how 'rally' events influence presidential approval in the United States.
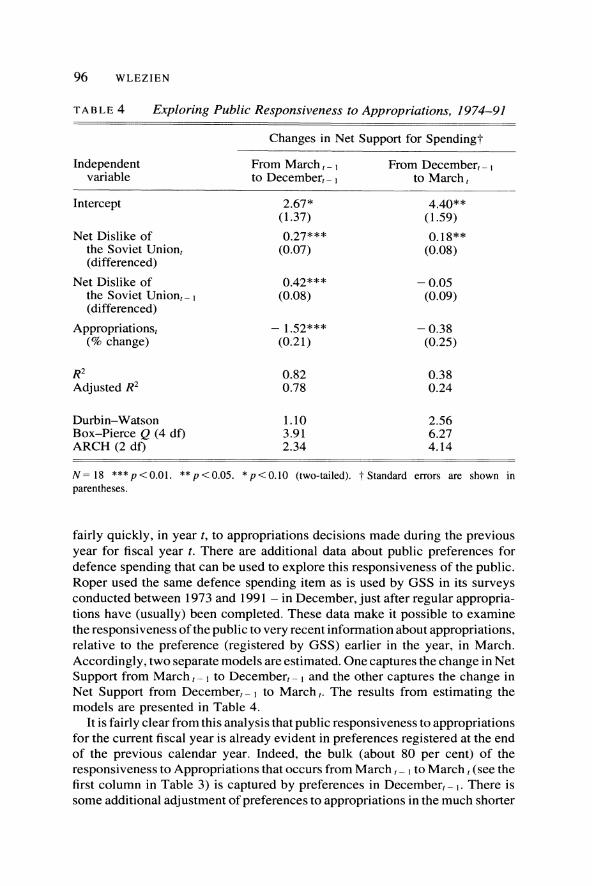
96 WLEZIEN 96 WLEZIEN
TABLE 4 Exploring Public Responsiveness to Appropriations, 1974-91
Changes in Net Support for Spendingt
Independent From March, - From December,- variable to December, - to March,
Intercept 2.67* 4.40** (1.37) (1.59)
Net Dislike of 0.27*** 0.18** the Soviet Union, (0.07) (0.08) (differenced)
Net Dislike of 0.42*** - 0.05 the Soviet Union,- (0.08) (0.09) (differenced)
Appropriations, -1.52*** -0.38 (% change) (0.21) (0.25)
R2 0.82 0.38 Adjusted R2 0.78 0.24
Durbin-Watson 1.10 2.56 Box-Pierce Q (4 df) 3.91 6.27 ARCH (2 df) 2.34 4.14
N= 18 ***p< 0.01. **p<0.05. * p<0.10 (two-tailed). t Standard parentheses. N= 18 ***p< 0.01. **p<0.05. * p<0.10 (two-tailed). t Standard parentheses.
errors are shown in errors are shown in
fairly quickly, in year t, to appropriations decisions made during the previous year for fiscal year t. There are additional data about public preferences for defence spending that can be used to explore this responsiveness of the public. Roper used the same defence spending item as is used by GSS in its surveys conducted between 1973 and 1991 - in December, just after regular appropria- tions have (usually) been completed. These data make it possible to examine the responsiveness of the public to very recent information about appropriations, relative to the preference (registered by GSS) earlier in the year, in March. Accordingly, two separate models are estimated. One captures the change in Net Support from March - I to December,t- and the other captures the change in Net Support from December,_ 1 to March,. The results from estimating the models are presented in Table 4.
It is fairly clear from this analysis that public responsiveness to appropriations for the current fiscal year is already evident in preferences registered at the end of the previous calendar year. Indeed, the bulk (about 80 per cent) of the responsiveness to Appropriations that occurs from March, - 1 to March t (see the first column in Table 3) is captured by preferences in December,- i. There is some additional adjustment of preferences to appropriations in the much shorter
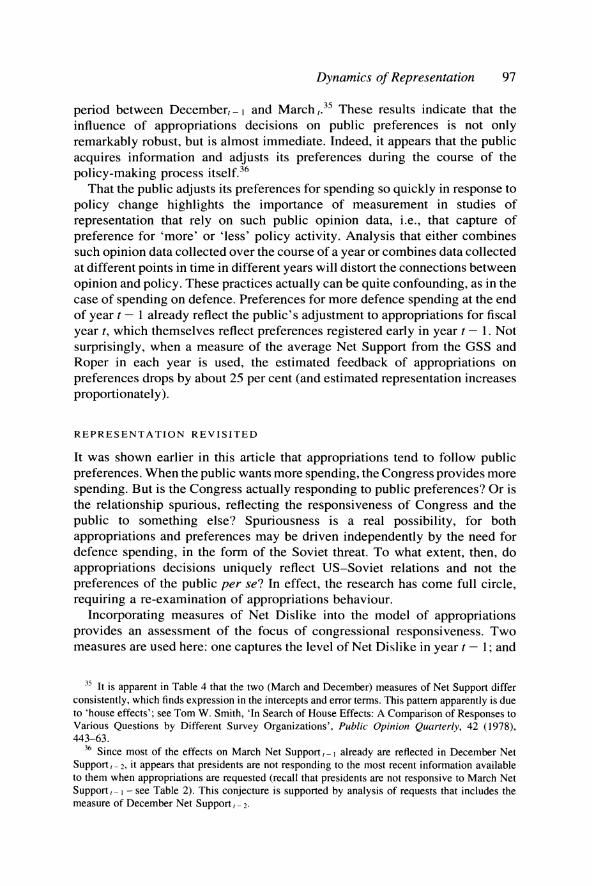
Dynamics of Representation 97 Dynamics of Representation 97
period between December,-1 and March .35 These results indicate that the influence of appropriations decisions on public preferences is not only remarkably robust, but is almost immediate. Indeed, it appears that the public acquires information and adjusts its preferences during the course of the policy-making process itself.36
That the public adjusts its preferences for spending so quickly in response to policy change highlights the importance of measurement in studies of representation that rely on such public opinion data, i.e., that capture of preference for 'more' or 'less' policy activity. Analysis that either combines such opinion data collected over the course of a year or combines data collected at different points in time in different years will distort the connections between opinion and policy. These practices actually can be quite confounding, as in the case of spending on defence. Preferences for more defence spending at the end of year t - 1 already reflect the public's adjustment to appropriations for fiscal year t, which themselves reflect preferences registered early in year t - 1. Not surprisingly, when a measure of the average Net Support from the GSS and Roper in each year is used, the estimated feedback of appropriations on preferences drops by about 25 per cent (and estimated representation increases proportionately).
REPRESENTATION REVISITED
It was shown earlier in this article that appropriations tend to follow public preferences. When the public wants more spending, the Congress provides more spending. But is the Congress actually responding to public preferences? Or is the relationship spurious, reflecting the responsiveness of Congress and the public to something else? Spuriousness is a real possibility, for both appropriations and preferences may be driven independently by the need for defence spending, in the form of the Soviet threat. To what extent, then, do appropriations decisions uniquely reflect US-Soviet relations and not the preferences of the public per se? In effect, the research has come full circle, requiring a re-examination of appropriations behaviour.
Incorporating measures of Net Dislike into the model of appropriations provides an assessment of the focus of congressional responsiveness. Two measures are used here: one captures the level of Net Dislike in year t - 1; and
35 It is apparent in Table 4 that the two (March and December) measures of Net Support differ consistently, which finds expression in the intercepts and error terms. This pattern apparently is due to 'house effects'; see Tom W. Smith, 'In Search of House Effects: A Comparison of Responses to Various Questions by Different Survey Organizations', Public Opinion Quarterly, 42 (1978), 443-63.
36 Since most of the effects on March Net Support,-l already are reflected in December Net Support - 2, it appears that presidents are not responding to the most recent information available to them when appropriations are requested (recall that presidents are not responsive to March Net Support,- - see Table 2). This conjecture is supported by analysis of requests that includes the measure of December Net Support, - 2.
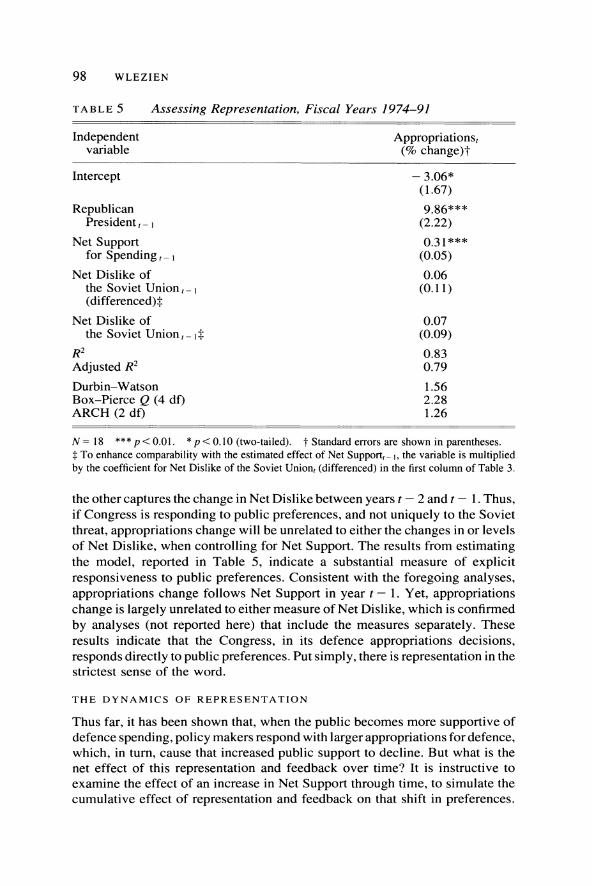
98 WLEZIEN 98 WLEZIEN
TABLE 5 Assessing Representation, Fiscal Years 1974-91
Independent Appropriations, variable (% change)t
Intercept - 3.06* (1.67)
Republican 9.86*** President,- (2.22)
Net Support 0.31** for Spending,-] (0.05)
Net Dislike of 0.06 the Soviet Union, _ (0.11) (differenced)T
Net Dislike of 0.07 the Soviet Union, -i (0.09)
R2 0.83 Adjusted R2 0.79
Durbin-Watson 1.56 Box-Pierce Q (4 df) 2.28 ARCH (2 df) 1.26
N = 18 *** p < 0.01. * p < 0.10 (two-tailed). t Standard errors are shown in parentheses. t To enhance comparability with the estimated effect of Net Support,- I, the variable is multiplied by the coefficient for Net Dislike of the Soviet Union, (differenced) in the first column of Table 3.
the other captures the change in Net Dislike between years t - 2 and t - 1. Thus, if Congress is responding to public preferences, and not uniquely to the Soviet threat, appropriations change will be unrelated to either the changes in or levels of Net Dislike, when controlling for Net Support. The results from estimating the model, reported in Table 5, indicate a substantial measure of explicit responsiveness to public preferences. Consistent with the foregoing analyses, appropriations change follows Net Support in year t- 1. Yet, appropriations change is largely unrelated to either measure of Net Dislike, which is confirmed by analyses (not reported here) that include the measures separately. These results indicate that the Congress, in its defence appropriations decisions, responds directly to public preferences. Put simply, there is representation in the strictest sense of the word.
THE DYNAMICS OF REPRESENTATION
Thus far, it has been shown that, when the public becomes more supportive of defence spending, policy makers respond with larger appropriations for defence, which, in turn, cause that increased public support to decline. But what is the net effect of this representation and feedback over time? It is instructive to examine the effect of an increase in Net Support through time, to simulate the cumulative effect of representation and feedback on that shift in preferences.
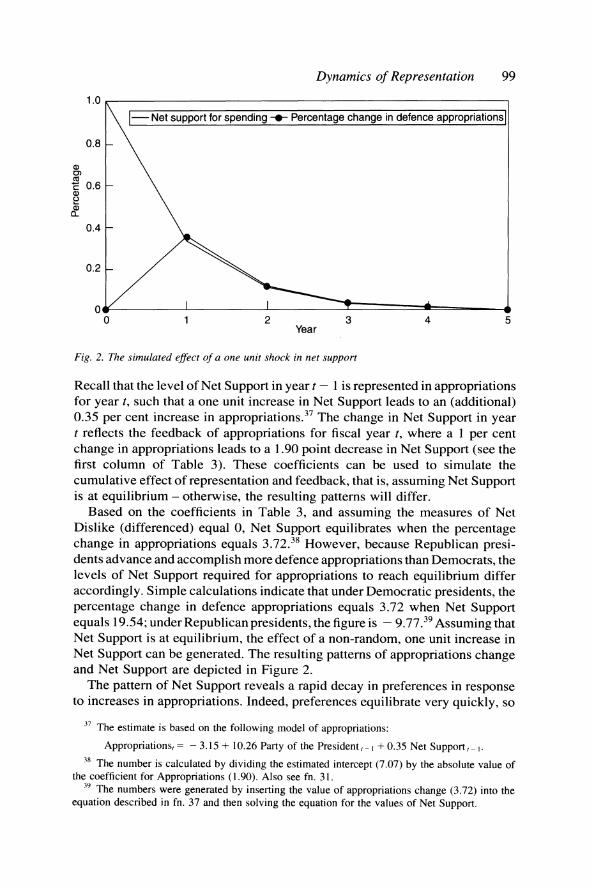
Dynamics of Representation 99 Dynamics of Representation 99
1.0
-\ Net support for spending --- Percentage change in defence appropriations|
0.8 -
) \
: 0.6 - a) \
Q. \
0.4 -
0.2-
0 I I ^L * * 0 1 2 3 4 5
Year
Fig. 2. The simulated effect of a one unit shock in net support
Recall that the level of Net Support in year t - 1 is represented in appropriations for year t, such that a one unit increase in Net Support leads to an (additional) 0.35 per cent increase in appropriations.37 The change in Net Support in year t reflects the feedback of appropriations for fiscal year t, where a 1 per cent
change in appropriations leads to a 1.90 point decrease in Net Support (see the first column of Table 3). These coefficients can be used to simulate the cumulative effect of representation and feedback, that is, assuming Net Support is at equilibrium - otherwise, the resulting patterns will differ.
Based on the coefficients in Table 3, and assuming the measures of Net Dislike (differenced) equal 0, Net Support equilibrates when the percentage change in appropriations equals 3.72.38 However, because Republican presi- dents advance and accomplish more defence appropriations than Democrats, the levels of Net Support required for appropriations to reach equilibrium differ
accordingly. Simple calculations indicate that under Democratic presidents, the percentage change in defence appropriations equals 3.72 when Net Support equals 19.54; under Republican presidents, the figure is - 9.77.39 Assuming that Net Support is at equilibrium, the effect of a non-random, one unit increase in Net Support can be generated. The resulting patterns of appropriations change and Net Support are depicted in Figure 2.
The pattern of Net Support reveals a rapid decay in preferences in response to increases in appropriations. Indeed, preferences equilibrate very quickly, so
37 The estimate is based on the following model of appropriations:
Appropriations, = - 3.15 + 10.26 Party of the President,- i + 0.35 Net Support,-i. 38 The number is calculated by dividing the estimated intercept (7.07) by the absolute value of
the coefficient for Appropriations (1.90). Also see fn. 31. 39 The numbers were generated by inserting the value of appropriations change (3.72) into the
equation described in fn. 37 and then solving the equation for the values of Net Support.
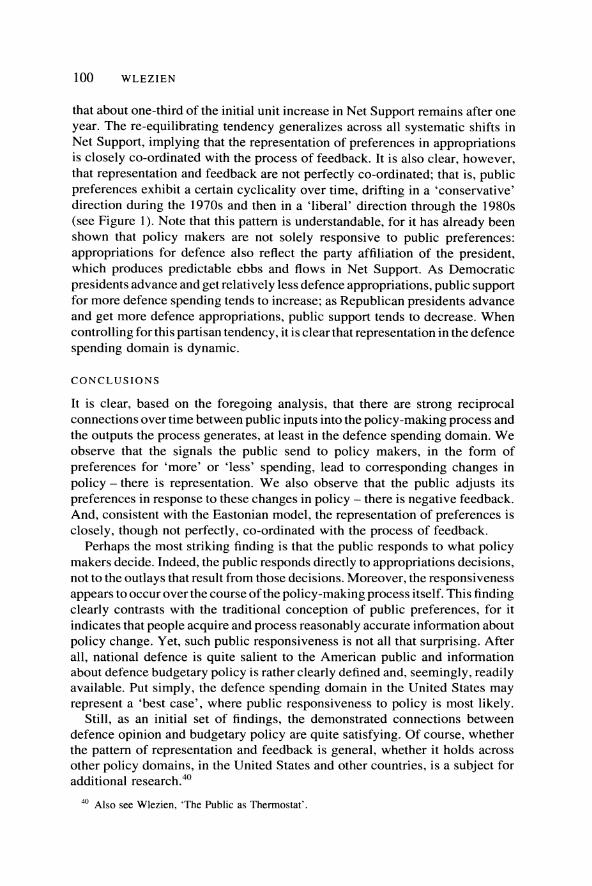
100 WLEZIEN 100 WLEZIEN
that about one-third of the initial unit increase in Net Support remains after one year. The re-equilibrating tendency generalizes across all systematic shifts in Net Support, implying that the representation of preferences in appropriations is closely co-ordinated with the process of feedback. It is also clear, however, that representation and feedback are not perfectly co-ordinated; that is, public preferences exhibit a certain cyclicality over time, drifting in a 'conservative' direction during the 1970s and then in a 'liberal' direction through the 1980s (see Figure 1). Note that this pattern is understandable, for it has already been shown that policy makers are not solely responsive to public preferences: appropriations for defence also reflect the party affiliation of the president, which produces predictable ebbs and flows in Net Support. As Democratic presidents advance and get relatively less defence appropriations, public support for more defence spending tends to increase; as Republican presidents advance and get more defence appropriations, public support tends to decrease. When controlling for this partisan tendency, it is clear that representation in the defence spending domain is dynamic.
CONCLUSIONS
It is clear, based on the foregoing analysis, that there are strong reciprocal connections over time between public inputs into the policy-making process and the outputs the process generates, at least in the defence spending domain. We observe that the signals the public send to policy makers, in the form of preferences for 'more' or 'less' spending, lead to corresponding changes in policy - there is representation. We also observe that the public adjusts its preferences in response to these changes in policy - there is negative feedback. And, consistent with the Eastonian model, the representation of preferences is closely, though not perfectly, co-ordinated with the process of feedback.
Perhaps the most striking finding is that the public responds to what policy makers decide. Indeed, the public responds directly to appropriations decisions, not to the outlays that result from those decisions. Moreover, the responsiveness appears to occur over the course of the policy-making process itself. This finding clearly contrasts with the traditional conception of public preferences, for it indicates that people acquire and process reasonably accurate information about policy change. Yet, such public responsiveness is not all that surprising. After all, national defence is quite salient to the American public and information about defence budgetary policy is rather clearly defined and, seemingly, readily available. Put simply, the defence spending domain in the United States may represent a 'best case', where public responsiveness to policy is most likely.
Still, as an initial set of findings, the demonstrated connections between defence opinion and budgetary policy are quite satisfying. Of course, whether the pattern of representation and feedback is general, whether it holds across other policy domains, in the United States and other countries, is a subject for additional research.40
40 Also see Wlezien, 'The Public as Thermostat'. 40 Also see Wlezien, 'The Public as Thermostat'.
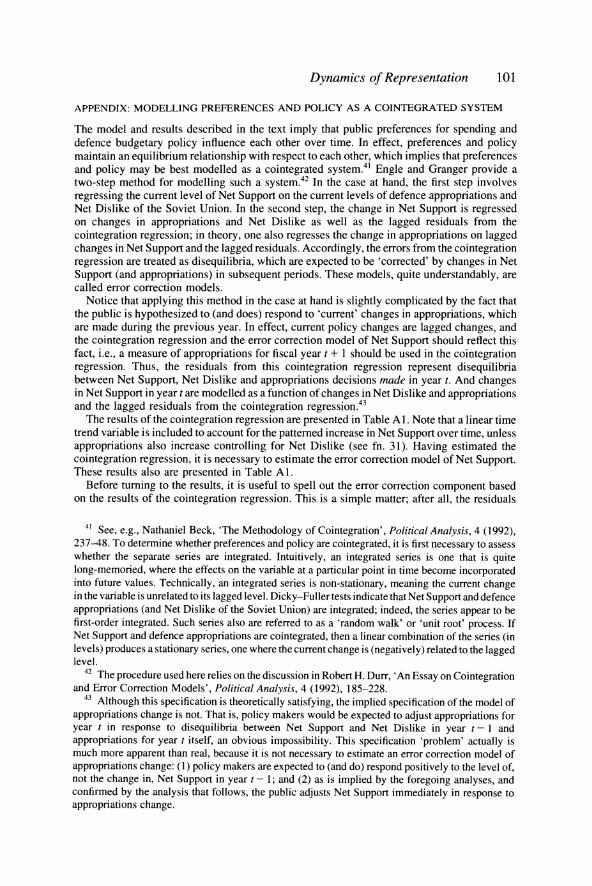
Dynamics of Representation 101 Dynamics of Representation 101
APPENDIX: MODELLING PREFERENCES AND POLICY AS A COINTEGRATED SYSTEM
The model and results described in the text imply that public preferences for spending and defence budgetary policy influence each other over time. In effect, preferences and policy maintain an equilibrium relationship with respect to each other, which implies that preferences and policy may be best modelled as a cointegrated system.4' Engle and Granger provide a two-step method for modelling such a system.42 In the case at hand, the first step involves regressing the current level of Net Support on the current levels of defence appropriations and Net Dislike of the Soviet Union. In the second step, the change in Net Support is regressed on changes in appropriations and Net Dislike as well as the lagged residuals from the cointegration regression; in theory, one also regresses the change in appropriations on lagged changes in Net Support and the lagged residuals. Accordingly, the errors from the cointegration regression are treated as disequilibria, which are expected to be 'corrected' by changes in Net Support (and appropriations) in subsequent periods. These models, quite understandably, are called error correction models.
Notice that applying this method in the case at hand is slightly complicated by the fact that the public is hypothesized to (and does) respond to 'current' changes in appropriations, which are made during the previous year. In effect, current policy changes are lagged changes, and the cointegration regression and the error correction model of Net Support should reflect this fact, i.e., a measure of appropriations for fiscal year t + 1 should be used in the cointegration regression. Thus, the residuals from this cointegration regression represent disequilibria between Net Support, Net Dislike and appropriations decisions made in year t. And changes in Net Support in year t are modelled as a function of changes in Net Dislike and appropriations and the lagged residuals from the cointegration regression.43
The results of the cointegration regression are presented in Table Al. Note that a linear time trend variable is included to account for the patterned increase in Net Support over time, unless appropriations also increase controlling for Net Dislike (see fn. 31). Having estimated the cointegration regression, it is necessary to estimate the error correction model of Net Support. These results also are presented in Table Al.
Before turning to the results, it is useful to spell out the error correction component based on the results of the cointegration regression. This is a simple matter; after all, the residuals
41 See, e.g., Nathaniel Beck, 'The Methodology of Cointegration', Political Analysis, 4 (1992), 237-48. To determine whether preferences and policy are cointegrated, it is first necessary to assess whether the separate series are integrated. Intuitively, an integrated series is one that is quite long-memoried, where the effects on the variable at a particular point in time become incorporated into future values. Technically, an integrated series is non-stationary, meaning the current change in the variable is unrelated to its lagged level. Dicky-Fuller tests indicate that Net Support and defence appropriations (and Net Dislike of the Soviet Union) are integrated; indeed, the series appear to be first-order integrated. Such series also are referred to as a 'random walk' or 'unit root' process. If Net Support and defence appropriations are cointegrated, then a linear combination of the series (in levels) produces a stationary series, one where the current change is (negatively) related to the lagged level.
42 The procedure used here relies on the discussion in Robert H. Durr, 'An Essay on Cointegration and Error Correction Models', Political Analysis, 4 (1992), 185-228.
43 Although this specification is theoretically satisfying, the implied specification of the model of appropriations change is not. That is, policy makers would be expected to adjust appropriations for year t in response to disequilibria between Net Support and Net Dislike in year t - 1 and appropriations for year t itself, an obvious impossibility. This specification 'problem' actually is much more apparent than real, because it is not necessary to estimate an error correction model of appropriations change: (1) policy makers are expected to (and do) respond positively to the level of, not the change in, Net Support in year t - 1; and (2) as is implied by the foregoing analyses, and confirmed by the analysis that follows, the public adjusts Net Support immediately in response to appropriations change.
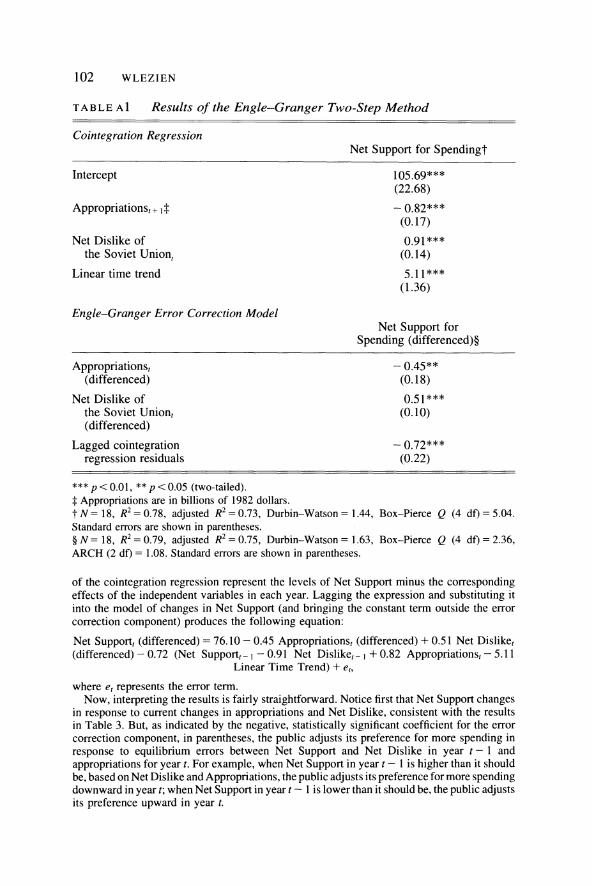
102 WLEZIEN 102 WLEZIEN
TABLE A1 Results of the Engle-Granger Two-Step Method TABLE A1 Results of the Engle-Granger Two-Step Method
Cointegration Regression Net Support for Spendingt
Intercept 105.69*** (22.68)
Appropriations + - 0.82*** (0.17)
Net Dislike of 0.91*** the Soviet Union, (0.14)
Linear time trend 5.11*** (1.36)
Engle-Granger Error Correction Model Net Support for
Spending (differenced)?
Appropriations, - 0.45** (differenced) (0.18)
Net Dislike of 0.51*** the Soviet Union, (0.10) (differenced)
Lagged cointegration -0.72*** regression residuals (0.22)
*** p < 0.01, ** p < 0.05 (two-tailed). t Appropriations are in billions of 1982 dollars. t N= 18, R2 = 0.78, adjusted R2= 0.73, Durbin-Watson = 1.44, Standard errors are shown in parentheses. ? N= 18, R2 = 0.79, adjusted R2 = 0.75, Durbin-Watson = 1.63, ARCH (2 df)= 1.08. Standard errors are shown in parentheses.
*** p < 0.01, ** p < 0.05 (two-tailed). t Appropriations are in billions of 1982 dollars. t N= 18, R2 = 0.78, adjusted R2= 0.73, Durbin-Watson = 1.44, Standard errors are shown in parentheses. ? N= 18, R2 = 0.79, adjusted R2 = 0.75, Durbin-Watson = 1.63, ARCH (2 df)= 1.08. Standard errors are shown in parentheses.
Box-Pierce Q (4 df)= 5.04.
Box-Pierce Q (4 df) = 2.36,
Box-Pierce Q (4 df)= 5.04.
Box-Pierce Q (4 df) = 2.36,
of the cointegration regression represent the levels of Net Support minus the corresponding effects of the independent variables in each year. Lagging the expression and substituting it into the model of changes in Net Support (and bringing the constant term outside the error correction component) produces the following equation:
Net Support, (differenced) = 76.10 - 0.45 Appropriations, (differenced) + 0.51 Net Disliket (differenced) - 0.72 (Net Supportt- 1 - 0.91 Net Dislike,_ 1 + 0.82 Appropriationst- 5.11
Linear Time Trend) + et,
where et represents the error term. Now, interpreting the results is fairly straightforward. Notice first that Net Support changes
in response to current changes in appropriations and Net Dislike, consistent with the results in Table 3. But, as indicated by the negative, statistically significant coefficient for the error correction component, in parentheses, the public adjusts its preference for more spending in response to equilibrium errors between Net Support and Net Dislike in year t- 1 and appropriations for year t. For example, when Net Support in year t - 1 is higher than it should be, based on Net Dislike and Appropriations, the public adjusts its preference for more spending downward in year t; when Net Support in year t - 1 is lower than it should be, the public adjusts its preference upward in year t.
Dynamics of Representation 103
Although these results support an error correction specification, notice that they do not differ meaningfully from the results presented earlier, in Table 3. Most notably, the coefficient (- 0.72) for the error correction component is not statistically different from - 1, implying that disequilibria are adjusted immediately. Even the simulated effects of Net Dislike and Appropriations are quite similar to those reported in Table 3. Take the effect of appropriations change. A $1 billion increase in defence appropriations for year t leads to a direct 0.45 decline in Net Support in year t and an indirect decline, through the error correction component, of 0.59 (- 0.72 * 0.82 * 1) in the same year. Thus, on the basis of the error correction model, the net effect of a $1 billion increase on Net Support in year t is - 1.04. Since the mean level of defence appropriations over the period is about $200 billion, a $1 billion increase represents a 0.5 per cent increase. Turning to the model employed in the text (see the first column in Table 3), a 0.5 per cent increase in appropriations leads to a 0.95 drop in Net Support. Quite clearly, these estimated effects, - 1.04 and - 0.95, do not differ meaningfully.


