Embed Size (px)
Citation preview

Private and Confidential
…..…..
TechnologySeptember 2020
e-Commerce valuation and trends
Private and Confidential
2
Boston
Shanghai
Dublin
Madrid
Paris
AmsterdamFrankfurt
ZurichMilan
Athens
Stockholm
LisbonBarcelona
Bogotá
Santiago de Chile
São Paulo
Buenos Aires
San Francisco
BrusselsVienna
London
Mexico City
New York City
Hong Kong
Copenhagen
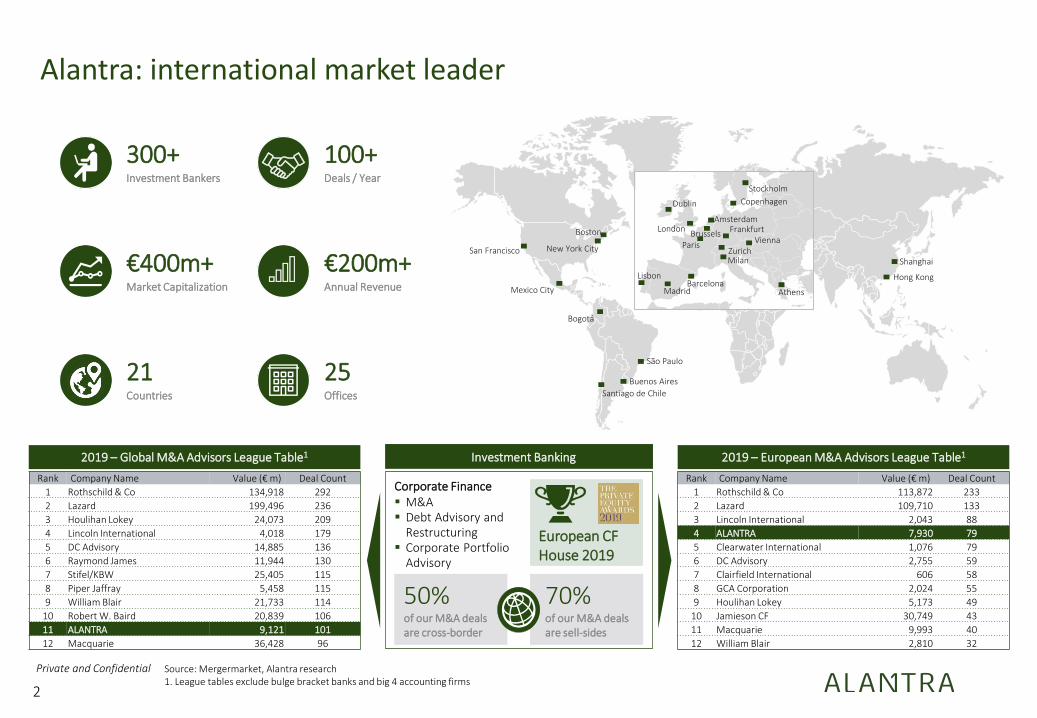
300+Investment Bankers
25Offices
21Countries
€400m+Market Capitalization
€200m+Annual Revenue
100+Deals / Year
Corporate Finance▪ M&A▪ Debt Advisory and
Restructuring▪ Corporate Portfolio
Advisory
European CF House 2019
50%of our M&A dealsare cross-border
70%of our M&A dealsare sell-sides
Investment Banking 2019 – European M&A Advisors League Table1
Rank Company Name Value (€ m) Deal Count
1 Rothschild & Co 113,872 233
2 Lazard 109,710 133
3 Lincoln International 2,043 88
4 ALANTRA 7,930 79
5 Clearwater International 1,076 79
6 DC Advisory 2,755 59
7 Clairfield International 606 58
8 GCA Corporation 2,024 55
9 Houlihan Lokey 5,173 49
10 Jamieson CF 30,749 43
11 Macquarie 9,993 40
12 William Blair 2,810 32
2019 – Global M&A Advisors League Table1
Rank Company Name Value (€ m) Deal Count
1 Rothschild & Co 134,918 292
2 Lazard 199,496 236
3 Houlihan Lokey 24,073 209
4 Lincoln International 4,018 179
5 DC Advisory 14,885 136
6 Raymond James 11,944 130
7 Stifel/KBW 25,405 115
8 Piper Jaffray 5,458 115
9 William Blair 21,733 114
10 Robert W. Baird 20,839 106
11 ALANTRA 9,121 101
12 Macquarie 36,428 96
Source: Mergermarket, Alantra research1. League tables exclude bulge bracket banks and big 4 accounting firms
Alantra: international market leader

Private and Confidential
3
Alantra global technology group 2019-2020 momentum
Note: Alantra has advised >20 transactions in the last 18 months with a total aggregate value of >US$2.1bn
2020
2019
2020 2020
2019
-
2019
2019
2020 2020
20192019
2019
20192019
2019 2019 201920192019
20202020

Private and Confidential
4
Advisor to iCracked on its sale to SquareTrade, a subsidiary of Allstate
2019
2014
Advisor to SMITH on the sale of Commerce Server to
Sitecore
2017
Advisor to ShipRush on its sale to The Descartes
Systems Group
Advisor to Pitney Bowes on its acquisition of Borderfree
2015
Advisor to Volusion on its growth financing from Silicon
Valley Bank
2014
-
2013
Advisor to SAP on its acquisition of Hybris
2013
Advisor to Streeteasycom. on its sale to Zillow
Advisor to Unilog on a minority investment from
LLR Partners
2018 2015
Advisor to Unisport in sale to Nordic Capital
2014
Advisor to the shareholders of Portal Inmobiliario on the sale of 100% of the Chilean and Mexican operations to
Mercado LibreUS$ 40 Mn
2014
Advisor to Equistoneon the debt raise for the
acquisition ofCaseKing.de
Advisor to Hayneedle on its debt financing from Triplepoint Capital
2013
2013
Advisor to HomeGain.com, a subsidiary of Classified Ventures, on its sale to
Reply!
Strategic advisor, restructuring, sell-side and debt
recapitalization multi-year engagement including the sale
of commerce Server.Net to Sitecore plus recaps from Comerica Bank and GKFF
2014
2010
Advisor to Buy.com on its sale to Rakuten
2010
Advisor to Amazon on its acquisition of Audible
2010
Advisor to Amazon on its acquisition of Zappos
Advisor to HP on the sale of Snapfish to District Photo
2011
Advisor to TMN on ABS Capital Partners initial
investment
2012
Advisor to Bazaarvoice on its Initial Public Offering
(IPO)
2015
Selected e-Commerce transactions advised by Alantra
Advisor to Group Label/Mister Menuiserie on the sale of a
minority Stake to IDl
2018

Private and Confidential
Massive market with consistent double-digit growth: online retail penetration crossing tipping point• A decade ago less than 5% of retail sales were online – that number has more than tripled to 15%+, driving double digit overall industry growth
annually.
• Physical retail has been declining for over a decade the 2020 COVID related lockdowns, have accelerated the decline – over 25 major retailershave filed for bankruptcy, and the trend is expected to continue.
• Major players have led the innovation around shifting consumer digital purchasing habits – top 5 players have 50% market share
• Several vertical categories, where online penetration was low, and several last-mile facilitation related businesses have enjoyed the benefitlockdown related growth – the long-term effects are unclear.
Technology and fintech enablers critical factors of widespread adoption• One of the biggest drivers of e-Commerce growth has been ubiquitous usage of mobile devices and smartphones coupled with developments
from online payment technologies that reduce friction.
• The digital shopping experience has improved substantially with reviews, rich media content, VR/AR, and the ease of reverse logistics – creatinga more efficient shopping experience and enabling trust to navigate endless online inventory.
• Retailers and SMB merchants have benefited substantially with democratized software enablement tools for storefronts, customer acquisition,offline/online convergence and a variety of advanced critical functionality.
Logistics and last-mile fulfillment advanced have fueled a step function increase• Significant advances in rapid delivery at deminimus consumer costs, that Amazon pioneered, has driven adoption in categories that were
historically not purchased online.
• Delivery models from local physical retail struggled for economic viability but COVID-driven increases have driven rapid demand increasesdriving viability – if consumer behavior permanently changes could translate to stable growth.
5
Macro e-Commerce market dynamics
US$4Tn+ market has evolved from a convenience to a critical facet of daily life globally

Private and Confidential
Executive summary
Page 7
Valuation metrics
Page 20
Introduction to Alantra
Page 32
Appendix
Page 37
e-Commerce market size and trends
Page 14
TABLE OF CONTENTS

Private and Confidential
Executive summary
POSSIBILITY IS IN THE ASCENT

Private and Confidential
8
Key to carving out sustainable models against Amazon, eBay, Alibaba and other major diversified incumbents.✓ Vertical marketplaces, specialized in a product or service niche have achieved some success against the larger horizontal marketplaces.✓ These vertical marketplaces are increasingly becoming more specific, offering specialized products or services in order to carve out
dominance within a niche and conquer market share from larger, horizontal marketplaces.✓ Often vertical marketplaces offer specific research and reviews along with inventory from varied suppliers that offer an advantageVertical e-
Commerce
1
Enablement solutions powering small and medium e-Tailers have experienced dramatic growth in the last few years.✓ There are over 7 million e-Tailers in the world. Over 5 million selling through their own websites powered by e-Commerce platforms,
with the remaining on marketplaces.✓ Advanced hosting, software driving merchandising, customer acquisition marketing, and shopping cart payments solutions previously
relegated to large players have become democratized.e-Commerce enablement solutions
2
A forced shift in adoption from COVID-19 of certain delivery models has driven renewed activity in this segment.✓ Supply chain companies have started perfecting their fulfilment processes to find new and profitable ways to deliver products to
online shoppers and meet their increasing expectations.✓ In order to carry out a successful multichannel strategy, both online and offline channels integrate and complement each other,
increasing customer satisfaction, customer loyalty and profit.✓ Some companies were struggling in the delivery category with low contribution margins, however have seen a rise in demand and
renewed strategic interest.Delivery and last
mile
3
Social engagement dominating time spent online and targeting millennial audiences.✓ Besides socializing, social media users also discover new products and follow their favourite brands accounts, which makes it an ideal
opportunity to increase engagement, loyalty and sell products.✓ High quality, engaging content has become increasingly important to acquire customers. Given that Social media dominates online
time spend it is increasingly an effective place to deliver advertising for eCommerce, particularly for niche brands.Social & content-centric models
4
Selected e-Commerce industry trends
Source: Alantra analysis, public available information

Private and Confidential
9
Crucial speed of innovation in the market dominance race.✓ Advanced analytics tools, such as predictive analytics and data mining, and IoT technologies will allow e-Commerce companies to
extract high-quality data to better understand online shoppers, their needs and deliver a more personalized experience.✓ Artificial intelligence is being used by online retailers for providing chatbot services, analysing customer comments, and providing
customized services to online shoppers based on their buying habits.✓ The online shopping experience will be closer to the traditional one to the extent that virtual reality and augmented reality
developments will allow online shoppers better feel and engage with the product.Leading edge digital
transformation
5
Fintech has shifted the way people and enterprises use and move money, and that’s increasingly impacting the world of e-Commerce.✓ Payment technology both from an ease of integration and from low consumer friction on completion have been critical success factors
to eCommerce adoption.✓ There is a growing need to start focusing on better know your customer (KYC) compliance and services. eCommerce companies are
prime targets as they scale with lax security measures.✓ Unbanked consumers require specialized financial technology solutions from blended card-issuing models and physical to digital
payments bridge.Fintech
6
Selected e-Commerce industry trends (cont.)
Source: Alantra analysis, public available information

Private and Confidential Source: Statista, GlobalWebIndex, ContentSquare1. Figures represent the findings of a survey of internet users aged 16 to 64, reflecting the number of respondents who say they have been spending more time shopping online since the start of the crisis. 2. Average increase in the volume of e-Commerce transactions in the week to 15 April 2020 compared to the first 6 weeks of 2020 (does not include activity in native apps, only website)
10
▪ The COVID pandemic has driven rapid acceleration of online adoption particularly in categories that previously were under penetrated
▪ Segments such as food/groceries or home furnishing have soared during the crisis and one of the key questions is whether these newly acquired
habits will continue or are temporary.
▪ Nearly half of the internet users have increase shopping online, with China showing the highest increase
Increase in e-Commerce interest by vertical1 (%) Impact on e-Commerce transactions by vertical2 (%)
33%29% 27%
19% 17% 15%
Food &Groceries
Householdessentials
Personal care Clothes Entertainment Cosmetics &Beauty
products
120%
77%
76%
70%
62%
33%
30%
2%
-4%
-5%
-15%
-20%
-92%
Home Furninshing & DIY
Sports Equipment
Supermarkets
Cosmetics
Retail Tech
Fashion
Banking & Insurance
Retail Healthcare
Telecom
Media
Luxury
Jewellery & watches
Tourism
▪ The Food & Groceries category has seen the greatest increase in e-Commerce
interest, finding that a third of internet users have been shopping more of these
items online as a result of their country’s COVID-19 lockdowns.
▪ This has translated into a significant increase in traffic to supermarket websites
too. ContentSquare reported a 251% increase in visits to supermarket websites in
the seven days from April 8th to April 15th, compared to average weekly traffic at
the start of 2020.
▪ ContentSquare also reported a 76% rise in transactions on supermarket websites
during the same period, compared to pre-lockdown levels.
▪ Home Furnishing and DIY categories show the higher growth in number of
transactions during the crisis, while tourism related webs have almost dried up,
as expected.
COVID tectonic impacts
COVID related lockdowns and shelter-in-place have naturally driven a sharp increase in the industry, with the exception of travel.Unclear what impact ‘normalized’ long-term trends will have but the force shift from late adopters likely to be net-positive

Private and Confidential
11
Source: Capital IQ as of August 31, 20201. Graphs show market capitalization trend over the past 12 months and market capitalization change from February 14, 2020 and August 31, 2020
Horizontal e-Commerce incumbents Classifieds listings Marketplaces
S&P 500 Nasdaq
Recent valuation trading trends by subsector
Δ in Mkt Cap: +43%
Aug 20
▪ Composed of 8 companies, our index grew a
72% in the last 12 months.
▪ COVID impacted this segment with a 18.4%
decline from Feb-20 to March-20 levels, but
since reaching its minimum peak has recovered
a 75.0%.
▪ Sales growth for this segment is 25.6% from
2018-2019.
▪ Average LTM EV/Sales multiple is 4.4x and the
average LTM EV/Gross profit multiple is 14.5x.
▪ Amazon, Tencent and Alibaba are the largest
players.
▪ Composed of 6 companies, our index grew a
24.2% in the last 12 months.
▪ COVID impacted this segment with a 27.3%
decline from Feb-20 to March-20 levels, but
since reaching its minimum peak has recovered
a 81.0%.
▪ Sales growth for this segment is 17.7% from
2018-2019.
▪ Average LTM EV/Sales multiple is 8.5x and the
average LTM EV/Gross profit multiple is 12.5x.
▪ Prosus and eBay are the largest players.
▪ Composed of 19 companies, our index grew a
33% in the last 12 months.
▪ COVID impacted this segment with a 34.1%
decline from Feb-20 to March-20 levels, but
since reaching its minimum peak has recovered
a 89.7%.
▪ Sales growth for this segment is 31.2% from
2018-2019.
▪ Average LTM EV/Sales multiple is 4.2x and the
average LTM EV/Gross profit multiple is 13.6x.
▪ Booking Holdings, JustEat, Zillow, Carvana and
Etsy are the largest players.
70%
90%
110%
130%
150%
170%
190%
Sep 19 Nov 19 Jan 20 Mar 20 May 20 Jul 20
60%70%80%90%
100%110%120%130%140%150%160%
Sep 19 Nov 19 Jan 20 Mar 20 May 20 Jul 20
Δ in Mkt Cap: +32%
Aug 20
60%70%80%90%
100%110%120%130%140%150%160%
Sep 19 Nov 19 Jan 20 Mar 20 May 20 Jul 20
Δ in Mkt Cap: +25%
Aug 20

Private and Confidential
12
Source: Capital IQ as of August 31, 20201. Graphs show market capitalization trend over the past 12 months and market capitalization change from February 14, 2020 and August 31, 2020
Vertical e-Commerce e-Commerce enablers
S&P 500 Nasdaq
Recent valuation trading trends by subsector (cont.)
▪ Composed of 13 companies, our index grew a
113.4% in the last 12 months.
▪ COVID impacted this segment with a 29.2%
decline from Feb-20 to March-20 levels, but
since reaching its minimum peak has recovered
a 195.9%.
▪ Sales growth for this segment is 25.6% from
2018-2019.
▪ Average LTM EV/Sales multiple is 4.1x and the
average LTM EV/Gross profit multiple is 7.1x.
▪ Chewy, Ocado, Peloton, Wayfair and Zalando
are the largest players.
▪ Composed of 6 companies, our index grew a
98.8% in the last 12 months.
▪ COVID impacted this segment with a 29.9%
decline from Feb-20 to March-20 levels, but
since reaching its minimum peak has recovered
a 124.8%.
▪ Sales growth for this segment is 20.1% from
2018-2019.
▪ Average LTM EV/Sales multiple is 10.2x and the
average LTM EV/Gross profit multiple is 16.0x.
▪ Adobe, PayPal and Shopify are the largest
players.
60%
80%
100%
120%
140%
160%
180%
200%
220%
240%
Sep 19 Nov 19 Jan 20 Mar 20 May 20 Jul 20
70%
90%
110%
130%
150%
170%
190%
210%
Sep 19 Nov 19 Jan 20 Mar 20 May 20 Jul 20
Δ in Mkt Cap: +58%
Aug 20
Δ in Mkt Cap: +110%
Aug 20

Private and Confidential Source: Capital IQ as of August 31, 2020
13
Stock price performance by segment between February 14th, 2020 and August 31st, 2020
Index weighted average market capitalization
COVID-19 impact on stock prices
+42.9%+31.6%
+25.0%
+109.5%
+57.6%
(60.0%)
(40.0%)
(20.0%)
-
+20.0%
+40.0%
+60.0%
+80.0%
+100.0%
+120.0%
+140.0%
+160.0%
+180.0%
+200.0%
+220.0%
+240.0%
+260.0%
+280.0%
+300.0%
Horizontal e-Commerce incumbents Classifieds listings Marketplaces Vertical e-Commerce e-Commerce enablers
+870.0%

Private and Confidential
e-Commerce market size and trends
POSSIBILITY IS IN THE ASCENT

Private and Confidential Source: Statista, GlobalWebIndex
15
Global B2B e-Commerce gross merchandise value worldwide (US$bn) Global retail e-Commerce sales worldwide (US$bn)
6,499 6,906 8,129
9,285 10,606
12,216
2014 2015 2016 2017 2018 2019F
1,336 1,548 1,845 2,382 2,982 3,535 4,206
4,927 5,695
6,542
2014 2015 2016 2017 2018 2019 2020F 2021F 2022F 2023F
▪ B2B companies are increasingly buying and selling their products or services to each other
via online sales portals, following either the direct model or the marketplace model to
conduct their business.
▪ Asia is the region with higher contribution, representing c. 80% of the global market, led by
China (more than 30% of the market) due to the size, the
e-Commerce share and a favourable regulation.
▪ After Asia, North America is the second biggest B2B e-Commerce market, representing c.
11%.
▪ The European market represents only c. 3%. One reason for this might be that many of the
suppliers in Central, Eastern and Southern Europe still do not offer user-friendly digital
purchasing options needed.
▪ Global e-Commerce sales amounted to more than US$3.5tr worldwide in 2019 and this
number is expected to continue growing over the next few years.
▪ Of the total global retail sales in 2019, c. 14% came from online purchases, with an
expectation to reach c. 22% of total sales by 2023.
▪ China is the top e-Commerce market, with total sales in 2019 of c. US$2.0tr, followed by
the US with c. US$0.5tr, both representing c. 70% of worldwide
e-Commerce market.
▪ In terms of channel, mobile phone was the most popular choice of consumers (24% of
global consumers) vs. PC or laptop (23%).
▪ In 2019, 14.9% of the total global retail sales came from online purchases, expecting a
continued growth to 22% by 2023.
Market share by gross merchandise value worldwide (2018)
▪ Top 5 players in the e-Commerce industry accounted for 50% of the market, lead by Alibaba owned brands Taobao.com and
Tmall.com, with 16% and 13% market share, respectively.
▪ Amazon was the third largest company in the sector with a 10% market share, followed by the Chinese web JD.com (8%) and
Ebay (3%).
▪ Other players present in the e-Commerce market are Pinduoduo, Rakuten or Suning.com, with market shares between 1 and 2%.
e-Commerce market size evolution (B2B and B2C)
16%
13%
10%
8%3%
Others50%

Private and Confidential Source: Statista, GlobalWebIndex
16
Global e-Commerce spend by category in 2019 and YoY growth (US$bn; %)
Fashion & BeautyUS$620.1
(+18%)
Electronics & Physical MediaUS$456.9
(+18%)
Food & Personal CareUS$168.8
(+13%)
Furniture & AppliancesUS$316.7
(+19%)
Toys, DIY & HobbiesUS$383.2
(+16%)
Travel & AccommodationUS$1.2tr
(+8%)
Digital musicUS$13.6
(+5%)
Video gamesUS$83.2
(+5%)
▪ Furniture & Appliances saw the fastest annual growth in 2019, with 19% growth in spend year-over-year, proving to be one of the specialized verticals
with better development perspectives.
▪ Fashion & Beauty and Electronics & Physical Media categories also saw relevant growth in 2019, increasing by 18% from 2018 to 2019.
▪ On the other hand, Travel & Accommodation, the largest category by online spending, showed a moderate increase of 8% (not considering the recent
impact of COVID-19), although its already relevant size makes more difficult to achieve higher growth rates.
Global retail e-Commerce spend by category (Pre COVID)
Private and Confidential
17
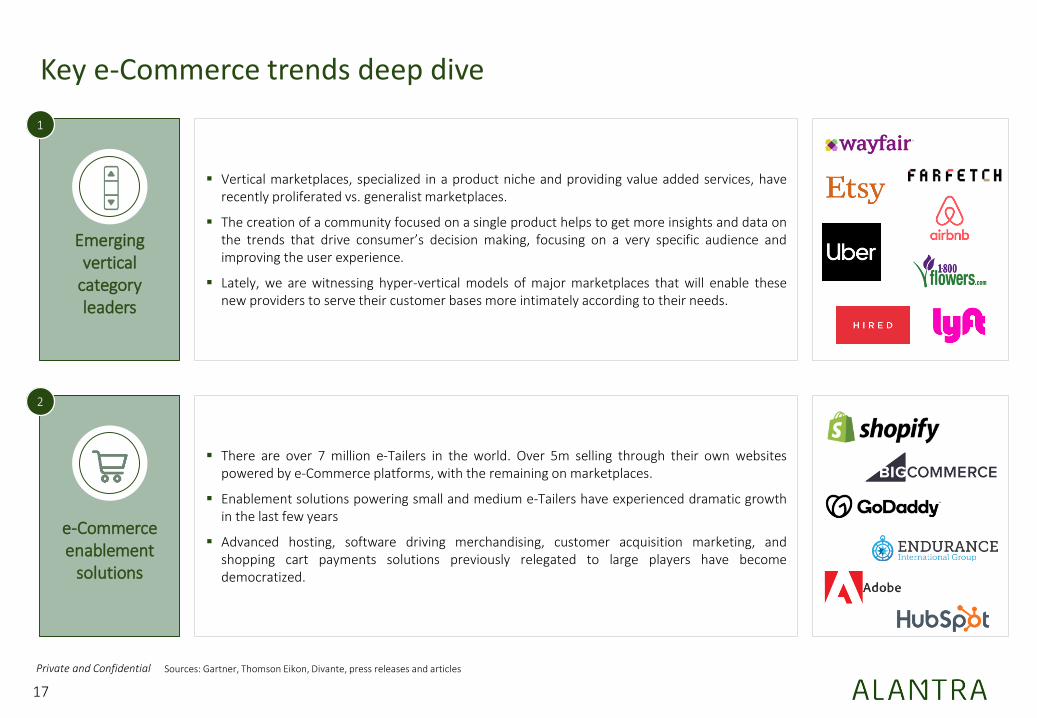
▪ Vertical marketplaces, specialized in a product niche and providing value added services, haverecently proliferated vs. generalist marketplaces.
▪ The creation of a community focused on a single product helps to get more insights and data onthe trends that drive consumer’s decision making, focusing on a very specific audience andimproving the user experience.
▪ Lately, we are witnessing hyper-vertical models of major marketplaces that will enable thesenew providers to serve their customer bases more intimately according to their needs.
Emerging vertical
category leaders
Key e-Commerce trends deep dive
Sources: Gartner, Thomson Eikon, Divante, press releases and articles
1
▪ There are over 7 million e-Tailers in the world. Over 5m selling through their own websitespowered by e-Commerce platforms, with the remaining on marketplaces.
▪ Enablement solutions powering small and medium e-Tailers have experienced dramatic growthin the last few years
▪ Advanced hosting, software driving merchandising, customer acquisition marketing, andshopping cart payments solutions previously relegated to large players have becomedemocratized.
e-Commerce enablement
solutions
2
Private and Confidential
18
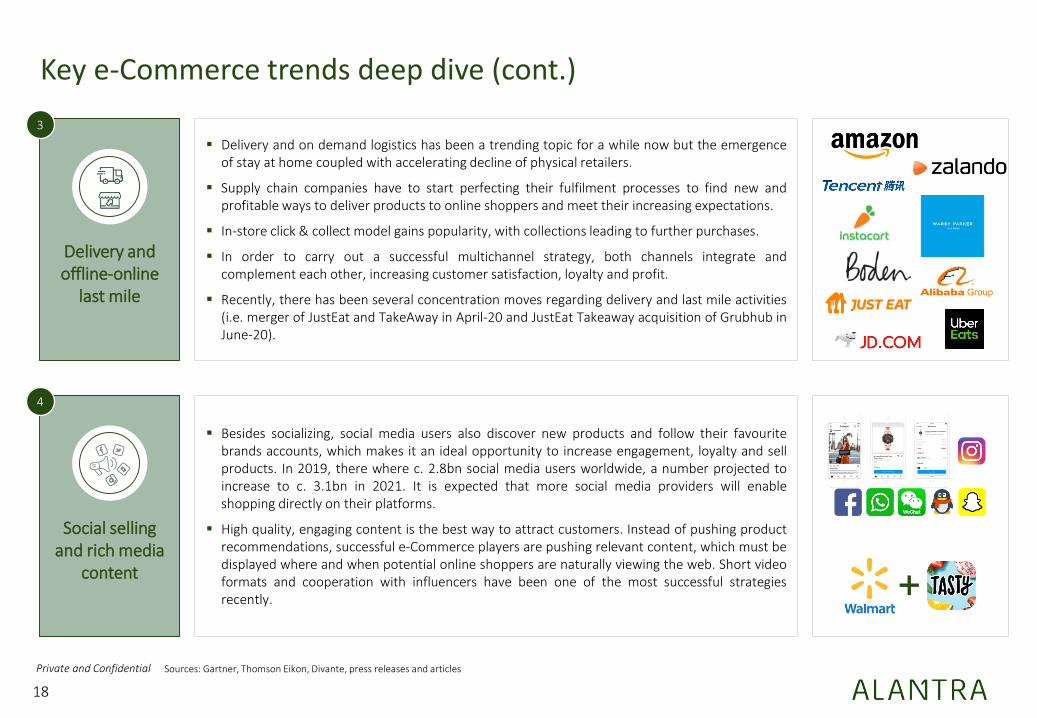
▪ Delivery and on demand logistics has been a trending topic for a while now but the emergenceof stay at home coupled with accelerating decline of physical retailers.
▪ Supply chain companies have to start perfecting their fulfilment processes to find new andprofitable ways to deliver products to online shoppers and meet their increasing expectations.
▪ In-store click & collect model gains popularity, with collections leading to further purchases.
▪ In order to carry out a successful multichannel strategy, both channels integrate andcomplement each other, increasing customer satisfaction, loyalty and profit.
▪ Recently, there has been several concentration moves regarding delivery and last mile activities(i.e. merger of JustEat and TakeAway in April-20 and JustEat Takeaway acquisition of Grubhub inJune-20).
Delivery and offline-online
last mile
Key e-Commerce trends deep dive (cont.)
Sources: Gartner, Thomson Eikon, Divante, press releases and articles
3
▪ Besides socializing, social media users also discover new products and follow their favouritebrands accounts, which makes it an ideal opportunity to increase engagement, loyalty and sellproducts. In 2019, there where c. 2.8bn social media users worldwide, a number projected toincrease to c. 3.1bn in 2021. It is expected that more social media providers will enableshopping directly on their platforms.
▪ High quality, engaging content is the best way to attract customers. Instead of pushing productrecommendations, successful e-Commerce players are pushing relevant content, which must bedisplayed where and when potential online shoppers are naturally viewing the web. Short videoformats and cooperation with influencers have been one of the most successful strategiesrecently.
Social selling and rich media
content
4
Private and Confidential
19
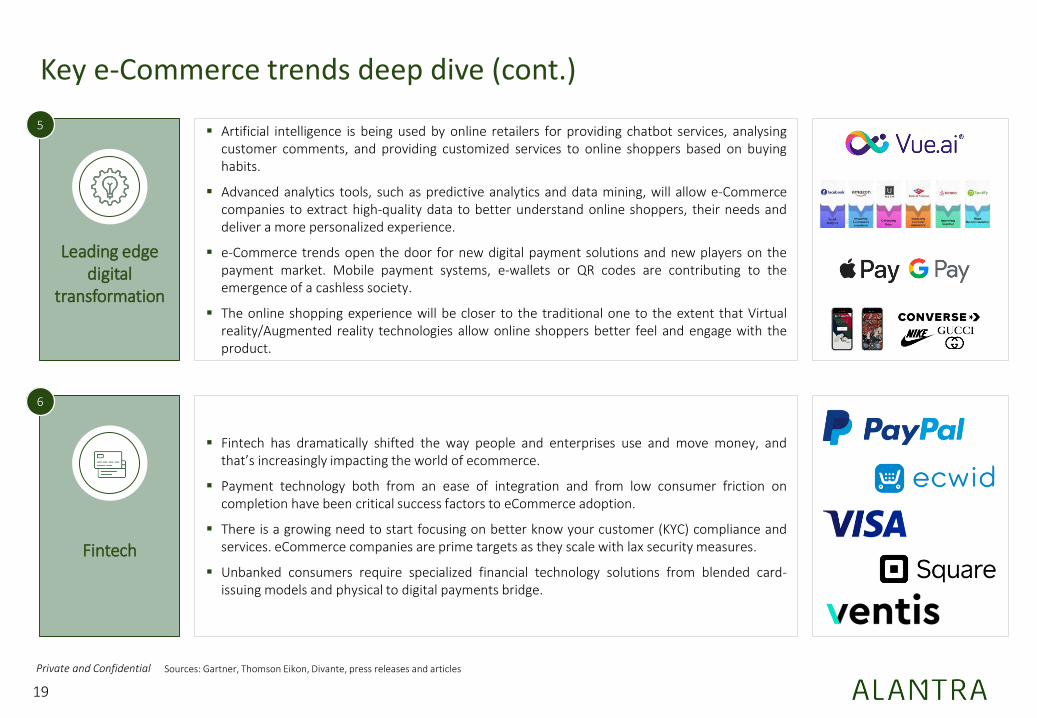
▪ Artificial intelligence is being used by online retailers for providing chatbot services, analysingcustomer comments, and providing customized services to online shoppers based on buyinghabits.
▪ Advanced analytics tools, such as predictive analytics and data mining, will allow e-Commercecompanies to extract high-quality data to better understand online shoppers, their needs anddeliver a more personalized experience.
▪ e-Commerce trends open the door for new digital payment solutions and new players on thepayment market. Mobile payment systems, e-wallets or QR codes are contributing to theemergence of a cashless society.
▪ The online shopping experience will be closer to the traditional one to the extent that Virtualreality/Augmented reality technologies allow online shoppers better feel and engage with theproduct.
Leading edge digital
transformation
Key e-Commerce trends deep dive (cont.)
Sources: Gartner, Thomson Eikon, Divante, press releases and articles
5
▪ Fintech has dramatically shifted the way people and enterprises use and move money, andthat’s increasingly impacting the world of ecommerce.
▪ Payment technology both from an ease of integration and from low consumer friction oncompletion have been critical success factors to eCommerce adoption.
▪ There is a growing need to start focusing on better know your customer (KYC) compliance andservices. eCommerce companies are prime targets as they scale with lax security measures.
▪ Unbanked consumers require specialized financial technology solutions from blended card-issuing models and physical to digital payments bridge.
Fintech
6

Private and Confidential
Valuation metrics
POSSIBILITY IS IN THE ASCENT

Private and Confidential Source: Capital IQ as of August 31, 20201. Trading comparables multiples excluding outliers
21
e-Commerce trading comparables1H
ori
zon
tal
e-C
om
mer
ce
incu
mb
ents
Cla
ssif
ied
s lis
tin
gsM
arke
tpla
ces
Ver
tica
le
-Co
mm
erce
e-C
om
mer
ce
en
able
rs
Public comparables
LTM 2020 2021
Valuation metrics - Average
EV/Sales 4.4x 3.8x 3.1x
EV/Gross profit 14.5x 8.6x 7.2x
EV/Sales 8.5x 7.8x 6.5x
EV/Gross profit 12.5x 22.1x 14.4x
EV/Sales 4.2x 4.3x 3.3x
EV/Gross profit 13.6x 11.5x 9.2x
EV/Sales 4.1x 3.3x 2.7x
EV/Gross profit 7.1x 7.8x 6.3x
EV/Sales 10.2x 9.3x 8.0x
EV/Gross profit 16.0x 15.1x 12.8x

Private and Confidential
Broader market performance and COVID-19 impact on valuation
EV/LTM sales evolution
22
Source: Capital IQ as of August 31, 20201. EV/LTM sales multiples excluding outliers
Horizontal e-Commerce incumbents
Classifieds listings Marketplaces Vertical e-Commerce e-Commerce enablers
4.4x 8.5x 4.2x 4.1x 10.2x
COVID-19 had an immediate impact on valuations, but recovery has been strong particularly in the e-Commerce enablers segment
0.0x
2.0x
4.0x
6.0x
8.0x
10.0x
12.0x
Aug-19 Nov-19 Feb-20 May-20 Aug-20
Horizontal e-Commerce incumbents Classifieds listings Marketplaces Vertical e-Commerce e-Commerce enablers

Private and Confidential
Average EV/2020 Sales vs. 1-year market capitalization performance
Price performance & valuation by segment
23
Source: Capital IQ as of August 31, 20201. Prosus, Vroom, Casper Sleep and Peloton Interactive were not quoting on August 2019 so for the purpose of this exercise have been adjusted
Bubble sizes correspond to the segment combined market capitalization in US$bn
Horizontal e-Commerce incumbents
3,746
Classifieds listings246
Marketplaces199 Vertical e-Commerce
148
e-Commerce enablers743
-
2.0x
4.0x
6.0x
8.0x
10.0x
12.0x
(10.0%) +10.0% +30.0% +50.0% +70.0% +90.0% +110.0% +130.0%
EV /
20
20
Sal
es
1-year market cap performance

Private and Confidential
24
e-Commerce sales multiples and growth by segment
Average EV/Sales multiples by segment
Average sales growth by segment
Source: Capital IQ as of August 31, 2020
4.4x
8.5x
4.2x 4.1x
10.2x
3.8x
7.8x
4.3x3.3x
9.3x
3.1x
6.5x
3.3x2.7x
8.0x
Horizontal e-Commerce incumbents Classifieds listings Marketplaces Vertical e-Commerce e-Commerce enablers
LTM 2020 2021
13.6%
1.0%
12.8% 10.8%
8.0%
30.7%
4.8%
32.9% 29.5%
18.7% 19.0% 20.1% 22.9%
20.0%
15.7%
Horizontal e-Commerce incumbents Classifieds listings Marketplaces Vertical e-Commerce e-Commerce enablers
LTM 2020 2021

Private and Confidential
25
e-Commerce gross profit multiples and margins by segment
Average EV/Gross profit multiples by segment
Average gross profit margins by segment
Source: Capital IQ as of August 31, 2020
34.2%
70.7%
57.4%
40.9%
61.3%
38.7%
69.5%
59.8%
39.2%
63.3%
38.7%
71.7%
61.4%
40.7%
63.4%
Horizontal e-Commerce incumbents Classifieds listings Marketplaces Vertical e-Commerce e-Commerce enablers
LTM 2020 2021
14.5x12.5x
13.6x
7.1x
16.0x
8.6x
22.1x
11.5x
7.8x
15.1x
7.2x
14.4x
9.2x
6.3x
12.8x
Horizontal e-Commerce incumbents Classifieds listings Marketplaces Vertical e-Commerce e-Commerce enablers
LTM 2020 2021

Private and Confidential
Transaction trends by deal type
Transaction value (€m) by deal type
26
Deal count by deal type
Source: Capital IQ as of June 30, 20201. Transactions include e-Commerce software and internet and direct marketing retail Capital IQ subsegments
Private placements accounted for 70% of volumes and 39% of transactional value in Q2 2020
100
200
300
400
500
Q1
20
15
Q2
20
15
Q3
20
15
Q4
20
15
Q1
20
16
Q2
20
16
Q3
20
16
Q4
20
16
Q1
20
17
Q2
20
17
Q3
20
17
Q4
20
17
Q1
20
18
Q2
20
18
Q3
20
18
Q4
20
18
Q1
20
19
Q2
20
19
Q3
20
19
Q4
20
19
Q1
20
20
Q2
20
20
5,000
10,000
15,000
20,000
25,000
30,000
Q1
20
15
Q2
20
15
Q3
20
15
Q4
20
15
Q1
20
16
Q2
20
16
Q3
20
16
Q4
20
16
Q1
20
17
Q2
20
17
Q3
20
17
Q4
20
17
Q1
20
18
Q2
20
18
Q3
20
18
Q4
20
18
Q1
20
19
Q2
20
19
Q3
20
19
Q4
20
19
Q1
20
20
Q2
20
20
0%
20%
40%
60%
80%
100%
Q1
20
15
Q2
20
15
Q3
20
15
Q4
20
15
Q1
20
16
Q2
20
16
Q3
20
16
Q4
20
16
Q1
20
17
Q2
20
17
Q3
20
17
Q4
20
17
Q1
20
18
Q2
20
18
Q3
20
18
Q4
20
18
Q1
20
19
Q2
20
19
Q3
20
19
Q4
20
19
Q1
20
20
Q2
20
20
Private Placement Merger/Acquisition
0%
20%
40%
60%
80%
100%
Q1
20
15
Q2
20
15
Q3
20
15
Q4
20
15
Q1
20
16
Q2
20
16
Q3
20
16
Q4
20
16
Q1
20
17
Q2
20
17
Q3
20
17
Q4
20
17
Q1
20
18
Q2
20
18
Q3
20
18
Q4
20
18
Q1
20
19
Q2
20
19
Q3
20
19
Q4
20
19
Q1
20
20
Q2
20
20
Private Placement Merger/Acquisition

Private and Confidential
€3,676m €3,614m
Source: Mergermarket, Capital IQ, Pitchbook, and other public available information1. Alantra estimate
27
Buyer
Target company
Deal value
EV/Sales
€364m
8.4x
1.8x5.3x
8.9x
3.0x
37.9x
3.7x 2.1x
20.0x
July-20 June-20 June-20 March-20 March-20 Feb-20 Feb-20 Feb-20 Jan-20
1
Recent e-Commerce M&A highlights
€124m
1
€7,730m
Hammer Capital
€949m€243m€6bn€447m
1

Private and Confidential Source: Pitchbook, SourceScrub, other public available information
28
Date Company Description Amount raised
September-20Singapore-based online property portal that allows property buyers to view property pages, and generate inquiries for realestate developers and agent advertisers. The US$221m funding round has been led by TPG and KKR.
US$221m
August-20Fashionphile
California-based pre-owned e-Commerce company focused exclusively on ultra-luxury handbags, watches and fine jewelry.The US$39m round has been led by NewSpring Growth.
US$39m
August-20US-based optical e-Commerce giant which sell prescription glasses, sunglasses and children’s frames. It has closed aUS$245m funding round from D1 Capital Partners, Durable Capital Partners, T. Rowe Price and Baillie Gifford.
US$245m
August-20Hong Kong-based food e-Commerce start up that offer an app featuring recipes and food videos, cooking classes in upscalemalls and a product line of its own branded food products. It has raised US$20m from Talis Capital and Ironfire Ventures.
US$20m
August-20Oregon-based e-Commerce solution for cannabis dispensaries. It has closed a US$3m Series B funding round, bringingDutchie’s total funding to $53 million to date.
US$35m
August-20Florida-based vertical e-Commerce dedicated to sports merchandise. The US$350m investment round was led by Fidelity,Thrive Capital, with participation from Franklin Templeton and Neuberger Berman.
US$350m
August-20Utah-based e-Commerce seller that uses its proprietary technology and data-driven insights to help brands attain profitablee-Commerce growth. The US$52M investment has been co-led by Ainge Advisory and KSV Global.
US$52m
August-20ASX-listed buy now, pay later fintech that enables customers to pay for purchases using their existing card, being able to splittheir purchases into fee or interest-free monthly installments, without the need for registration, application or approval.
US$72m
August-20New-York-based commerce marketing cloud with solutions for customer reviews, visual marketing, loyalty, and referrals. Ithas raised US$75m from Bessemer Venture Partners, Access industries, Vertex Ventures and Hanaco.
US$75m
August-20New-York-based e-Commerce marketing platform. The US$10m round of funding has been led by Wavecrest GrowthPartners and Luminari Capital and Brave Ventures have participated.
US$10m
July-20 Minnesota-based payment platform that enables bank-to-bank transfer of money between consumers and businesses US$86m
June-20Las Vegas-based startup that provides tools to prevent fraud within e-Commerce marketplaces, online merchants, paymentsgateways and ticketing services. It has raised US$123m from Lightspeed and AXA Venture Partners.
US$123m
May-20e-Commerce platform that provides daily groceries and miscellaneous products. It has raised US$81M from GGV Capital,China Growth Capital, Cygnus Capital and others.
US$81m
Selected recent e-Commerce funding transactions

Private and Confidential Source: Pitchbook, SourceScrub, other public available information
29
Date Company Description Amount raised
May-20Startup that sells e-Commerce tools, letting businesses build e-Commerce experiences on their own websites and apps hasraised US$42M from Morgan Stanley and PeakSpan Capital.
US$42m
May-20c
Developer of an industrial products e-Commerce platform. It has raised US$230 million of Series A venture funding in a dealled by GGV Capital. CITIC Capital and Sequoia Capital China also participated in the round.
US$230m
May-20Dingdongmaicai
Operator of a fresh food e-Commerce platform. It received US$300 million of development capital from General Atlantic. US$300m
May-20Provider of a used car retail platform intended to trade cars directly among individuals. It raised US$200 million of Series D+venture funding from SoftBank Investment Advisers and Sequoia Capital China.
US$200m
May-20Operator of an online refurbished goods marketplace. It raised US$120 million of venture funding from Eurazeo, Daphni andAglaé Ventures. Goldman Sachs Merchant Banking Division also participated in the round.
US$120m
May-20Operator of a fresh food delivery platform in Korea. It raised US$164 million of Series E venture funding in a deal led by DSTGlobal. SK Networks, Hillhouse, Sequoia, Fuse, Aspex and TransLink also participated in the round.
US$164m
May-20Provides of a platform for last-mile deliveries specifically to help companies to planning and tracking deliveries more easily.It has closed a US$144 million investment, which constitutes its first-ever funding.
US$144m
April-20Operator of an e-Commerce and retail platform. It raised US$75 million of Series B venture funding in a deal led by PEAK6,RiverPark and Western Technology with a combination of equity and debt (US$35 million loan led by Upper90 Capital).
US$110m
March-20Provider of an online shopping platform. It raised US$120 million of venture funding in a deal led by OLX. Warburg Pincu,GGV Capital and Andreessen Horowitz also participated in the round.
US$120m
February-20Developer of an online food delivery platform. It raised US$156 million of Series I venture funding in a deal led by NaspersVentures, Tencent Holdings and Prosus Ventures.
US$156m
January-20Developer of an e-Commerce fashion platform. It raised US$100 million of debt and equity funding in a deal led by Apax andNew Enterprise Associates. Comerica Bank, TriplePoint Venture and Lauren Santo Domingo also participated in the round.
US$100m
January-20Operator of an online marketplace for DIY and gardening products. The company raised US$139 million of Series E venturefunding in a deal led by Temasek. General Atlantic, Eurazeo, Piton, Bpifrance and Kismet also participated in the round.
US$139m
January-20Developer of an online payment and loyalty platform intended to convert point of sale to point of service. It received US$300million of development capital from MasterCard and Advent Capital Management.
US$300m
Selected recent e-Commerce funding transactions (cont.)

Private and Confidential Source: Nasdaq, Marker Medium, Bloomberg, bne IntelliNews, Weetracker
30
e-Commerce IPOs rumours
According to Nasdaq news, US-based e-Commerce company, Wish, has submitted a pressrelease filing to go public. The Company hassubmitted the first draft with the SEC (Securitiesand Exchange Commission) for review.
August-20
China-based online payments fintech, Ant Group,has already filed for its IPO which, according toMarker Medium, plans to raise US$30 billionwhen going public in October.
August-20
UK-based e-Commerce company, The Hut Group,is planning to sell US$1.2 billion of new shares inan initial public offering, as stated by Bloomberg.
August-20 Poland-based e-Commerce, Allegro, owned byCinven, Permira and Mid Europa Partners, areplanning to list the portal on the Warsaw StockExchange in October. The potential IPO would fallin the US$2.3-3 billion range, according to bneIntelliNews.
August-20
Nigeria-based online retailer, Konga intends to gopublic on the NYSE and LSE bourses. As stated byWeetracker, it is unclear if the firm is planning tolist on both exchanges and when would thepotential IPO happen.
August-20
Recent relevant rumours in the market

Private and Confidential
31
Valuation outliers - EV/LTM Gross profit and EV/LTM Sales correlation
Horizontal e-Commerce incumbents Classifieds listings Marketplaces
e-Commerce enablers
0.0x
5.0x
10.0x
15.0x
20.0x
25.0x
30.0x
35.0x
40.0x
0.0x 5.0x 10.0x 15.0x 20.0x 25.0x
EV/L
TM G
ross
pro
fit
EV/LTM Sales
0.0x
20.0x
40.0x
60.0x
80.0x
100.0x
120.0x
140.0x
160.0x
0.0x 20.0x 40.0x 60.0x
EV/L
TM G
ross
pro
fitEV/LTM Sales
0.0x
20.0x
40.0x
60.0x
80.0x
100.0x
120.0x
0.0x 5.0x 10.0x 15.0x 20.0x
EV/L
TM G
ross
pro
fit
EV/LTM Sales
0.0x
20.0x
40.0x
60.0x
80.0x
100.0x
120.0x
0.0x 20.0x 40.0x 60.0x 80.0x
EV/L
TM G
ross
pro
fit
EV/LTM Sales
0.0x
5.0x
10.0x
15.0x
20.0x
25.0x
30.0x
35.0x
0.0x 5.0x 10.0x 15.0x 20.0x
EV/L
TM G
ross
pro
fit
EV/LTM Sales
Vertical e-Commerce
Source: Capital IQ as of August 31, 2020

Private and Confidential
Introduction to Alantra
POSSIBILITY IS IN THE ASCENT

Private and Confidential
33
Alternative Asset Management
▪ Direct investments: Private Equity, Private Debt,Active Funds, Real Estate, Venture Capital
▪ Other asset classes (through Access CapitalPartners): Infrastructure, Funds of Funds
▪ Wealth Management: advisory, asset managementand family office services to institutions and HighNet Worth Individuals
Corporate Portfolio Advisory
▪ Valuation and structuring of non-performing loans :credit transactions, real estate portfolios
▪ Funding & Structured Finance: financing facilitiesand structured securitization solutions
▪ Investor Services: transaction management, assetlevel underwriting, portfolio pricing, propertysupport
▪ PropTech: big data analytics to maximize returns inreal estate investments
Investment Banking
▪ M&A and Strategic Advisory: buy-side, sell-side,private placement, public tenders, fairnessopinions
▪ Debt Advisory: debt raising, refinancing, acquisitionfinancing, bond issuance
▪ Equity Capital Markets: equity raising, IPOs,convertible shares, share buyback, take private,block sale
300+ professionals
1,000+ deals advised since 2013
50% cross-border deals since 2013
Deep expertise in 12 sectors
Focus: Worldwide
60+ professionals
€1.9bn AuM in direct investments
€2.3bn AuM in wealth management
€10.8bn of cumulated funds since inception
Focus: Europe
150+ professionals
250+ deals advised since 2013
€283bn+ transaction value since 2013
Focus: Worldwide
Alantra at a glance
Private and Confidential
34
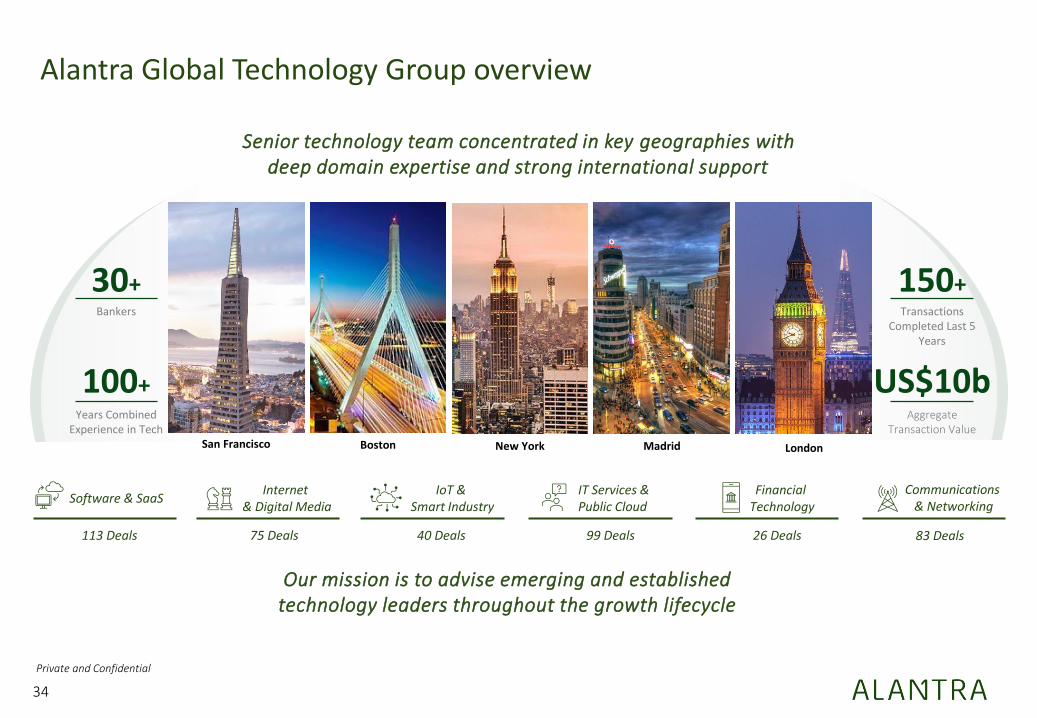
Alantra Global Technology Group overview
Our mission is to advise emerging and established technology leaders throughout the growth lifecycle
Senior technology team concentrated in key geographies with deep domain expertise and strong international support
New YorkSan Francisco Boston London
30+Bankers
100+Years Combined
Experience in Tech
150+Transactions
Completed Last 5 Years
US$10bAggregate
Transaction Value
Madrid
Communications & Networking
83 Deals
IT Services & Public Cloud
99 Deals
Financial Technology
26 Deals
Software & SaaS
113 Deals
Internet & Digital Media
75 Deals
IoT & Smart Industry
40 Deals

Private and Confidential
35
e-Commerce & Marketplace
Content
Travel
Gaming
Content Delivery
Martech / Adtech
Application Middleware
11 Deals
21 Deals
6 Deals
5 Deals
20 Deals
9 Deals
3 Deals
Real Estate
Asset Management
Banking & Trading
Payment
Credit & Lending
Insurance
8 Deals
3 Deals
3 Deals
3 Deals
6 Deals
3 Deals
Vertical / Industry Specific
Customer Relationship Management (CRM)
Enterprise Resource Planning (ERP)
Security
Enterprise Information Management (EIM)
Advanced Analytics & BI
AI & ML
Digital Commerce
32 Deals
6 Deals
29 Deals
7 Deals
16 Deals
12 Deals
4 Deals
7 Deals
Smart Cities, Homes, Buildings, Factory, Auto
Connectivity & Device Platforms
Sensors & Smart Devices
Logistics & Fleet Management
7 Deals
9 Deals
11 Deals
7 Deals
6 Deals
Location
Software & SaaS
113 Deals
Internet & Digital Media
75 Deals 83 Deals99 Deals40 Deals 26 Deals
Unified Communications (UcaaS) & Collaboration
Communication Platform (CPaaS) & Messaging
Cloud Infrastructure & Software
Enterprise Wireless & Mobility
Network Management, Optimization & Security
22 Deals
16 Deals
5 Deals
15 Deals
20 Deals
Fibre/Cable Connectivity
3 Deals
Communication Hardware
2 Deals
Interactive Agencies and Digital Consultancies
IT & Managed Services
Business Services / Outsourcing
Information & Data
Managed Security Services
24 Deals
40 Deals
21 Deals
9 Deals
2 Deals
Value Added Reseller / Distributor
2 Deals
Hosting & datacenter Services
1 Deal
Communications & Networking
Tech-enabled Business Services
IoT & Smart Industry
Financial Technology
Deep sub-sector knowledge from our global specialists

Private and Confidential
36
Unique Investment Banking proposition
A truly global playerWith deep local presence
Global brand with professionals in Europe, US,Latin America and AsiaSince 2013, we have advised on deals in 25different countries
Real sector specialisationDeep coverage of chosen niches
All our Partners and bankers focus at a sub-sector level
Full service advisory offeringTailor made solutions for our clients’ needs
Global Corporate Finance team offering fullservice capability of M&A and equity/debtcapital markets advisory
Mid-market focusInvest in long term relationships
Over 100 Partners with 20 years plusaverage mid-market experience lead alltransactions providing a hands on,dedicated and proven mid-market approach
Fully aligned partnershipWorking to the same strategy
Best in class global collaboration,underpinned by listed partnership structure
What sets us apart
ALANTRABULGE
BRACKETM&A
BOUTIQUE
GEOGRAPHIES
Global reach ✓ ✓
Local presence ✓ ✓
SECTORS
Complete coverage ✓ ✓
Sub sector depth ✓ ✓ ✓
ENTREPRENEURSHIP
Partner ownership ✓ ✓
Flexible decision making ✓ ✓
STRATEGIC RELATIONSHIPS
Mid-market focus ✓ ✓
Multi national ✓ ✓
PRIVATE AND PUBLIC CAPITAL MARKETS
M&A execution ✓ ✓ ✓
Equity and Debt ✓ ✓

Private and Confidential
Appendix
POSSIBILITY IS IN THE ASCENT

Private and Confidential Source: public information
38
BigCommerce at a glance
Company background and key statistics Business description Product offering
Corporate activity Management team and Board of Directors
Storefront Design• Helps retailers create, edit and implement
site pages, themes, and checkout features.• Allows retailers to test site functionality and
mobile responsiveness in a local environment before public use.
B2B Ecommerce Solutions• Easy customer group segmentation.• Customizable price lists and options by group
and individual.• Flexible B2B payment methods, credit
authorization, and quote management.
International Scaling• Multi-currency enabled payment. • Cross border fulfillment tools.• App and API based translation tools for
multi-language accessibility.
Storefront Conversion• Easy execution of discounts, custom product
recommendations, and headless APIs.• Customizable SEO tools.• Integration of digital wallets such as Apple
Pay, Amazon Pay, Paypal, and more.
Cross-Channel Commerce• Facilitates sale via other marketplaces such
as Amazon, eBay, Google Shopping.• Simplified social channel advertising through
Facebook, Pinterest, and Instagram.• In-store sales updated with native POS
systems.
Brent Bellm – President, CEO, ChairmanPreviously COO of Homeaway
Robert Alvarez – CFO Previously CFO of LibreDigital
Brian Dhatt – CTO Previously CTO at Borderfree
Lawrence Bohn – DirectorGeneral Catalyst Partners
Steven Murray – DirectorSoftbank, Revolution Growth
Lisa Pearson – CMO Previously at Umbel
Russell Klein – CCO Previously SVP of Hands-On Mobile & CEO of SendMe
▪ Develops an open SaaS e-commerce platform thathelps B2B and B2C merchants sell across multiple saleschannels such as online marketplaces, search engines,POS systems, and social networks.
▪ Their cloud-based platform and tools ease the scalingof e-commerce operations, online store design, catalogmanagement, hosting, and payment among otherservices.
Headquartered in Austin, TX with additional offices in San Francisco, Sydney, and London
600+ employees
~$128.5m ARR in 2019, targeting +21.6% growth in 2020. Uneven operating losses despite strong revenue growth
Serves more than 60,000 online retail stores in 120 countries
Date Description
Jul-20 • Filed to raise $130m in IPO, offering 6.9m shares• Updated price range and planned to instead
offer 9m shares to raise $198m
Feb-20 • Raised $11m of mezzanine financing from WestRiver Group
Apr-18 • Raised $64m of Series F funding in round led by Goldman Sachs; post-money valuation at $514m
Jun-17 • Raised $40m of Series E in deal led by GGV Capital with 13 additional investors
Dec-14 • Raised $55m of Series D funding in deal led by Softbank; post money valuation at $384m
Jul-13 • Raised $46m of Series C funding in deal led by Revolution; post money valuation at $243m
Sep-12 • Raised $20m of Series B funding led by General Catalyst Partners; post money valuation at $157m
Aug-11 • Raised $15m of Series A funding from General Catalyst Partners; post money valuation at $72m

Private and Confidential Source: public information1. 2020 estimate represents annualized look based on CY Q1 actuals
39
BigCommerce IPO and financial detail
IPO overview
▪ IPO filing on July 13th aiming to raise US$100m in sale of 6.85 million shares.▪ Price range initially adjusted to US$18 to US$20 per share with expectation to raise
~US$130m.▪ Tiger Global Mgmt intended to purchase up to 20% of shares.▪ On August 3rd, the company increased the number of shares it plans to offer to 9.02
million and adjusted the estimated price range to US$21 to US$23 per share, withfundraising goal of US$198m.
▪ Price range implies a valuation of US$1.7b.▪ Exact IPO date is TBA.
Use of funds and ongoing corporate strategy
▪ Intends to use a portion proceeds to pay cash dividends on outstanding shares of Series Fpreferred stock.
▪ The remainder of the offering will likely be allocated for working capital purposes andgeneral corporate purposes such as sales and marketing, research and development, andcapital expenditures.
▪ Acquire new mid-market and large enterprise customers, which have historically exhibitedNRR of greater than 100%.
▪ Expand presence in emerging segments: headless commerce, B2B, and large enterpriseclients.
▪ Opportunity to expand internationally.
Selected customers
Financial overview
91.9
112.1
119.7
132.68
76.1%75.9%
76.1%
77.5%
2018A 2019A LTM Mar-20 2020 An.
Revenue Gross Margin %
20.2% CAGR
M&A strategy
▪ Company is unlikely to pursue acquisitions in the near future but will consider options:▪ "We may also use a portion of the net proceeds from this offering to acquire, license, or invest in
products, technologies or businesses that are complementary to our business. However, wecurrently have no agreements or commitments to complete any such transaction.“
▪ Company is cognizant of certain risks associated with potential acquisitions:▪ “We may encounter difficulties assimilating or integrating the businesses, technologies, products,
personnel, or operations of the acquired companies. Key personnel of the acquired companiesmay choose not to work for us, their software may not be easily adapted to work with ours, or wemay have difficulty retaining the customers of any acquired business due to changes in ownership,management, or otherwise… The anticipated benefits of any acquisition, investment, or businessrelationship may not be realized or we may be exposed to unknown risks or liabilities”
1

Private and Confidential
40
ALANTRA Madrid29 José Ortega y Gasset
28006 Madrid
ALANTRA San Francisco220 Montgomery St., Suite 2100
San Francisco, CA 94104
Kelemen Papp
Managing Director
+1 415 992 4363+1 415 425 3851
Irfan Iqbal
Managing Director
+1 415 341 5820+1 415 341 5820
Jose Martin Avanzini
Director
+34 628 432 851+34 91 745 84 64
Carlos Boggiero
Vice-President
+34 616 980 695+34 91 745 82 53
Contactse-Commerce Team Leads Global team
Wolfram Schmerl
Managing Partner, Germany
+49 69 977 886 11+49 171 227 3685
Franck Portais
Managing Partner, France
+33 170 913 572+33 680 284 256
Jonas Bauréus
Managing Partner, Nordics
+46 70 508 6725+46 70 508 6725
Mario Schlup
Managing Director, Switzerland
+41 445 525 055+41 445 525 055
Stefano Bellavita
Managing Partner, Italy
+39 026 367 1611+39 335 605 8447
Dragan Manoev
Managing Director
+1 415 336 6446+1 415 336 6446

Private and Confidential
41
Disclaimer
This document has been prepared by ALANTRA Partners (hereinafter “ALANTRA”) for information purpose only.
The materials contained in this document have been prepared by ALANTRA from public information available on the Company. ALANTRA assesses that such information is fair, trueand accurate and therefore did not carry out any independent verification in connection therewith. ALANTRA gives no guarantee, representation or warranty, express or implied, asto the accuracy, completeness and correctness of the information contained in this document.
The information and analysis included in such document shall not create any liability towards ALANTRA nor constitute the unique basis of an investment making decision. Opinionsexpressed herein reflect the judgement of ALANTRA as of the date hereof and may be subject to change without notice if ALANTRA becomes aware of any information which mayhave a material impact on any such opinions. ALANTRA does not accept liability for any direct, consequential or other losses arising out from reliance on these materials.
This document, including its content, belongs to ALANTRA and is strictly confidential. It must not be disclosed or made available, by any means, in whole or in part, or summarized,without the prior written consent of ALANTRA, to any third party (individual or legal entity).


