Embed Size (px)
Citation preview
ORIGINAL ARTICLE
E6/E7 oncogenes increase and tumor suppressors decrease the proportion of
self-renewing neural progenitor cells
K Piltti1, L Kerosuo1, J Hakanen2, M Eriksson3, A Angers-Loustau1, S Leppa3, M Salminen2,H Sariola1,4 and K Wartiovaara1
1Developmental Biology, Institute of Biomedicine, University of Helsinki, Helsinki, Finland; 2Institute of Biotechnology, University ofHelsinki, Helsinki, Finland; 3Molecular and Cancer Biology, Institute of Biomedicine, University of Helsinki, Helsinki, Finland and4HUCH Laboratory Diagnostics, Helsinki University Central Hospital, Helsinki, Finland
Many if not most tissues need a controlled number of stemcells to maintain normal function. Cancer can be seen as aprocess of disturbed tissue homeostasis, in which too manycells have or acquire too primitive identity. Here wemeasured how oncogenes and tumour suppressors affectthe differentiation capacity, proportion and characteris-tics of progenitor cells in a model tissue. Neuralprogenitor cells (NPCs) were exposed to human papillomavirus E6, E7 or E6/E7 oncogenes, which degrade tumoursuppressors p53 and pRb family members, respectively.E6/E7-expressing or p53�/� NPCs were able todifferentiate, but simultaneously retained high capacityfor self-renewal, proliferation, ability to remain multi-potent in conditions promoting differentiation and showeddelayed cell cycle exit. These functions were mediatedthrough p53 and pRb family, and involved MEK–ERKsignalling. Decreased amount of p53 increased self-renewal and proliferation, whereas pRb affected onlyproliferation. Our results suggest that the oncogenesincrease whereas p53 and pRb family tumour suppressorsdecrease the number and proportion of progenitor cells.These findings provide one explanation how oncogenesand tumour suppressors control tissue homeostasis andhighlight their importance in stem cell self- renewal, linkedboth to cancer and life-long tissue turnover.Oncogene (2006) 25, 4880–4889. doi:10.1038/sj.onc.1209492;published online 13 March 2006
Keywords: oncogene; tumor suppressor; progenitor;self-renewal
Introduction
The existence of stem cells throughout the lifespan of theindividual is due to the ability to self-renew. Upondifferentiation, stem cells divide asymmetrically, andproduce one committed precursor cell and one stem cell
to maintain the stem cell pool. Interestingly, the samemechanisms that keep the stem cells primitive are oftenactivated in malignant transformation, in which the cellsacquire uncontrolled capacity for self-renewal (Pardalet al., 2003). These cancer and normal stem cells shareseveral characteristics and often express the samemarkers and factors (Singh et al., 2003).One of the most important questions in cancer and stem
cell biology is the mechanism of self-renewal. As severalvirus oncogenes (Dyson et al., 1993; Harris et al., 1998;Whyte et al., 1988; DeCaprio 1999) contribute totumorigenesis, we addressed the question: what happensif the cells with self-renewal capacity are exposed to viraloncogenes? For this, we transduced neural progenitor cells(NPCs) with HPV 16 E6 and E7 oncogenes. HPV 16 E6/E7is a classical oncogene complex (Fehrmann and Laimins,2003) and an established risk factor for HPV-related cervixcancers and head and neck squamous cell carcinomas(Walboomers et al., 1999; van Houten et al., 2001). InHPV-infected cells, E6 and E7 oncogenes degrade thetumour suppressor p53 and pRb/p107/p130, respectively(Scheffner et al., 1990; Davies et al., 1993; Boyer et al.,1996) and interfere with several other cellular activities(reviewed by Munger et al., 2004). E6/E7 immortalize andtransform at least keratinocytes, epithelial and endothelialcells (Hawley-Nelson et al., 1989; Coursen et al., 1997).During their differentiation to neurons, NPCs under-
go changes that are considered normally irreversible.These include cell cycle exit, which involves theactivation of tumour suppressors p53 (Miller et al.,2003) and pRb (Slack et al., 1993; Slack et al., 1998).Both of them are important at various times of braindevelopment (reviewed by Choi and Donehower, 1999),and their deficiency frequently results in brain anomalies(Armstrong et al., 1995) or embryonic death (Macleodet al., 1996; Slack et al., 1998). The role of pRb familymembers in terminal differentiation of neurons seems tobe complex, as pRb has both cell cycle (cell-autono-mous) and differentiation controlling functions (non-cell-autonomous) (Liu et al., 2004). Other Rb familymembers, p107 and p130, have also a role in differentia-tion (Callaghan et al., 1999; Liu et al., 2004). Thearguably most important function of p53 in neurons isto prevent cell cycle re-entry (Miller et al., 2003).Interestingly, increasing the amount of p53 seems toaccelerate the ageing of several tissues (Tyner et al.,
Received 30 September 2005; revised 20 December 2005; accepted 24January 2006; published online 13 March 2006
Correspondence: Dr K Wartiovaara, Developmental Biology, Instituteof Biomedicine, PO Box 63, University of Helsinki, FIN-00014Helsinki, Finland.E-mail: [email protected]
Oncogene (2006) 25, 4880–4889& 2006 Nature Publishing Group All rights reserved 0950-9232/06 $30.00
www.nature.com/onc
2002), which can be seen as a failure to keep up thenormal homeostasis of tissues.Here, we have analysed the effects of common
oncogenic alterations to behaviour of progenitors or stemcells. Our results show that the oncogenes degrading p53/Rb increase the proportion of NPCs with stem cell-relatedcharacteristics, and p53 and pRb family are involvedin the process. Our results suggest that these tumoursuppressors, which are known to have a role in controllingcell proliferation and tumour development, also regulatethe self-renewal, maintenance and proliferation of NPCs,the balance of which is disturbed by oncogenes.
Results
HPV16 E6/E7 oncogenes increase cell proliferation andself-renewal of NPCsTo study the effects of E6 and E7 on NPC character-istics, we transduced them with retroviruses expressing
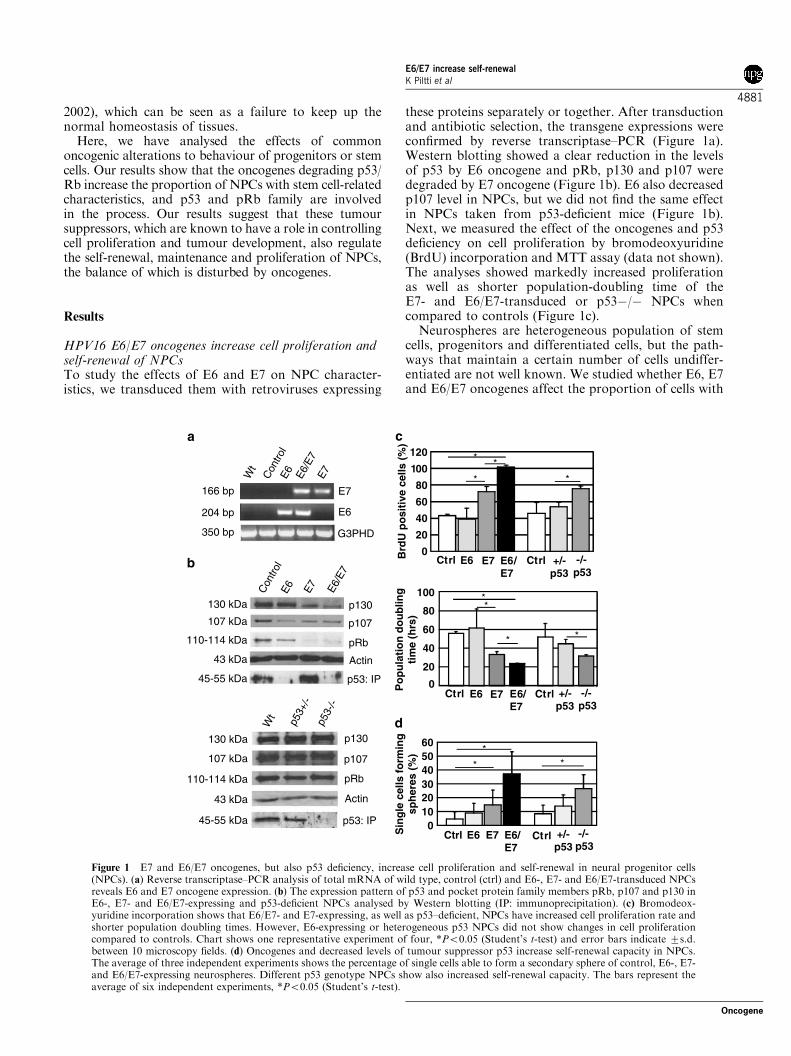
these proteins separately or together. After transductionand antibiotic selection, the transgene expressions wereconfirmed by reverse transcriptase–PCR (Figure 1a).Western blotting showed a clear reduction in the levelsof p53 by E6 oncogene and pRb, p130 and p107 weredegraded by E7 oncogene (Figure 1b). E6 also decreasedp107 level in NPCs, but we did not find the same effectin NPCs taken from p53-deficient mice (Figure 1b).Next, we measured the effect of the oncogenes and p53deficiency on cell proliferation by bromodeoxyuridine(BrdU) incorporation and MTT assay (data not shown).The analyses showed markedly increased proliferationas well as shorter population-doubling time of theE7- and E6/E7-transduced or p53�/� NPCs whencompared to controls (Figure 1c).Neurospheres are heterogeneous population of stem
cells, progenitors and differentiated cells, but the path-ways that maintain a certain number of cells undiffer-entiated are not well known. We studied whether E6, E7and E6/E7 oncogenes affect the proportion of cells with
a
b
350 bp
166 bp E7
G3PHD
E6204 bp
c
0
20
40
60
80
100
120
E6 E7 E6/E7
+/-p53
-/-p53
Ctrl Ctrl
*
**
*
110-114 kDa
107 kDa
130 kDa
45-55 kDa
43 kDa
110-114 kDa
107 kDa
130 kDa
45-55 kDa
43 kDa
p53: IP
pRb
p130
p107
Actin
p53: IP
pRb
p130
p107
Actin
0102030405060
*
**
E6 E7 E6/E7
+/-p53
-/-p53
Ctrl Ctrl
d
Po
pu
lati
on
do
ub
ling
ti
me
(hrs
)S
ing
le c
ells
fo
rmin
g
sph
eres
(%
)
0
20
40
60
80
100
E6 E7 E6/E7
+/-p53
-/-p53
Ctrl Ctrl
*
*
*
*
Wt
Con
trol
E6 E6/E
7E7
Con
trol
Wt
p53+
/-p5
3-/-
E6 E6/E
7
E7
Brd
U p
osi
tive
cel
ls (
%)
Figure 1 E7 and E6/E7 oncogenes, but also p53 deficiency, increase cell proliferation and self-renewal in neural progenitor cells(NPCs). (a) Reverse transcriptase–PCR analysis of total mRNA of wild type, control (ctrl) and E6-, E7- and E6/E7-transduced NPCsreveals E6 and E7 oncogene expression. (b) The expression pattern of p53 and pocket protein family members pRb, p107 and p130 inE6-, E7- and E6/E7-expressing and p53-deficient NPCs analysed by Western blotting (IP: immunoprecipitation). (c) Bromodeox-yuridine incorporation shows that E6/E7- and E7-expressing, as well as p53–deficient, NPCs have increased cell proliferation rate andshorter population doubling times. However, E6-expressing or heterogeneous p53 NPCs did not show changes in cell proliferationcompared to controls. Chart shows one representative experiment of four, *Po0.05 (Student’s t-test) and error bars indicate 7s.d.between 10 microscopy fields. (d) Oncogenes and decreased levels of tumour suppressor p53 increase self-renewal capacity in NPCs.The average of three independent experiments shows the percentage of single cells able to form a secondary sphere of control, E6-, E7-and E6/E7-expressing neurospheres. Different p53 genotype NPCs show also increased self-renewal capacity. The bars represent theaverage of six independent experiments, *Po0.05 (Student’s t-test).
E6/E7 increase self-renewalK Piltti et al
4881
Oncogene

neural stem cell (NSC) or NPC identity by measuringthe number of cells capable of self-renewal, indicated bysecondary sphere formation from single cell suspension.In this assay, all oncogenes increased the self-renewaland E6/E7 NPCs showed up to fivefold increase inpotential to form secondary spheres when comparedwith neurospheres transduced with several controlviruses expressing enhanced green fluorescent protein(EGFP), lacZ and empty vector (Figure 1d and data notshown). The secondary E6/E7 spheres were also biggerthan controls, likely because of the enhanced prolifera-tion rate. Self-renewal was also increased in E7- andslightly in E6-expressing NPCs. Also p53 deficiencyincreased self-renewal capacity (Figure 1d). However,we could not find statistical significance in the self-renewal capacity of E6-expressing or p53þ /� NPCswhen compared to controls. The clonally formedsecondary spheres were all able to produce immunohis-tochemically positive neurons and astrocytes, whichindicates that the spheres were derived from a multi-potent progenitor and not from more committed cell.
E6/E7 oncogenes induce or maintain sphere-formingcapacity in an environment promoting differentiationTo investigate how oncogene-transduced NPCs respondto differentiation signals, we cultured cells in EGF–FGF2-free medium supplemented with serum, whichfavours differentiation (see below). All cultured cellsattached to surface of wells and developed differentiatedcell morphology. In control cells, this differentiation wasnon-reversible and complete, as virtually no cells stayedmultipotent. This was measured by changing the cellsback to EGF-and FGF2-supplemented serum-freemedium after 2 weeks of differentiation and countingthe possible re-forming neurospheres. Very low number,if any, of re-formed spheres were detected in all E6, E7,p53þ /� and control virus cells (o10 spheres/200 000plated cells) (Figure 2a–c). In contrast, frequent (>2000spheres/200 000 plated cells) sphere re-formation wasseen in E6/E7-expressing cells (Figure 2a–c). Also p53�/� cells were able to re-form large numbers of spheres(>400 spheres/200 000 plated cells) after growth factorre-introduction (Figure 2a–c). The re-formed spherescould be collected, expanded in culture and re-differ-entiated successfully into both neurons and astrocytesunder differentiation-promoting conditions (data notshown).
E6/E7 delays and inhibits terminal mitosis during in vitrodifferentiation of NPCsTo study the cause for sphere re-formation afterdifferentiation, the cells were BrdU pulse labelled for24 h during different days of differentiation. Bromo-deoxyuridine incorporation analysis (Figure 3a and b)showed that virtually all control NPCs withdrew fromthe cell cycle through terminal mitosis within the first48–72 h of differentiation. However, NPCs expressingE6/E7 did not undergo terminal mitosis as often, but amajor fraction of cells enter S phase (incorporatedBrdU) as late as between 168 and 192 h (Figure 3a).
Terminal mitosis was also markedly delayed, butcomplete in p53�/� and E7-expressing cells (Figure 3aand b).We wanted to investigate that the re-formation of
spheres and delayed cell cycle exit was not due to majorgenomic instability occurring in the cells. Therefore, weexamined the DNA content of the cells by analysingpropidium iodide-stained NPCs in fluorescence-acti-vated cell sorting (FACS) flow cytometer. No distur-bance in cell ploidy was seen, as all E6/E7, p53�/� andcontrol NPCs were diploid (Figure 4a–c). The higherproliferation of E6/E7 and p53�/� NPCs was seen asan increase in cell numbers in S and G2Mphases.
E6/E7 expression does not block differentiation in NPCsin vitro or in vivoNext we asked whether the E6/E7-induced cell cycleactivation and increased self-renewal prevents the NPCsfrom differentiating. We found no difference in theexpression of neural bHLH transcription factors Mash1,Hes1, Hes5 and Id2 (Farah et al., 2000; Toma et al.,2000; Ross et al., 2003) in undifferentiated E6/E7 andcontrol NPCs (Figure 4d). Proneural gene Neurogenin1was not expressed in control or E6/E7 NPCs (data notshown). By immunostaining we observed a variablepercentage of bIII-tubulin (TUJ-1)-positive neurons andglial fibrillary acidic protein (GFAP)-positive astrocytesboth from control and E6/E7 NPCs after in vitro
a
0
500
1000
1500
2000
2500
3000
Differentiation SCM
WtCtrlE6E7E6/E7p53+/-p53-/-
(14 days) (1-6 days)
37172
25003
500
Spheres /200 000 cells
Day 6
Re-
form
ed s
ph
eres
af
ter
dif
fere
nti
atio
n
b c
Figure 2 E6/E7 oncogenes increase the ability of neural progeni-tor cells (NPCs) to maintain multipotency in an environmentpromoting differentiation. Number of re-formed spheres inmedium supplemented with growth factors (EGF and FGF2) after2 weeks of differentiation with serum is shown. (a) E6/E7-expressing and p53�/� NPCs re-form large numbers of spheres(>2000 and >400 spheres/200 000 plated cells, respectively). Verylow numbers of re-formed spheres (o10 spheres/200 000 platedcells) are formed in other cell populations. The chart represents oneof three independent experiments. The image of cells after 7 days ofculture in medium containing growth factors: (b) control and (c)E6/E7-expressing cells. Scale bar, 200mm.
E6/E7 increase self-renewalK Piltti et al
4882
Oncogene

differentiation (Figure 4e–i). In vitro differentiation withfetal calf serum (FCS) produced oligodendrocytesrarely. In both groups, a high proportion (up to 90%)of the cells were still positive for nestin after 96 h in vitrodifferentiation (data not shown), indicating that cell fatedetermination was still in process, even though incontrol group the cells had exited the cell cycle.To further characterize the differentiation capacity of
the cells, we transplanted EGFP-positive E6/E7 andcontrol NPCs into brain ventricles of E14.5 mouseembryos in utero, and after 96 h analysed the colocaliza-tion of EGFP and TUJ-1, GFAP or oligodendrocytemarker O4 on serial cryostat sections (Figure 5a–l).Enhanced green fluorescent protein-positive cells werefound all over the brain tissue, most often in thecollicular area. Immunohistochemistry showed that E6/E7-expressing and control NPCs can differentiate in vivoand form all three types of neural cells: neurons,astrocytes and oligodendrocytes (Figure 5a–m). Afterin vivo differentiation, the cells in both groups werenegative for nestin.To analyse whether terminal mitosis was delayed or
inhibited in the transplanted NPCs, we examined theexistence of cells positive for both EGFP and Ki-67 asthe marker of proliferating cells. However, no double
positive cells were detected either in E6/E7 or controls96 h after transplantations. Therefore, opposite to our invitro differentiation assay, the E6/E7-expressing NPCsdid not show inhibited terminal mitosis in vivo (data notshown).
Increased pRb expression affects cell proliferation but notself-renewal in E7- and E6/E7-expressing NPCsTo examine further pRb involvement in NPCmaintenance, E7- and E6/E7-expressing NPCs weretransduced with retroviruses carrying pRb under cyto-megalovirus promoter (pRb-NIT). After pRb trans-duction, E7- and E6/E7-expressing NPCs showed arestoration of their pRb level when compared to non-transduced controls (Figure 6a). No changes in p107and p130 levels were detected. Restored pRb expressionclearly decreased cell proliferation (Figure 6b), but didnot seem to affect the increased self-renewal capacity ofE7- or E6/E7-expressing oncogenes (Figure 6c).
MEK–ERK pathway separates self-renewal fromproliferationTo find out the possible signalling pathways mediatingthe E6/E7 effects, we focused to mitogen-activatedprotein kinases (MAPKs), the known mediators ofcell proliferation, differentiation and cell activation.Extracellular signal-regulated kinase (ERK) pathway isimportant in self-renewal of some progenitor cells (Dazyet al., 2003). In epithelial cells, E6 and E7 oncogenesupregulate MAPKs (Antinore et al., 1996; Chakrabartiet al., 2004). By Western blot, we found a modest butrepeatable increase in the level of phosphorylated ERKin undifferentiated E6/E7 NPCs in comparison tocontrols (Figure 7a). However, during differentiationinduced by FCS, phosphorylated ERK was reduced,and JunD transcription factor in c-Jun NH2-terminalprotein kinase (JNK) pathway increased in E6/E7 NPCscompared with controls (Figure 7a). Also the levels ofc-Jun were upregulated in undifferentiated E6/E7-expressing NPCs (Figure 7a). However, JNK activationdid not differ between the groups (Figure 7a).To study the difference and connection between cell
proliferation and self-renewal, we used MEK–ERKinhibitor U0126 (Favata et al., 1998) and cyclin-dependent kinase (CDK) inhibitor R-Roscovitine (Mei-jer et al., 1997). Neural progenitor cells express at leastCDK-2, -4, -5 and -6, and all of these except CDK-5 areinvolved in cell cycle regulation (Ferguson et al., 2000).R-Roscovitine targets CDK-1, -2, -5, -7 and -9 almostequally (IC50 values o1 mM) (Bach et al., 2005). Inneurons, MEK–ERK signalling is related to regulationof proliferation, differentiation, neurite outgrowth andsynaptic plasticity (reviewed by Grewal et al., 1999). Ourresults show that blocking the MEK–ERK pathwaydecreased proliferation more than 50% of both controland E6/E7 NPCs measured by BrdU (Figure 7b) andMTT (not shown). Interestingly, the effect on self-renewal was even more dramatic, as the secondarysphere formation was almost completely abolished(Figure 7c). U0126 did not affect the cell adhesion
a
b
0
20
40
60
80
100
1 2 3 4 8
WtCtrlE6E7E6/E7
Day
0
20
40
60
80
100
1 2 3 4
Wtp53 -/-
Day
Brd
U p
osi
tive
cel
ls (
%)
Brd
U p
osi
tive
cel
ls (
%)
Figure 3 E6/E7 oncogenes delay or inhibit the cell cycle exitduring in vitro differentiation. (a) Bromodeoxyuridine incorpora-tion during differentiation reveals that cell cycle exit is delayed inE6/E7-expressing neural progenitor cells (NPCs) when comparedwith controls. In E7-expressing cells, cell cycle exit was delayed, butthe cells were still able to silence the cell cycle. Controls and E6-expressing NPCs undergo terminal mitosis in first the 48–72 h. (b)p53-deficient NPCs also show slightly delayed cell cycle exit, but dosilence the proliferation. Error bars indicate 7s.d. between 10microscopy fields in one experiment of three with similar results.
E6/E7 increase self-renewalK Piltti et al
4883
Oncogene

when tested on small spheres, and after removal ofU0126 secondary sphere formation returned to the samelevel as the controls treated with dimethylsulphoxide(DMSO) (data not shown). Inhibiting CDKs alsodecreased the number of secondary spheres (Figure 7d)but this decrease in self-renewal was of the samemagnitude (50%) than the effect on proliferation probedwith BrdU incorporation (Figure 7e) and MTT assay(data not shown), suggesting that self-renewal andproliferation pathways can be separated.
Discussion
Here we have analysed the effects of common oncogenicalterations on the behaviour of progenitors or stem cells.Our data support the following conclusions: (1) HPV 16E6, E7 and E6/E7 oncogenes do not block thedifferentiation potential of the NPCs, but (2) increasecell proliferation and self-renewal, as well as decreasethe number of cells undergoing terminal mitosis. (3)Self-renewal and proliferation are linked, but can beseparated: pRb restoration decreases only cell prolifera-tion but does not have effect on self-renewal, and MEK/ERK signalling is more important to self-renewal thanproliferation. (4) A fraction of NPCs expressing E6/E7
oncogenes maintain their multipotency in differentia-tion-promoting environment and are able to re-formneurospheres when the environmental circumstancesallow it. However, when placed into highly differentiat-ing environment in vivo, all the cells differentiatedwithout delayed cell cycle exit, suggesting that they arestill controlled and able to respond to environmentalsignals.We present here the evidence that E6, E7 and E6/E7
oncogenes affect the balance of NPC self-renewal anddifferentiation. This seems to be linked to the abilityof E6/E7 to degrade p53 and pRb family proteins,although viral oncogenes can interfere with severalother cellular activities (reviewed by Munger et al.,2004). We found that E7 oncogene separately increasedthe number and proportion of cells able to formsecondary spheres. Coexpression of E6 and E7 augmen-ted these effects. The high self-renewal capacity of E7-and E6/E7-expressing neurospheres can be thought of asa sign of increased ‘stemness’ in the heterogeneousmixture of cells in each neurosphere. Therefore, wepropose that E6 and E7 expression results in aproportional shift from differentiating NPCs towardsa more primitive cell with stem cell characteristics. Thisincreased number of primitive cells is possibly due to anenhanced ratio of symmetric NPC/NSC divisions.
d
Mash1
Hes1
G3PHD
150bp
170bp
350bp
E16brain Ctrl E6/E7
Id2237bp
Control
Chanels (FL2-A)
DebrisG0G1
G2MS-Phase
1600
1200
800
400
050 100 150 200 2500
a E6/E7
0
200
400
600
800
50 100 150 200 2500Chanels (FL2-A)
DebrisG0G1G2MS-Phase
b
p53-/-
DebrisG0G1G2MS-Phase
1600
1200
800
400
050 100 150 200 2500
Chanels (FL2-A)
c
i
0102030405060708090
Control E6E7
TUJGFAP
Nu
mb
erN
um
ber
Nu
mb
er
Th
e p
rop
ort
ion
s o
f in
vit
ro d
iffe
ren
tiat
ed
cells
(%
)
e f
g h
Figure 4 E6/E7-expressing neural progenitor cells (NPCs) show normal cell cycle distribution and capacity to differentiate whencompared to controls. Cell cycle distribution data analysed by fluorescence-activated cell sorting (FACS) show that (a) control, (b) E6/E7-expressing (different scale) and (c) p53-deficient NPCs are diploid. All cells were cultured for 10 passages before FACS analysis. (d)Reverse transcriptase–PCR results show similar expression patterns of neural development-linked bHLH transcription factors inundifferentiated control and E6/E7 NPCs. The positive control was E16 mouse brain cDNA. E6/E7-expressing NPCs differentiate invitro. The image of TUJ-1 and GFAP-positive cells in control (e, f, respectively) and in E6/E7-expressing NPCs (g, h) counterstainedwith Hoechst (in blue) after 7 days of in vitro differentiation. Scale bar, 20 mm. (i) Example of different cell proportions formed fromcontrol and E6/E7-expressing NPCs during 4 days in vitro differentiation.
E6/E7 increase self-renewalK Piltti et al
4884
Oncogene

The mechanisms underlying the adoption of self-renewal ability of cancer stem cells are not well known.However, most transforming mutations affect tumoursuppressor pathways and viral oncogenes like SV40large T antigen (DeCaprio 1999), BKV TAg (Harriset al., 1998) and adenovirus E1B /E1A oncogenes(Whyte et al., 1988; Dyson et al., 1993) interact withp53 and pRb family members. Our results support theestablished view that viral oncogenes block tumoursuppressor pathways, which control the cell senescenceand apoptosis. Additionally, we found that in NPCsthey also increase self-renewal, which is an evidentadvantage and necessary in malignant transformation.Also, by increasing the proportion of stem cells/progenitors, oncogenes may enlarge the population ofprimitive and long-lasting cells in tissues, which arepotential targets of other transforming mutations. Toour knowledge, these functions of viral oncogenes andtumour suppressors have not been described in thenervous system, but they are in accordance with the dataabout Bmi-1 oncogene, which converges to the same p53and Rb pathways through p16INK4a and p19ARF (Mo-lofsky et al., 2003, 2005; Bruggeman et al., 2005) in
a c d
e hg
020406080
100
Control E6/E7
Tuj-1GFAPO4
m
k l
b
f
ji
Th
e p
rop
ort
ion
of
in v
ivo
dif
fere
nti
ated
cells
(%
)
Figure 5 In vivo differentiation assay. Anti-GFP (green) and anti-TUJ-1 (red) costaining on sections containing (a) control virus NIT-EGFP-transduced cells and (c) E6/E7-transduced EGFP cells. Double positive areas appear yellow when overlaid. Anti-GFP (green)and GFAP (red) costaining on sections containing (e) control cells and (g) E6/E7-expressing cells. Costaining of anti-GFP (green) andO4 (red) on sections containing (i) control cells and (k) E6/E7-expressing cells. Corresponding nuclei (arrows) stained with Hoechst areshown below the images (b, d, f, h, j, l). Scale bars, 5mm in panels (a–d) and 10 mm in panels (e–l). (m) An example of different cellproportions formed from control and E6/E7-expressing neural progenitor cells during 4 days in vivo differentiation.
a b
c
0
10
20
30
40
50
Ctrl
Ctrl
Brd
U p
osi
tive
cel
ls (
%)
Sin
gle
cel
ls f
orm
ing
sp
her
es (
%)
E7 E7+Rb
E6/E7 E6/E7+Rb
020406080
100120
E7+Rb +Rb
E6/E7
**
110-114 kDa
107 kDa
130 kDa
pRb
p130
p107
43 kDa Actin
Con
trol
E7 E7+R
bE6
/E7
E6/E
7+R
b
Figure 6 The increased self-renewal cannot be rescued byrestoring pRb in E7- or E6/E7-expressing neural progenitor cells(NPCs). (a) Western blot reveals that pRb protein level is increasedin E7- and E6/E7-expressing NPCs. Restored pRb does not affectthe levels of decreased p107 and p130. (b) Restored pRb decreasesexcess cell proliferation in E7- and E6/E7-expressing NPCs, but (c)is unable to decrease the increased self-renewal capacity in E7- andE6/E7-expressing NPCs. Charts represent averages of two experi-ments, *Po0.05 (Student’s t-test) and error bars indicate 7s.d.
E6/E7 increase self-renewalK Piltti et al
4885
Oncogene

many stem cells and also in the nervous system.However, it may well be that viral oncogenes havesimilar functions to stem/progenitor cells of othersystems. Human papilloma virus, for example, infectsusually epithelial tissues and E7 oncogene does keep thedifferentiating keratinocytes in cell cycle with increasedcharacteristics of undifferentiated cells (Cheng et al.,1995). In our work, papilloma virus genes were used astools and they are normally unlikely to play a role in thecentral nervous system.p53-deficient mice have an increased number of
haematopoietic stem cells (TeKippe et al., 2003) andp53-deficient neuron-like cells are capable of re-enteringthe cell cycle (Miller et al., 2003). Our data suggest thatp53 is involved in suppressing cell proliferation and self-renewal in NPCs. We detected re-formation of spheresafter growth factor re-introduction in p53-deficientNPCs, even though their cell cycle was initially silenced.
However, either E6 or E7 oncogenes alone or p53þ /�were not sufficient to induce sphere re-formation.E7 oncogene reduced the levels of all Rb family
pocket protein members, pRb, p107 and p130, whichhave a role in differentiation (Callaghan et al., 1999;Liu et al., 2004). p107 also regulates the number of self-renewing NPCs (Vanderluit et al., 2004). In our hands,restored pRb expression in NPCs expressing E7 or E6/E7 did not decrease the excess self-renewal but only cellproliferation. Thus, some of the E7-induced effects aremost likely mediated through the p107/p130 pathways.E6/E7 oncogenes did not block the differentiation of
NPCs despite low levels of p53 and pRb, both of whichhave a role in neuronal differentiation (reviewed byChoi and Donehower, 1999). Remarkably, the E6/E7-expressing NPCs were able to integrate into thedeveloping brain tissue and differentiate into neurons,astrocytes and oligodendrocytes after transplantation
b
c d
e
a
JunD
pJNK
JNK
42 kDa
46 kDa
46 kDa
39 kDa
39 kDa
42 kDa pERK
cJun
ERK
Control
- + +Pc12
NGF
0
5
10
15
20
DmsoRosco
*
0
5
10
15
Ctrl E6/E7
Ctrl E6/E7
E6/E7
DmsoU0126
*
*
0102030405060708090
100
Ctrl
DmsoRosco
*
*
01020304050607080
Ctrl
Brd
U p
ositi
ve c
ells
(%)
Brd
U p
ositi
ve c
ells
(%)
Sin
gle
cells
fo
rmin
g sp
here
s (%
)
Sin
gle
cells
fo
rmin
g sp
here
s (%
)
E6/E7
DmsoU0126
*
*5% FCS
E6/E7
-
Figure 7 MEK–ERK pathway is involved in self-renewal signalling. (a) Western blot of MEK–ERK activation pattern inundifferentiated (�) and fetal calf serum-induced (þ ) control and E6/E7-transduced neural progenitor cells (NPCs). UndifferentiatedE6/E7 spheres show an increased level of pERK and c-Jun when compared to controls. Differentiation causes JunD upregulation andpERK downregulation in E6/E7-expressing NPCs, and upregulation of pERK and c-Jun in controls. PC-12 cells induced with NGFwere used as a positive control. (b) Bromodeoxyuridine (BrdU) labelling shows the effect of MEK–ERK inhibitor (50 mM U0126) oncell proliferation (b) in E6/E7-expressing and control NPCs. However, the effect of U0126 on self-renewal capacity in both NPCs ismore dramatic (c). Inhibition of cyclin-dependent kinases (10mM R-Roscovitine) decreases cell proliferation (BrdU) (d) and self-renewal (e) in NPCs. The decreases in proliferation and self-renewal are of the same magnitude. All charts represent one of threeindependent experiments. *Po0.05 (Student’s t-test). Error bars indicate7s.e.m. replicas.
E6/E7 increase self-renewalK Piltti et al
4886
Oncogene

into embryos. Interestingly, all transplanted cells be-came postmitotic and no proliferating cells weredetected. Also nestin expression was downregulatedfaster than in vitro. It seems that the specific micro-environment in vivo could overrule the proliferativesignals and the delay in terminal mitosis observed afterin vitro differentiation. Alternatively, it is possible thatall proliferating NPCs were destroyed by apoptosis.In culture, MEK–ERK inhibition decreased prolif-
eration about 50% and almost totally blocked the self-renewal, which suggested that MEK/ERK pathway wasessential for maintaining stem cell characteristics. MEK/ERK pathway is important for self-renewal of immatureavian erythroid progenitors (Dazy et al., 2003), andtumours often have a constitutively active Ras–Raf–MEK–ERK intracellular signalling cascade. E6 and E7oncogenes upregulate MAPKs in epithelial cells (Anti-nore et al., 1996; Chakrabarti et al., 2004), and here weshow that in NPCs, E6/E7 oncogenes enhance prolif-eration and self-renewal through the pathway. Inneuronal cells, activation of MEK–ERK signalling hasbeen related to regulation of proliferation, differentia-tion, neurite outgrowth and synaptic plasticity (reviewedby Grewal et al., 1999). We also found an increase inanother MAPK pathway member, c-Jun, in E6/E7–expressing NPCs when compared to controls. c-Jun isinvolved in cell proliferation, differentiation, tumourtransformation and apoptosis in various cell types(reviewed by Herdegen et al., 1997). Our results suggestthat proliferating E6/E7 NPCs have a higher level ofERK phosphorylation than controls, and the cells donot upregulate this signalling upon differentiation. Here,it is not possible to conclude the exact signalling cascadeof increased stemness, but our results suggest thatMEK–ERK pathway is involved, especially in prolif-erative conditions. The experiments with chemicalblockers need to be confirmed using other methods,but our data from two different sources suggest that theself-renewal and proliferation can be separated as cellcycle inhibition through CDKs and pRb restorationaffected self-renewal much less than blocking of theMEK–ERK pathway.
Materials and methods
Neural progenitor cellsNPCs were collected by dissecting the lateral ventricular wallof embryonic day 11.5 (E11.5) mouse brain (NMRI, UBI-EGFP/BL6, 129/Sv-Trp53tm1Tyj, Jackson Laboratory, Barhar-bor, ME, USA). Neurospheres were cultured after clonaldivision in serum-free medium, which was supplemented withFGF2 and EGF as described in Toma et al. (2001) and gaverise to different neuronal cell types. NIT-EGFP, LXSN-lacZ,empty BABE-vector transduced or untransduced NPCs wereused as a control for E6-, E7- and E6/E7-expressing NPCs. Allexperiments were performed with low passage (o15) cells,even though NPCs could be cultured and maintained for >30passages without signs of senescence. NPCs were differentiatedin FGF2-EGF-free medium supplemented with 2 or 5% FCS(PromoCell, Heidelberg, Germany) on 50 mg/ml poly-L-lysine(Sigma, St Louis, MO, USA) coated glass cover slides, fixed
with 4% paraformaldehyde (PFA) and permeabilised with0.2% Triton X-100 (Sigma) supplemented with 5% FCS.
RetrovirusesFor retroviral constructs, we used E6-BABE, E7-BABE and E6/E7-BABE (Dr D McCance, University of Rochester) orpLXSN-E6/E7 (Halbert et al., 1991) (Dr D Galloway) and forcontrols empty BABE, pNIT-EGFP (Dr F Gage, La Jolla) orpLXSN-lacZ. For restoring pRb in E7 and E6/E7-expressingNPCs, we cloned human-pRb into pNIT. Viruses wereproduced in PA317 cell line and transduced into low passage(o5) NPCs with 8mg/ml polybrene (Sigma). NPCs were selectedwith 10mg/ml puromycin dihydrochloride (Sigma) or 400mg/mlgeneticin G418 (Sigma). To exclude the effects of randomtransgene genomic insertion loci, the in vitro experiments werereplicated with NPCs from 3 to 5 different transductions.
RT–PCRTRIzol reagent (Invitrogen, Carlsbad, CA, USA) was used fortotal RNA extraction and total RNA (3 mg) was treated withRQ1 DNase (Promega, Madison, WI, USA), denatured at751C for 5min and diluted in 10ml of H2O. RNA (5 ml)was incubated for 2 h at þ 371C with random primers andSuperScript II reverse transcriptase (Invitrogen). RNA with-out RT was diluted into same concentration as cDNA andused as a control for possible genomic DNA contamination.AmpliTaq Gold PCR products (Roche, Nutley, NJ, USA) and1 ml of each RT reactions and genomic DNA controls wereused for 34 cycle PCR amplifications. Primers were designedby using Primer3 program and sequences are as follows:G3PHD 50-ACCACAGTCCATGCCATCAC-30/50-TCCACCACCCTGTTGCTGTA-30, E6 50-TTGCTTTTCGGGATTTATGC-30/50-CAGGACACAGTGGCTTTTGA-30, E7 50-ATGCATGGAGATACACCTAC-30/50-TTATGGTTTCTGAGAACAGATG-30, Mash1 50-CGGCCAACAAGAAGATGAG-30/50-TGGAGTAGTTGGGGGAGATG-30, Neurogenin150 GACACTGAGTCCTGGGGTTC-30/50GTCGTGTGGAGCAGGTCTTT-30, Id2 50-CGTGAGGTCCGTTAGGAAAA-30/50-ATAGTGGGATGCGAGTCCAG-30, Hes1 50-CTACCCCAGCCAGTGTCAAC-30/50-ATGCCGGGAGCTATCTTTCT-30.
FACS flow cytometryTo analyze cell cycle and ploidy of NPCs spheres weredispersed into single cells, fixed with 1% PFA and stained with50mg/ml propidiumiodide (Sigma) containing 25mg/ml ofRNase. Cells were incubated at 371C for 30min, sorted withFACSScan flow cytometer (Becton Dickinson, FranklinLakes, NJ, USA) and analyzed with Sync Wizard ModelModFit LT software (Becton Dickinson).
BrdU incorporation, self-renewal capacity test and re-sphereformation after differentiationCell proliferation was measured with BrdU incorporationkit (Amersham Biosciences, Uppsala, Sweden). To measurethe percentage of cells in S-phase, cells were incubated withBrdU (1:1000) for 18 h, cytospinned onto microscope slidesand fixed for immunocytochemistry. In terminal mitosis assay,differentiating cells were BrdU labelled for 24 h, and fixed forimmunocytochemistry. In figures, the data is modified tocorrespond to 24 h BrdU incorporation by using formula:(BrdU positive cells (%)/time of incorporation (min))� 1440.The self-renewal capacity of NPCs was measured by clonal
divisions: 1500 single cells from several neurospheres were platedin a density of 15 cells/well in a 96-well plate and the number ofsingle cell-derived spheres was counted after 7–10 days.
E6/E7 increase self-renewalK Piltti et al
4887
Oncogene

Re-formation of spheres after differentiation was detectedafter culturing attached single cells in density of 200 000 cells/well in six-well plates in FGF2-EGF-free medium supplemen-ted with 2% FCS for 14 days. After this period, the mediumwas replaced with FCS-free medium supplemented with FGF2and EGF.
Protein extraction, Western blotting and antibodiesProtocols for total protein extraction and Western blottingwere as described by Popsueva et al. (2003). For analyzingMAPK pathway activation in control and E6/E7 NPCs,neurospheres were induced with 5% FCS after withdrawal ofgrowth factors for 24 h. Proteins were immunodetected byanti-TUJ-1 (BAbCo, Princeton, NJ, USA or Nordic Biosite,Taby, Sweden), anti-GFAP, anti-O4 (Chemicon, Temencula,CA, USA), anti-GFP (Invitrogen), anti-Ki-67 (NeoMarkers,Fremont, CA, USA), anti-p53 (sc-100 or sc-6243, Santa Cruz,Santa Cruz, CA, USA), anti-Rb (BD Biosciences Pharmingen,San Diego, CA, USA), p107, p130 (Santa Cruz), c-Jun (CellSignaling, Davers, MA, USA), JunD (Santa Cruz), p-ERK(Promega), ERK (Santa Cruz), p-JNK (Promega), JNK andanti-Actin (Santa Cruz) antibodies. For secondary antibodies,we used Rhodamine Red-X-conjugated goat anti-mouseIgG and FITC-conjugated goat anti-rabbit IgG secondaryantibodies (Jackson Immuno Research) or horseradish per-oxidase-conjugated secondary antibodies (DAKO, Glostrup,Denmark).
CDK and MAPK pathway inhibitorsR-Roscovitine (Alexis Biochemicals, Lausen, Switzerland)was used to inhibit CDKs (1, 2, 5, 7, and 9) and U0126(Calbiochem, San Diego, CA, USA) for specific inhibition ofMEK1 and MEK2 in MAPK pathway. Inhibitors weredissolved to the concentration of 10mM in DMSO and wereused at 10 and 50mM concentrations, respectively.
Cell transplantations in uteroE6/E7-EGFP and EGFP-NIT NPCs were triturated to asingle-cell suspension 6 h before transplantation. PregnantNMRI mice with E14.5 embryos were anesthetized withinhaled Enfluran (Efrane, Abbott Scandinavia, Kista, Sweden)for the entire process. A midline laparotomy was used toexpose the uterine horns and the embryos were manipulated inthe uterus. B50 000 cells in 1 ml of the cell suspension with0.05% fast green (Richard-Allan Scientific, Kalamazoo, MI,USA) was injected with a glass capillary attached to a mouthpipette into one of the embryonic brain ventricles. Afteroperation, the mother was sutured and given analgesic. Thepregnant mice were killed 4 days after injections; the injectedbrains were dissected from E18.5 embryos, fixed with 4%PFA, cryoprotected with 30% sucrose overnight and cryosec-tioned coronally at a thickness of 10–12 mm.
Statistical analysisAll results are shown as mean7s.d. or s.e.m. A two sampleunequal variance Student’s t-test with two tailed distributionwas used to compare the scores after proliferation measured byBrdU or MTT. Po0.05 was considered significant.
Acknowledgements
We thank Drs Kirsi Sainio and Anu Wartiovaara for insightfulcomments, Monica Shoulz for FACS flow cytometry, LeaArmassalo, Valtteri Harri, Jetta Kelppe, Virpi Syvalahti,Maria Herranen, Susanna Rasanen, Jouni Kvist and AgnesVihera for technical support and Kimmo Tanhuanpaa andKatri Jauhiainen for assistance with confocal microscopy. Thisresearch was funded by Helsinki Biomedical Graduate School,Academy of Finland, National Technology Agency of Finland(TEKES) and University of Helsinki.
References
Antinore MJ, Birrer MJ, Patel D, Nader L, McCance DJ.(1996). EMBO J 15: 1950–1960.Armstrong JF, Kaufman MH, Harrison DJ, Clarke AR.(1995). Curr Biol 5: 931–936.Bach S, Knockaert M, Reinhardt J. (2005). J Biol Chem 280:31208–31219.Boyer SN, Wazer DE, Band V. (1996). Cancer Res 56:4620–4624.Bruggeman SW, Valk-Lingbeek ME, van der StoopPP. (2005). Genes Dev 19: 1438–1443.Callaghan DA, Dong L, Callaghan SM, Hou YX, Dagnino L,Slack RS. (1999). Dev Biol 207: 257–270.Chakrabarti O, Veeraraghavalu K, Tergaonkar V. (2004).
J Virol 78: 5934–5945.Cheng S, Schmidt-Grimminger DC, Murant T, Broker TR,Chow LT. (1995). Genes Dev 9: 2335–2349.Choi J, Donehower LA. (1999). Cell Mol Life Sci 55: 38–47.Coursen JD, Bennett WP, Gollahon L, Shay JW, Harris CC.(1997). Exp Cell Res 235: 245–253.Davies R, Hicks R, Crook T, Morris J, Vousden K. (1993).
J Virol 67: 2521–2528.Dazy S, Damiola F, Parisey N, Beug H, Gandrillon O. (2003).
Oncogene 22: 9205–9216.DeCaprio JA. (1999). Biologicals 27: 23–28.Dyson N, Dembski M, Fattaey A, Ngwu C, Ewen M, Helin K.(1993). J Virol 67: 7641–7647.Farah MH, Olson JM, Sucic HB, Hume RI, Tapscott SJ,Turner DL. (2000). Development 127: 693–702.
Favata MF, Horiuchi KY, Manos EJ. (1998). J Biol Chem 273:18623–18632.Fehrmann F, Laimins LA. (2003). Oncogene 22:5201–5207.Ferguson KL, Callaghan SM, O’Hare MJ, Park DS, Slack RS.(2000). J Biol Chem 275: 33593–33600.Grewal SS, York RD, Stork PJ. (1999). Curr Opin Neurobiol 9:544–553.Halbert CL, Demers GW, Galloway DA. (1991). J Virol 65:473–478.Harris KF, Christensen JB, Radany EH, Imperiale MJ. (1998).
Mol Cell Biol 18: 1746–1756.Hawley-Nelson P, Vousden KH, Hubbert NL, Lowy DR,Schiller JT. (1989). EMBO J 8: 3905–3910.Herdegen T, Skene P, Bahr M. (1997). Trends Neurosci 20:227–231.Liu H, Dibling B, Spike B, Dirlam A, Macleod K. (2004).
Curr Opin Genet Dev 14: 55–64.Macleod KF, Hu Y, Jacks T. (1996). EMBO J 15:6178–6188.Meijer L, Borgne A, Mulner O. (1997). Eur J Biochem 243:527–536.Miller MW, Peter A, Wharton SB, Wyllie AH. (2003). Brain
Res 965: 57–66.Molofsky AV, He S, Bydon M, Morrison SJ, Pardal R. (2005).
Genes Dev 19: 1432–1437.Molofsky AV, Pardal R, Iwashita T, Park IK, Clarke MF,Morrison SJ. (2003). Nature 425: 962–967.
E6/E7 increase self-renewalK Piltti et al
4888
Oncogene

Munger K, Baldwin A, Edwards KM. (2004). J Virol 78:11451–11460.Pardal R, Clarke MF, Morrison SJ. (2003). Nat Rev Cancer 3:895–902.Popsueva A, Poteryaev D, Arighi E. (2003). J Cell Biol 161:119–129.Ross SE, Greenberg ME, Stiles CD. (2003). Neuron 39: 13–25.Scheffner M, Werness BA, Huibregtse JM, Levine AJ, HowleyPM. (1990). Cell 63: 1129–1136.Singh SK, Clarke ID, Terasaki M. (2003). Cancer Res 63:5821–5828.Slack RS, El-Bizri H, Wong J, Belliveau DJ, Miller FD.(1998). J Cell Biol 140: 1497–1509.Slack RS, Hamel PA, Bladon TS, Gill RM, McBurney MW.(1993). Oncogene 8: 1585–1591.
TeKippe M, Harrison DE, Chen J. (2003). Exp Hematol 31:521–527.Toma JG, Akhavan M, Fernandes KJ. (2001). Nat Cell Biol 3:778–784.Toma JG, El-Bizri H, Barnabe-Heider F, Aloyz R, Miller FD.(2000). J Neurosci 20: 7648–7656.Tyner SD, Venkatachalam S, Choi J. (2002).Nature 415: 45–53.van Houten VM, Snijders PJ, van den Brekel MW. (2001).
Int J Cancer 93: 232–235.Vanderluit JL, Ferguson KL, Nikoletopoulou V. (2004). J Cell
Biol 166: 853–863.Walboomers JM, Jacobs MV, Manos MM. (1999). J Pathol189: 12–19.Whyte P, Buchkovich KJ, Horowitz JM. (1988). Nature 334:124–129.
E6/E7 increase self-renewalK Piltti et al
4889
Oncogene


![Renewing a historical legacy: Tourism, leisure shopping and urban branding in Paris [Cities, 2015]](https://img.pdfslide.net/doc/110x75/631d1acf5a0be56b6e0e874a/renewing-a-historical-legacy-tourism-leisure-shopping-and-urban-branding-in-paris.jpg)


