Embed Size (px)
Citation preview

INDEX TO
VOLUME XXVIII
1962-1963

EAST AFRICAN AGRICULTURAL AND FORESTRY JOURNAL INDEX TO VOLUME XXVIII—1962-63
PageAlbizia antunesiana—a Useful Timber Tree of
Western Tanganyika. (J. A. C. Howard) . . 11Animal Diseases VIII—Notes on Mineral De
ficiency Diseases. (D. A. Howard) . . . . ✓ 191, / Arable Cropping. Continuous with the Use of __ ,
Manure and Fertilizers. (R. C. G rimes and R. T. Clarke) ....................................................... 74
Bacon Pigs, Restricting the Feed of and its Consequences. (M. F. Watson) . . . . . . 168
Bacon Pigs, the Effect of Maize on the Carcass quality. (P. Myers) ........................................ 255
{/ Biennially Bearing Crops, a Note on the Stat- . /in. (J. t /
126istical Analysis of Yield Differences D ancer) .......................................................Baran Type Cattle in Ethiopia, Preliminary
Observations on the Milk Production of. (J. C.G lenn, Shankuti T essema, Peter Mziray and Leon FIolland) .......................................................Broiler Production in Uganda, Small Scale.
(J. C. M. T rail) ..........................................Cattle Browse and Fodder Plants of Karamoja—
Northern Province, Uganda, Nutritional Value of Some Common. (J. G. Wilson and R. M.Bredon) . . . . .............................
Cattle Trypanosomiasis, the Control with Drugs in Kenya. Methods and Costs. (E. F. W hiteside)
Cashew Production in the Southern Province o f j ganyika. (P. J. Northwqop) . . ^Jr
Climate of Kenya Masailand. (J. F. G riffiths /—-nrJC and M. D. G wynne) . . . . . . . .
- ie Kenya Roughages, Crude Fibre—Crude Protein 0~^ Relationship in. (H. W. Dougall) . .
Knapsack Mistblowers, Some Physical Properties of Various. (C. W. Lee) ............................
Leaf Rust, Spraying Arabica Coffee for the Control of. (J. A. N . Wallis and L D. Firmin) . .
Napier Grass for Milk Production in the Trans Nzoia. (W. D . Sare-A ustin)
Nematocerus sp. (nr. brevicornis Hust) Part IV. (J. A. Bullock) .........................................
Nematocerus sp. (nr. brevicornis Hust) Part V. (J. A. Bullock) .........................................
New Cereal. Varieties 1962. (G. E. Dixon, K.W. Lynch and F. F. Pinto) ............................
Pig Feeding, the Value of African-type Swill for. (A. N. A. Mobebe) .........................................
- ^ P la n ts . Changes in the Chemical Composition of. During Growth in the Field. (H. W. Dougall)
Poultry. Meat Production from Indigenous Crossbred and Imported, in Uganda. (J. C. M. Trail)
— <f"Pyrethrum, Diseases of, in Kenya. (R. A. 204 Robinson) ......................................................
^Pyrethrum, the Effects of Fertilizers, Manures, 67 Irrigation and Ridging on the Yield of.
(U. K roll) .....................................................
Coffee Leaves, the Physical Assessment and Biological Importance of Pesticidal Dosages on. (D. Yeo) .......................................................
~ J Coffee. Preliminary Observation and Discussion on the Dry Soil Nutrition of. (J. C. Warden)
V Cotton and Maize. Intercropping and Alternate * Row Cropping of. (R. C. G rimes) . .
Engteromyces Goetzei, Note on. (I. A. S. G ibsonand J. Kimeria) ..........................................
Ethiopian Cattle, Preliminary Observations on Gestation Length and Birth Weight o f (J. G. G lenn, Shankute Tessema and R. Larsen)
Fertilizer Requirements, a Comparison of the Minus-one and 2n Designs for the Exploratory Investigation of Fertilizer Requirements. (P. H. Le Mare)
Forestry Operations, Plant Tray Carrier. (J. F. H ughes) ...................................................................
Gazelle, Observations on Free-Ranging Herds of Thomson’s and Grant’s in Kenya. (G. M. oleM aloiy) ...................................................................
Herbage Plants at Serere, Uganda, 1957-61. (C. R. Horrell) .........................................
Intercropping, Studies of. (A. C. Evans and A. Sreedharan) .........................................
Kenana Calves, Body Reactions of. Fed Allroughage Rations under Hot Dry Conditions in the Sudan. (K. A. A lim) ............................
Kenya Roughages, Ash Distribution in. (H. W. Dougall) ■ ......................................................
55 %/ Pyrethrum. the Occurrence, Sampling, Control of Tetranychus ludeni Zacher (Acarina-Tetrany- chidae). (J. A. Bullock) ...........................
•/Rainfall Reliability and Maize Yields in r /- . Mackakos District. (B. D. Dowker)
s 9 V Rice Fertilizer and Spacing Trials at Mwea- Tebere. (J. M. Suttie) ............................
— 195
r_ \ 61 -
61
219
213
148
151
174
&
209
Page
88
55
8?
223
29
105
181
258
182
249
164
139
252
134 v.
- Soil Fertility Studies in Tanganyika II. (A. C.Evans) ..................................................... .....
Soil Fertility Studies in Tanganyika III. (A. C. Evans) ..................................................................
Sugar Beet Trials in West Kenya. (J. L. Elmer, J. M. Gosnell and R. G. Smith) . .
Swamp Forest Clearing, Colonization of a. (J. McCarthy) ......................................................
System of Lakes, Rivers and Swamps in S.W. Kigczi, Uganda, Chemical Investigation into a (S. A. Visser) ......................................................
Tabanidae of Tanganyika, Key to the. (J. F. Lamerton)
Tea Soils, Effect of Fertilizers, Sulphur and Mulch on East African. Part II. (A. N. Smith)
Tea Soils. Effect of Fertilizers. Sulphur and Mulch on East African. Part 111. (A. N. Smith)
Tea Soils, the Chemical and Physical Characteristics of. (A. N. Smith) ............................
Turkeys, Fattening in Uganda. (J. C. M. T rail)
Turkeys, Rearing in Uganda. (J. C. M. T rail)
Wildlife on the Serengeti, Mara and Loita Plains,
(Syt-Os.240
22
81
40
16
117
12314664
wiiame on me ocrcugeu, maia uuu mud riams,87 Censusof.(D.R.M.STEWARTandL.M .Talbot) ( 5 8
1
INDEX—(Con Id.)
Page PageReviews—
African Army Worm Spodopiera exempta 265 vj Natural Resources of East Africa 128Agricultural Entomology in the Tropics 189 Nitrogen in the Tropics with Particular Ref-
109Bibliography of Subterranean Clover 66 erence to Pastures, a Review of
Cattle Ticks, the Control of in East Africa . . 264 Pathology in Kenya Forest Plantations, Notebook on 15
Crop Adaptation and Distribution . . 66Perennial Plant. Carbohydrate Resources
- Crop Husbandry ........................................S '
within the 109
Dictionary o f Agricultural Engineering Pigs and Poultry, Nutrition of 265Farming the Land 265 Plan of Operations 264Flowering Plants o f Uganda, Some Common 120 Sisal ................................................................ 133Forests Open, C.S.A. Meeting of Specialists on,
in Tropical Africa 190 Soil and Land Use Surveys . . . . , . 66
Forests o f In d ia ..................................................... 264 Soil Organic M a t t e r ....................................... 28
Forestry, Tropical with Particular Reference to Third In ter-A frican Soil C onference,West Africa 120 Dalaba 1959 ...................................................... 6
Game Management 265 Tropical Agriculture 28
f i jr-
T
,£Sav-?y

EAST AFRICAN AGRICULTURAL AND FORESTRYJOURNAL
Vol. XXVIII— No. 1 JULY, 1962Printed and published by the Government Printer. Nairobi
Issued under the authority of the East African Common Services Organization and published every three months—July, October. January. April. Volume consists of four issues (commencing July issue)
Editorial Board: Director of E.A. Agriculture and Forestry Research Organization: Director of E.A. Veterinary Research Organization; Directors of Agriculture, Kenya, Uganda and Zanzibar, and Commissioner for Agriculture, Tanganyika; Director of Veterinary Services. Kenya and Uganda, and Commissioner of Veterinary Services, Tanganyika; Conservators of Forests, Kenya, Tanganyika and Uganda.
Executive Committee: Director of E.A. Agriculture and Forestry Research Organization; Director of E.A. Veterinary Research Organization; The Editor.
E d it o r : J. G lover
E.A.A.F.R.O., P.O. Box 21, K ik u y u , K enya
Subscription Sh. 15 per volume (Sh. 4 single copy) including postage, payable to the Editor. Subscribers are advised to remit postal orders in payment, otherwise bank commission must be added in the case o f cheques.
The Editor does not hold himself responsible for opinions expressed by contributors.
Matter submitted for publication should preferably be sent through the local member of the Editorial Board. Double spacing should be used in typescript. Contributors receive 25 prints of their articles free. Additional copies may be obtained on payment if asked for in advance. Prints bear the same page numbers as the original articles in the Journal, except where, to meet a contributor's wishes, prints are supplied before publication has been completed.
Readers are reminded that all agricultural inquiries, whether they relate to articles in the Journal or not, should be addressed to the local Director of Agriculture, and not to the Editor.
CONTENTSPACE
Climate of Kenya Masailand (J. F. Griffiths and M.D.Gwynne) . . . . . . . . . . 1
Studies of Intercropping (A. C. Evans and A. Sreedharan) . . . . . . . . . . 7
The Physical Assessment and Biological Importance of Pesticidal Dosages on Coffee Leaves (£>. Y e o ) ................................................................ 9
Effect of Fertilizers, Sulphur and Mulch on East African Tea Soils. Part II (A. N. Smith) 16
Colonization of a Swamp Forest Clearing (J. M c C a r th y ) ................................................... 22
Nematocerus sp. Part IV (J. A. Bullock) . . 29
Cashew Production in the Southern Province of Tanganyika (P. J. N orthw ood).......................... 35
Key to the Tabanidae of Tanganyika (J. F. Lamer tori)................................................... 40
Some Physical Properties of Various KnapsackMistblowers (C. tV. Lee)...................................... 55
PACECensus o f Wildlife on the Serengeti, Mara
and Loita Plains (D. R. M. Stewart andL. M. T a l b o t ) ................................................... 58
Note on Engleromyces Goetzei P. Henn.(I. A. S. Gibson and J. Kimeria).......................... 61
Rearing Turkeys in Uganda (J. C. M. Trail) .. 64
Reviews;Third Inter-African Soils Conference, Dalaba.
1959 6A Notebook on Pathology in Kenya Forest
Plantations ................................................... l JSoil Organic Matter ...................................... 28Tropical Agriculture ...................................... 28Crop Adaptation and Distribution 66Aromatic or Oriental Tobaccos . . 66A Bibliography of Subterranean Clover . . 66Soil and Land-use Surveys . . . . 66
INDEX TO ADVERTISERSPACE PAOS
Barclays Bank D.C.O cover page 2 National & Grindlays Bank ............................. IE.A. Breweries ........................... cover pace 3 Standard Bank ...................................................... IEsso Standard (East Africa) Ltd. cover pace 4

EAST AFRICAN AGRICULTURAL AND FORESTRY JOURNAL
THE CLIMATE OF KENYA MASAILANDBy J. F. Griffiths, E.A. Meteorlogical Department, Nairobi, and M. D. Gwynne, E.A. Agriculture
and Forestry Research Organization(Received for publication on 17th November, 1961)
The interest at present being shown in Kenya Masailand stems from the various ecological problems which exist there and which have been outlined by Glover and Gwynne (1961). In view of the further scientific studies which will undoubtedly be undertaken in this region it is thought advisable to present the available climatic data for the area in the hope that they will aid in the interpretation of any future ecological observations. The area has previously been included in the more general climatic studies for East Africa (Griffiths, 1958; Kenworthy and Glover, J.,-1958; Trap- nell and Griffiths, 1960) with the relevant published information being summarized by Glover, Walker and Gwynne (1961). The fo llowing report is based upon the data held by the East African Meteorological Department, and the personal observations o f the authors on the topography of the region and on its vegetation.
G eography
Kenya Masailand geography extends over15,000 square miles in the southern part of the colony. It is bordered by the Chyulu Hills, the Kenya-Uganda railway which separates it from the Kamba country, the Mau Escarpment, Kipsigis, Kisii and Kuria country, a 250-mile length of the Kenya-Tanganyika border, and the western boundary of the Royal Tsavo National Park. The Great Rift Valley running north-south from the Kedong Valley to Lake Natron divides the region into two geographical units.
The western wall of the Great Rift Valley forms the Nguruman Ecarpment reaching nearly 9,000 ft. and which marks the eastern boundary of the western region. Westwards, beyond the escarpment, the hills gradually merge into the rolling Talek and Mara country and the Loita Plains—all lying between 5,000 and 7,000 ft. In the north, the forest-covered Mau rises to 10,000 ft. in places while in the far west, the elevated table-land of Trans-Mara merges into the foothills of the Kisii Highlands.
The eastern region is mainly one of plains in the north with broken hilly country between
Namanga and Kajiado. Further east there is the flat, waterless Nyiri Desert which gives way in turn to swampy areas fed mainly by streams from Kilimanjaro. In the extreme north-east rises the fertile volcanic Chyulu Hills range whose uppermost peaks are in excess of7,000 ft.
V egetation
The vegetation o f Masailand includes a large range o f ecological communities. The main features, however, are a transition from the wetter climatic and vegetation forms in the west to the drier regions and vegetation types of the east. There is similar wet to dry vegetation transition from north to south.
The highland areas, particularly the Mau and the Nguruman Escarpment are mostly covered with a dense growth of Montane Sclerophy.il Forest containing Juniperus procera, Podo- carpus sp., Ocotea sp. and in the drier areas such trees as Olea sp. Smaller areas o f this forest also occur on the upper slopes o f the Chyulu Hills, Kilimanjaro, Olembarashi and Namanga Mountain. On the upper elevations some areas of Montane Open Grassland occur containing such grasses as Themeda triandra, Pennisetum schimperi, and Eleusine jaegeri. Occasional patches of Montane Moorland are also present containing various species of Senecio, Lobelia and Helichrysum. Montane Bamboo Forest occurs on the Mau.
Large areas of Upland Evergreen Bushland and Semi-evergreen Scrub occur along the upper southern Uaso Nyiro and the western edge of the Mau slopes. Extensive areas of Derived Tarchonanthus Bushland occur throughout the Acacia grasslands present at intermediate altitudes. In these areas such Acacia as A. drepanolobium, A. seyal and A. Senegal are present with A. xanthophloea along the water courses. Large tree Euphorbia and other succulents such as Aloe are common on rocky places.
The Kisii foothills in western Masailand contain large areas of Highland Acacia Savanna the common species being Acacia abyssinica, A. lahai and A. seyal, but in the more moist

EAST AFRICAN AGRICULTURAL AND FORESTRY JOURNAL JULY, 1962
regions other genera are found such as Acokanthera, Euclea and Commiphora. West of the Mara River is an extensive zone of Sclerophyll Bush Clumps which is associated along the river tributaries with galleries of Transitional Sclerophyll Forest containing species o f Olea, Euclea. Teclea, Rhus, and other genera.
The area between the Mara River in the west and the River Tsavo in the east is covered with various forms o f Thom Savanna and Thom Bushland, most o f which is Acacia Themeda Savanna. In some areas, however, particularly in Kajiado, mixed Acacia Bush- land occurs in which other genera present include Com m iphora, Indigofera and Barleria and in such communities the Acacia may be mainly a secondary component.
The floor of the Great Rift Valley contains extensive areas of dense Acacia-Commiphora Bushland and Thicket and Transitional Desert Acacia Bushland in which Acacia misera communities indicate a transition to Desert Thorn Scrub.
C lim ate
The clim ate o f an area is due to the interaction o f many single factors such as temperature, rainfall and wind speed. It is generally possible to give some idea o f the variations that can be expected in each o f these factors within a selected region, but the demands made on a climatological study are usually more extensive. When such climatological knowledge is to be applied to a specific study the inter-relations between the factors are needed and, in East Africa, these have not yet been investigated adequately. Rainfall, however, is one factor that is more important than all the others and it is possible to consider the other parameters in relation to it as a satisfactory first step in a climatic investigation.
RainfallAlthough the area involved is comparatively
small the positioning of the annual isohyets is not easy owing to the lack of permanent settlements and therefore of long-term rainfall records, the observed variability in the annual rainfall which makes such long-term records necessary for the calculation of the mean annual rainfall, and the great variation in altitude.
The rainfall in this region of East Africa is generally associated with the movement of the low pressure belt due to the convergence of
the Trade Winds in the two hemispheres. This belt, variously termed the Intertropical Convergence Zone or the Equatorial Trough, m oving between mid-Sudan and Northern Rhodesia, follows the apparent movement o f the zenith sun, with a lag of about one month. Owing, however, to synoptic factors which are at present not fully understood appreciable variations in this movement occur. Added to these variations are those which are due to the local topography. The combination of these two main fluctuations can often make the underlying norm difficult to identify.
Kenya Masailand possesses three fairly distinct rainfall regimes (Fig. 1). In the northwestern region around Kilgoris and on the slopes of the Mau rain falls throughout the year, usually more than 2 in. in each month. The soil of this area, therefore, except for the uppermost few inches, is unlikely to dry out. This is very unusual in East Africa and occurs in less than 2 per cent of the area of the three territories.
In the north-eastern region east of a line from the Chyulu Hills to the Athi Plains, there are two rainy seasons per year. About 50 per cent of the annual total rainfall is received in March, April and May when the Equatorial Trough is moving northwards, and 25 per cent of the total in November and December. Around Simba these percentages change to 40 and 45 respectively.
The rest of Kenya Masailand is in the single season rainfall regime, receiving about 85 per cent o f its annual fall during the period November to May. (Appendix A.)
The rain occuring in January and February is thought to be due to confluence of air at the extreme edge of the Equatorial Trough. It should be noted, however, that some of the highlands in this area, from which figures are not available, are likely to have a more even annual rainfall distribution which approaches the pattern obtained in the north-western area.
It can be seen, therefore, that in about 90 per cent of the whole of Kenya Masailand a drought period of some five months may be expected each year.
The mean annual rainfall patterns are shown in Fig. 2. This map has been constructed from the few available measurements and a knowledge of the local vegetation.
As will be seen, the annual totals vary from less than 10 in. in the Nyiri Desert and the Lake Magadi-Lake Natron zones, to over 60 in.

EAST AFRICAN AGRICULTURAL AND FORESTRY JOURNAL JULY, 1962
on the Mau and Nguruman Escarpment. The figures given in the “boxes” represent estimates of the likely highest mean annual rainfall to be received on the particular isolated hill or hill range.
A rather unusual feature of the pattern is the rapid increase of rainfall with altitude in the pattern is the rapid increase with altitude in the Loita Hills and Namanga Mountain regions. This increase occurs only above approximately 7,000 feet and is then of the order of 20 in. per 1,000 ft. and leads, therefore, to relatively small patches of dense vegetation on the higher ground. There is also a marked increase in rainfall to the west o f the Isuria Escarpment, which is due, in part, to the sudden topographical change.
Three areas o f rain shadow occur, that is, areas that are sheltered from the prevailing rain bearing winds by high land and so receive a very low rainfall. These are found around Kilgoris, in the Lake Magadi-Lake Natron zone, and in the Nyiri Desert. In some years a slight change in the main wind direction will
alter the shape and position of these areas, but the map gives an indication of where they generally occur.
Monthly and annual rainfall variability are very great and it is quite possible for months with a mean o f 5 in. or more to experience at least double this amount. The degree of variability gets greater as the amount decreases so that months with means of less than 2 in. may get as much as five or six times this occasionally. There are only few months for any station which do not get as low as 2 in. at some period.
Maximum daily falls are normally in the range of 2 in. to 4 in., there being no apparent geographical pattern except that around Kiu falls of 5 in. or more occur. The record is8.7 in. at Loitokitok in March, 1947.
The rain throughout Kenya Masailand generally falls from convective storms of fairly short (i-3 hour) duration. It is not known whether, at any time of the year, these storms move along definite identifiable tracks. On the
3

EAST AFRICAN AGRICULTURAL AN D FORESTRY JOURNAL JULY, 1962
4
MEA
N AN
NUAL
RA
INFA
LL

EAST AFRICAN AGRICULTURAL AND FORESTRY JOURNAL JULY, 1962
hill slopes and areas immediately affected by the highlands, however, it is reported that drizzles of fairly long duration occur.
T emperature
In equatorial latitudes there is remarkably little variation in the mean daily temperature from month to month and in some coastal areas this variation can be as little as 1° F. In Kenya Masailand, however, which is an inland region this variation is increased to about 6°F. Thus, the mean monthly temperatures lie within + 3° F. o f the mean annual temperature with February the hottest month and July the coldest.
The mean diurnal temperature range is high for these latitudes being between 20° F. and 30° F. with Narok having a diurnal range of 35° F. in February. These values apply only to screen temperatures. Screen frosts are likely to occur occasionally down to 7,000 ft. in the western part of the regions and ground frosts may sometimes be encountered as low as6.000 ft. Maximum temperatures above 105° F. are rare, but temperatures of over 100° F. will most likely be recorded at altitudes below 2,500 ft. at some time during each year.
Temperature recording stations within the area are, unfortunately, very scarce, but available measurements from those which exist very closely fit the regression equation: —
Mean annual temperature (°F) = 93-2 — 4-8 x altitude (in thousands of feet).
(r = 0-96)This very high temperature (4.8° F. per 1,000 f t altitude) infers that the area as a whole is very dry. Using this equation and the previous comments it is possible to calculate, approximately, any required temperatures.
Example 1
What is the likely minimum temperature in June at a height o f 7,000 ft.?
From the equation, mean annual temperature = 93.2 - 4.8 X 7 = 59.6. In June, that is near the coldest month, this should be reduced by about 2° F. to 57.6°. The daily range is some 25° F. so the minimum will be 12.5° lower than the mean. Thus, the likely minimum will be around 45° F.
Example 2
What is the likely maximum temperature in February at an altitude of 2,000 ft.?
The equation gives mean annual temperature = 93.2 — 4.8 X 2 = 83.6. In February,
the hottest month, we add 3° so that the mean February temperature will be about 86.6°. As in the above example the daily range is about 25° F. so that the likely maximum is about 86.6 + 12.5 = 99° F.It must be noted that individual days can
vary widely, order o f + 10° F„ from these means.
HumidityThe relative humidity, the most generally
known and used humidity parameter, is unfortunately implicitly related under normal meteorological conditions to the temperature. This is demonstrated by the way in which the relative humidity falls during the afternoon while the temperature is rising. This relationship makes the relative humidity rather intractable to analysis and so use has been made here of a more explicit parameter, the dew point temperature. This temperature is defined as that at which dew will form if the air is cooled, and it is most useful when considering nocturnal conditions.
During a day the dew point shows very little variation, normally about i 2° F., and it is quite steady from month to month, with the mean monthly value falling within + 3° F. of the annual mean.
As there are only three stations in Kenya Masailand that record dew point temperatures, it is not possible to derive a reliable equation connecting altitude and dew point. The expression, however, derived for the whole of inland East Africa and based on measurements from over one hundred stations is: —
Dew point temperature (° F.) = 68.7 — 2.5 X altitude (in thousands of feet).
This equation fits the observed values for Narok and Magadi but is greatly in error (+ 6° F.) for Loitokitok. This discrepancy is so far unexplained, but it may be due to the subsidence of moist air from the slopes of Kilimanjaro.
The dew point equation can now be used to calculate air moisture values at places and times for which no records are available. For example, in the section on temperature the minimum in June at 7,000 ft. was found to be 45° F., we now require the corresponding dew point. From the equation, the mean annual dew point will be (68.7 — 2.5 X 7) or 51.2° F. During June, a dry month, this will be reduced to about 49° F. The diurnal pattern of dew point, like relative humidity, shows a minimum
5

EAST AFRICAN AGRICULTURAL AND FORESTRY JOURNAL JULY, 1962
in the afternoon and a maximum at night, therefore the night dew point will be around 51° F. and, with a night temperature minimum of 45° F. dew is almost certain to form.
MiscellaneaThere is only one full-time station of the
Meteorological Department within Kenya Masailand (at Narok) so that measurements of wind speed and direction, evaporation, radiation and sunshine are scarce or nonexistent. A few generalizations, however, may be made.
The prevailing wind direction is south-east which during the daylight hours accounts for over 50 per cent of the records. Around sunrise the prevailing wind at Narok is from the north, but this is probably due to a local effect, the katabatic flow of cold air from the Mau. During the day the wind speed increases to about 10 m.p.h., this value being quite constant throughout the year.
Evaporation from the gridded pan at Narok averages 62 in. per year with a range of from 4 in. in April to 6.5 in. in December. In the more arid regions the annual figure is likely to reach a value o f at least twice that recorded at Narok.
The cloud amount at Narok averages 6 /8 during the day compared with 4 /8 at Magadi; there is very little seasonal variation. Clouds will form over most hills on most days throughout the area.
A ckno w led g em en t
We are indebted to P. E. Glover and D. R. P. Zaphiro for their advice. One o f us (M. D. G.) would like to thank the Trustees of the Nuffield Foundation for the award of a Research Grant during the tenure of which he was able to work on this project at the East African Agriculture and Forestry Organization, Muguga, Kenya.
References
Glover, P. E., and Gwynne, M. D. (1961). The Destruction of Masailand. New. Scient. 11:450-453.
Glover, P. E., Walker, J. B., and Gwynne. M. D. (1961). An ecological survey of Kenya Masailand. Sci. Rep. E. Agric. Wild Life Soc. 25 pps.
Griffiths, J. F. (1958). Climatic zones of East Africa.E Afr. agric. J. 2 3 :179-185.
Kenworthy, J. M., and Glover, J. (1958). The reliability of the main rains in Kenya. E. Afr. agric. J. 2 3 :267-272.
Trapnell, C. G., and Griffiths. J. F. (1960). The rainfall altitude relation and its ecological significance in Kenya. E. Afr. agric. J. 25:207-213.
REVIEWT h ir d I n t e r -A frican S o ils C onference,
D alaba , 1959. C.C.T.A., Publication No. 50. Tw o volumes, 926 pp. C.C.T.A. Publications Bureau, Watergate House, York Buildings, London, W.C.2. N o price given.
This publication deals with recent work on the classification and utilization o f African soils. The range of subjects covered under these three headings is considerable and presented in such a way that the publication serves as a very useful reference book. Obviously many o f the papers presented are applicable to tropical soils in general and the publications should therefore be of value to most workers concerned with tropical soils and will, no doubt, enjoy a wide circulation. It is certainly convenient to have these three important aspects o f African soils so systematically arranged in these two volumes.
Section 1 deals with the study and classification of soils and comprises 63 papers, covering 436 pages. Section 2 deals with conservation of soils, and Section 3 on the utilization of soils and is made up o f 15 papers (102 pages). The average length of each paper is about seven pages which is generally sufficient for communicating the essential facts. Roughly half the papers are in French and the other half in English.
The print, diagrams and quality o f paper are excellent and add to the enjoyment of studying the papers. An author index, with the title of the paper presented, is included. The subject index is rather poor and this is a pity since a large range of topics are covered in this excellent publication.
H. F. B
6

EAST AFRICAN AGRICULTURAL AND FORESTRY JOURNAL JULY, 1962
STUDIES OF INTERCROPPINGII—CASTOR-BEAN WITH GROUNDNUTS OR SOYA-BEAN
By A. C. Evans and A. Srecdharan, Ministry of Agriculture, Dar es Salaam, TanganyikaCReceived for publication on 20th December. 1961)
Evans (1960) showed that intercropping groundnuts with maize or sorghum generally gave an increased production per acre.
The combinations castor-bean—groundnuts and castor-bean— soya-bean have now been studied.
Castor-bean has an indeterminate flowering habit and is regarded as a somewhat drought resistant plant. It is often planted rather late in the rainy season in some areas. An experiment was planted at Ilonga, 1960 to determine the effects of intercropping castor in early planted soya-bean or groundnuts, the castor being planted at three dates. Soya-beans and groundnuts were planted on 18th-19th January and castor-beans on 16th January, 20th February and 14th March.
Ridges were 28 in. apart. Natal Common groundnuts were planted 4 in. apart, Hemon 237 soya-bean 2 in. apart but with two rows per ridge and Adamdam castor-bean 36 in. apart.
Intercropping with castor-beans had no effect on plant populations of groundnuts or soyabeans. Groundnuts and soya-beans however did reduce populations of later planted castor- bean.
Table 1—Effect of G roundnuts and Soya-beanson Castor-bean Populations, Thousands Per Acre
Date of Planting for Castor-bean
Jan. 16 Feb. 20 Mar. 14 Mean
Pure stand .. 5-6 5-4 4-5 5-2With groundnuts 5-5 3-7 3-7 4-3With Soya-bean 5-6 1-4 0-2 2-4
Mean . . 5-6 3-5 2-8
Significant Differences: 5% 1%Body of Table •5 •7Date and crop means •: •4
When planted at the same time neither groundnuts nor soya-beans had any effect on castor-bean populations. In the February planting. soya-beans greatly reduced the castor-bean population to about one-quarter of that in pure stand, groundnuts however reduced it to about three-quarters. In the March planting the
reduction of the castor-bean population by groundnuts was small, soya-beans however almost completely suppressed growth of castor- bean. This greater reduction by soya-beans was probably due to a higher reduction in the amount of light reaching the emerging castor- bean seedling, leading to severe etiolation and subsequent death since the soya-beans were more closely spaced and were taller than the groundnuts at the later dates of planting for castor-beans.
Intercropping caused reductions in yields per acre of one or both crops. Table 3.
T able 2— Effects of Intercropping on Y ields, Lb . Per Acre
PureStand
Intercropping
G’nuts Castor Soya Castor
Groundnuts 936Soya-beans 1614 — — — —
Early castor-beans Medium castor-
536 500 476 994 473
beans .. 558 1146 350 1708 84Late castor-beans 599 1098 295 1700 26
SignificantDifferences:
G'nuts Soya Castor
5 % 320 158 1491% -- 450 222 200
Date of planting had no effect on yields of castor-bean in pure stands but when intercropped with groundnuts or soya-bean there was a significant reduction with the former and highly significant reduction with the latter at the later planting dates. At the later planting dates in soya-bean the yield of castor-bean was negligible.
Early planted castor-beans gave highly significant reductions in yield of 436 lb. of groundnuts and 620 lb. o f soya-bean per acre. Castor- bean planted in February and March, however, had no effect on the yields of the other two crops.
A comparison of intercropping and pure stands on a production per acre basis is given in Table 3.
7

EAST AFRICAN AGRICULTURAL AND FORESTRY JOURNAL JULY, 1962
T able 3— Comparison op Y ields (Lb.) from One A cre of Intercropping with T wo Half-acres of
Pure Stands
Castor Pure StandIntercrop
withGroundnuts
Gain or Loss from
Intercropping
Planting Castor G’nuts Castor G’nuts Castor G’nutsdate:
Early . . 268 468 476 500 208 32Medium 279 468 350 1146 71 678Late . . 300 468 295 1096 - 5 630
With Soya-bean
Castor G'nuts Castoi Soya Castor SoyaEarly . . 268 807 473 994 205 187Medium 279 807 84 1708 -1 9 5 901Late . . 300 807 26 1700 -2 7 4 893
In the case o f castor-bean and groundnuts there is clearly an all round increase in production from intercropping. For castor-bean and soya-bean, however, there is a clear increase in production for both crops when both crops are planted together. For medium and late castor-bean plantings in soya-bean, even though the yields o f castor-bean are low, intercropping may well be advantageous since there is no reduction between the yields of soya-bean and a small yield from castor-bean.
Evans (1960) showed that with maize and groundnuts planted together the spatial distribution of the intercrops, alternate rows versus in the same row, did not affect yields. It might however be possible to make the intercropping o f soya-bean and later planted castor-bean more worthwhile by planting the castor-beans between the rows o f soya-beans thus reducing the severe effect o f the soya-beans on the population of castor-beans by giving the emerging castor-bean plants a better chance of establishing themselves. This possibility is suggested by a study o f the mean plant yields for the various treatments, Table 4.
T able 4— Mean Y ields (Lb.) per 100 Plants
PureStands
Intercrop
Castor-bean
Soya-bean
Castor-bean G’nuts
Groundnut Soya-bean Early Castor-bean Medium Castor-
beanLate Castor-bean
3-72-99-5
10-313-3
8-5
5-9130
1-9
3 03-2
8-6
9-5 8 0
21
4 24 0
The yields per acre of medium and late castor-bean in the presence o f soya-bean were drastically reduced but the yields per plant were reduced by 43 per cent at the medium planting and scarcely at all for the late planting. Yields per plant of late planted castor-bean in groundnuts was reduced by 40 per cent. This suggests that if it were possible to establish a reasonable
plant population of later planted castor-bean in soya-bean and groundnuts it might be possible to produce a reasonable yields of castor-bean without any further reduction in groundnut or soya-bean yield.
The reductions in yield per plant o f groundnuts and soya-bean with early planted castor- bean were approximately of the same order, 43 and 35 per cent respectively and for early planted castor-bean in both soya-bean and groundnuts it was only 11 per cent
At Mwanhala, in 1958, pure stands and intercrops of groundnuts and castor-bean were studied at low and high plant populations.T able 5—Comparison of Y ields (Lb.) from One Acre of Intercropping with T wo Half-acres of Pure
Stands, M wanhala
PlantPopulation
Level
Puie Stai.ds IntercropGain or Lou
fromIntercropping
G’nuts Castor G'nuts Castor G'nuts Castor
LowHigh
227360
136181
505542
5164
+278 -8J + 182 -117
Plant spacing in row (28 in. between rows)Low . . Groundnuts 8 in. Castor 3 ft. in alternate
rows.High . . Groundnuts 4 in. Castor 3 ft. in every row. At low plant populations there is a gain from
intercropping so long as there is not a price differential of three times in favour of castor, a rather unlikely occurrence at present prices. At high populations there would appear to be no economic advantage in successful intercropping but its possible value as an insurance against failure o f the castor to produce a yield must be taken into account. A severe attack by Mirids usually reduces castor yields drastically. Thus in pure stands the castor-bean could be a failure without any compensating yield from groundnuts.
SummaryIntercropping castor-bean with soya-bean or
groundnuts usually showed an overall gain in production per acre, never an overall loss. Since insect attacks can reduce castor-bean yields drastically intercropping will give a compensating yield of another crop in such a case.A cknow ledgem ents
We are indebted to the staff at the Central Regional Research Centre, Ilonga, and the Mwanhala Experiment Station for carrying out the field work.
Reffrences
Evans A. C. (I960). Studies of Intercropping. I Maize or Sorghum with groundnuts. E. Afr. agric. for J 26. 1.
8

EAST AFRICAN AGRICULTURAL AND FORESTRY JOURNAL JULY, 1962
THE PHYSICAL ASSESSMENT AND BIOLOGICAL IMPORTANCE OF PESTICIDAL DOSAGES
ON COFFEE LEAVESBy D. Yeo, Tropical Pesticides Research Institute, Arusha, Tanganyika
(Received for publication on 11th December. 1961)
In very general terms, pesticides research may be described as an attempt to explain rationally the biological consequences of applying a toxic chemical to a pest habitat. The underlying aim is therefore simple, but in practice its achievement is rare. Laboratory work such as bio-assay is essentially a standardization o f the habitat, and of the way in which the toxic chemical comes into contact with the pest; for example, in the laboratory it is possible to carry out topical applications of insecticides in such a way that the only important variables are basically the choice of chemical and of its dosage, and valuable comparative data can then be obtained upon relative toxi- cities and upon the responses of the insects to insecticides applied in this way. In the natural habitat, on the other hand, such close control of dosage is not possible, nor is it possible to standardize the circumstances under which contact is made between pest and pesticide; it is nevertheless important to know how the toxic chemical is distributed if the biological consequences of a pesticidal application are to be properly understood.
This paper records some preliminary physicochemical assessments of the dosages obtained on coffee leaves sprayed with tractor-drawn machines. Valid comparisons between the performances of the various machines were rarely possible because the work had to be done where the machines were to be found and valid replication was usually not possible. However, little has been published on the dosage distributions achieved in coffee-spraying and it seems worth while recording the results; the opportunity is also taken for outlining how such work should best be done in the future, and for discussing some of the problems that are likely to arise when attempts are made to relate physicochemical and biological data.
F ield M ethods
The assessments were done in plantations o f arabica coffee in the Northern Province o f Tanganyika and in the Ruiru District of Kenya. Normally the machine was in regular use for applying fungicides or insecticides, and the
routine work was interrupted so that dyed water could be sprayed. A brief description of the various experiments is given in Table 1.
T able I—Some G eneral D etails of the Experiments
Plantation DetailsOS g
Date MachinePruning
Row
spac
ing
O L> T3 S3 tjP S3O>
Jan. 1958.. Pestmaster Multiple-stemFt.
9 140Oct. 1958.. Pestmaster Single-stem 9 120Oct. 1958 .. Hockey stick* Mulliple-stem 10 140Nov. 1959.. Conomist Multiple-stem 8 67Dec. 1959.. Conomist Multiple-stem 8 70Jan. I960 .. Autoblast Multiple-stem 10 67May I960.. Micro Twin Multiple-stem 8 19May 1960.. Chiron Multiple-stem 8 21Jan. 1961 .. Modified Platz Multiple-stem 12 28Jan. 1961 .. Modified Platz Multiple-stem 12 42Jan. 1961 .. Modified Platz Multiple-stem 12 87
•The only machine without an airblast, the “hockey stick” had nozzles fitted on vertical booms shaped like hockey sticks.
Coffee leaves have been the sampling units, except in two experiments where Whatman filter papers were attached to upper and lower leaf surfaces and used as samples. A number of coffee bushes were chosen at random within the sprayed area; from each bush a leaf was picked from each o f a series of sites classified in terms of height above the ground and of an exact position in the plan section of the bush at that height; terminal and young leaves were avoided, and for sites near the outside of the bushes it was usually the fourth or fifth leaf from the tip that was chosen. Deposits were removed by swabbing the leaves with a solution of alcohol and water to which a little Teepol had been added to help wet the leaf surface, and deposits were then estimated colorimetrically; care was taken to keep separate the washings from the two leaf surfaces, but some cross-contamination probably occurred on occasions. Leaf areas were measured with a planimeter, and dosages were finally expressed in terms o f c.c. o f liquid per m.'- of leaf surface.
9

co
rre
cte
d
do
sag
EAST AFRICAN AGRICULTURAL AND FORESTRY JOURNAL JULY.:
Fig. 1. "Corrected” mean dosages on upper leaf-surfaces
10

‘co
rre
cte
d1
do
sag
e
in
EAST AFRICAN AGRICULTURAL AND FORESTRY JOURNAL JULY, 1962
Fig. 2.—“Corrected” mean dosages on lower leaf-surfaces
11

EAST AFRICAN AGRICULTURAL AND FORESTRY JOURNAL JUL\
R e su l t s
The volume dosages varied considerably from assessment to assessment, but the relative efficiencies o f the various applications can be compared if actual dosages are multiplied by the factor
100
gallons per acre
Such “corrected" dosages are summarized in Figs. 1 and 2. Mean dosages varied greatly, but as a rough guide the “corrected” means were about 10-20 c.c ./m .2 on upper leaf surfaces and somewhat less and certainly more variable on lower leaf surfaces.
D isc u ssio n
The variations illustrated in Figs. 1 and 2 were partly caused by differences in design of the machines; but it was quite obvious that the shape and form of the coffee bushes varied so greatly, both from plantation to plantation and from season to season, that valid com parisons between the performances of machines were not possible with data collected in this somewhat disjointed fashion. It would therefore be unwise, and in some cases misleading, to assume that the “corrected” dosages reflect the relative efficiencies of the various machines. In the work with the Chiron and the Micron, where there was valid replication in sampling, there were striking differences between the dosages achieved with the two sprayers; but the differences may well have been caused by the quite different ways in which the machines were used, rather than by inherent differences in their performance.
Individual machines are often not used to the best advantage, or are not ideal for the purpose to which they are put. For example, gross variations in dosage, such as an appreciable decrease with height, are generally considered to be undesirable, and yet the arrangement commonly used with air-blast machines is likely to lead to reduced dosages in the upper levels of the canopy merely because the top of the bush is farthest from the machine. A typical arrangement is shown in Fig. 3, which represents an air-blast sprayer with radial airflow and nozzles o f constant output uniformly spaced throughout the sectors aimed at the coffee bush. A width L of vegetation, perpendicular to the air flow and situated at a distance d from the centre of the fan, subtends an angle L /d and will collect the spray con
tained in that angle if any effects of col efficiency are ignored. Near the bottom bush, and therefore near the sprayer, minimal and the subtended angle is max - so that identical nozzles spaced uni: around the periphery of a fan would be pected to give higher dosages on leaves ne the machine.
Fig. 3.—A schematic diagram of an airblast sprayer with radial airflow
It is interesting to pursue this idea a lit: farther. Deposition on a leaf is obviously complex event, but it seems reasonable to su pose that deposits on under surfaces are form- by impaction, and that very crudely sc. deposits would be directly proportional to
QE
dwhere Q=em ission of liquid per unit angle.
d = radial distance from the centre o. the fan, and
E=efficiency of impaction.
12

EAST AFRICAN AGRICULTURAL AN D FORESTRY JOURNAL JULY, 1962
These ideas were applied to the data obtained when a Pestmaster was used to spray multiple- stem coffee, with the results given in Table 2. The geometrical considerations satisfactorily
Table 2—T he Calculation of E, the Efficiency of Impaction
Height(ft-)
Dosage(c.c./m.2)
Q/d(arbitrary
units)
E(arbitrary
units)
2 34 0 0-99 343 33-5 0-99 344 32-3 0-94 345 300 0-87 346 26-6 0-80 337 22-5 0-73 318 160 0-64 259 8 0 0-54 15
accounted for the variations in mean dosage on lower surfaces for heights up to 6 ft., but at greater heights the efficiency of impaction was reduced. The suggestion is that the airblast was inadequate for spraying efficiently at heights above 6 ft., and that dosages on under surfaces would be very small above about 10 ft. It should be emphasized that this shortcoming is not confined to the Pestmaster; planters com monly talk of a “spray line” above which good pest control is rarely achieved.
In any case, a preliminary study of dosage distributions is always advisable. For example, a Conomist was being used to spray coffee; the operator had appreciated that the top of multiple-stem coffee was more difficult to spray, and had increased the proportionate amount of spray directed towards those parts of his bushes. A preliminary assessment showed a considerable decrease in dosage with an increase in height, however, and from this a more satisfactory arrangement of nozzles was deduced. The results are summarized in Table 3; there were very few leaves below about 3 ft., and the new arrangement gave a much better utilization of the spray.
Table 3— A n Improvement in Dosage D istribution with the Conomist
Dosage in c.c./m.J for
Height(ft)
Original arrangement Modified arrangement
Uppersurfaces
Lowersurfaces
Uppersurfaces
Lowersurfaces
2 20-6 6 0 3-9 104 16-8 18-4 18 8 14 96 6 4 8-6 20-4 14-68 4-4 2 0 17-7 20-1
Manipulation of the data raised special statistical problems. Dosages were distributed
in a skew fashion, but sufficiently normal statistics were usually possible by using a transformation of the form
y = lo g (D + a ), where D =dosage per unit area, and a = constant.
An analysis of variance then usually showed that there were significant differences between mean dosages in various sites, but often there were complex interactions; the dosage in a particular site was complexly related to height and position, and a general picture o f the distribution o f dosage was often too complex to have much immediate value. Furthermore, it was quite evident that even the transformed data were often not from a homogeneous population of uniform variance; not only were different transformations often required for the data for different machines, but with some machines the dosages were differently distributed in the different sites. Such events are likely to complicate the statistical analyses.
It is now convenient to discuss the usefulness of dosage measurements. Comparisons between dosage distributions can be made on such physico-chemical grounds as—
(i) overall level of deposit,(ii) uniformity of deposit,
(iii) level of deposit in specified sites such as the under surface of leaves,
and so on. Such criteria are not necessarily valuable in assessing effectiveness against a particular pest, however; for this there must be a combined approach by physicist, chemist and biologist, in an attempt to produce overlapping data with which the importance of the physicochemical criteria can be assessed in terms of biological effectiveness.
Such an approach can be highly complex. With a mobile pest, very wide differences in dosage distribution might be expected to give comparable degrees o f pest control provided that the overall dosage levels were comparable ; the pest would move over a wide range of deposit levels and would pick up a relatively uniform dosage. With static pests, on the other hand, mean levels of deposit may be of little value in determining the degree o f pest control, and it is likely that the variation in dosage from place to place in the bushes would be most important. It is, for example, easy to imagine occasions when a high mean dosage, badly distributed, would give less satisfactory results than a low, but more uniformly distributed, dosage.
13

EAST AFRICAN AGRICULTURAL AND FORESTRY JOURNAL JULY, 1962
The relation between dosage distribution and degree of pest control may be even more complex. One machine may give a more uniform dosage distribution than another, as shown in Fig. 4 where machine A gives a larger median
Fig. 4.—Two hypothetical dosage distributions
dosage and bigger variations than machine B. Simplifying somewhat, suppose that there is a deposit level above which all pests are killed, and below which none is killed. If this level were below seven in Fig. 4, then machine B would be more effective than machine A, w'hile the reverse would be true if this minimum lethal level were to exceed seven. Ramifying this reasoning, an increase in concentration of toxic chemical in the spray might well reverse the effectiveness of two machines in controlling a particular pest. Another possibility is that one machine would be better than another in controlling one particular pest, but worse at controlling another pest with a somewhat different habitat, merely because of the forms of the dosage distributions.
Sample size is often likely to have a profound influence upon the correlation between physico-chemical measurements and biological data on a static pest. Ideally the unit of dosage measured must be of a size such that the pest response is uniquely related to the mean deposit in the sample. Thus in the present work the sampling unit was a complete leaf, for which the deposits on each surface were measured; a complete correlation between biological data on kill, and dosage measurements, would only be expected if the pest habitat was essentially an entire leaf surface, or possibly an entire leaf. This would rarely be true for fungal infec
tions ; there would then usually be important microscopic variations in dosage on the individual leaves, as well as microscopic variations from leaf to le a f; and if these microscopic variations were not taken into account, then the correlation between the physico-chemical and the biological data would be less complete, and perhaps non-existent in some cases.
Most field experimenters evade the complexities of the problem by carrying out replicated field trials with various machines, chemicals and rates of application. They base their conclusions on yield figures for the crop being protected, often with supporting data upon pest populations but rarely with any truly complementary figures upon the distribution and ultimate fate of the toxic chemical. It is my belief, however, that if more attention was paid to the inter-relations between physico-chemical and biological data, progress would be obtained with a saving of effort, and experimental results would often be less inexplicable and less contradictory.
Future studies of the relative efficiencies of machines will need to be more extensive and more systematic. Experimental designs must be statistically sound, either by spraying the same bushes with the different machines or by carrying out properly randomized treatments within a relatively uniform plantation. Such comparisons should be made in areas with different pruning practices, and at different times of the year; while much of value would be lost if measurements were not also made of such ancillary factors as droplet size, air blast, outlet configuration and meteorological conditions. To describe the coffee it would not be sufficient merely to record how the bushes were planted and how tall and wide they were, because this would take no account of the density of leaf cover. Most probably a systematic, proportionate sampling, combined with a fairly detailed geometrical description of primary and secondary branches, would be required to give a useful picture of the distribution of leaves.
It seems fairly certain that no machine at present used to spray coffee is without faults. This raises a question of future policy. There are so many machines applied to coffee-spraying problems—and they tend to become obsolete quite rapidly—that a more fruitful approach than comparative studies would perhaps be a more fundamental study o f the influence, upon performance, of changes in the important features of design.
14

EAST AFRICAN AGRICULTURAL AND FORESTRY JOURNAL JULY, 1962
The actual rdgime of sampling needs careful consideration. To investigate a machine, the obvious approach is to sample deposits in specified sites, so that the general form of the dosage distribution can be defined in a geometrical way. Such sampling would most easily show whether dosages fell off with height, and whether the leaf canopy was so dense as to attenuate the spray very considerably. If the effect of the toxic chemical upon a pest can also be sampled from such sites, then a valid attempt can be made to relate dosage data and mortality counts within each site; but it is then often difficult to assess the relative importance of the various sites and the overall effects are then difficult to deduce. It seems wisest to differentiate between dosage measurements which are made for purely physical- chemical purposes, and those with which attempts are to be made at correlation with the degree of pest control. Site sampling is well suited to the first group, and can give useful information upon the geometrical distribution of dosage. It would also give useful pointers to the rational stratification of the second type o f sampling, where it would be wisest to consider the bush as formed from a series o f
volumes, and to carry out randomized and probably proportionate sampling from each of these volum es; from such a sampling procedure the overall picture of dosage distribution, and of the degree of pest control, could be readily deduced, and would provide data which would be most likely to relate to the eventual crop. It must not be forgotten that the stratification of the samples should not ignore the distribution o f the pest and of the crop throughout the bush ; such factors can obviously affect the way in which a machine is used, and can also affect the amount of sampling devoted to any particular part o f the bush.
S ummary
Data are presented on the dosages achieved on coffee bushes sprayed with various tractor- drawn machines. The experiments were preliminary in nature, and a better basis is outlined for future work.
The usefulness of physico-chemical data is discused in general terms, and it is argued that a more concerted attempt to relate them directly to their effects upon pest populations would lead to advances in pest technology.
REVIEWA N otebook, on P athology in K enya Fo r est
P lantations, Second Edition (1961), by I. A. S. Gibson, Nairobi, Kenya. 57 pages, 26 plates, 3 figures and 6 tables. The Government Printer, Nairobi. Price Sh. 4.
This manual for forest officers was first published in 1957 but has not been previously reviewed. The second edition is brought up to date and, in particular, provides information on potentially important diseases including some which have so far only been recorded in Tanganyika but which will no doubt reach Kenya fairly soon. The title is perhaps too modest as there are a general introductory chapter on diseases and chapters on nursery and conversion diseases and the deterioration
of converted timber in addition to the main chapter on plantation diseases.
A very high technical standard has been maintained throughout in spite of the need for non-technical terms suitable for foresters. A useful feature is that every left-hand page has been left blank for note-taking. High quality paper has been used and this has also enabled the very fine photographs to be excellently reproduced. Some 24 diseases are described in detail and, in so far as forest diseases can be controlled or prevented, appropriate measures are described. This is a valuable work, essential to foresters and useful to anyone interested in trees and timber.
R. A. R.
15

EAST AFRICAN AGRICULTURAL AND FORESTRY JOURNAL JULY, 1962
THE EFFECT OF FERTILIZERS, SULPHUR AND MULCH ON EAST AFRICAN TEA SOILS
l l—THE EFFECT ON THE BASE STATUS AND ORGANIC MATTER CONTENT OF THE SOIL
By A. N. Smith, Tea Research Institute o f East Africa, Kericho, KenyaThe effects of fertilizers, sulphur and mulch
on the pH of the soil were discussed in a previous paper (Smith, 1961a); pH is a very convenient, but not a very sensitive measure of the acidity of a soil. With a crop such as tea, which grows on very acid, highly-leached, base-deficient soils and where an increase in acidity is in itself not harmful, it is desirable to measure what changes in calcium, magnesium and potassium have been associated with any change in acidity.
Me t h o d s
The method of sampling the soil from the plots has been presented elsewhere (Smith, 1962a).
The determination of the exchangeable bases in the soil was made in a neutral N ammonium acetate extract. Calcium and magnesium were estimated using a modification of the procedure of Cheng et al. (1953). A flame photometer was used to measure the potassium. Walkley’s (1935) modification of Walkley and Black’s (1934) procedure was used for the determination of organic carbon and the van Bemmelen factor of 1.724 was used to convert the organic carbon percentages to organic matter. All results are expressed on a dry soil basis.
Re s u l t s
A full description of the four experiments was presented in the previous paper (Smith, 1962a), for convenience the main points may be recapitulated here. Experiment T2 is situated at Kivere, Mufindi, Tanganyika; it is a 25 experiment with N, P, K, S, VI, treatments and had been running for five years when samples were taken. Experiment K1 is situated at Kericho, Kenya; it is a 4 x 2 x 2 experiment with four levels o f nitrogen, each plot is split and the leaf fall from the shade trees removed from one half-plot periodically. When samples were taken the experiment had been running in its present form for four years. Experiment K3 is also situated at Kericho; it is a 4 x 2 x 2 experiment with four levels of nitrogen and at the time of sampling had been running for 5-) years. Experiment 111 is at Salama, Uganda, it is a 25 experiment with
N , P, K, S, M, treatments. It had been running for five years when samples were taken.
All nitrogen treatments were in the form of sulphate of ammonia except U1 in which the nitrogen was applied as urea.
CalciumThe effects of the various treatments on the
exchangeable calcium in the soil of the experiments are shown in Tables I, II, III and IV.
Table I—Experiment T2— Effect of Sulphate of A mmonia and Mulch at Depth
Exchangeable calcium mg./lOOg. diy soil
0-1 ft. 1-2 ft. 2-3 ft.
N 46-5 41-2 18-8No N 64-8 46-8 20-6
Diff. —18-3 - 5 - 6 -1 -8
M 66-4 53-7 23-8No M 45-0 34-2 15-6
Diff. +21-4 + 19-5 + 8-2
Significant difference (P = 0-05) between treatment means at same depth = 9-4 mg.
T able II— Experiment K1— Effect of Sulphate of Ammonia at D epth
Exchangeable calcium mg./lOOg. dry soil
| 0-6 in. 6-12 in. 12-18 in. 18-24 in. 24-30 in.
1 49-0 47-8 37-6 29-0 25-535-6 i 381 33-0 27-0 22-3
! 27-9 41 -0 39-4 32-0 28-224-9
| |38-6 38-1 34-6 29-4
Significant difference (P=0-05) between treatment means at same depth — 11-3 mg.
T able III—Experiment U1—Effect of Sulphur at Depth
Exchangeable calcium mg./lOOg. dry soilMean effect
0-30 in.0-6in.
6-12in.
12-18in.
18-24in.
24-30in.
SNo S
98-5113-9
91 -2 107-3
56-470-6
46-250-5
41-046-1
66-677-7
Diff. — 15-4 —16 1 - 1 4 2 -4 -3 -5-1 -11-1
Significant difference (P^-0-05) between treatment means. Mean effect = 9-9 mg.
Significant difference (P = 0 05) between treatmentmeans at same depth = 9-7 mg.
16

EAST AFRICAN AGRICULTURAL AND FORESTRY JOURNAL JULY, 1962
T able IV— Experiment K3—Eftect of Sulphate of A mmonia at Depth
Exchangeable calcium mg./lOOg. dry soil
0-6 in. 6-12 in. 12-18 in. 18-24 in. 24-30 in.
178-8 152-0 106-0 77-0 52-2138-4 131-6 97-0 74-0 66-0158-4 149-6 137-8 94-8 72-6134-0 150-8 119-6 87-0 68-6
Significant difference (P=0-05) between treatment means at same depth = 31-8 mg.
Sulphate of ammonia has significantly reduced the exchangeable calcium content of the soil to a depth of one foot in experiment T2 and to six inches in experments K.1 and K3. Sulphur has also reduced the calcium content to 18 inches in experiment U1 but has had no effect on experiment T2. Mulch has increased the calcium on T2 but has had no effect on the calcium status of the soil on U l.
Magnesium
The effects of the various treatments on the exchangeable magnesium content of the soil are shown in Tables V, VI and VII.
Table V—Experiment T2— Effect of Sulphate of Ammonia and Mulch at D epth
Exchangeable magnesium mg./lOOg. dry soil
0-1 ft. 1-2 ft. 2-3 ft.
NNo N
6-74 10 40
6-007-45
4-014-46
Diff. -3 -6 6 -1-45 -0 -4 5
MNo M
10-716-42
7-625-83
4-883-59
Diff. +4-29 + 1-79 + 1-29
Significant difference (P=0-05) between treatment means at same depth = 1 -37 mg.
Table VI— Experiment UI.— Effect of Sulphur at D epth
SNo S
Diff.
Significant difference (P=0-05) between treatment means at same depth = 3 -4 mg.
Exchangeable magnesium mg./IOOg. dry soil
0-6 in. 6-12 in. 12-18 in. 18-24 in. 24-30 in.
22-1 22-7 19-3 16-7 13-327-8 24-9 18-8 15-0 13-7
-5 -7 -2 -2 +0-5 + 1-7 -0 -4
Table VII— Experiment K3.— Effect of Sulphate of Ammonia at D epth
Exchangeable magnesium mg./IOOg. dry soil
0-6 in. 6-12 in. 12-18 in. 18-24 in. 24-30 in
27-2 22-3 19-1 17-3 13-320-3 20-9 19-2 18-4 15-413-5 20-9 22-9 16-1 14-714-7 17-0 22-1 19-8 18-7
Significant difference (P=0-05) between treatment means at same depth — 8-3 mg.
Application of sulphate of ammonia has significantly reduced the exchangeable magnesium content of the soil to a depth of two feet in T2 and to a depth of six inches in K.3. In experiment K1 the exchangeable magnesium on the N 2 plots was significantly lower than that on the N„ plots in the top six inches of soil; there were no other significant effects. Sulphur has reduced the exchangeable magnesium down to six inches in experiment U l but has had no effect in experiment T2. The application of mulch has increased the magnesium status of the soil in experiment T2 but has had no effect on experiment U l.
PotassiumThe effects of the treatments on the exchange
able potassium content of the soil are shown in Fig. 1 and Tables VIII and IX.
Table VIII— Experiment U l.— Effect of Sulphate of Ammonia, Muriate of Potash and M ulch on the
Soil at D epth
Exchangeable potassium mg./IOOg. dry soil
0-6 in. 6-12 in. 12-18 in. 18-24 in. 24-30 in.
24-6 14-0 9-5 9-2 8-014-7 9-3 6-3 4-9 5-3
+ 9-9 + 4-7 + 3-2 + 4-3 + 2-7
23-6 12-6 8-8 9-0 7-915-7 10-7 6-9 5-1 5-4
+ 7-9 + 1-9 + 1-9 -F 3-9 + 2-5
23-4 12-8 9-2 7-8 6-915-9 10-5 6-6 6-3 6-3
+ 7-5 + 2-3 + 2-6 + 1-5 + 0-6
NNo N
Diff.
K.No K
Diff.
MNo M
Diff.Significant difference (P 005) between treatment
means at same depth = 4-6 mg.
Table IX— Experiment K3.— Effect of Sulphate of A mmonia on the Soil at D epth
Exchangeable potassium mg./IOOg. dry soil
0-6 in. 6-12 in. 12-18 in. 18-24 in. 24-30 in.
No 84-2 72-9 56-9 48-4 39-4N, 60-8 56-2 48-7 42-1 39-4n 2 67-5 61-2 60-4 52-6 48-4Nj 52-6 50-7 45-6 40-6 35-5
Significant difference (P - 0 05) between treatmentmeans at same depth = 10-8 mg.
17

INCR
EASE
EAST AFRICAN AGRICULTURAL AND FORESTRY JOURNAL JULY, 1962
XI-o.s
Fig. | .—Experiment T j: Effect of fertilizers and mulch on the potassium content of the soil
18
DEC
REA
SE

EAST AFRICAN AGRICULTURAL AND FORESTRY JOURNAL JULY, 1962
Sulphate of ammonia has reduced the exchangeable potassium content of the soil in experiment T2 down to one foot and in experiment K.3 down to one foot. (There are no results for potassium from experiment K.1.) The application of muriate of potash has increased the exchangeable potassium in the soil in experimentsT2 and Ul.Sulphurhasdecreased the exchangeable potassium content of the top foot of soil in experiment T2 but has had no effect on experiment U l, whilst mulch has increased the exchangeable potassium content of the top six inches of soil on experiment Ul and the top two feet of experiment T2. It should be noted here that the mulch in experiment T2 consists of local road-side grasses, no sampling has been made for analysis but the indications are that the calcium, magnesium and potassium contents of the final mulch are of the same order. The mulch in experiment U l is elephant grass Pennisetum purpureum K. Schum. which is known to contain a very high proportion of potassium; the only effect due to mulch on this experiment is an increase in potassium.
Organic MatterThe effect of the treatments on the organic
matter content of the soil is shown in Tables X, XI, XII and XIII.
Table X—Experiment T2.— Effect of Fertilizers andMulch on the Soil
Organic matter per cent of dry soil
0-1 ft. 1-2 ft. 2-3 ft.
s 10-98 8 00 5-53No S 11-61 8-19 5-85
Diff. -0 -6 3 -0 -19 -0 -33K 11*11 7-97 5-57
No K 11-48 8-22 5-82
Diff. -0 -3 7 -0-25 -0 -25
Significant difference (P=0-05) for treatments at same depth = 0-37 per cent.
Table XI—Experiment K l.— Effect of Sulphate of Ammonia on the Soil
Organic matter per cent o f dry soil
0-6 in. 6-12 in. 12-18 in. 18-24 in. 6oro4r l
No 11-67 9-03 7-14 6-67 6-02N, 11-02 8-64 6-93 6-43 5-91n 2 11-50 9-15 7-27 6-72 6-03Nj 12-40 9-41 7-57 6-95 6-24
Significant difference (P=0-05) between treatmentmeans at the same depth = 0-51 per cent.
Table XII—Experiment U l.—Mean Effect to 30 in .
Organic matter per cent dry soil
N P K S M
With treat. 3-60 3-53 3-48 3-46 3-53Without
treat. 3-38 3-45 3-52 3-53 3-45
Diff. + 0-22 + 0-08 -0-04 -0 -0 7 +0-08
Significant difference (P=0-05) between treatment means = 0-21 per cent.
Table XIII— Experiment U l.— Effect of Sulphur on the Soil
Organic matter per cent dry soil
0-6 in. 6-12 in. 12-18 in. 18-24 in. 24-30 in.
S 6-44 5-04 2-82 1-67 1-33No S 6-10 5-28 3-26 1 -65 1-37
Diff. + 0-34 -0 -2 2 | -0 -44 +0-02 -0 -0 4
Significant difference (P=0-05) between treatment means at same depth = 0-33 per cent.
The effect of nitrogen, whether as sulphate of ammonia or as urea has been to increase the organic matter content of the soil. Sulphur has produced a significant decrease in the organic matter in the top foot of T2 soil and in the 12-18 inches horizon on the U l experiment; in the 0-6 inches horizon of this experiment there is an increase in the organic matter in the soil. Sulphur has been shown to increase the yield of tea on this experiment (Goodchild, 1960), and the increased organic matter in the top soil may be the result of this increased growth and consequently greater leaf fall.
The results may be summarized as follows:—Sulphate of ammonia at the rate of 40 lb. N
per acre has decreased the exchangeable calcium on the plots on which it has been applied to a depth of at least six inches; decreased the exchangeable magnesium down to two feet on experiment T2; decreased the exchangeable potassium down to a depth o f at least six inches on two of the experiments.
Urea at the rate of 40 lb. N per acre has increased the exchangeable potassium to a depth of 12 inches and increased the organic matter content of the soil.
Sulphur has decreased the calcium on experiment Ul to a depth of 18 inches; decreased the magnesium on experiment U l down to a depth of six inches; decreased the potassium on experiment T2 down to a depth of one
19

EAST AFRICAN AGRICULTURAL AND FORESTRY JOURNAL JULY. 1962
foot; reduced the organic matter content of the soil on experiment T2 to a depth of one foot and of the 12-18 inches horizon on U l. The organic matter in the 0-6 inches level in U l has been increased.
Mulch has increased the exchangeable calcium and magnesium on T2 down to a depth of two feet and increased the exchangeable potassium on U l down to six inches depth.
D isc u ssio n
The effect of mulch on the soil of the Ul experiment has been small, the significant increase in the exchangeable potassium in the top six inches of soil is a reflection of the high potassium content of the elephant grass mulch, and has not gone as deep as might have been expected. The mulch does not remain for a long time on the soil of this experiment (about six to eight months), probably as a result o f the activities of termites. This may explain the low contribution of the mulch to the base status of the soil.
It should be noted that when sulphate of ammonia and mulch are applied together on the T2 experiment there is no reduction in the pH or of the bases in the soil. So in districts which are dry and in which mulch is applied as a necessary treatment to conserve soil moisture then the use of sulphate of ammonia will not result in the loss of bases.
Sulphur has had the anticipated effect of reducing the exchangeable bases in the soil, and also the organic matter content. A probable explanation for the increase in organic matter in the top six inches of soil in experiment U l has been presented above.
Urea has increased the organic matter in the soil of experiment U l—a result of the increased growth and leaf-fail from the bushes. Urea has also increased the exchangeable potassium in the soil of this experiment. Potassium and ammonium ions have radii which are very nearly the same, and it is possible that the ammonium ions have replaced some of the fixed potassium in the sooil colloid and brought it into a more available form. If this is the case then the same mechanism ought to operate when sulphate of ammonia is applied; it may do so, the effect being masked by the acidifying action of the fertilizer.
Urea is by no means a physiologically neutral form of fertilizer and in this connexion its lack of effect in reducing the base status of the soil of experiment U l should be noted.
The losses in bases from the soil as a result of the application of sulphate of ammonia are not all made by way of leaching through the soil, some are removed in the extra crop which has resulted from the fertilizer, others go into the frame and maintenance foliage of the bush. There was virtually no extra crop resulting from nitrogen applications on experiment K1 as the field is very heavily shaded. On K.3 every 100 lb. N applied has resulted in the removal o f 6.3 lb. K, 1.4 lb. Ca, and1.0 lb Mg; for experiment T2 the figures are 3.6 lb. K. 0.8 lb. Ca, and 0.5 lb. Mg.
All the figures which are quoted subsequently for loss of bases have been corrected for the amounts removed in the crop, but no correction has been made for the bases stored in the frames of the bushes and removed in pruning.
The losses of bases from the soil can be expressed in percentages of the bases originally present. In Table XIV the T2 figures refer to the loss of three feet depth and those for K l and K3 to the loss of 30 inches.
Table XIV
Percentage reduction of exchangeablebases (Ni treatments)
T2 Kl K3
Ca 19 17 10Mg 25 7 5K ,6 18
The soil analysis of the control plots of theexperiments is shown in Table XV.
Table XV
Exchangeable bases as m.e./lOOg.dry soil for plots receiving no treatment
T2 Kl K3
Ca 2-53 1 .<? 7-34Mg 0-79 6-77 212K 0-45 1 -82
The 25 per cent reduction in the exchangeable magnesium in the top three feet of soil in the T2 experiment, a soil which only contains 0.79 m.e. M g/100 g. soil, is of first importance. The magnesium in experiment K l, although present at about the same level, has not been significantly reduced, nor has the magnesium content of the soil of experiment K3?
20

EAST AFRICAN AGRICULTURAL AND FORESTRY JOURNAL JULY, 1962
Following the discovery by Chenery and Schoenmaekers (1959) of magnesium deficiency in tea in the Congo, the tea in East Africa has been closely inspected. Deficiency symptoms have been observed on the bushes on experiment Kl (Smith, 1960), and from many other places in East Africa (Chenery, 1961). Whilst the symptoms are quite plain, the leaves, on analysis, have not shown low magnesium levels (Smith, 1961). The subject is still under investigation.
The percentage loss o f potassium in the T2 experiment is also high taking into account the low level of potassium in the soil.
If the bases lost from each acres of soil are calculated in terms of calcium carbonate per 100 lb. sulphate of ammonia applied, figures are obtained of 102 lb. for T2, 134 lb. for K3 and 39 lb. for K1 (calculated from calcium only). Values of from 100-120 lb. have been obtained in America and the United Kingdom (Russell, 1950); Leutenegger (1956) obtained a value of 1,214 Kg. o f ground limestone for every 1,000 Kg. sulphate of ammonia.
Gokhale and Bhattacharyya (1958) have presented data on the loss of calcium from tea soils in North India. Their soil is described as “having pH about 4.5, a base exchange capacity of about 5 m.e./lOO gm., and highly unsaturated with a very low calcium content, and other bases even lower”. They obtained figures of 22 ± 1 lb. and 23 ± 3 lb. calcium carbonate lost from each acre for every 100 lb. of sulphate of ammonia applied. The fertilizer had been applied for 14 and 20 years respectively. This soil is somewhat similar to the soil o f experiment K l, being low in pH and in base status. The results from India and that of a calcium loss equivalent to 39 lb. calcium carbonate per acre for every 100 lb. sulphate of ammonia applied from experiment Kl appear to agree fairly well if length of time is taken into account.
The average response in terms of made tea per lb. N applied is 1.8 lb. for T2 and 3.2 lb. for K3 (calculated from Goodchild, 1960). If the nitrogen content of the tea is taken as 5 per cent the percentage recoveries o f nitrogen are 9 per cent for T2 and 16 per cent for K3. If the figures of nitrogen removed in the crop and nitrogen lost directly from the soil are combined, then in experiment T2 for every 100 lb. sulphate of ammonia applied about 2 lb. go in the increased crop and 36 lb. are removed as nitrate with the bases, while, in experiment K3 the figures are 3 lb. in the crop and 79 lb. from the soil direct.
An early warning of the bad effect of ammonium salts on the soil w'as given by L.awes, Gilbert and Warington in 1881. They said, “the action of ammonium salts in impoverishing a soil of lime and magnesia should always be borne in mind when their application to a soil poor in lime is in question”. The results of the experiments presented in this paper have again confirmed this.
Conclusions
Sulphate of ammonia is the most common fertilizer applied to tea in East Africa, with good reason, for it supplies sulphur which corrects sulphur deficiency where it occurs, and it is efficient in increasing yields. In the present author’s opinion, however, on acid soils with a pH of less than 5.0 its bad effects by far outweigh its beneficial yield-prcducing and nutrient properties; a transfer should be made to alternative forms o f fertilizer, which are neutral or only very slightly acidic in reaction, before magnesium and other deficiencies become acute.
S ummary
Data have been presented on the effect of sulphate of ammonia, urea, sulphur, muriate of potash, superphosphate and mulch on the base status and organic matter content of the soil.
The magnitude of the losses of bases from the soil due to sulphate of ammonia have been calculated.
The importance of the use of neutral forms of nitrogenous fertilizer on the most acid soils has been stressed.
References
Chenery, E. M. and Schoenmaekers, J. (1959). E. Afr. agric. J., 25, 25.
Chenery, E. M. (1961). Tea. No. 3, 22.Cheng. K. L„ Mclsted, S. W. and Bray, R. H. (1953).
Soil Sci., 75, 37.Gokhale, N. G. and Bhattacharyya, N. G. (1958).
Emp. J. Exp. Agric., 26, 309.Goodchild, N. A. (1960). Tea Res. Inst. E. Afr. Ann.
Rep.. 1959, 23.Lawcs, J. B.. Gilbert, J. H. and Warington, R. / . Roy.
Agric. Soc. England, 42. 241.Leutenegger, F. (1956). E. Afr. agric. J.. 22. 81. Russell. E. J., rewritten by Russell. E. W. Soil Con
ditions and Plant Growth, London, Longmans Green and Co. Ltd., 1950, 119.
Smith, A. N. (1960). Tea Res. Inst. E. Afr. Ann. Rep., 1959, 35.
Smith, A. N. (1962a). E. Afr. agric. for. J., 27, 158. Smith, A. N. (1961). Unpublished work.Walkley, A. and Armstrong Black, I. (1934). Soil Sci..
37. 29.Walkley, A. (1935). J. Agric. Sci.. 25, 598.
21

EAST AFRICAN AGRICULTURAL AND FORESTRY JOURNAL JULY, 1962
THE COLONIZATION OF A SWAMP FOREST CLEARING(with special reference to Mitragyna stipulosa)
By J. McCarthy, Makerere University College, Kampala(Received for publication on 23rd October. I96J)
During the course of an investigation into the regeneration of the tree species Mitragyna stipulosa (D.C.) O.Ktze., the colonization of a clearing in Mitragyna forest was studied. The object o f this was to follow the initial stages of colonization of a clear-felled gap in typical, permanent, freshwater swamp forest, and to investigate the distribution of the main species. The field work was carried out between January, 1960, and July, 1960, at Mpanga Research Forest, Mengo District, with the co operation of the Uganda Forest Department. Particular thanks are due to Dr. E. M. Lind o f the Botany Department, Makerere College, for advice in the planning of the work and assistance in the identification o f the plant species. Plant collections have been deposited in the herbarium of the above department. The work was made possible by a Leverhulme Research Scholarship.
LocationMpanga Forest is situated immediately north
of the main Kampala-Masaka road, between 25 and 27 miles from Kampala. The forest lies on the 3.800 ft. contour, covering the main valley of the River Nabukongole which eventually drains southwards into Lake Victoria via Nakyetema Swamp. The clearing under particular study lies on line 15 south of the main east-west base line dividing Mpanga Forest. It covers an area of approximately two acres in a small depression bordering the Nabukongole.
ClimateMeteorological records for Mpanga show
that the mean annual rainfall is 45 in., with two low rainfall periods in January-February and July. Thus the period o f this study covered both wet and dry seasons. There is a temperature range between 50 and 92 degrees Fahrenheit, modified by relative humidities between 60 per cent and 95 per cent (Dawkins, 1955).
Soil and Water LevelThe soil is composed of fine grey clay and
silt particles, deposited by the very slow-moving river system, and is in the form o f a wet plastic mud overlain by a thin layer o f decomposing plant material. In this portion o f the forest it
is permanently waterlogged and there may be as much as 1 ft. of water above the soil surface. Fluctuations of the water level were recorded by two graduated metal tubes inserted into the mud. Weekly readings were taken between January and July. These showed that the water level did not fluctuate more than 2 in. during this period.
Swamp Forest CommunityThe clearing lies within the wet Mitragyna
Forest type (Fig. 1). In this permanent swamp forest zone, M. stipulosa is the dominant and most abundant tree species, forming an almost pure stand. The canopy of mature individuals averages 100 ft. in height, but is very irregular. On the wettest sites it is frequently associated with Macaranga schweinfurtii, and towards the slightly drier slopes in the south, with Pseudo- spondias microcarpa. The lowest canopy of the tree layer is indistinctly separated from the common shrub Dracaena laxissima, while the herb layer is predominantly o f Marantachloa spp. Ferns are abundant under the forest canopy and in the clearing, although limited in genera. There is also a large number o f epiphytes, particularly Ficus spp., and climbing lianes. A few mosses are particularly common on stems and branches in the forest.
M eth o ds and Re su l t s
The area under study was felled in the last months of 1958. Suitable logs were removed by an access line cut southwards to the main road, leaving the remaining logs and branch- wood in the gap created. These operations obviously destroyed most o f the herbaceous vegetation, and only the debris was left behind to decay in the following year.
TransectsIn January two belt transects, 1 metre wide
and 60 metres long, were taken at 90 degrees to each other across the clearing. Transect A-B followed a north-south direction and transect C-D cut this east-west (Fig. 1). Since the object of these transects was to record the regeneration of M. stipulosa only, they were not extended further than 60 metres, for beyond this, in the south-west comer of the gap, the land
22

EAST AFRICAN AGRICULTURAL AND FORESTRY JOURNALJULY, 1962
23

H r . 2. C louring in Mpunga Forest, T ransects A-B and C-D show ing soil level profile and distribution of M . stipulosa seedling groups according to height classes. The circled num ber refers to
the num ber of seedlings in each group
EA
ST A
FR
ICA
N A
GR
ICU
LT
UR
AL
AN
D FO
RE
STR
Y JO
UR
NA
L
JUL
Y, 1962

EAST AFRICAN AGRICULTURAL AND FORESTRY JOURNAL JULY, 1962
sloped gently upwards, and no seedlings of this species was to be found there. Along these transects, taking the water level as the datum line (O), the soil levels above and below this were recorded at 10-centimetre intervals, and a profile was drawn. All M. stipulosa seedlings were measured and their heights recorded. For convenience, these were grouped into 20-centi- metre height classes, and the average height class of plants growing on any one part of the mound was taken as the representative for that group. These average height classes are drawn to scale in Fig. 2.
From Fig. 2 it can be seen that the soil level undulates to produce mounds of different levels (Richards, 1939). These can be divided into low mounds (up to 20 cm. high) and high mounds (over 20 cm. high). The formation o f these two mound levels is quite distinct.
Low Mounds
When examined, these are found to consist almost entirely of worm casts and very fine humic detritus in a sodden condition. The only worm found in abundance was Alma sp. and it is known that members of this genus are capable of building up an extensive mound system under swamp conditions, from their prolific casting. (Wasawo and Visser, 1959.) At this level there was an abundance of Mitragyna seedlings, but very few other species apart from occasional young Marantachloa shoots From the measurements taken, it appeared that the seedlings were concentrated on the lower slopes o f the mounds, but that the taller seedlings were grouped on the higher slopes.
High Mounds
The high mounds were found to consist largely of felling debris in various states o f decay. This included tree stumps, logs, branch- wood and much leaf litter from the crowns of felled trees and the surrounding forest. These mounds at this level were, therefore, mainly composed of organic material in process of decomposition, forming dense thickets over- lying the swamp soil. The dominant and most abundant plants on these mounds were Marantachloa purpurea and M. leucantha. Other species occurred {see species list), but these were dwarfed by the Marantachloa, and only rarely did Mitragyna appear in this dense scrub.
Table 1— D ata Obtained from T ransects
A-B C-DNo. of mounds with seedlings 10 13Average height o f mounds 20 cm. 18 cm.Average number of seedlings per
mound 16 18Average height of seedlings 40 cm. 54 cm.
Quadrats
From the transects there was an apparent height difference between the seedlings growing at different levels on the mounds. In order to determine this, one metre square quadrats were laid down in this area. Each of the five quadrats was spaced at roughly equal intervals near the original transects to cover convenient soil mounds. To obtain information on the growth rates of M. stipulosa at different mound levels, each quadrat was subdivided by wires into sections of 20 cm. square. The mounds were then divided into three contour bands (again taking the water level as the datum) as follows: —
Level I—0-10 cm.Level II— 10-20 cm.Level III— 20 cm. and above.
The quadrats were then placed on the mounds to cover all three contour levels. Since in many cases the subsections overlapped more than one level, these sections were allotted to the level which included the largest area within a square. Thus (Fig. 3), although section 18 includes a portion o f the 0-10 cm. band, the greatest area of this square lies within the 10-20 cm. band and was, therefore, allotted to this level.
All plants were accordingly grouped to a particular level depending on the subsection which they occupied, and the heights of plants above 10 cm. were recorded for each of the quadrats. Measurements were taken in February and April and the summary of results is given in Table 2 below: —
Table 2—Summary of D ata Obtained from Quadrats
Mound levelNo. of
seedlingsMean
height (cm.)
Feb. April Feb. April
I. (0-10 cm.) .. 34 34 39-8 44-6II. (10-20 cm.) 65 69 49-9 55-9
III. (20 cm. and above).. 50 55 60-1 60-5Combined (I, 11 and III) 149 158 500 55-6
25

EAST AFRICAN AGRICULTURAL AND FORESTRY JOURNAL JULY, 1962
O 20 4 0 40 to /CO c m
_ to n a n
X
2
X " v
, 7 *
V
tz „
* X
,
S < J > c■v jN v “
_ £Z _______
X
5
XX
8X
\\
\
' X
/ 3\
\\
\
x\
X
>% x '
X
XX
x £ 3 —
\ ' ____\ *
' \ ___
' \
4 x ?
\
1
* / 4 ;
* /
/
j
X
n
i «
i i t i
2 4
i ’ i • _, i '
5 /0
/
x /
/
A T
/
/
✓
£ 0X
X ,/
1 t • /
» f
/ z s ~! *
/
Fig. 3.—Quadrat D showing grid system and contour bands. Position of individual Mitragynaseedlings is marked by a cross ( X )
From the table above it can be seen that the area of each quadrat could support approximately 30 Mitragyna seedlings, with an average height o f 50 cm. in February, increasing to 55 cm. in April. The increase in number of seedlings over this period is due to the growth of the seedlings previously below 10 cm. which have now come into the measurable class above this height. While the greatest number of stems was concentrated at the middle level, the highest mean height was found at the top of the mound (level III), decreasing progressively to level I. This pattern was repeated in the April enumeration. Since a relatively large number o f observations were taken, the mean height o f the seedlings for the combined levels was taken as the population mean, and the difference between this and the means for levels I and II was tested by the t distribution.
Taking the February count, it was found that the height difference of seedlings at each o f these levels and the mean of the whole population was just significant at 1.5 per cent probability in both cases. In April, this difference was not maintained by level III, which was significant only at 8 per cent probability, although the difference of level 1 was still significant at less than 0.2 per cent.
It was intended to continue these measurements, but by late May it was found that all the quadrats had suffered severe insect damage. Shoot-boring and defoliation had by this time seriously retarded growth and measurements were therefore discontinued.Species List
Throughout the study period the commonest flowering plants were collected from the clearing. together with a record of the main tree

EAST AFRICAN AGRICULTURAL AND FORESTRY JOURNAL JULY, 1962
species from the surrounding forest. The relative frequency was estimated by a purely visual assessment during a series of 10 traverses across the area.
T a b u 3— List of Common Species in Clearing and Surrounding Forest
abundant (a), frequent (f), occasional (o), present (p).
Herb.No.
Tree species of surrounding forest
Relativefrequency
200•201 |
202203204 1205 |
•206 | •207 •208
208209210 211
Albizzia gummifera Alchornea cordifolia . . j Erythrina exelsa Euphorbia teke Funtumia latifolia Macaranga schweinfurtii Mitragyna stipulosa Parkia tilicoidea Phoenix reclinata Pseudospondias microcarpa Raphia monbuttorum Spondianthus preussii Voacanga obtusa
F00ffa0fo0o0
Herb Flowering herbs and shrubs RelativeNo. in clearing frequency
t212 Afromomum sanguinem P213 Altemanthera sessilis .. f214 Aneilcma beniniense P
t2l5 Asystasia goegeliana f216 Bidens pilosa 0
4217 Coleus dccurrcns o218 Crassocephalum picridifolium.. p219 Crassocephalum vitellinum p220 Desmodium salicifolium p
+221 Dracoena laxissima p222 Enhydia fluctuans a223 Fleurya podocarpa 0
+224 Impaliens eminii f+225 Impaliens stuhlmanni .. o+226 Marantachloa lcucantha a+227 Marantachloa purpurea a228 Melanthera scandens .. p229 Mclothria maderaspatana 0
t230 Piper umbel latum P231 Pittosporum abyssinicum p232 Polygonum strigosum .. 0233 Stictocardia iaxiflora .. p
t234 Tristemma incompletum 0235 Triumfctta annua f236 Vigna n ilo t ic a .......................... o
•Species which also colonize clearing.tSpecies which also appear under the surrounding forest.
From this list it can be seen that there is a far greater variety of herbaceous plants in the clearing than under the forest canopy, but that
the dominant and most abundant herb in both cases is Maranrachloa. The only tree species which appears in abundance is M. stipulosci. At the water level, which can be considered as a distinct habitat, E. fluctuans is the dominant aquatic, though it does not appear under the surrounding forest.
D isc u ssio n
From the results obtained, the effect of microtopography on the initial distribution of species after felling can be seen. It appears that there are three distinct habitats differing in origin, and related to different soil levels. Each level supports a characteristic dominant species. A comparative summary of these habitats is given in Table 4 below.
The first plant to appear in these initial stages following felling is Marantachloa. With its underground rhizomes it is capable of withstanding felling damage, and re-establishes itself rapidly on the higher and slightly drier mounds. The seeds of Mitragyna. on the other hand, usually appear between July and October, and have been found to be extremely light sensitive. Neither will they germinate on swamp mud when this is covered by water. They cannot, therefore, tolerate the light conditions below the felling debris and the subsequent shade produced by the fast-growing Marantachloa, or the flooded condition of the mud below water level. The species is, therefore, confined to the parts of the mounds between these two levels and is the second dominant species to appear in abundance. In the third stage, Enhydra fluctuans colonizes the margin of the mounds and extends over the water surface, being a characteristic water plant.
Observations from older clearings show that from this stage onwards competition between the dominant plants determines the final distribution and frequency of species. (Photo 8.) Marantachloa, though it invades the lower mounds, becomes dominated by the greater height of the surviving Mitragyna, while as the canopy becomes more closed E. fluctuans
Table 4— Comparative D ata on D istribution of Dominant S pecies in Clearing
Mound Level Water Status Soil Plant Group DominantSpecies
Order of Appearance
(cm.)20+ . . wet plant detritus tall herbs Marantachloa 10-20 . . waterlogged worm casts tree M. stipulosa 20 flooded mud aquatics E. fluctuans 3
27

EAST AFRICAN AGRICULTURAL AND FORESTRY JOURNAL JULY, 1962
almost disappears. In the final stage, Mitragyna forest forms the climax on such sites, and may constitute up to 30 per cent of all tree species. (Eggeling, 1947.)
The results of the quadrat measurements suggest also that microtopography affects the growth of Mitragyna seedlings, even within the small range between the top and bottom of a soil mound. It may well be that the increased water-logging of the soil is responsible for the difference in height growth between seedlings growing at different levels on these mounds. Su m m a r y and Conclusion
1. The distribution of colonizing plants in a fresh-water swamp forest after felling was investigated and found to be closely correlated with differences in microtopography.
2. Two main soil levels were differentiated and their formation discussed.
3. The soil and water levels were found to support a characteristic and dominant species at different stages of colonization. The reasons for this distribution are discussed.
4. Measurements of the heights of M. stipu- losa seedlings at different mound levels show that the height growth in the initial stages increases with soil level above the water line.
In conclusion it is suggested that M. stipu- losa is the dominant and most abundant tree species in this habitat because of its ability to germinate and grow successfully under waterlogged conditions prior to the invasion of other tree species.
REFERENCES
Dawkins, H. C. (1956). Emp. For. Rev., 35, 454. Eggeling. W. J (1947). J. Ecol., 34. 60.Richards, P. W. (1939). J. Ecol., 27, 42.Wasawo, D. P. S., and Visser, S. A. (1959). E. Afr.
agr. J., 25. 86.
REVIEWSSoil O rganic M a t t e r : Its nature, its role in
soil formation and in soil fertility, by M. M. Kononova, translated from the Russian by T. Z. Nowakowski and G. A. Greenwood. Published by Pergammon Press, London. 1961, pp. 450. Price Sh. 80.
This book gives a very full and comprehensive account o f the present state of knowledge of that important soil constituent—organic matter.
The opening chapter is an historical account of the early work on soil organic matter, leading up to present-day methods of fractionation of humic substances and the nature of these substances.
The bio-chemistry o f the process o f humus formation is discussed in detail followed by the role of organic matter in soil formation, soil fertility and the natural factors affecting humus formation.
In dealing with the nature o f the humus of different soils and the changes in soil organic matter under different methods o f cultivation, the author has confined herself to data for the U.S.S.R .; these are, however, most important chapters for the agronomist as the information contained in them is o f universal interest and application.
There is a useful appendix o f methods of investigation of organic matter followed by a short survey of the main soil types of the U.S.S.R.
An extensive bibliography o f over 900 references completes this invaluable contribution to soil science.
T ropical A griculture, by Gordon Wrigley. Published by B. T. Batsford Ltd., London. First Edition, 1961, pp. 291. Price Sh. 45 net.
According to the publishers this book will be especially useful to the student, agriculturist, administrator, civil servant and politicians of newly independent countries. Briefly, the object of the book is to explain the scientific basis for increasing agricultural production in the tropics and to point out the risks involved in the introduction of new methods. While it has been necessary to assume a certain basic knowledge o f agriculture on the part o f the reader, this should not deter the non-technical reader since the inclusion of numerous diagrams, tables and excellent illustrations help considerably to explain the text.
The book is divided into five chapters, namely Crop Ecology, Crop Culture, Crop Improvement, Crop Protection and the Place of Cattle in Tropical Agriculture. This is a well-chosen selection of subjects and covers many important aspects of tropical agriculture. These include, among others, soil classification, essential soil elements, rainfall, temperature, agricultural systems, irrigation methods, distribution of crops, parasites, application of crop protection chemicals, improved management o f cattle, cattle breeding and mixed farming.
This book is recommended not only because of the wide range of subjects covered but also because of the intelligible manner in which they are presented.
H. F. B.28

EAST AFRICAN AGRICULTURAL AND FORESTRY JOURNAL JULY, 1962
N E M A T O C E R U S SF. (NR. B R E V I C O R N I S HUST.)—A PEST OF CEREALS IN KENYA
IV—THE ESTIMATION OF LARVAL POPULATIONS AND THE DISTRIBUTION OF LARVAE ON A FARM
By J. A. Bullock, Department of Zoology, University of Malaya, Kuala Lumpur, Malaya*(Received for publication on 31st January. 1962)
An infestation of Nematocerus larvae at the Plant Breeding Station, Njoro. resulting from oviposition by a heavy infestation of adults in May, I960, and later supplemented from a smaller infestation in September-October, 1960, offered an opportunity to study the distribution of larvae and to see if any relationship existed between cropping history and degree of infestation. Before doing so, however, it was necessary to determine a satisfactory sampling technique so that representative samples could be taken.
E xtraction T echniques
In the first part o f the study, the method developed by Salt and Hollick [1] for the estimation of soil arthropods was used. Individual samples were frozen for 24 hours and thawed out before being washed through two sieves of different meshes. The residue was then flooded with magnesium sulphate solution (S.G. 1.18-1.2) and air bubbled through to release all animal material which then floated to the surface. The floating material was poured into a further sieve, transferred to a beaker, and vegetable material thrown down by boiling in water to release air. Thereafter, the sample was shaken with water and benzene (or petrol) which wetted the insect cuticle so that the larvae floated at the interface and could be picked off. The residue on the lower sieve was also examined by flotation in magnesium sulphate solution since some large larvae failed to pass through the finer mesh.
For survey purposes, this method was impractical as the time taken to examine a single sample for even the relatively large larvae of Nematocerus was two hours. Therefore, a coarse soil washing technique, developed for the extraction of soil arthropods by the National Agricultural Advisory Service of Great Britain [2] was utilized. This followed the same principles as that o f Salt and Hollick, but samples were bulked together prior to extraction, the soil washed through two large
sieves without pre-freezing, and the arthropods retained in the second sieve. The sieve was then transferred to a tank of magnesium sulphate solution (S.G. 1.18-1.2) where the residue was stirred and the level of the solution increased from a reservoir tank so that floating material poured over a lip into a small sieve of similar mesh. This fraction was boiled and examined at an interface as before.
The technique was found to be less satisfactory than that o f Salt and Hollick, because—
(1) through lack o f freezing, particles of soil containing larvae did not necessarily break up and therefore some larvae remained trapped;
(2) stirring was not as satisfactory as bubbling and larvae were liable to remain trapped;
(3) the bulk of vegetation extracted prevented satisfactory admixture of the organic solvent, so that some larvae were not wetted, and therefore did not appear at the interface.
Nevertheless, it was found that a reproducible result could be obtained by this method and that a correction factor could be applied to equate results with those obtained by the Salt and Hollick technique.
H orizontal D istribution
Two series, each of 18 cores 4 in. in diameter, were taken to a depth of 6 in. on a plot o f approximately one acre which had been divided into a 3 X 3 Latin square design, two cores in each series being taken from each of the nine plots. The variance ratio between and within plots was determined for each series, and for the combined series and none was significant at P=0.05 indicating that the entire variation was due to sampling error. At about the same time, a single sample consisting of 18 in. of one row was taken from each of
Formerly Entomologist, Department of Agriculture, Kenya.
29

EAST AFRICAN AGRICULTURAL AND FORESTRY JOURNAL JULY, 1962
these plots, whilst a series o f 20 4 in. cores was taken from plot II, which apparently had the highest population, and several miscellaneous samples were taken in the same area. The results were tested for correlation between the two first series, and between the sum of these series and the 18 in. row series, and confirmed that the observed variation between plots was the result o f sampling error and that the population was normally distributed.
This hypothesis was corroborated by analysing the results of the first two series together and attributing sources of variation to rows and columns, and to left and right diagonals, where no significant differences were found by the variance ratio test, nor was any difference between the highest and lowest plot totals revealed by the multiple range test (P = 0.05) [3], Of the miscellaneous samples, those from plot II show that the high figure obtained in all three previous assessments was the result of sampling error, the value determined from 20 samples coming very close to that for the whole area.
With the resources available, it was not possible to examine other areas as a further check on these results, nor was it possible to repeat them on a larger area to determine in detail whether a population was normally distributed in a whole field. In this latter case it was assumed that sampling over the whole field would give a reasonable estimate of the overall population regardless of population gradients.
D istr ibu tio n in a R ow Crop
The series of samples described above were taken in a row crop, and it was assumed that if any difference in populations occurred
between “in-the-row” and “between-the-rows” areas, the former would have the higher population. This was confirmed by comparative sampling in barley, 20 paired samples being taken in a preliminary examination, whilst as a check later in the year when there was considerable weed growth in the crop, bulk samples were examined (Table 1). Although these last showed an increased proportion o f larvae between the rows, a real difference between populations was indicated. This difference was not apparent in bulk samples on a field of maize where only a low population was recorded. Observations suggested that this pattern was normal in small grain cereals, which are usually planted in rows 6-8 in. apart and that, where it was desirable to express infestations in terms of acreage, samples should be taken from within and between rows in a 1:1 ratio as giving a reasonably accurate estimate.
Vertical D istribution
It has already been stated [4] from qualitative observations only, that larvae move downwards in drought conditions. Quantitative proof of this was obtained by taking samples (i) during the rainy season, (ii) while the soil was drying out, and (iii) after a long period of rain (Table 2). The results confirmed the observation that a downward movement took place, but showed that a proportion o f the population remained nearer the surface than was previously believed. Whether this upper fraction can survive the drought is not known.
T able 1
Crop State of “between rows” area
Larvae per coreRatio
(I/B)
Probable population
per acre
( I + B x 10**)in the row
a )
between the rows
(B)2 2
Barley .. Barley ... Barley . . Maize ..
A few tufts of grass only Heavy weed growth Heavy weed growth Very light weed growth
6-9336- 7337- 667 0-667
2- 4673- 9334- 533 0-667
0-3560-5840- 5911- 000
2-35 x 10*2- 67 x 10*3- 05 x 10* 0-33 x 10*
2*A 4 in. diameter core is approximately — acres.
10*
30
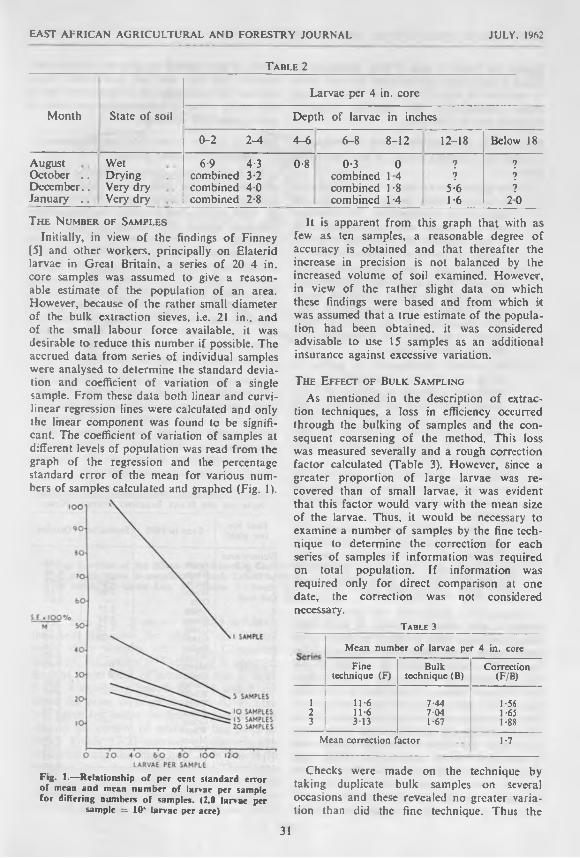
EAST AFRICAN AGRICULTURAL AND FORESTRY JOURNAL JULY. 1962
T a b l e 2
Month State of soil
Larvae per 4 in. core
Depth of larvae in inches
0-2 2-4 4-6 6-8 8-12 12-18 Below 18
August Wet 6-9 4-3 0-8 0-3 0 ? ?October . . Drying combined 3-2 combined 14 ? 7December.. Very dry combined 4-0 combined 1-8 5-6 7January . . Very dry combined 2-8 combined 14 1-6 2 0
T he N umber of Sam ples Initially, in view of the findings o f Finney
[5] and other workers, principally on Elaterid larvae in Great Britain, a series o f 20 4 in. core samples was assumed to give a reasonable estimate of the population of an area. However, because of the rather small diameter of the bulk extraction sieves, i.e. 21 in., and of the small labour force available, it was desirable to reduce this number if possible. The accrued data from series of individual samples were analysed to determine the standard deviation and coefficient of variation of a single sample. From these data both linear and curvilinear regression lines were calculated and only the linear component was found to be significant. The coefficient o f variation of samples at different levels of population was read from the graph of the regression and the percentage standard error of the mean for various numbers of samples calculated and graphed (Fig. 1).
^■g- L —Relationship o f per cent standard error o f mean and mean num ber of larvae per sample fo r differing numbers o f samples. (2.0 larvae per
sample = 10‘ larvae per acre)
It is apparent from this graph that with as few as ten samples, a reasonable degree of accuracy is obtained and that thereafter the increase in precision is not balanced by the increased volume of soil examined. However, in view of the rather slight data on which these findings were based and from which k was assumed that a true estimate of the population had been obtained, it was considered advisable to use 15 samples as an additional insurance against excessive variation.
The E ffect of Bu lk S ampling
As mentioned in the description of extraction techniques, a loss in efficiency occurred through the bulking o f samples and the consequent coarsening of the method. This loss was measured severally and a rough correction factor calculated (Table 3). However, since a greater proportion of large larvae was recovered than of small larvae, it was evident that this factor would vary with the mean size of the larvae. Thus, it would be necessary to examine a number of samples by the fine technique to determine the correction for each series of samples if information was required on total population. If information was required only for direct comparison at one date, the correction was not considered necessary.
T able 3
Mean number o f larvae per 4 in. core
Finetechnique (F)
Bulktechnique (B)
Correction(F/B)
l 11 -6 7-44 I -562 11-6 704 1-653 313 I -67 1-88
Mean correction factor 1-7
Checks were made on the technique by taking duplicate bulk samples on several occasions and these revealed no greater variation than did the fine technique. Thus the
31

EAST AFRICAN AGRICULTURAL AND FORESTRY JOURNAL JULY, 1962
figures for Series 1 and 2 bulk technique in Table 3 were taken on the same day and show a variation of only 5.3 per cent, whilst in all other comparisons the greatest variation recorded was 20.3 per cent.
Summary of the T echnique for a Survey
From the foregoing results, it was concluded that—
(1) the population of larvae in a limited areais normal, there being no evidence of aggregation or dispersion. N o information on a larger area was obtained, but it was assumed that sampling over the whole area gives an overall estimate;
(2) in row crops, the infestation variesbetween “in-the-row” and “between-the- rows” areas, so that a correction needs to be applied. This correction is variable, depending on the extent of weed growth in the crop and. presumably, the distance between rows;
(3) the vertical distribution of larvae is dependent on soil conditions; in wet conditions a sample to a depth of 6 in. includes practically all the larvae in the unit, but in very dry conditions, samples need to be taken to a depth of at least 18-24 in. if they are to give a total estimate of population;
(4) fifteen 4 in. diameter cores samples givea reasonably accurate estimate of a population, especially with large populations;
(5) the bulk sampling technique leads to areduced estimate of the population of the order of 40-50 per cent, but the exact correction depends on the size of the larvae present, since larger larvae are more readily recovered.
Consequently, the survey was conducted by taking 15 4 in. cores to a depth of 6 in., with, when row crops were involved, the main series being taken in the row, but occasional series being taken between rows to establish a correction factor. In small grain cereals, where the distance between rows was 6-8 in. the population was assumed to be equally composed o f between and within rows areas. Series of individual cores were extracted by the mere exact Salt and Hollick technique to establish a correction for the bulk method, whilst bulk samples were taken from the 6-12 in. zone to give a correction for distribution. Ideally, individual samples should have been taken from the 6-12 in. zone and indeed to a greater
depth in dry weather to give an absolute correction, but this was not practicable. Even without this refinement, it is considered that a reasonably accurate comparative estimate o f populations was obtained.
R e su l t s of the S urvey of th e P lant Breeding Station, N joro
The survey was undertaken with the purpose of determining the limits of the infestation on the station, and discovering whether any crop or crop rdgime had affected the infestation. Although records of cropping go back many years, it was not considered of value to examine the regime in detail for a period greater than three years. The standard rdgime on the station is a seven-year rotation with four years grass ley, one year small grains, one year maize and a further year small grains. The first year ley is often undersown to oats, and leys consist of seeded Rhodes grass (Chloris gayana) with wild grasses, notably Pennisetum clandestinum, coming in.
Two surveys were conducted between 8th and 19th September and I Ith and 19th October, 1960, and the results of these are shown in Table 6, in terms of millions of larvae per acre, together with the “crop” growing in 1960. The figures have been corrected in accordance with the conclusions drawn from the examination of the estimation of populations.
Table 4— Recorded Infestations in Millions per Acre on the Plant Breeding Station, Njoro
Field No. (see plan) Crop in I960 September October
Nursery area (N.A.) .. Grass . . 1 -38
1 and 2 . . Grass .. — 0-463 .. Barley 2-66 1 -923 Wheat 1-60 1153 Oats — 0-674 Grass .. 3-2* —
4 and 5 Gtass .. 1-34 1 -236 Grass .. M2 2-257 Grass . . 0-20 0-468 Barley — 0-248 Wheat — 0-909 and 10 . . Maize .. 0-96 0-4611 .. Grass . . 219 —
12 .. Bariev 0-9112 .. Wheat 0-9113 . . Wheat 0-8014 . . Grass .. — 1 0 017 . . Grass .. — 0-2218 . . Wheat — 0-4819 . . Maize .. — 0-3020 . . Wheat — 0-48Ul Uncultivated . . — 0-92U2 Uncultivated . — 0-61U3 Uncultivated .. — 0-69U4 Uncultivated .. 0-84 1-76U5 Uncultivated .. — 0-30
•Taken from boundary nearest field 3.
32

EAST AFRICAN AGRICULTURAL AND FORESTRY JOURNAL JULY, 1962
The plan (Fig. 2) shows the field layout of the farm and also the sites in uncultivated areas where samples were taken. Comparing this with the results in Table 6 it is apparent that the main focus of infestation was in fields 3 and 4 extending into fields 5, 6 and 8 and on to the grass verge of the road (U 4). (The low figure for barley on field 8 was due probably to the control o f adults on this patch in May.) Fields 17-20 carried a relatively low infestation and this may have been due to its isolation from the rest of the farm. There is no correlation of distribution with any apparent feature of topography or soil type. Comparing the data available for both months on indivi
dual fields, it is noticeable that that three out of the four grass areas show a 100 per cent increase in population (viz. fields 6 and 7 and U 4) whilst the cereal fields 3 (barley), 3 (wheat) and 9 and 10 all show a decrease. The data are insufficient for a general conclusion to be drawn, but suggest either that vertical distribution may vary between grass and cereal crops and that a correction based on that found in cereals is not applicable to grass or that oviposition by a small infestation of adults in late September was heavier on the grass areas, due to young shoots being present, than on the cereals which were ripening and therefore drying out.
33

EAST AFRICAN AGRICULTURAL AND FORESTRY JOURNAL JULY, 1962
Table 5— Recorded Populations in M illions perAcre on Various Crops; October Sample Unless
Otherwise Stated Maize . . 0-46, 0-30.Barley . . 1-92, 0-24, 0-91.Wheat . . 1 15, 0-90, 0-91, 0-8, 0-48, 0-48.Oats . . . . 0-6.1st year grass 0-46, 2-52.2nd year grass None on farm.3rd year grass 1-23, 219 (Sept.).4th year grass 1 00, 0-46, 0-22.Unbroken . . 0-30, 1-76, 0-61, 0-69, 0-92.
Table 5 shows the recorded infestations on the crops grown in 1960 and it is apparent that no crop with the possible exception of maize has affected the larval population. Also, even on old leys and unbroken ground, populations of considerable size flourished. Maize has been recorded as carrying a heavy population o f larvae elsewhere [4] and it is evident I hat the low figures recorded here are not due to the unsuitability o f the crop as a food plant. However, whilst on all previous occasions, the populations recorded on crops have been those occurring early in the season and hence resulting from oviposition in a previous crop; on this occasion the infestations originating from oviposition in the current year and on the current crop. It follows that maize may be less suitable for oviposition than other crops and it is suggested that this is due to the more fibrous and less lanceolate type of leaf which would make it far less easy for the adult to fold and make the egg “pocket". This factor would only be important when, as happened here, weed growth was very slight so that alternative oviposition sites were not available in the field.
The variation between fields is not explicable in terms of any character recordable at the time o f sampling. However, the suitability o f a field for oviposition must be a variable, the extreme case being a fallow when no oviposition would take place, while it is probable that a weed-free crop just prior to harvest would also be unsuitable since the leaves would then be at their most fibrous. No information is available on the effect o f the state of the crop between these extremes, although all observed cases of heavy oviposition have been on crops between emergence of the coleoptile and prior to “piping” (i.e. elongation o f the stems). Any effect o f this nature would o f course be nullified by heavy weed- growth.
Further ResultsIn addition to the samples taken at Njoro,
a few bulk samples were taken on the Government E xperim ental Farm, OI Joro Orok. These
revealed populations of between 500,000 and1,500,000 larvae per acre on two new grass leys and two fields of oats whilst a population of 500,000 was found on an established grass ley two to three years old. This confirms the carrying potential o f grass leys and emphasizes that oats is a suitable food-plant for the larvae.
Small samples (c. 2 in. diameter core) were taken in the virgin forest land along a transect between Naro Moru and Nanyuki at an altitude o f c. 7,000 ft. by Mr. F. W. Collier. Larvae were found in half of these samples indiscriminately along the transect. Since the m ode of collection was not standard, it was impossible to make a quantitative estimate o f the population, but this result serves to con firm the conclusion that Nematocerus larvae occur in numbers in uncultivated land.
S ummary
The variables in assessing a population o f larvae are discussed and a bulk sampling technique for survey work outlined.
A survey of the Plant Breeding Station, Njoro, revealed wide differences between the recorded populations but these could not be correlated with the crop regime, topography or soil type.
It is suggested that the state of the crop at the time of the proceeding adult generation has an important bearing on the subsequent larval infestation.
It is concluded that the grass-cereal rotation is unlikely as such to affect larval infestations, and that larvae are present in considerable numbers in uncultivated land.
A cknow ledgements
Thanks are due to the Senior Plant Breeder, Njoro, for permission to conduct this survey, to my African staff for their work in collecting and examining samples, and to Mr. F. W. Collier for the samples collected at Naro Moru- Nanyuki.
R eferences
|1] Sail, G. and Hollick, F. S. J. (1944). Ann. appl. Biot. 31. 52.
[2] Cohen, J. in “Soil Zoology" cd. Devan, D. KMcE. (1955). 347.
[3] Sncdecon. G. W. (1956). Stastical Methods, 5th Ed 251.
[4] Bullock, J. A. (1961). E. Afr. agric. for. J. 27. 24.[5] Finney, D. J. (1941). Ann. appl. Biol. 28. 282.
34

EAST AFRICAN AGRICULTURAL AND FORESTRY JOURNAL JULY, 1962
CASHEW PRODUCTION IN THE SOUTHERN PROVINCEOF TANGANYIKA
By P. J. Northwood, Department of Agriculture, Tanganyika(Received for publication on 15th February. 1962)
Cashew (Anacardiurn occidental) is Tanganyika's fourth most valuable export crop, it being worth over £2 million to the Territory in 1960. The bulk of the crop is produced in the Southern Province under varied ecological and climatic conditions.
Table I gives an indication of the importance of cashew in the various Districts of the Province, whilst Fig. 1 shows roughly the distribution of cashew growing. The black dots on the map indicate the main cashew markets, these being situated in the larger producing areas.
T able IYields of marketed Cashew in tons of
Southern Province Districts:
District 1958 1959 1960
Newala 6,017 4,670 11,680Masasi 5,413 4.448 6,200Lindi 3,524 3,868 9.427Mtwara .. 2,488 1,772 3,863Nachingwea 337 366 715Tunduru .. 390 670 1,239Kiiwa 510 672 2,283
T o t a l s 18,679 16.466 35,407
In order to define the most suitable conditions of soil, climate and vegetation for cashew cultivation, a survey of many different areas of the Province was carried out in I960. The following were chosen as illustrating the widest range of factors: —
1. The area leased by Tanganyika Agricultural Corporation in Nachingweaand the surrounding locality.
2. The Makonde Plateau.3. The Eastern half o f Masasi District.4. The Tunduru and Namasakata area of
Tunduru District.5. The coastal region between Lindi and
Mtwara.
It is proposed to describe and compare each of these areas. A difficulty which arose during the survey was the fact that few yield figures were available and consequently findings are based mainly on observation.
T he T.A.C. and S urr o u n din g A rea o fN achingwea.
The cashew grown on T.A.C. farms and in the surrounding villages provides the bulk o f Nachingwea District’s production o f a few hundred tons of nuts. The area is gently undulating with the altitude varying from 1.300-1,600 ft. above sea level. The average rainfall is 34 in., but it may vary from 20 to 45 in. Much of the rain falls in heavy storms of several inches. There is thus a considerable run-off from the less absorbent soils.
The underlying rocks are mostly gneisses o f the Lower Basement Complex [1], from which the soils originate. There is a soil textural catena in Nachingwea and cashew growing is restricted to the soils o f the mid-slope and upland sites. In the valleys, although the soils are the most fertile, they are too heavy and poorly drained for cashew.
On the tops of the ridges and upper slopes are found red loams and sandy loams. On the mid-slopes, these give way to sands which are at first shallow, but become deeper. Lower down they become shallow again with a clay sub-soil or hardpan horizon. The natural vegetation of the red loams is mainly Pterocarpus-Combretum woodland. On the sandy loams and sands where water penetration is better. “Miombo” woodland, with species of Brachystegia and Julbemadia dominant. is the natural cover. Brachystegia micro- phylla is common on the deep well-drained soils, whereas Brachystegia boehmii is a good indicator of the shallow poorly drained sands. Jttlhernadia globiflora occurs mainly on infertile sands.
On T.A.C. farms, most of the cashew was planted on the sands, which are insufficiently fertile to grow good annual crops. On some of these cashew grows satisfactorily and on others it does not. The deciding factor appears to be the drainage. The sands which lie just down the slope from the red sandy loams have reasonable drainage and although the fertility is low, the crop produces economic yields on them. On the shallow poorly-drained sands further down, the trees are stunted and do not flower either so vigorously or so early
35

EAST AFRICAN AGRICULTURAL AND FORESTRY JOURNAL JULY, 1962
F I G U R E |.
as these higher up the slopes. Their overall bearing surface is lower and the leaves are paler than the deep green of flourishing cashew. Yields are about 200 lb. per acre which might be improved a little with optimum management, but not to an economic level for estate farming.
The best cashew in the area is that grown on the more fertile and better drained upland red soils. Here it flowers earliest and most profusely and the experience of farmers is that yields are heaviest. Trees in their third year have given nearly 800 lb. of nuts per acre (8 lb. per tree), whereas on the better sands, fifth year trees only gave this amount. The difference is largely due to soil though variations in site, planting material and management are also involved.
There is little difference in the size and growth rate of trees of similar age on red soils and the best sands, but those on the former have a larger bearing surface. It may be that fertilizer applications on these sands would improve yields considerably, as the low nutrient status appears to be the main limiting factor.
Cashew seems to be tolerant of a fairly wide range of acidity as it is growing well both on neutral and acid soils at Nachingwea.
The Nachingwea area has conditions which are suitable for high yields of good quality cashew, the red soils being excellent. It is likely that under a rather higher rainfall regime yields would be even better as the difference in yield potential between wet and dry years is quite considerable. It is unfortunate that in wet years Helopeltis attack is more prevalent, and in many instances the increase in yield due to extra moisture is nullified by this pest where control measures are not taken.
T he M akonde PlateauThe Makonde Plateau is a roughly rectangu
lar stretch of country 80 miles by 60 miles, lying between the Lukulcdi and Ruvuma River systems. At its Western end near Newala it reaches a height of 2,640 ft. and presents a scarp face to the West and South. It slopes gently Eastwards and six or eight miles from the sea, where it ends, is only a few hundred feet high.
The soils are formed from Cretaceous sediments and are mostly very sandy, but there is some variation in texture. Areas of loamy
36

EAST AFRICAN AGRICULTURAL AND FORESTRY JOURNAL JULY, 1962
sand are found which have a better water holding capacity than the very free draining coarser sands. The loamy sands are rather more fertile than the sands, but both soil types are basically poor and will support only a short cropping cycle under the present agricultural system. The average rainfall is 35 in., but is rather more at the coastal end of the plateau.
The natural vegetation consists mainly of the man-induced Makonde thicket, which is practically impenetrable and varies in height from 10-20 ft. depending on the time it has been left. Originally the vegetation was tall open woodland, small areas of which can still be seen today. The thicket contains many legume species which probably help to restore fertility to the soil during a fallow. Its composition does not vary greatly over the plateau, but on the least fertile sands, regeneration of the bush is slower with a greater proportion of grasses than on the better soils. The local name for this poorer and more open bush is “Jangwani”, and that of the dense bush “Porini” according to K. Rwiza [2] in a small survey of the Mtopwa area.
In the Mtopwa area, most of the cashew is grown in “Jangwani” country and the people say that it does best there. This is hard to understand because better cashew was seen on the more loamy soils. It may be that “Jangwani” provides a less suitable environment for Helopeltis than “Porini” and therefore the trees suffer less from its attack. Also, the people may keep the better land for annual cropping and merely say that Cashew does best in “Jangwani” because annual crops only grow poorly.
The bulk of the Newala District cashew crop comes from the Makonde Plateau. The main production comes from the belt of land running close to the Southern edge of the escarpment. This area is densely populated and cultivation has been so intensive in the past that the soils are impoverished. At present, the only crops that produce a reasonable return are cashew and cassava. As more cashew is planted, the acreage available for food crops diminishes with the result that the land is too infrequently fallowed and the infertility problem becomes more acute. New areas are being opened up in the Ruvuma Valley to grow food and also in the less populated areas of the centre and North of the Plateau where both food crop and cashew planting is
expanding. Despite the increase in land pressure, cashew production should be encouraged as well managed trees will give a better return than any other crop yet tried.
The only record o f cashew yields on the Makonde comes from Mkunya Leprosarium on the escarpment edge, where 70 tons were harvested from 9.300 trees at wide spacing. This works out at 16 lb. per tree which is poor for large trees. With no other figures available, one has to rely on observation in making yield comparisons both within the plateau and between other areas.
From the general vigour of the crop and the degree of flowering and fruiting, differences could be seen in the yield potential of young trees on the various soils, the best growth being on the loamy sands, particularly on a red type which occurs in certain areas. Differences between older trees are less marked and this is probably because the soils are deep and mature trees can send their roots down a long way in search of nutrients. On any one soil type, young trees do better on land freshly cleared from bush than on land which has been cropped for several years.
It would be thought that on these loose soils an above average number of trees would blow over. However, this is not the case presumably due to an extensive root system encouraged by great soil depth. More trees seem to fall over on the stiff red soils formed over gneisses where the roots find it harder to penetrate and are less extensive. The taproot on these soils gives little mechanical support.
Under good management, the potential yield from cashew on the Makonde is about equal to that on the best sands in the Nachingwea District, but inferior to that on the red sandy loams. But the average standard of management on the plateau is poor and it is four, five or even six years before the trees give any appreciable yield.
There is evidence that cashew on Makonde soils may suffer considerably from lack of water. At the end of 1959, after two years of below average rainfall, a large number of trees had lost many of their leaves and the total harvest from the plateau was about 40 per cent less than in 1958. In 1960, after good rains, production more than doubled that of 1959 and the trees had recovered their vigour. This effect of varying yield with varying ra nfall may be confounded to a certain
37

EAST AFRICAN AGRICULTURAL AND FORESTRY JOURNAL JULY, 1962
extent with the biennial bearing phenomenon which seems to be apparent in some of the older trees.
Although conditions are not ideal for cashew on the plateau, it is still a very profitable crop for the area, especially since the price o f cassava has fallen so low. The people realize this and production has expanded rapidly from 110 tons marketed in 1948 to 11.680 tons in 1960. New planting is continuing, some farmers putting down as much as 3-4 acres at a time.
T h e E astern H alf of M a sa si D istrict
This area is part of the gently undulating peneplain which lies inland from the Makonde Plateau. It slopes from the north, where the altitude is 1,300-1,500 ft., southwards to the Ruvuma River. The underlying rocks are mostly gneisses and schists of the Basic Complex and the natural vegetation and soils are broadly similar to those of the Naching- wea area. An exception is near the Ruvuma River where many of the soils are thin and gravelly and support a generally stunted bush- tree vegetation. The best cashew soils are again the upland reds followed by the better drained sands. The low-lying sands are frequently wet and of poor fertility, and allow restricted root penetration and support only a thin and stunted natural cover.
The main cashew production is centred on the villages at the foot o f the Makonde escarpment. This area is well-watered and quite heavily populated. Many of the soils are very suited to cashew growing and some excellent mature trees were seen which must yield over 100 lb. of nuts. The local people say that many of their trees produce over 300 lb. The potential yield per acre of cashew in this area is about the same as Nachingwea where soils are similar, but there are no figures available. The altitude is on the whole lower and this area together with the coastal region has the earliest harvest. The traders say that Masasi nuts are of excellent quality and a small premium was given for them in 1959.
In the densely populated areas, cashew planting is increasing only slowly, partly due to land shortage and also because groundnuts and simsim are two other profitable cash crops which do well on the red soils. On the more sandy soils which have to be rested from annual cropping fairly frequently, it is considered that cashew is the most economic crop and plantings there could be increased. Much
of Eastern Masasi is free from tsetse fly and more cattle are being introduced. The development of a cattle and cashew system could be very profitable and make full use of land in an area where it is in short supply.
T u n d u r u -N amas ak ata
This is an undulating stretch of country with an altitude of 1,800-2,200 ft. The soils are formed from Karroo sedimentary deposits and are mostly light in texture except for the valley clays. Red sandy loams are frequently found on the hill-tops, but the stiff red loam s common in the Nachingwea area are absent.
The natural vegetation is nearly all “M iombo” woodland except in the seasonally waterlogged valleys. The average rainfall is 40 in.
The population is fairly sparse and there is no land pressure. The people cultivate the fertile soils in the valleys and also the well- drained deep sands and sandy loams of the uplands. The sands of the mid and lower slopes are mostly of poor fertility and drainage.
As with the Nachingwea and Masasi areas, the upland soils are the best for cashew growing, those of the mid and lower slopes being progressively less suitable. Provided the most suitable soils are used, this area can produce good yields of good quality nuts comparable with those of most areas of the Province. The rather higher rainfall of 40 in. is an advantage. The altitude of 2,000 ft. does not appear to greatly affect yields, but there are no figures to confirm this. The higher altitude does, how ever, put back the main harvest period by 1-2 weeks, which means that early rains can spoil the previous season’s unharvested nuts. Rain is liable to damage nuts anywhere in the Province, but the problem is greater in the late harvest areas such as Tunduru and the Western end of the Makonde Plateau. What is needed, therefore, are some earlier maturing varieties selected from the different maturing types which we have at present.
It has been reported that cashew does not always grow well in Tunduru but this is largely because much was planted on the poor soils.If this is remedied, the crop is very suitable for the district. Also, apart from its profitability, the tree is useful in an area of shifting cultivation, such as Tunduru, because a farmer who has a good cashew holding will not m ove far away.
38

EAST AFRICAN AGRICULTURAL AND FORESTRY JOURNAL JULY. 1962
T h e Coastal Region
This is a low altitude undulating stretch of country, the surface rocks being of Tertiary and Quarternary ages. The main soil types are red sandy loams and sands. Sisal has been tried on some of the sandy loams, but they were usually insufficiently fertile to support more than one cycle. They are, however, excellent for cashew. The natural vegetation is chiefly a mixture o f open deciduous woodland and secondary thicket.
Compared with inland areas the coast is warmer, more humid and has a higher rainfall (much of this area is in the 40-50 in. rain belt). Cashew grows very fast and produces heavy yields where management is good. Many of the native holdings are poorly managed so that the trees in fact look no better than those inland. Nevertheless it is felt that potentially the coast has the most suitable environment for cashew production in the Province. Evidence in support of this view comes from recordings taken from 80 trees in their fifth year growing on a well-managed estate. The average yield of nuts per tree was 15 lb„ which is considerably in excess of figures obtained from other areas for trees of this age. In addition, less work is involved with cashew cultivation than with other crops and this can be important where the climate is hot.
Summary
Large areas of the Southern Province are highly suitable for cashew production and judging from the limited information which is available, yield figures compare very favourably with those of other countries. As regards rainfall, all the areas discussed have sufficient for good production. There is a danger that dry season storms during the flowering and fruit-settling period will reduce yields, but fortunately these are not common. It is considered that soil type is the chief limiting factor for production rather than rainfall or altitude. There are, however, large areas of well-drained sandy and loamy soils suitable for cashew in all the areas discussed on which planting could be increased. The tree grows best on soils which are not too sandy. When one considers that individual four- or five-year- old trees can yield 25-35 lb. of nuts, it should be possible with the conditions pertaining in the Southern Province to eventually raise production to 1,500-2.000 lb. per acre, when suitable material has been selected.
A ck nowledgement
I would like to think Dr. A. C. Evans and Mr. B. C. Akehurst, M.B.E., for their most helpful advice and encouragement.
R efere nces
(1) Anderson, B.—Univ. Reading Dept. Agr. Chem.,1957.
[2] Rwiza, K. J.—Private Communication.
39

EAST AFRICAN AGRICULTURAL AND FORESTRY JOURNAL JULY, 196:
KEY TO THE T A B A N I D A E OF TANGANYIKABy J. F. Lamerton, Department of Veterinary Services, Tanganyika
(Received for publication on 16th November, 1961)
The Tabanidae (Horse-flies, Hippo-flies, Clegs, etc.) include some of the most painfully- biting flies in Africa, which, because of their numbers, can be a great nuisance to man and beast. They are also the cyclical or mechanical vectors of several diseases o f medical and veterinary importance, such as anaplasmosis, loaiasis, tularaemia and trypanosomiasis. Any potential vector must be identified precisely before information on its life-history and habits can be gathered in order to allow specific, economic control measures to be put into operation. That identification must often be carried out, or confirmed, in the field.
Tabanidae are fairly stout flies, ranging from the size of a small house-fly to that of a large hornet. Although sometimes called Blind-flies, they have large heads and eyes, with mouth- parts usually adapted for biting and sucking. They are active flies, but not as a rule conspicuous in their colouring. Having a single pair of wings, they are classified in the order Diptera of the class lnsecta, and are a family of the suborder Brachycera.
The standard work on these insects is Horseflies o f the Ethiopian Region, Vols. I, II, III (1952-57), by H. Oldroyd, published by the British Museum (Natural History), and this is rather bulky for field work. It is also rather technical for non-specialists, as it deals with the Tabanidae throughout Africa South of the Sahara. The present key has been devised for field use by non-entomologists in Tanganyika; covering only a few species, several short cuts in the separation of groups can be employed. These would not be practicable if all the Tabanidae of the surrounding territories were
to be included. The key follows the standard work with regard to the revised classification and naming, and Mr. Oldroyd's own guidance on identification at the Museum is gratefully acknowledged.
The whole has been broken into generic or subgeneric sections, and some numbers have not been used in the key to Haematopota, to allow for its future development without undue disarrangement.
It is sometimes hard to decide whether a specimen matches better with one choice or another. Difficult species will usually key out on either side of such a question.
Flies other than Tabanidae are also biters, but they can easily be distinguished. Many have feathery antennae, or are small, less than 7 mm. in body length. Of those more likely to be confused with the Tabanidae. lion-flies can be identified by their flat round leathery bodies, and tsetse-flies and stable-flies by their different mouthparts (Fig. I).
Most of the key can only be applied to fem ales; the colour-patterns of the males, which do not bite, often differ from those o f the corresponding females. Unless caught during mating, males are best identified by comparison with museum specimens. They are comparatively rare, and can be distinguished from the females by the fact that whereas, with very few exceptions, the eyes of the males meet in front of the head, those of the females do not (Fig. 2).
The key is published by permission of the Commissioner for Veterinary Services, Tanganyika.
Section A : Key to Genera and Subgenera
La. Proboscis very small. Insect appears to have white mould all over except for the eyes and antennae.Rare, mainly coastal insects, probably non-biting but belonging to a little-known group.
Subfamily SCEPSIDINAE. Adersia ........................................................................................ Section Bb. Proboscis elongated, projecting in front of the head (Fig. 3 (a), (b)). Includes genera previously
known as Pangonia and Dorcaloemus.Subfamily P A N G O N IN A E ................................................................................................................ 2
c. Proboscis directed downward from the head (Fig. 3 (c)).Subfamilies CHRYSOPINAE and TABANINAE............................................................................ 6
2. a. Proboscis very elongated and projecting in line with the body (Fig. 3 (b)). Antenna-bases separatedby a gap as wide as one base.
Phihliche subgenus Stenophara . . . . . . . . • • • • • • • • • • Section ob. Proboscis moderately elongated, pointed slightly downward (Fig. 3 (a)). Antenna-bascs set very
close together .........................................................................................................................................
3. a. General colour brown or grey-black ...............................................................................................b. General colour shiny black or very dark brown.......................................................................................
40

EAST AFRICAN AGRICULTURAL AND FORESTRY JOURNAL JULY. 1962
4. a. Wing comparatively short and broad (Fig. 4 (<■)).Philoliche subgenus Dorcaloemus . . . . . . . . . . . . ...........................
b. Wing or normal shape.Philoliche subgenus Ommatiosteres . .
5. a. Markings all white.Philoliche subgenus Ommatiosteres . . . . . . . . . . . . ...........................
b. Markings yellow, at least on the thorax.Philoliche subgenus Phara.
6. a. Wing with one or two coloured cross-bands (Fig. 5 (a))b. Wing with many dark spots on a clear membrane. Gaily-coloured body. Euancaiac. Wing very dark, with a narrow white stripe across the tip; OR with light spots or streaks, often
arranged in groups or rosettes, on a darker background (Fig. 5 (b)).Haematopota . . . . . . . . . . . . . . . . , .
d. The rest: wing evenly-coloured, perhaps with a light tip; or fenestrated (Fig. 5 (c)); or infuscated(Fig. 5 (<0); or clear . . . . . . . . .......................................
7. a. Length overall, excluding antennae, 11 mm. or less. Eyes when alive brightly coloured. Chrysopsb. Length 12 mm. Dull blue-black body.
Tabanus laucostomus Loew . . . . . . . . . . . . . . . . . . . .c. Length 12-13 mm. (honey-bee size); dull brown body.
Tabanocella ........................... . . . . . . . . . . . . ...........................d. Length 15 mm. Wings bright black and yellow; body shiny black.
Thriambeutese. Length 17 mm. or more. Body greenish or orange.
Ancala . . ........................... . . . . . . . . . . . . ...........................
8. a. Spurs (sometimes very small) on the tibia of the hind leg (Fig. 6 (a)). Ocelli on vertex of head(Fig. 6 (6)).
Remainder o f the subfamily CHRYSOPINAE b. No spurs or ocelli.
Remainder of the subfamily TABANINAE ............................................................................
9. a. Length overall, excluding antennae, 17 mm. Wasp-like, with dark brown thorax and wings, blackabdomen with reddish tip, legs and head partly or wholly orange or yellow. Duller after long keeping in collections.
Hinea . . ................................................... . . . . . . . . ...........................b. Length 11-12 mm. Other colouring .....................................................................................................
lO.a. 1st and 4th posterior wing-cells closed (Fig. 4 (c)); abdomen orange with a median dark line. Aegophagamyia
b. O t h e r w is e ......................................................................................................................................................
1 La. Pairs o f spots on the abdominal segments (Fig. 7).Mesomyia ........................... . . . . . . . . . . . , ...........................
b. Otherwise. Mesomyia subgenus Perisilvius
12. a. Basicostal scale (Fig. 4 (c)) o f wing bare. (Microscope required, but these are rare insects) ..b. Basicostal scale hairy. Almost all of these arc normal T a b a n in a e ...................................................
13. a. Very nartow frons, whose height is four times its breadth or mere (Fig. 8 (a)).Amanella..
b. Frons proportions 21: 1 or l e s s .................................................................................................................
14. a. Very broad bucca (Fig. 8 (</))• Very bee-like. So far, found in mountains of Southern and SouthernFlighlands Provinces only.
Atelozella ........................... . . . . . . . . . . . . ...........................b. Otherwise, though body is also bee-like. Coastal distribution.
Neavella . .
15. a. Head hemispherical when seen from above (Fig. 8 (/)).Atylotus . . . . . . . . . . . . . . . . . , ...........................
b. Otherwise
16. a. Hairy species, very bee-like in shape, size and colour; large pale areas in the posterior halves ofabdominal segments 1 and 2. Highland distribution only.
Tebanus subgenus Therioplectes . . . . ....................................... ...........................b. Otherwise.
Tabanus (and T. subgenus Hybomitra) . . . . . . . . . . .........................
SUBFAMILY SCEPSIDINAE Section B: Adersia
Only one species so far recorded from Tanganyika: oestroides Karsch.
41
Section D
Section E
Section E
Section F
7Section V
Section T
8
Section H
Section 7
Section K
Section L
Section U
9
12
Section J 10
Section M I I
Section N Section O
1315
Section Q14
Section R
Section S
Section W16
Section X
Section 7 (and V)

EAST AFRICAN AGRICULTURAL AND FORESTRY JOURNAL JULY, 1962
SUBFAMILY PANGONIINAE Section D: PH/LOUCHE subgenus DORCALOEMUS
La. Abdomen pale at base, dark at tip. b. O t h e r w is e ..............................................................
2.a.
b.
3.a.
4. a.
b.
5. a.
b.
General colour grey-black (male). senex Endcrlcin.
General colour brown
3rd abdominal segment clear in male, banded in female. Frons narrow. If doubtful, hair on thorax is brown rather than grey. Found in the South-East comer of Tanganyika only.
fodiens Austen.Otherwise. 3rd abdominal segment banded in both sexes. Found elsewhere in Tanganyika.
compactus Austen.
Yellow hair only on the hind margins of abdominal segments 4-7; other hairs black. candidolimbatus Austen.
Yellow hairs all over those segments .....................................................................................................
Frontal callus (Fig. 3 (a)) prominent and shining. Found in North-East to Central Tanganyika. nireibasis Endcrlcin.
Callus not prominent. Found in South-West to Central Tanganyika. auricomus Austen.
Section E: PH/LOUCHE subgenus OMMA T/OSTERESl.a. General colour brown, thorax greyish.
acutipalpis Endcrlcin.General colour black or dark brownb.
2.a. Complete white hind margins on all abdominal segments. elongata Ricardo.
b. White hind margins on lateral parts of the abdominal segments only. lautissima Austen.
Section F: PH1LOLICHE subgenus PHARA.l.a. All markings yellow.
chrysopila Macquart.b. Thoracic markings yellow, abdominal marks white.
speciosa Austen.
Section G: PHILOLICHE subgenus STENOPHARA1. a. Fore edge of 1st abdominal segment, and most of the rest o f the abdomen, dark brown or black;
the whole appearance being black with grey hind m a r g in s ...............................................................b. Otherwise; general colour brown . . . . . . . . ...................................................
2. a. Light median triangles arising from the hind margins of abdominal segments 2 and 4.distincta Ricardo,
b. Otherwise.distincta subspecies neavie Austen.
3. a. Sharp contrast between the first two abdominal segments, which are light except sometimes formedian spots, and the rest o f the abdomen.
zonata Walker.b. 1st segment light, the rest dark, brown; segments 2 and 3 often lighter at the sides.
carpenteri Austen.c. Each side of the abdomen with a rounded patch of orange-brown; the median dark brown or black
line is narrowest in the second segment
4. a. 2 yellow-grey lateral stripes on the thorax. Only collected in the Usambara area.morstaiti Endcrlcin.
b Otherwisesimillima Enderlein, hastata Austen, makueni Oldroyd. It is almost impossible to distinguish
between these species except by comparison with museum specimens.
SUBFAMILY CHRYSOPANAE TRIBE CHRYSOPINI Section H: CHR YSOPS
1. a. Black stripes alternating with yellow or orange on the thorax and usually on the abdomenb. O t h e r w is e .....................................................................................................................................................
2. a. Abdominal stripes absent or less than the minimum shown in Fig. 9 (a).magnifica var. inornata Austen.
b. O t h e r w is e .....................................................................................................................................................
42

EAST AFRICAN AGRICULTURAL AND FORESTRY JOURNAL JULY, 1962
3. a. Fairly long narrow abdomen, with the black portion of the stripes shading off or absent in the lastfew segments (Fig. 9 (a)),
magnified Austen.b. Short abdomen, with the stripes getting much wider towards the end ....................................... 4
4. a. Very sharp margins between the yellow and the black; the black stripes of the abdomen wider thanthe yellow ones (Fig. 9 (b)).
bicolor Cordier.b. Black margins ragged on abdomen, often fading into grey; more yellow than black (Fig. 9 (c)).
perpensa Austen.
5. a. Whole wing-tip co lou rless......................................................................................................................... 6b. Wing-tip cloudy or with dark fore e d g e .....................................................................................................
6. a. Outer end of discal cell clear (Fig. 5 (a)).ciliaris Loew.
b. Outer end of discal cell covered by dark wing band. peiersi Aldroyd.
7. a. Blueish-grey thorax. Abdomen pale at base, darker towards the tip.laniger Loew.
b. O t h e r w is e ..................................................................................................................................................... S
8. a. 2nd abdominal segment bright yellow with a black median triangle.longicornis Macquart.
b. Otherwise . . ........................... . . . . . . . . . . . . ........................... 9
9. a. 2nd abdominal segment reddish-yellow, with two dark-brown stripes near the median line.nigrobasaslis Krobcr.
Only one specimen of this species has been collected, from the Uluguru area, b. Otherwise 10
10. a. Rounded abdomen.brucei Austen.
Not recorded from Tanganyika, but found near the Uganda border, b. Narrow a b d o m e n ......................................................................................................................................... 11
1 La. Dark wing band reaches junction of veins R 4 and R 5, leaving a clear spot in the 1st submarginal wing cell.
obliquefasciaia form stigmaticalis Loew.Not recorded from Tanganyika, but occurs near the Rhodesia border,
b. Otherwise: the clear spot is a broad extension of the main clear area. distinctipennis Austen.
TRIBE RHINOMYZINI Section.!: HINEA
Only one species so far recorded from Tanganyika. pertusa Loew.
Section K: TABANOCELLAl.a. Abdomen with two narrow dark cross-bands, or all the abdomen behind the second band may be
dark.innoiata Karsch.
b. Abdomen with one narrow dark band and a second wider band, irregular but in the form of a forward-pointing V, its point in the 2nd and the lateral parts in the 3rd segment.
concinna Austen.
Section L: THRIAMBEUTESOnly one species so far recorded from Tanganyika.
mesembrinoides Surcouf.
Tribe BOUVIEROMYIINI Section M: AEGOPHAGOMYIA
Only one species so far recorded from Tanganyika. pungens Austen.
Section N: MESOMYIAOnly one species so far recorded from Tanganyika.
decora subspecies schoutedeni Bcq.
Section O: MESOMYIA subgenus PERISILVJUSl.a. Female unknown. Male with abdominal segments 2-4 reddish-brown; the rest, also the markings
on those segments, dark brown. Taken at Lumbira, Njombe District, near to Lake Nyasa. nyassicus Endcrlein.
b. Male unknown. Abdomen of female dark brown, with yellowish hind margins and small median triangles. From Tukuyu, Rungwe District.
stannusi Oldroyd.
43

EAST AFRICAN AGRICULTURAL AND FORESTRY JOURNAL JULY, 1962
SUBFAMILY TABANINAE TRIBE DIACHLORINI Section Q: AMANELLA
La. General colour dark brown. Abdominal segments with grey hind margins. amblvchroma Speiser.
b. General colour dark and light brown. Abdomen darker towards tip. imbecilla Karsch.
Section R: ATELOZELLA
l.a. Wings almost clear. Thorax black and brown. Taken in the Matengo Highlands, Southern Province.
subidata Oldroyd.b. Wings brownish. Thorax grey. Taken in Njombe District near Lake Nyasa.
fullborni Enderlein.A single specimen of subulala or a closely related species has been taken near Tukuyu, Rungwe
District. Wings clear, thorax black with light brown hairs.
Section S: NEA VELLAl.a. Abdomen all grey-brown or reddish-brown, sometimes darker towards the tip.
albipectus Bigot.b. 2nd abdominal segment light brown with median black spot or line. Scutellum greyer than thorax.
produclicornis Austen.
TRIBE HAEMATOPOTINI Section T: HAEMATOPATA
l.a. Wing black with white streak at tip and along the hind edge; no rosettes. Thorax black with lateralgrey stripes.
nobilis Grunberg.b. O t h e r w is e ....................................................................................................................................................... 2
2. a. Thoracic lateral stripes complete (Fig. 10 (a)). Basal wing-rosettes often blending into large paleareas ...................................................................................................................................................... 3
b. Lateral stripes end as separate spots (Fig. 10 (b)). Wings seldom as above .. 9
3. a. Basal rosettes almost completely blending together 4b. Basal rosettes distinct or only b l u r r e d ....................................................................................................
4. a. Thorax blucish.masseyi Austen.
b. Otherwise . . . . . . . . . . . . . . .......................................
5. a. Femur of leg yellow-brown.pottsi Oldroyd.
b. Femur g r e y ......................................................................................................................................................
6. a. Wing often with dark brown costs.similis Ricardo.
b. Wing with clear costa. Male with reddish abdomen. denshamii Austen.
The females of these two species may have to be identified by comparison with museum specimens.
7. a. Wing pattern blurred at base.pottsi Austen.
b. Otherwise . . . , . . . . . • . • • • .......................................
8. a. The light band at the wing-tip reaches the fore edge in the 1st submarginal cell (Fig. 5 (/>)).brunnipennis Ricardo.
b. Band reaches edge in the marginal cell. pertinens Austen.
9. a. Frons abnormally broad (Fig. 2 (a)). Abdomen broad, dark, with pairs of very conspicuous greyspots. Insect hairy unless rubbed.
hirta Ricardo.b . Otherwise . . . . . . . - • ■ • • • • ........................ ..
1 l.a. Distinct notch on upper side o f 1st antennal segment, near the tip (Fig. 11 ( o ) ) ...........................b. Otherwise (a curve does not count as a n o tc h ) .......................................................................................
44

EAST AFRICAN AGRICULTURAL AND FORESTRY JOURNAL JULY, 1962
12. a. The number of light rings on the tibiae (Fig. 6) of the fore, mid and hind legs is 1:2:1 respectively.Thorax with white marks on brown.
decora Walker.b. Tibial rings 1: 2 : 2 .......................... . . . . . . . . . . ........................... 13c. Tibial rings 2 : 2 : 2 .......................... . . . . . . . . . . . . . . 14
13. a. Length 9 mm. Dark, no white patches.fuse a Austen.
b. Length 11-12 mm. Otherwise . . . . . . . . ........................... 14
14. a. 1st tibial ring very while against the dark brown leg. Thoracic pattern of small neat separate spots.albihina Karsch.
b. Otherwise, as in 14 a, below. vittata Loew.
15. a. Parafacials (Fig. 8(d)) very sharplv divided into upper black or brown and lower grey areas. Foundthroughout Tanganyika except North and North-West parts.
villa la Loew.b. Otherwise. Converse distribution, with some overlap.
patellicorne Enderlein.
17.a. Frons height distinctly greater than width: or, if only slightly greater, frons is not divergent (Fig.8 (a), ( b ) ) ...................................................................................................................................................... 18
b. Otherwise: if frons height is slightly greater than width, frons is divergent (Fig. 8 (c)) 26
18. a. Light band straight across the wing tip 19b. Otherwise . . ........................... . . . . ........................... . . ........................... 21
19. a. No yellow hairs on thorax (may be hard to judge if rubbed).maculosifacieI Austen.
b. Yellow hairs, especially towards the hind end ....................................... .......................... 20
20. a. If the yellow hairs of the thorax are rubbed, a pale prescutcllar band remains.fasciatapex Edwards.
b. Otherwise. One-half of axillary wing cell (Fig. 4 (a)) completely white. divisapex Austen.
21. a. Long yellow prescutcllar hairs.burtti Oldroyd.
b. O t h e r w is e ................................................................................................................. ........................... 22
22. a. Light grey scutellum and lateral prescutellar patches much bolder than the abdominal marks.Usually only one ring on the hind tibia.
crudelis Austen.b. Otherwise . . 23
23. a. Broad median prescutellar patch.cognaia Grunberg.
b. Otherwise ........................... . . ........................... . . ........................... 24
24. a. Median line on thorax is widest at its fore and hind ends, thinner in between. Prescutellar trianglespresent. Scutellum plain. The single specimen taken in Tanganyika is, in some features, more like ingluviosa Austen.
vulnifica Seguy.b. Prescutellar triangles present, also median and lateral marks on scutellum
coalescens Oldroyd.c. Marks, other than the thoracic lines, are negligible.
brunnescens Ricardo.H. Maculiplena Karsch may be found to key out here, when undamaged specimens have been col
lected.
26. a. Length at least 11 mm., and or with a very conspicuous light mark affecting the scutellum and thethorax nearby . . . . , , 27
b. Otherwise ............................................................... ............................................................................ 29
27. a. Brownalluaudii Surcouf.
b. Very dark b r o w n ......................................................................................................................................... 28
45

HAST AFRICAN AGRICULTURAL AND FORESTRY JOURNAL JULY. 1962
28. a. A considerable amount of infuscation is added to the normal wing pattern. The tip of tF.c whitemark on the scutellum is almost square.
distincta Ricardo.b. Some infuscation. Mark on scutellum is triangular at the tip.
distincta form sica Oldroyd.
29. a. Large wing rosettes, with cloudy inner rosettes.ugandae Ricardo.
b. Otherwise
30. a. 1st antennal segment more or less triangular, i.e. smallest at base (Fig. 11 (A), (r))..b. This segment cylindrical or swollen 01 largest at base (Fig. 11 id), (r)) .......................................
31. a. 1st antennal segment not much longer than deep (Fig. 11 (A))b. This segment definitely longer than it is deep (Fig. 11 (e)) .......................................
32. a. 1st antennal segment swollen, barrel-shaped: wider especially from above, than the 3rd (Fig. 11 id)) b. This segment cylindrical, or not swollen to barrel-shape, or broadest at base (Fig. 11 (e))
33. a. Wing markings are thick pale lines, with triangles on the edges of most or all posterior cells.brevicornis Austen.
b. Wing markings are faint thin lines, not reaching the hind edge ..........................
34. a. Small: length 8 mm.wittei Oldroyd.
b. Length 10 mm.brunnescens Ricardo.
36. a. Abdominal segments 1-4 reddish. Scutellum grey. Wing markings more or less blended into contrasting light and dark patches. Antennae as in Fig. 11 (c).
rubens Austen.b. O t h e r w is e ......................................................................................................................................................
37. a. Basal rosettes blended into large pale areas.avida Speiser.
b. O t h e r w is e ......................................................................................................................................................
38. a. Long yellow prescutellar hairs.burtti Oldroyd.
b. Otherwise. H. maculiplena Karsch may key out here, when undamaged specimens have been collected . . . . . . . . . . . . . . .......................................
39. a. Length 8 9 mm. Scutellum brown. Indistinct abdominal pattern.desidiosa Austen.
b. Length 10-11 mm. Scutellum grey with a pair of brown spots. Abdominal pattern more or less distinct .....................................................................................................................................................
40. a. Wing pale. Abdomen usually dark brown with clear white spots.noxialis Austen.
b. Wing markings distinct. Abdomen brown, darker towards the tip, with large blurted pale paired lateral spots and median line or triangles.
insidiatrix Austen.
42. a. Some fenestration in the colour of the basal and some other wing cells, added to the normal wingpattern. (Good light may be needed to confirm this) ..........................
b. Otherwise . . . . . . . . • • •. • • • • ..........................
43. a. All posterior cells fenestrated. Frons as in Fig. 8 (r). Found beyond North-West border.fencstralis Oldroyd.
b. Of the posterior cells, only the first is fenestrated. Found beyond North-East border. tumidicornis Austen.
44. a. Pale triangles on the hind edges of, usually, all posterior cells. Antennae as in Fig. II id ) .lamborni Oldroyd.
b. Hind edge without such triangles. peusi Oldroyd.
46.a. Double narrow stripe at wing tip.hieroglyphica Gerstaeckcr.
b. Otherwise . . . . . . . . , . ■ • ......................................
30
3532
3336
4246
34
37
38
39
40
4344
47
46

EAST AFRICAN AGRICULTURAL AND FORESTRY JOURNAL JULY, 1962
47. a. Length of 1st antennal segment 3 or more times its width ........................................................... 48b. Length definitely less than 3 times the width 51
48. a. Elongated abdomen; width of middle segments only about twice their length.Tonga Ricardo.
b. O t h e r w is e ....................................... . . . . ....................................... ........................... 49
49. a. No yellow hairs on thorax. Shiny frontal callus. Snipe across wing tip may be narrow in the 2ndsubmarginal cell. May be hard to separate from tonga except'by comparison with museum specimens.
maculosifacies Austen.b. Clear broad almost straight light band right across the wing tip. Dull frontal callus. Yellow hairs
on thorax, especially towards the hind end 50
50. a. I f the lon g ye llow hairs o f the thorax are rubbed, a pa le prcscutcllar band remains.fascialap’x Edwards.
b Otherwise. One-half o f axillary wing cell (Fig. 4 (a)) completely white. dirisapex Austen.
51. a. Stripe across wing tip is broad and straight ........................... . . 52b. Otherwise . . ........................... . . . . ........................... . . . . . . . . 53
52. a. Length 8 mm. Dull frontal callus. Spots on 4th abdominal segment and onward. One-half ofaxillary wing cell completely white.
divisapex Austen.b. Length 7 mm. Shiny callus. Spots on 2nd abdominal segment and onward. Wing not as above.
crassicrus Edwards.
53. a. Elongated abdomen; width of middle segments only about twice their length. Wing pattern withmany spots. Antennae as in Fig. 11 (e).
abyssinica Surcouf.b. Otherwise. Wing pattern mainly of short stripes across the cells,
iu/nerans Surcouf.
TRIBE TABANINI Section U: ANCAL.A
I .a. Body greenish. Legs black and green or black and yellow. fasciola var. nilotica Austen,
b. Body orange. Legs b l a c k ....................................... . . ........................... . . . . . . 2
2. a. Wing with two colour-banjs, discounting the dark wing-base. Palps mainly black.africana Grey.
b. Wing with one colour band. Palps mainly orange ............................................................................ 3
3. a. Abdomen coloured plain orange above and black below.brucei Ricardo.
b. Abdomen orange with black marks above; black with orange marks below. seprempunctata Ricardo.
Section V: EUASCALAOnly one species so far recorded from Tanganyika.
maculaiissima Macquart.
Section W : ATYLOTUSLa. Short post-occipital fringe (Fig. 8(f)). Area between lower callus and antenna-bases is flat with a
grey matt surface. agrestis Wiedemann,
b. Otherwise. Abdomen brighter. fuscipes Walker
Section X: TABANUS subgenus THERIOPLECTESOnly one species so far recorded from Tanganyika.
canofasciatus Austen.
Section Y: TABANUS subgenus H Y BO MIT R A La. Frons as in Fig. 13 (b). Occurs North and South o f Tanganyika, but not collected here.
chevalieri Surcouf. b. Frons as in Fig. 13 (c).
muluha Bequacrt.
47

EAST AFRICAN AGRICULTURAL AND FORESTRY JOURNAL JULY. i%:
Section Z : TABANUS
La. Markings simple or nil. At least four abdominal segments black. Over 20 mm. longb. Plain colourings, but not plain black. Under 17 mm. longc. Patterned markings. Various sizes
2. a. Wing-tip clear; the rest o f the wing uniformly dark. Thorax of male dark; thorax of female whiteor yellow. Abdomen black in both sexes, sometimes with while median triangles.
biguitatus Wiedemann.b. Wing tip coloured; some cells fenestrated (Fig. 5 (<■)). Abdominal segments 1-3 may be yellow ot
grey, the rest black, with or without median marks. Found bevond the border from Uganda to Nyasaland.
xamliomelas Austen.
3. a. Thorax and abdomen very dark; brown or purplish-grey. Wings clear, but some yellowing onveins.
piilhihts Austen.b. Abdomen with brown background colour. Wings light brown, with long appendix to vein R 4
(Fig. 4 (a)), impurus Karsch.
c. Abdomen brown, somewhat lighter at base. Wing clear, with or without appendixd. Abdomen orange or yellow
4. a. Wing with long appendix to R 4. Found beyond the South-West border.sandersoni Austen.
b. Otherwise.clarilibialis Ricardo.
5. a. Proboscis yellow.par Walker.
b. Proboscis black
6. a. Thorax grey. Fore femur and abdomen light brown.ihoracinus P. de B.
b. Thorax and abdomen light brown. Fore femur blackish. zoulouensis Bigot.
7. a. Insects with a pattern of white on black or dark brown, the abdominal pattern being series of spotsor blotches across the segm ents.................................................................................................................
b. Abdomen otherwise, with light spots and/or triangles or stripes on a dark ground. If with simple spots on a blue-black ground, the wing is banded
8. a. White prescutellar band complete (Fig. 10 (a)), i.e. not consisting only of the prescutellar crescents(may be hard to judge in rubbed specimens)
b. Otherwise
9. a. Abdomen brown, or light brown, and white.insignis form velulinus Surcouf.
b. Abdomen generally black, or black-brown, and white
10. a. Five neat white spots on the 2nd abdominal segment.insignis Loew.
b. Spots on 2nd abdominal segment blurred, joined into two larger patches. insignis form neavei Austen.
Many specimens arc intermediate between these forms.
11. a. Palps and femur black.rariabilis Loew.
b. Palp and femur white or grey ....................................... ...............................................................
12. a. Median spots on the 3rd and 4th abdominal segments are bell-shaped, and appear to join in a smallstripe (Fig. 12 (a)).
aiversus Ricardo.b. Median abdominal spots triangular, separate (Fig. 12 (A)).
atrimanus Loew .
13. a. Upper callus of frons not linear (Fig. 13(a))b. Upper callus linear, usually joined to the lower callus (Fig. 13 (b)-igi) .......................................
14. a. Wing banded. Body blue-black.leucostomus Loew.
b. Otherwise ............................ ............................................................................................
6
8
13
9II
10
12
IS
48
o u

HAST AFRICAN AGRICULTURAL AND FORESTRY JOURNAL JULY. 1962
15. a. Lateral spots of abdomen squareish, filling most o f the side. Frons as in Fig. 8 (6).pertinens Austen.
b. Lateral spots from diagonal streaks across the sides of the segments. Frons very convergent.sufis Jacnnicke.
c. Lateral spots joined into long stripes. Frons as in Fig. 13 (a).grants Loew.
16. a. Thorax with a greyish stripe on each side of the brown median line . . 17b. Thorax with three stripes, or none, on a brown background: the median one may be fainter than
the laterals ......................................................................................................................................... 19
17. a. Abdomen with broad median triangles and lateral spots on a background that usually becomesdarker towards the tip.
quadrisignatus Ricardo.b. Abdomen with a median grey stripe . . . . . . 18
18. a. Palps with white hairs only. This species probably occurs in Tanganyika, but has not been collectedhere.
laverani Surcouf.b. Palps with white and black hairs (use good lens).
unilinealus Loew.
19. a. Abdomen with median light stripe.. . . . . ....................................... ........................... 20b. Abdomen with median light triangles ....................................... ........................... 22
20. a. Light median and lateral abdominal stripes. Lateral parts of all abdominal segments similar incolour. Frons as in Fig. 13 Id),
taeniola P. dc B.b. Median abdominal stripe only. Lateral parts of segments 1-4 orange, 5-7 darker 21
21. a. Thorax brown with covering of short yellow matted hairs. Abdominal stripe yellow.livenlipes Surcouf.
b. Thorax brown with grey covering. Abdominal stripe grey. unilinealus Loew.
22. a. Median abdominal marks white; none on segments 6-7 . . 23b. Abdominal marks usually grey, occurring on all segments ........................... ........................... 24
23. a. Most wing-veins darkened, especially at the junctions. White median and lateral spots on fourabdominal segments. quadrigutlatus Ricardo.
b. Some wing-veins darkened as in Fig. 5 (</). Abdominal segments 5-7 darker than 1-4. Whitemedian posterior triangles on segments 2-4.
fraternus Macquart.c. Wing clear. Abdomen with orange base, darker towards the tip. White median posterior triangles
on segments 1-3. coniformis Ricardo.
24. a. Wing-vein R 4 with long appendix. Found beyond the South-West border.sandersoni Austen.
b. Otherwise . . . . . . . . 25
25. a. Length 13 mm. Frons with callus on vertex. Upper callus linear, connected to the lower callus.which is nearly square and which fills the space between the eyes as in Fig. 13 (6), (r).
Tabanus subgenus Hybomitra . . . . . . Seclion Yb. Length 16 mm. or more. Frons variable (Fig. 13 (d)-(g)) 26
26. a. Abdomen usually yellow-brown, sometimes grey-grown. The lateral marks give the whole abdomenan appearance of a wide dark median line, with the light median triangles superimposed.. 27
b. Abdomen dark brown: some species have a purplish tinge . . . . 28
27. a. Mid and hind femora black. Lateral abdominal marks poorly defined. Frons as in Fig. 13 Ul)taeniola form variatus Walker.
b. Femora orange or grey. All abdominal marks definite. Frons as in Fig. 13 (e). irianguliger Austen.
28. a. Length 20 mm. or more. Purple tinge to body colour. Some clouding of the wings and darkeningof the veins. Abdominal pattern blurred.
nyasae Ricardo.b. Length 17-18 mm. Dark brown, slightly reddish. Some infuscation of the wings, especially at the
base. Lateral abdominal marks vaguely four-sided. Frons as in Fig. 13(f). usius Walker.
c. Length 16 mm. Wings clear. Body brown with orange tinee. Lateral spots triangular. Frons asin Fig. 13 (g).
disiinctus Ricardo.
49

EAST AFRICAN AGRICULTURAL AND FORESTRY JOURNAL JULY. 1962
Fig I s ome b i t i n g f l i e s t ha t are no t T a b a n i d a e
L i on f l y H i p p o b o s c a S t a b l e f ly St o m o* y s
Fig 2 Tabanid heads
i
Fig 3 T a b a n i d M o u t h p a r t s
(C )
50

EAST AFRICAN AGRICULTURAL AND FORESTRY JOURNAL JULY, 1962
F>g 4 Wing e d i t and v e na t io n
Fig 5 Wing Pat te rns
51
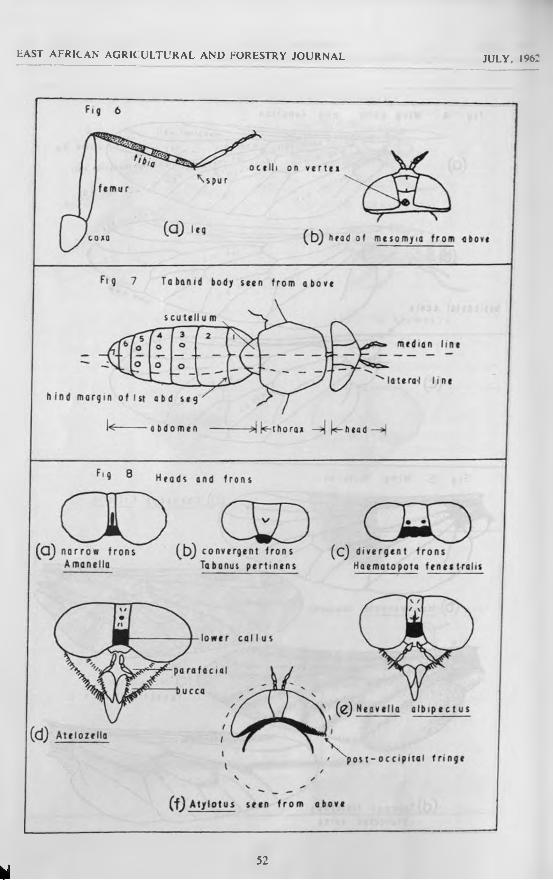
tAST AFRICAN AGRICULTURAL AND FORESTRY JOURNAL JULY, 1962
y52

EAST AFRICAN AGRICULTURAL AND FORESTRY JOURNAL JULY, 1962
Fig 9 Abdomens of c h r y s op s
( a ) Mggni f ico ( 5 ) b i co l or
1 1 Tal ternat i ves
(c) p e r p e n s a
I
I Ia l t e r not i ve s
Fig 1 0 Thor a c i c p a t t e r n s
^ ' 9 11 Ant en na e of H o e m a t o p o t a
<x>^ w i t t e i
albih i r t a
czyo'( d ) l o m b o r n i
( C ) f uA»«» ( e ) o b y s t i n i c a
53

EAST AFRICAN AGRICULTURAL AND FORESTRY JOURNAL JULY, 196:
54

EAST AFRICAN AGRICULTURAL AND FORESTRY JOURNAL JULY, 1962
SOME PHYSICAL PROPERTIES OF VARIOUS KNAPSACK MISTBLOWERS
By C. W. Lee, Tropical Pesticides Research Institute, Arusha, Tanganyika
(Received for publication on 29th January, 1962)
The Knapsack Mistblower is a completely portable machine and can be operated by one person. It is fitted with a two-stroke engine which by V-belt transmission or in later models by direct drive, powers a fan, forcing air down a duct to the outlet. The spray liquid is fed from a tank to a nozzle at the outlet. The nozzle is located in the centre of the outlet tube so that atomization of the liquid is achieved by the air stream passing the nozzle at high velocity. Liquid emission rate can be varied by replaceable restrictors or orifices fitted in the feed line or at the outlet, whilst in some models a liquid flow regulator is incorporated with the on/off tap.
This report deals with the physical aspects of the Mistblowers listed in Table I, with particular reference to emission rates, droplet sizes and air volumes. It may seem that the Motoblo (1960) receives preferential treatment in this report, but this was the only machine available at the Institute for a considerable period. No comments are made on the robustness or reliability of these machines because it is felt that these properties can only be properly assessed after continuous operation in the field. It is, however, worth mentioning here that in an effort to reduce the basic weight of a machine, some metal parts have been replaced by plastic in certain later models. This has led to some operational problems in a few cases, e.g. plastic on/off taps have softened and eventually disintegrated when using emulsions of Dieldrin while with Perenox suspensions, the taps tend to stick.
E xperim ental T ec h n iq ues
Emission rates were measured using water as the test liquid. The tank was filled to capacity, the machine operated at full throttle for two minutes, with the lance held
in a horizontal position. The volume of water required to fill the tank was then measured and emission rate deduced. Droplet assessments were carried out using a solution of 1 per cent Croceine Scarlet dye in water and collecting the droplets on photographic paper. The true droplet sizes were evaluated from measurements of the stains produced on the paper (Tropical Pesticides Research Institute, Annual Report, 1960-61). To assess the air- blast properties of each machine, measurements of air velocity were taken 4 ft. from the outlet using a velometer, and from these recordings, total air volume was deducted.
R esults
Data of emission rates with the lances held horizontally are given in Table 2. Further tests revealed that with all machines (except the Holder) emission rate was reduced as the lance was raised above the horizontal. Typical results are shown in Tables 3 and 4 for the Motoblo (1960) and the Fontan. In these tables, the degree of elevation of the lance is expressed as the vertical distance between the level of water in the tank and the outlet.
The results of the droplet assessments are given in Table 2. Droplet size is recorded as the volume Median Diameter (V.M.D.) defined as the diameter “d” such that 50 per cent of the total volume of the spray exists as droplets of diameters less than “d”. Larger droplets are obtained with higher emission rates, e.g. in general, for emission rates below1,000 c.c./min. the droplet range is approximately 80-130 microns and above 1,000 c.c./ min. it is approximately 130-180 microns.
Measurements of air velocity and volume are given in Table 5. The figures are much higher than those quoted in the handbook, but because measurements were taken at an
55
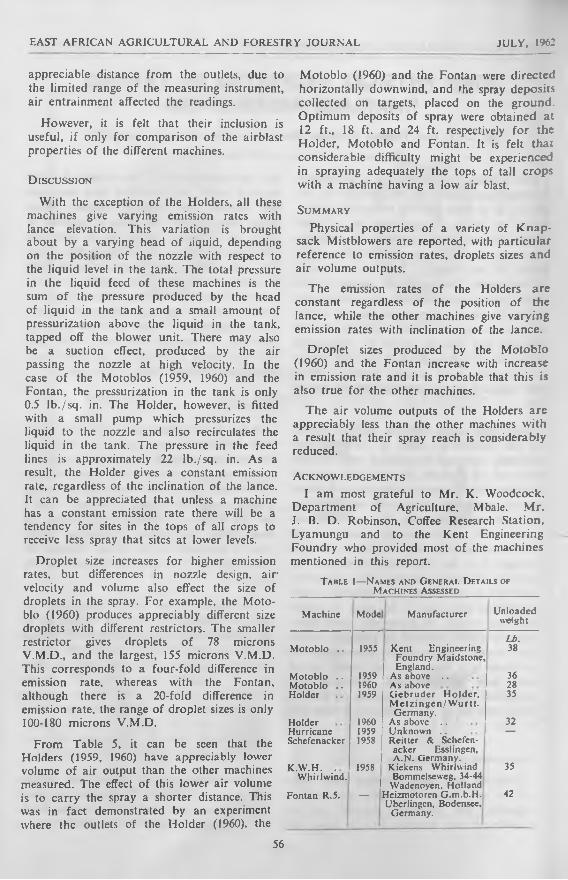
EAST AFRICAN AGRICULTURAL AND FORESTRY JOURNAL JULY, 1962
appreciable distance from the outlets, due to the limited range of the measuring instrument, air entrainment affected the readings.
However, it is felt that their inclusion is useful, if only for comparison of the airblast properties o f the different machines.
D isc u ss io n
With the exception of the Holders, all these machines give varying emission rates with lance elevation. This variation is brought about by a varying head o f liquid, depending on the position of the nozzle with respect to the liquid level in the tank. The total pressure in the liquid feed of these machines is the sum o f the pressure produced by the head of liquid in the tank and a small amount of pressurization above the liquid in the tank, tapped off the blower unit. There may also be a suction effect, produced by the air passing the nozzle at high velocity. In the case o f the Motoblos (1959, 1960) and the Fontan, the pressurization in the tank is only 0.5 Ib./sq. in. The Holder, however, is fitted with a small pump which pressurizes the liquid to the nozzle and also recirculates the liquid in the tank. The pressure in the feed lines is approximately 22 lb./sq. in. As a result, the Holder gives a constant emission rate, regardless of the inclination of the lance. It can be appreciated that unless a machine has a constant emission rate there will be a tendency for sites in the tops of all crops to receive less spray that sites at lower levels.
Droplet size increases for higher emission rates, but differences in nozzle design, air velocity and volume also effect the size of droplets in the spray. For example, the Moto- blo (1960) produces appreciably different size droplets with different restrictors. The smaller restrictor gives droplets o f 78 microns V.M.D., and the largest, 155 microns V.M.D. This corresponds to a four-fold difference in emission rate, whereas with the Fontan, although there is a 20-fold difference in emission rate, the range of droplet sizes is only 100-180 microns V.M.D.
From Table 5, it can be seen that the Holders (1959, 1960) have appreciably lower volume o f air output than the other machines measured. The effect o f this lower air volume is to carry the spray a shorter distance. This was in fact demonstrated by an experiment where the outlets of the Holder (1960), the
M otoblo (1960) and the Fontan were directed horizontally downwind, and the spray deposits collected on targets, placed on the ground. Optimum deposits of spray were obtained at 12 ft., 18 ft. and 24 ft. respectively for the Holder, Motoblo and Fontan. It is felt that considerable difficulty might be experienced in spraying adequately the tops of tall crops with a machine having a low air blast.
Su m m a r y
Physical properties of a variety of K napsack Mistblowers are reported, with particular reference to emission rates, droplets sizes and air volume outputs.
The emission rates o f the Holders are constant regardless of the position of the lance, while the other machines give varying emission rates with inclination of the lance.
Droplet sizes produced by the M otoblo (1960) and the Fontan increase with increase in emission rate and it is probable that this is also true for the other machines.
The air volume outputs of the Holders are appreciably less than the other machines with a result that their spray reach is considerably reduced.
A c k now ledgem ents
I am most grateful to Mr. K. Woodcock, Department of Agriculture, Mbale. Mr.J. B. D. Robinson, Coffee Research Station, Lyamungu and to the Kent Engineering Foundry who provided most o f the machines mentioned in this report.
T able 1— N ames and G eneral D etails of Machines Assessed
Machine Mode Manufacturer Unloadedweight
Motoblo .. 1955 Kent EngineeringLb.38
Motoblo .. 1959
Foundry Maidstone, England.
As above .. 36Motoblo .. I960 As above 28Holder 1959 Gebruder Holder, 35
Holder 1960
M etzingen/W urtt.Germany.
As above .. 32Hurricane 1959 Unknown .. —Schefenacker 1958 Reitter & Schefen-
K.W.H. . 1958
acker Esslingen, A.N. Germany.
Kickens Whirlwind 35Whirlwind.
Fontan R.5.1
—
Bommclseweg, 34-44 Wadenoyen. Holland
Heizmotoren G.m.b.H. 42Uberlingcn, Bodensee.
Germany.
56

EAST AFRICAN AGRICULTURAL AND FORESTRY JOURNAL JULY, 1962
Table 2— Emission Rates and Volume Median ____ D iameters (V.M.D.)______
Machine Model RestrictorEmiss
ion rate (c.c./ min.)
V.M.D.(microns)
Motoblo 1955 Norestrictor
1380 150
Motoblo 1959 2-2 mm. 1000 110Motoblo I960 No No. 4 1840 155Motoblo 1960 No. 3 1100 130Motoblo 1960 No. 2-2 620 95Motoblo I960 No. 1-7 470 78Holdci lQ g 7 0 mm. 1000 ISOHolder I960 2-0 mm. 1100 166Holder 1960 1 -5 mm. 760 145Holder I960 1 -2 mm. 630 148Hurricane 1959 No. 2 1875 170Schefenackcr 1958 No
restrictor2000 140
K.W.H. 1958 No. 3 970 127Fontan — No. 8 175 100Fontan — No. 140 3570 180
T able 3— Variation of Emission Rate (c.c.s per M inute) of the Motoblo (I960) with Inclination
___ of Lance
Head of WaterRestrictor No.
1-7 2-2 3- 4-
inches26* 470 615 1110 184020 420 570 1070 164016 405 510 1010 153012 360 490 950 13808 350 445 830 12404 290 410 820 10700
'Lance horizontal.
280 385 635 990
Table 4— Variation of Emission Rate (c.c.s per M inute) of the Font an with Inclination of Lance
Head of waterRestrictor No.
8 40 140
inches25* 175 520 3,57018 150 485 3,25012 145 440 3,0806 135 410 2.7200 115 370 2.500
'Lance horizontal.
T able 5—A ir Velocities and Volumes
Machine Model
Air movement 4 ft. from nozzle
Maxvelocityft./min.
Volumeft.3/min.
Motoblo 1955 1950 1400Motoblo 1959 2300 1400
Motoblo 1960 2600 1440
Holder 1959 2000 630Holder 1960 2000 720Hurricane 1958 1950 1550
Schefenacker . . 1958 1450 2000K.W.H................ 1958 2700 2000
Fontan .. — 3000 2000
57

EAST AFRICAN AGRICULTURAL AND FORESTRY JOURNAL JULY, 1962
CENSUS OF WILDLIFE ON THE SERENCETI, MARA AND LOITA PLAINS
By D. R. M. Stewart, Kenya Game Department, and Lee M. Talbot, Wildlife Research Project(Received for publication on 15th December, 1961)
In May, 1961, the authors, using a light aeroplane, carried out a wildlife census on the Serengeti Plains in Tanganyika and the Mara and Loita Plains in Kenya. It was already known that animal movement takes place between Tanganyika and Kenya and dial the region surveyed forms a single ecological unit bounded by topographical features and human settlement which largely prevent the plains wildlife o f the region from moving outside it. Although previous censuses and estimates (Pearsall, 1957; Swynnerton, 1958; Grimwood, 1960; Grzimek, 1960; Zaphiro, 1960; Talbot, 1961) had been made for various areas within the region, there had been no attempt to survey it as a whole.
A full account of the operation and the methods used has been offered for publication elsewhere; this summary merely records the results and compares them with previous figures. Table 1 gives the figures for zebra and wildebeest; a count of these two species formed the principal purpose of the survey, so that they are regarded as having been counted with the greatest degree of accuracy. Table 2 records the species which are easily seen from the air or which were not associated to any great extent with zebra and wildebeest and could therefore be given full attention when encountered. The accuracy of these counts is probably within 10 per cent. Table 3 records species which for various reasons are known to have been substantially undercounted, or which were only estimated.
A week before this survey reached the Serengeti, a Royal Air Force photographic reconnaissance aircraft on routine training photographed concentrations of wildebeest (and zebra) on the central Serengeti Plains. On the same day Talbot, on the ground, saw at least an additional 3,000 wildebeest on the plains outside the area covered by the aircraft. The total of the wildebeest photographed by the R.A.F., which became available in July after expert interpretation of the photographs by the Joint Air Reconnaissance Intelligence Centre, London, was 194,411. With Talbot's additional3,000 this gives a grand total on the central plains on 15th May o f some 197,411.
From the evidence provided by fresh tracks and by observers on the ground, it was possible a week after the R.A.F. survey to delimit within a few thousands the same wildebeest when counted from the light aircraft. The great majority (184,000 by the light aircraft count) had by then concentrated on the Simiyu River, and a number o f others were grouped around this concentration or were spread out further north towards Seronera. Of these, a minimum of 13,000 and a maximum of 16,000 appeared to have come from the concentrations photographed by the R.A.F. and the additional herds seen by Talbot. The total light aircraft count of these animals was therefore 197-200,000.
The R.A.F. count of the animals they photographed is likely to have been extremely accurate in view of their well-proven methods of aerial reconnaissance and interpretation of photographs. Their figures therefore provide a check on the accuracy of those obtained from the light aircraft partly visually and partly by means of photographs. The comparison indicates the degree of accuracy obtainable from light aircraft surveys.
R eferences
Darling, F. F. (1960). An ecological reconnaissance of the Mara Plains in Kenya Colony. Wildl. M onographs, 5.
Grimwood, I. R. (1960). Report of an aerial count of game in the Loita Plains. Kenya Game Dept., Nairobi (typed: ref. GA 3/1 /8 /8).
Grzimek, M., and Grzimek, B. (1960). Census of plains animals in the Serengeti National Park, Tanganyika. 1. Wildl. Mgmt., 24, 27.
Pearsall, W. H. (1957). Report on an ecological survey of the Serengeti National Park, Tanganyika. Oryx,4. 71.
Swynnerton, G. H. (1958). Fauna of the Serengeti National Park. Mammalia, 22, 435.
Talbot, L. M. (1961). Preliminary observations on the Population Dynamics of the Wildebeest in Narok District, Kenya. E. Afr. agric. for. 3., 27, 108.
Zaphiro, D. R. P. (1960). Report on Mara count. Kenya Game Dept., Nairobi (typed: ref. GA3/1/8/8).
58

EAST AFRICAN AGRICULTURAL AND FORESTRY JOURNAL JULY, 1962
T able 1—T hf Principal S pecies
Species Source and Date Serengeti (1) Mara Total
Wildebeest.. Pearsall, Nov.-Dee., 1956 (“rough estimate”) .
Swynnerton, 1956-7 (“very approximate101,000 — —
estimate”) 180,000-200,000 _
Grzimek, Jan.. 1958 (aerial census of Serengeti National Park) (2) .
Darling, Oct. Nov., 1958 (“individually99,481 — —
counted”) ........................................Zaphiro and Talbot, Nov., 1959-Nov.,
— 15,000 —
1960 (aerial and ground counts) — 7,000-8,000 —
Grimwood, April, 1960 (aerial count) . Talbot and Stewart, May, 1961 (complete
— 5,897 —
census) ........................................ 221,699 17,817 239,516
Zebra Grzimek, Jan., 1958 (aerial census of Serengeti National Park) (2) . .
Darling, Oct.-Nov., 1958 (“estimate from57,199 — —
critical sample counts”) — 12,000 —
Grimwood, April. 1960 (aerial count) . Talbot and Stewart, May, 1961 (complete
— 7,000 —
census) ....................................... 151,006 20,867 171,873
Footnotes: (1) Excluding Crater Highlands.
(2) Excluding the Northern Extension added in 1958.
T able 2— Species Counted with Probable A ccuracy of Co u n t W ithin T en per cent
Species Source and Date Serengeti (1) Mara Total
Topi Grzimek, Jan., 1958 (aerial census of Serengeti National Park) (2) . . 5,172
Darling, Oct.-Nov., 1958 (“estimate from critical sample counts”) 4,000
Talbot and Stewart, May, 1961 (possibly up to 10 per cent lo w )............................ 15,766 4,111 19,877
Buffalo Grzimek, Jan., 1958 (aerial census of Serengeti National Park) (2) . . 1,813
Darling, Oct.-Nov., 1958 (“estimate from critical sample counts”) 4,000
Talbot and Stewart, May, 1961 .. 15,898 5,934 21,832
Elephant . . Grzimek, Jan., 1958 (aerialc ensus of Serengeti National Park) (2) . . 60
Darling, Oct.-Nov., 1958 (“estimate from critical sample counts”) 500
Talbot and Stewart, May, 1961 . 702 455 1,157
Footnotes: (1) Excluding Crater Highlands.
(2) Excluding the Northern Extension added in 1958.
59

EAST AFRICAN AGRICULTURAL AND FORESTRY JOURNAL JULY. 1962
T able 3— S pecies Partially C ounted or Estimated
Species Source and Date Serengeti (1) Mara Total
Kongoni . . Grzimek, Jan., 1958 (aerial census of Screngeti National Park) (2) .
Darling, Oct.-Nov., 1958 (“estimate from1,285 — —
critical sample counts”)Talbot and Stewart, May, 1961 (minimal
— 1,000 —
count, population possibly substantially higher) ............................ 1,379 721 2,100
Eland Grzimek, Jan., 1958 (aerial census o fScrengeti National Park) (2) .. 2,452 — —
Darling, O ct.-Nov., 1958 (“estimate from critical sample counts”)
Talbot and Stewart, May, 1961:500 —
(Partial count) . . . . . J 2,450 750 3,200Estimate based on partial count \ 4,900-7,350 1,500-2,250 6,400-9,600
Rhinoceros Grzimek, Jan., 1958 (aerial census o f Serengeti National Park) (2) ..
Darling, Oct.-Nov., 1958 (“estimate from11 — —
critical sample counts”)Talbot and Stewart, May, 1961 (minimal
— 100 —
count, only small proportion of total).. 29 54 83
Thomson’s Pearsall, 1953 (estimate from groundgazelle. sa m p le ) .....................................................
Grzimek, Jan., 1958 (aerial census of180,000 — —
Screngeti National Park) (2) . . Darling, Oct.-Nov., 1958 (“estimate from
194,654 (3) —
critical sample counts”)Talbot and Stewart, May, 1961 (estimate)
— 12,000
480,000-(4) .....................................................800,000
Lion Temple-Boreham, Talbot, 1961 (estimate based on ground counts)
Talbot and Stewart, May, 1961:— 200-300
159(Partial count) 75 84Estimate .. . . ^ 1 300-400 250-300 550-700
Footnotes: (1) Excluding Crater Highlands.(2) Excluding the Northern Extension added in 1958.(3) Combined figure for Thomson’s and Grant’s Gazelle; however, Grant’s make up a
very small percentage of the total gazelle population.(4) Estimate based on visual impression of their numbers as compared with the numbers
of zebra.

EAST AFRICAN AGRICULTURAL AND FORESTRY JOURNAL JULY, 1962
A SHORT NOTE ON E N C L E R O M Y C E S C O E T Z E I P. Henn.By I. A. S. Gibson, Kenya Forest Department, and J. Kimeria, Makercre College, Kampala
(Received for publication on 15th January. 1962)
Engleromyces goctzei P. Henn. was first described from Tanganyika in 1899, where it was found growing on bamboo (Arundinaria alpitta K. Schum.) [1], Since then it has featured in several works on systematic mycology [2, 3, 4] but studies on the biology of this outstanding fungus appear to be lacking.
It has been recorded throughout East Africa, where bamboo occurs in any quantity, and also from the Kivu district of the Congo [4]. In the Southern Aberdares, where the present study was made, it is known as Kieha and is used to make an aqueous extract for the treatment of fevers and digestive disorders. Elsewhere, it is called Ihula (Rungwe. Tanganyika) or Ingunzidi (Kivu, Congo) but no reference to its medicinal use in these regions has been found.
The present study was carried out mainly between May and July, 1961, and was designed to provide information on the development of the fungus in the field and its relation with bamboo.
A . al pitta occurs at altitudes above 8.000 ft. in Kenya, often forming almost pure stands. It grows to a height of 40-50 ft. with a basal stem diameter of about 3 in. when mature.
F ield O bservations
A collection of 61 fruit bodies was made from bamboos in the Kinale forest area. This included all stages of development with notes on distribution and apparent effects of E. goetzei on bamboo. Ten fruit bodies were selected for growth studies, marked and measured in situ and then revisited after seven weeks for a second measurement. Collections were also made of small lesions on bamboo stems which might prove to be the initial stages of the development of fruit bodies of E. goetzei.
The appearance of collections conformed fairly closely with previous descriptions, with the exception that the smaller, and presumably younger, fruit bodies were of a pinkish tint rather than pale yellowish [4], Some older specimens were characterized by a black incrustation which at times almost covered the surface. All fruit bodies were found
towards the tops of bamboo stems, about 30- 40 ft. from the ground and within 5 ft. of the tip. Size varied considerably, from small growths weighing a few ounces to the largest with a diameter of nearly a foot and weighing 17 lb. The distribution of the fungus within the bamboo forest was not completely uniform but, in those areas where it was found, infected bamboos were seldom less than 50 yards apart. On only three occasions, in the 71 observations that were made, were two fruit bodies found on the same stem.
A marked accumulation of water was noted within the bamboo internodes which bore fructifications, particularly where these were small. This could be accounted for in the majority of cases by the presence of insect bore holes.
Plate 1.—Small, young, fructification of Englero- myces goetzei (scale in inch squares)
61

EAST AFRICAN AGRICULTURAL AND FORESTRY JOURNAL JULY. 1962
The effect of E. goeizei on the host seemed relatively mild. Only four collections were made from stems that were completely dead and in 46 others only the stem above the point o f attachment of the fungus had succumbed. Only well-grown bamboo was found associated with the fungus.
D eta ils o f Infections
The point of attachment of fruit bodies ofE. goeizei covers a very small area, relative to the size o f the fully grown fungus, rarely exceeding 1£ in. in lengh and i in. in breadth. This area is stained a dark grey at the perimeter and a lighter grey-brown within. The tissues in this region are not markedly decomposed but the fibres tend to be more brittle than those in surrounding healthy tissues. This stained area penetrates through to the central stem cavity where it connects with a thick mycelial plug about 2 in. long which fills the cavity. At its ends, this plug is white, but tends to darken where it is in contact with the stained area o f bamboo.
Plate 2.—Longitudinal section through tissues of bamboo showing hyphac of E. goeizei penetrating
fibre walls
Longitudinal sections of the stained tissues show them to be full o f hyphae running at approximately right angles to the fibres (Plate 2), the water conducting tissues and parenchyma in particular, being packed with hyphae Transverse sections are required to show that the cell walls of the fibrous tissues are heavily penetrated by the fungus. Invasion of the host by the fungus is limited to the stained region mentioned above, but here the colonization is intense.
This characteristic invasion pattern has enabled us to detect the earliest stages of fruit body development on the host. Small black stem lesions, collected in the field, were sectioned, and two were found to be associated with fungal invasion very similar to that o f well-developed fruit bodies. In these cases a similar staining of the internal host tissues was evident with some development o f a mycelial mass in the stem cavity. Externally there was some longitudinal darkening of the stem with one or two centrally disposed small black raised areas about J in. to i in. long and superficially cracked in the centre to show white tissues beneath. Sections of these raised portions showed them to contain a small mycelial mass (Fig. I), probably the first stage in fruit body formation.
Our information on the rate of growth o f the fructification is based on field measurement o f ten fruit bodies, varying from 3 to 5 in. in diameter. After seven weeks these were found to have increased in diameter by1.7 in. on average, or roughly a volume of 40 cubic centimetres. The specific gravity of fruit bodies brought to the laboratory was found to be in the region of 0.5 and the moisture content about 80 per cent. An estimate of growth rate as grams dry weight per week, derived from these figures, gives a value of0.4. This relatively high growth rate could only be supported by a highly efficient system for tapping the translocation stream of the host. Further evidence for this is found in analyses of the fruit body and the host substrate for nitrogen content. The results o f these give 1.60 per cent for the fungus and 0.29 per cent for associated bamboo tissues.
Development of asci appeared to be a feature of the later stages of fruit body growth. Of the 61 specimens originally brought to the laboratory in June, only six were producing mature asci. However, after
62

EAST AFRICAN AGRICULTURAL AND FORESTRY JOURNAL JULY, 1962
Fig. 1.—Sketch of small raised black lesions with internal white mycelial mass on sections of bamboo stem. These were the earliest stages observed in the development of fruit bodies of
E. goetzei
they had been in store for five months they were re-examined and 31 were then found to have formed mature spores.
Although these observations have been extremely limited in scope, it is hoped that they will be sufficient to stimulate further study. The relationship between E. goetzei and its bamboo host appears to be extremely well balanced and further research into this might well prove rewarding.
We are indebted to Dr. H. Birch for his assistance with analyses, and to Messrs.
W. G. Dyson and D. Whitfield who assisted with the photographs.
R e fere nces
[1] Hennings, P. (1901). Fungi Africani Orientalis. Bot. Jahrb. 28. 327
[2] Duke, M. M. (1926). Fungi from Kenya Colony. Kew Bull. No. 8.
[3] MacDonald, J. (1924). Ann. Rept. Kenya Dept. Agric. 1922, 111
[4] Dennis, R. W. G. (1961). Xyiarioideae and Thamnomycetoideae of Congo. Bull. bot. Gard. Brux. 31. 109.
63

EAST AFRICAN AGRICULTURAL AND FORESTRY JOURNAL JULY, 196:
REARING TURKEYS IN UGANDABy J. C. M. Trail, Livestock Experimental Station, Entebbe, Uganda
(Received for publication on 24th October. 1961)
The turkey is a comparatively easy bird to rear in Uganda using conventional poultry equipment, provided correct management and feeding methods are applied. In company with the goose, the turkey makes by far the most efficient use of food of any farm poultry, and in fact is not surpassed in its ability to convert food into meat by any farm animal (Feltwell).
The aims of this paper are by using information gained at the Livestock Experimental Station, Entebbe, to outline the most suitable rearing methods, and give the growth rate, food consumption and feed conversion figures and the costs of production o f 12-week-old turkey poults in Uganda obtained from a turkey-rearing trial carried out at Entebbe.
Rearing M ethods
The two types of brooder found to be best suited for the early part of chick rearing in Uganda (Trail. 1962) are also most suitable for turkey rearing. These are the warm-floor brooder, where heat is supplied from beneath the wire floor by small paraffin lamps, and the infra-red ray lamp either bright or dull, where electricity is available, with poults kept in a wire-floored cage. Both these brooders can be easily purchased in East Africa. For turkey rearing, the chick-carrying capacity of the equipment is halved.
Under the most successful system of turkey rearing used at the Livestock Experimental Station, Entebbe, the poults are supplied with artificial heat in either type o f brooder for three weeks, and after a further week in the brooder without heat, are transferred to fold units in batches of 20 birds. These fold units provide 1| square feet per bird inside the house section, and 21 square feet in the run. The poults are kept in these fold units to 12 weeks of age, when they are sold as growers, or transferred to deep litter houses with straw yards for breeding or fattening. The fold units are moved daily onto clean ground with good grass cover, in order that the risk of coccidiosis may be greatly reduced and fresh green food be continuously available. From day-old to
12 weeks a commercial turkey mash produced in East Africa is fed ad lib., thereafter a normal poultry layers mash is used. Chick mash is not suitable for the early growing stages of the poults, as the relative growth rate of the turkey is greater than that of the fowl, and therefore larger amounts of body building materials are required.
R e su l t s
Growth Rates and Food Consumption
The following results were obtained from a trial carried out at the Livestock Experimental Station. Entebbe. Three groups of 24 Broad Breasted Bronze day-old poults were obtained from the stock produced for sale to farmers, reared to four weeks of age under infra-red lamps and then transferred to fold units where they remained until disposal at 12 weeks o f age. A commercial turkey mash was fed ad lib. to 12 weeks, and the chemical analysis is given in Table 1.
T able 1— Chemical Analysis of Turkey Mash
DryMatter
CrudeProtein
EtherExtract
CrudeFibre
TotalAsh
Nitrogen free extract
91-56 25-03 5-34 3-72 14-52 42-95
The fold units were moved onto clean ground with a good grass cover, daily, and fresh water provided at all times.
The average growth, food consumption and feed conversion rates of the poults are given in Table 2.
From Table 2 it is seen that the poults averaged approximately 1 lb., 11 lb. and 41 lb. live- weight, and had consumed I f lb., 51 lb. and 13J lb. food at the one month, two months and three months stages respectively. The overall feed conversion rate to three months of age was 3.4:1. The poor feed conversion rate in the first week was due to food wastage on the floor of the brooder while inducing the poults to start eating.
I

EAST AFRICAN AGRICULTURAL AND FORESTRY JOURNAL JULY, 1962
Table 2
Age Averageliveweight
Food consumption per poult Feed conversion
Weekly Cumulative Weekly Overall
(02.) (02 .) (02.)At hatching 1-81 week 2-5 5-6 _ 8-0 : I2 weeks 4 0 5-8 11-4 3-9 : 1 5-2 • 13 weeks 5-4 6-6 18-0 4-7 : 1 5-0 • I4 weeks 7-9 7-7 25-7 3-1 : 1 4-2 : 15 weeks 10-4 10-2 35-9 4-1 : 1 4-2 • 16 weeks 15-8 15-8 51-7 3-0 : 1 3-7 : 17 weeks 20-8 15-9 67-6 3-2 : 1 3-6 - 18 weeks 29-5 20-3 87-9 2-3 : 1 3-2 • 19 weeks 36-2 28-8 116-7 4-3 : 1 3-4 : 110 weeks 46-1 29-6 146-3 3-0 : 1 3-3 : 111 weeks 58-4 33-9 180-2 2-8 : 1 3-2 • 112 weeks 67-1 40-1 220-3 4-6 : 1 3 -4 : 1
Culling and mortality to 12 weeks of age was five poults, equivalent to a 7 per cent loss. N o outbreaks of coccidiosis occurred, due to the daily moving of the fold units onto clean ground.
Costings
The costings for the three hatches o f poults were as follows: —
12-day-old poults: sh. cts.At Sh. 6 ea ch ................................................... 432 00
Depreciation on infra-red brooder, food and water troughs:
Total cost Sh. 225, 5-ycar life, used for 3 months . . . . . . . . 11 25
Depreciation on fold unit:Total cost Sh. 350, 5-year life, used for 6
months ................................................... 35 00Fuel:
Electric lamp, 250 watts rating, for 1,500 hours at 12-5 cents per kilowatt . . 47 00
Labour:l / 12th of one man per day for 6 months at
Sh. 120 per month .......................... 60 00Feedingstuffs:
70 poults at 13J lb. per poult =963 lb. at Sh. 46 per 150 lb. bag ........................... 295 40
t iterest on capital:5 per cent o f Sh. 1,200 for 6 months . . 30 00
Sh. 910 65
Thus with a mortality and culling rate of 7 per cent, it is seen from these figures that the cost of production o f the 67 three-month- old poults worked out at Sh. 13/60 per bird.
The main items of expenditure expressed as percentages of the total cost of productionwere as follows: —
Day-old poults . . . . 4 7 %Depreciation on houses and
equipment ............................ 5 %Fuel ......................................... 5%Labour . . . . . , 7 %Food .................................................. 3 2 %
Summary
The rearing methods best suited for the production of 12-week-old turkey poults in Uganda are outlined. The weekly growth rates, food consumption and feed conversion rates for poults from day-old to 12 weeks are given, the three-month-old poults weighing 4 £ lb., having eaten 131 lb. o f turkey mash, and given a feed conversion rate o f 3.4:1. The cost o f production of the three-month-old poult is Sh. 13/60, the main items of day-old poults, depreciation on equipment, fuel, labour and food making up 47 per cent, 5 per cent, 5 per cent, 7 per cent, and 32 per cent o f the total cost respectively.
Acknowledgements
The author wishes to thank the Director of Veterinary Services and Animal Industry for permission to publish this paper.
R efe r e n c e s
Feltwell, Ray. (1954). Turkey Farming, p. 14.Trail, J. C. M. (1962). E. Afr. agric. for, J. “Chick
Rearing in Uganda", p. 154.
65

EAST AFRICAN AGRICULTURAL AND FORESTRY JOURNAL JULY, I96Z
REVIEWSCrop A daptation and D istr ibu tio n , by
Carroll P. Wilsie. Published by W. H. Freeman and Company, San Francisco 4, California, U.S.A., pp. 448. 145 illus. Price $9.
This book is concerned with the principles of crop adaptation and distribution. It is divided into three main sections. The first is concerned with general principles. It contains six chapters which range from such items as plant distribution and limiting factors to the origin of cultivated plants. The second section contains seven chapters which refer to the effects of environmental factors. The third section, o f five chapters, discusses crop distribution on a climatic basis.
It is designed as a students’ textbook because it would be impossible to give a detailed review of such a wide range of subjects within its 448 pages. Nevertheless it can be used by the research worker as well as the student, for a long list o f useful references is appended to each chapter. For that reason alone it can be highly recommended to all workers in the agricultural sciences. It has, of course, many other good pioints.
A romatic or O riental T obaccos, by Frederick A. Wolf. Published by the Duke University Press, Durham, North Carolina, pp. 278. Price S12/50.
This lavishly produced and expensive book deals exclusively with the aromatic or oriental tobaccos which for many centuries were grown only in the Near East. It deals in detail with plant structure and development, physiology, quality, cultivation, grading, genetics, diseases and pests as well as the economic aspects.
It is likely to be a prized reference book for a long time to come.
A B ibliography o f Subterranean Clover with a descriptive introduction by D . E. Symon. Mimeographed Publication N o 1/1961 by the Commonwealth Bureau of Pastures and Field Crops, Hurly, Berkshire, pp. 122. Price Sh. 12.
All Commonwealth Agricultural Bureaux publications are of a very high standard and this one maintains it. It is an essential reference book for the pasture research worker. It is particularly noteworthy in that it contains cross-references under specific headings such as growth, development, climatic requirements, mineral nutrition and so on.
So il and L and-u s e Su r v e y s , by the Regional Research Centre of the British Caribbean Obtainable from the Imperial College of Tropical Agriculture, Trinidad, W.l.
7. Jamaica, Parish of C larendon, by T. F Finch under the direction of T. A. Jones, pp. 33 and map. Price Sh. 20.
8 . Jamaica, Pa rish of St . Jam es, by R. W . Price under the direction of T. A. Jones, pp. 26 and map. Price Sh. 12.
9. G renada, by K. C. Vernon, Hugh Payne and J. Spector under the direction of T. A. Jones, pp. 44 and map. Price Sh. 18.
10. Jamaica, Parish of St . M ary, by K. C. Vernon, pp. 30 and map. Price Sh. 14.
11. Jamaica, Parish of Portland , by T. F. Finch, pp. 32 and map. Price Sh. 15.
EAST AFRICAN AGRICULTURAL AND FORESTRYJOURNAL
Vol. XXVIII—No. 2 October, 1962Primed and published by the Government Printer, Nairobi
Issued under the authority of the East African Common Services Organization and published every three months—July, October, January, April. Volume consists of four issues (commencing July issue)
Editorial Board: Director o f E.A. Agriculture and Forestry Research Organization; Director of E.A. Veterinary Research Organization; Directors of Agriculture. Kenya, Uganda and Zanzibar, and Commissioner for Agriculture. Tanganyika: Director of Veterinary Services, Kenya and Uganda, and Commissioner of veterinary Services, Tanganyika; Conservators of Forests, Kenya, Tanganyika and Uganda.
Executive Committee: Director of E.A. Agriculture and Forestry Research Organization; Director of E.A. Veterinary Research Organization: The Editor.
E d it o r : J. G lover
E.A.A.F.R.O., P.O. Box 21, K ik u yu , K enya
Subscription Sh. 15 per volume (Sh. 4 single copy) including postage, payable to the Editor. Subscribers are advised to remit postal orders in payment, otherwise bank commission must be added in the case of cheques.
The Editor does not hold himself responsible for opinions expressed by contributors.
Matter submitted for publication should preferably be sent through the local member of the Editorial Board. Double spacing should be used in typescript. Contributors receive 25 prints of their articles free. Additional copies may be obtained on payment if asked for in advance. Prints bear the same page numbers as the original articles in the Journal, except where, to meet a contributor’s wishes, prints are supplied before publication has been completed.
Readers are reminded that all agricultural inquiries, whether they relate to articles in the Journal or not, should be addressed to the local Director of Agriculture, and not to the Editor.
CONTENTS
The Control of Cattle Trypanosomiasis with Drugs in Kenya: Methods and Costs(E . F. Whiteside)
Continuous Arabic Cropping with the use of Manure and Fertilizers (R. C. Grimes and R. T. C l a r k e ) ...................................................
Chemical Investigations into a System of Lakes. Rivers and Swamps in SW. Kigezi. Uganda (S’. A. Viser) ...................................................
Ash Distribution in Kenya Roughages (H. W. Don gall) . .
Crude Fibre—Crude Protein Relationship in Kenya Roughages (H. W . Dougall) . .
PACIE PAGE
Spraying Arabica Codec for the Control ofLeaf Rust [J. A. ,V. Wallis and I. D. Firman) 89
67Nematocerus sp. Part V (J. A. Bullock) . . 105
74 Albizia atunesiana—A Useful Timber Tree ofWestern Tanganyika (J. A. C. Howard) . . 110
Small Sca'c Broiler Production in Uganda 81 (J. C. M. T ra il) ................................................... 113
„ 7 Effect of Fertilizers. Sulphur and Mulch onEasl African Tea Soils. Part III . . . . 117
88 Reviews ....................................... 104, 109, 116, 120
INDEX TO ADVERTISERS
PAGB PACE
D u n l o p ........................................... COVER PAGE. 4 National & Grindlays Bank . . co v er pag e 2I .A. Breweries cover pag e 7 Standard Bank , . co v er pag e 2

FOR ADVERTISING SPACE IN THIS JOURNAL
Apply to the
KENYA ADVERTISING CORPORATION, Ltd.NEW STANLEY HOUSE, NAIROBI, KENYA
P.O. Box 563 - Telephone: 21018
Published I960T H E IN D IG EN O U S L IV ES T O C K O F EA STERN A N D S O U TH ER N A FR IC Aby I. L. MASON and J. P. MAULE
Technical Communication No. 14 of the Commonwealth Bureau of Animal Breeding and Genetics
ISO pp. 180 illustrations and 3 maps Price: 45s.
The book provides a comprehensive description of all types of livestock in the area east of a line drawn from the Northern Sudan to the mouth of the Congo. Measurements and live weights, as well as an indication of performance, are given wherever possible and there is a complete bibliography.
"The information given in this book should form a guide as to which of the various types it will be worthwhile to concentrate on for improvement in production. . . .” — Sir |ohn Hammond in “ Nature".
The book is indispensable to anyone connected with the livestock industry of Africa
Orders for this publication can be placed with any major bookseller or sent to:
C O M M O N W E A L T H A G R I C U L T U R A L B U R E A U X , C E N T R A L SA LE S B R A N C H , F A R N H A M R O Y A L , B U C K S , E N G L A N D .
II P le a se m e n t io n th is Journal w h e n r e p ly in g to a d v e r tise r s

EAST AFRICAN AGRICULTURAL AND FORESTRY JOURNAL
THE CONTROL OF CATTLE TRYPANOSOMIASIS WITH DRUGS IN KENYA: METHODS AND COSTS
By E. F. Whiteside, Department of Veterinary Services, Kenya(Received for publication
In former years the fly-belts of eastern Africa contained no cattle. Cattle could not survive in them because of a lethal disease (trypanosomiasis) carried by tsetse flies. During the present century a demand for occupation of the fly-infested areas has grown up. largely due to the pressure of rising population and sometimes exacerbated by expansion of the fly-belts themselves. At first the demand was met by eradicating the tsetse fly; and the various ways of achieving this are still the most satisfactory and permanent solution to the problem. But they are relatively expensive. A different, less permanent, solution has recently come from the discovery of effective trypanocidal drugs which can cure or protect domestic animals. These have been so rapidly exploited that, today, several million cattle are maintained in fly-belts throughout tropical Africa by such means. In Kenya alone, over half a million doses of trypanocidal drugs were used during I960; and consumption rises annually as more and more experience is gained in this field of chemotherapy.
During the past five years a number of longterm field trials with cattle and trypanocidal drugs have been carried out in a representative selection of the tsetse-infested areas of Kenya. The cattle used were fairly typical of the average indigenous shorthorn Zebu found in East Africa, being for the most part bought locally from the nearest fly-free area. All the drugs currently available for the treatment of cattle trypanosomiasis were included in the trials, and the regimen of each drug that gave adequate control of the disease was determined. This paper briefly describes the regimens found necessary in each situation that was investigated, with special reference to the cost of the drugs required. There are additional costs inseparable from chemotherapy—staff, instruments, facilities for microscopic diagnosis, and so on—which vary greatly according to circumstances; an attempt is made to include these in the final discussion.
It must be emphasized that the results presented here do not apply to “grade” cattle (i.e. crosses between indigenous and exotic breeds), nor to imported European types.
on 26th February. 1962)These are more susceptible to trypanosomiasis than indigenous cattle and need different systems of treatment.
Experimental M ethods
In each trial area a cattle boma, a crush, and buildings for staff (including a microscope room) were constructed of local materials, and a net work of paths was marked out. Regular catches to determine the tsetse fly density were made along the paths, and from time to time batches of flies were dissected in order to find the proportion infected with trypanosomes. The experimental cattle were kept in the boma at night and herded throughout the trial area during the day; they were watered daily within it. Blood smears from them were examined twice weekly to detect infections. The drugs were always injected subcutaneously into the dewlap, and the system of treatments varied with the type of drug being tested. In the case of curative drugs, treatment was normally given 1 to 5 days after the first appearance of an infection as indicated by a positive blood smear. Over a long period this gave the average number of treatments required per annum. For testing prophylactic drugs several systems were used. In one, treatment was repeated when 10 per cent of the cattle at risk had positive smears. In another, the interval between successive treatments was adjusted until a period just sufficient to prevent any intervening positive smears was arrived at. In another, each animal stayed until it showed infection and was then removed; when all had shown infection the group was re-treated and returned to the trial area. All these systems furnished reasonable measures of the length of protection afforded by the prophylactic drug wherever it was being tested.
A list of trials used for the present study will be found in Table 1. Ngomeni is near the Kenya coast in Kwale District; Lambwe is near Lake Victoria in Kisii District; Imenti and Mariara are both near Meru in northern Kenya. The predominant species of tsetse fly in all areas was Glossina pallidipes Austen. Ngomeni contained G. austeni Newstead in addition. The other areas had low densities ofG. brevipalpis Newstead.
67

EAST AFRICAN AGRICULTURAL AND FORESTRY JOURNAL OCTOBER, 1962
T able 1— Long-term F ield T rials
Place and Drugs TestedGroup
No. CattleObservation
Period in Months
Trypanosomiasis | Incidence
Ngomeni ......................................... 18D 10 steers . . 35 (1957-59) Low.Berenil Ethidium 18ABC 26 mixed (a) 63 (1957-62)Antrycide 18F, 28 calves (b) 32 (1959-62)Antrycide Pro-salt 18F2 ! 9 calves . . 19(1960-62) Medium
30AB 40 steers . . 30 0 957-59) 1 t062A 10 mixed . . 28 (1959-62) high.62F, 8 calves . . 19 (1960-62)80AB 20 steers . . 6(1961-62) J
Lamb w e ................................ 42A 20 cows 43 (1958-61) -Berenil . . 42F,A 15 calves . 32 (1959-62)Ethidium Antrycide 42F]B 9 calves . 19(1960-62)Antrycide Pro-salt 54 A B 60 steers . 34 0 959-62) ►High.Prothidium 54 DE 20 steers . 35 0 959-62)
60 ABC 36 steers . . 26 0959-61)64AB 18 cows .. 24 0960-62)64Fi 8 calves . . 19 (1960-62)
Imenti ............................ 39B 6 mixed . | 28 0958-60) Low.Berenil . . 40A 30 mixed . 31 (1958-60)Ethidium Prothidium . 40Fi 8 calves .. 18 (1959-60) ^Medium.40 B 5 steers . ! 6(1959-60)
77A 12 cows . 3 (1960-61)
M ariara . 40A 17 mixed . 19 (1960-62) 'Berenil . . 40F, 8 calves . 19 0960-62)Ethidium Prothidium 40CD 7 steers . 19 (1960-62) Very high.
77A 11 cows 12 (1961-62)77F, 4 calves . .
,7 (1961-62) ij
(a) “Mixed” denotes bulls, steers and cows.(b) “Calves" denotes offspring of experimental cows reared in the trial area.
In som e groups the number of cattle was rather small; but since every regimen was duplicated or triplicated the number of cattle actually tested with each drug was reasonably large. The distribution of treatments cannot conveniently be shown because they were often switched from group to group in order to avoid bias, but they can be summarized as follows. The trials shown in Table 1 are equivalent in sum to observing 50 cattle for nearly 21 years: classified by the drugs used they are equivalent to observing 50 cattle for 2} years on Berenil. for 2) years on Ethidium. for 5 | years on Antrycide, for 5 years on Antrycide Pro-salt, and for 5± years on Prothidium*.
The natural incidence of trypanosomiasis in the trial areas was measured in various ways but only the simplest is reported here. It also seems to be the most satisfactory. It is the average number of infections per head per annum recorded from cattle continuously exposed in the trial area, every infection being treated with Berenil. The higher this figure, the greater the incidence (cf. Table 2, second and third columns). Since Berenil has hardly any prophylactic effect [1], every animal cured with it is almost immediately open to fresh infection, hence the incidence recorded is fairly close to the true natural incidence.
‘ Berenil Farbwerke Hoechst A.G., Frankfurt, Germany.Ethidium
Prothidium j Boots Pure Drug Co., Ltd.. Nottingham. England.
Antrycide P r o - s a k ) Imperial Chemical Industries (Pharmaceuticals) Ltd., Wilmslow, England.
68

EAST AFRICAN AGRICULTURAL AND FORESTRY JOURNAL OCTOBER, 1962
R e su l t s
Drug-regimensA detailed description of individual trial
results is outside the scope of this paper, though it may be mentioned that the variation between trials of the same drug in the same place was fairly small. The principal factor causing variation was, of course, natural changes in the incidence of the disease. It is scarcely necessary to state that, whatever the drug, more frequent treatments were needed in a high incidence of trypanosomiasis than in a low one. The results are summarized on this basis in Table 2, showing the annual number of treatments with each drug required in four different levels of incidence: area “A" is derived from the Mariara records, area "B" is derived from the Lambwe records, area “C” is a slight extrapolation from the Ngomeni and Imenti records, and area “D” is derived from the author’s general experience of low-incidence areas in Kenya.
A few comments on Table 2 are needed before the regimens can be described in detail. First, some apparent anomalies must be explained. One of these can be seen in area "B”, where prophylactic Antrycide was required six times a year but curative Antrycide only four times. It must be remembered that on the curative regimen every animal had an infection before treatment, whereas on the prophylactic regimen every animal was to all appearances kept free of infection. In other words, the infection rate of cattle on the curative regimen was 400 per cent per annum, while on the prophylactic regimen it was nil. Thus, relatively more prophylactic treatments are needed because the level of protection aimed at is much higher. Another type of
anomaly occurs amongst curative drugs in higher incidence. For example. Berenil was required in area "B" 6.5 times a year but Ethidium only 3.2 times. This is because some curatives in fact exert a prophylactic effect, which, as Table 2 shows, is greatest with Ethidium [3], somewhat less with Antrycide, and least with Berenil [1].
The maximum safe interval between treatments with Antrycide Pro-salt in Kenya is considered to be three months. Though it will protect for longer than this under some circumstances, the danger of drug-resistance is such as to prevent a longer interval being used. For the same reason the maximum safe interval between Prothidium treatments is considered to be five months. The corresponding numbers of treatments per annum are 4.0 and 2.4 respectively. These are shown against “medium incidence" in Table 2, and partly account for further anomalies between the numbers of curative and prophylactic treatments.
Finally, it should be explained that the single-drug regimens of Table 2 all have to be modified in practice because of drug- resistance. Trypanosomes in cattle become resistant to the action of almost every drug rather easily, whereupon the drug ceases to be effective. Resistance tends to develop more rapidly where the natural incidence is higher, but may eventually appear anywhere. Whenever it occurs it must be controlled without undue delay by a change of drug [5]. The drug next exhibited should cure infections resistant to the first, and is conveniently termed a “sanative" [4]. For all practical purposes the best sanative now available seems to be Berenil. It can generally be relied upon to cure infections resistant to all other
T able 2—T he N umber of Treatments with D ifferent D rugs R equired to Control CattleT rypanosomiasis of V a rying Incidence
AreaRef.
Incidence of Trypanosomiasis
Average Number of T reatments per Beast per Annum
Curative D rugs Prophylactics
Berenil Antrycide Ethidium AntrycideProsalt Prothidium
A Very high 12 (a) 6-5 (a) 6B High 6-5 4 0 3-2 6 0 3-5C Medium . , 3 2 2 4 0 2-4D Low 1 1 1 (b) (b)
(a) Not tested. (A) Would not be used.
69
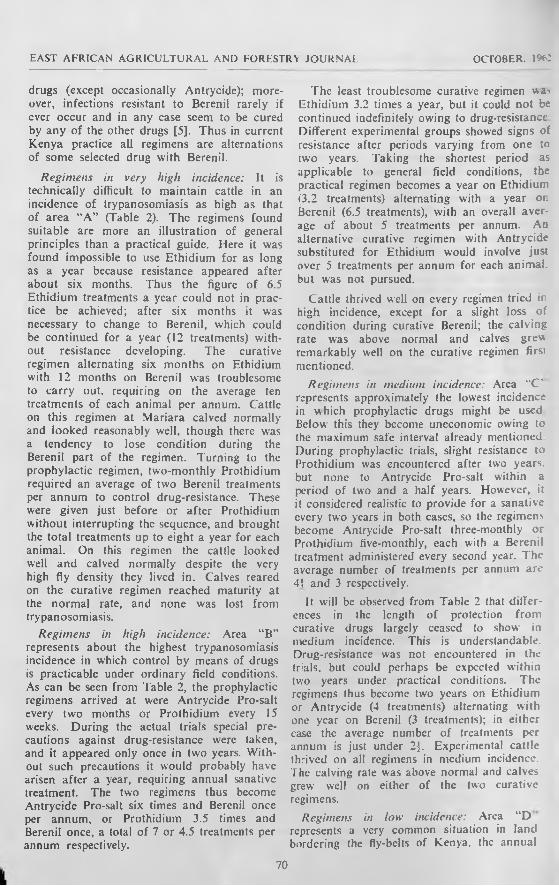
EAST AFRICAN AGRICULTURAL AND FORESTRY JOURNAL OCTOBER. 19f0
drugs (except occasionally Antrycide); moreover, infections resistant to Berenil rarely if ever occur and in any case seem to be cured by any of the other drugs [5]. Thus in current Kenya practice all regimens are alternations of some selected drug with Berenil.
Regimens in very high incidence: It is technically difficult to maintain cattle in an incidence of trypanosomiasis as high as that of area “A ” (Table 2). The regimens found suitable are more an illustration of general principles than a practical guide. Here it was found impossible to use Ethidium for as long as a year because resistance appeared after about six months. Thus the figure of 6.5 Ethidium treatments a year could not in practice be achieved; after six months it w'as necessary to change to Berenil, which could be continued for a year (12 treatments) without resistance developing. The curative regimen alternating six months on Ethidium with 12 months on Berenil was troublesome to carry out, requiring on the average ten treatments of each animal per annum. Cattle on this regimen at Mariara calved normally and looked reasonably well, though there was a tendency to lose condition during the Berenil part of the regimen. Turning to the prophylactic regimen, two-monthly Prothidium required an average of two Berenil treatments per annum to control drug-resistance. These were given just before or after Prothidium without interrupting the sequence, and brought the total treatments up to eight a year for each animal. On this regimen the cattle looked well and calved normally despite the very high fly density they lived in. Calves reared on the curative regimen reached maturity at the normal rate, and none was lost from trypanosomiasis.
Regimens in high incidence: Area “B” represents about the highest trypanosomiasis incidence in which control by means of drugs is practicable under ordinary field conditions. As can be seen from Table 2, the prophylactic regimens arrived at were Antrycide Pro-salt every two months or Prothidium every 15 weeks. During the actual trials special precautions against drug-resistance were taken, and it appeared only once in two years. Without such precautions it would probably have arisen after a year, requiring annual sanative treatment. The two regimens thus become Antrycide Pro-salt six times and Berenil once per annum, or Prothidium 3.5 times and Berenil once, a total of 7 or 4.5 treatments per annum respectively.
The least troublesome curative regimen wa> Ethidium 3.2 times a year, but it could not be continued indefinitely owing to drug-resistance Different experimental groups showed signs of resistance after periods varying from one to two years. Taking the shortest period as applicable to general field conditions, the practical regimen becomes a year on Ethidium (3.2 treatments) alternating with a year or. Berenil (6.5 treatments), with an overall average of about 5 treatments per annum. An alternative curative regimen with Antrycide substituted for Ethidium would involve just over 5 treatments per annum for each animal, but was not pursued.
Cattle thrived well on every regimen tried ir high incidence, except for a slight loss of condition during curative Berenil; the calving rate was above normal and calves grew remarkably well on the curative regimen firs: mentioned.
Regimens in medium incidence: Area "C' represents approximately the lowest incidence in which prophylactic drugs might be used Below' this they become uneconomic owing to the maximum safe interval already mentioned During prophylactic trials, slight resistance to Prothidium was encountered after two years, but none to Antrycide Pro-salt w'ithin a period of two and a half years. However, it it considered realistic to provide for a sanative every two years in both cases, so the regimens become Antrycide Pro-salt three-monthly or Prothidium five-monthly, each with a Berenil treatment administered every second year. The average number of treatments per annum are 41 and 3 respectively.
It will be observed from Table 2 that differences in the length of protection from curative drugs largely ceased to show in medium incidence. This is understandable. Drug-resistance was not encountered in the trials, but could perhaps be expected within two years under practical conditions. The regimens thus become two years on Ethidium or Antrycide (4 treatments) alternating with one year on Berenil (3 treatments); in either case the average number of treatments per annum is just under 2j. Experimental cattle thrived on all regimens in medium incidence. The calving rate was above normal and calves grew well on either of the two curative regimens.
Regimens in low incidence: Area “D represents a very common situation in land bordering the fly-bells of Kenya, the annual
70

EAST AFRICAN AGRICULTURAL AND FORESTRY JOURNAL OCTOBER, 1962
infection sometimes being due to an annual invasion of the fly-belt in search of grazing. Here prophylactics would not be used for obvious reasons. The choice of curative is a matter of indifference (save for cost), and in practice is usually determined by the regimen adopted in adjacent areas of higher incidence.
It will be noted that Berenil was never used in curative regimens for less than a year at a time. This was to ensure that every animal received it. Since cattle on curatives were treated only when infected (following present field practice in Kenya), some might miss Berenil altogether if it were exhibited for too short a period, in which case resistant infections would not be eliminated. Too long a period, on the other hand, would raise the cost un-necessarily because the Ethidium regimen was cheaper. The present compromise is a year. These considerations did not apply to prophylactic regimens, for every animal could be treated when required; but special dosage rates of Berenil were employed because of the need to eliminate all resistant infections by a single treatment. For Prothidium the sanative dosage of Berenil was used (Table 3), principally to guard against any chance of dosing at less than the normal rate. For Antrycide Prosalt twice the normal dosage of Berenil was used (i.e. 7 mg./kg.), because this is more likely to cure resistant infections than the sanative dosage, though neither can be completely relied on [5].
CostsThree curative drugs and two prophylactics
were tested. The current prices per gram to the consumer in Kenya [2] are displayed in Table 3 together with the cost of treating ten cattle, each weighing 550 lb., at the manufacturer's recommended dosage. The cost of sanative dosage of Berenil is also shown. It
will be observed that the cost per dose varies greatly from drug to drug; but they cannot be compared on this basis. The real cost of a drug depends on the number of times it has to be used in a given period, and this depends on the length of prophylaxis; it follows that the proper basis of comparison is by regimens. The cost of drugs in shillings per annum required to maintain ten cattle on each regimen is next described, using data from Tables 2 and 3.
Regimens in the very high trypanosomiasis incidence of area "A" were expensive. Here Prothidium cost 6 X 26.95 = Sh. 161/70 per annum and Berenil 2 X 9.21 = Sh. 18/42, so the total cost of drugs for the prophylactic regimen was about Sh. 180 per annum for ten cattle. The average cost of drugs for the curative regimen was Sh. 66 per annum for ten cattle. Unless the cattle are very valuable these costs are prohibitive; but valuable cattle would not normally be risked in such places.
Regimens in high incidence (area “B") were less expensive. Here Prothidium cost3.5 X 26.95 = Sh. 100/74, which together with Sh. 9/21 for sanative Berenil made a total of Sh. 109/95 per annum for ten cattle. Antrycide Pro-salt cost 6 X 17.30 = Sh. 103/80 plus 2 X 6.42 = Sh. 12/84 for a double dose of Berenil, a total of Sh. 116/64. The curative regimen of Ethidium and Berenil cost3.2 X 6.60 = Sh. 21/12 and 6.5 X 6.42 = Sh. 41/73 in alternate years, an average of Sh. 31/43 per annum for ten cattle. While this is very much cheaper than either of the two prophylactic regimens it has certain disadvantages by comparison. On the curative regimen the cattle suffered overt trypanosomiasis several times a year, with some consequent loss of condition; whereas on the prophylactic regimen this was not so. On the
T able 3—Prices of Trypanocidal Drugs in K enya
D rugPriceper
Gram
NormalDosage
Rate
Dose for 10 cattle (a)
Price for 10 cattle Usage
Sh. mg.jkg . grams. Sh.Prothidium 4-90 2 0 5-50 26-95 Prophylactic.Antrycide Pro-salt 0-85 7-4 20-35 17-30 Prophylactic.Antrycide. . . . ; 0-80 4-4 1210 9-68 Curative.Ethidium . . 2-40 1 0 2-75 6 60 Curative.Berenil 0-67 3-5 9-62 6-42 Curative.Berenil 0 67 5 0 13-75 9-21 Sanative.
(a) Average weight 550 lb. 10% for wastage added.
71

EAST AFRICAN AGRICULTURAL AND FORESTRY JOURNAL OCTOBER, 196:
curative regimen the cattle had to be continuously watched so that infections were treated in good time, while on the prophylactic regimen much less attention was required. In practice it has to be decided whether these factors outweigh a saving of Sh. 75 per annum pier ten cattle, the difference between the cheapest curative and the cheapest prophylactic regimen. The other possible curative regimen, Antrycidc-Berenil. which was not in fact pursued owing to possible difficulties with drug-resistance, would cost 4 X 9.68 = Sh. 38/72 and Sh. 41/73 in alternate years, an average of Sh. 40/23 per annum for ten cattle.
In medium incidence (area “C”) Antrycide Pro-salt would cost 8 X 17.30 = Sh. 138/40 and Berenil Sh. 12/84 over two years, an average of Sh. 75/62 per annum for ten cattle. Prothidium would cost 4.8 X 26.95 = Sh. 129/36 and Berenil Sh. 9/21 over two years, an average of Sh. 69/28 per annum. A curative regimen alternating Ethidium for two years with Berenil for one year would cost Sh. 15/22 per annum on the average; and a similar regimen with Antrycide substituted for Ethidium would cost Sh. 19/33 per annum. Here the difference between the cheapest prophylactic and curative regimens is Sh. 54 per annum for ten cattle.
The cost of a single treatment every year obviously depends on the curative drug chosen. If Ethidium and Berenil are alternated as in area “C” the average cost would be about Sh. 6/50, or with Antrycide substituted for Ethidium. Sh. 8 /50 per annum for ten cattle.
Table 4 displays all the foregoing comparisons in terms of the annual cost for a single animal, rounded off to two significant figures.
1 he corresponding numbers of treatments are also shown, since these are important economically.
D isc u ssio n
It is very difficult to hazard any estimate of the overhead costs of treatment. These include staff wages, transport, instruments, and even buildings if permanent centres are set up. Treatment is administered in Kenya som etimes from permanent centres, sometimes from temporary centres, and sometimes b> individuals on circuit. Clearly the overheads must differ in each case. The matter is further complicated by the fact that none of the services mentioned is confined to trypanosomiasis control; other diseases are dealt with as well. These must account for a varying proportion of the total expense depending on their relative incidence as compared with trypanosomiasis. It should be possible to arrive at costs for a series of different cond - tions, but this has not been done. Instead. Table 5 has been constructed to show the cost of each regimen when the overhead expenses of a single treatment are 25 cents or 50 cents. Similar tables for other overhead expenses are easily constructed from the data in Table 4.
Table 5 draws attention to the obvious fact that, when treatment overheads are taken into account, regimens involving fewer treatments are cheaper. The principal object of Table 5 is, however, to furnish for the first time an approximate estimate of the cost of controlling cattle trypanosomiasis by means of drugs for comparison with other methods of control. Such comparisons are beyond the scope of this paper, but one may be briefly mentioned as an example. A conservative estimate of the cost
T able 4—Cost (in Shillings per Head per Annum) of D rugs Required to M aintain Cattle in D ifferent Levels of T rypanosomiasis Incidence
Incidence
Prophylactic Regimens (including sanatives)
C urative Regimens
AntrycidePro-salt Prothidium Antrycide/
BerenilEthidium/
Berenil
H i g h ........................... 11-7 1 1 0 4 0 31(7) (44) (5i) (5)
Medium 7-6 6-9 1-9 1-5(44) (3) (2i) (2i)
Low . . . . I — — 0-85(1)
0-65(1)
The figures in brackets are the average number of treatments per annum in each regimen.-n

EAST AFRICAN AGRICULTURAL AND FORESTRY JOURNAL OCTOBER. 1962
T able 5— Cost (in Shillings per Head per A nnum) of Regimens to Control Cattle T rypanosomiasis when the Overhead Charges are (a) 25 cents, or (b) 50 cents per D ose
Incidence
Prophylactic Regimens(INCLUDING SANATIVES)
C urative Regimens
AntrycidePro-salt Prothidium Antrycide/
BerenilEthidium/
Berenil
High (a) 13-5 121 5-3 4-3( « 15 2 13 2 6-6 5-3
Medium (a) 8-8 7-7 2-5 2 1(b) . . 9-8 8-4 31 2-7
Low (a) _ _ 1 1 0 0-90(b) — — 1 35 115
of bush-clearing land of “medium incidence" in Kenya is Sh. 20 per acre. The cheapest drug-regimen in such an area (treatment 25 cents) would amount to 14 cents an acre annually for a stocking rate of one bovine to 15 acres, or 21 cents an acre annually for a stocking rate of one to ten acres. Thus, to use an analogy, one acre of land could be rented from the tsetse fly for 14 or 21 cents per annum, or bought! outright for Sh. 20.
S ummary
Long-term field trials with cattle and trypanocidal drugs in Kenya revealed regimens of each drug which gave adequate control of cattle trypanosomiasis at various levels of incidence of the disease. In every regimen provision for the control of drug-resistance was included.
The regimens and the principles governing them arc described, and the final results are discussed in terms of costs. In a high incidence of trypanosomiasis, where the non- protec'jve drug Berenil was required 61 times a yea/ prophylactic regimens of Antrycide Pro-saft or Prothidium cost 13.5 and 12.1 shillings per head per annum respectively; and curative regimens alternating Antrycide or Ethidium with Berenil cost 4.0 and 3.1 shillings per head per annum respectively. In a medium incidence, where treatments with Berenil were required three times a year, the respective costs were 8 .8 , 7.7. 2.5 and 2.1 shillings per head per annum. In a low incid
ence of one infection a year the cost of curative treatment was less than a shilling per annum. The foregoing figures assume overhead expenses of 0.25 shillings per treatment.
Acknowledgements
These experiments could not have been carried out without the faithful work of the five African microscopists who tended the cattle, supervised the herdsmen, collected the records, and often injected the drugs. Their help is gratefully acknowledged. Thanks are also due to Mr. J. F. K. Dawson, in charge of one station for several years, and to Messrs.J. G. le Roux, R. J. B. Power, and M. C. Round, Field Zoologists, who exercised a general supervision of the trials from time to time. For interest and encouragement I am indebted to Mr. K. D. S. MacOwan, Director of Veterinary Services, Kenya, and Dr. P. E. Glover, Chief Zoologist. This paper is published by permission of the Director of Veterinary Services.
R efe r e n c e s
[1] Bauer. F. (1958). ZbI. f. Bakt. Abl. orig. 172; 605.[2] Kenya Gazette Supplement No. 9 (1962), p. 217
(Legal Notice No. 98). Govt. Primer, Nairobi, Kenya.
[3| Leach, T. M„ Karib, A. A., Ford, E. J. H. and Wilimhurst, E. C. (1955). J. romp. Path. 65; 130.
[4] Whiteside, E. F. (1958). Proc. 7th Mtg. l.S.C.T.R. CCTA/CSA Publ. No. 41. London.
|5| Whiteside, E. F. (1960). Proc. 8th Mtg. l.S.C.T.R. CCTA/CSA Publ. No. 62. London.
73

EAST AFRICAN AGRICULTURAL AND FORESTRY JOURNAL OCTOBER. 1962
CONTINUOUS ARABLE CROPPING WITH THE USE OF MANURE AND FERTILIZERS
Bv R. C. Grimes and R. T. Clarke, Agricultural Department, Kenya(Received for publication on 23rd February, 1962)
The problem of maintaining soil fertility is becoming increasingly important in African areas where shifting cultivation is giving way to settled agriculture and rapid growth of the population is placing more and more strain on the resources of the land. The judicious use of fallows, green manures, farmyard manure and artificial fertilizers, singly or in combination. can maintain soil fertility under certain conditions. The correct application of these factors to local conditions o f soil and climate can only be determined by field trials. Due to the difficulties of carrying out such long-term trials, comparatively few are laid down and fewer still survive long enough to yield useful information.
James and Kerkham [1] report on a trial in Uganda where three cycles o f a five-year rotation have been completed. With a fallow crop one year in five, an application of five tons farmyard manure once in the rotation was sufficient to maintain crop yields. When the fallow period was extended to two or three years, no manure was necessary to maintain yields. Fallows under planted grass, annual legumes or natural regeneration were found equally effective.
Dennison [2] in Northern Nigeria found pigeon pea to be a more effective fallow crop than either planted Andropogon spp. or natural regeneration. Similarly, in the Coast Province of Kenya, pigeon pea was found to be more effective than Star Grass (Cynodon dactylon) or cassava [3]. As an alternative to the three- year fallow of pigeon pea, Dennison [2] found that two tons farmyard manure applied once every three years maintained yields equally well.
Although fallows may be effective in restoring soil fertility, the yields o f arable crops grown between fallows rarely make up for the loss o f crops during the fallow period. Unless the fallow is used profitably for animal production, there is considerable incentive for continuous arable cropping with the use of farmyard manure or artificial fertilizers.
In areas where, due to either tribal custom or the incidence of tsetse tty, few cattle are kept, suitable alternatives to farmyard manure
have to be found. Although a wealth of expen mental work has been done on the use o: artificial fertilizers, comparatively little ;s known about their long-term effect on the so;!
In Ghana [4] artificial fertilizers maintained crop yields over a period of nine years, but the mean annual losses o f organic carbon were2.8 per cent in the 0-6 in. layer averaged over a number of experiments for periods of up to nine years.
The application of sulphate of ammonia invariably leads to a lowering of pH and a reduction of the base status of the soil. This is confirmed by Djokoto and Stephens [4], and also by Leutenegger [5] who reported that a’ Mlingano in Tanganyika, an application of one ton/acre sulphate of ammonia reduced the pH by 0.34 units during 12 months.
Hartley [6 ], in Nigeria, found that dressings of nitrate of soda, superphosphates and muriate of potash, equivalent to one ton farmyard manure, gave higher yields than the farmyard manure.
Co n tin u o u s A rable C ropping T rial
This trial w'as conducted to determine if crop yields could be maintained under continuous arable cropping, with the use of farmyard manure or artificial fertilizers. It was laid down in 1953 at Matuga Experimental Station in the Coast Province of Kenya, and was terminated when the experimental station closed in 1960.
The soil, which is derived from the Maga- rini Sands, is a free-draining, red sand, e x tremely deficient in both nitrogen ar t phosphorus. The rotation of crops was: — ,
Sorghum.Sweet Potatoes.Maize.Cassava.Prior to 1957, cotton was grown in place o f
sweet potatoes. All crops were planted during the long rains which commence in April During the short rains in October, green gram was planted following sorghum, maize and sweet potatoes, whilst cassava was left in the ground until just before the next long rains.

EAST AFRICAN AGRICULTURAL AND FORESTRY JOURNAL OCTOBER, 1962
Due to the unreliability of the short rains, the green gram crop was often a failure, so that data for this crop is not presented.
T reatments
The fertilizer and manurial treatments were as follows: —
0—Control.M /3—Three tons farmyard manure applied
annually.A 3—Equivalent in artificial fertilizers of
three tons farmyard manure, applied annually.
M .— Direct application of nine tons farmyard manure.
M .—First year residual effect of nine tons farmyard manure.
M , -Second year residual effect of nine tons farmyard manure.
In order to determine the fertilizers necessary for A /3, the farmyard manure was analysed each year, except 1956 and 1957. For these two years, the A /3 dressing was the same as in 1955.
Table 1—Analyses of Farmyard Manure % o f Dry Mailer
N P ,05 K20
1953 1-29 0-28 2-361954 2-24 0-79 5-401955 2-24 1 06 4-791958 2-37 0 79 4 111959 5-67 2-54 0-50I960 2-51 1 43 3-94
Mean 2-72 1 15 3-52
Cooke and Carner [6 ] estimated the average composition of fresh manure used in experiments at Rothamsted as 2.17 N, 1.04 P.O. and 2.17 K..O; Reith and Inkson [7] give a range of values for 13 samples which have means of2.00 N, 0.83 P ,0 and 3.16 K.O. Both these sets of values are calculated from the percentages in fresh manure quoted in the original data and assume a mean dry matter percentage of 23 per cent. Hemingway [8] gives mean values of 1.73 N. 0.24 P.CL and 1.29 KX> for 50 samples, expressed as percentages of dry matter in the original data. It is evident, both from these examples and the analyses in Table 1, that the nutrient content of farmyard manure is extremely variable, and that the phosphate status is low in relation to nitrogen and potash.
At the site of the trial, the soils are very deficient in phosphorus, as well as nitrogen. In the early years of the trial, yields of cotton and maize were extremely low, especially in the control plots. It w’as thought at the time that it might prove impossible to produce any crops at all from the control plots, which would remove the yardstick by which the effects of manure and fertilizers were being measured. Therefore, it was decided in 1956 to apply a dressing of 1 cwt. double superphospate over the entire trial area.
From the analyses of farmyard manure, the content of nitrogen, phosphorus and potash were calculated in terms of sulphate of, ammonia, double superphosphate and sulphate of potash. The applications ranged from 1 to4.3 cwt./acre sulphate of ammonia (overall means 2.1 cwt.). 0.1 to 0.9 cwt. acre double superphosphate (overall mean 0.4 cwt.) and0.1 to 1.4 cwt./acre muriate of potash (60 per cent K.O) (overall mean 0.9 cwt.).
The nine-ton application of farmyard manure was only applied to the appropriate plots once every three years. In order to measure the direct effect o f this dressing applied annually, yield figures for each crop were taken from those plots actually receiving the dressing in each year of the trial.
All the fertilizers and farmyard manure were applied on the flat and then incorporated, together with crop residues, into ridges.
Experimental LayoutThe trial was divided into four series, each
series following the rotation as a single unit. Within each series, the six treatments were replicated three times in randomized blocks. The plot size was 1/40 acre out of which 3 ft. horizontal and vertical cropped discards W'ere taken.
CropsDwarf Hegari sorghum was grown through
out the trial. It was planted at 3 ft. X 6 in. on ridges.
The local variety of sweet potatoes was grown, at a spacing of 3 ft. X 18 in. on ridges. It was first introduced to the rotation in 1957. Prior to this, cotton was grown, but proved quite unsuitable to the area.
Local white maize was grown throughout. It was planted at 3 ft. X 2 ft. on ridges and thinned to two plants per hill.
75
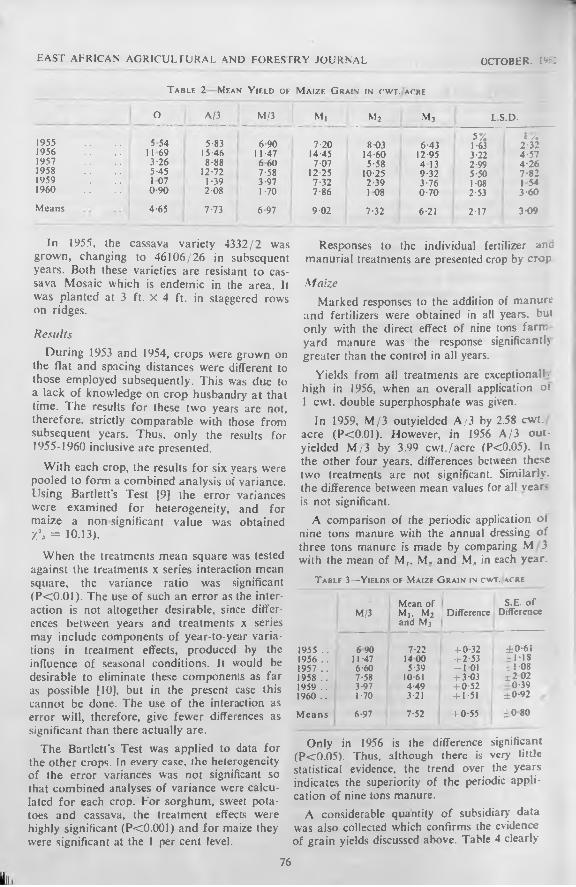
EAST AFRICAN AGRICULTURAL AND FORESTRY JOURNAL OCTOBER. W :
T able 2 Mean Y ield o f M aize G rain in cwt. acre
o A /3 M /3 M i m 2 M j L .S .D .
1955 5 54 5-83 6 -9 0 7 -2 0 8-03 6-435 % 1 -63
1%2 -3 2
1956 11 69 15-46 11-47 14-45 14-60 12-95 3-22 4 -5 71957 3-26 8-88 6 60 7-07 5-58 4 13 2-99 4 -2 61958 5-45 12-72 7-58 12-25 10-25 9-32 5-50 7 -8 21959 1 0 7 1 -39 3-97 7-32 2-39 3 -7 6 I -08 1 5 4I9 6 0 0 -9 0 2-08 1 -70 7-86 1 0 8 0 -7 0 2-53 3 -6 0
M e a n s 4-65 7-73 6-97 9-02 7-32 6-21 2-17 3 -0 9
In 1955. the cassava variety 4332/2 was grown, changing to 46106/26 in subsequent years. Both these varieties are resistant to cassava Mosaic which is endemic in the area. It was planted at 3 ft. X 4 ft. in staggered rows on ridges.
ResultsDuring 1953 and 1954, crops were grown on
the flat and spacing distances were different to those employed subsequently. This was due to a lack of knowledge on crop husbandry at that time. The results for these two years are not, therefore, strictly comparable with those from subsequent years. Thus, only the results for 1955-1960 inclusive are presented.
With each crop, the results for six years were pooled to form a combined analysis of variance. Using Bartlett’s Test 19] the error variances were examined for heterogeneity, and for maize a non significant value was obtained X*. = 10.13).
When the treatments mean square was tested against the treatments x series interaction mean square, the variance ratio was significant (P<0.01). The use o f such an error as the interaction is not altogether desirable, since differences between years and treatments x series may include components of year-to-year variations in treatment effects, produced by the influence of seasonal conditions. It would be desirable to eliminate these components as far as possible [10], but in the present case this cannot be done. The use of the interaction as error will, therefore, give fewer differences as significant than there actually are.
The Bartlett's Test was applied to data for the other crops. In every case, the heterogeneity of (he error variances was not significant so that combined analyses of variance were calculated for each crop. Tor sorghum, sweet potatoes and cassava, the treatment effects were highly significant (P<0.001) and for maize they were significant at the 1 per cent level.
Responses to the individual fertilizer anc manurial treatments are presented crop by crop
M aizeMarked responses to the addition of manure
and fertilizers were obtained in all years, but only with the direct effect of nine tons farm yard manure was the response significant!} greater than the control in all years.
Yields from all treatments are exceptional!- high in 1956, when an overall application or 1 cwt. double superphosphate was given.
In 1959, M /3 outyielded A /3 by 2.58 cwt. acre (P<0.01). However, in 1956 A /3 out- yielded M /3 by 3.99 cwt./acre (P<0.05). In the other four years, differences between these two treatments are not significant. Similarly, the difference between mean values for all vear- is not significant.
A comparison of the periodic application ot nine tons manure with the annual dressing o f three tons manure is made by comparing M 3 with the mean of M,, M, and M., in each year.
T able 3 —Yields oe Maize G rain in cwt. acre
M/3Mean of M,. M2 and Mj
S.E. o f| Difference Difference
1955 .. 6 90 7-22 + 0-32 ±0-611956 .. 11-47 14 00 + 2-53 ±1-181957 .. 6-60 5-39 -101 i ± 1 -081958 .. 7-58 10-61 + 3-03 *2 0 21959 .. 3-97 4-49 + 0-52 0-39I960 .. 1 -70 3-21 + 1-51 ±0-92
Means 6-97 7-52 + 0-55 j * 0 80
Only in 1956 is the difference significant(P < 0 .0 5 ) . Thus, although there is very littlestatistical evidence, the trend over the years indicates the superiority of the periodic application of nine tons manure.
A considerable quantity of subsidiary data was also collected which confirms the evidence of grain yields discussed above. Table 4 clearly
76
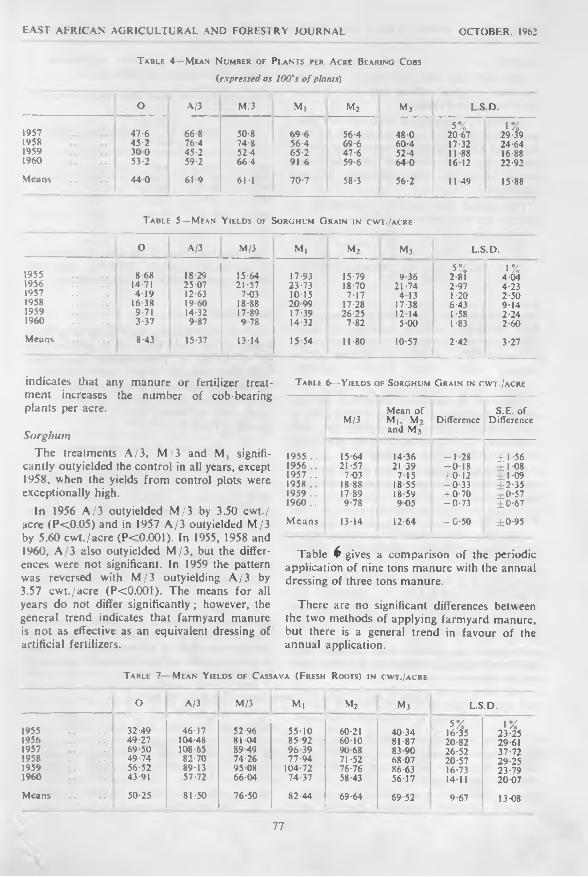
EAST AFRICAN AGRICULTURAL AND FORESTRY JOURNAL OCTOBER. 1962
T able 4 —Mean N umber of Plants per Acre Bearing Cobs
(expressed as 100's o f plants)
O A/3 M/3 Mi m 2 Mj LS D.
1957 47-6 66 8 50-8 69 6 56-4 48-05°/J / o
20-671%
29-391958 45-2 76-4 74-8 56-4 69-6 60-4 17-32 24-641959 30 0 45-2 52-4 65-2 47-6 52-4 11 88 16-88I960 53-2 59-2 66-4 91 6 59-6 64 0 16-12 22-92Means 44 0 61 9 61 -1 70-7 58-3 56-2 11-49 15-88
T able 5— Mean Y ields of Sorghum G rain in cwt. iacre
O A/3 M/3 M, Mi Mj L.S.D.
1955 8-68 18 29 15-64 17-93 15-79 9 365°/J SQ
2 811%
4-041956 14-71 25-07 21-57 23-73 18-70 21-74 2-97 4-231957 4 19 12-63 7-03 10-15 7-17 4 13 1-20 2-501958 16 38 19 60 18-88 20 99 17-28 17-38 6-43 9-141959 9-71 14-32 17-89 17-39 26-25 12-14 I -58 2-241960 3-37 9-87 9 78 14-32 7-82 5-00 1 -83 2-60Means 8-43 15-37 13-14 15-54 11-80 10-57 2-42 3-27
indicates that any manure or fertilizer treatment increases the number of cob-bearing plants per acre.
SorghumThe treatments A /3 , M /3 and M, signifi
cantly outyielded the control in all years, except 1958, when the yields from control plots were exceptionally high.
In 1956 A /3 outyielded M /3 by 3.50 cwt./ acre (P<0.05) and in 1957 A /3 outyielded M/3 by 5.60 cwt./acre (PcO.OOl). In 1955, 1958 and I960, A 3 also outyielded M /3, but the differences were not significant. In 1959 the pattern was reversed with M /3 outyielding A /3 by 3.57 cwt./acre (PcO.OOl). The means for all years do not differ significantly; however, the general trend indicates that farmyard manure is not as effective as an equivalent dressing of artificial fertilizers.
Table 6— Yields of Sorghum G rain in cwt./acre
Mean of S.E. ofM/3 Mi, Mi Difference Difference
and M3
1955 .. 15 64 14-36 -1 28 ±1-561956 .. 21-57 21 39 —0 18 ±1-081957 .. 7-03 7 15 + 0-12 1-091958 .. 18-88 18-55 -0-33 + 2-351959 .. 17-89 18-59 + 0-70 3:0-571960 .. 9-78 9 05 -0-73 ±0-67
Means 13-14 12-64 -0 -5 0 ±0-95
Table Ogives a comparison of the periodic application of nine tons manure with the annual dressing of three tons manure.
There are no significant differences between the two methods of applying farmyard manure, but there is a general trend in favour of the annual application.
Table 7 Mean Yields of Cassava (F resh Roots) in cwt./acre
O A/3 M/3
1955 32-49 46-17 52-961956 49-27 104-48 81-041957 69-50 108-65 89 491958 49-74 82-70 74-261959 56-52 89-13 95-081960 43-91 57-72 66-04
Means 50-25 81-50 76-50
M, Mj Mj L.S.D.
55-10 60-21 40-345%
16-351%
23-2585 92 60-10 81-87 20-82 29-6196 39 90 68 83 90 26-52 37-7277-94 71-52 68-07 20-57 29-25
104-72 76-76 86-63 16-73 23-7974-37 58-43 56-17 14-11 20-0782-44 69-64 69 52 9-67 13-08
77

HAST AFRICAN AGRICULTURAL AND FORESTRY JOURNAL OCTOBER. 1967
CassavaOnly with this crop was there a significant
response to either artificial fertilizers or farmyard manure, in all years.
In 1956 A /3 outyielded M /3 by 23.44 cwt./ acre (P<0.05). A /3 also outyielded M /3 in 1957 and 1958, but the differences are not significant. In 1955, 1959 and I960, M /3 out- yielded A /3 , but the differences are not significant.
The annual and periodic applications of manure are compared in Table 8 : —
T able 8— Y ields of Cassava Roots in cwt./acre
M/3Mean of M i. M 2
and M 3
DifferenceS.E. o f
Difference
1955 . . 52-96 51-88 — 1 -08 ± 6 -0 71956 . . 81-04 75-96 -5 -0 8 ±7-731957 . . 89-49 90-32 +0-83 ±9-851958 . . 74-26 72-51 — 1 -75 ± 7-641959 . . 95-08 89-70 -5 -3 8 — 6 - 2 1
1960 . . 66-04 62-99 -3 -0 5 ± 5 -2 4
M e an s 76-50 73-87 -2 -6 3 ± 3 8 8
There are no significant differences between the two methods of applying manure, but as with sorghum, the results indicate the slight superiority of the annual three-ton application over the triennial nine-ton application.
Supplementary data on the stand of plants showed that there was no treatment effect on stand.
Sweet PotatoesOnly four years' results are available because
sweet potatoes were first grown in the rotation in 1957.
In 1958 A /3 outyielded M /3 by 19.99 cwt./ acre (P<0.05) and in 1960 M /3 outyielded A /3 by 24.63 cwt./acre (P<0.01). Neither the mean values for 1957 and 1959, nor the mean values for all years, differ significantly.
Responses to manure and fertilizers were greater with this crop than with the other three in the rotation.
The annual and periodic applications of manure are compared in Table 10: —
Table 10—Y ield of Sweet Potatoes in cwt./acre
Mean of S.E. o fM/3 M i, M 2
and M 3
Difference Difference
1957 . . 32-25 32-57 + 0-32 ±3-031958 . . 48-91 37-90 — 1 1 - 0 1 -4-361959 . . 46-65 48-00 + 1-35 ±5-861960 . . 45-34 29-55 —15-79 ±3-48
M e a n s 43-28 37-35 - 5 93 ±3-92
In 1960 the effect of the annual application is significantly greater (P<0.05) than the periodic application of farmyard manure.
So il A nalyses
In 1952, soil samples were taken from three points in the trial. These were analysed for pH, % N and Exchangeable Bases onl\ Different techniques are now used in determining exchangeable bases, so the analyses are not comparable with those made at the present time Thus, only the values for pH and % N are quoted in Table 11: —
Table It— Soil A nalyses— 1952
Point 1 Point 2 Point 3
pH 0 -6 ' . . 7-1 6-9 716 - 1 2 ' . . 7-8 6-5 7 6
%N 0 -6 ' . . 0-08 0 04 0 06
Point 2 sample was taken from an area of particularly poor growth. By 1953, the obvious patchiness in the crop had largely disappeared.
In August, 1961. 16 months after the last applications of manure and fertilizer had been made, soil samples were taken from two points in every plot. All the sub-samples were bulked to g iv e one top soil and one sub-soil sample for each treatment.
Table 9— Mean Y ields of Sweet Potato Roots in cwt./acre
O A /3 M /3 M i m 2 m 3 L S D
1957 15-11 25 -23 32-25 38-56 35-70 23-445 %
11-691 %
16-62
1958 21-06 6 8 -9 0 48-91 44-08 44-86 24-75 16-82 23-92
1959 39-87 48-31 46-65 64-38 41-41 38-20 22-62 32-17
I9 6 0 6-31 20-71 45 -34 50-34 21-78 16-54 13-45 19-13
M ea n s 20 -60 4 0 -78 43-28 50-35 35-96 25-75 14-45 20 0 2
78

EAST AFRIC AN AGRICULTURAL AND FORESTRY JOURNAL OCTOBER. 1962
1Table I2—Soil Analyses— 196I
O A/3 M/3 M, m 2 m 3
pH 0-6' 5-9 5-3 6 3 6-3 6-l 6-46— 12' .. 6 0 5-5 6-l 6 I 5-9 6-0
K. m.e. % 0-6' 0-2 0-2 0-4 0-3 0-3 0-36-12' .. 0-I 0-2 0 3 0-3 0-3 0-2
Ca m.e. % 0-6' 2-8 2-2 3 0 3-8 3-2 4-46-12' . . I-6 I-2 !-0 l -4 I -2 l -4
Mg m.e. % 0-6' l-O 0-6 0 9 l-O l 2 I I6- 12' .. 0-9 0-6 0 6 0-8 0-7 0-8
Mn m.e. % 0-6' 0-7 0-7 0-5 0-6 0-8 0-66-12' .. 0-5 0-5 0-5 0-5 0 4 0-5
P p.p.m. 0-6' 7 I6 9 to I0 I26- 12' . . 3 7 3 7 4 4
N. % 0-6' 0-06 0 06 007 0-07 0-06 0076— 12' .. 0 05 0 05 005 0-05 005 004
C. % 0-6' 0 55 0 65 0 68 0-75 0-64 0 846-12' .. 0-37 0-31 0-36 0-34 0 31 0-25
C/N. ratio 0-6' 9 -17 10-83 9-71 10-71 I0 67 12 006- 12' .. 7-40 6-20 7-20 6-80 6-20 6-25
The results of the analyses indicate large errors in sampling or analysis, which cannot be estimated. Certain effects, however, may be distinguished. All the manurial treatments have a mean pH of 6.3 in the 0-6" layer and 6.0 in the 6 -12" layer, whereas the corresponding values for the A /3 plots are 5.3 and 5.5. The control plots have intermediate values of 5.9 and 6.0. There is also some indication that !he calcium and magnesium status in the top 6 " has been lowered in the A /3 plots.
Both phosphate and nitrogen are low in all treatments. The phosphate level is low'est in the control plots and highest in the A /3 plots. Nitrogen values are similar in all treatments and do not differ appreciably from the original determinations in 1952.
The carbon determinations do not give any clear indications of treatment effects.
D isc u ss io n
All four crops in the rotation gave large responses to the addition of either three tons farmyard manure or its equivalent in artificial fertilizers. Crop yields indicate that there is very little difference between these two treatments. However, soil analysis data for 1961 (Table 12) indicates that in the plots receiving artificial fertilizers every year, the pH of the soil has been reduced more than under any other treatment. There is also a suggestion that the status of divalent cations has been lowered with this treatment. Because both these effects are due to sulphate of ammonia, it should be possible to avoid them by substituting calcium ammonium nitrate for sulphate of ammonia.
In comparing the annual and periodic application of farmyard manure, taking the yields of all crops, there is little evidence to indicate which method of applying the manure is superior.
It should be appreciated that in order to evaluate the periodic application of farmyard manure on all crops, it was necessary in the design of the trial to superimpose a three-year manure cycle on a four-year crop rotation. In practice, if a nine-ton application of manure is to be made every three years, it should be applied to that crop in the rotation which gives the best response. This may be confused, however, by the preferences o f the local people for one crop as a soutce of food.
With sweet potatoes, the mean of M /3 gave 110 per cent increase over the control and the mean of M, gave 144 per cent increase over control. These are the largest responses of any crop to farmyard manure. Good responses to the direct effect of nine tons farmyard manure are also obtained with maize and sorghum. With cassava, M /3 gave 52 per cent increase over control whilst M, gave 64 per cent increase. This additional increment due to the direct effect o f nine tons farmyard manure which is only 5.94 cwt. is so small that it cannot be considered worthwhile to apply nine tons farmyard manure to cassava.
The local Wadigo people who live in the area where this trial was carried out rely almost exclusively on cassava for their food. Sorghum is very rarely grown, whilst maize and sweet potatoes are grown on a small scale. In the light of local conditions, therefore, it can be
79

EAST AFRICAN AGRICULTURAL AND FORESTRY JOURNAL OCTOBER. 1962
recommended that three tons farmyard manure should be applied each year to a rotation of maize, sweet potatoes and cassava.
Where farmyard manure is not available, artificial fertilizers may be applied, as appropriate to each crop in the rotation. The results of another trial carried out in 1952 and 1953 indicate the order of responses to nitrogen and phosphorus with sorghum. Sulphate of ammonia and double superphosphate were both applied at 0, 1 and 2 cwt./acre. Muriate of potash was also applied, but in this, as in all other trials in this area, there was no response to this fertilizer.
T able 13— Mean Yield Sorghum G rain in cwt./acre
No N, n 2 L.S.D.
5% 1%1952 10-3 10-4 11-9 2-8 3-81953 4-5 6-7 7-9 1-9 2-6
Po Pi P2
1952 7-6 11-2 13-7 2-8 3-81953 6-9 6-3 6 0 1-9 2-6
In 1952 the response to nitrogen is not significant, but in 1953, 2 cwt./acre sulphate of ammonia increased the yield by 3.4 cwt. (PcO.OI). The fertilizer was applied in both years.
With phosphate, the fertilizer was only applied in 1952. There is a significant response to 1 cwt./acre (P<0.001) in the first year, but there is no significant difference between the two rates of application. There is no residual effect in the year after application.
Responses with maize have been similar in other trials, but there is no information available on the precise response of sweet potatoes and cassava to nitrogen and phosphorus.
Summary
In a rotation of sorghum, sweet potatoes, maize and cassava, there were large responses to farmyard manure and artificial fertilizers.
The largest response to farmyard manure was found with sweet potatoes. Th; additional response to nine tons farmyard rranure over an application of three tons was smaller with cassava than with the other crops.
Artificial fertilizers were as effective as farm yard manure in sustaining crop yields.
There is no clear difference between the effect of applying three tons farmyard manure annually and applying nine tons once every' three years.
Acknowledgements
The authors wish to thank the Director of Agriculture for permission to publish this paper. Also Mr. E. Beilis, Senior Soil Chemist, for valuable assistance in its preparation, and Dr. E. W. Russell, Director, E.A.A.F.R.O.. for advice on the interpretation o f the results.
Finally, our thanks are due to all those who have been responsible for running this trial since its inception.
REFEREN CES
' [I] Jam eson, J . D. and Kerkham, R . K.. E m p. 1. E xp . Agric., I960, 28, 179.
(2) D ennison. E. B., Trap. Agric., 1959, 36, 171.
[3] K enya Dept, of Agric., Arm. Rep., 1957, Vol. I t , 126.
•*[4] D jokoto , R. K. and Stephens, D ., Emp. J. E xp . Agric., 1961, 29, 245.
|5] Leulcnegger, F., E. A fr. agric. J.. 1956. 22, 81.
| 6 ] H artley, K . T., Em p. J. Exp. Agric., 1937, S, 254.
17) Cooke. G. W and Gamer, H . V., J. Roy. A gric. Soc. England, 1954. 115, 27.
[8 J R eith . J . W. S. and Inkson. R. H. E ., J. A gric. Sci., 1958, 51, 218.
j |9 ] Hemingway, R. G ., Emp. J. Exp. Agric., 1961, 29. 14.
(10) Bartlett. M . S.. Proc. Roy. Soc. (London). 1937, A901. 160, 273.
[I l l Patterson. H. D., Biometrics, 1959, 15, 30.
I ,80

EAST AFRICAN AGRICULTURAL AND FORESTRY JOURNAL OCTOBER, 1962
CHEMICAL INVESTIGATIONS INTO A SYSTEM OF LAKES, RIVERS AND SWAMPS IN S.W. KIGEZI, UGANDA
By S. A, Visser, Department of Zoology. Makcrcre University College, Kampala, Uganda(Received fo r publication on 7th March. 1962)
The following investigation was undertaken with the object to examine how the chemical composition of the water of a drainage system can change during its course; in particular when the drainage leads through lakes and swamps.
The water system chosen is found in a region of volcanic origin and it comprises several lakes and a extensive swamp area. It will be attempted to correlate the chemical composition of the water with geo-morphological properties of the area.
G eography and G eology
Most of the area investigated is a high and deeply dissected mountainous country of rocks of the Karagwe-Ankolean system, which consist of blue, grey or pink mudstones, shales and phylilites with sandstones and quartzites. The age of the deposits appears to be pre- Cambrian. or perhaps very early Palaeozoic. The regional tectonic strikes is NW. and exposures of granite rocks and belts of metamorphosed or mineralized rocks are also aligned in this direction. [7]
The area is rich in minerals such as scheelite. wolframite, cassiterite, borax, tan- talite, columbite. siderite, beryl, gold and sulphides of lead, zinc, bismuth and iron.
The average rainfall in the area discussed is 30-45 in. per year and the mean maximum and minimum temperatures are 24° C. and 10° C. respectively.
The investigated watercourse is one of the most important in Kigezi District and has probably the most variable discharge. It comprises: L. Munyonyi. Ruhuma River. Ruheza- minda River, L. Mutanda and the Kaku River. The area investigated extends over a total distance of 50 miles (see map A).
L. Bunyonyi covers an area of approximately 82. sq. miles and is approximately 15 miles long. It is situated at a height of 6,474 ft. above sea level, and has a maximum depth of 130 ft. The lake was formed when the Muko lava streams dammed off a valley in the Rugika Hills. This lava damming is a young feature, the modernity of which is
apparent from the fact that the lake level has practically not fallen since its formation, which seems to show that the river into which the discharge of the lake passes, has not had time to cut down the level of the outlet. The same applies later to Lake Mutanda. The Muko lavas are possibly more than 100 ft. deep at the north end of the lake; they are very rich in olivine and augite, while feldspar is absent.
L. Bunyonyi discharges into the Ruhuma River which flows over lava for about half a mile and goes on into a wide swampy valley with papyrus as the main vegetation. This area is known as the Ruhuma Swamp (35 sq. miles) and is for the greater part surrounded by high wall-like ridges.
After miles the river leaves this swampy area and now flows as the Ruhezaminda River which enters Lake Mutanda after another 11 miles. After 7-} miles the Ruhezaminda River unites with its principal tributary, the Mulindi River, which originates from a phragmites swamp, the Muchoya Swamp.
L. Mutanda covers an area of approximately 37 sq. miles. It is situated at an altitude of 5.877 ft. above sea level and has a depth of 180 ft. in some places. This lake was probably formed by the flooding of two parallel valleys, when the original watercourse was blocked by lava flows. Besides being the drainage area for the Ruhezaminda River, Lake Mutanda also receives subsoil water originating from the slopes of the Bufumbira volcanoes as well as water from Lake Mulehe (31 sq. miles and 5,914 ft. above sea level).
The out-flow of L. Mutanda is at its southwest corner through a papyrus swamp, into the Kaku River. The water eventually flows into the Albert Nile via the Rutchuru River, Lake Edward and Lake Albert. Measurements of the Uganda Development Department on the outlet of Lake Mutanda have shown an average discharge of 6.7 cu. metre per sec. [8]
S ampling and A nalysis
The samples were collected in polythene bottles or in glass Winchesters and care was taken that the containers were entirely filled.
81
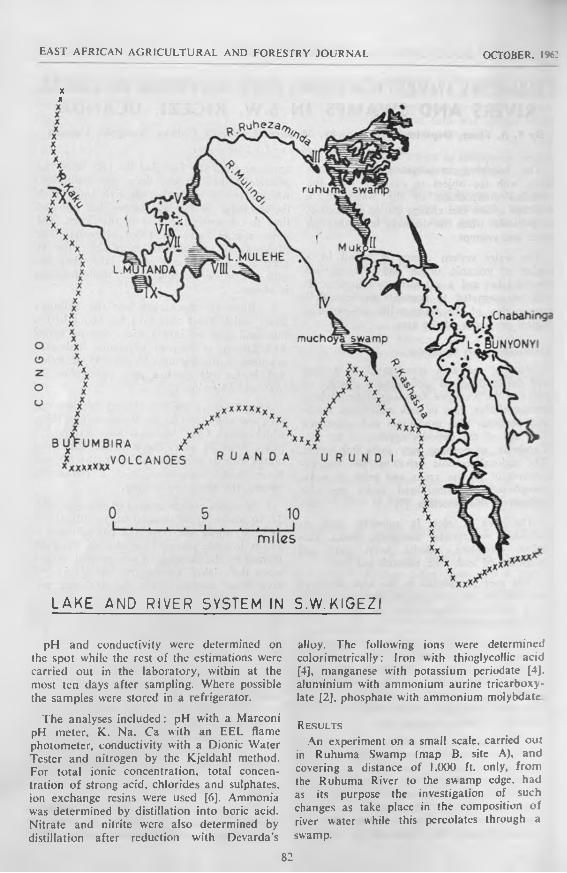
EAST AFRICAN AGRICULTURAL AND FORESTRY JOURNAL OCTOBER. 1%:
xx
L A K E A N D R I V E R S Y S T E M IN S . W . K I G E Z I
pH and conductivity were determined on the spot while the rest of the estimations were carried out in the laboratory, within at the most ten days after sampling. Where possible the samples were stored in a refrigerator.
The analyses included: pH with a Marconi pH meter, K. Na, Ca with an EEL flame photometer, conductivity with a Dionic Water Tester and nitrogen by the Kjeldahl method. For total ionic concentration, total concentration o f strong acid, chlorides and sulphates, ion exchange resins were used [6 ]. Ammonia was determined by distillation into boric acid. Nitrate and nitrite were also determined by distillation after reduction with Dcvarda's
alloy. The following ions were determined colorimetrically: Iron with thioglycollic acid [4], manganese with potassium periodate [4], aluminium with ammonium aurine tricarboxy- late [2 ], phosphate with ammonium molybdate
Results
An experiment on a small scale, carried out in Ruhuma Swamp (map B. site A), and covering a distance of 1.000 ft. only, from the Ruhuma River to the swamp edge, had as its purpose the investigation of such changes as take place in the composition of river water while this percolates through a swamp.
82

EAST AFRICAN AGRICULTURAL AND FORESTRY JOURNAL OCTOBER, 1962
R U H U M A S W A M P
83

EAST AFRICAN AGRICULTURAL AND FORESTRY JOURNAL OCTOBER. 1962
WO 200 300 400 500 600 700 SOO 900distance from swamp edge
in feetGraph 1
Graph I shows how the conductivity first increases, probably because the fast evaporation of the water in the swamp results in a concentration of ions. (The increase of the conductivity to the edges of a swamp as observed by Carter [1] may also be explained in this way.) When going further to the edge of the swamp the conductivity quickly decreases to a value less than 2 0 per cent of the original: a difference similar to a decrease from 170 p.p.m. NaCl to 25 p.p.m. NaCl (cf. Graph 2).
Graph 2
For the same area Graph 1 also shows that the pH o f 6 .6 , after a small increase to 6 .8 . decreases to 5.5 near the swamp edge. It is obvious that part of the cations, originally present in the water, are exchanged by the peat for H + , whilst undoubtedly part of them have also been absorbed, because, as a simple calculations shows, the decrease of the pH is too small to attribute this phenomenon entirely to ion exchange.
In the case of the Ruhuma River as it flows through the Ruhuma Swamp the same tendency is observed, although to a lesser extent because of incomplete equilibration. (Table 1.)
T able 1—The Changes in Conductivity and pH in Ruhuma R iver (Map B)
Conductivity pH
Site 1 260 7-3Site 2 260 7-3Site 3 260 7-3Site 4 260 7-3Site 5 230 6-6Site 6 200 6-3Site 7 225 7 0
Lake BunyonyiThree samples were collected in ihe Lake
Bunyonyi area: —
I. From L. Bunyonyi at Chabahinga.II. At the outlet of L. Bunyonyi near Muko.
III. In the northern part of the Ruhuma Swamp near Munja island.
I and II are almost identical. From I to III a small increase in ions is noticed on the whole. The amounts of chloride and sulphate, however, show a very large increase over this section, probably because of the conlribution of water by hot springs, or because of water originating from the area of the Muko lava fields. In the section between II and 111 a drop in ionic concentrations is noticed. In the case of most o f the ions this drop amounts to about 50 per cent of the original value. This result agrees with our earlier finding that a swamp absorbs ions from the percolating water. The most important tributary of the Ruhezaminda between the Ruhuma Swamp and Lake Mutanda is the Mulindi River. A sample from this river was collected as it emerged from Muchoya Swamp. 11 miles before it joins the Ruhezaminda River. The analyses (IV) show that the river is very poor in ions, poorer than the water which comes from the Ruhuma Swamps (III). This great dilution can be partially explained because the water, before reaching the place of sampling, flows as an undefinable stream through a phragmites swamp for a distance of over five miles.
The relatively high concentrations of Fe. Mn and A1 in the water emerging from the swamp are also striking. A reason for this is
84

EAST AFRICAN AGRICULTURAL AND FORESTRY JOURNAL OCTOBER, 1962
probably the occurrence of deposits of volcanic ash which have been found in the Muchoya Swamp and which could also account for the high sulphate content. The other ions are probably absorbed again for the greater part by the peat. Column V shows the results of the analysis o f the water of the Ruhezaminda River, at the point where it enters Lake Mutanda. Since the concentration is almost the same as when the river leaves the Ruhuma Swamp, we must conclude that either the Mulindi contributes a relatively small amount of water to the Ruhezaminda, or that so many ions are collected on the way, that the dilution effect is largely compensated by this. At this point it is perhaps desirable to draw the attention to the continuous increase of nitrate from Lake Bunyonyi onwards. A similar occurrence will later again be observed in the Kaku River. The reason for this is most probably that through the better aeration which takes place in running river waters in comparison to the almost stagnant lake waters, the NH, and other N containing products are oxydized to NO,. The results of redox measurements also seem to indicate this, as the amounts of nitrate were found to be positively correlated with the redox potentials.
Lake MutandaWhen comparing the composition of the
water of Lake Mutanda (VI) with that of Lake Bunyonyi (I), the higher concentrations of K (2x), Cl (12x) and SO, and the lower ones for Ca (3x) are noticed in Lake Mutanda. The
greater part of this K, as well as the Cl and SO,, do not seem to originate from the Ruhezaminda River (V), but from another source. Most likely this has to be looked for in the subsoil water originating from the slopes of the Bufumbira volcanoes.
Much of the Fe, Mn and A1 seems to be precipitated by the higher pH of Lake Mutanda and to be withdrawn in this way from the lake water.
To examine whether stratification occurs in Lake Mutanda (in which lake a depth of 56 metres was measured in some places), a water sample collected at a depth of 50 metres (VII) was compared with samples from the surface of the lake (VI), and with that of the inflowing W'ater of the Ruhezaminda River (V). From the results, especially of Kjeldahl Nitrogen, NCL,, SO, and NH, it follows that no stratification takes place, but that the water is well mixed throughout the entire lake. Data obtained from mud samples, collected at a depth of 56 metres, led to similar conclusions. The greater part of the stirring is probably brought about by the cold and rather fast- flowing water of the Ruhezaminda River. Lake Bunyonyi, on the other hand, is reported to be stratified [5].
Lake MuleheAnother, though less important contributor
of water to Lake Mutanda (VI) is Lake Mulehe(VIII). A higher concentration in acids and
Table 2— Chemical Composition of the Water of Some Rivers and Lakes in Kigezi D istrict
1 ii III IV V VI VII VIII IX X
P H ................................ 7-7 7-8 6-5 5-6 7-4 8-5 7-8 7-3 7-9 8-7Potassium (p.p.m.) 7-5 7-8 4-3 0 6 4-2 16-8 16-2 14-7 16 5 18-9Sodium (p.p.m.) 6 1 6-3 2-9 0-5 3-9 5-3 4-5 4-1 4-7 5-3Calcium (p.p.m .) . . 1 3 0 140 3-5 0 0 1 0 4-0 2 - 0 2 - 0 4-0 2 - 0Total ions (mcq 1 ) 2-26 2-45 1 -56 0 46 1 - 8 6 1 - 8 8 2-14 2 - 2 1 1-71 1 -99Conductivity (mhos) N itro g e n -K je ld a h l
275 0 300 0 2 0 0 0 25 0 160-0 225-0 2 0 0 - 0 275-0 225-0 250-0
(p.p.m .) . . 2-7 3-6 2 - 2 3-5 1-7 2 - 2 2 - 6 2-5 2-5 1-9Strong acids (m eq/i) 0 189 1 2 2 0 80 0 403 0-715 0 - 8 6 8 0-690 0-826 0-534 0-560Chloride (p.p.m .) . . 2 - 2 0 35-7 2 0 0 1-49 17-8 25-3 14-4 11-4 1 1 - 2 1 0 - 2N itra te (p.p.m.) 107 118 1 - 8 1 -55 2-48 1 -49 1-18 3-17 0-99 1 -30Sulphate (p.p.m .) . . none 91 3-8 161 8-3 6-3 1 2 - 6 2 1 - 8 9-6 1 2 - 1Phosphate (p.p.m.) 0-29 trace trace 0 047 trace trace 0-018 0-41 0-39 0-009Am m onia (p.p.m.) 0 - 6 8 0-63 0-70 0-51 0-41 0-48 0-41 0-27 0-61 0-34Iron (p.p.m.) 0 06 0 1 6 0 - 2 0 2-03 2-83 0-08 0-16 0-52 0 - 1 0 0-75Manganese (p.p.m.) < 0 0 2 0 - 2 0 0 1 8 < 0 - 0 2 0-43 0-03 0-25 0-45 < 0 - 0 2 0 - 1 1Aluminium (p.p.m.) 0 0 2 9 0 007 0 0 3 0 - 2 2 0-225 0 - 0 1 2 0 - 0 1 1 0-041 0 0 1 0 0-024
I. L. Bunyonyi at Chabahinga. VI. L. Mutanda.II. O utlet L. Bunyonyi near Muko. VII. L. M utanda, collected a t a depth of 50 metres.III. N. P art o f R uhum a Swamp near M unja Island. VIII. L. Mulehe.IV. Mulindi River a t ou tle t o f Muchoya Swamp. IX. Outlet o f L. M utanda.V. Ruhezaminda River a t inlet o f L. M utanda. X. Kaku River near Congo Border.
85

EAST AFRICAN AGRICULTURAL AND FORESTRY JOURNAL OCTOBER, 1%:
in Fe. Mn and A1 (volcanic origin) and a lower concentration in alkaline metals is noticed compared with Lake Mutanda.
Finally the condition of the water was investigated after it had left Lake Mutanda(IX) and until it reached the Congo border(X) . An increase in the concentration of almost all ions was noticed except in the case of NHj. This can probably be explained by the fairly fast-flowing water (several rapids), because of which NH , will be oxidized to NO,.
If, finally, the overall balance between Chababinga and the Congo Border is considered, then an overall increase in the various anions is noticed, which, however, is more than compensated for by a marked increase in K, because of which the total acidity even decreases. The only ions which show a decrease are NH, and Ca.
Conclusions
Water flowing through a swamp looses a considerable percentage of its ions in the peat, either by absorption or by ion exchange.
A good correlation was found between the value o f the pH and the concentration of the alkali metals and to a lesser extent between the earth alkali metals. N o correlation was found between the pH and the anions determined (the most abundant ones are probably HCO,’ and CO,”).
The pH seems to be inversely proportional to the Kjcldahl nitrogen, which might be due to a colloidal effect.
The concentrations of the alkali metals were well correlated with one another and parti \ with Ca. A reasonable correlation between these and the conductivity was also observed, whilst this was not the case with the anions or the heavy metals.
The concentrations of Fe, Mn and A1 were reasonably well correlated.
R efere nces
( I j C arter, G . S. (1955). The Papyrus swamps of U ganda. Cambridge, Heller.
|2 | C herery , E. M. (1948). Thiogylycollic acid as inhibitor for iron in the colorimetric determination of aluminium by means o f aluminon. Analyst. 73. 501.
[3] Combe, A. D. and Simmons, W. C. (1933). The volcanic area of Bufumbira. Geo. Surv. Uganda. M em. 3 Entebbe.
|4) Dickison, D. (1950). The chemical analysis o; waters. Glasgow, Blackie, p. 81.
[5J East African Fisheries Research Organization. (1953). Annual R eport, pp. 6-7.
[6] M ackereth, F. J. H. (1955). Ion exchange p ro cedures. Intern. Ass. Theor. & Appl. Limnol. Comm. 4. Stuttgart, Schweizerbart.
[71 Pargeter, D . C. (1954). T he Ruhizha Fcrbcrite Deposit, Kigezi. Rec. Geol. Surv. Uganda.
|8 | U ganda. W ater Development Department. (1956) Annual Report, p 65.

EAST AFRICAN AGRICULTURAL AND FORESTRY JOURNAL OCTOBER. 1962
ASH DISTRIBUTION IN KENYA ROUCHACESBy H. W. Dougall, Grassland Research Station. Kitale, Kenya
(Received for publication on 22nd February 1962)
The distribution of the percentage of ash contained in over 2,000 cattle, sheep and goat fodders described by Schneider (1947) has been examined by Glover and Dougall (1960), who found that there was a close grouping around the m ean of just under nine per cent of the dry matter of the feed. Schneider’s records include a variety of feeds such as hays and other dry roughages, green soiling crops, silages, cereal grains, fruit-pulp meals and concentrates, etc.
A recent study of the distribution of the percentage o f ash contained in grasses, cereals. legumes and browse plants growing in Kenya and analysed in this laboratory, has led to a very similar result. The browse plants which have already been described by Dougall and Bogdan (1958), were composed of a variety of materials such as bark of branches, pods, leaves, young twigs with leaves and young to almost-ripe fruits, etc., but the remaining plants are all roughages which were sampled either at the early flowering stage of growth or at weekly intervals throughout their growth.
Figure I shows the close grouping around the mean of (a) 10.48 per cent of ash contained in the dry matter of 603 plants and (b) 10.26 per cent of ash contained in the dry matter of 418 plants, when all legumes and browse plants are excluded. The very slight difference in mean ash content between Schneider's data and the Kenya data can be ascribed to the fact that the latter are composed almost entirely of roughages. For these latter, therefore, CHO + CP ~ 90. since CHO -f CP +■ Ash = 100, where CP is the
percentage of crude protein and CFIO is the percentage of non-protein (mainly carbohydrate) contained in the dry matter of the roughage.
R efere n c es
Dougall, H. W. and Bogdan, A. V. (1958). E. Afr. agric. J., 23, 236.
Glover. J. and Dougall, H. W. (1960). J. agric. Sci., 55, 391.
Schneider, B. H. (1947). Feeds of the World. West Virginia University, Morgantown, U.S.A.
. 40
<H*z111o£ ioa
Fig. 1.—The percentage d istribution of the ash contained in the dry m atter o f 603 grasses, legumes andbrowse plants is given by the continuous line (--------)and that for grasses only by the dotted line (........... ).T he arrow s point to the m ean ash content of all
records and to that o f grasses only
. <
87

EAST AFRICAN AGRICULTURAL AND FORESTRY JOURNAL OCTOBER. : ;*'-
CRUDE FIBRE—CRUDE PROTEIN RELATIONSHIP INKENYA ROUGHAGES
By H. W. Dougall, Grassland Research Station, Kitalc, Kenya
(Received for publication on 22nd February. 1962)
The generalization that in feeding stuffs high crude fibre values are associated with low crude protein values and vice versa has been examined by Glover and French (1957), who used the data for 1,300 cattle, sheep and goat feeds described by Schneider (1947). Glover and French found that there is a very significant correlation between the percentage of crude fibre and the percentage of crude protein contained in the dry matter o f these feeds and that the regression of crude fibre on crude protein gives—
% crude fibre = 37-0.55% crude protein
them at different levels of crude protein shown in Table I: —T able I—E stimates of Crude F ibre fro'
THE EQUAIIONS, AT DIFFERENT LEVELS OiCrude P rotein
% of Dry Mailer
CrudeProtein
C rude F ibre
Eqn. (1) Eqn. (2) Eqn. (3)
5 34-25 32-68 35-3810 31-50 29-68 31-3315 28-75 26-68 27-2820 26-00 23-68 23-2325 23-25 20-68 19-18
A study of the percentage o f crude fibre in relation to the percentage o f crude protein contained in the dry matter o f grasses, cereals, legumes and browse plants growing in Kenya and analysed in this laboratory has led to similar equations being derived. The browse plants have already been described by Dougall and Bogdan (1958) and the remaining plant materials which are all roughages were sampled either at the early flowering stage of growth or at weekly intervals throughout their growth.
The combined Kenya data also show a very significant correlation between the percentage of crude fibre and the percentage of crude protein and the regression of the former on the latter gives—
% crude fibre = 35.68-0.6% crude protein (n = 521) . . . (2)
When legumes and browse plants are excluded the regression becomes—
% crude fibre = 39.43-0.81 % crude protein (n = 386; r2 = 0.62) . . . (3)
and the difference between these two regressions is non-significant.
The three regressions are shown diagram- matically in Fig. 1 and the respective estimates of crude fibre that are obtained from each of
These estimates are in reasonably good agree ment and they suggest that any one of the equations could be used to obtain an estima’- of the crude fibre contained in a roughag- when there is knowledge only of the amour of crude protein contained in its dry matter It is convenient to make such an estimate when the nutritive value of a feed is to be expressec in terms of the amounts of digestible crude protein and total digestible nutrients that are held in its dry matter (Glover el at.. 1961).
R e fere nces
Dougall, H. W. and Bogdan, A. V. (1958). E. Ajr. agric. J., 23. 236.
Glover, J. and French. M. H. (1957). J. agric. Sci.. 49 78.
Glover, J., Duthie, D. W. and Dougall, H. W. (1961 E. Afr. agric. for. J.. 26, 117.
Schneider, B. H. (1947). Feeds of the World. W ee Virginia University, Morgantown, U.S.A.
88lit

EAST AFRICAN AGRICULTURAL AND FORESTRY JOURNAL OCTOBER, 1961
SPRAYING ARABICA COFFEE FOR THE CONTROL OFLEAF RUST
By J. A. N. Wallis, and I. I). Firman. Coffee Research Station, Ruiru, Kenya(Received for publication on 7th March, 1962)
Coffee Leaf Rust (caused by Hemileia vastatrix Berk, and Br.) has recently been studied in detail, so that the development of the disease is well understood and the very great importance of correct spray timing has been clearly established (Bock, 1962). Despite this knowledge a practical control remains a serious problem to coffee growers in areas suitable for the development of the disease.
Failure to apply successfully the results of careful research may be attributed to difficulty in predicting the onset of each season of rain and more particularly to slow and inefficient spray application. The main coffee producing area in Kenya is east of the Rift Valley where there is an alternation of dry and wet seasons. In this part of Kenya it is reasonable to expect the Long Rains to start in the latter part of March and the Short Rains to break a little before the end of October. It has been shown to be necessary to apply fungicidal sprays to the coffee leaves just before these periods in order to control Leaf Rust. For the best effect the protective sprays must be applied within three weeks of the beginning of the rains (Nutman, 1961), therefore all the coffee in areas liable to Leaf Rust attack should be treated during these periods of not more than 21 days.
Previous studies o f Leaf Rust control generally have been based on the use of at least a pint of spray per tree, although in one trial a satisfactory reduction of Leaf Rust was achieved using only ten gallons per acre (g.p.a.) applied with a Micron "Meg'’ tractor- mounted sprayer (Rayner, 1960a). So far recommendations to Kenya coffee growers have advised at least a pint (568 ml.) a tree for hand-operated sprayers and 60 to 80 g.p.a. for tractor-powered air-assisted sprayers (Anon., 1961). The supply of these volumes of water has been found to be one of the most serious impediments to timely spraying. On large plantations the total volume of spray can be very great and this is also a serious problem for peasant coffee growers who have to carry water by hand for considerable distances from streams to their plots of coffee.
Recently there has been a rapid development of equipment designed to apply low volumes of spray to crop plants. For instance motorized knapsack mist blowers have been used with success in the banana plantations of the West Indies and tractor-powered concentrate sprayers are now in commercial use in England for the control of Apple Scab (Rose, 1961).
In Kenya there is a real need for low- volume spray techniques for use on coffee plantations and by peasant farmers growing this crop. Experience in many parts of the world has shown that in many cases it is possible to use low volumes of spray to achieve satisfactory results. Therefore in 1960 a programme of research was initiated to study the use of reduced volumes o f spray, and the first problem to be studied was the control of coffee Leaf Rust.
E xperimental Methods
Leaf Rust AssessmentsThe intensity of rust infection has been
assessed as the percentage of attacked leaves and as the number of rust lesions on a given sample of leaves. Five leaves were collected at random each week from every tree in Trials 1 and 2 and ten leaves were collected weekly from every tree in Trials 3 and 5. Trial 4 was sited far from the Coffee Research .Station so leaves were collected only once a month for most of the period but weekly during the main build-up of the Rust attack.
Leaf Fall RecordsThe recording of leaf fall has been used for
a number of years to determine the effect of fungicides on coffee leaf retention. It has been found that the use of such sprays generally prolongs the life of coffee leaves even in the absence of Leaf Rust (Anon., 1958). Therefore leaf fall data alone do not provide an adequate record of the intensity of Rust attack although they give a useful measure of the overall effect of fungicidal sprays on the coffee tree. In the present series o f trials fallen leaves were collected regularly from areas cleared at the base of five or ten trees on each plot.
89

EAST AFRICAN AGRICULTURAL AND FORESTRY JOURNAL OCTOBER. I96J
Statistical A Italy sis
There have been two recent studies o f the relationship between the percentage of rusted leaves and the number of rust lesions per leaf. Rayner (1961) plotted the cumulative percentages o f leaves with rust against the number of lesions per leaf and was able to show that where only 30 per cent o f the leaves were attacked by rust there was a truncated normal distribution. With higher percentages of infected leaves there were higher proportions of leaves falling in the higher “lesion-per-leaf” categories. The relationship between the percentage of rusted leaves and the number of rust lesions per hundred leaves was found to be exponential so that one measurement could be considered as a transform of the other. In the same paper Rayner stated that in practice the percentage of rusted leaves was a good measure of the effect o f a rust attack on the coffee tree since there was a direct relationship between this and the subsequent foliage density.
Clarke has studied this subject using data collected by Bock (1962) and from Trial 1 reported in this paper. He found that although two treatments might result in the same percentage o f infected leaves the lesion counts could be very different. The relationship between the proportion of rusted leaves and the number of lesions was not consistent in all treatments. He concluded that the number of infected leaves per sample is an insensitive index o f rust infection (Clarke, 1961).
In the trials to be described both methods of measuring rust attack have been used so that the percentage o f rusted leaves provides an index of the effect of the disease on coffee trees while the lesion counts show the extent to which the fungus has been reduced by spraying.
In previous studies of Leaf Rust great importance has been attached to sampling leaves from many sites on each tree in order to account for the variations in foliage density (Rayner, 1961). In the present investigations the emphasis has been placed on frequent rather than very detailed sampling made at longer intervals. This method has been adopted so that with the resources available it was possible to follow in detail the very rapid changes in rust infection, which can rise from a minimum to a maximum within a month (see Figure I).
Leaf Rust records for Trial 1 were analysed in great detail and showed that the sampling method was satisfactory for the degree of replication in the experimental design. It was found that if the degree of sampling had been doubled the “Error” variance would have been reduced by nine per cent, but that had the field replication been doubled the “Error variance would have been reduced by 40 per cent (Clarke, 1961).
The Leaf Rust assessments were analysed statistically for all trials to be described using a logarithmic transformation of the lesion counts. A standard analysis of variance was computed for each week of Trials 1 and 2. Tractor-mounted sprays were used for Trials 3, 4 and 5 in which treatments were not replicated but were applied to large plots of j to 1 an acre each; in these trials sprayed and unsprayed plots were of equal number and therefore the analysis of the transformed lesion data in each trial was carried out according to the following system: —
Sprayed v. unsprayed 1 degree of freedom Between sprayed . . 4 degrees of freedomBetween unsprayed
(Error) 4 degrees of freedom
Total . . 9
Full details of the design of each experiment are described under the heading “Field Experiments”.
Yield o f CoffeeIn 1961 the crop was recorded from Trial I
by weighing the ripe coffee from the plots immediately after each picking. There were four pickings in all between 1st June and 26th July. The results given in Table 3 are derived by using an assumed ratio of 6:1 for cherry to clean coffee yield.
Copper Deposit Estimations In the present series of trials the surface
copper deposits were determined for leaf samples collected on one or more occasions for each treatment. The object has been to establish a relationship between the amount of copper deposited on the leaf surfaces, the volume and concentration of the sprays and the resultant effect on disease intensity.
The determinations for Trials 1, 2 and 4 were carried out by Messrs. Mesmer and Mc- Kinlay of the Colonial Pesticides Research
I]..90

EAST AFRICAN AGRICULTURAL AND FORESTRY JOURNAL OCTOBER. 1962
Unit. Arusha, Tanganyika, and the remainder of the analyses were conducted at the Coffee Research Station. Ruiru.
The copper deposits were removed from the leaves by swabbing separately the upper and lower surfaces with normal sulphuric acid containing 0.2 per cent “Teepol". The amount of copper in solution was then determined colori- metrically using the reagent Ms-cyclohexanone oxalyldihydrazone (Martin. 1955). The surface area of the sample leaves was estimated using the formula
S = 0.48 + 0.65Lwhere S is the area of one surface and L is the product of the length and breadth of the leaf (Sleep, 1958).
In Trials 1 and 2 leaves were collected from branches about five feet above ground, but in the remaining trials it was possible to sample leaves from several sites to give an integrated assessment of the overall efficiency of spraying.
T he Location of Sampling Sites—Height from the G round
Trials 3 and 5 Trial 4(single stem pruning) (multiple stem pruning)
Between rows* In rowt Between rows In row4 ft. 4 ft. 6 ft. 6 ft.
Centrel 3 ft. Centre 4 ft.2 ft. 2 fL 3 ft. 3 ft.
•Between rows—branches projecting into the tractor lane, tin row—branches in line with the row of trees.{Centre—centre of the tree.
Biological AssayDuring the course of the investigations a
laboratory technique has been devised for the following purposes: to determine if biological assay results could be correlated with estimations of the copper deposit on leaf surfaces; to determine if the assay could give a prediction of the degree o f Leaf Rust control achieved by field scale spraying; to determine to what extent copper deposits remained fungi- cidally active after a period of weathering under field conditions and to determine whether a favourable redistribution of copper could result from weathering.
In Trial 3 leaves were collected from ten trees in each plot using the same sampling sites as for the copper deposit estimations. From each leaf 1.5 cm. diameter discs were punched from either side of the main vein. All leaf discs were inoculated with the same
rust spore suspension and then incubated on moist blotting paper in clear plastic sandwich containers. For the first 48 hours the discs were kept in the dark to allow spore germination and penetration, but thereafter they were placed in the daylight on a laboratory bench. The number of lesions developing on each disc was recorded four weeks after inoculation; lesions developing before this time were attributed to earlier infection. Contrary to the findings of Rayner (1960b) no difficulty was experienced in keeping leaf discs long enough to allow the normal development of rust lesions.
Dyes. Fluorescent Tracers and Leaf Hr inisVarious methods have been compared to
obtain a reliable and rapid assessment of the spray cover and uniformity of distribution throughout the foliage. The following techniques are only briefly described because, since all spray treatments were almost equally successful in controlling Leaf Rust, it is still not possible to define a minimum acceptable standard of spraying.
The dye "Kiton Red” was used at a strength of 2.5 per cent w /w in the spray liquid, and was caught on (Whatman No. 1 4.25 mm.) filter papers which were clipped to the upper and low'er surfaces of leaves located at 16 sites on each tree. For each treatment, these targets were placed in five trees to give a total of 160 filter papers to be examined. Initially each papier was soaked in 10 ml. water for at least 20 minutes and the intensity o f the solution determined with a Unicam spectrometer. Subsequently, it was found that if each papier was scored visually on a scale o f 0 for no deposit to 10 for complete cover, the conclusions were so close to those derived from the spectrometer readings that extra time for the solution determinations was unwarranted.
The fluorescent tracer “Fluorink 600/7 Yellow” was used at a strength of 0.2 pier cent w /w in the spray liquid. After each treatment had been applied, leaves were collected from 16 sites on ten trees per plot. The uppier and lower surfaces of each leaf were inspected under an ultra-violet lamp and were scored visually on a scale of 0 for no deposit to 5 for a uniform deposit.
Rubeanic acid prints were made from leaves collected from all the treatments in Trial 2, but only one site could be sampled from each of ten trees for each treatment. This restriction
91

EAST AFRICAN AGRICULTURAL AND FORESTRY JOURNAL OCTOBER, 1962
was necessary as the technique is rather laborious and time-consuming. Separate halfleaf prints were made of the upper and lower leaf surfaces and were scored visually in the same way as for the fluorescent tracer method.
Spraying Equipment
Trial 1 was with a KWH Type 75 "Kiekens Whirlwind” Mistblower 1958 Model. This is a motorized knapsack sprayer with the spray fluid introduced into a powerful airstream which forms the droplets and conveys a beam of spray into the target. The Volume Mean Diameter of the spray has been estimated as 127 microns for 970 ml./minute with an air displacement of 2,000 cu. ft./m inute and a maximum velocity o f 2,700 ft. per minute at four feet from the nozzle (Lee, 1961).
Trial 2 was with a "Holder” Mistblower 1960 model. This is a motorized knapsack sprayer similar to the KWH but with the improvement that a small pump maintains the liquid output at a constant rate whatever the position of the outlet in relation to the spray tank. The Volume Mean Diameter has been estimated as 166 microns for 1,100 ml./minute output with an air displacement of 720 cu. ft./ minute and a maximum velocity of 2,000 ft. / minute at four feet from the nozzle (Lee, 1961). These physical measurements would suggest that the Holder was inferior to the K.W.H. but in practice it appeared to be the more satisfactory for spraying coffee because the uniform emission rate ensured that the tops of the trees were well covered.
Trials 3 and 4 were with a “Chiron LM 2/200” tractor-mounted sprayer. This is an air- blast sprayer with two groups o f four nozzles which can be independently directed. The liquid feed can be regulated by a tap on the main line from the pump and further adjusted by the insertion of various sized jets discharging into the air streams. A preliminary examination of this unit had indicated that it would be suitable for these two trials. The sprayer was mounted on an International Harvester B250 tractor which was driven in second or third gear.
Trial 5 with a “R.S.M. (10-spout)” tractor- mounted sprayer. This is an air-blast sprayer with ten fixed outlets arranged in an arc of a little over 180 degrees. As this trial was situated in single-stem coffee, the two topmost outlets were not used. 1 mm. jets were used in the eight remaining outlets and the
liquid pressure adjusted to approximately 55 p.s.i. The sprayer was mounted on a Massey Ferguson 35 tractor which was driven in second gear, low ratio with the throttle fully open. This gave a forward speed of 2.02 m.p.h. and an estimated p.t.o. speed o: 761 r.p.m. A separate brief investigation showed that at this setting the air velocity at the centre of the nozzles was 11,400 ft.; minute and total air displacement for the sprayer approximately 4,000 cu. ft. per minute (Johnson, 1961). All treatments in Trial 5 were applied at the rate of 20 gallons per acre.
The Fungicide Spray Timing
In each trial all the spray treatments have been applied on only one occasion although it is known that for consistently thorough rust control supplementary sprays are often necessary (Bock, 1962). These were omitted so that the single spray applications could be fully studied without the confusing effects of overlapping spray deposits.
“Perenox” was one of the first of these fungicides available in Kenya and therefore has been used throughout these investigations. In the trials to be described spray strengths are given as the percentage weight of "Perenox" to the weight of water. For instance 1 per cent w /w indicates 1 lb. o f the fungicide in 10 gallons of water (or I gm. per 100 ml.).
Field Experiments
All the trials were carried out on Coffee arahica L. grown without shade. Trials 1, 2, 3 and 5 were carried out at the Coffee Research Station, Ruiru; altitude 5,275 ft. a.s.I. Trial 4 was conducted at the Tana Ranch, Makuyu, 3.450 ft. a.s.I.
The cofTee in 1 and 2 was spaced at 8 ft. by 8 ft. and pruned on a multiple-stem system with three heads per tree. Before the trials began it had not been treated with any fungicide for over two years. During Trial 1 the maximum height of the trees was about 8 ft. and for Trial 2 the maximum height was approximately 9 ft.
Trial 1The main object o f the experiment was to
establish if it is possible to control Leaf Rust with low volumes of spray. Various subsidiary investigations were included to study techniques of research into the general subject o f spraying coffee.
i92
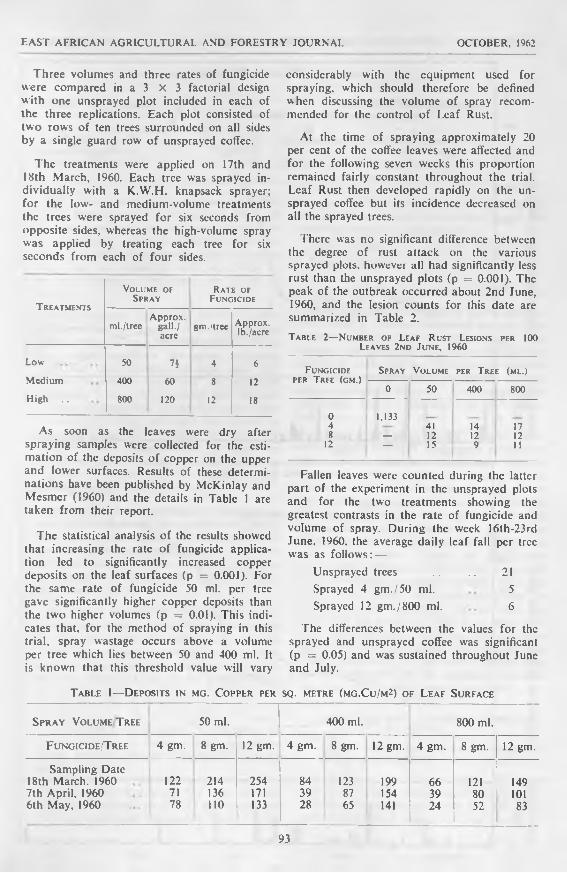
EAST AFRICAN AGRICULTURAL AND FORESTRY JOURNAL OCTOBER, 1962
Three volumes and three rates of fungicide were compared in a 3 X 3 factorial design with one unsprayed plot included in each of the three replications. Each plot consisted of two rows of ten trees surrounded on all sides by a single guard row o f unsprayed coffee.
The treatments were applied on 17th and 18th March, i960. Each tree was sprayed individually with a K.W.H. knapsack sprayer; for the low- and medium-volume treatments the trees were sprayed for six seconds from opposite sides, whereas the high-volume spray was applied by treating each tree for six seconds from each of four sides.
T reatments
Volume of Spray
Rate of Fungicide
Approx, ml./tree gall./
acregm./tree Approx.
Ib./acre
Low 50 73 4 6
Medium 400 60 8 12
High . . 800 120 12 18
As soon as the leaves were dry after spraying samples were collected for the estimation of the deposits o f copper on the upper and lower surfaces. Results of these determinations have been published by McKinlay and Mesmer (1960) and the details in Table 1 are taken from their report.
The statistical analysis of the results showed that increasing the rate of fungicide application led to significantly increased copper deposits on the leaf surfaces (p = 0.001). For the same rate of fungicide 50 ml. per tree gave significantly higher copper deposits than the two higher volumes (p = 0.01). This indicates that, for the method of spraying in this trial, spray wastage occurs above a volume per tree which lies between 50 and 400 ml. It is known that this threshold value will vary
considerably with the equipment used for spraying, which should therefore be defined when discussing the volume of spray recommended for the control of Leaf Rust.
At the time of spraying approximately 20 per cent of the coffee leaves were affected and for the following seven weeks this proportion remained fairly constant throughout the trial. Leaf Rust then developed rapidly on the unsprayed coffee but its incidence decreased on all the sprayed trees.
There was no significant difference between the degree of rust attack on the various sprayed plots, however all had significantly less rust than the unsprayed plots (p = 0.001). The peak of the outbreak occurred about 2nd June, I960, and the lesion counts for this date are summarized in Table 2.
Table 2—N umber of Leaf Rust Lesions per 100 Leaves 2nd June, I960
Fungicide per Tree (gm.)
Spray Volume per Tree (ml.)
0 50 400 800
0 1,1334 41 14 178 — 12 12 12
12— 15 9 11
Fallen leaves were counted during the latter part of the experiment in the unsprayed plots and for the two treatments showing the greatest contrasts in the rate of fungicide and volume of spray. During the week 16th-23rd June, 1960. the average daily leaf fall per tree was as follows: —
Unsprayed trees . . . . 21Sprayed 4 gm./50 ml. 5Sprayed 12 gm./800 ml. 6
The differences between the values for the sprayed and unsprayed coffee was significant (p = 0.05) and was sustained throughout June and July.
Table 1—Deposits in mg. Copper per sq. metre (mg.Cu/m2) of Leaf Surface
Spray Volume T ree 50 ml. 400 ml. 800 ml.
F ungicide/Tree 4 gm. 8 gm. 12 gm. 4 gm. 8 gm. 12 gm. 4 gm. 8 gm. 12 gm.
Sampling Date18th March. I960 122 214 254 84 123 199 66 121 1497th April. 1960 71 136 171 39 87 154 39 80 1016th May, 1960 78 110 133 28 65 141 24 52 83
93

RAIN
FALL
IN
PE
RCEN
TAG
E O
F LE
AVE
S W
ITH
RU
ST.
RAIN
FALL
IN
PE
RCEN
TAG
E O
F LE
AVES
WIT
H R
UST
.iN
CHES
IN
CHES
EAST AFRICAN AGRICULTURAL AND FORESTRY JOURNAL OCTOBER. 1962
94

EAST AFRICAN AGRICULTURAL AND FORESTRY JOURNAL OCTOBER. 1962
Table 3—1961 Yield of Clean Coffee in cwt. per acre
March 1960 Treatment per Tree Yield Least Significant Differences
Unsprayed . . 9-77 Between sprayed and unsprayedSprayed 4 gm./50 ml........................ 1613 p=0001 408.Sprayed 12 gm./800 ml.................... 14-97 Between sprayed treatments
p = 0 0 5 2-92.
The yield of coffee was not recorded in 1960 but in 1961 the crop was weighed from all the plots, and was off the trees before the 1961 Leaf Rust epidemic could have had any effect. All the 1960 treatments had a marked effect, but for simplicity only the yields of the most extreme treatments are given in Table 3.
Both treatments raised the yield of coffee by over 5 cwt. per acre. This was a very substantial response to a treatment carried out a year earlier; however the most important result was that between the high- and low- volume treatments there was no significant difference. It may be concluded that the low- volume treatment was as effective as the high- volume spray which contained three times the weight of fungicide in 16 times the volume of water. It should not be assumed that the mean annual response to copper spraying would be as great as is shown for 1961 because of the biennial bearing habit o f coffee.
The results o f this preliminary trial gave a clear indication that it was possible to control Leaf Rust using volumes of spray far lower than were currently recommended. However the results were based on a spraying technique not suitable for use by coffee growers (Wallis and Firman, 1960).
An initial deposit o f 66 mg.Cu/m- gave satisfactory control o f Leaf Rust. Four grams of fungicide in 50 ml. spray per tree gave double this deposit, therefore it is possible that the rate of fungicide could be reduced to less than 4 gm. per tree in this spray volume.
Trial 2
This experiment designed to confirm the results of Trial I using a spray procedure which could readily be adapted for use by coffee growers.
Three spray volumes and five rates o f fungicide were combined to give 13 treatments, and one unspraved plot was added to each of the
three replications of the randomized block design. The treatment combinations gave the following ranges of comparisons: —
Spray Volume 125 to 500 ml./treeFungicide Rate . . 2.5 to 50.0 gm./treeSpray
Concentration .. 1.25 to 40.00% w /w
The treatments were applied on 8th March, 1961, using a “Holder” knapsack sprayer. The sprayer operator walked along every lane between the rows of coffee and directed the nozzle at each tree for five or six seconds. Thus each tree was treated twice for a total of ten seconds in the case of the low-volume treatments and 12 seconds for the higher volumes.
As soon as the spray was dry on the leaves samples were collected for copper estimation.I here was no significant difference between the mean deposits obtained with the various treatments although they ranged from128 mg.Cu m= for the lowest concentration (1.25 per cent w/w) to 659 mg.Cu/m2 for the highest concentration (40.00 per cent w/w). Significantly more copper was deposited on the upper leaf surfaces than on the lower (p - 0.001) whereas in Trial 1 the lower surfaces had higher copper deposits than the upper (p = 0.01). No explanation can be offered for the difference between the two trials, but the results in Trial 2 are in accordance with previous experience. Certain treatments in Trial 2 are comparable with those in T rial I, therefore it is possible to examine the relative efficiency of the spraying technique in terms of the mean copper deposits.T rial 1—
4 0 gm. fungicidc/50 ml. per tree. 122 mg.Cu/m2.
T rial 2—3-3 gm. fungicide/130 ml. per tree. 253 mg.Cu/m2.5-6 gm. fungicide/125 ml. per tree. 300 mg.Cu/m2-
It is clear that the deposits of copper achieved in Trial 2 were greater than in Trial 1 and that all treatments could be expected to give a satisfactory control of Leaf Rust.
95
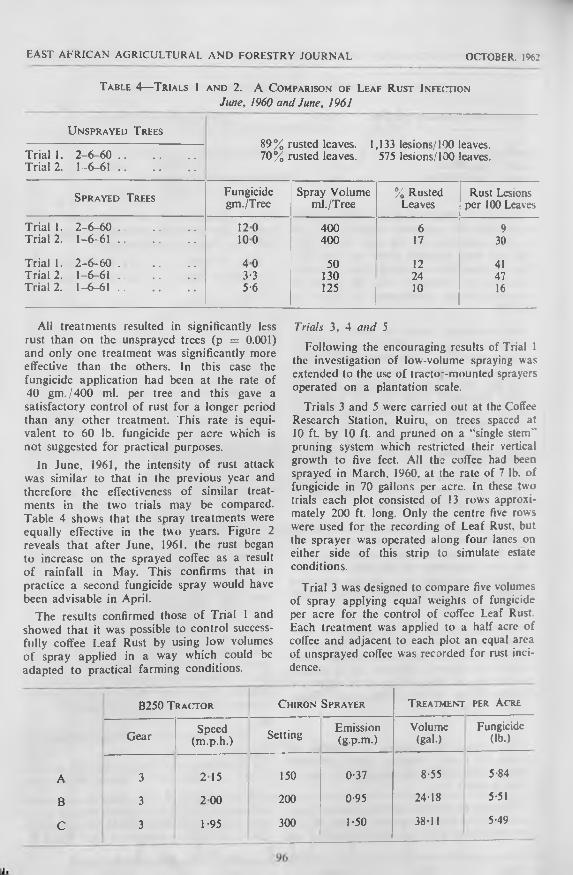
EAST AFRICAN AGRICULTURAL AND FORESTRY JOURNAL OCTOBER, 1962
Table 4— T rials 1 and 2. A Comparison of Leaf Rust Infection June, I960 and June, 1961
U nsprayed Trees— ------------------------------------------- 89% rusted leaves. 1,133 lesions/100 leaves.Trial 1. 2-6-60 ........................... 70% rusted leaves. 575 lesions/100 leaves.Trial 2. 1 - 6 -6 1 ............................
Sprayed TreesFungicidegm./Tree
Spray Volume ml./Tree
% Rusted Leaves
Rust Lesions per 100 Leaves
Trial 1. 2-6-60 ........................... 120 400 6 9Trial 2. 1 - 6 -6 1 ........................... 100 400 17 30
Trial 1. 2-6-60 ........................... 4 0 50 12 41Trial 2. 1 - 6 -6 1 ........................... 3-3 130 24 47Trial 2. 1 - 6 -6 1 ........................... 5-6 125 10 16
All treatments resulted in significantly less rust than on the unsprayed trees (p = 0.001) and only one treatment was significantly more effective than the others. In this case the fungicide application had been at the rate of 40 gm ./400 ml. per tree and this gave a satisfactory control of rust for a longer period than any other treatment. This rate is equivalent to 60 lb. fungicide per acre which is not suggested for practical purposes.
In June, 1961, the intensity of rust attack was similar to that in the previous year and therefore the effectiveness of similar treatments in the two trials may be compared. Table 4 shows that the spray treatments were equally effective in the two years. Figure 2 reveals that after June, 1961. the rust began to increase on the sprayed coffee as a result of rainfall in May. This confirms that in practice a second fungicide spray would have been advisable in April.
The results confirmed those of Trial 1 and showed that it was possible to control successfully coffee Leaf Rust by using low volumes of spray applied in a way which could be adapted to practical farming conditions.
Trials 3, 4 and 5
Following the encouraging results of Trial 1 the investigation of low-volume spraying was extended to the use of tractor-mounted sprayers operated on a plantation scale.
Trials 3 and 5 were carried out at the Coffee Research Station. Ruiru, on trees spaced at 10 ft. by 10 ft. and pruned on a “single stem" pruning system which restricted their vertical growth to five feet. All the coffee had been sprayed in March, 1960, at the rate of 7 lb. of fungicide in 70 gallons per acre. In these two trials each plot consisted of 13 rows approximately 200 ft. long. Only the centre five rows were used for the recording of Leaf Rust, but the sprayer was operated along four lanes on either side of this strip to simulate estate conditions.
Trial 3 was designed to compare five volumes of spray applying equal weights of fungicide per acre for the control of coffee Leaf Rust. Each treatment was applied to a half acre of coffee and adjacent to each plot an equal area of unsprayed coffee was recorded for rust incidence.
B250 Tractor Chiron Sprayer Treatment per Acre
Gear Speed(m.p.h.) Setting Emission
(g.p.m.)Volume
(gal.)Fungicide
(lb.)
A 3 215 150 0-37 8-55 5-84
B 3 2 0 0 200 0-95 24-18 5-51
C 3 1-95 300 1 -50 38-11 5-49

EAST AFRICAN AGRICULTURAL AND FORESTRY JOURNAL OCTOBER, 1962
T able 5—Copper D eposits on Leaf Surfaces (mg.Cu/m2) 4th O ctober, 1960
Sampling SiteMeans Sites
2 ft. 4 ft. 3 ft.1 UK ALL
Fungicide(lb.)
Spray(gal.)
Inrow
Betweenrow
Inrow
Betweenrow Centre Upper
SurfaceLowerSurface Mean
A 5-84 8-55 38-1 n - i 47-2 24-1 32-1 44-2 16-9 30-6B 5-51 24-18 43-9 35-4 35-6 32-4 50-7 481 31-1 39-6C 5-49 38-11 44-1 43-2 35-4 82-9 48-4 57-5 44-0 50-7
Table 6—A Summary of Copper Deposits and Biological Assessments
T reatment per AcreInitial Biological Assay % Infection
Copper --------- ---------------------------------------------------Deposit on 4-10-60 15-11-60
Fungicide(lb.)
Spray(gal.)
LUWCI LCdlSurface
mg.Cu/m2Leaf Discs with rust Lesions Leaf Discs
with rust Lesions
A 5-84 8-55 16 5 77-6 69-7 58-6 42-9B 5-51 24-18 311 55 1 52-5 56-3 40-0C 5-49 38-11 44-0 51-0 50-5 43-7 36-2D 4-07 46-28 26-2 53-1 34-3 63-2 40-9E 3-73 51-81 17-0 61 -2 56-6 47-1 33-9
Means for sprayed coffee 59-6 52-3 53-8 38-8Unsprayed .. 100-0 1000 1000 100-0
Treatments D and E were intended to apply higher volumes of spray but the sprayer pump was defective and in fact Treatment D was 4.07 lb. in 46.28 gal. per acre, and Treatment E 3.73 lb. in 51.81 gal. per acre.
The spraying was carried out on 3rd and 4th October, 1960, using a “Chiron” sprayer mounted on an International Harvester B250 tractor. Details are given in the accompanying table.
Leaves were collected for copper estimates immediately after spraying and the results of these analyses are summarized in Table 5. A full report on these determinations has been published already (Mesmer and McKinlay. 1961).
The copper deposits in Table 5 cannot be compared directly with those shown in Table 1 for the first trial because the leaves were sampled from only one site on each tree in Trial 1 but from five sites in Trial 3. The general level of copper deposit in this trial was low and good rust control was not expected.
For biological assay leaf samples were collected from the trees in each plot from the
same sites as for copper estimation. The first set of leaves were gathered as soon as the spray had dried and a second set was collected six weeks later.
The analysis of the results of the biological assay showed that there was no significant difference between the five treatments and indicated that under conditions favourable to heavy rust infection the deposit of copper on the lower leaf surfaces was sufficient to reduce the intensity of attack only by 40-50 per cent.
Field and biological assay rust counts cannot be compared directly because the lesions which develop in the laboratory are the result o f only one very heavy application of spore inoculum, whereas in the field the peak of a Leaf Rust epidemic is the result o f overlapping generations of the fungus.
The results of the biological assay are most clearly represented by considering as 100 per cent the infection found on the discs punched from untreated leaves. The data in Tables 6 and 7 have been prepared by this method.
97

HAST AFRICAN AGRICULTURAL AND FORESTRY JOURNAL OCTOBER. 1%:
Table 7—A Summary of Biological Assessments in the Laboratory and the Field
F ield E xperimental Treatments
R usted D iscs or L eaves R ust Lesions
Biological Assay Field Biological Assay Field
4-10-60 15-11-60 18-1-61 4-10-60 15-11-60 18-1-61
Means for sprayed treatments .. 59-6 53-8 41 -9 52-3 38-8 25-4
Unsprayed ............................ 1000 1000 1000 1000 1000 100-0
There was no significant diirerence between treatments shown by the field assessments or the laboratory biological assay although all substantially reduced the severity of the rust attack. The biological assay showed that six weeks after spraying the copper on the leaves was fungicidally active, although much of the original deposit must have been removed by the intervening rainfall (11 in.). That which remained successfully reduced the infection by Leaf Rust in the second laboratory assessment.
The two treatments receiving the least copper showed the highest rust infection at the first sampling, but this difference was no longer evident in the samples collected six weeks later.
For reasons already given it was not expected that laboratory results would be closely correlated with those from the field: however in the present trial the efficiency of the spray treatments could have been predicted from the results of the second biological assay.
At no time during this trial was there a severe rust epidemic. All treatments significantly reduced the intensity of the attack (p = 0.01), but there was no significant difference between the treatments.T able 8—N umber of Leaf Rust Lesions per 100
Leaves 18th January, 1961
T reatment per Acre RustLesions per 100 LeavesLb.
Fungicide Gal. spray
Sprayed8-55 95A 5-84
B 5-51 24-18 31C 5-49 38-11 22
Unsprayed . . 205
The peak of the rust infection occurred about 18th January, 1961, and lesion counts for this date are summarized in Table 8. Although the difference between treatments
did not attain statistical significance it is interesting that the highest lesion counts were recorded from Treatment A which had a poor copper deposit on the lower leaf surface (Table 5) and which the first biological assay had shown to be one of the two least effective treatments (Table 6).
The copper deposits had been expected to be inadequate for satisfactory rust control: however all treatments reduced the Leaf Rust attacks so that less than 20 per cent of the leaves were infected whereas the unsprayed coffee had as many as half the leaves with the disease.
For the same rates of fungicide and volumes of spray the tractor-mounted sprayer was less effective than the knapsack sprayers used in Trials 1 and 2. There was no difference in the rust control using 8 or 51 gallons of spray per acre or betw-een 3.73 and 5.84 lb. fungicide per acre. It was concluded that in practice a volume of about 20 gallons per acre would be the most satisfactory.
In Trial 4 the coffee was planted five ft. apart in contour rows spaced at intervals o f approximately ten ft. The area was irrigated frequently by a system of water furrows: it was pruned on a multiple-stem system and at the time of spraying the maximum height of the heads was about nine ft. The coffee had never been sprayed with a fungicide and had been severely defoliated by Leaf Rust in August, 1959.
The object of this trial was to repeat Trial 3 under low-altitude conditions where Leaf Rust could be extremely serious.
Each treatment was applied to a one-third acre plot and adjacent to each treated area a plot o f equal size remained unsprayed. The plots consisted of 11 rows of coffee approximately 145 ft. long and as in Trial 3 only the centre five rows were used for recording purposes.
98

HAST AFRICAN AGRICULTURAL AND FORESTRY JOURNAI OCTOBER, 1962
B250 Tractor Chiron Sprayer T reatment per A cre
Gear Speed(m.p.h.) Setting Emission
(g.p.m.)Volume
(gal.)Fungicide
(lb.)
A 3 205 150 0-40 9-20 6*14
B 3 205 300 1 -63 40 00 3-60
C 2 118 350 2-73 100 06 7-30
The spraying was carried out on 6th and 7th October, 1960, using a “Chiron” sprayer mounted on an International Harvester B250 tractor. Details are given in the accompanying table.
Leaves were collected on 7th October for analysis and the results of these determinations are summarized in Table 9 and have been fully reported (Mesmer and McKinlay, 1961).
The lowest volume of spray gave the highest deposit of copper (p = 0.01) as had been the case with the comparable treatment in Trial 1 although this had not been found in Trial 3. In general the copper deposits were far higher than in the previous trial despite the fact that the spraying technique was identical, and the only differences were in the systems of planting and pruning at the two sites.
Leaf Rust was never severe on the unspraycd coffee; nevertheless all treatments gave a significant reduction in the incidence of rust and, as is evident from Figure 4, there was no significant difference between treatments.
T able 10—N umber of Leaf Rust Lesions per 100 Leaves 9th February, 1961
T reatment per Acre R ustLesions per
Lb.Fungicide Gal. Spray 100 Leaves
Sprayed9-20A 6 1 4 3
B 5-60 400 0 2C 7-30 10006 2
Unsprayed........................... 77
The peak of the epidemic was about 9th February, 1961, and the lesion counts for this date are shown in Table 10.
The results of Trial 4 confirmed those of Trial 3 in that it was clear that Leaf Rust could be controlled with volumes of spray as low as 9 gallons per acre applied with a tractor- mounted sprayer.
Trial 5Whereas Trials 3 and 4 showed that a
tractor-mounted sprayer could be used successfully to control Leaf Rust with low volumes of spray, they did not indicate the optimum rate of fungicide for this purpose. Various
T able 9—Copper D eposits on Leaf Surfaces (mg. Cu/m2) 7th O ctober, 1960
T reatment per AcreSampling Site
M eans FOR ALL Sites3 ft. 6 ft. 4 ft.
Fungicide(lb.)
Spray(gal.)
InRow
BetweenRow
InRow
BetweenRow Centre Upper
SurfaceLowerSurface Mean
A 6 1 4 9 20 112 0 237-8 59-2 67-8 133-1 141-4 102-6 122-0
B 5 60 40 00 471 661 49-6 25-7 72-7 53-4 51 -2 52-3
C 7-30 100 06 38 0 551 35-9 51 4 83-9 68-4 37-4 52-9
99

EAST AFRICAN AGRICULTURAL AND FORESTRY JOURNAL OCTOBER. 1962
100

EAST AFRICAN AGRICULTURAL AND FORESTRY JOURNAL OCTOBER.I%2
mechanical considerations had led to the conclusion that, with the sprayers then available in Kenya, the most practical spray volume would be about 20 gallons per acre. Trial 5 was designed to study spraying at this volume and was laid out on the coffee which had been used for Trial 3.
T r e a t m e n t pe r A c r e Concentrationw/w
L b . Fungicide Gal. Spray
7-5 20 3-756 0 20 3 004-5 20 2-253-0 20 1 -501-5 20 0-75
All spray treatments were applied on 18th March, 1961, using an "R.S.M.” sprayer mounted on a Massey Ferguson 35 vineyard tractor operated as described in the section on spraying machinery. Details are given in the accompanying table.
As soon as the spray had dried leaf samples were collected for copper estimation, and a second set of samples was collected 11 weeks later, on 30th May, 1961.
The initial copper deposits in Treatments A and B were significantly higher than Treatments C, D (p = 0.01) and Treatment E (p = 0.001). Treatments C and D also gave significantly higher deposits than E (p = 0.01). The upper leaf surfaces in all treatments received more copper than the underside of the leaves, but this was significant only in the case o f A (p = 0.01), B (p = 0.05) and C(p = 0.01).
Treatment A lost considerably less copper than any of the other treatments between sampling dates, and on the second occasion
the mean copper deposit for this treatment was significantly higher than all others (p = 0.001). At the same time the mean deposit on Treatment B was greater than on E (p = 0.001) and D (p = 0.05); and C was greater than E (p = 0.05).
For a constant spray volume (20 gallons/ acre), increasing the fungicide concentration led to improved copper deposits and at 3.75 per cent w /w the persistence was considerably greater than at lower rates of fungicide.
Treatment differences were apparent from 17th May, but the peak of the rust epidemic did not occur until about 9th August, 1961. The differences in the efficiency of the five treatments were most evident during July and August.T able 12—T he Statistical Significance of the
Effects of Spray Treatments on Leaf Rust L esion Counts
July-Augusl, 1961
Treat-ment
July August
5 12 19 26 2 9 16 23 30
A X XX XX XX XX XX XX X XB X XX X XX X XX X X XC NS X NS X NS X X NS NSD NS NS NS X NS X X NS NSE NS NS NS NS NS NS NS NS NS
NS=not statistically significanL x = p a t0 0 5 . x x = p a t0 0 1 .
Table 12 summarizes the statistical analyses for the most important period of the trial and shows that throughout the nine weeks Treatments A and B had significantly less rust than on the unsprayed coffee whereas for Treatment E the differences were never statistically significant. Treatments C and D were not adequate although they had some effect on the incidence of Leaf Rust.
T able 11—Copper D eposits on L eaf Surfaces (mg.Cu/m2)
SamplingDate
18th March, 1961 30th May, 1961
Treatment UpperSurface
LowerSurface Mean Upper
SurfaceLower
Surface Mean% o f Original Dose
UpperSurface
LowerSurface Mean
A 86-4 5 4 0 70-2 68-2 31-8 50-0 78-9 58-9 71 -2B 82-2 5 5 0 68-8 25-2 16-0 20-6 30-7 29-1 29-9C 50-6 44-6 47-6 17-8 13-8 15-8 35-2 30-9 33-2D 63-6 27-4 45-5 7-8 4-2 6-0 12-3 15-3 13-2E 260 16-2 211 1-8 3-6 2-7 6-9 22-2 12-8
101

EAST AFRICAN AGRICULTURAI. AND FORESTRY JOURNAL OCTOBER, I%2
Table 13— N umber of Leaf Rust Lesions per 100 Leaves and Leaf-fall
Treatment9th August, 1961
Rust LesionsAugust plus September
per 100 Leaves j Leaf-fall/Tree
A 77 410B 136 204C 153 283D 182 994E 424 558
U nsprayed 567 1,022
The number of rust lesions per J00 leaves on 9th August, 1961, are tabulated above to indicate the intensity of the epidemic at its maximum. These figures make it quite clear that Treatment E was quite ineffective while the March spray containing 7+ lb. fungicide in 20 gallons per acre had satisfactorily controlled the outbreak of Leaf Rust.
The main period of leaf-fail occurred in August and September and for these two months the total number of leaves lost per tree are shown in Table 13. It is clear that the leaf-fall was not closely correlated with
earlier disease intensity which suggests that factors other than Leaf Rust were also influencing the rate of leaf loss.
This trial confirmed that Leaf Rust can be effectively controlled using a tractor-mounted sprayer to apply 20 gallons of spray per acre. At least 6 lb. of fungicide per acre was necessary to give reliable reduction in rust attack. 7} lb. o f fungicide per acre provided a good residue of copper deposit on the leaves 11 weeks after spraying and could be expected to provide protection against Leaf Rust for a period considerably longer than any of the lower rates o f fungicide.
D iscussion
The recording of rust incidence from samples of leaves collected each week has provided a clear picture of the development of each attack by the disease. The sampling error for each week has been shown to be rather high (Clarke, 1961) but nevertheless consistent and reliable results have been obtained from the study of successive samples (Table 12 and Figure 5).
102

EAST AFRICAN AGRICULTURAL AND FORESTRY JOURNAL OCTOBER. 1962
Leaf-fall is not an adequate measure of disease intensity (Table 13) because it is the result o f many factors and at present cannot be associated closely with the amount of foliage remaining on the trees. However, work is in progress to devise a reliable method for the estimation of foliage density on multiple- stem coffee trees.
The present investigations have indicated that an overall mean copper deposit of 60 mg.Cu/rn- leaf surface is sufficient for adequate disease control, but it is not yet possible to give a maximum value for the standard deviation to be associated with this mean. In practice the variability o f the spray deposit has been found to be extremely high and it seems probable that if it could be reduced then a lower mean copper deposit would provide satisfactory disease control. Once definition can be given to the fungicide dosage requirements in terms of the mean and standard deviation then spraying equipment and application techniques can be tested against these criteria (Rayner. 1960c). In order to obtain more information on this subject leaf sampling would have to be more intensive than has been possible with the copper determination techniques used in this series of experiments. The leaf washing method described by Rayner (1960d) possibly may be more convenient than the swabbing technique used in the present work.
Courshee and Ireson (1961) have shown that a combination of chemical measurements and visual scores of spray deposits can provide the necessary information on potatoes; such a correlation has not been fully established for coffee. Experience with various techniques already described has shown that a dye gives an accurate indication of the amount of spray received by the leaf, but does not necessarily indicate the dosage of fungicide retained. This is because the filter papers absorb spray which might run off a leaf surface; this objection does not apply if spray volumes are low and no run-off occurs. The fluorescent tracer technique has been found particularly useful for estimating the uniformity of spray penetration throughout the tree. As it was found to be a rapid method, leaves could be collected from many parts o f the tree to give a valuable measure of spraying efficiency. The tracer and the method of scoring used did not give a reliable measure of the quantity of copper fungicide deposited and. in this respect, the technique was inferior to the dye assessments.
The leaf printing method gave a clear impression of the spray distribution on leaves, but as it was so laborious, the number of leaves examined had to be restricted.
The biological assay technique demonstrated the difference between sprayed and unsprayed leaves and revealed that the fungicide deposit was still effective six weeks after spraying. More detailed study of the technique will be necessary before its sensitivity can be defined more clearly. The great advantage of the method is that it provides a useful link between field and laboratory investigations and may facilitate the testing of fungicides and spraying equipment.
The sprayers used in the five field trials were chosen as being the most suitable of those locally available. The knapsack mist- blowers were used to treat trees individually, therefore the spray volume has been given as the rate per tree and the volume per acre will vary with the coffee population density. It was found that the spray emission rate becomes irregular when restricted to less than 200 ml. per minute and that a total of 20 seconds per tree was necessary for thorough spraying. For these reasons the lowest practicable volume of spray per tree was considered to be between 60 and 70 ml.; this is equivalent to approximately 10 g.p.a. at 8 ft. X 8 ft. or 8 g.p.a. at 9 ft. X 9 ft. spacing. Mounted sprayers have been used with tractors travelling at about 21 m.p.h. and obviously the trees have not been treated individually but considered as continuous rows of coffee. Because there are spaces between the trees tractor-mounted sprayers are more wasteful of fluid, but may well produce a more uniform spray than manually directed equipment. Small jets are liable to blockages and the mounted sprayers available in Kenya and suitable for use in coffee have eight or ten outlets. These facts combine to set a minimum practicable total emission rate for existing tractor-mounted sprayers at about 4 litres/minute or approximately 20 g.p.a.
C onclusions
Coffee Leaf Rust can be controlled with correctly timed fungicide sprays applied with a knapsack mistblower at 60 to 70 ml. per tree (approx. 10 g.p.a.) or with a tractor- mounted air-assisted sprayer applying 20 g.p.a.
Not more than 4 gm. of a 50 per cent copper fungicide need be used per tree (approx. 6 lb./acre) where the spray is
103

EAST AFRICAN AGRICULTURAL AND FORESTRY JOURNAL OCTOBER, 1%:
applied by a knapsack mistblower or 6 lb. per acre applied by a tractor-mounted sprayer.
With the spraying equipment available at present the fungicide application should provide an initial mean deposit o f at least 60 m g.Cu/m 2 leaf surface.
No phytotoxic symptom has been observed using the above fungicide concentrations or at any concentration up to and including 40 per cent w /w .
A cknow ledgem ents
We gratefully acknowledge the help of Mr.K. S. McKinlay and Mr. E. T. Mesmer of the Tropical Pesticides Research Institute, Arusha, Tanganyika, Mr. G. L. James who assisted in all the laboratory work and prepared the graphs, and Mr. W. F. Coltman who supervised most o f the field operations. Mr. R. T. Clarke provided invaluable advice on the statistical analysis of the results.
R efere n c es
Anon. (1958). Ann. Repl. Coffee Res. Slat., Kenya, 1956/7: 38.
------ (1961). An atlas of coffee pests and diseases:100. Coffee Board of Kenya, Nairobi.
Bock, K. R. (1962). Trans. Brit, mycol. Soc. (In pre-Clarke, R. T. (1961). Coffee leaf sampling for Ra«
assessment. Unpublished report, Kenya Dep Agric.
Courshee, R. J. and Ireson, M. J. (1961). J. agric Engng. Res., 6: 183.
Johnson, I. M. (1961). R.S.M. Sprayer trials. Unpublished report, Kenya Dep. Agric.
Lee, C. W. (1961). Misc. Rep. 298. Tropical Pesticides Research Institute, Arusha.
Martin. J. T. Ann. Repl. Long Ashton Res. Slat 1955 : 98.
McKinlay, K. S. and Mesmer, E. T. (1960). Misc. Rept. 269. Colonial Pesticides Research Unit, Arusha.
Mesmer, E. T. and McKinlay, K. S. (1961). Misc Rept. 277. Tropical Pesticides Research Institute. Arusha.
Nutman, F. J. (1961). Private communication.Rayner, R. W. (1960a). Field trials on the control by
fungicides of Leaf Rust of coffee. Unpub. Rept.. Kenya Dep. Agric.
------ (1960b). World Crops. 12 : 261.------ (1960c). World Crops. 12: 309.------ (I960d). J. agric. Engng. Res., 5: 441.------ (1961). Nature. 190: 328.Rose, G. J. (1961). Pest Techn., 3: 166.Sleep, K. C. (1958). Misc. Rept. 204, Colonial Pesti
cides Research Unit. Arusha.Wallis, J. A. N. and Firman, I. D. (1960). Kenya
Coffee, 25: 417.
REVIEWSC rop A daptation a nd D istr ibu tio n , by
Carroll P. Wilsie. Published by W. H. Freeman and Company, San Francisco 4, California, U.S.A. 448 pp., 145 illus. Price S9.
This book is concerned with the principles of crop adaptation and distribution. It is divided into three main sections. The first is concerned with general principles. It contains six chapters which range from such items as plant distribution and limiting factors to the origin o f cultivated plants. The second section contains seven chapters which refer to the effects of environmental factors. The third section, o f five chapters, discusses crop distribution on a climatic basis.
It is designed as a students’ textbook because it would be impossible to give a detailed review of such a wide range of subjects within its 448 pages. Nevertheless it can be used by the research worker as well as the student, for a long list of useful references is appended to each chapter. For that reason alone it can be highly recommended to all workers in the agricultural sciences. It has, of course, many other good points.
Soil a n d L and-u se Su rv ey s , by the Regional Research Centre of the British Caribbean. Obtainable from the Imperial College of Tropical Agriculture, Trinidad, W.l.
7. Jamaica , Parish of C larendon, by T.F. Finch, under the direction of T. A. Jones. 33 pp. and map. Price Sh. 20.
8. Jamaica, Parish of St. Jam es, by R. W. Price, under the direction of T. A. Jones. 26 pp. and map. Price Sh. 12.
9. G renada, by K. C. Vernon, Hugh Payne and J. Spector. under the direction of T. A. Jones. 44 pp. and map. Price Sh. 18.
10. Jamaica, Parish of St. M ary, by K. C. Vernon. 30 pp. and map. Price Sh. 14.
11. Jamaica. Parish of Portland , by T. F. Finch. 32 pp. and map. Price Sh. 15.
F arm O rganization and M anagement, by Gordon Hayes. Published by Crosby Lock- wood, London, 1961. 355 pages. Price Sh. 25.
This is the second edition of the book. It is much revised to bring it up to date.
104

EAST AFRICAN AGRICULTURAL AND FORESTRY JOURNAL OCTOBER. I%2
N E M A T O C E R U S SP. (NR. B R E V I C O R N I S HUST.)—A PESTOF CEREALS IN KENYA
V— AN EXPLORATORY TRIAL ON THE CONTROL OF LARVAEWITH SOIL TREATMENTS
By J. A. Bullock. Department of Zoology, University of Malaya, Kuala Lumpur, Malaya (Formerly Entomologist, Department of Agriculture, Kenya.)
(Received for publication on 31st January, 1962)
Laboratory tests [I] had indicated that several insecticides, notably gamma-BHC. were toxic to young larvae, and whilst it was probable that the cost of such treatments would be prohibitive, it was considered advisable to test them in the field. An opportunity to conduct an exploratory trial occurred in August. 1960, when a heavy infestation of larvae (c. 4 X 10“ per acre) was discovered on a barley trial at Njoro. A preliminary examination of the site revealed no differences in the infestations on the different treatments of the original barley trial; the land was then cleared of barley by hand, the soil dug with mattocks, and all trash raked off.
The trial was planted with barley on 7th September. I960, each of the 16 treatments (Table 1) being replicated five times in a 5 X 4 Balanced Lattice Design. Each plot consisted of five rows, 6.5 in. apart and 52 ft. long
(c. 16 sq. yd.) and were arranged in a continuous strip. Seed barley (cultivar Proctor) had been pre-treated with a I per cent phenyl-mercurial fungicide at a rate of 3.5 oz. per 100 lb. and seed and fertilizer treatments were applied and mixed in an eccentrically- mounted drum five days before planting. Seed treated with liquid formulations was spread out and air-dried to prevent it sticking in the hoppers.
Both seed and fertilizer (42 per cent—43 per cent P„Os) were applied by single-row hand drills at 65 lb. and 75 lb. per acre respectively, the drill containing fertilizer following the seed-drill closely and keeping to the drill-line.
Treatment 7, being a broadcast application, was applied prior to planting with a rotary knapsack duster to give a more or less even overall deposit, and was partially covered-in during planting.
T able 1
T reatment Insecticide FormulationA ctive Ingredient per A cre
Cost per A creApplied to
SeedApplied in Fertilizer
1 gamma-BHC .. 50% WP 2 lb.Sh. (E.A.)
53/332 gamma-BHC . 50% WP — 1 lb. 26/673 . . gamma-BHC . 50% WP — 0-5 lb. 13/334 gamma-BHC .. 20% EC 9-3 oz. — 26/155 . . gamma-BHC . 20% EC 4-7 oz. — 13/226 gamma-BHC . 20% EC 2-3 oz. — 6/477 . . gamma-BHC . 2-6% dust Broadcast overall at 2 lb. 68/608 . . gamma-BHC . 2-6% dust 1 0 lb. 1 0 lb. 68/609 . . gamma-BHC . 2-6% dust 0-5 lb. 0-5 lb. 34/30
10 gamma-BHC .. 2-6% dust 0-25 lb. 0-25 lb. 17/1511 Baytex 40% WP — 1 0 lb. Not known12 Dipterex 100% EC* 23-2 oz. — Not known13 . . Dipterex l00°o EC* 11 -6 oz. — Not known14 . . Metasystox 50% EC 11 -6 oz. — 31/9015 Control — — — —16 . . Control — — — —
•Assumed concentration since no data provided.
105

HAST AFRICAN AGRICULTURAL AND FORESTRY JOURNAL OCTOBER. 1%;
Subsequent to planting, a drought prevailed until late October. 1960. and, although sufficient moisture remained to permit germination, overhead irrigation had to be given at a rate of 1 in. of water per week in order to keep the crop growing.
As a result of the previous crop being removed and the soil broken in preparation for replanting, larvae had migrated down the soil profile and the succeeding drought prevented their return to the surface, so that no early attack occurred, and the only assessment of value was a visual assessment of stand (Table 2). The absence of larvae from the top layers of soil was confirmed by the examination of a series of soil samples from the control plots, taken to a depth of 6 in., which gave an estimated infestation of less than 0.25 X 10⁶ larvae per acre in the row. whilst a similar series on adjacent uncleared land gave an estimate of over 3.0 X 10“ larvae per acre. Since, prior to clearing, both these areas were found to have a population of c. 4.0 X 10“ larvae per acre it is apparent that clearing and cultivation of the land had greatly enhanced the rate of downward migration. This lends weight to the previous observations on the value of early planting prior to the onset of the rainy season [2].
As a result of heavy rain in late October, larvae returned to the surface and attacked the roots, but due to the advanced state of the crop, this attack failed to cause outright death on any significant proportion of the crop. However, the attack hindered the growth of the crop, and resulted in slower production of ears where treatments failed to give protection.
Ear production began on some plots in late November, and by mid-December a pronounced differential was apparent between various plots. A preliminary count was made at this stage, four samples, each consisting of a half metre of two adjacent rows, being examined on each of the 80 plots, and the number of shoots in which the head was visible recorded (Table 3, count 1). Samples were taken at set positions along the length of the plot, at 4 yd. intervals in the four- sample count and at 3 yd. intervals in the two five-sample counts. This was done to equate a fertility gradient running the length of the plots. The count was repeated four days later, in this case five samples per plot being examined (Table 3. count 2). Thereafter, no count was made until mid-January, when a similar series of five samples per plot was
taken (Table 3, count 3). At the same time, a plant population assessment was made by counting the plants in five half metre lengths of row on each plot (Table 2). The experiment was then abandoned since the recurrence of drought had caused only very poor heads of grain to be produced and yield figures would have been of little value.
Throughout the course of the experiment, the trial was visited at least once a week and examined for attacks by insects and other pests. An attack of Hylemyia arambourgi Seguy (Dipt.—Anthomyidae) developed early on and although this was at a low level, it wa- considered necessary to eliminate it. Three applications at weekly intervals of Endrin at a rate of c. 4.0 oz. active per acre were made with a power knapsack sprayer and effectively eliminated the attack and prevented any recurrence. This method of control had been decided on prior to planting as that least likely to affect any soil dweller and one known not to affect Nematocerns [2]. The alternative of a Dieldrin seed-treatment was discounted, since although not toxic to the larvae [2. 1] it' action on other soil dwellers and on the crop was unknown, especially in conjunction with the other treatments used. No other pest attack occurred apart from that of Nematocerus larvae.
Results
Phytotoxic effect of treatmentsTable 2 shows the result of the visual assess
ment of 19th September. 1960, and of the population counts of mid-January, 1961. These clearly indicate that gamma-BHC when applied direct to the seed produced a definite phytotoxic response whilst the Metasystox and Dipterex treatments also may have been phytotoxic.
Effect o f treatments on shootsTable 3 shows the result of the three esti
mates of shoot production. The first two exhibit definite differences between treatments and these were tested statistically using the method given in Cochrane and Cox [3]. Tests of significance were applied by the calculation of the least significant difference between the control and any treatment and by the multiple range test [4] (Table 4). Although the data appeared to be normal, a v'% transformation was applied to the raw data from the second count, to ensure that high values were not

HAST AFRICAN AGRICULTURAL AND FORESTRY JOURNAL OCTOBER. 1962
over-weighted. This is shown in Table 3 and the results do not differ from those obtained from untransformed data.
These results imply that in December. 1960, the production of ears in the three gamma- BHC/fertilizer treatments were all significantly superior to that in the control; the gamma-BHC broadcast treatment may also have been partially successful. However, a month later, these differences from the controls had disappeared.
D isc u ssio n and C o n c lu sio n s
It is postulated that the late attack of Nematocerus larvae caused a decrease in growth rate of the plants which was reflected in a retardation of shoot production as compared with those plots on which a degree of control had been obtained. N o other explanation of the results is readily apparent since no other insect attack occurred, other than the uniform light attack of H. aramhourgi which was effectively eradicated before any significant damage could occur. Since the plots received indentical treatments in all respects, each being given identical applications of phosphatic fertilizer, mercurial fungicide and extra water, differences must be attributed to the insecticidal treatment and hence, ignoring the possibilities of tonic action, etc., to protection from Nematocerus larvae and reaction to phytotoxic properties.
It is therefore concluded that gamma-BHC applied in the fertilizer and possibly gamma- BHC applied broadcast caused a significant reduction in Nematocerus attack, whilst the failure of other treatments may be due to
phytotoxic effects acting in conjunction with the failure of the insecticide or even masking an effective control.
The recovery of the controls and increases in most of the unsuccessful treatments in January, 1961, appear to confirm this hypothesis, the later production of ears being a traumatic response to injury, occasioned in the controls by Nematocerus and in the others by phytotoxicity and Nematocerus either jointly or singly.
S ummary
An experiment on the control of the larvae of Nematocerus sp. is described.
All treatments which were applied direct to the seed were more or less phytotoxic and this was especially so with gamma-BHC at the rates tested.
Treatments containing gamma-BHC mixed with a phosphatic fertilizer showed a significantly higher production of ears early on, and it is postulated that these treatments have given a measure of control of Nematocerus larvae.
A treatment in which a gamma-BHC dust was applied broadcast appeared to be marginally successful.A cknow ledgem ents
I have to thank the Senior Plant Breeder and his staff for considerable assistance in this experiment and especially for providing overhead irrigation of the trial area. Thanks are also due to the African staff of my section who have afforded me great assistance in routine sampling.
T able 2— A ssessment of G ermination a n d Count of U ltimate S tand
No. T reatment—Description Stand 14 days after Planting Ultimate stand
1 2 lb. BHC in fertilizerVisual assessment
Goodi Pla’tts per / metre)
25-22 1 lb. BHC in fertilizer . . Good 24-63 i lb. BHC in fertilizer Good 2514 9.3 oz. BHC on seed . . Very poor Very low5 4-7 oz. BHC on seed Very poor Verv low6 2-3 oz. BHC on seed Poor 16-27 2 lb. BHC broadcast Good 21 -88 2 lb. BHC on seed and fertilizer Very poor Very low9 1 lb. BHC on seed and fertilizer Very poor Very low
10 i lb. BHC on seed and fertilizer Poor 15-711 1 lb. Baytex in fer tilizer ......................... Good 25-612 23-2 oz. Dipterex on seed Rather poor 21-213 11 -6 oz. Dipterex on seed Rather poor 20-214 11 -6 oz. Metasystox on seed Rather poor 18-615 Control Good 25-916 Control Good 23 0
107

FAST AFRICAN AGRICULTURAL AND FORESTRY JOURNAL OCTOBER. 1962
T able 3—P roduction of E ars (N o . per I M. of Ro w )
T reatmentM id-D ecember M id-January
Count 1 Count 2 Count 2 (V x trans.)
Count 3 (unadjusted)
1. 2 lb. BHC in fertilizer 47-6f 40-17t 2-79+ 48-02. 1 lb. BHC in fertilizer 38-7+ 46-18+ 3-03+ 40-03. i lb. BHC in fertilizer 37-3* 37-17* 2-69* 37-04. 9-3 oz. BHC on seed 0-15 4-59 0-83 15-45. 4-7 oz. BHC on seed 1-3 3-20 0 81 8-56. 2-3 oz. BHC on seed 25-9 19-91 1-98 24-47. 2 lb. BHC broadcast8. 2 lb. BHC on seed and fer-
28-7 38-46* 2-71* 34-7
lizer 3-2 7-29 1-17 14-09. 1 lb. BHC on seed and fer-
lizer ............................ 3-5 2-26 0-66 14-410. j lb. BHC on seed and fer-
lizer 9-7 13-18 1 -55 15-011. 1 lb. Bavtex in fertilizer 34-2 32-97 2-56 28-612. 20 oz. Dipterex on seed 20-2 27-42 2-07 21-113. 10 oz. Dipterex on seed 21-4 25-83 2-28 31 *614. 10 oz. Metasystox on seed .. 24-3 28-72 2-37 39-415. C ontrol!16. C on tro l/ 27-7 28-02 2-23 43-3
L.S.D. between^ P=0-05 ±7-99 ±8-63 ±0-39
Not calculated.treatment J P=0-01 ±10-76 ±11-48 ±0-52
S.E. between treatments . ±4-52 ±4-98 ±0-22
* = Significantly superior to the control (P<0-05)t=Significantly superior to the control (P<0-01)
T+|xWFigures adjusted using the formula: adjusted m ea n = -----------(vide ref. 3, p. 397 et seq.)
T able 4— S e q u e n t i a l Test on the Ranked Means (P=0-05)
Count 1 Count 2
123
117 6
141312 10 98 54
47-6 3 238-7 ) 137-3 J 7.14-2 >1 328-7 1 11
! 2S-9 ( 1424-3 1221-4 1 1320-2 J 69-7 j 103-5 1 83-2 )• 41-3 1 50-15 J 9
Treatments within the same bracket do not differ significantly inter se (P=0-05).
R e fe r e n c e s
|1J Bullock. J. A. (1961). E. Air. agric. for. J.. 27.pp. 121-126.
|2| Bullock. J. A. (1961). E. Afr. agric. for. J.. 27. pp. 24-32.
[3] Cochran, W. G. and Cox. G. M. (1957). Experimental Designs (2nd Edition).
|4| Snedccor. G. W. (1956). Statistical Methods <5th Edition).
APPENDIX
Summary of Control Measures Discussed in Papers I-V
C hemical Control
Adults.—The adults have been shown to be susceptible to both DDT and gamma-BHC in spray and dust formulations (Paper I) and these appear to offer a good prospect for control whilst further research will doubtless reveal other effective insecticides. The use of
108

EAST AFRICAN AGRICULTURAL AND FORESTRY JOURNAL OCTOBER, 1962
an adult control is rendered the more attractive since this is by far the most easily seen stage. Two methods of control are envisaged: —
(i) Eradication from cultivated areas byoverall treatment.
(ii) Prevention of immigration to cultivatedareas by perimeter treatment.
Ova.—No insecticidal treatment has offered any prospect of control (Paper II). The ova are securely sealed into the folded leaf probably to prevent desiccation and it is therefore unlikely that any insecticide could enter the pocket by penetrating the seal. There remains the possibility of a systemic insecticide being transpired into the pocket.
Larvae.—The tests so far (Papers III and V i suggest that insecticidal treatments applied at the time of planting may give a measure of control but whether such a treatment would be economic is doubtful. The impossibility of predicting outbreaks of larvae would entail a prophylactic treatment being applied to every field of cereals with the probability of less than half the fields, even in a heavily infested area, being attacked.
C ultural Control
So far as can be seen, no part of the normal cereal grass rotation adversely affects the infestation of larvae (Paper IV). There is however evidence that the absence of a crop reduces an infestation (Paper I) either through death by starvation of the larvae or through emigration of adults in search of suitable food and oviposition sites. The absence of a crop would be effective if land were properly fallowed to remove all green stuff suitable for feeding or for oviposition by the adults.
Reduction of losses could also be effected by planting prior to the re-ascent of larvae. This was inferred from observations (Paper I) and incidental proof obtained during an experiment in control (Paper V).
Biological Control
N o research has been done on this facet, apart from a few observations on an ectoparasite of egg-masses, which has recently been identified at the British Museum (N.H.). London, as Eupteromalus sp. (cf. Paper I). The factors affecting its distribution, with the possibility of introduction into areas where it does not occur, e.g. Naro Moru, may well repay study.
REVIEWSA Review of N itrogen in the T ropics w ith
Particular R eference to Pastures, edited by a committee o f the Division of Tropical Pastures, C.S.I.R.O., Australia. Published as Bull. 46 by the Commonwealth Bureau of Pastures and Field Crops, Hurley, Berkshire, England. 185 pages. Price Sh. 35.
This publication results from a symposium attended by 150 Australian scientists whose intention was to review existing formation on the role of nitrogen in the agriculture of the tropics and sub-tropics, and in particular those aspects relevant to the problems of Northern Australia.
It covers in some detail such aspects as the general problem of nitrogen economy, soil and plant nitrogen, nitrogen fixation and so on. In doing so it refers to the animal aspect as well as that of the plant and soil. For example, the
nitrogen intake and excretion of grazing ruminants is discussed as well as the nitrogen uptake and nitrogen transformations in plants.
Each chapter contains a useful list o f references and there is a subject index.
It can be recommended to all agriculturists in the tropics and sub-tropics and to those in the temperate zones as well.
C arbohydrate Resources w ithin the Perennial Plant, by C. A. Priestly. Techn. Comn. No. 27 Commonwealth Bureau of Horticulture and Plantation Crops, East Mailing, Maidstone, Kent. 116 pages. Price Sh. 15.
This is a useful addition to the literature on the carbohydrate resources of the plant. Although it deals mainly with the physiology of carbohydrates in fruit trees it will also be a useful source of reference for those who deal only with annual crops.
109

EAST AFRICAN AGRICULTURAL AND FORESTRY JOURNAL OCTOBER. 1%:
A L B I Z I A A N T U N E S I A N A —A USEFUL TIMBER TREE O F WESTERN TANGANYIKA
By J. A. C. Howard(Received for publication on 19tli February. 1962)
The importance of this species lies in the fact that the timber is an excellent substitute for muninga (Pterocarpus angolensis D.C.). Its distribution, however, is sparse in comparison with muninga.
D esc r iptio n
Albizia antunesiana Harms, belongs to the family Mimosaceae and the genus Albizia. Twenty-four species of Albizia have been recorded in Tanganyika. Local names for Albiziu (intunesiana include mgando kagua (Nyam- wezi), mgando kaguba or mgando (Sumbwa). umugando (Ha) and msaku (Fipa). Muninga Kagua is suggested as the trade name.
The tree attains medium size with a top height o f 40 ft. to 55 ft., is deciduous and has a short cylindrical bole. Usually only one saw- log of 6 ft. to 10 ft. can be obtained from a single mature tree. Branches are usually large and spreading, and the crown is broad. The bark is smooth and dark grey on young trees, under about 2 ft. girth at breast height, and on the smaller branches of the large trees ; but on old trees the bark is blackish grey, not flecky, reticulated, and has reddish tinge in the reticulations. The inside of the bark is whitish yellow ; and the sapwood, which is conspicuous and broad, is similar in colour but has pinkish streaks which tend to bleed when slashed tangentially. Bark thickness is given in Table I.
T able I—A rithmetic means of 3 Trees of each 1 ft. G irth C lass
Girth at Breast Height Bark Thickness
Feet Inches2/3 i - i3/4 i - i4/5 4-1
D istr ibu tio n and H abitat
In its natural habitat, the tree is distributed throughout the woodland miombo formation of Western Province and is reported to extend into Lake Province and Central Province. Greenway [I] has recorded the species as far northwards as Bukoba D istrict; and Burtt [21
reported it as extending southwards into Northern Rhodesia. Burtt also recorded the tree as occurring very locally and rarely in the Bua River area of Nyasaland ; and commented, during his journey across Bereka Ridge (south of Babati), on Brachystegia micropltylla “with which is associated several species including Albizia antunesiana”. The tree is not recorded as being planted.
Enumerations carried out by the writer in 1956-58 in Tabora District. Western Province, indicate the distribution of the species to be sparse to rare. The stocking of the trees, 4 ft. girth at breast height and over, is shown in Table II. For comparison the stocking of muninga trees of the same girth classes is given
T able II
N a m e o f F o r e st
R eserve
Area of Reserve
Number of Albizia
antunesiana
Number of Muninga
trees
Uyui-Kigwa-Sq. mile Sq. mile Sq. mile
Rubaga .. 520 10 96Sikonge 220 6 81Igombe River 955 A 150
Brief ecological studies made in Kahama. Nzega and Tabora District; show that within the woodland formation Albizia antunesiana occurs on the eluvial soil of the Brachystegia spiciformis-Julbernardia globiflora woodland Locally the eluvial soil is termed “ichenga and “kikungu". In catena sequence, the specie- occurs below the hill-top or Brachystegia tamarinoides var. micropltylla woodland and above the illuvial soils of the Acaciapseudoflstula-Combretum ternifolium grassland It is rare or absent on the Afronnosia an golensis-A Ibiziabarveyi-A caciatanganyikensts wooded grassland. The species has not been recorded on anthills. Study of aerial photo graphs have shown that the Brachystegia spiciformis-Julbernardia globi flora community occupies 40 per cent to 50 per cent of the total land area [5].
Little information is available on the climatic conditions. Jackson [3] recorded at Kakoma. 65 miles south of Tabora, that in 1^36 the highest maximum temperature was 92.2 F (November); and that the lowest minimum
110
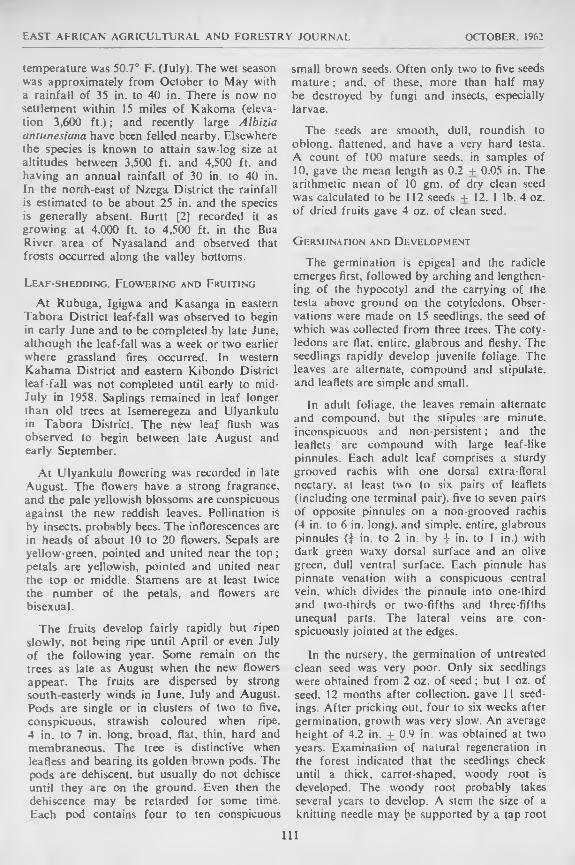
EAST AFRICAN AGRICULTURAL AND FORESTRY JOURNAL OCTOBER. 1962
temperature was 50.7° F. (July). The wet season was approximately from October to May with a rainfall of 35 in. to 40 in. There is now no settlement within 15 miles o f Kakoma (elevation 3,600 f t .) ; and recently large Albizia antunesiana have been felled nearby. Elsewhere the species is known to attain saw-log size at altitudes between 3,500 ft. and 4,500 ft. and having an annual rainfall of 30 in. to 40 in. In the north-east of Nzega District the rainfall is estimated to be about 25 in. and the species is generally absent. Burtt [2] recorded it as growing at 4,000 ft. to 4,500 ft. in the Bua River area of Nyasaland and observed that frosts occurred along the valley bottoms.
Leaf-shedding . F lowering and F ruiting
At Rubuga, Igigwa and Kasanga in eastern Tabora District leaf-fall was observed to begin in early June and to be completed by late June, although the leaf-fail was a week or two earlier where grassland fires occurred. In western Kahama District and eastern Kibondo District leaf-fail was not completed until early to mid- July in 1958. Saplings remained in leaf longer than old trees at Isemeregeza and Ulyankulu in Tabora District. The new leaf flush was observed to begin between late August and early September.
At Ulyankulu flowering was recorded in late August. The flowers have a strong fragrance, and the pale yellowish blossoms are conspicuous against the new reddish leaves. Pollination is by insects, probably bees. The inflorescences are in heads of about 10 to 20 flowers. Sepals are yellow-green, pointed and united near the to p ; petals are yellowish, pointed and united near the top or middle. Stamens are at least twice the number of the petals, and flowers are bisexual.
The fruits develop fairly rapidly but ripen slowly, not being ripe until April or even July of the following year. Some remain on the trees as late as August when the new flowers appear. The fruits are dispersed by strong south-easterly winds in June, July and August. Pods are single or in clusters of two to five, conspicuous, strawish coloured when ripe. 4 in. to 7 in. long, broad, flat, thin, hard and membraneous. The tree is distinctive when leafless and bearing its golden brown pods. The pods are dehiscent, but usually do not dehisce until they are on the ground. Even then the dehiscence may be retarded for some time. Each pod contains four to ten conspicuous
small brown seeds. Often only two to five seeds m ature; and, of these, more than half may be destroyed by fungi and insects, especially larvae.
The seeds are smooth, dull, roundish to oblong, flattened, and have a very hard testa. A count of 100 mature seeds, in samples of 10, gave the mean length as 0.2 + 0.05 in. The arithmetic mean of 10 gm. of dry clean seed was calculated to be 112 seeds + 12. 1 lb. 4 oz. o f dried fruits gave 4 oz. of clean seed.
G ermination and D evelopment
The germination is epigeal and the radicle emerges first, followed by arching and lengthening of the hypocotyl and the carrying of the testa above ground on the cotyledons. Observations were made on 15 seedlings, the seed of which was collected from three trees. The cotyledons are flat, entire, glabrous and fleshy. The seedlings rapidly develop juvenile foliage. The leaves are alternate, compound and stipulate, and leaflets are simple and small.
In adult foliage, the leaves remain alternate and compound, but the stipules are minute, inconspicuous and non-persistent; and the leaflets are compound with large leaf-like pinnules. Each adult leaf comprises a sturdy grooved rachis with one dorsal extra-floral nectary, at least two to six pairs o f leaflets (including one terminal pair), five to seven pairs of opposite pinnules on a non-grooved rachis (4 in. to 6 in. long), and simple, entire, glabrous pinnules ( | in. to 2 in. by + in. to I in.) with dark green waxy dorsal surface and an olive green, dull ventral surface. Each pinnule has pinnate venation with a conspicuous central vein, which divides the pinnule into one-third and two-thirds or two-fifths and three-fifths unequal parts. The lateral veins are conspicuously jointed at the edges.
In the nursery, the germination of untreated clean seed was very poor. Only six seedlings were obtained from 2 oz. of seed; but 1 oz. of seed. 12 months after collection, gave 11 seed- ings. After pricking out. four to six weeks after germination, growth was very slow. An average height of 4.2 in. + 0.9 in. was obtained at two years. Examination of natural regeneration in the forest indicated that the seedlings check until a thick, carrot-shaped, woody root is developed. The woody root probably takes several years to develop. A stem the size of a knitting needle may t>e supported by a tap root
111

EAST AFRICAN AGRICULTURAL AND FORESTRY JOURNAL OCTOBER. 1%:
of 2 in. diameter! This, however, is characteristic of other tree species of the woodland formation.
Silvicultural C haracteristics
Young plants seem capable of withstanding a moderate amount of direct overhead shade from surrounding trees. The nearest tree to a sapling was some 12 ft. away. Young seedlings are killed by grass fires but older saplings are only killed back to ground level. Saplings of about 8 in. girth or larger seem capable of surviving severe grass fires. Natural regeneration is sporadic and uncertain. At Kigwa, natural regeneration was observed to commence about four weeks after the beginning of the long rainy season and seemed best where there was light weed growth and some side shade from large trees. Five two-year-old nursery transplants were able to survive complete drought in the nursery at Tabora for two months. Seedling regeneration was only observed on eluvial soils.
T imber P roperties
Little is known about the timber properties. Albizia antunesicina has been bought and sold as muninga in Dar es Salaam, Tabora, Nzega, Kahama and Mwanza. It is, however, usually redder than muninga. The heartw'ood is reddish- brown with blackish-brown streaks, which darken on exposure. The sapwood is pale, being usually yellowish-white and 1 in. to 2 in. wide.
The grain is interlocked and the characteristic "Albizia" flecking is conspicuous on the planed surface. The weight of seasoned timber is estimated to be about 40 lb. per cubic foot, and when green up to 40 per cent heavier.
The sawn timber of the heartwood seasons easily but slowly with little radial and tangential shrinkage and end splitting. The manufactured timber is usually stable. Furniture maker- at Tabora reported the timber to be a little more difficult to work than muninga. Planing by hand is fairly easy and a good finish can be obtained except at the knots. An attractive wax finish can be obtained. The timber takes screws easily but nailing at the ends produces splitting. The heartwood is very resistant to attack by insects, including white ants. Poles have been used in the construction of mud and wattle houses. The timber has been used in the past for railway sleepers; and local African uses include the making of trays, chairs and tables. Door and window frames and weather doors had remained stable at Nzega for several years. The timber is considered most suited for high-class furniture manufacture, including tables and chairs.
R eferences
| l | Brcnan. J. P. and Greenway. P. J. A check list of forest trees and shrubs. Tanganyika Territory. Pt. II, Imp. For. Inst., Oxford, 1949.
|2| Burtt. B. D.. J. Ecol., 30. 65. 1942.13) Glover, P. E. S. Afr. J. Sci.. 26. 316, 1939.|4| Howard, J. A. C. Emp. For. Rev., 38. 348. 1959 (51 Phillips, J. J. Ecol. 18. 193, 1930.

EAST AFRICAN AGRICULTURAL AND FORESTRY JOURNAL OCTOBER, 1962
SMALL SCALE BROILER PRODUCTION IN UGANDABy J. C. M. Trail, Livestock Experimental Station, Entebbe, Uganda
{Received for publication on l l t l i November, 1961)
As a result of the egg production side of poultry farming becoming more competitive as the industry expands in Uganda, resulting in lower profit margins, more African farmers are turning to the hitherto neglected aspect of table poultry. Up to the present time the specialized production o f high-quality table birds has been non-existent, and the aims of this paper are to examine a small-scale broiler unit and determine the growth rates, food consumption and feed conversion, mortality and culling rates, killing-out percentages, costs of production and profitability of good-quality broilers, using a feeding programme which has given the most economic returns to date in Uganda.
M ethod
A small-scale broiler unit designed to produce 50-60 broilers each month was set up and run for a period of 13 months, involving a total of 649 Light Sussex x Rhode Island Red cockerels in 10 batches. The day-to-day running of this unit was carried out by an average African poultry stockman, under general supervision from the officer in charge of poultry, and the level of management was that to be expected from a good African poultry farmer. The growth rates, food consumption and feed conversion, mortality and culling, killing-out percentages and all costs of production were measured and recorded.
Housing
A poultry deep-litter house measuring 20 ft. by 10 ft. was divided into three sections of 45 sq. ft., 60 sq. ft. and 80 sq. ft., with a working passage of 15 sq. ft. giving access from the outside door of the building to the door of each section. In the largest section, at a height of 3 ft. above the floor, was constructed a frame holding a 100 chick-size warm floor brooder and a wire-floored run of the same floor area. The food and water troughs of the brooder were accessible from the working passage, and the whole brooder and run could be easily removed for cleaning. Thus four groups of birds of different ages were housed in this building, and the birds actually remained in each section for one month.
From day old to one month the birds were kept in the wire-floored brooder and run, having j sq. ft. per bird. From one month to two months J sq. ft. of floor space was provided, from tw'o months to three months 1 sq. ft. and from three months to four months H sq. ft. to 1 | sq. ft. The three sections for one month to four months of age had coffee husk provided as deep litter on the floors.
Each month the group which had reached four months of age was removed, killed and dressed for sale, the pen swept out and new coffee husk litter provided, and the three- month-old batch moved in. Similarly the second pen was cleaned out, and the next batch of birds moved in. The brooder was removed, scrubbed and disinfected and the new batch of chicks housed. Each group o f birds did not have to be handled, but was merely driven through the working passage from one section of the house to the next.
In the management of the brooder, heat was provided for three weeks by the paraffin lamps beneath the wire floor, the final week being without heat and with the solid top of the brooder replaced by wire.
Feeding
Five different methods of feeding the broilers were tested, the results will be reported in a separate paper (Trail, 1961). In this present paper the feeding method that gave the best economic return is described.
A commercial chick mash manufactured in East Africa was fed from day old to 12 weeks of age, thereafter a mixture consisting of 50 per cent commercial growers' mash and 50 per cent maize bran was used to four months, all foods being provided ad lib. The chemical analyses of the feeding stuffs are given in Table I.
Greenfood in the form of Russian comfrey from day old to one month of age and young elephant grass thereafter was provided fresh daily, and water was available at all times. A small amount of insoluble grit was occasionally scattered on the food during the fourth month.
113
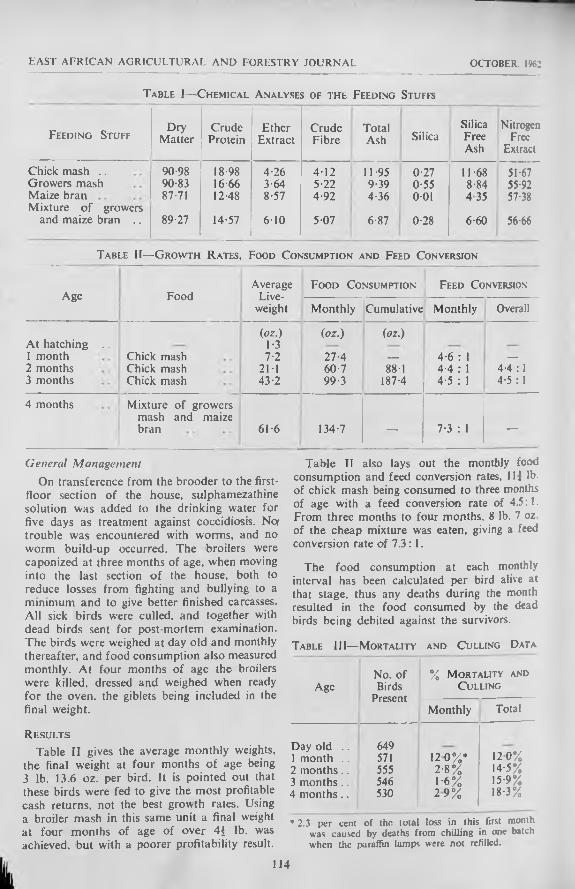
FAST AFRICAN AGRICULTURAL AND FORKSTRY JOURNAL OCTOBER, 1%;
T able 1— C hemical A nalyses of the F eeding Stuffs
F eeding StuffDry
MatterCrude
ProteinEther
ExtractCrudeFibre
TotalAsh Silica
SilicaFreeAsh
NitrogenFree
Extract
Chick mash .. 90-98 18-98 4-26 4-12 11-95 0-27 11-68 51-67Growers mash 90-83 16-66 3-64 5-22 9-39 0-55 8-84 55-92Maize bran Mixture o f growers
87-71 12-48 8-57 4-92 4-36 0-01 4 35 57-38
and maize bran .. 89-27 14-57 6-10 5-07 6-87 0-28 6-60 56-66
T able I I — G rowth R ates, Food Consum ption a n d Feed Conversion
Age FoodAverage
Live-weight
F ood Consumption Feed Conversion
Monthly Cumulative Monthly Overall
At hatching ..(oz.)
1-3(oz.) (oz.)
1 month Chick mash 7-2 27-4 — 4-6 : 1 —
2 months Chick mash 21-1 60-7 88-1 4-4 : 1 4-4 :13 months Chick mash 43-2 99-3 187-4 4-5 : 1 4-5 :1
4 months Mixture of growers mash and maize bran 61 -6 134-7 — 7-3 : 1 —
General ManagementOn transference from the brooder to the first-
floor section of the house, sulphamezathine solution was added to the drinking water for five days as treatment against coccidiosis. N o trouble was encountered with worms, and no worm build-up occurred. The broilers were caponized at three months of age, when moving into the last section o f the house, both to reduce losses from fighting and bullying to a minimum and to give better finished carcasses. All sick birds were culled, and together with dead birds sent for post-mortem examination. The birds were weighed at day old and monthly thereafter, and food consumption also measured monthly. At four months of age the broilers were killed, dressed and weighed when ready for the oven, the giblets being included in the final weight.
R e su lt s
Table II gives the average monthly weights, the final weight at four months o f age being 3 lb. 13.6 oz. per bird. It is pointed out that these birds were fed to give the most profitable cash returns, not the best growth rates. Using a broiler mash in this same unit a final weight at four months of age of over 4$ lb. was achieved, but with a poorer profitability result.
Table II also lays out the monthly food consumption and feed conversion rates, 111 lb. of chick mash being consumed to three months of age with a feed conversion rate of 4.5:1. From three months to four months, 8 lb. 7 oz of the cheap mixture was eaten, giving a feed conversion rate of 7.3:1.
The food consumption at each monthly interval has been calculated per bird alive at that stage, thus any deaths during the month resulted in the food consumed by the dead birds being debited against the survivors.
T able H I— M ortality a n d C ulling D ata
AgeNo. of Birds
Present
% M ortality and C ulling
Monthly Total
Day old .. 6491 month .. 571 12 0 %* 12 0 %2 m onths.. 555 2 S % 14-5%3 months . 546 1-6% 15-9%4 m onths. . 530 29% 18-3%
* 2.3 per cent of the total loss in this first month was caused by deaths from chilling in one batch when the paraffin lamps were not refilled.
114

HAST AFRICAN AGRICULTURAL AND FORESTRY JOURNAL OCTOBER. 1962
Table III gives the number of birds present at each monthly interval, the percentage mortality and culling during each month, and the overall mortality and culling percentage which was 18.3 per cent. Two-thirds of all losses were sustained during the first month. Post-mortem examinations were carried out on all the dead and culled birds, and coccidiosis accounted for 25 per cent of the losses, although no other outstanding single cause of mortality could be ascertained.
The average liveweight at four months was 3 lb. 13.6 oz. and the dressed weight including the giblets 2 lb. 13.3 oz., giving a killing-out figure o f 73.5 per cent. The quality and finish oi the carcasses were very good.
Costs were as follows: —Sh.
66-day-old Cockerels—At Sh. 5 per dozen . . . . . . 27/50
Depreciation on Building—Cost Sh. 1.200, 10-year life, 12
batches broilers per year . . 10/00Depreciation on Brooder and Run—
Cost Sh. 350, 10-year life, 12 batches broilers per year . . . . . . 2/95
Depreciation on Food and Water Troughs—
Cost Sh. 200, 5-year life, 12 batches broilers per y e a r ............................3/35
Fuel—6 pints paraffin per batch . . . . 3/00
Labour—1 6th o f one man averaged over each
month including the cleaning out once per month, at Sh. 120 per month . . . . . . . . 20/00
Feeding Stuffs—645 lb. chick mash at Sh. 41/90 per
150 lb. bag=Sh. 180/20 and 447 lb. cheap mixture at Sh. 23/85 per150 lb. bag=Sh. 71/10 . . . . 251/30
Drugs . . . . . . . . . . 6/00Caponizing . . . . . . . . 5/10Depreciation on Capital—
(5% o f Sh. 2.000 for 12 batches) . . 8/40
Sh. 337/60
Thus the cost of production of each batch of 53 live broilers at four months of age was Sh. 337/60 or Sh. 6/38 per bird, or Sh. 1/66 per pound liveweight.
The killing, plucking and dressing of each batch required Sh. 16 for labour and Sh. 1 for materials. The cost of production was thus Sh. 6 /7 0 per dressed broiler or Sh. 2/37 per pound dressed weight.
The main items of expenditure expressed as costs per bird, costs pier pound liveweight, costs per pound dressed weight and percentages of the total costs of production per bird are given in Table IV.
An attempt to forecast the future profitability of broiler production in Uganda is open to many errors. However, at the present time it is possible to obtain from Sh. 3 to Sh. 3 /50 per pound dressed weight for good quality broilers as produced in this trial. In this case the profit per broiler ranged from Sh. 1/79 when the selling price was Sh. 3 per pound dressed weight to Sh. 3/21 when Sh. 3 /50 per pound was obtained.
These figures for profit are very much higher than in the United Kingdom and America where greatly increased competition has steadily forced down the profit per bird over the past few years.
S u m m a r y
A small-scale broiler unit producing 50 to 60 broilers per month was set up and operated for 13 months, during which time 10 batches of Light Sussex x Rhode Island Red broilers were produced. The housing, feeding and general management methods are outlined. The feeding programme described is that which gave the greatest economic return. The growth rates, food consumption and feed conversion, mortality and culling, killing-out percentage, complete costings and income obtained, are given. The broilers reached 3 lb. 13.6 oz. at 16 weeks, had eaten 11$ lb. of commercial chick mash and 8$ lb. of a cheap mixture of 50 per cent growers' mash and 50 per cent maize bran, giving a feed conversion rate of 4.5:1 on chick mash to three months of age, and 7.3:1 on the cheap mixture from three months to four months. The total mortality and culling was18.3 per cent from day old to four months. The dressed weight was 2 lb. 13.3 oz., giving a killing-out figure of 73.5 per cent. The total cost of production of each live broiler was Sh. 6 /38 or Sh. 1/66 per pound liveweight, and when dressed, Sh. 6/70 per bird or Sh. 2/37 per pound dressed weight. The main items of expenditure are listed as percentages of the total costs of production, food accounting for
115

FAST AFRICAN AGRICULTURAL AND FORESTRY JOURNAL OCTOBER. 1962
T able IV — B reakdown of Costs of P roduction
Item Cost per Bird
% of Total Costs of Production of
4-month-old Live Broiler
Cost per Pound
Liveweight
Cost per Pound
Dressed Weight
Day old cockerels ............................ 0/52 8 -2 % 0/14 0/19Food 4/74 74-4% 1/23 1/68Labour ..................................................... 0/38 5-9% 0/10 0/13Fuel, drugs, caponizing 0/27 4-2% 0/07 0/09Depreciation on building, brooder,
equipment, capital . . 0/47 7-3% 0/12 0/17
T otal ................................ 6/38 100 0 % 1/66
Plucking and dressing 0/32 0/11
T otal ................................ 6/70 2/37
74.4 per cent of the cost. The profit per bird was Sh. 1/79 when Sh. 3 per pound dressed weight was the selling price, and Sh. 3/21 when Sh. 3 /5 0 per pound was obtained.
A ck n o w led g e m ents
The author wishes to thank the Nutritional Section o f the Animal Health Research Centre,
Entebbe, for the chemical analyses of the feeding stuffs, the Disease Investigation Unit for post-mortem examinations, and the Director of Veterinary Services and Animal Husbandn for permission to publish this paper.
R eference
Trail, J. C. M. (1961). Unpublished dala.
REVIEWSArom atic or O riental T obaccos, by Frederick
A. Wolf. Published by the Duke University Press, Durham, North Carolina. 278 pp. Price SI2/50.
This lavishly produced and expensive book deals exclusively with the aromatic or oriental tobaccos which for many centuries were grown only in the Near East. It deals in detail with plant structure and development, physiology, quality, cultivation, grading, genetics, diseases and pests as well as the economic aspects. It is likely to be a prized reference book for a long time to come.
A B ibliography o f Subterranean Clover with a descriptive introduction by D. 1 Symon. Mimeographed Publication No 1/1961 by the Commonwealth Bureau of Pastures and Field Crops. Hurley. Berkshire. 122 pp. Price Sh. 12.
All Commonwealth Agricultural Bureaux publications are of a very high standard and this one maintains it. It is an essential reter ence book for the pasture research worker. It is particularly noteworthy in that it contains cross-references under specific headings such as growth, development, climatic requirements, mineral nutrition and so on.

EAST AFRICAN AGRICULTURAL AND FORESTRY JOURNAL OCTOBER, 1962
THE EFFECT OF FERTILIZERS, SULPHUR AND MULCH ON EAST AFRICAN TEA SOILS
I I I—THE SAMPLING AND ACCURACY OF THE EXPERIMENTSBy A. N. Smith, Tea Research Institute of East Africa, Kericho, Kenya
(Received for publication on 6th July, J962)
In the taking of samples some middle way must be maintained between the large number of samples necessary for greatest accuracy and the small number of samples necessary to keep subsequent analyses within manageable proportions. This is true with any kind of sampling. In sampling soil of fertilizer experiments on tea a further complication is added in that, to test the effect of fertilizers on the soil, it must be sampled in the places where the fertilizers have been applied. Ideally, for sampling, the soil should be totally covered wilh fertilizer, eliminating the risk of sampling from places which have not received equal quantities. In practice it is not possible to have a complete cover, because the trunks and surface roots of the tea bushes take up space, and also the estate practice, for cheapness and convenience, is to spread the fertilizer merely in the spaces between the rows o f tea. This method is perfectly satisfactory as far as the nutrition of the bushes is concerned but does add a further complication when sampling of the soil for subsequent analysis is necessary.
Data are presented below to show what the accuracy of some of the experimental determinations has been on soil from the experiments described in the earlier paper. (Smith, 1961a.)
M e t h o d s
The methods of analysis and sampling are those given in the two previous papers (Smith. 1961a, 1961b). it is sufficient to repeat here that experiments T2 and Kl were sampled at five positions in each plot whilst samples from K3 and U1 were taken from three positions.
R e s u l t s
In the first experiment to be sampled (T2), the fertilizer is applied, in double quantities, on every alternate space. It was found on inspection that four o f the holes were in spaces which had received this double application, and one hole was in a space
which had received no fertilizers. The results of statistical analysis of the pH results are shown in Table I.
T able I—V ariation between Sampling Positions
E xperiment T2. pH (1 : 5; Soil : W ater) Mean Figures per Plot
Position 1 2 3 4 5 Means
Depth 0-4 in. 5-38 5-28 518 5-22 5-31 5-274-8 in. 5 31 5-23 514 5-17 5-27 5-228-12 in. 5-33 5-31 5-20 5-28 5-41 5-31
12-18 in. 5-36 5-36 5-25 5-31 5-49 5 3518-24 in. 5-23 5-25 5-20 5-21 5-38 5-2524-36 in. 514 519 5-22 5-16 5-25 5-19M eans. . 5-29 5-27 5-20 5-22 5-35
Significant difference between two depth means (P = 0 05) = 0 06 pH units.
Significant difference between two position means<P=0-05) = 0 05 pH units.
Significant difference between individual means(P = 0 05) = 0 13 pH units.
It will be seen that there are significant differences between the mean figures for positions with position 5 being higher than all the rest; considering the pH values in the body of the table, those for position 5 are consistently higher than all the rest with the exception of the 0-4 and 4-8 in. horizons for position 1.
The individual samples from experiment Kl were not analysed separately owing to pressure of work at the time they were taken.
In experiment U1 the accuracy of the sampling procedure was investigated. Topsoil samples from seven plots of the experiment were taken, one sample from each of the nine spaces in each plot and one from within each of the rows of tea. The samples were all analysed for pH (soil: water) and potassium. The pH results showed that there was no significant difference between the mean value
117

HAST AFRICAN AGRICULTURAL AND FORESTRY JOURNAL OCTOBER. 1%;
for the rows and the mean value for the spaces, nor were there any significant differences amongst the space figures or the row figures. For potassium the mean content of the row samples was 23.7 mg./lOOg. dry soil, whilst that for the space samples was 38.2 mg./IO()g.: the significant difference between the mean figures at a probability of 0.1 per cent was 7.4 mg.
pH is only an indirect measure of fertilizer distribution in that it measures the changes in acidity resulting from the application of fertilizers. It was discovered subsequently that urea had not produced any great changes in acidity (Smith. 1961b); thus, either the increase in acidity from the sulphur had been insufficient to produce a significant difference between the row and space samples, or the fertilizer had been spread so widely that there was in fact no difference between samples taken from the rows or from the spaces. The results for potassium, with large differences between the row and space samples show that the application, for the muriate of potash at least, has been well contained within the spaces and that the soil has been uniformly sampled. It was assumed that all the fertilizers had been applied in like manner and from this it was decided to reduce the number of sampling positions to three.
The average results of the pH and potassium determinations on samples taken from three positions in each of the 32 plots of experiment Ul are shown in Tables II and III.
T able II—V ariation between Sampling Positions
E xperiment U l. pH (I : 5; Soil : W ater) Mean Figures per Plot
Position 1 2 3 Means
Depth 0-6 in. 5-54 5-61 5-47 5-546-12 in. . . 5-58 5-63 5-51 5-57
12-18 in. . 5-38 5-42 5-43 5-4118-24 in. .. 5-43 5-39 5-39 5-4024-30 in. . . 5-44 5-41 5-42 5-42Means 5-47 5-49 5-44
Significant difference between two depth means (P = 0 0 5 ) = 0 06 pH units.
Significant difference between two position means (P=0-05) = 0 05 pH units.
Significant difference between individual means (P = 0 05) = 0 1 0 pH units.
T able III—V ariation between Sampling Positions
Experiment U 1. Potassium mg./ I 00g . D ry Soil
Mean Figures per Plot
Position 1 2 3 Means
Depth 0-6 in. 19-23 18-35 13-62 17-076-12 in. 12-12 12-66 9-76 11-51
12-18 in. .. 6-40 8-24 6-17 6 9318-24 in. .. 5-04 6-87 4-75 5-5524-30 in. .. 5 00 6-40 4-35 5-25Means 9-55 10-50 7-73
Significant difference between two depth means <P=0-05) = 1-28 mg.
Significant difference between two position means(P=0-05) = 0 99 mg.
Significant difference between individual means(P = 0 0 5 ) = 2-21 mg.
In the results in each of the tables the mean of the position 2 determinations is significantly higher than that of position 3. If the figures in the body of the table are inspected it will be seen that in each case the greatest variation occurs in the top foot of soil. This result is also obtained in experiment K3; the mean values for pH are shown in Table IV.
Table IV—V ariation between Sampling Positions
Experiment K3. pH (1 : 5; Soil : Water) Mean Figures per Plot
Position 1 2 3 Means
Depth 0-6 in. 5-31 5-38 5-27 5-326-12 in. 5-32 5-40 5-24 5-32
12-18 in. . 5-16 5-26 5-16 5-1918-24 in. .. 5 00 5-11 4-99 5-0324-30 in. .. 4-92 4-98 4-94 4-95Means 5-14 5-23 5-12
Significant difference between two depth means (P = 0 05) = 0 09 pH units.
Significant difference between two position means (P = 0 05) 0 07 pH units.
Significant difference between individual means (P = 0 0 5 ) -- 0 15 pH units.
These variations between sampling positions are incorporated in the sampling error. The assessment of the total accuracy of experiments is provided by the coefficients of
118

EAST AFRICAN AGRICULTURAL AND FORESTRY JOURNAL OCTOBER. !%2
variation, some of which are quoted in Table V.
T able V— Coefficients of Variation
Experiment T2 K1 Ul K3
Determination pH (water) 3-85 2-91 2-53 3-35pH (CaCl2) 3-36 2-53 3-40 3-22Ca 34-3 36-2 180 25-5Mg 31 -9 26-7 27-3 35-3K ............................ 24-5 — 63-8 21 -9Organic matter . . 617 5-97 7-80 13-4
Two results o f importance arise from the figures in Table V. The reduction of the number of samples to three per plot for experiments K3 and U1 has not noticeably increased the coefficients of variation for these experiments, and the coefficients of variation for the bases calcium, magnesium and potassium are much larger than those for pH or organic matter. This latter result is. in part, accounted for by the much larger variation that occurs in soils for bases as compared with pH: as an example, the mean potassium content (0-6 in.) of the plots which did not receive potassium in experiment U1 was 14.1 mg./lOOg. dry soil with a standard deviation of +10.6. whilst for pH (soil: water) the mean figure is 5.56 with a standard deviation of +0.36.
D iscussion
Two major results have been observed, the variation existing between sampling positions with the main source of variation in the top 12 in. or 18 in. o f soil, and the large coefficients of variation for calcium, magnesium and potassium. It is also apparent that, notwithstanding the uniformity of the placing of the fertilizer and the regularity of the sampling, the natural variation in the base status of the soil in a plot is so great that a larger number of samples would have to be taken to obtain an accurate figure for the average for any plot. In fact, the number of samples necessary to obtain a mean figure for potassium which is within 10 per cent of the true mean for the 0.6 in. horizon on the No. K plots of experiment U l is 224 (95 per cent confidence limits); for the soil on an experiment at Sotik in Kenya the same figure for calcium in the 0-6 in. horizon was 26, figures of this order are the more usual.
Coefficients of variation of less than 15 per cent would be considered satisfactory. The coefficient includes sampling errors, errors of the experiment and errors in determination. The sampling error is the only one that can be readily reduced— by taking more samples. From the figures quoted above it appears that the number of samples should be of the order of 25. To take 25 per plot depth, with five depths on a 32 plot experiment would prove to be an immense task if the samples were taken separately and bulked subsequently; if, however, the samples from each depth were bulked on the site the task would be made much easier, but a new source of error might be introduced if the samples differed widely in weight. Even if the samples were taken and bulked in this way the taking of 25 samples per plot depth might still be considered too time consuming: the number of samples which can be taken does, of course, depend on other factors, but it is plain that it must be increased from three or five to at least 15 if any great increase is to be obtained in the accuracy of experiments to determine the effects of fertilizers on the bases in the soil. Since the variation is greatest in the topsoil, samples from the lower horizons could be reduced in number.
S ummary
Data arc presented to show the variation that occurs between soil samples from different positions within plots of tea manurial experiments. Data for coefficients of variation are also presented. It is concluded that when the effect of fertilizers on the bases in the soil is to be measured the number of samples taken at each depth should be increased to 15 per one-tenth acre plot.
A cknow ledgem ent
The statistical analysis of the material which has gone to form Table I of this paper was made by Mr. N. A. Goodchild; he has helped on many occasions with the statistical procedures necessary for the presentation of the results in these three papers.
The analyst of the soils has. for the most part, been carried out by the African staff of the Tea Research Institute.
R e f e r e n c e s
Smith. A. N. (1961a) E. Afr. agric. for. J. (In press.)
Smith, A. N. (1961b). E. Afr. agric. for. J. (In press.)
119

EAST A FR IC A N A G R IC U LTU R A L AND FO RESTRY JO U RN AL OCTOBER. 1%:
REVIEWST ropical Forestry w ith Particular R e fe r
ence to W est A frica . Published by Oxford University Press, London, 1962. 163 pages. Price Sh. 21.
This book is the result of the author's service in Ghana. At the outset, however, it must be stated that its title does not reflect its contents. It is in effect an elementary textbook intended for Ghana forest rangers in training and would have been better entitled "Forestry in Ghana and neighbouring countries— a textbook for forest rangers.”
The book contains 156 pages of text and is followed by a concise list of 16 selected references and an index. It has chapters on forests and their uses; forest influences; protection ; policy and law ; reservation; forest ecology; silviculture; silvicultural system s; mensuration ; management; education and research; administration; land use and amenities.
It is well written and well produced at the reasonable price of Sh. 21. It is illustrated by 18 plates which are excellently reproduced and by several line drawings.
While reading the book, it must be remembered that Ghana is a minute part of Africa with an area of only some 90.000 square miles and a population of some 4,000.000 people. Compare this with Kenya's Northern Frontier District o f 117,000 square miles, i.e. one district of Kenya is considerably bigger than the whole of Ghana.
Further, from the maps given in the author's previous book (Synecology and Silviculture in Ghana), the important forest type o f the rain forest is only some 5 per cent of the country or some 4.000 square miles. Compare this with the dry woodland of Africa south of the Sahara w'hich is about 5.000.000 square miles (or some 1,250 times as large). With this area must be considered the many millions of people and their animals who are almost enlirely dependent on the forest for their day-to-day existence.
Most of the examples given in the book are from Ghana or the neighbouring countries of West Africa and consequently it must be realized that the scope is very limited and does not represent forestry in the tropics of the world.
I would also suggest that this book being about forestry in the tropics does not lay near.. sufficient stress on the value of the forests in the daily life of the people and the tremendou' influence they exert on the prevention of soil erosion and the preservation of water supplies.
Bearing these limitations in mind the book is very readable and should achieve its obje_: in helping forest rangers in their studies.
In conclusion. Dr. Taylor and his publisher' have produced an excellent little book which should find a place in all tropical forest ranger schools.
A.L.G.
Som e C ommon F lowering P lants of Uganda. by E. M. Lind and A. C. Tallantire. 1962. Crowm 8 vo. pp. 328, 150 line drawings. 16 coloured plates 25s., Oxford University Press. London.
The two authors, both from Makerere University College, are to be congratulated on adding a very fine and useful book to the small but growing collection of works dealing with East African plants. Botanists, farmers and the general public alike have been asking for books on the East African flora for over 50 years, and this is the first book to appear on East African plants dealing with herbs and smaller shrubs which contains keys, usable by the amateur, to find out what he or she has collected.
The authors have limited themselves to plants occurring below 6,000 ft. and have selected some 300 examples of the more common representatives to be found in Uganda. However, this should not deter people from buying book in the other East African countries, as the vast majority of examples can be found in the wetter parts of Kenya and Tanganyika. As always occurs when selecting a representative collection ot plants to describe, many other common ones are left out. However, it does mean another 300 plants are described in simple terms, so aiding us all to recognize some more of our common wild flowers.
120

EAST AFRICAN AGRICULTURAL AND FORESTRY JOURNAL OCTOBER, 1962
The keys to the families and genera, along with the descriptive text and fine line drawings will not only be useful to the amateur, but the very greatest help to teachers in all three East African countries. Up to now the teacher has had no reference work or example to show his pupils on how to use or make a simple key for herbaceous plants. The terminology is kept to the very simplest botanical terms and an adequate glossary is provided at the end, along with a list o f vernacular names which will no doubt provide a useful reference for Uganda people. Nothing in the work is assumed, an introduction explaining what a flower is, how to collect plants, and how to use a key is included. Too often these basic things are overlooked, but obviously the authors have realized this gap and filled it very neatly.
The overall size of the book is designed to fit the pocket and has soft covers, perhaps not the most durable for field work, but I'm told a hard-covered edition will be available. The back cover has a conversion scale for those not practised in estimating sizes in centimetres.
Besides the line drawings there are 16 colour plates which in a book of this size and price is very surprising and although the colours are not quite life-like in some cases, the general impression of each plate is quite good. I have no hesitation in recommending this work to all those interested in knowing their plants a little better.
G.L1.L.
121
EAST AFRICAN AGRICULTURAL AND FORESTRY JOURNAL OCTOBER. 1%:
COMMONWEALTH ECONOMIC COMMITTEECOMMODITY SERIES—ANNUAL REVIEWS
DAIRY P R O D U C E ............................
MEAT ..........................................
FRUIT ..........................................
INDUSTRIAL FIBRES
GRAIN CROPS ............................
PLANTATION CROPS
VEGETABLE OILS & OILSEEDS
Butter, cheese, condensed milk, milk powder, case.' eggs, egg products and margarine.
Cattle, sheep, pigs, beef, mutton and Iamb, bacon and hams, pork, canned meat, offals and poultry- meat.
Apples, pears, plums, cherries, peaches, apricot-, bananas, citrus fruits, grapes, pine-apples, fruit juices, dried tree fruits, raisins, currants, canned fruit and wine.
Cotton, wool, mohair, silk, flax, jute, coir, kapok, sisal and other hemps, rayon and other man-made fibres.
Wheat, wheat flour, barley, oats, maize, rye ar J rice.
Sugar, tea, coffee, cocoa, spices, tobacco and rubber
Cottonseed, linseed, rapeseed, sesame seed, sunflower seed, soya beans, groundnuts, copra, coconut oil, palm kernels, palm oil, olive oil. castor seed, tung oil and some twenty miscellaneous o: seeds and vegetable oils.
The price of each volume is 5s. Id. including postage. Orders for these publications should be sent direct to the Secretary, Commonwealth Economic Committee, 2, Queen
Anne’s Gate Buildings, Dartmouth Street, London, S.W.l.
COMMONWEALTH AGRICULTURAL BUREAUXThis Commonwealth Organization provides an unrivalled and world-wide information service in all branches of agriculture, animal health and forestry. It comprises three special institutes and ten specialist bureaux, and publishes the following Abstract Journals: —
Review of Applied Entomology—Series A: Agricultural Series B: Medical and Veterinary
Review of Applied Mycology Animal Breeding Abstracts Veterinary Bulletin Nutrition Abstracts and Reviews Dairy Science Abstracts
From the wealth of material collected, other Periodical Publications and OccasionalPublications are prepared.
A catalogue will be sent on application to: —
COMMONWEALTH AGRICULTURAL BUREAUX
FARNHAM ROYAL, BUCKS, ENGLAND
Please mention this Journal when replying to advertisers
Forestry Abstracts Helminthological Abstracts Horticultural Abstracts Herbage Abstracts Field Crop Abstracts Plant Breeding Abstracts Soils and Fertilizers

EAST AFRICAN AGRICULTURAL AND FORESTRYJOURNAL
Vol. XXVIII— No. 3 JANUARY, 1963Prim ed and published b y the G overnm ent Printer, Nairobi
Issued under the authority o f the East A frican C om m on Services Organization and published every three m onths—July, October, January, April. V olum e consists o f four issues (com m encing July issue)
Editorial Board: Director of E.A. Agriculture and Forestry Research Organization: Director of E.A. Veterinary Research Organization; Directors of Agriculture, Kenya, Uganda and Zanzibar, and Commissioner for Agriculture, Tanganyika: Director of Veterinary Services, Kenya and Uganda, and Commissioner of Veterinary Services, Tanganyika; Conservators of Forests, Kenya, Tanganyika and Uganda.
Executive C om m ittee : Director of E.A. Agriculture and Forestry Research Organization; Director of E.A. Veterinary Research Organization; The Editor.
E d it o r : J. G lover E.A.A.F.R.O., P.O. Box 21, K ik u y u , K enya
Subscription Sh. 15 per volume (Sh. 4 single copy) including postage, payable to the Editor. Subscribers ate advised to remit postal orders in payment, otherwise bank commission must be added in the case of cheques.
The Editor does not hold himself responsible for opinions expressed by contributors.
Matter submitted for publication should preferably be sent through the local member of the Editorial Board. Double spacing should be used in typescript. Contributors receive 25 prints of their articles free. Additional copies may be obtained on payment if asked for in advance. Prints bear the same page numbers as the original articles in the Journal, except where, to meet a contributor's wishes, prints are supplied before publication has been completed.
Readers are reminded that all agricultural inquiries, whether they relate to articles in the Journal or not, should be addressed to the local Director of Agriculture, and not to the Editor.
CONTENTSPAGE
The Chemical and Physical Characteristics of Tea Soils (A. N. Smith) . . . . . . 123
A Note on the Statistical Analysis of YieldDifferences in Biennially Bearing Crops (J. Dancer) . . . . . . . . . . 126
Rice Fertilizer and Spacing Trials at Mwea- Tebcre (J. M. S u ttie ) ....................................... 129
Rainfall Reliability and Maize Yields inMachakos District (B. D. Dow her) . . . . 134
The Effect of Fertilizers, Manures, Irrigation and Ridging on the Yield of Pyrethrum (U. Krolt) .................................................... 139
Fattening Turkeys in Uganda (J. C. M. Trail) 146A Plant Tray Carrier for Forestry Operations
(J. F. H u gh es) ................................................... 148
PAGE
Observations on Free-ranging of Thomson'sand Grant's Gazelles in Kenya (G. M. ole Maloiy) . . . . . . . . . . . . 151
Intercropping and Alternate Row Cropping of Cotton and Maize (R. C. Grimes) . . 161
X^Eftseases of Pyrethrum in Kenya (R. A.Robinson) . , . . . . . . . . 164
Restricting the Feed of Bacon Pigs and its Consequences (M . F. Watson) . . . . 168
Herbage Plants at Serere, Uganda, 1957-61(C. R. H orrell)................................................... 174
New Cereal Varieties—1962 (G. E. Dixon.K . W. Lynch and F. F. Pinto) . . . . 181
Changes in the Chemical Composition of Plantsduring Growth in the Field (H . IV. Dougall) 182
Reviews .......................................128, 133, 189, 190
INDEX TO ADVERTISERS
Barclays Bank D.C.O..................... COVER
PAGE
PAGE 3 Industrial Distributors Ltd.PAGE
ICommonwealth Agriculture Bureaux COVER PAGE 3 Kenya Advertising Corporation .. IIDunlop COVER PAGE 4 National & Grindlays Bank IE.A. Breweries COVER PAGE 2 Standard Bank II

EAST AFRICAN AGRICULTURAL AND FORESTRY JOURNAL JANUARY, 1963
COMMONWEALTH ECONOMIC COMMITTEECOMMODITY SERIES—ANNUAL REVIEWS
DAIRY P R O D U C E ............................
M EAT ..........................................
FRUIT ..........................................
INDUSTRIAL FIBRES
GRAIN CROPS .............................
PLANTATION CROPS
VEGETABLE OILS & OILSEEDS
Butter, cheese, condensed milk, milk powder, casern, eggs, egg products and margarine.
Cattle, sheep, pigs, beef, mutton and lamb, bacon and hams, pork, canned meat, offals and poultry- meat.
Apples, pears, plums, cherries, peaches, apricots, bananas, citrus fruits, grapes, pine-apples, fruit juices, dried tree fruits, raisins, currants, canned fruit and wine.
Cotton, wool, mohair, silk, flax, jute, coir, kapok, sisal and other hemps, rayon and other man-made fibres.
Wheat, wheat flour, barley, oats, maize, rye and rice.
Sugar, tea, coffee, cocoa, spices, tobacco and rubber.
Cottonseed, linseed, rapeseed, sesame seed, sunflower seed, soya beans, groundnuts, copra, coconut oil, palm kernels, palm oil, olive oil, castor seed, tung oil and some twenty miscellaneous c - seeds and vegetable oils.
The price of each volume is 5s. Id. including postage. Orders for these publications should be sent direct to the Secretary, Commonwealth Economic Committee, 2, Queen
Anne’s Gate Buildings, Dartmouth Street, London, S.W.l.
COMMONWEALTH AGRICULTURAL BUREAUXThis Commonwealth Organization provides an unrivalled and world-wide information service in all branches of agriculture, animal health and forestry. It comprises three special institutes and ten specialist bureaux, and publishes the following Abstract Journals: —
Review of Applied Entomology—Series A: Agricultural Series B: Medical and Veterinary
Review of Applied Mycology Animal Breeding Abstracts Veterinary' Bulletin Nutrition Abstracts and Reviews Dairy Science Abstracts
From the wealth of material collected, other Periodical Publications and OccasionalPublications are prepared.
A catalogue will be sent on application to: —
COMMONWEALTH AGRICULTURAL BUREAUX
FARNHAM ROYAL, BUCKS, ENGLAND
Forestry Abstracts Helminthological Abstracts Horticultural Abstracts Herbage Abstracts Field Crop Abstracts Plant Breeding Abstracts Soils and Fertilizers
I V Please mention this Journal when replying to advertisers

EAST AFRICAN AGRICULTURAL AND FORESTRY JOURNAL
THE CHEMICAL AND PHYSICAL CHARACTERISTICSOF TEA SOILS
By A. N. Smith, Tea Research Institute of East Africa. Kericho, Kenya
(Received for publication on 1st July. 1961)
Permeability was the first quality to be recognized as essential for the good growth of tea by MacClelland in 1834 (quoted by Von Bemegg, 1936). Some fifty years later, Money (1883) recognized the “qualities in soils in which the tea plant delights” as being a friable soil, porous imbibing and parting with water freely, with plenty of vegetable matter and of a light colour. He states, “If, however, the dark colour arises from decayed vegetation, that is not the colour of the soil, and, as observed, vegetable matter is a great advantage. Judge of colour when soil is dry—for even light coloured soil looks dark when wet.” Kelway Bamber (1893) from analyses of Chinese and Assam tea soils found that besides permeability the following qualities were to be noticed in tea soils: a great deficiency of calcium, an absence of sulphuric acid or sulphates and the constant occurrence of manganese. Five years later Boutilly (1898) describes tea soils, with particular reference to Ceylon, as being poor, and particularly low in lime and soda, but rich in aluminium silicate, in manganese and especially in iron.
The agreed requirements at the end of the century can be summarized as being, a deep, well-drained porous soil, with little lime or soda, but with plenty of aluminium, iron and manganese; the soil usually of a light colour and often reddish in hue. Following the introduction of the concept of pH by Sorenson in 1909 the suitability of soils for tea has come to be expressed in terms of this scale rather than in terms o f individual constituents of the soil.
The effect of acidity on the growth of the tea plant was measured in water culture (Gadd 1928a, 1928b), and in pot experiments by Prillwitz in Java (1930), by Gadd in Ceylon (1929) and in the Soviet Union by Menagarish- vili (quoted in von Bernegg. 1936).
The results of these and other field investigations showed that tea grew best in soils which had a pH of less than 6.5, with rate of growth
increasing with increasing acidity down to about pH 4.3. The determination of pH was usually made on water extract, but Harrison (1930) determined the pH on mineral salt extract (potassium nitrate) and great importance was attached to the comparison of the results of this determination with those on water extract, as a measure of “reserve acidity”. Lamb (1955) has used a potassium chloride extract for pH determination, whilst Prillwitz (1932) has determined titratable acidity.
The opinions of the various research centres are, broadly speaking, the same. All are agreed on the necessity for a deep and permeable soil containing small amounts of exchangeable calcium and certainly no free calcium carbonate. In Table I are quoted the pH ranges which authorities in various countries regard as being most suitable for tea. An exact comparison of the pH figures is not possible, because, almost invariably the method used in determination is not quoted.T able I.—T he O ptimum Soil Reaction for Tea
According to Various A uthorities
Author Country pH range
Mann (1932) Parfenova and Troit-
Russian Georgia 50-5-5
skii (1951) . U.S.S.R. 4-5—5-3Harrison (1932) N. India .. > 6-0Gokhale (1954) N. India . . > 6-0Norris (1934) Ceylon .. > 6-0Schoorel (1949) Indonesia 5 0-6 0Guinard (1953) Indochina 50-5-5C h a n g (1953) Taiwan 4-3 5-7Wu (1957) ..Kawai and Morita
Taiwan . . 4-S-5-4
(1958) Japan 39-4-3Eden (1956) .. Tanaanyika 5 0-6-0Mulungu (1955) Belgian Congo .. 50-5-5
How far the tea soils o f East Africa fit into the criteria already established in other parts of the world will be seen from the results presented below, it much be noted at this stage, however, that none of the authorities recommends the growing of tea where the pH is greater than 6.0
123

EAST AFRICAN AGRICULTURAL AND FORESTRY JOURNAL JANUARY, 1963
M eth o d s
pH is measured electrometrically using a glass electrode on water and M /100 calcium chloride (Schofield and Taylor, 1955) extracts with s o il: extract ratios of 1:5. Exchangeable bases are estimated in neutral N ammonium acetate extract, calcium and magnesium by a modification of the method of Cheng et al (1953), and potassium on a flame photometer. Exchangeable hydrogen is measured by a modification of Shaw’s (1951) method using magnesium acetate instead of calcium acetate. Walkley’s (1935) method was used for organic carbon and the factor of 1.724 was used to convert to organic matter. The clay content of the soil is determined by the hydrometer method Bouyoucos (1951). Exchangeable aluminium is determined by the method of Chenery (1955). The Comber’s colouration is the optional density produced in 10 ml. o f a saturated alcoholic solution of potassium thiocyanate after shaking twice with 1 g. o f dry soil. All results are expressed on a dry soil basis.
Results and D iscussion
To quote the results of the analyses that have been made on soils from all over East Africa would take up too much space, instead the range of values found for some of the soil constituents is shown in Table II; all are from soils which are supporting tea.
It must be emphasized that the figures quoted do not represent the absolute limits for tea cultivation in East Africa, but only the range which has been found in the soils received in the laboratory. This range is in all cases quite large. The pH figures (on water extract) show that tea is growing in East Africa where the pH is greater than 6.0. The values found for exchangeable magnesium also need some comment; Chenery and Schoen- maekers (1959) have shown magnesium deficiency to occur in tea in the Belgian Congo when the soil has an exchangeable magnesium content of 0.5-0.6 me./lOOg. From the data in the table it appears that there are soils
in each of the three territories which are critically low in magnesium.
If the recommended pH limit of 6.0 U adhered to strictly it excludes many soils in East Africa which are, in fact, suitable for tea. The need is for a simple way of determining the suitability of soil for tea by a method which is more nearly related to the essential conditions for growth than is pH. Child (19531 recommended the use of Comber’s (1920) test as suitable for use by planters in the field.
The work of Chenery (1955) focussed attention on the presence of available aluminium as a diagnostic characteristic of a good tea soil. It was shown by Smith (1957a. 1957b) that the availability of iron increased with increasing acidity to roughly the same degree that the availability of aluminium did. Correlation coefficients of 0.85 and 0.94 were obtained, for two soils, between the optical density of the potassium thiocyanate extract of the soil and the exchangeable aluminium. The correlation' were considered to be sufficiently good for the Comber’s colour to be regarded as an indicator of available aluminium.
Smith (1957a, 1957b) also found that for Kericho soils (47) there was a relationship between pH (water extract) and intensity of colouration such that: —
log (100 E) = -0 .673 pH + 4.87 r = 0.84.
It was estimated that the least colour wh:ch could easily be detected under field conditions was equal to a density of E = 0.08. At this value the pH of the soil, from the above equation. would be 5.9.
For another soil at Tukuyu. in Tangansika the equation was: —
log (100 E) = -0 .326 pH + 3.16 r = 0.61.When E = 0.08 the pH is 6.9.
It is known from observation that the maximum pH at which tea will grow successful!) in Kericho is not greater than 6.0; in Tukuyu tea will grow in soils which have a pH ol much more than 6.0.
T able It.— Range for Constituents Found in the T op 12 in. of East African T ea Soils
Territory pHwater
pHCaCl2
Exch. Ca mc./IOOg.
Exch. Mg me./IOOg.
Exch. K me./IOOg.
Organic matter
per cent
Nper cent
Clay per cent
KenyaUgandaTanganyika
4-2-6-24-2-5-94-8-63
41-5-24 0 - 5 04 1 - 5 0
1-8 -10-7 0-72- 7-2 0 06- 5-7
0-71-4-1 0-57-1-7 0-18-1 -5
0-62-2-3 0-15-1-0 0-53-1 4
7-8-12-8 4-3- 8-8 3-1- 9-8
0-32-0-440-17-0-290-22-0-38
60-7022-4226-53
124

EAST AFRICAN AGRICULTURAL AND FORESTRY JO URNA L JANUARY, 1963
These results were obtained from relatively few samples in only two districts and were by no means conclusive: they did, however, indicate that Comber’s test may give a better indication of the upper limit o f the growth of tea. This conclusion has been borne out from the results of hundreds of advisory analyses. In all cases where tea is known to be growing successfully in a soil with pH (water extract) greater than 6.0 the Comber’s test has proved to be positive. The mechanism o f Comber’s test has been investigated by Chang and Feng (1960). They found that inter alia “Combers lest functions only when the pH of the soil— KSCN solution system is between 3 and 5. The pH o f the soil—KSCN solution system is usually lower than the soil—H .,0 system due to the replacement o f exchangeable hydrogen by potassium. The magnitude o f the decrease depends on the exchange capacity and degree o f unsaturation of the soil”.
An investigation has been made into the exchangeable hydrogen of 40 soils with pH of water extract between 6.0 and 6.6: 22 of these gave a readily discernible colour with Comber's solution, the mean exchangeable hydrogen for these was 7.35 ±2.37 me./lOOg. soil: whilst the 18 soils which had no discernible colour had a mean exchangeable hydrogen o f 4.41+1.05 me./lOOg.
It appears then that in the range of soil pH from 6.0 to 6.6 the Comber test is not measuring the amount o f available iron but rather the available hydrogen in the soil. Those soils in which the exchangeable hydrogen is not sufficient to bring the pH of the KSCN extract to below 5.0 also have insufficient exchangeable hydrogen to produce conditions in the soil favourable to the good growth of tea.
S ummary
A short account of the evolution of criteria of suitability of soils for tea has been presented. Optimum pH ranges from almost all tea growing countries have been tabulated. The ranges of soil constituents in East African soils have been presented and the usefulness of Comber’s test in choosing soils suitable for tea has been demonstrated.
R e f e r e n c e s
Von Bemcgg, A. S. (1936). Tropische und Subtropische Weltwirtschaftspflanzcn III Teil, 3 Band. Ferdinand Enke, Stuttgart, pp. 31 and 35.
Boutilly, V. (1898). Le Th6, G. Carr6 and C. Naud, Paris.
Bouyoucos, G. J. (1951). Agron J., 43, 434.Chang. J. M. (1953). Taiwan Agric. For. News, 5,
No. 4. 6, No. 1. Abstract only seen.Chang, S. C., and Feng, M. P. (1960). Soil Sci., 89.
219.Chenery, E. M. (1955). Plant and Soil, 6, 174.Chenery, E. M.. and Schoenmaekcrs, J. (1959). E. Afr.
agric. J., 25, 25.Cheng. K. L.. Mclsted, S. W., and Bray, R.H. (1953).
Soil Sci., 75, 37.Child, R. (1953). Tea Res. Inst. E. Afr. Pamph. No. 5,
p. 9.Comber, N. M. (1920). I. Agric. Sci., 10, 420.Eden. J . (1956). Report on the possible extension of
tea cultivation in Tanganyika, Govt. Printer, Dar es Salaam.
Gadd, C. H. (1928a). Tea Quart., I, 2.Gadd, C. H. (1928b). ibid., 1, 31.Gadd, C. H. (1929). ibid, 2, 1.Gokhale. N . G. (1954). World Crops. 280.Guinard, A. (1953). La culture du Th£ en Indochine.
Arch. Res. Agron. Viet-Nam, 20.
Harrison, C. J. (1930). Indian Tea Assoc. Scient. Dept. Quart. J. 170.
Harrison, C. J. (1932). ibid, 70.Kawai, S. and Morila, N. (1958). J. Sci. Soil Tokyo,
29, 61. Abstract only, seen.Kelway Bamber, M. (1893). The chemistry and agricul
ture of tea. Law-Publishing Press, Calcutta.
Lamb, J. (1955). Tea Quart., 26, 31.Mann, H. H. (1932). Indian Tea Assoc. Scient. Dept.
Quart. J. p. 55.Money, E. (1883). The cultivation and manufacture of
tea, W. B. Whittingham & Co., London.Mulungu Res. Sta. (1955). Bull. Inst. Etud. agron.
Congo Beige, 4, 97.Norris, R. V. (1934). Tea Quart. 7. 28.Parfenova, E. I. and Troitskii, A. I. (1951). Pocltvove-
denie, 322. Abstract only, seen.Prillwitz, P. M. H. H. (1930). Arch. Tea Cult. 4. 69.Prillwitz, P. M. H. H. (1932). De Invlocd van den
Basentoestand van den Grond op dc Ontwikkeling van de Theeplant, H. Veenman & Sons, Wage- ningen.
Schofield, R. K. and Taylor, A. W. (1955). Proc. Soil Sci. Soc. Amer. 19, 164.
Schoorel, A. F. (1949). Handleiding voor de Theccul- tuur, H. Veenman and Sons, Wageningcn, p. 46.
Shaw, W. M. (1951). J. Ass. Off. Agric. Chem. 34. 595. Sorenson, S. P. L. (1909). Biocliem. Z. 21, 131, 201. Smith, A. N. (1957a). Tea Res. Inst. E. Air. Ann.
Rept. 1956.Sm ith, A. N . (1957b). Unpublished work.
Walkley, A. (1935). J. Agric. Sci. 25. 598.Wu, C. T. (1957). Coll. Agric. Taiwan. Univ. Spec.
Pub. No. 4.
125

EAST AFRICAN AGRICULTURAL AND FORESTRY JOURNAL JANUARY, 1965
A NOTE ON THE STATISTICAL ANALYSIS OF YIELD DIFFERENCES IN BIENNIALLY BEARING CROPS
By J. Dancer, Department of Agriculture, Uganda(Received for publication on 8th March, 1962)
The statistical analysis o f crop yields for species in which biennial bearing occurs can be undertaken by a method developed by Stevens [2]. However, this method of analysis is somewhat laborious yet necessary if one wishes to take into account the biennial effects of crop variation without confining interest to the total crop produced. The analysis uses a polynomial function to remove oscillation in crop yield, but the utility of this process would appear to depend on the alternation of maxima and minima, although of course this is not essential to the mathematical theory. Should this not occur, as in data to be presented, then the method is not useful.
Hoblyn et al [1] assumed that biennial bearing is a regime whereby a heavy crop is followed by a lighter one and vice versa, and suggested an index “B” as a measure of this phenomenon. This was calculated as the percentage of unlike pairs of signs over a period of cropping, when consecutive crops are either positive or negative depending on increase or decrease of yield between consecutive years. The authors also suggested a further measure “I”, to describe the intensity of biennial bearing, this being the ratio o f the difference between each consecutive crop to the sum of the consecutive crops.
It will be suggested that cumulative crop totals can be used as a suitable, easy method for comparing clonal or varietal trials where biennial or “irregular” bearing may be apparent. The varietal differences can then be examined by linear methods of statistical analysis and the irregularity of bearing by comparing the variations from the mean lines of the two varieties or clones under investigation. This later factor need not be examined if only total crop production is needed.
Calculations from Recorded D ata
The following discussion is based on records of the Robusta coffee clonal trials at Kawanda Research Station planted in 1935 and recorded until 1952. In this trial the crop of 40 trees of each clone under investigation was recorded individually.
Tables 1 and 2 give the data from this trial treated by the methods first suggested by Hoblyn et al. (loc cit.).
T a b l e I .— C a l c u l a t e d “ I” a n d “ B ” Values for f • pCLONES COMPARED W ITH THE AVERAGE FOR THE Tru.
“I” value Years Clones Overallmean
36 47 218 2221938-39 •37 ■43 •16 •32 -341939-40 •90 •82 •86 •84 -841940-41 •21 •51 •40 •22 -371941-42 •33 ■55 •51 •41 -421942-43 •86 •08 •04 •03 181943-44 •34 •09 •17 •08 -121944-45 •93 •88 •77 •34 -681945-46 •97 •94 ■82 •60 -831946-47 •99 100 •94 •98 -981947-48 ■99 •99 •70 -95 -831948-49 •88 •74 •41 •23 -521949-50 •38 •55 ■55 •06 -261950-51 •27 •20 •48 •22 -33Mean ■65 •52 •49 •39
"B" value 61% 69%
00 85%
T a b l e 2.— C a l c u l a t e d M e a n "1” a n d "B" V a l if p
Clone 236 203 208 209 213 214 224 225
“I” •55 •51 •52 •52 •52 •49 •50 •45
“ B” 85% 69 69 69 69 69 85 56
It is noted that high "B” and “1” values do not always coincide, e.g. clone 222 and 36.
An examination of “I” values for individua. pairs of years (table 1) shows that in a selection under trial it is possible for the “1” value to range from less than 0.1 to 0.90 in consecutive years, indicating a wide fluctuation. The mean values for years also fluctuates wideh from 0.12-0.98.
When Hoblyn's method of analysis is applied to Steven's data, the “B” values are 73 per cent, except for Maragogipe which is 54 per cent, and this indicates that the fluctuation ir. yield may be high. However the calculated “I" values are, except for the years 1940-41 much lower than the average Kawanda figures. Thus the intensity of biennial bearing would be less than that recorded here at Kawanda and the average "I” value for varieties and years, 0.36, would appear low. A disadvantage in using a calculated “I” is that for a given percentage crop change in consecutive years, the "1” value may vary considerably (see Fig. 1) i.e. when the crop change is 50 per cent in adjacent years if positive, the “I” value is 0.20 yet if
126
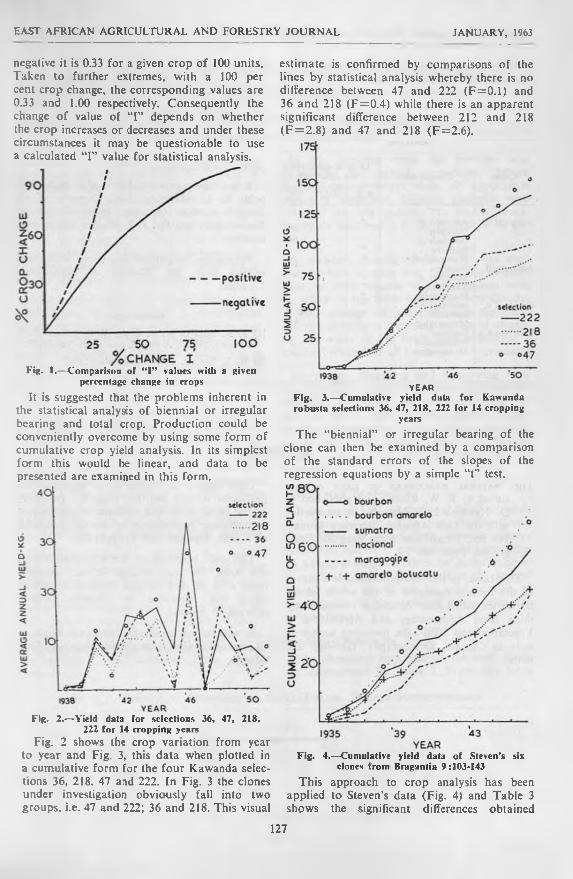
EAST AFRICAN AGRICULTURAL AND FORESTRY JO URNA L JANUARY, 1963
negative it is 0.33 for a given crop of 100 units. Taken to further extremes, with a 100 per cent crop change, the corresponding values are 0.33 and 1.00 respectively. Consequently the change of value of “I” depends on whether the crop increases or decreases and under these circumstances it may be questionable to use a calculated “I” value for statistical analysis.
Fig. 1.—Comparison of “I” values with a given percentage change in crops
It is suggested that the problems inherent in the statistical analysis of biennial or irregular bearing and total crop. Production could be conveniently overcome by using some form of cumulative crop yield analysis. In its simplest form this would be linear, and data to be presented are examined in this form.
Fig. 2.—Yield data for selections 36, 47, 218, 222 for 14 cropping years
Fig. 2 shows the crop variation from year to year and Fig. 3, this data when plotted in a cumulative form for the four Kawanda selections 36, 218. 47 and 222. In Fig. 3 the clones under investigation obviously fall into two groups, i.e. 47 and 222; 36 and 218. This visual
estimate is confirmed by comparisons of the lines by statistical analysis whereby there is no ditference between 47 and 222 (F=0.1) and 36 and 218 (F = 0 .4 ) while there is an apparent significant difference between 212 and 218 (F = 2 .8 ) and 47 and 218 (F=2.6).
Y E A RFig. 3.—Cumulative yield data for Kawanda robusta selections 36, 47, 218, 222 for 14 cropping
yearsThe “biennial” or irregular bearing of the
clone can then be examined by a comparison of the standard errors o f the slopes of the regression equations by a simple “t” test.
Fig. 4.—Cumulative yield data of Steven’s six clones from Bragantia 9:103-143
This approach to crop analysis has been applied to Steven’s data (Fig. 4) and Table 3 shows the significant differences obtained
127

EAST AFRICAN AGRICULTURAL AND FORESTRY JOURNAL JANUARY, 1%}
indicating that Bourbon and Bourbon A are in a separate group from Sumatra and similarly the remainder. This is in agreement with his evaluation.T able 3 .— C o m pa r is o n s B e t w e e n C l o n e s . S t e v e n ’s D a ta (B r a g a n t ia 9:103-123) U s in g L in e a r R e g r e ssio n
A n a l y sis
Clone ComparisonLevel of significance
for difference
N.S. 10% 5%
National v. Amarelo B •Bourbon .. *Bourbon A *Sumatra .. *Maragogipe •
Amarelo B Bourbon ..Bourbon A •Sumatra .. *Maragopipe •
Bourbon v. Bourbon A •Sumatra .. •Maragogipe
Bourbon A.v. Sumatra ..Maragogipe
Sumatra v. Maragogipe
Summary
A simple method of crop analysis has been suggested for plantation crops in which biennial or irregular bearing occurs. The total crops and irregularities in bearing for given varieties or clones can be easily compared.
Acknowledgements
I am most grateful for useful discussions with H. L. Manning, Esq., Director of the Empire Cotton Growing Research Station. Naniulonge, and Dr. J. T. Walker of the same station.
Permission to publish this paper is acknowledged from the Director of Agriculture, Uganda.
R e fe r e n c e s
[1] T. N. Hoblyn, N. H. Grub, A. C. Painter, B L.Waters. (1936). / . Pomol, and Hori. Sci. 14:39.
[2] W. L. Stevens. (1949). Bragantia 9:103.
REVIEWT he N atural Resources of East Africa,
edited by E. W. Russell and published by D. Hawkins Ltd., Nairobi, in association with the East African Literature Bureau, 144 pp„ 7 maps and more than 50 photographs. Price Sh. 21.
This book, as the title proclaims, is a survey of the natural resources of the whole of the territories called East Africa. It covers everything from Archaeology and Agriculture to Vegetation and Wild Life, including such subjects as Climate, Demography, Geology and Soils.
Each chapter is written by an expert in the particular subject and they present a summary of the latest work and opinions of the various co-operating departments of the Governments of Kenya. Uganda and Tanganyika.
The seven maps, alone, are worth the cost of the book, for they present in very succinct form a lot of very detailed information which could not otherwise be presented within reasonable bounds.
It will be an invaluable reference book to all concerned with future developments in East Africa.
L i . . .128

EAST AFRICAN AGRICULTURAL AND FORESTRY JO URNA L JANUARY, 1963
RICE FERTILIZER AND SPACING TRIALS AT MWEATEBERE
By J. M. Suttie, Department of Agriculture, Kenya(Received for publication on 12th March, 1962)
The trials here described set out to provide information on the fertilizing and spacing of rice on the Mwea Irrigation Settlement which lies to the south of Mount Kenya at an altitude of 3.800 ft. and is watered by the Thiba aad Nyamindi rivers. Annual rainfall is about 30" and is unreliable; it falls in two distinct rainy seasons; the Long Rains, between mid- March and late June, and the Short Rains between October and December.
In the earlier years the Long Rains crop suffered from “Empty Heads”, a physiological disorder o f unknown cause thought to-be due to the colder conditions obtaining at that season. Consequently on the Settlement a crop is taken only in the Short Rains season; in the trials, however, crops were taken in both seasons.
The soil on which rice is grown on the Settlement is a heavy black clay which cracks on drying. All experiments were carried out on similar soils but in the case of the “Small fields”, in which the earlier experiments were conducted, the method of field construction resulted in the removal of an excessive amount of topsoil. In the later experimental area, the “Large fields", the method of field construction was such as to minimize topsoil removal.
Following Settlement practice the rice in these trials was transplanted and grown under swamp conditions. Before 1960 the first cultivation o f the fields was done by hand or by tractor-drawn ploughs on dry land. Since 1960 cultivation has been by tractor-mounted rotary hoes in flooded fields so that the field is cultivated and puddled and the weeds are buried in one operation. Final levelling of the plots is done by hand.
In the fertilizer trials the fertilizer was applied to the puddle immediately before planting except where time of application formed a treatment. Organic manures were trampled into the puddle. The double superphosphate used had a P- CL content of 42 per cent.
A standard spacing of 6" X 6" was used except where spacing was under observation. Prior to I960 trouble was experienced with the water in the fields becoming very cloudy; as slow passage of water through the fields was not possible a watering regime of changing the water in the fields weekly became a standard practice in all trials.
Harvesting, threshing and winnowing were done by hand; the paddy was sun dried before weighing. All straw was removed from the field at harvest and was not returned except in straw reapplication trials. The variety used in all trials was Sindano an East African variety which is the standard variety of the Settlement.
F er tilizer s Re spo n se s
A series of 3 x 3 x 3 factorial fertilizer trials have been carried out on both the small and large fields. As interactions between factors have been rare it is convenient to summarize the results in separate tables for each fertilizer. A combined statistical analysis of the several seasons yields would not be valid because of the disparity of the standard errors over the various seasons.
Phosphate ResponsesThe phosphate responses on the small fields
are summarized in Table I. From this table
T able I.—Phosphate R esponses on Small F ields. Double Superphosphate
Season HoNil
Pi1 cwt./acre
p 22 cwt./acre
L .R .1957 2,259 3.594 3,773 Pi and P2>Po sig. at P=0-01S.R. 1957 3,943 4,959 5,285 Pi and P2>Po sig. at P = 0 01S.R. 1957 3,273 3,775 4,178 Pt>Po sig. at P = 0 01
Mean 3,158 4,109 4,412 P2> P i sig. at P = 0 05
129
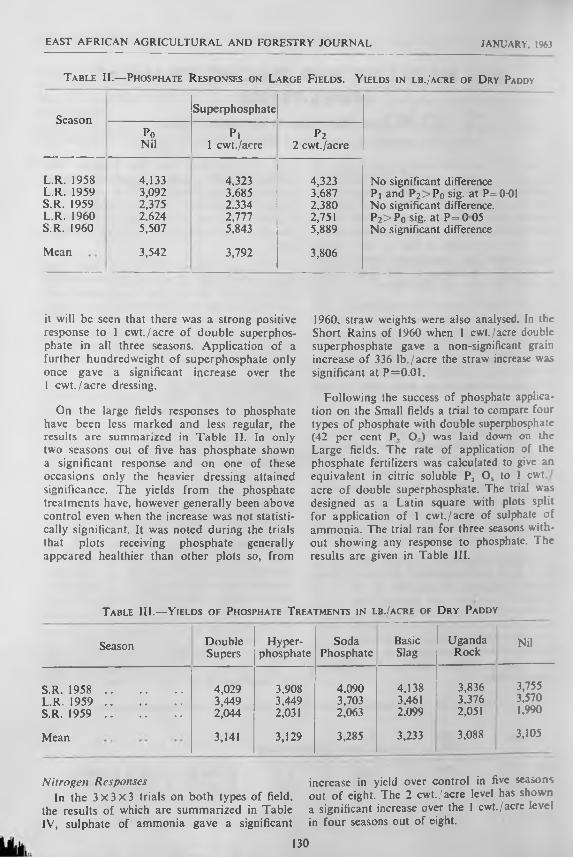
JANUARY. 1963EAST AFRICAN AGRICULTURAL AND FORESTRY JOURNAL
T able II.— Phosphate R esponses on Large F ields. Yields in lb./acre of D ry Paddy
SeasonSuperphosphate
PoNil
Pi1 cwt./acre
P22 cwt./acre
L.R. 1958 4,133 4,323 4,323 No significant differenceL.R. 1959 3,092 3.685 3,687 Pi and P2>Po sig. at P=0-01S.R. 1959 2,375 2.334 2,380 No significant difference.L.R. 1960 2.624 2,777 2,751 P2> Po sig- at P= 0 05S.R. 1960 5,507 5,843 5,889 No significant difference
Mean 3,542 3,792 3,806
it will be seen that there was a strong positive response to 1 cwt./acre of double superphosphate in all three seasons. Application of a further hundredweight of superphosphate only once gave a significant increase over the 1 cw t./acre dressing.
On the large fields responses to phosphate have been less marked and less regular, the results arc summarized in Table II. In only two seasons out of five has phosphate shown a significant response and on one of these occasions only the heavier dressing attained significance. The yields from the phosphate treatments have, however generally been above control even when the increase was not statistically significant. It was noted during the trials that plots receiving phosphate generally appeared healthier than other plots so, from
I960, straw weights were also analysed. In the Short Rains of 1960 when 1 cwt./acre double superphosphate gave a non-significant grain increase of 336 lb./acre the straw increase was significant at P=0.01.
Following the success of phosphate application on the Small fields a trial to compare four types of phosphate with double superphosphate (42 per cent P. O.) was laid down on the Large fields. The rate of application of the phosphate fertilizers was calculated to give an equivalent in citric soluble P2 O, to 1 cwt. acre of double superphosphate. The trial was designed as a Latin square with plots split for application of 1 cwt./acre of sulphate of ammonia. The trial ran for three seasons without showing any response to phosphate. The results are given in Table III.
Table III.—Yields of Phosphate T reatments in lb./acre of D ry Paddy
Season DoubleSupers
Hyperphosphate
SodaPhosphate
BasicSlag
UgandaRock
Nil
S.R. 1958 ........................... 4,029 3,908 4.090 4.138 3,836 3,755L.R. 1959 ........................... 3,449 3,449 3,703 3,461 3.376 3,570S.R. 1959 ........................... 2,044 2,031 2,063 2.099 2,051 1,990
Mean 3,141 3,129 3,285 3,233 3,088 3,105
Nitrogen ResponsesIn the 3 x 3 x 3 trials on both types of field,
the results of which are summarized in Table IV, sulphate of ammonia gave a significant
increase in yield over control in five seasons out of eight. The 2 cwt./acre level has shown a significant increase over the I cwt./acre level in four seasons out of eight.
130

EAST AFRICAN AGRICULTURAL AND FORESTRY JOURNAL JANUARY, 1963
Table IV.—N itrogen Responses o n S mall a n d L arge F ields. Y ields in lb./acre of D ry Pa d d y
SeasonSulphate of ammonia
NoNil
N i1 cwt./acre
n 22 cwt./acre
S.R. 1957 ir. 4,833 4,358 4,955 N 2> N i sig. at P = 0 0 5L.R. 1957# 3,461 3,808 3.824 N 2> N 0 sig. at P = 0 0 5S.R. 19571 3.470 3,748 4.008 N i and N 2> N o sig. at P = 0 01L.R. 1958i 4,103 4,306 4.369 N o significant differencesL.R. 19591 3.230 3.519 3.686 N i and N 2> N o sig. at P = 0 01S.R. 1959 2,178 2.352 2,380 No significant differencesL.R. I960' 2,453 2,684 3,014 N i> N o sig. at P=0-01
N 2> N i sig. at P = 01S.R. 1960 5,369 5,889 6,029 N i> N 0 sig. at P = 0 05
N 2> N i sig. at P = 0 01Mean 3,637 3,833 4,033
In the types of Phosphate trial mentioned earlier where the plots were split for sulphate of ammonia; the application of 1 cwt./acre of sulphate of ammonia gave an increase in yield significant at P = 0.05 in each of the three seasons. The results are given in Table V.
T a b l e V .— Y ie l d s in L b . /A c r e o f D r y P a d d y
1 cwt./acreSeason Nil sulphate of
ammonia
S.R. 1958 3,485 4,440L.R. 1959 3,114 3,888S.R. 1959 1,940 2,134
Mean 2,846 3,487
Time o f application of sulphate of ammonia Trials have been carried out on both types
of field to see if there is any advantage in applying sulphate of ammonia as a top dress
ing instead of as a pre-planting application. On both types of field the mean of the sulphate of ammonia treatments was significantly greater than the control but there was no significant difference between times of application. It will be noted from Table VI, however, that the application at planting has consistently given the highest yields.
Organic matterThese trials have been carried out on the
large fields only; in each of the three seasons FYM at 2 \ ton/acre has given a significant increase in yield; reapplication of straw has had no significant effect. The results are given in Table VII.
Spacing trialsTrials on both types of field show that close
spacing is extremely important with the variety Sindano. The results are shown in Table VIII
Table VI.—T imes of A pplication of S ulphate of A mm onia . Y ields in lb./acre of D ry Pa dd y
Season1
Atplanting
23 weeks
after
39 weeks
after
4Split over 1 ,2 and 3
5At
flowering
6Control
7N Mean
S.R. 1957 4.523 4,280 3,929 4,224 — 3,991 4,224L.R. 1960 2.256 2.154 2,124 — 1,938 1,764 2,188S.R. 1960 6.144 5.984 5.648 — 5.568 5.664 5.840
T able VII
Season Nil Strawreturned
2-J tons/acre FYM
S.R. 1959 2,115 2,380 2,415 FYM N il sig. at P = 0 05L.R. 1960 2,583 2,731 2,837 FYM >NiLsig. at P 0 01S.R. 1960 5.635 5.494 6,120 FYM >N il sig. at P = 0 05
FYM>Straw sig. at P—0-01Mean 3.445 3,535 3,790
131

EAST AFRICAN AGRICULTURAL AND FORESTRY JOURNAL JANUARY. isc-
T able VIII.— Y ields in lb. /acre of D ry Paddy
SeasonSpacing
12'x 12' 9 'x 9' 6 'x 6'
L.R. 1957 3,227 3,816 4,050 6' and 9 '> 1 2 ' sig. at P=0-01S.R. 1957 3,309 3,667 4,250 6'>9" and 12' sig. at P 0 001
9"> 12' sig. at P 0 05L.R. 1958 3,814 4,219 4.745 6'>9" and 12' sig. at P-0-01
9"> 12" sig. at P = 0 01L.R. 1959 2,358 3.084 3,881 6">9" and 12' sig. at P=0 01
9"> 12" sig. at P 0 01Mean 3,177 3.696 4.231
A further set of trials was carried out on the large fields to study the efTect of even closer spacing. In the first season the 6"X 6V spacing was significantly better than the other two, in the second season there was no significant difference between treatments; the results are given in Table IX.
Nursery trialThis trial, although it has only completed
one season, gives promise of interesting results. It was laid down in the Long Rains of 1961 to study the effects of three seed rates (30 sq. ft. per lb.; 70 sq. ft. per lb.; and 110 sq. ft. per lb.) two rates of sulphate of ammonia (4.86 cwt./ acre and N il and two rates o f double superphosphate (4.86 cwt/acre and Nil). The trial was designed as a 3 x 2 x 2 factorial with three replications; it was fully replicated in the nur
series as well as in the field, a single nursery plot being used for plants for each plot, since preliminary work had showed the difficulties of getting complete evenness between nurseries.
From the beginning, nurseries which had received sulphate of ammonia showed superior growth to the others and plants from these nurseries were ready to transplant 10 days earlier. This superiority persisted through to harvest and the plots receiving sulphate of ammonia yielded 3,760 lb./acre as compared with 3,147 lb./acre from the plots which did not; the difference was significant at P=tl.u01.
PotashPotash trials have only been carried out on
the small fields. In no case has Potash given a significant increase in yield. The results are given in Table X.
Table IX.—Y ields in lb. /acre of D ry Paddy
SeasonSpacing
9 'x 9' 6 'x 6" 3 'x 3"
S.R. 1960 5,157 5,898 5,659 6' and 3 '> 9 ' sig. at P 0-016">3" sig. at P = 0 05
L.R. 1961 3,194 3,469 3,412 No significant difference.
Mean 4,175 4,653 4,535
T able X.—Y ields in lb. /acre of D ry Paddy
Muriate of PotashOCa&UU
K0NIL
K,1 cwt./acre
k 22 cwt./acre
S.R. 1955 5.471 5,337 5,437 No significant differenceL.R. 1956* 425 522 517 No significant differenceS.R. 1957 4,842 4,977 4,367 K |> K 2 sig. at P = 0 05
Mean . . 3,579 3,612 3,440
*Bad season for empty heads.132

EAST AFRICAN AGRICULTURAL AND FORESTRY JOURNAL JANUARY, 1963
Conclusions
While the trials were not designed to com pare two methods of field construction it seems fairly safe to conclude from Phosphate results that care in field construction is essential and that topsoil removal for bund making should be kept to a minimum. Phosphate application is beneficial on both types of field, it is essential where removal of topsoil has occurred. Comparisons of various types of phosphate have been inconclusive. There is no advantage in applying more than 1 cwt./acre of double superphosphate.
Sulphate of ammonia has given increase on both types of field; it has given significant increase more regularly than phosphate. Two cwt. acre seems to give a worthwhile additional increase. Trials on time of application show that top dressings have no advantage over application at planting time.
Farmyard manure, at a light dressing of 21 ton acre, has given consistent responses and would be worth using when available. Return
ing o f straw to the field has had no significant effect.
The variety Sindano is extremely sensitive to spacing; the optimum spacing seems lo be 6" X 6".
Potash has had no significant effect on yields. Interactions between fertilizers and between spacing and fertilizers, have been rare.
The low yields in Short Rains I95J and Long Rains 1960 were largely due to influx of reed buck onto the station. The experimental area was fenced prior to the Short Rains 1960 and this along with improved watering techniques has brought yields back to a reasonable level. The Empty Heads problem which caused trouble in earlier years has not caused a marked variation in the yields of the trials.
A c k n o w led g em en ts
Thanks are due to Mr. L. J. Collings-Wells who carried out the earlier trials; to Mr. E. Beilis, Senior Soil Chemist, for guidance on fertilizer trials and to the Director of Agriculture for permission to publish this paper.
REVIEWSisa l , by G. W. Lock, published by Longmans,
Green and Co. Ltd., London, 355 pp., 62 plates. Price Sh. 60.
This book, which forms one of the Tropical Science Series, has been eagerly awaited by all who have had anything to do with one of the world's great fibre plants, sisal.
The sub-title is "twenty-five years” sisal research”. The book is much more than that. It results from a unique combination of experience of both research and practice, so that it has something for both the laboratory and the
field worker. For example, after dealing with the History and Development of the Sisal Industry, the author discusses Nomenclature and Taxonomy, Planting Material, Nursery Technique, Establishment of Field Sisal, Cultivation Systems and so on. Then, he has chapters on Plant Nutrition. Soils. Manures, Pest and Diseases, as well as chapters on Breeding. Characteristics o f Sisal Fibre. Decortication and Planning and Organization of a Sisal Estate.
It will be a standard work of reference for many years. It is cheap at its price and it can be recommended to all who deal with sisal.

EAST AFRICAN AGRICULTURAL AND FORESTRY JOURNAL JANUARY, 1963
RAINFALL RELIABILITY AND MAIZE YIELDS IN MACHAKOS DISTRICT
By B. D. Dowker, Department of Agriculture, Kenya
(Received for publication on 15th July, 1961)
The history of maize growing in the Macha- kos District of Kenya has been a chequered one. Crop failures have been frequent, an excess o f imports over exports the rule, and “famine relief” an all too common feature. In recent years with improved soil conservation and husbandry methods, maize surpluses have been obtained, but following a succession of low rainfall seasons, famine relief has again been necessary in the District in 1961.
What can be done to stabilize maize yields obtained on African smallholdings? This paper sets out information on the rainfall reliability at three selected stations in Machakos District, and shows how to calculate the relative advantages of growing maizes with short or medium length growing seasons, given the yield/rain, fall relation for the maizes in question. The relative advantage o f low populations and quick maturing maizes in stabilizing maize yields is discussed.
Rainfall R eliability D ata for S elected Sta tio n s
Monthly and seasonal data are presented for * Potha, some two miles from the Katumani. Experimental Farm; Kampi ya Mawe, a sub-,- station o f Katumani situated within the Maku- eni settlement; and Kangundo in the higher rainfall coffee growing areas of the District. Table I shows that the majority of months have standard deviations which are greater than two-thirds of the mean, i.e. these monthly distributions are skew. Accurate assessments of rainfall probabilities for these months are not therefore possible. Nevertheless from an examination o f monthly means and standard deviations, a clear pattern of rainfall reliability emerges, essentially similar for all three stations. This pattern conforms to two distinct seasons, the “peak” months being November- and April respectively.The seasons may be defined as follows: —
October - November - December - January: “Short Rains”.
March - April - May - June: “Long Rains”. The second month of each season is the most reliable one, with the possible exception of Kampi ya Mawe short rains. The first month
is likely to provide sufficient rainfall for the establishment of the crop, and the third and fourth months represent “tailing off” of the season, the former being more reliable than the latter. In fact, the rainfall expected in the fourth month of the long rains, June, is seen to be virtually negligible. February, which is seen to have very unreliable rain, would represent a harvest period for the short rains crop providing it has matured by that time. This harvest period would be followed by cultivation and the planting of the long rains crop in early March.
T able I.— M o n t h l y D ata
Potha1
Kangundo Kampi ya Mawe
Mea
n
Stan
dard
devi
atio
n
Mea
n
Stan
dard
devi
atio
n
c■5
1!i f73-3
Jan. 1-31 1-53 I-72 2-14 1-80 1 90Feb. . . 1-55 2-08 2-56 2-64 1-27 1-86March . 3-42 2-58 4-49 3-29 2-66 1 -86April . . 6-36 3-92 9-08 4-61 5-25 3-06May . . 201 1 -62 2-47 1 -96 2-11 1-68June 0-33 0-50 0-20 0-36 0 17 0-27July . . 008 0 19 0-05 0-08 0-22 0-38Aug. . . 009 0-24 0-16 0-90 0-16 0-22Sept. . . 0-37 0 60 011 0-23 0 10 0-12Oct. . . 1 -33 1 -34 2-25 2-42 I -66 1-36Nov. . . 4-39 1 -92 8-13 3-49 7-73 5-20Dec. . . 310 1 -93 4-96 2-96 3 69 1-46
Annualrainfall 24-35 36-19 26-80
Having defined the seasons, the reliability of the seasonal totals may be examined. This is calculated using the simple method of Glover and Robinson [1], No attempt is made to define minimum totals for any particular month within the season; the calculations are made on seasonal totals only.
Tables II. I ll and IV give the percentage probabilities of obtaining at least 5, 6, 7. 8, 9. 10, 11, 12, 13, 14, 15, 16 and 17 inches of rain per season. In each case the seasonal means are more than one and a half times their standard deviations.-Thus the assumption that these seasonal totals are normally distributed is reasonable, and the calculated probabilities may be expected to be accurate.

EAST AFRICAN AGRICULTURAL AND FORESTRY JOURNAL JANUARY. 1963
T able II.— P o th a— Seaso nal D ata
Season MeanStandard
deviation
Per C ent Proba bility of O btaining at Least
5" 6" 7 ' 8 ' 9 ' 10" 11' 12" 13' 14" 15' 16" 17'
"Short Rains” Oct.-Nov.- Dec.-Jan.
10 06 4-21 89 83 77 69 60 50 41 32 24 18 12 8 5
"Long Rains” Mar.-April- May-June.
1211 6-32 87 83 79 74 69 63 57 51 44 38 32 27 22
T able III.— K ampi ya M a w e— Seasonal D ata
SeasonStandard
deviation
P er C ent P robability of O btaining at Least
5" 6' r 8' 9" 10" 11' 12' 13' 14' 15' 16' 17'
“Short Rains" Oct.-Nov.- Dec.-Jan.
14 81 6-97 92 89 86 83 80 76 71 65 60 55 49 43 38
“ Long Rains” Mar.-April- May-June.
1019 3-95 90 85 79 71 62 52 42 33 24 17 11 7 5
T able IV.—K a n g u n d o— S easonal D ata
Standard Per Cent P robability of O bt MNING AT Least
tion 5" 6' 7" 8" 9" 10" 11' 12' 13' 14’ 15' 16' 17'
“Short Rains" Oct.-Nov.- Dec.-Jan.
1716 5 50 98 98 96 95 93 90 87 83 78 72 65 58 53
"Long Rains” Mar.-April- May-June.
16-23 7-36
V
94 92 89 87 84 80 76 72 67 62 57 51 46
Y ield /R ainfall Relationships
Data are presented for two maizes of different maturity lengths—“Local White” (5} months to maturity at 5,300 ft.) and “Taboran” (four months to maturity at 5,300 ft.). The latter was chosen as it appeared to fit into the previously defined fourth months season. Results are taken from six seasons of trials, both at Katumani (5,300 ft.) and Kampi ya Mawe (3.750 ft.). These trials were carried out under conditions of adequate fertility, early planting and good weeding on land cropped twice a year. Linear regressions of yield on rainfall are calculated for each maize at four
different plant populations— 4.840, 7,260, 14.520 and 29,040 plants/acre, equivalent to single plant spacing at 3 ft. X 3 ft., 3 ft. X 2 ft., 3 ft. X 1 ft. and 3 ft. X 6 in. The data appear to fit a linear form at yield levels of 17 in. and below; the only trial w'here more than 17 in. was obtained in the season (Katumani S.R. 57-58: 26 in.) has therefore been omitted. One trial (Katumani L.R. 60) in which there was very considerable run off has been left out, whilst nil yields have been omitted also. Graph 1 g ives the reprpcdonc of yield on rainfall for Taboran at four populations, and Graph II similar regressions for Local White. Table V gives the regression equations.
135

EAST AFRICAN AGRICULTURAL AND FORESTRY JOURNAL JANUARY, 1963
mupn x
v u p * a
1 A POP AM PA! HP ALL / TKLD PtAPCS StOMi
136

EAST AFRICAN AGRICULTURAL AND FORESTRY JOURNAL JANUARY, 1963
T able V
Regression equation S.E. o f regression equation
Significance level of b
YpI Tab 1,339 + 437 1 (R-9.78)(lb. acre)
669 5% (D.F.5)Yp2Tab = 1,645 + 282-0 (R-10-63) 457 0-1% (D.F.8)Yp3Tab = 1,190 + 148-7 (R-10-90) 377 1 % (D.F.7)Yp4Tab = 924 + 96-7 (R -l 1-49) 285 5% (D.F.4)YpIL.W. = 894 + 360-8 (R-9-78) 541 5% (D.F.5)Yp2L.W. = 1,597 + 461-2 (R-10-63) 614 0-1% (D.F.8)Yp3L.W. = 1,547 + 299-8 (R-10-90) 674 1 % (D.F.7)Yp4L .W . = 1,392 + 209-1 (R -l 1 49) 513 5% (D.F.4)
Key Y p I = Yield at population of 29,040 plants/acre, expressed in lb./acre.
Yp2=Yield at population of 14,520 plants/acre, expressed in lb./acre.
Y p3 = Yield at population of 7,260 plants/acre, expressed in lb./acre.
Y p4 = Yield at population of 4,840 plants/acre, expressed in lb./acre.
Tab=Taboran maize.
L.W. = Local White maize.
R = Rainfall from planting (or date of first effective rain if dry planted) to 120 days later, expressed in inches.
M4W in
137

EAST AFRICAN AGRICULTURAL AND FORESTRY JOURNAL JANUARY. IS63
T able VI
Site SeasonExpectation of obtaining
more than 11'
Expectation of obtaining less than 5'
Number of years out of 100 that advantage will be gained
from
Local White Taboran
Potha . . S.R. 41 11 41 48Potha . . L.R. 57 13 57 30KYM . . S.R. 71 8 71 21KYM . . L.R. 42 10 42 48Kangundo S.R. 87 2 87 11Kangundo L.R. 76 6 76 18
As an example of the effect o f rainfall on yields a comparison is made of Taboran and Local White at populations of 14.520 plants per acre (Graph 111). It is seen that if the seasonal rainfall totals are below 11 in. Taboran yields best, and above 11 in. Local White yields best. The magnitude of any difference in yield can be read off from the graph for any particular seasonal total.
The expectation of getting 11 in. in the short rains at Potha is 41 per cent (Table II). Thus in 41 years out of 100, there will be an advantage from planting Local White. Then, assuming that 5 in. represents the minimum rainfall to get any yield whatsoever, it can be seen that Taboran gives an advantage in (59—1I) = 48 years out of 100. In the remaining 11. no crop at all from either maize may be expected.
Similar calculations may be made for the long rains at Potha, and both seasons at Kampi ya Mawe and Kungundo. Table VI gives the complete list of results obtained.
D isc u ssio n
It has been shown that reliability of yield may be increased by using either low plant populations or a quick maturing maize. Of the two methods, use of a quick maturing maize is the more satisfactory. From Graphs I and II it can be seen that Taboran at 14,520 plants/acre still gives slightly more reliable yields under low rainfall than Local White at the very low population of 4.840 plants/acre. This advantage becomes much greater under higher rainfall. Even greater reliability at the expense of a drop in yield may be obtained from the Taboran by lowering its plant population.
Clearly reliability of yield is a major factor in maize growing on smallholdings in Macha- kos District, particularly those situated in the
under 30 in. annual rainfall areas, with a distribution similar to that for Potha and Kampi ya Mawe. Thus farmers in these areas operating on the two seasons per year basis should include in their maize acreages a proportion of Taboran. The figures given form a guide to the yields obtainable under conditions of good soil conservation (i.e. elimination of run-off), adequate fertility, early planting and careful weeding. A quick maturing maize is no substitute for soil conservation and good husbandry: reliable maize yields can only be obtained with a combination of all these factors.
S ummary
1. Rainfall reliability data are given for three selected stations in Machakos District. From an examination of monthly data, the most reliable “seasons” are defined, and from these seasonal expectations of rainfall are calculated.
2. The yield/rainfall relationship is given for two maizes. Local White and Taboran. at four plant populations. The figures are shown to fit a linear relationship within the rainfall range experienced.
3. Examples of calculations of the relative advantages of the two maizes at defined populations are given.
4. These calculations are discussed in relation to maize growing on smallholdings in Machakos District.
Acknowledgements
Special thanks are due to Dr. A. Lazenby School of Agriculture. Cambridge, and Mr. J. Glover. E.A.A.F.R.O.. Muguga. for reading the draft and giving helpful advice.
R e f e r e n c e s
11] Glover J. and Robinson P. (1953). A simplemethod of calculating the reliability of rainfall.E . A /ri. ugiic. 19: I I
138

EAST AFRICAN AGRICULTURAL AND FORESTRY JOURNAL JANUARY, 1963
THE EFFECT OF FERTILIZERS, MANURES, IRRIGATION AND RIDGING ON THE YIELD OF PYRETHRUM
By U. Kroll, Department of Agriculture, Kenya
(Received for publication on 12th March, 1962)
Martin and Tattersfield [2] carried out a number of trials on pyrethrum in England as early as 1929 on the heavy soils of Rotham- sted. The reaction of the soil was neutral. Nitrogen plus phosphate with the omission of potash, produced a significant yield increase over the unfertilized treatments in the first harvest. This increase, however, was not maintained during the second and third harvests o f the plots. The pyrethrins content of the flowers was in no way influenced by the manurial treatments. In a subsequent trial, again, nitrogen in combination with phosphates alone produced a yield increase in the first season only.
In the South of France [1], pyrethrum was grown on a commercial scale during the 30's: the plants were established on land which had previously been used for vineyards: these had to be uprooted on account o f severe attack of phylloxera; the soils were comparatively poor and gravelly. It was found that it was necessary to use fertilizers in order to produce satisfactory yields; complete rations of nitrogen, phosphorus and potash produced the best results. During wet years, the effect of Sulphate of Ammonia and Superphosphates, i.e. nutrients soluble in water, proved more efficient than cyanamide, basic slag, etc., which in their turn proved more beneficient in a dry year.
Again, as in England, it was not found that fertilizer treatments had an effect on the pyrethrins content.
In India [3], on the Nilgiris. pyrethrum has been established in the past on poor extremely acid (pH 3.0-5.1) black and red loams derived from gneiss. On these soils it was found that applications of manure had no effect on the yield.
Japanese cultivators [4, 5] growing pyrethrum on soils of volcanic origin are reported to apply manure between the rows of plants after picking. The application of too much nitrogen results in too much leaf and too little flower production.
In its country of origin. Dalmatia, the cultivators do not use any fertilizer or manurial treatments: this is on calcareous slightly alkaline soil.
P h o sp h o r u s
In East Africa the first experiments were laid down by the late R. Ball in the 30's, and more intensive work was started by Gaddum and Kroll [9] after the Second World War. The first experiments included treatments with phosphates, mulch and lime. Some of the phosphates were applied at planting time into the holes and some were applied at a later date drilled along the rows of plants. Superphosphates being in short supply at that time, a mixture of 4} units Uganda Rock Phosphate to I unit o f Triple Superphosphates was used. It was soon evident that only the water-soluble superphosphates in this mixture had any effect on flower production, which, in most cases, was short-lived (Tables I-III).
T a b l e I .— M o l o
1945/46 Phosphates in planting holes 6 lb. acre \ not 1946/47 Phosphates in planting holes-181b. acre/sig.
T a b l e I I .— K in a n g o p
1946/47 Phosphates in planting holes+159 lb/acre* 1947/48 Phosphates in planting h o le s- 21 Ib./acre
T a b l e III.—S u b u k ia
1946/47 Phosphates in planting holes + 45 Ib. acret 1947 48 Phosphates in planting holes 87 lb./acre
•Significant at P^0-05 tSignificant at P 0 01
In fact, it seemed that initial yield increases were sometimes followed by a depression in yield. No responses were recorded to phosphates drilled at a later date near the roots of the plants. In the following trials, such natural phosphates as Uganda Rock were used no longer, especially since superphosphates became more freely available. On the whole, the first experiments conducted between 1945 and 1947, proved rather disappointing, giving little indication that any fertilizer treatments had an economic effect on the flower yields. However, from 1950 onwards, another series o f trials was started on a large range of soil types, when it was found that, especially on the more leached and exhausted soils of the high altitudes. phosphorus was almost a necessity. The following tables [10. 11] give an indication of the results achieved on such soils (Tables IV and V).
139

EAST AFRICAN AGRICULTURAL AND FORESTRY JOURNAL JANUARY, 1963
T able IV .— K in a n g o p , K ip k a b u s , A in a b k o i a n d L o n d ia n i (1954/56 A v e r a g e Y ie l d s fo r 2 S easo ns O v er
F o u r T r ia l s)
Control (no fertilizer) . . 649 Ib./acre300 lb. Triple Supers. . . . . 890 lb./acret750 lb. K e n a f ........................... 761 Ib./acre*
Both types of phosphate produced significant yield increases over the untreated controls at the 1 per cent and 5 per cent probability level respectively. Superphosphate also proved superior in action to Kenaf (p = 0.05). (Some of these trials were conducted over two seasons only.)
T a ble V .— M a r in d a s
1950/51 Control (no fertilizer) . . 164 lb. acre150 lb. Triple Supers.................... 203 lb. acret1951/52 Control........................... 1,289 lb. acre150 lb. Triple Supers.................... 1,397 lb./acret
(In this case, no further effect o f the superphosphate was recorded in the third season.)
the weight of this fertilizer would have to be used as compared with Triple Superphosphates thus increasing the transport costs.
T a b l e VI.—M a r in d a s , 1957/60 (3 Seasons)
Control (no fertilizer) 200 lb. Triple Supers. 450 lb. Basic Slag 450 lb. Kenaf ..
1,927 Ib./acre 2,825 lb..acre+ 2,749 lb. acre* 2,600 lb. acre+
Although all types of phosphate produced a yield increase over the Control, significant at the 1 per cent probability level, the effect of Triple Superphosphate was superior to that of Kenaf at the 5 per cent level. The yearly increase in flower production through the application o f superphosphates has been in the neighbourhood of 300 Ib./acre—anastonishing performance.
Table VII.—Smallwood, Ol Joro Orok. 1957 60 (3 Seasons)
Control (no fertilizer) . . 717 lb. acre200 lb. Triple Supers. .. . . 1,328 lb. acre*500 lb. Basic Slag . . 1,013 Ib./acre
A low rate of 50 Ib./acre Triple Superphosphate was insufficient to produce any effect. One large experiment [11] conducted on 12 different pyrethrum varieties, showed an increased yield through phosphate application of nearly 800 lb. over three seasons (Table V).
T a b l e Va.— M a r in d a s , 1957/60 (3 S easons)
Control (no fertilizer) . . . . 2,362 Ib./acre200 lb. Triple Supers. . . . . 3,156 lb./acret
Most o f these soils which responded to phos- phatic fertilizers are distinguished by a red or reddish colour, but occasionally responses were achieved on slightly richer and darker soils as, for instance, in one case in the Subukia Valley (Table III).
At one stage [8] it was thought that basic fertilizers of slower action such as basic slag produced a more pronounced and lasting effect than superphosphates. Several trials were laid down in many areas of the Highlands to investigate this question. They, however, gave no indication that superphosphates were either less efficient or had an effect over a shorter period than basic phosphates. Similarly, soda phosphate was put into comparison with superphosphates and basic slag in a number of trials. Soda phosphate (Kenaf) is being produced locally and may therefore offer certain advantages. On the other hand, about 2J times
In this case. Triple Superphosphate proved superior to Basic Slag at 5 per cent probability.
In one small trial [9, 10] in 1950 at Molo, which unfortunately was not designed on statistical principles, Bonemeal, applied in the planting holes produced the best results (Table VIII).
T a ble VIII.—M o l o , 1950/52 (2 S easons)
200 lb. Bonemeal . . . . 893 Ib./acre150 1b. Triple Supers................... 769 Ib./acreControl (no fertilizer) . . . . 724 Ib./acre
The plots were sited on rather poor, red soil; but the results have obviously to be judged with caution. Bonemeal is usually regarded as containing 21 per cent phosphoric acid. It appears to be in short supply. Further studies were undertaken to determine the optimum quantity of phosphoric acid in a number o f trials containing linear comparisons between 0, 150, 300 and 450 lb. per acre of Triple Superphosphates (0, 61. 122 and 183 lb. of P.O. per acre). On the Kinangop on a greyish-orangey soil (transition from forest to vlei) the heavy application of 450 lb. per acre seemed superior to the lower amounts (Table IX).
T a b l e IX.—K in a n g o p , 1956/57 (S e c o n d Season O n l y )
Control (no fertilizer) 150 lb. Triple Supers. 300 lb. Triple Supers. 450 lb. Triple Supers.
646 lb. acre 736 lb. acre 920 Ib./acre
1,022 Ib./acre*
140

EAST AFRICAN AGRICULTURAL AND FORESTRY JOURNAL JANUARY, 1963
In most other cases, however, 150 lb. to 200 lb. Triple Superphosphates (61-82 lb. P ,0 ?) proved adequate and economically the optimum (Table X).
T a b l e X.— M a r in d a s , 1955/57 (Two S ea so n s)
Control (no fertilizer) . . 1,056 Ib./acre150 lb. Triple Supers. .. . . 1,390 lb./acret300 lb. Triple Supers. . . . . 1,406 lb./acret450 lb. Triple Supers.................... 1,342 lb./acret
It is, therefore, advisable, unless special soil conditions require heavier applications, to restrict the dosage to 150-200 Ib./acre Triple Superphosphate (65-86 lb. PaOs).
It also appeared important to establish the optimum placement of these fertilizers. As reported before, the first trials showed that only placement at planting time near the roots had an effect, but with different methods of planting it would still be important to know how to apply the fertilizer. Therefore experiments were laid down in which the fertilizer was either placed into the planting holes when the pyrethrum was planted on the flat or below a ridge when plants were planted on top of ridges, or into planting holes on top of the ridges, or, split into portions for the planting holes on top of the ridges and for the furrows below. Some of the results follow herewith (Tables XI and XII).
T a b l e XL— S c h a l c h . T h o m s o n ' s F a l l s , 1956/57
P. in planting
holes
P. placed below ridges
Control (no fertilizer) . . 149 134150 lb. Triple Supers. 237t 218300 lb. Triple Supers. 224 296t
In this case, 300 lb. Triple Supers, placed below the ridges produced a significant (p = 0.01) yield increase over all other treatments except 150 lb. on the flat in the planting holes which was better than both Controls (p = 0.01). Although the flower yields in this season were rather poor owing to soil and weather conditions, they still demonstrate the point in question.
T able X II.—Oulton, N anyuki, 1956/59 (3 Seasons)
P. in P. placedplanting below
holes ridges
Control (no fertilizer) .. 1,422 1.634*150 lb. Triple Supers. 1,499 1.708*300 lb. Triple Supers. 1,569* 1,570*
Ridge planting by itself raised the yield over the Control on the flat (p = 0.05). While there is a great difference between the effects of the lower phosphate rates on the flat and on the ridge (p = 0.05) there is no difference in the case o f the heavier applications. The results show again that a heavier dressing than 60 lb. P.C),. per acre is not necessarily economic, while other points like the absence of a yield difference between the two higher rates on the flat and the ridge are not easy to understand. The soil was comparatively rich in this instance and possibly not particularly suited for the test. On similar soil, in 1957/58, the following results were recorded: —
300 lb. Triple Supers, placed below the ridges and the same rate split into 100 lb. in the planting holes on top of the ridges and 200 lb. below the ridges, produced significantly (p = 0.01) better results than 700 lb. Kenaf below the ridges or on the flat in planting holes, or 300 lb. Triple Supers, on the flat or both Controls.
Even 300 lb. Triple Supers, in planting holes on top of the ridges were better (p = 0.01) than 300 lb. on the flat or 700 lb. Kenaf on the flat.
In an extensive trial at Marindas lasting from 1955 to 1958, the results were not so clearly in favour of placement below the ridge, although there were indications for the benefit derived from this method : —
T able X1IL— M a r in d a s , 1955-58 (3 Seasons)
On the flat
On ridges
No fertilizer 1,686 1,753150 lb. Triple Supers. 2,190* 2,298*300 lb. Triple Supers. 2,167* 2,444+450 lb. Triple Supers. 2,038 2,455t
(* ^Significant at P = 0 05, t “ Significant at P = 001)
There seems, therefore, a case for advocating the placing of the phosphates below the ridges. It would obviously save time and labour if the phosphates could be drilled into the ridges at the same time as these are made, which is possible with some of the potato planting machinery. Fertilizers would be mixed in the middle of the ridge with the soil and should be immediately available to the young plants. Otherwise it would be easiest to make shallow furrows first with a ridger, dibble the fertilizer into these furrows with some fertilizer equipment and then to split the small ridges by offsetting the ridger bodies on the tool bar of the tractor.
141

EAST AFRICAN AGRICULTURAL AND FORESTRY JOURNAL JANUARY, 1%3
Pyrethrum growers have— on occasions— complained that the fertilizer placed close to the roots of the young splits or seedlings, had caused scorching and a loss in plants, especially during dry periods. This may be possible, although such observation has never been made on the research stations, if however the phosphates are applied either below the ridge or mixed with the soil in the centre of the ridge, scorching should not occur.
The effect of phosphorous applications at the time of planting varies greatly, according to the rate of growth made in the first season, the fertility state of the soil, etc. So, for instance, in one experiment at Marindas (1950- 1953) the yield increase through 150 lb. Triple Supers, was only 39 ib. in the first and 111 lb. in the second season, while no further effect was observed in the last year (Table V). On the other hand, in another trial at Molo on rather poor soil, the total increase over three seasons amounted to 679 lb./acre dry flowers through an application of 200 lb. Triple Supers., the additional yield in the third year alone being 133 lb. This effect was even greater in the trial shown in Table VI.
In a large rotation experiment, started at Ol Joro Orok in 1947, phosphatic fertilizers have been applied to cereal crops and grass leys intervening between the pyrethrum plantings. While the general effect o f the grass leys on the succeeding pyrethrum crops has been beneficial it is by no means clear that phosphorus applied to the grass produced a residual effect on subsequent plantings. In fact the results of this experiment indicate that pyrethrum grown repeatedly on the same land should receive phosphorus applications, irrespective o f whether it is being rotated with other crops or not.
In a large experiment on the Kinangop where pyrethrum followed a crop of potatoes, a slight residual effect of phosphorus was recorded (not significant) in the first year but none in the second.
The Appendix gives a list o f soils which have been tested chemically and by field trials. Those which have given ready responses to phosphorus are usually low in base saturation and pH values.
Experimental results in Southern Tanganyika were o f a similar trend to those recorded in Kenya. The natural fertility of the soils in the Njombe/Uwemba areas [6] is not very high but
the yield increases through phosphates have been of the highest economic level on the ash deposits overlying the basement complex.
Most of the other major elements have beer tested on several occasions and on varying soi types but seem, up to date, of little practical importance. They will, therefore, be treated here more summarily.
Potash
At the rates of 50 and 150 lb./acre Muriate of Potash repeated every season, produced no response at Marindas from 1950 to 1953. In other trials, such as one at A. James' farm in Molo and Schalch's in Thomson’s Falls, there were indications for a decrease in yield through those applications, although analysis of the soils showed a shortage in potash.
N itrogen
Nitrogen has shown little promise, even if applied together with mulch as in several trials planted in 1951 and run for three seasons. Contrary to expectations, nitrogen as such has not resulted in excessive vegetative growth at the expense of regenerative development. This is not in accordance with the claims made b> Japanese cultivators.
Calcium
One of the most problematical elements seems to be calcium. Considering the rather low pH values of most Kenya soils, one would expect a more definite answer to applications of lime. However, experimental results have neither been consistent nor conclusive. On some heavily leached soils of high acidity lime applications have had a beneficial effect on various but not all occasions. The treatments wrere aimed to ameliorate the top soil. On a more fertile soil the comparatively light dressing o f 500 lb./acre limestone produced better flower yields than the untreated control and heavier applications of 1.000. 2,000. 4.000 and8.000 lb./acre, the yield differences being significant at the 1 per cent probability level.
Su lph u r in the F orm of G y psum
This has so far given a significant yield increase (p = 0.05) in one case only: this was on rather acid soil of the bracken type in Sitotcn (Molo). The main effect was at the rate of 114 lb./acre. The result is not quite understood, but investigations on this element are continuing.
142

EAST AFRICAN AGRICULTURAL AND FORESTRY JOURNAL JANUARY, 1963
Magnesium
This has given no responses up to date in several experiments.
Minor E lements
Pot tests undertaken on some of the Marin- das soil indicated severe deficiencies in phosphorus. molybdenum, zinc and copper in tomatoes. When these results were put to the test on pyrethrum in the field no reactions, however. were observed. It appears that the plant is not very susceptible to a variation in the state of balance of the minor elements. Further tests are under way.
Farmyard M anure
Pyrethrum also seems to be rather indifferent to applications of farmyard manure; this was applied in numerous trials but always without any results. The only exception was a rather problematical soil of the High Bracken type at Embu where 5 tons/acre animal manure produced a significant yield increase (p = 0.05), but even on a similar soil in the Sitbten area there was no significant response. This phenomenon is difficult to understand, all the more as manure applied to nursery beds usually stimulates a more vigorous development of the seedlings. In general it can be said that it would be economic to apply available dung to other crops rather than pyrethrum. One interesting result has been recorded on the South Kinan- gop where pyrethrum was planted following a potato crop; while farmyard manure produced a considerable yield increase in the potatoes the residual effect of dung on the pyrethrum yield in the first season was disastrous, decreasing the yield by 149 lb./acre. (p = 0.01). In Southern Tanganyika [6, 7, 12] on rather different soils which have been derived from granites chiefly but where often ash deposits overlay the original soils, farmyard manure has given significant yield increases on several occasions.
Deep litter chicken manure, however, can be used with great advantage. At Marindas,1.000 lb./acre of this material applied into planting holes gave a yield increase of 129 lb. an acre in the first year, after which the effect semed to have worn off. According to the chemical analysis carried out on this material, the application would have equalled that of 32.2 lb. 'acre PO. or 75 lb. Triple Superphosphates.
M u lch
Especially in areas with higher mean temperatures and long dry seasons it would appear useful to improve the growing conditions for pyrethrum by putting down mulch. Trials were started in the earliest days of research by the late R. Ball and have been continued for many years by later workers. Results have, however, not always been consistent. In Molo, for instance, mulch applied between rows and kept up to a thickness of about 4 in., decreased the yield in the first year by 63 lb. an acre (p = 0.05), while in the succeeding year it produced an increase of 67 lb. (p = 0.05). These results quite obviously cancel each other out. What is difficult to understand is that mulch combined with phosphates drilled along the rows of plants decreased the yield over two seasons by as much as 223 lb. in the same trial. In the identical trial at 01 Joro Orok, mulch gave a yield increase of 212 lb. over the second and third seasons (p = 0.01). It was thought that in the case of Molo, in the first season at least, mulch kept the top layers of soil too cold for a quick development of the young plants, therefore this experience was repeated in a further trial on that station lasting from 1949 to 1953. On the warmer station Subukia (7.000 ft.), however, results have been more encouraging. Between 1955 and 1959 mulch applied between the rows only (halfmulch) produced a yield increase of 405 lb. per acre, which is most likely of an economic nature. On the colder station of the South Kinangop, the recordings were similar to those in Molo; only during the second season was there a significant positive response to mulch of over 101 lb. per acre (p = 0.01).
G reen M anure
Although pyrethrum is usually grown within a balanced mixed farm rotation which includes a grass ley, it has been thought that it might be possible to keep up reasonable yields by interpolating one year of cereals or a green manure crop only. The first experiment was conducted in Molo from 1948 to 1952; it was found that the growing of one wheat crop or lupins or sunflower ploughed in as green manure had very little effect on the succeeding pyrethrum yields. Especially if wheat was grown without any phosphatic fertilizers, the following crop was poor. Heavy applications of compost plus phosphates remedied this position considerably. A later trial at Marindas showed clearly that one year of a different crop
143

EAST AFRICAN AGRICULTURAL AND FORESTRY JOURNAL JANUARY. 1963
or green manure or oats was not sufficient to ensure good pyrethrum yields in the next cycle, in fact the yields on the same land compared with those of the first cycle were decidedly inferior and only reached the same level if the crop was planted with heavy applications of phosphorus.
Irrigation
With the increased construction of dams and other water supplies the question of improving pyrethrum yields through added water has become a more urgent topic. Several trials have been undertaken in the Molo Nursery to investigate the effect o f overhead irrigation. It became obvious fairly soon that it was not possible to extend the flush far into the dry weather after the cessation of the normal rains, i.e. the irrigated plots dried up at the same time as the untreated controls. If, however, rains fall short during the normal time of flowering and are then supplemented by artificial watering, significant yield increases can be achieved. Trials undertaken in the Southern Highlands of Tanganyika where there is only one comparatively short rainy season but where chilling occurs from June to August yields have been stepped up quite considerably through overhead irrigation during the cool months, again without any success in prolonging the natural flush. One important aspect o f water supplementation during dry periods is, however, the increase in the pyrethrins per cent. So, in Molo during the 1960 season the percentage was 1.75 on the irrigated as compared with 1.61 on the control treatments (p = 0.01). This seems to tie up with Gaddum’s earlier findings that a minimum of 4 in. of rain per month is required for the full development o f the pyrethrins. At the same time overhead irrigation increased the yield of young pyrethrum from 379 to 493 lb., and a similar increase was obtained during the first dry half of 1961. The writer is not in a position to judge whether these increases justify the installation of an irrigation system, but it should also be remembered that in difficult years like those mentioned, irrigation could assure the good establishment of young plants.
R idge Planting
As mentioned during the discussion of phos- phatic fertilizers. It was found on many occasions that planting on ridges resulted in better yields. Most probably several factors combine to ensure this favourable result. In the first
place, as ridges are made up of rich top soi! only, the young plants have a better chance to get away, further they are protected from waterlogging in wet periods, aeration may be better and the soil may be subjected more intensely to the warming rays of the sun. Last, and this is most important, ridges following the contour lines not only prevent excessive soil erosion, but also run-off of rainwater which is forced to sink in between the ridges, so building up a water reserve for dry periods. In one large trial at Molo using 12 different varieties, the total yield increase through ridge planting over three seasons was over 156 lb. per acre (p = 0.01). As planting on ridges has further practical advantages, this method can be strongly recommended. Similar results were also recorded at Kipkabus and the Kinangop Here, from 1957 to 1959 the yield increase through ridge planting was 223 lb./acre (Sign p = 0.05). In the Southern Highlands of Tanganyika all pyrethrum is grown on ridges following the results of their field trials.
S ummary
The results of experiments with fertilizers, irrigation and ridge planting on pyrethrum are discussed.
Phosphorus appears to be in short supply on many soils in the Kenya Highlands as well as in Southern Tanganyika. Applications of 150 to 200 lb. Triple Superphosphate at planting time either placed into the planting holes or below the ridges are recommended. The effect of these treatments usually lasts over two to three seasons.
Basic phosphates have shown no advantage over superphosphates.
Nitrogen and potash have so far produced no yield increases.
Calcium (lime) has on occasions and on highly leached acid soils given positive responses. Results are not conclusive.
Applications of the minor elements Zinc. Molybdenum and Copper have had no results
Farmyard manure, except in nurseries to stimulate the initial growth of seedlings, is not recommended.
Mulch between the rows of plants has produced yield increases especially in drier seasons and at the warmer altitudes.
144

EAST AFRICAN AGRICULTURAL AND FORESTRY JOURNAL JANUARY, 1963
Green manures have, on the whole, been disappointing. One year of a green crop between two pyrethrum plantings, does not constitute a means to keep up yields. A grass ley should be included in a balanced rotation. Satisfactory yields on land which is repeatedly planted with pyrethrum can only be maintained by phosphorus application, even if a reasonable rotation is followed.
The pyrethrum content cannot be influenced by any fertilizer or manure.
Irrigation at the rate of 4 ins. per month can increase the flower yield as well as the pyre- thrins content during dry spells within the growing season but does not prolong flowering into the dry season.
Ridge planting has in most cases given increased yields and is recommended.
Ac k n ow ledgem ents
Acknowledgements are gratefully made for the help given by the scientific staff of the Pyrethrum Board who undertook a large number of chemical analyses, to Dr. Birch and Mr. Chamberlain of E.A.A.F.R.O., and to the Senior Soil Chemist of the Department of Agriculture for numerous soil analyses, advice on the lay-out of fertilizer trials and useful suggestions on the present paper.
R e f e r e n c e s
[1] Le Pyrithre Francois, Dr. J. Ripert, 1935. Dehon et Cie, Paris.
12] The Effect of Environmental Conditions upon Pyrethrum (Chrysanthemum cinerariaefolium). J. T. Martin and F. Tattersfield. Ann. Appl. Biol., 21. 1934, 26, 1939.
[3] Cultivation of Pyrethrum on the Nilgiris. K. N. Raghavan Nair, World Crops, July, 1955.
[4] Pyrethum Flowers. Supplement to Second Edition, C. B. Gnadinger, 1945. McLaughlin Gormley King Co., Minneapolis.
[5] Pyrethrum Culture. J. S. Yip, Soap 21, No. 2, 1945.
[6] Uwemba Pyrethrum. J. S. Tuckett, Dept. Agric. Tanganyika, 1956.
[7] Ann. Rept. Tanganyika Dept. Agric. 1959.
18] Prelim. Rept. on the Action of Different Plios- phatic Fertilizers. U. Kroll, 1956 (unpublished).
|9] Ann. Repts. Agric. Officer (Pyrethrum), Kenya. 1946-1950, E. W. Gaddum.
(10) Ann. Repts. Agric. Officer (Pyrethrum), Kenya. 1951 & 1952, F. H. Ormerod, 1953-1955, U. Kroll.
| l l ] Ann. Repts. Senior Pyrethrum Officer, Kenya. 1956-1960, U. Kroll.
[12] Tanganyika Pyrethrum Res. Ann. Rept. 1960, D. F. Osbourn.
APPENDIX —SOIL ANALYSES OF PYRETHRUM SITES
Exchangeable Bases m.e. per cent
pH TotalP205ppm
Calcium Magnesium
Manganese
Potassium B.E.C. v
Sat.
Marindas (Grassland Station). 0- 6' 5-8 180 4 08 10 •093 214 17-6 41-5Red loam. 6'—12" 5-4 55 6-9 3-25 •020 1 -85 20-8 58-2
Londiani A 0- 6' 51 65 31 •88 •063 0-76 16-5 291very red sandy loam. 6' - 12' 5-2 25 3 05 1 -50 •0575 103 15-5 36-1
Londiani B 0- 6' 6-5 340 17-4 2-65 •0185 212 27-1 84 0dark, former forest soil. 6' - 12' 6-6 120 9-5 2-85 •0245 2-44 20-9 71 0
Mweiga 0- 6' 61 350 16-2 6-8 •0262 2-41 33-2 76-5dark brown soil . . 6' - 12' 5-9 105 14-6 6-7 •0155 104 29-7 75-5
Kinangop 0-6 ' 51 120 21 •76 •150 •59 13-6 26-5 *grey, clayish soil. 6' - 12' 5 0 75 1-5 •43 •081 •42 10-9 22 0
Ainabkoi 0- 6' 5-6 125 71 2-4 •180 2-1 22-7 51-5 *red sandy loam. 6' - 12' 5-3 90 61 1-7 ■110 2 0 18-5 53-5
Lumbwa 0- 6' 6-2 108 10-6 1-3 •Oil 1-9 211 65-5dark, former forest soil. 6' - 12' 6-2 23 8-1 10 •01 1-4 16-4 64 0
'Indicates soils which responded to phosphorus treatment.
145

HAST AFRICAN AGRICULTURAL AND FORESTRY JOURNAL JANUARY. 196?
FATTENING TURKEYS IN UGANDABy J. C. M. Trail, Livestock Experimental Station, Entebbe. Uganda
(Received for publication on ISth January, 1962)
A previous paper (Trail, 1962) described the most suitable methods of rearing turkeys in Uganda, and gave the growth rates, food consumption and feed conversion figures and costs of production of 12-week-old turkey poults. This paper gives the results o f a trial on the fattening of turkeys under deep litter management from the age of 12 weeks to killing at 22 weeks. The liveweight increases, food consumption, feed conversion and killing out percentages arc given, together with the costs of production and profits to be expected.
Method
Thirty-four Broad Breasted Bronze turkeys reared to 12 weeks of age in fold units were placed in a deep litter house with outside straw yard allowing five square feet inside and five square feet outside per bird. The turkeys were fed a commercial layers mash produced in East Africa from 12 weeks to 17 weeks, and a mixture of half layers mash and half maize meal from 17 to 22 weeks. The mash was supplied ad lib. and fresh green food in the form o f young elephant grass given daily. The birds were caponized at 17 weeks with one 15 mgm. tablet of hexoestrol, and liveweights
and food consumption measured at weekh intervals throughout the 10-week period.
Results
(i) Growth rates, food consumption and fee,:conversion
Table 1 gives the weekly figures for live- weight. food consumption and feed corners. The liveweights at 2 weeks were 10 lb. 11.2 oz. per bird, and food consumption from 12 to 22 weeks was 40 lb. 5.9 oz., giving a total food consumption per turkey from hatching to 22 weeks of 54 lb. 2.2 oz. The overall feed conversion rate rose from 3.4:1 at 12 weeks *o 4.0: 1 at 17 weeks, then during the five-wee period when the cheaper food mixture wa- provided from 4.0: I to 5.1 : 1.
One bird died during the trial, when 17 weeks old. and a post-mortem examination revealed a fractured pelvis.
(ii) Killing out percentageThe average liveweight at 22 weeks was
10 lb. 11.2 oz. and the dressed weight including the giblets 8 lb. 9.3 oz.. giving a killing out figure of 80.2 per cent. The finish and appearance of the carcasses was very good.
T able 1
Age Food AverageLiveweights
Food consumption poult
per Feed Conversion
Weekly Cumulative Weekly Overall
lb . O Z . lb. OZ. lb. oz.12 weeks Layers 4 31 13 12-3 3-4 113 weeks Mash 4 130 2 12-5 16 8-8 4-5 i 3-5 114 weeks 5 10 9 3 1-6 19 104 3 6 i 3-5 115 weeks 6 7-8 3 7-2 23 1-6 4-3 i 3-6 116 weeks 7 2-4 3 7-2 26 8-8 5-2 i 3-8 117 weeks 7 13-3 4 0 1 30 8-9 5-9 i 4 0 1
18 weeks 1 Layers 8 7-2 4 11-8 35 4-7 7-7 i 4-2 1
19 weeks Mash 9 2-7 5 8-4 40 131 / ' / 1 4020 weeks 4 Maize 9 9 0 4 4-2 45 1-3 10-8 i 4-8 1
21 weeks Meal 9 150 4 6-8 49 8-1 11 -8 122 weeks 10 11-2
____4 101 54 2-2 61 i 5*1 1
146

FAST AFRICAN AGRICULTURAL AND FORESTRY JOURNAL JANUARY, 1%3
(iii) CostingsStock Sh. cts.
34 three-month-old turkey poults at Sh. 13'60 each 462 40
Feedingstuees567 lb. layers mash at Sh. 38/50 per 150 lb.
and 778 lb. mixture at Sh. 32/00 per 1501b............................................................. 311 50
LabourI hour daily by one man for 10 weeks plus
one complete day cleaning house at Sh. 120 per m o n t h ........................................ 13 00
Ca p o n i z i n g ....................................................... 3 00Depreciation on House
Cost Sh. 1,200, 10 year life, used for 10 weeks 13 00
Depreciation on Equipment Cost Sh. 100, 5-year life, used for 10 weeks 4 00
Depreciation on Capital 5 per cent o f Sh. 2,000 for 10 weeks 20 00
Total . . 837 90
Thus the total cost of production of the 33turkeys, alive at 22 weeks of age was Sh. 837 90, or Sh. 25/39 per bird, or Sh. 2 /38 per pound liveweight. TTie killing, plucking and dressing of the turkeys required Sh. 20 for labour and Sh. 2 for materials. The cost of production was thus Sh. 26/06 per carcass or Sh. 3 04 per pound dressed weight.
The main items of expenditure expressed as costs per live turkey, costs per pound live- weight. costs per pound dressed weight and percentages of the total costs of production per bird are given in Table II.
(iv) IncomeThe demand for fat turkeys in Uganda is
largely limited to Christmas, and the price to
be obtained varies annually. At the present time it is possible to get Sh. 4 /50 per pound dressed weight for first qualtiy turkeys as produced in this trial giving a profit of Sh. 12/55 per bird. The production o f fat turkeys in "Uganda is therefore a very profitable undertaking, but it must be emphasized that the market is very seasonal and the demand likely to prove limited in the future.
S um m ary
Broad breasted bronze turkeys were fattened from 12 weeks to 22 weeks of age under deep litter management. The liveweights at 22 weeks averaged 10 lb. 11.2 oz. per bird, with a total food consumption from hatching of 54 lb. 2.2 oz. and an overall feed conversion rate of 5.1:1 The killing out percentage was 80.2 per cent, giving a dressed carcass weight of 8 lb. 9.3 oz. The total cost o f production was Sh. 25/39 per bird or Sh. 2/38 per pound liveweight or Sh. 3/04 per pound dressed weight. The main items of expenditure are listed as percentages of the total costs of production, food accounting for 55 per cent of the cost. The profit per bird was Sh. 12/55 when a selling price of Sh. 4 /50 per pound dressed weight was obtained.
A ckn o w led g em en ts
The author wishes to thank the Director of Veterinary Services and Animal Industry for permission to publish this paper.
R e f e r e n c b
Trail, J. C. M. (1962). E. Afr. agric. lor. J. (in press).
T able II.— Breakdow n of C osts of Production
ItemCost per bird at 22 weeks
Per cent of total costs of production of 22
week live turkey
Cost per pound
liveweight
Cost per pound dressed weight
Sh. cts. Sh. cts. Sh. cts.Day old poults 6 65 26-2 0 62 0 78Food 13 98 551 1 31 1 62Labour 1 32 5-2 0 12 0 15Fuel and caponizing 0 81 3-2 0 08 0 10Depreciation of brooder equip-
ment and capital 2 63 10-3 0 25 0 31
Total 25 39 100 0 2 38
Plucking and dressing . . 0 67 0 08
Total 26 06 3 04
147

EAST AFRICAN AGRICULTURAL AND FORESTRY JOURNAL JANUARY, 1%3
A PLANT TRAY CARRIER FOR FORESTRY OPERATIONS
By J. F. Hughes, Forest Department, Uganda
(Received for publication on 6th November, 1961)
In 1960, as part of a trial scheme to centralize forest nursery work in Buganda, an easily rigged plant tray carrier was constructed to fit <a three-ton lorry or a three-ton tractor trailer. This carrier has now been used for two years and an improved model suitable for a five-ton lorry has been in operation for one planting season. It is thought that this idea may be of application elsewhere, particularly for use with large or centralized nurseries.
The frame is made from either seven (three- ton type) or nine (five-ton type) | |shaped members constructed from 4 in. X 2 in. channel. These stand crosswise on the lorry body and extend the full width, which is normally about seven feet. The side pieces are about 5{ ft. in height. Cross members are spaced according to the size of plant tray to be carried. Local custom will usually determine this, but it is well worth changing the size of trays to get the best possible pack in the frame. At the Nakawa Central Nursery trays are 17$ in. long X 12$ in. wide, for which, as will be shown later, the correct cross member spacing is 20 in. centre to centre. This gives six loading bays in a normal three-ton lorry body (10 ft. length) and nine in a five- tonner (13 ft. 8 in.). Cross members are held in place by flat iron strips o f 1$ in. X $ in. bolted with $ in. bolts to the side pieces, as shown in Figs. 1 and 2. The position of bolt holes on the cross members and on the bracing strips must be calculated and bored with great accuracy. Calculation should be done by drawing carefully to scale. Squared paper must not be used—a frame constructed from a drawing done in this way almost certainly will not fit. From the top of each side piece, or from alternate side pieces, are fixed 1$ in. X $ in. strips forming a support for tarpaulins slung across the top and sides of the frame to protect the plants from windblow.
Trays are supported on wooden T-shaped members suspended from the channel iron side pieces of the cross members on $ in. bolts traversing these near to the inner (and free) edge (Fig. 3). Each tray support consists of a piece of 1$ in. X 4 in. (or 2 in. X 4 in.), lying flat and running crosswise within the cross members, and a piece of 4 in. X $ in. (or 4 in. X 1 in.) set vertically in the middle of the 1$ in. X 4 in. and fixed there with large screws (Figs. 3 and 4). The vertical spacing between tray supports will be determined by the size of plants to be carried. For most purposes an interval of 20 in. is suitable, which allows four tiers of trays with 4 in. deep boxes and plants 14 in. in height. It is well worth drilling the side pieces of cross members at regular intervals so that the spacing of tray supports can be adjusted easily as required to suit the size of plants being carried. The ends of the tray supports should be shaped to allow an easy fit in the channel of the cross member side pieces, because they have to be removed when off-loading and replaced when loading. They should be treated with creosote or with an oil-based wood preservative.
Cross members should be bolted through the floor of the lorry. The frame itself, if properly constructed, should be perfectly rigid with its own cross bracing strips. It is essentia! to have a tarpaulin or tarpaulins which will cover the frame completely on top. back, front and sides. Seedlings of some species, for example. Eucalyptus, are very easily damaged by wind, and even pines can be completely spoiled by bad packing. Fitting and unfitting of the whole frame can be done by three men in about an hour. Dismounted it requires negligible storage space.
The weight of a frame for a three- to four- ton lorry is about 1.600 lb., and for a five-ton lorry about 2,040 lb. It is suggested that the
148
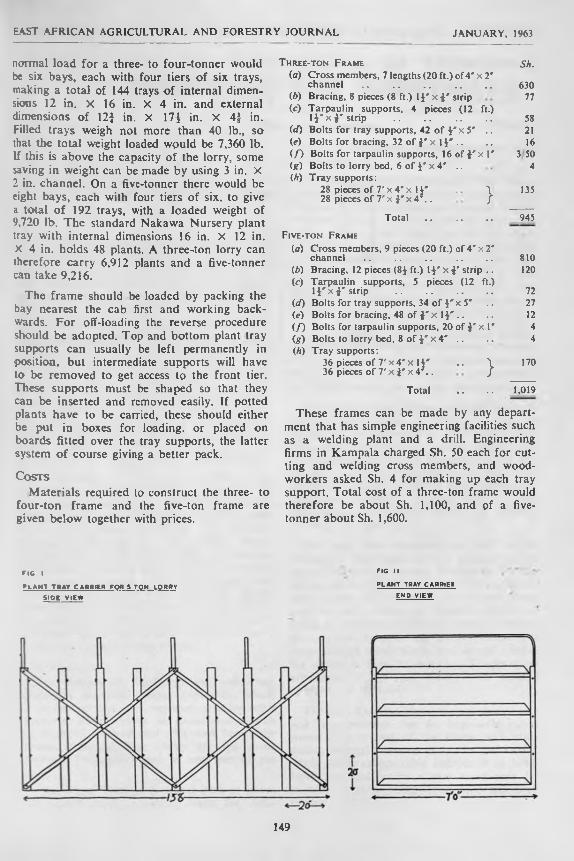
EAST AFRICAN AGRICULTURAL AND FORESTRY JOURNAL JANUARY, 1963
normal load for a three- to four-tonner would be six bays, each with four tiers o f six trays, making a total of 144 trays o f internal dimensions 12 in. X 16 in. X 4 in. and external dimensions o f 12| in. X \ 1 \ in. X 4f in. Filled trays weigh not more than 40 lb., so that the total weight loaded would be 7,360 lb. If this is above the capacity o f the lorry, some saving in weight can be made by using 3 in. X 2 in. channel. On a five-tonner there would be eight bays, each with four tiers of six. to give a total o f 192 trays, with a loaded weight of 9,720 lb. The standard Nakawa Nursery plant tray with internal dimensions 16 in. X 12 in. X 4 in. holds 48 plants. A three-ton lorry can therefore carry 6,912 plants and a five-tonner can take 9,216.
The frame should be loaded by packing the bay nearest the cab first and working backwards. For off-loading the reverse procedure should be adopted. Top and bottom plant tray supports can usually be left permanently in position, but intermediate supports will have to be removed to get access to the front tier. These supports must be shaped so that they can be inserted and removed easily. If potted plants have to be carried, these should either be put in boxes for loading, or placed on boards fitted over the tray supports, the latter system o f course giving a better pack.
C o s t s
Materials required (o construct the three- to four-ton frame and the five-ton frame are given below together with prices.
T h r e e - t o n F r a m e Sh.(а) Cross members, 7 lengths (20 ft.) o f4' x 2'
channel .............. . . . . 630(б) Bracing, 8 pieces (8 ft.) l i ' x i ' s t r ip 77(c) Tarpaulin supports, 4 pieces (12 ft.)
l i ' x i ' strip ........................................ 58W) Bolts for tray supports, 42 o f F x 5' . . 21(e) Bolts for bracing, 32 of F x I F ■ ■ .. 16( / ) Bolts for tarpaulin supports, 16 of J* x 1* 3 50(g) Bolts to lorry bed, 6 of F x 4 ' .. 4(A) Tray supports:
28 pieces of 7 'x 4 ' x IF \ 13528 pieces o f V x j ' x 4 ' . . /
Total . . . . . . 945
Five-ton Frame
(а) Cross members, 9 pieces (20 ft.) of 4' x 2'channel .................................................... 810
(б) Bracing, 12 pieces (8$ ft.) IF x F strip . . 120(c) Tarpaulin supports, 5 pieces (12 ft.)
I F x i 's t r ip ....................................... 72( d ) Bolts for tray supports, 34 of F x 5* •• 27(e) Bolts for bracing, 48 of i ' x I F • • • • 12( / ) Bolts for tarpaulin supports, 20 of F x 1' 4(g) Bolts to lorry bed, 8 o f 1 ' x 4' . . . . 4(A) Tray supports:
36 pieces of 7 'x 4 ' x I F •• \ 17036 pieces of 7 ' x i ' x 4 ' . . /
Total . . . . 1,019
These frames can be made by any department that has simple engineering facilities such as a welding plant and a drill. Engineering firms in Kampala charged Sh. 50 each for cutting and welding cross members, and woodworkers asked Sh. 4 for making up each tray support. Total cost of a three-ton frame would therefore be about Sh. 1,100, and of a five- tonner about Sh. 1,600.
F ig I
p l a n t t r a y c a r r i e r f o r s t o w l o b b y
S ID E VIEW
F IG I I
PLA N T TRAY CARR IES
END VIEW
149

EAST AFRICAN AGRICULTURAL AND FORESTRY JOURNAL JANUARY. 1963
F IG III
S ID E VIEW O F TWO C R O SSM EM BER S SHOWING END VIEW O F TRAY S U P P O R TS W ITH P LA N T TRAY IN P L A C E
F IG IV
END V IEW O F PART OF CROSSM EM BER SHOWING TRAY SUPPO RTS WITH PLANT TRAYS IN P L A C E
k/W ^ |
CROSSMEMBER
in r• II i II
. - I u _
P L A N T TRAY‘i r j:i«j L .
TRAYSUPPO RT
150
III.

EAST AFRICAN AGRICULTURAL AND FORESTRY JOURNAL JANUARY, 1%3
OBSERVATIONS ON FREE-RANGING OF THOMSONS AND GRANT S GAZELLES IN KENYA
By G. M. Ole Maloiy, University of British Columbia, Vancouver, Canada(Received for publication on 1st March, 1962)
The distribution and abundance of any mammalian population is governed by many interacting characteristics of the animal and its environment; certain fundamental environmental requirements are necessary for sustained existence within the natural habitat of the species.
Two East African species of gazelle occur in Kenya, Gazeila thomsonii and Gazella grant'd but on the continent-wide basis, several other species are to be found in the Sudan, Somalia Republic, the Republic of South Africa and the Rhodesias. This paper is concerned only with the former two species.
As mentioned later in this paper, gazelle are not uniformly distributed throughout an area, but are found in various degrees of concentration (Map 2), regionally and locally. From observation made in both the Nairobi Royal National Park (a wet season concentration area (Fig. la)), and the Athi-Kaputiei Plains (a dry season dispersal area (Figs, lb, lc)), it was noted that the densities were greater in the Nairobi Royal National Park.
In the course of these observations, it was also noted that the movements of gazelle did not coincide with those of larger animals. Petricides [4] gave the reason as simply a protective one against predators. This view is strongly supported by the present paper. During the dry season, gazelle, as well as wildebeest (Gorgon taurinus) remained in their dry season dispersal areas, and moved into concentration areas at the beginning of the rainy seasons (March to May and October to December). The different grazing requirements of heavy game and gazelle appears to be a feature cf ecological importance.
T he FI abitat
The habitat of gazelle is the undulating plains of the East African grasslands, which is an environment well represented on the Athi- Kaputiei Plains which lie immediately south of Nairobi. Part of this area now forms the Royal National Park (Map 1), and game animals frequently move in and out of the park.
The Royal Nairobi National Park is about 40 square miles in extent, while the Athi-
Kaputiei Plains cover an area of about 1,200 square miles.
The Royal Nairobi National Park has a more varied flora than the plains. It is bordered by the Mctoine and Langata Forests, while the plains are almost treeless except for a few which occur along the water courses. The rolling undulating plains are divided by the main Nairobi-Mombasa railway line. They lie at a mean elevation of over 5,000 to 6,000 feet, and the heavy brown to black clay soils, which are characteristic o f this area, are of volcanic origin and are badly drained.
The vegetation is open grassland characterized by red “oat grass” (Themeda triandra) or by a mozaic of other perennial tussocky species. Trees, mostly Acacia xanthopliloea. are found mainly along the watercourses.
The Athi-Kaputiei Plains constitute a clearly defined environment of which the eastern branch of the East African Rift Valley forms the western boundary. A portion north of the Machakos-Masai District boundary, which was formerly an important part of the habitat, is at present being denied to gazelle owing to settlement, ranching, fencing and shooting with mishale yenye sitnut (Swahili for poisoned arrows), by tribesmen.
The Mua Hills Settlement as well as the Ukambani Highlands form a definite eastern barrier to further eastern movements for the plains animals. South of the Athi-Kaputiei Plains there is a scarcity of surface water and this, plus grazing by domestic flocks and herds of the Masai tribesmen, tends to exclude plains game except during the wet season. The mean annual temperatures and annual rainfall arc shown in Figs. la. b and c. Temperatures are higher at the Athi Plains, while rainfall is higher at Nairobi.
The Athi-Kaputiei Plains form a natural unit and it is probable that no large-scale movements into or out of the plains take place during normal seasons. Instances are known where easily recognizable individuals or herds have remained within a very small area for months or even years, when food has been readily available.
151

EAST AFRICAN AGRICULTURAL AND FORESTRY JOURNAL JANUARY, 1965
SOUTH KENYA: THE STUDY AREA36° 37*E
LEGEND |A L A K E S E 3 F 0 R E S Tg H ILLS O A T H I - K A P U T I E I
I R IFT VALLEY ( > RIVERS
.PLA IN3 MILES
---MASAILAND BOUNDARYK l SISAL a OTHER PLANTATIONS
TSAVO
~ ^^^engareeT I e -
MT. KILIMANJARO J37*E
MAP I
152

EAST AFRICAN AGRICULTURAL AND FORESTRY JOURNAL JANUARY. 1963
SOUTH KENYA: DISTRIBUTION OF THOMSON'S AND GRANT'S GAZELLE
36 * 37* E 38*
153

EAST AFRICAN AGRICULTURAL AND FORESTRY JOURNAL JANUARY. 1V*5
IN C H E S
F I G l a
NAIROBI AIRPORT, EMBAKASI i«i9's 36* 35'e
1 9 5 9 I960 1961
154

EAST AFRICAN AGRICULTURAL AND FORESTRY JOURNAL JANUARY, 19M
IN C H ES
F I G I
ATHI RIVER •* 2 7‘S 3 6 ' 5 8 ' E
1959 I9 6 0 1961
155

EAST AFRICAN AGRICULTURAL AND FORESTRY JOURNAL JANUARY. 1963
KAPUTIEI PLAIN S 3 7 * 0 8 ' E !• 38'sMEAN PRECIPITATION ELEV. 5 6 0 0 ‘
1959 I960 1961
156

EAST AFRICAN AGRICULTURAL AND FORESTRY JOURNAL JANUARY, 1963
For the purpose of this study Robinson and Cowan’s [6] concept of a home range is adopted.
The boundaries of the home ranges of both species appeared to be more in the nature of a band or zone rather than a line, and the range was found to be influenced partly by abundance, quality and ratio of habitat elements in the area. In the Northern Frontier regions and elsewhere, Grant’s gazelle seem to survive in areas which are virtually waterless. However, it was difficult to determine the factors which influenced the actual home range boundaries.
Food and feeding habits
Very little is known about the composition of the food of these animals except that Thomson’s gazelle is primarily a grazer and Grant’s a browser.
As the gazelle do not drink frequently, it is not necessary for water to be readily available. This enables them to exploit the drier regions when these are too waterless and the herbage too dry for other animals. Similarly, the larger animals are relieved from the competition o f gazelle in concentration areas.
When the rain falls, the grasses of the drier areas tend to become rank, and it is then that the gazelle benefit by the short, over-cropped grasses left by the larger animals as the latter vacate their dry season concentration areas.
Social organizationSince the social organization of the gazelle
herds has a considerable influence on the boundaries o f the individual home ranges, it is appropriate to describe briefly the basic organization of the gazelle community.
On observation of herd structures and formation, two groups were noted:
(1) The family group which consists o f onefemale and her last offspring.
(2) The larger, more temporary, groups orassociations formed within herds. These consist of a number of gazelle associating together as they feed, travel, rest or mate. These associations are continually forming, splitting and amalgamating.
Seasonal segregation o f sexes does occur (Table 1), but solitary males and females of both species have also been observed. The females of both species usually isolate themselves from the herd when they are about to fawn. Sickness and wounds from butting by males, and sometimes females, may cause an animal, of either sex, to isolate itself from the rest o f the herd.
Thomson [3] noticed early in 1879 that although they rarely mingle, the two species have been observed grazing in close proximity to each other. Dr. Darling, who did an extensive Ecological study of the Mara Plains, informed me that he has on several occasions seen two or more Grant’s in a group or herd of Thomson’s gazelle.
H e r d O bservations
Table 1.— Athi-K aputiei Plains (Observations made along the area bordering the main
Nairobi-Arusha road only)
MonthMonthly Observations
TotalApril May Aug. Sept.
No. o f herds Adults and Juven-
8 5 12 10 35
iles 61 46 143 95 445Juveniles alone . . 14 9 25 30 78Solitary Males .. 4 1 5 0
____10
The normal size of a herd is estimated to be eight to 12 gazelle. This figure cannot be considered as a final one. Sometimes congregations of dozens or even hundreds of animals, which may be regarded as one or more herds, do occur in certain areas such as that between Senya and Ngatatack, in the Kajiado District of the Southern Province. However, a male and about 15 females and a few juveniles are sometimes seen together.
Variation within species
Measurements show that the two species differ in body weights and skeletal measurements.
Horn, skull and lower premolar row measurements were taken from the only four specimens which are at the Nairobi Coryndon Museum. Weight and heart-girth measurements o f freshly killed, whole gazelle were also taken by a member of the Kenya Game Department, Fauna Research Unit Division in Nairobi [7], All these measurements and weights are tabulated below. Grant’s gazelle weighs more and
157

EAST AFRICAN AGRICULTURAL AND FORESTRY JOURNAL JANUARY, ISC-
can apparently withstand a drier habitat than Thomson’s gazelle. Grant's gazelle, however, avoid rough, broken country.
T a b l e 2a.— S k e l e t a l M e a su r e m e n t s
Cod
e N
o.
Spec
ies
Sex
Hor
n Le
ngth
Gre
ates
t L
engt
h of
the
Skul
l
Len
gth
of
Low
er P
rcm
olar
R
ow
in. in. in.No. 6433 T. Gazelle Male 12 7-75 0-80No. 6435 T. Gazelle Male 11 7-75 0-75No. 6362 G. Gazelle Female 12 9-25 100
The horn measurements reported in this paper are almost the same as those for the South African Springbok: 11-14 in. asrecorded by Captain G. S. Shortridge [6].
T a b l e 2b.— Bo d y W e ig h t a n d H e a r t - G ir t h M e a s u r e m ents o f A d u l t G a z e l l e
Species SexBodvWt.’lb.
Heart-Girthcm.
Locality1
Territory
T.Gazelle M 42 65 Ngorongoro Tanganyika
53 68Maralal Kenya55 68
54 6248 — Mara49 — Uaso-oo-
52Nkidongi
Trans MaraF 42 —43 —
40 — Mara37 —47 — Konza45 _
G.Gazelle M 154 Uaso-oo-
128Nkidongi
E Marti154 — Uaso-oo-
F 95 83Nkidongi
Loita98 82 Isiolo
** 98 — ,, »»t.» 95 Loita
The vegetation of the different localities seems to have a bearing on the weights of the individual animals.
The horns of both species form a distinct V-shape. while those of females are slightly U-shaped. The distal quarter or third of the male Grant's gazelle horns tend to take a more lateral’ outward direction than those of Thomson’s gazelle.
The average body weight of the freshly killed gazelle, by sexes, is summarized Table 3.
T a b l e 3 .— A v e ra g e A d u l t Bo d y W eight bv Spu is
Species Sex Average Body Weight
S.E.
T. G azelle.. Male 50 18T. Gazelle. . Female 42 1-5G. Gazelle Male 145 10-7G. Gazelle Female 97 | 0-9
Petrides [4] gave an estimated average bod> weight of 130 lb. for Grant’s gazelle and 45 lb. for Thomson's gazelle.
Breeding habitsMating was observed on several occasions.
Apparently the female Thomson's gazelle can defer the time of fawning until the rain has fallen and some green grass is available. The reason could scarcely be conscious will, but it might well be the result of h p r m o n i c control. This is a topic for future studies.
The birth of several fawns was observed while the current study was in progress; and Darling [I] also witnessed the birth of fawn- It took the mother a short while to lick the after-birth materials from the fawn’s body. After a period of about 30 to 40 minutes the fawn was seen following the mother. From time to time, one sees young ones curled up on the bare ground along the Athi River- Namanga road.
Maternal nursing continued for a period of three or more months. When weaned, male fawns joined the male troop, whereas female fawns settled down with other adult females. Males formed one or twro loose troops in which no leadership, or any rigid social institution could be confirmed. Some adult male- which were normally found within the troop occasionally left the troop and behaved as solitary individuals. Young males rarely left the troop and on losing their companions they usually became restless. A similar behaviour was also observed among female fawns upon missing their mothers. On these occasions the fawns become bewildered and are easily captured by predators.
Mortality factorsGazelle are still numerous, and poaching and
legal hunting are negligible. However, Wright [8] discussed at length the subject of predation
158

EAST AFRICAN AGRICULTURAL AND FORESTRY JOURNAL JANUARY, 1963
of adult gazelle by such predators as lions tPuntlieru leo) and cheetahs (Acinonyx jubatas). Young ones are chiefly preyed upon by hyenas (Croatia crocuta), the East African wild dog (Lycaon pictus) and vultures.
The recent 1960-1961 drought has affected the numbers and health of gazelle, as well as of other wild animals. Many diseases are known to attack gazelle which can be transmitted to domestic animals. In the tsetse fly belts antelopes and other animals are known to harbour infection without showing symptoms of trypanosomiasis and hence act as carriers of this disease, but as the gazelle are primarily plains animals serological tests of the blood inside numbers of engorged tsetse fltes indicated that these animals appear to be seldom bitten by tsetse flies (Langridge [9]).
Behaviour
Gazelle of both species have been found to be alert even when browsing or drinking. From observation it has been noticed that usually one member of the herd will lift up its head to keep watch while the other members are grazing. This is very common among females, although when in a troop males are normally more alert than when they are in a herd in which several females are present.
When disturbed, or when an enemy is seen approaching, one member usually makes an odd grunting noise which is quickly repeated by other members of the herd. The whole herd then makes off in a long line, of which the females and young ones form the vanguard while the males guard the rear.
It has also been noted that when pressed, or when crossing a road, the gazelle usually bound into the air half a dozen times, or more. What appears to be exuberance may also cause a gazelle to bound into the air.
The droppings resemble those of a domesticated goat. These droppings are found scattered a ir over the plains, but it has been observed that sometimes they are dropped in specially selected places by the herds.
Gazelle can exist for a long time without water, but when water is available they drink at very regular intervals. During the course of this study gazelle spoor was noted regularly during early mornings at Ilkesumeti and Nchorroi water-holes.
Another observation made by Darling [1] is that unlike wildebeest, gazelle are not sensitive in reaction to rain; hence they are very slow in finding shelter.
DistributionGazelle are the most widely distributed of
the game animals in East Africa. Thomson [3] gave the range in which gazelle occur in 1879 as being that country which lies between Mount Kilimanjaro and Lake Baringo, in what is known as the Rift Valley Province. He noted that the two species occur at various heights under 6.000 feet.
Gazella grantii seem to occur further north and south than Gazella thomsonii. Captain Speke [3] noted some herds of Grant's gazelle in the Ugogo District, and Sir John Kirk reported seeing other herds in the area south of Somaliland. They occur as far north as Isiolo and Marala! and as far south as the Loita Plains, the Serengeti Plains and the Masai Steppe.
Darling [1] estimated a total population of about 12,000 Thomson's gazelle and 500 Grant's gazelle in the Mara Plains. Grzimek and Grzimek [2] reported a combined figure for the two species of 195.000 in the Serengeti National Park. In the Royal Nairobi National Park counts in 1961 averaged 386 Grant's and 375 Thomson’s gazelle.
However, one may add that the distribution and natural habitat of gazelle has been affected by recent changes in various fields of human progress. Before the settlement of the Mua Hills in the Machakos District took place, gazelle as well as big game, occupied most of the habitat which is presently being denied to game by the increasing agricultural projects and the creation of permanent settlements.
The forested slopes of the East African Highlands, which lie north of the Athi- Kaputiei Plains, have for a long time acted as the northernmost range of the game animals. To make way for sisal, pyrethrum and coffee plantations, this forest has now been cleared and. at the same time, the forested area between Ngong and Nairobi has been partially settled.
Summary
The distribution, behaviour and movements of small herds of Thomson’s gazelle (Gazella thomsonii) and Grant’s gazelle (Gazella grantii) were observed in the Royal Nairobi National
159

EAST AFRICAN AGRICULTURAL AND FORESTRY JOURNAL JANUARY. 196:
Park, and on the Athi-Kaputiei Plains. While this study was in progress, the movements of gazelles were found to alternate with the movements of the larger animals. It was also found that gazelle populations or herds, like many other animal populations, were not uniformly distributed throughout an area, but were found in various degrees of concentration regionally and locally. The type of range available depends to a certain extent on the amount of food and water which is available in the habitat. Ranching, settlement, shooting and fencing limited the habitat and distribution of both species. Gazelle tend to prefer open savannah and plains rather than closed bush.
A c k n o w l e d g e m e n t s
The author would like to express thanks to Dr. I. McT. Cowan, Professor and Head of the Department of Zoology, The University of British Columbia; Dr. F. Fraser Darling. Director of Research, The Conservation Foundation, New York, and Dr. G. A. Petrides. Professor o f Fisheries and Wildlife Management, Michigan State University, for reading the manuscript and giving valuable editorial suggestions; to Dr. D. R. M. Stewart, Fauna Research Officer, Kenya Game Department, for furnishing the weights and measurements of freshly killed gazelle. Acknowledgement is also made to Drs. A. J. Wood and D. M. Beach, both of the University of British Columbia, for the interest they have shown in the project.
R eferences
11J Fraser Darling, F. Wildlife in an African Ter: tory, London, Oxford University Press. 1960 Ecological Reconnaissance of the Mara Plain r Kenya Colony. Wildlife Society monographs 41 p . Chestertown, M.D.
|2] Grzimek. M. and Grzimek. B. Census of Plain- Animals in the Serengeti. J. Wildlife Managemer.: 24 : 27, 1960.
[3J Gunther. A. Ann. and Mag. Nat. Hist. 14: 4 .'. 1884.
[4] Langridgc. W. P. I. Wild Life Magazine. Nairobi. 2. 1960.
[5] Petrides, G. A. Big Game Densities and Range Carrying Capacities in East Africa: .Vor.'i American Wildlife Conf. Trans. 1956.
|6] Robinson, D. J. and I. McT. Cowan. An Introduced Population of the Gray Squirrel in British Columbia. Canad. J. Zool. 32, 261. 1954.
|7j Shortridgc. G. C. The Mammals of South Afr William Heinemann, Ltd., London. II p. 549, 1934.
[8] Stewart, D. R. M. Personal Communications. 1961.
[9] Thomson. J. Through Masailand. London. Sampson Low. (1887).
110] Wright, S. B. Predation on Big Game in East Africa, J. Wildlife Management 24:1. 1960.
[II] Vescy FitzGerald. D. F. Personal correspondence. 1961.
112] Veterinary Department, Kenya Colony. Notes on Animal Diseases. E. Afr. agric. for. J. 25. 1960.
160

EAST AFRICAN AGRICULTURAL AND FORESTRY JOURNAL JANUARY. 1963
INTERCROPPING AND ALTERNATE ROW CROPPING OFCOTTON AND MAIZE
By R. C. Grimes
(Received for publication on 9th March, 1962)
The term “intercropping” has been used in connexion with quite distinct systems of growing two or more crops together at the same time. The practice of growing several crops together in a random admixture is common throughout Africa. The system of growing crops in alternate rows has been evolved as a compromise between the time-honoured customs of the African cultivator and the modern practice of planting in pure stands.
In spite of the efforts of extension workers over many years, the African system of intercropping remains a common practice and in Kenya, this is particularly true in the Coastal area. The reason invariably put forward for the failure to change this system, is that intercropping is an insurance policy. At least one crop will emerge to fruition from the melee, according to the viscissitudes of the weather. However, it is overlooked that similar areas of all the crops grown may be planted equally well in the pure stand, providing the same insurance policy, whilst greatly easing the problems o f weed control, pest and disease control measures and harvesting. The reason for the persistence of intercropping may be more reasonably attributed to the reluctance of the African cultivator to accept orderliness and precision as basic tenets of agricultural husbandry.
In the Coast Province of Kenya, Wright [1], [2] laid out trials during 1955 and 1956, to compare crop yields and cash return from the local system of intercropping with the recommended system of growing cotton and maize in pure stands. He concluded [3] that "the relative yields of pure stands and interplanting is very much a matter of site and season, but the balance is in favour of pure stands”. The results indicate that cash returns from intercropping are usually higher. Therefore, the "balance in favour of pure stands” must refer to the greater convenience of planting, weeding, dusting and harvesting with this system. This is to be expected in view of the fact that Wright’s system of intercropping was a replica of that followed by the local Africans.
In Nyasaland, Munro [4] compared alternate row cropping in which cotton and maize were grown on alternate ridges, with pure stands of each. His results show that yields of both cotton and maize were much higher when these crops were grown in alternate rows. Munro also compared two planting dates with cotton and found that if cotton planting is delayed for three weeks, the yield of maize under alternate row cropping is not increased, but the yields of cotton are reduced.
Other work [5], [6] has been carried out to determine the effect of growing legumes in combination with cotton and maize.
In order to gain more information on the effects of growing maize and cotton in alternate rows, two trials were laid down in 1961.
Experiments— 1961The two sites chosen, at Msabaha and
Mtwapa, are representative of the cotton growing area in the Coast Province of Kenya. The soil at both sites is similar, a pale grey silty sand of low fertility. At Mtwapa, the soil had been exhausted by three years of cropping, whereas at Msabaha, the site was newly cleared from a six-year bush fallow. At both sites, 300 lb./acre of sulphate of ammonia was applied as a top dressing one month after planting. Yields of cotton were very similar at the two sites, but maize yields were low at Mtwapa due to a very severe attack of Maize stalkborer which did not occur at Msabaha.
Both cotton and maize were planted at 3 ft. X 1-J ft. with two plants per hill. The plot size was 15 ft. X 96 ft. with a harvest area of 12 ft. X 90 ft. There were seven replications. Alternate single rows of cotton and maize were planted in the plots under alternate row cropping. With pure stands, subplots of 15 ft. X 48 ft. were planted to either cotton or maize.
Cash returns are calculated on the value of maize as Sh. 50 per 200 lb. bag, A.R. cotton at 55 cents per lb. and R.R. cotton at 20 cents per lb. The A.R. cotton has to be free from insect or rain damage and must contain no foreign material.
161

HAST AFRICAN AGRICULTURAL AND FORESTRY JOURNAL JANUARY. 1%:
T able I
Seed Cotton Maize Grain Cash Return
lb. lb. Sh.acreMsabaha i acre pure stand 686-2 (45% A.R.) 1,386-2 692
1 acre alternate rows 507-5 (41 % A.R.) 2,241 -0 735
Mtwapa ■£ acre pure stand 611-2 (32% A.R.) 671-7 5501 acre alternate rows 682-2 (24% A.R.) 684-2 559
At Msabaha, cotton from pure stand plots outyielded the cotton grown in alternate rows by 178.7 lb./acre (P > 0.05). Maize grown in alternate rows gave 854.8 lb./acre more than maize in pure stands (P > 0.01).
At Mtwapa, alternate row cropping gave slightly higher yields of both maize and cotton, but the differences are not significant. Cash returns were greater from alternate row cropping at both sites.
It may be seen from Table 1 that the percentages of A.R. Grade cotton are very low and this is accentuated by growing in alternate rows. The overall low proportion of A.R. cotton may be attributed to an extremely unfavourable growing season in which periods of drought alternated with torrential rain.
The low percentage of A.R. cotton from alternate row cropping may be due to the inefficiency of the present commercial dusting recommendations which have been evolved from experiments in which cotton has invariably been grown in pure stands. It is clear from Table 2 that the seasonal pattern of cotton production from alternate row cropping is very different to that in pure stands. With alternate rows, the bulk of the cotton is harvested much later in the season than under pure stands.
Table 2.— Percentage of Total Cotton Crop Taken at each Pick
Picking Dale Alternate Rows Pure Stands
Msa
baha
Mtw
apa
Msa
baha
1
! Mtw
apa
1 Msa
balm
! Mtw
apa
24- 8 8-9
25- 9 27-10
21 -8 12-9 2-10
25-10
7-7 9-4
28-8 54 1
15024-238-422-4
18-921-926-133-1
27-726-030-715-6
The commercial recommendations for dusting. which were followed in these trials, are to apply as 3 :5 :0 dust containing 3 per cent BHC and 5 per cent DDT. using 12 lb., acre at each application. The first is applied 60 days after planting, after which five more applications are made at intervals of 10 days. It cotton is planted in early April, dusting will cease in the latter half of August. Thus, the pure stand cotton, cropping earlier, has better protection from insect attack than does cotton planted in alternate rows which matures later.
With alternate rows, it may be necessary either to increase the number of dust applications, or to start dusting later than 60 days from planting.
D isc u ssio n
When maize and cotton are grown in alternate rows, the maize plants will provide shelter from the wind and shade from the sun. The former may be beneficial, but the latter is of doubtful value.
Throughout the growing season, maize and cotton plants will compete for moisture and nutrients. Maize develops and matures earlier than cotton. As expected, therefore, maize yields are almost invariably higher under alternate row cropping because the competition given by cotton plants in the adjacent rows is less than would be given by plants of maize. In view of the fact that cotton under alternate row cropping suffers adverse competition from maize, it matures later in the season. It appears that it will produce yields similar to those from pure stand cotton, provided that the maize matures early and there is sufficient rainfall in the latter half o f the season for the cotton to increase the framework of vegetative growth and produce more bolls.
A possible improvement to growing cotton and maize in alternate single rows, would be to grow alternate double rows. In this system, the cotton plants would not be so densely

EAST AFRICAN AGRICULTURAL AND FORESTRY JOURNAL JANUARY, 1963
shaded and cotton dusting would be simplified because two rows could be dusted simultaneously. It is proposed to evaluate this system in 1962.
The logical progression from this system would be to grow strips of three, four and five row's width, eventually ending up with pure stands. However, as previously stated, pure stands are quite alien to the average African cultivator. Alternate row cropping, if advocated, may be accepted as a reasonable compromise.
Sum m ary
“ Intercropping" or "interplanting’’ is defined as the local African system of growing several crops together in a random mixture.
“ Alternate row cropping" is a more orderly progression from this. This system was com pared with pure stands of cotton and maize.
The main conclusion is that alternate row cropping may depress the yield of one crop.
but the overall cash returns per acre are as high as those from growing cotton and maize in pure stands..
With alternate row cropping, maturation of the cotton is delayed, so that existing recommendations for cotton dusting may have to be modified if this system is to be followed.
R e f e r e n c e s
|I1 Wright. W. A. Progress Reports from Experiment Stations. 1955-56 Kenya, 12. Empire Cotton Growing Corporation.
|2] Wright. W. A. Progress Report from Experiment Stations, 1956-57 Kenya, 13. Empire Cotton Growing Corporation.
13] Wright. W. A. Department of Agriculture. Kenya Annual Report, 1956, Vol. II, 175.
(41 Munro, J. M. Progress Reports from Experiment Stations 1958-59 Nyasaland. 6. Empire Cotton Growing Corporation. ___
[5| Evans. A. C. E. Ajr. agr. for. J.. 1960, 26. 1.
(6] Anthonv, K. R. M. and Willimott. S. G. Empire J. Expl. Agric. 1957, 25. 29.
163

EAST AFRICAN AGRICULTURAL AND FORESTRY JOURNAL JANUARY. ! •
DISEASES OF PYRETHRUM IN KENYABy R. A. Robinson, Scott Agricultural Laboratories, Department of Agriculture. Nairobi
(Received for publication on 16th March, 1962)
Of the 23 pyrethrum (Chrysanthemum cine- rariifolium Vis.) diseases recorded in Kenya and listed at the end of this paper, only “True Bud Disease” and “False Bud Disease” are of possible economic significance. The various root rots have occasionally caused severe damage but this condition is invariably associated with an adverse environmental factor such as impeded soil drainage, and is local in distribution.
The effects of nematode infestations on yield have not been determined. In particular. Meloi- dogyne hapla, the root knot nematode, is widely distributed but does not appear to be damaging. Attempts to assess its effects on yield have failed due to the lack of nematode-free clonal material of pyrethrum; genetic differences between individual plants grown from seed appear to have a greater influence on yield than do the presence or absence of root galls caused by M. hapla [20], In 1954, a bud disease caused by a species o f Ascochyta was found at Molo. Although the symptoms associated with Ascochyta were similar to those associated with R. bellunensis the incubation period was short [13]. The disease has not been seen again.
T rue Bud D isease
True Bud Disease of pyrethrum is caused by a fungus morphologically indistinguishable from Ranutlaria bellunensis Speg., described on Chrysanthemum parthenium Pers. However, attempts to infect C. parthenium with isolates of the fungus from pyrethrum have failed and the relationship between R. bellunensis isolated from C. parthenium and the fungus isolated from pyrethrum remains unknown [12]. On pyrethrum, the fungus produces white sporo- dochia of conidiophores on which hyaline spores, 14-28 X 4-8 /<, generally one-septate but occasionally non-septate or two-septate, are produced in acropetal succession. Sclerotia are formed but no perfect stage has been found [11].
The fungus normally attacks flower buds only and infection occurs through the bracts.It may later invade the flower stalk. While leaf infection is rare [7, 12], it has been observed, occasionally on plants without diseased buds or flowers and, in severe instances, almost
every leaf is fully diseased and bears spor dochia [12], However, leaf immunity to the fungus is almost universal.
True Bud disease results in dead buds whic" have the “hanged man” symptom [13], as opposed to the “shepherd's crook” symptom of false bud disease (Fig. 1). In the earlier stages, only one or two bracts of the bud turn brown and die. Later, the whole bud is killed, the fungus spreads a few millimetres down the flower stalk and the dead bud becomes twisted sideways with a suggestion of a broken neck In its latest stages, the disease may spread several inches down the flower stalk, but the dead bud retains the “hanged man” symptom and the stalk does not bend as it does with false bud disease. Infection of mature buds results in diseased open flowers in which the dead bracts, florets and rays are often confined to one side of the flower only [12. 13].
A BFig. 1.—Diagram of bud disease symptoms: A : The “hanged man” symptom of true bud disease. B : The “shepherd’s crook” symptom of
false bud disease
164
EAST AFRICAN AGRICULTURAL AND FORESTRY JOURNAL JANUARY. 1963
Infection can take place any time after emergence of the bud. The period between infection and the appearance of macroscopic symptoms is never less than 20 days [12]. During this period, the bud continues to develop normally and it is only after macroscopic symptoms have appeared that growth is disturbed and the bud eventually dies. In pyre- thrum, the growth period of a bud from emergence to flowering is about six weeks and, during this time, it increases in diameter from about one millimetre to eight or ten millimetres. Consequently, a dead bud of less than four millimetres diameter cannot have been killed by R. kellitnensis [12, 20] and such dead buds, which are common, may be attributed to false bud disease. True bud disease is essentially a disease of maturing buds and open flowers.
As the diseased bracts become necrotic, the fungus forms sporodochia on their inner surfaces; the presence of these sporodochia is diagnostic [12]. A further characteristic symptom is that the bracts of buds killed by R. bel- lurtcnsis remain tightly adpressed; bracts of buds killed by false bud disease separate slightly.
True bud disease of pyrethrum was first recorded in 1946 in Kenya [1, 7. 8] when it is reported to have caused considerable damage [7], Although widely distributed, the incidence o f the disease declined greatly during subsequent years [2. 3, 4, 8, 9, 10, 11, 15]. It is now- considered to be no longer economically important [20],
There are two reasons for this decline of true bud disease. Firstly, because the disease attacks the buds and reduces or prevents reproduction o f susceptible plants, susceptibility has gradually been lost and an increasingly high proportion of resistant plants remain. Pyre- thrum is a crop which is genetically very mixed and which is propagated mainly by seed and there is wide variation in susceptibility to R. helhinensis between individual plants. As early as 1948, variations in susceptibility were studied. Comparative counts of the numbers o f dead buds per plant were made on 148 clones and they varied between clones from I per cent to 40 per cent [3]. Secondly, when false bud disease was recognized as a condition distinct from true bud disease, it became evident that earlier assessments had overestimated the importance of true bud disease and that a considerable proportion of the dam
age was due to false bud disease. In view of the debudding experiments which are described below, it is now doubtful whether true bud disease was responsible for any great losses in yield in spite of the concern which followed its initial outbreak. During the year following its initial outbreak, when the disease was supposedly very severe, the yields of pyrethrum were described as “about normal" and reduced yields in individual localities were attributed to other factors such as poorly distributed rainfall [2],
Numerous fungicidal spray trials, which included a wide range of modern fungicides, have been conducted in an attempt to control true bud disease [5. 12, 18], Although there was some evidence of fungicidal control, results were variable and an economic control was not achieved. It is now thought that the failure to recognize false bud disease, which is unaffected by fungicidal applications, was responsible for the inconclusive results.
F alsf. Bud D isease
During the course of studies on true bud disease, it was observed that pyrethrum buds often died, showing symptoms similar to those associated with R. bellunensis, but that this fungus was not present in the dead buds. The term “false bud disease” was used to describe this condition which is believed to be a physiological disorder [13],
The characteristic symptom of false bud disease is the rapid death of several inches of stem below the dead bud and the bending of the dead stem to produce a “shepherd’s crook” appearance (Fig. I). Less obvious, but equally characteristic, are the lighter colour of the dead buds and the slight outward curling and separation of the dead bracts.
Buds of any age may be killed by false bud diseases and dead buds of 1-2 millimetres diameter are common, although they are often difficult to observe because they are hidden deep within the foliage. These small, dead buds have been termed “pin-head" buds. The stalk of a pin-head bud ceases to elongate, but increases in girth and eventually reaches a diameter similar to that o f the pin-head bud; it subsequently dies back.
The tissues of buds killed by false bud disease may be invaded by secondary fungi. Inoculation experiments showed that none of
165

EAST AFRICAN AGRICULTURAL AND FORESTRY JOURNAL JANUARY. i C
these can infect healthy buds. Cladosporium is the most common of the secondary fungi and it often imparts a green colour to the moribund bracts [17, 20].
The cause of false bud disease is not known but its incidence is governed by three factors : —
(i) the genetic constitution of the individualpyrethrum plant or clone;
(ii) those environmental factors such as altitude, soil type, etc., which are constant or relatively constant;
(iii) those environmental factors such as weather conditions which are variable.
Pyrethrum clones show varying amounts of false bud disease in different localities in one season and in different seasons in one locality. In a particular locality during one season, one clones may be more affected than another [6],
The Losses in Yield Due to Bud DiseasesIt is difficult to distinguish with certainty
between true and false bud disease in the field. For this reason, and because most of the earlier counts were made before false bud disease was known, it is clear that the records involve only “dead buds”, with no information on the proportions killed by each of the two bud diseases.
Shortly after true bud disease appeared, a co-operative experiment was instituted in which 33 growers submitted returns giving weekly counts for disease rates on plants o f Clone 24. The experiment was designed to investigate the relationship of environmental factors to disease incidence; it also provides the most extensive available data on bud disease losses. It involved a maximum of 60,000 buds and flowers counted in one year. The following were the average percentages of dead buds and flow’ers per plant[5, 18]: —
1949/50 1950/51 1951/52
East of Rift%
. . 4-6%8-6
0//o12*25
West o f Rift n -4 16-8 6-74
In subsequent years, counts were made on various single plant selections grown in four, widely different environments [6] and the following average percentages of total dead buds per plant were obtained : —
1953/54 1954/55 1955 56 1956 57
Molo%7-6
%4-3
%2-9 &
Ol Joro Orok .. 8-7 164 20-0 8-4Marindas 0-6 30 0 191 27-8Subukia 6 0 11 -4 2-6 3-5
The figures 0.6 per cent and 2.6 per cent came from immature plants with low flowering rate>
The heaviest recorded incidences of bud diseases involve relatively few individual plan - with up to 78 per cent of the buds diseased with true bud disease [12]; in 1956, a particular clone, one of the parents of “C.51" suffered such severe losses that only a small amount >■: seed of this cross was produced [6],
Studies were made on the effects of “de- budding” on yields. Varying degrees of inci- dence of bud disease were simulated by the removal of different percentages of healthy buds per plant. It was shown that even when as many as 50 per cent of the buds were regularly removed, the plants apparently compensated for the losses by increased bud production and debudding had no adverse effect on yields [19] It is not clear to what extent the removal of healthy buds can be compared with pathological and physiological losses of buds. However. it is likely that buds which are killed by an external factor such as R. bellunensi' would be replaced while buds which die from physiological causes are unlikely to be replaced. It is consequently difficult to assess the effects of bud diseases on pyrethrum yields but it is probable that they are not very great
The Control of Pyrethrum Bud Diseases Pyrethrum is an open pollinated plant and
is propagated principally by seed or by vegetative “splits” from genetically mixed populations which originate from seed. Consequently, the majority of pyrethrum crops in Kenya are genetically mixed. Even the so-called “varieties”, which consist of the F, generations of bi-clonal crosses, produce wide variations between individual plants. Of the many types of variations that occur, those most readily observed are leaf shape, diameter of the plant, number of open flowers and incidence of diseased buds. It is probable that length o f flowering period and pyrethrin content are also variable. The pyrethrum cultivated in Kenya therefore resembles a wild species in its variability rather than a domesticated, genetically constant clone or Dure line.
166

HAST A FR IC A N A G R IC U LT U R A L AND FO R ESTR Y JO U RN AL JAN U ARY. 1963
The incidence of both true and false bud diseases is governed by the genetical constitution o f the host. It follows, therefore, that both diseases could be controlled by selection of resistant plants and subsequent vegetative propagation of the selected lines. It is doubtful, however, whether such selection could be economically justified if disease control were its sole object. Because pyrethrum crops are genetically mixed, yields must tend to be modal rather than maximum. Any selection of clones should consequently have high yield of flowers and high pyrethrin content as its first objectives. If such a programme were undertaken, subsidiary selection criteria could include resistance to true and false bud diseases.
S ummary
The diseases of pyrethrum in Kenya are listed and an account is given of “True Bud Disease” and “False Bud Disease”. True bud diseases caused by Rtimularia bellunensis Speg., first appeared in 1946 but has declined in importance due to natural selection and the failure of early workers to recognize false bud disease. The incidence of false bud disease, which is apparently a physiological disorder, is governed by (i) the genetic constitution of the individual plant or clone, (ii) locality and (iii) season. The losses caused by the two bud diseases are discussed: losses are difficult to assess but are probably small. Both diseases can be controlled by the use of selected clones but such control is not economically justified except as a secondary objective in a programme of selection for high yield.
Diseases o j Pyrethrum in KenyaThe following diseases have been recorded
on pyrethrum (Chrysanthemum cinerariifolium Vis.) in Kenya.
1. True Bud Disease: Rtimularia bellunensisSpeg. [16]
2. False Bud Disease: physiological.3. Ascochyta Disease: Ascochyta sp. [16]4. Root R ots: Sclerotinia minor Jagger;
5. sclerotiorum (Lib.) de Bary;Corticiurn sp. [16]Pratylenchtis n. sp. [21]
5. Miscellaneous fungi of doubtful pathogenicity include [16]—
Absidia glum a Hagem Alternaria tenuis Nees ex Pers. Botrytis cinerea Pers. ex Fr.
Candida sp.Coniothyrium sp.Fusarium equiseti (Cola) Sacc. Fusarium later ilium Nees Fusarium scirpi Lamb & Fautr. var.
filiferum (Preuss) Wollenw F. semitectum Nees Glomerella cingulata (Stonem) Spauld
& SchrenkMucor subtilissimus Oud.Pythium sp.Rliizopus stolonifer (Ehrenb. ex Fr.)
LindSordaria destruens (Shear) Hawker.
6. Root Knot Nematode: Meloidogynehapla Chitwood [21]
7. Leaf Nematode : Aphelenchoides ritzema-bosi (Schwartz) Steiner [21],
M
12
13
|4
15
16 17
|8
19
MO
111
112
113
[14
115
|16
117
118
|19
120121
R e f e r e n c e s
Gaddum, E. W.. Ann. Rept. Dept. Agric., Kenya.1946.Gaddum. E. W.. Ann. Rept. Dept. Agric.. Kenya,1947.Gaddum. E. W„ Ann. Rept. Dept. Agric., Kenya.1948.Gaddum. E. W„ Ann. Rept. Dept. Agric., Kenya,1949.Gaddum. E. W„ Ann. Rept. Dept. Agric., Kenya,1950.Kroll. U., Ann. Rept. Dept. Agric.. Kenya. 1956. Nattrass, R. M., A Disease of Pyrethrum in
Kenya. Nature. 160 (1947), pp. 120-121.Nattrass. R. M„ Ann. Rept. Dept. Agric., Kenya, 1947.Nattrass. R. M.. Ann. Rept. Dept. Agric., Kenya,1949.Nattrass. R. M„ Ann. Rept. Dept. Agric., Kenya.1950.Nattrass. R. M„ Ann. Rept. Dept. Agric., Kenya,1951Nattrass. R. M„ Ann. Rept. Dept. Agric., Kenya.1952Nattrass. R. M„ Ann. Rept. Dept. Agric., Kenya,1953.Nattrass. R. M.. Ann. Rept. Dept. Agric., Kenya,1954.Nattrass. R. M„ Ann. Rept. Dept. Agric.. Kenya.1955.Nattrass. R. M.. Mycological Papers No. 81. Commonwealth Mycological Institute, Host Lists of Kenya Fungi and Bacteria. 1961.Nattrass, R. M., private communication. Ormerod. F. H. Ann. Rept. Dept. Agric.. Kenya,1951.Ormerod, F. II., Ann. Rept. Dept. Agric.. Kenya, 1952Robinson. R. A., unpublished data.Whitehead. A. G.. Nematoscs of Pyrethrum in East Africa. Nature. 182 (1958). p. 542. ,
167

EAST AFRICAN AGRICULTURAL AND FORESTRY JOURNAL JANUARY, 1963
RESTRICTING THE FEED OF BACON PIGS AND ITSCONSEQUENCES
By M F. Watson, Agricultural Research Officer, Nakuru, Kenya
(Received for publication on 30ih March, 1962)
The level of feeding bacon pigs can have considerable effects on the ultimate quality of the carcass, particularly in respect of the quality o f the fat produced and the deposition of lean during the early stages of growth. The experiment described below was designed primarily to determine the level of restriction which is required to produce a good average carcass when pigs are fed the Kenya Pig Industry Board protein supplement with a mixed cereal ration. At the same time this ration was compared with a mixed cereal and meat meal ration and one composed of barley meal and skim milk.
M ethod
The experiment was conducted during the period October, 1959, to June, 1960, on the Experimental farm of the Agricultural Department at Ol Joro Orok. Thirty-six Large White weaner pigs were divided into six groups of six and the animals in each group were matched as evenly as possible in respect of litters, sex and weight for age. The design of the experiment was a standard randomized block layout with six replications of each treatment. All the pigs were individually fed on dry meal and the uneaten meal was weighed back after each feeding. Water was freely available to the pigs. The pigs were fed twice a day, in the morning and in the evening.
The three rations used in the trials are given in Tables 1, II and III.
The components of the Pig Industry Board concentrate and the mineral mixtures used in the rations are given in Appendix I.
The levels of restriction for each treatment are given in Table IV.
Table I.— Ration I which was Fed in T reatment A
Table II.— Ration 2 which was Fed in Treatments B, C, D and E
ConstituentsPercentages by Weight
From weaning to 100 lb.
From 100 to 2001b.
Barley..%60 &
O a t s ........................... 20 24P.I.B. Concentrate .. 20 6
Table III.— Ration 3 which was Fed in Treatment F
Percentages by WeightConstituents
From weaning From 100 toto 100 lb. 2001b.
Barley meal . . 98% ’ T4Minerals 2%Skim milk powder/day 12 oz. 1 12 oz.
These treatments can be summarized as follow s: —
Treatment A .—A mixed cereal and meat- meal ration fed on a fairly liberal scale according to the normal 01 Joro Orok farm practice.
Treatment B.—A mixed cereal and P.I.B. concentrate ration fed ad lib.
Treatment C.—The same ration fed ad lib. to 100 lb. liveweight and thereafter restricted.
Treatment D .—The same ration mildly restricted to 100 lb. and thereafter restricted as treatment C.
Treatment E.—The same ration heavily restricted from weaning to slaughter.
Treatment F.—A barley and skim miik ration restricted according to Danish standards based on the assumption that six pints of skim milk are equivalent to three-quarters of a pound of barley meal. 12 oz. of milk powder per head per day were fed to the pigs on this treatment from weaning to slaughter, this amount being equivalent to six pints of liquid skim.
ConstituentsPercentages by Weight
Barley.. Oats .. Meat Meal Minerals
From weaning to 100 lb.
62 20 16 2
From 100 to 200 lb.
%751582
168

EAST AFRICAN AGRICULTURAL AND FORESTRY JOURNAL JANUARY, 1963
T able IV.—T he A m ounts of M eal F ed
Liveweight of the Pig
in lb.
Amount of Meal Fed per Day in Pounds
Ration 1 Treatment
A
Ration 2 Treatment
B
Ration 2 Treatment
C
Ration 2 Treatment
D
Ration 2 Treatment
E
Ration 3 Treatment F
Barleymeal
Skimpowder
3 0 -3 5 1-6 Ad lib Ad lib 1 -75 1 50 100 0-753 6 -3 9 1-9 99 99
4 0 -4 5 2-1 99 99
4 6 -4 9 2-3 99 99
5 0 -5 5 2-5 »> 99
5 6 -5 9 2-7 99
6 0 -6 9 2-9 99 99
7 0 -7 9 3-2 99 99
8 0 -8 9 3-5 99 99
9 0 -9 9 3-8 99 99
100-109 41 >9 4 00110-119 4-3 >9 4-25120-129 4-6 99 4-50130-139 4-8 99 4-50140-149 51 99 4-75150-159 5-3 99 5 00160-169 5-6 99 5 00170-179 6 0 99 5 00180-189 6 0 5 00190-199 6 0 5 00200- . . 6 0 „ 5 00
The pigs on all treatments were weighed weekly and the food intake was recorded daily. The pigs were sent to the factory for processing at or about 200 lb. liveweight and routine measurements were carried out.
Re su lt s
Two pigs on treatment B developed severe abscesses during the course of the experiment and grew very slowly from 100 lb. liveweight to slaughter weight. These pigs were treated as missing plots where necessary for the purposes of the statistical analysis of the trial using the method of Yates (1933) cited by Cochran and Cox (1957). One pig on treatment A grew very slowly from weaning to 100 lb., and this pig was also treated as a missing plot in the analyses where necessary. Two pigs on treatment C put on only 6 and 10 lb. liveweight respectively during a three- week period when the other pigs on the treatment were averaging a liveweight gain of over a pound a day. The reason for this was not obvious and they returned to a normal rate of growth immediately afterwards. The figures relating to these pigs were included in the analysis, but the detrimental effects of these
1 75 1 -50 105 0-752 00 1 -75 1 -25 0-752 00 1-75 1 -25 0-752-50 2 00 1 -50 0-752-50 2 00 1 50 0-752-75 2-50 1 -75 0-753 00 2-75 2 00 0-753-50 3 00 2-25 0-753-75 3-50 2-75 0-754 00 4 0 0 3-25 0-754-25 4-25 3-50 0-754-50 4-50 3-75 0-754-50 4-50 4-25 0-754-75 4-75 4-50 0-75500 5 00 5 00 0-755 00 5 00 5-25 0-755 00 5 00 5-50 0-755 00 5 00 5-75 0-755 00 5 00 5-75 0-755 00 5 00 5-75 0 75
pigs is strongly reflected in the means for treatment C which should be treated with caution.
The number of days taken to reach slaughter weight and liveweight gain per day
The mean number of days taken to reach slaughter weight and the mean rates of growth are shown in Tables V and VI.
It is seen that from 40-200 lb. the pigs fed barley and skim milk grew quicker and finished three weeks earlier than the pigs fed mixed cereals and meat meal and three and a half weeks earlier than the pigs on treatment C, although it must be remembered that two of the pigs on treatment C were poor growers. These differences were highly significant. The differences between the groups fed mixed cereals with P.l.B. concentrate were not significant.
Further examination of the figures show that the main differences occurred during the period between 40 lb. and 100 lb. liveweight, the pigs on treatment F being significantly better than the pigs on treatments A. C, D and E at the
169

EAST AFRICAN AGRICULTURAL AND FORESTRY JOURNAL JANUARY. I%3
0.1 per cent level of P. and better than treatment B at the 1 per cent level o f P. The differences between A. B. C, D and E were not significant.
The differences between treatments from 100 lb. liveweight to 200 lb. liveweight were not significant.
Conversion ratiosThe mean conversion ratios from weaning
to slaughter are summarized in Table VII.
The overall conversion ratio of group F was significantly better than those of groups D and E at the 5 per cent level o f P. groups A and C at the I per cent level of P and group B at the 0.1 per cent level o f P. Group E was significantly better than group B at the 5 per cent level of P. The main differences
again occurred during the period between weaning and 100 lb. liveweight. group F being significantly better than groups A. B. C and D at the 0.1 per cent level o f P and significantly better than group E at the 1 per cent level o f P. The differences between groups from 100 lb. liveweight to slaughter weight were not significant.
Killing-out percentagesAn analysis of variance was carried out on
the killing-out percentages, these first being transformed to the angle p = sin2 0 using the method outlined by Fisher and Yates (1947). The means are given in Table VIII.
The pigs on treatment F had significantly higher killing-out percentages than those on treatments A. C or D. The differences were significant at the 5 per cent level of P.
T a b l e V . — M e a n N u m b e r o f D a y s T a k e n t o R e a c h S l a u g h t e r W e i g h t
Treatment A B C D E F S.E.5%
L.S.D’s.
1% 0-1%
Coeff. of variation
From 40 lb. to 200 lb. 167 157 170 156 157 145 ±5-1 14-9 20-2 27-0 7-93%
From 40 lb. to 100 lb. 79 75 76 76 76 62 ± 2-6 7-7* 10-4* 13-9* 8 68%
From 100 lb. to 200 lb. 88 82 93 80 81 83 ±4-0 N.S. N.S. N.S. It 70%
•These are the L.S.D's. between treatments B, C, D. E and F only. The L.S.D's. between treatment A and the others are 8 1 , II 0 and 14-7 at the 5%, 1 % and 0-1 % levels of P respectively.
T a b l e V I . — M e a n L i v e w f i g h t G a i n p e r D a y
Treatment A B C D E F S.E.5%
L.S.D’s.
1% 0-1%
Coeff. of variation
From 40 lb. to 200 lb. 0-960 1 -030 0-962 1-028 1-025 1-103 ±0-031 0-089 0-121 0-161 7-35%
From 40 lb. to 100 lb. 0-760 0-800 0-793 0-797 0-795 0*973 ± 0-026 0-076 0-103 0-138 7-82 %
From 100 lb. to 200 lb. 1-153 1-243 1-108 1-262 1-252 1-208 ±0-049 N.S. N.S. N.S. 10-00%
T a b l e V I I . — M e a n C o n v e r s i o n R a t i o s
Treatment B s .L.S.D's. Coeff. of
varia- tionA L
5% 1% 0-1%
From weaning slaughter
to4-16 4-23 4 00 3-77 3-59 2-95 ± 0-21 0-62 0-83 111 13%
From weaning to lb. .-.
too3-58 3-65 3-36 3-17 2-91 1 -47 ±0-42 0-87 1-17 1-57 24 16%
---------- -From 100 lb.
slaughter . .to
4-56 4-69 4-41 4-18 4-07 3-92 ±0-29 N.S. N.S. N.S._ u
165%
170

\ST AFRICAN AGRICULTURAL AND FORESTRY JOURNAL JANUARY, l%3
T a b l e VIII.— M ean K il l in g - O u t P e r c e n t a g e s a n d A n g u l a r T r a n s f o r m a t io n
Treatment A B C D E F5%
L.S.Ds.
1% 0 1 %
Coeff. of varia- tion
Kil!:ng-out percentage 71-2 73 0 71-6 71-3 72-9 74-1 - — 1 __ —
Angular transformation 57-53 58-70 57-82 57-58 58-63 59-60 ± 0 47 1 -39 1-88 2-51 2 0 %
T a b l e IX.—M e a n I o d in e V a l u e s
T reatment A B E F 1 S.E.L.S.D’s. Coeff. of
s% 1 V1 /0 0 1 % tion
63-1 60-3 62-4 63-0 61-7 58-9 ±0-82* 2-39* 3-24* 4-35* 3-3%
'These figures apply to treatments A, C. D, E. and F only. The relative figures for treatment B arc SE. : 1-22, L.SD's. 2-53. 3-43 and 4-50 at the 5%, I % and 01 % levels of P respectively.
Far qualityThe iodine test was applied to the fat of
all the pigs under trial with the exception of the two condemned carcasses. These were nerefore treated as missing plots for the purposes o f the analysis of variance. The results of these tests are given in Table IX.
It is seen that treatment F differed significantly from treatments A, C and D at the 1 per cent level of P and from treatment E st the 5 per cent level of P. The fat setting crades determined visually are given in Table X.
Carcass conformationThe mean measurements of the carcasses are
summarized in Tables XI and XII. Analyses of variance were carried out on the mid-back fat measurements and the depth of streak
T a b l e X.— F a t S e t t in g G ra d es
T reatment A B c D E F Total
Very firm 2 5 2 3 3 3 18Firm 1 1 3 0 3 2 10Fairly firm 3 0 1 3 0 1 8
T a b l e XII.— M e a n C a r c a ss M e a su r em en ts in M il l im e t r e s
Measurement A B C D E F
Carcass length .. 796 771 778 785 784 787Length of eye 102 104 99 104 99 103Shoulder fat 50 47 47 47 49 48Max. fat over eye 27 28 28 27 30 32Posl. muscle 31 32 34 30 34 33Mid. muscle 26 28 26 24 28 28Ant. muscle 33 34 32 33 34 34Depth of eye 38 37 40 41 41 43
T a b l e XL— M ean D e p t h o f S t r e a k a n d M ean M id B a c k - F at D e p t h in M il l im e t r e s
T reatment B D S.E.L.S.D’s. Coeff. of
5% 1% 0 1 % tion
Depth o f mid-back fat 23-0 27-0 26-8 25-0 26-0 25-5 ±1-49 N.S. N.S. N.S. 14-50%
Depth o f streak 24-8 23-3 26-5 23-0 26-8 31-5 ±1-41 4-13* 5-59* 7-49* 13-32%
•These figures apply to treatments A, C, D, E, and F only. The relevant figures for the differences between treatment B and the others are 4-37, 5-92, and 7-93.
measurements only since the others were so variable.
Treatment F had significantly more streak than treatments B and D at the 0.1 per cent level of P. more than A at the 1 per cent level and more than C and E at the 5 per cent levelof P.
The mean figures for the oilier measurements taken are given in Table XII.
Early growth
Over 50 per cent of the pigs in the trial had weaning weights of under 30 lb. and very
171

EAST AFRICAN AGRICULTURAL AND FORESTRY JOURNAL JANUARY. I*
marked differences were apparent between treatments during the period from weaning to 40 lb. liveweight. Although the figures cannot be treated statistically they do illustrate the values of the trial rations for young pigs. The average weaning weights and growth rates of the young pigs are given in Table XIII.
Table XIII.—Mean Weaning Weights and G rowth Rates to 40 lb. Liveweight
Treatment A B C D E F
Mean weaning weight in pounds 33-6 30-7 30-3 31 -0 29-5 30-7
Liveweight gain per day from weaning to 40 lb. 0-37 0-73 0-59 052 0-56 I 00
It is seen that the pigs fed meat meal and mixed cereal rations grew much slower than the pigs fed on P.I.B. concentrate and mixed cereal rations. After they reached 40 lb. live- weight. however, the differences in rate of gain were much less noticeable. The pigs fed barley and skim grew much faster than the others and continued to do so until they reached 100 lb. liveweight.
Food consumption.The individual food consumption figures are
a function of a large number of independent variable factors such as the weaning weight, slaughter weight, conversion ratio and growth rate and it is not surprising therefore, that the differences did not reach statistical significance. These figures dp, however, show definite trends which are of interest. The mean consumption figures are summarized in Table XIV.
Table XIV.— Mean Consumption of Meal per Pig in Pounds
Treatment A B C D E F
From weaning to 100 lb. 240 247 235 218 206 103
From 100 lb. loslaughter 560 476 461 430 412 513
Fiom weaning lo618 616slaughter 700 723 696 648
It is seen that as the level of restriction is increased the mean food consumption decreases, giving a saving of 100 lb. of meal per pig between the ad lib. treatment B and the heavily restricted treatment E.
D isc u ssio n
The level of feeding of the P.I.B. concentrate and mixed cereal ration within the limits
imposed by the treatments had no measura-;. effects on carcass quality. All the pigs receiver A .A .+ or A.A. grading at the factory exctr for the two pigs on treatment B which de.: loped abscesses. Even at the lowest level . feeding the growth rates were not reduced and there was a marked tendency towards lower food consumption and better conversion ra: os as the level o f restriction was increased. The feeding standard used on treatment E c n therefore be recommended when pigs are fee mixed cereal and P.I.B. concentrate ratie-.i and should result in reduced costs of from Sh. 10 to Sh. 20 pier pig in comparison wr.h a d lib. feeding.
The type of food fed had very marked effects on the pigs at different stages of growth. The meat meal and mixed cereal ration appeared to be quite unsuitable for young pigs below 40 lb. liveweight and resulted ir, very low growth rates. After 40 lb. liveweight however, this ration gave similar growth rates to the P.I.B. concentrate mixed cereal ration
The barley and skim milk ration proved to be far superior to the meat meal ration and the P.I.B. concentrate ration up to 100 lb. liveweight. After reaching this weight, however, the growth rates and conversion ratios of the pigs were very similar on all rations. The skim milk was particularly beneficial to the very small weaners below 40 lb. liveweig.'.'. which grew about three times as fast as the weaners on the meat meal ration. It is therefore recommended that where only limited amounts of skim are available this should fir-: be used to meet the full requirements of the smallest pigs, the remainder being fed to the pigs up to 100 lb. liveweight. At this stage the skim milk can be replaced by either P.I.B concentrate or meat meal without detrimental effect.
The pigs fed on barley meal and skim milk killed out slightly better than the others and produced a body fat with a considerably lower iodine value. The amount of streak was a:SO significantly greater than that of the other Pigs-
Finally, a word about the breeding of tne pigs. It was noticeable from the results that the best pigs on each treatment were mainly from two litters and the imptortance of carefully selecting breeding stock for baconer production cannot be too highly emphasized.
172

E\ST AFRICAN AGRICULTURAL AND FORESTRY JOURNAL JANUARY, 1963
Summary
Comparisons were made between four levels feeding a mixed cereal and P.l.B. concen
trate ration and the results compared with nose obtained from a mixed cereal and meat "teal ration and a barley and skim milk ration. Restricted feeding did not affect the growth rate or carcass quality but there was a tendency towards reduced food consumption and better conversion ratios as the level of restriction was increased. The meat meal ration was unsuitable for pigs below 40 lb. liveweight and the skim milk and barley ration was far 'uperior to the others up to 100 lb. liveweight. The pigs fed on skim milk and barley killed out better, had a better quality fat and produced more streak in the bacon than the others. The practical application of these findings is discussed.
Ac k n ow ledgem ents
The author is grateful to Dr. W. J. A. Payne, Head of the Animal Husbandry Division, E.A.A.F.R.O., who designed the trial: to his staff who made the measurements on the carcasses; and to Mr. T. R. Evans, Agricultural Research Officer, who carried out the trial.
R e f e r e n c e s
111 Cochran, W. G. and Cox, G. M. (1957). Experimental Designs. J. Wiley and Sons, New York.
121 Fisher, R. A. and Yates, F. (1949). Statistical Tables. Oliver and Boyd, London.
131 Yates, F. (1933). The analysis of replicated experiments when the field results are incomplete. Ernp. J. Exp. Agric., I. 139.
Appendix /
The components of the Pig Industry Board concentrate and mineral mixture.
T a b l e I .— P ig In d u s t r y Bo a r d C o n c e n t r a t e
Component Parts by weight
Cottonseed cake 20 0 partsGroundnut cake 20 0 partsLiver meal .. 2-5 partsBlood m eal.. 14 0 partsCarcass meal 33-5 partsMineral 10 0 parts {see Table II)Nicotinic acid 15 grams per 100 lb. of
mixture.
T a b l e I I .— T he M in e r a l M ix t u r e
Component Parts by weight
Trace Element Premix 17 parts (see Table III)Common Salt 17 partsAgricultural Lime 66 parts
T a b l e III.—T he T r a c e E l e m e n t P rem ix
Component Weight
Ferrous sulphate .. 377 0 gramsZinc sulphate 70 0 gramsCopper sulphate 4 0 gramsCobalt sulphate . . 1-5 gramsManganese sulphate 1 -4 gramsPotassium iodide .. 01 grams
173

EAST AFRICAN AGRICULTURAL AND FORESTRY JOURNAL JANUARY. I*
HERBAGE PLANTS AT SERERE, UGANDA, 1957-61By C. R. Horrell, Department of Agriculture. Uganda
(Received for publication on 9th April, 1962)
An account of the herbage plants studied in nursery plots or under grazing at Serere Experimental Station from 1954 to 1957 was communicated in 1958 (Horrell). The object of these studies was given, together with a description of the environment in which they were carried out. In this contribution, that account is continued and brought up-to-date. The species described are indigenous to Africa except where otherwise indicated.
GRASSESEragrosteae Elettsine coracana Gaertn.
Finger millet is the predominant cereal crop in eastern Uganda. It requires good soil and moisture conditions and gives way to sorghum on overcultivated soils o f declining fertility (Stephens. 1960). It matures as a grain crop, in 120-135 days. Trial plots sown towards the end o f the rainy season as a catch-crop to produce forage in the early part of the dry season, provided two light grazings and proved very palatable to cattle at all stages of growth up to flowering. However, productivity was considerably less than that of bulrush millet used for the same purpose. E. indica Gaertn.. and E. africana Kennedy O'Byrne. have not been tested: their use would be considered ill- advised in this area as they can be important weeds of the finger millet grain crop.
Eragrostis superbtt Pe>r.Wilman's Love-grass is a common perennial
on overcultivated soils in this neighbourhood.It withstands heavy grazing and is drought resistant but stemmy and depauperate on infertile soils. An introduction (Kalolcni, SR5848) from the coastal region of Kenya is leafy and bulky, and seeds abundantly. This may be worth further investigation for hard conditions but not where better species can be used.
Clitoris gay ana Kunth.Rhodes grass is now considered to require
soils of medium to good fertility. It is used here as a constituent of mixtures with Panicum maximum or Hyparrhenia ntfa because of three attributes: good seed production, relatively rapid establishment and stoloniferous habit. It is drought resistant but. particularly when
heavily grazed, is not persistent enough 1 • use in three-year leys on poor soils, in th. absence of fertilizers. Davies (1961) states th... persistence and high productivity can be r, >- tained by application of nitrogen fertilizer practice which can rapidly renovate po - stands. At Serere it is relatively poor in feeding value: inflorescence stems are produce: throughout the year which are unpalatable and wasted by stock. Maximum growth is fror June onwards, i.e. two-three months after the break of the main rains.
Cynodon daelylon Pers.Pasture types of this species are not pro
ductive under local conditions except r patches of soil of abnormally high fertility This applies to Coastal Bermuda and Suwanc. as well as local varieties. Lawn types, including Tift-lawn and Tifline from the United States and Madi River from Kenya, form excellent lawns if well fertilized and well managed: without good management they rapidly deteriorate and are invaded by weeds.
Brachiaria brizantha Stapf.Signal grass has qualities which make it j
potentially valuable pasture plant. It has a high lea f: stem ratio, high protein content, drought resistance, dry-season greenness and the abili:;- to form a good soil cover. In parts of Northern Uganda it is widespread, forming a boitor: grass in natural Hyparrhenia grassland. Seen production is very poor, many empty florets being produced, and it is this aspect which needs most attention, before it is likely to become of value for sown pastures.
A local selection SR 594 shows high production and good spreading capabilities. SR.'SII11 from Paraa, Northern Province, is also bulky. Spreading in this species is by means of short rhizomes situated in the surface of the soil where they are protected from damage by trampling.
Ceiichriis ciliaris L.African Foxtail or BufTel grass is a short
tufted perennial of medium to good productivity at Serere. with many valuable characteristics. It has a long growing season, producing both early and late; it is leafy and highly
174

HAST AFRICAN AGRICULTURAL AND FORESTRY JOURNAL JANUARY, 1963
palatable if well managed and shows excellent persistence under grazing, it also possesses drought resistance to an outstanding degree. It produces good quality seed which germinates well and establishes rapidly if first stored to overcome dormancy. Varieties from Australia (where it is exotic), Tanganyika and elsewhere, have been grown and wide differences in performance observed. Many of these varieties are very susceptible to leaf rusts which can be severe, particularly in wet weather. The most promising selection is No. SR5625, collected from a dry area in Karamoja.
Buffet grass is now widely grown throughout the drier tropics and sub-tropics, particularly in Queensland (Marriott, 1961). Under Serere conditions with relatively high rainfall, though less productive than Guinea grass or Hyparr- henia, it could provide a useful component in seeds mixtures with the object of extending the grazing season.
Panicum coloration L.Tw o strains of this African species selected
in Texas were grown. They are prostrate, root at the nodes and form a low dense sward. They proved extremely drought resistant. A small amount o f seed is produced in May-June and both strains remain leafy and vegetative for the rest o f the year. The species perhaps contains more productive forms which could be most valuable.
Panicum maximum Jacq.Guinea grass is now one of the main species
in use for three-year leys. Though drought resistant, it prefers good moisture conditions and requires soils of good fertility status; on poor soils it soon becomes chlorotic, due to nutrient deficiencies, and production falls sharply after the first year. On very poor soils it is often poor in establishment and unproductive from the start. It is particularly susceptible to competition from the weed Cynodon dactylon. At Serere it produces considerably more than Rhodes grass. In cutting trials, yields without fertilizer under a nine-weekly cutting regime were 75 cwts. dry matter (13 tons green herbage) containing 4.8 cwts. crude protein: and there was a marked response to even small dressings of sulphate of ammonia (Horrell and Bredon, 1961). It has a high leaf: stem ratio and its palatability rating is high. Many varieties have been obtained of which Sigor. SR5837 and Likoni, SR5829 both from Kenya, look the most promising. Slender
Guinea grass P. maximum var. trichoglume is not so good, its main asset being the ability to produce heavy yields of good quality seed. Varieties Poko-poko and Nchisi from the Federation of Rhodesia and Nyasaland. flower very sparsely; perhaps this is a light or temperature effect. The quality of seed is a factor which requires improvement in most strains. Good stands are produced by the local type of Guinea grass when sown in Juiy/August with a small proportion of Rhodes grass and a pasture legume. Full grazing use of the pasture can usually be made from the December following establishment. Guinea grass makes maximum growth in April, May and June.
Paspalum plicatulum Michx. (Australia)This is a short, dense leafy perennial which
is very attractive in form but rather slow in growth. It seeds sparsely, but produces high quality viable seed. It is a sub-tropical grass and may be insufficiently adapted to tropical conditions. It’s value at Serere or in Uganda has not been fully assessed and it should be investigated further.
Pennisetum purpureum Schumach.Investigations continue with elephant grass
which is planted vegetatively by laying mature canes end to end in furrows and covering with 2-3 in. of soil. Three-foot row widths are preferred to wider spacings which leave a large amount of bare ground and become very weedy unless frequently cultivated. Weeds have a marked depressing ell'ect on growth. Yields of green herbage (without fertilizers) have been 38 tons in the first year, dropping to 14. 17 and 11 tons in the 2nd, 3rd and 4th years, the main cause of the fall probably being nutrient starvation. It would appear to need special management techniques with intensive cultivation and use of heavy fertilizer applications in order to show any advantage over the “short" grasses for general purposes. It has proved useful, however, to grow a relatively small acreage to provide supplementary grazing in the dry season or cut fodder for stall-feeding to young calves and sick animals confined to the sheds. Several varieties have been grown. Cameroons, a broad-leaved, thin stemmed type is regarded as the best, since it is leafy and does not “cane" so rapidly as others.
Pennisetum typhoides Stapf. and C. E. HubbardBulrush millet is a minor grain crop which
is grown in parts of Northern Uganda where
175

EAST AFRICAN AGRICULTURAL AND FORESTRY JOURNAL JANUARY, 1963
the second rains are not sufficiently reliable for sorghum; it matures in 70 days. It was tested as a catch-crop for grazing during the early part of the dry season. A crop was sown in early October, 1959, and was grazed two weeks after germination when it was 9 in. high. Abundant tillering and rapid regrowth followed and grazing for two or three days at a time was carried out at weekly intervals for the next two months which was the limit o f the crop’s persistence. 105 grazing days per acre were obtained (9 a.m. to 5 p.m.. with the cattle night-paddocked elsewhere). Bulrush millet is sown, with a minimum of land preparation after the harvesting of an earlier crop, at a seed rate of 20 lb. per acre. Planting can be timed to produce herbage at the end of the rains thus reducing grazing pressure on the perennial pastures at this critical time and enabling them to carry a bigger foggage reserve into the dry season. An interesting attribute of bulrush millet is reported by Wetselaar and Norman (1960) who record that it is an outstanding crop for the recovery of deep accumulations o f soil nitrates and their conversion to harvestable fodder protein.
Andropogoneae
Hyparrhenia rufa Stapf.Hyparrhenia is the dominant grass species in
natural vegetation in this ecological region and has proved to be most valuable for sown pastures. On poor soil types where Guinea grass is not suited, it is seeded with either Stylo- santhes or Centrosema and Rhodes grass. Though slow in establishment, it is highly productive. In cutting trials without fertilizers it yielded 435, 221 and 163 cwt. o f green herbage in three consecutive years compared with 206, 102 and 85 cwt. from Rhodes grass in the same trial. In grazing trials it has equalled Guinea grass in liveweight production per acre. In an experiment to measure palatability, it proved to be the most acceptable among all the important species tested (Joblin, 1961). It can survive under very heavy grazing and withstands grazing abuse—an important asset in local peasant agriculture. Its disadvantages include the heavy awning of the seed which make it difficult to sow by hand-broadcasting and impossible by machine. In the latter part of the season, management cannot entirely control the undesirable production of many woody flowering culms. At this stage, chemical analysis o f the whole plant gives very low values. Cattle select the leaves, however, stripping them
from the culms as well as from the base of the plant. Chemical analysis of the leaves give- good values and explains the finding that cattle can continue to thrive on this species when in the flowering stage (Juko and Bredon, 1961 >. At Serere. some selection has been carried out for leafiness and late flowering character.m .- No. SR5765 called “Gola” is most promising and appears to be breeding true to type.
Among the species under trial, some have not yet been adequately assessed. Others have proved of very little interest, being unsuitable for pasture or fodder production for one reason or another, in this environment. A record of their trial is provided in abbreviated form in Table I.
LEGUMES
T ribe H edysareae
Desmodium intortum Urb. Tropical AmericaThis is a perennial and highly productive
herbaceous legume which is very palatable and in mixture with grass was grazed out in the first year. It is not a heavy seeder: difficulty is experienced in bulking seed due to this and to the damage caused by blossom beetles (Meloidae) and possibly thrips. Further investigation under grazing is required as this legume has many highly desirable qualities and appears to be well adapted to this environment.
Desmodium iincinatum Jacq. Tropical AmericaSpanish clover is a semi-prostrate perennial
which is palatable and highly productive. It seeds heavily twice a year—in June/July and in November. Further testing under grazing is required. It is reported to be efficient in nitrogen fixation (Andrew and Bryan, 1958).
Stylosamhes gracilis H. B. K. South America
Stylo is the most widely adapted perennial legume for pastures yet investigated It has been grown on a wide range of sites in the East and North of Uganda and can thrive on the poorest of soils, producing considerable quantities of grazing. It nodulates freely, is vigorous, aggressive and drought resistant. It grows most rapidly from July to November but continues to produce in the dry season long after growth of most species has stopped. Its aggressiveness is largely due to two reasons —it has lower palatability than the companion grasses with which it is grown, and it reseeds itself vigorously, colonizing at the expense o f
176

EAST AFRICAN AGRICULTURAL AND FORESTRY JOURNAL JANUARY, 1%3
T able INote—A Annual, P=Perennial
Eragrosteae1
Eragrostis curvuta Nees . . . . P Ermelo variety. Coarse, wiry. Few seed heads. Slow growth.Tussocks attacked by termites in dry season.
E. tef Trotter
Paniceae
A Stemmy, unproductive. Seeded heavily after 3-4 months.
Acrocerus macrum Stapf. . . . . P Stoloniferous, water loving. Unsuited to dry land conditions.
Brachiaria humidicola Schweickerdt P Prostrate, rooting at the nodes . Planted vegetatively. Unproductive. Good soil cover.
Digitaria decumbens Stent. . . . . P Pangola grass. Dense, sward forming. Planted vegetatively. Poor drought resistance. Probably requires high soil fertility.
Echinochloa crus-gatH Beauv. A Barnyard millet, 70-80 day ephemerals (vars. edulis and frumentacea). Vegetatively unproductive. Possible weeds, due to heavy seeding.
Panicum mitiaceum L. A Proso millet, 70-day ephemeral. Varieties from S. Africa and Queensland appeared stunted in growth.
P. stapfianum Fourcade .. P Similar to P. coloratura in habit. Less productive.Pennisetum giganteum A. Rich . . P “Bamboo-like" woody stems. Grown from seed.
Unsuitable.P. stramineum Peter P Loosely tufted, 2 ft. high. Drought resistant, un
productive.Pennisetum hybrid
A ndropogoneae
P “Bana grass". P. purpureum X P. typhoides. Bred in S. Africa. Similar to, but apparently no better than, elephant grass.
Bothriochloa ischaemum (L.) Keng P Stemmy, lacks vigour.Cymbopogon martinii W. Watts P Palma rosa grass, India. Valuable perfume. Lacks
vigour.Dicanthium annulatum (Forsk.) Stapf.
Tripsaceae
P Densely matted, leafy, drought resistant, not highly productive.
Coix lachryma-jobi L. . . A Job's Tears. India, now widespread in tropics. No value for grazing.
Euchlaena mexicana Schrad. . . A Teosinte. Americas. Tall, maize-like plant, not promising. Perennial forms may be worth trial.
Tripsacum taxum Nash P Guatemala grass. C. America: fodder grass, vegetatively propagated, high productivity, palatable. Needs special management.
the companion grass. This is more particularly the case on poor soils where drought or shortage of nutrients limit grass growth. Disadvantages o f Stylo are its relatively low protein content compared with other legumes (though protein is considerably higher than that of grasses) and its tendency to woodiness when mature. Cattle have been observed to overcome the latter fault by selectively grazing the leaves and tips of the shoots. Other varieties are being sought to get better palatability and more even seed maturation which, with suitable management applied at flowering time to remove potential seed heads, would restrict the aggressiveness of the plant. In Queensland Stylo
is regarded as one of the less efficient nitrogen fixers. (C.S.I.R.O., 1961). Rhizobial nitrogen fixation is closely bound with soil nutrient status and Stylo at Serere has shown marked response in growth and colour to dressings of phosphate and, more particularly, sulphur. In general Stylo is now regarded as a pioneer legume which is o f immediate value to farming but which may be replaced by more efficient legumes in due course. Grass/Stylo pastures are considerably more productive and maintain their productivity over a longer period than pastures of grass alone. Two pounds of Stylo seed per acre are adequate when it is sown in a mixed pasture.
177

FAST AFRICAN AGRICULTURAL AND FORESTRY JOURNAL JANUARY. 196:
T rifoleae
M elilotus alba Desv. MediterraneanWhite Sweet Clover contains annual and
biennial varieties. The annual varieties Hubam, Floranna and Israel produce a large amount of highly palatable fodder in three months from sowing, standing over 4 ft. high. The former two then flower and seed profusely but Israel remains vegetative for 12 months before seeding and appears to be the most useful of the three. Three biennial varieties. Spanish. Willamette and Arctic have a low spreading and branching habit. They appear to be rather unproductive. All varieties nodulated well after inoculation. Further investigation of this species is required to discover the management under which it may best reach its potential value as a producer of high quality cattle feed.
M elilotus officinalis Lam. Mediterranean Three biennial varieties o f Yellow Sweet
Clover are under test, Madrid. Currino and Gold Top. They have a similar habit to the biennial forms of M. alba but appear to be more vigorous, and are no less palatable. Nodulation was good, after inoculation.
Melilotus suaveolens Ledeb. Mediterranean This is a yellow flowered annual species
similar in form to the biennial M. officinalis.It grows vigorously and shows some promise. Like the other Melilots it needs to be inoculated before nodulation occurs.
T ribe P haseoleae
Calopogonium orthocarpum Urb. Calopo. Tropical America
Calopo is a vigorous climbing perennial which makes rapid growth from July onwards and seeds heavily at the onset o f the dry season. It then drops its leaves and many plants die; vigorous seedlings are produced at the onset o f the rains. Calopo is productive, fairly palatable to cattle and widely adapted, even on poor soils. However, it is considered that one of the functions of a pasture legume is to supplement the low protein content of the grasses during the dry season and for this reason it is now regarded less favourably than Centro.
Centrosema ptibescens Benth. Tropical America Centro is a climbing perennial which was
introduced to Uganda in the 1920 s and is now naturalized in several localities. It is vigorous,
178
drought resistant, very palatable and combines well with both Guinea grass and Hypurrhen ■ rufa. Early indications are that with Hyparr- henia rufa animal production is increased when Centro is included. Seed production is good and harvesting is no problem. Germination and establishment are hastened if the seed is pre-soaked in water at blood temperature or acid-treated. In mixture with grass, 3 lb. of Centro seed per acre gives an adequate stand. Accessions so far received from other countries have all been very similar. It is not known whether the species as a whole lacks variability.
Glycine javanica L.Glycine is one of the few indigenous legumes
yet tested that showed initial promise. However, further observation of many selections, obtained both from Kenya and locally, have shown it to be disappointing in rate of growth and productivity. Accessions from higher latitudes and higher altitudes have failed to flower at Serere.
Pueraria pbaseoloides Benth. South-east AsiaTropical Kudzu, a high-yielding climbing
perennial is a promising legume for combining with elephant grass. It requires a fertile soil and on poor soil at Serere it gives a spectacular response to sulphur and phosphate fertilizers It produces large nodules of a green or brownish colour; it is not yet known whether this is due to ineffective rhizobia or whether the nodules are in fact functional but unusually pigmented. This legume should have an important place in agriculture particularly in Uganda's so-called “tall grass" zone.
Vigna sinensis Endl.Cowpeas form the major pulse crop grown
for human consumption in Northern and Eastern Uganda. Several types have recently been introduced from Basutoland. This produced good seed crops in 70-80 days from sowing, outyielding the local variety. However, none were sufficiently productive in foliage to be considered as good fodder crops.
M imosaceae
Leucaena glauca Benth This is a small tree. 20 ft. high if allowed
to develop as such, but can be controlled by cutting and grazing when used to provide forage. Introduced to Uganda many years ago. it was once used in coffee plantations, first as

EAST AFRICAN AGRICULTURAL AND FORESTRY JOURNAL JANUARY. 1963
shade for young plants then cut down and kept short to provide ground cover. It proved very drought resistant at Serere in recent years, giving rise to many self sown seedlings, and tending to get out of hand. It was eliminated as being of little potential value. Interest in this legume has revived following reports of its value in Queensland and elsewhere (Hutton and Gray, 1959) which, in particular, emphasize its very high yields of protein. The leafy variety. "Peru” has recently been obtained and will possibly find a place in supplementing the protein content o f permanent pastures.
D isc u ssio n
Grasses and legumes have been tested over many years, in nursery plots at Serere. by- officers of the Agricultural Department. The results of these tests have been recorded in the Annual Reports of the Department, by Hosking and Stephens (1941), by Horrell (1958) and in this paper. These results have led to detailed agronomic trials (not reported here) on several species which are now recommended for planted pastures in Eastern and Northern Uganda. These are: Cliloris guy ana, Panicum
maximum, Hyparrhenia rufa, Stylosanthes gracilis and Centrosema pubescens.
There is. naturally, a need for continued plant testing to extend the range of species available for different farming conditions. There is also plenty of scope for developing those already known to be successful. Bogdan (1959) has made recommendations on how and to what purpose, improvement may be effected in Cliloris gay ana. Panicum maximum and other major species which are being studied at Kitale, Kenya. In Hyparrhenia rufa there is a need to reduce stemminess and to improve protein content and seed production. This species does not appear to out-cross to any extent. The improvement sought in Stylosanthes gracilis has been described above, viz. better palatability and also uniformity in seed maturation.
Some other perennial species which require further study are Brachiaria brizanlha, Cen- chrus ciliaris, Centrosema pubescens, Pueraria phaseoloides, Desmodium spp.. Phaseolus atro- purpureus and Leucaena glauca. These need to be tested under a wider range of environments in Uganda than hitherto.
T able 2N ote—A = Annual, P Perennial.
G enisteaeLotononis bainesii Bak. P Small vigorous, rooting at the nodes. Complete
failure unless inoculated. Growing successfully, not yet evaluated.
H edysareaeArachis diogoi Hoehne P Tropical America. Small, semi-prostrate. Flowers
but does not set seed. Unproductive.Desmodium barbatum Benth & Oerst.. P Tropical America. Erect, slow in establishment and
lacking in vigour.D. distortion Macb. P Tropical America. Erect, grows 8 ft. high, seeds
well. Possible fodder plant.D. gyroides D.C. P S.E. Asia. Erect, woody if unchecked, growing
12 ft. high. Palatable, possibly of use as browse plant or for hedges. Seeds sparsely.
D. ovalifolium Guill. et Perr.................. P Woody stems, 3 ft. high. No apparent value.D. tortuosum D.C. (Syn. D. purpureum) P Florida Beggar Weed. West Indies. Erect, growing
to 2 ft. high and apparently unproductive. Used in New World and warrants further investigation.
Hedysarum coronarium L........................ P Sainfoin. Mediterranean. Useless when not inoculated. Requires testing with inoculant.
PhaseoleaePhaseolus atropurpureus Moc. and
Sesse Ex D.C.P Atro. New World creeping semi-climber, rooting
at the nodes. Pasture types bred in Queensland very successful, C.S.I.R.O. (1961). Introduced Uganda 1961. shows promise.
Pueraria thunbergiana Benth.................. P Japanese Kudzu. Complete failure in this environment.

EAST A F R IC A N A G R IC U L T U R A L A N D FO R ESTR Y JO U R N A L JANUARY, 1963
The short-term plants Pennisetum typhoides and Melilotus spp. are very promising as catch- crops for grazing. There should be an important place for such crops in the present recommended farming system based on integrated crop and animal husbandry within a six- course rotation.
It has been proposed (Horrell, 1959) that a farming system for parts of Eastern Uganda, dependent on very short-term leys of 12 to 18 months alternating with a similar period of cultivation might be an alternative to the present recommended system o f 3^ years ley alternating with years cropping. This could be the case more especially where intensive use of the land is necessary, that is, on farms of, say, less than 20 acres in areas where population pressure is high. Thus more investigation o f the largely neglected annual-biennial grasses and legumes is required.
Finally it should be noted that all the results reported from Uganda have been obtained without the application of fertilizers, on soils that have now been shown to have a relatively low nutrient status. Recent experience indicates that sulphate of ammonia gives large yield increases with grasses while legumes have given marked responses to phosphate and large responses to sulphur. Soil fertility investigations being pursued at this Station are likely to lead to practical methods of correcting nutrient status. This will lead to an extension of the range of species which can be successfully grown. Particularly in the case of legumes it may be possible to include better herbage types and species that are more efficient in N-fixa- tion than, for instance, Stylosanthes gracilis.
A cknow ledgem ents
Thanks are due to Messrs. D. E. Okanya and A. E. M. Oule who carried out the field work and to the many workers in other countries who have supplied material for testing Permission to publish this article has been given by the Director of Agriculture.
R e fe r e n c e s
Andrew, C. S., and Bryan, W. W.. Ausl. J. agric. Rt 9. 267.
Bogdan. A. V. (1959), E. Afr. agric. J. 24. 206.
C.S.I.R.O. (1961). Officers of the Cunningham Laboratory, Brisbane. Personal Communication.
Davies, J. Griffiths (1961). Personal Communication
Horrell, C. R. (1958). E. Afr. agric. J. 24. 41 and 133.
Horrell, C. R. (1959). Memo to Uganda Department o f Agriculture Experiment Committee (unpublished).
Horrell, C. R. and Bredon. R. M. (1961). Management Studics with Panicum maximum. (In press).
Hosting. H. R. and Stephens, A. L. (1937). E. Afr. agric. J. 3, 192.
Hutton, E. M. and Gray, S. C. (1959). Emp. J. Exp. Agric. 27, 187.
Joblin, A. D. H. (1961). J. Bril. Grassl. Soc. (In Pressi.
Juko, C. D. and Bredon, R. M. (1961). Trop. Agriculture, Trin. 38, 179.
Marriott, S. (1961). Personal Communication.
Stephens, A. L. (1960). Personal Communication.
Wetselaar, R. and Norman, M. J. T. (1960). Ausl■ J agric. Res. 11, 693.
180

EAST AFRICAN AGRICULTURAL AND FORESTRY JOURNAL JANUARY, 1963
NEW CEREAL VARIETIES— 1962By G. E. Dixon, K. W. Lynch and F. F. Pinto, Plant Breeding Station, Njoro
(Received for publication on 16th April, 1962)
The following three new wheats have been released by the Department o f Agriculture for the 1962 season; two are Kenya-bred and the third has been multiplied from the F.A.O. Wheat Rust Nursery of 1955.
Kenya JayThis is a further selection in the “Bird"
series o f wheats developed at Molo for the higher altitudes from the cross 318 X Equator made in 1948; this series was first released in 1959 [1], Jay was bred under the selection number 3 84 /5 .BJ.6.B.1.
It is a beardless, white-chaffed, white-grained variety o f late maturity, fair straw strength and fair baking quality. Due to severe attacks of stem rust (Puccinia graminis tritici) on the Bird varieties in 1960. the release of this additional selection for 1961 was withheld. Further comparison has confirmed that Jay has a rather higher level o f stem rust resistance than the other selections and it has continued to yield well. It has excellent resistance to yellow rust (P. striiformis), both as a leaf and ear rust.
Kenya Jay is now released for the highest altitudes, over 9,000 feet, where it can replace the other Bird varieties which aTe more susceptible to stem rust. It is recommended for Mau Narok and upper Molo, but should not be attempted in the Kinangop and Laikipia areas where severe stem rust is more prevalent.
K en ya GrangeThis is a selection from the cross 360.F.8.D.3
X Granadero Klein, made at Njoro in 1951, and has been multiplied under the number 599 (L).4.A .l. It is a mid-season, bearded, brown-chaffed, white-grained variety of fair straw strength and fair baking quality. It showed good resistance to stem rust during selection and multiplication, but carried some slight infection in 1961. It has a high level of resistance to brown leaf rust (P. recondita) and is also fairly resistant to yellow rust. It has the tendency of white-grained wheats to sprout under wet conditions at harvest.
Grange is recommended for the 7,500-8,500 feet altitude range, where it widens the range of choice at this t'me. It has shown itself a high yielder during multiplication.
Yaqui 50
This is a variety bred in Mexico from the cross Marroqui 588 X Newthatch and taken from the F.A.O. Wheat Rust Nursery of 1955 as entry number 176.
It is a beardless, white-chaffed, red-grained variety of early maturity, good straw strength and good baking quality. Though it is susceptible in seedling tests, Yaqui 50 has shown a high level of field resistance to stem rust; it has satisfactory resistance to brown leaf rust, but is rather susceptible to yellow rust.
Yaqui 50 is recommended for the lower drier wheat areas, from 6,000-6,500 feet; its quick maturity and good field resistance to stem rust make it a useful choice for Naro Moru, Mweiga, Solai and Rongai. It is not suited to the wetter conditions of the Trans Nzoia.
A fourth variety, Gala, will also be available for general use for the first lime in 1962. It was issued primarily for the East of Rift areas and was ready for release for the Short Rains (October) plantings of 1961; the description of this variety was therefore included in the releases for 1961 [2], Gala is recommended for the drier areas, from 6,000-7,000 feel, but is not suited to the wetter conditions of the Trans Nzoia.
R e f e r e n c e s
[1] Release of New Cereal Varieties, 1959, by H. C. Thorpe and G. E. Dixon. E. Afr. agr. J. 24, 1959.
[2] New Cereal Varieties, 1961, by G. E. Dixon et al, E. Afr. agr. for. J„ 1962.
181

EAST AFRICAN AGRICULTURAL AND FORESTRY JOURNAL JANUARY, l%3
CHANGES IN THE CHEMICAL COMPOSITION OF PLANTS DURING GROWTH IN THE FIELD
By H. W. Dougall, Grassland Research Station, Kitale. Kenya
(Received for publication on 27th April, 1962)
The chemical changes that occur in grasses, cereals and legumes throughout their growth and maturation under field conditions have been studied in this laboratory for several years. Amongst many others, three indigenous perennial grasses, setaria CSet aria sphacelata), star grass (Cynodon ductyloti) and Hyparrhenia dissolutct, have been examined together with two cereals, wheat and barley, and a legume, lucerne (Medicago saliva). All these plants are important in the Kenya Highlands althoughH. dissoluta, which is widely distributed from sea level to 8,000 ft. altitude, except in the driest parts of the country, is very stemmy and of poor nutriment value at its later stages of growth. It was sampled from the natural grassland at Kitale where the star grass, lucerne and cereals were cultivated. The setaria was cultivated at Njoro as a ley grass.
S ituation and Climate
Kitale is situated in north-west Kenya (latitude 1° N., longitude 35° E.). approx - malely 15 miles from the lower footslopes o: Mount Elgon (14.000 ft.) at an altitude of 6,200 ft. The average rainfall for the past 30 years is just over 44 inches annually and its distribution throughout the three years that concern this paper is shown in Fig. I, from which it is seen that there is a dry season of some four months’ duration, usually from November to March. During this period the maximum air temperature averages 82 F.: from the end of March there is a progressive decrease until July when it averages 72". The minimum air temperature varies between 50 and 55c F. throughout the year.
12
lO
COUJIUZ
_]<
<a.
OJ * ------- I V j / --------- * ^ *■'
Fie. I—The monthly rainfall distribution over three suceessive years at Kitale. The average mont > rainfall for the past 30 years is shown by the dotted lines in the 19.7 diagram
182

[ AST AFRICAN AGRICULTURAL AND FORESTRY JOURNAL JANUARY, 1963
Methods of Sampling and A n a l y s is
Samples of the plants were obtained at weekly intervals throughout their growth and maturation. They were cut approximately 2-3 inches above ground level with scissors and brought from the field to the laboratory where their average height was measured and stage of growth recorded. Two pounds o f the fresh material were accurately weighed, dried at 50- 55 C. for 24 hours and weighed again. The dried material was then ground in a power mill to pass through a sieve containing apertures of 1 mm. diameter. The moisture remaining in the samples was determined in a moisture- content oven by exposing 10 g. of the ground material to a temperature of 130“ C. for 20 m:n. This material was not used in the subsequent analysis.
With the exception only of setaria, all plants were analysed for their proximate constituents including ash, crude protein-N and true pre- tein-N. total phosphorus (P), total sulphur (S) and non-nitrogenous organic matter (CHO). This latter fraction is the sum of the ether- extractives, the crude fibre and the nitrogen- free extractives, the latter being determined by d tference. Methods of analysis followed
conventional procedures with the exception of the ether-extractives which were determined after 8-hour extraction with petroleum ether, 60“-80° b.p. A correction o f the crude fibre estimation for the effect of altitude was made throughout [1], Total sulphur was determined by use of the bomb calorimeter, following the gross energy determination: precipitation of the sulphur as sulphate was carried out with barium chloride (2.4 g. hydrated salt in 100 ml. water) and the sulphate was estimated by titration with magnesium chloride (4 g. hydrated salt in 1 litre water), using eriochronte black as indicator, after complexing the sulphate with excess 0.02 molar disodium ethylene diamine tetra-acetic acid in the presence of 9N- ammonia. Blank determinations were made throughout. All results were calculated on a moisture-free basis. Those obtained for ash and crude fibre have been described in this Journal [2, 3],R e s u l t s
Patterns of change in the percentages of N, P. S and CHO contained in the dry matter of the six plants are shown in Figs. 2, 3, 4 and 5. where all the fluctuations in response to water regime are shown week by week.
Fig. 2.—Weekly changes in the percentages o f N (o-------o), P (»------• ) and CHO ( • -------•) containedin the dry m atter of setaria (a) and in the percentage o f N , P, S (x------x) and CHO containedin the dry m atter of s ta r grass (b) and (c), during grow th. Weekly changes in the rainfall are also
show n, in inches
183

EAST AFRICAN AGRICULTURAL AND FORESTRY JOURNAL JANUARY, 1963
The setaria was grown from seed and without fertilizers at Njoro (latitude < S., longitude 36° E. altitude 7,000 ft.) and by the time it was sampled on 1st September, 1954, 33.5 inches o f rain had fallen since the beginning of that year. During the 28 consecutive weeks of sampling, falls of more than 1 inch of rain per week were exceeded only on three occasions and during the same period there were six separated weeks when no rain was recorded.
Fig. 2 (a) shows that as the setaria ages, there is a general decrease in the concentrations o f N and P and a general increase in the concentration of CHO contained in its dry matter until the 23rd week, when, following3.9 inches of rain, new growth was added to the plants and the respective levels of N and P increase while that of the CHO decreases. Throughout the whole period N and P follow very similar patterns of change in response to changes in water regime and each pattern is an apparent inversion of that o f the CHO.
The star grass was grown from splits that had been planted at Kitale the previous year with a placed dressing of triple superphosphate equivalent to 1 cwt. per acre. Its patterns of change present the contrasting pictures that are shown in Figs. 2 (b) and (c). During the first phase of sampling the grass was passing out of the dormant stage of the dry season and when the first sample was obtained on 22nd February, 1957, only 2.3 inches of rain had fallen during the previous four months. The grass added only |-1 inch to its average height during the next seven weeks but from the eighth week onwards, and following a change in water regime, changes in composition become apparent and these are characterized by a progressive decrease in the concentration of crude and true protein-N, P and S and a progressive increase in the concentration of CHO as the grass grows to maturation. The grass was eventually cut back to almost ground- level on 17th July and the sampling of its regrowth began some three weeks later, on 7th August, during which period 3.3 inches of rain had fallen. During this second phase of sampling, growth was unrestricted. The initial concentrations of N, P and S are considerably greater than their counterparts of the first phase but they decrease rapidly throughout the 10-week period and are of the same order as before when the grass reaches maturation.
The Hyparrhenia dissoluta was first sampled from the natural grassland on 24th April, 1957,
184
after 8.9 inches of rain had fallen since the beginning of the year. Its water regime v is apparently satisfactory for rapid growth and maturat:on. for no serious growth checks are noticeable and the overall growth pattern, shown in Fig. 3 (a), for the first eight weeks is not unlike that of star grass during its second phase. During these eight weeks the H. Jis- soluta grew from 6 to 65 inches in height and its total nitrogen fell from 2.3 to 0.6 per cent. The natural grassland was cut back on 17th July and the sampling of the regrowth ofH. dissoluta began on 13th August. Regeneration was slow and erratic. During the 11 weeks of sampling that followed, the grass grew to 33 inches in height but it did not flower. It tended during this time to accumulate P but there was a general decline in N, with time, from the initially low level of 1.1 per cent. These changes are shown in Fig. 3 (b).
When the wheat and barley were drilled with triple superphosphate at the rate of 150 lb. per acre on 20th June, 1959, 18.2 inches of rain had fallen since the beginning of that year. The sampling of each began on 6th July when the plants averaged 6 inches of growth above ground. Between the time of planting and the first sampling 2.9 inches of rain had fallen but during the next three weeks only 0.5 inches were added and at the time of the fourth sampling both cereals were wilting under the stress of water shortage. This effect is shown in the respective severe checks to the growth patterns illustrated in Figs. 4 (ai and (b). Between the fourth and fifth sampling 2 inches of rain had fallen and the sharp rise in the percentage contents of P and S and to a lesser extent of N in both cereals reflects the sensitivity of these young plants to changes in water regime. Thereafter no serious fluctua- t'ons in growth occur and the cereals were last sampled and their grain harvested 20 weeks after planting.
Each of the cereals reached the piping stage during the eighth week of sampling and from the ninth week onwards the “heads" were sampled in addition to the “whole’ plants. The heads were sampled twice weekly in order that any chemical changes might be more easily traced. In the even! this precaution was hardly necessary and weekly changes only are shown in Figs. 4 (c) and (d). In the wheat heads, CHO (81.35 + 0.29): crude protein-N (2.073 ± 0.038); tTue protein-N (1.678 + 0.04): P (0.323 ± 0.007) and S (0.165 ± 0.003) remain fairly constant throughout while in the barley heads, CHO (81.44 + 0 .415) is fairly constant but there is a slight though significant

EAST AFRICAN AGRICULTURAL AND FORESTRY JOURNAL JANUARY, 1963
gain (P > 0.001) in N, P and S with time, as the relevant equations show:
crude protein-N = 1.87 + 0.0085 t(r5 = 0.703)
true prote:n-N = 1.42 + 0.016 t(rs = 0.928)
P = 0.217 + 0.00144 t<r2 = 0.634)
S = 0.147 + 0.0006 t(t j = 0.706)
n = 16 throughout and t = time, in days, from piping.
The lucerne sampled in 1958 had been inoculated but planted without fertilizers the previous year. It had already yielded four harvests in 1958 before the first sample of its fifth growth cycle was taken on 1st September, by which time 39.6 inches of rain had fallen since the beginning of that year. Growth proceeded with very little restriction and the patterns of change shown in Fig. 3 (c) are not unlike those of star grass during its second phase. This was not the case with the inoculated lucerne planted the following May with and without fertilizers applied to the seed bed. The ferti-
l u c e r n e C OH Y P A R R H E N IA D IS S O L U T A
2 n d p h a s e ( b)
1 ( — W E E K S — » U
Q-rTU-TTn r-1(f----- W EEK L Y R A IN F A L L -------*
Fig . 3.—Weekly changes in the percentages o f N (o— o ), P ( • - ..... ♦ ) , S (x------ x) and CH O ( • ------ • )contained in the dry m atter o f H . dissolula (a) and (b) and of lucerne (c)
185
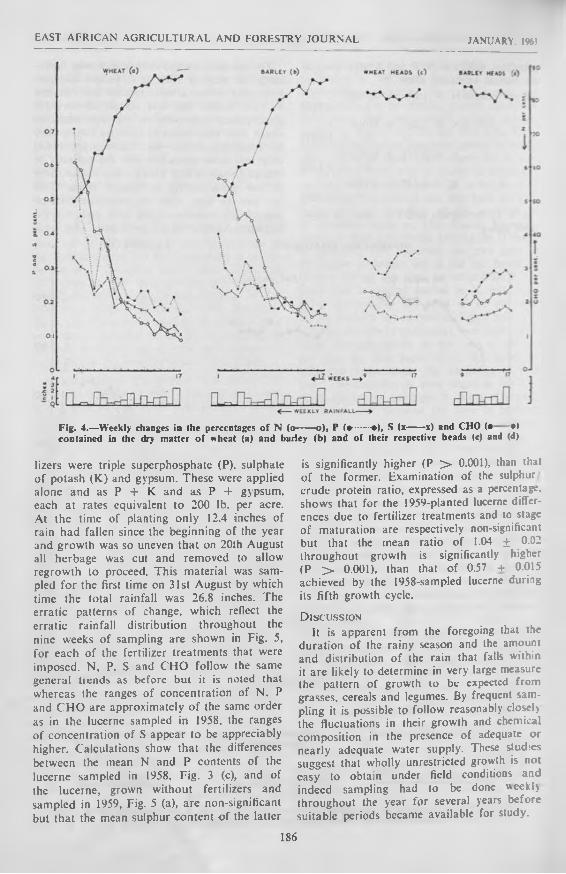
EAST AFRICAN AGRICULTURAL AND FORESTRY JOURNAL JANUARY. 1965
Fig . 4.—W eekly changes in the percentages o f N (o------ o), P (►— ■•), S (x------x) and CHO (• • >contained in the dry m atter o f wheat (a) and barley (b) and of their respective heads (c) and (d)
lizers were triple superphosphate (P), sulphate of potash (K) and gypsum. These were applied alone and as P + K and as P + gypsum, each at rates equivalent to 200 lb. per acre. At the time of planting only 12.4 inches of rain had fallen since the beginning of the year and growth was so uneven that on 20th August all herbage was cut and removed to allow regrowth to proceed. This material was sampled for the first lime on 31st August by which time the total rainfall was 26.8 inches. The erratic patterns of change, which reflect the erratic rainfall distribution throughout the nine weeks of sampling are shown in Fig. 5, for each of the fertilizer treatments that were imposed. N. P. S and CHO follow the same general trends as before but it is noted that whereas the ranges of concentration of N. P and CHO are approximately o f the same order as in the lucerne sampled in 1958, the ranges of concentration of S appear to be appreciably higher. Calculations show that the differences between the mean N and P contents of the lucerne sampled in 1958, Fig. 3 (c), and of the lucerne, grown without fertilizers and sampled in 1959, Fig. 5 (a), are non-significant but that the mean sulphur content o f the latter
is significantly higher (P > 0.001), than that of the former. Examination of the sulphur' crude protein ratio, expressed as a percentage, shows that for the 1959-planted lucerne differences due to fertilizer treatments and to stage of maturation are respectively non-significant but that the mean ratio of 1.04 ± 0.02 throughout growth is significantly higher (P > 0.001), than that of 0.57 + 0.015 achieved by the 1958-sampled lucerne during its fifth growth cycle.
D iscussionIt is apparent from the foregoing that the
duration of the rainy season and the amount and distribution of the rain that falls within it are likely to determine in very large measure the pattern of growth to be expected from grasses, cereals and legumes. By frequent sampling it is possible to follow reasonably closely the fluctuations in their growth and chemical composition in the presence of adequate or nearly adequate water supply. These studies suggest that wholly unrestricted growth is not easy to obtain under field conditions and indeed sampling had to be done weekly throughout the year for several years before suitable periods became available for study.
186

EAST AFRICAN AGRICULTURAL AND FORESTRY JOURNAL JANUARY, 1963
I & -H -fT-m T! r-rLfT-m il r f L umJ~i rfln-rn-T]«-- WEEKLY RAINFALL---♦
P • K(•) (0
r f lrkTlJ] \Fig. 5.—Weekly changes in the percentages o f N (o------ o), P (*■......• ) , S (x-------x) and CHO (•
contained in the dry m atter o f lucem c grow n in the presence and absence of fertilizers
The first phase of star grass demonstrates the behaviour of a perennial grass as it emerges from a four-month dry season. It was remarked earlier that this grass was observed to have grown only 4-1 in. during the first seven weeks o f sampling. Its failure to make vegetative growth in the absence o f a favourable water regime is reflected in the relatively slight changes that are noted in its chemical com position and especially in its inefficient use of nitrogen to form protein. Thus during this period the ratio true protein (TP)/crude protein (CP) is only 0.47 + 0.014. During the succeeding eight weeks when growth has become less restricted under a more favourable water status, the ratio becomes 0.72 + 0.029, a value that is significantly higher (P > 0.001) than the former. During the second phase of sampling the star grass, when growth is by now unrestricted, the TP/C P ratio over the 10-weeks period is 0.77 + 0.003, a value which does not differ statistically from that of the last eight weeks of the first phase. H. dissolula (0.80 + 0.02), wheat (0.83 ± 0.014). barley (0.81 + 0.015) and lucerne (0.80 + 0.018) all show very similar TP/CP ratios during their respective phases of unrestricted or almost unrestricted growth. The T P/C P ratio for wheat heads between the time of emergence
and maturity is 0.81 ± 0.02 while that of barley heads increases with advancing maturity, and this is expressed in the equation TP/CP = 0.77 + 0.004 t (n = 16, r2 = 0.705), where “t” is the time in days between emergence and maturity. The relationships between true protein and crude protein in each of the materials examined are shown in Fig. 6 .
It is apparent that during periods of unrestricted growth the initial concentration of nitrogen within young plants such as lucerne and cereals is high; in the perennial ley grasses such as setaria and star grass it is relatively high and in H. dissolula it is moderately high. As all of these plants grow to maturation, the overall pattern of change is a decrease in nitrogen concentration, closely associated with an increase in concentration o f the non-nitro- genous organic matter.
The initial concentration of phosphorus within the young plants is high or relatively high initially but it also decreases as the plants age and the pattern of change in the concentration of P follows closely that of N during unrestricted growth. It may not always do so when growth is restricted, and this can be seen in the diagram showing the second phase of sampling H. dissolula, Fig. 3 (b), where this grass appears to be accumulating P.
187

EAST AFRICAN AGRICULTURAL AND FORESTRY JOURNAL JANUARY, 1963
F ig . 6 .—The crude protein (o------ o) in relation to the true protein (o------o ) contained in the drym atter of different plants sampled at weekly intervals throughout growth
Sulphur follows similar patterns of change to those of N and P though its ranges of concentration within the plants examined are somewhat less than those of P, whether growth is restricted or not. It is seen from Fig. 3 (c) and from Figs 5 (a, b, c. d, e and 0 . that the range o f sulphur concentration in the 1958- sampled lucerne is appreciably different from any of those ranges obtained in 1959, and it has already been noted that the mean concentration in 1958 is significantly lower than that obtained in 1959 from unfertilized lucerne. The sites were approximately one mile apart and it is possible that differences in sulphur concentration within the different lucerne plants may be reflecting local differences in sulphur distribution within soil of basement- complex origin.
It is evident that during periods of active growth N. P and S have a common pattern of behaviour that is characterized by a decrease in the concentration of each, with time. The rate of decrease of each appears to be reasonably similar within each of the plants examined and this suggests that it might be better to consider N. P and S together, rather than as separate entities. It is also evident from the
diagrams that as the concentration of N, P and S decreases respectively with maturation, that o f non-nitrogenous organic matter increases. This in turn suggests that each of the anions is inversely related to the nor.-nitro- genous organic matter and that maturation therefore implies a progressive dilution of the former by the latter.
These aspects of plant growth are discussed in a succeeding paper.
Summary
The changes that occur in the concentration of nitrogen, phosphorus, sulphur and non- nitrogenous organic matter in three perennial grasses, two cereals and a legume during restricted and/or unrestricted growth under field conditions are described.
All these plants are sensitive to changes in water regime and when this is adequate or nearly adequate and growth is unrestricted, the concentrations of N. P and S which are initially high or relatively high in the young growth, decrease with time and there is a concomitant increase in the concentration of the non-nitrogenous organic matter.
188

EAST AFRICAN AGRICULTURAL AND FORESTRY JOURNAL JANUARY, 1963
The patterns of change in concentration of N, P and S are very similar in each of the plants examined and it is therefore suggested that these anions might better be considered together.
Maturation implies a progressive dilution of the anions by non-nitrogenous organic matter.
R e f e r e n c e s
111 Dougall, H. W. (1955). Nature. Loud.. 175. 957.
|2] Dougall, H. W. (1962). E. Afr. agric. for. J.. in the press.
[3] Dougall, H. W. (1962). E. Afr. agric. for. J., in the press.
REVIEWAgricultural Entomology in the T ropics,
by G. H. Caswell, published by Edward Arnold, London, 1962, 152 pp. Price Sh. 21.
This book consists of a general account of the major insect pests of agricultural crops in the tropics. After a brief introduction the insect orders are considered in turn. In most o f the more important orders each relevant family or sub-family is reviewed, and the better-known insects mentioned by name. As an aid to recognition there is a brief description of the general appearance of each group when usefully outstanding features are present. The bulk of the text is devoted to insect life histories in relation to the crops attacked. Their world distribution and examples o f the extent of damage are sometimes given.
The author divides the insect problem into three stages. The first is a study of the pest and its relationship with the commodity to be protected. Mr. Caswell's ten years of tropical
experience of this aspect is summarized in the book. The second, a study of the existing factors which regulate the number of pests present, and the third, the effect of changing existing factors or introducing new ones, are represented by occasional references to climatic factors or parasites. The author stresses his concern here with the first stage, and it is doubtful whether he would support the publisher’s claim on the dust cover that a thorough account of all three stages is given.
N o pretence is made of enabling the agriculturist to identify pests, and there are no illustrations. A basic knowledge of entomology is therefore presupposed, and the book is probably of most use to an entomologist as an agricultural background, but an entomologi- cally-minded agriculturist would find it interesting for reference. The bibliography, classified under about 20 o f the more important crops, is a useful starting point for anyone investigating the pests of a particular crop.
W.W.
189

EAST A FR IC A N A G R IC U LTU R A L AN D FO RESTRY JO U RN A L JANUARY, 1965
REVIEWSC rop H usbandry, by R. D. Park, published by
Oxford University Press, London, 1961, 237 pp. Price 18/-.
This book is ideal for the purpose for which it was written, i.e. Farm Institute students or part-time courses on agriculture.
It gives a sound basic knowledge of simple agriculture but is very specific to conditions and practices in U.K... and it is doubtful if it would be suitable for students in Tropical Agriculture.
C.S.A. Meeting of Specialists on Open Forests in Tropical Africa, July. 1960. Pub. No. 52. Commission for Technical Co-operation South of the Sahara. Publications Bureau, Watergate House. York Buildings. London, W.C.2.
This publication records in English and French the recommendations and conclusions of a meeting of specialists on the “woodlands'' (forets claires) of tropical Africa. The meeting was convened by the Scientific Council of Africa South of the Sahara (C.C.T.A./C.S.A.) at Ndola. Northern Rhodesia, in November. 1959. It was the result of a recommendation made by the second Inter-African Forest Conference held at Pointe Noire. Congo Republic (Brazzaville), in July, 1958. This gathering was both international and inter-scientific and was attended by the surprisingly large number of 45 delegates representing four nationalities, some 15 countries and included botanists and ecologists as well as foresters.
The agenda was of wide interest and some 32 technical papers were submitted of which no less than 17 have been included in the publication.
The first chapter sets out the conclusions arrived at and the recommendations made by the meeting on the numerous facets of the dry woodlands of Africa.
These cover such aspects as defining and designating the various types of woodlands, the nomenclature and classification of plant species, the compilation of a comprehensive bibliography, fire protection, protection of woodlands (national viewpoint), silviculture and management, climatology, soils, hydrology, introduction of exotics, utilization, research and other allied subjects.
Of the very many points made by the meeting. too numerous to mention here, perhaps the section on protection of woodlands contains some of the more important items. In this the specialists having noted that mans woodlands are in the process of degradation or even destruction, request C.S.A. to draw the attention of governments to the dangers that would result from the wholesale destruction of the woodlands and to recommend that member governments lake appropriate protection measures for the conservation of large areas of woodland which cover some five million square miles o f Africa South of the Sahara. Throughout all the sections in this chapter one reads of the urgent need for a complete interchange of information between the countries and the essential requirement to this end of common standards, definitions, etc. There are four useful appendices: (1) a list of 78 main species of the woodlands, (2) a questionnaire for inquiring into the problems of African woodlands,(3) a draft questionnaire on the effects of fire and. (4) a list of the 32 technical documents submitted to the meeting.
The last part of the publication contains 17 working documents selected for their great value to the future development of woodland regions and between them they cover all the major aspects of African woodland working.
This publication is one of the few outward and visible signs, o f the growing awareness and the vital importance, o f these dry area forests not only to the millions of people who live in them and therefore depend on them for their day-to-day existence, but also to large industries such as copper mining, gold mining and local agriculture.
P.H.
190

EAST AFRICAN AGRICULTURAL AND FORESTRYJOURNAL
Vol. XXVIII—No. 4 APRIL, 1963Printed and published by the Government Printer. Nairobi
Issued under the authority of the East African Common Services Organization and published every three months—July. October, January. April. Volume consists of four issues (commencing July issue)
\Editorial Board: Director of E.A. Agriculture and Forestry Research Organization: Director of E.A. Veterinary
Research Organization; Directors of Agriculture, Kenya, Uganda and Zanzibar, and Commissioner for Agriculture, Tanganyika; Director of Veterinary Services, Kenya and Uganda, and Commissioner of Veterinary Services, Tanganyika; Conservators of Forests, Kenya, Tanganyika and Uganda.
Executive Committee: Director of E.A. Agriculture and Forestry Research Organization; Director of E.A. Veterinary Research Organization; The Editor.
E d i t o r : J. G l o v e r
E.A.A.F.R.O., P.O. Box 21, K ikuyu, K enya
Subscription Sh. 13 per volume (Sh. 4 single copy) including postage, payable to the Editor. Subscribers are advised to remit postal orders in payment, otherwise bank commission must be added in the case of cheques.
The Editor does not hold himself responsible for opinions expressed by contributors.
Matter submitted for publication should preferably be sent through the local member of the Editorial Board. Double spacing should be used in typescript. Contributors receive 25 prints of their articles free. Additional copies may be obtained on payment if asked for in advance. Prints bear the same page numbers as the original articles in the Journal, except where, to meet a contributor’s wishes, prints are supplied before publication has been completed.Readers are reminded that all agricultural inquiries, whether they relate to articles in the Journal or not, should t>e addressed to the local Director of Agriculture, and not to the Editor.
CONTENTSPAGE
Notes on Animal Diseases. XXIII—Mineral Deficiency Diseases (D. A. Howard) . . 191
Preliminary Observation and Discussion on the Dry Soil Nutrition of Coflee (J. C. IVarden) 195
Nutritional Value of some common Cattle Browse and Fodder plants of Karamoja— Northern Province, Uganda (J. G. tVilson and R. M . Bredon) . . . . . . . . 204
Body Reactions of Kenana Calves Fed All- Roughage Rations under Hot Dry Conditions in the Sudan (K. A. Alim) ........................... 209
A Comparison of the Minus-one and 2"Designs for the Exploratory Investigation of Fertilizer Requirements (/’. H. Eemare) . . 213
Preliminary Observations on Gestation Length and Birth Weight of Ethiopian Cattle (J. G.Glen, Shankute Tessema and R. Larsen) . . 221
The Use of Napier Grass for Milk Productionin the Trans Nzoia (IF. D. IVare-Auslin) . . 223
PACE
Soil Fertility Studies in Tanganyika—II(A . C. Evans) . . . . . . . . . . 228
Soil Fertility Studies in Tanganyika—111(A . C. E v a n s ) ................................................... 231
Sugar Beet Trials in West Kenya (J. L. Elmer.J. M. Gosnell and R. G. Smith) . . . . 240
Meal Production from Indigenous, Crossbred and Imported Poultry in Uganda (J. C. M.Trail) ........................... 249
The Occurrence, Sampling and Control of Tetranychus Ludeni Zacher. (Acarina-Tetranychidae) on Pyrethrum (J. A. Bullock) 252
The Effect of Maize on the Carcass Quality of Bacon Pigs (P. Myers) 255
The Value of African Type Swill for PigFeeding (A N. A. Modebe) . . . . 258
Reviews .......................... 264
INDEX TO ADVERTISERSPAGE
Barclays Bank D.C.O............................................... IVCommonwealth Agriculture Bureaux . . . . IVDunlop ....................................... co v er p ag e 4
E.A. Breweries ........................... c o v e r p a g e 2Industrial Distributors Ltd. .......................... I
Kenya Advertising Corporation ..
National & Grindlays Bank
Old East African Trading Company
Standard Bank
p a g e
c o v e r p a g e
III3
II

What feeds the roots ?
In the last analysis.lhe same essential that nourishes any business — money. Money is Barclays business. Since the early days of coffee in Kenya, Barclays have provided top class service to the coffee growing industry. An example of Barclays ever increasing service is the opening of their new office in Plantation House.
Hours nf business — Monday to Friday 9 a.m. — 12 noon
Saturday 9 a .m .— II a.m.
Published I960T H E IN D IG EN O U S L IV ESTO C K OF EA STERN A N D SO U TH ERN AFRICAby I. L. MASON and J. P. MAULE
Technical Communication No. 14 of the Commonwealth Bureau of Animal Breeding and Genetics
150 pp. 180 illustrations and 3 maps Price: 45s.
The book provides a comprehensive description of all types of livestock in the area east of a line drawn from the Northern Sudan to *he mouth of the Congo. Measurements and live weights, as well as an indication of pe'formance, are given wherever possible and there is a complete bibliography.
"The information given in this book should form a guide as to which of the various types it will be worthwhile to concentrate on for improvement in production. . . . ” — Sir John Hammond in "Nature".
The book is indispensable to anyone connected with the livestock industyry of Africa
O rd e rs fo r th is p u b lica tio n ca n b e p la c e d w ith any
m a jo r b o o k s e l le r o r seat to:C O M M O N W E A L T H A G R I C U L T U R A L B U R E A U X , C E N T R A L SA L E S B R A N C H , F A R N H A M R O Y A L , B U C K S , E N G L A N D .
Please m en tio n th is Journal when rep ly in g to advertisers

EAST AFRICAN AGRICULTURAL AND FORESTRY JOURNAL
NOTES ON ANIMAL DISEASESXX III—MINERAL DEFICIENCY DISEASES
By D. A. Howard, Veterinary Research Laboratory, Kabete, Kenya(Received for publication on 12th May, 1962)
Parts of Kenya, like many other regions of Africa, are deficient in a number of the mineral elements essential in animal nutrition. This was first shown in experiments carried out by workers from the Rowett Research Institute at Molo as long ago as 1927-29 where dairy cows provided with mineral supplements in this area produced heavier calves and gave a considerably increased milk yield, while maintaining better condition than the unsupplemented controls, particularly during the dry seasons.
This paper will mention some of the more important mineral elements concerned with animal nutrition, together with some of the clinical symptoms of deficiency, and will describe measures for the correction of these deficiencies.
The elements under discussion may be divided into two groups, minor and major. The minor, or trace, elements such as copper, cobalt, and iodine, are needed in very small amounts which can be measured in milligrammes or even microgrammes per day (a microgramme is 1/1,000,000 of a gram). The major elements such as calcium, magnesium and phosphorus are needed in relatively large amounts, which can be measured in grams or even ounces per day.
M inor E lem ents
CobaltIn 1926 the Rowett Institute worked on
“Nakuruitis”, a wasting disease of ruminants. At that time these workers considered that the condition was due to a deficiency of iron, but there is no doubt that the efficacious results obtained by feeding iron were due to traces of cobalt in the iron oxide used, for cobalt is an impurity in most crude iron compounds. This was later proved by the feeding of minute amounts of a chemically pure cobalt salt which controlled the condition.
“Nakuruitis” may occur even when there is abundant pasture available, as cobalt is not essential for plant growth. It is clinically indis
tinguishable from Enzootic Marasmus which occurs in certain parts o f Western Australia. Characteristic symptoms are loss of condition and anaemia, some animals showing signs of abdominal pain in the later stages. At postmortem examination, there are rarely any obvious lesions other than emaciation and anaemia. Cobalt deficiency in sheep leads to poor growth and reduced wool production. It should be emphasized that no clinical cases of “Nakuruitis” have been confirmed in Kenya for some years, almost certainly because of the widespread use of mineral licks throughout the Colony, and the general awareness of farmers of the possible occurrence of mineral deficiencies. The main incidence of the disease in the past appears to have been along the Rift Valley on an area of volcanic soil from Mount Longonot to Nakuru. This area appears to coincide almost exactly with that where today most copper deficiency occurs.
CopperCopper deficiency has been described in
many countries in recent years where it sometimes constitutes a serious economic problem. In new-born Iambs the disease is characterized by anaemia and incoordination of movement or paralysis, hence the name “Swayback” which is the common name of the condition in Britain. There is no loss o f appetite, but the disease usually progresses to a fatal end. A similar disease of Iambs has been reported in South America, Sweden, South Africa and India, and is called “enzootic ataxia” in Australia. In some areas of Australia “stringy” or “straight steely wool” has been described as the chief symptom of deficiency in sheep over the age of weaning and is noticeable, particularly in the Merino breed. The wool becomes straight and stringy and loses its bulk and black sheep lose their colour. The provision of extra copper causes an immediate return to natural crimp and bands of normal and steely wool may be seen in the staple cut from sheep which have been through alternating periods of deficiency and supplementation.
191

EAST AFRICAN AGRICULTURAL AND FORESTRY JOURNAL APRIL, 1963
i Copper deficiency of cattle has been described in most parts of the world and has been diagnosed in Kenya. The symptoms of deficiency can include a stilted gait, a dull rough coat often with loss o f pigment with patches of pale hairs around the eyes, anaemia and unthriftiness leading finally to emaciation. In some instances, diarrhoea has been noted.
1 Copper deficiency is sometimes induced by excess of other elements, such as molybdenum, or molybdenum and sulphate acting together, so that even although the pasture copper levels are apparently adequate, the symptoms of copper deficiency may occur. Molybdenosis, a condition caused by straightforward excess molybdenum is known as “teart” in the United Kingdom. Black cattle become rusty in colour with harsh, staring coats, they lose weight and milk yield is depressed. Scouring is a constant symptom. A similar condition has been reported as “peat scours” in New Zealand where bone fragility is also a symptom. Clinical molybdenosis has not been recorded in Kenya.
In Kenya work on blood, liver and pasture samples has established that there is an area of copper deficiency extending along the edge of the Rift Valley to Nakuru. There are also marginal areas in the Nakuru, Njoro, Rongai and Solai regions, the Mweiga, Naro Moru. Nanyuki and Timau districts and in Thomson’s Falls, OI Kalou and Oi Joro Orok. Approximately 35 per cent of the Kenya pastures recently analysed contained less than five parts per million of copper and are therefore below the level at which copper deficiency is generally considered to show'itself.
In most cases obvious clinical cases of deficiency have been rare, again owing to conscientious mineral supplementation by farmers. But recently striking examples were found on a farm in the Naivasha/Gilgil area where very high-grade Friesian calves exhibited typical rust-coloured coats. Analysis o f liver samples from some of the calves showed that they were very deficient in copper. Bone fragility occurring on this farm among these calves was similar to that found in severe deficiency in New Zealand.
IodineIodine is another trace element of which
very minute quantities are required. Analysis of this element has not been undertaken in this country to date owing to the technical difficulties involved and the special facilities
required. Although very few cases of goitre have been described in Kenya most proprietary licks include iodine, in much the same way as many brands of table salt contain additional iodine.
M ajor E lements
PhosphorusIn Great Britain Orr (1929) found a phos
phate level of just over 0.7 per cent P.O, in good cultivated pastures, while Du Toil, Louw and Malan (1940) in South Africa suggested that 0.3 per cent P20 3 was the minimum level of pasture phosphorus required for normal growth of grazing cattle. Hignett and Hignett (l 952) working on the fertility of heifers in England estimated that a daily intake of 50 g. PjO, was necessary for full fertility. At a consumption of 9 Kg. of dry matter per day a pasture would need to contain at least 0.55 per cent P.Oj in order to meet these requirements. Recent work in America by Wise, et al (19581 found a level of 0.5 per cent P2Oa to be necessary for calves.
In the current mineral deficiency survey in Kenya 36 per cent of the ordinary pastures analysed have been found to contain levels of less than 0.3 per cent P.O., which is below most of the suggested minimum levels, whilst the overall average for nearly 800 pastures taken from all over the colony was only0.41 per cent P:0 3. The survey indicated that the only area of those tested in Kenya with a fairly satisfactory level o f phosphorus was Naivasha/Gilgil. As most farmers feed phos- phatic supplements very few clinical manifestations of phosphorus deficiency have been observed. The main symptoms of this deficiency are unthriftiness, infertility especially in heifers, poor milk production, lameness and. in extreme cases, emaciation and depraved appetite. In South Africa before phosphorus supplementation was widely practised osteo- phagia or bone eating was commonly observed and this led in some cases to the disease called “Lamsiekte”, caused by the toxins produced by Clostridium botulinum in decaying bone and animal matter. Few reports of osteopbagia have been received in Kenya, but a survey in 1953 indicated that the habit was common in parts o f the Non-Scheduled Areas.
CalciumCalcium levels in pastures throughout the
Colony have been found to be satisfactory although the overall average of 0.532 per cent
192

EAST AFRICAN AGRICULTURAL AND FORESTRY JOURNAL APRIL, 1963
CaO is below the normal British level. A straightforward calcium deficiency in the grazing ruminant is most unlikely and it should be remembered that bonemeal and dicalcium phosphate which are most commonly used to counteract phosphorus deficiency contain more calcium than phosphorus. The hypocalcaemia or low serum calcium levels found in milk fever are caused by a physiological disturbance at the time of calving, and not as the result o f a straightforward calcium deficiency.
Sodium
The sodium levels found in pasture throughout Kenya are very low compared with the 0.26 per cent N a ,0 quoted by Orr as normal for British pasture. In Kenya, excluding the Naivasha area, 77 per cent o f all the pastures analysed contained 0.01 per cent Na.,0 or less, and only 1.8 per cent contained more than 0.1 per cent Na„0. In comparison our pastures contain normal amounts of the similar element potassium which has, however, quite different functions in the animal. There is at the moment considerable controversy over the amount of sodium necessary for livestock. The mammalian body has considerable ability to conserve sodium and to get rid of the invariably more abundant potassium when the intake of the former is inadequate. Breakdown occurs only after a very long period of sodium deprivation and when it does the animal collapses completely and dies. In the present state of our knowledge it would appear that by any standards the sodium content of Kenya pastures is inadequate to meet the requirements of dairy cattle and the inference is that beef cattle would also benefit from salt supplementation. All proprietary licks sold in Kenya either contain, or are intended to be mixed with, salt.
Potassium
The levels of potassium found in Kenya pastures compare well with those in productive grasses elsewhere in the world and are adequate for animal nutrition. In any case Neal (1941) in America held that plant growth would fail before the amount of potassium in the plant was reduced to a level inadequate for livestock. As mentioned previously, the animal in Kenya is obliged to eliminate excess potassium which is found in great amounts compared with sodium. During the survey some K /N a ratios were found as great as 1000 / 1, among the highest ever recorded.
MagnesiumThe magnesium levels in Kenya pastures
compare favourably with those recorded in the United Kingdom, where workers have sometimes had recourse to magnesium feeding and top dressing to prevent grass tetany in the spring. Although some cases of hypomagnas- aemia have been suspected, particularly in the Naivasha area, we have not been able to confirm a single case by serum analysis and magnesium supplementation is not yet justified.
IronA deficiency o f iron is not likely to occur
in grazing stock in Kenya because of the large quantities present in the soil and therefore in dust on herbage; such iron is available to the animal when consumed. Young pigs which are housed in sties with impermeable floors may develop piglet anaemia, but the condition is rare. All proprietary licks designed for consumption by pigs contain iron, and iron compounds for injection are also employed.
Correction of Mineral DeficienciesFor generations it has been the practice of
native herdsmen to move their cattle to natural earth licks at regular intervals and both cattle and game animals seek out such licks. Detailed analysis of a number of natural licks from several areas o f Kenya has shown that the major elements are not present in sufficient quantity to alleviate any deficiency, but that cobalt probably is. There is the possibility that the value to cattle of these licks may be only as a condiment.
The application of 5 lb. of copper sulphate per acre to correct a copper deficiency in the pasture has proved o f value in some cases, but the same treatment has occasionally caused copper poisoning in sheep when the application was followed by a long dry spell. Copper deficiency in sheep and cattle can also be corrected by injection with copper glycinate, but this method should only be used following professional advice. Cobalt deficiency can be counteracted by dosing cattle and sheep with cobalt “bullets” if a mineral lick is not provided, but most proprietary mineral licks provide adequate amounts of cobalt and also sodium which is always deficient.
In general it is most economic to correct mineral deficiencies by supplementation of the animals themselves; compound mineral licks are most suitable for this purpose. The following formula is recommended for a home-made
193
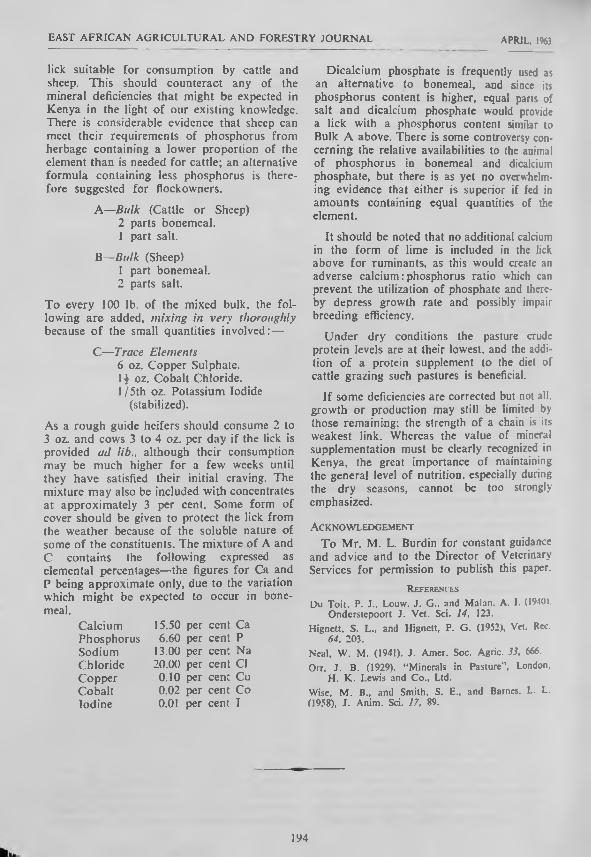
EAST AFRICAN AGRICULTURAL AND FORESTRY JOURNAL APRIL, 1963
lick suitable for consumption by cattle and sheep. This should counteract any of the mineral deficiencies that might be expected in Kenya in the light o f our existing knowledge. There is considerable evidence that sheep can meet their requirements of phosphorus from herbage containing a lower proportion of the element than is needed for cattle; an alternative formula containing less phosphorus is therefore suggested for flockowners.
A —Bulk (Cattle or Sheep)2 parts bonemeal.1 part salt.
B —Bulk (Sheep)1 part bonemeal.2 parts salt.
To every 100 lb. of the mixed bulk, the following are added, mixing in very thoroughly because o f the small quantities involved:—
C— Trace Elements6 oz. Copper Sulphate.H oz- Cobalt Chloride.1 /5th oz. Potassium Iodide
(stabilized).
As a rough guide heifers should consume 2 to 3 oz. and cows 3 to 4 oz. per day if the lick is provided ad lib., although their consumption may be much higher for a few weeks until they have satisfied their initial craving. The mixture may also be included with concentrates at approximately 3 per cent. Some form of cover should be given to protect the lick from the weather because of the soluble nature of some of the constituents. The mixture of A and C contains the following expressed as elemental percentages—the figures for Ca and P being approximate only, due to the variation which might be expected to occur in bone- meal.
Calcium 15.50 per cent CaPhosphorus 6.60 per cent PSodium 13.00 per cent NaChloride 20.00 per cent ClCopper 0.10 per cent CuCobalt 0.02 per cent CoIodine 0 .0 1 per cent I
Dicalcium phosphate is frequently used as an alternative to bonemeal, and since its phosphorus content is higher, equal parts of salt and dicalcium phosphate would provide a lick with a phosphorus content similar to Bulk A above. There is some controversy concerning the relative availabilities to the animal of phosphorus in bonemeal and dicalcium phosphate, but there is as yet no overwhelming evidence that either is superior if fed in amounts containing equal quantities of the element.
It should be noted that no additional calcium in the form of lime is included in the lick above for ruminants, as this would create an adverse calcium: phosphorus ratio which can prevent the utilization of phosphate and thereby depress growth rate and possibly impair breeding efficiency.
Under dry conditions the pasture crude protein levels are at their lowest, and the addition o f a protein supplement to the diet of cattle grazing such pastures is beneficial.
If some deficiencies are corrected but not all. growth or production may still be limited by those remaining; the strength of a chain is its weakest link. Whereas the value of mineral supplementation must be clearly recognized in Kenya, the great importance of maintaining the general level of nutrition, especially during the dry seasons, cannot be too strongly emphasized.
A cknow ledgement
To Mr. M. L. Burdin for constant guidance and advice and to the Director of Veterinary Services for permission to publish this paper.
R eferences
Du Toil. P. J.. Louw. J. G.. and Malan. A. I. (19401.Onderstepoort J. Vet. Sci. 1 4 , 123.
Higoett, S. L., and Hignett, P. G. (1952), Vet. Rec.6 4 . 203.
Neal, W. M. (1941). J. Amer. Soc. Agric. 3 3 . 666. Orr, J. B. (1929). “ Minerals in Pasture", London.
H. K . Lewis and Co., Ltd.Wise, M. B., and Smith, S. E„ and Barnes. L. L. (1958), J. Anim. Sci. 1 7 . 89.
194

EAST AFRICAN AGRICULTURAL AND FORESTRY JOURNAL APRIL, I%3
THE DRY SOIL NUTRITION OF COFFEEBy J. C. Warden. Chemist, Coffee Research Station, Lyamungu, Tanganyika
(Received for publication on 24 th A pril, 1962)
Coffee trees (Coffea arabica L.) in the Northern Province of Tanganyika suffer from extensive periods without rain. At the Coffee Research Station, Lyamungu. for instance, almost 60 per cent of the rainfall (the annual mean is 62 in.) has fallen on average during the two months of April and May over the past 27 years. Overhead sprinkler irrigation is practised on most of the larger plantations but the present limits imposed by water economy and expenditure, together with a lack o f detailed knowledge, permit the application o f only 2£ to 3 in. per month. Seriously low levels of the major plant nutrients occur in the coffee trees during the dry periods, and knowledge of the part played by a lack of topsoil moisture is o f importance.
A paper by Mason [1] about the effect of soil moisture on the mineral composition of apple plants grown in pots is of considerable interest. However, in common with the literature reviewed by Mason, some of which is discussed later (18, 19, 20], no difference was distinguished (i.e. by experimental treatment) between changes in mineral composition caused by changes in the metabolism of plants imposed by a total general restriction of water, and those changes immediately caused by unavailability of the elements to the feeder roots under the dry soil conditions. This distinction is considered to be important in coffee experimentation for the following reasons: —
1. There is a very great predominance offeeder roots in the top 2 to 3 ft. o f soil with the highest concentration in many cases in the top foot. The results of Nutman [3] who made a comprehensive study of root development in East African coffee trees, emphasizes this, as does a photograph o f a typical coffee root system in Kenya on a red latosol similar to the Kilimanjaro red loam soil at Lyamungu, published by Pereira [5].
2. The top of the soil profile is known todry very rapidly under conditions of clean cultivation in the dry season (see Figure 1).
3. In spite of the proliferation of the lateralroot system in the topsoil, vertical roots penetrate very deeply where there is an
adequate depth of free draining soil; in many cases down to 15 ft. Here available moisture will persist for much longer periods than it does in the topsoil, Pereira and Jones [21], Pereira [5].
4. Badly wilted coffee trees, i.e. with a pooroverall turgidity, are rare and are generally found to have damaged root systems. Trees are sometimes seen to wilt temporarily in the midday sun.
5. Wadleigh and Richards [12] have recentlyemphasized that the fertile topsoil may dry to less than wilting point, although moisture may be available in the deeper but less fertile part of the profile. Analytical data on soil profiles at this Research Station have been published by Stent [4],
It is thus probable that a coffee tree can extract from the soil sufficient water to maintain turgidity and yet show symptoms of malnutrition which cannot wholly be ascribed to soil infertility. The volcanic clay loams and silty ash soils o f the Northern Province of Tanganyika are exceptionally fertile [2, 4], though heavy crops may have reduced this in some areas.
Some of the discrepancies revealed in the literature reviewed by Mason [1] may have been dfie to inadequate appreciation of physiological changes in nutrient requirement brought about by wilting conditions, and it was hoped that a clearer picture would emerge if a treatment could be found whereby the effect of total plant water on metabolism could be obviated.
The following trial was designed with this consideration in view.
E xperimental
Nine -similar one-year-old seedlings of arabica coffee of a Kenya selection S.L. 6 (chosen for convenience of age, and size) were taken from a nursery bed with their roots as far as possible intact. The seedlings were planted in “bags” made front 9-in. lengths of polythene tube of 5-in. lay-flat diameter, closed at one end around corks bored with a -(-in. hole. The soil used was typical Lyamungu topsoil which had been carefully mixed in bulk for another greenhouse trial. Six seedlings were
195

EAST AFRICAN AGRICULTURAL AND FORESTRY JOURNAL APRIL. I%3
Fig. 1.—Rainfall and moisture tension as recorded by the resistance in log ohms of gypsum blocks buried at different depths. Coffee Research Station, Lyamungu, conditions
of clean cultivation and absence of shadeNote.—Measurements (unpublished) at this Station show that coffee seedlings in boxes filled with local topsoil experience serious loss of turgidity above a reading of 5 log ohms
inserted in the “bags” with their lowest roots protruding some 4 to 5 in. through the holes in the corks. The roots were loosely wedged in the corks with cotton wool. The plants were then placed upright on tripods and the protruding roots inserted into lengths o f large-bore glass tubing (approximately 7 in. X 1£ in. diameter) leaving about 1 in. of empty tube at the bottom. The bottoms of the tubes were closed with cotton wool; they were then set up in petri-dishes and filled with charcoal granules of between six and eight B.S. mesh (treatments WO and WW. see below). The remaining three seedlings were planted normally in polythene tubes filled with topsoil (Treatment OO, see below). The plants were transferred to the greenhouse and positioned in
three replicates of three seedlings each. The charcoal was moistened with distilled water leaving a level of | in. in the petri-dishes (Plate I). The plants were supplied with ample soil moisture for three weeks to establish themselves. The distilled water in the charcoal was changed daily.
After three weeks, soil water was withheld completely from the plants with roots wholly in soil (treatment OO), and from three of the remaining six seedlings with protruding roots (treatment WO), while enough water was supplied to the soil of the remaining three seedlings (treatment WW), to keep the top of the soil permanently moist, but without causing any leaching. The dry treatments were weighed
196

e a s t AFRICAN AGRICULTURAL AND FORESTRY JOURNAL APRIL, 1963
daily (after distilled water had been sucked out of the petri-dishes of treatment WO) and soil drying curves were drawn. These were very similar and there was no difference between the OO and WO treatments until wilting began after 18 days.
Plate I.—Replicate C.W.W. and C.W.O. Root development at completion of experiment.
WW = Full wet treatment; WO = Water supplied to lower roots in the charcoal only
When the wilting stage was reached the weight o f water lost through transpiration was added each day to the soil in both the OO and WO treatments; the OO treatments stayed in a state o f permanent moderate wilt. The WO treatments showed some slight wilting at first but later recovered.
An intense storm caused a leak on to one of the replicates before wilting was induced, resulting in a delay to this group (replicate C). When drought had been maintained for ten days it was decided to sample replicates A and B. since at this stage growth was likely to introduce errors in the weight o f water added to the WO treatments. As no obvious visual mineral deficiency symptoms were present on any of the treatments, it was decided to keep the WO and WW treatments of replicate C for an
extended period. The OO treatment of this replicate was sampled after the statutory ten days, since the wilted plants did not seem healthy enough to undergo extended treatment. The plants CWO and CWW were sampled after a further 18 days. At this time CWW was h^ealthy and flourishing; CWO showed no signs of wilt but was obviously suffering a reduced rate of growth, and the leaves, especially the tips, were a paler green.
Substantial root development had been induced in the charcoal area of the plant CWO. and healthy but less prolific roots were visible in the charcoal area of the plant CWW. The roots of these two plants at the end of the experiment are shown in Plate I. In none of the replicates had the roots in the charcoal died, and it was clear that the plants grew under the WO treatment in a satisfactory fashion. However, the results of leaf analysis showed later that the further 18 days were necessary to obtain appreciable nutritional differences from the treatment.
When the decision was made to keep the plants CWO and CWW for an extended period, it was felt that any error introduced would be one of degree and that the additional information gained on experimental method would be a great help towards greater precision in the future.
S ampling
The immature tip-leaves of each plant were collected separately; all the remaining leaves were collected as an additional sample. The leaf material was dried at between 70° and 80° C., ground to pass 40 B.S. mesh bolting cloth, and each sample thoroughly mixed. Separate sub-samples of the mature leaf material were dried at 105° C. for moisture correction. Micro-determinations of nitrogen only were made on the tip samples, after the whole of the material had been dried at 105° C.
A n aly ses
It is not proposed to describe analytical techniques in detail. All determinations other than total ash and water soluble nitrogen were made in duplicate. Nitrogen was determined by the method of Robinson [6]. The remaining elements were analysed after digestion with nitric and perchloric acids; calcium and magnesium by the method of Padhye [7], potassium by direct flame photometry, and phosphorus colourimetrically using ammonium
197

EAST AFRICAN AGRICULTURAL AND FORESTRY JOURNAL APRIL, 1%3
vanadate and ammonium molybdate [22], An attempt was also made to obtain a figure for non-protein reserves of leaf nitrogen. 200 mg. sub-samples were boiled for ten minutes in Kjeldahl flasks with distilled water and the solutions distilled with caustic soda in a Strafford still. Duplicate determinations were performed on three samples where material allowed, and agreement was excellent. Total ash was determined by ignition at 520° C. in a muffle furnace.
R e s u l t s
The results from all nine plants were submitted to analyses of variance, element by element. While the changes between treatments in replicate C conformed with those of the other replicates in general, they were of a much higher order, and differences of the plant CWO from the experimental mean reached statistical significance in two of the elements analysed. (Marked thus * in Table 2.) The results are given in Tables 1 and 2.
Table 1.—Leaf M ineral Content of Coffee Seedlings under Three Moisture Treatments
P er Cent in D ry MatterTotal Content
Per cent in Dry Matter x Wt. of Dry Leaf Material Meq.
Dry Soil (OO)
Dry Soil + Water
(WO)
Wet Soil -f Water
(WW)Level
of Sig.Dry Soil
(OO)Dry Soil + Water
(WO)
Wet Soil + Water
(WW)Level
of Sig.
Nitrogen in tips 3-91 3-63 3-88 NS _ _ _Nitrogen mature leaf (3-24 310) 3-64 5% (8-0 8-8) 15-6 1%Nitrogen all leaves . . — — — — (JO-4 10-0) 171 1%Water-sol N mature
leaf •32 •28 •38 NS -Phosphorus mature
leaf •069 •082 ■089 NS (2-12) 3 08 (5-34) 5% 'Potassium mature leaf 2-70 2-45 2-43 NS (22-4) (24-6) 37-3 5%Calcium mature leaf 1-99 (1-45 1-44) 5% 34-7 28-6 41-8 NSMagnesium mature
leaf •41 (■32 ■33) 5% ' (11-7 103) 161 5%Total ash mg. 11-6 (9 2 8-9) 5% 372 363 530 NSTotal dry matter, g. . . (4-05 4-49) 6-59 5% | — - —
Note.—The significance figures refer to differences between the mean of bracketed results and the unbracketed result, except in the case of phosphorus, where the two bracketed results are significantly different from each other.
All results are means of three replicates.
T able 2.—E xtended R eplicate (CWO) of D ry Soil + Water Treatment
Per Cent in D ry MatterCWO(single
seedling)
Mean of all
seedlings
CWO—mean L.S.D. 5% (last
column)mean
Nitrogen in tips 316 3-80 -17% -27%N, mature leaf 2-75 3-32 -1 8 % —14%*P, mature leaf •061 •079 -23% -63%K, mature leaf 1-72 2-53 -32% -4 1 %Ca, mature leaf 1 -06 1 -33 -35% -39%Mg, mature leaf •25 •35 -30% — 26%*Soluble: Total N, mature leaf % . . 7-6 9-7 - 2 2 %Total dry matter, g r a m s ........................... 5-36 5-05 + 6 %
198

EAST AFRICAN AGRICULTURAL AND FORESTRY JOURNAL APRIL, 1%3
Total D ry MatterThe wet soil treatment (WW) produced
significant increases in the total leaf dry matter content over the other two treatments during the short period of the experiment. Where the dry soil + distilled water treatment was applied for the extended period, the plant (CWO) had a slightly higher leaf dry matter content than the experimental mean, suggesting that growth took place under the treatment.
NitrogenDifferences in the tip leaf nitrogen did not
reach statistical significance, and did not conform with the results of the older leaves. The highest concentration was found in the willing plants (OO), however, and the lowest in those provided with distilled water under dry soil (WO). In the mature leaves the wet treatment (WW) resulted in a significantly increased concentration of nitrogen over the other two treatments. WO having the lowest. The same proportions were reflected in the water-soluble (non-protein) nitrogen. The results of the total nitrogen content of the mature leaves per plant were similar to the results o f concentration in dry matter.
PhosphorusThere was a good deal o f variation in the
phosphorus content between plants, and consequently statistical significance was not reached in the concentration results. The concentrations were lower than those normally found in mature trees on this Station (cf. Table 3; also Robinson [13], Muller [11]. Med- calf et at. [14], Culot and van Wambcke [23]) but were all higher than the level of .058 per cent P at which Loue [10] reports finding the first visible phosphorus deficiency symptoms in Robusta coffee seedlings grown in water culture. The results o f the wilting plants (treatment OO) would seem to have been especially low. In this respect the results differ markedly from the other elements, especially the cationic elements. In the total mature leaf content per plant, statistical significance was shown between the fully wet and fully droughted plants (treatments WW and OO). with the value of the WO treatment lying almost exactly on the mean.
Potassium, Calcium and MagnesiumThe concentrations of these elements were
consistently and (except potassium) significantly higher in the wilting plants (treatment OO) with little or no difference between the
other treatments. The result from the treatment replicate CWO was, however, the lowest in each case. In the total mature leaf content per plant, on the other hand, potassium and magnesium were significantly increased by the wet treatment, with little difference between the other two. The results o f the total mature leaf content of calcium did not reach satistical significance, but in contrast with the other two elements much less calcium was found in the WO plants than in either o f the other treatments.
Total AshThe concentration of total ash constituents
was significantly higher in the wilting plants (treatment OO). The total content per plant in the mature leaves was higher (not significantly) in the wet treatment (WW).
DiscussionPerhaps the most important result of this
trial was the success of the WO treatment. By allowing the soil to dry, but maintaining at the same time the turgidity o f the plants, it was possible to study the uptake of the major nutrient elements under dry versus wet soil conditions without complications arising from changes in metabolism directly caused by water shortage, i.e. treatment WW compared with treatments WO and OO.
Plate II illustrates differences between the roots of two plants, which received treatments WO and WW, at the end of the experiment. The roots were less prolific in the dry soil, but in reasonable health. It is the author's opinion that this treatment (WO) provided a useful approximation to conditions of mature, deep rooted coffee trees during drought periods, when growing in a deep latosol.
All the elements determined were reduced in leaf concentration in one replicate where the new treatment was extended for an additional 18 days. The percentage reduction varied between 17 per cent and 35 per cent, and it is deduced that dry soil conditions particularly in the fertile top-soil, must be at least partially responsible for major element deficiencies found in coffee trees during extended periods of dry weather, particularly during the period of crop maturation.
The increase in the concentration of the basic elements and of total ash in the wilting plants, is almost certainly due to ' a relative drop in the protein and carbohydrate contents,
199

HAST AFRICAN AGRICULTURAL AND FORESTRY JOURNAL APRIL, 1963
and this cause may be responsible in some cases for discrepancies in data from similar pot trials in the literature [1], [12], [19], References to decreases in leaf nitrogen in the field under irrigation [1], [18], are not supported by this work, but great caution should be exercised when relating nitrogen work on pot trials to conditions in the field, since micro-organisms are responsible for soil concentrations o f nitrate: Birch [8] has shown that alternate drying and wetting of tropical soils will cause flushes in the concentration o f soil nitrate, and this is likely to be overriding in effect. However, the results of this trial indicate that there is a lowering of availability o f nitrate to the roots under dry soil conditions.
Phosphorus nutrition is of particular interest. The results suggest that in the case of this element alone the total quantity of water absorbed by the plant is of direct relevance, the dryness of the soil being probably of secondary importance. This is presumed to be due to some co-dependence of phosphorus on turgidity for its proper function in the plant. The result is of additional interest in view of the recognized deficiency symptom of phosphorus in the coffee tree. From the author’s observations, confirmed by Robinson [9] and Loue [10], this is a drooping state of the leaves on the bearing nodes, with the appearance o f autumnal tints in the oldest leaves in severe cases (Muller [II] does not appear to mention the drooping condition of the leaves). The symptoms are common in unshaded coffee trees in the Northern Province of Tanganyika, and appear irrespective of normal amounts of available soil phosphorus as determined by the Truog method. Table 3 shows analytical data from bearing multiple stem coffee in one unshaded block at this station during hot dry weather in January,
1960. Only the tops of the trees exhibited the symptoms. No difference was found in the available surface soil phosphorus under good and bad trees.
Wadleigh and Richards [12] refer to the differing capacity of soils to fix phosphorus under dry conditions, the capacity being greater in the case of acid soils. The pH of the soil used was about 6.5. While indications of soil fixation of phosphorus are present, the greater dependence upon total water uptake suggests that phosphorus deficiency is to be expected rather in trees with poorly developed, shallow root systems. More recent observations in the field tend to bear this out.
The phosphorus content of coffee cherries is considerably less than that of either nitrogen or potassium (Robinson [13]) but leaf phosphorus is known to have an important bearing on crop yield. (Medcalf et al. [14], Muller [II]). Medcalf el al. also find correlation between soil moisture and the leaf content of phosphorus in coffee trees in the field.
The greatest apparent difference in the total potassium content of the mature leaves was the increase in the wet treatment (WW) over the other two, whereas in the case of calcium it was the decrease in the dry soil + distilled water treatment (WO) which was the most marked. The ratio of potassium to calcium in the plant is .o f great interest: in both concentration and total mature leaf content per tree there is a very large and significant drop in the values for the wilting plants, suggesting that, in common with phosphorus, there is a change in the ratio of potassium to calcium uptake when total water uptake is reduced. The potassium : calcium ratios are given in Table 4.
Table 3.—Phosphorus Deficiency in Bearing Multiple Stem Coffee Trees in Hot Dry Weather (Coffee R esearch Station, Lyamungu, January, 1960)
Clean Cultivation. % P in Dry Matter o f 1th Leaf Pairs. Means of 6 Trees
1 2 Top Bottom
Branches Branches Affected trees.
3Top
BranchesGood
4Bottom
Branchestrees
(Mean 2, 3, 4)— 1 Mean 2, 3, 4
Sig. at
N% 1-63 2-26 2-33 2-28 3% 1 %
P% •07 •17 •15 •18 59% 1 %
K% •75 •96 •84 •86 16% 1%
200

EAST AFRICAN AGRICULTURAL AND FORESTRY JOURNAL APRIL, 1963
T able 4.—Leaf K Ca R atio of Coffee Seedlings under T hree Moisture T reatments
K CaDry Soil
(OO)Dry Soil + Water
(WO)
Wet Soil + Water
(WW)
Level o f Significance
Concentration in dry leaf % 1-34 (1-70 1-69) 5%
Total mature leaf content per plant (Meq) •66 (■87 ■90) 5%
It was found in earlier work at this station from month by month analysis of the leaves of heavily bearing and lightly bearing groups of trees, that the most striking correlation with yield and rainfall was obtained from the potassium: calcium concentration ratio. (Some correlation was also obtained with phosphorus.) It is considered of sufficient interest in view of the results above to produce the graphs of these figures (K/Ca) together with yield and monthly rainfall, covering a period of two years. (Figure 2.) It would appear that abnormalities in this ratio are also to be expected in trees with poorly developed root systems. Wadleigh and Richards [12] review evidence in the literature on the reciprocal entry of
potassium and calcium into the plant with inadequate soil moisture. While a number of authors support the relationship described here there are inconsistancies, apparently between fertilized and unfertilized plots. No special consideration was, however, given to whether the plants were wilting, and once again this would appear to be the discriminating factor.
Warne [15] produced evidence of a reduction in the conductivity of water in the plant when potassium was deficient. He reported that potassium deficient trees were more subject to drought, and that potassium fertilizers increased cell size, and consequently leaf size, without increasing the number of stomata.
s o t T r n A n J 7 A S O Y J> J F l - I A M J J
U S '* . n s s
----< ( c o K b i t H e i i i c u r . « r m x v c x n t i n a t e x t :
--------- I V 17 --------- / 1 « * .
-----------11 1 4 r-«iFig. 2.—Monthly leaf analysis (K :Ca), yield and rainfall. First fully open leaves sampled from two groups of trees in the same experimental block. Concentration ratio of % dry leaf. Coffee
Research Sfation, l.yamungu. Kent's selection, planted 1943; shaded conditions
201
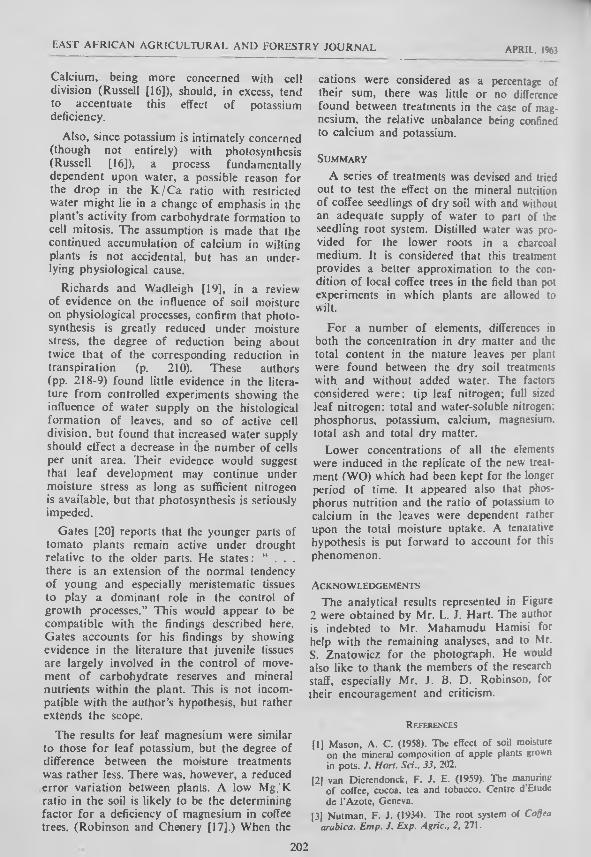
EAST AFRICAN AGRICULTURAL AND FORESTRY JOURNAL APRIL, 1963
Calcium, being more concerned with cell division (Russell [16]), should, in excess, tend to accentuate this effect of potassium deficiency.
Also, since potassium is intimately concerned (though not entirely) with photosynthesis (Russell [16]), a process fundamentally dependent upon water, a possible reason for the drop in the K /C a ratio with restricted water might lie in a change of emphasis in the plant’s activity from carbohydrate formation to cell mitosis. The assumption is made that the continued accumulation of calcium in wilting plants is not accidental, but has an underlying physiological cause.
Richards and Wadleigh [19], in a review of evidence on the influence o f soil moisture on physiological processes, confirm that photosynthesis is greatly reduced under moisture stress, the degree of reduction being about twice that of the corresponding reduction in transpiration (p. 210). These authors(pp. 218-9) found little evidence in the literature from controlled experiments showing the influence of water supply on the histological formation of leaves, and so of active cell division, but found that increased water supply should effect a decrease in the number of cells per unit area. Their evidence would suggest that leaf development may continue under moisture stress as long as sufficient nitrogen is available, but that photosynthesis is seriously impeded.
Gates [20] reports that the younger parts of tomato plants remain active under drought relative to the older parts. He states: “ . . . there is an extension of the normal tendency of young and especially meristematic tissues to play a dominant role in the control of growth processes.” This would appear to be compatible with the findings described here. Gates accounts for his findings by showing evidence in the literature that juvenile tissues are largely involved in the control o f movement of carbohydrate reserves and mineral nutrients within the plant. This is not incompatible with the author’s hypothesis, but rather extends the scope.
The results for leaf magnesium were similar to those for leaf potassium, but the degree of difference between the moisture treatments was rather less. There was, however, a reduced error variation between plants. A low M g/K ratio in the soil is likely to be the determining factor for a deficiency of magnesium in coffee trees. (Robinson and Chenery [17].) When the
cations were considered as a percentage of their sum, there was little or no difference found between treatments in the case of magnesium, the relative unbalance being confined to calcium and potassium.
S ummary
A series of treatments was devised and tried out to test the effect on the mineral nutrition of coffee seedlings of dry soil with and without an adequate supply of water to part of the seedling root system. Distilled water was provided for the lower roots in a charcoal medium. It is considered that this treatment provides a better approximation to the condition of local coffee trees in the field than pot experiments in which plants are allowed to wilt.
For a number of elements, differences in both the concentration in dry matter and the total content in the mature leaves per plant were found between the dry soil treatments with and without added water. The factors considered were: tip leaf nitrogen; full sized leaf nitrogen: total and water-soluble nitrogen: phosphorus, potassium, calcium, magnesium, total ash and total dry matter.
Lower concentrations of all the elements were induced in the replicate of the new treatment (WO) which had been kept for the longer period of time. It appeared also that phosphorus nutrition and the ratio of potassium to calcium in the leaves were dependent rather upon the total moisture uptake. A tenatative hypothesis is put forward to account for this phenomenon.
Acknowledgements
The analytical results represented in Figure 2 were obtained by Mr. L. J. Hart. The author is indebted to Mr. Mahamudu Hamisi for help with the remaining analyses, and to Mr. S. Znatowicz for the photograph. He would also like to thank the members of the research staff, especially Mr. J. B. D. Robinson, for their encouragement and criticism.
R e f e r e n c e s
[I] Mason, A. C. (1958). The effect of soil moisture on the mineral composition of apple plants grown in pots. J. Hon. Sci.. 33, 202.
[2J van Dierendonck, F. J. E. (1959). The manuring of coffee, cocoa, tea and tobacco. Centre d'Etude de l’Azote, Geneva.
[3] Nutman, F. J. (1934). The root system of Coffea arabica. Emp. J. Exp. Agric., 2, 271.
202

EAST AFRICAN AGRICULTURAL AND FORESTRY JOURNAL APRIL, 1963
14] Stent. H. B. (1936). Third Annual Report of the Coffee Research and Experimental Station. Lya- mungu, Tanganyika. 72.
[ 5] Pereira. H. C. (1957). Field measurements of water use for irrigation control in Kenya coffee. J. Agric. Set.. 49, 459.
[6] Robinson, J. B. D. (1956). Rapid Kjeldahl nitrogen determination of coffee leaf material. The Analyst. 81. 316.
17] Padhve. V. P. (1957). A rapid method for the determination of calcium and magnesium in plant material by titration with sodium ethylenc-diamine- letra-acctate. The Analyst. 82, 634.
18] Birch, H. F. (1958). The effect of soil drying on humus decomposition and availability. Plant and Soil. 10. 9.
[9] Robinson, J. B. D. Private communication.
(10] Loue, A. (1957). Studies on the inorganic nutrition of the coffee trees in the Ivory Coast. International Potash Institute, Bemc, pp. 16.
| l l ] Muller. L. E. (1959). Algunas deficicncias minerales comunes en cl cafelo (Coflea arabica /..) Instituto Interamericano de Ciencias Agricolas. Tunialba, Costa Rica, Bolctin technico No. 4,pp. 12.
[12] Wadleigh, C. H., and Richards, L. A. (1951). Soil moisture and the mineral nutrition of plants. Mineral Nutrition of Plants. Ed. Emil Truog., pp. 411-451. The William Boyd Press Inc., Richmond, Virginia, U.S.A.
113] Robinson. J. B. D. (1959). Annual Report of the Coffee Research Station, Ruiru, Kenya, 1959, p. 41.
(14] Mcdcalf. J. C., Lott, W. L., Teeter. P. B., and Quinn, L. R. (1955). Experimental Programs in Brazil, pp. 13 and 32. 1BEC Research Institute. Bulletin No. 6. (30 Rockefeller Plaza, New York 20. )
(15] Wame, L. G. G. (1937). Observations on the effect of potash supply on the water relations of apple trees. J. Pom. Hort. Sci.. 15. 49.
(16] Russell. Sir E. J. Soil Conditions and Plant Growth. 8th ed. (1950). 39-42. Longman's. Green and Co., London.
117] Robinson, J. B. D., and Chenery, E. M. (1958). Magnesium deficiency in coffee with special reference to mulching. Emp. J. Exp. Agric.. 26, 259.
118] El Tomi, A. L., and Wolfe. H. S. (1955). A study of some tesponses of Florida citrus trees to nitrogen application and irrigation. Proc. Amer. Soc. Hort. Sci., 65, 113-120.
119] Richards, L. A., and Wadleigh. C. H. (1952). Soil, water and plant growth. Soil Physical Conditions and Plant Growth, pp. Ed. B. T. Shaw. Academic Press Inc., New York.
|2U] Gates, C. T. (1957). The response of the young tomato plant to a brief period of water shortage. III. Drifts in nitrogen and phosphorus. Aust. J. Biol. Set.. 51, 457-462.
|21| Pereira, H. C., and Jones, P. A. (1954). Field responses by Kenya coffee to fertilizers, manures and mulches. Emp. J. Exp. Agric., 22, 23.
122] Snell. F. D., Snell, C. T., and Snell, G. A. (1959). “Colorimetric methods of Analysis", Vol. I1A, pp. 561-2, and p. 569.
[23] Culot. J. P.. and van Wambecke, A. (1958). Contribution a l’etude des deficicnces minerales du cafeicr d'Arabic au Kivu. I.N.E.A.C. Scrie Scien- tifique, No. 73.
203

EAST AFRICAN AGRICULTURAL AND FORESTRY JOURNAL APRIL, 1963
NUTRITIONAL VALUE OF SOME COMMON CATTLE BROWSE AND FODDER PLANTS OF KARAMOJA,
NORTHERN PROVINCE, UGANDABy J. G. Wilson, Department of Agriculture, Uganda; and R. M. Bredon, Animal Health Research
Centre, Department of Veterinary Services and Animal Industry, Uganda(Received for publico I ion on 30 th April, 1962)
Karamoja District lies in the north-east of Uganda and measures, with the inclusion of the Karasuk area of Kenya which is administered by Uganda, about 13,000 square miles. Ecologically, the District is similar to many of the dry areas of East Africa; the central and eastern areas consists of eroded bush- covered land, while the western and northern areas carry tree savanna and savanna woodland. During the dry season which is often of five to six months duration (October to April), grazing in the eastern parts becomes acutely short and browse plants then become important items of the animal's diet.
The terme “Steppe” has been used to distinguish those plant communities which are dominated by small trees and shrubs with a poorly developed ground layer of grass and herbs [I], This is synonymous with “bush”. The term “Savanna” has been used to denote those plant communities which are dominated by grasses which form a continuous or nearly continuous cover with a scattered or woodland tree cover. The browse and fodder plants of Karamoja occur most commonly in the Steppe communities and rarely in the Savanna communities. Many of the plants mentioned are eaten in both seasons (wet and dry) but some are eaten only in the dry season.
M eth o ds
Sampling of individual plant species was carried out over a wide area and. wherever possible, at different seasons. The samples consisted of leaves and young shoots, unless otherwise specified in the text.
Samples were air-dried and then oven-dried prior to determination of crude protein, petroleum ether extract, crude fibre, total and silica free ash.
M aterials
A. Trees anil Shrubs
Acacia albiila Del: tree often growing to a height o f 30 to 40 ft. Produces a prolific number of twisted pods which are relished by
cattle. Commonly distributed on flood plains and banks of large rivers in the eastern parts of the district on alluvial soils, where it may occur in pure stand or as a constituent of riparian woodland.
Acacia nilotica (L.) Willd. ex Del. var. subulaia (Vatke) Brenan: very common small tree 6-10 ft. high. Often fruits twice a year and produces numerous pods up to 6 in. long which are readily eaten by cattle.
Widely distributed in steppe communities particularly in post-cultivation successions where it may occur in almost pure stand.
Acacia Senegal (L.) Willd. var. Senegal: small tree 6-10 ft. high, fairly widespread often in transitional steppe areas. Produces numerous small flat pods which are readily eaten by cattle.
Acalvpha frulicosa Forsk: clump-forming shrub 5-8 ft. high, often forming a pure stand. The leaves and young twigs are readily eaten by cattle.
Widely distributed along river banks and flood plains in riparian woodland.
Doscia patens Sprague cl M. L. Green; erect tree 10 to 15 ft. high, scattered but fairly common in many drier steppe communities. The leaves of the tree are avidly browsed by cattle, particularly in the dry season.
Cadaha farinosa Forsk: bushy often scan- dent clump-forming shrub 3 to 8 ft. high.
The most important browse plant in Karamoja because of its wide distribution in many steppe communities particularly on heavy soils. Both leaves and young twigs are browsed throughout the year but particularly in the dry season when this plant may be practically the only source of green palatable herbage.
Cordia gharaf (Forsk) Ehrenb. ex Anschers: small tree 6-10 ft. high, fairly common in some steppe communities. The leaves in spite of their rough “sandpapery” surface are browsed by cattle in the dry season and can
204

LAST AFRICAN AGRICULTURAL AND FORESTRY JOURNAL APRIL, 1963
be an important supplementary source of palatable fodder. The fruits are also a source of human food.
Dichrostachys cinerea L. var. cinerea Brenan: shrub or small tree of savanna and steppe communities occasionally browsed.
Gossypium longicaly.x Hutchinson and R ees: low spreading sub-shrub of grass steppe, fairly common. Readily eaten by cattle.
Grewia bicolor Juss: small tree or shrub, 5-10 ft. high, common in many steppe and some savanna communities. The plant may occur singly or in clumps, often in association with thickets and is readily browsed by cattle.
Grewia canescens A. Rich: a clump-forming shrub or small tree, 6-10 ft. high, frequently found in rocky places and occasionally in thickets. Readily browsed.
Grewia similis K. Schum: clump-forming shrub 4 to 8 ft. high. This plant is among the major sources of browse and occurs extensively in association with other plants in steppe communities in the eastern parts of the district.
Grewia villosa W illd: loose clump-forming shrub 2 to 6 ft. high, widespread and common in steppe communities on a wide range of soils. The large round leaves are extremely palatable to cattle and extensively browsed throughout the year. The fruits are a source of human food.
Htirrisonia abyssinica O liv.: semi evergreen clump-forming shrub 4 to 10 ft. high, occurring mainly in riparian habitats often on heavy soils, it also occurs to some extent in savanna communities. Not an important plant as it is only occasionally browsed.
Kleinia sp .: clump-forming succulent shrub, 2 to 5 ft. high, usually leafless with cylindrical stems and purple flowers. Fairly widespread in steppe communities. Of considerable importance in Karasuk where it is heavily browsed in the dry season.
Lannea fulva (Engl.) Engl.: sprawling semievergreen tree (?) to 8 ft. high, occurring occasionally in transitional savanna/steppe communities. Occasionally browsed.
Lannea tripliylla (Hochst. ex A. Rich.) Engl.: small tree 6 to 8 ft. high, common in some steppe communities and rarely in some savanna communities, occasionally browsed during the dry season.
Maerua sphaerocaroa G ilg .: small tree 6 to 8 ft. high, common in certain steppe communities. Readily browsed by cattle.
Oclma inermis (Forsk.) Schweinf.: small evergreen tree or shrub up to 8 ft. high. Occurs in certain steppe communities and sometimes associated with rock outcrops and stony ground. Occasionally browsed by cattle in the dry season.
Ormocarpnm Irichocaroum (Taub.) Harms: shrub or small tree 5 to 8 ft. high in steppe communities and in some savanna communities.
An important browse plant of widespread occurrence over a wide range of soils. It is readily browsed at all times of the year.
Rhus natalensis Bernh. ex Krause: small bushy tree up to 10 ft. high, common in many steppe communities and some savanna communities on a wide range o f soils. It is readily browsed in the dry season.
X i m e n i a c a f f r a Sond.: shrub or small tree up to 8 ft. high, fairly widespread in certain savanna communities also in a few steppe communities. Occasionally browsed in the dry season.
B. Edible HerbsAcalyplm indica L .: small annual herb up
to 2 ft. high, extremely widely distributed in numerous different steppe communities, is usually found on heavy soils. The plant is readily eaten by cattle in the wet season and early dry season and it appears to be highly palatable.
Blepharis iniegrifolia (L.F.) E. M ey: small annual herb of low spreading habit o f wide distribution in steppe communities. It is readily eaten by cattle particularly when grass is scarce.
Blepliaris sp .: small creeping annual orperennial herb, widely distributed in steppe communities particularly in very driest areas. Readily eaten by cattle when grass is scarce
Cleome monophylla L .: small annual herb 1 to 2 ft. high, fairly widespread in steppe communities particularly in very dry areas, it also appears as a weed in post-cultivation successions. Highly palatable and relished by cattle.
Commelina albescens Hassk.: small annual spreading herb common on bare ground and under partial shade in steppe communities and in savanna-steppe transitions. Readily eaten by cattle particularly when grass is scarce.
Commelina elgonensis Bullock: low spreading herb common in some savanna communities. Readily eaten by cattle.
205

EAST AFRICAN AGRICULTURAL AND FORESTRY JOURNAL APRIL, 1963
Crossandra stenostachys (I.indav) C.B. C l.: small perennial herb of steppe communities, often forms a close mat at the base of thicket clumps or in shady places. Palatable and readily eaten by cattle in the dry season.
Erlangen cordifolia S. Moore: annual herb 1 to 3 ft. high, widespread and common in steppe communities and as a weed of cultivated land, readily eaten by cattle in the dry season.
Cyathula orthocantha Schinz: annual herb. 1 to 2 ft. high, common in steppe communities and often as a weed of cultivated land. Readily eaten by cattle when grass is scarce in spite of the prickly seed.
Heliotropium zeylanica Lam .: small dump forming annual herb, 1 to 2 ft. high, common in steppe communities. Readily eaten by cattle when grass is scarce.
Table 1.— Chemical Composition of Cattle Browse Plants of Karamoja
N a m e
Acacia albida—P o d s ..........................................PodsD ry pods ............................G reen p o d s .......................... ..
Acacia nilolica var. subulata podsD ry pods ............................G reen p o d s ............................D ry pods ............................
Acacia senegaI ............................D ry pods ............................P o d s .........................................
Acalypha fruticosa
Boscia patens ............................
Cadaba farinosa
Cordia ghara f Dichrostachys cinerca Gossypium longicalyx Grewia bicolor
Grewia canescens . • Grewia similis
Grewia villosa
Grewia sp. . ■Harrisonia abyssinica Kleinia sp ..............................
Lannea fu lva Lannea triphylla
Maerua spaerocarpa Ormocarpum trichocarpum
Ochna inermis Rhus nalalensis Ximenia caffra
Results
D ateCrudeProtein
CrudeF at
CrudeFibre
1-12-1957 10-53-f 0-94 c/27-555-8-1958 12-36f 0-68 /40-73
20-1-1959 — 1113 0-84 | 32-4520-1-1959 -10-19) 0-49 1 30-36
5-8-1958 10-17 1 -36 15-075-8-1958 9-50 I I I 14-94
20-1-1959 —4 1 -87 0-85 -16-1920-1-1957 *-10-00 0-94 16-281-12-1957 23-42 3-78 19-351-12-1957 -19-65 2-14 29-645-11-1958 -22-03 0-96 39-02
5-8-1958 20-12 2-22 17-285-11-1958 12-66 3-47 13-72
1-3-1958 15 51 1-73 34-135-11-1958 16-27 1 -68 40-3220-1-1959 24-96 3-18 10-30
1-8-1957 26-72 3-09 17-051-12-1957 30-89 2-08 15-11
1-3-1958 27-74 3-29 11-036-5-1958 29-03 4-17 9-788-8-1958 26-05 2-92 11-59
5-11-1958 27-47 2-47 12-5620-1-1959 27-89 3-94 10-79
8-8-1958 19-52 1-12 19-008-8-1958 15-33 1-23 28-09
5-11-1958 15-38 5-00 14-061-3-1958 19-43 2-45 19-948-8-1958 17-25 1-44 20-29
5-11-1958 14-07 4-18 20-718-8-1958 16-35 1 -76 26-69
1-12-1957 23-42 2-91 15-241-3-1958 16-17 3-07 26-896-5-1958 17-44 3-10 17-778-8-1958 17-95 1-21 17-30
5-11-19581-12-1957
9-6618-50
5-582-59
18-3320-06
1-3-1958 22-17 2-83 19-748-8-1958 17-68 1-58 20-878-8-1958 11-71 3-09 20-88
5-11-1958 15-77 3-07 17-9120-1-1959 14-85 3-71 20-2520-1-1959 19-76 3-29 16-27
1-3-1958 17-58 5-03 12-068-8-1958 11-22 3-89 31-14
5-11-1958 7-40 6-19 44-931-3-1958 12-21 2-23 21-496-5-1958 17-03 2-85 17-948-8-1958 14-05 2-76 27-98
5-11-1958 21-37 2-19 27-981-12-1957 20-35 3-69 13-06
1-3-1958 14-42 2-94 15-786-5-1958 25-50 2-50 17-348-8-1958 22-15 3-22 13-458-8-1958 16-94 1 -31 28-41
9-12-1957 11-36 2-52 19-611-3-1958 12-40 5-12 12-01
Expressed as Per Cent o f Dry Matter
TotalAsh Silica
SilicaFreeAsh
NitrogenFree
Extract
3-92 0-34 3-58 57-063-56 0-01 3-55 ■ 42-679-48 0-45 9-03 46-104-02 0-23 3-79 54-944-56 0-28 4-28 68-844-42 0-19 4-23 70-034-96 0-46 4 50 66-136-68 0-06 6-62 66-109-49 0-11 9-38 43-965-31 0-57 4-74 43-267-06 1 -84 5-22 30-93
11-39 0-45 10-94 48-9910-17 0-81 9-36 59-987-21 2-42 4-79 41-426-56 1-40 5-16 35-17
15-63 0-42 15-21 45-9314-38 1-06 13-32 38-7612-46 5-80 6-66 39-4614-72 0-48 14-24 43-3215-45 0-52 14-93 41-5717-66 0-38 17-28 41-7813-93 0-34 13-59 43-5713-44 0-43 13-01 43-9415-90 8-39 7-51 44 464-89 0-27 4-62 50-46
16-32 3-72 12-60 49-2411 -47 3-18 8-29 46-7111 -36 4-68 6-68 49 668-79 1-16 7-63 52-257-21 0-51 6-70 47-99
11-22 1-24 9-98 47-2112*26 1-10 11-16 41-6112 07 1 -50 10-57 49-6213-48 0-23 13-25 50-0618-84 1-00 17-84 47-5910-76 1-51 9-25 48-0911*61 1 -78 9-83 43-6519-88 12-47 7-41 39-9918-55 8-37 1018 45-776-58 0-71 5-87 56-67
10-64 1-20 9-44 50 557*19 4-51 2-68 53-499-10 0-60 8-50 56-23
14-00 0-95 13-05 39-758-12 0-17 8-15 33-169 09 0-83 8-26 54 98
11 -47 3-18 8-29 50-717-02 0-81 6-21 48-197-9 0-32 7-59 40-55
12-44 0-70 11-74 50-4610-64 3-93 6-71 56-2211 -81 2-23 9-58 42-8511 -02 0-94 10-08 50-164-98 0-82 4-16 48-36
10-32 0-59 9-73 56-1913-33 0-64 12-69 57-14
206

EAST AFRICAN AGRICULTURAL AND FORESTRY JOURNAL APRIL, 1963
Table 2.—Chemical Composition of Fodder Plants (H erbs) of Karamoja
Results Expressed as Per Cent of Dry Matter
Name DateCrudeProtein
CrudeFat
CrudeFibre
TotalAsh Silica
SilicaFreeAsh
NitrogenFree
Extract
Acatypha indica 8-8-1958 14-08 3-77 18-12 12-75 4-72 8-03 51-28Blepharis integrifolia 8-8-1958 13-00 2-75 20-89 20-73 8-82 11-91 42-63Blepharis sp. 8-11-1958 10-01 2-21 33-09 10-00 3-77 6-23 44-69Cleome monophvlla 8-8-1958 19-74 3-35 30-23 13-08 4-09 8-99 33-60Commelina sp. (species not scpar-
on analysis).6-5-1958 20-73 1-42 18-41 26-04V » 14-15 11-89 33-40
Commelina sp. 8-8-1958 7-09 1-20 21-27 25-65 15-26 10-39 44-79Commelina sp. 8-8-1958 8-85 1 -83 19-76 19-15 11-15 8-00 50-41Commelina sp. 8-8-1958 9-66 1-72 27-33 17-15 7-31 9-84 44-14Commelina sp. 8-8-1958 10-93 1-62 28-27 20-00 9-23 10-77 39-18Commelina sp. 8-8-1958 14-41 2-19 23-47 17-08 5-30 11-78 42-85Crossandra stenostachys 8-8-1958 10-94 1-13 24-31 20-82 11-49 9-33 42-80Cyathula orthocantha 8-8-1958 14-08 1 -25 28-29 19-33 2-76 16-57 37-05Cy at hula sp. 8-11-1958 8-19 1 -53 42-21 8-08 1-16 6-92 39-99Erlangea cordifolia 8-8-1958 13-15 2-29 25 59 16-36 6-31 10-05 42-61Erlangia sp. 8-11-1958 7-17 4-74 32-28 10-29 3-39 6-90 45-52Heliotropium zeylanicum 8-8-1958 14-61 4-84 28-80 16-23 5-27 10-96 35-52Hibiscus micrantha 8-8-1958 18-95 1 -91 18-24 19-94 7-99 11-95 40-96Hibiscus trionum 8-8-1958 15-36 1-48 20-43 26-91 14-70 12-21 35-82Ipomea cordofana .. 8-8-1958 18-97 1-74 20-74 16-77 5-13 11-64 41-78Justicia caerulea . . 8-8-1958 17-72 2-13 23-18 21-50 3-86 17-64 35-47Justicia exigua 8-8-1958 10-84 1 -29 23-85 17-97 5-99 11-98 46-05Justicia leptocarpa 8-8-1958 19-53 2-34 22-96 21-24 0-56 20-68 33-93Leonotis nepelifolia 8-8-1958 19-29 2-98 27-32 10-03 2-24 7-79 40-38Monechma debile . . 8-8-1958 18-20 4-30 26-49 14-10 1-64 12-46 36-91Paronia burchellii . . 8-8-1958 19-11 1-20 16-27 20-84 11-89 8-95 42-58
T able 3.— M ineral Content of Some Cattle Browse Plants of K aramoja
Results Expressed D.M. — 100
Name Date CaO% SO SO
Mg%
MnP.p.m.
Acacia albida (pods) 1-12-1957 0-51 / 1 -51 f 108 / 009 / 0Acacia Senegal 1-12-1957 319 3-98,1 1 -66 / 016 0
Dry pods 1-12-1957 1-40/ 1 -78/ 0-73 009 0Green pods 5-11-1958 1-14, 2-450 2-29 0 45/ 0
Cadaba farinosa 1-3-1958 1-62 1-35 5 09 043 06-5-1958 3-53 1 68 2-88 037 0
Grewia similis 1-3-1958 2-62 1 -69 2-65 047 1156-5-1958 3-26 1-76 2-07 0-55 121
Grewia vilosa 1 — 12—1957 1 -76 1 -83 2-41 0-36 05-11-1958 3-82 1-46 1 -69 0-45 Trace
Gossypium longicalyx 5-11-1958 2-90 1 -82 2-27 0-44 131Kleinia sp. . . 5-11-1958 104 1-16 2-73 009 TraceLannea fulva 1-3-1958 1 -79 1 -55 1-42 0-57 0Ormocarpum triehocarpum 1-12-1957 1-55 2-13 1 -23 0-22 Trace
1-3-1958 2-68 1-44 2-53 0-39 167
Ximenia caffra6-5-1958 1-34 4-32 2-39 0-09 01-3-1958 2-60 2-24 2-98 0-42 0
7-11-1958 3-36 I -38 1 -23 0-57 Trace
207

EAST AFRICAN AGRICULTURAL AND FORESTRY JOURNAL APRIL. 1963
Hibiscus micraniha L .: common erect herb or sub-shrub, 2 to 4 ft. high, usually associated with steppe communities. Often on heavy soils. Readily browsed at all seasons.
Hibiscus trionum L .: very common small spreading herb, usually found growing on “black cotton” soil in savanna and steppe communities. Readily eaten at all times.
Ipomea cordofana Choisy: very common creeping herb of many steppe communities. Readily eaten when grass is scarce.
Justicia caerulea Forsk.: erect annual herb, 12 to 15 in. high. Widespread in many steppe communities. Readily eaten at all times, very palatable.
Justicia exigua Milne-Redhead: small, loose annual herb, 6 in. to 1 ft. high, a component of numerous steppe communities. Very palatable.
Justicia leptocarpa Lindau: erect annualherb, 12 to 24 in. high usually associated with riparian communities or on damp ground. Very palatable.
Leonotis nepetifolia R. Br.: erect herb to (?) 8 ft. high often occurring in riparian communities. Leaves and young growth eaten during the dry season when grass is scarce.
Monechma debile (Forsk.) N ees: fairly common herb of savanna and steppe communities, occurring mainly on “black cotton” soils. Readily eaten.
Pavonia burchellii (D.C.) D yer: clumpforming erect herb or sub-shrub herbs, 2 to 5 ft. high. Widespread in steppe communities or heavy clay soils. Readily eaten.
Re su l t s
The chemical composition o f browse trees and shrubs and of edible herbs is given in Tables I and II respectively.
It can be seen from these tables that the plants listed are all high in protein and ash and, with very few exceptions, low in crude fibre. Further, the protein content of leaves and young shoots of trees and shrubs is, in general, higher than that of herbs but the ash content does not show a similar tendency and is very variable in both groups.
In Table III the content of some minerals of a few samples of shrubs and trees show a high calcium and phosphorus content which would make them useful as supplement to grass.
D isc u ssio n
Dougall and Bogdan [2] made some observations on browse and fodder plants of cattle and goats in Kenya. Apart from that little published information is available in East Africa on the contribution^ that browse and foHr)fr plants malro t'Mh'* nUtltUOnof Cattle. There is no doubt that during the dry season in semi-arid areas, when grass is extremely scarce, cattle browse to a considerable extent and as the chemical composition of both shrubs and herbs indicates a high nutritive value, this must be a valuable adjunct to available grazing. In some species the protein and ash content may be as high as 30 per cent and 16 per cent respectively, and this high nutritive value in shrubs remains throughout the dry season. The nutritive valnp nf hfrhs js also good but as they mainly occur in the rainy -season, when grass is plentiful and nutritious, they are of less importance.
S ummary
Samples of young shoots with leaves and pods of shrubs, trees and herbs browsed or grazed by cattle were collected and their chemical composition determined.
All samples were high in protein and ash and generally low in fibre which indicates a high nutritive value.
Field observations were made of the distribution of different species and their utilization by cattle.
A cknowledgements
Grateful thanks are due to the staff of the East African Herbarium for the identification of numerous plants; Mr. E. W. Hughes of Agricultural Department, Kawanda, for spec- tographic analyses of minerals. The authors would like to express their thanks to the Director of Agriculture and the Director of Veterinary Services and Animal Industry, for permission to publish this paper.
R e fe r e n c e s
[1] Wilson, J. G. (1961). Vegetation of Karamoja District Research Memoir, Department of Agriculture, Uganda, Government Press, Entebbe.
[2] Dougall and Bogdan, A. V. (1958). E. Afr. agric. J.. 23, 236.
[3] Yangambi Conference 1956. Phytogeography (including the “Yangambi” physiognomic classification). Publ. 22. Published by C.S.A./C.C. T_A., Paris.

EAST AFRICAN AGRICULTURAL AND FORESTRY JOURNAL APRIL, 1963
BODY REACTIONS OF KENANA CALVES FED ALL-ROUGHAGE RATIONS UNDER HOT DRY CONDITIONS
IN THE SUDANBy K. A. Alim, Faculty of Agriculture, Alexandria University, Egypt
(Received for publication on 5th May. 1962)
In Sudan, the common practice used by some of the cattle owners is to maintain suckling calves during the hot dry season, on dry rough- ages alone. The object of this study is to examine the influence of feeding different types of roughages on body temperatures and respiration rates o f calves under these conditions. Another object of the work is to determine the relationship of body reactions to the climatological data, and to estimate the repeatability of these physiological responses.
M aterials and M ethods
Eight Kenana calves from the Livestock Improvement Centre Herd, Umbanein, Singa (Mackinnon, 1952) were used in this study between 15 March and 24 April, 1958. They were approximately five months of age and averaged 175 lb. in weight when placed on the experiment. These calves were divided randomly into two groups of four, receiving each of two roughages in a single reversal experiment. The two roughages employed were second cutting hyacinth bean hay (Dolichos lablab L.) and dry sorghum straw (Sorghum vulgare Pers.) o f the Feterita type (Burnett, 1952). The testing period was 12 days in length, and before each period there was a five-day interval as an adjustment to the roughage.
The test calves were kept under straw- covered shades of 10 ft. in height, and were suckled during the hours of 6 a.m. and 5 p.m. each day. Roughages used in feeding trial were fed ad libitum, and fresh drinking water was available during all day.
Four observations of rectal temperature and respiration rate were made on each animal every day during the 24-day test. The observations were taken at 7 a.m., 10 a.m., 1 p.m. and 4 p.m. Dry and wet bulb temperatures were also noted down at each observation using a whirling hygrometer (Lee, 1953). Statistical procedures as outlined by Snedecor (1956) were used in the analysis of the data.
R e s u l t s and D isc u ssio n
Body ReactionsTable 1 shows the performance of calves
during the experiment. Analysis of variance of the data in Table 1, revealed highly significant differences among roughages, showing a definite decrease in body temperature of calves fed on hyacinth bean hay compared to calves fed on dry sorghum straw. The rate of rise in body temperature with feeding straw had no significant influence on respiration rate (Table 2). The possible cause for the lower body temperature of calves is that hyacinth bean hay, which is higher in nutritive value than dry sorghum straw, has relatively less fibre, especially lignin, and is digested with less internal heat production. Ingredients of the feed other than its low fibre content might also be responsible for lowering body temperature (Morrison, 1956).
The pattern of body temperature and respiration rate behaviour throughout the day in these data, indicates that the diurnal variations in body reactions tend to coincide with diurnal changes in air temperature (Table 3). The mean air temperature during the trial was comparatively high, whereas the mean vapour pressure was low. In a climate such as this, animals should be able to lose heat by evaporation much more readily than in humid weather.
Correlation AnalysisCorrelations were derived for all combina
tions of body reactions and climatological data under study on between and within calves basis. However, the within calves, correlations are more informative. The calculations were made between roughage treatments as there was no significant difference between correlation coefficients due to treatments. The results in Table 4, arranged according to the time of reading, indicate that higher estimates either between or within calves are generally obtained in the first daily reading. The high variability found in the climatic data in the early reading, is probably responsible for these differences (Table 3). An important exception of this is
209

EAST AFRICAN AGRICULTURAL AND FORESTRY JOURNAL APRIL, 1963
the relationship between respiration rate and body temperature which is indicated by a significant (P<0.05) correlation and regression at later reading when the hot weather stress was more severe. The correlation coefficient obtained was low and amounted to +.146. The regression of respiration rate gave a value of 0.598 respiration per half-minute for each increase of 1°F. in body temperature. This shows that, although respiration rate increases with rise in body temperature, it did so at a lesser rate, thus decreasing the additional body heat which is contributed through respiratory muscle activity. The fact that the degree of relationship between respiration rate and body temperature is low, indicates that respiration rate alone could not be used as indices of thermal stress. According to Casady et al. (1956), the correlation between these physiological reactions in Holstein dairy bulls under controlled conditions is highly significant when the air temperature ranged from 80°-90°F. On the other hand, McDowell et al. (1953a) and Beaklcy and Findlay (1955a, 19556), showed that respiration rate is not significantly correlated with body temperature under the condition of laboratory experiments.
As expected, the physiological reactions as measured are more closely associated with air temperature than with vapour pressure. The trend in these reactions to increasing air temperature indicated that respiration rate is more responsive to higher air temperature than body temperature. This is supported by the significant correlations between respiration rate and air temperature at 10 a.m. and I p.m. when the mean air temperature was 100.96 + 0.995 °F. and 105.58 + 0.667 F. It seems likely that the increase in respiration rate at high air temperature reduces the rate o f rise in rectal temperature by increasing the portion of heat loss through evaporative loss in the respiratory passages. Evidence in the literature (Johnston and Branton, 1953) indicated that respiration rate is closely associated with the mean environmental temperature.
Repeatability estimates of body reactions were obtained by the intra-class correlation utilizing the components of variance. The calculations were made within treatments and time o f reading. The overall estimates were 0.245 + 0.070 for body temperature and 0.143 + 0.073 for respiration rate. Thisindicates that body temperature is to some extent fixed in the individual, whereas respiration rate is mostly influenced by environment (Seath, 1947. McDowell et al., 19536).
Summary
Body reaction data were obtained on eight suckling Kenana calves kept in open sheds and fed liberal amounts of hyacinth bean hav and dry sorghum straw for 24-day test under hot dry conditions in the Sudan.
The body temperature of calves was significantly lower when fed hyacinth bean hay than when fed dry sorghum straw. The rate of increase in body temperature with feeding straw had no significant effect on respiration rate.
Air temperature variations were more important than vapour pressure in causing variations in body reactions. The correlation between respiration rate and body temperature under hot weather stress was statistically significant, though of a low level (+ .146, P < .05).
The repeatability estimate was 0.245 + 0.070 for body temperature and 0.143 + 0.073 for respiration rate.
Table 1.—Comparison of Body Temperature and Respiration Rate of Kenana Calves Fed Hyacinth Bean H ay and D ry Sorghum Straw During Trial
Treatment
Hyacinth DryBean Sorghum TotalHay Straw
Body Temperature F.Number of tests 384 384 768Mean . . 102-297 102 540 102 418o* 0-529 0-531 0 530C.V. % 0-517 0-518 0-518
Respiration Rate 4 MlNUTEtNumber of tests 384 384 768Mean .. 12-838 12-705 12-771a* 2-206 2-320 2-263C.V. % 17-183 18-260 17-721
•Within calves and time of reading. tAvcrage of two readings.
Table 2.— Statistical Summary Evaluating the Effect of Roughages, Time of Reading and Days
on Body Temperature and Respiration per H alf-Minute in Kenana Calves
S o u r c e o f V a r ia t io n
BodyTemperature
RespirationRate
(dm (A/, sq.) (F.) (A/, sq.) , (F.)767
Roughages (R) 1 11-400 3 000Time o f reading (T) 3 86-110 225-666 *•Days (D) . .R. x T.....................
233
2-3231-480 • •
37-391 *• 1-667
R. x D..................... 23 0-438 5-739T . x D ..................... 69 1-743 ** 7-275 • •R. x T. X D. 69 0-162 4-101Error 576 0-293 4-710
••^Significant at 1 % level.
210

EAST AFRICAN AGRICULTURAL AND FORESTRY JOURNAL APRIL, 1963
T able 3.— M ea n , Range, Sta n d a r d D eviation a n d Coefficient of V ariation of the A tmospherical a n d P hysiological O bservations o n all C alves a t E ach of
F our D aily R eadings T hroughout the C ourse of the Experiment
T ime of R eading
7 a.m. 10 a.m. 1 p.m. 4 p.m. Total
A ir T emperature F.Mean . . . . 85-250 100-958 105-583 105-208 99-249Range . . . . 75-99 92-112 101-112 98-113 75-1136 , . 6-320 4-876 3-269 3-269 4-433c.v. % •• 7-413 4-829 3-096 3-107 4-611
V apour Pressure mm. Hg.Mean . . 9-520 10-758 9-437 9-045 9-690Range . . . , 4-5-17-7 4-0-16-0 5-0-16-0 5-4-14-9 4-0-17-76 4-472 3-823 3-508 2-705 3-627C.V. % •• 46-974 35-536 37-172 29-906 37-397
IBody T emperature °F.
Mean . . . . 101-601 102-400 104-432 103-241 102-418Range . . . . 97-0-103-2 101-4-104-0 101 0-104-7 102-2-105-4 97 0-105-46 * . , 0 790 0-405 0-521 0-404 0-529C.V. % •• 0-777 0-396 0-507 0-389 0-517
R espi ration R ate M NUTEMean . . 11-260 12-796 13-776 13-255 12-772Range . . 9 . 8-18 8 -2 0 9-28 8-26 8-286 * 1-760 2-371 2-602 2-318 2-262C.V. % 15-630 18-529 18-887 17-487 17-633
♦Within calves and treatments.
T able 4.— Correlation Coefficients Between C limatological D a ta a n d other Physiological R esponses for all Calves A ccording to T ime of R eading
FactorsCompared*
SourceT ime of R eading
7 a.m. 10 a.m. 1 p .m . 4 p.m .
BTxRR . . Between calves . . 0-279$C orrelation C oefficient
0-122 1 0-125 0-074Within calves 0-103 0-079 0-005 0-146+
BTxAT .-. Between calves . . 0-661+ 0-255$ 0-038 -0 -0 5 0Within calves 0-501$ 0-132 0-007 0-118
BTxVP . . Between calves .. 0-526$ 0-259$ 0-207$ -0-234$Within calves 0-126 0-101 0-081 0-105
RRxAT . . Between calves . . 0-426$ 0-179+ 0-150+ 0-062Within calves 0-291$ 0-146+ 0-147+ - 0 046
RRxVP . . Between calves . . 0-276$ 0-173 0-114 0-175$Within calves - 0 002 0-017 -0-081 0-005
*BT=Body temperature; RR -Respiration rate; A T ^A ir temperature; VP =Vapour pressure. t=Significant at 5% level.$ = Significant at 1 % level.
211

EA ST A FR IC A N A G R IC U LTU R A L AND FO RESTRY JO U RN AL APRIL. 1963
A cknow ledgem ent
Acknowledgement is made to Kassamallah Hussein and Abdel Rahman El-Geli for their technical assistance in this work.
Literature Cited
Bcaklcy, W. R.. and Findlay, J. D. (1955a). The effect of environmental temperature and humidity on the skin temperature of Ayrshire calves. J. Agr. Sci., 45. 353.
Beakiey, W. R., and Findlay, J. D. (19556). The effect of cnvironmetal temperature and humidity on the respiration rate of Ayrshire calves. J. Agr. Sci., 45, 452.
Burnett, J. R. (1952). Agriculture in the Sudan (2nd ed.) Ed. Tothill, J. D. Ch. XV. Oxford University Press.
Casady, R. B., Legates, J. E., and Myers, R. E. (1956). Correlations between ambient temperatures varying from 60-90 F. and certain physiological responses in young dairy bulls. J. Animal Sci., 15, 141.
Johnson, J. E., Branton, C. (1953). Effects of seasonal climatic changes on certain physiological reactions. semen production and fertility of dairy bulls. J. Dairy Sci., 36, 934.
Lee, D. H. K. (1953). Manual of Field Studies on the Heat Tolerance of Domestic Animals. F.A.O. Agr. Develop. Paper No. 38.
Mackinnon. E. (1952). Agriculture in the Sudan 2nd ed.) Ed. Tothill. J. D„ Ch. XXVII. Oxford University Press.
McDowell, R. E., Lee, D. H. K., Fohrman, M. H., and Anderson. R. S. (1953a). Respiratory activity as an index of heat tolerance in Jersey and Sindhi v Jersey (F.) crossbred cows. 1953a. J. Animal Sci. 12, 573.
McDowell, R. E., Lee, D. H. K., and Fohrman, M. H. (19536). Repeatability of an experimental heat tolerance test and the influence of season. 1. Animal Sci., 12, 757.
Morrison, F. B. (1956). Feeds and Feeding (22nd ed.).Ithaca, New York. Morrison Publishing Company.
Seath, D . M. (1947). Heritability of heat tolerance in dairy cattle. 1. Dairy Sci., 30, 137.
Snedecor, G. W. (1956). Statistical Methods (5th ed.). Ames. Iowa State College Press.
212

EAST AFRICAN AGRICULTURAL AND FORESTRY JOURNAL APRIL, 1963
A COMPARISON OF THE MINUS-ONE AND 2" DESIGNS FOR THE EXPLORATORY INVESTIGATION OF
FERTILIZER REQUIREMENTSBy P. H. Le Mare, Cotton Research Station, Namulonge, Uganda
(Received for publication on 27th April, 1962)
In the field study of soil fertility and in the investigation of nutrient deficiencies in developing areas experiments with fertilizers and manures are essential. The first need in such work is to discover what nutrients are needed leaving the optimum rates of application to be examined later. In the initial work we usually wish to obtain information on several factors, the most common being nitrogen, phosphorus, potassium and lime. The effect of farm yard manure is frequently examined also, as this material often indicates the importance of factors other than those supplied by the fertilizers.
In any experimental programme the use of efficient designs, that is of designs which provide a maximum of the required information for a minimum of effort expended, is desirable. During the past 25 years one of the most widely used has been the 2" factorial design, in which all possible combinations of two levels, usually the presence and absence, of n factors form the plot treatments. In practice there are usually four or five factors and the experiment occupies 32 plots. In the 2* two replicates and in the 2 5 only one replicate are normally used. Such small replication means that comparisons of individual treatment combinations are made with low precision. Instead what are conventionally known as main effects and interactions are used as the estimate of treatment effects. For each factor or interaction of factors the estimate is based on a comparison of two groups of plots, each group being made up of half the total number of experiment plots. Thus in a 2" experiment in 32 plots the main effects and interactions are all determined as the difference between two groups each of 16 plots, so that the effective replication is sixteenfold. This design therefore enables a great deal of information on the effects and interactions of factors to be obtained in a small experiment.
Another design which has been used in pot experiments and more recently in the field is the so-called “Minus-one" design in which the
yield obtained from the application of all factors under investigation is compared with that from all except one factor. An estimate of the yield improvement caused by the application of treatments over the basic level is provided by the inclusion in the experiment of plots without any treatment. Evans (1962) has given examples of experiments using this design and he has concluded that it provides a satisfactory means of making exploratory surveys of fertilizer needs, and requires fewer plots to obtain the necessary information, than the 2 ‘ in 32 plots.
An important difference between the two designs is that whereas in the 2" each main effect is determined as the average of the effect in the absence and presence of other factors, in the minus-one design it is determined in the presence of all other treatments. In plant nutrition the greatest effect of any factor usually occurs when all other factors are present in adequate amounts. It follows from this that each main effect determined in the minus-one design will tend to be in excess of that which would be obtained in the absence of the other factors. An estimate of the influence of one or more factors on the effect of another, i.e. of interactions, is not determined in the minus-one as it is in the 2" design. For this reason Evans recommends the exclusion of organic manure from experiments of the minus-one design.
In under-developed areas of inherently low soil fertility the margip of profit to be gained from fertilizer use is often small because of the high cost of fertilizer relative to the return from the extra crop produced, which often has a low cash value. Because the effect of a fertilizer as determined in the minus-one design may be in excess of that which would occur if it were applied alone this design may lead to uneconomical use of fertilizer. Generally only one or two fertilizers will produce an economic response and it is important to know the interaction between them in order to decide whether
213

EAST AFRICAN AGRICULTURAL AND FORESTRY JOURNAL APRIL, 1963
the return from either will be increased or decreased by use of the other. N o design will provide all the information required for a sound fertilizer policy but the 2 “ design seems likely to be more useful for initial investigation of fertilizer requirements to supply major nutrients. A discussion on the principles and criticisms of the factorial design is provided bv Yates (1937).
T he Structure of the M inus-one and 24D e sig n s
In order to consider the influence of “disturbing” interactions on the effects as determined in the Minus-one design Evans sets up a numerical model of a 2* factorial experiment and calculates the yields which would have been obtained in a Minus-one design. A more revealing and fundamental approach is to consider the structure of the Minus-one design in terms of the 2 ‘. For four factors the main effects and interactions of a 21 are made up of treatment combinations according to Table 1. In this table the convention used by Yates (op. cit.) is adopted; lower case letters represent treatment combinations, ( 1) is used for the absence of treatment and capital letters for main effects and interactions. If there are two replicates each entry in Table 1 represents the sum of yields from two plots. In order to obtain the mean yield for the experiment the total of all plots is divided by 32, and to obtain effects and interactions the divisor is 16.
If we consider the difference between two treatments, say npkl and pkl. we have an estimate of the main effect, in this case of N, in the Minus-one design. We can express this in terms of the effects and interactions of a 2* design by subtracting the pkl column from the npkl column. If there are two replicates then the difference between treatment means is
i (npkl - pkl) = N + NP + NK + NPK + NL + NPL + NKL ( + NPKL) . . (I)
A similar procedure may be adopted for an> other comparison of treatment combinations.
The above equation indicates clearly that the effect of N as determined in the Minus-one design is the conventional effect of N plus all interactions involving N.
Experience has shown that the third order interaction in a factorial experiment is rarely large and in order to improve the precision of an experiment this interaction is frequently confounded with one degree of freedom corresponding to block differences. If this is done it is not available for use in equation (1) and must be assumed to be zero. It is included in parentheses in the equation to indicate that it is formally a part of the equation.
Evans discusses the number of replicates required for a Minus-one design in order to give the same accuracy as a 2 * with two replicates in which the third order interaction
T able 1
FactorialEffect
T reatment CombinationDivisor
0 ) n p np k nk Pk npk 1 nl p . npl kl nkl pkl npkl
Mean .. + + + + + + + + + + + + + + 4- + 32N — + — + — + — + — + — + — + 16P _ + + — — + + — — + + — — + + 16NP + — + + — — + + — — + + — — + 16K — — + 4* + + — — — — + + + + 16NK .. 4- — + — — + — + + — + — — + — + 16PK + + — — — + + + 4- — — — — + + 16NPK .. + + — + — — + — + + — + — — + 16L + + + + + + + 4- 16NL .. + — + — + — + — — — + — + - + 16PL + + — + + — — — — + + — — + + 16NPL .. +■ + — — + + — + — — + + — — + 16KL . . + + + + + + + + 16NKL . . -i + -1- — + — + — + — + — 4~ 16PKL .. _ + + + + — — + + — — — — + + 16NPKL + — +
+ ++ + + + 16
214

EAST AFRICAN AGRICULTURAL AND FORESTRY JOURNAL APRIL, 1963
is confounded with block differences. In doing this the formula given by Cochran and Cox (1950. p. 19) is used.
S= V 7 ’’ (‘ i + • • • • (2)
where 3 = true difference it is desired to detect.o=true standard error per unit (standard
deviation).r=number of replications.
ti=significant value of t in the test o f significance.
t2=value of t in the ordinary table corresponding to the value 2(1-P) where P is the probability o f obtaining a significant result.
L is taken at probability 0.05, and P as 0.90 so that L corresponds to the value of t at probability 2(1 - 0.90) = 0.20.
In Evans’ comparison between the Minus- one and 2 * designs there appear to be three errors or incorrect assumptions:
In a 2‘ design with 2 replicates, having the third order interaction confounded with block differences, there are 14, not 13. degrees of freedom available for error.
A 2* experiment is not used to make comparisons between individual treatment combinations because such comparisons are determined with low precision, being based on only two replicates. The main effects and interactions, as mentioned already, are determined on the basis of two groups of 16 plots. The effective replication is therefore sixteenfold and we must put r = 16 in equation (2).
Failure to recognize that r = 16 has led to the value 9 for the level o f significance for effects and interactions in the model. This value applies to a difference between individual plots.
With a coefficient of variation of 15 per cent and a mean yield of 20 , the standard error perplot is
15x20± — ----- = ± 3
100The standard error for main effects and
interactions is therefore
± 3 x v | - ± l «
and the least value for significant effects and interactions is
± 1 06 X 2-145 = ± 2-27
where 2.145 is the 5 per cent value of t for 14 degrees of freedom. Thus in Evans’ model not only the NP interaction but all those with the value 3 are also significant at P < 0.05.
Evans appears to have used a one-tailed test to obtain the value (t, + t,) = 3.121, the use of one-tailed test assumes that only positive or negative differences, effects and interactions are acceptable and that those of opposite sign may be ascribed to error (see Cochran and Cox. p. 18, footnote). In fertilizer experiments it is possible to have positive and negative effects, and more particularly, interactions. Hence a two-tailed test must be used.
For a 2 ‘ experiment having 14 d.f. for error we have, using a two-tailed test t, + t, = 2.145 + 1.345 = 3.490.
Equation (2) may be re-written
Hence for the main effects and interactions of a 2 ‘ in two replicates
a /16¥ ~ V~2
0-810
Transforming equation (2) and using this
value of ~ we can determine the minimum
value of r which will give the same precision in estimating differences in the Minus-one design with six treatments as is given for effects and interactions in the 2 \ thus
r 5 2 a y (tl + t2)2
The number of degrees o f freedom available for error will be 5(r — 1), but since we do not know r we must first assume a value in order to obtain values for t, and t, from published tables. A final value for r is found by successive approximation. Using this procedure we find r > 14.3. We must therefore have 15 replications in the Minus-one design to obtain the same precision as is provided for main effects and interactions in 24 design.
2 1 5

EAST AFRICAN AGRICULTURAL AND FORESTRY JOURNAL APRIL, 1963
Alternatively we may consider the Minus- one design with six treatments and three replications which Evans proposes, and determine the detectable difference or main effect.8.
For the Minus-one design this will be
« (t, + 12) = J ~ o (3-60) = 2-94*
on a two-tailed test. For a 24 with two replicates the value for main effects and interactions will be
Vf 6 a ( t i + t 2) = y ^ a (3 -4 9 ) = l-23c
If we assume that a is the same in each case the ratio of the detectable effects in the two designs will be 2.94/1.23 = 2.4; thus, for significance at P = 0.05, effects in the proposed Minus-one design must be about 2$ times those which can be detected in the 24 design.
The 2 ‘ design may of course be used to compare mean yields from important treatment combinations. If all four factors have proved to be important such a comparison will, as mentioned above, have very low precision, being estimated on the basis of only two replicates. In practice all four factors rarely need be examined in this way. When three or fewer factors are important treatment yield comparisons are made with greater precision than is given by the Minus-one design with three replicates, replication being increased because such comparisons are made on all plots with and without the unimportant factor or factors.
T he Coefficient of Variation in 2" Experiments
Although Evans provides yield data from three actual Minus-one experiments he does not give standard errors for any of them, so that no estimate of the precision of his experiments is available. This is unfortunate since he states that the 24 design, using two replicates, frequently leads to high coefficients of variation and implies that the Minus-one design with three replicates would be at least as satisfactory. Reference is made to experiments of 2* design conducted in Tanganyika by the present writer (Le Mare, 1959), and the statement is made that coefficients o f variation were often high, 20-30 per cent. N o data on these coefficients were given in the paper by Le Mare nor could they be derived from data presented,
but as the matter has been raised they arc examined here to provide information from a large series of experiments for the guidance of future workers. The data presented below have been derived from standard errors and mean yields contained in the Annual Reports of the Scientific Department of the Overseas Food Corporation for 1947 to 1950. Some hitherto unpublished records have been used to obtain data for 1951.
The coefficient of variation (C) is the ratio of the standard deviation or standard error per plot (s) to the overall experiment mean yield ( y ) and is usually expressed as a percentage:
sC = — X 100
yC is therefore affected by both the standard deviation and the mean yield. The influence of the design on s is discussed in standard tests on experiment design (e.g. Cox, 1958). In the present examination we are concerned with the 2° design, and in particular, the 2 4 having two replications laid down in four blocks, the highest order interaction being confounded with one degree of freedom for block differences. As no comparison can be made with the Minus-one or other design because inadequate data are available, the influence of design on s. and hence on C will not be discussed further.
The influence of mean yield on the coefficient of variation must be considered because any factor which affects the experiment as a whole, and does not therefore influence the precision with which contrasts within the experiment are determined, will affect C. Thus, for example, drought or other climatic factor causing low yield will result in a high value for C. To bear this in mind is therefore essential when considering values of C, which taken alone has limited use.
The 2“ design was used in Tanganyika during the four seasons 1947-8 to 1950-1, and data are available for 46 groundnut and 22 maize experiments. Of these one groundnut and five maize experiments were single replicates of 2 . the remainder being two replicates of 2*. Ingeneral the 25 design in a single replicate provides slightly poorer control of error than the 2 ‘ so the inclusion of 2J experiments may tend to bias the data unfavourably with respect to the 2* which form the majority, but as the numbers are small they are likely to have little effect.
216

EAST AFRICAN AGRICULTURAL AND FORESTRY JOURNAL APRIL, 1963
Table 2.—Experiments Classified According to Value of C.
C, % G roundnuts M aize
No. of ExperimentsNo. of
Experiments
4 Seasons 3 Seasons 3 Seasons1947-51 1948-49
Excluded1948-51*
Oto 5 0 0 0to 10 5 5 0to 15 14 14 4to 20 12 9 6to 25 5 5 2to 30 5 2 8> 30
5 3 2
Total 46 38 22
*There was no maize experiment in the 1947-8 season.
Of the groundnut experiments about one- third had values of C greater than 20 per cent. 1-c Mare pointed out in his paper (op. cit.) that in 1948-9 groundnut yields were seriously affected by drought in the Kongwa and Urambo regions. In that season the mean yield in eight experiments was only 256 lb. kernels per acre; in five o f them C was greater than 20 per cent. In the remaining three seasons when mean yields were satisfactory only about
G roundnuts
one-quarter of the experiments had values of C greater than 20 per cent; in half of them the value was less than 15 per cent.
In the maize experiments there were more high values, over half the experiments having C greater than 20 per cent. The reason for this is to be found in the generally poor yields which were obtained in all three areas throughout the period of the experiments. There was only one maize experiment in the 1948-9 season and in general the low yields cannot be attributed to climatic conditions.
In figure 1, C is plotted against mean yield. In groundnuts there is considerable spread; values of C less than 20 per cent occur over a wide range of yield but in general experiments with high C have low yield. A single experiment with high yield and a very high C appears to be anomalous.
In the maize experiments C is negatively correlated with yield, the correlation being significant at P < 0.001. The regression (see fig. 1) indicates that values o f C less than about 15 per cent are unlikely to be obtained (P < 0.05) at yields less than about 1,800 lb. grain per acre.
The conditions under which the experiments were performed were abnormally difficult for field experimentation and should be considered in an examination of the coefficients of variation obtained. Many of the experiments were on land newly cleared from indigenous bush.
Maize
C
°/»o
4 0
30
2 0
IO
o
kernels, lb. per acre grain, lb. per acre
PiR- 1-—Relationship between coefficient of variation, C, and mean y icld, y, in groundnut and niai/eexperiments
217

EAST AFRICAN AGRICULTURAL AND FORESTRY JOURNAL APRIL, 1963
and on occasions planting was delayed while clearing and land preparation were completed. In addition many of the field staff had no previous experience of field experimentation. As a result of these difficulties the standard errors obtained were probably higher than would occur under more satisfactory conditions and hence C was adversely affected. Quenouille (1953) indicates that in a field plot experiment the unaccountable variation is often about 12 per cent and this is in general accordance with results in Britain. Sncdecor (1946) states that for maize experiments the value is often between 5 and 15 per cent. From the fact that half the groundnut experiments had values in the range 5 to 15 per cent and that at the higher yields the maize experiments gave values less than 15 per cent we may infer that under satisfactory conditions of site and yield the 2 " design does not lead to high values of C but gives values in good agreement with those generally recognized to be satisfactory for field plot experimentation.
Summary
The Minus-one design determines effects of fertilizers at a generally high level of fertility. It may therefore give estimates of the effects in excess o f those which would obtain under normal conditions in areas of low soil fertility. This may lead to misleading estimates of the likely economic return from fertilizer use. The Minus-one, unlike the 2" design, is incapable
of estimating interactions between factors. Interactions are often important in fertilizer studies and are essential when the nutrient value of organic manures is being investigated.
In order to detect differences between treatment combinations comparable with main effects and interactions in a 2‘ experiment 15 replications would be needed in a Minus-one experiment.
The use of the 2" design with groundnuts under difficult experimental conditions is shown to provide satisfactory values for the coefficient of variation over a wide range of yield. If yields are low C is likely to be high. Under similar conditions with maize C is negatively correlated with yield. Satisfactory values are unlikely if yield is less than 1.800 lb. grain per acre.
R e fe r e n c e s
Evans, A. C. (1962). E. Afr. agric. for. 27, 164. Yates. F. (1937). Design and Analysis of Factorial
Experiments. Tech. Comm. 35. Imperial Bureau of Soil Science, Harpenden.
Cochran. W. G., and Cox. G. M. (1950). Experimental Designs. John Wiley and Sons, New York.
Cox. D. R. (1958). Planning of Experiments. John Wiley and Sons, New York.
Lc Mare, P. H. (1959). Emp. J. Exp. Agric., 27, 197.Quenouille. M. H. (1953). The Design and Analysis of
Experiment. Charles Griffin and Co. Ltd., London.Snedecor, G. W. (1946). Statistical Methods (4th ed.).
Iowa State College Press, Amer.
218

EAST AFRICAN AGRICULTURAL AND FORESTRY JOURNAL APRIL, 1963
PRELIMINARY OBSERVATIONS ON GESTATION LENGTH AND BIRTH WEIGHT OF ETHIOPIAN CATTLE
By John C. Glenn1, Shankute Tcssema2, and Randolph Larsen3
(Received lo r publication on 7th May, 1962)
Ethiopia, a land until very recently isolated from the rest of the world, is a country with a rather great agricultural potential. It is a country much like Kenya in climate and topography except that it is slightly more mountainous and rugged. Because of the isolation the agricultural progress of this country has been very slow, and in an effort to accelerate this progress, an agricultural college has been established in the eastern part o f the country between Dire Dawa and Harrar. This college, which has an organizational pattern similar to a land grant college in the United States, is a joint project of the United Stales and Ethiopian Governments. It is staffed by college personnel from the United States and Ethiopian personnel with advanced degrees earned abroad.
A part of the research activity of the college involves gathering basic information on the native cattle of Ethiopia and the development of a programme of improvement. There are a number of different types of cattle in Ethiopia but all are Bos indietts.
The purpose of the work to be reported in this paper was to determine the reproductive behaviour of a group of native cattle purchased from the nomadic Somali tribe of the Ogaden Plain in south-eastern Ethiopia. These cattle are of similar type if not exactly the same type as the cattle of the Kenya N.F.D. as described by Lampkin and Lampkin (1960).
Ninety cows were purchased in August of 1959. These animals were selected from a group o f approximately 600 cows, an effort being made to select animals of a young age and similar type. They were trailed to the college and put on good quality pasture. The animals were given no supplementary roughage or concentrates during any season of the year. An adequate amount of grass was left on the ground at the end of the rainy season to furnish feed through the dry season.
The cattle were dipped in B.H.C. or D.D.T. at varying intervals depending upon the buildup of ectoparasites. In the wet season dipping was necessary' about every ten days, but in the dry part of the year dipping at intervals of six to eight weeks was adequate.
Six of the 90 cows were culled because of a positive reaction to either a tuberculosis of Brucellosis test. An additional 11 cows previously purchased from the same area were added to the group prior to the breeding season.
M e t h o d s
Ninety-five cows, ranging from three to five years of age. were exposed to fertile bulls from 10th April to 15th July. 1960. For the first six weeks the cows were penned each evening and three mature bulls were placed with them for an hour in the evening and an hour in the morning before the cows were turned on pasture. Cows in estrus in the evening were placed in a separate pen with the bulls at night.
During the remainder o f the season the bulls were with the cows during the daytime while on pasture and separated at night. The cows were checked night and morning for estrus. In some cases cows came on estrus after leaving the pens in the morning, were bred, and out of estrus before returning to the pen in the evening. In these cases the record of breeding was taken from the herder.
At birth, weights were taken within 24 hours and were recorded to the nearest one half- pound.
Re su l t s
Three of the cows calved during the breeding season from matings prior to purchase. Only one of these returned to estrus during the breedilng season. Seventy-seven of the 95 cows calved during the subsequent calving season.
1 Present Address: Animal Science Department, Louisiana State University. Baton Rouge, Louisiana. Formerly Head. Dept, of An. Sci.. Imperial Ethiopian College.
= Present address: Kansas State College.’ Present address: Iowa State College.
219

EAST AFRICAN AGRICULTURAL AND FORESTRY JOURNAL APRIL, 1963
All cows for which a breeding date was recorded, calved. The two which calved and failed to return to estrus and 16 for which no estrus was observed, failed to calve.
The cows started calving on 19th December. 1960. The first three calves born were classified as premature due to their extremely low birth weights and general appearance. Average gestation for these three cows was 259 days with an average birth weight of 21 lb.
Five calves were born dead or died shortly after birth. No birth weights were obtained on these calves since in some cases several hours had passed before the calves were found. Average gestation for the five cows losing their calves was 275 days.
The remainder of the calves were born after an average gestation period of 286 days (range 275 to 292, standard deviation 3.07 days). The birth weight average was 44.66 lb. (range 30.58 to 49.94 lb., standard deviation 3.52 lb.).
One other group of calves were available for birth weight data. The dams of these calves were exposed to a Hereford bull (to the
author's knowledge the only European-type beef bull in Ethiopia) which had survived from an importation of Hereford cattle in 1952. The calves from this bull averaged 56.76 lb. (range 49.06 to 64.9 lb., standard deviation 3.96).
Summary
A preliminary study of average gestation lengths and birth weights of Ethiopian cattle was conducted at the Imperial Ethiopian Agricultural and Mechanical College. In 68 live, normal calves the average birth weight was 44.66 lb. and gestation length was 275 days. A group of 14 Hereford-native cattle crosses averaged 56.76 lb. birth weight.
This study is being continued and expanded to include other crosses. A study of the effect of supplementary protein during the gestation period on birth weights will also be made.
Literature Cited
Lampkin, G., and Lampkin, G. H. (1960). Studies on ihc Produclion of Beef from Zebu Cattle of East Africa—I. J. Agric. Sci.. 55, 229.
220

EAST AFRICAN AGRICULTURAL AND FORESTRY JOURNAL APRIL, 1963
PRELIMINARY OBSERVATIONS ON THE MILK PRODUCTION OF BORAN TYPE CATTLE
IN ETHIOPIABy John C. Glen* 1, Shankutc Tessema2, Peter Mziray3, Leon Holland4
(Received for publication on 7th May, 1962)
The cattle used in this study were part of the herd o f the Imperial Ethiopian College. These cattle are described in an earlier paper (Glenn, et al. 1962). Various projects are under way seeking to obtain basic productivity information on these cattle and to improve them by selection and/or upgrading. The primary purpose o f these projects is to develop a beef producing animal from which meat will be exported. Milk production is judged important because of the desire to get rapid, early growth of calves in order that their post-weaning size and thus ability to utilize large amounts of roughage will be at a maximum.
Meth o ds
Five cow's and their calves were selected at random from a group of three- to five-year-old cows calving between 15th January and 15th February, 1961. The number of calves used was limited due to inadequate labour availability; however, in view o f the preliminary nature of the work, the small number was not considered too great a disadvantage.
The test was started after the calves had reached four weeks of age in order that they might be able to consume all the cows’ milk at each suckling.
During the first 30 days of the study calves were weighed three times a day, seven days a week. The calves were with their dams approximately 30 minutes at each suckling. At other times the cows were on pasture. During the last 70 days of the study the calves were separated from their dams on three days during each week and weighed at two suckling periods at 12-hour intervals.
It was observed that after the first week of the trial the cows grazed normally during the period that their calves were separated from them.
The cows received only grass from unimproved native pastures during the period that records were taken except for having access to a bonemeal-salt mixture. The calves had no source of nutrients other than milk during the first month and subsequently only had access to pasture four days a week.
Weights were taken on the calves before putting them with their dams and as soon as they had completed suckling. There were very infrequent occurrences of urination or defecation between weighings, thus errors in estimating milk production which might be caused by such excretion were not considered to be important.
The calves became used to the weighing procedure very quickly and would move on and off the scales with a minimum of excitement.
Results
The average milk production of the five cows is shown in Table 1. Since there is no previous data available on similar cattle in Ethiopia, it is not possible to know if the sample used is average, low or high in milk production. The results compare favourably with those reported by Lampkin and Lampkin (1960b) for cattle from the Kenya N.F.D. The estimate obtained here is about the same as that reported by Gifford (1949, 1953) for European breeds of beef cattle.
The effect of the milk production o f the dam on rate of gain of her calf is shown in Table 2. During the last ten weeks o f this trial, gains would have been due to both milk production of the dam and grass consumed by the calf. It was observed that the calves were grazing to a limited extent during this period.
‘ Present address: Animal Science Department, Louisiana Slate University. Baton Rouge. Formerly Head, Animal Science Department, Imperial Ethiopian A. & M. College.
1 Present address: Kansas Stale College.’ Present address: Ministry of Agric., Tanganyika.' Head, Animal Science Department, Imperial Ethiopian A. & M. College.
221

EAST AFRICAN AGRICULTURAL AND FORESTRY JOURNAL APRIL, 1963
Table 1.— Average D aily Milk Production of Five Zebu Cows (Pounds)
Week* 1 2 3 4 5 6 7 8 9 10 11 12 13 14 14-weekAverage
Cow16 10-3 111 114 10-3 114 9-5 11-3 12-1 11-3 12-3 121 12-3 11-2 11-5 11-146 8-8 9-0 10 0 7-3 8-8 9-1 9-5 10-8 9-7 10-8 100 10-5 101 10-8 9-39
90 8-6 11-6 9-2 7-9 8-2 5-5 7-0 8-1 7-6 8-3 9-8 8-7 8-1 • • 8-2036 7 4 8-9 74 8-2 8-3 71 8-5 9-0 7-3 9-6 9 0 9-0 6-8 8 1 8-1145 8 0 7-7 7-8 7-1 6-5 5 0 6-6 7-9 6-3 6-8 8-2 7-3 84 7-8 7-37
•Weeks 1-4 calves weighed 3 times per day, 7 days each week. Weeks 5-4 calves weighed 2 times per day, 3 days each week.
••N o weights available.
Table 2.— G ains of Calves Suckling Zebu Cows (Pounds)
Cow Calf BeginningWeight
EndingWeight
Average Daily Gain
16 172 65 195 1-326 168 65 188 1-26
90 171 55 154 1 -0236 15+ 63 165 1-0445 158 64 155 0-93
S ummary
The milk production of five Zebu cattle from south-western Ethiopia was estimated. Calves were weighed before and after suckling either three times a day, seven days a week or two times a day, three days each week.
Average daily production for a 14-week period was 11.14. 9.39, 8.20, 8.11 and 7.37 lb. of milk. Daily gains for calves o f Ihese cows in the same order as above were 1.32, 1.26.1.02, 1.04 and 0.93 lb.
No peak of production was noied during the course of the experiment nor was there any marked decrease in production up to the end of the experiment.
Literature Cited
Gifford, W. (1949). Importance of High Milk Production in Beef Cows found Overestimated. J. Animal Sci., 8. 605.
Gifford. W. (1953). Records of Performance Tests for Beef Cattle in Breeding Herds. Arkansas Agric. Expt. Sla. Bull., 531.
Glenn. J. C., Shankute Tesscma and Larsen. R. E. (1962). Preliminary Observation on Gestation Length and Birth Weight of Ethiopian Cattle. (Refer to first paper of series.)
Lampkin, G.. and Lampkin, G. H. (1960a). Studies on the Production of Beef from Zebu Cattle of East Africa. I. J. Agric. Sci., 55, 229.
Lampkin. G., and Lampkin, G. H. (1960b). Studies on the Production of Beef from Zebu Cattle of East Africa. II. J. Agric. Sci., 55, 233.

EAST AFRICAN AGRICULTURAL AN D FORESTRY JOURNAL APRIL, 1963
NAPIER GRASS FOR MILK PRODUCTION IN THE TRANS NZOIA
By W. D. Ware-Austin, Department of Agriculture, Kitale, Kenya
(Received for publication on 15th June, 1962)
The agricultural economy in the Trans Nzoia i based mainly on a complementary mixed farming system that involves maize and butterfat production.
It is this latter part of the farming system which concerns us here, and within the context that reasonable profits have to be obtained from a market in which one gallon of milk, as butterfat, is worth only Sh. 1/10-1/30. The cost of purchased concentrates is high and it is apparent that the judicious farmer will wish to rely in very large measure on pasture grass to meet the requirements of his dairy stock, and to supplement their requirements from home-grown feeds to the fullest possible extent. This procedure is simple and attractive but it is known from the work of Dougall [1] and of Glover and Dougall [2] that pastures 'ary widely in their protein content throughout the year and that whereas available energy in the form of “total digestible nutrients" remains remarkably constant at all stages of growth, digestible crude protein may be in excess during the early stages of growth, in deficit during the latter stages of growth. Glover and Dougall have shown that there is a cross-over point between the two stages which can be specified by the crude protein content of the pasture and that this value is some 11-12 per cent of its dry matter. At this level of crude protein, which is equivalent to some 6.5-7.5 per cent of digestible crude protein, “a Jersey cow of some 800 lb. livewe:ght and average appetite can produce only some two gallons of milk of 5 per cent butterfat” [2],
We cannot usually expect to maintain crude protein levels in our pastures at 11-12 per cent for very much more than 5-6 months o f the year, be they seeded leys or natural grassland, for our climate dictates that we have a dry season of some 3-4 months or more, during which time all our grasses are dormant or nearly so, and it frequently happens that the additive effects of periods of relative dryness, serve simply to check seriously the growth and nutritive value of our pastures. Furthermore, under the prevailing status of our Trans Nzoia soils, which are mainly deeply weathered and highly leached, there is an apparent lack of persistence in our sown
grasses and a lack of bulk in all our pastures. The ageing of local pastures and the consequent reduction of yield from them over successive years has recently been discussed by Glover and Birch [3]. Thus, for example, it is not unusual to find that whereas sown pastures may yield14-2 tons of dry matter per acre in their first and second years, they do not yield much more than 1 ton/acre in their third and fourth years, and frequently less. This is not encouraging knowledge if we remember that an 800-lb. Jersey-type animal, eating to appetite, consumes some 3* tons of dry matter annually. Wre might therefore expect our grass leys in their first and second years to carry one mature beast on about 2 \ acres, and in their third and fourth years to carry one mature beast on about acres. It is interesting to note that Kirkwood [4] in a recent survey of 12 Trans Nzoia mixed farms showed that one mature beast to some 2^-3 acres was optimum if economic returns from milk production were to be obtained on a butterfat market. Moreover, he showed that on average, one milk cow on one acre produced only 81 gallons o f milk annually.
There is no doubt that our climate and the seasonal variation in the composition o f our pastures, in particular their lack of persistence and bulk, have a strong influence on milk production in the Trans Nzoia. Even if we make the assumption that all our dairy animals have in fact the inherent potential for maximum milk production from such pastures, we cannot assume that they have been nurtured adequately for the purpose either during pregnancy or throughout their lactation.
In recent years the agricultural Experimental Station, Kitale, has been making an appraisal of the dairy husbandry problems of the Trans Nzoia and seeking practical, economical solutions. The object of this paper is to explain one promising line of approach, namely, the use of Napier grass to supplement sown pastures and/or natural grassland at all times throughout the year when the pastures alone can neither support an animal adequately during its pregnancy nor meet the requirements for its potential milk production.
223

EAST AFRICAN AGRICULTURAL AND FORESTRY JOURNAL APRIL, 1963
The sown pastures on the Experimental Station consist of Rhodes grass var. Endebess grown alone or in mixture with Nandi setaria and/or Kenya white clover and there is available an increasing acreage of Napier grass, var. French Cameroons, Gold Coast and Cameroons.
During the season 1961-62, a study was made of the changes that occur in the crude protein content of the sown pastures and of the Napier grass with a view to the complementary use of each by the Station's Jersey cows during their pregnancy and throughout their subsequent lactations. These changes are recorded in Table 1.
It is seen from this Table that the crude protein content of the Napier grass is almost consistently higher than that of the sown pastures throughout each month of a season which was remarkable for its extensive rains, particularly during the October-November period, at which time it is more usual in this district to find sown pastures entering into a period of dormancy and consequently, of very low- productivity.
When these crude protein values are expressed in terms of digestible crude protein (DCP) and total digestible nutrients (TDN) in accordance with the Glover el al. “Table of Estimates" [5], after taking into account the crude fibre content of the herbage [6], the variation in the feeding value that occurs during the same period is shown graphically in Fig. I.This diagram shows clearly that whereas Napier grass can supply almost consistently greater amounts of DCP than sown pastures throughout the season, it cannot supply very much additional energy, in terms of TDN. Morrison [7], amongst others, has specified the DCP and TDN requirements of dairy animals according to their body weight and the amount of butter- fat contained in their milk. Fig. 1 also shows
what these requirements are for an Ayrshire- type of dairy cow of 9 cwt. liveweight and giving milk containing 4 per cent butterfat and for a Jersey-type of 7 cwt. liveweight giving milk containing 5 per cent butterfat. expressed in terms of the DCP and TDN contained in 100 lb. of moisture-free feed, and assuming that each of the animals consumes 3 lb. of dry matter for each 1 cwt. of its bodyweight.
It is seen from Fig. 1 that the larger. Ayrshire-type of animal, with its larger appetite, is apparently able to extract sufficient energy (TDN) from the Napier grass to permit a yield of some three gallons of milk throughout the year but that it can only extract sufficient energy from the sown pastures to support some 2)-2j gallons. It is also seen that the smaller, Jersey-type of animal, with its correspondingly smaller appetite can only extract sufficient TDN from the Napier grass to permit a yield of some I | gallons, and from the sown pastures, sufficiefif energy to permit a yield of some l j gallons. From the standpoint of digestibie~crude protein, however, the Napier grass might be expected to support yields of three gallons of milk from the Ayrshire-type of animal for II months of the year whereas the sown pastures at best can only subscribe to this level of production for approximately one-half of this time. Similarly, for the smaller Jersey-type of animals the Napier grass might be expected in terms of DCP to support yields of 1_J gallons for 11 months of the year whereas the sown pastures can support this yield for about six months of the year. It is clear from Fig. 1 that in the case of the smaller animal, it is the lack of available energy that is restricting the yield of milk from Napier grass, for the amount of digestible crude protein that it contains is adequate to maintain three or more gallons of milk from this Jersey-type of animal for at least ten months of the year, while throughout the same period, as already stated, there is
T able 1.— Seasonal Variation in the C rude Protein Content of Kitale H erbage
C rude Protein— P er C ent of D ry M atter
M o n th s............................ M A M J J A S O N D J F
Sown pastures . . 8-4 10-8 12-4 10-3 10-9 150 13-9 13-2 11-6 11-5 10-0 6-8 i
Napier grass 130 17-7 19 7 16-7 17-5 14-6 161 14-6 16-2 16-4 16-1 9-6
Rainfall (in.) . . 0-71 4-49 3-37 5-33 8-70 7-73 5-68 9-44 14-27 5-27 1-56 0-32
224

EAST AFRICAN AGRICULTURAL AND FORESTRY JOURNAL APRIL, 1963
Fig. 1.—The estim ated am ounts of D C P and T D N contained in the dry m atter of N apiergrass (x------x) and o f sown pastures (o------ o) throughout the 1961-1962 season at theA gricultural Experim ental Station, Kitale. The requirements o f a Jersey-type and of an Ayrshire-type of dairy animal for D C P and T D N for maintenance and fo r maintenance and the production of 1, 2 and 3 gallons of m ilk are shown alongside, expressed on the
sam e percentage basis
225

EAST AFRICAN AGRICULTURAL AND FORESTRY JOURNAL APRIL, 1963
sufficient T D N to meet the requirements for It gallons only. These aspects o f milk production from pasture have been discussed fully by Glover and Dougall [2].
D isc u ssio n and P ractical Implications
It is apparent from the foregoing that although Napier grass is not expected to contribute much additional energy to the diet of a dairy cow , it is expected to contribute markedly to the amount of digestible crude protein contained in the diet. This is particularly important to the Agricultural Experimental Station, where a programme of seasonal calving for the Jersey herd is followed, and the time of calving is as far as possible restricted to within the months of April. May and June. This means that the animals in the herd are calving down at times when the sown grasses may not yet have fully emerged from their dormancy. The nutritive value of such herbage is low. and more frequently than not it is at maintenance or sub-maintenance levels. This situation is usually accompanied by a lack of adequate bulk in the grazing with a result that individual appetites for dry matter may never be satisfied.
It is considered that carefully managed Napier grass can play an important part in alleviating this situation. Beginning with the last two-three months of the dairy cows’ pregnancy, when sown pastures have reached a low level of productivity and of nutrient value, Napier grass put aside for the purpose, can also be grazed by these animals so that they can be assured of a satisfied appetite that will meet their DCP and TDN requirements for maintenance and for pregnancy. The pregnancy allowance may be taken to be the same as that required for one gallon of milk. Any surplus TDN which the animals may be able to assimilate from their mixed or single diet will almost certainly be used after parturition to compensate for the additional
energy that the pastures lack and thus assist to meet the animal's initial potential for milk production which, in the case of the Ayrshire- type of animal is, as already stated some three gallons and, in the case of the Jersey-type, about two gallons. Similarly, at any time during the subsequent lactation, Napier grass can be grazed for the purpose of satisfying dry matter intake and for supplementing any protein shortage in the sown pastures, so that DCP and TDN requirements for milk production at any given stage of an animal's lactation can be satisfied.
It is important to emphasize that for Napier grass to succeed in this purpose it must be carefully managed in such manner that it can always be fully utilized in its younger stages of growth. It is a grass that is well suited to a system of rapid, rotational grazing at the younger stages of growth and its regeneration following defoliation is correspondingly rapid. This system implies that the grass is never grazed so hard that rapid regrowth is not possible.
The practice on this Station is to apply 75-100 lb. triple superphosphate and 100 lb sulphate of ammonia per acre, at the time of planting the grass from splits. Similar amounts may be given annually thereafter. The use of farmyard manure and shed washings is however, being explored with a view to restricting the necessity to purchase fertilizers. Under this system of management the production of Napier grass is no more expensive than that of any comparable fodder that can be grown on this Station. For its purpose as a supplementary feed for milk production, it is economically superior to any purchased concentrate under the existing terms of the butterfat market.
Napier grass gives yields of dry matter that compare very favourably indeed with those of sown leys, as can be seen from the data given in Table 2.
T able 2.— Annual Yields of H erbage from Sown Leys and Napier G rass Respectively. T he Estimated Stocking R ates for an Ayrshire-type and a Jersey-type of
Dairy Animal are Shown A longside.
H erbage
Sown ley (1st year) . . Sown ley (2nd year)Sown ley (3rd year). . Napier grass (2nd season) Napier grass (3rd season)
Annual Yield of Dry Matter
Stocking R ate (acres per beast)
Jersey-type Ayrshire-type
2-4 1-5 1-91-4 2-6 3-30-7 5-2 6-641 0-9 113-8 10 1-2
226

E\ST AFRICAN AGRICULTURAL AND FORESTRY JOURNAL APRIL, 1963
This data shows clearly the decline in productivity of a typical Trans N zoia pasture with age (8 ) and how this in turn markedly affects the carrying capacity of the pasture. On the other hand no such marked decrease in productivity or in carrying capacity is apparent in the Napier grass of comparable age.
It would seem therefore that Napier grass, carefully managed, can be relied on to produce a continuous supply of green herbage throughout the year and indeed one quarter or more of its annual yield is obtained during the months between January and March. This is particularly important in the light of the reference made earlier to the lack of persistence and productivity of local, sown pastures not only during their third and fourth years but
also during the long dry season when these pastures are characterized by their low productivity and their low nutritional status.
R eferen ces
[1] Dougall, H. W. (1960). E. Afr. agric. for. J., 26,119.
[2] Glover, J., and Dougall, H . W. (1961). J. agric. Sci.. 56, 261.
[3] Glover, J., and Birch, W. R . (1962). J. agric. Sci., 58. 53.
[4] Kirkwood, R. D. B. The Kenya Farmer, August, 1960.
[5] Glover, J., Duthie, D. W., and Dougall, H. W. (1960). E. Afr. agric. for. J., 26, 117.
16] Dougall. H. W. E. Afr. for. J. (in the press).|7) Morrison, F. B. (1951). Feeds and Feeding, 21 st.
ed. The Morrison Publishing Company, New York. [81 Strange, L. R. N . Personal communication.
227

EAST AFRICAN AGRICULTURAL AND FORESTRY JOURNAL APRIL, 1963
SOIL FERTILITY STUDIES IN TANGANYIKAII— CONTINUED APPLICATIONS OF FERTILIZER ON THE RED AND RED-BROWN LOAMS OF THE NACHINCWEA
SERIESBy A. C. Evans, Ministry of Agriculture, Tanganyika
(Received for publication on 19th April. 1962)
Numerous short-term fertilizer experiments have been carried out in the Nachingwea area o f Tanganyika on a range of crops, and the results reported briefly in the Annual Reports o f the Overseas Food Corporation and Tanganyika Agricultural Corporation, and in a comprehensive paper by Le Mare (1959).
These results clearly showed that phosphatic fertilizers applied to leguminous crops and together with sulphate of ammonia for cereal crops give worthwhile economic returns.
In 1954 four permanent fertilizer experiments were begun to study the effect of the continued application of fertilizers on soil productivity. The following treatments were given annually in a factorial design partially confounded for NP and N P K : Nil, 100, 200 lb. per acre single superphosphate; Nil, 50 lb. per acre muriate of potash: Nil, 100. 200 lb. per acre sulphate of ammonia.
Although in annual experiments potash rarely gave a response, it was included here since there was a possibility that high yields brought about by the continued application of nitrogen and phosphorus might deplete the reserves o f this nutrient. However, since in the first two years the occasional significant responses obtained on yield or plant population were low but usually negative, its application was discontinued.
The rotation adopted was that current in the area, groundnuts, maize, soya-beans, sorghum, each experiment began with a different crop.
In 1958 when the Department o f Agriculture took over the research work o f the Tanganyika Agricultural Corporation, the old Experimental Farm was abandoned. Maize was planted on the four experiments to determine whether any build-up in soil fertility had occurred, but the crop fared badly and no conclusive results were obtained.
Re su lt s
Responses to potash were recorded occasionally and were usually negative. In 1954, a significant mean reduction of 194 lb. per acre was noted for maize. Groundnuts gave a negative response of 130 lb. per acre in 1955 and a positive response of 124 lb. in 1956. Soya bean, however, was more regularly affected. In 1954, 1955, and 1957, plant populations were markedly reduced and significant reductions in yield of 70 lb. and 130 lb. per acre were recorded in 1955 and 1957. Interactions with N and P, when present, were positive.
Cereals
Table 1.—Mean Yields of Maize, over Four Years, as Affected by Superphosphate and Sulphate of Ammonia, lb. Grain per Acre
O Pi Pz Mean
o 1,653 1,635 1,633 1,640Nr . a, 1.796 2,171 2,207 2,058n 2 . 2.135 2,381 2,461 2,326Mean . 1.861 2,062 2,100
Superphosphate alone produced no increase in yield of maize, but sulphate of ammonia alone did give a small increase, not significant statistically at the lower level, but a large significant increase at the higher level o f application. Sulphate of ammonia applied in the presence of superphosphate gave greater increases than when applied alone, the increases being roughly of the same order for both levels of superphosphate application. The interaction was positive and appreciable, 206 lb. per acre for the low level of sulphate of ammonia and 152 lb. pier acre for the high level averaged over the superphosphate applications. The response to sulphate of ammonia in the presence of superphosphate was not
228

i AST AFRICAN AGRICULTURAL AND FORESTRY JOURNAL APRIL, 1963
linear, the first 100 lb. per acre giving a mean response of 555 lb. per acre and the second 232 lb.
Table 2.— M ean Y ields of Sorghum , over Four Years, as Affected by Superphosphate and Sulphate of A mmonia, lb. G rain per _________ A cre
o Pi Pz Mean
1.118 1,283 1,451 1,2841,162 1,597 1,709 1,4891,278 1,711 1,804 1,5981,186 1,531 1,655
Both fertilizers gave small increases in yield when applied alone but large increases when applied together. The interactions were not so large as in the case of maize, being 135 and 138 lb. per acre for the low and high levels of sulphate of ammonia at the low superphosphate level and 107 and 101 lb. at the high superphosphate level.
LegumesTable 3.— Mean Y ields of G roundnuts, over Four Y ears, as A ffected by A pplications of Superphosphate and Residual E ffects of Sulphate of Ammonia, lb. K ernel per Acre
O Pi Pz Mean
O 987 1,019 1,082 1,029N , . . 966 1,118 1,108 1.064n 2 . . 993 1,066 1,110 1,057Mean . . 982 1,068 1,110
Significant responses were not shown by groundnuts to applications of sulphate of ammonia alone nor in the presence of superphosphate. Responses to superphosphate were appreciable and significant, the greater response per unit of superphosphate being given by the lower rate of application.
Table 4.— Mean Y ields of Soya Beans, Over Four Y ears, as Affected by Applications of Superphosphate and R esidual E ffects of Sulphate of Ammonia, lb. G rain per Acre
O Pi Pz Mean
° . . 583 618 674 625N t . . 532 705 622 620Nz .. 545 706 679 644Mean . . 1 554 676 659
Responses shown by soya bean were very similar to those shown by groundnuts, sulphate of ammonia applied in the previous year, having no effect, and superphosphate giving appreciable and significant responses. The response given by the higher rate of application was similar to that given by the lower rate.
D iscussion
The land on which these experiments were planted was cropped for two years previously. It was terraced, and crops were grown on ridges. During the four years of experimentation no definite signs were observed either in the mechanical cultivation o f the soil or in the yields of the crops that suggested any deterioration in soil structure or productivity. Table 5 gives the yields for the plots which did not receive any fertilizer during the period.
T able 5.—Yields of Control Plots for F our Successive Years, lb. per Acre
Year Maize Sorghum Groundnuts
Soya
1954 1,802 1.186 757 3501955 1,736 1.080 1,117 7401956 1,472 949 1,430 5211957 1,604 1,256 644 721
Also, there was no indication that responses to fertilizers were decreasing with time. Table 6 gives results for the treatments considered most suitable for the appropriate crops, superphosphate for legumes and superphosphate with sulphate of ammonia for cereals.
T able 6 .— R esponses to S uitable F ertilizer A pplications for F ou r S uccessive Y ears,
lb. per A cre
Year Maize Sorghum Groundnuts
Soya
1954 27 284 23 271955 847 617 53 861956 754 587 266 351957 974 861 66 307
No provision had been made in the above experiments to determine any residual effects of fertilizers. Four experiments were planted in 1954 to determine residual effects of phosphate for soya and sorghum since direct
229

EAST AFRICAN AGRICULTURAL AND FORESTRY JOURNAL APRIL, 1963
responses by these crops were low and not economic, but by utilizing any residual value would increase the total return when the phosphate was applied to more responsive crops. Central-shoot fly ruined one o f the sorghum experiments. Maize and sorghum received 100 and 2 0 0 lb. of single superphosphate and 100 lb. of sulphate of ammonia in 1954 as appropriate, soya receiving only phosphate. In 1955 half the plots of sorghum received the sulphate of ammonia dressing.
Table 7.—R esidual Responses to Phosphate, lb. per Acre
1954 crop Maize Sorghum Soya1955 crop . . Soya Soya SorghumControl 586 531 584Responses to:
Pi .. 66 118 129P2 .. 82 199 194N .. 104 69 94Pl.N 23 148 123p 2.n 192 238 206
Significantdifference:5% 201 105 1111 % 274 145 151
In 1954, maize and sorghum gave appreciable and significant responses to phosphate but soya did not. In 1955 one soya experiment and the sorghum experiment gave appreciable and significant responses to phosphate. The other soya experiment gave low and nonsignificant responses.
Le Mare (1959) has reported similar variable residual responses, maize in two experiments did not show any residual response, in three other experiments responses of 300, 843 and 449 were recorded. Groundnuts also showed residual responses of the order of 125-165 lb. per acre. In Le Mare’s experiments much higher dressings of superphosphate were used. 56 lb. of P20 5 per acre.
The responses shown by maize and sorghum in successive years. Table 6 , show a tendency to increase. This may be due to a general improvement in the phosphate status of the soil due to continued application of phosphate.
R e f e r e n c e s
Le Marc, P. H. (1959). Soil Fertility Studies in Three Areas of Tanganyika. Emp. J. Exp. Agric., V . 197.
Overseas Food Corporation, Annual Reports, 1948- 1955.
230

EAST AFRICAN AGRICULTURAL AND FORESTRY JOURNAL APRIL, 1963
SOIL FERTILITY STUDIES IN TANGANYIKAI I I—ON THE KIKUNCU AND LUSENI SOIL TYPES OF THE
LAKE AND WESTERN REGIONSBy A. C. Evans, Ministry of Agriculture, Dar es Salaam
(Received for publication on 29th May, 1962)
The Mwanhala Experiment Station is situated in Nzega District about 60 miles northeast o f Tabora. The original poor miombo forest was cleared many years ago and the land has been under cultivation or poor grass fallow.
The rain falls from October to April with characteristic wide annual variations and even wider, relatively, monthly variations so that severe drought periods are characteristic of the area. The mean monthly rainfall in the cropping season for 22 years is given below.
Oct. Nov. Dec. Jan. Feb. Mar. Apr. Total
0 60 3-23 6 08 5-59 4-14 515 5-39 3018
During the years in which the work was carried out for seasonal totals were: —
1956/7 1957/8 1958/9 1959/60 1960/1
27-3 29-6 181 36-6 23-8
Except for 1958/59 and 1960/61 seasonal totals were reasonable but only in 1959/60 were all monthly totals adequate for good crop growth. In February 1957 and January 1958 monthly totals were 2.40 and 2.31 in. In 1959, monthly totals for January to April were all much lower than the average, 3.39, 3.84, 3.96 and 0.93 in. In December 1960 and January 1961 the monthly totals were 3.22 and 3.11.
The soils at Mwanhala are of two main types, kikungu and luseni, with an intermediate type, luseni overlying kikungu. Kikungu is a red clayey soil low in fertility and crops grown on it are more susceptible to drought than those grown on luseni which is a fine gritty soil, free working and more productive than kikungu.
The present programme began in 1957. Previous experimentation on soil fertility was largely based on fallows, fertilizers and farm
yard manure using sorghum, groundnuts and maize as indicator crops. The results were frequently vitiated by devastating attacks of Central-shoot fly. Atherigona indica, on sorghum and rosette disease on groundnuts. In the new programme sorghum was not used as an indicator crop, since locally maize is a more desired food crop than sorghum, and a rosette resistant groundnut variety was introduced. These changes have had the desired effect in producing results free from the confounding effects of pests and diseases.
Previous results suggested that fallows were useless in restoring soil fertility but that farmyard manure and fertilizers might be valuable so attention was focussed on these two aspects. The area carries a large stock population and so farmyard manure could be produced in large quantities if its value were to be proved. Yields in the district are generally on the low side due to the general low fertility status of the soil, occurrence o f droughts, rather late planting and often low plant populations. Experiments were designed to study long-term residual effects, cumulative effects o f annual and biennial applications, interactions between farmyard manure and fertilizers and to test the value of fertilizers in counteracting the “date of planting effect”.
Unless specified, rates of application were 100-120 lb. per acre of double superphosphate or sulphate of ammonia and three tons of farmyard manure made in a covered shed. Phosphate was applied in the ridge before planting and nitrogen as a top-dressing to non- leguminous crops.
Responses by maize and groundnuts to fertilizer applications are appreciable (Tables 1 and 2). Groundnuts gave high responses to farmyard manure, but responses by maize were disappointingly low. These lower responses by maize appear to be real and not due to chance effects since, in each experiment, other treatments gave high responses and rainfall was good in both years. In experiment 2 (1958) the response to fertilizer applied in 1957 and 1958 was very high, 1,156 lb. per acre.
231
\
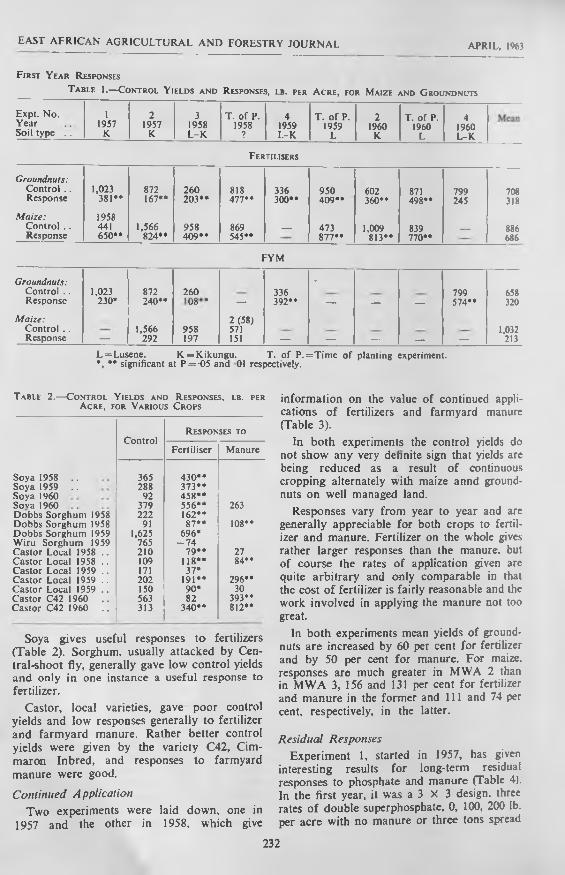
EAST AFRICAN AGRICULTURAL AND FORESTRY JOURNAL APRIL, 1963
F ir s t Y e a r R espo n se s
T a b l e I .— C o n t r o l Y ie l d s a n d R espo n se s , l b . p e r A c r e , fo r M a iz e a n d G r o u n d n u t s
Expt. No. 1 2 3 T. of P. 4 T. o f P. 2 T. of P. 4Year 1957 1957 1958 1958 1959 1959 I960 I960 I960Soil type . . K K L-K 7 L-K L K L L-K
F e r til ise r s
Groundnuts: Control . . Response
1,023381**
872167**
260 203 ••
818477**
336300**
950 409* •
602360**
871498**
799245
708318
Maize: Control . . Response
1958441650**
1,566824**
958409**
869545**
— 473877**
1,009813**
839770**
— 886686
FYM
Groundnuts: Control . . 1,023 872 260 336
•799 658
Response 230* 240**
•00O
— 392** — — — 574** 320
Maize: Control . . 1,566 958
2(58)571 1,032
Response — 292 197 151 — — — — — 213L=Lusene. K=Kikungu. T. of P.=Time of planting experiment. *, ** significant at P = -05 and 01 respectively.
T able 2 .— C o n t r o l Y ie l d s a n d R e spo n se s , l b . p e r A c r e , fo r V a r io u s C r o p s
ControlRes pon
Fertiliser
SES TO
Manure
Soya 1958 .. 365 430**Soya 1959 .. 288 373**Soya 1960 92 458**Sova I960 379 556** 263Dobbs Sorghum 1958 222 162**Dobbs Sorghum 1958 91 87** 108**Dobbs Sorghum 1959 1,625 696*Wiru Sorghum 1959 765 - 7 4Castor Local 1958 .. 210 79** 27Castor Local 1958 .. 109 118** 84**Castor Local 1959 .. 171 37*Castor Local 1959 .. 202 191** 296**Castor Local 1959 .. 150 90* 30Castor C42 1960 563 82 393**Castor C42 1960 313 340** 812**
Soya gives useful responses to fertilizers (Table 2). Sorghum, usually attacked by Central-shoot fly, generally gave low control yields and only in one instance a useful response to fertilizer.
Castor, local varieties, gave poor control yields and low responses generally to fertilizer and farmyard manure. Rather better control yields were given by the variety C42, Cim- maron Inbred, and responses to farmyard manure were good.
Continued ApplicationTwo experiments were laid down, one in
1957 and the other in 1958, which give
information on the value of continued applications of fertilizers and farmyard manure (Table 3).
In both experiments the control yields do not show any very definite sign that yields are being reduced as a result o f continuous cropping alternately with maize annd groundnuts on well managed land.
Responses vary from year to year and are generally appreciable for both crops to fertilizer and manure. Fertilizer on the whole gives rather larger responses than the manure, but of course the rates o f application given are quite arbitrary and only comparable in that the cost o f fertilizer is fairly reasonable and the work involved in applying the manure not too great.
In both experiments mean yields of groundnuts are increased by 60 per cent for fertilizer and by 50 per cent for manure. For maize, responses are much greater in MWA 2 than in MWA 3, 156 and 131 per cent for fertilizer and manure in the former and 111 and 74 per cent, respectively, in the latter.
Residual ResponsesExperiment 1, started in 1957, has given
interesting results for long-term residual responses to phosphate and manure (Table 4). In the first year, it was a 3 X 3 design, three rates of double superphosphate, 0 , 100, 200 lb. per acre with no manure or three tons spread
232

EAST AFRICAN AGRICULTURAL AND FORESTRY JOURNAL APRIL, 1963
T able 3 .— C ontrol Y ields a n d R esponses for C ontinuous A pp u c a t io n , lb . per A cre
1957 1958 1959 1960 1961 Mean
Experiment MWA 2
Groundnuts: % MeanControl 872 461 243 602 700 576 IncreaseResponse to Fertiliser 164 180** 62 538** 847** 359 62Manure 240 -3 1 71 465** 634** 276 48
Maize:Control 1,566 690 369 1,009 709 869Response to Fertiliser 824 1,037** 868** 1,669** 2,365* 1,353 156Manure 292 350** 824** 1,718** 2,492* 1,135 131
Experiment MWA 3
Groundnuts:Control — 260 341 812 529 486Response to Fertiliser — 203** 113** 441** 366** 281 58Manure — 108** 37 467** 295** 227 47
Maize:Control ____ 958 909 1,216 762 961Responses to Fertiliser — 409** 1,092** 1,759** 1,013** 1,068 111Manure — 197 731** 677* 1,246** 713 74
Table 4.— Long Term R esidual R esponses to P hosphate and Manure Applied in 1957,l b . per A cre
No D ouble S uperphosphate in 1958
Maize Groundnuts
1958 1960 and 1961 1959
Rate o f phosphate . . Nil FYM Nil FYM Nil FYMNil . . ____ 331* — 126 — 42100 . . 486** 790** 421 744** 102 83200 ......................................... 1,034 1,314** 1,266** 1,604** 121* 131*
100 lb . D ouble S uperphosphate in 1958
1957 19580 100 . . — — 725* 653* 38 20
100 100 . . 217 226 1,114** 1,052** 69 37200 100 . . 396* 616** 1,571** 1,900** 116* 106*
Nil Y ie ld s ............................ 441 2,047 315
or applied in the ridge. In the second year pairs of blocks were combined and 100 lb. per acre o f double superphosphate was applied to one pilot o f each of the 1957 treatments. Thus, in 1958 residual and direct effects could be compared. Residual responses only were measured in subsequent years. The annual sequence of cropping was groundnuts, maize,
groundnuts, maize, maize. An overall dressing of 100 lb. pier acre of sulphate of ammonia was applied to maize.
It was found that responses to manure spread or applied in the ridge were not significantly different and the results presented are the means of the two treatments.
233
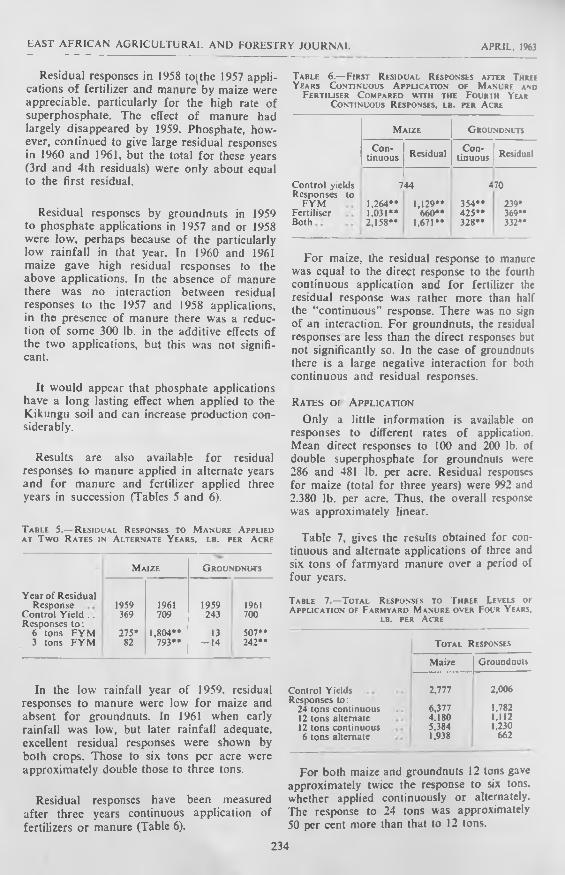
EAST AFRICAN AGRICULTURAL AND FORESTRY JOURNAL APRIL, 1963
Residual responses in 1958 tojthe 1957 applications of fertilizer and manure by maize were appreciable, particularly for the high rate of superphosphate. The effect o f manure had largely disappeared by 1959. Phosphate, however, continued to give large residual responses in 1960 and 1961, but the total for these years (3rd and 4th residuals) were only about equal to the first residual.
Residual responses by groundnuts in 1959 to phosphate applications in 1957 and or 1958 were low, perhaps because of the particularly low rainfall in that year. In 1960 and 1961 maize gave high residual responses to the above applications. In the absence of manure there was no interaction between residual responses to the 1957 and 1958 applications, in the presence of manure there was a reduction of some 300 lb. in the additive effects o f the two applications, but this was not significant.
It would appear that phosphate applications have a long lasting effect when applied to the Kikungu soil and can increase production considerably.
Results are also available for residual responses to manure applied in alternate years and for manure and fertilizer applied three years in succession (Tables 5 and 6 ).
Table 5.— R esidual Responses to M anure A pplied at Tw o Rates in Alternate Years, lb. per Acre
Maize G roundnuts
Year of ResidualResponse 1959 1961 1959 1961
Control Yield . . 369 709 243 700Responses t o :
6 tons FYM 275* 1,804** 13 507**3 tons FYM 82 793*. - 1 4 242* *
In the low rainfall year of 1959, residual responses to manure were low for maize and absent for groundnuts. In 1961 when early rainfall was low, but later rainfall adequate, excellent residual responses were shown by both crops. Those to six tons per acre were approximately double those to three tons.
Residual responses have been measured after three years continuous application of fertilizers or manure (Table 6).
Table 6.— First Residual Responses after Three Years Continuous A pplication of Manure a n d
Fertiliser Compared with the Fourth Year Continuous Responses, lb. per Acre
Control yields Responses to
FYM Fertiliser Both
Maize Groundnuts
Continuous Residual Con
tinuous Residual
7
1.264**1.031**2,158**
44
1,129**660**
1,671**
4
354* • 425** 328**
70
239* 369* • 332**
For maize, the residual response to manure was equal to the direct response to the fourth continuous application and for fertilizer the residual response was rather more than half the “continuous” response. There was no sign of an interaction. For groundnuts, the residual responses are less than the direct responses but not significantly so. In the case of groundnuts there is a large negative interaction for both continuous and residual responses.
Rates or A pplication
Only a little information is available on responses to different rates o f application. Mean direct responses to 100 and 200 lb. of double superphosphate for groundnuts were 286 and 481 lb. per acre. Residual responses for maize (total for three years) were 992 and 2,380 lb. per acre. Thus, the overall response was approximately linear.
Table 7, gives the results obtained for continuous and alternate applications of three and six tons of farmyard manure over a period of four years.
Table 7.—Total Responses to Three Levels o f
Application of Farmyard Manure over Four Years, lb. per Acre
Total Responses
Maize Groundnuts
Control Yields 2,777 2,006Responses to:
24 tons continuous 6,377 1.78212 tons alternate 4.180 1.11212 tons continuous 5,384 1,2306 tons alternate 1,938 662
For both maize and groundnuts 12 tons gave approximately twice the response to six tons, whether applied continuously or alternately. The response to 24 tons was approximately 50 per cent more than that to 12 tons.
234

EAST AFRICAN AGRICULTURAL AND FORESTRY JOURNAL APRIL, 1963
Interactions Between Fertilizers and Farmyard Manure
It might be expected that large and significant interactions between fertilizers and manure would occur particularly when both had been applied over a number of years. This was not found to be the case. Although negative interactions generally occurred, 17 out of 20 cases, their numerical values were small and only two were of statistical significance, one at the 5 per cent level and one at the 1 per cent level.
D a tes o f P la n tin g
In areas which have a single rainfall season lasting about five months on the average but with great variation in seasonal totals and irregular distribution within seasons it would be expected that the yields of crops sown late in the season would be lower than those sown early since they normally receive less rain. However, it has been found for a number of crops that even if the later sowings do receive sufficient rain to produce a reasonable yield the actual yield is very low. It would appear that another factor (or factors) is present which causes a reduction in yield of late-sown crops. Maize, sorghum, groundnuts and soya bean are particularly susceptible to this date of planting effect.
Experiments were carried out over several years to see whether fertilizer applications would reduce the adverse effect of late planting sufficiently to make it an economic practice and so give more latitude to sowing dates in farm management since it has been found at Mwanhala that crops should be planted in the first fortnight of the rainy season to be sure of obtaining maximum yields for that season.
The results obtained are shown in Table 8 in summary form. It is quite clear that fertilizers do give increases in yield for late sowings, but the increases are far too small to offset the "date of planting effect” which has the same relative effect whether fertilizer is applied or not. To obtain the full economic value of fertilizer it must only be applied to early planted crops.
T a b l e 8 . — E f f e c t o f P l a n t i n g D a t e o n P r o d u c t i o n
i n t h e P r e s e n c e a n d A b s e n c e o f F e r t i l i s e r s ,
l b . p e r A c r e
(In brackets, y ie ld s a s % o f D ecem ber Y ield)
December January February
Groundnuts:—Nil . . 907 (100) 340 (37) 73 (8)Fertiliser 1,366 (100) 459 (34) 112 (8 )
Maize:—Nil .. 792 (100) 380 (48) 237 (30)Fertiliser 1,497 (100) 835 (56) 412 (28)
Soya Bean:—Nil .. 263 (100) 172 (65) 21 ( 8)Fertiliser 614 (100) 351 (57) 63 (10)
IntercroppingIt has been shown that intercropping
groundnuts with maize or sorghum generally gives increased production per acre compared with pure stands (Evans, 1960).
Intercropped maize and groundnuts were grown with fertilizers, manure and both. The results obtained over three years were unexpected, but consistent (Table 9).
T able 9.— Mean Yields for T hree Years of Intercropped Maize and G roundnuts,
lb. per A cre
Maize G roundnuts
Nil Fertiliser Nil Fertiliser
N il . . 359 1,180** 293 291
FYM 1,152** 1,723** 318 267
Maize gave large, highly significant responses to fertilizer and manure and these responses were of the same order as for pure stands. Groundnuts did not respond when intercropped even though in pure stands responses were 204 and 252 lb. per acre for manure and fertilizer respectively.
The parallel between this result and the failure of tea to respond to fertilizer application under heavy shade is striking. It might be possible to improve the yield of fertilized groundnuts in an intercrop by planting them in alternate rows with the other crop as it has been found that yields were similar for intercropping in the same row or in alternate rows (Evans, 1960).
235
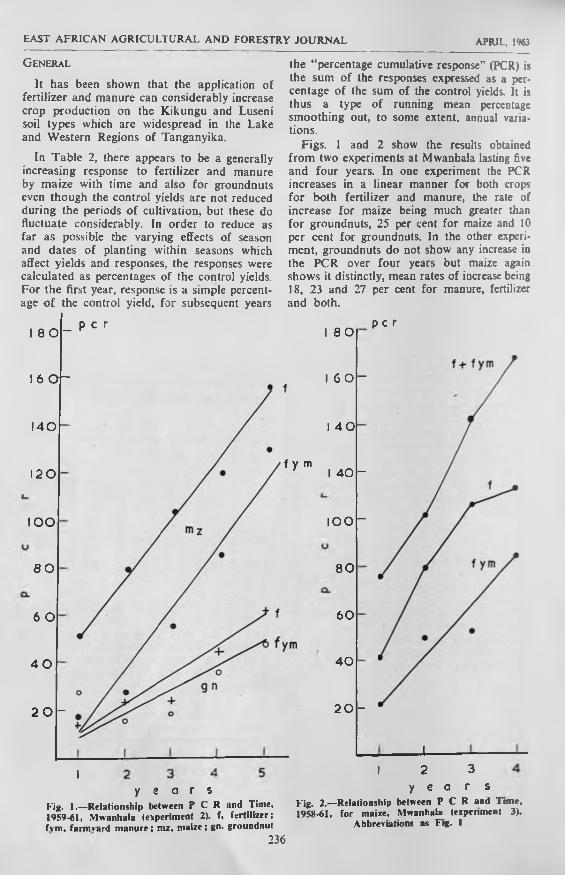
EAST AFRICAN AGRICULTURAL AND FORESTRY JOURNAL APRIL, 1963
G eneral
It has been shown that the application of fertilizer and manure can considerably increase crop production on the Kikungu and Luseni soil types which are widespread in the Lake and Western Regions of Tanganyika.
In Table 2, there appears to be a generally increasing response to fertilizer and manure by maize with time and also for groundnuts even though the control yields are not reduced during the periods o f cultivation, but these do fluctuate considerably. In order to reduce as far as possible the varying effects of season and dates of planting within seasons which affect yields and responses, the responses were calculated as percentages of the control yields. For the first year, response is a simple percentage o f the control yield, for subsequent years
the “percentage cumulative response" (PCR) is the sum of the responses expressed as a percentage of the sum of the control yields. It is thus a type of running mean percentage smoothing out, to some extent, annual variations.
Figs. 1 and 2 show the results obtained from two experiments at Mwanhala lasting five and four years. In one experiment the PCR increases in a linear manner for both crops for both fertilizer and manure, the rate of increase for maize being much greater than for groundnuts, 25 per cent for maize and 10 per cent for groundnuts. In the other experiment, groundnuts do not show any increase in the PCR over four years but maize again shows it distinctly, mean rates of increase being 18, 23 and 27 per cent for manure, fertilizer and both.
I 8 0
I 6 0 -
140
120
IO O
8 0
6 O
4 0
2 0 -
_ P c r I 80p c r
I
( y m
1 6 0 -
I 40
I 40 -
I OO “
80
60
40
2 0 -
1
_L2 3
y e a r sy e a r sFig. I.—Relationship between P C R and Time, Fig. 2.—Relationship between P C R and Tune,1959-61, Mwanhala (experiment 2). f, fertilizer; 1958-61, for maize, Mwanhala (experiment 3).fvm, farmvard m anure; mz, maize; gn, groundnut Abbreviations as Fig. 1
236

HAST AFRICAN AGRICULTURAL AND FORESTRY JOURNAL APRIL. 1963
Castor bean also shows similarly large increases in PCR over the three years for which results are available, the only difference being that the values for fertilizer are not greater than those for manure (Fig. 3).
Thus, there is definite evidence for three croP that with the continued application of fertilizer or manure a progressive increase in response can occur.
There are very few experiments in other areas o f Tanganyika in which continuous applications o f manure and (or) fertilizer, either annually or at regular intervals, have been made. Four experiments at Nachingwea (Evans, 1962) yield a little further evidence (Fig. 4). Maize and sorghum show increasing PCR's over a period of four years, soya is a doubtful case and groundnuts show no increase.
At Ukiriguru, a cotton experiment (UKI.26) testing fertilizer and compost, factorially, has been in progress for nine years on the hill sand soil (Ann. Rept.). The treatments are six tons o f manure per acre every three years, or
p c r
y e a r s
Fig. 3.—Relationship between P C R and Time, 1958-61. for castor bean, Mwanhala. Abbre
viations as Fig 1
150 lb. triple superphosphate every three years with annual applications of sulphate of ammonia. The nitrogen applications have varied during the course of the experiment both as regards rate and time of application, but it has been possible to pick out a reasonably uniform regime for the purpose of this study. Figure 4 shows that here again there is a steadily increasing PCR with time for the three treatments, for manure and fertilizer the mean annual increase is 7 per cent and for both applied together 11 per cent. In this experiment, however, there is evidence that the yields of the control plots are decreasing, the means for the successive three-year cycles bring 795. 526 and 370 lb. of seed cotton per acre. In spite o f recent low control yields the mean responses to fertilizer and manure that have been measured, 456 and 458 lb. per acre during the third cycle are sufficiently large to justify continued use of these soils.
In another experiment at Ukiriguru (UKI.9) in which the treatments have been changed from time to time the PCR shows a linear response over two three-year cycles using
y e a r s
Fig. 4.—Relationship between P C R for fertilizers and Time, 1954-57, Nachingwea. sg. sorghum, mz. maize, sy. soya bean, gn.
groundnut
237

EAST AFRICAN AGRICULTURAL AND FORESTRY JOURNAL APRIL, 1963
y e a r sFig. 5.—Relationship bet«een P C R and Time, 1953-61, for cotton, l kiriguru. Abbreviations as
Fig. 1
superphosphate and/or manure (Fig. 6 ). In the first cycle silicophosphate and potash were used, in the second and third cycles superphosphate was substituted for silicophosphate and manure for potash. In the fourth cycle basic slag was substituted for superphosphate. There appears to have been a levelling off of the PCR in the fourth cycle. Whether this is a real levelling is, however, doubtful. It may be the result o f changing the type of phosphate used. In this experiment control yields were reasonably constant during the course of the experiments.
At Mwanhala and Ukiriguru, appreciable residual responses have been recorded for phosphate and manure for periods of up to two years and more in some cases at Nachi- ngwea, such residual responses have only been studied for one year, but they can be appreciable in both cases and have been recorded for maize, sorghum, sesame, groundnuts and soya.
It has not been possible to estimate the amount of the three nutrients N, P. K in the manure applied in the various experiments. It is known that such fertilizers have low organic
matter, nitrogen and phosphate contents with a fairly high potash content. As a very approximate guide only, the amounts of N and P applied in three tons of manure would be equivalent to 100 lb. of sulphate of ammonia and 35 lb. of double superphosphate. Thus, at Mwanhala, the lower residual responses shown to manure may be a reflection of its lower phosphate content. In the Ukiriguru experiment, the residual responses in the first three-year cycle were appreciably greater for fertilizer than for manure, again possibly a reflection of the difference in the amounts of phosphate applied, but they were very similar indeed in the second and third cycles.
The steady increase in the PCR is probably due largely to a build up of the phosphate status of the soil. i.e. an accumulation of residual responses. The generally lower values given by manure may be a reflection of the smaller amount of available phosphate applied.
When a relationship between time and PCR has been established it is approximately linear and so can scarcely be expected to continue for a long time. The maximum values found have
238

P AST AFRICAN AGRICULTURAL AND FORESTRY JOURNAL APRIL, 1963
s i l ico phosphate f— p o t a sh — )
triple supers <------------
double supe rs ---- co mpost —
| bas ic slag ---------------->
Fig. 6.—Relationship between P C R and Time, 1948-59, for cotton, L'kiriguru. Abbreviations asFig. I
been for manure and fertilizer applied together, i.e. 130 for cotton and 168 for maize. These values represent annual responses, in the last recorded year of the appropriate experiment so far. of 1,253 lb. and 2,140 lb. per acre. The corresponding annual responses for fertilizer or manure alone are: —
Cotton Maize
Fertiliser 668 1,013
Manure 642 1,246
thus it can be expected that continued applications of these alone will produce larger annual responses for a few years.
It would appear that for certain soil types it is possible to improve productivity considerably by annual or regular periodic applications of fertilizers or manure, particularly for non-leguminous crops, maize, cotton, sorghum, castor. Only one clear-cut instance of a linear relationship between time and PCR for ground
nuts has been found. In other experiments although groundnuts do give responses these continue at about the same level. In certain experiments, groundnuts have not given a response to phosphate or manure even though maize has given high response and the level o f the yield of groundnuts is well below the potential of the variety planted. No instance of a linear relationship between time and PCR has been found for soya bean either, even though soya usually responds to applications of phosphate. This marked contrast between legumes and non-legumes would warrant further investigation.
Acknow ledgem ents
I am indebted to Messrs. J. Russell. B. Farrell. D. Scott, T. J. Aldington and R. Naburi, who carried out the experiments reported here.
R e f e r e n c e s
Annual Reports, Part II, Department of Agriculture.Tanganyika, 1953, el. seq.
Evans, A. C. (1960). E. Afr. agric. for. J.. 26, 1. Evans, A. C. E. Afr. agric. for. J. (in the press).

EAST AFRICAN AGRICULTURAL AND FORESTRY JOURNAL APRIL
SUGAR BEET TRIALS IN WEST KENYABy J. L. Elmer, J. M. Gosnell and R. G. Smith, East African Tanning Extract Co. Ltd-, Eld< r
Kenya
(Received for publication on I6tli April, 1962)
Whilst fodder beet is successfully grown in many parts of the Trans Nzoia and Uasin
•Gishu. few serious attempts have been made to grow sugar beet. A series of 18 field experiments was laid down in 1959 and 1960 on the Company's estates in the Uasin Gishu, in order to ascertain whether sugar beet might become a successful and economical cash crop to add to the rather limited range of crops at present grown in the area.
D escr iptio n o f E x perim ents
Experiments were planted in the Turbo. Soy, Kipkabus and Nandi Border districts and a brief description of these areas follows: —
Turbo.—Altitude 6.000 ft.. 49 in. rainfall (36 in. in 104 days on the crop in 1960 and 25 in.-29 in. in 70-80 days in 1959). Two sites .were chosen:(i) Red ferruginous clay derived from
phonolitic lava.(ii) Vleiland drained by ridge-and-furrow.
heavy grey clay loam.Soy .— Altitude 6.200 ft., 45 in. rainfall
(26 in. in 85 days on the crop in 1960 and 22 in.-25 in. in 64-79 days in 1959). Here three sites were chosen— (i) and (ii) Red ferruginous clay derived from phonolitic lava, underlain by an impervious lateritic layer (murrum) at 2 ft. 6 in. in (i). and (iii) Brown medium loam derived from the basement complex of Archaean granites and gneisses. This soil is far more fertile than the others.
Kipkabus.— Altitude 8,500 ft., 51 in. rainfall (27 in. in 101 days on the crop in 1960 and 26 in. in 97 days in 1959). The experiments were laid down on the typical deep red clay soil derived from phonolitic lava, with an intrusion of brown loam o f far greater organic matter and fertility (old forest soil).
Nandi Border.—Altitude 72200 ft., 51 in. rainfall (35 in. in 87 days on the crop in 1960 and 43 in. in 95 days in 1959). The soil is a red clay derived from phonolite.
At Eldoret the mean maximum temperature is around 73-74 F.. the mean minimum
48-49°F. Absolute maxima and minima are
about 83 5F. and 40=F. No exact temper :are recordings are available for the Soy anc Turbo districts but it is estimated that the;, are about 10°F. hotter than the above Nandi Border has mean maxima rangrrc from 70rF. in July to 80:F. in Februar;.- March, and mean minima ranging from 48- 55 F. The temperature at Kipkabus appreciably lower—mean maxima of 61- 70CF. and mean minima of 45-50"F.
C ultivation
With the exception of the factors under experiment, the crop was grown in accordance with recommendations from the Unitec Kingdom. These were: 20 in. row width, planting rate of 15 lb. seed/acre (rubbed seed at 6 lb./acre was used in 1960), singling and thinning to 10 in. in the row. cultivation when required. Harvesting was done by hand, and samples were taken for sucrose analysis, whic. was carried out in 1959 with a polarimeter and sodium flame using the standard method. In 1960. these analyses were kindly done for us by the Agricultural Chemist. Scott Agriculiura. Laboratories. Nairobi, using the copper reduction method. The experiments (apart from the time of planting trial) were mostly planted in May.
The various experiments tested fertilizer-, varieties, time and method of planting and subsoiling.
R e su lt s
As a commercial proposition, the results ol the beet experiments must be considered a failure. Nevertheless, a great deal of information on the crop was obtained, and it is believed that under certain conditions a good crop could be obtained. In 1959. good germination was obtained in most of the trials hu: growth was poor in general, although individual plots at Kipkabus and Soy yielded between v and 10 tons./acre. In I960, all experiments except that at Nandi Border gave very poor germination indeed. This necessitated the abandonment of two experiments, and in genera: resulted in far lower yields than would be expected from the vigour of the crop whi.h was excellent in certain places. (The highest
240

EAST AFRICAN AGRICULTURAL AND FORESTRY JOURNAL APRIL, 1963
\ield was 13^ tons acre). This poor germination was probably due to a combination of three factors: —
(4) Inherent infertility o f the soil. As can be seen from Plate I, germination was far better where superphosphate was applied than in the control plots where it was almost nil. However, even plots receiving 2 0 0 lb. triple superphosphate/acre achieved poor stands by normal standards.
(b) The loose tilth of the soil. The land had been well prepared by deep ploughing three months before planting and was in excellent condition, requiring only a rolling to produce a perfect seedbed. This was not given, however, and it is possible that seedling rootgrowth was retarded by excessive aeration. In addition. although planting was done at a shallow depth not exceeding 1 in., the seed may have sunk further into the soil.
(c> Insufficient rain after planting at Soy. This was not the case at Kipkabus which received excellent rain after planting.
The results of experiments are detailed below. In most experiments, interactions between two or more of the factors discussed were tested, e.g. variety and fertilizer. In no case were these interactions significant, and to save space they have been omitted, main effects only being presented.
Soil FertilityUnder local conditions, sugar beet showed
the most incredible responses in growth as well as germination, to variations in natural soil fertility. These variations sometimes overcame all treatment effects, e.g. in a 4 X 4 Latin square (plots were split, but below are the whole plot figures), the yields in lb. per plot were: —
50 38 63 105 25656 66 107 137 366
102 122 148 156 528101 211 222 267 799
309 437 538 665
In another case, one plot on forest soil out- yielded by 100 times another with the same treatment on red soil some 40 yards away (13.4 tons/acre and 0.13 tons/acre). The soil
from these two plots were analysed with thefollowing results:
DarkForest Soil Red Soil
pH 5-4 4-5Ca m.e. % 6-8 0-9Mg m.e. % 4-4 1-9
Other nutrients were similar in both cases. At Turbo, the growth and yield of beet on
an anthill was 25 times better than that on similar plots of ordinary red soil adjacent to it. The analyses for these two plots were:
Anthill Red Soil
pH 5-4 4-7Ca m.e. % 4-2 0-8Mg m.e. % 1 0 0-9
Plate II shows clearly the differencevigour of growth between anthill sites and the normal red phonolitic soil.
The above analyses of the red clay soils derived from phonolitic lava are fairly typical of the majority of the soils of the Uasin Gishu although many are not quite as acid as the above. The soils derived from acid basement complex rocks, which occur below the escarpment and in river basins in the north-western parts of the Uasin Gishu are quite different, as the following analysis shows:
Red brown sandy loam
pH .. 5-5Ca m.e. % . . 7-8Mg m.e. % . . 3-7
Growth on these soils has been far better than on the phonolite.
From the analyses, it is evident that the acidity and calcium content of the soil are of the utmost importance, while magnesium may also play a role. Forest soil, anthills and granitic soils are also thought to have a rather better structure than the phonolitic red clays.
It can thus be stated that sugar beet is unlikely to be successful on the typical Plateau soils with their low pH and Ca content and that attempts to grow the crop should be confined to the granitic soils in the north-west, the
241

EAST AFRICAN AGRICULTURAL AND FORESTRY JOURNAL APRIL. 1963
Plate I.—Effect of phosphate on germination of sugar beet in old nattle land: Foreground: Left Control. Right 200 Ih. triple supers/acre
fertile high altitude forest soils in the southeast or any other particular soil type with a pH of 5.4 or over and a Ca m.e. o f at least 5.
LimingA number of experiments tested lime appli
cations and although in all o f them lime caused some yield increase, the results were disappointing. In this connexion, it should be stated that beet was grown as an intercrop between
the rows of wattle re-establishment in all experiments except those on vleiland. It is only possible to take one beet crop off a particular field since the wattle is too tall in the second year; thus no residual effects of lime could be observed. The lime was applied at planting in 1959 and three months prior to planting in 1960.
Results of the experiments in which lime was tested are:
T able 1.— Effect of Lime
Site Soil YearY ield T ons/A cre Sucrose % Lime
Levellb./Acrc
Significance(over
Control)No Lime Lime No Lime Lime
Turbo .. Phonolite 1959 1-77 1 -81 ____ — 1,000 NSVlei 1959 2-85 6 04 — — 1.200 —
Soy . . Phonolite 1959 2-36 2-97 10-2 10-2 1,000 NSPhonolite 1960 1-26 1 -83 15-3 16-1 1,000 NSPhonolite 1960 1 -26 1 -59 15-3 161 2,000 NSPhonolite 1960 1-26 2-24 15-3 14-2 3,000 NSGranite 1959 616 5-78 10-7 10-6 500 —
i Granite 1959 616 6-85 10-7 10-5 1,000 —Granite 1959 616 6-44 10-7 11-8 1.500 —
Kipkabus .. Phonolite 1959 315 •3-56 12-6 12-2 1,000 NSNandi Border Phonolite 1959 1 66 1 -76 11-5 11-1 1,000 NS
Phonolite 1959 1-35 1 -74 12-6 12-3 1,000 —Phonolite 1959 1-35 204 12-6 12-3 4,000
Mean of 1.000 lb. acre lime 1959 60 2-53 2-93 12-2 12-1
242

EAST A FR IC A N AGRICULTURAL AND FORESTRY JOURNAL APRIL, 1963
The only site on which lime had a marked effect was on vleiland at Turbo. This effect was again^ visible in I960 but unfortunately this experiment had to be abandoned since the beet died fo llow ing a rise in the water table during the wet m onths o f July and August. The remaining experim ents produced a consistent but non-significant and economically unimportant response to lim e.
The effect o f lime on the pH of the topsoil was quite marked, however. The following analyses were taken from adjacent plots at harvest tim e, i.e. six months after lime application.
Nandi Border:Control pH. 5 051.000 1b. lime 5-784.000 lb. lime 6-27
Turbo:Control 5-141,0001b. lime 5-76
It is curious that although lime has raised the pH to the level at which successful growth was obtained on other sites, the increase in growth is not at all commensurate. A possible explanation is that the soil was not limed sufficiently deeply, or that sufficient time had not elapsed after liming before planting.
While lime may hold the key to successful sugar beet cultivation on the phonolite soils, it will require considerably more experimentation to determine how best to apply it.
PhosphateOn our phosphate-deficient soils, sugar beet,
like other crops, shows a marked response to water-soluble phosphate; about 40 lb. P.O. / acre is probably the optimum level. In these experiments, triple superphosphate (40-42% water soluble P O.) was compared with soda- phosphate (19.1% c.a.s. P.,05) and Minjingu rock phosphate (15% c.a.s. POR
TABLE 2 .— E ffect of T riple S uperphosphate a n d S uperphosphate N andi Border(P honolite) 1959
Lb. c.a.s. P20 5 Yield (tons acre) Supers Soda
Sucrose % Supers Soda
Significance (over control)
0 0-36 13-640 2-04 0-67 10-5 111 1%80 1 -52 0-56 11-3 12-4 1°/.
120 . 2 07 0-41 10-9 10-3 1%
Mean 1-88 0-55 10-9 113
T able 3 .— E ffect of T riple Superphosphate a n d M injingu Rock Phosphate, Soy(P honolite) 1960
Lb. c.a.s. P20 5 Yield (tons/acre) Sucrose % SignificanceSupers Minjingu Supers Minjingu (over control)
0 0-76 16-724 1 -88 16 6 — 1 %48 219 14-2 1%72 2 09 14-2 — 1 %
0 0-25 16040 1 -80 1 -24 16-4 17-2 1 o/1 /O80 1 -86 0-96 14-7 15-6 1 0/ 1 /o
Mean of Supers vs Minjingu . . 1-83 1-10 15-5 16-4
243

EAST AFRICAN AGRICULTURAL AND FORESTRY JOURNAL APRIL, 1963
Apart from its effect on germination, discussed earlier, phosphate improved growth and yield considerably. It was found that triple superphosphate gave considerably better results than either sodaphosphate or Minjingu rock phosphate when applied at equivalent levels of c.a.s. P.O.. This is presumably largely due to the rapid action of the water soluble phosphate in superphosphate, but it is also partly due to the fact that the sodaphosphate plots were grazed by the antelope Oribi and Duiker while the superphosphate plots were left untouched. A distinct difference in taste could be observed between the leaves of these plots: those receiving sodaphosphate being saltier. It is unfortunate that all the other beet experiments in 1959 were planted with standard dressings of sodaphosphate: had superphosphate been used the yields would have been greater.
A fairly consistent reduction in sucrose content with phosphate application was observed, but this reduction is small compared with the yield increase.
Nitrogen
Experiments in wattle re-establishment have indicated that no response is obtained from maize to nitrogen applications, presumably due to adequate N-fixation by the wattle. It is therefore somewhat surprising to obtain a positive response, both significant and economic, to topdressing with ammonium sulphate on sugar beet in such land. No such increase was obtained by applying the nitrogen at planting, nor was any obtained on the granite soil at Soy. when calcium ammonium nitrate was used.
Table 4 .—Effect of N itrogen
Site Soil Year Rate FertiliserApplica
tionTime
Yield(tons/acre)
Sucrose%
Significance(over
control)
Soy . . Granite 1959 0 7-41 12 3Granite 1959 100 CAN P 8 09 11-4 —
Granite 1959 200 CAN P 6-85 1 2 0 —
Granite 1960 0 — — 3-93 13-3 —
Granite 1960 100 CAN TD 3-63 14-4 NSKipkabus Phonolite 1959 0 — — 2-89 12-2 —
Phonolite 1959 200 AS TD 3-81 12-6 5°.Nandi Border Phonolite 1959 0 — — 1 -75 12-6 —
Phonolite 1959 200 CAN P 1 -67 12-2 NSPhonolite I960 0 — — 602 16 8 —Phonolite 1960 75 AS Early TD 7-21 170 NSPhonolite 1960 75 AS Late TD 7-56 16-8 5%Phonolite 1960 150 AS Early TD 8-44 16-7 1%Phonolite 1960 150 AS Late TD 7 09 18-5 NS
CAN--Calcium ammonium nitrate. AS Ammonium sulphate.
P=Planting.TD=Topdressing.
Topdressing at an early stage (five weeks after planting) with 100-150 lb. ammonium sulphate per acre can be expected to give a good response. There did not appear to be a consistent effect o f nitrogen on sucrose content.
Other FertilizersNo other fertilizer produced a significant or
economic response. The following were tried:{a) Potash.—200 lb. muriate of potash per
acre appeared to decrease the yield from 3.93 to 2.74 tons/acre at Soy on
granite soil in 1960. Sucrose percentage was increased from 13.3 to 15.7. These results were non-significant. Responses to potash are very rare in the Uasin Gishu. since the soils are adequately supplied.
(b) Rock Salt.—This appeared to give a slight response on vlei soil in 1959 and should these soils become a practical proposition for growing sugar beet, the use of salt would need to be investigated further. No response was obtained on other soils.
244

APRIL, 1963HAST AFRICAN AGRICULTURAL AND FORESTRY JOURNAL
T able 5.— R esponse to Rock Salt
Site_______________
Soil Year Rate Yield(tons/acre)
Sucrose%
Significance (over control)
Turbo Vlei . . 1959 0 4-44Vlei . . 1959 400 5-27 ____
Soy Granite 1959 0 7-41 12-3 —
Granite 1959 200 6-65 11 -4 —
Granite 1959 400 7-33 12-3 —
Nandi Border Phonolite . . 1959 0 1-82 12-4 —
Phonolite . . 1959 400 1-60 12-5 NS
Damage by buck was also observed on plots to which rock salt had been applied, since the leaves tasted appreciably saltier. The sodium content of these soils is very low, about 0.1 m.e.% or less.
(c) Gypsum .—The sulphur content of our soils is variable and sometimes low; responses to gypsum in the growth of legumes have been obtained. No result was obtained in the case of sugar beet, however.
T able 6.— R esponse to G ypsum
Site Soil Year
Soy Granite 1959Granite 1959Granite 1959
Nandi Border Phonolite .. 1959Phonolite . . 1959
T ime and M ethod o f P lanting
Due to severe soil phosphate fixation, it is considered essential to band the fertilizer close to the seed rather than broadcast it as is believed to be the practice in U.K. An experiment was laid down on phonolitic soil at Nandi Border in 1959 to determine whether emplacement of fertilizer 3 in. below the seed (M l) or with the seed (M2) produced highest yields. In addition three times of planting were tried.
T a b l e 7.— T im e a n d M e th o d of P l a n t in g
Time of Planting
Y ie l d (t o n s /a c r e ) S u c r o s e %
Ml M2 Mean Ml M2 Mean
May 106 0 57 0-82 121 11 0 11 -6June 045 0-46 0-46 11 -5 11 -5 115July 0-24 013 018 111 111 111
Mean 0-58 0-39 11-6 11-2
The effect of time o f planting on yield was highly significant (.1 %) and method of planting was also significant (5 "„).
Rate Yield (tons, acre)
Sucroseyso
Significance (over control)
0 7-41 12-3100 7-13 11 -6 —200 7-53 11 -4 —
0 1-75 12-6 —300 1-67 12-3 NS
It seems clear, therefore, that sugar-beet should be planted as soon as possible after the start of the rains, and that fertilizer should, if practicable, be placed below the seed.
Land Preparation
In 1959 land was prepared for sugar-beet using the normal method for intercropping maize in wattle, viz. two passes with a Caterpillar D4 tractor and heavy Rome Harrow, followed by a light harrow to break down the soil into a seed bed. It became abundantly clear that this method did not prepare the soil deeply enough for sugar-beet and many cases of forked or bent root occurred where the growth of the plant was limited by a hard pan at 4-6 in. This malformation did not occur on the granite soil, indicating that the more sandy open texture of this soil also favoured the crop. In 1960, care was taken to prevent a recurrence of this hard pan by deep ploughing to 10-12 in. Two subsoiling experiments were also laid down, but it would appear that subsoiling is unnecessary, given proper cultivation.
245
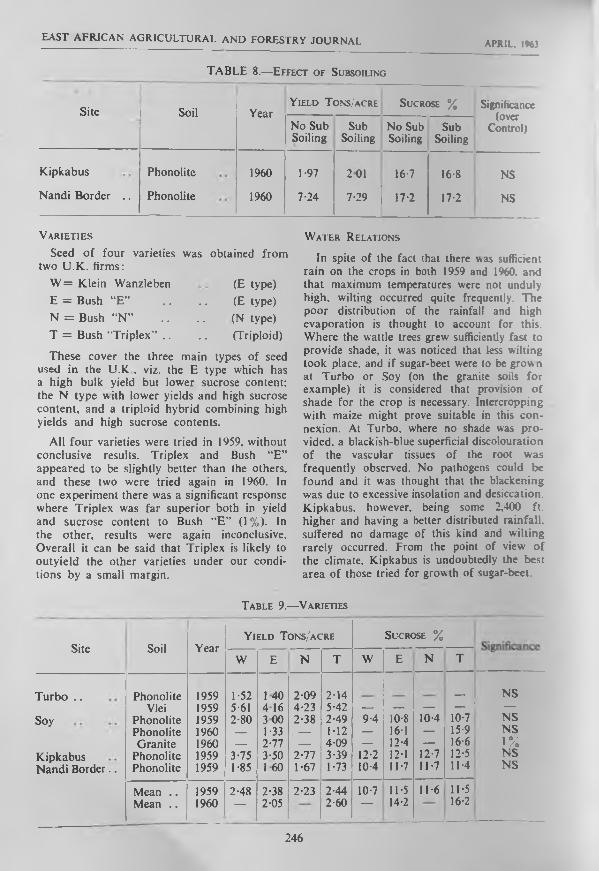
EAST AFRICAN AGRICULTURAL AND FORESTRY JOURNAL APRIL. 1963
TABLE 8.— E ffect of S ubsoiling
Site Soil YearYield Tons/acre Sucrose % Significance
(overControl)No Sub
SoilingSub
SoilingNo Sub Soiling
SubSoiling
Kipkabus Phonolite 1960 1 -97 2 0 1 16-7 16-8 NS
Nandi Border . . Phonolite 1960 7-24 7-29 17-2 17-2 NS
V a r ie t ie s
Seed of four varieties was obtained from two U.K. firms:
W = Klein Wanzleben (E type)E = Bush “E” . . . . (E type)N = Bush “N ” . . . . (N type)T = Bush “Triplex" . . . . (Triploid)
These cover the three main types of seed used in the U.K . viz. the E type which has a high bulk yield but lower sucrose content; the N type with lower yields and high sucrose content, and a triploid hybrid combining high yields and high sucrose contents.
All four varieties were tried in 1959, without conclusive results. Triplex and Bush “E” appeared to be slightly better than the others, and these two were tried again in 1960. In one experiment there was a significant response where Triplex was far superior both in yield and sucrose content to Bush “E” (1%). In the other, results were again inconclusive. Overall it can be said that Triplex is likely to outyield the other varieties under our conditions by a small margin.
W ater R elations
In spite of the fact that there was sufficient rain on the crops in both 1959 and 1960, and that maximum temperatures were not unduly high, wilting occurred quite frequently. The poor distribution of the rainfall and high evaporation is thought to account for this. Where the wattle trees grew sufficiently fast to provide shade, it was noticed that less wilting took place, and if sugar-beet were to be grown at Turbo or Soy (on the granite soils for example) it is considered that provision of shade for the crop is necessary. Intercropping with maize might prove suitable in this connexion. At Turbo, where no shade was provided. a blackish-blue superficial discolouration of the vascular tissues of the root was frequently observed. No pathogens could be found and it was thought that the blackening was due to excessive insolation and desiccation. Kipkabus, however, being some 2,400 ft. higher and having a better distributed rainfall, suffered no damage of this kind and wilting rarely occurred. From the point of view of the climate. Kipkabus is undoubtedly the best area of those tried for growth of sugar-beet.
Table 9.—Varieties
Site Soil YearY ield Tons/acre Sucrose %
W E N T W E N T
Turbo .. Phonolite 1959 1-52 I 40 2-09 2-14 — NSVlei 1959 5-61 4 16 4-23 5-42 — — — --- 1 ---
Soy Phonolite 1959 2-80 300 2-38 2-49 9-4 10-8 10-4 10-7 NSPhonolite 1960 — 1-33 — 1-12 — 16-1 — 15-9 NSGranite 1960 — 2-77 — 4-09 — 12-4 — 16-6 1 %
Kipkabus Phonolite 1959 3-75 3-50 2-77 3-39 12-2 12-1 12-7 12-5 NSNandi Border.. Phonolite 1959 1 -85 1 60 1-67 1-73 10-4 11-7 11-7 11 -4 NS
Mean . . 1959 2-48 2-38 2-23 2-44 10-7 11-5 11-6 11-5Mean . . 1960 — 2-05 2-60 _ 14-2 16-2
246

E A S T AFRIC A N AGRICULTURAL AND FORESTRY JOURNAL APRIL, 1963
In drained vleiland. growth was initially '•ery good (provided lime and phosphate were present), but during the heavy rains in July and August, the crop stopped growing, started to die back and became severely infested with the lea f spot, Cercospora beticola. In 1959 the experim ent was harvested, but in I960 the stand died out entirely. It seems clear that ' l e i soils, unless exceptionally light and well drained, are not suitable for beet.
P e s t s and D iseases
N o pests o f importance troubled the crop in either year except for some grazing by buck or plots fertilized with sodaphosphate or salt.
As already discussed. Cercospora beticola was very severe in vleiland and the discolouration probably caused by insolation was severe in the hotter areas. Severe celworm attack and heartrot (see Plate VI) affected a few plants at
one site only in 1959. In general, diseases were not important: if the crop were grown on a large scale, this position might alter rapidly.
Seed Production
N o bolting whatever occurred, and although some plots were left to stand into the second year for the purposes of seed production, none was in fact produced. Presumably the short daylength in East Africa acounts for the lack of flowering.
C onclusions
Sugar-beet is unlikely to be a competitor to sugar-cane in areas where sugar-cane grows well. For example, yields of the order of 60- 80 tons/acre on a 12-month rotation can be achieved by irrigated cane under hot conditions in East Africa. The sugar production would be around 6-8 tons/acre. It is expected that beet yields of around 15 tons acre could be produced on the forest soils at Kipkabus. At15-18 per cent sucrose this yields 2 J-2J tons of sugar per acre. In addition, costs of growing beet will be greater (with the exception of irrigation required by cane) since there are more operations to be carried out. East Africa is at present a sugar importer, but the expansion of cane production at present occurring, especially in Tanganyika, means that the region could become a sugar exporter in the not-too-distant future. The world market is also over supplied at present. Under these circumstances, the outlook for beet is not very promising, and further work on the crop is not being undertaken at present.
It will, however, be of value to discuss further some points arising from the experiments.
The highest yield obtained from individual plots in 1959 was 9 | tons, and in 1960 13 tons'acre. In the latter case, the stand was poor, and it is estimated that a full stand would have yielded about 18-20 tons/acre. This was on forest soil at Kipkabus, and it is recommended that if further attempts are made to grow sugar-beet, they should be confined to similar high altitude soils. The fertile basement complex soils and granite/phonolite admixtures will also grow adequate beet, but climate is the limiting factor here, whereas at Kipkabus the cold wet climate is ideal. When good soils are selected, there should be little
Plate II.—Poor growth on red phonolitic soil. Foreground con tro l; background 300 lb. triple supers,'acre. Young w attle regenerated along
stump lines
247

EA ST a h r ic a n a g r i c u l t u r a l a n d f o r e s t r y j o u r n a lA PR IL . 1963
difficulty in growing the crop, provided the following points are borne in mind:
(a) deep in thorough cultivation and good seedbed preparation including rolling:
(/>) early planting;
(c) emplacement of phosphate below the seed if possible;
(</) use of nitrogen topdressing;
(e) use of lime experimentally.
Summary
A series of 18 field experiments with sugar- beet was planted in the Turbo, Soy. Kipkabus and Nandi Border districts of the Uasin Gichu in 1959/1960. Overall, the crop was not successful. but very good growth occurred at Kipkabus on forest soil and good growth was also obtained on granite soil at Soy, and on anthills.
The common factors of these soils are higher pH (>5.4) and calcium content of the soil ( > 5 m.e.%). Growth was poor on the common red phonolitic clay of the plateau. Vlei soil also proved unsuitable. Climatic conditions were most suitable at Kipkabus; in other districts, shade appears to be required to prevent wilting.
Marked responses to phosphate and nitrogen were obtained: the application of 100 lb. triple superphosphate planted with or below the seed and 100-150 lb. ammonium sulphate acre as a topdressing is recommended.
Lime gave a slight improvement, but gypsum. salt and potash had no effect. Triplex was the best variety oul of four tested. Early planting is essential; subsoiling had no effect where deep ploughing had been carried out.
Acknowledgement
Permission to publish this paper was kindly granted by the management of the East African Tanning Extract Co. Ltd.
248

HAS I A F R IC A N AGRICULTURAL AND FORESTRY JOURNAL APRIL, 1963
m e a t p r o d u c t io n fro m in d ig e n o u s , c ro ssbredAND IMPORTED POULTRY IN UGANDAB> J. C. M. Trail, Livestock Experimental Station, Entebbe. Uganda
(R ece ived fo r pu b lica tio n o n 13th M arch . 1962)
From trials carried out to gain a detailed knowledge o f the characteristics of the indigenous poultry o f Uganda and assess the im provem ents to be brought about by upgrading w ith imported breeds, data on the meat production qualities o f surplus cockerels have been collected , and are presented in this paper. Very little information is available on the performance o f indigenous and crossbred cockerels kept under good conditions of m anagem ent, and the aims of this paper are to exam ine and compare growth rates, food consumption, feed conversion, killing out percentages and costs of production of meat from indigenous, crossbred and imported cockerels in U ganda.
M e t h o d
A total o f 900 cockerels, comprising 150 each of indigenous Light Sussex X indigenous, Rhode Island Red x indigenous, Black Australorp X indigenous. White Leghorn X indigenous and a group of three imported breeds (R hode Island Red, Black Australorp and Light Sussex) were reared to four weeks o f age in groups of 50 in identically constructed wire cages each with a floor space of 12 sq. ft., under 250-watt infra-red bright emitter lam ps. At four weeks the groups were transferred to deep litter houses with outside strawyards. The litter inside the houses was coffee husks and outside dried grass. The indigenous and imported breeds were reared first, the four crossbred groups following six months later.
The birds were fed a commercial chick mash, manufactured in East Africa, to 12 weeks o f age and growers mash thereafter. Green food in the form of Russian comfrey or young elephant grass was provided fresh daily.
At 16 weeks a batch of 50 birds, being the average weight of the group, was taken from each lot o f 150 cockerels, killed and dressed and the killing out percentage calculated. This was was repeated at 20 weeks of age, when 50 of each remaining group of 100 birds were killed.
The food consumption from hatching to 16 and 2 0 weeks was measured for each group.
R e s u l t s
Growth Rates’The mean monthly weights of each category
of cockerels from day old to five months of age are given in Table I.
At the I month, 2 month. 3 month, 4 month and 5 month stages, the imported breed cockerels were 35 per cent, 45 per cent, 49 per cent, 38 per cent and 34 per cent heavier than the indigenous cockerels, while the three imported heavy breed X indigenous crossbreeds grew at a rate approximately half-way between the indigenous and imported breeds.
The White Leghorn X indigenous cockerels grew more slowly than the other three crossbreeds, as expected, and at 20 weeks weighed almost exactly the same as the indigenous birds.
The Rhode Island Red X indigenous and Light Sussex X indigenous crosses grew faster at all times than the Black Australorp X indigenous cross.
Food ConsumptionThe average food consumption per bird to
4 months and 5 months of age is given in Table 2.
The cumulative average food consumption to 16 weeks was 18 lb. 9 oz. with the Black Australorp X indigenous birds consuming more than any other breed. At the 20-week stage the average food consumption was 26 lb. 10 oz. with the Black Australorp X indigenous birds again having the highest consumption.
Feed ConversionThe overall feed conversion rates for each
breed are shown in Table. 3.
The cockerels of the three imported breeds gave the best feed conversion rates at both 4 and 5 months, with the Light Sussex X indigenous and Rhode Island Red X indigenous both superior to the indigenous, but the Black Australorp X indigenous and White Leghorn X indigenous slightly inferior.
249

EAST AFRICAN AGRICULTURAL AND FORESTRY JOURNAL APRIL. 1963
Killing Out PercentagesThe killing out percentages at 16 and 20
weeks are given in Table 4.
The dressed weights used in the calculation of these figures included the weight of the giblets. There was little difference in killing out percentages between the indigenous and the four cross breeds, while the imported breeds gave slightly higher figures at both stages.
Costs o f ProductionThe costs of stock, labour housing and
brooding, fuel and drugs, depreciation on capital and dressing, worked out at Sh. 1 80 per bird at 16 weeks and Sh. 2/00 per bird at 20 weeks.
Table V gives the food costs, other costs and total costs per pound dressed carcass weight at 16 weeks and 20 weeks for each group o f cockerels.
T able 1.— L iveweights (o z .)
Light Rhode Black WhiteAge Indigenous Sussex Island Red Australorp Leghorn Imported
X X X X BreedsIndigenous Indigenous Indigenous Indigenous
At hatching.. 1 0 0-9 0-9 0-9 0-9 1-31 month 5-4 5-4 7-5 6-6 61 7-32 months 14-6 17-9 18-8 18-3 16-5 21-23 months 28-9 37-1 40-3 34-9 33-2 43 04 months 43-2 52-3 55-1 500 44-5 59-65 months . . 56-3 69-3 67-6 63-4 55-4 75-4
T able II.—Food Consumption
Light Rhode Black WhiteAge Indigenous Sussex Island Red Australorp Leghorn Imported
X X X X BreedsIndigenous Indigenous Indigenous Indigenous
lb. oz. lb. oz. lb. oz. lb. oz. lb. oz. lb. oz.4 months . . 18 4 17 4 17 5 22 3 18 13 17 9
5 months . . 25 5 25 6 25 5 30 0 26 13 26 15
T able III.— O verall F eed Conversion R ates, R atios to U nity
Light Rhode Black WhiteAge Indigenous Sussex
XIsland Red
XAustralorp
XLeghorn
XImported
BreedsIndigenous Indigenous Indigenous Indigenous
4 months . . 6-9 5-4 5 1 7-2 6-9 4-8
5 months . . 7-3 5-9 61 7-7 7-9 5-8
250

A G R IC U LTU R A L AND FORESTRY JOURNAL APRIL, 1963e a s t A f r i c a n
T able IV— K illing O ut Percentages
A g eLight Rhode Black White
Indigenous Sussex Island Red Australorp Leghorn ImportedX X X X Breeds
Indigenous Indigenous Indigenous Indigenous
4 m on th s 70-6 70-3 67-2 68-6 66-6 73-5
5 m on th s 73-4 72-3 75-2 71-9 72-6 75-7
T able V .— Costs per Po u n d D ressed C arcass W eight
.
Breed16 W eeks 20 Weeks
Food OtherCosts
Total Food OtherCosts
Total
Indigenous . . 2 58 0 94 3/52 2 59 0/77 3 36Light Sussex x indigenous 2 01 0 78 2 79 2/13 0 64 2/77Rhode Island Red x indigeous . . 2 00 0 78 2/78 2 02 0/63 2/65Black Australorp x indigenous 2/77 0 84 3/61 2/77 0/70 3/47White Leghorn x indigenous 2/74 0 97 3 71 2 81 0 80 3/61Imported breeds . . 1/72 0 6 6 2/38 1 98 0 56 2/54
The imported breeds had the lowest costs of production at both 16 and 20 weeks. Crossing 'he indigenous poultry with Rhode Island Red and Light Sussex breeds gave birds capable of producing meat at a lower cost than the indigenous and, especially at 20 weeks, comparable with the costs of the imported breeds. The Black Australorp X indigenous cockerels had a higher cost o f production than the indigenous, due mainly to poor feed conversion. The White Leghorn X indigenous, as might be expected, also gave slightly poorer results than the indigenous.
It is clear from the prices obtained for poultry meat in Uganda that it is possible to make a profit from the sale o f imported. Light Sussex x indigenous and Rhode Island Red X indigenous cockerels at 16 and 20 weeks of age. but impossible to cover costs from the rearing of indigenous. Black Australorp X indigenous or White Leghorn X indigenous birds produced under good conditions of housing, feeding and management.
Summary
Nine hundred cockerels o f indigenous. Light Sussex X indigenous, Rhode Island Red
X indigenous. Black Australorp X indigenous. White Leghorn X indigenous and three pure imported breeds were reared from day old to 5 months of age, and growth rates, food consumption, feed conversion, killing out percentages and costs o f production measured at the 6 week and 20 week stages. The imported breeds gave the best results throughout, the Light Sussex X indigenous and Rhode Island Red X indigenous were superior to the indigenous, and the Black Australorp X indigenous and White Leghorn X indigenous were inferior to the indigenous.
The production of meat from imported. Light Sussex X indigenous and Rhode Island Red x indigenous cockerels at 16 and 20 weeks of age was a profitable undertaking, but it was not possible to avoid incurring a loss in the rearing of indigenous. Black Australorp X indigenous and White Leghorn X indigenous birds.
Acknowledgements
The author wishes to thank the Director of Veterinary Services and Animal Industry for permission to publish this papier.
251

EAST AFRICAN AGRICULTURAL AND FORESTRY JOURNAL APRIL, 1963
THE OCCURRENCE, SAMPLING, AND CONTROL OFT E T R A N Y C H U S L U D E N I ZACHER.
(ACARINA TETRANYCHIDAE) ON PYRETHRUMBy J. A. Bullock, Department of Zoology, University of Malaya, Kuala Lumpur
(Received for publication on 3rd May. 1962)
Apart from references to a red spider (mite?) on pyrethrum in 1946 and 1947 [1. 2] the first definite record of a tetranychid on this crop does not occur until 1958 when Bullock [3] reported a species, since identified as Tetrany- chtis ludeni Zacher., causing damage to the plant in Kenya. Since then the mite has continued to attack the pyrethrum crop in Kenya [4] and has also been reported from Tanganyika [5], Although the importance of the animal was nowhere near as great as that of a simultaneous outbreak of Thrips nigropilosus Uzel. on the same crop (cf. same sources as above) it nevertheless constituted a considerable threat and a programme of research was formulated to cope with the problem.
Biology and Pathology
The biology of the species was not examined in detail. Bond (pers. comm.) estimated the entire cycle to occupy ten days under favourable conditions, with all stages occurring simultaneously on the plant. The ova are a pallid yellow and more or less spherical. The larvae are similar in colour at hatching, but with successive eedyses gradually progress through shades of pink until the adult stage, which is a bright red.
The mite occurs all over the plant, initially concentrating on the underside of the leaves and in the young curled leaves, but dispersing outwards to include the upper surface and the stems, and in heavy infestations the web formed by the mites envelopes the entire plant. Damage follows the usual pattern, the leaves first turning yellow with subsequent necrotic patches appearing which speedily spread to include the whole leaf. In many cases attacks result in the plant dying down to the ground and occasionally the plant is killed completely. More often, the plant eventually recovers after a resting period, but this is quite sufficient to upset the economics of the crop and greatly reduce the production of flowers.
O rigin o f the O utbreak
Although LePelley [6] does not record the species for East Africa, the phytophagous mites have received such slight attention in the area that this cannot be regarded as evidence for its absence, and the evidence points to its having been present for some time. The sudden appearance of Tlirips nigropilosus in late 1957 resulted in the use of insecticides (chiefly DDT) for the first time ever on the pyrethrum crop and it is most probable that this led to the sudden emergence of T. ludeni as a pest. This is a fairly frequently recorded effect and although proof positive was not obtained, a body of circumstantial evidence was built up. Thus, in the author’s first experiment (December. 1957) on the control of T. nigropilosus, the mite appeared within a few weeks of the first spray application of DDT and speedily increased until it was constituting a greater threat to the crop than had the original thrips infestation. The path of this infestation is shown in figure I. Similar results were reported by a number of growers in the succeeding year and in a survey conducted by the Pyrethrum Board of Kenya in mid-1959 more than 20 per cent of growers reported that an infestation followed the use of DDT whilst very few claimed outbreaks without such an application. It must, therefore, be concluded that the use of DDT altered conditions in some way and favoured an increase in the mite, and that there is no need to postulate a new introduction as has been done for T. nigropilosus [4],
E stimation of Populations
Initially, populations were estimated by means of an ethanol rinse technique based on that of LePelley [7]. This proved satisfactory for obtaining a proportional estimate when no acaricidal treatment had been used but as soon as such treatment had been applied the method became ineffective and misleading. This was
252

EAST A F R I C A N AGRICULTURAL AND FORESTRY JOURNALAPRIL, 1963
253

HAST AFRICAN AGRICULTURAL AND FORESTRY JOURNAL APRIL, 1963
Table I.—Effect of Metasystox and Rogor (M ites per 100 Leaves; Mean of 3 x 3 Samples)
Days after spraying
Metasystox at 5 oz. per acre
Rogor at 4 oz. per acre
0 2,000 ;- 2.0004-5 23-8 273-08 123-6 263-6
13 34-7 48-722 560 41-8
T able 2.—Effect of Acaricides on T. ludeni (M ites per 100 Leaves)
CompoundRate per
Acre
Days after Treatment
0
•3 6 10 17 20
Rogor 40% . . i pt. 1,834-6 246-0 60-0 160-3 227-4 88-0MC 47 1 pt. 2,697-4 115-0 254-0 34-0 160-6 56-0Chlorobenzilate i pt. 84-0 620-0 580-0 644-0 1,602-0 526-0Kelthane 2 pt. 2,092-0 900-0 427-0 657-4 1,643-4 1,332-0Malathion 50% 1 pt. 2,590-6 336-0 480-0 507-4 1,325-4 1,440-0Control 1,630-6 400-0 636-0 2,217-4 1,043-4 1,354-0
time the experiment was concluded. No control plot was kept, but a similar infestation on a nearby field remained at a high level throughout the course of the trial.
A small plot trial (Table 2) was conducted at about the same time as the previous trial to test a number of acaricides on a heavy infestation of mites. Single plots were sprayed with aqueous solutions of the compounds using a knapsack sprayer to give a rate of application of about 30 gallons of water per acre. The results (Table 2) are less clear than in the previous test, due to the variation between plants and the difficulty o f ensuring that the same plants were sampled each time and to natural fluctuations in the population, but nevertheless indicate the relative efficacy of Rogor and a “new” compound, MC47. The experiment was also examined for the effect of these compounds on a population of T. nigropilosus, but due to a low initial infestation these results were inconclusive although they suggested that no treatment was outstandingly effective.
Summary
The sudden appearance of Tetranyehus ludeni Zacher as a pest o f pyrethrum was probably a result of the use of insecticides to control infestations of Thrips nigropilosus Uzel. although the method in which this
operated is not known. Infestations of the mite resulted in death of the aerial shoots and occasionally in the outright death of the plants. Insecticidal tests were initially assessed visually but later by taking samples of leaves and trapping the mites in banding grease as they quit the wilting leaves. The tests resulted in the adoption of Metasystox applied at a rate of 5 ounces actual per acre because it was often effective against both the mite and T. nigropilosus, whilst Rogor and MC47 both appeared to be effective against the mite.
A cknow ledgem ents
My thanks are due to the late D. C. Bond who assisted me with much of this work, to the many farmers who permitted experiments to be conducted on their farms, and to the various firms who supplied chemicals.
R e fe r e n c e s
[1J Gaddum, E. W. (1948). Ann. Rep. Depl. Agric., Kenya, 1946.
[2] Gaddum, E. W. (1949). Ann. Rep. Dept. Agric., Kenya, 1947.
[3| Bullock, J. A. (1960). In Report of the Senior Entomologist, Ann. Rep. Dept. Agric., Kenya, 1958.
|4 | Bullock. J. A. (1961). Pyrethrum Post. 6 (2), 22. Ann. Rep. Dept. Agric., 1958 and 1959, Tanganyika.
|6] LePellcy, R. H. (1959). Agricultural Insects of East Africa.
[7] LcPelley. R. H. (1943). Bull. ent. Res.. 24. 349.
254

EAST AFRICAN AGRICULTURAL AND FORESTRY JOURNAL APRIL, 1963
THE EFFECT OF MAIZE ON THE CARCASS QUALITYOF BACON PICS
By P. Myers, Veterinary Experimental Station, Naivasha
(Received for publication on 18tli May. 1962)
In maize growing areas and at such times as maize is available at concession rates to pig producers, there is an incentive to feed large proportions of this cereal to fattening pigs. At the special rate in 1961 of Sh. 28 per bag. not including transport, one pound of maize cost 14 cents and in many areas was the cheapest and most readily available cereal. Maize had the ability to fatten pigs efficiently but it is generally agreed that rations containing large proportions cause poor grading and aggravate any tendency towards soft setting fat.
Considerable work in connexion with maize feeding has already been carried out in East Africa; Duthie. Dent and Ledger (1958) used groups of Large White pigs and fed them rations containing 15, 30, 45, 75 and 90 per cent respectively. The crude protein level was maintained fairly constant, between 14 and 16 per cent and the rations were fed ad libitum from 100 lb. liveweight to slaughter at 200 lb. Body fat tended to become slightly softer (indicated by a higher iodine value when analysed chemically) as the maize content of the ration increased, but not sufficiently to cause down grading for this factor. The trend towards poorer grading with the higher maize levels was quite distinct. Liveweight gain appeared to fall off in the groups fed the highest levels o f maize, possibly due to lower palatability of such diets, while food conversion was not greatly affected by the different treatments.
Workers at the Department of Agriculture Experimental Station at Kitale have devoted a good deal o f attention to the subject o f maize feeding and in 1960 compared maize with barley as the sole source of energy when skim- milk was used as the protein balancer. In all cases better grading resulted from a barley diet. Food conversion was equally good in either treatment and the high maize diet did not cause soft setting fat. A second trial was set up at Kitale in' the same year, comparing 60. 90, and 80 per cent maize in the finishing ration from 120 lb. liveweight to slaughter at bacon weight. Results again indicated that high levels of maize should not be used as poor carcass grades resulted. The trial confirmed the
fact that a high proportion of maize does not necessarily lead to soft setting fat.
At the Naivasha Experimental Station experiments were carried out in 1959 in collaboration with E.A.A.F.R.O. comparing maize at 55 per cent in a control against 92.5 per cent in a test ration, in the fattening stage for baconers. The crude protein contents of the diets were 14.4 per cent and 12.2 per cent, respectively, the protein source in the latter case being carefully adjusted to balance the amino-acid deficiency of maize. The resulting rations contained approximately the same proportions of lysine, tryptophane, methionine and cystine. Both groups of pigs were fed to a generous maximum of 6 lb. of food per head per day. The high maize level resulted in a slightly better growth rate and food conversion over the control group; but this diet caused a greater fat deposition over loin and shoulder and the pigs in this group were significantly shorter than those in the control pen. Grading standards were very obviously poorer on the high maize diet. Seven out of ten were graded “Fat" and only three “B”. Of the control pigs, three graded “A ”, six “B" and only one “Fat”. No cases of soft setting resulted although the iodine value indicated that the fat setting quality of the control pigs was slightly better.
A maize feeding trial completed at Naivasha in 1961 covered a wide range in an attempt to indicate the maximum level at which this cereal can be used economically. Three groups of eight pigs were used, each selected at weaning from three litters on a basis of weight, sex and litter source. The average age at the start of the trial was 9.5 weeks and their average weight was 43 lb. Rations were prepared containing 75. 60 and 45 per cent maize and these levels were fed in each respective treatment throughout the trial. In each ration 20 per cent Pig Industry Board Concentrate was fed in the starter and 10 per cent in the finishing stage, the balance of the ration being made up of wheat and barley meal as illustrated in Table I. All rations were fed to a maximum of 5 lb. per head daily, a level which was reached in 11 weeks by means of weekly increases of 0.25 lb. per head of the daily ration.
255

EAST AFRICAN AGRICULTURAL AND FORESTRY JOURNAL APRIL, 1963
T able l
R ations
Group . . . . ...........................Maize meal . . ...........................Barley meal Wheat mealP.I.B. Concentrate* ...........................Dig. Crude ProteinCost o f Ration Sh. per 100 lb. (maize at
14 cts./lb.) ........................................
R earing Ration F attening R ationStart to 110 lb. 110 lb. to Slaughter
175
5
2015-7
17 62
26020
2016-6
17,60
34535
2017-2
17/58
1755
1010
11-3
15 89
260102010
12-3
15/71
345103510
130
15/45
♦The Pig Industry Board Concentrate is composed of 12% high quality cotton seed cake; 17% blood meal; 2-5% liver meal; 60-5% carcass meal; 8 % general mineral mixture. Nicotinic acid is added at 15 gms. per 100 lb. of mix.
Re su lt s
Food Conversion and Growth Rate
Although the differences between groups did not achieve statistical significance, Table II shows that both the above factors improved slightly as the proportion of maize was increased in the ration from 45 to 75 per cent. Individual performance cannot be shown as the pigs in each treatment were fed as a group.
Table 2
Maize Level
75% 60% 45%
Food Conversion43 lb. to 110 liveweight .. 2-36 2-37 2-43110 lb to bacon weight .. 3-40 3-53 3-65Overall food conversion .. 2-93 2-97 3 06
G rowth Rate— lb. per Day per H ead
1-1343 lb. to 110 lb. liveweight 116 1-16110 lb. to bacon weight .. 1 -58 1 -54 1 -47Overall growth rate 1-34 1-33 I -29
Factory Grading, Carcass Value and Killing- out Percentage
It is apparent from Table 111 that an increase in the maize portion of the diet resulted in a lower standard of carcass grading with a consequent diminished value. The difference in average carcass value and killing-out percentage is significant between treatments 1 (75 per cent) and 3 (45 per cent maize).
Table 3
Maize Level
75% 60% 45%
Grading standard:A plusA ...........................B plusB ...........................C ...........................F a t ...........................
12
4
12 2 12 1
1 1
Average carcass return (S h .) ........................... 190/15 205/79 215/69
Average killing-out percentage 80 0 77-5 75-9
Costs
Since carcass grading is the most important economic factor, the margin over food costs was highest in that group fed 45 per cent maize where grading returns were best. Calculations show that this remains the case even when the maize portion of the ration is taken to cost nothing.
Table 4
Maize Level
75% 60% 45%
Food costs overall (Sh.) . . 74/05 ' 74/89 74/25
Margin over food costs .. 116/10 130/90 141/44
256

EAST AFRICAN AGRICULTURAL AND FORESTRY JOURNAL APRIL, 1963
Maize has been taken at the concession rate to pig producers in 1960, of 14 cents per lb. The difference in the margin over food costs is statistically significant between groups 1 (75 per cent) and 3 (45 per cent maize).
Hadlin et al. (1961) reported the findings of three feeding trials using different types of fattening rations. The grain portion of the ration was varied between treatments and the effect o f maize against barley, milo and oats was studied. Maize caused significantly faster weight gains than the other cereals studied, and groups fed maize required significantly less food per lb. o f liveweight gain than those fed other cereals. As found in the trial reported above, maize tended to improve the killing out percentage, but caused an increase in the back- fat thickness, whereas the proportion of lean meat was lower. The iodine values showed increasing hardness of fat associated with cereals in the following order: oats, maize, barley and milo.
A recent trial undertaken by D. Vukavic (1961) and other workers using 20, 40, 60 and 85 per cent degermed maize gave results com parable with the experiment described above.
In all cases a slightly improved food conversion and growth rate resulted from increased maize levels, but with increased back-fat thickness and higher iodine values. This worker concluded that 40 per cent of maize should not be exceeded in order to achieve a reasonable back-fat thickness.
It is evident from a study of our results that the most economic level of maize inclusion was not reached in our trial, and that such a level will prove to be below 45 per cent. The suggestion that 45 per cent maize in the ration should not be exceeded is the only advice of practical value that can be put forward at present.
R e f e r e n c e s
Duthie, D. W„ Dent, A. F„ Ledger, H. P. (1958).East. Afr. agric. J.. 24, 106.
Handlin. Abies, Kropt and Wheeler (1961). J. anim. Sci.. 20.
Vukavic, D.. Sreckovic, A., Ziukovic, S. (1961). Nulr. Abst. Rev., 31.
Department of Agriculture, Kitalc report: Pig Feeding Trial, 1960.
Department of Agriculture. Kitale report: Pig Feeding Trial, 1960/61.
257

EAST AFRICAN AGRICULTURAL AND FORESTRY JOURNAL APRIL. 1963
THE VALUE OF AFRICAN-TYPE SWILL FOR PIC FEEDING
By A. N. A. Modebc, University College, Ibadan. Nigeria
(Received lor publication on llth June. 1962)
In most African countries and other underdeveloped parts of the tropics insufficient supply and high cost of animal feedstuffs, coupled with inavailability to farmers, of adequate capital, are among the most serious factors which hinder intensive pig production.
Many of the feedstuffs like maize, guinea com , cassava and millet, which are suitable for pig feeding, also comprise important items o f the human diet. Pigs and humans, therefore, tend to compete for feeds which, due to predominantly primitive farming, methods, are not produced in large enough quantities.
The practice of using kitchen waste or “swill”, in animal feeding, particularly pigs, is age-old. It was particularly popular in Europe during the emergency of the war years, when supply of normal feedstuffs was limited and the demand for human food was high.
The composition o f swill is known to be highly variable and this, in the main, might be responsible for the considerable differences of opinion held by scientists and animal feeders in America and Europe on its feeding value. But in spite of these differences the use of swill for pig feeding continues to be fairly wide-spread, particularly in the United States of America and continental Europe, and sustained attention is being given to the subject by scientists in these countries, for example. Engel et al. (1959); Costa and March (1959); Gurin (1959); Gajnetdinov (1959) and others.
The purpose of the trials reported here was to assess the value for pig feeding of the type of swill obtainable in Nigeria and in other African countries.
M aterials and M ethods
AnimalsThe animals used in these experiments
included both pure and crossbred weaner pigs. For each experiment animals were selected from litters farrowed within a period not exceeding 14 days.
The pigs were sorted into groups, as far as was possible, on the basis of age. litter, live-
weight and sex. The groups were then all on-: at random to the treatments. There were :» treatments in Experiment 1 and four Experiment 2. In all. 50 pigs were used. > Experiment 1 and 24 in Experiment 2
All animals were weaned at eight weeks r . fed on University College. Ibadan, standa: w'eaners' meal mixture until the experiments started. The animals used in the first cxper ment were, at the start, between three-and-a- half and four months old and those u«d the second experiment were three to three-..: a-half months old.
HousingThe experimental animals were housed in
indoor pens with outdoor runs, on concrete. In each experiment, the various treatment groups of pigs were housed in identical and adjoining pens. Individual feeding compar:- ments were not available at the time. Group feeding was practised and consequently feed intake could not be controlled and recorded for each pig.
Experimental DietsTwo types of meal mixtures were used. O-
was the University College. Ibadan, standard meal mixture and the other a special mcai concentrate. The composition of both mea mixtures is given in Table 1.
The swill was obtained from University College Ibadan Teaching Hospital situated about two miles from the College. Collection was made daily. On arrival at the College farm the swill was steamed by means of washed half tar drums divided into two sections with expanded metal screen and perforated iron sheet. Swill was placed on the top half of the drum while the bottom half contained a small amount of water. A 50-gallon capacity Barford Type “PY" rapid steamer was used for this purpose, during the later stages of the exper - ments. The fuel used came from the College cassia plantations which were regularly harvested for sale as firewood to College staff.
258

EAST AFRICAN AGRICULTURAL AND FORESTRY JOURNAL APRIL, 1963
The gross composition of the swill varied from day to day reflecting the daily dietary of patients at the hospital. The main ingredients, however, were: —
Dodo (Yoruba) (Musa sapientum var. paradisiaca. Linn).— Fried plantain.
Boiled Yam (Dioscorea rotundata, Poir).Moi-moi and Akara (Yoruba) (Vigna
unguiculata, Walp).—Steamed or baked or fried pea pudding.
Eba (Yoruba) (Manihot utilissima, Pohl). Fried cassava.
samples of daily swill collections were taken for chemical analysis. The average chemical composition of the swill is given in Table 1.
Treat men’sIn the first experiment one group of pigs was
fed the University College. Ibadan, standard meal diet alone on a restricted feeding system. Rationing was made according to a feeding scale based on liveweights. rations rising from 1£ lb. pig/day at 30 lb. liveweight to a maximum of 6 i lb ./p ig /day at 155 lb. liveweight. The second group was fed a pig concentrate meal, allowing 1 lb. of concentrate per pig per day, with swill fed ad lib.
In the second experiment one group of pigs was fed the standard meal alone and. as in Experiment 1, the animals were fed according to a standard scale. Two other groups also received the standard meal, with swill replacing, on a dry matter basis, one third and one half respectively, of the animals’ daily rations. The fourth group was fed the concentrate meal up to a maximum of lib ./pig/day. with swill fed in sufficient quantities to replace, also on a dry matter basis, the remainder of the total ration.
Estimation of the quantities of swill required for these replacements was based on the data obtained from the chemical analysis of the daily samples of swill, made both before and during the first experiment.
General ManagementMeal was fed as a slop, about 1-J lb. of
water being poured over each I lb. of meal. In addition the pigs had access to water ad lib. in drinking troughs. The quantities of meal and swill remaining after each feeding were removed and weighed.
Carcass Quality StudiesAt the end of each experiment a number of
pigs from each treatment group were slaughtered for carcass quality assessment. Due
to limitations in the storage facilities it was not possible, at the conclusion of each experiment, to slaughter all the animals.
As far as was possible, sex and litter origin were taken into account in making selection, and the pigs slaughtered from each treatment group were representative of that group.
The animals were shrunk overnight prior to slaughter and the data obtained were carcass weights, killing-out percentage, length of carcass and back fat thickness. The quality of fat was determined by chemical analysis and carcasses w-ere graded according to the British Ministry of Agriculture. Fisheries and Food Grading Standards for Bacon Pigs (1957).
R e su l t s
In both experiments animals ate their swill rations with relish and often tended to abandon their meal rations for the obviously more palatable swill feed.
Liveweight GainThe summary of the results of Experiments 1
and 2 are presented in Table 2. It will be seen from this table that in both experiments the swill-fed pigs showed greater liveweight gains than those on the standard all-meal diet.
In Experiment 1 the superiority in the mean liveweight gain of the swill-fed pigs over that of pigs on the standard diet was found to be statistically significant (P < 0.01). It will be recalled that in this experiment swill was fed ad lib. in conjunction with a meal concentrate fed at a maximum ration of 1 Ib./pig/day.
In Experiment 2 where swill feeding was rationed, although the swill-fed pigs showed, on an average, greater liveweight gains than the control pigs fed the normal all-meal diet, there were no statistically significant treatment differences.
Feed Conversion EfficiencyAs food consumption could not be accu
rately estimated during Experiment 1. the determination of mean food conversion for the various treatment groups of pigs on this experiment was not possible.
In respect of Experiment 2, the recorded quantities of meal and swill actually fed were used to calculate feed conversion figures. This was because of the difficulties experienced during the experiment in recovering food leftovers, due partly to pigs wallowing in the feed troughs in which swill was fed and also to the system of wet meal feeding used.
259

EAST AFRICAN AGRICULTURAL AND FORESTRY JOURNAL APRIL. 19(3
T able 1 .--P ercentage Composition of Meal Mixtures and Swill used in Experiments
D iets
M eal M ixture (University College,
Stanfard)
AIbadan
MealM ixture B
(Special Concentrate)
Swill
Start 80 lb.
80-120 lb. 120 lb. to finish
Start to finish
Start to finish
Ing r edien ts:—% % % %
Guinea Corn .. 52 52 62 22Groundnut cake 25 20 10 40 _Palm kernel meal 15 20 20 20 __Blood meal 5 5 5 10 ___
Mineral mixture 3 3 3 8 ___
Palm oil i oz. added to ration pig, day £ oz. added —
- to ration/pig day
B y Chemical A A nalysis-A ir D ry* (A verage): S.D.Crude protein . . 2 0 0 2 20-57 18-71 37-53 9-87 ± 3-12Ether Extract . . 4-38 3-95 3-98 7-05 11-53 ±2-77Crude Fibre . . 4-23 4-10 5-80 5-50 1-69 ±0-79Dry matter—air dry .. 90-77 89-92 89-82 91-41 91-55 - 1-51
Dry matter of fresh sample — — —~
3100 ± 4 -22
•Proximate analysis of swill samples was made on the dry materials left after estimating the dr>matter content of the samples.
Table 2.—Summary of Liveweight G ains, F eed Conversion Rates and Costs of Feeding
Mean Mean Mean Food Cost ofInitial Final Weekly Conversion* Rates Pro-
Treatment Weight(lb.)
Weight(lb.)
Gain in (lb. Feed lb. Gain) ductionWeight (per pig)
(lb.) Actual Corrected
£ f. d.Experiment 1
1. Meal Mixture A:—All-meal diet .. 42-9 167-9 7-8 — — —
2. Meal Mixture B:—Meal ration 1 lb. pig
day + Swill ad lib. Experiment 2
42-5 207-8 10-3 — — —
1. Meal Mixture A:—All-meal diet.. 50-1 186-3 9-1 3-90 3-90 4 2 4
2. Meal Mixture A:—Swill replacing £ of
2-72 3 7 4itotal ration 48-3 191-8 9-6 3-523. Meal Mixture A:—
Swill replacing £ of3-54 2-36 3 5 7total ration 49-1 198-0 9-9
4. Meal Mixture B:—Meal ration 1 lb. pig(
day, Swill replacing10-1 3-57 1 -68remainder of ration 48-9 199-6 3 2 3
• “Actual” figures were calculated from the total meal and fresh swill fed to pigs while the corrected figures were calculated after adjusting for the dry matter content of fresh swill which was approximately one-third that o f meal.
260

EAST A F R IC A N AGRICULTURAL AND FORESTRY JOURNAL A P R IL , 1963
I wo sets o f figures are presented in Table 2, Tvf actu a' ar>d the other as “corrected”.1 he form er w as based on the total recorded weight of fresh feed (meal and swill) fed, while n the latter case adjustments were first made on the recorded quantities o f swill fed so as to equate w ith m eal on a dry matter basis.
It will be seen that in this experiment swill- ied pigs gave a more efficient feed conversion than pigs receiving the standard all-meal diet.
( arcass Q u ality Assessm entThe results presented in Table 3 indicate that
in both experim ents the swill-fed pigs gave higher killing-out percentages than those on the standard all-meal diet. The differences were found to be statistically significant ( P < 0 .01 ) in Experiment 2 , but not in Experiment 1.
There was evidence of breed differences in respect o f killing-out percentage, the crossbred pigs giving significantly higher killing-out percentage figures than the pure bred Tamworth and Large White pigs used in the experiments (P < 0 .01).
The carcasses of the swill-fed pigs were on an average longer than those on the standard diet, in both experiments. The differences between swill and non-swill pigs in respect o f mean carcass length was found to be statistically significant in Experiment 1 IP < 0.05) but not in Experiment 2.
As would be expected the swill-fed pigs tended to greater fat deposition than their counterparts on the standard all-meal diet. The differences between back fat thickness Coin and shoulder) measurements of pigs fed the standard meal and those of pigs receiving swill were found to be statistically significant *P < 0.05) and in some cases highly so (P<0.01).
Evidence obtained in Experiment 2 on the quality o f fat as indicated by the iodine number showed that swill-fed pigs had significantly
< 0 .0 5 ) softer fat than those on the standard all-meal diet. The degree of softness o f fat appeared to increase with the increase in the quantity of swill fed.
As was previously stated, carcass grading was done according to the British Ministry of Agriculture. Fisheries and Food Standards for Bacon Pigs (1957) based on carcass length and back fat measurements. It will be seen from Table 3 that in both experiments the carcasses of the all-meal fed pigs graded better than those of the swill-fed pigs.
Cost o f ProductionCost of production as presented here is
limited to feeding and these costs include meal, transport used in collecting swill and the firewood used in its preparation. Feeding costs were calculated for Experiment 2 only.
It is evident from Table 2 that swill-fed pigs were produced more cheaply than the all-meal- fed pigs by amounts ranging from about 17/- to 2 2 /- per pig, according to the amount of swill fed. the reduction in cost being greater as the quantity of swill fed increased.
D isc u ssio n
The main feature of the results of these experiments is the indication that the feeding of African-type swill to growing/fattening pigs accelerated their growth rate, improved feed conversion and resulted in a considerable saving in feeding costs. These findings agree with those of similar experiments by other workers in Europe and America.
As previously stated, high costs and low availability of the conventional feedstulfs, due partly to the competition which exists between man and animal for these feeds, are among the most serious obstacles to a more intensive pig production in African and other underdeveloped countries of the world. It is of interest therefore that swill, easily obtainable from large residential or catering institutions which are springing up in increasing numbers in most African countries, can be effectively and cheaply converted into pig meat and thus increase the supply of protein for the local population.
The quality of the finished product is an important consideration, when assessing the value of any feeding programme. In the more developed parts o f the world, carcass quality standards for pigs are mainly related to suitability for bacon production. The Wiltshire bacon market, for instance, which in Britain absorbs a sizeable proportion of all pigs produced, requires animals of about 200 lb. liveweight and carcasses which conform to certain measurements. This is because of the method of processing which involves curing of whole sides which are then sliced to provide bacon rashers of such lean-to-fat proportions as are acceptable to consumers.
Evidence from these experiments is that the African-type swill, when fed to pigs up to market weight even in limited amounts, produces carcasses which by overseas standards are of poor quality. But although there is a
261

EAST AFRICAN AGRICULTURAL AND FORESTRY JOURNAL APRIL. !
growing demand in Africa for bacon the main demand, at least with the vast proportion of the indigenous population, is still largely for fresh pork. Such fresh pig meat is obtainable at the markets where no rigid standards of quality are laid down. In fact, Africans for the most part are not as seriously averse to excess fat in meat, as are Europeans and Americans, and as was indicated earlier, high oil content is a notable feature of most African dishes. In any case the level of fat of the carcasses of swill-fed pigs can be reduced by adopting such measures as withdrawing or replacing swill during the latter stages of fattening.
Swill-feeding to pigs is extensively practised in many of the more developed countries of the world. According to Smith, cited by Davidson (1954) “several million tons of kitchen waste are produced in the United States of America annually. Of 66 cities with populations in excess of 100.000 . . . more than 30 per cent disposed of their garbage by feeding to pigs and of 544 cities with populations from 10,000 to 100,000 the proportion was 36 per cent”.
The use of some form of kitchen waste such as cassava and yam peelings for domestic animals is not an uncommon practice among peasant farmers in Africa, but because of the predominantly low living standards, the nutritional quality of such wastes is necessarily poor.
With suitable organization, large scale use can be made of swill for pig feeding by farmers in the neighbourhood of large cities and towns in Africa. Some of the practical difficulties connected with collection, prevention of disease infection to stock, standardization of quality
and of distribution can be largely over, setting up special swill centres, perhar- charge of local councils. Such measures - in fact, adopted in Britain during the 1940-1' war years, when special concentrating pla- were set up to process swill for the use , animal feeders. (Davidson, 1954.)
Summary
Two trials involving a total of 50 amra were made to assess the value of African swill for pig feeding. In Trial 1. one gr< pigs received an all-meal diet with no s- ‘ while a second group was fed a spec ai . centrate at a maximum of I lb. pg da- : swill fed a lib. In Trial 2. the control gr. ..- pigs received a standard all-meal diet ra' - .. according to liveweight. while two gro-p pigs were fed swill replacing, on a dry basis, one third and one half respectis. their total daily meal rations. The fourr. group was fed a special meal concentrate at _ maximum of 1 lb ./ pig/day plus swill fee - sufficient quantities to replace, on a dry matte- basis, the remainder of the total daily rati -
In both experiments the swill-fed gr showed superiority in liveweight gains those on the standard all-meal diet. In E le ment 1, the mean weekly liveweight ga n f : pigs on the all-meal diet was 7.81 lb. wh . that for pigs receiving swill was 10.31 lb. 1- Experiment 2, while pigs on the standard a - meal diet gained an average of 9.08 !b p c week, the corresponding figures for pige swill were 9.57, 9.92 and 10 05 lb. respective. .
The difference in liveweight gains betwee swill and non-swill groups in Experiment »!■ statistically significant (P < 0.05). Feed ccn-
T able 3.—Carcass M easurements and G rades—Experiments 1 and 2
T reatments—No. of pigs used in experiment No. o f pigs slaughtered Mean liveweight (lb.) at slaughter . . Mean killing-out percentage Mean carcass length (mm.)Mean maximum shoulder fat (mm.)Mean loin fat (m m .)............................Carcass grading ............................
Mean Iodine No.
Experiment 1 Experiment 2
i 2 1 2 3 413 13 6 6 6 66 6 4 4 4 4
189 201 225 233 252 23569 71 72 74 75 75
737 750 820 835 856 84444 57 54 64 61 6325 33 37 48 47 45
A (6)* A (1) B (2) F (3)
A A --(l) C (2)F (1)
37F (4)
37F (4)
37F (4)
38
♦Number in brackets is number of animals graded.
262

APRIL, 1963EAST AFRICAN AG RICULTURAL AND FORESTRY JOURNAL
version was better for the swill-fed pigs than °r those on all-meal diets in both experiments, will feeding also reduced feeding costs by
amounts ranging from 17 /- to 2 2 / - per pig, the reduction in cost being greater as the quantity o f swill fed increased.
The swill-fed pigs gave higher killing-out percentages than those on the standard all-meal diet. In Experiment 1, while pigs on the standard diet gave mean killing-out of 69.00 per cent, those receiving swill averaged 71.23 per -ent. Similarly, in Experiment 2 , the mean killing-out figure for all-meal-fed pigs was '-.49 pier cent while the corresponding figures for the groups of pigs receiving swill were ■ 4.01. 75.23 and 74.05 per cent respectively. In both experiments swill-fed pigs had greater back fat and softer fat than those on the normal all-meal diet.
Suggestion is made about the possible large scale use of swill for intensive pig production in African and in other under-developed countries of the world.
R eferences
II] Costa Batlori, P., and March Duran, N. (1959). Swill from Barcelona and neighbourhood in pig feeding. A ndes Colej. Veter. Barcelona. 184, 689.
[2] Davidson, H. H. (1954). The production and marketing of pigs. Longmans, Green and Co., London.
13] Engel, R. W., Brooks. C. C , Kramer. C. Y., Watson, D. F„ and Bell, W. B. (1959). The composition and feeding value of cooked garbage for swine. Va. Agric. Expt. Sta. Tech. Bull., 133.
[4] Gurin, A. I. (1959) Swill for fattening pigs on suburban farms. Thesis Vet. Acad., Moscow.
[5] Gajnethdinov, M. F. (1959). Wider use of kitchen waste in pig feeding. Svinovodstvo, No. 9, Moscow.
[6] Ministry of Agriculture, Fisheries and Food Grading Standards for Bacon Pigs (1957-58).
263

EAST AFRICAN AGRICULTURAL AND FORESTRY JOURNAL APRIL, 1963
REVIEWST he Control of Cattle T icks in E ast
A frica, published by Cooper, McDougall and Robertson (East Africa), P.O. Box 596, Nairobi, 27 pp. Price Sh. 3/50.
In many parts o f East Africa the indigenous Zebu cattle have developed a resistance to some of the most important tick-borne diseases such as East Coast fever. Increasingly, however, exotic cattle which are highly susceptible to such diseases are being kept and efficient tick control on these animals is an absolute necessity. This booklet, which is written in simple language, begins with a brief account of the common species of ticks, their biology and the diseases they carry. This is followed by a review of the various compounds used in tick control, a well-illustrated account of the methods of applying them, information on the management of dipping tanks and some general principles of tick control.
There are a number of small misprints in the first part of the booklet, and the tick shown as Amblyomma variegatum on page 6 belongs to another species. Nevertheless the booklet can be recommended as a brief guide to good tick control.
T he P lan of O perations, United Kingdom Forestry Commission. Booklet No. 7. Her Majesty’s Stationery Office, London. 1962. 44 pp. Price 3/-.
The sub-title of this booklet “A guide to the preparation of the plan o f operations for dedicated and approved woodlands” clearly indicates its purpose. It is directed specifically to the owners of dedicated and approved woodlands in the United Kingdom.
The plan of operations, which must be prepared and maintained up to date by owners of such woodlands in order to qualify for Planting and Management grants, has been reduced, at its simplest, to a map and 14 Standard forms, of which one is optional. The first 12 pages of the booklet are devoted to an introduction to the new plan and to brief, general, advisory remarks on the preparation of Working Plans. The remaining 32 pages reproduce a specimen map (Form GDI) and the 14 standard forms. On the page opposite to each form detailed notes are provided on the information required for the map and the forms, and precisely how they should be written up. Inside the back cover is a list of
addresses of Regional Conservators of Forests who can be consulted if further advice is required.
This booklet is not a treatise on the preparation of management plans for small woodlands, although the introductory portion does contain sound general advice, but a guide to the correct method of filling up a set of Government forms. It gives precise directions and should fulfil its purpose admirably. While principally of use to woodland owners in the United Kingdom, it may also be of interest to students of forest management as giving examples of well designed, precise control forms.
W.G.D.
T he Forests of India . Vol. 4. Edited by Sir Harry Champion and F. C. Osmaston. Oxford University Press, London, 1962. pi. XVI and pp. 485. Price 70/-.
This fourth volume of Professor E. P. Steb- bing’s "The Forests of India”, covers the history, from 1925 to 1947, of the forests now- in Burma, India and Pakistan. It is divided into two parts: Part I dealing with the general progress of forest conservancy from 1925 to 1947 and in Part II. Chapters XI to XXVIII describe progress in the several separate provinces during the same period.
Chapters 1-X are devoted to a review of General Administration in India. Forest Policy and Law. Forest Education, the Research Institute at Dehra Dun, Forest Protection, Silviculture. Forest Management. Forest Exploitation. the War years 1939-45 and Yield and Financial Results. In Part II each chapter deals with a province and describes forestry progress summarized under ten headings. Forest Areas. Administration. Policy. Protection, Silviculture. Working Plans. Communications, Buildings, Utilization, War Supplies and Financial Results. The systematic layout and a good index facilitate reference to specific subjects, and a glossary of Indian words, used in the text, is provided. The book is illustrated with 66 well reproduced photographs.
The book is principally a reference work with detailed facts and figures for the period covered and is not a narrative account of forestry in India for general reading. However. its interest is not confined to people specifically concerned with Indian Forests because
264

EAST AFRICAN AGRICULTURAL AND FORESTRY JOURNAL APRIL, 1963
it does describe the development of forest policy, administration, training of staff and forestry practice in the Indian Forest Service, which was the first in the English-speaking world and served as a model for many subsequently established forest services.
When it became apparent in 1960, that the late Professor Stebbing would be unable to complete the massive task of accumulating and editing the many contributions to a book of this type, the natural choice was for Sir Harry Champion, with his extensive knowledge of Indian and tropical forests, to complete the task. He was fortunate in being assisted by Mr. F. C. Osmaston, who also has long experience o f Indian Forestry and they have been singularly successful in welding the many contributions'into a coherent whole and making a closely fitting sequel to Professor Stebbing's three earlier volumes, published 36 years ago.
W.G.D.
T h e A frican A rmy W orm Spodoptera cxetnpta (Walker) (Lepidoptera, Noc- tuidae): A Review of the literature, by E. S. Brown. Commonwealth Institute of Entomology. Price 7/6.
Although the emphasis is on Spodoptera exem pta (Walker), which is principally African and by far the most important species in the continent, consideration is also given to various other species o f Army Worms, both in Africa and in other countries. Some o f these belong to the same genus Spodoptera, while some are in other quite unrelated genera. The general similarity in their biology is therefore the more remarkable.
The review covers all aspects of biology, ecology and economics of the insect, including geographical distribution, life-history, host plants, the nature and causes o f outbreaks, phase-change (which closely parallels that in locusts), parasites (including virus disease), predators, and control methods. Throughout, emphasis is laid not only on what is known, but also on the many and important gaps in existing knowledge of Army Worms, with the object o f pointing the way for future research.
E.S.B.
N utrition of P ig s and Poultry, edited byJ. T. Morgan and D. Lewis, published by Butterworths, 1962. pp. 366. Price 70/-.
Readers will need no introduction to the Easter Schools of Agriculture held annually at the University of Nottingham, as they are now
in the tenth year and have acquired an excellent reputation. Many aspects of agricultural science are dealt with each session and the 8th Easter School. 1961. deals with the important and widespread problem of the nutrition of pigs and poultry. Ably edited by J. T. Morgan and D. Lewis this volume is a natural follow-on o f the 7th School which covered the Nutrition of the Ruminant. This comprehensive work collates existing knowledge on the numerous aspects of the digestive physiology of pigs and poultry as well as including papers of immediate practical value to the producer on the farm.
L.D.V.
F arming the L and , by Victor Bonham-Carter, published by Routledge and Kegan Paul, London, 1959, pp. 161. Price 15/-.
This little book is written as an introduction to all aspects o f farming and is a useful student's guide. As such it is admirable in its simplicity of explanation and lack of confusing technical jargon. The book is limited in its usefulness because it is confined to English farming but contains a selective bibliography of suggested further reading.
L.D.V.
D ictionary of A gricultural Engineering , by H. J. Hine, published by Heffer and Sons. Cambridge, 1961, pp. 252. Price ?
The author has attempted to provide data on machinery and equipment to help engineers and farmers to apply the benefits available from research and development in the present- day field of agricultural engineering. The subjects are covered in alphabetical sequence with French and German translations of the titles as a special help to foreign students. This pocket-sized reference book is the compilation of notes, tables and formulae from many sources and should prove of daily value to engineers, farmers and students alike.
L.D.V.
Game management is taking place among the farming practices of the world. Those of our readers who are interested in this subject should note that scientific papers on this subject will be appearing in the new East African Wildlife Journal which will appear in September, 1963. It will be produced by the East African Wildlife Society, P.O. Box 20110, Nairobi, Kenya.
265
^ g^^> <^^a t< ^3% y ^> i c<^:>> Cg^> <^^*a c<^>
COMMONWEALTH ECONOMIC COMMITTEERecent publications of the Committee include: —
A Review of Commonwealth Raw Materials. Vol. I (1958) 16s. Od.A Review of Commonwealth Raw Materials. Vol. 11 (1960) . . £1 16s. 5 d.Commonwealth Trade 1961-62 6s. 10 d.Fertilizers in the Commonwealth, 1950-53 4s. Ad.Raw Hides and Skins (1960) . . 6s. lOd.
Commonwealth Development and its Financing: —No. 1. Canada . . . . (8*. 5d.) No. 3. Pakistan (8s. 5d.)No. 2. Federation of No. 4. New Zealand (7s. lOd.)
Rhodesia and Nyasaland (7s. 5d.) No. 5. Nigeria (7s. 0d.)No. 6 . Australia (7s. 1 Or/.)
COMMODITY SERIESThis series reviews the significant trends in world production, consumption, trade and pricesthe commodities concerned. The seven volumes in the series, which are revised annually.as under:—Meat (8s. Id.) Dairy Produce (8s. Id.)Fruit (10s. 9 d.) Industrial Fibres (10s. lOd.)Grain Crops (10s. 10 d.) Plantation Crops (10s. 9 d.)
Vegetable Oils and Oilseeds (10s. lOd.)
♦ * * *
NEW SERIESIron and Steel and Alloying Metals . . . . ........................... . . (13j:. 5d.)
The prices of all the above publications include postage. The publications may be obtained from the Secretary, Commonwealth Economic Committee, Marlborough House. Pall Mall, London, S.W.l, England, or from H.M. Stationery Office, P.O. Box 569, London, S.E.l, England, or through any bookseller.
PERIODICAL INTELLIGENCE SERVICES ISSUED BY THE COMMITTEEWool Intelligence (Monthly, including Fibres Supplement).Intelligence Bulletin (Dairy Produce and Meat) (Monthly, with supplement. Weekly Dairy
Produce Supplies).Fruit Intelligence (Monthly, with supplement. Weekly Fruit Supplies).Tobacco Intelligence (Quarterly, with supplement, Tobacco Bulletin, in intervening months).Grain Bulletin (Monthly, including Rice Supplement).Tropical Products Quarterly, covering coffee, cocoa, spices, vegetable oils and oilseeds.Hides and Skins Quarterly.
The subscription rate for Wool Intelligence is £2 per annum and for Tobacco Intelligence £1 10s. per annum. For Fruit Intelligence and the Intelligence Bulletin it is £4 10s. per annum each including the weekly supplements, or £3 per annum without the supplements. For the Grain Bulletin the subscription rate is £2 per annum including the Rice Supplement which can also be obtained separately for £1 per annum. For Tropical Products Quarterly or Hides and Skins Quarterly the subscription rate is £1 per annum. All rates are post free. These publications are available only from the Secretary, Commonwealth Economic Committee.
Phase mention this Journal when replying to advertisers
COLLfcfiSt» * t u


![Thesis [Minyeto Daniel] Correctoins - UoN Repository](https://img.pdfslide.net/doc/110x75/63239730f021b67e7408293a/thesis-minyeto-daniel-correctoins-uon-repository.jpg)

