Embed Size (px)
Citation preview
Summer Solstice
due on June 21st
Fall
Equinox
Nov 7th
Winter
Solstice
Mid-season
turn
High
Mid-season
turn
Feb 4th
HighHigh
Low
The SPX sold off into the
Mid-Season turn due Feb 4th
and then bounced back.
Low
Spring
Equinox
Mid-season
turn
Summer
Solstice
Price : 1,737.9200
Date/Time : 2/5/2014
Date/Time : 8/8/2014
Solar Degrees : 179.3
180 Solar Degrees
Low to Low?
Given the selloff into
this Mid-Season Turn,
there is a risk that we
could get a temporary
Low here Friday.
What I said:
"temporary
low"Mid-season
turn
Fall
Equinox
Nov
7th
High Mid-season
turn
Winter
Solstice
Temporary
Top
Mid-season
turnPrice : 2,019.2600
Date/Time : 9/19/2014
Date/Time : 1/29/2015
Bars : 91
90-TD
Price : 1,820.6600
Date/Time : 10/15/2014
Date/Time : 1/14/2015
Calendar : 91 Days
90-CD
Price : 2,011.1700
Date/Time : 9/4/2014
Date/Time : 1/14/2015
Bars : 92
90-TD
Spring
Equinox
High
Mid-season
turn
Low
The "Mid-Season Turn"
due on May 6th called
a "higher low" and the
turn higher.
Summer
Solstice
Summer
Solstice
S&P 500 Index "Cash" (SPX)
Mid-season
Fall
Equinox
Mid-season
turnWinter
Solstice
High
Spring
EquionxMid-season
turn
Summer
Solstice
June 20th
High
High
Mid-season
turn
High
Sept 22nd
Fall
Equinox
Low
Mid-season
turnNov 7th
High
High
Spring
Equinox
ph: 609-897-1020
Mid-Season
TurnSummer
Solstice
Low
Price : 2,400.9800
Date/Time : 3/1/2017High
High
The Mid-Season Turn
due August 8th coincided
with a high.
Fall Equinox
Sept 22nd
Mid-Season
High
High
Low
Low
Winter
Solstice
Low
Mid-Season
Low
Spring
Equinox
High
Price : 2,872.8700
Date/Time : 1/26/2018
Date/Time : 3/12/2018
Calendar : 45 Days
Date/Time : 6/11/2018
Calendar : 91 Days
High
Price : 2,872.8700
Date/Time : 1/26/2018
Date/Time : 6/8/2018
Bars : 93
Summer
Solstice
Spring
Equinox
Mid-Season
Low
Mid-Season
June 21st
Summer
Solstice
High
Fall
Equinox
ph: 609-203-2757
High
Mid-Season
High
High
March 20th
Spring Equinox
Low
Low
High
Mid-Season
Price : 2,351.1000
Date/Time : 12/24/2018
Date/Time : 5/6/2019
Bars : 91
Price : 2,939.8600
Date/Time : 10/3/2018
Date/Time : 5/2/2019
Bars : 145
Date/Time : 9/12/2019
Bars : 93
Summer
Solstice
June 21st
Price : 2,346.5800
Date/Time : 12/26/2018
Date/Time : 6/24/2019
Calendar : 180 Days Lunar Eclipse
due on July 16th
Solar
Eclipse
High
High
Fall
Equinox
Price : 2,346.5800
Date/Time : 12/26/2018
Date/Time : 9/13/2019
Bars : 181
Price : 2,825.7100
Date/Time : 8/7/2019
Date/Time : 2/5/2020
Solar Degrees : 181.4
Mid-Season
Date/Time : 2/12/2020
Bars : 91
Price : 2,855.9400
Date/Time : 10/3/2019
High
Spring
Equinox
on March
20th
Price : 3,393.5200
Date/Time : 2/19/2020
Price : 2,191.8600
Date/Time : 3/23/2020
Calendar : 33 Days
Price : 3,155.5300
Date/Time : 6/19/2020
Calendar : 88 Days
Price : 3,385.0900
Date/Time : 2/13/2020
Date/Time : 6/23/2020
Bars : 91
High
Price : 3,232.3900
Date/Time : 6/8/2020
A
A
Z
Z
Z
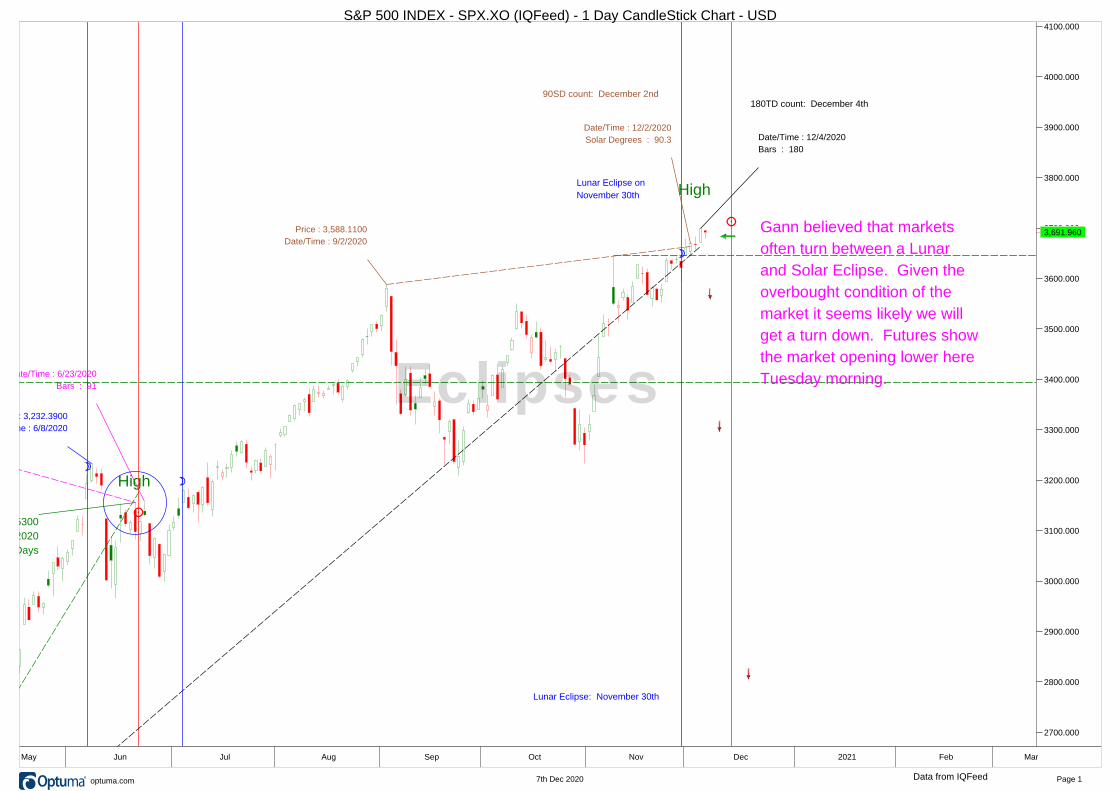
Lunar Eclipse on
November 30th
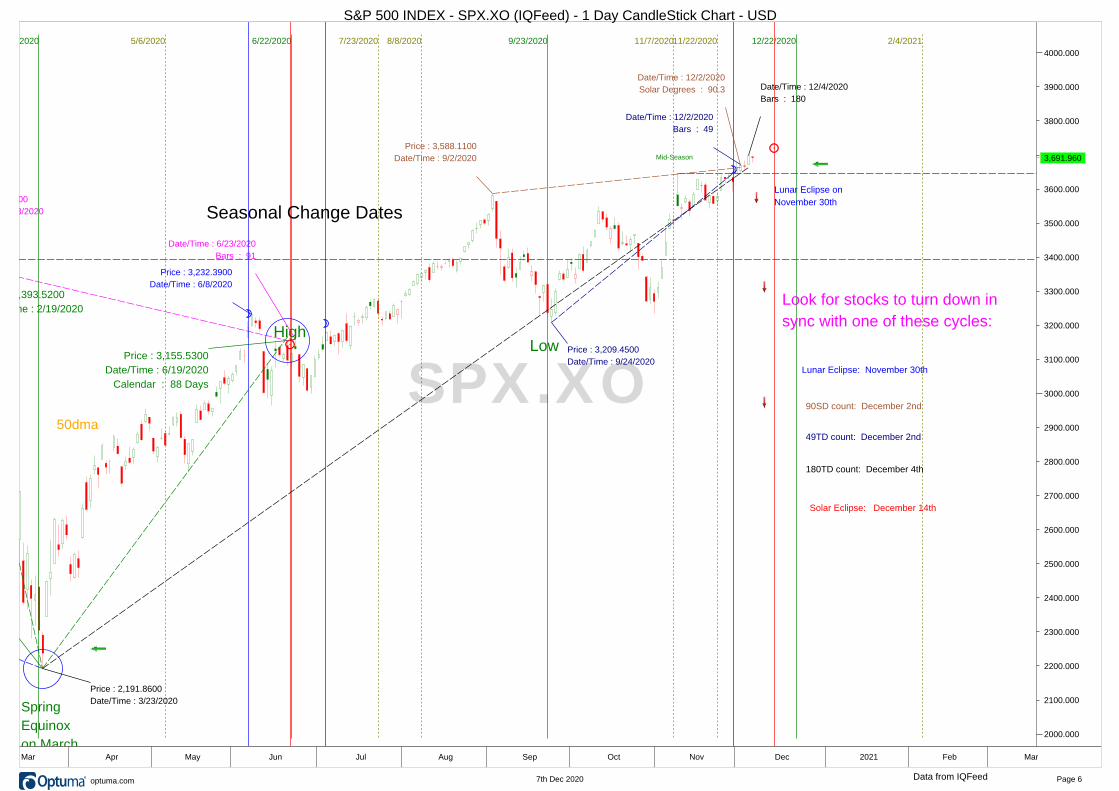
Lunar Eclipse: November 30th
Solar Eclipse: December 14th
Price : 2,191.8600
Date/Time : 3/23/2020
Date/Time : 12/4/2020
Bars : 180
180TD count: December 4th
Price : 3,588.1100
Date/Time : 9/2/2020
Date/Time : 12/2/2020
Solar Degrees : 90.3
90SD count: December 2nd
Gann believed that markets
often turn between a Lunar
and Solar Eclipse. Given the
overbought condition of the
market it seems likely we will
get a turn down. Futures show
the market opening lower here
Tuesday morning.
High
Solar
EclipseHigh
High
HighHigh
Winter
Solstice
July 2nd200dma
50dma
Eclipses
2700.000
2800.000
2900.000
3000.000
3100.000
3200.000
3300.000
3400.000
3500.000
3600.000
3700.000
3800.000
3900.000
4000.000
4100.000
3,691.9603,691.960
Apr May Jun Jul Aug Sep Oct Nov Dec 2021 Feb Mar Apr
S&P 500 INDEX - SPX.XO (IQFeed) - 1 Day CandleStick Chart - USD
Data from IQFeed Page 17th Dec 2020® optuma.com
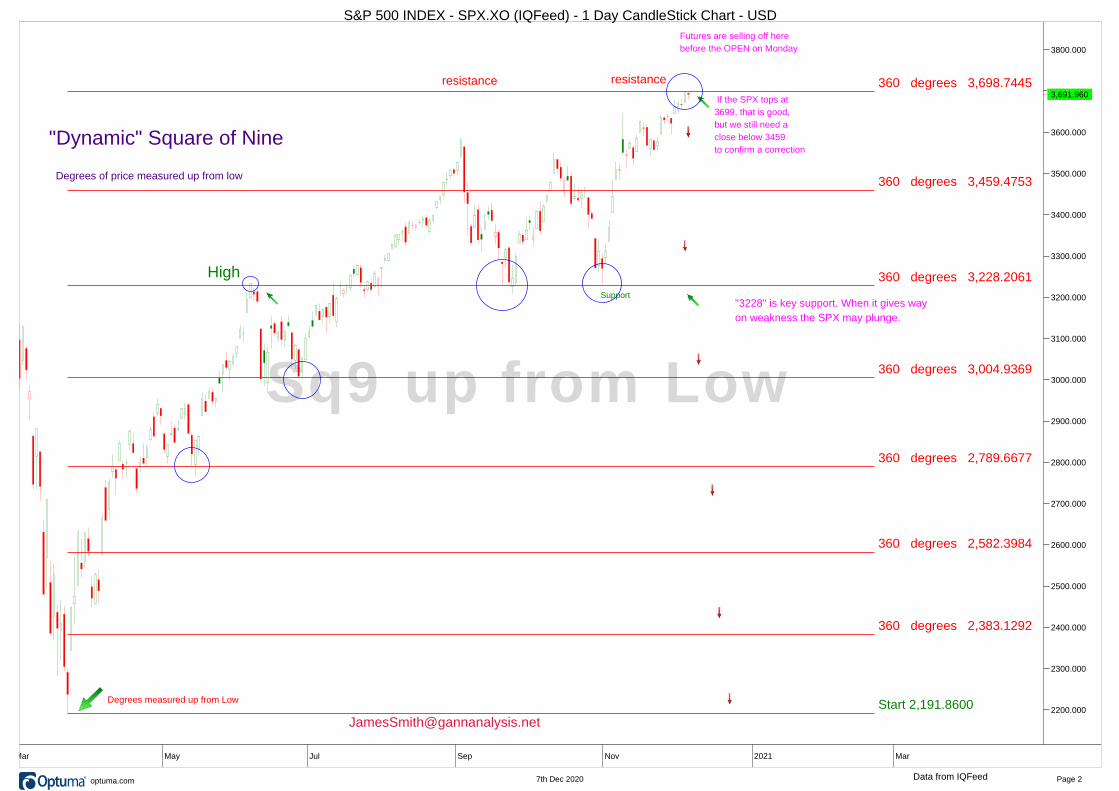
resistance
Degrees of price measured up from low
"Dynamic" Square of Nine
Price : 2,939.8600
Date/Time : 10/3/2018 Date/Time : 5/2/2019
Bars : 145144 TD High to High
Price : 2,351.1000
Date/Time : 12/24/2018
Date/Time : 5/3/2019
Bars : 90
Start 2,191.8600
360 degrees 2,383.1292
360 degrees 2,582.3984
360 degrees 2,789.6677
360 degrees 3,004.9369
360 degrees 3,228.2061
360 degrees 3,459.4753
360 degrees 3,698.7445
360 degrees 3,946.0137
360 degrees 4,201.2830
Price : 2,346.5800
Date/Time : 12/26/2018
Date/Time : 9/13/2019
Bars : 181
HighHigh
Degrees measured up from Low
High
resistance
Support"3228" is key support. When it gives way
on weakness the SPX may plunge.
If the SPX tops at
3699, that is good,
but we still need a
close below 3459
to confirm a correction
Futures are selling off here
before the OPEN on Monday
Sq9 up from Low
2100.000
2200.000
2300.000
2400.000
2500.000
2600.000
2700.000
2800.000
2900.000
3000.000
3100.000
3200.000
3300.000
3400.000
3500.000
3600.000
3700.000
3800.000
3,691.9603,691.960
2020 Mar May Jul Sep Nov 2021 Mar May
S&P 500 INDEX - SPX.XO (IQFeed) - 1 Day CandleStick Chart - USD
Data from IQFeed Page 27th Dec 2020® optuma.com
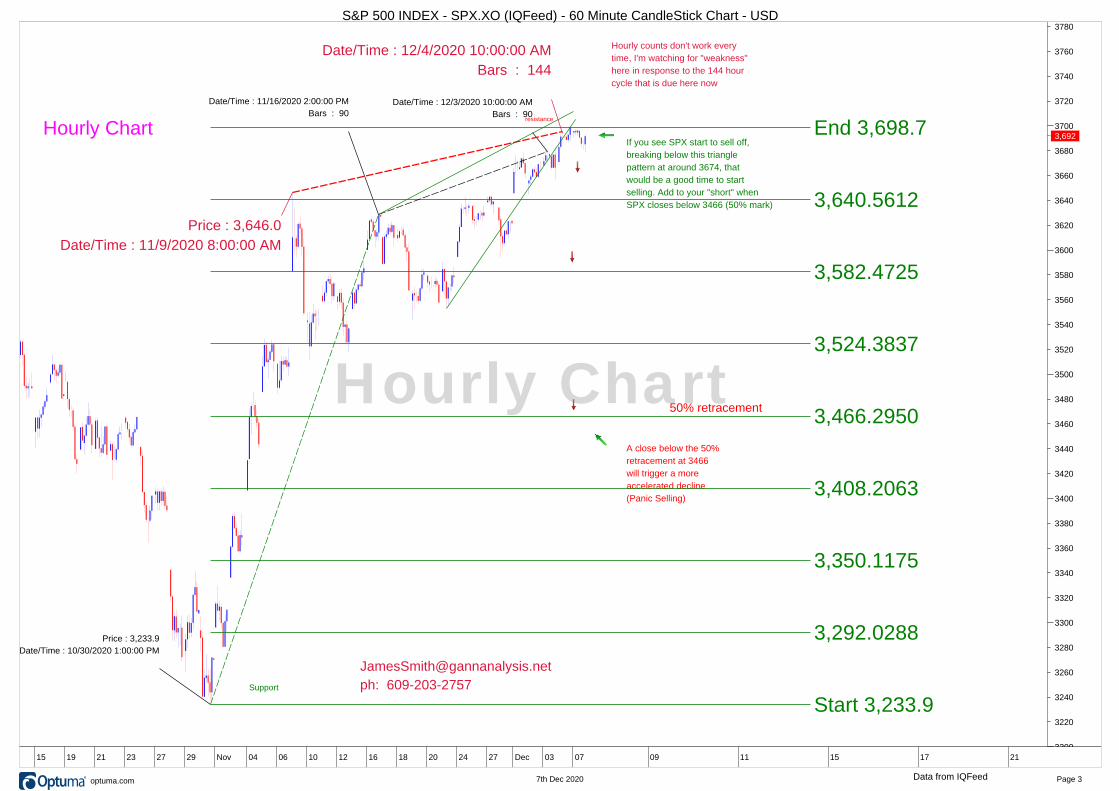
50% retracement
Hourly Chart
Price : 3,209.5
Date/Time : 9/24/2020 8:00:00 AM
ph: 609-203-2757Support
A close below the 50%
retracement at 3466
will trigger a more
accelerated decline
(Panic Selling)
Price : 3,233.9
Date/Time : 10/30/2020 1:00:00 PM
Date/Time : 11/16/2020 2:00:00 PM
Bars : 90
Date/Time : 12/3/2020 10:00:00 AM
Bars : 90resistance
Hourly counts don't work every
time, I'm watching for "weakness"
here in response to the 144 hour
cycle that is due here now
Price : 3,646.0
Date/Time : 11/9/2020 8:00:00 AM
Date/Time : 12/4/2020 10:00:00 AM
Bars : 144
Date/Time : 12/21/2020 11:00:00 PM
Bars : 261
Start 3,233.9
End 3,698.7
3,292.0288
3,350.1175
3,408.2063
3,466.2950
3,524.3837
3,582.4725
3,640.5612
If you see SPX start to sell off,
breaking below this triangle
pattern at around 3674, that
would be a good time to start
selling. Add to your "short" when
SPX closes below 3466 (50% mark)
Hourly Chart
3200
3220
3240
3260
3280
3300
3320
3340
3360
3380
3400
3420
3440
3460
3480
3500
3520
3540
3560
3580
3600
3620
3640
3660
3680
3700
3720
3740
3760
3780
3,692
Sep 05 07 09 13 15 19 21 23 27 29 Nov 04 06 10 12 16 18 20 24 27 Dec 03 07 09 11 15 17 21 23
S&P 500 INDEX - SPX.XO (IQFeed) - 60 Minute CandleStick Chart - USD
Data from IQFeed Page 37th Dec 2020® optuma.com
Price : 666.7900
Date/Time : 3/1/2009
Start 666.7900
End 3,716.9262
1,048.0570
1,429.3240
1,810.5911
2,191.8581
2,573.1251
2,954.3921
3,335.6592
If this low at 2191 is a 50%
retracement, it implies a rally
to 3716
Possible Top
Gann believe that the last "higher
low" before the top was often a
50% retracement of the entire
swing move up. This would imply
a rally to 3716 --assuming that
the the March Low at 291 is going
to be a 50% retracement of the
entire swing.
Price : 2,191.8600
Date/Time : 3/1/2020
A rally to 3717 is not at all a
certainty. It may not happen.
But it is pretty darn close to
this level here now. If SPX
gets to 3717 and thereafter
begins to show weakness,
it might be a top
Close enough for a game
of nuclear handgrenades
Projection
600.000
700.000
800.000
900.000
1000.000
1100.000
1200.000
1300.000
1400.000
1500.000
1600.000
1700.000
1800.000
1900.000
2000.000
2100.000
2200.000
2300.000
2400.000
2500.000
2600.000
2700.000
2800.000
2900.000
3000.000
3100.000
3200.000
3300.000
3400.000
3500.000
3600.000
3700.000
3800.000
3900.000
4000.000
3,691.9603,691.960
2002 2004 2006 2008 2010 2012 2014 2016 2018 2020 2022 2024 2026 2028
S&P 500 INDEX - SPX.XO (IQFeed) - 1 Month CandleStick Chart - USD
Data from IQFeed Page 47th Dec 2020® optuma.com
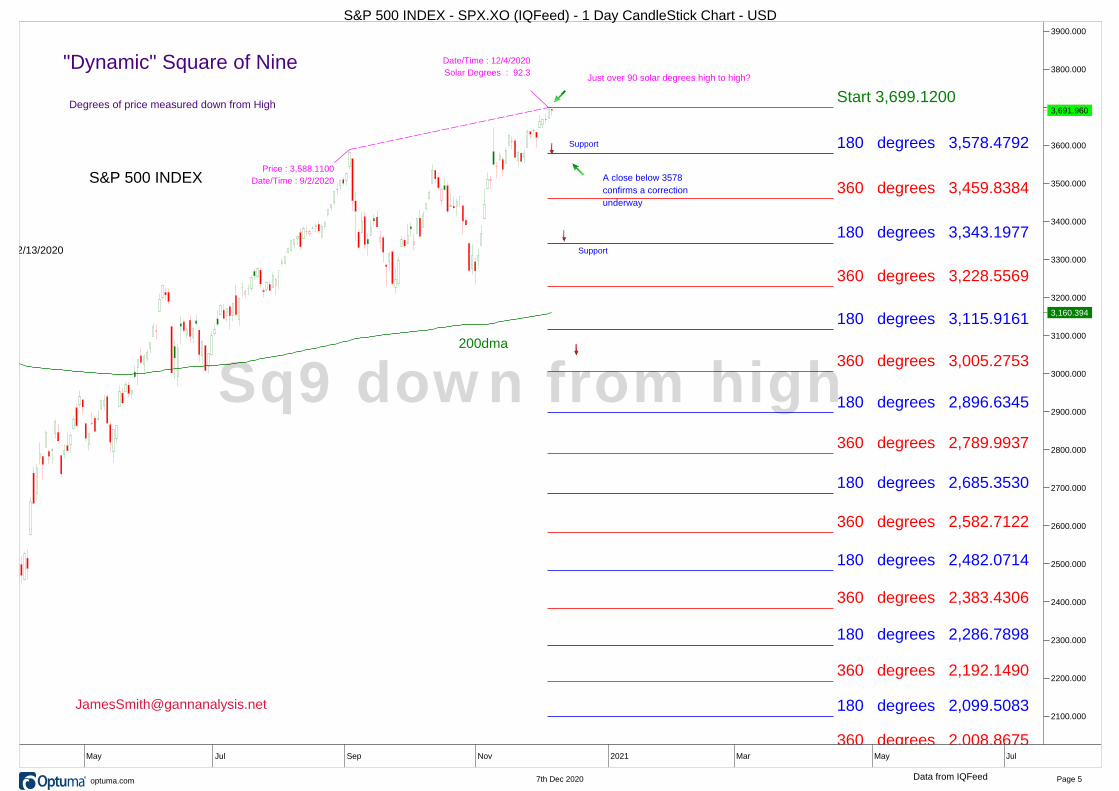
Degrees of price measured down from High
"Dynamic" Square of Nine
Price : 2,939.8600
Date/Time : 10/3/2018 Date/Time : 5/2/2019
Bars : 145144 TD High to High
Price : 2,351.1000
Date/Time : 12/24/2018
Date/Time : 5/3/2019
Bars : 90
Start 3,699.1200
180 degrees 3,578.4792
180 degrees 3,343.1977
180 degrees 3,115.9161
180 degrees 2,896.6345
180 degrees 2,685.3530
180 degrees 2,482.0714
180 degrees 2,286.7898
180 degrees 2,099.5083
180 degrees 1,920.2267
360 degrees 3,459.8384
360 degrees 3,228.5569
360 degrees 3,005.2753
360 degrees 2,789.9937
360 degrees 2,582.7122
360 degrees 2,383.4306
360 degrees 2,192.1490
360 degrees 2,008.8675
360 degrees 1,833.5859
Price : 2,346.5800
Date/Time : 12/26/2018
Date/Time : 9/13/2019
Bars : 181
High
200dma
High
High
Price : 2,855.9400
Date/Time : 10/3/2019
Date/Time : 2/13/2020
Bars : 92
S&P 500 INDEXPrice : 3,588.1100
Date/Time : 9/2/2020
Date/Time : 12/4/2020
Solar Degrees : 92.3
Support
A close below 3578
confirms a correction
underway
Just over 90 solar degrees high to high?
Support
Sq9 down from high
2100.000
2200.000
2300.000
2400.000
2500.000
2600.000
2700.000
2800.000
2900.000
3000.000
3100.000
3200.000
3300.000
3400.000
3500.000
3600.000
3700.000
3800.000
3900.000
3,691.960
3,160.394
3,691.960
Mar May Jul Sep Nov 2021 Mar May Jul Sep
S&P 500 INDEX - SPX.XO (IQFeed) - 1 Day CandleStick Chart - USD
Data from IQFeed Page 57th Dec 2020® optuma.com
Summer Solstice
due on June 21st
3/21/1950 6/22/1950 9/23/1950 12/22/1950 3/21/1951 6/22/1951 9/23/1951 12/22/1951 3/21/1952 6/22/1952 9/23/1952 12/22/1952 3/21/1953 6/22/1953 9/23/1953 12/22/1953 3/21/1954 6/22/1954 9/23/1954 12/22/1954 3/21/1955 6/22/1955 9/23/1955 12/22/1955 3/21/1956 6/22/1956 9/23/1956 12/22/1956 3/21/1957 6/22/1957 9/23/1957 12/22/1957 3/21/1958 6/22/1958 9/23/1958 12/22/1958 3/21/1959 6/22/1959 9/23/1959 12/22/1959 3/21/1960 6/22/1960 9/23/1960 12/22/1960 3/21/1961 6/22/1961 9/23/1961 12/22/1961 3/21/1962 6/22/1962 9/23/1962 12/22/1962 3/21/1963 6/22/1963 9/23/1963 12/22/1963 3/21/1964 6/22/1964 9/23/1964 12/22/1964 3/21/1965 6/22/1965 9/23/1965 12/22/1965 3/21/1966 6/22/1966 9/23/1966 12/22/1966 3/21/1967 6/22/1967 9/23/1967 12/22/1967 3/21/1968 6/22/1968 9/23/1968 12/22/1968 3/21/1969 6/22/1969 9/23/1969 12/22/1969 3/21/1970 6/22/1970 9/23/1970 12/22/1970 3/21/1971 6/22/1971 9/23/1971 12/22/1971 3/21/1972 6/22/1972 9/23/1972 12/22/1972 3/21/1973 6/22/1973 9/23/1973 12/22/1973 3/21/1974 6/22/1974 9/23/1974 12/22/1974 3/21/1975 6/22/1975 9/23/1975 12/22/1975 3/21/1976 6/22/1976 9/23/1976 12/22/1976 3/21/1977 6/22/1977 9/23/1977 12/22/1977 3/21/1978 6/22/1978 9/23/1978 12/22/1978 3/21/1979 6/22/1979 9/23/1979 12/22/1979 3/21/1980 6/22/1980 9/23/1980 12/22/1980 3/21/1981 6/22/1981 9/23/1981 12/22/1981 3/21/1982 6/22/1982 9/23/1982 12/22/1982 3/21/1983 6/22/1983 9/23/1983 12/22/1983 3/21/1984 6/22/1984 9/23/1984 12/22/1984 3/21/1985 6/22/1985 9/23/1985 12/22/1985 3/21/1986 6/22/1986 9/23/1986 12/22/1986 3/21/1987 6/22/1987 9/23/1987 12/22/1987 3/21/1988 6/22/1988 9/23/1988 12/22/1988 3/21/1989 6/22/1989 9/23/1989 12/22/1989 3/21/1990 6/22/1990 9/23/1990 12/22/1990 3/21/1991 6/22/1991 9/23/1991 12/22/1991 3/21/1992 6/22/1992 9/23/1992 12/22/1992 3/21/1993 6/22/1993 9/23/1993 12/22/1993 3/21/1994 6/22/1994 9/23/1994 12/22/1994 3/21/1995 6/22/1995 9/23/1995 12/22/1995 3/21/1996 6/22/1996 9/23/1996 12/22/1996 3/21/1997 6/22/1997 9/23/1997 12/22/1997 3/21/1998 6/22/1998 9/23/1998 12/22/1998 3/21/1999 6/22/1999 9/23/1999 12/22/1999 3/21/2000 6/22/2000 9/23/2000 12/22/2000 3/21/2001 6/22/2001 9/23/2001 12/22/2001 3/21/2002 6/22/2002 9/23/2002 12/22/2002 3/21/2003 6/22/2003 9/23/2003 12/22/2003 3/21/2004 6/22/2004 9/23/2004 12/22/2004 3/21/2005 6/22/2005 9/23/2005 12/22/2005 3/21/2006 6/22/2006 9/23/2006 12/22/2006 3/21/2007 6/22/2007 9/23/2007 12/22/2007 3/21/2008 6/22/2008 9/23/2008 12/22/2008 3/21/2009 6/22/2009 9/23/2009 12/22/2009 3/21/2010 6/22/2010 9/23/2010 12/22/2010 3/21/2011 6/22/2011 9/23/2011 12/22/2011 3/21/2012 6/22/2012 9/23/2012 12/22/2012 3/21/2013 6/22/2013 9/23/2013 12/22/2013 3/21/2014 6/22/2014 9/23/2014 12/22/2014 3/21/2015 6/22/2015 9/23/2015 12/22/2015 3/21/2016 6/22/2016 9/23/2016 12/22/2016 3/21/2017 6/22/2017 9/23/2017 12/22/2017 3/21/2018 6/22/2018 9/23/2018 12/22/2018 3/21/2019 6/22/2019 9/23/2019 12/22/2019 3/21/2020 6/22/2020 9/23/2020 12/22/20202/4/1950 5/6/1950 7/23/1950 8/8/1950 11/7/195011/22/1950 2/4/1951 5/6/1951 7/23/1951 8/8/1951 11/7/195111/22/1951 2/4/1952 5/6/1952 7/23/1952 8/8/1952 11/7/195211/22/1952 2/4/1953 5/6/1953 7/23/1953 8/8/1953 11/7/195311/22/1953 2/4/1954 5/6/1954 7/23/1954 8/8/1954 11/7/195411/22/1954 2/4/1955 5/6/1955 7/23/1955 8/8/1955 11/7/195511/22/1955 2/4/1956 5/6/1956 7/23/1956 8/8/1956 11/7/195611/22/1956 2/4/1957 5/6/1957 7/23/1957 8/8/1957 11/7/195711/22/1957 2/4/1958 5/6/1958 7/23/1958 8/8/1958 11/7/195811/22/1958 2/4/1959 5/6/1959 7/23/1959 8/8/1959 11/7/195911/22/1959 2/4/1960 5/6/1960 7/23/1960 8/8/1960 11/7/196011/22/1960 2/4/1961 5/6/1961 7/23/1961 8/8/1961 11/7/196111/22/1961 2/4/1962 5/6/1962 7/23/1962 8/8/1962 11/7/196211/22/1962 2/4/1963 5/6/1963 7/23/1963 8/8/1963 11/7/196311/22/1963 2/4/1964 5/6/1964 7/23/1964 8/8/1964 11/7/196411/22/1964 2/4/1965 5/6/1965 7/23/1965 8/8/1965 11/7/196511/22/1965 2/4/1966 5/6/1966 7/23/1966 8/8/1966 11/7/196611/22/1966 2/4/1967 5/6/1967 7/23/1967 8/8/1967 11/7/196711/22/1967 2/4/1968 5/6/1968 7/23/19688/8/1968 11/7/196811/22/1968 2/4/1969 5/6/1969 7/23/1969 8/8/1969 11/7/196911/22/1969 2/4/1970 5/6/1970 7/23/1970 8/8/1970 11/7/197011/22/1970 2/4/1971 5/6/1971 7/23/1971 8/8/1971 11/7/197111/22/1971 2/4/1972 5/6/1972 7/23/1972 8/8/1972 11/7/197211/22/1972 2/4/1973 5/6/1973 7/23/1973 8/8/1973 11/7/197311/22/1973 2/4/1974 5/6/1974 7/23/1974 8/8/1974 11/7/197411/22/1974 2/4/1975 5/6/1975 7/23/1975 8/8/1975 11/7/197511/22/1975 2/4/1976 5/6/1976 7/23/1976 8/8/1976 11/7/197611/22/1976 2/4/1977 5/6/1977 7/23/1977 8/8/1977 11/7/197711/22/1977 2/4/1978 5/6/1978 7/23/1978 8/8/1978 11/7/197811/22/1978 2/4/1979 5/6/1979 7/23/1979 8/8/1979 11/7/197911/22/1979 2/4/1980 5/6/1980 7/23/1980 8/8/1980 11/7/198011/22/1980 2/4/1981 5/6/1981 7/23/1981 8/8/1981 11/7/198111/22/1981 2/4/1982 5/6/1982 7/23/1982 8/8/1982 11/7/198211/22/1982 2/4/1983 5/6/1983 7/23/1983 8/8/1983 11/7/198311/22/1983 2/4/1984 5/6/1984 7/23/1984 8/8/1984 11/7/198411/22/1984 2/4/1985 5/6/1985 7/23/1985 8/8/1985 11/7/198511/22/1985 2/4/1986 5/6/1986 7/23/1986 8/8/1986 11/7/198611/22/1986 2/4/1987 5/6/1987 7/23/1987 8/8/1987 11/7/198711/22/1987 2/4/1988 5/6/1988 7/23/1988 8/8/1988 11/7/198811/22/1988 2/4/1989 5/6/1989 7/23/1989 8/8/1989 11/7/198911/22/1989 2/4/1990 5/6/1990 7/23/1990 8/8/1990 11/7/199011/22/1990 2/4/1991 5/6/1991 7/23/1991 8/8/1991 11/7/199111/22/1991 2/4/1992 5/6/1992 7/23/1992 8/8/1992 11/7/199211/22/1992 2/4/1993 5/6/1993 7/23/1993 8/8/1993 11/7/199311/22/1993 2/4/1994 5/6/1994 7/23/1994 8/8/1994 11/7/199411/22/1994 2/4/1995 5/6/1995 7/23/1995 8/8/1995 11/7/199511/22/1995 2/4/1996 5/6/1996 7/23/1996 8/8/1996 11/7/199611/22/1996 2/4/1997 5/6/1997 7/23/1997 8/8/1997 11/7/199711/22/1997 2/4/1998 5/6/1998 7/23/1998 8/8/1998 11/7/199811/22/1998 2/4/1999 5/6/1999 7/23/1999 8/8/1999 11/7/199911/22/1999 2/4/2000 5/6/2000 7/23/2000 8/8/2000 11/7/200011/22/2000 2/4/2001 5/6/2001 7/23/2001 8/8/2001 11/7/200111/22/2001 2/4/2002 5/6/2002 7/23/2002 8/8/2002 11/7/200211/22/2002 2/4/2003 5/6/2003 7/23/2003 8/8/2003 11/7/200311/22/2003 2/4/2004 5/6/2004 7/23/2004 8/8/2004 11/7/200411/22/2004 2/4/2005 5/6/2005 7/23/2005 8/8/2005 11/7/200511/22/2005 2/4/2006 5/6/2006 7/23/2006 8/8/2006 11/7/200611/22/2006 2/4/2007 5/6/2007 7/23/2007 8/8/2007 11/7/200711/22/2007 2/4/2008 5/6/2008 7/23/2008 8/8/2008 11/7/200811/22/2008 2/4/2009 5/6/2009 7/23/2009 8/8/2009 11/7/200911/22/2009 2/4/2010 5/6/2010 7/23/2010 8/8/2010 11/7/201011/22/2010 2/4/2011 5/6/2011 7/23/2011 8/8/2011 11/7/201111/22/2011 2/4/2012 5/6/2012 7/23/2012 8/8/2012 11/7/201211/22/2012 2/4/2013 5/6/2013 7/23/2013 8/8/2013 11/7/201311/22/2013 2/4/2014 5/6/2014 7/23/2014 8/8/2014 11/7/201411/22/2014 2/4/2015 5/6/2015 7/23/2015 8/8/2015 11/7/201511/22/2015 2/4/2016 5/6/2016 7/23/2016 8/8/2016 11/7/201611/22/2016 2/4/2017 5/6/2017 7/23/2017 8/8/2017 11/7/201711/22/2017 2/4/2018 5/6/2018 7/23/2018 8/8/2018 11/7/201811/22/2018 2/4/2019 5/6/2019 7/23/2019 8/8/2019 11/7/201911/22/2019 2/4/2020 5/6/2020 7/23/2020 8/8/2020 11/7/202011/22/2020 2/4/2021
Fall
Equinox
Midpoint
between
Summer
Solstice &
Fall Equinox
Nov 7th
Winter
Solstice
Mid-season
turn
High
Mid-season
turn
Feb 4th
HighHigh
Low
The SPX sold off into the
Mid-Season turn due Feb 4th
and then bounced back.
Low
Spring
Equinox
Mid-season
turn
Summer
Solstice
Price : 1,737.9200
Date/Time : 2/5/2014
Date/Time : 8/8/2014
Solar Degrees : 179.3
180 Solar Degrees
Low to Low? Given the selloff into
this Mid-Season Turn,
there is a risk that we
could get a temporary
Low here Friday.
What I said:
"temporary
low"Mid-season
turn
Fall
Equinox
Nov
7th
High Mid-season
turn
Winter
SolsticeTemporary
Top
Mid-season
turn
Price : 2,019.2600
Date/Time : 9/19/2014
Date/Time : 1/29/2015
Bars : 91
90-TD
Price : 1,820.6600
Date/Time : 10/15/2014
Date/Time : 1/14/2015
Calendar : 91 Days
90-CD
Price : 2,011.1700
Date/Time : 9/4/2014
Date/Time : 1/14/2015
Bars : 92
90-TD
Spring
Equinox
High
Mid-season
turn
Low
The "Mid-Season Turn"
due on May 6th called
a "higher low" and the
turn higher.
Summer
Solstice
Summer
Solstice
ph: 609-897-1020
S&P 500 Index "Cash" (SPX)
Mid-seasonFall
Equinox
Mid-season
turnWinter
Solstice
High
Spring
Equionx
Mid-season
turn
Summer
Solstice
June 20thHigh
High
Mid-season
turn
High
Sept 22nd
Fall
Equinox
Low
Mid-season
turnNov 7th
High
High
Spring
Equinox
ph: 609-897-1020
Mid-Season
TurnSummer
Solstice
Low
Price : 2,400.9800
Date/Time : 3/1/2017High
High
The Mid-Season Turn
due August 8th coincided
with a high.
Fall Equinox
Sept 22nd
Mid-SeasonHigh
High
Low
Low
Winter
Solstice
Low
Mid-Season
Low
Spring
Equinox
High
Price : 2,872.8700
Date/Time : 1/26/2018 Date/Time : 3/12/2018
Calendar : 45 Days
Date/Time : 6/11/2018
Calendar : 91 Days
High
Price : 2,872.8700
Date/Time : 1/26/2018
Date/Time : 6/8/2018
Bars : 93
Summer
Solstice
Spring
Equinox
Mid-Season
Low
Mid-Season
June 21st
Summer
Solstice
High
Fall
Equinox
ph: 609-203-2757
High
Mid-Season
High
High
March 20thSpring Equinox
Low
Low
High
Mid-Season
Price : 2,351.1000
Date/Time : 12/24/2018
Date/Time : 5/6/2019
Bars : 91
Price : 2,939.8600
Date/Time : 10/3/2018
Date/Time : 5/2/2019
Bars : 145
Date/Time : 9/12/2019
Bars : 93
Summer
Solstice
June 21st
Price : 2,346.5800
Date/Time : 12/26/2018
Date/Time : 6/24/2019
Calendar : 180 DaysLunar Eclipse
due on July 16th
Solar
Eclipse
High
High
Fall
Equinox
Price : 2,346.5800
Date/Time : 12/26/2018
Date/Time : 9/13/2019
Bars : 181
Price : 2,825.7100
Date/Time : 8/7/2019
Date/Time : 2/5/2020
Solar Degrees : 181.4
Mid-Season
Date/Time : 2/12/2020
Bars : 91
Price : 2,855.9400
Date/Time : 10/3/2019
High
Spring
Equinox
on March
20th
Price : 3,393.5200
Date/Time : 2/19/2020
Price : 2,191.8600
Date/Time : 3/23/2020
Calendar : 33 Days
Price : 3,155.5300
Date/Time : 6/19/2020
Calendar : 88 Days
Price : 3,385.0900
Date/Time : 2/13/2020
Date/Time : 6/23/2020
Bars : 91
High
Price : 3,232.3900
Date/Time : 6/8/2020
Low
Mid-Season
A
A
ZZ
Z
Lunar Eclipse on
November 30th
Lunar Eclipse: November 30th
Solar Eclipse: December 14th
Price : 2,191.8600
Date/Time : 3/23/2020
Date/Time : 12/4/2020
Bars : 180
180TD count: December 4th
Price : 3,588.1100
Date/Time : 9/2/2020
Date/Time : 12/2/2020
Solar Degrees : 90.3
90SD count: December 2nd
Look for stocks to turn down in
sync with one of these cycles:
Price : 3,209.4500
Date/Time : 9/24/2020
Date/Time : 12/2/2020
Bars : 49
49TD count: December 2nd
Solar
Eclipse High
Seasonal Change Dates
High
HighHigh
Winter
Solstice
July 2nd200dma
50dma
SPX.XO
2000.000
2100.000
2200.000
2300.000
2400.000
2500.000
2600.000
2700.000
2800.000
2900.000
3000.000
3100.000
3200.000
3300.000
3400.000
3500.000
3600.000
3700.000
3800.000
3900.000
4000.000
3,691.9603,691.960
Feb Mar Apr May Jun Jul Aug Sep Oct Nov Dec 2021 Feb Mar Apr
S&P 500 INDEX - SPX.XO (IQFeed) - 1 Day CandleStick Chart - USD
Data from IQFeed Page 67th Dec 2020® optuma.com
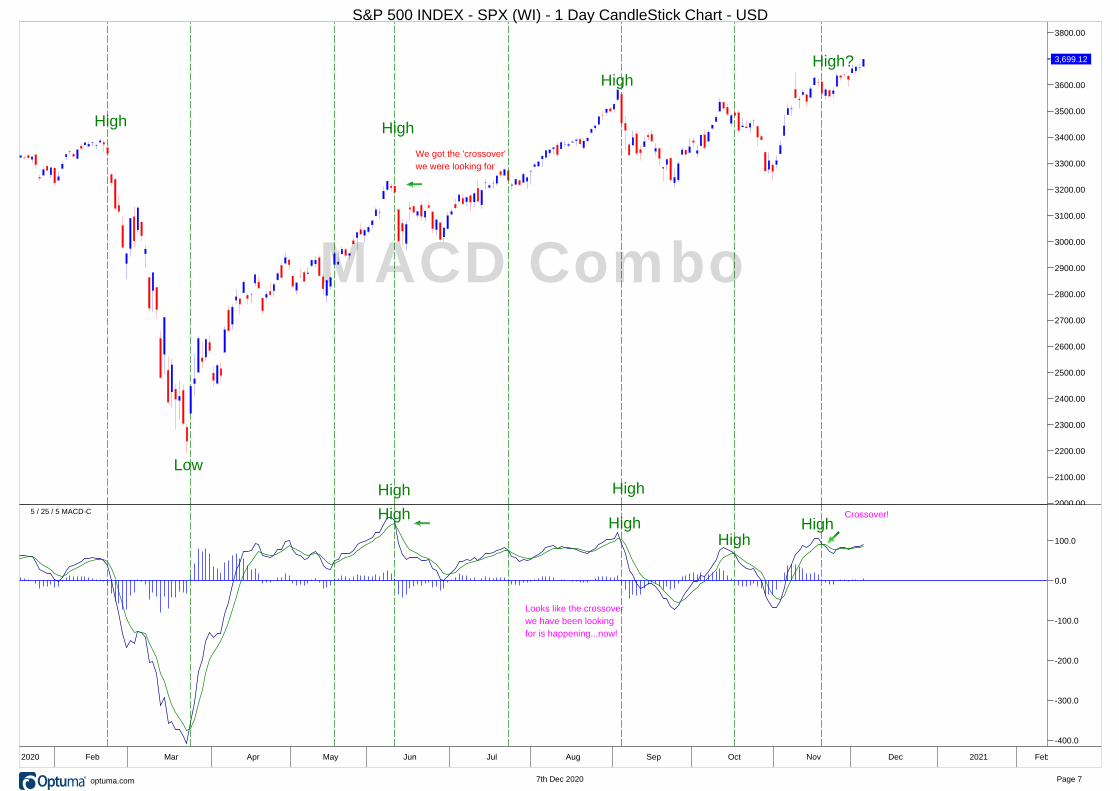
We got the 'crossover'
we were looking for
High
High
High
High
High
Low
High
High?
MACD Combo
Looks like the crossover
we have been looking
for is happening...now!
HighHigh Crossover!
HighHigh
5 / 25 / 5 MACD-C2000.00
2100.00
2200.00
2300.00
2400.00
2500.00
2600.00
2700.00
2800.00
2900.00
3000.00
3100.00
3200.00
3300.00
3400.00
3500.00
3600.00
3700.00
3800.00
3,699.12
-400.0
-300.0
-200.0
-100.0
0.0
100.0
Dec 2020 Feb Mar Apr May Jun Jul Aug Sep Oct Nov Dec 2021 Feb Mar
S&P 500 INDEX - SPX (WI) - 1 Day CandleStick Chart - USD
Page 77th Dec 2020® optuma.com
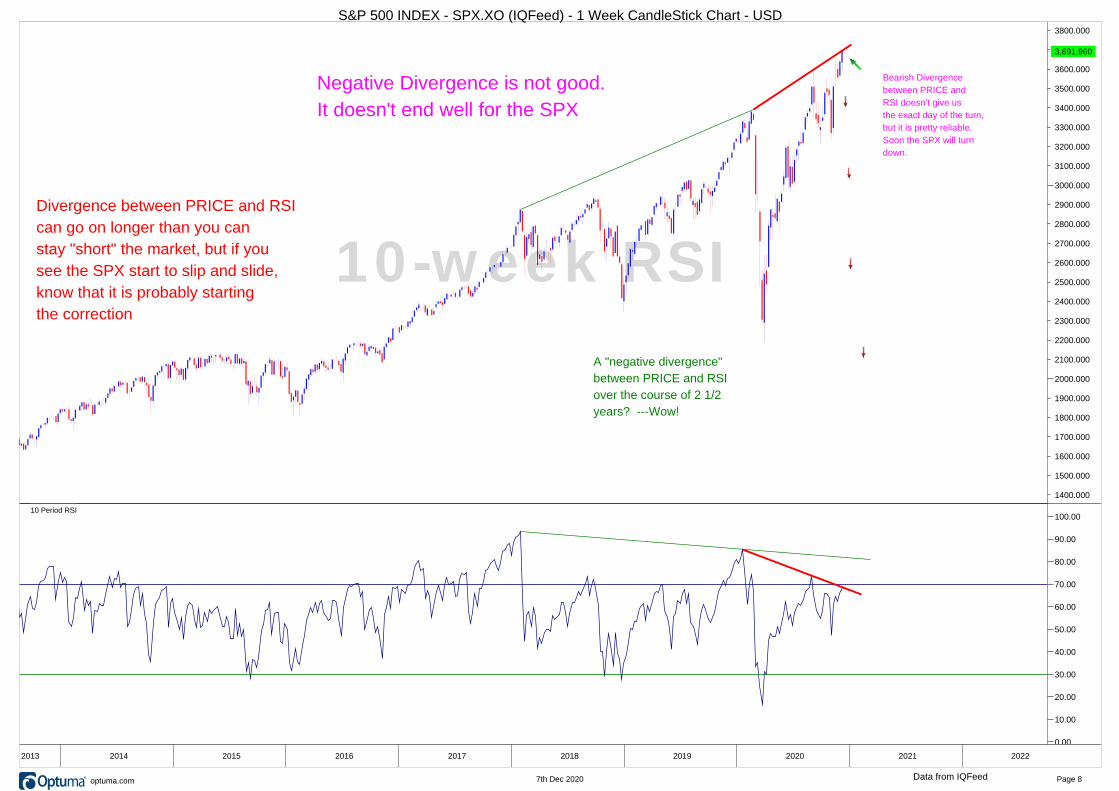
A "negative divergence"
between PRICE and RSI
over the course of 2 1/2
years? ---Wow!
Negative Divergence is not good.
It doesn't end well for the SPX
Divergence between PRICE and RSI
can go on longer than you can
stay "short" the market, but if you
see the SPX start to slip and slide,
know that it is probably starting
the correction
Bearish Divergence
between PRICE and
RSI doesn't give us
the exact day of the turn,
but it is pretty reliable.
Soon the SPX will turn
down.
10-week RSI
10 Period RSI
1400.000
1500.000
1600.000
1700.000
1800.000
1900.000
2000.000
2100.000
2200.000
2300.000
2400.000
2500.000
2600.000
2700.000
2800.000
2900.000
3000.000
3100.000
3200.000
3300.000
3400.000
3500.000
3600.000
3700.000
3800.000
3,691.9603,691.960
0.00
10.00
20.00
30.00
40.00
50.00
60.00
70.00
80.00
90.00
100.00
2012 2013 2014 2015 2016 2017 2018 2019 2020 2021 2022 2023
S&P 500 INDEX - SPX.XO (IQFeed) - 1 Week CandleStick Chart - USD
Data from IQFeed Page 87th Dec 2020® optuma.com
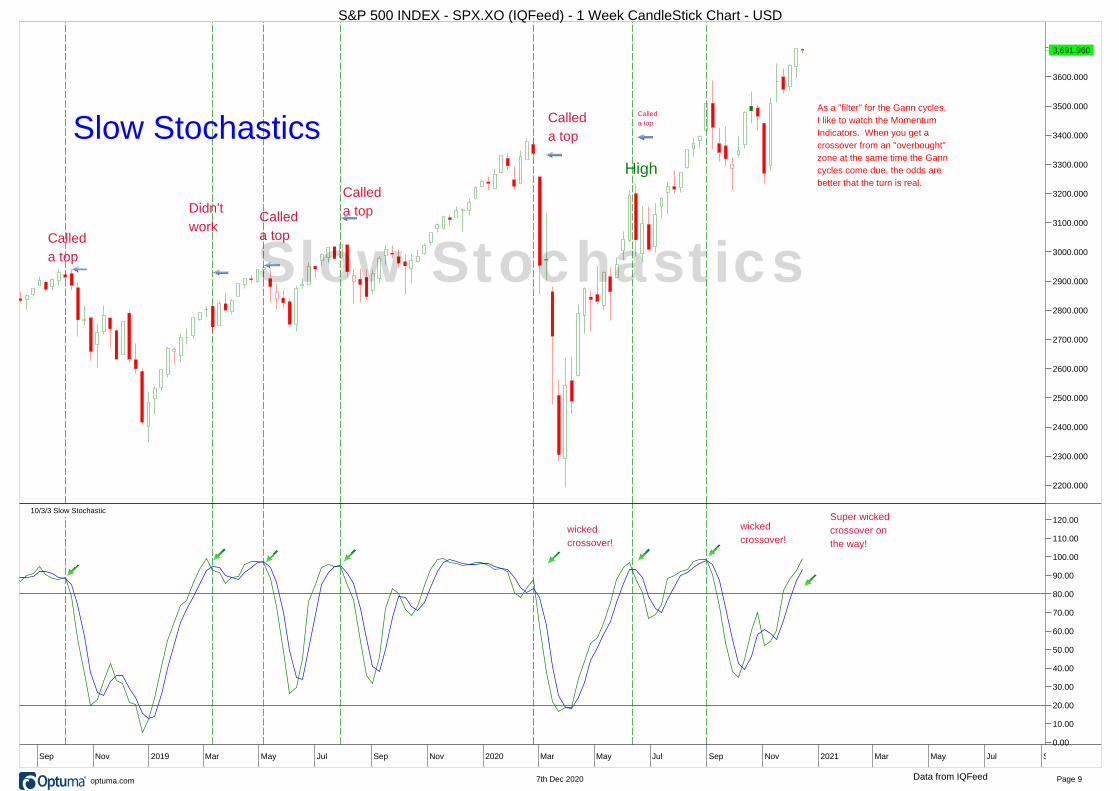
Didn't
workCalled
a top
Called
a top
Called
a top
Called
a top
Called
a top
Slow Stochastics Called
a top
As a "filter" for the Gann cycles,
I like to watch the Momentum
Indicators. When you get a
crossover from an "overbought"
zone at the same time the Gann
cycles come due, the odds are
better that the turn is real.
High
Called
a top
Slow Stochastics
Called
a top
Called
a top
Called
a top
wicked
crossover!
wicked
crossover!
Super wicked
crossover on
the way!
10/3/3 Slow Stochastic
2200.000
2300.000
2400.000
2500.000
2600.000
2700.000
2800.000
2900.000
3000.000
3100.000
3200.000
3300.000
3400.000
3500.000
3600.000
3700.0003,691.9603,691.960
0.00
10.00
20.00
30.00
40.00
50.00
60.00
70.00
80.00
90.00
100.00
110.00
120.00
May Jul Sep Nov 2019 Mar May Jul Sep Nov 2020 Mar May Jul Sep Nov 2021 Mar May Jul Sep Nov
S&P 500 INDEX - SPX.XO (IQFeed) - 1 Week CandleStick Chart - USD
Data from IQFeed Page 97th Dec 2020® optuma.com
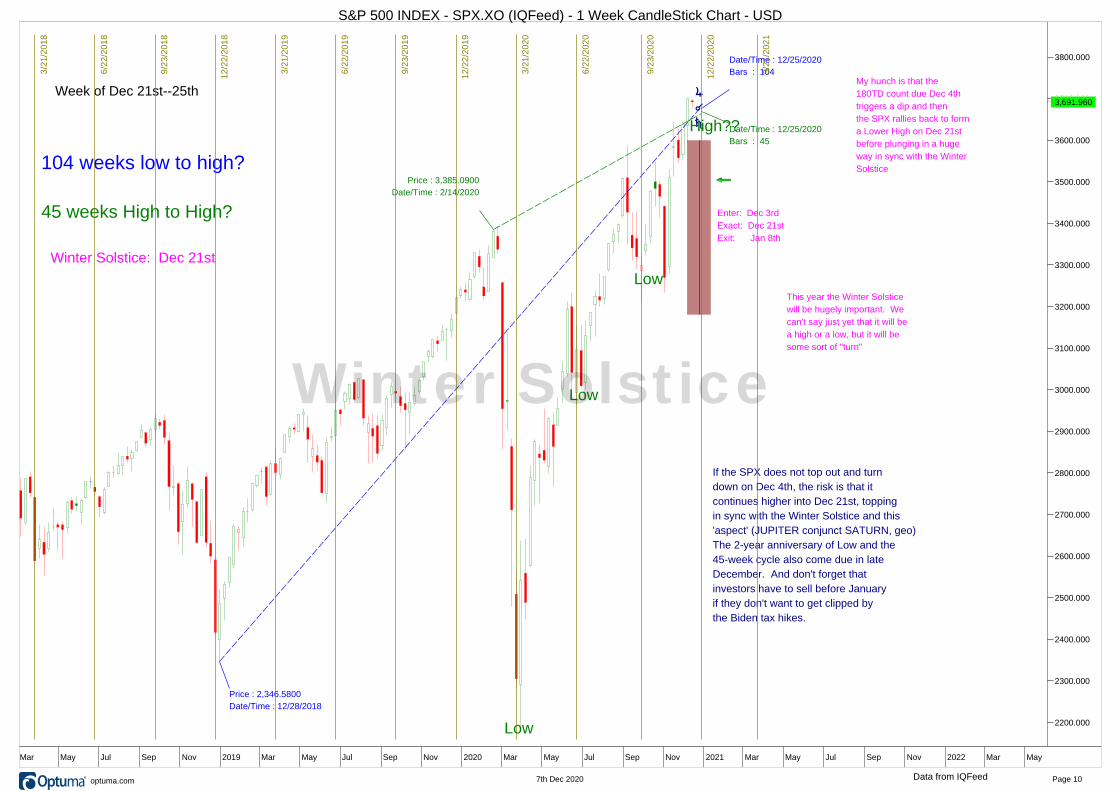
F
!
G
Price : 3,385.0900
Date/Time : 2/14/2020
Date/Time : 12/25/2020
Bars : 45
Price : 2,346.5800
Date/Time : 12/28/2018
Date/Time : 12/25/2020
Bars : 104
Enter: Dec 3rd
Exact: Dec 21st
Exit: Jan 8th
104 weeks low to high?
45 weeks High to High?
Week of Dec 21st--25th
Winter Solstice: Dec 21st
If the SPX does not top out and turn
down on Dec 4th, the risk is that it
continues higher into Dec 21st, topping
in sync with the Winter Solstice and this
'aspect' (JUPITER conjunct SATURN, geo)
The 2-year anniversary of Low and the
45-week cycle also come due in late
December. And don't forget that
investors have to sell before January
if they don't want to get clipped by
the Biden tax hikes.
This year the Winter Solstice
will be hugely important. We
can't say just yet that it will be
a high or a low, but it will be
some sort of "turn"
3/2
1/1
95
0
6/2
2/1
95
0
9/2
3/1
95
0
12
/22
/19
50
3/2
1/1
95
1
6/2
2/1
95
1
9/2
3/1
95
1
12
/22
/19
51
3/2
1/1
95
2
6/2
2/1
95
2
9/2
3/1
95
2
12
/22
/19
52
3/2
1/1
95
3
6/2
2/1
95
3
9/2
3/1
95
3
12
/22
/19
53
3/2
1/1
95
4
6/2
2/1
95
4
9/2
3/1
95
4
12
/22
/19
54
3/2
1/1
95
5
6/2
2/1
95
5
9/2
3/1
95
5
12
/22
/19
55
3/2
1/1
95
6
6/2
2/1
95
6
9/2
3/1
95
6
12
/22
/19
56
3/2
1/1
95
7
6/2
2/1
95
7
9/2
3/1
95
7
12
/22
/19
57
3/2
1/1
95
8
6/2
2/1
95
8
9/2
3/1
95
8
12
/22
/19
58
3/2
1/1
95
9
6/2
2/1
95
9
9/2
3/1
95
9
12
/22
/19
59
3/2
1/1
96
0
6/2
2/1
96
0
9/2
3/1
96
0
12
/22
/19
60
3/2
1/1
96
1
6/2
2/1
96
1
9/2
3/1
96
1
12
/22
/19
61
3/2
1/1
96
2
6/2
2/1
96
2
9/2
3/1
96
2
12
/22
/19
62
3/2
1/1
96
3
6/2
2/1
96
3
9/2
3/1
96
3
12
/22
/19
63
3/2
1/1
96
4
6/2
2/1
96
4
9/2
3/1
96
4
12
/22
/19
64
3/2
1/1
96
5
6/2
2/1
96
5
9/2
3/1
96
5
12
/22
/19
65
3/2
1/1
96
6
6/2
2/1
96
6
9/2
3/1
96
6
12
/22
/19
66
3/2
1/1
96
7
6/2
2/1
96
7
9/2
3/1
96
7
12
/22
/19
67
3/2
1/1
96
8
6/2
2/1
96
8
9/2
3/1
96
8
12
/22
/19
68
3/2
1/1
96
9
6/2
2/1
96
9
9/2
3/1
96
9
12
/22
/19
69
3/2
1/1
97
0
6/2
2/1
97
0
9/2
3/1
97
0
12
/22
/19
70
3/2
1/1
97
1
6/2
2/1
97
1
9/2
3/1
97
1
12
/22
/19
71
3/2
1/1
97
2
6/2
2/1
97
2
9/2
3/1
97
2
12
/22
/19
72
3/2
1/1
97
3
6/2
2/1
97
3
9/2
3/1
97
3
12
/22
/19
73
3/2
1/1
97
4
6/2
2/1
97
4
9/2
3/1
97
4
12
/22
/19
74
3/2
1/1
97
5
6/2
2/1
97
5
9/2
3/1
97
5
12
/22
/19
75
3/2
1/1
97
6
6/2
2/1
97
6
9/2
3/1
97
6
12
/22
/19
76
3/2
1/1
97
7
6/2
2/1
97
7
9/2
3/1
97
7
12
/22
/19
77
3/2
1/1
97
8
6/2
2/1
97
8
9/2
3/1
97
8
12
/22
/19
78
3/2
1/1
97
9
6/2
2/1
97
9
9/2
3/1
97
9
12
/22
/19
79
3/2
1/1
98
0
6/2
2/1
98
0
9/2
3/1
98
0
12
/22
/19
80
3/2
1/1
98
1
6/2
2/1
98
1
9/2
3/1
98
1
12
/22
/19
81
3/2
1/1
98
2
6/2
2/1
98
2
9/2
3/1
98
2
12
/22
/19
82
3/2
1/1
98
3
6/2
2/1
98
3
9/2
3/1
98
3
12
/22
/19
83
3/2
1/1
98
4
6/2
2/1
98
4
9/2
3/1
98
4
12
/22
/19
84
3/2
1/1
98
5
6/2
2/1
98
5
9/2
3/1
98
5
12
/22
/19
85
3/2
1/1
98
6
6/2
2/1
98
6
9/2
3/1
98
6
12
/22
/19
86
3/2
1/1
98
7
6/2
2/1
98
7
9/2
3/1
98
7
12
/22
/19
87
3/2
1/1
98
8
6/2
2/1
98
8
9/2
3/1
98
8
12
/22
/19
88
3/2
1/1
98
9
6/2
2/1
98
9
9/2
3/1
98
9
12
/22
/19
89
3/2
1/1
99
0
6/2
2/1
99
0
9/2
3/1
99
0
12
/22
/19
90
3/2
1/1
99
1
6/2
2/1
99
1
9/2
3/1
99
1
12
/22
/19
91
3/2
1/1
99
2
6/2
2/1
99
2
9/2
3/1
99
2
12
/22
/19
92
3/2
1/1
99
3
6/2
2/1
99
3
9/2
3/1
99
3
12
/22
/19
93
3/2
1/1
99
4
6/2
2/1
99
4
9/2
3/1
99
4
12
/22
/19
94
3/2
1/1
99
5
6/2
2/1
99
5
9/2
3/1
99
5
12
/22
/19
95
3/2
1/1
99
6
6/2
2/1
99
6
9/2
3/1
99
6
12
/22
/19
96
3/2
1/1
99
7
6/2
2/1
99
7
9/2
3/1
99
7
12
/22
/19
97
3/2
1/1
99
8
6/2
2/1
99
8
9/2
3/1
99
8
12
/22
/19
98
3/2
1/1
99
9
6/2
2/1
99
9
9/2
3/1
99
9
12
/22
/19
99
3/2
1/2
00
0
6/2
2/2
00
0
9/2
3/2
00
0
12
/22
/20
00
3/2
1/2
00
1
6/2
2/2
00
1
9/2
3/2
00
1
12
/22
/20
01
3/2
1/2
00
2
6/2
2/2
00
2
9/2
3/2
00
2
12
/22
/20
02
3/2
1/2
00
3
6/2
2/2
00
3
9/2
3/2
00
3
12
/22
/20
03
3/2
1/2
00
4
6/2
2/2
00
4
9/2
3/2
00
4
12
/22
/20
04
3/2
1/2
00
5
6/2
2/2
00
5
9/2
3/2
00
5
12
/22
/20
05
3/2
1/2
00
6
6/2
2/2
00
6
9/2
3/2
00
6
12
/22
/20
06
3/2
1/2
00
7
6/2
2/2
00
7
9/2
3/2
00
7
12
/22
/20
07
3/2
1/2
00
8
6/2
2/2
00
8
9/2
3/2
00
8
12
/22
/20
08
3/2
1/2
00
9
6/2
2/2
00
9
9/2
3/2
00
9
12
/22
/20
09
3/2
1/2
01
0
6/2
2/2
01
0
9/2
3/2
01
0
12
/22
/20
10
3/2
1/2
01
1
6/2
2/2
01
1
9/2
3/2
01
1
12
/22
/20
11
3/2
1/2
01
2
6/2
2/2
01
2
9/2
3/2
01
2
12
/22
/20
12
3/2
1/2
01
3
6/2
2/2
01
3
9/2
3/2
01
3
12
/22
/20
13
3/2
1/2
01
4
6/2
2/2
01
4
9/2
3/2
01
4
12
/22
/20
14
3/2
1/2
01
5
6/2
2/2
01
5
9/2
3/2
01
5
12
/22
/20
15
3/2
1/2
01
6
6/2
2/2
01
6
9/2
3/2
01
6
12
/22
/20
16
3/2
1/2
01
7
6/2
2/2
01
7
9/2
3/2
01
7
12
/22
/20
17
3/2
1/2
01
8
6/2
2/2
01
8
9/2
3/2
01
8
12
/22
/20
18
3/2
1/2
01
9
6/2
2/2
01
9
9/2
3/2
01
9
12
/22
/20
19
3/2
1/2
02
0
6/2
2/2
02
0
9/2
3/2
02
0
12
/22
/20
20
3/2
1/2
02
1
Low
Low
Low
High??
My hunch is that the
180TD count due Dec 4th
triggers a dip and then
the SPX rallies back to form
a Lower High on Dec 21st
before plunging in a huge
way in sync with the Winter
Solstice
Winter Solstice
2200.000
2300.000
2400.000
2500.000
2600.000
2700.000
2800.000
2900.000
3000.000
3100.000
3200.000
3300.000
3400.000
3500.000
3600.000
3700.000
3800.000
3,691.9603,691.960
Nov 2018 Mar May Jul Sep Nov 2019 Mar May Jul Sep Nov 2020 Mar May Jul Sep Nov 2021 Mar May Jul Sep Nov 2022 Mar May Jul
S&P 500 INDEX - SPX.XO (IQFeed) - 1 Week CandleStick Chart - USD
Data from IQFeed Page 107th Dec 2020® optuma.com
Price : 2,191.8600
Date/Time : 3/23/2020
Date/Time : 12/4/2020
Bars : 180
Price : 3,588.1100
Date/Time : 9/2/2020
Date/Time : 12/1/2020
Calendar : 90 Days
LowLow
Low
61.8%
High?
I'm expecting the SPX
to turn down on Friday
December 4th as the
180TD count comes due.
I like these Fib Channels.
It looks like the SPX has
just dipped below the
Fibonacci Channel in the
last few days. So perhaps
the SPX will crash here
as the the 180TD count
comes due.
100%
161.8%
261.8%
Fibonacci Channels
2100.000
2200.000
2300.000
2400.000
2500.000
2600.000
2700.000
2800.000
2900.000
3000.000
3100.000
3200.000
3300.000
3400.000
3500.000
3600.000
3700.000
3800.000
3900.000
4000.000
4100.000
3,691.9603,691.960
Dec 2020 Feb Mar Apr May Jun Jul Aug Sep Oct Nov Dec 2021 Feb Mar Apr
S&P 500 INDEX - SPX.XO (IQFeed) - 1 Day CandleStick Chart - USD
Data from IQFeed Page 117th Dec 2020® optuma.com
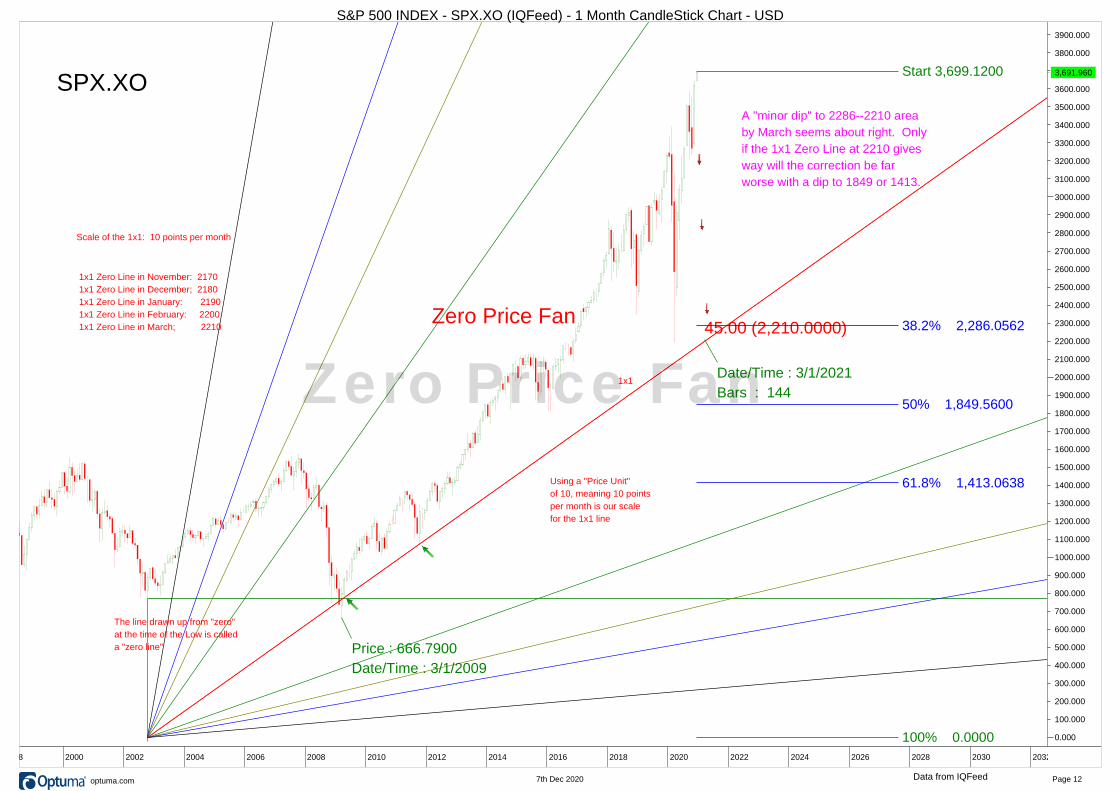
45.00 (2,210.0000)
Start 3,699.1200
38.2% 2,286.0562
50% 1,849.5600
61.8% 1,413.0638
100% 0.0000
SPX.XO
Zero Price Fan
The line drawn up from "zero"
at the time of the Low is called
a "zero line"
A "minor dip" to 2286--2210 area
by March seems about right. Only
if the 1x1 Zero Line at 2210 gives
way will the correction be far
worse with a dip to 1849 or 1413.
Price : 666.7900
Date/Time : 3/1/2009
Date/Time : 3/1/2021
Bars : 144
Using a "Price Unit"
of 10, meaning 10 points
per month is our scale
for the 1x1 line
1x1 Zero Line in November: 2170
1x1 Zero Line in December; 2180
1x1 Zero Line in January: 2190
1x1 Zero Line in February: 2200
1x1 Zero Line in March; 2210
Scale of the 1x1: 10 points per month
1x1Zero Price Fan
0.000
100.000
200.000
300.000
400.000
500.000
600.000
700.000
800.000
900.000
1000.000
1100.000
1200.000
1300.000
1400.000
1500.000
1600.000
1700.000
1800.000
1900.000
2000.000
2100.000
2200.000
2300.000
2400.000
2500.000
2600.000
2700.000
2800.000
2900.000
3000.000
3100.000
3200.000
3300.000
3400.000
3500.000
3600.000
3700.000
3800.000
3900.000
3,691.9603,691.960
1994 1996 1998 2000 2002 2004 2006 2008 2010 2012 2014 2016 2018 2020 2022 2024 2026 2028 2030 2032 2034
S&P 500 INDEX - SPX.XO (IQFeed) - 1 Month CandleStick Chart - USD
Data from IQFeed Page 127th Dec 2020® optuma.com
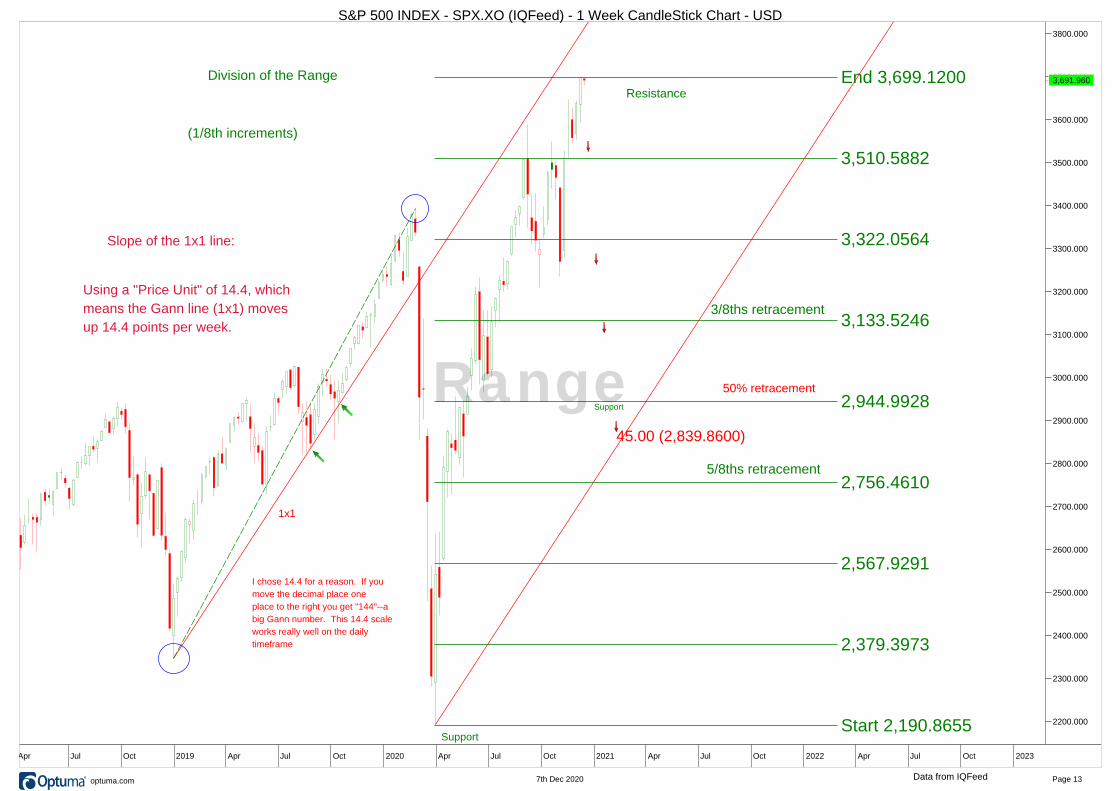
Start 2,190.8655
End 3,699.1200
2,379.3973
2,567.9291
2,756.4610
2,944.9928
3,133.5246
3,322.0564
3,510.5882
3/8ths retracement
50% retracement
5/8ths retracement
45.00 (3,901.7800)
Support
Division of the Range
(1/8th increments)
Using a "Price Unit" of 14.4, which
means the Gann line (1x1) moves
up 14.4 points per week.
Slope of the 1x1 line:
1x1
Resistance
I chose 14.4 for a reason. If you
move the decimal place one
place to the right you get "144"--a
big Gann number. This 14.4 scale
works really well on the daily
timeframe
45.00 (2,839.8600)
SupportRange
2200.000
2300.000
2400.000
2500.000
2600.000
2700.000
2800.000
2900.000
3000.000
3100.000
3200.000
3300.000
3400.000
3500.000
3600.000
3700.000
3800.000
3,691.9603,691.960
Oct 2018 Apr Jul Oct 2019 Apr Jul Oct 2020 Apr Jul Oct 2021 Apr Jul Oct 2022 Apr Jul Oct 2023 Apr
S&P 500 INDEX - SPX.XO (IQFeed) - 1 Week CandleStick Chart - USD
Data from IQFeed Page 137th Dec 2020® optuma.com
High
High
High
Low
Low
Full
Moon
Full
Moon
Full
Moon
Full
Moon
Low
Jan
16th
Full
Moon
High
High
Feb
15thTemporary
High
Mar
16th
Full
MoonFull
Moon
Lunar
Eclipse
Lunar
Eclipse
Low
Temporary
High
Low
Full
Moon June
13th
Low July
12th
High
Aug
10th
Sept
8th
Low
Oct
8th
HighHigh
Lunar
Eclipse
Solar
Eclipse
Oct
23rd
Nov
7th
Daily Chart
"consolidation"
Dec
6th
Jan
7thHigh
Low
Feb
4th
March
20th
Eclipse
Spring
EquinoxMar
6thApr
6thHigh
Solar
Eclipse
High
High
Low
High
New
Moon
June
16thNew
Moon
Low
High
New
MoonJuly
16thHighNew
MoonHigh
Solar
Eclipse
New
Moon
Low
Lunar
Eclipse
Sept
27th
Low
Oct
13thNew
Moon
Low
High
Full
Moon
Full
MoonHigh
New
MoonNov
11th
Nov
25th
Full
Moon
Full
Moon
New
Moon
HighHigh
Price : 2,134.7100
Date/Time : 5/20/2015
Date/Time : 12/14/2015
Bars : 145
Price : 2,132.8200
Date/Time : 7/20/2015
Date/Time : 12/14/2015
Solar Degrees : 144.7LowNew
MoonIn this case a "New Moon"
is going to give us a Higher Low
on December 11th. Then on
Monday Dec 14th the SPX will
turn higher in a big way in sync
with the 144-TD and 144-SD cycles
What I said:
High
Jan 9thLow
Feb
8th
Low
High
Feb
22ndFull
Moon
Eclipse
March
8th
Lunar phases
Lunar
EclipseSolar
Eclipse
Price : 2,104.2700
Date/Time : 12/2/2015 March
23rd Full
Moon May
6th
New
Moon
High
April
22nd New
Moon
Full
MoonLow
High
June 4th
New
MoonFull
Moon
Summer
Solstice
Price : 1,810.1000
Date/Time : 2/11/2016
Date/Time : 8/9/2016
Calendar : 180 Days
180 calendar days
Low to High
July 4th
S&P 500 Index "Cash" (SPX)
ph: 609-897-1020High
July
20th
New
Moon
Aug 2nd
New
Moon
Full
Moon
Aug 18th
Price : 2,025.9100
Date/Time : 5/19/2016
Date/Time : 8/18/2016
Calendar : 91 Days
Price : 2,111.0500
Date/Time : 4/20/2016
Date/Time : 8/18/2016
Calendar : 120 Days
Price : 1,991.6800
Date/Time : 6/27/2016
Date/Time : 8/18/2016
Solar Degrees : 49.7
HighSept 1st
Solar
EclipseNew
Moon
Sept 16th
LowHigh
Oct 3rd
New Moon High
High
High
Dec 14th
Full
Moon
Full
Moon
Low
High
High
Full
Moon
Lunar
Eclipse
Solar
Eclipse
Feb
26th
March
12th
Full
Moon
HighApril 11thFull
MoonHigh
HighFull Moon
High
Full Moon
Solar
Eclipse
Aug 21st
Full Moon
Full Moon
Full Moon
Price : 2,400.9800
Date/Time : 3/1/2017
2401
Sept 6th
Low
Oct 6thHigh
Full Moon
Full Moon
High
Price : 2,665.1900
Date/Time : 12/4/2017Jan 2nd
Full Moon
High
Full MoonLunar Eclipse
Jan 31st
Feb 15th
Solar
Eclipse
March 2nd
Low
April 2nd
45 trading days
High to Lower HIgh
Low
200-DMAApril 30th
High
May 29th
(Full Moon"
Low
June 27th
Full Moon
High
High
HighHigh
Aug 26thSept
24th
Full Moon
High
Oct 24th
LowFull Moon
Nov 23rd
Low
Dec
22nd
Full Moon Feb 19th
Low
Low
Super
Moon
The Moon will appear
bigger as it is at "perigee"
(closer to the Earth)March 20th
April 19th
Full Moon
High
Full Moon
May 18th
200dma
Followers of Lune (Lunatics?)
will tell you to look for changes
in trend in sync with the Full Moon.
But "rational" people believe that
irrational decisions in the markets
can't have any relationship to the
Moon. That's right, and the tides
that rise and fall have nothing to do
with the Moon either.
HighFull Moon
Solar
EclipseJuly 2nd
Lunar
Eclipse
Lunar
Eclipse
High
August
15th
Low
Sept 14thFull Moon Oct 13th
High
Nov 12th
50dma
50 day moving average
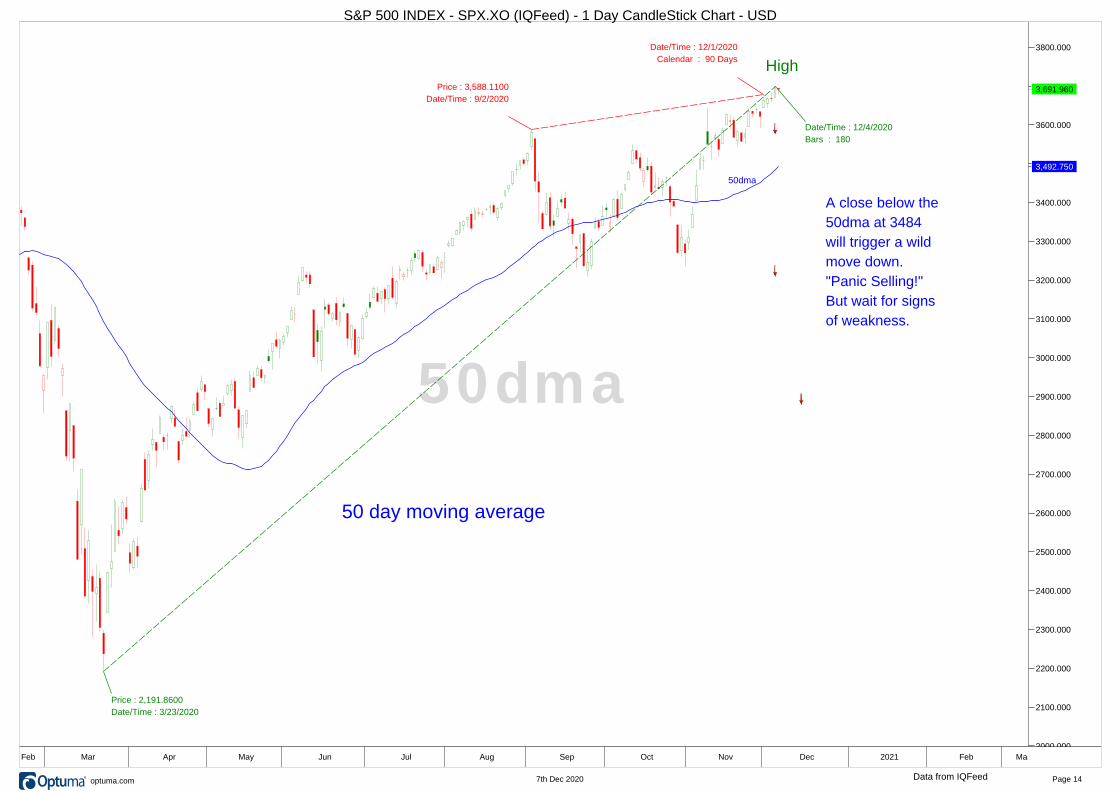
Price : 2,191.8600
Date/Time : 3/23/2020
Date/Time : 12/4/2020
Bars : 180
Price : 3,588.1100
Date/Time : 9/2/2020
Date/Time : 12/1/2020
Calendar : 90 Days
A close below the
50dma at 3484
will trigger a wild
move down.
"Panic Selling!"
But wait for signs
of weakness.
High
50dma
2000.000
2100.000
2200.000
2300.000
2400.000
2500.000
2600.000
2700.000
2800.000
2900.000
3000.000
3100.000
3200.000
3300.000
3400.000
3500.000
3600.000
3700.000
3800.000
3,691.960
3,492.750
3,691.960
2020 Feb Mar Apr May Jun Jul Aug Sep Oct Nov Dec 2021 Feb Mar Apr
S&P 500 INDEX - SPX.XO (IQFeed) - 1 Day CandleStick Chart - USD
Data from IQFeed Page 147th Dec 2020® optuma.com
2243
BASE
= 1201
Price : 3,393.5200
Date/Time : 2/19/2020
Price : 2,191.8600
Date/Time : 3/23/2020
Range : 1,201.6600
Price : 3,232.3900
Date/Time : 6/8/2020
A "measured move" down
implies a dip to 2237 if
the SPX closes below the
triangle at 3438 on Dec 4th
Price : 3,444.3259
Date/Time : 12/8/2020
resistance
resistance
Support
2/3rd of the distance
from the base to the
apex is when you should
look for a violent break.
I think SPX is about to
break down.
Normally a market will not continue all the way to the
apex of the triangle. If it is going to break one way or
the other, it should happen 2/3rds of the distance from
the base to the apex
Triangle
1400.000
1500.000
1600.000
1700.000
1800.000
1900.000
2000.000
2100.000
2200.000
2300.000
2400.000
2500.000
2600.000
2700.000
2800.000
2900.000
3000.000
3100.000
3200.000
3300.000
3400.000
3500.000
3600.000
3700.000
3800.000
3900.000
3,691.9603,691.960
Dec 2020 Feb Mar Apr May Jun Jul Aug Sep Oct Nov Dec 2021 Feb Mar
S&P 500 INDEX - SPX.XO (IQFeed) - 1 Day CandleStick Chart - USD
Data from IQFeed Page 157th Dec 2020® optuma.com
Price : 294.5100
Date/Time : 10/11/1990
Price : 216.4600
Date/Time : 10/20/1987
Price : 147.2600
Date/Time : 7/25/1984Price : 102.2000
Date/Time : 8/9/1982
Price : 62.2800
Date/Time : 10/3/1974The Low on October
3rd, 1974 was 62.28.
Price : 69.2900
Date/Time : 5/26/1970
The low on May 26th, 1970
was 69.29 Price : 52.3200
Date/Time : 6/26/1962
Price : 120.2079
Date/Time : 1/16/1973 Price : 86.9000
Date/Time : 3/6/1978
Price : 442.8800
Date/Time : 12/9/1994
Price : 680.3200
Date/Time : 6/6/1996
Price : 768.6300
Date/Time : 10/10/2002
Price : 1,810.1000
Date/Time : 2/11/2016
Price : 2,346.5800
Date/Time : 12/26/2018
Price : 2,939.8600
Date/Time : 10/3/2018
Price : 52.2000
Date/Time : 10/25/1960Price : 38.9800
Date/Time : 10/22/1957Price : 22.7100
Date/Time : 9/14/1953
Price : 94.0600
Date/Time : 2/9/1966
Price : 108.3700
Date/Time : 11/29/1968
Price : 666.7900
Date/Time : 3/6/2009
The Low on March 6th, 2009
was 666.79---call it "667"
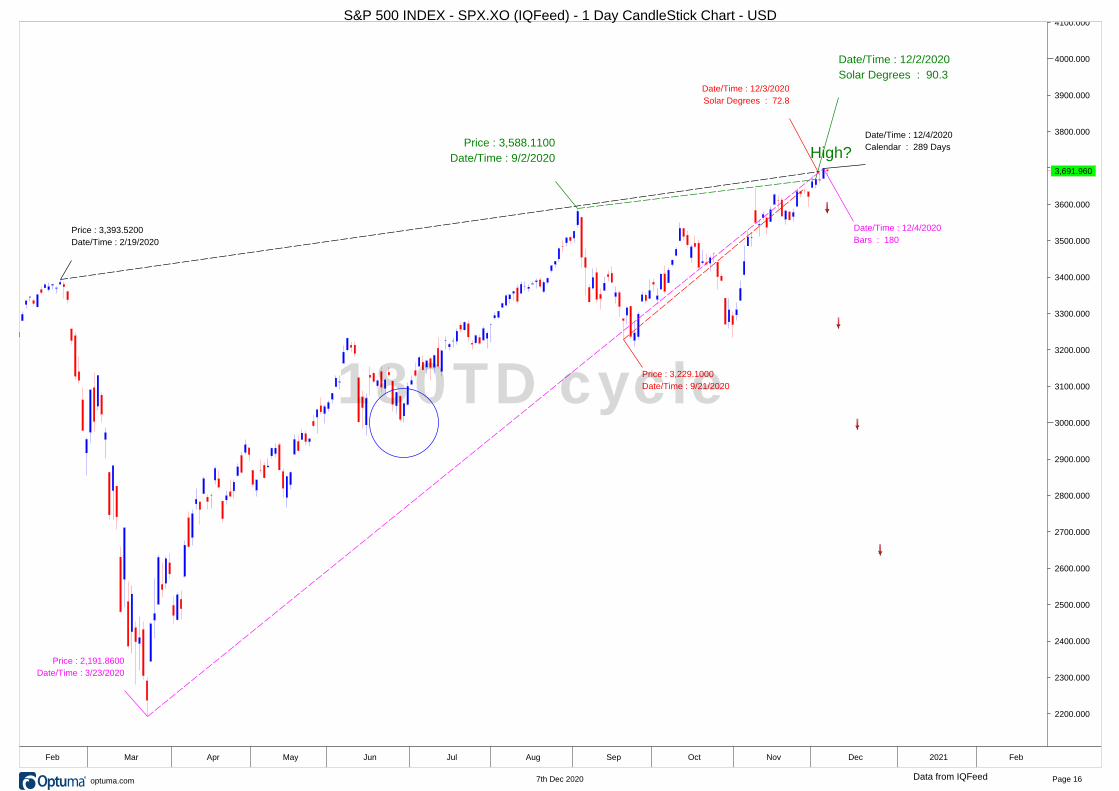
Price : 3,588.1100
Date/Time : 9/2/2020
Date/Time : 12/2/2020
Solar Degrees : 90.3
High?
Price : 2,191.8600
Date/Time : 3/23/2020
Date/Time : 12/4/2020
Bars : 180
Price : 3,229.1000
Date/Time : 9/21/2020
Date/Time : 12/3/2020
Solar Degrees : 72.8
Price : 3,393.5200
Date/Time : 2/19/2020
Date/Time : 12/4/2020
Calendar : 289 Days
180TD cycle
2100.000
2200.000
2300.000
2400.000
2500.000
2600.000
2700.000
2800.000
2900.000
3000.000
3100.000
3200.000
3300.000
3400.000
3500.000
3600.000
3700.000
3800.000
3900.000
4000.000
4100.000
3,691.9603,691.960
Dec 2020 Feb Mar Apr May Jun Jul Aug Sep Oct Nov Dec 2021 Feb Mar
S&P 500 INDEX - SPX.XO (IQFeed) - 1 Day CandleStick Chart - USD
Data from IQFeed Page 167th Dec 2020® optuma.com
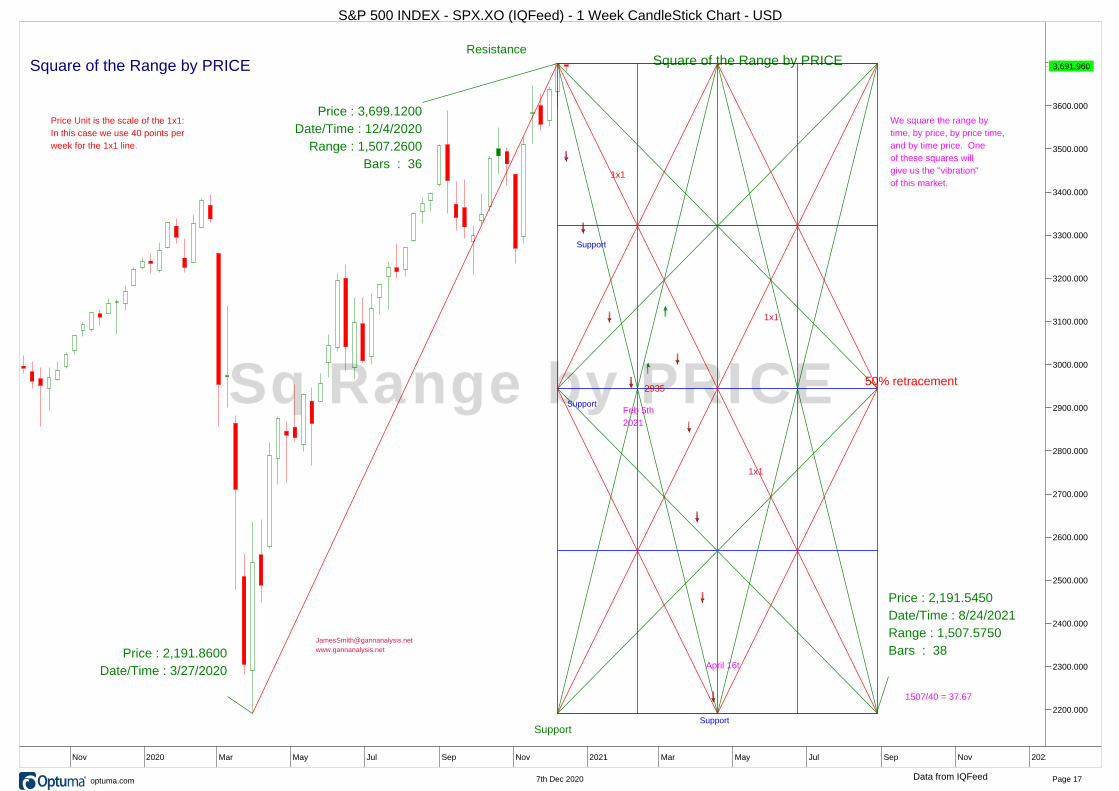
50% retracement
Support
Square of the Range by PRICEResistance
Support
Support
Support
2935
Price : 2,191.8600
Date/Time : 3/27/2020
Price : 3,699.1200
Date/Time : 12/4/2020
Range : 1,507.2600
Bars : 36
Price : 2,191.5450
Date/Time : 8/24/2021
Range : 1,507.5750
Bars : 38
1x1
1x1
Feb 5th
2021
Square of the Range by PRICE
Price Unit is the scale of the 1x1:
In this case we use 40 points per
week for the 1x1 line.
1x1
www.gannanalysis.net
1507/40 = 37.67
April 16t
We square the range by
time, by price, by price time,
and by time price. One
of these squares will
give us the "vibration"
of this market.
Sq Range by PRICE
2100.000
2200.000
2300.000
2400.000
2500.000
2600.000
2700.000
2800.000
2900.000
3000.000
3100.000
3200.000
3300.000
3400.000
3500.000
3600.000
3700.0003,691.9603,691.960
Jul Sep Nov 2020 Mar May Jul Sep Nov 2021 Mar May Jul Sep Nov 2022 Mar
S&P 500 INDEX - SPX.XO (IQFeed) - 1 Week CandleStick Chart - USD
Data from IQFeed Page 177th Dec 2020® optuma.com
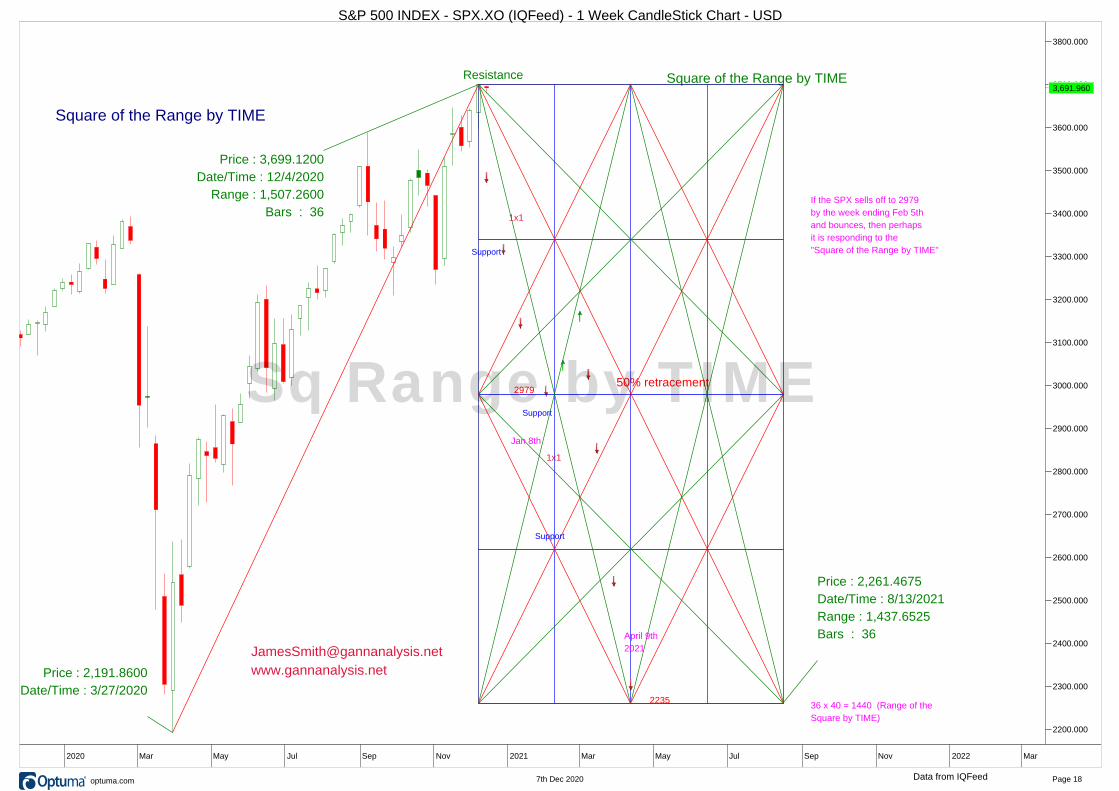
50% retracement
Support
Square of the Range by TIMEResistance
Support
Support
Support
2235
Price : 2,191.8600
Date/Time : 3/27/2020
Price : 3,699.1200
Date/Time : 12/4/2020
Range : 1,507.2600
Bars : 36
Price : 2,261.4675
Date/Time : 8/13/2021
Range : 1,437.6525
Bars : 36
Price : 2,701.1984
Date/Time : 8/23/2022
Range : 439.7309
Bars : 54
1x1
1x1
April 9th
2021
2979
Square of the Range by TIME
36 x 40 = 1440 (Range of the
Square by TIME)
www.gannanalysis.net
Jan 8th
If the SPX sells off to 2979
by the week ending Feb 5th
and bounces, then perhaps
it is responding to the
"Square of the Range by TIME"
Sq Range by TIME
2200.000
2300.000
2400.000
2500.000
2600.000
2700.000
2800.000
2900.000
3000.000
3100.000
3200.000
3300.000
3400.000
3500.000
3600.000
3700.000
3800.000
3,691.9603,691.960
Sep Nov 2020 Mar May Jul Sep Nov 2021 Mar May Jul Sep Nov 2022 Mar May
S&P 500 INDEX - SPX.XO (IQFeed) - 1 Week CandleStick Chart - USD
Data from IQFeed Page 187th Dec 2020® optuma.com
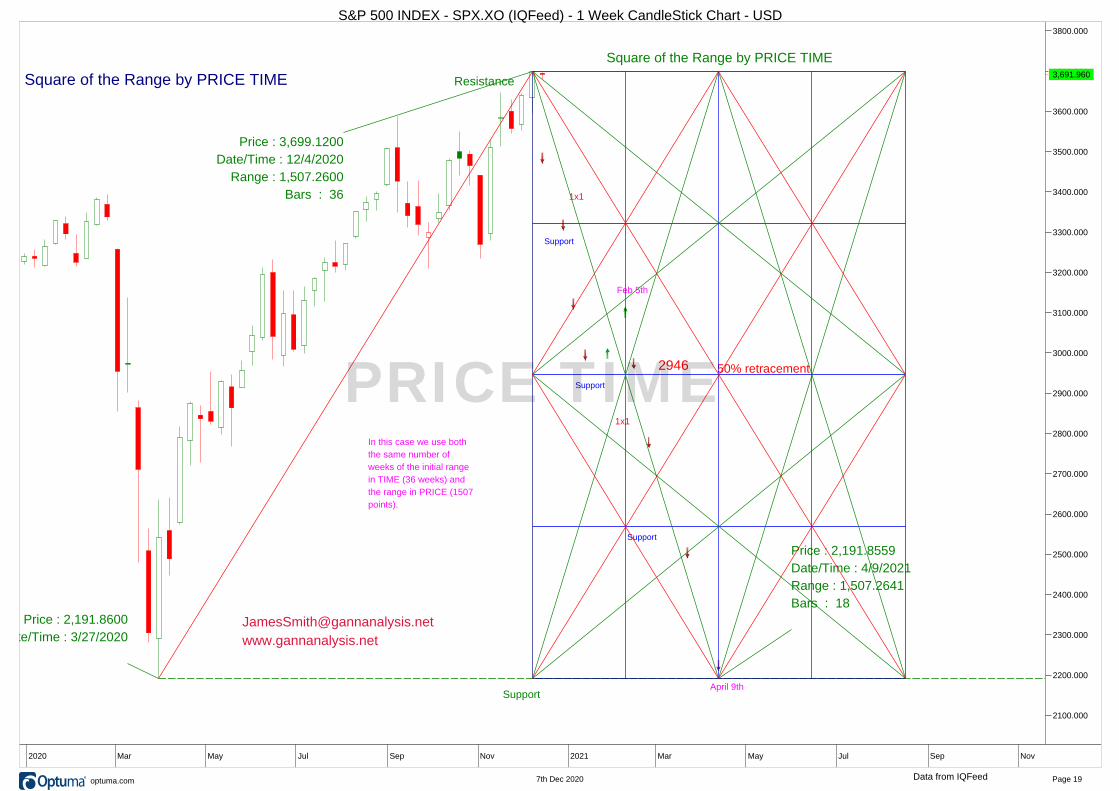
50% retracement
Support
Square of the Range by PRICE TIME
Resistance
Support
Support
Support
Price : 2,191.8600
Date/Time : 3/27/2020
Price : 3,699.1200
Date/Time : 12/4/2020
Range : 1,507.2600
Bars : 36
Price : 2,191.8559
Date/Time : 4/9/2021
Range : 1,507.2641
Bars : 18
Price : 2,701.1984
Date/Time : 8/23/2022
Range : 509.3425
Bars : 72
1x1
1x1
2946
In this case we use both
the same number of
weeks of the initial range
in TIME (36 weeks) and
the range in PRICE (1507
points).
Square of the Range by PRICE TIME
www.gannanalysis.net
April 9th
Feb 5th
PRICE TIME
2100.000
2200.000
2300.000
2400.000
2500.000
2600.000
2700.000
2800.000
2900.000
3000.000
3100.000
3200.000
3300.000
3400.000
3500.000
3600.000
3700.000
3800.000
3,691.9603,691.960
Nov 2020 Mar May Jul Sep Nov 2021 Mar May Jul Sep Nov 2022
S&P 500 INDEX - SPX.XO (IQFeed) - 1 Week CandleStick Chart - USD
Data from IQFeed Page 197th Dec 2020® optuma.com
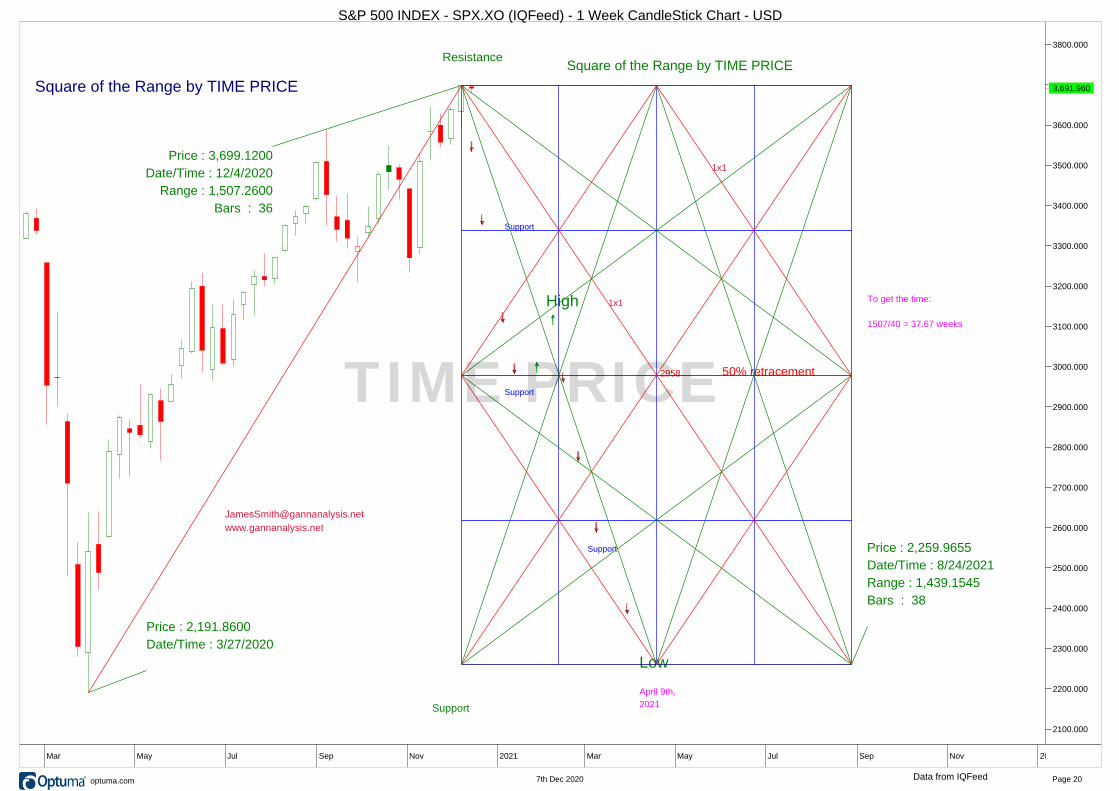
50% retracement
Support
Square of the Range by TIME PRICEResistance
Support
Support
Support
2958
Price : 2,191.8600
Date/Time : 3/27/2020
Price : 3,699.1200
Date/Time : 12/4/2020
Range : 1,507.2600
Bars : 36
Price : 2,259.9655
Date/Time : 8/24/2021
Range : 1,439.1545
Bars : 38
Price : 2,701.1984
Date/Time : 8/23/2022
Range : 441.2329
Bars : 52
1x1
1x1
April 9th,
2021
Square of the Range by TIME PRICE
www.gannanalysis.net
To get the time:
1507/40 = 37.67 weeks
High
Low
TIME PRICE
2100.000
2200.000
2300.000
2400.000
2500.000
2600.000
2700.000
2800.000
2900.000
3000.000
3100.000
3200.000
3300.000
3400.000
3500.000
3600.000
3700.000
3800.000
3,691.9603,691.960
2019 Mar May Jul Sep Nov 2020 Mar May Jul Sep Nov 2021 Mar May Jul Sep Nov 2022 Mar
S&P 500 INDEX - SPX.XO (IQFeed) - 1 Week CandleStick Chart - USD
Data from IQFeed Page 207th Dec 2020® optuma.com
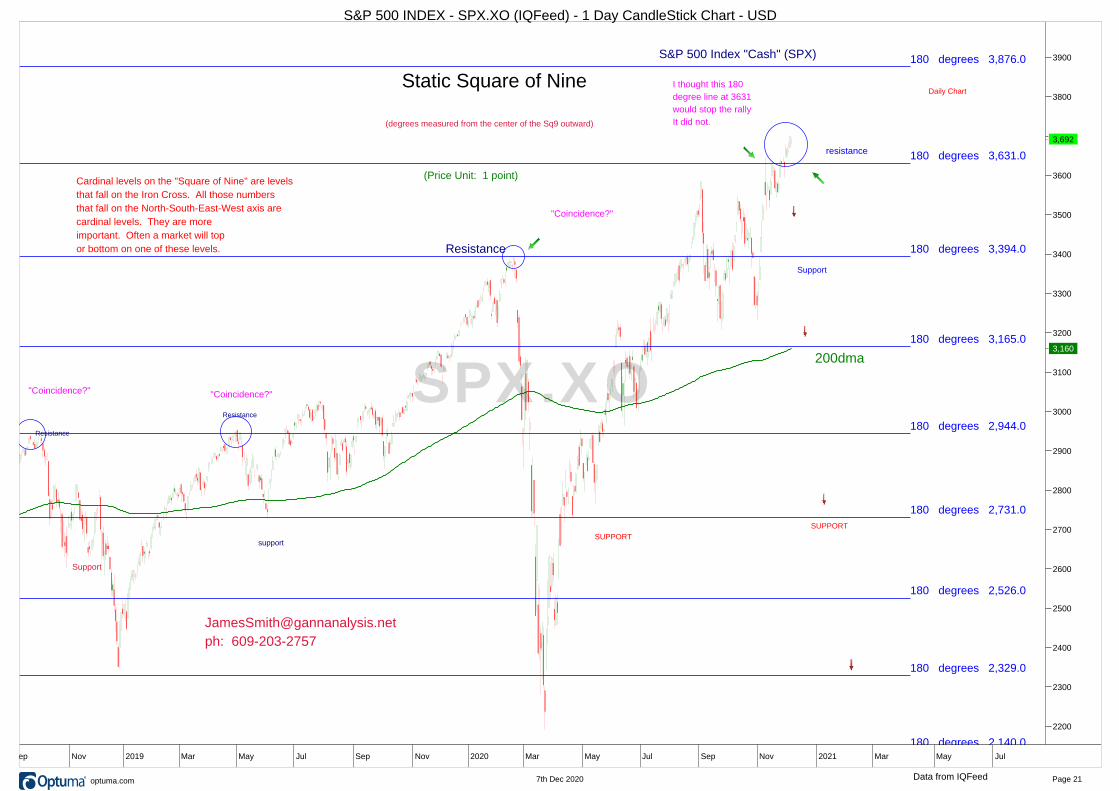
Static Square of Nine
The "cardinal cross" are 2 lines
crossing North-South-East-West
on the Square of Nine. Any number
that falls on the "cardinal cross" will
be
strong support or resistance. All the
lines you see on this chart are
"cardinal cross" levels. To see the
Gann Wheel or the "Square of Nine"
as it normally appears with numbers
rotating outwards from the center,
see the last chart of my report.
ph: 609-897-1020
Daily Chart
Low
Low
(Price Unit: 1 point)
Low
Low
Low
Low
High
Low
High
High
Daily Chart
support
resistance
support
Price : 2,093.6
Date/Time : 12/29/2014
Date/Time : 6/29/2015
Calendar : 182 Days
180-TD
Price : 2,048.4
Date/Time : 4/1/2015
Date/Time : 6/30/2015
Calendar : 90 Days
Price : 2,134.3
Date/Time : 5/21/2015
Date/Time : 7/7/2015
Calendar : 47 Days
ph: 609-897-1020
S&P 500 Index "Cash" (SPX)
Support
(degrees measured from the center of the Sq9 outward)
Resistance
Support
Support
Support
Support
Support
Resistance
Support
Support
Resistance
Support
Support
ph: 609-897-1020
Resistance
Support
Support
Support
SUPPORT
support
The March 1st High at 2401
could now become critical
support to this market as
the stock market sells off.
High
support
support
Resistance
Support
200dma
Resistance
Resistance
Cardinal levels on the "Square of Nine" are levels
that fall on the Iron Cross. All those numbers
that fall on the North-South-East-West axis are
cardinal levels. They are more
important. Often a market will top
or bottom on one of these levels.
180 degrees 6.0180 degrees 19.0180 degrees 40.0180 degrees 69.0
180 degrees 106.0
180 degrees 151.0
180 degrees 204.0
180 degrees 265.0
180 degrees 334.0
180 degrees 411.0
180 degrees 496.0
180 degrees 589.0
180 degrees 690.0
180 degrees 799.0
180 degrees 916.0
180 degrees 1,041.0
180 degrees 1,174.0
180 degrees 1,315.0
180 degrees 1,464.0
180 degrees 1,621.0
180 degrees 1,786.0
180 degrees 1,959.0
180 degrees 2,140.0
180 degrees 2,329.0
180 degrees 2,526.0
180 degrees 2,731.0
180 degrees 2,944.0
180 degrees 3,165.0
180 degrees 3,394.0
180 degrees 3,631.0
180 degrees 3,876.0
resistance
ph: 609-203-2757
SUPPORT
SUPPORT
Support
"Coincidence?"
"Coincidence?""Coincidence?"
I thought this 180
degree line at 3631
would stop the rally
It did not.
SPX.XO
2200
2300
2400
2500
2600
2700
2800
2900
3000
3100
3200
3300
3400
3500
3600
3700
3800
3900
3,692
3,160
3,692
May Jul Sep Nov 2019 Mar May Jul Sep Nov 2020 Mar May Jul Sep Nov 2021 Mar May Jul Sep
S&P 500 INDEX - SPX.XO (IQFeed) - 1 Day CandleStick Chart - USD
Data from IQFeed Page 217th Dec 2020® optuma.com
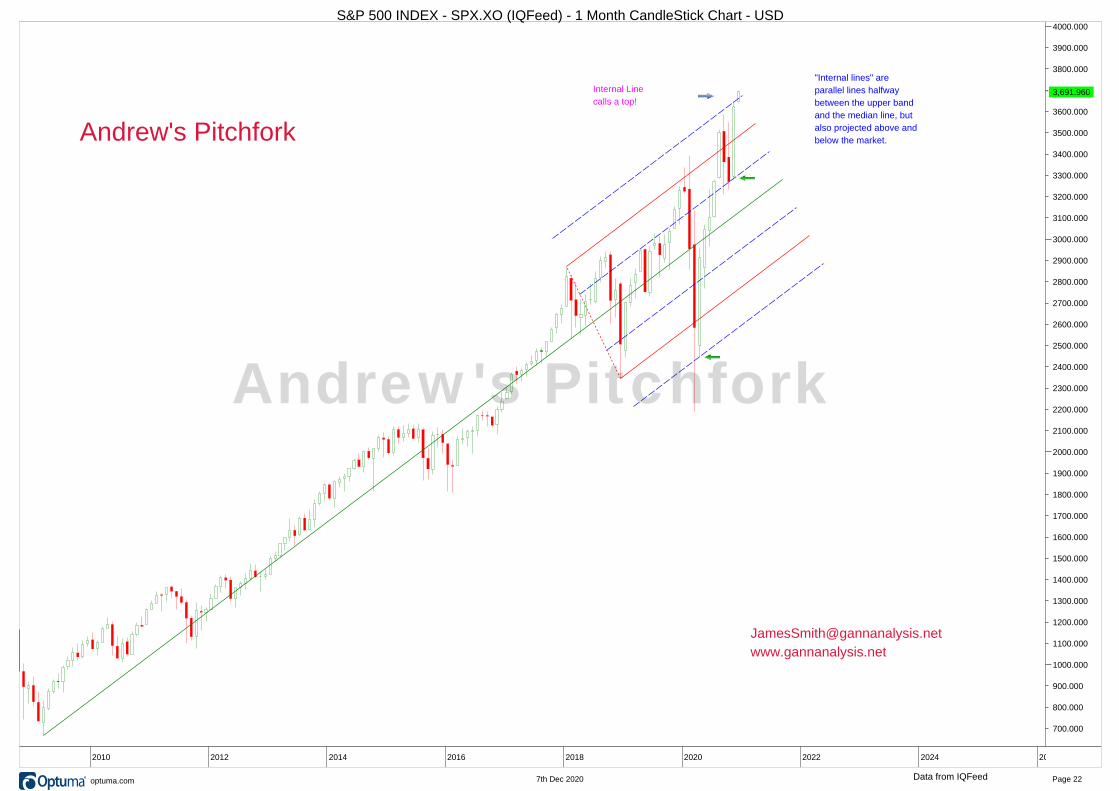
Andrew's Pitchfork
Hagopian Lines
www.gannanalysis.net
Internal Line
calls a top!
"Internal lines" are
parallel lines halfway
between the upper band
and the median line, but
also projected above and
below the market.
Andrew's Pitchfork
600.000
700.000
800.000
900.000
1000.000
1100.000
1200.000
1300.000
1400.000
1500.000
1600.000
1700.000
1800.000
1900.000
2000.000
2100.000
2200.000
2300.000
2400.000
2500.000
2600.000
2700.000
2800.000
2900.000
3000.000
3100.000
3200.000
3300.000
3400.000
3500.000
3600.000
3700.000
3800.000
3900.000
4000.000
3,691.9603,691.960
2006 2008 2010 2012 2014 2016 2018 2020 2022 2024 2026 2028
S&P 500 INDEX - SPX.XO (IQFeed) - 1 Month CandleStick Chart - USD
Data from IQFeed Page 227th Dec 2020® optuma.com
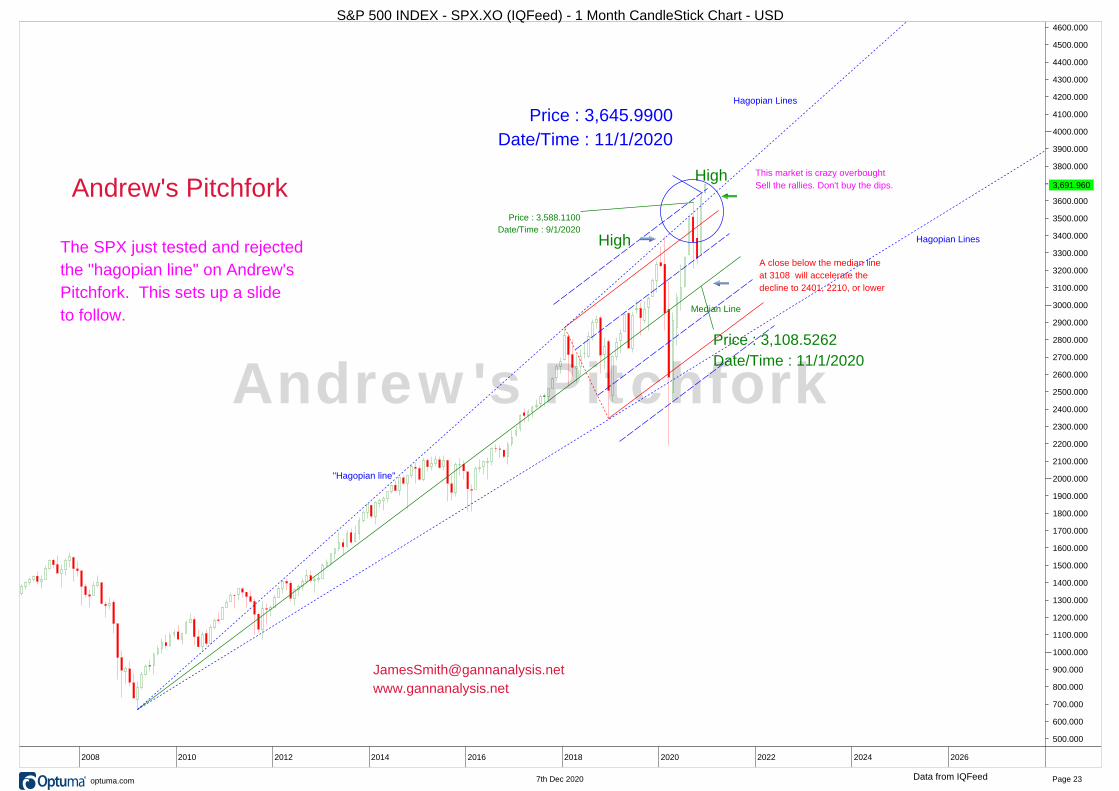
Price : 3,108.5262
Date/Time : 11/1/2020
Andrew's Pitchfork
High
A close below the median line
at 3108 will accelerate the
decline to 2401, 2210, or lower
High
Price : 3,645.9900
Date/Time : 11/1/2020
This market is crazy overbought
Sell the rallies. Don't buy the dips.
The SPX just tested and rejected
the "hagopian line" on Andrew's
Pitchfork. This sets up a slide
to follow.
"Hagopian line"
Hagopian Lines
Median Line
Price : 3,588.1100
Date/Time : 9/1/2020
www.gannanalysis.net
Hagopian Lines
Andrew's Pitchfork
500.000
600.000
700.000
800.000
900.000
1000.000
1100.000
1200.000
1300.000
1400.000
1500.000
1600.000
1700.000
1800.000
1900.000
2000.000
2100.000
2200.000
2300.000
2400.000
2500.000
2600.000
2700.000
2800.000
2900.000
3000.000
3100.000
3200.000
3300.000
3400.000
3500.000
3600.000
3700.000
3800.000
3900.000
4000.000
4100.000
4200.000
4300.000
4400.000
4500.000
4600.000
3,691.9603,691.960
2004 2006 2008 2010 2012 2014 2016 2018 2020 2022 2024 2026 2028 2030
S&P 500 INDEX - SPX.XO (IQFeed) - 1 Month CandleStick Chart - USD
Data from IQFeed Page 237th Dec 2020® optuma.com
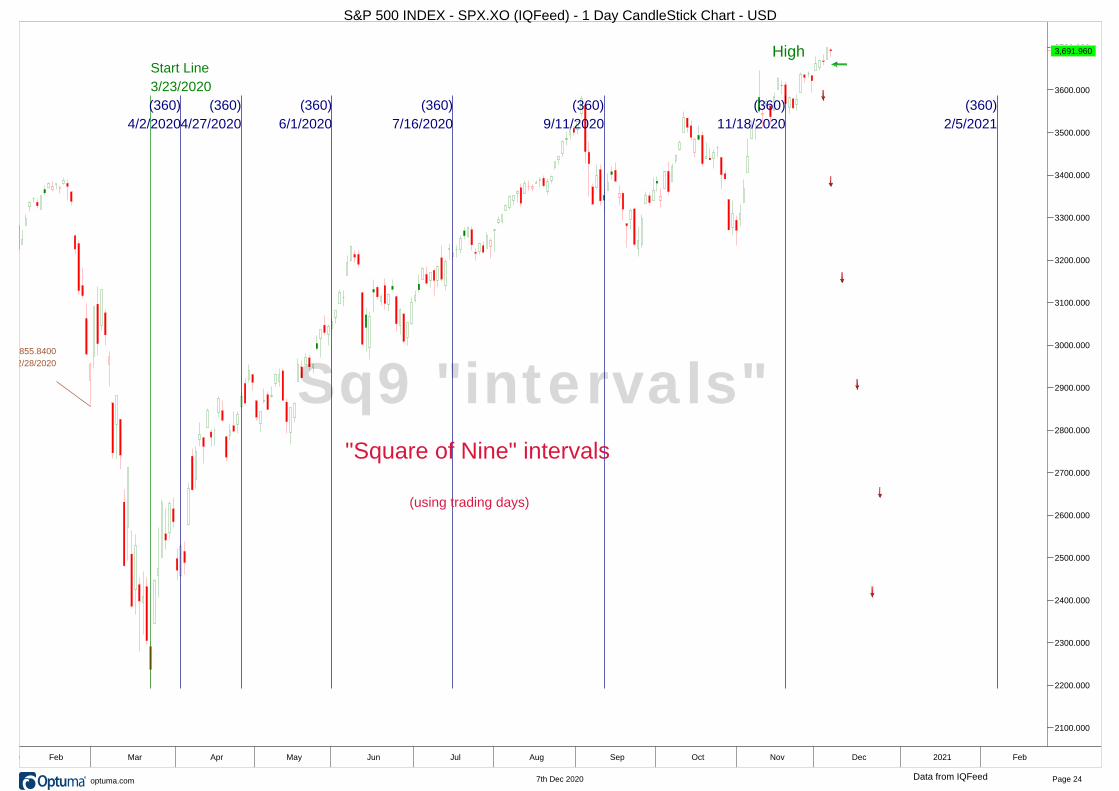
Start Line
3/23/2020
(360)
4/2/2020
(360)
4/27/2020
(360)
6/1/2020
(360)
7/16/2020
(360)
9/11/2020
(360)
11/18/2020
(360)
2/5/2021
Low
Low
Low
High
"Square of Nine" intervals
(using trading days)
START DATE
12/26/2018
Price : 2,855.8400
Date/Time : 2/28/2020
High
Sq9 "intervals"
2100.000
2200.000
2300.000
2400.000
2500.000
2600.000
2700.000
2800.000
2900.000
3000.000
3100.000
3200.000
3300.000
3400.000
3500.000
3600.000
3700.0003,691.9603,691.960
Dec 2020 Feb Mar Apr May Jun Jul Aug Sep Oct Nov Dec 2021 Feb Mar
S&P 500 INDEX - SPX.XO (IQFeed) - 1 Day CandleStick Chart - USD
Data from IQFeed Page 247th Dec 2020® optuma.com
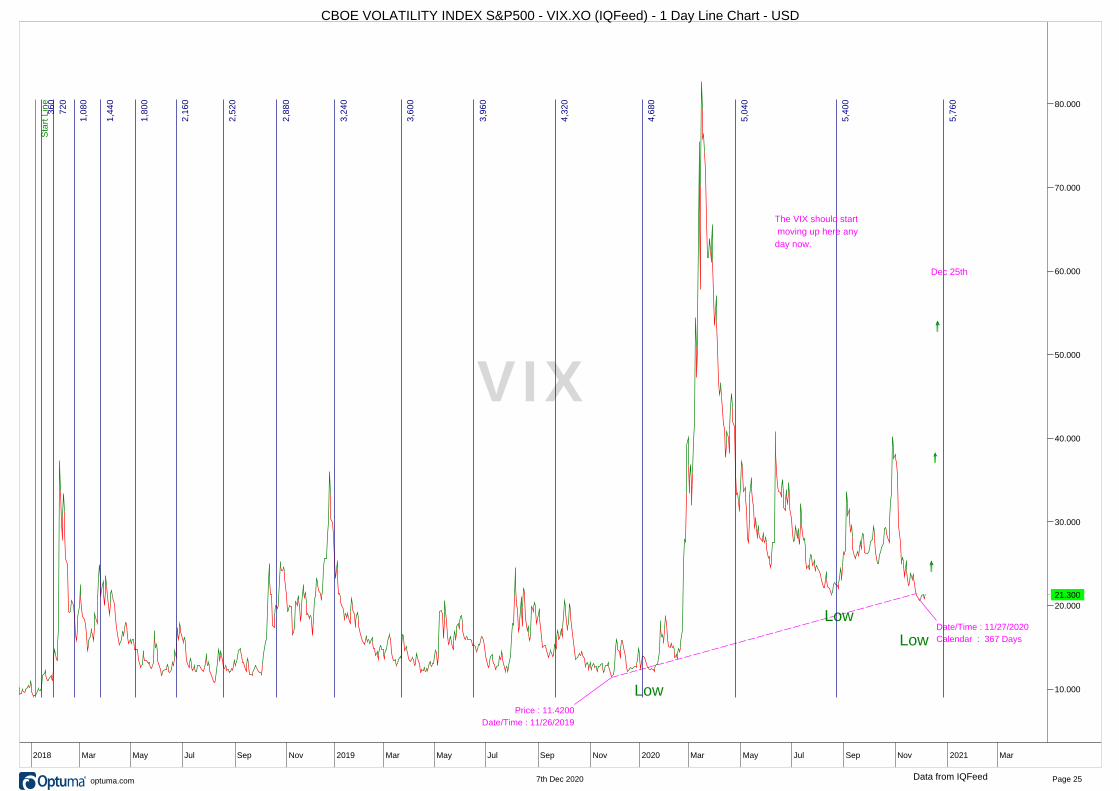
CBOE Volatility Index ---VIX
Price : 9.3900
Date/Time : 12/1/2006
High
Price : 48.3390
Date/Time : 8/9/2011
Low
Price : 80.8600
Date/Time : 11/20/2008
Volatility Index (VIX)
Price : 11.4200
Date/Time : 11/26/2019
Date/Time : 11/27/2020
Calendar : 367 Days
Low
Sta
rt L
ine
36
0
72
0
1,0
80
1,4
40
1,8
00
2,1
60
2,5
20
2,8
80
3,2
40
3,6
00
3,9
60
4,3
20
4,6
80
5,0
40
5,4
00
5,7
60
6,1
20
6,4
80
6,8
40
7,2
00
7,5
60
7,9
20
8,2
80
8,6
40
Dec 25th
Low
The VIX should start
moving up here any
day now.
VIX
10.000
20.000
30.000
40.000
50.000
60.000
70.000
80.000
21.30021.300
Sep Nov 2018 Mar May Jul Sep Nov 2019 Mar May Jul Sep Nov 2020 Mar May Jul Sep Nov 2021 Mar May
CBOE VOLATILITY INDEX S&P500 - VIX.XO (IQFeed) - 1 Day Line Chart - USD
Data from IQFeed Page 257th Dec 2020® optuma.com
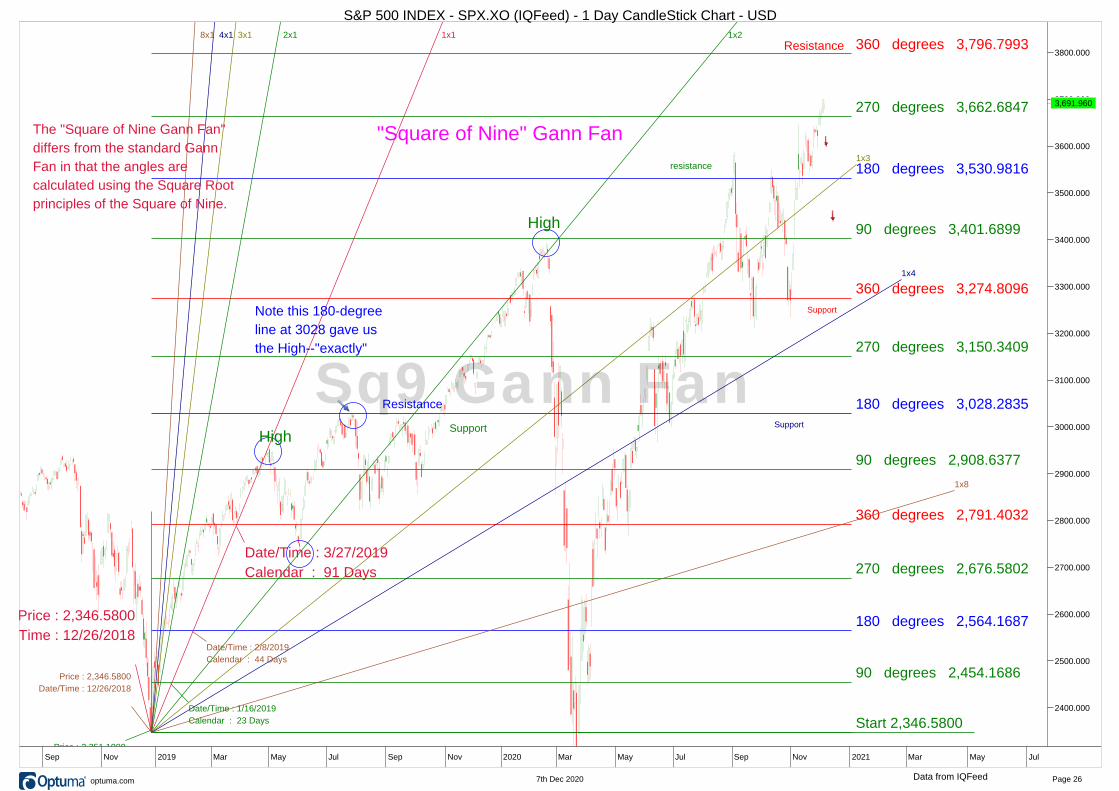
Start 2,346.5800
90 degrees 2,454.1686
90 degrees 2,908.6377
90 degrees 3,401.6899
180 degrees 2,564.1687
180 degrees 3,028.2835
180 degrees 3,530.9816
270 degrees 2,676.5802
270 degrees 3,150.3409
270 degrees 3,662.6847
360 degrees 2,791.4032
360 degrees 3,274.8096
360 degrees 3,796.79938x1 4x1 3x1 2x1 1x1 1x2
1x3
1x4
1x8
Price : 2,346.5800
Date/Time : 12/26/2018
Date/Time : 2/8/2019
Calendar : 44 Days
Price : 2,346.5800
Date/Time : 12/26/2018
Date/Time : 3/27/2019
Calendar : 91 Days
The "Square of Nine Gann Fan"
differs from the standard Gann
Fan in that the angles are
calculated using the Square Root
principles of the Square of Nine.
Note this 180-degree
line at 3028 gave us
the High--"exactly"
Resistance
Support
Price : 2,351.1000
Date/Time : 12/24/2018
Date/Time : 1/16/2019
Calendar : 23 Days
"Square of Nine" Gann Fan
High
HighSupport
resistance
Support
Resistance
Sq9 Gann Fan
2400.000
2500.000
2600.000
2700.000
2800.000
2900.000
3000.000
3100.000
3200.000
3300.000
3400.000
3500.000
3600.000
3700.000
3800.000
3,691.9603,691.960
May Jul Sep Nov 2019 Mar May Jul Sep Nov 2020 Mar May Jul Sep Nov 2021 Mar May Jul Sep
S&P 500 INDEX - SPX.XO (IQFeed) - 1 Day CandleStick Chart - USD
Data from IQFeed Page 267th Dec 2020® optuma.com
Support
50% retracement
Low
2942
3322
2567
"Square of the Range by PRICE
(using 10 points per day as the 1x1 scale)
1x1
Range
2200.000
2300.000
2400.000
2500.000
2600.000
2700.000
2800.000
2900.000
3000.000
3100.000
3200.000
3300.000
3400.000
3500.000
3600.000
3700.0003,691.9603,691.960
2020 Mar May Jul Sep Nov 2021 Mar May Jul Sep
S&P 500 INDEX - SPX.XO (IQFeed) - 1 Day CandleStick Chart - USD
Data from IQFeed Page 277th Dec 2020® optuma.com
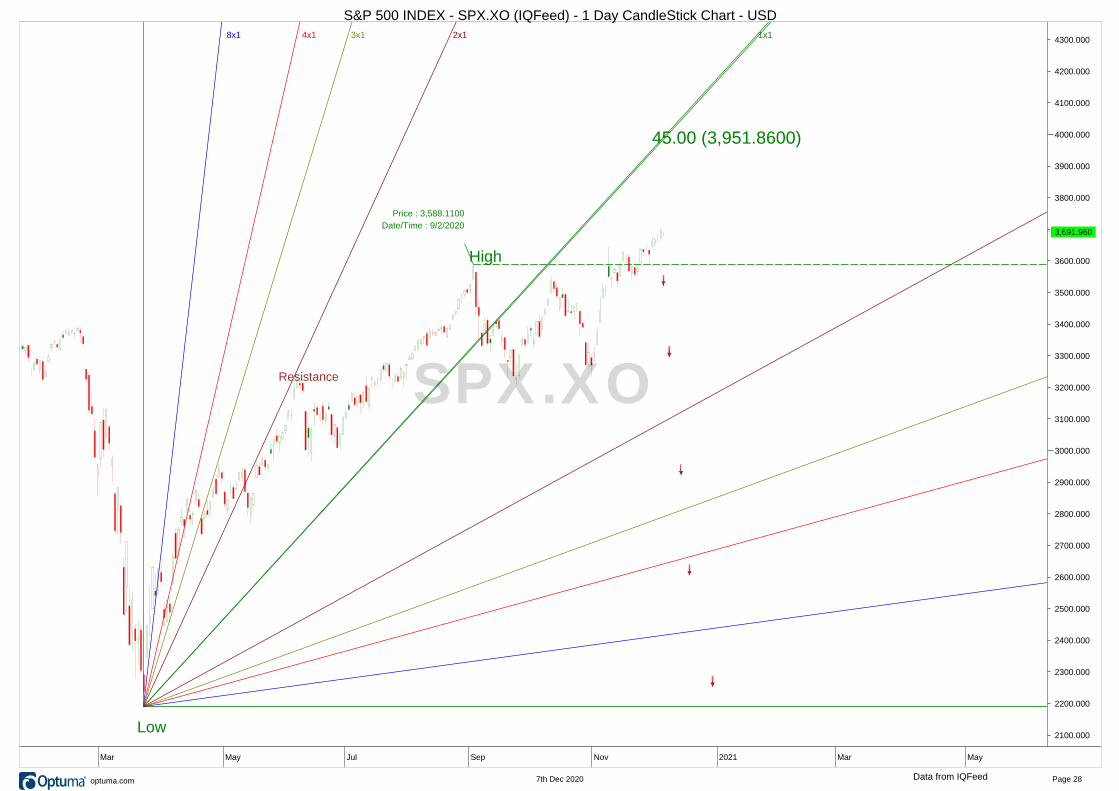
8x1 4x1 3x1 2x1 1x1
1x2
1x3
1x4
1x8
Price : 2,939.8600
Date/Time : 10/3/2018
Resistance
Low
High
Price : 3,588.1100
Date/Time : 9/2/2020
45.00 (3,951.8600)
SPX.XO
2100.000
2200.000
2300.000
2400.000
2500.000
2600.000
2700.000
2800.000
2900.000
3000.000
3100.000
3200.000
3300.000
3400.000
3500.000
3600.000
3700.000
3800.000
3900.000
4000.000
4100.000
4200.000
4300.000
3,691.9603,691.960
Nov 2020 Mar May Jul Sep Nov 2021 Mar May Jul
S&P 500 INDEX - SPX.XO (IQFeed) - 1 Day CandleStick Chart - USD
Data from IQFeed Page 287th Dec 2020® optuma.com
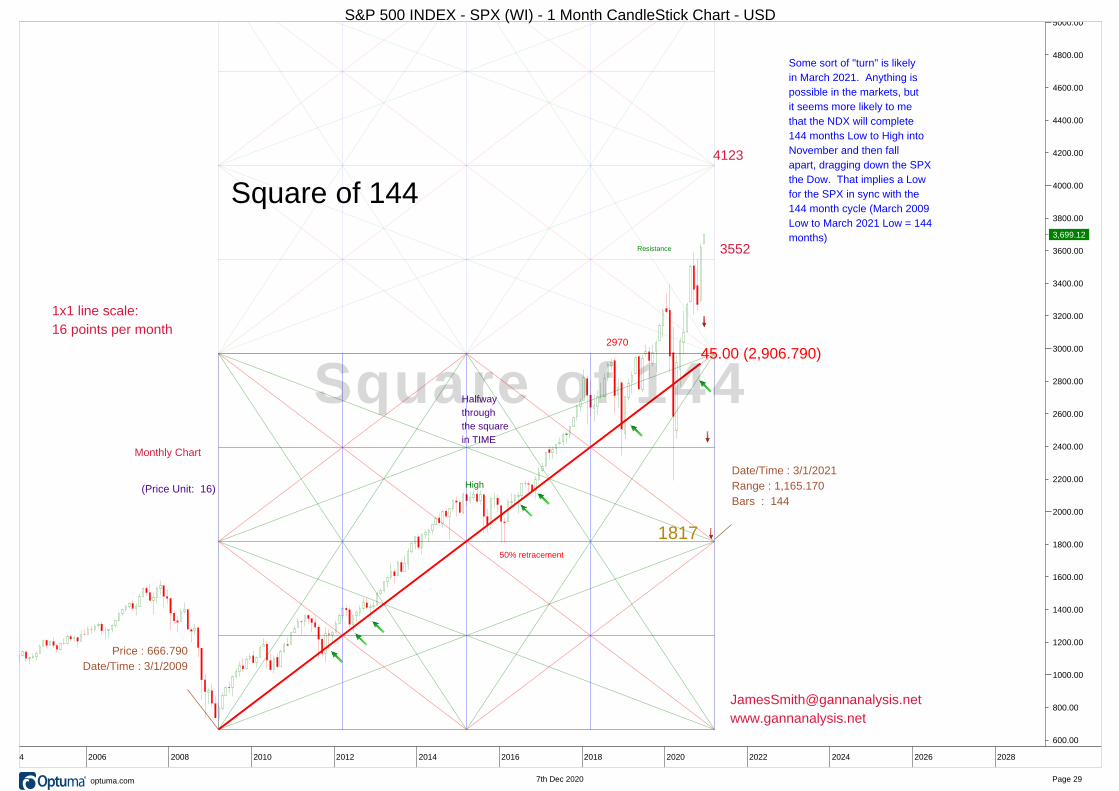
2970
Resistance
Price : 666.790
Date/Time : 3/1/2009
Date/Time : 3/1/2021
Range : 1,165.170
Bars : 144
Halfway
through
the square
in TIME
Square of 144
High(Price Unit: 16)
45.00 (2,906.790)
50% retracement
Monthly Chart
1817
4123
3552
Some sort of "turn" is likely
in March 2021. Anything is
possible in the markets, but
it seems more likely to me
that the NDX will complete
144 months Low to High into
November and then fall
apart, dragging down the SPX
the Dow. That implies a Low
for the SPX in sync with the
144 month cycle (March 2009
Low to March 2021 Low = 144
months)
1x1 line scale:
16 points per month
www.gannanalysis.net
Square of 144
600.00
800.00
1000.00
1200.00
1400.00
1600.00
1800.00
2000.00
2200.00
2400.00
2600.00
2800.00
3000.00
3200.00
3400.00
3600.00
3800.00
4000.00
4200.00
4400.00
4600.00
4800.00
5000.00
3,699.12
2000 2002 2004 2006 2008 2010 2012 2014 2016 2018 2020 2022 2024 2026 2028 2030
S&P 500 INDEX - SPX (WI) - 1 Month CandleStick Chart - USD
Page 297th Dec 2020® optuma.com
Date/Time : 2/19/2020
Bars : 181
Date/Time : 11/6/2020
Bars : 184
Price : 2,728.8100
Date/Time : 6/3/2019
Start Line
2/20/2020
180
11/4/2020
360
7/15/2021
540
3/24/2022
720
12/1/2022
900
8/10/2023
1,080
4/18/2024
180
6/4/2019
360
9/13/2018
540
12/26/2017
720
4/10/2017
900
7/22/2016
1,080
11/3/2015
1,260
2/18/2015
1,440
6/2/2014
1,620
9/12/2013
1,800
12/24/2012
1,980
4/5/2012
2,160
7/20/2011
2,340
11/1/2010
2,520
2/16/2010
2,700
5/29/2009
2,880
9/10/2008
3,060
12/21/2007
3,240
4/9/2007
3,420
7/19/2006
3,600
10/28/2005
3,780
2/11/2005
3,960
5/26/2004
4,140
9/9/2003
4,320
12/19/2002
4,500
4/5/2002
4,680
7/12/2001
4,860
10/23/2000
5,040
2/7/2000
5,220
5/21/1999
5,400
9/2/1998
5,580
12/15/1997
5,760
4/1/1997
5,940
7/15/1996
6,120
10/26/1995
6,300
2/9/1995
6,480
5/25/1994
6,660
9/9/1993
6,840
12/22/1992
7,020
4/7/1992
7,200
7/23/1991
7,380
11/2/1990
7,560
2/16/1990
7,740
6/2/1989
7,920
9/15/1988
8,100
12/30/1987
8,280
4/14/1987
8,460
7/29/1986
8,640
11/8/1985
8,820
2/22/1985
9,000
6/7/1984
9,180
9/21/1983
9,360
1/5/1983
9,540
4/21/1982
9,720
8/4/1981
9,900
11/14/1980
10,080
2/29/1980
10,260
6/14/1979
10,440
9/27/1978
10,620
1/11/1978
10,800
4/25/1977
10,980
8/6/1976
11,160
11/19/1975
11,340
3/6/1975
11,520
6/19/1974
11,700
10/2/1973
11,880
1/15/1973
12,060
4/26/1972
12,240
8/11/1971
12,420
11/23/1970
12,600
3/11/1970
12,780
6/23/1969
12,960
9/13/1968
13,140
12/6/1967
13,320
3/21/1967
13,500
7/1/1966
13,680
10/14/1965
13,860
1/28/1965
14,040
5/12/1964
14,220
8/22/1963
14,400
12/5/1962
14,580
3/20/1962
14,760
6/30/1961
14,940
10/11/1960
15,120
1/26/1960
15,300
5/11/1959
15,480
8/20/1958
15,660
12/4/1957
15,840
3/19/1957
16,020
6/28/1956
16,200
10/11/1955
16,380
1/25/1955
16,560
5/10/1954
16,740
8/18/1953
16,920
12/2/1952
17,100
3/13/1952
17,280
6/21/1951
17,460
9/29/1950
17,640
1/12/1950
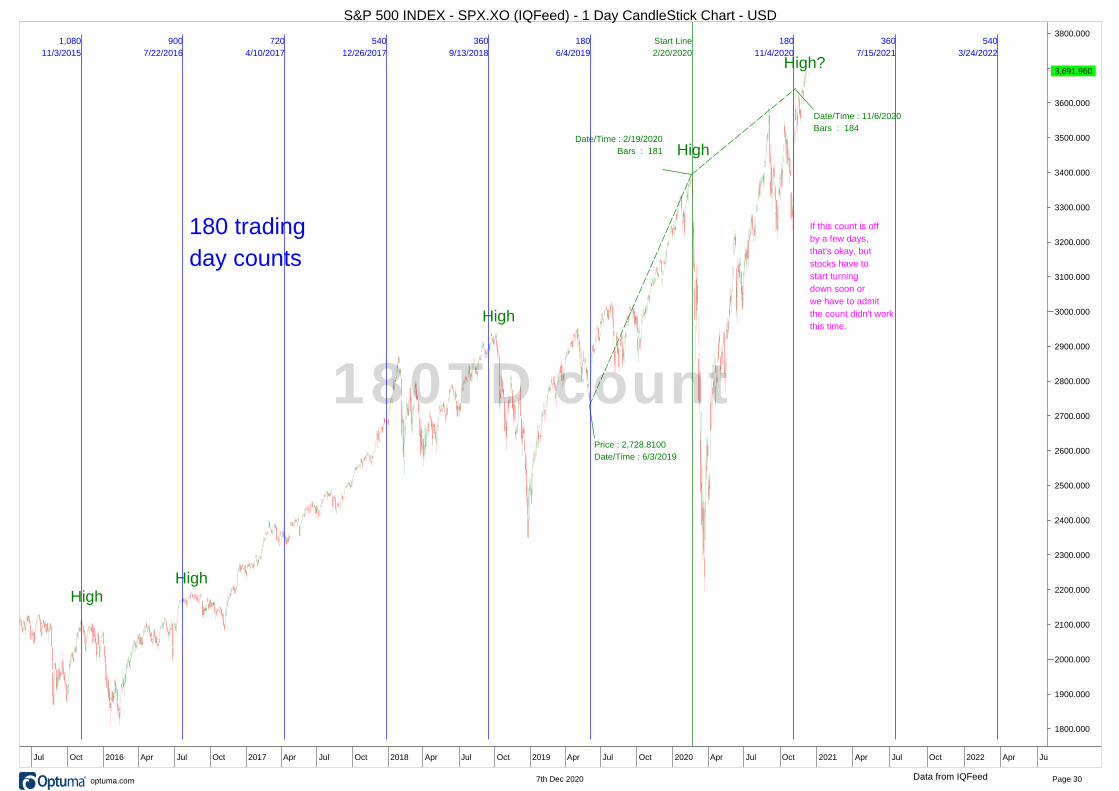
HighHigh
High
High
High
High?
180 trading
day counts
If this count is off
by a few days,
that's okay, but
stocks have to
start turning
down soon or
we have to admit
the count didn't work
this time.
180TD count
1800.000
1900.000
2000.000
2100.000
2200.000
2300.000
2400.000
2500.000
2600.000
2700.000
2800.000
2900.000
3000.000
3100.000
3200.000
3300.000
3400.000
3500.000
3600.000
3700.000
3800.000
3,691.9603,691.960
Oct 2015 Apr Jul Oct 2016 Apr Jul Oct 2017 Apr Jul Oct 2018 Apr Jul Oct 2019 Apr Jul Oct 2020 Apr Jul Oct 2021 Apr Jul Oct 2022 Apr Jul Oct
S&P 500 INDEX - SPX.XO (IQFeed) - 1 Day CandleStick Chart - USD
Data from IQFeed Page 307th Dec 2020® optuma.com
Low
High
High
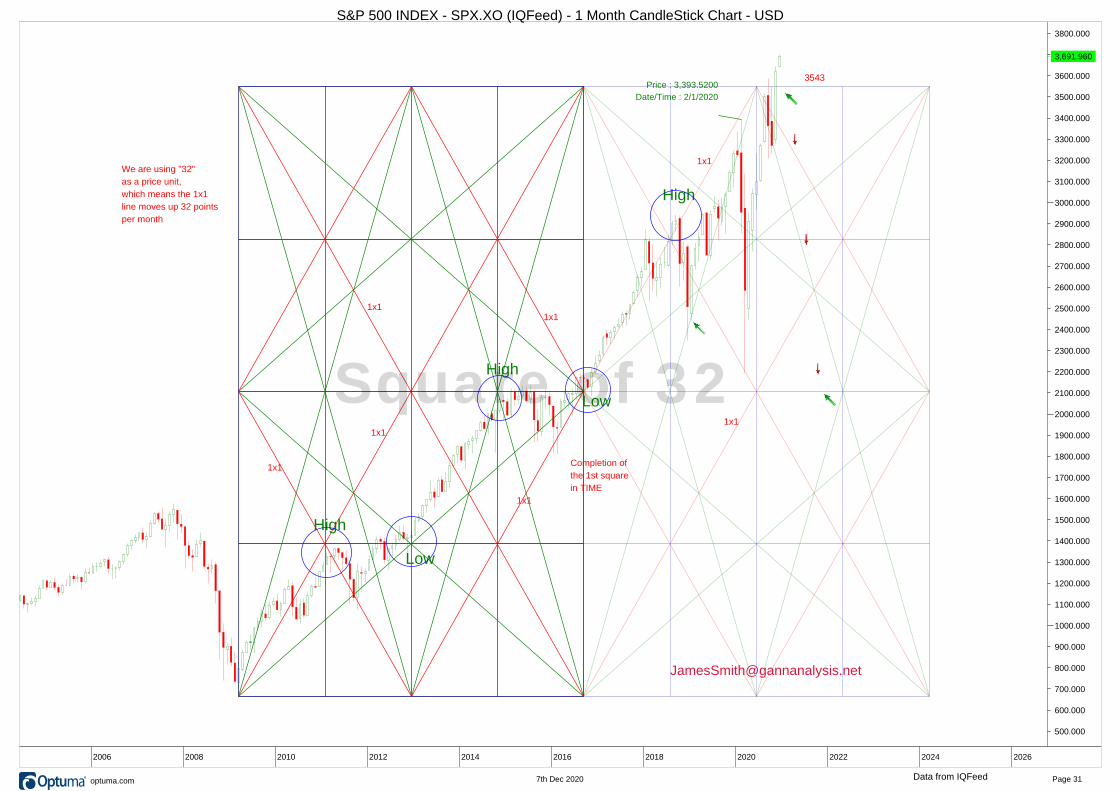
Completion of
the 1st square
in TIME
Price : 3,393.5200
Date/Time : 2/1/2020
3543
We are using "32"
as a price unit,
which means the 1x1
line moves up 32 points
per month
1x1
1x1
1x1
1x1
1x11x1
1x1
High
LowSquare of 32
400.000
500.000
600.000
700.000
800.000
900.000
1000.000
1100.000
1200.000
1300.000
1400.000
1500.000
1600.000
1700.000
1800.000
1900.000
2000.000
2100.000
2200.000
2300.000
2400.000
2500.000
2600.000
2700.000
2800.000
2900.000
3000.000
3100.000
3200.000
3300.000
3400.000
3500.000
3600.000
3700.000
3800.000
3,691.9603,691.960
2002 2004 2006 2008 2010 2012 2014 2016 2018 2020 2022 2024 2026 2028
S&P 500 INDEX - SPX.XO (IQFeed) - 1 Month CandleStick Chart - USD
Data from IQFeed Page 317th Dec 2020® optuma.com
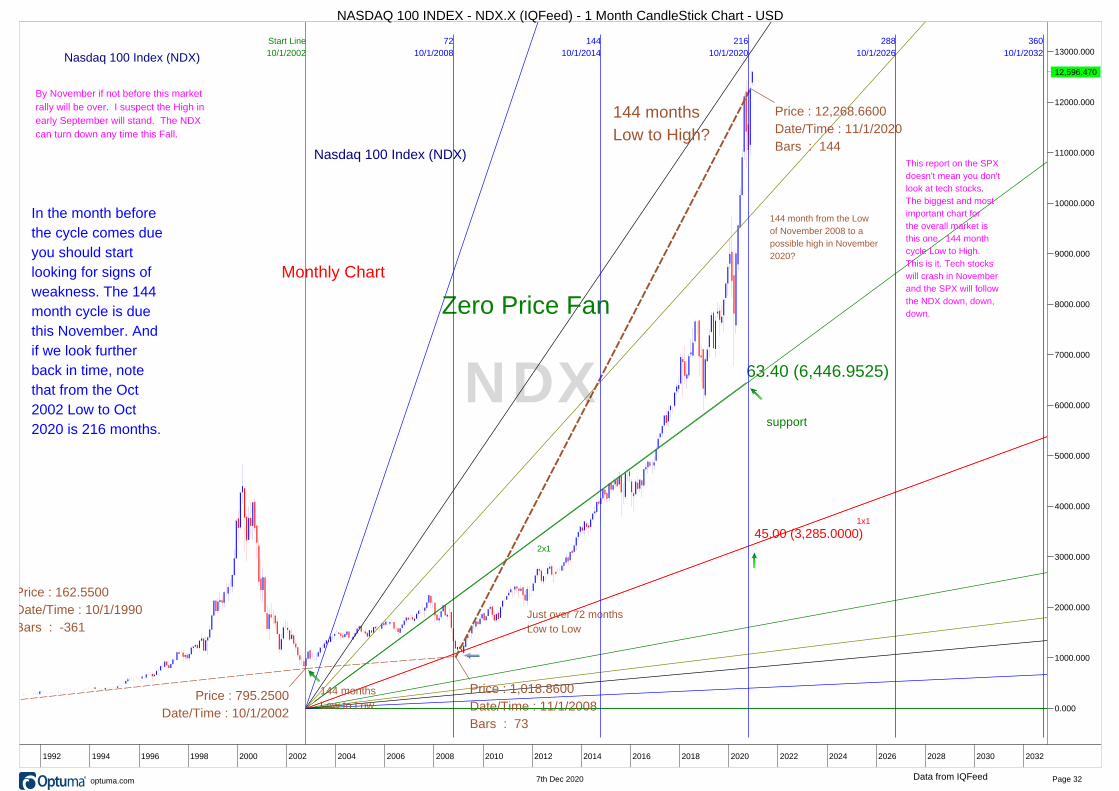
45.00 (3,285.0000)
Monthly Chart
Zero Price Fan
63.40 (6,446.9525)
1x1
2x1
support
Nasdaq 100 Index (NDX)
144 months
Low to LowPrice : 795.2500
Date/Time : 10/1/2002
Price : 1,018.8600
Date/Time : 11/1/2008
Bars : 73
Price : 12,268.6600
Date/Time : 11/1/2020
Bars : 144
Price : 162.5500
Date/Time : 10/1/1990
Bars : -361
144 months
Low to High?
Just over 72 months
Low to Low
144 month from the Low
of November 2008 to a
possible high in November
2020?
Start Line
10/1/2002
72
10/1/2008
144
10/1/2014
216
10/1/2020
288
10/1/2026
360
10/1/2032
432
10/1/2038
504
10/1/2044
576
10/1/2050
648
10/1/2056
720
10/1/2062
792
10/1/2068
864
10/1/2074
936
10/1/2080
1,008
10/1/2086
1,080
10/1/2092
1,152
10/1/2098
By November if not before this market
rally will be over. I suspect the High in
early September will stand. The NDX
can turn down any time this Fall.
Nasdaq 100 Index (NDX)
In the month before
the cycle comes due
you should start
looking for signs of
weakness. The 144
month cycle is due
this November. And
if we look further
back in time, note
that from the Oct
2002 Low to Oct
2020 is 216 months.
This report on the SPX
doesn't mean you don't
look at tech stocks.
The biggest and most
important chart for
the overall market is
this one. 144 month
cycle Low to High.
This is it. Tech stocks
will crash in November
and the SPX will follow
the NDX down, down,
down.
NDX
0.000
1000.000
2000.000
3000.000
4000.000
5000.000
6000.000
7000.000
8000.000
9000.000
10000.000
11000.000
12000.000
13000.000
12,596.47012,596.470
1986 1988 1990 1992 1994 1996 1998 2000 2002 2004 2006 2008 2010 2012 2014 2016 2018 2020 2022 2024 2026 2028 2030 2032 2034
NASDAQ 100 INDEX - NDX.X (IQFeed) - 1 Month CandleStick Chart - USD
Data from IQFeed Page 327th Dec 2020® optuma.com
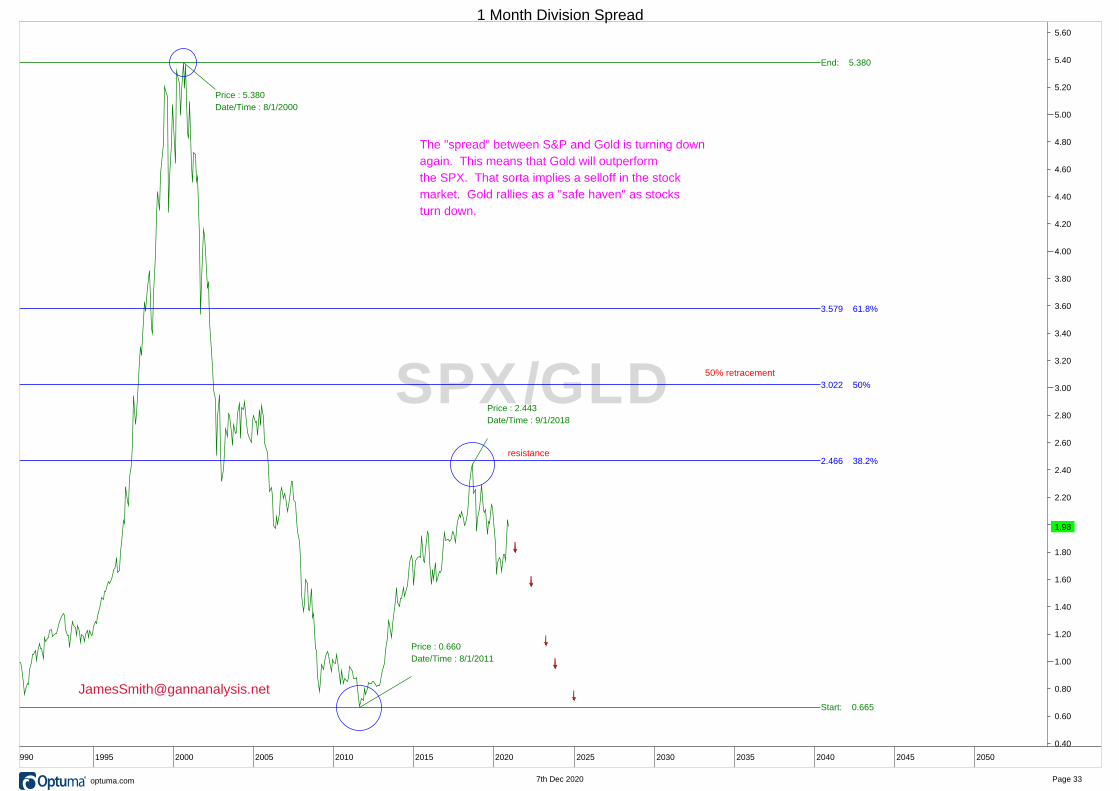
Start: 0.665
End: 5.380
2.466 38.2%
3.022 50%
3.579 61.8%
50% retracement
resistance
Price : 5.380
Date/Time : 8/1/2000
Price : 0.660
Date/Time : 8/1/2011
Price : 2.443
Date/Time : 9/1/2018
The "spread" between S&P and Gold is turning down
again. This means that Gold will outperform
the SPX. That sorta implies a selloff in the stock
market. Gold rallies as a "safe haven" as stocks
turn down.
SPX/GLD
0.40
0.60
0.80
1.00
1.20
1.40
1.60
1.80
2.00
2.20
2.40
2.60
2.80
3.00
3.20
3.40
3.60
3.80
4.00
4.20
4.40
4.60
4.80
5.00
5.20
5.40
5.60
1.98
1980 1985 1990 1995 2000 2005 2010 2015 2020 2025 2030 2035 2040 2045 2050 2055
1 Month Division Spread
Page 337th Dec 2020® optuma.com
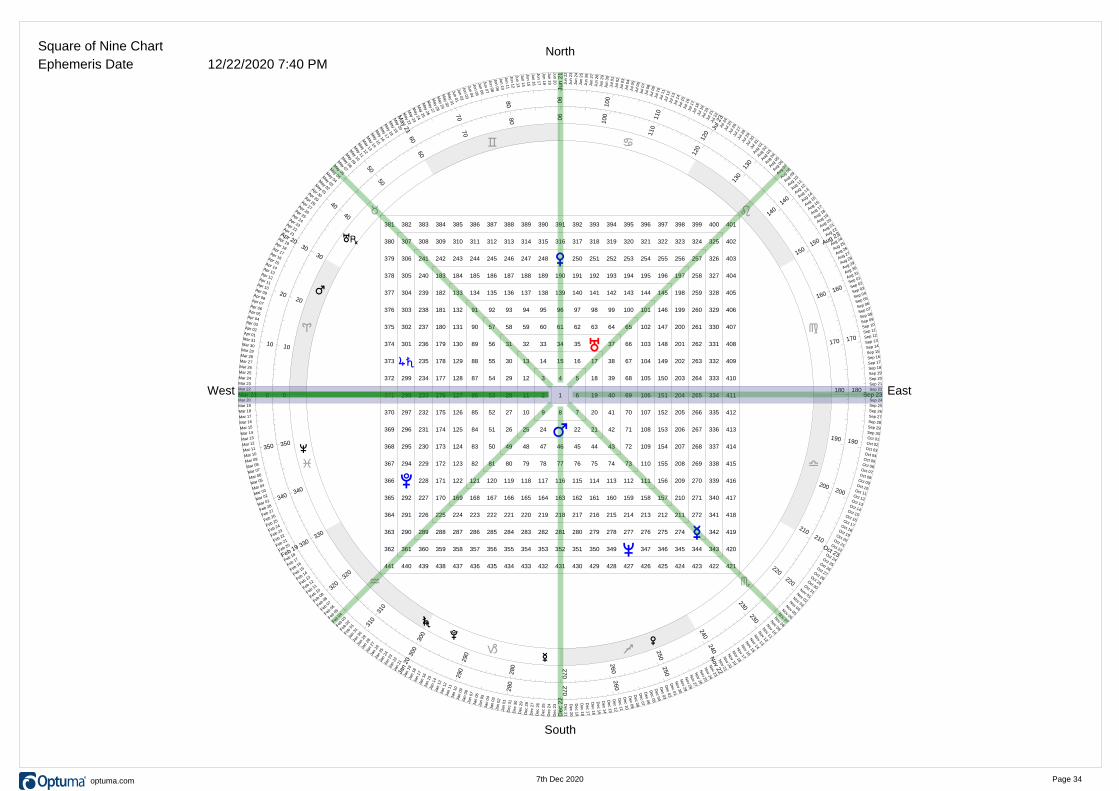
12
3 4 5
6
78910
11
12
13 14 15 16 17
18
19
20
2122E242526
27
28
29
30
31 32 33 34 35 I 37
38
39
40
41
42
4344454647484950
51
52
53
54
55
56
57 58 59 60 61 62 63 64 65
66
67
68
69
70
71
72
73747576777879808182
83
84
85
86
87
88
89
90
91 92 93 94 95 96 97 98 99 100 101
102
103
104
105
106
107
108
109
110
111112113114115116117118119120121122
123
124
125
126
127
128
129
130
131
132
133 134 135 136 137 138 139 140 141 142 143 144 145
146
147
148
149
150
151
152
153
154
155
156
157158159160161162163164165166167168169170
171
172
173
174
175
176
177
178
179
180
181
182
183 184 185 186 187 188 189 190 191 192 193 194 195 196 197
198
199
200
201
202
203
204
205
206
207
208
209
210
211212213214215216217218219220221222223224225226
227
228
229
230
231
232
233
234
235
236
237
238
239
240
241 242 243 244 245 246 247 248 D 250 251 252 253 254 255 256 257
258
259
260
261
262
263
264
265
266
267
268
269
270
271
272
C274275276277278279280281282283284285286287288289290
291
292
K
294
295
296
297
298
299
FG
301
302
303
304
305
306
307 308 309 310 311 312 313 314 315 316 317 318 319 320 321 322 323 324 325
326
327
328
329
330
331
332
333
334
335
336
337
338
339
340
341
342
343344345346347J349350351352353354355356357358359360361362
363
364
365
366
367
368
369
370
371
372
373
374
375
376
377
378
379
380
381 382 383 384 385 386 387 388 389 390 391 392 393 394 395 396 397 398 399 400 401
402
403
404
405
406
407
408
409
410
411
412
413
414
415
416
417
418
419
420
421422423424425426427428429430431432433434435436437438439440441
a
b
c d
e
f
g
h
ij
k
l
C
D
E
FG
I,
J
K
0
10
20
30
40
50
60
70
80
90
100
110
120
130
140
150
160
170
180
190
200
210
220
230
240
250
2602702
80
290
300
310
320
330
340
350
0
10
20
30
40
50
60
70
80
90
100
110
120
130
140
150
160
170
180
190
200
210
220
230
240
250
2602702
80
290
300
310
320
330
340
350
Mar 21Mar 22
Mar 23
Mar 24
Mar 25
Mar 26
Mar 27
Mar 28
Mar 29
Mar 30
Mar 31
Apr 01
Apr 02
Apr 03
Apr 04
Apr 05
Apr 06
Apr 07
Apr 08
Apr 09
Apr 10
Apr 11
Apr 12
Apr 13
Apr 14
Apr 15
Apr 16
Apr 17
Apr 18
Apr 19
Apr 20
Apr 21
Apr 22
Apr 23
Apr 24
Apr 25
Apr 26
Apr 27
Apr 28
Apr 29
Apr 30
May 01
May 02
May 03
May 04
May 05
May 06
May 07
May 08
May 09
May 10
May 11
May 12
May 13
May 14
May 15
May 16
May 17
May 18
May 1
9M
ay 2
0M
ay 2
1M
ay 2
2M
ay 2
3M
ay 2
4M
ay 2
5M
ay 2
6M
ay 2
7M
ay 2
8M
ay 2
9M
ay 3
0M
ay 3
1Jun 0
1Jun 0
2Jun 0
3Jun 0
4Jun 0
5Jun 0
6Jun 0
7Jun 0
8Jun 0
9Jun 1
0Jun 1
1Jun 1
2Jun 1
3Jun 1
4Jun 1
5Jun 1
6Jun 1
7
Jun 1
8
Jun 1
9
Jun 2
0Jun 2
1Jun 2
2
Jun 2
3
Jun 2
4Jun 2
5Jun 2
6Jun 2
7Jun 2
8Jun 2
9Jun 3
0Jul 01
Jul 02
Jul 03
Jul 04
Jul 05
Jul 06
Jul 07
Jul 08
Jul 09
Jul 10
Jul 11
Jul 12
Jul 1
3Ju
l 14
Jul 1
5Ju
l 16
Jul 1
7Ju
l 18
Jul 1
9Ju
l 20
Jul 2
1Ju
l 22
Jul 2
3Ju
l 24
Jul 2
5Ju
l 26
Jul 2
7Ju
l 28
Jul 2
9Ju
l 30
Jul 3
1Aug
01
Aug
02
Aug
03
Aug
04
Aug
05
Aug
06
Aug
07
Aug 0
8
Aug 0
9
Aug 1
0
Aug 1
1
Aug 12
Aug 13
Aug 14
Aug 15
Aug 16
Aug 17
Aug 18
Aug 19
Aug 20
Aug 21
Aug 22
Aug 23
Aug 24
Aug 25
Aug 26
Aug 27
Aug 28
Aug 29
Aug 30
Aug 31
Sep 01
Sep 02
Sep 03
Sep 04
Sep 05
Sep 06
Sep 07
Sep 08
Sep 09
Sep 10
Sep 11
Sep 12
Sep 13
Sep 14
Sep 15
Sep 16
Sep 17
Sep 18
Sep 19
Sep 20
Sep 21
Sep 22
Sep 23Sep 24
Sep 25
Sep 26
Sep 27Sep 28Sep 29Sep 30Oct 01Oct 02Oct 03Oct 04Oct 05
Oct 06Oct 07
Oct 08Oct 09
Oct 10Oct 11
Oct 12Oct 13Oct 14Oct 15Oct 16Oct 17Oct 18Oct 19Oct 20Oct 21Oct 22
Oct 23Oct 24Oct 25Oct 26Oct 27Oct 28Oct 29Oct 30Oct 31
Nov 01Nov 02
Nov 03
Nov 04
Nov 05
Nov 06
Nov 07
Nov 08
Nov 09
Nov 10
Nov 11
Nov 12
Nov 13
Nov 14
Nov 15
Nov 16
Nov 17
Nov 18
Nov 19
Nov 2
0
Nov 2
1
Nov 2
2
Nov 2
3
Nov 2
4
Nov 2
5
Nov 2
6
Nov 2
7
Nov 2
8
Nov 2
9
Nov 3
0
Dec 0
1
Dec 0
2
Dec 0
3
Dec 0
4
Dec 0
5
Dec 0
6
Dec 0
7
Dec 0
8
Dec 0
9
Dec 1
0
Dec 1
1
Dec 1
2
Dec 1
3
Dec 1
4
Dec 1
5
Dec 1
6
Dec 1
7
Dec 1
8
Dec 1
9
Dec 2
0
Dec 2
1Dec 2
2D
ec 2
3
Dec 2
4
Dec 2
5
Dec 2
6
Dec 2
7
Dec 2
8
Dec 2
9
Dec 3
0
Dec 3
1
Jan 0
1
Jan 0
2
Jan 0
3
Jan 0
4
Jan 0
5
Jan 0
6
Jan 0
7
Jan 0
8
Jan 0
9
Jan 1
0
Jan 1
1
Jan 1
2
Jan 1
3
Jan 1
4
Jan 1
5
Jan 1
6
Jan 1
7
Jan 1
8
Jan 1
9
Jan 2
0
Jan 2
1
Jan 2
2
Jan
23
Jan
24
Jan
25
Jan
26
Jan
27
Jan
28
Jan
29
Jan
30
Jan
31
Feb
01
Feb
02
Feb 0
3
Feb 0
4Feb
05
Feb 0
6Feb
07
Feb 08
Feb 09
Feb 10
Feb 11Feb 1
2Feb 13Feb 1
4Feb 15Feb 16Feb 17Feb 18Feb 19Feb 20Feb 21Feb 22Feb 23Feb 24Feb 25Feb 26Feb 27Feb 28Mar 01Mar 02
Mar 03Mar 04
Mar 05Mar 06
Mar 07Mar 08
Mar 09Mar 10Mar 11Mar 12Mar 13Mar 14Mar 15Mar 16Mar 17
Mar 18
Mar 19
Mar 20
North
West
South
East
Square of Nine Chart
Ephemeris Date 12/22/2020 7:40 PM
Page 347th Dec 2020® optuma.com


