Embed Size (px)
Citation preview

Ecologically or BiologicallySignificant Areas in the PelagicRealm: Examples & GuidelinesWorkshop Report
INTERNATIONAL UNION FOR CONSERVATION OF NATURE
Report of a scientific workshop organized by the Global Ocean Biodiversity Initiative (GOBI) and the MarineGeospatial Ecology Lab (MGEL) at Duke University, in Sidney, B.C., Canada, from May 12th–14th, 2011.
The designation of geographical entities in this book, and the presentation of the material, do not imply theexpression of any opinion whatsoever on the part of IUCN concerning the legal status of any country, terri-tory, or area, or of its authorities, or concerning the delimitation of its frontiers or boundaries.The views expressed in this publication do not necessarily reflect those of IUCN.
Published by: IUCN, Gland, Switzerland
Copyright: © 2011 International Union for Conservation of Nature and Natural Resources
Reproduction of this publication for educational or other non-commercial purposes isauthorized without prior written permission from the copyright holder provided thesource is fully acknowledged.
Reproduction of this publication for resale or other commercial purposes is prohibitedwithout prior written permission of the copyright holder.
Citation: Dunn, D.C. (ed.), Ardron, J., Ban, N., Bax, N., Bernal, P., Bograd, S., Corrigan, C., Dun-stan, P., Game, E., Gjerde, K., Grantham, H., Halpin, P.N., Harrison, A.L., Hazen, E., Lagabrielle, E., Lascelles, B., Maxwell, S., McKenna, S., Nicol, S., Norse, E.,Palacios, D., Reeve, L., Shillinger, G., Simard, F., Sink, K., Smith, F., Spadone, A., Würtz, M. (2011). Ecologically or Biologically Significant Areas in the Pelagic Realm: Ex-amples & Guidelines – Workshop Report. Gland, Switzerland: IUCN. 44pp.
ISBN: 978-2-8317-1426-4
Cover photo: Harbor Porpoise in the Bay of Fundy © A.S. Friedlaender
Layout by: Tim Davis, DJEnvironmental, UK
Printed by: UNI Global Union, Nyon, Switzerland
Available from: IUCN (International Union for Conservation of Nature)Publications ServicesRue Mauverney 281196 GlandSwitzerlandTel +41 22 999 0000Fax +41 22 999 [email protected]/publications

Ecologically or BiologicallySignificant Areas in the PelagicRealm: Examples & GuidelinesWorkshop Report
May 12th–14th, 2011The Sidney Pier Hotel, Sidney, B.C., Canada

The workshop organizers would like to thank the government of Belgium, the Sloan Foundation, the Censusof Marine Life, the J.M. Kaplan Fund, the Richard and Rhoda Goldman Fund, and the German FederalAgency for Nature Conservation for their generous support of this workshop. We would also like to thank theparticipants for their contributions to the workshop and to forwarding our understanding of how to identifyecological or biologically significant areas in the open ocean. Several participants funded their ownparticipation in the workshop and their support and dedication to this work is deeply appreciated. We wouldalso like to thank the workshop participants and Francine Kershaw for their constructive reviews of the report.
WORKSHOP SPONSORS

1. Executive Summary...........................................................................................................................4
2. Workshop Description.......................................................................................................................5
2.1 Purpose ...............................................................................................................................6
2.2 Process................................................................................................................................6
3. Background........................................................................................................................................8
3.1 The Pelagic Open Ocean......................................................................................................8
3.2 The EBSA Criteria ..............................................................................................................10
3.3 The Regional Context & Population of the CBD EBSA Repository ......................................11
3.4 Relevance of Identifying EBSAs..........................................................................................12
4. Guidelines and Considerations for the Application of the EBSA Criteria
in the Pelagic Zone..........................................................................................................................19
4.1 General Guidelines for the Identification of Pelagic EBSAs ..................................................19
4.2 Special Importance to Life-History Stage & Importance for Threatened,
Endangered or Declining Species and/or Habitats ..............................................................20
4.3 Biological Productivity ........................................................................................................23
4.4 Biological Diversity..............................................................................................................25
4.5 Uniqueness and Rarity .......................................................................................................27
4.6 Vulnerability, Fragility, Sensitivity, or Slow Recovery & Naturalness ......................................30
5. Types of Pelagic Areas that May Meet the EBSA Criteria .............................................................31
5.1 Pelagic Areas Over Static Bathymetric Features .................................................................31
5.2 Persistent Hydrographic Features & Ephemeral Features....................................................32
6. References .......................................................................................................................................34
Appendix 1. Participants List ..............................................................................................................40
Appendix 2. CBD Decision IX/20 Annex I & II.....................................................................................41
GOBI Pelagic EBSA Identification Workshop Report 3
TABLE OF CONTENTS

4 GOBI Pelagic ESBA Identification Workshop Report
There have been a variety of calls for moresustainable use and conservation of the open ocean,leading to the recent re-affirmation by the Conventionon Biological Diversity (CBD) of its goal to conserve10% of the area beyond national jurisdiction (part ofthe Aichi Biodiversity Targets). As a first step towardthis goal, the 10th Conference of Parties to the CBDrecommended the convening of a series of regionalworkshops, in coordination with various relevantpartners, to identify Ecologically or BiologicallySignificant Areas (EBSAs) in need of protection. Thedevelopment of an EBSA Repository and InformationSharing Mechanism and the relationship between theCBD and other concurrent UN and externalprocesses, as well as management efforts bycompetent authorities, ensure that the EBSAidentification process will inform a wide variety ofpolicy and regulatory decisions.
Given the importance of the pelagic realm and theissues raised above concerning access andassessment, it is vital that the Parties to the CBD
The pelagic realm has twice the surface area and168 times the habitable volume of terrestrial biomes,and it is as important as it is immense. Theecosystem services provided to us by the pelagicocean include, among others, the provision of morethan half the oxygen we breathe, the absorption ofnearly 35% of the CO2 released into the atmosphereand 80% of the heat added to the climate system bythe accumulation of CO2, the provision of greaterthan 15% of the animal nutrients consumed, and thetransportation of ~90% of international trade.However, the pelagic open ocean is not onlyimportant and immense, but deep, distant anddynamic, making it the largest and yet leastunderstood biome on our planet. Despite our limitedknowledge of the pelagic ecosystem, humanactivities and climate change continue to negativelyimpact its functioning. Assessment of these impactsis very difficult in this biome due to difficultiesaccessing the open ocean, and because much ofthe pelagic realm falls outside of nationaljurisdictions.
1. EXECUTIVE SUMMARY
Sea nettles, Chrysaora fuscescens, Monterey Bay, California, October 2007 Credit: Richard Herrmann, Galatée Films, Census of Marine Life

GOBI Pelagic EBSA Identification Workshop Report 5
EXECUTIVE SUMMARY
fully consider how to incorporate the pelagic realminto the EBSA identification process. For the AichiBiodiversity Targets to be met in full, and for theother relevant processes to be successful,examples and guidelines for the identification ofimportant pelagic areas must be made available topolicy makers involved in the EBSA identificationprocess. In an effort to provide such examples andguidelines, a workshop of 27 international expertson pelagic biodiversity was convened by the GlobalOcean Biodiversity Initiative (GOBI) and the MarineGeospatial Ecology Lab (MGEL) of Duke University.The context for that workshop and the examplesand guidelines developed by the experts arepresented in this report.
Through a series of break-out groups and plenarydiscussions, in-depth guidelines were developed forspecific criteria and over-arching general guidelineswere articulated. The general guidelines andconsiderations developed by the workshop are:
Guidelines
1. Size matters – the scale of pelagic features andlife-history stages can be 1,000s–10,000s km2,delineation of EBSAs must match these scales.
2. Consider time – the pelagic ocean is highlydynamic, consideration must be given to howfeatures and organisms move over time.
3. Think deeply – the average depth of the oceanis ~3,700m, the delineation of pelagic EBSAsshould not solely consider surficial elements.
4. Be dynamic – the use of oceanographicvariables that vary over space and time todelineate EBSAs is possible and encouraged.
5. Quantify uncertainty and be adaptive – given therelative lack of data for the pelagic realm, there isan increased need to build uncertainty into theEBSA identification process. Further, there is aneed to ensure the process is adaptive andongoing so adjustments can be made as newdata become available.
Other considerations
1. Not all phytoplankton are created equal – areasof interest likely involve some level of trophictransfer, not just high productivity.
2. Prioritize complexity – areas where currents,frontal systems or eddies meet complextopographic features tend to produce areas ofparticular ecological interest.
3. Process drives pattern – appropriateconsideration should be given to the underlyingprocesses that result in an area meeting theEBSA criteria.
Further, the workshop participants developed atypology of oceanographic features that might meetthe EBSA criteria and specific examples of eachtype. The types are also accompanied by adescription of how the features have been identifiedin scientific peer-reviewed literature. The participantsin the workshop and the workshop organizerssincerely hope that the provision of these guidelinesand examples will both encourage and help relevantorganizations and agencies to include pelagic areasof ecological importance in their information-gathering processes and management.

2.2 Process
Twenty-seven international experts includingbiologists, ecologists, oceanographers, systematicconservation scientists, international marine policyspecialists and resource managers met for two daysin Sidney, British Columbia, Canada to address theapplication of the CBD EBSA criteria to the pelagiczone. The workshop programme is available as asupplementary online appendix (S1). Prior to theworkshop a large volume of publications on pelagicbiodiversity was made available to the workshopparticipants, as well as a white paper outlining typesof pelagic features/habitats that might meet theEBSA criteria. Participants were asked to submit aone-page document describing how their workcould inform the identification of EBSAs, or moregenerally any thoughts they had on pelagic EBSAidentification. These were compiled and are alsoavailable as a supplementary online appendix (S2).
The first day of this two-day workshop began withan introduction to the Global Ocean BiodiversityInitiative and its supporting role in the collection ofinformation pertinent to the identification of candidateEBSAs. This was followed by general presentationson the international policy context surrounding theidentification of EBSAs and a review of the EBSAcriteria themselves. The morning session concludedwith three discussions about data availability,applicable methods and multi-criteria considerationsin the identification of candidate EBSAs.
2.1 Purpose
The overarching purpose of the workshop was toenumerate types of pelagic systems that might meetthe Convention on Biological Diversity’s criteria forEcologically or Biologically Significant Areas, and topresent examples for each criterion. Workshopparticipants were further tasked with:
1. synthesizing information on factors affecting theecological significance of pelagic areas;
2. enumerating available data and methods toidentify ecologically significant areas in dynamicpelagic systems;
3. compiling a preliminary, non-exhaustive list ofcandidate areas for pelagic conservation(particularly with reference to the South Pacific)for submission to CBD Regional Workshops, theUnited Nations Food and AgricultureOrganization (FAO), regional fisheriesmanagement organizations (RFMOs) and otherrelevant intergovernmental and regional bodies;and
4. outlining methods for global or regionalprioritization of pelagic zones.
The workshop also discussed guidelines for theapplication of the EBSA criteria to the pelagic zone.
6 GOBI Pelagic ESBA Identification Workshop Report
2. WORKSHOP DESCRIPTION
Ecologically or Biologically Significant Areas in the Pelagic Realm Workshop participants

GOBI Pelagic EBSA Identification Workshop Report 7
WORKSHOP DESCRIPTION
The main focus of the workshop was a series ofbreak-out groups tasked with looking at specificcriteria. These took place on the afternoon of the firstday and throughout much of the second day.Questions addressed by the break-out groupsincluded:
1. What types of pelagic areas or systems mightmeet your criterion?
2. What factors explain the importance of suchareas/systems?
3. How can such areas/systems be identified?
4. What data are required to identify suchareas/systems?
5. How can such systems be identified in data-poor regions?
6. Is there any way to compare the relativeimportance of such areas?
7. What are some examples of each type ofarea/system identified?
To inform the break-out group process, threepresentations were given to start the second day.These presentations focused on the regional natureof the CBD EBSA process, the biogeography andpolicy context of a region of interest (the SouthwestPacific) and an example of a previous workshop onregional EBSA identification (the Arctic). Results fromthe break-out groups were presented to the wholeworkshop on the second afternoon and werefollowed by a lengthy discussion of the findings andthe problems/questions raised during the process.
8 GOBI Pelagic ESBA Identification Workshop Report
realm falls outside of national jurisdictions, whichmakes management and protection of this biomeeven more problematic. Probably most challengingis the fact that critical areas in the pelagicenvironment are often shifting in space and time,requiring the development of methods to delineatethe location and factors influencing these features infour dimensions. These challenges, combined withthe common misinterpretation that the “freedom ofthe seas” means unregulated exploitation of theseemingly limitless wealth of the oceans, havelimited our efforts to manage and conserve the openocean to date. However, new technologicaladvances in autonomous data gatheringinstruments, telemetry and biologging, andgeospatial analyses and remote sensing arebeginning to allow us to gather and store orders ofmagnitude more data (Halpin et al. 2009; Bograd etal. 2010), which can help to define, characterize,monitor and manage dynamic pelagic habitats in theopen oceans (Hobday & Hartmann 2006; Howell et
3.1 The Pelagic Open Ocean
The size and importance of the pelagic realm havebeen repeatedly described over the last severaldecades (e.g., Riley & Chester 1971; Couper 1983;Angel 1993, 1997 & 2003; Norse & Gerber 1993;Chandler et al. 1996; Hyrenbach et al. 2000; Verityet al. 2002; Game et al. 2009; and Robison 2009).Specifically, the pelagic realm is cited as havingmore than twice the surface area of all terrestrialbiomes combined and 168 times the habitablevolume. The importance of the pelagic realm isdescribed by the growing list of ecosystem servicesit provides. More than 70% of the fish consumedcome from marine ecosystems. Fisheries supportapproximately 34 million fishers worldwide andUS$93.9 billion in first-sale revenue. Overall fisheriesprovide 6.1% of all protein (and 15.7% of animalprotein) to the world’s population (FAO 2010).However, the importance of fisheries to small-scalefishers is not adequately described by suchstatistics. Fisheries, largely pelagic fisheries, are the“bank of last resort” when economies fail indeveloping countries. Beyond fisheries, the oceansrepresent the longest “highways” on the planet,connecting the globe and providing for thetransportation of ~90% of international trade. Further,the pelagic ocean provides even more basic servicethan fisheries and commerce: it provides more thanhalf the oxygen we breathe; on a daily basis itmitigates anthropogenic CO2 production byabsorbing nearly 35% of the CO2 released into theatmosphere and 80% of the heat added to theclimate system by the accumulation of CO2.
The pelagic open ocean is not only important andimmense, but deep, distant and dynamic. Thesefactors combine to make it the largest and yet leastunderstood biome on our planet. The lack of datadescribing the pelagic realm is well illustrated by anexamination of the holdings of the largest marinebiogeographic database in the world, the OceanBiogeographic Information System, where mostrecords are either from surface sampling or in thefirst 1,000 meters of the benthic environment (Webbet al. 2010; Fig. 1). Access and assessment aremore difficult in this biome than virtually anywhereelse on Earth, presenting some of the greatestchallenges for ocean resource management andconservation planning. This situation is onlyexacerbated by the fact that much of the pelagic
3. BACKGROUND
Pelagic RealmDefined here, as in Game et al. 2009, as: “Thephysical, chemical and biological features ofthe marine water column of the open oceansor seas rather than waters adjacent to land orinland waters.“
Clione limacina, an Arctic pelagic snail (pteropod)Credit: Kevin Raskoff, Census of Marine Life

GOBI Pelagic EBSA Identification Workshop Report 9
BACKGROUND
al. 2008; Hobday et al. 2010, 2011; Dunn etal. 2011).
Pelagic ecosystems face numerousexogenous stressors which threaten thesustainability of their current functions.Eutrophication, habitat degradation, biologicaland geological removals and collateralimpacts from extractive activities, introductionof invasive species, pollution (e.g., physical,thermal or auditory), climate change andocean acidification are caused by a myriad ofhuman activities. The potential impacts ofthese stressors on the pelagic open ocean,much less their interaction and cumulativeeffects, are largely unknown. However, arecent study indicates that there remain noplaces in the ocean, no matter how deep,distant or dynamic, that are not affected byhuman activities (Halpern et al. 2008). Inresponse to these intensifying threats therehave been increasing calls for greatermanagement, conservation and protection ofmarine biodiversity (see below).
of Parties to the CBD (COP10), where the previousgoal of conserving 10% of marine biomes by 2012was extended to 2020, while the target for terrestrialbiomes and inland waters was increased to 17% bythe year 2020.
Clearly, management, conservation and preservationof the pelagic realm has been hindered by its deep,distant and dynamic nature, and by the governancechallenges presented by an environment thatcrosses national borders and is largely in areasbeyond national jurisdiction. While progress ontargets for marine conservation lagged at COP10,other processes to support sustainable use andconservation of the marine realm moved forward.Specifically, the Conference of Parties promulgatedmore than 25 recommendations outlining theprocess for identifying and cataloguing informationabout areas that meet the criteria for Ecologically orBiologically Significant Areas (EBSAs). This processmirrors a number of similar activities in otherinternational policy fora. However, each of theseefforts is limited by the scientific information andguidance which is brought to bear during theprocess. To date this information has been largelylimited to benthic habitat types or, more specifically,
Figure 1: The number of records in OBIS as a function of distance from shore and depth. Webb et al. 2010.
Appeals for representative conservation of the allbiomes (including the pelagic realm) have beenissued for at least two decades. As far back as1992, the Fourth World Parks Congress called forplacing at least 10% of each major biome underprotection by the year 2000. This figure was laterraised to 30% by 2012 during the Fifth World ParksCongress. Simultaneously, the World Summit onSustainable Development (WSSD) established agoal in 2002 for the creation of a global network ofmarine protected areas (MPAs) by the year 2012.Since then, the Convention on Biological Diversity(CBD) adopted the WSSD timeline and committedto protect 10% of each marine biome by 2012.While progress has been made in terrestrialconservation (~12.2% protected), marine biomeshave lagged far behind. Currently 6.3% of territorialwaters are protected, but only 1.91% of ExclusiveEconomic Zone (EEZ) waters and a meager 0.5% ofareas beyond national jurisdiction (ABNJ) areprotected. At the current rate of protection, it isestimated that the targets will be met between theyears 2067 and 2092 (Wood et al. 2008). The slowprogress on achieving these internationally agreed-upon goals was made explicit in the AichiBiodiversity targets agreed to at the 10th Convention

10 GOBI Pelagic ESBA Identification Workshop Report
BACKGROUND
appendices (see Appendix 2). COP9 also called fora follow-on CBD expert workshop to be convenedto provide “scientific and technical guidance on theuse of biogeographic classification systems andidentification of marine areas beyond nationaljurisdiction in need of protection”. COP10 took noteof the results of the expert workshop, and invitedParties, other Governments and relevantorganizations to use the scientific guidance. In therecommendations coming out of COP10, the Partieswent on to request that the Secretariat establish arepository and information-sharing mechanism forscientific and technical information and experiencerelated to the application of the EBSA criteria, as wellas “other relevant compatible and complementary
topographic features. If the Aichi Biodiversity Targetsare to be met in full, examples and guidelines for theidentification of important pelagic areas must bemade available to policy makers involved in theEBSA identification process.
3.2 The EBSA criteria
Since the 1980s a variety of national agencies,NGOs, and academic researchers have published orpromulgated suites of criteria for the identification ofareas of biological or ecological importance in theopen ocean. The Convention on Biological Diversitytook up the call to identify such areas in 2006 at theeighth meeting of the Conference of Parties (Fig. 2).Decision VIII/24, paragraph 46, called for theconvening of an expert workshop to “Refine anddevelop a consolidated set of scientific criteria foridentifying ecologically or biologically significantmarine areas in need of protection, in open oceanwaters and deep sea habitats, building upon existingsets of criteria used nationally, regionally andglobally”. The Expert Workshop, held in the Azores in2007, collated available criteria suites and selectedthose which fell within the purview of the CBD tosupply scientific information on the management andconservation of biodiversity to authorities withcompetency to manage marine resources.1 Theworkshop produced a set of seven criteria whichwere later adopted by the Parties to the CBD inDecision IX/20 at COP9 in 2008.
The seven scientific criteria for identifyingEcologically or Biologically Significant Marine Areas(EBSAs) in need of protection are:
1. Uniqueness or rarity2. Special importance for life history of species3. Importance for threatened, endangered or
declining species and/or habitats4. Vulnerability, fragility, sensitivity, slow recovery5. Biological productivity6. Biological diversity7. Naturalness
The seven EBSA criteria and four network criteriawere adopted in Decision IX/20 and included as
More on pelagic ecosystems fromHyrenbach et al. 2000Pelagic systems are inherently different fromterrestrial landscapes... Terrestrial and marineecosystems differ in the ecologicalconstraints shaping life, in the processesresponsible for pattern, and in the dominantscales of physical and biological variability(Smith 1978; Steele 1985). The distributionsof pelagic species are largely dictated by theintricacies of water flow, and by the couplingof physical and biological processes thatpromote the growth and retention ofplanktonic populations (Haury et al. 1978;Steele 1978; McGowan and Walker 1985).These, in turn, are mediated by physicalforcing dominated by large scales of time andspace, between seasons and decades andtens to thousands of kilometers (meso tomega scales; Stommel 1963; Smith 1978;Denman 1994). The dynamic nature ofpelagic systems and the prevalence ofvariability over large scales blur the linkagesbetween physical and biological processes,spreading biotic interactions over spatialscales that greatly exceed those prevalent interrestrial systems (Vinogradov 1981; Steele1985; Jaquet et al. 1996).
1 The background paper submitted to the workshop by Fisheries and Oceans Canada (Dearden & Topelko 2005) did anexcellent job of summarizing the various criteria suites and is recommended for further reading on the subject. See also Gilmanet al. (2011) for a broader and more recent review.

GOBI Pelagic EBSA Identification Workshop Report 11
BACKGROUND
nationally and inter-governmentally agreed scientificcriteria”. In accordance with this furtherrecommendation, the CBD Secretariat or regionalpartner organizations have scheduled a number ofregional workshops for 2011 and 2012 (see Fig. 2)to enable the description of candidate EBSAs.
3.3 The Regional Context & Population of theCBD EBSA Repository
The process by which candidate EBSAs will bedescribed, entered into the repository, and endorsedby the COP was generally laid out during COP10(Fig. 3). Decision X/29, paragraph 36, offers contextfor the relevance of a regional process to theidentification of EBSAs and the population of theEBSA repository:
36. Requests the Executive Secretary to work withParties and other Governments as well ascompetent organizations and regional initiatives,such as the Food and Agriculture Organization ofthe United Nations (FAO), regional seas conventionsand action plans, and, where appropriate, regionalfisheries management organizations (RFMOs)… toorganize… a series of regional workshops, before afuture meeting of the Subsidiary Body on Scientific,Technical and Technological Advice (SBSTTA) priorto the eleventh meeting of the Conference of theParties to the Convention, with a primary objectiveto facilitate the description of ecologically or
biologically significant marine areas throughapplication of scientific criteria in annex I of decisionIX/20 as well as other relevant compatible andcomplementary nationally and intergovernmentallyagreed scientific criteria… (emphasis added)
The concept of a regional approach to identifyingecologically or biologically important areas is in linewith both the approach taken through the variousregional seas programmes, action plans andconventions, and with management of fisheries bythe regional fisheries management organizations(RFMOs). Further, it is ecologically and politicallycoherent as it recognizes the fundamentallyconnected nature of the pelagic environment at aregional scale, and the consequent responsibilitywhich nations have toward their neighbors whentheir actions affect this shared resource. Theregional context is also important to implementanother recommendation from the same COP10decision which called for additional training andcapacity building workshops.
The process envisioned by the Parties at COP10(Fig. 3) put the onus on regional workshops todescribe potential EBSAs. These candidate EBSAswould then be entered into the EBSA Repository,shared with relevant agencies, organizations andpartners, and compiled into a report to be forwarded
Figure 2: Timeline of the development and application of the CBD EBSA criteria.
COP8:Call for the expert
workshop on ecologicalcriteria and biogeographic
classification
COP9:Adopted EBSA criteria. Calledfor the expert workshop onguidance on the application of
the EBSA criteria andbiogeographic classifications
Azores ExpertWorkshop
Collated criteria suites, recommended
EBSA criteria
Ottawa ExpertWorkshop
Produced guidance on the application ofthe EBSA criteria
COP10:Established an EBSA
repository and information-sharing mechanism and aregional process for
identifying candidate EBSAs
SBSTTA 15 & 16COP11
CBD Regional EBSA Workshops

12 GOBI Pelagic ESBA Identification Workshop Report
BACKGROUND
3.4 Relevance of Identifying EBSAs
How does the identification of areas meeting theEBSA criteria affect management and conservationof the pelagic open-ocean? As the CBD has nomanagement authority, the answer to this question isgrounded in the relationship between the CBD, theUN General Assembly, international conventions andother multilateral agreements, and related competentmanagement authorities. The 1982 United NationsConvention on the Law of the Sea (UNCLOS)established zones of national maritime jurisdictionand the governance framework for the regulation ofmarine areas beyond national jurisdiction (ABNJ).UNCLOS covers a broad range of human activitiesincluding, inter alia, maritime navigation, rights tomarine resources, pollution and conservation ofmarine biodiversity. To address issues pertaining to the sustainable useand conservation of biodiversity in ABNJ, the UnitedNations General Assembly (UNGA) established anAd Hoc Open-ended Informal Working Group to
to the next meeting of the CBD Subsidiary Body forScientific, Technical and Technological Advice(SBSTTA). The Parties would then recommendspecific EBSAs to be included in a report to theCOP, which would have an opportunity to endorsethe EBSAs recommended by the SBSTTA.
The CBD has begun to implement this process. TheEBSA Repository was developed in early 2011 andis currently being reviewed by the Parties. TheSecretariat has also produced documentation onthe use of the Repository including broaderdescriptions of the regional process and instructionalPowerpoint modules. Both of these products shouldbe released to the public by September 2011.Finally, as mentioned earlier, the CBD and itsregional partners have scheduled regionalworkshops to identify candidate EBSAs in theNortheast Atlantic (OSPAR region), theMediterranean, the Southwest Pacific, and theCaribbean and Western-central Atlantic (includingBrazil).
Figure 3: CBD EBSA Identification and information-sharing process.
EBSAs & data/capacity building
EBSARepositiory
Long-term research &capacity development plan
COP
SBSTTA
Report on ESBAsrecommended by
SBSTTA
Report on ESBAsendorsed by COP
UN GA, Ad Hoc Open-endedInformal Working Group onBiodiversity Beyond National
Jurisdiction (BBNJ)
RegionalWorkshops
Information Sharing with:
l UNDOALOS, FAO, ISA, IMO, UNEP
l CBD Scientific Partnersl WCMC, GOBI, OBIS
l RSOs, RFMOs
Report on EBSAs compiled fromthe Regional Workshops

are significant (e.g., Table 1 – see pages 17-18),and thus there is much to be gained by collaborationand sharing between conventions, agencies andorganizations. The Parties to the CBD clearlyunderstand this and have repeatedly recommendedworking together with relevant organizations,conventions and regional initiatives. They have alsorecommended the creation of biodiversityinformation-sharing mechanisms (e.g., the Clearing-House Mechanism and the EBSA Repository). Giventheir common connection to the UN and their use ofa criteria suite to identify marine areas of importance,there are five UN Agencies, Programmes or relatedorganizations for which the identification of EBSAsand the sharing of information and experiencesrelated to EBSAs are directly relevant.
1. The International Seabed Authority: Article 156 ofthe UNCLOS mandates the creation of theInternational Seabed Authority (ISA) to regulateactivities related to exploration for, andexploitation of, the resources of the seabed“area” beyond national jurisdiction This mandate
GOBI Pelagic EBSA Identification Workshop Report 13
BACKGROUND
study issues relating to the conservation andsustainable use of marine biological diversity beyondareas of national jurisdiction (or UN Working Groupon Biodiversity Beyond National Jurisdiction or BBNJ).The most recent UN Working Group on BBNJmeeting (June 2011) produced strong resultsrecommending that the UNGA develop the legalframework for establishing marine protected areas inareas beyond national jurisdiction – thus laying thegroundwork for a new agreement or process toenhance the conservation of biological diversitybeyond national jurisdiction. The CBD has afundamental role in supplying information on biologicaldiversity to the UNGA to support this process.
Further, as mentioned above, there are a number ofUN Agencies, Programmes and relatedorganizations, as well as nations and regions, whichhave proposed or promulgated suites of criteria forthe identification of areas of biological or ecologicalimportance to support conservation and sustainableuse of biodiversity resources (Fig. 4). The overlapbetween these criteria suites and the EBSA criteria
Figure 4: UN Agencies, Programmes and related organizations with criteria suites to identify important marine areas in need of heightened protection. The names given to such areas are italicized in bold.
UNESCO
FAO
IMO
RFMOsSpecializedAgencies
Programmes & Funds
Secretariat Office of Legal Affairs
Division of Ocean and Law of the Sea (DOALOS)
UNICPOLOS‘Biodiversity BeyondNational Jurisdiction’
(BBNJ)
International Seabed Authority
The Regular Process“A regular process for global reporting and assessment of the state of the
marine environment, including socio-economic aspects”
United Nations General Assembly
AREAS OF PARTICULARENVIRONMENTAL INTEREST (APEIS)
UNEP
CBD Secretariat
CMS Secretariat
Regional SeasSecretariat
ECOLOGICALLY OR BIOLOGICALLYSIGNIFICANT AREAS (EBSAS)
PARTICULARLY SENSITIVE SEA AREAS(PSSAS)
VULNERABLE MARINE ECOSYSTEMS(VMES)
WORLD HERITAGE SITES

carries with it responsibility for the protection ofthe marine environment from harmful effectswhich may arise from such activities, includingprotection and conservation of the naturalresources of the area and the prevention ofdamage to the flora and fauna of the marineenvironment.
Thus, identification of benthic EBSAs, or pelagicEBSAs that can be impacted by those activitiesregulated by the ISA, is of direct relevance to themanagement of the area. In the leasing of thearea for exploration and extraction activities, theISA has considered the use of Areas ofParticular Environmental Interest (APEIs; Smith2008). Although there is significant overlapbetween the APEI criteria and the EBSA criteria,the APEI criteria more closely reflect the criteriafor representative networks of MPAs that can beapplied in areas with limited knowledge such asthe deep seabed. These criteria are consideredin Table 1 as they have recently been endorsedby the ISA.
2. The International Maritime Organization: Similarlythe International Maritime Organization (IMO) isthe global institution responsible for safety ofnavigation and the prevention of marine pollutionfrom ships. As part of this authority, the IMOdeveloped a set of criteria for identifyingParticularly Sensitive Sea Areas (PSSAs) – areaswhich may be susceptible to the impacts ofshipping, and other environmental stressors. Inaddition, under the International Convention forthe Prevention of Pollution From Ships 1973 asmodified by the Protocol of 1978 (MARPOL73/78), “special areas” may be designated withheightened discharge controls.
3. The FAO and Regional Fisheries Bodies: TheFAO is the UN organization responsible forpromoting food security; its Fisheries andAquaculture Department provides advice toStates and regional fisheries bodies (RFBs) forachieving sustainable fisheries and aquaculture.Under the UN Fish Stocks Agreement (UNFSA),states are to cooperate to achieve the long-termconservation and sustainable use of straddlingfish stocks and highly migratory fish stocks.UNFSA sets out principles for the conservationand management of those fish stocks and
establishes that such management must bebased on the precautionary approach and thebest available scientific information. It definesand clarifies the role of regional fisheriesmanagement bodies. There are three types ofregional fisheries management bodies: thoseestablished under the UN FAO’s constitution,those established outside the FAO charter butfor which the FAO performs depositoryfunctions, and those established and functioningentirely outside the FAO’s structure, known asregional fisheries management organizations orarrangements (RFMOs).
With respect to deep sea fishing that was notcovered by the Fish Stocks Agreement orotherwise regulated by the RFMOs, in 2006, theUnited Nations General Assembly passedResolution 61/105 calling “upon States to takeaction immediately, individually and throughregional fisheries management organizations and
14 GOBI Pelagic ESBA Identification Workshop Report
BACKGROUND
The jewelled squid, Histioteuthis bonnellii, swims above theMid-Atlantic Ridge at depths from 500m to 2,000m.
Credit: David Shale, Census of Marine Life
criteria, the other six World Heritage Site criteriaincorporate cultural values which are notconsidered in the EBSA criteria. In particular, theEBSA criteria are very relevant to the applicationof World Heritage Site criterion 10: “to contain themost important and significant natural habitats forin situ conservation of biological diversity,including those containing threatened species ofoutstanding universal value from the point of viewof science or conservation.”
5. The UN Regular Process of Global Reporting andAssessment of the Marine Environment includingsocio-economic aspects: In 2002 the WorldSummit on Sustainable Development inJohannesburg decided to put the ocean underpermanent review. This decision was adopted asa precautionary measure, because sector-by-sector management of human activities in theocean has proven insufficient. The UN’sshorthand name for this initiative – the “RegularProcess” – emphasizes the importance ofconducting this assessment regularly, initiallyplanning for an ocean review every 4-5 years.The cyclical nature of the process would enablethe adoption of an adaptive strategy formanaging the global ocean. In 2010, the UNGeneral Assembly committed to carrying out thefirst cycle of the assessment from 2010 to 2014.
arrangements, and consistent with theprecautionary approach and ecosystemapproaches, to sustainably manage fish stocksand protect vulnerable marine ecosystems[VMEs]”. The criteria for VMEs, establishedthrough a series of FAO Expert Consultationsbetween 2006 and 2008, have much incommon with the CBD EBSA criteria. Althoughthey have been focused on deep-sea fisheriesand their impacts on benthic communities onseamounts, VMEs are not limited to thatecosystem. Thus, there is an opportunity for theapplication of the EBSA criteria in the pelagicrealm to provide experience and information tothe FAO and the RFMOs as they continue toimplement Resolution 61/105.
4. UNESCO and the World Heritage Convention:The UN Education, Scientific and CulturalOrganization (UNESCO) houses the WorldHeritage Committee – the body responsible forthe implementation of the World HeritageConvention. The criteria for identifying WorldHeritage Sites were established in 1977 andhave been repeatedly refined. The most recentversion is contained in the 2008 OperationalGuidelines for the Implementation of the WorldHeritage Convention. Only four of the ten WorldHeritage Site criteria overlap with the EBSA
GOBI Pelagic EBSA Identification Workshop Report 15
BACKGROUND
A juvenile Risso’s dolphin. Credit: A.S. Friedlaender

In 2011–12, preparatory regional workshops arebeing conducted all over the world to define thepriority questions and identify data gaps. Beingan integrated assessment using a Driver-Pressure-State-Impact-Response methodology,biodiversity is an extremely important component.The data gathering and information developmentto identify EBSAs will naturally inform this periodicassessment of the ocean under the authority ofthe UN General Assembly.
Thus, the CBD is in a valuable position to contributeto the management and conservation of biodiversityin the pelagic realm by sharing information andexperiences related to the identification of EBSAsdirectly with the UNGA through the Regular Processof Reporting and Assessment of the MarineEnvironment and its Working Group on BBNJ, andwith other relevant UN Agencies, Programmes andrelated organizations. Further, the CBD Secretariathas a role in the provision of information, guidelinesand when requested, technical assistance to itsParties to support the identification of EBSAs withinnational jurisdictions. The importance of thiselement of EBSA identification was made extremelyclear at COP10 by the removal of references toABNJ in the recommendations pertaining toEBSAs. Reporting on the identification of EBSAswithin national jurisdictions may thus be acomponent of future National Reporting
requirements, and a focus of National BiodiversityStrategies and Action Plans.
Finally, the identification of EBSAs is important tobusinesses and a healthy economy. The EBSAidentification process is essentially an information-gathering effort. Where marine spatial planningframeworks exist, EBSAs will inform those planningprocesses. Where such frameworks don’t exist,EBSAs can still inform relevant managementauthorities of areas in need of enhanced protectionand supply vital information to industry to decreaseoperational and other risks and increase confidence.The global economic downturn arising from thefinancial crises of 2008 clearly illustrated the role thatconfidence plays in driving credit markets. Similarly,corporate spending has been hindered since thatperiod by uncertainty surrounding the financial andregulatory landscape. A decrease in uncertaintysurrounding operational and legal risk, whether itcomes from a clearer regulatory environment orimproved knowledge of the ecosystem andecosystem services, is a goal of any industry. Byproviding information on marine biodiversity tobusinesses, it is possible to decrease uncertainty inthe operational and legal arena and to allow industryto better quantify the risk associated with operationalfailures. In this sense, industry has a role in providinginformation to assist the identification of EBSAs (orsupporting the collection of such information).
16 GOBI Pelagic ESBA Identification Workshop Report
BACKGROUND
Balearic Shearwater. Credit: Ben Lascelles, BirdLife International

Organization
Criteria for
identification of:
Uniqueness
or rarity
Special importance
for life-history
stages of species
Importance to
threatened or
endangered
species
Vulnerability,
fragility,
sensitivity, or
slow recovery
GOBI Pelagic EBSA Identification Workshop Report 17
CBD
Ecologically or Biologically
Significant Areas
Uniqueness or rarity
–Area co
ntains
either: (i) unique (“the on
ly one of its
kind
”), rare (“oc
curs only in few
locations”) or ende
mic spe
cies,
popu
lations or co
mmunities; a
nd/or (ii)
unique, rare or distinct, h
abitats or
ecosystems; and
/or (iii) un
ique or
unusual geo
morph
olog
ical or
oceano
grap
hic features.
Special importance for life-history
stages of species–Areas th
at are
requ
ired for a po
pulation to survive and
thrive. (...) Areas con
taining: (i) b
reed
ing
grou
nds, spa
wning
areas, n
ursery areas,
juvenile hab
itat o
r other areas impo
rtant
for life-history stag
es of spe
cies; o
r (ii)
habitats of m
igratory spe
cies (feeding
,wintering or re
sting areas, breed
ing,
mou
lting
, migratory ro
utes).
Importance for threatened,
endangered or declining species
and/or habitats
–Area co
ntaining
habitat for th
e survival and
reco
very of
enda
ngered
, threatened, declining
species or area with significant
assemblag
es of such species.
Vulnerability, Fragility, Sensitivity, or
Slow recovery
–Areas th
at con
tain a
relatively high
propo
rtion of sensitive
habitats, b
iotope
s or spe
cies th
at are
functionally frag
ile (highly suscep
tible to
degrad
ation or dep
letion by hum
anactivity or by natural events) or with slow
reco
very.
FAO
Vulnerable Marine Ecosystems
Uniqueness or rarity
–An area or
ecosystem th
at is uniqu
e or th
at con
tains
rare spe
cies who
se loss cou
ld not be
compe
nsated
for by similar areas or
ecosystems. These includ
e: hab
itats th
atco
ntain ende
mic spe
cies; h
abitats of
rare, threatened or end
ange
red species
that occur only in discrete areas; or
nurseries or discrete feed
ing, breed
ing,
or spa
wning
areas.
Functional significance of the habitat
– Discrete areas or hab
itats th
at are
necessary for the survival, function,
spaw
ning
/rep
rodu
ction or re
covery of
fish stoc
ks, p
articular life-history stage
s(e.g., nursery grou
nds or re
aring areas),
or of rare, th
reatened
or enda
ngered
marine species.
Fragility – An ecosystem th
at is highly
suscep
tible to
deg
rada
tion by
anthropo
genic activities.
Life-history traits of component
species that make recovery difficult–
Eco
system
s that are characterized
by
popu
lations or assemblag
es of spe
cies
with one or more of th
e following
characteristics: slow growth rates; late
age of m
aturity; low
or unpred
ictable
recruitm
ent; or long
-lived.
IMO
Particularly Sensitive Sea Areas
Uniqueness or rarity
–An area or
ecosystem is uniqu
e if it is “the on
ly one
of its kind
”. Hab
itats of rare, th
reatened
,or end
ange
red species that occur only in
one area are an exam
ple. An area or
ecosystem is rare if it on
ly occurs in a
few locations or has be
en seriously
depleted
across its range
. (...) N
urseries
or certain feed
ing, breed
ing, or spaw
ning
areas may also be
rare or uniqu
e.
Spawning or breeding grounds– An
area th
at m
ay be a critical spa
wning
or
breeding
groun
d or nursery area for
marine species which m
ay spe
nd th
erest of their life-cycle elsewhere, o
r is
reco
gnized
as migratory ro
utes fo
r fish,
reptiles, birds, m
ammals, or
inverteb
rates.
Critical habitat– A sea area that m
ay be
essential for th
e survival, fun
ction, or
reco
very of fish stocks or rare or
enda
ngered
marine species, or for the
supp
ort o
f large
marine ecosystems.
Fragility
– An area th
at is highly
suscep
tible to
deg
rada
tion by natural
events or by th
e activities of p
eople. (…
)
UNESCO
World Heritage Sites
Con
tain sup
erlative natural pheno
mena
or areas of excep
tional natural beauty
and aesthetic im
portance.
Be ou
tstand
ing exam
ples re
presenting
sign
ificant on-go
ing ecolog
ical and
biolog
ical processes in th
e evolution and
developm
ent o
f terrestrial, fre
shwater,
coastal and
marine ecosystems and
commun
ities of p
lants and animals.
Con
tain th
e most impo
rtant a
ndsign
ificant natural hab
itats fo
r in situ
conservation of biological diversity,
includ
ing those co
ntaining
threatened
species of outstanding
universal value.
Table 1: Criteria Crosswalk –Relationship amongst various UN Agencies and Programmes criteria for identifying ecologically important areas.

18 GOBI Pelagic ESBA Identification Workshop Report
Organization
Criteria for
identification of:
Productivity
Biodiversity
Naturalness
Structure
Historical
geomorphological
importance
CBD
Ecologically or Biologically
Significant Areas
Biological productivity
–Area
containing
spe
cies, p
opulations or
communities with com
paratively high
ernatural biological produ
ctivity.
Biological diversity
–Area co
ntains
compa
ratively high
er diversity of
ecosystems, hab
itats, c
ommunities, o
rspecies, or has high
er genetic diversity.
Naturalness
–Area with a com
paratively
high
er deg
ree of naturalness as a result
of th
e lack of o
r low level of hum
an-
indu
ced disturba
nce or deg
rada
tion.
FAO
Vulnerable Marine Ecosystems
Structural complexity
– An ecosystem
that is characterized
by co
mplex physical
structures created
by sign
ificant
concentrations of b
iotic and
abiotic
features. In these ecosystems, eco
logical
proc
esses are usually highly de
pend
ent
on th
ese structured
systems. Further,
such eco
system
s often have high
diversity, w
hich is dep
ende
nt on the
structuring orga
nism
s.
IMO
Particularly Sensitive Sea Areas
Productivity
– An area th
at has a
particularly high rate of n
atural biological
prod
uction. Such prod
uctivity is th
e net
result of biological and
physical
proc
esses which re
sult in an increase in
biom
ass in areas such as oceanic fron
ts,
upwelling areas and some gyres.
Diversity
– An area th
at m
ay have an
exceptional variety of spe
cies or ge
netic
diversity or includ
es highly varied
ecosystems, hab
itats, a
nd com
mun
ities.
Naturalness
– An area th
at has
expe
rienced
a re
lative lack of h
uman-
indu
ced disturba
nce or deg
rada
tion.
Dependency
– An area where eco
logical
proc
esses are high
ly dep
ende
nt on
biotically structured system
s (e.g., co
ral
reefs, kelp forests, m
angrove forests,
seag
rass bed
s). S
uch ecosystems often
have high diversity, w
hich is dep
ende
nton
the structuring orga
nism
s.Dep
ende
ncy also embraces th
emigratory ro
utes of fish, rep
tiles, b
irds,
mam
mals, and
inverteb
rates.
UNESCO
World Heritage Sites
Be ou
tstand
ing exam
ples re
presenting
sign
ificant on-go
ing ecolog
ical and
biolog
ical processes in th
e evolution and
developm
ent o
f terrestrial, fre
shwater,
coastal and
marine ecosystems and
commun
ities of p
lants and animals.
Con
tain th
e most impo
rtant a
ndsign
ificant natural hab
itats fo
r in situ
conservation of biological diversity,
includ
ing those co
ntaining
threatened
species of outstanding
universal.
Con
tain sup
erlative natural pheno
mena
or areas of excep
tional natural beauty
and aesthetic im
portance.
Be ou
tstand
ing exam
ples re
presenting
major stage
s of earth’s history, including
the reco
rd of life, significant o
n-go
ing
geolog
ical processes in th
e de
velopm
ent
of land
form
s, or sign
ificant geo
morph
icor physiog
raph
ic features.
Table 1 (cont.): Criteria Crosswalk –Relationship amongst various UN Agencies and Programmes criteria for identifying ecologically important areas.

variables (e.g., sea surface temperature). Giventhe strong connections mentioned abovebetween dynamic oceanographic processesand species life-history stages, as well asecological communities, the use of dynamicdelineations may be necessary. Theconsequence of relying on static EBSAs will bean increase in the size of the EBSAs delineatedin order to incorporate the variability in spaceand time of the feature (habitat) they describe.
5. Quantify uncertainty and be adaptive
l Given the relative lack of data for the pelagicrealm, there is an increased need to builduncertainty into the EBSA identification process.Further, there is a need to ensure the process isadaptive and ongoing so adjustments can bemade as new data become available. This isparticularly important in the context ofincorporating climate change into the EBSAidentification process. (See the specificguidelines on quantifying uncertainty below.)Various approaches can be used to address therelative scarcity of pelagic data, including delphicprocesses, modeling and proxies (i.e.,oceanographic features or indicator species).(See below.)
Other considerations:
6. Not all phytoplankton are created equal…
l Practitioners should not assume all areas ofhigh-productivity are “in need of protection”.Areas of interest likely involve some level oftrophic transfer, not just high productivity.
7. Prioritize complexity
l Areas where currents, frontal systems oreddies/eddy fields meet complex topographicfeatures tend to produce areas of particularecological interest. When specific data are notavailable, oceanographic complexity may serveas a proxy.
8. Process drives pattern – incorporate process
l Many EBSAs will be delineated by means thatdo not incorporate the oceanographicprocesses that drive a location to be ofecological or biological significance. These“outside” processes should be considered in theEBSA identification process and cited when they
The main focus of the workshop and the break-outgroups was the development of guidelines andexamples of the application of the EBSA criteria inthe pelagic realm. Towards this end, the summariesand examples presented by each break-out groupwere modified and fleshed out as necessary todevelop criteria-specific guidelines for this report.The general guidelines in section 4.1 weredeveloped by the editor from the break-out groupsummaries (sections 4.2 – 4.5) and agreed uponthrough editing by the group. We provide thegeneral guidelines first as an overview and to denotethe importance of these concepts.
4.1 General Guidelines for the identification ofpelagic EBSAs
Guidelines:
1. Think big
l The scale of many pelagic features and habitatsis broad. Practitioners should delineate EBSAsat the scale of these features and habitats.Larger EBSAs, even at the scale of 10,000s ofsquare kilometers, may be informative even ifsome management measures will beimplemented on a finer scale.
2. Consider time
l Pelagic EBSAs should incorporate the frequencyand persistence of features. The dynamic natureof many pelagic areas over varying time periodsmeans that time series of data can help to mosteffectively define a site.
3. Think deeply
l Accounting for over 99% of the habitable volumeof the planet, life in the pelagic realm is notconfined to thin layers as it is on land and theseafloor. It interacts over thousands of meters ofdepth and thousands of kilometers in length andbreadth. Full consideration of pelagic biodiversityrequires the representation of biodiversity at alldepths.
4. Be dynamic
l Although the delineation of static EBSAs is likelyto be the outcome of initial efforts at delineatingEBSAs, those involved in the process areencouraged to explore EBSAs defined by thepresence of a feature or by oceanographic
GOBI Pelagic EBSA Identification Workshop Report 19
4. GUIDELINES AND CONSIDERATIONS FOR THE APPLICATION
OF THE EBSA CRITERIA IN THE PELAGIC ZONE

Table 2: Quantification of uncertainty used in Working Group III to the Fourth Assessment Report of the IPCC (Metz et al. 2007).
Amount of evidence (number and quantity of independent sources)
Level of agreement (on a particular finding)
High Agreement, High Agreement, High Agreement,limited evidence medium evidence much evidence
Medium agreement, Medium agreement, Medium agreement,limited evidence medium evidence much evidence
Low agreement, Low agreement, Low agreement,Low evidence medium evidence much evidence
are known so that appropriate consideration canbe given to how activities occurring with thesame process might affect the EBSA (e.g.,down-current effects).
Quantifying uncertainty:
In applying the EBSA criteria we considered bothdata-rich and data-poor regions and recognized thatit is necessary to give some level of certainty toareas identified as important. Various schemes havebeen used to quantify uncertainty by differentorganizations. During the workshop the BiologicalProductivity break-out group recommended oneused in fisheries by assigning four levels of certaintyto areas identified (Williams et al. 1996). These are:
1. Area is well validated by data2. Area is validated by some data, some expert
knowledge3. Area identified by expert knowledge4. Area identified by anecdotal information
Using these criteria allow us to assign confidence toany given area, and also helps to identify additionalresearch needs.
Another means of quantifying uncertainty is offeredby the Intergovernmental Panel on Climate Change(Metz et al. 2007; Table 2).
We highly recommend the adoption and use of aknown classification of uncertainty, such as theexamples above, by any organization seeking toidentify areas of importance in the pelagic realm.
4.2 Special Importance to Life History Stage &Importance for Threatened, Endangered orDeclining Species and/or Habitats
Participants: Simon Nicol (chair), Ben Lascelles(rapporteur), Autumn-Lynn Harrison, Daniel Palacios,Lora Reeve, George Shillinger, Maurizio Würtz
Criteria:
These two criteria, the life-history stage andthreatened, endangered or declining species, wereconsidered together due to the large overlap in theirapplication. Although the life-history stage criterioncan be more broadly applied and should beconsidered at a population scale, the examplesgiven by the CBD for both criteria are exactly thesame (see Appendix 2). The group considered allareas that met the importance for threatenedspecies criterion to meet the importance to life-history stage criterion, but the converse (that allareas meeting the life-history stage criterion wouldalso meet the importance to threatened speciescriterion) was not necessarily true.
These two criteria are highly relevant to the pelagicrealm. Through projects of the Census of Marine Lifelike OBIS, OBIS-SEAMAP the Tagging of PelagicPredators (TOPP), and the ongoing work of BirdLifeInternational, Movebank, Seaturtle.org and otherresearch programs supporting the collection andstorage of pelagic tagging and surveys efforts overthe last decade, the amount of available data toidentify core-use areas for many species hasincreased dramatically.2 A variety of life-history stage
20 GOBI Pelagic ESBA Identification Workshop Report
GUIDELINES AND CONSIDERATIONS FOR THE APPLICATION OF THE EBSA CRITERIA IN THE PELAGIC ZONE

m State-Space Models (SSM) (Jonsen et al.2003 & 2005; Eckert et al. 2008; Pattersonet al. 2008; Bailey et al. 2010; Maxwell et al.2011 & in press)
l For tracking and or survey data:m Kernel Home Range Analysis (Shillinger et al.
2008; Shillinger et al. 2010; Maxwell et al.2011; Curtice et al. 2011; many others)
m Regression, Machine Learning (CARTs,Random Forests, Bagged Decision Tree andother Habitat Modelling (Friedlaender et al.2006; Torres et al. 2008; Bailey et al. 2010;Péron et al. 2010; Louzao et al. 2011;Zydelis 2011; Nur et al. 2011; many others)
m Water mass distribution based on models ofSST preferences (Hobday & Hartmann2006; other Hobday papers; referred to inLouzao et al. 2011)
These methods can be used on both tracking dataand survey data. The CBD will make furtherinformation on this subject available through theirEBSA identification manual which is set to bereleased in September of 2011 (see also BirdLifeInternational 2009). While these methods are usefulin identifying important life-history areas for a givenspecies, the delineation of EBSAs for every speciesof interest may not be useful. Practitioners shouldconsider larger areas that incorporate the life-historystages of multiple species to make site identificationand large-scale management more palatable. Morespecific, sector-based management may requiremore detailed information on the distribution of lifehistory-stages of given species, but more generalmulti-species EBSAs should at least give an initialindication of areas requiring further consideration.
For the importance to threatened, endangered ordeclining species and/or habitats criterion, someclassification will be needed to determine whichspecies and/or habitats to consider. Species can bethreatened at global, regional, national or localscales, so an appropriate classification should befitted to the scale of analysis. The IUCN Red Listprovides a global classification of species risk ofextinction, many regional agreements also containannexes of threatened species that are of particular
habitats are directly cited in CBD Decision IX/20 asmeeting these criteria, specifically:
1. breeding grounds2. spawning areas3. nursery areas4. juvenile habitat5. habitats of migratory species, including:
a. feeding areasb. wintering areasc. resting areasd. breeding arease. moulting areasf. migratory routes
Other types of areas that might meet these criteriaconsidered by the break-out group were areas oflarval dispersal, and feeding areas used duringdifferent life-history stages of seabirds (i.e., thepotentially different areas seabirds forage in duringincubation, brooding, chick-rearing periods). Finally,there was also consensus that greater attention ondeclining habitats (e.g., sea ice) was needed in theapplication of the importance to threatenedspecies/habitat criterion, as the CBD offered noexamples and the concept of declining habitatseems to get lost in the many species core-useareas that fall under these criteria.
Means of identification:
A number of documents describe the variety ofmeans managers and researchers have at theirdisposal to define core use areas reflecting variouslife-history stages. These are listed below with somerecent and relevant examples of their application(adapted from Ardron et al. 2008; BirdLifeInternational 2009):
l For tracking data:m Sinuosity Analysis (Benhamou 2004;
Grémillet et al. 2004)m Fractal Analysis (With 1994; Tremblay et al.
2007)m Time spent per area (Péron et al. 2010;
Louzao et al. 2011)m First-Passage Time Analysis (Fauchald &
Tavera 2003; Pinaud & Weimerskirch 2005;Kappes et al. 2010; Louzao et al. 2011)
GOBI Pelagic EBSA Identification Workshop Report 21
GUIDELINES AND CONSIDERATIONS FOR THE APPLICATION OF THE EBSA CRITERIA IN THE PELAGIC ZONE
2 For more information see www.iobis.org, seamap.mgel.duke.edu, www.topp.org, www.seabirdtracking.org,www.movebank.org, www.seaturtle.org

focus. These types of agreed classification systemsshould be adopted wherever possible. The methodsdescribed above also apply to the importance tothreatened, endangered or declining species and/orhabitats. Fisheries observer data (catch, CPUE,bycatch, etc.) will also be of great use in identifyingthese areas. Although it is common practice toidentify areas of importance to endangered,threatened and declining species by directlymapping areas of high bycatch (e.g., Lewison et al.2009; Peterson et al. 2009a & b), it may be moreappropriate in the context of EBSAs to use thesedata to generate habitat suitability models forspecies of interest (e.g., Zagaglia et al. 2004;Hobday & Hartmann 2006; Morris & Ball 2006; seealso: Redfern et al. 2006). It is also possible tocombine tracking data and fisheries observer data indynamic habitat models (Zydelis et al. 2011).
Precautionary points:
l The observation data which drive identificationof “core use” areas are often based on sex-,age- and/or life-history stage biased data. Forexample, most data on sea turtle habitat are
based on tagging studies of nesting adultfemale sea turtles (Godley et al. 2008). Clearlysuch data do not adequately define all areas ofimportance for sea turtles. Similarly largeamounts of data are available on many aspectsof breeding seabirds distributions, but studieson movement of juveniles and during the non-breeding period are minimal by comparison(BirdLife International 2004). All efforts must bemade to adequately incorporate any sex, ageor life-history stage specific differences inhabitat usage.
l Caution is necessary when interpreting resultsfrom small sample sizes, particularly whenlooking to extrapolate results from the studypopulation to the wider population.
l This type of niche-partitioning in the pelagicrealm is more likely to occur over a greatervertical extent than in any other biome. Thus, theinclusion of three-dimensional data whenconsidering the delineation of pelagic EBSAs isimportant.
l Within a given pelagic species, life-historystages may also vary widely in scale. As such,
22 GOBI Pelagic ESBA Identification Workshop Report
GUIDELINES AND CONSIDERATIONS FOR THE APPLICATION OF THE EBSA CRITERIA IN THE PELAGIC ZONE
Gentoo penguins in the Antarctic Peninsula. Credit: A.S. Friedlaender

4.3 Biological Productivity Summarized by Sara Maxwell
Participants: Steven Bograd (chair), Sara Maxwell(rapporteur), Natalie Ban, Nic Bax, Patricio Bernal,Elliott Hazen, Aurélie Spadone
Criteria:
Two areas of importance for determining areas ofhigh biological productivity were considered: (1)areas that result in direct increases of productivity(i.e., upwelling regions) and (2) areas that result inspatial or temporal aggregation of productivity (i.e.,fronts). The group considered productive areas tobe those that are productive across multiple levels(i.e., primary, secondary and higher). In other words,the area must be important over multiple trophiclevels and be persistent or recurrent in space andtime. Thus, the three conditions used in determiningareas of importance were:
1. Higher biomass or productivity than surroundingarea; and
2. At least one level of trophic transfer; and
3. Be recurrent or persistent in space and time
For biologically productive areas there must besome sort of biological forcing that is transferredbetween trophic levels which may not be the caseat, for example, calving grounds in which noforaging occurs.
Means of identification:
A number of mechanisms were identified that resultin high biological productivity, including areas ofupwelling – whether wind-driven, topographically-induced or equatorial. Some mechanisms result inincreased nutrient availability including advection andmixing. Thermocline shoaling can also result inelevated productivity by concentrating productivityvertically; oxycline shoaling can result in similarcompression. Aggregating features such as eddiesand fronts retain and concentrate productivity bothvertically and horizontally and can persist from daysto months. Topographic features also increasebiological productivity, either by physical forcing(interruptions of flow, upwelling, etc) or bycongregating productivity. These features includecanyons, shelf breaks, islands and seamounts.
sampling and modeling methods must bematched to the specific resolution and scale ofthe life-history stage being considered.
l Given the number of considerations beingbrought to bear on the description of core-useareas for the various life-history stages of asingles species, it is understandable thatmanagers and policy makers might be interestedin “umbrella” approaches and proxies toidentifying EBSAs relevant to these criteria.
m Top predators can be used as indicators ofecosystem health. Care is needed inchoosing appropriate umbrella species, butthis approach is reasonable in data limitedsituations.
m Physical proxies for areas of importance tolife-history stages or threatened speciesmay also offer a means to identify suchareas. For many life-history stages, processdrives pattern – that is, physical processesgovern where prey will be aggregated, andwhere trophic transfers occur. (See theProductivity criterion below for furtherdiscussion of this topic.)
Examples:
l Spawning area:
m Coral triangle & Equatorial belt (tuna)
l Migratory route:
m Straits of Gibraltarm Line islands – c. 60% of tracked sooty
shearwaters use this as a migratorycorridor/bottleneck
m Pacific sea turtle migration corridors
l A larger area containing areas of importance tothe life history of multiple species:
m North Pacific Transition Zone – albatross andother seabirds, loggerhead sea turtles,seals, bluefin tuna
m Tasman Sea – albatross and other seabirdsm Patagonian Shelf – seabirds, sealsm Sargasso Sea – sea turtles, seabirds, fish
and sharksm Central Indian Ocean – seabirdsm Humboldt Current
GOBI Pelagic EBSA Identification Workshop Report 23
GUIDELINES AND CONSIDERATIONS FOR THE APPLICATION OF THE EBSA CRITERIA IN THE PELAGIC ZONE

These areas of productivity can be identified in anumber of ways including by using:
l Remotely sensed data from the ocean’s surface
l In situ oceanographic data (ships, moorings)
l Floats, drifters, biologgers (animal-borne dataloggers)
l Climatologies for identifying areas of persistence
l Boat-based surveys such as those for marinemammals
l Fishing data (catch, CPUE, bycatch, etc)
l Predictive modeling of additional areas based onin-hand data
l OBIS, AquaMaps and other geographic databases
l Expert opinion
Precautionary points:
l Areas with high productivity can be determinedby remote sensing but some productivity occursin the water column, making these regions moredifficult to detect (i.e., Oxygen Minimum Zone(OMZ) shoaling); the subsurface will always bedata poor regardless of the region of the worldbecause it cannot be detected by satellite, andin situ sampling is sparse and more frequentlyundertaken at the surface.
l Additionally, some surface productivity does nottranslate to higher trophic levels and this shouldbe a caution, particularly in trying to determineEBSAs in data-poor regions. Where possible, itis critical to validate high-productivity regionsdetected via remote sensing and by ground-truthing with biological data (i.e., tagging data,survey data, etc).
l The process should be iterative and adaptive aswe acquire more knowledge through time.
l Looking at historical changes to candidateEBSAs may be important for understanding thevariability and persistence of the area, and inpredicting future changes to these sites,particularly with regard to climate change.
Examples:
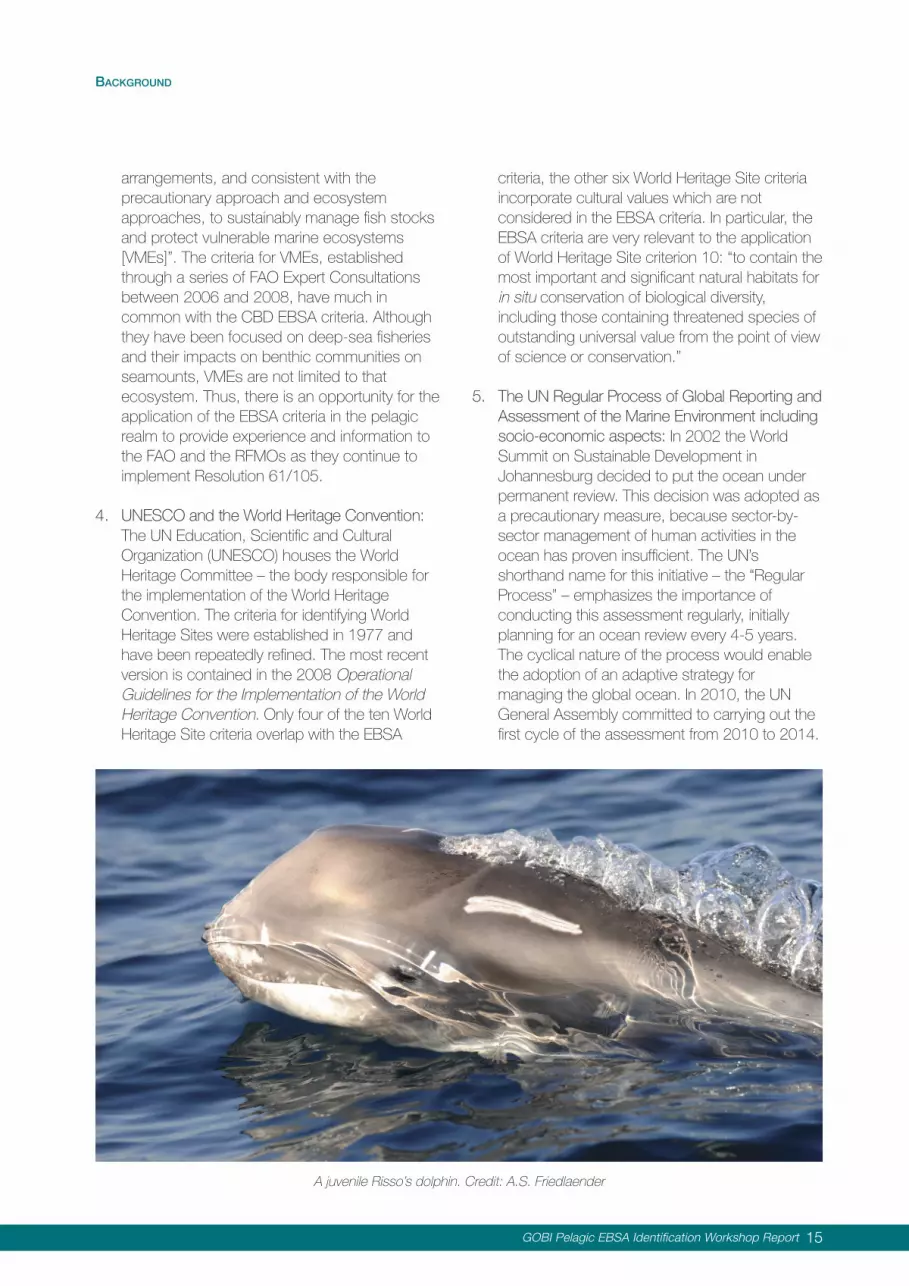
We chose the Equatorial Tropical Pacific as anexample region and identified a number of potentialareas of high biological productivity, the drivingmechanisms and associated uncertainty (Fig. 5).
We further identified a number of examples of areasof biological productivity and assigned a level ofcertainty based on Williams et al. (1996) (seesection 4.1 General guidelines) to each areadiscussed.
l Topographically induced upwelling:
m West of Galapagosm Seasonal (Palacios 1999, 2002, 2004)m Used by top predators (blue whales,
dolphins, sea lions, seabirds)m Data uncertainty: 1
l Wind driven:m Gulf of Papagayo and Tehuantepecm Identified with remote sensing data – SST,
chlorophyll (Palacios et al. 2006)m Leatherback area (Bograd et al –
unpublished)m Seasonally recurrent (Palacios et al. 2006,
Chelton et al. 2000)m Data uncertainty: 2
l Thermocline shoaling:
m Costa Rica Dome: m Lots of data (oceanographic and biological),
ETP cruises (Fiedler 2002)m Clear remote sensing signal in sea-surface
height, chlorophyll, SST (Fiedler 2002)m Persistence (Fiedler 2002)m High biomass of prey base (Fiedler et al.
1998) and top predators (Reilly & Thayer1990; Fiedler 2002; Balance et al. 2006)
m Data uncertainty: 1
l Shoaling of the OMZ (Area where some oxygenlevel reaches the photic zone):
m In situ oceanographic data (Fuenzalida et al.2009; Paulmier & Ruiz-Pino, 2009)
m Persistent feature in time (Fuenzalida et al.2009; Paulmier & Ruiz-Pino, 2009)
m Vertical compression of habitat that createsa foraging hotspot (trophic complexity;Stramma et al. 2010)
m Data uncertainty: 3
24 GOBI Pelagic ESBA Identification Workshop Report
GUIDELINES AND CONSIDERATIONS FOR THE APPLICATION OF THE EBSA CRITERIA IN THE PELAGIC ZONE
sources. Further, the sampling platform used tocollect observation data also biases the estimate.For example, a box core does not sample the sametype of organisms as trawl samples. Even two trawlsmay sample differently based on net characteristics,trawl configuration and the survey duration, location,depth and date/time. These issues are not unique toquantifying biodiversity in the pelagic open ocean,but the challenges mentioned in the introduction ofcollecting data in a vast, deep, distant and dynamicocean make it far more difficult to do in the pelagicrealm than in any other biome. Given these issues,every effort must be made to make use of availabledata including fisheries observer datasets and tosupport data collection programs (e.g., CoML) anddata aggregation thorough data warehouses (e.g.,OBIS, BirdLife International, Movebank,Seaturtle.org). This criterion was considered lessrelevant for application in the pelagic realm becauseof these challenges.
While further data are collected, there is still a needto understand how the biodiversity criterion can beapplied in efforts to identify pelagic EBSAs. Three
4.4 Biological Diversity
Participants: Kerry Sink (chair), Jeff Ardron(rapporteur), Piers Dunstan, Hedley Grantham, Pat Halpin, François Simard, Franz Smith
Criteria:
As with the two previous criteria, quantifyingbiodiversity is a data-driven process. However, thedata requirements for quantifying biodiversity aresignificantly harder to meet than in either of thosecriteria. We are not able to directly remote sensebiodiversity as we can with many oceanographicvariables, and data are required across all speciesand all regions. The understanding of pelagicbiodiversity pattern lags behind that for benthicbiodiversity and there has been less research aimedat elucidating key drivers of pelagic biodiversitypattern at the level of entire pelagic speciesassemblages. Observation data in the open oceanare generally opportunistic and of insufficient quantityto drive reliable biodiversity estimates, requiringresearchers to use data from many different
GOBI Pelagic EBSA Identification Workshop Report 25
GUIDELINES AND CONSIDERATIONS FOR THE APPLICATION OF THE EBSA CRITERIA IN THE PELAGIC ZONE
Figure 5: The Equatorial Tropical Pacific as an example of types of areas that might meet the Biological Productivity criterion.

methods are available in the normal circumstancewhere insufficient data exist to quantify biodiversitythrough normal metrics: a Delphic approach, use ofproxies, and use of predictive models. Through aDelphic approach, scientific, local and indigenousexpert opinion can be used to begin a process toidentify important pelagic areas that are then groundtruthed. Proxies based on correlative or processmodels from other locations can suggest types ofareas that may have increased levels of biodiversity.For instance, Morato et al. (2008) found that pelagicbiodiversity increased within 40km of seamounts inthe southwest Pacific. This information providesgrounds for the hypothesis that the same would betrue for seamounts in other regions, and thus thearea around seamounts in any given region could beconsidered as a candidate EBSA. Finally, the use ofpredictive habitat models to drive quantification ofbiodiversity metrics is another available approach(see Ready et al. 2010, Tittensor et al. 2010). Ineach of these cases an adaptive approach isimportant so that further work can be done to verifythe validity of, and adjust as necessary, the areaproposed as an EBSA.
Means of identification:
l Traditional biodiversity indices:m Berger-Parker Indexm Simpson’s Indexm Shannon-Wiener Indexm Pielou’s Evenness Indexm Hurlbert (ES50) Index
l Species richness:m based on environmental envelopes
(Kaschner 2007, Lucifora et al. 2011)m based on habitat models (Ready et al. 2010;
Kaschner et al. 2011; Tittensor et al. 2010)m based on extrapolated species discovery
curves (Tittensor et al. 2010)m based on fisheries catch data
l e.g., Worm et al. (2003 & 2005); Trebilco et al.(2011)
l distribution maps of relative abundance of targetspecies from fisheries dependent andindependent data (Grantham et al. 2011)
l Standardized abundance indices (-1 to 1) (Nuret al. 2011)m calculated for all species and then combined
l Summed weighted core areas (Nur et al. 2011)m inversely weighted by the size of the core
area required by the species and thensummed.
l Persistence of hotspot (Nur et al. 2011)m # of times the cell was in the top 5% of
predicted abundance for a species acrossall years (11 max), averaged over all species
l Rank Abundance Distributions (Dunstan &Foster 2011)
l Proxies:m based on distance to seamount (Morato et
al. 2008)m based on distance to frontal zonem based on areas of high prey species
density:
l Interpolation of copepod biomass from in situzooplankton samples (Grantham et al. 2011)
l Relative density of the deep scattering layer(DSL) based on acoustic sampling (Hazen et al.2011)
Precautionary points:
l Not all biodiversity is the same. Thus it may beinappropriate to compare one place to anotherbased on biodiversity indices unless it is knownthat the sites are biogeographically similar.
l Partly due to the problems just of comparingbiodiversity mentioned above, global scalecomparisons are less meaningful than regionalscale comparisons.
l It bears repeating: Quantification of biodiversitymetrics is linked to sampling methods, i.e., thesampling mechanism, the sampling effort, theextent of the area sampled in space and time,and variation in observer experience.
l As the list of methods above indicates, there isno single agreed-upon measure of biodiversity.Care should be taken to understand what themeasure used actually quantifies (e.g., the totalnumber of different species, the evenness ofabundance of the different species, thephylogenic range of the samples, etc.).
Examples:
l Mediterranean hotspots (Coll et al. 2011)
l OBIS ES50 example (see GOBI illustrations)
26 GOBI Pelagic ESBA Identification Workshop Report
GUIDELINES AND CONSIDERATIONS FOR THE APPLICATION OF THE EBSA CRITERIA IN THE PELAGIC ZONE

fundamental level this criterion stresses that “less ismore”: the smaller the geographic range, the fewerthe number of habitats occupied, and the smallerthe population size of a given species the rarer it isconsidered. These ideas were formalized byRabinowitz (1981) as the seven forms of rarity. Giventhe incredible dynamism of the pelagic zone, wesuggest a fourth factor, temporal periodicity (i.e.,patterns in presence of a species or habitat in time),be added to the rarity matrix (Table 3). Uniquenesscan simply be interpreted as the highest level ofrarity – i.e., there is only one instance of the speciesor habitat.
Quantification of uniqueness and rarity on a specieslevel relies on the same type of observation data asthe biodiversity criterion, and is thus subject to thesame biases and problems. In particular, rarity ishighly correlated to sample size. Thus an adaptiveapproach is again recommended such that newestimates of rarity can be produced as more dataare collected. The reliance on observation data alsomeans that the same methods may be used in data-poor scenarios (i.e., with increasing complexity anddata needs we recommend: a Delphic approach,use of proxies, and use of predictive models.)
However, quantification of rarity in habitat types maybe done on a broader scale using remote sensing.For instance, polynyas (large, persistent regions ofgenerally open water within thick pack ice) arespecifically mentioned in Annex 2 to CBD DecisionIX/20 as meeting the uniqueness and rarity criteria.Such features (and many others) can be identified,measured, counted and tracked with remotelysensed datasets. This is particularly important to theapplication of the EBSA criteria to pelagic areas, asthese data are readily available on a global scale atresolutions relevant to regional and country-levelplanning and management (see the list of types ofpelagic areas that may meet the EBSA criteriabelow). It is also critical to note that the description inAnnex 2 to the CBD decision goes beyond merelyidentifying species and features in its definition of theuniqueness and rarity criterion to include “unique orunusual geomorphological or oceanographicfeatures”. This not only reiterates that types ofoceanographic features may meet this criterion, butalso broadens the conception of the criterion toinclude pelagically important geomorphologicalfeatures like physical bottlenecks (i.e., areas like
l Aquamaps marine mammal richness studies(Kaschner et al. 2011)
l Areas of high richness from pelagic fisheriesdata (Worm et al. 2003)
l Also see Worm et al. (2005); Tittensor et al.(2010); Trebilco et al. (2011)
l BirdLife International albatross hotspots (BirdLifeInternational, 2004)
4.5 Uniqueness and Rarity
Participants: Elliott Norse (chair), Kristina Gjerde(rapporteur), Daniel Dunn, Eddie Game, Erwann Lagabrielle, Sheila McKenna, Franz Smith
Criteria:
The uniqueness and rarity criterion is likely the mosteasily understood of all the EBSA criteria. On a
GOBI Pelagic EBSA Identification Workshop Report 27
GUIDELINES AND CONSIDERATIONS FOR THE APPLICATION OF THE EBSA CRITERIA IN THE PELAGIC ZONE
European Storm-petrels. Credit: Ben Lascelles, BirdLife International

straits that physically reduce the amount of space aspecies has to move through, often increasing theirvulnerability to a variety of stressors and impacts.)
Finally, in discussing and presenting examples ofuniqueness and rarity in the pelagic realm, the groupoften found itself offering examples of what might beconsidered the “best” examples from other criteria.For example, the importance to life-history stagecriterion and the importance to endangered speciescriterion have countless examples to depict each,yet few of these might be entirely unique or evencomparatively rare (e.g., only one important site for agiven life-history stage). However, there areexamples, like the two known spawningaggregations of northern (Atlantic) bluefin tuna or thelimited known range of the giant squid, which wouldmeet the uniqueness or rarity criterion. The New
Zealand Storm Petrel, Beck’s Petrel and Fiji Petrelare all seabirds whose breeding sites are currentlyunknown, but they have been found at single sitesat sea where they are known to regularlycongregate. Similarly, endemic species and theirhabitats would be considered unique.
Means of identification:
l In data limited situations:m Delphic processesm Proxiesm Predictive models
l When data are available:m Quantification of geographic range, habitat
specificity and local abundance (seediscussion above on the “forms of rarity”)
28 GOBI Pelagic ESBA Identification Workshop Report
GUIDELINES AND CONSIDERATIONS FOR THE APPLICATION OF THE EBSA CRITERIA IN THE PELAGIC ZONE
Table 3: Fifteen forms of rarity: Categorization of rarity in the pelagic realm (modified from Rabinowitz 1981)

l Domes:m Sumbawa Dome m Costa Rica Domem Angola Domem Guinea Dome
l Shallow submerged seamounts, banks,plateaus:m Saya de Malha Banksm Cortez Bankm Argos and Challenger Banksm Grand Banks
l On a regional or ocean basin scale:m Transition zonesm Boundary currentsm Upwelling zones
Species-specific examples:
l Endemic species
l Species with limited number of spawningaggregations/sites
l Aggregations/congregations
m Superlative and uncommon examples fromother criteria
Precautionary points:
l Uniqueness and rarity are entirely scaledependent. What is rare on a global level mightbe common on a local or regional level.
l 10.11. Assemblages/congregations (either ofsingle or multiple species) can be rare orunique…
Habitat-specific examples:
l Aggregations of structure forming pelagicspecies:m Sargasso Sea
l Straits & Channels (i.e., physical bottlenecks):m Strait of Gibraltarm Strait of Messinam Strait of Malaccam Lombok Straitm Bering Straitm Sicilian Channel
GOBI Pelagic EBSA Identification Workshop Report 29
GUIDELINES AND CONSIDERATIONS FOR THE APPLICATION OF THE EBSA CRITERIA IN THE PELAGIC ZONE
Blue whale. Credit: A.S. Friedlaender

4.6 Vulnerability, Fragility, Sensitivity, or SlowRecovery & NaturalnessIssues summarized by J. Ardron (Fragility) and N. Ban (Naturalness)
Criteria:
The fragility criterion and the naturalness criterionwere not given the same consideration during theworkshop (i.e., they were not topics for their ownbreak-out groups). The main factor driving thisdecision was not that they were unimportant in theidentification of pelagic EBSAs, but that theirapplication in the open ocean was no different thanin benthic or neritic environments. As such, thereader is encouraged to review other relevantliterature which looks at these criteria in more depth.In particular we would recommend the forthcomingCBD Training manual for the identification ofecologically and biologically significant areas(EBSAs) in the oceans, and the Report of the ExpertWorkshop on ecological criteria and biogeographicclassification systems for marine areas in need ofprotection, both of which contain guidelines on theapplication of the EBSA criteria.
Despite the lack of directed break-out groups, theworkshop did come up with a few considerationswhich are unique to the pelagic realm or bearrepeating due to their importance.
Considerations:
Naturalness
l It is critical that the naturalness criterion be notsolely based on a snapshot of the presentthreats and impacts. Historical records ormodels of resource extraction and pollution arevital to a full understanding of naturalness in thepelagic realm. The trophic structure andfunctioning of many current ecosystems is aconsequence of levels of use in the past, notthe present. Further, consideration of futureimpacts should also be considered whenapplying this criterion. For example, climatechange scenarios offer a means to understandpossible levels of naturalness in the future.
l It is important to define baselines from which tojudge the naturalness of an area. For example,many current systems differ significantly frompre-industrial times, however the lack of abaseline makes the degree of naturalnessdifficult to measure.
l The benthic and pelagic realms are notindependent. Activities in the one realm canaffect communities in the other. These cross-system impacts are more common than not –that is, most activities in one realm have someimpact on the other. For example:m removal of top predators in a benthic system
(who may be pelagic species) by pelagicfishing
m mortality or behavioral changes in pelagicspecies from noise produced by energyexploration on the seafloor
m increased transfer of organic matter tobenthic communities from pelagic fishing
m invasive species and pollution from shippingaffects both realms
Fragility, Vulnerability, Sensitivity, or Slow Recovery
l Although cold water coral and chemosyntheticcommunities are often cited as examples of thiscriterion, the definition goes well beyond physicalfragility and can be applied to a variety of pelagicspecies and habitats.
l Species that are overfished or where bycatchthreatens population sustainability are likely“species that are… highly susceptible todegradation or depletion by human activity”(taken from the CBD Fragility criterion definition).
l Application of this criterion should includeconsideration of species that may be sensitive toclimate change (e.g., krill reliant spp).
l Wasp waist ecosystems (mid-trophic changes)may be more sensitive to threats and stressorsthan more top-down or bottom-up governedecosystems.
l Particular attention should be given to thevulnerability of coccolithophores to oceanacidification, given the importance of theseorganisms as a nutrient source in oligotrophicareas. Loss of the food source in such systemsmay produce drastic regime shifts.
30 GOBI Pelagic ESBA Identification Workshop Report
GUIDELINES AND CONSIDERATIONS FOR THE APPLICATION OF THE EBSA CRITERIA IN THE PELAGIC ZONE

ii. Methods:1. Self-evident2. Can use methods based on terrestrial
watershed analysis could applya. Relative Slope Position index, Curvature,
etc.
D. Areas of high slope (continental shelfbreaks are a sub-class of this)
i. Examples:1. Southwest Indian Ridge (Louzao et al. 2011)
ii. Methods:1. Neighborhood Slope
E. Straits & channels (i.e., physicalbottlenecks)
i. Examples:1. Sicilian Channel2. Strait of Messina3. Lombok Strait4. Strait of Malacca5. Strait of Gibraltar6. Bering Strait
ii. Methods:1. Self-evident from bathymetry
F. Areas of high rugosity
i. Methods:1. Bathymetric gradient (Louzao et al. 2011)2. Rugosity indices (see Dunn & Halpin 2009;
Ardron & Sointula 2002; etc.)
G. Areas of terrestrial nutrient input (notnecessarily static…)
l Wind-driven dusti. Examples:
1. Southern Mediterranean (Würtz 2011)2. Western mid-Atlantic?3. South Pacific (Bishop et al. 2002)
ii. Methods:1. Chlorophyll a levels
l River plumes (though must considereutrophication effects)
i. Examples:1. Amazon and Orinoco Delta2. (Negative example: Mississippi Delta)
5.1 Pelagic Areas Over Static BathymetricFeatures
A. Continental shelf breaks
i. Examples:1. Benguela and Agulhas shelf break2. Middle and South Atlantic Bight shelf break3. Many more examples are readily available
and easily defined
ii. Methods:1. Self-evident at coarse resolutions, finer
resolutions lead to the identification ofmultiple breaksa. Usually approximated as -200mb. Theoretically could use the point of
maximum acceleration along a slope(i.e., the maximum slope of the slope)
B. Seamounts
i. Examples:1. Ob and Llena South Crozet; Del Cano Rise
between Crozet and Prince Edwardseamounts (Louzao et al. 2011)
2. Nazca Ridge and Sala y Gomez seamountchain
3. Eratosthenes seamount4. Altair seamount (Ramirez et al. 2008)5. See also: Pitcher et al. (2007); Kaschner
(2007); Morato et al. (2010)
ii. Methods:1. Generally looked at by distance from surface
and rise from seabed.a. See Kitchingman & Lai (2004); Pitcher et
al. (2007); Allain et al. (2008)2. Area of influence estimated:
a. 10km on each side of the shelf break(Grantham et al. 2011; Campbell &Hobday 2003)
b. 30-40km around the seamount (Moratoet al. 2010)
3. Can be identified using satellite tracking datafor pelagic predators (Ramirez et al. 2008)
4. See also: Kaschner (2007)
C. Submarine Canyons
i. Examples:1. The Gully (Hooker et al 1999)2. Mediterranean submarine canyons (Würtz
2011)
GOBI Pelagic EBSA Identification Workshop Report 31
5. TYPES OF PELAGIC AREAS THAT MAY MEET THE
EBSA CRITERIA

ii. Methods:1. Regionally increased Chlorophyll a levels and
turbidity, decreased transparency, possiblydecreased salinity levels
5.2 Persistent Hydrographic Features &Ephemeral Features
A. Coastal upwelling
i. Examples:1. Chile-Peru (Humboldt) Current System
(Bernal et al. 1983)2. California Current (Bograd et al. 2009;
Palacios et al. 2006; Nur et al. 2011)3. Benguela Upwelling System (Grnatham et al.
2011)4. Mauritanian upwelling area
ii. Methods: 1. Chl a from space-borne sensors
a. monthly max value (Grantham et al.2011)
b. Empirical orthogonal function (EOF)analysis of spatially & temporallydetrended monthly values (Palacios et al.2006)
2. Based on SST and Chl a concentration(Klein & Castillo 2009)
B. Fronts & frontal systems
i. Examples:1. TZCF (Polovina 2001, 2005; Bograd et al.
2004; Palacios et al. 2006)2. Pacific coastal and marginal seas fronts
(Belkin & Cornillon 2003)3. Fronts in Large Marine Ecosystems (Belkin
et al. 2009)4. Ocean Fronts in the East China, Yellow and
Bohai Seas (Hickox et al. 2000)5. Antarctic Polar Front (Moore et al. 1999)
ii. Methods:1. Can be based on Chl a, SST or SLA data
a. Gradients based on within cell standarddeviation (sd; Louzao et al. 2011)
b. Neighboorhood sd (Gardner et al. 2008)c. Edge-detection algorithms (Cayula &
Cornillion 1992, 1995; Ullman &Cornillon 1999, 2000; Diehl et al. 2002;Belkin & O’Reilly 2009)
2. Based on water mass detection using SST(Hobday papers)
C. Currents
i. Examples:1. Agulhas2. Benguela3. California4. Canary5. Gulf stream6. Kuroshio
ii. Methods:1. Derived from SSH and SST
D. Eddies & eddy fields: offshore upwelling &downwelling
i. Examples:1. Global analysis of eddies (Chelton et al.
2007 & 2011)2. California current eddies (Palacios et al.
2006)3. East China Sea eddies (Kobayashi et al.
2011)4. Costa Rica Dome (Palacios et al 2006)5. The Gulfs of Tehuantepec, Papagayo &
Panama (Palacios et al. 2006.)6. Persistent eddy fields
a. Central North Pacific (Palacios et al.2006)
b. Northeastern Tropical Pacific (Palacios etal. 2006)
ii. Methods:1. SLA ±10cm (Chelton et al. 2011)2. High values from a time series of the
standard deviation of the mean monthly SSTand SSH (Polovina & Howell 2005)
3. MSLA height exceeding ±10 cm asindicative of both strength and persistenceof feature strength (Grantham et al. 2011;Alpine & Hobday 2007)
4. See also Klein & Castillo (2009)
E. Oxygen minimum zone shoaling
i. Examples:1. Eastern South Pacific (Fuenzalida et al.
2009; Paulmier & Ruiz-Pino 2009)2. Eastern North Pacific (off of Mexico &
California)3. Northern Indian Ocean4. Arabian Sea (Morrison et al. 1999)5. Bay of Bengal (Paulmier & Ruiz-Pino 2009)
32 GOBI Pelagic ESBA Identification Workshop Report
TYPES OF PELAGIC AREAS THAT MAY MEET THE EBSA CRITERIA

H. Divergence/Convergence zones
i. Examples:1. Inter-tropical Convergence Zone (ITCZ;
Zagaglia 2004)a. South Pacific Convergence Zone (SPCZ)
2. Crozet and Kerguelen Basins, and over theSouthwest Indian Ridge (Louzao et al. 2011)
ii. Methods:1. SSH2. Oceanographic models (ROMS, etc.)3. Water mass distribution based on SST
(Louzao et al. 2011; Hobday papers)
I. Oceanic gyres
i. Examples:1. South Pacific Gyre (Shillinger et al. 2008)2. Sargasso Sea (McKenna & Hemphill 2009)3. Rhodes Gyre
ii. Methods:1. Low eddy kinetic energy (EKE; Shillinger et
al. 2008)
ii. Methods:1. Generally cited as waters with ≤20 μM of
dissolved oxygena. most references use the World Ocean
Atlas 2001 (WOA01) dataset.
F. Thermocline Shoaling
i. Examples:1. Over domes:
a. Costa Rica Dome (Fiedler 2002;Palacios et al. 2006)
ii. Methods:1. Analysis of hydrographic data (vertical
profiles of temperature and salinity)
G. Retention areas
i. Examples:1. Eddies (see above)2. Taylor columns3. Coastal retention areas:
a. Eg. California current retention areas:i. The Strait of Juan de Fuca Eddy
Retention Zoneii. Central California Retention Zoneiii. The Southern California Bight
Retention Zone
ii. Methods:1. Indices of larval retention based on:
a. Altimetry data driven circulation models(Polovina et al. 1999; Polovina & Howell2005)
b. Regional Ocean Modelling System(ROMS) derived from Lagrangian particletracking (Grantham et al. 2011)
GOBI Pelagic EBSA Identification Workshop Report 33
TYPES OF PELAGIC AREAS THAT MAY MEET THE EBSA CRITERIA

Angel, M.V. 1993. Biodiversity of the Pelagic Ocean.Conservation Biology 7(4):760–772
Angel, M.V. 1997. Pelagic Biodiversity, In MarineBiodiversity: Patterns and Processes. eds R.F.G. Ormond,J. Gage, M.V. Angel, pp. 35–68. Cambridge UniversityPress, Cambridge.
Angel, M.V. 2003. The pelagic environment of the openocean, In Ecosystems of the deep oceans. ed. P.A. Tyler,pp. 39–79. Elsevier, Amsterdam.
Ardron, J. and Sointula, B.C. 2002. A GIS Recipe forDetermining Benthic Complexity: An Indicator of SpeciesRichness, In Marine Geography: GIS for the Oceans andSeas. ed. J. Breman, pp. 169–175. ESRI, Redlands, CA.
Ardron, J., Dunn, D.C., Corrigan, C., Gjerde, K., Halpin,P.N., Rice, J., Vanden Berghe, E., Vierros, M. 2009.Defining ecologically or biologically significant areas in theopen oceans and deep seas: Analysis, tools, resourcesand illustrations. Report to the CBD Expert Workshop onscientific and technical guidance on the use ofbiogeographic classification systems and identification ofmarine areas beyond national jurisdiction in need ofprotection. GOBI and IUCN: Gland, Switzerland.
Allain, V., Kerandel, J.-A., Andréfouët, S., Magron, F.,Clark, M., Kirby, D.S., Muller-Karger, F.E. 2008. Enhancedseamount location database for the western and centralPacific Ocean: Screening and cross-checking of 20existing datasets. Deep Sea Research Part I:Oceanographic Research Papers 55, 1035–1047.
Alpine, J.E., Hobday, A.J. 2007. Area requirements andpelagic protected areas: is size an impediment toimplementation? Marine and Freshwater Research 58,558–569.
Bailey, H., Mate, B.R., Palacios, D.M., Irvine, L., Bograd,S.J., Costa, D.P. 2009. Behavioural estimation of bluewhale movements in the Northeast Pacific from state-space model analysis of satellite tracks. EndangeredSpecies Research 10:93–106
Ballance, L.T.B., Pitman, R.L., Fiedler, P.C. 2006.Oceanographic influences on seabirds and cetaceans ofthe eastern tropical Pacific: a review. Progress InOceanography, 69: 360–390.
Bernal, P.A., Robles F.L., Rojas, O.1982. Variabilidad físicay biológica en la región meridional del sistema deCorrientes Chile-Perú. In: Castilla JC (ed) Basesbiológicas para el uso y manejo de recursos naturalesrenovables: recursos biológicos marinos. MonografíasBiológicas, Vol. 2, Pontificia Universidad Católica de Chile,Santiago, p 75–102
Belkin, I.M. and Cornillon, P.C. 2003. SST fronts of thePacific coastal and marginal seas, Pacific Oceanography1 (2) (2003), pp. 90–113.
Belkin, I.M. and O’Reilly, J.E. 2009. An algorithm foroceanic front detection in chlorophyll and SST satelliteimagery. Journal of Marine Systems 78, 319–326.
Belkin, I.M., Cornillon, P.C., Sherman, K. 2009. Fronts inLarge Marine Ecosystems. Progress In Oceanography 81,223–236.
Benhamou, S. 2004. How to reliably estimate thetortousity of an animal’s path: straightness, sinuosity orfractal dimension? Journal of Theoretical Biology 229,209–220.
BirdLife International. 2004. Tracking ocean wanderers:the global distribution of albatrosses and petrels. Resultsfrom the Global Procellariiform Tracking Workshop, 1–5September, 2003, Gordon‘s Bay, South Africa.Cambridge, UK: BirdLife International.
BirdLife International. 2009. Using seabird satellite trackingdata to identify marine IBAs: A workshop to determinehow to achieve this goal. Held 1st–3rd July 2009, atCNRS, Chize, France.
Bishop, J.K.B, Davis, R.E., Sherman, J.T. 2002. RoboticObservations of Dust Storm Enhancement of CarbonBiomass in the North Pacific. Science. 298(5594):817–821.
Bograd, S.J., Foley, D.G., Schwing, F.B., Wilson, C.,Laurs, R.M., Polovina, J.J., Howell, E.A., Brainard, R.E.2004. On the seasonal and interannual migrations of thetransition zone chlorophyll front. Geophysical ResearchLetters. 31:L17204.
Bograd, S.J., Schroeder, I., Sarkar, N., Qiu, X., Sydeman,W.J., Schwing, F.B. 2009. Phenology of coastal upwellingin the California Current. Geophysical Research Letters36(1):L01602
Bograd, S.J., Block, B.A., Costa, D.P., Godley, B.J.2010. Biologging technologies: new tools forconservation. Endangered Species Research, 10:1–7.
Campbell, R.A. and Hobday, A. 2003. Swordfish –Seamount – Environment – Fishery Interactions off EasternAustralia. Working Paper BBRG-3 presented to the 16thmeeting of the Standing Committee on Tunas and Billfish,held July 9–17, Mooloolaba, Australia. Secretariat of thePacific Community, Noumea, New Caledonia.
Cayula, J.-F. and Cornillon, P. 1992. Edge DetectionAlgorithm for SST Images. Journal of Atmospheric andOceanic Technology 9, 67–80.
34 GOBI Pelagic ESBA Identification Workshop Report
6. REFERENCES

Dunn, D.C. and Halpin, P.N. 2009. Rugosity-basedregional modeling of hard-bottom habitat. Marine EcologyProgress Series 377, 1–11.
Dunn, D.C., A. Boustany, P.N. Halpin. 2011. Spatio-temporal management of fisheries to reduce bycatch andincrease fishing selectivity. Fish and Fisheries. 12:110–119.
Dunstan, P.K., Foster, S.D. 2011. RAD biodiversity:prediction of rank abundance distributions from deepwater benthic assemblages. Ecography. Online early.
Eckert, S., Moore., J.E., Dunn, D.C., Sagarminaga, R.,Eckert, K., Halpin, P.N. 2008. Hierarchical state-spacemodels of loggerhead sea turtle movement in relation tosize and oceanographic features in the westernMediterranean Sea. Ecological Applications 18, 290`–308.
FAO. 2010. The state of the world fisheries andaquaculture 2010. Food and Agriculture Organization ofthe United Nations, Rome.
Fauchald, P. and Tavera, T. 2003. Using first-passagetime in the analysis of area-restricted search and habitatselection. Ecology 84, 282–288.
Fielder, P.C. 2002. The annual cycle and biological effectsof the Costa Rica Dome. Deep-Sea Research I 49: 321–338.
Friedlaender, A., Halpin, P., Qian, S., Lawson, G., Wiebe,P., Thiele, D., Read, A. 2006. Whale distribution in relationto prey abundance and oceanographic processes in shelfwaters of the Western Antarctic Peninsula. MarineEcology Progress Series 317, 297–310.
Fuenzalida, R., Schneider, W., Garcés-Vargas, J., Bravo,L., Lange, C. 2009. Vertical and horizontal extension ofthe oxygen minimum zone in the eastern South PacificOcean. Deep Sea Research Part II: Topical Studies inOceanography 56, 992–1003
Game, E.T., Grantham, H.S., Hobday, A.J., Pressey, R.L.,Lombard, A.T., Beckley, L.E., Gjerde, K., Bustamante, R.,Possingham, H.P., Richardson, A.J. 2009. Pelagicprotected areas: the missing dimension in oceanconservation. Trends in Ecology & Evolution 24(7):360–369.
Gardner, B., Sullivan, P.J., Morreale, S.J., Epperly, S.P.2008. Spatial and temporal statistical analysis of bycatchdata: patterns of sea turtle bycatch in the North Atlantic.Canadian Journal of Fisheries and Aquatic Sciences 65,2461–2470.
Cayula, J.-F. and Cornillon, P. 1995. Multi-Image EdgeDetection for SST Images. Journal of Atmospheric andOceanic Technology 12, 821–829.
Chandler, M., Kaufman, L.S., Mulsow, S. 1996. Humanimpact, biodiversity and ecosystem processes in theopen ocean., In Functional Roles of Biodiversity: A GlobalPerspective. eds H.A. Mooney, J.H. Cushman, E.Medina, O.E. Sala, E.-D. Schulze, pp. 431–474, JohnWiley and Sons Ltd.
Chelton, D.B., Freilich, M.H., Esbensen, S.K. 2000.Satellite observations of the wind jets off the Pacific coastof Central America. Part I: Case studies and statisticalcharacteristics. Monthly Weather Review 128:1993–2018.
Chelton, D.B., Schlax, M.G., Samelson, R.M., deSzoeke, R.A. 2007. Global observations of large oceaniceddies. Geophysical Research Letters 34 :L15606.
Chelton, D.B., M.G. Schlax, R.M. Samelson. 2011.Global observations of nonlinear mesoscale eddies.Progress In Oceanography 91(2):167–216
Coll, M., Piroddi, C., Steenbeek, J., Kaschner, K., BenRais Lasram, F., Aguzzi, J., Ballesteros, E., Bianchi, C.N.,Corbera, J., Dailianis, T., Danovaro, R., Estrada, M.,Froglia, C., Galil, B.S., Gasol, J.M., Gertwagen, R., Gil, J.,Guilhaumon, F., Kesner-Reyes, K., Kitsos, M.-S.,Koukouras, A., Lampadariou, N., Laxamana, E., López-Féde la Cuadra, C.M., Lotze, H.K., Martin, D., Mouillot, D.,Oro, D., Raicevich, S., Rius-Barile, J., Saiz-Salinas, J.I.,San Vicente, C., Somot, S., Templado, J., Turon, X.,Vafidis, D., Villanueva, R., Voultsiadou, E. 2010. TheBiodiversity of the Mediterranean Sea: Estimates,Patterns, and Threats. PLoS ONE 5, e11842.
Couper, A. 1983. The Times Atlas of the Oceans. TimesBooks: London, U.K.
Curtice, C., Schick, R.S., Dunn, D.C., Halpin, P.N. 2011.Home range analysis of Hawaiian Monk Seals (Monachusschauinslandi) based on colony, age and gender. AquaticMammals. 37(3): 360–371.
Dearden, P. and Topelko, K.N. (2005). Establishing criteriafor the identification of ecologically and biologicallysignificant areas on the high seas. Background Paper forthe CBD Expert Workshop On Ecological Criteria AndBiogeographic Classification Systems For Marine Areas InNeed Of Protection Azores, Portugal, 2–4 October 2007.Fisheries and Oceans Canada, Ottawa, Ontario.
Diehl, S.F., Budd, J.W., Ullman, D., Cayula, J.-F. 2002.Geographic Window Sizes Applied to Remote SensingSea Surface Temperature Front Detection. Journal ofAtmospheric and Oceanic Technology 19, 1105–1113.
GOBI Pelagic EBSA Identification Workshop Report 35
REFERENCES

Godley, B.J., Blumenthal, J.M., Broderick, A.C., Coyne,M.S., Godfrey, M.H., Hawkes, L.A., Witt, M.J. 2008.Satellite tracking of sea turtles: Where have we been andwhere do we go next?. Endangered Species Research4:3–22.
Gilman, E., Dunn, D.C., Read, A., Warner, R., Hyrenbach,K.D. 2011. Designing criteria suites to identify sites andnetworks of high value across manifestations ofbiodiversity. Biodiversity and Conservation.
Grantham, H.S., Game, E.T., Lombard, A.T., Hobday,A.J., Richardson, A.J., Beckley, L.E., Pressey, R.L.,Huggett, J.A., Coetzee, J.C., van der Lingen, C.D.,Petersen, S.L., Merkle, D., Possingham, H.P. 2011.Accommodating Dynamic Oceanographic Processes andPelagic Biodiversity in Marine Conservation Planning.PLoS ONE 6, e16552.
Grémillet, D., Dell’Omo, G., Ryan, P.G., Peters, G.,Ropert-Coudert, Y., Weeks, S. 2004. Offshore diplomacy,or how seabirds mitigate intra-specific competition: a casestudy based on GPS tracking of Cape Gannet fromneighbouring breeding sites. Marine Ecology ProgressSeries 268, 265–279.
Halpin, P.N., Read, A.J., Fujioka, E., Best, B.D., Donnelly,B., Hazen, L.J., Kot, C., Urian, K., LaBrecque, E.,Dimatteo, A., Cleary, J., Good, C., Crowder, L.B.,Hyrenbach, K.D. 2009. OBIS-SEAMAP: The world datacenter for marine mammal, sea bird, and sea turtledistributions. Oceanography 22(2):104–115,
Halpern, B.S., Walbridge, S., Selkoe, K.A., Kappel, C.V.,Micheli, F., D’Agrosa, C., Bruno, J.F., Casey, K.S., Ebert,C., Fox, H.E., Fujita, R., Heinemann, D., Lenihan, H.S.,Madin, E.M.P., Perry, M.T., Selig, E.R., Spalding, M.,Steneck, R., Watson, R. 2008. A Global Map of HumanImpact on Marine Ecosystems. Science 319(5865): 948–952.
Hazen, E.L., Nowacek, D.P., St. Laurent, L., Halpin, P.N.,Moretti, D.J. 2011. The Relationship amongOceanography, Prey Fields, and Beaked Whale ForagingHabitat in the Tongue of the Ocean. PLoS ONE6:e19269.
Hickox, R., Belkin, I., Cornillon, P., Shan, Z. 2000.Climatology and seasonal variability of ocean fronts in theEast China, Yellow and Bohai seas from satellite SSTdata. Geophysical Research Letters 27:2945–2948.
Hobday, A.J., Hartmann, K. 2006. Near real-time spatialmanagement based on habitat predictions for a longlinebycatch species. Fisheries Management & Ecology13(6):365–380.
Hobday, A.J., Hartog, J.R., Timmiss, T., Fielding, J. 2010.Dynamic spatial zoning to manage southern bluefin tuna(Thunnus maccoyii) capture in a multi-species longlinefishery. Fisheries Oceanography 19(3):243–253.
Hobday, A.J., Hartog, J.R., Spillman, C.M., Alves, O.2011. Seasonal forecasting of tuna habitat for dynamicspatial management. Canadian Journal of Fisheries andAquatic Sciences 68(5):898–911.
Hobday, A.J., Young, J.W., Moeseneder, C., Dambacher,J.M. 2011. Defining dynamic pelagic habitats in oceanicwaters off eastern Australia. Deep Sea Research Part II:Topical Studies in Oceanography 58, 734–745.
Hooker, S.K., Whitehead, H., Gowans, S. 1999. MarineProtected Area Design and the Spatial and TemporalDistribution of Cetaceans in a Submarine Canyon.Conservation Biology 13, 592–602.
Howell, E.A., Kobayashi, D.R., Parker, D.M., Balazs, G.H.,Polovina, J.J. 2008. TurtleWatch: a tool to aid in thebycatch reduction of loggerhead turtles Caretta caretta inthe Hawaii-based pelagic longline fishery. EndangeredSpecies Research 5(2–3):267–278.
Hyrenbach, K.D., Forney, K.A., Dayton, P.K. 2000. Marineprotected areas and ocean basin management. AquaticConservation: Marine & Freshwater Ecosystems10(6):437–458
Jonsen, I.D., Myers, R.A., Flemming, J. M. 2003. Meta-analysis of animal movement using state-space models.Ecology 84:3055–3063
Jonsen, I.D., Flemming, J.M., Myers, R.A. 2005. Robuststate-space modeling of animal movement data. Ecology86:2874–2880
Kappes, M.A., Shaffer, S.A., Tremblay, Y., Foley, D.G.,Palacios, D.M., Robinson, P.W., Bograd, S.J., Costa, D.P.2010. Hawaiian albatrosses track interannual variability ofmarine habitats in the North Pacific. Progress InOceanography 86, 246–260.
Kaschner, K., Watson, R., Trites, A.W., Pauly, D. 2006.Mapping world-wide distributions of marine mammalspecies using a relative environmental suitability (RES)model. Marine Ecology Progress Series 316, 285–310.
Kaschner, K., 2007. Air breathing visitors to seamounts, InSeamounts: Ecology, Fisheries and Conservation. ed. T.Pitcher, et al., pp. 230–238. Blackwell Science, Oxford,UK.
Kaschner, K., Tittensor, D.P., Ready, J., Gerrodette, T.,Worm, B. 2011. Current and Future Patterns of GlobalMarine Mammal Biodiversity. PLoS ONE 6(5):e19653
36 GOBI Pelagic ESBA Identification Workshop Report
REFERENCES

Metz, B., Davidson, O.R. , Bosch, P.R., Dave, R., Meyer,L.A. (eds) 2007. Contribution of Working Group III to theFourth Assessment Report of the Intergovernmental Panelon Climate Change, 2007. Cambridge University Press,Cambridge, United Kingdom and New York, NY, USA.
Moore, J.K., Abbott, M.R., Richman, J.G. 1999. Locationand dynamics of the Antarctic Polar Front from satellitesea surface temperature data. J. Geophys. Res. 104,3059–3073.
Morato, T., Hoyle, S.D., Allain, V., Nicol, S.J. 2010.Seamounts are hotspots of pelagic biodiversity in theopen ocean. Proc Natl Acad Sci U S A 107, 9707–9711.
Morris, L. and Ball, D. 2006. Habitat suitability modellingof economically important fish species with commercialfisheries data. ICES Journal of Marine Science: Journal duConseil 63(9):1590–1603
Morrison, J.M., Codispoti, L.A., Smith, S.L., Wishner, K.,Flagg, C., Gardner, W.D., Gaurin, S., Naqvi, S.W.A.,Manghnani, V., Prosperie, L., Gundersen, J.S. 1999. Theoxygen minimum zone in the Arabian Sea during 1995.Deep Sea Research Part II: Topical Studies inOceanography 46, 1903–1931.
Norse, E.A. and Gerber, L.R. 1993. A global strategy forconserving biological diversity in the sea. Diversity9(3):40–42
Nur, N., Jahncke, J., Herzog, M.P., Howar, J., Hyrenbach,K.D., Zamon, J.E., Ainley, D.G., Wiens, J.A., Morgan, K.,Ballance, L.T., Stralberg, D. 2011. Where the wild thingsare: predicting hotspots of seabird aggregations in theCalifornia Current System. Ecological Applications21(6):2241–2257.
Palacios, D.M. 1999. Blue whale (Balaenoptera musculus)occurrence off the Galápagos Islands, 1978–1995,Journal of Cetacean Research and Management 1(1):41–51.
Palacios, D.M. 2002. Factors influencing the island-masseffect of the Galápagos Islands, Geophysical ResearchLetters 29(23):2134.
Palacios, D.M. 2004. Seasonal patterns of sea-surfacetemperature and ocean color around the Galapagos:regional and local influences. Deep-Sea Research Part II –Topical Studies In Oceanography 51:43–57.
Palacios, D.M. and Bograd, S.J. 2005. A census ofTehuantepec and Papagayo eddies in the northeasterntropical Pacific, Geophysical Research Letters32:L23606.
Kitchingman, A. and Lai, S. 2004. Inferences on potentialseamount locations from mid-resolution bathymetric data,In Seamounts: Biodiversity and Fisheries. eds T. Morato,D. Pauly, pp. 7–12. Univ of British Columbia Vancouver,B.C.
Klein, E. and Castillo, J.C. 2009. ObservatorioOceanográfico Digital del Mar Venezolano. Laboratorio deSensores Remotos, Centro de Biodiversidad MarinaINTECMAR-USB. Available online: http://ood.cbm.usb.ve
Kobayashi, D.R., Cheng, I.J., Parker, D.M., Polovina, J.J.,Kamezaki, N., Balazs, G.H. 2011. Loggerhead turtle(Caretta caretta) movement off the coast of Taiwan:characterization of a hotspot in the East China Sea andinvestigation of mesoscale eddies. ICES Journal of MarineScience: Journal du Conseil 68(4):707–718
Lewison, R.L., Soykan, C.U., Franklin, J. 2009. Mappingthe bycatch seascape: multispecies and multi-scalespatial patterns of fisheries bycatch. Ecol Appl 19(4):920–930.
Louzao, M., Pinaud, D., Péron, C., Delord, K., Wiegand,T., Weimerskirch, H. 2011. Conserving pelagic habitats:seascape modelling of an oceanic top predator. Journal ofApplied Ecology 48, 121–132.
Lucifora, L.O., García, V.B., Worm, B. 2011. GlobalDiversity Hotspots and Conservation Priorities for Sharks.PLoS ONE 6, e19356.
Maxwell, S.M., Breed, G.A., Nickel, B.A., Makanga-Bahouna, J., Pemo-Makaya, E., Parnell, R.J., Formia, A.,Ngouessono, S., Godley, B.J., Costa, D.P., Witt, M.J.,Coyne, M.S. 2011. Using Satellite Tracking to OptimizeProtection of Long-Lived Marine Species: Olive RidleySea Turtle Conservation in Central Africa. PLoS ONE6(5):e19905
Maxwell, S.M., Frank, J.J., Breed, G.A., Robinson, P.W.,Simmons, S.E., Crocker, D.E., Gallo-Reynoso, J.P.,Costa, D.P. In press. Benthic foraging on seamounts: aspecialized foraging behavior in a deep diving marinemammal.
McKenna, S.A. and Hemphill, A. 2009. Uniqueness andrarity illustration: The Sargasso Sea. p.12–16 in: Ardron,J., D.C. Dunn, C. Corrigan, K. Gjerde, P.N. Halpin, J.Rice, E. Vanden Berghe, M. Vierros. 2009. Definingecologically or biologically significant areas in the openoceans and deep seas: Analysis, tools, resources andillustrations. Report to the CBD Expert Workshop onscientific and technical guidance on the use ofbiogeographic classification systems and identification ofmarine areas beyond national jurisdiction in need ofprotection. GOBI and IUCN: Gland, Switzerland.
GOBI Pelagic EBSA Identification Workshop Report 37
REFERENCES

Palacios, D.M., Bograd, S.J., Foley, D.G., Schwing, F.B.2006. Oceanographic characteristics of biological hotspots in the North Pacific: A remote sensing perspective.Deep Sea Research Part II: Topical Studies inOceanography 53, 250–269.
Patterson, T.A., Thomas, L., Wilcox, C., Ovaskainen, O.,Matthiopoulos, J. 2008. State–space models of individualanimal movement. Trends in Ecology and Evolution 23,87–94.
Paulmier, A. and Ruiz-Pino, D. 2009. Oxygen minimumzones (OMZs) in the modern ocean. Progress InOceanography 80, 113–128.
Peron, C., Delord, K., Phillips, R.A., Charbonnier, Y.,Marteau, C., Louzao, M., Weimerskirch, H. 2010.Seasonal variation in oceanographic habitat and behaviourof white-chinned petrels Procellaria aequinoctialis fromKerguelen Island. Marine Ecology Progress Series 416,267–284.
Petersen, S.L., Honig, M.B., Ryan, P.G., Underhill, L.G.2009a. Seabird bycatch in the pelagic longline fishery offsouthern Africa. African Journal of Marine Science31(2):191–204.
Petersen, S.L., Honig, M.B., Ryan, P.G., Underhill, L.G.,Compagno, L.J.V. 2009b. Pelagic shark bycatch in thetuna- and swordfish-directed longline fishery off southernAfrica. African Journal of Marine Science 31(2):215–225.
Pinaud, D. and Weimerskirch, H. 2005. Scale-dependanthabitat use in a long-ranging central place predator.Journal of Animal Ecology 74, 852–863.
Pitcher, T.J., Morato, T., Hart, P.J.B, Clark, M., Haggan,N., Santos, R.S. (eds) 2007. Seamounts: Ecology,Fisheries and Conservation. Fish and Aquatic ResourcesSeries 12, Blackwell, Oxford, UK, 536 pp.
Polovina, J.J., Kleiber, P., Kobayashi, D.R. 1999.Application of TOPEX/Poseidon satellite altimetry tosimulate transport dynamics of larvae of spiny lobster,Panulirus marginatus, in the Northwestern HawaiianIslands, 1993–1996. Fishery Bulletin 97, 132–143.
Polovina, J.J., Howell, E., Kobayashi, D.R., Seki, M.P.2001. The transition zone chlorophyll front, a dynamicglobal feature defining migration and forage habitat formarine resources. Process in Oceanography 49, 469–483.
Polovina, J.J. and Howell, E.A., 2005. Ecosystemindicators derived from satellite remotely sensedoceanographic data for the North Pacific. ICES Journal ofMarine Science: Journal du Conseil 62, 319–327.
Rabinowitz, D. 1981. Seven forms of rarity, In TheBiological Aspects of Rare Plant Conservation. eds H.Synge, J. Chichester, pp. 205–217. John Wiley & Sons,New York.
Ramírez, I., Geraldes, P., Meirinho, A., Amorim, P., Paiva,V. 2008. Áreas Marinhas Importantes para as Aves emPortugal. Projecto LIFE04NAT/PT/000213 – SociedadePortuguesa Para o Estudo das Aves. Lisboa.http://lifeibasmarinhas.spea.pt/en/y-book/marineibas
Ready, J., Kaschner, K., South, A.B., Eastwood, P.D.,Rees, T., Rius, J., Agbayani, E., Kullander, S., Froese, R.2010. Predicting the distributions of marine organisms atthe global scale. Ecological Modelling 221(3):467–478
Redfern, J.V., Ferguson, M.C., Becker, E.A., Hyrenbach,K.D., Good, C., Barlow, J., Kaschner, K., Baumgartner,M.F., Forney, K.A., Ballance, L.T., Fauchald, P., Halpin, P.,Hamazaki, T., Pershing, A.J., Qian, S.S., Read, A., Reilly,S.B., Torres, L., Werner, F. 2006. Techniques forcetacean-habitat modeling. Marine Ecology-ProgressSeries 310:271–295.
Reilly, S.B. and Thayer, V.G. 1990. Blue whale(Balaenoptera musculus) distribution in the eastern tropicalPacific. Marine Mammal Science 6, 265–277.
Riley, J.P. and Chester, R. 1971. Introduction to marinechemistry. Academic Press, New York.
Robison, B.H. 2009. Conservation of Deep PelagicBiodiversity. Conservation Biology 23(4):847–858
Shillinger, G., Swithenbank, A., Bograd, S., Bailey, H.,Castelton, M., Wallace, B.P., Spotila, J.R., Paladino, F.V.,Piedra, R., Block, B.A. 2010. Identification of high-useinternesting habitats for eastern Pacific leatherback turtles:role of the environment and implications for conservation.Endangered Species Research 10:215–232
Stramma, L., Schmidtko, S., Levin, L.A., Johnson, G.C.2010. Ocean oxygen minima expansions and theirbiological impacts. Deep Sea Research Part I:Oceanographic Research Papers 57(4):587–595.
Strömberg, K.H.P., Smyth, T.J., Allen, J.I., Pitois, S.,O’Brien, T.D. 2009. Estimation of global zooplanktonbiomass from satellite ocean colour. Journal of MarineSystems 78, 18–27.
Trebilco, R., Halpern, B.S., Flemming, J.M., Field, C.,Blanchard, W., Worm, B. 2011. Mapping speciesrichness and human impact drivers to inform globalpelagic conservation prioritisation. Biological Conservation144, 1758–1766.
38 GOBI Pelagic ESBA Identification Workshop Report
REFERENCES
With, K.A. 1994. Using fractal analyses of animalmovement: a critique. Ecology 77, 2086–2090.
Wood, L.J., Fish, L., Laughren, J., Pauly, D. 2008.Assessing progress towards global marine protectiontargets: shortfalls in information and action. Oryx42(03):340–351
Worm, B., Lotze, H.K., Myers, R.A. 2003. Predatordiversity hotspots in the blue ocean. Proc Natl Acad Sci US A 100, 9884–9888.
Worm, B., Sandow, M., Oschlies, A., Lotze, H.K., Myers,R.A. 2005. Global patterns of predator diversity in theopen oceans. Science 309, 1365–1369.
Würtz, M., 2010. Mediterranean Pelagic Habitat:Oceanographic and Biological Processes, An Overview.IUCN, Gland, Switzerland and Malaga, Spain.
Zagaglia, C.R., Lorenzzetti, J.A., Stech, J.L. 2004.Remote sensing data and longline catches of yellowfintuna (Thunnus albacares) in the equatorial Atlantic.Remote Sensing of Environment 93, 267–281.
Žydelis, R., Lewison, R.L., Shaffer, S.A., Moore, J.E.,Boustany, A.M., Roberts, J.J., Sims, M., Dunn, D.C.,Best, B.D., Tremblay, Y., Kappes, M.A., Halpin, P.N.,Costa, D.P., Crowder, L.B. 2011. Dynamic habitatmodels: using telemetry data to project fisheries bycatch.Proceedings of the Royal Society B: Biological Sciences278:3191–3200.
Tremblay, Y., Roberts, A.J., Costa, D.P. 2007. Fractallandscape method: an alternative approach to measuringarea-restricted searching behaviour. Journal ofExperimental Biology 210, 935–945.
Tittensor, D.P., Mora, C., Jetz, W., Lotze, H.K., Ricard, D.,Berghe, E.V., Worm, B. 2010. Global patterns andpredictors of marine biodiversity across taxa. Nature 466,1098–1101.
Torres, L.G., Read, A.J., Halpin, P. 2008. Fine-scalehabitat modeling of a top marine predator: do prey dataimprove predictive capacity. Ecological Applications18(7):1702–1717
Ullman, D.S. and Cornillon, P.C. 2000. Evaluation of FrontDetection Methods for Satellite-Derived SST Data Using InSitu Observations. Journal of Atmospheric and OceanicTechnology 17, 1667–1675.
Ullman, D.S. and Cornillon, P.C. 1999. Satellite-derivedsea surface temperature fronts on the continental shelf offthe northeast U.S. coast. J. Geophys. Res. 104, 23459–23478.
Verity, P.G., Smetacek, V., Smayda, T.J. 2002. Status,trends and the future of the marine pelagic ecosystem.Environmental Conservation 29(02):207–237
Webb, T.J., Vanden Berghe, E., O’Dor, R. 2010.Biodiversity’s Big Wet Secret: The Global Distribution ofMarine Biological Records Reveals Chronic Under-Exploration of the Deep Pelagic Ocean. PLoS ONE5(8):e10223
Williams, A., Last, P.R.L., Gomon, M.F., Paxton, J.R.1996. Species composition and checklist of the demersalichthyofauna of the continental slope off Western Australia(20–35° S). Rec West Aust Mus 18:135–155
GOBI Pelagic EBSA Identification Workshop Report 39
REFERENCES

Organizing Committee:
Dunn, Daniel – Duke University, Marine Geospatial Ecology Lab
Halpin, Patrick – Duke University, Marine Geospatial Ecology Lab
Bernal, Patricio – GOBI/IUCN
Spadone, Aurélie – GOBI/IUCN
Attendees:
Ardron, Jeff – Marine Conservation Institute
Ban, Natalie – James Cook Univ.
Bax, Nic – CSIRO
Bograd, Steven – NOAA Pacific Fisheries Environmental Lab, Tagging of Pacific Predators
Corrigan, Colleen – UNEP-World Conservation Monitoring Center
Dunstan, Piers – CSIRO
Game, Eddie – The Nature Conservancy
Gjerde, Kristina – IUCN
Grantham, Hedley – Conservation International
Harrison, Autumn-Lynn – Tagging of Pacific Predators, Univ. of California, Santa Cruz
Hazen, Elliott – NOAA Pacific Fisheries Environmental Lab
Lagabrielle, Erwann – Nelson Mandela Metropolitan University
Lascelles, Ben – BirdLife International
Maxwell, Sara – Marine Conservation Institute, Univ. of California, Santa Cruz
McKenna, Sheila – Ind. Consultant, Sylvia Earle Alliance, Member of IUCN, WCPA
Nicol, Simon – Secretariat of the Pacific Community, Oceanic Fisheries Programme
Norse, Elliott – Marine Conservation Institute
Palacios, Daniel – NOAA Pacific Fisheries Environmental Lab; Tagging of Pacific Predators
Reeve, Lora – University of Hawaii
Shillinger, George – Center for Ocean Solutions, Stanford University
Simard, François – IUCN
Sink, Kerry – South African National Biodiversity Institute
Smith, Franz – CSIRO
Würtz, Maurizio – University of Genoa; IUCN
40 GOBI Pelagic ESBA Identification Workshop Report
APPENDIX 1. PARTICIPANTS LIST

GOBI Pelagic EBSA Identification Workshop Report 41
APPENDIX 2. CBD DECISION IX/20 ANNEX I & II
Criteria Definition Rationale ExamplesConsideration inapplication
Uniqueness or rarity Area contains either: (i)unique (“the only one ofits kind”), rare (“occursonly in few locations”) orendemic species,populations orcommunities, and/or (ii)unique, rare or distinct,habitats or ecosystems;and/or (iii) unique orunusualgeomorphological oroceanographic features
l Irreplaceable
l Loss would mean theprobable permanentdisappearance ofdiversity or a feature,or reduction of thediversity at any level
Open-ocean waters
Sargasso Sea, Taylorcolumn, persistentpolynyas.
Deep-sea habitats
endemic communitiesaround submergedatolls; hydrothermalvents; sea mounts;pseudo-abyssaldepression
l Risk of biased-view ofthe perceiveduniquenessdepending on theinformation availability
l Scale dependency offeatures such thatunique features at onescale may be typical atanother, thus a globaland regionalperspective must betaken
Special importance forlife-history stages ofspecies
Areas that are requiredfor a population tosurvive and thrive
Various biotic and abioticconditions coupled withspecies-specificphysiological constraintsand preferences tend tomake some parts ofmarine regions moresuitable to particular life-stages and functionsthan other parts
Area containing: (i)breeding grounds,spawning areas, nurseryareas, juvenile habitat orother areas important forlife-history stages ofspecies; or (ii) habitats ofmigratory species(feeding, wintering orresting areas, breeding,moulting, migratoryroutes)
l Connectivity betweenlife-history stages andlinkages betweenareas: trophicinteractions, physicaltransport, physicaloceanography, lifehistory of species
l Sources forinformation include:e.g., remote sensing,satellite tracking,historical catch andby-catch data, vesselmonitoring system(VMS) data
l Spatial and temporaldistribution and/oraggregation of thespecies
Importance forthreatened,endangered ordeclining speciesand/or habitats
Area containing habitatfor the survival andrecovery of endangered,threatened, decliningspecies or area withsignificant assemblagesof such species
To ensure the restorationand recovery of suchspecies and habitats
Areas critical forthreatened, endangeredor declining speciesand/or habitats,containing (i) breedinggrounds, spawningareas, nursery areas,juvenile habitat or otherareas important for life-history stages ofspecies; or (ii) habitats ofmigratory species(feeding, wintering orresting areas, breeding,moulting, migratoryroutes)
l Includes species withvery large geographicranges.
l In many casesrecovery will requirere-establishment ofthe species in areas ofits historic range
l Sources forinformation include:e.g., remote sensing,satellite tracking,historical catch andby-catch data, vessel-monitoring system(VMS) data
DECISION IX/20 – ANNEX I [ADOPTED AT CBD COP 9 MAY 30, 2008]
SCIENTIFIC CRITERIA FOR IDENTIFYING ECOLOGICALLY OR BIOLOGICALLY SIGNIFICANT MARINEAREAS IN NEED OF PROTECTION IN OPEN-OCEAN WATERS AND DEEP-SEA HABITATS

42 GOBI Pelagic ESBA Identification Workshop Report
APPENDIX 2. CBD DECISION IX/20 ANNEX I & II
Criteria Definition Rationale ExamplesConsideration inapplication
Vulnerability, fragility,sensitivity, or slowrecovery
Areas that contain arelatively high proportionof sensitive habitats,biotopes or species thatare functionally fragile(highly susceptible todegradation or depletionby human activity or bynatural events) or withslow recovery
The criteria indicate thedegree of risk that will beincurred if humanactivities or naturalevents in the area orcomponent cannot bemanaged effectively, orare pursued at anunsustainable rate
Vulnerability of species
l Inferred from thehistory of how speciesor populations in othersimilar areasresponded toperturbations
l Species of lowfecundity, slow growth,long time to sexualmaturity, longevity(e.g., sharks, etc)
l Species withstructures providingbiogenic habitats,such as deepwatercorals, sponges andbryozoans; deep-water species
Vulnerability of habitats
l Ice-covered areassusceptible to ship-based pollution
l Ocean acidificationcan make deep seahabitats morevulnerable to others,and increasesusceptibility to humaninduced changes
l Interactions betweenvulnerability to humanimpacts and naturalevents
l Existing definitionemphasizes site-specific ideas andrequires considerationfor highly mobilespecies
l Criteria can be usedboth in its own rightand in conjunctionwith other criteria
Biological productivity Area containing species,populations orcommunities withcomparatively highernatural biologicalproductivity
Important role in fuellingecosystems andincreasing the growthrates of organisms andtheir capacity forreproduction
l Frontal areas
l Upwellings
l Hydrothermal vents
l Seamounts polynyas
l Can be measured asthe rate of growth ofmarine organisms andtheir populations,either through thefixation of inorganiccarbon byphotosynthesis,chemosynthesis, orthrough the ingestionof prey, dissolvedorganic matter orparticulate organicmatter
l Can be inferred fromremote-sensedproducts, e.g., oceancolour or process-based models
l Time-series fisheriesdata can be used, butcaution is required

GOBI Pelagic EBSA Identification Workshop Report 43
APPENDIX 2. CBD DECISION IX/20 ANNEX I & II
Criteria Definition Rationale ExamplesConsideration inapplication
Biological diversity Area containscomparatively higherdiversity of ecosystems,habitats, communities, orspecies, or has highergenetic diversity
Important for evolutionand maintaining theresilience of marinespecies and ecosystems
l Sea-mounts
l Fronts andconvergence zones
l Cold coralcommunities
l Deep-water spongecommunities
l Diversity needs to beseen in relation to thesurroundingenvironment
l Diversity indices areindifferent to speciessubstitutions
l Diversity indices areindifferent to whichspecies may becontributing to thevalue of the index, andhence would not pickup areas important tospecies of specialconcern, such asendangered species
l Can be inferred fromhabitat heterogeneityor diversity as asurrogate for speciesdiversity in areaswhere biodiversity hasnot been sampledintensively
Naturalness Area with a comparativelyhigher degree ofnaturalness as a result ofthe lack of or low level ofhuman-induceddisturbance ordegradation
l To protect areas withnear natural structure,processes andfunctions
l To maintain theseareas as referencesites
l To safeguard andenhance ecosystemresilience
Most ecosystems andhabitats have exampleswith varying levels ofnaturalness, and theintent is that the morenatural examples shouldbe selected
l Priority should begiven to areas havinga low level ofdisturbance relative totheir surroundings
l In areas where nonatural areas remain,areas that havesuccessfullyrecovered, includingreestablishment ofspecies, should beconsidered
l Criteria can be usedboth in its own rightand in conjunctionwith other criteria

44 GOBI Pelagic ESBA Identification Workshop Report
APPENDIX 2. CBD DECISION IX/20 ANNEX I & II
DECISION IX/20 – ANNEX II [ADOPTED AT CBD COP 9 MAY 30, 2008]
SCIENTIFIC GUIDANCE FOR SELECTING AREAS TO ESTABLISH A REPRESENTATIVE NETWORK OFMARINE PROTECTED AREAS, INCLUDING IN OPEN OCEAN WATERS AND DEEP-SEA HABITATS
Required network properties and components
DefinitionApplicable site specificconsiderations (inter alia)
Ecologically and biologically significantareas
Ecologically and biologically significant areasare geographically or oceanographicallydiscrete areas that provide importantservices to one or more species/populationsof an ecosystem or to the ecosystem as awhole, compared to other surrounding areasor areas of similar ecological characteristics,or otherwise meet the criteria as identified inannex I. Representativity is captured in anetwork when it consists of areasrepresenting the different biogeographicalsubdivisions of the global oceans andregional seas that reasonably reflect the fullrange of ecosystems, including the bioticand habitat diversity of those marineecosystems
l Uniqueness or rarity
l Special importance for life-history stagesof species
l Importance for threatened, endangered ordeclining species and/or habitats
l Vulnerability, fragility, sensitivity or slowrecovery
l Biological productivity
l Biological diversity
l Naturalness
Representativity Representativity is captured in a networkwhen it consists of areas representing thedifferent biogeographical subdivisions of theglobal oceans and regional seas thatreasonably reflect the full range ofecosystems, including the biotic and habitatdiversity of those marine ecosystems
A full range of examples across abiogeographic habitat, or communityclassification; relative health of species andcommunities; relative intactness ofhabitat(s); naturalness
Connectivity Connectivity in the design of a networkallows for linkages whereby protected sitesbenefit from larval and/or speciesexchanges, and functional linkages fromother network sites. In a connected networkindividual sites benefit one another
Currents; gyres; physical bottlenecks;migration routes; species dispersal; detritus;functional linkages. Isolated sites, such asisolated seamount communities, may alsobe included
Replicated ecological features Replication of ecological features meansthat more than one site shall containexamples of a given feature in the givenbiogeographic area. The term “features”means “species, habitats and ecologicalprocesses” that naturally occur in the givenbiogeographic area
Accounting for uncertainty, natural variationand the possibility of catastrophic events.Features that exhibit less natural variation orare precisely defined may require lessreplication than features that are inherentlyhighly variable or are only very generallydefined
Adequate and viable sites Adequate and viable sites indicate that allsites within a network should have size andprotection sufficient to ensure the ecologicalviability and integrity of the feature(s) forwhich they were selected
Adequacy and viability will depend on size;shape; buffers; persistence of features;threats; surrounding environment (context);physical constraints; scale offeatures/processes; spillover/compactness

About IUCN
IUCN, International Union for Conservation of Nature, helps the world find pragmatic
solutions to our most pressing environment and development challenges.
IUCN works on biodiversity, climate change, energy, human livelihoods and greening
the world economy by supporting scientific research, managing field projects all over
the world, and bringing governments, NGOs, the UN and companies together to
develop policy, laws and best practice.
IUCN is the world’s oldest and largest global environmental organization, with more
than 1,000 government and NGO members and almost 11,000 volunteer experts in
some 160 countries. IUCN’s work is supported by over 1,000 staff in 60 offices and
hundreds of partners in public, NGO and private sectors around the world.
www.iucn.org

INTERNATIONAL UNION FOR CONSERVATION OF NATURE
WORLD HEADQUARTERSRue Mauverney 281196 Gland, [email protected] +4122 999 0000Fax +41 22 999 0002www.iucn.org/waterwww.waterandnature.org