Embed Size (px)
Citation preview
Economic Growth and Income Inequality Relationship: Role of Credit Market Imperfection
Amina Tabassum M.Phil. Student, Department of Economics,
Quaid-i-Azam University, Islamabad
Abstract
This paper examines the empirical relationship between economic growth and income inequality both at aggregate and regional level using more comparable data set for 69 developing countries over the period 1965-2003. The study identifies credit market imperfection in low-income developing countries as the likely reason for a strong negative relationship between income inequality and economic growth. While in short run the relationship between growth and income inequality might be positive but over time more income inequalities reduces economic growth. Moreover, this paper finds evidence that more physical and human capital investment, Openness to trade and higher government spending have statistically significant impact on enhancing economic growth and reducing inequality.
1. Introduction The 20th century has witnessed unequalled success in improving the living standard of people in most part of the world. According to World Bank annual Statistical reports, poverty has declined significantly in developing countries over the past twenty years but the progress has been uneven. The number of people living in poverty fell from 1.5 billion in 1981 to 1.1 billion in 2001. However, many low-income developing countries are still trapped in vicious circle of poverty. In Sub-Saharan Africa, the number of poor rose from 41 percent to 46% between 1981 to 2001.While in Eastern Europe and Central Asia, the numbers of poor people have risen to around 20 percent in 20011.Therefore; reduction of widely scattered poverty is the most challenging goal for low income developing countries. Economic growth is considered to be a powerful force for reducing poverty. High and sustained economic growth increases the labor demand and wages which in return will reduce poverty. Similarly, better earnings as a result of reduction in poverty lead to increase productivity and growth. But the extent of poverty reduction as a result of economic growth depends on how the distribution of income changes with economic growth and on initial Inequalities in income. If income inequality increases, then economic growth does not lead to a significant poverty reduction. Many developing countries achieved high growth rates in different periods but poverty does not reduce significantly in these periods due to increase in income inequalities. Most South and East Asian economies grew at higher per capita rates since early 1970 along with rise in income inequality over time. In contrast, Latin American countries grew by less than the half of average growth rates in South and East Asia while maintaining high income inequality. 2The differences in income inequality at a given rate of growth require that efforts to reduce poverty by stimulating growth are not sufficient and need to be complemented by efforts to reduce income inequalities. A large number of empirical studies have attempted to explore the relationship between income inequality and economic growth3. But there are only few studies that discuss the role of credit market imperfections in growth inequality relationship. Most of earlier studies that highlight the role of credit market imperfections in growth inequality relationship used Ordinary Least Squares to estimate the cross-country growth regression, which has a problem of omitted variable bias. Secondly, due to limited availability of comparable inequality statistics, sample selection remained a problem in most of earlier studies. The resulting estimates of most of these studies found a negative coefficient on inequality suggested that countries with a more equal income distribution (that is a lower Gini index) tend to have higher levels of income4. We attempt to address these problems by using the fixed effect estimation technique and relatively more 1 Statistics that are discussed above are taken from World Development Indicator (2004). 2 The trends of Economic growth and Income Inequalities in selected countries are shown in Appendix. 3 Ravallion (1997), Dollar and Kraay (2001), Barro R. (2000), Deininger and Squire (1996), Deininger and Squire (1998) etc. 4 .Galor and Zeira (1993), Banerjee and Newman (1993), Aghion and Bolton (1997) and Person and Tabellini (1994), King and Levine (1993), Galor (2000) etc.
comparable statistics on growth and inequality. In this paper, an effort has been made to ensure that statistics are comparable across countries and over time using the similar definitions of variables for each country and year. In this paper, an effort has been made to explore the growth inequality relationship not only on aggregate level but also on regional level. This study includes data set for 69 developing countries that have become available from 1965 to 2003.
No country has achieved rapid economic growth by closing themselves off to international trade. Trade openness is defined as the degree to which foreigners and domestic citizen can transact without government imposed costs that are levied on a transaction between them. For example, tariff, non tariff barriers, local content requirements, inspection delays raise the cost of buying from abroad. Despite of having consistent emphasis on how trade promotes growth, the theory also suggested in the presence of distortions like Credit market imperfection, political instability, less improved infra structure etc., free trade might not be best for growth. For instance, a high real return to capital in unskilled labor abundant countries exploit their comparative advantage. Even if trade openness leads to more rapid growth, it does not necessarily imply that it is an effective instrument for reducing poverty. If a growth strategy based on trade openness leads to a significant worsening of income inequality of households, it does not lead to significant reduction in poverty. How trade affects income distribution of a country is purely an empirical question. This paper also considers the role of trade openness, physical and human capital investment and government spending in enhancing economic growth and reducing inequalities.
2. Economic Growth and Income Inequality: Theory and Evidence.
2.1 Economic Growth and Income Inequality: Empirical research on economic growth-income inequality relationship started in 1955 when Simon Kuznet published his study. Kuznet composed data from three developed countries (USA, Germany and Britain). The results of his study suggested that income inequality increases in the initial phase of development and then decreases in the course of development. However, this study was based on simple OLS estimation technique that did create the problem of omitted variable bias. If region, country or some group specific factors affected growth rates, explanatory variables would capture the effects of these factors and estimates would not represent the true effect of explanatory variables. The data on growth and inequality used in that study was highly questionable. Deininger and Squire (1996) using the data for 108 countries over the period 1960-1974 found no systematic relationship between growth and changes in aggregate inequality. According to their analysis, periods of aggregate growth were associated with increased inequality in fourty three cases and with a decrease in inequality in fourty five cases. Similarly, periods of economic decline were associated with increased inequality in five
cases and with a more equitable distribution of income in two cases. The simple relationship between current as well as lagged income growth and the change in the Gini coefficient is insignificant for the whole sample as well as for sub samples defined in terms of country characteristics like rich or poor, equal or unequal, fast-growing or slow-growing economies, suggesting no strong relationship between growth and changes in aggregate inequality. The data set used in this study overcome many weaknesses of earlier data set as it should be based on household surveys, rather than estimates drawn from national accounts statistics. It had comprehensive coverage of all sources of income or uses of expenditure rather than covering, say, wages only; and be representative of the population at the national level, rather than dealing with only the rural or urban population, or with taxpayers. But countries in the Middle East and North Africa, and especially Sub-Saharan Africa, are not well represented in this data. The coverage of Sub-Saharan Africa and the Middle East and North Africa is also thin with in countries, with less than two observations or each country on average. Forbes (2000) found positive relationship between inequality and growth. The author argued that most likely reasons for the contradiction of results are country specific, omitted variable bias, data quality issues and length of period under consideration. In order to overcome such problems, the author used fixed effect model and the sample contained 45 countries whose income inequality data was deemed to be of high quality. The author also concluded that in the long run the relationship is negative while it is positive in the short. Deininger and Squire (1998) argued that inconsistency in results was basically due to the fact that income inequality data might be poor proxy for wealth inequality. They used the data on land inequality as a proxy for wealth inequality. They argued that data on land holdings are attractive for a number of reasons. First, possession of land could be a major determinant of individuals’ productive capacity and their ability to invest, especially in agrarian economies where land is a major asset. Second, in contrast to income, the measurement of which is often associated with large errors, is relatively easily ascertained and does not require assumptions regarding the mapping from income flows into stocks of assets. The available data, however, refer to the operational rather than the ownership distribution of land. The results could be summarized in three points. First, initial inequality in the distribution of land appears to be associated with lower subsequent growth. Second, there is no support for a redistributive median-voter based explanation of initial inequality’s effect on growth. Third, imperfections in financial markets for credit appear to be more relevant for investment in human capital rather than physical capital. However, data on land inequality was very limited and it could not be used in the panel data model to check if cross sectional results hold after controlling for omitted variable bias.
2.1 Role Of credit Market Imperfection Galor and Zeira (1993), Banerjee and Newman (1993) and Aghion and Bolton (1997) found that inequality lead to lower economic growth because of credit market imperfections. They argued that in the short run the relationship might be positive but in the long run, more income inequality hampered economic growth. In the situation of credit market imperfections, the poor people do not borrow due to lack of enough collateral. Thus, poor people do not have the same chances in life as rich people so they cannot provide a good education to their children, however talented they may be, or because they can’t get loans to start up a business. Countries with a high poverty or with unequal distribution of wealth thus underutilize their productive and growth potential to a greater degree than countries with fewer poor people or with a more equitable distribution. Barro (2000) using data of 84 countries from Deininger and Squire (1996) data set, found that the empirical results are sensitive to the specific choice of sample of countries. In the case of transition economies, there is clear evidence that inequality has a negative and significant effect on growth. The results are surprisingly strong to the use of alternative inequality data sources, different specifications, and estimation methods. The author used 3SLS, claiming that the use of fixed effects eliminated the main (cross-sectional) source of variation in the data. With random effects, no significant relationship between inequality and growth is found for the whole sample. Yet, when the sample is divided into sub-samples of poor and rich countries, the growth inequality relationship is negative in the sample of poor countries but positive in the sample of rich countries. These results suggest that the inequality-growth relationship is likely to vary across samples. The author also discussed theoretical analyses of the macroeconomic relationship between income inequality and economic growth and argued that credit market imperfection might be the possible reason of positive relationship between inequality and economic growth in short time period. The credit-market imperfections typically reflected asymmetric information and limitations of legal institutions. For example, creditors might have difficulty in collecting on defaulted loans because law enforcement was imperfect. A bankruptcy law that protected the assets of debtors might also hamper collection. With limited access to credit, the exploitation of investment opportunities depended, to some extent, on individuals’ levels of assets and incomes. Specifically, poor households tended to forego human-capital investments that offered relatively high rates of return. 2.3 Openness to trade, Economic Growth and Income Inequality The idea that trade liberalization has an impact on the country’s growth is not new and goes back at least to Adam Smith. New classical model based on constant and decreasing returns to scale as in Solow (1956) and Swan (1956) predicted that a country would have static gains from lowering its trade barriers. Most of the recent studies including Dollar (1992), Edwards (1993), Sachs and Warner (1995) and Dollar and Kraay (2001a) have found a positive association between trade liberalization and growth. There are number of channels through which trade promotes growth rates by
allocating the resources more efficiently. Trade promotes growth by encouraging economies to specialize and produce in areas where they have relative cost advantage over other economies. Overtime, this helps economies to employ more of their human, physical and capital resources in sectors where they get returns in open international markets, boosting productivity and returns to workers. Trade also expands the markets that local producers can access, allowing them to produce at most efficient scale to keep down the costs. Trade disperses new technologies and ideas, increasing the productivity of local workers and managers. Technology transfers through trade are also more valuable for developing countries, which employ less advance technologies and have little capacity to develop new technologies themselves. Removing trade barriers e.g. tariff on imports gives consumers access to cheaper products, increasing their Purchasing power and living standard. It also provides producers an access to cheap inputs, reducing costs and boosting their competitiveness. Tullock in 1967 noted that the welfare costs of protectionism may actually be a much larger once the costs of monopoly power, tariffs, rent-seeking activities or other pre existing distortions are all taken into account. Thus, removal of such distortions could significantly boost income. Grossman and Helpman in 1990 argued that there could be a host of other dynamic gains to be had from trade and the introduction of competition in terms of scale economies, technological innovations, learning-by-doing effects, etc. which in turn lead to sustained rates of growth (not just one-off increases in income levels. Frankel and Romer (1999) in his study including 100 countries during the period since 1960 found that openness in general does have a statistically and economically significant effect on Growth. Hiranya and Abdullah (2004) in his study Trade Liberalization, Growth and inequality in Bangladesh found some evidence of trade liberalization accelerating growth in Bangladesh and also found little evidence affecting income distribution or of income distribution affecting growth or investment. Data on income inequality used in study is of poor quality. Dollar and Kraay (2001a) using data on trade liberalization as a share of GDP in constant prices for 101 countries including 73 developing countries between 1975-79 and 1995-97 found that trade openness leads to declining inequality between countries, and declining poverty within countries. The poor countries that have reduced trade barriers and participated more in international trade over the past twenty years have seen their growth rates accelerate. In the 1990s they grew far more rapidly than the rich countries, and hence reduced the gap between themselves and the developed world. At the same time the developing countries that are not participating in globalization are falling further and further behind. Within the globalizing developing countries there has been no general trend in inequality. Thus, rapid growth has translated into dramatic declines in absolute poverty in countries such as China, India, Thailand, and Vietnam. OLS estimation results showed that in the 1990s the globalizing developing countries grew at 5.0% per capita; rich countries at 2.2% per capita; and no globalizing developing countries at only 1.4% per capita. While 100 percent increase in the trade share would have the cumulative effect of raising incomes by 25 percent over a decade. The data
used on income inequality and poverty is highly questionable. Most developing countries did not have good household surveys conducted each year, so they had to work with the limited data that were available at that time.
3. DATA ISSUES
The Income inequality data may not be comparable across countries due to differences in definitions and methodologies. We use Gini coefficient to measure income inequality, which is one of the most popular representations of income inequality. It is based on Lorenz Curve, which plots the share of population against the share of income received and has a minimum value of 0 (case of perfect equality) and maximum value of 1 (perfect inequality). Missing values in Income inequality data are the major problem in cross country analysis. Many of developing countries have only one or two observations.
Therefore, we expanded the existing database by including the comparable data on poverty and inequality from recent household surveys included in World Bank, IMF Staff reports and Poverty Reduction Strategy Papers. However, perfect comparability is not attainable. World Bank data on inequality and poverty has still had many problems. The questionnaires used in household surveys differ among countries and also with in countries over time leading to significantly different estimates of average income and consumption. Some surveys obtain information on income of household while others obtain information on consumption. More than half of the observations based on expenditure survey are considered to be more accurate than observations based on income of household because they are likely to have less errors of under-reporting. Data on expenditures also yield lower estimates of inequality due to higher saving rates of upper income class. There are also significant methodological differences across surveys in different countries but there has been no solution to solve these problems. There are also problems in converting nominal terms.
To make the data more comparable, we take data on variables in the form of averages between two survey years. Per capita real GDP growth rates are annual averages between two survey years. To find per capita real GDP growth rates, we subtract value in current year from the value in the previous year and then divide it by the value in the previous year. We use the same formula to find the previous year’s growth rate and then took the average of the growth rates of two consecutive periods. The data on real GDP are derived from the IMF and the International Financial Statistics database. To measure credit market imperfection, we construct a dummy variable HFI equals to one for countries having high level of financial intermediation that is above median in the sample. Following King and Levine (1993), the level of financial intermediation is represented by the summation of the share of broad money (M2) in GDP, and the share of credit to the economy in GDP. M2 as a percentage of GDP show broad money and is taken from line34 plus 35 of the IFS. Credit as percentage of GDP is the claims on the non private sector and is taken from 32d line of IFS. This study identifies credit market imperfection in low income developing countries as the likely reason for a strong
negative relationship between inequality and economic growth. While in short run the relationship between growth and income inequality might be positive but overtime more inequality hampers economic growth. To measure trade openness, we add exports and imports and then divide it by gross domestic product. Data on imports and exports are the annual averages between two survey years. Data on exports and imports are derived from IFS database. Population growth rates are taken from the World Bank development reports. The secondary school enrollment is at the beginning of the period and derived from World Bank database. Data on the ratio of government expenditure and investment as shares of GDP are averages for the period between two survey years and come from the IFS5. The data set includes countries from all regions of developing world, including 11 countries from south and East Asia, 24 countries from Central and Eastern Europe, 16 countries from Latin America, 12 countries from Sub Saharan Africa and 6 countries from Middle East and North Africa. 4. FRAMEWORK OF ANALYSIS AND ESTIMATION TECHNIQUE 4.1 Framework of Analysis There are different channels through which income inequality affects growth rates. Kaldor (1957) suggests that marginal propensity to save of the rich is higher than that of the poor, implying that that a higher degree of inequality will yield higher aggregate savings, higher capital accumulation and growth. In contrast, Persson and Tabellini (1994) and Alsenia and Rodrick (1994) emphasize the four main channels through which income inequality lowers growth rates. First, the impact of inequality on encouraging rent-seeking activities that reduce the security of property rights; second, unequal societies face more difficulties in collective action—possibly reflected in political instability, a propensity for populist redistributive policies, or greater volatility in policies—all of which can lower growth; third, the median voter in a more unequal society is relatively poorer and favors a higher (and thus more inefficient) tax burden; fourth, to the extent that inequality in income or assets coexists with imperfect credit markets, poorer people may be unable to invest in their human and physical capital, with adverse consequences for long-run growth.
Galor and Zeira 1993 and Fisherman and Simhon, 2002 found that under imperfect
capital market, a higher inequality means more individuals facing credit constraints. Consequently, they cannot carry out productive investments in physical or human capital. These can take place in the short run or long run. Second, a worsening inequality generates a rise in the fertility rate among, and less investment in human capital of the poor.
5 Description of variables is shown in Appendix.
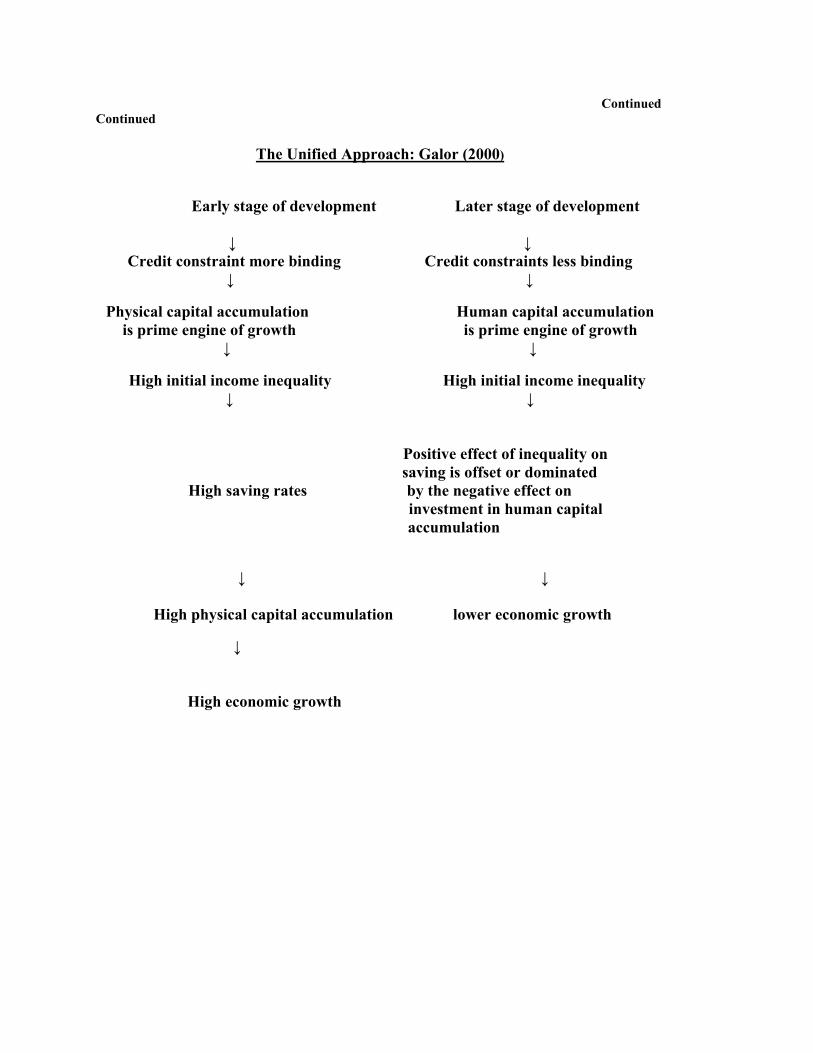
Galor’s (2000) argues that the classical approach holds at low-income levels but not at later stages of development. In the early stage of development, inequality would promote growth because physical capital is scarce at this stage and its accumulation requires saving. Inequality in income would then result in higher savings and rapid growth. In later stages of economic development, however, as the return to human capital increases owing to capital-skill complementarily, human capital becomes the main engine of growth. Credit constraints, however, become less binding as wages increase, and the adverse effect of income inequality on human capital accumulation subsides, and thus the effect of inequality on the growth process becomes insignificant. Galor and Weil (1999, 2000) who developed unified models that encompasses the transition between three distinct regimes that have characterized the process of economic development: the Malthusian Regime, the Post-Malthusian Regime, and the Modern Growth Regime, focusing on the historical evolution of the relationship between population growth, technological change, and economic growth.
Galor and Moav (1999) argue that inequality has a positive effect on capital accumulation but negative effect on human capital accumulation in the presence of credit constraints. In the early stages of development physical capital is scarce, the rate of return to human capital is lower than the return on physical capital and the process of further development is driven mainly by capital accumulation. In the early stages of development, the positive effect of inequality on aggregate saving more than offsets the negative effect on investment in human capital and, since the marginal propensity to save is an increasing function of the individual’s wealth, inequality increases aggregate savings and capital accumulation, enhancing the process of development. In the later stages of development, however, the positive effect of inequality on saving is offset by the negative effect on investment in human capital.
Based on theoretical literature on economic inequalities and some other potential factors that determine economic growth, we develop the following model, which is also in lines with Garbis Iradian (2005). GRit=α1t+β1GINIit+β2Yit-1+β3INVit+β4GINI*HFI+β5SCHit+β6TRADEit +µi+νt+εit Where; GR = average growth rate of per capita GDP at 1993 prices and PPP adjusted; GINI = gini index in the current period; Yit-1 = natural logarithm at the beginning of the period of per capita GDP in dollars at 1993 prices and PPP adjusted; INVit = share of gross capital formation in GDP; HFI = a dummy variable equal to one for countries with a high level of financial Intermediation, that is, above the sample median (as measured by the share of M2 and credit to the private sector in GDP); SCH = secondary school enrollment rate (in percent of the total secondary school aged
population). This variable is used as a proxy to human capital µi = it is a country-specific unobservable effect; νt = it is a time-specific factor; and εit = it is the disturbance term.
4.2 Estimation Technique The technique of Ordinary Least Squares (OLS) has a problem of omitted variable bias. If region, country or some group specific factors affected growth rates, explanatory variables would capture the effects of these factors and estimates would not represent the true effect of explanatory variables. Baltagi (2001) proposes fixed effect econometric techniques to estimate panel data, which could avoid the problem of omitted variable bias. This chosen technique is necessary to control for unobserved time- and country-specific effects because these may be correlated with the right-hand side variables, and produce biased coefficients if omitted. Using time-period dummies could control for the unobserved time-specific effects; this entails the elimination of information related to those variables that vary across time periods but not across countries. The fixed-effects estimator allows intercepts to differ across countries by estimating different constants for each country. The fixed effects model is equivalent to taking deviations from individual (country) means and then estimating an ordinary OLS regression using the transformed data. The deviation from the mean purges the data of the fixed effects by removing means of these variables across countries. 5. RESULTS AND DISUSSIONS The panel regression results regarding growth inequality relationship given in second column of table 5.1 confirms the over all negative and highly significant relationship between growth and inequality. The coefficient of interaction term GINI*HFI is positive and highly significant showing that more inequality in those countries that have relatively more developed financial structure lead to promote economic growth. Due to credit market imperfections, the negative impact of decline in investment in human capital on growth is very strong that it dominates over the positive impact of investment in physical capital on growth leading to overall decline in growth rates. The results also show positive and highly significant relationship between growth and initial income per capita expressed in U.S. dollars. It implies that keeping other factors constant, a country with more initial income per capita tends to grow faster that a country with low initial income per capita. In order to develop a deeper insight regarding the relationship between growth and income inequality, we split the whole sample into short and long time period. In short time period, we include observations having a gap of 3 to 7 years between two survey years. For long time period, we include observations having a gap of 8 to 15 years between two survey years. The panel regression results in short time period are given in third column of table 5.1. We have found that some of macro economic variables do not
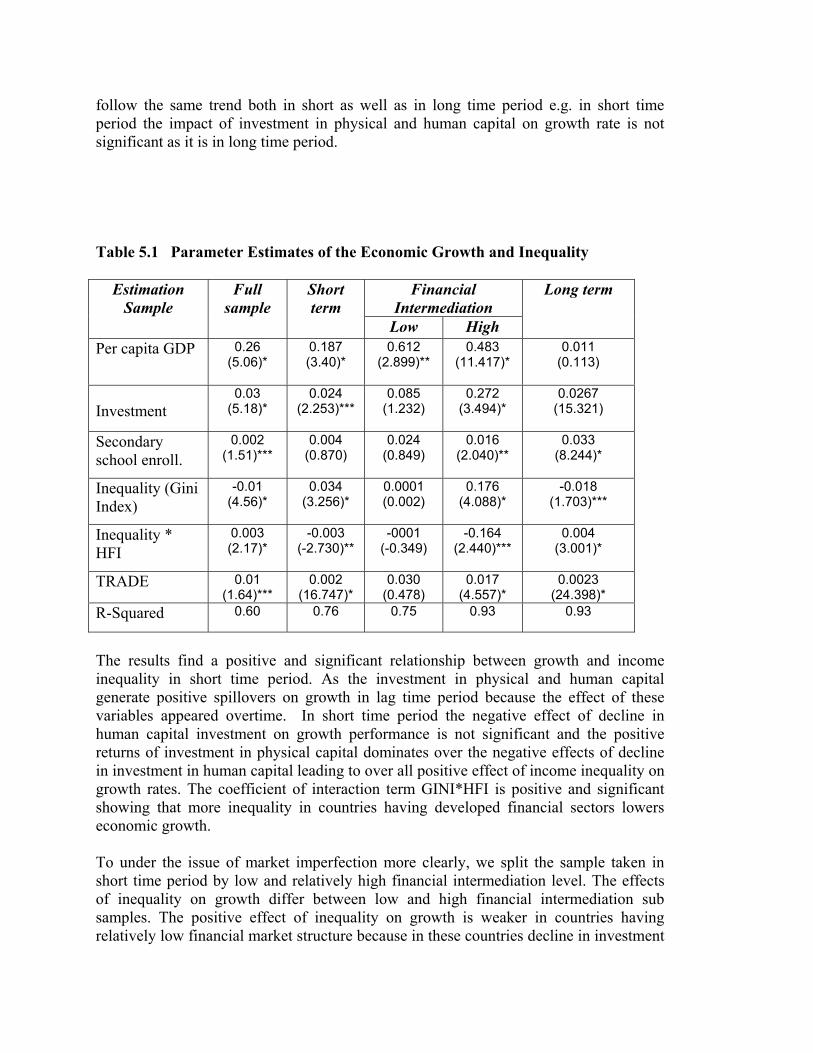
follow the same trend both in short as well as in long time period e.g. in short time period the impact of investment in physical and human capital on growth rate is not significant as it is in long time period. Table 5.1 Parameter Estimates of the Economic Growth and Inequality
The results find a positive and significant relationship between growth and income inequality in short time period. As the investment in physical and human capital generate positive spillovers on growth in lag time period because the effect of these variables appeared overtime. In short time period the negative effect of decline in human capital investment on growth performance is not significant and the positive returns of investment in physical capital dominates over the negative effects of decline in investment in human capital leading to over all positive effect of income inequality on growth rates. The coefficient of interaction term GINI*HFI is positive and significant showing that more inequality in countries having developed financial sectors lowers economic growth. To under the issue of market imperfection more clearly, we split the sample taken in short time period by low and relatively high financial intermediation level. The effects of inequality on growth differ between low and high financial intermediation sub samples. The positive effect of inequality on growth is weaker in countries having relatively low financial market structure because in these countries decline in investment
Financial Intermediation
Estimation Sample
Full sample
Short term
Low High
Long term
Per capita GDP
0.26 (5.06)*
0.187 (3.40)*
0.612 (2.899)**
0.483 (11.417)*
0.011 (0.113)
Investment 0.03
(5.18)* 0.024
(2.253)*** 0.085
(1.232) 0.272
(3.494)* 0.0267
(15.321)
Secondary school enroll.
0.002 (1.51)***
0.004 (0.870)
0.024 (0.849)
0.016 (2.040)**
0.033 (8.244)*
Inequality (Gini Index)
-0.01 (4.56)*
0.034 (3.256)*
0.0001 (0.002)
0.176 (4.088)*
-0.018 (1.703)***
Inequality * HFI
0.003 (2.17)*
-0.003 (-2.730)**
-0001 (-0.349)
-0.164 (2.440)***
0.004 (3.001)*
TRADE 0.01
(1.64)*** 0.002
(16.747)* 0.030
(0.478) 0.017
(4.557)* 0.0023
(24.398)* R-Squared 0.60 0.76 0.75 0.93 0.93
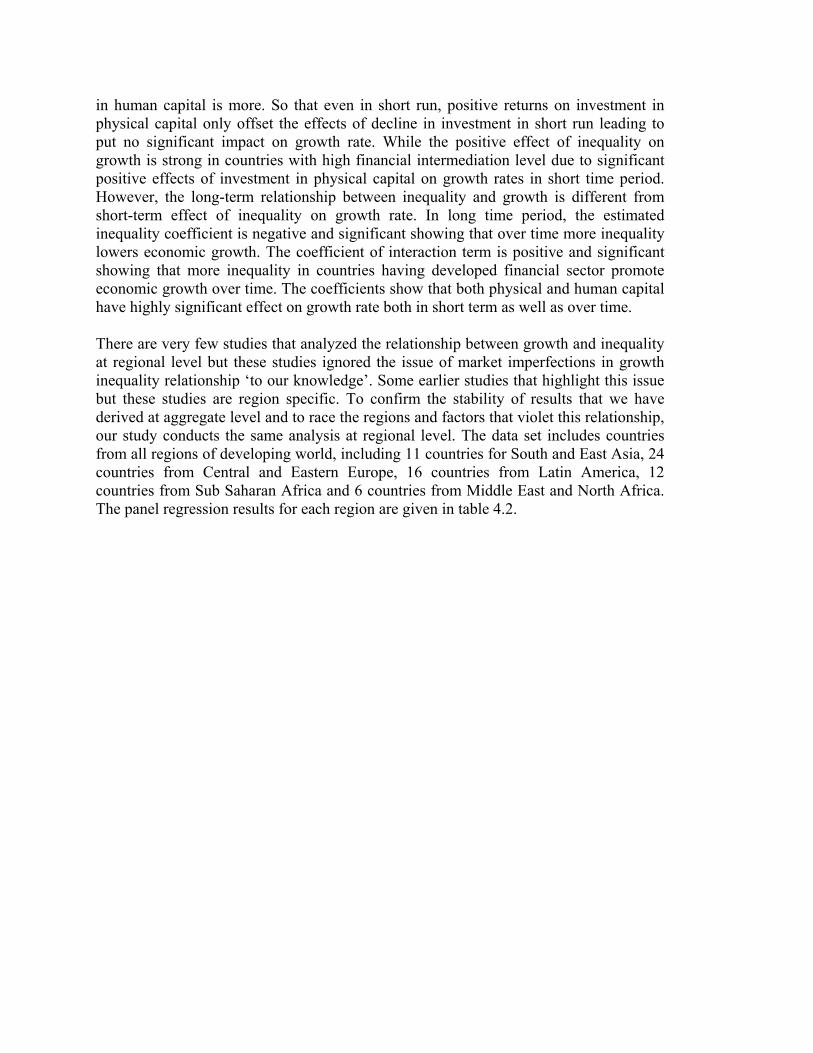
in human capital is more. So that even in short run, positive returns on investment in physical capital only offset the effects of decline in investment in short run leading to put no significant impact on growth rate. While the positive effect of inequality on growth is strong in countries with high financial intermediation level due to significant positive effects of investment in physical capital on growth rates in short time period. However, the long-term relationship between inequality and growth is different from short-term effect of inequality on growth rate. In long time period, the estimated inequality coefficient is negative and significant showing that over time more inequality lowers economic growth. The coefficient of interaction term is positive and significant showing that more inequality in countries having developed financial sector promote economic growth over time. The coefficients show that both physical and human capital have highly significant effect on growth rate both in short term as well as over time. There are very few studies that analyzed the relationship between growth and inequality at regional level but these studies ignored the issue of market imperfections in growth inequality relationship ‘to our knowledge’. Some earlier studies that highlight this issue but these studies are region specific. To confirm the stability of results that we have derived at aggregate level and to race the regions and factors that violet this relationship, our study conducts the same analysis at regional level. The data set includes countries from all regions of developing world, including 11 countries for South and East Asia, 24 countries from Central and Eastern Europe, 16 countries from Latin America, 12 countries from Sub Saharan Africa and 6 countries from Middle East and North Africa. The panel regression results for each region are given in table 4.2.
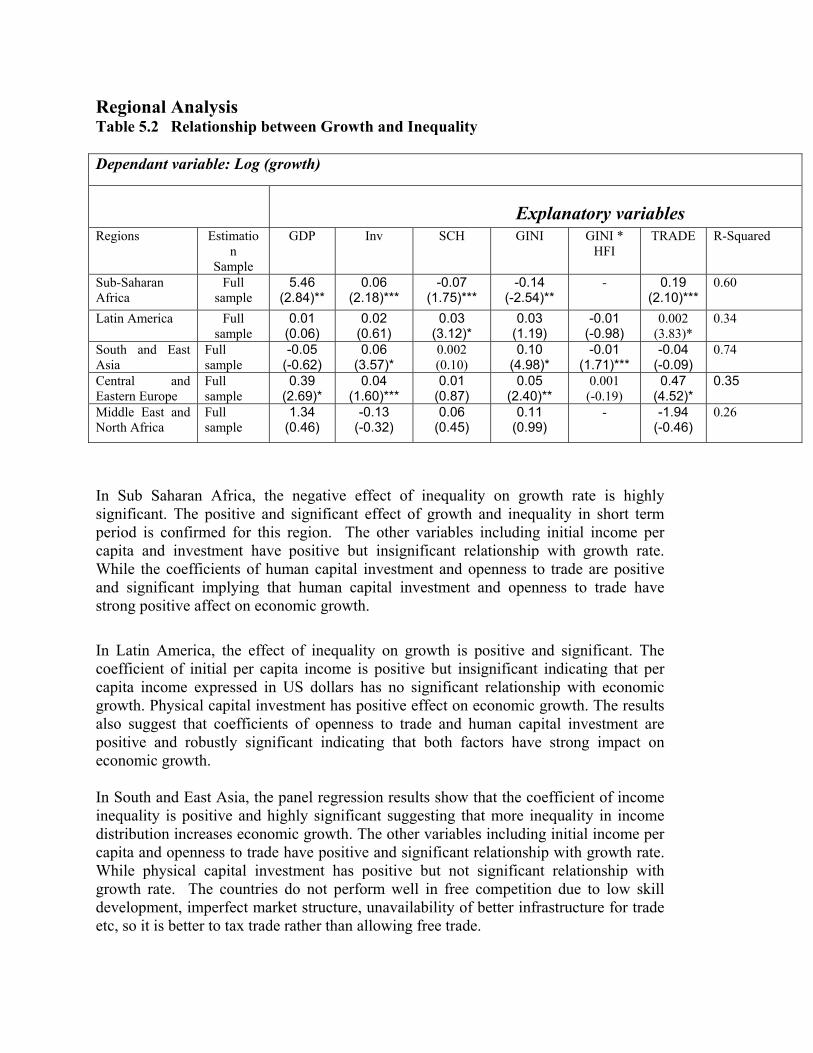
Regional Analysis Table 5.2 Relationship between Growth and Inequality
Dependant variable: Log (growth)
Explanatory variables
Regions Estimation
Sample
GDP Inv SCH GINI GINI * HFI
TRADE R-Squared
Sub-Saharan Africa
Full sample
5.46 (2.84)**
0.06 (2.18)***
-0.07 (1.75)***
-0.14 (-2.54)**
- 0.19 (2.10)***
0.60
Latin America Full sample
0.01 (0.06)
0.02 (0.61)
0.03 (3.12)*
0.03 (1.19)
-0.01 (-0.98)
0.002 (3.83)*
0.34
South and East Asia
Full sample
-0.05 (-0.62)
0.06 (3.57)*
0.002 (0.10)
0.10 (4.98)*
-0.01 (1.71)***
-0.04 (-0.09)
0.74
Central and Eastern Europe
Full sample
0.39 (2.69)*
0.04 (1.60)***
0.01 (0.87)
0.05 (2.40)**
0.001 (-0.19)
0.47 (4.52)*
0.35
Middle East and North Africa
Full sample
1.34 (0.46)
-0.13 (-0.32)
0.06 (0.45)
0.11 (0.99)
- -1.94 (-0.46)
0.26
In Sub Saharan Africa, the negative effect of inequality on growth rate is highly significant. The positive and significant effect of growth and inequality in short term period is confirmed for this region. The other variables including initial income per capita and investment have positive but insignificant relationship with growth rate. While the coefficients of human capital investment and openness to trade are positive and significant implying that human capital investment and openness to trade have strong positive affect on economic growth.
In Latin America, the effect of inequality on growth is positive and significant. The coefficient of initial per capita income is positive but insignificant indicating that per capita income expressed in US dollars has no significant relationship with economic growth. Physical capital investment has positive effect on economic growth. The results also suggest that coefficients of openness to trade and human capital investment are positive and robustly significant indicating that both factors have strong impact on economic growth. In South and East Asia, the panel regression results show that the coefficient of income inequality is positive and highly significant suggesting that more inequality in income distribution increases economic growth. The other variables including initial income per capita and openness to trade have positive and significant relationship with growth rate. While physical capital investment has positive but not significant relationship with growth rate. The countries do not perform well in free competition due to low skill development, imperfect market structure, unavailability of better infrastructure for trade etc, so it is better to tax trade rather than allowing free trade.
In Central and Eastern Europe, the positive relationship between growth and income inequality is observed in both short run as well as overtime. In this region, the coefficient of physical and human capital investment is positive and significant. As most of the countries in this region have relatively developed financial sector, so even in the presence of more inequalities, economic growth increases. The results also suggest that openness to trade have robust impact on growth rate. In Middle East and North Africa, the relationship between growth and inequality is positive but not significant. The other variables including initial income per capita, human capital investment has positive effect on overall growth rates. Openness to trade has a negative and insignificant impact on economic growth. 6. Conclusion From the above discussion, it is concluded that income distribution matters as much as growth for poverty reduction. If income inequality increases overtime along with increase in economic growth, then economic growth does not lead to a significant reduction in poverty. Therefore, it is important to consider growth and income distribution simultaneously. This study attempts to examine the empirical relationship between growth and income inequality and high lights the issue of credit market imperfection in growth inequality relationship both at aggregate and regional level for 69 developing countries over the period 1965-2003. The results of this paper clearly indicate that more inequality hampers the growth rate. It might be possible that more inequality facilitates economic growth for a short time period but overtime, it has strong negative effect on economic growth due to credit market imperfection. The results also show positive and highly significant relationship between growth and initial income per capita expressed in U.S. dollars. It implies that keeping other factors constant, a country with more initial income per capita tends to grow faster that a country with low initial income per capita. The coefficients show that both physical and human capital have highly significant effect on growth rate both in short term as well as over time. From the regional analysis on growth inequality relationship, we conclude that it is not necessary that in all developing countries, more inequality promotes economic growth. Secondly, developing countries in some regions do not perform well in free competition due to low skill development, imperfect market structure, unavailability of better infrastructure for trade etc. So it is better to restrict trade rather than free competition. While both physical and human capital investment has strong positive effect on economic growth in most of the regions.
Policy Implication A pro-poor economic growth leading to a rapid and sustainable poverty reduction depends upon the interaction of a wide range of policy measures which are discussed as follows:- A). A pro-poor growth strategy does not have to only focus on economic growth, but could also be combined with an active policy of income redistribution. b). Credit market imperfection is found to be most crucial factor in growth inequality relationship. Due to limited access to credit, poor households tend to forego human-capital investments that offer relatively high rates of return. In this case, a distortion free redistribution of incomes from rich to poor tends to raise the quantity and average productivity of investment. As a result, a reduction in inequality raises the rate of pro poor economic growth. c).The higher the level of both physical and human capital investment, the higher is the level of output per capita. A better-educated labor force can improve productivity and technological level in the economy, which have a long-run positive effect on economic growth. Therefore, government has to take the responsibility for building up human capital and intergenerational dimension in the effects of education must be taken into account. Policies must be based on a sound understanding of the factors that govern household decisions about schooling and of the means by which subsidized services can lead to better outcomes for the poor. d).Governments must create an environment that is conducive to growth. Macroeconomic policy should aim at stability, and openness towards the rest of the world. For all these efforts to be effective, the government must develop good institutions, and provide good governance.
References
Aghion and Bolton P. (1997), “Distribution and Economic growth in model of imperfect capital Markets”, European Economic Review, Vol: 36, pages 603-611. Alesina, Alberto and Rodrick D. (1994), “Distributive Politics and Economic Growth”, Quarterly Journal of Economics, Vol: 108, pages 465-90. Banerjee A.V. and Newman A.F. (1993), "Occupational Choice and the Process of Development", Journal of Political Economy, Vol: 101, No: 2, pages 274-298. Barro R. (2000), “Inequality and Growth in a Panel of Countries,” Journal of Economic Growth, Vol: 5, pages 5–32. Clarke G. (1995), “More Evidence on Income Distribution and Growth”, Journal of Development Economics, Vol: 47, pages 403-428. Deininger K. and Squire L. (1996), “A New Data Set Measuring Income Inequality”, World Bank Economic Review, Vol: 10, pages 565–92. Deininger K. and Squire L. (1998), "New Ways of Looking at Old Issues: Inequality and Growth", Journal of Development Economics, Vol: 57, pages 259-87. Dollar and David (1992), “Outward-Oriented Developing Economies Really Do Grow More Rapidly: Evidence from 95 LDCs 1976–1985”, Economic Development and Cultural Change, Vol: 40, No: 3, pages 523–44. Dollar, David and Kraay A. (2001), "Growth is good for the Poor" World Bank Policy Research Working Paper, No: 2587, Washington, DC: World Bank. Dollar D. and Kraay A. (2001a), "Trade, Growth, and Poverty", Finance and Development, Vol: 38, pages 16-19. Edwards S. (1993) "Openness, Trade Liberalization, and Growth in Developing Countries", Journal of Economic Literature, Vol: 31, pages 1358-1393. Fishman, Arthur and Simhon (2002), “The division of labor, inequality and growth”, Journal of Economic Growth, Vol: 7, pages 117-36. Forbes K. (2000), “A Reassessment of the Relationship between Inequality and Growth”, American Economic Review, Vol: 90, pages 869–97. Frankel J. and Romer D. (1999), “Does trade cause Growth?”, American Economic Review, Vol: 89, pp.379-99.
Galor (2000), “Income Distribution and the process of Development”, European Economic Review, Vol: 44, pp. 706-12. Galor and Moav (1999), “From Physical to Human Capital Accumulation: Inequality in the Process of Development”, CEPR discussion paper, No: 2307. Galor, Oded and Zeira J. (1993), "Income Distribution and Macroeconomics", Review of Economic Studies, Vol: 60, pages 35-52. Galor and Weil (1999), “From Malthusian Stagnation to Modern Growth”, American Economic Review, Vol: 89, pages 150–154. Galor and Weil (2000), “Population, Technology and Growth: From Malthusian Stagnation to Growth and Beyond”, American Economic Review, Vol: 90, pages 806–828. Garbis Iradian (2005), “Inequality, Poverty and Growth: Cross Country Evidence”, IMF Working Paper, Vol: 5, unpublished. Grossman and Helpman (1991), “Innovation and Growth in the Global Economy”, MIT Press, Cambridge. Hiranya K Nath and Khawaja Abdullah (2004), “Trade Liberalization, Growth and Inequality in Bangladesh: An Empirical Analysis”, pages 1-12. International Monetary Fund (2004), ‘International financial statistics yearbook’, International Monetary Fund, Washington DC. Kaldor N. (1957), “A model of economic growth”, Economic Journal, Vol: 57, pages 591-624. King, Robert and Levine R. (1993), “Finance and Growth: Schumpeter Might be Right”, Quarterly Journal of Economics, Vol: 108. Kuznet S. (1955), “Economic Growth and Income Inequality”, American Economic Review, Vol: 45, No: 1, pages 1–28. Persson, Torsten and Tabellini (1994), “Is Inequality Harmful for Growth?”, American Economic Review, Vol: 84, pages 600-621. Ravallion M. (1997), “Good and Bad Growth: The Human Development Reports,” World Development, Vol: 25, pages 631–38.
Sachs J.D. and Warner A.M. (1995) "Economic Reform and the Process of Global Integration", Brookings Papers on Economic Activity, pages 1-95. Solow R. (1956), “A contribution to the theory of economic growth”, Quarterly Journal of Economics, Vol: 70, pages 65-94. Swan T. (1956) “Economic growth and capital accumulation”, Vol: 32, pages 334-61. Tullock G. (1967) “Welfare costs of Tariffs, Monopolies and Theft”, Western Economic Journal, Vol: 5, pp. 224-32. World Bank (2004) ‘World Development Indicators database’ Washington, DC.
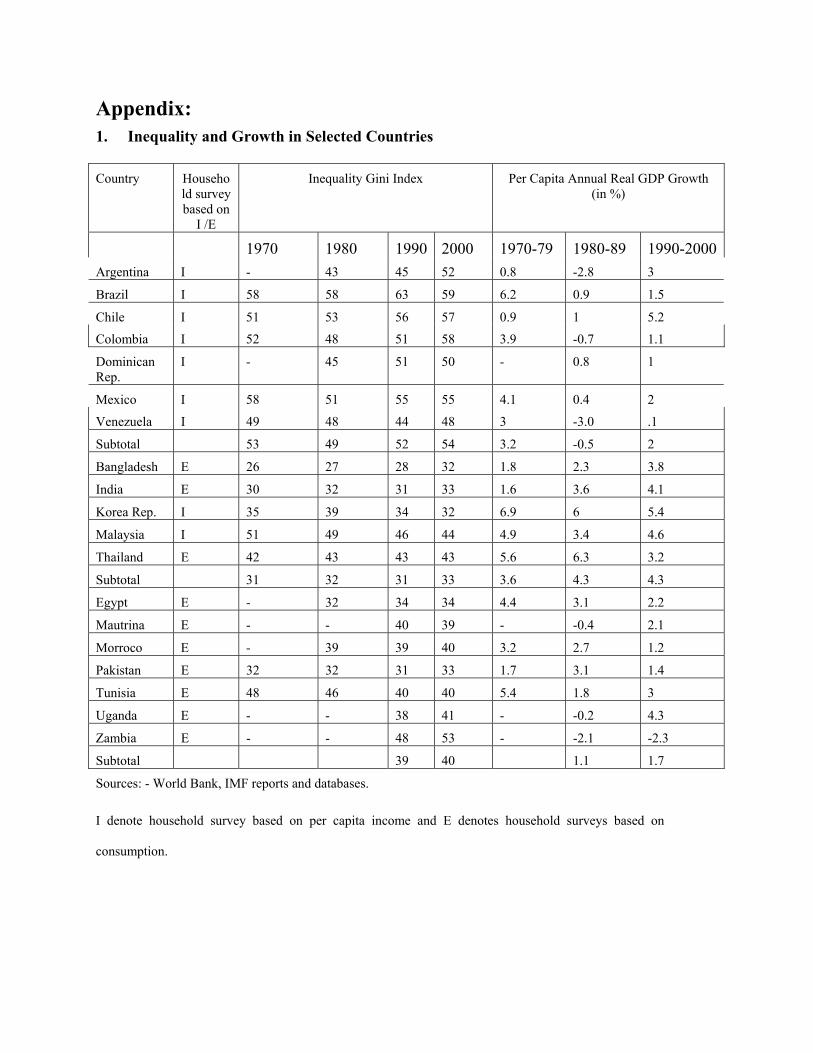
Appendix: 1. Inequality and Growth in Selected Countries
Country Household survey based on
I /E
Inequality Gini Index Per Capita Annual Real GDP Growth (in %)
1970 1980 1990 2000 1970-79 1980-89 1990-2000Argentina I - 43 45 52 0.8 -2.8 3
Brazil I 58 58 63 59 6.2 0.9 1.5
Chile I 51 53 56 57 0.9 1 5.2
Colombia I 52 48 51 58 3.9 -0.7 1.1
Dominican Rep.
I - 45 51 50 - 0.8 1
Mexico I 58 51 55 55 4.1 0.4 2
Venezuela I 49 48 44 48 3 -3.0 .1
Subtotal 53 49 52 54 3.2 -0.5 2
Bangladesh E 26 27 28 32 1.8 2.3 3.8
India E 30 32 31 33 1.6 3.6 4.1
Korea Rep. I 35 39 34 32 6.9 6 5.4
Malaysia I 51 49 46 44 4.9 3.4 4.6
Thailand E 42 43 43 43 5.6 6.3 3.2
Subtotal 31 32 31 33 3.6 4.3 4.3
Egypt E - 32 34 34 4.4 3.1 2.2
Mautrina E - - 40 39 - -0.4 2.1
Morroco E - 39 39 40 3.2 2.7 1.2
Pakistan E 32 32 31 33 1.7 3.1 1.4
Tunisia E 48 46 40 40 5.4 1.8 3
Uganda E - - 38 41 - -0.2 4.3
Zambia E - - 48 53 - -2.1 -2.3
Subtotal 39 40 1.1 1.7
Sources: - World Bank, IMF reports and databases.
I denote household survey based on per capita income and E denotes household surveys based on
consumption.
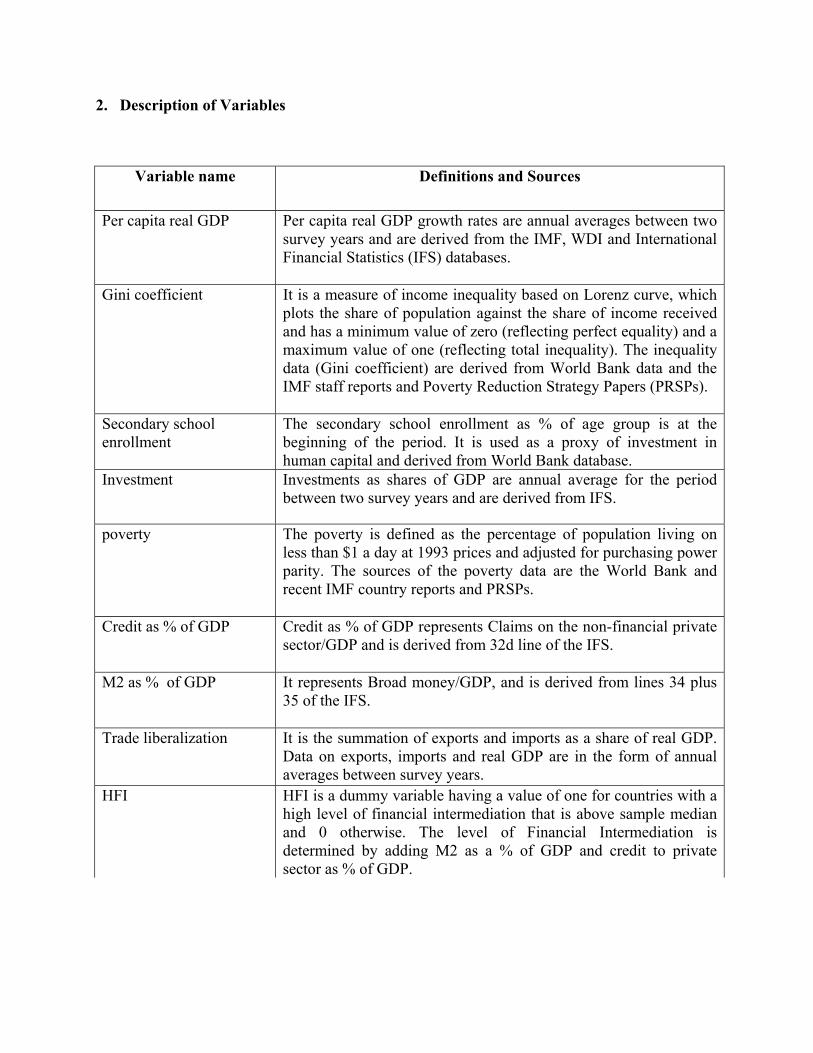
2. Description of Variables
Variable name Definitions and Sources
Per capita real GDP Per capita real GDP growth rates are annual averages between two survey years and are derived from the IMF, WDI and International Financial Statistics (IFS) databases.
Gini coefficient It is a measure of income inequality based on Lorenz curve, which plots the share of population against the share of income received and has a minimum value of zero (reflecting perfect equality) and a maximum value of one (reflecting total inequality). The inequality data (Gini coefficient) are derived from World Bank data and the IMF staff reports and Poverty Reduction Strategy Papers (PRSPs).
Secondary school enrollment
The secondary school enrollment as % of age group is at the beginning of the period. It is used as a proxy of investment in human capital and derived from World Bank database.
Investment Investments as shares of GDP are annual average for the period between two survey years and are derived from IFS.
poverty The poverty is defined as the percentage of population living on less than $1 a day at 1993 prices and adjusted for purchasing power parity. The sources of the poverty data are the World Bank and recent IMF country reports and PRSPs.
Credit as % of GDP Credit as % of GDP represents Claims on the non-financial private sector/GDP and is derived from 32d line of the IFS.
M2 as % of GDP It represents Broad money/GDP, and is derived from lines 34 plus 35 of the IFS.
Trade liberalization It is the summation of exports and imports as a share of real GDP. Data on exports, imports and real GDP are in the form of annual averages between survey years.
HFI HFI is a dummy variable having a value of one for countries with a high level of financial intermediation that is above sample median and 0 otherwise. The level of Financial Intermediation is determined by adding M2 as a % of GDP and credit to private sector as % of GDP.
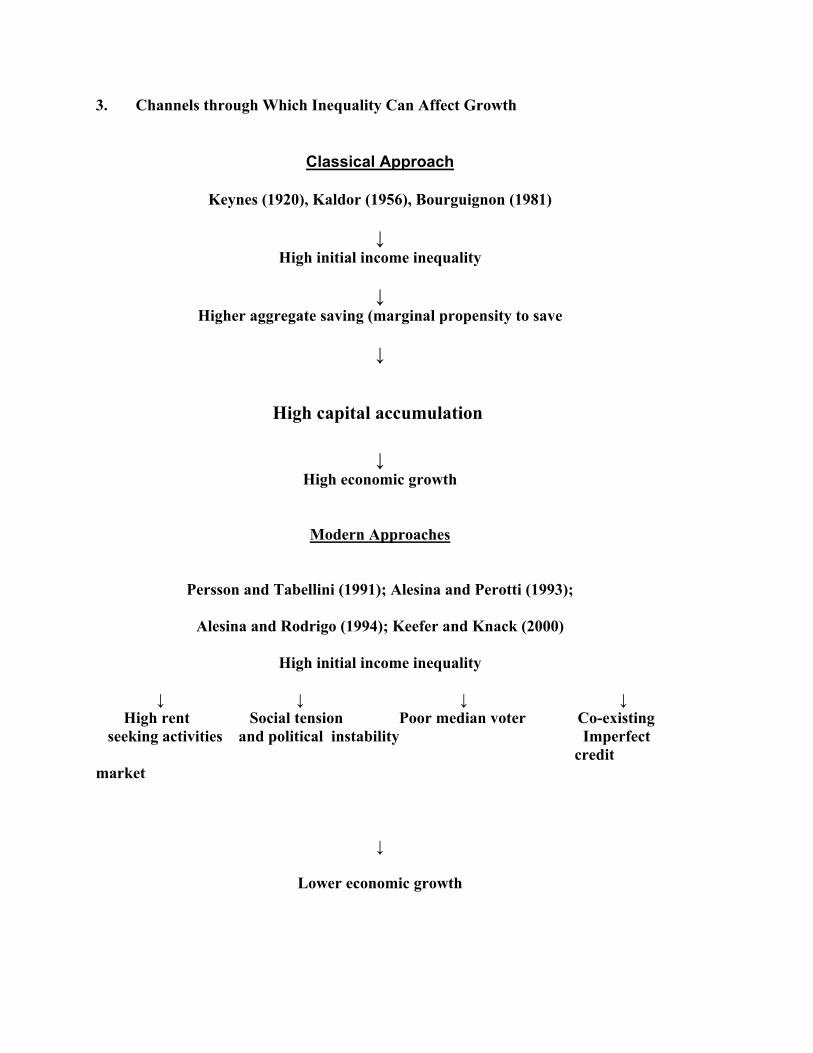
3. Channels through Which Inequality Can Affect Growth
Classical Approach
Keynes (1920), Kaldor (1956), Bourguignon (1981)
↓ High initial income inequality
↓ Higher aggregate saving (marginal propensity to save
↓
High capital accumulation ↓
High economic growth
Modern Approaches
Persson and Tabellini (1991); Alesina and Perotti (1993);
Alesina and Rodrigo (1994); Keefer and Knack (2000)
High initial income inequality
↓ ↓ ↓ ↓ High rent Social tension Poor median voter Co-existing seeking activities and political instability Imperfect credit market
↓
Lower economic growth
Continued Continued
The Unified Approach: Galor (2000)
Early stage of development Later stage of development
↓ ↓ Credit constraint more binding Credit constraints less binding
↓ ↓
Physical capital accumulation Human capital accumulation is prime engine of growth is prime engine of growth
↓ ↓
High initial income inequality High initial income inequality ↓ ↓
Positive effect of inequality on
saving is offset or dominated High saving rates by the negative effect on
investment in human capital accumulation
↓ ↓ High physical capital accumulation lower economic growth ↓ High economic growth


