Embed Size (px)
Citation preview


Government of Bihar Finance Department
Economic Survey 2019 - 20


I
CONTENTS Chapter Title Glossary of Abbreviations i-x Index of Tables and Appendices xi-xxvi Technical Notes xxvii-xxxiv Executive Summary xxxv-lii Chapter - I : Bihar Economy : An Overview 1-21 1.1 Socio-Economic Profile of the State 2-4 1.2 Growth of Bihar Economy 4-8 1.3 Structural Composition of the Bihar Economy 8-10 1.4 District-wise Disparity 11-12 1.5 Consumer Price Index 12-13 Appendices 14-21 Chapter - II : State Finances 22-71 2.1 Overview of Financial Position 23-28
2.2 Fiscal Performance 29-32 2.3 Sustainability, Flexibility and Vulnerability of State Finances 33-35 2.4 Deficit Management 35-39 2.5 Cash Management and Guarantees 39-39 2.6 Debt Management 40-43 2.7 Resource Management 43-55 2.8 Expenditure Management 56-67 Appendices 68-71 Chapter - III : Agriculture and Allied Sectors 72-135 3.1 Public Expenditure in Agricultural Sector 74-76 3.2 Land Resources 76-79 3.3 Production Trends of Crop and Horticulture 80-92 3.4 Animal Husbandry, Fisheries and Dairy Sector 93-99 3.5 Agricultural Inputs 99-105 3.6 Storage and Warehouse 105-106 3.7 Irrigation 107-114 Appendices 115-135
Chapter - IV : Enterprises Sector 136-166 4.1 Status of Industries 138-150 4.2 Agro-based Industries 150-155 4.3 Non-Agro Based Industries 156-166

II
Chapter - V : Labour, Employment and Migration 167-196 5.1 Size of Labour Force and Work Force 168-177 5.2 Initiatives of the State Government for Labour 178-182 5.3 Minimum Wages Rates 182-183 5.4 Recruitment by State and Other Organizations 184-190 5.5 Support for Migrant Workers 190-192 Appendices 193-196 Chapter - VI : Infrastructure 197-248 6.1 Transport Sector and Economic Growth 198-198 6.2 Public Investment in Road Transport 199-200 6.3 Road Safety 200-202 6.4 Road Network 202-222 6.5 Bridge Sector 223-224 6.6 Road Transportation 225-233 6.7 Railway Network 233-235 6.8 Civil Aviation 236-236 6.9 Building Construction 237-238 6.10 Telecom Network 238-241 6.11 Postal Network 242-243 Appendices 244-248 Chapter - VII : Energy Sector 249-275 7.1 Availability of Power 250-252 7.2 Projection of Power Requirement 252-254 7.3 Institutional Structure of Power Sector 254-256 7.4 Distribution Companies (DISCOMs) 256-257 7.5 Operational and Financial Status 257-259 7.6 Central Government Programmes for Power Sector 259-262 7.7 Transmission 262-263 7.8 Generation 264-266 7.9 New Schemes / Projects 267-268 7.10 Recent Developments in Power Sector 268-270 7.11 Bihar Renewable Energy Development Agency (BREDA) 270-272 7.12 Bihar State Hydroelectric Power Corporation (BSHPC) 272-275 Chapter - VIII : Rural Development 276-296 8.1 Bihar Rural Livelihood Mission (JEEViKA) 277-281 8.2 Mahatma Gandhi National Rural Employment Guarantee Act 281-285 8.3 Pradhan Mantri Awas Yojana Gramin (PMAY-G) 285-286

III
8.4 Public Distribution System 286-288 8.5 Panchayati Raj Institutions 288-290 8.6 Distribution of Homestead Land 290-291 Appendices 292-296
Chapter - IX : Urban Development 297-319 9.1 Level of Urbanisation 298-301 9.2 Expenditure on Urban Development 301-302 9.3 Urban Development Programmes (State Plan) 302-305 9.4 Urban Development Programmes (Jointly Funded by 305-316 Centre and State) 9.5 Municipal Finance 316-317 Appendices 318-319
Chapter - X : Banking and Allied Sectors 320-350 10.1 Banking Infrastructure 322-329 10.2 Deposits, Credits and Credit-Deposit Ratio 329-339 10.3 Achievements under Annual Credit plan (ACP) 339-343 10.4 Kisan Credit Card (KCC) 343-345 10.5 Pradhan Mantri Mudra Yojana (PMMY) 346-347 Appendices 348-350
Chapter - XI : Human Development 351-440 11.1 Demography Scenario 353-358 11.2 Health Scenario 358-374 11.3 Drinking Water Supply and Sanitation 374-379 11.4 Education, Art, Culture and Youth 379-394 11.5 Social Welfare 394-403 11.6 Women Empowerment 403-410 11.7 Social Security for Old and Disabled 410-412 Appendices 413-440
Chapter - XII : Child Development 441-466 12.1 Demographic Status 442-444 12.2 Allocation for Children 445-447 12.3 Survival, Health and Nutrition Status 447-449 12.4 Development Programme for Children 449-454 12.5 Drinking Water and Sanitation 454-455 12.6 Educational and Development Status 455-459 12.7 Status of Child Protection 459-462 12.8 Status of Child Participation 462-463 Appendices 464-466
IV
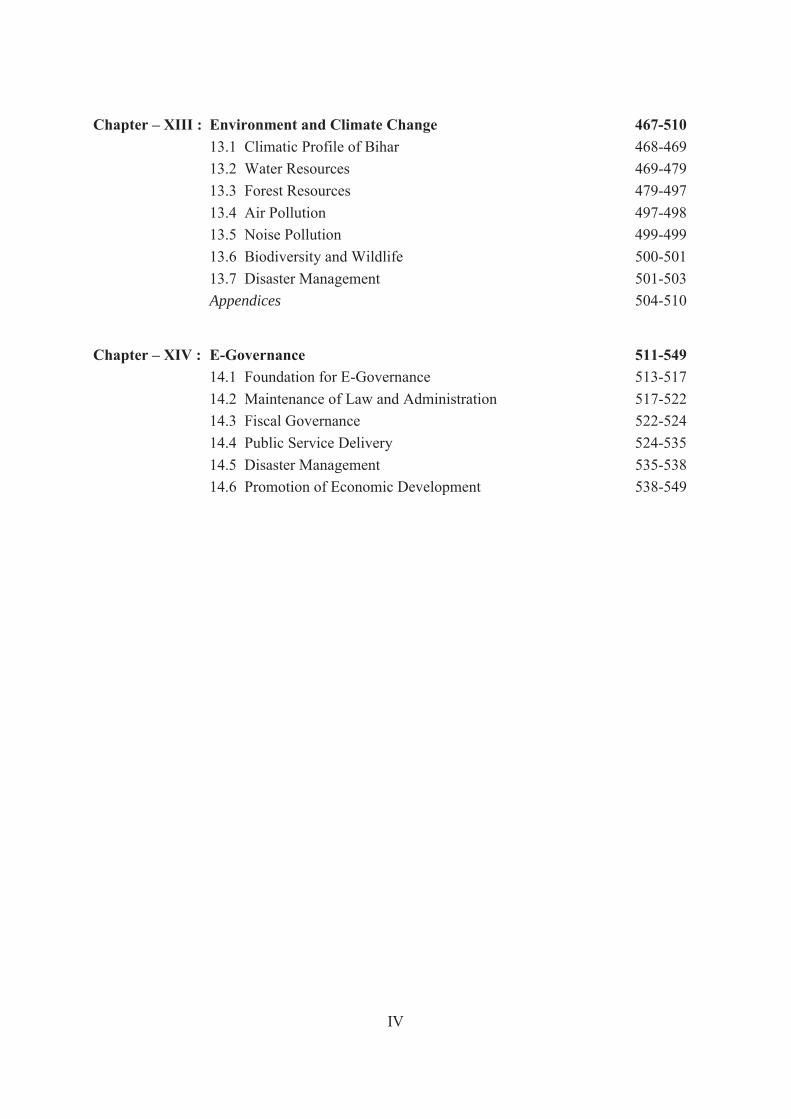
Chapter – XIII : Environment and Climate Change 467-510 13.1 Climatic Profile of Bihar 468-469 13.2 Water Resources 469-479 13.3 Forest Resources 479-497 13.4 Air Pollution 497-498
13.5 Noise Pollution 499-499 13.6 Biodiversity and Wildlife 500-501 13.7 Disaster Management 501-503 Appendices 504-510
Chapter – XIV : E-Governance 511-549 14.1 Foundation for E-Governance 513-517 14.2 Maintenance of Law and Administration 517-522 14.3 Fiscal Governance 522-524 14.4 Public Service Delivery 524-535
14.5 Disaster Management 535-538 14.6 Promotion of Economic Development 538-549

i
GLOSSARY OF ABBREVIATIONS
AA Alternative Analysis AB-NHPMC Ayushman Bharat National Health Protection Mission Council ACP Annual Credit Plan ADB Asian Development Bank ADV Advertisement Tax AIBP Accelerated Irrigation Benefit Programme AIIMS All India Institute of Medical Sciences AMRUT Atal Mission for Rejuvenation and Urban Transformation ANC Ante-Natal Care ANM Auxiliary Nurse-Cum-Mid-wife APEDA Agriculture and Processed Food Products Exports Development
Authority APHC Additional Primary Health Centres AQMS Air Quality Monitoring Stations ARI Acute Respiratory Infection ASHA Accredited Social Health Activist ASI Annual Survey of Industries AT&C Aggregate Technical and Commercial ATMA Agricultural Technology Management Agency AVS Anganwadi Vikas Samiti AWC Anganwadi Centers AWH Anganwadi Helper AWW Anganwadi Worker BAAF Bihar AADHAR Authentication Framework BAPCC Bihar State Action Plan for Climate Change BBOSE Bihar Board of Open Schooling Examination BC Backward Classes BE Budget Estimates BELTRON Bihar State Electronic Development Corporation BEST Bihar Easy School Tracking BCC Behaviour Change Communication BDL Below Detection Limit BEPC Bihar Education Project Council BGREI Bringing Green Revolution to Eastern India
BHIM Bharat Interface for Money BIADA Bihar Industrial Area Development Authority BLRS Bonded Labour Rehabilitation Scheme BMI Body Mass Index BMGF Bill and Melinda Gates Foundation BOD Bio-chemical Oxygen Demand

ii
BPSC Bihar Public Services Commission BSPCB Bihar State Pollution Control Board BREDA Bihar Renewable Energy Development Agency BRGF Backward Region Grant Fund BRJP Bihar Rajya Jal Parishad BRLP Bihar Rural Livelihood Project BRPNNL Bihar Rajya Pul Nirman Nigam Limited BSDM Bihar Skill Development Mission BSDMA Bihar State Disaster Management Authority BSEB Bihar State Electricity Board BSEDC Bihar State Electronics Development Corporation BSHP Bihar State Highways Project BSHPC Bihar State Hydroelectric Power Corporation BSNL Bharat Sanchar Nigam Limited BSPCB Bihar State Pollution Control Board BSPGCL Bihar State Power Generation Company Limited BSPHCL Bihar State Power (Holding) Company Limited BSPTCL Bihar State Power Transmission Company Limited BSRDCL Bihar State Road Development Corporation Limited BSRTC Bihar State Road Transport Corporation BSSOCA Bihar State Seed and Organic Certification Agency BSWAN Bihar State Wide Area Network BSWC Bihar State Warehousing Corporation BTPS Barauni Thermal Power Station BTSC Bihar Technical Service Commission BUIDCO Bihar Urban Infrastructure Development Corporation CAGR Compound Annual Growth Rate CAMPA Compensatory Afforestation Fund Management and Planning
Authority CBR Crude Birth Rate CCB Central Co-operative Banks CCS Culturable Command Area CCTNS Crime and Criminal Tracking Network and Systems CCPWC Cyber-Crime Prevention against Women and Children CD Credit-Deposit CDPO Child Development Project Officer CEA Central Electricity Authority CERT-IN Indian Computer Emergency Response Team CFMS Comprehensive Financial Management System CFC Common Facility Centres CGRC Centralised Grievance Redressed Cell CGST Central Goods and Services Tax

iii
CHC Community Health Centres CIDC Construction Industry Development Council CIMMYT International Maize and Wheat Improvement Center CIPET Central Institute of Plastic Engineering and Technology CLF Cluster Level Federations CLTS Child Labour Tracking System CMRF Chief Minister Relief Fund CMP Comprehensive Mobility Plan CMR Child Mortality Rate CNG Compressed Natural Gas CoC Champions of Change COMFED Bihar State Milk Co-Operative Federation Limited CPI Consumer Price Index CRF Central Road Fund CSC Community Service Centre CSC Citizen Service Centre CSO Central Statistical Organisation CSP Customer Service Point CSR Corporate Social Responsibility C&SRB Communication & services related to broadcasting CSSM Centrally Sponsored and State Managed CSS Centrally Sponsored Scheme CTMIS Comprehensive Treasury Management Information System CWC Central Warehousing Corporation
DAY-NULM Deendayal Antyoday Yojana - National Urban Livelihoods Mission
DBT Direct Beneficiary Transfer DCMS Document Case Management System DDUGJY Deen Dayal Upadhyaya Gram Jyoti Yojana DEAS Double Entry Accounting System DGT Directorate General of Training DIC District Industries Centre DIKSHA Digital Saksharta Abhiyan DPR Detailed Project Report DR Disaster Response DSLAM Digital Subscriber Line Access Multiplexers DSR Demand Side Response EAP Externally Aided Project EBC Extremely Backward Classes ECCE Early Childhood Care and Education ED Electricity Duty EDGI E-Government Development Index

iv
EDP Entrepreneurs Development Programmes EGWUS Electricity, gas, water supply & other utility services EMM Equipment Maintenance and Management System ENT Entertainment Tax EPC Engineering, Procurement and Construction EPI Expanded Programme of Immunization ERSS Emergency Response Support System ESIC Employees’ State Insurance Corporation ESTP Employment through Skill Training and Placement ET Tax on Entry of Goods FDDI Footwear Design and Development Institute FESO Fishery Extension Services Officer FFM Flood Forecast Model FISEP Financial Inclusion and Self-Employment Programme FMCG Fast-Moving Consumer Goods FMIS Forest Management Information System FPII Faster Payments Innovation Index FRBM Fiscal Responsibility and Budget Management FTH Fiber to Home GCA Gross Cropped Area GeM Government e-Marketplace GFD Gross Fiscal Deficit GIA Gross Irrigated Area GPMS Gram Panchayat Management System GSDP Gross State Domestic Product GST Goods and Services Tax GSTN Goods and Services Tax Network
GSVA Gross State Value Added GTSNY Gramin Tola Sampark Nishchay Yojana GVO Gross Value of Output HCI Human Capital Index HFA Housing for All HLT Taxation on Luxuries in Hotel HRIDAY Heritage City Development and Augmentation Yojana HRMS Human Resource Management System HT High Tension HUDCO Housing and Urban Development Corporation HSPI Health System Progress Tracker IAMC Industrial Area Management Committee IAP Integrated Action Plan IBC Insolvency and Bankruptcy Code ICAR Indian Council of Agricultural Research

v
ICD Investment Plus Credit to Deposit ICDS Integrated Child Development Services IED Institute of Entrepreneurship Development IFAD International Fund for Agricultural Development IGAS Indian Government Accounting Standard IGMSY Indira Gandhi Matritva Sahyog Yojana IGNOU Indira Gandhi National Open University IGST Inter-State Goods and Service Tax IHHL Individual Household Latrine IL&FS Infrastructure Leasing and Financial Services IMFL Indian-made Foreign Liquor IMPS Immediate Payment Service IMR Infant Mortality Rate IPCC Intergovernmental Panel on Climate Change IPDS Integrated Power Development Scheme IPDS In-patient Department IPPB India Post Payments Bank ISBT Interstate Bus Terminus ISDP Integrated Disease Surveillance Programme ICT Information and Communication Technology ITI Industrial Training Institutes JE Japanese Encephalitis JICA Japan International Cooperation Agency JOCODE Judicial Officer Code JSY Janani Suraksha Yojana KBUNL Kanti Bijlee Utpadan Nigam Limited KCC Kisan Credit Card KGBV Kasturba Gandhi Balika Vidyalaya KHPS Kosi Hydel Power Station KVIC Khadi and Village Industries Commission KLPD kilo litres per day KVK Krishi Vigyan Kendra KYP Kushal Yuva Program LEB Life Expectancy at Birth LFPR Labour Force Participation Rate LPS Low Performing States LS Lady Supervisor LSBA Lohiya Swachh Bihar Abhiyan LT Low Tension LWE Left-Wing Extremists MBS Maternity Benefit Scheme MCM Million Cubic Metre

vi
MCS Micro Credit Scheme MDF Moderately Dense Forest MDMS Mid-Day Meal Scheme MDR Major District Road MGNREGS Mahatma Gandhi National Rural Employment Guarantee
Scheme MI Mission Indradhanush MKUY Mukhya Mantri Kanya Uthan Yojna MMGSY Mukhya Mantri Gram Sampark Yojana MMR Maternal Mortality Rate MMSNY Mukhyamantri Setu Nirman Yojana MMVSNY Mukhyamantri Vidyut Sambandh Nishchay Yojana MNRE Ministry of New and Renewable Energy MPI Multidimensional Poverty Index MSDE Ministry of Skill Development and Entrepreneurship MSDG Mobile e-Governance Service Delivery Gateway MSDP Multi-Sectoral Development Programme MSME Micro, Small and Medium Enterprises MV Mamidipudi Venkatarangaiya MWCD Ministry of Women and Child Development NABARD National Bank for Agriculture and Rural Development NBFC Non-Banking Financial Companies NBPDCL North Bihar Power Distribution Company Limited NCAP National Clean Air Programme NDDB National Dairy Development Board NDPS Narcotic Drugs and Psychotropic Substances NeGP National e-Governance Plan NFHS National Family Health Survey NGN Next Generation Network NH National Highway NHDP National Highways Development Project NHM National Health Mission NIELIT National Institute of Electronic and Information Technology NIOS National Institute of Open Schooling NMCG National Mission for Clean Ganga NMR Neo-Natal Mortality Rate NNM National Nutrition Mission NOFN National Optical Fiber Network NOS National Open School NPA Non-Performing Assets NPCI National Payments Corporation of India NPK Nitrogen, Phosphate and Potash

vii
NP-NSPE National Programme of Nutritional Support to Primary Education
NRDWP National Rural Drinking Water Supply Programme NRHM National Rural Health Mission NRLM National Rural Livelihood Missions NSA Net Sown Area NSDA National Skill Development Agency NSDC National Skill Development Corporation NSDG National e-Governance Service Delivery Gateway NSDM National Skill Development Mission NSDP Net State Domestic Product NSQC National Skills Qualifications Committee NSQF National Skills Qualifications Framework NSSF National Small Savings Fund NSSO National Sample Survey Organisation NUHM National Urban Health Mission OAE Own Account Enterprises OD Open Defecation ODF Open Defecation-Free OFC Optical Fiber Cable OF Open Forest O-GRAS Online Government Revenue and Accounting Management
System OSI Online Service Index OOSC Out-of-School Children OPD Outpatient Department OPHI Oxford Poverty and Human Development Initiative OPRMC Output and Performance Based Road Maintenance Contract OPWD Other Public Works Departments OWRC Overseas Workers Resource Centre P Provisional PACS Primary Agricultural Credit Societies PCA Prompt Corrective Action PCDE Per Capita Development Expenditure PDS Public Distribution System PFC Power Finance Corporation PFMS Public Finance Management System PHC Primary Health Centers PHED Public Health Engineering Department PIA Project Implementation Agencies PM Particulate Matters PMAY-G Pradhan Mantri Awas Yojana-Gramin PMRCI Patna Metro Rail Corporation Ltd

viii
PMEGP Prime Minister’s Employment Generation Programme PMKSY Pradhan Mantri Krishi Sinchai Yojna
PMGSY Pradhan Mantri Gram Sadak Yojana PMJDY Pradhan Mantri Jan-Dhan-Yojana PMJJBY Pradhan Mantri Jeevan Jyoti Bima Yojana PMKVY Pradhan Mantri Kaushal Vikas Yojana PMMVY Pradhan Mantri Matri Vandana Yojana PMMY Pradhan Mantri Mudra Yojana PMR Peri-Natal Mortality Rate PMSBM Pradhan Mantri Suraksha Bima Yojana POB Post Office Bank PoP Point of Presence POSCO Protection of Children from Sexual Offences POSHAN Prime Minister Overarching Scheme for Holistic Nourishment PPA Power Purchase Agreements PPP Public-Private-Partnership PRI Panchayati Raj Institutions PSE Pre-School Education PSS Power Sub Stations PT Tax on Professions PTR Pupil Teacher Ratio Q Quick RBI Reserve Bank of India RCH Reproductive and Child Health RE Revised Estimates REID&PS Real Estate, ownership of Dwelling & Professional Services RFA Recorded Forest Area RIDF Rural Infrastructure Development Fund RMSA Rashtriya Madhyamik Shiksha Abhiyan RNTCP Revised National Tuberculosis Control Programme ROB Rail Over Bridges RPL Recognition of Prior Learning RRB Regional Rural Banks RRP Road Requirement Plan RSETI Rural Self-Employment Training Institutes RTD Recruit-Train-Deploy RTE Right to Education RTPS Real Time Processing System RUDSETI Rural Development and Self-employment Training Institute RUSA Rashtriya Uchchatar Shiksha Abhiyan SAG Scheme for Adolescent Girls

ix
SAMIS Student Attendance Management Information System SAPFIN Financial Framework for State Action Plan on Climate Change SAPCC State Action Plan on Climate Change SAUBHAGYA Sahaj Bijli Har Ghar Yojana SBD Standard Bidding Document SBM Swachh Bharat Mission SBPDCL South Bihar Power Distribution Company Limited SC Sub-Centers SC Scheduled Caste SCB Scheduled Commercial Banks SCERT State Council of Education Research and Training SDC Skill Development Centers SDC State Data Centres SDG Sustainable Development Goals SDMS Skill Development Management System SECC Socio-economic and Caste Census SFC State Food and Civil Supplies Corporation Sec-LAN Secretariat Local Area Networks SEITRA Smart Energy Infrastructure and Revenue Administration SFRTI Scheme of Fund for Regeneration of Traditional Industries SGST State Goods and Services Tax SH State Highway SHA State Health Agency SHG Self Help Groups SHG-BLP SHG-Bank Linkage Programme SIPB State Investment Promotion Board SJVNL Satluj Jal Vidyut Nigam Limited SKCC Sapno Ko Chali Chhooney SLBC State Level Bankers’ Committee SMID Social Mobilisation and Institutional Development SNP Supplementary Nutrition Programme SOC Soil Organic Carbon SOULS Solar Urja through Localization for Sustainability SPARROW Smart Performance Appraisal Report Recording Online
Window SPV Special Purpose Vehicle SRI System of Rice Intensification SRR Seed Replacement Rate SS Samagra Shiksha SSA Sarva Shiksha Abhiyan SSDG State e-Governance Service Delivery Gateway SSGS Special State Government Securities

x
STPI Software Technology Park of India SUH Shelter for Urban Homeless SSC Sector Skills Council SUSV Support to Urban Street Vendors SWAN State Wide Area Network TDS Tax Deducted at Source TE Teacher Education TII Telecommunications Infrastructure Index TFR Total Fertility Rate TRFA Targeting Rice Fallow Areas TSC&S Transport, Storage, Communication & Services related to
broadcasting TVC Town Vending Committees U5MR Under-Five Mortality Rate UDAN Ude Desh Ka Aam Naagrik UDAY Ujjwal DISCOM Assurance Yojana UIP Ultimate Irrigation Potential UNAE Unincorporated Non-Agricultural Enterprises UNCRC United Nations Convention on the Rights of the Child UNDP United Nations Development Programme UPI Unified Payments Interface USO Universal Service Obligation VAT Value Added Tax VC Video Conferencing VDF Very Dense Forest VLE Village Level Entrepreneur VO Village Organisations VTR Valmiki Tiger Reserve WBM Water Bound Macadam WDC Women Development Corporation WHO World Health Organisation WPI Wholesale Price Index WPR Worker Population Ratio ZP Zila Parishad
_________

xi
INDEX OF TABLES
Table No. Title Page
No.
Chapter - I : Bihar Economy : An Overview
1.1 Demographic Profile and Administrative Structure of Bihar and India (2001 and 2011) 3
1.2 Poverty Ratio of Bihar and India (1993-94, 1999-00, 2004-05 and 2011-12) 4
1.3 Sectoral Growth rate of GDP/GSDP in India and Bihar at Constant Price 2011-12 (2012-13 to 2018-19) 4
1.4 Per Capita Net State Domestic Product (NSDP) at (2011-12) Prices of Major Indian States (2011-12 to 2018-19) 6
1.5 Sectoral Growth Rate of GSDP (2016-17 to 2018-19) 7
1.6 Sectoral Composition of GSVA at Constant (2011-12) Prices (2012-13 to 2018-19) 10
1.7 Relatively Prosperous and Backward Districts of Bihar 11
1.8 State-wise Annual Inflation Rates for CPI (Base: 2012 = 100) (October, 2018 to October, 2019) 12
Chapter - II : State Finances 2.1 Receipts and Expenditure (2014-15 to 2019-20) 28 2.2 Major Fiscal Indicators (2017-18 to 2019-20) 31-32 2.3 Fiscal and Financial Performance Indicators (2015-16 to 2019-20) 33
2.4 Deficit/Surplus in Revenue Account of States (Rs crore) (2017-18 to 2019-20) 36
2.5 Gross Fiscal Deficit (2017-18 to 2019-20) 37
2.6 Gross Fiscal Deficit of states as percentage of GSDP (2016-17 to 2019-20) 37
2.7 Decomposition of Gross Fiscal Deficit of Bihar (2014-15 to 2019-20) 38
2.8 Financing of Gross Fiscal Deficit in Bihar (2015-16 to 2019-20) 39 2.9 Outstanding Liabilities (2014-15 to 2019-20) 40
2.10 Composition of Outstanding Liabilities in the Consolidated Fund (2017-18 and 2018-19) 41
2.11 Public Debt Repayment Liabilities (2014-15 to 2019-20) 42 2.12 Net Public Debt Received (2014-15 to 2019-20) 43 2.13 Revenue Account : Receipts (2014-15 to 2019-20) 44
2.14 Transfer of Resources from Central Government (2014-15 to 2019-20) 45
2.15 Tax : GSDP Ratio of States (2017-18) 46 2.16 Revenue Receipts (2014-15 to 2019-20) 47

xii
2.17 Tax Revenues under Different Heads (2014-15 to 2019-20) 48 2.18 Share of Direct and Indirect Taxes (2014-15 to 2019-20) 48 2.19 Major Non-Tax Revenues (2014-15 to 2019-20) 49 2.20 Growth Rates of Non-Tax Revenues (2014-15 to 2019-20) 49
2.21 Tax and Non-tax Revenue as Percentage of GSDP (2014-15 to 2019-20) 50
2.22 Buoyancy of Important Tax and Non-Tax Revenue Sources (2014-15 to 2019-20) 50
2.23 Act-wise Commercial Tax Collection (2014-15 to 2018-19) 51 2.24 Share of Commercial Taxes in Total Revenue (2014-15 to 2018-19) 51
2.25 Collection against State GST and Integrated GST (2017-18 and 2018-19) 51
2.26 Collection against SGST and IGST (April, 2018 to August, 2019) 52
2.27 Revenue from Stamp Duty and Registration Fees (2014-15 to 2018-19) 53
2.28 District-wise Revenue from Stamp Duty and Registration Fees (2018-19) 54
2.29 Cost of Collection of Taxes (2014-15 to 2018-19) 55
2.30 Variation between the Estimated and Actual Realisation of Tax and Non-Tax Revenue (2018-19) 55
2.31 Expenditure from Consolidated Fund (2014-15 to 2019-20) 57 2.32 Composition of Government Expenditure (2014-15 to 2019-20) 57 2.33 Growth Rates of Expenditure (2014-15 to 2019-20) 57 2.34 Percentage Composition of Total Expenditure (2014-15 to 2019-20) 58
2.35 Development and Non-development Revenue Expenditure (2014-15 to 2019-20) 58
2.36 Revenue and Capital Expenditure (2014-15 to 2019-20) 59 2.37 Revenue and Capital Outlay (2014-15 to 2019-20) 60 2.38 Interest Payment and Receipt (2014-15 to 2019-20) 60 2.39 Expenditure on Salaries and Pensions (2014-15 to 2018-19) 61 2.40 Expenditure on Social Services (2014-15 to 2019-20) 62 2.41 Expenditure on Economic Services (2014-15 to 2019-20) 64
2.42 Per Capita Expenditure on Social and Economic Services (2014-15 to 2019-20) 65
2.43 Quality Parameters of Expenditure (2014-15 to 2019-20) 66
2.44 Percentage Distribution of Consolidated Fund – Receipts and Expenditure (2017-18 to 2019-20) 67
Chapter - III : Agriculture and Allied Sectors
3.1 Share of Agriculture Sector in Gross State Value Added (2013-14 to 2018-19)
74
3.2 Trends in Expenditure in Agriculture and Allied Sector (2014-15 to 2018-19)
75

xiii
3.3 Land Utilization Pattern (2015-16 to 2017-18) 77 3.4 Class-wise Distribution of Landholdings (2010-11 and 2015-16) 78 3.5 Gender-wise Distribution of Landholdings (2015-16) 79 3.6 Cropping Pattern (2014-15 to 2018-19) 80 3.7 Levels of Major Crops in Bihar (2014-15 to 2018-19) 83 3.8 Productivity Levels of Major Crops (2014-15 to 2018-19) 84
3.9 Classification of Districts based on Production/ Productivity for Major Crops (2018-19) 86
3.10 Area and Production of Fruits in Bihar (2016-17 to 2018-19) 88 3.11 Area and Production of Vegetables in Bihar (2016-17 to 2018-19) 90 3.12 Livestock Population in Major States of India (2012 and 2019) 93 3.13 Livestock Wealth (2003, 2007, 2012 and 2019) 94 3.14 Livestock Services in Bihar (2014-15 to 2018-19) 95 3.15 Livestock and Fish Production in Bihar (2014-15 to 2018-19) 96
3.16 Distribution of Certified Seeds and Seed Replacement (2016-17 to 2018-19) 100
3.17 Trends in Fertilizer Consumption in Bihar (2016-17 to 2018-19) 101
3.18 Number of Farm Implements bought through Subsidy Scheme (2016-17 to 2018-19) 102
3.19 Trends in Power use for Agricultural Purposes in Bihar (2013-14 to 2018-19) 103
3.20 Year-wise Achievement (KCC and procurement) (2014-15 to 2018-19) 103
3.21 KCC to Allied Agriculture Activities (2018-19) 104 3.22 Bank-wise Total Farm Credit in Bihar (2018-19) 104 3.23 Distribution of Subsidies for Diesel in Bihar (2010-11 to 2018-19) 105 3.24 Status of Warehouse in Bihar (2010-11 to 2018-19) 106 3.25 Source-wise Gross Irrigated Area (2011-12 to 2017-18) 108
3.26 Gross irrigated area as percentage of Gross cropped area (2011-12 to 2017-18) 108
3.27 Trends in Public Expenditure in Irrigation Sector (2013-14 to 2018-19) 109
3.28 Status of Irrigation Potential in Bihar (2016-17 to 2018-19) 110
3.29 Irrigation Potential created under Major and Medium Irrigation Schemes (2018-19) 111
3.30 Water Use Efficiency under Major and Medium Irrigation Schemes (2013-2019) 111
3.31 Area Brought under Irrigation through Minor Irrigation Sources (2013-14 to 2018-19) 112
3.32 Status of Farmers' Societies (As on March 2019) 112
xiv
Chapter - IV : Enterprises Sector
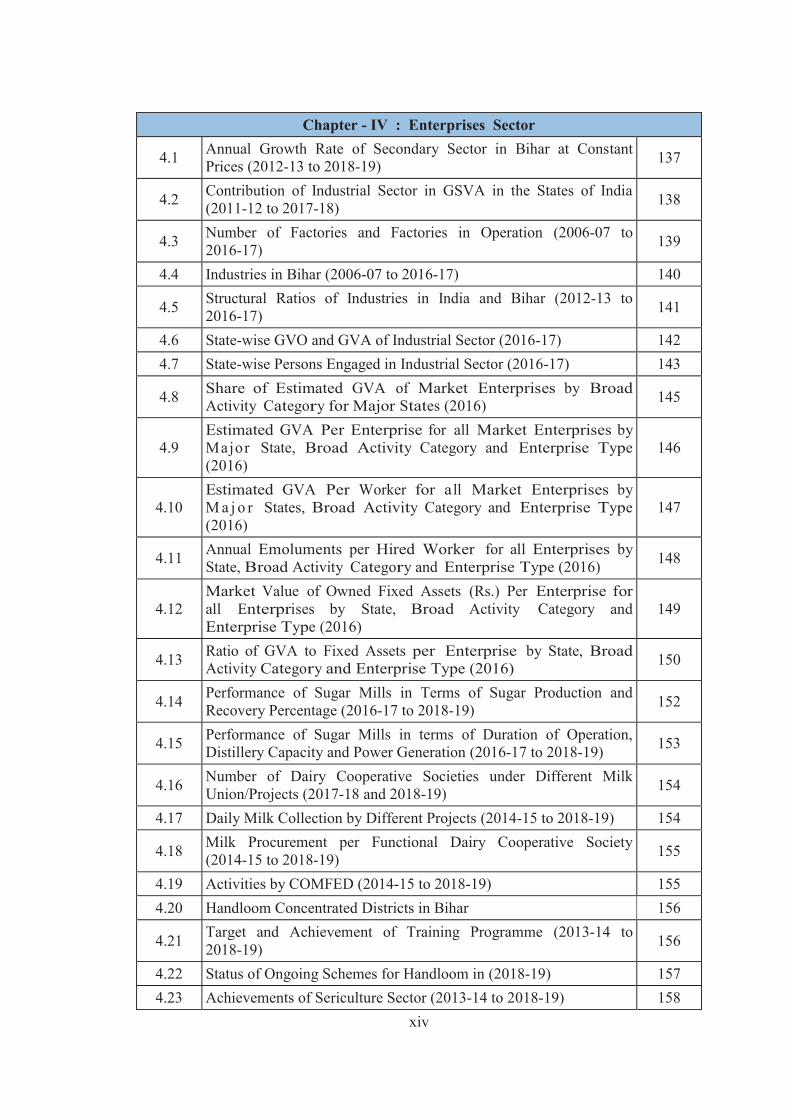
4.1 Annual Growth Rate of Secondary Sector in Bihar at Constant Prices (2012-13 to 2018-19) 137
4.2 Contribution of Industrial Sector in GSVA in the States of India (2011-12 to 2017-18) 138
4.3 Number of Factories and Factories in Operation (2006-07 to 2016-17) 139
4.4 Industries in Bihar (2006-07 to 2016-17) 140
4.5 Structural Ratios of Industries in India and Bihar (2012-13 to 2016-17) 141
4.6 State-wise GVO and GVA of Industrial Sector (2016-17) 142 4.7 State-wise Persons Engaged in Industrial Sector (2016-17) 143
4.8 Share of Estimated GVA of Market Enterprises by Broad Activity Category for Major States (2016) 145
4.9 Estimated GVA Per Enterprise for all Market Enterprises by Major State, Broad Activity Category and Enterprise Type (2016)
146
4.10 Estimated GVA Per Worker for all Market Enterprises by M a j o r States, Broad Activity Category and Enterprise Type (2016)
147
4.11 Annual Emoluments per Hired Worker for all Enterprises by State, Broad Activity Category and Enterprise Type (2016) 148
4.12 Market Value of Owned Fixed Assets (Rs.) Per Enterprise for all Enterprises by State, Broad Activity Category and Enterprise Type (2016)
149
4.13 Ratio of GVA to Fixed Assets per Enterprise by State, Broad Activity Category and Enterprise Type (2016) 150
4.14 Performance of Sugar Mills in Terms of Sugar Production and Recovery Percentage (2016-17 to 2018-19) 152
4.15 Performance of Sugar Mills in terms of Duration of Operation, Distillery Capacity and Power Generation (2016-17 to 2018-19) 153
4.16 Number of Dairy Cooperative Societies under Different Milk Union/Projects (2017-18 and 2018-19) 154
4.17 Daily Milk Collection by Different Projects (2014-15 to 2018-19) 154
4.18 Milk Procurement per Functional Dairy Cooperative Society (2014-15 to 2018-19) 155
4.19 Activities by COMFED (2014-15 to 2018-19) 155 4.20 Handloom Concentrated Districts in Bihar 156
4.21 Target and Achievement of Training Programme (2013-14 to 2018-19) 156
4.22 Status of Ongoing Schemes for Handloom in (2018-19) 157 4.23 Achievements of Sericulture Sector (2013-14 to 2018-19) 158

xv
4.24 Performance of PMEGP (2016-17 to 2018-19) 159 4.25 Details of BIADA Land and Activities (September 2019) 161 4.26 Investment by Type of Enterprise (2017-18 and 2018-19) 162
4.27 Detailed Information on Investment by Sector (2017-18 and 2018-19) 162
4.28 Physical and Financial Achievements of Udyog Mitra (2011-12 to 2018-19) 163
4.29 Targets and Collection of Revenue from Minerals in Bihar (2014-15 to 2018-19) 164
4.30 Revenues from Minerals in Bihar (2014-15 to 2018-19) 164 4.31 Expenditure of Department of Tourism (2012-13 to 2018-19) 165
Chapter - V : Labour, Employment and Migration 5.1 Labour Force Participation Rate (LFPR) by State (2017-18) 168 5.2 Worker Population Ratio (WPR) by State (2017-18) 169 5.3 Unemployment Rate by State (2017-18) 170
5.4 Percentage Distribution of Male Workers by Status of Employment by State (2017-18) 171
5.5 Percentage Distribution of Female Workers by Employment Status by State (2017-18) 172
5.6 Percentage Distribution of Workers by Industry for Bihar and all-India (2017-18) 173
5.7 Reason and Gender-wise Migration in India and Bihar (2011 Census) 175
5.8 Districtwise Number of Passports Issued (2018-19) 177
5.9 Sub-scheme wise Grant Provisions under Bihar Shatabdi Asangatith Karyakhetra Kamgar Evam Shilpkar Samajik Surakhsha Yojana 180
5.10 Grants provided under Bihar Shatabdi Asangatith Karyakhetra Kamgar Evam Shilpkar Samajik Surakhsha Yojana (2015-16 to 2018-19)
180
5.11 Number of Registered Construction Workers, Beneficiaries and Fund Utilization (2014-15 to 2018-19) 181
5.12 Sector-wise Minimum Wage in Bihar (2015 to 2019) 183 5.13 Number of Vacancies Advertised by BPSC (2017-18 and 2018-19) 184
5.14 Number of Vacancies Advertised by BTSC for Various Posts (2018-19 and 2019-20) 184
5.15 Budget Allocation and Expenditure of BTSC (2017-18 and 2018-19) 185
5.16 Type of Skill and Duration of the Training Programmes 186 5.17 Number of Trainees by RSETI (2014-15 to 2018-19) 186
5.18 Number of Trainees Completed Training and Number of Trainees Received Employment (2014-15 to 2018-19) 187

xvi
5.19 Number of Insured and Treated People under Employees’ State Insurance (2017-18 and 2018-19) 188
5.20 Financial Allocation and Expenditure under Different Schemes for Training (2018-19) 189
5.21 Department-wise Budget for Skilling Programmes (2016-17 to 2018-19) 190
5.22 State-wise Share in Inward Remittances (2016-17) 192 Chapter - VI : Infrastructure
6.1 Public Investment in Roads and Bridges in Bihar (2012-13 to 2019-20) 199
6.2 Road Accident in Major Indian States (2015 to 2018) 201
6.3 Road Network in Major States of India (2003-07, 2008-12 and 2013-17) 203
6.4 Total and Surfaced Road Network by Authority in Bihar (2012 to 2017) 205
6.5 National Highways Network in Major States of India (2003-07, 2008-12 and 2013-17) 207
6.6 Number of National Highways and Length in Bihar (September, 2019) 209
6.7 Expenditure on National Highway Development in Bihar and India (2010-11 to 2017-18) 210
6.8 Road Project under Bharatmala Project Phase-I 211
6.9 State Highways Network in Major States of India (2003-07, 2008-12 and 2013-17) 212
6.10 Overview of Widening of State Highways 215
6.11 Programme-wise Length of Rural Roads Constructed (September, 2019) 219
6.12 Status of Financial Management of BSRDC Ltd. (2012 to 2019) 222
6.13 Financial Status of Bihar Rajya Pul Nirman Nigam Limited (2012-13 to 2018-19) 224
6.14 Year-wise Number of Registered Vehicles and Revenue Collection (2013-14 to 2018-19) 226
6.15 Revenue Collection and Number of Passengers Carried by BSRTC (2012-13 to 2018-19) 233
6.16 Progress of Rail Route Network in Major States of India (2003-07, 2008-12 and 2013-17) 234
6.17 Summary of Aircraft Movements, Number of Passengers and Freights at Patna Airport (2004-05 to 2019-20) 236
6.18 Status of Financial Management and Expenditure on Projects of BSBCCL (2013-14 to 2017-18) 238
6.19 Tele-density of Major Indian States (2016 to 2019) 239

xvii
6.20 Telecom Demography of BSNL in Bihar (September 2019) 240 6.21 Trends of expansion of BSNL Network (2014-15 to 2019-20) 240 6.22 Postal Network in Major States of India (March 31, 2018) 242
6.23 Summary of Financial Services of Post Office in India (March 31, 2018) 243
Chapter - VII : Energy Sector 7.1 Power Scenario (2012-13 to 2018-19) 250 7.2 District-wise Power Consumption (2014-15 to 2018-19) 251
7.3 Annual Energy Requirement for Rural and Urban Consumers (2019-20 to 2021-22) 252
7.4 Annual Energy and Peak Demand Requirement at State Periphery (2019-20 to 2021-22) 253
7.5 Year-wise and Source-wise Details of Capacity Expansion (2017-18 to 2021-22) 253
7.6 Estimated Availability of Power and Energy (2019-20 to 2021-22) 254
7.7 Projected Surplus/ Deficit in Power and Energy (2019-20 to 2021-22) 254
7.8 Allocation of Funds under BSPHCL (2015-16 to 2019-20) 256
7.9 Category-wise Number of Effective Consumers (As per billing data) (2014-15 to 2018-19) 257
7.10 Financial Status of Power Sector (2015-16 to 2018-19) 258 7.11 Aggregate Technical and Commercial losses (2011-12 to 2018-19) 259 7.12 Capital Expenditure of R-APDRP & IPDS 261 7.13 Projected Required Capacity for Power (2019-20 to 2021-22) 263 7.14 Plan of Action for Strengthening Transmission (2019-20 to 2021-22) 263 7.15 Existing Generation Capacity (March 2019) 264
7.16 Details of Existing and Planned Generation Units (2016-17 to 2020-21) 266
7.17 Status of Reconductoring Schemes (September, 2019) 267 7.18 Achievements of BREDA (2017-18 to 2019-20) 271-272 7.19 Minor Hydel Projects under Construction (September, 2019) 274
7.20 Site and Capacity of Gandak, Burhi Gandak & Mahananda River Basin Projects 275
Chapter - VIII : Rural Development 8.1 Progress under JEEViKA (2015-16 to 2018-19) 278 8.2 Extent of Livelihood Related Activities by SHGs (March, 2019) 279 8.3 Performance of MGNREGA (2014-15 to 2018-19) 283
8.4 Category-wise Completed work under MGNREGS (2014-15 to 2018-19) 284
xviii
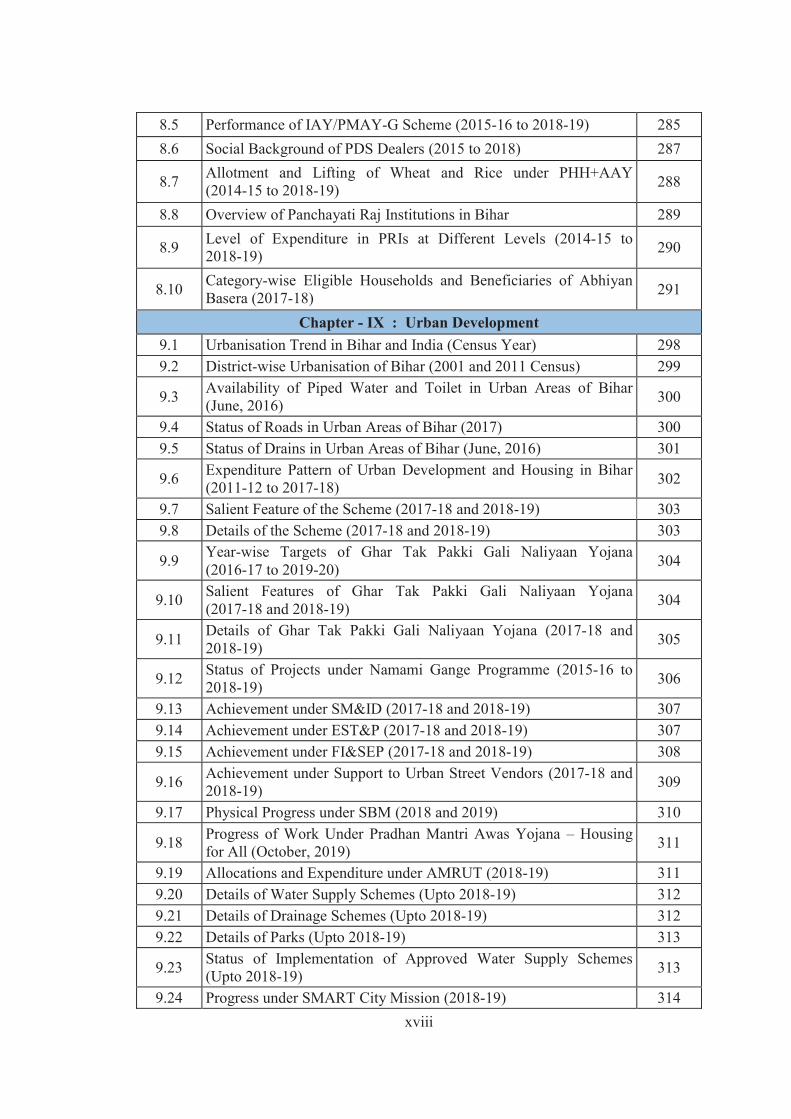
8.5 Performance of IAY/PMAY-G Scheme (2015-16 to 2018-19) 285 8.6 Social Background of PDS Dealers (2015 to 2018) 287
8.7 Allotment and Lifting of Wheat and Rice under PHH+AAY (2014-15 to 2018-19) 288
8.8 Overview of Panchayati Raj Institutions in Bihar 289
8.9 Level of Expenditure in PRIs at Different Levels (2014-15 to 2018-19) 290
8.10 Category-wise Eligible Households and Beneficiaries of Abhiyan Basera (2017-18) 291
Chapter - IX : Urban Development 9.1 Urbanisation Trend in Bihar and India (Census Year) 298 9.2 District-wise Urbanisation of Bihar (2001 and 2011 Census) 299
9.3 Availability of Piped Water and Toilet in Urban Areas of Bihar (June, 2016) 300
9.4 Status of Roads in Urban Areas of Bihar (2017) 300 9.5 Status of Drains in Urban Areas of Bihar (June, 2016) 301
9.6 Expenditure Pattern of Urban Development and Housing in Bihar (2011-12 to 2017-18) 302
9.7 Salient Feature of the Scheme (2017-18 and 2018-19) 303 9.8 Details of the Scheme (2017-18 and 2018-19) 303
9.9 Year-wise Targets of Ghar Tak Pakki Gali Naliyaan Yojana (2016-17 to 2019-20) 304
9.10 Salient Features of Ghar Tak Pakki Gali Naliyaan Yojana (2017-18 and 2018-19) 304
9.11 Details of Ghar Tak Pakki Gali Naliyaan Yojana (2017-18 and 2018-19) 305
9.12 Status of Projects under Namami Gange Programme (2015-16 to 2018-19) 306
9.13 Achievement under SM&ID (2017-18 and 2018-19) 307 9.14 Achievement under EST&P (2017-18 and 2018-19) 307 9.15 Achievement under FI&SEP (2017-18 and 2018-19) 308
9.16 Achievement under Support to Urban Street Vendors (2017-18 and 2018-19) 309
9.17 Physical Progress under SBM (2018 and 2019) 310
9.18 Progress of Work Under Pradhan Mantri Awas Yojana – Housing for All (October, 2019) 311
9.19 Allocations and Expenditure under AMRUT (2018-19) 311 9.20 Details of Water Supply Schemes (Upto 2018-19) 312 9.21 Details of Drainage Schemes (Upto 2018-19) 312 9.22 Details of Parks (Upto 2018-19) 313
9.23 Status of Implementation of Approved Water Supply Schemes (Upto 2018-19) 313
9.24 Progress under SMART City Mission (2018-19) 314
xix
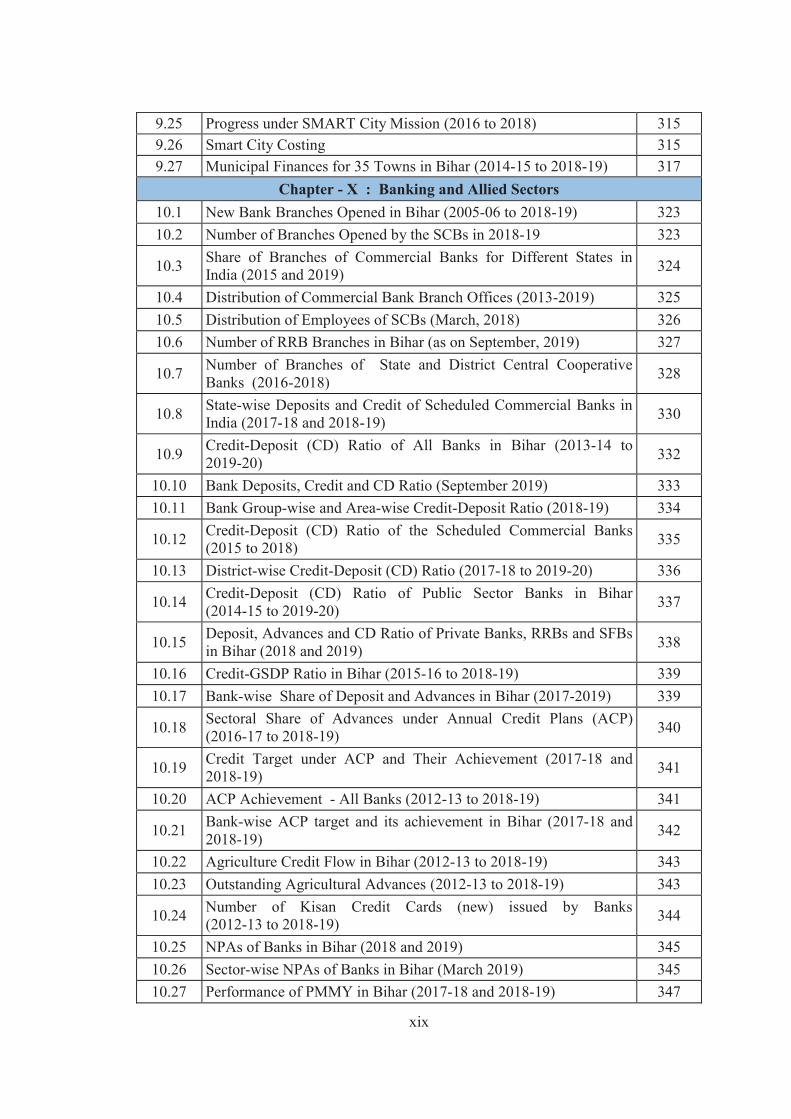
9.25 Progress under SMART City Mission (2016 to 2018) 315 9.26 Smart City Costing 315 9.27 Municipal Finances for 35 Towns in Bihar (2014-15 to 2018-19) 317
Chapter - X : Banking and Allied Sectors 10.1 New Bank Branches Opened in Bihar (2005-06 to 2018-19) 323 10.2 Number of Branches Opened by the SCBs in 2018-19 323
10.3 Share of Branches of Commercial Banks for Different States in India (2015 and 2019) 324
10.4 Distribution of Commercial Bank Branch Offices (2013-2019) 325 10.5 Distribution of Employees of SCBs (March, 2018) 326 10.6 Number of RRB Branches in Bihar (as on September, 2019) 327
10.7 Number of Branches of State and District Central Cooperative Banks (2016-2018) 328
10.8 State-wise Deposits and Credit of Scheduled Commercial Banks in India (2017-18 and 2018-19) 330
10.9 Credit-Deposit (CD) Ratio of All Banks in Bihar (2013-14 to 2019-20) 332
10.10 Bank Deposits, Credit and CD Ratio (September 2019) 333 10.11 Bank Group-wise and Area-wise Credit-Deposit Ratio (2018-19) 334
10.12 Credit-Deposit (CD) Ratio of the Scheduled Commercial Banks (2015 to 2018) 335
10.13 District-wise Credit-Deposit (CD) Ratio (2017-18 to 2019-20) 336
10.14 Credit-Deposit (CD) Ratio of Public Sector Banks in Bihar (2014-15 to 2019-20) 337
10.15 Deposit, Advances and CD Ratio of Private Banks, RRBs and SFBs in Bihar (2018 and 2019) 338
10.16 Credit-GSDP Ratio in Bihar (2015-16 to 2018-19) 339 10.17 Bank-wise Share of Deposit and Advances in Bihar (2017-2019) 339
10.18 Sectoral Share of Advances under Annual Credit Plans (ACP) (2016-17 to 2018-19) 340
10.19 Credit Target under ACP and Their Achievement (2017-18 and 2018-19) 341
10.20 ACP Achievement - All Banks (2012-13 to 2018-19) 341
10.21 Bank-wise ACP target and its achievement in Bihar (2017-18 and 2018-19) 342
10.22 Agriculture Credit Flow in Bihar (2012-13 to 2018-19) 343 10.23 Outstanding Agricultural Advances (2012-13 to 2018-19) 343
10.24 Number of Kisan Credit Cards (new) issued by Banks (2012-13 to 2018-19) 344
10.25 NPAs of Banks in Bihar (2018 and 2019) 345 10.26 Sector-wise NPAs of Banks in Bihar (March 2019) 345 10.27 Performance of PMMY in Bihar (2017-18 and 2018-19) 347

xx
Chapter - XI : Human Development
11.1 Trend of Education, Health and Social Services Expenditure (2011-12 to 2018-19) 352
11.2 Demographic Profile and Administrative Structure of Bihar and India (2001 and 2011) 355
11.3 Projected Total Fertility Rate of Bihar (2012-2041) 357 11.4 Population in Bihar by Age Structure (2011-2041) 358 11.5 Life Expectancy at Birth (2006-10 and 2013-17) 360 11.6 Selected Health Indicators for Bihar and India (2013 to 2017) 361
11.7 Monthly Average Number of Patients Visiting Government Hospitals (2015 to 2019) 362
11.8 Overall Status of Health Infrastructure (2012 to 2019) 364 11.9 Number of Health Personnel (2017-18 and 2018-19) 366 11.10 Institutional Delivery under JSY (2014-15 to 2019-20) 367
11.11 Antigen-wise Immunisation Coverage in Bihar (2017-18 to 2019-20) 370
11.12 Prevalence of Main Diseases (2015-16 to 2018-19) 371 11.13 Fund Disbursed to Health Societies (2011-12 to 2018-19) 372 11.14 Districts Mapping of Contamination 376
11.15 Achievement under Water Supply and Sanitation (2011-12 to 2018-19) 377
11.16 Financial Progress under NRDWP (2012-13 to 2018-19) 378
11.17 Financial Status of Water Supply and Sanitation (2012-13 to 2018-19) 378
11.18 Physical Targets in State Plan Schemes for Water Supply and Sanitation (2012-13 to 2018-19) 379
11.19 Trend of Literacy Rates in India and Bihar (1961-2011) 380
11.20 Total Enrolment in Primary and Upper Primary Levels (2012-13 to 2017-18) 382
11.21 Dropout Rates at Primary, Upper Primary and Secondary Levels (2012-13 to 2017-18) 384
11.22 Dropout Rates (SC & ST) at Primary, Upper Primary and Secondary Levels (2012-13 to 2017-18) 385
11.23 Expenditure on Education (2013-14 to 2018-19) 386
11.24 Food, Nutritional and Calorific norms and Day-wise Menu under MDMS 388
11.25 Coverage of MDMS (2013-14 to 2018-19) 388
11.26 Status of Fund Received and Expenditure under Different Schemes (2017-18 to 2018-19) 391
11.27 Institutions of Higher Education (2014 to 2018) 392
11.28 Overview of Outlay Allocation of SC and ST Welfare (2017-18 and 2018-19) 397
11.29 Subsidy Scheme of BSSCCDC (Executed through Bank) (2013-14 to 2018-19) 399

xxi
11.30 Financial Progress of BC and EBC Welfare (2014-15 to 2018-19) 399
11.31 Physical and Financial Details of BC and EBC Welfare Programmes (2013-14 to 2018-19) 401
11.32 Budget and Expenditure of Minority Welfare Department ( 2013-14 to 2017-18) 402
11.33 Gender Budget Summary (2014-15 to 2018-19) 404 11.34 Overview of Expenditure on Women Development (2017-18) 405
11.35 Flagship Schemes to Address Gender Disparity (2014-15 to 2018-19) 406
11.36 Number of Cases Registered and Disposed under Social Empowerment (2017-18 to 2019-20) 409
11.37 Schemes for Old Age, Widow and Persons with Disabilities (2017-18 and 2018-19) 411
Chapter - XII : Child Development
12.1 Demographic Profile of Children in Bihar and India (2001 and 2011) 442
12.2 Children with Special Needs (0-19 years) (2001 and 2011) 443 12.3 Adolescent Population in EAG States of India (2011) 444 12.4 Overview of Child Budget (2013-14 to 2018-19) 445
12.5 Department-wise Expenditure on Child Budget (2013-14 to 2018-19) 447
12.6 Percentage of Children suffering from malnutrition in Bihar and India (2005-06 and 2015-16) 448
12.7 Staffing Position in ICDS (2013-14 to 2018-19) 451 12.8 Resource Utilisation in ICDS (2013-14 to 2018-19) 452
12.9 Drinking Water and Sanitation Facilities in Elementary Schools of Bihar (in percent) (2011-12 to 2016-17) 455
12.10 Percentage of Literates by Age and Sex in Bihar (2001 and 2011) 456 12.11 Number of Out of School Children in Bihar (2016-17 to 2018-19) 458
Chapter - XIII : Environment and Climate Change 13.1 Features of the Agro-Climatic Zones in Bihar 469 13.2 Season-wise Annual Rainfall (2001-2019) 470 13.3 Status of Rivers in Bihar 472 13.4 Details on River Basin in Bihar 473 13.5 State-wise River Water Quality (2017) 474
13.6 State-wise Contribution of Recharge Components in Annual Groundwater Recharge (2017) 475
13.7 State-wise Details on Affected Districts with Ground Water Contamination 477
13.8 Wetlands within the Recorded Forest Area/Green Wash (2019) 478
13.9 Share of Forestry and Logging in Agriculture GSVA (2013-14 to 2018-19) 480
13.10 Recorded Forest Areas (RFA) in Selected States of India (2019) 481

xxii
13.11 Forest Cover in the Major States of India (2019) 482 13.12 Forest and Tree Cover in Bihar (2011 to 2019) 483 13.13 Area under different types of Forest (2011 to 2019) 484 13.14 Forest Carbon Stock in Bihar (2017 and 2019) 486 13.15 Diversion of Forest Land for Different Purposes during 2010-11 to
2018-19 487
13.16 Division-wise Forest Fire Incidents (2005-06 to 2018-19) 488 13.17 Revenue and Expenditure for Department of Forest (2014-15 to
2018-19) 490
13.18 Distribution of Saplings to Farmers under Krishi Vanika - Other Species Yojana (2013-14 to 2018-19) 491
13.19 Agricultural Forestry Scheme (2012-13 to 2018-19) 491 13.20 Achievement of Chief Minister Private Nursery-Poplar ETP Scheme
(2012-13 to 2018-19) 492
13.21 Achievement of Mukhya Mantri Niji Paudhshala - Other Species Yojana (2012-13 to 2018-19) 492
13.22 Department-wise Work-Plan and Estimated Budget (2019-20 to 2021-22) 495-496
13.23 Annual Average Values of Ambient Air Quality in Bihar (2017 and 2018) 498
13.24 Annual Data on Ambient Noise Monitoring at Five Locations in Patna (2016-2018) 499
13.25 Wildlife, Biosphere Reserves and Bird Sanctuaries in Bihar 501 13.26 Flood and Drought related Reports in Kharif (2019) 502
Chapter - XIV : E-Governance
14.1 Coverage of Mobile and Internet Services and Aadhar in Major Indian States (as on March, 2018) 516
14.2 Direct Benefit Transfer under Different Schemes of the Department of Education 525
14.3 Provision of DBT under Social Welfare Scheme in Bihar 532
14.4 Status of Start-up and Mukhyamantri SC and ST Entrepreneurship Scheme in Bihar (2017-20) 541
14.5 Status of BIMMS Project in Bihar (2017-20) 542
14.6 Overview of Online Services under Different Labour Laws (2017-20) 543
14.7 Number of Beneficiaries and Investment for Quality Improvement of Milk Products (2017-20) 548
14.8 E-governance Programmes for Green Cover (2019) 549
___________

xxiii
INDEX OF APPENDICES
Appendix Title Page No.
Chapter - I : Bihar Economy : An Overview
Table A 1.1 Gross State Domestic Product (GSDP) and Net State Domestic Product (NSDP) of Bihar (2004-05 to 2018-19) 14
Table A 1.2 Gross State Domestic Product (GSDP) of Bihar at Current Price (2011-12 to 2018-19) 15
Table A 1.3 Gross State Domestic Product (GSDP) of Bihar at Constant (2011-12) Price (2011-12 to 2018-19) 16
Table A 1.4 Net State Domestic Product (NSDP) of Bihar at Current Price (2011-12 to 2018-19) 17
Table A 1.5 Net State Domestic Product (NSDP) of Bihar at Constant (2011-12) Price (2011-12 to 2018-19) 18
Table A 1.6 District-wise Per Capita Gross District Domestic Product (2004-05) Price (2007-08 to 2011-12) 19
Table A 1.7 District-wise Consumption of Petroleum Products (2014-15 to 2018-19) 20
Table A 1.8 District-wise Small Savings in Post Offices and Public Provident Fund (2016-17 to 2018-19) 21
Chapter - II : State Finances Table A 2.1 Revenue Deficit of Bihar (2001-02 to 2009-10) 68 Table A 2.2 Revenue Accounts of Bihar Government (2013-14 to 2019-20) 68 Table A 2.3 Receipts in Revenue Account (2017-18 and 2018-19) 68 Table A 2.4 Composition of Revenue Receipts (1990-91 to 2004-05) 69 Table A 2.5 Sectoral Expenditure (2017-18 and 2018-19) Rs crore 69
Table A 2.6 Gross Fiscal Deficit as percentage of GSDP in Bihar (2007-08 to 2018-19) 69
Table A 2.7 Revenue Surplus vs Capital Outlay in Bihar (2006-07 to 2018-19) 70
Table A 2.8 Outstanding Liability as Percentage of GSDP (2007-08 to 2018-19) 70
Table A 2.9 Percentage Growth in Revenue Receipt and Expenditure (2008-09 to 2018-19) 70
Table A 2.10 State’s Own Tax Receipts / GSDP (2007-08 to 2018-19) 71 Table A 2.11 Collection from GST in 2018-19 71 Table A 2.12 Capital Outlay in Total Expenditure (2008-09 to 2019-20) 71 Table A 2.13 Growth in expenditure on salary and pension (2008-09 to 2019-20) 71
Chapter - III : Agriculture and Allied Sectors Table A 3.1 District-wise Land Utilization Pattern (2017-18) 115-116
Table A 3.2 District-wise Area, Production and Productivity of Rice (2017-18 and 2018-19) 117

xxiv
Table A 3.3 District-wise Area, Production and Productivity of Wheat (2017-18 and 2018-19) 118
Table A 3.4 District-wise Area, Production and Productivity of Maize (2017-18 and 2018-19) 119
Table A 3.5 District-wise Area, Production and Productivity of Pulses (2017-18 and 2018-19) 120
Table A 3.6 District-wise Area, Production and Productivity of Sugarcane (2017-18 and 2018-19) 121
Table A 3.7 District-wise Area and Production of Important Fruits (2017-18 and 2018-19) 122-123
Table A 3.8 District-wise Area and Production of Important Vegetables (2017-18 and 2018-19) 124-125
Table A 3.9 District-wise Achievement for Livestock-Related Services (2017-18 and 2018-19) 126
Table A 3.10 District-wise Production of Fish and Fish Seeds (2016-17 to 2018-19) 127
Table A 3.11 District-wise Milk Production in Bihar (2017-18) 128 Table A 3.12 District-wise Milk Production in Bihar (2018-19) 129 Table A 3.13 District-wise Consumption of Fertilizers in Bihar (2017-18) 130 Table A 3.14 District-wise Consumption of Fertilizers in Bihar (2018-19) 131 Table A 3.15 District-wise Number of Farm Implements (2017-18) 132 Table A 3.16 District-wise Number of Farm Implements (2018-19) 133
Table A 3.17 District-wise Cooperative Credit Distribution (2016-17 to 2018-19) 134
Table A 3.18 District-wise Gross Irrigated Area in Bihar (2017-18) 135 Chapter - V : Labour, Employment and Migration
Table A 5.1 District-wise Passport Issued in Bihar During (2016-17 to 2018-19) 193
Table A 5.2 Number of Released and Rehabilitated Bonded Labour by Old and New Scheme (2013 to 2019) 194
Table A 5.3 Rescued and Rehabilitated Child Labour under Chief Minister’s Relief Fund (2016-17 to 2018-19) 195
Table A 5.4 District-wise Deaths of Migrant Worker and Fund Allotment to the Family of Deceased (2016-17 to 2018-19) 196
Chapter - VI : Infrastructure Table A 6.1 District-wise National Highway Network in Bihar (in km) (2013 to
2020) 244
Table A 6.2 District-wise State Highway Network in Bihar (in km) (2013 to 2020) 245
Table A 6.3 District-wise Major District Road Network in Bihar (in km) (2013 to 2020) 246
Table A 6.4 District-wise Rural Road Network in Bihar (in km) (2014 to 2020) 247 Table A 6.5 District-wise Number of Registered Vehicles in Bihar (2018-19) 248

xxv
Chapter - VIII : Rural Development Table A 8.1 District-wise Progress of MGNREGS (2016-17 to 2018-19) 292-293
Table A 8.2 District-wise Financial Progress under MGNREGS (2016-17 to 2018-19) 294
Table A 8.3 District-wise Distribution of DPS Dealers by Social Background in Bihar (2018-19) 295
Table A 8.4 District-Wise Allotment and Lifting of Wheat and Rice under NFSA (2018-19) 296
Chapter - IX : Urban Development
Table A 9.1 District-wise Progress of the Mukhyamantri Shahri Peyjal Nishchay Yojana (2016-17 to 2019-20) 318
Table A 9.2 District-wise Targets and Achievements of Ghar Tak Pakki Gali Naali Yojana (Upto October, 2019) 319
Chapter - X : Banking and Allied Sectors
Table A 10.1 District-wise Performance Under Annual Credit Plan (Agriculture and Small and Medium Enterprises) (March, 2019) 348
Table A 10.2 District-wise Performance Under Annual Credit Plan (Other Priority Sector and Total Priority Sector) (March, 2019) 349
Table A 10.3 District-wise Achievement of Kisan Credit Card (NEW and RENEW) (2010-11 to 2018-19) 350
Chapter - XI : Human Development Table A 11.1 District-wise Demographic Profile of Bihar (2001 and 2011) 413 Table A 11.2 District-wise Projected Population of Bihar in Lakh)
(2011 to 2041) 414
Table A 11.3 Projected Total Fertility Rate in Districts of Bihar (2012 to 2041) 415 Table A 11.4 District-wise Projected Population of Bihar by Age Structure
(in Lakh) (2021 to 2041) 416
Table A 11.5 District-wise Projected Population of Bihar by Age Structure (in percent) (2021 to 2041) 417
Table A 11.6 Number of Health Institutions in Bihar (As on September, 2019) 418 Table A 11.7 District-wise Average Number of Outpatients Visiting per Day and
In-patient Bed Occupancy Rate (2016-17 to 2019-20) 419
Table A 11.8 District-wise Employment of Regular and Contractual Doctors (2017-18 and 2018-19) 420
Table A 11.9 District-wise Employment of Grade A Nurses (2017-18 and 2018-19) 421
Table A 11.10 District-wise Employment of ANM (2017-18 and 2018-19) 422 Table A 11.11 District-wise Employment of ASHA Worker (2016-17 to 2018-19) 423 Table A 11.12 District-wise Coverage of Institutional Deliveries under Janani
Suraksha Yojana (JSY) (2014-15 to 2019-20) 424
Table A 11.13 Prevalence of Diseases (2018-19) 425-426 Table A 11.14 District-wise Fund Disbursed to Health Societies (2013-14 to
2018-19) 427

xxvi
Table A 11.15 District-wise Hand Pumps under National Rural Drinking Water Programme (NRDWP) (2015-16 to 2018-19) 428
Table A 11.16 District-wise Achievement in Individual Household Lantrine (IHHL) under Central Rural Sanitation Programme (2017-18 and 2018-19)
429
Table A 11.17 Total Enrolment in Primary and Upper Primary Levels (All) (2015-16 to 2017-18) 430
Table A 11.18 Total Enrolment in Primary and Upper Primary Levels (SC) (2015-16 to 2017-18) 431
Table A 11.19 Total Enrolment in Primary and Upper Primary Levels (ST) (2015-16 to 2017-18) 432
Table A 11.20 District-wise Number of Primary and Upper Primary Schools in Bihar (2016-17 and 2017-18) 433
Table A 11.21 District-wise Number of Primary and Upper Primary Teachers in Bihar (2016-17 and 2017-18) 434
Table A 11.22 District-wise Coverage of MDMS (Class I-V) (2016-17 to 2018-19) 435
Table A 11.23 District-wise Coverage of MDMS (Class VI-VIII) (2016-17 to 2018-19) 436
Table A 11.24 District-wise Number of Colleges of Bihar (2016-17 to 2018-19) 437
Table A 11.25 District-wise and Steam-wise Number of Colleges in Bihar (2018-19) 438
Table A 11.26 District Level Overview of SC/ST Welfare 439-440 Chapter - XII : Child Development
Table A 12.1 District-wise Child Population in Bihar (2011) 464
Table A 12.2 District-wise and age-wise Sex Ratios of Population in Bihar (2011) 465
Table A 12.3 District-wise Percentage of Children under Five Years of Age Suffering from Malnutrition in Bihar (2015-16) 466
Chapter - XIII : Environment and Climate Change
Table A 13.1 District-wise Annual Rainfall across Different Seasons (2018 and 2019) 504
Table A 13.2 District-wise Groundwater Recharge in Bihar (2017) 505-506 Table A 13.3 District-wise Wetland Area in Bihar 507 Table A 13.4 District-wise Forest Area in Bihar (2017 and 2019) 508 Table A 13.5 Greening of Urban Spaces (2017-18 to 2019-20) 509
Table A 13.6 District-wise Incidence of Deaths due to Thunderstorms (2015-2019) 510
__________

xxvii
TECHNICAL NOTES
CHAPTER-I : BIHAR ECONOMY : AN OVERVIEW
Constant Prices : Constant prices adjust for the effects of inflation ,while computing GSDP. Use
of constant prices enables measurement of the actual change in output , correcting for the effects
of inflation. Generally, a base year is identified for constant price estimates of income.
Consumer Price Index (CPI) : CPI is a measure that examines the weighted average of prices of
a basket of consumer goods and services, such as transportation, food, medical care. It is calculated
by taking price changes for each item in the predetermined basket of goods and averaging them
with appropriate weight.
Gross State Domestic Product (GSDP) : GSDP is defined as a measure, in monetary terms, of
the volume of all final goods and services produced within the boundaries of the State during a
given period of time .
Gross State Value Added (GSVA) : Value of output minus cost of inputs is the value added by
a production unit. GSVA is the sum of value added for all final goods and services. GSDP is GSVA
plus subsidies, minus taxes.
Per Capita Income (PCI) : PCI or average income measures the average income earned per
person in a given area in a specified year. It is calculated by dividing the area's total income by its
total population.
Wholesale Price Index (WPI) : WPI is used to measure the average change in price of the sale of
goods and services, when transactions are made in bulk by the wholesalers.
CHAPTER-II : STATE FINANCES
Capital and Revenue Accounts : Capital accounts include those transactions of the State
Government which have long term implication. For example, borrowing is a capital receipt, and
investment on road is a capital expenditure. On the other hand, revenue accounts include those
transactions that have implications only for the current year. For example, collections under GST
(revenue receipt) and payment of salary (revenue expenditure).

xxviii
Direct and Indirect Tax : Direct taxes are taxes where the burden of tax falls on the person on
whom it is levied (for example, taxes on income or wealth). In case of indirect taxes, the incidence
of tax is usually not on the person who pays the tax. For example, sales taxes , which is paid by
the seller, but paid by the buyer.
Fiscal Deficit : The excess of total expenditure over total non-borrowed receipts is called the fiscal
deficit.
Primary Deficit : The primary deficit is the revenue deficit, minus the interest payments. It
denotes government’s deficit, without taking into account liabilities created in the past.
Public Debt : Public debt receipts and disbursals are borrowings and repayments during the year,
respectively. The difference between borrowings and repayments in a year is the net accretion to
the public debt.
Ways and means advance (WMA) : One of RBI's roles is to serve as banker to both central and
state governments. In this capacity, RBI provides temporary support to tide over mismatches in
their receipts and payments in the form of ways and means advances.
CHAPTER-III : AGRICULTURE AND ALLIED SECTOR
Artificial Insemination : The mechanical injection of male semen into the womb of the female
with a special syringe-like apparatus. The process begins with the collection of semen from the
male. This method is used extensively in dairy husbandry.
Barren and Unculturable Land : Land which cannot be brought under cultivation except at an
exorbitant cost is classified as unculturable, whether such land is in isolated blocks or within
cultivated holdings.
Certified Seed : The seed grown from a pure stock which meets the standards of certifying agency
(usually a state government agency). The certification of seeds is based on germination rate,
freedom from weeds and disease, and trueness to variety.
Culturable Waste Land : This includes land available for cultivation, but not cultivated during
the last five years or more in succession including the current year for some reason or the other.
Such land may be either fallow or covered with shrubs and jungles which are not put to any use.
Current Fallows : This represents cropped area which is kept fallow during the current year.

xxix
Gross Cropped Area (GCA) : This represents the total area sown once, and those areas sown
more than once in a particular year. For areas sown more than once, they are counted as many
times as they are sown.
Gross Irrigated Area (GIA) : It is the total area under crops, irrigated either once or more than
once in a year. For areas irrigated more than once, they are counted as many times as they are
irrigated.
Land under Miscellaneous Tree Crops : This includes all cultivable land which is not included
in ‘Net area sown’ but is put to some agricultural use.
Net Area Sown (NSA) : This represents the total area sown with crops and orchards. Area sown
more than once in the same year is counted only once.
Net Irrigated Area (NIA) : It is the total area irrigated through any source in a year , irrespective
of the number of times it is irrigated.
System of Rice Intensification (SRI) : The System of Rice Intensification is a low water, labor-
intensive method that uses younger seedlings singly-spaced and typically hand-weeded with
special tools, aimed at increasing the yield of rice production.
Zero-Tillage: Zero-tillage (also No-tillage) is a practice in which the crop is sown directly into
soil not tilled since the harvest of the previous crop. It is typically practised in arable areas where
fallowing is important.
CHAPTER-IV : ENTERPRISES SECTOR
Capital-intensive industries : An industry which requires substantial amount of physical capital
to produce goods and services.
Household Enterprise : A household enterprise is one which is run by one or more members of
a household, irrespective of whether the enterprise is located on the premises of the household or
not.
Own-account Enterprise (OAE) : An enterprise which is run without any hired worker employed
on a fairly regular basis, is termed as an own-account enterprise.
Unincorporated non-agricultural enterprises : This includes non-agricultural enterprises which
are ‘not incorporated’ (i.e. not registered under Companies Act, 1956). The domain of

xxx
‘unincorporated enterprises’ excluded : (a) enterprises registered under Sections 2m (i) and 2m (ii) of the Factories Act, 1948 or beedi and cigar manufacturing enterprises registered under Beedi and
Cigar Workers (Condition of Employment) Act, 1966, (b) government/public sector enterprises,
and (c) cooperatives. Thus, the coverage is restricted primarily to all household proprietary and
partnership enterprises. In addition, Self Help groups (SHGs), Private Non-Profit Institutions
(NPIs) including Non-Profit Institutions Serving Households (NPISH) and Trusts all also covered
under OAE.
CHAPTER-V : LABOUR, EMPLOYMENT AND MIGRATION
Child Labour : Child labour is defined as the work that deprives children of their childhood, their
potential and their dignity, and harm their physical and mental development.
Labour Force Participation Rate (LFPR) : Labour Force includes all workers, either employed
or unemployed. LFPR is the number of persons in labour force as a percentage of total population.
Unemployment Rate (UR) : UR is defined as the percentage of persons unemployed.
Worker Population Ratio (WPR) : WPR is defined as the percentage of employed persons in the
population.
CHAPTER-VII : ENERGY SECTOR
Conventional Energy : Conventional energy is the energy obtained from source which are fixed
in nature like oil, gas and coal.
Non-Conventional energy : Non-conventional energy includes energy from wind, tides, sun,
geothermal heat and biomass. The energy supply from these sources are unlimited.
Peak Demand : Peak demand is used in energy demand management describing a period in which
electrical power is expected to be provided for a sustained period at a significantly higher than
average supply level.
Transmission and Distribution loss (T&D) : T&D loss is the loss of energy during its
transmission from the point of generation to the point of billing. This is calculated for a period of
time, generally a year.

xxxi
CHAPTER-VIII : RURAL DEVELOPMENT
System of Wheat Intensification (SWI) : SWI is a new wheat cultivation technique aimed to
increase productivity of wheat crop using the principles of system of rice intensification.
CHAPTER-IX : BANKING AND ALLIED SECTORS
Credit Deposit Ratio (CD Ratio) : It is the ratio of how much a bank lends out of the deposits it
has mobilized in a particular State.
Non-Performing Asset (NPA) : A non performing asset is a loan or advance for which the
principal or interest payment has remained overdue for a period of at least 90 days.
Repo Rate : It is the rate at which the Reserve Bank of India lends money to commercial banks in
the event of any shortfall of funds.
CHAPTER-XI : HUMAN DEVELOPMENT
Crude Birth Rate (CBR) : CBR is defined as the number of live births per 1000 population.
Infant Mortality Rate (IMR) : IMR indicates the number of children dying before the age of one
year per 1000 live births.
Life Expectancy at Birth (LEB) : LEB reflects the average number of years a newly born is expected to
survive under the current schedule of mortality.
Maternal Mortality Rate (MMR) : MMR is the number of registered maternal deaths due to birth
or pregnancy-related complications per 100,000 live births.
Neo-Natal Mortality Rate (NMR) : NMR denotes the number of children dying during the first
28 days of their birth, per 1000 children.
Peri-Natal Mortality Rate (PMR) : PMR indicates stillbirths and deaths in the first week of life
per 1000 live and stillbirths.
Slipped-back Habitations : It includes those habitations which were fully covered for water
supply at one time, but have slipped back partially or not-covered in the current year.
Total Fertility Rate (TFR) : TFR refers to the total number of children born or likely to be born
to a woman of child-bearing age in her lifetime.

xxxii
Under-five Mortality Rate (U5MR) : It is the number of children dying between birth and exactly
five years of age per 1000 live births.
CHAPTER-XII : CHILD DEVELOPMENT
Stunting (height-for-age) : Is a measure of linear growth retardation and cumulative growth
deficits. Children whose height-for-age score is below minus two standard deviations (-2 SD) from
the median of the reference population are considered short for their age (stunted), or chronically
undernourished. Children who are below minus three standard deviations (-3 SD) are considered
severely stunted.
Underweight (weight-for-age) : This is a composite index of height-for-age and weight-for-
height. It takes into account both acute and chronic under-nutrition. Children whose weight-for-
age score is below minus two standard deviations (-2 SD) from the median of the reference
population are classified as underweight. Children whose weight-for-age score is below minus
three standard deviations (-3 SD) from the median are considered severely underweight.
Wasting (weight-for-height) : It measures the body mass in relation to body height and describes
current nutritional status. Children with score less than minus two standard deviations (-2 SD)
from the median of the reference population are considered thin (wasted), or undernourished.
Children with weight-for-height score less than minus three standard deviations (-3 SD) from the
median of the reference population are considered severely wasted.
CHAPTER-XIII : ENVIRONMENT AND CLIMATE CHANGE
Bio-chemical Oxygen Demand (BOD) : The amount of dissolved oxygen used by
microorganisms in the biological process of metabolizing organic matter in water.
Carbon Dioxide (CO2) : A colourless, odourless, nonpoisonous gas that results from fossil fuel
combustion and is normally a part of the ambient air.
Carbon Stock : Forest carbon stock is the amount of carbon that has been sequestered from the
atmosphere and is now stored within the forest ecosystem, mainly within living biomass and soil,
and to a lesser extent also in dead wood and litter.
Chemical Oxygen Demand (COD) : A measure of the oxygen required to oxidize all compounds
in water, both organic and inorganic.

xxxiii
Crown Density : The density tells us the amount of plant material, such as leaves, branches, and
fruit, that block skylight from shining through the tree crown. It is measured as the percent of total
light that is blocked by tree material.
Dead Organic Matter : This carbon pool contains all non-living woody biomass and can be
divided into two components – wood (fallen trees, roots and stumps with diameter over 10cm) and
litter (greater than 2mm and less than 10cm diameter) .
Dissolved Oxygen : The oxygen freely available in water; vital to fish and other aquatic life. It is
the concentration of oxygen dissolved in water, expressed as milligrams per liter or as a percent of
saturation.
Faecal Coliform : Bacteria found in the intestinal tracts of mammals. Their presence in water or
sludge is an indicator of pollution and possible contamination by pathogens.
Fluoride : Gaseous, solid, or dissolved compounds containing fluorine that result from industrial
processes; Excessive Fluoride amounts in food can lead to fluorosis.
Forest Cover : This includes all lands, more than one hectare in area, with a tree crown density of
more than 10 percent, irrespective of ownership and legal status. Such lands may not necessarily
be a recorded forest area. It also includes orchards, bamboo and palm.
Nitrogen Dioxide (NO2) : Products of combustion from transport and stationary sources and
major contributors to acid deposition and the formation of ground-level ozone in the troposphere.
Particulate Matter : Fine solid or liquid particles that pollute the air and are added to the
atmosphere by natural and man-made processes at the earth’s surface. Examples of particulate matter include dust, smoke, soot, pollen and soil particles.
Protected Forest : An area notified under the provisions of the Indian Forest Act or other State
Forest Acts, having limited degree of protection. In protected forest, all activities are permitted,
except those specifically prohibited.
Reserved Forest : An area constituted under the provisions of the Indian Forest Act or other State
Forest Acts, having full degree of protection. In reserved forests, all activities are prohibited, unless
specially permitted.

xxxiv
River Basin : The portion of land drained by a river and the streams that flow into it. The quality
of a river basin affects the quality of water, so efforts to protect and improve water quality must
often include plans for managing river basins.
Soil Organic Carbon : It is a measurable component of soil organic matter. Soil Organic Matter
is the organic component of soil, containing small plants residues, small living soil organism and
decomposed organic matter.
Sulphur Dioxide (SO2) : A corrosive gas produced by the burning of fuels, such as coal and oil,
that contain sulphur. It is also produced from sea spray, organic decomposition and volcanic
eruptions.
CHAPTER-XIV : E-GOVERNANCE
E-Government Development Index (EGDI) : The EGDI is a composite index based on the
weighted average of three normalized indices. One-third is derived from a Telecommunications
Infrastructure Index (TII), one-third from a Human Capital Index (HCI) and one-third from the
Online Service Index (OSI) which assesses e-government development at the national level.
LAN : Local Area Network is a computer network that spans a relatively small area. Most often,
a LAN is confined to a single room, building or group of buildings. However, one LAN can be
connected to other LANs over any distance via telephone lines and radio waves.
WAN : Wide Area Network is a telecommunications network that extends over a large
geographical area for the primary purpose of computer networking. WAN is often established
with leased telecommunication circuits.
___________

xxxv
EXECUTIVE SUMMARY
CHAPTER-I : BIHAR ECONOMY : AN OVERVIEW
1. Bihar has experienced consistent socio-economic development over the last decade, despite limited availability of financial resources. According to the new series of data on Gross State Domestic Product (GSDP), the growth rate of Bihar’s economy in 2018-19 was 10.53 percent (at constant prices) and 15.01 percent (at current prices), which is higher than the growth ratefor the Indian economy.
2. The GSDP of Bihar at current prices was Rs 5,57,490 crore at current prices and Rs 3,94,350 crore at constant (2011-12) prices in 2018-19. The NSDP for the state in 2018-19 was Rs 5,13,881 crore at current prices and Rs 3,59,030 crore at constant prices. The resulting Per Capita GSDP of Bihar was Rs 47,541 at current prices and Rs. 33,629 at constant prices.
3. The share of Primary, Secondary and Tertiary sectors in the GSVA was 21.3, 19.7 and 59.0 percent, respectively. Within the Secondary sector, Construction and Manufacturing are major contributors to the GSVA and their shares were 9.5 and 8.2 percent respectively in 2018-19 and these shares have remained almost unchanged in the last five years. The contribution of the overall Secondary sector has remained between 19 and 20 percent during 2013-14 to 2018-19. In the Tertiary sector, major contributors to GSVA were — Trade & Repair services (18.2 percent), and Real Estate, Ownership of Dwelling and Professional Services (9.1 percent). The share of overall Tertiary sector in GSVA has increased between 2012-13 to 2018-19.
4. There is a considerable disparity across the districts within the state in terms of socio-economic development, as evident from the various indicators. The three relatively most prosperous districts based on Petrol consumption per thousand persons are — Patna, Muzaffarpur, Gopalganj. The three most prosperous districts in terms of per capita small savings are — Patna, Saran and Buxar.
CHAPTER-II : STATE FINANCES
1. The management of the state finances in Bihar in 2018-19 has adhered to the resolutions of the Bihar Fiscal Responsibility and Budget Management Act, 2006. The fiscal deficit was 2.68 percent of GSDP, revenue surplus 1.34 percent of GSDP and the outstanding public debt liability of the State Government was 32.34 percent of GSDP during the year.

xxxvi
2. Given the limited revenue receipt from its own sources, the State Government has been dependent on the central transfers and the grants for resources. These transfers are mostly as per the recommendations of the Finance Commission. The 15th Finance Commission has submitted its report for the year 2020-21. As per its recommendation, the share of Bihar in the total shareable resource pool of the centre has increased from 9.67 percent to 10.06 percent for the year 2020-21.
3. In an attempt to improve the efficiency in financial management, the State Government has introduced Comprehensive Financial Management System (CFMS) on April 1, 2019, which will make all financial activities in the state online and paperless. In another development in 2018-19, the State Government made it mandatory for all the departments to make all the purchases through the GeM Portal.
4. The total revenue receipt of Bihar in 2018-19 was Rs 1,31,793 crore and capital receipt Rs 20,494 crore. The revenue expenditure and the total expenditure in the state were Rs 1,24,897 crore and Rs 1,54,655 crore respectively. The revenue receipt increased by 12.2 percent,whereas the revenue expenditure increased by 21.7 percent in 2018-19 over the previous year. The capital expenditure decreased by 12.0 percent to Rs 29,759 crore during the same period.
5. The receipt from the tax revenues increased by Rs 14,791 crore in 2018-19 to reach Rs 1,03,011 crore, which is 16.8 percent higher than the previous year and the non-tax revenue was Rs 4,131 crore during 2018-19, after an increase of 17.8 percent over the previous year. The receipts under Grants-in-Aid and contributions from the Central Government declined to Rs 24,652 crore in 2018-19. The SGST and IGST revenue collected by the state was Rs 17,861 crore in 2018-19. The revenue from IGST was about 58 percent of the total revenue collected from GST for the state.
6. The share of revenue expenditure in total expenditure has increased to 80.8 percent in 2018-19 from 75.2 percent in 2017-18. Correspondingly, the share of capital expenditure has declined from 24.8 percent in 2017-18 to 19.2 percent in 2018-19. Out of the total expenditure of Rs 1,54,655 crore, the developmental expenditure was Rs 1,07,737 crore (69.7 percent). The expenditure by the State Government on salary and pension has grown by 12.2 percent in 2018-19 over the previous year to reach Rs 35,996 crore.
7. In 2018-19, the total expenditure on General Services, Social Services and Economic Services increased to Rs 38,691 crore, Rs 58,284 crore and Rs 27,918 crore, respectively. The growth rates observed in expenditure under these heads over the previous year are 15.9, 27.3 and 18.9 percent, respectively.

xxxvii
8. In 2018-19, the share of social services expenditure in total expenditure increased by two percentage points, whereas the share of economic services and general services expenditures declined by one percentage point each. The social services expenditure increased by 27.3 percent to Rs 58,284 crore in 2018-19 over the previous year. The expenditure on three major heads of the social services were — Rs. 28,080 crore (Education, Sports, Art and Culture), Rs. 7318 crore (Health and Family Welfare) and Rs. 15,638 crore (Water Supply, Sanitation, Housing and Urban Development). The growth in expenditure for these three components was 13.1, 18.4 and 105.5 percent, respectively, over the previous year.
9. The outstanding liability of the State Government was Rs 1,68,921 crore at the end of 2018-19, which is 7.7 percent higher than the outstanding liability for the previous year. The public debt accounted for 74.7 percent of the total outstanding liability of the state, and the remaining 25.3 percent of the outstanding liability comprises Small Savings, Provident Fund, Reserve Funds, and Deposits and Advances.
10. The total borrowing by the State Government in 2018-19 was Rs 18,668 crore, compared to Rs 13,169 crore in 2017-18 and Rs 21,577 crore in 2016-17. In a significant development, there was an increase of 55.4 percent from the previous year in the repayment of public debt by the State Government during 2018-19. The repayment of public debt was Rs 7230 crore in 2018-19, compared to Rs 4654 crore in 2017-18.
11. Bihar maintained a lower GFD of Rs 13,807 crore in 2018-19, compared to Rs 14,305 crore in 2017-18. The share of net borrowing in financing GFD was 82.0 percent in 2018-19, whereas the net balance of public account contributed only 18.0 percent.
CHAPTER-III : AGRICULTURE AND ALLIED SECTORS
1. The contribution of agricultural and allied sectors to the Bihar’s GSVA was 21 percent in 2017-18 and the share of crop sector in the GSVA was 12.1 percent. Total expenditure on agriculture and allied sectors in the state increased from Rs. 3615 crore in 2014-15 to Rs. 5176 crore in 2018-19.
2. The gross cropped area in Bihar was 75.25 lakh hectares and the cropping intensity was 144 percent in 2017-18.
3. The production of cereals increased from 143.21 lakh tonnes in 2017-18 to 158.58 lakh tonnes in 2018-19. Within cereals, rice and wheat together contributed more than 70 percent of the total gross cropped area.
4. The Government of India has conferred the Krishi Karman Award to the state on 2nd January 2020, for its achievements in production and productivity of Maize and Wheat.

xxxviii
5. Livestock and aquaculture together contributed about 7.1 percent of GSVA in the agriculture sector in Bihar during 2018-19. To increase fish production in the state, about 9286.5 lakh fish seeds was distributed in 2018-19. The fish farmers have started exporting fish to the tune of 30,000 MT to the neighbouring states and Nepal.
6. Egg production has increased from 111.17 crore in 2016-17 to 176.34 crore in 2018-19. The tentative figure for 2019-20 is 265 crore eggs. With this, the per capita egg production in the state has increased from 11 in 2016-17 to 25 in 2019-20.
7. In 2018-19, a total of Rs. 229.93 crore was sanctioned as electricity subsidy for the cultivators by the energy department. Further, the diesel subsidy was Rs. 263.60 crore during 2018-19. The State Government has taken a new initiative to provide subsidy to the extent of 80 percent on machinery used for crop residue management.
8. The total expenditure on irrigation development increased from Rs. 854.17 crore in 2013-14 to Rs. 1328.43 crore in 2018-19, recording an annual growth rate of 11.4 percent. The State Government is providing subsidy of 90 percent on drip irrigation and 75 percent on sprinkler irrigation.
CHAPTER-IV : ENTERPRISES SECTOR
1. In Bihar, the relation between annual growth rate of the secondary sector and GSDP has been rather moderate. However, the state has performed remarkably well in the secondary sector, particularly in providing electricity, gas, water supply, and other utility services (EGWUS) in the recent past. The growth rate of EGWUS has been consistently positive in recent years and appreciably high in some years.
2. The annual growth rate of operational agro-based factories in Bihar was 16.4 percent over the last 10 years, compared to only 3.3 percent at the all-India level.
3. The performance of unincorporated non-agricultural enterprises (UNAEs) has been particularly impressive in Bihar. The GVA per worker in own-account enterprises (OAEs) within the manufacturing sector in Bihar was Rs 71 thousand, almost 54 percent higher than the all-India average (Rs 46 thousand). Similarly, GVA per worker in OAEs in trade was Rs 94 thousand, again 7 percent more than the all-India average (Rs 88 thousand). The ratio of GVA to fixed assets of UNAEs in Bihar was also higher than the national average.
4. In 2017-18 and 2018-19, a sum of Rs. 742.54 crore has been invested in food processing industries, the highest among all the industries classified under ‘High Priority Sector.’ To facilitate industrialisation in the state, several important reforms have been carried out by the State Government.

xxxix
5. In Bihar, 11 sugar mills are presently operating spread across six districts. In 2018-19, 810.17 lakh quintals of sugarcane were crushed to produce 84.02 lakh quintals of sugar. Between 2017-18 and 2018-19, sugar production has increased by 17.4 percent in the state. Moreover, the recovery rate improved from 9.57 percent in 2017-18 to 10.37 percent in 2018-19.
6. In 2018-19, COMFED has inducted more societies in Supaul Milk Union in Bihar and Bokaro Dairy in Jharkhand. The number of organised societies under the COMFED increased by 9.4 percent, from 20,997 in 2017-18 to 22,971 in 2018-19. The daily milk collection across all dairies registered a growth of 18.7 percent during the year.
7. The number of targeted beneficiaries of the Prime Minister’s Employment Generation Programme (PMEGP) has gone up from 2850 in 2017-18 to 4348 in 2018-19, an increase of 52 percent. The financial allocation also increased from Rs 5653 lakh in 2017-18 to Rs 10,869 lakh in 2018-19, registering an increase of 93 percent.
8. The State Government has generously allocated funds to the Department of Tourism during the recent years, and the utilisation ratio has generally been high throughout this period. The Department of Tourism has undertaken various projects worth Rs 45.67 crore in 2018-19.
CHAPTER-V : LABOUR, EMPLOYMENT AND MIGRATION
1. The worker population ratio (WPR) for male workers in rural Bihar was 64.0 percent, about 8 percent lower than the all-India average. The WPR for female workers was abysmally low at 3.9 percent in rural Bihar. In Bihar, 55.9 percent males were self-employed in 2017-18.The share of casual labour in Bihar (32.1 percent) was significantly higher than the all-India level (24.3 percent).
2. Major employment-generating industries for working males in Bihar were — agriculture,
forestry and fishing (44.6 percent), construction (17.1 percent), wholesale and retail trade,
repair of vehicles (12.3 percent), and manufacturing (9.3 percent). For female workers, major
employment-generating industries were — agriculture, forestry and fishing (53.6 percent),
and education (25.7 percent).
3. In Bihar, 75 percent of total migration took place due to marriage, compared to 46 percent at
the all-India level in 2011. Only 2.9 percent of total migration took place due to
work/employment and business. Of the total number of people migrating due to work,
employment and business, 76 percent were men.
4. The number of passports issued from the Regional Passport Office in Patna is more than 3
lakhs per year during 2015-16 to 2018-19. The highest number of applications for passport

xl
was received in 2018-19 (348.3 thousand), while the highest (357.6 thousand) number of
passports issued was in 2015-16 (357.6 thousand).
5. During the last five years, Rural Self Employment Training Institute (RSETI) has trained
1,38,104 candidates, of which 62,618 (45 percent) were male and 75,457 (54 percent) were
female, and less than one percent were transgender. Of the total trained candidates, 74
percent obtained gainful employment in various economic activities. The financial
institutions have financed 26 percent of the trained candidates, as part of various schemes.
6. The Bihar State Migrant Labour Accidental Grant Scheme, 2008 was implemented in all
districts of Bihar. The quantum of compensation are — Rs. 1.00 lakh for death, Rs. 75.00
thousand for permanent absolute disability, and Rs. 37.50 thousand for permanent partial
disability.
CHAPTER-VI : INFRASTRUCTURE
1. The physical infrastructure in Bihar has been strengthened considerably during the last decade. The growth in the transport sector was 11.0 percent during the period 2011-12 to 2018-19. The GSDP of the transport sector has increased from Rs. 11,236 crore in 2011-12 to Rs. 24,692 crore in 2018-19. It is mainly on account of massive public investment, which has tripled from Rs. 5988 crore (2012-13) to Rs. 18,677 crore (2019-20).
2. Implementation of road safety measures has ensured that the number of road accidents per lakh population is the lowest in Bihar (9.3) among all major Indian states during 2018.
3. Bihar was the sixth highest state in terms of building additional road length (1,30,799 km), during 2008-2017. The length of National Highways in Bihar has increased over the years and the expansion of road length was higher during 2013-17 compared earlier years. The State Government has spent a substantial amount on widening the SH network.
4. The public investments in rural roads by the State Government has increased by more than five times from Rs. 1874 crore in 2012-13 to Rs. 10,476 crore in 2019-20. The total paved road was only 35 percent in 2015, but it has increased to 75 percent in 2019. The length of the paved rural roads has increased to 92,204 km in 2019, from 48,794 km in 2015.
5. As most of the population resides in rural areas, the registration of two-wheelers is growing at a much faster rate in the state, compared to other vehicles. Apart from two-wheelers, the major growth drivers of registered vehicles in 2018-19 are — trucks (20.5 percent), cars (19.0 percent) and trailors (12.1 percent).

xli
6. The number of new motor vehicles registered has increased annually by 17.7 percent during 2013-19. In 2018-19, a total of 11.89 lakh vehicles were registered, compared to only 5.53 lakh in 2013-14. The revenue through tax collection under the Motor Vehicles Act in the state has increased substantially from Rs. 835 crore in 2013-14 to Rs. 2067 crore in 2018-19, registering an annual growth of around 20 percent.
7. The expenditure on building construction has registered 34 percent annual growth during 2008-09 to 2018-19. The Public Sector Undertakings (PSUs) in road, bridge, transport and building construction sectors are managing their projects efficiently by completing them on time and making profit in the business.
8. The Railways is an affordable means of transportation for millions of passengers and also for bulk freight. Bihar was at the third position among major states of India in 2017 in terms of rail route per thousand sq.km. of area.
9. Air transport has registered a massive annual growth (35.6 percent) in the state, as the contribution of the sector in the GSDP increased from Rs. 31 crore in 2011-12 to Rs. 252 crore in 2018-19. As many as 40.61 lakh passengers availed air travel during 2018-19,compared to 31.11 lakh in 2017-18.
10. The telecom sector has registered tremendous growth and tele-density has been increasing rapidly over the years in both Bihar and other states. Presently, the rural tele-density in Bihar is 46 connections per 100 persons. The urban tele-density in Bihar is 149 connections per 100 persons.
11. A total of 9084 post offices were in Bihar as of March, 2018. Out of this, 8625 (94.9 percent) were in rural areas and 459 (5.1 percent) in urban areas. Many financial services are being provided through the vast postal network. There are 272 lakh account holders in Post Office Bank (POB) in Bihar, which constituted 7.3 percent of the all-India total. In terms of the total outstanding balance in the Post Office Bank, Bihar accounts for Rs. 92,810 crore, constituting 15.5 percent of the all-India total.
CHAPTER-VII : ENERGY SECTOR
1. There has been a significant increase in the projected peak demand for electricity in Bihar from 2650 MW in 2012-13 to 5300 MW in 2018-19, implying a growth of around 100 percent in six years. The peak demand met increased by 185 percent and reached 5139 MW during 2018-19, from 1802 MW in 2012-13.
2. The peak deficit in power was around 32 percent in 2012-13, which has substantially decreased to only 3 percent in 2018-19. The availability of power has increased from an

xlii
average of 6-8 hours to 20-22 hours in rural areas and from 10-12 hours to 22-24 hours in urban areas. The per capita consumption of the electricity in the state has risen from 145 kwh in 2012-13 to 311 kwh in 2018-19, implying a growth of 114 percent in six years.
3. The electricity connection has been provided to all willing households in the state. In the next phase, the connection is being provided to all agriculture pump sets, which are presently running on diesel. Providing electricity connection has been taken up in a mission mode inthe state and the target for its completion is set for March 2020.
4. The expected power demand of Bihar by 2021-22 shall be of the order of 6900 MW, with an annual energy requirement of 39,841 MU. The power capacity availability in the state was 3889 MW in 2018, and increased to 4767 MW in 2019, implying a growth of 22.6 percent. In order to meet the increased demand for power, the State Government has already planned for additional capacity of 5335 MW from different sources in a phased manner by 2021-22.The total available capacity for Bihar by 2021-22 is expected to be 10,102 MW, of which 6421 MW (63.6 percent) will be conventional and the remaining 3681 MW (36.4 percent) non-conventional.
5. The total allocation of fund for BSPHCL and its subsidiary companies, Bihar Renewable Energy Development Agency (BREDA) and Bihar State Hydroelectric Power Corporation (BSHPC) was Rs. 3663.49 crore in 2015-16, and it has increased to Rs. 6185.63 crore in 2018-19.
6. The generation and purchase of power (net of central transmission loss) in Bihar increased from 21,677 MU in 2015-16 to 28,112 MU in 2018-19, implying a growth of around 30 percent in four years. With an increase in sales, the revenue collection has also increased. The cost coverage was around 80 percent in 2017-18 and it has increased to over 86 percent in 2018-19.
7. The total generation capacity of power as on March 2019 for the state was 4767 MW. Out of this, 82 percent is from coal-based thermal power, 11 percent from hydropower, and the balance 7 percent from renewable energy sources. In terms of ownership, the central sector has the largest share of 86 percent, followed by the private sector/IPPs (13 percent) and state sector (1 percent).
8. To prioritise the renewable energy sources, the State Government has created an institution called Bihar Renewable Energy Development Agency (BREDA), which is primarily engaged in the execution of various projects on solar pumps and solar installations. BREDA also carries out various energy efficiency schemes in Bihar.
xliii
CHAPTER-VIII : RURAL DEVELOPMENT
1. In recent years, JEEViKA has received recognition at both national and international forums for its excellent achievements. About 84,88,964 SHGs were formed by JEEViKA. Further, SHGs have been federated into 55,628 Village Organizations (VO) and 925 Cluster Level Federations (CLF). The project has been able to leverage bank credit worth Rs 8169 crore till 2018-19.
2. The State Government has launched a new scheme, ‘Satat Jivikoparjan Yojana’ (SJY), in August 2018. JEEViKA has been designated as the nodal agency for implementation of SJY, with a budgetary outlay of Rs 840 crore for three years. The objective of this scheme is to provide sustainable income-generating assets to extremely poor households, including those who were traditionally involved in production and sale of country liquor or toddy before the imposition of liquor prohibition in April 2016.
3. Till March, 2019, 2.2 lakh youth were trained and 2.5 lakh placed either by the Project Implementation Agency (PIA), or Rural Self-employment Training Institutes (RSETIs), or through job fairs organized by JEEViKA.
4. Under MNREGA, between 2017-18 and 2018-19, the number of job cards issued increased from 148 lakh to 155 lakh. The number of households receiving employment has increased by about 32 percent, from 22 lakh in 2017-18 to 29 lakhs in 2018-19. The number of person-days generated has increased three and a half times, from 352 lakh person-days in 2014-15to 1234 lakh person-days in 2018-19.
5. In Bihar, PMAY-G is an important rural development scheme for housing, as a large share of the population is living in rural areas. The share of fund utilization under this scheme has increased from 38.2 percent in 2015-16 to 41.2 percent in 2017-18.
6. Under PDS, the total allotment of wheat and rice has increased from 4914.9 thousand tonnes in 2014-15 to 5220.2 thousand tonnes in 2018-19. The allotment of rice has increased by 183 thousand tonnes and allotment of wheat has increased by 122 thousand tonnes, between 2014-15 and 2018-19. It is worthwhile to note that the State Government has been fully utilising the allocation of food grains.
7. The total expenditure of the PRIs during 2018-19 was around Rs 780 crore, which is Rs 527 crore more as compared to 2014-15. At the GP level, there has been a reduction in expenditure in 2018-19, as compared to the previous year. At the PS level, a marginal increase in expenditure (Rs 1.10 crore) has been observed during the same period. In 2018-19, the expenditure was Rs. 27.70 crore at the PS level.

xliv
8. Under the Abhiyan Basera, a survey was conducted in 2014 to identify eligible beneficiaries of the scheme. It has identified 1,11,080 households belonging to different categories and, till 2017-18, 66,396 households were provided with required homestead land. This accounts for 59.7 percent of the targeted population. The coverage for different social groups are —Extremely Backward Castes (53.0 percent), Scheduled Caste (50.8 percent), Scheduled Tribe (55.5 percent) and Mahadalit (62.6 percent).
CHAPTER-IX : URBAN DEVELOPMENT
1. In Bihar, the rate of urbanization has been low compared to the all-India level. Within Bihar, the level of urbanization across the districts has been very skewed. At one extreme, the rate of urbanization was as high as 43.1 percent in Patna and, on another, it was only 3.5 percent in Banka.
2. To improve amenities at the urban centres, the State Government has introduced various schemes like 'Har Ghar Nal ka Jal', 'Ghar Tak Pakki Gali-Naliyaan' to name a few. By 2019-20, around 3,65,490 houses will be covered under the Pucca Naliyaan scheme, of which 3,57,217 have already been covered so far.
3. The budget allocation on urban development and housing has increased from Rs. 2079 crore in 2011-12 to Rs. 3151 crore in 2017-18, registering a growth of 52 percent. The actual expenditure on urban development and housing in the state has increased from Rs. 1395 crore in 2011-12 to Rs. 3227 crore in 2017-18, implying a growth of 131 percent.
4. The number of Self-Help Groups (SHGs) formed under NULM has increased from 2185 in 2017-18 to 5640 in 2018-19. The number of members in SHG under NULM also increased from 21,850 in 2017-18 to 56,402 in 2018-19. The number of SHGs which got Revolving Fund (RF) has shown an increase from 1260 in 2017-18 to 2622 in 2018-19.
5. Recently, Patna Metro Rail Project, with a total cost of Rs 13,366 crore, has been sanctioned.In this regard, the State Government has already constituted Patna Metro Rail Corporation Ltd. (PMRCL) to construct 31.39 kms of the metro to cover East-West and North-South corridors.
CHAPTER-X : BANKING AND ALLIED SECTORS
1. The banking infrastructure has increased in the semi-urban areas in Bihar at a higher pace than in the rural and urban areas in Bihar. The Scheduled Commercial Banks (SCB) have the largest presence in the state among all types of banking institutions. However, if one compares their presence in Bihar with other states in the country, it is found that the SCBs
xlv
have relatively less coverage, and their branches in Bihar are also comparatively under-staffed.
2. With a share of 4.9 percent in 2019, Bihar is at the 10th position in terms of share of branches of the commercial banks. This share has remained almost the same during the years 2015 to 2019. If one compares this share with the population share of Bihar in the entire country (8.6 percent), it is observed that the bank branches in Bihar are serving a larger population than the national average.
3. Among the 221 new branches opened in the state during 2018-19, 42 percent were opened in semi-urban areas and 30 percent in rural areas. There is a significant decline in the number of bank branches being opened by the SCBs in the state in recent years. With the introduction of the Small Finance Banks and the Payment Banks in India as banking services providers, Bihar has seen their presence with 107 and 38 new branches, respectively. Within three years of their introduction, these banks have 234 branches in the state.
4. There is an increase of Rs. 36,148 crore in the deposits in SCBs in Bihar between 2017-18 and 2018-19. During the same period, credit provided by the SCBs expanded by Rs. 18,776 crore, an increase of 18.5 percent in the state. The share of Bihar in the total deposit and credit in India has remained at 2.8 percent and 1.2 percent respectively in 2018-19. Compared to its population share in the country, Bihar’s share in both deposit and credit in the SCBs has remained much lower.
5. The CD ratio of the SCBs in Bihar during 2018-19 increased to 34.0 percent from 32.0 percent in 2017-18. However, it is still lower than the CD ratio of 121.8, 106.5 and 109.7 percent for Andhra Pradesh, Maharashtra and Tamil Nadu, respectively. Only Jharkhand and Himachal Pradesh are among the major states which have lower CD ratios than Bihar. The CD ratio at all-India level increased from 75.6 percent in 2017-18 to 78.2 percent in 2018-19.
6. There are 16 districts in Bihar that have CD ratio of the SCBs lower than 40 per cent (as on September 2019). Among the banks, the RRBs have the highest CD ratio and it has increased over the years, whereas the SBI and its associate banks have shown declining trends.
7. The overall achievement of the ACPs in the state has dropped to 84.3 percent in 2018-19from 90.8 percent in 2017-18. The achievement of ACPs in non-priority sectors has remained higher compared to the priority sectors. It was 91.0 percent and 81.6 percent for the priority and non-priority sectors respectively in 2018-19. Both the sectors have seen a drop in achievements in the ACPs over the years. The drop was more in the priority sectors, where it decreased from 86.5 percent in 2017-18 to 81.6 percent in 2018-19.

xlvi
8. The total credit flow to the Agriculture sector in the state under the ACP was Rs 41,798 crore in 2018-19, which is marginally lower than Rs. 42,161 crore in the previous year. The overall target under the ACP for the agriculture sector was Rs. 60,000 crore in 2018-19, which is higher than the target of Rs. 49,000 crore for 2017-18. However, the achievement percentage of the target set for the Agriculture sector dropped from 86.0 percent in 2017-18 to 70.7 percent in 2018-19. Among the banks, Commercial Banks were the worst performers in achieving the credit target for the agriculture sector in Bihar.
9. During 2018-19, 2.19 lakh KCCs were issued in the state by different financial institutions. Out of this, a majority of 1.55 lakh cards were issued by the commercial banks, followed by 62.3 thousand cards by the RRBs and 2.0 thousand cards by the CCBs. However, over the years, the achievement percentage in issuing 15.00 lakh cards per year until 2017-18 has steadily declined. The target for issuing the new KCC in the state was revised to 10.00 lakh cards for 2018-19, but only 21.9 percent of the target could be achieved in the year.
10. The NPA of all banks in Bihar as on March 2019 was 10.9 percent. Among the banks inBihar, the NPA for the RRBs is the highest at 25.2 percent in March 2019; however, it has declined from 27.5 percent in March 2018. The NPA for the Cooperative Banks has also come down from 9.7 percent in March 2018 to 7.2 percent in March 2019. The NPA of the Commercial Banks, however, has increased to 9.1 percent in March, 2019 from 8.1 percent in the previous year.
11. The highest percentage of NPA was in the agriculture sector at 19.1 percent in March 2019, which is higher than 17.1 percent in March 2018. The NPA for the MSME sector declined from 13.9 percent on March 2018 to 12.8 on March 2019. The NPA in the non-priority sector has also come down from 2.1 percent in March, 2018 to 1.7 percent in March, 2019.
12. During 2018-19, loan amounting Rs. 7458.00 crore was sanctioned in Bihar under the PMMY scheme, which was more than the target amount of Rs. 4170.45 crore. The share of Kishore Loans was 47 percent, followed by Shishu and Tarun Loans with the shares of 30 and 23 percent, respectively. The achievement percentage for this scheme was 217.1 percent (Shishu), 208.3 percent (Kishore) and 118.6 percent (Tarun).
CHAPTER-XI : HUMAN DEVELOPMENT
1. Between 2011-12 and 2018-19, the level of Per Capita Development Expenditure (PCDE) in Bihar has grown at 14.2 percent, compared to the national average of 13.3 percent. The expenditure on education in the state increased at an annual rate of 13.8 percent, which is higher than that of the all-India average of 12.8 percent. The expenditure on health also registered an annual growth rate of 20.8 percent, and was higher than that of the all-India

xlvii
average. In absolute terms, the expenditures on education in Bihar were — Rs. 10,214 crore in 2011-12 and Rs. 28,080 crore in 2018-19. Likewise, the expenditure on health also increased from Rs. 2125 crore in 2011-12 to Rs. 7318 crore in 2018-19.
2. The life expectancy at birth in Bihar in 2013-17 was 69.2 and 68.6 years for males and females, respectively. The increase in life expectancy has been 3.7 years for males and 2.4 years for females over 2006-10. The life expectancy in 2013-17 has increased by 2.1 years in the rural and 4.5 years in the urban areas, as compared to 2006-10. It should also be noted that, in these 7 years, the gap between India and Bihar in terms of life expectancy at birth, has come down from 0.3 year in 2006-10 to 0.1 year in 2013-17.
3. Between 2014-15 and 2018-19, the number of institutional deliveries increased from 14.94 lakh to 16.02 lakh, registering an annual growth rate of 7.2 percent. Under Mission Indradhanush, there was an increase of 41 percentage points in immunisation coverage, from 62 percent in 2015-16 to 103 percent in 2017-18 in Bihar.
4. Under National Rural Drinking Water Programme, there is a steady progress till 2015-16 when 26.7 thousand handpumps were installed; thereafter there is a decline in recent years. As regards the coverage of water quality problems, a remarkable achievement was made in 2018-19, when 20,290 wards were covered as per Mukhyamantri Peyjal Nishchay Yojana. A considerable achievement is recorded in the construction of Individual Household Latrine (IHHL). In 2018-19, out of the total 61.4 lakh IHHL constructed, 23.9 lakh (38.9 percent) latrines are for APL families and 37.5 lakh (61.1 percent) latrines are for BPL families.
5. There was an increase of 14.8 percentage points in the literacy rate of Bihar which has improved significantly from 47.0 percent in 2001 to 61.8 percent in 2011. It is worth noting that this decadal increase is not only the highest among all decadal growth rates in Bihar since 1961, it is also the highest among all states for the decade 2001-11.
6. The total enrolment in primary level was 160.08 lakhs in 2017-18, increasing from 154.51 lakhs in 2012-13. At the upper primary level, the total enrolment has increased from 60.36 lakh in 2012-13 to 75.76 lakh in 2017-18, implying an annual growth rate of 4.5 percent. At the primary level, the dropout rate recorded a decrease of 15.5 percentage points, between 2012-13 (31.7 percent) and 2017-18 (16.2 percent). At the upper primary level, the decline was of 6.9 percentage points.
7. With an estimated 11.8 million young population (aged between 18-23 years), Bihar needs to create adequate opportunities for higher education. Bihar has 879 colleges and 33 universities, of which 28 are traditional universities, four are private universities and one of

xlviii
them is an open university. There are also 15 research institutes in the state. The state has 34 engineering colleges and 54 polytechnic institutes.
8. Under the Chief Minister Merit Scholarship Schemes, in 2019-20, an amount of Rs. 105.00 crore for SC students and Rs. 16.36 crore for ST students have been allotted for those passing matric examinations. For SC/ST students in higher secondary, the allotment was Rs. 63.40 crore. At present, 65 Residential Schools for Scheduled Castes and 20 for Scheduled Tribes are being run by the State Government.
9. Under Chief Minister Backward Classes Merit Scholarship Scheme, an amount of Rs. 55.94 crore has been given to the Department of Education for benefitting 55,942 students in 2018-19. There is a provision of Rs. 60.00 crore in 2019-20 for benefitting 60,000 students. Correspondingly, under Pre-Matric Scholarship Scheme, 1.25 crore students have been benefited with Rs. 1359.20 crore till date.
10. Under Mukhyamantri Alpsankhayak Kalyan Chhatrawas Anudan Yojana, students residing in minority hostels are given a grant of Rs. 1000 per month to promote higher education among the minority. In 2018-19, there was a provision of Rs. 1.00 crore, out of which Rs. 81.86 lakh was distributed among 8186 students.
CHAPTER-XII : CHILD DEVELOPMENT
1. In India, 39 percent of the population belongs to the age group of 0-18 years, as per Census
2011; whereas, in Bihar, 48 percent of the population is in that age group. Bihar accounts for
11 percent of India’s total child population. The total child population of the state adds upto
4.98 crore, of which females account for 47.4 percent (2.36 crore) and males for 52.6 percent
(2.62 crore).
2. The Census 2011 data reveals that the child sex ratio was higher than the overall sex ratio in
Bihar. The child sex ratio was 935 females per 1000 males, 923 in 0-14 years age-group, and
897 in the age group of 0-18 years. The child sex ratios among the Scheduled Castes (962)
and Scheduled Tribes (969) are better than the state average of 935.
3. The practice of Child Budgeting started in Bihar in 2013-14, presenting the details of all
schemes related to child welfare. Between 2013-14 and 2018-19, the expenditure on Child
development grew at an annual rate of 23.3 percent. In the same period, the per capita
expenditure increased from Rs. 1225 in 2013-14 to Rs. 3727 in 2018-19. The share of
expenditure on child development in the total state budget lies around 12 percent, with some
year-to-year variation.

xlix
4. The Integrated Child Development Scheme is primarily a service-based programme, and its
staffing pattern is extremely vital for its achievement. In all, 1.07 lakh Anganwadi Centres
have been established to cater to 19.1 million children (0-6 years) and 60.3 lakh pregnant
and lactating women. Compared to 2013-14, there has been an increase in the number of
Anganwadi Workers and Anganwadi Helpers in 2018-19.
5. The percentage of elementary schools with drinking water facility has increased from 93.0
percent in 2011-12 to 99.0 percent in 2016-17. In 2011-12, the percentage of schools with
boy’s toilets was 70.3 percent, which increased to 97.8 percent in 2016-17. Similarly, the
number of schools having toilet facility for girls had increased from 52.2 percent in 2011-12
to 94.0 percent in 2016-17.
6. As per 2011 census, the literacy rate in Bihar stood at 61.8 percent. However, female literacy
rate has been much lower at 51.5 percent compared to the male literacy rate (71.2 percent)
in Bihar. The decrease in the number of total out-of-school children from 2.17 lakh in 2016-
17 to 1.44 lakh in 2018-19 is the result of the focused approach of the State Government.
Out of these, 29.4 percent were SC, 13.8 percent were minority and only 3.0 percent were
ST.
7. There are 33 Child Homes functioning in different districts of the state to support and
rehabilitate destitute, abandoned and orphaned children. Out of these 33 homes, 22 are meant
for boys and 11 for girls. Till date, a total of 6540 children have been provided with
residential facilities in different Child Homes.
CHAPTER-XIII : ENVIRONMENT AND CLIMATE CHANGE
1. During 2018-19, Bihar recorded an annual rainfall of 780 mms. Kishanganj received the highest annual rainfall of 1522 mms., while the lowest rainfall was observed in the district of Jehanabad (403 mms.).
2. The annual groundwater extraction in Bihar has been estimated to be around 29 bcm, while the total annual groundwater recharge is about 31.4 bcm in 2017-18. Bihar’s rate of groundwater extraction stands at 45.8 percent, which is lesser than the all-India average of 63.3 percent.
3. Bihar has about 285 wetlands, with a total area of 3992 hectares, accounting for nearly 0.6 percent of the total recorded forest area of the state in 2019.

l
4. The total forest and tree cover together in Bihar constituted about 9309 sq. kms. in 2019,
which is about 9.9 percent of the total geographical area of the state. The Bihar State
Agroforestry Policy, 2018 seeks to protect and stabilize ecosystems, promote resilient
cropping systems, and enhance employment of rural households through expansion of
agroforestry.
5. There is a steady increase in the revenue of the Department of Environment, Forest and
Climate Change from Rs. 16.10 crore in 2014-15 to Rs. 24.13 crore in 2018-19, registering
an compound annual growth rate of 11.0 percent.
6. Jal-Jeevan-Hariyali is a flagship programme of the State Government which is intended to
tackle issues relating to climate change and environmental degradation. The total expenditure
for the execution of various schemes under Jal-Jeevan Hariyali Campaign is estimated to be
Rs 24,524 crore during 2019-20 to 2021-22. The expenditures for 2019-20, 2020-21 and
2021-22 are estimated to be Rs 5870 crore, Rs 9874 crore, Rs 8780 crore, respectively. Under
the administrative head of Jal-Jeevan Hariyali Campaign, the estimated expenditures are —
Rs. 6.19 crore in 2019-20, Rs. 8.42 crore in 2020-21 and Rs. 8.78 crore in 2021-22.
7. The burning of crop stubble in agricultural fields in Bihar is of concern. The State
Government has announced that the farmers who are found to be burning crop residue would
be deprived of financial assistance for a period of three years.
8. As per the estimates of the Bihar State Pollution Control Board (BSPCB), there has been a
declining trend in the noise pollution levels in Patna during 2016-18. The State Government
is conducting awareness drive against honking to reduce noise pollution in the city.
9. The Valmiki Tiger Reserve is located in an area of 893.73 sq. kms. in the district of West
Champaran, housing the Panthera Tigris. As per the estimates of the National Tiger
Conservation Authority, the tiger population in Bihar increased from 8 in 2010 to 31 in 2018.
The Vikramshila Gangeya Dolphin Sanctuary, situated in Bhagalpur, provides habitat for the
Gangetic Dolphin (Platanista Gangetica), freshwater fishes and turtles.
10. Excessive rainfall in the kharif season in 2019-20 and overflowing rivers have resulted in
substantial crop damage. As per the estimates of the Department of Agriculture, more than
5 lakh hectares could not be sown in the state.

li
CHAPTER-XIV : E–GOVERNANCE
1. Bihar has received as many as eight prestigious awards in the field of e-governance. The objective of e-governance is to make all government services accessible to the common man in their locality, through common service delivery outlets. It also ensures efficiency, transparency, and reliability of such services at affordable costs to realise the basic needs of the common man.
2. E-governance comprises the use of Information and Communication Technology (ICT) for wider participation of citizens in public affairs. The ICT infrastructure in the state has been strengthened through implementation of BSWAN, SecLAN, State Data Centre, Common Service Centres, Wi-Fi Projects, Aadhar, Bharat Net, etc. and expansion of IT Institutions.
3. An IT city in Rajgir (Nalanda), one IT tower and one IT park in Patna, Software Technology Park of India (STPI) in Darbhanga, Bhagalpur and Patna, Centre of National Institute of Electronic and Information Technology (NIELIT) in Bihta, Buxar and Muzaffarpur and Incubation Centre at IIT, Patna (Bihta) for Medical Electronics have either been completed or are in progress.
4. Law and Governance is a very complex issue and ICT plays an important role in Bihar through implementation of CCTN, Cyber Security, e-prison, CCTV and VC, Bihar Police Help Line, e-court, Child Labour Tracking System, e-Municipality Bihar, e-Office etc. toenforce law and order and speed up peaceful environment in the state.
5. Public Finance Management includes the cycle of budget formulation, budget execution, accounting, reporting, external scrutiny and audit; therefore, the State Government has implemented CFMS in 2019. CFMS has been rolled out by connecting all departments, treasuries, DDOs, Reserve Bank of India and other government offices to provide real-time information regarding receipts, expenditures, debt and investments, and ways and means advances to facilitate office-wise and agency-specific policy decisions.
6. Nearly all the departments of the State Government have been running e-Governanceprogrammes in the state. For example, e-Labharthi provides several e-services like social security pension, disability allowance, payments for dress and reading materials, and scholarship amount, etc. These services are provided by various departments like Education, Social Welfare, SC / ST Welfare, Backward and Most Backward Castes Welfare, Minority Welfare etc. In addition to service delivery programmes, several right-based powers havebeen provided to the citizens through e-service in order to empower them with their legal rights.

lii
7. For smooth and leakage-proof management of food supply chain, an IT module has been developed to track doorstep delivery through GPS and SMS alert. There is also an IT module for grievance redressal of beneficiaries by the Project Management Unit.
8. All procurement activities for paddy are being undertaken online through a procurement software and payment is being released within 48 hours through RTGS/ NEFT to registered farmers.
9. E-governance plays a crucial role in providing disaster-related services, both before and in response to the disasters. Disaster awareness is being ensured through the alerts sent to the citizens to prepare themselves for the disaster through WRD Scheme Implementation. The State Government is also using ICT for Monitoring System, Flood Forecast Model, River Behavioural Analysis Model, Embankment Asset Management System, Real-Time Data Acquisition System, Mathematical Modelling Centre, Distribution of Gratuitous Relief (GR) and Tatkal Sahayata, etc.
10. The State Government has implemented many e-governance programmes to provide transparent bidding and public procurement, and monitoring and evaluation of physical infrastructure projects. E-governance in Bihar also includes digitisation and updation of land records, skill development and employment promotion, support to enhance productivity, etc. The State Government is also concerned about the climate change and environment, andmany IT-enabled programmes related to Forest Management Information System have been initiated.
__________

1
CHAPTER - I
BIHAR ECONOMY : AN OVERVIEW
We will be remembered only if we give to our younger generation a prosperous and safe India, resulting out of economic prosperity coupled with civilizational heritage.
— A.P.J. Abdul Kalam
Bihar has consistently experienced socio-economic development over the last decade, despite
limited availability of financial resources. The emphasis of the policy in state has been on
making the benefits of the government programmes reach everyone in the society. This is
evident from the achievements of the state in various sectors, both economic and social. The
development achieved so far is a result of multiple policy initiatives of the State Government,
including increased level of development expenditure.
To supplement the growth process, the State Government is working on the ‘Seven Resolves’
(Saat Nishchay) which includes — welfare of youth, women employment, supply of electricity
to all households, clean drinking water, road connectivity, toilet facility, and provision of
Abstract
Over the last decade, there was a steady growth process in Bihar, spanning both economic
and social sectors. Thanks to the strategies of the State Government, this growth was not only
robust but inclusive as well, benefitting particularly the poor households. The Bihar economy
has registered higher growth than the overall growth of the Indian economy in the last three
years and the real Gross State Domestic Product (GSDP) of Bihar increased by 10.5 percent
in 2018-19. The growth is primarily led by the tertiary sector, with a growth rate of 13.3
percent. The varying growth rates of different sectors has also resulted in structural changes
in the economy— the share of the primary sector in GSDP has decreased and the share of
tertiary has increased. Finally, in the recent years, the overall inflation rate and rural
inflation rate have been much lower in Bihar than the national inflation rates. This growth
performance of the Bihar economy was possible because of high development expenditure by
the State Government in the recent past.

2
higher technical education. In addition to the efforts to achieve higher economic growth, the
State Government has also focused on addressing challenges to the environment through its
ambitious programme ‘Jal Jeevan Hariyali Abhiyan’, started in 2019-20. This programme is an
initiative of the State Government that brings focus of the policy making to the issues consistent
with sustainable development. An amount of Rs. 24,524 crore is budgeted to be spent on this
scheme in Bihar over the next three years starting from the current fiscal.
The growth in real Gross State Domestic Product (GSDP) of Bihar was 10.5 percent in 2018-19,
which is higher than the growth rate for the Indian economy. The state has managed its finances
prudently and has adhered to the resolutions of the Bihar Fiscal Responsibility and Budget
Management (FRBM) Act, 2006. Despite the limitations in improving revenue generation from
own sources, the state could generate substantial revenue surplus during the last decade which
provided some useful fiscal space for public investment. A discussion on the status of the various
sectors of Bihar economy, along with the major policy initiative and their impact has been
covered in the different chapters of the present Economic Survey. The current chapter presents
an overall review of the economy.
1.1 Socio-Economic Profile of the State
Bihar is a densely populated state, where 1106 persons lived per sq. km. in 2011, which was
nearly three times the average population density of the country (382 persons per sq. km.). The
population density is expected to increase further in the coming years. In 2011, Bihar had a
population of 104.1 million, whereas the population of the country was 1210.6 million. The
demographic profile of the State using census data for the years 2001 and 2011, along with the
number of the administrative units, is presented in Table 1.1. Between these two censuses, the
sex ratio at birth and the child sex ratio had declined in both Bihar and India. Most of the
population of the state lives in rural areas with the urbanization ratio at only 11.3 percent in
2011. However, with the consistent socio-economic development of the state, these ratios are
expected to improve for Bihar in the next census.

3
Table 1.1 : Demographic Profile and Administrative Structure of Bihar and India (2001 and 2011)
Population (million) Sex Ratio
Sex ratio at birth 2013-15
Sex ratio at birth 2014-16
Child Sex
Ratio
Total Rural Urban (females per '000 males)
Bihar 2001 82.9 74.3 8.7 919
916 908 942
2011 104.1 92.3 11.8 918 935
India 2001 1028.7 742.5 286.1 933
900 898 927
2011 1210.6 833.7 377.1 943 919
Density (persons per sq. km.)
Urbaniz-ation (%)
Decadal Growth
(%)
Administrative Structure
No. of Districts
No. of CD
blocks
No. of Towns
(statutory/census)
No. of Villages
Bihar 2001 880 10.5 28.6 37 533 130 45098
2011 1106 11.3 25.1 38 534 199 39073
India 2001 325 27.8 21.5 593 5463 5161 638596
2011 382 31.2 17.6 640 5924 7935 597369
Sources : Census 2001 and 2011
The poverty ratios using the Tendulkar Committee methodology, for Bihar was 34.1 percent for
rural and 31.2 percent for urban areas in 2011-12. The overall poverty ratio was 33.7 percent
(Table 1.2). These poverty ratios are much higher than at the all-India level. The pace of poverty
reduction, as measured by the difference between the poverty ratios in 2004-05 and 2011-12, was
higher in Bihar than at the all-India level. Further, it is also observed that the reduction in the
poverty ratio in rural areas of Bihar (21.6 percentage points) was higher than that in the urban
areas (12.5 percentage points). The difference between Bihar and all-India average for the
poverty ratio is more for urban areas (17.5 percentage points) compared to the rural areas (8.4
percentage points).

4
Table 1.2 : Poverty Ratio of Bihar and India (1993-94, 1999-00, 2004-05 and 2011-12)
Area 1993-94 1999-00 2004-05 2011-12
Reduction in Poverty ratio
between 2004-05 and
2011-12
Bihar
Rural 58.2 44.3 55.7 34.1 21.6
Urban 34.5 32.9 43.7 31.2 12.5
Combined 55.0 42.6 54.4 33.7 20.7
India
Rural 37.3 27.1 41.8 25.7 16.1
Urban 32.1 23.6 25.7 13.7 12.0
Combined 36.0 26.1 37.2 21.9 15.3
Monthly Per Capita Expenditure (Rs.)
Bihar Rural — — 433 778 —
Urban — — 526 923 —
India Rural — — 447 816 —
Urban — — 579 1000 —
Source : Planning Commission, Government of India
1.2 Growth of Bihar Economy
Bihar economy has grown at a higher rate than the growth registered by the country in last three years (Chart 1.1). The real GDP growth estimated for the Indian economy has come down in last two years, whereas Bihar has registered double-digit growth during the same period. The sectoral growth in Bihar and Indian economy for the period 2012-13 to 2018-19 is compared in the Table 1.3. The higher growth rate achieved by the Bihar economy compared to the Indian economy during 2017-18 and 2018-19 has largely been due to relatively higher growth in the tertiary sector in the state; the two other sectors have grown at a relatively lower rate.
Table 1.3 : Sectoral Growth rate of GDP/GSDP in India and Bihar at
Constant Price 2011-12 (2012-13 to 2018-19)
Year Primary Secondary Tertiary
India Bihar India Bihar India Bihar
2012-13 1.4 9.6 3.6 -13.2 8.3 7.4
2013-14 4.8 -10.8 4.2 27.8 7.7 3.8
2014-15 1.2 -1.6 6.7 11.9 9.8 2.5
2015-16 2.1 4.3 9.5 0.1 9.4 9.1
2016-17 6.8 10.0 7.5 14.3 8.4 7.0
2017-18 5.0 6.4 6.0 4.7 8.1 13.1
2018-19 2.7 0.6 7.5 6.3 7.5 13.3
Source : Central Statistical Organisation, Government of India

5
Various figures related to the macroeconomic indicators for Bihar is presented in Appendix at
the end of this chapter. As per the quick estimates available from the Central Statistical
Organisation (CSO), Government of India, the GSDP of Bihar at current prices was Rs 5,57,490
crore in 2018-19. At constant (2011-12) prices, the GSDP figure for the state was Rs 3,94,350
crore in 2018-19. The NSDP for the state in 2018-19 was Rs 5,13,881 crore (current prices) and
Rs 3,59,030 crore (constant prices). The resulting Per Capita GSDP of Bihar in 2018-19 was Rs
47,541 (current prices) and Rs. 33,629 (constant prices). Table A 1.2 (Statistical Appendix)
presents the time series data on GSDP and NSDP for the period 2004-05 to 2014-15, with base
year 2004-05. Further, Tables A 1.2 - A1.5 present the sector-wise breakdown of GSDP and
NSDP for the years 2011-12 to 2018-19, both at current and constant (2011-12) prices.
Per capita NSDP
Per capita NSDP at constant prices is reported for different States in Table 1.4. The per capita
income for Bihar has increased from Rs. 21,750 in 2011-12 to Rs 30,617 in 2018-19. However,
Bihar has the lowest per capita income among the states in India and it was at only 33.1 percent
of the national average (Rs. 92,565) in 2018-19. Thus, the state needs extra push to increase its
economic activity so that it converges towards the national average of per capita income. The
pattern of per capita NSDP for the state and the country is shown in Chart 1.2.
0.00
2.00
4.00
6.00
8.00
10.00
12.00
2012-13 2013-14 2014-15 2015-16 2016-17 2017-18 2018-19
Chart 1.1 : Real GDP and GSDP Growth rate
India GDP Bihar GSDP

6
Table 1.4 : Per Capita Net State Domestic Product (NSDP) at (2011-12) Prices of Major Indian States (2011-12 to 2018-19)
State 2011-12 2012-13 2013-14 2014-15 2015-16 2016-17 2017-18 2018-19
Andhra Pradesh 69000 68865 72254 79174 88609 97086 106864 117261
Bihar 21750 22201 22776 23223 24064 25825 28101 30617
Chhattisgarh 55177 56777 61409 61122 61504 65948 68543 71429 Gujarat 87481 96683 102589 111370 120683 131281 144090 NA Haryana 106085 111780 119791 125032 137748 148193 157649 168209 Jharkhand 41254 44176 43779 48781 44524 48826 54246 57157 Karnataka 90269 94382 101864 105703 116819 131260 142943 154809 Kerala 97912 103551 107846 112444 120387 129256 136364 NA Madhya Pradesh 38551 41287 42778 44336 47763 53253 55677 58706 Maharashtra 99564 103904 109399 114746 122422 132899 141152 NA Odisha 48370 50714 54109 54210 57592 66240 69864 74927 Punjab 85577 88915 93238 95807 100141 105848 110834 116222 Rajasthan 57192 58441 61053 64496 68565 71076 74453 78785 Tamil Nadu 92984 96890 101559 106189 114581 121378 129328 138805 Uttar Pradesh 32002 32908 34044 34583 36923 38965 41082 43102 West Bengal 51543 53157 53811 54520 57255 60618 65497 73202 India 63462 65538 68572 72805 77659 82931 87623 92565 PCI of Bihar as percentage of PCI of India
34.3 33.9 33.2 31.9 31.0 31.1 32.1 33.1
Source : Central Statistical Organisation, Government of India
Chart 1.2 : Per Capita Net State Domestic Product (NSDP) at (2011-12) Prices
Sectoral Growth Rate
The sectoral growth rate of the Bihar economy for the years 2017-18 (provisional estimates) and 2018-19 (quick estimates) along with year 2016-17 is presented in Table 1.5. The overall growth rate for the GSDP in Bihar was estimated to be in double digit during last two years. The rapid
21750
22201
22776
23223
24064
25825
28101
30617
63462
65538
68572
72805
77659
82931
87623
92565
3434
33
32
31 31
32
33
29
30
31
32
33
34
35
0100002000030000400005000060000700008000090000
100000
2011-12 2012-13 2013-14 2014-15 2015-16 2016-17 2017-18 2018-19
Bihar India PCI of Bihar as percentage of PCI of India

7
Table 1.5 : Sectoral Growth Rate of GSDP (2016-17 to 2018-19)
Sl. No. Sector
2016-17 2017-18 (P) 2018-19 (Q) Current Prices
Constant Prices
Current Prices
Constant Prices
Current Prices
Constant Prices
1 Agriculture, forestry and fishing 16.9 11.0 12.7 6.7 6.5 0.6
1.1 Crops 17.9 11.9 8.7 4.9 4.0 -3.9
1.2 Livestock 14.0 7.8 20.6 9.9 12.4 8.4
1.3 Forestry and logging 32.8 27.1 6.8 2.5 7.3 4.9
1.4 Fishing and aquaculture 5.8 0.5 23.0 15.5 3.1 2.4
2 Mining and quarrying -6.2 -24.6 2.8 -12.0 14.2 2.7
Primary 16.2 10.0 12.5 6.4 6.7 0.6
3 Manufacturing 25.4 25.6 5.8 1.3 5.1 3.0
4 EGWUS* -5.6 8.3 -1.6 12.0 5.2 5.3
5 Construction 8.5 6.0 13.3 7.0 14.6 9.4
Secondary 14.2 14.3 9.0 4.7 9.9 6.3
6 Trade, repair, hotels and restaurants 13.8 10.1 14.2 10.7 22.5 17.0
6.1 Trade & repair services 14.0 10.3 14.4 10.9 23.1 17.6
6.2 Hotels & restaurants 9.4 5.8 11.4 8.1 12.0 5.8
7 TSC&S* 7.5 3.2 8.2 7.5 14.0 8.8
7.1 Railways 3.0 -13.3 1.1 20.1 1.8 2.1
7.2 Road transport 14.7 11.6 16.1 12.7 20.4 14.0
7.3 Water transport 60.8 56.5 -5.1 -7.9 -1.8 -5.4
7.4 Air transport 21.4 18.2 28.2 24.4 44.0 36.0
7.5 Services incidental to transport 17.8 14.6 14.5 11.0 12.7 6.8
7.6 Storage 6.9 4.2 17.4 13.8 8.6 3.8
7.7 Communication & services related to broadcasting -3.1 -4.3 -4.3 -7.0 5.6 1.2
8 Financial services 1.7 2.0 22.5 13.8 22.5 13.8
9 REID&PS* 5.2 3.6 7.2 5.1 6.9 4.9
10 Public administration 10.4 7.3 34.9 33.5 11.1 8.2
11 Other services 15.1 10.7 24.8 20.3 23.3 20.0
Tertiary 10.5 7.0 16.5 13.1 18.0 13.3
12 Total GSVA at basic prices 12.5 9.1 14.2 9.9 13.9 9.2
13 Gross State Domestic Product 13.6 8.9 14.8 10.5 15.0 10.5
Note : EGWUS = Electricity, gas, water supply & other utility services TSC&S = Transport, storage, communication & services related to broadcasting REID&PS = Real estate, ownership of dwelling & professional services
Source : Directorate of Economic and Statistics, GoB

8
growth registered in the state was mainly on account of the growth in the tertiary sector of the
economy, which grew at 13.10 and 13.30 percent in 2017-18 and 2018-19 respectively. Among
the sub-sectors, air transport is seen to have grown at a rate of 36 percent in 2018-19. The
secondary sector had modest growth rates of 4.73 and 6.29 percent in those two years. It was the
growth in the primary sector which lost its momentum in 2018-19 and the growth rate came
down to 0.63 percent. Within the primary sector, agriculture and allied activities is the major
part, and a major proportion of the state’s population is dependent on agriculture and allied
activities. The estimated growth in the agriculture came down to -3.87 percent in 2018-19 from
4.88 percent in 2017-18. In the secondary sector, manufacturing grew at 3.02 percent and
construction at 9.44 percent in 2018-19. It can be concluded that the Bihar economy has grown
on account of the growth in the tertiary sector. The untapped potential for growth in the primary
sector will help the state achieve a higher growth rate in the coming years.
Following sectors have registered a double-digit growth and has contributed towards growth of
the overall economy of Bihar during 2018-19 at constant prices : Air transport (36.0 percent),
Other Services (20.0 percent), Trade, Trade & repair services (17.6 percent), Road transport
(14.0 percent) and Financial Services (13.8 percent).
1.3 Structural Composition of the Bihar Economy
The sectoral contribution of the three broad sectors (Primary, Secondary and Tertiary) in the
Bihar economy for 2017-18 is reported in Chart 1.3. The share of Primary, Secondary and
Tertiary sector in the GSVA was 21.3 percent, 19.7 percent and 59.0 percent, respectively. The
sectoral composition of the Bihar Economy has changed during 2011-12 to 2018-19. This is
mainly due to shift in the sectoral share from Primary to the Tertiary sector, while the share of
Secondary sector has remained almost unchanged (Chart 1.4). The share of Primary sector has
come down from 25.8 percent to 19.7 percent during 2011-12 to 2018-19, whereas the share of
Tertiary sector has increased from 55.5 percent to 61.2 percent during the same period. The share
of Secondary sector was 18.8 percent in 2011-12 and marginally higher at 19.1 percent in
2018-19.

9
Chart 1.3 : Sectoral Distribution of GSVA 2017-18 at Basic Prices, in percent
The sectoral composition of the Bihar economy for the years 2012-13 to 2018-19, taking into account all the sub-sectors, is reported in the Table 1.6. The Crops and Livestock are the major part of the Primary sector in the state. The share of Livestock in the GSVA has remained almost unchanged at 5.6 percent, whereas the share for Crops has declined from 18.9 percent to 10.6 percent. This has led to the decline in the overall share of the Primary sector, from 27.1 percent to 19.7 percent. Within the Secondary sector, Construction and Manufacturing are major contributor to the GSVA and their shares were 9.5 percent and 8.2 percent respectively in 2018-19 and these shares have remained almost unchanged in last five years. The contribution of the Secondary sector has remained between 19 and 20 percent during 2013-14 to 2018-19. In the Tertiary sector, major contributors in 2018-19 were — Trade & Repair services (18.2 percent), Real estate, Ownership of dwelling and Professional Services (9.1 percent), Road Transport (5.4 percent), and Financial Services (4.3 percent). The share of all these components in the GSVA of Bihar (except Real estate, Ownership of dwelling and Professional Services) has increased during 2012-13 to 2018-19.
Primary21.3 %
Secondary19.7 %
Tertiary59.0 %
Constant Price
Primary24.3 %
Secondary16.8 %
Tertiary58.9 %
Current Price
0.010.020.030.040.050.060.070.080.090.0
100.0
2011-12 2012-13 2013-14 2014-15 2015-16 2016-17 2017-18(P)
2018-19(Q)
Chart 1.4 : Sectoral compostion in the GSVA
Primary Secondary Tertiary

10
Table 1.6 : Sectoral Composition of GSVA at Constant (2011-12) Prices (2012-13 to 2018-19)
Sl. No. Sector 2012-13 2013-14 2014-15 2015-16 2016-17 2017-18
(P) 2018-19
(Q)
1. Agriculture, forestry and fishing 27.0 22.8 22.0 21.2 21.6 21.0 19.3
1.1 Crops 18.9 14.2 13.1 12.3 12.7 12.1 10.6
1.2 Livestock 5.0 5.4 5.7 5.7 5.6 5.6 5.6
1.3 Forestry and logging 1.7 1.7 1.6 1.5 1.8 1.7 1.6
1.4 Fishing and aquaculture 1.5 1.6 1.7 1.7 1.5 1.6 1.5
2. Mining and quarrying 0.1 0.5 0.2 0.6 0.4 0.3 0.3
Primary 27.1 23.4 22.2 21.9 22.0 21.3 19.7
3. Manufacturing 3.9 7.2 9.6 8.2 9.4 8.7 8.2
4. EGWUS* 1.6 1.6 1.6 1.5 1.5 1.5 1.5
5. Construction 10.2 10.5 9.7 10.0 9.7 9.5 9.5
Secondary 15.6 19.3 20.9 19.7 20.6 19.7 19.1
6. Trade, repair, hotels and restaurants 18.6 17.5 15.8 17.6 17.8 17.9 19.2
6.1 Trade & repair services 17.5 16.4 14.8 16.6 16.8 16.9 18.2
6.2 Hotels & restaurants 1.1 1.1 1.0 1.0 1.0 1.0 0.9
7. TSC&S* 8.1 9.0 9.7 10.3 9.7 9.5 9.5
7.1 Railways 1.3 1.5 1.5 1.4 1.1 1.2 1.2
7.2 Road transport 4.0 4.4 4.7 4.9 5.0 5.1 5.4
7.3 Water transport 0.0 0.0 0.0 0.0 0.0 0.0 0.0
7.4 Air transport 0.0 0.0 0.0 0.0 0.0 0.1 0.1
7.5 Services incidental to transport 0.4 0.5 0.5 0.5 0.6 0.6 0.5
7.6 Storage 0.0 0.0 0.0 0.0 0.0 0.0 0.0
7.7 C&SRB* 2.3 2.6 2.9 3.4 3.0 2.5 2.3
8. Financial services 3.8 3.9 4.3 4.3 4.0 4.2 4.3
9. REID&PS* 11.4 11.4 11.4 10.5 10.0 9.5 9.1
10. Public administration 5.3 4.9 4.9 4.6 4.5 5.5 5.4
11. Other services 10.1 10.5 10.8 11.2 11.3 12.4 13.6
Tertiary 57.2 57.3 56.9 58.5 57.3 59.0 61.2
12. Total GSVA at basic prices 100.0 100.0 100.0 100.0 100.0 100.0 100.0
Note : EGWUS = Electricity, gas, water supply & other utility services TSC&S = Transport, storage, communication & services related to broadcasting REID&PS = Real estate, ownership of dwelling & professional services
Source : Directorate of Economics and Statistics, GoB

11
1.4 District-wise Disparity
There exists considerable disparity across the districts in Bihar in terms of socio-economic
development, as evident from various indicators. The detailed discussions on various parameters
are covered in other chapters of the Economic Survey. The latest figures available for the
district-wise Per Capita Income for Bihar are for 2011-12 only and are reported in Table A 1.6
(Statistical Appendix) As per these estimates, three most prosperous districts in Bihar were —
Patna, Munger and Begusarai, and the three most economically disadvantaged districts were —
Madhepura, Supaul and Sheohar.
In the absence of the latest district-wise figures for per capita income ‘consumption of Petroleum
Products’ per 1000 persons (Petrol, Diesel and LPG) in different districts can give some idea
about the level of economic activity taking place at the district level. The district-wise
consumption of the petroleum products per 1000 person for 2018-19, along with the average
consumption during 2014-15 to 2018-19 are shown in Table A 1.7 (Statistical Appendix). In
addition, the table also presents the share of each district in the total consumption in Bihar for the
three petroleum products — Petrol, Diesel and LPG. The average per capita consumption of
these petroleum products can be used to judge the level of economic activity at the district level
and, hence, the district-wise disparity. The relatively prosperous and backward districts on the
basis of per 1000 person consumption of petroleum products are listed in the Table 1.7. The three
most prosperous districts on the basis of per thousand person Petrol consumption are — Patna,
Muzaffarpur, and Gopalganj, whereas the three most disadvantaged districts are — Sheohar,
Lakhisarai and Banka.
Table 1.7 : Relatively Prosperous and Backward Districts of Bihar
Criteria Districts
Top 3 Bottom 3
Petrol Patna, Muzaffarpur, Gopalganj Sheohar, Lakhisarai, Banka
Diesel Patna, Begusarai, Muzaffarpur Sheohar, Madhubani, Banka
LPG Patna, Munger, Muzaffarpur Kishanganj, Araria, Banka
Small Savings Patna, Saran, Buxar Araria, Kishanganj, Khagaria
Source : Finance Department, Bihar and Indian Oil Corporation
Apart from the consumption of petroleum products, one can also obtain an idea about the district-wise disparity in economic status from the data on Small Savings in post offices. The

12
data on this indicator for all the districts is presented in Table A 1.8 (Statistical Appendix). From the data, it emerges that three most prosperous districts in terms of Per Capita small savings are — Patna, Saran and Buxar. At the other end, the most disadvantaged districts are — Araria, Kishanganj and Khagaria. Taking into account both the indicators of district-wise disparity, it is observed that Patna and Muzaffarpur are the two most prosperous districts in Bihar. Similarly, the two most economically disadvantaged districts in Bihar are — Sheohar and Banka. 1.5 Consumer Price Index
Recently, the Central Statistical Organisation has introduced a new series of price index, with 2011-12 as the base year. This series covers both Wholesale Price Index (WPI) and Consumer Price Index (CPI). The WPI is available only for India as a whole; but fortunately, CPI is available for all the states, along with the national average. Further, CPI is also estimated separately for the rural and urban areas. Table 1.8 presents the CPI for all the major states of
Table 1.8 : State-wise Annual Inflation Rates for CPI (Base: 2012 = 100) (October, 2018 to October, 2019)
Name of the State/UT
Rural Urban Combined
Oct.18 Index (Final)
Oct.19 Index
(Prov.)
Inflation Rate (%)
Oct.18 Index (Final)
Oct.19 Index
(Prov.)
Inflation Rate (%)
Oct.18 Index (Final)
Oct.19 Index
(Prov.)
Inflation Rate (%)
Andhra Pradesh 138.5 144.8 4.55 139.4 147.1 5.52 138.8 145.6 4.90
Bihar 145.5 146.3 0.55 137.4 144.8 5.39 144.3 146.1 1.25
Chhattisgarh 144.2 145.2 0.69 139.7 145.5 4.15 142.5 145.3 1.96
Gujarat 142.4 144.6 1.54 132.9 140.9 6.02 137.0 142.5 4.01
Haryana 137.7 145.4 5.59 136.3 141.2 3.60 137.0 143.4 4.67
Jharkhand 146.4 150.1 2.53 138.6 146.7 5.84 143.4 148.8 3.77
Karnataka 143.4 150.5 4.95 145.0 153.3 5.72 144.3 152.0 5.34
Kerala 145.8 156.5 7.34 144.3 152.4 5.61 145.3 155.1 6.74
Madhya Pradesh 135.8 145.6 7.22 140.4 145.5 3.63 137.7 145.6 5.74
Maharashtra 143.5 147.9 3.07 134.9 142.0 5.26 137.8 144.0 4.50
Odisha 145.4 149.2 2.61 137.2 144.5 5.32 143.1 147.9 3.35
Punjab 139.9 148.6 6.22 135.3 140.4 3.77 137.8 144.9 5.15
Rajasthan 140.4 149.7 6.62 140.9 147.3 4.54 140.6 148.8 5.83
Tamil Nadu 143.9 151.1 5.00 142.1 150.1 5.63 142.8 150.5 5.39
Uttar Pradesh 137.9 146.3 6.09 141.0 148.3 5.18 139.0 147.0 5.76
West Bengal 145.3 150.2 3.37 139.5 146.9 5.30 142.6 148.6 4.21
All-India 142.2 148.3 4.29 138.9 146.0 5.11 140.7 147.2 4.62
Source : RBI and Labour Bureau, Government of India

13
Chart 1.5 : Inflation Rates in Bihar and India
India during October, 2018 to October, 2019 and the resulting annual inflation rate. Interestingly,
the combined inflation rate has been the lowest in Bihar (1.25 percent), while it was 4.62 percent
for India as a whole. In the rural areas, the inflation rate in Bihar (0.55 percent) again has been
the lowest among all the Indian states, the national average being 4.29 percent. In contrast, for
the urban areas, the inflation rate in Bihar (5.39 percent) has been higher compared to the
national average (5.11 percent). This may be partially due to the high growth rate of the tertiary
sector of Bihar’s economy in the recent past. As is obvious, most of the activities in the tertiary
sector are located in the urban areas.
0.00
1.00
2.00
3.00
4.00
5.00
6.00
Rural Urban Combined
0.55
5.39
1.25
4.295.11
4.62
Bihar All India

14
APPENDIX
Table A 1.1 : Gross State Domestic Product (GSDP) and Net State Domestic Product (NSDP) of Bihar (2004-05 to 2018-19)
Year
GSDP (Rs. crore) NSDP (Rs. crore) Per Capita GSDP (Rs.)
At current Price
At constant (2004-05)
Price
At current Price
At constant (2004-05)
Price
At current Price
At constant (2004-05)
Price
Base Year 2004-05
2004-05 77781 77781 70167 70167 8773 8773
2005-06 82490 76466 74144 68419 9149 8481
2006-07 100737 88840 91331 80260 10994 9695
2007-08 113680 93774 102853 84415 12215 10076
2008-09 142279 107412 129690 97284 15060 11369
2009-10 162923 113158 148151 101938 16998 11806
2010-11 203555 130171 185745 117503 20944 13393
2011-12 243269 143560 222442 129521 24696 14574
2012-13 293616 158909 268902 143250 29425 15925
2013-14 343663 173409 315225 156671 34014 17163
2014-15 402283 189789 369576 171802 39341 18560
Base Year 2011-12
2011-12 247144 247144 228497 228497 23525 23525
2012-13 282368 256851 261327 236933 26459 24068
2013-14 317101 269650 292143 246915 29251 24874
2014-15 342951 279482 315732 255739 31142 25379
2015-16 371602 296488 340119 269200 33218 26504
2016-17 422316 323004 388144 293471 37163 28424
2017-18 (P) 484740 356768 445942 324395 41992 30906
2018-19 (Q) 557490 394350 513881 359030 47541 33629
Note : Data of 2017-18 is Provisional Estimates (P) and 2018-19 Quick Estimates (Q) Source : Directorate of Economics and Statistics, GOB

15
Table A 1.2 : Gross State Domestic Product (GSDP) of Bihar at Current Price (2011-12 to 2018-19)
(Rs. crore) Sl. No. Item 2011-12 2012-13 2013-14 2014-15 2015-16 2016-17 2017-18
(P) 2018-19
(Q)
1. Agriculture, forestry and fishing 62067 76700 73719 78632 84284 98546 111084 118315
1.1 Crops 42608 53365 45223 46222 48987 57760 62778 65272 1.2 Livestock 12028 14811 18316 20621 22677 25862 31196 35055 1.3 Forestry and logging 4187 4571 5010 5258 5824 7734 8264 8866 1.4 Fishing and aquaculture 3244 3953 5170 6532 6795 7191 8846 9123 2. Mining and quarrying 199 234 1508 851 2670 2505 2574 2941 Primary 62265 76934 75227 79483 86954 101052 113658 121256 3. Manufacturing 14666 10351 21209 29978 25490 31962 33831 35540 4. EGWUS* 3659 4422 3859 3313 5036 4755 4680 4923 5. Construction 27017 27810 31848 32678 32515 35269 39974 45797 Secondary 45341 42583 56916 65968 63040 71986 78485 86260
6. Trade, repair, hotels & restaurants 43904 51755 52051 53410 66060 75146 85810 105100
6.1 Trade & repair services 41109 48672 48735 49959 62213 70937 81120 99845 6.2 Hotels and restaurants 2796 3083 3316 3451 3846 4209 4690 5255 7. TSC&S* 17545 21616 26850 31889 36465 39216 42413 48346 7.1 Railways 2751 3348 3957 4725 4784 4928 4983 5073 7.2 Road transport 8405 10697 13479 15723 17565 20153 23407 28186 7.3 Water transport 49 26 17 21 22 36 34 34 7.4 Air transport 31 58 46 79 158 192 246 355
7.5 Services incidental to transport 893 1120 1425 1666 1880 2213 2533 2855
7.6 Storage 74 84 85 93 100 107 126 137 7.7 C&SRB* 5342 6282 7842 9582 11956 11587 11083 11706 8. Financial services 8839 9774 11223 12188 13233 13459 16494 20213 9. REID&PS* 28023 31217 34604 36675 36357 38260 41000 43843 10. Public administration 13587 14777 15768 17203 17676 19520 26336 29255 11. Other services 22193 28043 34046 38383 44370 51081 63763 78613
Tertiary 134092 157182 174542 189748 214161 236684 275816 325369
12. Total GSVA 241698 276699 306685 335199 364155 409722 467960 532885 13. Taxes on Products 17169 21185 26236 27007 34787 35291 42248 53184
14. Subsidies on products 11724 15517 15820 19255 27340 22697 25468 28578
15. GSDP 247144 282368 317101 342951 371602 422316 484740 557490 16. Population (crore) 10.5 10.7 10.8 11.0 11.2 11.4 11.5 11.7
17. Per Capita GSDP (Rs.) 23525 26459 29251 31142 33218 37163 41992 47541 Note : Data of 2017-18 is Provisional Estimates (P) and 2018-19 Quick Estimates (Q) EGWUS = Electricity, gas, water supply & other utility services
TSC&S = Transport, storage, communication & services related to broadcasting REID&PS = Real estate, ownership of dwelling & professional services
Source : Directorate of Economics and Statistics, GoB

16
Table A 1.3 : Gross State Domestic Product (GSDP) of Bihar at Constant (2011-12) Price (2011-12 to 2018-19)
(Rs. crore) Sl. No. Item 2011-12 2012-13 2013-14 2014-15 2015-16 2016-17 2017-18
(P) 2018-19
(Q)
1. Agriculture, forestry and fishing 62067 68040 59516 59349 60735 67414 71963 72393
1.1 Crops 42608 47493 37107 35254 35330 39530 41458 39853
1.2 Livestock 12028 12525 14008 15359 16281 17559 19298 20922
1.3 Forestry and logging 4187 4253 4330 4218 4353 5533 5671 5948
1.4 Fishing and aquaculture 3244 3768 4071 4518 4772 4793 5536 5670
2. Mining and quarrying 199 216 1386 577 1789 1349 1188 1220
Primary 62265 68256 60902 59926 62524 68764 73150 73613
3. Manufacturing 14666 9714 18893 25958 23384 29361 29734 30632
4. EGWUS* 3659 4017 4128 4270 4272 4628 5182 5455
5. Construction 27017 25608 27261 26019 28669 30396 32511 35579
Secondary 45341 39339 50282 56247 56325 64384 67427 71666
6. Trade, repair, hotels and restaurants 43904 46729 45683 42626 50424 55501 61441 71876
6.1 Trade & repair services 41109 43945 42775 39877 47496 52404 58094 68336
6.2 Hotels and restaurants 2796 2784 2908 2749 2927 3096 3347 3541
7. TSC&S* 17545 20372 23473 26054 29428 30358 32636 35498
7.1 Railways 2751 3346 3965 4092 4070 3529 4239 4328
7.2 Road transport 8405 9962 11373 12678 14006 15637 17617 20087
7.3 Water transport 49 24 15 17 18 28 26 24
7.4 Air transport 31 54 38 64 126 149 185 252
7.5 Services incidental to transport 893 1043 1202 1344 1499 1717 1906 2035
7.6 Storage 74 79 71 75 80 83 95 99
7.7 C&SRB* 5342 5863 6808 7785 9629 9214 8568 8672
8. Financial services 8839 9580 10273 11653 12258 12506 14236 16205
9. REID&PS* 28023 28686 29819 30739 29991 31079 32658 34244
10. Public administration 13587 13350 12752 13171 13132 14097 18825 20364
11. Other services 22193 25297 27478 29002 32008 35419 42600 51119
Tertiary 134092 144015 149478 153245 167240 178960 202397 229307
12. Total GSVA 241698 251609 260662 269418 286090 312108 342974 374585
13. Taxes on Products 17169 19588 22638 26793 30900 30532 34732 42722
14. Subsidies on products 11724 14347 13650 16729 20501 19636 20937 22956
15. GSDP 247144 256851 269650 279482 296488 323004 356768 394350
16. Population (crore) 10.5 10.7 10.8 11.0 11.2 11.4 11.5 11.7
17. Per Capita GSDP (Rs.) 23525 24068 24874 25379 26504 28424 30906 33629 Note : Data of 2017-18 is Provisional Estimates and 2018-19 Quick Estimates
Source : Directorate of Economics and Statistics, GoB

17
Table A 1.4 : Net State Domestic Product (NSDP) of Bihar at Current Price (2011-12 to 2018-19)
(Rs. crore) Sl. No. Item 2011-12 2012-13 2013-14 2014-15 2015-16 2016-17 2017-18
(P) 2018-19
(Q)
1. Agriculture, forestry and fishing 57852 71802 67874 72063 77265 90993 102970 109178
1.1 Crops 39053 49248 40320 40687 42987 51233 55796 57410
1.2 Livestock 11795 14525 17975 20253 22321 25482 30780 34586
1.3 Forestry and logging 4141 4520 4953 5206 5770 7674 8192 8785 1.4 Fishing and aquaculture 2862 3509 4625 5917 6187 6605 8201 8397 2. Mining and quarrying 174 203 1291 724 2234 2104 2520 2879
Primary 58025 72005 69166 72786 79498 93097 105490 112058
3. Manufacturing 12681 8450 19073 27523 23138 29501 31158 32531
4. EGWUS* 2431 2892 2554 2145 3390 3167 3225 3284
5. Construction 25764 26372 29909 30757 30582 33106 37432 42935
Secondary 40876 37713 51536 60426 57110 65774 71815 78749
6. Trade, repair, hotels and restaurants 43256 50952 51087 52321 64039 72838 83101 102049
6.1 Trade & repair services 40564 47998 47926 49031 60445 68901 78717 97139
6.2 Hotels and restaurants 2692 2955 3161 3290 3594 3937 4384 4910
7. TSC&S* 14845 18612 22530 26925 30841 32801 35095 40105
7.1 Railways 2022 2558 2996 3516 3432 3410 3327 3208
7.2 Road transport 7582 9771 12282 14474 16224 18492 21343 25862
7.3 Water transport 44 20 10 13 14 25 23 21
7.4 Air transport 15 40 22 53 130 162 208 312
7.5 Services incidental to transport 761 971 1233 1469 1645 1924 2197 2477
7.6 Storage 63 74 72 78 84 90 102 110
7.7 C&SRB* 4359 5178 5916 7323 9312 8699 7894 8115
8. Financial services 8700 9601 11035 11963 12960 13162 16131 19804
9. REID&PS* 25298 28025 30922 32624 32005 33578 35796 38060
10. Public administration 10485 11490 12339 13598 14163 15794 21659 23990
11. Other services 21567 27259 33112 37338 42056 48506 60075 74460
Tertiary 124151 145940 161025 174769 196064 216679 251857 298468
12. Total NSVA 223052 255658 281727 307980 332672 375550 429162 489275
13. Taxes on Products 17169 21185 26236 27007 34787 35291 42248 53184
14. Subsidies on products 11724 15517 15820 19255 27340 22697 25468 28578
15. NSDP 228497 261327 292143 315732 340119 388144 445942 513881
16. Population (crore) 10.5 10.7 10.8 11.0 11.2 11.4 11.5 11.7
17. Per Capita NSDP (Rs.) 21750 24487 26948 28671 30404 34156 38631 43822
Note : Data of 2017-18 is Provisional Estimates and 2018-19 Quick Estimates Source : Directorate of Economics and Statistics, GoB

18
Table A 1.5 : Net State Domestic Product (NSDP) of Bihar at Constant (2011-12) Price (2011-12 to 2018-19)
(Rs. crore) Sl. No. Item 2011-12 2012-13 2013-14 2014-15 2015-16 2016-17 2017-18
(P) 2018-19
(Q)
1. Agriculture, forestry and fishing 57852 63491 54487 53929 55146 61586 65800 65670
1.1 Crops 39053 43675 32908 30738 30640 34607 36312 34238
1.2 Livestock 11795 12260 13706 15042 15962 17230 18950 20543
1.3 Forestry and logging 4141 4206 4280 4173 4305 5479 5608 5879
1.4 Fishing and aquaculture 2862 3350 3593 3975 4240 4271 4930 5009
2. Mining and quarrying 174 187 1187 468 1424 984 1140 1168
Primary 58025 63678 55674 54396 56570 62570 66941 66838
3. Manufacturing 12681 7896 16913 23761 21270 27153 27406 28092
4. EGWUS* 2431 2542 2904 3226 2798 3179 3453 3568
5. Construction 25764 24235 25437 24238 26866 28333 30133 32985
Secondary 40876 34674 45253 51225 50934 58664 60992 64645
6. Trade, repair, hotels and restaurants 43256 45972 44805 41669 48617 53358 59025 69240
6.1 Trade & repair services 40564 43309 42038 39062 45915 50502 55933 65978
6.2 Hotels and restaurants 2692 2663 2767 2607 2702 2856 3092 3262
7. TSC&S* 14845 17490 19386 21654 24507 24762 26426 28722
7.1 Railways 2022 2605 3088 3040 2893 2226 2864 2828
7.2 Road transport 7582 9077 10265 11514 12756 14114 15791 18095
7.3 Water transport 44 18 7 10 10 18 16 13
7.4 Air transport 15 37 17 39 100 122 152 215
7.5 Services incidental to transport 761 899 1021 1169 1293 1465 1635 1740
7.6 Storage 63 68 60 62 66 68 78 81
7.7 C&SRB* 4359 4785 4927 5819 7389 6749 5890 5750
8. Financial services 8700 9412 10095 11454 12021 12246 13926 15867
9. REID&PS* 25298 25724 26548 27285 26254 27121 28496 29704
10. Public administration 10485 10191 9553 9910 9933 10708 14696 15859
11. Other services 21567 24550 26613 28082 29967 33145 40099 48390
Tertiary 124151 133339 137000 140053 151297 161340 182668 207782
12. Total NSVA 223052 231691 237927 245674 258801 282575 310600 339265
13. Taxes on Products 17169 19588 22638 26793 30900 30532 34732 42722
14. Subsidies on products 11724 14347 13650 16729 20501 19636 20937 22956
15. NSDP 228497 236933 246915 255739 269200 293471 324395 359030
16. Population (crore) 10.5 10.7 10.8 11.0 11.2 11.4 11.5 11.7
17. Per Capita NSDP (Rs.) 21750 22201 22776 23223 24064 25825 28101 30617
Note : Data of 2017-18 is Provisional Estimates (P) and 2018-19 Quick Estimates (Q) Source : Directorate of Economics and Statistics, GoB

19
Table A 1.6 : District-wise Per Capita Gross District Domestic Product (2004-05) Price (2007-08 to 2011-12) (Rupees)
District 2007-08 2008-09 2009-10 2010-11 2011-12 Patna 43448 (1) 48719 (1) 53428 (1) 57823 (1) 63063 (1) Nalanda 8219 (14) 9152 (11) 9787 (10) 10971 (11) 12561 (8) Bhojpur 8775 (8) 10146 (8) 10134 (8) 11537 (9) 12459 (10) Buxar 8368 (12) 8992 (15) 8812 (18) 9732 (20) 11289 (15) Rohtas 9544 (7) 10950 (6) 10908 (7) 12265 (6) 13909 (6) Kaimur 7564 (21) 8441 (22) 7785 (27) 9539 (22) 10412 (24)
Gaya 8660 (9) 9135 (12) 9519 (15) 10504 (18) 11897 (13) Jehanabad 7490 (24) 8588 (19) 8478 (22) 9322 (24) 11182 (17) Arwal 6475 (33) 7028 (35) 7283 (35) 8133 (35) 9125 (34) Nawada 6739 (31) 7409 (32) 7602 (30) 8437 (31) 9560 (30) Aurangabad 7575 (20) 7922 (29) 8189 (23) 9293 (25) 11012 (18)
Saran 7522 (23) 7938 (28) 8559 (20) 9576 (21) 10615 (23) Siwan 7377 (26) 8864 (16) 8042 (26) 9192 (26) 10685 (22) Gopalganj 7646 (17) 8059 (26) 8543 (21) 10386 (19) 12129 (12)
W. Champaran 8476 (11) 9484 (10) 9706 (11) 10577 (17) 9971 (27) E. Champaran 6223 (35) 8457 (21) 7571 (31) 8790 (29) 10735 (21) Muzaffarpur 9814 (5) 11602 (5) 12159 (5) 14082 (5) 15402 (5) Sitamarhi 6180 (37) 7301 (33) 7456 (32) 8274 (33) 9538 (31) Sheohar 5541 (38) 6128 (38) 5438 (38) 6208 (38) 7092 (38) Vaishali 7728 (16) 9604 (9) 9937 (9) 11591 (8) 12490 (9)
Darbhanga 7614 (18) 8516 (20) 9036 (16) 10798 (12) 10932 (19) Madhubani 6216 (36) 7643 (30) 7455 (33) 10607 (15) 9241 (33) Samastipur 7559 (22) 8729 (18) 8843 (17) 10705 (14) 10762 (20)
Begusarai 12419 (3) 15001 (3) 14235 (4) 18433 (3) 17587 (3) Munger 15791 (2) 17034 (2) 18554 (2) 21011 (2) 22051 (2) Sheikhpura 7209 (28) 8105 (25) 7775 (28) 8377 (32) 9687 (29) Lakhisarai 9549 (6) 10209 (7) 10950 (6) 11870 (7) 13073 (7) Jamui 7584 (19) 8028 (27) 8186 (24) 8944 (28) 10166 (25) Khagaria 8517 (10) 9111 (13) 9642 (12) 10603 (16) 11515 (14)
Bhagalpur 12097 (4) 13351 (4) 14253 (3) 15870 (4) 17324 (4) Banka 6882 (30) 7596 (31) 7724 (29) 7756 (37) 9269 (32)
Saharsa 8164 (15) 8744 (17) 9591 (14) 11268 (10) 12197 (11) Supaul 6382 (34) 6790 (36) 7043 (36) 8193 (34) 8492 (37) Madhepura 6920 (29) 6602 (37) 6979 (37) 8096 (36) 8609 (36)
Purnea 7419 (25) 8228 (23) 8743 (19) 9357 (23) 10099 (26) Kishanganj 7312 (27) 8120 (24) 8085 (25) 9126 (27) 9928 (28) Araria 6635 (32) 7251 (34) 7376 (34) 8534 (30) 8776 (35) Katihar 8267 (13) 9060 (14) 9594 (13) 10721 (13) 11278 (16)
Bihar 10076 11369 11806 13393 14574 Note : Figures in parenthesis denote rank
Source : Directorate of Economic and Statistics, GoB

20
Table A 1.7 : District-wise Consumption of Petroleum Products (2014-15 to 2018-19)
(Figures in TMT)
District
Petrol Diesel LPG Consumption (MT) per 1000 person
Average (2014-2019) 2018-19 Average
(2014-2019) 2018-19 Average (2014-2019) 2018-19 Petrol Diesel LPG
Patna 80.5 (13.1) 99.8 229.8 (10.3) 263.5 125.9 (13.4) 148.1 13.8 39.4 21.6 Nalanda 12.8 (2.1) 17.1 58.5 (2.6) 73.1 25.3 (2.7) 32.3 4.4 20.3 8.8 Bhojpur 14.4 (2.3) 19.2 55.4 (2.5) 63.2 27.9 (3) 33.9 5.3 20.3 10.2 Buxar 9.6 (1.6) 12.2 34.9 (1.6) 33.3 14.8 (1.6) 18.6 5.6 20.5 8.7 Rohtas 18.1 (2.9) 23.8 78.8 (3.5) 81.7 26.5 (2.8) 33.6 6.1 26.6 9.0 Kaimur 7.7 (1.2) 9.3 31.9 (1.4) 27 10 (1.1) 14.5 4.7 19.6 6.1
Gaya 23.2 (3.8) 30.5 87.6 (3.9) 99.1 33.4 (3.5) 44.2 5.3 19.9 7.6 Jehanabad 4.6 (0.7) 6.2 20.3 (0.9) 25.1 10.7 (1.1) 12.9 4.1 18.0 9.5 Arwal 2.9 (0.5) 4 11.3 (0.5) 12.7 5.1 (0.5) 6.7 4.1 16.1 7.3 Nawada 7.9 (1.3) 10.8 37.3 (1.7) 44.5 17.1 (1.8) 22 3.6 16.8 7.7 Aurangabad 12.7 (2.1) 16.8 69.1 (3.1) 86.6 17.3 (1.8) 23.1 5.0 27.2 6.8
Saran 23.7 (3.9) 31.4 95.2 (4.3) 100.4 36 (3.8) 46.3 6.0 24.1 9.1 Siwan 23.3 (3.8) 28.5 55.2 (2.5) 54.5 32.9 (3.5) 41.1 7.0 16.6 9.9 Gopalganj 19.5 (3.2) 23.5 47.5 (2.1) 44.5 29 (3.1) 36.4 7.6 18.5 11.3
E. Champaran 30.9 (5) 38.2 105.3 (4.7) 102.7 45.3 (4.8) 62.3 6.1 20.6 8.9 W. Champaran 22.8 (3.7) 29 70.3 (3.2) 73.5 31.6 (3.4) 43.3 5.8 17.9 8.0 Muzaffarpur 38.2 (6.2) 51.1 138.9 (6.2) 154.3 55.1 (5.9) 71.9 8.0 28.9 11.5 Sitamarhi 14.5 (2.3) 17.7 44.8 (2) 47.1 29.7 (3.2) 41.5 4.2 13.1 8.7 Sheohar 2 (0.3) 2.9 5.4 (0.2) 6.4 5.4 (0.6) 7.7 3.0 8.2 8.2 Vaishali 26.1 (4.2) 33.4 78.6 (3.5) 81.9 38.7 (4.1) 47.2 7.5 22.5 11.1
Darbhanga 21.2 (3.5) 28.9 63 (2.8) 76.3 40.5 (4.3) 54.1 5.4 16.0 10.3 Madhubani 22.7 (3.7) 27.7 54 (2.4) 59.8 37.1 (3.9) 53.2 5.1 12.0 8.3 Samastipur 22.9 (3.7) 30.9 84.1 (3.8) 97 32.7 (3.5) 46.8 5.4 19.7 7.7
Begusarai 15.4 (2.5) 20 108.8 (4.9) 115.6 33.6 (3.6) 48.7 5.2 36.6 11.3 Munger 6.2 (1) 7.8 32 (1.4) 33.9 15.7 (1.7) 19 4.5 23.4 11.5 Sheikhpura 2.6 (0.4) 3.6 17.9 (0.8) 26 4.5 (0.5) 6.4 4.1 28.1 7.1 Lakhisarai 3.2 (0.5) 4.3 19.2 (0.9) 22.4 6.9 (0.7) 8.7 3.2 19.2 6.9 Jamui 6.4 (1) 8.4 23.4 (1) 27 10.1 (1.1) 15.1 3.6 13.3 5.7 Khagaria 5.9 (1) 7.9 32.7 (1.5) 35.9 10.2 (1.1) 14.5 3.5 19.6 6.1
Bhagalpur 17 (2.8) 21.8 76.2 (3.4) 85.7 29.6 (3.1) 38.5 5.6 25.1 9.7 Banka 6.9 (1.1) 9 25.5 (1.1) 28.7 10.1 (1.1) 14.2 3.4 12.5 5.0
Saharsa 8.8 (1.4) 12 37.7 (1.7) 42 12.8 (1.4) 16.9 4.6 19.8 6.7 Supaul 11.5 (1.9) 15.2 35.6 (1.6) 40.7 11.9 (1.3) 17.3 5.2 16.0 5.3 Madhepura 10 (1.6) 13.5 33.7 (1.5) 37.3 11.5 (1.2) 15.1 5.0 16.8 5.7
Purnea 20.5 (3.3) 27.7 83 (3.7) 90.4 18.5 (2) 25.2 6.3 25.4 5.7 Kishanganj 9.3 (1.5) 11.2 21.3 (1) 21.3 8 (0.8) 11.8 5.5 12.6 4.7 Araria 16.4 (2.7) 20.3 53 (2.4) 52.4 13.4 (1.4) 19 5.8 18.9 4.8 Katihar 13.6 (2.2) 17.4 70.4 (3.2) 74.4 16.9 (1.8) 22.8 4.4 22.9 5.5
Bihar 615.6 (100) 793 2227.4 (100) 2441.9 941.6 (100) 1234.8 5.9 21.4 9.0 Note : Figures in parenthesis present share of Bihar
Source : Indian Oil Corporation

21
Table A 1.8 : District-wise Small Savings in Post Offices and Public Provident Fund (2016-17 to 2018-19)
(Rs. crore)
District
Per Capita Postal
Savings (Rs)
2016-17 2017-18 2018-19 Average of Achive-
ment (2016-19)
Target Achieve-ment Target Achive-
ment Target Achive-ment
Patna 982.6 500 525.83 545 479.14 549.00 716.13 573.7 (18.0) Nalanda 597.0 270 244.12 262 162.40 186.00 109.01 171.8 (5.4) Bhojpur 421.5 195 88.73 115 106.08 122.00 150.24 115 (3.6) Buxar 627.1 85 86.48 93 106.32 122.00 128.15 107 (3.4) Rohtas 431.4 125 125.03 134 113.73 130.00 144.23 127.7 (4.0) Kaimur 344.3 50 51.36 55 50.28 58.00 66.27 56 (1.8) Gaya 265.7 80 94.94 102 104.00 119.00 151.25 116.7 (3.7) Jehanabad 526.1 40 47.79 51 51.22 59.00 78.73 59.2 (1.9) Arwal 382.4 20 22.13 24 24.25 28.00 34.10 26.8 (0.8) Nawada 425.4 120 125.98 135 55.76 64.00 101.41 94.4 (3.0) Aurangabad 327.9 70 59.35 64 70.14 80.00 120.51 83.3 (2.6) Saran 750.3 260 265.49 270 307.76 353.00 316.36 296.5 (9.3) Siwan 360.9 140 121.40 140 115.68 133.00 123.53 120.2 (3.8) Gopalganj 322.0 110 78.61 89 75.98 87.00 92.89 82.5 (2.6) E. Champaran 154.3 65 66.84 72 79.64 91.00 89.57 78.7 (2.5) W. Champaran 97.3 50 46.36 50 18.58 21.00 49.84 38.3 (1.2) Muzzaffarpur 294.7 110 112.67 121 131.16 150.00 180.65 141.5 (4.4) Sitamarhi 131.1 45 34.85 37 35.28 40.00 64.59 44.9 (1.4) Sheohar 175.2 10 9.18 10 9.19 11.00 16.14 11.5 (0.4) Vaishali 341.1 120 111.56 120 115.83 133.00 130.21 119.2 (3.7) Darbhanga 296.9 115 115.64 124 121.45 139.00 113.52 116.9 (3.7) Madhubani 121.9 80 59.29 64 53.97 62.00 50.97 54.7 (1.7) Samastipur 128.6 90 74.96 80 64.74 74.00 24.82 54.8 (1.7) Begusarai 191.2 60 49.16 53 48.90 56.00 72.25 56.8 (1.8) Munger 421.9 75 62.40 67 57.23 66.00 53.32 57.7 (1.8) Sheikhpura 399.2 25 20.21 22 18.99 22.00 37.08 25.4 (0.8) Lakhisarai 199.8 25 20.21 22 18.99 22.00 20.94 20 (0.6) Jamui 151.1 25 26.17 28 21.29 24.00 32.42 26.6 (0.8) Khagaria 88.2 15 12.04 13 13.66 16.00 18.27 14.7 (0.5) Bhagalpur 271.3 105 79.83 86 82.25 94.00 85.13 82.4 (2.6) Banka 106.2 25 21.52 23 25.31 29.00 17.97 21.6 (0.7) Saharsa 181.0 40 33.67 36 28.49 33.00 41.11 34.4 (1.1) Supaul 138.2 35 37.66 40 22.60 26.00 32.03 30.8 (1.0) Madhepura 115.4 30 22.73 25 19.12 22.00 27.41 23.1 (0.7) Purnea 136.0 35 49.78 53 32.66 37.00 50.71 44.4 (1.4) Kishanganj 55.0 10 11.78 13 5.66 6.00 10.45 9.3 (0.3) Araria 52.3 10 15.73 17 10.73 12.00 17.55 14.7 (0.5) Katihar 112.0 35 41.57 45 21.12 24.00 40.59 34.4 (1.1)
Bihar 306.2 3300 3073.05 3300 2879.58 3300.00 3610.38 3187.7 (100) Note : Figures in parenthesis present share of Bihar
Source : Department of Finance, GoB ______________

22
CHAPTER - II
STATE FINANCES
nSoe~ foufriz;Rue~ djksfr ;Ùkfn~oiQye~A μ pk.kD; A well-planned work produces good results, even in adverse condition. — Chanakya
The management of the state finances in Bihar in 2018-19 has adhered to the resolutions of the Bihar Fiscal Responsibility and Budget Management Act, 2006. The overall position of the state’s finances was in good shape at the end of the financial year 2018-19. The fiscal deficit was 2.68 percent of GSDP, revenue surplus 1.34 percent of GSDP and the outstanding public debt liability of the state government was 32.34 percent of GSDP during the year. Net interest payment was 6.61 percent of the total receipt in revenue account of the state in 2018-19, which has remained within the 10 percent limit, as recommended by the 14th Finance Commission. Given the limited revenue receipt from its own sources, the State Government has been dependent on the central transfers and the grants for resources. These transfers are mostly as per
Abstract
Bihar has consistently shown fiscal prudence in the last few years where deficits are within the stipulated thresholds. The management of state finance has adhered to the resolutions of the Bihar Fiscal Responsibility and Budget Management Act, 2006. Fiscal indicators suggest that the means of state finances are sustainable for the current level of expenditure. The fiscal deficit was 2.68 percent of GSDP, revenue surplus 1.34 percent of GSDP, the outstanding public debt liability was 32.34 percent of GSDP and net interest payment was 6.61 percent of the total receipt in revenue account of the state in 2018-19. Both total receipt and total expenditure increased in the state. The revenue receipt increased by 12 percent whereas revenue expenditure increased by 21.7 percent in 2018-19. However, capital expenditure declined by 12 percent in 2018-19. The share of social services expenditure in total expenditure increased by two percentage points during 2018-19 over the previous year. The overall position of the state finance in Bihar was in good shape during 2018-19.

23
the recommendations of the Finance Commission, and the current financial year (2019-20) is the
last year to have fiscal implications of the recommendations by the 14th Finance Commission of
the Central Government. The 15th Finance Commission has submitted its report for the year 2020-
21. As per their recommendation, the share of Bihar in the total shareable resource pool has
increased from 9.67 percent to 10.06 percent.
The year 2018-19 was the first full financial year when the Goods and Services Tax (GST)
collection replaced revenue from multiple taxes in the country after its implementation in July
2017. The GST collection of the states and union territories remained lower than the target, and
the compensations were made by the Central Government to the states on account of shortfall in
the revenue collection from the promised target at the time of implementation of the GST. The
current economic slowdown has affected revenue collection under GST in 2019-20 in the State.
The shortfall in revenue collection of the states through the GST is to be compensated by the
Central Government. The State needs to put in place a system of increasing revenues from its own
sources.
In an attempt to improve the efficiency in financial management, the State Government has
introduced Comprehensive Financial Management System (CFMS) on April 1, 2019, which will
make all financial activities in the state online and paperless. In another development in 2018-19,
the State Government made it mandatory for all the departments to make all the purchases through
the GeM Portal.
2.1 Overview of Financial Position
An overview of the financial position of the State Government is presented in this section. The
receipt and expenditure for the State Government are summarised in Table 2.1. The actual figures
have been used for the financial years 2014-15 to 2018-19 and the budget estimates for 2019-20.
The financial position of Bihar is also compared with the other major states of the country using
some of the fiscal indicators. The data on major fiscal indicators for different states is reported in
Table 2.2. In this table, actual figures have been used only for 2016-17, while Revised Estimates
(RE) and Budget Estimates (BE) are used for 2017-18 and 2018-19 respectively. The total revenue receipt and capital receipt of Bihar in 2018-19 was Rs 1,31,793 crore and Rs 20,494 crore respectively. The revenue receipt in 2018-19 was 12.2 percent higher than the previous year. Both revenue and total expenditure also increased in the state during 2018-19 over

24
the previous year. The revenue expenditure and the total expenditure in the state were Rs 1,24,897 crore and Rs 1,54,655 crore respectively, in 2018-19. The capital expenditure decreased by 12 percent to Rs 29,759 crore in 2018-19 over the previous year. The revenue expenditure increased by 21.7 percent during the 2018-19.
Source : Finance Accounts and State Government Budgets
Bihar has consistently been a revenue surplus state since 2004-05 (Chart 2.1). The revenue surplus
for Bihar was 1.34 percent of the GSDP in 2018-19. Also, revenue surplus in Bihar increased
continuously till 2014-15 and then jumped by 153 percent to reach an all-time high of Rs 14,823
crore in 2017-18. However, it declined by 52.5 percent to reach the figure of Rs 6897 crore in
2018-19. It is projected to be Rs 21,517 crore in the budget estimate of 2019-20.
All the components of the revenue receipt have shown an increase in 2018-19 over the previous
year (Chart 2.2). The total receipt in the revenue account of Bihar increased by 12.2 percent over
the previous year to become Rs 1,31,793 crore in 2018-19. The tax revenues increased by Rs
14,791 crore in 2018-19 to reach Rs 1,03,011 crore, which is 16.8 percent higher than the previous
year. The non-tax revenue was only three percent of the total revenue receipt in the state. It was
Rs 4131 crore during 2018-19, after an increase of 17.8 percent over the previous year. The tax
and non-tax revenues projected in the budgeted estimates for 2019-20 are Rs 1,22,922 crore and
Rs 4,806 crore respectively. The receipts under Grants-in-aid and contributions from the Central
-15000
-13000
-11000
-9000
-7000
-5000
-3000
-1000
1000
3000
2001 - 2002
2002 - 2003
2003 - 2004
2004 - 2005
2005 - 2006
2006 - 2007
2007 - 2008
2008 - 2009
2009 - 2010
2010 - 2011
2011 - 2012
2012 - 2013
2013 - 2014
2014 - 2015
2015 - 2016
2016 - 2017
2017 - 2018
2018 - 2019
Chart 2.1 : Revenue Deflicit of Bihar (Rs crore)

25
Government declined to Rs 24,652 crore in 2018-19, from Rs 25,720 crore in the previous year. It
is projected to increase to Rs 49,019 crore in the budgeted estimate for 2019-20.
The composition of the revenue receipt in Bihar for the financial years 2017-18 and 2018-19 is
shown in Chart 2.3. During this period, the share of tax revenue has increased from 75 percent to
78 percent, whereas the share of Grants-in-Aid and contribution declined from 22 percent to 19
percent. The share of non-tax revenue has remained unchanged at three percent.
The Tax-GSDP ratio in the state increased to 20.0 percent in 2018-19 from 18.2 percent in
2017-18. It is projected to be 21.5 percent in the budgeted estimate for 2019-20. The receipt from
Grants-in-Aid and Contributions came down from 5.3 percent of GSDP in 2017-18 to 4.8 percent
in 2018-19. It is projected to be 8.6 percent of GSDP in the budgeted estimate for 2019-20.
Source : Finance Accounts and State Government Budgets
The share of different components in total revenue receipt for Bihar during 1990-91 to 2018-19 is
shown in Chart 2.4. A significant change in the composition is observed after 1999-2000. The
share of the revenue from the state’s own resources came down significantly after the creation of
Jharkhand as a separate state, mainly on account of the drop in non-tax revenue from own
resources. The contribution of state’s own tax revenue in total revenue receipt also declined
gradually till 2007-08, after which it recovered. It has again been falling since 2013-14. Therefore,
Bihar has largely been dependent on transfers from the Central Government for its revenue receipts
since 2000-01.
0
20000
40000
60000
80000
100000
120000
140000
2012-13 2013-14 2014-15 2015-16 2016-17 2017-18 2018-19
Total Receipts Revenue AccountTax RevenueNon Tax RevenueGrants in Aid and ContributionsTotal Exp. Revenue Account
Chart 2.2 : Revenue Accounts of Bihar Government (Rs crore)
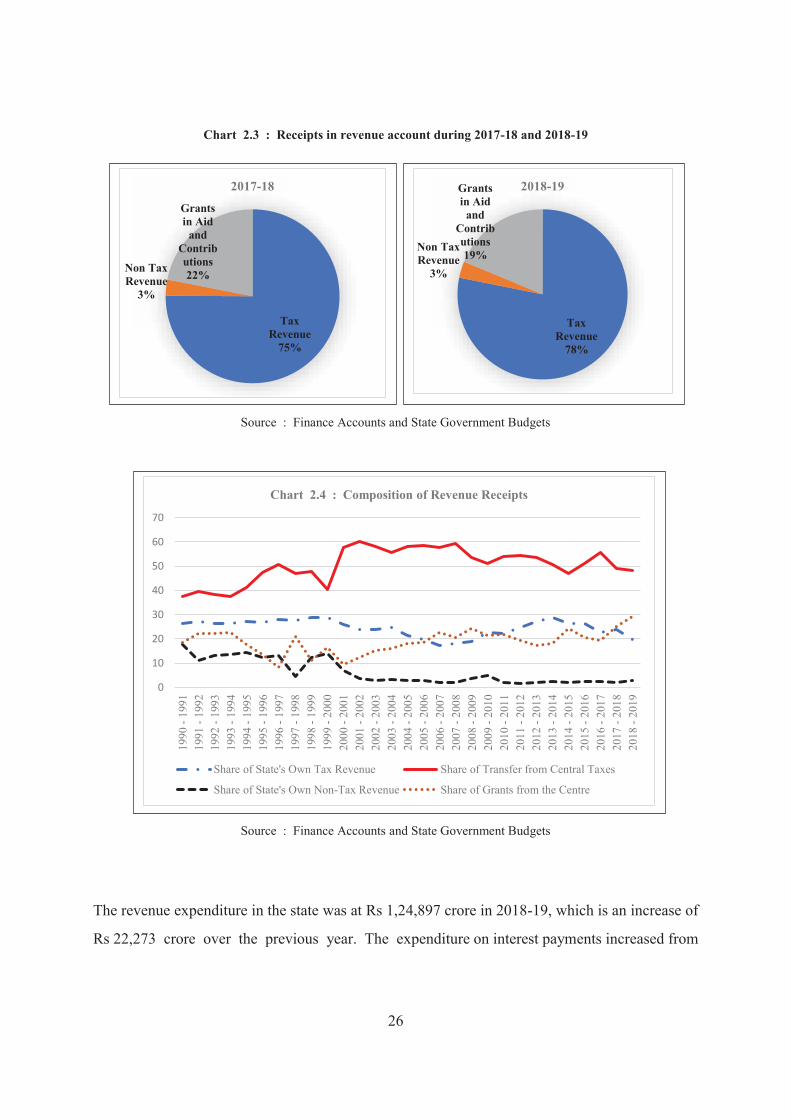
26
Chart 2.3 : Receipts in revenue account during 2017-18 and 2018-19
Source : Finance Accounts and State Government Budgets
Source : Finance Accounts and State Government Budgets
The revenue expenditure in the state was at Rs 1,24,897 crore in 2018-19, which is an increase of
Rs 22,273 crore over the previous year. The expenditure on interest payments increased from
Tax Revenue
75%
Non Tax Revenue
3%
Grants in Aid
and Contributions22%
2017-18
Tax Revenue
78%
Non Tax Revenue
3%
Grants in Aid
and Contributions19%
2018-19
0
10
20
30
40
50
60
70
1990
- 19
9119
91 -
1992
1992
- 19
9319
93 -
1994
1994
- 19
9519
95 -
1996
1996
- 19
9719
97 -
1998
1998
- 19
9919
99 -
2000
2000
- 20
0120
01 -
2002
2002
- 20
0320
03 -
2004
2004
- 20
0520
05 -
2006
2006
- 20
0720
07 -
2008
2008
- 20
0920
09 -
2010
2010
- 20
1120
11 -
2012
2012
- 20
1320
13 -
2014
2014
- 20
1520
15 -
2016
2016
- 20
1720
17 -
2018
2018
- 20
19
Chart 2.4 : Composition of Revenue Receipts
Share of State's Own Tax Revenue Share of Transfer from Central Taxes
Share of State's Own Non-Tax Revenue Share of Grants from the Centre

27
Rs 9054 crore in 2017-18 to Rs. 10,071 crore in 2018-19. The social services expenditure increased
by 27.3 percent to Rs 58,284 crore in 2018-19 over the previous year. The composition of
expenditure in revenue account for years 2017-18 and 2018-19 is shown in Chart 2.5. In 2018-19,
the share of social services expenditure has increased by two percentage points, whereas the share
of economic services and general services expenditures declined by one percentage point each.
Chart 2.5 : Sectoral expenditure in revenue account during 2017-18 and 2018-19
Source : Finance Accounts and State Government Budgets
The total borrowing by the state in 2018-19 was Rs 18,668 crore, compared to Rs 13,169 crore
and Rs 21,577 crore during 2017-18 and 2016-17 respectively. The outstanding debt as a
percentage of GSDP has remained at almost the same level in the last three years. The outstanding
debt was 32.8 percent of GSDP in 2018-19. It is projected to be 32.5 percent of GSDP in the
budgeted estimate for 2019-20. The revenue expenditure on account of interest payment has been
increasing over the years. It was Rs 10,071 core in 2018-19, compared to Rs 9054 crore during
2017-18.
In a significant development, there was an increase of 55.4 percent from the previous year in the
repayment of public debt by the State Government during 2018-19. The repayment of public debt
was Rs 7230 crore in 2018-19, compared to Rs 4654 crore in 2017-18. A summary of the state
finances of Bihar for the period 2014-15 to 2018-19 along with the budgeted estimate for 2019-20
are reported in Table 2.1.
General Services
32%
Social Services
45%
Economic
Services23%
2017-18
General Services
31%
Social Services
47%
Economic
Services22%
2018-19
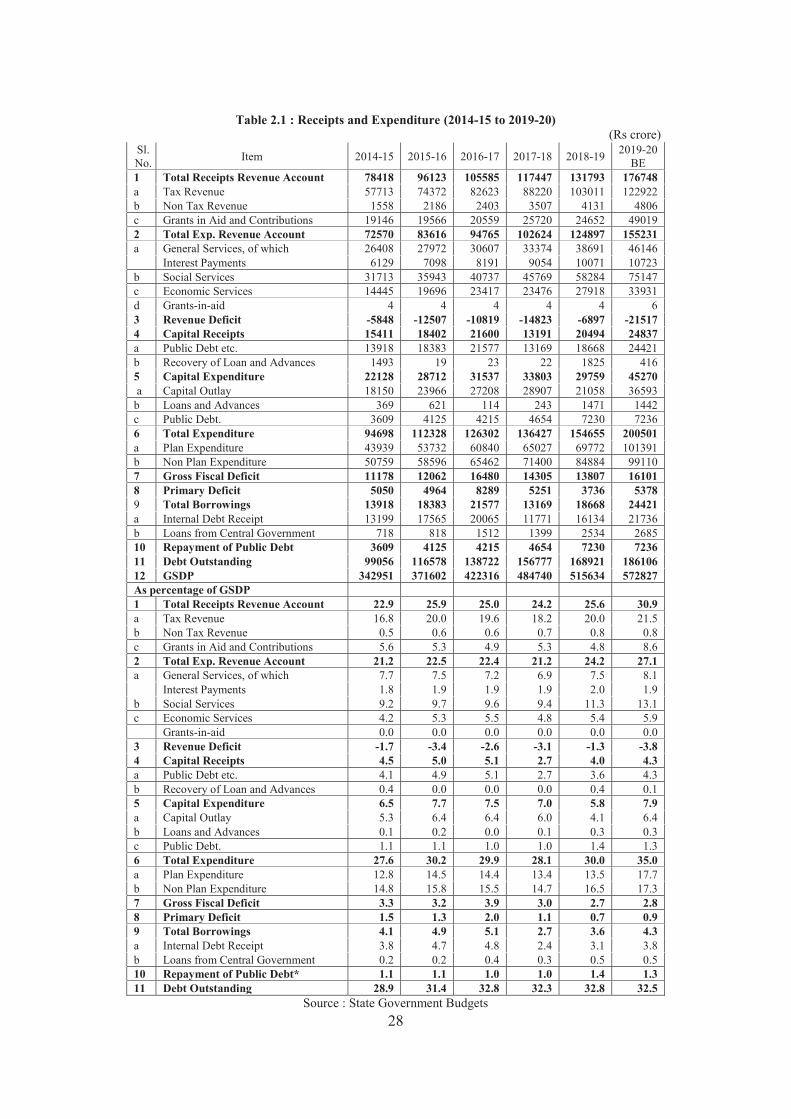
28
Table 2.1 : Receipts and Expenditure (2014-15 to 2019-20) (Rs crore)
Sl. No. Item 2014-15 2015-16 2016-17 2017-18 2018-19 2019-20
BE 1 Total Receipts Revenue Account 78418 96123 105585 117447 131793 176748 a Tax Revenue 57713 74372 82623 88220 103011 122922 b Non Tax Revenue 1558 2186 2403 3507 4131 4806 c Grants in Aid and Contributions 19146 19566 20559 25720 24652 49019 2 Total Exp. Revenue Account 72570 83616 94765 102624 124897 155231 a General Services, of which 26408 27972 30607 33374 38691 46146 Interest Payments 6129 7098 8191 9054 10071 10723 b Social Services 31713 35943 40737 45769 58284 75147 c Economic Services 14445 19696 23417 23476 27918 33931 d Grants-in-aid 4 4 4 4 4 6 3 Revenue Deficit -5848 -12507 -10819 -14823 -6897 -21517 4 Capital Receipts 15411 18402 21600 13191 20494 24837 a Public Debt etc. 13918 18383 21577 13169 18668 24421 b Recovery of Loan and Advances 1493 19 23 22 1825 416 5 Capital Expenditure 22128 28712 31537 33803 29759 45270 a Capital Outlay 18150 23966 27208 28907 21058 36593 b Loans and Advances 369 621 114 243 1471 1442 c Public Debt. 3609 4125 4215 4654 7230 7236 6 Total Expenditure 94698 112328 126302 136427 154655 200501 a Plan Expenditure 43939 53732 60840 65027 69772 101391 b Non Plan Expenditure 50759 58596 65462 71400 84884 99110 7 Gross Fiscal Deficit 11178 12062 16480 14305 13807 16101 8 Primary Deficit 5050 4964 8289 5251 3736 5378 9 Total Borrowings 13918 18383 21577 13169 18668 24421 a Internal Debt Receipt 13199 17565 20065 11771 16134 21736 b Loans from Central Government 718 818 1512 1399 2534 2685 10 Repayment of Public Debt 3609 4125 4215 4654 7230 7236 11 Debt Outstanding 99056 116578 138722 156777 168921 186106 12 GSDP 342951 371602 422316 484740 515634 572827 As percentage of GSDP 1 Total Receipts Revenue Account 22.9 25.9 25.0 24.2 25.6 30.9 a Tax Revenue 16.8 20.0 19.6 18.2 20.0 21.5 b Non Tax Revenue 0.5 0.6 0.6 0.7 0.8 0.8 c Grants in Aid and Contributions 5.6 5.3 4.9 5.3 4.8 8.6 2 Total Exp. Revenue Account 21.2 22.5 22.4 21.2 24.2 27.1 a General Services, of which 7.7 7.5 7.2 6.9 7.5 8.1 Interest Payments 1.8 1.9 1.9 1.9 2.0 1.9 b Social Services 9.2 9.7 9.6 9.4 11.3 13.1 c Economic Services 4.2 5.3 5.5 4.8 5.4 5.9 Grants-in-aid 0.0 0.0 0.0 0.0 0.0 0.0 3 Revenue Deficit -1.7 -3.4 -2.6 -3.1 -1.3 -3.8 4 Capital Receipts 4.5 5.0 5.1 2.7 4.0 4.3 a Public Debt etc. 4.1 4.9 5.1 2.7 3.6 4.3 b Recovery of Loan and Advances 0.4 0.0 0.0 0.0 0.4 0.1 5 Capital Expenditure 6.5 7.7 7.5 7.0 5.8 7.9 a Capital Outlay 5.3 6.4 6.4 6.0 4.1 6.4 b Loans and Advances 0.1 0.2 0.0 0.1 0.3 0.3 c Public Debt. 1.1 1.1 1.0 1.0 1.4 1.3 6 Total Expenditure 27.6 30.2 29.9 28.1 30.0 35.0 a Plan Expenditure 12.8 14.5 14.4 13.4 13.5 17.7 b Non Plan Expenditure 14.8 15.8 15.5 14.7 16.5 17.3 7 Gross Fiscal Deficit 3.3 3.2 3.9 3.0 2.7 2.8 8 Primary Deficit 1.5 1.3 2.0 1.1 0.7 0.9 9 Total Borrowings 4.1 4.9 5.1 2.7 3.6 4.3 a Internal Debt Receipt 3.8 4.7 4.8 2.4 3.1 3.8 b Loans from Central Government 0.2 0.2 0.4 0.3 0.5 0.5 10 Repayment of Public Debt* 1.1 1.1 1.0 1.0 1.4 1.3 11 Debt Outstanding 28.9 31.4 32.8 32.3 32.8 32.5
Source : State Government Budgets

29
2.2 Fiscal Performance
The fiscal performance of the State Government is compared with some major states of the country
in this section, using the following indicators - (a) Ratio of Revenue Deficit to GFD, (b) Ratio of
Capital Outlay to GFD, (c) Ratio of Non-Development Revenue Expenditure to Aggregate
Disbursement, (d) Ratio of Non-Development Revenue Expenditure to Revenue Receipt, (e) Ratio
of Interest Payment to Revenue Expenditure, (f) Ratio of State’s Own Revenue to Revenue
Expenditure, (g) Ratio of Gross Transfer from Central Government to Aggregate Disbursement,
and (h) Ratio of Debt Servicing Expenditure to Gross Transfers from Central Government. The
data related to these indicators for the years 2017-18 (actual), 2018-19 (RE) and 2019-20 (BE) are
reported in Table 2.2.
(a) Ratio of Revenue Deficit to GFD : This ratio indicates the extent to which revenue deficit
contributes to GFD. In case the ratio is more than 100, indicating surplus, it shows the extent
to which surpluses from the revenue account may be used for the creation of capital assets.
Bihar has consistently maintained a surplus in the revenue account since 2004-05. The
revenue surplus has allowed the State Government to increase its capital outlay much beyond
what it borrowed to finance the same. The revenue surplus in Bihar was 104 percent of the
GFD in 2017-18, which is only second to 143 percent for Odisha among the states in India.
However, it has come down to 50 percent of the GFD for Bihar in 2018-19.
(b) Ratio of Capital Outlay to GFD : This ratio indicates the proportion of GFD caused by
capital outlay. The capital outlay in Bihar was 202 percent of the GFD in 2017-18 and 135
percent in 2018-19. It is projected to be 227 percent in the budgeted estimate for 2019-20.
Bihar could maintain such a high ratio only because of the high revenue surplus that it
generates. Among the major states, only Odisha had a higher ratio of capital outlay to GFD
than Bihar in 2017-18.
(c) Ratio of Non-Development Revenue Expenditure to Aggregate Disbursements : This
ratio indicates what proportion of the total expenditure is for administrative or general
services. A smaller value for this ratio is seen as a better fiscal indicator. In Bihar, this ratio
has come down from 26.5 percent in 2017-18 to 23.4 percent in 2018-19. The performance
of the state on this indicator is much better than many other states. This ratio for Punjab and
Kerala was 48.0 percent and 39.1 percent respectively in 2017-18.

30
(d) Ratio of Non-Development Revenue Expenditure to Revenue Receipts : This ratio
indicates the extent to which the revenue receipts of the State Government was used for
expenditure on administrative or general services. In Bihar, the expenditure on administrative
or general services consumed 31 percent of the total revenue receipts in 2017-18 and it came
down to 28 percent in 2018-19. This ratio for Bihar was much lower than in the states like
Punjab (65 percent), Kerala (55 percent), West Bengal (41 percent) in 2017-18. Only four
states (Odisha, Madhya Pradesh, Karnataka and Chhattisgarh) had a lower ratio than Bihar
in 2017-18.
(e) Ratio of Interest Payment to Revenue Expenditure : This ratio indicates what proportion
of the revenue expenditure is spent on interest payment for the past borrowings of the state.
The interest payment was 8.8 percent of the total revenue expenditure in Bihar in 2017-18,
which was higher than only three other states (Madhya Pradesh, Odisha and Chhattisgarh).
It has come down to 7.2 percent in 2018-19 and is further budgeted to be 6.9 percent in 2019-
20.
(f) Ratios of State’s Own Revenue to Revenue Expenditure : The ratio of the state’s own
revenue to its total revenue expenditure indicates the self-sufficiency of the State
Government to meet its revenue expenditure. The ratio has come down from 32.4 percent in
2017-18 to 25.2 percent in 2018-19 for Bihar, and is projected to be 26.4 percent in
2019-20.
(g) Ratio of Gross Transfers from Central Government to Aggregate Disbursements : This
ratio indicates the State Government’s dependence on central transfers. The central transfer
has accounted for more than 60 percent of Bihar’s total expenditure in recent years. The ratio
was 62.8 percent for Bihar in 2017-18 and increased to 64.3 percent in 2018-19. The ratio
for states like Maharashtra and Haryana was only 19.4 and 13.1 percent respectively in
2017-18.
(h) Ratio of Debt Servicing to Gross Transfers from Central Government : This ratio
indicates what proportion of the central transfers is utilised by the State Government for debt
servicing. The debt servicing payment was 16.0 percent of Gross Transfers to the State
Government in 2017-18 and declined to 14.7 percent in 2018-19. As per the budgeted
estimates of 2019-20, it is projected to decline further to 13.0 percent. The ratio was more
than 100 percent for states like Punjab, Haryana and Kerala in 2017-18.

31
Table 2.2 : Major Fiscal Indicators (2017-18 to 2019-20)
State a. Revenue Deficit : GFD (%) b. Capital Outlay : GFD (%)
2017-18 2018-19 RE
2019-20 BE 2017-18 2018-19
RE 2019-20
BE Bihar -104 -50 -134 202 135 227 Jharkhand -15 -94 -120 100 174 194 West Bengal 34 23 - 67 75 98 Odisha -143 -76 -35 226 170 130 Uttar Pradesh -45 -108 -59 141 202 166 Madhya Pradesh -20 0 -2 136 95 104 Rajasthan 73 79 83 81 67 60 Maharashtra -9 27 33 112 74 68 Gujarat -24 -4 -9 123 99 105 Punjab 76 68 59 19 28 116 Haryana 55 41 54 71 78 72 Karnataka -15 0 -1 99 89 95 Andhra Pradesh 50 35 5 42 61 92 Kerala 63 55 33 33 41 62 Tamil Nadu 54 42 32 51 58 71 Himachal Pradesh -8 28 32 97 63 62 Chhattisgarh -50 34 -11 147 65 111
State
c. Non-Dev. Exp: Agg. Disbursements (%)
d. Non-Dev. Exp: Revenue Receipts (%)
2017-18 2018-19 RE
2019-20 BE 2017-18 2018-19
RE 2019-20
BE Bihar 26.5 23.4 25.3 31 28 29 Jharkhand 25.7 24.2 22.9 33 28 26 West Bengal 29.7 28.2 28.4 41 38 37 Odisha 21.3 22.1 22.4 24 26 27 Uttar Pradesh 34.0 31.7 33.0 39 38 40 Madhya Pradesh 19.5 21.0 20.7 24 26 26 Rajasthan 24.5 26.2 25.5 35 38 36 Maharashtra 27.9 24.4 27.1 33 32 35 Gujarat 26.7 25.6 28.0 34 34 37 Punjab 48.0 39.2 32.9 65 54 53 Haryana 30.0 28.5 31.2 43 40 45 Karnataka 19.0 20.9 22.0 24 27 28 Andhra Pradesh 26.8 24.9 21.9 38 35 28 Kerala 39.1 39.8 37.9 55 53 50 Tamil Nadu 30.2 29.8 31.2 42 41 42 Himachal Pradesh 32.6 30.9 32.8 41 42 43 Chhattisgarh 19.5 17.2 19.4 22 22 23

32
State
e. Interest Payments: Revenue Expenditure (%)
f. State’s Own Revenue: Revenue Expenditure (%)
2017-18 2018-19 RE
2019-20 BE 2017-18 2018-19
RE 2019-20
BE Bihar 8.8 7.2 6.9 32.4 25.2 26.4
Jharkhand 9.1 8.8 7.9 43.8 49.8 52.3 West Bengal 19.9 18.2 19.0 43.1 41.1 43.3
Odisha 6.9 6.4 6.0 54.9 45.2 41.8
Uttar Pradesh 10.9 9.6 9.7 48.6 50.2 48.1 Madhya Pradesh 8.5 8.1 8.1 45.3 41.3 44.4
Rajasthan 13.5 12.6 12.1 48.0 47.3 48.6
Maharashtra 13.7 11.3 10.5 78.0 68.3 68.1 Gujarat 16.1 14.6 14.2 75.1 68.6 69.6
Punjab 24.5 19.8 19.6 57.3 52.2 52.3
Haryana 16.3 16.2 17.6 69.5 70.7 65.0 Karnataka 9.8 9.4 10.5 67.9 62.6 60.5
Andhra Pradesh 11.4 11.3 9.6 46.4 49.9 45.9
Kerala 15.1 13.8 13.9 59.4 59.5 66.2 Tamil Nadu 15.5 14.4 15.3 63.9 62.5 65.1
Himachal Pradesh 14.0 12.3 12.6 36.8 27.5 28.7
Chhattisgarh 5.5 4.8 6.0 50.4 38.6 41.4
State
g. Gross Transfers: Aggregate Disbursements (%)
h. Debt Servicing: Gross Transfers (%)
2017-18 2018-19 RE
2019-20 BE 2017-18 2018-19
RE 2019-20
BE Bihar 62.8 64.3 69.1 16.0 14.7 13.0
Jharkhand 45.3 48.4 47.4 24.8 23.0 22.3
West Bengal 40.3 42.8 43.8 73.2 80.1 81.3 Odisha 47.8 51.5 51.2 16.5 16.2 15.7
Uttar Pradesh 47.2 47.6 46.5 29.3 24.5 32.4
Madhya Pradesh 46.2 48.6 46.3 21.6 24.6 28.1 Rajasthan 32.8 32.5 32.7 53.4 56.0 57.0
Maharashtra 19.4 21.8 21.7 90.9 76.6 70.2
Gujarat 21.8 25.0 25.4 94.2 76.0 73.9 Punjab 24.4 30.0 25.8 284.9 189.5 192.6
Haryana 13.1 15.5 17.9 154.0 186.9 174.3
Karnataka 28.0 29.1 31.4 42.6 42.3 39.5 Andhra Pradesh 33.9 33.1 43.2 46.8 52.0 31.2
Kerala 20.6 25.5 23.4 117.2 98.9 99.2 Tamil Nadu 20.5 23.6 23.8 83.7 75.1 79.6
Himachal Pradesh 50.8 52.4 52.8 41.7 39.5 33.3
Chhattisgarh 47.0 46.3 51.5 12.9 13.6 15.9 Source : State Finances : A Study of Budgets of 2019-20, RBI

33
2.3 Sustainability, Flexibility and Vulnerability of State Finances
Table 2.3 presents data for selected indicators that are used to measure the sustainability, flexibility
and vulnerability of the state finances in Bihar. Some of the key indicators for Bihar are analysed
in this section.
Table 2.3 : Fiscal and Financial Performance Indicators (2015-16 to 2019-20)
Indicators 2015-16 2016-17 2017-18 2018-19 2019-20 BE
A. Sustainability
Balance from Current Revenue (Rs crore) 26027 28330 33996 36956 47205
Interest Ratio (%) 8.5 8.6 8.3 8.2 6.7
Buoyancy of State’s Own Tax Receipts w.r.t. GSDP 2.7 -0.5 -0.2 4.3 1.3
Buoyancy of State’s Own Non-Tax Receipts w.r.t. GSDP 4.8 0.7 3.1 2.8 1.5
Growth in outstanding debt (%) 17.7 19.0 13.0 7.7 10.2
Growth in total revenue receipts (%) 22.6 9.8 11.2 12.2 34.1
Growth in state’s own revenue receipts (%) 23.9 -5.4 1.9 25.9 15.1
Growth in GSDP (%) 8.4 13.6 14.8 6.4 11.1
B. Flexibility
Capital Repayment / Capital Borrowings (%) 25.8 20.1 37.2 46.6 35.5
Total Tax Receipts / GSDP (%) 20.0 19.6 18.2 20.0 21.5
Capital Outlay / Capital Receipts(%) 130.2 126.0 219.1 102.8 147.3
State’s Own Tax Receipts / GSDP(%) 6.8 5.6 4.8 5.7 5.9
State’s Own Non-Tax Receipts / GSDP(%) 0.6 0.6 0.7 0.8 0.8
Debt Outstanding / GSDP (%) 31.4 32.8 32.3 32.8 32.5
C. Vulnerability
Revenue Deficit (Rs crore) -12507 -10819 -14823 -6897 -21517
Fiscal Deficit (Rs crore) 12062 16480 14305 13807 16101
Primary Deficit (Rs crore) 4964 8289 5251 3736 5378
Primary Deficit / Fiscal Deficit (%) 41.2 50.3 36.7 27.1 33.4
Revenue Deficit / Fiscal Deficit (%) -103.7 -65.7 -103.6 -50.0 -133.6
Source : Finance Accounts, GoB
Sustainability
The following indicators are used to know whether the means of financing development activities in the state are sustainable, i.e., the resources are available to meet the expenditure requirements of the state without adding to its debt burden. These indicators suggest that the means of state finances in Bihar are sustainable.

34
Interest Ratio : This ratio is calculated as the ratio between (Interest Payment - Interest Receipt) and (Total Revenue – Interest Receipt). The interest ratio is used to measure the ability of the State Government to service fresh debt and their ability to meet revenue expenditure from the revenue receipts. A higher ratio indicates a reduced ability of the State Government to service any fresh debt and meet its revenue expenditure from its revenue receipts. The interest ratio has remained low for Bihar in recent years. This ratio was 8.5 percent in 2015-16 and has since fallen to 8.2 percent in 2018-19. It is projected to be 6.7 percent in the budget estimate for 2019-20. This is within the 10 percent limit suggested by the Fourteenth Finance Commission of India. Buoyancy of State’s Tax and Non-Tax Revenues : The buoyancy of own tax receipts of the State Government shows considerable variation in recent times. It has generally remained buoyant till 2015-16. The own tax revenues of the State Government show a jump in tax buoyancy in 2018-19 to 4.3 percent. It is also expected to be buoyant as per the budgeted estimate for 2019-20. The non-tax revenue has also shown varying levels of buoyancy over recent years. The buoyancy for non-tax revenue was 4.8 in 2015-16, which declined in later years. Such wide variation in the buoyancy for non-tax revenue is primarily due to some of its heads (like royalty from minerals etc.) being highly sensitive to the economic cycles in the state. It is important to note that the share of non-tax revenue in the total revenue receipt of Bihar has remained very low since 2001-02 after the partition of the state. Hence it is the buoyancy of the tax revenue which is more important for understanding the sustainability of the state finances in Bihar. Flexibility
These indicators are used to measure the flexibility of the State Government in arranging the means of finances, either by increasing the revenue or through borrowing. Capital Outlay to Capital Receipts ratio : This ratio indicates the extent to which capital receipts are being utilised for capital formation in the state. A ratio of less than 100 percent would not be sustainable in the long run, as that would indicate that capital receipts are being utilized for revenue expenditure. This ratio has remained higher than 100 percent for Bihar in recent years. However, it declined to 102.8 percent in 2018-19 from 219.1 percent in 2017-18. Overall, it indicates that the entire capital receipt of the State Government is presently being used for capital outlay. A part of the revenue surplus was also used for capital expenditure in recent years in Bihar. State's Own Tax Receipts to GSDP ratio : The ratio of its own tax receipts to GSDP for Bihar was stagnant at around four percent till 2008-09. It improved to 6.8 percent in 2015-16. However,

35
the ratio again declined to 4.8 percent in 2017-18. It was 5.7 percent in 2018-19 and is estimated to rise marginally to 5.9 percent in the current fiscal. This ratio is much lower for Bihar compared to the other states, highlighting the fact that there is need to further improve the own tax revenue collection. Moreover, the state’s own non-tax revenue as a share of GSDP has also remained at 0.8 percent in 2018-19. It is estimated to remain the same in 2019-20. Outstanding Debt Liability to GSDP Ratio : This ratio can be used as an indicator of the debt sustainability of the State Government. A high ratio leaves little room for the State Government for financial leverage and indicates a lack of flexibility. It can be noted here that the total liability (which also includes the liability pertaining to Public Account) constituted 31.4 percent of the GSDP in 2015-16 and it increased to 32.8 percent in 2018-19 and is budgeted to be at 32.5 percent in 2019-20. Vulnerability
The vulnerability of the state finances is best indicated by the amount of the deficit, particularly Primary Deficit. Primary Deficit is the difference between the fiscal deficit of the current year and interest payments in the current year on the previous borrowings by the government. It shows the deficit caused by the current expenditure decisions of the government, without considering the liabilities created in the past, for which interest has to be paid in the current financial year. In 2008-09, Bihar had a primary surplus of Rs 1246 crore, but since then, Bihar could not generate any surplus in its primary account. The exception was in 2010-11 when there was a modest primary surplus of Rs 349 crore. In 2018-19, Bihar’s primary deficit reached Rs 3736 crore from Rs 5251 crore in the previous year. 2.4 Deficit Management
Maintaining deficit within the FRBM threshold during the period of an economic slowdown is a challenge. This is more difficult for poorer states like Bihar, where the fiscal space is limited. Despite the limitations on the revenue front, Bihar has consistently shown fiscal prudence in the last few years, when deficits remained within the stipulated limits. The position of revenue account of major states is shown in Table 2.4. Bihar is one of the states which have consistently maintained revenue surplus in recent years. It had a revenue surplus of Rs 14,823.0 crore in 2017-18, which was higher than the revenue surplus in the other states. Revenue surplus reached Rs 6,897.6 crore in 2018-19.
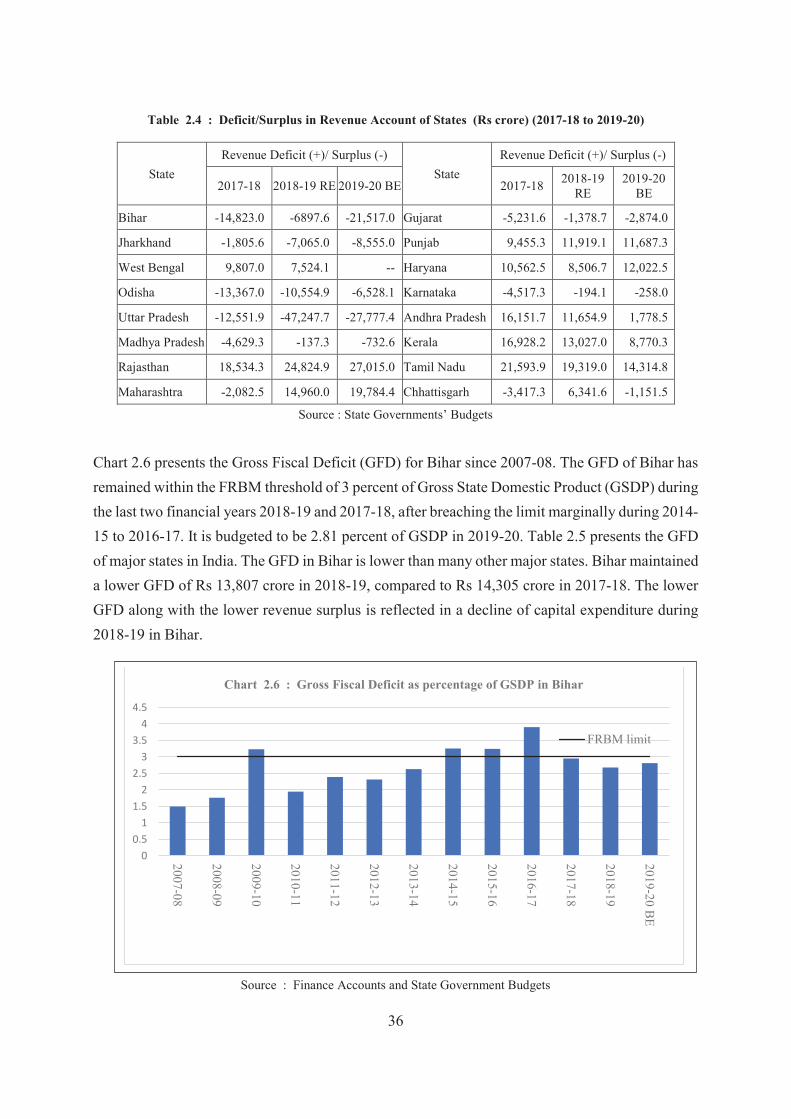
36
Table 2.4 : Deficit/Surplus in Revenue Account of States (Rs crore) (2017-18 to 2019-20)
State Revenue Deficit (+)/ Surplus (-)
State Revenue Deficit (+)/ Surplus (-)
2017-18 2018-19 RE 2019-20 BE 2017-18 2018-19 RE
2019-20 BE
Bihar -14,823.0 -6897.6 -21,517.0 Gujarat -5,231.6 -1,378.7 -2,874.0
Jharkhand -1,805.6 -7,065.0 -8,555.0 Punjab 9,455.3 11,919.1 11,687.3
West Bengal 9,807.0 7,524.1 -- Haryana 10,562.5 8,506.7 12,022.5
Odisha -13,367.0 -10,554.9 -6,528.1 Karnataka -4,517.3 -194.1 -258.0
Uttar Pradesh -12,551.9 -47,247.7 -27,777.4 Andhra Pradesh 16,151.7 11,654.9 1,778.5
Madhya Pradesh -4,629.3 -137.3 -732.6 Kerala 16,928.2 13,027.0 8,770.3
Rajasthan 18,534.3 24,824.9 27,015.0 Tamil Nadu 21,593.9 19,319.0 14,314.8
Maharashtra -2,082.5 14,960.0 19,784.4 Chhattisgarh -3,417.3 6,341.6 -1,151.5
Source : State Governments’ Budgets
Chart 2.6 presents the Gross Fiscal Deficit (GFD) for Bihar since 2007-08. The GFD of Bihar has remained within the FRBM threshold of 3 percent of Gross State Domestic Product (GSDP) during the last two financial years 2018-19 and 2017-18, after breaching the limit marginally during 2014-15 to 2016-17. It is budgeted to be 2.81 percent of GSDP in 2019-20. Table 2.5 presents the GFD of major states in India. The GFD in Bihar is lower than many other major states. Bihar maintained a lower GFD of Rs 13,807 crore in 2018-19, compared to Rs 14,305 crore in 2017-18. The lower GFD along with the lower revenue surplus is reflected in a decline of capital expenditure during 2018-19 in Bihar.
Source : Finance Accounts and State Government Budgets
00.5
11.5
22.5
33.5
44.5
2007-08
2008-09
2009-10
2010-11
2011-12
2012-13
2013-14
2014-15
2015-16
2016-17
2017-18
2018-19
2019-20 BE
Chart 2.6 : Gross Fiscal Deficit as percentage of GSDP in Bihar
FRBM limit
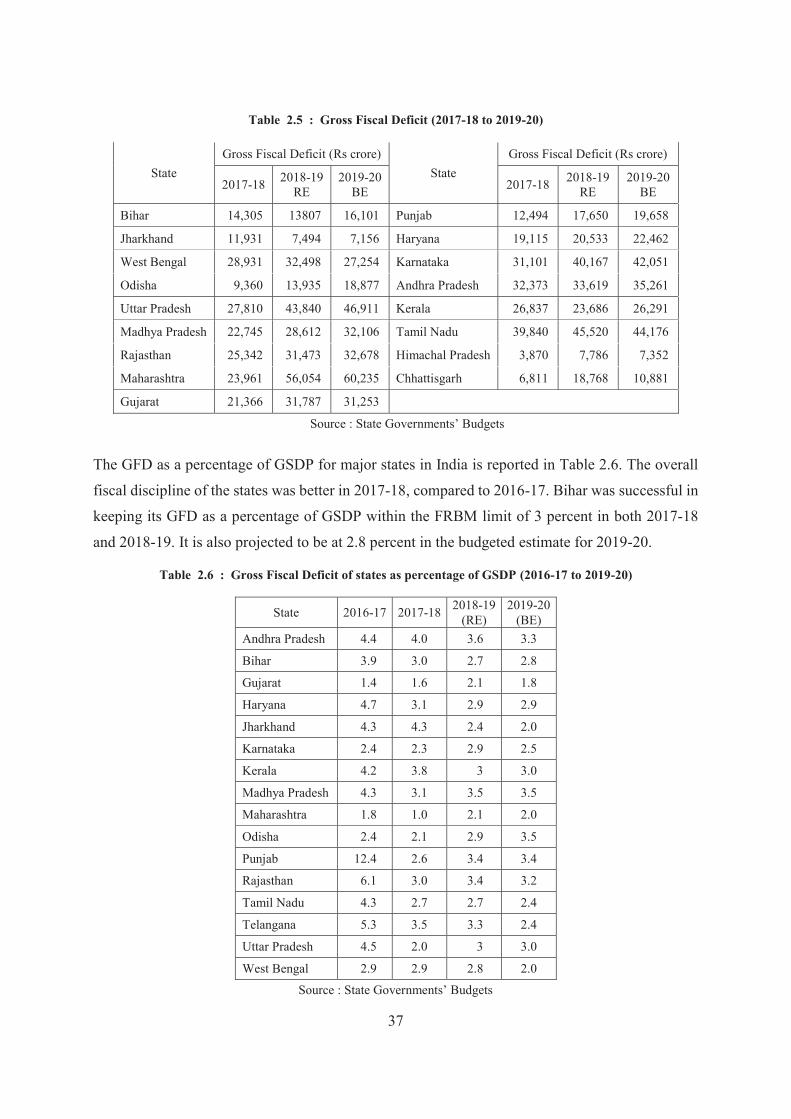
37
Table 2.5 : Gross Fiscal Deficit (2017-18 to 2019-20)
State Gross Fiscal Deficit (Rs crore)
State Gross Fiscal Deficit (Rs crore)
2017-18 2018-19 RE
2019-20 BE 2017-18 2018-19
RE 2019-20
BE
Bihar 14,305 13807 16,101 Punjab 12,494 17,650 19,658
Jharkhand 11,931 7,494 7,156 Haryana 19,115 20,533 22,462
West Bengal 28,931 32,498 27,254 Karnataka 31,101 40,167 42,051
Odisha 9,360 13,935 18,877 Andhra Pradesh 32,373 33,619 35,261
Uttar Pradesh 27,810 43,840 46,911 Kerala 26,837 23,686 26,291
Madhya Pradesh 22,745 28,612 32,106 Tamil Nadu 39,840 45,520 44,176
Rajasthan 25,342 31,473 32,678 Himachal Pradesh 3,870 7,786 7,352
Maharashtra 23,961 56,054 60,235 Chhattisgarh 6,811 18,768 10,881
Gujarat 21,366 31,787 31,253
Source : State Governments’ Budgets The GFD as a percentage of GSDP for major states in India is reported in Table 2.6. The overall
fiscal discipline of the states was better in 2017-18, compared to 2016-17. Bihar was successful in
keeping its GFD as a percentage of GSDP within the FRBM limit of 3 percent in both 2017-18
and 2018-19. It is also projected to be at 2.8 percent in the budgeted estimate for 2019-20.
Table 2.6 : Gross Fiscal Deficit of states as percentage of GSDP (2016-17 to 2019-20)
State 2016-17 2017-18 2018-19 (RE)
2019-20 (BE)
Andhra Pradesh 4.4 4.0 3.6 3.3
Bihar 3.9 3.0 2.7 2.8
Gujarat 1.4 1.6 2.1 1.8
Haryana 4.7 3.1 2.9 2.9
Jharkhand 4.3 4.3 2.4 2.0
Karnataka 2.4 2.3 2.9 2.5
Kerala 4.2 3.8 3 3.0
Madhya Pradesh 4.3 3.1 3.5 3.5
Maharashtra 1.8 1.0 2.1 2.0
Odisha 2.4 2.1 2.9 3.5
Punjab 12.4 2.6 3.4 3.4
Rajasthan 6.1 3.0 3.4 3.2
Tamil Nadu 4.3 2.7 2.7 2.4
Telangana 5.3 3.5 3.3 2.4
Uttar Pradesh 4.5 2.0 3 3.0
West Bengal 2.9 2.9 2.8 2.0
Source : State Governments’ Budgets
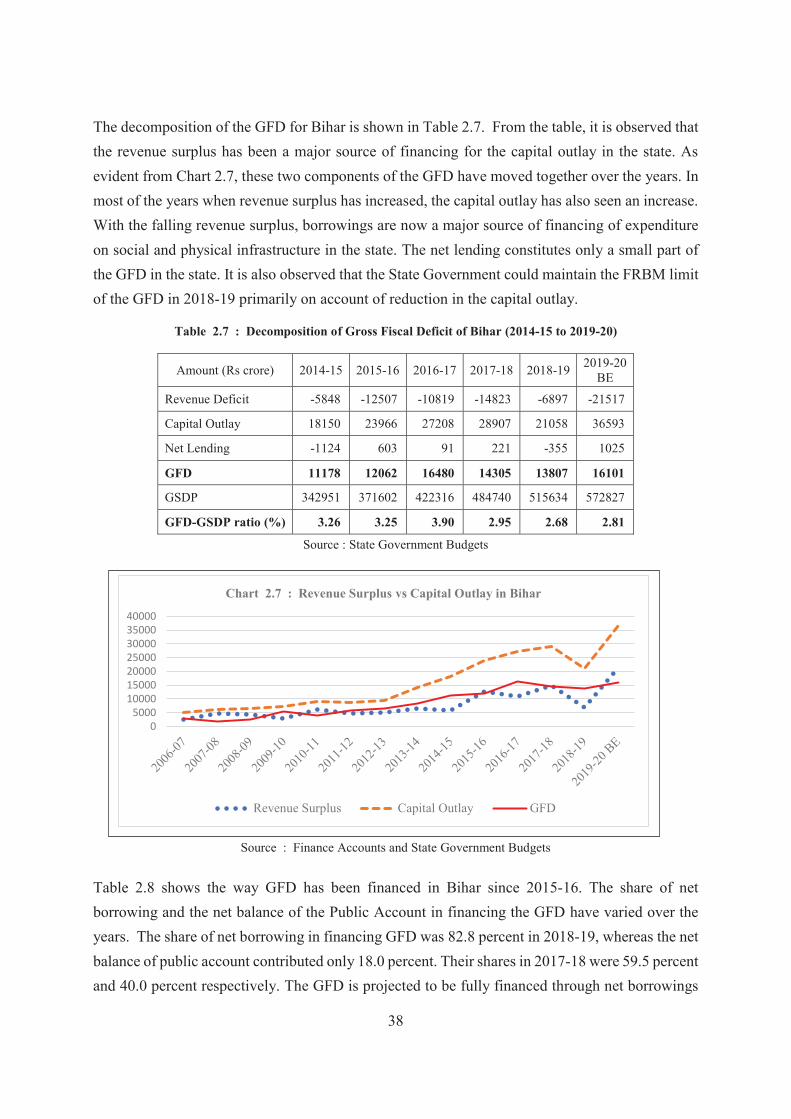
38
The decomposition of the GFD for Bihar is shown in Table 2.7. From the table, it is observed that the revenue surplus has been a major source of financing for the capital outlay in the state. As evident from Chart 2.7, these two components of the GFD have moved together over the years. In most of the years when revenue surplus has increased, the capital outlay has also seen an increase. With the falling revenue surplus, borrowings are now a major source of financing of expenditure on social and physical infrastructure in the state. The net lending constitutes only a small part of the GFD in the state. It is also observed that the State Government could maintain the FRBM limit of the GFD in 2018-19 primarily on account of reduction in the capital outlay.
Table 2.7 : Decomposition of Gross Fiscal Deficit of Bihar (2014-15 to 2019-20)
Amount (Rs crore) 2014-15 2015-16 2016-17 2017-18 2018-19 2019-20 BE
Revenue Deficit -5848 -12507 -10819 -14823 -6897 -21517
Capital Outlay 18150 23966 27208 28907 21058 36593
Net Lending -1124 603 91 221 -355 1025
GFD 11178 12062 16480 14305 13807 16101
GSDP 342951 371602 422316 484740 515634 572827
GFD-GSDP ratio (%) 3.26 3.25 3.90 2.95 2.68 2.81
Source : State Government Budgets
Source : Finance Accounts and State Government Budgets Table 2.8 shows the way GFD has been financed in Bihar since 2015-16. The share of net borrowing and the net balance of the Public Account in financing the GFD have varied over the years. The share of net borrowing in financing GFD was 82.8 percent in 2018-19, whereas the net balance of public account contributed only 18.0 percent. Their shares in 2017-18 were 59.5 percent and 40.0 percent respectively. The GFD is projected to be fully financed through net borrowings
05000
10000150002000025000300003500040000
Chart 2.7 : Revenue Surplus vs Capital Outlay in Bihar
Revenue Surplus Capital Outlay GFD

39
in the budgeted estimates for 2019-20. In 2017-18, Rs 68 crore of the cash balance of the State Government with the RBI was withdrawn to finance the GFD.
Table 2.8 : Financing of Gross Fiscal Deficit in Bihar (2015-16 to 2019-20)
Amounts (Rs crore) 2015-16 2016-17 2017-18 2018-19 2019-20 BE
Net Borrowing 14258 17362 8516 11438 17185
Net Public Account -1983 -893 5721 2479 -1084 Net Decrease in Cash Balance (Opening-Closing Balance) -214 10 68 -110 0
GFD 12062 16480 14305 13807 16101
Percentage Composition
Net Borrowing 118.2 105.4 59.5 82.8 106.7
Net Public Account -16.4 -5.4 40.0 18.0 -6.7
Net Decrease in Cash Balance -1.8 0.1 0.5 -0.8 0.0
Source : State Government Budgets
2.5 Cash Management and Guarantees
The State Government is required to maintain a minimum daily cash balance of Rs. 1.73 crore
with the Reserve Bank of India (RBI), failing which it has to resort to Ordinary Advances or
Special Ways and Means Advances. During 2018-19, the State Government was able to maintain
its daily minimum balance with the RBI throughout the year. The cash balance of the State
Government was Rs 20,837.31 crore on March 31, 2019, compared to Rs 22,081 crore on March
31, 2018. Out of this, Rs 14,791 crore was invested in the Cash Balance Investment Account and
Rs 234.65 crore was lying as cash with departmental officers, and Rs 758.52 crore as permanent
advances for contingent expenditure with various departments at the end of 2018-19. Further, a
sum of Rs 4895.22 crore was invested in earmarked funds like the Sinking Fund, leaving a net
credit cash balance of Rs 157.12 crore with the RBI as on March 31, 2019.
The outstanding guarantees of the State Government at the end of 2018-19 was Rs 5501.86 crore,
compared to Rs 5346.42 crore at the end of 2017-18. Out of the total outstanding guarantees, Rs
3717 crore were against the loans to the Power Sector, Rs 127.47 crore against the Bihar State
Financial Corporation, and Rs. 495.66 crore against Credit Cooperative Societies and Housing
Cooperatives. In 2018-19, a sum of Rs. 2.64 crore was received as guarantee commission or fees.

40
2.6 Debt Management
The outstanding debt liability (excluding guarantees) of the State Government and their components are shown in Table 2.9 for the period 2014-15 to 2019-20. The outstanding liability of the state was Rs 1,68,921 crore at the end of 2018-19, which is 7.7 percent higher than the total outstanding liability for the previous year. The increase in the outstanding liability in 2018-19 (7.7 percent) has come down from the same in 2015-16 (17.7 percent) and in 2016-17 (19.0 percent). The public debt accounted for 74.7 percent of the total outstanding liability of the state at the end of 2018-19, and the remaining part of the outstanding liability comprises small savings, Provident Fund, Reserve Funds, and Deposits and Advances. The share of internal debt has remained around 90 percent of the total public debt since the financial year 2015-16. It was only 76.4 percent in 2007-08 and has increased over the years since then. The share of loan from the Central Government in the public debt has gradually declined over the years, finally stabilising at around nine percent since 2015-16. Table 2.9 also shows that there is an increase in the outstanding liability as a percentage of GSDP from 28.8 percent in 2014-15 to 32.5 percent in 2018-19. The total outstanding liability as a percentage of GSDP has stabilised at around 32-33 percent in the last three years. The outstanding liability was as high as 45 percent of GSDP in 2007-08 and had come down to 27 percent in 2011-12 (See Chart 2.8).
Table 2.9 : Outstanding Liabilities (2014-15 to 2019-20)
(Rs. crore)
Heads 2014-15 2015-16 2016-17 2017-18 2018-19 2019-20 BE
Public Debt
Internal Debt 65848 79990 96595 104525 114360 129943
Central Loans 8722 8838 9596 10182 11785 13387
Total 74570 88829 106191 114707 126145 143330 Public Debt as % of GSDP 21.7 23.9 25.1 23.7 24.5 25.0
Other Liabilities
Small Savings, PF etc. 8865 8792 8891 8811 9089 8989
Reserve Funds 1836 1435 723 26 26 26
Deposits and Advances 13589 17523 22917 33233 33661 33761
Total 24290 27749 32531 42070 42776 42776 Other Liabilities as % of GSDP 7.1 7.5 7.7 8.7 8.3 7.5
Total (Public Debt + Other Liabilities) 98860 116578 138722 156777 168921 186106
Outstanding Liability as % of GSDP 28.9 31.4 32.8 32.3 32.8 32.5
Source : Finance Accounts and State Government Budgets

41
Source : Finance Accounts and State Government Budgets
The liability of the State Government from the Public Account was Rs 42,776 crore at the end of both 2018-19 and 2019-20. Its share in total outstanding liability of the State Government was 25.3 percent in 2018-19 and is budgeted to come down to 23.0 percent in 2019-20. This decline will be mostly on account of increase in outstanding liability through the internal debt.
Table 2.10 : Composition of Outstanding Liabilities in the Consolidated Fund (2017-18 and 2018-19)
Nature of Borrowings Fresh Borrowings Outstanding Balance Percentage
Increase in 2019 from
2018
Percentage Composi-
tion 2017-18
(Rs crore) 2018-19
(Rs crore) 31.03.2018 (Rs crore)
31.03.2019 (Rs crore)
A. Internal Debt 11,771 16,134 1,04,525 1,14,360 9.4 90.7
Market Loans 10,000 14,300 73,897 84,800 14.8 74.2
WMA from the RBI 0 0 0 0 0.0
Bonds 0 0 2351 2,351 0.0 2.1 Loans from Financial Institutions 1,771 1,834 6820 7,571 11.0 6.6
Special Securities Issued to NSSF 0 0 21450 19,631 -8.5 17.2
Others 0 0 7 7.45 0.0 0.0
B. Loans and Advances from Central Government 1,398 2534 10182 11785 15.7 9.3
Non plan loans 0 0 1 1 0.0 0.0
Loans for Central Plan Schemes 0 0 1 1 0.0 0.0
Loans for State Plan Schemes 0 0 191 191 0.2 0.2 Loans for Centrally Sponsored Plan Schemes 7.19 0 1 1 0.0 0.0
Other Loans 1391.46 2,533.78 9989 11592 16.0 7.9
Total (A+B) 13,169 18,668 1,14,707 1,26,145 10.0 100.0
Source : Finance Accounts, GoB
20.00
25.00
30.00
35.00
40.00
45.00
50.00
Chart 2.8 : Outstanding Liability as percentage of GSDP
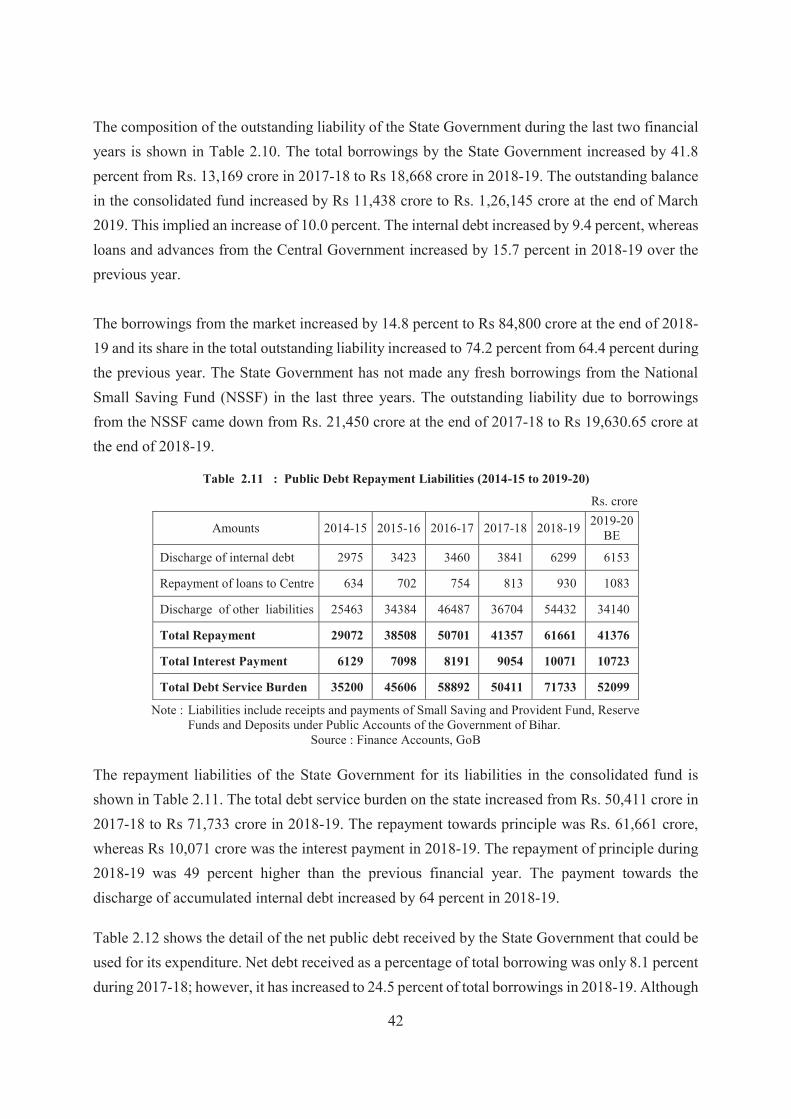
42
The composition of the outstanding liability of the State Government during the last two financial years is shown in Table 2.10. The total borrowings by the State Government increased by 41.8 percent from Rs. 13,169 crore in 2017-18 to Rs 18,668 crore in 2018-19. The outstanding balance in the consolidated fund increased by Rs 11,438 crore to Rs. 1,26,145 crore at the end of March 2019. This implied an increase of 10.0 percent. The internal debt increased by 9.4 percent, whereas loans and advances from the Central Government increased by 15.7 percent in 2018-19 over the previous year. The borrowings from the market increased by 14.8 percent to Rs 84,800 crore at the end of 2018-19 and its share in the total outstanding liability increased to 74.2 percent from 64.4 percent during the previous year. The State Government has not made any fresh borrowings from the National Small Saving Fund (NSSF) in the last three years. The outstanding liability due to borrowings from the NSSF came down from Rs. 21,450 crore at the end of 2017-18 to Rs 19,630.65 crore at the end of 2018-19.
Table 2.11 : Public Debt Repayment Liabilities (2014-15 to 2019-20)
Rs. crore
Amounts 2014-15 2015-16 2016-17 2017-18 2018-19 2019-20 BE
Discharge of internal debt 2975 3423 3460 3841 6299 6153
Repayment of loans to Centre 634 702 754 813 930 1083
Discharge of other liabilities 25463 34384 46487 36704 54432 34140
Total Repayment 29072 38508 50701 41357 61661 41376
Total Interest Payment 6129 7098 8191 9054 10071 10723
Total Debt Service Burden 35200 45606 58892 50411 71733 52099
Note : Liabilities include receipts and payments of Small Saving and Provident Fund, Reserve Funds and Deposits under Public Accounts of the Government of Bihar.
Source : Finance Accounts, GoB
The repayment liabilities of the State Government for its liabilities in the consolidated fund is shown in Table 2.11. The total debt service burden on the state increased from Rs. 50,411 crore in 2017-18 to Rs 71,733 crore in 2018-19. The repayment towards principle was Rs. 61,661 crore, whereas Rs 10,071 crore was the interest payment in 2018-19. The repayment of principle during 2018-19 was 49 percent higher than the previous financial year. The payment towards the discharge of accumulated internal debt increased by 64 percent in 2018-19.
Table 2.12 shows the detail of the net public debt received by the State Government that could be used for its expenditure. Net debt received as a percentage of total borrowing was only 8.1 percent during 2017-18; however, it has increased to 24.5 percent of total borrowings in 2018-19. Although

43
the repayment of principle increased by 55.4 percent in 2018-19, the increase in net debt receipt for the State Government is on account of increased borrowings and a huge increase in the recoveries of loans and advances. The recoveries of loans and advances increased from Rs 22 crore in 2017-18 to Rs 1825 crore in 2018-19. The budgeted estimate of net public debt for 2019-20 is Rs 9172 crore, which is 37.6 percent of total borrowings.
Table 2.12 : Net Public Debt Received (2014-15 to 2019-20)
(Rs. crore)
Amounts 2014-15 2015-16 2016-17 2017-18 2018-19 2019-20 BE
Gross Central Loans Received 718 818 1512 1399 2534 2685
Internal Debt Received 13199 17565 20065 11771 16134 21736
Total Public Debt Received 13918 18383 21577 13169 18668 24421
Recoveries of Loans and Advances 1493 19 23 22 1825 416
Interest payments 6129 7098 8191 9054 10071 10723
Interest Received 345 584 940 1577 1372 2294
Repayment of Debt 3609 4125 4215 4654 7230 7236
Net Public Debt Received 6018 7763 10135 1061 4565 9172 Net Debt Received as percentage of total borrowing 43.2 42.2 47.0 8.1 24.5 37.6
Source : Finance Accounts, GoB and State Government Budget
2.7 Resource Management
The revenue receipts of the State Government come from both tax and non-tax sources. The tax
revenue consists of its own tax revenues and its share in the divisible pool of taxes and duties of
the Central Government. Similarly, the non-tax revenues consist of the state government’s own
non-tax revenue as well as central grants for plan and non-plan purposes. With the introduction of
the Goods and Services Tax (GST) in July 2017, many of the central and state taxes have been
replaced by GST, which has three components — SGST, CGST and IGST.
The GST has subsumed the Sales Tax/ VAT on all items (except for petroleum, petroleum products
and alcohol), Taxes on Goods and Passengers, State Excise (except for alcohol), Entertainment
Tax, Luxury Tax, Tax on Lottery, and Tax on Advertisement. In Bihar, the State Government does
not receive any revenue from sales of alcohol, since prohibition was implemented in the state. All
these taxes were hitherto being collected by the Commercial Taxes Department, which now
collects the GST in place of these taxes.
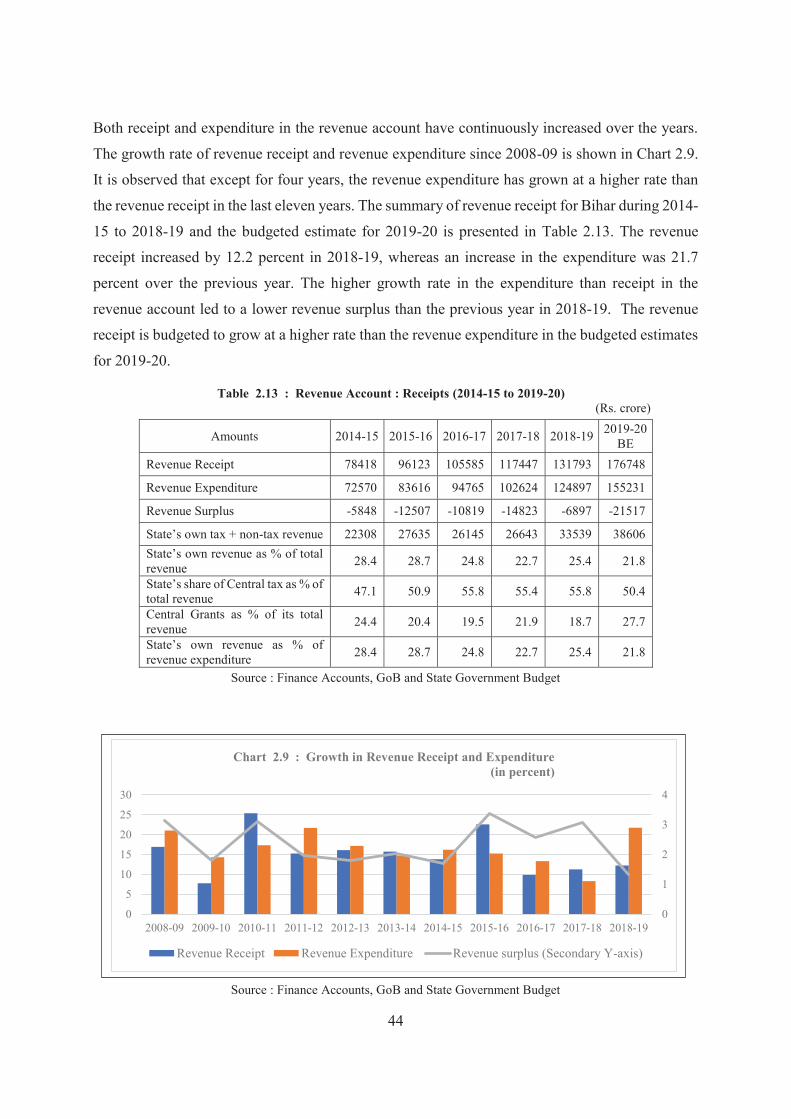
44
Both receipt and expenditure in the revenue account have continuously increased over the years.
The growth rate of revenue receipt and revenue expenditure since 2008-09 is shown in Chart 2.9.
It is observed that except for four years, the revenue expenditure has grown at a higher rate than
the revenue receipt in the last eleven years. The summary of revenue receipt for Bihar during 2014-
15 to 2018-19 and the budgeted estimate for 2019-20 is presented in Table 2.13. The revenue
receipt increased by 12.2 percent in 2018-19, whereas an increase in the expenditure was 21.7
percent over the previous year. The higher growth rate in the expenditure than receipt in the
revenue account led to a lower revenue surplus than the previous year in 2018-19. The revenue
receipt is budgeted to grow at a higher rate than the revenue expenditure in the budgeted estimates
for 2019-20.
Table 2.13 : Revenue Account : Receipts (2014-15 to 2019-20) (Rs. crore)
Amounts 2014-15 2015-16 2016-17 2017-18 2018-19 2019-20 BE
Revenue Receipt 78418 96123 105585 117447 131793 176748
Revenue Expenditure 72570 83616 94765 102624 124897 155231
Revenue Surplus -5848 -12507 -10819 -14823 -6897 -21517
State’s own tax + non-tax revenue 22308 27635 26145 26643 33539 38606 State’s own revenue as % of total revenue 28.4 28.7 24.8 22.7 25.4 21.8
State’s share of Central tax as % of total revenue 47.1 50.9 55.8 55.4 55.8 50.4
Central Grants as % of its total revenue 24.4 20.4 19.5 21.9 18.7 27.7
State’s own revenue as % of revenue expenditure 28.4 28.7 24.8 22.7 25.4 21.8
Source : Finance Accounts, GoB and State Government Budget
Source : Finance Accounts, GoB and State Government Budget
0
1
2
3
4
0
5
10
15
20
25
30
2008-09 2009-10 2010-11 2011-12 2012-13 2013-14 2014-15 2015-16 2016-17 2017-18 2018-19
Chart 2.9 : Growth in Revenue Receipt and Expenditure (in percent)
Revenue Receipt Revenue Expenditure Revenue surplus (Secondary Y-axis)

45
The share of the state’s own revenue, both tax and non-tax, increased in 2018-19, after observing a decline in the previous two financial years. The state’s own revenue was 25.4 percent of the total revenue in 2018-19. In 2015-16, this ratio was 28.7 percent, but it has steadily declined during the last three years. Therefore, the State Government depends heavily on its share in central taxes and grant from the Central Government along with the borrowings to finance its expenditure. the revenue receipt from the state’s share in the central taxes was 55.8 percent in 2018-19. It has remained almost the same during last three years. The share of central grants in the revenue receipt has declined to 18.7 percent in 2018-19 from 24.4 percent in 2014-15. The pattern of transfer of resources form the Central Government to Bihar is shown in Table 2.14. The gross transfer of resources includes the State Government's share in central taxes, grants-in-aid from the Central Government, as well as loans from the Central Government. The net transfer of resources from centre to the state increased from Rs 56,194 crore in 2014-15 to Rs 99,858 crore in 2018-19 and is budgeted to be Rs 1,39,743 crore in 2019-20. The Grant-in-Aid from the Central Government was Rs 24,652 crore in 2018-19, which is Rs 1068 crore lower than in the previous year. The resource transfer as a loan from the Central Government to Bihar increased from Rs 85 crore in 2014-15 to Rs 1603 crore in 2018-19. The net transfer from the Central Government was 59.3 percent of the total expenditure of the state in 2014-15, and it has increased to 64.6 percent in 2018-19. The own resources of the State Government were able to finance 21.7 percent of the total expenditure in 2018-19.
Table 2.14 : Transfer of Resources from Central Government (2014-15 to 2019-20)
(Rs Crore)
Amounts 2014-15 2015-16 2016-17 2017-18 2018-19 2019-20 BE
Aggregate Disbursements 94698 112328 126302 136427 154655 200501
Share in Central Tax 36963 48923 58881 65083 73603 89122
Grants-in-Aid from Centre 19146 19566 20559 25720 24652 49019
Gross Loans from Centre 718 818 1512 1399 2534 2685
Gross transfer of Resources 56828 69306 80951 92202 100789 140826
Net Loans from Centre 85 116 758 586 1603 1602
Net Transfer of Resources 56194 68604 80197 91390 99858 139743
Own Tax + Non-tax Revenue 22308 27635 26145 26643 33539 38606 Net transfer to total expenditure ratio (percent) 59.3 61.1 63.5 67.0 64.6 69.7
Own resources to total expenditure ratio (percent) 23.6 24.6 20.7 19.5 21.7 19.2
Source : Finance Accounts, GoB and State Government Budget

46
Source : Finance Accounts, GoB
Table 2.15 shows the state’s own tax-GSDP ratio of the different states for 2017-18. Own tax revenue as a percentage of GSDP ratio for Bihar was the lowest among all the states in 2017-18, whereas the total revenue as a share of GSDP was the highest among the states in the same year. However, it should be noted that the high revenue-GSDP ratio for the state was partly due to lower GSDP of the state compared to its size of the population. Thus, the per capita fiscal space for the state remains much lower compared to the other states. The own tax receipt as a percentage of GSDP for Bihar increased from 4.5 percent in 2007-08 to 4.8 percent in 2017-18. However, it remains lower than the ratio of 6.8 percent in 2015-16 (Chart 2.10).
Table 2.15 : Tax : GSDP Ratio of States (2017-18)
State Revenue Receipts
(Rs. crore)
State's Own Tax
(Rs. crore)
GSDP (Rs. crore)
State’s Own Tax: Revenue Receipts
State's Own Tax:
GSDP
Total Revenue:
GSDP
Bihar 1,17,447 29708 4,84,740 25.3 4.8 24.2 Jharkhand 52,756 14488 2,76,243 27.5 5.2 19.1 West Bengal 1,31,270 57701 9,99,585 44.0 5.8 13.1 Odisha 85,204 31070 4,36,374 36.5 7.1 19.5 Uttar Pradesh 2,78,776 109605 13,76,324 39.3 8.0 20.3 Madhya Pradesh 1,34,875 49943 7,28,242 37.0 6.9 18.5 Rajasthan 1,27,307 54342 8,35,558 42.7 6.5 15.2 Maharashtra 2,43,654 171686 24,11,600 70.5 7.1 10.1 Gujarat 1,23,291 73646 13,14,680 59.7 5.6 9.4 Punjab 53,010 31496 4,79,141 59.4 6.6 11.1 Haryana 62,695 41836 6,26,054 66.7 6.7 10.0 Karnataka 1,47,000 90335 13,50,257 61.5 6.7 10.9 Andhra Pradesh 1,05,062 52414 8,09,547 49.9 6.5 13.0 Kerala 83,020 48160 7,00,532 58.0 6.9 11.9 Tamil Nadu 1,46,280 96472 14,61,841 66.0 6.6 10.0 Himachal Pradesh 27,367 7593 1,40,613 27.7 5.4 19.5 Chhattisgarh 59,647 21989 2,84,194 36.9 7.7 21.0
Source : State Governments’ Budgets
4.5 4.35.0 4.8 5.1
5.86.3 6.1
6.85.6
4.85.7
0.01.02.03.04.05.06.07.08.0
2007-08
2008-09
2009-10
2010-11
2011-12
2012-13
2013-14
2014-15
2015-16
2016-17
2017-18
2018-19
Chart 2.10 : State’s Own Tax Receipts / GSDP (%)
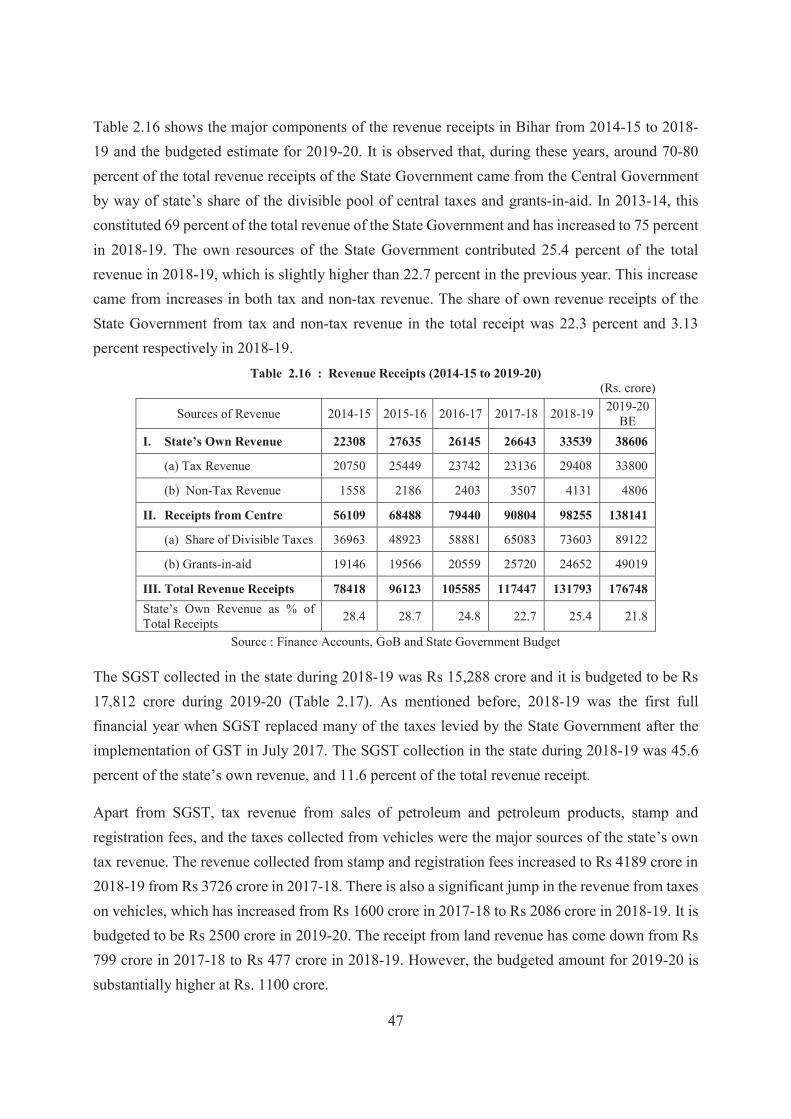
47
Table 2.16 shows the major components of the revenue receipts in Bihar from 2014-15 to 2018-19 and the budgeted estimate for 2019-20. It is observed that, during these years, around 70-80 percent of the total revenue receipts of the State Government came from the Central Government by way of state’s share of the divisible pool of central taxes and grants-in-aid. In 2013-14, this constituted 69 percent of the total revenue of the State Government and has increased to 75 percent in 2018-19. The own resources of the State Government contributed 25.4 percent of the total revenue in 2018-19, which is slightly higher than 22.7 percent in the previous year. This increase came from increases in both tax and non-tax revenue. The share of own revenue receipts of the State Government from tax and non-tax revenue in the total receipt was 22.3 percent and 3.13 percent respectively in 2018-19.
Table 2.16 : Revenue Receipts (2014-15 to 2019-20) (Rs. crore)
Sources of Revenue 2014-15 2015-16 2016-17 2017-18 2018-19 2019-20 BE
I. State’s Own Revenue 22308 27635 26145 26643 33539 38606
(a) Tax Revenue 20750 25449 23742 23136 29408 33800
(b) Non-Tax Revenue 1558 2186 2403 3507 4131 4806
II. Receipts from Centre 56109 68488 79440 90804 98255 138141
(a) Share of Divisible Taxes 36963 48923 58881 65083 73603 89122
(b) Grants-in-aid 19146 19566 20559 25720 24652 49019
III. Total Revenue Receipts 78418 96123 105585 117447 131793 176748 State’s Own Revenue as % of Total Receipts 28.4 28.7 24.8 22.7 25.4 21.8
Source : Finance Accounts, GoB and State Government Budget
The SGST collected in the state during 2018-19 was Rs 15,288 crore and it is budgeted to be Rs 17,812 crore during 2019-20 (Table 2.17). As mentioned before, 2018-19 was the first full financial year when SGST replaced many of the taxes levied by the State Government after the implementation of GST in July 2017. The SGST collection in the state during 2018-19 was 45.6 percent of the state’s own revenue, and 11.6 percent of the total revenue receipt.
Apart from SGST, tax revenue from sales of petroleum and petroleum products, stamp and registration fees, and the taxes collected from vehicles were the major sources of the state’s own tax revenue. The revenue collected from stamp and registration fees increased to Rs 4189 crore in 2018-19 from Rs 3726 crore in 2017-18. There is also a significant jump in the revenue from taxes on vehicles, which has increased from Rs 1600 crore in 2017-18 to Rs 2086 crore in 2018-19. It is budgeted to be Rs 2500 crore in 2019-20. The receipt from land revenue has come down from Rs 799 crore in 2017-18 to Rs 477 crore in 2018-19. However, the budgeted amount for 2019-20 is substantially higher at Rs. 1100 crore.

48
Table 2.17 : Tax Revenues under Different Heads (2014-15 to 2019-20)
Source of Revenue (Rs crore) 2014-15 2015-16 2016-17 2017-18 2018-19 2019-20 BE
SGST - - - 6747 15288 17812
Taxes on Sales, Trade, etc. 8607 10603 11874 8298 6584 7150
Taxes on Goods and Passengers 4451 6087 6246 1645 399 50
State Excise 3217 3142 30 -3 -10 0
Stamp and Registration Fees 2699 3409 2982 3726 4189 4700
Taxes on Vehicles 964 1081 1257 1600 2086 2500
Land Revenue 277 695 971 779 477 1100
Taxes & Duties on Electricity 375 298 224 239 269 350
Other Taxes/ Duties on Comm. and Services 105 69 81 20 1 0
Other taxes on Income & Expenditure 55 65 79 87 125 138
Others 160 134 160 107 126 138
Total 20750 25449 23742 23136 29408 33800
Source : Finance Accounts, GoB and State Government Budget
Table 2.18 presents the share of direct and indirect taxes in own tax revenue of the State Government. The direct taxes are usually structured to be progressive in nature. However, indirect taxes can also be designed to be a progressive tax. The share of direct taxes in own tax revenue of Bihar was only 21.1 percent in 2014-15, but it has increased to 24.3 percent in 2018-19. Correspondingly, the share of indirect taxes in 2018-19 was 75.7 percent.
Table 2.18 : Share of Direct and Indirect Taxes (2014-15 to 2019-20)
Source 2014-15 2015-16 2016-17 2017-18 2018-19 2019-20 BE
Share of Indirect Taxes in State’s Own Tax Revenue (%) 78.9 78.2 76.8 72.2 75.7 74.0
Share of Direct Taxes in State’s Own Tax Revenue (%) 21.1 21.8 23.2 27.8 24.3 26.0
Total 100.0 100.0 100.0 100.0 100.0 100.0 Source : Finance Accounts, GoB and State Government Budget and Calculation
The revenue from major sources of non-tax revenue in the state is presented in Table 2.19. The revenue from interest receipts and non-ferrous mining and metallurgical industries are major contributors in the own non-tax revenue of the state. The revenue from interest receipt was Rs 1372 crore in 2018-19, which is lower than Rs 1577 crore in 2017-18. It had continuously increased during 2012-13 to 2017-18 from Rs 167 crore to Rs 1577 crore. It is projected to be Rs 2294 crore in the budgeted estimate for 2019-20.

49
The revenue from the non-ferrous mining and metallurgical industries has increased by 44.1 percent to Rs 1,561 crore in 2018-19 over the previous year. However, over the years, the growth rate of the revenue from non-ferrous mining and metallurgical industries has come down from 54.6 percent in 2014-15 to 44.1 percent in 2018-19 (Table 2.20). The minerals available in the state are all minor minerals that include brick earth, stones, limestone, sand, etc., used mainly in the real estate sector. Hence, the growth in revenue from these minerals is dependent on the increase in the related economic activity.
Table 2.19 : Major Non-Tax Revenues (2014-15 to 2019-20)
(Rs. crore)
Source of Revenue 2014-15 2015-16 2016-17 2017-18 2018-19 2019-20 BE
Non-Ferrous Mining and Metallurgical Industries 880 971 998 1083 1561 1600
Interest Receipts 345 584 940 1577 1372 2294
Miscellaneous General Services 2 1 6 3 4 1
Other Administrative Services 22 73 100 26 47 23
Police 30 66 42 86 30 53
Major Irrigation 1 15 14 22 37 50 Education, Sports, Arts and Culture 11 41 17 21 19 22
Roads and Bridges 55 42 42 67 118 75
Medical and Public Health 30 40 40 55 67 55 Other Rural Development Programmes 29 24 36 49 62 15
Social Security and Welfare 0 0 0 0 0 0 Others 154 328 168 518 814 620
Total 1558 2186 2403 3507 4131 4806
Source : Finance Accounts, GoB and State Government Budget
Table 2.20 : Growth Rates of Non-Tax Revenues (2014-15 to 2019-20) (Percent)
Source of Revenue Yearly Growth Rates CAGR
(2014-19) 2014-15 2015-16 2016-17 2017-18 2018-19 2019-20 BE
Non-Ferrous Mining and Metallurgical Industries 54.6 10.4 2.7 8.5 44.1 2.5 13.7
Interest Receipts 27.9 69.3 61.0 67.8 -13.0 67.2 43.2
Miscellaneous General Services 611.0 -48.3 512.0 -45.2 8.2 -82.8 -6.7
Other Administrative Services 113.9 233.5 37.6 -74.1 81.1 -51.7 -6.8
Other non-Tax Revenues -55.5 79.9 -35.5 127.7 40.4 -22.5 26.6
Total 0.9 40.3 9.9 45.9 17.8 16.4 25.4
Source : Finance Accounts, GoB and State Government Budget

50
The own tax revenue as a percentage of GSDP was 5.7 percent in 2018-19 in Bihar, which is higher than the 4.8 percent in the previous year (Table 2.21). The own non-tax revenue was only 0.8 percent of the GSDP in 2018-19. Buoyancies for total revenue and own tax revenue to GSDP has been volatile in recent years, indicating no trend. In 2018-19, both these buoyancies were, however, high — 1.9 for total revenue and 4.3 for own tax revenue. As regards individual tax heads, the buoyancies are again volatile, as evident from Table 2.22.
The buoyancy ratio for individual tax heads and non-tax revenue from own sources is shown in Table 2.22. These buoyancy ratios have remained volatile. This ratio for taxes on vehicles and tax revenue from non-ferrous minerals has always remained positive in recent years. This highlights their contribution to revenue collection as the GSDP of the state grows. At the same time, there remains a challenge to improve these buoyancy ratios to GSDP.
Table 2.21 : Tax and Non-tax Revenue as Percentage of GSDP (2014-15 to 2019-20)
Indicators 2014-15 2015-16 2016-17 2017-18 2018-19 2019-20 BE
Own Tax Revenue as % of GSDP 6.1 6.8 5.6 4.8 5.7 5.9 Own Non-Tax Revenue as % of GSDP 0.5 0.6 0.6 0.7 0.8 0.8
Total Revenue as % of GSDP 22.9 25.9 25.0 24.2 25.6 30.9 Buoyancy of Total Revenue w.r.t. GSDP (Ratio) 1.7 2.7 0.7 0.8 1.9 3.1
Buoyancy of State’s Own Taxes w.r.t. GSDP (Ratio) 0.5 2.7 -0.5 -0.2 4.3 1.3
Source : Finance Accounts, GoB and State Government Budget
Table 2.22 : Buoyancy of Important Tax and Non-Tax Revenue Sources (2014-15 to 2019-20)
Source of Revenue 2014-15 2015-16 2016-17 2017-18 2018-19 2019-20 BE
Taxes on Sales, Trade (SGST) 0.2 2.8 0.9 -2.0 -3.2 0.8
Stamp Duty and Registration Fees -0.1 3.1 -0.9 1.7 1.9 1.1
Taxes on Vehicles 1.8 1.5 1.2 1.8 4.8 1.8
Land Revenue 4.6 18.1 2.9 -1.3 -6.1 11.8
Taxes & Duties on Electricity 20.3 -2.5 -1.8 0.5 2.0 2.7
Total Tax Revenue 0.7 3.5 0.8 0.5 2.6 1.7
Non Ferrous Minerals 6.7 1.2 0.2 0.6 6.9 0.2
Interest Receipts 3.4 8.3 4.5 4.6 -2.0 6.1
Total Non Tax Revenue 0.1 4.8 0.7 3.1 2.8 1.5
Source : Finance Accounts, GoB and State Government Budget
The taxes collected by the Commercial Tax Department of Bihar is shown in Table 2.23. There was a structural shift in the way the department collects taxes after implementation of the GST when a set of taxes were subsumed under the GST. The share of commercial taxes in total revenue is shown in Table 2.24. This share has remained around 17-18 percent during 2014-15 to 2018-19.

51
Table 2.23 : Act-wise Commercial Tax Collection (2014-15 to 2018-19)
(Rs. crore) Year VAT CST ENT. ED ADV HLT ET PT Total
2014-15 8796 71 46 373 1 11 4406 55 13758
2015-16 10726 60 55 297 1 11 6162 66 17378
2016-17 11908 70 70 226 1 11 6389 77 18751
2017-18 A 1893 13 13 29 0 1 877 4 2832
2017-18 B 6438 43 4 208 0 2 879 84 7658
2018-19 6802 26 14 280 0 0 472 127 7722
Note : 1) 2017-18 A refers to April-June, 2017. Next, 2017-18 B refers to July, 2017 to March, 2018. 2.) VAT: Value Added Tax, ENT: Entertainment Tax, ED: Electricity Duty, ADV: Advertisement Tax, HLT: Taxation on Luxuries in Hotel, ET: Tax on Entry of Goods into Local Area for Consumption, Use or Sale therein, PT: Tax on Professions, Trades, Calling and Employment Act
Source : Department of Commercial Tax
Table 2.24 : Share of Commercial Taxes in Total Revenue (2014-15 to 2018-19)
Amounts 2014-15 2015-16 2016-17 2017-18 2018-19
Total Revenue of State (Rs. crore) 78418 96123 105585 117447 131793
State’s Own Tax Revenues (Rs. crore) 20750 25449 23742 23136 29408
Revenue from Commercial Taxes (Rs. crore) 13758 17378 18751 20277 23013
Share of Commercial Taxes in Total Revenue (%) 17.5 18.1 17.8 17.3 17.5
Share of Commercial Taxes in State’s Own Taxes (%) 66.3 68.3 79.0 87.6 78.3
Source : Department of Commercial Taxes, GoB
The collection against SGST and IGST by the State Government is reported in Table 2.25. The
SGST and IGST revenue collected by the state was Rs 17,861 crore in 2018-19. The share of
SGST, IGST and the SGST grant in the total collection are shown in Chart 2.11. The revenue from
IGST was about 58 percent of the total revenue collected from GST for the state. The monthly
collection of the GST for the state from April 2018 to August 2019 is presented in Table 2.26.
Table 2:25 : Collection against State GST and Integrated GST (2017-18 and 2018-19)
(Rs crore)
Year SGST IGST
IGST Settlement (Advance/ Ad-hoc)
SGST Grant Total
2017-18 (July 17 to March 18) 2362.90 3831.95 552.00 3041.00 9787.85
2018-19 4871.60 8368.06 2051.16 2571.00 17861.82
Source : Department of Commercial Taxes, GoB

52
Source : Department of Commercial Taxes, GoB
Table 2.26 : Collection against SGST and IGST (April, 2018 to August, 2019)
(Rs crore)
SGST IGST
IGST Settlement (Advance/ Ad-hoc)
SGST Grant Total
Apr-18 422.07 598.09 1020.16
May-18 336.25 618.25 99.00 1053.50
Jun-18 362.69 719.08 789.00 1870.77
Jul-18 390.93 737.12 325.00 1453.05
Aug-18 360.87 704.91 1065.78
Sep-18 369.86 665.89 189.00 633.00 1857.75
Oct-18 394.50 771.15 473.45 1639.10
Nov-18 400.85 709.59 498.00 1608.44
Dec-18 388.06 706.19 284.07 1378.32
Jan-19 452.87 740.33 508.00 1701.20
Feb-19 437.40 702.68 1140.08
Mar-19 555.25 694.78 315.64 508.00 2073.67
Apr-19 563.01 797.21 189.38 1549.60
May-19 464.64 721.15 326.00 1511.79
Jun-19 485.99 874.21 1360.20
July-19 530.67 904.8 236.47 568.00 2239.94
Aug-19 454.67 719.35 739.00 1913.02
Source : Department of Commercial Taxes, GoB
Table 2.27 presents revenue from Stamp Duty and Registration Fees collected during 2014-15 to 2018-19. The revenue collected from this source has increased from Rs 2855 crore to Rs 4441 crore during 2014-15 to 2018-19. Out of the total revenue of Rs 4441 crore in 2018-19, Rs 3425 crore was from Stamp Duty, whereas Rs 1016 crore was from Registration Fees.
GST27%
IGST58%
SGST Grant15%
Chart 2.11 : Share of collections from GST in 2018-19

53
Table 2.27 : Revenue from Stamp Duty and Registration Fees (2014-15 to 2018-19)
(Rs crore)
Source of Revenue 2014-15 2015-16 2016-17 2017-18 2018-19
From Printed Non-judicial stamps 330 391 339 410 417 From Non-judicial stamp duty deposited through Bank challan 1750 2024 2064 2436 2896
Non-Judicial adhesive stamps 30 32 26 34 38 Non-Judicial special adhesive stamp – through Franking machines 18 20 17 20 25
Revenue Stamps 2 2 2 2 3
Judicial Stamps 37 40 37 43 46
Sub-Total 2167 2508 2485 2945 3425
Fees on registration of instruments 646 741 730 832 965
Landlord’s Registration fee 31 34 31 36 39
Landlord’s Processing fee 4 5 4 4 5 Fee from searches of records & Non-Encumbrances 5 5 5 5 5
Fee from certified copies 2 2 2 2 2
Sub-Total 688 787 772 879 1016
Total 2855 3295 3257 3824 4441 Source : Department of Prohibition, Excise and Registration, GoB
The district-wise revenue collection from Stamp Duty and Registration Fees in 2018-19, along with target and its achievement, is reported in Table 2.28. Bhagalpur was the best performing district in terms of achieving the target of the revenue, with 99.8 percent of the target being achieved. Jehanabad with 77.6 percent achievement was at the bottom. Patna and Muzaffarpur were the top two districts in contributing revenue from this source with the collection of Rs 815.78 crore and Rs. 227.62 crore respectively. Arwal and Sheohar could contribute only Rs 15.84 crore and Rs. 17.42 crore respectively and were at the bottom among all the districts in the state.
The cost of collection of major taxes in the state is shown in Table 2.29. The cost of collection of taxes has come down over the years in the state. Among the four categories of taxes listed in the table, the highest cost of collection is for taxes on vehicles. However, it has also come down to 2.7 percent in 2018-19 from 4.0 percent in 2014-15.
A comparison of the budgeted estimate and actual realisation of tax and non-tax revenue in the state is shown in Table 2.30. The shortfall in total revenue from the budgeted estimate was of Rs 1909 crore, which is 5.7 percent of the budgeted estimate. It is an improvement over the shortfall of 23.6 percent observed in 2017-18. The major sources of the revenue that missed the budgeted target during 2018-19 are — Taxes on Sales, Trade, etc., Stamp and Registration Fees, and Land Revenue in the tax category, and interest receipt in the non-tax revenue category.

54
Table 2.28 : District-wise Revenue from Stamp Duty and Registration Fees (2018-19)
(Rs crore)
District No. of Document
Total Receipt
(Registration and Stamp
Fee)
Target % receipt against target
Receipt per Document
(Rs.)
Patna 86367 815.78 932.00 87.53 94455 Nalanda 31229 105.86 123.00 86.07 33898 Bhojpur 30225 133.43 136.00 98.11 44146 Buxar 15724 58.20 66.00 88.18 37013 Rohtas 29218 117.41 134.00 87.62 40184 Kaimur 17477 47.69 49.00 97.33 27287 Gaya 41840 180.57 200.00 90.29 43157 Jehanabad 9501 36.46 47.00 77.57 38375 Arwal 6322 15.84 20.00 79.20 25055 Nawada 21586 58.49 66.00 88.62 27096 Aurangabad 24482 99.42 110.00 90.38 40609 Saran 36391 103.53 128.00 80.88 28449 Siwan 37349 110.42 128.00 86.27 29564 Gopalganj 30917 99.38 117.00 84.94 32144 W. Champaran 47526 110.26 118.00 93.44 23200 E. Champaran 64173 193.67 225.00 86.08 30179 Muzaffarpur 56235 227.62 264.00 86.22 40477 Sitamarhi 40764 113.77 123.00 92.50 27909 Sheohar 8078 17.42 19.00 91.68 21565 Vaishali 40414 142.67 158.00 90.30 35302 Darbhanga 37920 131.40 140.00 93.86 34652 Madhubani 50492 112.69 127.00 88.73 22318 Samastipur 50988 122.06 140.00 87.19 23939 Begusarai 26775 110.72 128.00 86.50 41352 Munger 8063 42.95 49.00 87.65 53268 Sheikhpura 8764 20.45 21.00 97.38 23334 Lakhisarai 9170 32.86 38.00 86.47 35834 Jamui 16390 36.43 42.00 86.74 22227 Khagaria 12666 37.05 41.00 90.37 29252 Bhagalpur 28073 182.59 183.00 99.78 65041 Banka 20041 44.35 51.00 86.96 22130 Saharsha 20371 62.69 71.00 88.30 30774 Supaul 19184 48.24 61.00 79.08 25146 Madhepura 21378 55.56 66.00 84.18 25989 Purnea 40963 122.69 136.00 90.21 29951 Kishanganj 28631 51.17 58.00 88.22 17872 Araria 35657 68.97 81.00 85.15 19343 Katihar 40947 96.03 104.00 92.34 23452 Total 1152291 4166.79 4700.00 88.66 1265938
Source : Department of Prohibition, Excise and Registration, GoB

55
Table 2.29 : Cost of Collection of Taxes (2014-15 to 2018-19)
Year Collection (Rs. crore)
Expenditure on
collection (Rs. crore)
Cost as Percentage
of Collection
Collection (Rs. crore)
Expenditure on
collection (Rs. crore)
Cost as Percentage
of Collection
SGST & Taxes on Sales / Trade, etc. Stamp duty and registration fee 2014-15 8607 96 1.1 2699 52 1.9 2015-16 10603 90 0.8 3409 55 1.6 2016-17 11874 117 1.0 2982 48 1.6 2017-18 8298 72 0.9 3726 54 1.4 2018-19 6584 0 0.0 4189 65 1.5 Taxes on Vehicles State Excise 2014-15 964 38 4.0 3217 50 1.6 2015-16 1081 40 3.7 3142 50 1.6 2016-17 1257 46 3.7 -30 92 — 2017-18 1600 62 3.9 -3 82 — 2018-19 2086 56 2.7 -10 98 —
Source : Finance Accounts, GoB
Table 2.30 : Variation between the Estimated and Actual Realisation of Tax and Non-Tax Revenue (2018-19)
(Rs crore)
Source of Revenue Budget Estimate Actuals
Variation (Excess (-), Shortfall +)
% Variation
Excess (-), Shortfall (+)
Own Tax Revenue SGST/ Taxes on Sales, Trade, etc./ Taxes on Goods and Passengers 15000 15288.06 -288.059 -1.88
Taxes on Sales, Trade, etc. 7890 6584 1306 19.8 Taxes on Goods and Passengers 0 399 -399 -100 State Excise 0 -10 10 -100 Stamp and Registration Fees 4700 4189 511 12.2 Taxes on Vehicles 2000 2086 -86 -4.1 Land Revenue 1000 477 523 109.7 Taxes & Duties on Electricity 310 269 41 15.2 Other Taxes and Duties on Commodities and Services 102 126 -24 -19.2
Total 31002 29408 1594 5.4 Own Non Tax Revenue Non-Ferrous Mining and Metallurgical Industries 1600 1561 39 2.5
Interest Receipts 2187 1372 815 59.4 Miscellaneous General Services 0 4 -4 -100 Other Administrative Services 20 47 -27 -57.1 Police 46 30 16 51.9 Major Irrigation 50 37 13 35.4 Education, Sports, Arts and Culture 18 19 -1 -6.8 Roads and Bridges 72 118 -46 -38.8 Medical and Public Health 47 67 -20 -29.5 Other Rural Development Programmes 36 62 -26 -41.7 Social Security and Welfare 0 0 0 -74.5 Others 369 814 -445 -54.7 Total 4446 4131 315 7.6 Grant Total 35448 33539 1909 5.7
Source : Finance Accounts, GoB and State Government Budget
56
2.8 Expenditure Management
The expenditure of the State Government from the consolidated fund under various heads for the period 2014-15 to 2018-19 and the budgeted estimate for 2019-20 is shown in Table 2.31. Next, Tables 2.32 presents the percentage distribution of the total expenditure under major heads. Thereafter, Table 2.33 presents the year-to-year growth rates of expenditure. There are three major functional categories of the State Government expenditure - General Services, Social Services and Economic Services. Apart from revenue expenditure and capital outlay on these three major services, the other areas of spending by the State Government are — repayment of loans on the capital account and grants to local bodies and autonomous institutions. The State Government also gives loans for various purposes to its Public Sector Undertakings, Urban Local Bodies, Panchayati Raj Institutions, and to its own employees. It is to be noted that while the repayments of principal amounts of loans are made from the capital account, the interest payment is made from the revenue account, under the General Services. The social and economic services, essential for the development of the state, constitute a major share of the expenditure in Bihar, reflecting the State Government’s commitment for overall development. In 2018-19, the total expenditure on General Services, Social Services and Economic Services increased to Rs 38,691 crore, Rs 58,284 crore and Rs 27,918 crore respectively. The growth rates observed in expenditure under these heads over the previous year are 15.9 percent, 27.3 percent and 18.9 percent, respectively. This has led to an increase in their share in total expenditure to 25.0 percent, 37.7 percent and 18.1 percent, respectively. The capital outlay decreased by 27.2 percent in 2018-19. Its share in total expenditure has come down from 21.2 percent in 2017-18 to 13.6 percent 2018-19. It might be noted here that, between 2014-15 and 2017-18, although the capital outlay has always increased, the year-to-year growth rate has steadily decreased. For analysing the structure of expenditure by the State Government, Table 2.34 presents its percentage composition in revenue and capital account and some sub-heads under both of them. In the capital account, the share of the developmental capital expenditure has come down from 20.6 percent to 13.6 percent during the last two years. Also, the share of capital outlay (General Public Works, Social and Economic Services) has declined from 20.4 percent (2017-18) to 12.6 percent (2018-19) Correspondingly, the share of non-developmental capital expenditure increased from 4.2 percent to 5.7 percent during the last two years. Realising the role of capital expenditure in economic development, the share of capital expenditure is projected to increase to 22.6 percent in the budgeted estimate for 2019-20.

57
The expenditure on the discharge of public debt increased to Rs 7230 crore in 2018-19, from Rs 4654 crore in 2017-18. It is observed that the State Government has focussed on servicing of the debt in recent years. There is a significant jump in expenditure under the head ‘discharge of public debt’ in 2018-19, which registered an increase of 55.4 percent over the previous year.
Table 2.31 : Expenditure from Consolidated Fund (2014-15 to 2019-20)
(Rs crore)
Expenditure Head 2014-15 2015-16 2016-17 2017-18 2018-19 2019-20 BE
General Services 26408 27972 30607 33374 38691 46146 Social Services 31713 35943 40737 45769 58284 75147 Economic Services 14445 19696 23417 23476 27918 33931 Grants- in-Aid 4 4 4 4 4 6 Capital Outlay 18150 23966 27208 28907 21058 36593 Discharge of Public Debt 3609 4125 4215 4654 7230 7236 Loans and Advances by State 369 621 114 243 1471 1442
Total 94698 112328 126302 136427 154655 200501 Source : Finance Accounts, GoB
Table 2.32 : Composition of Government Expenditure (2014-15 to 2019-20)
(Percentage)
Expenditure Head 2014-15 2015-16 2016-17 2017-18 2018-19 2019-20 BE
General Services 27.9 24.9 24.2 24.5 25.0 23.0 Social Services 33.5 32.0 32.3 33.5 37.7 37.5 Economic Services 15.3 17.5 18.5 17.2 18.1 16.9 Capital Outlay 19.2 21.3 21.5 21.2 13.6 18.3 Discharge of Public Debt 3.8 3.7 3.3 3.4 4.7 3.6 Loans and Advances 0.4 0.6 0.1 0.2 1.0 0.7
Total 100.0 100.0 100.0 100.0 100.0 100.0 Source : Finance Accounts, GoB
Table 2.33 : Growth Rates of Expenditure (2014-15 to 2019-20)
Expenditure Head Annual Growth Rates
2014-15 2015-16 2016-17 2017-18 2018-19 2019-20 BE
General Services 19.9 5.9 9.4 9.0 15.9 19.3
Social Services 20.1 13.3 13.3 12.4 27.3 28.9
Economic Services 2.7 36.4 18.9 0.3 18.9 21.5
Capital Outlay 29.6 32.0 13.5 6.2 -27.2 73.8
Discharge of Public Debt 15.7 14.3 2.2 10.4 55.4 0.1
Loans and Advances -54.3 68.5 -81.7 113.2 505.7 -2.0
Total 17.8 18.6 12.4 8.0 13.4 29.6
Source : Finance Accounts, GoB
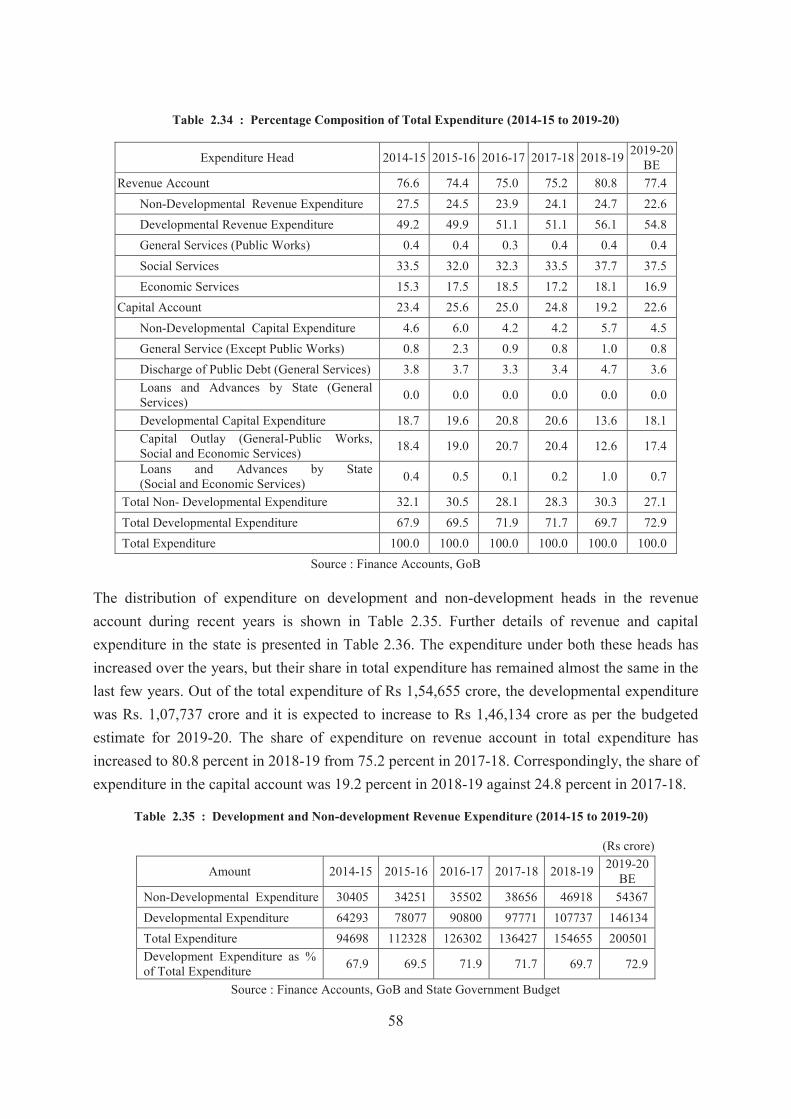
58
Table 2.34 : Percentage Composition of Total Expenditure (2014-15 to 2019-20)
Expenditure Head 2014-15 2015-16 2016-17 2017-18 2018-19 2019-20 BE
Revenue Account 76.6 74.4 75.0 75.2 80.8 77.4 Non-Developmental Revenue Expenditure 27.5 24.5 23.9 24.1 24.7 22.6 Developmental Revenue Expenditure 49.2 49.9 51.1 51.1 56.1 54.8 General Services (Public Works) 0.4 0.4 0.3 0.4 0.4 0.4 Social Services 33.5 32.0 32.3 33.5 37.7 37.5 Economic Services 15.3 17.5 18.5 17.2 18.1 16.9
Capital Account 23.4 25.6 25.0 24.8 19.2 22.6 Non-Developmental Capital Expenditure 4.6 6.0 4.2 4.2 5.7 4.5 General Service (Except Public Works) 0.8 2.3 0.9 0.8 1.0 0.8 Discharge of Public Debt (General Services) 3.8 3.7 3.3 3.4 4.7 3.6 Loans and Advances by State (General Services) 0.0 0.0 0.0 0.0 0.0 0.0
Developmental Capital Expenditure 18.7 19.6 20.8 20.6 13.6 18.1 Capital Outlay (General-Public Works, Social and Economic Services) 18.4 19.0 20.7 20.4 12.6 17.4
Loans and Advances by State (Social and Economic Services) 0.4 0.5 0.1 0.2 1.0 0.7
Total Non- Developmental Expenditure 32.1 30.5 28.1 28.3 30.3 27.1 Total Developmental Expenditure 67.9 69.5 71.9 71.7 69.7 72.9 Total Expenditure 100.0 100.0 100.0 100.0 100.0 100.0
Source : Finance Accounts, GoB
The distribution of expenditure on development and non-development heads in the revenue account during recent years is shown in Table 2.35. Further details of revenue and capital expenditure in the state is presented in Table 2.36. The expenditure under both these heads has increased over the years, but their share in total expenditure has remained almost the same in the last few years. Out of the total expenditure of Rs 1,54,655 crore, the developmental expenditure was Rs. 1,07,737 crore and it is expected to increase to Rs 1,46,134 crore as per the budgeted estimate for 2019-20. The share of expenditure on revenue account in total expenditure has increased to 80.8 percent in 2018-19 from 75.2 percent in 2017-18. Correspondingly, the share of expenditure in the capital account was 19.2 percent in 2018-19 against 24.8 percent in 2017-18.
Table 2.35 : Development and Non-development Revenue Expenditure (2014-15 to 2019-20)
(Rs crore)
Amount 2014-15 2015-16 2016-17 2017-18 2018-19 2019-20 BE
Non-Developmental Expenditure 30405 34251 35502 38656 46918 54367 Developmental Expenditure 64293 78077 90800 97771 107737 146134 Total Expenditure 94698 112328 126302 136427 154655 200501 Development Expenditure as % of Total Expenditure 67.9 69.5 71.9 71.7 69.7 72.9
Source : Finance Accounts, GoB and State Government Budget

59
The revenue expenditure increased by 21.7 percent between 2017-18 and 2018-19, whereas the capital expenditure declined by 12.0 percent (Table 2.36). The major component of the capital expenditure, the capital outlay declined by 27.2 percent during the same period. However, the capital expenditure and capital outlay are estimated to grow at 52.1 percent and 73.8 percent respectively in the budgeted estimate for 2019-20. The ratio of revenue expenditure to total expenditure and GSDP has increased in the last two years. At the same time, the ratio of revenue receipt to total expenditure has declined from 86.1 percent to 85.2 percent. The ratio of revenue receipt to total expenditure is budgeted to increase to 88.2 percent in 2019-20. The buoyancy of the revenue expenditure with respect to the GSDP was higher, compared to the buoyancy for revenue receipts in 2018-19.
Table 2.36 : Revenue and Capital Expenditure (2014-15 to 2019-20)
(Rs crore)
Expenditure Heads 2014-15 2015-16 2016-17 2017-18 2018-19 2019-20 BE
Revenue Expenditure (RE) 72570 83616 94765 102624 124897 155231
Capital Expenditure (CE) 22128 28712 31537 33803 29759 45270
Total Expenditure (TE) 94698 112328 126302 136427 154655 200501
GSDP 342951 371602 422316 484740 515634 572827
Rate of growth of RE (%) 16.2 15.2 13.3 8.3 21.7 24.3
Rate of growth of CE (%) 23.4 29.8 9.8 7.2 -12.0 52.1
Rate of growth of TE (%) 17.8 18.6 12.4 8 13.4 29.6
RE/TE (%) 76.6 74.4 75 75.2 80.8 77.4
TE/GSDP (%) 27.6 30.4 29.9 28.1 30 35
RE/GSDP (%) 21.2 22.6 22.4 21.2 24.2 27.1
Revenue Receipt (RR)/TE (%) 82.8 85.6 83.6 86.1 85.2 88.2
Buoyancy of RE w.r.t. GSDP 1.98 1.97 0.87 0.57 3.41 2.19
Buoyancy of RE w.r.t. RR 1.17 0.67 1.35 0.74 1.78 0.71
Source : Finance Accounts, GoB
The capital outlay in the state has increased from Rs 18,150 crore in 2014-15 to Rs 28,907 crore
in 2017-18 (Table 2.37). However, it declined by 27 percent to Rs 21,058 crore in 2018-19. The
growth rate of the capital outlay has shown a declining trend since 2013-14 and it was negative in
2018-19. This has led to the reduction in the share of capital outlay in the total expenditure of the
state to 13.6 percent (Chart 2.12). The capital outlay is projected to increase to Rs 36,593 crore in
2019-20, which is estimated to be 18.2 percent of the total expenditure as per the budget estimate
for the year.

60
Table 2.37 : Revenue and Capital Outlay (2014-15 to 2019-20) (Rs crore)
Amount 2014-15 2015-16 2016-17 2017-18 2018-19 2019-20 BE
Total Tax Revenue 57713 74372 82623 88220 103011 122922 Own Tax Revenue 20750 25449 23742 23136 29408 33800 Own Non-tax Revenue 1558 2186 2403 3507 4131 4806 Own Tax + Non-tax Revenue 22308 27635 26145 26643 33539 38606 Capital Outlay 18150 23966 27208 28907 21058 36593 Capital Outlay as % of Total Expenditure 19.17 21.34 21.54 21.19 13.62 18.25
Source : Finance Accounts, GoB and State Government Budget
Source : Finance Accounts, GOB
Table 2.38 presents the pattern of interest payment and receipt of the State Government during recent years. The net interest paid by the State Government increased by 16.4 percent in 2018-19 over the previous year. The difference between the Gross and Net interest payment is the interest earned by the State Government during a financial year. This difference increased from Rs 345 crore in 2014-15 to Rs 1577 crore in 2017-18. However, it declined to Rs 1372 crore in 2018-19.
Table 2.38 : Interest Payment and Receipt (2014-15 to 2019-20)
(Rs crore)
Amount 2014-15 2015-16 2016-17 2017-18 2018-19 2019-20 BE
Gross Interest Payment 6129 7098 8191 9054 10071 10723 Net Interest Payment 5784 6514 7251 7477 8699 8430
Source : Finance Accounts, GoB and State Government Budget
Expenditure on Salary and Pension
The expenditure by the State Government on salary and pension has grown by 12.2 percent in 2018-19 over the previous year to reach the level of Rs 35,996 crore (Table 2.39). It was 7.0 percent of the GSDP of the state in 2018-19. The expenditure on both these heads had single-digit growth rates during 2015-16 and 2016-17. The expenditure on pension has grown at a higher rate than the
-40
-20
0
20
40
60
2008-09 2009-10 2010-11 2011-12 2012-13 2013-14 2014-15 2015-16 2016-17 2017-18 2018-19
Chart 2.12 : Capital Outlay in Total Expenditure
Growth in Capital Outlay (%) Capital Outlay as % of Total Expenditure

61
salary expenditure during 2010-11 to 2017-18 (Chart 2.13). However, this trend is expected to reverse in the coming years when the impact of change in the pension scheme for the employees will be reflected in the expenditure. The recent higher growth on these two heads is the outcome of an increase in salary and pension as per the Pay Commission recommendations. The expenditure on salary and pension is 28.8 percent of the total revenue expenditure. This share has gradually come down over the years, from 35.8 percent in 2014-15 to 28.8 percent in 2018-19. The expenditure on salary as a share of total expenditure has also come down from 20.1 percent to 16.0 percent between 2014-15 and 2018-19. Simultaneously, the share of expenditure on pension has come down from 15.6 percent to 12.8 percent.
Table 2.39 : Expenditure on Salaries and Pensions (2014-15 to 2018-19)
Head 2014-15 2015-16 2016-17 2017-18 2018-19
Expenditure on Salaries (Rs crore) 14607 14924 15784 17779 19968
Rate of Growth (%) 4.07 2.17 5.76 12.64 12.32
Salary as percentage of GSDP 4.3 4 3.7 3.6 3.9
Salary as percentage of RR 18.6 15.5 14.9 15.1 15.2
Salary as percentage of RE 20.1 17.8 16.7 17.3 16
Expenditure on Pensions (Rs crore) 11345 11850 12508 14293 16027
Rate of Growth (%) 19.6 4.5 5.5 14.3 12.1
Pension as percentage of GSDP 3.3 3.2 2.9 2.9 3.1
Pension as percentage of RR 14.5 12.3 11.8 12.2 12.2
Pension as percentage of RE 15.6 14.2 13.2 13.9 12.8
Total expenditure on Salary & Pension (Rs crore) 25952 26774 28292 32072 35996
Rate of Growth (%) 10.35 3.17 5.67 13.36 12.23
Total as percentage of GSDP 7.6 7.2 6.6 6.6 7.0
Total as percentage of RR 33.1 27.9 26.8 27.3 27.3
Total as percentage of RE 35.8 32 29.9 31.3 28.8
Source : Finance Accounts, GoB
0
10
20
30
40
50
2008-09 2009-10 2010-11 2011-12 2012-13 2013-14 2014-15 2015-16 2016-17 2017-18 2018-19
Chart 2.13 : Growth in Expenditure on Salary and Pension
Growth in salary Growth in pension

62
Sectoral Expenditure
Expenditure on Social Services
The expenditure on various heads under social services in the state is shown in Table 2.40. The total expenditure on social services increased by 24.6 percent to Rs 62,346 crore in 2018-19. This is a substantial increase compared to the previous years. The growth rate in the expenditure on social services in 2017-18 and 2016-17 was 12.9 percent and 14.6 percent respectively. It is budgeted to grow at 32.8 percent in 2019-20.
Table 2.40 : Expenditure on Social Services (2014-15 to 2019-20)
Expenditure Head 2014-15 2015-16 2016-17 2017-18 2018-19 2019-20 BE
Education, Sports, Arts & Culture
Total Expenditure (Rs. crore) 16531 19155 20226 24833 28080 35942
Revenue Expenditure (Rs. crore) 16267 18605 19152 23315 27024 34458
(a) Salary component (%) 30 24 22.8 20.4 18.8 17.3
(b) Non-salary component (%) 70 76 77.2 79.6 81.2 82.7
Capital Outlay (Rs. crore) 263 550 1074 1519 1056 1484
Capital Outlay (%) 1.6 2.9 5.3 6.1 3.8 4.1
Health and Family Welfare
Total Expenditure (Rs. crore) 3604 4571 5493 6182 7318 9157
Revenue Expenditure (Rs. crore) 3288 3481 4622 5617 6172 7216
(a) Salary component (%) 48.6 52.6 48.3 46.9 49.1 50.2
(b) Non-salary component (%) 51.4 47.4 51.7 53.1 50.9 49.8
Capital Outlay (Rs. crore) 316 1091 870 565 1146 1941
Capital Outlay (%) 8.8 23.9 15.8 9.1 15.7 21.2
Water Supply, Sanitation, Housing and Urban Development
Total Expenditure (Rs. crore) 4542 4518 8786 7609 15638 20744
Revenue Expenditure (Rs. crore) 3639 3694 7463 5676 13921 16857
(a) Salary component (%) 6.5 6.3 3.1 4.6 1.9 1.7
(b) Non-salary component (%) 93.5 93.7 96.9 95.4 98.1 98.3
Capital Outlay (Rs. crore) 903 824 1323 1933 1717 3887
Capital Outlay (%) 19.9 18.2 15.1 25.4 11 18.7
Total (Social Services)
Total Expenditure (Rs. crore) 33386 38684 44329 50028 62346 82779
Revenue Expenditure (Rs. crore) 31713 35943 40737 45769 58284 75147
(a) Salary component (%) 22.4 19.2 17.7 17.6 17.8 16.9
(b) Non-salary component (%) 77.6 80.8 82.3 82.4 82.2 83.1
Capital Outlay (Rs. crore) 1674 2740 3592 4258 4061 7632
Capital Outlay (%) 5.0 7.1 8.1 8.5 6.5 9.2
Source : Finance Accounts, GoB, (Appendix I)

63
In 2018-19, the expenditure on three major heads of the social services was — Rs. 28,080 crore (Education, Sports, Art and Culture), Rs. 7318 crore (Health and Family Welfare) and Rs. 15,638 crore (Water Supply, Sanitation, Housing and Urban Development). The growth in expenditure for these three components was 13.1 percent, 18.4 percent and 105.5 percent, respectively, over the previous year. The growth of 105.5 percent in expenditure under the head Water Supply, Sanitation, Housing and Urban Development is after a decline of 13.4 percent in 2017-18. The Capital outlay was 6.5 percent of the total expenditure on social services. It was 15.7 percent
and 11 percent of total expenditure for Health and Family Welfare; and Water Supply, Sanitation,
Housing and Urban Development respectively in 2018-19. The expenditure on Education, Sports,
Arts & Culture was 45 percent of the total expenditure on social services. However, the capital
outlay was only 3.8 percent of the total expenditure on Education, Sports, Arts & Culture in
2018-19.
The share of salary expenses has varied across subheads of social services. The expense on salary component was 17.8 percent of the total expenditure taking into account all social services. However, it was 49.1 percent for Health and Family Welfare, 18.8 percent for Education, Sports, Arts and Culture, and 1.9 percent for Water Supply, Sanitation, Housing and Urban Development.
Expenditure on Economic Services
The expenditure on major heads under economic services (Agriculture and Allied Activities, Irrigation and Flood Control, Energy and Power, Industry and Minerals, and Transport) is presented in Table 2.41. The total expenditure on these heads was Rs 28,113 crore in 2018-19 and it accounted for 67.6 percent of the total expenditure, which is higher than the share of 59.0 percent in 2017-18.
The revenue component of the expenditure on economic services increased by 18.9 percent to Rs 27,918 crore in 2018-19, whereas the capital outlay declined by 37.5 percent to Rs 13,686 crore. The total expenditure on economic services declined from Rs 45,360 crore in 2017-18 to Rs 41,603 crore in 2018-19. However, it is projected to grow at 40 percent in the budgeted estimate for 2019-20. The share of expenditure on salary came down to 8.3 percent of the revenue expenditure on economic services in 2018-19 from 10.2 percent in 2017-18. Also, the share of capital outlay on economic services came down from 48.2 percent in 2017-18 to 32.9 percent in 2018-19. Both these expenses are budgeted to increase in 2019-20. It is to be noted that compared to social services, the capital outlay in economic services has always been higher, as is evident from Tables 2.40 and 2.41.

64
Table 2.41 : Expenditure on Economic Services (2014-15 to 2019-20)
Expenditure Head 2014-15 2015-16 2016-17 2017-18 2018-19 2019-20 BE
Agriculture and Allied Activities Total Expenditure (Rs. crore) 3615 4120 2414 3824 3740 6537 Revenue Expenditure (Rs. crore) 3431 3515 2287 3626 3636 6220
(a) Salary component (%) 13.9 14.6 22.7 16.3 21.0 15.0 (b) Non-salary component (%) 86.1 85.4 77.3 83.7 79.0 85.0
Capital Outlay (Rs. crore) 185 605 128 198 105 317 Capital Outlay (%) 5.1 14.7 5.3 5.2 2.8 4.8 Irrigation and Flood Control Total Expenditure (Rs. crore) 2444 2836 2844 3967 3406 4357 Revenue Expenditure (Rs. crore) 1020 1151 1048 1301 1360 1575
(a) Salary component (%) 58.0 57.0 56.9 51.2 50.8 45.9 (b) Non-salary component (%) 42.0 43.0 43.1 48.8 49.2 54.2
Capital Outlay (Rs. crore) 1424 1685 1796 2665 2046 2782 Capital Outlay (%) 58.3 59.4 63.1 67.2 60.1 63.9 Energy and Power Total Expenditure (Rs. crore) 7948 8945 13437 11236 11958 8795 Revenue Expenditure (Rs. crore) 3773 6151 7698 4305 6923 4318
(a) Salary component (%) 0.0 0.0 0.0 1.0 0.0 0.0 (b) Non-salary component (%) 100.0 100.0 100.0 99.0 100.0 100.0
Capital Outlay (Rs. crore) 4175 2794 5739 6931 5035 4477 Capital Outlay (%) 52.5 31.2 42.7 61.7 42.1 50.9 Industry and Minerals Total Expenditure (Rs. crore) 564 1230 1116 866 938 1184 Revenue Expenditure (Rs. crore) 561 1201 888 756 840 1062
(a) Salary component (%) 11.5 5.2 5.7 7.8 9 12 (b) Non-salary component (%) 88.5 94.8 93.0 90.7 91 88
Capital Outlay (Rs. crore) 3 29 228 110 98 121 Capital Outlay (%) 0.5 2.4 20.4 12.8 10.4 10.2 Transport Total Expenditure (Rs. crore) 5194 6130 7388 6804 8071 8360 Revenue Expenditure (Rs. crore) 996 1712 1787 1402 2795 2673
(a) Salary component (%) 21.7 13.9 13.0 19.0 10.0 16.0 (b) Non-salary component (%) 78.3 86.1 87.0 81.0 90.0 84.0
Capital Outlay (Rs. crore) 4198 4417 5601 5402 5275 5687 Capital Outlay (%) 80.8 72.1 75.8 79.4 65.4 68.0 Total (Economic Services) Total Expenditure (Rs. crore) 29173 37305 44943 45360 41603 58245 Revenue Expenditure (Rs. crore) 14445 19696 23417 23476 27918 33931
(a) Salary component (%) 14.4 11.2 9.2 10.2 8.3 9.9 (b) Non-salary component (%) 85.6 88.8 90.8 89.8 91.8 90.1
Capital Outlay (Rs. crore) 14728 17609 21526 21884 13686 24314 Capital Outlay (%) 50.5 47.2 47.9 48.2 32.9 41.7
Source : Finance Accounts, GoB (Appendix I)

65
The per capita expenditure on social and economic services in the state for years 2014-15 to 2018-19 and the budgeted estimate for the year 2019-20 is shown in Table 2.42, using the estimated population of Bihar. The per capita expenditure has increased for most of the heads mentioned in the table, except for economic services and the capital outlay. The per capita expenditure on social services and economic services was Rs 5116 and Rs 3414 respectively in 2018-19. A year before, the per capita expenditure was Rs. 4199 and Rs. 3807 respectively. The per capita expenditure on Medical and Public health has consistently increased in the state over the years. It increased from Rs 519 in 2017-18 to Rs 600 in 2018-19. From Table 2.40, it is also observed that 49 percent of this is spent on salary expenses under this head, and this leaves in effect Rs 305 per capita to be spent on Medical and Public Health in 2018-19. The per capita expenditure on Education, Sports, art and Culture increased from Rs 2084 in 2017-18 to Rs. 2304 in 2018-19.
Table 2.42 : Per Capita Expenditure on Social and Economic Services (2014-15 to 2019-20)
2014-15 2015-16 2016-17 2017-18 2018-19 2019-20 BE
Estimated Population (crore) 10.9 11.1 11.3 11.5 11.7 11.9
Total Expenditure (Rs. crore)
Education, Sports, art & Culture
16531 19155 20226 24833 28080 35942
Medical and Public Health 3604 4571 5493 6182 7318 9157
Water Supply and Sanitation 4542 4518 8786 7609 15638 20744
Social Services 33386 38684 44329 50028 62346 82779
Economic Services 29173 37305 44943 45360 41603 58245
Capital Outlay 18150 23966 27208 28907 21058 36593
General Services 28157 31589 32697 36139 42002 50793
Per Capita Expenditure (Rs.)
Education, Sports,art & Culture
1513 1724 1791 2162 2404 3025
Medical and Public Health 330 411 486 538 626 771
Water Supply and Sanitation 416 407 778 662 1339 1746
Social Services 3055 3482 3924 4355 5337 6966
Economic Services 2670 3358 3979 3949 3561 4901
Capital Outlay 1661 2157 2409 2517 1803 3079
General Services 2577 2843 2895 3146 3595 4274
Source : Finance Accounts and State Government Budgets

66
The data on some of the parameters used to judge the quality of expenditure is reported in Table
2.43. The parameters of quality in expenditure shown in the table are — (i) ratio of capital outlay
to total expenditure, (ii) ratio of capital outlay to GSDP, (iii) ratio of revenue expenditure on social
and economic services to GSDP, and (iv) ratio of non-salary expenditure incurred on social and
economic services. Both the ratios of capital outlay to total expenditure and capital outlay to GSDP
have declined in 2018-19, after increasing steadily in the previous four years. It is projected to
increase in the budgeted estimate for 2019-20. In terms of the other two parameters, the quality of
expenditure has shown improvement in Bihar in recent years.
Table 2.43 : Quality Parameters of Expenditure (2014-15 to 2019-20)
Expenditure Head 2014-15 2015-16 2016-17 2017-18 2018-19 2019-20 BE
Capital Outlay (Rs. crore) 18150 23966 27208 28907 21058 36593
Revenue Expenditure (Rs. crore) 72570 83616 94765 102624 124897 155231
Of which Social and Economic Services 46158 55639 64154 69245 86202 109078
(a) Salary Component (Rs. crore) 9176 9108 9349 10458 11265 13836
Percentage of salary component (%) 19.9 16.4 14.6 15.1 13.1 12.7
(b) Non-salary component (Rs. crore) 36982 46531 54805 58788 74937 95242
Percentage of non-salary component (%) 80.1 83.6 85.4 84.9 86.9 87.3
Capital Outlay/ Total Expenditure (%) 19.2 21.3 21.5 21.2 13.6 18.3
Revenue Expenditure / Total Expenditure (%) 76.6 74.4 75.0 75.2 80.8 77.4
Revenue Expenditure on Social and Economic Services /GSDP (%) 21.2 22.5 22.4 21.2 24.2 27.1
Capital Outlay / GSDP (%) 5.3 6.5 6.4 5.9 4.1 6.4
Source : Finance Accounts and State Government Budgets
Finally, the structure of receipts and expenditure of the state government is summarised in Table 2.44. The data indicates that there was a structural change in the composition of receipt and expenditure in the state between 2017-18 to 2018-19. On the receipt side, the share of Grants-in-Aid and Contributions came down from 19.7 percent to 16.2 percent, whereas the share of Public Debt increased from 10.1 percent to 12.3 percent. Further, the share of expenditure on social services increased from 33.5 percent to 37.7 percent between 2017-18 and 2018-19, whereas the share of the capital outlay came down from 21.2 percent to 13.6 percent.

67
Table 2.44 : Percentage Distribution of Consolidated Fund – Receipts and Expenditure (2017-18 to 2019-20)
Receipt 2017-18 2018-19 2019-20 BE Expenditure 2017-18 2018-19 2019-20
BE Revenue Account Revenue Account
Tax Revenue 67.5 67.6 61 General Services 24.5 25 23
Non-Tax Revenue 2.7 2.7 2.4 Social Services 33.5 37.7 37.5
Grants-in-Aid and Contributions 19.7 16.2 24.3 Economic Services 17.2 18.1 16.9
Capital Account Capital Account
Public Debt 10.1 12.3 12.1 Discharge of Public Debt 3.4 4.7 3.6
Recovery of Loans and Advances 0 1.2 0.2 Loans and
Advances 0.2 1 0.7
Inter-State Settlement 0 0 0 Capital Outlay 21.2 13.6 18.3
Total 100 100 100 Total 100 100 100
Source : Finance Accounts and State Government Budgets

68
APPENDIX
Data corresponding to the figures used in the chapter are presented in the following tables. The sources of the data are: Finance Accounts, State Government Budgets and previous Economic Surveys of Bihar.
Table A 2.1 : Revenue Deficit of Bihar (2001-02 to 2009-10)
(Rs crore)
Year Revenue Deficit Year Revenue
Deficit
2001-02 2342 2010-11 -6316
2002-03 2457 2011-12 -4820
2003-04 1107 2012-13 -5101
2004-05 -1076 2013-14 -6441
2005-06 -81 2014-15 -5848
2006-07 -2498 2015-16 -12507
2007-08 -4647 2016-17 -10819
2008-09 -4469 2017-18 -14823
2009-10 -2943 2018-19 -6897
Table A 2.2 : Revenue Accounts of Bihar Government (2013-14 to 2019-20)
(Rs crore)
Head 2013-14 2014-15 2015-16 2016-17 2017-18 2018-19 2019-20 BE
Total Receipts Revenue Account 68918.55 78417.53 96123.1 105584.6 117446.7 131793.5 176747.6
Tax Revenue 54789.76 57713.29 74371.86 82622.85 88219.87 103011.3 122921.8
Non-Tax Revenue 1544.76 1557.982 2185.641 2402.764 3506.737 4130.562 4806.467
Grants-in-Aid and Contributions 12584.03 19146.26 19565.6 20559.02 25720.13 24651.63 49019.38
Total Expenditure (Revenue Account)
62477.34 72569.97 83615.94 94765.18 102623.7 124896.8 155230.7
Table A 2.3 : Receipts in Revenue Account (2017-18 and 2018-19)
(Rs crore)
Head 2017-18 2018-19
Tax Revenue 88219.87 103011.3
Non-Tax Revenue 3506.737 4130.562
Grants-in-Aid and Contributions 25720.13 24651.63

69
Table A 2.4 : Composition of Revenue Receipts (1990-91 to 2004-05)
(Percentage share)
Year Own Tax Revenue
Transfer from
Central Taxes
State's Own
Non-Tax Revenue
Grants from the Centre
Year Own Tax Revenue
Transfer from
Central Taxes
State's Own
Non-Tax Revenue
Grants from the Centre
1990-91 26.4 37.4 17.7 18.5 2005-06 20.00 58.4 2.9 18.7
1991-92 27.0 39.5 11.2 22.4 2006-07 17.5 57.6 2.2 22.7
1992-93 26.2 38.4 13.0 22.4 2007-08 18.0 59.4 1.9 20.7
1993-94 26.4 37.7 13.4 22.6 2008-09 18.7 53.6 3.5 24.1
1994-95 27.0 41.0 14.3 17.6 2009-10 22.8 51.2 4.7 21.3
1995-96 26.8 47.2 12.4 13.6 2010-11 22.2 53.8 2.2 21.8
1996-97 28.0 50.7 13.2 8.1 2011-12 24.6 54.4 1.7 19.3
1997-98 27.5 46.9 4.5 21.1 2012-13 27.3 53.6 1.9 17.2
1998-99 28.8 47.9 12.4 10.9 2013-14 29.0 50.5 2.2 18.3
1999-00 28.9 40.5 14.0 16.6 2014-15 26.5 47.1 2.0 24.4
2000-01 25.8 57.7 7.1 9.4 2015-16 26.5 50.9 2.3 20.4
2001-02 23.9 60.4 3.5 12.2 2016-17 22.5 55.8 2.3 19.5
2002-03 23.9 58.1 2.8 15.2 2017-18 24.0 48.9 2.2 24.9
2003-04 24.8 55.7 3.3 16.2 2018-19 19.6 48.2 2.8 29.4
2004-05 21.3 58.0 2.7 18.0
Table A 2.5 : Sectoral Expenditure (2017-18 and 2018-19) (Rs crore)
Head 2017-18 2018-19
General Services 33374 38691.01
Social Services 45769 58284.31
Economic Services 23476 27918
Table A 2.6 : Gross Fiscal Deficit as percentage of GSDP in Bihar (2007-08 to 2018-19)
Year GFD as
Percentage of GSDP
Year GFD as
Percentage of GSDP
2007-08 1.50 2013-14 2.63
2008-09 1.76 2014-15 3.26
2009-10 3.24 2015-16 3.25
2010-11 1.95 2016-17 3.90
2011-12 2.39 2017-18 2.95
2012-13 2.32 2018-19 2.68

70
Table A 2.7 : Revenue Surplus and Capital Outlay in Bihar (2006-07 to 2018-19)
(Rs crore)
Year Revenue Surplus
Capital Outlay GFD Year Revenue
Surplus Capital Outlay GFD
2006-07 2498 5211 3021 2013-14 6441 14001 8352
2007-08 4647 6104 1703 2014-15 5848 18150 11178
2008-09 4469 6436 2507 2015-16 12507 23966 12062
2009-10 2943 7332 5272 2016-17 10819 27208 16480
2010-11 6316 9196 3970 2017-18 14823 28907 14305
2011-12 4820 8852 5915 2018-19 6897 21058 13807
2012-13 5101 9585 6545
Table A 2.8 : Outstanding Liability as Percentage of GSDP (2007-08 to 2018-19)
Year Liability as Percentage of GSDP
Year Liability as Percentage of GSDP
2007-08 44.9 2013-14 27.4
2008-09 38.6 2014-15 28.9
2009-10 36.0 2015-16 31.4
2010-11 30.9 2016-17 32.8
2011-12 27.4 2017-18 32.3
2012-13 27.1 2018-19 32.8
Table A 2.9 : Percentage Growth in Revenue Receipt and Expenditure (2008-09 to 2018-19)
(Growth in percentage)
Year Revenue Receipt
Revenue Expenditure
Revenue surplus
2008-09 16.91 21.00 3.14
2009-10 7.72 14.28 1.81
2010-11 25.35 17.29 3.10
2011-12 15.24 21.68 1.95
2012-13 16.07 17.13 1.81
2013-14 15.70 14.71 2.03
2014-15 13.78 16.15 1.71
2015-16 22.58 15.22 3.37
2016-17 9.84 13.33 2.56
2017-18 11.23 8.29 3.06
2018-19 12.22 21.70 1.34

71
Table A 2.10 : State’s Own Tax Receipts / GSDP (2007-08 to 2018-19)
(Percentage)
Year
State’s Own Tax Receipts / GSDP (%)
Year
State’s Own Tax Receipts / GSDP (%)
2007-08 4.47 2013-14 6.29 2008-09 4.34 2014-15 6.05 2009-10 4.97 2015-16 6.85 2010-11 4.85 2016-17 5.62 2011-12 5.10 2017-18 4.77 2012-13 5.76 2018-19 5.70
Table A 2.11 : Collection from GST in 2018-19
(Rs crore)
Year GST IGST SGST Grant
2018-19 4871.6 10419.2 2571.0
Table A 2.12 : Capital Outlay in Total Expenditure (2008-09 to 2019-20)
Year Growth in
Capital Outlay (%)
Capital Outlay as %
of Total Expenditure
2008-09 5.45 17.31 2009-10 13.92 17.13 2010-11 25.42 18.14 2011-12 -3.74 14.71 2012-13 8.28 13.85 2013-14 46.08 17.41 2014-15 29.64 19.17 2015-16 32.04 21.34 2016-17 13.53 21.54 2017-18 6.24 21.19 2018-19 -27.15 13.62 2019-20 BE 73.77 18.25
Table A 2.13 : Growth in expenditure on salary and pension (2008-09 to 2019-20)
(Percentage)
Year Growth in salary
Growth in
pension Year
Growth in
salary
Growth in
pension
2008-09 16.64 24.74 2014-15 4.07 19.65 2009-10 28 24.13 2015-16 2.17 4.46 2010-11 9.23 42.26 2016-17 5.76 5.55 2011-12 15.58 27.09 2017-18 12.64 14.27 2012-13 11.19 7.11 2018-19 12.32 12.13 2013-14 3.53 13.37 2019-20 BE 22.88 15.16
_____________

72
–
CHAPTER - III
AGRICULTURE AND ALLIED SECTORS
Agriculture is the most healthful, most useful and most noble employment of man.— George Washington
Economic activities in states such as Bihar is closely linked to development of agriculture and allied sectors for its significant links with food and nutritional security. Not only does this sector augment food supply, it also generates employment opportunities, improves livelihood opportunities, and causes poverty alleviation. Over the last two decades, the economy of Bihar has undergone a structural change, as evident in the shift in the sectoral composition of Gross State
Abstract
Agriculture is the mainstay of economies such as Bihar, underpinning their food security, employment, and rural development. It supports the livelihoods of more than three-fourth of the population. Besides generating employment, it also provides raw material to industries, augments food supply, and assists in poverty alleviation. The contribution of agricultural sector to State’s GSVA stands around 20 percent in 2017-18. The share of crop sector in total GSVA was 10.64 percent during 2018-19. Despite the constraints of finite land resource, fragmented land holdings, and erratic rainfall, the production performance of crop and horticulture has been encouraging. In 2018-19, foodgrain production in Bihar stood at 163.12 lakh tonnes. Livestock, fisheries, and aquaculture together contributed about 7.10 percent of Gross value added in agriculture sector in Bihar during 2018-19. The total fish production in Bihar increased from 4.79 lakh tonnes in 2013-14 to 6.02 lakh tonnes in 2018-19, registering a compound annual growth rate of 6.22 percent. The demands for financial resources for cropping, farm investments, purchase of inputs and other machinery have been increasing in Bihar. A sum of Rs. 1.54 lakh crore has been allocated for the Third Agriculture Roadmap 2017-22 for the development of agriculture and allied sectors, to include projects to strengthen irrigation, flood protection, food processing, and dairy development. The State Government isundertaking various schemes to promote climate-resilient agricultural practices; provide technological assistance; and improve access to modern inputs to ensure livelihood security to the farming community.

73
Domestic Product (GSDP) from agriculture to service sector. The relative share of agricultural sector in state’s GSDP declined from 35.8 percent in 2000-01 to 19.7 percent in 2017-18 due to the increase in share of Tertiary Sector. However, its continued importance lies in the fact that more than 70 percent of the population is engaged in agricultural operations. Since the bifurcation of the state in 2000, the bulk of the mineral resources are currently in the state of Jharkhand.Therefore, a vibrant agricultural system forms a crucial part of the development strategy of overall economic growth in Bihar. Achieving high and sustained growth in agricultural sector is crucial to creating both on-farm and off-farm employment opportunities and improving income, particularly for the poor.
Located in the sub-tropical region of the temperate zone, Bihar is situated between 240 20' N to 270 31' N latitude and 830 19' E to 880 17' E longitude. The Ganges divides the state into two halves — Northern Bihar, which is densely populated and mostly involved in agricultural activities, while the Southern Bihar has a mix of agricultural and industrial activities. The Northern Bihar receives its water from the Himalayan rivers and is flood-prone, while the Southern Bihar is mostly drought-prone, and relies on rivers from Central India. Based on rainfall, temperature, soil and terrain, the state is divided into three agro-climatic zones — North-West alluvial plain, North-East alluvial plain and South Bihar alluvial plain. Compared to the Southern part, the alluvial plains of the north-western and north-eastern regions receive higher rainfall. As a land-locked state, Bihar has around 8.6 percent of India’s population, while its agricultural land area is only 3.8 percent of India. The population density of Bihar is one of the highest in the country at 1106 per square kilometre,compared to 382 per square kilometre in India, as per Census, 2011. Overall, the rising population, limited arable land, fragmented land holdings, high cost of inputs, erratic rainfall, floods and land degradation pose serious challenges to agricultural sector in Bihar.
To reach the agricultural potential, the State Government has initiated several programmes under the Agriculture Roadmap for development of crop, livestock, fisheries, dairy and irrigation sector in Bihar. The main objective of the Agriculture Roadmap of the State Government lies in creating an enabling environment to achieve profitable and sustainable farming to ensure food and nutritional security to the growing population. The State Government is undertaking various schemes to promote climate-resilient agricultural practices, provide technological assistance and improve access to modern inputs to ensure livelihood security to the farming community.
The contribution of agriculture and allied sectors in Gross State Value Added (GSVA) in Bihar for the period 2013-14 to 2018-19 is given in Table 3.1. Overall, the contribution of agriculture and allied sectors to GSVA in Bihar decreased from 22.8 percent in 2013-14 to 19.3 percent in 2018-19. During 2018-19, the largest contributor to GSVA was the crop sector (10.6 percent);

74
while the lowest contributor was fishing and aquaculture (1.5 percent). The livestock sector is emerging as an important segment in Bihar, as evident from its increasing contribution to state’s GSVA from 5.4 percent in 2013-14 to 5.6 percent in 2018-19. The share of crop sector in total GSVA was 10.6 percent during 2018-19, a decrease of 3.6 percentage points from 14.2 percent in 2013-14. Forest and logging sector contributed to around 1.6 percent of total GSVA in Bihar in 2018-19. Assessing the trend of contribution of agricultural sector to the state’s GSVA over the last six years, it is indicated that the prospects of crop, livestock and fisheries are critical to spearheading agricultural growth in Bihar.
Table 3.1 : Share of Agriculture Sector in Gross State Value Added (2013-14 to 2018-19)
(at constant prices)
Sector 2013-14 2014-15 2015-16 2016-17 2017-18(P)
2018-19(Q)
Agriculture, Forestry and Fishing 22.8 22.0 21.2 21.6 21.0 19.3
Crops 14.2 13.1 12.4 12.7 12.1 10.6
Livestock 5.4 5.7 5.7 5.6 5.6 5.6
Forestry and Logging 1.7 1.6 1.5 1.8 1.6 1.6
Fishing and Aquaculture 1.6 1.7 1.7 1.5 1.6 1.5
Note : Data of 2017-18 is Provisional Estimates and of 2018-19 is Quick Estimates Source : Directorate of Economics and Statistics, GoB
3.1 Public Expenditure in Agricultural Sector
Given that the multiplier effects of agriculture on poverty reduction is large, the State Government
has allocated substantial financial resources to promote sustainable agricultural growth through
targeted investments, infrastructure development and incentive schemes in Bihar. The Agriculture
Roadmap III (2017-22) has allocated a sum of Rs. 1.54 lakh crore for development of agriculture
and allied sectors, which includes projects to strengthen irrigation, flood protection, food
processing, and dairy development. The public spending on agricultural sector will enhance the
adoption of high-yielding varieties of seeds, modern technology and other implements needed to
improve productivity.
The trends in public expenditure in agriculture and sub-sectors are presented in Table 3.2 for the
period 2010-11 to 2018-19. The total expenditure of the State Budget for agriculture and allied
sector stood at Rs. 5176 crore in 2018-19, accounting for 9.7 percent of the expenditure of the total
economic services. Among the sub-sectors, the highest expenditure was observed in crop sector at
Rs. 2674 crore, followed by expenditure for food storage (Rs. 552 crore) during 2018-19. The

75
compound annual growth in expenditure for agriculture and allied sector during 2014-15 to
2018-19 was 11.0 percent. Thus, the overall public expenditure on agriculture and allied sectors in
Bihar increased from Rs. 3615 crore in 2014-15 to Rs. 5176 crore in 2018-19. However, its overall
share in total economic services has decreased form 12.4 percent in 2014-15 to 9.6 percent in 2018-
19. The public expenditure from state budget for agricultural research and education has been on
a decline during the last five years. One of the reasons for this could be conversion of Rajendra
Agriculture University to Dr. Rajendra Prasad Central Agriculture University, Pusa. However,
there has been a spurt in expenditure for animal husbandry from Rs. 156 crore in 2014-15 to Rs.
451 crore in 2018-19.
Table 3.2 : Trends in Expenditure in Agriculture and Allied Sector (2014-15 to 2018-19)
(Rs. lakh)
Particulars 2014-15 2015-16 2016-17 2017-18 2018-19
Crop Husbandry 188035 (6.4) 174915 (4.7) 99201 (2.2) 299151 (5.4) 267419 (5.0)
Soil and Water Conservation 3000 (0.1) 3944 (0.1) 8314 (0.2) 9077 (0.2) 14003 (0.3)
Animal Husbandry 15606 (0.5) 20489 (0.6) 23598 (0.5) 45209 (0.8) 45055 (0.8)
Dairy Development 13577 (0.5) 8657 (0.2) 9749 (0.2) 12619 (0.2) 11185 (0.2)
Fisheries 3039 (0.1) 4434 (0.1) 3791 (0.1) 10571 (0.2) 10326 (0.2)
Forestry and Wild Life 32501 (1.1) 28258 (0.8) 33176 (0.7) 31299 (0.6) 40674 (0.8)
Food Storage/ Warehousing 30698 (1.0) 108513 (2.9) 1331 (neg.) 80983 (1.5) 55221 (1.0)
Agricultural Research/ Education 58943 (2.0) 35158 (0.9) 45619 (neg.) 37196 (0.7) 40405 (0.8)
Co-operation 16140 (0.6) 27286 (0.7) 17981 (neg.) 44763 (0.8) 32220 (0.6)
Other Programmes — 338 neg.) 1348 (neg.) 1545 (neg.) 1143 (neg.)
Agriculture/ Allied Activities 361538 (12.4) 411993 (11.0) 241446 (5.4) 572414 (10.3) 517650 (9.7)
Note : Figures in parentheses denote percentage to total economic services Source : State Budget Documents
Chart 3.1 presents a snapshot of the trends in expenditure in sub-sectors of agriculture and allied sector as a share in total economic services in two periods, trienniums 2010-13 and 2016-19. Overall, the share of expenditure of agriculture and allied sectors in total economic services decreased from 13.6 percent in triennium 2010-13 to 8.4 percent in triennium 2016-19. Though expenditure on crop husbandry remains the highest, there has been a decline in its share in triennium 2016-19. Overall, the State Government has prioritized the development of agricultural sector by allocating substantial public resources to crop, animal husbandry, food storage and warehousing in Bihar.

76
Chart 3.1 : Trends in Public Expenditure in Agriculture and Allied Sectors
(Percent to Total Economic Services)
Source : State Budget Documents, Bihar
3.2 Land Resources
The land resources form a basis of production of food, fodder, and fibre in any economy to enable expansion of economic, social, and human activity. With increasing demand and competing usesof land for both agriculture and non-agricultural purposes, land is becoming increasingly scarce for cultivation. Further, increasing population, migration, deforestation, soil degradation and risks of climate change pose challenge to sustainable management of land resources. The amount of land is finite, but the demands for alternative uses (other than agriculture) are growing, calling for proper planning for optimal use of land resources.
Pattern of Land Utilization
The overall pattern of land utilization has largely remained unchanged in Bihar during the period 2015-16 to 2017-18, as shown in Table 3.3. Agricultural land constitutes a substantial part of Bihar’s total geographical area, as nearly 56.0 percent is under net sown area (52.42 lakh hectares) in 2017-18. The gross cropped area was 75.25 lakh hectares in 2017-18, implying a cropping intensity of 144 percent. The land under miscellaneous tree crops amounted to 2.48 lakh hectares, which is 2.6 percent of the total area in the state; while permanent pastures account for about 0.2 percent of the total geographical area in 2017-18. The total unculturable land slightly decreased from 41.55 lakh hectares in 2015-16 to 41.18 lakh hectares in 2017-18, accounting for 44.0 percent of total geographical area. The gradual decrease in culturable waste could be partly due to increasing pressure on land for both agricultural and non-agricultural purposes. Around 11.1 percent of the total geographical area falls under total fallow land. The land put to non-agricultural
0%10%20%30%40%50%60%70%80%90%
100%
TE 2010-13 TE 2016-19
Perc
ent t
o to
tal e
cono
mic
serv
ices Other Agricultural Programmes
Fisheries
Soil and Water Conservation
Dairy Development
Co-operation
Forestry and Wild Life
Animal Husbandry
Agricultural Research and Education
Food Storage and Warehousing
Crop Husbandry

77
uses has marginally increased from 17.13 lakh hectares to 17.18 lakh hectares during 2015-16 to 2017-18. This could be largely attributed to increasing urbanization, industrialization, infrastructure development and increasing settlements leading to conversion of land to non-agricultural uses. Overall, Bihar shows consistency in land use pattern over the three-year period.
Table 3.3 : Land Utilization Pattern (2015-16 to 2017-18)
(Area in '000 hectares)
No. Land Use 2015-16 2016-17 2017-18
1 Geographical Area 9359.57 (100.0) 9359.57 (100.0) 9359.57 (100.0)
2 Area under Forest 621.64 (6.6) 621.64 (6.6) 621.64 (6.6)
3
Land not available for cultivation
(a) Barren and Unculturable Land 431.72 (4.6) 431.72 (4.6) 431.72 (4.6)
(b) Land put to Non-agricultural use 1713.02 (18.3) 1718.59 (18.4) 1718.31 (18.4)
Land Area 1360.65 (14.5) 1366.15 (14.6) 1366.65 (14.6)
Water Area 352.37 (3.8) 352.44 (3.8) 351.66 (3.8)
4 Culturable Waste 44.46 (0.5) 44.41 (0.5) 44.28 (0.5)
5
Uncultivated land excluding fallow land
(a) Permanent Pastures 15.23 (0.2) 15.14 (0.2) 15.08 (0.2)
(b) Land under Tree Crops 247.95 (2.6) 248.05 (2.6) 248.15 (2.6)
6
Fallow Land
(a) Current Fallow 961.42 (10.3) 868.01 (9.3) 919.5 (9.8)
(b) Other Fallow Land 119.24 (1.3) 119.08 (1.3) 118.92 (1.3)
7 Total Unculturable Land (2 to 6) 4154.68 (44.4) 4066.64 (43.4) 4117.60 (44.0)
8 Net Sown Area 5204.90 (55.6) 5292.93 (56.6) 5241.97 (56.0)
9 Gross Sown Area 7572.41 7654.36 7525.18
Cropping Intensity 1.45 1.45 1.44
Note : The figures in parentheses denote percentage share in total geographical area Source : Directorate of Economics and Statistics, GoB
Chart 3.2 : Land Utilization (2017-18)
(In percentage)
Source: Directorate of Economics and Statistics, GOB
Forest, 6.6 Culturable Waste, 0.5 Fallow Land,
11.1
Land not available for
cultivation, 23.0
Net Sown Area,56.0
Uncultivated land excluding fallow land, 2.8
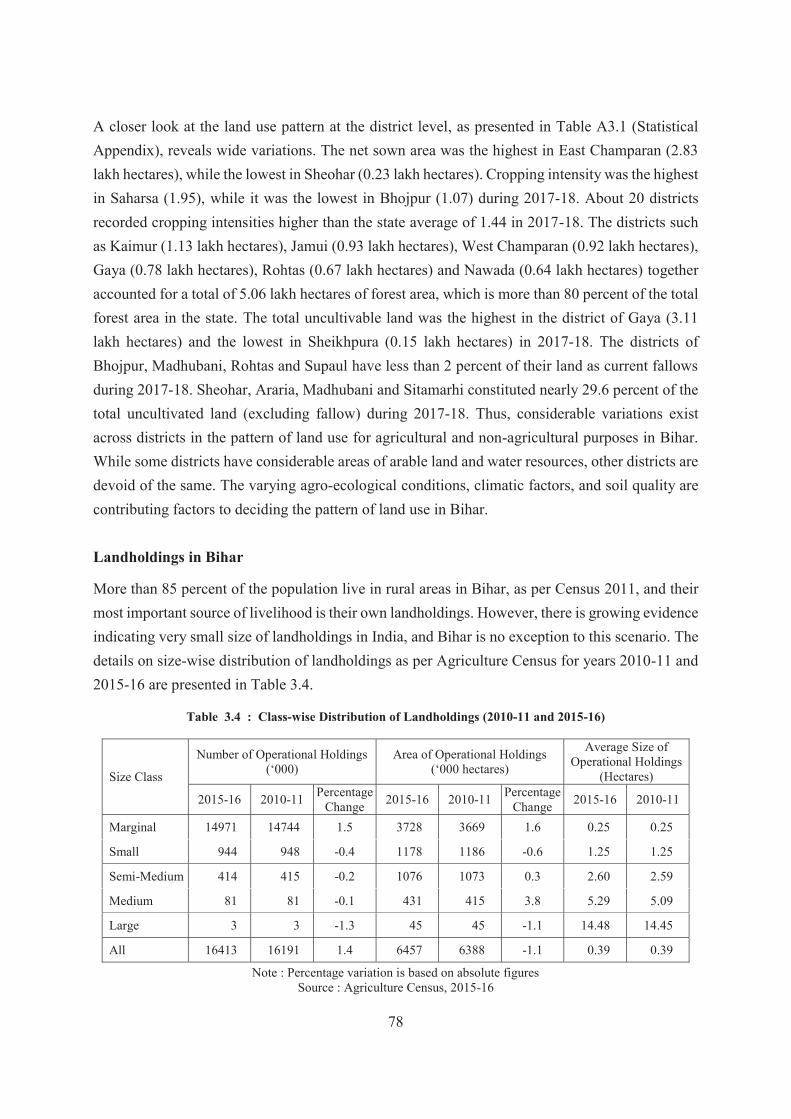
78
A closer look at the land use pattern at the district level, as presented in Table A3.1 (Statistical Appendix), reveals wide variations. The net sown area was the highest in East Champaran (2.83 lakh hectares), while the lowest in Sheohar (0.23 lakh hectares). Cropping intensity was the highest in Saharsa (1.95), while it was the lowest in Bhojpur (1.07) during 2017-18. About 20 districts recorded cropping intensities higher than the state average of 1.44 in 2017-18. The districts such as Kaimur (1.13 lakh hectares), Jamui (0.93 lakh hectares), West Champaran (0.92 lakh hectares), Gaya (0.78 lakh hectares), Rohtas (0.67 lakh hectares) and Nawada (0.64 lakh hectares) together accounted for a total of 5.06 lakh hectares of forest area, which is more than 80 percent of the total forest area in the state. The total uncultivable land was the highest in the district of Gaya (3.11 lakh hectares) and the lowest in Sheikhpura (0.15 lakh hectares) in 2017-18. The districts of Bhojpur, Madhubani, Rohtas and Supaul have less than 2 percent of their land as current fallows during 2017-18. Sheohar, Araria, Madhubani and Sitamarhi constituted nearly 29.6 percent of the total uncultivated land (excluding fallow) during 2017-18. Thus, considerable variations exist across districts in the pattern of land use for agricultural and non-agricultural purposes in Bihar. While some districts have considerable areas of arable land and water resources, other districts are devoid of the same. The varying agro-ecological conditions, climatic factors, and soil quality are contributing factors to deciding the pattern of land use in Bihar.
Landholdings in Bihar
More than 85 percent of the population live in rural areas in Bihar, as per Census 2011, and their most important source of livelihood is their own landholdings. However, there is growing evidence indicating very small size of landholdings in India, and Bihar is no exception to this scenario. The details on size-wise distribution of landholdings as per Agriculture Census for years 2010-11 and 2015-16 are presented in Table 3.4.
Table 3.4 : Class-wise Distribution of Landholdings (2010-11 and 2015-16)
Size Class
Number of Operational Holdings (‘000)
Area of Operational Holdings (‘000 hectares)
Average Size of Operational Holdings
(Hectares)
2015-16 2010-11 Percentage Change 2015-16 2010-11 Percentage
Change 2015-16 2010-11
Marginal 14971 14744 1.5 3728 3669 1.6 0.25 0.25
Small 944 948 -0.4 1178 1186 -0.6 1.25 1.25
Semi-Medium 414 415 -0.2 1076 1073 0.3 2.60 2.59
Medium 81 81 -0.1 431 415 3.8 5.29 5.09
Large 3 3 -1.3 45 45 -1.1 14.48 14.45
All 16413 16191 1.4 6457 6388 -1.1 0.39 0.39
Note : Percentage variation is based on absolute figures Source : Agriculture Census, 2015-16

79
The total number of operational holdings in Bihar increased from 16.19 million in 2010-11 to
16.41 million in 2015-16, an increase of 1.4 percent. The small and marginal landholdings which
are less than two hectares, account for nearly 97 percent of the landholdings in Bihar, operating
about 76 percent of the total area of operational holdings in the state during 2015-16. The marginal
landholdings have shown an increase of 1.5 percent between 2010-11 and 2015-16. About 3.0
percent of the households have semi-medium and medium size landholdings, operating an area of
1507 thousand hectares, accounting for 23.3 percent of the total area. The average size of
landholdings in Bihar during 2015-16 is 0.39 hectares and has not changed over the previous
census period 2010-11.
The gender-wise distribution of landholdings across all size groups in Bihar for the year 2015-16
is given in Table 3.5. The average size of landholdings stood at 0.39 hectares for both males and
females. Interestingly, the average size of landholding for marginal, semi-medium and large size
class was higher for females than for males.
Table 3.5 : Gender-wise Distribution of Landholdings (2015-16)
Number (‘000), Area (‘000 hectares)
Gender/ Size class
Number of Operational Holdings (‘000)
Area of Operational Holdings (‘000 hectares)
Average Size per Holding (hectares)
Male Female Total Male Female Total Male Female Total
Marginal 12835 2136 14971 3165 563 3728 0.25 0.26 0.25
Small 821 123 944 1024 154 1178 1.25 1.25 1.25
Semi-Medium 360 54 414 933 143 1076 2.59 2.62 2.60
Medium 71 10 81 379 52 431 5.30 5.15 5.29
Large 3 0 3 35 10 45 13.59 14.14 14.48
All 14090 2323 16413 5537 920 6457 0.39 0.39 0.39
Source : Agriculture Census, 2015-16
The total operated area in Bihar was higher for males at 5.54 million hectares, while it was 0.92
million hectares for females across all class groups. The highest number of operational holdings
among males belonged to the marginal size class with 12.84 million holdings, followed by medium
(0.93 million). Among females, marginal size constituted the highest number of holdings (2.1
million), operating an area of 0.82 million hectares. The large size land holdings among females
(0.14 million) was operating in an area of 0.05 million hectares. Clearly, the data reveals that only
14.2 percent of the total land holdings are owned by females in Bihar, suggesting gender bias in
land rights in Bihar.

80
3.3 Production Trends of Crop and Horticulture
The rich Gangetic plains, fertile alluvial soil, and abundant water resources provide impetus for a
diversified farming system in the state, producing both food and non-food crops. The main crops
such as rice, wheat, and maize, along with vegetables and fruits are cultivated across the three
distinct agricultural seasons of Kharif (June-September), Rabi (October-March) and Zaid (April-
June). The agricultural production in the state is largely dependent on south-west monsoon. The
expansion of irrigation facilities has played a crucial role in diversifying agricultural output
through adoption of HYV seeds, chemical fertilizers, pesticides and modern machinery.
Crop Sector
The cropping pattern in the state is largely determined by biophysical and climatic factors,
irrigation, technological adoption and socio-economic capability of the farmers. The pattern of
land use and cropping system have implications not only for food and nutritional security, but also
for environmental sustainability. The agro-climatic and topographical factors in Bihar have led to
cultivation of cereals, pulses, oilseeds, fibre, and cash crops. Table 3.6 presents the cropping
pattern in the state during 2014-15 to 2018-19. Cereals dominate the cropping pattern in the state,
occupying more than 86 percent of the gross cropped area. Within cereals, rice and wheat together
contribute more than 70 percent of the total gross cropped area.
Table 3.6 : Cropping Pattern (2014-15 to 2018-19)
(in percentage)
Crop 2014-15 2015-16 2016-17 2017-18 2018-19
Foodgrains 93.23 93.26 91.63 93.72 94.04
Cereals 86.15 86.19 84.88 86.94 87.10
Pulses 7.09 7.07 6.76 6.77 6.94
Oilseeds 1.63 1.70 1.49 1.46 1.46
Fibre Crops 1.57 1.58 3.59 1.50 1.24
Sugarcane 3.56 3.46 3.28 3.33 3.26
Total Area 100 100 100 100 100
Source : Directorate of Economics and Statistics, GoB
During the last four years, the area under pulses in gross cropped area has been declining, though
there has been a revival in 2018-19. The decline in acreage under pulses and their rising prices has

81
welfare implications for the poor people in the state. Both oilseeds and fibre crops have seen a
steady decline in their share in gross cropped area in the last five years. The large share of
foodgrains in the total gross cropped area at 94.0 percent in 2018-19 is indicative of the subsistence
nature of agriculture in the state. As an important cash crop, sugarcane occupies 3.3 percent of the
gross cropped area in 2017-18. Since the crop production is mainly dependent on monsoon,
stepping up irrigation facilities and other infrastructure can go a long way in bringing more land
under cultivation in Bihar.
Trends in Production and Productivity
The trends in production and productivity levels of most important crops during the period 2014-
15 to 2018-19 are given in Tables 3.7 and 3.8 respectively. The compound annual growth rate for
the five-year period is given in the last column of the tables. The total foodgrain production in
Bihar stood at 163.12 lakh tonnes in 2018-19, compared to 147.50 lakh tonnes in 2014-15,
recording a growth rate of 4.14 percent. In meeting the growing demand for food, cereals play an
important role.
As a traditional foodgrain economy, the major food crops grown in Bihar include rice, wheat,
maize and pulses. The production of cereals recorded an increase from 143.21 lakh tonnes in 2017-
18 to 158.58 lakh tonnes in 2018-19, an increase of 4.21 percent. A large part of this increase was
due to its higher productivity, which grew from 2328 kg per hectare in 2014-15 to 2636 kg per
hectare in 2018-19, registering a growth of 4.31 percent. Also, the surge in wheat and maize crop
impacted cereal growth. The production of wheat increased from a modest quantum of 35.70 lakh
tonnes in 2014-15 to about 64.66 lakh tonnes in 2018-19. For maize, the production increased from
24.79 lakh tonnes to 31.94 lakh tonnes during the same period. Though the area under maize has
steadily increased in Bihar, there are considerable fluctuations in yield leading to instability in
production. With respect to rice also, there has been inconsistency in its production and
productivity during the last five years. The production of rice declined from 82.42 lakh tonnes in
2014-15 to 61.56 lakh tonnes in 2018-19, and its productivity declined by 3.61 percent from 2525
kg per hectare in 2014-15 to 1948 kg per hectare in 2018-19. The falling productivity of rice could
be attributed to inadequate availability of water for cultivation, because of droughts, deficient rain
and floods in certain districts, along with rising input costs. The State Government has made
significant efforts through promotion of Zero Tillage methods and System of Rice Intensification

82
technique to increase rice production. To enhance the productivity of cereals, the State
Government is making efforts through modernization of farms, technological adoption, investment
in irrigation infrastructure and abating pest attack.
The production of pulses stood at 4.53 lakh tonnes in 2018-19, growing at a rate of 1.89 percent
per annum during 2014-15 to 2018-19. Much of this increase was due to growth in Rabi pulses,
mainly contributed by lentil (36.5 percent), summer moong (26.3 percent) and gram (16.0 percent).
The production of Rabi pulses grew at a rate of 2.71 percent, with an average productivity of 897
kg per hectare over the five-year period. In case of kharif pulses, there was an increase in
production from 22.01 lakh tonnes in 2017-18 to 23.22 lakh tonnes in 2018-19; while its
productivity stood at an average of 843.2 kg per hectare during the same period. To streamline the
pulse production in the state, the State Government has undertaken various initiatives to minimize
pest infestation, increase yield, and enhance price realization to the farmers.
Though the production of total oilseeds declined marginally from 1.27 lakh tonnes in 2014-15 to
1.25 lakh tonnes in 2018-19, groundnut and mustard showed higher production levels in 2018-19,
compared to 2014-15, recording an increase of 9.7 percent and 2.7 percent respectively. The
productivity of oilseeds increased from 1093 kg per hectare in 2014-15 to 1247 kg per hectare in
208-19, recording a growth of 4.0 percent per annum. Except linseed, groundnut, and sunflower,
all other oilseeds registered growth in their productivity levels. Despite being sensitive to climate,
mustard/rapeseed registered the highest growth in productivity, growing at a rate of 5.0 percent
per annum during 2014-15 to 2018-19. This was possible due to improvement in seed quality and
irrigation facilities. As regards fibre crops (jute and mesta), there was a drop in production during
the last five years, due to decline in both area and productivity.
Thus, assessing the trends in production and productivity of important crops in Bihar, it emerges
that there is scope for increasing the yield for foodgrains, in both rainfed and irrigated areas of the
state. Growth in production in crop sector in Bihar owes a great deal to expansion in productivity,
rather than increases in area, since the scope for any additional land for cultivation is very limited
in the state. Growing population has accentuated the need to step up production in the state to meet
the needs of food and nutritional security.
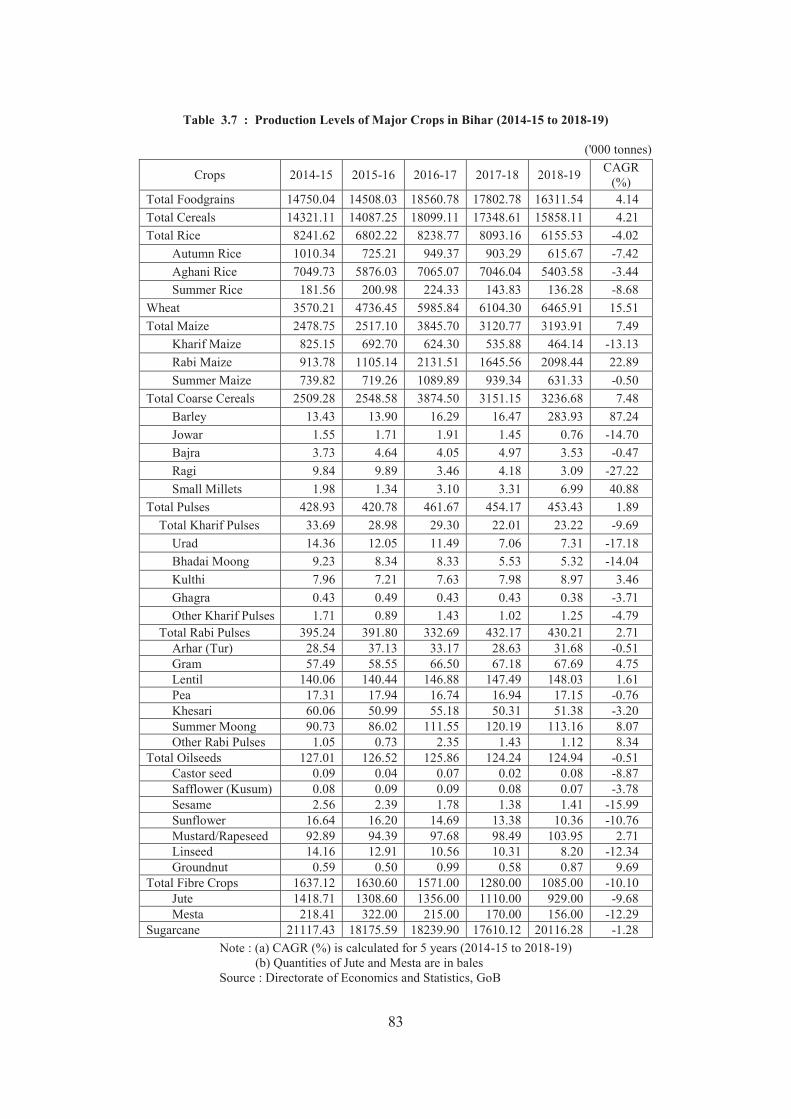
83
Table 3.7 : Production Levels of Major Crops in Bihar (2014-15 to 2018-19)
('000 tonnes)
Crops 2014-15 2015-16 2016-17 2017-18 2018-19 CAGR (%)
Total Foodgrains 14750.04 14508.03 18560.78 17802.78 16311.54 4.14Total Cereals 14321.11 14087.25 18099.11 17348.61 15858.11 4.21Total Rice 8241.62 6802.22 8238.77 8093.16 6155.53 -4.02
Autumn Rice 1010.34 725.21 949.37 903.29 615.67 -7.42Aghani Rice 7049.73 5876.03 7065.07 7046.04 5403.58 -3.44Summer Rice 181.56 200.98 224.33 143.83 136.28 -8.68
Wheat 3570.21 4736.45 5985.84 6104.30 6465.91 15.51Total Maize 2478.75 2517.10 3845.70 3120.77 3193.91 7.49
Kharif Maize 825.15 692.70 624.30 535.88 464.14 -13.13Rabi Maize 913.78 1105.14 2131.51 1645.56 2098.44 22.89Summer Maize 739.82 719.26 1089.89 939.34 631.33 -0.50
Total Coarse Cereals 2509.28 2548.58 3874.50 3151.15 3236.68 7.48Barley 13.43 13.90 16.29 16.47 283.93 87.24Jowar 1.55 1.71 1.91 1.45 0.76 -14.70Bajra 3.73 4.64 4.05 4.97 3.53 -0.47Ragi 9.84 9.89 3.46 4.18 3.09 -27.22Small Millets 1.98 1.34 3.10 3.31 6.99 40.88
Total Pulses 428.93 420.78 461.67 454.17 453.43 1.89Total Kharif Pulses 33.69 28.98 29.30 22.01 23.22 -9.69
Urad 14.36 12.05 11.49 7.06 7.31 -17.18Bhadai Moong 9.23 8.34 8.33 5.53 5.32 -14.04Kulthi 7.96 7.21 7.63 7.98 8.97 3.46Ghagra 0.43 0.49 0.43 0.43 0.38 -3.71Other Kharif Pulses 1.71 0.89 1.43 1.02 1.25 -4.79
Total Rabi Pulses 395.24 391.80 332.69 432.17 430.21 2.71Arhar (Tur) 28.54 37.13 33.17 28.63 31.68 -0.51Gram 57.49 58.55 66.50 67.18 67.69 4.75Lentil 140.06 140.44 146.88 147.49 148.03 1.61Pea 17.31 17.94 16.74 16.94 17.15 -0.76Khesari 60.06 50.99 55.18 50.31 51.38 -3.20Summer Moong 90.73 86.02 111.55 120.19 113.16 8.07Other Rabi Pulses 1.05 0.73 2.35 1.43 1.12 8.34
Total Oilseeds 127.01 126.52 125.86 124.24 124.94 -0.51Castor seed 0.09 0.04 0.07 0.02 0.08 -8.87Safflower (Kusum) 0.08 0.09 0.09 0.08 0.07 -3.78Sesame 2.56 2.39 1.78 1.38 1.41 -15.99Sunflower 16.64 16.20 14.69 13.38 10.36 -10.76Mustard/Rapeseed 92.89 94.39 97.68 98.49 103.95 2.71Linseed 14.16 12.91 10.56 10.31 8.20 -12.34Groundnut 0.59 0.50 0.99 0.58 0.87 9.69
Total Fibre Crops 1637.12 1630.60 1571.00 1280.00 1085.00 -10.10Jute 1418.71 1308.60 1356.00 1110.00 929.00 -9.68Mesta 218.41 322.00 215.00 170.00 156.00 -12.29
Sugarcane 21117.43 18175.59 18239.90 17610.12 20116.28 -1.28Note : (a) CAGR (%) is calculated for 5 years (2014-15 to 2018-19)
(b) Quantities of Jute and Mesta are in bales Source : Directorate of Economics and Statistics, GoB
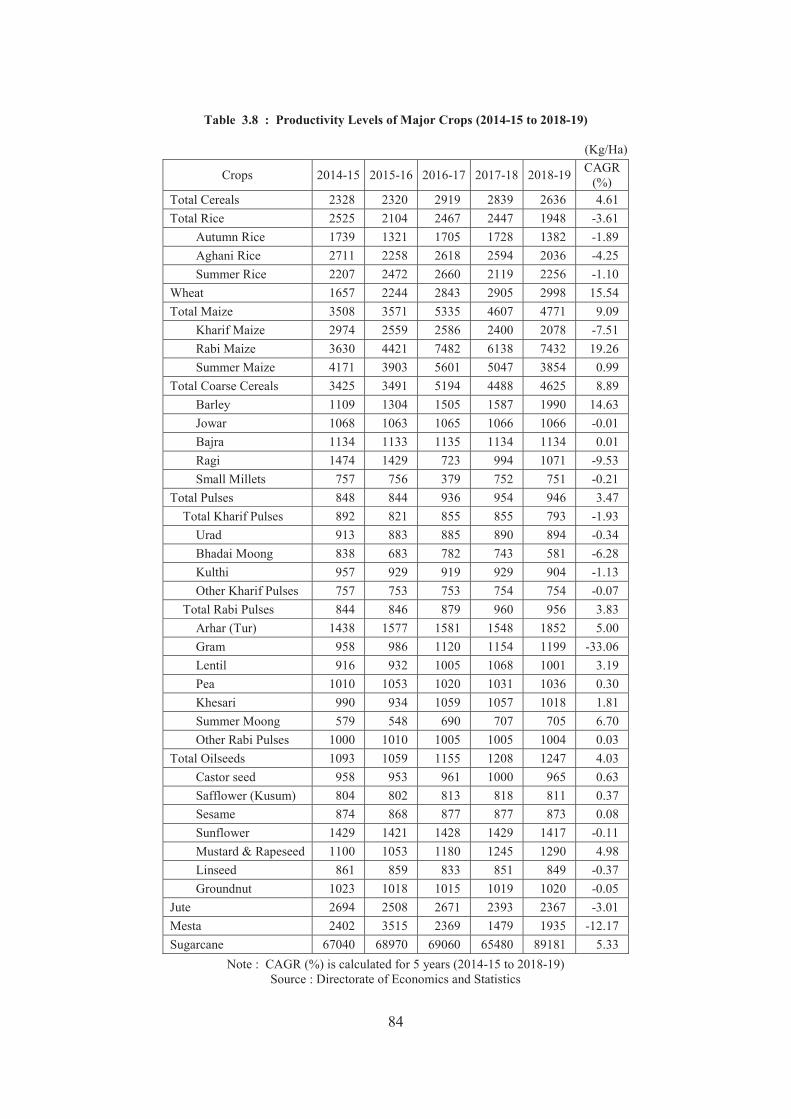
84
Table 3.8 : Productivity Levels of Major Crops (2014-15 to 2018-19)
(Kg/Ha)
Crops 2014-15 2015-16 2016-17 2017-18 2018-19 CAGR (%)
Total Cereals 2328 2320 2919 2839 2636 4.61Total Rice 2525 2104 2467 2447 1948 -3.61
Autumn Rice 1739 1321 1705 1728 1382 -1.89Aghani Rice 2711 2258 2618 2594 2036 -4.25Summer Rice 2207 2472 2660 2119 2256 -1.10
Wheat 1657 2244 2843 2905 2998 15.54Total Maize 3508 3571 5335 4607 4771 9.09
Kharif Maize 2974 2559 2586 2400 2078 -7.51Rabi Maize 3630 4421 7482 6138 7432 19.26Summer Maize 4171 3903 5601 5047 3854 0.99
Total Coarse Cereals 3425 3491 5194 4488 4625 8.89Barley 1109 1304 1505 1587 1990 14.63Jowar 1068 1063 1065 1066 1066 -0.01Bajra 1134 1133 1135 1134 1134 0.01Ragi 1474 1429 723 994 1071 -9.53Small Millets 757 756 379 752 751 -0.21
Total Pulses 848 844 936 954 946 3.47Total Kharif Pulses 892 821 855 855 793 -1.93
Urad 913 883 885 890 894 -0.34Bhadai Moong 838 683 782 743 581 -6.28Kulthi 957 929 919 929 904 -1.13Other Kharif Pulses 757 753 753 754 754 -0.07
Total Rabi Pulses 844 846 879 960 956 3.83Arhar (Tur) 1438 1577 1581 1548 1852 5.00Gram 958 986 1120 1154 1199 -33.06Lentil 916 932 1005 1068 1001 3.19Pea 1010 1053 1020 1031 1036 0.30Khesari 990 934 1059 1057 1018 1.81Summer Moong 579 548 690 707 705 6.70Other Rabi Pulses 1000 1010 1005 1005 1004 0.03
Total Oilseeds 1093 1059 1155 1208 1247 4.03Castor seed 958 953 961 1000 965 0.63Safflower (Kusum) 804 802 813 818 811 0.37Sesame 874 868 877 877 873 0.08Sunflower 1429 1421 1428 1429 1417 -0.11Mustard & Rapeseed 1100 1053 1180 1245 1290 4.98Linseed 861 859 833 851 849 -0.37Groundnut 1023 1018 1015 1019 1020 -0.05
Jute 2694 2508 2671 2393 2367 -3.01Mesta 2402 3515 2369 1479 1935 -12.17Sugarcane 67040 68970 69060 65480 89181 5.33
Note : CAGR (%) is calculated for 5 years (2014-15 to 2018-19)Source : Directorate of Economics and Statistics
85
District-wise Production and Productivity Levels
The state support in investing in irrigation, infrastructures, and technology has yielded impressive growth rates in production and yield of cereals, coarse cereals, and pulses in Bihar, thereby strengthening the food economy. However, the district-wise trends in production and productivity have displayed varied performance. The district-wise trends in area, production and productivity for rice, wheat, maize, and pulses during the years 2017-18 and 2018-19 are presented in Tables A3.2, A3.3, A3.4 and A3.5, respectively, in the Statistical Appendix. The shares in total area and production, and productivity rankings for each district are given in parentheses in respective columns. The Table 3.9 presents the classification of districts for four major crops — rice, wheat, maize, and pulses, based on the data for the year 2018-19.
Rice
As one of the widely cultivated food crops in Bihar, rice is crucial for ensuring both livelihoods and food security of the rural population. Rice is one of the most water intensive crops, and persistent drought or deficient rain can impact its yield. Also, in flood-prone areas, poor drainage and water logging can shrink its production. In 2017-18, the highest productivity of rice was recorded in Rohtas (4105 kg per hectare), while the lowest was observed in the district of Siwan (709 kg per hectare). The top three districts with respect to rice production are — Rohtas (7.92 lakh tonnes), Aurangabad (5.42 lakh tonnes) and Kaimur (3.54 lakh tonnes). The adoption of the System of Rice Intensification (SRI) has augmented productivity of rice with higher water efficiency and greater resistance to environmental stresses.
Wheat
Wheat is one of the most important rabi crop in Bihar, sown during November and harvested between March and April. The three leading districts in terms of production level are — Rohtas (5.18 lakh tonnes), Muzaffarpur (3.36 lakh tonnes) and Sitamarhi (3.21 lakh tonnes) in 2017-18. The top three districts in terms of wheat productivity are — Madhepura (3805 kg per hectare), Begusarai (3775 kg per hectare) and Rohtas (3680 kg per hectare). The districts of Sheikhpura (2200 kg per hectare), Jamui (2113 kg per hectare) and Madhubani (1993 kg per hectare) have registered low productivity levels. Investing in mechanization of farms, early sowing and increasing seed replacement rates can accentuate wheat productivity in the state.
Maize
Maize is an important staple crop in Bihar and is largely grown under different agro-ecological zones across all the districts. It is the most suitable food and fodder crop, and increasing its

86
production is, therefore, useful to meet the growing demand for diversified uses such as human consumption, animal feed (for poultry and livestock), and other industrial uses. The fertile Gangetic plains, and use of hybrid seeds have enabled achieving higher yield in maize, though there are large scale fluctuations across the districts. While Purnea (9188 kg per hectare) registered the highest productivity in maize during 2017-18, the lowest yield was observed in Bhojpur (1378 kg per hectare). The top three performing districts with respect to maize production are — Katihar (4.76 lakh tonnes), Purnea (3.44 lakh tonnes) and Araria (3.28 lakh tonnes).
Pulses
Due to the increasing awareness about significant nutritional benefits, there has been a soaring demand for pulses in Bihar, especially among the vegetarians. Not only does it form an important component of nutrition, it is also crucial for achieving ecological sustainability owing to their key role in improving soil fertility. In Bihar, pulses are largely grown under rainfed conditions and, therefore, are prone to high fluctuations in yield. In 2017-18, the productivity of pulses was the highest in the district of Buxar (1374 kg per hectare). The districts such as Supaul (567 kg per hectare), Samastipur (496 kg per hectare) and Kishanganj (492 kg per hectare) registered low productivity levels. The three leading districts in terms of production level are — Patna (0.68 lakh tonnes), Aurangabad (0.31 lakh tonnes) and Nalanda (0.28 lakh tonnes).
Table 3.9 : Classification of Districts based on Production/ Productivity for Major Crops (2018-19)
Crops Production/ Productivity Low High
Rice
Production(‘000 tonnes)
Bhagalpur (28.68)Begusarai (27.48)Khagaria (27.25)
Rohtas (792.14)Aurangabad (542.10)Kaimur (354.09)
Productivity(kg/hectare)
Bhagalpur (874)Gopalganj (842)Siwan (709)
Rohtas (4105)Arwal (3113)Aurangabad (3086)
Wheat
Production(‘000 tonnes)
Sheikhpura (46.70)Sheohar (43.97)Munger (38.30)
Rohtas (517.85)Muzaffarpur (335.65)Sitamarhi (321.41)
Productivity(kg/hectare)
Sheikhpura (2200)Jamui (2113)Madhubani (1993)
Madhepura (3805)Begusarai (3775)Rohtas (3680)
Maize
Production(‘000 tonnes)
Arwal (0.44)Kaimur (0.16)Aurangabad (0.13)
Katihar (475.83)Purnea (344.26)Araria (327.78)
Productivity(kg/hectare)
Sheikhpura (1618)Aurangabad (1420)Bhojpur (1378)
Purnea (9188)Araria (7396)Supaul (6928)
Pulses
Production(‘000 tonnes)
Sheohar (1.77)Gopalganj (1.70)Purnea (1.16)
Patna (67.89)Aurangabad (31.39)Nalanda (28)
Productivity(kg/hectare)
Supaul (567)Samastipur (496)Kishanganj (492)
Buxar (1374)Patna (1362)East Champaran (1333)
Source : Compilation based on data from Directorate of Economics and Statistics, GoB

87
Sugarcane
Sugarcane is one of the most important commercial crops of Bihar and provides raw materials to one of the largest agro-based industries. As a labour-intensive crop, sugarcane provides employment to many workers in rural Bihar. As per the data given in Table A3.6 (Statistical Appendix), sugarcane production stood at 182.97 lakh tonnes. The productivity of sugarcane crop decreased from 69.06 ton per hectare in 2017-18 to 60.15 ton per hectare in 2018-19. A district-wise analysis reveals that there exists considerable variation in productivity of sugarcane. In 2018-19, the highest productivity was observed in Patna (84.77 ton per hectare), while the lowest was in Bhagalpur district (46.14 ton per hectare). The district of West Champaran accounted for nearly 58.3 percent of the total sugarcane production in the state, produced in an area of 1.72 lakh hectares, which is about 56.6 percent of the total area under sugarcane in 2018-19. About 13 districts had productivity higher than that of the state average of 60,150 kg per hectare.
A major incentive scheme for sugarcane growers is the Mukhyamantri Ganna Vikas Yojana, aimed at distributing subsidized certified seeds to farmer beneficiaries selected through the Panchayati Raj Institutions. The scheme provides subsidy of Rs. 160 per quintal (for SC/ST Rs. 200 per quintal) to farmers on purchase of certified sugarcane seed of 16 selected varieties for a maximum of 2.5 acres. During 2018-19, the scheme has benefitted 8468 beneficiaries, covering an area of 7023 hectares. Clearly, there is scope for improving sugarcane yield in Bihar. Despite adoption of technology, investments in irrigation, and incentives from the State Government, the fluctuations in yield and production of sugarcane are a cause of concern.
Horticulture
Horticulture has emerged as one of the most important agricultural enterprises in Bihar in the last two decades, as it offers a wide range of opportunities for farmers to diversify their cropping pattern to include fruits, vegetables, flowers, spices, plantation crops, medicinal and aromatic plants. The increasing diversification provides opportunities for absorption of labour and earning remunerative returns to the farmers. The horticultural products form an important component of food and nutritional security in Bihar. To meet the growing demand for affordable and high-quality fruits in local, national, and international markets, this sector is experiencing substantial competition. Since horticultural crops are highly perishable and seasonal in nature, they require adequate post-harvest infrastructure. The State Government is promoting horticulture sector in a big way in Bihar to help the farmers.
Fruits
The trends in area and production of fruits in Bihar for the period 2016-17 to 2018-19 are presented in Table 3.10. The total production of fruits in Bihar increased from 41.05 lakh tonnes in 2016-17

88
to 42.29 lakh tonnes in 2018-19, registering an annual growth rate of 4.9 percent. Except pineapple,all other fruits registered growth in production in the last three years. The state is performing well in production of litchi, amounting to 3.07 lakh tonnes cultivated in an area of 0.36 lakh hectares in 2018-19. This was possible due to increase in both its acreage and productivity. Substantial increases in production was observed for banana (2.1 percent), papaya (4.1 percent), mango (3.5 percent), guava (8.2 percent), watermelon (10.7 percent), and muskmelon (11.8 percent) during 2016-17 to 2018-19.
Table 3.10 : Area and Production of Fruits in Bihar (2016-17 to 2018-19)
(Area in ’000 hectares/ production in ’000 metric tonnes)
Year 2016-17 2017-18 2018-19 CAGR (%)
Area/Production Area Production Area Production Area Production Area Production
Mango 149.96 1472.38 153.45 1533.64 158.50 1577.43 2.81 3.51
Guava 29.38 370.37 27.613 427.6 29.15 433.44 -0.39 8.18
Litchi 32.2 198.6 33.26 282.27 35.81 307.58 5.46 24.45
Banana 35.1 1527.8 31.06 1396.39 34.34 1591.58 -1.09 2.07
Pineapple 4.3 116.6 4.26 115.13 4.17 111.83 -1.52 -2.07
Papaya 1.6 43.9 1.9 42.72 2.24 47.58 18.32 4.11
Gooseberry 0.9 14.2 1.59 14.917 1.78 15.97 40.63 6.05
Watermelon 1.4 29.7 1.48 23.73 2.09 36.37 22.18 10.66
Muskmelon 1.7 12.9 1.81 10.2 2.90 16.14 30.61 11.86
Others 32.4 311 44.36 360.67 47.70 373.87 21.34 9.64
Total 288.9 4097.5 300.78 4207.26 318.68 4511.79 5.03 4.93
Source : Directorate of Horticulture, GoB
Chart 3.3 : Productivity of Fruits (Tonne/Ha) in Bihar (Triennium 2016-19)
Source : Directorate of Horticulture, GoB
6.267.758.22
9.9211.38
14.3218.22
23.7326.98
44.94
0.00 10.00 20.00 30.00 40.00 50.00
MuskmelonLitchi
OthersMango
GooseberryGuava
WatermelonPapaya
PineappleBanana

89
Chart 3.3 gives a picture of average productivity of fruits in Bihar during the triennium 2016-19.The productivity was the highest for banana, averaging around 44.94 tonnes per hectare and the lowest productivity was observed in the case of muskmelon at 6.26 tonnes per hectare. The productivity of litchi in the last three years averaged to 7.75 tonnes per hectare. The district-wise trends in area and production of fruits such as mango, litchi, bananas, and guava are given in Table A 3.7 (Statistical Appendix) for the period 2017-18 and 2018-19. The top three mango-producing districts are Darbhanga, East Champaran, and Muzaffarpur, together contributed nearly 24.8 percent of the total mango production in the state during 2018-19. These three districts together accounted for 23.2 percent of the total area under mango in Bihar. The leading producer of litchi was Muzaffarpur at 1.48 lakh tonnes, producing 48 percent of the total litchi production. In case of banana, Katihar, Vaishali and Muzaffarpur together produced nearly 33 percent of the total banana in the state. The shahi litchi variety and malda of mango from Bihar are widely known for their flavour and taste. The investment in facilities which enhance the shelf life of fruits can go a long way in promoting both fruit production in Bihar and food processing industries.
Vegetables
As a high-income generating sector, the production of vegetables has received special impetus in Bihar since the implementation of the National Horticulture Mission in 2005. The State Government is providing substantial support through investments in technology, post-harvest management and processing of vegetables in Bihar. Further, the climate, alluvial soil and water resources are conducive to produce vegetables at low cost. The trends in area and production level of 16 important vegetables in Bihar are presented in Table 3.11 for the years 2016-17 to 2018-19.In 2018-19, a total of 166.03 lakh tonnes of vegetables was produced in an area of 8.57 lakh hectares. During 2016-17 to 2018-19, the total area under the vegetables increased from about 8.28 lakh hectares to 8.57 lakh hectares, at an annual growth rate of about 1.99 percent.Correspondingly, the total vegetable production increased from 143.62 lakh tonnes to 166.03 lakh tonnes, recording an annual growth rate of 7.52 percent. The growth in vegetable production is primarily led by growth in productivity at the rate of 18.81 percent. On an average, the area under total vegetables cultivation grew at the rate of 1.99 percent per annum during the last three years. Over the period 2016-17 to 2018-19, potato accounted for nearly half (49.11 percent) of the total vegetable production in an area of 3.20 lakh hectares. Except cucumber, radish, tomato, and cabbage, all other vegetables registered a positive annual growth rate during 2016-17 to 2018-19. The vegetables such as tomato, cabbage, cucumber, and radish registered a decline in production during 2016-17 to 2018-19. The highest growth in production was observed for carrots (63.82 percent); in terms of area, the highest growth was for sweet potato (39.04 percent) during the three-year period.

90
Table 3.11 : Area and Production of Vegetables in Bihar (2016-17 to 2018-19)
(Area in ’000 hectares/ Production in ’000 tonnes)
Year Area/ Production Potato Onion Tomato Cauliflower Cabbage Brinjal
2016-17Area 320.48 54.06 46.21 66.11 41.18 57.88
Production 6377.71 1248.96 1009.6 1003.74 725.9 1141.2
2017-18Area 304.78 53.77 45.08 62.03 37.94 58.21
Production 7740.73 1267.18 941.56 935.55 673.43 1241.71
2018-19Area 321.88 56.5 51.44 67.9 41.26 61.36
Production 8153.91 1311.45 964.45 1035.69 721.37 1319.87
CAGR(%)
Area 0.22 2.23 5.51 1.34 0.10 2.96
Production 13.07 2.47 -2.26 1.58 -0.31 7.54
Year Area/ Production
Lady’s finger Chilli Bottlegourd Cucumber Pointed
gourd Bittergourd
2016-17Area 58 45.24 40.35 3.6 6.83 9.71
Production 765.95 476.84 634.73 67 72.13 67.32
2017-18Area 57.41 42.9 41.43 3.89 7.11 10
Production 787.77 451.19 699.68 25.35 77.77 83.44
2018-19Area 61.14 47.05 43.28 4.38 8.21 11.18
Production 841.6 488.66 679.83 30.19 88.92 94.86
CAGR(%)
Area 2.67 1.98 3.57 10.30 9.64 7.30
Production 4.82 1.23 3.49 -32.87 11.03 18.71
Year Area/ Production Pea Radish Carrot Sweet
Potato Others Total
2016-17Area 10.54 24.35 9.15 0.9 29.18 823.77
Production 64.24 246.99 53.73 8.4 397.79 14362.23
2017-18Area 9.65 23.45 14 1.04 30.94 803.63
Production 57.76 233.95 147.44 8.5 399.25 15772.26
2018-19Area 10.87 23.65 12.93 1.74 32.1 856.87
Production 65.94 232 144.2 13.38 416.82 16603.14
CAGR(%)
Area 1.55 -1.45 18.87 39.04 4.88 1.99
Production 1.31 -3.08 63.82 26.21 2.36 7.52
Note : CAGR (%) is calculated for 3 years (2016-17 to 2018-19)Source : Directorate of Horticulture, GoB
The district-wise area and production of four important vegetables (potato, onion, cauliflower and brinjal) have been presented in Table A 3.8 (Statistical Appendix) for the years 2017-18 and 2018-19. The production level and acreage share of each district are shown in the bracket. During

91
2018-19, Patna, Nalanda and Vaishali are the highest producing districts of potato. Potato yield was the highest in Vaishali district at 29.2 tonnes per hectare. For onion, the lead districts are Nalanda, Katihar and Muzaffarpur. Similarly, for cauliflower, the lead districts are Vaishali, Nalanda and Muzaffarpur. There is still scope for improvement of vegetable production and productivity.
Chart 3.4 gives a snapshot of the productivity of vegetables in tonnes per hectare in Bihar during the period triennium 2016-19. The yield was the highest in case of potato (23.5 metric tonne per hectare), while it was the lowest for pea (6.0 metric tonne per hectare). Next to potato, the productivity of onion was the second highest at 23.3 metric tonne per hectare.
Chart 3.4 : Productivity of Vegetables (MT/ha) in Bihar (TE 2016-19)
Source : Directorate of Horticulture, GoB
As noted in the Agriculture Roadmap (2017-22), specific focus is now being given by the State
Government to organic cultivation, and promotion of cultivation on rooftops. Further, setting up
of low-cost cold storage units and cool chain for marketing of fruits and vegetables have resulted
in better management of horticulture produce and minimize their wastages. The increasing
awareness on adoption of new technology, high yielding varieties, usage of quality planting
material, protected farming, micro irrigation methods and banana tissue culture plantlets have
enabled growth in this sector in the recent period. Given the negative effects of using chemical
pesticides in vegetable cultivation, the State Government is giving priority to promote organic
farming in fruits and vegetables and setting up of government nurseries to develop mother plants.
6.07.9
8.49.2
10.010.510.710.8
13.213.6
15.216.1
17.620.5
20.923.323.5
0.0 5.0 10.0 15.0 20.0 25.0
PeaBittergourd
Sweet PotatoCarrotRadish
ChilliCucumber
Pointed gourdOthers
Lady's fingerCauliflowerBottlegourd
CabbageTomatoBrinjalOnionPotato

92
Schemes of the Department of Agriculture, GOB
The State Government is implementing Agriculture Roadmap since 2008. It has led to laudable achievements in agriculture sector. The Government of India has conferred the Krishi Karman Award to the state on 2nd January 2020, for its achievements in production and productivity of Maize and Wheat.
Under the Chief Minister Horticulture Mission, there is a provision of grants for promoting roof top horticulture in five cities of the state, including Patna. Out of the total allocated amount of Rs. 4126.31 lakh, an expenditure of Rs. 3569.86 lakh has been incurred under the scheme.
The Bihar State Organic Mission is being implemented in 12 districts (Patna, Buxar, Bhojpur, Nalanda, Vaishali, Saran, Samastipur, Begusarai, Lakhisarai, Khagaria, Bhagalpur and Munger) with a total approved sum of Rs. 15,588.58 lakh for the period 2019-20 to 2021-22. The main objectives of the scheme is to promote organic farming in the state, protect the environment, soil and water resources from pollution and make farming sustainable. It also aims at increasing the value of produce to ensure better incomes for farmers. Under the Adoption and Certification Programme of organic seeds, the farmers will be provided certification for adoption of organic seeds.
Prime Minister Kisan Samman Nidhi Yojana is a centrally sponsored scheme, which aims to increase the income of farmers by providing income support of Rs. 6000 per year. This support will be provided to all farmer families in three equal instalments of Rs. 2000 every four months.
Under the Jal-Jeevan-Hariyali campaign, the State government has recently launched a new scheme of Jalvayu ke Anukul Krishi (Climate Resilient Agriculture) Karykram. In the first phase, the project is implemented in 8 districts, where 40 villages (5 villages per district) will be developed as model climate resilient agriculture village. Based on the experience of this project, the entire state will be covered in the coming years. The project broadly covers two components, firstly, the demonstration of already developed suitable climate resilient and futuristic cropping system (Crop cycle) modules in 8 districts and secondly, Strategic Research for future germplasm, cropping system (crop cycle) and Climate Change. The Climate Resilient Agriculture Programme is implemented by Dr Rajendra Prasad Central Agriculture University, Bihar Agriculture University, ICAR-Research Complex for Eastern Region and CIMMYT-BISA. The State government has sanctioned Rs. 60 crore for the project for five years.

93
3.4 Animal Husbandry, Fisheries and Dairy Sector
The growing importance of allied sectors such as fisheries, livestock and dairy farming in Bihar is largely due to its role in supporting livelihoods. As labour-intensive sectors, they employ a large segment of population and help the poor rural households in earning supplementary income. Animal food is considered a great source of protein and is, therefore, in high demand in both national and international markets. Livestock and aquaculture together contributed about 7.10 percent of Gross Value Added in agriculture sector in Bihar during 2018-19. Its contribution to GDP in the last three years, i.e. during 2016-17 to 2018-19 stands at Rs. 1.45 lakh crores. The Department of Animal and Fisheries Resources has brought out a Livestock Master Plan (LMP) for the years 2018-19 to 2022-23 to augment production and marketing of milk, meat, eggs, and fish to meet their growing demand. As growing sub-sectors, livestock and fisheries still have substantial potential to develop on a commercial scale in Bihar.
Livestock
Livestock production constitutes an important component of agricultural economy in Bihar for it assists in supply of food and nutrition, enhancement of income and livelihood and diversification of agricultural activities. Table 3.12 presents the livestock population in major states of India as per two Livestock Census years. A comparative analysis of the livestock population across the major states of India reveals that, between 2012 and 2019, livestock population increased in Bihar from 32.9 million to 36.5 million, registering a growth of 10.67 percent. The highest growth in livestock population was recorded in West Bengal (23.32 percent).
Table 3.12 : Livestock Population in Major States of India (2012 and 2019)
StatesPopulation (in million) Percentage
Change2012 2019
Uttar Pradesh 68.7 67.8 -1.35
Rajasthan 57.7 56.8 -1.66
Madhya Pradesh 36.3 40.6 11.81
West Bengal 30.3 37.4 23.32
Bihar 32.9 36.5 10.67
Andhra Pradesh 29.4 34.0 15.79
Maharashtra 32.5 33.0 1.61
Telangana 26.7 32.6 22.21
Karnataka 27.7 29.0 4.70
Gujarat 27.1 26.9 -0.95
Source : Livestock Census (Various Years)

94
The livestock wealth across different species of animal population in Bihar as per the last four censuses is presented in Table 3.13. As per the latest Livestock Census of 2019, the total livestock population in Bihar increased from 269.57 lakh in 2003 to 364.54 lakh in 2019, registering anincrease of 35.23 percent. The milch animals constituted about 63.18 percent of the total livestock population. The population of cattle was 153.11 lakh (42.00 percent) and it was higher than that of buffaloes at 77.20 lakh (21.18 percent) in 2019. The poultry population registered a growth of 18.31 percent, increasing from 139.68 lakh in 2003 to 165.25 lakh in 2019. The substantial increase in buffalo population in the state indicates their adaptability to changing climate and resilience to diseases. Next to cattle, the proportion of goats in total livestock population stood at 35.1 percent (128.21 lakhs). Goat is an extremely popular among small and marginal farmers and plays an important role in poverty-alleviation. The increasing demand for livestock products is on account of their nutritional value. This sector helps the small and marginal farmers by providing alternative source of income, especially in times of decrease in crop income, due to natural disasters.
Table 3.13 : Livestock Wealth (2003, 2007, 2012 and 2019)
(Figures in ‘000)
Livestock and Poultry 2003 2007 2012 2019
Cattle 10470 12408 12232 15311
Buffalo 5766 6690 7567 7720
Sheep 346 218 232 213
Goats 9606 10167 12154 12821
Pigs 627 632 650 343
Horses and Ponies 115 51 49 32
Others 0 0 55 13
Total Livestock 26957 30167 32939 36454
Total Poultry 13968 11420 12748 16525
Source : Department of Animal Husbandry, GoB
Livestock Services
To improve the productivity of livestock, it is crucial to provide access to good quality services to promote health and breeding of livestock animals. The State Government has laid special focus on delivery of veterinary and preventive care services by systematic implementation of vaccination drives. One of the major objectives of the State Government is to increase the production of livestock, improve the health of milch animals, and increased access to livestock-related services by marginalized communities. The Bihar Livestock Master Plan and the agriculture roadmap outlines the need to increase the quantity and quality of animal health services to minimize diseases. The vaccination campaigns are being conducted as per the calendar and four important vaccinations i.e., HSBQ, F MDCP, Brucellosis and PPR are given without fail since last four years
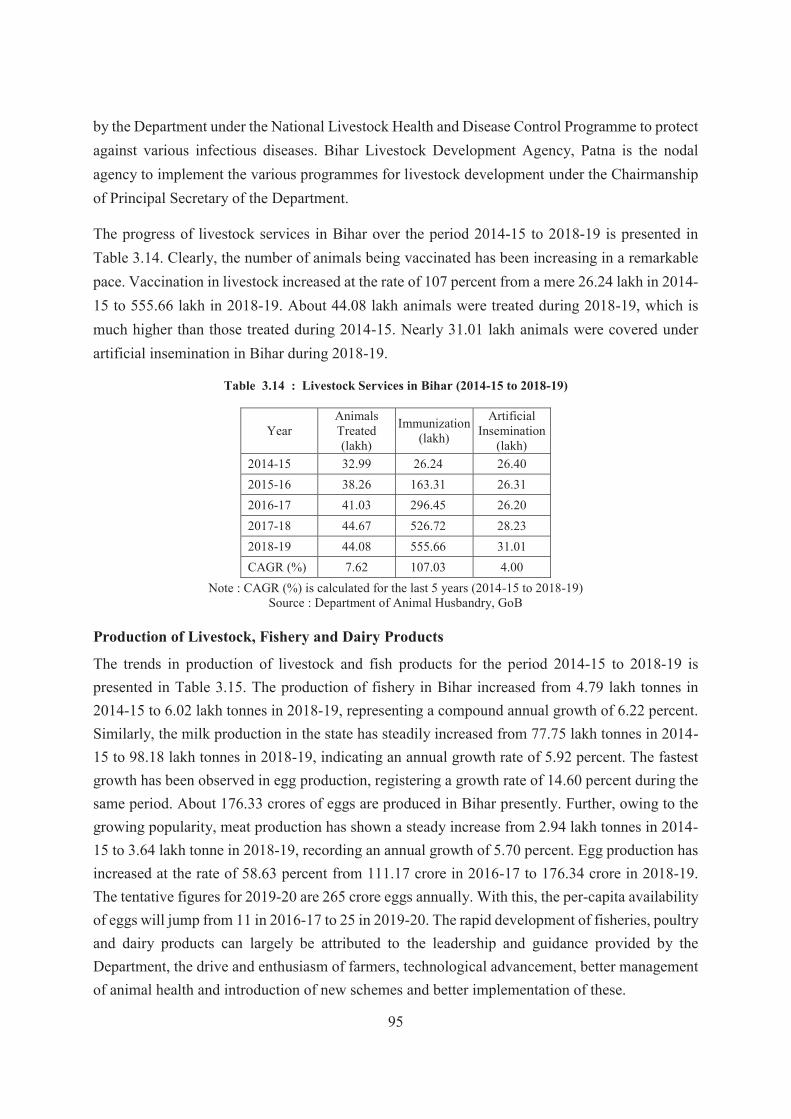
95
by the Department under the National Livestock Health and Disease Control Programme to protect against various infectious diseases. Bihar Livestock Development Agency, Patna is the nodal agency to implement the various programmes for livestock development under the Chairmanship of Principal Secretary of the Department.
The progress of livestock services in Bihar over the period 2014-15 to 2018-19 is presented in Table 3.14. Clearly, the number of animals being vaccinated has been increasing in a remarkable pace. Vaccination in livestock increased at the rate of 107 percent from a mere 26.24 lakh in 2014-15 to 555.66 lakh in 2018-19. About 44.08 lakh animals were treated during 2018-19, which is much higher than those treated during 2014-15. Nearly 31.01 lakh animals were covered under artificial insemination in Bihar during 2018-19.
Table 3.14 : Livestock Services in Bihar (2014-15 to 2018-19)
YearAnimals Treated (lakh)
Immunization (lakh)
Artificial Insemination
(lakh)2014-15 32.99 26.24 26.402015-16 38.26 163.31 26.312016-17 41.03 296.45 26.202017-18 44.67 526.72 28.232018-19 44.08 555.66 31.01CAGR (%) 7.62 107.03 4.00
Note : CAGR (%) is calculated for the last 5 years (2014-15 to 2018-19)Source : Department of Animal Husbandry, GoB
Production of Livestock, Fishery and Dairy Products
The trends in production of livestock and fish products for the period 2014-15 to 2018-19 is presented in Table 3.15. The production of fishery in Bihar increased from 4.79 lakh tonnes in 2014-15 to 6.02 lakh tonnes in 2018-19, representing a compound annual growth of 6.22 percent. Similarly, the milk production in the state has steadily increased from 77.75 lakh tonnes in 2014-15 to 98.18 lakh tonnes in 2018-19, indicating an annual growth rate of 5.92 percent. The fastest growth has been observed in egg production, registering a growth rate of 14.60 percent during the same period. About 176.33 crores of eggs are produced in Bihar presently. Further, owing to the growing popularity, meat production has shown a steady increase from 2.94 lakh tonnes in 2014-15 to 3.64 lakh tonne in 2018-19, recording an annual growth of 5.70 percent. Egg production has increased at the rate of 58.63 percent from 111.17 crore in 2016-17 to 176.34 crore in 2018-19. The tentative figures for 2019-20 are 265 crore eggs annually. With this, the per-capita availability of eggs will jump from 11 in 2016-17 to 25 in 2019-20. The rapid development of fisheries, poultry and dairy products can largely be attributed to the leadership and guidance provided by the Department, the drive and enthusiasm of farmers, technological advancement, better management of animal health and introduction of new schemes and better implementation of these.

96
Table 3.15 : Livestock and Fish Production in Bihar (2014-15 to 2018-19)
YearMilk (lakh
tonnes)
Egg (crores)
Wool (lakh kgs)
Meat (lakh
tonnes)
Fish (lakh
tonnes)2014-15 77.75 98.35 2.78 2.94 4.79
2015-16 82.88 100.21 2.40 3.02 5.07
2016-17 87.10 111.17 2.81 3.26 5.09
2017-18 92.41 121.85 2.98 3.43 5.87
2018-19 98.18 176.33 3.12 3.64 6.02
CAGR (%) 5.92 14.60 4.57 5.70 6.22
Note : CAGR (%) is calculated for the last 5 years (2014-15 to 2018-19) Source : Department of Animal Husbandry, GoB
Fisheries
Fisheries is one of the most promising sectors in Bihar as it provides livelihood security to many economically poor households. As a booming commercial activity, fisheries play an important role in increasing food and nutritional security, yielding foreign exchange, generating employment and enhancing incomes. Owing to their high protein content, the demand for fish is growing steadily. Also, fish farming in aquatic ecosystems complement crop and livestock farming activities,assisting in conservation of water and recharging groundwater table. Most of the fish farming is developed in ponds which are convenient for rearing of fish seed in the form of fry, fingerlings and earlings. Presently, Bihar is one of the leading inland fish producing states in India, and ranks fourth in Inland Fisheries in the country. The fisheries sector contributed to about 1.6 percent of the state’s Gross Value Addition, while it grew at the rate of 6.70 percent per annum during the period 2013-14 to 2018-19. The total fish production in Bihar increased from 4.79 lakh tonnes in 2013-14 to 6.02 lakh tonnes in 2018-19, registering an annual growth rate of 6.22 percent. While it has grown at the rate of 15 percent during 2017-18, the severe drought like conditions in the following year was responsible for lesser growth in 2018-19. The fish production from aquaculture requires adequate supply of quality fish seeds. In order to meet the demand for improved varieties of seeds for fish species, the State Government is distributing seeds on a priority basis. To increase fish production in the state, about 9286.5 lakh fish seeds have been distributed in the state during 2018-19, which was higher by 17.07 percentage points compared to 2016-17. The fish farmers have started exporting fist to the tune of 30000 MT to other neighbouring states and Nepal. This fish which used to come from Andhra Pradesh has reduced substantially.
The district-wise trends in production of fish and distribution of fish seeds during 2016-17 to 2018-19 are given in Table A 3.10 (Statistical Appendix). The leading districts in terms of production of fish during 2018-19 are Madhubani (0.69 lakh tonnes), Darbhanga (0.55 lakh tonnes) and East Champaran (0.51 lakh tonnes). The districts of Madhubani, Darbhanga, East Champaran, Katihar and West Champaran together accounted for nearly 39.4 percent of the total fish production in the

97
state. The distribution of fish seeds was highest in the district of Darbhanga (1748 lakh), followed by Madhubani (1630 lakh) and the lowest in Nawada (1.2 lakh) during the latest year. The district of Darbhanga, Madhubani and Sitamarhi received nearly 45.1 percent of the total fish seeds distributed in the state during 2018-19.
The State Government is introducing the farmers to all latest technologies and quality fish seeds to increase production in an efficient manner. Besides training programmes, subsidies for development and renovation of ponds, distribution of vehicles for fish marketing, construction of fish seed hatcheries and establishment of fish feed mills are being given high priority in Bihar. In the districts that are prone to drought and face the challenge of fluctuating fish production, the State Government is providing insurance coverage to members of fishermen cooperative societies.
New Initiatives of Animal and Fisheries Resources Department
The preparation of Bihar Livestock Master Plan with the support of International Livestock Research Institute and Bill and Melinda Gates Foundation (BMGF) was launched by Honourable Chief Minister in January 2019.
Out of the total 800 Livestock Development Centres sanctioned to deliver artificial insemination services at the doorstep of the farmers, 780 are operational.
The mass deworming programme which had started in 2017-18 has now been institutionalised.
For better conservation of indigenous breeds of cattle, Gokul Gram is being established at Dumraon in Buxar district.
One of the largest frozen semen stations is being constructed with a production capacity of 50 lakh frozen semen straws per annum in Purnea, which would prove to be a boon to the farmers of the state.
A proposal has been approved by the Government to enable small holder producers and landless farmers to initiate development of small livestock and aquaculture in a commercially viable and sustainable manner. This would enhance their income and food security and strengthen services and value chains. The scheme will receive assistance of International Fund for Agricultural Development (IFAD). A target of upto 1 million poor households with a focus on women farmers has been set up.
To improve high quality protein availability to children and pregnant/lactating women belonging to the under-privileged group, the Department of Animal Husbandry has tied up with the Directorate of Integrated Child Development Services (ICDS), Department of Social Welfare, Bihar for supply of milk powder and eggs to Anganwadi Centres (AWCs). Eggs produced from the layer poultry farms (established with the grants-in-aid provided by the Department) are being supplied to AWCs.

98
Dairy Sector
Dairy sector has the potential to enhance the income of rural population, as many small and marginal farmers are dependent on this sector for regular source of income. The performance of dairy co-operatives has been commendable in Bihar in recent years. Figure 3.5 presents the trends in milk production in Bihar during 2011-12 to 2018-19. Clearly, the milk production in the state has increased from 65.17 lakh tonnes in 2011-12 to 98.18 lakh tonnes in 2018-19. The trends in district-wise production of milk in the state for the years 2017-18 and 2018-19 are presented in Tables A 3.11 and A 3.12 (Statistical Appendix). The largest milk production in the state comes from cows, which accounted for 58.59 percent of the total milk production, followed by buffaloes (39.22 percent) and goats (2.19 percent). The districts of Samastipur, Begusarai, and Patna together contribute to nearly 17.05 percent of the total milk produced from cows in 2018-19. In case of goat milk, the leading producers are Araria (33.64 thousand tonnes), East Champaran (11.77 thousand tonnes) and Muzaffarpur (9.4 thousand tonnes), accounting for 25.5 percent of the total milk produced from goats in the state.
Chart 3.5 : Production of Milk in Bihar (2011-12 to 2018-19)
Source : Department of Animal Husbandry and Fisheries Resources, GoB
Poultry
Poultry farming has emerged as one of the most profitable occupations in Bihar due its high production, low initial cost, and low land requirement. As shown in Table 3.15, egg production in the state increased from 98.35 crores in 2014-15 to 176.33 crores in 2018-19, registering an annual growth of 14.60 percent. Since the launch of the Rural Backyard Poultry Scheme in 2014-15, the State Government has been emphasizing on poultry farming and linking with poultry business.
0
1
2
3
4
5
6
7
8
9
0
20
40
60
80
100
120
2011-12 2012-13 2013-14 2014-15 2015-16 2016-17 2017-18 2018-19
Milk (lakh tonnes) Year on year growth

99
Adequate training, credit and marketing support are being provided to the entrepreneurs. The State Government has been providing grants to Jeevika for distribution of day old chicks and mother units to support the rural households with additional incomes continuously since last five years. Through the programme of low-input variety of chickens, the BPL families are being provided self-employment aimed at increasing production of chicken meat and eggs. Under the Integrated Poultry Development Scheme, grants for infrastructure construction of broiler poultry firms are being given to provide gainful employment opportunities for the youth and increase poultry meat production in the state. Since 2016-17, the State Government has been giving subsidy for the establishment of layer poultry farm of 5000 and 10,000 capacity which has acted as a catalyst for the growth of may layer farms in the state which has resulted in the phenomenal growth of this sector. For increasing the production of goat meat and to provide gainful employment for rural households, 3 goats per family are being distributed for Jeevika self-help group women through the grants given by the Department of Animal and Fisheries resources. An incentive scheme for establishment of goat and buck farm of 21, 42 and 105 animal units have been launched to provide livelihood opportunities for the rural households.
3.5 Agricultural Inputs
Considering the pressure to diversify cultivation, achieve higher yields and attain production targets to meet the growing demands of the population, timely and adequate supply of inputs is crucial. Since the launch of the programme of Bringing Green Revolution to Eastern India (BGREI) in 2010-11, the State Government has given considerable attention on providing farmers access to modern inputs, such as fertilizer, pesticide, seed, tractors, and other mechanized implements to enhance productivity. The use of chemical fertilizers and mechanised equipment have played a positive role in achieving self-sufficiency in food production in the state. Given that many farmers in Bihar are marginal in nature, extending financial support can also act as a catalyst to promote modern technology and inputs. Towards this, the State Government is giving different kinds of subsidies for seeds and agricultural implements, and credit support which cause increased productivity. This section discusses the trends in seed, fertilizer, machinery, energy use and credit in Bihar.
Seed
The timely availability and quality of seeds play a crucial role in enhancing productivity of crops. The merit of hybrid seeds is that they are resilient to climate and yield-enhancing. The Bihar State Seed Corporation has set up infrastructural facilities for seed storage and processing to minimize the dependency on seed imports. The farmers are also being trained on the adoption of certified

100
seeds. The trends in Seed Replacement Rates (SRR) for major crops during the years 2016-17 to 2018-19 across the kharif and rabi season are presented in Table 3.16. The SRR for kharif paddy which stood at 42.9 percent in 2016-17 decreased to 41.3 percent in 2018-19. However, it is yet to reach the target of 50 percent as per the Agricultural Road Map III. The SRR has been the highest in case of rabi maize, averaging at 86.5 percent in the last three years. The SRR for gram has increased from 3.6 percent in 2016-17 to 35.1 during 2018-19. For other crops, SRR has not reached optimum levels, but with increasing availability of certified seeds, the situation should improve in the coming years. In case of seed for gram, the supply of certified seeds was in excess of the required quantity by 12.41 thousand quintals. However, for other kharif and rabi crops, there was a glitch in the supply of required quantity of certified seeds. Overall, the concerted efforts made by the State Government to stimulate use of certified seeds have yielded gains in both production and productivity.
Table 3.16 : Distribution of Certified Seeds and Seed Replacement (2016-17 to 2018-19)
(Requirement and supply in '000 quintal/SRR in percentage)
Crop2016-17 2017-18 2018-19
Require-ment Supply SRR Require-
ment Supply SRR Require-ment Supply SRR
Kharif CropsPaddy 431.25 317.54 42.9 428.40 319.08 40.74 448.80 320.99 41.3
Maize 90.00 11.96 13.8 81.70 13.05 16.0 82.65 13.42 16.9
Urad 1.78 - - - - - - - -Tur 6.02 1.05 8.7 3.24 1.56 11.6 3.60 2.73 21.6Moong 1.65 0.32 13.5 0.90 - - 0.90 - -
Rabi CropsWheat 930.00 465.16 20.3 720.75 674.10 30.8 744.00 753.52 32.9Maize 112.50 108.78 87.0 73.10 72.68 85.5 87.00 82.70 87.0Gram 30.36 2.99 3.6 16.56 5.83 9.8 18.40 30.81 35.1Pea 9.24 0.20 0.8 5.04 0.95 5.1 5.60 0.13 0.5Masoor 28.38 6.24 7.3 15.48 5.14 9.2 17.60 4.23 5.0Rapeseed/Mustard 8.21 4.44 58.6 2.57 1.67 31.6 4.38 4.38 63.5
Source : Department of Agriculture, GoB
Fertilizer
The chemical fertilizers have become an integral input in augmenting crop productivity since the era of Green revolution. A number of scientific and technological innovations have led to the production of nutrient-rich fertilizers, which is crucial to increasing yields across varied crops and agro-climatic zones. The trends in fertilizer consumption in Bihar during 2016-17 to 2018-19 are presented in Table 3.17. There is a distinct pattern in the consumption of fertilizers during the

101
kharif and rabi seasons. Overall, the consumption of fertilizers has been relatively higher during the rabi season for the last three years. Among all agricultural seasons, the consumption of urea has been the highest at 2183.7 thousand tonnes, accounting for 41.7 percent of the total fertilizer consumption during 2018-19. The consumption of NPK increased from 1510.39 thousand tonnes in 2016-17 to 1731.7 thousand tonnes in 2018-19. The consumption of fertilizers in the Kharif season increased from 1735.76 thousand tonnes in 2016-17 to 2173.49 thousand tonnes in 2018-19. The data clearly shows that the growth rate in fertilizer consumption has reduced during the last three years, although there has been an increase in absolute amount.
Tables A 3.13 and A 3.14 (Statistical Appendix) present the district-wise trends in the consumption of chemical fertilizers in Bihar for the years, 2017-18 and 2018-19. The highest consumption of urea during 2018-19 was observed in Purnea (68.72 thousand tonnes), while the lowest was in Sheohar (5.88 thousand tonnes). Nearly 15.5 percent of the total NPK consumption in the state came from the districts of Purnea, East Champaran and Katihar during 2018-19. The State Government is promoting the use of organic farming and providing field demonstrations for the balance use of chemical fertilizers, which is crucial for agricultural growth in Bihar.
Table 3.17 : Trends in Fertilizer Consumption in Bihar (2016-17 to 2018-19)
(‘000 tonnes)
Fertilizer Type2016-17 2017-18 2018-19
Kharif Rabi Total Kharif Rabi Total Kharif Rabi Total
Urea 882.7 1094.8 1977.5 885.6 1154.0 2039.5 883.7 1300.0 2183.7DAP 148.7 383.1 531.7 250.5 431.8 682.3 312.7 364.8 677.5SSP 33.4 33.1 66.5 41.1 30.9 72.0 41.9 35.3 77.1MOP 50.6 179.2 229.8 81.6 163.2 244.9 98.5 124.3 222.8Ammonium Sulphate 6.0 21.4 27.4 7.5 25.3 32.8 4.5 24.2 28.7
Complex 53.4 187.2 240.6 58.1 204.0 262.2 107.2 204.9 312.1Sub Total 1174.7 1898.7 3073.5 1324.4 2009.3 3333.6 1448.4 2053.5 3501.9N 444.0 610.8 1054.8 464.2 649.0 1113.2 481.5 706.2 1187.7P 85.2 223.6 308.8 134.9 251.4 386.2 176.9 218.7 395.6K 31.8 115.0 146.7 52.1 109.6 161.8 66.6 81.8 148.4Total (NPK) 561.0 949.4 1510.4 651.2 1010.0 1661.2 725.1 1006.7 1731.7Grand Total 1735.8 2848.1 4583.9 1975.6 3019.2 4994.9 2173.5 3060.2 5233.6Consumption of Fertilizer (kg/ha.) 137.0 205.7 173.4 153.6 216.3 186.5 177.3 222.4 201.0
Source : Department of Agriculture, GoB
Agricultural Machinery
Growing population and increasing trend of diversification require the use of modern technology and implements to improve agricultural productivity. The use of modern agricultural machinery
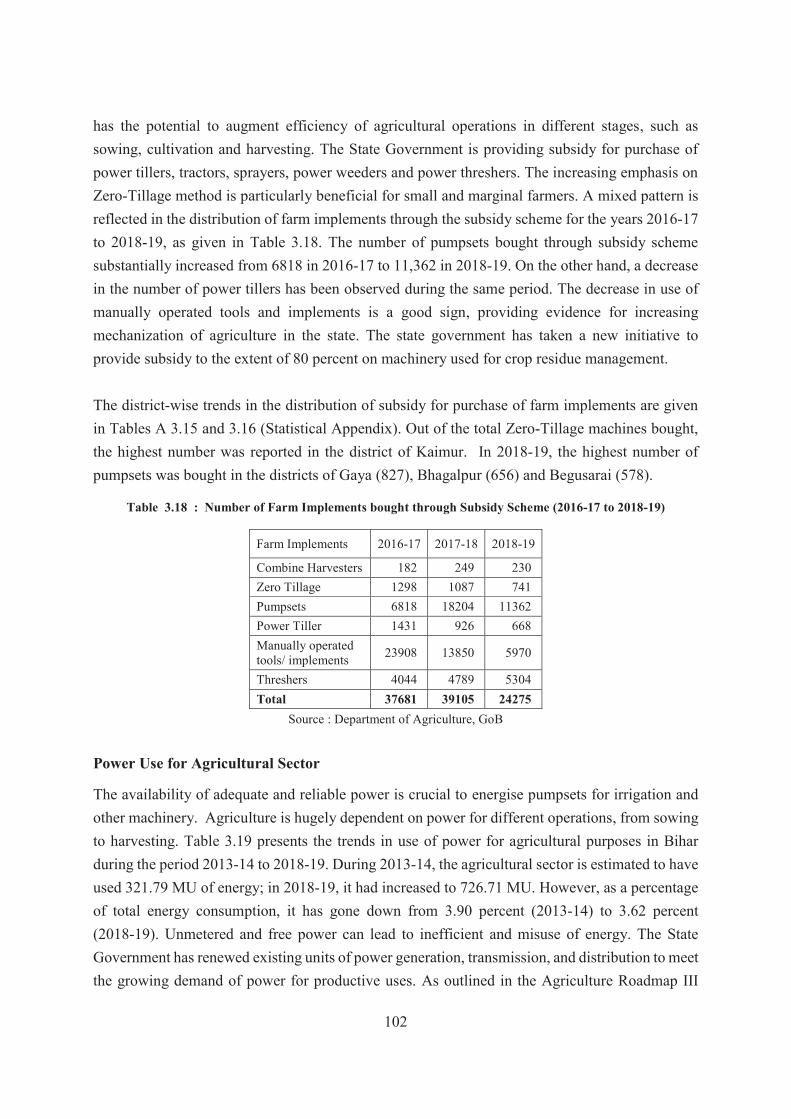
102
has the potential to augment efficiency of agricultural operations in different stages, such as sowing, cultivation and harvesting. The State Government is providing subsidy for purchase of power tillers, tractors, sprayers, power weeders and power threshers. The increasing emphasis on Zero-Tillage method is particularly beneficial for small and marginal farmers. A mixed pattern isreflected in the distribution of farm implements through the subsidy scheme for the years 2016-17to 2018-19, as given in Table 3.18. The number of pumpsets bought through subsidy scheme substantially increased from 6818 in 2016-17 to 11,362 in 2018-19. On the other hand, a decrease in the number of power tillers has been observed during the same period. The decrease in use of manually operated tools and implements is a good sign, providing evidence for increasing mechanization of agriculture in the state. The state government has taken a new initiative to provide subsidy to the extent of 80 percent on machinery used for crop residue management.
The district-wise trends in the distribution of subsidy for purchase of farm implements are given in Tables A 3.15 and 3.16 (Statistical Appendix). Out of the total Zero-Tillage machines bought, the highest number was reported in the district of Kaimur. In 2018-19, the highest number of pumpsets was bought in the districts of Gaya (827), Bhagalpur (656) and Begusarai (578).
Table 3.18 : Number of Farm Implements bought through Subsidy Scheme (2016-17 to 2018-19)
Farm Implements 2016-17 2017-18 2018-19
Combine Harvesters 182 249 230Zero Tillage 1298 1087 741Pumpsets 6818 18204 11362Power Tiller 1431 926 668Manually operated tools/ implements 23908 13850 5970
Threshers 4044 4789 5304Total 37681 39105 24275
Source : Department of Agriculture, GoB
Power Use for Agricultural Sector
The availability of adequate and reliable power is crucial to energise pumpsets for irrigation and other machinery. Agriculture is hugely dependent on power for different operations, from sowing to harvesting. Table 3.19 presents the trends in use of power for agricultural purposes in Bihar during the period 2013-14 to 2018-19. During 2013-14, the agricultural sector is estimated to have used 321.79 MU of energy; in 2018-19, it had increased to 726.71 MU. However, as a percentage of total energy consumption, it has gone down from 3.90 percent (2013-14) to 3.62 percent (2018-19). Unmetered and free power can lead to inefficient and misuse of energy. The State Government has renewed existing units of power generation, transmission, and distribution to meet the growing demand of power for productive uses. As outlined in the Agriculture Roadmap III

103
(2017-22), the State Government is taking steps to ensure continuous supply of electricity by commissioning dedicated feeders for agriculture sector.
Table 3.19 : Trends in Power use for Agricultural Purposes in Bihar (2013-14 to 2018-19)
Years 2013-14 2014-15 2015-16 2016-17 2017-18 2018-19
Power Consumption (in MU) 321.79 313.21 355.24 393.98 479.84 726.71Percentage in Total Power Consumption 3.90 2.90 2.59 2.48 2.63 3.62
Source : Bihar State Power Holding Limited
Agricultural Credit
The advent of technology has led to increased demand for modern inputs which require credit support. Credit is an important input to accelerate production and productivity in agriculture. The main channels of disbursement of institutional credit to agriculture are commercial banks, co-operatives, and micro-finance institutions. Timely provision of institutional credit helps meet the expenses of working capital. In 2018-19, the gross flow of agricultural credit stood at Rs. 41,798 crore in Bihar, of which nearly 52.0 percent came from the commercial banks, followed by regional rural banks (41.3 percent) and central-co-operative banks (6.7 percent).
Kisan Credit Card
Since 1998, the Kisan Credit Card scheme is providing timely credit support to farmers through the interest subvention scheme. Table 3.20 presents the trends in achievement of KCC for agriculture during the period 2014-15 to 2018-19. In 2018-19, about 2.53 lakh farmers benefitted from this scheme. Besides this, KCC scheme has been introduced for allied activities in agriculture such as dairy, poultry and fishery, the details of which have been given in Table 3.21. Against the set targets, dairy sector had the highest achievement level of 38.5 percent, followed by poultry (9.8 percent) and fisheries (3.8 percent) in 2018-19.
Table 3.20 : Year-wise Achievement (KCC and procurement) (2014-15 to 2018-19)
(Rs Lakh)
YearAgriculture Achievement
Members Amount
2014-15 167513 38088.51
2015-16 406574 125759.00
2016-17 384139 182546.00
2017-18 370746 254800.00
2018-19 253060 279986.00
Source : Bihar State Co-operative Bank Limited

104
Table 3.21 : KCC to Allied Agriculture Activities (2018-19)
(Amount Rs. crore)
SchemeTarget Sanctioned Disbursement Percent
AchievedAmount Number Amount Number Amount
Dairy 3616 230380 1379 230213 1391 38.5
Poultry 1440 9530 141 9569 143 10.00
Fishery 1391 3441 51 3478 53 3.8
Source : State Level Bankers' Committee Report
The demand for financial resources for cropping, farm investments, purchase of inputs and other machinery have been increasing in Bihar. Among the institutional sources of agricultural credit, commercial banks and co-operatives are playing a pioneering role in Bihar. A look at Table 3.22, which presents bank-wise total farm credit in Bihar for the year 2018-19, shows that against the set target, co-operative banks have reached 165.0 percent of the disbursements, followed by regional rural banks (91.4 percent) during the year 2018-19.
Table 3.22 : Bank-wise Total Farm Credit in Bihar (2018-19)
(Amount in Rs crore)
BanksTarget Sanctioned Disbursement Achieve-
ment (Percent)Amount Number Amount Number Amount
Commercial Banks 30837 1884959 19324 1939745 19802 64.2
Co-operative Banks 1697 253060 2800 253060 2800 165.0
RRBs 18896 1589654 18266 1588201 17264 91.4
Small Finance Banks 553642 1804 553642 1802 -
Total 51430 4281015 42194 4334648 41671 81.0
Source : State Level Bankers' Committee Report
The district-wise targets and achievements of Co-operative Banks is given in Table A 3.17 (Statistical Appendix) for the period 2016-17 to 2018-19. It is evident from the table that the targets of co-operative credit supply were comparatively higher in the districts of Begusarai, Khagaria and Madhubani during 2018-19. It is remarkable to note that Katihar was able to supply nearly 90.6 percent of credit against the set target in 2018-19. In districts such as Jehanabad and Arwal, the achievements of co-operative credit supply are far below the set targets.
Subsidy
The subsidies is the assistance given to farmers by the government for provision of inputs at reduced prices. It is a boon to the farmers, especially in incentivising certain crops. The input and diesel subsidies can greatly motivate the farmers to continue their cultivation. The Agriculture

105
Input Subsidy Scheme provides farmers subsidy twice a year before sowing for adoption of organic vegetables. As per the Pradhan Mantri Krishi Sinchai Yojana (micro irrigation), there is a provision for 55 percent subsidy to marginal farmers (those having landholding of less than one hectare) and 45 percent to those having land holdings over one hectare. The State government is providing additional top up subsidy to encourage use of micro irrigation system in Bihar. After adding additional top up, farmers of state get 90 percent subsidy on drip irrigation and 75 percent subsidy on sprinkler irrigation. In 2018-19, a total of Rs. 229.93 crore has been sanctioned as electricity subsidy by the energy department. The diesel subsidy up to Rs. 263.60 crore have been distributed in Bihar during 2018-19 (Table 3.23). Further, the State Government is providing subsidy of up to 80 percent on the purchase of farm equipment such as happy seeder, straw reaper, straw baler and rotary mulcher for management of crop residue, as part of its efforts to dissuade farmers from burning stubble and promote environmental friendly practices.
Table 3.23 : Distribution of Subsidies for Diesel in Bihar (2010-11 to 2018-19)
(Subsidy Rs. crore)
Years Diesel
2010-11 76.53
2011-12 4.09
2012-13 140.55
2013-14 175.99
2014-15 97.15
2015-16 195.24
2016-17 65.75
2017-18 49.70
2018-19 263.60
Source : Department of Agriculture, GoB
3.6 Storage and Warehouse
The warehouses in Bihar are being managed by the Bihar State Warehousing Corporation (BSWC)
since its establishment in 1957 under the Agricultural Produce Corporation Act, 1956. Providing
adequate storage, including sorting, grading units, cold storage units and warehouses are crucial
to assist in post-harvest management of produce.
Table 3.24 presents the status of warehouses in Bihar for the period 2010-11 to 2018-19. As on
March 2018-19, Bihar has a total warehousing capacity of around 5.21 lakh tonnes to store and
preserve foodgrains. The annual capacity available was higher among own warehouses at 4.86

106
lakh tonnes in 2018-19, compared to the hired warehouses at 0.35 lakh tonnes. The percentage of
utilization of hired warehouses was hundred for all the years. The utilization capacity among own
warehouses stood at 3.48 lakh metric tonnes, which is about 71.6 percent of the total available
capacity during 2018-19.
Table 3.24 : Status of Warehouse in Bihar (2010-11 to 2018-19)
Years No. of Centres
Annual Capacity Available
(in lakh tonnes)
Annual Capacity Utilized
(in lakh tonnes)
Percentage of capacity
utilizationOwned Hired Total Owned Hired Total Owned Hired
2010-11 33 1.45 0.87 2.31 1.16 0.87 2.02 80.0 100.0
2011-12 30 1.65 0.7 2.35 1.27 0.7 1.97 77.0 100.0
2012-13 28 1.75 0.68 2.43 1.53 0.68 2.21 87.4 100.0
2013-14 30 1.96 0.64 2.6 1.65 0.64 2.29 84.2 100.0
2014-15 29 1.98 0.51 2.49 1.61 0.51 2.12 81.3 100.0
2015-16 30 2.13 0.42 2.55 1.71 0.42 2.12 80.3 100.0
2016-17 35 3.93 0.34 4.27 1.82 0.34 2.17 46.3 100.0
2017-18 38 4.67 0.32 4.99 2.14 0.32 2.47 45.8 100.0
2018-19 41 4.86 0.35 5.21 3.48 0.35 3.82 71.6 100.0
Source : Bihar State Warehousing Corporation (BSWC)
The State Government is making considerable efforts to increase the storage capacity in Bihar
through various storage, processing, and marketing schemes. The scope for food processing is
huge in Bihar, because of the high production of foodgrains and horticulture crops. Under the
Scheme for Integrated Development of Food Processing, about 3 cold storages and 5 dry
warehouses have been established. The State Government, in collaboration with COMFED and
private companies, is establishing common facility centre for facilitating value addition,
packaging, cold storage and warehouse for processing of various agricultural products. Besides
BSWC, foodgrain storage capacity is created by agencies such as PACS, SFC and CWC. The
Bihar State Seed Corporation will set up a plant to control humidity in its warehouses to maintain
the germination quality of seed. To develop horticultural sector, basic infrastructure support is
being provided through construction of low-cost storage units, development of cold chain (for
marketing of fresh fruit and vegetables), and on-farm collection, sorting, grading and packaging.

107
3.7 Irrigation
The need for adequate and assured supply of water hardly needs any emphasis in times of adoption of high-yielding varieties, modern technology, fertilizer, and mechanized equipment for increasing production and productivity. In Bihar, the water area constitutes about 3.6 percent of the total geographical area. On an average, the state receives annual rainfall amounting to 1000 mms, bulk of which comes from the south-west monsoon. However, erratic rainfall patterns and recurring droughts leading to scarcity of water for irrigation have affected achieving higher productivity. Therefore, a well-planned irrigation system is needed to assist in stabilizing production, improving yield and cropping intensities. Indeed, in recent years, erratic rainfall patterns, recurrent droughts and over-exploitation of groundwater have emerged as major challenges to achieve water use efficiency in Bihar. Reducing the cost of accessing water for irrigation, especially for small and marginal farmers, can go a long way in improving their welfare. Further, improving water use efficiency is important to balance the environmental costs of groundwater usage.
During 2017-18, Bihar received an annual rainfall of 994.4 mms, out of which 84.9 percent was largely due to the south-west monsoon. However, this is not adequate to water the entire farming activities in the state. Chart 3.6 presents the source-wise Gross Irrigated Area (GIA) in Bihar during 2017-18. The tubewells are the major source of irrigation in the state, irrigating nearly 63.1 percent of the total irrigated area. Next to tubewells, canal water offers about 30.7 percent of the total GIA in the state. The source-wise gross irrigated area across the districts for the period 2017-18 is given in Table A 3.18 (Statistical Appendix). The gross irrigated area was the highest in Rohtas (338.13 thousand hectares), while the lowest was in Sheohar (26.25 thousand hectares) under all sources. The district of Samastipur was well-equipped with 227.69 hectares under tubewell irrigation during 2017-18.
Chart 3.6 : Source-wise Gross Irrigated area in Bihar (2017-18)
(Percent share)
Source : Directorate of Economics and Statistics, GoB
Canals31%
Tanks2%
Tubewells63%
Otherwells1%
Other Sources3%

108
The source-wise irrigation (percent of gross irrigated area) for the period 2011-12 to 2017-18 is presented in Table 3.25. The gross area irrigated in the state has increased to 54.14 lakhs during 2017-18, compared to 51.58 lakh hectares in 2011-12, showing an increase of only 4.7 percent.Tubewells are the largest source of irrigation in Bihar, contributing to about 63.1 of the total gross irrigated area in the state, while the second most important source is government canals (30.7 percent). The gross irrigated area under tanks increased from 0.74 lakh hectares in 2011-12 to about 1.05 lakh hectares in 2017-18, registering an annual growth rate of 7.25 percent. The growing share of tubewells in irrigation is of concern, because it leads to over-exploitation of groundwater and fall in water tables.
Table 3.25 : Source-wise Gross Irrigated Area (2011-12 to 2017-18)
(Area in ‘000 hectares)
Year Canals TanksWells Other
Sources TotalTubewells Other
wellsTotal wells
2011-12 1473.48 (28.6)
74.09 (1.4)
3402.64 (66)
28.84 (0.6)
3431.48 (66.5)
178.46 (3.5)
5157.51 (100)
2012-13 1521.73 (28.6)
72.74 (1.4)
3516.83 (66)
29.37 (0.6)
3546.2 (66.6)
186.3 (3.5)
5326.97 (100)
2013-14 1470.88 (28.6)
73.54 (1.4)
3401.36 (66.1)
28.27 (0.5)
3429.63 (66.7)
170.72 (3.3)
5144.77 (100)
2014-15 1490.08 (28.3)
73.7 (1.4)
3497.44 (66.4)
29.58 (0.6)
3527.02 (67)
176.73 (3.4)
5267.52 (100)
2015-16 1466.07(27.9)
84.57(1.6)
3482.18(66.4)
28.60(0.5)
3510.78(67)
185.43(3.5)
5246.85 (100)
2016-17 1628.97 (30.5)
107.27 (2)
3377.1 (63.2)
37.57 (0.7)
3414.67 (63.9)
190.56 (3.6)
5341.46 (100)
2017-18 1660.00(29.6)
104.88 (1.9)
3418.26 (63.1)
39.63 (0.7)
3457.89 (63.9)
190.74 (3.5)
5413.51(100)
CAGR (%) 1.37 7.25 -0.16 5.34 -0.10 1.14 0.61
Note : Figures in parentheses indicate percentage share in total GIA Source : Directorate of Economics and Statistics, GoB
Table 3.26 : Gross irrigated area as percentage of Gross cropped area (2011-12 to 2017-18)
(Area in '000 hectare)
YearsGross
Cropped Area (GCA)
Gross Irrigated Area
(GIA)
GIA as per cent of GCA
2011-12 7646.76 5157.51 67.45
2012-13 7777.52 5326.97 68.49
2013-14 7580.14 5144.77 67.87
2014-15 7672.95 5267.52 68.65
2015-16 7572.41 5246.85 69.29
2016-17 7654.36 5341.46 69.78
2017-18 7525.18 5413.51 71.94
Source : Directorate of Economics and Statistics, GoB

109
Chart 3.7 : Gross irrigated area as percentage of Gross cropped area (2011-12 to 2017-18)
Source : Directorate of Economics and Statistics, GoB
Table 3.26 presents the gross irrigated area as percentage of gross cropped area for the period 2011-12 to 2017-18. The same information has been presented in Chart 3.7. The ratio of gross irrigated area to gross cropped area has shown a steady increasing trend since 2013-14. During 2017-18, the share of gross irrigated area as percentage of gross cropped area stood at 71.9 percent, compared to 67.4 percent in 2011-12.
Table 3.27 : Trends in Public Expenditure in Irrigation Sector (2013-14 to 2018-19)
(Rs. crore)
Year Revenue Expenditure
Capital Expenditure
Total Expenditure
2013-14 86.85 767.32 854.17
2014-15 86.87 721.67 808.55
2015-16 107.16 845.58 952.74
2016-17 106.53 772.22 878.75
2017-18 129.32 1268.71 1398.03
2018-19 120.86 1207.57 1328.43
Source : Department of Water Resources, GoB
Chart 3.8 : Composition of Public Expenditure in Irrigation Sector (2013-14 to 2018-19)
(Rs. crore)
Source : Department of Water Resources, GoB
67.468.5
67.968.7
69.369.8
71.9
65.066.067.068.069.070.071.072.073.0
2011-12 2012-13 2013-14 2014-15 2015-16 2016-17 2017-18
020000400006000080000
100000120000140000
2013-14 2014-15 2015-16 2016-17 2017-18 2018-19
Revenue Expenditure Capital Expenditure

110
Since agriculture is a state subject under the Indian constitution, the responsibility of spending on irrigation and water conservation lies with the State Governments. Chart 3.8 demonstrates the trends in public expenditure in irrigation sector for the period 2013-14 to 2018-19 and the data for the same is given in Table 3.27. The total expenditure for irrigation development increased from Rs. 854.17 crore in 2013-14 to Rs. 1328.43 crore in 2018-19, recording an annual growth rate of 11.4 percent. The share of capital expenditure stood at 90.9 percent of the total expenditure. Asignificant part of the government spending for irrigation is capital expenditure for creation of infrastructure and other assets. The capital expenditure increased from Rs. 767.32 crore in 2013-14 to Rs. 1207.57 crore in 2018-19. The increasing trend in capital expenditure in irrigation (especially over the last two years) signifies the high priority that the State Government has laid on developing irrigation infrastructure.
Irrigation potential
Bihar, because of its geographical location, is well-endowed with water resources. However, erratic rainfall and its irregular spatial distribution is of concern for achieving stability in agricultural production. Therefore, investing in different irrigation schemes is crucial for agricultural growth. The irrigation schemes in Bihar can be broadly divided into major, medium, and minor irrigation schemes. Table 3.28 presents the status of irrigation potential in Bihar for the period 2016-17 to 2018-19. Out of the ultimate irrigation potential of 117.54 lakh hectares in Bihar, the irrigation potential has been estimated to be 53.53 lakh hectares for major and medium irrigation schemes, while it is 64.01 lakh hectares from minor irrigation schemes. Further, the groundwater resource accounts for about 75.9 percent (48.57 lakh hectares) of ultimate irrigation potential. The total irrigation potential created from major and medium irrigation projects during 2018-19 stood around 30.04 lakh hectares, while it was 42.03 lakh hectares from minor irrigation projects.
Table 3.28 : Status of Irrigation Potential in Bihar (2016-17 to 2018-19)
(Area in lakh hectares)
Type of Irrigation Potential Ultimate Potential
2016-17 2017-18 2018-19Created Potential
Utilized Potential
Created Potential
Utilized Potential
Created Potential
Utilized Potential
(a) Major & Medium Irrigation 53.53 29.69 26.72 29.91 23.80 30.04 26.56
(b) Minor Irrigation 64.01 40.79 36.71 41.12 36.99 42.03 37.82
Surface Irrigation 15.44 8.14 7.33 8.35 7.50 8.70 7.83
Groundwater 48.57 32.66 29.38 32.77 29.49 33.33 30.00
Total 117.54 70.48 63.43 71.03 60.79 72.07 64.38
Note : The created and utilised potential is upto March Source : Department of Minor Water Resources and Department of Water Resources, GoB
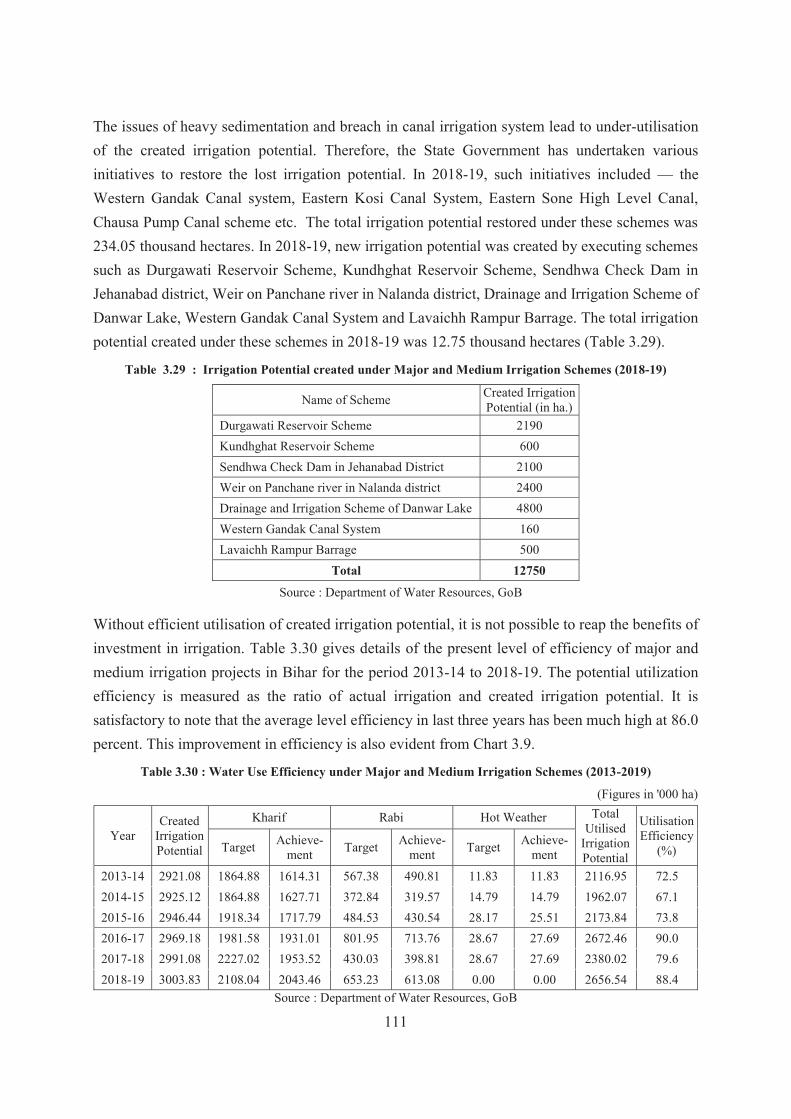
111
The issues of heavy sedimentation and breach in canal irrigation system lead to under-utilisation of the created irrigation potential. Therefore, the State Government has undertaken various initiatives to restore the lost irrigation potential. In 2018-19, such initiatives included — the Western Gandak Canal system, Eastern Kosi Canal System, Eastern Sone High Level Canal, Chausa Pump Canal scheme etc. The total irrigation potential restored under these schemes was 234.05 thousand hectares. In 2018-19, new irrigation potential was created by executing schemes such as Durgawati Reservoir Scheme, Kundhghat Reservoir Scheme, Sendhwa Check Dam in Jehanabad district, Weir on Panchane river in Nalanda district, Drainage and Irrigation Scheme of Danwar Lake, Western Gandak Canal System and Lavaichh Rampur Barrage. The total irrigation potential created under these schemes in 2018-19 was 12.75 thousand hectares (Table 3.29).
Table 3.29 : Irrigation Potential created under Major and Medium Irrigation Schemes (2018-19)
Name of Scheme Created Irrigation Potential (in ha.)
Durgawati Reservoir Scheme 2190Kundhghat Reservoir Scheme 600Sendhwa Check Dam in Jehanabad District 2100Weir on Panchane river in Nalanda district 2400Drainage and Irrigation Scheme of Danwar Lake 4800Western Gandak Canal System 160Lavaichh Rampur Barrage 500
Total 12750
Source : Department of Water Resources, GoB
Without efficient utilisation of created irrigation potential, it is not possible to reap the benefits of investment in irrigation. Table 3.30 gives details of the present level of efficiency of major and medium irrigation projects in Bihar for the period 2013-14 to 2018-19. The potential utilization efficiency is measured as the ratio of actual irrigation and created irrigation potential. It is satisfactory to note that the average level efficiency in last three years has been much high at 86.0 percent. This improvement in efficiency is also evident from Chart 3.9.
Table 3.30 : Water Use Efficiency under Major and Medium Irrigation Schemes (2013-2019)
(Figures in '000 ha)
YearCreated
Irrigation Potential
Kharif Rabi Hot Weather TotalUtilised
Irrigation Potential
Utilisation Efficiency
(%)Target Achieve-ment Target Achieve-
ment Target Achieve-ment
2013-14 2921.08 1864.88 1614.31 567.38 490.81 11.83 11.83 2116.95 72.52014-15 2925.12 1864.88 1627.71 372.84 319.57 14.79 14.79 1962.07 67.12015-16 2946.44 1918.34 1717.79 484.53 430.54 28.17 25.51 2173.84 73.82016-17 2969.18 1981.58 1931.01 801.95 713.76 28.67 27.69 2672.46 90.02017-18 2991.08 2227.02 1953.52 430.03 398.81 28.67 27.69 2380.02 79.62018-19 3003.83 2108.04 2043.46 653.23 613.08 0.00 0.00 2656.54 88.4
Source : Department of Water Resources, GoB

112
Chart 3.9 : Pattern of Water Utilization of Major and Medium Irrigation Schemes (2013-19)
Source : Department of Water Resources, GoB
The information on area brought under irrigation through minor irrigation sources, such as surface canal, tanks (including ahars and pyne), tubewells and other sources is presented in Table 3.31.Under the minor irrigation projects, an area of 90.76 thousand hectares was brought under irrigation during 2018-19. The share of irrigation potential created by tubewells was the highest at an average of 52.0 percent during the period 2013-14 to 2018-19. Next in importance was tanks (including ahars and pynes) which accounted for 32.9 percent of the area. The total land brought under irrigation through minor sources has fluctuated over the years. It was the highest in 2016-17 (127.30 thousand hectares) and the lowest in 2014-15 (38.42 thousand hectares).
Table 3.31 : Area Brought under Irrigation through Minor Irrigation Sources (2013-14 to 2018-19)
(Area in hectares)
Source 2013-14 2014-15 2015-16 2016-17 2017-18 2018-19
Surface Canal 26086 9310 - 2600 5500 -
Tanks (including Ahars and Pyne) 41591 10934 28631 20500 15830 29876
Tubewells (Private and State) 64251 15610 38440 86200 24000 55931Other Sources (Lift Irrigation) and Barge Lift Irrigation 9627 2564 5055 18000 10160 4950
Total 141555 38418 72126 127300 55490 90757
Source : Department of Minor Water Resources, GoB
Table 3.32 : Status of Farmers' Societies (As on March 2019)
Status Number
Management of Irrigation System Transferred 54
Irrigation systems ready for transfer to Societies 27
Applied for Registration 30
Under the process of motivation 511
Total 622Source : Department of Water Resources, GoB
0
20
40
60
80
100
0
500
1000
1500
2000
2500
3000
3500
2013-14 2014-15 2015-16 2016-17 2017-18 2018-19
Created Irrigation Potential Utilised Irrigation Potential Utilisation Efficiency (%)

113
Initiatives of Minor Water Resources Department
The Department of Minor Water Resources has taken up several programmes to extend irrigation schemes under Agricultural Road Map III (2017-22). The Department has planned to create an additional irrigation potential of 8.25 lakh hectares through surface irrigation —Ahar- Pyne (5.56 lakh ha) and weir scheme (1.82 lakh ha), lift irrigation scheme (0.88 lakh ha).
1. Surface Irrigation Scheme : The Ahar Pyne Irrigation System, Weirs and Irrigation Ponds are renovated under three different sources of funding.
State Plan : A total of 77 schemes have been completed in 2018-19, creating an additional irrigation potential of 14708 hectares.RIDF Scheme (NABARD): 202 Ahar Pyne schemes are executed under Rural Infrastructure Development Fund (RIDF), out of which 189 schemes have been completed. An irrigation potential of 60.55 thousand hectares has been created in 2019-20.Pradhan Mantri Krishi Sinchai Yojna (PMKSY) : A total of 44 Ahar-Pyne schemes in the districts of Nawada, Rohtas, Kaimur and Sitamarhi are being implemented andan irrigation potential of 18.85 thousand hectares has been created till date.
2. Jal-Jeevan-Hariyali Abhiyan : This scheme intends to assist in water conservation, storage and irrigation. All Public ahar-pynes and tanks will be renovated and check dams/weirs will be constructed on small rivers, nalas, etc. for collecting rain water during monsoon. These schemes will be completed in three years (from 2019-20 to 2021-22). An amount of Rs. 13610 crore has been allocated for completion of these schemes. In 2019-20, tenders of 1413 Ahar-Pyne, and Pond schemes have been finalized for execution with an estimated cost of Rs. 978 crore.
3. Ground Water Irrigation Scheme : As present, a total of 5183 state tubewells schemes are functional, out of 10,240 tubewells in Bihar.
4. Bihar Shatabdi Nalkup Yojana : The State Government provides grants up to a maximum of Rs 15,000 for 70-meter deep and Rs 35,000 for 100-meter deep tubewell to farmers. In addition, 50 percent of the cost of motor pump set is also provided, subject to a maximum of Rs 10,000. All the grants are transferred through Direct Benefit Transfer (DBT) Scheme. Till date, about 31,468 private tubewells have been established by farmers.
5. Telemetry Scheme (Automatic Digital Water Level Recorder) : A telemetry instrument has been installed at 564 places, of which 539 systems are already functional.
6. Tubewell Ownership : All the state tubewells have been transferred to Gram Panchayats (GP) for operation and maintenance. The GPs have been empowered to collect revenue and fix irrigation rates. A revenue of Rs. 21.25 lakh has been collected by the GPs in 2018-19.

114
The participatory irrigation system has provided impetus for the farmers to be involved in various
aspects of irrigation system, particularly water distribution. The State Government is focused on
participatory irrigation management so as to create a sense of ownership of water resources among
the users, promote economy in water use and achieve equity in water distribution. As depicted in
Table 3.32, as of March 2019, the management of irrigation system have already been transferred
to 54 societies. Currently, the process of transfer for 27 more societies is ongoing in the state. At
present, the State Government has adopted an ‘Integrated Water Management System’ which encompasses the major objects of water in dry land areas, recharge of groundwater and soil
conservation. In addition, the system also encourages judicious use of water resources to ensure
agricultural growth in the state.

115
APPENDIX
Table A 3.1 : District-wise Land Utilization Pattern (2017-18)
(Area in ‘000 hectares)
District Geographical Area (1)
Area under
Forest (2)
Land not available for cultivation (3) Culturable Waste
Land (4)
Barren & Unculturable
land
Non- Agriculture Use
Land Area Water AreaPerennial Temporary
Patna 317.2 (100) 0.1 (0) 12.4 (3.9) 67.9 (21.4) 10.3 (3.3) 2 (0.6) 0.7 (0.2)Nalanda 232.7 (100) 4.6 (2) 1.2 (0.5) 35.9 (15.4) 2.5 (1.1) 7 (3) 0.2 (0.1)Bhojpur 237.3 (100) 0 (0) 6.7 (2.8) 30.4 (12.8) 2.8 (1.2) 1.5 (0.6) 0.6 (0.2)Buxar 167 (100) 0 (0) 2.2 (1.3) 13.2 (7.9) 3.2 (1.9) 1.1 (0.7) 0.6 (0.4)Rohtas 390.7 (100) 66.7 (17.1) 16.8 (4.3) 44.4 (11.4) 9 (2.3) 0.6 (0.2) 1.1 (0.3)Kaimur 342.5 (100) 113 (33) 19.3 (5.6) 31.2 (9.1) 2.5 (0.7) 1.6 (0.5) 1.8 (0.5)
Gaya 493.8 (100) 77.8 (15.8) 27.5 (5.6) 63.4 (12.8) 3.8 (0.8) 6 (1.2) 3.2 (0.7)Jehanabad 94 (100) 0.6 (0.7) 3.3 (3.5) 13.9 (14.8) 0.8 (0.9) 0.5 (0.6) 0.1 (0.1)Arwal 62.6 (100) 0 (0) 2.2 (3.5) 9.2 (14.7) 0.6 (0.9) 0.8 (1.3) 0.1 (0.1)Nawada 248.7 (100) 63.8 (25.6) 11.2 (4.5) 25.8 (10.4) 3 (1.2) 6.9 (2.8) 1.1 (0.4)Aurangabad 330 (100) 18.8 (5.7) 16.4 (5) 56.4 (17.1) 1.7 (0.5) 1.7 (0.5) 1.8 (0.5)Saran 264.9 (100) 0 (0) 17.9 (6.8) 28.9 (10.9) 3.5 (1.3) 0.2 (0.1) 0.2 (0.1)Siwan 224.4 (100) 0 (0) 8.7 (3.9) 29.8 (13.3) 2 (0.9) 1.5 (0.7) 0.7 (0.3)Gopalganj 203.8 (100) 0 (0) 5.5 (2.7) 31.3 (15.4) 2.1 (1) 0.5 (0.2) 1.4 (0.7)
W. Champaran 484.4 (100) 91.8 (18.9) 2.9 (0.6) 71.2 (14.7) 15.2 (3.1) 8.8 (1.8) 1.2 (0.3)E. Champaran 431.7 (100) 0.1 (0) 8.1 (1.9) 51.7 (12) 10.1 (2.3) 15.2 (3.5) 0.2 (0.1)Muzaffarpur 315.4 (100) 0 (0) 5.3 (1.7) 51.6 (16.4) 7.8 (2.5) 4 (1.3) 0.3 (0.1)Sitamarhi 221.9 (100) 0 (0) 1.8 (0.8) 45.2 (20.4) 2.5 (1.1) 16 (7.2) 0.1 (0)Sheohar 43.5 (100) 0 (0) 0.4 (0.9) 10 (23) 1.3 (2.9) 0.2 (0.3) 0 (0)Vaishali 201.5 (100) 0 (0) 24.1 (12) 30.5 (15.1) 5.8 (2.9) 1.9 (1) 0.1 (0.1)
Darbhanga 254.1 (100) 0 (0) 1.3 (0.5) 44.3 (17.4) 9.4 (3.7) 7.4 (2.9) 0.1 (0.1)Madhubani 353.5 (100) 0 (0) 2.2 (0.6) 71.3 (20.2) 13.4 (3.8) 2.2 (0.6) 0.5 (0.1)Samastipur 262.4 (100) 0 (0) 3.8 (1.5) 54.7 (20.9) 8.2 (3.1) 0.8 (0.3) 0 (0)
Begusarai 187.8 (100) 0 (0) 18 (9.6) 30.3 (16.1) 7.7 (4.1) 4 (2.1) 0 (0)Munger 139.8 (100) 28.5 (20.4) 11.4 (8.2) 20.9 (15) 5.8 (4.2) 5.3 (3.8) 0.9 (0.7)Sheikhpura 62.1 (100) 0 (0) 1 (1.6) 7.8 (12.5) 0.9 (1.4) 2 (3.2) 0.2 (0.4)Lakhisarai 128.6 (100) 13.5 (10.5) 7 (5.5) 9.3 (7.3) 1.2 (0.9) 4.7 (3.7) 0.7 (0.5)Jamui 305.3 (100) 92.9 (30.4) 28.6 (9.4) 39.6 (13) 2.2 (0.7) 2.8 (0.9) 10.3 (3.4)Khagaria 149.3 (100) 0 (0) 13.6 (9.1) 19.3 (12.9) 7.7 (5.2) 4.2 (2.8) 0.6 (0.4)
Bhagalpur 254.3 (100) 0.1 (0) 22.4 (8.8) 54.9 (21.6) 6.6 (2.6) 9.6 (3.8) 2.3 (0.9)Banka 305.6 (100) 46.3 (15.2) 43 (14.1) 36.9 (12.1) 2.9 (0.9) 3 (1) 7.9 (2.6)
Saharsa 164.6 (100) 0 (0) 10.8 (6.6) 22.3 (13.5) 4.8 (2.9) 2.2 (1.3) 0.4 (0.2)Supaul 238.6 (100) 0 (0) 20.2 (8.5) 39.3 (16.5) 9.8 (4.1) 3.1 (1.3) 1.4 (0.6)Madhepura 179.6 (100) 0 (0) 3.9 (2.2) 26.9 (15) 3.9 (2.1) 1.2 (0.7) 0 (0)
Purnea 313.9 (100) 0.1 (0) 12.3 (3.9) 38.1 (12.1) 6.9 (2.2) 1.6 (0.5) 1.1 (0.4)Kishanganj 189.1 (100) 0.4 (0.2) 11.2 (5.9) 26 (13.7) 7.3 (3.8) 2.7 (1.4) 1.2 (0.6)Araria 271.7 (100) 0.8 (0.3) 5 (1.8) 41 (15.1) 6.4 (2.4) 5.5 (2) 0.5 (0.2)Katihar 291.4 (100) 1.8 (0.6) 22.1 (7.6) 42.2 (14.5) 12.1 (4.2) 4.2 (1.4) 0.6 (0.2)
Bihar 9359.6 (100) 621.6 (6.6) 431.7 (4.6) 1366.7 (14.6) 207.4 (2.2) 144.3 (1.5) 44.3 (0.5) Note : Figures in the parentheses denote percentage
Source : Directorate of Economics and Statistics, GoB (Contd.)

116
Table A 3.1 : District-wise Land Utilization Pattern (2017-18) (Contd.)
(Area in ‘000 hectares)
District
Uncultivated land excluding fallow (5) Fallow Land
Total Uncultiva-
ble NSA(8)
GCA (9)
CI(10)Permanent
PasturesTree
CropsCurrent Fallow
Other Fallow
Land (7)(2 to 6)
Patna 0.1 (0) 1 (0.3) 45.5 (14.3) 1.5 (0.5) 141.5 (44.6) 175.7 (55.4) 218.9 (69) 1.2Nalanda 0 (0) 1.3 (0.6) 6.3 (2.7) 0.1 (0.1) 59.1 (25.4) 173.6 (74.6) 252.2 (108.4) 1.5Bhojpur 0.1 (0) 2.1 (0.9) 4.5 (1.9) 2.3 (1) 51 (21.5) 186.4 (78.5) 199.3 (84) 1.1Buxar 0 (0) 0.8 (0.5) 3.6 (2.1) 0.6 (0.3) 25.3 (15.1) 141.7 (84.9) 198.6 (118.9) 1.4Rohtas 0.1 (0) 2.9 (0.7) 3.3 (0.8) 0.7 (0.2) 145.6 (37.3) 245.1 (62.7) 349.8 (89.5) 1.4Kaimur 0.1 (0) 0.8 (0.2) 34.6 (10.1) 0.1 (0) 205 (59.9) 137.5 (40.1) 202.9 (59.3) 1.5
Gaya 2 (0.4) 3.9 (0.8) 111.9 (22.7) 11.3 (2.3) 310.9 (63) 182.9 (37) 212.9 (43.1) 1.2Jehanabad 0.1 (0.1) 0.7 (0.8) 32 (34) 0.2 (0.2) 52.3 (55.6) 41.7 (44.4) 77.3 (82.2) 1.9Arwal 0.1 (0.2) 0.9 (1.5) 3.5 (5.5) 1.6 (2.5) 18.9 (30.2) 43.7 (69.8) 65 (103.8) 1.5Nawada 0.9 (0.3) 0.7 (0.3) 12.9 (5.2) 2.6 (1) 128.9 (51.8) 119.9 (48.2) 137.4 (55.2) 1.1Aurangabad 0.5 (0.2) 0.7 (0.2) 25.4 (7.7) 1.1 (0.3) 124.4 (37.7) 205.6 (62.3) 287.4 (87.1) 1.4
Saran 0.1 (0.1) 8.6 (3.3) 45.5 (17.2) 3.6 (1.4) 108.5 (40.9) 156.4 (59.1) 191.8 (72.4) 1.2Siwan 0.2 (0.1) 9 (4) 6.8 (3) 1.4 (0.6) 60.1 (26.8) 164.4 (73.2) 226.1 (100.7) 1.4Gopalganj 0.2 (0.1) 7.5 (3.7) 13.6 (6.6) 2.3 (1.1) 64.3 (31.6) 139.5 (68.4) 207.4 (101.8) 1.5
W. Champaran 1.1 (0.2) 6.5 (1.3) 41.6 (8.6) 2.2 (0.5) 242.5 (50.1) 241.8 (49.9) 391.2 (80.8) 1.6E. Champaran 0.4 (0.1) 27.2 (6.3) 32.4 (7.5) 2.9 (0.7) 148.2 (34.3) 283.5 (65.7) 412.9 (95.6) 1.5Muzaffarpur 0 (0) 17.5 (5.5) 24.9 (7.9) 1.3 (0.4) 112.8 (35.8) 202.6 (64.2) 299.6 (95) 1.5Sitamarhi 1.3 (0.6) 14 (6.3) 13 (5.8) 0.5 (0.2) 94.3 (42.5) 127.6 (57.5) 232.8 (104.9) 1.8Sheohar 0 (0) 3.7 (8.4) 3.8 (8.7) 0.8 (1.9) 20.1 (46.2) 23.4 (53.7) 45.6 (104.9) 2Vaishali 0.3 (0.2) 9.8 (4.9) 4.7 (2.3) 0.3 (0.1) 77.5 (38.5) 123.9 (61.5) 181.5 (90.1) 1.5
Darbhanga 0.1 (0.1) 12.5 (4.9) 29.4 (11.6) 2.1 (0.8) 106.6 (42) 147.5 (58) 171.9 (67.7) 1.2Madhubani 1.3 (0.4) 24 (6.8) 3.2 (0.9) 2.9 (0.8) 120.9 (34.2) 232.6 (65.8) 340.1 (96.2) 1.5Samastipur 0.1 (0) 8.3 (3.2) 9.9 (3.8) 0.9 (0.3) 86.7 (33) 175.7 (67) 307.8 (117.3) 1.8
Begusarai 0 (0) 3.8 (2) 15.7 (8.4) 0.8 (0.4) 80.2 (42.7) 107.6 (57.3) 157.7 (84) 1.5Munger 0.2 (0.1) 0.6 (0.4) 21.9 (15.6) 1.9 (1.3) 97.4 (69.7) 42.4 (30.3) 48.7 (34.8) 1.1Sheikhpura 0 (0) 0.3 (0.5) 1.3 (2) 1.6 (2.6) 15.1 (24.3) 47 (75.7) 60.7 (97.7) 1.3Lakhisarai 0.1 (0) 0.4 (0.3) 29.3 (22.8) 6.3 (4.9) 72.4 (56.3) 56.2 (43.7) 77.3 (60.1) 1.4Jamui 1.6 (0.5) 2.1 (0.7) 38.5 (12.6) 16 (5.2) 234.6 (76.8) 70.7 (23.2) 126.2 (41.3) 1.8Khagaria 0.2 (0.1) 3.1 (2.1) 9.9 (6.6) 2.2 (1.4) 60.8 (40.7) 88.6 (59.3) 126.2 (84.5) 1.4
Bhagalpur 0.6 (0.2) 6.8 (2.7) 23.3 (9.2) 4.9 (1.9) 131.3 (51.6) 123 (48.4) 149.3 (58.7) 1.2Banka 1 (0.3) 7.5 (2.4) 25.6 (8.4) 11.1 (3.6) 185.3 (60.6) 120.4 (39.4) 154.6 (50.6) 1.3
Saharsa 1.1 (0.7) 4.4 (2.7) 28.2 (17.1) 3.7 (2.3) 77.9 (47.3) 86.7 (52.7) 169.3 (102.9) 2Supaul 0.2 (0.1) 3.1 (1.3) 1.7 (0.7) 9.4 (3.9) 88.3 (37) 150.4 (63) 252.3 (105.7) 1.7Madhepura 0 (0) 7.2 (4) 8.4 (4.7) 1 (0.5) 52.4 (29.2) 127.2 (70.8) 187.9 (104.6) 1.5
Purnea 0 (0) 8.9 (2.8) 65.2 (20.8) 4.6 (1.5) 138.9 (44.3) 175 (55.7) 194.8 (62.1) 1.1Kishanganj 0.4 (0.2) 5.2 (2.8) 30.1 (15.9) 3 (1.6) 87.4 (46.2) 101.7 (53.8) 143.9 (76.1) 1.4Araria 0.2 (0.1) 19.2 (7.1) 51.2 (18.8) 3.5 (1.3) 133.3 (49) 138.4 (51) 264.9 (97.5) 1.9Katihar 0.1 (0) 11.1 (3.8) 57.2 (19.6) 5.9 (2) 157.3 (54) 134 (46) 201.3 (69.1) 1.5
Bihar 15.1 (0.2) 248.2 (2.7) 919.5 (9.8) 118.9 (1.3) 4117.6 (44) 5242 (56) 7525.2 (80.4) 1.4
Note : CI represents cropping intensity; Figures in the parentheses denote percentage Source : Directorate of Economics and Statistics, GoB

117
Table A 3.2 : District-wise Area, Production and Productivity of Rice (2017-18 and 2018-19)
(Area in ‘000 hectare/Production in’000 tonnes/ Productivity in kg/ha)
District2017-18 2018-19
Area Production Productivity Area Production ProductivityPatna 72.1 (2.2) 216.66 (2.7) 3005 (14) 73.47 (2.3) 178.89 (2.9) 2435 (7)Nalanda 119.79 (3.6) 381.09 (4.7) 3181 (13) 107.63 (3.4) 225.22 (3.7) 2092 (13)Bhojpur 97.11 (2.9) 393.67 (4.9) 4054 (1) 102.11 (3.2) 277.9 (4.5) 2722 (5)Buxar 87.48 (2.6) 306.03 (3.8) 3498 (6) 87.52 (2.8) 199.29 (3.2) 2277 (11)Rohtas 190.72 (5.8) 739.67 (9.1) 3878 (2) 192.98 (6.1) 792.14 (12.9) 4105 (1)Kaimur 117.43 (3.6) 400.63 (5) 3412 (9) 118.44 (3.7) 354.09 (5.8) 2990 (4)
Gaya 100.02 (3) 342.28 (4.2) 3422 (8) 94.12 (3) 142.55 (2.3) 1515 (21)Jehanabad 35.53 (1.1) 117.59 (1.5) 3310 (11) 34.1 (1.1) 80.34 (1.3) 2356 (8)Arwal 42.52 (1.3) 159.9 (2) 3761 (3) 35.01 (1.1) 108.98 (1.8) 3113 (2)Nawada 77.05 (2.3) 247.15 (3.1) 3208 (12) 65.2 (2.1) 104.33 (1.7) 1600 (20)Aurangabad 178.07 (5.4) 638.83 (7.9) 3588 (4) 175.65 (5.6) 542.1 (8.8) 3086 (3)
Saran 62.39 (1.9) 116.16 (1.4) 1862 (24) 64.21 (2) 65.21 (1.1) 1016 (35)Siwan 91 (2.8) 151.3 (1.9) 1663 (34) 91 (2.9) 64.52 (1) 709 (38)Gopalganj 83.24 (2.5) 145.62 (1.8) 1749 (30) 35.42 (1.1) 29.81 (0.5) 842 (37)
W. Champaran 140.28 (4.2) 238.73 (2.9) 1702 (32) 138.26 (4.4) 254.35 (4.1) 1840 (15)E. Champaran 188.95 (5.7) 270.04 (3.3) 1429 (37) 189.63 (6) 252.61 (4.1) 1332 (27)Muzaffarpur 122.74 (3.7) 162.92 (2) 1327 (38) 118.13 (3.7) 128.45 (2.1) 1087 (34)Sitamarhi 97.9 (3) 180.6 (2.2) 1845 (26) 98.72 (3.1) 175.15 (2.8) 1774 (16)Sheohar 22.02 (0.7) 36.87 (0.5) 1675 (33) 21.58 (0.7) 32.17 (0.5) 1491 (22)Vaishali 42.03 (1.3) 89.26 (1.1) 2124 (21) 40.88 (1.3) 45.87 (0.7) 1122 (32)
Darbhanga 78.57 (2.4) 135.76 (1.7) 1728 (31) 79.96 (2.5) 101.22 (1.6) 1266 (28)Madhubani 203.4 (6.2) 303.34 (3.7) 1491 (36) 196.9 (6.2) 216.8 (3.5) 1101 (33)Samastipur 97.11 (2.9) 202.59 (2.5) 2086 (22) 93.47 (3) 165.66 (2.7) 1772 (17)
Begusarai 18.68 (0.6) 51.44 (0.6) 2753 (16) 16.02 (0.5) 27.48 (0.4) 1716 (19)Munger 27.18 (0.8) 76.67 (0.9) 2821 (15) 25.82 (0.8) 36.22 (0.6) 1403 (26)Sheikhpura 30.7 (0.9) 71.27 (0.9) 2322 (18) 27.25 (0.9) 32.66 (0.5) 1199 (30)Lakhisarai 31.68 (1) 107.29 (1.3) 3387 (10) 41.27 (1.3) 97.21 (1.6) 2355 (9)Jamui 65.8 (2) 165.66 (2) 2518 (17) 45.79 (1.4) 53.31 (0.9) 1164 (31)Khagaria 18.9 (0.6) 42.04 (0.5) 2224 (19) 18.87 (0.6) 27.25 (0.4) 1444 (25)
Bhagalpur 33.69 (1) 115.95 (1.4) 3442 (7) 32.82 (1) 28.68 (0.5) 874 (36)Banka 91.76 (2.8) 325.73 (4) 3550 (5) 106.37 (3.4) 155.61 (2.5) 1463 (24)
Saharsa 67.54 (2) 120.25 (1.5) 1780 (28) 77.87 (2.5) 98.09 (1.6) 1260 (29)Supaul 101.31 (3.1) 159.45 (2) 1574 (35) 103.35 (3.3) 201.73 (3.3) 1952 (14)Madhepura 71.91 (2.2) 133.25 (1.6) 1853 (25) 79.71 (2.5) 201.24 (3.3) 2525 (6)
Purnea 110.9 (3.4) 217.59 (2.7) 1960 (23) 103.5 (3.3) 239.53 (3.9) 2314 (10)Kishanganj 78.53 (2.4) 140.19 (1.7) 1785 (27) 78.59 (2.5) 116.21 (1.9) 1479 (23)Araria 157.36 (4.8) 275.84 (3.4) 1753 (29) 57.98 (1.8) 101.52 (1.6) 1751 (18)Katihar 53.51 (1.6) 113.85 (1.4) 2128 (20) 90.12 (2.9) 201.14 (3.3) 2232 (12)
Bihar 3306.9 (100) 8093.16 (100) 2447 3159.72 (100) 6155.53 (100) 1948Note : Figures in parentheses denote percentage for area and production and ranking for productivity
Source : Department of Agriculture, GoB

118
Table A 3.3 : District-wise Area, Production and Productivity of Wheat (2017-18 and 2018-19)
(Area in ‘000 hectare/Production in’000 tonnes/ Productivity in kg/ha)
District2017-18 2018-19
Area Production Productivity Area Production ProductivityPatna 68.18 (3.2) 246.69 (4) 3618 (1) 72.02 (3.3) 252.15 (3.9) 3501 (8)Nalanda 80.5 (3.8) 253.45 (4.2) 3149 (11) 75.2 (3.5) 266.55 (4.1) 3545 (7)Bhojpur 71.5 (3.4) 213.08 (3.5) 2980 (16) 85.92 (4) 308 (4.8) 3585 (6)Buxar 78.75 (3.7) 272.22 (4.5) 3456 (5) 80.12 (3.7) 265.5 (4.1) 3314 (11)Rohtas 140.75 (6.7) 472.04 (7.7) 3354 (7) 140.73 (6.5) 517.85 (8) 3680 (3)Kaimur 68.51 (3.3) 161.44 (2.6) 2356 (33) 73.43 (3.4) 218.39 (3.4) 2974 (16)
Gaya 71.95 (3.4) 231.67 (3.8) 3220 (10) 66.84 (3.1) 185.89 (2.9) 2781 (21)Jehanabad 23.43 (1.1) 58.33 (1) 2490 (28) 23.2 (1.1) 76.92 (1.2) 3316 (10)Arwal 13.56 (0.6) 31.54 (0.5) 2327 (34) 18.14 (0.8) 47.34 (0.7) 2609 (30)Nawada 43.03 (2) 132.29 (2.2) 3075 (14) 46.2 (2.1) 127.86 (2) 2768 (23)Aurangabad 70.32 (3.3) 177.44 (2.9) 2523 (27) 86.38 (4) 224.76 (3.5) 2602 (31)
Saran 77.6 (3.7) 243.27 (4) 3135 (12) 89.6 (4.2) 255.8 (4) 2855 (20)Siwan 90.63 (4.3) 262.86 (4.3) 2901 (19) 90.63 (4.2) 276.42 (4.3) 3050 (15)Gopalganj 74.21 (3.5) 192.6 (3.2) 2595 (26) 74.4 (3.4) 194.44 (3) 2613 (29)
W. Champaran 70.31 (3.3) 160.94 (2.6) 2289 (36) 70.13 (3.3) 192.92 (3) 2751 (25)E. Champaran 118.82 (5.7) 289.77 (4.7) 2439 (31) 118.51 (5.5) 301.43 (4.7) 2544 (33)Muzaffarpur 91.87 (4.4) 258.18 (4.2) 2810 (21) 123.3 (5.7) 335.65 (5.2) 2722 (26)Sitamarhi 87.79 (4.2) 258.99 (4.2) 2950 (18) 88.57 (4.1) 321.41 (5) 3629 (4)Sheohar 14.45 (0.7) 44.55 (0.7) 3083 (13) 14.27 (0.7) 43.97 (0.7) 3082 (14)Vaishali 40.75 (1.9) 132.67 (2.2) 3256 (9) 40.7 (1.9) 112.72 (1.7) 2769 (22)
Darbhanga 57.92 (2.8) 173.99 (2.9) 3004 (15) 58.3 (2.7) 146.39 (2.3) 2511 (34)Madhubani 90.46 (4.3) 196.94 (3.2) 2177 (37) 91.43 (4.2) 182.21 (2.8) 1993 (38)Samastipur 55.97 (2.7) 202.36 (3.3) 3616 (2) 55.8 (2.6) 200.72 (3.1) 3597 (5)
Begusarai 57.33 (2.7) 200.23 (3.3) 3492 (4) 68.28 (3.2) 257.79 (4) 3775 (2)Munger 13.89 (0.7) 38.83 (0.6) 2795 (22) 13.85 (0.6) 38.3 (0.6) 2765 (24)Sheikhpura 21.93 (1) 60.66 (1) 2766 (23) 21.23 (1) 46.7 (0.7) 2200 (36)Lakhisarai 29.69 (1.4) 88.05 (1.4) 2966 (17) 29.55 (1.4) 87.37 (1.4) 2957 (17)Jamui 42.92 (2) 105.71 (1.7) 2463 (29) 26.97 (1.3) 57.01 (0.9) 2113 (37)Khagaria 28.48 (1.4) 97.21 (1.6) 3414 (6) 28.19 (1.3) 95.93 (1.5) 3403 (9)
Bhagalpur 47.5 (2.3) 156.47 (2.6) 3294 (8) 49.06 (2.3) 160.67 (2.5) 3275 (12)Banka 33.13 (1.6) 90.88 (1.5) 2743 (24) 22.63 (1) 65.44 (1) 2892 (19)
Saharsa 49.38 (2.3) 140.53 (2.3) 2846 (20) 48.66 (2.3) 124.71 (1.9) 2563 (32)Supaul 52.62 (2.5) 126.33 (2.1) 2401 (32) 53.27 (2.5) 131.46 (2) 2468 (35)Madhepura 32.03 (1.5) 115.71 (1.9) 3612 (3) 28.43 (1.3) 108.18 (1.7) 3805 (1)
Purnea 19.78 (0.9) 48.7 (0.8) 2462 (30) 18.1 (0.8) 58.86 (0.9) 3252 (13)Kishanganj 17.77 (0.8) 33.09 (0.5) 1862 (38) 17.79 (0.8) 47.25 (0.7) 2655 (27)Araria 25.36 (1.2) 58.14 (1) 2293 (35) 23.36 (1.1) 61.69 (1) 2641 (28)Katihar 28.25 (1.3) 76.45 (1.3) 2706 (25) 23.46 (1.1) 69.26 (1.1) 2952 (18)
Bihar 2101.31 (100) 6104.3 (100) 2905 2156.65 (100) 6465.91 (100) 2998Note : Figures in parentheses denote percentage for area and production and ranking for productivity
Source : Department of Agriculture, GoB

119
Table A 3.4 : District-wise Area, Production and Productivity of Maize (2017-18 and 2018-19)
(Area in ‘000 hectare/Production in’000 tonnes/ Productivity in kg/ha)
District2017-18 2018-19
Area Production Productivity Area Production ProductivityPatna 5.56 (0.8) 24.58 (0.8) 4418 (12) 8.23 (1.2) 28.82 (0.9) 3501 (19)Nalanda 6.92 (1) 29.48 (0.9) 4263 (14) 6.33 (0.9) 17.54 (0.5) 2772 (23)Bhojpur 2.11 (0.3) 5.24 (0.2) 2482 (33) 3.69 (0.6) 5.08 (0.2) 1378 (37)Buxar 1.35 (0.2) 3.59 (0.1) 2665 (31) 0.6 (0.1) 1.13 (0.04) 1885 (34)Rohtas 0.07 (0) 0.22 (0) 3027 (26) - - -Kaimur 0.12 (0) 0.43 (0) 3612 (20) 0.07 (0) 0.16 (0) 2397 (30)
Gaya 2.88 (0.4) 8.81 (0.3) 3057 (25) 0.72 (0.1) 2.57 (0.1) 3552 (17)Jehanabad 0.4 (0.1) 1.66 (0.1) 4163 (15) 0.23 (0) 0.86 (0.03) 3675 (14)Arwal 0.45 (0.1) 2.09 (0.1) 4634 (9) 0.17 (0) 0.44 (0.01) 2618 (26)Nawada 1.21 (0.2) 4.38 (0.1) 3622 (19) 1.13 (0.2) 2.45 (0.1) 2170 (31)Aurangabad 0.23 (0) 0.6 (0) 2658 (32) 0.09 (0) 0.13 (0.004) 1420 (36)
Saran 26.89 (4) 84.13 (2.7) 3129 (24) 22.87 (3.4) 58.56 (1.8) 2561 (27)Siwan 18.96 (2.8) 53.14 (1.7) 2802 (29) 17.75 (2.7) 43.45 (1.4) 2448 (29)Gopalganj 14.9 (2.2) 41.2 (1.3) 2765 (30) 10.03 (1.5) 31.16 (1) 3107 (21)
W. Champaran 4.9 (0.7) 15.91 (0.5) 3245 (23) 4.82 (0.7) 17.24 (0.5) 3575 (16)E. Champaran 46.09 (6.8) 111.43 (3.6) 2418 (34) 46.23 (6.9) 89.83 (2.8) 1943 (33)Muzaffarpur 35.04 (5.2) 54.01 (1.7) 1542 (37) 33.34 (5) 117.71 (3.7) 3531 (18)Sitamarhi 5.34 (0.8) 21.07 (0.7) 3945 (16) 3.74 (0.6) 17.32 (0.5) 4627 (10)Sheohar 1.63 (0.2) 5.71 (0.2) 3503 (21) 1.78 (0.3) 7.51 (0.2) 4232 (12)Vaishali 32.18 (4.8) 105.22 (3.4) 3269 (22) 32.15 (4.8) 84.99 (2.7) 2644 (25)
Darbhanga 9.38 (1.4) 34.47 (1.1) 3675 (18) 8.57 (1.3) 43.54 (1.4) 5083 (9)Madhubani 0.17 (0) 0.84 (0) 5078 (7) 0.28 (0) 0.78 (0.02) 2756 (24)Samastipur 66.89 (9.9) 444.68 (14.2) 6648 (3) 68.76 (10.3) 266.68 (8.3) 3878 (13)
Begusarai 46.45 (6.9) 99.95 (3.2) 2152 (35) 54.32 (8.1) 199.11 (6.2) 3666 (15)Munger 2.2 (0.3) 6.61 (0.2) 3002 (27) 2.34 (0.3) 4.87 (0.2) 2078 (32)Sheikhpura 0.61 (0.1) 0.91 (0) 1497 (38) 0.65 (0.1) 1.06 (0) 1618 (35)Lakhisarai 2.47 (0.4) 5.03 (0.2) 2032 (36) 7.53 (1.1) 20.91 (0.7) 2776 (22)Jamui 3.42 (0.5) 9.75 (0.3) 2852 (28) 4.01 (0.6) 10.08 (0.3) 2514 (28)Khagaria 59.51 (8.8) 295.74 (9.5) 4953 (8) 59.48 (8.9) 255.42 (8) 4294 (11)
Bhagalpur 38.91 (5.7) 179.46 (5.8) 4613 (10) 30.17 (4.5) 170.14 (5.3) 5638 (8)Banka 10.13 (1.5) 39.09 (1.3) 3859 (17) 8.29 (1.2) 27.46 (0.9) 3310 (20)
Saharsa 26.14 (3.9) 134.49 (4.3) 5145 (6) 26.17 (3.9) 148.34 (4.6) 5668 (7)Supaul 17.91 (2.6) 100.1 (3.2) 5641 (5) 11.88 (1.8) 82.3 (2.6) 6928 (3)Madhepura 37.61 (5.6) 166.7 (5.3) 4432 (11) 39.34 (5.9) 269.66 (8.4) 6855 (5)
Purnea 30.53 (4.5) 205.7 (6.6) 6738 (2) 37.47 (5.6) 344.26 (10.8) 9188 (1)Kishanganj 3.56 (0.5) 23.3 (0.7) 6541 (4) 3.23 (0.5) 18.75 (0.6) 5809 (6)Araria 48.9 (7.2) 212.19 (6.8) 4339 (13) 44.32 (6.6) 327.78 (10.3) 7396 (2)Katihar 65.42 (9.7) 588.87 (18.9) 9002 (1) 68.7 (10.3) 475.83 (14.9) 6927 (4)
Bihar 677.44 (100) 3120.77 (100) 4607 (48) 669.48 (100) 3193.91 (100) 4771Note : Figures in parentheses denote percentage for area and production and ranking for productivity
Source : Department of Agriculture, GoB

120
Table A 3.5 : District-wise Area, Production and Productivity of Pulses (2017-18 and 2018-19)
(Area in ‘000 hectare/Production in ’000 tonnes/ Productivity in kg/ha)
District2017-18 2018-19
Area Production Productivity Area Production ProductivityPatna 46.9 (9.9) 69.92 (15.4) 1491 (3) 49.82 (10.4) 67.89 (15) 1362 (2)Nalanda 25.43 (5.3) 28.76 (6.3) 1131 (11) 25.96 (5.4) 28 (6.2) 1079 (12)Bhojpur 12.8 (2.7) 13.76 (3) 1076 (12) 12.81 (2.7) 14.93 (3.3) 1165 (7)Buxar 7.71 (1.6) 10.88 (2.4) 1410 (4) 5.65 (1.2) 7.76 (1.7) 1374 (1)Rohtas 10.92 (2.3) 11.41 (2.5) 1046 (13) 10.87 (2.3) 12.46 (2.7) 1146 (8)Kaimur 11.46 (2.4) 10.81 (2.4) 944 (19) 11.97 (2.5) 10.58 (2.3) 884 (24)
Gaya 18.78 (3.9) 16.68 (3.7) 888 (22) 16.69 (3.5) 17.58 (3.9) 1054 (14)Jehanabad 14.54 (3.1) 18.44 (4.1) 1268 (6) 14.32 (3) 17.55 (3.9) 1226 (5)Arwal 5.65 (1.2) 4.66 (1) 825 (25) 5.82 (1.2) 6.06 (1.3) 1042 (15)Nawada 9.58 (2) 12.27 (2.7) 1281 (5) 9.81 (2) 9.76 (2.2) 995 (16)Aurangabad 31.06 (6.5) 29.8 (6.6) 959 (17) 42.2 (8.8) 31.39 (6.9) 744 (34)
Saran 2.39 (0.5) 4.68 (1) 1960 (1) 2.51 (0.5) 2.27 (0.5) 902 (21)Siwan 3.76 (0.8) 4.48 (1) 1190 (9) 3.76 (0.8) 3.56 (0.8) 948 (19)Gopalganj 1.58 (0.3) 1.14 (0.3) 718 (31) 1.56 (0.3) 1.7 (0.4) 1087 (11)
W. Champaran 9.79 (2.1) 7.72 (1.7) 789 (27) 9.48 (2) 8.83 (1.9) 889 (23)E. Champaran 9.94 (2.1) 11.76 (2.6) 1183 (10) 9.91 (2.1) 13.22 (2.9) 1333 (3)Muzaffarpur 27.71 (5.8) 15.74 (3.5) 568 (35) 26.04 (5.4) 20.2 (4.5) 776 (31)Sitamarhi 6.12 (1.3) 4.57 (1) 748 (30) 6.13 (1.3) 4.35 (1) 710 (35)Sheohar 2.11 (0.4) 1.22 (0.3) 577 (34) 2.12 (0.4) 1.77 (0.4) 834 (28)Vaishali 8.64 (1.8) 13.19 (2.9) 1526 (2) 8.6 (1.8) 8.39 (1.9) 976 (17)
Darbhanga 12.12 (2.5) 9.16 (2) 756 (29) 10.78 (2.2) 8.41 (1.9) 780 (30)Madhubani 23.51 (4.9) 21.72 (4.8) 924 (21) 23.95 (5) 25.33 (5.6) 1058 (13)Samastipur 15.77 (3.3) 8.77 (1.9) 556 (36) 17.09 (3.6) 8.47 (1.9) 496 (37)
Begusarai 4.96 (1) 4.98 (1.1) 1003 (14) 4.75 (1) 5.3 (1.2) 1115 (10)Munger 2.3 (0.5) 2.25 (0.5) 980 (16) 2.36 (0.5) 2.2 (0.5) 934 (20)Sheikhpura 5.02 (1.1) 6.2 (1.4) 1235 (7) 4.49 (0.9) 5.25 (1.2) 1170 (6)Lakhisarai 10.42 (2.2) 12.6 (2.8) 1209 (8) 10 (2.1) 12.3 (2.7) 1229 (4)Jamui 8.61 (1.8) 8.24 (1.8) 957 (18) 9.67 (2) 10.89 (2.4) 1126 (9)Khagaria 6.82 (1.4) 6.31 (1.4) 925 (20) 6.83 (1.4) 6.52 (1.4) 954 (18)
Bhagalpur 12.06 (2.5) 9.37 (2.1) 777 (28) 11.92 (2.5) 9.05 (2) 759 (32)Banka 9.2 (1.9) 7.43 (1.6) 807 (26) 8.49 (1.8) 7.28 (1.6) 858 (26)
Saharsa 20.1 (4.2) 12.73 (2.8) 633 (33) 19.21 (4) 14.37 (3.2) 748 (33)Supaul 32.14 (6.8) 16.09 (3.5) 501 (37) 32.81 (6.8) 18.61 (4.1) 567 (36)Madhepura 19.55 (4.1) 16.76 (3.7) 857 (24) 17.36 (3.6) 14.92 (3.3) 859 (25)
Purnea 5.45 (1.1) 2.59 (0.6) 475 (38) 1.3 (0.3) 1.16 (0.3) 895 (22)Kishanganj 9.49 (2) 6.22 (1.4) 656 (32) 8.88 (1.9) 4.37 (1) 492 (38)Araria 5.15 (1.1) 4.49 (1) 871 (23) 4.84 (1) 3.8 (0.8) 785 (29)Katihar 6.46 (1.4) 6.37 (1.4) 986 (15) 8.61 (1.8) 7.35 (1.6) 854 (27)
Bihar 476 (100) 454.17 (100) 954 479.37 (100) 453.43 (100) 946Note : Figures in parentheses denote percentage for area and production and ranking for productivity
Source : Department of Agriculture, GoB

121
Table A 3.6 : District-wise Area, Production and Productivity of Sugarcane (2017-18 and 2018-19)
(Area in ’000 ha./ Production in ’000 tonnes/ Yield in Ton/ha)
District2017-18 2018-19
Area Production Productivity Area Production ProductivityPatna 0.38 (0.14) 3.52 (0.2) 92.14 (1) 0.35 (0.12) 2.97 (0.16) 84.77 (1)Nalanda 0.06 (0.02) 0.39 (0.02) 63.84 (15) 0.06 (0.02) 0.34 (0.02) 60 (14)Bhojpur 0.33 (0.12) 1.66 (0.09) 50 (36) 0.35 (0.12) 1.77 (0.1) 50 (33)Buxar 0.21 (0.08) 1.26 (0.07) 60.01 (18) 0.18 (0.06) 1 (0.05) 57.05 (23)Rohtas 0.1 (0.04) 0.52 (0.03) 52.22 (35) 0.09 (0.03) 0.47 (0.03) 52.5 (29)Kaimur 0.18 (0.07) 0.89 (0.05) 48.83 (37) 0.18 (0.06) 0.85 (0.05) 46.85 (36)
Gaya 0.15 (0.06) 1.11 (0.06) 73.99 (3) 0.14 (0.05) 0.94 (0.05) 67.72 (4)Jehanabad 0.1 (0.04) 0.61 (0.03) 59.75 (20) 0.09 (0.03) 0.49 (0.03) 53.78 (27)Arwal 0.01 (0) 0.06 (0) 65.79 (11) 0.01 (0) 0.05 (0) 59.6 (15)Nawada 0.21 (0.08) 1.21 (0.07) 56.81 (27) 0.19 (0.06) 1 (0.05) 51.75 (31)Aurangabad 0.1 (0.04) 0.72 (0.04) 73.98 (4) 0.09 (0.03) 0.59 (0.03) 66.59 (5)
Saran 1.17 (0.43) 8.54 (0.49) 73.17 (6) 1.32 (0.44) 7.63 (0.42) 57.64 (22)Siwan 1.35 (0.5) 9.86 (0.56) 73.21 (5) 1.28 (0.42) 7.58 (0.41) 59.43 (16)Gopalgunj 25.11 (9.34) 162.99 (9.26) 64.92 (12) 25.95 (8.53) 162.76 (8.9) 62.72 (9)
W. Champaran 145.33 (54.04) 992.1 (56.34) 68.27 (8) 172.3 (56.65) 1067.14 (58.32) 61.93 (11)E. Champaran 34.7 (12.9) 220.85 (12.54) 63.65 (16) 38.54 (12.67) 189.89 ( 10.38) 49.27 (34)Muzaffarpur 8.17 (3.04) 54.35 (3.09) 66.54 (9) 9.18 (3.02) 60.49 (3.31) 65.91 (6)Sitamarhi 15.45 (5.75) 92.44 (5.25) 59.82 (19) 18.07 (5.94) 109.28 (5.97) 60.49 (12)Sheohar 3.59 (1.33) 20.83 (1.18) 58.08 (25) 3.93 (1.29) 23.02 (1.26) 58.51 (19)Vaisali 1.24 (0.46) 8.19 (0.46) 65.93 (10) 1.29 (0.42) 8.45 (0.46) 65.51 (7)
Darbhanga 1.56 (0.58) 10.11 (0.57) 64.83 (13) 1.36 (0.45) 7.88 (0.43) 57.91 (21)Madhubani 4.28 (1.59) 27.75 (1.58) 64.83 (14) 3.82 (1.26) 22.62 (1.24) 59.26 (17)Samastipur 6.05 (2.25) 33.51 (1.9) 55.38 (30) 7.77 (2.55) 46.85 (2.56) 60.31 (13)
Begusarai 5.88 (2.19) 33.68 (1.91) 57.3 (26) 7.36 (2.42) 47.84 (2.61) 65.02 (8)Munger 0.18 (0.07) 1.08 (0.06) 60.86 (17) 0.16 (0.05) 0.91 (0.05) 55.99 (25)Sheikhpura 0.32 (0.12) 1.86 (0.11) 58.86 (22) 0.28 (0.09) 1.45 (0.08) 51.92 (30)Lakhisarai 0.02 (0.01) 0.11 (0.01) 56.14 (29) 0.02 (0.01) 0.09 (0.01) 51.02 (32)Jamui 0.29 (0.11) 1.74 (0.1) 59.27 (21) 0.26 (0.09) 1.41 (0.08) 53.32 (28)Khagaria 0.38 (0.14) 2.19 (0.12) 58.16 (24) 0.42 (0.14) 2.6 (0.14) 62.49 (10)
Bhagalpur 2.4 (0.89) 12.95 (0.74) 53.92 (33) 0.65 (0.21) 3 (0.16) 46.14 (37)Banka 2.2 (0.82) 12.36 (0.7) 56.3 (28) 1.05 (0.34) 5.05 (0.28) 48.32 (35)
Saharsa 1.29 (0.48) 7.12 (0.4) 55.22 (31) 1.29 (0.42) 7.5 (0.41) 58.1 (20)Supaul - - - - - -Madhepura 4.68 (1.74) 25.04 (1.42) 53.57 (34) 4.68 (1.54) 26.65 (1.46) 57.01 (24)
Purnea 0.9 (0.33) 5.26 (0.3) 58.46 (23) 0.9 (0.3) 5.29 (0.29) 58.83 (18)Kishanganj 0.22 (0.08) 2.05 (0.12) 91.51 (2) 0.22 (0.07) 1.79 (0.1) 79.86 (2)Araria 0.28 (0.1) 1.52 (0.09) 54.07 (32) 0.28 (0.09) 1.52 (0.08) 54.07 (26)Katihar 0.08 (0.03) 0.55 (0.03) 68.74 (7) 0.08 (0.03) 0.55 (0.03) 68.74 (3)
Bihar 268.94 (100) 1761.01 (100) 69.06 304.18 (100) 1829.72 (100) 60.15Note : Figures in parentheses denote percentage and ranking for productivity
Source : Department of Sugarcane, GoB

122
Table A 3.7 : District-wise Area and Production of Important Fruits (2017-18 and 2018-19)
(Area in '000 hectare/Production in '000 tonnes)
DistrictBanana Guava
2017-18 2018-19 2017-18 2018-19Area Production Area Production Area Production Area Production
Patna 0.72 (2.3) 31.17 (2.2) 1.24 (3.6) 53.23 (3.3) 1.23 (4.5) 10.06 (2.4) 2.09 (7.2) 17.12 (3.9)Nalanda 0.54 (1.7) 22.5 (1.6) 0.03 (0.1) 1.04 (0.1) 1.5 (5.4) 170.6 (39.9) 1.52 (5.2)171.35 (39.5)Bhojpur 0.5 (1.6) 19 (1.4) 0.26 (0.8) 9.8 (0.6) 1.93 (7) 16.5 (3.9) 1.58 (5.4) 13.53 (3.1)Buxar 0.16 (0.5) 8.3 (0.6) 0.17 (0.5) 8.72 (0.5) 1.2 (4.3) 9.37 (2.2) 1.26 (4.3) 9.78 (2.3)Rohtas 0.34 (1.1) 16 (1.1) 0.42 (1.2) 20 (1.3) 3.48 (12.6) 28.45 (6.7) 4.35 (14.9) 35.57 (8.2)Kaimur 0.21 (0.7) 9.24 (0.7) 0.21 (0.6) 8.31 (0.5) 1.4 (5.1) 10.6 (2.5) 1.39 (4.8) 10.09 (2.3)
Gaya 0.3 (1) 12.9 (0.9) 0.31 (0.9) 13 (0.8) 0.7 (2.5) 5.5 (1.3) 0.74 (2.5) 5.7 (1.3)Jehanabad 0.21 (0.7) 8.3 (0.6) 0.23 (0.7) 9.11 (0.6) 0.3 (1.1) 2.1 (0.5) 0.31 (1.1) 2.19 (0.5)Arwal 0.15 (0.5) 9.15 (0.7) 0.14 (0.4) 9.01 (0.6) 0.2 (0.7) 1.8 (0.4) 0.19 (0.7) 1.77 (0.4)Nawada 0.31 (1) 9.27 (0.7) 0.3 (0.9) 9 (0.6) 0.38 (1.4) 3 (0.7) 0.3 (1) 2.4 (0.6)Aurangabad 0.31 (1) 1.21 (0.1) 0.24 (0.7) 0.96 (0.1) 0.54 (2) 3.7 (0.9) 0.5 (1.7) 3.51 (0.8)
Saran 0.92 (2.7) 37.48 (2.4)Siwan 0.8 (2.6) 45.1 (3.2) 0.82 (2.4) 46.23 (2.9) 0.7 (2.5) 5.46 (1.3) 0.7 (2.4) 5.5 (1.3)Gopalganj 0.65 (2.1) 43 (3.1) 0.54 (1.6) 34 (2.1) 0.6 (2.2) 4.85 (1.1) 0.47 (1.6) 3.8 (0.9)
W. Champaran 1.15 (3.7) 53.32 (3.8) 1.2 (3.5) 55.64 (3.5) 1.65 (6) 14.23 (3.3) 1.7 (5.8) 14.66 (3.4)E. Champaran 1.05 (3.4) 45.91 (3.3) 1.38 (4) 61.37 (3.9) 1.28 (4.6) 10.53 (2.5) 1.3 (4.5) 11.1 (2.6)Muzaffarpur 1.9 (6.1) 140.91 (10.1) 1.86 (5.4) 138.75 (8.7) 0.92 (3.3) 54.23 (12.7) 0.85 (2.9) 46.85 (10.8)Sitamarhi 0.71 (2.3) 30.83 (2.2) 0.8 (2.3) 32 (2) 0.7 (2.5) 6.19 (1.4) 0.7 (2.4) 6.19 (1.4)Sheohar 0.3 (1) 13 (0.9) 0.3 (0.9) 13.2 (0.8) 0.3 (1.1) 2.62 (0.6) 0.3 (1) 2.7 (0.6)Vaishali 3.4 (10.9) 142.08 (10.2) 3.63 (10.6) 152.63 (9.6) 1.5 (5.4) 11.2 (2.6) 1.69 (5.8) 12.52 (2.9)
Darbhanga 1.31 (4.2) 72.19 (5.2) 1.03 (3) 56.8 (3.6) 0.54 (2) 4.41 (1) 0.56 (1.9) 4.44 (1)Madhubani 1 (3.2) 49 (3.5) 1 (2.9) 48.35 (3) 0.5 (1.8) 4.1 (1) 0.49 (1.7) 4.08 (0.9)Samastipur 2.31 (7.4) 102.95 (7.4) 2.32 (6.7) 102.1 (6.4) 0.7 (2.5) 5.31 (1.2) 0.71 (2.4) 5.34 (1.2)
Begusarai 1.11 (3.6) 50.39 (3.6) 1.12 (3.3) 51 (3.2) 0.4 (1.5) 3.71 (0.9) 0.4 (1.4) 3.72 (0.9)Munger 0.32 (1) 13.54 (1) 0.32 (0.9) 13.7 (0.9) 0.3 (1.1) 2.53 (0.6) 0.35 (1.2) 2.78 (0.6)Sheikhpura 0.08 (0.3) 4.9 (0.4) 0.07 (0.2) 4.59 (0.3) 0.08 (0.3) 0.9 (0.2) 0.08 (0.3) 0.86 (0.2)Lakhisarai 0.16 (0.5) 6.94 (0.5) 0.17 (0.5) 7.05 (0.4) 0.15 (0.5) 1.17 (0.3) 0.15 (0.5) 1.25 (0.3)Jamui 0.2 (0.7) 9.35 (0.7) 0.2 (0.6) 9.45 (0.6) 0.2 (0.7) 1.67 (0.4) 0.2 (0.7) 1.64 (0.4)Khagaria 1.11 (3.6) 46.12 (3.3) 1.1 (3.2) 45.79 (2.9) 0.4 (1.4) 3 (0.7) 0.39 (1.3) 2.93 (0.7)
Bhagalpur 1.35 (4.3) 54.43 (3.9) 1.35 (3.9) 55.19 (3.5) 0.71 (2.6) 5.58 (1.3) 0.71 (2.4) 5.58 (1.3)Banka 0.41 (1.3) 15.07 (1.1) 0.4 (1.2) 15.05 (0.9) 0.3 (1.1) 2.5 (0.6) 0.3 (1) 2.5 (0.6)
Saharsa 1.21 (3.9) 51.97 (3.7) 1.21 (3.5) 51.85 (3.3) 0.72 (2.6) 5.39 (1.3) 0.72 (2.5) 5.41 (1.2)Supaul 0.74 (2.4) 25.24 (1.8) 0.86 (2.5) 29.19 (1.8) 0.42 (1.5) 3.47 (0.8) 0.49 (1.7) 4.01 (0.9)Madhepura 1.78 (5.7) 86.72 (6.2) 1.43 (4.1) 69.44 (4.4) 0.53 (1.9) 3.75 (0.9) 0.69 (2.4) 4.93 (1.1)
Purnea 1.2 (3.9) 44.77 (3.2) 1.21 (3.5) 44.77 (2.8) 0.4 (1.4) 3.2 (0.7) 0.4 (1.4) 3.2 (0.7)Kishanganj 0.71 (2.3) 31.86 (2.3) 0.66 (1.9) 27.21 (1.7) 0.2 (0.7) 1.9 (0.4) 0.18 (0.6) 1.78 (0.4)Araria 0.5 (1.6) 18.7 (1.3) 0.53 (1.5) 19.64 (1.2) 0.2 (0.7) 1.2 (0.3) 0.21 (0.7) 1.26 (0.3)Katihar 1.88 (6.1) 51.08 (3.7) 4.42 (12.9) 226.94(14.3) 0.38 (1.4) 2.85 (0.7) 0.19 (0.6) 1.45 (0.3)
Bihar 31.07 (100) 1396.39 (100) 34.34 (100) 1591.58 (100) 27.61 (100) 427.61 (100) 29.15 (100) 433.44 (100)
Note : Figure in parentheses denotes percentage (Contd.) Source : Department of Horticulture, GoB

123
Table A 3.7 : District-wise Area and Production of Important Fruits (2017-18 and 2018-19) (Contd.)
(Area in '000 hectare/Production in '000 tonnes)
DistrictLitchi Mango
2017-18 2018-19 2017-18 2018-19Area Production Area Production Area Production Area Production
Patna 4.5 (2.9) 52.92 (3.5) 7.73 (4.88) 73.76 (4.68)Nalanda 2.91 (1.9) 30.4 (2) 2.95 (1.86) 30.79 (1.95)Bhojpur 4.7 (3.1) 47.3 (3.1) 3.57 (2.25) 35.95 (2.28)Buxar 2.63 (1.7) 26.57 (1.7) 2.75 (1.73) 27.3 (1.73)Rohtas 6 (3.9) 61.87 (4) 5.83 (3.68) 59.97 (3.8)Kaimur 3.42 (2.2) 34.4 (2.2) 3.42 (2.16) 34.5 (2.19)
Gaya 1.41 (0.9) 14.55 (0.9) 1.43 (0.9) 14.73 (0.93)Jehanabad 0.41 (0.3) 4.23 (0.3) 0.41 (0.26) 4.19 (0.27)Arwal 0.5 (0.3) 4.5 (0.3) 0.49 (0.31) 4.42 (0.28)Nawada 1.13 (0.7) 10.25 (0.7) 0.9 (0.57) 8.65 (0.55)Aurangabad 0.99 (0.6) 10.8 (0.7) 0.78 (0.49) 8.53 (0.54)
Saran 1.11 (3.11) 9.03 (2.93) 5.18 (3.4) 51.26 (3.3) 5.18 (3.27) 51.26 (3.25)Siwan 1.21 (3.6) 8.63 (3.1) 1.21 (3.38) 8.67 (2.82) 2.56 (1.7) 28.65 (1.9) 2.57 (1.62) 28.7 (1.82)Gopalganj 1 (3) 8.5 (3) 0.99 (2.76) 8.42 (2.74) 3.11 (2) 34 (2.2) 3.43 (2.16) 35.22 (2.23)
W. Champaran 2.15 (6.5) 11.77 (4.2) 2.2 (6.14) 12.05 (3.92) 7.35 (4.8) 72.85 (4.7) 7.4 (4.67) 73.34 (4.65)E. Champaran 2.51 (7.5) 15.41 (5.5) 3.59 (10.02) 22.51 (7.32) 11.23 (7.3) 111.1 (7.2) 12.04 (7.59) 128.81 (8.17)Muzaffarpur 10.1 (30.5) 132.69 (47) 11.2 (31.25) 147.7 (48.04) 10.57 (6.9) 113.52 (7.4) 10.57 (6.67) 113.5 (7.2)Sitamarhi 2.31 (6.9) 17.49 (6.2) 2.31 (6.46) 17.49 (5.69) 5.3 (3.5) 51.58 (3.4) 5.41 (3.41) 52.59 (3.33)Sheohar 1.03 (3.1) 7 (2.5) 1.03 (2.87) 7 (2.28) 2.71 (1.8) 27.2 (1.8) 2.71 (1.71) 27.2 (1.72)Vaishali 3.7 (11.1) 21.67 (7.7) 3.82 (10.67) 22.13 (7.19) 8.46 (5.5) 85.9 (5.6) 8.46 (5.34) 85.96 (5.45)
Darbhanga 0.72 (2.2) 3.69 (1.3) 0.89 (2.49) 4.41 (1.43) 13.56 (8.8) 140.51 (9.2) 14.27 (9) 148.61 (9.42)Madhubani 0.8 (2.4) 5.42 (1.9) 0.75 (2.09) 4.21 (1.37) 6.2 (4) 61.78 (4) 6.2 (3.91) 61.9 (3.92)Samastipur 1.51 (4.5) 10.38 (3.7) 1.52 (4.23) 10.48 (3.41) 10.65 (6.9) 99.31 (6.5) 10.65 (6.72) 99.41 (6.3)
Begusarai 0.52 (1.6) 2.84 (1) 0.5 (1.4) 2.89 (0.94) 4.3 (2.8) 42.48 (2.8) 4.2 (2.65) 41.49 (2.63)Munger 0.3 (0.9) 1.77 (0.6) 0.3 (0.84) 1.84 (0.6) 1.3 (0.8) 16.41 (1.1) 1.4 (0.88) 18.51 (1.17)Sheikhpura 0 (0) 0 (0) 0.71 (0.5) 7.54 (0.5) 0.67 (0.42) 7.02 (0.45)Lakhisarai 0.06 (0.2) 0.35 (0.1) 0.06 (0.16) 0.36 (0.12) 0.59 (0.4) 5.09 (0.3) 0.55 (0.35) 5.82 (0.37)Jamui 0.1 (0.3) 1.18 (0.4) 0.1 (0.28) 1.22 (0.4) 1.16 (0.8) 10.53 (0.7) 1.17 (0.74) 11.77 (0.75)Khagaria 0.3 (0.9) 2.12 (0.8) 0.3 (0.84) 2.22 (0.72) 1.71 (1.1) 16.58 (1.1) 1.6 (1.01) 15.02 (0.95)
Bhagalpur 0.6 (1.8) 4.1 (1.5) 0.6 (1.68) 4.1 (1.33) 7.9 (5.1) 73.09 (4.8) 8.1 (5.11) 74.1 (4.7)Banka 0.1 (0.3) 0.3 (0.1) 0.1 (0.28) 0.3 (0.1) 6.5 (4.2) 52.1 (3.4) 6.5 (4.1) 52.1 (3.3)
Saharsa 0.62 (1.9) 4.78 (1.7) 0.61 (1.71) 4.8 (1.56) 2.24 (1.5) 23.4 (1.5) 2.34 (1.48) 23.5 (1.49)Supaul 0.11 (0.3) 0.74 (0.3) 0.12 (0.35) 0.86 (0.28) 1.37 (0.9) 13.73 (0.9) 1.59 (1.01) 15.89 (1.01)Madhepura 0.26 (0.8) 1.83 (0.6) 0.21 (0.59) 1.47 (0.48) 2.52 (1.6) 22.97 (1.5) 2 (1.26) 18.1 (1.15)
Purnea 1.29 (3.9) 8.43 (3) 1.29 (3.6) 8.43 (2.74) 2.58 (1.7) 25.47 (1.7) 2.58 (1.62) 25.47 (1.61)Kishanganj 0.4 (1.2) 2.1 (0.7) 0.38 (1.06) 2.01 (0.65) 0.81 (0.5) 7.6 (0.5) 0.8 (0.5) 7.52 (0.48)Araria 0.4 (1.2) 1.4 (0.5) 0.42 (1.17) 1.47 (0.48) 0.71 (0.5) 5.72 (0.4) 0.74 (0.47) 6.01 (0.38)Katihar 1.13 (3.4) 7.67 (2.7) 0.21 (0.59) 1.49 (0.48) 3.64 (2.4) 35.5 (2.3) 5.15 (3.25) 45.83 (2.91)
Bihar 33.3 (100) 282.27 (100) 35.81 (100) 307.58 (100) 153.46 (100) 1533.6 (100) 158.5 (100) 1577.43 (100)
Note : Figure in parentheses denotes percentage Source : Department of Horticulture, GoB

124
Table A 3.8 : District-wise Area and Production of Important Vegetables (2017-18 and 2018-19)
(Area in '000 hectare/Production in '000 tonnes)
DistrictPotato Onion
2017-18 2018-19 2017-18 2018-19Area Production Area Production Area Production Area Production
Patna 17.8 (5.8) 512.39 (6.6) 29.88 (9.3) 860.19 (10.5) 2.98 (5.5) 72.21 (5.7) 3 (5.3) 72.9 (5.6)Nalanda 24 (7.9) 691.98 (8.9) 24.33 (7.6) 701.35 (8.6) 5.97 (11.1) 159.2 (12.6) 6.03 (10.7) 165.2 (12.6)Bhojpur 8.8 (2.9) 242 (3.1) 5.63 (1.7) 154.88 (1.9) 1.2 (2.2) 26 (2.1) 1.5 (2.7) 32.5 (2.5)Buxar 3 (1) 81 (1) 3.1 (1) 84.9 (1) 0.8 (1.5) 20.01 (1.6) 0.84 (1.5) 21.8 (1.7)Rohtas 11.45 (3.8) 296 (3.8) 12.31 (3.8) 340 (4.2) 1.27 (2.4) 28.88 (2.3) 1.49 (2.6) 33.1 (2.5)Kaimur 3.23 (1.1) 84.23 (1.1) 3.23 (1) 48.91 (0.6) 1.01 (1.9) 20.95 (1.7) 1.01 (1.8) 13.54 (1)
Gaya 10.9 (3.6) 10.9 (0.1) 11.21 (3.5) 11.21 (0.1) 1.41 (2.6) 28 (2.2) 1.45 (2.6) 28.1 (2.1)Jehanabad 2.81 (0.9) 73.85 (1) 3.5 (1.1) 92.05 (1.1) 0.52 (1) 13.52 (1.1) 0.55 (1) 14.41 (1.1)Arwal 2.5 (0.8) 67.16 (0.9) 2.5 (0.8) 67.16 (0.8) 0.4 (0.7) 9.9 (0.8) 0.38 (0.7) 9.62 (0.7)Nawada 4.85 (1.6) 115 (1.5) 5 (1.6) 118.55 (1.5) 1.04 (1.9) 22.45 (1.8) 1.1 (1.9) 23.75 (1.8)Aurangabad 5.17 (1.7) 133.33 (1.7) 4.08 (1.3) 105.33 (1.3) 0.88 (1.6) 19.91 (1.6) 0.67 (1.2) 15.33 (1.2)
Saran 13.6 (4.5) 353.24 (4.6) 13.62 (4.2) 280.85 (3.4) 1.01 (1.9) 18.25 (1.4) 1.02 (1.8) 18.24 (1.4)Siwan 9.8 (3.2) 291.44 (3.8) 9.86 (3.1) 293.1 (3.6) 0.95 (1.8) 22.17 (1.7) 0.95 (1.7) 22.17 (1.7)Gopalganj 12.8 (4.2) 307.2 (4) 12.01 (3.7) 288.71 (3.5) 0.75 (1.4) 18.6 (1.5) 0.92 (1.6) 18.95 (1.4)
W. Champaran 12 (3.9) 323.62 (4.2) 12.5 (3.9) 337.11 (4.1) 3 (5.6) 77.4 (6.1) 3.1 (5.5) 79 (6)E. Champaran 10.7 (3.5) 299.6 (3.9) 13.23 (4.1) 377.71 (4.6) 2.32 (4.3) 57.3 (4.5) 2.51 (4.4) 53.21 (4.1)Muzaffarpur 15.41 (5.1) 231.12 (3) 15.35 (4.8) 241 (3) 2.69 (5) 62.32 (4.9) 2.9 (5.1) 63.57 (4.8)Sitamarhi 5.12 (1.7) 137.09 (1.8) 5.12 (1.6) 137.09 (1.7) 1.3 (2.4) 32.58 (2.6) 1.37 (2.4) 34.09 (2.6)Sheohar 3.21 (1.1) 83.87 (1.1) 3.22 (1) 83.94 (1) 0.7 (1.3) 17.35 (1.4) 0.7 (1.2) 17.4 (1.3)Vaishali 12 (3.9) 351.04 (4.5) 13.41 (4.2) 391.34 (4.8) 2.25 (4.2) 55.05 (4.3) 2.84 (5) 69.35 (5.3)
Darbhanga 10.02 (3.3) 285.82 (3.7) 13.03 (4) 371.56 (4.6) 1 (1.9) 25 (2) 1.2 (2.1) 30 (2.3)Madhubani 10.8 (3.5) 289 (3.7) 10.6 (3.3) 286 (3.5) 1 (1.9) 22 (1.7) 0.97 (1.7) 21.8 (1.7)Samastipur 12 (3.9) 326.09 (4.2) 12.01 (3.7) 326.15 (4) 1.4 (2.6) 30.46 (2.4) 1.39 (2.5) 30.4 (2.3)
Begusarai 8.5 (2.8) 238 (3.1) 9 (2.8) 252.1 (3.1) 1.8 (3.3) 38.16 (3) 1.85 (3.3) 41.06 (3.1)Munger 7.2 (2.4) 160.05 (2.1) 7.2 (2.2) 170.12 (2.1) 1.1 (2) 26.9 (2.1) 1.12 (2) 25.31 (1.9)Sheikhpura 3.25 (1.1) 92.63 (1.2) 3.02 (0.9) 86.13 (1.1) 1.31 (2.4) 29.07 (2.3) 1.4 (2.5) 30.73 (2.3)Lakhisarai 3.11 (1) 58.6 (0.8) 3.1 (1) 57.99 (0.7) 0.35 (0.7) 8.84 (0.7) 0.36 (0.6) 8.96 (0.7)Jamui 2.61 (0.9) 64.08 (0.8) 2.55 (0.8) 64.57 (0.8) 0.81 (1.5) 21.27 (1.7) 0.8 (1.4) 20.07 (1.5)Khagaria 4.11 (1.3) 108.92 (1.4) 4.11 (1.3) 108.55 (1.3) 0.8 (1.5) 17.39 (1.4) 0.8 (1.4) 17.4 (1.3)
Bhagalpur 9.85 (3.2) 262.88 (3.4) 9.83 (3.1) 263.26 (3.2) 1.61 (3) 40.16 (3.2) 1.53 (2.7) 38.24 (2.9)Banka 4.9 (1.6) 125.7 (1.6) 4.9 (1.5) 125.99 (1.5) 0.71 (1.3) 15.72 (1.2) 0.71 (1.3) 15.75 (1.2)
Saharsa 5.72 (1.9) 151.97 (2) 5.72 (1.8) 151.97 (1.9) 0.62 (1.1) 15.38 (1.2) 0.62 (1.1) 15.38 (1.2)Supaul 4.73 (1.6) 121.84 (1.6) 5.52 (1.7) 133.3 (1.6) 0.42 (0.8) 8.95 (0.7) 0.49 (0.9) 9.79 (0.7)Madhepura 6.64 (2.2) 175.46 (2.3) 5.4 (1.7) 145.04 (1.8) 0.75 (1.4) 16.95 (1.3) 1 (1.8) 22.58 (1.7)
Purnea 5.15 (1.7) 135.98 (1.8) 5.16 (1.6) 136.02 (1.7) 1.8 (3.3) 42.5 (3.4) 1.8 (3.2) 42.5 (3.2)Kishanganj 4.51 (1.5) 118.14 (1.5) 4.4 (1.4) 100.23 (1.2) 1.41 (2.6) 31.65 (2.5) 1.42 (2.5) 33.1 (2.5)Araria 4.56 (1.5) 111.74 (1.4) 4.79 (1.5) 117.33 (1.4) 1.5 (2.8) 32.31 (2.6) 1.58 (2.8) 33.93 (2.6)Katihar 7.98 (2.6) 227.85 (2.9) 8.48 (2.6) 242.24 (3) 2.93 (5.5) 62.44 (4.9) 3.15 (5.6) 68.25 (5.2)
Bihar 304.78 (100) 7740.79 (100) 321.88 (100) 8153.91 (100) 53.77 (100) 1267.18 (100) 56.5 (100) 1311.45 (100) Note : Figure in parentheses denotes percentage
Source : Department of Horticulture, GoB (Contd.)

125
Table A 3.8 : District-wise Area and Production of Important Vegetables (2017-18 and 2018-19) (Contd.)
(Area in '000 hectare/Production in '000 tonnes)
DistrictBrinjal Cauliflower
2017-18 2018-19 2017-18 2018-19Area Production Area Production Area Production Area Production
Patna 2.15 (3.7) 55.19 (4.4) 3.73 (6.1) 95.87 (7.3) 4.48 (7.2) 1.53 (0.2) 7.58 (11.2) 2.59 (0.3)Nalanda 7.21 (12.4) 148.12 (11.9) 6.86 (11.2) 141.14 (10.7) 3.15 (5.1) 60.87 (6.5) 3.33 (4.9) 64.39 (6.2)Bhojpur 1.2 (2.1) 28.9 (2.3) 0.92 (1.5) 22.25 (1.7) 1.11 (1.8) 21.7 (2.3) 0.89 (1.3) 17.36 (1.7)Buxar 0.82 (1.4) 17.16 (1.4) 0.64 (1) 13.5 (1) 0.53 (0.9) 9.6 (1) 0.56 (0.8) 10.09 (1)Rohtas 1.06 (1.8) 19.98 (1.6) 1.33 (2.2) 24.97 (1.9) 1.38 (2.2) 23.21 (2.5) 1.73 (2.6) 29.01 (2.8)Kaimur 0.61 (1) 14.51 (1.2) 0.61 (1) 8.32 (0.6) 0.81 (1.3) 13.62 (1.5) 0.81 (1.2) 8.96 (0.9)
Gaya 1.6 (2.8) 3.88 (0.3) 1.62 (2.6) 1.62 (0.1) 2 (3.2) 2 (0.2) 2.02 (3) 2.02 (0.2)Jehanabad 0.72 (1.2) 14.09 (1.1) 0.73 (1.2) 14.27 (1.1) 0.52 (0.8) 10.01 (1.1) 0.52 (0.8) 10.09 (1)Arwal 0.41 (0.7) 9.74 (0.8) 0.41 (0.7) 9.74 (0.7) 0.4 (0.6) 8.1 (0.9) 0.4 (0.6) 8.1 (0.8)Nawada 1.85 (3.2) 37 (3) 1.9 (3.1) 38 (2.9) 1.88 (3) 30 (3.2) 1.85 (2.7) 29.6 (2.9)Aurangabad 1.11 (1.9) 22.53 (1.8) 0.92 (1.5) 18.29 (1.4) 1.25 (2) 25.18 (2.7) 0.99 (1.5) 19.89 (1.9)
Saran 1.81 (3.1) 38.78 (3.1) 1.82 (3) 38.8 (2.9) 2.91 (4.7) 38.17 (4.1) 2.92 (4.3) 38.24 (3.7)Siwan 1.6 (2.7) 36 (2.9) 1.69 (2.8) 37.96 (2.9) 1.6 (2.6) 28.4 (3) 1.59 (2.3) 28.23 (2.7)Gopalganj 1.42 (2.4) 30.5 (2.5) 1.43 (2.3) 30.8 (2.3) 1.6 (2.6) 44.9 (4.8) 1.6 (2.4) 44.9 (4.3)
W. Champaran 2 (3.4) 45 (3.6) 2.05 (3.3) 46.13 (3.5) 3.05 (4.9) 56.16 (6) 3.1 (4.6) 57.08 (5.5)E. Champaran 1.7 (2.9) 38.58 (3.1) 1.71 (2.8) 38.99 (3) 3.15 (5.1) 42.56 (4.5) 3.3 (4.9) 45.04 (4.3)Muzaffarpur 2.91 (5) 58.2 (4.7) 3 (4.9) 59.07 (4.5) - - - -Sitamarhi 1.31 (2.3) 27.15 (2.2) 1.58 (2.6) 32.58 (2.5) 1.41 (2.3) 24.41 (2.6) 1.77 (2.6) 30.51 (2.9)Sheohar 0.7 (1.2) 14.06 (1.1) 0.7 (1.1) 14.06 (1.1) 0.81 (1.3) 15.23 (1.6) 0.82 (1.2) 15.25 (1.5)Vaishali 3.21 (5.5) 96.2 (7.7) 3.86 (6.3) 111.92 (8.5) 4.5 (7.2) 74.91 (8) 5.74 (8.4) 95.38 (9.2)
Darbhanga 2.55 (4.4) 52 (4.2) 3.18 (5.2) 65.66 (5) 1.65 (2.7) 29.39 (3.1) 2.22 (3.3) 39.56 (3.8)Madhubani 2.1 (3.6) 42.9 (3.5) 2.3 (3.7) 46.15 (3.5) 2.6 (4.2) 45.65 (4.9) 2.59 (3.8) 45.6 (4.4)Samastipur 2.31 (4) 58.53 (4.7) 2.31 (3.8) 58.52 (4.4) 3.01 (4.9) 59.74 (6.4) 3.01 (4.4) 59.74 (5.8)
Begusarai 2.82 (4.8) 58.94 (4.7) 2.72 (4.4) 68.08 (5.2) 1.72 (2.8) 33.35 (3.6) 1.72 (2.5) 35.02 (3.4)Munger 0.79 (1.4) 18.97 (1.5) 0.79 (1.3) 19.84 (1.5) 0.81 (1.3) 10.78 (1.2) 0.81 (1.2) 11.01 (1.1)Sheikhpura 0.23 (0.4) 5.09 (0.4) 0.21 (0.3) 4.77 (0.4) 0.16 (0.3) 3.56 (0.4) 0.15 (0.2) 3.28 (0.3)Lakhisarai - - 0.2 (0.3) 4.32 (0.3) - - 0.28 (0.4) 5.21 (0.5)Jamui 0.61 (1) 11.88 (1) 0.61 (1) 11.85 (0.9) 0.4 (0.6) 7.24 (0.8) 0.39 (0.6) 7.39 (0.7)Khagaria 1.21 (2.1) 29.8 (2.4) 1.15 (1.9) 29 (2.2) 1.31 (2.1) 21.58 (2.3) 1.31 (1.9) 21.49 (2.1)
Bhagalpur 1.7 (2.9) 34 (2.7) 1.65 (2.7) 33.5 (2.5) 1.7 (2.7) 29 (3.1) 1.7 (2.5) 29 (2.8)Banka 0.8 (1.4) 17.4 (1.4) 0.8 (1.3) 17.42 (1.3) 0.81 (1.3) 12.57 (1.3) 0.81 (1.2) 12.43 (1.2)
Saharsa 1.32 (2.3) 28.93 (2.3) 1.33 (2.2) 28.93 (2.2) 1.82 (2.9) 31.68 (3.4) 1.82 (2.7) 31.68 (3.1)Supaul 0.63 (1.1) 13.67 (1.1) 0.74 (1.2) 15.85 (1.2) 0.74 (1.2) 12.31 (1.3) 0.86 (1.3) 13.49 (1.3)Madhepura 1.6 (2.7) 32.03 (2.6) 1.6 (2.6) 33.75 (2.6) 2.28 (3.7) 39.05 (4.2) 1.82 (2.7) 32.3 (3.1)
Purnea 1.11 (1.9) 20.92 (1.7) 1.11 (1.8) 20.98 (1.6) 2.11 (3.4) 35.37 (3.8) 2.11 (3.1) 35.37 (3.4)Kishanganj 0.62 (1.1) 12.65 (1) 0.6 (1) 12.05 (0.9) 0.91 (1.5) 16.09 (1.7) 0.8 (1.2) 14.09 (1.4)Araria 0.71 (1.2) 13.92 (1.1) 0.74 (1.2) 14.62 (1.1) 0.81 (1.3) 14.99 (1.6) 0.85 (1.3) 15.73 (1.5)Katihar 1.73 (3) 34.54 (2.8) 1.82 (3) 36.33 (2.8) 2.68 (4.3) 2.66 (0.3) 3.15 (4.6) 66.56 (6.4)
Bihar 58.22 (100) 1241.71 (100) 61.36 (100) 1319.88 (100) 62.04 (100) 935.56 (100) 67.9 (100) 1035.69 (100) Note : Figure in parentheses denotes percentage
Source : Department of Horticulture, GoB

126
Table A 3.9 : District-wise Achievement for Livestock-Related Services (2017-18 and 2018-19)
(in lakh)
DistrictAnimals Treated Immunization Artificial Insemination
2017-18 2018-19 2017-18 2018-19 2017-18 2018-19Patna 2.4 2.6 16.52 17.2 1.32 1.35Nalanda 1.6 1.72 13.48 14.23 0.72 0.72Bhojpur 1.19 1.11 10.95 11.62 1.44 1.6Buxar 0.54 0.69 8.98 10.19 1.01 0.97Rohtas 1.3 1.23 14.91 15.75 0.86 0.99Kaimur 0.55 0.55 11.07 11.05 0.51 0.47
Gaya 2.2 2.27 26.94 28.3 0.72 0.85Jehanabad 0.73 0.76 5.5 5.84 0.32 0.38Arwal 0.35 0.31 3.22 3.38 0.19 0.24Nawada 1.1 1.52 11.71 12.43 0.26 0.28Aurangabad 1.37 1.36 15.78 16.6 0.33 0.4
Saran 1.95 1.63 13.4 14.14 0.8 0.94Siwan 0.83 0.8 9.8 12.92 0.63 0.74Gopalganj 0.95 1.14 10.81 8.82 1.21 1.37
W. Champaran 1.18 0.88 18.21 19.16 0.51 0.74E. Champaran 1.76 1.65 20.38 21.44 0.93 1.17Muzaffarpur 1.94 1.97 18.11 19.01 2.37 2.49Sitamarhi 1.15 0.76 9.83 10.33 0.53 0.65Sheohar 0.28 0.19 2.53 2.63 0.41 0.44Vaishali 1.09 1.18 10.68 11.35 1.47 1.45
Darbhanga 1.58 1.5 13.15 13.89 0.71 0.9Madhubani 1.24 1.15 22.15 23.33 0.53 0.74Samastipur 2.91 2.75 19.16 20.18 3.31 3.18
Begusarai 1.74 1.94 12.76 13.33 2.32 2.51Munger 0.82 0.82 6.13 6.48 0.55 0.58Sheikhpura 0.63 0.67 3.03 3.19 0.13 0.1Lakhisarai 0.54 0.38 4.98 5.28 0.52 0.48Jamui 0.77 0.66 15.18 16.05 0.08 0.09Khagaria 0.7 0.75 9.22 9.75 1.12 1.29
Bhagalpur 1.26 1.64 19.53 21.15 0.59 0.69Banka 0.94 1.21 18.91 19.96 0.59 0.57
Saharsa 1.06 1 12.84 13.55 0.27 0.32Supaul 1.18 0.67 21.38 22.5 0.13 0.24Madhepura 1.23 1 16.63 17.49 0.18 0.36
Purnea 1.4 1.52 17.81 18.75 0.23 0.24Kishanganj 0.56 0.46 12.93 13.64 0.07 0.05Araria 0.72 0.68 28.24 29.77 0.16 0.19Katihar 0.93 0.96 19.87 20.98 0.19 0.24
Bihar 44.67 44.08 526.71 555.66 28.23 31.01Source : Directorate of Animal Husbandry, GoB

127
Table A 3.10 : District-wise Production of Fish and Fish Seeds (2016-17 to 2018-19)
District
Fish Production
('000 tonnes)
Fish Seeds (Lakh)
Fish Production
('000 tonnes)
Fish Seeds (Lakh)
Fish Production
('000 tonnes)
Fish Seeds (Lakh)
2016-17 2017-18 2018-19Patna 15.63 225.00 17.43 467.80 18.03 468.80Nalanda 17.62 360.00 20.33 365.25 22.20 365.50Bhojpur 10.07 60.05 12.20 62.50 12.20 62.60Buxar 6.92 84.00 6.69 85.02 6.70 69.00Rohtas 6.78 175.00 8.44 178.30 9.50 210.00Kaimur 9.98 125.00 12.51 127.50 13.75 190.25
Gaya 6.50 150.00 8.07 152.15 8.10 155.00Jehanabad 1.26 15.00 1.26 16.05 1.25 17.00Arwal 1.37 20.00 1.26 21.03 1.25 37.60Nawada 5.50 1.00 4.90 1.50 4.00 1.20Aurangabad 8.13 70.00 9.15 75.00 9.10 80.00
Saran 9.71 56.80 11.25 57.25 11.05 55.00Siwan 6.22 20.00 7.27 21.02 7.21 30.00Gopalganj 9.41 16.25 10.80 17.30 11.50 17.60
W. Champaran 23.20 461.00 25.02 462.15 29.02 275.00E. Champaran 50.00 725.00 51.62 731.02 51.20 231.00Muzaffarpur 21.75 520.00 25.60 520.00 22.70 375.00Sitamarhi 12.25 598.00 12.41 599.70 13.11 810.00Sheohar 2.20 6.00 2.62 35.00 2.55 55.00Vaishali 15.09 96.00 18.90 97.25 19.00 28.50
Darbhanga 44.00 1000.00 54.00 1750.00 54.80 1748.00Madhubani 51.80 1600.00 65.65 1625.65 68.70 1630.00Samastipur 14.02 320.00 14.24 320.30 14.35 405.00
Begusarai 21.81 0.00 24.10 0.00 24.51 32.75Munger 9.40 20.00 9.20 18.00 9.11 22.00Sheikhpura 2.93 10.00 2.91 15.00 2.95 15.00Lakhisarai 7.90 0.00 6.75 0.00 6.74 24.00Jamui 2.35 1.50 2.51 2.00 2.25 17.60Khagaria 20.00 120.00 23.89 124.30 25.31 127.35
Bhagalpur 13.61 375.00 14.09 377.25 14.25 373.20Banka 9.91 0.00 9.98 0.00 9.95 298.80
Saharsa 6.85 10.00 8.82 11.50 8.83 13.50Supaul 8.10 2.20 12.95 10.00 12.90 13.00Madhepura 3.82 1.25 4.30 15.00 4.70 15.25
Purnea 12.10 70.00 16.40 160.00 16.60 315.00Kishanganj 6.19 115.00 5.75 117.25 5.76 121.00Araria 10.85 33.50 13.13 95.00 13.50 80.00Katihar 23.85 470.00 31.45 472.25 33.50 501.00
Bihar 509.08 7932.55 587.85 9206.29 602.13 9286.50Source : Department of Animal Husbandry and Fisheries Resources, GoB

128
Table A 3.11 : District-wise Milk Production in Bihar (2017-18)
('000 tonnes)
District Crossbred Cow Local Cow Total Cow Buffalo Total
(Cow+Buffalo) Goat Total Production
Patna 285.03 (9.8) 17.38 (0.7) 302.41 (5.6) 196.06 (5.4) 498.47 (5.5) 3.9 (1.9) 502.37 (5.4)Nalanda 118.36 (4.1) 28.14 (1.1) 146.49 (2.7) 213.99 (5.9) 360.49 (4) 3.16 (1.5) 363.65 (3.9)Bhojpur 138.97 (4.8) 24.48 (1) 163.45 (3) 136.9 (3.8) 300.35 (3.3) 2.75 (1.3) 303.1 (3.3)Rohtas 71.19 (2.4) 62.37 (2.5) 133.56 (2.5) 159.29 (4.4) 292.85 (3.2) 3.12 (1.5) 295.97 (3.2)Kaimur 29.45 (1) 50.54 (2) 79.99 (1.5) 118.35 (3.3) 198.33 (2.2) 1.08 (0.5) 199.41 (2.2)Buxar 63.93 (2.2) 35.42 (1.4) 99.36 (1.8) 92.98 (2.6) 192.34 (2.1) 1.23 (0.6) 193.56 (2.1)
Gaya 40.91 (1.4) 144.68 (5.8) 185.59 (3.4) 132.16 (3.7) 317.75 (3.5) 7.33 (3.5) 325.08 (3.5)Jehanabad 25.9 (0.9) 13 (0.5) 38.9 (0.7) 64.59 (1.8) 103.49 (1.1) 1.34 (0.6) 104.82 (1.1)Arwal 30.26 (1) 2.88 (0.1) 33.14 (0.6) 41.53 (1.1) 74.67 (0.8) 1.09 (0.5) 75.75 (0.8)Nawada 18.79 (0.6) 68.63 (2.7) 87.42 (1.6) 60.83 (1.7) 148.25 (1.6) 3.49 (1.7) 151.74 (1.6)Aurangabad 34.99 (1.2) 94.66 (3.8) 129.66 (2.4) 106.86 (3) 236.52 (2.6) 4.8 (2.3) 241.31 (2.6)
Saran 127.62 (4.4) 63.17 (2.5) 190.79 (3.5) 90.98 (2.5) 281.77 (3.1) 2.94 (1.4) 284.71 (3.1)Siwan 54.81 (1.9) 64.82 (2.6) 119.63 (2.2) 80.87 (2.2) 200.5 (2.2) 3.44 (1.7) 203.94 (2.2)Gopalganj 39.27 (1.3) 42.84 (1.7) 82.11 (1.5) 62.77 (1.7) 144.88 (1.6) 3.26 (1.6) 148.14 (1.6)
W. Champaran 61.83 (2.1) 93.53 (3.7) 155.35 (2.9) 101.33 (2.8) 256.68 (2.8) 9.04 (4.4) 265.72 (2.9)E. Champaran 40.22 (1.4) 108.95 (4.4) 149.17 (2.8) 150.05 (4.1) 299.23 (3.3) 11.13 (5.4) 310.36 (3.4)Muzaffarpur 194.68 (6.7) 19.5 (0.8) 214.19 (4) 138.27 (3.8) 352.45 (3.9) 8.92 (4.3) 361.37 (3.9)Sitamarhi 24.46 (0.8) 17.39 (0.7) 41.86 (0.8) 89.1 (2.5) 130.95 (1.4) 6.56 (3.2) 137.51 (1.5)Sheohar 12.26 (0.4) 8.23 (0.3) 20.49 (0.4) 22.35 (0.6) 42.84 (0.5) 1.79 (0.9) 44.63 (0.5)Vaishali 180.5 (6.2) 5.01 (0.2) 185.5 (3.4) 81.8 (2.3) 267.31 (3) 4.54 (2.2) 271.85 (2.9)
Darbhanga 53.14 (1.8) 64.72 (2.6) 117.87 (2.2) 130.3 (3.6) 248.17 (2.7) 5.2 (2.5) 253.37 (2.7)Madhubani 9.85 (0.3) 122.01 (4.9) 131.86 (2.4) 151.68 (4.2) 283.54 (3.1) 7.12 (3.4) 290.67 (3.1)Samastipur 338.76 (11.6) 12.38 (0.5) 351.14 (6.5) 111.42 (3.1) 462.56 (5.1) 5.78 (2.8) 468.34 (5.1)
Begusarai 294.73 (10.1) 6.23 (0.2) 300.96 (5.6) 52.66 (1.5) 353.62 (3.9) 3.76 (1.8) 357.38 (3.9)Munger 74.02 (2.5) 40.08 (1.6) 114.09 (2.1) 36.01 (1) 150.1 (1.7) 3.42 (1.7) 153.53 (1.7)Sheikhpura 28.06 (1) 13.3 (0.5) 41.35 (0.8) 28.56 (0.8) 69.91 (0.8) 1.1 (0.5) 71.01 (0.8)Lakhisarai 61.33 (2.1) 16.73 (0.7) 78.06 (1.4) 34.61 (1) 112.67 (1.2) 1.48 (0.7) 114.16 (1.2)Jamui 12.94 (0.4) 110.02 (4.4) 122.95 (2.3) 42.36 (1.2) 165.31 (1.8) 5.79 (2.8) 171.1 (1.9)Khagaria 176.25 (6) 28.78 (1.2) 205.03 (3.8) 63.3 (1.7) 268.33 (3) 3.81 (1.8) 272.15 (2.9)
Bhagalpur 145.64 (5) 99.11 (4) 244.74 (4.5) 102.46 (2.8) 347.21 (3.8) 7.93 (3.8) 355.14 (3.8)Banka 28.22 (1) 144.15 (5.8) 172.37 (3.2) 68.85 (1.9) 241.22 (2.7) 5.98 (2.9) 247.2 (2.7)
Saharsa 21.28 ( 0.7) 85.77 (3.4) 107.05 (2) 92.08 (2.5) 199.12 (2.2) 5.48 (2.6) 204.6 (2.2)Supaul 2.51 (0.1) 121.44 (4.9) 123.95 (2.3) 220.23 (6.1) 344.18 (3.8) 7.15 (3.5) 351.33 (3.8)Madhepura 18.39 (0.6) 89.76 (3.6) 108.15 (2) 91.55 (2.5) 199.7 (2.2) 5.94 (2.9) 205.65 (2.2)
Purnea 24.33 (0.8) 138.35 (5.5) 162.68 (3) 60.65 (1.7) 223.33 (2.5) 6.55 (3.2) 229.89 (2.5)Kishanganj 13.87 (0.5) 120.76 (4.8) 134.63 (2.5) 29.49 (0.8) 164.13 (1.8) 6.33 (3.1) 170.46 (1.8)Araria 7.81 (0.3) 164.8 (6.6) 172.61 (3.2) 105.61 (2.9) 278.22 (3.1) 30.3 (14.7) 308.53 (3.3)Katihar 10.52 (0.4) 156.18 (6.2) 166.71 (3.1) 56.49 (1.6) 223.2 (2.5) 8.8 (4.3) 232 (2.5)
Bihar 2915.06 (100) 2500.21 (100) 5415.27 (100) 3619.37 (100) 9034.64 (100) 206.85 (100) 9241.49 (100)
Source : Department of Animal Husbandry and Fisheries Resources, GoB

129
Table A 3.12 : District-wise Milk Production in Bihar (2018-19)
('000 tonnes)
District Crossbred Cow Local Cow Total Cow Buffalo Total
(Cow +Buffalo) Goat Total Production
Patna 279.94 (9) 17.71 (0.7) 297.65 (5.2) 200.4 (5.2) 498.05 (5.2) 3.68 (1.7) 501.73 (5.1)Nalanda 128.68 (4.2) 29.83 (1.1) 158.51 (2.8) 210.64 (5.5) 369.15 (3.8) 3.12 (1.5) 372.27 (3.8)Bhojpur 149 (4.8) 25.69 (1) 174.69 (3) 138.52 (3.6) 313.21 (3.3) 2.44 (1.1) 315.65 (3.2)Rohtas 79.9 (2.6) 67.34 (2.5) 147.24 (2.6) 162.28 (4.2) 309.52 (3.2) 3.05 (1.4) 312.57 (3.2)Kaimur 31.95 (1) 52.04 (2) 83.99 (1.5) 120.85 (3.1) 204.84 (2.1) 1.23 (0.6) 206.07 (2.1)Buxar 65.52 (2.1) 36.92 (1.4) 102.44 (1.8) 91.7 (2.4) 194.14 (2) 1.26 (0.6) 195.4 (2)
Gaya 45.53 (1.5) 154.07 (5.8) 199.6 (3.5) 141.77 (3.7) 341.37 (3.6) 7.14 (3.3) 348.51 (3.5)Jehanabad 29.31 (0.9) 13.29 (0.5) 42.6 (0.7) 74.23 (1.9) 116.83 (1.2) 1.49 (0.7) 118.32 (1.2)Arwal 34.54 (1.1) 3.11 (0.1) 37.65 (0.7) 45.14 (1.2) 82.79 (0.9) 1.06 (0.5) 83.85 (0.9)Nawada 20.77 (0.7) 77.07 (2.9) 97.84 (1.7) 64.47 (1.7) 162.31 (1.7) 3.13 (1.5) 165.44 (1.7)Aurangabad 42 (1.4) 96.14 (3.6) 138.14 (2.4) 115.04 (3) 253.18 (2.6) 4.19 (1.9) 257.37 (2.6)
Saran 147.81 (4.8) 63.65 (2.4) 211.46 (3.7) 92.64 (2.4) 304.1 (3.2) 3.11 (1.4) 307.21 (3.1)Siwan 61.81 (2) 67.68 (2.5) 129.49 (2.3) 82.47 (2.1) 211.96 (2.2) 3.66 (1.7) 215.62 (2.2)Gopalganj 41 (1.3) 48.78 (1.8) 89.78 (1.6) 66.82 (1.7) 156.6 (1.6) 3.16 (1.5) 159.76 (1.6)
W. Champaran 66.54 (2.1) 95.48 (3.6) 162.02 (2.8) 113.75 (3) 275.77 (2.9) 9.18 (4.3) 284.95 (2.9)E. Champaran 43.8 (1.4) 112.22 (4.2) 156.02 (2.7) 172.32 (4.5) 328.34 (3.4) 11.77 (5.5) 340.11 (3.5)Muzaffarpur 202.47 (6.5) 20.47 (0.8) 222.94 (3.9) 148.54 (3.9) 371.48 (3.9) 9.4 (4.4) 380.88 (3.9)Sitamarhi 27 (0.9) 19.96 (0.8) 46.96 (0.8) 92.37 (2.4) 139.33 (1.5) 6.72 (3.1) 146.05 (1.5)Sheohar 13.63 (0.4) 9.18 (0.3) 22.81 (0.4) 28.16 (0.7) 50.97 (0.5) 1.95 (0.9) 52.92 (0.5)Vaishali 193.25 (6.2) 5.76 (0.2) 199.01 (3.5) 92.57 (2.4) 291.58 (3) 5.04 (2.3) 296.62 (3)
Darbhanga 57.85 (1.9) 66.08 (2.5) 123.93 (2.2) 133.57 (3.5) 257.5 (2.7) 5.31 (2.5) 262.81 (2.7)Madhubani 10.45 (0.3) 130.07 (4.9) 140.52 (2.4) 167.55 (4.4) 308.07 (3.2) 6.92 (3.2) 314.99 (3.2)Samastipur 357 (11.5) 13.2 (0.5) 370.2 (6.4) 116.61 (3) 486.81 (5.1) 6.4 (3) 493.21 (5)
Begusarai 306.8 (9.9) 6.48 (0.2) 313.28 (5.4) 55.36 (1.4) 368.64 (3.8) 3.73 (1.7) 372.37 (3.8)Munger 84.85 (2.7) 42.87 (1.6) 127.72 (2.2) 42.43 (1.1) 170.15 (1.8) 3.79 (1.8) 173.94 (1.8)Sheikhpura 29 (0.9) 14.65 (0.6) 43.65 (0.8) 26 (0.7) 69.65 (0.7) 1.17 (0.5) 70.82 (0.7)Lakhisarai 63.74 (2.1) 18.08 (0.7) 81.82 (1.4) 38.2 (1) 120.02 (1.2) 1.69 (0.8) 121.71 (1.2)Jamui 13.58 (0.4) 122.49 (4.6) 136.07 (2.4) 45.36 (1.2) 181.43 (1.9) 6.48 (3) 187.91 (1.9)Khagaria 184.14 (5.9) 30.48 (1.1) 214.62 (3.7) 66 (1.7) 280.62 (2.9) 4.06 (1.9) 284.68 (2.9)
Bhagalpur 149.28 (4.8) 102.74 (3.9) 252.02 (4.4) 109.44 (2.8) 361.46 (3.8) 8.21 (3.8) 369.67 (3.8)Banka 28 (0.9) 152.34 (5.7) 180.34 (3.1) 72.44 (1.9) 252.78 (2.6) 6.31 (2.9) 259.09 (2.6)
Saharsa 22.31 (0.7) 86.95 (3.3) 109.26 (1.9) 96.35 (2.5) 205.61 (2.1) 5.41 (2.5) 211.02 (2.1)Supaul 2.74 (0.1) 127.44 (4.8) 130.18 (2.3) 241.99 (6.3) 372.17 (3.9) 6.8 (3.2) 378.97 (3.9)Madhepura 21.38 (0.7) 94.34 (3.6) 115.72 (2) 101.08 (2.6) 216.8 (2.3) 5.92 (2.8) 222.72 (2.3)
Purnea 27 (0.9) 150.46 (5.7) 177.46 (3.1) 72.43 (1.9) 249.89 (2.6) 7.01 (3.3) 256.9 (2.6)Kishanganj 15 (0.5) 134.93 (5.1) 149.93 (2.6) 30.91 (0.8) 180.84 (1.9) 7.23 (3.4) 188.07 (1.9)Araria 8.83 (0.3) 172.95 (6.5) 181.78 (3.2) 117.07 (3) 298.85 (3.1) 33.64 (15.7) 332.49 (3.4)Katihar 11.94 (0.4) 171.66 (6.5) 183.6 (3.2) 63.17 (1.6) 246.77 (2.6) 9.07 (4.2) 255.84 (2.6)
Bihar 3098.34 (100) 2654.6 (100) 5752.94 (100) 3850.64 (100) 9603.58 (100) 214.93 (100) 9818.51 (100)
Source : Department of Animal Husbandry and Fisheries Resources, GoB
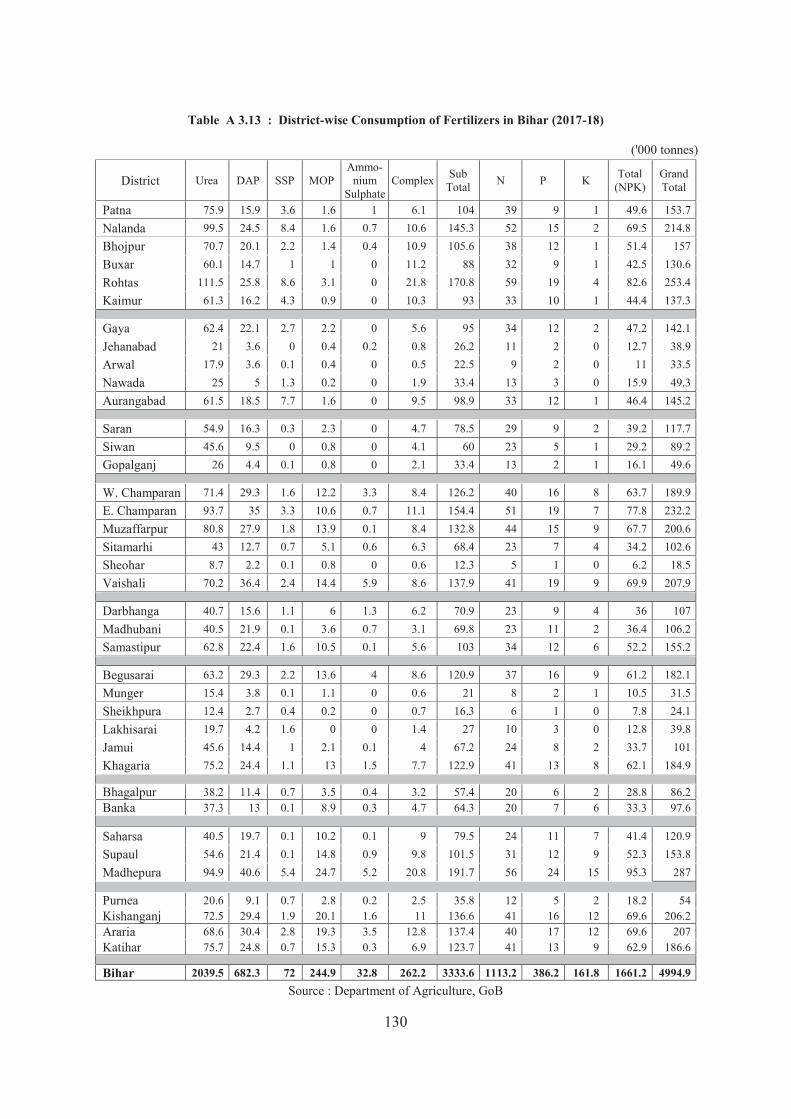
130
Table A 3.13 : District-wise Consumption of Fertilizers in Bihar (2017-18)
('000 tonnes)
District Urea DAP SSP MOPAmmo-
nium Sulphate
Complex Sub Total N P K Total
(NPK)Grand Total
Patna 75.9 15.9 3.6 1.6 1 6.1 104 39 9 1 49.6 153.7Nalanda 99.5 24.5 8.4 1.6 0.7 10.6 145.3 52 15 2 69.5 214.8Bhojpur 70.7 20.1 2.2 1.4 0.4 10.9 105.6 38 12 1 51.4 157Buxar 60.1 14.7 1 1 0 11.2 88 32 9 1 42.5 130.6Rohtas 111.5 25.8 8.6 3.1 0 21.8 170.8 59 19 4 82.6 253.4Kaimur 61.3 16.2 4.3 0.9 0 10.3 93 33 10 1 44.4 137.3
Gaya 62.4 22.1 2.7 2.2 0 5.6 95 34 12 2 47.2 142.1Jehanabad 21 3.6 0 0.4 0.2 0.8 26.2 11 2 0 12.7 38.9Arwal 17.9 3.6 0.1 0.4 0 0.5 22.5 9 2 0 11 33.5Nawada 25 5 1.3 0.2 0 1.9 33.4 13 3 0 15.9 49.3Aurangabad 61.5 18.5 7.7 1.6 0 9.5 98.9 33 12 1 46.4 145.2
Saran 54.9 16.3 0.3 2.3 0 4.7 78.5 29 9 2 39.2 117.7Siwan 45.6 9.5 0 0.8 0 4.1 60 23 5 1 29.2 89.2Gopalganj 26 4.4 0.1 0.8 0 2.1 33.4 13 2 1 16.1 49.6
W. Champaran 71.4 29.3 1.6 12.2 3.3 8.4 126.2 40 16 8 63.7 189.9E. Champaran 93.7 35 3.3 10.6 0.7 11.1 154.4 51 19 7 77.8 232.2Muzaffarpur 80.8 27.9 1.8 13.9 0.1 8.4 132.8 44 15 9 67.7 200.6Sitamarhi 43 12.7 0.7 5.1 0.6 6.3 68.4 23 7 4 34.2 102.6Sheohar 8.7 2.2 0.1 0.8 0 0.6 12.3 5 1 0 6.2 18.5Vaishali 70.2 36.4 2.4 14.4 5.9 8.6 137.9 41 19 9 69.9 207.9
Darbhanga 40.7 15.6 1.1 6 1.3 6.2 70.9 23 9 4 36 107Madhubani 40.5 21.9 0.1 3.6 0.7 3.1 69.8 23 11 2 36.4 106.2Samastipur 62.8 22.4 1.6 10.5 0.1 5.6 103 34 12 6 52.2 155.2
Begusarai 63.2 29.3 2.2 13.6 4 8.6 120.9 37 16 9 61.2 182.1Munger 15.4 3.8 0.1 1.1 0 0.6 21 8 2 1 10.5 31.5Sheikhpura 12.4 2.7 0.4 0.2 0 0.7 16.3 6 1 0 7.8 24.1Lakhisarai 19.7 4.2 1.6 0 0 1.4 27 10 3 0 12.8 39.8Jamui 45.6 14.4 1 2.1 0.1 4 67.2 24 8 2 33.7 101Khagaria 75.2 24.4 1.1 13 1.5 7.7 122.9 41 13 8 62.1 184.9
Bhagalpur 38.2 11.4 0.7 3.5 0.4 3.2 57.4 20 6 2 28.8 86.2Banka 37.3 13 0.1 8.9 0.3 4.7 64.3 20 7 6 33.3 97.6
Saharsa 40.5 19.7 0.1 10.2 0.1 9 79.5 24 11 7 41.4 120.9Supaul 54.6 21.4 0.1 14.8 0.9 9.8 101.5 31 12 9 52.3 153.8Madhepura 94.9 40.6 5.4 24.7 5.2 20.8 191.7 56 24 15 95.3 287
Purnea 20.6 9.1 0.7 2.8 0.2 2.5 35.8 12 5 2 18.2 54Kishanganj 72.5 29.4 1.9 20.1 1.6 11 136.6 41 16 12 69.6 206.2Araria 68.6 30.4 2.8 19.3 3.5 12.8 137.4 40 17 12 69.6 207Katihar 75.7 24.8 0.7 15.3 0.3 6.9 123.7 41 13 9 62.9 186.6
Bihar 2039.5 682.3 72 244.9 32.8 262.2 3333.6 1113.2 386.2 161.8 1661.2 4994.9Source : Department of Agriculture, GoB

131
Table A 3.14 : District-wise Consumption of Fertilizers in Bihar (2018-19) ('000 tonnes)
District Urea DAP SSP MOPAmmo-
nium Sulphate
Complex Sub Total N P K Total
(NPK)Grand Total
Patna 49.62 10.35 0.42 0.33 0.52 5.17 66.41 25.72 5.95 0.43 32.11 98.52Nalanda 59.66 13.05 2.78 1.41 0.80 7.83 85.53 31.33 8.23 1.24 40.80 126.32Bhojpur 44.04 8.51 0.70 0.61 0.28 8.01 62.16 23.42 5.66 0.44 29.52 91.67Buxar 31.39 6.26 0.45 0.45 0.43 12.67 51.64 18.15 5.53 0.36 24.03 75.68Rohtas 58.74 9.94 1.42 0.38 0.05 18.72 89.24 31.80 9.70 1.83 43.33 132.56Kaimur 32.83 6.20 0.53 0.24 0.00 9.41 49.21 17.96 5.03 0.42 23.41 72.62
Gaya 35.93 7.73 0.62 0.10 0.00 2.77 47.16 18.47 4.21 0.06 22.75 69.91Jehanabad 12.20 1.48 0.00 0.00 0.36 0.87 14.91 6.12 0.86 0.02 6.99 21.90Arwal 10.54 0.90 0.00 0.10 0.00 0.22 11.76 5.05 0.45 0.07 5.58 17.34Nawada 12.92 3.02 0.37 0.10 0.00 1.43 17.83 6.75 1.76 0.09 8.60 26.43Aurangabad 36.46 7.17 2.21 0.16 0.00 6.24 52.24 19.27 4.95 0.17 24.39 76.63
Saran 39.02 13.64 0.25 1.79 0.00 8.79 63.49 22.08 8.19 1.24 31.52 95.00Siwan 27.29 8.50 0.03 1.27 0.00 3.50 40.58 14.74 4.67 0.85 20.26 60.85Gopalganj 18.10 2.90 0.22 0.52 0.00 2.04 23.79 9.24 1.78 0.36 11.39 35.18
W. Champaran 41.19 15.56 2.06 6.29 0.00 8.32 73.42 23.28 9.26 4.11 36.66 110.08E. Champaran 61.92 15.09 1.53 6.65 0.45 8.52 94.17 32.72 9.30 4.54 46.56 140.73Muzaffarpur 52.63 15.93 0.79 6.83 3.77 5.45 85.40 28.84 8.64 4.28 41.76 127.16Sitamarhi 27.83 7.36 0.64 3.12 0.34 3.36 42.65 14.79 4.25 2.05 21.08 63.73Sheohar 5.88 1.46 0.05 0.39 0.00 0.73 8.50 3.11 0.83 0.24 4.18 12.68Vaishali 52.64 11.43 0.45 1.88 3.73 4.61 74.74 27.83 6.36 1.38 35.57 110.31
Darbhanga 27.33 10.04 0.63 3.60 1.38 3.42 46.40 15.20 5.58 2.47 23.25 69.66Madhubani 21.36 10.00 0.05 3.34 0.83 2.33 37.91 12.19 5.13 2.16 19.49 57.40Samastipur 44.09 13.89 0.68 5.82 0.51 5.96 70.97 23.88 7.95 3.93 35.76 106.73
Begusarai 47.74 18.58 0.44 6.38 2.63 8.72 84.49 27.40 10.60 4.18 42.19 126.68Munger 8.57 2.20 0.00 0.16 0.00 0.54 11.47 4.45 1.12 0.10 5.66 17.13Sheikhpura 11.24 2.99 0.32 0.27 0.00 1.29 16.10 5.94 1.72 0.21 7.87 23.97Lakhisarai 8.48 1.12 0.09 0.09 0.00 1.05 10.82 4.31 0.74 0.06 5.11 15.93Jamui 22.24 4.04 0.21 0.26 0.09 2.13 28.98 11.40 2.32 0.16 13.88 42.86Khagaria 58.79 15.93 1.10 7.02 0.08 6.16 89.08 31.14 8.75 4.27 44.16 133.24
Bhagalpur 38.81 11.25 0.93 6.97 0.58 7.37 65.90 21.43 6.82 4.26 32.52 98.41Banka 20.54 4.99 0.18 0.61 0.00 1.71 28.04 10.69 2.67 0.38 13.74 41.78
Saharsa 28.11 9.76 0.06 4.74 0.05 3.19 45.91 15.24 5.20 3.06 23.50 69.41Supaul 28.95 12.24 0.14 6.00 0.25 5.83 53.42 16.67 6.86 3.77 27.30 80.73Madhepura 37.51 13.59 0.26 7.70 0.82 7.99 67.87 21.33 8.04 4.93 34.29 102.16
Purnea 69.71 25.81 5.83 15.66 3.37 11.98 132.36 39.72 15.30 9.53 64.54 196.91Kishanganj 15.18 6.86 3.33 1.89 0.35 1.31 28.91 8.53 3.97 1.19 13.68 42.59Araria 48.85 17.91 2.84 11.23 0.72 6.51 88.06 27.14 10.00 6.75 43.89 131.94Katihar 51.70 17.13 2.65 9.90 1.84 8.75 91.97 28.83 10.27 6.26 45.36 137.33
Bihar 1300.05 364.81 35.25 124.29 24.23 204.86 2053.49 706.16 218.65 81.84 1006.66 3060.15
Source : Department of Agriculture, GoB
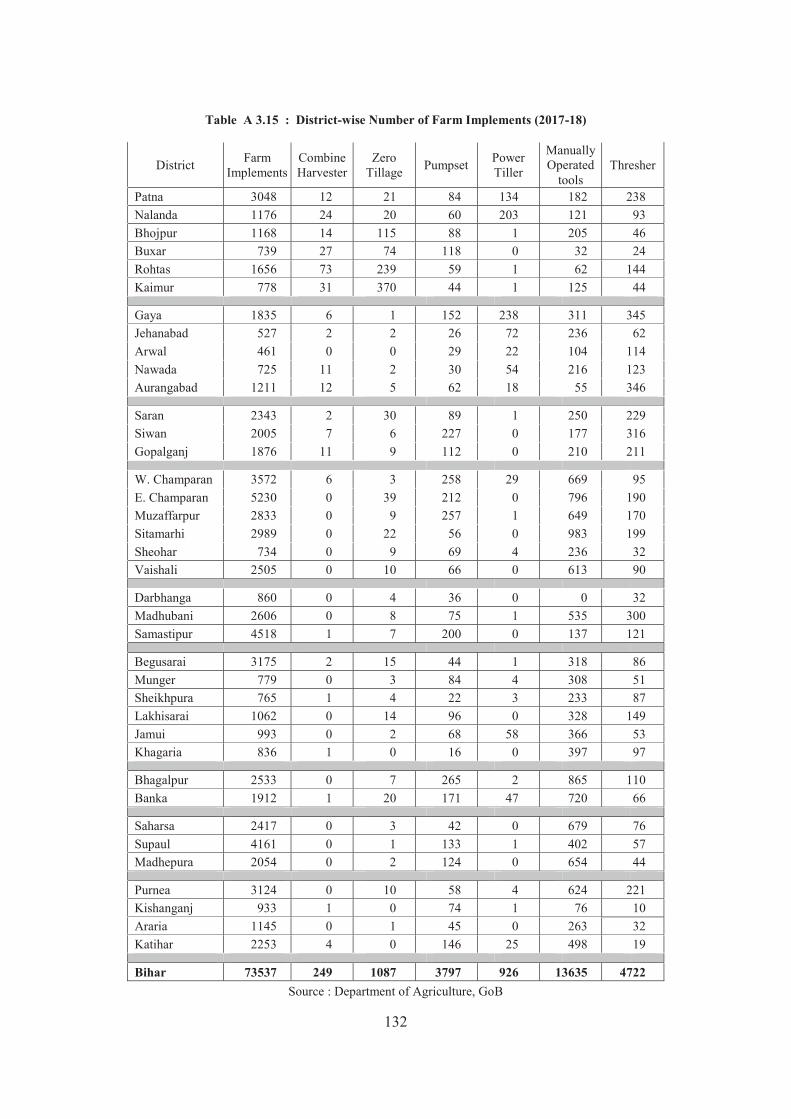
132
Table A 3.15 : District-wise Number of Farm Implements (2017-18)
District Farm Implements
Combine Harvester
Zero Tillage Pumpset Power
Tiller
Manually Operated
toolsThresher
Patna 3048 12 21 84 134 182 238Nalanda 1176 24 20 60 203 121 93Bhojpur 1168 14 115 88 1 205 46Buxar 739 27 74 118 0 32 24Rohtas 1656 73 239 59 1 62 144Kaimur 778 31 370 44 1 125 44
Gaya 1835 6 1 152 238 311 345Jehanabad 527 2 2 26 72 236 62Arwal 461 0 0 29 22 104 114Nawada 725 11 2 30 54 216 123Aurangabad 1211 12 5 62 18 55 346
Saran 2343 2 30 89 1 250 229Siwan 2005 7 6 227 0 177 316Gopalganj 1876 11 9 112 0 210 211
W. Champaran 3572 6 3 258 29 669 95E. Champaran 5230 0 39 212 0 796 190Muzaffarpur 2833 0 9 257 1 649 170Sitamarhi 2989 0 22 56 0 983 199Sheohar 734 0 9 69 4 236 32Vaishali 2505 0 10 66 0 613 90
Darbhanga 860 0 4 36 0 0 32Madhubani 2606 0 8 75 1 535 300Samastipur 4518 1 7 200 0 137 121
Begusarai 3175 2 15 44 1 318 86Munger 779 0 3 84 4 308 51Sheikhpura 765 1 4 22 3 233 87Lakhisarai 1062 0 14 96 0 328 149Jamui 993 0 2 68 58 366 53Khagaria 836 1 0 16 0 397 97
Bhagalpur 2533 0 7 265 2 865 110Banka 1912 1 20 171 47 720 66
Saharsa 2417 0 3 42 0 679 76Supaul 4161 0 1 133 1 402 57Madhepura 2054 0 2 124 0 654 44
Purnea 3124 0 10 58 4 624 221Kishanganj 933 1 0 74 1 76 10Araria 1145 0 1 45 0 263 32Katihar 2253 4 0 146 25 498 19
Bihar 73537 249 1087 3797 926 13635 4722Source : Department of Agriculture, GoB

133
Table A 3.16 : District-wise Number of Farm Implements (2018-19)
District Farm Implements
Combine Harvester
Zero Tillage Pumpset Power
Tiller
Manually Operated
toolsThresher
Patna 2381 34 3 540 113 15 171Nalanda 2082 41 39 190 204 53 92Bhojpur 1302 9 117 309 0 47 140Buxar 673 20 40 219 0 24 10Rohtas 639 31 134 108 0 7 2Kaimur 1263 14 229 190 0 28 26
Gaya 2827 12 2 827 130 171 441Jehanabad 1085 1 0 156 62 103 93Arwal 654 0 0 242 11 10 156Nawada 1171 7 5 292 32 67 190Aurangabad 1471 16 7 394 9 17 421
Saran 1957 1 24 367 0 86 226Siwan 1791 14 1 309 0 68 292Gopalganj 1463 7 0 281 0 75 132
W. Champaran 3367 2 2 473 6 362 124E. Champaran 3907 1 32 488 0 356 241Muzaffarpur 2123 0 7 383 0 209 197Sitamarhi 1928 1 18 149 0 394 246Sheohar 720 0 9 57 0 124 63Vaishali 2277 0 7 429 1 209 88
Darbhanga 830 0 0 164 0 0 29Madhubani 2231 1 5 301 0 127 295Samastipur 4380 0 3 468 0 594 173
Begusarai 4128 2 8 578 0 203 183Munger 688 1 0 152 4 101 86Sheikhpura 625 2 0 47 5 55 86Lakhisarai 798 4 5 93 0 140 95Jamui 463 1 2 141 34 64 43Khagaria 1039 0 0 114 0 263 73
Bhagalpur 2566 2 2 656 2 354 136Banka 1210 1 12 401 32 146 38
Saharsa 2019 0 5 242 0 331 119Supaul 2652 0 3 203 2 146 90Madhepura 3032 0 3 415 0 362 109
Purnea 2823 0 6 190 3 259 146Kishanganj 897 1 0 161 0 26 50Araria 1788 2 10 171 1 141 95Katihar 2159 2 1 462 17 233 107
Bihar 69409 230 741 11362 668 5970 5304Source : Department of Agriculture, GoB

134
Table A 3.17 : District-wise Cooperative Credit Distribution (2016-17 to 2018-19)
DistrictTarget (Rs. Lakh) Achievement (Rs. lakh)
2016-17 2017-18 2018-19 2016-17 2017-18 2018-19Patna 3990 7197 1285 3065.15 (76.8) 680.33 (9.5) 453.22 (35.3)Nalanda 5586 5758 521 794.05 (14.2) 276.37 (4.8) 37.96 (7.3)Bhojpur 6383 5758 998 472.79 (7.4) 528.01 (9.2) 377.34 (37.8)Buxar 3724 3359 567 292.11 (7.8) 300.55 (8.9) 238.05 (42)Rohtas 3458 3838 3680 2035.91 (58.9) 1947.09 (50.7) 1284.02 (34.9)Kaimur 2926 2879 1606 864.05 (29.5) 849.86 (29.5) 741.8 (46.2)
Gaya 1596 1439 519 231.97 (14.5) 168.91 (11.7) 52.99 (10.2)Jehanabad 532 480 309 4.7 (0.9) 4.7 (1) 1.2 (0.4)Arwal – – 204 – 1.7 1.1 (0.5)Nawada 6118 6237 2663 589 (9.6) 1785.03 (28.6) 1437.54 (54)Aurangabad 5320 4798 769 558.77 (10.5) 406.95 (8.5) 68.09 (8.9)
Saran – – - – –Siwan 4242 3838 1446 1049.73 (24.7) 765.77 (20) 603.76 (41.8)Gopalganj 6383 5758 4491 1618.93 (25.4) 2376.75 (41.3) 1463.34 (32.6)
W. Champaran 2128 2877 1098 556.63 (26.2) 581.06 (20.2) 766.62 (69.8)E. Champaran 4256 3838 5568 2385.44 (56) 2946 (76.8) 881.64 (15.8)Muzaffarpur 4256 3838 489 341.67 (8) 259.1 (6.8) 194.23 (39.7)Sitamarhi 3192 2879 463 196.62 (6.2) 245.36 (8.5) 183.72 (39.7)Sheohar 532 480 294 66.99 (12.6) 49.56 ( 10.3) 23.98 (8.2)Vaishali 1862 1919 227 6.52 (0.4) 66.91 (3.5) 164.02 (72.3)
Darbhanga – – – –Madhubani 6118 6237 6573 4668.6 (76.3) 3478.72 (55.8) 1367.21 (20.8)Samastipur 2660 2879 3081 1989.01 (74.8) 2053.88 (71.3) 1804.95 (58.6)
Begusarai 3458 4318 11945 8054.83 (232.9) 6312.49 (146.2) 5477.81 (45.9)Munger – – 130 19.96 (0) 68.84 (0) 11.8 (9.1)Sheikhpura – – 119 – 10.47 (0) 2.77 (2.3)Lakhisarai – – 140 – 20.73 (0) 9.8 (7)Jamui – – 128 – 15.28 (0) 4.52 (3.5)Khagaria 2394 2399 7276 5100.63 (213.1) 3850.35 (160.5) 4688.4 (64.4)
Bhagalpur 2660 3359 585 346.03 (13) 310.85 (9.3) 231.32 (39.5)Banka 3458 3359 242 24.35 (0.7) 22.62 (0.7) 12.81 (5.3)
Saharsa – – – – – –Supaul – – – – – –Madhepura – – – – – –
Purnea 4522 4798 904 393.6 (8.7) 478.69 (10) 123.27 (13.6)Kishanganj 2128 2399 327 86.97 (4.1) 173.28 (7.2) 163.73 (50.1)Araria 2926 3359 1155 274.62 (9.4) 611.66 (18.2) 214.38 (18.6)Katihar 3192 3359 261 60.38 (1.9) 137.79 (4.1) 236.46 (90.6)
Bihar 100000 103618 60063 36150.01 (36.2) 31785.66 (30.7) 23323.85 (38.8)Note : Figures in parentheses denote percentage
Source : Department of Cooperative, GoB

135
Table A 3.18 : District-wise Gross Irrigated Area in Bihar (2017-18)
(Area in ’000 hectare)
District Canals TanksWells
Other Sources TotalTubewells Other wells
Patna 43.36 (2.6) 0 (0) 96.35 (2.8) 19.27 (48.6) 1.61 (0.8) 160.58 (3.0)Nalanda 29.39 (1.8) 0 (0) 190.01 (5.6) 1.7 (4.3) 5.14 (2.7) 226.23 (4.2)Bhojpur 124.08 (7.5) 0 (0) 49.82 (1.5) 1.47 (3.7) 5.8 (3) 181.16 (3.3)Buxar 79.28 (4.8) 0.45 (0.4) 89.01 (2.6) 0.36 (0.9) 11.08 (5.8) 180.17 (3.3)Rohtas 254.1 (15.3) 0 (0) 35.5 (1) 9.81 (24.7) 38.72 (20.3) 338.13 (6.2)Kaimur 86.54 (5.2) 0 (0) 85.89 (2.5) 0 (0) 13.88 (7.3) 186.3 (3.4)
Gaya 60.36 (3.6) 0.13 (0.1) 126.1 (3.7) 0 (0) 2.04 (1.1) 188.63 (3.5)Jehanabad 26.6 (1.6) 0 (0) 33.26 (1) 0 (0) 0.61 (0.3) 60.47 (1.1)Arwal 46.97 (2.8) 0 (0) 10.01 (0.3) 0 (0) 1.73 (0.9) 58.71 (1.1)Nawada 35.45 (2.1) 0 (0) 85.5 (2.5) 0 (0) 4.79 (2.5) 125.74 (2.3)Aurangabad 140.98 (8.5) 0.35 (0.3) 55.81 (1.6) 4.98 (12.6) 47.05 (24.7) 249.17 (4.6)
Saran 25.81 (1.6) 0.35 (0.3) 90.7 (2.7) 0 (0) 0.47 (0.2) 117.33 (2.2)Siwan 22.51 (1.4) 2.52 (2.4) 85.63 (2.5) 0 (0) 2.43 (1.3) 113.09 (2.1)Gopalganj 63.48 (3.8) 0 (0) 82.78 (2.4) 0 (0) 0.35 (0.2) 146.61 (2.7)
W. Champaran 185.44 (11.2) 0 (0) 128.94 (3.8) 0 (0) 1.1 (0.6) 315.48 (5.8)E. Champaran 52.26 (3.1) 0 (0) 162.03 (4.7) 0 (0) 5.86 (3.1) 220.14 (4.1)Muzaffarpur 45.04 (2.7) 0 (0) 129.97 (3.8) 0 (0) 7.33 (3.8) 182.34 (3.4)Sitamarhi 0 (0) 5.46 (5.2) 188.93 (5.5) 0 (0) 2.1 (1.1) 196.49 (3.6)Sheohar 0 (0) 0 (0) 26.25 (0.8) 0 (0) 0 (0) 26.25 (0.5)Vaishali 0 (0) 0.39 (0.4) 111.7 (3.3) 0 (0) 9.99 (5.2) 122.08 (2.3)
Darbhanga 0 (0) 82.42 (78.6) 33.67 (1) 0 (0) 10.72 (5.6) 126.8 (2.3)Madhubani 77.19 (4.6) 0.31 (0.3) 64.31 (1.9) 0 (0) 0.53 (0.3) 142.34 (2.6)Samastipur 0 (0) 0 (0) 227.69 (6.7) 0 (0) 1.05 (0.6) 228.75 (4.2)
Begusarai 0 (0) 0.62 (0.6) 115.88 (3.4) 0 (0) 0.25 (0.1) 116.74 (2.2)Munger 23.42 (1.4) 0.14 (0.1) 14.95 (0.4) 0 (0) 0.25 (0.1) 38.75 (0.7)Sheikhpura 2.78 (0.2) 11.41 (10.9) 39.57 (1.2) 0 (0) 0.16 (0.1) 53.9 (1)Lakhisarai 14.7 (0.9) 0 (0) 46.72 (1.4) 0 (0) 0.2 (0.1) 61.61 (1.1)Jamui 20.3 (1.2) 0 (0) 44.15 (1.3) 0 (0) 0 (0) 64.46 (1.2)Khagaria 0 (0) 0 (0) 86.52 (2.5) 0 (0) 0.09 (0) 86.61 (1.6)
Bhagalpur 8.42 (0.5) 0 (0) 90.46 (2.6) 0 (0) 1.01 (0.5) 99.89 (1.8)Banka 53.84 (3.2) 0.33 (0.3) 62.5 (1.8) 1.85 (4.7) 0.8 (0.4) 119.32 (2.2)
Saharsa 7.05 (0.4) 0 (0) 93.68 (2.7) 0 (0) 3.71 (1.9) 104.43 (1.9)Supaul 38.56 (2.3) 0 (0) 127.92 (3.7) 0 (0) 4.53 (2.4) 171.02 (3.2)Madhepura 20.83 (1.3) 0 (0) 106.33 (3.1) 0 (0) 0.31 (0.2) 127.46 (2.4)
Purnea 22.92 (1.4) 0 (0) 128.89 (3.8) 0 (0) 3.29 (1.7) 155.11 (2.9)Kishanganj 0 (0) 0 (0) 47.36 (1.4) 0.05 (0.1) 0.24 (0.1) 47.65 (0.9)Araria 43.79 (2.6) 0 (0) 85.49 (2.5) 0 (0) 0.16 (0.1) 129.43 (2.4)Katihar 4.58 (0.3) 0 (0) 138.02 (4) 0.14 (0.4) 1.4 (0.7) 144.14 (2.7)
Bihar 1660.00 (100) 104.88 (100) 3418.26 (100) 39.63 (100) 190.74 (100) 5413.51 (100)Note : Figures in parentheses indicate percentage share of total GIA
Source : Directorate of Economics and Statistics ______________

136
CHAPTER - IV
ENTERPRISES SECTOR
Capturing incomes from domestic demand requires policies oriented to improving social inclusiveness and building industrial capabilities.
— Industrial Development Report 2018, UN Industrial Development Organization
Industrialisation is a strong driver for promoting growth and eradicating economic disparities across countries, and across regions within a country. Since the distant past, Bihar has been suffering from surplus population in an agrarian economy and the burgeoning population has been migrating towards the urban centres in the state and beyond. Admittedly, the remittances from migrants have positive impact on consumption demand, but it fails to add to the production capacity of the state’s economy. The most sustainable solution for this problem is rapid industrialisation. Given the large size of working population, Bihar would require a kind of industrialisation that is broadly labour-intensive and also leads to large-scale capital formation within the state, expanding the base of the non-agricultural economy. Towards this, the State
Abstract
Bihar, a state with abundant physical and human resources, has enormous potential for industrialisation. The State Government has adopted several strategies for industrialisation of the state. The state has developed agro-processing industries, based on its comparative advantage in the agricultural sector. The official data on informal enterprises shows that a significantly large section of the working-age population has been engaged in small scale production activities. Importantly, the informal enterprises have contributed substantially to capital formation and employment generation in the state. Among the major agro-based industries, dairy and sugar industries have performed particularly well. Bihar Industrial Area Development Authority (BIADA) has facilitated industrialisation in Bihar through several reforms. The impact of major reforms was visible, as the level of investment has increased in the last two years. Furthermore, the revenue collection from the minerals in Bihar has substantially increased from Rs 1083 crore in 2017-18 to Rs 1557 crore in 2018-19. Lastly, the tourism sector has also attracted a significantly large number of foreign and domestic tourists in the last few years.

137
Government has taken some important steps through infrastructural development and institutional reforms and some initial impacts of such investment are already visible.
In Bihar, the relation between annual growth rate of the secondary sector and Gross State Domestic Product has been rather moderate. It implies that fluctuation in the growth of the secondary sector contributes very marginally to the overall economic growth of the state. The growth trajectories of the constituent sub-sectors of the secondary sector have been volatile during the last five years. However, the most important driver of growth of the secondary sector has been the manufacturing sector. The performance of the manufacturing sector has a strong bearing on the overall growth achieved in the secondary sector. The state has performed remarkably well in providing electricity, gas, water supply, and other utility services (EGWUS) in the recent past. It is worthy to mention that, unlike other sub-sectors of the secondary sector, the growth rate of EGWUS has been consistently positive in the recent years and appreciably high in some years (Table 4.1).
The comparison of the contribution of the industrial sector to the Gross State Value Added (GSVA) across states suggests that it was the lowest in Bihar among all the major states of India. Till now, with a preponderance of small-sized industrial enterprises, Bihar’s industrial economy is driven by the demand for consumption goods. The sectoral composition suggests that the industrial sector’s contribution to GSVA in Bihar was merely 20.0 percent in 2017-18, 11.2 percentage points lower than the all-India average. It was also significantly lower than in states like Jharkhand (37.1 percent), Chhattisgarh (48.0 percent), and Odisha (42.1 percent) (Table 4.2). The lower share of the industrial sector in Bihar indicates a strong presence of the tertiary sector, as the agricultural sector has contributed only 25 percent of GSVA. Within the secondary sector, the size of the manufacturing sector is also very small in Bihar. To increase the contribution of the industrial sector in the GSDP, the State Government has strategized industrialisation by introducing a well-articulated Industrial Investment Promotion Policy, 2016 and brought in some institutional changes to aid the process of industrialisation.
Table 4.1 : Annual Growth Rate of Secondary Sector in Bihar at Constant Prices (2012-13 to 2018-19)
Sector Secondary Sector Gross State
Domestic Product
Mining and quarrying Manufacturing EGWUS* Construction Total
2012-13 8.9 -33.8 9.8 -5.2 -13.1 3.9 2013-14 540.6 94.5 2.8 6.5 30.6 5.0 2014-15 -58.3 37.4 3.4 -4.6 10.0 3.6 2015-16 210.0 -10.0 0.1 10.2 2.3 6.1 2016-17 -24.6 25.6 8.3 6.0 13.1 8.9 2017-18 (P) -12.0 1.3 12.0 7.0 4.4 10.5 2018-19 (Q) 2.7 3.0 5.3 9.4 6.2 10.5
Note : * EGWUS = Electricity, gas, water supply & other utility services Source : Directorate of Economics and Statistics, GoB

138
Table 4.2 : Contribution of Industrial Sector in GSVA in the States of India (2011-12 to 2017-18)
State 2011-12 2012-13 2013-14 2014-15 2015-16 2016-17 2017-18
Andhra Pradesh 32.2 27.7 26.5 27.5 27.5 27.6 27.0
Assam 32.4 29.8 30.8 30.8 37.7 39.7 39.0
Bihar 18.8 15.7 19.8 21.1 20.3 21.1 20.0
Chhattisgarh 47.3 47.1 49.1 47.6 47.1 47.5 47.3
Gujarat 43.8 47.2 45.0 47.2 49.8 49.8 49.5
Haryana 31.6 32.2 32.1 31.7 32.2 32.7 32.1
Jharkhand 45.4 46.4 45.2 43.5 41.3 41.0 40.6
Karnataka 29.5 28.2 27.8 26.5 27.6 28.7 28.0
Kerala 28.2 27.2 27.3 27.3 27.7 28.9 28.6
Madhya Pradesh 30.9 28.0 27.6 27.3 29.3 27.3 27.6
Maharashtra 35.8 35.5 34.3 34.9 35.5 34.8 34.8
Odisha 43.6 41.0 43.8 40.2 42.8 45.3 44.4
Punjab 25.4 24.8 24.7 25.0 25.2 25.1 25.1
Rajasthan 32.7 31.4 29.7 30.5 33.3 33.1 32.9
Tamil Nadu 36.9 37.7 35.8 33.6 36.2 37.3 36.9
Telangana 30.9 27.1 25.5 23.7 25.7 24.0 23.8
Uttar Pradesh 27.6 27.0 27.7 26.5 28.2 29.1 28.6
West Bengal 26.6 26.1 26.2 24.4 25.0 27.1 28.3
India 32.5 31.8 31.2 31.1 31.6 31.5 31.2
Source : Central Statistical Organisation (CSO)
4.1 Status of Industries
The official data source, Annual Survey of Industries (ASI), provides information on factories registered under the Factories Act, 1948. Apart from that, ASI collects information on bidi and cigar making units, employing 10 or more workers with the aid of power and 20 or more workers without the aid of power and registered under the Bidi & Cigar Workers (Conditions of Employment) Act, 1966.
Table 4.3 reports the number of factories and number of operational factories in Bihar and at all-India level. The annual growth rate of the number of factories (both agro-based and non-agro based) and the number of operational factories (both agro-based and non-agro based) was higher in Bihar than that at the all-India level. It is heartening to note that the growth rate of operational agro-based factories in Bihar was 16.4 percent over the last 10 years, compared to only 3.3 percent at the all-India level, although there has been a marginal drop in the number of industries in some of the years.

139
Table 4.3 : Number of Factories and Factories in Operation (2006-07 to 2016-17)
Year
No. of Factories No. of Factories in Operation Operational Factories
on Percentage
of Total No. of
Factories (Total)
Agro-based
Non-Agro Based
Total Agro-based
Non-Agro Based
Total
Bihar
2006-07 278 1323 1601 228 1182 1410 88.1
2007-08 466 1319 1785 404 1209 1613 90.4
2008-09 437 1340 1777 377 1172 1549 87.2
2009-10 510 1409 1919 454 1271 1725 89.9
2010-11 918 1889 2807 822 1725 2547 90.7
2011-12 1126 2106 3232 1014 1858 2872 88.9
2012-13 1141 2206 3347 1005 1941 2946 88.0
2013-14 1148 2272 3420 1036 2096 3132 91.6
2014-15 1232 2298 3530 1129 1813 2942 83.3
2015-16 1251 2372 3623 1092 1826 2918 80.5
2016-17 1229 2302 3531 1049 1859 2908 82.4
CAGR 16.0 7.4 9.7 16.4 5.9 8.8 —
India
2006-07 54902 89809 144711 51681 86937 138618 95.8
2007-08 62189 84196 146385 59124 81443 140567 96.0
2008-09 67259 88063 155322 64005 86285 150290 96.8
2009-10 65409 93469 158878 62299 90336 152635 96.1
2010-11 87520 117011 204531 69249 97387 166636 81.5
2011-12 93251 124303 217554 72769 102939 175708 80.8
2012-13 87803 134317 222120 68698 110403 179101 80.6
2013-14 87775 136803 224578 70993 114697 185690 82.7
2014-15 95887 134546 230433 77049 112417 189466 82.2
2015-16 90762 142354 233116 73427 117635 191062 82.0
2016-17 91159 143706 234865 75684 118696 194380 82.8
CAGR 5.3 6.2 5.8 3.3 4.1 3.8 —
Source : Annual Survey of Industries
Table 4.4 presents the data on some crucial indicators to judge the relative size and scale of operations of industries in India and Bihar. The indicators are — the amount of fixed capital, amount of working capital, number of employees, value of output, and net value-added. Some

140
Table 4.4 : Industries in Bihar (2006-07 to 2016-17)
Year Number of Factories in
Operation (in ‘000) Bihar as
Percentage of India
Fixed capital (Rs. ‘000 crore)
Bihar as Percentage
of India India Bihar India Bihar 2006-07 139 1.41 1.0 715 2.95 0.4 2007-08 141 1.61 1.1 845 3.01 0.4 2008-09 150 1.55 1.0 1056 3.03 0.3 2009-10 153 1.73 1.1 1352 4.45 0.3 2010-11 167 2.55 1.5 1607 5.26 0.3 2011-12 176 2.87 1.6 1950 7.55 0.4 2012-13 179 2.95 1.6 2180 6.47 0.3 2013-14 186 3.13 1.7 2374 8.04 0.3 2014-15 189 2.94 1.6 2474 9.94 0.4 2015-16 191 2.92 1.5 2810 9.92 0.4 2016-17 194 2.91 1.5 3190 18.04 0.6 CAGR 3.7 8.8 — 15.9 18.6 —
Year Working Capital (Rs. ‘000 crore)
Bihar as Percentage
of India
Persons Engaged (in ‘000)
Bihar as Percentage
of India India Bihar India Bihar 2006-07 282 1.61 0.6 10328 67.00 0.6 2007-08 317 1.64 0.5 10453 74.00 0.7 2008-09 311 1.47 0.5 11327 74.00 0.6 2009-10 388 0.95 0.2 11792 87.00 0.7 2010-11 620 2.47 0.4 12695 106.00 0.8 2011-12 589 (-) 0.24 — 13430 127.00 1.0 2012-13 603 2.48 0.4 12950 116.00 0.9 2013-14 1011 5.88 0.6 13538 114.00 0.8 2014-15 641 3.49 0.5 13881 146.00 1.0 2015-16 741 1.45 0.2 14300 119.50 0.8 2016-17 663 2.08 0.3 14911 116.23 0.8 CAGR 11.2 7.0 — 3.7 6.9 —
Year Value of Output (Rs. ‘000 crore)
Bihar as Percentage
of India
Net Value Added (Rs. ‘000 crore)
Bihar as Percentage
of India India Bihar India Bihar 2006-07 2409 19.04 0.8 396 0.32 0.1 2007-08 2776 21.87 0.8 482 1.16 0.2 2008-09 3273 29.54 0.9 528 3.18 0.6 2009-10 3733 2.83 0.1 592 2.32 0.4 2010-11 4676 36.05 0.8 705 4.42 0.6 2011-12 5776 60.17 1.0 837 5.64 0.7 2012-13 6026 51.68 0.9 852 1.30 0.2 2013-14 6555 55.30 0.8 895 5.15 0.6 2014-15 6884 58.76 0.8 975 5.82 0.6 2015-16 6862 47.73 0.7 1072 5.24 0.5 2016-17 7266 47.69 0.7 1146 5.37 0.5 CAGR 12.3 15.7 — 10.9 22.5 —
Source : Annual Survey of Industries

141
interesting conclusions emerge out of this table. First, except growth of working capital, all the above-mentioned indicators grew at a much faster pace in Bihar vis-à-vis at the all-India level. Second, between 2015-16 and 2016-17, though the number of operational factories declined marginally in Bihar, the size of the fixed capital and working capital increased by 82 and 43 percent, respectively. Third, between 2015-16 and 2016-17, the value of output and net value added have increased marginally, although, as mentioned before, the number of operational factories declined. Fourth, between 2015-16 and 2016-17, the number of persons engaged declined almost by 3 percent in Bihar. These four observations together are indicative of the fact that the capital intensive industries are gradually emerging in Bihar, contrary to the general perception.
Table 4.5, using different measures of labour, capital and output, confirms that the financial year 2016-17 has seen a remarkable improvement in the fixed capital per factory in operation, and fixed capital per person engaged in Bihar. Other characteristics like workers per factory in operation, persons engaged per factory in operation, net value added per factory in operation, and net value added per person engaged have either changed insignificantly or remained the same between 2015-16 and 2016-17. The amount of fixed capital per factory in operation and fixed capital per person engaged has increased by 82.5 percent and 87 percent, respectively between 2015-16 and 2016-17. This again clearly indicates an increase in capital intensity in the industries operating in Bihar. However, the average size of fixed capital per factory in Bihar was just 37.8 percent of the all-India average, indicating the smaller size of factories in Bihar. In case of capital-labour ratio, the gap between Bihar and the all-India level has narrowed down significantly between 2015-16 and 2016-17.
Table 4.5 : Structural Ratios of Industries in India and Bihar (2012-13 to 2016-17)
Characteristics 2012-13 2013-14 2014-15 2015-16 2016-17
India Bihar India Bihar India Bihar India Bihar India Bihar Fixed capital / Factory in Operation (Rs. lakh)
1217 220 (18.1) 1278 257
(20.1) 1306 338 (25.9) 1470.5 339.9
(23.1) 1641.3 620.4 (37.8)
Fixed capital/ Persons Engaged (Rs. lakh)
16.9 5.6 (33.1) 17.5 7.1
(40.4) 17.8 6.8 (38.2) 19.6 8.3
(42.2) 21.4 15.5 (72.6)
Workers / Factory in Operation (Number) 56 34
(60.7) 56 31 (54.6) 57 43
(75.2) 58.3 35.4 (60.7) 60.0 34
(56.7) Persons Engaged / Factory in operation (Number)
72 40 (55.6) 73 36
(49.7) 73 50 (67.8) 74.8 41
(54.7) 76.7 40 (52.1)
Net Value Added / Factory in operation (Rs. lakh)
476 44 (9.2) 482 165
(34.1) 515 197 (38.5) 561.3 179.6
(32) 589.5 184.6 (31.3)
Net Value Added / Persons Engaged (Rs. lakh)
6.6 1.1 (17) 6.6 4.5
(68.6) 7 4.0 (56.7) 7.5 4.4
(58.5) 7.7 4.6 (60.1)
Note : The data in bracket indicate Bihar’s figure as percentage of India’s figure. Source : Annual Survey of Industries

142
The contribution of Bihar to the country’s industrial output has been extremely limited, at 0.5 percent of total Gross Value Added (GVA) of the industrial sector in India in 2016-17 (Table 4.6). In earlier years, this ratio was even lower at around 0.3 percent of total GVA of the industrial sector in India. The share of GVA in GVO of Bihar has been low at 13.4 percent, which is 9.1 percentage points lower than that of Maharashtra, the best performing state in terms of industrial output. At the national level, this ratio stands at 18.8 percent. If the average scales of operation of factories in Bihar and Maharashtra are compared, a factory in Bihar added only Rs. 2.2 crore compared to Rs. 11.5 crore in Maharashtra. This again indicates the relatively lower size of operations of factories in Bihar.
Table 4.6 : State-wise GVO and GVA of Industrial Sector (2016-17)
State
No. of Factories
in Operation
Gross Value of Output (GVO)
(Rs. crore)
Gross Value Added (GVA)
Amount (Rs. crore)
Percent-age Share in Total
As Percent-age of GVO
Andhra Pradesh 13084 265834 35406 2.6 13.3
Bihar 2908 47693 6414 0.5 13.4
Chhattisgarh 2874 108669 17076 1.2 15.7
Gujarat 18980 1222201 199211 14.6 16.3
Haryana 6854 500387 78960 5.8 15.8
Jharkhand 2449 123228 26942 2.0 21.9
Karnataka 10748 501647 97292 7.1 19.4
Kerala 6748 143187 22362 1.6 15.6
Madhya Pradesh 3975 204673 39676 2.9 19.4
Maharashtra 21095 1074970 242152 17.7 22.5
Odisha 2694 151092 30836 2.3 20.4
Punjab 10705 189215 29143 2.1 15.4
Rajasthan 8263 270546 50224 3.7 18.6
Tamil Nadu 31614 765524 143044 10.5 18.7
Telangana 12725 203818 42201 3.1 20.7
Uttar Pradesh 12894 495523 101007 7.4 20.4
West Bengal 8604 288236 37094 2.7 12.9
India 194380 7265514 1368050 100.0 18.8
Source : Annual Survey of Industries
The above-mentioned characteristics of factories in Bihar is also reflected in Table 4.7, presenting
data on employment and wages. On an average, a factory in Bihar employs only 40.0 workers,
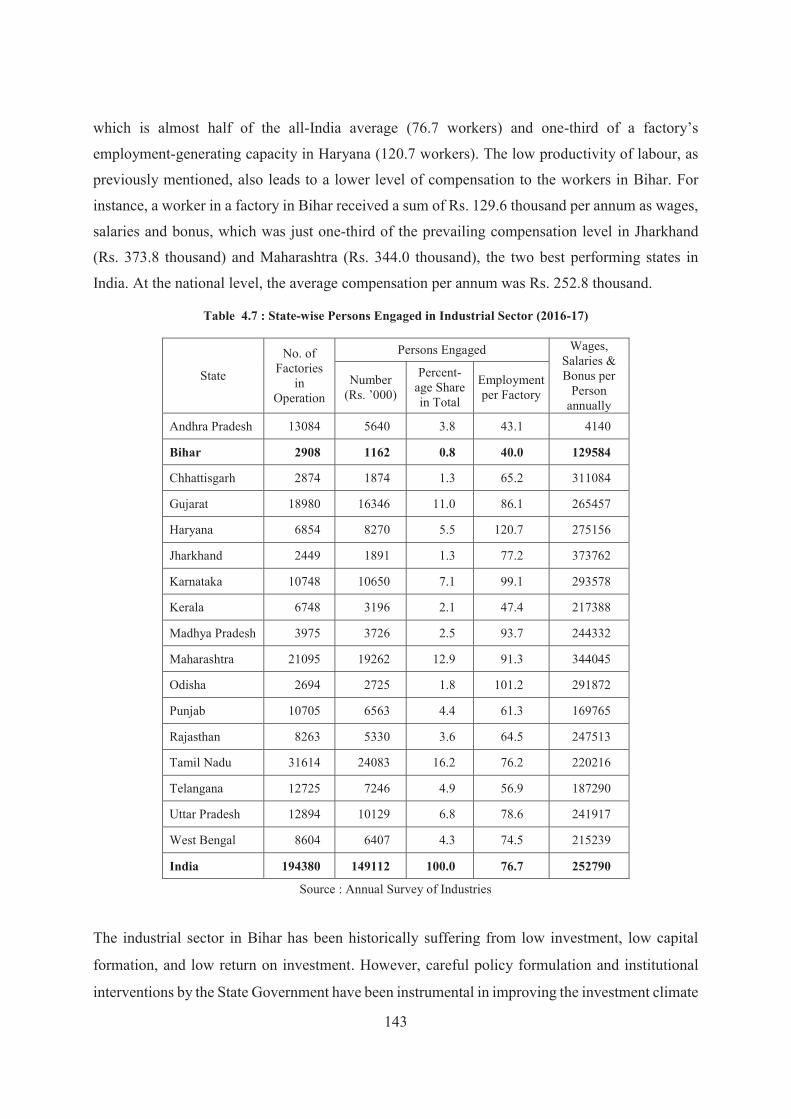
143
which is almost half of the all-India average (76.7 workers) and one-third of a factory’s
employment-generating capacity in Haryana (120.7 workers). The low productivity of labour, as
previously mentioned, also leads to a lower level of compensation to the workers in Bihar. For
instance, a worker in a factory in Bihar received a sum of Rs. 129.6 thousand per annum as wages,
salaries and bonus, which was just one-third of the prevailing compensation level in Jharkhand
(Rs. 373.8 thousand) and Maharashtra (Rs. 344.0 thousand), the two best performing states in
India. At the national level, the average compensation per annum was Rs. 252.8 thousand.
Table 4.7 : State-wise Persons Engaged in Industrial Sector (2016-17)
State
No. of Factories
in Operation
Persons Engaged Wages, Salaries & Bonus per
Person annually
Number (Rs. ’000)
Percent-age Share in Total
Employment per Factory
Andhra Pradesh 13084 5640 3.8 43.1 4140
Bihar 2908 1162 0.8 40.0 129584
Chhattisgarh 2874 1874 1.3 65.2 311084
Gujarat 18980 16346 11.0 86.1 265457
Haryana 6854 8270 5.5 120.7 275156
Jharkhand 2449 1891 1.3 77.2 373762
Karnataka 10748 10650 7.1 99.1 293578
Kerala 6748 3196 2.1 47.4 217388
Madhya Pradesh 3975 3726 2.5 93.7 244332
Maharashtra 21095 19262 12.9 91.3 344045
Odisha 2694 2725 1.8 101.2 291872
Punjab 10705 6563 4.4 61.3 169765
Rajasthan 8263 5330 3.6 64.5 247513
Tamil Nadu 31614 24083 16.2 76.2 220216
Telangana 12725 7246 4.9 56.9 187290
Uttar Pradesh 12894 10129 6.8 78.6 241917
West Bengal 8604 6407 4.3 74.5 215239
India 194380 149112 100.0 76.7 252790
Source : Annual Survey of Industries
The industrial sector in Bihar has been historically suffering from low investment, low capital
formation, and low return on investment. However, careful policy formulation and institutional
interventions by the State Government have been instrumental in improving the investment climate

144
of the state in the last five years. The ASI data suggest that the levels of fixed capital and working
capital have increased significantly between 2015-16 and 2016-17. It also clearly indicates that the
industrial sector is growing in the right direction to be able to play an important role in the state’s
economic growth process in future.
Informal Enterprises in Bihar
According to the NSS 73rd Round (July 2015 – June 2016) ‘Survey on Unincorporated Non-
Agricultural Enterprises (Excluding Construction)’, the number of unincorporated non-
agricultural enterprises (UNAEs) was estimated at 6.34 crore at the all-India level, whereas Bihar
is the place of operation for 5.4 percent of such enterprises in the country. To understand various
aspects of the informal sector, NSS 73rd Round covered UNAEs belonging to three sectors —
Manufacturing, Trade and Other Services (excluding construction). It may be mentioned here that
the Annual Survey of Industries (ASI) does not cover the large section of informal sector
production units in the country. Seven types of enterprises were surveyed — (i) manufacturing
enterprises (excluding those registered under Sections 2m(i) and 2m(ii) of the Factories Act, 1948),
(ii) manufacturing enterprises registered under Section 85 of Factories Act, 1948, (iii) enterprises
engaged in cotton ginning, cleaning and baling excluding those registered under Factories Act,
1948, (iv) enterprises manufacturing beedi and cigar, excluding those registered under Beedi and
Cigar Workers (Conditions of Employment) Act, 1966, (v) non-captive electric power generation,
transmission and distribution by units not registered with the Central Electricity Authority (CEA),
(vi) trading enterprises and (vii) other services sector enterprises (excluding construction).
In this section, some of the key economic aspects of UNAEs are highlighted, using the three most
important activity categories (manufacturing, trade, and other services) and two types of
enterprises (Own Account Enterprises (OAE) and Establishment), within each activity category.
Table 4.8 suggests that, at the all-India level, the share of manufacturing was 23.5 percent of total
Gross Value Added (GVA) of enterprises, engaged exclusively in market production, while trade
and other services contributed 38.7 percent and 37.8 percent, respectively of total GVA of
enterprises. The share of manufacturing was high in states like Gujarat (42.6 percent), followed by
West Bengal (32.7 percent). The share of manufacturing total GVA in Bihar was only 18.3 percent;
however, the share of trade was 53.8 percent, the highest among all the states. The share of other
services was the lowest (27.9 percent) in Bihar.

145
Table 4.8 : Share of Estimated GVA of Market Enterprises by Broad Activity Category for Major States (2016)
State Manufacturing Trade Other services All
Andhra Pradesh 22.3 32.6 45.1 100.0
Assam 18.3 53.8 27.9 100.0
Bihar 18.1 45.1 36.9 100.0
Chhattisgarh 19.3 46.1 34.7 100.0
Gujarat 42.6 26.7 30.8 100.0
Haryana 16.2 39.1 44.7 100.0
Jharkhand 18.4 40.2 41.5 100.0
Karnataka 21.0 39.7 39.4 100.0
Kerala 15.7 37.6 46.7 100.0
Madhya Pradesh 18.0 37.0 45.1 100.0
Maharashtra 20.0 39.4 40.6 100.0
Odisha 15.6 45.5 38.8 100.0
Punjab 23.2 47.4 29.3 100.0
Rajasthan 21.8 34.3 44.0 100.0
Tamil Nadu 27.6 32.5 40.0 100.0
Telangana 23.2 34.9 41.9 100.0
Uttar Pradesh 20.9 46.3 32.8 100.0
West Bengal 32.7 36.3 31.0 100.0
India 23.5 38.7 37.8 100.0
Source : NSS 73rd Round, July 2015 - June 2016
Within the manufacturing sector, the GVA per enterprise of OAE in Bihar (Rs. 99 thousand) was
higher than that at the all-India level (Rs. 62 thousand) (Table 4.9). However, the performance of
the establishments within the manufacturing sector in Bihar (Rs. 301 thousand) was below the
national average (Rs. 574 thousand). The gap between the best-performing state of Gujarat (Rs
1209 thousand) and Bihar (at Rs 301 thousand) was substantial. An establishment within the
manufacturing sector in Bihar could generate only one-fourth of the GVA generated in Gujarat. In
the case of the trade sector, both OAE and establishments performed relatively better than the
manufacturing sector. Admittedly, taking into account all the sectors, the level of performance of
UNAEs is better at the national level; but if one takes into account OAEs only, the level of
performance is better in Bihar than the national average.

146
Table 4.9 : Estimated GVA Per Enterprise for all Market Enterprises by M ajo r State, Broad Activity Category and Enterprise Type (2016)
State
GVA per enterprise (in Rs. ’000)
Manufacturing Trade Other services
OAE Establish- ment All OAE Establish-
ment All OAE Establish- ment All
Andhra Pradesh 50 353 99 104 587 161 72 911 140
Assam 89 348 153 105 316 137 90 314 139
Bihar 99 301 121 120 526 154 107 435 163
Chhattisgarh 61 462 109 77 469 125 71 536 156
Gujarat 87 1209 278 133 609 206 108 1192 243
Haryana 115 669 271 162 611 267 123 1276 405
Jharkhand 45 383 64 85 505 114 81 419 146
Karnataka 71 629 155 167 591 264 123 980 304
Kerala 69 588 189 134 747 333 128 872 282
Madhya Pradesh 52 392 85 94 400 136 88 856 230
Maharashtra 79 789 217 164 736 281 132 1046 336
Odisha 44 301 65 71 555 116 63 356 112
Punjab 100 465 188 144 623 256 104 554 179
Rajasthan 86 587 162 112 603 181 136 1072 281
Tamil Nadu 66 585 167 130 569 225 117 660 252
Telangana 49 485 81 128 589 216 92 866 208
Uttar Pradesh 69 415 120 102 562 146 84 534 150
West Bengal 33 414 67 104 407 137 71 441 110
India 62 574 136 121 598 195 100 737 211
Source : NSS 73rd Round, July 2015 - June 2016
Table 4.10 examines the labour productivity of all market enterprises across three activity
categories and two enterprise types. The GVA per worker in OAEs within the manufacturing sector
in Bihar was Rs 71 thousand, almost 54 percent higher than the all-India average (Rs. 46 thousand).
Similarly, GVA per worker in OAEs in trade was Rs 94 thousand, again 7 percent more than the
all-India average (Rs. 88 thousand). However, establishments in Bihar across all the three
categories performed below the all-India level average. Combining the observations from Tables
4.9 and 4.10, one can safely conclude that, in spite of the smaller size, the OAEs in Bihar operate
more efficiently than the establishments in the state.

147
Table 4.10 : Estimated GVA Per Worker for all Market Enterprises by M a j o r States, Broad
Activity Category and Enterprise Type (2016)
State
GVA per worker (in Rs. ’000)
Manufacturing Trade Other services
OAE Establish-ment All OAE Establish-
ment All OAE Establish- ment All
Andhra Pradesh 37 74 52 71 164 93 70 149 98
Assam 70 91 81 94 122 102 84 95 89
Bihar 71 96 76 94 159 107 88 119 100
Chhattisgarh 35 86 51 45 137 65 53 116 80
Gujarat 71 185 131 95 179 120 98 228 150
Haryana 95 132 118 133 202 163 109 224 181
Jharkhand 33 84 42 61 156 74 67 114 87
Karnataka 56 144 89 115 175 139 112 191 156
Kerala 56 150 102 105 224 171 116 187 153
Madhya Pradesh 35 94 49 68 113 81 70 139 107
Maharashtra 62 158 108 112 220 152 117 230 178
Odisha 28 85 37 47 167 70 53 93 69
Punjab 83 127 105 118 195 153 95 128 110
Rajasthan 65 136 91 90 200 121 113 176 143
Tamil Nadu 53 121 86 89 164 118 99 146 125
Telangana 44 132 62 83 181 115 94 164 128
Uttar Pradesh 42 83 56 69 154 87 68 103 82
West Bengal 25 84 40 83 131 95 66 117 81
India 46 122 74 88 180 116 88 158 120
Source : NSS 73rd Round, July 2015 - June 2016
The annual income of the workers varies within a range of Rs 53 thousand (OAEs in
manufacturing) to Rs. 82 thousand (establishments in other services) across the three activity
categories and two enterprises types at the all-India level. It clearly suggests that the majority of
the hired workers in the unincorporated sector earn very low wages across the states vis-à-vis hired
workers in the formal industrial sector. In Bihar, the wage level of the hired workers was even
lower, ranging from Rs. 48 thousand (OAEs in manufacturing) to Rs. 68 thousand (establishment
in other services).
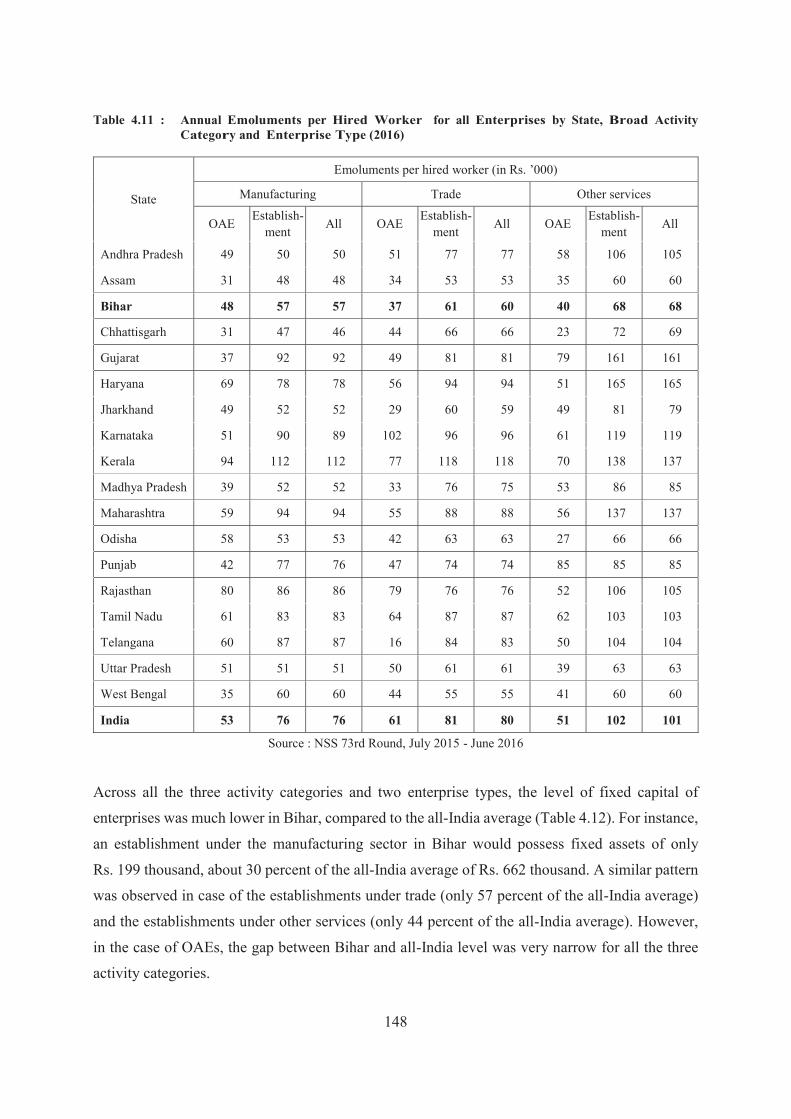
148
Table 4.11 : Annual Emoluments per Hired Worker for all Enterprises by State, Broad Activity Category and Enterprise Type (2016)
State
Emoluments per hired worker (in Rs. ’000)
Manufacturing Trade Other services
OAE Establish- ment All OAE Establish-
ment All OAE Establish- ment All
Andhra Pradesh 49 50 50 51 77 77 58 106 105
Assam 31 48 48 34 53 53 35 60 60
Bihar 48 57 57 37 61 60 40 68 68
Chhattisgarh 31 47 46 44 66 66 23 72 69
Gujarat 37 92 92 49 81 81 79 161 161
Haryana 69 78 78 56 94 94 51 165 165
Jharkhand 49 52 52 29 60 59 49 81 79
Karnataka 51 90 89 102 96 96 61 119 119
Kerala 94 112 112 77 118 118 70 138 137
Madhya Pradesh 39 52 52 33 76 75 53 86 85
Maharashtra 59 94 94 55 88 88 56 137 137
Odisha 58 53 53 42 63 63 27 66 66
Punjab 42 77 76 47 74 74 85 85 85
Rajasthan 80 86 86 79 76 76 52 106 105
Tamil Nadu 61 83 83 64 87 87 62 103 103
Telangana 60 87 87 16 84 83 50 104 104
Uttar Pradesh 51 51 51 50 61 61 39 63 63
West Bengal 35 60 60 44 55 55 41 60 60
India 53 76 76 61 81 80 51 102 101
Source : NSS 73rd Round, July 2015 - June 2016
Across all the three activity categories and two enterprise types, the level of fixed capital of
enterprises was much lower in Bihar, compared to the all-India average (Table 4.12). For instance,
an establishment under the manufacturing sector in Bihar would possess fixed assets of only
Rs. 199 thousand, about 30 percent of the all-India average of Rs. 662 thousand. A similar pattern
was observed in case of the establishments under trade (only 57 percent of the all-India average)
and the establishments under other services (only 44 percent of the all-India average). However,
in the case of OAEs, the gap between Bihar and all-India level was very narrow for all the three
activity categories.

149
Table 4.12 : Market Value of Owned Fixed Assets (Rs.) Per Enterprise for all Enterprises by State,
Broad Activity Category and Enterprise Type (2016)
State
Value of owned fixed assets per enterprise (in Rs. ’000)
Manufacturing Trade Other services
OAE Establish-
ment All OAE
Establish- ment
All OAE Establish-
ment All
Andhra Pradesh 66 351 112 62 416 103 86 1217 178
Assam 36 221 81 45 123 57 118 326 164
Bihar 69 199 83 70 361 94 102 527 174
Chhattisgarh 86 535 140 127 527 175 101 1405 340
Gujarat 162 2479 556 260 1228 409 151 2170 404
Haryana 144 687 296 180 479 250 162 1664 528
Jharkhand 38 275 52 76 325 93 93 764 224
Karnataka 74 631 158 109 327 159 177 1284 412
Kerala 58 351 126 111 393 203 175 1380 426
Madhya Pradesh 91 473 128 136 873 237 171 1299 382
Maharashtra 147 1298 372 254 1409 491 252 1956 635
Odisha 38 194 50 48 232 65 69 626 161
Punjab 120 532 219 162 692 286 145 926 275
Rajasthan 127 547 191 161 605 224 245 1975 514
Tamil Nadu 89 617 192 107 356 160 203 960 392
Telangana 55 231 68 115 197 130 137 784 234
Uttar Pradesh 100 470 154 117 954 198 126 1318 301
West Bengal 31 246 50 70 246 90 74 498 119
India 79 662 163 125 636 204 147 1185 328
Source : NSS 73rd Round, July 2015 - June 2016
In spite of the low average value of fixed assets, the ratio of GVA to fixed assets in Bihar indicate
that UNAEs have performed remarkably well, compared to the national average (Table 4.13).
Across all activity categories and enterprise types, the ratio of GVA to fixed assets per enterprise
was much higher in Bihar compared to even industrialised states like Maharashtra, Karnataka and
Haryana, to name a few.
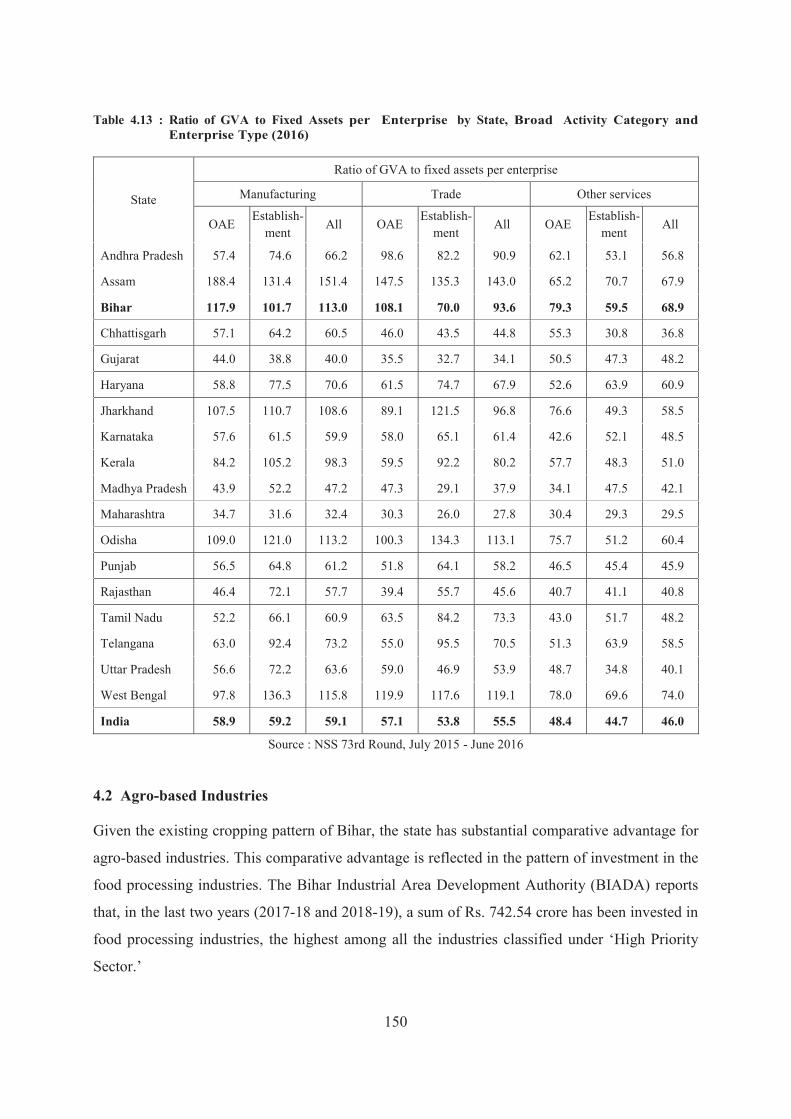
150
Table 4.13 : Ratio of GVA to Fixed Assets per Enterprise by State, Broad Activity Category and Enterprise Type (2016)
State
Ratio of GVA to fixed assets per enterprise
Manufacturing Trade Other services
OAE Establish- ment
All OAE Establish- ment
All OAE Establish- ment
All
Andhra Pradesh 57.4 74.6 66.2 98.6 82.2 90.9 62.1 53.1 56.8
Assam 188.4 131.4 151.4 147.5 135.3 143.0 65.2 70.7 67.9
Bihar 117.9 101.7 113.0 108.1 70.0 93.6 79.3 59.5 68.9
Chhattisgarh 57.1 64.2 60.5 46.0 43.5 44.8 55.3 30.8 36.8
Gujarat 44.0 38.8 40.0 35.5 32.7 34.1 50.5 47.3 48.2
Haryana 58.8 77.5 70.6 61.5 74.7 67.9 52.6 63.9 60.9
Jharkhand 107.5 110.7 108.6 89.1 121.5 96.8 76.6 49.3 58.5
Karnataka 57.6 61.5 59.9 58.0 65.1 61.4 42.6 52.1 48.5
Kerala 84.2 105.2 98.3 59.5 92.2 80.2 57.7 48.3 51.0
Madhya Pradesh 43.9 52.2 47.2 47.3 29.1 37.9 34.1 47.5 42.1
Maharashtra 34.7 31.6 32.4 30.3 26.0 27.8 30.4 29.3 29.5
Odisha 109.0 121.0 113.2 100.3 134.3 113.1 75.7 51.2 60.4
Punjab 56.5 64.8 61.2 51.8 64.1 58.2 46.5 45.4 45.9
Rajasthan 46.4 72.1 57.7 39.4 55.7 45.6 40.7 41.1 40.8
Tamil Nadu 52.2 66.1 60.9 63.5 84.2 73.3 43.0 51.7 48.2
Telangana 63.0 92.4 73.2 55.0 95.5 70.5 51.3 63.9 58.5
Uttar Pradesh 56.6 72.2 63.6 59.0 46.9 53.9 48.7 34.8 40.1
West Bengal 97.8 136.3 115.8 119.9 117.6 119.1 78.0 69.6 74.0
India 58.9 59.2 59.1 57.1 53.8 55.5 48.4 44.7 46.0
Source : NSS 73rd Round, July 2015 - June 2016
4.2 Agro-based Industries
Given the existing cropping pattern of Bihar, the state has substantial comparative advantage for
agro-based industries. This comparative advantage is reflected in the pattern of investment in the
food processing industries. The Bihar Industrial Area Development Authority (BIADA) reports
that, in the last two years (2017-18 and 2018-19), a sum of Rs. 742.54 crore has been invested in
food processing industries, the highest among all the industries classified under ‘High Priority
Sector.’

151
Sugar Industry
Bihar accounts for 3.5 percent of the total sugarcane production in India. The State Government has been seriously harnessing the potential of sugarcane cultivation and sugar production. The sugar production also becomes very important as the by-products obtained from the production process have multiple usages. The most important by-products of the sugar industry are — cane top, bagasse, filter muds, and molasses. Cane tops are primarily used for animal feed. Bagasse is the fibrous residue of the cane after cane crushing and can be used to generate electricity. Bagasse can also be used to produce particleboard, that can reduce the use of timber, plywood, and fibreboard. Furthermore, bagasse is also used to produce paper. Another by-product, filter muds, is used as animal feed and a good input as bio-fertiliser. Molasses again has multiple usages, as molasses fermentation produces ethyl alcohol, acetic acid, acetone, etc. So, a ‘sugar mill’ is now a days characterised as a ‘sugar complex’ because of its production of both sugar and a large number of by-products. In Bihar, 11 sugar mills are presently operating, spread across six districts. Of these 11 sugar mills, seven are situated in two districts — West Champaran (four sugar mills) and Gopalganj (three sugar mills). This indicates the concentration of sugar mills in the north-western Bihar. In 2018-19, 810.17 lakh quintals of sugarcane were crushed to produce 84.02 lakh quintals of sugar. Between 2017-18 and 2018-19, sugarcane production has increased by 8.3 percent, while sugar production has increased by 17.4 percent in the state. The reason for higher sugar production was a remarkable improvement in the recovery rate, which has improved from 9.57 percent in 2017-18 to 10.37 percent in 2018-19. Apart from sugar production, all sugar mills (except two at Sasamusa and Gopalganj) have installed capacity to produce useful by-products, such as ethyl alcohol, electricity and bio-fertiliser. The total distillery capacity installed by six sugar mills to produce ethyl alcohol was 395 KLPD (kilo litres per day). The sugar mills at Bagha and Sidhwalia are in the process of installing distillery on their premises. Out of 11 sugar mills, 8 mills undertook generation of electricity from bagasse and together generated about 88.5 MW electricity during the crushing season of 2018-19. Apart from that, bio-fertiliser units were set up at Harinagar, Narkatiaganj, Gopalganj, and Riga sugar mills. Further, Sidhwalia and Hasanpur sugar mills have started producing vermicompost. Due to improvement in utilisation of installed capacity, the crushing season in Bihar has been elongated in 2018-19. In the crushing season of 2015-16, the number of days of operation was only 95, which increased to 145 days in 2018-19, registering an increase of 52 percent in just four years. This, in turn, resulted in an increase in employment opportunity.

152
To encourage sugarcane cultivation, the State Government is presently implementing the three-tier seed replacement programme, known as Mukhya Mantri Ganna Vikas Yojana. The following measures were implemented under the programme in 2018-19.
(i) The sugar mills have received in incentive of Rs. 25,000 per hectare for growing foundation seed. For this purpose, the State Government had earmarked a sum of Rs. 162.5 lakh, of which Rs. 59.56 lakh has been disbursed.
(ii) To promote certified seeds for higher productivity, a subsidy of Rs. 160 per quintal for general category farmers and Rs 200 per quintal for SC/ST farmers was given to the cultivators on purchase of 16 listed certified varieties of seeds. Under this programme, a sum of Rs. 682.78 lakh has been distributed.
(iii) To encourage the production of certified seeds, farmers were offered Rs 30 per quintal as bonus. For this purpose, the State Government has allocated Rs. 351 lakh in 2018-19, of which Rs. 126 lakh was distributed among the cultivators of certified seeds.
In 2018-19, the above-mentioned initiatives benefitted about 8468 farmers and covered almost 7023 hectares of sugarcane field.
Table 4.14 : Performance of Sugar Mills in Terms of Sugar Production and Recovery Percentage
(2016-17 to 2018-19)
Name of Sugar Mill
Sugarcane Crushed
(lakh qntl.)
Sugar Produced
(lakh qntl.)
Recovery (Percent-
age)
Sugarcane Crushed
(lakh qntl.)
Sugar Produced
(lakh qntl.)
Recovery (Percent-
age)
Sugarcane Crushed
(lakh qntl.)
Sugar Produced
(lakh qntl.)
Recovery (Percent-
age)
2016-17 2017-18 2018-19
Bagaha 82.60 7.33 8.88 113.75 10.36 9.11 121.01 12.53 10.35
Harinagar 126.44 11.60 9.23 175.55 17.67 10.04 175.18 18.76 10.71
Narkatiaganj 88.06 8.54 9.70 118.08 12.17 10.31 121.90 13.78 11.31
Manjhaulia 49.93 4.50 9.03 60.51 5.46 9.00 64.51 6.45 10.0
Sasamusa 16.15 1.32 8.42 4.88 0.31 6.35 18.75 1.75 9.25
Gopalganj 38.81 3.55 9.20 55.11 5.19 9.45 65.5 6.78 10.36
Sidhwalia 47.69 4.37 9.18 58.24 5.38 9.24 65.67 6.77 10.33
Riga 32.70 2.86 8.72 46.90 4.08 8.77 45.26 3.62 8.05
Hasanpur 29.00 2.88 9.94 38.97 4.08 10.47 59.64 6.69 11.23
Lauriya 32.63 2.96 9.08 40.10 3.65 9.13 35.61 3.49 9.95
Sugauli 27.13 2.57 9.47 35.80 3.19 9.03 37.14 3.40 9.40
Total 571.14 52.48 9.17 747.89 71.54 9.57 810.17 84.02 10.37
Source : Department of Sugarcane, GoB

153
Table 4.15 : Performance of Sugar Mills in terms of Duration of Operation, Distillery Capacity and Power Generation (2016-17 to 2018-19)
Name of Sugar Mill
Duration of operation Distillery Capacity
(KLPD) in 2018-19
Cogen in MW in 2018-19 2016-17 2017-18 2018-19
Bagaha 122 154 165 NA 6.0
Harinagar 125 156 161 120 14.5
Narkatiaganj 125 162 173 60 10.0
Manjhaulia 111 129 149 45 —
Sasamusa 87 22 102 NA —
Gopalganj 99 129 146 NA —
Sidhwalia 97 115 131 NA 10.0
Riga 92 122 148 45 3.0
Hasanpur 88 115 143 NA 10.0
Lauriya 116 151 136 60 20.0
Sugauli 102 121 138 60 20.0
Average 106 125 145 390 93.5
Source : Department of Sugarcane, GoB
Dairy Industry
Since 1983, the Bihar State Milk Co-operative Federation Ltd. (COMFED) became a major institutional support for the rural households producing milk in Bihar. Operationally, COMFED has three-tier co-operative structure in Bihar – milk producers’ cooperative society at the village level, milk union at the district level, and milk federation at the state level. In 2018-19, COMFED has inducted more societies in Supaul Milk Union in Bihar and Bokaro Dairy in Jharkhand. So, in 2018-19, 22,971 organised societies were functioning, registering a growth of 9.4 percent over 2017-18. The daily milk collection across all dairies increased from 1627.25 thousand kg per day in 2017-18 to 1931.11 thousand kg per day in 2018-19, implying a growth of 18.7 percent. Importantly, this growth was registered at all the locations of the project. Value addition is the key in marketing activities of COMFED. Though milk sale has declined marginally between 2017-18 and 2018-19, sale of milk products like lassi, peda, paneer, gulab jamun has increased commensurately. COMFED also provides various services like artificial insemination of animal, vaccination, de-worming, seed distribution, and cattle feed distribution. Except seed distribution and De-worming, all other service provisions have registered a significant improvement in 2018-19.

154
Table 4.16 : Number of Dairy Cooperative Societies under Different Milk Union/Projects (2017-18 and 2018-19)
(In Number)
Location of Union/Project 2017-18 2018-19
Organised Societies
Working Societies
Registered Societies
Organised Societies
Working Societies
Registered Societies
Vaishali Patliputra Milk Union, Patna 4383 2726 1311 4515 2792 1337
Deshratna Dr. Rajendra Prasad Milk Union, Barauni 2272 2132 1122 2321 2145 1127
Mithila Milk Union, Samastipur 2529 2030 1172 2565 2045 1187
Tirhut Milk Union, Muzaffarpur 3521 2032 1003 3756 2298 1109
Shahabad Millk Union, Ara 3533 2368 1262 3623 2415 1275 Vikramshila Milk Union, Bhagalpur 1828 1355 346 1856 1476 356
Magadh Dairy Project, Gaya 2048 1784 247 2181 1931 333
Kosi Dairy Project, Purnea 828 726 39 996 894 51
Ranchi Dairy Project, Ranchi 60 50 12 62 48 12
Supaul Milk Union NA NA NA 1077 826 170
Bokaro Dairy NA NA NA 19 9 0
Total 21002 15203 6514 22971 16879 6957 Source : COMFED, GoB
Table 4.17 : Daily Milk Collection by Different Projects (2014-15 to 2018-19)
(in 000 kgs)
Union/Project 2014-15 2015-16 2016-17 2017-18 2018-19 CAGR
Vaishali Patliputra Milk Union, Patna 318.91 307.73 273.66 263.3 331.53 -0.8
Deshratna Dr. Rajendra Prasad Milk Union, Barauni 409.72 457.52 427.53 454.86 529.85 5.3
Mithila Milk Union, Samastipur 354.51 353.67 354.26 349.65 379.87 1.4
Tirhut Milk Union, Muzaffarpur 196.87 191.55 205.73 196.35 232.49 4.0
Shahabad Milk Union, Ara 257.57 258.29 199.55 189.65 225.85 -2.6
Vikramshila Milk Union, Bhagalpur 70.13 72.94 60.34 72.71 78.76 2.3
Magadh Dairy Project, Gaya 39.53 39.82 35.36 40.54 54.0 6.4
Kosi Milk Union, Supaul 21.85 18.64 32.38 14.0
Kosi Dairy Project, Purnea 29.24 41.48 16.22 17.75 28.78 0.31
Ranchi/Bokaro/Jamshedpur Dairy 13.84 17.43 17.84 23.8 37.61 22.1
Total 1690.32 1740.43 1612.34 1627.25 1931.11 2.7
Source : COMFED, GoB

155
Table 4.18 : Milk Procurement per Functional Dairy Cooperative Society (2014-15 to 2018-19)
(Kl. per day)
Location of Union/Project 2014-15 2015-16 2016-17 2017-18 2018-19
Patna 108.88 123.58 107.15 96.59 118.74 Barauni 206.2 232.24 209.99 213.35 247.02 Samastipur 177.17 192.1 181.86 172.24 185.76 Muzaffarpur 100.24 100.6 105.99 96.63 101.17 Ara 108.49 106.2 86.72 80.09 93.52 Bhagalpur 86.26 71.02 52.02 53.66 53.36 Gaya 35.08 30.19 22.02 22.72 27.96 Supaul NA NA 32.61 25.75 39.20 Purnea 30.78 42.03 28.51 24.46 32.19 Ranchi Dairy 277.64 347.17 312.98 371.16 599.38 Bokaro Dairy NA NA NA NA 982.22 All Dairies 120.59 124.18 108.67 102.11 114.41
Source : COMFED, GoB
Table 4.19 : Activities by COMFED (2014-15 to 2018-19)
Indicators 2014-15 2015-16 2016-17 2017-18 2018-19
Cooperative Societies Organised 18385 19543 20769 22018 22971 Operational 14189 14016 14842 15936 16879 Registered 5754 6042 6384 6643 6957 No. of Members (lakh) 9.42 10.04 10.86 11.4 11.85
Collection of Milk Collection of Milk (lakh kg/day) 16.9 17.4 16.13 16.27 19.31
Marketing of Products No. of Retail Outlet 12299 13099 15857 17726 19238 Milk (lakh litres/day) 11.52 12.18 13.45 14.55 14.36 Ghee (Tonnes) 1669 1643 1342 1513 1487 Lassi (tonnes) 4385 4103 4975 6387 8019 Peda (tonnes) 1173 1190 1314.42 1236 1316 Paneer (tonnes) 3385 3946 4300 4523 5253 Dahi (tonnes) 7498 8088 9110 10290 9411 Gulab Jamun (tonnes) 1152 1220 1365 1360 1484 Ice-Cream (tonnes) 1702 1743 1375 1577 1520
Services No. of Artificial Insemination Centres 3117 3275 3436 3852 4220
Artificial Insemination (lakh) 20.3 21.37 20.41 21.62 22.71 Vaccination (lakh) 15.53 18.05 17.01 12.31 15.39 De-worming (lakh) 12.92 16.46 14.3 14.49 14.29 Seed Distribution (tonnes) 930.93 1016.79 1279.53 1554.23 1333.61 Cattle Feed Distribution (tonnes) 56143 62130 53810 46889 55160
Source : COMFED, GoB

156
4.3 Non-Agro Based Industries
Handloom and Powerloom
In the era of automation of cloth production and early stage of adoption of Artificial Intelligence (AI) in the textile industry, handloom survives by catering to upscale markets, both at home and abroad. The weaving community also plays an important role in preserving the legacy of cultural history of the state. To preserve the cultural history of Bihar and to support the handloom weaving community, the policy of protection of the State Government has played a crucial role. Table 4.20 indicates that 13 locations in Bihar have specialised in the production of different fabrics and clothing materials. Some of the clusters also produce handloom products, exclusively for export market. Table 4.21 suggests that the State Government has been conducting training programmes to impart skill among the weavers at various locations. Since 2013-14, the State Government has been helping to organise 204 training programmes each year and the reported achievement rates ranged between 78.4 percent (2014-15) and 82.8 percent (2016-17). In 2018-19, the achievement rate was 75.9 percent. Table 4.22 reports various schemes adopted by the State Government to promote and subsidise the handloom and powerloom weavers in the state.
Table 4.20 : Handloom Concentrated Districts in Bihar
District Products
Bhagalpur Silk, Cotton, Furnishing cloth, Staple chadar, Exportable Silk and Linen cloth.
Banka Tasar Silk, Exportable Silk Cloth, and Cotton towel
Gaya Cotton Long Cloth, Bed sheet, Towel Nalanda Ornamental Curtain, Bed Cover, Interior
decoration material and ornamented cloth Nawada Tasar Silk and ladies dress material, Linen
Madhubani Fine Cotton long cloth, dhoti, shirting
Aurangabad, Rohtas Woolen Blanket, Woolen Carpet and Sari
Kaimur Woolen Carpet, Banarasi Sari
Patna, Siwan Cotton cloth and Furnishing Cloth Purnea, Katihar Jute bags, Jute-blended material, Interior
decorative material Source : Department of Industries, Handloom, GoB
Table 4.21 : Target and Achievement of Training Programme (2013-14 to 2018-19)
(In number) 2013-14 2014-15 2015-16 2016-17 2017-18 2018-19
Target 204 204 204 204 204 204
Achievement 163 160 167 169 156 155
Achievement (%) 79.9 78.4 81.9 82.8 76.4 75.9
Source : Department of Industries, Handloom, GoB

157
Table 4.22 : Status of Ongoing Schemes for Handloom (2018-19)
Sl. No. Name of Scheme Objective of Scheme Physical
target
Financial target (Rs. in lakh)
1 2 3 4 5 1 The grant of power subsidy Grant power subsidy at the rate of Rs.
3.00 per unit to powerloom weavers - 300.00
2 Scheme for scholarship for trainees at six training centre
Training of weaving, dyeing, and designing clothes is provided to the family of handloom weavers.
144 -
3 All the powerloom of Gaya District (approx. 900) were reimbursed 60% of the fee amount deposited to the Bihar State Pollution Control Board (BSPCB) to adhere to the norms laid down by them
The compensation was given to the powerlooms so that the industry do not face loss.
- 100.00
4 10% relaxation in sell of handloom clothes as khadi
It will increase the sale of handloom products and make them popular.
- 5.00
5 Conversion of old handloom into 68” inch loom
Due to availability of 68” inch frame looms production and quality of cloth/blanket will get better.
166 44.82
6 Power Tax Yojana Providing the modern equipment to the powerloom weavers. Contribution of the State Government in the plan of In-Situ upgradation of powerloom of Textile Ministry.
53 5.842
7 Scheme for buffer fund (State/ Union)
Weavers who are involved in manufacturing of colourful cloth should be paid timely for their wage
Chadar 200.00
8 Scheme for buffer fund (Sheep and Wool Union)
Provision of payment to solve the problem of delay in payment for supply of blanket/cloth by sheep and wool union to different government offices/institutions
- 50.00
9 Scheme for Working capital Rs. 10,000 working capital will be given to operational handlooms with U.I.D mark within the state.
6727 666.00
10 Scheme for registration of handloom mark
Provision of handloom mark label for all the U.I.D mark handloom weavers, primary weaver cooperatives, regional loom weavers’ association
- 15.00
Total 1386.662
Sericulture
Bihar has remarkable potential in silk-based production. Three types of silks are cultivated in Bihar — mulberry, tasar, and castor (eri). Except Tasar, Mulberry and Eri cocoon production declined and hence raw silk production has also declined significantly in 2018-19, compared to 2017-18. The mulberry cocoon production has declined by 78.04 tonnes between 2017-18 and 2018-19, which is just 43 percent of the previous year’s production.

158
To improve the performance of sericulture, the State Government has allocated Rs. 6.00 crore in
2019-20 in the following schemes. First, an allocation of Rs 1.51 crore is made to construct
sericulture farms at different locations and for providing irrigation facility. Secondly, the State
Government has also felt the need to construct a Mulberry Reeling Bhawan in Kishanganj, and
allocated Rs. 56.46 lakh for this purpose. Apart from that, the State Government has undertaken
renovation of reeling units in Supaul. To construct administrative building, grainage building,
cocoon bank as different locations, it has allocated Rs 100 lakh. Lastly, the State Government also
received proposal to provide Rs 200 lakh as subsidy to mulberry and eri farmers for plantation or
rearing appliances, irrigation facility and construction of rearing house, etc.
Table 4.23 : Achievements of Sericulture Sector (2013-14 to 2018-19)
Year Type of Silk
Plantation (ha)
DFLs Rearing (lakh)
Total Cocoon Production
Raw Silk (Tonnes)
2013-14 Mulberry 117 5.07 122.73 (tonne) 15.08
Tasar 608 7.10 386.94 (lakh) 37.89
Castor 575 0.81 6.50 (tonne) 5.2
2014-15 Mulberry 184 5.04 162.16 (tonne) 19.5
Tasar 5198 7.48 293.88 (lakh) 32.95
Castor 232 1.19 10.20 (tonne) 8.16
2015-16 Mulberry 136 5.78 202.56 (tonne) 22.55
Tasar 2325 9.21 466.00 (lakh) 42
Castor 161 1.19 9.50 (tonne) 7.6
2016-17 Mulberry 340 5.69 191.69 (tonne) 23.49
Tasar 1218 8.62 482.20 (lakh) 43.51
Castor 232 1.27 12.43 (tonne) 9.94
2017-18
Mulberry 362 4.54 138.74 (tonne) 17.17
Tasar — 8.64 426.73 (lakh) 36.00
Castor 276 1.31 12.10 (tonne) 9.68
2018-19
Mulberry 131 2.20 60.70 (tonne) 7.55
Tasar — 9.09 457.02 (lakh) 38.39
Castor — 1.33 10.91 (tonne) 8.73
Note : DFL = Disease Free Layings Source : Department of Industries, Sericulture, GoB

159
Khadi and Village Industries
The Khadi and Village Industries Commission (KVIC), together with the KVI Board in Bihar, performs various activities to promote khadi and village industries. The major activities are — dissemination of knowledge of newer skills, transfer of technology, and research and development. The KVIC is also responsible for handling the Scheme of Fund for Regeneration of Traditional Industries (SFURTI) and Prime Minister’s Employment Generation Programme (PMEGP), which started in 2008. This programme is implemented by the KVIC, KVI Board at the state level and the District Industries Centres (DIC) at the district level. The information on performance of PMEGP in Bihar for the last three years (2016-17 to 2018-19) is presented in Table 4.24. The targets, both physical and financial, have been substantially revised in 2018-19, compared to 2017-18. The number of targeted beneficiaries has gone up from 2850 in 2017-18 to 4348 in 2018-19, an increase of 52 percent. In a similar pattern, the financial allocation has also increased from Rs 5653 lakh in 2017-18 to Rs 10,869 lakh in 2018-19, registering an increase of 93 percent. The realisation of the targets was also impressive, as 74 percent of physical target and 89 percent of financial targets were achieved in 2018-19. It is worthy to mention that DICs performed very efficiently to achieve these targets in 2018-19. Furthermore, the schemes which were initiated by the State Government in 2017-18 continue to benefit the target groups.
Table 4.24 : Performance of PMEGP (2016-17 to 2018-19)
Agencies KVIC KVI Board DIC Total
2016-17
Target/Margin Money
Physical (Nos.) 1122 (29.9) 1122 (29.9) 1506 (40.2) 3750 (100.0) Financial (Rs. lakh) 2244 (29.4) 2248 (30.0) 3008 (40.1) 7500 (100.0)
Margin Money disbursed by Nodal banks
Physical (Nos.) 532 (16.5) 313 (9.7) 2389 (73.9) 3234 (100.0)
Financial (Rs. lakh) 810.33 (9.7) 995.34 (11.9) 6530.83 (78.3) 8336.5 (100.0)
2017-18
Target/Margin Money
Physical (Nos.) 855 (30.0) 855 (30.0) 1140 (40.0) 2850 (100.0) Financial (Rs. Lakh) 1695.93 (30.0) 1695.93 (30.0) 2261.24 (40.0) 5653.1 (100.0)
Margin Money disbursed by Nodal banks
Physical (Nos.) 324 (14.3) 223 (9.9) 1708 (75.7) 2255 (100.0)
Financial (Rs. Lakh) 622.58 (9.7) 689.58 (10.8) 5095.33 (79.5) 6407.64 (100.0)
2018-19
Target/Margin Money
Physical (Nos.) 1304 (30.0) 1304 (30.0) 1740 (40.0) 4348 (100.0) Financial (Rs. Lakh) 3292 (30.3) 3292 (30.3) 4285 (39.4) 10869 (100.0)
Margin Money disbursed by Nodal banks
Physical (Nos.) 342 (11.0) 277 (9.0) 2621 (80.0) 3240 (100.0)
Financial (Rs. Lakh) 985.74 (10.0) 969.86 (10.0) 7741.23 (80.0) 9696.83 (100.0)
Note : The Figures in the parenthesis denote percent share to total Source : Department of Industry, GoB

160
Chief Minister Micro and Small Industries Cluster Development Scheme
Under the Chief Minister Micro and Small Industries Cluster Development Scheme, a Detailed Project Report (DPR) was prepared to establish Common Facility Centres for 8 clusters, approved by the state level committee. Till date, Rs. 17.96 crore has been granted for the establishment of a Common Facility Centre at 7 clusters. As part of the scheme, an apparel park in Bihta (Patna) and a leather goods complex in Muzaffarpur have been proposed. The DPR of makhaana cluster in Supaul, sanitary pad cluster in Lodhipur, Sabaur, Bhagalpur have been approved by the state level committee. Under Industrial Incentive Policy-2011 and the Bihar Industrial Investment Promotion Policy, 2016, an amount of Rs. 284.75 crore has been approved by the State Government to provide basic facilities to the industrial units. Under this scheme, Rs 200 crore has been provided to the Sales Tax Department for VAT reimbursement. Till date, an amount of Rs. 112.53 crore has been spent. In the financial year 2018-19, under the Bihar Industrial Investment Promotion Policy, 2016, a total of 337 units were given Stage-I clearance and 142 units were given clearance for financial incentive in State Investment Promotion Board (SIPB) meetings. In 2018-19, 126 units have received funds worth Rs. 40.06 crore through SIPB. Support Institution
Bihar Industrial Area Development Authority (BIADA)
To promote industrialisation, BIADA was constituted under the statutory provision of the Bihar Industrial Development Act, 1974. The key function of BIADA is to undertake planned development of Industrial Areas and matter appurtenant thereto in Bihar with its regional offices in Patna, Muzaffarpur, Bhagalpur and Darbhanga.
As of September, 2019, BIADA has acquired cumulatively 6061.7 acres of land and, hence, added 876.5 acres of land between October 2018 and September 2019. Of the total acquired land, 3363.77 acres (55.5 percent) has already been allotted to entrepreneurs. Between September 2018 and October 2019, the major land acquisition took place in Muzaffarpur (877.78 acres), followed by Darbhanga (148.88 acres). This also suggests that the State Government has tried to disperse industrialisation across the state, rather than encouraging its concentration in and around Patna.
To facilitate industrialisation in the state, several important reforms have been carried out by the State Government. The following are the key reforms :
(i) Bihar Industrial Area Development Authority (BIADA) (Amendment) Act, 2017 was passed, replacing the earlier BIADA, 1974 Act.

161
(ii) Various policies were formulated which included — Exit Policy, Allotment Policy,
Allotment Facilitation and Surrender Policy, Lease and License Policy, and a Land Pooling
Policy, as per the new BIADA (Amendment) Act, 2017.
(iii) Industrial Area Management Committee (IAMC) has been constituted for better industrial
area management.
(iv) Provision for direct purchase of land from land owners for the establishment of new
Industrial Areas.
Table 4.25 : Details of BIADA Land and Activities (September 2019)
Regional Office
Total Acquired Land & Sheds
Land Reserved for
Infrastructure, Administrative Blocks, Roads
etc. (acres)
Total Allotted land & Sheds Litigated
land (acres)
Total Vacant land & Sheds (Allottable)
Land (acres)
Constructed Sheds (Nos.)
Land (acres)
Constructed Sheds (Nos.)
Land (acres)
Constructed Sheds (Nos.)
Patna 2550.22 230 232.63 2071.77 207 133.24 102.08 23
Bhagalpur 1347.29 148 75.66 404.31 145 827.05 40.27 3
Darbhanga 874.49 144 56.16 270.20 131 427.06 121.07 13
Muzaffarpur 1289.74 158 209.19 617.49 142 350.45 112.62 16
Total 6061.74 680 573.64 3363.77 625 1737.8 376.04 55
Source : BIADA, GoB
To give an account of the extent of investment in the state thus far, about Rs 6446.05 crore was
invested in 1641 production units and 33,076 people have received direct employment till 2019. It
is observed that the number of production units has been increasing consistently since 2005-06.
Apart from 1641 units that are working, another 315 units are under construction and will soon
start production. In the 2018-19, Rs. 742.93 crore was invested in 62 production units. Food
processing was the major constituent of the new production units. The food processing sector
attracted Rs 601.01 crore, plastic and rubber sector attracted Rs 73.87 crore, and textile received
Rs 53.69 crore. In terms of the size classification of industries, seven large-scale industries
accounted for Rs 608.95 crore, about 82 percent of the total investment. The major investors were
Britannia Industries Limited (Rs 205.6 crore), ABIS Exports (India) Private Ltd., UNO Digital
Private Ltd., and Rakesh Masala Udyog (Rs 54.61 crore). In 2018-19, 37 small-scale enterprises
invested around Rs 103.27 crore and, on an average, generated employment for 45 persons per
unit. It is worthy to mention that the level and pattern of investment across different categories of
enterprises have been consistent in the last two financial years.

162
Table 4.26 : Investment by Type of Enterprise (2017-18 and 2018-19)
Category of enterprise
No of Allotment Investment (in Rs crore)
Employment (number)
2017-18 2018-19 2017-18 2018-19 2017-18 2018-19
Micro 23 17 19.93 10.97 397 302
Small 53 37 244.83 103.27 2316 1658
Medium 2 1 14.63 19.73 124 60
Large 3 7 440.3 608.96 448 2313
Total 81 62 719.71 742.93 3285 4333
Source : BIADA, GoB
Table 4.27 : Detailed Information on Investment by Sector (2017-18 and 2018-19)
Category of enterprise No of Allotment Investment
(in Rs Crore) Employment
(number)
2017-18 2018-19 2017-18 2018-19 2017-18 2018-19
High Priority Sector
Food Processing 39 34 141.54 601.00 1507 3017
Textile 3 4 3.94 53.69 44 471
Leather 1 11 780.7 0.19 8 5
IT/ITES/ESDM 2 0 1.54 48 0
Priority Sector
Plastic & Rubber 24 19 57.23 73.87 949 676
Small Machine Manufacturing 5 1 64.82 0.49 243 15
Health Care 4 3 12.01 13.68 261 149
Renewable Energy Sector 1 0 1.78 0 35 0
Tech Education 0 0 0 0 0 0
Tourism 0 0 0 0 0 0
Non-Priority 2 0 358.77 0 192 0
Total 81 62 719.71 742.93 3285 4333
Note : IT = Information Technology; ITES = Information Technology Enabled Services; ESDB = Electronic System Development and Maintenance
Source : BIADA, GoB
Udyog Mitra
Over the years, Udyog Mitra has played a pivotal role in promoting industrialisation in Bihar. Udyog Mitra provides consultancy services to prospective industrialists to establish and/or expand their industry, make required project profile, provide necessary information and address various
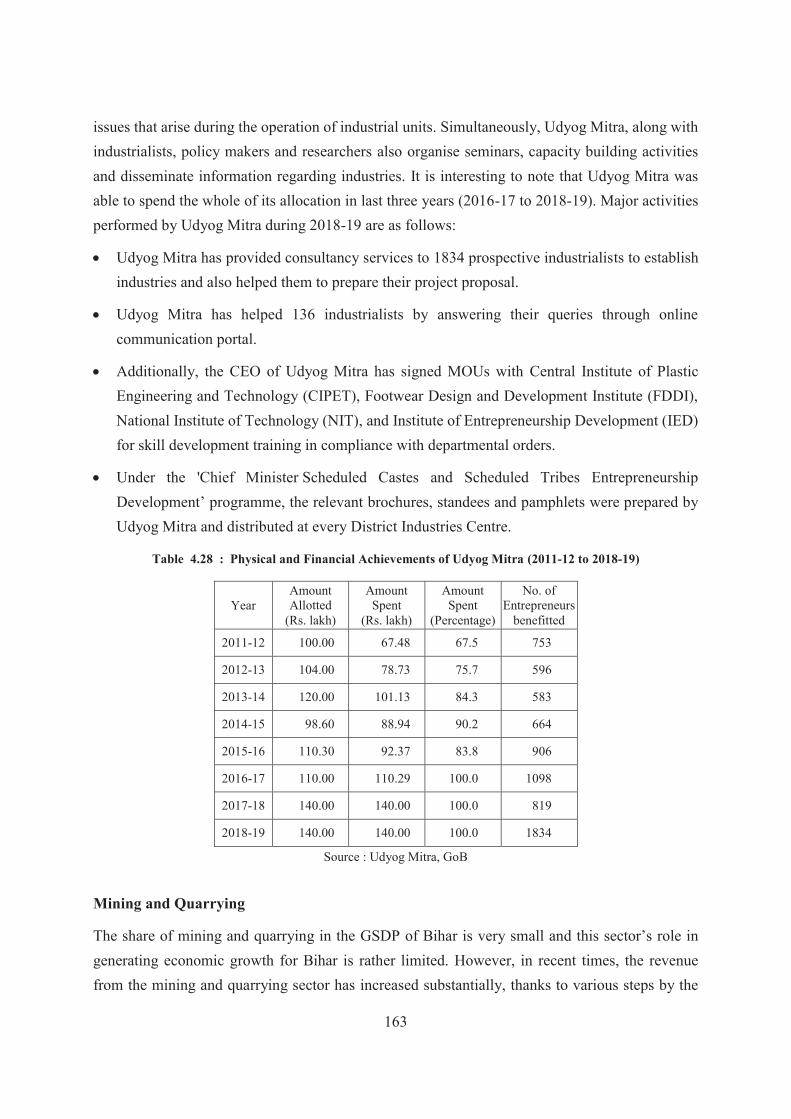
163
issues that arise during the operation of industrial units. Simultaneously, Udyog Mitra, along with industrialists, policy makers and researchers also organise seminars, capacity building activities and disseminate information regarding industries. It is interesting to note that Udyog Mitra was able to spend the whole of its allocation in last three years (2016-17 to 2018-19). Major activities performed by Udyog Mitra during 2018-19 are as follows:
Udyog Mitra has provided consultancy services to 1834 prospective industrialists to establish industries and also helped them to prepare their project proposal.
Udyog Mitra has helped 136 industrialists by answering their queries through online communication portal.
Additionally, the CEO of Udyog Mitra has signed MOUs with Central Institute of Plastic Engineering and Technology (CIPET), Footwear Design and Development Institute (FDDI), National Institute of Technology (NIT), and Institute of Entrepreneurship Development (IED) for skill development training in compliance with departmental orders.
Under the 'Chief Minister Scheduled Castes and Scheduled Tribes Entrepreneurship Development’ programme, the relevant brochures, standees and pamphlets were prepared by Udyog Mitra and distributed at every District Industries Centre.
Table 4.28 : Physical and Financial Achievements of Udyog Mitra (2011-12 to 2018-19)
Year Amount Allotted
(Rs. lakh)
Amount Spent
(Rs. lakh)
Amount Spent
(Percentage)
No. of Entrepreneurs
benefitted
2011-12 100.00 67.48 67.5 753
2012-13 104.00 78.73 75.7 596
2013-14 120.00 101.13 84.3 583
2014-15 98.60 88.94 90.2 664
2015-16 110.30 92.37 83.8 906
2016-17 110.00 110.29 100.0 1098
2017-18 140.00 140.00 100.0 819
2018-19 140.00 140.00 100.0 1834
Source : Udyog Mitra, GoB
Mining and Quarrying
The share of mining and quarrying in the GSDP of Bihar is very small and this sector’s role in generating economic growth for Bihar is rather limited. However, in recent times, the revenue from the mining and quarrying sector has increased substantially, thanks to various steps by the

164
State Government. For instance, in 2018-19, the State Government aimed to collect Rs 1600 crore revenue from the mining sector, and the actual collection was Rs 1556.77 crore (97.3 percent of the target). Moreover, the collection of revenue in 2018-19 was 43.8 percent more than that in 2017-18. The major revenue sources were sand, works department, stone and crusher, bricks, and others. Between 2017-18 and 2018-19, the revenue collected from sand mining, stone crushing, and bricks increased by 87, 27 and 5 percent, respectively. This essentially indicates an increase in construction works in the state. The State Government has been using Geo-mapping application to track revenue collection from brick kilns. The State Government has also been pursuing the sustainable Sand and Stone Mining Policy to minimise the impact of mining activities on the environment.
Table 4.29 : Targets and Collection of Revenue from Minerals in Bihar (2014-15 to 2018-19)
(in Rs Crore)
Year Target Collection Ratio (in percent)
2014-15 750.0 859.34 114.58
2015-16 1000.0 971.0 97.1
2016-17 1100.0 994.1 90.37
2017-18 1350.0 1082.67 80.2
2018-19 1600.0 1556.77 97.3
Source : Department of Mines and Geology, GoB
Table 4.30 : Revenues from Minerals in Bihar (2014-15 to 2018-19)
(Rs. lakh)
Sources 2014-15 2015-16 2016-17 2017-18 2018-19
1. Major Minerals 107.3 99.1 57.5 152.8 588.6
2. Minor Minerals
(i) bricks 2659.1 4295.6 3639.9 3934.5 4154.6
(ii) sand 50542.1 42806.3 45765.2 41066.8 76740.7
(iii) stone + crusher 7516.9 11097.9 11140.6 12784.9 16283.6
(iv) morum 0.5 56.4 0.0 0.0 0.0
(v) soil 270.3 271.4 833.4 485.4 702.4
(vi) Works Deptt. 24074.5 36413.5 35999.8 41893.1 43687.7
(vii) Transit Pass 42.4 40.7 25.2 1039.1 0.0
(viii) Others 278.7 626.2 1564.9 1636.5 6382.7
3. Arrears 443.3 1392.9 383.7 172.8 7137.0
Total 85935.10 97100.0 99410.2 108265.9 155677.3
Source : Department of Mines and Geology, GoB

165
Tourism
Both at the national and international level, the attractive tourist spots in Bihar are generally known to be the historical sites at Bodhgaya, Rajgir, Nalanda and Vaishali. But this perception about Bihar is untrue. Taking into account other places of tourist attractions in Bihar, the State Government has planned as many as eight tourist circuits in the state — (i) Buddhist Circuit, (ii) Jain Circuit, (iii) Ramayan Circuit, (iv) Shiv Shakti Circuit, (v) Sufi Circuit, (vi) Sikh Circuit, (vii) Gandhi Circuit, and (viii) Eco Circuit. In the last decade, the Department of Tourism, along with the Union Ministry of Tourism, has made provisions for additional amenities and tourist-friendly infrastructure along different tourist circuits. To promote tourism, the State Government has generously allocated funds to the Department of Tourism during the recent years, and the expenditure as a percentage of the budget has been quite high throughout this period, except 2018-19. In 2019-20, a sum of Rs 275 crore was allocated to the Department, which was three times more than the allocation of 2018-19. In terms of utilisation, Rs 88.56 crore has been spent by September 2019.
Table 4.31 : Expenditure of Department of Tourism (2012-13 to 2018-19)
Year Approved
Budget (Rs. Crore)
Expenditure (Rs. Crore)
Expenditure as
percentage of Budget
2012-13 100.1 99.3 99.2
2013-14 65.5 59.4 90.7
2014-15 118.1 87.4 74.0
2015-16 66.0 65.4 99.0
2016-17 94.5 86.4 91.5
2017-18 91.0 76.7 84.3
2018-19 84.6 47.2 55.8 2019-20 up to Sep 2019 275.0 88.56 32.2
Source : Budget Document, GoB
The number of tourist arrivals in Bihar has increased substantially from 183.96 lakh in 2011 to 336.21 lakh in 2018, growing at an annual rate of 7.8 percent. Further, between 2011 and 2018, the annual growth rate of foreign tourists was 1.4 percent. It is important to mention that the majority of tourists arrived in Bihar for religious and heritage tourism. To realise the potential of other types of tourism, the State Government has been encouraging the development of nature and adventure tourism to attract tourists from different parts of the world.

166
It is important to note that the growth of footfall of foreign tourists has a positive impact on the balance of payment of our country. Foreign tourists, along with domestic ones, can also contribute substantially to the generation of employment opportunities, increase in income of the local service providers, reduce incidence of migration and development of real estate at the tourist destinations.
Chart 4.1 : Number of Domestic and Foreign Tourist Arrivals
Source : Department of Tourism, GoB
The Department of Tourism of the State Government has undertaken various projects worth
Rs 45.67 crore in 2018-19. This includes renovation and beautification of Baba Ganinath Temple
in Vaishali. For this purpose, a sum of Rs 7.62 crore was allocated. For Sitamarhi, an amount of
Rs 10.68 crore was allocated for beautification and creation of amenities for tourists. In Bhojpur,
Vir Kunwar Singh Vijay Stambh will be constructed at four locations (Shivpur Ghat, Bibiganj,
Kayam Nagar, Barasingha Buzurg). For this purpose, an amount of Rs 7.78 crore was earmarked
by the State Government.
_____________
0
50
100
150
200
250
300
350
400
2011 2012 2013 2014 2015 2016 2017 2018
Domestic Foreign

167
CHAPTER - V
LABOUR, EMPLOYMENT AND MIGRATION
Labour was the first price, the original purchase-money that was paid for all things. It was not by gold or by silver, but by labour, that all wealth of the world was originally purchased.
—Adam Smith
Bihar is a labour surplus state, and the welfare of the working-age population is of paramount
importance. Being an agrarian economy, a large section of the working-age population is engaged
in agriculture and allied activities. Historically, due to low industrial development and existence
of few skill-based services sector, a large share of this working-age population has also been
migrating to other states and foreign countries in search of remunerative employment
opportunities. Over the period, the nature and geography of migration have undergone qualitative
changes. The increase in expenditure on infrastructure in Bihar has slowed the migration of
labourers from the State.
Abstract
Bihar is one of the prominent labour surplus states in India. Bihar supplies both skilled and
unskilled labour to other parts of the country, as well as to the foreign ones. Data from different
official sources suggest that Work Participation Rate in Bihar is lower than the all-India
average, specially for women workers. In Bihar, different government agencies and institutions
are trying to create additional employment opportunities for different sections of the working-
age population. This chapter provides the detailed information on the size and type of labour
force, employment opportunity and the efforts of the State Government initiatives to ensure
labour welfare. It also discusses the initiatives of the State Government to abolish the child and
bonded labour and ensure their rehabilitation. In Bihar, different state agencies and
commissions are also conducting skill development programmes for the youth to improve their
employability.

168
5.1 Size of Labour Force and Work Force
Before discussing the State Government’s initiatives to improve the conditions of the working-age population of the state, it is relevant to discuss the size and composition of the labour force in Bihar vis-à-vis the rest of the country. Table 5.1 suggests that the labour force participation rate (LFPR) for males and females in Bihar was lower than the all-India average during 2017-18. Importantly, the LFPR for females was abysmally low in Bihar compared to the all-India average. For example, female LFPR in rural Bihar was just 3.9 percent compared to 24.6 percent at the all-India level. Similarly, LFPR for urban females was 6.4 percent in Bihar, compared to 20.4 percent at the all-India level. Such abysmally low level of LFPR of females is a matter of concern for the policymakers. The reasons for such a low level of LFPR for females are multidimensional — social, economic and cultural. For male workers also, the LFPR in Bihar was the lowest among all the states in both rural and urban areas. The data on worker population ratio (WPR) for 2017-18, which is defined as the percentage of employed persons in the population, draws a similar picture (Table 5.2). The WPR for both male and female workers has been very low in Bihar vis-à-vis the all-India average. In rural Bihar,
Table 5.1 : Labour Force Participation Rate (LFPR) by State (2017-18)
State Rural Urban
Male Female Person Male Female Person
Andhra Pradesh 79.5 48.4 63.3 78.3 30.7 52.8 Assam 80.9 12.3 47.7 75.3 15.4 45.7 Bihar 68.8 3.9 38.2 66.5 6.4 38.2 Chhattisgarh 79.6 54 67.1 77.6 30.5 54.0 Gujarat 78.7 22.5 51.7 76.6 16.2 47.1 Haryana 73.9 14.7 45.5 74.8 13.7 45.5 Jharkhand 75.7 15.7 46.3 66.9 14.3 40.2 Karnataka 80.5 28.2 54.0 73.8 22.8 48.0 Kerala 71.1 25.9 46.6 68.9 27.3 46.4 Madhya Pradesh 81.5 35.3 59.3 75.4 21.0 49.0 Maharashtra 75.4 37.7 56.8 74.2 21.6 48.2 Odisha 79.4 20.0 49.0 74.6 16.9 44.8 Punjab 72.9 14.0 44.5 78.2 18.2 49.6 Rajasthan 73.9 30.8 52.6 72.2 14.5 44.8 Tamil Nadu 78.5 39.0 58.3 76.7 27.6 51.4 Telangana 73.7 39.2 56.6 76.7 22.9 49.9 Uttar Pradesh 75.6 14.2 44.9 73.4 11.1 43.4 West Bengal 81.3 19.8 50.4 75.1 23.0 49.2 All-India 76.4 24.6 50.7 74.5 20.4 47.6
Source : Periodic Labour Force Survey (MoSPI) NSO, 2018

169
the WPR for male workers was 64.0 percent, almost 8 percent lower than the all-India average.
The WPR for female workers was abysmally low at 3.9 percent in rural Bihar. However, the WPR
for female workers in urban Bihar was significantly higher at 6.1 percent, compared to WPR for
rural females. Given the size of 2.69 crore of female population in the age group of 15 years and
above, only 4.1 percent (10.75 lakh females) were engaged in any kind of gainful economic
activities in Bihar. It clearly suggests that an overwhelming majority of the employable population
in Bihar has been out of work. It is necessary for the State Government to draw alternative
strategies to harness the available human resources in the state which can lead to higher levels of
social and economic development.
Table 5.2 : Worker Population Ratio (WPR) by State (2017-18)
State Rural Urban
Male Female Person Male Female Person
Andhra Pradesh 75.9 47.3 61 74 27.9 49.3
Assam 75.0 10.6 43.8 71.3 13.6 42.8
Bihar 64.0 3.8 35.6 60.3 6 34.7
Chhattisgarh 77.5 52.8 65.5 73 27 50
Gujarat 74.4 21.6 49.1 73.4 15.5 45.1
Haryana 67.2 13.2 41.3 70.3 12.1 42.4
Jharkhand 70.1 15.1 43.2 60.1 12.6 36
Karnataka 77.2 27.2 51.9 69.2 21.2 44.9
Kerala 67 20.8 41.9 64.4 19.8 40.2
Madhya Pradesh 78 34.9 57.3 69.5 19.6 45.3
Maharashtra 72.8 36.7 55 69.6 19.1 44.7
Odisha 73.6 18.9 45.6 69.1 14.8 41.1
Punjab 67.7 12.5 41.1 73.1 15.7 45.8
Rajasthan 69.7 30.4 50.3 67.4 13.1 41.5
Tamil Nadu 71.6 36.7 53.7 71.9 25.2 47.9
Telangana 68.3 37.3 52.9 70.2 20 45.2
Uttar Pradesh 71 14 42.5 66.5 9.9 39.3
West Bengal 77.7 19.5 48.5 70.2 21.6 46.1
All-India 72 23.7 48.1 69.3 18.2 43.9
Source : Periodic Labour Force Survey (MoSPI) NSO, 2018

170
Table 5.3 explains the unemployment rate across the states of India during 2017-18. The
unemployment rate is defined as the percentage of persons unemployed among the persons in the
labour force (that includes both employed and persons). At the all-India level, the unemployment
rate was 5.7 percent for rural males and 6.9 percent for urban males. Further, the unemployment
rate was 3.8 percent for rural females and 10.8 percent for urban females at the all-India level. In
Bihar, the unemployment rate for male workforce was higher than that at the all-India level, while
the female unemployment rate was much lower than the all-India level. The pattern was similar in
both urban and rural areas. A plausible reason for the low unemployment rate among females is
that majority of them cannot afford to be unemployed due to their poverty and, as such, are forced
to accept employment even at a very low wage.
Table 5.3 : Unemployment Rate by State (2017-18)
State Rural Urban
Male Female Person Male Female Person
Andhra Pradesh 4.5 2.3 3.6 5.5 9.0 6.6
Assam 7.3 14 8.1 5.3 11.4 6.3
Bihar 7.0 2.3 6.8 9.3 6.2 9.0
Chhattisgarh 2.7 2.1 2.5 5.9 11.4 7.5
Gujarat 5.4 4.1 5.2 4.2 4.3 4.2
Haryana 9 9.9 9.2 6.0 12.0 6.9
Jharkhand 7.4 3.7 6.8 10.2 11.5 10.4
Karnataka 4.0 3.4 3.9 6.3 7.2 6.5
Kerala 5.9 19.6 10.0 6.6 27.4 13.2
Madhya Pradesh 4.3 1.2 3.4 7.8 6.9 7.6
Maharashtra 3.4 2.8 3.2 6.2 11.4 7.4
Odisha 7.3 5.3 6.9 7.3 12.7 8.4
Punjab 7.2 10.3 7.6 6.5 13.5 7.7
Rajasthan 5.6 1.2 4.4 6.7 9.9 7.2
Tamil Nadu 8.8 6.0 7.9 6.2 9.0 6.9
Telangana 7.2 5.0 6.5 8.5 12.6 9.4
Uttar Pradesh 6.1 1.5 5.4 9.4 10.6 9.5
West Bengal 4.4 1.7 3.8 6.6 5.9 6.4
All-India 5.7 3.8 5.3 6.9 10.8 7.7
Source : Periodic Labour Force Survey (MoSPI) NSO, 2018

171
Pattern of Employment
The broad categories of status in employment are — self-employed (own account worker, employer, and helper in the household enterprise), regular wage/salary, and causal labour. Tables 5.4 and Table 5.5 suggest that majority of the workers were self-employed, especially as own-account worker across all the states of India during 2017-18. In Bihar, 55.9 percent males were self-employed, which is slightly higher than the all-India average (52.3 percent). The share of casual labour in Bihar (32.1 percent) was significantly higher than the all-India level (24.3 percent). The proportion of regular wage/salaried male was the lowest in Bihar (11.9 percent) compared to all other states in India. The small proportion of regular wage/salaried male workers signifies that male workers of Bihar have limited options in stable and long-term employment.
Table 5.4 : Percentage Distribution of Male Workers by Status of Employment by State (2017-18)
State
Self-employed Regular wage/ salary
Casual labour All
Own account worker,
employer
Helper in household enterprise
All self employed
Andhra Pradesh 40.3 5.7 46.1 21.0 33.0 100.0
Assam 55.6 5.9 61.5 20.3 18.2 100.0
Bihar 50.4 5.5 55.9 11.9 32.1 100.0
Chhattisgarh 45.8 17.9 63.7 17.8 18.4 100.0
Gujarat 43.2 11.5 54.7 29.9 15.5 100.0
Haryana 38.8 5.3 44.1 36.9 19.0 100.0
Jharkhand 51.4 8.3 59.7 15.4 24.9 100.0
Karnataka 41.4 9.0 50.3 25.3 24.4 100.0
Kerala 40.1 0.7 40.8 27.5 31.7 100.0
Madhya Pradesh 43.7 13.8 57.5 15.7 26.8 100.0
Maharashtra 39.3 8.5 47.8 31.7 20.6 100.0
Odisha 52.5 6.8 59.3 15.7 25.1 100.0
Punjab 40.2 6.7 47.0 31.5 21.5 100.0
Rajasthan 50.5 9.5 60.0 22.4 17.6 100.0
Tamil Nadu 30.4 2.1 32.4 35.5 32.1 100.0
Telangana 42.6 5.1 47.7 32.0 20.3 100.0
Uttar Pradesh 50.1 11.8 61.9 15.2 22.8 100.0
West Bengal 40.5 5.6 46.1 20.7 33.1 100.0
All-India 44.1 8.2 52.3 23.4 24.3 100.0 Source : Periodic Labour Force Survey (MoSPI) NSO, 2018
The pattern of employment for female workers was strikingly different (Table 5.5). The proportion of self-employed workers was significantly lower at 33.9 percent in Bihar compared to 51.9

172
percent at the all-India level in 2017-18. Interestingly, the share of female workers as a helper in household enterprises within the self-employed status was only 6.4 percent in Bihar compared to 31.7 percent at the all-India level. One possible reason for such low level of self-employment is that the small size of operational landholdings or landlessness among rural households is unable to generate employment opportunities even for family labour, particularly for female family members. Secondly, socio-cultural restrictions on women belonging to certain caste and classes force them to stay out of the economic activities even within their own farms and remain confined to do household chores. The lower self-employment implied that the proportion of women in the regular wage/salary and casual labour status was higher in Bihar compared to the all-India averages. Given the small size of female labour force participation rate (as mentioned in Table 5.1), the majority of female workers belonging to the regular wage/salary and casual labour were engaged in the services sector.
Table 5.5 : Percentage Distribution of Female Workers by Employment Status by State (2017-18)
State
Self-employed Regular wage/ salary
Casual labour All
Own account worker,
employer
Helper in household enterprise
All self employed
Andhra Pradesh 17.3 25.0 42.3 14.2 43.5 100.0
Assam 11.9 8.5 20.4 59.3 20.3 100.0
Bihar 27.5 6.4 33.9 32.9 33.3 100.0
Chhattisgarh 8.9 61.5 70.4 7.9 21.7 100.0
Gujarat 30.2 24.6 54.9 23.1 22.1 100.0
Haryana 34.6 7.7 42.3 27.8 30.0 100.0
Jharkhand 18.0 50.6 68.6 14.1 17.3 100.0
Karnataka 16.9 23.5 40.4 25.8 33.8 100.0
Kerala 21.9 7.7 29.6 47.5 22.9 100.0
Madhya Pradesh 9.7 47.9 57.6 10.6 31.8 100.0
Maharashtra 12.2 32.8 45.1 21.8 33.1 100.0
Odisha 15.0 35.3 50.3 14.2 35.5 100.0
Punjab 31.9 8.4 40.3 45.2 14.5 100.0
Rajasthan 22.1 57.9 80.0 8.6 11.4 100.0
Tamil Nadu 17.4 16.0 33.5 30.1 36.4 100.0
Telangana 23.4 25.1 48.5 17.9 33.7 100.0
Uttar Pradesh 28.8 44.5 73.4 13.8 12.9 100.0
West Bengal 32.1 13.8 45.9 27.2 26.9 100.0
All-India 20.2 31.7 51.9 21.0 27.0 100.0
Source : Periodic Labour Force Survey (MoSPI) NSO, 2018

173
The distribution of workers (for both males and females) across major industries in 2017-18 is
discussed in Table 5.6. In Bihar, major employment-generating industries for working males were
— agriculture, forestry and fishing (44.6 percent), construction (17.1 percent), wholesale and
retail trade, repair of vehicles (12.3 percent), and manufacturing (9.3 percent). For female workers,
major employment-generating industries were — agriculture, forestry and fishing (53.6 percent),
education (25.7 percent), and accommodation and food service activities (5.2 percent). It can be
Table 5.6 : Percentage Distribution of Workers by Industry for Bihar and all-India (2017-18)
Industry Male Female Person
Bihar All-India Bihar All-
India Bihar All-India
Agriculture, forestry and fishing 44.6 40.2 53.6 57.0 45.1 44.1
Mining and quarrying 0.1 0.5 0.0 0.2 0.1 0.4
Manufacturing 9.3 12.0 3.2 12.5 8.9 12.1 Electricity, gas, steam and air conditioning supply 0.1 0.4 0.0 0.1 0.1 0.3
Water supply; sewerage, waste management and remediation activities 0.0 0.3 0.0 0.1 0.0 0.3
Construction 17.1 13.7 2.8 5.0 16.3 11.7 Wholesale and retail trade; repair of motor vehicles and motorcycles 12.3 11.7 4.1 4.8 11.8 10.1
Transportation and storage 3.8 6.3 0.0 0.3 3.6 4.9
Accommodation and Food service activities 1.7 2.0 5.2 1.5 1.9 1.9
Information and communication 0.6 1.1 0.1 0.7 0.5 1.0
Financial and insurance activities 0.9 1.1 0.3 0.8 0.9 1.1
Real estate activities 0.2 0.3 0.0 0.1 0.2 0.2
Professional, scientific and technical activities 0.9 0.9 0.1 0.5 0.9 0.8
Administrative and support service activities 1.2 1.4 0.5 0.6 1.2 1.2 Public administration and defence; compulsory social security 0.6 1.8 0.9 1.0 0.6 1.6
Education 2.9 2.6 25.7 7.6 4.1 3.8
Human health and social work activities 0.7 0.8 1.2 2.5 0.8 1.2
Arts, entertainment and recreation 0.6 0.3 0.0 0.1 0.6 0.3
Other service activities 2.0 2.0 0.5 1.7 2.0 1.9 Activities of households as employers; undifferentiated goods and services producing activities of households for own use
0.6 0.5 1.9 3.0 0.7 1.1
Activities of extraterritorial organizations and bodies 0.0 0.0 0.0 0.0 0.0 0.0
All 100.0 100.0 100.0 100.0 100.0 100.0
Source : Periodic Labour Force Survey (MoSPI) NSO, 2018

174
observed from Table 5.6 that the pattern of engagement of male workers in various industries of Bihar had similarity with the all-India pattern. However, the pattern of engagement of female workers in Bihar was strikingly different from that of the all-India pattern. For instance, in Bihar, after agriculture, forestry and fishing, the most important employment provider to the female workers was education, contrary to the common perception that construction or manufacturing would be the second largest employment provider to the female workers. As data suggest, only 3.2 percent of female workers were engaged in manufacturing in Bihar, compared to 12.5 percent at the all-India level. The large share of female workers engaged in the education industry manifests the success of the state-sponsored schemes and programmes currently underway in Bihar. Given the small number of female workers in Bihar, a significantly large fraction of them were engaged in the services sector, the sector where remuneration and work environment are relatively better. The state has sought to increase women’s formal employment through 35 percent reservation in all government jobs in the state. The State Government had announced reservation of 50 percent for women in cooperative societies and in Panchayat to improve the female LFPR in the state. Migration
The economic history of India confirms that Bihar has been an uninterrupted source of migrant workers at different stages of economic and social development in India. The workers (skilled, semi-skilled, unskilled) have migrated to different parts of India to work as labour for both agricultural and industrial growth. Historically, migration to international locations has also been observed. The data from Census 2011 suggest that workers from Siwan, Gopalganj, West Champaran and East Champaran districts in Bihar often migrate to the gulf countries. In India, most of the migrant workers come from Uttar Pradesh, Assam, Odisha and Bihar and their most favoured destinations have been the economically prosperous states like Maharashtra, Delhi, Punjab, Haryana and Karnataka. Census 2011 provides information on number of migrants and their reasons for migration. Table 5.7 presents the number of migrants in Bihar and India by gender and reasons for migration. The major reasons of migration are work/employment, business, education, marriage, moved after birth, moved with the household, etc. In Bihar, 75 percent of total migration took place due to marriage, compared to 46 percent at the all-India level. Only 2.9 percent of total migration took place due to work/employment and business. Of the total number of migrating people due to marriage, 98 percent were women. Moreover, of the total migrating people due to work, employment and business, 76 percent of them were men. These two patterns indicate that in India, more specifically in Bihar, migration due to social norms and customs has been overwhelmingly dominant over economic reasons of migration. Secondly, migration of women has been primarily

175
controlled by social and cultural factors, and the migration of men has been determined by economic factors.
Table 5.7 : Reason and Gender-wise Migration in India and Bihar (2011 Census)
(Fig. in 000’)
Category India Bihar
Total Rural Urban Total Rural Urban
Work/Employment
Persons 41,423 26,736 13,394 707 288 419
Males 35,017 22,673 11,382 539 166 373
Females 6,406 4,064 2,011 167 121 46
Business
Persons 3,590 2,005 1,438 84 48 36
Males 2,683 1,501 1,088 39 12 27
Females 907 504 350 45 35 10
Education
Persons 5,458 3,403 1,784 122 48 74
Males 3,296 2,060 1,077 74 23 51
Females 2,161 1,344 707 48 25 23
Marriage
Persons 211,186 175,816 27,764 20,440 18,719 1,721
Males 5,347 4,242 879 380 339 41
Females 205,840 171,574 26,885 20,060 18,380 1,680
Moved after birth
Persons 33,856 18,352 14,098 293 183 110
Males 20,079 11,189 8,057 177 108 69
Females 13,777 7,162 6,041 116 75 41
Moved with household
Persons 65,960 37,684 25,071 1,268 519 749
Males 29,680 16,991 11,132 605 264 341
Females 36,280 20,693 13,940 663 255 408
Others
Persons 94,314 31,118 22,806 4,331 3,463 868
Males 50,044 14,867 12,347 2,023 1,543 479
Females 44,270 16,251 10,459 2,308 1,919 389
Total migrants
Persons 455,788 295,114 106,356 27,245 23,267 3,978
Males 146,146 73,523 45,962 3,837 2,457 1,381
Females 309,642 221,592 60,394 23,407 20,810 2,597
Source : Registrar General & Commissioner of Census, India, Census 2011
As regards international migration, one can get some indirect evidence from the emigration
clearances at the Indian airports. As per this data, Bihar accounted for 15 percent of emigration
clearance, which is the second highest after Andhra Pradesh (31 percent). The overall scenario is
presented in Chart 5.1, presenting state-wise data on emigration clearances.

176
Chart 5.1 : State-wise Emigration Clearances Granted, 2011-16
MEA data, 2011-2016 (Cross references : Indian Labour Migration Update 2018)
Yet another indicator of international migration is the number of passport application received and issued from the Regional Passport Office in Patna. The relevant data is presented in Chart 5.2 for the years 2015-16 to 2018-19. This figure shows that there is considerable variation over the years for the number of passports issued. The highest (348.3 thousand) number of applications for passport was received in 2018-19, while the highest (357.6 thousand) number of passports were issued in 2015-16, followed by 2017-18 (339.1 thousand). On an average, the number of passports issued from Regional Passport Office in Patna is more than 3 lakhs per year and it is indeed a large number.
Sources : Ministry of External Affairs, Regional Passport Office, Patna
7%
15%
10%
2%
7%
7%11%
2%
31%
8%
Andhra Pradesh
Bihar
Keral
Odisha
Punjab
Rajasthan
Tamil Nadu
Telangana
Uttar Pradesh
West Bengal
348.3322.6 296.3
323.9317.3 339.1296.8
357.6
0.050.0
100.0150.0200.0250.0300.0350.0400.0
2018-19 2017-18 2016-17 2015-16
Thou
sand
Years
Chart 5.2 : Number of Passport Applications Received and Passposrt Issued
Received
Issued

177
As regards inter-district variation with respect to issuance of passport, Table 5.8 suggests that a significantly large share of the passport was issued to the residents from Siwan (13.1 percent), Gopalganj (10.8 percent), Patna (11 percent) and Aurangabad (8 percent). These four districts together accounted for 42.9 percent of the total passport issued in 2018-19. One can safely assume that this inter-district disparity is valid for other years also.
Table A 5.1 (Statistical Appendix) shows the district-wise number of passport application received by the Regional Passport Office, Patna and passports issued during 2016-17 to 2018-19. It needs to be clarified that, in some cases, the number of passports issued was higher than the number of passport applicants; this is because of the backlog in issuance of the passport. The number of applications from Siwan and Gopalganj was much higher compared to other districts.
Table 5.8 : Districtwise Number of Passports Issued (2018-19)
District No. of
Passport ('000)
District No. of
Passport ('000)
Patna 34.0 (11.0) Darbhanga 10.1 (3.2) Nalanda 4.6 (1.5) Madhubani 9.6 (3.0) Bhojpur 5.9 (1.9) Samastipur 5.1 (1.6) Buxar 6.1 (1.9) Begusarai 4.8 (1.5) Rohtas 6.8 (2.2) Munger 2.2 (0.7) Kaimur 2.0 (0.6) Sheikhpura 1.0 (0.3) Gaya 7.9 (2.5) Lakhisarai 1.1 (0.4) Jehanabad 1.6 (0.9) Jamui 2.9 (0.9) Arwal 1.2 (0.4) Khagaria 1.4 (0.4) Nawada 4.9 (1.5) Bhagalpur 5.0 (1.6) Aurangabad 25.4 (8.0) Banka 1.1 (0.4) Saran 13.8 (4.3) Saharsa 1.9 (0.6) Siwan 41.7 (13.1) Supaul 2.8 (0.9) Gopalganj 34.2 (10.8) Madhepura 1.1 (0.3) W. Champaran 317.3 (4.5) Purnia 7.0 (2.2) E. Champaran 12.7 (4.0) Kishanganj 4.7 (1.5) Muzaffarpur 13.6 (4.3) Araria 4.8 (1.5) Sitamarhi 7.3 (2.3) Katihar 4.6 (1.5) Sheohar 0.9 (0.3) Vaishali 6.3 (2.0 Bihar 337.4
Note : Figures in bracket denote percentage share Source : Regional Passport Office, Patna
It is well known that majority of the migrants from Siwan and Gopalganj went to the gulf countries for work. One can also safely assume that, over the years, the aspirants have already established a strong network to continue the flow of migration to the gulf countries.

178
5.2 Initiatives of the State Government for Labour
Over the years, the State Government has undertaken several measures to improve the livelihood and working conditions of various sections of workers. This Section presents the details of some of these measures. Bonded Labour Rehabilitation Scheme (BLRS)
The Bonded Labour System (Abolition) Act, 1976 has entrusted the State Governments with the responsibility to free bonded labourers from various forms of oppression and then ensure their rehabilitation. To support the State Governments, the Central Government initiated a scheme in 1978, known as the Centrally Sponsored Scheme for Rehabilitation of Bonded Labour. Later, the Central Government revamped the old scheme in 2016. Under the revised scheme, the Central Government would bear the entire burden of financial rehabilitation assistance. The financial assistance components for the freed bonded labourers are categorised as follows: First Category : Rescued adult male bonded labourers would be given financial assistance of Rs. 1.00 lakh for rehabilitation. This financial assistance is given to the beneficiaries either in terms of annuity plan or one-time cash transfer. Second Category : This category includes specifically defined bonded labourers, such as orphaned children, children and women who are forcibly engaged in bonded labour and children who are rescued from a nexus of organised or forced begging. Under this category, a sum of Rs 2.00 lakh is given to the rescued bonded labourer, of which Rs. 1.25 lakh is deposited in annuity plan in the name of the rescued labourer and the rest of the amount, Rs 75,000 is deposited in the bank account of the rescued labourer. Third Category : This category includes transgender, children and women who have been rescued from sexual exploitation from brothels, massage parlours or placement agencies. They are provided Rs. 3.00 lakh as financial compensation, of which Rs 2.00 lakh is provided as annuity plan and the remaining Rs. 1.00 lakh is deposited in the bank account of the rescued person. Apart from financial assistance, the scheme also has non-financial components. The most important non-financial aspects are — allotment of plots for house construction and farming; land development; provision of low-cost dwelling units; animal husbandry, dairy and pig farming, etc.; generation of wage employment and ensuring minimum wages; collection and processing of minor forest produce; supply of essential commodities through Targeted Public Distribution System; and education for children.

179
The scheme provides for the creation of Bonded Labour Rehabilitation Fund at the district level,
which is monitored by the District Magistrate. The corpus fund of Rs 10.00 lakh is meant to
provide immediate financial help to the rescued bonded labourers. The upper limit of immediate
financial help is Rs 20,000. The State Governments have to ensure a safe environment for the
rescued bonded labourers and impart training to enhance their skills. For all rescued people,
including differently abled people, psychosocial and skill development programmes are the key
components of the rehabilitation scheme.
Between 2013 and 2016, 1922 bonded labourers were released and they received the total
rehabilitation amount worth of Rs 192.20 lakh (Table A 5.2) (Statistical Appendix). The most
number of freed bonded labourers between 2013 to 2016 belonged to — Gaya (693), Samastipur
(139), Madhubani (137), Sitamarhi (114), and Katihar (111), and they accounted for 62 percent of
total freed bonded labourers. Later, 798 bonded labourers were freed and under the new scheme
Rs 84.40 lakh was spent on their rehabilitation. Most number of freed bonded labourers were
residents of — Nawada (252), Gaya (79), Samastipur (57), Jehanabad (56), Supaul (54), and
Darbhanga (50). These six-district together accounted for more than 68 percent of the total rescued
bonded labourers between 2016 and 2019.
Bihar Shatabdi Asangatith Karyakhetra Kamgar Awam Shilpkar Samajik Surakhsha
Yojana 2011
The State Government initiated Bihar Shatabdi Asangatith Karyakhetra Kamgar Awam Shilpkar
Samajik Surakhsha Yojana in 2011 to provide social security to unorganised workers as a large
proportion of workers in Bihar are engaged in the unorganised sector. There are 88 occupations
which have been identified under the unorganized sector. Along with the unorganised sector
workers, the scheme also covers artisan and others. The scheme provides financial support and
security at the time of emergency such as death, disability, accident or in case of terminal
diseases/illness. The amount of grants is presented in Table 5.9. The dependent spouses of
deceased workers receive the grant, against the submission of valid certificates and documents.
The District Magistrate is the implementation officer of the scheme.
In 2015-16, the total number of claims in all the categories was 728 and the total disbursed amount
was Rs 393.30 lakh. The data suggest that the number of claims has increased from 728 in 2015-
16 to 1448 in 2018-19. Consequently, the amount of disbursement increased from Rs 393.30 lakh
in 2015-16 to Rs 820.23 lakh in 2018-19. During the last four years, the State Government has
provided financial support of Rs 2844.00 lakh against 5085 claims under the scheme (Table 5.10).

180
Table 5.9 : Sub-scheme wise Grant Provisions under Bihar Shatabdi Asangatith Karyakhetra Kamgar Evam Shilpkar Samajik Surakhsha Yojana
Sub-scheme Amount (Rs.)
Accidental death 1,00,000
Natural death 30,000
Complete permanent disability 75,000
Permanent partial disability 37,500
Injuries due to accident 5000
Incurable diseases/illness. 7500-30,000 Sources : Labour Resources Department, GoB
Table 5.10 : Grants provided under Bihar Shatabdi Asangatith Karyakhetra Kamgar Evam
Shilpkar Samajik Surakhsha Yojana (2015-16 to 2018-19)
Year No. of
accidental deaths
No. of Permanent Disability
Partial Disability
Normal Deaths
Hospitalization
Incurable Diseases
Total no. of Claims
Total Amount
(Rs. lakh) 2015-16 249 3 6 462 2 6 728 393.30
2016-17 634 9 35 1093 2 18 1791 985.93
2017-18 440 5 8 636 0 29 1118 644.55
2018-19 548 8 11 855 1 25 1448 820.23
Total 1871 25 60 3046 5 78 5085 2844.00
Sources : Labour Resources Department, GoB
Construction Workers
The two most important acts regarding construction workers are — (i) Building and Other Construction Worker (Regulation of Employment and Conditions of Service) Act, 1996, and (ii) Building and Other Construction Workers Welfare Cess Act, 1996. To implement the Building and Other Construction Worker Act, 1996, the State Government enacted Bihar Building and other Construction Workers (Regulation of Employment and conditions of service) Rule, 2005, which was amended time to time. The Central Government has framed the rules for implementation of the Building and Other Construction Workers Welfare Cess Act, 1996. In the law, provisions have been made for monitoring working condition, health, safety and welfare of the construction workers. To implement the above-mentioned Act and rule, the State Government has enacted Bihar Building and other Construction Workers Welfare Board. At present, 20 different categories of workers has been identified as construction workers.
To avail the benefits of Bihar Building and other Construction Workers Welfare Board, a construction worker (in the age group of 18 to 60 years) need to be a registered member of the Board. All applications are uploaded online through a software developed by the Board, and an

181
identity card is issued to the registered construction workers. The Board ensures the health and safety of the construction workers at the workplace, promotes their welfare, and also manages the funds for different welfare schemes. These welfare schemes include — death benefits, maternity benefits, financial support for education, cash awards, financial support for the marriage, cycle purchase plan, instrument purchase plan, house repair grant, medical assistance, annual medical assistance, pension, disability pension, financial assistance for the funeral, family pension, and paternity benefits.
To provide the above-mentioned benefits to the eligible registered construction workers, the Bihar Building and other Construction Workers Welfare Board has earmarked a significantly large fund, which is accrued from the construction cess collected from the estimated cost of all type of construction within state. Table 5.11 represents the details of registered construction workers and the number of beneficiaries. During 2014-15 to 2018-19, a total of 1295 thousand construction workers have registered themselves with the Board and around 339.3 thousand workers have received some benefit from various schemes. The allocation of funds has been increasing over the years. In 2014-15 and 2018-19, the total allocation was Rs 163.80 crore and Rs 370.00 crore respectively, registering an increase of 126 percent in just five years.
Table 5.11 : Number of Registered Construction Workers, Beneficiaries and Fund Utilization
(2014-15 to 2018-19)
Year
No. of registered constru-
ction workers (in 000’)
Fund (Rs. crore)
No. of benefici-
aries (in ’000)
Fund utilized
(Rs. crore)
2014-15 309.8 163.8 27.5 41.3
2015-16 409.6 203.7 5.5 8.3
2016-17 57.4 231.1 7.3 10.9
2017-18 191.3 266.0 40.8 61.3
2018-19 326.9 370.0 258.2 80.9
Total 1295.0 1234.6 339.3 202.7
Source : Labour Resources Department, GoB
Child Labour
According to the World Report on Child Labour 2015, globally 168 million children were trapped in child labour. Within India, there have been variations in incidents of child labour across the states.
Under the Child and Adolescent Labour (Prohibition and Regulation) Act 1986, section 3 completely prohibits the engagement of children in all processes and occupations. In 2009, the
182
State Government launched a ‘State Plan of Action for Child Protection, Rescue and Rehabilitation’, to create a child-friendly and safe environment for the overall wellbeing of children. The State Action Plan was further amended in year 2017. A Child Labour Tracking System software was developed to monitor the rehabilitation process of the rescued child labour. Between 2014 and 2019, 5616 child labourers were rescued and 82 children were enrolled in schools. Additionally, the State Government has also made a provision for financial support of Rs 25,000 for the child labour from the Chief Minister Relief Fund. The scheme has benefitted around 1492 child labourers between 2014 and 2019. Furthermore, the Action Plan also includes the provision of residential training centres to carry forward the educational and economic rehabilitation for the rescued child labourers. Before enrolling the rescued children in mainstream schools, the children have been provided with bridge courses. Along with formal education, the interested children have been provided with vocational education and eventually accommodated in various state-run skill development programmes. Special residential training centres were to be set up in Gaya, Nawada, Nalanda, Patna, Banka, Sitamarhi and Jamui. Currently, the special residential training centres in Patna, Gaya, Jamui, and Banka are functional.
Table A 5.3 (Statistical Appendix) presents district-wise data of rescued child labour and rehabilitation under Chief Minister’s Relief Fund (CMRF) for the years 2016-17, 2017-18 and 2018-19. Around 1054 children were rescued in 2016-17. In the subsequent years, the number of rescued children has declined. However, the rehabilitation rate was highest in 2017-18, when 230 out of 930 rescued children were provided with rehabilitation in the state. The children coming from other states but rescued in Bihar, have been handed over to the authorities of other states as per the norms. 5.3 Minimum Wages Rates
The determination of minimum wage is one of the most important means to ensure the livelihood of the people who are working in the unorganised sector. The effective enforcement of minimum wages is also important to reduce wage inequality and promote a decent living standard for the workers. The Department of Labour Resources periodically revises the minimum wages for six categories of work — Work category I (69 types of informal work) Work category II (Papad and Agarbatti Udhyog, dry toilet construction), Work category III (drug sale promotion and planning), Work category IV (domestic worker) Work category V (breaking and grinding stone, beedi and brick making, hair cutting, power loom, silk and thread industry, workers in lac and tea industry, etc.), and Work category VI (Agriculture). The minimum wages are revised twice a year, in April and October. A list of the minimum wages for all the six categories during the last five years is presented in Table 5.12.

183
Table 5.12 : Sector-wise Minimum Wage in Bihar (2015 to 2019)
Category 2015 2016 2017 2018 2019
Worker Category I and V
Unskilled (per day) 197 237 247 257 277
Semi-Skilled (per day) 206 247 257 268 289
Skilled (per day) 251 301 313 325 352
Highly-Skilled (per day) 306 367 381 396 429
Supervisor/Clerk (per month) 5664 6799 7074 7359 7955
Worker Category II
Unskilled (per day) 189 227 237 246 266
Semi-Skilled (per day) 197 237 247 257 277
Skilled (per day) 241 290 302 314 339
Highly-Skilled (per day) 295 353 367 382 413
Supervisor/Clerk (per month) 5444 6535 6799 7073 7646
Worker Category III
Unskilled (per day) 181 217 225 234 254
Semi-Skilled (per day) 188 225 235 244 263
Skilled (per day) 232 278 290 302 325
Highly-Skilled (per day) 282 339 353 368 397
Supervisor/Clerk (per month) 5229 6277 6531 6794 7344
Worker Category IV Washing dishes (one hour per day for a month) 589 707 735 765 827
Washing dishes/clothes (one hour per day for a month) 589 707 735 765 827
Washing dishes/clothes/ Mop in 1000 square feet (one hour per day for a month)
589 707 735 765 827
Washing dishes/clothes, Mop in 1000 square feet, looking after children (8 hours per day for a month)
4703 5645 5873 6109 6605
Washing dishes/clothes, Mop in 1000 square feet, taking children to the school and bring them back (8 hours per day for a month).
4703 5645 5873 6109 6605
Worker Category VI
Unskilled (per day) 197 237 247 257 277 Other work except harvest related work (per day) 189 227 237 246 266
Tractor drivers and pump operators (per month) 6805 8168 8498 8841 9557
Harvest work (per month) 5294 6355 6612 6878 7435
Note : For comparison purpose, the minimum wages revised in the month of October are reported here. Sources : Labour Resources Department, GoB

184
5.4 Recruitment by State and Other Organizations
The State Government has taken several steps over the years to give employment opportunities to the eligible working-age population in the departments and different state-run undertakings. At various points in time, the State Government has formed agencies and commissions to create employment opportunities. Some of the most prominent commissions and agencies are — Bihar Public Service Commission (BPSC), Bihar Technical Service Commission (BTSC), BELTRON and Rural Self Employment Training Institute (RSETI). Bihar Public Services Commission
The Bihar Public Service Commission (BPSC) is a constitutional body under Article 315 of the Constitution of India. The BPSC is one of the biggest commissions to recruit people by conducting competitive examinations to provide human resource to various departments of the State Government. In 2017-18, BPSC had recruited 1528 persons; in 2018-19, the number has become nearly doubled to be 2930 persons.
Table 5.13 : Number of Vacancies Advertised by BPSC (2017-18 and 2018-19)
Year Particulars General SC ST EBC BC BC (Women) Total
2017-18 Vacancies 936 309 17 331 219 50 1862 Recommendation sent 924 160 7 209 207 21 1528
2018-19 Vacancies 1559 579 28 685 369 120 3340 Recommendation sent 1550 394 27 511 359 68 2930*
Note : * Includes 21 posts recommended against the order of Hon’ble Court Source : Bihar Public Services Commission (BPSC), GoB
Bihar Technical Service Commission (BTSC)
The Bihar Technical Services Commission (BTSC) was constituted by the State Government in 2014 and became functional from 2017. BTSC recommends candidates to fill the technical posts in various departments and regional offices of Bihar. About 109 technical posts have been identified by BTSC, which makes recommendations for recruitment at regular intervals. As Table 5.14 suggests, during 2018-19 and 2019-20, BTSC had advertised for 22,115 posts.
Table 5.14 : Number of Vacancies Advertised by BTSC for Various Posts (2018-19 and 2019-20)
Year Post Seat
2018-19 Junior Engineer 6379
2019-20 Staff Nurse 9130 Tutors 169 Medical Officer 6437 Total 22115
Source : Bihar Technical Services Commission, GoB
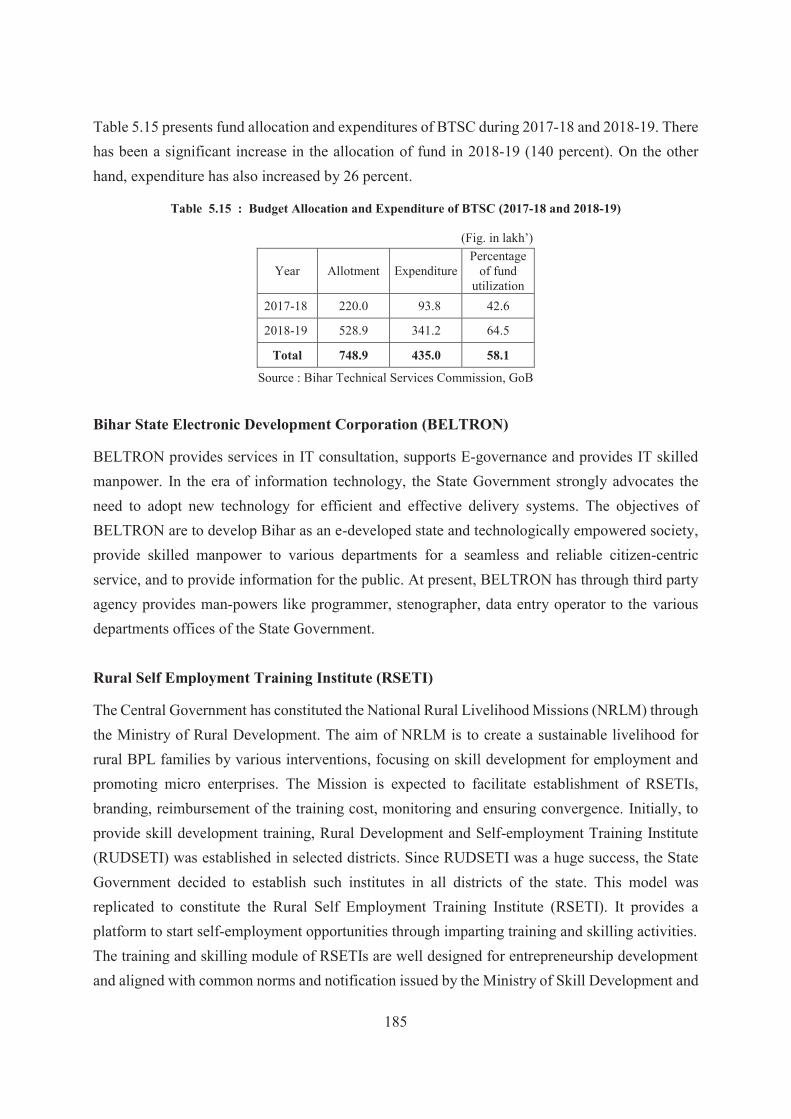
185
Table 5.15 presents fund allocation and expenditures of BTSC during 2017-18 and 2018-19. There has been a significant increase in the allocation of fund in 2018-19 (140 percent). On the other hand, expenditure has also increased by 26 percent.
Table 5.15 : Budget Allocation and Expenditure of BTSC (2017-18 and 2018-19)
(Fig. in lakh’)
Year Allotment Expenditure Percentage
of fund utilization
2017-18 220.0 93.8 42.6
2018-19 528.9 341.2 64.5
Total 748.9 435.0 58.1
Source : Bihar Technical Services Commission, GoB
Bihar State Electronic Development Corporation (BELTRON)
BELTRON provides services in IT consultation, supports E-governance and provides IT skilled manpower. In the era of information technology, the State Government strongly advocates the need to adopt new technology for efficient and effective delivery systems. The objectives of BELTRON are to develop Bihar as an e-developed state and technologically empowered society, provide skilled manpower to various departments for a seamless and reliable citizen-centric service, and to provide information for the public. At present, BELTRON has through third party agency provides man-powers like programmer, stenographer, data entry operator to the various departments offices of the State Government. Rural Self Employment Training Institute (RSETI)
The Central Government has constituted the National Rural Livelihood Missions (NRLM) through the Ministry of Rural Development. The aim of NRLM is to create a sustainable livelihood for rural BPL families by various interventions, focusing on skill development for employment and promoting micro enterprises. The Mission is expected to facilitate establishment of RSETIs, branding, reimbursement of the training cost, monitoring and ensuring convergence. Initially, to provide skill development training, Rural Development and Self-employment Training Institute (RUDSETI) was established in selected districts. Since RUDSETI was a huge success, the State Government decided to establish such institutes in all districts of the state. This model was replicated to constitute the Rural Self Employment Training Institute (RSETI). It provides a platform to start self-employment opportunities through imparting training and skilling activities. The training and skilling module of RSETIs are well designed for entrepreneurship development and aligned with common norms and notification issued by the Ministry of Skill Development and
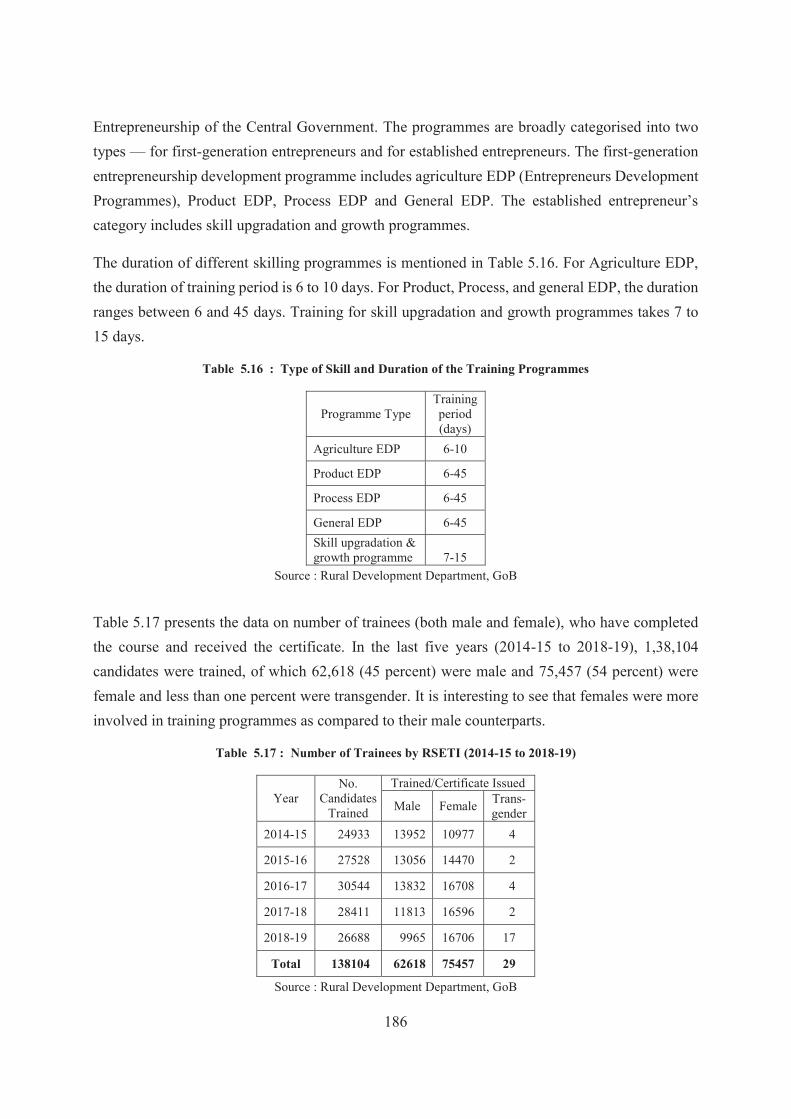
186
Entrepreneurship of the Central Government. The programmes are broadly categorised into two types — for first-generation entrepreneurs and for established entrepreneurs. The first-generation entrepreneurship development programme includes agriculture EDP (Entrepreneurs Development Programmes), Product EDP, Process EDP and General EDP. The established entrepreneur’s category includes skill upgradation and growth programmes.
The duration of different skilling programmes is mentioned in Table 5.16. For Agriculture EDP, the duration of training period is 6 to 10 days. For Product, Process, and general EDP, the duration ranges between 6 and 45 days. Training for skill upgradation and growth programmes takes 7 to 15 days.
Table 5.16 : Type of Skill and Duration of the Training Programmes
Programme Type Training period (days)
Agriculture EDP 6-10
Product EDP 6-45
Process EDP 6-45
General EDP 6-45 Skill upgradation & growth programme 7-15
Source : Rural Development Department, GoB
Table 5.17 presents the data on number of trainees (both male and female), who have completed the course and received the certificate. In the last five years (2014-15 to 2018-19), 1,38,104 candidates were trained, of which 62,618 (45 percent) were male and 75,457 (54 percent) were female and less than one percent were transgender. It is interesting to see that females were more involved in training programmes as compared to their male counterparts.
Table 5.17 : Number of Trainees by RSETI (2014-15 to 2018-19)
Year No.
Candidates Trained
Trained/Certificate Issued
Male Female Trans-gender
2014-15 24933 13952 10977 4
2015-16 27528 13056 14470 2
2016-17 30544 13832 16708 4
2017-18 28411 11813 16596 2
2018-19 26688 9965 16706 17
Total 138104 62618 75457 29
Source : Rural Development Department, GoB

187
Table 5.18 indicates that 4919 programmes were conducted under RSETIs, and 1,38,104 candidates received training between 2014-15 and 2018-19. Of the total trained candidates, 74 percent obtained gainful employment in various economic activities. The financial institutions (as part of various schemes) have financed 26 percent of the trained candidates. The availability of credit has certainly opened several opportunities for the trained people.
Table 5.18 : Number of Trainees Completed Training and Number of Trainees Received Employment
(2014-15 to 2018-19)
Year No. of
training Programmes
No. of trainees
completed training
No. of trainees received
employment 2014-15 882 24933 17402
2015-16 998 27528 19980
2016-17 1073 30544 23290
2017-18 1041 28411 22221
2018-19 925 26688 16059
Total 4919 138104 102682
Source : Rural Development Department, GoB
Dashrath Manjhi Labour and Planning Institute
In 2019-20, the State Government has allocated Rs 2.00 crore to establish Dashrath Manjhi Labour and Planning Institute to perform the role of a thinktank for the State Government on the issues of labour and planning. The Institute will engage in policy-oriented research on labour resources in the state and prepare an action plan for the upliftment of the working population. The Institute will arrange training programmes for capacity building of government officials and will provide relevant information on enforcement of labour laws, and desired changes and amendments in labour laws to guide the State Government. Furthermore, based on the trend in the progress of technology in various fields of work, the Institute will recommend a revision of the curricula of Industrial Training Institutes (ITIs) to enable the youth to take up market demanded jobs. The Institute will also review the welfare programmes run by the State Government at regular intervals and will recommend necessary changes.
Technical Education in Bihar
The number of Technical Training Institutes run by the State Government is 38, across the districts of Bihar. The State Government has also started 11 Women Industrial Training Institutes (WITIs). The number of Polytechnic Colleges is 44, of which 32 colleges have received government affiliation. In 2018-19, the total approved intake in Government Polytechnic Diploma courses was 10,035 and the same in Private Polytechnic Diploma courses was 17,095.

188
Employees’ State Insurance (ESI)
The Employees’ State Insurance Act, 1948 was the first major legislation by the Parliament on social security of the workers. The Act was initially implemented for factory workers, but later expanded to employees of all establishments with 10 or more workers. The Employee’s State Insurance Scheme is a self-financed health insurance scheme that is managed by Employees’ State Insurance Corporation (ESIC). The ESIC is an autonomous body under the Ministry of Labour and Employment, Government of India. The total number of registered workers under the ESIS was 2.02 lakh in 2017-18, and the number has increased to 2.83 lakh in 2018-19, an increase of 40 percent. In 2017-18, 65,821 workers had received treatment under the scheme, while 56,919 workers had received treatment in 2018-19.
Table 5.19 : Number of Insured and Treated People under Employees’ State Insurance
(2017-18 and 2018-19)
Year No. of Insured people
No. of Treated people
2017-18 201950 65821
2018-19 283220 56919
Sources : Labour Resources Department, GoB
Skill Development
The Bihar Skill Development Mission (BSDM) was constituted in 2010. The primary objective of the Mission is to facilitate training programmes for the youth and provide them with adequate employment opportunities. Two key schemes run by BSDM are :
Kushal Yuva Programme (KYP) : The BSDM has launched a unique skill training programme, called Kushal Yuva Programme, targeting people in the age group 15 to 28 years with a minimum educational level of Standard 10. Under the KYP, the Mission organises training programmes to impart soft skills, comprising life skills, communication skills (Hindi and English) and basic computer literacy. The official data suggest that 7,37,473 students have registered themselves in 1561 operational centres till date across all districts of Bihar. Furthermore, 3,02,974 students have completed their training programmes.
Recruit-Train-Deploy (RTD) Scheme : The RTD scheme is an innovative initiative to establish an effective and efficient skill ecosystem in Bihar. In this direction, BSDM has constituted ‘Dynamic and Demand-Based System Planning’. The RTD scheme invites representatives from different industries and corporate bodies to assess the market demand of different domain skills. The RTD scheme is specifically designed to facilitate industries to train candidates according to their requirements. Evidently, the RTD model is beneficial for both job seekers and industries.

189
Table 5.20 presents the financial details of different training programmes initiated under various schemes. The fund utilisation across all schemes has been remarkably high, that affirms the State Government’s commitment in imparting skill training and improve employability of a large section of the youth in Bihar.
Table 5.20 : Financial Allocation and Expenditure under Different Schemes for Training (2018-19)
(Rs. lakh)
Scheme Budget Expenditure Utilisation Percentage
Training & Re-Training 26.10 25.87 99.1
Introduction of New Trades in existing ITIs 100.00 30.14 30.1 Modernization of Machines and Equipments of ITIs 4000.00 577.81 14.4 Introduction of New Trades in existing Women’s ITIs 50.00 19.98 40.0
Establishment of New ITIs 4000.00 3449.12 86.2
Management Information System 493.90 132.68 26.9 Bihar Skill Development Mission (TSP) 379.19 379.19 100.0
Bihar Skill Development Mission (SCSP) 10136.20 10136.20 100.0
Bihar Skill Development Mission 21459.88 21459.88 100.0 Establishment of New Women ITIs 1000.00 617.59 61.8
Skill Development Mission 2384.70 283.50 11.9
Land Acquisition for ITIs 2000.00 307.20 15.4
Total (A) 46029.97 37419.14 81.3 Skill Development Mission for Building Construction 480.00 312.72 65.2 Skill Development Mission for Building Construction (SCSP) 90.00 0.00 0.0 Skill Development Mission for Building Construction (TSP) 30.00 0.00 0.0 Construction/Renovation/Strengthening of ITIs Buildings 13491.15 11915.07 88.3 Construction/Renovation/Strengthening of ITIs Buildings (TSP) 250.00 50.00 20.0 Construction/Renovation/Strengthening of ITIs Buildings 1497.70 1368.22 91.4
Total (B) 15838.85 13646.01 86.1 Skill Development Mission for Building Construction (Central share) 1125.00 612.89 54.5
Skill Development Mission (Central share) 2875.00 45.07 1.6 Total (C) 4000.00 657.96 16.4 G Total (A+B+C) 65868.80 51723.11 78.5
Sources : Labour Resources Department, GoB
Table 5.21 presents the departments-wise budget for skilling programmes. The budget allocation
has significantly increased for Department of Health, Department of SC/ST welfare, Department
of Social welfare and Department of Minority welfare in 2018-19 as compared to 2017-18.
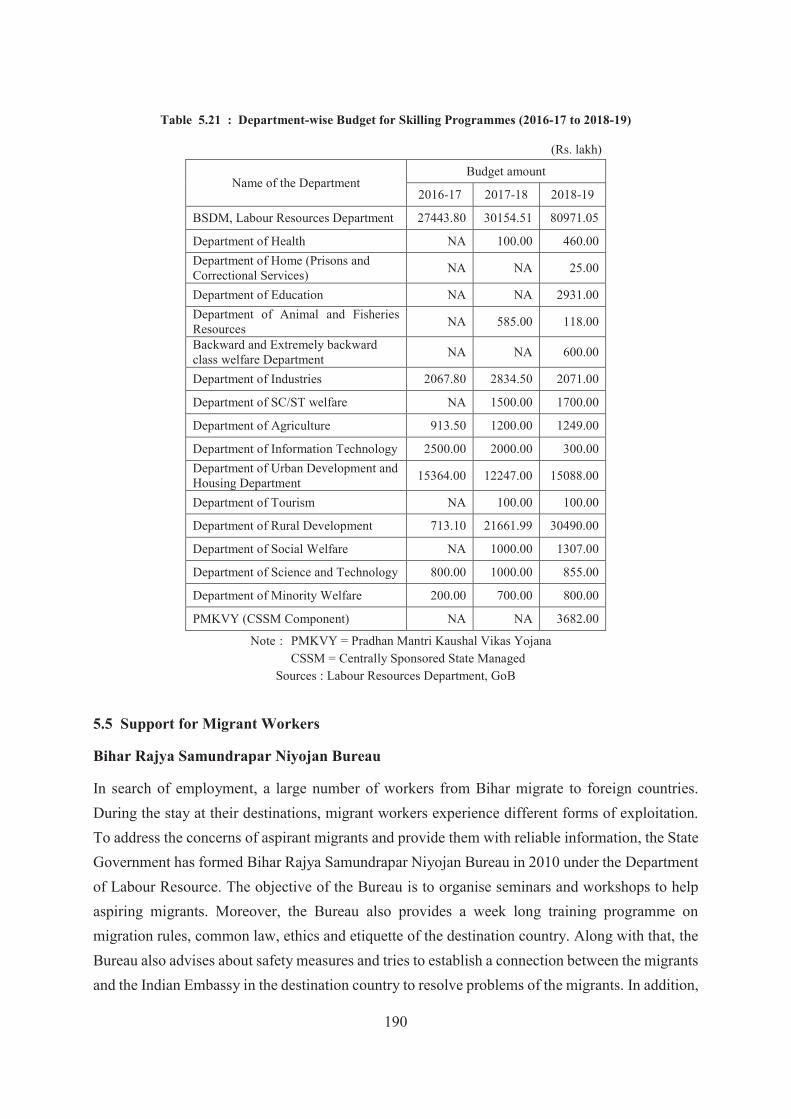
190
Table 5.21 : Department-wise Budget for Skilling Programmes (2016-17 to 2018-19)
(Rs. lakh)
Name of the Department Budget amount
2016-17 2017-18 2018-19
BSDM, Labour Resources Department 27443.80 30154.51 80971.05
Department of Health NA 100.00 460.00 Department of Home (Prisons and Correctional Services) NA NA 25.00
Department of Education NA NA 2931.00 Department of Animal and Fisheries Resources NA 585.00 118.00
Backward and Extremely backward class welfare Department NA NA 600.00
Department of Industries 2067.80 2834.50 2071.00
Department of SC/ST welfare NA 1500.00 1700.00
Department of Agriculture 913.50 1200.00 1249.00
Department of Information Technology 2500.00 2000.00 300.00 Department of Urban Development and Housing Department 15364.00 12247.00 15088.00
Department of Tourism NA 100.00 100.00
Department of Rural Development 713.10 21661.99 30490.00
Department of Social Welfare NA 1000.00 1307.00
Department of Science and Technology 800.00 1000.00 855.00
Department of Minority Welfare 200.00 700.00 800.00
PMKVY (CSSM Component) NA NA 3682.00
Note : PMKVY = Pradhan Mantri Kaushal Vikas Yojana CSSM = Centrally Sponsored State Managed
Sources : Labour Resources Department, GoB
5.5 Support for Migrant Workers
Bihar Rajya Samundrapar Niyojan Bureau
In search of employment, a large number of workers from Bihar migrate to foreign countries. During the stay at their destinations, migrant workers experience different forms of exploitation. To address the concerns of aspirant migrants and provide them with reliable information, the State Government has formed Bihar Rajya Samundrapar Niyojan Bureau in 2010 under the Department of Labour Resource. The objective of the Bureau is to organise seminars and workshops to help aspiring migrants. Moreover, the Bureau also provides a week long training programme on migration rules, common law, ethics and etiquette of the destination country. Along with that, the Bureau also advises about safety measures and tries to establish a connection between the migrants and the Indian Embassy in the destination country to resolve problems of the migrants. In addition,

191
the Bureau helps the aspiring migrants in applying for passport, visa procedure and emigration clearance. The Central government has also started online portals (24X7) to help migrant workers. To tackle unfortunate circumstances, the following online portals might be used to seek help — (i) MADAD Portal-http://www.madad.gov.in, (ii) eMigrants-http:/emigrate.gov.in, (iii) Overseas Workers Resource Centre (OWRC) and (iv) Indian Labour Resource Centre. Bihar State Migrant Labour Accidental Grant Scheme, 2008
The Bihar State Migrant Labour Accidental Grant Scheme, 2008 was implemented in all districts of Bihar. Later, this scheme was modified in 2016. In the amended scheme of 2016, along with all the death cases, permanent complete disability and permanent partial disability were also incorporated to enlarge the coverage of the scheme. The grant amount is directly transferred to the bank account of beneficiary The quantum of compensation is — Rs. 1.00 lakh for death, Rs. 75.00 thousand for permanent absolute disability, and Rs. 37.50 thousand for permanent complete partial disability.
Chart 5.3 : Total Amount Allotted to Dependents of Deceased Migrant Workers during 2014-2019
Source : Labour Resources Department, GoB
In 2016-17, the State Government had spent Rs. 22.03 lakh to provide compensation to 221 beneficiary. Most of the deceased migrant workers were from Begusarai (26), followed by Saran (20) and Samastipur (19). In 2017-18 and 2018-19, the total number of deceased, number of partial permanent disability and number of permanent disabilities declined significantly. Consequently, the total amount disbursed by the State Government has come down commensurately, as presented in Table A 5.4 (Statistical Appendix).
0
50
100
150
200
250
2014-15 2015-16 2016-17 2017-18 2018-19
Fig
in La
kh
Years

192
Remittances
The remittances are a crucial aspect of migration. The families of the migrants are heavily dependent on the size of the fund remitted to them. The Reserve Bank of India conducted a survey called ‘India’s Inward Remittances Survey 2016-17’ to report on the status of migration and remittances across the states of India. Table 5.22 shows state-wise share of the inward flow of
Table 5.22 : State-wise Share in Inward Remittances (2016-17)
Rank Destination State
Share in total
remittances (percent)
Rank Destination State
Share in total
remittances (percent)
1 Kerala 19.0 13 Goa 0.8 2 Maharashtra 16.70 14 Haryana 0.8 3 Karnataka 15.0 15 Madhya Pradesh 0.4 4 Tamil Nadu 8.0 16 Odisha 0.4 5 Delhi 5.9 17 Jharkhand 0.3 6 Andhra Pradesh 4.0 18 Uttarakhand 0.2 7 Uttar Pradesh 3.1 19 Puducherry 0.2 8 West Bengal 2.7 20 Chandigarh 0.2 9 Gujarat 2.1 21 Jammu and Kashmir 0.2 10 Punjab 1.7 25 Others 15.8 11 Bihar 1.3 Total 100.0 12 Rajasthan 1.2
Note : Others includes those remittances for which banks could not identify the specific destination. Source : India’s Inward Remittances Survey 2016-17, RBI
remittances from other countries. As is observed from the table, Kerala received 19.0 percent of the total remittances, followed by Maharashtra (16.7 percent) and Karnataka (15 percent). Among all states, Bihar stood at the 11th rank, with 1.3 percent of the total remittances. According to the findings of this report, almost 59.2 percent of total remittances was used primarily to maintain consumption at the origin households, while 20.0 percent remittances were used for bank deposit, followed by 8.3 percent for investment purposes, especially to purchase immovable and financial assets. It is clear that when more than half of the remittances is used for household consumption, the standard of living of the households at the origin improved due to remittances.

193
APPENDIX
Table A 5.1 : District-wise Passport Issued in Bihar (2016-17 to 2018-19)
District 2016-17 2017-18 2018-19
Received Issued Received Issued Received Issued Patna 29925 28956 31780 32513 34209 34911 Nalanda 3988 3983 4640 4870 5053 4620 Bhojpur 6168 6062 6761 7196 6456 5880 Buxar 7710 7143 7405 8510 6861 6071 Rohtas 6648 6808 7355 7778 7608 6845 Kaimur 1951 1950 2016 2214 2204 2040
Gaya 7342 7293 7804 7955 9703 7949 Jehanabad 1394 1425 1630 1649 1712 1648 Arwal 1062 980 1112 1249 1268 1231 Nawada 4199 4389 4752 5156 5517 4886 Aurangabad 16472 17610 27854 26257 25483 25462
Saran 15087 14859 15143 16405 15729 13766 Siwan 42142 41709 45819 49263 45093 41668 Gopalganj 37355 38680 37244 39924 35893 34239 W. Champaran NA NA NA NA 348348 317338 E. Champaran 13587 13738 14148 14813 14908 12753 Muzaffarpur 14091 13833 14878 15301 16545 13642 Sitamarhi 7924 7643 7908 8763 8462 7306 Sheohar 792 671 761 925 897 860 Vaishali 5622 5497 6356 6855 6782 6312 Darbhanga 12327 12923 11982 12889 12643 10112 Madhubani 12184 12387 11018 12024 11944 9607 Samastipur 5090 5178 5582 5779 6118 5067 Begusarai 4854 4503 5027 5293 5605 4797 Munger 1956 1971 2374 2452 2667 2215 Sheikhpura 883 911 950 1021 1058 961 Lakhisarai 1037 996 1117 1205 1286 1126 Jamui 2289 2291 2724 2849 2989 2864 Khagaria 1510 1498 1601 1840 1609 1350 Bhagalpur 4834 4989 6967 6736 6192 4989 Banka 1091 1087 1364 1424 1456 1147 Saharsa 2053 1967 2241 2457 2175 1909 Supaul 2896 3026 2658 3205 2981 2755 Madhepura 1086 1152 1041 1209 1209 1073 Purnea 5406 5438 6380 6511 7100 6973 Kishanganj 4665 4594 4937 5280 4887 4749 Araria 4690 4678 4570 4581 4762 4776 Katihar 3985 3968 4743 4757 4951 4603
Bihar 296295 296786 322642 339108 367908 337401 Note : Included backlog of applications
Sources : Ministry of External Affairs, Regional Passport Office, Patna

194
Table A 5.2 : Number of Released and Rehabilitated Bonded Labour by Old and New Scheme (2013 to 2019)
District
Old Scheme (2013 to May 16, 2016)
New Scheme (May 2016 onward)
No. of Bonded Labour
Released (within and
outside state)
No of Bonded Labour
received Assistance
Amount Paid as
Immediate Assistance (Rs. ’crore)
No. of Bonded Labour
Released (within and
outside state)
No of Bonded Labour
received Assistance
Amount Paid as
Immediate Assistance (Rs. ’000)
Patna 20 20 20.0 15 10 200.0 Nalanda 66 66 66.0 9 6 120.0 Bhojpur 13 13 13.0 Buxar 1 1 10.0 Rohtas 30 30 30.0 Kaimur 7 7 70.0 2 1 20.0
Gaya 693 693 6930.0 79 40 800.0 Jehanabad 64 64 640.0 56 27 540.0 Arwal 3 3 30.0 Nawada 64 64 64.0 252 89 1780.0 Aurangabad 3 3 30.0
Saran 2 2 20.0 2 Siwan 1 1 10.0 29 Gopalganj 1
W. Champaran 4 4 40.0 1 E. Champaran 59 59 590.0 33 31 620.0 Muzaffarpur 78 78 780.0 19 7 140.0 Sitamarhi 114 114 1140.0 21 14 280.0 Sheohar 2 2 20.0 1 Vaishali 43 43 430.0 8 5 100.0
Darbhanga 59 59 590.0 50 18 360.0 Madhubani 137 137 1370.0 22 16 320.0 Samastipur 139 139 1390.0 57 53 1060.0
Begusarai 22 22 220.0 4 4 80.0 Munger 7 7 70.0 Sheikhpura 4 4 40.0 Lakhisarai Jamui Khagaria 4 4 40.0 1 1 20.0
Bhagalpur 8 8 80.0 11 10 200.0 Banka 14 14 140.0 19 19 380.0
Saharsa 1 1 10.0 Supaul 7 7 70.0 54 48 960.0 Madhepura
Purnia 28 28 280.0 2 1 20.0 Kishanganj 91 91 910.0 1 Araria 23 23 230.0 20 Katihar 111 111 1110.0 29 22 440.0
Bihar 1922 1922 19220.0 798 422 8440.0
Sources : Labour Resources Department, GoB

195
Table A 5.3 : Rescued and Rehabilitated Child Labour under Chief Minister’s Relief Fund (2016-17 to 2018-19)
District
2016-17 2017-18 2018-19
Child Labour
Rescued
Chief Minister's
Relief Fund transferred to CL/AC
Child Labour
Rescued
Chief Minister's
Relief Fund transferred to CL/AC
Child Labour
Rescued
Chief Minister's
Relief Fund transferred to CL/AC
Patna 294 6 35 2 55 3 Nalanda 41 2 74 9 39 0 Bhojpur 3 3 23 11 27 18 Buxar 2 0 8 6 5 0 Rohtas 0 0 16 4 17 2 Kaimur 0 0 11 1 12 0
Gaya 141 20 115 18 132 0 Jehanabad 34 13 25 2 23 0 Arwal 1 0 9 0 4 0 Nawada 37 20 55 11 51 0 Aurangabad 23 6 30 1 25 0
Saran 32 13 34 12 18 0 Siwan 9 2 31 13 6 0 Gopalganj 5 3 14 2 13 0
W. Champaran 34 11 16 9 48 9 E. Champaran 34 12 36 5 97 0 Muzaffarpur 7 2 10 0 48 0 Sitamarhi 12 5 26 10 14 2 Sheohar 1 1 5 0 8 Vaishali 41 21 52 9 31 1
Darbhanga 41 5 8 1 15 0 Madhubani 11 7 30 19 20 0 Samastipur 53 29 27 14 73 3
Begusarai 6 0 11 0 42 0 Munger 6 0 14 5 6 0 Sheikhpura 1 0 11 5 10 0 Lakhisarai 1 0 3 0 6 0 Jamui 0 0 23 9 16 3 Khagaria 7 6 26 7 9 0
Bhagalpur 2 1 16 9 21 0 Banka 5 4 15 2 33 0
Saharsa 21 15 16 1 19 0 Supaul 2 0 8 3 6 0 Madhepura 8 5 10 4 10 0
Purnia 77 13 31 8 23 3 Kishanganj 40 6 18 0 5 0 Araria 11 7 18 8 24 5 Katihar 11 7 20 10 16 5
Bihar 1054 245 930 230 1027 54
Sources : Labour Resources Department, GoB

196
Table A 5.4 : District-wise Deaths of Migrant Worker and Fund Allotment to the Family of Deceased (2016-17 to 2018-19)
District
2016-17 2017-18 2018-19 No.
deceased persons
Allotted amount (000’)
No. deceased persons
Allotted amount (000’)
No. deceased persons
Allotted amount (000’)
Patna 4 400 2 200 4 400 Nalanda 2 200 0 0 — — Bhojpur 16 1600 9 900 11 1100 Buxar 10 1000 1 100 3 300 Rohtas 9* 837.5 8* 737.5 2 200 Kaimur 4 400 1 100 1 100
Gaya 4 400 4 400 1 100 Jehanabad — — 1 100 Arwal — — 5 500 3 300 Nawada 3 300 6 600 1 100 Aurangabad 5 500 6 600 7 700
Saran 20 2000 3 300 13 1300 Siwan 13 1300 17 1700 4 400 Gopalganj 8 800 4* 337.5 10 1000
W. Champaran — — 1 100 10 1000 E. Champaran 5 500 10 1000 2 200 Muzaffarpur 13 1300 11 1100 Sitamarhi 2 200 1 100 1 100 Sheohar 1 100 1 100 1 100 Vaishali 14 1400 6 600 7 700
Darbhanga — — 5 500 2 200 Madhubani 2 200 — — 1 100 Samastipur 19 1900 12 1200 15 1500
Begusarai 26 2600 -- -- 9 900 Munger 2 200 2 200 — — Sheikhpura 3 300 1 100 8 800 Lakhisarai — — 1 100 3 300 Jamui 6 600 2 200 5 500 Khagaria 3 300 2 200 9 900
Bhagalpur 4 400 4@ 375 6 600 Banka 6 600 — — 1 100
Saharsa 5 500 10 1000 8 800 Supaul 3 300 2 200 Madhepura 2 200 — — 2 200
Purnea 5 500 11 1100 1 100 Kishanganj — — — — 1 100 Araria 2 200 2 200 3 300 Katihar — — 4 400 1 100 Bihar 221 22037.5 155 15350 156 15600
Note : * One partial permanent disability, @One permanent disability Sources : Labour Resources Department, GoB
______________

197
CHAPTER - VI
INFRASTRUCTURE
You and I come by road or rail, but economists travel on infrastructure. — Margaret Thatcher
The aim of Sustainable Development Goal-9 (SDG 9) is to develop quality and resilient infrastructure at the regional and transborder levels. The available and accessible infrastructure is an important driver for economic development. Infrastructure complements economic growth and vice versa. For instance, the development of transport infrastructure expands the scope and size of the market and also improves productivity significantly; on the other hand, economic growth enables the state to create more infrastructure. Apart from ensuring better economic growth prospect, integration of local markets with the global market, technological innovation, and the progress in infrastructure also help in reducing poverty. Advancement in infrastructure enables better management of logistics by combining purchasing, production and marketing function. The provision of infrastructure services is the shared responsibility of the Central and State Governments. In the present global economic order, private capital also plays a pivotal role in
Abstract
The infrastructure is one of the main pillars of economic development. The transport sector has registered double-digit growth in the recent period and has increased its share in economy. It is mainly the outcome of the investment made by the State Government. The major achievement in the area of road safety is that road accidents per lakh population has been the lowest in Bihar among major Indian states. In terms of road density (per 1000 sq.km.), Bihar ranks fourth among major states of India. The State Government has been expanding rural roads in a massive manner and has doubled its length in the last five years to strengthen the rural economy. The State Transport Corporation has earned the highest growth in revenue collection and its has increased by more than seven times during the last five years. The Railways and Air Transport have also been playing an important role in the development of the state economy. The Building Construction Department has endeavoured to create adequate and quality infrastructure for delivering good governance through building administrative buildings, as well as social infrastructure. Telecommunication has been useful in providing e-governance programmes in the state, while the Postal Department has been providing substantial banking services apart from basic postal services.
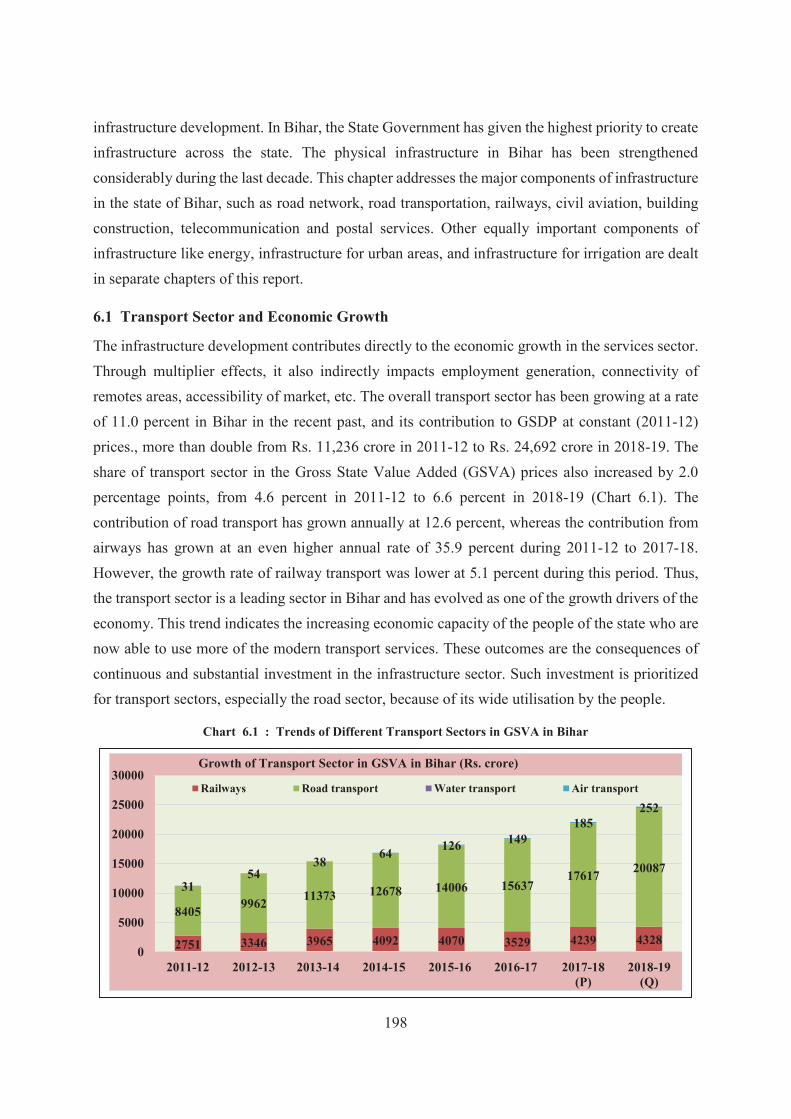
198
infrastructure development. In Bihar, the State Government has given the highest priority to create infrastructure across the state. The physical infrastructure in Bihar has been strengthened considerably during the last decade. This chapter addresses the major components of infrastructure in the state of Bihar, such as road network, road transportation, railways, civil aviation, building construction, telecommunication and postal services. Other equally important components of infrastructure like energy, infrastructure for urban areas, and infrastructure for irrigation are dealt in separate chapters of this report.
6.1 Transport Sector and Economic Growth
The infrastructure development contributes directly to the economic growth in the services sector. Through multiplier effects, it also indirectly impacts employment generation, connectivity of remotes areas, accessibility of market, etc. The overall transport sector has been growing at a rate of 11.0 percent in Bihar in the recent past, and its contribution to GSDP at constant (2011-12) prices., more than double from Rs. 11,236 crore in 2011-12 to Rs. 24,692 crore in 2018-19. The share of transport sector in the Gross State Value Added (GSVA) prices also increased by 2.0 percentage points, from 4.6 percent in 2011-12 to 6.6 percent in 2018-19 (Chart 6.1). The contribution of road transport has grown annually at 12.6 percent, whereas the contribution from airways has grown at an even higher annual rate of 35.9 percent during 2011-12 to 2017-18.However, the growth rate of railway transport was lower at 5.1 percent during this period. Thus,the transport sector is a leading sector in Bihar and has evolved as one of the growth drivers of the economy. This trend indicates the increasing economic capacity of the people of the state who are now able to use more of the modern transport services. These outcomes are the consequences of continuous and substantial investment in the infrastructure sector. Such investment is prioritized for transport sectors, especially the road sector, because of its wide utilisation by the people.
Chart 6.1 : Trends of Different Transport Sectors in GSVA in Bihar
2751 3346 3965 4092 4070 3529 4239 4328
8405 9962 11373 12678 14006 1563717617 20087
3154
3864 126 149
185252
0
5000
10000
15000
20000
25000
30000
2011-12 2012-13 2013-14 2014-15 2015-16 2016-17 2017-18(P)
2018-19(Q)
Growth of Transport Sector in GSVA in Bihar (Rs. crore)
Railways Road transport Water transport Air transport

199
6.2 Public Investment in Road Transport
Building of road and its maintenance generate sizeable employment and promote other economic
activities. In this scenario, expansion of road network in the state has always been on a high priority
for the State Government. In the recent years, the State Government has invested considerably on
construction of roads and bridges, as well as their maintenance for smooth transportation of goods
and passengers. Indeed, the State Government has taken a resolution to create a quality road
network for the people to reach the state capital of Patna from any remote area of the state within
five hours. Consequently, the allocations for roads and bridges have been showing an increase
from Rs. 5988 crore (2012-13) to Rs. 18,677 crore (2019-20).
Table 6.1 : Public Investment in Roads and Bridges in Bihar (2012-13 to 2019-20)
(Rs. crore)
Expenditure Head 2012-13 2013-14 2014-15 2015-16 2016-17 2017-18 2018-19 2019-20BE CAGR
Public Investment in Road and Bridges (i+ii)
5988 7392 9816 14125 14993 13158 9015 18677 12.5
(i) Expenditure on Road and Bridges 4114 5458 5168 6112 7101 6770 8055 8201 9.6
(ii) Expenditure on Rural Road 1874 1934 4648 8013 7892 6388 960 10476 12.0
Revenue Expenditure on Road and Bridges 823 1375 991 1709 1776 1398 2792 2665 16.5
Capital Expenditure on Road and Bridges 3291 4083 4177 4403 5326 5373 5264 5536 7.2
Expenditure on Economic Services 20246 24871 29173 37305 44943 45360 41603 58245 14.6
Development Expenditure 47282 54718 64293 78077 90800 97771 107737 146134 16.3
Total Budget 69207 80405 94698 112328 126302 136427 154655 200501 15.3
GSDP 282368 317101 342951 371602 422316 484740 515634 572827 10.7
Percentage of Public Investment in Road and Bridges
Economic Services 29.6 29.7 33.6 37.9 33.4 29.0 21.7 32.1 —
Development Expenditure 12.7 13.5 15.3 18.1 16.5 13.5 8.4 12.8 —
Total Budget 8.7 9.2 10.4 12.6 11.9 9.6 5.8 9.3 —
GSDP 2.1 2.3 2.9 3.8 3.6 2.7 1.7 3.3 —
Source : State Budget Documents, Government of Bihar
The annual growth rate of public investment in the roads and bridges sectors was 12.5 percent. The expenditure on maintenance was growing faster (16.5 percent) in the state, significantly higher than the growth in expenditure on construction of new roads and bridges (7.2 percent). This will

200
ensure quality of the road network in the state. Given that 88.7 percent of the total population resides in rural areas of Bihar, the availability of rural roads is very important. In this direction,the State Government has taken a resolution to build paved road and drainage system to connect every house. On average, the State Government had spent 9.3 percent of its total budget for construction of road and bridges, including rural roads. In 2019-20, the State Government allotted Rs. 18677.26 crore for the road transport that constituted 32.1 percent of the expenditure on economic services, 12.8 percent of the development expenditure and 3.3 percent of the GSDP of the state.
Chart 6.2 : Trend of Developmental Expenditure in Bihar (Rs. crore)
6.3. Road Safety
Road Safety is one of the defining issues of the last decade. Bihar has made progress and now is on its way to have one of the best road safety records in India. India alone accounts for about ten percent share of the global road crashes. The road crash fatalities in India has been increasing at a rate of 6 percent annually over the past ten years. Many lives have been saved through widespread changes in driver behavior, better engineering and enhanced enforcement.
During 2018, a total of 4.67 lakh road accidents was reported in India. The highest number of accidents was registered in Tamil Nadu (63,920), followed by Madhya Pradesh (51,397) and Uttar Pradesh (42,568). These three states together accounted for 34 percent of total accidents in India. Bihar is at the 15th position in terms of road accidents in India, reporting 9600 road accidents during 2018 (Table 6.2). It is worth noting that the number of road accidents per lakh population is the lowest in Bihar (9.0) among all major Indian states and its rank is 26. The number of road accidents per lakh of population was the highest in Kerala (111) and, for the entire country, the figure stood at 36. Among the million population plus with cities in India, Patna ranked 32 out of
-10000
10000
30000
50000
70000
90000
110000
130000
150000
2007
-08
2008
-09
2009
-10
2010
-11
2011
-12
2012
-13
2013
-14
2014
-15
2015
-16
2016
-17
2017
-18
2018
-19
2019
-20
BE
Total Expenditure on Road and Bridges
Rural Roads
Expenditure on Economic Services
Development Expenditure

201
50 in terms of road accidents in 2018. There were 966 road accidents in Patna, which was about 10 percent of the total road accidents in Bihar. The road accidents are the result of various factors, such as human error, road environment and vehicular condition. The traffic rule violation, driving without licence, non-use of safety devices, higher traffic congestion, speed of vehicles, overloading, weather conditions, etc. are the major causes of road accidents. To improve road safety across the state, various initiatives have been undertaken to enhance Road Safety covering a wide spectrum of areas — Legislation, Infrastructure, Technology, Enforcement, Emergency Response and Education.
Table 6.2 : Road Accident in Major Indian States (2015 to 2018)
StatesNumber of Road Accidents Number of Accidents Per Lakh
Population
2015 2016 2017 2018 2015 2016 2017 2018
Andhra Pradesh 24258 24888 25727 24475 27.7 28.2 28.9 27.3
Bihar 9555 8222 8855 9600 9.3 7.9 8.4 9.0
Chhattisgarh 14446 13580 13563 13864 56.5 52.5 51.8 52.3
Gujarat 23183 21859 19081 18769 37.3 34.8 30.0 29.2
Haryana 11174 11234 11258 11238 41.3 40.9 40.4 39.8
Jharkhand 5162 4932 5198 5394 15.5 14.7 15.3 15.6
Karnataka 44011 44403 42542 41707 71.2 71.2 67.6 65.7
Kerala 39014 39420 38470 40181 110.0 110.5 107.2 111.4
Madhya Pradesh 54947 53972 53399 51397 71.6 69.3 67.6 64.2
Maharashtra 63805 39878 35853 35717 53.8 33.2 29.5 29.1
Odisha 10542 10532 10855 11262 25.0 24.8 25.4 26.1
Punjab 6702 6952 6273 6428 23.2 23.9 21.4 21.7
Rajasthan 24072 23066 22112 21743 33.4 31.6 29.9 29.0
Tamil Nadu 69059 71431 65562 63920 100.0 102.9 94.0 91.3
Uttarakhand 1523 1591 1603 1468 14.5 15.0 14.9 13.5
Uttar Pradesh 32385 35612 38783 42568 15.1 16.3 17.5 18.9
West Bengal 13208 13580 11631 12705 14.2 14.5 12.3 13.4
All-India 501423 480652 464910 467044 38.3 37.9 36.2 36.0Source : Ministry of Road Transport and Highways, Government of India
Road safety is emerging as a major social concern in the country. While new roads are being built,
faster and faster automobiles are being invented in high numbers making road safety a crucial
question. A Road Safety Policy, 2015 has been adopted by the State Government for minimizing
road accidents and making road transport more safe. Subsequently, the Bihar Road Safety Action
Plan and Road Safety Fund have been created. The Road Safety Council Rules-2018 has been
framed and adopted. The State Road Safety Council and District Road Safety Committee have
been made more effective through strict monitoring systems. The road safety has been

202
incorporated in the curriculum of Class VI to Class VII and awareness programmes have been
organized for the common people of the state on a regular basis. A School Vehicle Management
Policy is being prepared to ensure safe transportation of students. Speed Limiting Device and
Reflective Tapes has been made mandatory for all vehicles to reduce accident. Black Spot Policy
along with Good Samaritan has been created. There are 44 advance life support ambulances (Toll
free no- 1099) and 749 basic life support ambulances (Toll free no- 102) for all districts of Bihar.
These ambulance services are provided by the State Government free of cost.
Every year, the first week of February is observed as the Road Safety Week. To mark the occasion,
various awareness programmes and activities such as exhibition, visual shows, slide shows and
displaying banners are organised. On this occasion, bus drivers/conductors are made aware of
accidents and precautions to be taken to avoid repetition of mistakes. Posters, appeals, instructions,
etc are issued by citing major/fatal accidents and their causes. In addition, the Department has also
started providing free-of-cost HMV License training to 2000 applicants at IDTR Aurangabad to
ensure safe during standards.
6.4. Road Network
The road network plays a pivotal role in the development of the economy of any region. It opens
up ample opportunity by connecting rural areas to the nearest urban or semi-urban centres,
provides access to the market, and thus helps to promote economic activity. India has about 58.98
lakh kms of road network, which is the second largest in the world. This comprises National
Highways, Expressways, State Highways, Major District Roads, Other District Roads and Village
Roads. Presently, Bihar has a road network of 2,09,549 kms. which includes 4839 kms of National
Highways (NH) and 4006 kms of State Highways (SH). This road network transports major share
of goods, and a large share of passenger traffic also uses the road network to reach their destination.
The road transportation has gradually increased over the years, leading to the improvement in
connectivity between cities, towns and villages in Bihar.
The total road length of major states in India between 2003 to 2017 is presented in Table 6.3. The
figures are five-year averages for the mentioned period. Table 6.3 also presents the data on road
density in terms of road length (in km) per lakh population and per 1000 sq.kms. of area. During
the period 2008 to 2017, the maximum expansion of road network was in Maharashtra (3,52,603
kms), followed by Madhya Pradesh (1,77,851 kms) and Uttar Pradesh (1,68,127 kms). Bihar was
the sixth highest state in terms of building additional road length (1,30,799 kms) during the same
period.

203
Table 6.3 : Road Network in Major States of India (2003-07, 2008-12 and 2013-17)
StateRoad Length (Kms.)
Density of Length of existing roads
km/lakh populationLength of existing roads
in km/ 1000 sq km
2003-07 2008-12 2013-17 2003 2010 2017 2003 2010 2017
Andhra Pradesh 282682 261484 193923 259 282 201 73 86 64
Bihar 102559 128337 205808 91 126 181 84 136 223
Chhattisgarh 73328 84670 95001 335 365 357 54 68 72
Gujarat 144048 155020 177412 272 262 280 73 79 92
Haryana 28859 37480 52263 130 150 301 64 84 184
Jharkhand 15468 22157 51537 41 69 195 14 28 88
Karnataka 215670 279080 329399 367 465 565 104 146 188
Kerala 167397 204594 202943 434 604 692 359 517 619
Madhya Pradesh 164854 188021 286067 263 266 435 53 62 111
Maharashtra 241716 367321 608769 272 367 532 88 132 203
Odisha 214505 238321 287254 564 564 689 137 150 195
Punjab 44516 76611 111168 160 299 482 79 163 277
Rajasthan 149430 220449 247080 239 332 355 41 65 78
Tamil Nadu 174931 196369 255156 261 267 350 129 146 201
Uttar Pradesh 259394 356699 419809 151 192 196 108 156 178
Uttarakhand 40731 46823 62576 395 472 640 65 88 130
West Bengal 156269 281672 311647 108 324 338 100 329 363
All-India 2873680 3636861 4621503 245 309 386 79 112 152
Source : Transport Research Wing, Ministry of Road Transport and Highways, GoI
During the last fifteen years, road density has increased from 245 kms. per lakh of population to
386 kms. per lakh of population of the state. However, Bihar has the lowest road density, with 181
kms. per lakh populations, compared to 386 kms. at the all-India level. This is because of the high
density of population in Bihar which reflects in a low road density per lakh population. The road
density of seven major states was higher than the all India average of 386, while ten major states
including Bihar has a lower density. In terms of road density in 2017, Kerala outperformed all
other states, accounting for 692 kms. road length per lakh population, followed by Odisha (689
kms.) and Karnataka (565 kms.) (Chart 6.3). In terms of road length (kms.) per 1000 sq. kms. of
area, Bihar ranked fourth (223 kms.) in 2017, substantially higher than the all-India average at
only 152 kms. Some other states with high road density in terms of area were — Kerala (619 kms.),
West Bengal (363 kms.) and Punjab (277 kms.).

204
Chart 6.3 : Total Road Length (km) per lakh population (2017)
Different agencies are involved in the construction of National Highways, State Highways, roads
of Public Works Department, Urban Roads, Rural Road and other roads. The details of the roads
in Bihar by different types are presented in Table 6.4. Out of 2,09,549 kms., a total of 1,17,573
kms road networks was surfaced. Roads under NH, SH and other PWD roads were fully surfaced,
while 52 percent of rural roads, 43 percent of urban roads and 20 percent of other projects road
were paved till 2017. A total of 92,000 kms roads are still not paved. Since Bihar is a largely rural
state, about 80 percent of total road network comes under rural roads. Other PWD, urban roads
and project roads constituted about 10-12 percent of the total road network. The figures in Table
6.4 also show that the expansion of rural roads has been faster than other roads in recent years and,
secondly, the share of surfaced roads in the total rural length has increased substantially. The length
of surfaced rural roads has been growing at 9.4 percent annually and increased by more than 50,000
kms between 2012 and 2017. The expansion of overall road network in the state has been growing
at a rate of 6.5 percent, and more than 60,000 kms of the additional roads were constructed during
the same period.
As already discussed, the State Government is committed to provide smooth road network to reach
the capital Patna from any interior point of the state within five hours. The road density of different
districts is shown in Chart 6.4. The chart presents the spread of road network (kms per lakh
0
100
200
300
400
500
600
700
181 195 196 201
280 301338 350 355 357
386435
482532
565
640689 692

205
population). Among all the districts, Jamui held the top position with 160 kms of road length per
lakh population, followed by Aurangabad (152 kms) and Kaimur (143 kms). The districts of
Begusarai (54 kms), Munger (67 kms) and Patna (69 kms) were at the bottom in terms of road
density. In terms of road density (kms. per 1000 square kms. of area), the top three districts were
Sheohar (1925 kms), Vaishali (1884 kms) and Darbhanga (1816 kms); at the other end, the three
lagging districts were Lakhisarai (698 kms), Munger (726 kms) and West Champaran (734 kms).
A total of 11 districts belonging to south Bihar and 7 districts of north Bihar had better road density
compared to the state average.
Table 6.4 : Total and Surfaced Road Network by Authority in Bihar (2012 to 2017)
(Length in kms.)
Type of road National Highways
StateHighways
Other PWD Roads
Rural Roads
Urban Roads
Project Roads Total
2012Total 4105
(3.0)4857(3.5)
9030(6.5)
108759 (78.5)
8918(6.4)
2848(2.1)
138517 (100.0)
Surfaced 4105(6.3)
4857(7.4)
9030(13.8)
42747 (65.4)
3819(5.8)
797(1.2)
65355 (100.0)
2013Total 4168
(2.1)4483(2.3)
9401(4.8)
167579 (85.0)
8760(4.4)
2848(1.4)
197239 (100.0)
Surfaced 4168(3.6)
4483(3.8)
9401(8.0)
94421 (80.8)
3661(3.1)
797(0.7)
116931 (100.0)
2014Total 4467
(2.1)4389(2.1)
10128 (4.8)
179392 (85.5)
8823(4.2)
2559(1.2)
209758 (100.0)
Surfaced 4467(4.3)
4389(4.2)
10128 (9.8)
80431 (77.6)
3699(3.6)
508(0.5)
103622 (100.0)
2015Total 4701
(2.3)4426(2.1)
10128 (4.9)
175373 (85.1)
8823(4.3)
2559(1.2)
206010 (100.0)
Surfaced 4701(4.3)
4426(4.1)
10128 (9.4)
84794 (78.3)
3699(3.4)
508(0.5)
108256 (100.0)
2016Total 4839
(2.3)4253(2.1)
10634(5.2)
175373 (84.9)
8826(4.3)
2559(1.2)
206484 (100.0)
Surfaced 4839(3.9)
4253(3.4)
10634 (8.6)
99476 (80.6)
3702(3.0)
508(0.4)
123412 (100.0)
2017Total 4839
(2.3)4006(1.9)
11145 (5.3)
178109 (85.0)
8891(4.2)
2559(1.2)
209549 (100.0)
Surfaced 4839(4.1)
4006(3.4)
11145 (9.5)
93275 (79.3)
3801(3.2)
508(0.4)
117573 (100.0)
Note : Figures in the parenthesis denote percent share to total Source : Transport Research Wing, Ministry of Road Transport and Highways, GoI

206
Chart 6.4 : District-wise Road Density in Bihar as on September 2019 (in kms)
National Highways (NH) Network
National Highways (NH) strengthen the economic foundation of any region and it has often led to the emergence of new towns along the highways. It also generates short-term employment during the course of construction and long-term employment through establishment of service points along the road (hotels, restaurants, etc.). The Central Government has started Bharatmala Pariyojna, the largest ever highway development programme in India, under which 34,800 kms of NHs are to be upgraded in the Phase 1 at an estimated cost of Rs. 5,35,000 crore. This project will ensure faster road traffic movement across the country by bridging critical infrastructure gaps. Further, the National Highway Authority of India (NHAI) envisions the development of new green corridors under the Bharatmala Pariyojana to connect remote areas. The project will reduce the cost of logistics, providing multimodal and efficient transport, last-mile connectivity and improve existing supply chain infrastructure in the country.
The total length of NH and its density in terms of population and area across the different states are shown in Table 6.5. The length of NH in Bihar has been gradually increasing over the years —from 3534 kms during the period 2003-07 to 4603 kms during 2013-17. The growth rate of NH construction was higher during 2013-17 compared to 2008-12. The density of road length per 1000
6981217
1925
0500
1000150020002500
Lakh
isara
iM
unge
rW
. Cha
mpa
ran
Kaim
urKh
agar
iaRo
htas
Begu
sara
iNa
wad
aAr
wal
Bhag
alpu
rKa
tihar
Jam
uiBa
nka
Bhoj
pur
Saha
rsa
Gaya
Sita
mar
hiSu
paul
Biha
rBu
xar
Purn
eaSh
eikh
pura
Mad
hepu
raAu
rang
abad
E. C
ham
para
nKi
shan
ganj
Arar
iaGo
palg
anj
Siw
anPa
tna
Nala
nda
Sam
astip
urM
adhu
bani
Muz
affa
rpur
Sara
nJe
hana
bad
Darb
hang
aVa
ishal
iSh
eoha
r
Road Length (Km) per 1000 sq km of Geographical Area
54
98
160
020406080
100120140160180
Begu
sara
iM
unge
rKh
agar
iaPa
tna
Sita
mar
hiBh
agal
pur
Lakh
isara
iAr
wal
Siw
anBh
ojpu
rW
. Cha
mpa
ran
Katih
arSa
mas
tipur
Saha
rsa
Sheo
har
E. C
ham
para
nDa
rbha
nga
Naw
ada
Muz
affa
rpur
Vaish
ali
Gopa
lgan
jBi
har
Sara
nM
adhe
pura
Mad
huba
niNa
land
aRo
htas
Buxa
rPu
rnea
Gaya
Supa
ulAr
aria
Jeha
naba
dSh
eikh
pura
Kish
anga
njBa
nka
Kaim
urAu
rang
abad
Jam
ui
Road Length (Km) per lakh Population

207
sq. kms had increased from 35.2 kms in 2003 to 51.4 kms in 2017. Of 56,043 kms additional NH construction between 2003 and 2017, the highest length (11,811 kms) had been constructed in Maharashtra, followed by Uttar Pradesh (3770 kms) and Rajasthan (3309 kms).
Table 6.5 : National Highways Network in Major States of India (2003-07, 2008-12 and 2013-17)
StateRoad Length (kms)
Density
Length of existing NH in kms/lakh population kms./ 1000 sq km
2003-07 2008-12 2013-17 2003 2010 2017 2003 2010 2017
Andhra Pradesh 4378 4524 5643 5.1 5.4 6.2 14.6 16.5 19.9
Bihar 3534 3735 4603 3.8 3.6 4.2 35.2 38.7 51.4
Chhattisgarh 2109 2205 2942 8.3 8.7 11.2 13.4 16.2 22.8
Gujarat 2939 3402 4696 4.7 5.5 7.7 12.5 16.5 25.3
Haryana 1463 1539 2247 6.2 6.1 9.7 30.7 34.3 59.3
Jharkhand 1765 1878 2656 5.7 5.6 7.4 20.1 22.6 33.3
Karnataka 3788 4285 6103 6.6 7.3 10.2 18.6 22.9 33.9
Kerala 1440 1457 1718 4.5 4.4 5.2 37.1 37.5 46.6
Madhya Pradesh 4881 4892 5693 7.4 7.1 6.6 15.1 16.3 16.8
Maharashtra 4066 4198 8133 3.6 3.8 6.3 11.8 13.6 24.2
Odisha 3623 3704 4657 8.7 8.9 11.0 21.2 23.8 31.1
Punjab 1557 1557 2207 6.2 5.7 9.6 30.9 30.9 55.0
Rajasthan 5387 5894 7705 7.8 8.3 10.6 13.4 16.3 23.1
Tamil Nadu 4210 4780 4963 5.8 6.8 6.6 28.9 37.2 38.0
Uttar Pradesh 5578 6803 8296 2.9 3.5 3.9 20.5 28.1 35.2
Uttarakhand 1808 2032 2519 12.2 20.6 24.9 20.1 38.2 50.7
West Bengal 2271 2588 2882 2.4 2.9 3.1 22.0 29.0 33.3
All - India 64487 71198 96713 5.5 6.0 7.8 17.7 21.6 30.7
Source : Ministry of Road Transport & Highways, Government of India
The district-wise spread of NH is shown in Table A 6.1 (Statistical Appendix). The increase in the
length of NH during 2013-19 was 716.5 kms in Bihar. Jamui has been the most benefitted district
through the construction of nearly 110.0 kms of additional NH, followed by Siwan (77.2 kms),
and Katihar (56.1 kms). Chart 6.5 displays the road density in terms of area as well as population
in different districts. With regard to population, the better performing three districts are — Arwal,
Jamui and Supaul. In terms of area, the top three districts are — Arwal, Patna and Supaul.

208
Chart 6.5 : District-wise Road Density of National Highways in Bihar as on September 2019 (in kms)
A total of 43 NHs, measuring 4917 kms, traverse through Bihar as on September 2019 compared
to 35 NHs (4321 kms) as on March, 2014. With the addition of 8 more NHs during these five
years, the total length of NH has become 4917 kms. Table 6.6 shows the list of NHs passing
through Bihar. As may be seen from the table, NH 31 has the maximum road length of 404 kms
that pass thorough the state.
Chart 6.6 displays the percentage distribution of National Highways by their width. A major share
of NH consists of multiple or double-lane roads (81 percent); the intermediate and single-lane
roads account for 11 percent and 8 percent respectively. With combined efforts of the Central and
State Governments, the length of multiple and double-lane roads has gradually increased over the
years in Bihar.
0
52
210
0
50
100
150
200
250
Jeha
naba
dW
. Cha
mpa
ran
Dar
bhan
gaSa
mas
tipur
Bank
aK
aim
urG
aya
E. C
ham
para
nN
awad
aB
hojp
urPu
rnea
Kis
hang
anj
Lakh
isara
iRo
htas
Gop
alga
njBu
xar
Kat
ihar
Biha
rB
egus
arai
Ara
riaSa
hars
aA
uran
gaba
dBh
agal
pur
Siw
anM
unge
rM
adhe
pura
Kha
garia
Vai
shal
iSh
eoha
rJa
mui
Shei
khpu
raM
adhu
bani
Sita
mar
hiN
alan
daM
uzaf
farp
urSa
ran
Supa
ulPa
tna
Arw
al
Road Length (Km) per 1000 sq km of Geographical Area
0
4
17
02468
1012141618
Jeha
naba
dD
arbh
anga
Sam
astip
urE.
Cha
mpa
ran
W. C
ham
para
nB
hojp
urSh
eoha
rB
egus
arai
Gay
aPu
rnea
Vai
shal
iG
opal
ganj
Naw
ada
Siw
anK
isha
ngan
jBa
nka
Biha
rBu
xar
Bhag
alpu
rSa
hars
aSi
tam
arhi
Lakh
isara
iK
atih
arM
adhu
bani
Muz
affa
rpur
Mad
hepu
raA
raria
Kha
garia
Sara
nK
aim
urN
alan
daRo
htas
Mun
ger
Patn
aSh
eikh
pura
Aur
anga
bad
Supa
ulJa
mui
Arw
al
Road Length (Km) per lakh Population

209
Table 6.6 : Number of National Highways and Length in Bihar (September, 2019)
(Length in kms) Sl.No.
NHNo.
Length (Km)
Sl.No.
NHNo.
Length (Km)
Sl.No.
NHNo.
Length (Km)
Sl.No.
NHNo.
Length (Km)
1 2 205.7 12 82 147.0 23 106 135.1 34 327A 25.12 19 93.0 13 83 125.0 24 107 180.0 35 122A 31.83 28 267.3 14 84 74.0 25 57A 13.0 36 333A 198.94 28A 66.7 15 85 92.0 26 28B 112.0 37 527A 28.25 30 230.0 16 98 152.0 27 110 90.0 38 219 46.86 30A 69.0 17 99 11.2 28 2C 105.0 39 333B 18.47 31 404.0 18 101 65.0 29 333 146.7 40 133B 7.58 57 310.0 19 102 75.0 30 527C 64.2 41 727A 4.59 77 139.0 20 103 59.0 31 327E 227.1 42 227A 147.0
10 80 190.0 21 104 214.0 32 131A 81.1 43 120 145.011 81 55.0 22 105 55.0 33 133 11.0 Total 4917.2
Source : Annual Report, Road Construction Department, GoB
Chart 6.6 : Distribution of National Highway according to Width in Bihar (as on September, 2019)
The Central Government has the responsibility to build National Highways. Table 6.7 presents the
details of the expenditure on NH development in Bihar and India during 2010-11 to 2017-18. The
expenditure on development of NH in Bihar was Rs. 199 crore in 2010-11 and it constituted barely
1.18 percent of the all-India expenditure. In absolute terms, the expenditure has increased to Rs.
1524 crore in 2017-18, which constitutes 3.07 percent of the all-India expenditure. The expenditure
on NH development had registered only marginal growth during 2010-11 to 2014-15. Thereafter,
however, the expenditure has increased from Rs 277 crore in 2014-15 to Rs 708 crore in 2015-16
8%
11%
40%
41%
Single Lane (3.75mwidth)
Intermediate Lane(5.50m width)
Double Lane (7.0mwidth)
Multiple Lane(More than 7.00mwidth)

210
to Rs. 1524 crore in 2017-18. During the last two years, there has been a substantial increase in
the share of Bihar in total national expenditure — 3.28 percent in 2016-17 and 3.07 percent in
2017-18.
Table 6.7 : Expenditure on National Highway Development in Bihar and India (2010-11 to 2017-18)
(Rs. crore)
2010-11 2011-12 2012-13 2013-14 2014-15 2015-16 2016-17 2017-18
Bihar 199 232 129 271 277 708 1332 1524
India 16869 25287 16319 20605 24405 40464 40622 49646Share of Bihar In All India 1.18 0.92 0.79 1.32 1.14 1.75 3.28 3.07
Source : Ministry of Road Transport & Highways, Government of India
Bihar has 4917 kms length of NH and more than 80 percent of these roads are two or more laneroads. In view of the high density of population, it is essential to have more NH in Bihar for smooth and fast traffic movement. At present, a number of projects are running in Bihar, some for construction of new roads, others for widening of existing roads.
National Highway Projects : There are 9 ongoing projects in Bihar, at different stages of progress.Out of these projects, two projects were approved for NH-2 (Varanasi-Aurangabad-Chordaha Border Section six-lane work) in which 260 kms roadway was taken up at a cost of Rs. 1730 crore.Another two projects were also approved under NH-28 (Bathanakutti in Uttar Pradesh –Devapur–Kotawa four lane work), involving 79 kms of length costing Rs. 806 crore. Under NH-19, thefollowing projects have been initiated — (i) widening of 67 kms. from Chhapra to Hazipur at a cost of Rs. 575 crore, (ii) widening of 63 kms. from Hajipur to Muzaffarpur, and (iii) widening of82 kms. of Muzaffarpur–Sonbarsha NH at a cost of Rs. 512 crore. The upgradation of 69 kms under NH28A from Pipara Kothi to Raxaul into 2-lane costing Rs 373 crore would be completed soon. In addition, 13 road stretches have been selected by the Central Government for widening.Out of these seven projects have been completed, four projects are in progress and the remainingtwo projects are yet to start.
As regards the new sanctions, five projects have been approved by the Central Government in three districts of Bihar (2 in Saran, 2 in Supaul and 1 in West Champaran) and they will cost Rs. 274 crore. The projects cover 45 kms. of road and 2 Rail Over Bridges (ROB). These projects are still under bidding.
The 4-lanning of 95 kms of road under NH82 (Gaya-Manpur-Hisua-Rajgir-Nalanda-Biharsharif) have been approved by Japan International Cooperation Agency (JICA). There are 16 ROBs

211
approved by the Central Government, of which seven are in progress, six are in under bidding and work for other three will start soon. A Hybrid Annuity Mode bridge over river Ganga in Mokama is under progress.
Bharatmala Pariyojana
The first phase of the project will be operational for a period of five years from 2017-18 to 2021-22. Bihar would be benefited under the three categories – Inter Corridors and Feeder Routes (305 kms), National Corridors Efficiency Improvements (70 kms) and Border and International Connectivity (50 kms). The total road length of 425 kms in Bihar under Bharatmala Phase-Iconstitutes 1.71 percent of all-India road length. The details are given in Table 6.8.
Table 6.8 : Road Project under Bharatmala Project Phase-I
(in kms)
Category
Total LengthIdentified
BharatmalaPariyojana Phase-I
Bihar’s Share in All-India
India Bihar India BiharTotal
LengthIdentified
BharatmalaPariyojana
Phase-IEconomic Corridors 26163 — 9000 - - -Inter Corridors and Feeder Routes 15403 272 6000 305 1.77 5.08
National Corridors Efficiency Improvements 13049 — 5000 70 - 1.40
Border and International Connectivity 5230 50 2000 50 0.96 2.50
Coastal and Port Connectivity 3305 — 2000 — — —
Expressways 1837 — 800 — — —
Total 64987 322 24800 425 0.50 1.71
Source : Press Information Bureau, MORTH, GoI
State Highway (SH) Network
The State Highways (SH) connect major district roads and establish the secondary level of road
transport. The SH roads are constructed and maintained by the State Government. Table 6.9
presents the progress and density of SH in major states of India. The length of SHs has been
gradually increasing in Bihar, from 3213 kms in 2003-07 to 4311 kms in 2013-17. The highest
increase was registered during the period 2007-12, as the State Government spent substantially
large amount to widen state highways network. For all-India, the length of SH has increased by
29,130 kms during 2003-07 to 2013-17. The expansion in the SH was the highest in Maharashtra
(5781 kms), followed by Karnataka (5513 kms) and Tamil Nadu (4043 kms). As on March 2017,

212
Bihar ranked 7 in terms of SH road density per 1000 sq. kms, with 45.2 kms of SH per 1000 sq.
km of area. In term of SH length per lakh population, Bihar holds 15th position among the major
states of India, with 3.7 kms of road for one lakh population.
Table 6.9 : State Highways Network in Major States of India (2003-07, 2008-12 and 2013-17)
StateAverage (Kms)
DensityLength of existing SH in
km/lakh populationLength of existing SH in
km/ 1000 sq km2003-07 2008-12 2013-17 2003 2010 2017 2003 2010 2017
Andhra Pradesh 9295 10522 7327 10.6 12.5 7.4 30.1 38.1 23.6
Bihar 3213 4118 4311 2.7 3.9 3.7 25.3 42.4 45.2
Chhattisgarh 3300 4470 4719 16.6 20.9 16.3 26.7 38.8 33.0
Gujarat 18908 18446 17788 36.5 31.0 26.6 97.7 93.9 87.7
Haryana 2513 2522 2049 11.2 10.1 6.7 55.7 57.0 40.7
Jharkhand 1886 1886 1510 — 5.8 3.6 — 23.7 16.3
Karnataka 14563 20743 20076 18.1 34.1 30.6 51.2 107.0 102.1
Kerala 3871 4300 4341 11.0 13.1 12.5 90.7 111.7 111.8
Madhya Pradesh 8351 9969 11025 12.9 14.4 13.9 26.3 33.2 35.5
Maharashtra 33519 32909 39299 33.8 29.6 33.2 109.5 106.7 126.7
Odisha 4340 3708 4233 13.1 8.9 9.5 31.8 23.8 26.9
Punjab 1414 1460 1232 5.1 5.4 3.9 25.3 29.3 22.5
Rajasthan 9832 11090 12581 14.4 16.7 20.3 24.8 32.8 44.4
Tamil Nadu 7548 9871 11591 11.2 13.2 15.8 55.5 72.2 90.4
Uttar Pradesh 8801 8181 7428 5.2 4.1 3.3 37.4 33.0 29.7
Uttarakhand 1018 2461 4031 13.0 15.9 41.5 21.3 29.5 84.5
West Bengal 2306 3940 3683 4.3 5.0 3.8 39.8 50.8 40.7
All-India 142541 160291 171671 12.7 13.4 13.6 41.0 48.7 53.6
Source : Ministry of Road Transport & Highways, Government of India
To improve the road density in Bihar, the State Government has undertaken various measures, as presented in Chart 6.7. As on September 2019, the total road network of SH in Bihar was 4006 kms, which constituted 2.1 percent of the total road length in the state. The State Government has been continuously expanding the SH network and improving its quality. The major components of SH is double-lane constituting 70 percent, followed by single-lane SH (15 percent), intermediate-lane SH (11 percent) and a very small portion (4 percent) of multiple-lane roads.

213
Chart 6.7 : Status of Bihar State Highways according to width as on September 2019
The spread of SH network across the district is not uniform and needs attention. The details of district-wise road network of SH are given in Table A 6.2 (Statistical Appendix). There are 25districts which have benefitted from the upgradation of SH into NH. As on September 2019,Darbhanga (5.6 percent), Gaya (5.2 percent) and Patna (5.2 percent) were the leading districts in terms of share in total SH network. In terms of road length per 1000 sq. km of area, top three districts are — Darbhanga (98.3 kms.), Nalanda (81.5 kms), and Nawada (74.6 kms.). With regard to road length per lakh population, top three districts are — Nawada (7.5 kms), Banka (7.4 kms), and Nalanda (5.9 kms.). All these three districts are from south Bihar.
Chart 6.8 : Road Density of SH in Districts of Bihar (As on September 2019)
15%
11%
70%
4%Single Lane(3.75m width)
IntermediateLane (5.50mwidth)
Double Lane(7.0m width)
Multiple Lane(More than7.00m width)
14
43
98
020406080
100120
Khag
aria
Jam
uiW
. Cha
mpa
ran
Begu
sara
iM
uzaf
farp
urM
unge
rAr
aria
Kaim
urKi
shan
ganj
Gopa
lgan
jM
adhu
bani
Bhag
alpu
rBu
xar
Shei
khpu
raE.
Cha
mpa
ran
Katih
arSh
eoha
rJe
hana
bad
Aura
ngab
adSi
wan
Lakh
isara
iSi
tam
arhi
Gaya
Biha
rPu
rnea
Roht
asSa
hars
aSu
paul
Mad
hepu
raVa
ishal
iBa
nka
Arw
alSa
ran
Patn
aSa
mas
tipur
Bhoj
pur
Naw
ada
Nala
nda
Darb
hang
a
Road Length (Km) per 1000 sq km of Geographical Area
1
3
7
0
3
6
9
Khag
aria
Begu
sara
iM
uzaf
farp
urSh
eoha
rGo
palg
anj
Mad
huba
niBh
agal
pur
Arar
iaM
unge
rE.
Cha
mpa
ran
Siw
anSi
tam
arhi
Kish
anga
njW
. Cha
mpa
ran
Jeha
naba
dBu
xar
Vaish
ali
Katih
arSh
eikh
pura
Patn
aJa
mui
Biha
rSa
ran
Purn
eaSa
mas
tipur
Gaya
Saha
rsa
Aura
ngab
adLa
khisa
rai
Mad
hepu
raKa
imur
Arw
alDa
rbha
nga
Supa
ulBh
ojpu
rRo
htas
Nala
nda
Bank
aNa
wad
a
Road Length (Km) per lakh Population

214
To improve the road communication in Bihar, the State Government has launched an ambitious project called Bihar State Highways Project (BSHP), with the financial support from the Asian Development Bank (ADB). In the first phase of BHSP, 825.4 kms of roads across 9 SHs have been completed at a cost of Rs. 2630 crore. After completion of the BSHP-I, the State Government has initiated BSHP-II for upgradation of 374.3 kms across 5 SHs into 2-lane, with a revised project cost of Rs. 3752 crore. Out of these 5 SH projects, 3 projects (SH 81 Sahar to Nasriganj, SH-89 and SH-90) have been completed and the remaining 2 projects (SH 78 and SH 91) are still under progress. ADB has sanctioned additional fund for four SHs (SH-83, SH-86, SH-87 and SH-88) for widening of 254.5 kms. into two-lane roads, with an outlay of Rs. 2171 crore. Under this project, major work (85 percent) has already been completed, including completion of SH-83 and SH-86. Further, 5 SHs selected by the State Government to be upgraded into two-lane through financing by ADB and has been included under BSHP-III. The total length of roads under BSHP-III is 231.8 kms. and the cost is Rs. 1860 crore. This cost will be met by loan from ADB (66 percent) and share of the State Government (34 percent). The works have been initiated. Further, ADB has also sanctioned loan for a 6-lane Ganga Bridge (9.8 kms bridge and 13 kms road) at an estimated cost of Rs. 4988 crore.
The rail-cum-road bridge on the Ganga river between Digha and Sonepur near Patna has minimized the distance and travel time for the freight as well as passengers. It has also helped in reducing the traffic load of Mahatma Gandhi Setu over the Ganga river. The total cost of this bridge construction was Rs. 2921 crore. The State Government had allocated Rs. 1240 crore for this bridge, using the Backward Region Grant Fund (BRGF). Another project supported under BRGF is elevated/semi-elevated road corridor project, which joins AIIMS in Patna (NH-98) with Digha Ghat (11.90 kms). This project has been completed at a total cost of the Rs. 1289 crore.
The cleanliness and beautification of the river Ganga is one of the priorities of the State Government. Presently, the Ganga Pathway of 20.5 kms (Digha to Didarganj in Patna) is under construction with 11.7 kms of elevated corridor, having four lanes with divided carriageway. About 40 percent of the entire work has been completed so far. The total cost of this project is Rs. 3390 crore, of which Rs. 2000 crore has been financed by taking loan from the Housing and Urban Development Corporation (HUDCO).
The State Government has also been working on some of the projects, under Public-Private-Partnership (PPP) mode. A Greenfield Bridge across the river Ganga, connecting Bakhtiyarpur Bypass on NH-31 and Tajpur on NH-28 is under construction at a total cost of Rs 1603 crore. Abridge of 5.5 kms with a total road length of 45.74 kms is covered under this. Till date, around 52percent of the work has been completed.

215
Table 6.10 : Overview of Widening of State Highways
Agency-wise Road / Bridge Length (kms) RemarksADB (BSHP-I) upgradation of 2-lane of 9 SH 825.4 Cost of Rs. 2629.86 crore (work completed)
ADB (BSHP-II) upgradation of 2-lane of 5 SH 374.3
Revised Cost of Rs. 3751.88 crore –SH-89 & 90 and Sahar Nasriganj section of SH-81 completed. Work in SH-78,91 & Sakkaddi-Sahar section of SH-81under progress
ADB (Additional Financing for BSHP-II) upgradation of 2-lane of 4 SH
254.5
Revised Cost of Rs. 2171.31 crore –84.31% completed (included the completion of SH-83 and substantial completion of SH-86). Rest work under progress
ADB (BSHP-III) upgradation of 2-lane of 5 SH 231.8 Cost of Rs. 1859.58 crore
ADB (Project in Pipeline)upgradation of 2-lane of 7 SH 324.96 Estimated Cost -Rs. 3145.38 Cr.
ADB (6-lane Ganga Bridge and Road Project)
9.8 (Bridge)13.0 (Road) Cost of Rs. 4988.40 crore - work under progress
BRGF (Ganga Bridge) Digha-Sonepur and approach road
Bridge onthe Ganga River
Bridge complete and approach road in progress (cost of Rs. 2921 crore)
BRGF (AIIMS to Digha Ghat) 11.9 Cost of Rs. 1289.25 crore (96.09% work completed)
HUDCO (Road) 20.5 (Ganga Path)/11.7 (elev. cord.)
Revised Cost of Rs. 3390.00 crore (37% work completed) –work in progress
PPP Mode (Greenfield Bridge on Ganga - Bakhtiyarpur on NH-31 to Tajpur NH-28)
5.5 (Bridge)45.74 (Road)
Cost of Rs. 1602.74 crore (52.07% work completed w.r.t EPC Contract)
Source : Department of Road Construction, GoB
Major District Road Network
The Major District Roads (MDR) traverse through the districts to provide communication to
areas of production and markets and connect these with highways and railways. The total road
length of MDRs is 13,498.65 kms, spread throughout the state. These roads account for more than
one and a half times the combined length of NHs and SHs. However, the spread of the MDRs
across the districts is uneven. Around 49 percent of the MDR roads are single lane (3.75 meters),
followed by 37 percent of intermediate lane (5.50 meters), 12 percent of double lane (7.00 meters)
and a small share of 2 percent multiple lane (more than 7.00 meters width). The State Government
is committed to upgrade all these MDR roads to a minimum of intermediate lane standard (5.50
meters), so that MDRs could cope with the increasing traffic intensity.
The status and availability of Major District Roads across the districts are given in Table A 6.3
(Statistical Appendix). During the period 2014 to 2019, a total of 4098 kms. of MDRs have been
constructed. The three most benefitted districts are – Gaya (527 kms), Patna (359 kms), and
Darbhanga (315 kms). During the same period, the districts of Katihar (111 kms), Banka (50 kms)
and Saharsa (41 kms) have been benefitted most through upgradation of MDR into SH / NH. Chart

216
6.10 presents the road density of different districts of Bihar, as on September 2019, in terms of
road length per 1000 sq.km. The top three districts are — Darbhanga (315 kms), Jehanabad (308
kms) and Patna (255 kms). However, the top three districts based on road density per lakh
population are — Sheikhpura (24 kms), Jehanabad (23 kms) and Supaul (22 kms).
Chart 6.9 : Composition of Major District Road According to the width (As on September 2019)
Chart 6.10 : Road Density of MDR in Bihar Across the Districts (As on September 2019)
49%
37%
12%2%
Single Lane (3.75mwidth)
Intermediate Lane(5.50m width)
Double Lane (7.0mwidth)
Multiple Lane (Morethan 7.00m width)
64143
315
050
100150200250300350
Mun
ger
Mad
hepu
raBa
nka
Naw
ada
W. C
ham
para
nK
atih
arBu
xar
Lakh
isara
iK
aim
urJa
mui
Purn
eaBh
agal
pur
Roht
asE.
Cha
mpa
ran
Mad
huba
niB
hojp
urA
rwal
Sheo
har
Beg
usar
aiK
isha
ngan
jSi
tam
arhi
Biha
rSi
wan
Aur
anga
bad
Sara
nK
haga
riaA
raria
Gay
aG
opal
ganj
Muz
affa
rpur
Saha
rsa
Nal
anda
Vai
shal
iSa
mas
tipur
Supa
ulSh
eikh
pura
Patn
aJe
hana
bad
Dar
bhan
ga
Road Length (Km) per 1000 sq km of Geographical Area
6
12
24
0
5
10
15
20
25
Mad
hepu
raSh
eoha
rM
unge
rN
awad
aK
atih
arB
egus
arai
E. C
ham
para
nBh
agal
pur
Mad
huba
niSi
tam
arhi
Buxa
rSi
wan
W. C
ham
para
nSa
ran
Bho
jpur
Bank
aPu
rnea
Arw
alLa
khisa
rai
Vai
shal
iM
uzaf
farp
urBi
har
Patn
aSa
mas
tipur
Kha
garia
Gop
alga
njRo
htas
Kis
hang
anj
Nal
anda
Saha
rsa
Ara
riaD
arbh
anga
Jam
uiA
uran
gaba
dG
aya
Kai
mur
Supa
ulJe
hana
bad
Shei
khpu
ra
Road Length (Km) per lakh Population

217
A number of sources of funding are utilized for construction, widening and maintenance of the
MDR projects. These sources are — State-Plan, Rural Infrastructure Development (RIDF) grants,
Central Road Fund, Road Connectivity Project Fund for Left Wing Extremism-Affected Areas,
Indo-Nepal Border Road Development Programme, Roads of Economic Importance, Roads of
International Importance, and Finance Commission grants.
State Schemes : Under the state schemes, different road projects are being implemented through
Scheduled Caste Special Component Scheme, Major District Road Scheme and other schemes.
Many schemes are financed through HUDCO, ADB, PPP, etc. A total of 825.31 kms. of MDR is
under progress at a cost of Rs. 2057 crore. In addition, 339.53 kms of road length has been
sanctioned costing Rs. 1512 crore during 2018-19. Under this scheme, 743.27 kms of MDRs have
been widened / strengthened / renovated during 2018-19. There is an additional provision of Rs.
1094 crore under Major Road Scheme and Rs. 950 crore under Scheduled Caste Special
Component Scheme sanctioned by the State Government.
Left Wing Extremism-affected Area Road Development Scheme : The Road Requirement
Plan-I (RRP-I) was executed for Left Wing Extremism (LWE) affected districts (Arwal,
Aurangabad, Gaya, Jamui and Jehanabad) involving 41 road projects of 675.35 kms by the Central
Government, costing Rs. 616 crore. The road projects comprised of 71.8 kms of NH, 68.1 kms of
SH and 534.4 kms of MDR. Further, RRP-II has been initiated in 6 identified LWE affected
districts of Bihar. Under this, 1052.27 kms road length of MDR have been identified under 60
MDR projects. The project is jointly funded by the Central and State Governments. A total of Rs
2070 crore of central share and Rs. 180 crore of state share have been budgeted for the financial
year 2019-20.
Indo-Nepal Border Road Project : The Indo-Nepal border road project has benefitted the states
of Bihar (564 kms), Uttar Pradesh (640 kms) and Uttarakhand (173 kms). This project will
facilitate smooth patrolling of the border by security forces, besides bringing about overall
development of the surroundings of border area through providing access to nearby market and
towns. The stretch of the border road projects in Bihar passes through 7 districts — West
Champaran, East Champaran, Sitamarhi, Madhubani, Supaul, Araria and Kishanganj. The Central
Government has approved 552.3 kms road length at a cost of Rs. 1656 crore under this project.
The State Government has also contributed Rs. 2261 crore for land acquisition, environmental
clearance and utility shifting. In addition, NABARD has provided a sum of Rs. 984 crore for

218
constructing 121 bridges in alignment with the border roads. The Indo-Nepal border road project
includes 127.3 kms of NH, 82.0 kms roads of Water Resource Department and 211.0 kms of rural
roads.
Rural Infrastructure Development Fund (RIDF) : A number of projects under RIDF I to RIDF
XIII have been completed in the past. In the recent years, a total of 326 projects under RIDF-XIV
to RIDF-XXIII have been approved at a cost of Rs. 6259 crore which will be met from a loan from
NABARD. The NABARD has also provided a loan of Rs. 790 crore under RIDF-XXIV in 2018-
19 and made provision of Rs. 1136.7 crore for 2019-20.
Central Road Fund (CRF) : A total of 125 projects have been approved under this fund, and out
of this, 83 projects have been completed, 18 projects are in progress and rest 24 are under tendering
stage. The Central Government has released Rs. 102 crore under CRF during 2018-19, and Rs.
400 crore has been budgeted under the CRF for 2019-20.
Rural Roads Network
The rural communication is a crucial requirement for development of rural habitats. Rural roads
help significantly to generate higher agricultural income and prospects for productive employment.
It also provides ample opportunity to the rural population for accessing economic and social
services. For this, both Central and State Governments are committed to connect every village
through rural roads. The State Government has resolved Ghar tak Pakki Gali Naliyaan’ as one of
its goal under Saat Nishchay (Seven Resolves). The public investments made by the State
Government in rural roads has been growing at a very impressive rate and it increased by more
than five times during the last seven years. From Rs. 1874 crore in 2012-13 the investment has
reached to Rs. 10,476 crore in 2019-20. The total paved road was only 35 percent in 2015; but
thereafter, the length of paved rural roads grew at an annual rate of 15 percent and its share reached
75 percent in 2019. The length of the paved rural roads has increased to 92,204 kms in 2019, from
48,794 kms in 2015.
Since 2004-05, the State Government has built around 40,000 kms of rural roads at a total cost of
Rs. 20,000 crore. In addition, a sum of Rs. 25,000 crore has been spent on construction of 52,203
kms of rural roads under the Pradhan Mantri Gram Sadak Yojana (PMGSY) during the last fifteen
years. Till 2019, a total of 52,194 kms of rural roads was constructed under this scheme. Apart

219
from these roads, 4122 bridges (including small bridges) have been constructed, 19,331 kms of
roads has been repaired, and 41,857 kms of roads maintained under routine maintenance at a cost
of Rs. 5274 crore. The PMGSY accounted for 56.6 percent of total rural roads. The State
Government has initiated two ambitious programmes — Mukhya Mantri Gram Sampark Yojana
(MMGSY) and Gramin Tola Sampark Nishchay Yojana (GTSNY) to provide household level
connectivity in scattered habitations. Under MMGSY, 10,825.4 kms of rural roads were built at a
cost of Rs. 7279 crore, and 2788.52 kms of rural roads were constructed at a cost of Rs. 1503.4
crore under GTSNY till September 2019. A budgetary provision of Rs. 1035 crore has been made
for 2019-20 and 724.3 kms of rural roads have been built till September 2019. A sum of Rs.
2915.95 crore has been budgeted for the financial year 2019-20 and 883 kms of roads and 11
bridges have already been built till September 2019 under MMGSY. Under PMGSY, 220 kms of
roads and 95 bridges at a cost of Rs. 581 crore have been constructed till September 2019.
Table 6.11 : Programme-wise Length of Rural Roads Constructed (September, 2019)
Name of SchemeRoad
Constructed (kms)
Bridge Constructed
(Nos.)
Expenditure (Rs. crore)
Gramin Tola Sampark Nishchay Yojana (GTSNY) 2788.52 1503.38
Mukhya Mantri Gram Sampark Yojana (MMGSY) 10825.40 7277.99
Pradhan Mantri Gram Sadak Yojana (PMGSY) 52194.11 393 24562.01
State Scheme 3511.77 401 4770.10
Other State Plan Schemes 22883.60 39 5954.64
Total 92203.40 833 44068.12
Source : Department of Rural Works, GoB
The extent of network of rural roads in different districts is presented in Table A 6.4 (Statistical
Appendix), which provides the details of road length and the progress during the last five years
(2015 to 2019). The total paved rural roads increased by 34,815 kms since 2015, nearly 7000 kms
per year. The maximum increase in paved rural road was registered in — Gaya (2182 kms),
Aurangabad (1928 kms), and East Champaran (1585 kms). However, these districts are large
districts in terms of geographical area. For knowing the spread of rural roads, it is, therefore,
necessary to note the road density with respect to both area and population. It is clear from Chart
6.8 that three top districts in terms of rural roads per 1000 sq.km. of area are — Sheohar, Vaishali
and Darbhanga. In terms of rural roads per lakh of population, three leading districts are — Jamui,
Aurangabad and Banka.

220
Chart 6.11 : Rural Road Density in Bihar Across the Districts (As on September 2019)
Bihar Output and Performance Road Maintenance Contract Policy – 2018
Road Asset Management (RAM) or road maintenance is one of the top priorities of the State Government for timely and quality maintenance of road network in the state. Performance-based road maintenance contracts (PBC) are an essential element of RAM and their implementation contributes to improving the effectiveness and efficiency of the maintenance of road networks. Well-designed PBCs keep roads in predefined good condition at relatively low cost. The Long-term PBCs are often referred to as Road Asset Management Contracts. The State Government has introduced this policy for newly constructed projects, with a condition of maintenance for five years’ tenure. Further, this policy ensures the emergency repair andconstruction of roads affected by natural disaster. In addition, measures for tree plantation along road side, road safety symbols, information board, speed breaker, crash barrier etc. have also been included. This policy also ensures that, along with five-year routine maintenance, the International Roughness Index (IRI) standard would also be compulsorily maintained, within an upper limit of 4000 mm per km.
Rural Works Department, Government of Bihar, has set a goal for construction of 17,500 kms of rural roads during 2019-20 under Bihar Rural Road Maintenance Programme and administrative approval for a total of 16,075 kms of rural road has been provided.
519
1049
1704
0
500
1000
1500
2000La
khisa
rai
Mun
ger
Arw
alW
. Cha
mpa
ran
Kaim
urKh
agar
iaRo
htas
Begu
sara
iNa
wad
aBh
agal
pur
Katih
arSu
paul
Jam
uiSa
hars
aBh
ojpu
rBa
nka
Gaya
Sita
mar
hiSh
eikh
pura
Biha
rPa
tna
Buxa
rAu
rang
abad
Purn
eaAr
aria
Nala
nda
Gopa
lgan
jM
adhe
pura
Kish
anga
njE.
Cha
mpa
ran
Siw
anSa
mas
tipur
Mad
huba
niJe
hana
bad
Sara
nM
uzaf
farp
urDa
rbha
nga
Vaish
ali
Sheo
har
Road Length (Km) per 1000 sq km of Geographical Area
43
81
131
0
50
100
150
Begu
sara
iAr
wal
Patn
aKh
agar
iaM
unge
rSi
tam
arhi
Lakh
isara
iBh
agal
pur
Saha
rsa
Bhoj
pur
Siw
anDa
rbha
nga
Sam
astip
urW
. Cha
mpa
ran
Katih
arNa
wad
aBi
har
Gopa
lgan
jE.
Cha
mpa
ran
Muz
affa
rpur
Vaish
ali
Supa
ulSh
eoha
rNa
land
aSa
ran
Roht
asM
adhe
pura
Mad
huba
niGa
yaSh
eikh
pura
Buxa
rPu
rnea
Jeha
naba
dAr
aria
Kish
anga
njKa
imur
Bank
aAu
rang
abad
Jam
ui
Road Length (Km) per lakh Population

221
Bihar State Road Development Corporation Limited (BSRDCL)
The building and maintenance of roads in the state is an ongoing process. In this background, the
State Government has established Bihar State Road Development Corporation Limited (BSRDCL)
in 2009 under the Companies Act, 1956. It has an objective of construction, repair and maintenance
of roads, bridges, and tunnels. Due to excellent work performance of BSRDCL, it has been
declared as an ISO 9001:2008 certified corporation.
The BSRDCL has taken up 13 SH projects for double-lane and a 6-lane bridge over river Ganga
under ADB supported project. A road length of 93 kms. of Gaya-Manpur-Hisua-Rajgir-Nalanda-
Biharsharif section has been sanctioned for upgradation into four lane under a project supported
by Japan International Cooperation Agency (JICA). The cost of the project is Rs. 2116 crore and
41 percent of the work has been completed. BSRDCL has also taken up a project of four-lane
bridge on river Ganga from Karja Village on NH-31 to Tajpur on NH-28. The bridge has a length
of 5.6 kms. and the project also includes 45.4 kms. of approach road. The total cost of the project
is Rs. 1603 crore, and 50 percent of the work has already been completed. In addition, Digha-
Didarganj four-lane Loknayak Ganga Pathways (35 percent of work completed), AIIMS-Digha 4-
lane elevated corridor of 12.27 kms (96 percent of work completed), and approach road from Digha
to AIIMS have also been sanctioned under the Engineering, Procurement and Construction (EPC)
mode. A bridge from Yogapatti-Navalpur-Ratwal Chowk involving 37 kms of road is sanctioned
under Central Road Fund and is expected to be completed by March, 2020.
The financial status of the BSRDCL is presented in Table 6.12 for 2012-18. The Corporation has
been continuously generating profit since its inception. The turnover of the BSRDC has been
fluctuating over the years and it registered maximum turnover of Rs. 1624.30 crore in 2016 and a
minimum turnover of Rs. 730.10 crore in 2013. The different projects with their progress are also
presented in Table 6.12.
The Corporation has been generous enough towards the society since its inception and has been
contributing to the Mukhya Mantri Relief Fund to the tune of around Rs. 10 crore every year. Apart
from this, the Corporation has also taken up several works under Corporate Social Responsibility
(CSR) in the field of social welfare and public health. In addition, BSRDCL has financed a Giraffe
‘Srishti’ at the Sanjay Gandhi Botanical Garden at Patna. A Rifle and cartridges costing Rs. 8.90
lakh have been provided to the shooter Ms. Meera Kumari which will give her a mileage in her
sport career. Under CSR, the Corporation has donated 35 stretchers and 60 three-seater chairs

222
Table 6.12 : Status of Financial Management of BSRDC Ltd. (2012 to 2019)
Calendar Year 2012 2013 2014 2015 2016 2017 20182019upto
Sept. 19Financial Year 2011-12 2012-13 2013-14 2014-15 2015-16 2016-17 2017-18 2018-19
Turn Over (Rs. crore) 956.89 730.10 879.27 1221.22 1624.30 1490.92 813.67 1173.55
Profit + Tax (Rs. crore) 66.45 46.69 56.50 88.50 119.69 107.61 61.14 46.61
Profit (Rs. crore) 53.12 37.35 44.70 69.42 93.87 84.48 48.95 29.24
BSHP-I
Target (Million USD) 132.4 50.77
Close
Achievement (Million USD) 125.27 50.77
Achievement (percent) 94.6 100.0
BSHP-II
Target (Million USD) 25.50 40.00 28.00 41.60 46.50 39.40 28.05
Achievement (Million USD) 16.86 31.20 27.63 38.60 44.08 33.40 28.05
Achievement (percent) 66.12 78.00 98.68 92.78 94.78 83.50 100.00
Additional Financing under BSHP-II
Target (Million USD) - 23.00 42.00 43.40 26.50 17.80 11.00 51.19
Achievement (Million USD) - 21.60 37.09 43.40 23.80 12.45 4.64 27.67
Achievement (percent) - 93.9 88.3 100.0 89.8 69.97 42.2 45.95
BSHP-III
Target (Million USD) 45.70
Achievement (Million USD) 20.79
Achievement (percent) 45.5
Source : Road Construction Department, GoB
to IGIMS, Patna. A total of 250 traffic trollies have been provided for smooth and efficient traffic
on Mahatma Gandhi Setu. The cost of these trollies is Rs. 30 lakh. In addition to this, a total of
150 trollies were given to District Magistrate, Vaishali, to facilitate uninterrupted traffic on NH-
19 at a cost of Rs 18 lakh. A multi-purpose hall was built at a cost of Rs. 26.36 lakh for Mahadalit
Girl’s School, Danapur. A passenger vehicle costing Rs. 6.25 lakh was donated to the Ashadeep
Institute for mentally and physically challenged children. The Corporation has taken up the
financial responsibility for beautification and renovation of the road from Raj Bhavan to
Secretariat. The cost of this project would be around Rs. 8.00 crore. It also maintains the Shatabdi
Smarak at Saguna More. In addition, the Corporation renovated and beautified the historical
Mangal Talab at Patna Sahib.

223
6.5 Bridge Sector
Bridges are important component of the roadway and railway networks, especially in densely
populated regions. Bridges make the road network more efficient by shortening distance and
reducing travel time. Many rivers flow within Bihar and, therefore, a network of bridges has been
constructed in the state or some more are under construction. The six bridges already operational
on river Ganga are at — Buxar, Patna, Mokama, Bhagalpur, Ara-Chhapra and Jai Prakash Bridge.
Four more bridges Kachchi Dargah-Bidupur (6 lane bridge), Bakhtiyarpur-Tajpur Bridge, Munger
Bridge and Sultanganj-Aguanighat Bridge are under construction. The Sultanganj-Aguanighat
Ghat bridge has unique features. As this bridge is located in the Dolphin Sanctuary area, a Dolphin
glass observatory hanging from the bridge will be constructed. The bridge also has Intelligent
Traffic System (ITS) facility. In addition to these bridges, the State Government has decided to
construct five more bridges over the Ganga, parallel to Buxar Bridge, Jai Prakash Bridge,
Mahatma Gandhi Bridge, Rajendra Bridge and Vikramshila Bridge for better connectivity between
north and south Bihar. The State Government has also built bridges over other major rivers. For
example, four bridges have been taken up over Gandak river, of which two (Dhanha-Ratwal and
Gopalganj-Bettiah) have already been completed and other two (Satar Ghat and Bangra Ghat) are
under progress. On river Kosi, three bridges (Kosi Mahasetu, Baluaha Ghat bridge and Vijay Ghat
bridge) are ready, while renovation work on Dumri Ghat bridge has been completed. In addition,
two more bridges at Bheja Ghat and Fulaut Ghat have been proposed. Till 2005, only two bridges
were there on the Sone river, but now one more bridge at Arwal-Sahar is operational. In addition
to these, work for two more bridges (Daudnagar-Nasriganj and a six-lane bridge parallel to
Koilwar bridge) are in progress. Presently, 8 bridges are operational on river Bagmati. There was
only one bridge on the Falgu river till 2005. However, the State Government has sanctioned six
more bridges, four of which are completed and two are under construction. There are now more
than 30 bridges on river Budhi Gandak. A total of 1392 major or minor bridges and culvert projects
have been completed since March 2010 under Mukhyamantri Setu Nirman Yojana (MMSNY) at
a cost of Rs. 10,989 crore.
Under Road Over Bridge (ROB) Project 2005, all the 22 bridges have been completed, except one
at Mithapur. Further, all the 11 bridges under ROB-2010 Project have been completed, except one
at Narkatiaganj yard. In addition, under ROB-2013, a bridge on SH-4 at Manpur has been
completed through the state fund of Rs. 95 crore. Apart from these, the State Government has

224
agreed to fund 50 percent of the cost for 65 ROBs on railway crossings. The NABARD has also
supported the construction of mega bridges in Bihar through loans under RIDF (Rural
Infrastructure Development Fund). Under RIDF-VII to XIII, all projects have been completed.
Further, 326 projects have been approved involving Rs. 10,844 crore under RIDF-XIV to RIDF-
XXIII and 14 projects have been sanctioned at a cost of Rs. 790 crore under RIDF-XXIV in 2018-
19. During 2019-20, a sum of Rs. 1136.7 crore has been provisioned by NABARD for different
projects in Bihar. Under Mukhyamantri Setu Nirman Yojana, nine projects have been sanctioned
with a budget of Rs. 29.00 crore in 2018-19 and six projects for Rs. 26.50 crore.
Bihar Rajya Pul Nirman Nigam Limited (BRPNNL)
The BRPNNL is a Public Sector Undertaking, registered under Indian Companies Act, 1956 and
the State Government contributed a share of Rs. 5.00 crore as its capital. It is one of the profit-
making Public Sector Undertaking in the state. The Corporation builds the bridges and roads,
besides maintenance of roads and collection of road tolls. As on September 2019, the BRPNNL
has completed 2202 projects, costing Rs. 12,704 crore since March 2005, including project under
Mukhyamantri Setu Nirman Yojana. The financial summary of BRPNNL is given in Table 6.13.
The average gross profit of the Nigam is more than Rs. 100 crore per year and net profit is above
Rs. 60 crore per year during 2012-13 to 2018-19. The maximum turnover of Rs. 1840 crore was
registered in 2016-17; whereas, the minimum of Rs. 1273 crore was in 2012-13. The revenue
collection also varied between Rs. 118 crore in 2017-18 to Rs. 183 crore in 2014-15. Overall, the
Corporation has been continuously striving for its sound financial position and quality
improvement of the projects.
Table 6.13 : Financial Status of Bihar Rajya Pul Nirman Nigam Limited (2012-13 to 2018-19)
Year No. of Bridges
Expenditure (Rs. crore)
Turnover(Work
Execution)(Rs. crore)
Total Revenue
(Rs. crore)
Administ-rative
Expenditure (Rs. crore)
Gross Profit
(Rs. crore)
Net Profit (Rs. crore)
2012-13 136 788 1273 142 35 107.0 63.8
2013-14 119 1152 1481 159 39 120.1 72.5
2014-15 179 730 1739 183 44 139.1 80.9
2015-16 176 2835 1699 151 43 107.7 70.3
2016-17 103 1188 1840 147 39 108.2 68.8
2017-18 84 638 1501 118 40 78.09 38.0
2018-19 94 1622 1503 128 48 80.66 42.7
Source : Bihar Rajya Pul Nirman Nigam Limited, GoB

225
6.6 Road Transportation
Road transport is easily accessible and more convenient. Therefore, every year new vehicles of various types are registered, both in Bihar and elsewhere in India. Chart 6.12 shows the details of motor vehicles registered in major states of India in 2015-16. The total number of registered vehicle per lakh population was the highest in Tamil Nadu (33 vehicles), closely followed by Haryana, Gujarat and Punjab (32 vehicles) and Kerala (29 vehicles). The number of vehicles per lakh population was the lowest in Bihar (5 vehicles), followed by West Bengal, Jharkhand (7 vehicles) and Uttar Pradesh (10 vehicles). At all-India level, registered vehicles were 18 per lakh population.
Chart 6.12 : Registered Motor Vehicles per lakh population in Major States of India (2015-16)
Source : Ministry of Road Transport and Highways, GoI
The progress of vehicle registration in the state is shown in Table 6.14. Under the Motor Vehicle Act, the Department of Transport registers new vehicles and thereby generates revenues. Table 6.14 also shows the trend of such revenue collection from registration of motor vehicles in Bihar. As most of the population in the state reside in the rural areas, the registration of two wheelers is growing at a much faster rate, compared to other vehicles. Apart from this, the major growth drivers of registered vehicles are — trucks (20.6 percent), cars (19.0 percent) and trailors (12.2percent). The number of new motor vehicles registered has increased annually by 17.7 percent during the 6 year period (2013-19). In 2018-19, a total of 11.89 lakh vehicles were registered, compared to only 5.53 lakh in 2013-14. The revenue through tax collection under Motor Vehicles Act in the state increased substantially from Rs. 835 crore in 2013-14 to Rs. 2067 crore in 2018-19, registering an annual growth of around 20 percent during the last six years.
0
5
10
15
20
25
30
35
57 7
10 1113 14
18 18 18
2426
2932 32 32 33


228
marginalized sections of society so that they too can be a part of the mainstream. MMGPY envisions providing self-employment opportunities to more than 40,000 unemployed people of the state. As an initiative to promote seamless and convenient public transportation from the remote areas to cities, MMGPY aims to bridge the gap between the opportunities available to the rural population vis-à-vis the population living in the cities.
Amnesty Scheme : Amnesty Scheme is a limited-time opportunity for a specified group of taxpayers to pay a defined amount in exchange for forgiveness of a tax liability (including interest and penalties) relating to previous tax periods and without fear of criminal prosecution. The State Government on November 15, 2019 has initiated Amnesty Scheme to grant amnesty to the vehicle owners of Tax Defaulter & Fitness Defaulter, registered and unregistered Tractor-trailer,and other Commercial Vehicles. The scheme was applicable for till March 2019 and the department had earned more than Rs 100 crore.
Inspection and Certification Centre (I&C) at Bihta, Patna : The existing vehicle inspection system has several weaknesses. To eliminate the subjectivity in the existing practice and bring in more objective practice, Inspection and Certification (I&C) programme is required to be implemented, which includes a combination of both Visual (having pre-defined guidelines) and Automated tests for Brakes, Suspension, Speedometer, Emissions, etc. The I&C centers will be set up at Bihta on a land of 3 acres provided by the State Government at an estimated cost of Rs 16.50 crore, being sanctioned by the Ministry of Road Transport and Highways (MORTH), Government of India.
Institutes of Driving and Traffic Research (IDTR) – Aurangabad : It is a joint venture between the Department of Transport, Government of Bihar and Maruti Suzuki India Ltd inaugurated on May 3, 2018. IDTR has adopted world class systems and quality standards. The institute is spread over more than 25 acres and has scientifically engineered training and testing tracks of international standards. The total cost of the project is Rs 25.15 crore. The salient features of the IDTR are – (a) Air-Conditioned class room, (b) Driver Training Simulators, (c) Scientifically developed track, (d) Auditorium with seating capacity of 180 persons, (e) 80-bed hostel facility,and (f) Canteen.
Shared Mobility : The more people use shared modes, it is more likely that they are to use public transit, own fewer cars, and spend less on transportation, overall. Shared modes complement public transit, and enhance urban mobility. Shared modes will continue to grow in significance, and public entities should identify opportunities to engage with them to ensure that benefits are widely and equitably shared. Bihar Taxi Aggregator Policy-2019 has been notified and has become

229
effective from January 4, 2019 which ease passenger travel by taxi or motorcycle. Bike Taxi operators are also allowed to ply. Rent-a-Cab Policy has also been notified, effective from January 4, 2019 and, under this policy, citizens will be able to rent a vehicle having tourist permit, and travel as per their ease and requirement.
DigilLocker : This allows for legal acceptance of Driving License and Registration Certification at par with original document. Targeted at the idea of paperless governance, DigilLocker is a platform for issuance and verification of documents and certificates in a digital way, thus eliminating the use of physical documents. Transport Department of the State Government aimed at the concept of paperless governance by implementation of DigilLocker through which citizens can access their digital documents anytime, anywhere and share it online. This is convenient, time saving and this will result in assured authenticity of such documents and reduction of administrative overhead. With this integration, people will no longer need to carry around physical copies of their Registration Certificate and Driving License. They can instead access digital copies of the same on their mobile phones via the DigilLocker mobile app.
e-Challan via Handheld Device and CCTV : This scheme promotes adoption of e-challan through CCTV and Hand-Held Device/Terminal for management of traffic violations in near real time, data maintenance, generation of prosecution reports and to prosecute repeat violators for appropriate punishment as provided in Motor Vehicle Act. Presently, CCTV based e-challan and through handheld device are being implemented across the state. The e-challan system is to ensure that all traffic violation are recorded in real time and stolen vehicles are tracked and legally prosecuted accordingly.
e-Auction Policy : Registration numbers of choice (at the cost of their Minimum Reserve Price) for motor vehicles in Bihar shall be, henceforth , allotted by “e- auction” process to vehicle owners.
A distinguished link via VAHAN 4.0 software will be provided for access to interested vehicle owners for log-in, followed by online credit of prescribed amount (Minimum Reserve Price), depending upon a specific registration number to participate in e-auction process for allotment of premium registration numbers of their choice by the Transport Department.
Implementation of Vahan 4.0 and Sarathi 4.0 software : All the 38 Districts have been upgraded to Vahan 4.0 and Sarathi 4.0 software. This has resulted in more transparency in the working of the Department and it also ensures that registration of all vehicles in Bihar is also recorded in the National e-register. In addition, the facility of registration of vehicles at the dealer point has been provided to get rid of inconvenience caused to the buyers of vehicles. The waiting time for Registration Certificate and Driving License has been reduced to minimum. In addition, the department facilitates the applicants by delivering RC and DL via speed post to provide improved

230
services, law compliance, status tracking of RC/DL and SMS alert services and quick and easy availability of delivery information. It helps to authenticate address of the applicant by reducing turn-around time at DTO office, compilation of MIS for decision-making and in easy detection of malpractices.
E-governance : Information and Communication Technology plays a stellar role as transparency, responsiveness and accountability are required by the citizens in the services and by the Department in administration and services, both. It’s helpful to overcome the problems of coordination due to manually operated services in the regional offices as well as headquarters. The major initiatives taken are as follows:
Online payment facility of motor vehicle tax and fees, driving license, vehicle registration,
Online Permit Services
Online License Services (Pollution Centre, Fitness Centre, Petrol Pumps & Motor Driving Training Institute)
Automated Pollution Under Control
Legacy Data Digitization
Inter-state Transport : An advanced and developed transport system connects backward regions with towns and markets within the state as well as other states for social, cultural and economic development. In order to facilitate inter-state road transportation, the State Government has made several agreements with the nearby states for convenience of passengers. In this background, the State Government has signed agreement with Jharkhand (200 routes), Chhattisgarh (28 routes), Odisha (07 routes), West Bengal (45 routes) and Uttar Pradesh (34 routes).
CNG & Electric Vehicles : Department has taken various initiatives to promote EV or CNG-based vehicles and 50% road tax rebate is being given by the Department for battery-operated/ electric vehicles being registered in the state. At present, 5 CNG stations are operational in Patna and more shall be operational soon.
Bihar Clean Fuel Scheme : Passenger three-wheelers are a critical part of the public transport infrastructure. They provide last mile connectivity and access to areas that are underserved by public transport. Bihar Clean Fuel Scheme 2019 will aim to incentivize the replacement/conversion of existing diesel/petrol operated three-wheelers to CNG auto-rickshaws/EVs and also retrofitting of petrol-operated motorcar/maxi cab. The Transport Department plans to ensure that no diesel-operated auto-rickshaws ply on the roads of Patna after March 31, 2021. Pollution Reduction Measures : Air pollution in Patna, Gaya and Muzaffarpur, the three prominent cities of Bihar, is a major concern which needs to be tackled systematically through
231
coordinated efforts between the government and other stakeholders. A concerted effort has been made by the Department of Transport to bring about a material improvement in the air quality of these cities through continuous interventions to strive towards reducing vehicular emissions. The Department of Transport has taken several instrumental steps for bringing down the pollution levels in Bihar. These are as follows :
(a) Restriction on plying of age-old vehicles – The state government issued a notification banning all government vehicles that are more than 15 years old. Commercial vehicles that are more than 15 years old have been banned in Patna and adjacent regions. The state government launched the Bihar Clean Fuel Policy, 2019 that prohibits plying of diesel-operated vehicles in Patna from 31 January 2021 and in Danapur, Khagaul & Phulwarisharif from 31 March, 2021. The state government has also levied Green Tax on commercial vehicles that are more than 12 years old.
(b) Incentive to switch over to greener fuels – (i) Purchase Incentive (CNG) : The state government launched the Bihar Clean Fuel Policy, 2019 that shall provide a one-time subsidy of Rs 40,000/- (Rupees Forty Thousand only) per vehicle on replacement of existing diesel/petrol-operated passenger three-wheelers with new passenger CNG-based three-wheelers. (ii) The Bihar Clean Fuel Policy, 2019 provides for one-time conversion incentive of Rs 20,000/- (Rupees Twenty Thousand only) to a three-wheeler passenger vehicle/motorcar/maxi cab with a valid permit issued by the Regional Transport Authority, Patna to help cover the cost of CNG Kit retrofitting. (iii) The state government has banned issuance of new permit to three-wheeler passenger vehicles in Patna urban area. The government is also planning to introduce the same in Gaya and Muzaffarpur.
(c) Efforts towards electric mobility – The state transport department provides a rebate of 50% of MV Tax to all electric vehicles being registered in Bihar. Bihar Clean Fuel Policy, 2019 provides for one-time a subsidy of Rs 25,000/- (Rupees Twenty Five Thousand only) per vehicle on replacement of existing diesel/petrol-operated passenger three-wheelers with new passenger electric vehicles. The state transport department is in the final stages of finalizing the Electric Vehicle policy for the state, which aims to incentivize the purchase of EVs and setting up EV charging infrastructure in the state. Bihar State Road Transport Corporation (BSRTC) plans to procure 25 Electric Buses under Government of India’s FAME-II scheme.
(d) Facilitation of Pollution-under-Control (PUC) Centers – The state government has mandated all PuC centers to issue online PuC certificates only. The state government has made it mandatory for all petrol pumps to have a PuC center. The procedure to set up new PuC centers has been simplified and the state government has launched an online portal for

232
application of new and renewal of PuC center license. The state government has relaxed the norms related to purchase of pollution checking equipments before applying for a PuC license. The fee for licensing/renewal of PuC centers has been reduced by the state transport department. The state transport department has relaxed the educational qualification norms required for operating a PuC center. Mobile Pollution Centers have also been granted approval to facilitate doorstep pollution check service.
(e) Strict enforcement & monitoring – The state transport department conducts regular pollution check drive to put a curb on defaulters. The District Transport Officers undertake regular calibration tests of Pollution-testing equipments being used at PuC enters. The Motor Vehicle Inspectors carry out fitness check of transport vehicles on a periodic basis to ensure adherence to pollution norms. An automated inspection and certification center is also being set up on Bihta for gauging road-worthiness of vehicles.
Bihar State Road Transport Corporation (BSRTC)
The Bihar State Road Transport Corporation (BSRTC) is a State Public Sector Undertaking, which is continuously striving to provide transport services to the people, which is accessible and affordable. In order to provide safe and comfortable services to the passengers, the public transportation system in the state has been strengthened, and currently 410 buses are plying in rural and urban areas under the Corporation. In addition, 231 buses are running under Public-Private Partnership (PPP) mode. In the light of increasing population of Patna, 107 buses have been provided for easy and speedy travel in Patna and nearby areas. The State Government has provided free passes to Jai Prakash Senani to travel in the public transport. There are special buses for women only, and 65 percent of seats in common buses are reserved for women. Again, 50 percent concession is allowed to differently-abled persons, up to the limit of 50 kms ofjourney, and two seats are also reserved in every bus for them. A mutual agreement has been signed to provide 3 bus services for comfortable and frequent travel between Bihar and West Bengal. Similarly, for travel between Bihar and Uttar Pradesh, 13 buses have been provided. BSRTC has facilitated two buses for Bodh Gaya – Patna – Kathmandu and four Buses for Patna-Janakpur for daily transportation. Table 6.15 presents the summary of revenue collected and passengers carried by the BSRTC. The revenue collection by the Corporation has been growing steadily, and it was Rs. 151.2 crore in 2018-19, more than seven times the amount collected in 2014-15 (Rs. 21.6 crore). The revenue has increased by 42.3 percent annually during the last seven years. The number of passengers carried by the Corporation has also been growing annually at 13.4 percent. In 2018-19, it carried 320.0 lakh passengers, compared to 146.6 lakh passengers in 2012-13. This indicates the extended coverage of services and changed perception

233
about the public transport by the people shown in Chart 6.14 the daily passenger has increased by more than four times within a year’s period.
Table 6.15 : Revenue Collection and Number of Passengers Carried by BSRTC (2012-13 to 2018-19)
Particular 2012-13 2013-14 2014-15 2015-16 2016-17 2017-18 2018-19 CAGR (2012-19)
Revenue Collection (Rs. crore) 26.0 21.1 21.6 24.9 61.4 124.8 151.2 42.3
No. of Passengers Carried (lakh) 146.6 152.3 110.6 126.6 184.5 212.0 320.0 13.4
Source : Bihar State Road Transport Corporation, GoB
Chart 6.14 : Quarterly Growth of Average Daily Passenger during 2018-19
6.7 Railway Network
Indian Railways Network is one of the oldest and largest rail networks in the world, spread over 68,400 kms route. It is the lifeline of the country, carrying nearly 230 lakh commuters every day, making it the largest passenger carrying system in the world. It is also the 4th largest freight transporter in the world, transporting 116 crore tonnes of freight annually, as it traverses the length and breadth of the country. Railways is an affordable means of transportation for millions of passengers and also for bulk freight. Uttar Pradesh had the longest rail route (8989 kms) in India,and Bihar was at the 9th position among major states of India in 2017. Table 6.16 provides the details of rail route and its density across the major states of India in 2017. The length of rail route in Bihar was 3714 kms. The share of rail route in Bihar was 5.5 percent of the total rail route. The density of rail route in Bihar was 39.4 kms per 1000 sq. km of area. However, Bihar had only 3.2kms of rail route available per lakh of population compared to 5.2 kms at the national level. In terms of rail route per lakh population, Gujarat topped with 8.1 kms, and West Bengal topped with 46.6 kms per 1000 sq. km in terms of geographical area.
12000
24000
36000
50000
0
10000
20000
30000
40000
50000
60000
June '18 September '18 December '18 March '19

234
Table 6.16 : Progress of Rail Route Network in Major States of India (2003-07, 2008-12 and 2013-17)
StateAverage (Kms)
Rail DensityRail Route (length in km) per
lakh populationRail Route (length in km) per
1000 sq km of Area2003-07 2008-12 2013-17 2003 2010 2017 2003 2010 2017
Andhra Pradesh 5191.0 5224.8 4018.4 — — 4.3 — — 13.9
Bihar 3344.4 3540.0 3678.4 3.7 3.5 3.2 34.2 37.9 39.4
Chhattisgarh 1174.0 1186.6 1203.6 5.4 4.7 4.4 8.7 8.8 9.0
Gujarat 5288.8 5236.6 5258.6 10.1 8.4 8.1 26.9 25.5 26.8
Haryana 1582.0 1533.2 1662.2 7.1 6.2 6.3 35.2 35.1 38.7
Jharkhand 1915.6 1991.6 2287.6 6.4 6.2 6.9 22.6 25.1 30.8
Karnataka 2988.8 3049.6 3299.0 5.5 5.1 5.4 15.5 16.0 17.9
Kerala 1050.0 1050.0 1048.0 3.3 3.2 3.0 27.0 27.0 26.9
Madhya Pradesh 4873.2 4938.0 5004.6 7.7 6.9 6.5 15.7 16.1 16.6
Maharashtra 5504.2 5588.8 5740.8 5.5 5.1 4.9 17.7 18.2 18.8
Odisha 2283.4 2417.6 2544.4 6.2 5.8 5.9 14.9 15.3 16.7
Punjab 2112.6 2137.8 2258.2 8.4 7.8 7.8 41.7 42.4 45.1
Rajasthan 5864.4 5784.6 5885.4 10.0 8.6 7.9 17.2 16.9 17.2
Tamil Nadu 4169.6 4060.8 4027.2 6.5 5.7 5.4 32.2 31.2 31.0
Uttar Pradesh 8606.4 8709.2 8989.2 5.1 4.4 4.2 36.5 36.2 38.0
Uttarakhand 345.0 345.0 343.0 3.9 3.5 3.1 6.5 6.5 6.4
West Bengal 3812.8 3933.6 4090.2 4.5 4.3 4.3 41.5 43.8 46.6
All-India 63293.4 64064.4 66264.2 5.9 5.4 5.2 19.2 19.5 20.5
Source : Annual Report 2018-19, Indian Railways, Government of India
Chart 6.15 : Rail Route Density (in km) per 1000 sq km of Geographical Area (As on March 2017)
0.05.0
10.015.020.025.030.035.040.045.050.0

235
Achievements of Railways in Bihar
The Union Ministry of Railways had established East Central Railway Zone in Bihar, with Hajipur as its headquarters. Some parts of the state are under the jurisdiction of the Northeast Frontier Railway, Eastern Railway and Northeast Railways. Two greenfield locomotive factories (Electric Locomotive Factory, Madhepura and Diesel Locomotive Factory, Marhaura) have been established in the state. Some of the important achievements of Railways in Bihar are as follows:
Infrastructure Creation : Between 2014 and 2019, Railways built 191 kms of new lines in Bihar, apart from 135 kms of doubling the track, 248 kms of gauge conversion, 1226 kms of railway track electrification, and built 85 Rail Over/Under Bridges for expansion of railway services. Two rail bridges over Ganga at Patna and Munger have already become operational. In addition, a new bridge over Ganga at Bhagalpur has been sanctioned. The construction of a new bridge over Kosi is also near completion and will provide transportation in flood affected Kosi region. Further, a new double line bridge, parallel to Rajendra Bridge in Mokameh, is under progress. The Railways have surveyed 2540 kms of new track for lagging regions at a cost of Rs. 40,234 crore.
Dedicated Freight Corridor : The Dedicated Freight Corridor Corporation of India is constructing two dedicated freight corridors to improve freight services. About 1840 kms long Eastern Dedicated Freight Corridor passes through four districts (Kaimur, Rohtas, Aurangabad and Gaya) in Bihar, and the stretch of this corridor in Bihar is about 240 kms. The estimated cost of this project is Rs. 6900 crore and is expected to be completed by December 2020.
Safety : Since Railways safety is on the high priority, there remains no unmanned level crossings in Bihar as on September 2019. Presently, Gate Mitra is deployed on all unmanned level crossings. Under Integrated Security System (ISS), there are 287 CCTV cameras installed at different stations in Bihar. The Railway Police Force has rescued 2557 children with the help of CCTV and handed over them to their guardian/ NGOs/police.
Passenger Services : Since 2014, for the convenience of the passengers, 52 pairs of new trains have been introduced and stoppages of more than 100 pairs of trains allowed at different stations. Recently, 32 foot over-bridges, 20 escalators, 11 lifts, 1050 platform sheds, 166 water vending machines, and toilets for differently abled persons have been provided at 27 major stations. In addition, at 81 stations in Bihar, the platforms have been either expanded or raised. Further, 23 new Unreserved Ticket Counters (UTC), 10 new UTC-cum-Passenger-Reservation-Counters (PRC) and one PRC have been opened. Free and fast wi-fi network has also been provided at more than 50 stations.

236
6.8 Civil Aviation
Air transport is an imperative facilitator for attaining economic growth and it also enables integration of different regions with the global economy. It provides an opportunity for trade, tourism and employment and minimizes the travel time. The air transport is developed and managed by the Central Government, with an objective of ‘Sab Ude Sab Jude’ (Let all fly and all connect). Bihar has registered a massive growth in air transport sector, as GSDP of this sectorhas increased from Rs. 31 crore in 2011-12 to Rs. 252 crore in 2018-19 (Chart 6.1). This implied an annual growth rate of 35.6 percent. As many as 40.61 lakh passengers availed air travel during 2018-19, compared to 31.11 lakh in 2017-18. The domestic passenger traffic registered an annual growth rate of 36.6 percent during the period 2014-15 to 2018-19. Similarly, the aircraft movements increased by 31.0 percent annually during the same period. The freight movement has also increased by more than six times, from 1.04 thousand tonnes in 2004-05 to 6.32 thousand tonnes in 2018-19. The freight business has crossed the previous year’s volume in the first sixmonths of 2019-20. (Table 6.17).
Table 6.17 : Summary of Aircraft Movements, Number of Passengers and Freights at Patna Airport (2004-05 to 2019-20)
YearNo. of
Aircraft Movements
Passengers (in lakh)
Freight (in '000 tonnes)
2004-05 3844 1.76 1.042009-10 10734 5.53 2.532014-15 11060 11.97 5.202015-16 13947 15.84 4.412016-17 15508 21.12 6.592017-18 24479 31.11 6.322018-19 32169 40.61 6.322019-20 (upto Sept. 19) 18257 22.80 6.46
CAGR (2014-19) 31.0 36.6 7.8Source : Airport Authority of India, Patna
Ude Desh Ka Aam Naagrik (UDAN)
UDAN is a joint initiative of Central and State Government, providing subsidy for flying at the ratio of 80:20 for the general category states, introduced under the National Civil Aviation Policy, 2016. It enhances the regional connectivity by providing regional air transportation at affordable cost to the masses. Darbhanga has been included under UDAN-II and work is in progress for construction of the proposed airport. Patna airport has already provided aircraft movement under UDAN from Patna to Prayagraj since June 2018. There are 27 airports / airstrips listed under different categories of aircraft under UDAN-IV. A solar power plant has been installed with the capacity of 219 kwh at Jayprakash Narayan International Airport, Patna to reduce carbon emission.

237
6.9 Building Construction
Bihar has witnessed a double digit growth since 2005 in the construction sector. The State
Government is committed to provide an adequate and quality infrastructure for delivering good
governance, including good buildings for health institutions, educational institutions,
administrative offices, community halls, warehouses, Kisan bhavans, museums, etc. The
construction of buildings also generates employment for the youth in the state. A number of
projects have been undertaken and completed for construction of buildings, within the stipulated
time frame. The expenditure on building construction and has been continuously increasing and
registered 34 percent annual growth in the last 12 years (2008-20) (Chart 6.16). This growth is
even higher for scheme expenditure which recorded 62 percent annual growth during the same
period, compared to 15 percent for establishment and committed expenditures. Among all the
projects, Public Works Department alone account for 69 percent of the funds, followed by
Department of Urban Development and Housing (15 percent) and Department of Education, Sport,
Art and Culture (12 percent).
Chart 6.16 : Expenditure of Building Construction Department (Rs. crore)
Source : Building Construction Department, Government of Bihar
0100020003000400050006000 Scheme Establishment and Committed Expenditure CSS CPS
Education, Sports Art and Culture, 635, 12%
Food Storage and Warehousing, 135,
3%
Housing, 822, 15%
Medical and Public Health, 11,
0%
Other Fiscal Services, 20, 0%
Police, 25, 0%Public Works, 3681,
69%
SC, St OBC and Minorities, 26, 1%
Social Security and Welfare, 17, 0%
Other, 3, 0%
2019-20 BE

238
The Department of Building Construction has optimally utilized its limited resources and achieved most of the physical targets of several ambitious projects. A State Sports Academy-cum-International Standard Modern Cricket Stadium in Rajgir is under construction at a cost of Rs. 633.00 crore. Mahabodhi Convention Centre, Gaya is being constructed at a cost of Rs. 145.00 crore. A sum of Rs. 301.40 crore is being spent on building Budh Samyak Darshan Sangrahalaya and Smriti Stup at Vaishali. In addition, A.P.J. Abdul Kalam Science City is being developed at a cost of Rs. 397.00 crore in Patna. A planetarium is being constructed in Darbhnga at a cost of Rs. 164.00 crore. Under e-governance programme, the department provides accessibility, transparency and accountability in allotment of government quarters, and it also includes through online application for renting Samrat Ashok Convention Centre, Adhiveshan Bhavan and Majharul Haq Auditorium. Different building projects and schemes are being monitored through Project Management Information System (PMIS).
Bihar State Building Construction Corporation Limited (BSBCCL)
The State Government has established Bihar State Building Construction Corporation Limited in 2008, as a Public Sector Undertaking. Presently, BSBCCL has nine units in all over Bihar. It has executed 1647 projects till date, worth of Rs. 5076.57 crore. The Corporation has witnessed considerable growth in recent years, and has also been generating profit. The net profit has fluctuated over the years. It was the minimum in 2015-16 (Rs. 5.51 crore) and maximum in 2014-15 (Rs. 26.78 crore). Table 6.18 presents the summary of financial management of the Corporation and its expenditure. It may also be noted here that the Corporation spends a substantial amount for its CSR (Corporate Social Responsibility) initiative each year. In 2017-18, the CSR amount was Rs. 40.14 lakh.
Table 6.18 : Status of Financial Management and Expenditure on Projects of BSBCCL (2013-14 to 2017-18)
Year No. of Projects
Expenditure (Rs. crore)
Turnover(Rs. crore)
Total Revenue
(Rs. crore)
Administ-rative
Expenditure (Rs. crore)
Gross Profit
(Rs. crore)
Net Profit (Rs. crore)
CSR Reserve
(Rs. lakh)
2013-14 747 300.50 28.76 41.27 14.12 14.59 9.43 19.892014-15 128 637.49 58.18 72.51 17.24 41.21 26.78 25.552015-16 87 445.82 27.34 38.82 18.47 8.30 5.51 64.102016-17 400 568.76 39.26 57.47 14.02 28.59 18.63 52.062017-18 254 602.16 40.93 67.39 20.12 23.32 14.95 40.14
Source : Bihar State Building Construction Corporation Limited.
6.10 Telecom Network
Tele-communication is an emerging sector at the global level which creates ample opportunity for fast communication and exchange of information. This sector is also important because of its expanding reach, widening network and adoption of tools that enhances digitisation of systems,

239
and interactions across the key economic sectors, including agriculture. India is presently the world’s second largest telecommunications market, with 118 crore subscribers. In Bihar also, the telecom is one of the fastest growing sectors. The state-wise tele-density (number of telephonesper hundred of population) is given in Table 6.19. The telecom sector has registered a tremendous growth and tele-density has been increasing rapidly over the years in both Bihar and other states.However, the increasing trend was slightly reversed in 2019, both for Bihar and India as a whole. In 2019, Bihar is at the second lowest position among major states of India in terms of rural tele-density (46 connections) and at the eighth position in terms of urban tele-density (149connections). The highest rural tele-density was registered by Tamil Nadu (86 connections) and the highest urban tele-density by Kerala (302 connection). The national average was — 57 connections (rural), 160 connections (urban) and 90 connections (overall).
Table 6.19 : Tele-density of Major Indian States (2016 to 2019)
State2016 2017 2018 2019
Rural Urban All Rural Urban All Rural Urban All Rural Urban All
Andhra Pradesh 51 177 86 60 192 97 61 189 53 65 181 98
Bihar 36 166 54 41 187 61 44 221 63 46 149 60
Gujarat 67 145 100 76 166 114 76 161 112 71 155 107
Haryana 65 123 86 65 136 91 69 211 121 71 142 98
Karnataka 53 179 102 59 198 113 62 182 109 69 172 110
Kerala 62 220 102 70 248 115 75 260 122 67 302 126
Madhya Pradesh 42 124 64 44 129 67 44 124 67 44 137 70
Maharashtra 65 135 99 70 151 110 74 144 108 71 144 107
Odisha 50 160 69 58 184 81 62 164 80 60 145 76
Punjab 72 150 106 81 166 118 81 180 123 78 182 125
Rajasthan 58 162 83 62 187 92 60 171 87 58 172 85
Tamil Nadu 85 140 118 94 151 128 105 155 136 86 135 117
Uttar Pradesh 42 145 66 46 168 74 46 164 73 49 133 69
West Bengal 53 145 80 62 169 93 63 159 91 58 159 87
All-India 51 154 83 57 172 93 59 166 93 57 160 90Source : Telecom Regulatory Authority of India (TRAI)
The Bharat Sanchar Nigam Limited (BSNL) is a Public Sector Undertaking, owned by the Central Government, which provides telecom services across the country, particularly in the rural areas. The services also include tribal and left-wing extremism affected areas. In Bihar, BSNL network covers 16.0 percent of the total geographical area, 84.7 percent of the population, 68.5 percent of villages and all the routes of NH, SH and railways. A summary of telecom demography of the state is presented in Table 6.20. In recent years, BSNL has taken many strides — launch of Wi-fi hotspot and next generation network exchange in 2017, WINGS (Wi-fi Internet Telephony Connections)

240
in 2018, and 4G Base Transceiver Station (BTS) in 2019. The status of telecom infrastructure of BSNL in Bihar is given in Table 6.21.
Table 6.20 : Telecom Demography of BSNL in Bihar (September 2019)
Item Total % Coverage
Area (sq. km) 94613 66.0
Population (Crore) 10.38 84.7
Revenue District (nos.) 38 100.0
Revenue Sub-Division (nos.) 101 100.0
Block HQ (nos.) 534 100.0
Total Villages (nos.) 44874 68.5
National Highway (km) 3734 100.0
State Highway (km) 4857 100.0
Total Railway Route (km) 3515 100.0
Source : BSNL, Patna
Table 6.21 : Trends of expansion of BSNL Network (2014-15 to 2019-20)
Particulars 2014-15 2015-16 2016-17 2017-18 2018-19 2019-20*
Total no. of BSNL Connections (in lakh) 21.69 25.14 30.32 32.64 33.58 36.38
No. of Mobile GSM Connections (in lakh) 18.61 22.36 28.76 31.27 32.38 35.34
Total Wireline connections (in Lakh) 1.95 1.66 1.56 1.37 1.20 1.04
WINGS (Wifi Internet Telephony) Connections w.e.f. July-2018 1130 12.56
Wireless Internet Connections (in Lakh) 21.50 23.48 28.76 31.27 32.38 35.34Total No. of FTTH ( Fiber-to-the Home) High Speed Broadband connection 215 519 869 5147 6005 7573
No. of Wireline Broadband Connections (in Lakh) 0.59 0.59 0.59 0.52 0.43 0.27
No. of GSM Mobile BTSs2G/3G 3256 3734 3875 4562 4874 4436
4G 4G Services w.e.f. 12.03.2019 34 323
No. of Wi-fi Hotspotsw.e.f. 2017
6 10 108 729
No. of Next Generation Network (NGN) Exchanges 5 16 177 367No. of OLTs for High-speed FTTH Broadband Connections (including Bharat Net Phase-1) 39 80 99 410 410 410
Total No. of Landline Telephone Exchanges 1196 1196 1196 1196 1118 1055
No. of Wireline Broadband DSLAMs 1160 1111 896 896 850 850
Source : BSNL, Patna
The Department of Telecommunication has taken several steps to strengthen the telecom infrastructure and network at the national level. Bihar is one of the beneficiaries of such projects:
Special Provision for Left Wing Extremism-Affected Areas : The Central Government has identified 2335 locations in 10 Left Wing Extremism (LWE) affected states (Andhra Pradesh,

241
Bihar, Chhattisgarh, Jharkhand, Maharashtra, Madhya Pradesh, Odisha, Telangana, Uttar Pradesh and West Bengal) and earmarked an outlay of Rs. 4781 crore for strengthening BSNL network in those locations. Bihar had 250 sites in different LWE affected districts. As part of LWE Phase-2,the Central Government has decided to install additional 4072 mobile towers at different locations in 96 districts in 10 states, out of which 8 districts are in Bihar. The estimated cost of this project is Rs. 7330 crore.
SAMPANN : A System for Accounting and Management of Pension, and a new software for direct disbursement of Pension to BSNL and Telecom Department retirees have been developed. Thiswill ensure Comprehensive Pension Management System (CPMS) and it has been rolled out at 12 offices of Controller of Communication Accounts (CCA) — Uttar Pradesh, Gujarat, Kerala, Rajasthan, Bihar, Madhya Pradesh, Andhra Pradesh, Tamil Nadu, West Bengal, Jammu and Kashmir and Delhi. The rest of the CCA offices in other states are likely to be included in due course. SAMPANN provides the following benefits to the pensioners — (i) A single-windowsystem for complete pension process, avoiding the complexities, (ii) Pensioners to be provided with a login, for tracking the pension status and the related processes, (iii) Direct disbursement of pension on timely basis without any intervention, (iv) Effective and Quick processing of pension arrears and pension revision cases. Till now, 2092 pensioners have been benefitted and an amount of Rs 296.51 crore has been disbursed as pension. The migration of bank data of old pensioners to CPMS is under process.
USOF Wi-fi Hotspot : The Central Government has planned to set up 25,000 public Wi-fi hotspots at rural telephone exchanges of BSNL. This shall provide broadband internet access over Wi-Fi, leveraging BSNL backhaul. A total of 895 Rural Telephone Exchanges is planned under USOF project, out of which 693 have already been commissioned and 202 more rural exchanges will be provided with Wi-fi services in 2019-20.
Bharat NET Project : The State Government has laid emphasis on growth of internet and broadband, as a part of the Digital India campaign. This project is implemented through the BSNL and 5986 Gram Panchayats (GPs) are to be connected with Optical Fibre Connection (OFC) for high-speed broadband connectivity. In addition, 226 GPs under Bharat Net project have been provided with Wi-fi Choupal services.
Crime and Criminal Tracking Network and Systems (CCTNS) Project : The connectivity under CCTNS project will ensure RF (Radio Frequency) to 980 Police Stations in different districts of Bihar. BSNL is required to provide network for 569 police stations, of which work in 400 police stations is already complete.

242
6.11 Postal Network
The postal network of India is the largest in the world, with altogether 1.55 lakh post offices. It provides many services, including mail, banking, insurance, money transfer and retail services. Atotal of 9084 post offices were in existence in Bihar in March, 2018 — 8625 (94.9 percent) being in rural and 459 (5.1 percent) in urban areas. In terms of share in the all-India postal network, Bihar’s share stands at 5.8 percent, compared to the population share of 8.6 percent. In terms of letter boxes, the top three states are — Uttar Pradesh, Maharashtra, and Tamil Nadu, accounting for 29 percent of the letter boxes. Bihar accounted for 4.6 percent of the total number of letter boxes in the country. (Table 6.22).
Table 6.22 : Postal Network in Major States of India (March 31, 2018)
StatesPost Offices (in Nos.) Letter Box (in Nos.)
Rural Urban Total Rural Urban Total
Andhra Pradesh 9707 (92.5) 783 (7.5) 10490 (100.0) 24846 (85.4) 4233 (14.6) 29079 (100.0)Bihar 8625 (94.9) 459 (5.1) 9084 (100.0) 19472 (86.2) 3111 (13.8) 22583 (100.0)Chhattisgarh 2898 (90.9) 289 (9.1) 3187 (100.0) 12219 (80.3) 2991 (19.7) 15210 (100.0)Gujarat 8167 (91.3) 781 (8.7) 8948 (100.0) 19764 (81.9) 4381 (18.1) 24145 (100.0)Haryana 2318 (86.1) 375 (13.9) 2693 (100.0) 5403 (81.2) 1250 (18.8) 6653 (100.0)Jharkhand 3190 (92.2) 270 (7.8) 3460 (100.0) 8533 (89.2) 1028 (10.8) 9561 (100.0)Karnataka 8624 (89.2) 1039 (10.8) 9663 (100.0) 23951 (80.2) 5922 (19.8) 29873 (100.0)Kerala 4181 (82.6) 883 (17.4) 5064 (100.0) 11315 (76.6) 3463 (23.4) 14778 (100.0)Madhya Pradesh 7473 (90.3) 807 (9.7) 8280 (100.0) 34122 (88.8) 4287 (11.2) 38409 (100.0)Maharashtra 11584 (90) 1286 (10) 12870 (100.0) 36468 (81.6) 8242 (18.4) 44710 (100.0)Odisha 7615 (92.7) 600 (7.3) 8215 (100.0) 16909 (87.2) 2491 (12.8) 19400 (100.0)Punjab 3417 (88.3) 453 (11.7) 3870 (100.0) 12044 (81.7) 2705 (18.3) 14749 (100.0)Rajasthan 9679 (93.9) 632 (6.1) 10311 (100.0) 23690 (86.8) 3613 (13.2) 27303 (100.0)Tamil Nadu 10283 (84.7) 1855 (15.3) 12138 (100.0) 30587 (76.4) 9427 (23.6) 40014 (100.0)Uttar Pradesh 15747 (89.1) 1924 (10.9) 17671 (100.0) 45224 (87) 6785 (13) 52009 (100.0)West Bengal 7940 (87.5) 1137 (12.5) 9077 (100.0) 22615 (83.7) 4416 (16.3) 27031 (100.0)All States 139882 (89.9) 15649 (10.1) 155531 (100.0) 394004 (83.6) 77439 (16.4) 471443 (100.0)
Note : Figures in parenthesis for rural and urban represent share from total and state-wise from all-India Source : Annual Report 2018-19, Department of Posts, India
Many financial services are provided through the vast postal network. These services include deposit, investments, Monthly Income Scheme (MIS) and payments under other government financial schemes (social benefit payments, MGNREGA payments, and social security pension schemes). Table 6.23 presents the details of different types of accounts and their outstanding balances in major states of India. There are 272 lakh account holders in Post Office Bank (POB) in Bihar, which constituted 7.3 percent of the all-India total. In terms of total outstanding balance, Bihar accounts for Rs. 92,810 crore, constituting 15.5 percent of all-India total.

243
Table 6.23 : Summary of Financial Services of Post Office in India (March 31, 2018)
State
No. of Accounts (lakh) Outstanding Balance (Rs. in crore)
Deposits Invest-ment MIS
Sukanya/ Mahila
Samridhi Account
Total Deposits Invest-ment MIS
Sukanya Mahila
Samridhi Account
Total
Andhra Pradesh 365 1 5 6 376 204 71 15 467 757Bihar 252 1 14 5 272 42410 3770 45768 863 92810Chhattisgarh 19 2 4 2 27 13326 1966 9431 1996 26720Gujarat 54 1 3 4 62 21491 4141 9911 3112 38656Haryana 51 0 2 2 55 720 124 328 84 1255Jharkhand 129 0 3 4 136 11324 4277 5563 3039 24203Karnataka 265 5 12 9 292 13705 1501 3723 657 19586Kerala 236 1 4 5 246 10135 491 3419 691 14735Madhya Pradesh 23 0 0 1 24 13800 4640 5236 844 24520Maharashtra 143 0 3 4 150 17608 7850 5864 766 32087Odisha 167 2 5 6 179 12749 783 2320 928 16781Punjab 305 3 5 15 328 21303 7352 13446 594 42696Rajasthan 334 2 12 13 361 8421 1206 2785 414 12826Tamil Nadu 230 2 47 7 285 3269 222 834 230 4556Uttar Pradesh 39 0 1 3 44 23034 9811 25973 1999 60816West Bengal 58 0 1 3 62 5247 750 1762 254 8013Total 3412 28 154 118 3712 319616 73084 181688 22906 597295
Note : Deposits include saving accounts, recurring deposits, term deposits and Senior citizen’s deposits andInvestment includes Public Provident Fund and National Savings Scheme
Source : Annual Report 2018-19, Department of Posts, Government of India
Passport Services : In order to extend passport services to the citizens in remote areas, the selected Head Post Offices (HPOs) have been authorised as Post Office Passport Seva Kendra (POPSK).
E-Commerce : The Department of Posts has launched the e-Commerce Portal on December 14, 2018 in order to strengthen the rural economy. This will promote digital and physical connectivity to facilitate a digital platform and e-market place for sale of Departmental and Third Party Products.
DARPAN : Under the Digital Advancement of Rural Post Office for A New India (DARPAN) Project, a SIM based hand held device has been provided to more than 1.29 lakh Branch Post offices all over the country for carrying out online postal and financial transactions. Through DARPAN, the following transactions are being done — deposit and withdrawal of money on core banking system, disbursement of benefits under MGNREGS and other social sector payment schemes, booking of Registered and Speed Post articles, booking of Money Orders, and deposits of Postal Life Insurance (PLI) / Rural Postal Life Insurance (RPLI) premium. All these transactions will give a boost to digital transactions in the remote rural areas.

244
APPENDIX
Table A 6.1 : District-wise National Highway Network in Bihar (in km) (2013 to 2020)
District 2013-14 2014-15 2015-16 2016-17 2017-18 2018-192019-20
(Upto Sept.)
Patna 395 395 395 395 395 395 395Nalanda 177 177 177 177 177 177 177Bhojpur 85 85 85 85 85 85 85Buxar 55 55 55 55 81 81 81Rohtas 145 145 145 145 183 183 183Kaimur 52 52 99 99 99 99 99
Gaya 120 120 120 120 155 155 155JehanabadArwal 134 134 134 134 134 134 134Nawada 84 84 84 84 84 84 84Aurangabad 137 137 137 137 186 186 186
Saran 181 181 181 181 227 227 227Siwan 54 54 54 54 131 131 131Gopalganj 96 96 96 96 96 96 96
W. Champaran 112 112 112 112 112 112 112E. Champaran 94 94 94 94 126 126 126Muzaffarpur 258 259 259 259 259 259 259Sitamarhi 136 168 168 168 168 168 168Sheohar 22 22 22 22 22 22 22Vaishali 128 128 128 128 128 128 128
Darbhanga 50 50 50 50 50 50 50Madhubani 208 208 236 236 236 236 236Samastipur 66 66 66 66 66 66 66
Begusarai 96 96 96 102 102 102 102Munger 97 73 73 85 85 85 85Sheikhpura 12 12 46 46 46 46 46Lakhisarai 45 45 51 51 51 51 51Jamui 88 112 197 197 197 197 197Khagaria 92 92 92 92 92 92 92
Bhagalpur 146 146 146 146 146 146 146Banka - 11 86 86 86 86 86
Saharsa 79 93 93 93 93 93 93Supaul 205 216 216 216 216 216 216Madhepura 109 109 109 109 109 109 109
Purnea 120 116 116 116 116 116 116Kishanganj 68 68 68 68 68 68 68Araria 154 154 154 154 154 154 154Katihar 102 158 158 165 158 158 158
Bihar 4201 4321 4595 4621 4917 4917 4917Source : Road Construction Department, GoB

245
Table A 6.2 : District-wise State Highway Network in Bihar (in km) (2013 to 2020)
District 2013-14 2014-15 2015-16 2016-17 2017-18 2018-192019-20
(Upto Sept.)
Patna 162 199 204 208 208 208 208Nalanda 172 172 186 192 192 192 192Bhojpur 153 153 177 167 167 167 167Buxar 79 79 78 78 52 52 52Rohtas 235 235 231 231 193 193 193Kaimur 99 99 91 85 85 85 85
Gaya 219 219 247 240 210 210 210Jehanabad 33 33 33 33 33Arwal 33 39 39 39 39Nawada 170 170 185 212 186 186 186Aurangabad 151 151 157 158 124 124 124
Saran 202 202 196 202 166 166 166Siwan 159 159 157 156 86 86 86Gopalganj 82 53 56 53 53 53 53
W. Champaran 102 102 115 115 115 115 115E. Champaran 144 144 131 131 128 128 128Muzaffarpur 70 70 76 76 76 76 76Sitamarhi 49 49 94 94 94 94 94Sheohar 14 14 12 12 12 12 12Vaishali 151 151 113 113 113 113 113
Darbhanga 198 198 224 224 224 224 224Madhubani 132 132 99 98 98 98 98Samastipur 222 222 194 194 194 194 194
Begusarai 42 42 43 43 43 43 43Munger 11 35 34 34 34 34 34Sheikhpura 53 53 22 22 22 22 22Lakhisarai 59 59 49 49 49 49 49Jamui 133 109 63 63 63 63 63Khagaria 15 15 18 16 21 21 21
Bhagalpur 81 81 72 72 72 72 72Banka 215 204 169 169 169 169 169
Saharsa 135 121 97 81 91 91 91Supaul 150 139 133 134 134 134 134Madhepura 99 99 100 99 99 99 99
Purnea 161 149 141 141 141 141 141Kishanganj 49 50 49 49 49 49 49Araria 95 94 69 69 69 69 69Katihar 116 100 103 103 103 103 103
Bihar 4483 4426 4253 4253 4006 4006 4006Source : Road Construction Department, GoB

246
Table A 6.3 : District-wise Major District Road Network in Bihar (in km) (2013 to 2020)
District 2013-14 2014-15 2015-16 2016-17 2017-18 2018-192019-20
(Upto Sept.)
Patna 458 496 565 562 562 763 817Nalanda 318 390 445 448 448 435 466Bhojpur 258 250 282 282 282 284 286Buxar 126 127 127 127 127 141 162Rohtas 398 415 366 383 404 429 439Kaimur 233 239 264 269 269 311 326
Gaya 351 601 628 624 627 855 878Jehanabad 203 280 289 289 289 287 287Arwal 69 65 65 65 77Nawada 137 158 157 172 151 171 183Aurangabad 259 245 256 256 256 486 486
Saran 262 219 200 360 365 398 400Siwan 329 250 292 306 306 307 323Gopalganj 312 322 353 353 353 367 378
W. Champaran 317 299 294 293 302 367 392E. Champaran 310 330 409 474 462 461 461Muzaffarpur 394 431 456 467 467 566 596Sitamarhi 222 287 214 214 214 250 323Sheohar 33 33 101 101 101 101 43Vaishali 177 177 179 343 347 345 423
Darbhanga 403 373 412 472 475 513 718Madhubani 315 371 381 380 380 418 418Samastipur 321 385 411 429 429 526 604
Begusarai 202 247 246 209 209 251 251Munger 45 53 46 46 46 82 91Sheikhpura 109 127 137 137 137 141 169Lakhisarai 58 87 91 93 93 114 119Jamui 184 198 208 208 239 329 327Khagaria 129 212 243 243 243 239 239
Bhagalpur 253 265 264 264 280 277 277Banka 264 206 200 200 200 213 214
Saharsa 358 332 279 279 279 286 317Supaul 470 547 498 505 505 539 539Madhepura 74 87 103 103 103 113 126
Purnea 269 257 227 227 227 344 344Kishanganj 234 286 290 221 221 265 265Araria 252 241 376 376 408 482 482Katihar 364 304 275 275 275 253 253
Bihar 9401 10128 10634 11054 11145 12774 13499Source : Road Construction Department, GoB

247
Table A 6.4 : District-wise Rural Road Network in Bihar (in km) (2014 to 2020)
District2014-15 2015-16 2016-17 2017-18 2018-19 2019-20 (upto Sept.) Total
LengthPaved Paved Paved Paved Paved Paved UnpavedPatna 1670.15 1874.77 2382.55 2606.23 2876.13 3177.20 492.17 3669.37Nalanda 1539.03 1712.25 1833.29 2127.37 2322.60 2617.79 706.78 3324.57Bhojpur 1286.95 1429.29 1622.39 1798.30 1966.11 2083.77 398.20 2481.96Buxar 1129.04 1252.03 1418.72 1692.90 1858.80 1786.55 413.04 2199.59Rohtas 1487.52 1786.46 2375.44 2959.76 3255.11 2751.16 626.40 3377.56Kaimur 1424.25 1451.39 1533.56 2170.16 2378.53 2095.96 1056.66 3152.62
Gaya 2303.07 2686.60 3047.17 3356.88 3725.12 4484.96 859.82 5344.78Jehanabad 550.35 617.78 824.04 1231.13 1337.54 1236.22 178.87 1415.08Arwal 230.37 258.60 297.13 379.52 423.30 378.94 234.83 613.77Nawada 1105.11 1240.51 1425.34 1920.42 2162.92 1933.36 498.71 2432.08Aurangabad 1615.34 2210.00 2654.51 2917.62 3178.29 3543.60 619.70 4163.30
Saran 2373.48 2532.24 3027.18 3366.44 3707.25 3599.09 984.00 4583.08Siwan 1743.91 1825.55 1983.32 2135.82 2385.65 2599.78 990.96 3590.74Gopalganj 1454.13 1632.29 1989.71 2093.67 2377.60 2276.85 476.80 2753.64
W. Champaran 2134.84 2132.35 3135.38 3278.80 3570.21 3217.45 1273.51 4490.96E. Champaran 2958.52 3422.35 3892.55 4003.92 4458.67 4543.57 934.87 5478.44Muzaffarpur 2880.31 3481.91 3980.84 4136.23 4515.03 4332.08 1789.88 6121.96Sitamarhi 1581.95 1729.77 2270.58 2351.03 2631.67 2105.96 850.27 2956.23Sheohar 362.70 407.14 467.80 514.06 576.17 594.82 311.19 906.01Vaishali 2287.21 2435.40 2569.83 2669.00 2930.96 3172.50 1070.73 4243.22
Darbhanga 2247.49 2499.51 2457.84 2576.41 2836.67 3146.23 1136.96 4283.19Madhubani 3012.76 3209.82 3464.55 3583.50 3925.20 4512.05 2427.17 6939.22Samastipur 2245.43 2388.51 2593.61 2925.57 3244.24 3437.54 651.10 4088.63
Begusarai 957.93 1075.29 1235.50 1352.05 1473.27 1420.27 337.02 1757.29Munger 363.09 407.58 468.31 559.73 657.73 819.93 213.68 1033.61Sheikhpura 488.43 548.28 560.29 565.96 655.99 658.60 864.77 1523.36Lakhisarai 372.26 417.87 480.13 520.84 627.44 637.56 253.47 891.03Jamui 1284.42 1558.48 1885.05 2314.40 2536.31 2588.81 414.73 3003.53Khagaria 414.01 495.40 563.24 660.79 731.14 940.71 390.28 1330.99
Bhagalpur 1231.14 1498.66 1702.10 1832.88 2006.38 2054.01 371.65 2425.66Banka 1608.35 1782.06 2401.06 2674.26 2951.36 2714.41 390.10 3104.51
Saharsa 1050.65 1078.01 1084.17 1129.13 1311.67 1438.07 1226.56 2664.63Supaul 1233.93 1314.41 1361.25 1459.52 1635.51 2021.17 687.50 2708.67Madhepura 1191.88 1368.56 1383.75 1458.77 1645.27 2003.42 1887.06 3890.48
Purnea 2298.21 2696.47 3078.37 3257.29 3558.65 3488.85 1344.76 4833.61Kishanganj 1291.35 1698.28 1931.45 1889.81 2111.70 2134.83 848.75 2983.58Araria 2323.53 2359.49 2616.68 2765.60 3070.53 3121.74 1370.36 4492.09Katihar 1655.36 1904.16 2019.01 2101.92 2329.39 2533.89 1335.89 3869.78
Bihar 57388.44 64419.49 74017.67 81337.67 89946.11 92203.69 30919.17 123122.85Source : Rural Works Department, GoB
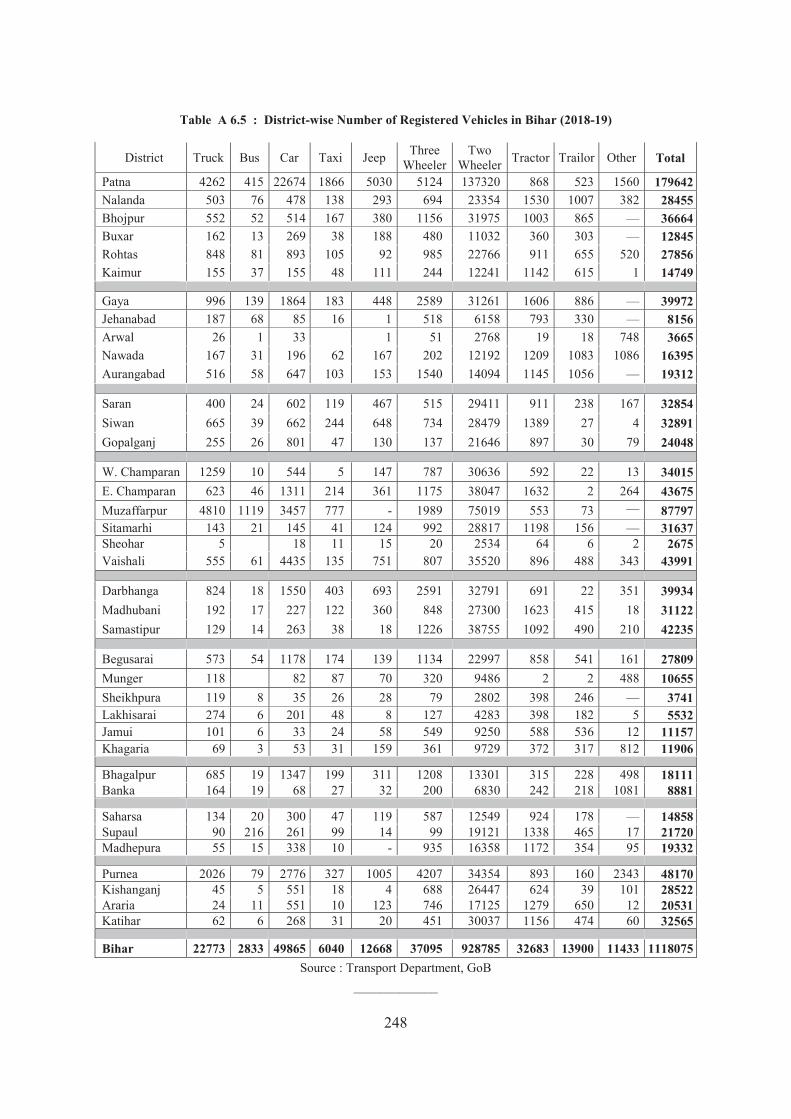
248
Table A 6.5 : District-wise Number of Registered Vehicles in Bihar (2018-19)
District Truck Bus Car Taxi Jeep Three Wheeler
Two Wheeler Tractor Trailor Other Total
Patna 4262 415 22674 1866 5030 5124 137320 868 523 1560 179642Nalanda 503 76 478 138 293 694 23354 1530 1007 382 28455Bhojpur 552 52 514 167 380 1156 31975 1003 865 — 36664Buxar 162 13 269 38 188 480 11032 360 303 — 12845Rohtas 848 81 893 105 92 985 22766 911 655 520 27856Kaimur 155 37 155 48 111 244 12241 1142 615 1 14749
Gaya 996 139 1864 183 448 2589 31261 1606 886 — 39972Jehanabad 187 68 85 16 1 518 6158 793 330 — 8156Arwal 26 1 33 1 51 2768 19 18 748 3665Nawada 167 31 196 62 167 202 12192 1209 1083 1086 16395Aurangabad 516 58 647 103 153 1540 14094 1145 1056 — 19312
Saran 400 24 602 119 467 515 29411 911 238 167 32854Siwan 665 39 662 244 648 734 28479 1389 27 4 32891Gopalganj 255 26 801 47 130 137 21646 897 30 79 24048
W. Champaran 1259 10 544 5 147 787 30636 592 22 13 34015E. Champaran 623 46 1311 214 361 1175 38047 1632 2 264 43675Muzaffarpur 4810 1119 3457 777 - 1989 75019 553 73 — 87797Sitamarhi 143 21 145 41 124 992 28817 1198 156 — 31637Sheohar 5 18 11 15 20 2534 64 6 2 2675Vaishali 555 61 4435 135 751 807 35520 896 488 343 43991
Darbhanga 824 18 1550 403 693 2591 32791 691 22 351 39934Madhubani 192 17 227 122 360 848 27300 1623 415 18 31122Samastipur 129 14 263 38 18 1226 38755 1092 490 210 42235
Begusarai 573 54 1178 174 139 1134 22997 858 541 161 27809Munger 118 82 87 70 320 9486 2 2 488 10655Sheikhpura 119 8 35 26 28 79 2802 398 246 — 3741Lakhisarai 274 6 201 48 8 127 4283 398 182 5 5532Jamui 101 6 33 24 58 549 9250 588 536 12 11157Khagaria 69 3 53 31 159 361 9729 372 317 812 11906
Bhagalpur 685 19 1347 199 311 1208 13301 315 228 498 18111Banka 164 19 68 27 32 200 6830 242 218 1081 8881
Saharsa 134 20 300 47 119 587 12549 924 178 — 14858Supaul 90 216 261 99 14 99 19121 1338 465 17 21720Madhepura 55 15 338 10 - 935 16358 1172 354 95 19332
Purnea 2026 79 2776 327 1005 4207 34354 893 160 2343 48170Kishanganj 45 5 551 18 4 688 26447 624 39 101 28522Araria 24 11 551 10 123 746 17125 1279 650 12 20531Katihar 62 6 268 31 20 451 30037 1156 474 60 32565
Bihar 22773 2833 49865 6040 12668 37095 928785 32683 13900 11433 1118075Source : Transport Department, GoB
_____________


250
companies in Bihar have been able to provide electricity to all 39,073 villages by the deadline, December, 2017 and to all 1.06 lakh rural habitations by April, 2018. Further, the target of providing electricity connection to all willing 1.40 crore households has been achieved in October, 2018.
7.1 Availability of Power
Bihar has taken various measures in the field of energy for capacity addition, improving Transmission & Distribution (T & D) network and energy conservation to improve supply position. Consequently, there was a significant improvement in projected peak demand in Bihar from 2650 MW in 2012-13 to 5300 MW in 2018-19, implying a growth of around 100 percent in six years (Table 7.1). The peak demand met again had a growth of around 185 percent to reach 5139 MW during 2018-19, from 1802 MW in 2012-13. As is apparent from the Table, the peak deficit in power has been around 32 percent in 2012-13, but it substantially decreased to 3 percent in 2018-19. The availability of power has increased from an average of 6-8 hours to 20-22 hours in rural areas and from 10-12 hours to 22-24 hours in urban areas. The per capita consumption in the state has risen from 145 kwh in 2012-13 to 311 kwh in 2018-19, implying a growth of 114 percent in six years.
Table 7.1 : Power Scenario (2012-13 to 2018-19)
Year
Peak Demand
Projection (MW)
Peak Demand
Met (MW)
Peak Deficit/ Surplus (MW)
Peak Deficit/ Surplus
(%)
Energy Require-
ment Projection
(MU)
Energy Availabi-lity (MU)
Energy Deficit/ Surplus (MU)
Energy Deficit/ Surplus
(%)
Per Capita Consump-tion (kwh)
2012-13 2650 1802 -848 -32.0 15321 13267 -2054 -13.4 145 2013-14 3150 2335 -815 -25.9 18212 15045 -3464 -19.0 160 2014-15 3500 2831 -669 -19.1 22226 18731 -3495 -15.7 203 2015-16 4112 3459 -653 -15.6 25550 21679 -3871 -15.2 258 2016-17 4405 3769 -636 -14.4 28245 23978 -4267 -15.1 272 2017-18 4965 4535 -430 -9.4 30095 26788 -3307 -12.3 280 2018-19 5300 5139 -161 -3.0 32257 29472 -2785 -8.6 311
Source : Department of Energy
Chart 7.1 : Per capita Energy Consumption from 2012-13 to 2018-19
145 160203
258 272 280311
050
100150200250300350
2012-13 2013-14 2014-15 2015-16 2016-17 2017-18 2018-19
Per Capita Consumption (kwh)

251
There exists considerable variation across the districts in terms of power consumption in Bihar (Table 7.2). The total power consumption of 15,375 MU in 2014-15 increased to 26,800 MU in
Table 7.2 : District-wise Power Consumption (2014-15 to 2018-19)
Districts Consumption (MU) CAGR (2014-19) 2014-15 2015-16 2016-17 2017-18 2018-19
Patna 3959 4197 4713 4965 5236 7.2 Nalanda 672 813 940 1008 1128 13.8 Bhojpur 380 494 601 715 756 18.6 Buxar 276 351 439 452 483 15.0 Rohtas 625 785 842 1004 1099 15.1 Kaimur 358 432 546 712 715 18.9
Gaya 1003 1214 1365 1522 1633 13.0 Jehanabad 216 273 337 363 428 18.6 Arwal 69 95 120 135 166 24.5 Nawada 161 286 374 466 559 36.5 Aurangabad 321 497 759 877 908 29.7
Saran 459 605 661 740 877 17.6 Siwan 233 291 350 497 641 28.8 Gopalganj 195 294 342 428 492 26.0
W. Champaran 260 402 438 543 615 24.0 E. Champaran 341 428 466 654 828 24.8 Muzaffarpur 735 916 937 986 1202 13.1 Sitamarhi 201 270 295 409 480 24.3 Sheohar 33 50 59 76 86 27.3 Vaishali 444 586 636 640 733 13.4
Darbhanga 381 482 522 570 635 13.6 Madhubani 325 407 469 512 565 14.8 Samastipur 343 453 501 572 687 19.0
Begusarai 370 452 488 547 603 13.0 Munger 255 310 368 382 385 10.8 Sheikhpura 114 136 165 176 190 13.6 Lakhisarai 171 213 300 327 335 18.3 Jamui 167 191 278 328 423 26.2 Khagaria 134 180 194 218 256 17.6
Bhagalpur 628 714 812 842 901 9.4 Banka 161 215 308 296 320 18.7
Saharsa 185 282 309 300 312 14.0 Supaul 185 264 284 294 320 14.7 Madhepura 165 235 255 283 299 16.0
Purnea 358 382 427 484 549 11.3 Kishanganj 143 188 197 215 212 10.3 Araria 161 207 269 306 334 20.0 Katihar 188 255 276 345 409 21.5
Bihar 15375 18845 21642 24189 26800 14.9 Source : Department of Energy, GoB

252
2018-19, implying a growth of over 74 percent in four years. In 2018-19, three most prosperous districts in terms of power consumption were — Patna (5236 MU), Gaya (1633 MU) and Nalanda (1128 MU). At the other end, three bottom districts were — Sheikhpura (190 MU), Arwal (166 MU) and Sheohar (86 MU). The three districts which have recorded the highest growth rate of power consumption are — Nawada (36.5 percent), Aurangabad (29.7 percent) and Siwan (28.8 percent) 7.2 Projection of Power Requirement
As mentioned before, Bihar has unveiled an ambitious plan to provide adequate and reliable electricity to all. Access to electricity on 24×7 basis to all the citizens is indeed synonymous with social equality. Thus, as mentioned above, the State Government-made ‘Har Ghar Bijli’ resolve targeted to achieve it by December, 2018. However, as indicated earlier, this target has already been achieved by October, 2018, which is two months ahead of the target. As of now, electric connection has been provided to all willing households in the state. In the next phase, connection is being provided to agriculture pump sets, both new as well as existing pumpsets running on diesel. This has been taken up in a mission mode and the target for its completion has been set at March, 2020.
There will be a quantum jump in power demand in the state in the coming years, mainly due to large scale release of service connection in rural areas towards full electrification, substantial increase in agricultural consumers, rise in demand of existing consumers (because of widespread use of electrical gadgets), and industrialisation of the state. Table 7.3 presents the estimated annual energy requirement for all consumers for the period 2019-20 to 2021-22.
Table 7.3 : Annual Energy Requirement for Rural and Urban Consumers (2019-20 to 2021-22)
(Figures in MU)
Year
Category of Consumers Existing
Electrified Households
New Households
Total Domestic
Requirement
Consumers other than Domestic
New Agricultural Connections
Total
2019-20 12558 1396 13954 8173 966 23093
2020-21 15245 1694 16939 8875 1160 26974
2021-22 18915 2105 21020 9852 1431 32303
Source : Department of Energy, GoB
Table 7.4 shows the projected energy requirement at the state periphery, considering distribution losses and transmission loss in intra-state trajectory. The expected power demand of Bihar by 2021-22 shall be of the order of 6900 MW, with an annual energy requirement of 39,841 MU.

253
Table 7.4 : Annual Energy and Peak Demand Requirement at State Periphery (2019-20 to 2021-22)
Indicators 2019-20 2020-21 2021-22 Energy requirement as per demand projections (MU) 23093 26974 32303
Distribution losses (Percentage) 26.98 20.00 15.00 Intra-state transmission losses (Percentage) 3.92 3.92 3.92 Energy requirement at state periphery (MU) 33420 35455 39841 Peak demand at 0.734 Load Factor (MW) 5868 6381 6900 Peak demand at 0.734 Load Factor (MW) (Including Agricultural load up to 50% only) 5624 6091 6600
Source : Department of Energy, GoB
The power capacity availability in the state was 3889 MW in 2018, which increased to 4767 MW in 2019, implying a growth of 22.6 percent. In order to meet the increased demand for power, the State Government has already planned for additional capacity of 5335 MW from different sources in a phased manner by 2021-22. These sources are — own generating stations, central generating stations, renewable energy sources, and long/ medium term Power Purchase Agreements (PPA) through competitive bidding. The source-wise details of this additional capacity is presented in Table 7.5. The additional capacity for power will be either from new projects, or from those under construction, or old projects which are being renovated or modernised. The total available capacity for Bihar by 2021-22 is expected to be 10,102 MW, of which 6421 MW (63.6 percent) will be conventional and the remaining 3681 MW (36.4 percent) non-conventional.
Table 7.5 : Year-wise and Source-wise Details of Capacity Expansion (2017-18 to 2021-22)
(Figures in MW)
Sources 2017-18 2018-19 Cumulative Proposed Capacity
2019-20 2020-21 2021-22
State Generating Stations (SGS)
SGS Thermal 110 0 0 0 0
SGS Small Hydro 10 54 64 64 64
Share in Central Generating Station (CGS)
CGS Thermal 2596 3421 4195 4969 5733
CGS Hydro 469 466 729 729 729
IPPs Projects (Case1) 260 488 688 688 688
NCE/RNES (Solar) 220 138 138 888 1338
NCE/RNES (Wind) 224 200 600 1200 1550
Total 3889 4767 6414 8538 10102
Note : IPP = Independent Power Producer; NCE = Non-Conventional Energy; RNES = Renewable Energy Source
Source : Department of Energy, GoB

254
Table 7.6 : Estimated Availability of Power and Energy (2019-20 to 2021-22)
Year Total Capacity (MW)
Estimated Peak
Availability at State Periphery
(MW)
Estimated Energy
Availability at State Periphery
(MU) 2019-20 6414 5323 32632
2020-21 8538 6199 36732
2021-22 10102 6992 41347
Source : Department of Energy, GoB
With the availability of additional generation capacity, the deficit in peak availability of 5.4
percent during 2019-20 will be bridged by 2020-21, with a surplus availability of 1.8 percent
(Table 7.7). The surplus availability is expected to rise further to 5.9 percent during 2021-22,
because of additional generation capacity. The deficit of 5.4 percent during 2019-20 will be met
by power purchase from open market. The gap between energy requirement and availability is
expected to go down steadily from 2.4 percent in 2019-20 to surplus of 3.6 percent in 2020-21
and 3.8 percent in 2021-22. The gap of 2.4 percent during 2019-20 will be met by Power
purchase through open market.
Table 7.7 : Projected Surplus/ Deficit in Power and Energy (2019-20 to 2021-22)
Power Supply Position 2019-20 2020-21 2021-22 Estimated Peak Requirement with 50 percent agriculture load only (MW) 5624 6091 6600
Estimated Peak Availability as per State Generation Plan (MW) 5323 6199 6992
Peak demand Surplus (+) / Deficit (-) (MW) (-) 301 (+) 108 (+) 392
Peak demand Surplus / Deficit (Percentage) (-) 5.4 (+) 1.8 (+) 5.9
Estimated Energy Requirement at State Periphery (MU) 33420 35455 39841
Estimated Energy Availability at State Periphery as per State generation Plan (MU) 32632 36732 41347
Energy Surplus (+) / Deficit (-) (MU) (-) 788 (+) 1277 (+) 1506
Energy Surplus (+) / Deficit (-) (Percentage) (-) 2.4 (+) 3.6 (+) 3.8
Note : 50 percent agriculture load will be supplied in rotation Source : Department of Energy, GoB
7.3 Institutional Structure of Power Sector
In April, 1958, the Bihar State Electricity Board (BSEB) was originally constituted under Section 5 of the Electricity (Supply) Act, 1948 and was mandated for the management of generation, transmission, distribution and other electricity-related activities in Bihar. Under the

255
new Bihar State Electricity Reforms Transfer Scheme 2012, the BSEB has been unbundled into five companies in November, 2012 — (i) Bihar State Power (Holding) Company Limited (BSPHCL), (ii) Bihar State Power Generation Company Limited (BSPGCL), (iii) Bihar State Power Transmission Company Limited (BSPTCL), (iv) North Bihar Power Distribution Company Limited (NBPDCL) and (v) South Bihar Power Distribution Company Limited (SBPDCL). The responsibilities of the newly-formed companies are briefly described below. Bihar State Power (Holding) Company Limited (BSPHCL) : This Company owns shares of the newly-incorporated, reorganized four companies — Bihar State Power Generation Company Limited, Bihar State Power Transmission Company Limited, South Bihar Power Distribution Company Limited, and North Bihar Power Distribution Company Limited. It is vested with the assets, interest in property, rights and liabilities of the erstwhile Bihar State Electricity Board (BSEB). The Company will primarily be an investment company. It will co-ordinate the activities of other companies, handle disputes and provide all necessary support to them. Bihar State Power Generation Company Limited (BSPGCL) : This company is responsible for coordinating and advising other companies and concerns, including subsidiaries, engaged in the generation of electricity. The coordination and advisory roles include all matters concerning the construction, operation and maintenance of generating stations and associated facilities. It is also responsible for procuring fuel and its transportation to various sites and settling pending disputes. Bihar State Power Transmission Company Limited (BSPTCL) : This company is responsible for transmission of electricity and is vested with the transmission assets, interest in property, and rights and liabilities of the erstwhile BSEB. Besides planning and coordination activities, this company is expected to develop an efficient system of intra-state transmission lines for electricity, connecting load centres to the generating stations. North and South Bihar Power Distribution Companies Limited (NBPDCL and SBPDCL) : These two companies undertake the activities of distribution of electricity to all consumers, trading of electricity, and implementation of rural electrification schemes. At present, rural electrification is done through several schemes — Deen Dayal Upadhyay Gram Jyoti Yojana (erstwhile Rajiv Gandhi Grameen Vidyutikaran Yojana), Special plan under Backward Region Grant Fund (BRGF), feeder separation for agriculture under Deen Dayal Upadhyaya Gram Jyoti Yojana (DDUGJY), electric connection to all willing households under Pradhan Mantri Sahaj Bijli Har Ghar Yojana (SAUBHAGYA). There are other schemes also under implementation for

256
system strengthening under Integrated Power Devolvement Scheme (IPDS), State Plan, and schemes funded by the Asian Development Bank (ADB), the last one being an Externally Aided Project (EAP). The introduction of open access in distribution sector as per the Electricity Act, 2003 and the directions of the regulator is also the responsibility of these two companies. They also tender, finalise and execute Power Purchase Agreements (PPA) and other agreements for sale or purchase of electricity. The allocation of fund for BSPHCL and its subsidiary companies, Bihar Renewable Energy Development Agency (BREDA) and Bihar State Hydroelectric Power Corporation (BSHPC) was Rs. 3663.49 crore in 2015-16, which increased steadily to Rs. 8271.59 crore in 2017-18. Thereafter, there was a decrease in allocation of funds — Rs. 6185.63 crore in 2018-19 and Rs. 4583.13 crore in 2019-20. The breakup of this amount under various heads is given in Table 7.8.
Table 7.8 : Allocation of Funds under BSPHCL (2015-16 to 2019-20)
(Rs. in crore)
2015-16 2016-17 2017-18 2018-19 2019-20
BRGF 2274.00 1329.40 2600.00 2013.83 1391.33
State Plan
BSPHCL 64.43 127.50 1576.10 1399.14 1989.00
Generation 181.01 1155.00 592.50 61.85 3.50
Transmission 448.99 700.00 510.00 500.00 325.00
Distribution 486.00 3126.65 1680.00 1450.00 768.50
BREDA 60.00 150.00 249.90 75.00 50.00
BSHPC 15.00 10.00 10.00 20.00 50.00
BSHPC (RIDF) 67.80 67.80 67.80 5.80 5.80
EAP 66.26 260.91 235.29 100.00 —
MMVSNY — 587.38 750.00 560.00 —
Total 3663.49 7514.64 8271.59 6185.63 4583.13
Note : MMVSNY = Mukhya Mantri Vidyut Sambandh Nischay Yojana Source : Department of Energy, GoB
7.4 Distribution Companies (DISCOMs)
Distribution is an extremely important component of the whole electricity supply chain, as this is
the only arm that generates revenue. This revenue enables the State Government to improve the

257
entire supply chain, by purchasing more electricity from the central sector. Thus, a major
challenge of the power sector reforms lies in the efficient management of the distribution sector.
The distribution system in Bihar is being served by two distribution companies — North Bihar
Power Distribution Company Limited (NBPDCL) and South Bihar Power Distribution Company
Limited (SBPDCL). As on March, 2019, these companies are serving more than 145 lakh
electricity consumers (Table 7.9).
Table 7.9 : Category-wise Number of Effective Consumers (As per billing data) (2014-15 to 2018-19)
Number of Effective Consumers
Domestic Commercial Industrial ( LT)
Industrial ( HT)
Public Lighting Traction Agriculture
Public Water Works
Total
2014-15
5174585 (92.5)
346375 (6.2)
19599 (0.4)
1582 (0.03)
511 (0.01)
19 (neg.)
52980 (0.9)
1302 (0.02)
5596953 (100.0)
2015-16 7407609
(92.5) 488690
(6.1) 31405 (0.4)
1922 (0.03)
1237 (0.02) 19 (neg.) 75087
(0.9) 1760 (0.02)
8007729 (100.0)
2016-17 9499943 ( 91.9)
616512 (6.0)
57433 (0.6)
2050 (0.02)
679 (0.01)
22 (neg.)
162188 (1.6)
2030 (0.02)
10340859 (100.0)
2017-18
10136625 (89.23)
620291 (5.46)
75023 (0.70)
2372 (0.02)
1553 (0.01)
23 (neg.)
176418 (1.6)
2779 (0.02)
11359508 (100.0)
2018-19
13475313 (92.51)
762438 (5.23)
90671 (0.62)
2806 (0.02)
2483 (0.02) 23 (neg.) 228423
(1.56) 3700 (0.02)
14565857 (100.0)
Note : Figures in bracket indicate percentage shares; neg. is negligible. All figures for the period 2014-15 to 2018-19 are based on Audited Annual Accounts.
Source : Department of Energy, GoB
The two distribution companies are already implementing several schemes for expanding and
strengthening their distribution networks. These ongoing schemes include transformer
replacement, procurement of new transformers, replacement of old conductors of existing high
tension (HT) and low tension (LT) lines, construction of new HT and LT lines, and construction
of Power Sub Stations (PSS) and bays, etc.
7.5 Operational and Financial Status
During the recent years, the demand for electricity has been increasing continuously in the state,
because of the fast economic growth at one hand and the growth of population on the other. The

258
generation and purchase of power (net of central transmission loss) in Bihar increased from
21,677 MU in 2015-16 to 28,112 MU in 2018-19, implying a growth of around 30 percent in
four years. With increase in sales, the revenue collection has also increased. The cost coverage
was around 80 percent in 2017-18 and this increased to over 86 percent in 2018-19. The financial
status of the two distribution companies is described in Table 7.10.
Table 7.10 : Financial Status of Power Sector (2015-16 to 2018-19)
Item 2015-16 2016-17 2017-18 2018-19
NBPDCL SBPDCL NBPDCL SBPDCL NBPDCL SBPDCL NBPDCL SBPDCL
Generation and Purchase (MU) 8929 12748 9647 13380 10983 14576 12478 15634
Sales (MU) 6505 7199 7195 8661 8745 9503 9493 10586
Losses (Percentage) 27.4 43.5 25.6 35.6 20.38 34.80 23.92 32.29
Average Revenue (Rs./Unit) 4.14 4.45 4.02 4.58 5.48 6.02 6.55 7.01
Sale of Power (Rs. crore) 2696 3202 2891 3971 4798 5718 6221 7419
Total Income (including subsidies) (Rs. crore) 4475 6309 4620 6755 5073 6189 7461 7953
Total Cost (Rs. crore) 4815 7043 5134 7527 5814 8520 8057 9766
Cost Coverage (Total Income/ Total cost) (Percentage) 92.9 89.6 90.0 89.7 87.3 72.6 92.6 81.4
Financial Loss (Percentage) 7.1 10.4 10.0 10.3 12.7 27.4 7.4 18.6
Source : Department of Energy, GoB
Recently, there has been a substantial improvement in the power situation in the state due to the
measures taken by the State Government in areas such as reducing transmission and distribution
(T&D) losses, and staggering of loads to 24 hours of the day. The distribution companies made
all out efforts to address this issue by improving the billing and collection system, along with the
metering of all consumer connections. This resulted in reduction of Aggregate Technical and
Commercial (AT&C) loss from 59.2 percent in 2011-12 to 40.6 percent in 2016-17 and further
reduced to 30.2 percent in 2017-18; however, there was a slight increase in 2018-19 (30.4
percent) (Table No. 7.11). Energy accounting and auditing at feeder level and distribution
transformer (DT) level are essential for reducing these losses and the distribution companies
have already started this exercise. Discoms are striving hard to bring down the AT&C loss to 15
percent.

259
Table 7.11 : Aggregate Technical and Commercial losses (2011-12 to 2018-19)
Year 2011-12 2012-13 2013-14 2014-15 2015-16 2016-17 2017-18 2018-19
AT&C Loss (%) 59.2 54.6 46.3 43.8 43.5 40.6 30.2 30.4
Note : AT&C loss is estimated using PFC formula (excluding Nepal) Source : Department of Energy, GoB
Chart 7.2 : Aggregate Technical and Commercial Losses (2011-12 to 2018-19)
7.6 Central Government Programmes for Power Sector
Four important programmes of the Central Government for expanding the coverage of electricity supply in urban and rural areas are — Deen Dayal Upadhyaya Gram Jyoti Yojana (DDUGJY) (Erstwhile Rajiv Gandhi Grameen Vidyutikaran Yojana - RGGVY), Integrated Power Development Scheme (IPDS) (Erstwhile Restructured Accelerated Power Development and Reforms Programme - R-APDRP), Pradhan Mantri Sahaj Bijli Har Ghar Yojana (SAUBHAGYA) and Special Plan (Backward Regions Grant Fund). The progress of these programmes is presented below: Deendayal Upadhyaya Gram Jyoti Yojana (DDUGJY)
Bihar, with 88.7 percent of its population living in rural areas (2011 census), remains the most ruralised state in India, the national average being around 68.9 percent. Thus, improving connectivity of rural areas to the grid power is of great importance. In view of this, under DDUGJY, the rural electrification work has been completed in all 38 districts of the state, with all villages and habitations fully electrified. The Central Government had launched DDUGJY with the following objectives:
59.254.6
46.343.8 43.5 40.6
30.2 30.4
0.010.020.030.040.050.060.070.0
2011-12 2012-13 2013-14 2014-15 2015-16 2016-17 2017-18 2018-19
AT & C Loss (%)

260
(i) Separation of agriculture and non-agriculture feeders, facilitating judicious restoring of supply to agricultural and non-agricultural consumers in the rural areas.
(ii) Strengthening and augmentation of sub-transmission and distribution infrastructure in rural areas, including metering of distribution transformers/feeders/consumers.
(iii) Rural electrification for completion of the targets laid down under RGGVY by carrying
forward the approved outlay of RGGVY to DDUGJY.
The scheme of RGGVY, as approved by the Central Government for implementation during
Twelfth and Thirteenth Plans, has now been subsumed in the new scheme of the Central
Government, called DDUGJY.
The total sanctioned cost of the project is Rs. 6500.71 crore, out of which Rs. 3791.88 crore has
been utilized up to September, 2019. Under this scheme, 60 percent of the project cost is being
provided by the Central Government as grant and the remaining 40 percent is being arranged by
the State Government. The work is under progress and the target month for completion of the
scheme is March, 2020.
Integrated Power Development Scheme (IPDS)
The earlier scheme of R-APDRP has now been subsumed in the newly launched Integrated
Power Development Scheme (IPDS). It has several components — IT enablement of distribution
sector, strengthening of sub-transmission and distribution network for addressing distribution
constraints, and provisioning of solar panels on government buildings to meet growing power
demand. In addition, the scheme also includes net-metering, and metering of distribution
transformers/feeders/ consumers in urban areas.
Under Part-A of the erstwhile R-APDRP scheme, the work of IT enablement in 67 towns
(excluding 4 franchisee towns) has been completed. The strengthening of distribution system in
60 towns under Part-B of the scheme and in 7 towns under the ADB-funded scheme has also
been completed. The aim is to provide real-time monitoring and control, minimizing losses, load
balancing, and improving voltage profiles.
The newly launched scheme of IPDS is being implemented in 133 towns of Bihar for —
(a) strengthening of sub-transmission and distribution network, (b) installation of solar panels on

261
government buildings, (c) metering of feeders/ distribution transformers/ consumers, and (d) IT
implementation in distribution system in urban areas. The project will ensure 24X7 power supply
and reduction in AT&C losses. The work is under progress and the target month for completion
of the scheme is March, 2020. The details of capital expenditure under R-APDRP and IPDS are
presented in Table 7.12.
Table 7.12 : Capital Expenditure of R-APDRP & IPDS
Project Component under R-APDRP
Outlay (Rs. crore)
Expenditure incurred
(Rs. crore)
Expenditure as
percentage of outlay
R-APDRP — Part A 253.68 176.84 69.7
R-APDRP — Part B 1155.21 992.01 85.9
R-APDRP — SCADA 34.36 16.02 46.6
IPDS (IT & ERP) 67.68 0.00 0.0
RT DAS 5.85 0.00 0.0
IPDS (System Strengthening) 2208.91 1192.56 54.0
Total 3725.69 2377.43 63.8
Source : Department of Energy, GoB
The Central Government has further sanctioned a scheme under IPDS for earlier DF (Distribution Franchise) towns — Muzaffarpur, Bhagalpur and Gaya. This scheme is meant for strengthening of system in these towns at a total cost of Rs. 454.77 crore. In addition, Rs. 71.20 crore has been sanctioned for Bodhgaya and Ara towns for underground (UG) cabling work and system strengthening. Over and above, sanction has also been accorded for an amount of Rs. 179.80 crore for construction of 14 GIS (Gas Insulated Switchgear) and 6 E-house Containerized Power Sub-Stations in different towns under NBPDCL & SBPDCL. For this scheme, the Central Government will provide 60 percent of the project cost as grant and the remaining 40 percent is to be arranged by the State Government and the distribution companies. The agencies for construction of GIS Power Sub-Stations have been finalized and the work has started; for E-house Power Sub-Stations, tendering is under process. Har Ghar Bijli under SAUBHAGYA
‘Har Ghar Bijli’ is one of the Seven Resolves (Saat Nischay) of the State Government, with an aim to provide electricity connection to each willing household. As all rural BPL households are covered under DDUGJY and there was no scheme for providing service connection to rural APL households, a scheme has been sanctioned by the State Government for releasing new service

262
connection to APL rural households under Mukhyamantri Vidyut Sambandh Nischay Yojana (MMVSNY). Meanwhile, in October 2017, the Union Ministry of Power had issued a memorandum conveying approval of Pradhan Mantri Sahaj Bijli Har Ghar Yojana (SAUBHAGYA) to provide electricity connection to each willing household across the country. Under this scheme, the central government has sanctioned an amount of Rs 3000 per household for connection, and Rs 1500 per household for last mile connectivity. The State Government has adopted SAUBHAGYA and the Mukhyamantri Vidyut Sambandh Nishchay Yojana (MMVSNY) is subsumed in SAUBHAGYA. The scheme has been completed in October, 2018 by providing 32,59,041 electricity connections to all willing households in rural areas. Similar connections are being given on demand in urban areas. Special Plan (Backward Regions Grant Fund)
The Backward Regions Grant Fund (BRGF) of the Central Government is designed to redress regional imbalances in development. This is a fully funded scheme of the Central Government. The fund provides financial resources for supplementing and converging existing developmental inflows into the identified backward districts. It aims to bridge critical gaps in local infrastructure and other development requirements that are not being adequately met through existing inflows. The fund facilitates participatory planning, decision making, implementation and monitoring, reflecting the locally felt needs. It also helps to improve the performance of critical functions by the State Government. The scheme is divided into four parts — Phase-I, Phase-II, Phase-II (Part-C) and Rural Electrification (RE). Phase-I was meant for addressing immediate distribution constraints and Phase-II for meeting the load growth for next 5 years. Next, Phase-II (Part-C) was meant for addressing the issue of reliability and safety of the distribution system by converting overhead LT and 11 KV lines with bare conductor by Arial Bunched Cable (AB Cable) at vulnerable locations and for bridging the gap in Rural Electrification work in 11 districts (under 11th Plan Phase-II). The cost of the above schemes is Rs. 6431.86 crore and, till September, 2019, the expenditure incurred is Rs. 3067.81 crore under NBPDCL and Rs. 2299.11 crore under SBPDCL, totaling to Rs. 5366.92 crore (83.4 percent of allocation). 7.7 Transmission
Power is supplied to various categories of consumers through a transmission network, which also involves the transformation of high voltage power to lower voltage. The transmission network serves as an important link between the generation and distribution of electricity. The challenges pertaining to the transmission process are, thus, mostly related to the growing needs of the other

263
two segments — generation and distribution. To meet the growing demand of power, a robust and reliable transmission network is required for both inter-state and intra-state transmission. The existing transmission system is, therefore, being strengthened with proper planning to cater to the demand for 24 hours availability of power by all categories of consumers. Presently, about 16,644 circuit km EHV (Extra High Voltage) transmission line, 148 grid sub-stations with total transformation capacity of 8510 MVA at 220/132 KV level and 13,870 MVA at 132/33 KV level comprise the transmission system in Bihar. The projection for 2019-20 is 17,300 circuit km transmission line, 153 grid sub-stations with 8830 MVA transformation capacity at 220/132 KV level and 14490 MVA at 132/33 KV level. The required capacity for 24 hours power supply for the period 2019-20 to 2021-22 has been projected, as presented in Table 7.13. The plan of action to meet the projected demand in 2019-20 to 2021-22 has been shown in Table 7.14. The peak demand met was 3459 MW in 2015-16, which increased to 5891 MW in September, 2019, implying an increase of 70 percent in four years.
Table 7.13 : Projected Required Capacity for Power (2019-20 to 2021-22)
Demand / Capacity 2019-20 2020-21 2021-22
Peak Demand (MW) 5868 6381 6900 Transformation Capacity needed to meet Peak Demand (MW) 11002 11964 12938
Available Capacity MVA at 400/220/132 KV level 220/132 KV level 132//33 KV level
Nil
8830 14490
3000
13270 16800
4000
13670 17500
Source : Department of Energy, GoB
Table 7.14 : Plan of Action for Strengthening Transmission (2019-20 to 2021-22)
Year Nos. of New Grid Sub-Stations
New Transmission Lines (Circuit km)
2019-20 400/220/132/33 kv-0 No. 400/220/132 kv-0 No. 220/132/33 kv-01 No. 220/33 kv- 01 No. 132/33 kv - 03 Nos.
400 kv-0 220 kv-500 132 kv-190
2020-21 400/220/132/33 kv-02 Nos. 400/220/132 kv – 01 No. 220/132/33 kv-10 Nos. 132/33 kv - 02 Nos.
400 kv-390 220 kv-1500 132 kv-1100
2021-22 400/220/132 kv-01 No. 400/220/132 kv-0 No. 132/33 kv – 07 Nos.
400 kv-70 220 kv-100 132 kv-250
Source : Department of Energy, GoB

264
7.8 Generation
The total generation capacity of power as on March 2019 for the state was 4767 MW. Out of this,
82 percent is from coal-based thermal power, 11 percent from hydro power, and the balance 7
percent from renewable energy sources. In terms of ownership, central sector has the largest share
of 86 percent, followed by the private sector/IPPs (13 percent) and state sector (1 percent). The
details of existing generation capacity in Bihar are shown in Table 7.15.
Table 7.15 : Existing Generation Capacity (March 2019)
(Figures in MW)
Ownership/ Sector
Thermal Nuclear Hydro
(Renewable) RES
(MNRE) Grand Total Coal Gas Diesel Total
State 0 0 0 0 0 54 0 54
Private/ IPPs 488 0 0 488 0 0 128 616
Central 3421 0 0 3421 0 466 210 4097
Total 3909 0 0 3909 0 520 338 4767
Note : RES = Renewable Energy Sources; MNRE = Ministry of New and Renewable Energy; IPP = Independent Power Producers
Source : Department of Energy, GoB
The present status of the two generating units that remained in Bihar after bifurcation of the state
in 2000 is as mentioned below :
(i) Barauni Thermal Power Station (BTPS)
BTPS has 7 different units, 5 of them have already run through their working life and are
not in service anymore. Unit 7 has started generation after completion of Renovation and
Modernisation (R&M). Further R&M work of Unit 6 is in progress. The construction work
of two new units (Unit 8 and 9) of 250 MW each is also going on under the extension
project of BTPS. The coal linkage and environmental clearance have been obtained for
these two new units. Capacity addition of Unit 8 has been achieved in January, 2018 and
that of Unit 9 in March, 2018. Further, the State Government has transferred the ownership
of Barauni Thermal Power Station to National Thermal Power Corporation (NTPC) to
reduce the cost of generated power from these units by utilizing expertise of NTPC.
(ii) Kanti Bijlee Utpadan Nigam Limited (KBUNL)
The KBUNL was a joint venture of NTPC and BSPGCL, having equity partnership ratio of
65:35. It has two units of 110 MW each. The power production has started in both the units

265
after renovation and modernization. The construction work of two additional units (Units 3
and 4) of 195 MW each has also been completed and the units have started generating
power. Further, as per the decision of the State Government, 100 percent equity share has
been transferred to NTPC.
At present, the work is in progress for some more generating units in Bihar. On completion
of all these projects, the dependence of Bihar on the central sector for power will be
lessened. The details of these new projects are presented below.
(i) Nabinagar Stage-1 Plant : This project is located in Aurangabad district. The Nabinagar
Power Generation Company (NPGC) was initially a joint venture of NTPC and BSPGCL,
having equity partnership ratio of 50:50. Later, as per the decision of the State Government,
100 percent equity share has been handed over to NTPC. Commissioning of the first unit of
660 MW has been completed in September, 2019. The construction work of the other 2
units of 660 MW each (total 1320 MW) is in progress and expected to be completed by
March, 2020.
(ii) Power Project in Buxar : An agreement was signed with Satluj Jal Vidyut Nigam Ltd.
(SJVNL) for construction of green field power project at Chausa (Buxar), having 2 units of
660 MW each. Topographical survey of the project area, erection of boundary pillars and
barbed wire fencing work for the project is completed. The Detailed Project Report (DPR)
has been updated on August, 2016 and private land has been acquired for the main plant.
Amrapali coal block has been allocated to SJVNL. The Power Purchase Agreement (PPA)
has been signed with distribution companies of Bihar and 85 percent power has been
allocated to Bihar. The environmental clearance has also been obtained. The Central
Government has accorded the investment approval in March, 2019. The work for main
plant was awarded to a private company in June, 2019. Foundation stone has been laid by
Hon’ble Prime Minister on 09.03.2019. Presently, concrete test pile, facilities and site work
are under progress. Consultancy service for main work and railway infrastructure has been
awarded to NTPC and RITES, respectively. The project is expected to be completed by the
year 2023.
(iii) Ultra Mega Power Project (Banka) : A proposal has been prepared for the establishment
of Ultra Mega Power Project in Banka (approximately 4000 MW), for which 2500 acres of

266
land has been identified. The Central Water Commission has given consent for 120 cusecs
of water from the Ganga river. The Power Finance Corporation (PFC) has incorporated two
Special Purpose Vehicles (SPV) for carrying out the pre-award project activities. The
Union Ministry of Power has allocated Pirpainti/ Barhat Coal Blocks for the project. Bihar
has been allotted 2000 MW of power from this project.
Table 7.16 : Details of Existing and Planned Generation Units (2016-17 to 2020-21)
2016-17
2017-18
2018-19 2019-20 (Under progress) 2020-21
By 2022 (Upcoming
Projects)
Beyond 2022
KANTI TPP (2x110 MW) & (2x195 MW)
220 MW 195 MW Unit 3
195 MW Unit 4 completed
—
—
—
—
BARAUNI TPP (2x110 MW) & (2x250 MW)
— 110 MW Unit 7: Nov. 16
500 MW Unit 8- Capacity addition achieved
in Jan'18 Unit 9- Capacity addition achieved
in Mar'18 (250 MW each)
Unit 8-COD on 22.11.19 (250 MW)
—
Unit 6- Dec' 19
(likely) (110 MW)
Unit 9- COD
(250 MW) — —
NABINAGAR TPP (3x660 MW) 1980 MW
—
—
—
1980 MW Unit 1: COD on
06.09.19 Unit 2: COD in
Mar'20 Unit 3: COD in
Mar'20 (660MW each)
— — —
BUXAR TPP (2x660 MW) SJVNL
— — — — — —
MoU signed on 20.11.15
1320 MW
BANKA UMPP (4000 MW)
— — — — — — 4000 MW
Total Installed Capacity
220 MW
525 MW
1220 MW
3310 MW
3310 MW
3310 MW
8,630 MW
Source : Department of Energy, GoB

267
7.9 New Schemes / Projects
Reconductoring Scheme
A new scheme of R&M (Renovation and Modernization) for replacement of existing old and
dilapidated conductors, poles, brackets, insulators, etc. of 33 KV, 11 KV and LT Lines has been
sanctioned by the State Government to strengthen the power infrastructure. A sum of
Rs. 3070.23 crore has been sanctioned to replace 1062 CKM of 33 KV Line, 25,272 CKM of 11
KV Line and 45,339 CKM of LT Line. The shares of two distribution companies in this amount
are — Rs. 1652.15 crore (NBPDCL) and Rs. 1418.08 crore (SBPDCL). The Turn key Agencies
have been selected circle-wise through e-tendering in March, 2018, and work has already started.
The scheme is planned to be completed within a period of three years. However, considering the
threat to the safety of life and property due to snapping of old and dilapidated conductors, a
target was given by the State Government to both DISCOMs to complete the work of
reconductoring by December, 2019. After completion of SAUBHAGYA Scheme for providing
electricity connection to all willing households by October, 2018, both distribution companies
(NBPDCL & SBPDCL) started the work of reconductoring in mission mode from November,
2018 with a view to complete the work within the targeted period. The project gained momentum
after a strategy was evolved to achieve the target divisionwise by mobilizing all resources. With
this strategy, two DISCOMs together have been able to complete the work in 17 divisions by
September, 2019. The status of completion of reconductoring scheme as on September, 2019 is
701 CKM for 33 KV line (66 percent), 15,759 CKM for 11 KV line (62 percent) and 24,071
CKM for LT line (53 percent). The progress report of the scheme is given in Table 7.17.
Table 7.17 : Status of Reconductoring Schemes (September, 2019)
Sl. No.
Line (In CKM)
NBPDCL SBPDCL Total
Scope Achieve-ment Scope Achieve-
ment Scope Achieve-ment
1 33 KV Line 684 477 (69.7) 378 224 (59.3) 1062 701 (66.0)
2 11 KV Line 13357 9271 (69.4) 11915 6488 (54.5) 25272 15759 (62.4)
3 LT Line 25500 15844 (62.1) 19839 8227 (41.5) 45339 24071 (53.1)
Note : The figures in brackets indicate achievement as percentage of the scope. Source : Department of Energy, GoB
Ujjwal Discom Assurance Yojana (UDAY)
For operational and financial turnaround of power distribution companies (DISCOM), the Union Ministry of Power had introduced the UDAY scheme. The scheme includes various activities for improvement in operational and financial efficiencies which ultimately aim at — (a) Reduction

268
in AT&C Loss to 15 percent, and (b) Reduction in gap between Average Cost of Supply (ACS) and Average Revenue Realized (ARR) to zero, both by 2019-20. A tripartite agreement among Government of Bihar, Union Ministry of Power and DISCOMs (NBPDCL and SBPDCL) was signed in February, 2016. The scheme also provides for taking over 75 percent of the debt of DISCOMs by the State Government over a period of two years (50 percent in 2015-16 and 25 percent in 2016-17). Out of the total debt of Rs. 3109.05 crore on both the DISCOMs of Bihar, Rs. 2332.01 crore has been taken over by the State Government under UDAY Scheme. Presently, information on all the parameters aiming to reduce AT&C Loss and ACS-ARR gap have been made available online through UDAY website portal (www.uday.gov.in), where every participating DISCOM has to upload the progress on monthly/quarterly basis. The marks are assigned to each activity and marks obtained on the basis of monthly/quarterly achievement are used to decide the ranking of DISCOMs among the participating states. Both DISCOMs of Bihar together have reduced AT&C loss from 43.5 percent (2015-16) to 30.42 percent (2018-19) and also reduced ACS-ARR gap from 89 paise per unit (2015-16) to 48 paise per unit (2018-19). 7.10 Recent Developments in Power Sector
1. Smart Prepaid Metering : Both NBPDCL and SBPDCL have signed an MoU with M/s Energy Efficiency Services Limited (EESL) for deployment of Smart Metering Solution with prepaid functionalities across all categories of LT consumers in urban and semi-urban areas and agriculture consumers in rural areas. M/s EESL has appointed M/s EDF, India along with M/s Accenture as its System Integrator. M/s GENUS Power is providing smart meters to the consumers. At present, M/s GENUS Power has supplied 82,610 smart meters (single as well as three phase), out of which a total of 6114 meters are installed in the field. There are 2578 Smart meters installed in urban/ semi- urban areas and 3536 smart meters installed in agriculture category of consumers.
Smart metering functionalities such as connect/disconnect, load control, monitoring of
daily consumption at consumer end, and prepaid functionality with arrear management are already commissioned and integrated with NIC billing solution of DISCOMs. The daily consumption is calculated in Meter Data Management solution and the corresponding amount is deducted from the prepaid balance. This information is updated on consumer App for being viewed by the consumer. On an average, 93 percent of the meters are getting communicated on a daily basis and all the smart metering functionalities are working fine.

269
Further, consumer indexing in Bhagalpur, Gaya, Areraj, Teghra and Dalsinghsarai towns has started for onward installation of smart meter. Also, smart meters are being installed in new connection related to ‘Har Ghar Nal Jal Yojana’.
2. Bill on Missed Call through SMS : The consumer can get information through SMS on
current payment due against electricity connection and due date, by giving a missed call on 7666008833. Additionally, the URL for downloading the latest electricity bill is also being provided. This service will reduce the consumer visits to electricity office.
3. Mobile Number Registration through Missed Call : The consumer can register/update his latest mobile number by giving a missed call on 7666008833. One Time Password (OTP) is sent to the consumer’s mobile number, with a link to register new mobile number in consumer account. In the provided link, the consumer has to enter Consumer Account (CA) number with OTP provided in the SMS.
4. Rural Revenue Franchise (RRF) Monitoring System : The power distribution
companies are engaging RRF (Rural Revenue Franchisee) on contract basis for billing related activities. DISCOM is developing an application software to provide various online services to RRF — hiring of RRF, allotment of work, payment to RRF, etc. Presently, these services are done manually which is time consuming and less flexible.
5. Special Task Force (STF) : DISCOMs have developed a software application for
monitoring various raids done by STF (Special Task Force) flying squad to improve the efficiency of STF. With this facility, DISCOM is able to analyse various information related to raids done by the STF staff.
6. Suvidha Mobile APP: DISCOMs have developed a mobile app (SUVIDHA) to facilitate
various services to the consumers. These services include — online bill payment, viewing energy bills, viewing payment transactions, registration of complaints, information on electricity theft, load change service, correction of spelling in the name and address, etc.
All divisions are equipped with the SUVIDHA counters. The counter will act as a single
window interface for registration of consumer complaints. The officer present at SUVIDHA counter will assist the consumer by providing required information related to various services of electricity supply. All consumers can view the status of the complaints online through a web portal.

270
7. Real Time Data Acquisition System (RT-DAS) : To improve the quality of electricity in IPDS towns, DISCOMs are in process of implementing Real Time Data Acquisition system to generate SAIFI/SAIDI reports for analysis of quality of electricity supply (SAIFI = System Average Interruption Frequency Index / SAIDI = System Average Interruption Distribution Index).
8. Implementation of ERP and Single Billing Solution : DISCOMs are in process of implementation of ERP (Enterprise Resource Planning) to improve the Government-to-Employee services. The ERP exercise includes human resources, finance, procurement and projects. Presently, there are two billing systems, one for rural and other for urban areas. Now DISCOMs are in the process to implement single billing solution with the latest technology. The tender for the same has been floated to select an implementing agency. A Consultant for the task has already been appointed.
9. Social Media : DISCOMs are setting up a dedicated cell to answer the issues raised in social media for creating a good reputation for itself.
10. Implementation of ISO 27001 : DISCOMs are in the process of implementing of ISO 27001:2013 certification to adopt best practices in cyber security which would secure all its IT infrastructures.
7.11 Bihar Renewable Energy Development Agency (BREDA)
Most of Bihar’s installed generation capacity is concentrated in thermal power plants. This not only leads to a concern about the clean generation of electricity, it also puts a fiscal burden on the State Government, given that the prices of coal may be very volatile. With increasing concerns of climate change due to emission of greenhouse gases into the atmosphere, use of clean energy is one of the viable solutions for mankind to preserve the environment for future generation.
Thus, to promote renewable energy power projects, the State Government has also created an agency called Bihar Renewable Energy Development Agency (BREDA). This agency is responsible for the development of projects that would use non-conventional energy sources for production of electricity. The State Government provides funds to BREDA, both for the schemes and also for the expenditure on establishments and expenditure on subsidies.
BREDA is currently executing projects of solar pumps and rooftop installations under CAPEX (Capital Expenditure) model. Various other projects like Floating Power Plants and Ground Mounted Grid-tied Solar Power Plants are under different stages of approval.

271
Table 7.18 : Achievements of BREDA (2017-18 to 2019-20)
2017-18
Physical
Achievement
Financial Outlay
(Rs. crore) A. Solar Photovoltaic Scheme Solar Water Pumping Systems installation under Mukhyamantri Naveen &
Naveekarniya irrigation scheme 280 nos. 8.63
Installation of 1kWp solar rooftop off-grid power plant systems under Mukhyamantri Naveen & Naveekarniya scheme 2135 nos. 32.00
Installation of 2 nos. of 40kWp solar off-grid power plant at Hon’ble Civil and Session Court buildings at Bhagalpur and Muzaffarpur districts under e-court mode mission
80 kWp 0.88
Installation of 23 kWp solar power plant at Hon’ble CM House, NEK SAMVAD BHAWAN 23 kWp 0.276
Solar Street Lighting System in Katihar district under District Minority Welfare Department
1425 Nos. (57.01 kWp) 2.19
Installation of 3.6 kWp off grid solar power plant at 27 locations LWE affected Police Stations 97.2 kWp 1.21
Installation of Solar Street Lighting System 157 nos. 0.274 B. BEE (Bureau of Energy Efficiency) Schemes Establishment of Energy Club in School 8 nos. 0.0264 Distribution of LED bulbs in selected 8 villages of Samastipur and Saran
districts 8 nos. 0.059
Model Energy Efficient Village Project 1 no. 0.025
2018-19
Physical
Achievement
Financial Outlay
(Rs. crore) A. Solar Photovoltaic Scheme
Installation of 1kWp solar rooftop off-grid power plant systems under Mukhyamantri Naveen & Naveekarniya scheme 744 nos. 11.15
Installation of 2 nos. of 40kWp solar off-grid power plant at Hon’ble Civil and Session Court buildings at Gaya, Nalanda, Bhagalpur & Muzaffarpur districts under e-court mode mission
160 kWp 1.76
Installation of 5 kWp off grid solar power plant at 62 locations of BSEIDC 310 kWp 3.875 Installation of 3.6 kWp off grid solar power plant at 72 locations LWE affected
Police Stations 259.2 kWp 3.24
Installation of 40 kWp off gird roof top solar power plant and 04 nos. of Solar Street Light at Mangal Talab, Patna under CSR initiative 40 kWp 0.446
Installation of 500 Wp off gird roof top solar power plant with 04 nos. of 9 W Street Lights at 25 nos. Police Stations in Gaya 12.5 kWp 0.31
Solar Water Pumping Systems installation under Mukhyamantri Naveen & Naveekarniya Irrigation Scheme 841 nos. 20.12
Distribution of Solar Home Lighting System through Jeevika in Muzaffarpur, Aurangabad, Jamui, Banka and Gaya districts 3485 nos. 1.34
B. BEE (Bureau of Energy Efficiency) Sponsored Schemes Energy Efficiency in Government Schools : Provision of free appliance to the
schools 23 nos. 0.16
Awareness campaign on Energy Conservation & Efficiency 5 nos. 0.17 Model Energy Efficient Village campaign 1 no. 0.06 Energy Audit at Hon'ble Governor House 1 no. 0.03

272
Source : BREDA
7.12 Bihar State Hydroelectric Power Corporation (BSHPC)
Besides the thermal power, Bihar also has the potential for generating power from water resources and, presently, this is being exploited through a number of hydroelectric power projects. The Bihar State Hydroelectric Power Corporation (BSHPC) was established to oversee expansion of hydroelectric power projects in the state. During the Tenth Plan, BSHPC had started exploring possibilities for major hydel projects, besides its earlier mandate for minor hydel projects. There are 13 minor hydel projects that are currently operational in the state with a total installed capacity of 54.3 MW. (i) Kosi Hydel Power Station (KHPS)
The Kosi Hydro Power Station (Kataiya), Birpur, consisting of 4 units of 4.8 MW each, was commissioned during 1970-78. This project was handed over to the BSHPC in November, 2003. The renovation work of 3 out of 4 units has been completed and power generation has started.
(ii) Eastern Gandak Canal HE (Hydroelectric) Project
The Eastern Gandak Canal HE Project in Valmikinagar, West Champaran was commissioned during 1996-97, consisting of 3 units of 5 MW each.
(iii) Sone Western Link Canal HE Project
Sone Western Link Canal HE Project in Dehri-on-Sone, Rohtas, consisting of 4 units of 1.65 MW each, was commissioned during 1991-92.
2019-20 (Up to September, 2019)
Physical
Achievement
Financial Outlay
(Rs. crore) A. Solar Photovoltaic Scheme Installation of 90 nos. of Solar Street Light system at Mangal Talab (Patna),
Jamui and Munger districts 30 nos. 0.05
Installation of Grid Connected Rooftop Solar Power Plant at 113 nos. of residential buildings all over Bihar under Mukhyamantri Naveen & Naveekarniya Rooftop Solar Sanyantra Adhisthapan Scheme
583 kW 3.26
Installation of Grid Connected Rooftop Solar Power Plant at 289 nos. of different Govt. buildings in all over Bihar 4.42 MW 22.85
Solar Water Pumping System installation under Mukhyamantri Naveen & Naveekarniya Irrigation Scheme 91 nos. 2.13
B. BEE (Bureau of Energy Efficiency) Sponsored Schemes Workshop for ECBC 02 nos. 0.04
273
(iv) Sone Eastern Link Canal HE Project
Sone Eastern Link Canal HE Project in Barun, Aurangabad, consisting of 2 units of 1.65
MW each, was commissioned during 1996-97.
(v) Agnoor HE Project
Agnoor HE Project, Arwal, consisting of 2 units of 0.5 MW each, was commissioned
during 2004-05.
(vi) Dhelabagh HE Project
Dhelabagh HE Project in Rohtas, consisting of 2 units of 0.5 MW each, was commissioned
during 2006-07.
(vii) Triveni Link Canal HE Project
Triveni Link Canal HE Project in West Champaran, consisting of 2 units of 1.5 MW each,
was commissioned during 2007-08.
(viii) Nasriganj HE Project
Nasriganj HE Project in Rohtas, consisting of 2 units of 0.5 MW each, was commissioned
during 2007-08.
(ix) Sebari HE Project
Sebari HE Project in Rohtas, consisting of 2 units of 0.5 MW each, was commissioned
during 2008-09.
(x) Jainagra HE Project
Jainagra HE Project in Rohtas, consisting of 2 units of 0.5 MW each, was commissioned
during 2007-08.
(xi) Shirkhinda HE Project
Shirkhinda HE Project in Rohtas, consisting of 2 units of 0.35 MW each, was
commissioned during 2009-10.
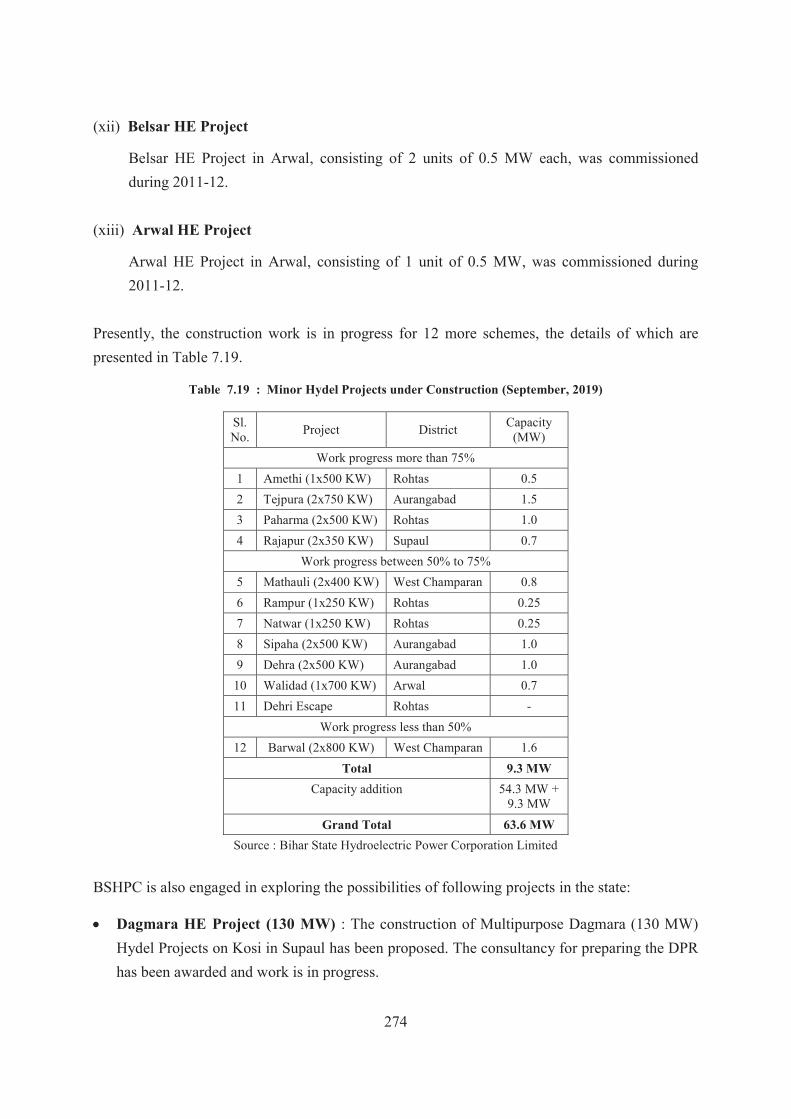
274
(xii) Belsar HE Project
Belsar HE Project in Arwal, consisting of 2 units of 0.5 MW each, was commissioned during 2011-12.
(xiii) Arwal HE Project
Arwal HE Project in Arwal, consisting of 1 unit of 0.5 MW, was commissioned during 2011-12.
Presently, the construction work is in progress for 12 more schemes, the details of which are presented in Table 7.19.
Table 7.19 : Minor Hydel Projects under Construction (September, 2019)
Sl. No. Project District Capacity
(MW) Work progress more than 75%
1 Amethi (1x500 KW) Rohtas 0.5 2 Tejpura (2x750 KW) Aurangabad 1.5 3 Paharma (2x500 KW) Rohtas 1.0 4 Rajapur (2x350 KW) Supaul 0.7
Work progress between 50% to 75% 5 Mathauli (2x400 KW) West Champaran 0.8 6 Rampur (1x250 KW) Rohtas 0.25 7 Natwar (1x250 KW) Rohtas 0.25 8 Sipaha (2x500 KW) Aurangabad 1.0 9 Dehra (2x500 KW) Aurangabad 1.0 10 Walidad (1x700 KW) Arwal 0.7 11 Dehri Escape Rohtas -
Work progress less than 50% 12 Barwal (2x800 KW) West Champaran 1.6
Total 9.3 MW Capacity addition 54.3 MW +
9.3 MW Grand Total 63.6 MW
Source : Bihar State Hydroelectric Power Corporation Limited BSHPC is also engaged in exploring the possibilities of following projects in the state:
Dagmara HE Project (130 MW) : The construction of Multipurpose Dagmara (130 MW) Hydel Projects on Kosi in Supaul has been proposed. The consultancy for preparing the DPR has been awarded and work is in progress.

275
Indrapuri HE Project (300 MW) : The State Government has sanctioned the construction of Indrapuri (300 MW) Hydel Projects on Sone River. The Department of Water Resources of the State Government is preparing DPR for the construction of dam for this project and it is in final stage.
Gandak, Burhi Gandak & Mahananda River Basin Projects : A survey was conducted in the Gandak, Burhi Gandak and Mahananda River Basin to assess its Hydro Power potential and to identify the sites for construction of hydel projects. As per the feasibility report, the sites and capacity of the projects have been identified, for which detailed survey, investigation and DPR are required. The details of sites are presented in Table 7.20.
Solar Plant on Vacant Land in Hydel Projects : BSHPC has decided to install solar plants on the roof tops of buildings of Power houses, Vacant lands, Power channels and Tailrace channels for generation of 10 MW of solar energy.
Table 7.20 : Site and Capacity of Gandak, Burhi Gandak & Mahananda River Basin Projects
Sl. No. Project/ Site Capacity
(MW) Gandak River Basin
1 Bettiah HEP 80.0
2 Bagaha HEP 50.0
Burhi Gandak River Basin
3 Raghunathpur HEP 2.0
4 Baragovind HEP 4.4
Mahananda River Basin
5 Basantpur SHP 2.1
6 Sonapur SHP 11.4
7 Dalkhola SHP 7.7
8 Rupadhar SHP 2.5
Total Capacity 160.1 MW
Source : Bihar State Hydroelectric Power Corporation Limited
_____________


277
Sustainable Development Goals (SDG) — SDG 1 (No poverty), SDG 5 (Gender equality) and
SDG 10 (Reduced inequality).
This chapter will discuss the rural development programmes in Bihar. The programmes include
Bihar Rural Livelihood Mission (BRLM), known as JEEViKA, and Mahatma Gandhi National
Rural Employment Guarantee Act (MGNREGA). The State Government also implemented the
Pradhan Mantri Aawas Yojana - Gramin (PMAY-G) to provide housing to the rural poor. The
Public Distribution System (PDS) in Bihar is also discussed in this chapter, since it has substantial
implications for rural development. This chapter will also focus on Panchayati Raj Institutions
(PRI), one of the key institutional set-ups to carry out rural development programmes and is
responsible for local governance. Finally, the distribution of Homestead land is also discussed,
along with the measures of land reforms.
8.1 Bihar State Rural Livelihood Mission (JEEViKA)
Bihar Rural Livelihood Promotion Society (BRLP) is an autonomous body under the aegies of
Rural Development Department of Bihar. The society is registered under the Societies Registration
Act, 1860. JEEViKA is entrusted to implement various schemes of the State Government and is
presently working extensively to alleviate poverty among the rural people through expanding
opportunities for sustainable livelihood. JEEViKA now covers all the 38 districts of the state, with
the aim to improve social and economic conditions of the rural people through strong community,
institutions, social capital, financial inclusion, health ntritions santitation activities and livelihood
programmes.
JEEViKA has achieved remarkable success in its core interventions and ranked first in the country
in terms of formation of SHGs, their federations, and financial inclusion. Till 2018-19, about
84,88,96 SHGs were formed. The SHGs have further been federated into 55,628 Village
Organizations (VO) and 925 Cluster-Level Federations (CLF). The project has been able to
leverage bank credit of Rs 8169 crore till 2018-19 (Table 8.1). JEEViKA is also responsible for
the implementation of the Lohiya Swachcha Bihar Abhiyan (LSBA) and SBM(G). JEEViKA has
achieved remarkable progress for this programme through sanitation intervention. The rural
households of Bihar has declared 100 percent access to toiliet. The same has been updated in MIS.
JEEViKA has achieved remarkable progress for this programme through sanitation intervention.
Till March, 2019, a total of 1.13 crore IHHLs have been constructed across all the districts.

278
The State Government has launched a new scheme called ‘Satat Jivikoparjan Yojana’ (SJY) in August 2018. JEEViKA has been designated as the nodal agency for implementation of SJY, with a budgetary outlay of Rs 840.00 crore for three years. The objective of this scheme is to provide sustainable income-generating assets to extremely poor households, including those who were traditionally engaged in production and sale of country liquor or toddy before the imposition of liquor prohibition in April 2016.
Table 8.1 : Progress under JEEViKA (2015-16 to 2018-19)
Item 2015-16 2016-17 2017-18 2018-19
Number of SHGs formed 470220 610808 790411 848896
Number of VOs formed 31229 35681 46756 55628
Number of CLFs formed 318 415 706 925
Number of SHGs Credit Linked with Banks 221261 391314 587616 810426
Bank Credit Amount (Rs. crore) 1300 2993 5358 8169
Source : JEEViKA, Government of Bihar
In recent years, JEEViKA has received recognition at both national and international forums for its excellent achievements. JEEViKA received a Certificate of Appreciation and award for its outstanding performance in the category of ‘Farm Livelihoods Promotion’ under DAY-NRLM for 2017-18. Under Sustainable Livelihoods and Adaptation to Climate Change (SLACC) project, JEEViKA made its mark and received third prize in the presentation of case study competition in ‘Livelihoods India Summit 2019’. Smt. Rasuhan Khatoon, a SHG member from Muzaffarpur received National Entrepreneurship Award in the category of the best individual entrepreneur. A new initiative for canteens, called Didi ki Rasooi and managed by SHG members, has received support from the government departments to run canteens in some of the government hospitals and other venues. Till now, 12 outlets of Didi Ki Rasoi have been opened, providing cooked meal to in-patients and out patients. The Rural Retail Mart established by JEEViKA to supply grocery items to more than 650 grocery shops, owned by JEEViKA SHG members. The marts aim at providing quality products at a reasonable price to SHG members. Under alternative banking, JEEViKA is working to provide banking services at the doorstep to rural households involving Banking Correspondent Agents of the banks. Over 600 Banking Correspondent Agents are running Custom Hiring Centres and have done a transaction of over Rs. 1243 crore. The programme also involved commercial banks and financial institutions, providing cheap insurance to the SHG members in Bihar. JEEViKA has been designated as a nodal agency
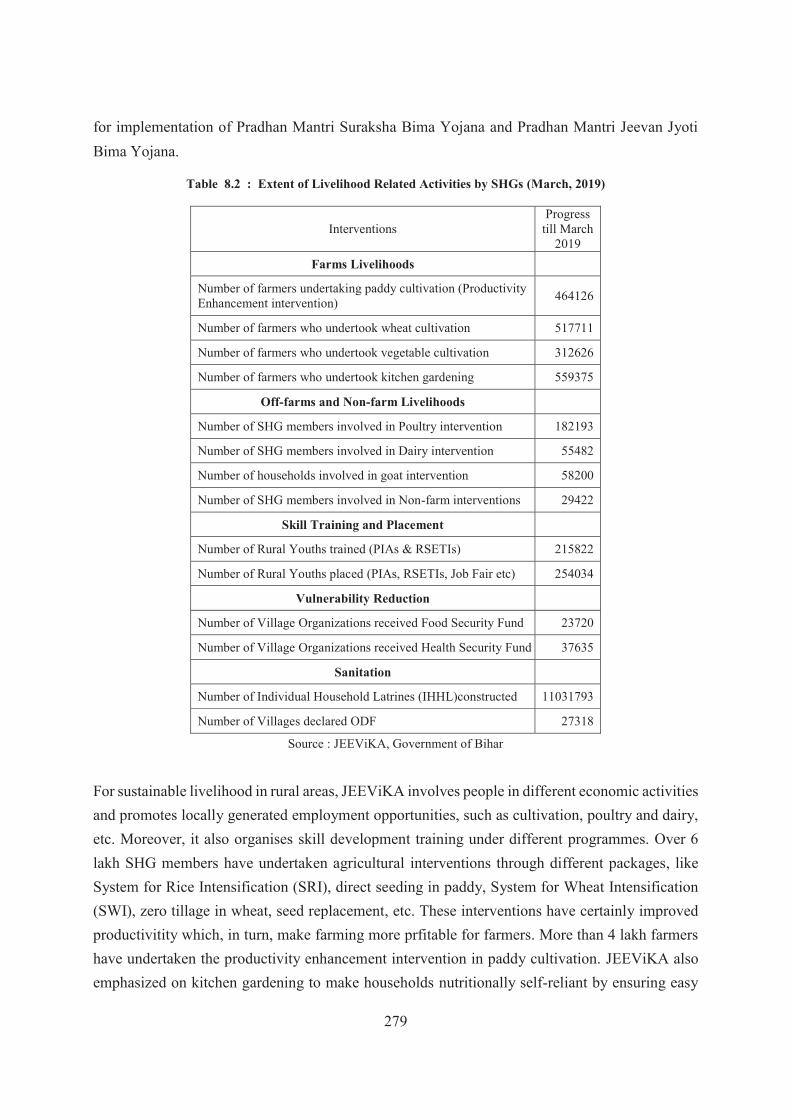
279
for implementation of Pradhan Mantri Suraksha Bima Yojana and Pradhan Mantri Jeevan Jyoti Bima Yojana.
Table 8.2 : Extent of Livelihood Related Activities by SHGs (March, 2019)
Interventions Progress
till March 2019
Farms Livelihoods Number of farmers undertaking paddy cultivation (Productivity Enhancement intervention) 464126
Number of farmers who undertook wheat cultivation 517711
Number of farmers who undertook vegetable cultivation 312626
Number of farmers who undertook kitchen gardening 559375
Off-farms and Non-farm Livelihoods
Number of SHG members involved in Poultry intervention 182193
Number of SHG members involved in Dairy intervention 55482
Number of households involved in goat intervention 58200
Number of SHG members involved in Non-farm interventions 29422
Skill Training and Placement
Number of Rural Youths trained (PIAs & RSETIs) 215822
Number of Rural Youths placed (PIAs, RSETIs, Job Fair etc) 254034
Vulnerability Reduction
Number of Village Organizations received Food Security Fund 23720
Number of Village Organizations received Health Security Fund 37635
Sanitation
Number of Individual Household Latrines (IHHL)constructed 11031793
Number of Villages declared ODF 27318
Source : JEEViKA, Government of Bihar
For sustainable livelihood in rural areas, JEEViKA involves people in different economic activities and promotes locally generated employment opportunities, such as cultivation, poultry and dairy, etc. Moreover, it also organises skill development training under different programmes. Over 6 lakh SHG members have undertaken agricultural interventions through different packages, like System for Rice Intensification (SRI), direct seeding in paddy, System for Wheat Intensification (SWI), zero tillage in wheat, seed replacement, etc. These interventions have certainly improved productivitity which, in turn, make farming more prfitable for farmers. More than 4 lakh farmers have undertaken the productivity enhancement intervention in paddy cultivation. JEEViKA also emphasized on kitchen gardening to make households nutritionally self-reliant by ensuring easy

280
availability of vegetables and fruits produced at the backyard or kitchen garden. Over 5.5 lakh SHG members have undetaken kitchen gardening. Moreover, large-scale production of vegetables was undertaken by over 3.1 lakh SHG members. The details of livelihood-related activities upto March, 2019 are presented in Table 8.2. In off-farm activities, around 1.8 lakh SHG members were involved in poultry, around 55 thousand were involved in dairy, and 58 thousand in rearing of goats. In addition, JEEViKA also trains rural youth and arranges a wide range of jobs for them. Till March, 2019, a total of 2.2 lakh youth were trained and 2.5 lakh were placed/settled either by the Project Implementation Agency (PIA), or by Rural Self-employment Training Institutes (RSETIs), or through job fairs organized by JEEViKA. Moreover, SHGs have played an important role in reducing the vulnerability of rural poor by providing Food Security Fund interventions and health security interventions. The food security intervention is also vital to improve nutrition level. Besides this, an intensive behaviour change communiction module on health, nutrition and sanitation are being rolled out in the entire state.
A decentralized system of State Rural Livelihood Mission (SLRM) has been initiated by JEEViKA, which focuses on community mobilization with Gram Panchayats driving the implementation through local action plans. Under this initiative, priority will be given to all Ganga Gram Panchayats in initial phases, and additional activities like tree plantation and environment safety will also be undertaken. In all, undedr 14 districts, 50 Gram Panchayat were selected for SLRM (Chart 8.1).
Chart 8.1 : Selected Gram Panchayat in Selected Districts for State Rural Livelihood Mission
Source : JEEViKA, Government of Bihar

281
8.2 Mahatma Gandhi National Rural Employment Guarantee Scheme
The Mahatma Gandhi National Rural Employment Guarantee Act, 2005 (MGNREGA) is a social
security measure to guarantee the right to work for at least one member of a family for 100 days
annually. The aim of the Act is to enhance livelihood security in rural areas by providing 100 days
of guaranteed wage employment to every household whose adult family member volunteer to
participate in unskilled or manual work. The works include rejuvenation of local natural resources,
and creation of productive assets in the rural areas. MGNREGS provides purchasing power to the
rural poor and thereby stimulates the local economy. The scheme also helps in achieving women
empowerment and restrict labour migration. Since its inception in 2005, the performance of
MGNREGA has been commendable. Chart 8.2 presents the number of job cards issued to
households during 2015-2019. The highest number of job cards was issued in 2016-17 (8.8 lakh),
while the lowest was issued in 2017-18 (5.9 lakh), which again increased to 7.01 lakh in 2018-19.
Source : Department of Rural Development, GoB
Skilling and Placement under JEEViKA
JEEViKA has done tremendous work for livelihood promotion at the grass-root level. Deen Dayal Upadhyay Grameen Kaushal Yojana (DDU-GKY) and Roshni Project and RSETIs are some imporant initiative undertaken by the JEEViKA.
To provide sustainable employability to youths from rural and left-wing extremism affected areas, 61 new training centres were established in different districts of Bihar. The training programme aimed at providing skill development training to native and migrated youth. During 2018-19, a total of 10,800 candidates were trained, out of which 8547 were placed in different sectors.
6.4
8.8
5.9 7.01
0
2
4
6
8
10
2015-16 2016-17 2017-18 2018-19
Job
Car
d (L
akh)
Years
Chart 8.2 : Number of Job Card Issued During 2015-2019

282
Source : Department of Rural Development, GoB
Given the fact that there has been a fluctuation in the issuance of job cards to households, the
number of households provided with actual employment is an important indicator of the
performance of MGNREGS. This data is provided in Table 8.3 and Chart 8.3. From Table 8.3, one
can easily observe that both the numbers of households with job card of households which had
obtained employment have increased consistently. Between 2017-18 and 2018-19, the number of
job cards issued increased from 148 lakh to 155 lakh. Similarly, the number of households
receiving employment has increased by about 32 percent from 22 lakh in 2017-18 to 29 lakhs in
2018-19. The number of households which obtained 100 days of employment has also increased
in the last three years. The number of person-days generated has again increased three and a half
times, from 352 lakh person-days in 2014-15 to 1234 lakh person-days in 2018-19. MGNREGA
has an in-built mechanism to ensure participation of women in the total employment created. In
Bihar, the share of women’s participation was higher than the statutory requirement of one-third
of the total person-days created. During the last five years, the share of women in the total
employment created has increased, and it stood at 51.8 percent in 2018-19. However, the average
number of days of employment per household has been fluctuating over the years. It was the lowest
in 2014-15 (34.0 mandays) and the highest in 2015-16 (45.1 mandays). The primary reason for
such low and fluctuating average number of days of employment per household has been the drop-
out of workers, without completing the mandatory 100 days of work. The fund utilization was low
in earlier years, but increased to around 90 in 2017-18 and 2018-19.
11.2
15.7 15.218.9
02468
101214161820
2015-16 2016-17 2017-18 2018-19
Empl
oym
ent (
Pece
nt)
Years
Chart 8.3 : Percent of Household Provided with Employment

283
Table 8.3 : Performance of MGNREGA (2014-15- to 2018-19)
Year 2014-15 2015-16 2016-17 2017-18 2018-19
No. of households Job Cards issued (lakh) 127.2 133.6 142.4 148.3 155.3 No. of households provided with employment (lakh) 10.4 14.9 22.3 22.5 29.2
No. of households obtaining 100 days of employment (lakh) 0.3 0.6 0.2 0.2 0.2
Employment generated (lakh person-days) 352 670.9 858.4 817.2 1234.1 Percentage share of women in total employment generated 37.3 40.8 43.8 46.6 51.8
Average employment per household (person-days) 34.0 45.1 37.4 36.4 42.2
Number of completed works (lakh) 1.2 1.1 0.8 1.1 1.8
Fund utilized (percentage) as per MIS 65.7 81.6 89.9 91.0 90.0
No. of accounts opened (lakh) 29.4 34 39.2 66.9 72.8
Source : Department of Rural Development, GoB
Source : Department of Rural Development, GoB
Over the years, the number of completed works under MGNREGS has increased in Bihar. Chart 8.4 suggests that the total number of completed works under MGNREGS increased from 116.0 thousand in 2014-15 to 183.3 thousand in 2018-19. A major slump in the number of completed works was observed in 2016-17 at 76.9 thousand. The district-wise details of MGNREGS are presented in Table A 8.1 (Statistical Appendix). There has been wide variation in the implementation of MGNREGA in the districts. The maximum number of job cards were issued in East Champaran (7.2 lakh), followed by Muzaffarpur (6.7 lakh), and Vaishali (6.5 lakh) in 2018-19. The minimum number of job cards was issued in Sheohar, along with Jehanabad, Arwal and Sheikhpura. In each of these districts, the number of job cards issued was less than 1 lakh.
3%%%%%%%4% 4%
56%1%
9%1%
17%
1%4%
Chart 8.4 : Completed work under MGNREGA in 2018-19
Water Conservation and WaterHarvestingDrought Proofing
Micro Irrigation Works
Works on Individuals Land(Category IV)Renovation of traditional waterbodies

284
Table 8.4 : Category-wise Completed work under MGNREGS (2014-15 to 2018-19)
Categories 2014-15 2015-16 2016-17 2017-18 2018-19 Water Conservation and Water Harvesting
2464 (2.1)
3234 (2.9)
3979 (5.2)
6651 (6.13)
5464 (3.01)
Drought Proofing 32201 (27.8)
42685 (38.6)
16352 (21.3)
7401 (6.82)
7597 (4.1)
Micro Irrigation Works 2274 (2.0)
3852 (3.5)
5501 (7.2)
9689 (8.93)
7700 (4.2)
Works on Individuals Land 4227 (3.6)
6612 (6.0)
6449 (8.4)
21162 (19.50)
103518 (56.5)
Renovation of traditional water bodies
825 (0.7)
1058 (1.0)
1324 (1.7)
1831 (1.69)
1638 (0.9)
Land Development 4312 (3.7)
6928 (6.3)
8798 (11.4)
16695 (15.38)
15897 (8.7)
Flood Control and Protection 395 (0.3)
640 (0.6)
651 (0.8)
1354 (1.25)
1277 (0.7)
Rural Connectivity 13847 (11.9)
20081 (18.2)
22494 (29.3)
32839 (30.26)
31269 (17.0)
Any Other Activity 55438 (47.8)
25447 (23.0)
11347 (14.8)
1563 (1.4)
1418 (0.8)
Rural Infrastructure — — — (0.00) 10 (0.1)
Bharat Nirman Rajeev Gandhi Sewa Kendra — — — 198
(0.2) 109 (0.1)
Coastal Areas — — — 4 (0.00) 0
Fisheries — — — 11 (0.01)
8 (0.00)
Play ground — — — 21 (0.02)
26 (0.01)
Rural Drinking Water — — — 28 (0.03)
74 (0.04)
Rural Sanitation — — — 9076 (8.4)
7339 (4.0)
Total 115983 (100.0)
110537 (100.0)
76895 (100.0)
108523 (100.0)
183344 (100.0)
Source : Department of Rural Development, GoB
Chart 8.5 : Total Number of Completed Works under MGNREGS (2014-2019)
Source : Department of Rural Development, GoB
116.0 110.5
76.9
108.5
183.3
0.020.040.060.080.0
100.0120.0140.0160.0180.0200.0
2014-15 2015-16 2016-17 2017-18 2018-19
Fig
in th
ousa
nd
Year

285
The share of SC households among all job cardholders has not changed much in the last three years. It was 24.6 percent in 2017-18, and 23.8 percent in 2018-19. The share of households with job cards demanding employment increased from 19.7 percent in 2017-18 to 23.6 percent in 2018-19. In Arwal, the demand was the highest where 45.5 percent demanded employment in 2017-18, followed by Jehanabad (37.8 percent) and Sheohar (36.9 percent). On the other hand, West Champaran showed the lowest demand for employment. The utilization of fund is another important indicator to assess the success of the implementation of schemes. District-wise figures for fund utilization in MGNREGA during the last three years are shown in Table A 8.2 (Statistical Appendix). The fund utilization during the last three years was more than 90 percent in most of the districts. 8.3 Pradhan Mantri Awas Yojana Gramin (PMAY-G)
Pradhan Mantri Awas Yojana Gramin (PMAY-G) previously known Indira Awaas Yojana (IAY) was launched by the Central Government to provide affordable housing for all in the rural areas by 2022. The Socio-economic and Caste Census is considered to be basis for the identification of the beneficiaries of the scheme. To achieve the target, a financial assistance is provided to the homeless households and those with old houses to construct pucca houses. The financial assistance for the beneficiaries living in plains is up to Rs 1.20 lakh, and for the residents in the hilly regions, it is upto Rs 1.30 lakh. Economically Weaker Section (EWS), Low Income Group (LIG), Middle Income Group I (MIG 1), Middle Income Group II (MIG II), Women, SC/ST and OBC households are the eligible beneficiaries of the scheme. In Bihar, PMAY-G is an important rural development scheme, as a large share of the population is living in rural areas. Table 8.5 depicts the performance of PMAY-G scheme during 2015-2019. It is also observed in Table 8.5 that the physical targets of PMAY-G have been achieved in all the years, except 2017-18.
Table 8.5 : Performance of IAY/PMAY-G Scheme (2015-16 to 2018-19)
Year
Annual Physical Target (Lakh)
House Completed (Lakh) Fund Utilization
PMAY-G IAY Total
Total Expenditure SC & ST
(Rs. in Lakh) (Rs. in Lakh)
PMAY-G IAY Total PMAY-G IAY Total
2015-16 2.33 — 2.8 2.8 — 127594 127594 — 48713 48713
2016-17 6.37 — 6.9 6.9 291 61961 62252 158 25316 25474
2017-18 5.38 0.3 2.9 3.2 324341 65207 389548 131037 29467 160504
2018-19 — 5.8 1.3 7.1 560296 26502 586797 115545 12112 127658
Source : Department of Rural Development, GoB

286
Chart 8.6 : Performance of IAY/PMAY-G Scheme
Source : Department of Rural Development, GoB
8.4 Public Distribution System
The Public Distribution System (PDS) is the largest distribution scheme of its kind in the world,
established by the Central Government. To ensure the food security of the poor and marginalized
population, the scheme was started under the Union Ministry of Consumer Affairs, Food and
Public Distribution. The main objective of the scheme is providing affordable and accessible
essential food and non-food items to the poor. The PDS is to provide under the Essential
Commodities Act 1955, which regulates the production, supply and distribution of essential
commodities, such as foodgrains and oils. The Food Corporation of India (FCI) procures
foodgrains from farmers at the Minimum Support Price (MSP), stores it, and then distributes it
among the people through the PDS.
The National Food Security Act (NFSA), 2013 was passed to make the right to food as a legal
right. The Act classifies the entire population into three categories — no entitlement households,
entitlement households and Antodaya Anna Yojana households.
The social background of PDS dealers in Bihar is shown in Table 8.6. The total number of PDS
dealers in the state is around 42,520 in 2018. The largest share of PDS dealership in 2018 was with
the Backward Castes (27.8 percent), followed by the General Castes (19. 9 percent). The share of
0
5
10
15
20
25
30
35
40
45
0
1
2
3
4
5
6
7
8
2015-16 2016-17 2017-18 2018-19
In L
akh
Years
Annual Physical Target (Lakh) House Complited % of fund utilization
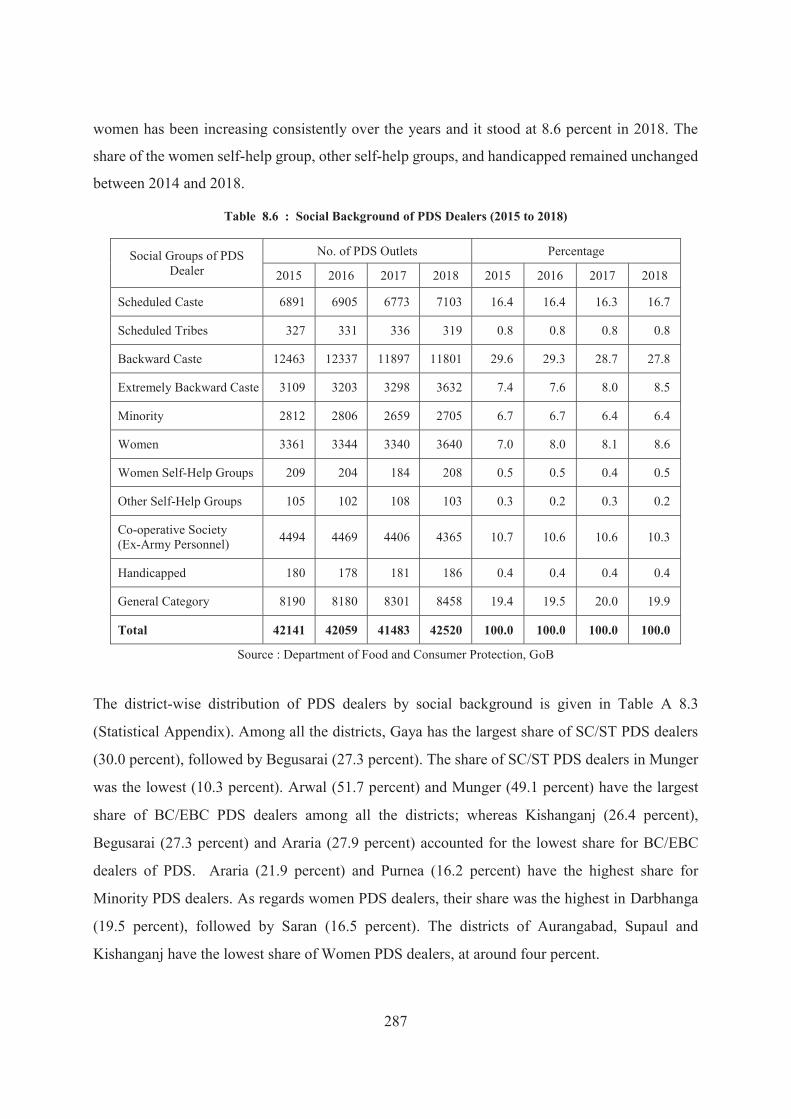
287
women has been increasing consistently over the years and it stood at 8.6 percent in 2018. The
share of the women self-help group, other self-help groups, and handicapped remained unchanged
between 2014 and 2018.
Table 8.6 : Social Background of PDS Dealers (2015 to 2018)
Social Groups of PDS Dealer
No. of PDS Outlets Percentage
2015 2016 2017 2018 2015 2016 2017 2018
Scheduled Caste 6891 6905 6773 7103 16.4 16.4 16.3 16.7
Scheduled Tribes 327 331 336 319 0.8 0.8 0.8 0.8
Backward Caste 12463 12337 11897 11801 29.6 29.3 28.7 27.8
Extremely Backward Caste 3109 3203 3298 3632 7.4 7.6 8.0 8.5
Minority 2812 2806 2659 2705 6.7 6.7 6.4 6.4
Women 3361 3344 3340 3640 7.0 8.0 8.1 8.6
Women Self-Help Groups 209 204 184 208 0.5 0.5 0.4 0.5
Other Self-Help Groups 105 102 108 103 0.3 0.2 0.3 0.2
Co-operative Society (Ex-Army Personnel) 4494 4469 4406 4365 10.7 10.6 10.6 10.3
Handicapped 180 178 181 186 0.4 0.4 0.4 0.4
General Category 8190 8180 8301 8458 19.4 19.5 20.0 19.9
Total 42141 42059 41483 42520 100.0 100.0 100.0 100.0
Source : Department of Food and Consumer Protection, GoB
The district-wise distribution of PDS dealers by social background is given in Table A 8.3
(Statistical Appendix). Among all the districts, Gaya has the largest share of SC/ST PDS dealers
(30.0 percent), followed by Begusarai (27.3 percent). The share of SC/ST PDS dealers in Munger
was the lowest (10.3 percent). Arwal (51.7 percent) and Munger (49.1 percent) have the largest
share of BC/EBC PDS dealers among all the districts; whereas Kishanganj (26.4 percent),
Begusarai (27.3 percent) and Araria (27.9 percent) accounted for the lowest share for BC/EBC
dealers of PDS. Araria (21.9 percent) and Purnea (16.2 percent) have the highest share for
Minority PDS dealers. As regards women PDS dealers, their share was the highest in Darbhanga
(19.5 percent), followed by Saran (16.5 percent). The districts of Aurangabad, Supaul and
Kishanganj have the lowest share of Women PDS dealers, at around four percent.

288
Under the PDS, there is a provision to distribute both food and non-food items to the poor people.
As such, sugar and kerosene are also distributed under PDS, but wheat and rice are the main
elements. The year-wise allotment and lifting of wheat and rice are presented in Table 8.7. The
total allotment of wheat and rice has increased from 4914.9 thousand tonnes in 2014-15 to 5220.2
thousand tonnes in 2018-19. The allotment of rice has increased by 183 thousand tonnes and
allotment of wheat has increased by 122 thousand tonnes between 2014-15 and 2018-19. It is
worthwhile to note that the State Government has been fully utilising the allocation of foodgrains.
During the last five years, the lifting percentage has always been above 95 percent. In 2018-19, it
was as high as 98.9 percent.
Table 8.7 : Allotment and Lifting of Wheat and Rice under PHH+AAY (2014-15 to 2018-19)
(Fig. in ‘000, tonnes)
Year
Total allotment (PHH+AAY) Total lifting (PHH+AAY) Total lifting in
% (PHH+ AAY) Wheat Rice Total Wheat Rice Total
2014-15 1966.0 2948.9 4914.9 1871.0 2828.4 4699.4 95.6
2015-16 2096.5 3144.6 5241.1 2053.6 2987.7 5041.3 96.2
2016-17 2197.4 3296.1 5493.5 2087.1 3165.0 5252.1 95.6
2017-18 2187.7 3281.6 5469.3 2135.2 3205.1 5340.3 97.6
2018-19 2088.1 3132.1 5220.2 2059.4 3104.3 5163.7 98.9
Source : Department of Food and Consumer Protection, GoB
The district-wise details of allotment and lifting of wheat and rice are given in Table A8.4
(Statistical Appendix). In 23 districts, 100 percent lifting of rice was observed in 2018-19.
Similarly, in 22 districts, 100 percent of wheat lifting has been observed. Most of the districts
report excellent performance in lifting wheat and rice, except Buxar (89.9 percent) and Munger
(84.8 percent).
8.5 Panchayati Raj Institutions
Bihar is one of the leading states in implementing panchayati raj for better representation of
socially and economically deprived rural population in the development process. In Bihar, there is

289
a reservation for Scheduled Castes (SC) and Extremely Backward Castes (EBC) in PRIs. Among
all categories, 50 percent of seats are reserved for women members. The details about the structure
of PRIs is given in Table 8.8. Currently, there are 38 Zila Parishad (ZP) at the district level, 534
Panchayat Samiti (PS) at the Block level, and 8386 Gram Panchayat (GP) at the village level.
There are 1161 ZP members, 11,497 PS members and 1,14,691 GP members. Apart from the
elected members, there are some functionaries who are employed to help the functioning of PRIs.
The State Government recruits these functionaries to support the activities related to self-
governance. It is clear that, at the district and block levels, there is an adequate number of
functionaries, but there is a need to employ more number of them at the village level. (Table 8.9).
Table 8.8 : Overview of Panchayati Raj Institutions in Bihar
Item No. Item No.
Zila Parishad 38 Gram Panchayat Secretary 3701
Panchayat Samiti 534 Nyaya Mitra 6947
Gram Panchayat 8386 Gram Kachahari Secretary 7474
Gram Panchayat Members 114691 Zila Panchayati Raj Officers 38
Panchayat Samiti Members 11497 Block Panchayati Raj Officers 528
Zila Parishad Members 1161 Gram Kachahari Members 114691
Source : Department of Panchayati Raj, GoB
The grants for the PRIs are based on the recommendation of the Fifth State Finance Commission
(2015-20). According to this, 2.75 percent of the actual expenditure of the State Government and
8.50 percent of state’s own tax revenue are transferred to the PRIs each year. The shares of total
GP, PS and ZP in the total transferred fund are 70 percent, 10 percent and 20 percent respectively.
The expenditure of PRIs at all three tiers has been presented in Table 8.9. There has not been a
consistent pattern in expenditure at all three levels of PRIs. The total expenditure of the PRIs
during 2018-19 was around Rs 780 crore, which is Rs 527 crore more than the expenditure in
2014-15. At the GP level, there has been a reduction in expenditure in 2018-19 as compared to
the previous year. At the PS level, a marginal increase in expenditure (Rs 1.10 crore) has been
observed during the same period. In 2018-19, the expenditure was Rs. 27.70 crore at the PS level.

290
Table 8.9 : Level of Expenditure in PRIs at Different Levels (2014-15 to 2018-19) (Rs Lakh)
Head 2014-15 2015-16 2016-17 2017-18 2018-19
Gram Panchayat
1. BRGF 27821 0 0 0 0
2. RGPSA 0 0 5091.1 0 0
3. MMGY 1084 0 0 0 0
4. Union Finance Commission Grants 107105 237627 314208 363039 419971
5. State Finance Commission Grants 0 0 135453.7 166407.9 167374.4
6. Mukhya Mantri Saat Nishchay Yojana 0 0 62000 162315.5 90000 7. Construction of Panchayat Sarkar
Bhawan 36863 12269 46222 5093 3553.5
8. Contingency Grant 0 321 4035 4852 4141.5 9. Payment and Allowance to GP
members/ functionaries 15383 8172 9161.7 12088.1 13850.2
Total 188256 258389 576171.4 713795.5 698891.3
Panchayat Samiti
1. BRGF 7949 0 0 0 0
2. RGPSA 0 0 0 0 0
3. Union Finance Commission Grants 30662 2829 0 0 0
4. State Finance Commission Grants 0 0 18729.8 22884.1 24695.4
5. Allowance to PS members 1946 1947 2140.7 2717.9 3004.9
6. Mukhya Mantri Saat Nishchay Yojana 0 0 0 0 0
Total 40557 4776 20870.5 25602 27700.3
Zila Parishad
1. BRGF 3975 227 0 0 0
2. RGPSA 0 0 0 0 0
3. Union Finance Commission Grants 15287 1414 0 0 0
4. State Finance Commission Grants 5026 0 47456 56164.1 53473
5. Allowance to ZP members 431 432 409.4 530.8 580.1
6. Mukhya Mantri Saat Nishchay Yojana 0 0 0 0 0
Total 24719 2073 47865.4 56694.8 54053.1
Grand Total 253532 265238 644907.2 796092.3 780644.7
Source : Department of Panchayati Raj, GoB
8.6 Distribution of Homestead Land
Better living conditions, including good housing, is an imporatnt part of the overall wellbeing of a population. Towards providing adequate housing facilities in rural areas, the Central Government is presently implementing Prime Minister Awas Yojana-Gramin (PMAY-G). The State

291
Government is also committed to provide adequate housing facility to the rural population, paticulary those who are poor. As such, the State Government is presently providing 5 decimals of land to all landless households for construction of a house under its programme of Abhiyan Basera. The beneficiaries include households from the following categories — Backward Castes, Extremely Backward Castes, Scheduled Castes, Scheduled Tribes, and Mahadalits.
Table 8.10 : Category-wise Eligible Households and Beneficiaries of Abhiyan Basera (2017-18)
Total
Surveyed Households
Beneficiary Households
% of Beneficiarie
s
Remaining Households
Backword Caste I 17176 10245 59.65 6931
Backword Caste II 10182 5460 53.62 4722
Schedule Caste 12479 6338 50.79 6141
Schedule Tribe 3903 2166 55.50 1737
Mahadalit 67340 42187 62.65 25153
Total 111080 66396 59.77 44684
Source : Department of Revenue and Land Reforms, GoB
Under Abhiyan Basera, a survey was conducted in 2014 to identify eligible beneficiaries of the
scheme. It has identified 1,11,080 households belonging to different categories, and till 2017-18,
66,396 households were provided with required homestead land. This accounts for 59.7 percent of
all targetted households. The present coverage of the scheme for different social categories —
Extremely Backward Castes (53.0 percent), Scheduled Castes (50.8 percent), Scheduled Tribes
(55.5 percent), and Mahadalits (62.6 percent).

292
APPENDIX
Table A 8.1 : District-wise Progress of MGNREGS (2016-17 to 2018-19) (Fig in lakh)
District No. of households issued
job cards (lakh)
Percentage share of SC households among
households with job cards
Percentage of households with job cards demanding
employment 2016-17 2017-18 2018-19 2016-17 2017-18 2018-19 2016-17 2017-18 2018-19
Patna 5.5 5.7 5.9 25.3 25.4 25.1 16.9 12.0 13.3 Nalanda 4.3 4.4 4.5 36.4 36.72 36.3 20.7 15.1 16.4 Bhojpur 3.5 3.6 3.7 32.7 32.51 31.7 26.5 16.6 16.4 Buxar 2.8 2.8 2.8 29.7 29.42 29.0 27.8 24.9 22.8 Rohtas 3.6 3.7 3.8 31.2 30.9 30.2 26.1 17.4 19.8 Kaimur 2.2 2.2 2.3 37.2 36.63 35.5 27.7 18.8 24.6 Gaya 5.9 6.0 6.2 55.1 54.63 53.9 18.8 18.2 18.8 Jehanabad 1.5 1.5 1.6 30.3 29.73 29.6 50.0 33.6 37.8 Arwal 1.1 1.1 1.2 27.7 25.03 22.9 52.4 42.7 45.5 Nawada 4.2 4.5 4.6 30.4 31.46 30.6 23.5 19.3 25.3 Aurangabad 3.6 3.8 4.0 41.4 41.13 40.2 29.0 23.4 30.0 Saran 5.2 5.4 5.9 24.8 24.36 22.9 21.9 17.4 23.1 Siwan 3.1 3.1 3.2 18.7 18.61 18.3 19.1 14.0 16.3 Gopalganj 3.5 3.4 3.4 19.5 18.9 18.5 20.6 16.7 19.0
W. Champaran 4.8 5.1 5.2 18.0 17.68 17.4 27.2 19.0 11.5 E. Champaran 6.5 6.8 7.1 18.9 18.29 17.4 20.3 14.7 22.1 Muzaffarpur 6.3 6.1 6.7 23.0 22.25 21.4 17.4 13.0 16.3 Sitamarhi 4.6 5.0 5.3 21.5 20.13 19.1 28.8 25.4 28.2 Sheohar 0.9 0.9 1.0 19.8 18.68 17.3 60.1 26.8 36.9 Vaishali 5.8 6.0 6.4 32.4 30.99 29.5 16.2 18.4 25.0 Darbhanga 5.1 5.7 6.1 25.1 24.15 22.6 26.7 19.4 30.7 Madhubani 5.4 5.6 5.9 21.5 20.86 19.9 21.2 13.5 18.5 Samastipur 5.1 5.8 6.2 29.4 28.18 26.4 29.8 20.8 31.9 Begusarai 3.4 3.5 3.7 22.4 21.47 20.4 19.7 17.2 18.7 Munger 2.0 2.1 2.2 16.4 16.01 15.5 25.7 23.5 29.3 Sheikhpura 0.9 1.0 1.0 36.2 36.23 35.6 30.9 21.5 19.9 Lakhisarai 1.7 1.8 1.9 23.2 23.05 22.4 29.4 27.0 31.4 Jamui 2.8 3.0 3.1 24.7 23.80 22.8 34.1 27.3 30.4 Khagaria 1.9 2.1 2.2 24.7 23.84 22.6 21.2 16.8 17.8 Bhagalpur 4.1 4.3 4.6 13.2 12.74 12.1 24.8 17.8 23.3 Banka 3.0 3.2 3.3 15.8 15.59 15.3 34.5 23.8 25.3 Saharsa 3.8 4.0 4.1 21.1 20.45 19.8 41.1 30.4 35.5 Supaul 3.3 3.4 3.6 21.3 25.06 24.6 29.9 19.5 24.6 Madhepura 3.6 3.8 3.9 24.2 22.89 21.6 45.0 29.6 34.4 Purnea 4.8 5.0 5.3 17.6 16.77 16.0 25.2 20.7 25.8 Kishanganj 2.6 2.7 2.8 9.7 9.33 9.2 32.1 25.7 24.5 Araria 4.5 4.8 5.0 16.7 16.0 17.4 35.1 20.1 27.2 Katihar 5.0 5.3 5.5 15.3 14.59 14.0 29.9 20.4 22.8 Bihar 148.3 155.3 24.65 23.8 19.7 23.6
Source : Department of Rural Development, GoB

293
Table A 8.1 : District-wise Progress of MGNREGS (2016-17 to 2018-19) (Contd.)
District
Household getting 100 days of employment as percentage of those obtaining employment
Person-days of employment generated (lakh)
Percentage share of women in total employment generated
2016-17 2017-18 2018-19 2016-17 2017-18 2018-19 2016-17 2017-18 2018-19 Patna 0.9 0.1 1.1 24.3 17.4 28.2 48.6 47.6 52.0 Nalanda 1.0 0.6 1.2 25.4 19.6 28.2 50.5 51.6 58.7 Bhojpur 0.7 0.2 0.4 15.9 13.1 17.9 34.2 39.4 43.6 Buxar 0.5 0.6 0.6 18.8 19.4 20.5 34.5 35.6 39.5 Rohtas 0.2 0.2 0.5 184 14 23.6 30.4 34.3 40.2 Kaimur 0.9 1.3 1.3 14.8 12.5 21.3 33.7 37.4 42.4 Gaya 0.2 0.2 0.6 28.0 25.9 39.9 55.1 55.1 59.0 Jehanabad 2.5 2.1 2.6 18.2 20.4 26.2 44.7 45.1 46.9 Arwal 1.0 0.4 0.7 12.4 14.4 20.9 40.2 43.0 44.8 Nawada 0.4 0.9 1.6 25.1 25.8 47.3 53.1 54.5 56.0 Aurangabad 1.9 2.9 3.3 31.0 32.2 48.4 35.5 38.2 43.2 Saran 2.1 2.8 3.1 38.8 34.9 57.5 28.7 34.8 41.9 Siwan 1.1 1.2 1.0 14.9 11.5 17.7 30.4 37.1 46.9 Gopalganj 0.7 0.6 0.4 22.2 18.2 22.3 30.8 34.6 41.9 W. Champaran 0.5 0.3 0.1 29.9 22 24.1 34.7 39.8 66.7 E. Champaran 0.4 0.5 0.7 38.0 33.9 57 35.7 39.0 45.4 Muzaffarpur 0.4 0.5 0.5 23.1 21.1 23.2 41.2 44.6 49.5 Sitamarhi 0.2 0.3 0.3 25.6 31.3 39.6 44.2 47.1 49.6 Sheohar 0.3 0 0.4 11.0 7.4 13.3 44.2 46.1 51.1 Vaishali 0.1 0.5 0.6 24.5 28.9 49.3 45.0 46.7 52.7 Darbhanga 0.4 0.1 0.2 29.2 30.3 51 49.9 51.0 57.5 Madhubani 0.2 0.3 0.3 25.9 18.6 34.6 50.6 52.3 58.1 Samastipur 1.3 2 1.2 35.8 41.9 66.5 48.3 51.4 57.9 Begusarai 1.3 1.4 1.0 13.7 16.3 23 57.0 55.6 58.4 Munger 0.6 0.3 0.9 12.2 14.8 25.6 44.4 47.8 50.8 Sheikhpura 0.7 0.4 0.4 8.7 6.7 8.3 54.1 51.4 56.6 Lakhisarai 0.2 0.2 1.0 14.8 17.1 25.5 49.6 50.7 53.9 Jamui 0.2 0.4 0.7 19.8 23.8 33.7 47.1 50.3 53.6 Khagaria 0.32 0.2 0.1 7.4 7.8 8.9 57.8 59.3 65.1 Bhagalpur 0.6 0.9 1.1 220 21.8 36.6 39.1 40.9 45.4 Banka 0.3 0.3 0.2 23.2 20.8 26.6 48.4 49.3 52.0 Saharsa 0.3 0.1 0.3 39.0 34.3 51.3 50.4 52.8 56.0 Supaul 0.4 0.3 0.5 19.3 16 27.6 46.9 49.6 53.4 Madhepura 0.7 0.9 0.1 36.3 36.7 40.5 499 51.6 53.3 Purnea 0.1 0.4 0.7 24.4 26.6 47.8 49.2 53.5 56.8 Kishanganj 1.1 0.8 0.7 20.0 19 24.5 42.4 46.3 53.0 Araria 0.2 0.1 0.2 22.0 15.9 31.7 43.5 47.9 52.5 Katihar 0.2 0.1 0.1 24.7 24.9 35.4 48.1 50.1 55.9 Bihar 0.6 0.7 0.8 858.4 817.2 1234.1 43.8 46.6 51.8
Source : Department of Rural Development, GoB

294
Table A 8.2 : District-wise Financial Progress under MGNREGS (2016-17 to 2018-19)
(Rs in Lakh)
District
2016-17 2017-18 2018-19
Funds available
Funds utilized
Percentage of
utilization
Funds available
Funds utilized
Percentage of
utilization
Funds available
Funds utilized
Percentage of
utilization Patna 6764.6 3077.5 45.5 8817.4 5310.2 60.2 9772.1 6111.5 62.5 Nalanda 6544.1 6050.3 92.5 7317.7 7003.0 95.7 6769.5 6444.9 95.2 Bhojpur 4381.3 3949.0 90.1 4841.6 4354.6 89.9 5051.8 4562.5 90.3 Buxar 8805.1 8307.8 94.4 8208.6 7630.8 93.0 5763.5 5130.5 89.0 Rohtas 4946.9 4007.6 81.0 5833.6 4899.3 84.0 6888.9 6401.8 92.9 Kaimur 4181.5 3828.2 91.6 4861.2 4232.9 87.1 6194.5 5691.1 91.9 Gaya 8078.1 6304.4 78.0 10888.6 8971.2 82.4 10836.8 9237.8 85.2 Jehanabad 5010.9 4844.1 96.7 6638.7 6447.4 97.1 9542.4 6234.5 65.3 Arwal 3322.0 3282.0 98.8 5541.0 5414.2 97.7 4511.1 4426.3 98.1 Nawada 6599.5 6405.5 97.1 8527.3 8311.0 97.5 10812.5 10536.7 97.4 Aurangabad 8563.5 7769.3 90.7 12703.0 11771.2 92.7 11069.9 10217.5 92.3 Saran 10545.1 9792.7 92.9 15947.6 15016.1 94.2 15183.7 14234.0 93.7 Siwan 4367.2 3709.5 84.9 4695.4 4017.7 85.6 4976.6 4387.1 88.2 Gopalganj 6720.0 6212.6 92.4 7917.8 7341.1 92.7 6589.4 6152.2 93.4 W. Champaran 6937.3 6244.1 90.0 7373.5 6668.0 90.4 6628.8 5875.3 88.6 E. Champaran 10682.5 9938.0 93.0 13155.1 12424.6 94.4 18428.8 14282.9 77.5 Muzaffarpur 6058.4 4315.9 71.2 7313.4 5416.4 74.1 8564.2 6423.6 75.0 Sitamarhi 7165.6 6101.6 85.2 11047.0 10096 91.4 10821.6 10028.5 92.7 Sheohar 4193.7 37086 88.4 3913.6 3431.5 87.7 4197.0 3688.5 87.9 Vaishali 6101.3 5506.7 90.3 11895.9 11116.3 93.4 13731.4 13104.2 95.4 Darbhanga 8123 6941.8 85.5 13022.6 11867 91.1 14567.9 13335.8 91.5 Madhubani 7626 7106.8 93.2 8610.9 8075.9 93.8 9883.8 9453.5 95.6 Samastipur 11260.6 10140.2 90.1 14820.7 13628 92.0 17793.2 16572.1 93.1 Begusarai 6668.7 6144.9 92.1 9057.9 8463.5 93.4 10300.4 9757.9 94.7 Munger 3148.1 2790.4 88.6 5638.7 5385.1 95.5 7772.9 7564.8 97.3 Sheikhpura 2215 2160.1 97.5 2345.5 2274.8 97.0 2091.1 2020.0 96.6 Lakhisarai 3269.5 3121.2 95.5 6585.5 6422.8 97.5 6672.3 6521.1 97.7 Jamui 6301.9 6137.5 97.4 8668.4 8468.1 97.7 9753.9 9582.9 98.2 Khagaria 1938.0 1822.5 94.0 2734.6 2548.6 93.2 2253.4 2158 95.8 Bhagalpur 5773.6 5310.3 92.0 8465.6 8066.3 95.3 11428.1 10930.4 95.6 Banka 5893.2 5492.1 93.2 6939.3 6550.1 94.4 7520.8 7004.9 93.1 Saharsa 12280.9 11942.1 97.2 12079 11820.7 97.9 10244 9885.5 96.5 Supaul 7173.0 5310.4 74.0 7879.4 5965.9 75.7 8755.2 6867.0 78.4 Madhepura 7558.8 7250.1 95.9 12468.4 11990.5 96.2 10628.3 10281.2 96.7 Purnea 7598.9 6483.7 85.3 9793.7 8634.0 88.2 14462.8 13099.4 90.6 Kishanganj 3953.4 3644.0 92.2 6149.3 5705.1 92.8 6030.5 5553.2 92.1 Araria 6570.4 5381.3 81.9 6842.4 5628.9 82.3 9156.6 7870.3 86.0 Katihar 6438.7 5994.6 93.1 8643.5 8293.0 95.9 9190.6 8758.0 95.3 Bihar 243760.0 219205.0 90.0 318183.0 289661.6 91.0 344840.4 310387.3 90.0
Source : Department of Rural Development, GoB

295
Table A 8.3 : District-wise Distribution of DPS Dealers by Social Background in Bihar (2018-19)
District Number
of Dealers
SC/ST BC/EBC Minority Women Women/
Other SHG
Helper Samiti/ PACS/
Samiti of Ex- Army Personnel
General Total
Patna 2531 17.3 45.6 2.5 11.8 0.4 7.2 15.3 100.0 Nalanda 1251 15.4 41.2 3.9 11.0 1.8 15.3 11.4 100.0 Bhojpur 1320 15.3 37.5 3.5 11.2 0.0 9.7 22.8 100.0 Buxar 848 20.4 33.8 2.8 11.7 1.2 10.8 19.2 100.0 Rohtas 996 21.8 32.2 6.1 5.4 1.1 11.7 21.6 100.0 Kaimur 802 22.7 41.3 3.4 15.5 0.0 3.1 14.1 100.0
Gaya 1954 30.0 30.8 4.8 9.0 1.6 8.7 15.1 100.0 Jehanabad 481 19.1 32.0 4.4 9.1 0.4 11.9 23.1 100.0 Arwal 325 22.5 51.7 0.0 3.4 0.0 0.0 22.5 100.0 Nawada 986 16.0 33.2 4.2 11.3 1.9 12.4 21.1 100.0 Aurangabad 1108 17.1 35.8 3.9 4.0 0.2 9.4 29.6 100.0
Saran 2255 11.8 32.2 2.4 16.5 0.0 10.3 26.9 100.0 Siwan 1571 12.5 34.4 7.3 6.8 0.4 6.7 31.9 100.0 Gopalganj 1129 12.5 29.4 2.6 8.4 0.2 16.7 30.3 100.0
W. Champaran 1945 20.4 31.3 12.0 6.3 0.1 13.1 16.9 100.0 E. Champaran 2169 13.2 38.1 9.0 5.1 0.6 10.0 24.0 100.0 Muzaffarpur 1915 17.8 32.3 4.1 9.3 1.1 11.2 24.2 100.0 Sitamarhi 1608 17.7 43.3 3.3 6.3 0.0 9.4 20.0 100.0 Sheohar 333 14.1 30.6 4.8 9.9 1.5 12.0 27.0 100.0 Vaishali 1295 15.1 37.1 1.7 6.9 1.0 16.6 21.5 100.0
Darbhanga 1772 12.4 32.2 8.7 19.5 0.5 6.4 20.3 100.0 Madhubani 1465 19.2 35.8 7.6 5.6 1.3 11.1 19.4 100.0 Samastipur 1462 20.6 35.2 2.5 5.3 0.7 13.9 22.0 100.0
Begusarai 1021 27.3 27.3 4.3 11.9 0.0 4.6 24.5 100.0 Munger 619 10.3 49.1 4.5 10.8 0.2 8.9 16.2 100.0 Sheikhpura 289 16.6 36.3 2.4 6.6 0.0 12.5 25.6 100.0 Lakhisarai 406 12.6 35.2 2.0 12.1 0.2 10.6 27.3 100.0 Jamui 856 20.4 33.1 2.9 5.1 0.0 12.1 26.3 100.0 Khagaria 601 13.8 49.6 2.7 14.6 3.2 5.5 10.6 100.0
Bhagalpur 1108 17.9 43.1 9.4 8.0 0.0 6.2 15.3 100.0 Banka 922 11.9 40.1 5.9 7.5 2.4 5.0 27.2 100.0
Saharsa 807 18.7 38.7 9.3 8.2 1.2 11.3 12.6 100.0 Supaul 708 11.7 46.5 8.9 4.2 0.0 15.3 13.4 100.0 Madhepura 977 15.1 43.5 4.7 11.5 0.2 9.9 15.0 100.0
Purnea 1154 18.6 36.1 16.2 9.7 2.8 6.2 10.3 100.0 Kishangunj 573 14.1 26.4 0.0 4.2 0.3 8.4 46.6 100.0 Araria 1354 18.5 27.9 21.9 15.5 0.0 6.5 9.7 100.0 Katihar 1443 16.6 34.0 7.6 12.3 0.0 9.3 20.3 100.0 Bihar 44359 17.2 36.2 5.9 9.6 9.6 0.7 20.6 100.0
Source : Department of Food and Consumer Protection, GoB
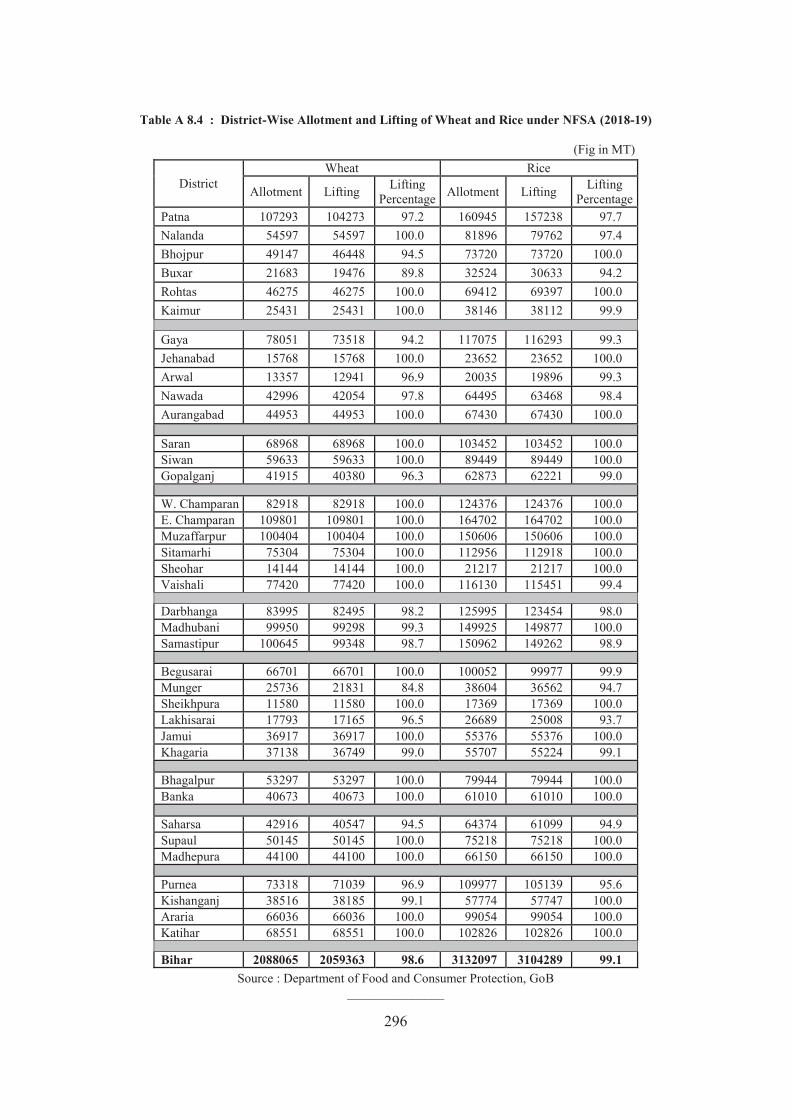
296
Table A 8.4 : District-Wise Allotment and Lifting of Wheat and Rice under NFSA (2018-19)
(Fig in MT)
District Wheat Rice
Allotment Lifting Lifting Percentage Allotment Lifting Lifting
Percentage Patna 107293 104273 97.2 160945 157238 97.7 Nalanda 54597 54597 100.0 81896 79762 97.4 Bhojpur 49147 46448 94.5 73720 73720 100.0 Buxar 21683 19476 89.8 32524 30633 94.2 Rohtas 46275 46275 100.0 69412 69397 100.0 Kaimur 25431 25431 100.0 38146 38112 99.9
Gaya 78051 73518 94.2 117075 116293 99.3 Jehanabad 15768 15768 100.0 23652 23652 100.0 Arwal 13357 12941 96.9 20035 19896 99.3 Nawada 42996 42054 97.8 64495 63468 98.4 Aurangabad 44953 44953 100.0 67430 67430 100.0
Saran 68968 68968 100.0 103452 103452 100.0 Siwan 59633 59633 100.0 89449 89449 100.0 Gopalganj 41915 40380 96.3 62873 62221 99.0
W. Champaran 82918 82918 100.0 124376 124376 100.0 E. Champaran 109801 109801 100.0 164702 164702 100.0 Muzaffarpur 100404 100404 100.0 150606 150606 100.0 Sitamarhi 75304 75304 100.0 112956 112918 100.0 Sheohar 14144 14144 100.0 21217 21217 100.0 Vaishali 77420 77420 100.0 116130 115451 99.4
Darbhanga 83995 82495 98.2 125995 123454 98.0 Madhubani 99950 99298 99.3 149925 149877 100.0 Samastipur 100645 99348 98.7 150962 149262 98.9
Begusarai 66701 66701 100.0 100052 99977 99.9 Munger 25736 21831 84.8 38604 36562 94.7 Sheikhpura 11580 11580 100.0 17369 17369 100.0 Lakhisarai 17793 17165 96.5 26689 25008 93.7 Jamui 36917 36917 100.0 55376 55376 100.0 Khagaria 37138 36749 99.0 55707 55224 99.1
Bhagalpur 53297 53297 100.0 79944 79944 100.0 Banka 40673 40673 100.0 61010 61010 100.0
Saharsa 42916 40547 94.5 64374 61099 94.9 Supaul 50145 50145 100.0 75218 75218 100.0 Madhepura 44100 44100 100.0 66150 66150 100.0
Purnea 73318 71039 96.9 109977 105139 95.6 Kishanganj 38516 38185 99.1 57774 57747 100.0 Araria 66036 66036 100.0 99054 99054 100.0 Katihar 68551 68551 100.0 102826 102826 100.0
Bihar 2088065 2059363 98.6 3132097 3104289 99.1 Source : Department of Food and Consumer Protection, GoB
_______________

297
CHAPTER - IX
URBAN DEVELOPMENT
By far the greatest and most admirable form of wisdom is that needed to plan and beautify cities and human communities. — Socrates
The urban areas are considered to be ‘engines of growth’ and ‘shrines of social change’, as they
are harbingers of economic prosperity and overall socio-spatial development. Urbanization is,
therefore, regarded as sine qua non of economic development. Urbanization is not only an
outcome of the growth process and sectoral transition, it also acts as an impetus for strengthening
the growth process through market exchanges, technology and social mobility. Bihar has always
remained a significant player in the economic and political history of contemporary India.
However, urban development in the state has been limited and, therefore, there is enormous
scope for promoting urban development in the state. This will lead to expansion of non-farm
activities and prevent massive out-migration of workers from Bihar to other Indian states.
Abstract
Urbanization indicates economic prosperity and alternation of sectoral composition away from the agricultural sector. In Bihar, the rate of urbanization has been very low compared to the all-India rate. Within Bihar, the pattern of urbanization has been very skewed as on one extreme the rate of urbanization was as high as 43.1 percent in Patna and on another it was only 3.5 percent in Banka. To improve amenities at the urban centers, the State Government has introduced various schemes like 'Har Ghar Nal ka Jal', 'Ghar Tak Pakki Gali-Naliyaan' to name a few. Moreover, the State Government has also implemented various development programmes of the Central Government, such as Namami Gange Programme, Deen Dayal Antyodaya Yojana– National Urban Livelihood Mission (DAY-NULM), etc. In Bihar, Patna, Bhagalpur, Biharsharif, and Muzaffarpur were identified for the SMART CITY Mission and different specific development programmes under the Mission have already been initiated. Recently, an amount of Rs. 13,366 crore has been sanctioned for Patna Metro Rail Project. In this regard, the State Government has already constituted Patna Metro Rail Corporation Ltd. (PMRCL) to construct 31.39 km of the metro to cover East-West and North-South corridors.

298
In recent years, Bihar has embarked on one of the most comprehensive programmes of planned and systematic urban development. This includes various flagship programme to bring about a transformative change in the lives of people and these programmes are inclusive, participative and sustainable. The challenge of urban development has two different dimensions. First, to facilitate urban development, there has to be provision of basic civic amenities with necessary supportive human and physical infrastructure. The second dimension, which is more important in the context of Bihar, refers to the conversion of relatively larger rural centres to urban centres, such that these places are able to promote more non-agricultural production activities. In this perspective, the State Government has been quite responsive to both these challenges in the recent past. Presently, a number of urban development initiatives are being implemented in the state, some of which are financially supported by the Central Government. 9.1 Level of Urbanisation
The degree of urbanization is a pointer to the relative number of people residing in urban areas. As per Census 2011, 1.18 crore people (11.3 percent of total population) lived in urban areas of Bihar. The national average for urbanisation stands at a much higher level at 31.2 percent (Table 9.1). The state accounts for 8.6 percent of India’s total population, but it has only 3.1 percent of country’s total urban population. Secondly, it should also be noted that, apart from recording a low ‘level’ of urbanisation, Bihar has also recorded a low ‘pace’ of urbanisation. Between 2001 and 2011, the level of urbanisation in India has increased by 3.4 percentage points, from 27.8 percent (2001) to 31.2 percent (2011). In contrast, such increase was only 0.8 percentage points in Bihar, from 10.5 percent (2001) to 11.3 percent (2011). This slow pace of urbanisation in Bihar is indeed a long-term phenomenon. Between 1961 and 2011, a span of half a century, the level of urbanisation in Bihar has increased by 3.9 percentage points, from 7.4 percent (1961) to 11.3 percent (2011). For the entire country, this increase was 13.2 percentage points, from 18.0 percent (1961) to 31.2 percent (2011).
Table 9.1 : Urbanisation Trend in Bihar and India (Census Years)
Census Year 1961 1971 1981 1991 2001 2011
Level of Urbanisation India 18.0 18.2 23.3 25.7 27.8 31.2
Bihar 7.4 7.7 9.6 10.0 10.5 11.3
Urban Population (lakh) India 789.4 1091.1 1594.6 2175.5 2853.5 3771.1
Bihar 25.8 33.6 51.4 67.1 86.9 117.6
Decadal Growth of Urban Population
India - 38.2 46.1 36.4 31.2 32.2
Bihar - 30.1 53.3 30.5 29.4 35.4
Source : Census of India, RGI, GOI

299
The pattern of urbanization in Bihar depicts high intra-state disparity, with district-wise levels of urbanization ranging from as high as 43.1 percent in Patna to 3.5 percent in Banka, as per Census 2011 (Table 9.2). The three highly urbanised districts are — Patna (43.1 percent), Munger (27.8 percent) and Bhagalpur (19.8 percent). Both Patna and Munger and half of Bhagalpur are in South Bihar. Out of a total of 199 towns in Bihar, only 26 have a population of at least one lakh, where one could expect the growth of secondary and tertiary activities. Patna, as the capital city, has maintained its primacy in the State’s urban system, as it accounts for 14 percent of state’s urban population, followed by Gaya, which has a share of 4 percent.
To fulfill the basic needs of urban population in a systematic and integrated way, the State Government has undertaken a number of schemes. From a recent survey, conducted by the Department of Urban Development and Housing, one can judge the extent of availability of basic services in urban areas of Bihar. This survey has covered four components of the basic urban services — Piped Water Supplies, Toilets, Roads, and Drainage. This data is now available for three types of urban centres — Municipal Corporations, Municipal Councils and Nagar Panchayats. The above survey had a sample of 19.08 lakh households.
Table 9.2 : District-wise Urbanisation of Bihar (2001 and 2011 Census)
Districts Urbanisation
Districts Urbanisation
2001 2011 2001 2011 Patna 41.6 43.1 Darbhanga 8.1 9.7 Nalanda 14.9 15.9 Madhubani 3.5 3.6 Bhojpur 13.9 14.3 Samastipur 3.7 3.5 Buxar 9.2 9.6 Begusarai 4.6 19.2 Rohtas 13.3 14.5 Munger 27.9 27.8 Kaimur 3.3 4 Sheikhpura 15.6 17.1 Gaya 13.7 13.2 Lakhisarai 14.7 14.3 Jehanabad 12.1 12 Jamui 7.4 8.3 Arwal -- 7.4 Khagaria 5.9 5.2 Nawada 7.7 9.7 Bhagalpur 18.7 19.8 Aurangabad 8.4 9.3 Banka 3.5 3.5 Saran 9.2 8.9 Saharsa 8.3 8.2 Siwan 5.5 5.5 Supaul 5.1 4.7 Gopalganj 6.1 6.4 Madhepura 4.5 4.4 W. Champaran 10.2 10 Purnea 8.7 10.5 E. Champaran 6.4 7.9 Kishanganj 10 9.5 Muzaffarpur 9.3 9.9 Araria 6.2 6.0 Sitamarhi 5.7 5.6 Katihar 9.2 8.9 Sheohar 4.1 4.3 Vaishali 6.8 6.7 Bihar 10.5 11.3
Source : Census of India

300
Chart 9.1 : Percentage distribution of Urban Services and Growth rate 2011
In terms of the supply of piped water, the coverage is rather low (17.6 percent), taking into
account all three types of urban habitations. Even for larger towns with Municipal Corporations,
the coverage of piped water is only 33.7 percent of the households (Table 9.3). However, the
status of basic services is much better with regard to toilets, as its overall coverage is about 94.1
percent. In larger towns, this coverage is even wider at 96.1 percent.
Table 9.3 : Availability of Piped Water and Toilet in Urban Areas of Bihar (June, 2016)
Particulars
No. of households surveyed
(thousand)
Percentage of
households with piped
water
Percentage of
households with toilets
Municipal Corporations 759.7 33.7 96.1
Municipal Councils 635.8 10.9 93.2
Nagar Panchayats 522.6 3.3.8 92.1
Total 1918.2 17.6 94.1
Source : Department of Urban Development and Housing, GoB
Table 9.4 : Status of Roads in Urban Areas of Bihar (2017)
Type of Town
Percentage Distribution of Roads by Type
Total Kutcha Roads
Tar Roads
Concrete Roads
Paved Block Roads
WBM Road
Brick Road
Municipal Corporations 9.0 6.0 74.0 4.0 1.0 6.0 100.0
Municipal Councils 21.0 12.0 61.0 2.0 1.0 3.0 100.0
Nagar Panchayats 20.0 17.0 52.0 2.0 1.0 8.0 100.0
Total 15.0 9.0 67.0 3.0 1.0 5.0 100.0
Source : Department of Urban Development and Housing, GoB
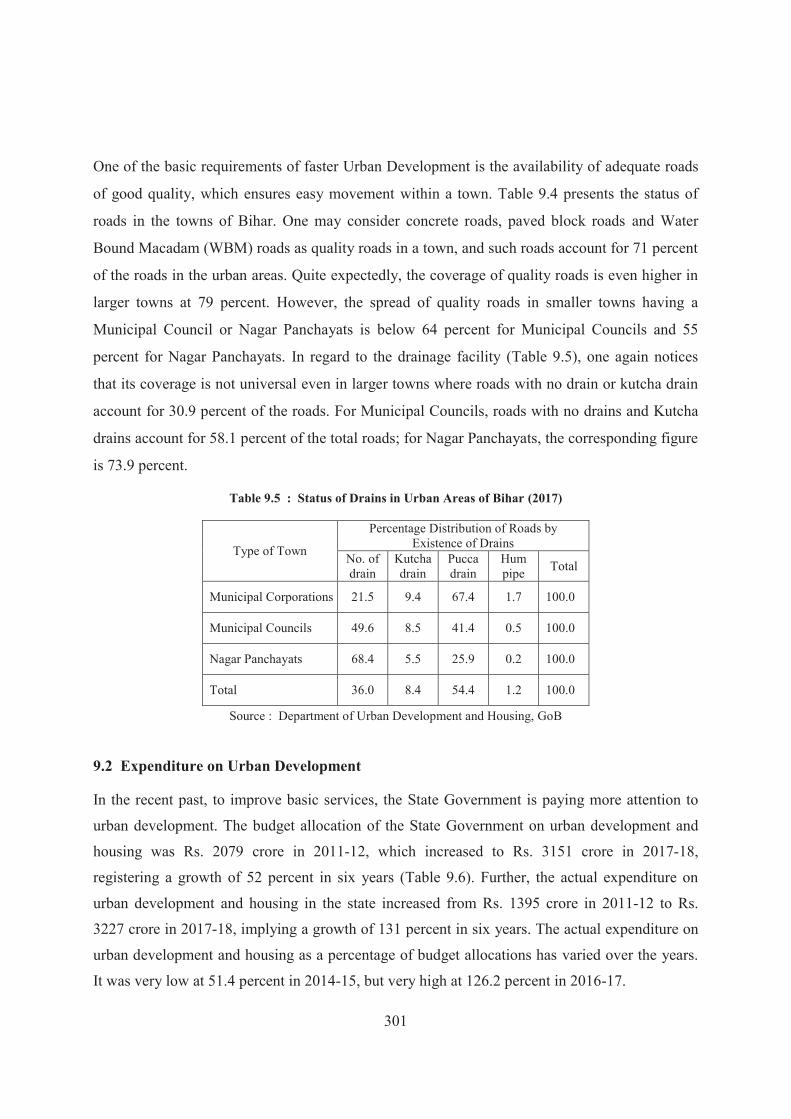
301
One of the basic requirements of faster Urban Development is the availability of adequate roads
of good quality, which ensures easy movement within a town. Table 9.4 presents the status of
roads in the towns of Bihar. One may consider concrete roads, paved block roads and Water
Bound Macadam (WBM) roads as quality roads in a town, and such roads account for 71 percent
of the roads in the urban areas. Quite expectedly, the coverage of quality roads is even higher in
larger towns at 79 percent. However, the spread of quality roads in smaller towns having a
Municipal Council or Nagar Panchayats is below 64 percent for Municipal Councils and 55
percent for Nagar Panchayats. In regard to the drainage facility (Table 9.5), one again notices
that its coverage is not universal even in larger towns where roads with no drain or kutcha drain
account for 30.9 percent of the roads. For Municipal Councils, roads with no drains and Kutcha
drains account for 58.1 percent of the total roads; for Nagar Panchayats, the corresponding figure
is 73.9 percent.
Table 9.5 : Status of Drains in Urban Areas of Bihar (2017)
Type of Town
Percentage Distribution of Roads by Existence of Drains
No. of drain
Kutcha drain
Pucca drain
Hum pipe Total
Municipal Corporations 21.5 9.4 67.4 1.7 100.0
Municipal Councils 49.6 8.5 41.4 0.5 100.0
Nagar Panchayats 68.4 5.5 25.9 0.2 100.0
Total 36.0 8.4 54.4 1.2 100.0
Source : Department of Urban Development and Housing, GoB
9.2 Expenditure on Urban Development
In the recent past, to improve basic services, the State Government is paying more attention to
urban development. The budget allocation of the State Government on urban development and
housing was Rs. 2079 crore in 2011-12, which increased to Rs. 3151 crore in 2017-18,
registering a growth of 52 percent in six years (Table 9.6). Further, the actual expenditure on
urban development and housing in the state increased from Rs. 1395 crore in 2011-12 to Rs.
3227 crore in 2017-18, implying a growth of 131 percent in six years. The actual expenditure on
urban development and housing as a percentage of budget allocations has varied over the years.
It was very low at 51.4 percent in 2014-15, but very high at 126.2 percent in 2016-17.

302
Table 9.6 : Expenditure Pattern of Urban Development and Housing in Bihar (2011-12 to 2017-18)
(Figures in Rs. crore)
Year 2011-12 2012-13 2013-14 2014-15 2015-16 2016-17 2017-18
Budget Allocation
Housing 846 967 1064 3826 1897 2249 756 Urban
Development 1233 1336 1784 2108 1737 2837 2395
Total 2079 2303 2849 5934 3634 5086 3151
Actual Expenditure
Housing 823 (97.3)
827 (85.5)
927 (87.1)
1598 (41.8)
1486 (78.3)
3596 (159.9)
1113 (147.2)
Urban Development
572 (46.4)
1139 (85.3)
1364 (76.5)
1455 (69.0)
1649 (94.9)
2824 (99.5)
2114 (88.3)
Total 1395 (67.1)
1966 (85.4)
2291 (80.4)
3053 (51.4)
3135 (86.3)
6420 (126.2)
3227 (102.4)
Notes : Figures in brackets indicate utilisation percentage Source : Finance Accounts, GoB
9.3 Urban Development Programmes (State Plan)
The State Government has been endeavouring to provide better living conditions in urban areas,
and it is now implementing a number of programmes to attain this goal. This section presents the
details of such programmes under the State Plan.
Mukhyamantri Saat Nishchay Yojana
The ‘Saat Nishchay’ (Seven Resolves) scheme aims at improving the lives of the people through
education, skill development, electricity connection, piped water supply, and road and drainage.
Out of these seven resolves, three are related to urban areas — 'Shauchalay Nirman Ghar Ka
Sammaan’, ‘Har Ghar Nal Ka Jal’ and ‘Har Ghar Pakki Gali evam Naaliyan’. The Department of
Urban Development and Housing is implementing the schemes, related to the three resolves
mentioned above.
Mukhyamantri Shahri Peyjal Nishchay Yojana
The State Government has introduced ‘Har Ghar Nal Ka Jal’ scheme to provide clean and safe
drinking water to all households in urban areas with water pipeline connection by 2019–20.
Under this scheme, it is targeted to remove all the handpumps, on which the urban people
generally depend for their water needs. It is roughly estimated that around 1.95 lakh households
would benefit from this programme. The scheme is being implemented through Bihar Rajya Jal
Parshad (BRJP), Bihar Urban Infrastructure Development Corporation (BUIDCO), Public Health

303
Engineering Department (PHED) and Urban Local Bodies. All urban bodies have been allotted
the funds as per the following norms — 30 percent of the total fund required would come from
the Fifth State Finance Commission, 30 percent of the fund required would come from the
Fourteenth Central Finance Commission and the rest of the funds would be provided from the
State Plan head. The salient features of the scheme are presented in Tables 9.7 and 9.8 and the
district-wise progress is reported in Table A 9.1 (Statistical Appendix).
Table 9.7 : Salient Feature of the Scheme (2017-18 and 2018-19)
Indicator 2017-18 2018-19
Total No. of Households (HHs) 19,08,164 1911721
No. of HHs with piped water supply 3,36,521 3,21391 No. of HHs to be covered with piped water supply 15,71,643 15,85,430
No. of wards in which tenders floated
2826 out of 3396 wards
3286 out of 3370 wards
No. of wards in which work started 2333 2826
No. of HHs provided with water pipeline connections 2,05,933 5,99,481
Source : Department of Urban Development and Housing, GoB
Table 9.8 : Details of the Scheme (2017-18 and 2018-19)
Year Details
Strategy (2017-18)
99,079 households in 32 towns under State Plan being executed by BRJP
6,05,148 households in 21 towns under AMRUT being executed by BRJP
1,44,504 households in 2 ADB schemes and 3 JnNURM Schemes being executed by BUIDCO
7,22,912 households in 116 towns under Saat Nishchay Yojana being executed by ULBs
Strategy (2018-19)
1,48,350 households in 337 wards under State Plan being executed by BUIDCO
5,00,328 households in 817 wards under AMRUT being executed by BUIDCO
54,603 households in 125 wards under 1 ADB schemes and 3 JnNURM Schemes being executed by BUIDCO
1,23,364 households in 233 wards under State Plan being executed by PHED
75,786 households in 125 wards are proposed to be included in the Scheme in Bhagalpur, Patna, Danapur and Bodhgaya
6,89,834 households in 1743 wards under Saat Nishchay Yojana are being executed by ULBs
Source : Department of Urban Development and Housing, GoB

304
Mukhyamantri Shahri Nali-Gali Pakkikaran Nishchay Yojana
It has been resolved that each street in all the wards of the urban areas in the state would be
concretised. Besides this, each urban habitat would be connected through concrete roads. In
order to provide each household with access to drainage system along with concrete streets, the
State Government has initiated the ‘Ghar Tak Pakki Gali-Naliyaan’. The scheme was launched
with the aim of linking every house located in the urban areas with a permanent drain and street.
The Urban Local Bodies, on the basis of the recommendation of the Ward Sabhas, have prepared
long-term plans which are now being implemented as per the priority list.
By 2019-20, around 3,65,490 houses will be covered under the Pucca Nali scheme, of which
3,57,217 have already been covered so far. To meet the fund requirements, 20 percent of Fifth
State Finance Commission funds have been reserved for the scheme, which will be supplemented
by State Plan funds. The year–wise target is presented in Table 9.9. The salient features of the
scheme are presented in Table 9.10 and Table 9.11. Finally, the district-wise targets and
achievements are presented in Table A 9.2 (Statistical Appendix).
Table 9.9 : Year-wise Targets of Ghar Tak Pakki Gali Naliyaan Yojana (2016-17 to 2019-20)
Year 2016-17 2017-18 2018-19 2019-20 Total
Target (No. of Households)
72188 (20)
108282 (30)
109282 (30)
72188 (20)
360940 (100)
Note : Figures in parenthesis indicate percentages Source : Department of Urban Development and Housing, GoB
Table 9.10 : Salient Features of Ghar Tak Pakki Gali Naliyaan Yojana (2017-18 and 2018-19)
Indicator 2017-18 2018-19
Total No. of Households (HHs) 1908164 1911517
No. of HHs to be covered under Nishchay Yojana 360938 360940
No. of wards in which tenders floated
In 3234 Wards out of 3396
In 3329 Wards out of 3330
No. of schemes tendered 7747 12281
No. of wards in which work started
3125 Wards out of 3377
3319 Wards out of 3330
No. of schemes completed 5510 8940
Length of Gali completed 572.96 (Km) 572.96 (Km)
Length of Nali completed 456.85 (Km) 456.85 (Km)
Source : Department of Urban Development and Housing, GoB
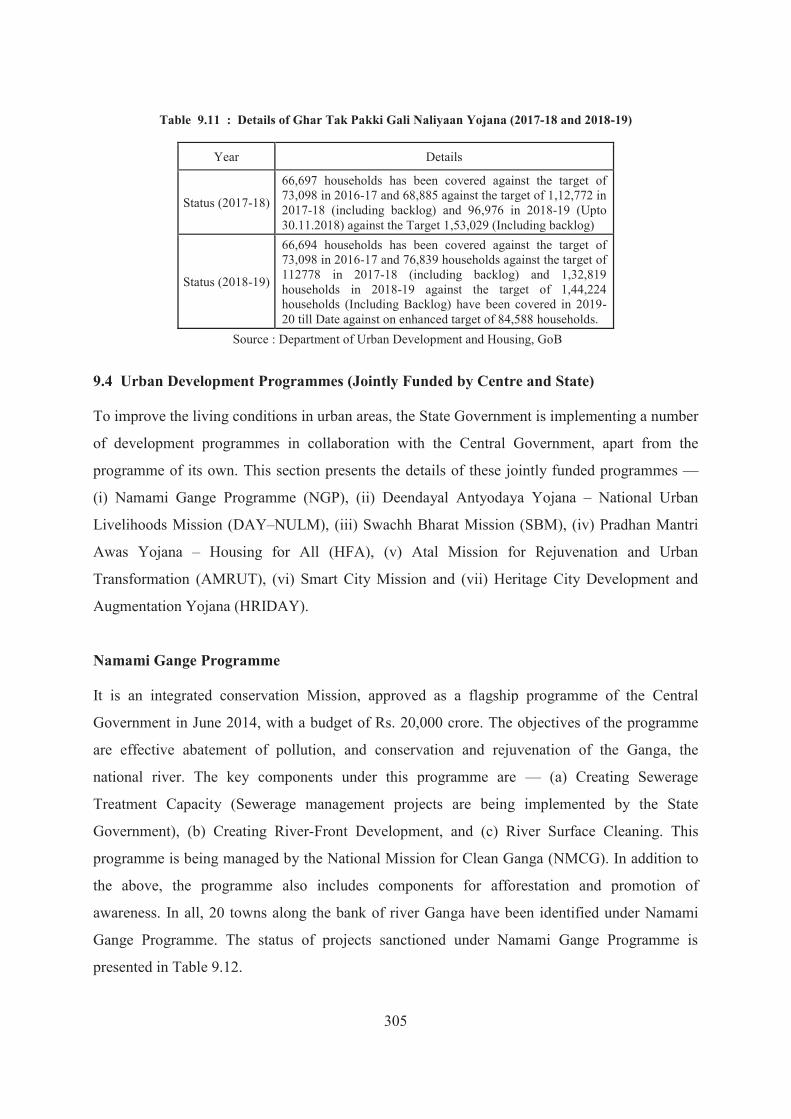
305
Table 9.11 : Details of Ghar Tak Pakki Gali Naliyaan Yojana (2017-18 and 2018-19)
Year Details
Status (2017-18)
66,697 households has been covered against the target of 73,098 in 2016-17 and 68,885 against the target of 1,12,772 in 2017-18 (including backlog) and 96,976 in 2018-19 (Upto 30.11.2018) against the Target 1,53,029 (Including backlog)
Status (2018-19)
66,694 households has been covered against the target of 73,098 in 2016-17 and 76,839 households against the target of 112778 in 2017-18 (including backlog) and 1,32,819 households in 2018-19 against the target of 1,44,224 households (Including Backlog) have been covered in 2019-20 till Date against on enhanced target of 84,588 households.
Source : Department of Urban Development and Housing, GoB 9.4 Urban Development Programmes (Jointly Funded by Centre and State)
To improve the living conditions in urban areas, the State Government is implementing a number
of development programmes in collaboration with the Central Government, apart from the
programme of its own. This section presents the details of these jointly funded programmes —
(i) Namami Gange Programme (NGP), (ii) Deendayal Antyodaya Yojana – National Urban
Livelihoods Mission (DAY–NULM), (iii) Swachh Bharat Mission (SBM), (iv) Pradhan Mantri
Awas Yojana – Housing for All (HFA), (v) Atal Mission for Rejuvenation and Urban
Transformation (AMRUT), (vi) Smart City Mission and (vii) Heritage City Development and
Augmentation Yojana (HRIDAY).
Namami Gange Programme
It is an integrated conservation Mission, approved as a flagship programme of the Central
Government in June 2014, with a budget of Rs. 20,000 crore. The objectives of the programme
are effective abatement of pollution, and conservation and rejuvenation of the Ganga, the
national river. The key components under this programme are — (a) Creating Sewerage
Treatment Capacity (Sewerage management projects are being implemented by the State
Government), (b) Creating River-Front Development, and (c) River Surface Cleaning. This
programme is being managed by the National Mission for Clean Ganga (NMCG). In addition to
the above, the programme also includes components for afforestation and promotion of
awareness. In all, 20 towns along the bank of river Ganga have been identified under Namami
Gange Programme. The status of projects sanctioned under Namami Gange Programme is
presented in Table 9.12.

306
Table 9.12 : Status of Projects under Namami Gange Programme (2015-16 to 2018-19)
Year
Cost of Projects (Rs. crore)
Solid Waste Manage-
ment
Sewerage Network
Interception and
Diversion of Drainage including
STP
River Front Develop-
ment Crematoria Community
Toilets Total
2015-16 - - - - - 1.05 1.05
2016-17 - 1177.00 - 243.30 40.86 4.05 1465.21
2017-18 - 2136.00 487.20 - - 6.84 2630.04
2018-19 426.90 829.30 414.50 - 66.63 1737.33
Source : Department of Urban Development and Housing, GoB
Deendayal Antyoday Yojana – National Urban Livelihoods Mission (DAY–NULM)
To reduce poverty and vulnerability of the urban poor households by enabling them access
gainful self-employment and skilled wage employment opportunities, this Mission aims to build
strong grassroots-level institutions of the poor. The Mission aims at providing shelters which are
equipped with essential services for the urban homeless in a phased manner. In addition, the
Mission also addresses livelihood concerns of the urban street vendors by facilitating access to
suitable spaces, institutional credit, social security and skills for accessing emerging market
opportunities. It is expected that the activities of the Mission will ultimately result in an
appreciable improvement in the livelihoods of the urban poor.
This programme has 5 components — (i) Social Mobilisation and Institutional Development
(SM&ID), (ii) Employment through Skill Training and Placement (EST&P), (iii) Financial
Inclusion and Self-Employment Programme (FI&SEP), (iv) Support to Urban Street Vendors
(SUSV) and (v) Shelter for Urban Homeless (SUH).
Social Mobilisation and Institutional Development (SM&ID) : The mobilization of urban
poor households to form their own institutions is an important instrument for an effective and
sustainable poverty reduction programme. The National Urban Livelihood Mission (NULM)
envisages universal social mobilization of urban poor into Self-Help Groups (SHGs) and their
federations. At least one member from each urban poor household, preferably a woman, should
be brought under the Self-Help Group network in a time-bound manner. These groups would
serve as a support system for the poor to meet their financial and social needs. The number of

307
Self-Help Groups (SHGs) formed under NULM has increased from 2185 in 2017-18 to 5640 in
2018-19. The number of members in SHG under NULM also increased from 21,850 in 2017-18
to 56,402 in 2018-19. The number of SHGs which got Revolving Fund (RF) has shown an
increase from 1260 in 2017-18 to 2622 in 2018-19 (Table 9.13).
Table 9.13 : Achievement under SM&ID (2017-18 and 2018-19)
Program/Monitoring Parameter Achievement
2017-18 2018-19
No. of Self-Help Groups (SHGs) formed under NULM 2185 5640
No. of members in the SHGs under NULM 21850 56402
No. of Area-Level Federations (ALFs) formed under NULM 25 150
No. of City-Level Federations formed under NULM 01 05
No. of SHG which Got Revolving Fund (RF) 1260 2622
Source : Department of Urban Development and Housing, GoB
Employment through Skill Training and Placement (EST&P) : The main objectives of the
programme are to train urban BPL youth and provide them with either salaried employment or
self-employment opportunities. This programme is implemented through National Urban
Livelihood Mission (NULM) and Bihar Skill Development Mission (BSDM). Due to
amendments in operational guidelines of NULM and introduction of process and cost norms of
BSDM, the concerned department had made an arrangement for assessment and certification of
trained beneficiary in association with Sector Skills Council (SSC). Table 9.14 shows that the
number of persons who completed training has increased from 3504 in 2017-18 to 4083 in
2018-19.
Table 9.14 : Achievement under EST&P (2017-18 and 2018-19)
Population Category
Number of Persons
2017-18 2018-19 Undergoing
Training Completed Training
Undergoing Training
Completed Training
SC 487 496 519 559
ST 39 147 67 111
Others 2219 2861 2466 3413
Total 2745 3504 3052 4083
Source : Department of Urban Development and Housing, GoB

308
Financial Inclusion & Self Employment Programme (FI&SEP) : This component of NULM focuses on providing financial assistance to individuals and groups of urban poor who are desirous of setting up gainful self-employment ventures or microenterprises, suited to their skills, aptitude and local conditions. Besides generation of income, the component empowers the urban poor by making them self-reliant. The urban local bodies provide support for processing loan application for individual urban poor. It also supports in assessing the skills requirement of the beneficiary and linking them with training programmes of Rural Self-Employment Training Institutes (RSETI). In Table 9.15, it is observed that there are significant number of beneficiaries under FI&SEP programme — 1819 in 2017-18 and 2891 in 2018-19. This implies a growth of 59 percent. In 2018-19, there were 208 SHGs with credit linkage.
Table 9.15 : Achievement under FI&SEP (2017-18 and 2018-19)
Program/ Monitoring Parameter
No. of Beneficiaries
2017-18 2018-19
SEP-I individual 1725 2680
SEP- Group 08 03
SHG Credit Linkage 103 208
Total 1819 2891
Source : Department of Urban Development and Housing, GoB
Support to Urban Street Vendors (SUSV) : This programme aims to organise street vending
activities in all 142 urban centres of Bihar. It first proposes to conduct a survey of the street
vendors, and then issue them I-Cards and facilitate their linkage with different welfare schemes.
In particular, the programme promotes financial inclusion, training, and insurance coverage for
identified street vendors across the state.
The Department of Urban Development & Housing of the State Government is currently
implementing the provisions of the Street Vendors (Protection of Livelihoods and Regulation of
Street Vending) Act, 2014. In exercise of the powers conferred by Section 38 of the Act and after
consultation with the Urban Local Bodies and Town Vending Committees, the State Government
has notified the Bihar Street Vendors (Protection of Livelihood and Regulation of Street

309
Vending) Rules, 2017 and is implementing them. In exercise of the powers conferred by Section
22 of the Act, the Town Vending Committees (TVC) has been constituted in all towns of Bihar.
As per these Rules, Identity Cards are being distributed to surveyed street vendors. The Urban
Local Bodies, in consultation with the Town Vending Committees, are in the process of
developing City Street Vending Plans. The proposal for Vending Zones in Motihari town has
already been sanctioned and it is under the process of implementation.
Table 9.16 : Achievement under Support to Urban Street Vendors (2017-18 and 2018-19)
Program/ Monitoring Parameter Progress
2017-18 2018-19
Survey of Street Vendors
No. of cities to be covered for Street vendor Survey 98 98
No. of cities in which vendor survey has started 98 98
No. of cities which has completed vendor survey 06 11
No. of Street Vendors identified in surveyed cities (Biometric survey) — 61074
No. of Street Vendors issued ID cards 9850 17788
Others
No. of basic Saving Accounts opened for Street Vendors 805 535
No. of Financial literacy camps organized for Street Vendors 25 09
No. of training programmes organized for Street vendors 27 04
Number of Street Vendors trained under Capacity Building 2875 298
No. of Credit Cards issued to Street Vendors 20 0
No of Street Vendors linked to insurance scheme 192 222
Source : Department of Urban Development and Housing, GoB
Shelter for Urban Homeless (SUH) : The SUH scheme aims to ensure availability and access
to permanent shelters for the urban homeless population, including the basic infrastructure
facilities like water supply, sanitation, safety and security. To cater to the needs of especially

310
vulnerable segments of the urban homeless population (dependent children, aged, disabled,
mentally ill and people recovering from grave illness), the State Government is creating special
sections within homeless shelters and providing special service linkages for them. The
Department had sanctioned construction of 48 new shelters (50-bedded) in 48 cities. Apart from
the new construction, refurbishment as well as operation and maintenance of 66 existing shelters
have also been undertaken under SUH scheme.
Swachh Bharat Mission (SBM)
This is one of the flagship projects launched by the Central Government in 2014 to improve the
sanitation standards in the country. With Bihar facing an acute problem of open defecation. Bihar
has set a target for the construction of 4.30 lakh toilets in the urban areas.
Table 9.17 : Physical Progress under SBM (2018 and 2019)
Particulars 2018 2019
Constructed Under Construction Constructed Under
Construction
Individual Toilet 263368 170170 394076 45810
Community Toilets 5213 4311 12148 5774
Public Toilets 3220 168 3220 168
Source : Department of Urban Development and Housing, GoB
For individual toilets, the State Government provides Rs. 8000 to each family, in addition to the
central assistance of Rs. 4000. Till date, all 141 urban centres and a total of 3367 wards out of
3367 wards have been declared as ODF (Open Defecation-Free) (Table 9.17).
Pradhan Mantri Awas Yojana - Housing for All
The Pradhan Mantri Awas Yojana Mission was launched in June 2015. The duration of the
Mission is up to March, 2022. The main objective of this scheme is to provide pucca houses for
the homeless families under different income slab. The details of this programme are presented
in Table 9.18.

311
Table 9.18 : Progress of Work Under Pradhan Mantri Awas Yojana – Housing for All (October, 2019)
Particulars Number Total target of houses to be constructed in different verticals under PMAY
5,50, 000
Total Demand of houses till date in different verticals under PMAY
5,21,500
i. Beneficiary-led Construction (BLC) 3,55,000
ii. Credit-linked Subsidy Scheme (CLSS) 30,000
iii. In-Situ Slum Redevelopment (ISSR) 18,500 iv. Affordable Housing in Partnership
(AHP) 1,18,000
Total Towns Covered 140
Total Sanctioned Projects 336 under Beneficiary Led Construction
Total Sanctioned Dwelling Units 2,70,739
Particulars Financial Details (Rs. lakh)
Total Project Cost 1380262.82
Total Central Share 406108.50
Total State Share 135369.50
Central Share Released 125168.00
State Share Released 32946.00
Total Expenditure till Oct. 2019 99190.00
Source : Department of Urban Development and Housing, GoB
Atal Mission for Rejuvenation and Urban Transformation (AMRUT)
The State Government has sanctioned a number of Water Supply Schemes, Drainage Schemes,
and Parks under AMRUT. The allocations and expenditures under these three heads are
presented in Table 9.19. The details about specific schemes under each category is presented in
Table 9.20 (Water Supply Schemes), Table 9.21 (Drainage Schemes) and Table 9.22 (Parks).
Table 9.19 : Allocations and Expenditure under AMRUT (2018-19)
Scheme Total Project
Cost (Rs. lakh)
Total Expenditure (Rs. lakh)
Financial Achievement
(%) Water Supply Schemes 226757.623 62589.276 27.6
Drainage Schemes 26673.62 485.71 1.8
Parks 2435.018 565.00 23.2
Total 255866.261 63639.986 24.9
Source : Department of Urban Development and Housing, GoB, 2020

312
Table 9.20 : Details of Water Supply Schemes (Upto 2018-19)
Scheme Total Project
Cost (Rs. lakh)
Total Expenditure
Cost (Rs. lakh)
Financial Achievement
(%)
Hajipur Water Supply Scheme-Phase l & II 10869.99 4730.228 43.5
Buxar Water Supply Scheme-Phase l & II 8015.60 3388.856 42.3
Chhapra Water Supply Scheme-Phase l & II 12762.27 4798.01 37.6
Jehanabad Water Supply Scheme-Phase l & II 7688.72 3604.72 46.9
Bagaha Water Supply Scheme-Phase l & II 9407.93 3471.37 36.9
Motihari Water Supply Scheme-Phase l & II 10544.82 2783.952 26.4
Siwan Water Supply Scheme-Phase l & II 11133.38 4147.00 37.2
Aurangabad Water Supply Scheme-Phase l 6606.08 1976.02 29.1
Purnea Water Supply Scheme-Phase l & II 21033.44 4550.00 21.6
Sasaram Water Supply Scheme-Phase l & II 11742.58 4291.19 36.5
Katihar Water Supply Scheme-Phase l & II 15454.65 3658.00 23.7
Begusarai Water Supply Scheme-Phase l & II 12796.86 1005.77 7.9
Kishanganj Water Supply Scheme-Phase l & II 7583.11 1600.00 21.1
Biharsharif Water Supply Scheme-Phase l & II 17199.62 6157.30 35.8
Aarah Water Supply Scheme-Phase l & II 13219.30 2235.25 16.9
Darbhanga Water Supply Scheme 6184.61 500 8.1
Saharsa Water Supply Scheme 9641.84 4312.00 44.7
Bettiah Water Supply Scheme 10192.76 1920.08 18.8
Dehri Water Supply Scheme 8807.00 3459.53 39.3
Munger Water Supply Scheme 12799.75 0.00 0.0
Jamalpur Water Supply Scheme 3073.313 0.00 0.0
Total 226757.623 62589.276 27.6
Source : Department of Urban Development and Housing, GoB, 2020
Table 9.21 : Details of Drainage Schemes (Upto 2018-19)
Scheme Total Project
Cost (Rs. lakh)
Total Expenditure
Cost (Rs. lakh)
Financial Achievement
(%)
Bhagalpur Storm water drainage Scheme 3161.00 158.08 5.0
Patna Storm water drainage Scheme 5172.62 327.63 6.3
Muzaffarpur Storm Water Drainage Scheme 18340.00 0.00 0.0
Total 26673.62 485.71 1.8
Source : Department of Urban Development and Housing, GoB, 2020
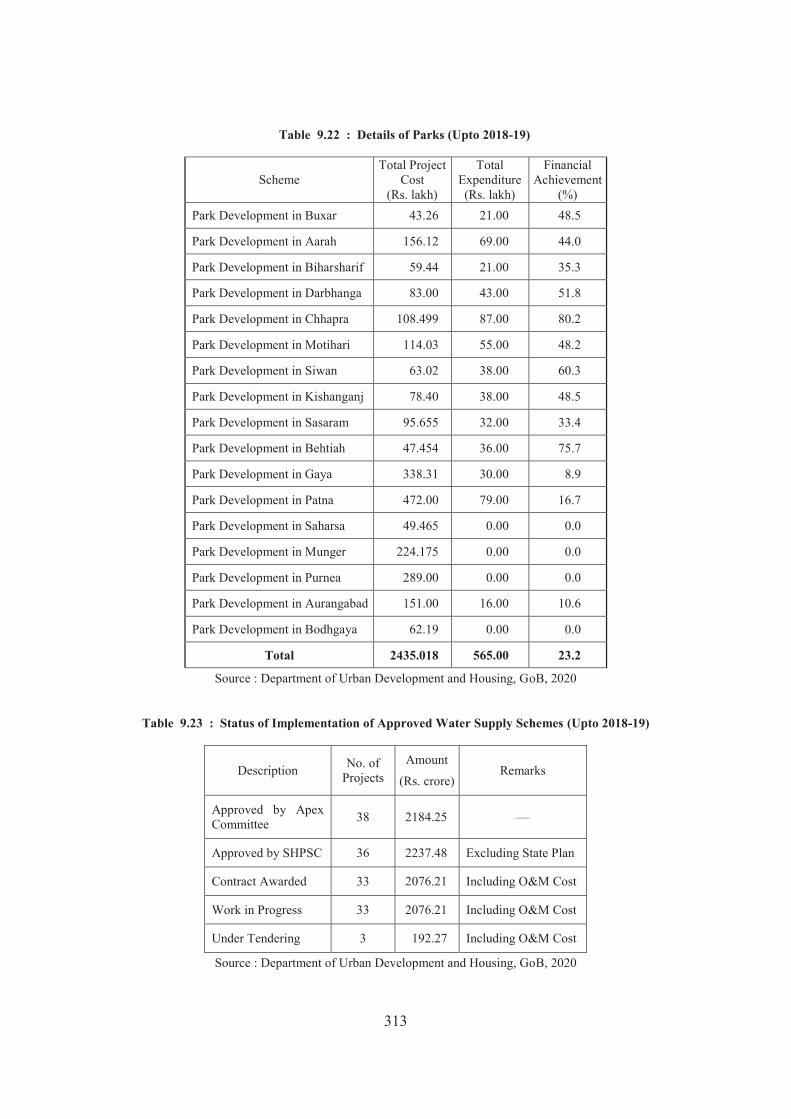
313
Table 9.22 : Details of Parks (Upto 2018-19)
Scheme Total Project
Cost (Rs. lakh)
Total Expenditure (Rs. lakh)
Financial Achievement
(%) Park Development in Buxar 43.26 21.00 48.5
Park Development in Aarah 156.12 69.00 44.0
Park Development in Biharsharif 59.44 21.00 35.3
Park Development in Darbhanga 83.00 43.00 51.8
Park Development in Chhapra 108.499 87.00 80.2
Park Development in Motihari 114.03 55.00 48.2
Park Development in Siwan 63.02 38.00 60.3
Park Development in Kishanganj 78.40 38.00 48.5
Park Development in Sasaram 95.655 32.00 33.4
Park Development in Behtiah 47.454 36.00 75.7
Park Development in Gaya 338.31 30.00 8.9
Park Development in Patna 472.00 79.00 16.7
Park Development in Saharsa 49.465 0.00 0.0
Park Development in Munger 224.175 0.00 0.0
Park Development in Purnea 289.00 0.00 0.0
Park Development in Aurangabad 151.00 16.00 10.6
Park Development in Bodhgaya 62.19 0.00 0.0
Total 2435.018 565.00 23.2
Source : Department of Urban Development and Housing, GoB, 2020
Table 9.23 : Status of Implementation of Approved Water Supply Schemes (Upto 2018-19)
Description No. of Projects
Amount
(Rs. crore) Remarks
Approved by Apex Committee 38 2184.25 —
Approved by SHPSC 36 2237.48 Excluding State Plan
Contract Awarded 33 2076.21 Including O&M Cost
Work in Progress 33 2076.21 Including O&M Cost
Under Tendering 3 192.27 Including O&M Cost
Source : Department of Urban Development and Housing, GoB, 2020
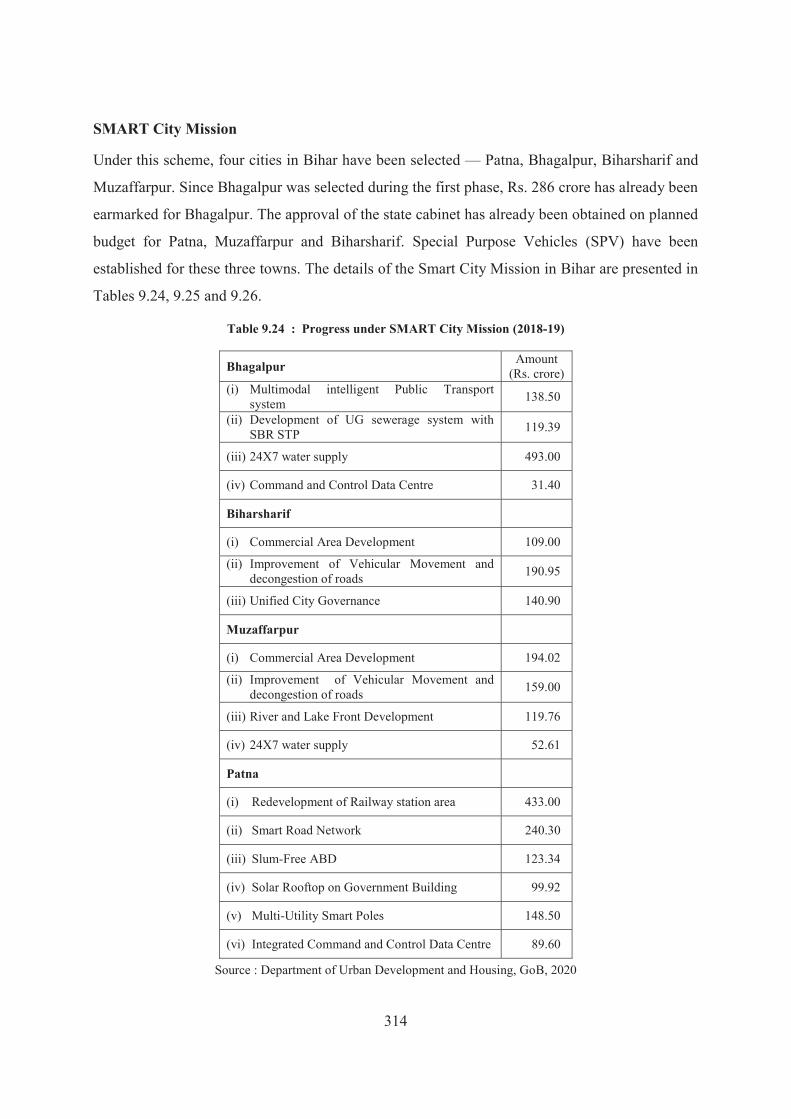
314
SMART City Mission
Under this scheme, four cities in Bihar have been selected — Patna, Bhagalpur, Biharsharif and
Muzaffarpur. Since Bhagalpur was selected during the first phase, Rs. 286 crore has already been
earmarked for Bhagalpur. The approval of the state cabinet has already been obtained on planned
budget for Patna, Muzaffarpur and Biharsharif. Special Purpose Vehicles (SPV) have been
established for these three towns. The details of the Smart City Mission in Bihar are presented in
Tables 9.24, 9.25 and 9.26.
Table 9.24 : Progress under SMART City Mission (2018-19)
Bhagalpur Amount (Rs. crore)
(i) Multimodal intelligent Public Transport system 138.50
(ii) Development of UG sewerage system with SBR STP 119.39
(iii) 24X7 water supply 493.00
(iv) Command and Control Data Centre 31.40
Biharsharif
(i) Commercial Area Development 109.00
(ii) Improvement of Vehicular Movement and decongestion of roads 190.95
(iii) Unified City Governance 140.90
Muzaffarpur
(i) Commercial Area Development 194.02
(ii) Improvement of Vehicular Movement and decongestion of roads 159.00
(iii) River and Lake Front Development 119.76
(iv) 24X7 water supply 52.61
Patna
(i) Redevelopment of Railway station area 433.00
(ii) Smart Road Network 240.30
(iii) Slum-Free ABD 123.34
(iv) Solar Rooftop on Government Building 99.92
(v) Multi-Utility Smart Poles 148.50
(vi) Integrated Command and Control Data Centre 89.60
Source : Department of Urban Development and Housing, GoB, 2020

315
Table 9.25 : Progress under SMART City Mission (2016 to 2018)
SCP Cost (Rs. crore)
SPV Establishment
CEO Appointment
PMC Appointment
Central Share Released
(Rs. crore)
State Share Released
(Rs. crore) Bhagalpur (Fast Track- 25.05.2016)
1,309.30 14.12.2016 14.12.2016 (Municipal
Commissioner)
Tender floated for selection of new PMC
196.00 186.00
Muzaffarpur (3rd Round-28.06.2017)
1,580.00 18.12.2017 18.12.2017 (Municipal
Commissioner)
18.06.2018 (M/s SREI
Infrastructure Finance Ltd)
60.00 52.50
Patna (3rd Round-28.06.2017)
2,776.16 09.11.2017
24.07.2018 (Addl.
Municipal Commissioner)
(M/s Eptisa with M/s IDeCK)
194.00 186.00
Biharsharif (4th Round-19.01.2018)
1,517.00 17.05.2018 17.05.2018 (Municipal
Commissioner)
23.07.2018 M/S URS
Scott Wilson 60.00 50.00
Total
7,182.46 510.00 474.50
Source : Department of Urban Development and Housing, GoB
Table 9.26 : Smart City Costing
City
Work Completed Stage Work Order Issuse Stage DPR under Preparation
No of Projects
Cost (Rs crore)
No of Projects
Cost (Rs crore)
No of Projects
Cost (Rs crore)
Bhagalpur 87 12.98 100 34.40 4 708.43
Muzaffarpur 0 0 1 11.392
(Breda Roof Top Solar)
5 238.58
Patna 0 0 19
1233.1 (Convergence)
1010.64 (SCM)
10 500.12
Biharsharif 0 0 15 232
(Convergence) 31.89 (SCM)
20 614
Total 87 12.98 135 1320.322 39 2061.13
Source : Department of Urban Development and Housing, GoB, 2020

316
Patna Metro Rail
Patna Metro Rail project with a total cost of Rs. 13,365.77 crore has been sanctioned in
February, 2019. For implementation of the project, Patna Metro Rail Corporation Ltd. (PMRCL)
has been constituted and registered again in February, 2019. The total length of the project is
31.39 Kms. with two corridors — East-West corridor and North-South corridor.
In the first phase, a total length of 16.94 kms has been proposed for the East-West Metro
Corridor (Danapur to Mithapur via Bailey Road and railway station). In the second phase, a total
length of 14.45 kms has been proposed for the North-South Metro corridor (from Patna railway
station to New Interstate Bus Terminus (New ISBT), via Gandhi Maidan, Patna Medical College
and Hospital, and Rajendra Nagar Railway Station. The work for Patna metro rail project has
been awarded to Delhi Metro Rail Corporation (DMRC). A contract agreement between PMRCL
and DMRC has been signed in September, 2019. The DMRC has already started the work of
Patna Metro Rail Project.
9.5 Municipal Finance
The State Government has been collecting data on municipal finance for 35 Urban Local Bodies
in which Double Entry Accounting System (DEAS) has been introduced by 2015-16. The
relevant data is presented in Table 9.27. The revenue grants comprise a very large part of total
revenue income of municipal bodies. For example, in 2018-19, out of a total income of Rs.
25962.44 lakh, the revenue grants accounted for Rs. 20395.74 lakh (78.6 percent). Unless the
self-generated income of the municipal bodies grows fast, their heavy dependence on the revenue
grants will continue for many more years. In the recent past, the self-generated income of the
local bodies has grown only at a modest rate. In case of expenditure, the major component is
establishment expenditure. In 2018-19, the expenditure on establishment was Rs. 4016.24 lakh,
which is no less than 48.1 percent of the total expenditure of Rs. 8349.23 lakh. In general, the
municipal bodies in Bihar, as elsewhere in India, are highly dependent on external support. If one
takes into account the share of self-generated income in total revenue income, it is less than 16
percent in all the years. The highest share (15.3 percent) was achieved in 2016-17. Consequently,
self-generated income is not able to cover even the establishment expenditure of the ULBs.
There is, however, a positive trend as self-generated income as percentage of total establishment
expenditure has increased from only 36.2 percent in 2014-15 to 85.3 percent in 2018-19.

317
Table 9.27 : Municipal Finances for 35 Towns in Bihar (2014-15 to 2018-19)
Indicator 2014-15 2015-16 2016-17 2017-18 2018-19
Revenue Income
(a) Self-Generated Income 1522.07 2179.63 12850.65 14784.76 3426.88
(i) Holding Tax 418.23 452.96 7957.36 8715.84 1642.65
(ii) Other Tax 209.69 331.51 1419.45 1426.60 1578.95
(iii) Non-Taxes 894.16 1395.16 3473.84 4642.32 205.28
(b) Assigned Income 284.66 176.31 10823.83 17075.03 917.62
(c) Revenue Grants 11885.73 11192.65 57913.36 71007.31 20395.74
(d) Other Income/Receipts 361.97 863.26 2315.49 5063.70 1222.20
Total (Revenue) 14054.44 14411.85 83903.33 107930.8 25962.44 Self-generated Income as percentage of Total Revenue Income
10.8 15.1 15.3 13.7 13.2
Revenue Expenditure
(a) Establishment 4206.79 5270.40 27311.26 27165.33 4016.24
(b) Programme 1811.09 2936.65 0.00 0.00 417.49
(c) Operation/Maintenance 1095.85 1925.97 5316.37 17727.53 2028.42
(d) Finance/Interest 0.68 0.55 0.02 0.05 0.38
(e) Others 7330.70 9474.68 14798.24 12847.37 1886.70
Total 14445.11 19608.25 47425.89 57740.28 8349.23
Capital Grants 32216.58 34418.31 46637.67 139337.05 26757.05
Capital Expenditure NA NA NA NA 36275.74
Self-generated Income as percentage of Establishment Cost
36.2 41.4 47.0 54.4 85.3
Source : Department of Urban Development and Housing, GoB

318
APPENDIX
Table A 9.1 : District-wise Progress of the Mukhyamantri Shahri Peyjal Nishchay Yojana (2016-17 to 2019-20)
District Urban Local Ward
No of Households
(HH)
Access to HH Tap
Total Access to HH Tap Water Total
2016-17 2017-18 2018-19 2019-20
Patna 363 334941 154630 18131 12317 23734 14751 68933 Nalanda 143 71177 21542 1908 5617 3674 11401 22600 Bhojpur 119 57531 4551 2667 1767 4835 12105 21374 Buxar 60 22209 2261 584 2712 5209 4789 13294 Rohtas 159 69214 12625 771 1027 4522 21895 28215 Kaimur 41 14294 1663 0 100 8214 2240 10554
Gaya 105 86134 32467 4550 514 1526 5229 11819 Jehanabad 52 27040 1718 3437 5512 7060 9602 25611 Arwal 25 8685 0 0 0 2430 2240 4670 Nawada 70 31307 2458 944 5695 8945 3038 18622 Aurangabad 86 33638 261 0 936 1903 4118 6957
Saran 162 75245 7353 1 2786 19801 6959 29547 Siwan 65 29674 76 35 1392 6921 7181 15529 Gopalganj 78 25947 0 85 1096 4900 2253 8334
W. Champaran 137 67902 217 1015 2516 4369 9635 17535 E. Champaran 170 69216 582 1917 2289 14567 13904 32677 Muzaffarpur 91 84825 24272 0 2493 8092 6343 16928 Sitamarhi 103 36389 1088 670 3456 5480 8709 18315 Sheohar 15 6344 36 36 785 0 3574 4395 Vaishali 97 36713 2441 2110 1656 10195 8851 22812
Darbhanga 77 75850 5182 505 1020 2580 17487 21592 Madhubani 71 30899 425 0 500 6394 7321 14215 Samastipur 61 23375 1671 0 0 5466 3979 9445
Begusarai 144 87881 2426 100 371 4651 10255 15377 Munger 99 40491 6370 0 0 0 1250 1250 Sheikhpura 53 18559 3252 0 1323 6566 5533 13422 Lakhisarai 57 28201 6896 1183 3437 4392 2929 11941 Jamui 52 25577 0 0 600 3200 5500 9300 Khagaria 46 18426 338 0 0 615 3956 4571
Bhagalpur 116 98991 22300 451 2054 17980 1422 21907 Banka 36 12851 49 0 1180 3656 546 5382
Saharsa 55 40033 62 510 1250 6547 7437 15744 Supaul 53 23219 1697 586 2835 2911 5027 11359 Madhepura 41 20293 6 163 844 4484 5987 11478
Purnea 80 68697 373 0 1182 5896 4706 11784 Katihar 77 41775 0 0 0 1866 6064 7930 Araria 73 33818 103 1154 1756 28 946 3884 Kishanganj 64 34360 0 0 0 2825 7354 10179
Total 3396 1911721 321391 43513 73018 226434 256516 599481 Source : Department of Urban Development and Housing, GoB, 2020

319
Table A 9.2 : District-wise Targets and Achievements of Ghar Tak Pakki Gali Naali Yojana (Upto October, 2019)
District Total Number of Urban Number of Households
Wards Households To be covered Covered
Patna 363 334941 51911 26517 Nalanda 143 71177 11306 27152 Bhojpur 119 57531 8948 22455 Buxar 60 22209 5469 10020 Rohtas 159 69214 16223 14150 Kaimur 41 14294 3103 2787
Gaya 105 86134 11591 8731 Jehanabad 52 27040 6627 4833 Arwal 25 8685 2171 1815 Nawada 70 31307 7586 5637 Aurangabad 86 33638 8219 7989
Saran 162 75245 12700 9820 Siwan 65 29674 7553 7729 Gopalganj 78 25947 6177 5824
W. Champaran 137 67884 16633 12947 E. Champaran 170 69525 16621 15303 Muzaffarpur 91 84836 11226 27276 Sitamarhi 103 36389 8680 7732 Sheohar 15 6344 1459 1307 Vaishali 97 36207 8840 5547
Darbhanga 77 75850 11226 15141 Madhubani 71 30899 7431 10291 Samastipur 61 23375 5609 3044
Begusarai 144 87881 14368 17641 Munger 99 40491 8931 7716 Sheikhpura 53 18559 4994 5446 Lakhisarai 57 28201 6959 3230 Jamui 52 25577 6232 3359 Khagaria 46 18426 4442 9410
Bhagalpur 116 98991 13336 11246 Banka 36 12851 2956 2910
Saharsa 55 40033 9870 4520 Supaul 53 23219 5516 5279 Madhepura 41 20293 4932 3415
Purnea 80 68697 9200 11934 Katihar 77 41775 8221 5009 Araria 73 33818 8398 7032 Kishanganj 64 34360 5276 5043
Bihar 3396 1911517 360940 357237 Source : Department of Urban Development and Housing, GoB, 2020
_____________

320
CHAPTER - X
BANKING AND ALLIED SECTORS
It is not by augmenting the capital of the country, but by rendering a greater part of that capital active and productive than would otherwise be so, that the most judicious operations of banking can increase the industry of the country. —Adam Smith
Abstract
This chapter presents the details about the banking infrastructure in Bihar. It highlights the role of banking and other financial institutions in socio-economic development. It is observed that there is a need to improve banking infrastructure for a better credit facility to promote economic activity in the state. The banking infrastructure has increased in the semi-urban areas at a higher pace than the rural and urban areas in the state. The Scheduled Commercial Banks (SCB) has the largest presence in the state among all types of banking institutions. However, if one compares their presence in Bihar with other states in the country, it is found that the SCBs have relatively less coverage, and their branches in Bihar are also comparatively under-staffed. The Credit to Deposit (CD) ratio of the Public Sector SCBs in Bihar is the lowest among major states of the country. To achieve the national CD ratio of 78.2 percent, the SCBs need to provide a huge amount of credit in the state. The current scenario indicates the flight of capital from the state through the SCBs. The performance of Private Banks, Small Finance Banks, Cooperative Banks and Regional Rural Banks are better than the Public Sector Banks in Bihar in terms of providing credit. Given the credit need for the economic activity in Bihar, Small Finance Banks, Regional Rural Banks and Micro-Finance Institutions will have to play a key role in providing much-needed capital support for further economic development of Bihar.
Financial transactions through banks and other financial institutions play a key role in economic development. These institutions serve as custodian of the wealth and provide capital, a key factor of production. The evidence in the literature suggests that there is a strong positive relationship between financial development and economic growth. The indicators of financial development are correlated with the growth of both total factor-productivity and investment. With the productive investment, labour is supplemented with more capital, which enhances the technological progress and the output in the economy. Also, the increase in disposable income with the economic

321
development and the increasing working population lead to higher demand for the banking and related services in both rural and urban areas. Thus, banks and financial institutions play an important role in promoting profitable investment and facilitating economic transactions. The present chapter looks at the functioning of key financial institutions in Bihar, taking into account the related local, national and global events. This is because Bihar economy is largely affected by the developments in the banking and financial sectors, both in India and the world. The overall operational efficiency of banks in India has improved in the recent years because of financial innovations like internet banking, mobile banking, use of debit and credit cards, and various other facilities through the ATMs (Automated Teller Machine). Admittedly, there remain challenges related to the risk of fraud for the consumers using these innovative means of banking. However, the enhanced security features and improvement in financial literacy and awareness will help in the reduction of these cases. The benefits of these can be fully realized in Bihar through the improvements in financial literacy and user awareness. The Indian economy has seen a significant reduction in the interest rates in the current financial year. The Reserve Bank of India (RBI) has reduced policy interest rate by 135 basis points from February to October 2019. The Repo Rate of 5.15 percent in October 2019 was the lowest since March 2010, when it stood at 5.0 percent. This is in line with the lower policy interest rates and accommodative stance of the majority of the central banks in the world amid the looming slowdown. However, there remains concern regarding the transmission of these rate cuts to the borrowers in the Indian economy. The banks have an option to benchmark the loans either to the RBI repo rate, or Government of India 3-month or 6-month Treasury Bill yield, or any other benchmark market interest rate published by Financial Benchmarks India Pvt Ltd. With the recent RBI guideline that made it mandatory for banks to link all new floating rate loans to retail, personal and MSME (Micro, Small & Medium Enterprises) borrowers with an external benchmark from October 1, 2019, the floating rate new borrowers in the economy are expected to benefit from lower interest rates. The Government of India announced merging the ten Public Sector Banks into four in the financial year 2018-19, to create robust banking infrastructure to meet the capital requirements of the growing Indian economy. These are the banks which were acquired by the Government of India through nationalisation during the period 1969 to 1980. The banking operation has increased manyfolds over the years since then, along with the expansion of the economy. With the changing structure of the credit and deposit in the economy, the objectives of these banks have also changed and they are expected to provide services on par with not only the private sector banks but the global lenders. The bigger banks with more funds should be in a better position to meet the financial needs of the state in the coming years. However, the merger of banks will lead to the

322
merger of their branches at the same location, which will reduce the availability of the banking services to the people. This must be compensated by improving the accessibility to the banking services in states. Various measures have been taken in recent years to boost the ecosystem for the cashless transactions in India. The RBI announced the conversion of the National Electronic Funds Transfer (NEFT) channel into a 24x7 service and on-tap participation in some retail payment systems. At present, there also exists the Real Time Gross Settlement (RTGS) system, which is primarily meant for large value transactions of Rs. 2.00 lakh and above. The RBI has also increased the RTGS time window for customer transactions from 4.30 p.m. to 6.00 p.m. Another remarkable achievement in the promotion of cashless transaction was the Unified Payments Interface (UPI) based transactions using mobile phones. The UPI platform enables users to send money from their bank account to any account without entering bank details by using the email or phone number or by scanning a QR (Quick Response) code. The transactions using UPI, India’s own domestic payments platform, crossed 100 million users in October 2019, with more than one billion transactions in three years after its launch in 2016. In the fifth monetary policy statement of the year 2019-20, announced on December 5, 2019, RBI has proposed to introduce a new type of Prepaid Payment Instrument (PPI) which can be used only for the purchase of goods and services up to a limit of Rs. 10 thousand. The loading-reloading of such PPI will be only through a bank account and they shall be used for making only digital payments. This move will play an important role in promoting digital payments. The RBI has also launched a Complaint Management System (CMS) to allow members of the public to lodge their complaints on its website against any of the regulated entities with public interface. Among others, these entities are Urban Cooperative Banks (UCB) and Non-Banking Financial Institutions (NBFC). Also, new safety measures are being taken by the RBI to safeguard the frauds through the ATMs. In the above background, the following analysis of the financial sector in Bihar takes into account five kinds of institutions functioning in the state — (i) Scheduled Commercial Banks (SCB), (ii) Regional Rural Banks (RRB), (iii) Cooperative Banks, (iv) Small Finance Banks (SFB), and (v) Microfinance Institutions. While the Scheduled Commercial Banks provide finance to both industry and agriculture, the Regional Rural Banks and Cooperative Banks largely look after the requirements of the agriculture sector. The role of Small Finance Banks and the Microfinance Institutions in Bihar economy has increased in recent years. 10.1 Banking Infrastructure
Table 10.1 presents the number of new bank branches opened by various banks in Bihar during 2005-06 to 2018-19. There is a significant decline in the number of bank branches being opened by the SCBs in the state in recent years. Majority of the addition in the number of bank branches

323
by the SCBs in the state during 2018-19 was by the private sector banks. State Bank of India and the RRBs added only one branch each in 2018-19 in the state. With the introduction of the Small Finance Banks and the Payment Banks in India as banking services providers, Bihar has seen their presence with 107 and 38 new branches, respectively. Within three years of their introduction in the banking sector, these banks have 234 branches in the state.
Table 10.1 : New Bank Branches Opened in Bihar (2005-06 to 2018-19)
Year SBI and
its Associates
Nationalised Banks
Other PSBs RRBS
Private Sector Banks
Foreign Banks
Small Finance Banks
Payment Banks
All Banks
2005-06 8 16 1 2 4 31
2006-07 6 36 6 10 1 59 2007-08 26 47 10 3 86
2008-09 37 80 1 30 14 162
2009-10 64 123 7 40 23 257 2010-11 38 116 5 25 25 209
2011-12 31 203 9 55 27 325
2012-13 60 182 6 142 59 449 2013-14 111 317 17 117 32 594
2014-15 28 206 13 158 29 434
2015-16 35 102 12 93 381 623 2016-17 35 77 4 30 80 1 227
2017-18 7 33 1 4 86 56 32 219
2018-19 1 17 1 57 107 38 221 Source : Quarterly Statistics on Deposits and Credit of Scheduled Commercial Banks, Reserve Bank of India
(RBI)
Among the 221 new branches opened in the state during 2018-19, 42 percent were opened in semi-
urban areas and 30 percent in the rural areas (Table 10.2). From Table 10.1, one can also notice
that the Small Finance Banks have expanded considerably in Bihar in 2018-19. Out of 221 new
branches opened in 2018-19, no less than 107 (48.4 percent) were opened by Small Finance Banks.
This reflects the faster growth of the Small Finance Banks in Bihar.
Table 10.2 : Number of Branches Opened by the SCBs in 2018-19
Area Number Percentage
Rural 67 30.3
Semi-urban 92 41.7
Urban 46 20.8
Metropolitan 16 7.2
Total 221 100.0
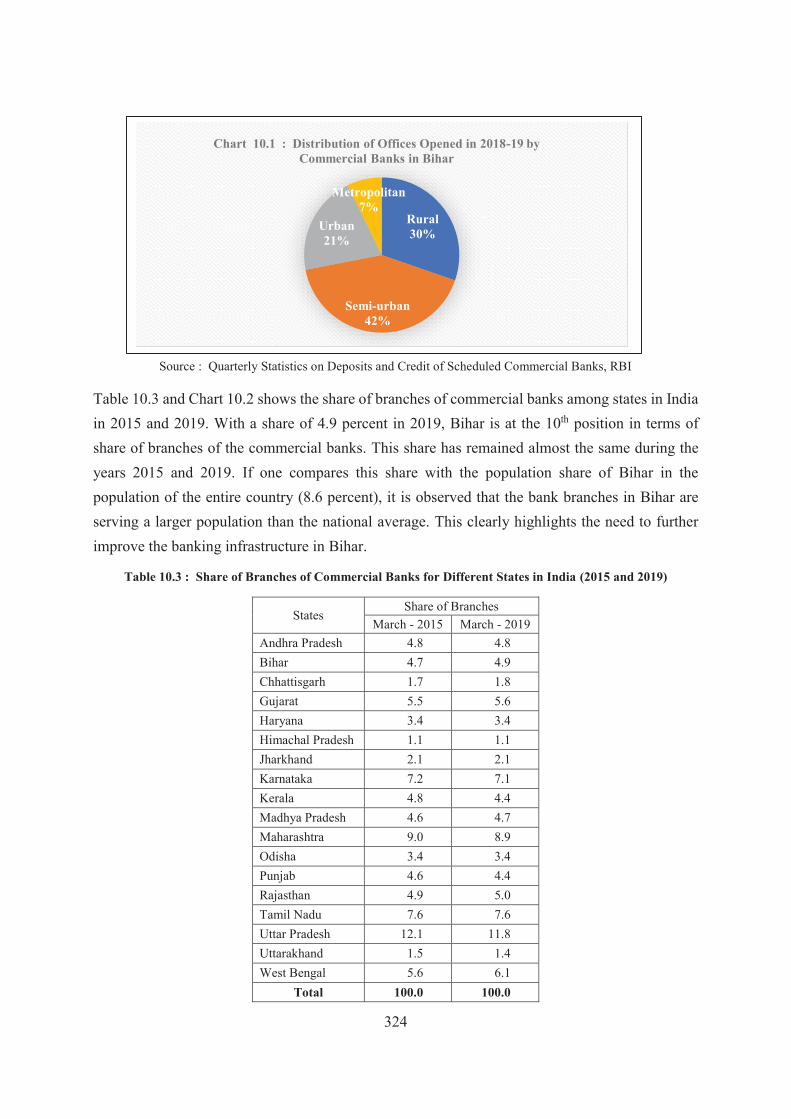
324
Source : Quarterly Statistics on Deposits and Credit of Scheduled Commercial Banks, RBI
Table 10.3 and Chart 10.2 shows the share of branches of commercial banks among states in India in 2015 and 2019. With a share of 4.9 percent in 2019, Bihar is at the 10th position in terms of share of branches of the commercial banks. This share has remained almost the same during the years 2015 and 2019. If one compares this share with the population share of Bihar in the population of the entire country (8.6 percent), it is observed that the bank branches in Bihar are serving a larger population than the national average. This clearly highlights the need to further improve the banking infrastructure in Bihar.
Table 10.3 : Share of Branches of Commercial Banks for Different States in India (2015 and 2019)
States Share of Branches
March - 2015 March - 2019 Andhra Pradesh 4.8 4.8 Bihar 4.7 4.9 Chhattisgarh 1.7 1.8 Gujarat 5.5 5.6 Haryana 3.4 3.4 Himachal Pradesh 1.1 1.1 Jharkhand 2.1 2.1 Karnataka 7.2 7.1 Kerala 4.8 4.4 Madhya Pradesh 4.6 4.7 Maharashtra 9.0 8.9 Odisha 3.4 3.4 Punjab 4.6 4.4 Rajasthan 4.9 5.0 Tamil Nadu 7.6 7.6 Uttar Pradesh 12.1 11.8 Uttarakhand 1.5 1.4 West Bengal 5.6 6.1
Total 100.0 100.0
Rural30%
Semi-urban42%
Urban21%
Metropolitan7%
Chart 10.1 : Distribution of Offices Opened in 2018-19 by Commercial Banks in Bihar

325
Source : Quarterly Statistics on Deposits and Credit of Scheduled Commercial Banks, RBI
Scheduled Commercial Banks (SCB)
The distribution of SCB branch offices in rural, semi-urban and urban areas and their growth in Bihar during 2013-19 is shown in Table 10.4. There were 7469 branches of the SCBs in Bihar at the end of 2018-19. The share of branches of the SCBs in the rural areas has shown a decline over the years. As of March 2019, 49.6 percent of the SCB branches were located in the rural areas, which was 59.6 percent in 2013. Correspondingly, the urban areas have seen an increase in their share in SCB branches, from 18.6 percent in 2013 to 20.8 percent in 2019. The semi-urban areas have also seen a significant increase in their share in the SCB branches over the years, from 21.8 percent in 2013 to 29.6 percent in 2019.
Table 10.4 : Distribution of Commercial Bank Branch Offices (2013-2019)
Years (End March) Total Growth
Rate
Percentage distribution of branches by location
Rural Semi-urban Urban All
2013 5270 8.4 59.6 21.8 18.6 100.0 2014 5908 12.1 58.7 23.0 18.3 100.0 2015 6297 6.6 57.9 23.1 19.0 100.0 2016 6661 5.8 55.4 25.2 19.4 100.0 2017 6844 2.7 51.0 28.5 20.5 100.0 2018 6905 0.9 51.0 29.0 20.0 100.0 2019 7469 8.2 49.6 29.6 20.8 100.0
Source : Quarterly Statistics on Deposits and Credit of Scheduled Commercial Banks, RBI
Table 10.5 shows the number of employees of the SCBs in different states and their percentage share in total employees of the SCBs in the country. Bihar with 48,136 employees of the SCBs ranked 12 among the states in terms of their share (3.5 percent) in total bank employees in March 2018, whereas it is the third most populous state in the country as per Census 2011. Although the
0.002.004.006.008.00
10.0012.0014.00
Chart 10.2 : Share of Branches of Commercial Banks among States in India
Share in All-India March-2019 Share in All-India March-2015

326
number of bank employees has increased over the years (42,500 in March 2016 and 48,136 in March 2018), the bank branches in the state remain more crowded than in the other states, due to lower share of Bihar in the total bank employees. Thus, apart from relatively less coverage, the branches of SCBs in Bihar are also comparatively under-staffed, compared to the national average.
Table 10.5 : Distribution of Employees of SCBs (March, 2018)
State Officers Share (percent) Clerks Share
(percent) Sub-
ordinates Share
(percent) Total Share (percent)
Andhra Pradesh 30,609 3.6 16,972 4.7 6,887 4.3 54,468 4.0
Bihar 26,472 3.1 15,393 4.3 6,271 3.9 48,136 3.5
Chhattisgarh 11,172 1.3 5,314 1.5 2,036 1.3 18,522 1.3
Gujarat 45,386 5.3 18,688 5.2 9,409 5.8 73,483 5.3
Haryana 29,846 3.5 11,240 3.1 4,820 3.0 45,906 3.3
Himachal Pradesh 4,950 0.6 3,458 1.0 1,959 1.2 10,367 0.8
Jharkhand 12,569 1.5 7,533 2.1 2,926 1.8 23,028 1.7
Karnataka 61,790 7.2 26,546 7.4 12,185 7.5 1,00,521 7.3
Kerala 33,972 4.0 18,038 5.0 6,400 4.0 58,410 4.2
Madhya Pradesh 31,142 3.6 15,424 4.3 7,758 4.8 54,324 3.9
Maharashtra 1,58,568 18.5 41,647 11.6 17,627 10.9 2,17,842 15.8
Odisha 19,823 2.3 10,631 3.0 4,509 2.8 34,963 2.5
Punjab 32,494 3.8 13,552 3.8 6,893 4.3 52,939 3.8
Rajasthan 35,321 4.1 16,132 4.5 11,671 7.2 63,124 4.6
Tamil Nadu 78,156 9.1 32,286 9.0 10,101 6.2 1,20,543 8.7
Uttar Pradesh 70,823 8.2 37,655 10.5 17,513 10.8 1,25,991 9.1
Uttarakhand 8,207 1.0 4,860 1.4 2,341 1.4 15,408 1.1
West Bengal 54,789 6.4 20,094 5.6 11,155 6.9 86,038 6.2
All India 8,59,075 100.0 3,59,862 100.0 1,61,524 100.0 13,80,461 100.0 Source : Basic Statistical Returns of Scheduled Commercial Banks in India, 2018-19, RBI
Regional Rural Banks (RRB)
Two Regional Rural Banks, Dakshin Bihar Gramin Bank and Uttar Bihar Kshetriya Gramin Bank, are functioning in Bihar. The Dakshin Bihar Gramin Bank was created on January 1, 2019, after merging the Madhya Bihar Kshetriya Gramin Bank and the Bihar Kshetriya Gramin Bank. Table 10.6 shows the number of branches of these two RRBs in Bihar. Majority of these branches are in rural areas, followed by the semi-urban areas (Chart 10.3). Uttar Bihar Kshetriya Gramin Bank has 34 percent of its branches in semi-urban areas and 62 percent in rural areas. Dakshin Bihar Gramin Bank had 19 percent of its branches in semi-urban areas and 75 percent in the rural areas of the state. Overall, these banks have 69 percent of their branches in rural areas. Presence of a wide network of the RRBs can be used to further support the capital requirement for growth of the state.

327
Table 10.6 : Number of RRB Branches in Bihar (as on September, 2019)
Banks Rural Semi-Urban Urban Total
Dakshin Bihar Gramin Bank 813 (75.41)
204 (18.92)
61 (5.65)
1078 (100)
Uttar Bihar Kshetriya Gramin Bank 639 (61.9)
349 (33.8)
44 (4.3)
1032 (100.0)
Total 1452 (68.8)
553 (26.2)
105 (5.0)
2110 (100.0)
Note : Values in parenthesis are percentage distribution Source : State Level Bankers' Committee
Chart 10.3 : Distribution of Branches of three RRBs in Bihar
Source : State Level Bankers' Committee report
There has been continuous increase in the number of offices of the RRBs in the country over the years (Chart 10.4). There was a sharp increase in the number of offices of the RRBs during the years 2013-14 and 2014-15 in Bihar, when it increased at the rate of 13.8 and 12.7 percent, respectively. With 2117 offices of the RRBs in the state, Bihar ranks second after Uttar Pradesh in the country in terms of the number of branches of RRBs.
Source : State Level Bankers' Committee report
Rural38%
Semi-Urban
9%Urban3%
Total50%
Dakshin Bihar Gramin Bank
Rural62%
Semi-Urban34%
Urban4%
Uttar Bihar Kshetriya Gramin Bank
14000
16000
18000
20000
22000
24000
140015001600170018001900200021002200
Chart 10.4 : Number of RRB offices
Bihar All-India (Secondary Y-axis)

328
Cooperative Banks
Data for the number of branches of the State Cooperative banks and the District Central Cooperative banks is shown in Table 10.7. It is observed that their presence in the state in terms of the number of branches has not changed in recent years. The share of Bihar in the number of branches of the cooperative banks in India has remained at only 2.1 percent during 2016-18. This shows the limited presence and role of these banks in Bihar, compared to the states like Maharashtra, Gujarat and Tamil Nadu.
Table 10.7 : Number of Branches of State and District Central Cooperative Banks (2016-2018)
State State Cooperative Banks District Central
Cooperative Banks Total
2016 2017 2018 2016 2017 2018 2016 2017 2018
Andhra Pradesh 7 14 14 378 397 404 385 411 418
Bihar 11 12 12 312 312 313 323 324 325
Gujarat 16 25 27 1322 1331 1367 1338 1356 1394
Haryana 14 14 14 621 625 627 635 639 641
Himachal Pradesh 227 227 227 261 274 249 488 501 476
Karnataka 42 42 42 715 729 742 757 771 784
Kerala 24 24 24 792 807 817 816 831 841
Madhya Pradesh 25 25 26 857 857 858 882 882 884
Maharashtra 48 51 55 3755 3729 3697 3803 3780 3752
Odisha 15 15 15 349 350 352 364 365 367
Punjab 19 18 18 816 817 817 835 835 835
Rajasthan 17 17 17 454 460 461 471 477 478
Tamil Nadu 47 47 47 812 844 849 859 891 896
Uttar Pradesh 29 29 29 1406 1406 1395 1435 1435 1424
Uttarakhand 16 16 16 255 261 269 271 277 285
West Bengal 48 48 48 313 318 318 361 366 366
All-India 1168 1197 1219 14241 14252 14293 15409 15449 15512
Source : National Federation of State Cooperative Banks (NAFSCOB)
Small Finance Banks (SFB)
Small Finance Banks (SFB) were given approval by the RBI in September 2015 with the objective of deepening financial inclusion by providing the banking services to the small and marginal farmers, migrant labourers, low-income households, small businesses and other unorganised entities. Within three years of their activity, the SFBs have made significant progress in Bihar. Their CD ratio is much higher than all other banking institutions in the state. Apart from the SFBs,

329
the Payment Banks have also started functioning in the state. As of March 2019, SFBs had 163 offices in the state and the Payment Banks had 70 offices. Microfinance Institutions
Microfinance Institutions play an instrumental role in providing credit to low-income households. Such credit is crucial for employment, economic development and overall empowerment of these households. It opens the credit market to the poor households with little or no collateral, which unleashes their productive capacities by ensuring the supply of necessary capital through small loans. These institutions are playing a key role in Bihar in improving the level of financial inclusion in the state. The Self-Help Groups (SHGs) and the SHG-Bank Linkage Programme (SHG-BLP), implemented by Scheduled Commercial Banks, Regional Rural Banks and Cooperative Banks, have emerged as the major microfinance programme in the country. As per the NABARD report on Microfinance, the SHG Bank Linkage Programme (SHG-BLP) now covers 100.14 lakh SHGs in India as on March 2019, covering more than 12 crore households for social, economic and financial empowerment of the rural poor, especially the women. Also, as per the Global Findex Database 2017 of the World Bank, India’s gender gap in access to financial service has come down to 6 percent. The NABARD report reiterates that the microfinance initiatives have played a major role in bringing the unbanked women to the mainstream by bringing them into the domain of SHG-BLP on a continuous basis. There was a net addition of 12.7 lakh savings-linked SHGs in 2018-19 in the country. As of March 2019, there were 7.70 lakh SHGs in Bihar which had a total saving of Rs. 1508.59 crore with the Commercial Banks, RRBs and the Cooperative Banks. Bihar has made phenomenal success in improving the financial inclusion through the formation of SHGs, thanks to the initiatives by JEEViKA, the rural livelihood mission of the State Government.
10.2 Deposits, Credits and Credit-Deposit Ratio
The banks play a crucial role in deposit mobilisation and facilitate credit to the borrowers. Table 10.8 shows the deposits and credit of the SCBs in Bihar vis-à-vis other major states of the country as of March 2018 and 2019. There is an increase of Rs. 36,148 crore in the deposits in SCBs in Bihar between 2017-18 and 2018-19 (11.4 percent). During the same period, credit provided by the SCBs expanded by Rs. 18,776 crore, an increase of 18.5 percent in the state. At the all-India level, deposit in the SCBs increased by 9.4 percent and the credit expanded by 13.1 percent. The share of Bihar in the total deposit and credit in India has remained at 2.8 percent and 1.2 percent respectively during 2017-18 and 2018-19. Compared to its population share in the country, Bihar’s share in both deposit and credit in the SCBs has remained much lower. This can be partly due to lower per capita income of Bihar compared to other states.

330
Table 10.8 : State-wise Deposits and Credit of Scheduled Commercial Banks in India (2017-18 and 2018-19)
States Deposits (Rs. crore) Credits (Rs. crore) CD Ratio
2017-18 2018-19 2017-18 2018-19 2017-18 2018-19
Andhra Pradesh 276527 (2.4) 300863 (2.4) 310457 (3.6) 366563 (3.7) 112.3 121.8
Bihar 317131 (2.8) 353279 (2.8) 101511 (1.2) 120287 (1.2) 32.0 34.0
Chhattisgarh 133067 (1.2) 142551 (1.1) 83352 (1) 89824 (0.9) 62.6 63.0
Gujarat 643747 (5.6) 674702 (5.4) 482779 (5.6) 531396 (5.4) 75.0 78.8
Haryana 367362 (3.2) 409923 (3.3) 218336 (2.5) 247345 (2.5) 59.4 60.3
Himachal Pradesh 85753 (0.7) 95522 (0.8) 26479 (0.3) 29424 (0.3) 30.9 30.8
Jharkhand 199475 (1.7) 218508 (1.7) 54639 (0.6) 60196 (0.6) 27.4 27.5
Karnataka 840424 (7.3) 934748 (7.4) 586740 (6.8) 648887 (6.6) 69.8 69.4
Kerala 440361 (3.8) 495741 (3.9) 281384 (3.2) 325280 (3.3) 63.9 65.6
Madhya Pradesh 340117 (3.0) 368521 (2.9) 221512 (2.6) 249290 (2.5) 65.1 67.6
Maharashtra 2289301 (19.9) 2549943 (20.3) 2404766 (27.7) 2714809 (27.7) 105.0 106.5
Odisha 271019 (2.4) 309618 (2.5) 100653 (1.2) 119090 (1.2) 37.1 38.5
Punjab 350459 (3.1) 379505 (3) 221388 (2.5) 228604 (2.3) 63.2 60.2
Rajasthan 336820 (2.9) 378636 (3) 254382 (2.9) 307134 (3.1) 75.5 81.1
Tamil Nadu 725810 (6.3) 798765 (6.4) 784172 (9) 876433 (8.9) 108.0 109.7
Uttar Pradesh 957832 (8.3) 1040758 (8.3) 391892 (4.5) 439716 (4.5) 40.9 42.2
Uttarakhand 123440 (1.1) 137027 (1.1) 44669 (0.5) 51574 (0.5) 36.2 37.6
West Bengal 722699 (6.3) 777410 (6.2) 364454 (4.2) 379817 (3.9) 50.4 48.9
All-India 11479288 (100) 12558671 (100) 8682573 (100) 9818367 (100) 75.6 78.2
Note : Figures in Parenthesis indicate share of the states Source : Statistical Tables Relating to Banks in India, 2018-19, RBI
Credit-Deposit (CD) Ratio
The CD ratio of the Scheduled Commercial Banks (SCB) is an indicator of the involvement of banks in the economic development of the state. It depends mostly on the level of economic activity and the credit absorption capacity of a particular state. The CD ratio shows the bank’s total loans as a percentage share of its deposits for the same period. In other words, CD ratio of the state denotes how much a bank lends out of the deposits it has mobilized from the state. The low ratio indicates banks are not making full use of their resources for promoting economic activity in the state. As highlighted earlier, the availability of credit is key to boost the entrepreneurial activity in the state. The CD ratio of the SCBs in Bihar during 2018-19 increased to 34.0 percent from 32.0 percent in 2017-18. However, it is still lower than the CD ratio of 121.8, 106.5 and 109.7 percent for Andhra Pradesh, Maharashtra and Tamil Nadu, respectively (Table 10.8). Only Jharkhand and Himachal

331
Pradesh are among the major states which have lower CD ratios than Bihar. The CD ratio at all-India level increased from 75.6 percent in 2017-18 to 78.2 percent in 2018-19.
Assuming that there is an unmet demand for the credit in the state, the low CD ratio needs serious attention of the SCBs doing business in Bihar. For the given level of deposit in the SCBs in Bihar, if the state has to achieve the national average CD ratio of 78.2 percent, the SCBs need to provide additional credit of Rs. 1.56 lakh crore. This could provide a much-needed boost to the investment in the state. The low disbursement of credit by the SCBs is also a major concern for the state because it indicates that the credit requirements of the state are being met at higher rates of interest from alternative sources of financing, which increases the cost of doing business in the state. Further, this also indicates that deposits collected from the state are being used to provide credit in other states by the SCBs, which is indeed the flight of capital away from a poor state like Bihar.
As per the SLBC report, there are 16 districts in Bihar that have CD ratio of the SCBs lower than 40 per cent (as on September 2019). Among the banks, the RRBs have the highest CD ratio and it is increasing over the years, whereas the SBI and its associate banks have shown declining trends (Chart 10.5).
The CD ratios for the rural and the urban areas were almost the same, around 25 percent, till 2004. However, it increased to 39.7 and 31.4 percent in rural and urban areas, respectively in March 2018 (Chart 10.6). The CD ratio has always remained higher for the rural areas than the urban areas in Bihar since 2004, largely due to high CD ratio of the RRBs and their larger presence in the rural areas. This may also be on account of the targeted lending schemes in rural areas. Among the banks in Bihar, the CD ratio for the RRBs is the highest and it increased from 23.0 percent in March 2001 to 52.1 percent in March 2018.
Source : State Level Bankers' Committee report
05
1015202530354045505560
Chart 10.5 : Bank-wise CD Ratio in Bihar
SBI & Associate Nationalised banks RRBs All SCBs

332
Source : State Level Bankers' Committee report
The CD ratio of all the banks in the state over the years is reported in Table 10.9. The CD ratio for Bihar has increased from 40.6 percent in 2012-13 to 45.9 percent in 2018-19. For the current year (2019-20), the CD ratio was 41.83 percent in September 2019, which is lower than in the previous year (Chart 10.7). The credit provided by the banks has not increased over the years at a pace which could lead to Bihar achieving the national average of the CD ratio.
Chart 10.7 : Credit, Deposit and CD Ratio in Bihar (as on September 2019)
Source : State Level Bankers' Committee report
Table 10.9 : Credit-Deposit (CD) Ratio of All Banks in Bihar (2013-14 to 2019-20)
2012-13 2013-14 2014-15 2015-16 2016-17 2017-18 2018-19 2019-20
(upto Sep 2019)
Deposit (Rs. crore) 161036 183458 211302 240288 280370 312829 345234 351165
Credit (Rs. crore) 65364 85334 100261 103238 129969 147797 158469 146900
CD Ratio (%) 40.6 46.5 47.4 43.0 46.4 47.24 45.9 41.8
Source : State Level Bankers' Committee report
0
1020304050
Chart 10.6 : Rural and Urban CD Ratio of all SCBs in Bihar
Rural CD ratio Urban CD ratio
46.547.4
43
46.447.24
45.9
41.83
38
40
42
44
46
48
050000
100000150000200000250000300000350000400000
2013-14 2014-15 2015-16 2016-17 2017-18 2018-19 2019-20(upto Sep 2019)
Deposit (Rs. crore) Credit (Rs. crore) CD Ratio (%, secondary Y-axis)
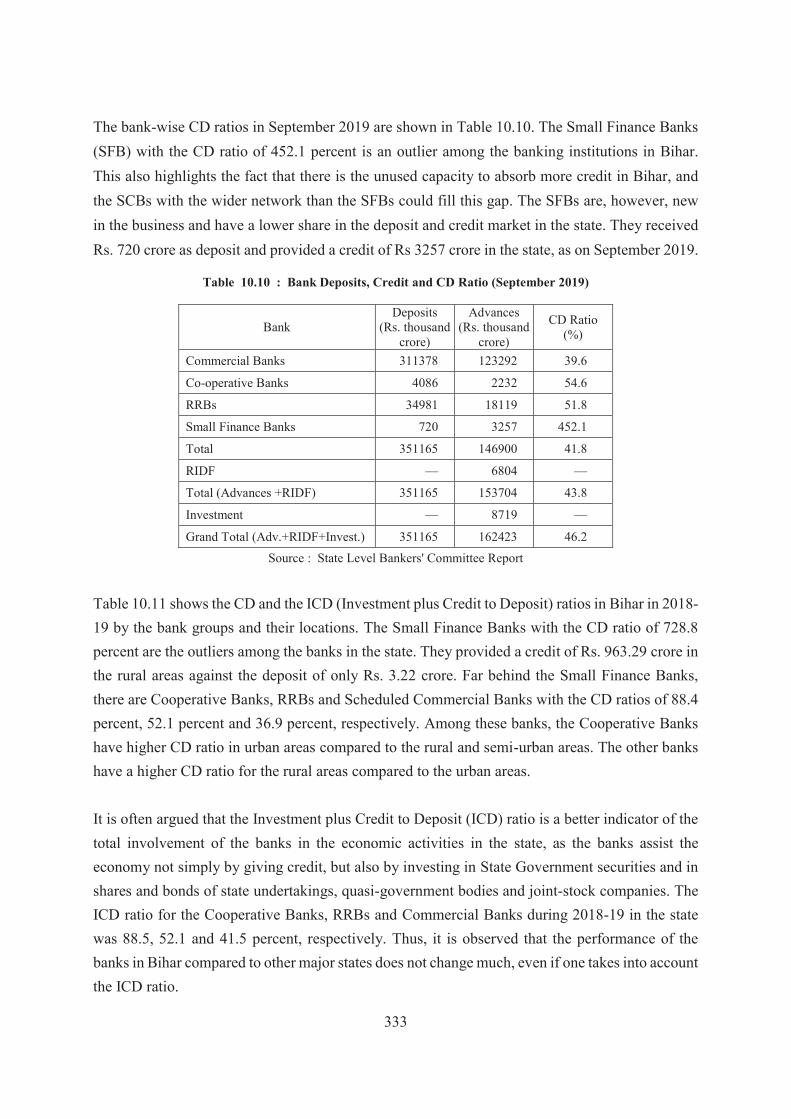
333
The bank-wise CD ratios in September 2019 are shown in Table 10.10. The Small Finance Banks (SFB) with the CD ratio of 452.1 percent is an outlier among the banking institutions in Bihar. This also highlights the fact that there is the unused capacity to absorb more credit in Bihar, and the SCBs with the wider network than the SFBs could fill this gap. The SFBs are, however, new in the business and have a lower share in the deposit and credit market in the state. They received Rs. 720 crore as deposit and provided a credit of Rs 3257 crore in the state, as on September 2019.
Table 10.10 : Bank Deposits, Credit and CD Ratio (September 2019)
Bank Deposits
(Rs. thousand crore)
Advances (Rs. thousand
crore)
CD Ratio (%)
Commercial Banks 311378 123292 39.6
Co-operative Banks 4086 2232 54.6
RRBs 34981 18119 51.8
Small Finance Banks 720 3257 452.1
Total 351165 146900 41.8
RIDF — 6804 —
Total (Advances +RIDF) 351165 153704 43.8
Investment — 8719 —
Grand Total (Adv.+RIDF+Invest.) 351165 162423 46.2
Source : State Level Bankers' Committee Report
Table 10.11 shows the CD and the ICD (Investment plus Credit to Deposit) ratios in Bihar in 2018-19 by the bank groups and their locations. The Small Finance Banks with the CD ratio of 728.8 percent are the outliers among the banks in the state. They provided a credit of Rs. 963.29 crore in the rural areas against the deposit of only Rs. 3.22 crore. Far behind the Small Finance Banks, there are Cooperative Banks, RRBs and Scheduled Commercial Banks with the CD ratios of 88.4 percent, 52.1 percent and 36.9 percent, respectively. Among these banks, the Cooperative Banks have higher CD ratio in urban areas compared to the rural and semi-urban areas. The other banks have a higher CD ratio for the rural areas compared to the urban areas. It is often argued that the Investment plus Credit to Deposit (ICD) ratio is a better indicator of the total involvement of the banks in the economic activities in the state, as the banks assist the economy not simply by giving credit, but also by investing in State Government securities and in shares and bonds of state undertakings, quasi-government bodies and joint-stock companies. The ICD ratio for the Cooperative Banks, RRBs and Commercial Banks during 2018-19 in the state was 88.5, 52.1 and 41.5 percent, respectively. Thus, it is observed that the performance of the banks in Bihar compared to other major states does not change much, even if one takes into account the ICD ratio.

334
Table 10.11 : Bank Group-wise and Area-wise Credit-Deposit Ratio (2018-19)
Bank Groups Area Deposits (Rs. crore)
Credits (Rs. crore) CD Ratio Investment
(Rs. crore) ICD Ratio
Scheduled Commercial Bank
Rural 54288.22 23116.85 42.6 — —
Semi-Urban 75828.12 28439.28 37.5 — —
Urban 176332.9 61440.66 34.8 — —
Total 306449.3 112996.8 36.9 6251.3 41.5
RRB
Rural 22261.48 12881.71 57.9 — —
Semi -Urban 7114.69 3519.99 49.5 — —
Urban 4685.09 1330.81 28.4 — —
Total 34061.26 17732.51 52.1 — 52.1
Cooperative Bank
Rural 1952.85 1729.95 88.6 — —
Semi-Urban 1521.5 1247.86 82.0 — —
Urban 883.15 873.23 98.9 — —
Total 4357.5 3851.04 88.4 5.0 88.5
Small Finance Bank
Rural 3.22 963.29 29915.8 — —
Semi-Urban 70.73 763.38 1079.3 — —
Urban 291.86 939.42 321.9 — —
Total 365.81 2666.09 728.8 — 728.8
All Banks
Rural 78505.77 38691.8 49.3 — —
Semi-Urban 84535.04 33970.51 40.2 — —
Urban 182193 64584.12 35.4 — —
Total 345233.8 137246.4 39.8 6256.4 43.8
Source : State Level Bankers' Committee Report
The CD ratio discussed above is the ratio which has conventionally been calculated on the basis
of credit sanctions by the banks in the state. This tells us the extent to which the banks employ the
deposits mobilized in a state to meet its credit demands. Another way to look at the issue is by
using credit utilisation in place of credit sanction. While a low CD ratio based on credit sanctions
would indicate the migration of deposits from one state to another, a comparatively lower CD ratio
based on credit utilization would indicate the migration of credit meant for investment in the state.
Table 10.12 presents the CD ratio for the major states in India, based on both credit sanction and
credit utilisation. The two ratios are obviously the same at the all-India level; however, there is
variation between these two ratios in different states. In the case of Bihar, the CD ratio of SCBs in
terms of utilisation is higher than the ratio in terms of sanction, but the difference is very marginal.

335
Table 10.12 : Credit-Deposit (CD) Ratio of the Scheduled Commercial Banks (2015 to 2018)
2015 2016 2017 2018
As per Sanction
As per Utilization
As per Sanction
As per Utilization
As per Sanction
As per Utilization
As per Sanction
As per Utilization
Andhra Pradesh 105.3 108.3 106 109.6 101.1 104.4 112.6 114.1
Bihar 33.6 34.3 33.4 34.5 30.9 32.0 32.2 34.0
Gujarat 72.7 79.0 75.4 82.4 68.9 75.2 75.6 82.2
Haryana 75.8 85.2 69.9 82.6 59.1 69.1 58.6 67.6
Himachal Pradesh 35.3 36.6 32.9 33.6 29.7 31.1 31.1 31.8
Jharkhand 29.6 30.6 29.6 30.7 27.1 29.1 27.7 30.6
Karnataka 67.7 72.6 70.1 75.4 67 71.2 69.7 75.7
Kerala 64.6 65.4 62.1 63.0 59.8 61.2 63.8 65.5
Madhya Pradesh 54.8 57.6 61.2 63.5 60.9 63.4 65.1 67.7
Maharashtra 92.0 82.7 102.9 91.4 106 94.0 106.9 94.1
Odisha 41.9 43.9 40.8 43.3 38.1 40.5 37.6 40.5
Punjab 75.1 76.8 69.8 71.7 69 71.2 63.5 68.3
Rajasthan 86.2 90.1 72.4 76.3 67.8 71.6 76.6 80.7
Tamil Nadu 119 117.5 113.7 112.4 105.8 103.8 113.5 110.8
Uttar Pradesh 45.4 48.9 44.6 49.6 40.0 43.0 41.2 43.9
Uttarakhand 34.5 35.2 34.9 35.8 34.3 35.3 36.4 37.8
West Bengal 57.8 60.3 55.1 57.3 50.3 52.5 51.1 53.8
All-India 77.1 77.1 78.4 78.4 73.8 73.8 76.7 76.7
Source : Report on Trend and Progress of Banking in India 2018-19, RBI
If we look at the CD ratio in Bihar, there is huge variation among districts. Table 10.13 presents
the CD ratios across the districts in Bihar. As on September 2019, there are 16 districts with a CD
ratio lower than 40 percent and 17 districts have CD ratios lower than the state average. None of
the districts has a CD ratio higher than the all-India average. Purnea has the highest CD ratio of
68.5 percent and Saran has the lowest at 27.0 percent. Sheohar with the CD ratio of 57.8 percent
is at the distant second position. Munger, Bhojpur and Saran are districts with their ratios lower
than even 30 percent.

336
Table 10.13 : District-wise Credit-Deposit (CD) Ratio (2017-18 to 2019-20)
District 2017-18 2018-19 2019-20 (Sep. 19) District 2017-18 2018-19 2019-20
(Sep. 19)
Patna 38.7 35.9 36.0 Darbhanga 32.5 33.4 32.8
Nalanda 37.9 34.7 32.4 Madhubani 33.6 34.2 32.5
Bhojpur 30.1 29.4 28.5 Samastipur 47.7 45.4 46.0
Buxar 42.8 44.2 40.4 Begusarai 49.5 53.4 53.5
Rohtas 46.6 44.9 44.7 Munger 30.3 31.4 28.7
Kaimur 57.8 52.6 57.6 Sheikhpura 40.3 41.9 42.2
Gaya 36.6 38.0 39.4 Lakhisarai 37.0 39.1 37.1
Jehanabad 34.5 34.8 32.1 Jamui 40.9 45.4 46.2
Arwal 38.5 35.0 31.8 Khagaria 55.1 53.4 57.0
Nawada 42.9 39.0 39.6 Bhagalpur 53.2 37.1 37.0
Aurangabad 42.0 38.2 45.7 Banka 43.8 46.8 48.6
Saran 28.4 29.2 27.0 Saharsa 44.6 45.1 47.4
Siwan 28.9 31.5 33.7 Supaul 52.8 49.2 42.7
Gopalganj 29.4 34.3 33.9 Madhepura 47.6 48.9 45.3
West Champaran 48.7 52.3 53.3 Purnea 65.1 72.0 68.5
East Champaran 44.0 48.6 49.8 Kishanganj 59.2 59.1 56.0
Muzaffarpur 46.3 49.1 48.8 Araria 51.0 53.9 55.1
Sitamarhi 35.6 38.6 35.6 Katihar 45.7 47.5 47.1
Sheohar 47.5 46.6 57.8
Vaishali 39.1 39.5 50.9 Bihar 40.6 39.8 41.8
Source : State Level Bankers' Committee Report
The bank-wise CD ratios of the Public Sector Banks in Bihar are shown in Table 10.14. UCO bank
has the highest CD ratio of 56.8 percent, whereas the Union Bank of India has the lowest (27.7
percent). Among the lead banks, the CD ratios of State Bank of India, Punjab National Bank and
Central Bank of India have declined over the last five years in Bihar. Except for Corporation Bank,
Bank of Maharashtra and UCO bank, the performance of the public sector banks has been
disappointing in terms of providing adequate credit in the state.

337
Table 10.14 : Credit-Deposit (CD) Ratio of Public Sector Banks in Bihar (2014-15 to 2019-20)
Banks 2014-15 2015-16 2016-17 2017-18 2018-19 2019-20
(upto Sep. 19)
Lead Banks
State Bank of India 37.5 36.0 35.5 35.2 31.6 31.4
Central Bank of India 37.2 33.0 35.2 35.2 31.4 29.4
Punjab National Bank 40.6 41.9 34.4 37.8 31.2 29.3
Canara bank 40.2 43.7 40.0 49.2 49.0 50.0
UCO Bank 39.3 40.7 42.8 43.1 57.0 56.8
Bank of Baroda 34.8 41.6 40.2 40.5 40.6 42.5
Union Bank of India 41.1 42.1 45.7 41.1 29.7 27.7
Other Banks
Bank of India 38.5 40.3 40.2 40.3 35.0 28.2
Allahabad Bank 41.8 42.8 38.2 40.4 40.5 39.9
Andhra Bank 16.8 20.7 63.0 45.9 40.0 53.7
Bank of Maharashtra 32.5 67.4 50.2 59.6 62.6 53.0
Corporation Bank 89.2 72.0 90.9 70.2 57.9 40.8
Dena Bank 30.3 33.1 40.0 40.2 26.6 —
Indian Bank 68.8 79.4 70.6 33.3 30.0 28.4
Indian Overseas bank 60.2 73.0 54.1 42.4 34.5 38.6
Oriental Bank of Commerce 39.9 47.3 47.0 42.3 45.5 47.3
Punjab and Sind Bank 108.7 21.8 9.8 36.2 39.4 48.3
Syndicate Bank 40.9 41.0 26.4 33.6 32.6 33.4
United Bank of India 53.9 52.1 50.9 49.8 47.7 47.5
All Public Sector Banks 41.9 43.0 41.9 43.1 42.0 34.4
Source : State Level Bankers' Committee Report
The deposit, advances and CD ratios of private sector banks, RRBs and Small Finance Banks (SFB) in Bihar are shown in Table 10.15. The CD ratio for 12 private banks that have offices in Bihar varies between 5.3 and 465.7 percent as on September 2019. The ratio for SFBs varies between 86.9 and 708.2 percent. Among the private sector banks, IndusInd bank is the best performer in the state, followed by Bandhan Bank with the CD ratios of 465.8 and 197.8 percent respectively. IndusInd Bank has made a significant jump in its CD ratio which zoomed from 224.6 percent in 2018 to 465.7 percent in 2019. Among the major private sector banks, the performance of IDBI Bank, AXIS Bank and Kotak Mahindra Banks is poor given their CD ratios of 40.1, 48.9 and 33.1 percent, respectively. The overall CD ratio of private sector banks in the state in 2019 was 79.4 percent, which is more than the double of 34.4 percent for the Public Sector Banks. However, the private banks have limited presence compared to the public sector banks in terms of

338
the banking infrastructure in the state. Hence, it is observed that there are need and scope for the public sector banks to improve their performance in terms of providing credit in Bihar. The RRBs in the state are doing better than other public sector banks; however, there is scope for improvement in credit delivery by these banks also. The RRBs have a wider presence in terms of branches in the state. For improving credit delivery in the state, one ray of hope is the Small Finance Banks. Although they are new in the banking business and also their size of business in the state is presently small compared to other banks, their performance is much better than other banks in terms of providing credit. The CD ratio of the SFBs in September 2019 was 452.1 percent and Utkarsh SFB had the highest CD ratio of 708.2 percent (Table 10.15).
Table 10.15 : Deposit, Advances and CD Ratio of Private Banks, RRBs and SFBs in Bihar (2018 and 2019)
As on 30 September 2018 As on 30 September 2019 Deposits
(Rs. Lakh) Advances (Rs. Lakh)
CD ratio (percent)
Deposits (Rs. Lakh)
Advances (Rs. Lakh)
CD ratio (percent)
Private Banks IDBI Bank 444643 187414 42.2 449901 181949 40.4 ICICI Bank 1011090 550172 54.4 977506 705002 72.1 Federal Bank 38514 16076 41.7 44504 9811 22.0 Jammu & Kashmir Bank 0 0 0 9485 10140 106.9 South Indian Bank 0 0 0 26205 1383 5.3 AXIS Bank 607353 284405 46.8 699649 342313 48.9 HDFC Bank 1017866 524563 51.5 928466 698248 75.2 IndusInd Bank 68754 154186 224.3 98095 456805 465.7 Karnataka Bank 2328 469 20.2 2492 664 26.6 Kotak Mahindra Bank 0 0 0 108886 36079 33.1 Yes Bank 37912 6958 18.4 50809 12853 25.3 Bandhan Bank 158086 317248 200.7 205250 406090 197.8 Total: Private Sector Banks 3386546 2041491 60.3 3601248 2861337 79.4 Total: Public Sector Banks 25319948 8871840 35.0 27536565 9467828 34.4 Total: Commercial Bank 28706494 10913331 38.0 31137813 12329165 39.6 Total: Cooperative Bank 383625 289998 75.6 408595 223162 54.6
RRBs Madhya Bihar KGB 1137084 532105 46.8 1894832 973655 51.4 Bihar KGB 548023 367240 67.0 -- -- -- Uttar Bihar KGB 1443543 765558 53.0 1603279 838258 52.3
Total: RRBs 3128650 1664903 53.2 3498111 1811913 51.8 Small Finance Bank (SFB)
Jana SFB 0 0 0 24767 21527 86.9 Utkarsh SFB 20454 151629 741.3 32639 231163 708.2 Ujjivan SFB 0 0 0 14634 73030 499.0 Total: Small Finance Banks 20454 151629 741.3 72040 325720 452.1
Source : State Level Bankers' Committee Report

339
To judge the adequacy of credit, one can also examine the Credit-GSDP ratio and this ratio in
Bihar has remained almost constant in the last four years (Table 10.16). From this, one can again
conclude that there is a need to improve the provisioning of credit through the financial institutions
in Bihar in order to reach the national-level average of growth and development.
Table 10.16 : Credit-GSDP Ratio in Bihar (2015-16 to 2018-19)
2015-16 2016-17 2017-18 2018-19
Credit-GSDP ratio (%) 27.9 27.6 27.7 27.8
CD ratio (%) 43.0 41.9 45.4 44.1
Source : State Level Bankers' Committee Report and Calculations
The bank-wise percentage share of deposits and advances in Bihar for the last three years is shown
in Table 10.17. As of September 2019, the Public Sector Banks have the highest share in both the
deposit and advances in Bihar, followed by the private banks and the RRBs. However, the share
of Public Sector Banks has fallen in the last three years. The drop in their share is more in the
advances, which has decreased from 73.0 percent in 2017 to 64.4 percent in 2019. The reduced
share of the public sector banks has been compensated by the private sector banks and the small
finance banks. It is observed that the private banks and the small finance banks have made
significant progress in providing credit in the state, whereas the performance of the public sector
banks has been disappointing.
Table 10.17 : Bank-wise Share of Deposit and Advances in Bihar (2017-2019)
Deposits Advances
Sep-17 Sep-18 Sep-19 Sep-17 Sep-18 Sep-19
Public Sector Banks 80.8 78.5 78.4 73.0 68.1 64.4
Private Banks 8.0 10.5 10.3 12.6 15.7 19.5
Cooperative Banks 0.9 1.2 1.2 1.5 2.2 1.5
RRBs 10.3 9.7 10.0 12.9 12.8 12.3
Small Finance Banks 0.0 0.1 0.2 0.0 1.2 2.2
Total 100.0 100.0 100.0 100.0 100.0 100.0
Source : State Level Bankers' Committee Report
10.3 Achievements under Annual Credit plan (ACP)
Table 10.18 shows the sectoral share of advances under the Annual Credit Plan (ACP) in the state.
The share of priority sector in total advances in the state has decreased in the last three years. It
has come down from 75.0 percent in 2016-17 to 71.5 percent in 2018-19. The share of the non-
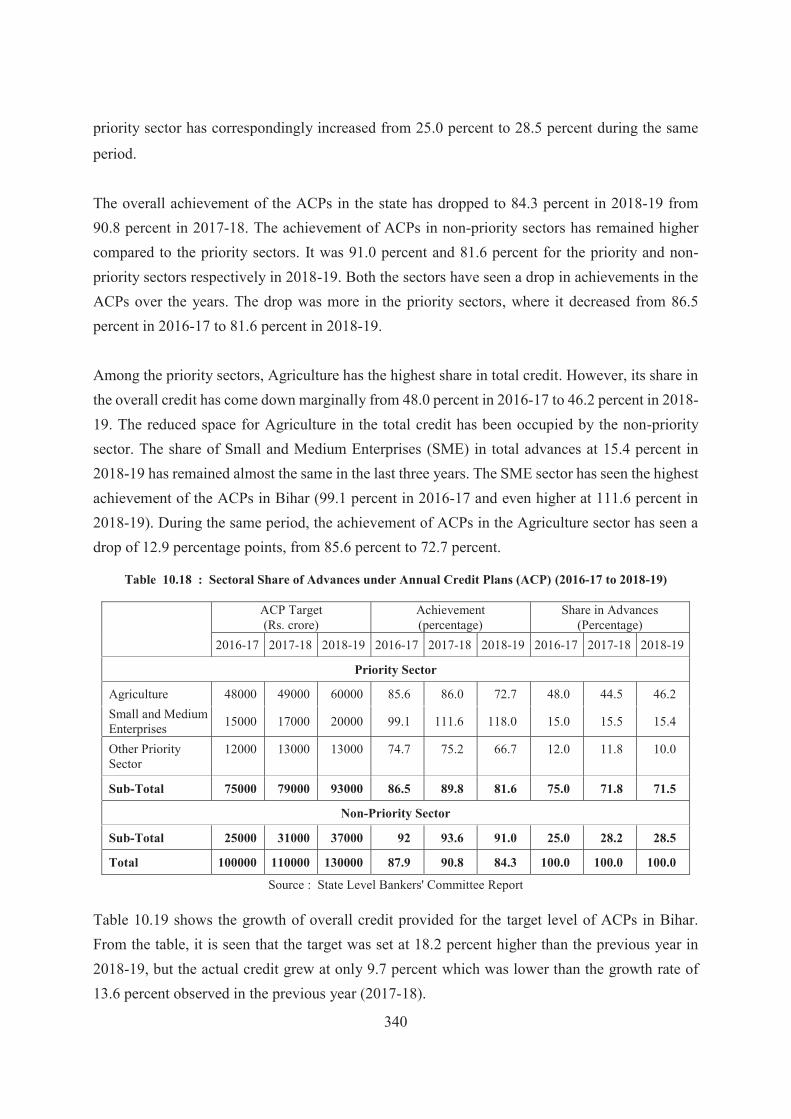
340
priority sector has correspondingly increased from 25.0 percent to 28.5 percent during the same
period. The overall achievement of the ACPs in the state has dropped to 84.3 percent in 2018-19 from 90.8 percent in 2017-18. The achievement of ACPs in non-priority sectors has remained higher compared to the priority sectors. It was 91.0 percent and 81.6 percent for the priority and non-priority sectors respectively in 2018-19. Both the sectors have seen a drop in achievements in the ACPs over the years. The drop was more in the priority sectors, where it decreased from 86.5 percent in 2016-17 to 81.6 percent in 2018-19. Among the priority sectors, Agriculture has the highest share in total credit. However, its share in the overall credit has come down marginally from 48.0 percent in 2016-17 to 46.2 percent in 2018-19. The reduced space for Agriculture in the total credit has been occupied by the non-priority sector. The share of Small and Medium Enterprises (SME) in total advances at 15.4 percent in 2018-19 has remained almost the same in the last three years. The SME sector has seen the highest achievement of the ACPs in Bihar (99.1 percent in 2016-17 and even higher at 111.6 percent in 2018-19). During the same period, the achievement of ACPs in the Agriculture sector has seen a drop of 12.9 percentage points, from 85.6 percent to 72.7 percent.
Table 10.18 : Sectoral Share of Advances under Annual Credit Plans (ACP) (2016-17 to 2018-19)
ACP Target
(Rs. crore) Achievement (percentage)
Share in Advances (Percentage)
2016-17 2017-18 2018-19 2016-17 2017-18 2018-19 2016-17 2017-18 2018-19
Priority Sector
Agriculture 48000 49000 60000 85.6 86.0 72.7 48.0 44.5 46.2 Small and Medium Enterprises 15000 17000 20000 99.1 111.6 118.0 15.0 15.5 15.4
Other Priority Sector
12000 13000 13000 74.7 75.2 66.7 12.0 11.8 10.0
Sub-Total 75000 79000 93000 86.5 89.8 81.6 75.0 71.8 71.5
Non-Priority Sector
Sub-Total 25000 31000 37000 92 93.6 91.0 25.0 28.2 28.5
Total 100000 110000 130000 87.9 90.8 84.3 100.0 100.0 100.0
Source : State Level Bankers' Committee Report
Table 10.19 shows the growth of overall credit provided for the target level of ACPs in Bihar. From the table, it is seen that the target was set at 18.2 percent higher than the previous year in 2018-19, but the actual credit grew at only 9.7 percent which was lower than the growth rate of 13.6 percent observed in the previous year (2017-18).
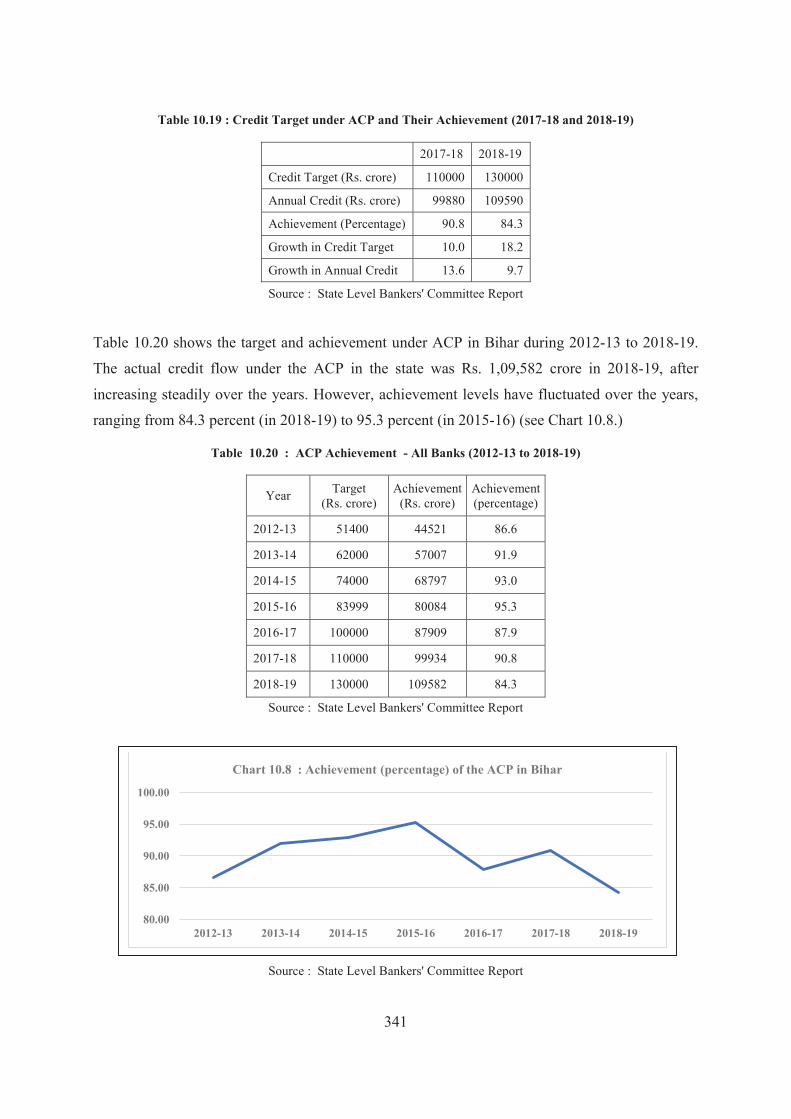
341
Table 10.19 : Credit Target under ACP and Their Achievement (2017-18 and 2018-19)
2017-18 2018-19
Credit Target (Rs. crore) 110000 130000
Annual Credit (Rs. crore) 99880 109590
Achievement (Percentage) 90.8 84.3
Growth in Credit Target 10.0 18.2
Growth in Annual Credit 13.6 9.7
Source : State Level Bankers' Committee Report
Table 10.20 shows the target and achievement under ACP in Bihar during 2012-13 to 2018-19.
The actual credit flow under the ACP in the state was Rs. 1,09,582 crore in 2018-19, after
increasing steadily over the years. However, achievement levels have fluctuated over the years,
ranging from 84.3 percent (in 2018-19) to 95.3 percent (in 2015-16) (see Chart 10.8.)
Table 10.20 : ACP Achievement - All Banks (2012-13 to 2018-19)
Year Target (Rs. crore)
Achievement (Rs. crore)
Achievement (percentage)
2012-13 51400 44521 86.6
2013-14 62000 57007 91.9
2014-15 74000 68797 93.0
2015-16 83999 80084 95.3
2016-17 100000 87909 87.9
2017-18 110000 99934 90.8
2018-19 130000 109582 84.3
Source : State Level Bankers' Committee Report
Source : State Level Bankers' Committee Report
80.00
85.00
90.00
95.00
100.00
2012-13 2013-14 2014-15 2015-16 2016-17 2017-18 2018-19
Chart 10.8 : Achievement (percentage) of the ACP in Bihar

342
Table 10.21 shows the bank category-wise ACP targets and their achievement in Bihar. Small
Finance Banks have shown the highest achievement in the ACP target in the state. However, their
share in the overall advances in the state is small, compared to the Commercial Banks and the
RRBs. The achievements of the Commercial Banks and the RRBs were 82.1 and 78.4 percent
respectively in 2018-19; these achievement levels are significantly lower than 90.2 percent and
86.3 percent in 2017-18. The Commercial Banks, specifically the public sector banks, and the
RRBs which together occupy a larger share in the deposit and credit market in the state have failed
in achieving their ACP targets. More than that, their performance has worsened in 2018-19 over
the previous year.
Table 10.21 : Bank-wise ACP target and its achievement in Bihar (2017-18 and 2018-19)
Agencies
Target (Rs. crore)
Achievement (Rs. crore)
Achievement (percentage)
Target (Rs. crore)
Achievement (Rs. crore)
Achievement (percentage)
2017-18 2018-19
Commercial Bank 86044 77594 90.2 101331 83226 82.1
Regional Rural Bank 22920 19770 86.3 26437 20730 78.4
Cooperative Bank 1036 2570 248.1 1980 2821 142.5
Small Finance Bank — — — 252 2805 1113.1
Total 110000 99934 90.8 130000 109582 84.3
Source : State Level Bankers' Committee Report
The credit flow to the Agriculture sector in Bihar is shown in Table 10.22. The total credit flow to
the Agriculture sector in the state under the ACP was Rs 41,798 crore, which is marginally lower
than Rs. 42,161 crore in the previous year. Moreover, the achievement of the targets under the
ACP in Bihar has seen a significant decline for the agriculture sector. The overall target under the
ACP for the agriculture sector was Rs. 60,000 crore in 2018-19, which is higher than the target of
Rs. 49,000 crore for 2017-18. However, the achievement percentage of the target set for the
Agriculture sector dropped from 86.0 percent in 2017-18 to 70.7 percent in 2018-19. Among the
banks, Commercial Banks were the worst performers in achieving the credit target for the
agriculture sector in Bihar.

343
Table 10.22 : Agriculture Credit Flow in Bihar (2012-13 to 2018-19)
(Rs. Crore)
Year Commercial Bank RRBs CCBs Total
Target Achieve-ment Target Achieve-
ment Target Achieve-ment Target Achieve-
ment
2012-13 14674 13203 (90.0) 8407 8035
(95.6) 2319 328 (14.2) 25401 21566
(84.9)
2013-14 18709 17786 (95.1) 10777 10676
(99.1) 800 307 (38.4) 30286 28770
(95.0)
2014-15 22191 21260 (95.8) 12809 13058
(101.9) 1000 362 (36.2) 36000 34680
(96.3)
2015-16 26554 24957 (94.0) 14946 15135
(101.3) 1000 1258 (125.8) 42500 41350
(97.3)
2016-17 28317 25004 (88.3) 18682 14247
(76.3) 1000 1825 (182.6) 48000 41076
(85.6)
2017-18 29281 24734 (84.5) 18682 14879
(79.6) 1036 2548 (246.0) 49000 42161
(86.0)
2018-19 35975 21734 (60.4) 22045 17264
(78.3) 1980 2800 (141.4) 60000 41798
(70.7) Note : Values in parenthesis are in percentage
Source : State Level Bankers' Committee Report
The data on outstanding advances to the agriculture sector and its growth is shown in Table 10.23. The outstanding advances to the agriculture sector in Bihar were Rs. 45,815 crore in 2018-19, which is only marginally higher than in the previous years. The Commercial Banks have the highest share in these advances at Rs. 31,239 crore, followed by the RRBs at Rs. 13,543 crore in 2018-19.
Table 10.23 : Outstanding Agricultural Advances (2012-13 to 2018-19)
Year
Outstanding Agricultural Advances (Rs. crore) Annual
Growth Rate Commercial
Banks RRBs Cooperative & LDBs Total
2012-13 15422 4219 2824 22538 23.2 2013-14 19231 5101 1047 25380 12.6 2014-15 23130 6311 1212 30652 20.8 2015-16 25281 8856 1536 35673 16.4 2016-17 27256 10938 3636 41830 17.3 2017-18 30932 12217 2557 45706 9.3 2018-19 31239 13543 1032 45815 0.24
Source : State Level Bankers' Committee Report
10.4 Kisan Credit Card (KCC)
The number of Kisan Credit Cards (KCC) issued by banks in Bihar is shown in Table 10.24. The
KCC scheme was introduced in 1998-99. Over the years, KCC has become a popular instrument

344
for providing credits to the farmers. The scheme is implemented by all Scheduled Commercial
Banks, Regional Rural Banks, State Cooperative Banks, Central Cooperative Banks, and Primary
Agricultural Cooperative Societies. The beneficiaries under the KCC are issued with a credit card-
cum-passbook, incorporating the borrowing limit and validity period. The credit limits are fixed
taking into account the production credit needs for a full year, plus ancillary activities relating to
crop production. At the discretion of lending banks, sub-limits for credits are also fixed. The crop
loan is provided in the form of a revolving cash credit facility, involving any number of
withdrawals and repayments within the fixed limit.
During 2018-19, 2.19 lakh KCCs were issued in the state by different financial institutions. Out of
this, a majority of 1.55 lakh cards were issued by the commercial banks, followed by 62.3 thousand
cards by the RRBs and 2.0 thousand cards by the CCBs. However, over the years, the achievement
percentage in issuing 15.00 lakh cards per year until 2017-18, has steadily declined. The target for
issuing the new KCC in the state was revised to 10.00 lakh cards for 2018-19, but only 21.9 percent
of the target could be achieved in the year.
Table 10.24 : Number of Kisan Credit Cards (new) issued by Banks (2012-13 to 2018-19)
Year Target Achievement Percentage Target Achievement Percentage
Commercial Banks RRBs
2012-13 811207 600343 74.0 467081 246987 52.9
2013-14 909186 675107 74.3 535348 387658 72.4
2014-15 903944 628370 69.5 537590 353841 65.8
2015-16 918912 484543 52.7 527226 269047 51.0
2016-17 873362 409441 46.9 576187 163919 28.4
2017-18 896357 405366 45.2 571902 119355 20.9
2018-19 599660 154825 25.8 367350 62311 17.0
Year CCB Total
2012-13 221712 16492 7.4 1500000 863822 57.6
2013-14 55466 11325 20.4 1500000 1074090 71.6
2014-15 58466 13057 22.3 1500000 995268 66.4
2015-16 53860 10093 18.7 1500000 763683 51.0
2016-17 50451 7087 14.0 1500000 580447 38.7
2017-18 31742 4489 14.1 1500000 529210 35.3
2018-19 32990 2049 6.2 1000000 219185 21.9
Source : State Level Bankers' Committee Report

345
Table 10.25 shows the Non-Performing Asset (NPA) of banks in Bihar on March 2018 and March
2019. The NPA of all banks in Bihar as on March 2019 was 10.9 percent, which is slightly higher
than 10.6 percent as on March 2018. Among the banks in Bihar, the NPA for the RRBs is the
highest at 25.2 percent in March 2019; however, it has declined from 27.5 percent in March 2018.
The NPA for the cooperative banks has also come down from 9.7 percent in March 2018 to 7.2
percent in March 2019. The NPA of the Commercial Banks, however, has increased in the state to
9.1 percent in March, 2019 from 8.1 percent in the previous year.
Table 10.25 : NPAs of Banks in Bihar (2018 and 2019)
Source : State Level Bankers' Committee Report
The sector-wise NPAs of the banks are shown in Table 10.26. As on March 2019, the highest
percentage of NPA was in the agriculture sector at 19.1 percent, which is higher than 17.1 percent
in March 2018. The NPA for the MSME sector declined from 13.9 percent on March 2018 to 12.8
on March 2019. Finally, the NPA in the non-priority sector has also come down from 2.1 percent
in March, 2018 to 1.7 percent in March, 2019.
Table 10.26 : Sector-wise NPAs of Banks in Bihar (March 2019)
Sector Total
Outstanding (Rs. crore)
Total NPA (Rs. crore)
NPA (Percentage)
Agriculture 47546.36 9071.04 19.1
MSME 33078.47 4249.23 12.8
Other Priority Sector 11897.44 940.62 7.9
Total Priority Sector 92522.27 14260.89 15.4
Non-Priority Sector 44724.16 741.62 1.7
Total 137246.43 15002.51 10.9
Source : State Level Bankers' Committee Report
Banks
March-18 March-19
Total Advances (Rs. crore)
Total NPA (Rs. crore)
NPA (Percentage)
Written off (Rs. crore)
Total Advances (Rs. crore)
Total NPA (Rs. crore)
NPA (Percentage)
Written off (Rs. crore)
Commercial Bank 108272 8770 8.1 953 112997 10255 9.1 716
Co-Operative Bank 2570 250 9.7 3851 279 7.2 —
RRB 16205 4461 27.5 17733 4462 25.2 — Small Finance Bank — — — — 2666 6 0.2 —
Total 127047 13481 10.6 953 137247 15002 10.9 716

346
10.5 Pradhan Mantri Mudra Yojana (PMMY)
The Pradhan Mantri Mudra Yojana (PMMY) was launched in April 2015 with the objective to
‘create an inclusive, sustainable and value-based entrepreneurial culture’, especially for
encouraging and supporting small entrepreneurs. Micro Units Development and Refinance
Agency (MUDRA) is a new institution set up by the Central Government to provide funding to
the non-corporate, non-farm sector income-generating activities of micro and small enterprises,
whose credit needs are below Rs. 10.0 lakh. The loans under this scheme are collateral-free. These
loans are given by the Commercial Banks, RRBs, Small Finance Banks, Cooperative Banks, Micro
Finance Institutions (MFI) and Non-Banking Financial Institutions (NBFC). Under this scheme,
MUDRA has created three products — 'Shishu', 'Kishore' and ‘Tarun’ as per the stage of growth
and funding needs of the beneficiary micro unit. This classification also provides a ‘reference point
for the next phase of graduation/growth’. The amounts available under each category are as follows
— Shishu (covering loans up to Rs. 50,000), Kishore (covering loans above Rs. 50,000 and up
to Rs. 5.00 lakh) and Tarun (covering loans above Rs. 5.00 lakh and up to Rs. 10.00 lakh). The
Non-Corporate Small Business Segment (NCSBS) comprising of proprietorship or partnership
firms are eligible for assistance under MUDRA. These firms include — small manufacturing units,
service sector units, shopkeepers, fruits/vegetable vendors, truck operators, food-service units,
repair shops, machine operators, small industries, food processors and others in rural and urban
areas.
Table 10.27 shows the performance of the PMMY in Bihar. During 2018-19, loan amounting Rs.
7458.00 crore was sanctioned in Bihar under the scheme, which was more than the target amount
of Rs. 4170.45 crore. The distribution of the loans among three categories (Shishu, Tarun and
Kishore) under the scheme is shown in Chart 10.9. The share of Kishore loans was 47 percent,
followed by Shishu and Tarun Loans with the shares of 30 and 23 percent, respectively, in the total
PMMY loans sanctioned during 2018-19. The achievement percentage for this scheme was 217.1
percent (Shishu), 208.3 percent (Kishore) and 118.6 percent (Tarun). Further, it is observed that
loans sanctioned under the scheme has decreased from Rs 9598 crore in 2017-18 to Rs 7458 crore
in 2018-19, which is a drop of 28.7 percent. The number of loans sanctioned have also come down
by 25.8 percent from 11.01 lakhs in 2017-18 to 8.75 lakhs in 2018-19.
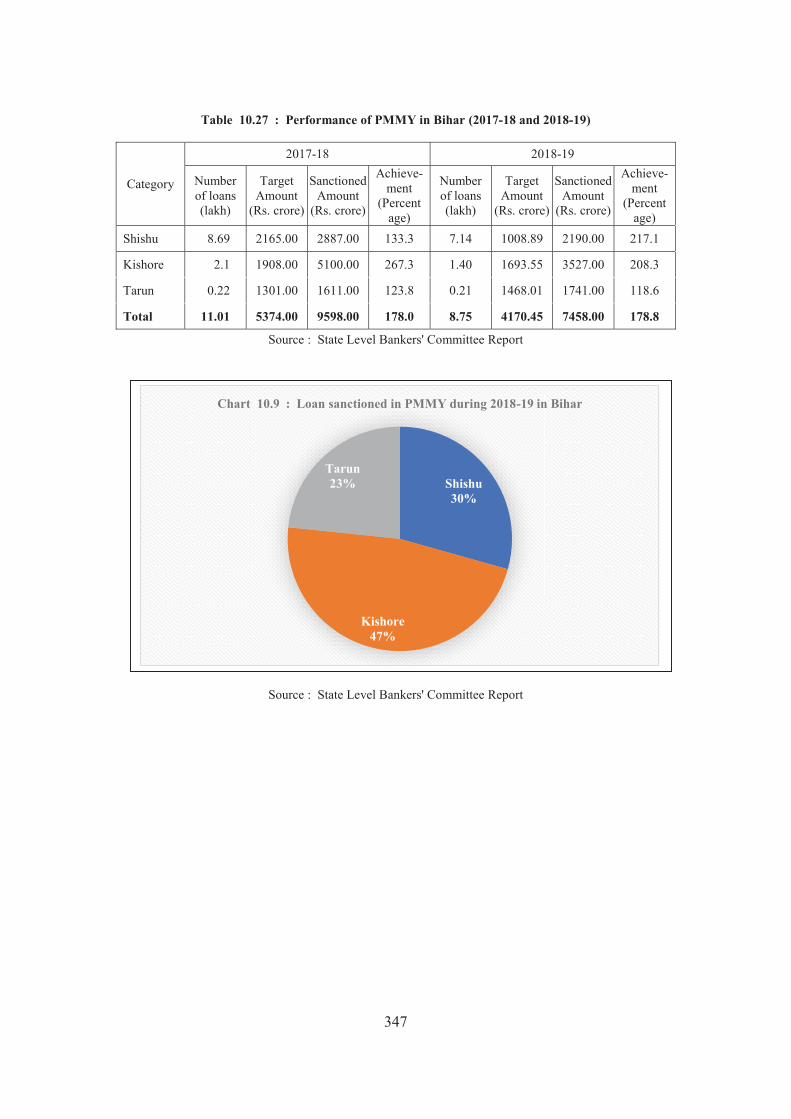
347
Table 10.27 : Performance of PMMY in Bihar (2017-18 and 2018-19)
Category
2017-18 2018-19
Number of loans (lakh)
Target Amount
(Rs. crore)
Sanctioned Amount
(Rs. crore)
Achieve-ment
(Percent age)
Number of loans (lakh)
Target Amount
(Rs. crore)
Sanctioned Amount
(Rs. crore)
Achieve-ment
(Percent age)
Shishu 8.69 2165.00 2887.00 133.3 7.14 1008.89 2190.00 217.1
Kishore 2.1 1908.00 5100.00 267.3 1.40 1693.55 3527.00 208.3
Tarun 0.22 1301.00 1611.00 123.8 0.21 1468.01 1741.00 118.6
Total 11.01 5374.00 9598.00 178.0 8.75 4170.45 7458.00 178.8
Source : State Level Bankers' Committee Report
Source : State Level Bankers' Committee Report
Shishu30%
Kishore47%
Tarun23%
Chart 10.9 : Loan sanctioned in PMMY during 2018-19 in Bihar

348
APPENDIX
Table A 10.1 : District-wise Performance Under Annual Credit Plan (Agriculture and Small and Medium Enterprises) (March, 2019)
(Amounts in Rs. crore)
Districts
Agriculture Small & Medium Enterprise
Target Achieve-ment
Achieve-ment
Percent-age
Target Achieve-ment
Achieve-ment
Percent-age
Patna 3726 2621 70.3 3583 6684 186.5 Nalanda 2047 1977 96.6 463 439 94.9 Bhojpur 1845 1104 59.9 476 491 103.2 Buxar 1372 1007 73.4 355 431 121.4 Rohtas 1835 1696 92.4 517 620 120.0 Kaimur 1172 1126 96.1 280 267 95.5
Gaya 2256 1699 75.3 803 914 113.8 Jehanabad 860 508 59.0 253 179 70.8 Arwal 581 360 62.0 118 88 74.4 Nawada 1352 944 69.9 235 289 123.0 Aurangabad 1668 1160 69.6 364 373 102.3
Saran 2026 1513 74.7 626 569 90.9 Siwan 1854 1144 61.7 510 510 99.9 Gopalganj 1767 1046 59.2 355 302 85.1
W. Champaran 1734 1421 81.9 520 480 92.3 E. Champaran 2509 2047 81.6 706 718 101.6 Muzafarpur 2661 2211 83.1 1138 1425 125.2 Sitamarhi 1637 937 57.2 439 403 91.7 Sheohar 472 297 63.0 120 78 64.9 Vaishali 1896 1309 69.1 568 532 93.7
Darbhanga 1846 1215 65.8 576 622 107.9 Madhubani 2876 1296 45.1 554 481 86.9 Samastipur 2824 2187 77.4 721 776 107.5
Begusarai 1765 1508 85.4 708 874 123.5 Munger 906 575 63.5 327 314 96.0 Sheikhpura 591 360 61.0 145 125 86.3 Lakhisarai 728 489 67.2 159 174 109.7 Jamui 1111 833 75.0 227 209 92.0 Khagaria 1077 847 78.6 301 292 96.8
Bhagalpur 1773 1278 72.1 924 953 103.1 Banka 1045 593 56.8 338 247 73.0
Saharsa 747 611 81.9 270 261 96.7 Supaul 1207 732 60.7 310 225 72.7 Madhepura 1144 692 60.5 273 247 90.3
Purnea 1418 1314 92.7 569 831 146.1 Kishanganj 837 847 101.1 282 287 101.9 Araria 1444 1210 83.8 407 474 116.4 Katihar 1394 908 65.1 480 420 87.5
Bihar 60000 43621 72.7 20000 23601 118.0 Source : State Level Bankers' Committee

349
Table A 10.2 : District-wise Performance Under Annual Credit Plan (Other Priority Sector and Total Priority Sector) (March, 2019)
(Amounts in Rs. crore)
Districts
Other Priority Sector Total Priority Sector
Target Achieve-ment
Achieve-ment
Percent-age
Target Achieve-ment
Achieve-ment
Percent-age
Patna 3148 2050 65.1 10457 11356 108.6 Nalanda 270 205 75.9 2780 2622 94.3 Bhojpur 317 225 70.8 2638 1820 69.0 Buxar 216 153 70.9 1944 1591 81.9 Rohtas 514 323 62.9 2866 2639 92.1 Kaimur 264 181 68.4 1716 1574 91.7
Gaya 857 528 61.7 3916 3141 80.2 Jehanabad 107 80 75.2 1220 767 62.9 Arwal 58 55 94.9 757 503 66.4 Nawada 141 135 95.9 1728 1368 79.2 Aurangabad 330 223 67.6 2362 1756 74.3
Saran 553 370 67.0 3205 2452 76.5 Siwan 398 251 63.1 2762 1904 69.0 Gopalganj 200 74 36.9 2322 1422 61.2
W. Champaran 738 387 52.4 2992 2288 76.5 E. Champaran 260 186 71.6 3475 2951 84.9 Muzafarpur 364 411 112.8 4163 4047 97.2 Sitamarhi 230 163 70.8 2306 1502 65.1 Sheohar 54 49 90.9 645 424 65.7 Vaishali 201 194 96.6 2665 2035 76.4
Darbhanga 257 192 74.8 2679 2029 75.7 Madhubani 331 234 70.6 3760 2010 53.5 Samastipur 709 366 51.6 4254 3328 78.2
Begusarai 407 218 53.6 2880 2600 90.3 Munger 127 85 67.1 1359 974 71.6 Sheikhpura 14 15 111.4 749 500 66.8 Lakhisarai 53 44 84.4 939 707 75.3 Jamui 138 77 55.9 1477 1119 75.8 Khagaria 117 77 65.4 1496 1215 81.2
Bhagalpur 218 212 97.3 2915 2443 83.8 Banka 77 69 89.2 1459 908 62.2
Saharsa 214 172 80.1 1231 1044 84.8 Supaul 198 131 66.1 1715 1089 63.5 Madhepura 105 79 75.6 1523 1018 66.9
Purnea 240 166 69.1 2227 2311 103.8 Kishanganj 119 61 51.2 1238 1194 96.5 Araria 188 110 58.4 2039 1794 88.0 Katihar 268 120 44.9 2142 1447 67.6
Bihar 13000 8672 66.7 93000 75894 81.6 Source : State Level Bankers' Committee

350
Table A 10.3 : District-wise Achievement of Kisan Credit Card (NEW and RENEW) (2010-11 to 2018-19)
(Numbers in ‘000)
Districts 2010-11 2011-12 2012-13 2013-14 2014-15 2015-16 2016-17 2017-18 2018-19
Patna 50.52 54.95 54.32 72.92 59.09 62.58 66.55 58.46 69.26 Nalanda 42.07 46.48 63.1 52.08 54.17 72.24 56.12 68.75 56.65 Bhojpur 59.02 84.54 86.53 96.03 90.5 83.7 50.31 99.98 57.83 Buxar 32.04 40.53 79.49 64.99 51.36 44.43 35.63 49.55 53.15 Rohtas 57.66 76.55 95.86 78.68 72.13 93.4 113.52 102.74 60.00 Kaimur 29.36 44.17 63.62 57.32 63.94 68.04 37.91 58.98 34.13
Gaya 41.01 60.65 85.44 95.49 86.97 104.28 93.17 90.73 76.37 Jehanabad 25.15 26.43 18.91 16.73 14.2 22.68 17.69 35.49 18.93 Arwal 8.36 12.75 13.46 11.1 13.47 18.68 13.99 21.65 16.00 Nawada 28.98 23.73 36.43 44.29 42.46 76.64 58.62 36.12 50.70 Aurangabad 42.35 54.79 67.64 31.7 54.1 73.83 75.75 55.18 55.46
Saran 34.84 39.06 66.26 72.48 61.32 91.86 82.06 76.91 55.03 Siwan 34.17 36.96 72.17 55.79 71.07 97.31 83.47 76.93 62.27 Gopalganj 53.93 60.45 82.85 97.37 98.8 88.55 109.34 88.95 41.47
W. Champaran 75.74 97.81 86.74 104.25 98.93 136.4 129.69 100.4 88.12 E. Champaran 82.86 104.24 129.86 147.01 156.8 160.34 153.66 142.86 126.18 Muzaffarpur 58.14 71.13 91.76 96.01 144.85 142.78 139.99 91 59.97 Sitamarhi 30.37 43.47 62.52 66.49 47.52 55.15 42.9 62.68 30.77 Sheohar 12.12 7.68 11.31 27.41 9.87 49.79 17.19 15.11 9.38 Vaishali 45.61 66.71 82.39 88.73 80.25 85.17 77.88 95.26 71.41
Darbhanga 26.36 41.68 56.13 52.02 39.35 41.38 48.46 47.24 37.05 Madhubani 55.26 72.37 101.07 95.6 97.56 129.11 95.02 136.74 60.14 Samastipur 80.4 95.79 94.51 155.58 154.74 173.89 170.53 206.55 120.34
Begusarai 72.81 89.8 111.45 152.53 134.32 134.01 119.82 122 91.51 Munger 16.7 28.05 19.33 36.37 36.22 44.2 46.09 57.42 27.88 Shiekhpura 5.22 12.74 13.62 12.6 21.87 13.45 26.97 37.24 19.99 Lakhisarai 15.85 18.07 16.62 35.84 39.83 37.07 38.71 44.76 25.89 Jamui 22.59 28.02 30.84 50.86 64.32 64.64 68.24 75.42 50.07 Khagaria 39.92 57.27 45.85 69.17 78.56 76.26 83.32 71.97 57.21
Bhagalpur 37.94 48.75 45.36 66.86 65.7 72.44 61.73 70.51 51.58 Banka 22.83 36.2 34.78 36.69 36.02 47.77 34.62 45.3 28.08
Saharsa 18.9 25.22 32.86 41.01 47.16 45.35 33.45 30.38 29.12 Supaul 16.79 27.26 40.51 45.48 46.71 43.3 42.94 44.73 40.18 Madhepura 14.71 24.8 29.93 36.54 25.39 20.35 28.71 22.02 35.67
Purnea 30.38 55.21 64.57 64.26 61.97 68.56 45.65 61.79 58.76 Kishanganj 20.79 36.76 44.19 51.11 46.03 54.16 40.5 57.6 42.23 Araria 29.47 47.76 54.05 82.37 53.92 60.22 42.71 54.5 48.84 Katihar 31.62 48.62 45.51 53.03 49.92 60.84 41.77 52.78 38.04
Bihar 1402.83 1847.44 2231.79 2514.76 2471.35 2814.83 2524.66 2666.65 1955.62 Source : State Level Bankers' Committee
____________

351
CHAPTER - XI
HUMAN DEVELOPMENT
To keep the body in good health is a duty... otherwise we shall not be able to keep our mind strong
and clear. — Gautam Buddha
Human Development is a broad concept and it is about creating an environment in which people can develop their full potential and lead productive lives in accordance with their needs and interests. It is sometimes believed that human development is associated with modernisation, leisure, comfort and affluence. But, this is a partial and one-sided view of human development. In a broader perspective, human development encompasses many more components. To assess different dimensions of human development in a rapidly evolving social and economic context, the role of public policy assumes paramount importance. The concept of human development
Abstract
The economic development in Bihar has been characterised predominantly by development of social indicators like health, education, social welfare and social security. In the last eight years, the level of Per Capita Development Expenditure in Bihar has been growing at the rate of 14.2 percent compared to the national average of 13.3 percent. Further, the expenditure on education and health in the state registered an annual growth rate of 13.8 percent and 20.8 percent respectively. The health sector in the state received mixed response in its three crucial development indicators like outcome (IMR), process (institutional delivery) and input (infrastructure). While IMR and institutional delivery improved, Government is keen to promote health infrastructure and expenditure with strong institutional mechanisms like NHM. The literacy rate illustrates an upward trend and the gender gap in literacy shows a downward trend which is a positive sign. The dropout rate at primary education recorded a decrease of 15.5 percentage points and at the upper primary level, this decrease was 6.9 percentage points. Access to safe drinking water is an area of concern. The welfare of SC, ST, minorities and women communities was accorded high priority in state’s development programme. The social security measures of the State Government not only uplifted the welfare of disadvantaged communities, it also installed confidence among them. There was a steady increase in expenditure on social security in Bihar.
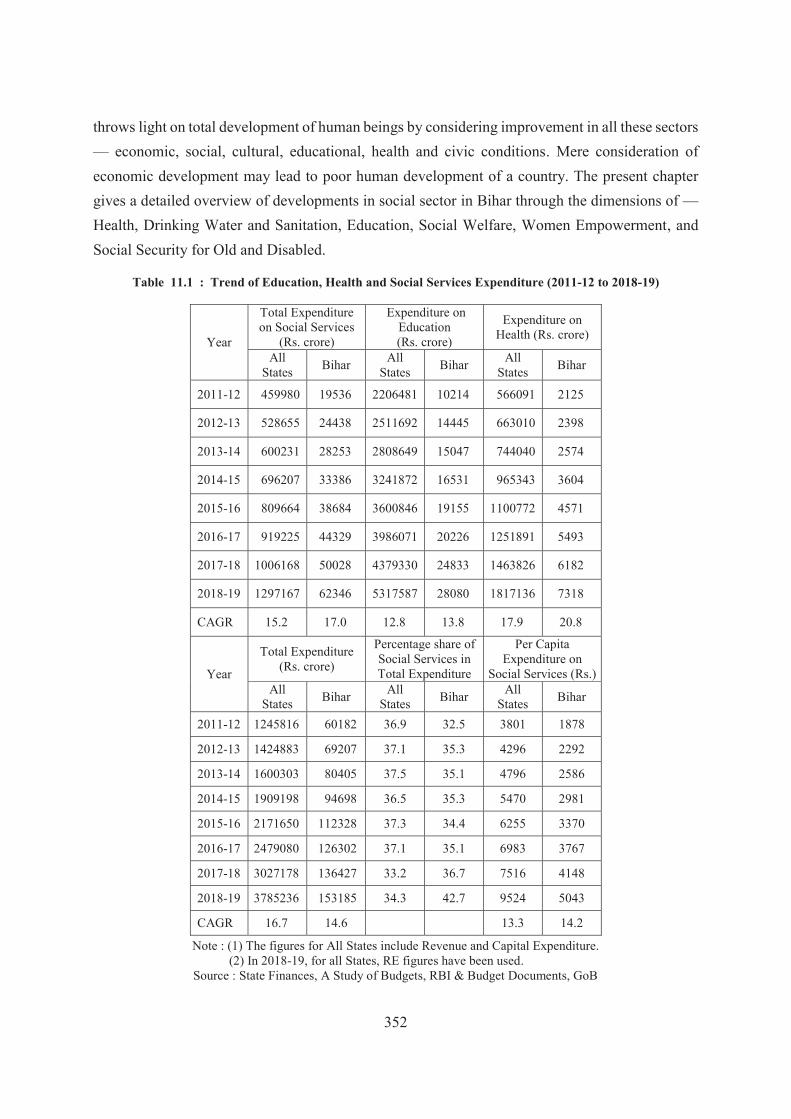
352
throws light on total development of human beings by considering improvement in all these sectors — economic, social, cultural, educational, health and civic conditions. Mere consideration of economic development may lead to poor human development of a country. The present chapter gives a detailed overview of developments in social sector in Bihar through the dimensions of —Health, Drinking Water and Sanitation, Education, Social Welfare, Women Empowerment, and Social Security for Old and Disabled.
Table 11.1 : Trend of Education, Health and Social Services Expenditure (2011-12 to 2018-19)
Year
Total Expenditure on Social Services
(Rs. crore)
Expenditure on Education (Rs. crore)
Expenditure on Health (Rs. crore)
All States Bihar All
States Bihar All States Bihar
2011-12 459980 19536 2206481 10214 566091 2125
2012-13 528655 24438 2511692 14445 663010 2398
2013-14 600231 28253 2808649 15047 744040 2574
2014-15 696207 33386 3241872 16531 965343 3604
2015-16 809664 38684 3600846 19155 1100772 4571
2016-17 919225 44329 3986071 20226 1251891 5493
2017-18 1006168 50028 4379330 24833 1463826 6182
2018-19 1297167 62346 5317587 28080 1817136 7318
CAGR 15.2 17.0 12.8 13.8 17.9 20.8
Year
Total Expenditure (Rs. crore)
Percentage share of Social Services in Total Expenditure
Per Capita Expenditure on
Social Services (Rs.)All
States Bihar All States Bihar All
States Bihar
2011-12 1245816 60182 36.9 32.5 3801 1878
2012-13 1424883 69207 37.1 35.3 4296 2292
2013-14 1600303 80405 37.5 35.1 4796 2586
2014-15 1909198 94698 36.5 35.3 5470 2981
2015-16 2171650 112328 37.3 34.4 6255 3370
2016-17 2479080 126302 37.1 35.1 6983 3767
2017-18 3027178 136427 33.2 36.7 7516 4148
2018-19 3785236 153185 34.3 42.7 9524 5043
CAGR 16.7 14.6 13.3 14.2
Note : (1) The figures for All States include Revenue and Capital Expenditure. (2) In 2018-19, for all States, RE figures have been used.
Source : State Finances, A Study of Budgets, RBI & Budget Documents, GoB

353
Chart 11.1 : Trend of Per Capita Expenditure on Social Services
During the last eight years (2011-12 to 2018-19), the economy of the state has experienced a steady
growth rate of 11.8 percent at current prices. In consequence, the progress in human development
has also been substantial in the state, particularly in the fields of education and health, the two
most important components of human development. During the last eight years, the level of Per
Capita Development Expenditure (PCDE) in Bihar has been growing at 14.2 percent, compared to
the national average of 13.3 percent. It is also praiseworthy that the expenditure on education in
the state increased at an annual rate of 13.8 percent, which is again higher than that of all-India
average of 12.8 percent. In absolute terms, the expenditures on education in Bihar were — Rs.
10,124 crore in 2011-12 and Rs. 28,080 crore in 2018-19. Likewise, the expenditure on health also
increased from Rs. 2125 crore in 2011-12 to Rs. 7318 crore in 2018-19, registering an annual
growth rate of 20.8 percent. This was 3.0 percentage points higher than that of all-India average
(Table 11.1).
11.1 Demography Scenario
Bihar, with a population of 104.1 million in 2011, is the third most populous state of India, which
has a total population of 1210.6 million. The share of Bihar is 8.6 percent in country’s total
population. It is estimated that in 2019, the state’s population would be 124.8 million. The
population growth rate in India has been slowing down in the recent decades from an annual
growth rate of 2.2 percent during 1981-91 to an estimated rate of 1.1 percent in 2011-19. Similarly,
the growth rate of population in Bihar has also been reducing from an annual growth rate of 2.5
percent during 1991-2001 to an estimated 1.8 percent in 2011-19 (Chart 11.2). The vital factor
1878 2292 2586 2981 3370 3767 414850433801
4296 47965470
62556983
7516
9524
02000400060008000
10000120001400016000
2011-12 2012-13 2013-14 2014-15 2015-16 2016-17 2017-18 2018-19
Rup
ees
Per Capita Expenditure on Social Services (Rs.) All States
Per Capita Expenditure on Social Services (Rs.) Bihar

354
behind this decline in population growth rate since 1980s is the decline in Total Fertility Rate
(TFR) in both India and Bihar. It is important to note that this decline has been steady throughout.
In Bihar, TFR declined from 5.7 children per woman in 1981 to 3.2 in 2017, registering a decline
of 2.5 children per woman. In India, this decline was from 4.5 children per woman in 1981 to 2.2
in 2017.
Chart 11.2 : Annual Growth Rate of Population in India and Bihar (Percent)
Note : The estimated figures for 2011-19 are based on annual growth rate of population given in Economic Survey of India, 2018-19.
According to census 2011, Bihar has a population density of 1106 persons per sq. km, which is
thrice the density in India (382 persons per sq. km.). As regards sex ratio, it is lower in Bihar (918),
compared to all India (943); however, the child sex ratio in Bihar (935) is higher than the national
average (919). The urbanisation is extremely low in Bihar (11.3 percent), compared to India (31.2
percent). More than 90 percent of the population in 26 out of 38 districts of Bihar live in rural
areas, making the state the least urbanised among all the major states in India. It may also be noted
that the decadal increase in urbanisation in Bihar has been only 0.8 percent, against a much higher
increase (3.4 percent) in India. The decadal rate of growth of population during the period 2001
and 2011 was 25.1 percent in Bihar, against 17.6 percent for all India (Table 11.2).
Between 2001 and 2011, the number of towns in Bihar has increased from 130 to 199, showing an
increase of 53.1 percent (bottom half of Table 11.2). For India as a whole, the increase in the
number of towns has been nearly the same at 53.7 percent (from 5161 to 7935). It is disheartening
to note that, during 2001-2011, only 6025 villages out of 45,098 villages in Bihar were turned into
urban areas.
0.0
0.5
1.0
1.5
2.0
2.5
3.0
1951-1961 1961-1971 1971-1981 1981-1991 1991-2001 2001-2011 2011-2019
Bihar India

355
Table 11.2 : Demographic Profile and Administrative Structure of Bihar and India (2001 and 2011)
Bihar India
2001 2011 2001 2011
Demographic Indicator
Population (million)
Total 82.9 104.1 1028.7 1210.6
Rural 74.3 92.3 742.5 833.7
Urban 8.7 11.8 286.1 377.1
Sex Ratio (females per '000 males) 919 918 933 943
Child Sex Ratio 942 935 927 919
Density (persons per sq. km.) 880 1106 325 382
Urbanisation (Percentage) 10.5 11.3 27.8 31.2
Decadal Growth (Percentage) 28.6 25.1 21.5 17.6
Administrative Structure
No. of Districts 37 38 593 640
No. of CD blocks 533 534 5463 5924
No. of Towns (statutory/census) 130 199 5161 7935
No. of Villages 45098 39073 638596 597369
Sources : Census 2001 and 2011
The inter-district variations with respect to demographic features are presented in Table A11.1
(Statistical Appendix), which presents district-wise data on population, overall sex-ratio, child sex-
ratio, density of population, decadal growth rate and urbanisation. As regards density of
population, 20 out of 38 districts in Bihar have population densities more than 1100 persons per
sq. km. Patna is the second most densely populated district with 1803 persons per sq. km. There
exists considerable variation with respect to the density of population, the highest being Sheohar
(1882 persons per sq. km) and the lowest Kaimur (488 persons per sq.km). As mentioned above,
more than 90 percent of the population in 26 districts of Bihar live in rural areas, making the state
the least urbanized. The level of urbanisation was the lowest in Samastipur and Banka (3.5 percent
each) and the highest in Patna (43.1 percent). The sex ratio in the districts varies from 1021 in
Gopalganj to less than 900 in 8 districts. It may be seen that the more urbanized districts like Patna
and Munger have relatively lower sex ratio. The child sex ratio in Bihar (935) is higher than the
national average at 919 and is more uniform among the districts, varying between 904 to 971. In
terms of decadal growth rate of population between 2001 and 2011, it varied from 18.9 percent
(Arwal) to 31.1 percent (Madhepura). Lastly, it might be noted that, in terms of population, Patna

356
district is at the top (58.4 lakhs), accounting for 5.6 percent of the state’s total population; on the
other end, Sheikhpura at the bottom (6.4 lakhs) accounts for only 0.6 percent of the state’s total
population. As mentioned above, in the recent years, due to several steps taken by the State
Government towards decreasing the fertility rate in Bihar, one would hopefully see their impact in
the coming 2021 census.
Population Projection for Districts
Bihar is a state with large population and what is happening to the population of this state has a
significant bearing on the population of the country. Thus, population projection is significant for
the state, as well as the country. For preparing district-wise policies, it is again pertinent to know
their population. But no official projections are available for the district population. Keeping these
in view, the present survey has tried to provide estimates of future population at the district level
in Bihar, for the period 2011-2041. These projections are based on annual population growth rates
of Bihar, as estimated in the Economic Survey of India, 2018-19. Bihar’s population is projected
to grow from 1041 lakh in 2011 to 1230 lakh in 2021 (1.82 percent increase) and further to 1395
lakh in 2031(1.34 percent increase) and again to 1534 lakh in 2041 (increase of 1.00 percent).
These projections show that the population of Bihar is expected to increase by 47 percent in thirty
years (Chart 11.3). While some of the developed states are expecting population decline, the
increase in Bihar is a matter of concern. The estimated district-wise population in 2021, 2031 and
2041 are presented in Table A11.2 (Statistical Appendix). From this table, it clearly emerges that
the growth of population will be faster in districts of north Bihar, compared to those in south Bihar.
Chart 11.3 : Population of Bihar (1991-2041) (in Lakh)
Note : Projections have been done on the basis of data presented in Economic Survey of India (2018-19)
645.31
828.79
1040.991188.35 1230.11
1395.131534.15
1991 2001 2011 2019 2021 2031 2041

357
Total Fertility Rate
The Total Fertility Rate (TFR) refers to the total number of children born to a woman of child-
bearing age in her lifetime. According to the projected values for 2021-41, the TFR at the state
may decline rapidly and, by 2041, it may be 1.8 (Table 11.3). It should be noted here that this level
of TFR is below the level of replacement TFR (2.1 children). A close look at the trends of Total
Fertility Rate (TFR) in Bihar from 2012 onwards suggests that it has been gradually declining.
Table 11.3 : Projected Total Fertility Rate of Bihar (2012-2041)
Year 2012 2019 2021 2031 2041
Bihar 3.50 2.79 2.50 2.00 1.80
Source : Sample Registration System (SRS), Office of the Registrar General, India
From the district-wise data in Table A 11.3 (Statistical Appendix), it is observed that TFR has
fallen significantly in recent decades in many districts of Bihar. In 2012, fertility was very high in
districts like East Champaran and Sheohar (4.60), Kishanganj (4.40), Saharsa and Araria (4.30)
and Khagaria (4.20). In rest of the districts, fertility remained between 2.60 and 4.00. With 2.60
children per woman, Patna was the district with the lowest fertility, followed by Lakhisarai (3.00),
Gaya (3.00) and Bhojpur (3.00). However, by 2041, there will be significant decline in the total
fertility rates in the high fertility districts. The fertility rates of East Champaran and Sheohar are
expected to come down to 2.37, Kishanganj 2.26, Sharasa and Araria 2.21, and Khagaria 2.16. In
addition, the districts with lower fertility will show further decline in 2041 as Patna will have a
total fertility of 1.34, Lakhisarai, Gaya, Bhojpur (1.54), and Jamui, Aurangabad (1.59).
Age Structure
Historically, low level of fertility combined with increased longevity imply that the population is
getting older. As may be seen from Table 11.4, the share of younger population in Bihar (0-19
years) has already started declining and is projected to drop from a high of 49.2 percent in 2011 to
30.1 percent by 2041. On the other hand, the share of elderly (60 years and above) is expected to
rise in the coming decades, but to a lesser extent. The elderly population is projected to increase
from 7.8 percent in 2011 to 11.6 percent in 2041, denoting an increase of only 3.8 percentage
points. Simultaneously, the working age group population (20-59 years) in Bihar is expected to
reach 58.3 percent by 2041. Thus, the emerging situation may provide an opportunity for
accelerated economic growth in Bihar, yielding a ‘demographic dividend’. The percentage of the

358
population in the working age group in Bihar is projected to rise steadily, from 43.0 percent in
2011 to 48.9 percent (2021), 55.8 percent (2031) and finally 58.3 percent (2041) (Table 11.4). The
variation in age structure of population could also be noticed in different districts of Bihar (Tables
A 11.4 and A 11.5) (Statistical Appendix).
Table 11.4 : Projected Population in Bihar by Age Structure (2011-2041)
Age Structures
Projected years
Population
Lakh Percentage Share
0-19 years
2011 511.9 49.2
2021 535.0 43.5
2031 489.0 35.1
2041 462.0 30.1
20-59 years
2011 447.9 43.0
2021 601.1 48.9
2031 779.1 55.8
2041 894.1 58.3
60 years and above
2011 81.1 7.8
2021 94.0 7.6
2031 127.0 9.1
2041 178.0 11.6
Note : Projections have been done on the basis of data presented in Economic Survey of India (2018-19)
11.2 Health Scenario
Health is an indispensable basis for defining a person's status of wellbeing. The health of
populations is a distinct key issue in public policy discourse in every society. Health care covers
not merely curative medical care, but all aspects of preventive care, too. Nor can it be limited to
care rendered by or financed out of public expenditure within the government sector alone; it must
also include care provided by the private sector. At its essential core, health care is widely
recognized to be a public good. Its demand and supply cannot, therefore, be left to be decided by
the market. For proper health care, four criteria are important — (1) universal access, (2) fair
distribution of financial costs, (3) providing training for competence and accountability, and (4)
special attention to vulnerable groups such as children, women, disabled and the aged. Moving
along these lines, in recent years, the State Government has strengthened both the infrastructure
and manpower for the health services in Bihar at all levels — primary, secondary and tertiary.
Better infrastructure, easy availability of drugs, and expansion of human resources for health

359
services have all led to an improvement in public health services. This may be attributed to
increased expenditure on health, as well as constant monitoring of the health services.
The challenges that the health sector faces are substantial — reduce mortality rates, improve
physical infrastructure, necessity to provide health insurance, ensuring availability of trained
medical personnel and many others. There has been a rise in both communicable diseases and non-
communicable diseases, including chronic diseases in Bihar. While ailments such as poliomyelitis,
leprosy, and neonatal tetanus will soon be eliminated, some infectious diseases have returned in
force or have developed a stubborn resistance to existing drugs. In addition, the growing elderly
population will place an enormous burden on Bihar’s healthcare systems and services. The
healthcare services in the state is mainly based on primary health care, which envisages attainment
of healthy status for all. Being inclusive in nature, it also aims to provide preventive, curative and
rehabilitative services. In this section, all these aspects of healthcare will be discussed.
Selected Health Indicators
Due to some pragmatic steps of the State Government, substantial progress have been achieved in
health outcomes in the recent years. Life Expectancy at Birth (LEB) reflects the average number
of years a newly born baby is expected to survive under the current schedule of mortality. It is a
proxy measure for several dimensions like adequate nutrition, good health, education and other
valued achievements. Table 11.5 shows the values of LEB for India and Bihar for the periods
2006-10 and 2013-17. The life expectancy at birth in Bihar in 2013-17 has been 69.2 and 68.6
years for males and females respectively. The increase in life expectancy has been 3.7 years for
males and 2.4 years for females over 2006-10. The life expectancy in 2013-17 has increased by
2.1 years in the rural and 4.5 years in the urban areas as compared to 2006-10. It should also be
noted that, in these 7 years, the gap between India and Bihar which was 0.3 year in 2006-10 has
reduced to 0.1 year in 2013-17. For India as a whole, LEB in 2013-17 has increased by 3.2 years
for males and 2.7 years for females over 2006-10. Similarly, the LEB for rural areas has increased
by 3.6 years and for urban areas by 2.1 years over 2006-10. In 2013-17, the LEB for males (69.2
years) was marginally higher than that of female (68.6 years) by about 0.6 year in Bihar. Contrary
to this, for India as a whole, the LEB of females (70.4 years) was higher than that of males (67.8
years).

360
Table 11.5 : Life Expectancy at Birth (2006-10 and 2013-17)
State/India2006-10 2013-17
Male Female All Male Female All
Bihar 65.5 66.2 65.8 69.2 68.6 68.9
India 64.6 67.7 66.1 67.8 70.4 69.0
State/India Rural Urban All Rural Urban All
Bihar 65.6 67.9 65.8 67.7 72.4 68.9
India 64.9 69.6 66.1 68.5 71.7 69.0
Source : Sample Registration System (SRS), Office of the Registrar General, India
Seven more indicators of health, for which there exists comparable data are — Crude Birth Rate
(CBR), Infant Mortality Rate (IMR), Child Mortality Rate (CMR), Under Five Mortality Rate
(U5MR), Neo-Natal Mortality Rate (NMR), Peri-Natal Mortality Rate (PMR) and Total Fertility
Rate (TFR). The related data for these indicators, for both Bihar and India, is presented in Table
11.6, covering the period 2013 to 2017. For Crude Birth Rate (CBR), the figures are persistently
higher for Bihar; in 2017, it was 26.4 for Bihar, compared to 20.2 for India, indicating a difference
of 6.2. The high growth rate of population in Bihar can be said to be an outcome of this constantly
high birth rate and a relatively faster declining death rate. The Infant Mortality Rate (IMR) which
indicates the death of children before the age of one year per 1000 live births, is another reliable
indicator of health and nutritional status of a population. The concerted efforts of the State
Government through ensuring round-the-clock delivery services in all PHCs had paid rich
dividends in bringing down the IMR considerably in Bihar. In 2017, the IMRs in Bihar were —
rural (36), urban (31), and overall (35). The corresponding figures for India were — rural (37),
urban (23), and overall (33). Thus, the situation in Bihar was very close to the national average, in
spite of its serious economic and social disadvantages. As regards CMR, it again declined in Bihar
from 11 in 2013 to 9 in 2017, whereas for all-India this decline was from 11 in 2013 to 9 in 2017.
This is admirable. While comparing the TFR, it is noticed that there is a marginal decline in TFR
in Bihar from 3.4 children per woman in 2013 to 3.2 children per woman in 2017, a drop of 0.2
child per woman. For all-India, the TFR was much lower than in Bihar throughout and it dropped
only marginally between the two years — from 2.3 in 2013 to 2.2 in 2017.
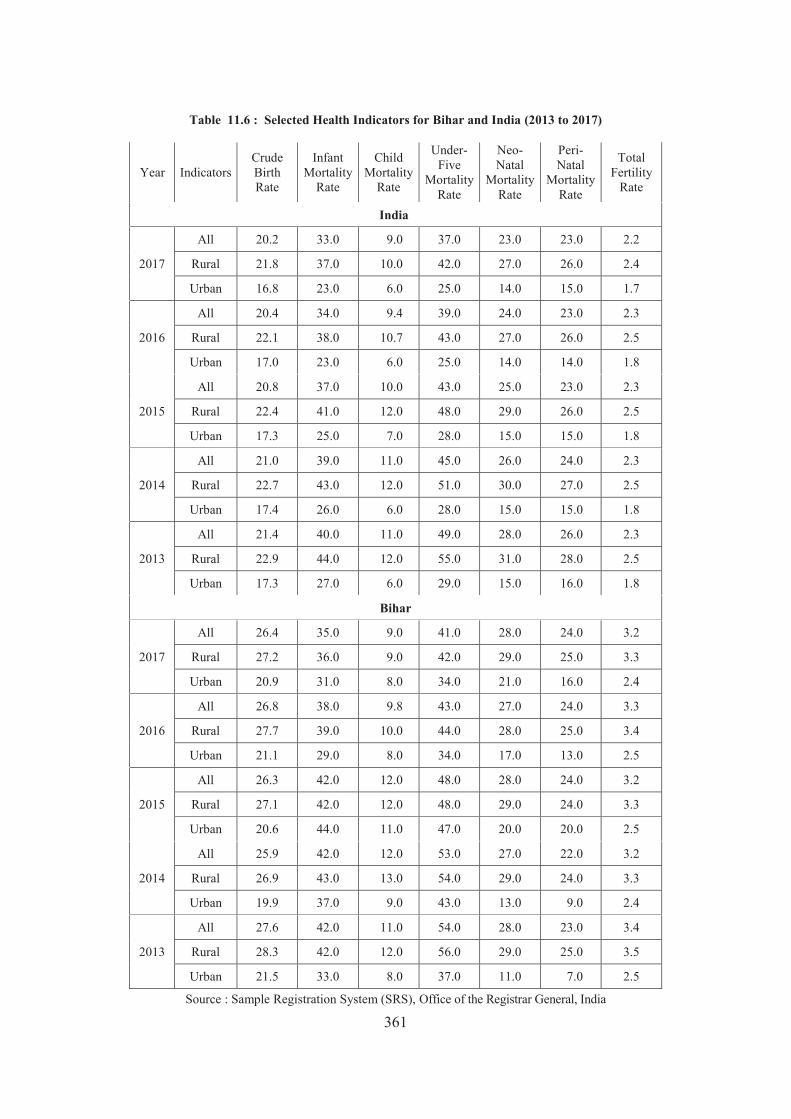
361
Table 11.6 : Selected Health Indicators for Bihar and India (2013 to 2017)
Year IndicatorsCrude Birth Rate
Infant Mortality
Rate
Child Mortality
Rate
Under-Five
Mortality Rate
Neo-Natal
Mortality Rate
Peri-Natal
Mortality Rate
Total Fertility
Rate
India
2017
All 20.2 33.0 9.0 37.0 23.0 23.0 2.2
Rural 21.8 37.0 10.0 42.0 27.0 26.0 2.4
Urban 16.8 23.0 6.0 25.0 14.0 15.0 1.7
2016
All 20.4 34.0 9.4 39.0 24.0 23.0 2.3
Rural 22.1 38.0 10.7 43.0 27.0 26.0 2.5
Urban 17.0 23.0 6.0 25.0 14.0 14.0 1.8
2015
All 20.8 37.0 10.0 43.0 25.0 23.0 2.3
Rural 22.4 41.0 12.0 48.0 29.0 26.0 2.5
Urban 17.3 25.0 7.0 28.0 15.0 15.0 1.8
2014
All 21.0 39.0 11.0 45.0 26.0 24.0 2.3
Rural 22.7 43.0 12.0 51.0 30.0 27.0 2.5
Urban 17.4 26.0 6.0 28.0 15.0 15.0 1.8
2013
All 21.4 40.0 11.0 49.0 28.0 26.0 2.3
Rural 22.9 44.0 12.0 55.0 31.0 28.0 2.5
Urban 17.3 27.0 6.0 29.0 15.0 16.0 1.8
Bihar
2017
All 26.4 35.0 9.0 41.0 28.0 24.0 3.2
Rural 27.2 36.0 9.0 42.0 29.0 25.0 3.3
Urban 20.9 31.0 8.0 34.0 21.0 16.0 2.4
2016
All 26.8 38.0 9.8 43.0 27.0 24.0 3.3
Rural 27.7 39.0 10.0 44.0 28.0 25.0 3.4
Urban 21.1 29.0 8.0 34.0 17.0 13.0 2.5
2015
All 26.3 42.0 12.0 48.0 28.0 24.0 3.2
Rural 27.1 42.0 12.0 48.0 29.0 24.0 3.3
Urban 20.6 44.0 11.0 47.0 20.0 20.0 2.5
2014
All 25.9 42.0 12.0 53.0 27.0 22.0 3.2
Rural 26.9 43.0 13.0 54.0 29.0 24.0 3.3
Urban 19.9 37.0 9.0 43.0 13.0 9.0 2.4
2013
All 27.6 42.0 11.0 54.0 28.0 23.0 3.4
Rural 28.3 42.0 12.0 56.0 29.0 25.0 3.5
Urban 21.5 33.0 8.0 37.0 11.0 7.0 2.5
Source : Sample Registration System (SRS), Office of the Registrar General, India

362
Health Infrastructure
Bihar has the third largest populations in the country, coupled with widespread poverty. Due to a
combined effect of poverty, population load and climatic factors, Bihar’s population is seriously
susceptible to diseases. To provide adequate health services to such a population, it is extremely
necessary to have a strong health infrastructure. The overall health infrastructure of a state can be
classified as — skilled workforce, public health organizations, resources, integrated electronic
information systems and research. Public health infrastructure is fundamental to the provision of
health services at all levels. A three- tier public health infrastructure, based on predetermined
population norms, has been developed in the state. The healthcare infrastructure consists of
primary, secondary, and tertiary health care. At the primary level of health care, it includes
Community Health Centers (CHC), Primary Health Centers (PHC), and Sub-Centers (SC) and
Additional PHCs (APHC). The sub-divisional hospitals come under the category of secondary
health care and, finally, the tertiary level of health care includes the district hospitals and medical
colleges.
The low income of the majority of population in Bihar leads to their dependence on public health
services. In recent years, the State Government has taken a number of steps to improve the
functioning of the public health institutions and, consequently, the number of patients visiting
government hospitals has increased significantly (Table 11.7). The average number of patients
visiting government hospitals per month was 9927 in 2015, which has become 10,446 in 2017.
This is an increase of 1.5 percent in the patient footfall, compared to the previous year. There was,
however, a drop in this number in 2018 and first nine months of 2019; but the drop was marginal.
Such large number of footfalls in hospitals is the result of comprehensive health services, with
provision of free medicines and quality care. The State Government has also been organising a
large number of health camps to raise awareness about health among the masses.
Table 11.7 : Monthly Average Number of Patients Visiting Government Hospitals (2015 to 2019)
Year 2015 2016 2017 20182019 (upto
Sept. 19)No. of patients visiting Government hospitals per month
9927 (5.3)
10294(3.7)
10446(1.5
9738 (-6.8) 9397
Note : Figures in the parenthesis represent annual increase Source : State Health Society, GoB
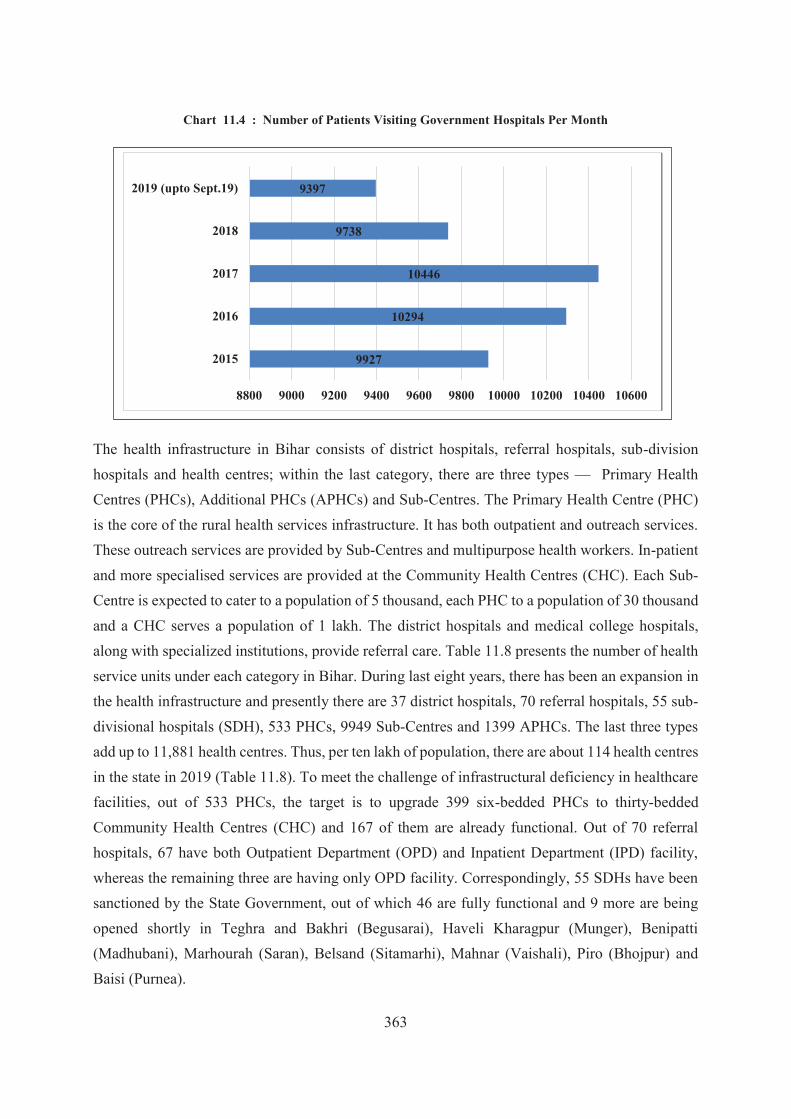
363
Chart 11.4 : Number of Patients Visiting Government Hospitals Per Month
The health infrastructure in Bihar consists of district hospitals, referral hospitals, sub-division hospitals and health centres; within the last category, there are three types — Primary Health Centres (PHCs), Additional PHCs (APHCs) and Sub-Centres. The Primary Health Centre (PHC) is the core of the rural health services infrastructure. It has both outpatient and outreach services. These outreach services are provided by Sub-Centres and multipurpose health workers. In-patient and more specialised services are provided at the Community Health Centres (CHC). Each Sub-Centre is expected to cater to a population of 5 thousand, each PHC to a population of 30 thousand and a CHC serves a population of 1 lakh. The district hospitals and medical college hospitals, along with specialized institutions, provide referral care. Table 11.8 presents the number of health service units under each category in Bihar. During last eight years, there has been an expansion in the health infrastructure and presently there are 37 district hospitals, 70 referral hospitals, 55 sub-divisional hospitals (SDH), 533 PHCs, 9949 Sub-Centres and 1399 APHCs. The last three types add up to 11,881 health centres. Thus, per ten lakh of population, there are about 114 health centres in the state in 2019 (Table 11.8). To meet the challenge of infrastructural deficiency in healthcare facilities, out of 533 PHCs, the target is to upgrade 399 six-bedded PHCs to thirty-bedded Community Health Centres (CHC) and 167 of them are already functional. Out of 70 referral hospitals, 67 have both Outpatient Department (OPD) and Inpatient Department (IPD) facility, whereas the remaining three are having only OPD facility. Correspondingly, 55 SDHs have been sanctioned by the State Government, out of which 46 are fully functional and 9 more are being opened shortly in Teghra and Bakhri (Begusarai), Haveli Kharagpur (Munger), Benipatti (Madhubani), Marhourah (Saran), Belsand (Sitamarhi), Mahnar (Vaishali), Piro (Bhojpur) and Baisi (Purnea).
9927
10294
10446
9738
9397
8800 9000 9200 9400 9600 9800 10000 10200 10400 10600
2015
2016
2017
2018
2019 (upto Sept.19)

364
Table 11.8 : Overall Status of Health Infrastructure (2012 to 2019)
(Figures in Number)
Year District Hospital
Referral Hospital
Sub Divisional Hospital
Health Centres Health centres per
ten lakh population
PHC Sub Centre APHC Total
2012 36 70 55 533 9696 1330 11559 109
2013 36 70 55 533 9696 1330 11559 106
2014 36 70 55 533 9729 1350 11612 104
2015 36 70 55 533 9729 1350 11612 102
2016 36 70 55 533 9729 1350 11612 100
2017 36 70 55 533 9949 1366 11848 99
2018 37 70 55 533 9949 1379 11861 114
2019 37 70 *55 **533 9949 1399 11881 114
Note : ** 399 PHC will be upgraded to 30-bedded CHC, 239 of which has been constructed and 167are functional * 46 SDH are fully functional and 9 more are being opened
Source : State Health Society, GoB
Since Bihar is home to diverse socio-cultural groups, the health needs of people also vary from
region to region. Given the size of state’s population and the burden of disease, the challenge of
attaining good health for people is a daunting one. From the data on the number of health
institutions in different districts, as presented in Table A 11.6 (Statistical Appendix), it is obvious
that there is considerable variation across the districts in terms of the availability of health
infrastructure. Taking into account, the number of health institutions per lakh of population, the
best three districts in terms of availability of health infrastructure are — Jamui (179), Sheikhpura
(173) and Sheohar (169). At the other end, three most disadvantaged districts are — Patna (62),
Sitamarhi (78) and Darbhanga (83).
In general, the performance of public health facilities is judged by the nature of outpatient and
inpatient visits. Such performance also varies considerably across the districts, as indicated by two
indicators — average number of outpatients visiting hospitals per day and the in-patient bed
occupancy rate. In 2018-19, three districts with the highest average number of outpatients visiting
hospitals per day are — Muzaffarpur (515), Khagaria (472) and Darbhanga (459). At the other
end, three districts with the lowest average number of outpatients visiting hospitals per day are —
Sheohar (147), Buxar (168) and Jamui (180). For Bihar as a whole, there has been a marginal
decrease in the average number of outpatient visits from 339 in 2016-17 to 311 in 2018-19. The
Bed Occupancy Rate (BOR) and length of stay in hospital are also sensitive indicators to assess

365
the health care utilization of any hospital. There was a fall in overall Bed Occupancy Rate of Bihar
from 64 percent in 2016-17 to 55 percent in 2018-19, and this may indicate that more people are
moving towards private health care facilities. In 2018-19, the Bed Occupancy Rate among the
districts varied between 111 percent in Khagaria to 23 percent in Sheohar. In the same year, three
outstanding districts with the highest Bed Occupancy Rates are — Khagaria (111 percent), Saharsa
(90 percent) and Madhepura (88 percent), whereas three worst performing districts are Sheohar
(23 percent), Nawada (26 percent) and Araria/Muzaffarpur (30 percent). The Bed Occupancy Rate
exceeds 80 percent in 5 districts which is indicative of high demand for public health services.
Table A 11.7 (Statistical Appendix) reports data for average number of outpatients visiting
hospitals per day and the in-patient bed occupancy rate for four years — 2016-17, 2017-18, 2018-
19 and 2019-20.
The non-availability and uneven distribution of human resources can be a serious challenge
towards meeting the health goals in a region. As regards the human resources for health services
in Bihar, the infrastructure consists of — doctors, nurses, Auxiliary Nurse-Cum-Mid-wife (ANM),
and Accredited Social Health Activist (ASHA). The availability of such personnel for the entire
state is presented in Table 11.9. The district-wise data is presented in Tables A 11.8 to A 11.11
(Statistical Appendix). As regards doctors, in 2018-19, there were 3821 regular doctors in Bihar,
against 6261 sanctioned posts, indicating a high vacancy ratio of 39 percent. In addition, there
were also sanctioned posts for 2314 contractual doctors, of which only 533 posts were filled up,
representing again a high vacancy ratio of 77 percent. Health care is a labour intensive sector,
where human resource plays critical role. However, in Bihar, there are as many as 7 districts
(Sheikhpura, Jehanabad, Arwal, Sheohar, Nalanda, Bhagalpur and Patna), in each of which a
government doctor has to serve more than 5 lakh people. As regards regular nurses, there were
4704 sanctioned posts, but the number of working nurses were lesser at 1994, indicating a high
vacancy ratio of 58 percent. Similarly, in case of contractual nurses, against the sanctioned strength
of 1719, only 308 were working, implying a high vacancy ratio of 82 percent. In contrast to the
situation of doctors and nurses, the strength of health personnel is much higher for ANMs and
ASHAs. In 2018-19, the actual strength of regular ANM was 11,830, against the sanctioned posts
of 21,859, indicating a vacancy ratio of 46 percent. Likewise, the working strength of contractual
ANMs was 5889, against 12,587 sanctioned posts, indicating a vacancy ratio of 53 percent. In case
of ASHA workers, it is found that there are in all 88 thousand of them working in the entire state
against a sanctioned strength of 93 thousand, implying a vacancy ratio of only 6 percent. Analyzing
healthcare sector within the four pillars of accessibility, availability, affordability and acceptability

366
can help in identification of gaps and challenges currently faced by the state. Based on the above
information, it can be easily realised that the present human resource base of the health system in
Bihar needs strengthening. One should also remember that the inadequacy in manpower is more
in rural areas, where health services like family planning and immunization are more needed.
Table 11.9 : Number of Health Personnel (2017-18 and 2018-19)
Name of the Post
Regular Contractual
Sanctioned Posts
Working Sanctioned Posts
Working
2017-18 2018-19 2017-18 2018-19
Doctors 6261 3921 3821 2314 83 531
Grade A Nurse 4704 1994 1994 1719 308 308
ANM 21859 11830 11830 12587 5889 5889
ASHA - - - 93687 85708 88664
Source : Health Department and State Health Society, GoB
Institutional Delivery
Maternal health is a core function of all public health services. Janani Suraksha Yojana (JSY) is a safe motherhood intervention under the National Health Mission launched in April, 2005, as a Centrally Sponsored Scheme. The reduction of maternal and infant mortality is one of the key goals of the National Health Mission. At the beginning of the Mission, Janani Suraksha Yojana, a demand promotion and conditional cash transfer scheme, was launched with the objective of reducing maternal and infant mortality. It has been lauded as a scheme that has been successful in bringing about a surge in institutional deliveries since its launch, especially in the Empowered Action Group states like Bihar. JSY promotes institutional delivery, especially among women from low socioeconomic households — Scheduled Castes, Scheduled Tribes and BPL households. The scheme focuses on the poor pregnant woman, specially in states having low institutional delivery rates (Uttar Pradesh, Uttarakhand, Bihar, Jharkhand, Madhya Pradesh, Chhattisgarh, Assam, Rajasthan, Odisha and Jammu and Kashmir). These states have been named as Low Performing States (LPS), and the remaining states have been named as High Performing States(HPS). The exclusion criteria of age of mother being 19 years or above and up to two children only under the JSY have been removed and all mothers are now entitled to JSY, benefit regardless of any age and any number of children. The scheme enables the States/UTs to hire the services of a private specialist to conduct Caesarean Section or for the management of Obstetric complications, in the public health facilities, where the government specialists are not available. The states are encouraged to accredit private health facilities for increasing the choice of delivery careinstitutions. The scheme also provides performance-based incentives to ASHAs for promoting

367
institutional delivery. The women in rural areas in LPS are given a cash assistance of Rs. 1400 for an institutional delivery. In addition, ASHAs are given a performance linked fee of Rs. 600 for each woman they motivate, which includes Rs. 300 for ante-natal care (ANC) component and Rs. 300 for facilitating institutional delivery. Similarly, in urban areas of the LPS, an amount of Rs. 1000 is given to mothers and Rs. 400 is given to ASHA (Rs. 200 for ANC and Rs. 200 for facilitating institutional delivery). ASHAs receive an initial training of three weeks in various aspects of maternal and child care. Under this scheme, ASHAs are required to identify pregnant women, facilitate at least four antenatal check-ups for them, and motivate them for institutional delivery. They are also required to visit the mother and newborn for a postnatal check-up within seven days of delivery and counsel them on early breastfeeding. Further, the BPL women, who prefer to deliver at home, are entitled to a cash assistance of Rs 500 per delivery regardless of theage of woman and the number of children. The State Government has been providing assistance to JSY beneficiaries through the Direct Benefits Transfer (DBT) model since 2013. Due to active participation of ASHAs and quality care at public health facilities, there has been substantial increase in number of institutional deliveries in Bihar. Between 2014-15 and 2018-19, the number of institutional deliveries increased from 14.94 lakh to 16.02 lakh, registering an increase of 7.2 percent. In 2019-20, 7.94 lakh institutional deliveries were recorded till September, 2019 (Table 11.10).
Table 11.10 : Institutional Delivery under JSY (2014-15 to 2019-20)
Year 2014-15 2015-16 2016-17 2017-18 2018-192019-20,
September,2019
Institutional Delivery (lakh) 14.94 15.33 15.45 16.37 16.02 7.94
Source : State Health Society, GoB
Chart 11.5 : Institutional Delivery under JSY
14.94 15.33 15.4516.37 16.02
02468
1012141618
2014-15 2015-16 2016-17 2017-18 2018-19
INST
ITU
TIO
NA
L D
ELIV
ERY
IN
LAK
H

368
The data for number of institutional deliveries in different districts of Bihar is presented in Table A 11.12 (Statistical Appendix). It is interesting to observe from the table that many of the districts where the extent of institutional deliveries is relatively higher are in North Bihar, like Samastipur (88 thousand), Purnea (74 thousand) and West Champaran (73 thousand). Opposite to this, it may be noted that except Sheohar (11 thousand), other two worst performing districts lie in south Bihar— Arwal (10 thousand) and Sheikhpura (13 thousand).
Immunisation
Immunization is considered as one of the key interventions for protection of children against life threatening conditions that are preventable. Both at the state and national levels, the benefits of immunization go beyond the improvements in health and life expectancy to an impact on social and economic indicators. An effective, evenly targeted immunization programme and its impact towards reducing the burden of Vaccine Preventable Diseases will greatly contribute in achieving the Sustainable Development Goal (SDG) of reducing IMR to 25 per 1000 live births by 2030.Immunization has been one of India’s greatest public health success stories. The Immunization Programme in India had started in 1978 as Expanded Programme on Immunization (EPI) with DPT, BCG, OPV, and typhoid paratyphoid fever vaccines. In 1985, the programme was modified as ‘Universal Immunization Programme’ (UIP), to be implemented in phased manner to cover all districts of the country by 1989-90. Despite being operational for many years, UIP was able to immunize only 65 percent children in the first year of their life. To address this slow progress in immunization coverage and to achieve 90 percent immunization coverage by 2020, the Ministry of Health and Family Welfare, Government of India, launched a massive routine immunization (RI) intensification campaign called Mission Indradhanush (MI) in December 2014. As of now, out of 640 districts as per 2011 census, 528 districts have been covered under various phases of MI. The programme gives special attention to unserved or low coverage pockets in sub-centres and urban slums with migratory population. The focus is also on the urban settlements and cities identified under National Urban Health Mission (NUHM). The MI provides for life-saving vaccines against Tuberculosis, Diphtheria, Pertussis, Tetanus, Polio, Hepatitis B, Pneumonia and Meningitis due to Haemophilus Influenzae type B (Hib), Measles, Rubella, Japanese Encephalitis (JE) and Rotavirus diarrhoea. The launching date for the Intensified Mission Indradhanush (IMI) 2.0 across India is December 2, 2019. The mission aims to immunize children under 2 years of age and pregnant women against eight vaccine-preventable diseases. The IMI 2.0 will focus on 272 districts of 27 states and Bihar is one of those states. The immunisation drive 2.0 will also providevaccines for two other diseases — Haemophilus influenza and Japanese encephalitis in certain selected areas. The IMI 2.0 will be carried out between December 2019 and March 2020.

369
Chart 11.6 shows improvement in full immunisation coverage in major states of India, before and
after MI. The coverage of children in states after MI ranged from 75 percent in Odisha to 119
percent in Kerala. For Bihar, there was an increase of 41 percentage points in immunisation
coverage, from 62 percent in 2015-16 to 103 percent in 2017-18. One should also note here that
the coverage was more than 100 percent in seven States — Kerala (119.2 percent), Jharkhand
(110.7 percent), West Bengal (106.9 percent), Punjab (104.3 percent), Maharashtra (103.4
percent), Karnataka and Bihar (102.7 percent). For the country as a whole, the increase was of 37
percentage points, from 62 percent in 2015-16 to 97 percent in 2017-18. Except Odisha, where
there is marginal decline of 3.4 percentage points between 2015-16 and 2017-18, all other states
have shown considerable increase in immunisation coverage. It is hoped that, in the longer term,
the lessons learnt from MI will be incorporated into routine programming for reducing vaccination
inequities.
Chart 11.6 : Percentage of children aged 12-23 months fully immunised before and after MI
Along with other states in India, Bihar has also made substantial progress towards universal
immunisation in recent years. The relevant data in this regard is presented in Table 11.11. This
data refers to five components of immunisation – TT (Anti-tetanus), BCG, OPV, PENTA and
measles. Looking at the most recent figures (2018-19), it is noticed that the coverage is more than
80 percent in — BCG, OPV 1, OPV 2 and PENTA-1. For the rest of the vaccines, the achievements
are always above 70 percent, except for OPV (zero dose) (56.7 percent). Looking at the data for
2019-20 (upto September, 2019 only), one might expect that in coming years all the vaccines will
have an achievement rate above 90 percent.
65.3 61.776.4
50.462.2 61.9 62.6
82.1
53.6 56.2
78.689.1
54.869.7
51.1
84.4
62.0
91.8102.7
91.098.9
87.6
110.7102.7
119.2
86.2
103.4
75.2
104.3
83.8 82.194.3
106.995.6
0.0
20.0
40.0
60.0
80.0
100.0
120.0
140.0
Fully
Imm
unis
ed %
Before MI, NFHS-4 (2015-16) After MI, coverage upto2017-18

370
Table 11.11 : Antigen-wise Immunisation Coverage in Bihar (2017-18 to 2019-20)
Antigen name
2017-18 2018-19 2019-20 (Upto September, 2019)
Target (’000)
Achieve-ment ('000)
Target (’000)
Achieve-ment ('000)
Target (’000) for 6
months
Achieve-ment ('000)
TT 2 + Booster (PW) 3340 2665
(79.8) 3424 2700(78.8) 1754 1480
(84.3)
BCG 3158 2722(86.2) 3239 2689
(83.0) 1660 1302(78.4)
OPV 0 3158 1861(58.9) 3239 1836
(56.7) 1660 906(54.6)
OPV 1 3158 2719(86.1) 3239 2682
(82.8) 1660 1323(79.6)
OPV 2 3158 2666(84.4) 3239 2600
(80.2) 1660 1394(83.9)
OPV 3 3158 2559(81.0) 3239 2478
(76.5) 1660 1392(83.8)
PENTA-1 3158 2726(86.3) 3239 2701
(83.3) 1660 1327(79.9)
PENTA-2 3158 2672(84.6) 3239 2621
(80.9) 1660 1400(84.3)
PENTA-3 3158 2565(81.2) 3239 2495
(77.0) 1660 1398(84.2)
Measles 3158 2627(83.2) 3239 2311
(71.3) 1660 1420(85.5)
Note : 1. DPT has been replaced by Pentavalent in 2015-16 2. Figures in parenthesis indicate achievement in percentage
Source : State Health Society, GoB
Prevalence of Main Diseases
An important dimension of health status of a population is the main diseases that affect it. At the
national level, the disease burden is changing. While the communicable diseases remain a
significant threat, noncommunicable diseases (NCDs) are now becoming country’s pre-eminent
threat to public health and wellbeing. The reasons for this are manifold which include a genetic
predisposition towards conditions such as diabetes and the increasing adoption of unhealthy diets
and sedentary lifestyles. These practices place Indians at elevated risk of conditions such as
hypertension and heart disease. Table 11.12 presents the data on the prevalence of various diseases
in Bihar during the last four years. It is observed from the table that, in 2018-19, the number of
cases was the highest in respect of Acute Respiratory Infections (10.0 lakh), followed by Fever of
Unknown Origin (8.2 lakh), Acute Diarrhoea (3.3 lakh), Dog Bite (2.8 lakh), Dysentery (1.7 lakh)
and Enteric Fever (1.4 lakh). It also emerges from the table that the cases of periodic water-borne

371
diseases like diarrhoea or dysentery are also very frequent in the state, underlining the inadequate
availability of safe drinking water. Along with these diseases, rabies caused by dog bite is another
reported disease accounting for 2.8 lakh patients. It is also obvious from the table that, due to
significant improvements in healthcare services, the total number of patients has declined from
38.8 lakh in 2015-16 to 28.8 lakh in 2018-19, registering a decline of 26 percent. The district-wise
figures for the same are provided in Table A 11.13 (Statistical Appendix).
Table 11.12 : Prevalence of Main Diseases (2015-16 to 2018-19)
(No. of patients in lakh)
Diseases 2015-16 2016-17 2017-18 2018-19
Acute Diarrhoea 5.1 (13.0) 2.7 (13.2) 4.2 (11.8) 3.3 (11.4)
Bacillary Dysentery 2.8 (7.2) 1.4 (6.9) 2.1 (5.9) 1.7 (5.8)
Viral Hepatitis 0.3 (0.7) 0.2 (1.0) 0.3 (0.9) 0.3 (1.0)
Enteric Fever 2.6 (6.7) 1.3 (6.9) 2.1 (5.9) 1.4 (4.8)
Malaria 0.3 (0.8) 0.2 (1.0) 0.3 (0.7) 0.2 (0.6)
Fever of Unknown Origin 10.3 (26.6) 5.1 (25.0) 9.0 (25.2) 8.2 (28.5)
Acute Respiratory Illnesses 13.5 (34.7) 6.9 (33.8) 12.8 (36.2) 10.0 (34.9)
Pneumonia 0.4 (1.1) 0.2 (1.0) 0.4 (1.0) 0.2 (0.6)
Dog Bite 2.7 (7.0) 1.9 (9.3) 3.7 (10.4) 2.8 (9.8)
Any other State Specific disease 0.3 (0.8) 0.2 (1.0) 0.2 (0.7) 0.2 (0.7)
Unusual Syndromes not captured above 0.6 (1.5) 0.2 (1.0) 0.5 (1.3) 0.6 (2.0)
Total 38.8 (100.0) 20.4 (100.0) 35.5 (100.0) 28.8 (100.0)
Note : Figures in the parenthesis denote percent share to total Source : State Health Society, GoB
National Health Mission
The National Health Mission (NHM), launched in 2005, incorporates two Sub-Missions — the
National Rural Health Mission (NRHM) and the National Urban Health Mission (NUHM). The
main programmatic components include Health System Strengthening, Reproductive-Maternal-
Neonatal-Child and Adolescent Health (RMNCH+A), and Communicable and Non-
Communicable Diseases. The NHM envisions accomplishment of universal access to equitable,
affordable and quality health care services that are accountable and responsive to public needs.
The NHM fund sharing pattern is 60:40 between the Central and the State Government. The
National Health Mission (NHM) is a major instrument of financing and supporting the states to
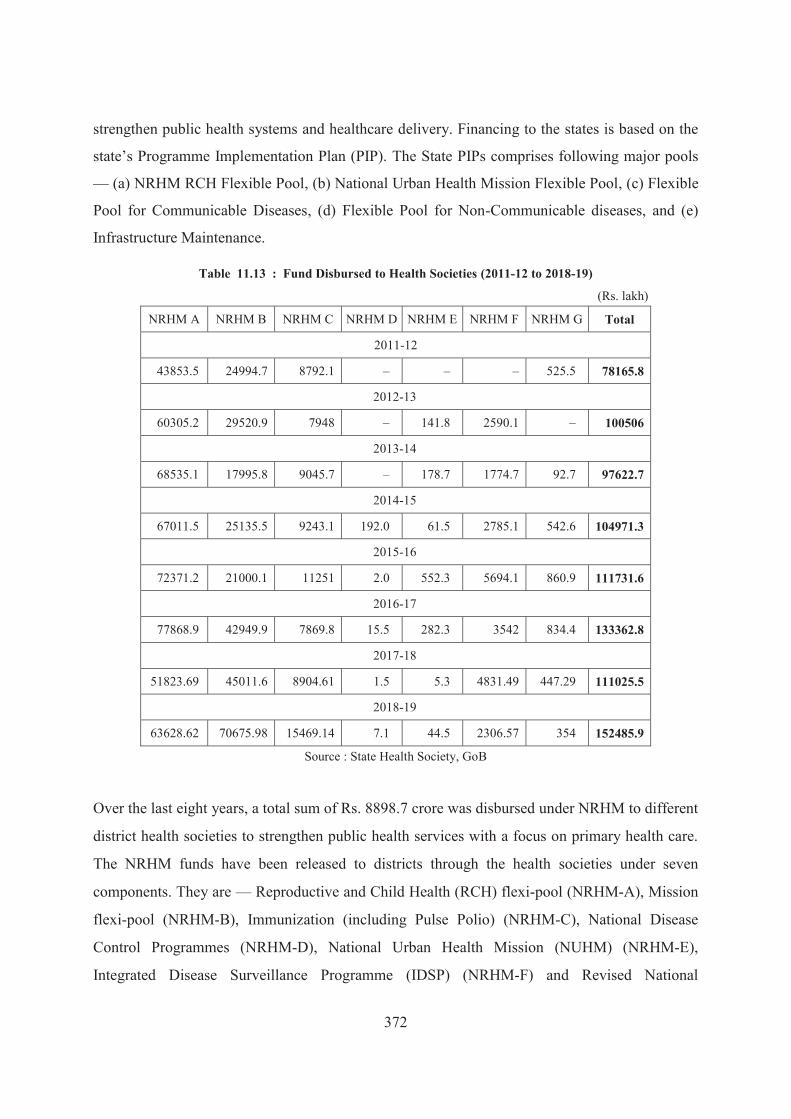
372
strengthen public health systems and healthcare delivery. Financing to the states is based on the
state’s Programme Implementation Plan (PIP). The State PIPs comprises following major pools
— (a) NRHM RCH Flexible Pool, (b) National Urban Health Mission Flexible Pool, (c) Flexible
Pool for Communicable Diseases, (d) Flexible Pool for Non-Communicable diseases, and (e)
Infrastructure Maintenance.
Table 11.13 : Fund Disbursed to Health Societies (2011-12 to 2018-19)
(Rs. lakh)
NRHM A NRHM B NRHM C NRHM D NRHM E NRHM F NRHM G Total
2011-12
43853.5 24994.7 8792.1 – – – 525.5 78165.8
2012-13
60305.2 29520.9 7948 – 141.8 2590.1 – 100506
2013-14
68535.1 17995.8 9045.7 – 178.7 1774.7 92.7 97622.7
2014-15
67011.5 25135.5 9243.1 192.0 61.5 2785.1 542.6 104971.3
2015-16
72371.2 21000.1 11251 2.0 552.3 5694.1 860.9 111731.6
2016-17
77868.9 42949.9 7869.8 15.5 282.3 3542 834.4 133362.8
2017-18
51823.69 45011.6 8904.61 1.5 5.3 4831.49 447.29 111025.5
2018-19
63628.62 70675.98 15469.14 7.1 44.5 2306.57 354 152485.9
Source : State Health Society, GoB
Over the last eight years, a total sum of Rs. 8898.7 crore was disbursed under NRHM to different
district health societies to strengthen public health services with a focus on primary health care.
The NRHM funds have been released to districts through the health societies under seven
components. They are — Reproductive and Child Health (RCH) flexi-pool (NRHM-A), Mission
flexi-pool (NRHM-B), Immunization (including Pulse Polio) (NRHM-C), National Disease
Control Programmes (NRHM-D), National Urban Health Mission (NUHM) (NRHM-E),
Integrated Disease Surveillance Programme (IDSP) (NRHM-F) and Revised National

373
Tuberculosis Control Programme (RNTCP) (NRHM-G). A component-wise breakdown of
expenditure suggests that in 2018-19, disbursement of funds under the NRHM-B (46 percent) and
NRHM-A (42 percent) were higher than those of other components of NHM. For all other
components together, it was about 12 percent (Table 11.13). The details of district-wise fund
disbursement to health societies are given in Table A 11.14 (Statistical Appendix).
Policy Implications for Population Growth for Health
The scope and emphasis of public health services are necessarily influenced by the changing
characteristics of the population it serves. The rate of population growth affects long-range
planning of public health and medical facilities. Similarly, alterations in age composition, internal
migration, changes in population density and urban-rural movement are all required to be noted
by the health system to solve the new problems they may create. Among such characteristics of
the population, ageing of the population is one of the most important burden on national health. If
health facilities remain at current levels, rising population over the next two decades (even with
slowing population growth rates) will reduce the per capita availability of hospitals (health
facilities) in Bihar (Chart 11.7). Hence, there is a strong case for expanding medical facilities to
meet the population burden and greater provision of geriatric care. A major problem with planning
for the provision of medical facilities is the scarcity of relevant data, especially on private hospitals.
Thus, to assess the true picture of health facilities available in the state, efforts should be made to
collect information on both public and private hospitals.
Chart 11.7 : Number of Health Facilities in Bihar per 1 million Population ( Estimated)
104 99 91 85
113 123140
153
020406080
100120140160180
2016 2021 2031 2041
Health Facility per Million Population in Million

374
11.3 Drinking Water Supply and Sanitation
A regular access to safe drinking water and sanitation is critical for healthy living. The StateGovernment is solely responsible for provision of clean drinking water and sanitation to improve the health status of a population. As per National Statistical Office (NSO) Report on Drinking Water, Sanitation, Hygiene and Housing condition in India (76th Round, July-December, 2018),it was revealed that the major source of drinking water of the households in Bihar was handpump in the rural areas and tube-wells and handpumps in the urban areas. About 94.3 percent of the households in the rural areas used handpumps and about 75.8 percent of the households in the urban areas used handpumps or tube-wells as the principal source of drinking water. Among these,
LaQshya
Government of India launched ‘LaQshya’ (Labour Room Quality Improvement Initiative) in 2017 to improve quality of care in labour room and maternity operation theatres in public health facilities. It is an all -round approach focused at intra-partum and immediate post-partum period.
AimTo reduce preventable maternal and new-born mortality, morbidity and stillbirths associated with the care around delivery in Labour room and Maternity Operation Theatre and ensure respectful maternity care.
ObjectivesTo reduce maternal and new-born mortality and morbidity due to haemorrhage, retained placenta, preterm, preeclampsia and eclampsia, obstructed labour, puerperal sepsis, new-bornasphyxia, and new-born sepsis, etc.
To improve quality of care during the delivery and immediate post-partum care, stabilization of complications and ensure timely referrals, and enable an effective two-way follow-up system.
To enhance satisfaction of beneficiaries visiting the health facilities and provide Respectful Maternity Care (RMC) to all pregnant women attending the public health facilities.
Following types of healthcare facilities have been identified for implementation of the programme:
Government medical college hospitals
District Hospitals and equivalent health facilities
Designated First Referral Units (FRU) and Community Health Centres (CHC) with high case load over 100 deliveries/month (60 in hills and desert areas)
Presently, 2427 public health facilities across country have been identified for implementation

375
about 91.8 percent of the households in the rural and about 95.3 percent in the urban areas had drinking water facilities within the household premises. For India, the corresponding figures were 58.2 percent for rural and 80.7 percent for urban area. Regarding sanitation coverage, about 63.8 percent of the households in the rural and about 95.0 percent in the urban areas in Bihar had access to latrine. For India, the corresponding figures were a little higher — about 71.3 percent in the rural and about 96.2 percent in the urban areas.
The National Rural Drinking Water Programme (NRDWP) is a centrally sponsored scheme introduced in 2009 to provide adequate and safe drinking water to the rural population of the country. NRDWP focuses on creating and sustaining rural drinking water infrastructure in the country. This has resulted in ensuring provision of significant additional resources to the sector and creating an environment which enables development of infrastructure and capabilities for successful operation of drinking water supply schemes in rural areas. The goal of NRDWP is to ensure access to at least 55 litres of water per capita per day (lpcd), within their household premises or at a distance of less than 50 meters, to every rural household in the country, by 2024. Along with this, a sub-mission programme is being implemented since March 22, 2017 that aims to eliminate the problems of water quality, by 2024, in about 28,000 habitations affected by Arsenic and Fluoride across the country. This includes 229 arsenic affected and 526 fluoride affected habitations in Bihar. For implementation of these schemes, an amount of Rs. 80.37 crore has been approved by the concerned Ministry.
To deliver clean drinking water and proper sanitation facility to every citizen of Bihar, Har Ghar Nal Ka Jal (every household should have running tap water) and Shauchalaya Nirman Ghar Ka Sammaan (construction of toilets enhance the prestige of the home) are the two resolves made by the State Government, under its ambitions programme of Saat Nishchay. To fulfill the first goal,the State Government has launched three schemes, of which two are meant for rural areas and the third one for the urban area. In the rural areas, two of the schemes are — Mukhyamantri Gramin Peyajal Nischay Yojana (Quality Affected Areas) and Mukhyamantri Gramin Peyajal Nischay Yojana (Non-quality Affected Areas). The first one covers those areas where the quality of water is infected by arsenic, fluoride or iron, and the second one covers non-quality affected areas. In 2018-19, an amount of Rs. 1099.00 crore has been approved for schemes of quality affected areas and Rs. 500.00 crore has been approved for schemes of non-quality affected areas. The programme is being executed through Public Health and Engineering Department (PHED) and Panchayati Raj Department. Out of 38 districts, 29 districts in Bihar are affected by arsenic, fluoride and iron. Table 11.14 shows the number of wards in different districts where work has been started for elimination of contamination in domestic water.
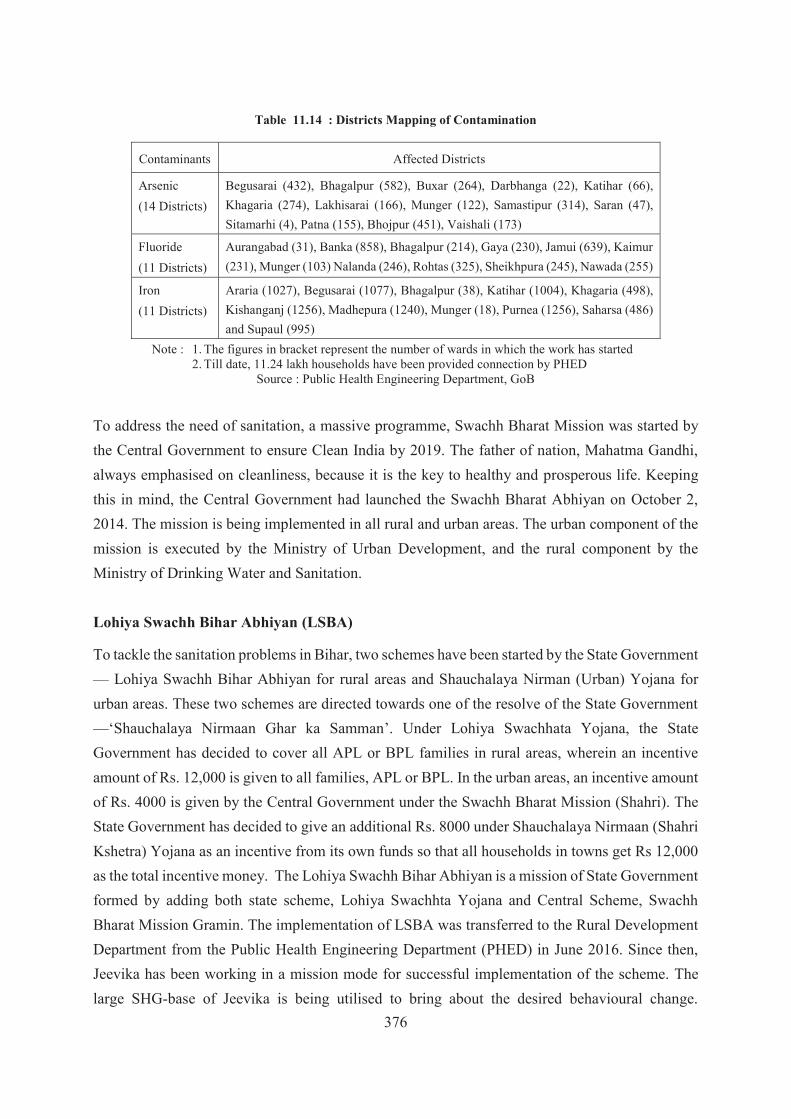
376
Table 11.14 : Districts Mapping of Contamination
Contaminants Affected Districts
Arsenic (14 Districts)
Begusarai (432), Bhagalpur (582), Buxar (264), Darbhanga (22), Katihar (66), Khagaria (274), Lakhisarai (166), Munger (122), Samastipur (314), Saran (47), Sitamarhi (4), Patna (155), Bhojpur (451), Vaishali (173)
Fluoride(11 Districts)
Aurangabad (31), Banka (858), Bhagalpur (214), Gaya (230), Jamui (639), Kaimur (231), Munger (103) Nalanda (246), Rohtas (325), Sheikhpura (245), Nawada (255)
Iron(11 Districts)
Araria (1027), Begusarai (1077), Bhagalpur (38), Katihar (1004), Khagaria (498), Kishanganj (1256), Madhepura (1240), Munger (18), Purnea (1256), Saharsa (486)and Supaul (995)
Note : 1. The figures in bracket represent the number of wards in which the work has started 2. Till date, 11.24 lakh households have been provided connection by PHED
Source : Public Health Engineering Department, GoB
To address the need of sanitation, a massive programme, Swachh Bharat Mission was started by the Central Government to ensure Clean India by 2019. The father of nation, Mahatma Gandhi, always emphasised on cleanliness, because it is the key to healthy and prosperous life. Keeping this in mind, the Central Government had launched the Swachh Bharat Abhiyan on October 2, 2014. The mission is being implemented in all rural and urban areas. The urban component of the mission is executed by the Ministry of Urban Development, and the rural component by the Ministry of Drinking Water and Sanitation.
Lohiya Swachh Bihar Abhiyan (LSBA)
To tackle the sanitation problems in Bihar, two schemes have been started by the State Government — Lohiya Swachh Bihar Abhiyan for rural areas and Shauchalaya Nirman (Urban) Yojana for urban areas. These two schemes are directed towards one of the resolve of the State Government —‘Shauchalaya Nirmaan Ghar ka Samman’. Under Lohiya Swachhata Yojana, the State Government has decided to cover all APL or BPL families in rural areas, wherein an incentive amount of Rs. 12,000 is given to all families, APL or BPL. In the urban areas, an incentive amount of Rs. 4000 is given by the Central Government under the Swachh Bharat Mission (Shahri). The State Government has decided to give an additional Rs. 8000 under Shauchalaya Nirmaan (Shahri Kshetra) Yojana as an incentive from its own funds so that all households in towns get Rs 12,000 as the total incentive money. The Lohiya Swachh Bihar Abhiyan is a mission of State Government formed by adding both state scheme, Lohiya Swachhta Yojana and Central Scheme, Swachh Bharat Mission Gramin. The implementation of LSBA was transferred to the Rural Development Department from the Public Health Engineering Department (PHED) in June 2016. Since then, Jeevika has been working in a mission mode for successful implementation of the scheme. The large SHG-base of Jeevika is being utilised to bring about the desired behavioural change.

377
Cumulatively, till September 2019, a total of 1.13 crore Individual Household Latrines (IHHL) have been constructed in 38 districts, declaring 38,691 villages and 534 blocks as Open Defecation Free (ODF).
The progress of work under water supply and sanitation and handpumps for the entire state are presented in Table 11.15. The yearly achievement under water supply and sanitation varies from year to year. As regards the number of handpumps installed under NRDWP, there is a constant progress till 2015-16 when 26.7 thousand handpumps were installed; thereafter, there is a decline in the recent years. As regards coverage of water quality problems, the highest achievement was made in 2013-14, when 12.8 thousand habitations were covered under the scheme. In 2018-19, the total handpumps installed under NRDWP was 3.7 thousand and water quality problems have been solved in even more 20290 wards as per Mukhyamantri Peyjal Nishchay Yojana. A considerable achievement is recorded in the construction of Individual Household Latrine (IHHL) in all these eight years. Out of the total 61.4 lakh IHHL constructed, 23.9 lakh (38.9 percent) latrines are for APL families and 37.5 lakh (61.1 percent) latrines are for BPL families. The district-wise coverage of habitations for water supply and sanitation through central schemes is presented in Tables A 11.15 and A 11.16 (Statistical Appendix). In 2018-19, three best performing districts in terms of installation of handpumps were — Muzaffarpur (405), Nalanda (344) and Gaya (265). In the same period, three best performing districts in terms of construction of IHHL were — Madhubani (5.9 percent), Samastipur (5.2 percent) and Darbhanga (5.1 percent).
Table 11.15 : Achievement under Water Supply and Sanitation (2011-12 to 2018-19)
(Figures in Number)
Year Handpumps Installed
Slipped back Habitations/
Water quality problems covered
Individual Household Latrine (IHHL) constructed
APL BPL Total
2011-12 28286 11243 193875 (23.1) 646052 (76.9) 839927 (100.0)
2012-13 31926 10960 236021 (29.6) 560678 (70.4) 796699 (100.0)
2013-14 34289 12787 63190 (39.1) 98456 (60.9) 161646 (100.0)
2014-15 24287 12236 47056 (28.4) 118401 (71.6) 165457 (100.0)
2015-16 26691 7189 146669 (34.3) 280365 (65.7) 427034 (100.0)
2016-17 6373 1289 320332 (36.7) 551999 (63.3) 872332 (100.0)
2017-18 8899 266 1246626 (36.3) 2187939 (63.7) 3434478 (100.0)
2018-19 3672 20290 2387019 (38.9) 3748536 (61.1) 6135555 (100.0)
Note : 1. Figures in the parenthesis represent percentage share of APL and BPL 2. From 2018-19 onwards, all wards will be covered as per Mukhyamantri Peyjal
Nischay Yojana Source : Public Health Engineering Department, GoB and JEEViKA
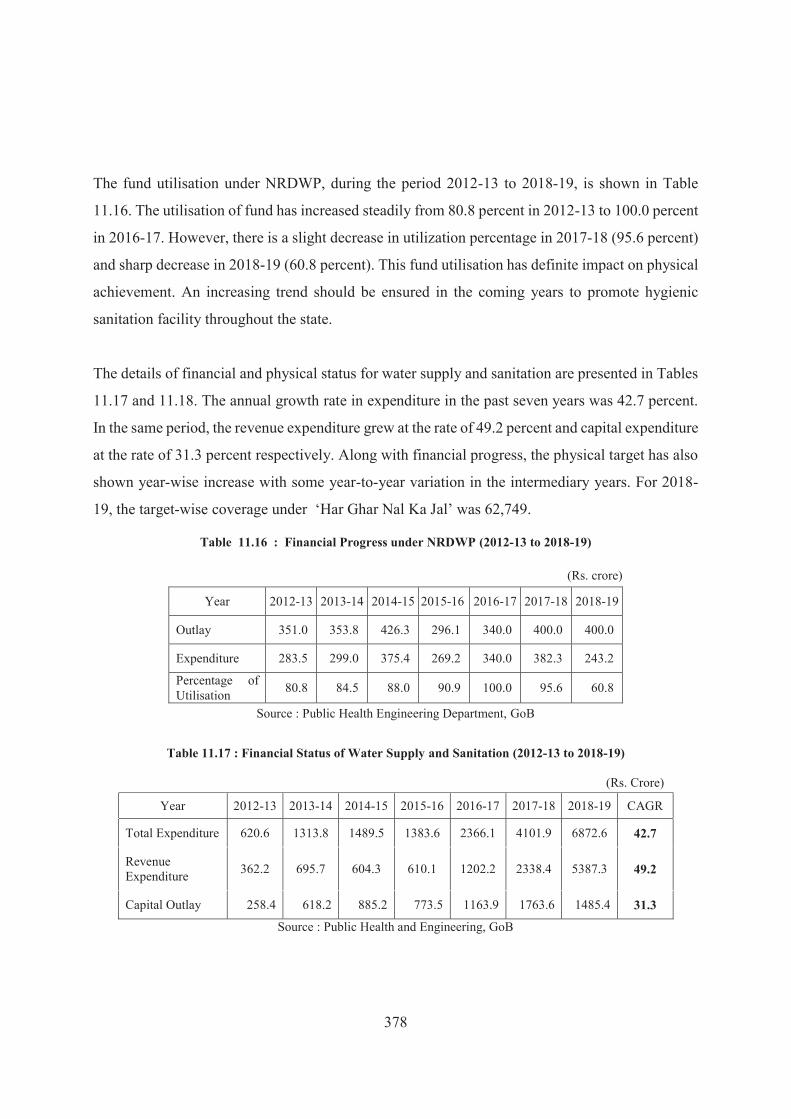
378
The fund utilisation under NRDWP, during the period 2012-13 to 2018-19, is shown in Table
11.16. The utilisation of fund has increased steadily from 80.8 percent in 2012-13 to 100.0 percent
in 2016-17. However, there is a slight decrease in utilization percentage in 2017-18 (95.6 percent)
and sharp decrease in 2018-19 (60.8 percent). This fund utilisation has definite impact on physical
achievement. An increasing trend should be ensured in the coming years to promote hygienic
sanitation facility throughout the state.
The details of financial and physical status for water supply and sanitation are presented in Tables
11.17 and 11.18. The annual growth rate in expenditure in the past seven years was 42.7 percent.
In the same period, the revenue expenditure grew at the rate of 49.2 percent and capital expenditure
at the rate of 31.3 percent respectively. Along with financial progress, the physical target has also
shown year-wise increase with some year-to-year variation in the intermediary years. For 2018-
19, the target-wise coverage under ‘Har Ghar Nal Ka Jal’ was 62,749.
Table 11.16 : Financial Progress under NRDWP (2012-13 to 2018-19)
(Rs. crore)
Year 2012-13 2013-14 2014-15 2015-16 2016-17 2017-18 2018-19
Outlay 351.0 353.8 426.3 296.1 340.0 400.0 400.0
Expenditure 283.5 299.0 375.4 269.2 340.0 382.3 243.2
Percentage of Utilisation 80.8 84.5 88.0 90.9 100.0 95.6 60.8
Source : Public Health Engineering Department, GoB
Table 11.17 : Financial Status of Water Supply and Sanitation (2012-13 to 2018-19)
(Rs. Crore)
Year 2012-13 2013-14 2014-15 2015-16 2016-17 2017-18 2018-19 CAGR
Total Expenditure 620.6 1313.8 1489.5 1383.6 2366.1 4101.9 6872.6 42.7
Revenue Expenditure 362.2 695.7 604.3 610.1 1202.2 2338.4 5387.3 49.2
Capital Outlay 258.4 618.2 885.2 773.5 1163.9 1763.6 1485.4 31.3
Source : Public Health and Engineering, GoB

379
Table 11.18 : Physical Targets in State Plan Schemes for Water Supply and Sanitation (2012-13 to 2018-19)
(Figures in Number)
Year
Installation of New instead of
Old Hand Pumps
Ward -wise target under
Har Ghar Nal Ka Jal
2012-13 50492 15015
2013-14 94526 13832
2014-15 105688 13000
2015-16 127449 7493
2016-17 3139 7777
2017-18 11720 9263
2018-19 8450 62749*
Note : * Target of ward-wise coverage under Har Ghar Nal Ka Jal under Nischay Yojana. Data includes coverage of Piped water scheme and works done by PRD.
Source : Public Health and Engineering, GoB
11.4 Education, Art, Culture and Youth
Education is the basis for developing and empowering children with knowledge and skills, which facilitate their access to productive employment. The education system has several challenges like the changing dynamics of the population, requirement of quality education, affordable vocational trainings, access to higher education, innovation and research. Keeping in view these challenges, various educational programmes are being implemented by the State Government, some of them with collaborations from the Central Government. To enhance the quality of technical education, institutes like Indian Institute of Technology and Indian Institute of Management have been established. The Central Government has also initiated schemes like Rashtriya Madhyamik Shiksha Abhiyan, Rashtriya Uchchatar Shiksha Abhiyan, and choice based credit system to enhance academic standards and quality of higher education. All these contribute towards economic growth and human development.
The education system of India is divided into three main layers — Elementary, Secondary and Higher Education. The Elementary education ranges from Grades I-VIII and children in the age group of 6-14 are a part of it and are entitled to free and compulsory education, as mandated by the Right to Education (RTE) Act (2010). The elementary level is further divided into 2 sub-categories — Primary (Grades I-V) and Upper Primary (Grades VI-VIII). A child undergoes Secondary education for four years (Grades IX-XII), split into Secondary (Grades IX-X) and Higher Secondary (Grades XI-XII). The Higher Education is the last stage which is divided into two streams — the academic stream and the vocational stream. The academic stream is envisioned

380
to prepare students for further study at a university or other higher educational institution, while the vocational stream prepares students for work or further vocational education. This section presents the status of education in Bihar, in terms of literacy rate, enrolment ratio, dropout rate, number of schools and teachers, expenditure on education, Mid-Day Meal Scheme, Sarva ShikshaAbhiyan and a few other related activities.
Literacy Rate
The literacy rate in Bihar remains one of the lowest in the country, but the state has made
remarkable progress in this field in the last decade. The literacy rate in Bihar increased from 47.0
percent in 2001 to 61.8 percent in 2011, implying an increase of 14.8 percentage point during the
decade (Table 11.19). This decadal increase is not only the highest among all the decades since
1961, it is also the highest among all the states in India for the decade 2001-2011. It might be noted
here that, for the country as a whole, the literacy rate in 2011 was 72.9 percent, compared to 64.8
percent in 2001, implying an increase 8.1 percentage point. Apart from recording the highest
increase in literacy rates, Bihar has been able to considerably reduce the gender difference in its
literacy rates. In 2001, the male and female literacy rates in Bihar were 60.3 percent and 33.6
percent respectively, implying a difference of 26.7 percentage point. In 2011, the gender-wise
literacy rates were 71.2 percent (male) and 51.5 percent (female), implying a reduced gender
difference of 20.1 percentage point. This was possible because the decadal growth in female
literacy rate in Bihar was as high as 17.9 percent, compared to 10.9 percent for the males. This
appreciable performance of Bihar in promoting literacy can be ascribed to two factors. First, due
to awareness of social justice, the demand for education is now very high among all sections of
the society and the second, state government has considerably enhanced its expenditure on
education.
Table 11.19 : Trend of Literacy Rates in India and Bihar (1961-2011)
YearIndia Bihar Gender Gap
Male Female Total Male Female Total India Bihar
1961 40.4 15.4 28.3 35.2 8.2 22.0 25.1 27.0
1971 46.0 22.0 34.5 35.8 10.2 23.2 24.0 25.5
1981 56.4 29.8 43.6 43.8 15.8 32.3 26.6 28.0
1991 64.1 39.3 52.2 52.5 22.9 37.5 24.8 29.6
2001 75.3 53.7 64.8 60.3 33.6 47.0 21.6 26.7
2011 80.9 64.6 72.9 71.2 51.5 61.8 16.6 20.1
Source : Census of India
381
Elementary and Secondary Education
For a socially disadvantaged state like Bihar, it is the elementary education sector that commands the highest importance, since it is this sector which feeds students to the secondary sector which, in turn, feeds students to the higher education sector. The progress in elementary education also implies that the process is an inclusive one; since it is more relevant for a large number of students who are first generation learners coming from disadvantaged sections of the society. The total number of primary schools in Bihar increased from 40,934 in 2011-12 to 42,932 in 2017-18. Similarly, the number of upper primary schools increased from 236 in 2011-12 to 31,074 in 2017-18, taking the total number of elementary schools to 74,006 from 41,170. The success of elementary education is determined by two crucial educational indices — high enrolment ratio and low dropout rate. The performance on these two indices, in turn, is mostly influenced by the availability of educational facilities like schools, teachers, etc.
Enrolment Ratio
The progress towards the goal of universal access to education has been steady over the years. Table 11.20 shows total enrolment at primary and upper primary levels in Bihar, during 2012-13to 2017-18. The annual growth rate of enrolment in primary level over this period was 0.6 percent. The total enrolment in primary level was 160.08 lakhs in 2017-18, increasing from 154.51 lakhs in 2012-13. Previously, the children passing out of primary classes were not able to get admission in the upper primary classes, because of non-availability of upper primary schools within a reasonable distance from their residence. During 2007-08 and 2008-09, this deficiency was removed by the State Government by upgrading many of the primary schools to upper primary level. Thus, Bihar has now reached a stage where enrolment in elementary classes for the children in age-group 6-14 years is nearly universal. At the upper primary level, the total enrolment has increased from 60.36 lakh in 2012-13 to 75.76 lakh in 2017-18, implying an annual growth rate of 4.5 percent. As a whole, the total enrolment, taking both primary and upper primary levels, rose to 235.84 lakhs in 2017-18 from 214.87 lakhs in 2012-13, with an annual growth rate of 1.8 percent. Additionally, the total enrolment for SC and ST students during this period has also grown at the rate of 3.0 and 4.8 percent respectively. Further, the gender gap in elementary education is also decreasing over the years, as the growth rate of enrolment of girls was 1.8 percent during 2012-13to 2017-18, compared to 1.7 percent for the boys. The total enrolment of boys (121.70 lakhs) at the elementary level was only marginally higher than that of the girls (114.14 lakhs) in 2017-18.This pattern of higher growth rate of enrolment for girls, and a marginally lower share of girls in total number of students, is also observed for both primary and upper primary schools. Taking primary and upper primary together, boys accounted for 51.6 percent of the total enrolment, whilethe share of girls was 48.4 percent in 2017-18.

382
Table 11.20 : Total Enrolment in Primary and Upper Primary Levels (2012-13 to 2017-18)
(Number in lakh) Level/
Type of Students 2012-13 2013-14 2014-15 2015-16 2016-17 2017-18 CAGR
Primary
Boys
Combined 79.74 83.34 83.72 84.4 83.97 82.69 0.6
SC 14.5 15.81 15.58 16.01 15.98 15.53 1.2
ST 1.59 1.64 1.7 1.81 1.83 1.9 3.7
Girls
Combined 74.77 77.86 77.63 78.96 78.35 77.39 0.6
SC 13.21 14.47 14.39 14.8 14.89 14.35 1.5
ST 1.33 1.36 1.4 1.5 1.48 1.53 3.0
All
Combined 154.51 161.2 161.35 163.36 162.32 160.08 0.6
SC 27.71 30.29 29.97 30.81 30.87 29.88 1.3
ST 2.92 3.01 3.11 3.31 3.31 3.43 3.3
Upper Primary
Boys
Combined 31.34 33.66 34.77 37.08 37.83 39.01 4.4
SC 4.81 5.59 6.12 6.47 6.75 6.68 6.7
ST 0.55 0.58 0.61 0.72 0.74 0.8 8.2
Girls
Combined 29.02 31.75 33.14 35.23 35.5 36.75 4.6
SC 4.23 5.11 5.47 5.92 6.31 6.36 8.2
ST 0.46 0.48 0.53 0.64 0.64 0.69 9.2
All
Combined 60.36 65.41 67.91 72.31 73.33 75.76 4.5
SC 9.04 10.71 11.59 12.39 13.06 13.04 7.4
ST 1.01 1.07 1.15 1.36 1.37 1.49 8.5
Total
Boys
Combined 111.08 117.00 118.49 121.48 121.8 121.7 1.7
SC 19.31 21.40 21.7 22.48 22.73 22.21 2.7
ST 2.14 2.22 2.31 2.53 2.57 2.7 5.0
Girls
Combined 103.79 109.61 110.77 114.19 113.85 114.14 1.8
SC 17.44 19.58 19.86 20.72 21.2 20.71 3.3
ST 1.79 1.84 1.93 2.14 2.12 2.22 4.7
All
Combined 214.87 226.62 229.26 235.67 235.65 235.84 1.8
SC 36.75 41.01 41.56 43.2 43.93 42.92 3.0
ST 3.93 4.08 4.26 4.67 4.68 4.92 4.8
Source : Department of Education, GoB
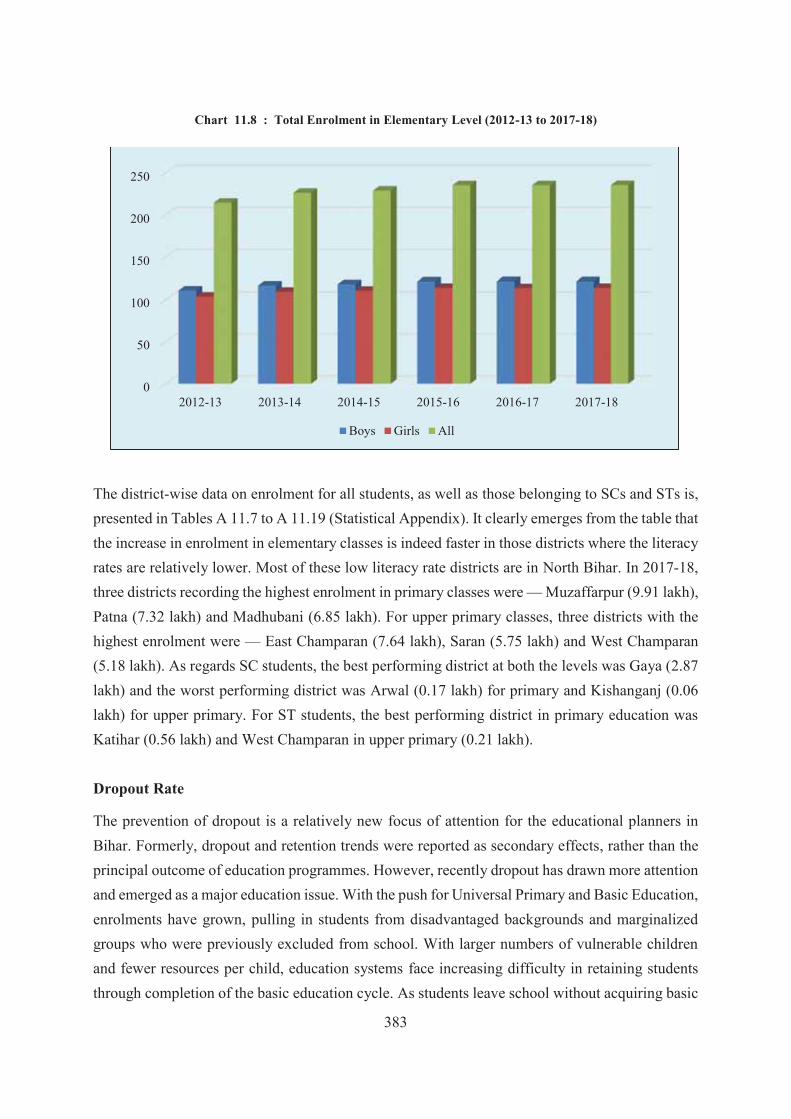
383
Chart 11.8 : Total Enrolment in Elementary Level (2012-13 to 2017-18)
The district-wise data on enrolment for all students, as well as those belonging to SCs and STs is,presented in Tables A 11.7 to A 11.19 (Statistical Appendix). It clearly emerges from the table that the increase in enrolment in elementary classes is indeed faster in those districts where the literacy rates are relatively lower. Most of these low literacy rate districts are in North Bihar. In 2017-18, three districts recording the highest enrolment in primary classes were — Muzaffarpur (9.91 lakh), Patna (7.32 lakh) and Madhubani (6.85 lakh). For upper primary classes, three districts with the highest enrolment were — East Champaran (7.64 lakh), Saran (5.75 lakh) and West Champaran (5.18 lakh). As regards SC students, the best performing district at both the levels was Gaya (2.87 lakh) and the worst performing district was Arwal (0.17 lakh) for primary and Kishanganj (0.06 lakh) for upper primary. For ST students, the best performing district in primary education was Katihar (0.56 lakh) and West Champaran in upper primary (0.21 lakh).
Dropout Rate
The prevention of dropout is a relatively new focus of attention for the educational planners in Bihar. Formerly, dropout and retention trends were reported as secondary effects, rather than the principal outcome of education programmes. However, recently dropout has drawn more attention and emerged as a major education issue. With the push for Universal Primary and Basic Education, enrolments have grown, pulling in students from disadvantaged backgrounds and marginalized groups who were previously excluded from school. With larger numbers of vulnerable children and fewer resources per child, education systems face increasing difficulty in retaining students through completion of the basic education cycle. As students leave school without acquiring basic
0
50
100
150
200
250
2012-13 2013-14 2014-15 2015-16 2016-17 2017-18
Boys Girls All

384
skills, they not only deprive themselves, but their premature departure also represents a significant waste of scarce education resources, raising the unit cost of education. Thus, for a state like Bihar, it is important to carefully design preventive measures and intervention strategies that could prevent dropouts. The dropout rates at primary, upper primary and secondary levels during 2012-13 to 2017-18 in Bihar are presented in Table 11.21. At all levels of education, these rates have steadily declined during the recent years. At the primary level, dropout rate recorded a decrease of 15.5 percentage points, between 2012-13 (31.7 percent) and 2017-18 (16.2 percent). At the upper primary level, this decrease was 6.9 percentage points. This denotes that the dropout rates are declining rapidly at both the levels, promoting Universalisation of Elementary Education (UEE). The dropout rates at secondary level are much higher than that at the elementary level. The dropout rate was 56.1 percent in 2017-18 at the secondary level, implying a decrease of 6.7 percentage point from 62.8 percent in 2012-13. Thus, only 44 percent of students enrolled in Standard I presently complete their secondary level education in Bihar.
Table 11.21 : Dropout Rates at Primary, Upper Primary and Secondary Levels (2012-13 to 2017-18)
Year 2012-13 2013-14 2014-15 2015-16 2016-17 2017-18
Primary
Girls 26.3 23.6 24.0 24.2 22.4 16.3
Boys 36.0 33.6 29.2 25.6 22.0 17.1
Combined 31.7 29.1 26.8 25.0 22.2 16.2
Upper Primary
Girls 38.7 34.7 38.9 36.3 38.1 36.2
Boys 52.4 52.4 49.9 47.0 46.8 43.0
Combined 46.7 46.5 45.1 42.2 42.9 39.8
Secondary
Girls 59.5 57.6 53.9 52.5 53.1 52.5
Boys 65.2 64.7 61.2 61.5 59.4 59.0
Combined 62.8 61.8 58.2 57.7 56.6 56.1
Source : Department of Education, GoB
It is encouraging to note that, at all the levels of education (primary, upper primary and secondary)
the dropout rate of girl students is lower than that of the boys. As goals of elementary education
have been substantially achieved, universalisation of secondary education should now be promoted
in Bihar. This will generate human capital to accelerate growth and social development in the state.
Table 11.22 shows the dropout rate of SC and ST students at the primary, upper primary and
secondary levels during 2012-13 to 2017-18 in Bihar. In order to uplift the disadvantaged sections
of the society, constant monitoring is required to enhance enrolment, retention and attendance of
students, belonging to SC and ST groups. The figures in the table clearly indicate that the dropout

385
rates for SC and ST students have also decreased progressively during this period. The dropout
rate of SC girls has been lower than that of SC boys throughout the period, at both elementary and
secondary stages. For ST students again, one observes a steady decline in dropout rates in
secondary level during this period.
Table 11.22 : Dropout Rates (SC & ST) at Primary, Upper Primary and Secondary Levels (2012-13 to 2017-18)
Year
Primary Upper Primary Secondary
Girls Boys Combined Girls Boys Combined Girls Boys Combined
Scheduled Caste
2012-13 24.3 36.3 31.2 49.0 61.4 56.5 65.1 70.6 68.4
2013-14 13.3 30.4 23.2 40.5 54.7 48.9 64.3 69.8 67.7
2014-15 25.5 32.9 29.6 39.7 47.1 44.0 61.5 67.8 65.3
2015-16 25.3 28.0 26.7 38.5 50.1 45.2 53.4 62.9 59.1
2016-17 23.6 23.9 23.8 34.5 49.0 42.9 51.9 60.3 56.7
2017-18 17.2 16.4 16.8 43.9 52.0 48.3 53.0 62.0 58.1
Scheduled Tribe
2012-13 NA NA NA NA 23.8 13.1 26.6 38.2 33.9
2013-14 15.1 23.8 10.0 2.0 21.7 12.7 23.5 37.6 32.3
2014-15 21.2 0.9 8.3 3.2 27.8 18.0 31.8 45.7 40.5
2015-16 2.8 2.3 2.6 0.0 19.9 19.9 22.7 41.1 34.1
2016-17 15.0 11.8 13.3 31.0 39.8 37.1 34.5 47.4 42.3
2017-18 8.9 10.0 9.5 18.7 18.5 18.3 24.8 38.7 33.0
Source : Department of Education, GoB
Number of Schools
The total number of primary and upper primary schools in Bihar increased from 41,170 in 2011-
12 to 74,006 in 2017-18. Three districts performing better in terms of number of schools are —
East Champaran (3852), Patna (3366), and Muzaffarpur (3359). On the other hand, three districts
with the least number of schools are — Sheikhpura (581), Arwal (526) and Sheohar (434). The
district-wise number of primary and upper primary schools is presented in Table A 11.20
(Statistical Appendix).
The Pupil-Teacher Ratio (PTR) is an important indicator of quality of education. The number of
teachers need to be increased in Bihar with the growth in enrolment ratio. At primary level, the
PTR should be 30:1 and at the upper primary level it should be 35:1. The Rashtriya Madhyamik
Shiksha Abhiyan (RMSA) framework specifies that the PTR at secondary level should be 30:1.

386
The total number of teachers at primary and upper primary schools increased from 3.5 lakh in
2012-13 to 4.1 lakh in 2017-18. In terms of number of teachers, Siwan (20,499), Patna (20,347)
and East Champaran (20,037) were the best performers in 2017-18, whereas Sheikhpura (2264),
Sheohar (2572) and Arwal (3227) were the worst performers. The district-wise number of teachers
at primary and upper primary schools is presented in Table A 11.21 (Statistical Appendix).
Expenditure on Education
An adequate expenditure on education is very important for the functioning of the educational
sector. Table 11.23 shows that the total public expenditure on elementary, secondary and higher
education has increased from Rs. 14,946 crore in 2013-14 to Rs. 30,736 crore in 2018-19 in Bihar.
Along with this, it also shows the share of expenditure on education in total budget and in total
expenditure on social services. The growth rate of total expenditure on education has been as high
as 13.6 percent during this period. As regards its share in total expenditure, it has increased from
18.6 percent in 2013-14 to 20.1 percent in 2018-19. On the other hand, the share of expenditure
on education to total expenditure on social services decreased from 52.9 percent in 2013-14 to 49.3
percent in 2018-19. About the breakdown of total expenditure on education in three components
(elementary, secondary and higher), it is evident that primary education has the highest share of
the total expenditure, compared to other two categories. In 2018-19, the expenditure on elementary
education was 62.3 percent, secondary education was 24.2 percent and higher education was 13.5
percent.
Table 11.23 : Expenditure on Education (2013-14 to 2018-19)
YearExpenditure on Education (Rs. crore)
Total
Expenditure on Education as percentage of
Elementary Secondary Higher Total Budget
Social Sector
2013-14 7764 (51.9) 2987 (20.0) 4195 (28.1) 14946 (100.0) 18.6 52.9
2014-15 12140 (68.1) 3368 (18.9) 2325 (13.0) 17833 (100.0) 18.8 53.4
2015-16 13327 (68.7) 3677 (19.0) 2382 (12.3) 19386 (100.0) 17.3 50.1
2016-17 13880 (70.4) 3507 (17.8) 2326 (11.8) 19713 (100.0) 15.6 44.5
2017-18 15638 (66.1) 3930 (16.6) 4088 (17.3) 23656 (100.0) 17.3 47.3
2018-19 19152 (62.3) 7450 (24.2) 4134 (13.5) 30736 (100.0) 20.1 49.3
CAGR 16.4 15.3 4.7 13.6 13.5 16.4
Note : Figures in the parenthesis represent percentage share Source : State Government Finances, GoB

387
Mid-Day Meal Scheme (MDMS)
The Scheme ‘National Programme of Nutritional Support to Primary Education’ (NP-
NSPE), commonly known as Mid-Day Meal Scheme (MDMS), was launched on August 15, 1995
on a nationwide scale by the Department of Elementary Education and Literacy, under Ministry
of Human Resource Development of the Central Government. The objective of the scheme is to
provide nutritional meal to children in government and aided schools to increase enrolment, reduce
dropout rate and improve the nutritional status of the children in the schools. The scheme was
launched initially in 2408 blocks in the country. By 1997-98, the NP-NSPE was introduced in all
blocks of the country. In 2001, MDMS became a cooked Mid-Day Meal Scheme with a minimum
content of 300 calories of energy and 8-12 grams protein per day for a minimum of 200 days in a
year. It was further extended in 2002 to cover not only children in Grades I -V, but also children
studying in Education Guarantee Scheme (EGS) and Alternative and Innovative Education (AIE)
centres. In addition to free supply of food grains, the revised scheme provided Central Assistance
for — (a) Cooking cost at Rs 1 per child per school day, (b) Transport subsidy was raised from the
earlier maximum of Rs. 50 per quintal to Rs. 100 per quintal for special category states, and Rs.
75 per quintal for other states, (c) Management, monitoring and evaluation costs at 2 percent of
the cost of food grains, transport subsidy and cooking assistance, and (d) Provision of mid-day
meal during summer vacation in drought affected areas. In 2006, the scheme was further revised
to enhance the cooking cost to Rs. 1.80 per child per school day for states in the North Eastern
Region and Rs. 1.50 per child per school day for other states. The nutritional norm was revised to
450 calories and 12 grams of protein. In October 2007, the scheme has been further revised to
cover children in upper primary (Grades VI to VIII), initially in 3479 Educationally Backward
Blocks (EBBs). From 2008-09, the programme covers all children studying in Government, Local
Body and Government-aided primary and upper primary schools and the EGS/AIE centres
including Madarsa and Maqtabs, supported under SSA of all areas across the country. The calorific
value of a mid-day meal at upper primary stage has been fixed at a minimum of 700 calories and
20 grams of protein by providing 150 grams of food grains (rice/wheat) per child per school day.
As per core scheme norm, the cost sharing pattern of MDMS is in the ratio of 60:40 for the Central
and State Government. To achieve the objectives of the scheme, the guidelines prescribe the
nutritional content and day-wise menu in the mid-day meal (Table 11.24).

388
Table 11.24 : Food, Nutritional and Calorific norms and Day-wise Menu under MDMS
Items Primary (I-V) Upper Primary (VI-VIII)
A. Nutritional Norms (Per child per day)
1. Calorie 450 700
2. Protein 12 gms 20 gms
B. Food Norms (Per child per day)
1. Food – grains (Rice/Wheat) 100 gms 150 gms
2. Pulses 20 gms 30 gms3. Vegetables 50 gms 75 gms4. Oil & fat 5 gms 7.5 gms5. Salt & condiments As per need As per need
6. Micro-nutrients Adequate quantities of micro-nutrients like iron, folic acid, vitamin-A etc. in convergence with NHM
Day-wise Menu for MDMS in Bihar
Monday Rice + Mixed Dal + Green Vegetables
Tuesday Zeera Rice+ Soyabean Potato Vegetable
Wednesday Khichadi with leafy vegetables+ chokha+Banana/Seasonal Fruits
Thursday Rice + Green Vegetables + Mixed Dal
Friday Pulao+Kabuli Chana/Red Peas+Green Salad+Egg/Seasonal Fruits
Saturday Khichadi with leafy vegetables+ chokha+Banana/Seasonal Fruits
Source : MDMS, GoB
The coverage of the MDMS signifies the percentage of children benefiting from the scheme (Table
11.25). In 2018-19, the coverage of MDMS at primary level was 60.8 percent, registering a
decrease of 6.2 percentage points from 67.0 percent in 2013-14. Similarly, the coverage of MDMS
at upper primary level was 67.0 percent in 2013-14 and it decreased to 56.3 percent in 2018-19.
Table 11.25 : Coverage of MDMS (2013-14 to 2018-19)
Year 2013-14 2014-15 2015-16 2016-17 2017-18 2018-19
Class I-V
Total Enrolment (in lakhs) 141.62 143.18 144.68 141.70 126.59 119.4No. of Children Availing MDMs (per day) (in lakhs) 94.89 94.36 99.28 89.70 79.85 72.64
Coverage Percentage 67.0 65.9 68.6 63.3 63.1 60.8
Class VI-VIII
Total Enrolment (in lakhs) 57.57 60.59 62.67 66.27 62.84 61.55No. of Children Availing MDM (per day) (in lakhs) 38.57 36.99 40.02 37.80 36.24 34.65
Coverage Percentage 67.0 61.0 63.9 57.0 57.7 56.3
Source : MDMS, GoB

389
Apart from the fact that the actual coverage of MDMS at both the levels is much below an ideal of 100 percent, it is also observed from Tables A 11.22 and A 11.23 (Statistical Appendix) that the coverage of the scheme varies extensively across the districts. The low coverage districts at the primary level in 2018-19 were — Vaishali (53.1 percent), Bhojpur (54.3 percent) and Katihar (54.4 percent), while the districts with relatively high coverage were — West Champaran (70.7 percent), Kaimur (67.5 percent) and Begusarai (65.8 percent). The low coverage districts for MDMS at upper primary level in 2018-19 were — Katihar (46.7 percent), Araria (47.7 percent) and Purnea (48.9 percent). The high coverage districts at the upper primary level in the same year were —West Champaran (64.3 percent), Sheohar (62.7 percent) and Saran (61.4 percent).
Samagra Shiksha Abhiyan
Education is the most important tool for social, economic and political transformation and a key instrument for building an equitable society. Before 1976, education was the exclusive responsibility of the states. Later, the Constitutional Amendment of 1976 included education in the Concurrent List. The Union Budget, 2018-19, had proposed to treat school education holistically, without segmentation from pre-school to Grade XII. In order to improve school effectiveness and learning outcomes, Samagra Shiksha Abhiyan (an overarching programme extending from pre-school to Grade XII) has been launched by the Central Government in2018-19. It subsumes the three erstwhile major flagship Schemes of the Ministry of Human Resource Development (MHRD) — (i) Sarva Shiksha Abhiyan (SSA), covering the elementary level (Grades I -VIII), (ii) Rashtriya Madhyamik Shiksha Abhiyan (RMSA) covering Grades IX-X and Grades XI-XII for certain components, and (iii) Centrally Sponsored Scheme on Teacher Education (CSSTE) that aims to provide infrastructural and institutional support to Teacher Education Institutions to enhance the quality of teachers across Grades I-X. This sector-wide development programme would also help harmonise the implementation mechanisms and transaction costs at all levels. The major objectives of the scheme are provision of quality education and enhancing learning outcomes of students, bridging down social and gender gaps in school education, and ensuring equity and inclusion at all levels of school education. The expectedoutcomes of the programme are envisaged as Universal Access, Equity and Quality, promoting Vocationalisation of Education and strengthening of Teacher Education Institutions.
The scheme will be implemented as a centrally sponsored scheme by the department through a single State Implementation Society (SIS) at the state level. At the national level, there would be a Governing Council, headed by the Minister of Human Resource Development and a Project Approval Board (PAB), headed by Secretary, Department of School Education and Literacy. The department will be assisted by a Technical Support Group (TSG) at Educational Consultants of

390
India Limited (EdCIL) to provide technical support in functional areas pertaining to access, equity and quality education. The new TSG will be formed by merging the TSGs of the Schemes of SSA, RMSA and CSSTE. The states would be expected to bring a single Plan for the entire school education sector. The fund sharing pattern for the scheme between Centre and States is at present in the ratio of 60:40 for non-special category states like Bihar. The major interventions proposed, across all levels of school education, under the scheme are: Universal Access including Infrastructure Development and Retention, Gender and Equity, Inclusive Education, Digital Initiatives, RTE Entitlements including uniforms, textbooks, pre-school education, vocational education, sports and physical education, etc. It is proposed that preference in the interventions would be given to Educationally Backward Blocks (EBBs), Left Wing Extremism (LWEs)affected districts, Special Focus Districts (SFDs), Border Areas and the 117 Aspirational districts.The main emphasis of the Scheme is on improving quality of school education by focussing on the two Ts – Teacher and Technology.
Kasturba Gandhi Balika Vidyalayas (KGBVs) are residential schools at upper primary level for girls belonging to disadvantaged groups such as SC, ST, OBC, Minority and Below Poverty Line (BPL) households. It aims to reduce gender gap at elementary level of education and is operational in Educationally Backward Blocks (EBBs). The EBB is an intermediate geographical cluster between village and a district, where the level of rural female literacy is less than the national average and the gender gap in literacy rate is above the national average. In KGBVs, 75 percent girls from SC, ST, OBC or Minority Communities would be accorded priority for enrolment and only thereafter, 25 percent girls from other families would be enrolled. The scheme of Samagra Shiksha has provision for existing KGBVs at upper primary level and Girls Hostels at secondary level to provide residential schooling facilities upto Grade XII. This would provide the facility of at least one residential school for girls from Grades VI-XII in every educationally backward block which does not have residential schools under any other scheme. Till date, 535 KGBVs are operational in Bihar. Of these, 500 are being run through Vidyalaya Shiksha Samiti and 35 by non-governmental organisations (NGO). A total of 50,581 girls have been enrolled in KGBVs, out of which 20,243 are in Grade VI, 15,508 in Grade VII and 14,830 are in Grade VIII. Out of these 50,581 girls enrolled, 23,255 (46 percent) are SC, 4189 (8 percent) are ST, 17,963 (35 percent) are OBC, 1762 (4 percent) are BPL and 3412 (7 percent) are minorities. Each KGBV has 10 sanctioned posts of Teaching and Non-Teaching staff. Also, 280 instructresses for vocational training are presently working in those schools.
Launched in 2013, Rashtriya Uchchatar Shiksha Abhiyan (RUSA) is a Centrally Sponsored
Scheme, which aims at providing strategic funding to eligible higher educational institutions in

391
different states. The funding norm will be 60:40 between the Central and State Governments. The
funding would flow from the Central Ministry through the State Governments to the State Higher
Education Councils, before reaching the identified institutions. The funding to states would be
made on the basis of critical appraisal of State Higher Education Plans, which would describe each
state’s strategy to address issues of equity, access and excellence in higher education. During the
first phase of RUSA, central assistance to states was provided for creation of one Model Degree
College each in 60 Educationally Backward Districts (EBDs) where Gross Enrolment Ratio (GER)
in higher education was less than the national average. During the second phase of RUSA, the
focus is on opening new Model Degree Colleges in ‘Aspirational Districts’, identified by NITI
Aayog and in unserved and underserved districts in North Eastern and Himalayan States.
Table 11.26 presents the approved budget and total expenditure of Bihar Education Project (BEP)
in 2017-18 and 2018-19, along with its break-up among RUSA, RMSA and SSA. It is apparent
from the table that the major share of BEP expenditure is on SSA. In 2017-18 and 2018-19, the
expenditure on SSA was Rs. 8396.1 crore and Rs. 4826.3 crore respectively, nearly 96 percent of
the total expenditure. The expenditure as a percentage of budget was also the highest for SSA —
79.5 percent in 2017-18 and 65.5 percent in 2018-19. For both RMSA and RUSA, this ratio is very
low.
Table 11.26 : Status of Fund Received and Expenditure under Different Schemes (2017-18 and 2018-19)
(Rs. crore)
Programmes Approved AWP & B
Fund ReleasedTotal
Expenditure
Expenditure as
Percentage of AWP & B
GOI GOB Total
2017-18
RUSA 133.33 29.51 17.75 47.26 44.37 33.3
RMSA 1448.74 186.34 134.51 320.85 320.85 22.1
SSA 10558.59 2557.97 5838.13 8396.10 8396.10 79.5
Total 12140.66 2773.82 5990.39 8764.21 8761.32 72.2
2018-19
RUSA 85.16 2.10 0.40 2.50 1.00 1.2
RMSA 1353.73 113.21 96.15 209.36 208.80 15.4
SSA 7371.58 2960.59 1940.39 4900.98 4826.27 65.5
Total 8810.47 3075.90 2036.94 5112.84 5036.07 57.2
Note : AWP&B = Annual Work Plan and Budget Source : Bihar Education Project, GoB

392
Higher Education
With an estimated population of young people (aged between 18-23 years) to be around 11.8million, Bihar needs to create adequate opportunities for higher education. Bihar now has 879 colleges and 33 universities, of which 28 are traditional universities and 1 of them is an open university. There are also 4 private universities and 15 research institutes in the state (Table 11.27).In 2018, there were 278 government colleges and 564 local body colleges. To ensure the delivery of quality education, teachers’ training is very important. There were 60 teacher training centresin Bihar in 2018, out of which only 31 were recorded as reporting centres. In comparison to 24engineering colleges in 2014, the state has 34 engineering colleges in 2018. There were also 54 polytechnic institutes. Presently, 87 colleges and 7 universities have NAAC accreditation in the state. The district-wise details of affiliated and constituent colleges and technical colleges for 2015-16 to 2018-19 are given in Tables A 11.23 and A 11.24 (Statistical Appendix).
Table 11.27 : Institutions of Higher Education (2014 to 2018)
(in Number)
Type of Institutions/Year 2014 2015 2016 2017 2018
Universities
Central University 2 2 4 4 4
State Public University 14 14 13 13 17
Institute of National Importance 3 3 3 3 5
State Open University 1 1 1 1 1
Institute Under State Legislative Act 1 1 1 1 1
Deemed University 1 1 1 1 1
State Private University 4
Total 22 22 23 23 33
Research Institute 15 15 15 15 15
Colleges/Centre
Government Colleges/ Constituent College 278 276 276 277 278
Local Body Colleges/ Affiliated College 416 468 478 496 564
P.G Centre/Off-Campus Centre 9 9 9 9 9
Recognized Centre 13 16 18 18 28
Total 716 769 781 800 879
Teacher Training Centre / Engineering Colleges
Education/Teacher Training Centre (Primary) 43 60 60 60 60
Engineering College 24 23 28 28 34
Polytechnic 26 29 39 50 54
Total 93 112 127 138 148
Source : Department of Education, GoB

393
Art, Culture and Youth
The youth population constitutes a critical segment, as the future social, economic and political developments depend on them. India is one of the youngest nations in the world, with 27.5 percent of its population belonging to the age-group 15-29 years; in Bihar, the share is 24.2 percent. The State Government has earmarked an amount of Rs. 155.19 crore in 2019-20 for different schemes
School Education Outcomes
Mukhyamantri Kanya Utthan Yojana is an ambitious umbrella scheme of the State Government, which also includes Mukhyamantri Poshak Yojana. Under Mukhyamantri Poshak Yojana, in 2018-19, 77.4 lakh students have been benefitted with an amount of Rs. 730.84 crore.
As per Samagra Shiksha Abhiyan, in 2018-19, a sum of Rs. 5589.82 crore has been spent which is around 82 percent of the allotted amount.
In 2018-19, 21,286 primary schools have been opened and 19,630 primary schools havebeen upgraded to secondary levels under Sarva Shiksha Abhiyan. Similarly, 1106 schools have been upgraded to higher secondary levels under Rahshtriya Madhyamik Shiksha Abhiyan.
Bihar has made notable progress in bringing out-of-school children of 6-14 years age group into schools. In 2018-19, approximately 64.14 lakh children were included in school network by direct admission and 64.8 thousand were covered through special training. Now, the number of out-of-school children has come down to 1 percent.
Teacher is the main component for ensuring quality education. Presently, there are 3,88,607 teachers working in the state. The gap between the sanctioned strength and thenumber of recruited teachers along with 42,754 part-time teachers are 2,46,688. The additional teachers will be recruited shortly. The Pupil Teacher Ratio (PTR) is about 50:1 in respect of working teacher, whereas it is 34:1 in respect of sanctioned teacher.
Bihar Board of Open Schooling and Examination (BBOSE), is an autonomous organisation created by the Department of Education of the State Government. It is an Open and Distance Learning Institution, set up on the lines of National Institute of Open Schooling (NIOS), under the Ministry of Human Resource Development, Government of India. Its mandate is to ‘Reach the Unreached’ in terms of education and skill, through open and distance learning mode. Presently, there are 3301 teaching centres in the state. As per academic session 2017-18, a total 66,378 students have been enrolled, out of which 42,081
394
of the Department of Art, Culture and Youth. For holistic development of art, culture and youth, the State Government has taken numerous steps:
(i) Creation of Cultural Environment : An amount of Rs. 7.00 lakh has been allotted to each district for various programmes like District Establishment Day, District Youth Festival and Bihar Diwas, etc. On the occasion of Shravani Mela, cultural programmes were organized in various places like (Sultanganj) Bhagalpur, (Avrakha) Banka, (Kamarsaar) Munger, (Bhagwanpur) Vaishali and Muzaffarpur. The cultural group of Bihar participated in the Kullu Dussehra Festival held between October 19-25, 2018 at Kullu, Himachal Pradesh. Patna Literature Festival was organized between February 1-3, 2019 in which litterateur from different parts of the country and abroad had participated.
(ii) Cultural Programme in Extremism Affected Areas : In order to connect extremist affected areas to the mainstream, cultural programmes were organized by district administration at Aurangabad, Rohtas, Kaimur, Patna, West Champaran (Bettiah), Banka, Sheohar, Lakhisarai, East Champaran (Motihari), Nawada, Gaya, Arwal, Vaishali and Jamui. In 2018-19, an amount of Rs. 30.00 lakh was earmarked at the rate of Rs. 2.00 lakh for eachdistrict.
(iii) Kalakaar Kalyan Kosh : An Artist Welfare Fund has been developed to help the artists for treatment of disease, purchase of musical instruments, visits to different parts of the country or abroad to perform on invitation, and higher education and research. The fund can also be used for exhibition of artistic work or organising lectures and seminars.
(iv) Construction of Film City : For the development of films in Bihar, film city will be constructed under Public-Private-Partnership mode in Rajgir, Nalanda. For this, 20 acres of land has been acquired in Rajgir. The state has also developed Bihar State Film Development and Promotion Policy, 2019.
(v) Eklavya State Awasiya Sports Training Centre : The talented students of the government schools are selected as per the norms of Mukhyamantri Khel Vikas Yojana and sent to Eklavya State Awasiya Sports Training Centre for proper training, so that their talents could be developed. Presently, 40 such training centres have been approved, out of which 30 are already operational. These are running in 22 districts of the state.
11.5 Social Welfare
Social welfare refers to the provision of social services, principally health care, housing, social
security, and education. The vision of the State Government is to build an inclusive society,
395
wherein members of the target groups can lead safe and dignified lives with adequate support for
their growth and development. The State Government aims to support and empower the target
groups through programmes of educational, economic and social development, and rehabilitation,
wherever necessary. In this section, the information is provided for various schemes in Bihar which
cover Dalits, Mahadalits, Backward Classes, Extremely Backward Classes, Minorities, Women
and other weaker sections of the society.
Welfare of Scheduled Caste and Scheduled Tribe
The State Government had created a separate Department in 2007 for the welfare of scheduled
castes and tribes in Bihar. There are 22 castes in Bihar which are listed as Scheduled Castes (SC),
which together account for 15.9 percent of its population, while communities listed as Scheduled
Tribes (ST) make up 1.3 percent of the state’s population, according to 2011 census. The
Department of Scheduled Caste and Scheduled Tribe runs the following various programmes for
their economic, educational and social upliftment :
Scholarships for Children of Musahar and Bhuyia Community : In 2018-19, under
scholarship scheme for Musahar and Bhuyia, an amount of Rs. 10.66 crore was approved, out
of which Rs. 2.40 crore was meant for committed and establishment expenditure. For
2019-20 again, Rs. 10.66 crore has been approved, with the share of committed and
establishment expenditure being at Rs. 2.40 crore.
Pre-Matric Scholarships to Children of those Engaged in Cleaning and Prone to Health
Hazards : This scheme of Pre-Matric Scholarship to children of those engaged in occupations
involving cleaning and prone to health hazards is a centrally sponsored scheme. Under the
scheme, 100 percent central assistance is provided to State Governments from the Central
Government. The objective of the scheme is to provide financial assistance to children of
whose parents belong to one of the following categories : (i) Persons who are Manual
Scavengers, (ii) Tanners and Flayers, (iii) Waste pickers and (iv) Persons engaged in
hazardous cleaning. For students in Class I-X, the rate is Rs. 225 per month for ten months;
for hostellers, from Class III-X, the amount is Rs. 700 per month, for ten months. In addition,
an ad-hoc grant of Rs. 750 per student per annum to day scholars and Rs. 1000 per student per
annum to hostellers would be admissible. Besides this, there are additional provisions of
allowances for students amongst target groups with disabilities. In 2019-20, an amount of Rs.
40.00 lakh has been approved as establishment and committed expenditure under the scheme.
396
Chief Minister Merit Scholarship Schemes : Under the Chief Minister Merit Scholarship
Schemes which started in 2008-09, a scholarship of Rs. 10,000 is given to SC/ST students,
who have passed matric examination of the Bihar School Examination Board with first
division. From 2016-17, those SC/ST students who have passed board examination with
second division, also get a scholarship of Rs. 8000. Further, for Higher Secondary education,
those passing with first division get Rs. 15,000 and those passing with second division get Rs.
10,000 as a merit scholarship. An amount of Rs. 101.61 crore for students belonging to SC
community and Rs. 12.68 crore for ST students was approved in 2018-19. Further, a sum of
Rs. 26.47 crore was approved for higher secondary. In 2019-20, an amount of Rs. 105.00 crore
for SC students and Rs. 16.36 crore for ST students have been allotted for those passing matric
examinations. For SC/ST students in higher secondary, the allotment was Rs. 63.40 crore.
Babu Jag Jivan Ram Chhatrawas Construction Yojana : Under centrally sponsored Babu
Jag Jivan Ram Hostel Construction scheme, an amount of Rs. 8.50 crore was spent in 2018-
19 and an amount of Rs. 8.50 crore again has been approved for 2019-20. This scheme of
construction of hostels for Scheduled Caste students is one of the means to enable and
encourage students belonging to these castes to attain quality education. Such hostels are
immensely beneficial for the students hailing from rural and remote areas of the state. While
the scheme of construction of hostels for SC girls is in operation from the Third Five Year
Plan (1961-66), the same for boys was started with effect from the year 1989-90. The scheme
was revised in 2008 and again recently in 2018.
Residential Schools : At present, 65 Residential Schools for Scheduled Castes and 20 for
Scheduled Tribes are being run by the State Government. The sanctioned strength of the
schools were 25040 for SC students and 7520 for ST students. The academic work for ST
students have started in 5 residential schools of Tharuhat Sector in 2018-19. A sum of Rs.
119.43 crore was allocated for SC students and Rs. 20.09 crore for ST students in 2018-19.
Pre-exam Coaching Centres : Presently, 7 pre-exam coaching centres (Patna, Bhagalpur,
Darbhanga, Gaya, Muzaffarpur, Saran and Ara) for SC students are being run, where about
1680 candidates are trained for different examinations. An approval was given for
establishment of three more pre- exam training centres in Munger, Purnea and Saharsa in
2017-18. Apart from this, one Student Guidance Centre is operational at Chandragupta
Institute of Management, Patna. All students who are being trained in these centres are entitled
for monthly scholarships. In 2018-19, a sum of Rs. 1.98 crore has been allotted for
establishment and committed expenditure of the scheme.

397
Integrated Tharuhat Development Project : Under the Integrated Tharuhat Development Project, an amount of Rs. 97.45 crore has been approved for such blocks where Scheduled Castes (including Tharu Tribe) are in majority. Out of 258 schemes for Bagha-2, Ramnagar, Gaunaha and Mainatar blocks, 243 have already been completed and rest 15 are in pipeline.
The total budget for SC/ST welfare increased from Rs. 1844.72 crore in 2017-18 to Rs. 1926.14crore in 2018-19 (Table 11.28). Moreover, the actual expenditure which was Rs. 1364.92 crore in2017-18 increased to Rs. 1465.20 crore in 2018-19, indicating an increase of 2.1 percentage points in utilization percentage. The district-level data on physical and financial progress under major SC/ST welfare schemes in the state is presented in Table A 11.26 (Statistical Appendix). This data reveals considerable variation across the districts, for both physical and financial progress.
Table 11.28 : Overview of Outlay Allocation of SC and ST Welfare (2017-18 and 2018-19)
(Rs. crore)
Item Major Head
2017-18 2018-19
Budget Actual Expenditure
Utilization Percentage Budget Actual
ExpenditureUtilization Percentage
SC & ST 2225 1388.18 920.39 66.3 1449.84 1049.09 72.4
Secretariat Service 2251 5.22 3.86 73.9 6.60 5.58 84.5
Capital Outlay 4059 434.21 428.07 98.6 457.50 402.83 88.0Capital Outlay on Co-operatives
4425 /2225 16.61 12.61 75.9 11.70 7.70 65.8
Other Administrative Service 2070 0.50 0.00 0.0 0.50 0.00 0.0
Total 1844.72 1364.92 74.0 1926.14 1465.20 76.1
Source : Department of SC/ST Welfare, GoB
Mahadalit
The Bihar Mahadalit Vikas Mission has been registered under the Societies Registration Act, 1860
for implementation of welfare schemes for the upliftment of Mahadalits, based on the report of the
State Mahadalit Commission. The Commission observed that, out of the 22 scheduled castes in
Bihar, 21 are acutely deprived in terms of economic, social, cultural and political status. The
population belonging to these castes have not been benefited significantly from affirmative actions
meant for the SC population. Thus, the idea of Bihar Mahadalit Vikas Mission is to fulfill the basic
necessities of all Mahadalit communities through a number of specific schemes. Some of the
schemes of the Mission are:
Vikas Mitras : For proper implementation of the welfare programmes in panchayats and
wards, Vikas Mitras have been appointed. These Vikas Mitras are selected from Mahadalit

398
community itself. To promote women empowerment, 50 percent of the posts are reserved
for women. Presently, 9492 Vikas Mitras are working in the state.
Dashrath Manjhi Kaushal Vikas Yojana : The scheme has been started with an objective
to improve the economic condition of the Mahadalit Community through skill development
training in different trades and thereby increase their employability. The scheme is being
implemented by the Department of Labour Resources. Till date, 6 batches have started by
Micro, Small and Medium Enterprises (MSME), Kolkata, out of which 5 have been already
been completed.
Vikas Register : The register is maintained online by Bihar Mahadalit Vikas Mission,
through Vikas Mitras to keep the record of different government welfare schemes through
which Mahadalit families are benefited. Till date, a database of 35.50 lakh families has been
prepared by Vikas Mitras.
Community Hall-cum-Workshed scheme : Between 2010-11 and 2018-19, under
Community Hall-cum-Workshed scheme, out of the target of constructing 4870 units, 3488
units have been constructed in different districts and work is in progress in 743 places. For
2018-19, there is a target for 400 more units.
Special School-cum-Hostel scheme : The scheme is run by a non-government organization,
(Nari Gunjan) in Patna and Gaya. The scheme has benefited 150 girls in Patna and 100 girls
in Gaya till date. Both formal and informal education are being given to the beneficiaries.
The school is receiving appreciation at the national level.
Sahayata (Call Centre) : The call centre has been established as per 1989 Act and 1995
Rule. The centre will register the complains related to SC/ST atrocities and help in their
complete eradication.
The Bihar State Scheduled Caste Cooperative Development Corporation was established in 1978
for all-round development of scheduled castes. The district offices of the Corporation are working
in 36 districts of Bihar. Between 2013-14 and 2018-19, the corporation benefited 15,165 people
through its subsidy scheme. In 2018-19, an amount of Rs. 641.10 lakh was distributed among 2031
people, of which Rs. 203.10 lakh was given as subsidy amount. The details are given in Table
11.29.

399
Table 11.29 : Subsidy Scheme of BSSCCDC (Executed through Bank) (2013-14 to 2018-19)
(Amount is Rs. lakh)
Year No. of Beneficiaries
Bank Loan Subsidy Total
2013-14 3301 627.90 330.10 958.00
2014-15 1806 343.50 180.60 524.10
2015-16 2921 555.61 292.10 847.71
2016-17 2827 537.75 282.70 820.45
2017-18 2279 433.50 227.90 661.40
2018-19 2031 438.00 203.10 641.10
Total 15165 2936.26 1516.50 4452.76
Source : Department of SC/ST Welfare, GoB
Welfare of Backward and Extremely Backward Classes
The backward classes are those castes/communities that are notified as so by the State or Central
Government. In Bihar, there are 131 backward castes and they account for about 60 percent of its
population. In 2007-08, the State Government had constituted the Department of Welfare of
Backward and Extremely Backward Classes for overall development of these communities. The
outline of financial progresses from 2014-15 to 2018-19 for welfare of backward and extremely
backward population is presented in Table 11.30. In the last five years, there have been fluctuations
in allocations and expenditure for the welfare of backward classes. In 2014-15, the expenditure of
the department was Rs. 1445.40 crore, which decreased to Rs. 1273.33 crore in 2018-19. However,
the utilization percentage for BC and EBC welfare schemes has been more than 70 percent in these
years.
Table 11.30 : Financial Progress of BC and EBC Welfare (2014-15 to 2018-19)
(Rs. crore)
Details 2014-15 2015-16 2016-17 2017-18 2018-19
Total Outlay 1477.97 2975.3 2000.6 1591.72 1643.83
Total Approved Amount 1477.97 2781.45 2000.6 1535.24 1521.35
Total Expenditure 1445.40 2695.07 1470.6 1223.16 1273.33
Utilisation percentage 97.8 90.6 73.5 76.8 77.5
Source : Department of BC and EBC Welfare, GoB
The welfare measures taken for Backward Classes (BC) and Extremely Backward Classes (EBC)
are as follows:

400
Chief Minister Backward Classes Merit Scholarship Scheme : Under Chief Minister
Backward Classes Merit Scholarship Scheme, an amount of Rs. 55.94 crore has been given to
the Department of Education for benefitting 55,942 students in 2018-19. There is provision of
Rs. 60.00 crore in 2019-20 for benefitting 60,000 students.
Pre-Matric Scholarship Scheme : Under Pre-Matric Scholarship Scheme, till date 1.25 crore
students have been benefited with Rs. 1359.20 crore. In 2017-18, an amount of Rs. 911.94
crore has been made available for the scholarship scheme. In 2018-19, the corresponding sum
was Rs. 978.71 crore.
Chief Minister Extremely Backward Classes Civil Merit Scheme : Under this scheme,
Rs. 1 lakh is given to the students qualifying UPSC (PT) and Rs. 50,000 is given to students
for qualifying BPSC (PT).
Chief Minister Backward Classes and Extremely Backward Classes Hostel Grant
Scheme : Under this scheme, Rs. 1000 is given per student per month. This scheme enables
students from disadvantaged classes to avail hostel facility for education.
Foodgrain Scheme for Backward Classes and Extremely Backward Classes Hostels : As
per this scheme, 15 kg foodgrain (9 kg rice and 6 kg wheat) is being supplied per student per
month, to students from backward and extremely backward classes residing in hostels.
Pre-Examination Training Centres : These centres have been established at 8 universities of
the state in 2015-16 to provide free training for competitive examinations to BC and EBC
students. Now, the facility has been extended to all 38 districts of Bihar.
Chief Minister Backward Classes and Extremely Backward Classes Skill Development
Training Scheme : Since 2017-18, Skill Development Training Programme for BC and EBC
is being conducted at selected institutions on the basis of domain skilling by the Department
of Labour Resources. The scheme is managed by Bihar State Backward Classes Finance and
Development Corporation, Patna.
The physical and financial details of allocation for different welfare schemes for the backward and
extremely backward population is presented in Table 11.31.

401
Table 11.31 : Physical and Financial Details of BC and EBC Welfare Programmes (2013-14 to 2018-19)
Year
Stipend for students of primary,
middle and high school
Post-Matric Scholarship
OBC Girls’ Higher
Secondary Residential
School (12 nos.)
Mukhyamantri Medhavriti Yojana for
EBC students
Construction of 38 Jannayak Karpuri Thakur
Hostels for EBC Students
No. of Beneficiaries (lakh)
2013-14 98.00 0.36 0.02 0.35 —
2014-15 122.00 2.44 0.02 0.40 —
2015-16 183.00 3.79 0.02 1.45 —
2016-17 99.04 — 0.03 0.70 —
2017-18 62.33 2.56 0.02 0.50 —
2018-19 80.95 — 0.03 0.63 —
Fund Allocation (Rs. crore)
2013-14 1168.24 58.15 5.85 35.00 9.35
2014-15 1054.70 369.97 7.26 40.00 —
2015-16 2253.98 619.78 9.77 144.97 5.00
2016-17 1359.21 — 12.16 87.25 10.00
2017-18 911.94 446.81 12.26 55.96 34.58
2018-19 978.71 338.43 12.64 62.63 5.00
Note : No allocation was made in 2016-17. Source : Department of Backward and Extremely Backward Class Welfare, GoB
Minority Welfare
The socio-economic status of minority population is generally lower in Bihar, as in most other
states of the country. Thus, to improve the socio-economic conditions of the minority communities
through affirmative actions, a separate Department of Minority Welfare was established in Bihar
in 1991. In Bihar, the religious minorities constitute 17.3 percent of the population, with 16.9
percent Muslims and the rest 0.4 percent belonging to other religions, like Buddhists, Jains, Sikhs,
and Christians. Muslims constitute a large part of the population in Kishanganj (68.0 percent),
Katihar (44.5 percent), Araria (42.9 percent) and Purnea (38.5 percent). Table 11.32 represents
budget allocation and expenditure of the Department of Minority Welfare for 2013-14 to 2017-18.
It is laudable to note that the utilization percentage has been more than 90 percent in the last three
consecutive years.

402
Table 11.32 : Budget and Expenditure of Minority Welfare Department ( 2013-14 to 2017-18)
(Rs. lakh)
Year BE ActualsUtilisation Percentage
(%)2013-14 33390.70 9266.10 27.8
2014-15 30075.10 28417.70 94.5
2015-16 52480.12 50862.19 96.9
2016-17 44545.12 93152.85 96.9
2017-18 40152.15 37310.62 92.9
Source : Department of Minority Welfare, GoB
The achievements of the Department in recent years are as follows :
Mukhyamantri Alpsankhayak Kalyan Chhatrawas Khadyanna Yojana : The scheme has started in 2018-19 to reduce financial burden of minority students due to expenditure on higher education. Under this scheme, 6 kg wheat and 9 kg rice (a total of 15 kg foodgrains) are made available through doorstep delivery per student per month in those hostels where one-third of the hostellers are either BC or EBC or from minority community. Presently, the foodgrains are distributed in 16 hostels in 15 districts (Patna, Bhojpur, Rohtas, Kaimur, Saran, East Champaran, Madhubani, Saharsa, Supaul, Madhepura, Gaya, Katihar, Bhagalpur, Jehanabad and Nawada). In 2018-19, foodgrains worth Rs. 50 lakh has been distributed in these districts. For 2019-20, there is a provision for Rs. 1.00 crore.
Mukhyamantri Alpsankhayak Kalyan Chhatrawas Anudan Yojana : Under this scheme, students residing in minority hostels are given a grant of Rs. 1000 per month to promote higher education among the minority community. In 2018-19, there was a provision of Rs. 1.00 crore, out of which Rs. 81.86 lakh was distributed among 8186 students. A provision of Rs. 3.00 crore has been made available for 2019-20.
Bihar Rajya Madarsa Shiksha Sudridhrikaran Yojana : Under this scheme, facilities like drinking water, library, equipment, toilets, multipurpose hall, official room , computer, science lab etc. for educational research will be provided for strengthening of Madarsa education. In 2018-19, a sum of Rs. 12.55 crore was approved for developing such facilities in Madarsas of Madhubani and Muzaffarpur.
Bihar Rajya Waqf Vikas Yojana : For development of property registered under Sunni and Shiya Waqf Board, construction and maintenance work will be started for multipurpose buildings, guest house, marriage hall, Waqf office building, market complex, etc. A budget of Rs. 30.00 crore is proposed for this scheme in 2019-20.

403
Rajya Post-Matric Yojana : Under State Post Matric Scholarship scheme, the State Government includes those boys/girls of minority community who are left out of Central Government’s post-matric scheme. The scheme was started in 2017-18. In 2018-19, an amount of Rs. 32.79 crore has been distributed among 57,888 minority students.
Bihar Rajya Alpsankhayak Awasiya Vidyalaya Yojana : In 2018-19, the State Government has decided to set up one residential school in each district for the students from the minority. Presently, the scheme is being launched in Kishanganj and Darbhanda districts.
Bihar Rajya Haj Samiti : The annual grant of Bihar Haj Committee has been increased from Rs. 60.00 lakh to Rs. 100.00 lakh to provide better facilities to pilgrims going for Haj. In 2018,Rs. 32.27 lakh from the contingency fund has been spent as additional support on Khadimul Hujjaj and Supervisors who were sent to Saudi Arabia to accompany the pilgrims.
Muslim Divorcee/Deserted Women Assistance Programme : Under Muslim Divorcee/Deserted Women Assistance Programme, financial assistance has been given to 12,527 divorcee / deserted Muslim women so far. The scheme was started in 2006-07. Since 2017-18, a revised sum of Rs. 25,000 per beneficiary is being given to each divorcee/ deserted woman in place of Rs. 10,000 earlier. In 2018-19, a total of 130 females have been benefitted by this e-welfare portal. The payment is made through Direct Benefit Transfer (DBT) method.
Mukhyamantri Alpsankhyak Vidyarthi Protsahan Yojana : Under this scheme, a total of Rs. 34.40 crore was sanctioned through which 30,933 students were benefitted in 2018-19. The students of Fauqania and Maulvi who have passed Bihar State Madarsa Education Board with first division has also been covered under the scheme since 2017-18.
11.6 Women Empowerment
In the recent past, the concept of women empowerment has undergone considerable change, from welfare oriented approach to equity approach. It is now understood as the process by which the powerless women gain greater control over the circumstances of their lives. The Constitution ofIndia not only grants equality to women, it also empowers the state to adopt measures of positive discrimination in favour of women. It was during the Eighth Plan when empowerment of women was first recognized as a distinct social goal. This was taken forward further in the Ninth Plan with the introduction of the concept of Women's Component Plan, whereby identified ministries were required to indicate the flow of funds to the programmes for women. Later, the Twelfth Plan identified the key indicators for gender equity to be addressed in the planning process through economic, social and cultural empowerment.

404
Bihar has been making various efforts to empower women in the recent years. The State
Government has prepared the Women Empowerment Policy in 2015 and promoted a centre
(Gender Resource Centre) for looking after gender related issues. This centre is a part of the
Women Development Corporation, under the Department of Social Welfare. The gender inequality
rising out of social norms and cultural traditions is now being addressed directly or indirectly
through efforts which would change attitude towards women. The State Government has been
publishing its gender budget since 2008-09. An overview of the gender budget for 2014-15 to
2018-19 is presented in Table 11.33. From the table, it is evident that the total outlay for women
development has increased over the years, except once in 2015-16. The share of the outlay for
women in total state budget has been about 11 percent, with some year-to-year variation.
Correspondingly, outlays for women as percentage of GSDP have been around 3-4 percent.
Table 11.33 : Gender Budget Summary (2014-15 to 2018-19)
(Amount in Rs. crore)
Details 2014-15 2015-16 2016-17 2017-18 2018-19BE
Category I schemes for Women (100% beneficiaries) 3920.10 2996.10 5564.80 8545.90 9287.99
Category II schemes for Women (30% beneficiaries) 8658.30 8130.90 9512.20 12069.50 16285.80
Total outlays for women 12578.30 11127.00 15077.00 20615.40 25573.79Total Outlays for related Departments 33703.70 31010.80 36411.50 46658.80 60559.08
Outlays for women as a percent of total outlays of related Departments
37.20 35.90 41.40 44.20 42.23
Total size of the State budget 116886.00 120685.00 144696.00 160086.00 176990.27Share of outlays in the State budget (percent) 10.80 9.20 10.40 12.90 14.45
GSDP 342951.00 369469.00 425888.00 487628.00 515634.00Outlays for women as percent of GSDP 3.70 3.00 3.50 4.20 4.96
Source : Department of Finance, GoB
Gender Budgeting, however, is not confined to budgets alone; it also covers analysing various
economic policies from the gender perspective. Table 11.34 represents the data for the gender
budget items under different departments for 2017-18. Category I schemes are those which are
provisioned entirely for women. Next, Category II schemes are those which are gender neutral; for
such schemes, it is assumed that 30 percent of the allocation is for women beneficiaries. The table
shows actual expenditure for 2017-18. It emerges from the data that out of overall expenditure ,
the expenditure for Category I schemes was 22 percent and, for Category II schemes, it was 78
percent.

405
Table 11.34 : Overview of Expenditure on Women Development (2017-18)
(Rs. crore)
Departments2017-18 ( Actuals) 2017-18 (Percent)
Under Category I
Under Category II Total Under
Category IUnder
Category II Total
Social Welfare 520.37 1396.94 1917.31 16.93 12.84 13.74
SC and ST welfare 0.00 250.30 250.30 0.00 2.30 1.79
Public Health Engineering 0.00 566.84 566.84 0.00 5.21 4.06
Minority Welfare 0.00 89.48 89.48 0.00 0.82 0.64
Education Department 572.66 5341.30 5913.96 18.64 49.10 42.39
Health 454.99 914.49 1369.48 14.81 8.41 9.82
Rural Development 1458.64 1004.73 2463.37 47.47 9.24 17.66
Urban Development and Housing 0.00 38.09 38.09 0.00 0.35 0.27
Panchayati Raj 0.00 200.05 200.05 0.00 1.84 1.43
Labour Resource 6.15 0.00 6.15 0.20 0.00 0.04
BC and EBC Welfare 11.06 342.79 353.84 0.36 3.15 2.54
Revenue and Land Reforms 2.59 0.00 2.59 0.08 0.00 0.02
Art, Culture and Youth 0.00 11.25 11.25 0.00 0.10 0.08
Industry 0.00 131.22 131.22 0.00 1.21 0.94
Agriculture 0.00 375.35 375.35 0.00 3.45 2.69
Science & Technology 46.53 0.00 46.53 1.51 0.00 0.33
Building Construction 0.00 153.53 153.53 0.00 1.41 1.10
Home 0.00 41.04 41.04 0.00 0.38 0.29
Tourism 0.00 21.15 21.15 0.00 0.19 0.15
Total 3072.99 10878.52 13951.51 100.00 100.00 100.00
Source : Department of Finance, GoB

406
Table 11.35 : Flagship Schemes to Address Gender Disparity (2014-15 to 2018-19)
(Rs. crore)
Scheme 2014-15 2015-16 2016-17 2017-18 2018-19
Lakshmibai Social Security Pension Scheme 32.51 357.48 213.86 260.47 281.83
Mukhyamantri Nari Shakti Yojana 0.00 11.2 24.6 61.52 66.17
Mukhyamantri Kanya Vivah Yojana 143.54 26.85 21.59 38.16 46.51
Mukhyamantri Kanya Utthan Yojana — — — — 96.72
Total 266.05 395.53 266.2 436.42 491.23
Source : Department of Social Welfare, GoB
The interventions by the State Government to address gender disparity can be clubbed under two main heads: child protection (Kanya Utthan Yojana to stop female foeticide) and social and economic security (Lakshmibai Social Security Pension scheme, Mukhyamantri Kanya Vivah Yojana and Mukhyamantri Nari Shakti Yojana) (Table 11.35). The Mukhyamantri Nari Shakti Yojana (MNSY) was launched in 2007-08 with an objective to empower women and make them self-reliant. The scheme included setting up Helpline Services, Short Stay Homes, Working Women Hostels, and Protection Homes. The Mukhyamantri Kanya Vivah Yojana extends financial support of Rs. 5000 to girls of BPL families who get married at the age of 18 years and above. The expenditure on these flagship schemes has gradually increased between 2014-15 and 2018-19 by 84.6 percent.
The empowerment of women can be evaluated by three criteria — economic, social and cultural.The steps of the State Government under each of these criteria are presented below :
Economic Empowerment
Project Implementation Unit : To accomplish the idea of social, economic and cultural empowerment of women in Bihar, Women Development Corporation has set up a Project Implementation Unit (PIU) to implement social and economic empowerment schemes.
Bihar Rural Livelihood Promotion Society (BRLPS) : To achieve the aim of economic and social empowerment of rural poor, particularly women, BRLPS is implementing various interventions since its inception.
Micro-Insurance : The target of hundred percent enrolment under Pradhan Mantri Jeevan Jyoti Bima Yojana (PMJJBY) and Pradhan Mantri Suraksha Bima Yojana (PMSBY) was achieved in 38 districts by the insurance team. In 2018-19, 12.87 lakh SHG members were

407
enrolled. In the same year, 1083 claims were registered, of which 77 percent were settled worth Rs. 10.14 crore.
Alternative Banking – ‘Bank Humare Gaon’ : Business Correspondents facilitated the opening of 1.19 lakh individual accounts. In 2018-19, the total transactions were of Rs. 800.40 crore and the commission earned by Business Correspondents was Rs. 236.52 lakh. Cumulatively, till September 2019, transactions over Rs. 1234 crore was done by the Business Correspondents.
Digital Financing : Digital financial inclusion of women has been achieved by Jeevika, working hand in hand with Vodafone, Airtel, Basix, SIDBI. This has promoted digital financial literacy. The intervention started with two blocks (Bihta and Maner) in Patna. Later,digital financial inclusion was extended to 165 blocks of 25 districts.
Satat Jeevikoparjan Yojana : The scheme started in August, 2018 with an objective to address the needs of ultra-poor households traditionally engaged in production, transportationand selling of country liquor/ toddy. To be a beneficiary of this scheme, the ultra-poor households should be from SC/ST and other ultra-poor community. The scheme targeted to cover 1 lakh ultra-poor households through customised ultra-poor graduation approach in three years.
Key Livelihood Intervention : Under this intervention, 6.28 lakh households were engaged in kitchen garden and 3.12 lakh in vegetable cultivation to improve income and nutritional status of the households.
Community-based Custom Hiring Carriers : Under this scheme, a revenue of Rs. 9.87 lakh was generated by providing services to 4212 farmers by providing them the agricultural implements procured by Custom Hiring Carriers.
Integrated Goat and Sheep Development Scheme : Under this scheme, Jeevika, in association with the Department of Animal Husbandry and Fisheries, has distributed 10,209goats through 96 Producer Groups to 3434 households in 7 districts in 2018-19.
Mini-Indoor Saras Mela : With the theme of ‘Unnat Mahila Ujjwal Bihar’, mini-indoor Saras Mela was organised at the multi-purpose hall of Gyan Bhawan (Patna) in September, 2018 anda total sale of Rs. 1.25 crore was made there.
Aarakshit Rozgar Mahilaon Ka Adhikar : Under the Saat Nishchay programme, ‘Aarakshit Rozgar Mahilaon Ka Adhikar’ is one of the commitments of the State Government. Since 2016, 35 percent reservation is being given to women for recruitment in all services of the State Government.

408
Social Empowerment
Mukhyamantri Kosi Mulberry Pariyojna : The scheme is being jointly implemented by the Department of Industry, MGNREGA wing of the Department of Rural Development,Rashtriya Krishi Vikash Yojana (under Department of Agriculture) and Jeevika in 8 districts (Saharsa, Supaul, Madhepura, Purnea, Araria, Kishanganj, Katihar and Bhagalpur). The aim of scheme to support Bhagalpur Silk Cluster and provide income generating options to marginal farmers in these districts. In 2018-19, construction of 639 rearing houses were completed and 63 mulberry farmers were trained at Keshla (Madhya Pradesh) on sericulture. During the same year, 31 quintal of cocoon was produced and sold in the market and 15 new nodal centres were established.
Behaviour Change Communication (BCC) : This module was started to promote awareness about right practices in health, nutrition and sanitation. Altogether, till September 2019, a total of 3.19 lakh SHGs received training on topics of Health, Nutrition and Sanitation.
Solar Intervention : Under Solar Urja through Localization for Sustainability (SOULS)initiative, a flagship programme of IIT Bombay, solar study lamps were distributed by the Ministry of New and Renewable Energy (MNRE) and Jeevika. This scheme is part of the programme ‘Power to All’. In 2018-19, a total of 12.5 lakh solar lamps were distributed among school going children. In partnership with Tata Energy Research Institute (TERI), solar based home lighting system was provided to 21,500 households.
Mukhyamantri Kanya Vivah Yojana : To stop child marriage and encourage her higher education, Mukhyamantri Kanya Vivah Yojana provides financial assistance of Rs. 5000 to the family of the girl child at the time of her marriage. The benefit of this scheme is given to those girls whose marriage has been registered and whose family income is not more than Rs. 60,000 per annum. In 2018-19, the budget provision for the scheme was of Rs. 4801.40 lakh,of which Rs. 4651.39 lakh was spent.
Mukhyamantri Kanya Utthan Yojana : The main objective of the scheme is to prevent foeticides and gender imbalance by promoting the birth of girl child. Under the scheme, a sum of Rs. 2000 is given at the time of birth and Rs. 1000 on completion of one year along with enrolment in Aadhar. For direct benefit transfer, the Aadhar will be linked with mother/father/guardian’s bank account. This facility will be given two girl child in each family. In 2018-19, against the budget outlay of Rs. 9672.18 lakh, the expenditure was almost 100 percent.

409
Mukhyamantri Nari Shakti Yojana : Under Mukhyamantri Nari Shakti Yojana, free socio-psychological support and legal aid are provided to the victims of domestic violence and trafficked women and adolescents. The Women Development Corporation (WDC) is running 38 Women Help Lines in different districts, in close coordination with respective District Magistrates. In 2018-19, against the budget outlay of Rs. 6617.75 lakh, the expenditure was almost 100 percent. In 2019-20, Rs. 31.98 crore was allotted for the scheme.
Table 11.36 : Number of Cases Registered and Disposed under Social Empowerment (2017-18 to 2019-20)
Types of Cases2017-18 2018-19 2019-20 (upto Sep-19)
Registered Disposed Registered Disposed Registered Disposed
Domestic Violence 4021 4113 (102.3) 3985 4418 (110.9) 2011 1726 (85.8)
Dowry Abused 815 698 (85.6) 727 772 (106.2) 367 314 (85.6)
Dowry Death 3 3 (100.0) 2 6 (300.0) 3 3 (100.0)
Second Marriage 107 99 (92.5) 117 152 (129.9) 43 34 (79.1)
Rape & Trafficking Case 3 3 (100.0) 12 6 (50.0) 8 10 (125.0)
Sexual Abuse at Other Places 95 87 (91.6) 90 121 (134.4) 43 41 (95.3)Sexual Harassment at Workplace Cases 16 7 (43.8) 29 19 (65.5) 16 11 (68.8)
Mobile and Social Media 0 0 4 2 (50.0) 2 1 (50.0)
Others 1357 1444 (106.4) 1268 1564 (123.3) 627 544 (86.8)
Total 6417 6454 (100.6) 6234 7060 (113.2) 3120 2684 (86.0)Note : Figures in parentheses denote the percentage of cases disposed. In some cases, disposed cases are carried
over from the previous years, due to which cases disposed are higher than registered. Source : Bihar State Women Development Corporation, GoB
In order to safeguard the offences against women, Women Development Corporation has started Mahila Helpline cum One-Stop Centre. The number of Cases against women are registered and disposed off by counselling and in case of court cases, direct cases are filed. Table 11.36 shows that there has been decrease in the number of cases registered and disposed off relating to offences against women. The proportion of cases which were disposed off was very high for most of the offences. Out of all the cases, the registration of cases is the highest for domestic violence. It is interesting to note that more than 100 percent of cases relating to domestic violence were disposed off in 2017-18 and 2018-19. Next to domestic violence were the cases registered under dowry abuse and 85.6 percent of such cases were disposed in 2019-20.
Cultural Empowerment
Meena Manch : It is a group of 20 girls, which includes 15 girls from upper primary schools and 5 dropout girls who have completed at least Class V education. The Manch is responsible for age appropriate admission of girls and boys in the school, ensuring regular attendance of students, and to boost up the students for completing the elementary education. Further, they

410
are also sensitised for taking decision regarding their upliftment, and personality development, etc. A Meena Prerak is selected from among the Manch girls. A woman teacher in each model cluster school is being selected as Meena Sugamkarta for organising the activities of the Meena Manch.
Satyagraha as Swachhagraha : This mega event was organised as a part of the commemoration of the completion of 100 years of Champaran Satyagraha movement by Mahatma Gandhi. The event was organised in April, 2018 in East Champaran district. The event was attended by 20,000 Swachhagrahis from different parts of the country.
Shilpgram Mahila Producer Company Ltd. : The company has been registered at zonal level covering all nearby districts. The company has started its business from October, 2018and has made sales of Rs. 35.00 lakh till September, 2019.
Didi ki Rasoi : Under this initiative, the canteens of Sadar hospitals are being run by Jeevika SHG members and Village Organisations (VO) as the nodal agency. In 2018-19, three canteens were inaugurated at Sadar Hospitals at Buxar, Sheikhpura and Vaishali. The canteens provide food service to indoor patients as well as visitors. The total sale of three canteens was of Rs. 14.50 lakh. Till September 2019, twelve Didi ki Rasoi have been started.
11.7 Social Security for Old and Disabled
As per Census 2011, out of the 10.41 crore population in Bihar, 23.3 lakh people are disabled (0.02 percent of the total population) and 60.7 lakh people are old (0.06 percent of the population). In an era where inclusive development is being emphasized, focused initiatives for the welfare of the old and disabled people are essential. Thus, in alliance with the Central Government, the State Government is presently promoting several social security schemes for old age people, widows and the disabled. The total expenditure on the pension schemes has increased from Rs. 98.34 crore in 2005-06 to Rs. 3138.88 crore in 2018-19. Table 11.37 shows the summary of expenditure under these welfare schemes. In 2018-19, the total expenditure on all the schemes was Rs. 3138.88 crore which has benefitted 63.6 lakh people.
Along with the above schemes, other new initiatives taken by the State Government for social security of senior citizens and those suffering from physical disabilities are:
From 2019-20, a new universal pension scheme for senior citizens named ‘Mukhyamantri Vridhjan Pension Scheme’ has been initiated in April, 2019. Under the scheme, the senior citizen (60 years and above), who has not availed any other social security pension scheme or any government pension scheme, will be benefited. The amount of pension is Rs. 400 per month for 60-79 years age-group and Rs. 500 for the age group of 80 years and above.

411
To make the social security pension schemes easy, simple and transparent, the amount is being directly deposited in the account of the beneficiaries through Direct Benefit Transfer (DBT), since 2016-17. Till September, 2019, approximately 71.00 lakh pensioners, 63.23 lakh pensioners were linked with Public Finance Management System (PFMS) and Aadhar.
Table 11.37 : Schemes for Old Age, Widow and Persons with Disabilities (2017-18 and 2018-19)
Name of the Scheme2017-18 2018-19
Expenditure(Rs. lakh)
Physical Achievement
Expenditure(Rs. lakh)
Physical Achievement
Indira Gandhi National Old Age Pension Scheme
104967.69
4247145 85858.10 4266142
Indira Gandhi National Widow Pension Scheme 541425 18747.97 545480
Indira Gandhi National Disability Pension Scheme 119139 3713.72 119775
National Family Benefit Scheme 0 6990.29 2716
NSAP (State Share) 183707.50 - 118686.41 -
Lakshmibai Social Security Pension Scheme 26046.96 575391 28183.88 581109
Bihar Disability Pension Scheme 31732.18 724303 35200.00 733672
State Social Security Pension Scheme 3000.00 62491 760.00 62531
Kabir Antyesthi Anudan Yojana 4824.00 144333 4830.00 42003
Chief Minister Family Benefit Scheme 500.00 2500 400.00 150
Bihar Shatabdi Leper Welfare Scheme 1260.00 9179 1700.00 9365
Mukhyamantri Bhikshavriti Nivaran Yojana 20.00 755.00
Old Age Home 1.00 150.00 99
Old Age Home Construction 726.00 2 old age
home 100.00 1
Bihar Aids Pirit Kalyan Yojna 1001.00 1000.00
Bihar Integrated Social Protection Strengthening Projects
11429.00 6800.00 38 Buniyad Centre
Chief Minister Disabled Marriage Grant Scheme 26.00 13.00 13
Total 369241.33 6425906 313888.37 6363056
Note : National Social Assistance Programme (NSAP) Source : Department of Social Welfare, GoB

412
Under Bihar Shatabdi Unorganised Sector Workers and Artisans Social Security Scheme 2011,
Bihar State Labour Welfare Society has been formed with the objective to provide social
security benefits to the unorganized workers and artisans of Bihar.
A uniformity is being maintained in all the pension schemes by making the pension amount as
Rs. 400 per month for every pensioner since July, 2014. The State Government contributes
from its internal resources to the national pension programmes — Rs. 200 in National Old Age
Pension, Rs. 100 in National Widow Pension, and Rs. 100 in National Disability Pension
Scheme. This contribution implied an expenditure of Rs. 1186.86 crore in 2018-19 by the State
Government.
The State Government has initiated Chief Minister Family Benefit Scheme from 2012-13. This
scheme provides one time grant of Rs. 20,000 in case of death, due to either accident or criminal
activity. An amount of Rs. 4.00 crore has been spent in 2018-19 under this scheme.
Land has been provided at Patna, Purnea and Gaya for construction of 3 Old Age Homes. The
construction has already been completed in Patna and the construction in Gaya is partially
complete. There are already 6 Old Age Homes (SAHARA) in Patna, Begusarai, Rohtas,
Purnea, Bhagalpur and West Champaran. These Old Age Homes are being managed by non-
government voluntary organizations.

413
APPENDIX
Table A 11.1 : District-wise Demographic Profile of Bihar (2001 and 2011)
Districts Population (lakh) Sex Ratio (Overall)
Sex Ratio (Child) Density Urbanisation Decadal
Growth2001 2011 2001 2011 2001 2011 2001 2011 2001 2011 2011
Patna 47.2 (5.7) 58.4 (5.6) 873 897 923 909 1471 1803 41.6 43.1 23.7Nalanda 23.7 (2.9) 28.8 (2.8) 914 922 941 931 1006 1220 14.9 15.9 21.4Bhojpur 22.4 (2.7) 27.3 (2.6) 901 907 940 918 903 1136 13.9 14.3 21.6Buxar 14.0 (1.7) 17.1 (1.6) 900 922 929 934 864 1003 9.2 9.6 21.7Rohtas 24.5 (3.0) 29.6 (2.8) 910 918 952 931 636 763 13.3 14.5 20.8Kaimur 12.9 (1.6) 16.3 (1.6) 901 920 942 942 382 488 3.3 4 26.2
Gaya 34.7 (4.2) 43.9 (4.2) 938 937 968 960 699 880 13.7 13.2 26.4Jehanabad 9.2 (1.1) 11.3 (1.1) 927 922 915 922 963 1206 12.1 12 21.7Arwal 5.9 (0.7) 7.0 (0.7) 931 928 917 940 -- 1099 0 7.4 18.9Nawada 18.1 (2.2) 22.2 (2.1) 946 939 978 945 726 889 7.7 9.7 22.6Aurangabad 20.1 (2.4) 25.4 (2.4) 934 926 941 944 607 760 8.4 9.3 26.2
Saran 32.5 (3.9) 39.5 (3.8) 966 954 949 926 1231 1493 9.2 8.9 21.6Siwan 27.1 (3.3) 33.3 (3.2) 1031 988 933 940 1221 1495 5.5 5.5 22.7Gopalganj 21.5 (2.6) 25.6 (2.5) 1001 1021 964 954 1057 1258 6.1 6.4 19.0
W. Champaran 30.4 (3.7) 39.4 (3.8) 901 909 952 953 582 750 10.2 10 29.3E. Champaran 39.4 (4.7) 51.0 (4.9) 896 902 935 933 991 1281 6.4 7.9 29.4Muzaffarpur 37.5 (4.5) 48.0 (4.6) 921 900 927 915 1180 1506 9.3 9.9 28.1Sitamarhi 26.8 (3.2) 34.2 (3.3) 892 899 924 930 1214 1491 5.7 5.6 27.6Sheohar 5.2 (0.6) 6.6 (0.6) 883 893 911 929 1161 1882 4.1 4.3 27.2Vaishali 27.2 (3.3) 35.0 (3.4) 919 895 939 904 1332 1717 6.8 6.7 28.6
Darbhanga 33.0 (4.0) 39.4 (3.8) 914 911 913 931 1442 1721 8.1 9.7 19.5Madhubani 35.8 (4.3) 44.9 (4.3) 942 926 941 936 1020 1279 3.5 3.6 25.5Samastipur 33.9 (4.1) 42.6 (4.1) 928 911 937 923 1175 1465 3.7 3.5 25.5
Begusarai 23.5 (2.8) 29.7 (2.9) 911 895 947 919 1222 1540 4.6 19.2 26.4Munger 11.4 (1.4) 13.7 (1.3) 872 876 916 922 800 958 27.9 27.8 20.2Sheikhpura 5.3 (0.6) 6.4 (0.6) 920 930 964 940 762 922 15.6 17.1 21.1Lakhisarai 8.0 (1.0) 10.0 (1.0) 919 902 954 920 652 815 14.7 14.3 24.8Jamui 14 (1.7) 17.6 (1.7) 919 922 965 956 451 567 7.4 8.3 25.9Khagaria 12.8 (1.5) 16.7 (1.6) 885 886 931 926 859 1115 5.9 5.2 30.2
Bhagalpur 24.2 (2.9) 30.4 (2.9) 875 880 967 938 946 1180 18.7 19.8 25.4Banka 16.1 (1.9) 20.3 (2.0) 909 907 964 943 533 672 3.5 3.5 26.5
Saharsa 15.1 (1.8) 19 (1.8) 911 906 910 933 885 1125 8.3 8.2 26Supaul 17.3 (2.1) 22.3 (2.1) 921 929 927 944 724 919 5.1 4.7 28.7Madhepura 15.3 (1.8) 20 (1.9) 916 911 930 930 853 1116 4.5 4.4 31.1
Purnea 25.4 (3.1) 32.6 (3.1) 916 921 968 954 787 1014 8.7 10.5 28.3Kishanganj 13 (1.6) 16.9 (1.6) 934 950 946 971 687 898 10 9.5 30.4Araria 21.6 (2.6) 28.1 (2.7) 914 921 963 957 751 992 6.2 6 30.2Katihar 23.9 (2.9) 30.7 (2.9) 919 919 966 961 782 1004 9.2 8.9 28.4
Bihar 830 (100.0) 1041(100.0) 919 918 942 935 880 1106 10.5 11.3 25.4Source : Census of India

414
Table A 11.2 : District-wise Projected Population of Bihar in Lakh) (2011 to 2041)
Districts 2011 2019 2021 2031 2041Patna 58.38 67.10 69.57 79.81 88.25Nalanda 28.78 32.89 34.06 38.74 42.71Bhojpur 27.28 31.22 32.34 36.87 40.69Buxar 17.06 19.49 20.18 22.97 25.36Rohtas 29.60 33.87 35.08 39.96 44.04Kaimur 16.26 18.54 19.18 21.73 23.92
Gaya 43.91 50.12 51.88 59.01 65.23Jehanabad 11.25 12.87 13.32 15.16 16.71Arwal 7.01 8.00 8.29 9.42 10.38Nawada 22.19 25.33 26.22 29.71 32.62Aurangabad 25.40 29.01 30.03 34.10 37.54
Saran 39.52 45.04 46.60 52.84 58.26Siwan 33.30 37.97 39.29 44.58 49.20Gopalganj 25.62 29.17 30.17 34.12 37.51
W. Champaran 39.35 44.86 46.42 52.42 57.40E. Champaran 50.99 58.09 60.10 67.83 74.28Muzaffarpur 48.01 54.93 56.89 64.86 71.64Sitamarhi 34.24 39.01 40.37 45.68 50.22Sheohar 6.56 7.47 7.73 8.75 9.63Vaishali 34.95 39.97 41.39 47.34 52.59
Darbhanga 39.37 44.94 46.52 52.71 57.91Madhubani 44.87 51.27 53.08 60.28 66.29Samastipur 42.62 48.62 50.32 57.01 62.64
Begusarai 29.71 33.90 35.10 39.73 43.58Munger 13.68 15.69 16.26 18.59 20.52Sheikhpura 6.36 7.25 7.50 8.48 9.31Lakhisarai 10.01 11.42 11.82 13.38 14.68Jamui 17.60 20.14 20.85 23.70 26.06Khagaria 16.67 18.96 19.62 22.05 24.07
Bhagalpur 30.38 34.73 35.96 40.87 44.97Banka 20.35 23.28 24.11 27.44 30.24
Saharsa 19.01 21.67 22.43 25.32 27.70Supaul 22.29 25.42 26.31 29.73 32.55Madhepura 20.02 22.83 23.62 26.66 29.15
Purnea 32.65 37.15 38.42 43.27 47.34Kishanganj 16.90 19.20 19.85 22.21 24.13Araria 28.12 31.99 33.08 37.16 40.50Katihar 30.71 34.96 36.16 40.66 44.31
Bihar 1040.99 1188.35 1230.11 1395.13 1534.15Source : Census of India

415
Table A 11.3 : Projected Total Fertility Rate in Districts of Bihar (2012 to 2041)
(Children per woman)
Districts 2012 2019 2021 2031 2041Patna 2.60 2.08 1.86 1.49 1.34Nalanda 3.10 2.47 2.21 1.77 1.59Bhojpur 3.00 2.39 2.14 1.71 1.54Buxar 3.20 2.55 2.29 1.83 1.65Rohtas 3.30 2.63 2.36 1.89 1.70Kaimur 3.20 2.55 2.29 1.83 1.65
Gaya 3.00 2.39 2.14 1.71 1.54Jehanabad 3.10 2.47 2.21 1.77 1.59Nawada 3.10 2.47 2.21 1.77 1.59Aurangabad 3.10 2.47 2.21 1.77 1.59
Saran 3.20 2.55 2.29 1.83 1.65Siwan 3.50 2.79 2.50 2.00 1.80Gopalganj 3.50 2.79 2.50 2.00 1.80
W. Champaran 4.00 3.19 2.86 2.29 2.06E. Champaran 4.60 3.67 3.29 2.63 2.37Muzaffarpur 3.40 2.71 2.43 1.94 1.75Sitamarhi 3.90 3.11 2.79 2.23 2.01Sheohar 4.60 3.67 3.29 2.63 2.37Vaishali 3.40 2.71 2.43 1.94 1.75
Darbhanga 3.80 3.03 2.71 2.17 1.95Madhubani 3.40 2.71 2.43 1.94 1.75Samastipur 3.80 3.03 2.71 2.17 1.95
Begusarai 3.30 2.63 2.36 1.89 1.70Munger 3.20 2.55 2.29 1.83 1.65Sheikhpura 3.60 2.87 2.57 2.06 1.85Lakhisarai 3.00 2.39 2.14 1.71 1.54Jamui 3.10 2.47 2.21 1.77 1.59Khagaria 4.20 3.35 3.00 2.40 2.16
Bhagalpur 3.30 2.63 2.36 1.89 1.70Banka 3.20 2.55 2.29 1.83 1.65
Saharsa 4.30 3.43 3.07 2.46 2.21Supaul 3.80 3.03 2.71 2.17 1.95Madhepura 4.00 3.19 2.86 2.29 2.06
Purnia 3.70 2.95 2.64 2.11 1.90Kishanganj 4.40 3.51 3.14 2.51 2.26Araria 4.30 3.43 3.07 2.46 2.21Katihar 3.90 3.11 2.79 2.23 2.01
Bihar 3.50 2.79 2.50 2.00 1.80Source : Census of India

416
Table A 11.4 : District-wise Projected Population of Bihar by Age Structure (in Lakh) (2021 to 2041)
Districts0-19 years 20-59 years 60 years and above
2021 2031 2041 2021 2031 2041 2021 2031 2041Patna 27.91 25.51 24.10 36.31 47.07 54.02 5.35 7.23 10.13Nalanda 14.53 13.28 12.55 16.79 21.76 24.97 2.74 3.70 5.19Bhojpur 13.59 12.42 11.74 16.13 20.91 24.00 2.62 3.53 4.95Buxar 8.60 7.86 7.43 9.85 12.76 14.65 1.74 2.35 3.29Rohtas 14.82 13.54 12.80 17.55 22.75 26.10 2.72 3.67 5.14Kaimur 8.42 7.70 7.27 9.18 11.89 13.65 1.58 2.14 2.99
Gaya 22.21 20.30 19.18 24.95 32.34 37.12 4.72 6.37 8.93Jehanabad 5.67 5.18 4.89 6.60 8.55 9.81 1.06 1.43 2.00Arwal 3.56 3.26 3.08 4.04 5.24 6.02 0.68 0.92 1.29Nawada 11.47 10.48 9.90 12.86 16.67 19.13 1.89 2.56 3.59Aurangabad 12.97 11.85 11.20 14.69 19.04 21.85 2.37 3.21 4.49
Saran 20.38 18.62 17.60 22.14 28.70 32.94 4.08 5.51 7.72Siwan 17.09 15.62 14.76 18.70 24.24 27.82 3.49 4.72 6.61Gopalganj 13.43 12.27 11.60 14.26 18.49 21.22 2.48 3.36 4.70
W. Champaran 20.73 18.95 17.90 22.52 29.19 33.50 3.17 4.28 6.00E. Champaran 26.97 24.65 23.29 28.93 37.49 43.03 4.21 5.68 7.96Muzaffarpur 23.90 21.84 20.64 28.23 36.59 41.99 4.76 6.44 9.02Sitamarhi 17.84 16.30 15.40 19.31 25.02 28.72 3.22 4.36 6.10Sheohar 3.42 3.13 2.96 3.64 4.72 5.41 0.67 0.90 1.26Vaishali 17.10 15.63 14.77 20.12 26.08 29.93 4.17 5.63 7.90
Darbhanga 20.33 18.58 17.56 22.73 29.46 33.81 3.45 4.67 6.54Madhubani 22.90 20.93 19.77 26.21 33.97 38.98 3.98 5.38 7.54Samastipur 22.05 20.15 19.04 24.46 31.71 36.39 3.81 5.15 7.21
Begusarai 15.42 14.09 13.31 17.22 22.32 25.62 2.45 3.32 4.65Munger 6.68 6.11 5.77 8.36 10.83 12.43 1.23 1.66 2.32Sheikhpura 3.33 3.05 2.88 3.59 4.65 5.34 0.58 0.78 1.09Lakhisarai 5.20 4.75 4.49 5.76 7.47 8.57 0.86 1.16 1.62Jamui 8.92 8.15 7.70 10.43 13.52 15.52 1.50 2.03 2.84Khagaria 9.00 8.22 7.77 9.37 12.14 13.93 1.25 1.69 2.37
Bhagalpur 15.42 14.09 13.31 17.84 23.13 26.54 2.70 3.65 5.11Banka 10.22 9.34 8.83 12.03 15.59 17.89 1.86 2.51 3.52
Saharsa 10.02 9.16 8.66 10.93 14.17 16.26 1.47 1.99 2.79Supaul 11.70 10.69 10.10 12.86 16.67 19.14 1.75 2.36 3.31Madhepura 10.57 9.66 9.13 11.54 14.96 17.17 1.51 2.03 2.85
Purnia 17.47 15.97 15.09 18.27 23.68 27.17 2.68 3.62 5.08Kishanganj 9.36 8.56 8.08 9.38 12.16 13.95 1.11 1.50 2.10Araria 15.26 13.95 13.18 15.84 20.53 23.56 1.98 2.68 3.76Katihar 16.58 15.16 14.32 17.45 22.62 25.96 2.13 2.88 4.03
Bihar 535.04 489.04 462.04 601.07 779.09 894.10 94.01 127.01 178.01Source : Census of India
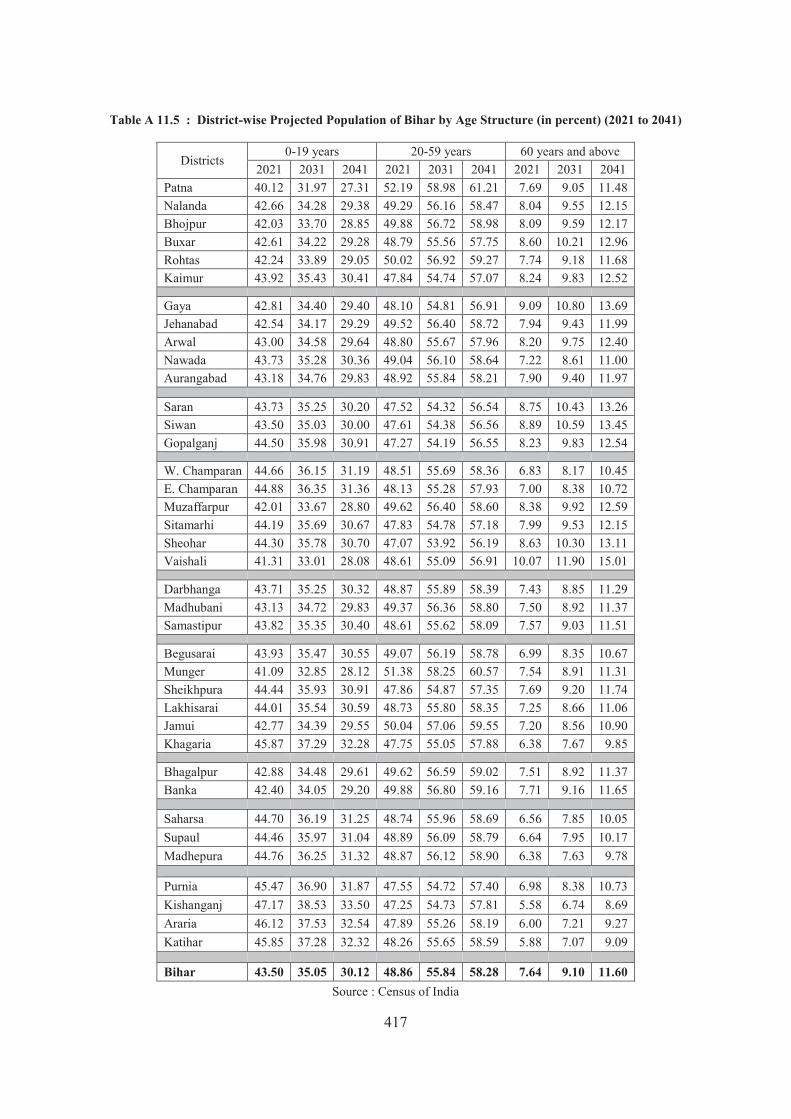
417
Table A 11.5 : District-wise Projected Population of Bihar by Age Structure (in percent) (2021 to 2041)
Districts 0-19 years 20-59 years 60 years and above
2021 2031 2041 2021 2031 2041 2021 2031 2041Patna 40.12 31.97 27.31 52.19 58.98 61.21 7.69 9.05 11.48Nalanda 42.66 34.28 29.38 49.29 56.16 58.47 8.04 9.55 12.15Bhojpur 42.03 33.70 28.85 49.88 56.72 58.98 8.09 9.59 12.17Buxar 42.61 34.22 29.28 48.79 55.56 57.75 8.60 10.21 12.96Rohtas 42.24 33.89 29.05 50.02 56.92 59.27 7.74 9.18 11.68Kaimur 43.92 35.43 30.41 47.84 54.74 57.07 8.24 9.83 12.52
Gaya 42.81 34.40 29.40 48.10 54.81 56.91 9.09 10.80 13.69Jehanabad 42.54 34.17 29.29 49.52 56.40 58.72 7.94 9.43 11.99Arwal 43.00 34.58 29.64 48.80 55.67 57.96 8.20 9.75 12.40Nawada 43.73 35.28 30.36 49.04 56.10 58.64 7.22 8.61 11.00Aurangabad 43.18 34.76 29.83 48.92 55.84 58.21 7.90 9.40 11.97
Saran 43.73 35.25 30.20 47.52 54.32 56.54 8.75 10.43 13.26Siwan 43.50 35.03 30.00 47.61 54.38 56.56 8.89 10.59 13.45Gopalganj 44.50 35.98 30.91 47.27 54.19 56.55 8.23 9.83 12.54
W. Champaran 44.66 36.15 31.19 48.51 55.69 58.36 6.83 8.17 10.45E. Champaran 44.88 36.35 31.36 48.13 55.28 57.93 7.00 8.38 10.72Muzaffarpur 42.01 33.67 28.80 49.62 56.40 58.60 8.38 9.92 12.59Sitamarhi 44.19 35.69 30.67 47.83 54.78 57.18 7.99 9.53 12.15Sheohar 44.30 35.78 30.70 47.07 53.92 56.19 8.63 10.30 13.11Vaishali 41.31 33.01 28.08 48.61 55.09 56.91 10.07 11.90 15.01
Darbhanga 43.71 35.25 30.32 48.87 55.89 58.39 7.43 8.85 11.29Madhubani 43.13 34.72 29.83 49.37 56.36 58.80 7.50 8.92 11.37Samastipur 43.82 35.35 30.40 48.61 55.62 58.09 7.57 9.03 11.51
Begusarai 43.93 35.47 30.55 49.07 56.19 58.78 6.99 8.35 10.67Munger 41.09 32.85 28.12 51.38 58.25 60.57 7.54 8.91 11.31Sheikhpura 44.44 35.93 30.91 47.86 54.87 57.35 7.69 9.20 11.74Lakhisarai 44.01 35.54 30.59 48.73 55.80 58.35 7.25 8.66 11.06Jamui 42.77 34.39 29.55 50.04 57.06 59.55 7.20 8.56 10.90Khagaria 45.87 37.29 32.28 47.75 55.05 57.88 6.38 7.67 9.85
Bhagalpur 42.88 34.48 29.61 49.62 56.59 59.02 7.51 8.92 11.37Banka 42.40 34.05 29.20 49.88 56.80 59.16 7.71 9.16 11.65
Saharsa 44.70 36.19 31.25 48.74 55.96 58.69 6.56 7.85 10.05Supaul 44.46 35.97 31.04 48.89 56.09 58.79 6.64 7.95 10.17Madhepura 44.76 36.25 31.32 48.87 56.12 58.90 6.38 7.63 9.78
Purnia 45.47 36.90 31.87 47.55 54.72 57.40 6.98 8.38 10.73Kishanganj 47.17 38.53 33.50 47.25 54.73 57.81 5.58 6.74 8.69Araria 46.12 37.53 32.54 47.89 55.26 58.19 6.00 7.21 9.27Katihar 45.85 37.28 32.32 48.26 55.65 58.59 5.88 7.07 9.09
Bihar 43.50 35.05 30.12 48.86 55.84 58.28 7.64 9.10 11.60Source : Census of India

418
Table A 11.6 : Number of Health Institutions in Bihar (As on September, 2019)
Districts District Hospital
Referral Hospital SDH PHC
Health Sub-
CentreAPHC
DH+RH+SDH+PHC+HSC +APHC
Health Institution
per ten lakh
populationPatna 1 4 4 23 234 96 362 62Nalanda 1 3 2 20 368 46 440 153Bhojpur 1 3 1 14 298 27 344 126Buxar 1 0 1 11 160 28 201 118Rohtas 1 2 2 19 251 32 307 104Kaimur 1 2 1 11 175 19 209 129
Gaya 1 2 2 24 469 42 536 122Jehanabad 1 2 0 7 107 34 151 134Arwal 1 0 0 5 65 28 98 140Nawada 1 2 1 14 174 36 228 103Aurangabad 1 3 1 11 254 62 331 130
Saran 1 3 1 20 414 41 480 121Siwan 1 3 1 19 378 44 446 134Gopalganj 1 3 1 14 185 24 228 89
W. Champaran 1 2 2 18 532 33 588 149E. Champaran 1 1 3 27 398 72 500 98Muzaffarpur 1 1 0 16 499 83 600 125Sitamarhi 1 1 1 17 208 38 266 78Sheohar 1 1 0 5 91 13 111 169Vaishali 1 4 1 16 334 35 391 112
Darbhanga 0 2 1 18 261 50 328 83Madhubani 1 3 3 21 376 61 465 104Samastipur 1 1 4 20 358 56 440 103
Begusarai 1 2 2 18 292 23 338 114Munger 1 0 1 9 154 20 185 135Sheikhpura 1 1 0 6 85 17 110 173Lakhisarai 1 1 0 6 102 12 122 122Jamui 1 3 0 10 279 22 315 179Khagaria 1 1 0 7 186 23 218 131
Bhagalpur 1 3 2 16 362 54 438 144Banka 1 3 0 11 239 31 285 140
Saharsa 1 0 1 10 171 32 215 113Supaul 1 2 1 11 181 23 219 98Madhepura 1 0 1 13 272 21 308 154
Purnea 1 2 2 14 312 33 364 111Kishanganj 1 1 0 7 156 10 175 104Araria 1 2 1 9 242 37 284 101Katihar 1 1 2 16 327 41 388 126
Bihar 37 70 46 533 9949 1399 12014 115Source : Bihar State Health Society, Patna; GoB

419
Table A 11.7 : District-wise Average Number of Outpatients Visiting per Day and In-patient Bed Occupancy Rate (2016-17 to 2019-20)
DistrictAverage no. of Outpatient visits per day
per hospital In-patient Bed Occupancy Rate (%)
2016-17 2017-18 2018-19 2019-20 2016-17 2017-18 2018-19 2019-20Patna 269 382 355 366 74 34 44 43Nalanda 448 290 333 335 121 83 82 82Bhojpur 254 244 244 271 41 33 37 35Buxar 219 186 168 167 50 27 31 33Rohtas 259 237 248 259 66 53 37 35Kaimur 297 254 280 295 54 62 75 75
Gaya 355 346 386 361 23 41 40 41Jehanabad 354 343 341 347 44 45 31 31Arwal 263 264 241 229 24 48 55 53Nawada 180 199 206 220 85 28 26 28Aurangabad 524 425 388 399 48 33 43 45
Saran 462 349 392 406 88 48 58 72Siwan 326 286 270 257 73 59 61 59Gopalganj 382 266 251 223 67 54 52 39
W.Champaran 275 173 231 239 41 50 66 58E.Champaran 398 268 260 285 74 50 50 53Muzaffarpur 514 493 515 544 18 27 30 32Sitamarhi 217 269 246 228 81 47 44 39Sheohar 148 145 147 139 48 27 23 14Vaishali 432 395 420 332 93 69 68 37
Darbhanga 343 410 459 485 38 54 56 53Madhubani 344 388 400 420 52 74 76 73Samastipur 363 313 272 320 118 73 80 73
Begusarai 267 241 286 316 69 67 70 81Munger 340 315 302 296 81 47 50 48Sheikhpura 160 237 232 229 66 40 34 42Lakhisarai 247 224 204 227 70 41 50 46Jamui 217 242 180 176 36 43 35 32Khagaria 555 489 472 505 108 116 111 113
Bhagalpur 318 278 260 258 126 44 48 47Banka 440 322 307 305 65 53 55 45
Saharsa 207 258 253 258 87 86 90 85Supaul 375 282 298 293 80 68 78 62Madhepura 392 449 411 405 126 96 88 82
Purnea 467 343 317 356 90 70 69 70Kishanganj 295 228 244 248 94 51 58 35Araria 480 352 329 319 147 28 30 28Katihar 364 335 338 348 81 78 81 74
Bihar 339 309 311 317 64 53 55 53Source : Bihar State Health Society, Patna; GoB

420
Table A 11.8 : District-wise Employment of Regular and Contractual Doctors (2017-18 and 2018-19)
(Figures in No.)
Districts
No. of sanctioned post at present Number of Doctors Employed No. of
doctors/lakh population* Regular Contractual Regular Contractual
2017-18 2018-19 2017-18 2018-19Patna 422 92 376 349 4 25 6Nalanda 158 95 169 169 4 20 6Bhojpur 194 65 125 124 2 14 4Buxar 115 54 77 75 2 9 4Rohtas 248 89 97 97 3 19 3Kaimur 114 48 58 55 2 8 3
Gaya 272 106 212 207 3 31 5Jehanabad 150 46 97 96 1 7 8Arwal 80 20 42 42 1 13 7Nawada 198 45 86 83 2 8 4Aurangabad 97 47 66 65 2 14 3
Saran 165 94 111 110 2 17 3Siwan 162 10 81 80 2 28 3Gopalganj 101 69 71 67 2 13 3
W. Champaran 132 83 153 151 3 18 4E. Champaran 190 128 96 93 4 15 2Muzaffarpur 274 64 218 211 1 18 4Sitamarhi 170 68 69 67 2 16 2Sheohar 75 19 44 42 1 2 6Vaishali 145 69 122 120 2 15 3
Darbhanga 190 72 167 159 1 42 4Madhubani 235 85 93 91 4 18 2Samastipur 192 95 112 111 5 19 3
Begusarai 122 94 81 78 3 27 3Munger 110 44 75 74 2 5 5Sheikhpura 93 24 65 65 1 4 9Lakhisarai 114 30 52 52 1 4 5Jamui 103 38 61 58 1 13 3Khagaria 101 44 57 57 1 3 3
Bhagalpur 206 64 182 182 3 15 6Banka 118 47 67 64 1 6 3
Saharsa 163 45 64 63 2 12 3Supaul 182 48 82 80 2 8 3Madhepura 190 67 66 65 2 14 3
Purnea 226 64 120 119 3 8 3Kishanganj 83 28 49 49 1 3 3Araria 179 36 64 63 2 15 2Katihar 192 78 94 90 3 5 3
Bihar 6261 2314 3921 3821 83 531 4Source : Bihar State Health Society, Patna; GoB

421
Table A 11.9 : District-wise Employment of Grade A Nurses (2017-18 and 2018-19)
(Figures in No.)
District
No. of sanctioned post at present Number of Grade A Nurses Employed No. of
Grade A Nurses/lakh populationRegular Contractual Regular Contractual
2017-18 2018-19 2017-18 2018-19Patna 161 46 130 130 44 44 3Nalanda 88 59 97 97 12 12 3Bhojpur 54 24 50 50 8 8 2Buxar 53 74 39 39 0 0 2Rohtas 88 20 55 55 16 16 2Kaimur 38 44 26 26 9 9 2
Gaya 146 25 27 27 15 15 1Jehanabad 85 34 76 76 1 1 6Arwal 81 50 17 17 2 2 2Nawada 82 175 73 73 0 0 3Aurangabad 128 22 28 28 0 0 1
Saran 86 25 46 46 6 6 1Siwan 110 16 34 34 0 0 1Gopalganj 84 18 29 29 2 2 1
W. Champaran 120 37 24 24 2 2 1E. Champaran 165 48 36 36 11 11 1Muzaffarpur 152 54 37 37 12 12 1Sitamarhi 116 17 29 29 2 2 1Sheohar 34 9 9 9 3 3 2Vaishali 118 51 64 64 0 0 2
Darbhanga 154 30 27 27 10 10 1Madhubani 114 34 54 54 2 2 1Samastipur 146 24 133 133 1 1 3
Begusarai 128 24 120 120 8 8 4Munger 114 34 100 100 9 9 7Sheikhpura 56 32 44 44 30 30 10Lakhisarai 58 60 52 52 1 1 5Jamui 62 13 38 38 4 4 2Khagaria 48 13 60 60 2 2 3
Bhagalpur 108 165 78 78 24 24 3Banka 64 18 58 58 0 0 2
Saharsa 52 30 46 46 4 4 2Supaul 107 172 39 39 1 1 2Madhepura 58 9 30 30 1 1 1
Purnea 110 112 76 76 12 12 2Kishanganj 44 34 23 23 42 42 3Araria 96 39 24 24 4 4 1Katihar 104 28 66 66 8 8 2
Bihar 3612 1719 1994 1994 308 308 2Source : Bihar State Health Society, Patna; GoB

422
Table A 11.10 : District-wise Employment of ANM (2017-18 and 2018-19)
(Figures in No.)
District
No. of sanctioned post currently Number of ANM Employed No. of
ANM/lakh populationRegular Contractual Regular Contractual
2017-18 2018-19 2017-18 2018-19Patna 1155 418 968 968 196 196 17Nalanda 835 370 711 711 158 158 26Bhojpur 706 350 622 622 147 147 24Buxar 382 162 199 199 91 91 15Rohtas 593 308 394 394 113 113 15Kaimur 325 287 242 242 110 110 19
Gaya 1170 541 587 587 287 287 17Jehanabad 351 151 178 178 73 73 19Arwal 125 65 76 76 39 39 14Nawada 443 525 217 217 102 102 12Aurangabad 581 308 328 328 156 156 16
Saran 789 643 297 297 266 266 12Siwan 501 370 325 325 97 97 11Gopalganj 512 186 191 191 79 79 9
W. Champaran 535 895 277 277 546 546 18E. Champaran 1017 503 201 201 401 401 10Muzaffarpur 956 583 674 674 238 238 16Sitamarhi 684 213 207 207 99 99 8Sheohar 97 172 25 25 98 98 16Vaishali 764 418 411 411 181 181 15
Darbhanga 585 419 284 284 202 202 11Madhubani 1017 702 307 307 225 225 10Samastipur 854 486 545 545 57 57 12
Begusarai 661 360 475 475 196 196 20Munger 491 165 324 324 70 70 25Sheikhpura 257 123 148 148 49 49 27Lakhisarai 400 102 205 205 54 54 22Jamui 609 212 230 230 129 129 18Khagaria 362 193 216 216 89 89 16
Bhagalpur 567 362 622 622 165 165 22Banka 406 265 348 348 137 137 21
Saharsa 350 212 140 140 119 119 12Supaul 212 246 87 87 157 157 9Madhepura 399 153 93 93 82 82 8
Purnea 655 370 207 207 179 179 10Kishanganj 338 186 69 69 117 117 10Araria 561 290 129 129 161 161 9Katihar 614 345 271 271 224 224 14
Bihar 21859 12659 11830 11830 5889 5889 15Source : Bihar State Health Society, Patna; GoB

423
Table A 11.11 : District-wise Employment of ASHA Worker (2016-17 to 2018-19)
(Figures in No.)
District2016-17 2017-18 2018-19
Target Selection Target Selection Target SelectionPatna 3461 2992 3461 2992 3461 3111
Nalanda 2415 2316 2415 2316 2415 2316Bhojpur 2331 2079 2331 2079 2331 2204Buxar 1551 1494 1551 1494 1551 1494Rohtas 2538 2465 2538 2465 2538 2509Kaimur 1570 1509 1570 1509 1570 1568
Gaya 3878 3448 3878 3448 3878 3680Jehanabad 990 870 990 870 990 960Arwal 749 747 749 747 749 712Nawada 2004 1957 2004 1957 2004 1931Aurangabad 2299 2243 2299 2243 2299 2299
Saran 3602 3408 3602 3408 3602 3450Siwan 3136 2822 3136 2822 3136 2885Gopalganj 2396 2395 2396 2395 2396 2392
W. Champaran 3644 3178 3644 3178 3644 3452E. Champaran 4684 4060 4684 4060 4684 4412Muzaffarpur 4510 3880 4510 3880 4510 3896Sitamarhi 3259 2919 3259 2919 3259 2985Sheohar 646 572 646 572 646 572Vaishali 3265 3129 3265 3129 3265 3246
Darbhanga 3729 3242 3729 3242 3729 3323Madhubani 4298 3910 4298 3910 4298 4000Samastipur 4161 3798 4161 3798 4161 4075
Begusarai 2493 2410 2493 2410 2493 2410Munger 1014 953 1014 953 1014 968Sheikhpura 526 478 526 478 526 506Lakhisarai 900 898 900 898 900 898Jamui 1654 1509 1654 1509 1654 1583Khagaria 1571 1501 1571 1501 1571 1526
Bhagalpur 2435 2236 2435 2236 2435 2338Banka 1966 1819 1966 1819 1966 1820
Saharsa 1823 1471 1823 1471 1823 1646Supaul 2140 2111 2140 2111 2140 2111Madhepura 2049 1704 2049 1704 2049 1764
Purnea 2983 2833 2983 2833 2983 2966Kishanganj 1585 1298 1585 1298 1585 1389Araria 2637 2284 2637 2284 2637 2476Katihar 2795 2770 2795 2770 2795 2791
Bihar 93687 85708 93687 85708 93687 88664Source : Bihar State Health Society, Patna; GoB

424
Table A 11.12 : District-wise Coverage of Institutional Deliveries under Janani Suraksha Yojana (JSY) (2014-15 to 2019-20)
(Figures in ‘000)
District 2014-15 2015-16 2016-17 2017-18 2018-19 2019-20, (Sept. 2019)
Patna 83 64 64 64 60 29Nalanda 41 41 39 44 42 21Bhojpur 39 38 36 39 37 19Buxar 25 21 21 22 21 10Rohtas 43 27 26 29 25 12Kaimur 23 24 24 25 23 12
Gaya 63 49 47 51 50 25Jehanabad 16 16 14 14 14 07Arwal 10 09 09 10 10 05Nawada 32 30 28 33 31 16Aurangabad 36 33 31 33 33 16
Saran 57 48 50 53 50 27Siwan 48 39 40 42 40 20Gopalganj 37 38 38 40 37 18
W. Champaran 57 67 68 70 73 34E. Champaran 73 62 62 67 65 32Muzaffarpur 69 54 53 54 55 29Sitamarhi 49 43 45 49 49 23Sheohar 09 09 10 11 11 06Vaishali 50 60 60 61 61 32
Darbhanga 57 48 50 53 56 26Madhubani 65 54 59 60 59 29Samastipur 61 88 89 94 88 45
Begusarai 43 55 54 57 52 28Munger 20 21 21 22 22 11Sheikhpura 9 13 12 14 13 07Lakhisarai 14 16 15 16 15 07Jamui 25 27 27 29 28 14Khagaria 24 34 35 38 38 19
Bhagalpur 44 52 51 54 53 26Banka 29 35 33 36 36 18
Saharsa 27 40 40 39 41 21Supaul 32 46 47 48 50 24Madhepura 29 37 42 47 47 23
Purnea 47 71 71 78 74 38Kishanganj 24 21 23 25 26 12Araria 40 51 54 55 55 26Katihar 44 52 57 61 61 30
Bihar 1494 1533 1545 1637 1601 797Source : Bihar State Health Society, Patna; GoB
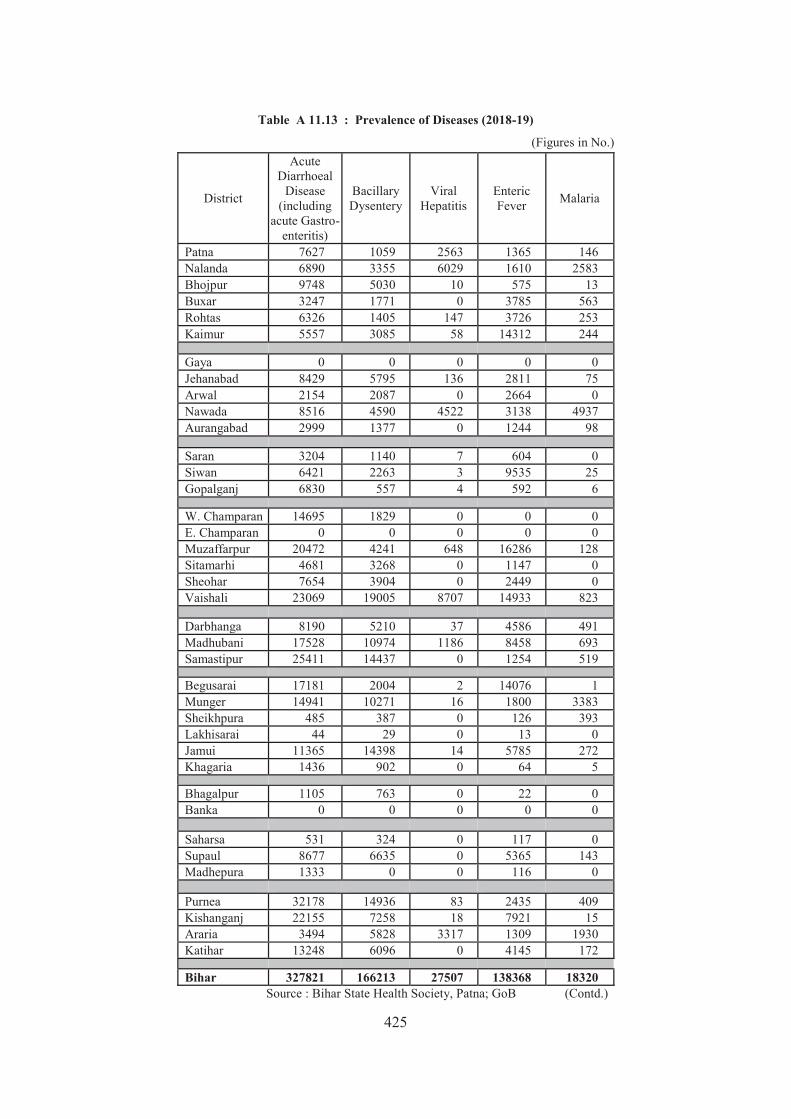
425
Table A 11.13 : Prevalence of Diseases (2018-19)
(Figures in No.)
District
Acute Diarrhoeal
Disease (including
acute Gastro-enteritis)
Bacillary Dysentery
Viral Hepatitis
Enteric Fever Malaria
Patna 7627 1059 2563 1365 146Nalanda 6890 3355 6029 1610 2583Bhojpur 9748 5030 10 575 13Buxar 3247 1771 0 3785 563Rohtas 6326 1405 147 3726 253Kaimur 5557 3085 58 14312 244
Gaya 0 0 0 0 0Jehanabad 8429 5795 136 2811 75Arwal 2154 2087 0 2664 0Nawada 8516 4590 4522 3138 4937Aurangabad 2999 1377 0 1244 98
Saran 3204 1140 7 604 0Siwan 6421 2263 3 9535 25Gopalganj 6830 557 4 592 6
W. Champaran 14695 1829 0 0 0E. Champaran 0 0 0 0 0Muzaffarpur 20472 4241 648 16286 128Sitamarhi 4681 3268 0 1147 0Sheohar 7654 3904 0 2449 0Vaishali 23069 19005 8707 14933 823
Darbhanga 8190 5210 37 4586 491Madhubani 17528 10974 1186 8458 693Samastipur 25411 14437 0 1254 519
Begusarai 17181 2004 2 14076 1Munger 14941 10271 16 1800 3383Sheikhpura 485 387 0 126 393Lakhisarai 44 29 0 13 0Jamui 11365 14398 14 5785 272Khagaria 1436 902 0 64 5
Bhagalpur 1105 763 0 22 0Banka 0 0 0 0 0
Saharsa 531 324 0 117 0Supaul 8677 6635 0 5365 143Madhepura 1333 0 0 116 0
Purnea 32178 14936 83 2435 409Kishanganj 22155 7258 18 7921 15Araria 3494 5828 3317 1309 1930Katihar 13248 6096 0 4145 172
Bihar 327821 166213 27507 138368 18320 Source : Bihar State Health Society, Patna; GoB (Contd.)
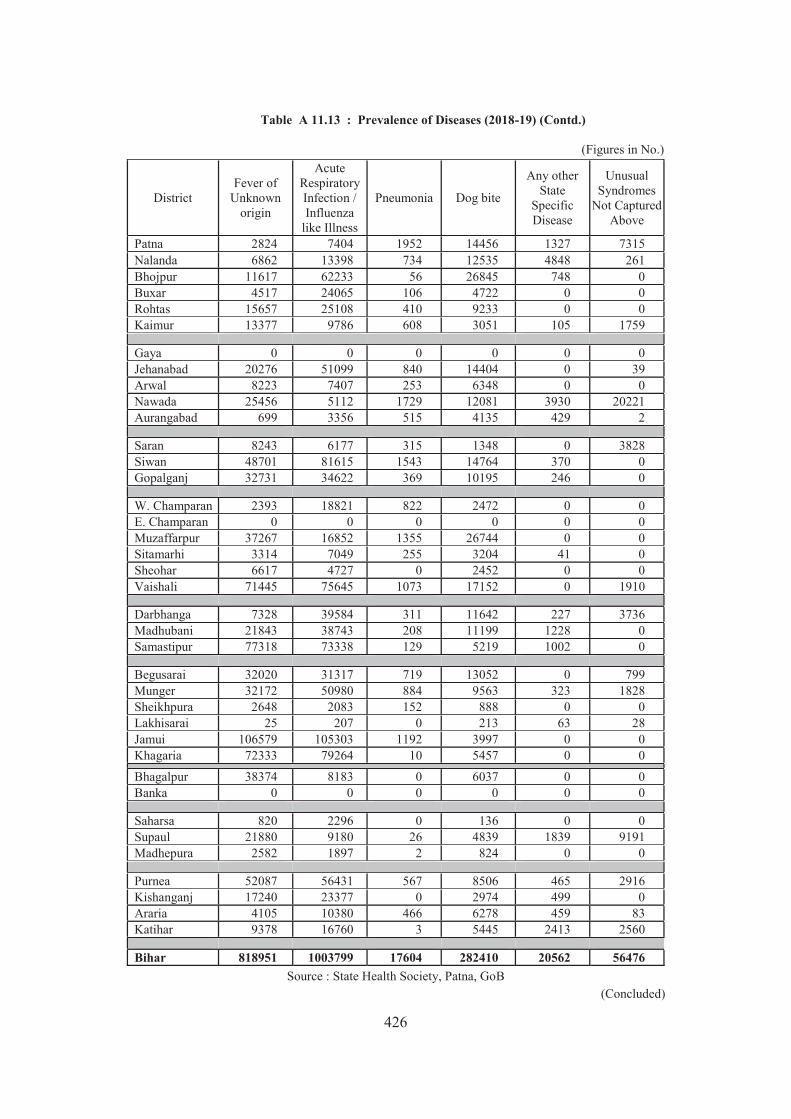
426
Table A 11.13 : Prevalence of Diseases (2018-19) (Contd.)
(Figures in No.)
DistrictFever of
Unknown origin
Acute Respiratory Infection / Influenza
like Illness
Pneumonia Dog bite
Any other State
Specific Disease
Unusual Syndromes
Not Captured Above
Patna 2824 7404 1952 14456 1327 7315Nalanda 6862 13398 734 12535 4848 261Bhojpur 11617 62233 56 26845 748 0Buxar 4517 24065 106 4722 0 0Rohtas 15657 25108 410 9233 0 0Kaimur 13377 9786 608 3051 105 1759
Gaya 0 0 0 0 0 0Jehanabad 20276 51099 840 14404 0 39Arwal 8223 7407 253 6348 0 0Nawada 25456 5112 1729 12081 3930 20221Aurangabad 699 3356 515 4135 429 2
Saran 8243 6177 315 1348 0 3828Siwan 48701 81615 1543 14764 370 0Gopalganj 32731 34622 369 10195 246 0
W. Champaran 2393 18821 822 2472 0 0E. Champaran 0 0 0 0 0 0Muzaffarpur 37267 16852 1355 26744 0 0Sitamarhi 3314 7049 255 3204 41 0Sheohar 6617 4727 0 2452 0 0Vaishali 71445 75645 1073 17152 0 1910
Darbhanga 7328 39584 311 11642 227 3736Madhubani 21843 38743 208 11199 1228 0Samastipur 77318 73338 129 5219 1002 0
Begusarai 32020 31317 719 13052 0 799Munger 32172 50980 884 9563 323 1828Sheikhpura 2648 2083 152 888 0 0Lakhisarai 25 207 0 213 63 28Jamui 106579 105303 1192 3997 0 0Khagaria 72333 79264 10 5457 0 0
Bhagalpur 38374 8183 0 6037 0 0Banka 0 0 0 0 0 0
Saharsa 820 2296 0 136 0 0Supaul 21880 9180 26 4839 1839 9191Madhepura 2582 1897 2 824 0 0
Purnea 52087 56431 567 8506 465 2916Kishanganj 17240 23377 0 2974 499 0Araria 4105 10380 466 6278 459 83Katihar 9378 16760 3 5445 2413 2560
Bihar 818951 1003799 17604 282410 20562 56476Source : State Health Society, Patna, GoB
(Concluded)

427
Table A 11.14 : District-wise Fund Disbursed to Health Societies (2013-14 to 2018-19)
(Rs. crore)
District 2013-14 2014-15 2015-16 2016-17 2017-18 2018-19Patna 40.36 52.93 39.93 55.50 55.03 60.65Nalanda 29.63 37.80 32.37 35.07 32.87 50.47Bhojpur 20.58 26.48 27.15 28.51 22.38 41.17Buxar 13.83 18.60 17.63 18.55 20.60 29.11Rohtas 19.33 19.24 23.72 32.94 24.39 24.47Kaimur 17.04 18.60 20.79 23.31 22.84 26.66
Gaya 44.60 40.57 41.18 48.20 52.89 54.08Jehanabad 13.30 15.36 11.74 16.24 13.96 22.43Arwal 9.21 8.29 9.16 12.30 9.78 19.71Nawada 17.43 20.49 19.09 27.82 19.58 26.41Aurangabad 25.94 27.33 22.89 31.92 32.10 29.59
Saran 28.52 26.50 30.69 44.76 45.52 43.35Siwan 27.21 25.38 32.85 30.22 28.81 36.64Gopalganj 25.21 24.10 20.63 31.87 20.60 33.07
W. Champaran 37.13 38.35 51.11 54.83 44.71 615.20E. Champaran 38.22 55.56 34.14 61.28 45.01 59.96Muzaffarpur 34.45 28.48 33.81 42.00 25.85 50.60Sitamarhi 25.07 21.51 26.21 39.54 27.87 56.16Sheohar 6.46 7.80 7.20 10.46 8.53 20.73Vaishali 40.12 34.51 39.25 49.79 35.70 59.33
Darbhanga 31.13 29.21 24.66 39.08 41.65 45.19Madhubani 35.30 30.91 36.03 45.03 34.82 60.33Samastipur 47.15 38.73 56.85 51.96 54.54 58.85
Begusarai 32.33 35.52 32.36 41.95 41.93 51.47Munger 19.45 15.13 17.12 19.41 17.72 23.87Sheikhpura 8.15 9.66 11.41 11.36 12.23 22.75Lakhisarai 10.46 11.88 13.62 13.21 14.71 19.78Jamui 16.22 24.51 20.91 27.18 24.21 28.00Khagaria 17.54 23.22 19.86 24.82 19.69 27.38
Bhagalpur 33.27 32.67 37.30 37.20 39.76 41.23Banka 23.22 25.95 24.30 27.02 32.06 27.06
Saharsa 20.94 19.62 24.10 27.26 18.57 33.50Supaul 18.58 21.55 26.89 30.63 23.29 30.29Madhepura 19.52 22.64 19.74 27.18 34.31 29.74
Purnea 33.93 44.15 39.23 47.76 39.47 62.73Kishanganj 9.66 14.05 13.27 21.74 13.47 265.91Araria 19.72 27.26 27.97 39.74 41.21 37.80Katihar 31.31 27.43 40.96 45.31 37.22 59.39
Bihar 941.53 1001.97 1028.14 1272.96 1129.92 1495.05Note : The Fund has been disbursed by SHS to its implementing Agencies like DHS, RPMU,
Medical Colleges, IGIMS and BMSICL, but the above table shows only fund disbursed to DHS
Source : State Health Society, Patna, GoB

428
Table A 11.15 : District-wise Hand Pumps under National Rural Drinking Water Programme (NRDWP) (2015-16 to 2018-19)
District Number of Handpumps Installed
Slipped back Habitations / Water quality Problems
Covered
Wards Covered
2015-16 2016-17 2017-18 2018-19 2015-16 2016-17 2017-18 2018-19Patna 1000 220 98 156 373 0 0 861Nalanda 1079 137 182 344 36 2 0 1083Bhojpur 669 82 4 45 244 0 0 672Buxar 389 30 287 71 13 1 0 586Rohtas 1066 19 250 125 253 1 0 191Kaimur 761 58 302 111 91 38 15 364
Gaya 1739 148 0 265 469 34 46 673Jehanabad 206 0 186 60 87 7 25 219Arwal 196 0 52 49 92 13 0 335Nawada 856 19 0 165 207 35 19 966Aurangabad 994 0 366 123 250 37 27 388
Saran 771 34 291 81 305 15 30 1409Siwan 736 441 300 35 337 15 0 885Gopalganj 497 74 234 35 269 11 0 664
W. Champaran 871 359 340 20 311 3 13 679E. Champaran 968 314 375 167 492 20 0 2047Muzaffarpur 1179 782 475 405 222 5 0 1007Sitamarhi 1113 140 303 75 21 14 23 2236Sheohar 106 35 88 30 108 0 0 183Vaishali 255 414 307 132 0 0 0 721
Darbhanga 588 339 410 145 0 5 0 911Madhubani 762 303 610 63 167 0 0 729Samastipur 937 237 431 250 336 96 0 1075
Begusarai 695 54 4 0 58 0 0 08Munger 453 78 376 83 301 38 25 200Sheikhpura 230 0 86 70 0 0 0 61Lakhisarai 485 12 133 75 174 122 0 145Jamui 700 51 306 120 250 43 23 217Khagaria 273 32 129 0 14 56 0 0
Bhagalpur 1346 84 430 120 223 2 0 354Banka 1132 112 360 120 281 0 0 370
Saharsa 232 69 168 0 311 101 0 36Supaul 458 552 91 33 358 163 0 0Madhepura 551 13 50 3 132 72 NA 7
Purnea 575 509 246 0 9 57 20 0Kishanganj 437 252 126 0 84 90 0 0Araria 480 170 218 96 71 132 0 3Katihar 906 200 285 0 240 61 0 5
Bihar 26691 6373 8899 3672 7189 1289 266 20290Note : 1. A habitation having status “Fully Covered” at one point of time but which is ‘Partially
Covered’ or ‘Quality Affected’ 2. ‘Wards Covered’ refer to Saat Nischay scheme of ‘Har Ghar Nal Ka Jal’
Source : Department of Public Health Engineering, and Panchayati Raj Department, GoB

429
Table A 11.16 : District-wise Achievement in Individual Household Lantrine (IHHL) under Central Rural Sanitation Programme (2017-18 and 2018-19)
DistrictsPopu-lation Share
2017-18 2018-19
BPL APL BPL+APL BPL APL BPL+APL
Patna 5.6 48197 46565 94762 (2.8) 83544 95032 178576 (2.9)Nalanda 2.8 94350 39371 133721 (3.9) 66154 25774 91928 (1.5)Bhojpur 2.6 35995 17032 53027 (1.5) 96487 41867 138354 (2.3)Buxar 1.6 37760 29423 67183 (2.0) 31470 54009 85479 (1.4)Rohtas 2.9 143551 79736 223287 (6.5) 4101 1716 5817 (0.1)Kaimur 1.6 91600 25933 117533 (3.4) 83939 43440 127379 (2.1)
Gaya 4.2 31998 51654 83652 (2.4) 65285 182239 247524 (4.0)Jehanabad 1.1 9598 11777 21375 (0.6) 28904 16746 45650 (0.7)Arwal 0.7 6386 3989 10375 (0.3) 49398 10359 59757 (1.0)Nawada 2.1 50300 26791 77091 (2.2) 73736 32989 106725 (1.7)Aurangabad 2.4 32093 31547 63640 (1.9) 79877 86879 166756 (2.7)
Saran 3.8 43232 44152 87384 (2.5) 111089 126151 237240 (3.9)Siwan 3.2 18666 49296 67962 (2.0) 55834 175487 231321 (3.8)Gopalganj 2.5 27872 61616 89488 (2.6) 22783 139160 161943 (2.6)
W. Champaran 3.8 86103 44880 130983 (3.8) 183616 105892 289508 (4.7)E. Champaran 4.9 188239 68829 257068 (7.5) 215445 63449 278894 (4.5)Muzaffarpur 4.6 29216 150799 180015 (5.2) 84516 224262 308778 (5)Sitamarhi 3.3 215910 22516 238426 (6.9) 82691 5862 88553 (1.4)Sheohar 0.6 8106 7312 15418 (0.4) 48347 14168 62515 (1.0)Vaishali 3.4 40242 21414 61656 (1.8) 131617 51169 182786 (3.0)
Darbhanga 3.8 67545 43470 111015 (3.2) 210959 103331 314290 (5.1)Madhubani 4.3 129001 40772 169773 (4.9) 280454 83668 364122 (5.9)Samastipur 4.1 38568 30015 68583 (2) 196103 125216 321319 (5.2)
Begusarai 2.8 36972 23301 60273 (1.8) 121519 64250 185769 (3.0)Munger 1.3 61772 14001 75773 (2.2) 41915 9242 51157 (0.8)Sheikhpura 0.6 19487 23780 43267 (1.3) 5674 5841 11515 (0.2)Lakhisarai 1 30644 127 30771 (0.9) 60337 5314 65651 (1.1)Jamui 1.7 42654 13323 55977 (1.6) 91476 34379 125855 (2.1)Khagaria 1.6 25357 35104 60461 (1.8) 52550 32981 85531 (1.4)
Bhagalpur 2.9 42635 15863 58498 (1.7) 106073 49389 155462 (2.5)Banka 2.0 27890 32293 60183 (1.8) 55009 76416 131425 (2.1)
Saharsa 1.8 37096 19515 56611 (1.6) 119777 37425 157202 (2.6)Supaul 2.1 98983 21162 120145 (3.5) 130525 36509 167034 (2.7)Madhepura 1.9 43985 15361 59346 (1.7) 142154 39340 181494 (3.0)
Purnea 3.2 63919 37085 101004 (2.9) 118666 75043 193709 (3.2)Kishanganj 1.6 48789 2200 50989 (1.5) 121125 5728 126853 (2.1)Araria 2.7 92799 8232 101031 (2.9) 216889 22821 239710 (3.9)Katihar 3.0 40429 36390 76819 (2.2) 78498 83476 161974 (2.6)
Bihar 100 2187939 1246626 3434565 (100) 3748536 2387019 6135555 (100)Note : Figures in parenthesis denote percent share;
Source : Jeevika, GoB
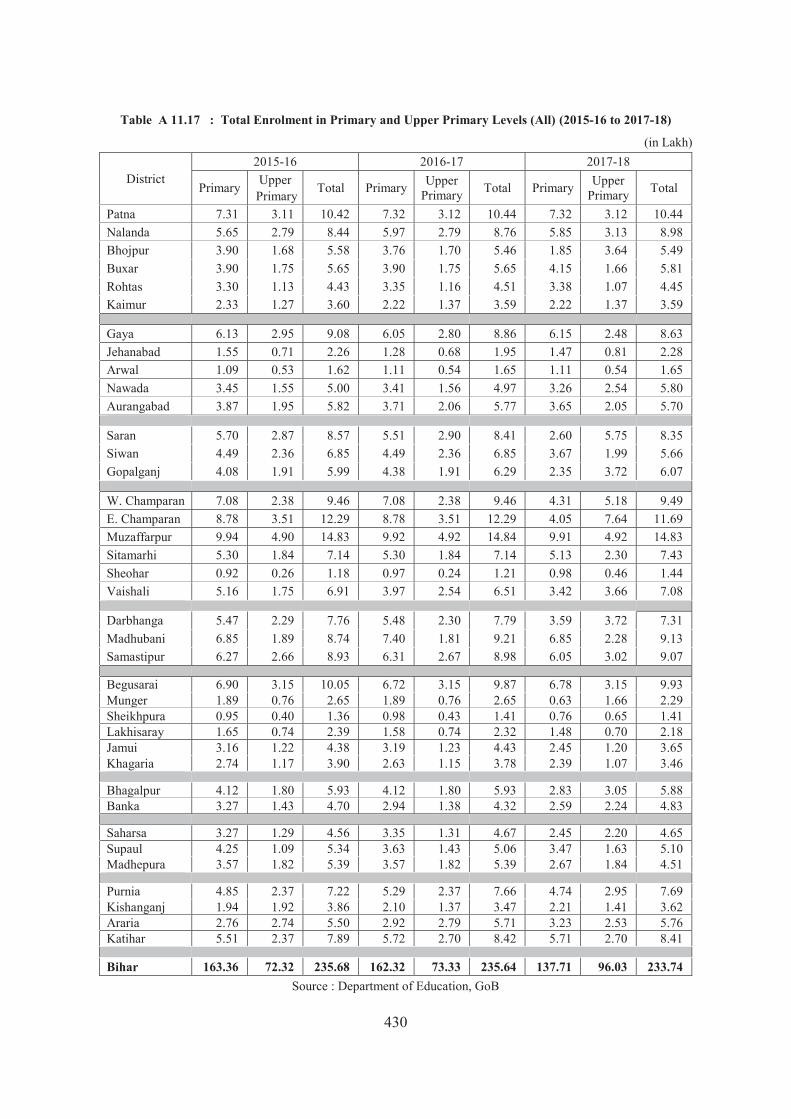
430
Table A 11.17 : Total Enrolment in Primary and Upper Primary Levels (All) (2015-16 to 2017-18)
(in Lakh)
District2015-16 2016-17 2017-18
Primary UpperPrimary Total Primary Upper
Primary Total Primary Upper Primary Total
Patna 7.31 3.11 10.42 7.32 3.12 10.44 7.32 3.12 10.44Nalanda 5.65 2.79 8.44 5.97 2.79 8.76 5.85 3.13 8.98Bhojpur 3.90 1.68 5.58 3.76 1.70 5.46 1.85 3.64 5.49Buxar 3.90 1.75 5.65 3.90 1.75 5.65 4.15 1.66 5.81Rohtas 3.30 1.13 4.43 3.35 1.16 4.51 3.38 1.07 4.45Kaimur 2.33 1.27 3.60 2.22 1.37 3.59 2.22 1.37 3.59
Gaya 6.13 2.95 9.08 6.05 2.80 8.86 6.15 2.48 8.63Jehanabad 1.55 0.71 2.26 1.28 0.68 1.95 1.47 0.81 2.28Arwal 1.09 0.53 1.62 1.11 0.54 1.65 1.11 0.54 1.65Nawada 3.45 1.55 5.00 3.41 1.56 4.97 3.26 2.54 5.80Aurangabad 3.87 1.95 5.82 3.71 2.06 5.77 3.65 2.05 5.70
Saran 5.70 2.87 8.57 5.51 2.90 8.41 2.60 5.75 8.35Siwan 4.49 2.36 6.85 4.49 2.36 6.85 3.67 1.99 5.66Gopalganj 4.08 1.91 5.99 4.38 1.91 6.29 2.35 3.72 6.07
W. Champaran 7.08 2.38 9.46 7.08 2.38 9.46 4.31 5.18 9.49E. Champaran 8.78 3.51 12.29 8.78 3.51 12.29 4.05 7.64 11.69Muzaffarpur 9.94 4.90 14.83 9.92 4.92 14.84 9.91 4.92 14.83Sitamarhi 5.30 1.84 7.14 5.30 1.84 7.14 5.13 2.30 7.43Sheohar 0.92 0.26 1.18 0.97 0.24 1.21 0.98 0.46 1.44Vaishali 5.16 1.75 6.91 3.97 2.54 6.51 3.42 3.66 7.08
Darbhanga 5.47 2.29 7.76 5.48 2.30 7.79 3.59 3.72 7.31Madhubani 6.85 1.89 8.74 7.40 1.81 9.21 6.85 2.28 9.13Samastipur 6.27 2.66 8.93 6.31 2.67 8.98 6.05 3.02 9.07
Begusarai 6.90 3.15 10.05 6.72 3.15 9.87 6.78 3.15 9.93Munger 1.89 0.76 2.65 1.89 0.76 2.65 0.63 1.66 2.29Sheikhpura 0.95 0.40 1.36 0.98 0.43 1.41 0.76 0.65 1.41Lakhisaray 1.65 0.74 2.39 1.58 0.74 2.32 1.48 0.70 2.18Jamui 3.16 1.22 4.38 3.19 1.23 4.43 2.45 1.20 3.65Khagaria 2.74 1.17 3.90 2.63 1.15 3.78 2.39 1.07 3.46
Bhagalpur 4.12 1.80 5.93 4.12 1.80 5.93 2.83 3.05 5.88Banka 3.27 1.43 4.70 2.94 1.38 4.32 2.59 2.24 4.83
Saharsa 3.27 1.29 4.56 3.35 1.31 4.67 2.45 2.20 4.65Supaul 4.25 1.09 5.34 3.63 1.43 5.06 3.47 1.63 5.10Madhepura 3.57 1.82 5.39 3.57 1.82 5.39 2.67 1.84 4.51
Purnia 4.85 2.37 7.22 5.29 2.37 7.66 4.74 2.95 7.69Kishanganj 1.94 1.92 3.86 2.10 1.37 3.47 2.21 1.41 3.62Araria 2.76 2.74 5.50 2.92 2.79 5.71 3.23 2.53 5.76Katihar 5.51 2.37 7.89 5.72 2.70 8.42 5.71 2.70 8.41
Bihar 163.36 72.32 235.68 162.32 73.33 235.64 137.71 96.03 233.74Source : Department of Education, GoB

431
Table A 11.18 : Total Enrolment in Primary and Upper Primary Levels (SC) (2015-16 to 2017-18)
(in Lakh)
District2015-16 2016-17 2017-18
Primary Upper Primary Total Primary Upper
Primary Total Primary Upper Primary Total
Patna 1.25 0.67 1.92 1.31 0.67 1.98 1.31 0.66 1.97 Nalanda 1.85 0.85 2.7 1.85 0.85 2.7 1.87 0.81 2.68 Bhojpur 0.73 0.36 1.09 0.69 0.39 1.08 0.69 0.39 1.08 Buxar 0.46 0.22 0.69 0.46 0.22 0.69 0.53 0.31 0.84 Rohtas 0.47 0.12 0.6 0.48 0.13 0.61 0.49 0.13 0.62 Kaimur 0.64 0.35 0.99 0.61 0.38 0.99 0.61 0.38 0.99
Gaya 2.38 0.97 3.35 2.34 0.93 3.28 2.03 0.84 2.87 Jehanabad 0.38 0.16 0.53 0.29 0.13 0.43 0.34 0.18 0.52 Arwal 0.17 0.08 0.25 0.18 0.09 0.26 0.17 0.08 0.25 Nawada 0.97 0.33 1.31 1.09 0.43 1.53 1.09 0.43 1.52 Aurangabad 1.24 0.58 1.82 1.18 0.58 1.77 1.06 0.53 1.59
Saran 0.92 0.41 1.33 0.87 0.41 1.29 0.87 0.41 1.28 Siwan 0.63 0.33 0.96 0.63 0.33 0.96 0.56 0.27 0.83 Gopalganj 0.67 0.28 0.96 0.67 0.28 0.96 0.67 0.28 0.95
W. Champaran 1.2 0.37 1.57 1.2 0.37 1.57 1.01 0.35 1.36 E. Champaran 1.35 0.47 1.81 1.35 0.47 1.81 1.34 0.49 1.83 Muzaffarpur 1.65 0.79 2.44 1.65 0.79 2.44 1.65 0.8 2.45 Sitamarhi 0.53 0.18 0.71 0.53 0.18 0.71 0.56 0.25 0.81 Sheohar 0.18 0.05 0.23 0.17 0.04 0.21 0.19 0.08 0.27 Vaishali 1.28 0.36 1.65 1.2 0.68 1.88 1.19 0.68 1.87
Darbhanga 1.14 0.41 1.56 1.17 0.5 1.67 1.07 0.47 1.54 Madhubani 1.23 0.23 1.46 1.21 0.22 1.43 1.21 0.22 1.43 Samastipur 1.32 0.49 1.8 1.32 0.49 1.81 1.32 0.48 1.8
Begusarai 0.91 0.36 1.27 1 0.45 1.45 0.97 0.44 1.41 Munger 0.38 0.12 0.51 0.38 0.12 0.51 0.32 0.14 0.46 Sheikhpura 0.17 0.05 0.22 0.22 0.08 0.3 0.22 0.07 0.29 Lakhisarai 0.31 0.13 0.44 0.29 0.14 0.42 0.23 0.1 0.33 Jamui 0.59 0.22 0.81 0.59 0.22 0.81 0.52 0.22 0.74 Khagaria 0.57 0.19 0.76 0.61 0.2 0.81 0.53 0.19 0.72
Bhagalpur 0.54 0.26 0.8 0.54 0.26 0.8 0.54 0.25 0.79 Banka 0.45 0.21 0.66 0.47 0.22 0.69 0.37 0.19 0.56
Saharsa 0.74 0.23 0.97 0.74 0.24 0.98 0.74 0.23 0.97 Supaul 0.71 0.11 0.82 0.71 0.11 0.82 0.71 0.11 0.82 Madhepura 0.58 0.37 0.95 0.58 0.37 0.95 0.61 0.27 0.88
Purnea 0.71 0.35 1.06 0.71 0.35 1.06 0.68 0.43 1.11 Kishanganj 0.18 0.07 0.24 0.19 0.06 0.25 0.18 0.06 0.24 Araria 0.26 0.2 0.46 0.27 0.2 0.47 0.26 0.2 0.46 Katihar 1.05 0.45 1.49 1.09 0.46 1.55 1.08 0.46 1.54
Bihar 30.81 12.39 43.2 30.88 13.06 43.94 29.79 12.88 42.67Source : Department of Education, GoB
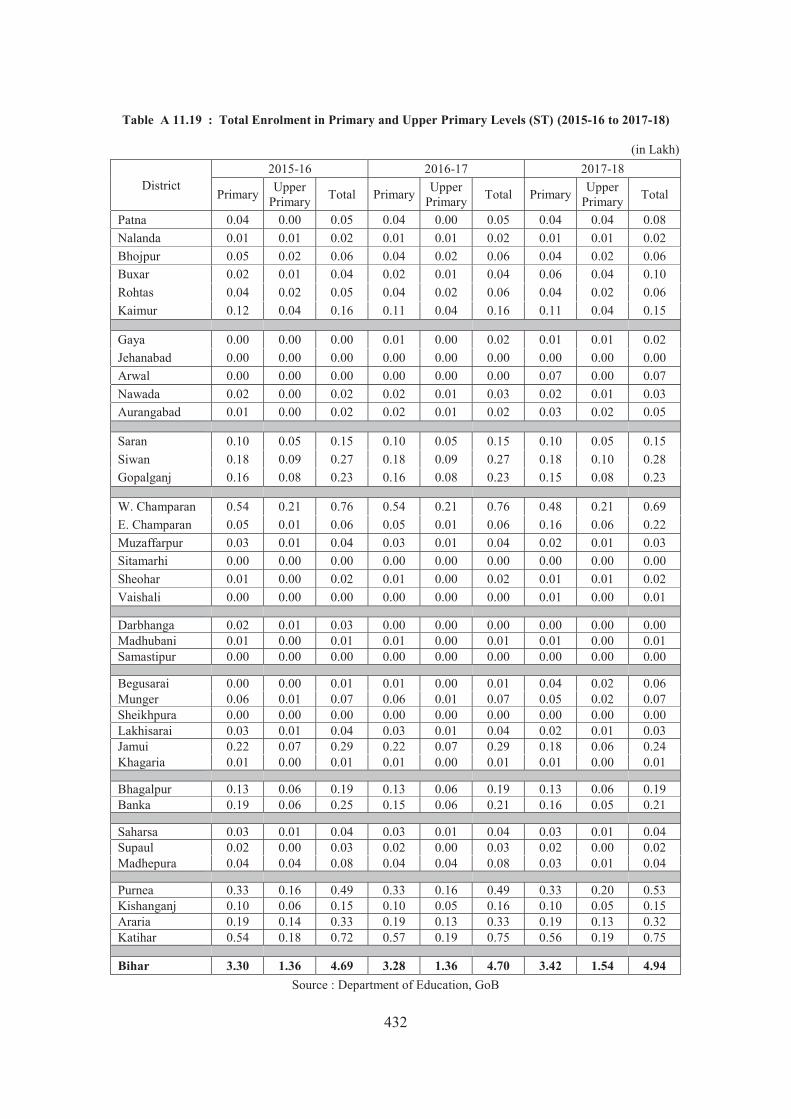
432
Table A 11.19 : Total Enrolment in Primary and Upper Primary Levels (ST) (2015-16 to 2017-18)
(in Lakh)
District2015-16 2016-17 2017-18
Primary Upper Primary Total Primary Upper
Primary Total Primary Upper Primary Total
Patna 0.04 0.00 0.05 0.04 0.00 0.05 0.04 0.04 0.08Nalanda 0.01 0.01 0.02 0.01 0.01 0.02 0.01 0.01 0.02Bhojpur 0.05 0.02 0.06 0.04 0.02 0.06 0.04 0.02 0.06Buxar 0.02 0.01 0.04 0.02 0.01 0.04 0.06 0.04 0.10Rohtas 0.04 0.02 0.05 0.04 0.02 0.06 0.04 0.02 0.06Kaimur 0.12 0.04 0.16 0.11 0.04 0.16 0.11 0.04 0.15
Gaya 0.00 0.00 0.00 0.01 0.00 0.02 0.01 0.01 0.02Jehanabad 0.00 0.00 0.00 0.00 0.00 0.00 0.00 0.00 0.00Arwal 0.00 0.00 0.00 0.00 0.00 0.00 0.07 0.00 0.07Nawada 0.02 0.00 0.02 0.02 0.01 0.03 0.02 0.01 0.03Aurangabad 0.01 0.00 0.02 0.02 0.01 0.02 0.03 0.02 0.05
Saran 0.10 0.05 0.15 0.10 0.05 0.15 0.10 0.05 0.15Siwan 0.18 0.09 0.27 0.18 0.09 0.27 0.18 0.10 0.28Gopalganj 0.16 0.08 0.23 0.16 0.08 0.23 0.15 0.08 0.23
W. Champaran 0.54 0.21 0.76 0.54 0.21 0.76 0.48 0.21 0.69E. Champaran 0.05 0.01 0.06 0.05 0.01 0.06 0.16 0.06 0.22Muzaffarpur 0.03 0.01 0.04 0.03 0.01 0.04 0.02 0.01 0.03Sitamarhi 0.00 0.00 0.00 0.00 0.00 0.00 0.00 0.00 0.00Sheohar 0.01 0.00 0.02 0.01 0.00 0.02 0.01 0.01 0.02Vaishali 0.00 0.00 0.00 0.00 0.00 0.00 0.01 0.00 0.01
Darbhanga 0.02 0.01 0.03 0.00 0.00 0.00 0.00 0.00 0.00Madhubani 0.01 0.00 0.01 0.01 0.00 0.01 0.01 0.00 0.01Samastipur 0.00 0.00 0.00 0.00 0.00 0.00 0.00 0.00 0.00
Begusarai 0.00 0.00 0.01 0.01 0.00 0.01 0.04 0.02 0.06Munger 0.06 0.01 0.07 0.06 0.01 0.07 0.05 0.02 0.07Sheikhpura 0.00 0.00 0.00 0.00 0.00 0.00 0.00 0.00 0.00Lakhisarai 0.03 0.01 0.04 0.03 0.01 0.04 0.02 0.01 0.03Jamui 0.22 0.07 0.29 0.22 0.07 0.29 0.18 0.06 0.24Khagaria 0.01 0.00 0.01 0.01 0.00 0.01 0.01 0.00 0.01
Bhagalpur 0.13 0.06 0.19 0.13 0.06 0.19 0.13 0.06 0.19Banka 0.19 0.06 0.25 0.15 0.06 0.21 0.16 0.05 0.21
Saharsa 0.03 0.01 0.04 0.03 0.01 0.04 0.03 0.01 0.04Supaul 0.02 0.00 0.03 0.02 0.00 0.03 0.02 0.00 0.02Madhepura 0.04 0.04 0.08 0.04 0.04 0.08 0.03 0.01 0.04
Purnea 0.33 0.16 0.49 0.33 0.16 0.49 0.33 0.20 0.53Kishanganj 0.10 0.06 0.15 0.10 0.05 0.16 0.10 0.05 0.15Araria 0.19 0.14 0.33 0.19 0.13 0.33 0.19 0.13 0.32Katihar 0.54 0.18 0.72 0.57 0.19 0.75 0.56 0.19 0.75
Bihar 3.30 1.36 4.69 3.28 1.36 4.70 3.42 1.54 4.94Source : Department of Education, GoB

433
Table A 11.20 : District-wise Number of Primary and Upper Primary Schools in Bihar (2016-17 and 2017-18)
District2016-17 2017-18
Primary Upper Primary Total Primary Upper
Primary Total
Patna 2190 1176 3366 2190 1176 3366Nalanda 1368 803 2171 1368 803 2171Bhojpur 1210 840 2050 1210 840 2050Buxar 789 512 1301 812 534 1346Rohtas 1324 556 1880 1525 1031 2556Kaimur 649 625 1274 649 625 1274
Gaya 1702 1413 3115 1699 1432 3131Jehanabad 557 359 916 557 359 916Arwal 333 193 526 333 193 526Nawada 910 698 1608 996 697 1693Aurangabad 961 960 1921 961 960 1921
Saran 1575 1152 2727 1575 1152 2727Siwan 1311 1188 2499 1308 1301 2609Gopalganj 1140 811 1951 1093 807 1900
W. Champaran 1694 1092 2786 1694 1116 2810E. Champaran 2059 1427 3486 2122 1730 3852Muzaffarpur 1790 1569 3359 1790 1569 3359Sitamarhi 1204 867 2071 1204 867 2071Sheohar 233 184 417 225 209 434Vaishali 1087 953 2040 1087 953 2040
Darbhanga 1512 909 2421 1512 909 2421Madhubani 1962 1005 2967 1962 1005 2967Samastipur 1708 1033 2741 1708 1033 2741
Begusarai 867 952 1819 862 1020 1882Munger 639 489 1128 554 521 1075Sheikhpura 294 287 581 294 287 581Lakhisaray 486 291 777 495 248 743Jamui 856 848 1704 829 836 1665Khagaria 538 515 1053 566 493 1059
Bhagalpur 961 841 1802 961 841 1802Banka 1250 885 2135 1281 904 2185
Saharsa 767 531 1298 767 531 1298Supaul 1111 713 1824 1111 713 1824Madhepura 959 744 1703 961 647 1608
Purnia 1484 958 2442 1326 955 2281Kishanganj 823 496 1319 823 496 1319Araria 1327 562 1889 1327 562 1889Katihar 1195 719 1914 1195 719 1914
Bihar 42825 30156 72981 42932 31074 74006Source : Department of Education, GoB

434
Table A 11.21 : District-wise Number of Primary and Upper Primary Teachers in Bihar (2016-17 and 2017-18)
District
2016-17 2017-18
Primary Schools
Upper Primary Schools
Total Primary Schools
Upper Primary Schools
Total
Patna 9237 11246 20483 9220 11127 20347Nalanda 4948 9678 14626 4956 9676 14632Bhojpur 4401 6580 10981 4394 6572 10966Buxar 3581 3650 7231 3723 3726 7449Rohtas 3466 2733 6199 3538 2780 6318Kaimur 2218 4079 6297 2218 4077 6295
Gaya 5856 8346 14202 6423 8961 15384Jehanabad 1884 3266 5150 1807 3363 5170Arwal 2313 914 3227 2313 914 3227Nawada 7131 6931 14062 7131 6931 14062Aurangabad 4228 5608 9836 4173 5558 9731
Saran 6019 10061 16080 6019 10061 16080Siwan 5808 11020 16828 8897 11602 20499Gopalganj 4391 6810 11201 4391 6810 11201
W. Champaran 5779 7738 13517 6165 11963 18128E.Champaran 7113 11470 18583 7689 12348 20037Muzaffarpur 5995 11203 17198 5990 10956 16946Sitamarhi 3659 7615 11274 3469 6751 10220Sheohar 654 1644 2298 948 1624 2572Vaishali 3870 8328 12198 3870 8328 12198
Darbhanga 5595 7377 12972 5595 7377 12972Madhubani 6825 7903 14728 6825 7903 14728Samastipur 5500 7920 13420 5500 7920 13420
Begusarai 11764 2110 13874 8188 8851 17039Munger 1705 2948 4653 1600 4405 6005Sheikhpura 699 1565 2264 699 1565 2264Lakhisarai 1882 2598 4480 1673 2321 3994Jamui 5872 2453 8325 5401 2253 7654Khagaria 1740 4141 5881 1902 4765 6667
Bhagalpur 4460 6371 10831 4460 6371 10831Banka 2859 4555 7414 3196 5038 8234
Saharsa 2861 5540 8401 2861 5540 8401Supaul 6688 2013 8701 6688 2013 8701Madhepura 2602 5731 8333 3869 5375 9244
Purnea 5071 5841 10912 5753 5101 10854Kishanganj 3763 2521 6284 3763 2521 6284Araria 7226 2099 9325 7226 2099 9325Katihar 4519 7717 12236 4519 7717 12236
Bihar 174182 220323 394505 177052 233263 410315Source : Department of Education, GoB

435
Table A 11.22 : District-wise Coverage of MDMS (Class I-V) (2016-17 to 2018-19)
Districts
2016-17 2017-18 2018-19
Total Enrolment (in lakhs)
Coverage of MDM (per day) (lakhs)
Coverage(%)
Total Enrolment (in lakhs)
Coverage of MDM (per day) (lakhs)
Coverage(%)
Total Enrolment (in lakhs)
No. ofChildren Availing
MDM (per day) (in lakhs)
Coverage(%)
Patna 5.25 3.56 67.77 4.71 3.02 64.19 4.50 2.59 57.6Nalanda 3.44 2.08 60.34 3.05 1.94 63.62 3.00 1.79 59.7Bhojpur 3.21 2.03 63.09 2.87 1.73 60.45 2.67 1.45 54.3Buxar 2.20 1.38 62.74 1.81 1.20 66.26 1.61 1.05 65.2Rohtas 3.54 2.23 62.92 3.23 2.01 62.27 2.97 1.77 59.6Kaimur 2.11 1.36 64.73 1.80 1.23 67.96 1.69 1.14 67.5
Gaya 5.71 3.42 59.87 5.23 3.04 58.11 4.61 2.75 59.7Jehanabad 1.24 0.83 67.00 1.19 0.71 59.67 0.99 0.62 62.6Arwal 0.94 0.57 61.12 0.88 0.50 56.14 0.81 0.46 56.8Nawada 3.25 1.97 60.63 2.72 1.70 62.59 2.50 1.55 62.0Aurangabad 3.44 2.17 63.06 3.17 1.98 62.37 3.11 1.78 57.2Saran 5.22 3.59 68.78 5.02 3.21 63.82 4.71 2.90 61.6Siwan 3.57 2.44 68.32 3.03 2.05 67.57 2.86 1.78 62.2Gopalganj 3.36 2.24 66.55 2.82 1.88 66.69 2.68 1.76 65.7W. Champaran 5.86 4.33 73.90 5.15 3.64 70.68 4.64 3.28 70.7E. Champaran 7.72 5.03 65.18 7.27 4.69 64.45 6.67 4.30 64.5Muzaffarpur 6.10 3.94 64.52 5.43 3.48 64.11 5.15 3.08 59.8Sitamarhi 5.56 3.48 62.51 5.14 3.00 58.35 4.50 2.77 61.6Sheohar 1.11 0.73 65.46 1.09 0.69 63.39 1.08 0.60 55.6Vaishali 4.11 2.29 55.63 3.63 2.05 56.47 3.50 1.86 53.1Darbhanga 5.12 3.38 66.01 4.74 3.10 65.33 4.63 2.87 62.0Madhubani 6.77 4.51 66.68 6.43 4.02 62.56 6.26 3.67 58.6Samastipur 5.46 3.49 63.82 4.68 3.02 64.58 4.34 2.80 64.5Begusarai 3.94 2.65 67.19 3.21 2.21 68.73 3.33 2.19 65.8Munger 1.71 1.04 60.85 1.47 0.92 62.67 1.37 0.84 61.3Sheikhpura 0.92 0.54 58.03 0.74 0.47 63.39 0.73 0.43 58.9Lakhisarai 1.51 0.98 64.95 1.28 0.83 65.05 1.19 0.7 58.8Jamui 2.92 1.85 63.38 2.61 1.67 64.05 2.32 1.48 63.8Khagaria 2.65 1.60 60.45 2.31 1.47 63.82 2.29 1.38 60.3Bhagalpur 4.02 2.50 62.31 3.56 2.27 63.71 3.35 2.08 62.1Banka 2.69 1.65 61.28 2.28 1.48 64.97 2.18 1.40 64.2Saharsa 3.23 1.92 59.42 2.84 1.68 59.22 2.69 1.58 58.7Supaul 3.26 2.01 61.74 2.93 1.80 61.38 2.76 1.66 60.1Madhepura 3.29 1.94 59.08 2.76 1.74 63.17 2.58 1.63 63.2Purnea 5.30 2.91 54.87 4.70 2.74 58.28 4.59 2.59 56.4Kishanganj 2.81 1.76 62.45 2.39 1.48 61.89 2.28 1.44 63.2Araria 4.44 2.54 57.29 3.94 2.32 58.71 3.87 2.22 57.4Katihar 4.74 2.79 58.91 4.45 2.58 57.93 4.39 2.39 54.4
Bihar 141.70 89.70 63.30 126.59 79.55 62.84 119.40 72.63 60.8Source : Directorate of Mid-Day Meal Scheme, GoB
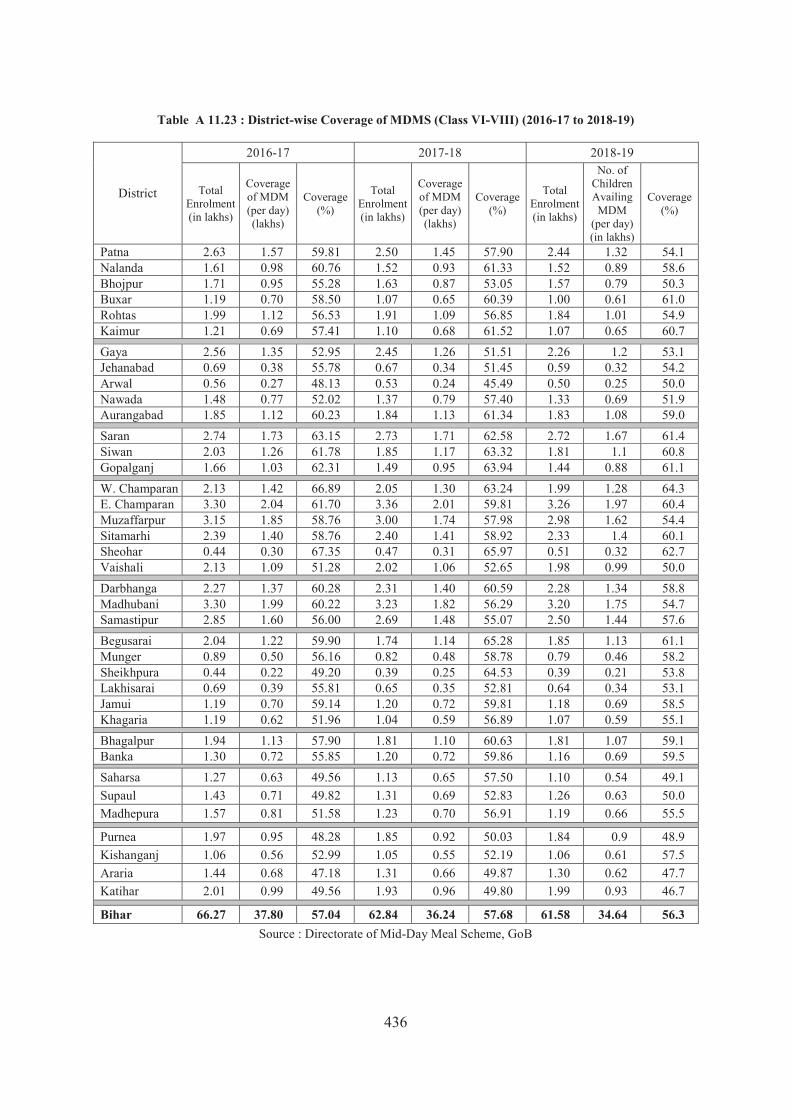
436
Table A 11.23 : District-wise Coverage of MDMS (Class VI-VIII) (2016-17 to 2018-19)
District
2016-17 2017-18 2018-19
Total Enrolment (in lakhs)
Coverage of MDM (per day) (lakhs)
Coverage (%)
Total Enrolment (in lakhs)
Coverage of MDM (per day) (lakhs)
Coverage (%)
Total Enrolment (in lakhs)
No. of Children AvailingMDM
(per day) (in lakhs)
Coverage (%)
Patna 2.63 1.57 59.81 2.50 1.45 57.90 2.44 1.32 54.1Nalanda 1.61 0.98 60.76 1.52 0.93 61.33 1.52 0.89 58.6Bhojpur 1.71 0.95 55.28 1.63 0.87 53.05 1.57 0.79 50.3Buxar 1.19 0.70 58.50 1.07 0.65 60.39 1.00 0.61 61.0Rohtas 1.99 1.12 56.53 1.91 1.09 56.85 1.84 1.01 54.9Kaimur 1.21 0.69 57.41 1.10 0.68 61.52 1.07 0.65 60.7Gaya 2.56 1.35 52.95 2.45 1.26 51.51 2.26 1.2 53.1Jehanabad 0.69 0.38 55.78 0.67 0.34 51.45 0.59 0.32 54.2Arwal 0.56 0.27 48.13 0.53 0.24 45.49 0.50 0.25 50.0Nawada 1.48 0.77 52.02 1.37 0.79 57.40 1.33 0.69 51.9Aurangabad 1.85 1.12 60.23 1.84 1.13 61.34 1.83 1.08 59.0Saran 2.74 1.73 63.15 2.73 1.71 62.58 2.72 1.67 61.4Siwan 2.03 1.26 61.78 1.85 1.17 63.32 1.81 1.1 60.8Gopalganj 1.66 1.03 62.31 1.49 0.95 63.94 1.44 0.88 61.1W. Champaran 2.13 1.42 66.89 2.05 1.30 63.24 1.99 1.28 64.3E. Champaran 3.30 2.04 61.70 3.36 2.01 59.81 3.26 1.97 60.4Muzaffarpur 3.15 1.85 58.76 3.00 1.74 57.98 2.98 1.62 54.4Sitamarhi 2.39 1.40 58.76 2.40 1.41 58.92 2.33 1.4 60.1Sheohar 0.44 0.30 67.35 0.47 0.31 65.97 0.51 0.32 62.7Vaishali 2.13 1.09 51.28 2.02 1.06 52.65 1.98 0.99 50.0Darbhanga 2.27 1.37 60.28 2.31 1.40 60.59 2.28 1.34 58.8Madhubani 3.30 1.99 60.22 3.23 1.82 56.29 3.20 1.75 54.7Samastipur 2.85 1.60 56.00 2.69 1.48 55.07 2.50 1.44 57.6Begusarai 2.04 1.22 59.90 1.74 1.14 65.28 1.85 1.13 61.1Munger 0.89 0.50 56.16 0.82 0.48 58.78 0.79 0.46 58.2Sheikhpura 0.44 0.22 49.20 0.39 0.25 64.53 0.39 0.21 53.8Lakhisarai 0.69 0.39 55.81 0.65 0.35 52.81 0.64 0.34 53.1Jamui 1.19 0.70 59.14 1.20 0.72 59.81 1.18 0.69 58.5Khagaria 1.19 0.62 51.96 1.04 0.59 56.89 1.07 0.59 55.1Bhagalpur 1.94 1.13 57.90 1.81 1.10 60.63 1.81 1.07 59.1Banka 1.30 0.72 55.85 1.20 0.72 59.86 1.16 0.69 59.5Saharsa 1.27 0.63 49.56 1.13 0.65 57.50 1.10 0.54 49.1Supaul 1.43 0.71 49.82 1.31 0.69 52.83 1.26 0.63 50.0Madhepura 1.57 0.81 51.58 1.23 0.70 56.91 1.19 0.66 55.5
Purnea 1.97 0.95 48.28 1.85 0.92 50.03 1.84 0.9 48.9Kishanganj 1.06 0.56 52.99 1.05 0.55 52.19 1.06 0.61 57.5Araria 1.44 0.68 47.18 1.31 0.66 49.87 1.30 0.62 47.7Katihar 2.01 0.99 49.56 1.93 0.96 49.80 1.99 0.93 46.7
Bihar 66.27 37.80 57.04 62.84 36.24 57.68 61.58 34.64 56.3Source : Directorate of Mid-Day Meal Scheme, GoB
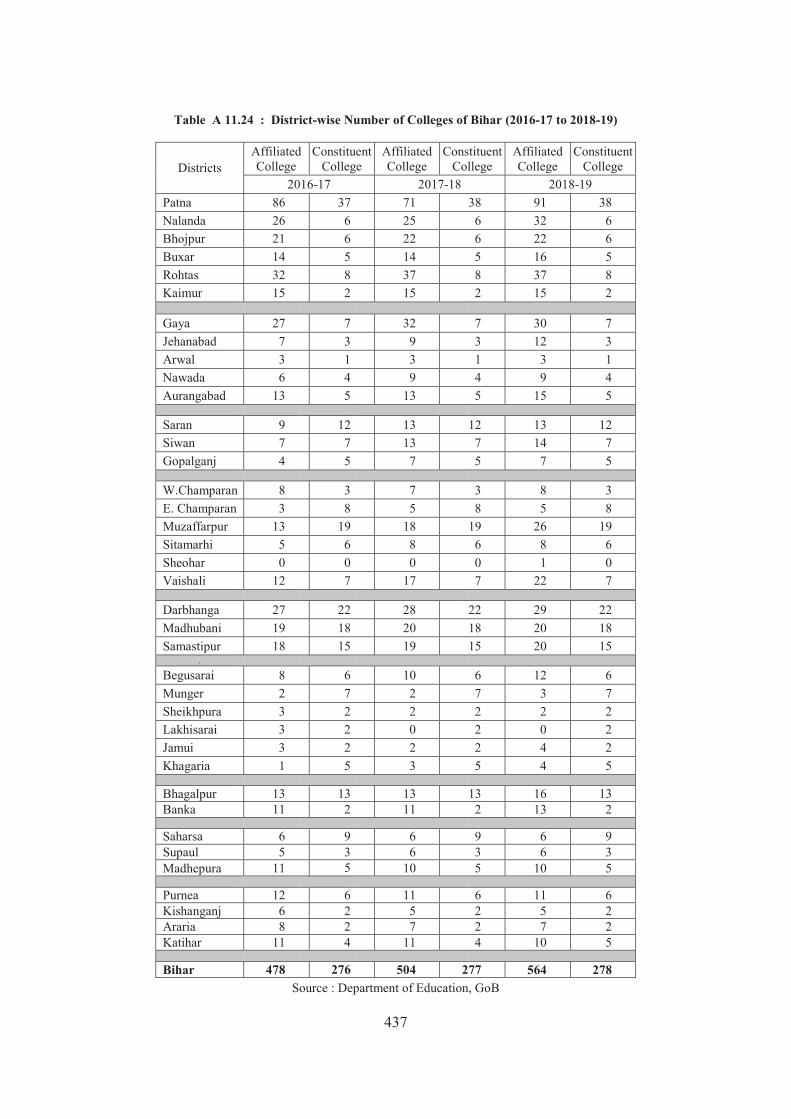
437
Table A 11.24 : District-wise Number of Colleges of Bihar (2016-17 to 2018-19)
DistrictsAffiliated College
Constituent College
Affiliated College
Constituent College
Affiliated College
Constituent College
2016-17 2017-18 2018-19Patna 86 37 71 38 91 38Nalanda 26 6 25 6 32 6Bhojpur 21 6 22 6 22 6Buxar 14 5 14 5 16 5Rohtas 32 8 37 8 37 8Kaimur 15 2 15 2 15 2
Gaya 27 7 32 7 30 7Jehanabad 7 3 9 3 12 3Arwal 3 1 3 1 3 1Nawada 6 4 9 4 9 4Aurangabad 13 5 13 5 15 5
Saran 9 12 13 12 13 12Siwan 7 7 13 7 14 7Gopalganj 4 5 7 5 7 5
W.Champaran 8 3 7 3 8 3E. Champaran 3 8 5 8 5 8Muzaffarpur 13 19 18 19 26 19Sitamarhi 5 6 8 6 8 6Sheohar 0 0 0 0 1 0Vaishali 12 7 17 7 22 7
Darbhanga 27 22 28 22 29 22Madhubani 19 18 20 18 20 18Samastipur 18 15 19 15 20 15
.
Begusarai 8 6 10 6 12 6Munger 2 7 2 7 3 7Sheikhpura 3 2 2 2 2 2Lakhisarai 3 2 0 2 0 2Jamui 3 2 2 2 4 2Khagaria 1 5 3 5 4 5
Bhagalpur 13 13 13 13 16 13Banka 11 2 11 2 13 2
Saharsa 6 9 6 9 6 9Supaul 5 3 6 3 6 3Madhepura 11 5 10 5 10 5
Purnea 12 6 11 6 11 6Kishanganj 6 2 5 2 5 2Araria 8 2 7 2 7 2Katihar 11 4 11 4 10 5
Bihar 478 276 504 277 564 278Source : Department of Education, GoB

438
Table 11.25 : District-wise and Steam-wise Number of Colleges in Bihar up (2018-19)
Districts
Arts Fine Arts,
Social Work,
Science & Commerce
Enginee-ring
Medical (including
Dental)B.Ed Law Others All
Colleges
Patna 50 4 5 47 3 20 129Nalanda 16 2 1 18 0 1 38Bhojpur 16 0 0 10 1 1 28Buxar 11 0 0 5 1 4 21Rohtas 34 1 1 7 1 1 45Kaimur 10 0 0 5 0 2 17
Gaya 11 2 1 20 0 3 37Jehanabad 7 0 0 7 0 1 15Arwal 4 0 0 0 0 0 4Nawada 7 0 0 5 1 0 13Aurangabad 8 1 0 11 0 0 20
Saran 15 1 0 6 0 3 25Siwan 11 1 0 8 0 1 21Gopalganj 7 0 0 3 0 2 12
W. Champaran 7 0 1 1 0 2 11E. Champaran 8 1 1 2 0 1 13Muzaffarpur 21 1 1 16 1 5 45Sitamarhi 9 1 0 3 0 1 14Sheohar 0 0 0 1 0 0 1Vaishali 15 2 0 12 0 0 29
Darbhanga 24 2 3 11 1 10 51Madhubani 22 0 0 6 0 10 38Samastipur 19 0 0 12 1 3 35
Begusarai 8 1 0 6 1 2 18Munger 7 0 0 2 1 0 10Sheikhpura 3 0 0 1 0 0 4Lakhisarai 2 0 0 0 0 0 2Jamui 1 1 0 1 0 3 6Khagaria 4 0 0 3 0 2 9
Bhagalpur 17 1 1 7 1 2 29Banka 6 2 0 6 0 1 15
Saharsa 8 1 0 2 1 3 15Supaul 7 1 0 1 0 0 9Madhepura 7 1 0 2 1 4 15
Purnea 10 3 0 2 1 1 17Kishanganj 5 2 0 0 0 0 7Araria 8 1 0 0 0 0 9Katihar 8 1 2 2 1 1 15
Bihar 433 34 17 251 17 90 842Source : Department of Education, GoB

439
Table A 11.26 : District Level Overview of SC/ST Welfare (2016-17 and 2017-18)
Districts
Stipend given to SC & STFinancial Allotment (Rs. lakh) Physical Achievement (Numbers)
Triennium Average
(2013-14 to 2015-16)
2016-17 2017-18
Triennium Average
(2013-14 to 2015-16)
2016-17 2017-18
Patna 4953.79 5606.15 498.00 228034 162496 2232Nalanda 2550.14 2454.71 110.00 151601 119182 3510Bhojpur 1790.43 2056.51 322.00 118125 80336 2584Buxar 2225.62 2530.08 72.00 79805 60321 510Rohtas 2187.75 2042.85 148.75 129910 135035 3655Kaimur 2275.81 2364.90 143.50 124521 64970 4756
Gaya 5997.12 6077.97 513.00 289426 218571 7527Jehanabad 1076.28 1031.15 120.00 61116 31681 1071Arwal 489.78 540.77 100.00 36281 27779 803Nawada 2442.63 2204.39 167.00 166846 117681 2296Aurangabad 3565.23 2431.86 132.00 270076 11875 3922
Saran 2671.59 2146.85 283.00 156606 131618 2428Siwan 2077.69 1852.09 262.00 104196 86307 970Gopalganj 1752.79 1616.01 152.00 121156 75848 414
W. Champaran 2914.80 3115.43 245.00 245979 144010 1080E. Champaran 2213.60 2151.82 130.00 142204 156058 1839Muzaffarpur 2714.79 2405.99 506.00 179228 160850 2395Sitamarhi 1330.16 1433.31 100.00 103062 97511 2184Sheohar 309.60 361.25 20.00 25550 26708 259Vaishali 2175.44 2054.08 350.00 156505 136421 614
Darbhanga 2123.23 2388.83 130.00 156714 123727 4950Madhubani 2328.07 2491.97 402.00 208065 180184 4750Samastipur 2179.31 1963.26 185.00 166204 140842 3148
Begusarai 1513.20 1721.89 120.00 111128 103188 4189Munger 988.75 1068.54 71.00 50339 39987 880Sheikhpura 546.83 723.45 60.00 32098 15916 770Lakhisarai 696.56 884.49 69.00 49244 28176 526Jamui 1218.54 1510.17 112.00 104444 75500 583Khagaria 762.17 940.90 75.00 50458 36518 462
Bhagalpur 2584.40 3093.34 206.00 138381 82176 1205Banka 1575.81 1816.58 97.00 70505 57199 663
Saharsa 959.87 1203.22 83.00 79790 62555 539Supaul 1241.26 1491.34 52.00 79737 64137 282Madhepura 985.66 771.80 154.00 58385 40097 287
Purnea 1899.13 2140.30 190.00 154029 114546 908Kishanganj 607.19 701.66 72.00 44856 27147 177Araria 894.26 1133.88 72.00 63299 30892 357Katihar 1172.64 1357.21 129.00 94735 42392 1173H.Q 103.43 142
Bihar 74316.99 73881.00 6653.25 4608403 3310437 70898 Source : Department of SC/ST Welfare, GoB (Contd…)

440
Table A 11.26 : District Level Overview of SC/ST Welfare (2015-16 to 2018-19) (Contd.)
Districts
Maintenance of Residential School (SC) Hostel Maintenance (SC)Financial Allotment
(Rs. lakh)Physical Achievement
(Numbers)Amount Allotted
(Rs. lakh)Triennium Average
(2015-16 to 2017-18)
2018-19
Triennium Average
(2015-16 to 2017-18)
2018-19
Triennium Average
(2015-16 to 2017-18)
2018-19
Patna 456.2 739.9 600.7 815.0 102.1 97.2Nalanda 347.7 409.2 793.3 796.0 18.9 36.8Bhojpur 376.6 473.6 746.0 682.0 32.7 29.9Buxar 205.0 194.0 330.0 284.0 13.1 10.3Rohtas 332.3 443.1 779.3 783.0 39.2 34.5Kaimur 338.5 493.3 558.0 474.0 41.1 20.9
Gaya 1348.5 1486.1 3172.0 3232.0 29.3 23.9Jehanabad 163.7 247.6 407.7 346.0 10.2 11.3Arwal 137.5 246.0 359.7 348.0 0.0 0.0Nawada 447.9 579.5 995.0 1000.0 19.8 7.2Aurangabad 135.1 179.7 325.7 378.0 9.0 8.3
Saran 162.2 133.3 317.7 293.0 25.0 26.0Siwan 119.9 164.5 228.7 245.0 40.5 42.0Gopalganj 188.0 325.4 356.3 399.0 25.3 45.8
W. Champaran 305.4 370.0 629.7 656.0 31.2 34.1E. Champaran 139.7 207.1 324.0 350.0 32.9 28.4Muzaffarpur 598.7 619.4 1084.7 1146.0 45.9 57.1Sitamarhi 192.9 210.5 400.0 367.0 32.3 40.1Sheohar 134.0 142.9 180.7 360.0 4.5 2.4Vaishali 197.8 209.6 335.7 288.0 9.5 6.4
Darbhanga 120.9 170.2 219.3 278.0 44.5 38.0Madhubani 482.3 619.7 1028.0 1064.0 11.1 2.4Samastipur 272.1 294.1 706.3 696.0 21.7 15.5
Begusarai 170.6 182.8 346.0 351.0 3.1 2.4Munger 155.9 216.3 319.3 335.0 18.0 16.6Sheikhpura 108.1 144.7 229.3 200.0 2.9 2.4Lakhisarai 110.1 201.4 244.0 305.0 6.8 2.4Jamui 136.0 198.7 242.3 325.0 2.9 7.2Khagaria 166.9 197.3 363.7 371.0 16.5 11.8
Bhagalpur 207.2 236.0 351.0 345.0 45.5 67.5Banka 110.6 139.3 222.3 230.0 11.4 8.3
Saharsa 193.6 271.5 378.0 373.0 25.2 15.7Supaul 109.9 123.2 138.0 153.0 18.2 10.7Madhepura 138.9 280.2 276.3 309.0 19.9 31.5
Purnea 197.3 146.7 394.0 339.0 34.2 17.9Kishanganj 171.7 204.7 352.7 361.0 6.2 11.6Araria 198.7 253.3 330.7 375.0 22.7 19.0Katihar 154.3 185.3 374.7 353.0 24.3 12.9
Bihar 9532.3 11940.0 19440.7 20005.0 897.5 856.6 Source : Department of SC/ST Welfare, GoB (Concluded)
_____________

441
CHAPTER - XII
CHILD DEVELOPMENT
Safety and security don't just happen, they are the result of collective consensus and public investment. We owe our children, the most vulnerable citizens in our society, a life free of violence and fear. — Nelson Mandela
Child development is a component of overall human development. The well-being of children is essential for the country’s development, as children constitute a country’s future human resource. Biologically, childhood is the span of life from birth to adolescence. A major part of the Bihar’s population (4.98 crore) is children, age-group of 0-18 years (2011 census). The physical, social and emotional development of children has direct impact on their overall development. Thus, comprehending the status of children is of immense importance which may be assessed on the basis of four criteria — (i) Survival, Health and Nutrition, (ii) Education and Development, (iii) Protection, and (iv) Participation. To ensure that every child develops well, adequate investment
Abstract
The child development programmes ensure that children do not lose their childhood, because of work, disease, and anguish. For this, the state should safeguard the rights of all children, including those who do not face adverse circumstances. Successful integration of survival, development, protection and participation policies are the core to overall wellbeing of the child. In order to satisfy all these needs, the process of child budgeting was initiated in Bihar in 2013-14. Between 2013-14 and 2018-19, the overall allocation for children has increased at an annual rate of 20.9 percent. Similarly, the expenditure also grew at the rate of 23.3 percent, which was higher than that of allocation. During the same period, the per capita expenditure increased more than three times from Rs. 1225 to Rs. 3727. The share of expenditure on child development in the total state budget lies at around 12 percent, with some year-to-year variation. Likewise, the share of expenditure as percentage of GSDP is around 3 percent. The concerted efforts of the State Government in educational sector has led to the reduction in number of out-of-school children from 2.17 lakh in 2016-17 to 1.44 lakh in 2018-19. The Integrated Child Development Scheme, Poshan Abhiyan and other schemes of the State Government for child development are making substantial impact on the growth and well-being of children in Bihar.

442
in early childhood development is essential. Every child has a basic right to be born in a safe and non-discriminatory environment and to grow through her formative years of life in a healthy and dignified way. However, the adverse sex ratio at birth, child mortality rates and the prevalent attitude towards girl children pose serious challenges in Bihar. Reducing the level of malnutrition and micronutrient deficiency, and increasing enrolment and retention rates in schools are the focused areas in child development in Bihar. In this background, this chapter focuses on the demographic, health, nutrition, education, protection and participation status of children in Bihar. Simultaneously, the Chapter also presents the details of the initiatives taken by the Central and State governments for the welfare of children. 12.1 Demographic Status
Bihar, with a population of 10.4 crore, is the third most populous state in India, behind Uttar Pradesh and Maharashtra. Bihar represents 8.6 percent of the India’s population. In India, 39 percent of the population lies in the age bracket of 0-18 years as per Census 2011; whereas, in Bihar, 48 percent of the population is in that age group. Thus, Bihar accounts for 11 percent of India’s total child population. With 4.47 crore (89.9 percent) rural children and 0.51 crore (10.1 percent) urban children, the total child population of the state adds upto 4.98 crore. In the 0-18 years age group, females account for 47.4 percent (2.36 crore) and males for 52.6 percent (2.62 crore). Between 2001 and 2011, the child population in the age-group 0-18 years in Bihar has
Table 12.1 : Demographic Profile of Children in Bihar and India (2001 and 2011)
(Figures in crore)
India/Bihar
Total India/Bihar
Total
Persons Males Females Persons Males Females
2011 2001
India 0-6
16.45 8.58 7.88 India 0-6
16.38 8.50 7.88
Bihar 1.91 0.99 0.92 Bihar 1.68 0.87 0.82
India 0-14
37.24 19.44 17.81 India 0-14
36.36 18.95 17.41
Bihar 4.17 2.17 2.00 Bihar 3.49 1.83 1.66
India 0-18
47.21 24.75 22.46 India 0-18
45.05 23.65 21.40
Bihar 4.98 2.62 2.36 Bihar 4.14 2.20 1.94
Source : Census 2001 and 2011
increased by 20.3 percent, from 4.14 crore in 2001 to 4.98 crore in 2011. Between 2001 and
2011, the child population in the age group of 0-14 years increased by 19.6 percent. The total
number of children in the age group of 0-6 years in Bihar was 1.91 crore in 2011, compared to

443
1.68 crore in 2001, implying a growth of 13.7 percent. This decreasing growth rate of child
population in the lower age-groups indicates early phase of demographic transition in Bihar. It
may also be mentioned here that the sex ratio is higher for children in the age group 0-6 years,
indicating the efforts of the State Government for promoting gender equality. The distribution of
the child population across different age-groups in different districts of Bihar is presented in
Table A 12.1 (Statistical Appendix).
Children with Special Needs (CWSN)
The disability among the children is a matter of serious concern, as it has wide implications. The
Census 2011 showed that, in Bihar, 8.3 lakhs children aged 0-18 years are disabled, which
constitutes 1.63 percent of all children in that age-group. The percentage of male disabled
children to total male children is 1.80 percent and the corresponding figure for females is 1.44
percent. At all-India level, however, disabled children constituted 1.57 percent of the total child
population. One may also note that, in Bihar, about 90 percent of disabled children are located in
rural areas and only 10 percent are in urban areas, as per Census 2011. Because of higher
urbanisation, the situation is somewhat different at the all-India level, where 76 percent live in
rural areas and 24 percent in urban areas. It is disheartening to note that, between 2001 and 2011,
the increase in the number of disabled children has been higher in the rural areas, in both Bihar
and India.
Table 12.2 : Children with Special Needs (0-19 years) (2001 and 2011)
(in Thousand)
India/Bihar Male/Female 2011 2001
Rural Urban Rural Urban
India Male 3363.63 1054.93 3124.12 1258.01
Female 2508.92 804.72 2466.35 1014.45
Bihar Male 435.00 49.77 459.43 58.61
Female 312.09 36.40 366.28 48.71
Source : Census 2001 and 2011
Child Sex Ratio (CSR)
The Sex Ratio is an important indicator of the status of women, both for children and adults. The Census 2011 data reveals that the child sex ratio is higher than the overall sex ratio in Bihar. The sex ratio in the age group 0 -6 years is 935 females per 1000 males, 923 in age-group 0-14 years age, and 897 in the age-group 0-18 years. For all ages, the ratio is 918. Among the districts,

444
Kishanganj (971), Katihar (961) and Gaya (960) have relatively better child sex ratio in the age group of 0-6 years, in comparison to Vaishali (904), Patna (909) and Muzaffarpur (915) which all have a highly adverse child sex ratio. The child sex ratios among the Scheduled Castes (962) and Scheduled Tribes (969) are better than the state average of 935. In fact, the child sex ratio of SC/ST is higher than the state average in all the districts of Bihar. It is important to note that the child sex ratio in the age group of 0-18 years has increased from 883 females per 1000 males in 2001 to 897 in 2011. The district-wise figures in Table A 12.2 (Statistical Appendix) indicate that the child sex ratio for 0-18 years as per 2011 census was above the state average in 20 districts. Out of all the districts, the highest sex ratio are recorded in — Gopalganj (959), Kishanganj (958) and Siwan (946). At the other end, Munger and Khagaria (861) and Vaishali (865) are districts with the lowest sex ratios. Adolescent Population of Bihar
The adolescents are the young people aged between 10 to 19 years. It is a transitional stage of physiological and psychological development from puberty to legal adulthood. As per Census 2011, adolescent population (10-19 years) in India is 25.32 crore, constituting 20.9 percent of the total population. In Bihar, the adolescent population is 2.34 crore, constituting 22.5 percent of the total population (Table 12.3). From Table 12.2, presenting the share of adolescents in total population in different Empowered Action Group (EAG) states, one can observe that this share is the highest in Uttar Pradesh (24.5 percent), followed by Rajasthan (22.9 percent). This pattern is also observed for both male and female adolescents.
Table 12.3 : Adolescent Population in EAG States of India (2011)
(Population in crore)
State Person Male Female
Bihar 2.34 (22.5) 1.26 (23.2) 1.08 (21.7)
Chhattisgarh 0.55 (21.5) 0.28 (21.8) 0.27 (21.2)
Jharkhand 0.73 (22.1) 0.38 (22.4) 0.35 (21.8)
Odisha 0.83 (19.8) 0.42 (19.8) 0.41 (19.7)
Madhya Pradesh 1.60 (22.0) 0.84 (22.3) 0.76 (21.7)
Rajasthan 1.57 (22.9) 0.83 (23.3) 0.74 (22.4)
Uttar Pradesh 4.89 (24.5) 2.60 (24.9) 2.29 (24.0)
Uttarakhand 0.23 (22.8) 0.12 (23.4) 0.11 (22.2)
India 25.32 (20.9) 13.34 (21.4) 11.98 (20.4)
Source : Census 2011, GoI

445
12.2 Allocation for Children
The budget for children is not a separate budget. It is basically an attempt to desegregate those
allocations which are made to specifically benefit children from the overall allocation. This
enables us to assess how far the policy commitments of the State Government are translated into
financial commitments. Admittedly, children could be benefitted even from those programmes
which are not exclusively meant for them. For example, the benefits of public provisioning of
immunization services are policy-driven and assured for children; in contrast, the benefits that
may accrue to children from a public sector hospital would be incidental. As such, both assured
and incidental benefits from public provisioning are important, and public spending on both
types of interventions, if designed and executed properly, would lead to an improvement in the
wellbeing of children.
The process of Child Budgeting started in Bihar in 2013-14. The document mainly presented the
details of all the schemes related to child welfare. These allocations mainly related to education
and health schemes, the special schemes for girls and child security. Table 12.4 shows that
there has been a constant increase in Child Budget allocation in Bihar during the last six years.
Table 12.4 : Overview of Child Budget (2013-14 to 2018-19)
Year Expenditure (Rs. crore)
Per-Capita Expenditure
(Rs)
Share of Child Budget in
State Budget GSDP
2013-14 6329.66 1225 7.9 2.0
2014-15 10020.6 1904 10.6 2.9
2015-16 14950.63 2788 13.3 4.0
2016-17 16638.47 3046 13.2 3.9
2017-18 17530.24 3151 12.8 3.6
2018-19 19161.93 3727 12.5 3.4
CAGR 23.3 — — —
Note : 1. For PCE, estimated population has been used based on 2001 and 2011 interpolation 2. For 2018-19, expenditure figures are revised estimates (RE)
Source : Child Budget, Department of Finance, GoB

446
Chart 12.1 : Share of Child Budget in State Budget and GSDP (percent)
Between 2013-14 and 2018-19, the overall expenditure for children increased at an annual rate of
23.3 percent, which is indeed commendable. In the same period, the per capita expenditure
increased more than thrice from Rs. 1225 in 2013-14 to Rs. 3727 in 2018-19. The share of
expenditure on child development in the total state budget lies around 12 percent, with some
year-to-year variation. Likewise, the share of expenditure as percentage of GSDP is around 3
percent.
Table 12.5 represents actual expenditure on the wellbeing of the children. From the table, it is
seen that, in the last six years, major contributors for child welfare in the state were Education
and Social Welfare departments. In 2017-18 and 2018-19, the share of Department of Education
was 75.8 and 71.2 percent respectively. For the Department of Social Welfare, these shares were
— 11.3 percent (2017-18) and 13.3 percent (2018-19). From the overall trend, one can easily
conclude that the State Government has been very responsive to the child welfare in the state.
However, in view of relatively lower level of child development in Bihar, there is a need to do
even more.
0
2
4
6
8
10
12
14
2013-14 2014-15 2015-16 2016-17 2017-18 2018-19
7.9
10.6
13.3 13.2 12.8 12.5
2.02.9
4.0 3.9 3.6 3.4
Share in State Budget Share in GSDP

447
Table 12.5 : Department-wise Expenditure on Child Budget (2013-14 to 2018-19)
DepartmentsActual Expenditure (in Rs. crore)
2013-14 2014-15 2015-16 2016-17 2017-18 2018-19
Art, Culture and Youth 2.95(0.05)
1.46(0.01)
5.40(0.04)
9.31(0.06)
6.96 (0.04)
12.00 (0.06)
BC and EBC Welfare 1191.15 (18.8)
1167.48 (11.6)
2234.76 (15.0)
1440.25(8.7)
1257.31 (7.6)
1630.19 (8.5)
Education 3068.07 (48.5)
5943.21 (59.3)
9299.24(62.2)
10091.94 (60.6)
12511.44 (75.8)
13642.02 (71.2)
Social Welfare 1475.29 (23.3)
1509.2(15.1)
1935.30(12.9)
1886.59(11.3)
2194.46 (13.3)
2861.62 (14.9)
Labour Resource 1.09(0.02)
1.06(0.01)
1.77(0.01)
0.88(0.01)
1.88 (0.01)
7.96 (0.04)
SC/ST Welfare 588.04(9.3)
610.55(6.1)
1136.41(7.6)
1870.97(11.2)
441.11 (2.7)
768.87 (4.0)
Health - 755.36(7.5)
329.31(2.2)
1218.91(7.3)
62.11 (0.4)
203.27 (1.1)
Minority Welfare 3.08(0.05)
32.29(0.32)
8.44(0.06)
119.62(0.72)
42.47 (0.26)
36(0.19)
Total 6329.66(100.0)
10020.6(100.0)
14950.63(100.0)
16638.47(100.0)
16517.74 (100.0)
19161.93 (100.0)
Note : 1. Figures in parenthesis denote percentage 2. For 2018-19, expenditure figures are revised estimates (RE)
Source : Child Budget, Department of Finance, GoB
12.3 Survival, Health and Nutrition Status
The Indian Constitution via Article 39 (f) directs the state to ensure that children are given
opportunities and facilities to develop in a healthy manner with freedom and dignity. Along with
this, the Constitution also tries to ensure that the child and youth are protected against
exploitation, and physical and moral abandonment. Factors like reduced spending on social
sectors, escalating impact of climate change, deteriorating social phenomena like discrimination
based on gender and caste, and the rural-urban bias together have contributed most to the
worsening child vulnerabilities. Child health is fundamental to building the capabilities of the
future of a growing nation. It is a great social responsibility in which the state has to play a
critical role. Child undernutrition has both short and long term negative effects. The short term
effects include morbidity and mortality and the long-term effects include preventing children
from reaching their full developmental potential and poor cognitive performance. Nutrition has
increasingly been recognized as a basic pillar for the survival and development from the early
stages of foetal development. Under-nutrition adversely affects human life and is particularly
harmful in the early stages of life. In this perception, there is a growing recognition that
supporting children in their early years is essential for their future development. To address these
issues, the present section deals with nutritional issues among the children. The indicators
relevant to evaluate the health status of children below five years are — Infant Mortality Rate

448
(IMR), Under Five Mortality Rate (U5MR), Neo-Natal Mortality Rate (NMR), Peri-Natal
Mortality Rate (PMR), and Immunisation. These indicators have already been analysed in
Chapter 11 under Human Development. Along with these, other parameters to assess the health
and nutrition of a children are — children under 5 years of age who are stunted (height-for-age),
wasted (weight-for-height) and underweight (weight-for-age).
Stunting (height-for-age)
The stunted growth of children reflects failure to receive adequate nutrition over a long period of
time. The indicator Height-for-age, therefore, represents the long-term effects of malnutrition
and not just recent dietary intake. In Bihar, NFHS-4 (2015-16) estimates that 48.3 percent of
children under 5 years are stunted (too short for their age), which signifies chronic under-
nutrition (Table 12.6). The prevalence of stunting in the state has, however, decreased from 56
percent in 2005-06 to 48.3 percent in 2015-16. The stunting is observed to be 9.5 percentage
points higher among the children in rural areas (49.3 percent), compared to urban areas (39.8
percent). For the country as a whole, the decline in stunting between 2005-06 and 2015-16 was
to the extent of 9.6 percentage points. Among the districts of Bihar, the prevalence of stunting is
the highest in Sitamarhi (57.3 percent) and Nalanda (54.1 percent), and the lowest in Gopalganj
(35.6 percent) and Siwan (37.9 percent).
Table 12.6 : Percentage of Children suffering from malnutrition in Bihar and India (2005-06 and 2015-16)
Bihar/India Stunted Wasted Under-weight
2015-16
Bihar 48.3 20.8 43.9
India 38.4 21.0 35.7
2005-06
Bihar 55.6 27.1 55.9
India 48.0 19.8 42.5
Source : NFHS 3 and 4,GoI
Wasting (weight-for-height)
The weight-for-height index measures body mass in relation to body length and reflects the
current nutritional status. Children who are critically below the median of the reference
population are considered thin (wasted) for their height, which is a consequence of
malnourishment. This critical level for ‘wasted’ children is decided by a statistical measure —

449
median minus twice the standard deviation. Children whose weight-for-height is below the
median of the reference population minus thrice the standard deviation are considered to be
‘severely’ wasted. Wasting may result from inadequate food intake or from a recent episode of
illness, causing weight loss. As per NFHS-4 survey (2015-16), 20.8 percent of children under 5
years of age in the state are wasted (too thin for their height), which signify acute under-
nutrition. The prevalence of wasting has registered a decrease of 6.3 percentage points between
2005-06 (27.1 percent) and 2015-16 (20.8 percent). Unlike stunting, wasting is recorded more in
urban areas (21.3 percent) than in the rural areas (20.8 percent). Unfortunately, for India, there is
an increase of 1.2 percentage points in the prevalence of wasting between 2005-06 and 2015-16
(Table 12.6). Among the districts, Arwal (30.7 percent), Jamui (29.4 percent) and Sheikhpura
(28.9 percent) are worst performing districts. Contrary to this, Sheohar (14.8 percent), Siwan
(15.0 percent) and Vaishali (15.1 percent) record the lowest level of wasting.
Underweight (weight-for-age)
Weight-for-age is a composite index of height-for-age and weight-for-height. It takes into
account both acute and chronic malnutrition. Children whose weight-for-age is below the median
of the reference population minus twice the standard deviation, are classified as underweight.
Similarly, children whose weight-for-age is below the median of the reference population minus
thrice the standard deviation are considered to be severely underweight. As per NFHS-4 results,
about 43.9 percent of children under 5 years are underweight in Bihar. Between 2005-06 and
2015-16, there is a reduction of 12.0 percentage points, which is really impressive. It is also
found that there is a difference of 7.1 percentage points between rural and urban areas, standing
at 44.6 percent and 37.5 percent respectively. For all India, the prevalence of underweight
reduced by 6.8 percentage points between 2005-06 (42.5 percent) and 2015-16 (35.7 percent)
(Table 12.6). Among the 38 districts, Arwal records the highest share of underweight children at
54.0 percent, followed by Gaya (53.1 percent) and Sheikhpura (51.7 percent). Opposite to this,
Gopalganj (30.5 percent), Siwan (31.6 percent) and West Champaran/ Begusarai (39.1 percent)
were the districts with the lowest ratio of underweight children. The district-wise details of
Stunted, Wasted and Underweight children are given in Table A 12.3 (Statistical Appendix).
12.4 Development Programme for Children
The children in the age group 0-6 years number around 19.1 million in Bihar, accounting for
18.3 percent of state’s total population (2011 census). Since the progress of the nation depends
substantially on the welfare of the children, both the Central and State Governments are

450
administering a number of development programmes for children. The details of the child related
programmes are discussed below.
Integrated Child Development Scheme (ICDS)
The flagship scheme of the Central Government (ICDS) was launched on October 2, 1975, as a
corrective intervention for young children in the age group 0-6 years, and also for the expectant
and nursing mothers. It aims at long term improvement in childcare, their early stimulation and
learning, as well as health and nutrition. The ICDS scheme was initially launched in pursuance
of the National Policy for Children in 33 experimental blocks in the country, of which 3 blocks
were in Bihar. In order to address various programmatic, management and institutional gaps and
to meet administrative and operational challenges, the Government approved the strengthening
and restructuring of ICDS Scheme as an Umbrella Integrated Child Development Services
Scheme. The Anganwadi Services Scheme (ASS) is one of the flagship programmes under
ICDS, which represents the largest and unique programme for early childhood care and
development. It is the foremost symbol of the country’s commitment to its children and nursing mothers, as a response to the challenge of providing pre-school non-formal education on the one
hand and breaking the vicious cycle of malnutrition, morbidity, reduced learning capacity and
mortality on the other. The main beneficiaries of the scheme are children in the age group of 6
months to 6 years. Along with this, pregnant women, lactating women, nursing child (upto 6
months) and adolescent girls (11-14 years) who are not going to school are also benefitted
through this scheme. The ICDS provides a package of six services under ASS, which are — (i)
supplementary nutrition, (ii) non-formal pre-school education (for children between the age of 3-
6 years), (iii) nutrition and health education for mothers, (iv) immunization, (v) health check-up
and (vi) referral services. Three of the six services (Immunisation, Health check-up and Referral
Services) are related to health and are provided through National Rural Health Mission (NRHM)
and Public Health Infrastructure. The target group of ICDS is reached through Anganwadi
Centers (AWC). The staffs for ICDS include Child Development Project Officer (CDPO), Lady
Supervisors (LS), Anganwadi Workers (AWW) and Anganwadi Helpers (AWH).
At present, ICDS is running in all the 38 districts of Bihar through 544 project offices. The Directorate of ICDS has started operationalizing 23,041 more newly sanctioned AWCs from 2017-18. These 23,041 AWCs were sanctioned for Bihar by the Union Ministry of Women and Child Development (MWCD) in 2015-16. The process of implementation of these newly

451
sanctioned centres has been initiated, based on demand raised by CDPOs. Till date, all 544 ICDS projects are running through 1,07,603 AWCs and additional AWCs, and 7115 Mini AWCs. As ICDS is primarily a service-based programme, its staffing pattern is extremely vital for its achievement. In all, 1.07 lakh AWCs have been established to cater to 19.1 million children (0-6 years) and 60.3 lakh pregnant and lactating women. Compared to 2013-14, there has been an increase in the number of Anganwadi Workers and Anganwadi Helpers in 2018-19; but there is a decrease in the number of CDPOs and Lady Supervisors. Similar is the trend in 2017-18, when there has been an increase in the number of Anganwadi Workers and Anganwadi Helpers and decrease in the number of CDPOs and Lady Supervisors. According to Table 12.7, the vacancy ratios in 2018-19 were — CDPO (28.3 percent), Lady Supervisors (29.0 percent), Anganwadi Workers (15.1 percent) and Anganwadi Helpers (18.2 percent).
Table 12.7 : Staffing Position in ICDS (2013-14 to 2018-19)
Year Posts CDPO Lady Supervisor
Anganwadi Worker
Anganwadi Helper
No. of Sanctioned Posts 544 3288 91677 86237
2013-14 Working 504 2859 82177 78076 Percentage of Vacant Post 7.4 13.0 10.4 9.5
No. of Sanctioned Posts 544 3288 91677 86237
2014-15 Working 458 2499 85936 80176 Percentage of Vacant Post 15.8 24.0 6.3 7.0
No. of Sanctioned Posts 544 3288 91677 86237
2015-16 Working 458 2499 85944 80178 Percentage of Vacant Post 15.8 24.0 6.3 7.1
No. of Sanctioned Posts 544 3288 114718 107603
2016-17 Working 442 2427 86800 80373 Percentage of Vacant Post 18.7 26.2 24.3 25.3
No. of Sanctioned Posts 544 4210 114718 107603
2017-18 Working 442 2349 87287 80357 Percentage of Vacant Post 18.8 44.2 23.9 25.3
No. of Sanctioned Posts 544 4210 114718 107603
2018-19 Working 390 2237 97347 88036 Percentage of Vacant Post 28.3 29.0 15.1 18.2
Source : Directorate of ICDS, GoB

452
The budget provision for ICDS in 2018-19 was Rs. 1213.9 crore, which was 22.8 percent higher than Rs. 988.7 crore in 2017-18. Moreover, the funds released by the Central Government in 2017-18 and 2018-19 were more than the budgetary amount. One may also note that, in 2018-19, 92 percent of the fund released has been utilized, which reflects the judicious management of funds by the State Government. The details of the contribution of Central and State Government for ICDS in the last six years are given in Table 12.8.
Table 12.8 : Resource Utilisation in ICDS (2013-14 to 2018-19)
Year Budget for ICDS Bihar (Rs. crore)
Funds Released by
GoI (Rs. crore)
Expenditure (Rs. crore)
Fund Released as Percentage of Budget
Expenditure as
Percentage of Fund Released
2013-14 1714.3 1153.5 1310.1 67.3 113.6
2014-15 2238.3 1281.5 1236.4 57.3 96.5
2015-16 1409.7 1062.2 983.4 75.3 92.6
2016-17 1494.1 987.3 893.5 66.1 90.5
2017-18 988.7 1075.2 940.4 108.7 87.5
2018-19 1213.9 1329.5 1119.9 84.7 92.2
Source : Directorate of ICDS, GoB
Scheme for Adolescent Girls (SAG)
Adolescence is a vital phase in the life of a woman. This stage is intermediary between
childhood and adulthood and is the most important stage for mental, emotional and
psychological well-being of the adolescent girls. The life-cycle approach for complete child
development remains unaddressed, if adolescent girls are excluded from the developmental
programmes aimed at human resource development. To address the needs of adolescent girls,
Rajiv Gandhi Scheme for Empowerment of Adolescent Girls (RGSEAG) or SABLA was
launched in November, 2010, as a comprehensive intervention for adolescent girls in the age
group of 11-19 years, with a special focus on out-of-school girls in 12 districts of Bihar. The
scheme has now been scaled up to all the districts using existing Anganwadi Centres (AWCs)
under ICDS with effect from April, 2018. It has now been renamed as Scheme for Adolescent
Girls (SAG). The new scheme is also meant for girls of 11-14 years who are not going to school.
With expansion of the scheme to all the districts of the country, the erstwhile Kishori Shakti
Yojana (KSY) has been phased out. The key objective of the scheme is to facilitate, educate and
empower adolescent girls so as to enable them to become self-reliant and well-aware citizens.

453
The scheme has a provision of funds from both Central and State Governments in the ratio of
50:50 for the nutritional component and 60:40 for non-nutritional component. At AWCs,
supplementary nutrition of 600 kcal and 18-20 gms of protein (including micronutrient) are
being provided as Take Home Ration to adolescent girls under this scheme. Further, Take-
Home-Rations are being provided once in a month for 25 days costing Rs. 9.50 per day. In
addition, out-of-school adolescent girls are also being provided other services, which include life
skill education. The Rapid Reporting System (RRS), a web-based online monitoring of SAG was
launched in January, 2018. The RRS facilitates the monitoring of the scheme and taking
corrective measures by ensuring faster flow of information, accurate targeting of the
beneficiaries and reduction of leakages in the scheme. In 2018-19, a sum of Rs. 12.71 crore was
spent for SAG, out of which Rs 6.86 crore was the central share and Rs. 5.85 crore the state
share.
Pradhan Mantri Matri Vandana Yojana (PMMVY)
PMMVY, earlier known as Maternity Benefit Scheme (MBS) or Indira Gandhi Matritva Sahyog
Yojana (IGMSY), is a Centrally Sponsored Scheme under which the cost sharing ratio between
the Central and State Government is 60:40. Under the scheme, maternity benefit of Rs. 5000 is
provided in three instalments to eligible pregnant woman and lactating mother during the period
of pregnancy and lactation. The first installment of Rs. 1000 is paid on early registration of
pregnancy, within three months of last menstruation period (LMP); the second installment of Rs.
2000 is paid after six months of pregnancy and attending at least one ANC (Ante Natal Check-
up); and finally, the third installment of Rs. 2000 is paid after delivery and completion of first
round of child immunization. The eligible beneficiary also receives the cash incentive of Rs.
1000 towards maternity benefit under Janani Suraksha Yojana (JSY), subject to institutional
delivery, so that a woman gets Rs. 6000 in total. In 2018-19, about Rs. 78.22 crore was spent
under this scheme in the state.
National Nutrition Mission (NNM)
The Central Government has set-up the POSHAN Abhiyaan (National Nutrition Mission) which
was launched on March 8, 2018 from Jhunjhunu in Rajasthan. With an overall budget of Rs.
9,046.17 crore (50 percent from the Central Government and 50 percent from International Bank
for Reconstruction and Development-IBRD), the programme endeavours to reduce the level of

454
stunting, under-nutrition, anaemia and low birth weight of children. The programme has a focus
on adolescent girls, pregnant women and lactating mothers, thus holistically addressing the
challenge of malnutrition. Further, it aims to ensure service delivery by use of technology, and
behavioural change through convergence. Further, it also lays down specific targets to be
achieved across different monitoring parameters. To ensure a holistic approach, all the 36 states
and Union Territories are to be covered under this programme in a phased manner over a three
year period (2017-18 to 2019-20). Altogether 315 districts were covered in 2017-18, another 268
districts in 2018-19 and the remaining 235 districts will be covered in 2019-20. More than 10
crore women will be benefitted under this programme. The Mission targets to annually reduce
stunting (by 2 percent), anaemia among young children, women and adolescent girls (by 3
percent), under nutrition (by 2 percent) and low birth weight (by 2 percent).
National Creche Scheme (NCS)
The National Creche Scheme (NCS) is being implemented as a Centrally Sponsored Scheme by
the states with effect from January, 2017 to provide daycare facilities to the children of working
mothers and other deserving women. The main features of the scheme are — (i) Daycare
facilities to the children in the age group of 6 months to 6 years of working women who are
employed for a minimum period of 15 days in a month or 6 months in a year, (ii) Facilities to be
provided to 25 children in each crèche, (iii) Daycare facilities would include sleeping facilities,
supplementary nutrition, health care inputs (immunisation, basic health monitoring and
emergency medicines), early stimulation for children below 3 years, and pre-school education for
3-6 years old children, (iv) Crèche may charge families an amount of Rs. 20 per child per month
for BPL families, Rs. 100 per child per month for families with income (both parents) upto Rs.
12,000 per month and Rs. 200 per child per month for families with income (both parents) above
Rs. 12,000 per month. This will ensure better participation of the community and also increase
the resources, which can be utilized for welfare of children and upgradation of crèche facilities.
During 2019-20, an amount of Rs. 60.00 lakh as Central share and Rs. 30.00 lakh as State share
have been earmarked for the scheme.
12.5 Drinking Water and Sanitation
The schools with adequate water, sanitation and hygiene facilities provide better environment for
students and teachers. Such facilities should cater to all, including small children, girls of

455
menstruation age, and children with disabilities. Table 12.9 reveals that the percentage of
elementary schools with drinking water facility has increased from 93.0 percent in 2011-12 to
99.0 percent in 2016-17. In 2011-12, the percentage of schools with boy’s toilets was 70.3
percent; the corresponding figure for girl’s toilet was lower at 52.2 percent. It is remarkable to
note that the number of schools having toilet facility for boys had increased from 70.3 percent in
2011-12 to 97.8 percent in 2016-17. Similarly, there was remarkable increase in percentage of
schools having girl’s toilets, which increased from 52.2 percent in 2011-12 to 94.0 percent in
2016-17. The benefits of improved sanitation infrastructure, however, depends on availability of
soap and water for handwash and on a latrine’s general maintenance.
Table 12.9 : Drinking Water and Sanitation Facilities in Elementary Schools of Bihar ( in percent) (2011-12 to 2016-17)
Facility Indicators 2011-12 2012-13 2013-14 2014-15 2015-16 2016-17
Schools with Drinking Water 93.0 93.5 92.3 92.5 98.8 99.0
Schools with Boys' Toilet 70.3 71.5 80.1 79.8 95.1 97.8
Schools with Girls' Toilet 52.2 76.8 70.2 71.2 96.4 94.0
Source : DISE, GoI
12.6 Educational and Development Status
Education is a fundamedntal requirement for a democracy. In the broader sense, education is not limited to a classroom or school only. It is considered to be a lifelong process, where all the experiences, knowledge and wisdom that an individual acquires at different stages of life through different channels (formal, informal and incidental) are part of education. Moving on these lines, Sustainable Development Goal 4 (SDG4) seeks to ensure inclusive and quality education and promote lifelong learning opportunities for all by 2030. Five of the seven targets of SDG4 focus on quality education and learning outcomes. The Indian education system can be divided into three main categories: Elementary Education, Secondary Education and Higher Education, based on the age of students enrolled. These categories have been discussed in detail in Chapter 11 on Human Development. The present section describes about pre-school education and out of school children. Literacy Rates
The literacy and level of education are basic indicators of development. The literacy rate of
population is defined as ‘the percentage of literates to the total population aged 7 years and

456
above’. As per 2011 census, the literacy rate in Bihar stood at 61.8 percent. However, female
literacy rate has been much lower at 51.5 percent, compared to the male literacy rate (71.2
percent) in Bihar. It is certainly commendable that the increase in literacy rate is reasonably
higher in case of females in all age groups and thus, the gender gap in literacy rate is gradually
decreasing over the years. This gap came down from 26.6 percent in 2001 to 19.7 percent in
2011. The overall literacy rate among the children (age-group 7-18 years) stood at 79.1 percent.
The gender gap observed between male (81.7 percent) and female (76.2 percent) for this age
group is 5.5 percentage points in 2011 (Table 12.10).
Table 12.10 : Percentage of Literates by Age and Sex in Bihar (2001 and 2011)
Years Age Group 7-9 10-14 07-18 7 and
above
2001
Person 46.0 60.0 56.1 47.0
Male 51.4 67.5 63.5 59.7
Female 39.9 51.2 47.4 33.1
2011
Person 73.2 83.3 79.1 61.8
Male 75.2 85.5 81.7 71.2
Female 71.1 80.9 76.2 51.5
Source : Census 2001 and 2011
Pre-School Education (PSE)
Early childhood is defined as the period from birth to eight years of age, a period of rapid
development of the brain and the years in which lifelong development of the child is rooted. The
concept of Early Childhood Care and Education (ECCE) addresses a child’s need for care,
education, nutrition and health holistically, in consonance with a life cycle approach. It gives
emphasis on developing the whole child, attending to his or her physical, social, emotional and
cognitive needs. This establishes a solid and broad foundation for lifelong learning and
wellbeing. The learning begins at birth and, as such, the very first goal to be achieved under
‘Education for All’ is ECCE. This has been included as a constitutional provision, which directs
the states to provide ECCE to all the children till they are six years old. The ECCE services may
be delivered through public, private or non-governmental channels. In the public sector,
Integrated Child Development Scheme (ICDS) is the largest flagship programme imparting
ECCE. As per Rapid Survey on Children, 2013-14, conducted by the Ministry of Women and
Child Development in Bihar, 49.5 percent of the children aged 3-6 years were attending pre-

457
schools under ICDS, 10.4 percent were attending privately run pre-schools and a little more than
one-third (35.2 percent) were not attending any pre-school. This sample size for the survey was
1.05 lakh households and 5630 AWCs. It is remarkable that, compared to 31.4 percent of
children in urban areas, 51.8 percent were attending the pre-schools in rural areas. The study
further reveals that about 93.3 percent of AWCs conducted PSE (Pre-School Education) sessions
for 16 or more days in one calendar month. However, only 34.1 percent boys and 37.4 percent
girls aged 36-71 months attended PSE for 16 or more days in one calendar month. Though the
coverage of ICDS programme in Bihar is extensive, there is a need to evaluate how the pre-
school education component is implemented by AWCs and also the factors responsible for some
children being deprived of this facility.
Out of School Children (OOSC)
Envisioning the objective of Sarva Shiksha Abhiyan (SSA) of universalizing elementary
education, it becomes imperative that all out-of-school children (OOSC) are brought into the
sphere of elementary education. There has been substantial improvement in the coverage of
elementary education in Bihar in terms of increased enrolment in the last decade. To assess the
actual burden of out-of-school children, Habitation Mapping has been carried out in the state
which collected information regarding presence of primary and upper primary schooling facility
as per State Right To Education norms. Out of a total of 1,12,067 habitations, 1,08,747 (97.0
percent) are served by government or government aided primary schools, 3320 habitations (3.0
percent) are without primary schools, out of which 1524 habitations are eligible for setting up
new primary schools as per the state norms. However, 1796 habitations still remain unserved and
331 children are out-of-schools. At the upper primary level, 1,10,020 habitations (98.2 percent)
are served by government or government aided upper primary schools, 2035 habitations (1.8
percent) are without upper primary school, out of which 967 habitations are found eligible for
construction of new upper primary schools. Further, there are 1068 unserved and ineligible
habitations, in which 13934 children are attending nearby schools and 192 children are out of
school.
In 2018-19, a total of 1.44 lakh OOSC in the age group of 6-13 years have been mainstreamed
through different interventions. Out of these, 29.4 percent were SC, 13.8 percent were minority
and only 3.0 percent were ST. The decrease in the number of total out-of-school children from

458
2.17 lakh in 2016-17 to 1.44 lakh in 2018-19 is the result of focused approach of the State
Government (Table 12.11).
Table 12.11 : Number of Out of School Children in Bihar (2016-17 to 2018-19)
2018-19
Category 6-10 years 11-13 years
Boys Girls Total Boys Girls Total
ALL 51792 47966 99758 24402 19418 43820
SC 14442 13293 27735 7988 6568 14556
ST 1166 976 2142 1149 991 2140
Minority 6887 6269 13156 3679 3029 6708
2017-18
Category 6-10 years 11-13 years
Boys Girls Total Boys Girls Total
ALL 64607 59138 123745 36562 31346 67908
SC 18053 16634 34687 10821 9789 20610
ST 1278 1249 2527 1293 1245 2538
Minority 12572 11280 23852 7850 7059 14909
2016-17
Category 6-10 years 11-13 years
Boys Girls Total Boys Girls Total
ALL 76030 71758 147788 37256 31792 69048
SC 20393 19151 39544 11728 9873 21601
ST 1010 1042 2052 1247 1209 2456
Minority 15753 14872 30625 7359 6586 13945
Source : Bihar Education Project
The State Government has taken several initiatives to ensure that OOSC are brought within the
mainstream of formal education. Some of these are :
Residential Schools/Hostels : Presently, 4 sanctioned residential schools are functional, 2 of
them are in urban Patna and 2 in Jamui. The enrolment in hostels is 396, against the sanctioned
number of 400. The hostels are being managed by Vidyalaya Shiksha Samiti (VSS) under the
supervision of district level offices of SSA.

459
Residential Special Training : A total of 11,845 OOSC have been covered under residential
special training against the target of 18,444, depending upon their age, social category and
competence. A set of different bridge books and workbooks have been designed with the name
of ‘Koshish’. These books have been earmarked for different types of target group children.
Non-Residential Special Training : About 59,498 OOSC have been covered under non-
residential special training.
Worksite Centre for Migrant Children : The children of migratory families, like families of
brick kiln workers and stone crushers, either from the different locations of the districts of Bihar
or from other states (West Bengal, Assam and Jharkhand) make a sizeable number. In 2017-18, a
total of 1050 migratory children were enrolled at 51 worksite centres.
Teaching-Learning Materials for Special Training : The materials for special training have
been developed by the State Government, with support from State Council of Education
Research and Training (SCERT), Patna. The organisations involved in the development of study
materials are — Bihar Education Project Council (BEPC), Vidya Bhawan Society, Mamidipudi
Venkatarangaiya (MV) Foundation and Pratham Foundation. Some education experts and
teachers were also involved.
Survey of OOSC : In order to maintain a Balpanji Register (Child Register) in every school, the
survey of children in the age-group 0-14 years (including OOSC) has been carried out across all
schools of the state. The data of OOSC have been computerised and the districts are using
Balpanji data for formulation of any policy related to children.
Muhim : A programme for controlling drop-outs with support of various stakeholders and peer
groups has been initiated. Some NGOs have united with other reputed NGOs and BEP to
provide special training to these OOSC.
12.7 Status of Child Protection
The child protection is about keeping children safe from an actual risk or perceived risk to their
lives or childhood. It is a collective responsibility to protect children from abuse or neglect,
prevent impairment of their health and development, and to ensure their overall growth. The
460
development, care and protection of children need to be ensured by facilitating their access to
learning, nutrition, and all required institutional support.
The practice of child labour prevents children from exercising their rights to development, proper
standards of living and protection from abuse and neglect. As per Census 2011, Bihar has the
highest proportion of child population (48 percent) among all states of India and the second
highest number of child workers. There are as many as 19 districts in the state that have a child
labour population in excess of 1.00 lakh. These districts are — Araria, Bhagalpur, Bhojpur,
Darbhanga, Gaya, Katihar, Madhubani, Muzaffarpur, Nalanda, Nawada, West Champaran, East
Champaran, Patna, Samastipur, Saran, Sitamarhi, Siwan and Vaishali. It is estimated that more
than a third of all child labourers in Bihar are employed in agriculture and allied sectors. In rural
areas, children take a major load of agricultural works, including weeding and sowing, which
adversely affect their attendance in schools during agricultural seasons. Under extreme economic
distress, children are forced to forego educational opportunities and take up work. The absence
of effective implementation of Child Labour Prohibition and Regulation Act often results in
children being employed in exploitative jobs under very poor work conditions. Improving the
quality of education and making special training as well as making bridge course available for
child workers are the key focus areas of the State Government to ensure that child labourers join
the schools.
Integrated Child Protection Scheme (ICPS)
In 2009-10, the Ministry of Women and Child Development of the Central Government had
introduced the Integrated Child Protection Scheme (ICPS) with the objective of creating a safe
and secured environment for children in distress. The flagship scheme aims at improving the
wellbeing of children in difficult circumstances, as also reducing their vulnerabilities to
situations and actions that lead to abuse, exploitation, abandonment and separation of children
from their families. The State Government has signed an MOU with the Union Ministry of
Women and Child Development in April 2010 for implementation of ICPS in the state.
Subsequently, the State Government has constituted the State Child Protection Society (SCPS), a
state-level body to implement, coordinate and monitor the implementation of the scheme. The
SCPS comes under the Directorate of Social Welfare of the State Government.
Under ICPS, financial assistance is provided by the State Governments for children, including
those in the 18-21 years age-group, to help them during their transition to independent life. The
461
services include housing facilities, vocational training, help to gain employment, counselling,
and stipend. The financial norms under ICPS were revised with effect from April, 2014. The key
features of the revised scheme included increased maintenance grant for children in protection
homes, from Rs. 750 to Rs. 2000 per child per month. This has been further enhanced to Rs.
2160 per child per month with effect from November, 2017. The expenditure on Juvenile Law
Council and Child Welfare Society under this scheme is borne by the Central and State
Governments in the ratio of 35:65. Apart from this, for other programmes run by the State
Government under ICPS, the cost is shared between the Central and the State Government in the
ratio of 60:40. For children stay homes run by non-government organisations (NGO), the
expenditure share of the three institutions are : centre (60 percent), State (30 percent) and NGO
(10 percent).
State Adoption Resource Authority
The State Adoption Resource Authority functions as the executive arm of the State Government
for promotion, facilitation, monitoring and regulation of the child adoption programme in the
state. The agency helps the orphans who got separated from their parents in getting new parents,
either national or international, through an adoption policy. This agency establishes co-
ordination between the Central and State Governments and helps in monitoring different
adoption agencies located in various districts. Adoption is carried out through 21 Specialised
Adoption Agencies running under ICPS. In the recent past, 100 children were unified with their
families in 2015-16, 90 children in 2016-17, and 164 children in 2017-18.
Children’s Home
Presently, 33 Children’s Homes are functioning in different districts of the state to support and
rehabilitate destitute, abandoned and orphaned children. Out of these 33 homes, 22 are meant for
boys and 11 for girls. Till date, a total of 6540 children have been provided with residential
facilities in different Children’s Homes.
Parvarish
Parvarish is an ambitious scheme of the State Government under which there is a provision of an
allowance of Rs. 900 per month for children in the age group 0-6 years and Rs. 1000 per month
for children in the age group 6-18 years to facilitate their upbringing. This scheme has been
revised now to include those children who are homeless, orphan or living with their relatives.

462
Also, children or their parents suffering from HIV, leprosy and cancer are covered under this
scheme. The provision of Rs. 1000 has also been extended to all children, including those who
are in the age group of 0-18 years. This is a state scheme and 15,461 children have been provided
protection from destitution and extreme vulnerability so far under the scheme. Along with this,
Child Friendly Courts are also being established by the Department of Social Welfare to provide
a safe and secured environment to the children, who are victims of sexual abuse and whose cases
are being heard under the provisions of the Protection of Children from Sexual Offences
(POCSO) Act, 2012.
Bihar Prohibition of Child Marriage Rule, 2010
According to the Prohibition of Child Marriage Rule 2010, marriage of a girl below 18 years and
a boy below 21 years is considered a ‘child marriage’, which is a cognizable offence. While the
child marriage has a long term negative consequences, both for boys and girls, its adverse effects
are more on girls. This includes early pregnancy, maternal and neonatal mortality, educational
setbacks, lower employment prospects, and exposure to violence and abuse. All these lead to
negative physical and psychological outcomes for children.
According to NFHS data, the prevalence of child marriage in Bihar amongst girls in the age
group of 15-19 years was 25.0 percent in 2005-06 (NFHS-III) and 12.2 percent in 2015-16
(NFHS-IV), registering a substantial decline of 12.8 percentage points. The child marriage
frequency in rural and urban Bihar is 12.8 percent and 8.3 percent, respectively. The trend of
data clearly indicates that the State Government’s efforts towards prevention of child marriage
through different welfare programmes are yielding positive results.
12.8 Status of Child Participation
The voice of children in decision-making in all situations, whether formal or informal, should be
ensured. It will help in getting the perspective of the children and decisions can be made keeping
in mind their best interests. In this perspective, participation is recognized by United Nations
Convention on the Rights of the Child (UNCRC) as one of the important rights of a child. The
participation of the community along with the children should also be ensured to promote active
citizenship for children and enhance the accountability of the system. The government and civil
society together should engage with children and communities in sensitising them about child
rights and empowering them to raise their voice and demand entitlements. Presently, both State

463
and Central Government have provisioned schemes for child’s participation in decision-making
process to ensure their active involvement in any planning process. Some of these schemes are :
Bal Sansads : The Bal Sansads have been set up in all the elementary schools of Bihar to ensure
participation of children in education. A committee with 12 students as its members, is
constituted in every school to assist the school management, which provides the students with a
platform for expressing their views and developing life skills. Similarly, Meena Manchs have
been established in all the upper primary schools of the state.
Integrated Child Protection Scheme : This is an important programme aimed at strengthening
the protection of children, under which there is a provision for representation of children in Child
Protection Committees, constituted at various levels. The child representative in the committee is
expected to bring in specific requirements and concerns related to protection of children. Bihar
has recently taken the initiative to constitute Child Protection Committees in all the districts.
Bal Samvad Adalat : This is a unique process initiated only in Bihar. The initiative proved to be
highly effective in disposal of minor offences of juvenile delinquents, based on consultations
with children through a dialogue. The process is facilitated by Juvenile Justice Boards in a few
districts of Bihar. Similarly, children are being provided with platforms such as Meena Manch in
schools of Bihar to develop leadership qualities.
Rashtriya Kishor Swasthya Karyakram (RKSK) : The programme aims to provide
opportunities for participation of adolescent girls in group activities. Under this scheme, the
concepts of ‘Sakhi’ and ‘Saheli’ have been developed as groups of adolescent girls. This scheme
is part of the Centrally sponsored scheme called Scheme for Adolescent Girls (SAG).

464
APPENDIX
Table A 12.1 : District-wise Child Population in Bihar (2011)
(Number in '000)
District 0-6 0-14 0-18
T M F T M F T M F Patna 943.6 494.2 449.3 1104.0 993.3 2097.2 2583.1 1372.4 1210.7 Nalanda 518.7 268.7 250.0 589.7 541.8 1131.5 1350.6 709.9 640.7 Bhojpur 459.2 239.4 219.8 541.3 490.9 1032.2 1262.4 668.5 593.9 Buxar 295.1 152.6 142.5 343.0 313.3 656.3 800.2 422.0 378.2 Rohtas 506.8 262.5 244.3 592.9 547.9 1140.9 1376.4 722.1 654.3 Kaimur 299.3 154.1 145.2 340.4 314.7 655.1 784.9 412.3 372.6
Gaya 783.1 399.4 383.6 883.0 833.5 1716.5 2058.2 1063.2 995.0 Jehananbad 198.8 103.5 95.3 230.5 211.0 441.4 527.3 276.4 250.9 Arwal 127.8 65.9 61.9 144.3 134.0 278.3 331.9 173.3 158.6 Nawada 393.5 202.3 191.2 458.2 427.4 885.5 1066.3 553.2 513.1 Aurangabad 455.4 234.3 221.1 518.1 486.5 1004.6 1207.2 627.0 580.2
Saran 681.1 353.7 327.4 800.1 746.4 1546.5 1896.5 989.4 907.1 Siwan 551.4 284.2 267.2 658.9 625.3 1284.2 1589.8 817.1 772.7 Gopalganj 449.5 230.0 219.5 523.6 501.3 1024.9 1251.1 638.7 612.4
W. Champaran 776.0 397.4 378.6 855.6 796.8 1652.4 1938.4 1020.5 917.9 E. Champaran 1018.3 526.8 491.5 1130.1 1029.0 2159.1 2522.2 1346.1 1176.0 Muzaffarpur 845.3 441.3 404.0 967.2 879.8 1847.0 2220.8 1183.4 1037.3 Sitamarhi 663.2 343.6 319.7 742.6 671.9 1414.5 1663.4 888.3 775.1 Sheohar 128.7 66.7 62.0 142.9 129.1 272.0 319.4 170.8 148.5 Vaishali 601.9 316.1 285.8 695.9 627.7 1323.5 1586.1 850.6 735.5
Darbhanga 725.5 375.7 349.8 826.5 755.9 1582.4 1891.9 1003.8 888.1 Madhubani 810.5 418.6 391.9 932.4 865.4 1797.8 2132.2 1122.3 1009.9 Samastipur 797.4 414.6 382.8 907.1 831.4 1738.5 2054.1 1092.7 961.3
Begusarai 546.0 284.5 261.4 633.2 576.2 1209.4 1434.6 766.7 667.9 Munger 229.9 119.6 110.2 267.6 240.4 507.9 619.3 332.8 286.5 Sheikhpura 121.6 62.7 58.9 136.4 125.9 262.3 310.3 162.8 147.5 Lakhisarai 188.2 98.1 90.2 212.9 193.6 406.6 484.7 257.6 227.1 Jamui 324.5 165.9 158.6 360.2 334.9 695.0 828.7 434.2 394.5 Khagaria 340.9 177.0 163.9 377.1 340.8 718.0 839.8 451.2 388.6
Bhagalpur 546.4 281.9 264.4 620.9 570.3 1191.2 1432.2 762.4 669.8 Banka 375.3 193.2 182.1 417.7 385.7 803.4 951.2 505.1 446.0
Saharsha 387.5 200.5 187.0 425.0 383.5 808.5 936.2 501.1 435.1 Supaul 437.4 225.0 212.4 488.8 455.4 944.2 1092.7 575.6 517.1 Madhepura 404.6 209.6 195.0 445.9 407.6 853.5 986.7 525.1 461.6
Purnia 656.5 336.0 320.6 712.4 668.6 1381.0 1625.4 850.9 774.5 Kishanganj 346.9 176.0 170.9 371.5 360.0 731.5 873.6 446.2 427.4 Araria 577.9 295.3 282.6 627.3 590.5 1217.8 1423.6 746.1 677.5 Katihar 620.3 316.4 303.9 671.6 636.6 1308.2 1544.0 806.9 737.1
Bihar 19134.0 9887.2 9246.7 21697.1 20024.1 41721.2 49797.1 26248.9 23548.2 Source : Census 2011, Registrar General of India

465
Table A 12.2 : District-wise and age-wise Sex Ratios of Population in Bihar (2011)
(Females per 1000 males)
District All 0-6 Years
0-14 years
0-18 years
7-18 Years
Patna 897 909 900 882 867 Nalanda 922 931 919 903 886 Bhojpur 907 918 907 888 872 Buxar 922 934 914 896 875 Rohtas 918 931 924 906 892 Kaimur 920 942 925 904 881
Gaya 937 960 944 936 921 Jehanabad 922 922 915 908 899 Arwal 928 940 929 916 901 Nawada 939 945 933 927 917 Aurangabad 926 944 939 925 914
Saran 954 926 933 917 912 Siwan 988 940 949 946 949 Gopalganj 1021 954 957 959 961
W. Champaran 909 953 931 899 865 E. Champaran 902 933 911 874 836 Muzaffarpur 900 915 910 877 853 Sitamarhi 899 930 905 872 836 Sheohar 893 929 903 869 831 Vaishali 895 904 902 865 841
Darbhanga 911 931 915 885 857 Madhubani 926 936 928 900 878 Samastipur 911 923 917 880 853
Begusarai 895 919 910 871 843 Munger 876 922 898 861 827 Sheikhpura 930 940 923 906 884 Lakhisarai 902 920 909 882 859 Jamui 922 956 930 908 879 Khagaria 886 926 904 861 820 Bhagalpur 880 938 918 878 844 Banka 907 943 923 883 846 Saharsa 906 933 902 868 825 Supaul 911 944 932 898 869 Madhepura 929 930 914 879 845 Purnea 921 954 939 910 882 Kishanganj 950 971 969 958 949 Araria 921 957 941 908 876 Katihar 919 961 948 913 883
Bihar 918 935 923 897 874 Source : Census 2011, Registrar General of India

466
Table A 12.3 : District-wise Percentage of Children under Five Years of Age Suffering from Malnutrition in Bihar (2015-16)
District Stunted Wasted Underweight
Rural Total Rural Total Rural Total Patna 51.4 43.5 27.2 28.5 49.2 43.3 Nalanda 55.7 54.1 23.7 24.3 50.0 50.2 Bhojpur 44.3 43.5 24.5 26.0 46.0 47.2 Buxar 45.4 43.9 20.5 19.6 43.1 41.2 Rohtas 48.1 48.5 19.4 19.9 44.7 45.1 Kaimur 55.0 53.8 21.6 21.4 49.1 48.1
Gaya 53.5 52.9 26.6 25.6 54.0 53.1 Jehanabad 54.7 52.1 18.5 19.6 49.3 47.1 Arwal 51.1 50.2 29.2 30.7 53.8 54.0 Nawada 50.4 48.4 21.3 21.4 47.8 45.9 Aurangabad 48.8 48.3 25.1 24.8 48.0 47.6
Saran 46.0 46.1 17.7 18.1 40.3 40.4 Siwan 38.2 37.9 15.3 15.0 32.2 31.6 Gopalganj 36.0 35.6 16.7 16.5 30.2 30.5
W. Champaran 45.9 43.6 22.2 21.7 41.7 39.1 E. Champaran 47.2 47.2 17.9 18.0 40.7 40.8 Muzaffarpur 48.6 47.9 17.5 17.5 42.3 42.3 Sitamarhi 58.1 57.3 15.7 15.8 47.9 47.7 Sheohar 53.1 53.0 15.3 14.8 42.9 42.8 Vaishali 53.6 53.7 15.5 15.1 41.9 41.3
Darbhanga 49.2 49.0 16.8 16.6 40.9 41.1 Madhubani 51.9 51.8 19.2 19.1 45.6 45.4 Samastipur 49.2 49.2 18.1 18.4 40.4 41.3
Begusarai 44.6 44.9 20.4 18.4 40.7 39.1 Munger 48.4 46.6 21.4 21.5 44.8 43.7 Sheikhpura 47.5 46.4 28.9 28.9 52.0 51.7 Lakhisarai 51.2 50.6 21.2 20.1 47.6 47.3 Jamui 46.7 45.9 29.1 29.4 48.1 47.2 Khagaria 50.5 49.8 17.0 17.0 42.9 42.4
Bhagalpur 48.6 46.6 24.8 23.1 44.5 40.8 Banka 50.3 49.6 26.0 26.0 49.1 48.5
Saharsa 44.8 43.9 23.7 24.0 45.2 44.4 Supaul 47.7 48.1 21.4 20.9 43.2 43.4 Madhepura 52.7 51.8 24.4 24.2 50.0 49.2
Purnea 53.9 52.1 20.6 20.8 48.3 47.0 Kishanganj 46.7 46.9 22.9 22.8 45.3 45.4 Araria 49.0 48.4 23.0 22.8 46.7 45.4 Katihar 50.4 49.2 21.7 20.7 46.2 45.1
Bihar 49.3 48.3 20.8 20.8 44.6 43.9 Source : NFHS 4,GoI
______________
467
CHAPTER - XIII
ENVIRONMENT AND CLIMATE CHANGE
Earth provides enough to satisfy every man's needs, but not every man's greed.
― Mahatma Gandhi
Introduction
Since the adoption of the Sustainable Development Goals (SDG) by the United Nations in 2015,
there is an emphasis that economic prosperity and environmental resource management must go
hand in hand for achieving long-run sustainable growth. Globally, the environmental resources
are under stress due to increasing population, urbanization and economic growth and, the state of
Bihar is no exception to this scenario. As one of the fastest growing economies of the country,
with a double-digit growth in Gross State Domestic Product (GSDP) in recent years, Bihar faces
Abstract
As one of the fastest growing economies, Bihar faces the challenge of realigning its growth with the goals of environmental sustainability. The forestry and logging sectors contributed to 1.6 percent of the Gross State Value Addition (GSVA) in Bihar during 2013-14 to 2018-19. In 2019, the recorded forest area in Bihar was around 6877 sq.kms., nearly 7.3 percent of the total geographical area. The Soil Organic Carbon contributes to 61.4 percent of the total forest carbon stock of Bihar, followed by above ground mass (27.2 percent). In 2019, the state experienced much higher than average rainfall of 968.3 mms. from the south-west monsoons. The Department of Environment, Forest, and Climate Change functions as the nodal agency, overseeing the activities and policies relating to environmental stability, ecological balance, and protection of wildlife and biodiversity in the state. The Bihar State Agroforestry Policy of 2018 seeks to protect and stabilize ecosystems, promote resilient cropping systems, and enhance employment of rural households through expansion of agroforestry. Jal-Jeevan-Hariyali is a flagship programme of the State Government which is intended to tackle issues related to climate change and environmental degradation. The total expenditure for the execution of various schemes under this campaign is estimated to be Rs. 24,524 crore during 2019-20 to 2021-22. The Bihar State Action Plan on Climate Change (Bihar-SAPCC) aims to focus on strategies relating to agriculture, water resources, forests and biodiversity, and disaster management.

468
the challenge of realigning its growth in line with the goals of environmental sustainability. More
than 85 percent of the population in Bihar live in rural areas and are dependent on climate-
sensitive sectors, such as agriculture, fisheries, and forestry for their livelihood. As the demand
for natural resources are growing for multiple uses, the quantity and quality of natural resources
such as water, soil, air, etc., are of serious concern.
The proper management of the environment has been a priority for the State Government to ensure efficient, equitable and sustainable use of the natural resources. In this regard, the State Government is undertaking sustained efforts to work towards the agenda, pushed by the SDGs to achieve a universal and integrated development path, encompassing economic progress, social equity, and environmental sustainability. The Department of Environment, Forest, and Climate Change of the State Government functions as the nodal agency, overseeing the activities and policies relating to environmental stability, ecological balance, and protection of wildlife and biodiversity in the state. 13.1 Climatic Profile of Bihar
As a land-locked state, Bihar is located in the eastern region of the country, lying between West Bengal in the east and Uttar Pradesh in the west, bounded by Nepal in the north and Jharkhand in the south. Situated at 52.7 meters above the sea level, its geographical co-ordinates are 240 20' N to 270 31' N latitude and 830 19' E to 880 17' E longitude. Bihar is bounded by the Himalayan foothills, the Indo-Gangetic Plains, the Vindhyan Plateau and the small Gondwana basin, extending for 483 kms from east to west and 345 kms from north to south. The river Ganga flows from west to east, dividing the state into two unequal halves. A snapshot of the physiographic features of the agro-climatic zones in Bihar is presented in Table 13.1. Three distinct agro-climatic zones of the state are — (i) North-West Zone, consisting of 13 districts with an annual rainfall of 1040-1450 mms., and sandy loam soil, (ii) North-East Zone, covering 8 districts with an annual rainfall ranging between 1200 and 1700 mms. and consisting of loam or clay loam soil, and (iii) South Zone, which has 17 districts, filled with soil of sandy loam, loam, clay or clay loam and receiving an annual rainfall of 990-1300 mms. The North-East Zone receives the highest amount of annual precipitation and more than 80 percent of it during the kharif season. The climate in Bihar can be characterized as humid and subtropical with three distinct seasons — summer, rainy and winter. The state faces extreme differences in temperature during the summer and winter months. The annual average temperature ranges between 80C in cold winter months during December-February to 380C in hot summer months during April-June.

469
Table 13.1 : Features of the Agro-Climatic Zones in Bihar
Agro-climatic
Zone Soil pH
Organic Matter
(%)
Available Nitrogen (kg/ha)
Available Phospho-
rous (Kg/Ha)
Available Potash
(Kg. /Ha.)
Average Rainfall (mms.)
Temperature (0C)
Max Min
North-West Sandy loam, Loam 6.5-8.4 0.2-1.0 150-350 5-50 100-300 1040-1450
(1245) 36.6 7.7
North-East Sandy loam, Clay loam 6.5-7.8 0.2-1.0 150-300 10-35 150-250 1200-1700
(1450) 33.8 8.8
South-East and South-West
Sandy loam, Clay loam, Loam, Clay
6.8-8.0 0.5-1.0 200-400 10-100 150-350 990-1240 (1115) 37.1 7.8
Source : Department of Agriculture, GoB
13.2 Water Resources
The state of Bihar is endowed with abundant surface and groundwater resources, enough to meet the growing demands of different sectors such as agriculture, industry, household, and environment. Though water is considered as a renewable resource because of regular replenishment by the rain spells, the growing population and indiscriminate development is inducing stress on the natural water ecosystems. Bihar is also prone to excessive flooding, where more than 70 percent of the population are living under the constant threat of floods. Rainfall
The climate change is impacting the natural resources and altering the patterns of precipitation around the globe. In a predominantly agrarian state such as Bihar, insufficient or excess rainfall leading to drought or flood-like situations has implications for agricultural production. In recent years, the monsoon patterns have become unpredictable, thereby affecting the sowing cycles, cropping decisions and crop yields. Besides agriculture, the variations in rainfall are also likely to impact the quality and flow of river water, affecting the livelihoods of the fishing communities. As such, inadequate and untimely rainfall with high variability has adverse effect on water table, agricultural production, livelihood, and survival of the vulnerable population. The temporal patterns of annual average rainfall in the state during four different seasons for the period 2001-2018 and the first nine months of 2019 are presented in Table 13.2.
During 2018-19, Bihar recorded an annual rainfall of 780 mms, which is lesser than the long-run average rainfall of 987.2 mms (2001-18). In 2018-19, 88.4 percent of the rains in Bihar were due to the south-west monsoons, occurring during the four months of June to September, while only 11.6 percent of the rains were due to the hot weather rain and north-west rain. The state experienced unprecedented rainfall of 968 mms during the south-west monsoons in 2019-20, which is much higher the long-run average of 839.4 mms. Overall, the annual rainfall received in Bihar varied between 677 mms (2010) to 1506 mms (2007), showing substantial variability in the rainfall pattern.

470
Table 13.2 : Season-wise Annual Rainfall (2001-2019) (Rainfall in mm)
Year Winter Rain Hot-Weather Rain
Southwest Monsoon
Northwest Monsoon Annual
2001 20.9 (145.2) 86.7 (114.4) 908.2 (108.2) 192.2 (333.8) 1208 (122.4)
2002 48.9 (339.7) 66.8 (88.2) 896.9 (106.9) 33.2 (57.7) 1045.8 (105.9)
2003 19.2 (133.4) 93 (122.7) 767.6 (91.4) 128.9 (223.8) 1008.7 (102.2)
2004 23.7 (164.6) 41.4 (54.6) 906.1 (107.9) 60.1 (104.4) 1031.3 (104.5)
2005 0.1 (0.7) 89.5 (118.1) 777.6 (92.6) 30.2 (52.4) 897.4 (90.9)
2006 0.1 (0.7) 90 (118.8) 925.9 (110.3) 27.8 (48.3) 1043.7 (105.7)
2007 28.3 (196.6) 76.4 (100.8) 1360 (162) 40.5 (70.3) 1506.1 (152.6)
2008 30.6 (212.6) 61.8 (81.6) 1084 (129.1) 19.3 (33.5) 1196 (121.1)
2009 0.1 (0.7) 98.2 (129.6) 699.2 (83.3) 71.1 (123.5) 868.6 (88)
2010 0.7 (4.9) 49.3 (65.1) 584.4 (69.6) 43.4 (75.4) 677.9 (68.7)
2011 5.2 (36.1) 79.4 (104.8) 1028 (122.5) 0.5 (0.9) 1113.1 (112.8)
2012 11.2 (77.8) 31.3 (41.3) 704.2 (83.9) 51.2 (88.9) 797.9 (80.8)
2013 17.1 (118.8) 73.8 (97.4) 518.4 (61.8) 164.3 (285.3) 773.6 (78.4)
2014 33.3 (231.3) 96.1 (126.8) 788.3 (93.9) 41.9 (72.8) 959.6 (97.2)
2015 11.7 (81.3) 89.3 (117.8) 690.7 (82.3) 4.3 (7.5) 796 (80.6)
2016 7.5 (52.1) 72.6 (95.8) 936.9 (111.6) 54.5 (94.6) 1071.6 (108.5)
2017 0.4 (2.8) 103.1 (136.1) 843.2 (100.5) 47.6 (82.7) 994.4 (100.7)
2018 0.1 (0.7) 65.3 (86.2) 689.6 (82.2) 25.5 (44.3) 780.4 (79.0)
2019 (Up to Sept.) 28.2 56.9 968.3 41.0 1094.4
Average (2001-2018) 14.4 75.8 839.4 57.6 987.2
Note : Figures in parentheses denote actual rainfall as the percentage of long run rainfall Source : Directorate of Economics and Statistics, GoB
Besides temporal variations, the rainfall distribution is also uneven across the districts of Bihar, as they fall under different agro-climatic zones. The agroclimatic Zones I (North-West) and II (North-East) form the wet zones in the state, which receive higher proportion of rainfall compared to the dry zone in the southern part of the state. The spatial variations of season-wise annual rainfall are shown in Table A13.1 (Statistical Appendix). The district-wise distribution of annual rainfall for the year 2018-19 is depicted in Chart 13.1. During 2018-19, Kishanganj received the highest annual rainfall of 1522 mms., while the lowest rainfall was observed in the district of Jehanabad (403 mms.). Out of the 38 districts, 15 districts received higher rainfall than the state’s annual rainfall of 780 mms.

471
Chart 13.1 : District-wise Rainfall Distribution in Bihar (2018-19)
Source : Directorate of Economics and Statistics, GoB
In case of south-west monsoons, there is no uniform distribution of rain as it varies from 1581
mms. in Kishanganj to 545.4 mms. in Arwal during 2019. The leading districts in terms of
rainfall in 2019 belonged to the northern plains — Kishanganj (1581 mms), Siwan (1403 mms),
and Araria (1310 mms). In stark contrast, the districts of Sheikhpura (580 mms) and Arwal
(545.4 mms), situated in the southern part of Bihar, recorded the least amount of south-west rain
spells. The lower intensity of rainfall in the southern districts is a cause of concern for
groundwater level, compared to the northern counterparts. Such extreme rainfall variability in the
state over time and space leads to low crop yields and the risk of crop failures in both flood and
drought-prone areas. The efforts of the State Government to combat the challenges of rainfall
variability, recurring flood, and droughts is evident through investments made for better
management of watersheds, construction of reservoirs and embankments.
Surface Water Resource
Other than the rain water, the river systems in the state form the basis for surface water. Bihar is
endowed with a favourable river system, comprising the river Ganga, its tributaries, and other
rivers, some of which are perennial and others seasonal in nature. The alluvial tract in the

472
northern part of Bihar and some areas in the south have enough water available throughout the
year. The river basins in Bihar are known to be fertile, with rich alluvial soil, and provide habitat
for different varieties of fish. The river Ganga has a total length of 445 kms. In Bihar, it has a
catchment area of 5473 sq.kms. Among other rivers in Bihar, the Ghaghra river system is the
biggest one with a catchment area of about 1.27 lakh sq.kms. and having a total length of 1116
kms (Table 13.3). Three other major rivers in terms of catchment area are — Kosi (74,030
sq.kms.), Sone (70,228 sq.kms.) and Gandak (40,553 sq.kms.). The river basins of Punpun, Kosi,
Bagmati, and Mahananda are responsible for causing extreme flooding in the state, leading to
loss of lives and property. Despite housing fifteen river basins, there has been a growing concern
in the state over the quality of river water due to depleting water levels of subsurface resources.
Table 13.3 : Status of Rivers in Bihar
List of Rivers Origin Total Length (km)
Catchment Area (km2) Seasonality
Ghaghra Tibet 1116 127950 Perennial
Kosi Tibet 260 (Bihar) 74030 Perennial
Sone Amarkantak (M.P.) 784 70228 Perennial
Gandak Tibet 260 (Bihar) 40553 Perennial
Bagmati Nepal 589 14384 Perennial
Mahananda Darjeeling (W. Bengal) 376 13308 Perennial
Burhi Gandak Chanpatia (Bihar) 320 12021 Perennial
Kamla Nepal 328 7232 Perennial
Ganga Stem Gangotri (Uttarakhand) 2525 (445 Bihar)
5473 (Bihar) Perennial
Harohar Jharkhand 53 14173 Seasonal
Punpun Palamau (Jharkhand) 235 9026 Seasonal
Karmnasha Kaimur 192 7792 Seasonal
Chandan Deoghar Hills 118 4093 Seasonal
Kiul Khajuri (Jharkhand) 181 3050 Seasonal
Badua Chakai Plateau 130 2215 Seasonal
Source : Lal, 2005, Annexure 2.5 of the Report of the Expert Committee on Impact of Interlinking of Rivers in Bihar and the Report of Second Bihar State Irrigation Commission Vol-5, Part-I
In order to ensure availability of water in drought-prone and rainfed areas, and achieve greater
equity in the distribution of water, the programme of inter-linking of the rivers has been launched
in India. The details of the distribution of river basin in Bihar are presented in Table 13.4. As per
the estimates, the basin-wise average water potential was the highest in the Gandak Baya river
basin (47,350 MCM), followed by the Kosi river basin (41,615 MCM). On the other hand, the

473
lowest water potential was observed in the river basin of Kiul (710 MCM). The total area of the
Ghaghra-Mahi basin is 1,30,458 sq. kms., with a catchment area of 5503 sq. kms. However, the
area outside the state has not been considered for water potential, because it has been assumed
that the upper states may completely divert their water.
Table 13.4 : Details on River Basin in Bihar
River Basin Catchment Area (km2)
Area (km2)
Water Potential (MCM)
Ghaghra-Mahi 5503 (in Bihar) 130458 1639
Gandak Baya 43574 43574 47350
Burhi Gandak 12021 12021 4040
Bagmati-Adhwara 14384 14384 7265
Kamla-Balan 7232 7232 3249
Kosi 74030 74030 41615
Mahananda 13308 13308 5895
Karmnasha 7792 7792 1245
Sone 70228 70228 7709
Kao-Gangi 4129 4129 884
Punpun 9026 9026 2253
Kiul 3050 3050 710
Harohar 14173 14173 3300
Badua 2215 2215 737
Chandan 4093 4093 1491
Ganga Stem 5473 (in Bihar) 5473 2793
Note : MCM = Million Cubic Metre Source : Lal, 2005, Annexure 2.5 of the Report of the Expert
Committee on Impact of Interlinking of Rivers in Bihar
Quality of River Water
In recent years, the quality of river water has become a major environmental concern. Owing to
population growth and growing demand of water (for irrigation, industry, domestic consumption
and other purposes), the water levels of subsurface resources have depleted. Secondly, there has
also been a decline in flow of river waters. These two factors together have affected the quality
of river water. Under the national water quality monitoring programme, the Central Pollution
Control Board is monitoring the quality of river water. The polluted river stretches over a

474
continuous sequence and are monitored along a number of parameters, such as dissolved oxygen,
pH level, conductivity, bio-chemical oxygen demand (BOD), and faecal and total coliform. The
limits of the parameters to measure the quality of river water for different states are presented in
Table 13.5. In Bihar, the organic pollution measured in terms of bio-chemical oxygen demand
(BOD) count was less than 3 mg/l. It is important to maintain adequate levels of dissolved
oxygen in the water to protect aquatic life. The level of dissolved oxygen was in the range of 2.1
mg and 10.2 mg per l.
Table 13.5 : State-wise River Water Quality (2017)
State
Dissolved Oxygen (mg/l)
pH Conductivity (μmho/ cm)
Bio-chemical Oxygen Demand (mg/ l)
Faecal Coliform (MPN/ 100 ml)
Total Coliform (MPN/ 100 ml)
Min Max Min Max Min Max Min Max Min Max Min Max
Andhra Pradesh 1.8 8.6 6.2 8.5 210 34100 0.5 62.4 2 200 65 2400
Bihar 2.1 10.2 6.4 8.84 62 975 0.5 21 1100 16X106 2100 16X106
Chhattisgarh 5.2 8.6 7.09 8.5 27 588 0.2 3.8 NIL 64 22 900
Gujarat 0.2 9.2 5.9 9.52 50 67670 BDL 206 BDL 550 BDL 1600
Haryana 2.3 12.4 6.7 8.95 196 3720 BDL 290 33 34000 49 16X105
Himachal Pradesh 2.1 11.4 6.45 8.68 27 3680 0.1 160 BDL 350 2 920
Jharkhand 2.5 9 6.4 8.5 120 402 0.2 10 140 260 730 1500
Madhya Pradesh 0.8 16.8 6.5 8.9 12 15244 0.3 430 BDL 900 BDL 1600
Maharashtra 0.5 8.8 6.1 8.92 23 69610 2 250 BDL 1600 4 1800
Odisha 0.3 14.3 6.3 8.5 77 52860 0.1 130 2 54X104 2 16X105
Punjab 0.6 8.8 6.9 8.42 136 2346 BDL 1299 43 34X104 46 47X104
Rajasthan 2.5 6.6 6.94 8.75 110 2100 0.8 11.5 2 150 2 460
Tamil Nadu 0.3 9.8 6.38 9.24 38 78500 0.4 325 2 22X105 12 35X105
Telangana 0.2 8.4 6.25 8.87 78 2130 BDL 60 NIL 210 20 2000
Uttar Pradesh 0.2 12 6.3 8.96 14 3770 1.2 120 8 92X105 17 16X106
Uttarakhand 0.2 10.6 6.7 8.26 63 1600 BDL 64 2 94000 NIL 920000
West Bengal 0.3 12.5 6.3 9.29 32 24650 0.6 23 700 24X105 280 30X105
Source : Central Pollution Control Board (2017)
Groundwater Resource in Bihar
The water collected in aquifers, the porous layers of the underground formations, form the basis of groundwater resource. The groundwater acts as major reservoir, especially in the drought

475
prone regions of Bihar, making the water available for agricultural purposes. In recent years, the dependency on groundwater resources has been rising on account of rapid economic and urban growth. Such growths lead to a decline in groundwater table, discharges and water quality. The impending water crisis is particularly severe, especially for food supply and healthy life of the poor. The Central Ground Water Board and the State Ground Water Board provide the estimates of the groundwater resources in the state. As per the estimates of the Dynamic Groundwater Resources of India (2017), the annual groundwater extraction for all uses in Bihar has been estimated to be around 29 bcm, while the total annual groundwater recharge is about 31.4 bcm. Bihar’s stage of groundwater extraction stands at 45.8 percent, which is lesser than the all-India average of 63.3 percent (Table 13.6).
Table 13.6 : State-wise Contribution of Recharge Components in Annual Groundwater Recharge (2017)
(In bcm)
State Annual
Groundwater Recharge
Total Natural Discharges
Annual Extractable
Groundwater Resource
Stage of Groundwater
Extraction (%)
Andhra Pradesh 21.22 1.07 20.15 44.15
Bihar 31.41 2.43 28.99 45.76
Chhattisgarh 11.57 1.00 10.57 44.43
Gujarat 22.37 1.12 21.25 63.89
Haryana 10.15 1.01 9.13 136.91
Himachal Pradesh 0.51 0.05 0.46 86.37
Jharkhand 6.21 0.52 5.69 27.73
Karnataka 16.84 2.05 14.79 69.87
Kerala 5.77 0.56 5.21 51.27
Madhya Pradesh 36.42 1.95 34.47 54.76
Maharashtra 31.64 1.74 29.90 54.62
Odisha 16.74 1.17 15.57 42.18
Punjab 23.93 2.35 21.58 165.77
Rajasthan 13.21 1.22 11.99 139.88
Tamil Nadu 20.22 2.02 18.20 80.94
Telangana 13.62 1.25 12.37 65.45
Uttar Pradesh 69.92 4.60 65.32 70.18
Uttarakhand 3.04 0.15 2.89 56.83
West Bengal 29.33 2.77 26.56 44.60
All-India 431.86 39.16 392.70 63.33
Note : 1. The Ground Water resources assessment as on 2013 has been considered for West Bengal 2. bcm = Billion Cubic Metres
Source : Central Ground Water Board (2019)

476
The district-wise groundwater recharge in Bihar for the year 2017 is presented in Table A13.2
(Statistical Appendix). The assessment of groundwater recharge in 2017 shows that the
groundwater recharge from rainfall during monsoon was higher at 19.83 bcm, compared to that
of non-monsoon recharge (3.14 bcm). The leading districts in groundwater recharge from rainfall
during monsoon season are — West Champaran (0.99 bcm), East Champaran (0.92 bcm) and
Rohtas (0.88 bcm). The districts of Sheikhpura (0.14), Arwal (0.13 bcm) and Sheohar (0.12 bcm)
had low levels of recharge from rainfall during monsoon. Overall, the annual extractable
groundwater resource was the highest in the district of West Champaran (1.61 bcm). Among the
purposes of annual groundwater extraction, the highest was observed in the category of irrigation
(10.78 bcm), followed by domestic purposes (1.83) for the state as whole. The leading districts
for extraction of groundwater for irrigation purposes were Muzaffarpur (0.62 bcm), Gaya (0.59
bcm) and Katihar (0.56 bcm), accounting for nearly 16.4 percent of the total extraction during
2017. The stage of groundwater extraction, expressed as percentage, is the ratio of annual
groundwater draft and net annual groundwater availability (Table 13.6). The overdraft of
groundwater resource has been the highest in the district of Jehanabad (95.7 percent), while the
least has been in Araria (19.6 percent). It is alarming to note that nearly 19 districts had the stage
of groundwater extraction higher than that of the state’s average of 45.8 percent. The dependency
of irrigation on groundwater resource is one of the leading causes for depletion of water tables.
Quality of Groundwater Resource
Since the launch of the National Water Policy of 2012, there has been a growing emphasis on the
need to maintain quantity and quality of groundwater resources. The state-wise details on the
districts affected with groundwater contamination are presented in Table 13.7. The groundwater
contamination refers to the presence of certain pollutants, such as fluoride, nitrate, arsenic, iron,
lead, cadmium and chromium in excess of the prescribed limits in water. In Bihar, the commonly
observed contaminants include fluoride, nitrate, arsenic, and iron, which are harmful for drinking
purposes. The State Government is making efforts to minimize the contamination and over-
exploitation of groundwater through the enactment of Groundwater Act, 2006 which aims to
regulate and control the over-exploitation of groundwater in the state. Towards this, various
awareness programmes and water management trainings are being undertaken in the state.
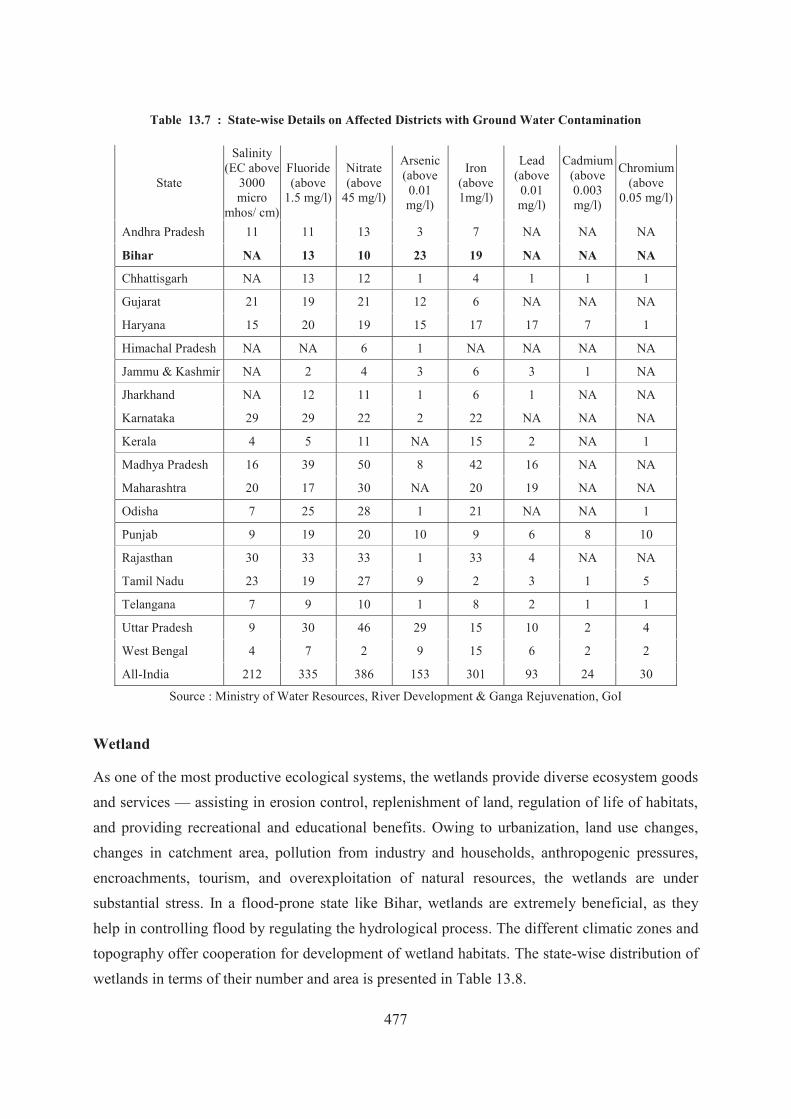
477
Table 13.7 : State-wise Details on Affected Districts with Ground Water Contamination
State
Salinity (EC above
3000 micro
mhos/ cm)
Fluoride (above
1.5 mg/l)
Nitrate (above
45 mg/l)
Arsenic (above 0.01 mg/l)
Iron (above 1mg/l)
Lead (above 0.01 mg/l)
Cadmium (above 0.003 mg/l)
Chromium (above
0.05 mg/l)
Andhra Pradesh 11 11 13 3 7 NA NA NA
Bihar NA 13 10 23 19 NA NA NA
Chhattisgarh NA 13 12 1 4 1 1 1
Gujarat 21 19 21 12 6 NA NA NA
Haryana 15 20 19 15 17 17 7 1
Himachal Pradesh NA NA 6 1 NA NA NA NA
Jammu & Kashmir NA 2 4 3 6 3 1 NA
Jharkhand NA 12 11 1 6 1 NA NA
Karnataka 29 29 22 2 22 NA NA NA
Kerala 4 5 11 NA 15 2 NA 1
Madhya Pradesh 16 39 50 8 42 16 NA NA
Maharashtra 20 17 30 NA 20 19 NA NA
Odisha 7 25 28 1 21 NA NA 1
Punjab 9 19 20 10 9 6 8 10
Rajasthan 30 33 33 1 33 4 NA NA
Tamil Nadu 23 19 27 9 2 3 1 5
Telangana 7 9 10 1 8 2 1 1
Uttar Pradesh 9 30 46 29 15 10 2 4
West Bengal 4 7 2 9 15 6 2 2
All-India 212 335 386 153 301 93 24 30
Source : Ministry of Water Resources, River Development & Ganga Rejuvenation, GoI
Wetland
As one of the most productive ecological systems, the wetlands provide diverse ecosystem goods and services — assisting in erosion control, replenishment of land, regulation of life of habitats, and providing recreational and educational benefits. Owing to urbanization, land use changes, changes in catchment area, pollution from industry and households, anthropogenic pressures, encroachments, tourism, and overexploitation of natural resources, the wetlands are under substantial stress. In a flood-prone state like Bihar, wetlands are extremely beneficial, as they help in controlling flood by regulating the hydrological process. The different climatic zones and topography offer cooperation for development of wetland habitats. The state-wise distribution of wetlands in terms of their number and area is presented in Table 13.8.

478
Table 13.8 : Wetlands within the Recorded Forest Area/Green Wash (2019) (Area in hectare)
State Inland Wetland
(Natural) Inland Wetland
(Manmade) Coastal Wetland
Wetland (<2.25 ha) Total Wetland
No. Area No. Area No. Area No. Area No. Area
Andhra Pradesh 99 9802 559 19956 213 42297 303 303 1174 72358 (1.9)
Bihar 72 2573 50 1256 0 0 163 163 285 3992 (0.6)
Chhattisgarh 101 39987 1182 21996 0 0 2415 2415 3698 64398 (1.2)
Gujarat 560 37958 1677 44454 681 1127652 611 611 3529 1210675 (39.9
Haryana 16 1700 27 150 0 0 35 35 78 1885 (3.3)
Himachal Pradesh 50 6227 14 1945 0 0 49 49 113 8221 (0.6)
Jharkhand 249 10100 551 5566 0 0 862 862 1662 16528 (0.9)
Karnataka 123 15344 633 36488 21 26 1261 1261 2038 53119 (1.7)
Kerala 143 10073 76 12944 0 0 140 140 359 23157 (2.0)
Madhya Pradesh 249 71116 2655 85821 0 0 5636 5636 8540 162573 (1.8)
Maharashtra 686 29947 4257 73062 432 10382 3446 3446 8821 116837 (2.1)
Odisha 393 13389 795 40227 170 8242 2769 2769 4127 64627 (1.5)
Punjab 46 1446 37 1586 0 0 36 36 119 3068 (3.3)
Rajasthan 284 21519 1275 28064 4 4495 2263 2263 3826 56341 (1.7)
Tamil Nadu 248 8494 743 19432 104 16865 428 428 1523 45219 (2.1)
Telangana 59 13086 654 14796 0 0 357 357 1070 28239 (1.1)
Uttar Pradesh 792 31828 660 9497 0 0 899 899 2351 42224 (3.1)
Uttarakhand 95 39007 10 15006 0 0 116 116 221 54129 (2.1)
West Bengal 353 220751 863 5542 239 202123 10060 10060 11515 438476 (32.7)
All-India 7017 814521 16859 444563 4029 1499496 34561 34561 62466 2793141 (3.8)
Note : 1. RFA = Recorded Forest Area 2. Figures in bracket denote wetland as percentage of RFA
Source : Report of the Forest Survey of India (2019)
As per the India Forest Report of 2019, a total of 62,466 wetlands within the Recorded Forest
Area (RFA) have been mapped in the country, covering an area of 27,93,141 hectares (Table
13.8). The area estimates of wetlands reveal that Bihar has about 285 wetlands, with a total area
of 3992 hectares, accounting for nearly 0.6 percent of the total recorded forest area of the state.
Out of this, the area under natural inland wetlands has been the highest at 2573 hectares,
accounting for 64.5 percent of the total area of wetlands in the state. In terms of the proportion of
the recorded forest area, Gujarat had the highest proportion of wetlands at 39.9 percent, followed
by West Bengal (32.7 percent).

479
The district-wise area under wetlands in Bihar has been given in Table A 13.3 (Statistical
Appendix). There is a large scale variation in the spread of wetlands across the districts. Across
all categories of wetlands, the water spread area was higher in the post-monsoon period,
compared to the pre-monsoons at the state level. In terms of the contribution of the total water
spread in the state, the highest was observed in the district of Katihar, both during pre-and post-
monsoon. The wetland area as percentage of the total geographical area across the districts has
been depicted in Chart 13.2. The district of Begusarai has about 10.8 percent of the district’s
geographical area as wetlands. The districts of Begusarai, Katihar, Sahasra, Bhagalpur and
Vaishali together constituted nearly 50 percent of the total wetland area in the state. The Central
Government has passed the Wetlands Conservation and Management Rules, 2017 to enable
better management of wetlands. Recognising that water resource is needed for sustenance of life,
biodiversity and development, the State Government is committed to minimize soil and water
losses, revive the traditional systems of water storage, preserve wetlands, and launch
programmes for groundwater recharge in over-exploited areas.
Chart 13.2 : District-wise Wetland Map of Bihar (percent to total geographical area)
Source : Department of Environment, Forest and Climate Change, GoB
13.3 Forest Resources
As an integral part of the natural resources and ecological systems, forests serve a multitude of
purposes — regulating the hydrological cycle, helping in soil conservation, providing forest
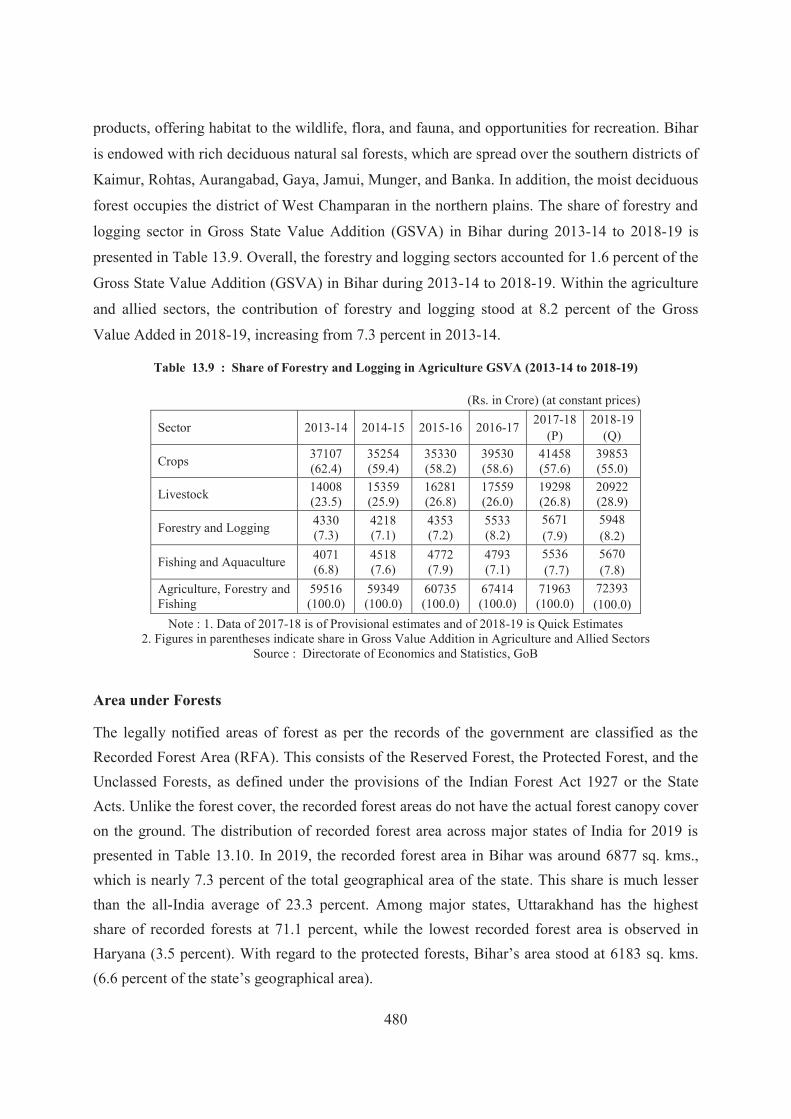
480
products, offering habitat to the wildlife, flora, and fauna, and opportunities for recreation. Bihar
is endowed with rich deciduous natural sal forests, which are spread over the southern districts of
Kaimur, Rohtas, Aurangabad, Gaya, Jamui, Munger, and Banka. In addition, the moist deciduous
forest occupies the district of West Champaran in the northern plains. The share of forestry and
logging sector in Gross State Value Addition (GSVA) in Bihar during 2013-14 to 2018-19 is
presented in Table 13.9. Overall, the forestry and logging sectors accounted for 1.6 percent of the
Gross State Value Addition (GSVA) in Bihar during 2013-14 to 2018-19. Within the agriculture
and allied sectors, the contribution of forestry and logging stood at 8.2 percent of the Gross
Value Added in 2018-19, increasing from 7.3 percent in 2013-14.
Table 13.9 : Share of Forestry and Logging in Agriculture GSVA (2013-14 to 2018-19)
(Rs. in Crore) (at constant prices)
Sector 2013-14 2014-15 2015-16 2016-17 2017-18 (P)
2018-19 (Q)
Crops 37107 (62.4)
35254 (59.4)
35330 (58.2)
39530 (58.6)
41458 (57.6)
39853 (55.0)
Livestock 14008 (23.5)
15359 (25.9)
16281 (26.8)
17559 (26.0)
19298 (26.8)
20922 (28.9)
Forestry and Logging 4330 (7.3)
4218 (7.1)
4353 (7.2)
5533 (8.2)
5671 (7.9)
5948 (8.2)
Fishing and Aquaculture 4071 (6.8)
4518 (7.6)
4772 (7.9)
4793 (7.1)
5536 (7.7)
5670 (7.8)
Agriculture, Forestry and Fishing
59516 (100.0)
59349 (100.0)
60735 (100.0)
67414 (100.0)
71963 (100.0)
72393 (100.0)
Note : 1. Data of 2017-18 is of Provisional estimates and of 2018-19 is Quick Estimates 2. Figures in parentheses indicate share in Gross Value Addition in Agriculture and Allied Sectors
Source : Directorate of Economics and Statistics, GoB
Area under Forests
The legally notified areas of forest as per the records of the government are classified as the Recorded Forest Area (RFA). This consists of the Reserved Forest, the Protected Forest, and the Unclassed Forests, as defined under the provisions of the Indian Forest Act 1927 or the State Acts. Unlike the forest cover, the recorded forest areas do not have the actual forest canopy cover on the ground. The distribution of recorded forest area across major states of India for 2019 is presented in Table 13.10. In 2019, the recorded forest area in Bihar was around 6877 sq. kms., which is nearly 7.3 percent of the total geographical area of the state. This share is much lesser than the all-India average of 23.3 percent. Among major states, Uttarakhand has the highest share of recorded forests at 71.1 percent, while the lowest recorded forest area is observed in Haryana (3.5 percent). With regard to the protected forests, Bihar’s area stood at 6183 sq. kms. (6.6 percent of the state’s geographical area).

481
Table 13.10 : Recorded Forest Areas (RFA) in Selected States of India (2019)
(Area in sq. km)
State Geographical Area (GA)
Recorded Forest Area (RFA) (in different categories) Total
RFA Percent of GA Reserved
Forest Protected
Forest Unclassed
Forests
Andhra Pradesh 162968 31959 5069 230 37258 22.9
Bihar 94163 693 6183 1 6877 7. 3
Chhattisgarh 135192 25782 24036 9954 59772 44.2
Gujarat 196244 14373 2886 4388 21647 11.0
Haryana 44212 249 1158 152 1559 3.5
Himachal Pradesh 55673 1898 33130 2005 37033 66.5
Jharkhand 79716 4387 19185 33 23605 29.6
Karnataka 191791 28690 3931 5663 38284 20.0
Kerala 38852 11309 — — 11309 29.1
Madhya Pradesh 308252 61886 31098 1705 94689 30.7
Maharashtra 307713 49546 6733 5300 61579 20.0
Odisha 155707 36049 25133 22 61204 39.3
Punjab 50362 44 1137 1903 3084 6.1
Rajasthan 342239 12475 18217 2045 32737 9.6
Tamil Nadu 130060 20293 1782 802 22877 17.6
Telangana 112077 20353 5939 612 26904 24.0
Uttar Pradesh 240928 12071 1157 3354 16582 6.9
Uttarakhand 53483 26547 9885 1568 38000 71.1
West Bengal 88752 7054 3772 1053 11879 13.4
All-India 3287469 434853 218924 113642 767419 23.3
Source : India State of Forest Report, 2019
Unlike the recorded forest areas, the forest cover includes all tree patches with a crown density
of more than 10 percent, covering an area of 1 hectare or more without any binding to its legal
status. The estimates of the forest cover for major states of India as per the assessment of the
India State Forest Report, 2019 are given in Table 13.11. With respect to the area under forest
cover, Madhya Pradesh has the largest forest cover at 77,482 sq. kms., accounting for nearly 10.9
percent of the total forest cover in the country. The lowest forest cover was observed in Haryana
at 1602 sq. kms. (0.2 percent). The forest cover of Bihar (7306 sq. kms.) accounted for only 1
percent of the country’s total forest area. Based on the crown density, the forests are classified as
— Very Dense Forest (VDF) having a crown density of more than 70 percent, Moderately Dense
Forest (MDF) with a crown density between 40 to 70 percent, and Open Forest (OF) with a

482
crown density of 10 to 40 percent. Out of the total forest cover in Bihar, the proportion was the
highest for open forests, accounting for 50.5 percent of the total forest cover.
Table 13.11 : Forest Cover in the Major States of India (2019)
(Area in sq. km)
State Geographical Area (GA)
2019 Assessment Forest cover as
percent of Geographical Area
VDF MDF OF Total Forest Cover
2019 2017
Andhra Pradesh 162968 1994 13938 13205 29137 17.9 17.3
Bihar 94163 333 3280 3693 7306 7.8 7.8
Chhattisgarh 135192 7068 32198 16345 55611 41.1 41.1
Gujarat 196244 378 5092 9387 14857 7.6 7.5
Haryana 44212 28 451 1123 1602 3.6 3.6
Himachal Pradesh 55673 3113 7126 5195 15434 27.7 27.1
Jharkhand 79716 2603 9687 11321 23611 29.6 29.5
Karnataka 191791 4501 21048 13026 38575 20.1 19.6
Kerala 38852 1935 9508 9701 21144 54.4 52.3
Madhya Pradesh 308252 6676 34341 36465 77482 25.1 25.1
Maharashtra 307713 8721 20572 21485 50778 16.5 16.5
Odisha 155707 6970 21552 23097 51619 33.2 33.0
Punjab 50362 8 801 1040 1849 3.7 3.6
Rajasthan 342239 78 4342 12210 16630 4.9 4.8
Tamil Nadu 130060 3605 11030 11729 26364 20.3 20.2
Telangana 112077 1608 8787 10187 20582 18.4 18.2
Uttar Pradesh 240928 2617 4080 8109 14806 6.2 6.1
Uttarakhand 53483 5047 12805 6451 24303 45.4 45.4
West Bengal 88752 3019 4160 9723 16902 19.0 19.0
All-India 3287469 99278 308472 304499 712249 21.7 21.5
Source : India State of Forest Report, 2019
Chart 13.3 presents the forest cover as percent of state’s geographical area in 2019 as per the estimates of the India State Forest Report. In terms of the share in state’s geographical area, the highest share was observed in Kerala with 54.4 percent of the state’s geographical area as forest cover. Bihar’s forest cover as percent of geographical area stood at 7.8 percent, which is lesser than that of the national average of 21.7 percent.

483
Chart 13.3 : Forest Cover as percentage of State’s Geographical Area (2019)
Source : India State of Forest Report, 2019
The area under forest and tree cover in Bihar for the period 2011 to 2019 is presented in Table
13.12. As per the estimates of the India State of Forest Report 2019, the tree cover constitutes
tree patches outside the recorded forest area, exclusive of forest cover and those patches which
are less than the minimum mappable area (1 hectare). The total tree cover in the state has been
estimated to be 2003 sq. kms., accounting for 2.1 percent of the state’s geographical area. From
the distribution of forest cover over the period 2011-2019 in Bihar, as given in the Table 13.12, it
can be seen that the total forest cover has marginally increased from 6845 sq. kms. in 2011 to
7306 sq. kms. in 2019. This notable increase has been possible due to the afforestation efforts of
the State Government and people in general. The forest cover in 2019 accounts for nearly 7.8
percent of the geographical area of the state. The total forest and tree cover together constituted
Table 13.12 : Forest and Tree Cover in Bihar (2011 to 2019)
(in sq. km)
Particulars 2011 2013 2015 2017 2019
Tree Cover 2369 (2.5) 2164 (2.3) 2182 (2.3) 2263 (2.4) 2003 (2.1)
Forest Cover 6845 (7.3) 7291 (7.7) 7288 (7.7) 7299 (7.8) 7306 (7.8) Forest and Tree Cover 9214 (9.8) 9455 (10.0) 9470 (10.1) 9562 (10.2) 9309 (9.9)
Note : Figures in parentheses denote share in state geographical area Source : Department of Environment, Forest and Climate Change, GoB
0.0 10.0 20.0 30.0 40.0 50.0 60.0
HaryanaPunjab
RajasthanUttar Pradesh
GujaratBihar
MaharashtraAndhra Pradesh
TelanganaWest Bengal
KarnatakaTamil Nadu
All-IndiaMadhya Pradesh
Himachal PradeshJharkhand
OdishaChhattisgarhUttarakhand
Kerala

484
about 9309 sq. kms. in 2019, which is about 9.9 percent of the total geographical area of the state. It has shown an increase of 95 sq. kms. between 2011 and 2019. The National Forest Policy of 1988 aims at bringing 33 percent of the total geographical area of the country under forest and tree cover. The Agroforestry Policy of 2018 of the State Government envisages a steady increase in tree cover in coming years. The area under different types of forest in Bihar is given in Table 13.13. Out of the total forest cover, nearly 50.5 percent of them are open forests, followed by moderately dense forest at 44.9 percent in 2019. There has been an increase in the area under very dense forest over the period 2011-2019. Chart 13.4 presents the classification of forest areas in Bihar according to different types of forest during 2011 to 2019.
Table 13.13 : Area under different types of Forest (2011 to 2019)
(Area in Sq. km)
Type of Forest 2011 2013 2015 2017 2019
Very Dense Forest 231 247 248 332 333
Moderately Dense Forest 3280 3380 3376 3260 3280
Open Forest 3334 3664 3664 3707 3693
Total 6845 7291 7288 7299 7306 Note : Figures in parentheses indicate percentage to total geographical area
Source : Department of Environment, Forest and Climate Change, GoB
Chart 13.4 : Classification of Forest Area in Bihar (2019)
Source : Department of Environment, Forest and Climate Change, GoB
The classification of districts based on forest cover as percentage of total geographical area into three categories (less than 10 percent, between 10-21 percent, and above 21 percent) is given in a district map in Chart 13.5. The districts of Kaimur, West Champaran, Rohtas, Jamui and Gaya
VDF (0.4%)MDF (3.5%)
OF (3.9%)Scrub (0.3%)Non-Forest
(92%)
Very Dense Forest
Moderately Dense Forest
Open Forest
Scrub
Non-Forest

485
together accounted for 53.0 percent of the total forest cover in the state during 2019. Clearly, the forest cover is denser in the southern parts of Bihar.
Chart 13.5 : District-wise Forest Cover in Bihar (2019)
Source : Department of Environment, Forest and Climate Change, GoB
The distribution of forest cover across the districts for the years 2017 and 2019 as per the
estimates of the India State of Forest Report is given in Table A 13.4 (Statistical Appendix).
Kaimur has the highest forest cover in the state at 1056.4 sq. kms., while the lowest was in
Jehanabad, with no forest. Among the types of forests, the district of West Champaran houses the
largest very dense forest, which has a crown density cover above 70 percent. In terms of open
forest, which refers to a crown density cover of 10 to 40 percent, Kaimur was the leading district,
accounting for 531.3 sq. kms. (14.4 percent of total forest cover). With respect to share in
district’s geographical area, Kaimur accounted for the highest share at 31.4 percent, followed by
Jamui (20.9 percent), and Nawada (20.6 percent).
Carbon Stock
Increasing deforestation and burning of fossil fuels leading to global warming have become a
serious environmental concern. As per the report of the Intergovernmental Panel on Climate
Change (IPCC), deforestation accounts for nearly 17 percent of global greenhouse gas emissions.
One of the ways to offset such effects is to have adequate green cover, which will help manage
surface temperatures and help balance the climate system. In this context, the carbon stocks form
an intrinsic component of the forest ecosystem, as the carbon absorbs the atmospheric carbon

486
dioxide and assimilate it into biomass. According to the Good Practices Guidance for Land Use,
Land-use Change and Forestry (2003), the forests are considered to have carbon in five pools —
above ground mass (tree trunk, branches, leaves, climbers, shrubs), below ground mass (root
system), deadwood, litter, and soil organic carbon (SOC). The living portion of biomass carbon
is categorized in two pools, the above ground biomass and below ground biomass. The SOC
includes organic carbon in mineral and organic soils to a specific depth. The carbon stock across
different pools during 2017 and 2019 for Bihar is presented in Table 13.14. The table reveals that
Bihar has a maximum carbon stock of 55,239 thousand tonnes in 2019, which was slightly lower
than 55,397 thousand tonnes in 2017.
Table 13.14 : Forest Carbon Stock in Bihar (2017 and 2019)
(‘000 tonnes)
Component Carbon Stock in Forest Percentage
change in Carbon Stock
2017 2019
Above Ground Biomass (AGB) 19063 (26.12)
15007 (20.54) -21.3
Below Gross Biomass (BGB) 6707 (9.19)
5428 (7.43) -19.1
Dead wood 138 (0.19)
127 (0.17) -8.0
Litter 625 (0.86)
746 (1.02) 19.4
Soil Organic Carbon (SOC) 28864 (39.55)
33931 (46.44) 17.6
Total 55397 (75.9)
55239 (75.61) -0.3
Note : Figures in parentheses indicate per hectare stock in tonnes Source : India State of Forest Report (Various Issues)
Chart 13.6 presents the forest carbon stock in different pools in 2019. The maximum per hectare
carbon stock was contained in soil organic carbon (SOC) at 46.44 tonnes per hectare, followed
by the carbon above ground biomass at 20.54 tonnes per hectare in 2019. The SOC contributes to
61.4 percent of the total forest carbon stock of Bihar, followed by above ground mass (27.2
percent). The dead organic matter consists of the pool of deadwood and litter, and it had a carbon
stock of 0.17 tonnes per hectare, accounting for only 0.2 percent of the total carbon stock in
Bihar. An increase of 5067 tonnes of forest carbon stock in soil organic carbon was found in
2019 compared to the estimates for 2017. This increase is crucial, as the soil organic carbon
would assist in improving the water-holding capacity of the soil, thereby minimizing the
vulnerability to drought conditions.

487
Chart 13.6 : Forest Carbon Stock in Different Pools in 2019
(Percent)
Source : India State of Forest Report (2019)
Diversion of Forest Area
The increasing demand for forest resources due to growing urbanization, increasing population, and developmental activities such as expansion of agriculture, industries, construction of roads etc. have led to depletion of forest resources. Table 13.15 presents the data on diversion of forest land for different purposes. As per the estimates of the concerned Department, during the period 2010-11 to 2018-19, around 155 projects have been undertaken in Bihar, where 1819.68 hectares of forest land has been converted for different purposes, such as construction of roads, laying of pipelines, development of rail and irrigation projects, and other uses.
Table 13.15 : Diversion of Forest Land for Different Purposes during 2010-11 to 2018-19
Nature of use/converted
land
Number of Projects
Area diverted to Non-forest
use (in hectare)
Road 60 1541.57
Electricity 33 145.06
Railway 3 50.42
Irrigation 1 60.41 Approach path for petrol pumps 53 1.72
Pipeline 2 5.31
Others 3 15.20
Total 155 1819.68
Source : Department of Environment, Forest and Climate Change, GoB
61.4, Soil Organic Carbon
27.2, Above Ground Biomass
9.8, Below Ground Biomass
1.4, Litter
0.2, Dead wood
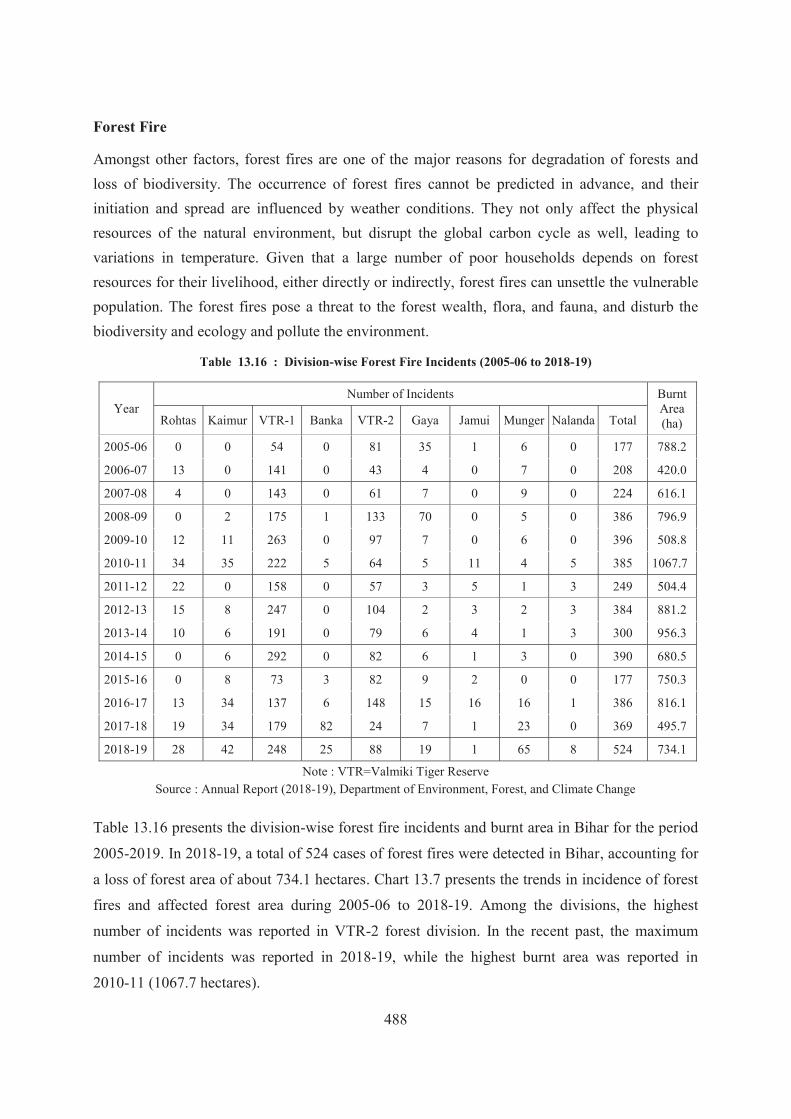
488
Forest Fire
Amongst other factors, forest fires are one of the major reasons for degradation of forests and loss of biodiversity. The occurrence of forest fires cannot be predicted in advance, and their initiation and spread are influenced by weather conditions. They not only affect the physical resources of the natural environment, but disrupt the global carbon cycle as well, leading to variations in temperature. Given that a large number of poor households depends on forest resources for their livelihood, either directly or indirectly, forest fires can unsettle the vulnerable population. The forest fires pose a threat to the forest wealth, flora, and fauna, and disturb the biodiversity and ecology and pollute the environment.
Table 13.16 : Division-wise Forest Fire Incidents (2005-06 to 2018-19)
Year Number of Incidents Burnt
Area (ha) Rohtas Kaimur VTR-1 Banka VTR-2 Gaya Jamui Munger Nalanda Total
2005-06 0 0 54 0 81 35 1 6 0 177 788.2
2006-07 13 0 141 0 43 4 0 7 0 208 420.0
2007-08 4 0 143 0 61 7 0 9 0 224 616.1
2008-09 0 2 175 1 133 70 0 5 0 386 796.9
2009-10 12 11 263 0 97 7 0 6 0 396 508.8
2010-11 34 35 222 5 64 5 11 4 5 385 1067.7
2011-12 22 0 158 0 57 3 5 1 3 249 504.4
2012-13 15 8 247 0 104 2 3 2 3 384 881.2
2013-14 10 6 191 0 79 6 4 1 3 300 956.3
2014-15 0 6 292 0 82 6 1 3 0 390 680.5
2015-16 0 8 73 3 82 9 2 0 0 177 750.3
2016-17 13 34 137 6 148 15 16 16 1 386 816.1
2017-18 19 34 179 82 24 7 1 23 0 369 495.7
2018-19 28 42 248 25 88 19 1 65 8 524 734.1
Note : VTR=Valmiki Tiger Reserve Source : Annual Report (2018-19), Department of Environment, Forest, and Climate Change
Table 13.16 presents the division-wise forest fire incidents and burnt area in Bihar for the period
2005-2019. In 2018-19, a total of 524 cases of forest fires were detected in Bihar, accounting for
a loss of forest area of about 734.1 hectares. Chart 13.7 presents the trends in incidence of forest
fires and affected forest area during 2005-06 to 2018-19. Among the divisions, the highest
number of incidents was reported in VTR-2 forest division. In the recent past, the maximum
number of incidents was reported in 2018-19, while the highest burnt area was reported in
2010-11 (1067.7 hectares).

489
Chart 13.7 : Trends in Incidence of Forest Fires and Affected Forest Area (2005-2018)
Source : Annual Report, Department of Environment, Forest and Climate Change, GoB
Revenue and Expenditure of Forest Department
The trend in revenue and expenditure of the Department of Environment, Forest and Climate Change for the years 2014-15 to 2018-19 is presented in Table 13.17 and in Chart 13.8. There is a steady increase in the revenue of the Department from Rs. 16.10 crore in 2014-15 to Rs. 24.13 crore in 2018-19, registering a compound annual growth rate of 11.0 percent. However, in case of overall expenditure, there is no clear trend. This is largely due to the mixed trends in plan expenditure, which has shown a negative growth of 2.5 percent during the last five years. However, the non-plan expenditure increased from Rs. 95.47 crore in 2014-15 to Rs. 122.86 crore in 2018-19, recording an annual growth of 6.2 percent. The highest level of expenditure for the Department was recorded in 2018-19 (Rs. 346.61 crore).
Chart 13.8 : Revenue and Expenditure of the Department of Forest (2013-14 to 2018-19)
(Rs. crore)
Source : Department of Environment, Forest & Climate Change, GoB
0
50100150200250300350400
2014-15 2015-16 2016-17 2017-18 2018-19
Revenue
Expenditure
0
200
400
600
800
1000
1200
0
100
200
300
400
500
600
2005 2006 2007 2008 2009 2010 2011 2012 2013 2014 2015 2016 2017 2018
Total Affected Forest Area (hectare) Number of Forest Fire Cases
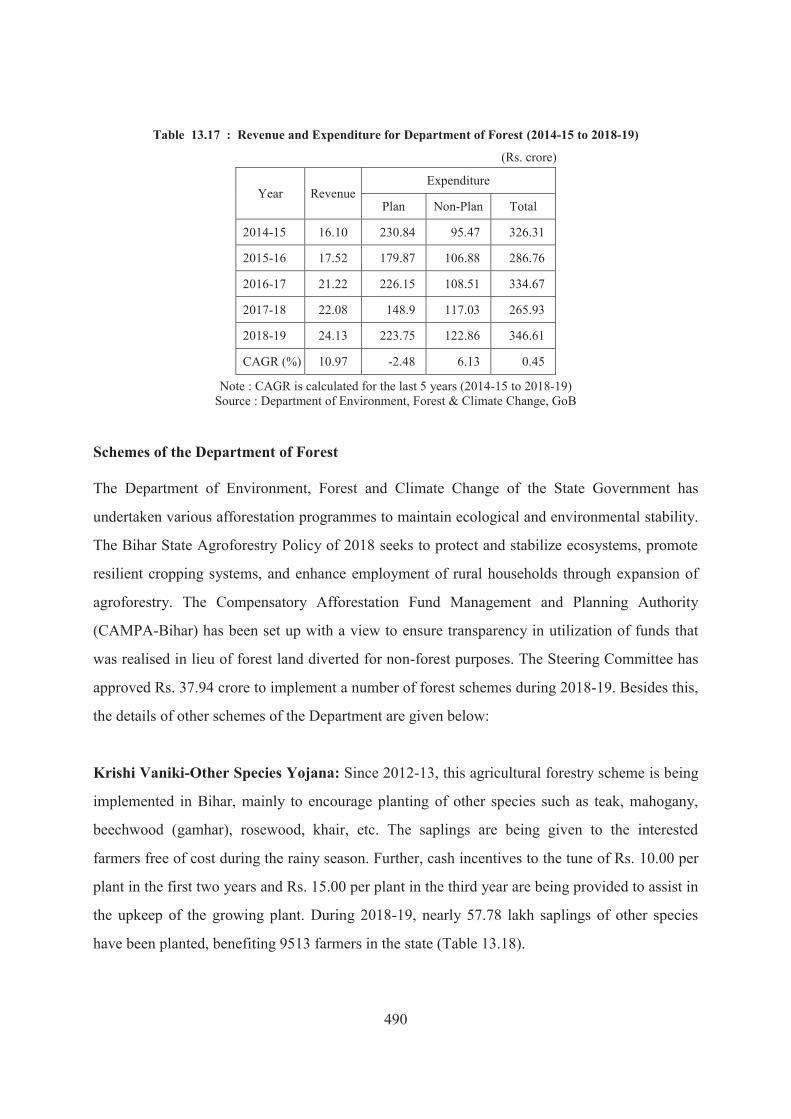
490
Table 13.17 : Revenue and Expenditure for Department of Forest (2014-15 to 2018-19)
(Rs. crore)
Year Revenue Expenditure
Plan Non-Plan Total
2014-15 16.10 230.84 95.47 326.31
2015-16 17.52 179.87 106.88 286.76
2016-17 21.22 226.15 108.51 334.67
2017-18 22.08 148.9 117.03 265.93
2018-19 24.13 223.75 122.86 346.61
CAGR (%) 10.97 -2.48 6.13 0.45
Note : CAGR is calculated for the last 5 years (2014-15 to 2018-19) Source : Department of Environment, Forest & Climate Change, GoB
Schemes of the Department of Forest
The Department of Environment, Forest and Climate Change of the State Government has
undertaken various afforestation programmes to maintain ecological and environmental stability.
The Bihar State Agroforestry Policy of 2018 seeks to protect and stabilize ecosystems, promote
resilient cropping systems, and enhance employment of rural households through expansion of
agroforestry. The Compensatory Afforestation Fund Management and Planning Authority
(CAMPA-Bihar) has been set up with a view to ensure transparency in utilization of funds that
was realised in lieu of forest land diverted for non-forest purposes. The Steering Committee has
approved Rs. 37.94 crore to implement a number of forest schemes during 2018-19. Besides this,
the details of other schemes of the Department are given below:
Krishi Vaniki-Other Species Yojana: Since 2012-13, this agricultural forestry scheme is being
implemented in Bihar, mainly to encourage planting of other species such as teak, mahogany,
beechwood (gamhar), rosewood, khair, etc. The saplings are being given to the interested
farmers free of cost during the rainy season. Further, cash incentives to the tune of Rs. 10.00 per
plant in the first two years and Rs. 15.00 per plant in the third year are being provided to assist in
the upkeep of the growing plant. During 2018-19, nearly 57.78 lakh saplings of other species
have been planted, benefiting 9513 farmers in the state (Table 13.18).

491
Table 13.18 : Distribution of Saplings to Farmers under Krishi Vaniki - Other Species Yojana (2013-14 to 2018-19)
Year Number of Beneficiaries
Total Number of Saplings
Planted (lakh) 2013-14 6897 71.06
2014-15 11863 103.36
2015-16 11298 95.17
2016-17 12355 94.63
2017-18 14272 104.4
2018-19 9513 57.78
Source : Department of Environment, Forest & Climate Change, GoB
Krishi Vaniki- Poplar Yojana (ETP) : This Agricultural Forestry Scheme is being implemented in Bihar to promote short rotation and commercial poplar plantation in farmers’ land with a view to increase tree cover for environmental protection. The Department provides poplar ETP free of cost to the selected beneficiaries, during December-January. Based on survival of the plants, the farmers get cash incentive amount towards maintenance of the plant — Rs. 10 each in first two years and Rs. 15 per plan in the third year. During 2012-2019, a total of 320.4 lakh plants have been planted, benefitting 40,628 farmers in the state.
Table 13.19 : Agricultural Forestry Scheme (2012-13 to 2018-19)
Year Number of
Beneficiaries Number of ETP (lakh)
2012-13 1091 4.87 2013-14 4399 31.71 2014-15 8811 87.52 2015-16 6980 60.34 2016-17 6817 52.73 2017-18 7819 56.29 2018-19 4711 26.94
Total 40628 320.4 Note : ETP = Entire Transport
Source : Department of Environment, Forest & Climate Change, GoB
Mukhya Mantri Niji Paudhshala-Poplar ETP Yojana : The poplar plantation scheme aims to set up nurseries with quality plants belonging to different species through entrepreneurs and farmers. This scheme is being implemented in the all the districts of Bihar, where the beneficiaries are being given a subsidy at the rate of Rs. 10,000 for cuttings per acre. The Department purchases the same at a pre-determined rate of Rs. 3.50 per plant. During 2018-19, 400 farmers have received about 40.0 lakh trees from the plantations (Table 13.20)
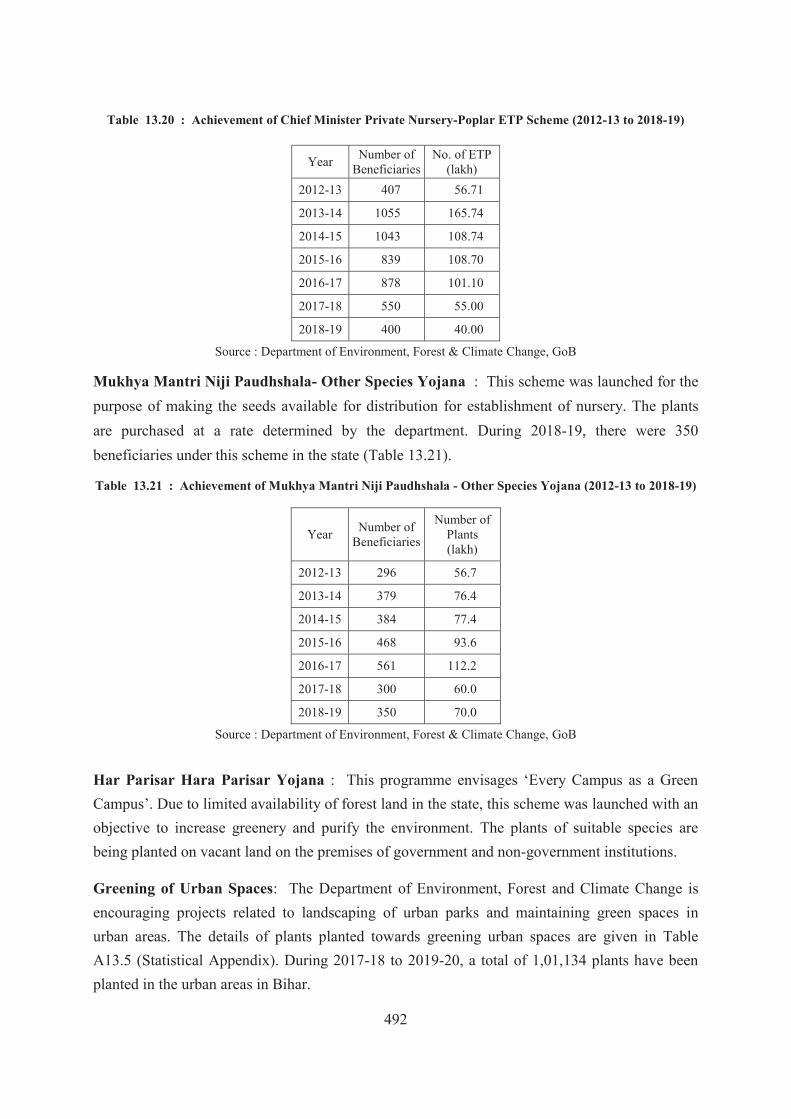
492
Table 13.20 : Achievement of Chief Minister Private Nursery-Poplar ETP Scheme (2012-13 to 2018-19)
Year Number of Beneficiaries
No. of ETP (lakh)
2012-13 407 56.71
2013-14 1055 165.74
2014-15 1043 108.74
2015-16 839 108.70
2016-17 878 101.10
2017-18 550 55.00
2018-19 400 40.00
Source : Department of Environment, Forest & Climate Change, GoB
Mukhya Mantri Niji Paudhshala- Other Species Yojana : This scheme was launched for the purpose of making the seeds available for distribution for establishment of nursery. The plants are purchased at a rate determined by the department. During 2018-19, there were 350 beneficiaries under this scheme in the state (Table 13.21).
Table 13.21 : Achievement of Mukhya Mantri Niji Paudhshala - Other Species Yojana (2012-13 to 2018-19)
Year Number of Beneficiaries
Number of Plants (lakh)
2012-13 296 56.7
2013-14 379 76.4
2014-15 384 77.4
2015-16 468 93.6
2016-17 561 112.2
2017-18 300 60.0
2018-19 350 70.0
Source : Department of Environment, Forest & Climate Change, GoB
Har Parisar Hara Parisar Yojana : This programme envisages ‘Every Campus as a Green Campus’. Due to limited availability of forest land in the state, this scheme was launched with an objective to increase greenery and purify the environment. The plants of suitable species are being planted on vacant land on the premises of government and non-government institutions.
Greening of Urban Spaces: The Department of Environment, Forest and Climate Change is encouraging projects related to landscaping of urban parks and maintaining green spaces in urban areas. The details of plants planted towards greening urban spaces are given in Table A13.5 (Statistical Appendix). During 2017-18 to 2019-20, a total of 1,01,134 plants have been planted in the urban areas in Bihar.

493
Jal-Jeevan-Hariyali Campaign
The climate change and its ever-increasing evil consequences have been considered by the State
Government of Bihar as a warning of nature. Recognising the significant consequences of
climate change, the State Government is focusing on managing water, forests, and other natural
resources to lessen the risks of environmental degradation. In this context, a joint meeting of the
members of the Legislative Assembly and Legislative Council was organized in July 2019.
There, the representatives from all parties expressed their concern for climate change and
environmental degradation. The Honourable Chief Minister also expressed his anxiety over the
issue and shared his views. Based on the suggestions, it was considered necessary to design
effective strategies to maintain environmental balance and, consequently, the Jal-Jeevan-Hariyali
scheme was conceptualized. It was also agreed that, for environmental conservation, an intensive
people’s campaign may be initiated. The Jal-Jeevan-Hariyali campaign started in the state,
keeping in view the challenge of environmental protection and making the people responsible
towards the environment.
The State Government has expressed concerns on the way the trees are felled all over the world
and their far-reaching consequences on environmental degradation. The rainfall in the state has
declined from 1200-1500 mms. to about 1027 mms. in the last thirty years. The decline is more
in the last decade, when the average rainfall in the state has been only about 900 mms. At the
same time, sudden high intensity rains in Nepal foothill and some adjoining districts of north
Bihar led to a situation of a flash flood. Also, last year Kishanganj district recorded 500 mms
rains during a period of only four days. Bihar is facing irregular rainfall, thunderstorm and
heatstroke, all occurring as a result of the changes in the environment. On one side, there is a
flood like situation in some regions of the state, particularly in North-Bihar and, on the other,
there is drought in some parts of southern Bihar. All this highlights the necessity for Jal-Jeevan-
Haryali campaign.
In a recent survey, it was observed that the state had green cover only to the extent of 9.7 percent
of the total geographical area. In order to increase green cover, a target of 24 crore plantations
has been set, out of which, plantations of 19 crore have already been completed by 2019. With a
view to increasing green cover, a target of 1.5 crore plantations per year has been fixed. There
are plans to plant trees along the roads, embankments, Ahar Pynes and the banks of ponds.

494
Jal-Jeevan-Hariyali Campaign
Jal-Jeevan-Hariyali is a flagship programme of the State Government which is intended to
tackle issues related to climate change and environmental degradation. The awareness
campaign for the Jal-Jeevan-Hariyali scheme was launched on August 9, 2019 on the
occasion of Bihar Earth Day. This programme was telecast live through webcasting and
electronic medium to all the districts of the state and was viewed by more than 20 lakh
JEEViKA didis, along with crores of people. Special meetings were organized at the cluster
level and various organisations resolved to plant ‘one member-two trees’. Also, a state-wide
human chain formation was organised on January 19, 2020, to create awareness about
environmental conservation under the Jal-Jeevan-Hariyali campaign. More than 5.17 crore
people participated in the 18,034-kilometre-long human chain expressing their solidarity
with the campaign. The Chief Minister launched a logo for Jal-Jeevan-Hariyali Campaign, on
which it is mentioned ‘Jal-Jeevan-Hariyali Tabhi Hogi Khush-hali’ (Only Jal Jeevan and
Hariyali can bring happiness). The total expenditure for the execution of various schemes
under Jal-Jeevan Hariyali Campaign is estimated to be Rs 24,524 crore in three years, during
2019-20 to 2021-22.
To make people aware of Jal-Jeevan-Hariyali campaign, communication networks with the co-operation of all the departments are being developed. The street plays (nukkad natak) are being organized for the awareness of the rural community. To promote the campaign, the State Government had organized a state-wide human chain formation on January 19, 2020 to create awareness about the environmental protection and climate change. This historic event saw participation of about 5.17 crore people, who formed a 18,034 kilometres long chain, one of the largest human chain formations in the world.
The State Government has prepared a detailed budget — department-wise, component-wise, and year-wise- for the Jal-Jeevan-Hariyali Campaign. For the execution of this programme, 12 departments are involved. The total expenditure for the execution of various schemes under Jal-Jeevan-Hariyali Campaign is estimated to be Rs. 24,524 crore in three years during 2019-20 to 2021-22. The expenditures for 2019-20, 2020-21 and 2021-22 are estimated to be — Rs. 5870 crore, Rs. 9874 crore and Rs. 8780 crore, respectively. Under the administrative head of Jal-Jeevan-Hariyali Campaign, the estimated expenditures are —Rs. 6.19 crore in 2019-20, Rs. 8.42 crore in 2020-21 and Rs. 8.78 crore in 2021-22. The detailed component wise proposed expenditure is given in Table 13.22.

495
Table 13.22 : Department-wise Work-Plan and Estimated Budget (2019-20 to 2021-22)
Sl. No. Department Components Estimated Amount (Rs. crore)
2019-20 2020-21 2021-22 Total
1 Rural
Development Department
1 Renovation of Public Water Harvesting Structures like – Talabs/Pokhars/Ahars/ Pynes (Up to approx. 1 acre)
737 1105 921 2763
2
Construction of Sokhta/Recharge/Others Water Harvesting Structures near Public wells /Handpumps/ Tube Wells (construction of Sokhtas near Public Hand pumps)
53 75 60 188
3
Construction of structures related to check-dam and water harvesting in the water collection area of small rivers/Nala and mountain areas
53 98 75 226
4 Creation of new water sources and routing of surplus river water to water deficient area (Public Pokhars and fields)
150 180 120 450
5
Construction of Rainwater harvesting structures on the building roof tops of the buildings (except Building Construction, Education, Health Department buildings)
21 50 34 105
6 Development of Nursery and dense Plantation 281 401 474 1156
Total 1295 1909 1684 4888
2 Minor Water
Resources Department
1
To identify and free Public Water harvesting structures like Talab/ Pokahars/Ahars/Pynes from encroach-ments (larger than 1 acre)
2820 4900 4900 12620
2
Construction of Sokhta/Recharge/Others Water Harvesting Structures near Public wells/ Handpumps/ Tube Wells (Near Public Tube wells )
0 15 15 30
3
Construction of structures related to check-dam and water harvesting in the water collection area of small rivers/Nala and mountain areas
360 300 300 960
Total 3180 5215 5215 13610
3
Urban Development and Housing Department
1 Renovation of Public Water Harvesting Structures like – Talabs/Pokhars/ Ahars/Pynes (in urban area)
100 100 100 300
2 To identify and renovate Public wells (in urban areas) 1 2 2 5
3
Construction of Sokhta/Recharge/Others Water Harvesting Structures near Public wells /Handpumps/ Tube Wells (in urban area)
10 10 10 30
Total 111 112 112 335
4
Public Health Engineering/ Panchayati
Raj Department
1 To identify and renovate Public wells
100 200 75 375 2
Construction of Sokhta/Recharge/Others Water Harvesting Structures near Public wells/ Handpumps/ Tube Wells (construction of Sokhtas near Public wells)
Total 100 200 75 375

496
5
Environment, Forest and
Climate Change
Department
1
Construction of structures related to check-dam and water harvesting in the water collection area of small rivers/Nala and mountain areas (groundwater conservation in forest areas – in hectares)
30 60 60 150
2 Development of Nursery and Dense Plantation 450 600 550 1600
Total 480 660 610 1750
6 Water
Resources Department
1 Creation of new water sources and routing of surplus river water to water deficient area (routing of surplus river water to water deficient area)
200 1200 600 2000
Total 200 1200 600 2000
7 Animal
Husbandry and Fisheries Department
1 Creation of new water sources and routing of surplus river water to water deficient area (development of Chaurs on private land)
10 50 40 100
Total 10 50 40 100
8 Department
of Agriculture
1 Use of alternate crops, drip irrigation, organic farming and other new techniques
2 Development of crops, gardening, plantation in fields through water conservation
25 50 25 100
3 Organic Farming 48 48 48 144 4 Drip irrigation system 130 140 150 420
5 Creation of new water sources and routing of surplus river water to water deficient area (in non-forest water catchment areas)
10 20 20 50
Total 213 258 243 714
9 Department of Energy
1 To encourage use of solar energy and energy saving
2 in govt. buildings (25% will be budget of energy department and 75% to be borne by respective department/organisation)
60 60 60 180
3 In private buildings (RESCO) 30 30 30 90 Total 90 90 90 270
10 Building
Construction Department
1
Construction of Rainwater harvesting structures on the building roof tops of the buildings (Maintenance of buildings under Building Construction Department)
65 0 0 65
2 To encourage use of solar energy and energy saving 15 15
Total 80 0 0 80
11 Other Departments
1 Construction of Rainwater harvesting structures on the building roof tops of the buildings (Education Department)
84 126 84 294
2 Construction of Rainwater harvesting structures on the building roof tops of the buildings (Health Department)
2 4 2 8
Total 86 130 86 302
12
Information and Public Relations
Department
1 Jal-Jeevan-Hariyali Awareness Campaign 25 50 25 100
Grand Total 5870 9874 8780 24524 Source : Department of Rural Development, GoB

497
To ensure success of the programme, it was agreed to establish Jal-Jeevan-Hariyali Mission in a meeting convened on September 25, 2019. This Mission has been registered under the Society Registration Act and it was decided to appoint an officer of the additional secretary rank to head the Mission. There are 16 members in its Governing body, with the Chief Secretary as its Chairman. The Executive Committee includes 13 members, with Development Commissioner as its Chairman. In order to provide consultancy in the execution of the Jal-Jeevan-Hariyali campaign, a state Consultative Committee has been constituted under the Chairmanship of Parliamentary Affairs Minister, with 15 legislative assembly members nominated by the Bihar Legislative Assembly, and 5 members nominated by the Bihar Legislative Council. The Consultative Committee will also include Development Commissioner, Additional Chief Secretary, Principal Secretary or Secretary of the Departments relating to Jal-Jeevan-Hariyali campaign. The Secretary of Rural Development will be its Member-Secretary. At the district level, under the Chairmanship of Minister-in-charge, the District Consultative Committee will be organized, with the District Magistrate as its Convenor. Officers from all the related departments at the district level will be the members of the District Consultative Committee.
13.4 Air Pollution
Air pollution is one of the biggest challenges of the world today. The rise in anthropogenic activities such as burning of fossil fuels, industrial and vehicular emissions, construction dust, agricultural residue, burning of domestic fuel and open waste, etc. is leading to high levels of air pollutants affecting the lung capacity and respiratory system of human beings. Besides these, pollution caused from natural phenomena such as forest fires, pollen grains, radioactive materials, and biological decay, etc. are also adding to air pollution. Through the National Air Quality Monitoring Programme, the Central Government is monitoring the levels of four major air pollutants in 312 cities/towns across the country. These pollutants are — sulphur dioxide (SO2), nitrogen dioxide (NO2), suspended particulate matters (PM10), and fine particulate matters (PM2.5). The annual average values of ambient air quality at different locations in Bihar during 2017 and 2018 are presented in Table 13.23. Chart 13.9 presents the annual average values on air quality at specific locations in Bihar in 2018.
Given that some cities in Bihar (Patna, Muzaffarpur, and Gaya) figure in the category of ‘very poor’ with regard to air quality, the State Government is creating awareness through campaigns, such as ‘Care for Air’. The burning of crop stubble in agricultural fields in Bihar is also of concern as it raises the concentration of particulate matter in the air to 1000 microgram per cubic metre. Recently, the State Government has announced that the farmers who are found to be burning crop residue would be deprived of financial assistance for a period of three years. There is also an emphasis on use of cleaner fuels such as CNG/LPG for vehicles, promotion and

498
operationalization of E-rickshaw, regular cleaning of road dust, tree plantation along the roads, covering of construction site, transportation of construction materials like sand, soil, stone chips etc. in a covered manner, and adoption of cleaner technology in brick kilns to control air pollution in the city of Patna. The State Government is promoting initiatives to develop green-belts and avenue plantations for in-situ urban pollution dispersal. Further, Gas Authority of India Limited (GAIL) is creating City Gas Distribution Network in Patna geographical area, comprising domestic Piped Natural Gas (PNG) connection and Compress Natural Gas (CNG) network. This will have a Minimum Work Plan of 50,154 PNG connection and 2445 inch-km. in the first five years. Patna covers an area of 3202 sq. kms. and the estimated project cost is Rs. 850 crore for a 25 years work plan. GAIL, with an investment of Rs. 98 crore, has already completed 11,000 PNG infrastructure and made 5 CNG stations operational. By March, 2020 two more CNG stations along with 1500 more PNG infrastructure shall be made ready.
Table 13.23 : Annual Average Values of Ambient Air Quality in Bihar (2017 and 2018)
Station Name Location Type
PM10 (RSPM) in μg/m3 SO2 in μg/m3 NO2 in μg/m3 PM2.5 in μg/m3
2017 2018 2017 2018 2017 2018 2017 2018 Gaya Raja Market Residential 77.5 90.1 11.1 11.8 21.6 21.5 — —
Darbhanga Kadirabad Chowk Residential 72.1 116 11.1 16.8 20.3 23.6 — —
Rohtas Sasaram Residential 84.3 87.5 11.1 11.7 21.8 21.3 — — Rajgir Sujkund Residential 84 88 10.9 11.9 22.1 22.3 — — Patna Shastri Nagar Residential 129 128 3.39 6.2 27.78 36.4 — — Patna Gandhi Maidan Residential 129 275 5.4 8.2 49.9 62.6 — —
Begusarai Industrial Area Barauni Industrial 126.5 108.4 9.9 12.1 22.9 21.5 68.1 58.6
Muzaffarpur Bela Industrial Area Industrial 166.5 138.8 10.9 14 20.1 24.3 88.7 105.8
Note : Standard Value for 24 hours : PM10 (RSPM) = 100 ug/m3, PM2.5 = 60/ug/m3, SO2 = 80 ug/m3, NO2 = 80 ug/m3
Source : Bihar State Pollution Control Board
Chart 13.9 : Annual Average Values on Air Quality at Specific Locations in Bihar (2018)
Source : Bihar State Pollution Control Board
0 50 100 150 200 250 300
GayaDarbhanga
RohtasRajgir
Patna_ShastrinagarPatna_Gandhi Maidan
BegusaraiMuzaffarpur
Limit
NO2
SO2
PM10

499
13.5 Noise Pollution
Increasing urbanization, population growth, and expanding economic activities have led to rising ambient noise pollution. The different sources are — construction, road traffic, railways, industries, loudspeakers, etc. The daily exposure to high noise levels over long periods of time can have adverse effects on the lives of humans and animals. The Bihar State Pollution Control Board (BSPCB) is monitoring noise level at five different locations in Patna to formulate an action plan to control the noise pollution level in the city.
Table 13.24 presents the annual data on ambient noise levels and standard limits at five locations in Patna for the period 2016-18 at both day and night times. In the three-year period, all the five locations had noise levels higher than the permissible decibels during the day time. The night-time ambient noise pollution was the highest at railway station, with 16 points higher than the permissible limit of 55 decibels during 2016. Chart 13.10 presents the annual values of ambient noise quality at these monitoring stations for day and night times. Notably, there has been a declining trend in noise pollution levels in Patna over the period. The State Government is promoting awareness drive against honking to reduce noise pollution in the city.
Table 13.24 : Annual Data on Ambient Noise Monitoring at Five Locations in Patna (2016-2018)
(Avg in Leq dB)
Year
Beltron Bhawan Shastrinagar
Coca Cola Patliputra
Planetarium Adalatganj
Railway Station Golambar
PMCH Ashok Rajpath
Residential Industrial Commercial Commercial Silence Day Night Day Night Day Night Day Night Day Night
2016 57.0 56.0 70.0 68.9 71.0 70.5 71.3 70.9 61.0 59.9 2017 48.7 47.3 61.2 61.1 64.1 61.9 60.4 58.9 58.1 57.6 2018 47.5 43.0 58.0 57.7 63.7 56.8 59.9 55.0 51.5 48.0 Limit 55.0 45.0 75.0 70.0 65.0 55.0 65.0 55.0 50.0 40.0
Note : Leq = Equivalent Continuous Sound Level Source : Bihar State Pollution Control Board
Chart 13.10 : Annual Values of Ambient Noise Quality in Monitoring Stations (2016-18)
Source : Bihar State Pollution Control Board
01020304050607080
BeltronBhawan
Shastrinagar(Residential)
Coca ColaPatliputra
(Industrial)
PlanetariumAdalat gan
(Commercial)
RailwayStation Junc.
Golambar(Commercial)
PMCH AshokRajpath
(Silence)
Noise Monitoring during Daytime in Patna
2016 2017 2018 Limit
01020304050607080
BeltronBhawan
Shastrinagar(Residential)
Coca ColaPatliputra
(Industrial)
PlanetariumAdalat gan
(Commercial)
RailwayStation Junc.
Golambar(Commercial)
PMCH AshokRajpath
(Silence)
Noise Monitoring during Nighttime in Patna
2016 2017 2018 Limit

500
13.6 Biodiversity and Wildlife
Climate change, deforestation, burning of fossil fuels and other anthropogenic influences are
causing high risk to the survival of diverse wildlife. In many ways, the threat of climate change
infringes the security of wildlife habitats, causing to change their habitat, disrupting ecological
linkages, or directly threatening their survival. The Shivalik-Gangetic Plain landscapes are one of
the most important centres of diverse biological diversity and ecosystem services. However, the
rise in temperature, variability in precipitation, emission flows, deforestation, dwindling water
resources and population dynamics are endangering the wildlife and their ecosystems. The State
Government’s efforts in conservation and protection of biodiversity and wildlife include many
activities, including a number of bird and wildlife sanctuaries in Bihar. Some of the areas are
notified as eco-sensitive zones in the state.
Table 13.25 presents the details of wildlife, biosphere and bird sanctuaries in Bihar. The Valmiki
Tiger Reserve is located in an area of 893.73 sq. kms. in the district of West Champaran, housing
the Panthera Tigris. As per the estimates of the National Tiger Conservation Authority, Bihar
experienced 11 tiger deaths during 2012 to 2018, out of which, 5 were due to natural causes and
2 each due to poaching and seizure. The tiger population in Bihar has increased from 8 in 2010
to 31 in 2018.
The Vikramshila Gangeya Dolphin Sanctuary situated in Bhagalpur in an area of 60 kms.
provides habitat for the Gangetic Dolphin (Platanista Gangetica), freshwater fishes and turtles.
The state has five bird sanctuaries, with diverse species of water and migratory birds. The state
also has a number of wildlife sanctuaries, such as Bheembandh Wildlife Sanctuary, Gautam
Buddha Wildlife Sanctuary, Pant Wildlife Sanctuary (Rajgir), Kaimur Wildlife Sanctuary,
Rajauli Wildlife Sanctuary (Nawada) and Udaipur Wildlife Sanctuary. The State Government is
encouraging people’s participation through eco-development committees to protect wildlife and
its habitat.

501
Table 13.25 : Wildlife, Biosphere Reserves and Bird Sanctuaries in Bihar
Name of Sanctuary/ Reserve Location (District) and Area
Date of Notification
Eco-Sensitive
Zone (Area in Ha)
Wildlife Species
Valmiki Tiger Reserve W. Champaran 893.73 Sq.Km 07.08.2012 83576.9
Tiger, Indian Rhinoceros, Black Bear, Indian Sloth Bear, Otter, Indian Leopard, Wild Dog, Buffalo, Boar, Barking Deer, Spotted Deer, Hog Deer, Sambar, Blue Bull, Hyena, Leopard Cat, Wild Cat, Fishing Cat, Langur, Monkey, Flying Squirrel, Clouded Leopard, Indian Gaur, Mongoose
Sanctuaries
Bheembandh Wildlife Sanctuary Munger
681.9 Sq.Km 27.05.1976 44311.3
Black Bear, Boar, Barking Deer, Spotted Deer, Hog Deer, Blue Bull, Leopard Cat, Wild Cat, Langur, Monkey, Mongoose
Gautam Buddha Wildlife Sanctuary
Gaya 138.33 Sq.Km
14.09.1976 14925.0
Pant Wildlife Sanctuary, Rajgir Nalanda
35.84 Sq.Km 25.05.1978 2954.5
Kaimur Wildlife Sanctuary Kaimur & Rohtas 1504.96 Sq.Km
20.07.1979 48555.0
Rajauli (Nawada) Wildlife Sanctuary
Nawada 2.72 Sq.Km
10.05.2019 —
Udaipur Wildlife Sanctuary W. Champaran
3.19 Sq.Km 05.05.1978 3759.0 Ox-Bow Lake with Swampy
Forest
Nagi Dam Bird Sanctuary Jamui
1.92 Sq.Km 28.11.1983 2140.4 Water Birds, Migratory Birds
Nakti Dam Bird Sanctuary Jamui 3.33 Sq.Km 22.07.1987 2329.2 Water Birds, Migratory Birds
Kaabar Jheel Bird Sanctuary Begusarai 63.12 Sq.Km 20.06.1989 Water Birds, Migratory Birds
Kusheshwarsthan Bird Sanctuary Darbhanga 29.21 Sq.Km 05.07.1994 3293.0 Water Birds, Migratory Birds
Salim Ali Jubba Sahni Baraila Jheel Bird Sanctuary
Vaishali 1.98 Sq.Km 28.01.1997 1083.6 Water Birds, Migratory Birds
Vikramshila Gangeya Dolphin Sanctuary
Bhagalpur 60 Km 22.08.1990 12221.0
Gangetic Dolphin (Platanista Gangetica), Freshwater Fishes and Turtles
Source : Department of Environment, Forest and Climate Change, GoB
13.7 Disaster Management
Bihar is one of the climate-sensitive states in India, because of its geographical location and
related hydro-meteorological uncertainties. This is evident in the frequent occurrence of disasters
such as earthquake, thunderstorm, heatwave, flood, drought, etc. The disasters affect the lives
and livelihood of people. The south-west monsoon brings the maximum rainfall in the state,
lasting from June to September, and often causes flood-like situation, especially in the northern

502
districts. In recent years, changing climatic conditions have led to increase in frequency and
intensity of floods and droughts. Bihar experienced heavy rainfall during the south-west
monsoons in 2019 leading to localised cyclonic circulations resulting in occurrence of lightning
and thunderstorms. The district-wise incidence of deaths due to thunderstorms during
2015-2019, is presented in Table A 13.6 (Statistical Appendix). In 2019, there were 216 reported
cases of death due to thunderstorms in the state. The districts of Jamui, Aurangabad, Gaya, and
Nalanda had more than 15 deaths each due to thunderstorms.
The damage to crop due to drought has been widespread in the state. The floods during July to
September, 2019 affected districts such as Sheohar, Sitamarhi, East Champaran, Madhubani,
Araria, Kishanganj, Supaul, Darbhanga, Muzaffarpur, Saharsa, Katihar, Purnea, and West
Champaran. Excessive rainfall in the kharif season and overflowing rivers have resulted in
substantial crop damage. As per the estimates of the Department of Agriculture, more than 5 lakh
hectares of the state could not be sown (Table 13.26). An amount of Rs 772.47 crore has been set
aside for distribution of agricultural input grant to the farmers facing crop damage due to floods.
Table 13.26 : Flood and Drought related Reports in Kharif (2019)
Particulars Damaged Area (’000 hectares)
Damage (Rs. lakh)
Net Sown Area 5259.34 —
Total Crop Area Affected 396.14 50788.62
Flood related Damage July 2019 (Loss more than 33 percent) 175.76 23645.70
Flood related Damage September 2019 (Loss more than 33 percent) 2208.38 27142.92
Unsown Area 389.10 26458.85
Total Loss 785.24 77247.47
Source : Department of Agriculture, GoB
The State Government lays high priority on efficient management of disasters in the state.
Keeping in view the damage caused by rains and floods in Bihar, the State Government has set
aside an expenditure of Rs. 1607.14 crore for relief on account of natural calamities in 2018-19.
Further, an expenditure of Rs. 300.00 crore has been assigned for providing diesel subsidy in
2018-19. The State Government is providing financial assistance to the farmers in case of
damage to the crops due to natural calamities under the Bihar Rajya Fasal Sahayata Scheme. For
the execution of this crop assistance scheme, an expenditure of Rs. 318.23 crore has been

503
earmarked by the State Government in 2018-19. The Bihar State Action Plan on Climate Change
(Bihar-SAPCC) aims to focus on strategies relating to agriculture, water resources, forests and
biodiversity, and disaster management. The 15-year Disaster Risk Reduction roadmap of Bihar
envisages to follow a community-centric approach for disaster reduction in priority sectors, such
as agriculture. The State Disaster Management Plan points to the need to establish ‘Sankalp
Kendra’ to enable community-based disaster management. There are measures being taken to
revive the ponds and reservoirs in north Bihar and Ahar-Pynes in the southern part to enable
water conservation measures to meet the flood and drought-like situations. The Disaster
Management Cell is overseeing the measures for better preparedness for tackling natural and
man-made disasters in the state. Further, efforts are being made towards capacity building,
strengthening the functioning of the District Disaster Management Authorities, organising public
awareness campaigns, and investing more in the management of disasters in the state.

504
APPENDIX
Table A 13.1 : District-wise Annual Rainfall across Different Seasons (2018 and 2019)
(Rainfall in mm)
District
2018 2019 (Up to September)
Winter Rain
Hot Weather
Rain
South-West
Monsoon
North-West
Monsoon Annual Winter
Rain
Hot Weather
Rain
South-West
Monsoon Annual
Patna 0.0 25.2 582.2 5.8 613.2 10.9 28.1 799.6 838.6 Nalanda 0.0 31.4 647.9 20.6 699.9 27.7 35.9 836.3 899.9 Bhojpur 0.0 19.1 723.6 0.6 743.3 17.6 33.5 814.7 865.8 Buxar 0.0 25.3 691.3 0.2 716.8 17.5 31.4 828.8 877.6 Rohtas 0.0 1.5 607.5 6.5 615.5 1.1 2.4 777.8 781.4 Kaimur 0.0 16.5 837.2 2.8 856.5 20.8 9.2 1032.6 1062.6
Gaya 0.0 16.0 747.2 20.1 783.3 22.8 23.5 855.7 902.0 Jehanabad 0.0 0.9 394.5 7.8 403.2 14.7 44.3 714.7 773.6 Arwal 0.0 0.0 581.4 3.6 585.0 19.6 7.5 545.4 572.5 Nawada 0.0 24.5 651.3 5.7 681.5 27.8 9.0 837.8 874.6 Aurangabad 0.0 2.2 727.7 26.3 756.6 16.0 14.0 854.2 884.2
Saran 0.0 37.4 464 0.6 502.0 16.6 11.9 990.6 1019.0 Siwan 0.0 74.5 599.9 0.2 674.6 24.2 18.3 1403.1 1445.6 Gopalganj 0.0 75.5 665.7 0.0 741.2 26.8 12.3 1245.8 1284.8
W. Champaran 0.0 55.2 483.5 7.8 546.5 32.9 15 1035.4 1083.3 E. Champaran 0.0 71.2 716.4 2.9 790.5 40.0 59.2 1184.5 1283.7 Muzaffarpur 0.0 156.5 1011.8 3.2 1171.5 53.2 58.0 1248.5 1359.7 Sitamarhi 0.0 89.5 877.3 0.7 967.5 24.1 84.0 1012.3 1120.3 Sheohar 0.0 83.6 678.1 0 761.7 27.8 42.3 951.1 1021.2 Vaishali 0.0 59.1 493.2 0.6 552.9 15.2 11.9 1003.9 1030.9
Darbhanga 0.0 57.7 513.6 7.0 578.3 16.9 65.3 977.6 1059.8 Madhubani 0.0 61.0 836.3 4.8 902.1 25.6 101.5 1025.1 1152.2 Samastipur 0.0 111.1 622.3 13.5 746.9 26.2 36.8 928.2 991.2
Munger 0.0 99.9 818.4 101.8 1020.1 40.2 23.2 798.8 862.2 Lakhisarai 0.0 73.4 561.7 180 815.1 34.0 18.6 680.6 733.2 Sheikhpura 0.0 26.1 525.7 33.9 585.7 27.8 13.6 580.2 621.7 Jamui 0.0 84.7 582.1 44.4 711.2 36.7 10.6 728.3 775.6 Begusarai 0.0 78.6 584.2 51.2 714.0 16.1 11.7 778.2 806.0 Khagaria 0.0 35.9 509.7 95.5 641.1 40.3 49.0 935.5 1024.7
Bhagalpur 0.0 120.0 728.8 62.6 911.4 45.7 96.4 1023.5 1165.6 Banka 0.0 33.8 699.2 41.9 774.9 44.7 79.9 817.7 942.3
Saharsa 0.0 81.3 556.4 38.4 676.1 35.7 85.2 1100.4 1221.2 Supaul 0.0 138.2 843.6 23.4 1005.2 61.7 126.9 1241.0 1429.6 Madhepura 0.0 102.7 765.6 28.8 897.1 32.4 116.0 1191.6 1339.9
Purnea 0.0 94.6 942.5 30.9 1068.0 35.8 131.2 1130.8 1297.8 Kishanganj 0.0 138.5 1358.1 25.7 1522.3 27.5 342.8 1581.4 1951.8 Araria 0.0 151.6 852.8 17.4 1021.8 36.4 160.2 1310.4 1507.1 Katihar 0.0 126.9 722.6 51.6 901.1 32.3 142.0 993.6 1167.9
Bihar 0.0 65.3 689.6 25.5 780.4 28.2 56.9 968.3 1053.5 Source : Directorate of Economics and Statistics, GoB

505
Table A 13.2 : District-wise Groundwater Recharge in Bihar (2017)
(in bcm)
District
Groundwater Recharge Total
Natural Discharge
Monsoon Season Non-Monsoon Season
Total Recharge from
rainfall
Recharge from other
sources
Recharge from
rainfall
Recharge from other
sources Patna 0.69 0.09 0.10 0.13 1.00 0.07 Nalanda 0.50 0.11 0.07 0.21 0.89 0.08 Bhojpur 0.55 0.18 0.03 0.18 0.94 0.09 Buxar 0.30 0.17 0.02 0.16 0.66 0.07 Rohtas 0.88 0.12 0.10 0.05 1.16 0.10 Kaimur 0.59 0.15 0.04 0.21 0.99 0.09
Gaya 0.81 0.09 0.14 0.12 1.15 0.08 Jehanabad 0.21 0.04 0.02 0.08 0.35 0.03 Arwal 0.13 0.05 0.02 0.03 0.22 0.01 Nawada 0.41 0.07 0.04 0.11 0.63 0.05 Aurangabad 0.73 0.10 0.13 0.08 1.04 0.05
Saran 0.59 0.10 0.06 0.12 0.88 0.06 Siwan 0.46 0.24 0.05 0.20 0.94 0.06 Gopalganj 0.51 0.16 0.06 0.17 0.89 0.07
W. Champaran 0.99 0.23 0.16 0.34 1.72 0.11 E. Champaran 0.92 0.24 0.16 0.15 1.46 0.12 Muzaffarpur 0.66 0.20 0.09 0.25 1.20 0.10 Sitamarhi 0.56 0.07 0.03 0.05 0.70 0.05 Sheohar 0.12 0.01 0.00 0.01 0.14 0.01 Vaishali 0.48 0.12 0.07 0.10 0.77 0.07
Darbhanga 0.55 0.14 0.11 0.16 0.96 0.08 Madhubani 0.76 0.18 0.10 0.14 1.17 0.11 Samastipur 0.58 0.27 0.13 0.36 1.34 0.08
Munger 0.25 0.06 0.02 0.05 0.37 0.03 Lakhisarai 0.22 0.05 0.02 0.03 0.32 0.03 Sheikhpura 0.14 0.03 0.02 0.04 0.23 0.02 Jamui 0.30 0.03 0.02 0.04 0.40 0.03 Begusarai 0.44 0.06 0.05 0.16 0.71 0.07 Khagaria 0.39 0.05 0.04 0.29 0.76 0.08
Bhagalpur 0.60 0.03 0.09 0.03 0.76 0.05 Banka 0.31 0.08 0.06 0.05 0.50 0.03
Saharsa 0.39 0.05 0.06 0.04 0.54 0.03 Supaul 0.54 0.11 0.19 0.09 0.92 0.07 Madhepura 0.38 0.07 0.09 0.10 0.65 0.04
Purnea 0.80 0.04 0.29 0.04 1.17 0.06 Kishanganj 0.60 0.01 0.16 0.02 0.79 0.08 Araria 0.68 0.05 0.23 0.02 0.99 0.07 Katihar 0.82 0.08 0.11 0.09 1.10 0.10
Bihar 19.83 3.95 3.14 4.50 31.41 2.43 Source : National Compilation on Dynamic Groundwater Resources of India, 2017
Contd.

506
Table A 13.2 : District-wise Groundwater Recharge in Bihar (2017) (Contd.)
(in bcm)
District
Annual Extractable
Ground-water
Resources
Current Annual Groundwater Extraction Stage of Ground Water
Extraction (%) Irrigation Industrial Domestic Total
Patna 0.93 0.43 0.03 0.10 0.56 60.1 Nalanda 0.80 0.47 0.03 0.05 0.55 68.8 Bhojpur 0.85 0.40 0.02 0.05 0.47 56.0 Buxar 0.59 0.26 0.01 0.03 0.31 51.6 Rohtas 1.06 0.19 0.01 0.05 0.26 24.3 Kaimur 0.90 0.26 0.01 0.03 0.30 33.2
Gaya 1.08 0.59 0.04 0.08 0.71 65.8 Jehanabad 0.32 0.28 0.01 0.02 0.31 95.7 Arwal 0.21 0.06 0.00 0.01 0.08 38.6 Nawada 0.58 0.26 0.02 0.03 0.31 52.9 Aurangabad 0.99 0.21 0.01 0.04 0.26 26.6
Saran 0.82 0.43 0.03 0.07 0.52 63.7 Siwan 0.88 0.42 0.02 0.06 0.50 56.8 Gopalganj 0.82 0.53 0.03 0.05 0.60 73.4
W. Champaran 1.61 0.27 0.02 0.07 0.36 22.6 E. Champaran 1.34 0.44 0.03 0.09 0.56 41.9 Muzaffarpur 1.10 0.62 0.04 0.09 0.74 67.6 Sitamarhi 0.65 0.23 0.01 0.06 0.30 45.9 Sheohar 0.13 0.06 0.00 0.01 0.08 58.0 Vaishali 0.70 0.35 0.02 0.06 0.44 62.3
Darbhanga 0.88 0.21 0.02 0.08 0.30 34.2 Madhubani 1.06 0.29 0.02 0.08 0.39 36.7 Samastipur 1.26 0.49 0.03 0.07 0.60 47.3
Munger 0.34 0.08 0.01 0.02 0.11 33.1 Lakhisarai 0.29 0.06 0.00 0.02 0.09 29.9 Sheikhpura 0.22 0.07 0.00 0.01 0.08 38.4 Jamui 0.37 0.08 0.01 0.03 0.12 32.0 Begusarai 0.64 0.26 0.02 0.06 0.34 52.3 Khagaria 0.69 0.18 0.01 0.03 0.22 32.3
Bhagalpur 0.70 0.14 0.01 0.04 0.19 27.5 Banka 0.47 0.12 0.01 0.04 0.16 34.6
Saharsa 0.50 0.17 0.01 0.03 0.21 40.8 Supaul 0.86 0.25 0.01 0.04 0.30 35.3 Madhepura 0.60 0.30 0.02 0.04 0.35 58.3
Purnea 1.11 0.53 0.03 0.06 0.61 55.2 Kishanganj 0.71 0.12 0.01 0.03 0.15 21.6 Araria 0.92 0.12 0.01 0.05 0.18 19.6 Katihar 1.00 0.56 0.03 0.05 0.64 63.7
Bihar 28.99 10.78 0.66 1.83 13.26 45.8 Source : National Compilation on Dynamic Groundwater Resources of India, 2017

507
Table A 13.3 : District-wise Wetland Area in Bihar
District Geographical area (Sq. km)
Wetland area (ha)
% of total wetland area
Percent of geographical
area
Open water (ha) Post-
monsoon Pre-
monsoon Patna 3130 20678 5.13 6.61 11943 7570 Nalanda 2362 1589 0.39 0.67 756 283 Bhojpur 2337 11154 2.77 4.77 5700 2435 Buxar 1634 3717 0.92 2.27 2449 1408 Kaimur 1840 796 0.2 0.43 296 174 Rohtas 3838 18641 4.62 4.86 9259 4040
Gaya 4941 11422 2.83 2.31 3979 626 Jehanabad 1569 4345 1.08 2.77 1843 564 Arwal - - - - - - Nawada 2498 5464 1.36 2.19 2445 1241 Aurangabad 3389 8116 2.01 2.39 3428 1436
Saran 2624 21170 5.25 8.07 12118 7950 Siwan 2213 7105 1.76 3.21 4295 2117 Gopalganj 2003 7122 1.77 3.56 5128 3783
W. Champaran 4250 21697 5.38 5.11 11924 10118 E. Champaran 4155 12477 3.09 3.0 8915 5119 Muzaffarpur 3123 10490 2.6 3.36 6984 4048 Sitamarhi 2628 2601 0.65 0.99 906 588 Sheohar 443 1476 0.37 3.33 845 782 Vaishali 1995 17148 4.25 8.6 11405 5970
Darbhanga 2502 8709 2.16 3.48 5171 2467 Madhubani 3478 8958 2.22 2.58 2411 2280 Samastipur 2579 15022 3.73 5.82 10867 7133
Begusarai 1889 20365 5.05 10.78 10628 7703 Munger 1419 11979 2.97 8.44 7001 5498 Sheikhpura 689 296 0.07 0.43 163 73 Lakhisarai 1229 4177 1.04 3.4 1759 1447 Jamui 2997 7351 1.82 2.45 3593 2734 Khagaria 1486 11645 2.89 7.84 9060 5807
Bhagalpur 2502 24171 5.99 9.66 16237 10273 Banka 3020 9895 2.45 3.28 5151 3847
Saharsa 1196 12086 3.0 10.11 7202 4125 Supaul 2985 19285 4.78 6.46 9004 9021 Madhepura 1797 3539 0.88 1.97 1589 967
Purnea 3203 12401 3.08 3.87 5279 3365 Kishanganj 1939 10954 2.72 5.65 5542 4886 Araria 2797 4157 1.03 1.49 2245 1930 Katihar 3010 31011 7.69 10.3 17135 14574
Bihar 91689 403209 100 166.51 224655 148382 Source : Department of Environment, Forest, and Climate Change, GoB

508
Table A 13.4 : District-wise Forest Area in Bihar (2017 and 2019)
(Area in sq. km)
District Geographical Area
2017 2019 Very
Dense Forest
Mod. Dense Forest
Open Forest
Total Forest Cover
Very Dense Forest
Mod. Dense Forest
Open Forest
Total Forest Cover
Patna 3202 0.0 21.0 5.0 26.0 0.0 18.8 4.8 23.5 Nalanda 2355 0.0 7.0 25.0 32.0 0.0 6.9 25.0 31.9 Bhojpur 2474 0.0 21.0 15.0 36.0 0.0 19.4 12.8 32.3 Buxar 1624 0.0 3.0 3.0 6.0 0.0 2.9 3.0 5.9 Kaimur 3362 0.0 520.0 551.0 1071.0 0.0 525.1 531.3 1056.4 Rohtas 3851 0.0 335.0 371.0 706.0 0.0 352.5 319.7 672.2
Gaya 4976 0.0 141.0 464.0 605.0 0.0 134.4 455.9 590.3 Jehanabad 1569 0.0 0.0 0.0 0.0 0.0 0.0 0.0 0.0 Arwal 237 0.0 2.0 3.0 5.0 0.0 1.6 2.4 4.0 Nawada 2494 0.0 189.0 323.0 512.0 0.0 201.0 312.5 513.5 Aurangabad 3305 0.0 62.0 95.0 157.0 0.0 62.3 94.5 156.8
Saran 2641 0.0 26.0 31.0 57.0 0.0 26.3 32.8 59.1 Siwan 2219 0.0 2.0 5.0 7.0 0.0 2.0 5.2 7.2 Gopalganj 2033 0.0 2.0 3.0 5.0 0.0 2.0 2.9 4.9
W. Champaran 5228 248.0 551.0 105.0 904.0 249.2 550.2 105.2 904.7 E. Champaran 3968 0.0 66.0 89.0 155.0 0.0 65.0 98.8 163.9 Muzaffarpur 3172 0.0 48.0 94.0 142.0 0.0 52.2 109.7 161.8 Sitamarhi 2200 0.0 37.0 109.0 146.0 0.0 37.4 110.4 147.8 Sheohar 443 0.0 2.0 17.0 19.0 0.0 2.0 18.6 20.6 Vaishali 2036 0.0 80.0 29.0 109.0 0.0 82.5 29.3 111.8
Darbhanga 2279 0.0 43.0 93.0 136.0 0.0 43.5 94.1 137.7 Madhubani 3501 0.0 39.0 158.0 197.0 0.0 40.3 163.7 204.1 Samastipur 2904 0.0 108.0 49.0 157.0 0.0 105.3 48.1 153.4
Begusarai 1918 0.0 29.0 54.0 83.0 0.0 28.6 53.3 82.0 Munger 1419 38.0 226.0 21.0 285.0 38.0 223.7 22.0 283.6 Sheikhpura 689 0.0 1.0 0.0 1.0 0.0 1.0 0.0 1.0 Lakhisarai 1228 17.0 147.0 19.0 183.0 17.0 144.4 19.0 180.4 Jamui 3098 29.0 351.0 261.0 641.0 29.0 351.7 267.3 648.0 Khagaria 1486 0.0 3.0 18.0 21.0 0.0 3.2 15.3 18.5
Bhagalpur 2569 0.0 49.0 19.0 68.0 0.0 46.2 23.5 69.7 Banka 3020 0.0 104.0 136.0 240.0 0.0 103.3 157.4 260.7
Saharsa 1702 0.0 4.0 30.0 34.0 0.0 4.2 30.5 34.6 Supaul 2410 0.0 4.0 126.0 130.0 0.0 3.9 134.9 138.8 Madhepura 1788 0.0 1.0 50.0 51.0 0.0 0.9 52.0 52.9
Purnea 3229 0.0 5.0 48.0 53.0 0.0 5.0 50.7 55.7 Kishanganj 1884 0.0 17.0 85.0 102.0 0.0 16.3 87.4 103.7 Araria 2830 0.0 8.0 148.0 156.0 0.0 8.1 142.9 151.0 Katihar 3057 0.0 6.0 55.0 61.0 0.0 6.0 56.0 62.0
Bihar 94400 332.0 3260.0 3707.0 7299.0 333.1 3280.3 3692.5 7306.0 Source : Department of Environment, Forest and Climate Change, GoB

509
Table A 13.5 : Greening of Urban Spaces (2017-18 to 2019-20)
Forest Division
No. of plants planted in forest festival
2017-18 2018-19 2019-20 Total
Bhagalpur 355 3000 1850 5205
Munger 200 200 400 800
Banka 460 550 300 1310
Jamui 1525 710 2678 4913
Purnea 155 2025 1500 3680
Saharsa 267 300 1100 1667
Supaul 500 3300 1500 5300
Araria 475 3190 2075 5740
Tirhut 275 500 1500 2275
Begusarai 400 350 3300 4050
Vaishali 460 800 1960 3220
Motihari 252 1955 2000 4207
Sitamarhi 650 1325 2000 3975
Bhitaha 131 1550 475 2156
Bhitaha-1 234 1000 150 1384
Gopalganj 210 310 400 920
Saran 273 450 600 1323
Rohtas 190 650 800 1640
Gaya 1500 2700 485 4685
Aurangabad 310 3500 250 4060
Nalanda 1109 1850 20500 23459
Nawada 240 600 - 840
Patna 265 1981 4166 6412
Bhojpur 67 151 1833 2051
Kaimur 2926 2926
Mithila 467 652 1817 2936
Total 10503 32947 51822 101134
Source : Department of Environment, Forest and Climate Change, GoB

510
Table A 13.6 : District-wise Incidence of Deaths due to Thunderstorms (2015-2019)
District 2015 2016 2017 2018 2019
Patna 2 7 9 4 5 Nalanda 7 6 3 2 13 Bhojpur 0 5 6 0 4 Buxar 0 5 3 5 4 Rohtas 3 5 6 3 6 Kaimur 7 4 0 5 3
Gaya 3 2 2 11 15 Jehanabad 2 0 4 2 3 Arwal 0 0 1 0 11 Nawada 2 0 4 2 14 Aurangabad 0 6 6 12 16
Saran 4 4 5 1 1 Siwan 1 0 2 1 5 Gopalganj 0 0 1 0 2
West Champaran 0 4 7 0 3 East Champaran 0 2 5 2 12 Muzaffarpur 0 1 1 0 0 Sitamarhi 0 0 2 0 1 Sheohar 1 1 1 0 0 Vaishali 0 0 9 3 1
Darbhanga 1 0 2 5 5 Madhubani 0 2 3 4 0 Samastipur 0 3 6 2 3
Munger 8 4 3 15 2 Lakhisarai 8 0 2 2 2 Sheikhpura 1 0 4 3 1 Jamui 10 1 17 0 20 Begusarai 2 0 0 3 8 Khagaria 0 0 4 8 4
Bhagalpur 7 8 23 6 12 Banka 3 3 8 6 12
Sahasra 6 3 0 4 3 Supaul 4 2 1 1 0 Madhepura 10 3 5 4 1
Purnea 12 8 10 5 5 Kishanganj 2 9 0 0 0 Araria 16 2 6 8 9 Katihar 11 14 9 10 10
Bihar 133 114 180 139 216
Source : Department of Disaster Management, GoB _____________

511
CHAPTER - XIV
E-GOVERNANCE
E-governance is a transparent, smart governance with seamless access, secure and authentic flow of information crossing the inter-departmental barrier and providing a fair and unbiased service to citizens. — A.P.J. Abdul Kalam
Throughout the world, deploying e-governance in support of good governance is crucial for building effective, accountable and inclusive institutions at all levels. E-governance has been growing rapidly around the last two decades since the first attempt of the United Nations to benchmark the state of e-governance in 2001. It improves public services, citizens’ engagement, and transparency and accountability of the authorities. The United Nations conduct Surveys on e-government development based on the holistic view of e-governance that incorporates three dimensions which facilitates people to benefit from online services and information, and these are:
Abstract
E-governance provides close interaction between the government and the citizen. In order to
promote e-Governance in a holistic manner, various policy initiatives and projects have been
undertaken by the State Government to deliver good governance and development with justice.
The State Government has received several awards in different areas of e-governance. The
State Government has taken several measures through CCTNS, Cyber Security, e-Prison,
CCTV and VC Surveillance, E-Court etc. to maintain the law and administration in the state.
Presently, CFMS allows the State Government to achieve more allocative and operational
efficiency in management of Public Finance. The better service delivery through DBT helps to
build trust between government and public. For examples, e-Labharthi alone provides DBT to
crores of beneficiaries in the field of education, health, social welfare, food security etc. The
State Government has enacted several rights based powers (RTI, RTPS, etc) for the citizen.
Bihar faces many types of disasters and, therefore, several e-project have been initiated to
make people alert through advance information about disasters. The State Government has
also implemented several e-governance programmes to promote economic development in the
state.

512
the adequacy of telecommunications infrastructure, the ability of human resources to promote and use ICT, and the availability of online services and content. The Survey tracks progress of e-government development via the E-Government Development Index (EGDI) at the national level of 193 United Nations member states, which is a composite index based on the weighted average of three normalized indices. These three indices are — Telecommunications Infrastructure Index (TII), Human Capital Index (HCI) and Online Service Index (OSI). India is among the high EGDI category states ranked 96 during 2018. The status of e-governance across the globe is presented through the Map 14.1.
Map 14.1 : Status of E-Government Development Index (EGDI) in the World
Source : United Nations E-Government Survey, 2018, Department of Economic and Social Affairs, UN
In the above background, the State Government has decided for two core priorities — good
governance and development with justice since 2005-06. The State has received as many as eight
awards in the field of e-governance. Bihar has been conferred with the Oracle E-Governance
Excellent Award for VAT Information Computerisation to optimise revenue yields in 2006. Bihar
got the prestigious 11th National e-Governance Award - 2008 by the Government of
India. Bihar has also been conferred the prestigious Prime Minister National Award for Excellence
in Public Administration for the year 2007-08 for the project e-Registration in Bihar (SCORE
System for Computerized Registration). During 2014-15, Bihar has bagged four awards - (i)

513
Digital India Award-2015, (ii) CSI Nihilent e-Governance 2014-15 award, (iii) National Award
for e-Governance 2014-15 and (iv) Skill Development and Employability under National e-
Governance award 2014-15. In 2018, Bihar has received another National E-Governance Award
for SEITRA (Smart Energy Infrastructure and Revenue Administration) which is a major IT
initiative in the State’s power sector for enhanced e-services. The government machinery has been
strengthened with many Information and Communication Technology (ICT) initiatives for
delivering good governance. Many forms of e-governance have been deployed by the State
Government. ICT facilitates e-governance programme by speeding up governmental process,
taking decisions expeditiously and judiciously, increasing transparency and enforcing
accountability. It escalates the reach of the government, geographically and demographically.
Nearly every department provides its e-services through several e-governance projects. In the
above background, apart from ICT Infrastructure, this chapter reports the functions of the
government channelled through e-governance — (i) Maintenance of Law and Administration, (ii)
Public Finance Management, (iii) Service Delivery, (iv) Emergency Services, and (v) Promotion
of Economic Development.
14.1 Foundation for E-Governance
The revolution in ICT has brought about a new agenda for governance into the realm of possibility.
E-governance comprises decisional processes and the use of ICT for wider participation of citizens
in public affairs. In order to promote the e-governance programme, development of ICT
infrastructure including mobile phones and internet access are essential. The State Government
has developed State Data Centre (SDC), State Wide Area Network (SWAN), Common Service
Centres (CSC) and middleware gateways to facilitate e-governance programme. These gateways
include State e-Governance Service Delivery Gateway (SSDG), National e-Governance Service
Delivery Gateway (NSDG) and Mobile e-Governance Service Delivery Gateway (MSDG).
Presently, working-from-home, distance learning, e-banking, and e-governance are possible with
an internet connection. Such infrastructure helps the State Government by providing e-services for
e-governance. The following basic infrastructures have been created for fast and better e-
governance services:
BSWAN 2.0 : It is a robust intra-network system established in all blocks and sub-divisions (635),
all districts (38) and at state headquarters. It connects around 2500 Government Offices. Apart
from the connectivity, a state of art video conferencing (VC) facility is available which can be

514
availed from anywhere any time with authentication. In order to use renewable energy, 674
BSWAN PoP connections have been equipped with solar power grid connectivity.
SecLAN 2.0 : It is used for e-governance services and information to the citizens for improving
service delivery and regular administration, which connects 25 Secretariat Offices. The State
Government has integrated data, voice and video communication across its nine existing offices
and ten newly identified buildings through SecLAN 2.0, which is an intranet.
Bihar State Data Centre 2.0 and Private Cloud : This comprises a high-end and state-of the art
IT infrastructure for delivery of shared, reliable and secured communication services for hosting
and managing the e-governance applications of state and its constituent departments. SDC is
envisaged to establish a robust infrastructure to enable the government to deliver the services
quickly and effectively to its stakeholders. It also incorporates the Private Cloud project as a subset
of SDC project. Provision of hardware, networking and connectivity, web applications, e-
commerce, IT training and an entire gamut of direct and indirect IT businesses has been done under
BSEDC Cloud. This is equipped with Open Stack and N-Flash Drive. Open Stack controls large
pools of compute, storage and networking resources through the data centre, while N-Flash Drive
allows users to store files on their servers, synchronise files across devices and share files. For
disaster mitigation and contingency, a separate BSEDC DR CLOUD has been set-up.
Wi-Fi Project : It provides free internet connectivity to the students, teaching and non-teaching
staff, guest visitors of the campus of Government Universities, Constituent Colleges and other
academic institutions of the state. As on November 2019, a total of 2.3 lakh users availed this
facility. Apart from the internet accessibility, video conferencing, biometric facility, CCTV
surveillance, and many awareness programmes of education system are implemented through this.
Sahaj Taknik Yojana : This yojana commenced in 2018 for deploying total digital solution for
helping people to discover their entitlements and avail the benefits of social welfare schemes and
government-to-citizen (G2C) services. The portal as well as the mobile-app have been made live
for more than 100 schemes of various departments and 10 more schemes related to the
Departments of Labour Resources and Minority Welfare are under progress.

515
Bihar AADHAR Authentication Framework (BAAF) : It is an umbrella framework which enables all adhar-based transactions to authenticate the identity of residents electronically, in a safe and quick manner, making service delivery more effective and efficient. Various departments have been integrated with the BAAF applications as a sub Authentication User Agency to use authentication services while delivering the service.
National Optical Fiber Network (NOFN) / Bharat Net : It is planned to connect all Gram Panchayats (GP) in the country with 100 MBPS speed broadband connectivity. As on September 2019, a total of 5773 GPs in Bihar have been connected through the NOFN.
Mobile Service Delivery Gateway (MSDG) : Started in 2013 to provide m-governance through SMS services with different IT projects.
Service Plus Framework : Implemented with an objective of paperless work in the different departments by computerised backend system (digitised). Currently, 33 services of Labour Resources Department, 11 services of General Administration Department and 8 services of Social Welfare Department have migrated to this platform.
New IT Institutions : The State Government is working towards making Bihar an Information Technology (IT) Hub. Towards this objective, a decision has been taken to build an IT city at Rajgir (Nalanda) and 111 acres of land have already been acquired. In addition, an IT tower and an IT park are being established in the state capital of Patna and the land is already acquired. The National Institute of Electronic and Information Technology (NIELIT) has been provided 15 acres of land in Bihta and one acre each for opening of additional centres at Buxar and Muzaffarpur. For training of students belonging to the deprived sections of the society, efforts are being made by the State Government and an MoU has been signed with the Centre for Development of Advanced Computing (C-DAC) Pune. Further, a Software Technology Park of India (STPI) has been provided 2 acres of land free of cost on long-term (30 years) lease for establishment of Park in Darbhanga and Bhagalpur. Apart from these STPI, the STPI Patna is being expanded at a cost of Rs. 26.55 crore. For research in the field of Medical Electronics, a matching grant of Rs. 25 crore has been approved to establish an Incubation Centre at IIT, Patna (Bihta). A full-fledged centre of the C-DAC is also going to be functional by June, 2020. Apart from the expansion of the above ICT infrastructure, internet accessibility and telecommunication penetration are also necessary to access the e-governance services to every citizen. Bihar has a tele-density of 74.3 connections per hundred people which indicates that almost

516
every household is having at least a telephone connection. The access of internet in Bihar is less than one-fifth of the population, which is a matter of concern, however, the coverage of Bharat Net extends to more than 55 percent of the GPs which may provide the e-governance facilities to the adjacent locality (Table 14.1). Aadhar is required for getting benefit of many e-governance programmes and its coverage is nearly 85 percent. These coverages need to be expanded to reach the last mile of e-governance services. The lack of financial literacy, financial inclusion, computer literacy, AADHAR entitlement, etc. limit the success and accessibility of e-governance programmes. The combined efforts of the State and the Central Government have been taken to resolve these limitations through Jan-Dhan Yojana, Direct Benefit Transfers (DBT), AADHAR seeding, Skill India, Bihar Skill Development Mission, SHG formation, Digital Saksharta Abhiyan (DIKSHA), Learning Management System, Pradhan Mantri Gramin Digital Abhiyan, SWAYAM etc.
Table 14.1 : Coverage of Mobile and Internet Services and Aadhar in Major Indian States (as on March, 2018)
State Tele-density
Internet Density
GP Coverage
under Bharat Net
Aadhaar Coverage
Andhra Pradesh 90.9 37.2 0.0 92.5
Bihar 74.3 17.0 55.6 84.1
Chhattisgarh — — 36.6 94.1
Gujarat 103.8 41.9 31.5 95.5
Haryana 91.2 35.6 93.7 100.0
Jharkhand — — 32.4 93.5
Karnataka 98.5 44.3 100.0 92.9
Kerala 111.0 48.0 100.0 100.0
Madhya Pradesh 50.8 22.3 45.6 90.1
Maharashtra 102.7 43.9 48.1 93.1
Odisha 73.1 24.1 38.5 93.2
Punjab 124.4 52.7 49.4 100.0
Rajasthan 82.1 30.2 88.6 86.5
Tamil Nadu 111.7 47.3 — 93.4
Uttar Pradesh 74.8 22.2 49.2 87.2
West Bengal 83.2 29.3 60.3 93.9
All-India 83.0 33.5 42.4 89.5
Source : SDG Report, NITI Ayog,

517
Chart 14.1 : Density of Telephone and Internet Connection in Major States of India (2019)
14.2 Maintenance of Law and Administration
Essential duties of any government – protection of public life and property are the most important. Maintenance of Law and Order is a State subject under the Seventh Schedule of the Constitution of India. The primary duty of the State Governments is to prevent, detect, register and investigate crime and prosecute the criminals. The Central Government, however, supplements the efforts of the State Governments by providing them financial assistance for modernization of their Police Forces in terms of weaponry, communication, equipment, mobility, training and other infrastructure facilities under the Scheme of Modernization of State Police Forces. Further, intelligence inputs are regularly shared by the Central Security and Intelligence Agencies with the State Law Enforcement Agencies to prevent crime and law and order-related incidents. It is a very complex issue and ICT may play an important role to maintain the law and administration through many ways. The different e-services are listed below which helps to enforce law and order and speed-up administration in the state:
Crime and Criminal Tracking Network and System (CCTNS): This aims to formulate a comprehensive and integrated system for enhancing the efficiency and effectiveness of policing
50.873.1 74.3 74.8 82.1 83.0 83.2 90.9 91.2 98.5 102.7 103.8 111.0 111.7 124.4
0.020.040.060.080.0
100.0120.0140.0 Tele-Density
17.022.2 22.3 24.1
29.3 30.2 33.5 35.6 37.241.9 43.9 44.3 47.3 48.0
52.7
0.0
10.0
20.0
30.0
40.0
50.0
60.0 Internet Density
518
through IT enabled state-of-the-art tracking system, as also the investigation of crime and detection of criminals. It will connect all police stations and allow data sharing related to all crimes, criminals, case diaries, etc. This also provides the facility of uploading of FIR by the districts which can be easily downloaded by citizens. Till date, nearly 9 lakh FIRs have been uploaded. The total approved fund is Rs. 280.17 crore, of which Rs 34.16 crore has been utilised so far.
Cyber Security: Indian Computer Emergency Response Team (CERT-IN) deals with cyber
security threats. It collects data, analyses dimensions of cyber incidents, forecasts and alerts cyber
security incidents. Apart from this, a scheme of cyber-crime prevention against women and
children (CCPWC) is implemented with the objective of limiting cyber threat to women and
children. A sum of Rs. 2.47 crore has been provided for this scheme. Additional cyber security
initiative by the Central Government is being taken in accordance with the objectives of the
National Cyber Security Policy, which envisages formulating a secured cyber eco-system in the
country.
e-Prison : It is an e-governance cloud-based project initiated since 2017-18, which integrates all
the activities related to prison and management in jails that provides vital information about the
inmates lodged in real-time environment to the prison officials and other entities involved in the
Criminal Justice System. It also facilitates online request and grievance redressal. The State
Government has provided Rs. 5.13 crore as grant for digitisation of prisoner’s information through prison ERP project. During the last five years (till September 2019), a sum of Rs. 12.78 crore has
been spent. Further, Prison Calling Solution Project with biometric calling solution that enables
jail inmates to make a definite number of calls in a prescribed time span to have conversation with
their near relatives and seek legal advice. Calls are recorded for monitoring purposes.
CCTV and VC Surveillance
(i) Jail-Court VC and Jail CCTV Surveillance Project is a CCTV-based surveillance system
and video conferencing facility in all district jails and sub-divisional jails of Bihar. The
CCTV system helps monitor unlawful activities, which affect the day-to-day proceedings of
the jail, and security of the jail officials and prisoners, whereas VC facility helps to carry out
the court hearing from the jail itself. Based on the technical feasibility survey, 58 Jails and
53 Courts (8 Central Jail, 50 Sub Jails and 53 District Courts) were found suitable for
implementation of CCTV Surveillance System and VC.

519
(ii) Multi VC Project is to be implemented for setting up a VC system for the trial of the accused
who is a jail inmate. The main objective of the project is to make a live VC trial online
showing the accused, the Judge, the witness and the lawyer on a single screen. It will also
include IG (prison), Patna, Bihar Institute of Correctional Administration (BICA), Hajipur
and Patna High Court.
(iii) Court CCTV Surveillance Project is being implemented in response to the recent increase
in the unlawful and socially disturbing activities in and around the court premises which
affects the day-to-day proceedings of the court, security of the court officials and other
citizens present in the court premises. The security of the prisoners brought to court for
proceedings, police personnel present and the judges is ensured under CCTV Surveillance
system.
(iv) Police Station and Prison IP-Based CCTV Surveillance System is to put police stations
and interrogation rooms under surveillance of CCTV cameras. The State Government has
decided to install CCTV cameras as a step towards tackling the allegations of police atrocities
at police stations and prisons with a view to checking the cases of alleged human rights
violation, frequent complaints regarding custodial violence and deaths in police lock-up. The
State Government has approved Rs. 282 crore for 960 PS. Till date, CCTV cameras have
been installed in 625 PS. This will help in monitoring, supervision and prevention of ongoing
custodial torture, harassment, malpractices, bribery, etc. inside the police stations. The
system will also ensure security of police stations and officials from Maoist and Naxal
attacks, including threats of mob attack, etc. It may also help in tracking down attendance,
performance and the works being done at the grass-root level from a central place such as
headquarters or control room.
(v) Smart City Mission Project for Patna was originally started in 2017 for safe city
surveillance in public places.
Emergency Response Support System (ERSS) : This would comprise computer-aided dispatch
(CAD) with AVLS (Automatic Vehicle Location System) facility, which will have digital trail of
all activities for better accountability and responsibility. It would provide a unique emergency
number 112 to integrate police, fire, medical services, disaster management, etc. This system will
further be integrated with city surveillance, traffic management system, and CCTNS. A sum of
Rs. 12.29 crore has been provided from the Nirbhaya Fund by the Central Government under this
system.

520
Bihar Police Helpline (18603456999) : A Centralised Grievance Redressed Cell (CGRC) with IVR (Interactive Voice Response) facility started since February, 2017 where anyone can file a complaint through making a call or by using CGRC web portal and through mobile App. After registration of the complaint, the applicant will get a unique token number through SMS. Till date, around 30,000 transactions have been registered by around 22,000 applicants. A Central Government initiative of Nirbhaya App provides interface to face emergency situations of women or any other individual. E-court : It has been set up at 68 locations out of 79 locations through Judicial Service Centre which is a citizen service interface counter for provision of various services such as case filing, status enquiry, etc. in 37 District Courts and 42 Sub-Divisional Courts. It is utilised as a point for reception-cum-enquiry and also as a Central Facilitation Centre by providing services like case status, certified copies, inquiries etc. The people of the state have been facilitated with an e-filing IT-enabled platform, which offers hassle free and convenient online case filing and payment facility. It is successfully tested in the Darbhanga District Court. Further, Case Information System (CIS) is installed in the High Court and 79 other lower courts for digitisation and digital preservation of case records since October 2016 and a total of 7.66 lakh cases have been digitised including 2.72 lakh civil and 4.94 lakh criminal cases via Document Case Management System (DCSM). It is helping in monitoring and analysing the day to day progress work of Judicial Officers of all the districts and its subordinate courts. The State Government has facilitated cloud-based court on pilot basis in Gaya District Court for implementation of cloud computing CIS. All processes for migration of court to cloud have been completed and users have been given URL for testing the software on their own and provide feedback for further improvement.
E-Kamaan : It is an e-governance project which helps to allot duty among home guards by district administration for maintenance of law and order and other duties in bank and other institutions on a daily basis. Bihar SPARROW : Smart Performance Appraisal Report Recording Online Window System is an online system based on the comprehensive performance appraisal dossier maintained for all officers of Bihar Administrative Service, Bihar Police Service, Bihar Prison Service, Bihar Prosecution Service, Bihar Home Guard Service and Bihar Fire Service. The aim of the system is to facilitate the e-filing of PAR by officers in a way that is not only user-friendly, but also accesses within a prescribed time limit to get PARs of all officers recorded.

521
Child Labour Tracking System (CLTS) : It is a web-based tracking system launched on June
12, 2016, which provides rehabilitation and monitoring for rescued child labour. After the release
of the child labour, a sum of Rs. 3000 is provided as an economic assistance by the Labour
Resources Department, Rs. 5000 from the District Rehabilitation Fund Assistance and Rs. 20,000
from the accused (according to the order of the Supreme Court). In addition to the above-
mentioned assistance, the child labour will get an additional amount of Rs. 25,000 from the CM
Relief Fund after getting registered on the portal of CLTS. Till date, 1530 child labours have
received this amount through annuity scheme. The total registered child labours under CLTS are
5759 as on December, 2019.
E-Municipality Bihar : This project has been rolled out by the Urban Development and Housing
Department in February 2016, with the objective of providing integrated end-to-end facilities to
citizens in a transparent and time bound manner. It provides civic services to common citizens via
a single-window system available at municipal bodies. It includes all citizen services related to the
urban local bodies like property tax, building permission, birth and death certificate, RTI, trade
licences, etc. Around 7.0 lakh beneficiaries have been connected to avail e-municipality services
involving amount of Rs. 210 crore. The municipal e-governance modules have been launched in
March 2019, which provides online citizen centric services like payment of property tax, birth and
death certificate, building permission and occupancy certificate, trade licence RTI, HR
management, monitoring of schemes, VC, online reporting, GIS-based property survey, etc. to the
different stakeholders including common citizens, professionals, commercial entities, construction
companies, etc. The accounting system has been improved through double accounting system and
use of PFMS/ CFMS. This module facilitates the urban local body with e-tendering, GeM portal,
e-office, and effective monitoring and control through CCTV cameras and bio-metric devices. The
fund is being transferred after verification through AADHAR and GIS coordination.
E-Office : It is developed by National Informatics Centre (NIC) and aims to usher in more
efficient, effective and transparent inter-government and intra-government transactions and
processes. The product is built as a single reusable system by bringing together independent
functions and systems under a single framework to enhance transparency, increase accountability
and transform the government work culture and ethics. Till September 2019, 43 departments /
PSUs/ Districts on border are connected through 4876 users’ interface.
522
Human Resource Management System (HRMS) : It is a project related to the General Administration Department, implemented since July 2019, which includes functions of record keeping and maintenance of personnel information (cadre, post, grade pay, salary scale, etc.), service agreement, other payable benefits (pension, leave, provident fund, etc.), e-service book, pay fixation, etc. These functions will be carried out through an online software-based system in a paperless manner covering about 3.5 lakh Government employees at a cost of Rs. 34.1 crore. Required information will be made available to the employees through Email or SMS based on their unique ID. Employees can access this information and carry out transaction through mobile app as well. E-Niwas : The State Government has been allotting government quarters through online application. It provides transparent speedy allotment of government quarters and applicants can monitor the status form anywhere at any time. 14.3 Fiscal Governance
The fiscal governance is a set of rules, regulations and procedures that influences the fiscal policy preparation, approval, implementation and monitoring. Prudent Public Finance Management (PFM) helps economy to grow at a faster rate through fiscal governance and strategic plan, which in turn help in achieving the objectives of allocative and operational efficiency. PFM governs through the cycle of budget formulation, budget execution, accounting, reporting, external scrutiny and audit. These functions are not easy to manage manually. The world has been experiencing e-fiscal management since the last two decades. IT platform provides mileage to estimate, operate, monitoring and evaluation in a scientific manner. The State Government is using CFMS for execution of state budget, while the Central Government is using PFMS for managing Union Finances. The following e-governance platforms provide paperless, real-time and online services related to e-fiscal management in the state: CFMS : The fiscal management was executed for the first time through IT-enabled module in Bihar in 2008 through the CTMIS (Comprehensive Treasury Management Information System) for constant tracking of revenues and expenditures. The transactions of Government are channelised through the treasuries of the state. It collects revenues, books expenditures and maintain the records of the treasuries systematically for future accountability. These functions were executed through the CTMIS till 2018-19. Since April 2019, the State Government has reformed the financial management modules and has come up with a latest technology, which

523
rolled out the robust IT with high security features well-equipped with latest PFM procedures known as CFMS (Comprehensive Financial Management System). For the first time, CFMS connects all departments, treasuries, DDOs, Reserve Bank of India and other government offices. It provides real-time information regarding receipts, expenditures, debt and investments, including ways and means, among the stakeholders to facilitate office-wise and agency specific policy decisions. This keeps the stakeholders informed and updated through online access of data and information at any point of time. The data is captured at the source of its origin for elimination of redundancy and anomalies to avoid time and labour cost. Automatic reconciliation of receipt and expenditure is possible at the departmental and treasury level through the CFMS and minimal reconciliation is required. It also helps in bringing effective financial discipline in terms of more accurate budget preparation and effective expenditure control, efficient monitoring and tracking of budget as well as debt, cash flow management, etc. In addition, it provides fast and transparent service delivery through faster payment of invoices/ claims of vendors/ employees, speedy refund, instant acknowledgement, etc. The high-security digital certificate of authorisation has been ensured through digital signature for authorisation of payments through online payment processing via e-kuber of RBI. E-treasury has been established to receive revenues of the Government in the form of e-receipt through Online Government Revenue and Accounting Management System (O-GRAS). O-GRAS provide an IT-enabled platform to facilitate online tax payment, etc. to provide easy and convenience services to the citizen, entrepreneurs, businessmen, traders etc. CFMS facilitates all stakeholders through email and SMS alert after creation of a user ID or any activity like payments, work flows, user access verification and bill authorisation via OTP confirmation. A total 5.39 lakh stakeholders are connected involving transaction of Rs. 3,09,208 crore under the ambit of CFMS. A CFMS cell has been established to resolve any type of queries, issues, bottlenecks and grievances related to the different modules of CFMS. PFMS : Public Finance Management System is an IT-based module executed by the Office of the Controller General of Accounts (CGA). It is implemented with the objective of tracking funds released under all Union Plan Schemes, and expenditure reporting on real-time basis at all levels of programme implementation since 2009. Prior to 2009, it was known as Central Plan Schemes Monitoring System (CPSMS). Further, the area was extended to cover DBT to the beneficiaries in all the Union Schemes in 2013. After a year, the digitization of accounts was the main focus to be achieved through PFMS. It is an e-governance tool which enables sound PFM of Union Government by creating an efficient fund flow mechanism and payment-cum-accounting network. It facilitates reliable and real time management information system for providing an effective decision support system to all the stakeholders. It includes different budgetary activities like payments under Central Sponsored and Central Sector Schemes, tax and non-tax receipts, and also

524
functions such as a comprehensive HRMIS and self-contained pension as well as GPF modules. Currently, PFMS offers the facility of Core Banking Solution (CBS) of all Public Sector Banks, Regional Rural Banks, major private sector banks, Reserve Bank of India, Post Office Banks and Cooperative Banks.
Goods and Service Tax Network : GSTN is a A unique and multifaceted IT initiative for the first time to establish a uniform interface for the tax payer on a common and shared IT platform among the Centre, States and RBI. The portal envisions becoming a trusted National Information Utility (NIU) which provides reliable, efficient and robust IT backbone for the smooth functioning of the Goods and Services Tax (GST) regime enabling economic agents to leverage the entire nation as One Market with minimal indirect tax compliance cost.
GeM : Government e-Marketplace is implemented since April 01, 2018 in Bihar with the objective to enhance transparency, efficiency and speed in public procurement. It is a single-window solution for online procurement of goods and services, which facilitates e-bidding, reverse e-auction and demand aggregation for optimum utilisation of limited resources of the Government. All common use items like computer, printer, photocopier, paper and stationery, as well as other office items like furniture, and bottled water, for example, are being purchased through GeM. It is a Business to Government (B2G) platform which has eliminated multiple levels of manual, sequential verification and decision-making process that leads to dramatic reductions in lead-time in Government procurement. This platform has opened attractive new options by eliminating intermediaries and guaranteeing prompt release of payment to the sellers. The payment provides end-to-end solution, integrated with the banking system through CFMS or treasury management system, ensures transparent and corruption-free procurement and bidding.
E-Procurement System : A real-time biding solution for buyers that enables users to participate in the tendering process by utilising the online solution of TENDERWIZARD. This solution provides faster and easy access of information related to the tenders of the Government of Bihar and BSEDC limited. 14.4 Public Service Delivery
Direct Benefit Transfer (DBT) was initiated with the aim to reform public delivery mechanism by re-engineering the existing process in the welfare schemes. This aimed at speedy and convenient transfer with a view to ensure accurate targeting of the beneficiaries and elimination of duplication and fraud through Aadhar and bank account linkages. E-Labharthi : It is a web-based unified portal which provides several e-services to the various departments such as Education, Social Welfare, SC/ST Welfare, BC/EB Welfare, Minority

525
Welfare, etc. related to different services including social security pension, disability allowance as well as free bicycles for girls, dress and reading materials, scholarship relating to the various schemes being implemented. Till date, 68 lakh pensioners have been getting benefited through the system and now, benefits of Mukhyamantri Vrudhjan Yojana has been provided to 25 lakh beneficiaries.
Education : The State Government is committed towards human development of the state and education is on the central focus, since the government allocates major share to this sector to create an educated society. It is decided to provide DBT through the MedhaSoft application software, which captures data and information regarding beneficiaries (bank account related, AADHAR no. etc.) via e-Labharthi portal. The students of the state are heading towards attainment of higher education. The State Government has been supporting students to pursue their education through several financial support and rewards in the education sector, which are given in Table 14.2.
Table 14.2 : Direct Benefit Transfer under Different Schemes of the Department of Education
Scheme Name Beneficiary Category Social Category (SC/ST/BC/EBC etc.)
Amount (in Rs.)
Mukhyamantri (MM) Scholarship Scheme
Boys and Girls from Class I to IV All Categories (except Musahar & Bhuiya) 50/PM
Boys and Girls from Class V to VI All Categories (except Musahar & Bhuiya) 100/PM
Boys and Girls from Class I to VI Musahar and Bhuiya 100/PM Boys and Girls from Class VII to X All Categories 150/PM Boys and Girls from Class XI and XII with a condition of 60% marks in XI
All Categories 1200/PM
MM Sanitary Napkin Yojana Girls from Class VIII to XII All Categories 300/PY
MM Cycle Yojana For all students of Class IX All Categories 3,000 MM Balika Poshak Yojana Girls from Class IX to XII All Categories 1,500/PY MM Chhatrawas Yojana Boys and Girls from Class I to XII All Categories except General 1,000/PM MM Balika Protsahan Yojana
Girls from all categories and Boys from EBC/ SC/ ST 1st division in Matric 10,000
MM Vidyarthi Protsahan Yojana Boys from General/ BC/ Minority
1st division in Matric and family yearly income is upto Rs. 1.5 Lakh
10,000
MM SC/ST Medhavriti Yojana Boys and Girls from SC/ST 2nd Division in Matric 8,000
MM SC/ST Medhavriti Yojana Boys and Girls from SC/ST 1st Division in Intermediate
(10+2) 15,000
MM SC/ST Medhavriti Yojana Boys and Girls from SC/ST 2nd Division in Intermediate
(10+2) 10,000
MM Protsahan Yojana under Kanya Utthan Yojana
Girl Students after completion of graduation All Communities 25,000
Source : Department of Education, Government of Bihar

526
Management Information System : In order to assist educational administrators and decision
makers at the elementary level, Bihar Education Project Council (BEPC) has been maintaining
MIS at the state, district and sub-district levels since the inception of Sarva Shiksha Abhiyan.
This supports the decision makers through collection, organization, distribution and storage of
information for analysis, control and integration in the planning process at each level.
Education MIS provides information regarding the educational issues and management of
schools. To avoid duplicity of efforts, instead of using two separate systems, viz. DISE (District
Information System for Education) for elementary and SEMIS (Secondary Education MIS) for
secondary, U-DISE (Unified DISE) has been used since 2012. Project MIS aims to monitor
project activities in terms of physical and financial progress against the target. The monthly,
quarterly and yearly progress reports are generated at sub-district, district, state and national
levels for monitoring of project activities through the portal of PMIS. It generates various types
of reports based on budget, expenditure, reimbursement, physical vs financial assessment, etc.
Financial MIS (FMIS) is a full-fledged double entry accounting system operated through Tally
and has been installed across the state since 2014 to maintain day-books and books of accounts.
Apart from these, MIS, BEPC have been utilising other MIS such as Student Attendance
Management Information System (SAMIS), Household Management/Bal-Panji, which are also
being utilized to assess the physical and financial progress of districts.
Bihar Easy School Tracking (BEST) : It is an android-based application which helps in real-time
monitoring of school activities and supports the decisions-making process to strengthen and
regulate the elementary schooling. It facilitates all stakeholders including parents, teachers and
functionaries of 39,000 schools. This application also works in offline mode in interior areas and
uploads after getting the connectivity on real-time basis.
Bihar School Examination Board : BSEB is committed to provide IT-enabled platform to
students right from filling of examination form to publishing of results through pre-exam and post-
exam software. Further, the Board has initiated digitisation of certificates, which may be uploaded
on the portal from the year 1984 to 2016. It has already been completed for the period of 2005 to
2016. Through this portal, anyone can verify certificates anytime from anywhere. Board has taken
the another step to build examination halls in all nine divisions of the state, which equipped with
CCTV cameras with an objective of taking malpractices free examination, storage of exam papers
and their evaluations.

527
Mid-day Meal Scheme : Web-Based Monthly MIS is introduced in 2011 to procure data from
71,000 schools on a monthly basis. The Block Resource Person collects data from the Headmasters
and uploads onto this MIS on the 15th of every month. The objectives of this MIS are monitoring
of the schemes, fund flow management, food grain flow management, cook-cum-helper details
and other infrastructures available in schools. Dopahar is a programme of Interactive Voice
Response System (IVRS) started in 2012 to obtain information from all the schools on real-time
daily basis to collect data regarding attendance, meal served, adherence to menu, adequacy of
cooking staff, adequacy of food grain and fund for the coming week.
Health, Water Supply and Sanitation
Health : Bihar is a disadvantaged state with the lowest per capita income in the country. Therefore,
it is necessary for the government to provide public health services at an affordable cost. Several
e-governance programmes have been implemented in the area of medical and public health to
improve its quality, accessibility, handiness, accountability and transparency. These IT services
are applied in the field of bidding, procurement, health MIS, human resource management, file
management, health management system, online OPD registration, GIS application for all health
facility locator, etc.
Health Management Information System (HMIS) : It is an online reporting platform, started
since 2008, which facilitates timely and regular reporting of health management system. HMIS
report is used for monitoring and reviewing the activities of health programmes at every level of
health facilities (HSC / APHC / PHC / RH / SDH / DH / MCH) as well as for the planning purpose.
Around 12,500 health facilities are reporting their service delivery data on a monthly basis. In
addition, DHIS (District Health Information System) has been developed for capturing,
reporting and analyzing the data, which are not being captured on the HMIS portal like – VHSND,
Bio-Medical Waste Management, NRC, COTPA, Family Planning (additional data elements),
training, etc. Health System Progress Tracker (HSPT) provides a single-window outlay to
access data from various sources including mobile and computer/laptop. The data received through
this portal is analyzed and further used for decision making at all levels of the governance.
Rashtriya Bal Swasthya Karyakram Portal has been developed for capturing PHC-wise
detailed information of the AWCs and schools, preparation and uploading of micro plan, daily
attendance of mobile health team, daily and monthly reporting of screened children.

528
Sanjivani : It is an online OPD registration and drug distribution system, working since 2014. It
has off-line as well as online module of the hospital management system which is functional in all
PHCs, RHs, SDHs and DHs. It has been integrated with 'Mera Aspataal' Application of MOHFW,
GoI for getting feedback from patients regarding service delivery extended to patients. Almost 2.5
crore people got benefitted every year in the state. It provides OPD registration of patients and
computerized prescription with unique ID, roster duty of doctors, on-line doctor’s appointment,
computerization of drug distribution to patients, computerization of prescribed radiology and
pathology tests, regular monitoring of drug availability, SMS to patient about drug distribution,
and radiology and pathology report from hospital, monitoring of doctor-wise and hospital-wise
OPD performance, etc.
RCH (Reproductive and Child Health) : This portal is designed for early identification and
tracking of the individual beneficiary throughout the reproductive lifecycle of women and
promotes, monitors and supports the reproductive, maternal, new-born and child health (RMNCH)
schemes to capture information on all RCH-related services, including family planning, maternal
health, child health and immunization. Application facilitates timely delivery of full component of
antenatal, postnatal and delivery services and tracking of the children for complete immunization
services. RCH portal meets the requirements of RMNCH programme with the provision of family
planning services, quality and comprehensive ANCs and alerts to ANMs, beneficiaries and Health
Managers. During 2018-19, a total of 10.4 lakh women and children were benefitted as compared
to 8.6 lakh in 2019-20 till September 2019.
Pradhan Mantri Matri Vandana Yojana (PMMVY) : It is a DBT scheme implemented
throughout the state since January 2017, where registered pregnant women get Rs. 5000 each in
three instalments on fulfilling certain conditions for each instalment — first instalment of Rs.
1000 on early registration of pregnancy within three months of the LMP (last menstruation period),
second instalment of Rs. 2000 after six months of pregnancy and attending at-least one ANC (Ante
Natal Check-up) and third instalment of Rs. 2000 after delivery and completion of first round of
child immunization. Apart from these three instalments, a beneficiary would be entitled for an
additional amount of Rs. 1000 if the delivery takes place at a Government Institution or registered
private institutions under the Maternity Benefit Scheme of the Health Department. This way, the
total amount a pregnant woman could avail is Rs. 6000.

529
E-Janani Portal : This has been developed for entry of beneficiary details of Janani Bal Surakhsa
Yojana for the payment of Rs. 2000 to mothers for first two female births. In addition, a payment
of Rs. 2000 for complete immunization of female child within 2 years of their birth under Mukhya
Mantri Kanya Uthan Yojna.
Ayushman Bharat- National Health Protection Mission (AB-NHPM) : It has subsumed the
Rashtriya Swasthya Bima Yojana (RSBY) and the Senior Citizen Health Insurance Scheme
(SCHIS) and provides health cover of upto Rs. 5 lakh per family per year for secondary and tertiary
care hospitalization to poor and deprived families, taken from the database of Socio-Economic
Caste Census, 2011 or from the Ration Card. A total of 23.3 lakh beneficiaries are connected and
have got golden card, involving Rs. 113 crore till September 2019.
BMSICL : Bihar Medical Service Infrastructure Corporation Limited is currently processing all
tenders for drug, medical equipment, infrastructure, etc. through e-tendering and e-proc IT
modules. It procures all items such as tablets, biometric devices, suction machine, nebulizer,
fogging machine, etc. through GeM portal. Drug Vaccine Distribution Management System
(DVDMS) is an IT platform to automate various activities like drug and vaccine supply chain
management, Health Financial Management System (HFMS), e-aushadhi, Equipment
Maintenance and Management System (EMMS) of BMSICL. EMMS deals with purchase,
inventory management, distribution of equipment and furniture to various regional and district
drug warehouses as also distribution to the lower level upto the end consumer in the supply chain.
HFMS is a financial module developed for payment of drugs to the suppliers and provides
complete history of delivery, quality check, tax, and final payment status through online on real-
time basis. E-PMS is a web-based application for the monitoring of infrastructure work being
executed by BMSICL. This application facilitates the approval process of proposal, DPR, etc. and
also contains a mobile based app to monitor progress of onsite project work. It also keeps the
records of stakeholders like contractor, consultants, etc.
Other Initiatives : ANMOL (ANM On-Line) App is android-based online system taking real-
time entry by ANM at the time of service delivery such as medicine, etc. using Tab on the NCD
portal. NCD Portal helps in visualisation of disease burden and monitors the gaps.
ManavSampada (e-HRMS) is a complete HR Life Cycle System, which has been implemented

530
to maintain HR record of contractual employees of the State Health Society. Apart from these
services, e-Office facilitates tracking letters and file, while Call Centre Application (104) helps
in grievance redressal, doctors’ advice and health helpline and Darpan Plus provides real time
online monitoring of health services in the government hospitals and health centers of the state.
Darpan Plus is used by Medical Officer In-Charge (MOIC), Medical Officer (MO), Block Health
Manager (BHM) and Supervisory Personnel. Apart from giving a picture on health facility
functioning, this App also validates the HR personnel of a health facility as well as give the detailed
picture of services like IPD, OPD, Drugs, Equipment, Ambulance, Outsourcing, etc.
Water Supply and Sanitation : MIS has been developed to capture data regarding different
schemes and tenders as well on real time basis for monitoring. Online Contractor Registration,
Management and Payment System is also being executed for payment integration and bidding
process. State Quality Monitoring System is an online module developed for independent
engineer for inspecting and monitoring through given schedule of the department and filling it
online. Scheme inspections are being carried out easily as the report accessibility is less time
consuming. Mobile Application for Geo-tagging of Hand Pump is developed for the geo-
tagging of the handpumps and is being painted with the habitation ID and the hand pump details
have been maintained as the database. Mobile application for Location Tracker is an android-
based mobile application developed for monitoring the officials of the department. Whether the
officials are on the field visit or in the office, their location would be accessible through the
application mandatorily between 10:00 am and 06:00 pm. Each location has been tagged with the
google map and each movement is trackable through the google map with the timeline narrations.
Water Quality Module has been developed with parameter inserted for the water quality as
reference. This module will help in treating the water for quality upgradation.
Food and Civil Supply : Food security is crucial to achieving sustainable livelihood for the poor
and weaker sections of society. Fair Price Shop (FPS) automation is implemented to authenticate
beneficiary (Aadhar-based biometric authentication) under National Food Security Mission for
food grains at the point of sale. Integrated Ration Card Management System has been
implemented for authentication of beneficiary. The State Government has developed this system
in 2015 for smooth supply chain management through IT module to track doorstep delivery
through GPS, SMS alert and grievance redressal of beneficiaries under the Project Management

531
Unit. All procurement-related processes in case of paddy are being conducted online through a
procurement software and payment is being released within 48 hours through RTGS/ NEFT to
registered farmers. Jan Vitaran Ann System (integrated with RTPS) is an online web-based
application to generate new ration card, modify existing ration card, surrender of ration card, split
of ration card, etc. So far, 3.44 lakh new ration cards have been generated and around 0.24 lakh
existing ration cards have been modified. The Department of Food and Consumer Protection has
developed online inspection management system, an android-based mobile application, for
online inspection and reporting on randomly selected Public Distribution Shops.
Social Welfare Services : The State Government has always given high priority to the
disadvantage groups, including women and senior citizens, and has been providing several social
security schemes for the people.
Social Security Pension Management Information System (SSPMIS) : It is a web-based
application developed in November 2017, envisioned to track the entire beneficiaries through
assigning a unique code which leads to effective utilization of funds. The different pension
schemes of the Central as well as the State Governments are executed through this single window
platform. It is also integrated with E-Labharthi portal for payment process. It provides transparent
implementation, centralized database, authentication of targeted beneficiary through ADHAAR,
online application tracking at all levels, online demand generation and fund allocation, online
payment solutions, day to day and consolidated reconciliation, digital signature authentication,
various MIS reports and monitoring of schemes on real-time basis. Mukhyamantri Vridhhjan
Pension Yojaya (MVPY) has also been channelised through SSPMIS. In addition, E-Suvidha
Portal has been developed in September 2018, to ensure timely payments through DBT. The State
Government has further developed several IT modules such as Utilisation Management System,
Bihar Social Security Grievances Redressal System and Online Attendance Management System
to strengthen the social welfare schemes through monitoring of expenditure, registering grievance
related to state social security pension and monitoring of attendance. Kanya Utthan Yojana has
also been executed through this portal. The details of DBT under different schemes are shown in
Table 14.3.

532
Table 14.3 : Provision of DBT under Social Welfare Scheme in Bihar
Scheme Name Age Group Category Rate (in Rs.)
Indira Gandhi National Old Age Pension Scheme
60-79 Years BPL Family 400/-PM
80 Years and above BPL Family 500/-PM
Indira Gandhi National Widow Pension Scheme 40-79 Years BPL Family 400/-PM
Indira Gandhi National Disability Pension Scheme
18-79 Years (Disability >=80 %) BPL Family 400/-PM
National Family Benefit Scheme 18-60 Years All Category (Sudden Death of Earning
Member) 20,000/-
Laxmibai Social Security Pension Scheme
18 Years and above BPL Family (Annual Income less than Rs
60,000) 400/-PM
Bihar Disability Pension Scheme All Age Groups (Disability >=40 % All category 400/-PM
Kabir Antyesti Anudan Yojana BPL family Members All category 3,000/- Chief Minister Family Benefit Scheme
18-60 Years All Categories (Sudden Death of Earning Member)
20,000/-
Bihar Shatabdi Leper Welfare Scheme
Visible Deformities Grade II All Categories 1,500/-PM
Bihar AIDS Peedit Kalyan Yojana All Age Group All Categories 1,500/-PM
Chief Minister Disabled Marriage Grant Scheme
Disabled (Female -18 Yrs) and Male (21Yrs) All Categories 1,00,000/-
Muslim Parityakta Mahila Sahayata Yojana — Divorcee Muslim
Woman 25,000/
Source : Social Welfare Department, GoB
Integrated Child Development Scheme (ICDS) : Aangan App has been developed and loaded
onto the Tabs for monitoring of all AWCs by Lady Supervisors and CDPOs. This application is
used during the inspection and its reporting of opened Anganwadi Centers, Supplementary
Nutrition, children present etc. This app is also used to take attendance of Anganwadi Workers
and helpers. It is being used for verifying the vouchers of purchases done under the Supplementary
Nutrition Programme (SNP). Based on the attendance and the uploaded vouchers, the Anganwadi
Workers are paid their honorarium through DBT directly and SNP fund is sent to the Bank account
of Anganwadi Vikas Samiti. The MIS of ICDS is being implemented since June 2011 and is
operational in all Anganwadi Centers (AWC) for online reporting. This MIS has been replaced by
the Rapid Reporting System to strengthen ICDS, which has been rolled out for web-enabled data
entry system for entry of revamped reporting formats at State/UT level. It has the objectives of
online monitoring of all critical indicators from Supervisor Level onwards through Anganwadi
Monthly Progress Report’s timely collection, updation and dissemination of information to all the

533
stakeholders anytime. ICT RTM (Mobile Based Real-Time Monitoring System) has been
running in all the AWC equipped with smart phone for reporting the activities conducted since
October 2019. The National Nutrition Mission (Poshan Abhiyan) has been initiated by the
Central Government after successful completion of World Bank’s ISSNIP Project in June 2018 to
combat malnutrition in all its forms in the country. It is also called Poshan Abhiyan and it
envisaged to sensitize each and every home with pregnant women, young children and nursing
mothers. ICT-RTMS was a successful pilot of the ISSNIP, which is taken forward to the NNM to
replicate in 11 districts (Aurangabad, Banka, Begusarai, Gaya, Jamui, Katihar, Khagaria,
Muzaffarpur, Nawada, Purnea and Sheikhpura). Under this, the smart phone procurement is in
process. Training MIS is a web-based software which is being developed for management of
training programme conducted for ICDS functionaries. The core objective of this project is to
strengthen data compilation, analysis and making decision related to the training of ICDS
functionaries. Grievances Redressal System (GRS) will be executed soon and will work as a
single connecting point for information, feedback and grievance management. The objective of
the GRS call center is to establish a direct communication channel between the citizens and the
directorate.
Transport-Centric Services : Citizens are facing multiple service-related issues pertaining to the
Transport Department such as Driving Licence (DL), Owner Book (OB), registration of vehicle,
permit, challan, penalty payment, checkpost and document security, particularly during travel. The
State and the Central Governments have developed many IT modules to provide easy, fast and
affordable services anytime from anywhere. E-receipt facility has been initiated to provide
e-payment facility for any service such as driving licence, registration, etc. through the OGRAS
portal. E-challan has been introduced for recovery of fine on the spot via hand-held device and
helps in tracking the person who frequently violate the traffic rules. It is also monitored through
CCTV cameras and penalty is being charged through web-e-challan. M-Parivahan and online
entry tax at checkposts facilitate citizens in a hassle-free travel, whereas digilocker makes
carrying documents like DL, Owner Book, etc. convenient.
PAHAL : It aims to reduce diversion and eliminates duplicate or bogus LPG connections. Under
the PAHAL scheme, LPG cylinders are sold at market rates and entitled consumers get the subsidy
directly into their bank accounts. This is done either through Aadhaar linkage or bank account
linkage.

534
Right and Grievance-Based Services
Jaankari : It is an e-governance system designed to enable a citizen wishing to file an application for seeking any information under the Right to Information (RTI), Act without any hassles of physical movement for purchase of postal order (for the requisite RTI application fee of Rs.10/-). The primary and mandatory requirement is to charge the RTI application fee (Rs.10/-) from the citizen without involving a physical transaction of money on behalf of the caller.
Bihar Right to Public Services Act, 2011 : With a view to ushering in accountability and transparency as a part of government’s ongoing administrative reforms, which provides statutory backing to citizens charter by developing a culture of timeliness, transparency and accountability that help check corruption and weed out intermediaries by simplifying procedures and better monitoring. It provides all applicants with a computer-generated acknowledgement receipt having a unique identity number. This helps them track the status of their applications through SMS or internet. The project was initially supported by DFID with a sum of Rs. 101.55 crore up to FY 2013-2014. Thereafter, it is being supported by the State Government with recurring annual expenses of around Rs.70.20 crore. A total of 3.14 crore applications were received by the citizen through BRTPS in 2017-18, 2.16 crore in 2018-19 and 1.61 crore during the first half of 2019-20. Bihar Right to Public Grievance Redressal Act : This was enacted in 2015 which ensures a legal right to the complainant of hearing and redressal within a maximum time limit of 60 working days. The law also created a new class of independent Quasi-Judicial Officers who would act as neutral instruments between the Government and employee without any prejudice to either the complainant or the responsible public authority. This legal right completes the three pillars of good governance, viz. right to a) information; b) public services, and c) public grievance redressal. Failure to comply with the mandate attracts penalties and disciplinary action against the respective PGROs or Public Authorities. The Act provides appeals at two levels and another for revision. The State Government has made an investment of Rs. 40 crore and allocates around the same amount annually. During April 2017 to September 2019, around 32 lakh grievances have been addressed.
Bihar Government Servant Grievance Redressal System : It is an e-governance initiative launched on 26.06.2019 for the service-related grievances of the employees and for retirement benefits at the employees of the State Government. It is a system in which service-related complaints are heard by Service Grievance Redressal Officers designated in the district and the departments in the presence of the complainant and the officer. The decision is taken within a

535
maximum time limit of 60 working days. A provision of appeal has also been made to strengthen this system. The State Government has invested Rs. 4.8 lakh as one-time capital and Rs. 10.0 lakh has been provisioned as recurring annual expenditure. During the last six months of 2018-19, 13,013 grievances has been resolved. 14.5 Disaster Management
E-governance plays a crucial role in evolving inclusive, resilient societies both before and in response to the disasters. Disaster awareness is being provided through the alerts sent to the citizens to prepare themselves for a disaster. The UN Economic and Social Commission for Asia and the Pacific (ESCAP) highlights that the use of ICT during all the phases of disaster risk management. This provides substantial opportunities to reduce disaster risks and enhance coping capabilities. The State Government has also developed many ICT platform to deal with disaster risks. A flood forecasting model has been developed to forecast floods in Bagmati and Kosi Basins with 72 hours of lead time. An Embankment Asset Management System has been set up in the Kosi belt and is being extended to the other rivers. Further, a National Hydrology Project is being implemented for data mining, processing and transmission for further action. A real-time system has been evolved through high quality image for monitoring of flood schemes. Additionally, the Department of Water Resources has developed a web-based system of WSIMS to obtain online progress from the field on the real-time basis.
WSIMS : The WRD Scheme Implementation and Monitoring System helps officials monitor both physical and financial progress of schemes, with real-time planning, implementation and monitoring. It is an e-governance programme which facilitates inspection and spot verification at the field level through effective monitoring. This web application consists of 13 modules which facilitate administrative approvals, tendering, monitoring and evaluation of physical and financial progress, fund allotment, etc. Flood Forecast Model (FFM) : It provides flood forecast by sending alert 72 hours in advance and consists of five sub models : (i) Bagmati – Adhwara FFM has been developed in 2016. This starts from Dheng to Benibad and is extended upto Hayaghat, involving 10 stations in 4 districts (Sitamarhi, Madhubani, Darbhanga and Muzaffarpur). This facilitates flood forecasting and discharge with 72 hours lead time; (ii) Kosi FFM started since 2018 use open source software, which comprises four rivers (Kosi, Kamla, Bhutahi Balan and Khando). This model gives forecast 72 hours in advance to 17 stations of seven districts (Supaul, Madhubani, Saharsa, Khagaria, Bhagalpur, Katihar and Darbhanga). This also involves an international territory with 4 stations in

536
the Kosi region (Barahkshetra, Chatra Bazar, Rajabas and Birpur) in Nepal; (iii) Gandak River Basin Model has been developed in 2018 which forecasts discharge of the rivers Narayani and Gandak, at two stations at Narayan Ghat (Nepal) and Valmikinagar (Bihar); (iv) Flood Forecast Model for Mahananda Basin has been working since 2018 and gives forecast of water level (stage) of Mahananda at two stations (Dhenghraghat and Jhawa); and (v) Regional Model has been designed in 2018 and is operational since 2019 monsoon season. It covers all the significant river networks of Bihar. This gives forecast of water level and discharge of ten rivers at 41 gauging stations in 20 districts of the State, with a lead period of 72 hours. River Behavioural Analysis Model : This has been working since 2017, based on Satellite Image Input, which is developed for the Kosi main channel. This model helps in the identification of vulnerable sites, braiding and meandering characteristic of a channel based on the output of this model on which, Anti-Erosion Schemes are formulated. Further, the main Kosi Channel has been divided into five reaches, viz. (i) from Kosi Barakhestra to Kosi Barage; (ii) from Kosi Barrage to Kosi Mahasetu; (iii) from Kosi Mahasetu to Basua; (iv) from Basua to Baltara; and (v) from Baltara to Kursela. Embankment Asset Management System (EAMS) : It contains significant features viz. maps, data, analytical tools, community participation tools, river cross sections, generation of alert from dynamic linking with FFM output and several other features for ensuring efficient and improved flood management. The State Government has developed three EAMS for strengthening of the disaster management system. These are — (i) Bagmati EAMS is the first EAMS developed in 2014 under DFID programme through the World Bank for Bagmati-Adhwara river basin. Engineers of the Department of Water Resources in the concerned field formations have also been imparted sufficient training. A total of 100 GPS-enabled Tables have been provided to concerned field officers for ensuring real-time feedback regarding embankment and river status; (ii) Kosi EAMS has been executed since 2016 which consists ten Modules. These Modules are : (a) Asset Information Module provides information regarding barrage, embankment, rivers bridges, sluice gates and other assets; (b) Engineering Information Module comprises information related to design of the Highest Flood Level (HFL) and formation level, geotechnical (soil) investigation survey (Kosi river basin), rainfall, gauge and discharge, cross-section of embankment etc.; (c) Basin Information Module provides information related to river cross section, river section (gross/original to survey data) etc.; (d) Store Information Module facilitates with information related to availability of materials at mechanical store, flood and site stores; (e) Analysis, Planning

537
and Design Module helps in the planning of flood protection, design template for planning of the flood protection and scheme preparation, design guidelines, etc.; (f) Documentation Module provides different codes, manuals and reports. In addition to these modules, (g) Data Control Module, (h) Telephone List Module, (i) Community SMS Module, and (j) Inspection Tools (Android based inspection) have been developed for efficient, effective, reliable, fast and accountable embankment management on real time basis; and (iii) Master module for Embankment Asset Management System is being developed under National Hydrology Project with specified data population for the Gandak Basin. Real Time Data Acquisition System (RTDAS) : It was established under World Bank funded project and the National Hydrology Project. This IT-enabled project shares information with stake-holders on hydro-meteorological data and stores, transmits and analyses those information. This will help in modelling work by providing real time hydro-meteorological data related to rainfall, water level and discharge through installation of 52 Automatic Rain Gauge (ARG) and 25 Automatic Water Level Gauge (AWLG) under the Bihar Kosi Basin Development Project of the World Bank. Similarly, under the National Hydrology Project, the goals are achieved through installation of 17 ARGs, 54 AWLG and 7 PANs at various locations, rivers and reservoirs in the state. Data are recorded and collected through data logger, sent to receiving station through INSAT/ VSAT/ GSM and then analysed for modelling. Mathematical Modelling Centre (MMC) : It has been established in 2018 as a Centre of Excellence with the purpose of research and development on water resources. The objectives of this Centre are to develop inhouse capacity to carry out independent mathematical modelling for the management of floods and sediment in the state, update existing models and develop regional network model for rivers of North Bihar with the Ganga River reach. The Centre has developed regional network model which begins from Buxar and extends to Kahalgon for Ganga, including Ghaghra, Gandak, Bagmati, Kosi and Mahananda. Distribution of Gratuitous Relief (GR) and Tatkal Sahayata : It is a post-disaster relief programme for speedy and transparent transfer of relief money to flood / drought-affected persons through the PFMS. The data related to affected people are captured through the Aapda Sampoorti Portal of NIC, right from the block to the state level. It is a DBT scheme which provides easy, convenient, fast and transparent fund transfer. During 2019-20 (as on November, 2019), a sum of Rs. 1547.09 crore has been transferred through DBT to 257.91 lakh families (Rs. 6000 per family)

538
in phase-I and 6.23 lakh families have got Rs. 373.92 crore in phase-II under GR. In addition to this, a total of 9.01 lakh families have got relief of Rs. 270.37 crore under the Tatkal Sahayata Scheme at the rate of Rs. 3000 per family. 14.6 Promotion of Economic Development
E-governance is an ICT platform to connect the citizens and businesses with other arms of the government and help them interact in a better way to improve the economy as a whole. The State Government has implemented many e-governance programme to provides transparent bidding and public procurement, monitoring and evaluation of physical infrastructure projects, economic development programmes and ease of doing business, etc. Infrastructure
Road : The State Government has taken several IT projects to develop and maintain the road network to cater to the smooth transportation in the state. The Rural Works and Road Construction Departments have initiated online Contractor Registration System, where in contractors can get registered in their respective class and payment for registration can be done online. After approval from the competent authority, applicants can download their registration certificate online. It was started in 2016 and a total of 620 contractors have been registered with payment Rs. 5.8 crore. The State Government has implemented Road Maintenance Public Grievance Redressal System and Road Ambulance equipped with GPS for better and speedy road maintenance by monitoring and online-tracking. Road inventory is being developed through GIS mapping. A toll-free (18003456233) and WhatsApp no (9470001346) have been allotted for the maintenance of road in the state. During April 2017 to September 2019, a total of 4375 grievances were redressed out of 4890 grievances reported. In addition, Online Management, Monitoring and Accounting System (OMMAS) has been developed for monitoring of schemes related to Pradhan Mantri Gram Sadak Yojana (PMGSY). OMMAS facilitates the operational requirement of planning, scheduling, monitoring, tracking and execution of the PMGSY and comprises master data relating to — rural road plan, proposal, tendering, execution, quality monitoring, receipt and payments and maintenance module. A citizen can track day-to-day progress report of schemes. State MIS is a web-based online system which facilitates the operational requirement of planning, scheduling, monitoring, tracking and execution of the schemes. The main objective of the Rural Works Department is to construct and maintain the rural roads falling in the category of Other District Roads (ODR) and Village Roads (VR). A citizen can track the day-to-day progress report of the scheme and actual beneficiaries can participate actively in the programme.

539
Energy : The Department of energy and its PSU have implemented many IT enabled projects to speed up the completion of energy sector infrastructure projects and business in the state. E-office minimizes the file processing time that increases transparency of the energy department and its PSUs through online tracking of files with a paperless office. Project Monitoring Information System helps to monitor different infrastructure projects such as construction, repair and maintenance of grid sub-stations, construction and re-conducting of transmission lines. The status of the project is updated by the concerned field engineers on a weekly basis through the mobile app for monitoring the progress of projects to meet the timelines. Online Tracking System facilitates time-bound processing of applications submitted by agencies for approval of projects, amendments, time extensions and release of payments. R-APDRP (Restructured Accelerated Power Development and Reforms Programme) scheme was implemented in 67 towns (35 towns under South Bihar Power Distribution Company Limited and 32 towns under North Bihar Power Distribution Company Limited). The objective of the programme is to reduce AT&C losses in project areas. Under this project, Data Centre and Disaster Recovery Centre were set up to provide various services like new connection, disconnection and dismantling, metering, billing, collection, energy accounting, web portal, asset management, maintenance management, meter data management, management information system, GIS-based consumer indexing and asset mapping, etc. This system provides various services to around 18 lakh consumers. Another billing automation system was implemented under State Plan to cater to the needs of remaining consumers. It encourages digital payments, facilitates rural consumers in energy bill payments at their doorstep and easy process to register and timely redressal of consumer complaints. Apart from these initiatives, three additional IT initiatives have been taken in the energy sector. These are: (i) Enterprise Resource Planning (ERP) project was initiated in 2018 and will go live very soon. The purpose of ERP implementation is to improve overall efficiency of the system through integration of five major sub-systems of the transmission utility like Plant Maintenance, Material Management, Project System, Financial and Control and Human Capital Management, Employee/Manager Self Service, Document Management System and Fiori (Mobility Solution) modules; (ii) Scheduling, Accounting, Metering and Settlement of Transactions (SAMAST) project was initiated in 2018, which will go live in March 2020 with objective to facilitate comprehensive accounting and settlement system that streamlines trade and exchange of power between entities across different regions. This project also aims to facilitate application of licenses to eligible Open Access Consumers; (iii) Grid Inspection Module was initiated in 2019 and it will go live very soon. The purpose of Grid Inspection Module is to process reports of Grid-Inspections by BSPTCL management for improving Grid health.

540
SEITRA (Smart Energy Infrastructure Revenue Administration) : It is a web-based energy billing application which has been successfully implemented in the North and South Bihar Power Distribution Companies (NBPDCL and SBPDCL) in all 38 districts with 16 Circles, 68 Divisions, 212 sub-divisions and 794 sections. It caters to the need of 1.41 crore rural consumers. Further, Mobile Apps based survey has been conducted for 36.04 lakh APL families and 19.36 lakh families have got connections till date. Under SEITRA, the Energy Spot Billing Mobile App has been developed for billing at the doorstep of rural consumers with objective of 100 percent billing and is stable to support the users. To promote digital payment, E- Wallet Mobile Apps is developed and door step collection of energy bill from 4.42 crore consumers who accrued Rs. 2505.46 crore till September 2019. It provides an online receipt and a SMS against a payment. There is no need to stand in a queue for bill payment at the counter. Pre-paid SMART meters have also been initiated as a pilot for 5000 consumers. Ease of Rules and Acts
Bihar Industrial Investment Promotion Policy 2016 : An online single-window clearance system has been developed to provide speedy, transparent and accountable processing of any investment application for approval / clearance. The State Government has set up a call centre to address queries and grievances of the investors. During April, 2017 to September, 2019, a total of 17,312 calls have been received and queries resolved, 5984 calls sent to DICs and 136 online grievances readdressed through the Udyog Samvad Portal. During the same period a total of Rs. 58.41 crore has been given as incentive to 131 entrepreneurs and 275 entrepreneurs have been given financial clearance out of 918 applied. Bihar Start-up Policy 2017 : It has been functioning since 2017 for promotion of investment and employment in the state. This policy targets to promote new innovative ideas with financial support. During the last two and a half years (April 2017 to September 2019), 70 start-ups have come up out of 9672 applications, 60 start-ups have got their first installment of Rs. 1.55 crore and 37 have received their second installment of Rs. 2.00 crore. In addition to this policy, Mukhyamantri SC and ST Entrepreneurship Scheme has been launched in 2018, with an objective to promote SC and ST communities to invest in the state. Under this scheme, out of 44,540 applications, 4868 have been selected and 3658 applicants got financial approval, 3641 got first installment, 137 got second installment and 11 start-ups got their third installment. A sum of Rs. 93.76 crore was provided to these start-ups in instalments during the same period. The progress of start-ups and Mukhyamantri SC and ST Entrepreneurship Scheme is given in Table 14.4.

541
Table 14.4 : Status of Start-up and Mukhyamantri SC and ST Entrepreneurship Scheme in Bihar (2017-20)
Details 2017-18 2018-19 2019-20* Total Bihar Start-Up Policy
Online Application 4556 2756 2360 9672 Related application for incubation 867 557 3537 4961 Number of authenticated start-up 41 29 — 70 1st installment (Rs. crore) (start-up number)
0.71 (29) 0.72 (27) 0.13 (04) 1.55 (60)
2nd installment (Rs. crore) (start-up number)
— 1.70 (33) 0.30 (04) 2.00 (37)
Chief Minister SC and ST Entrepreneurship Scheme Online Application — 33655 10885 44540 Selected Application — 4545 323 4868 Approved for Financial Assistance — 2616 1042 3658 Applicants received 1st installment — 2337 1304 3641 Applicants received 2nd installment — 68 69 137 Applicants received 3rd installment — — 11 11 Total Disbursed Amount (in Rs. crore) — 58.89 34.87 93.76
Note : *-denotes data upto September, 2019 Source : Department of Industries, GoB;
BIADA : Bihar Industrial Area Development Authority is a nodal agency to provide planned industrial area, promotion of industries and matters related thereto. BIADA has been providing IT enabled services for lease, sublease, change in products, land transfer, mortgage consent, change in company and change in bylaws via My BIADA App. E-Office has been implemented for file movements. Online Service Portal has been providing land allotment and other entrepreneur-related services since 2017. Till date, 167 plots of land pieces have been allotted to 447 applicants. GIS mapping is being implemented since 2017, with an objective to capture, store, edit, analyse, manage and maintain spatial or geographical information related to industrial area unit details, infrastructure (road, drainage, electricity), report, etc.
Bihar Integrated Mines and Mineral Management System : BIMMS has been set up in 2017, with the objective of achieving integrated inter-departmental access to information related to mining in the state. It provides IT platform to facilitate the Department of Mines and Geology related activities like challan generation, monitoring of activities relating to mining and to put a check on various other activities. This application helps in reaching different decision points and monitoring of field, level activities. The beneficiaries involved in this application are lessee, stockists, dealers and crushers (Table 14.5). A Project Management Unit (PMU) has been established to develop and maintain the BIMMS. This IT solution increases efficiency in

542
monitoring and maintaining, transparency and competitiveness. In addition to this, district mineral survey report is being prepared for all the districts through GIS mapping. The State Government has developed Geo-Mapping Application to improve revenue collection from brick kilns. E-lock and e-biding have been implemented to facilitate transparency and accountability in the area of mining.
Table 14.5 : Status of BIMMS Project in Bihar (2017-20)
Beneficiary Type 2017-18 2018-19 2019-20
Lessee (Sand)
Beneficiary 387 536 389 Transaction (in lakh) 11.42 53.84 24.42 Excavation (in lakh MT) 108.40 560.74 315.38
Lessee (Stone)
Beneficiary 31 32 33 Transaction (in lakh) 1.13 5.38 2.28 Excavation (in lakh MT) 18.14 107.42 50.15
Stockist Beneficiary - 384 329 Transaction (in lakh) - 2.47 2.74 Excavation (in lakh MT) - 37.02 45.89
Crusher Beneficiary - 77 71 Transaction (in lakh) - 0.24 0.16 Excavation (in lakh MT) - 4.20 2.85
Source : Department of Mines and Geology, GoB
Integrated Excise Management System (IESM) : This is being executed since 2016 to connect
all Excise Offices, Sugar Mills, Distilleries and the Headquarters through IT-enabled 10 modules.
The Department of Prohibition, Excise and Registration has taken an initiative for Chemical Lab
Module and Court Case Management Module.
Online Services under different Labour Laws : The Department of Labour Resources provides
31 hassle free online services under 9 labour laws to the citizens, employers, proprietors of
factories/ establishment and contractors. These labour laws are — (i) Trade Union Act, 1926, (ii)
Contract Labour Act, 1970, (iii) Motor Transport Workers Act, 1961, (iv) Bihar Shop and
Establishment Act, 1953, (v) Building and Other Construction Workers Act, 1966, (vi) Beedi and
Cigar Workers Act, 1966, (vii) Factories Act, 1948, (viii) Boiler Act, 1923 and (ix) Inter-State
Migrant Act, 1979. The fees for all the services are deposited through OGRAS and timeline to
deliver these services is 15 days from the date of online registration without physical interaction.
The physical and financial progresses of these e-governance programmes are given in Table 14.6.

543
Table 14.6 : Overview of Online Services under Different Labour Laws (2017-20)
Year
Trade Union Act, 1926
Contract Labour
Act, 1970
Motor Transport Workers
Act, 1961
The Bihar Shops and
Establishment Act, 1953
The Building and Other
Construction Workers Act,
1996
Beedi and Cigar Workers
Act, 1966
Factories Act, 1948
Boiler Act, 1923
Inter- State
Migrant Act, 1979
Total
Application Received (in No.)
2017-18 15 5881 1211 17053 47 9 670 425 11 25322
2018-19 16 6439 1388 13746 57 6 743 402 7 22804
2019-20 16 3234 631 7956 107 9 446 269 13 12681
Total 47 15554 3230 38755 211 24 1859 1096 31 60807
Service Delivered (in No.)
2017-18 0 4762 914 14485 35 6 450 423 2 21077
2018-19 0 5408 866 11021 40 5 542 365 4 18251
2019-20 0 2546 342 6059 81 6 312 254 8 9608
Total 0 12716 2122 31565 156 17 1304 1042 14 48936
Fee Collected (in Rs. lakh)
2017-18 0.01 8.62 0.33 2.67 0.63 0.01 76.10 116.99 0.02 205.36
2018-19 0.01 8.80 0.39 2.59 0.72 0.00 72.37 100.46 0.02 185.35
2019-20 0.01 5.36 0.17 1.71 0.98 0.00 56.10 80.69 0.03 145.05
Total 0.03 22.78 0.89 6.97 2.32 0.01 204.57 298.14 0.07 535.77
Source : Department of Labour Resources, GoB
Registration and Upgradation of Land Records : For land registration and payment of
registration fee and stamp duty, the State Government has provided IT-enabled platform for easy,
transparent, speedy and digital payment facility for the beneficiaries. The manual registers of
43,758 Institutions and 8153 Firms have been digitised for the period of 2008-09 to 2016-17. Since
February 2016, an online facility has been initiated for the common masses for registration of land.
A model deed of 30 types of documents is available on the website in three languages – English,
Hindi and Urdu and a portal has been provided to upload data related to respective deed and get
document prepared by themselves. A total of 124 registration offices have been connected through
the online data centre. The State Government is accepting all fees through e-receipts portal of O-
GRAS. These e-services provide leakage-free registration and authentication of the real owner of
the land. A total of 18.93 lakh people got benefitted, involving Rs. 3072 crore during 2016-17,
21.9 lakh people paid Rs. 3597 crore in 2017-18 and 23.05 lakh people spent Rs. 4167 crore during
2018-19 for their online registration fees.

544
The Department of Land Reforms has been digitizing land records of the state through Digital
India Land Record Modernisation Programme (DILRMP), with an objective to undertake total
survey of land, deed publication and rent fixation of those lands measured through cadastral
survey. Under this programme, five major works are being undertaken :
(i) Data Centre cum Modern Archive is being established in all the 534 circles of the state,
out of which 426 circles are ready with their own buildings and modern equipments have
been provided by BELTRON to 145 Circle Offices. The rest of the circle buildings will be
completed very soon. The Centre will provide land record access to the landlords after
digitisation of resurvey maps and deeds prepared through the modern technology. A training
institution for survey (revenue) has been set up in Patna to provide technical training to the
revenue personnel of the state.
(ii) Digitisation of Survey Map facilitates supply of cadastral maps for all 38 districts,
revisional maps for 28 districts and consolidation map for 18 districts. In addition, a platter
each has been established at the Bihar Foundation, Mumbai and at the Bihar Bhavan, New
Delhi, which are functional.
(iii) Data entry / re-entry / data convergence has been initiated for supply of deed to the raiyats
/ farmers through facilitation centres or via website throughout Bihar.
(iv) Online Mutation is being facilitated with transparent, speedy, and corruption-free services
to the citizens of the state. It provides online mutation, land-ownership certification and rent
payment. and
(v) Re-survey : Arial photography of all the 38 districts have been completed. Maps are being
provided in 13 districts and will be published for the rest of 25 districts in near future.
Skill Development and Employment Promotion
Skill Development : All the facilities are provided through online portal, including registration,
issuance of admit cards, results and provisional certificates of Industrial Training Institutes (ITI),
regulated under the State Council of Vocational Training and National Council of Vocational
545
Training. In order to promote vocational degrees and diplomas, the Department of Science and
Technology provides online information right from admission to the final result. There are in all
38 Engineering colleges, one in each district, and 44 Polytechnic Institutes running under Seven
Resolves, having the capacity of 9613 and 11,232 seats respectively. The students pursuing degree
courses are being provided an amount of Rs. 4984 and students pursuing diploma courses are
getting Rs. 3542 each and per month during the course period. In addition, 176 degree and 184
diploma holders are getting Rs. 15,000 and Rs. 10,000, respectively, per month for one year
apprenticeship training programme run by each institution. Apart from these initiatives, many skill
development programmes are running under Digital India, Kaushal Vikas Mission, NEILIT, C-
DAC, etc. Bihar Student Credit Card (BSCC) scheme is a fully online scheme under Seven
Resolves for students residing in Bihar who have passed class 12th (10th for Polytechnic) and are
enrolled for higher studies in selected streams as per programme guidelines in a recognized
institute. Students are entitled for an education loan up to Rs. 4 lakh with interest rate of one percent
for female, transgender and disabled and 4 percent for others upon satisfactory loan appraisal.
BSCC is being issued with the objective to make it easily available, with minimum manual
intervention, avoiding unnecessary delays and effective monitoring and tracking of the scheme
progress.
Employment Promotion: Employment Exchanges have been equipped with IT-enabled
platform which facilitates unemployed youths through registration by providing them information
regarding employment opportunities, career counselling, job fare, etc. Further, National Career
Services Portal facilitates job seekers through registration and till date, 26.80 lakh job seeker have
been registered. Mukhyamantri Nishchaya Swayam Sahayata Bhatta Yojana (MNSSBY) has
been introduced in 2016 for unemployed 12th pass youths in the age group of 20-25 years who
have not undergone for any higher education. Under this yojana, a sum of Rs. 320 crore has been
given to the 7.16 lakh unemployed youths through Aadhar authentication. Furthermore, the State
Government has been providing incentive for preparation of Civil Services to Preliminary Test
qualified candidates from SC and ST communities. Bihar Public Service Commission
(BPSC) provides a transparent and easily accessible online facility for the employment under state
civil services. Apart from the examination system, right from the advertisement to result,
attendance surveillance is being done online.

546
Labour Welfare : Bihar Building and Other Construction Workers Welfare
Scheme provides online window for registration of the related workers and their dependents. It
facilitates the information of eligibility, benefits, etc. Under the state scheme of financial
assistance for marriage upto 2 daughters, 351 daughters of the workers got benefitted involving a
sum of Rs. 175.50 lakh at the rate of Rs. 50,000 per girl in 2018-19. Under maternity benefit
scheme, 46 newly mothers got benefitted with Rs. 10,000 each in 2018-19. The State Government
has been providing pension to the registered workers and 11 workers have got a pension of Rs.
1000 per month during same year. Under annual medical assistance scheme, 2,57,345 registered
workers have been benefitted with Rs. 3000 annually disbursed via PFMS during 2018-
19. Departments of 59 workers have been benefitted with an amount of Rs. 1.10 crore under the
state scheme of compensation after death in 2018-19. Further, 37 workers got financial help for
funeral, involving the amount of Rs. 37,000. Till September 2019, 2.41 lakh workers have been
registered on the portal.
Support to Enhance Productivity and Investment
Agriculture and Allied Sectors : National e-Governance Project in Agriculture (NeGP-A) has
been started since 2016, with the objective of strengthening service delivery through DBT in
agriculture sector to eliminate mediator and to promote transparency, efficiency and speedup
service delivery to the farmers. A sum of Rs. 4.47 crore has been disbursed in 2017-18, Rs. 3.68
crore in 2018-19 and Rs. 2.51 crore in 2019-20 till September 2019 through DBT. The State
Government has been providing diesel subsidy to the drought affected farmers for protecting their
crops at the rate of Rs. 50 per litre diesel and Rs. 500 is being provided for one acre of land. A sum
of Rs. 1000 is being provided for 2 times irrigation of jute, Rs. 2500 for 5 times irrigation of paddy
and Rs. 1500 for 3 times irrigation of maize and other rabi crops for one acre area. The diesel
subsidy is provided through online transfer to the registered farmers and 13.86 lakh farmers got
benefitted under the kharif season, while 2.1 lakh farmers under rabi season till September, 2019.
In addition to this, the State Government has also provided an input subsidy to 13.91 lakh farmers
from 280 blocks of 25 drought declared districts. Further, Pradhan Mantri Samman Nidhi
Yojana is a central sector scheme, which has launched in December 2018 with an objective to
enhance farmers’ income. Under this scheme, farmers are getting Rs. 6000 per annum in three

547
equal installments through DBT and 43.95 lakh farmers have been benefitted out of 62.56 lakh
applications. E-Kisan Bhavan has been established in all 534 blocks and 38 district headquarters
for facilitation of schemes and other agriculture related information. Procurement Scheme is
functional since 2015, which provides a minimum support price to the farmers to ensure a
minimum rate for their crops and payment is being made through online in the farmer’s bank
account. During 2018-19, a total of 2.10 lakh MT paddy has been procured by paying Rs. 2478.68
crore to 2.10 lakh farmers and Rs. 3.04 crore to 3128 wheat farmers for 17,504 MT wheat. The
Department of Cooperatives has developed ePAC mobile based solution for paddy procurement.
The Directorate of Economics and Statistics provides financial support for crop cutting
experiment to the farmer through DBT and Rs. 4.28 crore have been given to 6.10 lakh farmers.
Subsidies for establishment of layer poultry farm (1000, 5000 and 10000 capacity), Goat Farm
(20+1, 40+2 and 100+5 capacity) and for building the infrastructure of Broiler Farm (3000
capacity) have been provided to 978 beneficiaries in 2017-18 and 937 in 2018-19, involving a
subsidy amount of Rs. 412.00 lakh and Rs. 12.06 lakh respectively through online payments.
JEEViKA has developed many mobile Apps on livestock. The App captures the process at Poultry
Mother Unit in terms of receiving chicks, vaccination and distribution to the members, households
and monitoring of production. PashuSakhi is an app used at producer’s group level to capture
details of goat herd, goat mortality, etc. at member level. A mobile App has been developed to
capture the details of goat beneficiaries with snap of goat distributed at the goat haat by JEEViKA.
Neera App was developed on the web and mobile app platform to capture details of tappers
including daily neera production and sales. Bihar Shatabdi Niji Nal kup Yojana is a DBT
scheme with an objective to provide subsidy for tubewells and motor pumps. Till date, a sum of
Rs. 40.04 crore has been disbursed through DBT since November 2018 under this scheme.
Industries : The State Government has started an e-governance programme to support power-
looms in Gaya for reimbursement of procurement fee of CTI/CTO since January 2019 and Rs.
5.18 lakh has been provided to 75 beneficiaries till September 2019. Mukhyamantri Ganna
Vikas Yojana has been started since 2016 for promotion of sugar industry as well as farmers
producing sugarcane. A sum of Rs. 7.60 crore has been disbursed among 8734 farmers during
2018-19 compared to Rs. 11.42 crore to 17,507 farmers a year before. JEEViKA has developed a

548
value chain application which captures process of aggregation and value addition to the goods
through community procurement and producer company.
Quality improvement through automation and digital payment of COMFED : It helps to
improve the quality of milk by providing automated testing machine through the investment of
Rs. 73.88 crore. In addition to this, it brings transparency in milk billing and digital payment to
dairy cooperatives / farmers through SAP ERP system. It boosts the trust of consumers of milk
products under the ‘Sudha’ brand. A total of 4.5 lakh farmers, 7224 dairy cooperatives and 8 milk
unions have been benefitted through this project. The details of the project is given in Table 14.7.
Table 14.7 : Number of Beneficiaries and Investment for Quality Improvement of Milk Products (2017-20)
Details 2017-18 2018-19 2019-20 (upto September, 2019)
Beneficiary Investment (Rs crore) Beneficiary Investment
(Rs crore) Beneficiary Investment (Rs crore)
AMCU Installation 3777 DCS 25.88 6744 DCS 55.44 7224 DCS 60.00
Milko Screen Installation — — 8 Milk Unions 1.29 8 Milk Unions 1.64
Milko Scanner Installation
5 Milk Unions 2.61
8 Milk Unions and Head
Office 5.26 8 Milk Unions and
Head Office 5.26
SAP ERP Installation and Configuration
Work in progress 5.50 Configuration
work award 6.98
At 3 plants of Patna Dairy Project, 1 at COMFED Head Office, 1 at Milk Union, 2700 at DCS and to 1.73 lakh members
6.98
Source : COMFED, Bihar
Forest Management Information System (FMIS) : Economic development has its impact on
environment. Many cities of the state are among the west polluted cities in the country. Therefore,
the State Government has started FMIS since 2012 to promote green cover with the objective of
increasing the outreach of forest officers effectively through IT-enabled applications. A sum of
Rs 1.4 crore has been spent during 2017-18 to 2019-20 (till September 2019) and this has
connected 2840 different types of stakeholders through 1808 transactions under this system. Many
IT-enabled programmes have been executed by the Department of Environment, Forest and
Climate Change, as given in Table 14.8 below.

549
Table 14.8 : E-governance Programmes for Green Cover (2019)
Source : Department of Environment, Forest and Climate Change, GoB
_______________
Application Benefit
e – Nursery This App is used for effective monitoring by concerned field officers and headquarter level officers through uploading inspection reports with geo-tagged photographs of Nurseries.
e – Plantation This app is used for effective monitoring by concerned field officers and headquarters level officers through uploading of inspection reports with geo-tagged photographs of Plantations.
e – Forestry
This is used by citizen of Bihar and farmers for applying online in government forestry schemes against which the Department distributes plants free of cost as per basic criteria. Other facilities, like purchase of plants from departmental nursery etc. can be availed. Online and offline payment modes are available.
e – Forest Mandi
It is being developed as a knowledge and information sharing to facilitate sale/purchase, quality improvement, service and technology sharing platform for forest produce. This is used for quality improvement and to reduce the nexus of middlemen, thereby purchaser and buyer can interact directly with each other.
Visitor Pass System This web application is used to create passes for visitors who come in to make an appointment with officials/personnel of the Department at PCCF Office, Aranya Bhawan.
e – JFM (Joint Forest Management)
With help of e-JFM app, field data can be inspected and captured. Hand Pump, Solar Light etc. and other entry point activities can be mapped.
e – Wildlife This App helps to monitor and take action about wildlife incidents, and to calculate how many and type of animals stay in a particular forest with help of animal sign and sighting.
e – Forest Offence It is beneficial for proper and fast reporting. Easy to monitor and take action regarding illegal felling, illegal mining, land encroachment & fire outbreak incidents.
e – Lekha In this application, entry of allotment and expenditure of different schemes such as Plan, Non-Plan, CAMPA, SFDA, and Durgawati is done. Entry of monthly account submission is also done through e-Lekha.
HRMS It is used to preserve employees’ most useful service information currently available in their service book records into electronic form (e-Service Book).
e – Leave This app is used by the department officials to apply for leave as CL, RH, CL+RH, outstation leave. Message facility is also available.
e – RDF (Scheme Formulation System)
This application is used to formulate scheme such as RDF, SMC and generate its detailed report.
e – Park Ticketing System
This application is being developed to facilitate park ticketing for visitors to generate QR code-based tickets and online payment integration.
e – Photo This application is to facilitate capturing of random event photos by forest officials.
e – Hariyali This application is to facilitate capturing of greening works done by citizens and public.
e – Report This application is to facilitate viewing of all forest reports in one place for forest officials.
SPARROW Implementation of SPARROW (e—PAR) for writing the APAR of IFS Officers.


